Embed Size (px)
Citation preview
arX
iv:h
ep-p
h/98
0528
8v3
2 O
ct 1
998
Exotic massive hadrons andultra-high energy cosmic rays
Ivone F. M. Albuquerque1
Department of Astronomy and Astrophysics, Enrico Fermi Institute
The University of Chicago, Chicago, Illinois 60637
Glennys R. Farrar2
Department of Physics and Astronomy
Rutgers University, Piscataway, New Jersey 08855
Edward W. Kolb3
NASA/Fermilab Astrophysics Center
Fermi National Accelerator Laboratory, Batavia, Illinois 60510, and
Department of Astronomy and Astrophysics, Enrico Fermi Institute
The University of Chicago, Chicago, Illinois 60637
We investigate the proposal that primary cosmic rays of energy above
the Greisen–Zatsepin–Kuzmin cutoff are exotic massive strongly interacting
particles (uhecrons). We study the properties of air showers produced by
uhecrons and find that masses in excess of about 50 GeV are inconsistent
with the highest energy event observed. We also estimate that with sufficient
statistics a uhecron of mass as low as 10 GeV may be distinguished from a
proton.
PACS number(s): 96.40, 98.70, 11.30.P
1Electronic mail: [email protected] mail: [email protected] mail: [email protected]

1 Introduction
About thirty years ago it was pointed out that sufficiently energetic cosmic rays will
lose energy scattering with the cosmic microwave background (CMB) or radio wavelength
background radiation (RBR). Greisen [1] and Zatsepin and Kuzmin [2] (GZK) noticed
that above threshold for pion production a cosmic-ray proton will lose energy by pion
photoproduction. Sufficiently energetic nuclei also have a limited range before suffering
photodissociation. The mean-free-path for a proton with energy above pion production
threshold is less than a dozen Mpc, and the mean–free–path for a nucleus above threshold
for photodissociation is even shorter1.
With the assumption that very high energy cosmic rays originate from sources more
distant than this, Greisen and Zatsepin and Kuzmin predicted that there should be a
maximum observed energy in the cosmic-ray spectrum. This maximum energy, known
as the GZK cutoff, is usually taken to be around 5 × 10¹⁹eV. Surprisingly, today there
are more than 20 events observed with energy in excess of the GZK limit, and 8 events2
above 1020eV [4, 5, 6, 7, 8]. The slope of the energy spectrum appears to change around
1019eV (in fact it appears to harden), possibly indicating a new hard component in the
cosmic-ray spectrum above the cutoff.
The most straightforward interpretation of the observation of cosmic rays above the
GZK cutoff is that the sources of the cosmic rays must be “local” (within 50 Mpc or so).
Since cosmic rays above the GZK cutoff should be largely unaffected by intergalactic
and galactic magnetic fields, there should be candidate cosmic accelerators associated
with the arrival direction of the UHE cosmic rays.3 But there seems to be no unusual
1However, the original estimates of the infrared and far infrared background have been recentlyreexamined, leading to a possibility of a larger photodissociation mean free path [3].
2This number does not include events from southern hemisphere detectors.3In this paper, ultra-high energy (UHE) will refer to energies near or above the GZK cutoff, which
we take as 5 × 10¹⁹eV.
1

astrophysical sources such as active galactic nuclei or quasars within 50 Mpc in the
direction of the events above the GZK cutoff. There are hints of unusual sources at
cosmological distances (redshift of order unity) associated with the arrival directions of
the highest energy cosmic rays [9, 10], but there is no way a UHE nucleon or nucleus
could reach us from such distances. This suggests that new physics or astrophysics is
required to understand the nature, production, composition, and propagation of such
high-energy cosmic rays. This issue has attracted a lot of attention, because even the
most conservative explanations involve exciting new physics.
The first possible explanation is that the UHE cosmic rays actually do originate
within 50 Mpc from us but we cannot see the accelerator. One might argue that the fact
that there are events above the GZK cutoff is evidence that there must be galactic or
extragalactic regions where the magnetic fields are far stronger than generally believed, so
the arrival direction would not be correlated with the source direction [11]. Or, perhaps
the reason we do not observe any vestige of the cosmic accelerator is that the acceleration
results from a transient phenomenon such as a cosmic defect [12] or a gamma-ray burst
in a relatively nearby galaxy [13]. In these scenarios the source could be within 50 Mpc
and a primary cosmic-ray hadron could reach us without appreciable energy loss. Note
however that the integrated flux reduction factor for a 3.2 × 10²⁰ eV cosmic ray is of
order 100 or more at 50 Mpc (c.f., Fig. 2 of Ref. [9]).
A second possibility is that the UHE cosmic rays are not nucleons, and originate
from sources at cosmological distances without suffering energy loss while propagating
through the radiation backgrounds. Stable non-hadronic primary candidates are elec-
trons, photons, and neutrinos. Electrons are not candidates since their energy loss during
propagation is huge. Photons interact with the CMB and RBR and lose energy by e+e−
production, resulting in a propagation distance comparable to protons. Furthermore,
the highest energy cosmic-ray events are unlikely to be due to photons because photon-
2

induced showers do not resemble the observed Fly’s Eye shower [14] and the muon content
of other events is consistent with expectations for a hadronic rather than photon pri-
mary [8]. Neutrinos could reach us from cosmological distance without energy loss, but
it was shown that even allowing for new physics, the observed events could not be due
to neutrino-induced showers [15]. Even with the meager number of UHE events it seems
very likely that the atmospheric shower was induced by a strongly interacting particle.4
A third possibility is that the primary is a hadron, as suggested by the properties
of the observed air showers, but for some reason it has a longer path length than a
normal nucleon. There are two ways this might happen. The first way is if the cross
section for interaction with the CMB is smaller. The second way is for the energy
threshold for resonant photoproduction interactions to be higher, so that the GZK bound
is “postponed” to higher energy. Farrar [17] pointed out that the existence in certain
supersymmetric models of a new stable hadron (e.g., S0) with a mass of several GeV
can realize this possibility. Due to its greater mass and its large mass-splitting to its
resonances, the threshold energy for resonance pion production is increased compared
to a proton. This increases its effective path length and postpones the GZK cutoff to
higher energy.
A complete calculation of energy loss due to pion photoproduction, redshift, and e+e−
production was done by Chung, Farrar and Kolb[18] (CFK) for S0’s in the mass range
around 2 GeV. Their analysis demonstrated that the effective range through the CMB of
a neutral primary as light as 2 GeV, with cross sections typical of a neutron but with a
larger gap to the lowest resonance, would be fifteen times more than a nucleon. Although
their detailed analysis involved masses of around 2-3 GeV, they pointed out that one
might entertain the possibility that the primary is much more massive than the nucleon.
4Weiler has proposed a hybrid model [16] where UHE neutrinos propagate from cosmological dis-tances, then produce hadrons in collisions with massive neutrinos in the galactic halo. This model seemsto require several parameters to be finely tuned.
3
Indeed, extensions of the standard model often involve new colored particles with masses
of order a TeV, which may be stable or long-lived. Since the pion production threshold
energy is directly proportional to the mass of the primary, the GZK cutoff energy trivially
increases for a massive primary and, in addition, the fractional energy loss per collision
is smaller for a more massive primary. Thus, from purely kinematical considerations the
path length of the primary increases rapidly as its mass increases. If a cosmic accelerator
produces primary protons with energies in excess of 1021 or so eV, then the accelerated
proton could collide with a proton at rest near the accelerator and produce massive,
high-energy particles with energy above the GZK cutoff: in the collision of a primary of
energy 1021eV with a proton at rest, the invariant energy is√
s ∼ 103TeV!
CFK coined the name “uhecron” to describe a new species of long-lived or stable,
electrically neutral5 hadron which, due to its mass, can provide the answer to the cosmic-
ray conundrum. Such a primary of mass M can have sufficient range through the cosmic
backgrounds to reach us from sources at cosmological distances (L ∼ 1 Gpc) if its mass
is more than a few GeV, and its lifetime is greater than 106s(M/3GeV)(L/1Gpc).
But, as CFK pointed out, the fact that the uhecron is hadronic does not guarantee
that it will shower in the atmosphere like a nucleon. If the uhecron contains a heavy
constituent of mass M , the fraction of its momentum which is carried by light degrees of
freedom is approximately ΛQCD/M . It is energy from the light degrees of freedom that
is released in a typical hadronic interaction. Thus, if the uhecron contains a massive
constituent, the energy spectrum of the particles produced in a uhecron-nucleon inter-
action will be very soft. CFK argued that for a sufficiently massive uhecron it should be
possible to differentiate between a shower induced by a uhecron and a shower induced
by a proton.
5The reason CFK take the uhecron to be neutral is to avoid its interaction with galactic and extra-galactic magnetic field and the consequent energy loss due to pair production and other mechanisms.This may not be an essential requirement, depending on the distance to the accelerator.
4
The purpose of this paper is to determine the maximum possible mass of a primary
consistent with present observations by comparing the shower of a massive uhecron with
the development of the highest-energy cosmic-ray shower observed, the E ∼ 3.2×10²⁰eV
event observed by the Fly’s-Eye detector [7]. On the basis of the comparison, we show
that the uhecron must be less massive than about 50 GeV in order to explain the highest
energy event.
We also perform a more general comparison of proton-induced and uhecron-induced
air showers to find means of discriminating between them. Since the fluctuations in
the development of hadronic showers is large, it is impossible to identify reliably the
difference between a massive uhecron and a proton on a shower-by-shower basis. But
we show that with sufficient statistics a uhecron with mass larger than 10 GeV may be
distinguishable from proton showers.
It is important again to restate explicitly the picture of the uhecron we will adopt for
this study. We will assume the uhecron consists of a single constituent which accounts
for the bulk of the mass of the particle, surrounded by light hadronic degrees of freedom
(gluons and/or light quarks). This definition of a uhecron strictly does not encompass
the archetypical uhecron, the S0 [17, 18] which is a bound state of light quarks and a
relatively light gluino (udsg). The momentum of the S0 is shared roughly equally by
all constituents, so its shower properties are expected to resemble those of a nucleon.6
However there are a number of interesting uhecron candidates for which the present
definition is appropriate:
1. Raby has proposed a class of low-energy SUSY models in which the gluino is the
lightest supersymmetric particle [19]. Presumably the lightest color-singlet state
containing the gluino is the R0 (a gluino–gluon color singlet). For gluinos more
6Furthermore, even if the S0 momentum were carried by a single constituent, our results (see below)indicate that with a mass of order 2 GeV its shower is not distinguishable from a proton.
5
massive than the QCD scale, the mass of the R0 would be approximately the mass
of the gluino, which could be anywhere from a few GeV to 100 GeV in his model.
2. Extensions of the standard model often include new colored particles of mass in
the 1 to 10 TeV range, often stable because of some accidental symmetry or a new
conserved quantum number (see [18, 20] for examples). Note that cosmological
restrictions require them to be unstable over some mass ranges [21].
3. The uhecron may be a massive magnetic monopole (mass around 1010±1GeV), ac-
celerated by galactic magnetic fields to UHE energies [22]. The magnetic monopole
would have a small core, but could also be surrounded by a gluon cloud. Since the
monopole is accelerated by galactic fields, there need be no striking astrophys-
ical sources in the direction of the incoming UHE cosmic rays. Note, however,
that it has been argued that their spectrum and arrival direction disagrees with
observation [23].
In the next section we describe the longitudinal development of air showers. After
a very brief description of the parameterization of the development of the air shower,
we describe the procedure used in the simulation of the phenomenon. We then discuss
the modifications necessary to study the development of uhecron-induced showers. In
Section 3 we present the results of the uhecron simulations and contrast the development
of uhecron showers and proton showers. We next compare the uhecron results to the
data for the highest-energy event observed and derive a limit on the mass of the uhecron.
We then discuss the kind of limit one might conceivably obtain with a larger data set.
Finally, before ending the section, we describe the ground-level particle content of a
uhecron shower as might be observed with a ground array of detectors. We then present
a short concluding section.
6
2 Ultra High Energy Air Showers
2.1 Shower development
The highest energy event was detected [7] by the Fly’s Eye collaboration using the
atmospheric fluorescence technique [24]. An air fluorescence detector measures the lon-
gitudinal profile of the air shower. This profile reflects the development of the cascade
generated by the interaction of the primary particle with the atmosphere.
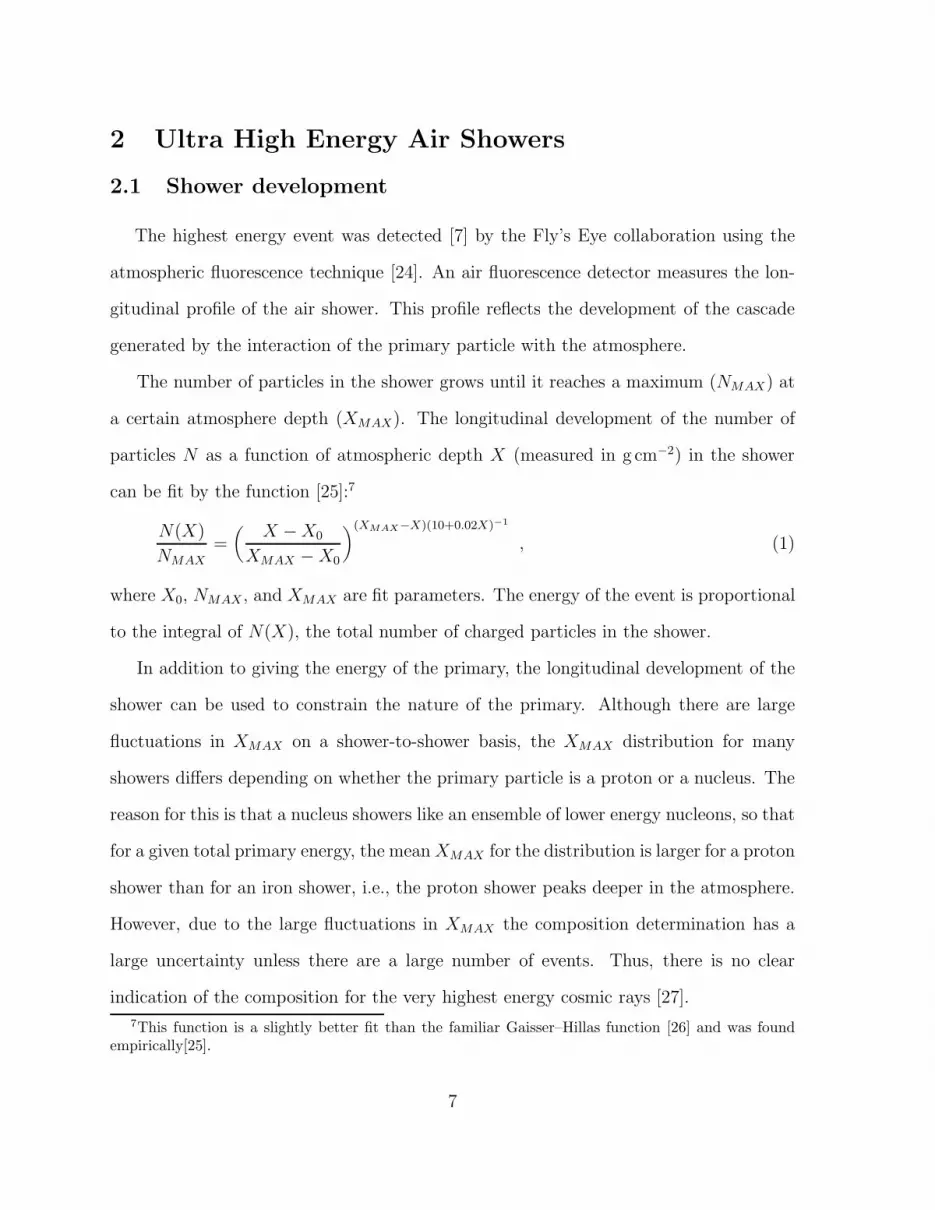
The number of particles in the shower grows until it reaches a maximum (NMAX) at
a certain atmosphere depth (XMAX). The longitudinal development of the number of
particles N as a function of atmospheric depth X (measured in g cm−2) in the shower
can be fit by the function [25]:7
N(X)
NMAX
=(
X − X0
XMAX − X0
)(XMAX−X)(10+0.02X)−1
, (1)
where X0, NMAX , and XMAX are fit parameters. The energy of the event is proportional
to the integral of N(X), the total number of charged particles in the shower.
In addition to giving the energy of the primary, the longitudinal development of the
shower can be used to constrain the nature of the primary. Although there are large
fluctuations in XMAX on a shower-to-shower basis, the XMAX distribution for many
showers differs depending on whether the primary particle is a proton or a nucleus. The
reason for this is that a nucleus showers like an ensemble of lower energy nucleons, so that
for a given total primary energy, the mean XMAX for the distribution is larger for a proton
shower than for an iron shower, i.e., the proton shower peaks deeper in the atmosphere.
However, due to the large fluctuations in XMAX the composition determination has a
large uncertainty unless there are a large number of events. Thus, there is no clear
indication of the composition for the very highest energy cosmic rays [27].
7This function is a slightly better fit than the familiar Gaisser–Hillas function [26] and was foundempirically[25].
7

Most of the statistics of UHE events have been gathered by extensive air shower
(EAS) arrays rather than with the air fluorescence technique. EAS arrays measure the
density of particles as a function of the distance from the core, from which the energy
of the primary is inferred. The ratio of muons to the electromagnetic density at some
distance from the core of the shower (600m or more) can be used to tell whether the
showers were induced by photons or hadrons. Discrimination between nucleons and
nuclei is more difficult but feasible with sufficient statistics.
In this work, we simulate the development of showers initiated by a 320 EeV uhecron
of various masses between 2.5 and 100 GeV. We compare the results of their longitudinal
development to the shower observed in the highest energy event. We also estimate the
ratio between muon and total charged particle densities at ground level. We find that
it is not possible to distinguish a proton from a uhecron on a shower-to-shower basis,
unless the uhecron is extremely massive. However, with sufficient statistics it may be
possible to discern the difference between the showers of a uhecron of mass greater than
about 10 GeV and those of a nucleon.
We emphasize that our goal is to look at differences between the shower development
of ultrarelativistic nucleon and uhecron primaries. It is known from new data at lower
energies that existing shower simulations are inadequate in several respects. This new
data will allow improvements in the modeling of the QCD processes, just as modeling
of hadronic collisions relevant for discovering new particle physics at LEP, SLC and the
FNAL collider gradually improved with more complete data on conventional processes.
Likewise, by the time enough events have been accumulated above the GZK bound to
apply the kind of analysis we envision, there will be a vastly larger number of events
at energies below the GZK bound, where we can be confident the primaries are domi-
nantly conventional particles. That will allow the understanding of conventional particle
showers to be improved to the point that we can have confidence in the modeling of the
8

showers due to proton primaries above the GZK bound. Then a deviation due to new
particles can be studied. Our purpose below is to estimate the extent of the deviation in
showering between proton and uhecron primaries which follows from the difference in the
momentum-fraction carried by light consituents in a uhecron as compared to a nucleon.
We expect this to be a robust discriminator, very weakly dependent of the details of how
the light constitutents produce a shower.
2.2 Air Shower Simulation
An air shower simulation requires an event generator to simulate the interaction of
each shower particle with an atmospheric nucleus and a simulation of the cascade devel-
opment. In our simulations we use Aires (AIR Shower Extended Simulations) [28] as the
cascade simulator8 and Sibyll [31] as the event generator. We modified Aires and Sibyll
to include a new particle, the uhecron. The modification to Aires was straightforward:
adding a new particle to the cascade development. The modifications to Sibyll were more
extensive.
Sibyll uses a combination of a model for low energy hadron-hadron interactions, a
model for the “hard” part of the cross section, and a model to go from hadron-hadron
to hadron-nucleus interactions. For the initial very high energy interactions at√
s up
to 800 TeV, an extrapolation from data taken in laboratory experiments is required. In
Sibyll this is done with the Dual Parton Model augmented by minijet production (see
[31] and references therein) as will be briefly described below.
In the low energy regime (√
s ≃10 to 20 GeV or Elab =50 to 200 GeV) the observed
hadronic cross section exhibits Feynman scaling. At these energies, hadron-hadron inter-
actions can be represented by the production and fragmentation of two QCD strings (see
8The cascade development used in Aires is similar to the one used in MOCCA [29]. For a comparisonbetween Aires and MOCCA, see [30].
9

[31] and references therein). The collision occurs between the incoming hadron (either
a baryon or a meson) and nucleons in a target nucleus, which is randomly taken to be
oxygen or nitrogen. In the case of a baryon-baryon collision the energy of each baryon
is divided between one quark q and one diquark qq. Sibyll employs a structure function
to describe the fraction x of the baryon energy carried by the quark fragment given by
fq(x) =(1 − x)α
(x2 + µ2/s)1/4. (2)
Here µ is considered as an “effective quark mass” and is taken to be 0.35 GeV and α
is taken to be 3.0. The diquark carries the remaining energy of the hadron, aside from
that part of the hadron energy going into minijet production.
QCD strings are formed between the quark of the incoming particle and the diquark
of the target, and vice-versa. The formation of strings obeys energy and momentum
conservation. At the end of this process, hadronization occurs. The energy of each
produced particle is generated according to the Lund fragmentation function [31]. At
each interaction, “leading particles” are produced. They are the baryons which contain
the original diquark from the incoming particle and from the target nucleons. The energy
carried by these particles is described by a harder fragmentation function than that for
the non-leading particles.
2.3 Modifications to Sibyll to include a uhecron
We modify Sibyll as described below to account for the difference between the energy
deposition properties of a hadron containing a heavy constituent “clothed” by light
quarks and gluons (a uhecron) and the energy deposition of a normal hadron whose
momentum is carried only by light constituents. As is well understood in the context of
Heavy Quark Effective Theory (HQET) [32], the interaction of the uhecron with matter
is dominated by the interaction of its light degrees of freedom (quarks and/or gluons).
10

Hadronic total cross sections are determined by the spatial extent of the colored
quanta. By the uncertainty principle, this is greatest for the lightest degrees of freedom,
so we take as our canonical choice for the uhecron-nucleon cross section σUN = σπN , since
the light degrees of freedom are light quarks, antiquarks, and gluons for nucleon, mesons
and uhecron. However we also consider explore the effect of taking σUN = 1/10σπN .
This lower cross section is motivated by lattice QCD studies which show that the radii
of glueballs tend to be two to four times smaller than the radii of ordinary mesons. The
reduced size of a hadron containing a valence color-octet particle is understood as being
due to its larger color charge and thus stronger confining potential. Thus, if the uhecron
contains a heavy color-octet constituent such as a gluino, the lower cross section may be
appropriate.
In an ultrarelativistic uhecron, as in a B meson, the heavy constituent (mass mQ)
has most of the momentum of the uhecron and the light degrees of freedom are left with
only a small fraction. In our modification of Sibyll, we use for the uhecron the standard
Peterson function [33] to describe the fraction of energy z of a heavy hadron carried by
its heavy quark Q:
fQ(z) =1
z
[
1 − 1
z− ǫQ
1 − z
]−2
. (3)
Here ǫQ is proportional to Λ2QCD/m2
Q. We use this function to replace the hadronic
structure function, Eq. (2), and the fragmentation function of a standard hadron. In the
fragmentation function the final hadron carries a fraction z of the energy of its parent
“quark”. This is a hard fragmentation function, and in the limit mQ → ∞ it approaches
a delta function peaked at 1. We use the Peterson fragmention function since it is in
good agreement [33] with data for b quark interactions and has the required qualitative
behavior in the limit of extremely heavy constituent.
In the hadron-hadron interaction model employed by Sibyll the quarks that belonged
11

to the original baryon undergo a hadronization process in which different probabilities
are taken for forming various hadrons [31]. In the uhecron case, the only possibility is
for the heavy “quark” Q to hadronize as a uhecron.
Sibyll also includes diffractive dissociation. When diffraction occurs the incoming
particle is excited into a higher mass state and then decays if its mass is not large. For
larger masses, as in the uhecron case, the excited state does not decay and is instead
split, e.g., into a quark and a diquark in the baryon case. These move apart stretching
a string between them. The string fragments as in the nondiffractive case. The only
modification in the diffractive part of Sibyll was to modify the minimal mass limit of the
excited state according to the uhecron mass.
A final modification was related to the “hard” part of the cross section in which the
momentum transfer is large. In this case Sibyll models the production of minijets with
energies of several GeV. As the uhecron interacts always with low energy because most
of the initial energy is carried by the heavy quark that does not interact, we neglect
minijet production when the incident particle is a uhecron. Of course, ordinary hadrons
are created even in a uhecron-initiated shower and minijets can be produced from the
subsequent interactions of these normal hadrons.
12

3 Results of the simulations
3.1 Longitudinal shower development
Assuming a shower energy of 320 EeV, in Fig. 1 we show the longitudinal distributions
(see Section 2) for protons, 2.5 GeV uhecrons, 10 GeV uhecrons, and 50 GeV uhecrons.9
For each case, the histogram is the single best representation of 500 shower simulations,
and the solid line is the best fit to the histogram using Eq. (1).
The first plot shows iron and proton showers for a reference. The other plots in
this figure show that 〈XMAX〉 increases as the uhecron mass increases. The shower
maximum is deeper for a heavier uhecron because the energy loss per uhecron–nucleon
collision decreases as the uhecron mass increases. The profile for a typical 2.5 GeV
uhecron resembles that of a proton, but 〈XMAX〉 is approximately 40 g cm−2 deeper and
NMAX is lower. The average profile for a 50 GeV uhecron appears very different than
the proton. However, it would be hard to distinguish a 50 GeV uhecron from a proton
for an individual shower just based on its longitudinal distribution. This is because of
the large fluctuations in the the value of XMAX for hadron-initiated showers.
In order to study the XMAX fluctuations, we show in Fig. 2 the XMAX distribution for
the 500 showers used in Fig. 1. It is evident that as the uhecron mass increases 〈XMAX〉
increases and the distribution becomes broader. This broadening of the distribution
makes it difficult for a single event identification of a high-mass uhecron since XMAX
fluctuates more when the particle mass is higher. Conversely, given a large number of
events, the observed dispersion in XMAX would itself be a useful tool in identifying a
uhecron and inferring its mass.
9Unless otherwise specified the uhecron-nucleon cross section is the same as for a pion-nucleon inter-action. We return to the reduced cross section case at the end of this section.
13

0
250
500
750
1000
1250
1500
1750
2000
2250
x 10 8
0 200 400 600 800 1000 1200 1400
IRON
PROTON
depth (g/cm2)
num
ber
of p
arti
cles
0
200
400
600
800
1000
1200
1400
1600
1800
x 10 8
0 200 400 600 800 1000 1200 1400
UHE(2.5 GeV)
PROTON
depth (g/cm2)
num
ber
of p
arti
cles
0
200
400
600
800
1000
1200
1400
1600
1800
x 10 8
0 200 400 600 800 1000 1200 1400
UHE(10 GeV)
PROTON
depth (g/cm2)
num
ber
of p
arti
cles
0
200
400
600
800
1000
1200
1400
1600
1800
x 10 8
0 200 400 600 800 1000 1200 1400
UHE(50 GeV)
PROTON
depth (g/cm2)
num
ber
of p
arti
cles
Figure 1: Longitudinal development for 320 EeV showers based on 500 showers foreach. All plots are compared with the proton profile: a) iron; b) uhecron (2.5 GeV); c)uhecron (10 GeV); d) uhecron (50 GeV). The fitted XMAX is given for each primary.
14

0
50
100
150
200
250
300
0 200 400 600 800 1000 1200 1400xmax (g/cm2)
num
ber
of s
how
ers
↑0
20
40
60
80
100
120
140
0 200 400 600 800 1000 1200 1400xmax (g/cm2)
num
ber
of s
how
ers
xmax (g/cm2)
num
ber
of s
how
ers
↑
0
20
40
60
80
100
120
140
0 200 400 600 800 1000 1200 1400xmax (g/cm2)
num
ber
of s
how
ers
xmax (g/cm2)
num
ber
of s
how
ers
↑0
20
40
60
80
100
120
140
0 200 400 600 800 1000 1200 1400xmax (g/cm2)
num
ber
of s
how
ers
xmax (g/cm2)
num
ber
of s
how
ers
↑Figure 2: XMAX distribution for 320 EeV showers. All plots are compared with theproton distribution: a) iron; b) 2.5 GeV uhecron; c) 10 GeV uhecron; d) 50 GeV uhecron.The distributions are based on 500 showers for each case.The arrows indicate the valueof XMAX for the Fly’s Eye event, 815+60
−53.
15
3.2 Uhecron showers compared to observation
From the XMAX distributions shown in Fig. 2 one can estimate the compatibility
between these simulated showers and the Fly’s Eye event. The energy of the observed
event [7] is 320+92−94 EeV, the XMAX is 815+60
−53 g cm−2, and the zenith angle is 43◦.9+1◦.8−1◦.3 (the
uncertainty is a combination of statistical and systematic effects). We use these values
for the primary energy and the zenith angle in our simulations.
We compare our results with this Fly’s Eye event because it is the only one with
energy above the GZK cutoff detected with the atmospheric fluorescence technique. This
allows a comparison of XMAX and the longitudinal distribution of our simulations with
the observed event.
One can get a qualitative understanding why there will be a mass limit for the uhecron
by examining Fig. 2. The distribution for a 2.5 GeV uhecron is not very different from
the proton distribution10. But as the uhecron mass increases, the distribution becomes
distinguishable from the proton distribution. The trend is that as the mass increases,
〈XMAX〉 increases, as does the variance of the distribution.
The 320 EeV event observed by Fly’s Eye had XMAX of 815 g cm−2. This value is
quite low compared to the mean of the distributions for large uhecron mass and therefore
the observed event is unlikely to come from the probability distribution for large uhecron
masses. The fact that the width of the uhecron’s XMAX distribution increases with mass
complicates this simple picture, but one can still estimate the maximum uhecron mass
consistent with observation, keeping in mind the fact that there is but one event.
We will assume that the observed event was generated by a uhecron of unknown
mass. The probability that the event resulted from a uhecron of mass Mi is proportional
to the probability for a uhecron of mass Mi to generate the observed event (Bayes’ rule
10Nor have we included sufficient refinement in the modeling for such a small difference to besignificant.
16
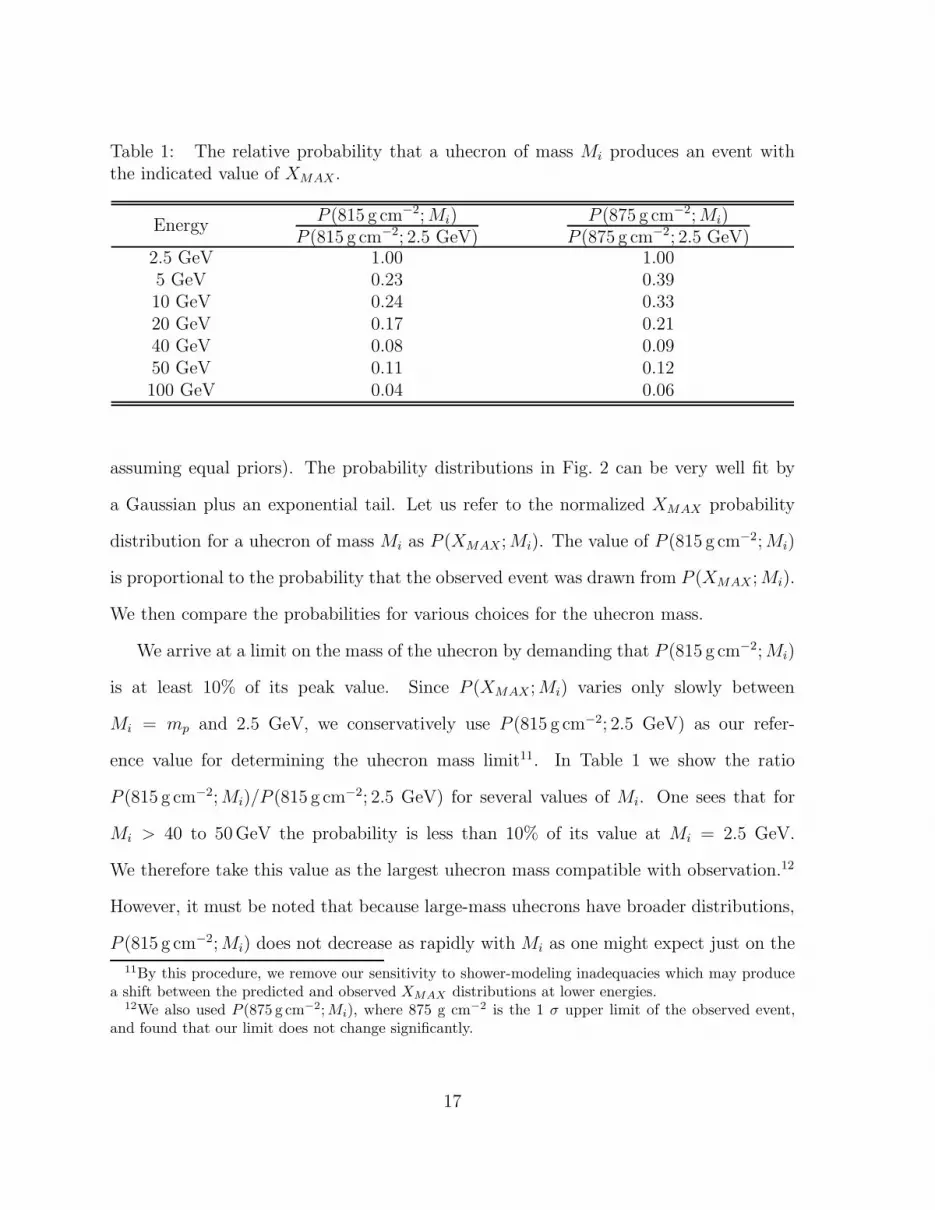
Table 1: The relative probability that a uhecron of mass Mi produces an event withthe indicated value of XMAX .
EnergyP (815 g cm−2; Mi)
P (815 g cm−2; 2.5 GeV)P (875 g cm−2; Mi)
P (875 g cm−2; 2.5 GeV)2.5 GeV 1.00 1.005 GeV 0.23 0.3910 GeV 0.24 0.3320 GeV 0.17 0.2140 GeV 0.08 0.0950 GeV 0.11 0.12100 GeV 0.04 0.06
assuming equal priors). The probability distributions in Fig. 2 can be very well fit by
a Gaussian plus an exponential tail. Let us refer to the normalized XMAX probability
distribution for a uhecron of mass Mi as P (XMAX; Mi). The value of P (815 g cm−2; Mi)
is proportional to the probability that the observed event was drawn from P (XMAX ; Mi).
We then compare the probabilities for various choices for the uhecron mass.
We arrive at a limit on the mass of the uhecron by demanding that P (815 g cm−2; Mi)
is at least 10% of its peak value. Since P (XMAX; Mi) varies only slowly between
Mi = mp and 2.5 GeV, we conservatively use P (815 g cm−2; 2.5 GeV) as our refer-
ence value for determining the uhecron mass limit11. In Table 1 we show the ratio
P (815 g cm−2; Mi)/P (815 g cm−2; 2.5 GeV) for several values of Mi. One sees that for
Mi > 40 to 50GeV the probability is less than 10% of its value at Mi = 2.5 GeV.
We therefore take this value as the largest uhecron mass compatible with observation.12
However, it must be noted that because large-mass uhecrons have broader distributions,
P (815 g cm−2; Mi) does not decrease as rapidly with Mi as one might expect just on the
11By this procedure, we remove our sensitivity to shower-modeling inadequacies which may producea shift between the predicted and observed XMAX distributions at lower energies.
12We also used P (875 g cm−2; Mi), where 875 g cm−2 is the 1 σ upper limit of the observed event,and found that our limit does not change significantly.
17

basis of the increase of 〈XMAX〉. For instance, P (815 g cm−2; 100 GeV) is only about half
as large as P (815 g cm−2; 50 GeV). The moral is that more data is needed, but just on
the basis of one event, a uhecron of mass larger than 40 to 50 GeV seems very unlikely.
3.3 Achievable mass limit with additional data
Now we turn to the question of how one might improve the limit on the uhecron
mass with the observation of many more events. This discussion is meant to be just an
indication of what might be obtained.
The most distinctive feature of the XMAX distribution for uhecron showers is the
prominence of the tail for large XMAX . As the mass increases, the tail becomes more
pronounced. If sufficient events are observed to form the XMAX probability distribution
function, then one can test for the size of the tail.
We proceed as follows:
1. For the proton and for various mass uhecrons, we fit the probability distribution
functions of Fig. 2 to a Gaussian plus an exponential tail for large XMAX . (The
distributions are very well fit by this form.)
2. We generate a synthetic data set of N events from the probability distribution
function for a uhecron of mass M .
3. We fit the N events generated in this way with the proton probability distribution
function generated in step 1. If it has a reasonable χ2, then we proceed, if not,
we say that the data set generated in step 2 is incompatible with arising from
proton-induced showers.
4. We subject data sets with a reasonable χ2 to another test by computing the number
of events in the exponential tail and comparing it to the number of events in the
Gaussian part of the distribution.
18

5. If this ratio is the same (within ±30%) of that expected from the proton distribu-
tion, we say that the generated events are consistent with arising from the proton
distribution function.
6. Then we repeat steps 2 through 5 many times. Some data sets of N events will be
consistent with a proton distribution, and some will not be consistent. We compute
the percent of data sets that are consistent with the proton. If a large percentage
of synthetic data sets are consistent, then we are unlikely on the basis of N events
to be able to differentiate between a uhecron of mass M and a proton. If, on the
other hand, only a small percentage of the synthetic data sets are consistent with
a proton distribution, then we are very likely to be able to discriminate between a
uhecron of mass M and a proton on the basis of N events.
7. We repeat the procedure for different M and N .
The result of this procedure is shown in Fig. 3. The trends in Fig. 3 are easy to un-
derstand. For a data set consisting of a given number of events, it is less likely for
a large-mass uhecron to be consistent with a proton distribution. For a given uhecron
mass, as the number of events increases, it becomes easier to differentiate a proton from a
uhecron. The apparent rise at 50 events for a 10 GeV uhecron is a statistical fluctuation.
We derive a “potential” mass limit from the fact that if the uhecron mass is larger
than 10 GeV, there is better than a 95% probability one would be able to tell that the
XMAX distribution was not generated by a proton from a data set with more than 30
events.
Again, we stress that this is just an illustrative calculation. For instance, we have
not included any smearing of the XMAX probability distribution functions as a result
of finite detector resolution. A full analysis of this issue must be left to the detector
collaborations, but we can get a preliminary idea of its importance as follows. Let
19
us assume that the experimentally determined XMAX is Gaussian distributed about the
actual XMAX , with width σE ≃ 20 g cm−2. As can be seen from Fig. 2, the proton XMAX
probability distribution function is also reasonably well fit by a normal distribution, due
to the stochastic nature of particle production in hadronic showers. The width of the
intrinsic XMAX spreading is rather large, σI ≃ 50 g cm−2. Thus the reconstructed XMAX
distribution will be Gaussian with width σ =√
σ2I + σ2
E . So long as σE is smaller than
σI , the experimentally measured width of the distribution would not be much different
than shown in Fig. 2 using only the intrinsic smearing. A more serious issue would be if
there are non-Gaussian tails in the detector resolution at large XMAX . This would cause
the observed proton distribution to resemble a uhecron distribution. A true limit on
the uhecron mass will require a simulation including the detector response function, but
unless there are large non-Gaussian tails in the detector response, our estimates should
give a reasonable indication of what is achievable.
3.4 The effect of the uhecron cross section
We also investigated the dependence of the longitudinal profile on the cross section
of the uhecron, as discussed in Section 2.3. In addition to using the same pion–nucleon
cross section, we simulated showers where the cross section for the uhecron–nucleon
interaction was 1/10 of the pion–nucleon interaction. Seven samples were produced, for
masses of 2.5, 5, 30, 35, 40, 45 and 50 GeV. The results of the cross section comparison
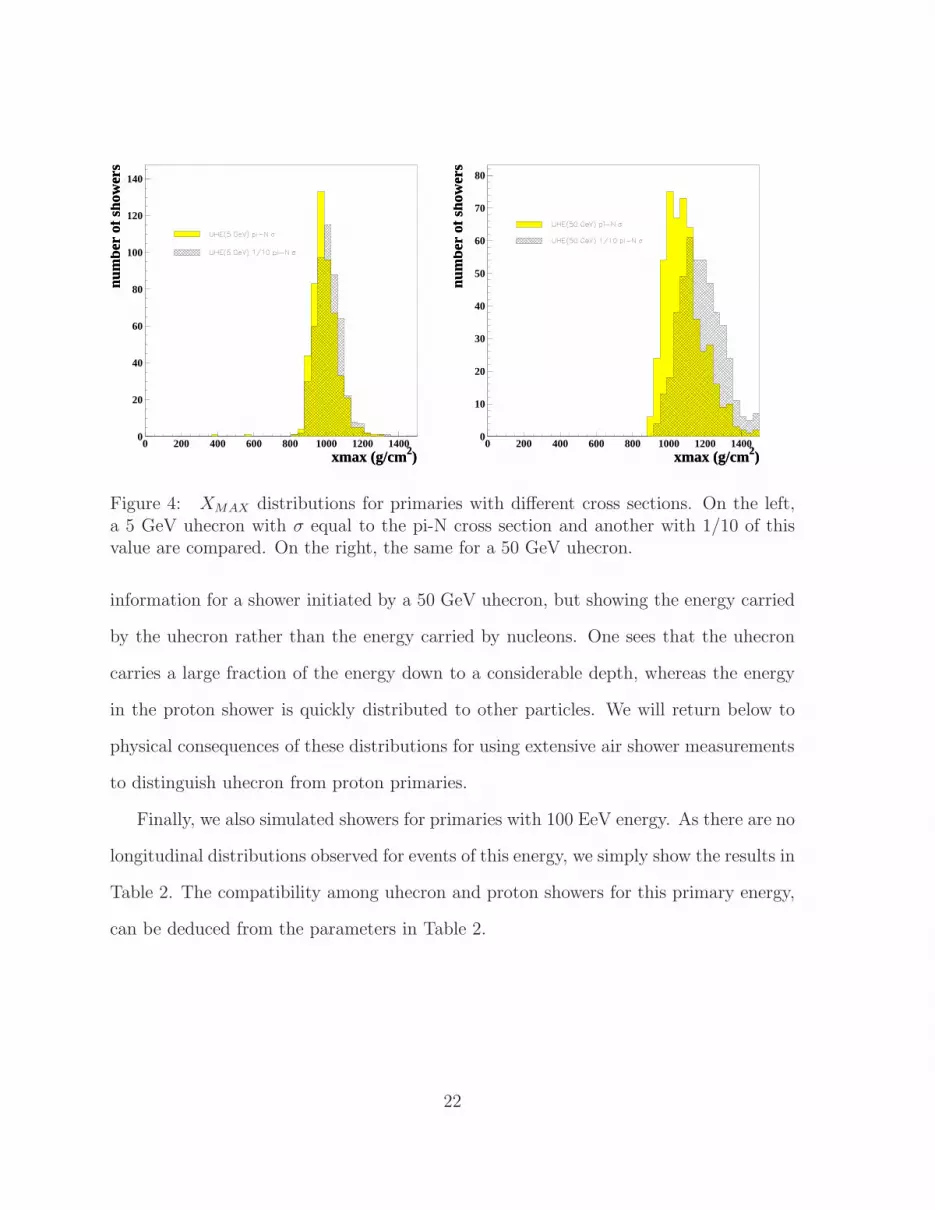
are shown in Fig. 4. As expected, the average XMAX is deeper for smaller cross section.
Also the XMAX distribution is broader.
Analyzing these distributions to determine the maximum uhecron mass compatible
with the observed shower, as in Section 3.2 above, shows that if the uhecron-nucleon
cross section is lower than a standard hadronic cross section, the uhecron mass limit is
even stronger. We find that for a cross section 1/10 the pion–nucleon cross section, the
20

0
2
4
6
8
10
12
14
16
18
30 35 40 45 50number of events
com
pati
bilit
y (%
)
Figure 3: Percentage of the time a number of uhecron showers cannot be distinguishedfrom a proton shower, for several different choices of the uhecron mass. For instance,given a data set with 40 showers, there is a 7% probability that the 2.5 GeV uhecronXMAX distribution function will be well fit by the proton XMAX distribution function.For a 5 GeV (10 GeV) uhecron, the probability is 4% (2%) if one has data from 40showers.
uhecron mass must be lower than 35 to 40 GeV13.
3.5 Other aspects of the shower development
We show in Fig. 5 the energy distribution among the shower particles for a proton and
a 50 GeV uhecron. The first plot shows how the energy is distributed among nucleons,
gammas, charged pions, and muons in a proton shower. The second plot shows the same
13For completeness, we also produced a sample for a 50 GeV uhecron, assuming σUN = 2σπN , inorder to assess the sensitivity to an increase in cross section. The change in the XMAX distribution ismuch smaller than in going from σUN = σπN to σUN = 1/10σπN ; it would have the effect of slightlyweakening the limit on uhecron mass. Since we do not consider the larger cross section as physicallywell-motivated, we do not pursue this possibility further.
21
0
20
40
60
80
100
120
140
0 200 400 600 800 1000 1200 1400xmax (g/cm2)
num
ber
of s
how
ers
xmax (g/cm2)
num
ber
of s
how
ers
0
10
20
30
40
50
60
70
80
0 200 400 600 800 1000 1200 1400xmax (g/cm2)
num
ber
of s
how
ers
xmax (g/cm2)nu
mbe
r of
sho
wer
s
Figure 4: XMAX distributions for primaries with different cross sections. On the left,a 5 GeV uhecron with σ equal to the pi-N cross section and another with 1/10 of thisvalue are compared. On the right, the same for a 50 GeV uhecron.
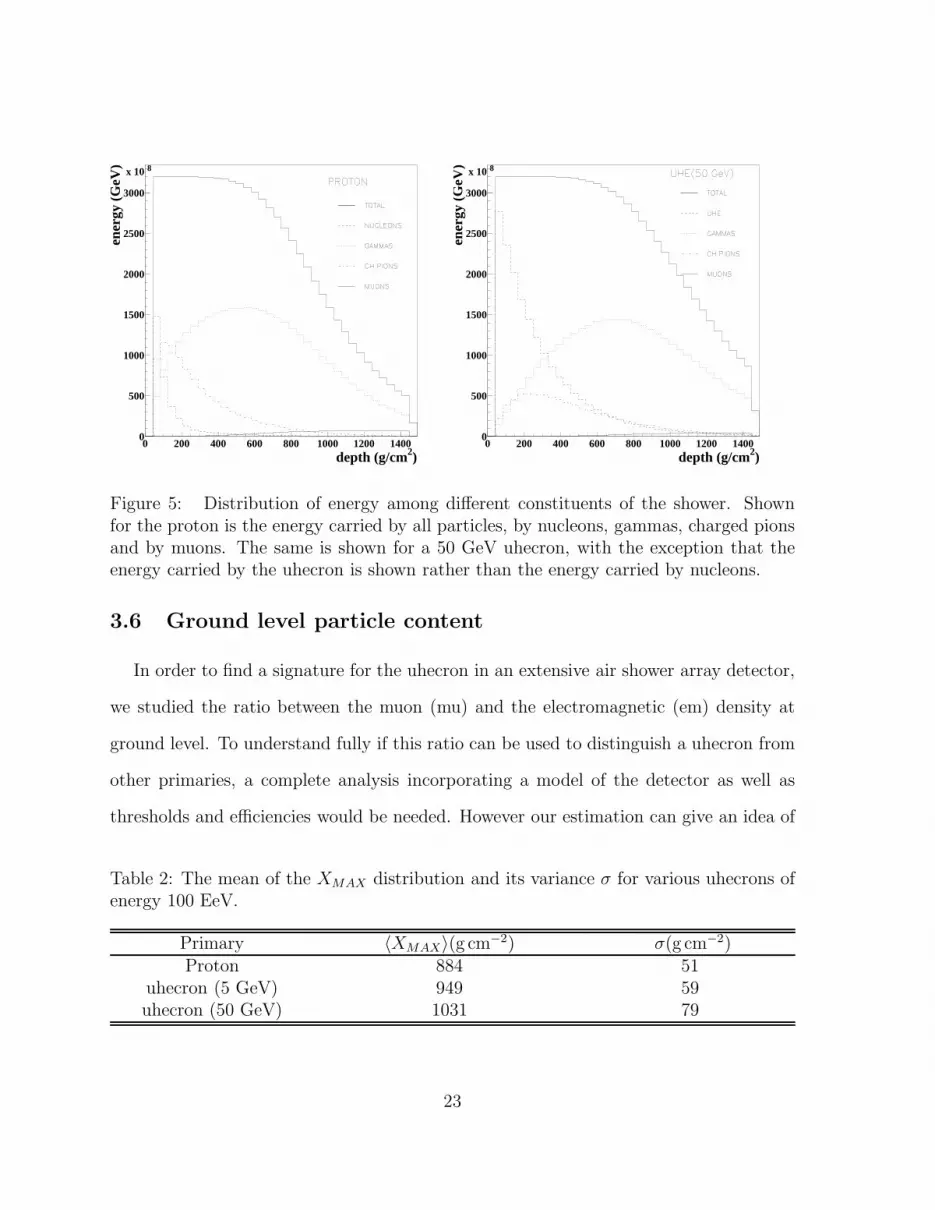
information for a shower initiated by a 50 GeV uhecron, but showing the energy carried
by the uhecron rather than the energy carried by nucleons. One sees that the uhecron
carries a large fraction of the energy down to a considerable depth, whereas the energy
in the proton shower is quickly distributed to other particles. We will return below to
physical consequences of these distributions for using extensive air shower measurements
to distinguish uhecron from proton primaries.
Finally, we also simulated showers for primaries with 100 EeV energy. As there are no
longitudinal distributions observed for events of this energy, we simply show the results in
Table 2. The compatibility among uhecron and proton showers for this primary energy,
can be deduced from the parameters in Table 2.
22
0
500
1000
1500
2000
2500
3000
x 10 8
0 200 400 600 800 1000 1200 1400depth (g/cm2)
ener
gy (
GeV
)
0
500
1000
1500
2000
2500
3000
x 10 8
0 200 400 600 800 1000 1200 1400depth (g/cm2)
ener
gy (
GeV
)
Figure 5: Distribution of energy among different constituents of the shower. Shownfor the proton is the energy carried by all particles, by nucleons, gammas, charged pionsand by muons. The same is shown for a 50 GeV uhecron, with the exception that theenergy carried by the uhecron is shown rather than the energy carried by nucleons.
3.6 Ground level particle content
In order to find a signature for the uhecron in an extensive air shower array detector,
we studied the ratio between the muon (mu) and the electromagnetic (em) density at
ground level. To understand fully if this ratio can be used to distinguish a uhecron from
other primaries, a complete analysis incorporating a model of the detector as well as
thresholds and efficiencies would be needed. However our estimation can give an idea of
Table 2: The mean of the XMAX distribution and its variance σ for various uhecrons ofenergy 100 EeV.
Primary 〈XMAX〉(g cm−2) σ(g cm−2)Proton 884 51
uhecron (5 GeV) 949 59uhecron (50 GeV) 1031 79
23

the feasibility of this kind of signature.
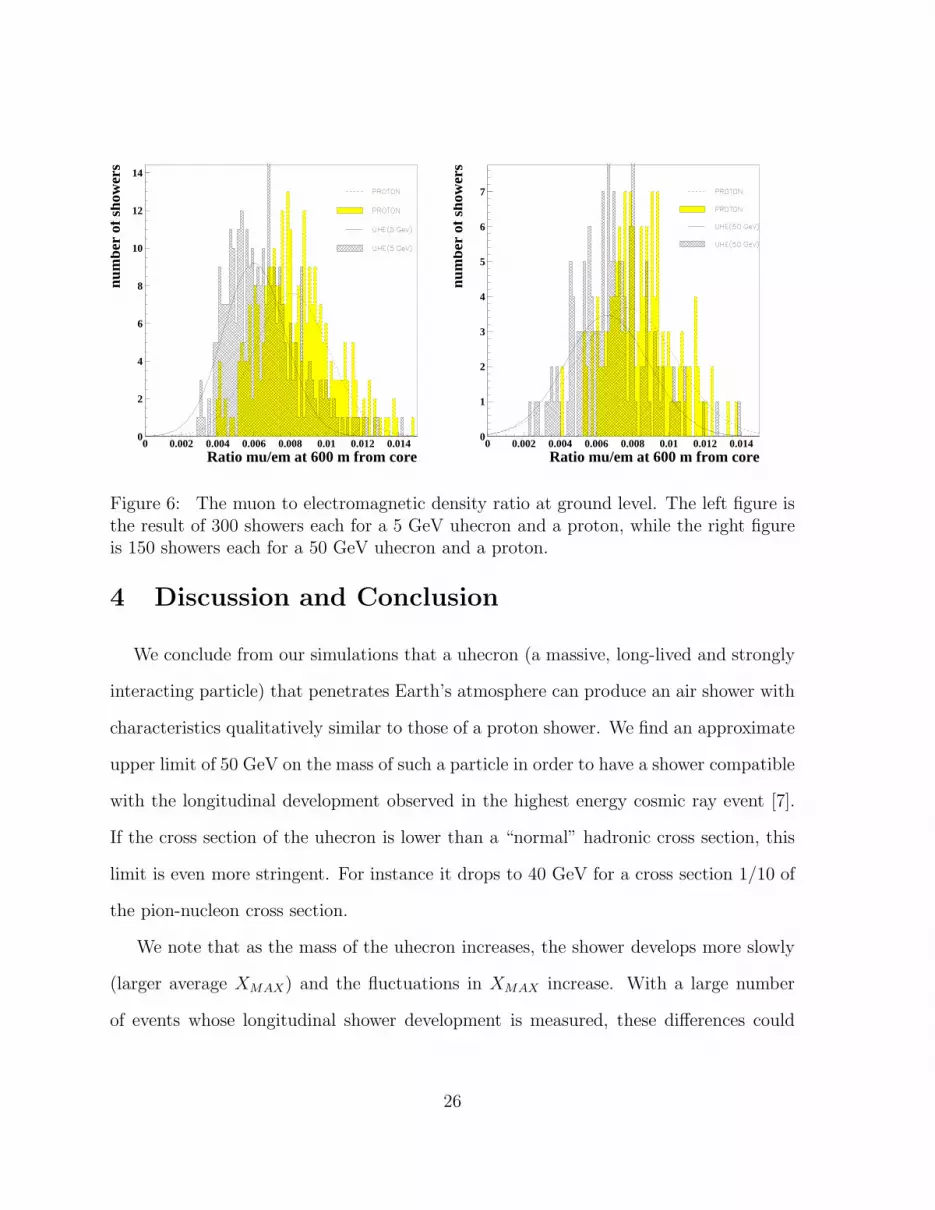
The zenith angle for this analysis is chosen to be 30◦ and ground level is taken to be
870 g cm−2. The distribution of the ratio mu/em at 600 meters from the core is plotted
in Fig. 6. The figure shows this ratio for a 5 GeV uhecron and for a proton, and for a
50 GeV uhecron and a proton.
From Fig. 6 one can see that the the mu/em ratio has a large dispersion. But the first
plot shows there seems to be a qualitative difference between even a 5 GeV uhecron and
a proton: the proton mu/em ratio is larger than the 5 GeV uhecron mu/em ratio. This
difference can be understood by analyzing the muonic and electromagnetic longitudinal
development, keeping in mind that the proton interaction with the atmosphere is very
different from the uhecron interaction. At the top of the atmosphere, the particles
produced by a proton shower are more energetic than the ones produced in a uhecron
shower, since the light, strongly-interacting quanta carry a larger fraction of the initial
energy in the former case. This can be seen from the plots of Fig. 5.
The analysis of the muonic and electromagnetic longitudinal development shows that
the difference in the number of muons between a proton and a uhecron shower is larger
than the difference between the number of electromagnetic particles. This is due to
the fact that the proton shower produces much more energetic pions in the top of the
atmosphere. The charged pions therefore have enough time to interact, multiplying the
number of pions, before decaying into muons. In the uhecron shower the charged pions
at the top of the atmosphere are less energetic and will most likely decay directly into
muons before interacting. This is not true for the electromagnetic component of the
shower, which behaves in the same way in a proton and a uhecron shower, since a π0
always decays rather than interacts.
The second plot in Fig. 6 is for a 50 GeV uhecron. At first sight it is surprising that
the uhecron mu/em ratio is closer to the proton ratio than the 5 GeV uhecron. This
24

seems to be counter to the above explanation since the pions in the top of the atmosphere
in the 50 GeV shower should be even less energetic than the ones in a 5 GeV shower.
The effect, however, is due to an artifact of our choices of the ground level (made in
order to be consistent with experimental sites) and the zenith angle for this analysis.
With the ground level depth at 870 g cm−2 and a 30◦ zenith angle, the atmospheric
depth is about 1005 g cm−2. This is enough for both a proton and a uhecron shower to
have passed their maxima, while it is not enough for a 50 GeV uhecron shower (see Fig.
1). Looking more closely at the muonic and electromagnetic longitudinal development,
reveals that the muonic component of a 50 GeV uhecron shower has not yet reached
its maximum when arriving at ground level, whereas the electromagnetic component is
almost at it’s maximum at 1005 g cm−2. This is confirmed when one chooses a deeper
ground level, where the 50 GeV mu/em ratio is smaller than the 5 GeV ratio.
An important point, evident from the difference between the fits to 300 and 150
proton showers in Fig. 6, is that very large statistics are essential to use mu/em as a
tool for discriminating a uhecron from a proton. This, combined with the small shift in
going from proton to uhecron, means that sensitivity to details of the shower modeling
must be understood before the calculated difference can be trusted.
If both longitudinal shower development and the mu/em ratio is available for a given
event, correlated features may provide greater resolving power. As shown in a comparison
between iron and proton showers [34], the mu/em ratio and the XMAX measurement are
correlated and dependent on shower development parameters. Thus with large statistics,
a multidimensional fit can be more sensitive than either alone.
25
0
2
4
6
8
10
12
14
0 0.002 0.004 0.006 0.008 0.01 0.012 0.014Ratio mu/em at 600 m from core
num
ber
of s
how
ers
0
1
2
3
4
5
6
7
0 0.002 0.004 0.006 0.008 0.01 0.012 0.014Ratio mu/em at 600 m from core
num
ber
of s
how
ers
Figure 6: The muon to electromagnetic density ratio at ground level. The left figure isthe result of 300 showers each for a 5 GeV uhecron and a proton, while the right figureis 150 showers each for a 50 GeV uhecron and a proton.
4 Discussion and Conclusion
We conclude from our simulations that a uhecron (a massive, long-lived and strongly
interacting particle) that penetrates Earth’s atmosphere can produce an air shower with
characteristics qualitatively similar to those of a proton shower. We find an approximate
upper limit of 50 GeV on the mass of such a particle in order to have a shower compatible
with the longitudinal development observed in the highest energy cosmic ray event [7].
If the cross section of the uhecron is lower than a “normal” hadronic cross section, this
limit is even more stringent. For instance it drops to 40 GeV for a cross section 1/10 of
the pion-nucleon cross section.
We note that as the mass of the uhecron increases, the shower develops more slowly
(larger average XMAX) and the fluctuations in XMAX increase. With a large number
of events whose longitudinal shower development is measured, these differences could
26
be sufficient to distinguish uhecron from proton primaries. We estimate that about
30 events may be enough to discriminate between uhecron and proton, if the uhecron
is more massive than 10 GeV. At lower uhecron mass the discrimination is difficult
because the longitudinal development profiles become too similar. In this case the ratio
of muon over electromagnetic density at large distances from the core could be helpful
with very high statistics. We conjecture that having combined information on a single
event, longitudinal development as well as lateral shower properties and the mu/em ratio,
may give improved resolving power. Such combined information would be available if the
event were observed simultaneously with both fluorescence and ground level detectors,
as in the Pierre Auger project [34].
It is encouraging that approved and proposed experimental efforts [34, 35, 36] are
likely to produce a substantial increase in the statistics available on ultrahigh energy
cosmic rays. We have shown that the detailed shower properties can allow candidate
new-particle explanations for the highest energy events to be ruled out or conceivably
confirmed. Many possible new-particle explanations are already excluded. In particular,
the highest energy cosmic ray event is very unlikely to have been produced by a new
superheavy (M >∼ 100 GeV) hadron containing a heavy colored particle or monopole.
We would like to thank Clem Pryke, Jim Cronin, Gustavo Burdman, Sergio Sciutto
and Albert Stebbins for useful discussions. IA was supported in part by NSF Grant
AST 94-20759 and the DOE through grant DE-FG02-90ER40606. The work of GRF
was supported by NSF-PHY-94-23002. The work of EWK was supported at Fermilab
by the Department of Energy and by NASA under number NAG5-7092.
References
27
[1] K. Greisen, Phys. Rev. Lett. 16, 748 (1966).
[2] G. T. Zatsepin and V. A. Kuzmin, Pis’ma Zh. Eksp. Teor. Fiz. 4, 114 (1966).
[3] M. A. Malkan and F. Stecker, Ap. J. 496, 13 (1998); F. Stecker, Phys. Rev. Lett.
80, 1816 (1998); F. Stecker and O.C. De Jager, astro-ph/9804196; L. N. Epele and
E. Roulet, astro-ph/9808104; F. Stecker and M. Salamon, astro-ph/9808110.
[4] J. Linsley, Phys. Rev. Lett. 10, 146 (1963).
[5] G. Brooke et al., Proc. of 19th International Cosmic Ray Conference, La Jolla (1985).
[6] N. N. Efimov et al. Proc. Of International Workshop on Astrophysical Aspects of the
Most Energetic Cosmic Rays, editors: M. Nagano and F. Takahara, World Scientific,
1990.
[7] D. J. Bird et al., Ap. J. 441, 144 (1995).
[8] N. Hayashida et al., Proc. of International Symp. on Extremely High Energy Cosmic
Rays, Tokyo, Japan, Sept., 1996.
[9] J. W. Elbert and P. Sommers, Ap. J. 441, 151 (1995).
[10] G. R. Farrar and P. L. Biermann, astro-ph/9806242, to be published Phys. Rev.
Lett.
[11] S. A. Colgate, private communication; P. Blasi and A. Olinto, astro-ph/9806264; G.
Sigl, M. Lemoine and P. Biermann, astro-ph/9806283.
[12] C. T. Hill, D.Schramm and T. Walker, Phys. Rev. D 34, 1622 (1986); F. A. Aha-
ronian, P. Bhattacharjee and D. N. Schramm, Phys. Rev. D 46, 4188 (1992); J. H.
MacGibbon and R. H. Brandenberger, Phys. Rev. D 47, 2283 (1993).
28
[13] E. Waxman, Ap. J. 452, L1 (1995).
[14] F. Halzen, R. A. Vazquez, T. Stanev and H. P. Vankov, Astropart. Phys. 3, 151
(1995).
[15] G. Burdman, F. Halzen and R. Gandhi, Phys. Lett. B 417, 107 (1998).
[16] T. J. Weiler, preprint hep-ph/9710431.
[17] G. R. Farrar, Phys. Rev. Lett. 76, 4111 (1996).
[18] D. J. H. Chung, G. R. Farrar and E. W. Kolb, Phys. Rev. D 57, 4606 (1998).
[19] S. Raby, Phys. Lett. B422, 158 (1998).
[20] R. N. Mohapatra and S. Nussinov, Phys. Rev. D 57, 1940 (1998).
[21] E. Nardi and E. Roulet, Phys. Lett. B 245, 105 (1990).
[22] T. W. Kephart and T. J. Weiler, Astropart. Phys. 4, 271 (1996); Nucl. Phys. Proc.
Suppl. 51B, 218 (1996).
[23] C. O. Escobar and R. A. Vazquez, astro-ph/9709148.
[24] R. M. Baltrusaitis et al., Nucl. Instr. Meth. A240, 410 (1985).
[25] C.Pryke, private communication.
[26] T. K. Gaisser and A. M. Hillas, Proc. 15th Internat. Cosmic Ray Conf, Plovdiv, 8,
353 (1977) .
[27] A. Watson, Proceedings of the 1997 Durban Symposium on High Energy Cosmic
Rays.
[28] S. J. Sciutto, GAP-98-005 (Pierre Auger project technical note) (1998).
29
[29] A. M. Hillas, Proc. of 19th International Cosmic Ray Conference, La Jolla, 1985.
[30] M. T. Dova and S. J. Sciutto, GAP-97-053 (Pierre Auger project technical note)
(1997).
[31] R. S. Fletcher, T. K. Gaisser, P. Lipari and T. Stanev, Phys. Rev. D50, 5710 (1994).
[32] N. Isgur and M. B. Wise, Phys. Lett. B232, 113 (1989); ibid B237, 527 (1990). For
a review see M. Neubert, Phys. Rep. 245, 259 (1994).
[33] R. M. Barnett et al., Phys. Rev. D54 (1996).
[34] Auger Collaboration, The Pierre Auger Project Design Report, 1996.
[35] M. Al-Seady et al., Proc. International Symposium on Extremely High Energy Cos-
mic Rays: Astrophysics and Future Observatories, edited by M. Nagano, Tokyo
(1996).
[36] N. Hayashida et al., ibid.
30


