Embed Size (px)
Citation preview
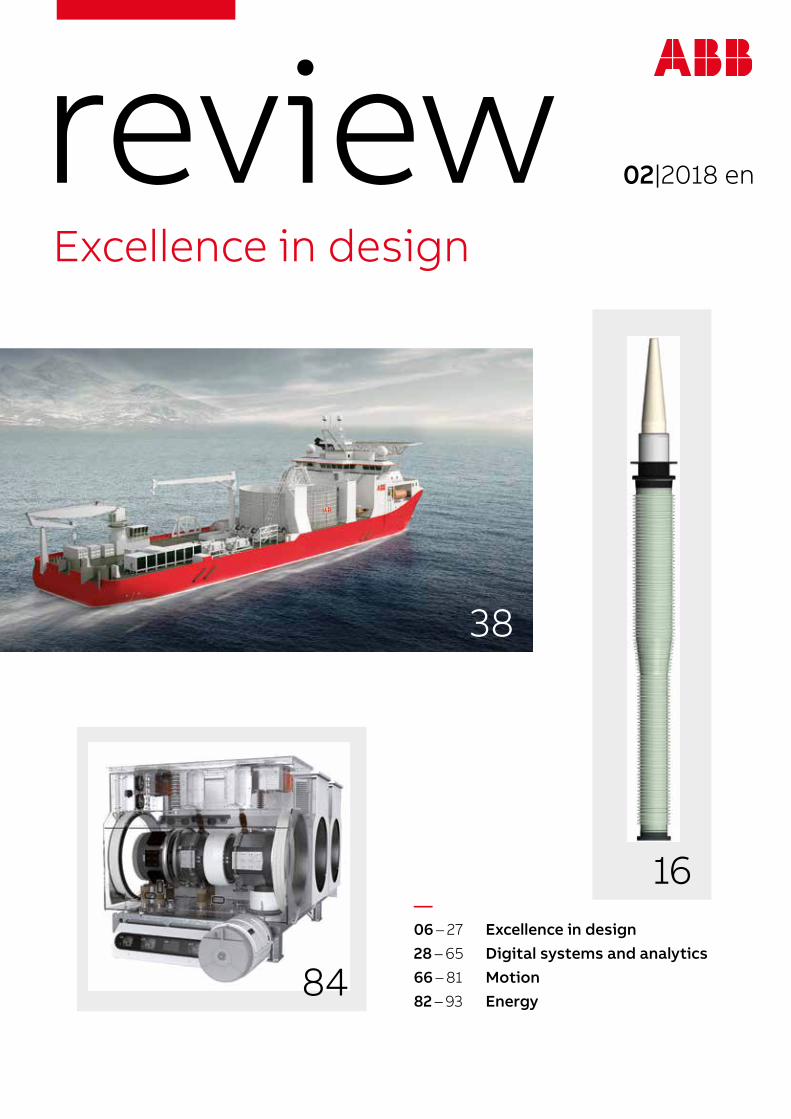
reviewExcellence in design
02|2018 en
— 06 – 27 Excellence in design28 – 65 Digital systems and analytics66 – 81 Motion82 – 93 Energy
16
38
84
2 ABB REVIEW
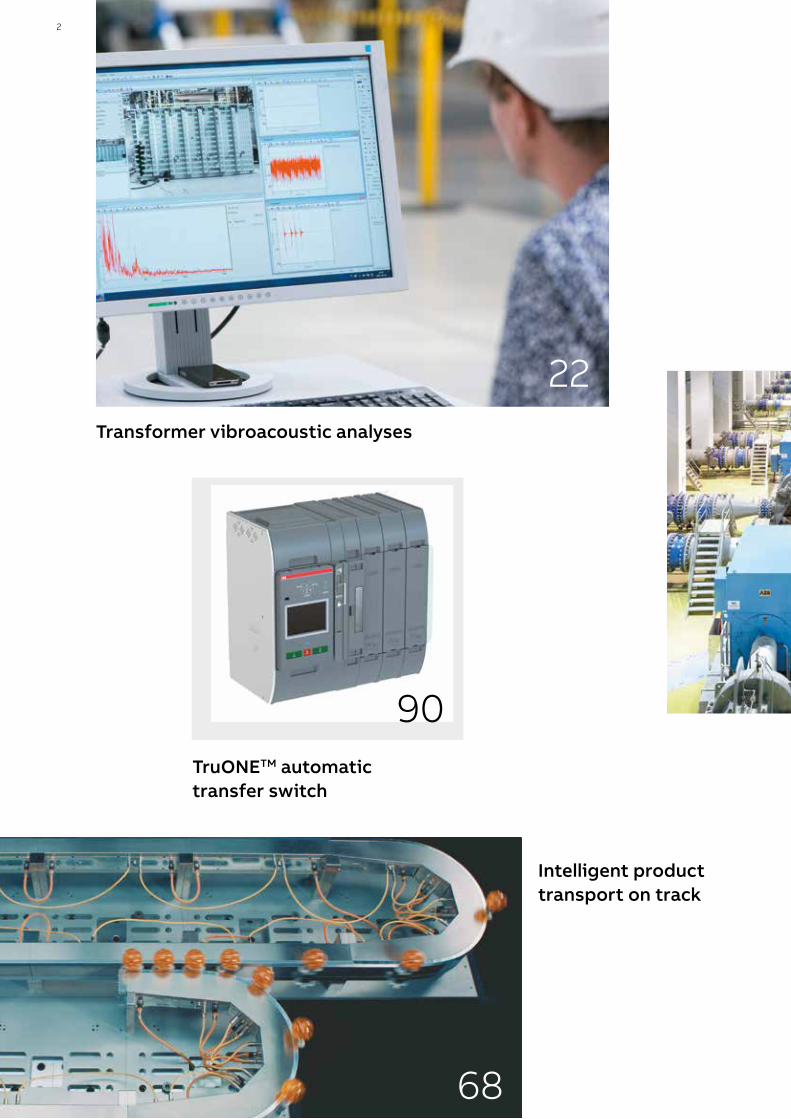
Transformer vibroacoustic analyses
Intelligent product transport on track
Electromagnetic flow meter digital twinTruONETM automatic
transfer switch
22
90
68
02|2018 3
Making sense of complexity
Electromagnetic flow meter digital twin
Fast, high-resolution web analysis
52
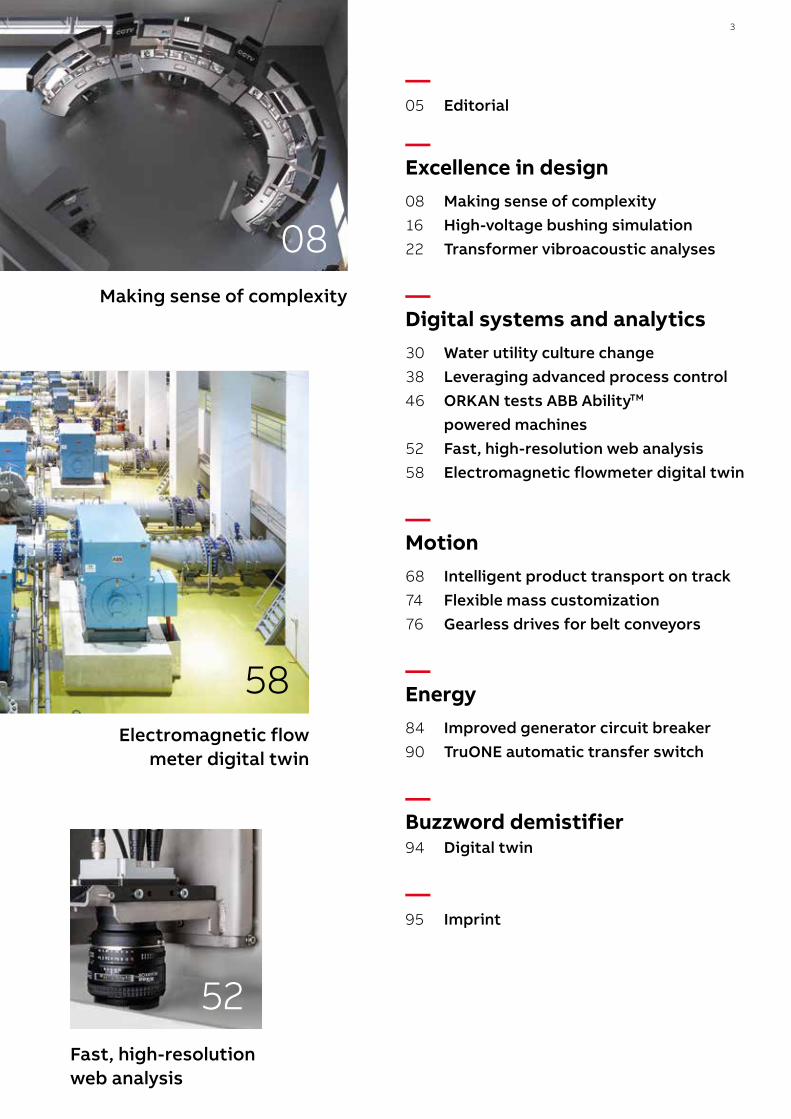
—05 Editorial
— Excellence in design08 Making sense of complexity16 High-voltage bushing simulation22 Transformer vibroacoustic analyses
— Digital systems and analytics30 Water utility culture change38 Leveraging advanced process control46 ORKAN tests ABB AbilityTM powered machines52 Fast, high-resolution web analysis58 Electromagnetic flowmeter digital twin
—Motion68 Intelligent product transport on track74 Flexible mass customization76 Gearless drives for belt conveyors
—Energy84 Improved generator circuit breaker90 TruONE automatic transfer switch
—Buzzword demistifier94 Digital twin
—95 Imprint
58
08
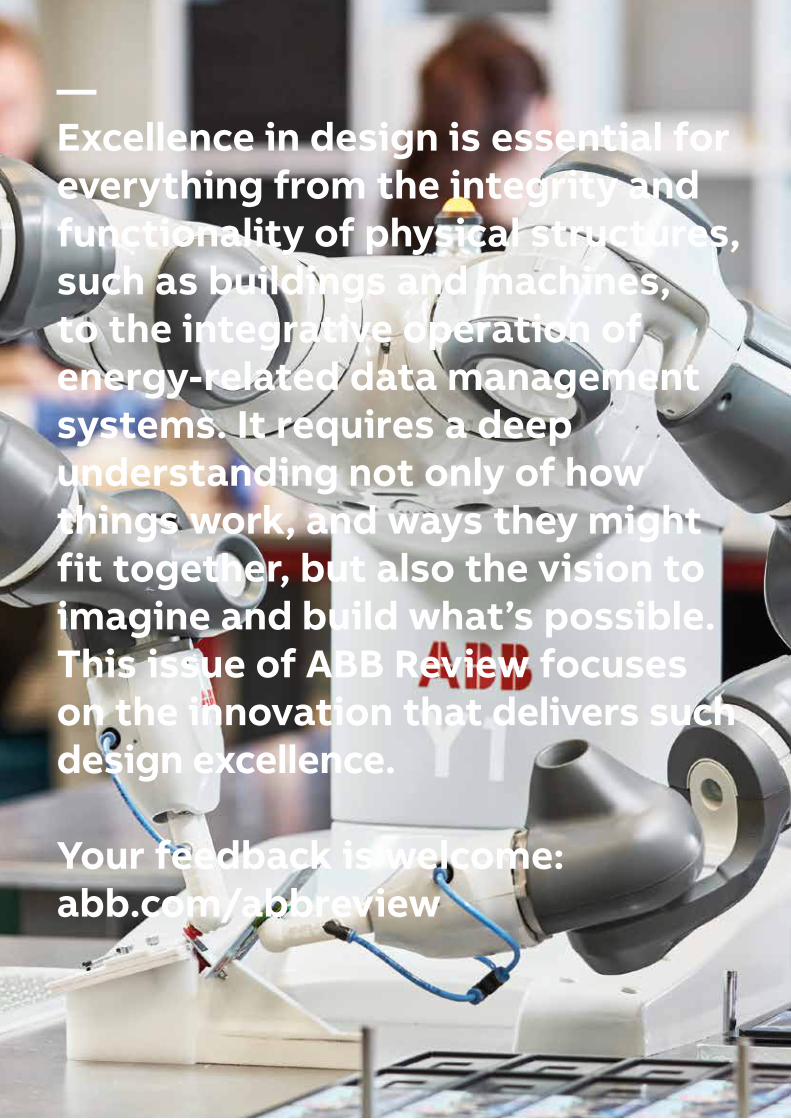
— Excellence in design is essential for everything from the integrity and functionality of physical structures, such as buildings and machines, to the integrative operation of energy-related data management systems. It requires a deep understanding not only of how things work, and ways they might fit together, but also the vision to imagine and build what’s possible. This issue of ABB Review focuses on the innovation that delivers such design excellence.
Your feedback is welcome: abb.com/abbreview
02|2018 5
Dear Reader,
What is it that characterizes a well-designed product? In an industrial context, it is no longer sufficient that a de-vice performs its own tasks flawlessly. More importantly, the device must be self-aware and fit in seamlessly with the rest of the plant and the broader value chain. By par-taking in the data-flows, processes and intelligence made possible by digitization, the device becomes part of an advanced digitized production environment in which the whole is so much more than the sum of its parts.
The availability and sharing of digital information lies at the core of the concept of “digital twin”. Beyond the cap-turing of individual data streams and trends, physical and contextual information is also captured digitally, permit-ting the behavior of a device or entire system to be mod-elled or predicted. Non-observable or future parameters can be simulated. A digital twin supports and removes uncertainty during design and configuration while sup-porting applications and ensuring availability and reliabil-ity through condition monitoring and advanced services.
I trust this issue of ABB Review will raise awareness of some maybe less-known aspects of digitization being designed into products.
Enjoy your reading!
Bazmi HusainChief Technology Officer
— EDITORIAL
Excellence in design

6 ABB REVIEW
22
— Excellencein design

7
08
02|2018
It can be said that unpredictability and noise evidence the absence of visibility into a system; ABB innovates ways to reveal these dependencies and patterns, and then model optimal performance in areas such as process control environments, HVDC components, and transformers.
08 Makingsenseofcomplexity16 Numericalsimulationsimprove bushing performance and lower cost22 Vibroacousticanalysesfornoise mitigation in transformers
— Excellencein design
16
8 ABB REVIEW
— EXCELLENCE IN DESIGN
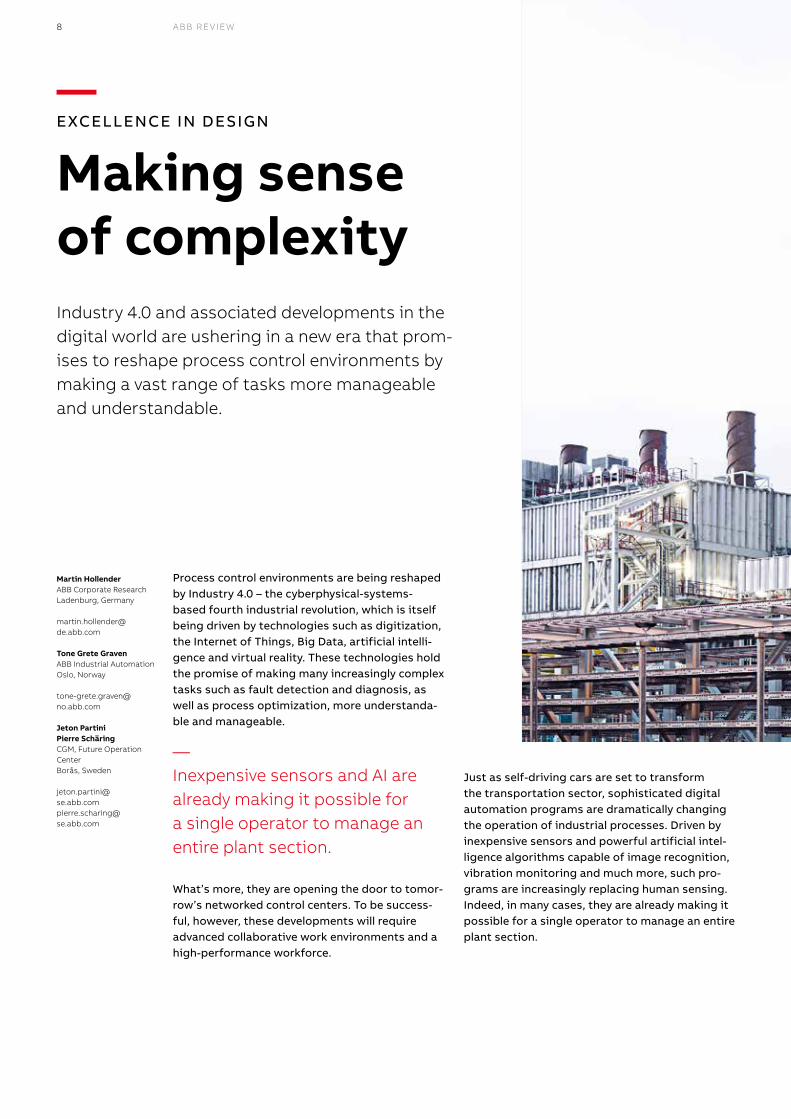
Making sense of complexity Industry 4.0 and associated developments in the digital world are ushering in a new era that prom-ises to reshape process control environments by making a vast range of tasks more manageable and understandable.
Process control environments are being reshaped by Industry 4.0 – the cyberphysical-systems- based fourth industrial revolution, which is itself being driven by technologies such as digitization, the Internet of Things, Big Data, artificial intelli-gence and virtual reality. These technologies hold the promise of making many increasingly complex tasks such as fault detection and diagnosis, as well as process optimization, more understanda-ble and manageable.
What’s more, they are opening the door to tomor-row’s networked control centers. To be success-ful, however, these developments will require advanced collaborative work environments and a high-performance workforce.
Just as self-driving cars are set to transform the transportation sector, sophisticated digital automation programs are dramatically changing the operation of industrial processes. Driven by inexpensive sensors and powerful artificial intel-ligence algorithms capable of image recognition, vibration monitoring and much more, such pro-grams are increasingly replacing human sensing. Indeed, in many cases, they are already making it possible for a single operator to manage an entire plant section.
Martin Hollender ABB Corporate ResearchLadenburg, Germany
martin.hollender@ de.abb.com
Tone Grete GravenABB Industrial AutomationOslo, Norway
tone-grete.graven@ no.abb.com
Jeton Partini Pierre Schäring CGM, Future Operation Center Borås, Sweden
jeton.partini@ se.abb.com pierre.scharing@ se.abb.com
—Inexpensive sensors and AI are already making it possible for a single operator to manage an entire plant section.
902|2018 MAKING SENSE OF COMPLEXIT Y
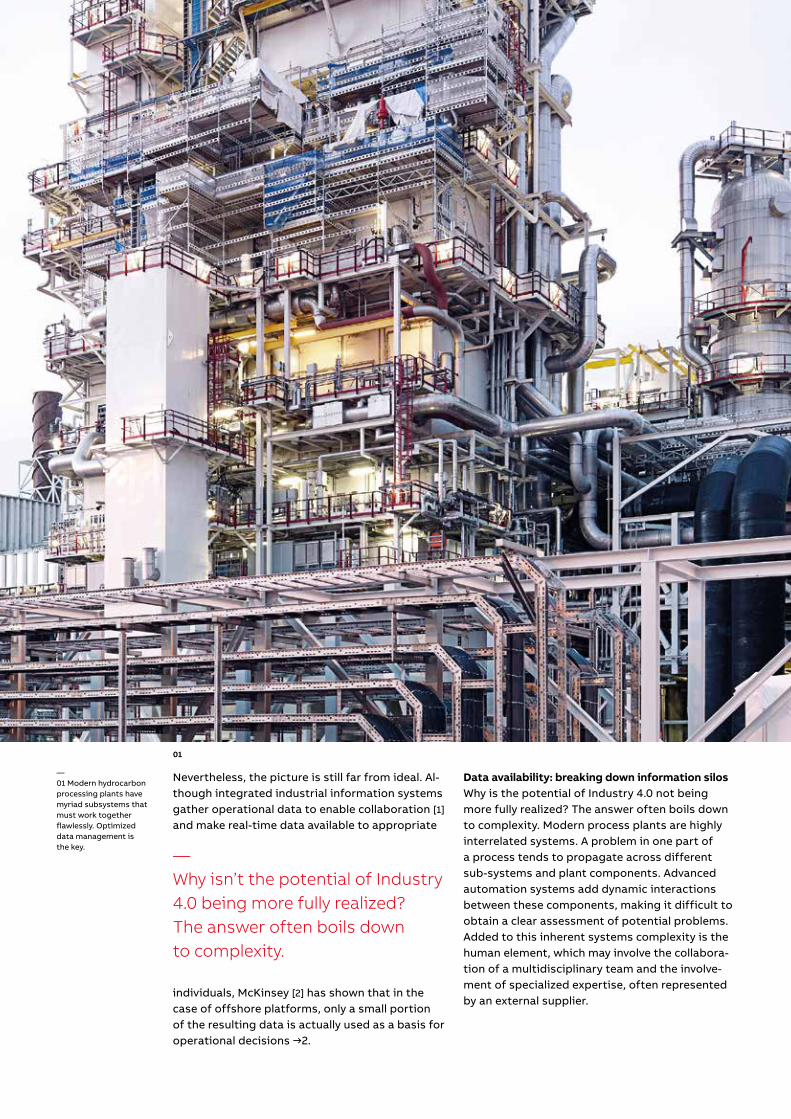
Nevertheless, the picture is still far from ideal. Al-though integrated industrial information systems gather operational data to enable collaboration [1] and make real-time data available to appropriate
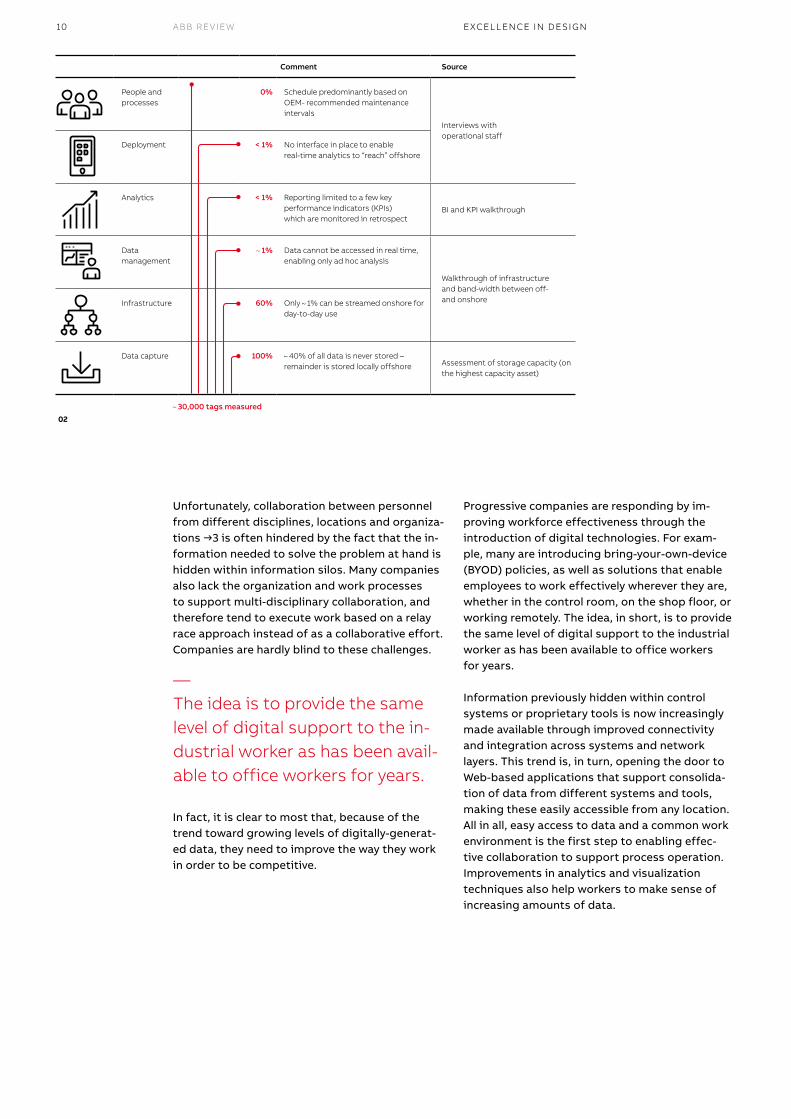
individuals, McKinsey [2] has shown that in the case of offshore platforms, only a small portion of the resulting data is actually used as a basis for operational decisions →2.
Data availability: breaking down information silosWhy is the potential of Industry 4.0 not being more fully realized? The answer often boils down to complexity. Modern process plants are highly interrelated systems. A problem in one part of a process tends to propagate across different sub-systems and plant components. Advanced automation systems add dynamic interactions between these components, making it difficult to obtain a clear assessment of potential problems. Added to this inherent systems complexity is the human element, which may involve the collabora-tion of a multidisciplinary team and the involve-ment of specialized expertise, often represented by an external supplier.
—Why isn’t the potential of Industry 4.0 being more fully realized? The answer often boils down to complexity.
01
—01 Modern hydrocarbon processing plants have myriad subsystems that must work together flawlessly. Optimized data management is the key.
10 ABB REVIEW EXCELLENCE IN DESIGN
Unfortunately, collaboration between personnel from different disciplines, locations and organiza-tions →3 is often hindered by the fact that the in-formation needed to solve the problem at hand is hidden within information silos. Many companies also lack the organization and work processes to support multi-disciplinary collaboration, and therefore tend to execute work based on a relay race approach instead of as a collaborative effort.Companies are hardly blind to these challenges.
In fact, it is clear to most that, because of the trend toward growing levels of digitally-generat-ed data, they need to improve the way they work in order to be competitive.
Progressive companies are responding by im-proving workforce effectiveness through the introduction of digital technologies. For exam-ple, many are introducing bring-your-own-device (BYOD) policies, as well as solutions that enable employees to work effectively wherever they are, whether in the control room, on the shop floor, or working remotely. The idea, in short, is to provide the same level of digital support to the industrial worker as has been available to office workers for years.
Information previously hidden within control systems or proprietary tools is now increasingly made available through improved connectivity and integration across systems and network layers. This trend is, in turn, opening the door to Web-based applications that support consolida-tion of data from different systems and tools, making these easily accessible from any location. All in all, easy access to data and a common work environment is the first step to enabling effec-tive collaboration to support process operation. Improvements in analytics and visualization techniques also help workers to make sense of increasing amounts of data.
—The idea is to provide the same level of digital support to the in-dustrial worker as has been avail-able to office workers for years.
Comment Source
People and processes
0% Schedule predominantly based on OEM- recommended maintenance intervals
Interviews with operational staff
Deployment < 1% No interface in place to enable real-time analytics to “reach” offshore
Analytics < 1% Reporting limited to a few key performance indicators (KPIs) which are monitored in retrospect
BI and KPI walkthrough
Data management
1% Data cannot be accessed in real time, enabling only ad hoc analysis
Walkthrough of infrastructure and band-width between off- and onshoreInfrastructure 60% Only 1% can be streamed onshore for
day-to-day use
Data capture 100% 40% of all data is never stored – remainder is stored locally offshore Assessment of storage capacity (on
the highest capacity asset)
30,000 tags measured
02
02|2018 11MAKING SENSE OF COMPLEXIT Y
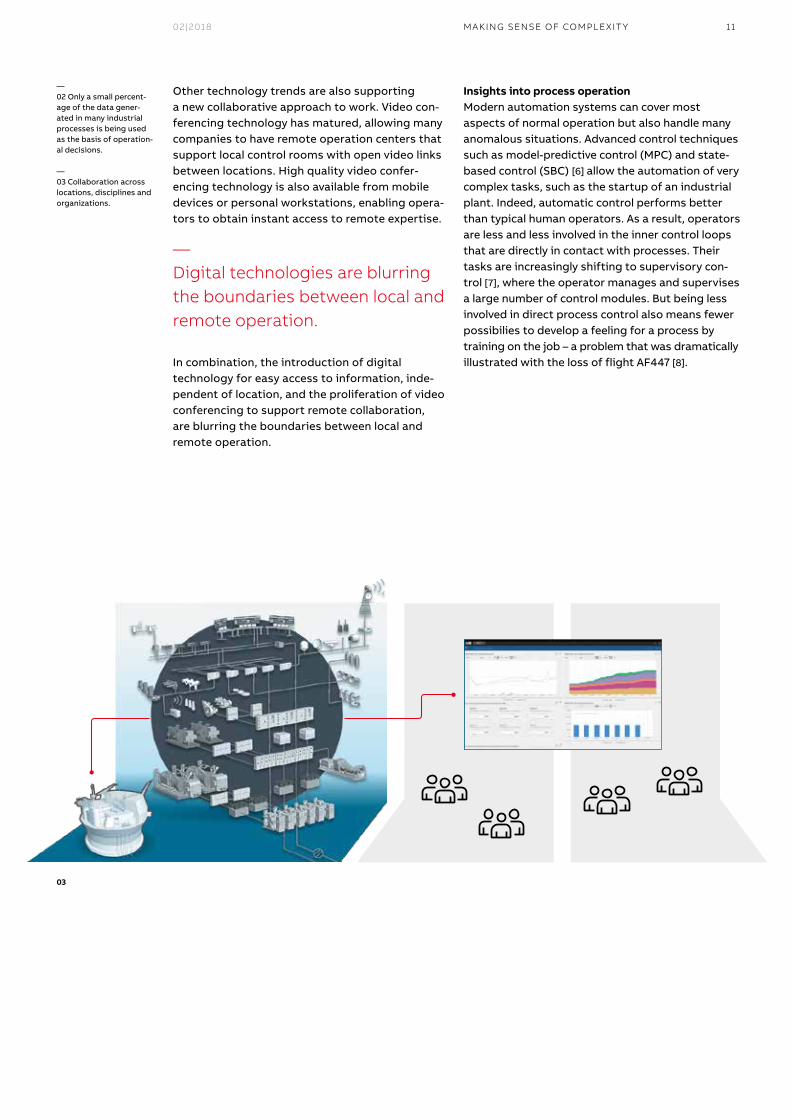
Other technology trends are also supporting a new collaborative approach to work. Video con-ferencing technology has matured, allowing many companies to have remote operation centers that support local control rooms with open video links between locations. High quality video confer-encing technology is also available from mobile devices or personal workstations, enabling opera-tors to obtain instant access to remote expertise.
In combination, the introduction of digital technology for easy access to information, inde-pendent of location, and the proliferation of video conferencing to support remote collaboration, are blurring the boundaries between local and remote operation.
Insights into process operationModern automation systems can cover most aspects of normal operation but also handle many anomalous situations. Advanced control techniques such as model-predictive control (MPC) and state-based control (SBC) [6] allow the automation of very complex tasks, such as the startup of an industrial plant. Indeed, automatic control performs better than typical human operators. As a result, operators are less and less involved in the inner control loops that are directly in contact with processes. Their tasks are increasingly shifting to supervisory con-trol [7], where the operator manages and supervises a large number of control modules. But being less involved in direct process control also means fewer possibilies to develop a feeling for a process by training on the job – a problem that was dramatically illustrated with the loss of flight AF447 [8].
—02 Only a small percent-age of the data gener-ated in many industrial processes is being used as the basis of operation-al decisions.
—03 Collaboration across locations, disciplines and organizations.
—Digital technologies are blurring the boundaries between local and remote operation.
03
12 ABB REVIEW EXCELLENCE IN DESIGN
To be able to take over when automation fails, op-erators need higher qualifications and a profound understanding of underlying technical processes, automation systems and control modules. Simu-lator training is necessary to develop a feeling for processes.
Operators should also be deeply involved in the optimization of process operations, because this keeps them involved and helps to build up the required knowledge that allows them to take over in case of automation failure.
Not only can Industry 4.0 have a profound influence on information flows and availability, it is also set to have a huge impact on industrial quality control [9]. Big Data techniques make it possible to distill historical process data into algorithms that can predict the quality of produc-tion [10]. Developing problems can be detected early and countermeasures can be taken before impact becomes significant. Previously, it took an operator many years to accumulate compara-ble experience.
Remote expertise can also play a decisive role in failure avoidance. For example, in the case of the Deepwater Horizon oil spill [11], the investiga-tion report clearly states that one major factor contributing to the accident was the incorrect interpretation of available measurements. Quite likely, advice from highly qualified remote experts would have avoided this accident.
—Not only can Industry 4.0 have a profound influence on informa-tion flows and availability, it is also set to have a huge impact on industrial quality control.
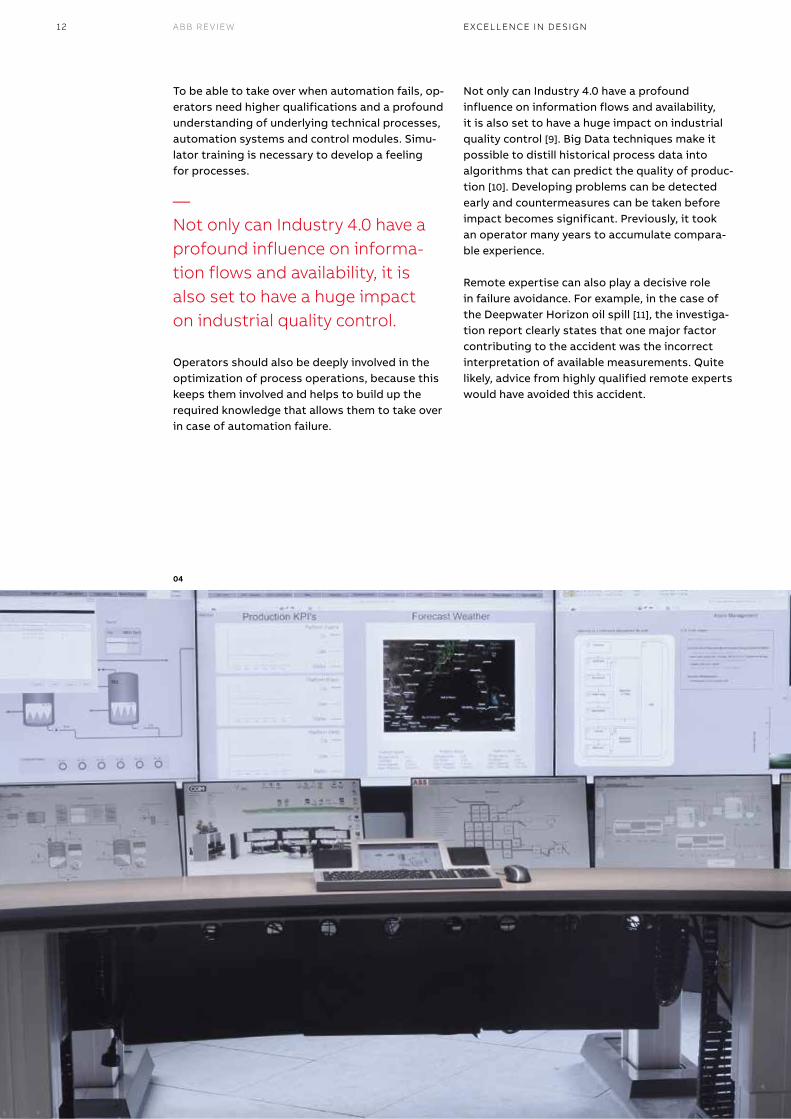
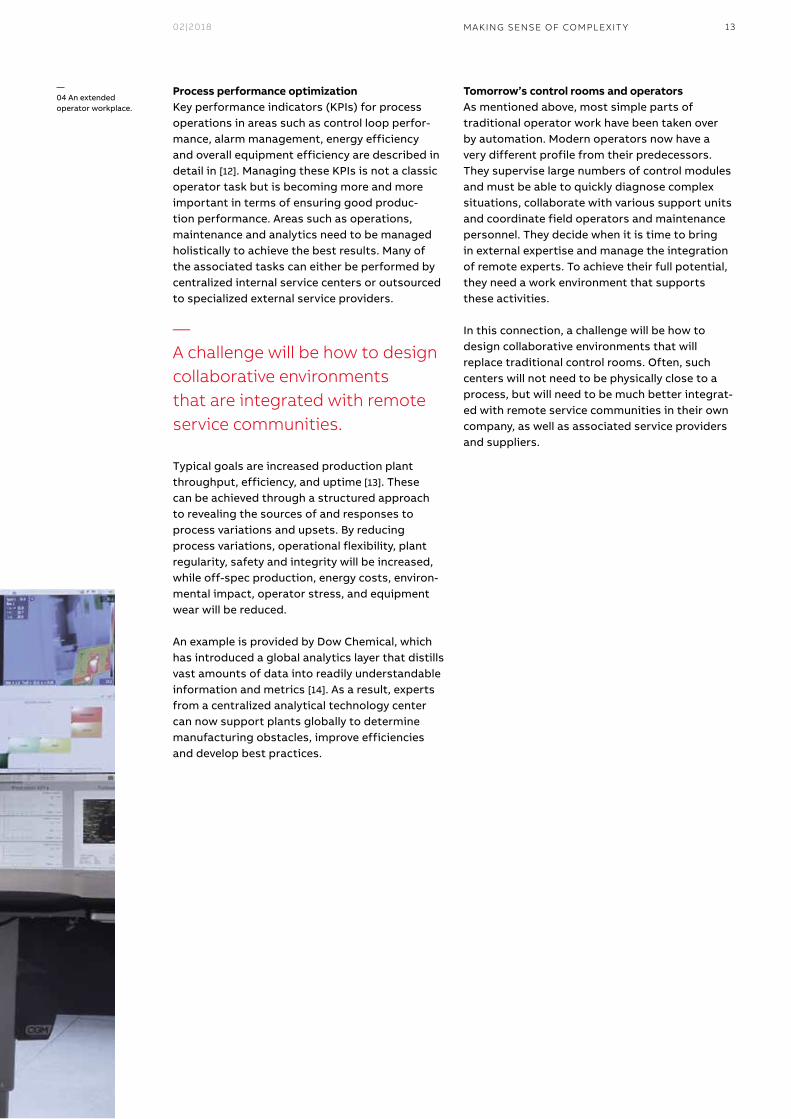
04
02|2018 13MAKING SENSE OF COMPLEXIT Y
—04 An extended operator workplace.
Tomorrow’s control rooms and operators As mentioned above, most simple parts of traditional operator work have been taken over by automation. Modern operators now have a very different profile from their predecessors. They supervise large numbers of control modules and must be able to quickly diagnose complex situations, collaborate with various support units and coordinate field operators and maintenance personnel. They decide when it is time to bring in external expertise and manage the integration of remote experts. To achieve their full potential, they need a work environment that supports these activities.
In this connection, a challenge will be how to design collaborative environments that will replace traditional control rooms. Often, such centers will not need to be physically close to a process, but will need to be much better integrat-ed with remote service communities in their own company, as well as associated service providers and suppliers.
Process performance optimizationKey performance indicators (KPIs) for process operations in areas such as control loop perfor-mance, alarm management, energy efficiency and overall equipment efficiency are described in detail in [12]. Managing these KPIs is not a classic operator task but is becoming more and more important in terms of ensuring good produc-tion performance. Areas such as operations, maintenance and analytics need to be managed holistically to achieve the best results. Many of the associated tasks can either be performed by centralized internal service centers or outsourced to specialized external service providers.
Typical goals are increased production plant throughput, efficiency, and uptime [13]. These can be achieved through a structured approach to revealing the sources of and responses to process variations and upsets. By reducing process variations, operational flexibility, plant regularity, safety and integrity will be increased, while off-spec production, energy costs, environ-mental impact, operator stress, and equipment wear will be reduced.
An example is provided by Dow Chemical, which has introduced a global analytics layer that distills vast amounts of data into readily understandable information and metrics [14]. As a result, experts from a centralized analytical technology center can now support plants globally to determine manufacturing obstacles, improve efficiencies and develop best practices.
—A challenge will be how to design collaborative environments that are integrated with remote service communities.
14 ABB REVIEW EXCELLENCE IN DESIGN
The involvement of experienced control room designers from an early stage on will be essential to the design of next-generation collaborative operation centers. Such centers will require a
totally new approach that takes the full potential of Industry 4.0 into account. As the traditional way of building control rooms becomes obsolete, new best practices will have to be defined.
The new centers will contain fewer operators, while the roles of operators will evolve from reactive to predictive problem solving and analytics. To achieve this, operators will have to be highly qualified and capable of interacting with many other specialized functions, such as IT/OT support, multifunctional support, technical and remote support, asset risk manage-ment, alarm handling, safety, cyber security and maintenance management.
Frequent interactive communication with a very broad range of remote service specialists – some-thing that is still rare today, but that will be the norm tomorrow – demands a new look at factors such as room layout, working zones, monitors, cameras, analytical tools and remote collabora-tion workspaces.
—In tomorrow’s control centers, the roles of operators will evolve from reactive to predictive problem solving and analytics.
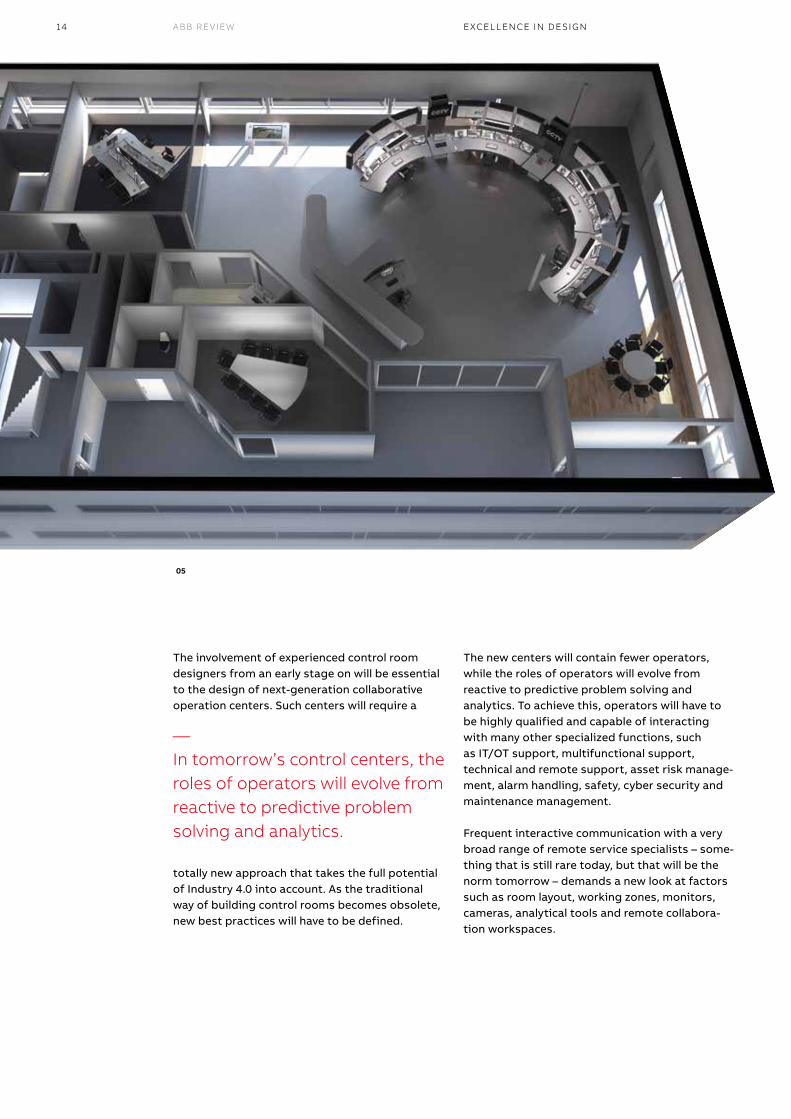
05
02|2018 15MAKING SENSE OF COMPLEXIT Y
Although working in a 24/7 environment can be exciting, it can also lead to reduced life expect- ancy. In view of this, →4 presents a platform that can be adapted and even automated to meet each user’s needs. For example, the distance between eyes and monitors can be automatically adjusted to reduce eye strain, and lighting can shift throughout the day to optimize circadian rhythms. Furthermore, big data analytics makes it possible to create a data-driven “day by day” improvement program for operators.
→5 illustrates the newly designed collaborative operation center for an energy and environment company. Five traditional control rooms with 12 operators will be replaced by a new collaborative operations center hosting two operators who will call in remote expertise on demand.
Next-generation operators As control centers metamorphose into collabora-tion centers, a major challenge will be to attract the next generation of operators – a generation for whom the connection between personal ergonomics and health is fundamental. This increasingly important factor calls for workplace designs that not only minimize acoustic distur-bances, while optimizing factors such as illumina-tion and air quality, but take into account aspects of the psychosocial working environment such as gamification, collaboration, individual space, flexibility, learning, sustainability, social presence, emotional engagement, and creativity. All in all, Technological development driven by operators’ needs can be expected to transform tomorrow’s working environment. l
— References[1] Pfeffer, J.; Graube, M.; Reipschlaeger, P.; et al.
[2] McKinsey Digital. Industry 4.0; 2015.
[3] Otten, W. Industrie 4.0 Und Digitalisierung. atp edition, 2016, 58, 28–32.
[4] Nimmo, I. Operator Effectiveness and The Human Side of Error; CreateSpace, 2015.
[5] Hollender, M. Collabo-rative Process Automation Systems; ISA: Triangle Park, North Carolina, 2010. [6] Sheridan, T.B. Tele- robotics, Automation, and Human Supervisory Control; MIT Press: Cam-bridge, MA, USA, 1992.
[7] BEA. Final Report On the Accident on 1st June 2009; 2012.
[8] Lorenz, M.; Rüßmann, M.; Strack, R.; Lueth, K.L.; Bolle, M. BCG Perspec-tives: Man and Machine in Industry 4.0; 2015.
[9] Atzmueller, M.; Klöpper, B.; Mawla, H.A.; Jäschke, B.; Hollender, M.; Graube, M.; Arnu, D.; Schmidt, A.; Heinze, S.; Schorer, L.; Kroll, A.; Stumme, G. Big data analytics for proactive industrial decision sup-port. atp edition, 2016, 58, 62–74.
[10] National Commission on the BP Deepwater Horizon Oil Spill and Off-shore Drilling. Deep Water The Gulf Oil Disaster and the Future of Offshore Drilling Report to the President; 2011. [11] Hollender, M.; Chioua, M.; Schlake, J.; Merkert, L.; Petersen, H. KPI-based Process Operation. atp edition, 2016, 58, 52–61.
[12] Bieker, H.P.; Slup-phaug, O.; Johansen, T.A. Real-Time Production Optimization of Oil and Gas Production Systems: A Technology Survey. SPE Production & Operations, 2007, 22, 382–391.
[13] Colegrove, L.F.; Seasholtz, M.B.; Khare, C. Big Data: Getting Started on the Journey. AIChE CEP Magazine, 2016.
[14] Doppelhamer, J.; Hollender, M. Intelligente Leitwarten. atp edition - Automatisierungstechnis-che Praxis, 2011, 53, 42.
—05 The newly designed collaborative operations center.
—Technological development that is driven by operators’ needs can be expected to transform tomor-row’s working environment.
16 ABB REVIEW
— EXCELLENCE IN DESIGN
Numerical simulations improve bushing perfor-mance and lower cost Lately, customers – especially those in China – have asked for significant increases in the current ratings of new high-voltage direct current (HVDC) systems. To accommodate these new requirements, while minimizing development costs, more advanced simulations have to be employed, especially for critical current-bearing components such as bushings.
Over the past few years, the power-carrying ability of HVDC lines has risen into the 10 to 12 GW range. This rise has been accompanied by a commensurate increase in voltage and current: Whereas the type test current of the first 800 kV power systems was around 4,000 A, that of more recent – 1,100 kV – HVDC systems is as high as 7,500 A. To handle these new requirements and to minimize development costs, more advanced computational fluid dynamics (CFD) simulations must be used.
Bushings – numerical methodsA critical HVDC component, present in all electrical networks, is the bushing. A bushing is an insulated conductor that carries current, at a high potential, through a grounded barrier (a wall or a transform-er) to the transmission line. As a bushing has no operational redundancy, its specification must be very stringent so as to ensure a long lifetime (up to 40 years) and trouble-free operation under very varied and extreme conditions.
ABB has scientists experienced in many types of numerical studies and with strong theoretical backgrounds and practical experience in the design and production of UHV (ultrahigh-voltage) AC and DC bushings. A solid knowledge of bushing thermal, electrical and mechanical simulation, and skill in constructing accurate numerical models that have been validated by many experimental tests, makes it possible to carry out fast and low-cost high-voltage (HV) bushing thermal performance studies.
Remigiusz NowakBogusław SamulAdam SitkoABB Corporate Research CenterKrakow, Poland
remigiusz.nowak@ pl.abb.comboguslaw.samul@ pl.abb.comadam.sitko@ pl.abb.com
Christos AthanasopoulosJonas BirgersonABB ComponentsLudvika, Sweden
[email protected]@ se.abb.com
—To handle new requirements and to minimize development costs, more advanced CFD simulations must be used.
EXCELLENCE IN DESIGN
02|2018 17HIGH-VOLTAGE BUSHING SIMULATION
The popularity of numerical methods has in-creased significantly in the past 10 years, mostly as a result of an increase in computational power and the consequent ability to solve ever-more-complex physical problems in a reasonable time.
The great advantage of numerical analysis is the capacity it delivers to carry out in-depth studies of product behavior under various conditions in a short time and at reasonable cost. Further, numerical analysis allows design optimization and performance enhancement before testing against the required technical standards.
Until recently, most thermal simulations treated all bushing constituent materials – even oil and air – as solids; only rarely were fluid dynamics included. However, with the advent of bushings for very high voltages came the requirement for new, capable thermal models that would also keep development times short. There was, too, a need to integrate several different existing approaches into a common thermal model for bushings.
Thermal effects in bushingsA thermal simulation gives the temperature distribution in a bushing for different currents and different ambient temperatures. Such a study is essential because some components have very strict temperature limits, in order to exclude thermal degradation and consequent electrical breakdown.
—Numerical analysis allows design optimization and performance enhancement before testing against the required technical standards.
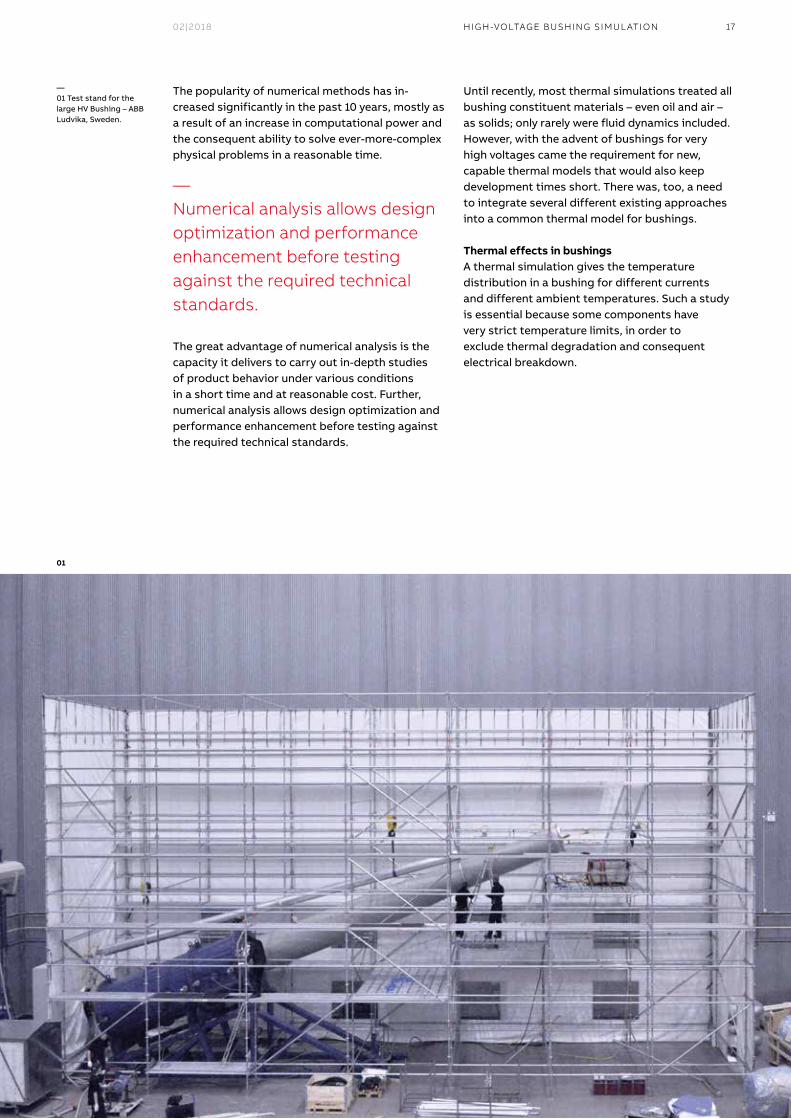
—01 Test stand for the large HV Bushing – ABB Ludvika, Sweden.
01
18 ABB REVIEW
To minimize the risk of a bushing failure in the sys-tem, regulations laid out in international standard IEC 60137 – as well as in stricter ABB standards – that define maximum allowable temperatures, are followed. Temperature rise tests performed on ac-tual bushings are complicated, resource-heavy and time-consuming, especially for larger bushings →1.
Building an HV bushing thermal modelThermal simulation of HV bushings is a complex exercise and many parameters influence the final results – for example, heat losses; treatment of conduction, convection and thermal radiation processes; material parameters; and turbulence modeling in the case of SF6-filled bushings. In general, the thermal simulation process can be broken down into four steps:• Preparation of the geometry model• Generation of the computational mesh• Setup of the numerical model parameters• Numerical analysis and post-processing
of the results
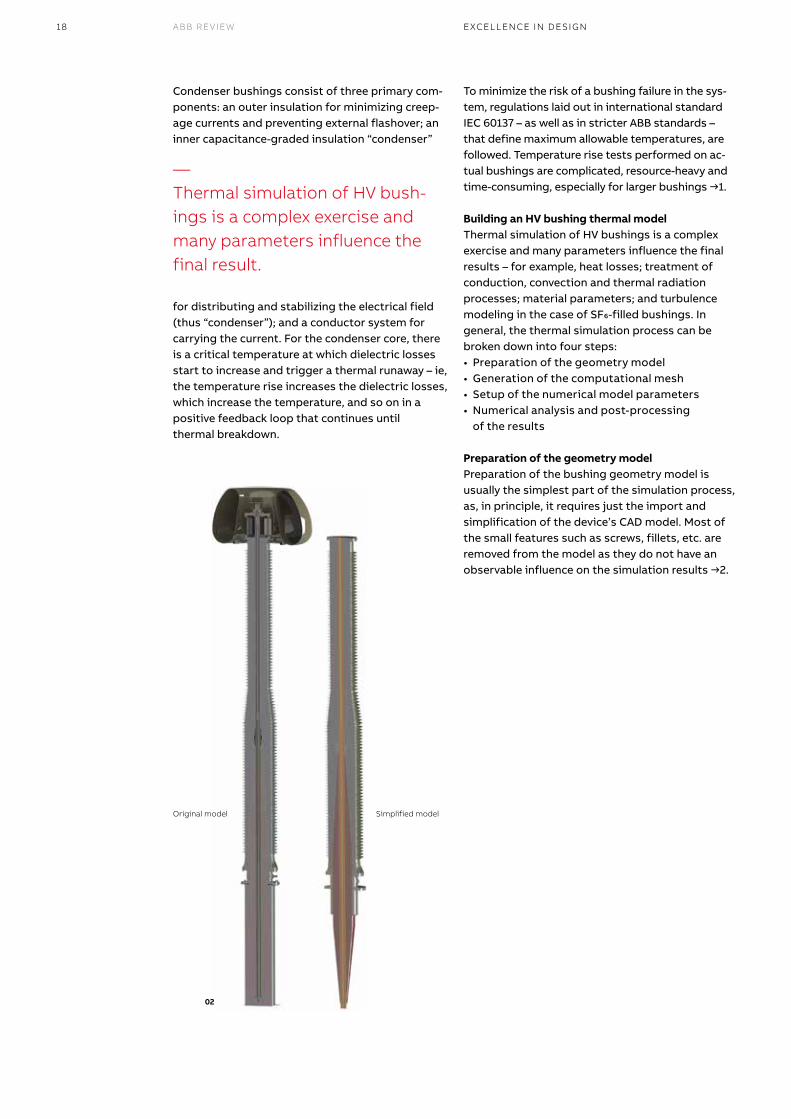
Preparation of the geometry modelPreparation of the bushing geometry model is usually the simplest part of the simulation process, as, in principle, it requires just the import and simplification of the device’s CAD model. Most of the small features such as screws, fillets, etc. are removed from the model as they do not have an observable influence on the simulation results →2.
Condenser bushings consist of three primary com-ponents: an outer insulation for minimizing creep-age currents and preventing external flashover; an inner capacitance-graded insulation “condenser”
for distributing and stabilizing the electrical field (thus “condenser”); and a conductor system for carrying the current. For the condenser core, there is a critical temperature at which dielectric losses start to increase and trigger a thermal runaway – ie, the temperature rise increases the dielectric losses, which increase the temperature, and so on in a positive feedback loop that continues until thermal breakdown.
02
—Thermal simulation of HV bush-ings is a complex exercise and many parameters influence the final result.
EXCELLENCE IN DESIGN
Original model Simplified model
02|2018 19
Setting up numerical model parametersWhen the computational mesh is prepared and its quality is acceptable, it can be transferred into CFD software, where the problem can be set up and solved. Setting up the numerical model is the most complex part of the simulation. In addition to some common model configuration functions – enabling energy equations, applying gravity forces, etc. – setting up also entails several other important tasks: heat loss and materials definition; initial, boundary and operating condi-tion specifications; turbulence model and thermal radiation model characterization; and solver settings selection.
Numerical analysis and post-processing of the resultsIn the numerical study, the values of the request-ed temperatures, velocities, pressures, etc. are calculated in each cell of the computational mesh. The solution process is iterative, which means that – starting from initial, random conditions – the solution to the investigated problem is updated step by step. Correctness is tracked by so-called residuals, which describe the imbalances in the model’s equations of mass, momentum and energy. A numerical problem is considered solved when the values of the residuals are minimized – ie, the tem-perature, velocity or pressure fields in the model do not change in the subsequent calculation steps. Additionally, user-defined monitoring tools are used for tracking simulation-specific values like velocity, temperature and pressure; in a stable solution, their values should reach a constant value.
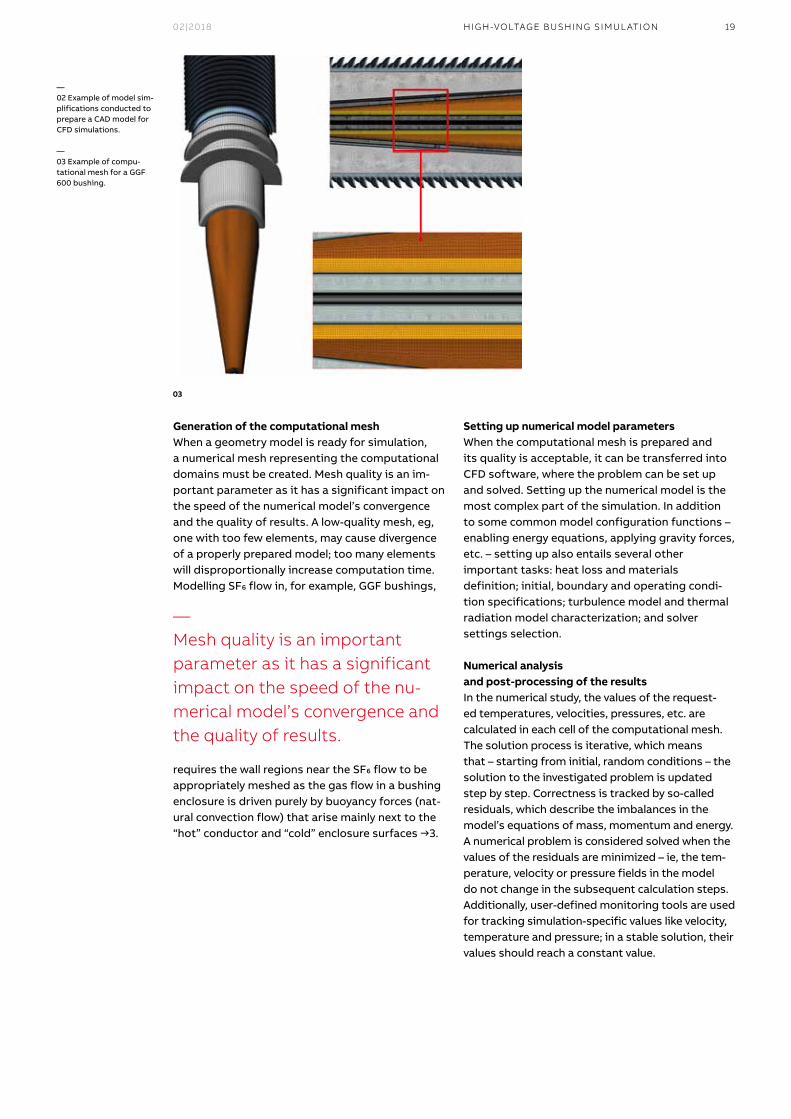
Generation of the computational meshWhen a geometry model is ready for simulation, a numerical mesh representing the computational domains must be created. Mesh quality is an im-portant parameter as it has a significant impact on the speed of the numerical model’s convergence and the quality of results. A low-quality mesh, eg, one with too few elements, may cause divergence of a properly prepared model; too many elements will disproportionally increase computation time.Modelling SF6 flow in, for example, GGF bushings,
requires the wall regions near the SF6 flow to be appropriately meshed as the gas flow in a bushing enclosure is driven purely by buoyancy forces (nat-ural convection flow) that arise mainly next to the “hot” conductor and “cold” enclosure surfaces →3.
—02 Example of model sim-plifications conducted to prepare a CAD model for CFD simulations.
—03 Example of compu-tational mesh for a GGF 600 bushing.
03
—Mesh quality is an important parameter as it has a significant impact on the speed of the nu-merical model’s convergence and the quality of results.
HIGH-VOLTAGE BUSHING SIMULATION

20 ABB REVIEW
Multiphysics – employ sophisticated algorithms and all the models they generated during the work described here have been shown to be accurate →4. Care must be taken with the thermal simu-lations as they are highly sensitive to boundary conditions. Therefore, the heat transfer rate at the external surfaces of the model must be carefully specified. In many cases, it is hard to predict heat removal from the system. For example, in the case of convection boundaries, the migration of heat will depend on air or oil properties, velocity and temperature as well as the shape of the surface from which heat is dissipated.
Results from temperature rise tests of differ-ent types of bushings were used, together with reports on the materials’ physical parameters, to build the simulation model. Initially, a target accuracy was set of a maximum ±2 K difference between simulation and temperature rise test results; a performance inside this margin would endorse simulation as a satisfactory bushing design tool.
Finally, the results obtained must be assessed from both a physics and a numerical point of view. In this step, the final confirmation of the veracity of the applied mesh and equations can be ob-tained. This assessment is also required to affirm that the simulation fulfills the basic principle of conservation of mass and energy.
Versatility and accuracy of numerical simulationsAs mentioned above, all heat transfer processes inside the bushing and on its external boundaries must be properly captured if a reliable numerical representation of the bushing is to be constructed. Modern commercial FEM (finite element meth-od) and FVM (finite volume method) simulation packages – such as Ansys Fluent or COMSOL
—All heat transfer processes inside the bushing and on its external boundaries must be properly captured for a reliable numerical representation.
EXCELLENCE IN DESIGN
04a
04b
04c
Temperature
Velocity
32.6
0.00
37.5
0.06
42.4
0.13
47.3
0.19
52.2
0.26
(C)
(m s^-1)
02|2018 21
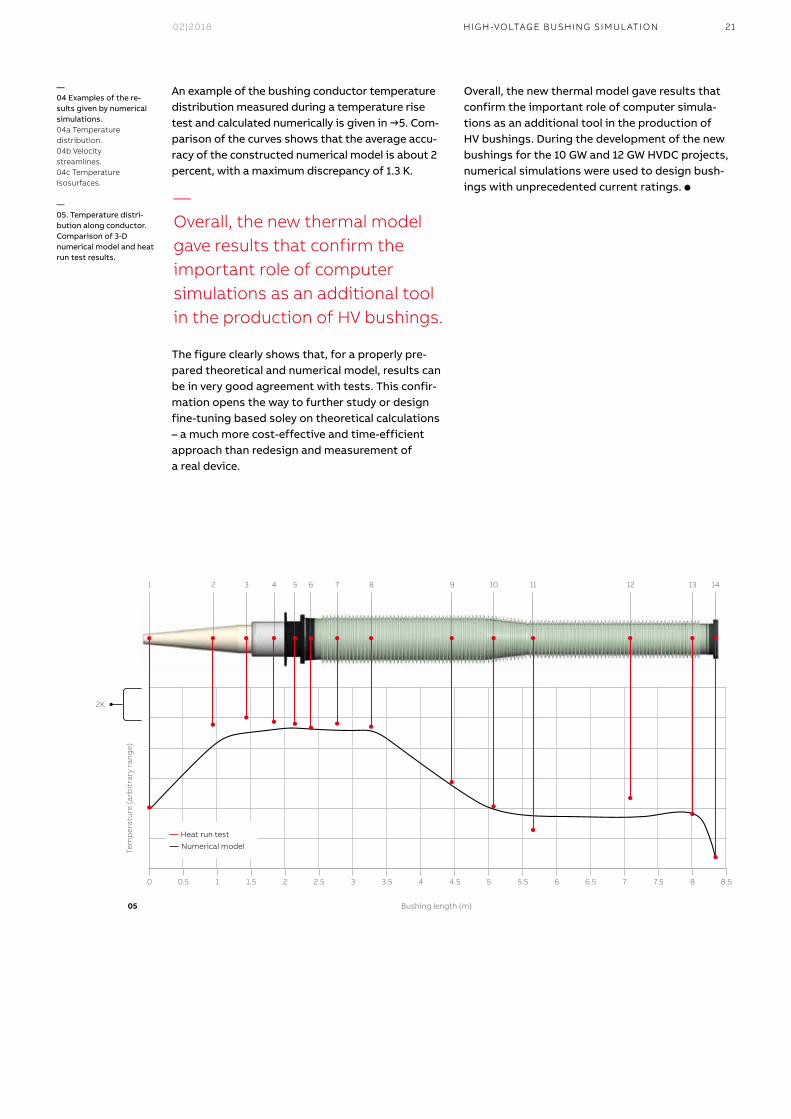
An example of the bushing conductor temperature distribution measured during a temperature rise test and calculated numerically is given in →5. Com-parison of the curves shows that the average accu-racy of the constructed numerical model is about 2 percent, with a maximum discrepancy of 1.3 K.
The figure clearly shows that, for a properly pre-pared theoretical and numerical model, results can be in very good agreement with tests. This confir-mation opens the way to further study or design fine-tuning based soley on theoretical calculations – a much more cost-effective and time-efficient approach than redesign and measurement of a real device.
Overall, the new thermal model gave results that confirm the important role of computer simula-tions as an additional tool in the production of HV bushings. During the development of the new bushings for the 10 GW and 12 GW HVDC projects, numerical simulations were used to design bush-ings with unprecedented current ratings. l
HIGH-VOLTAGE BUSHING SIMULATION
—04 Examples of the re-sults given by numerical simulations.04a Temperature distribution.04b Velocity streamlines.04c Temperature isosurfaces.
—05. Temperature distri-bution along conductor. Comparison of 3-D numerical model and heat run test results.
05
Tem
per
atu
re (a
rbit
rary
ran
ge)
2K
Bushing length (m)
0
1 2 3 4 5 6 7 8 9 10 11 12 13 14
0.5 1 1.5 2 2.5 3 3.5 4 4.5 5 5.5 6 6.5 7 7.5 8 8.5
Heat run test
Numerical model
—Overall, the new thermal model gave results that confirm the important role of computer simulations as an additional tool in the production of HV bushings.
22 ABB REVIEW
— PROTECTION AND SAFETY
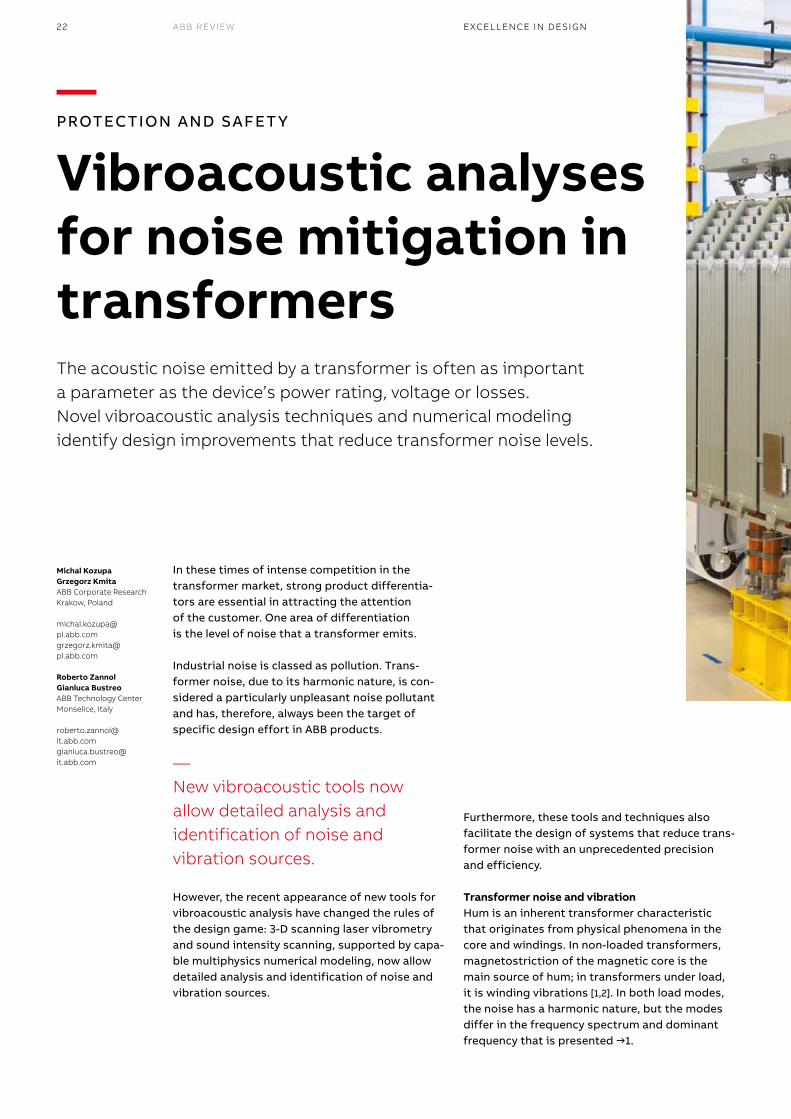
Vibroacoustic analyses for noise mitigation in transformersThe acoustic noise emitted by a transformer is often as important a parameter as the device’s power rating, voltage or losses. Novel vibroacoustic analysis techniques and numerical modeling identify design improvements that reduce transformer noise levels.
In these times of intense competition in the transformer market, strong product differentia-tors are essential in attracting the attention of the customer. One area of differentiation is the level of noise that a transformer emits.
Industrial noise is classed as pollution. Trans-former noise, due to its harmonic nature, is con-sidered a particularly unpleasant noise pollutant and has, therefore, always been the target of specific design effort in ABB products.
However, the recent appearance of new tools for vibroacoustic analysis have changed the rules of the design game: 3-D scanning laser vibrometry and sound intensity scanning, supported by capa-ble multiphysics numerical modeling, now allow detailed analysis and identification of noise and vibration sources.
Furthermore, these tools and techniques also facilitate the design of systems that reduce trans-former noise with an unprecedented precision and efficiency.
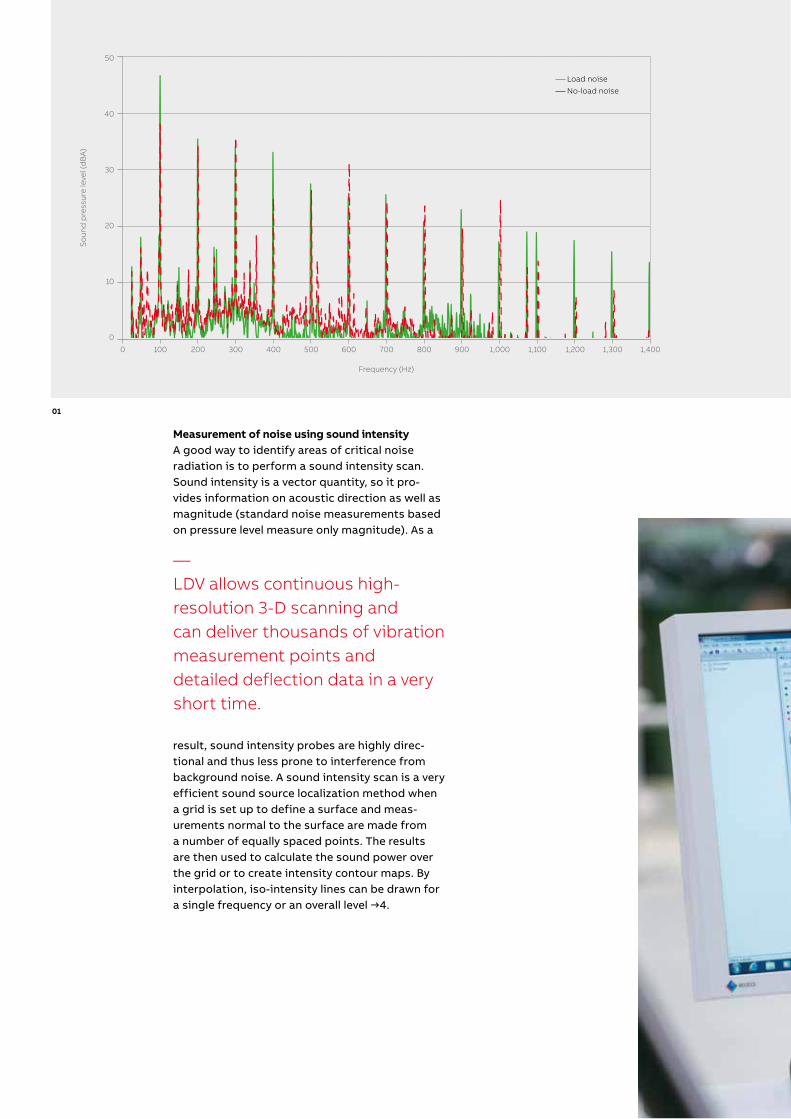
Transformer noise and vibrationHum is an inherent transformer characteristic that originates from physical phenomena in the core and windings. In non-loaded transformers, magnetostriction of the magnetic core is the main source of hum; in transformers under load, it is winding vibrations [1,2]. In both load modes, the noise has a harmonic nature, but the modes differ in the frequency spectrum and dominant frequency that is presented →1.
Michal KozupaGrzegorz KmitaABB Corporate ResearchKrakow, Poland
[email protected]@pl.abb.com
Roberto ZannolGianluca BustreoABB Technology CenterMonselice, Italy
[email protected]@it.abb.com
EXCELLENCE IN DESIGN
—New vibroacoustic tools now allow detailed analysis and identification of noise and vibration sources.
02|2018 23
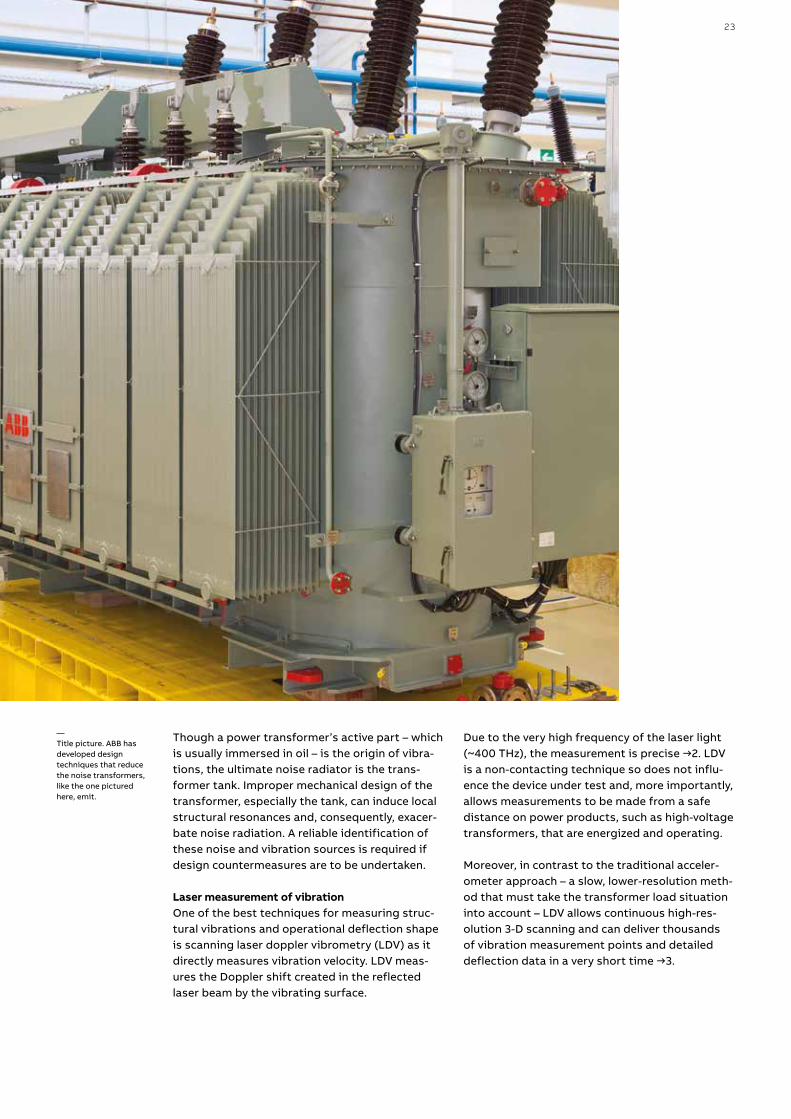
Though a power transformer’s active part – which is usually immersed in oil – is the origin of vibra-tions, the ultimate noise radiator is the trans-former tank. Improper mechanical design of the transformer, especially the tank, can induce local structural resonances and, consequently, exacer-bate noise radiation. A reliable identification of these noise and vibration sources is required if design countermeasures are to be undertaken.
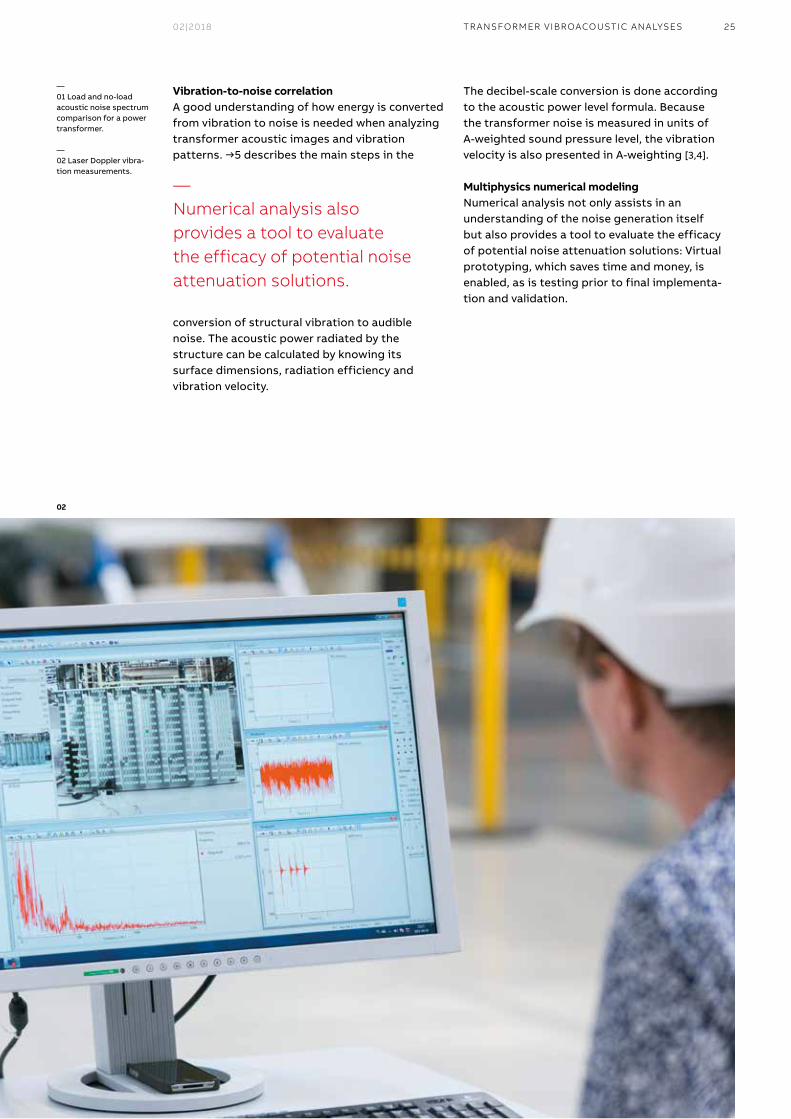
Laser measurement of vibrationOne of the best techniques for measuring struc-tural vibrations and operational deflection shape is scanning laser doppler vibrometry (LDV) as it directly measures vibration velocity. LDV meas-ures the Doppler shift created in the reflected laser beam by the vibrating surface.
Due to the very high frequency of the laser light (~400 THz), the measurement is precise →2. LDV is a non-contacting technique so does not influ-ence the device under test and, more importantly, allows measurements to be made from a safe distance on power products, such as high-voltage transformers, that are energized and operating.
Moreover, in contrast to the traditional acceler-ometer approach – a slow, lower-resolution meth-od that must take the transformer load situation into account – LDV allows continuous high-res-olution 3-D scanning and can deliver thousands of vibration measurement points and detailed deflection data in a very short time →3.
—Title picture. ABB has developed design techniques that reduce the noise transformers, like the one pictured here, emit.
24 ABB REVIEW
Measurement of noise using sound intensityA good way to identify areas of critical noise radiation is to perform a sound intensity scan. Sound intensity is a vector quantity, so it pro-vides information on acoustic direction as well as magnitude (standard noise measurements based on pressure level measure only magnitude). As a
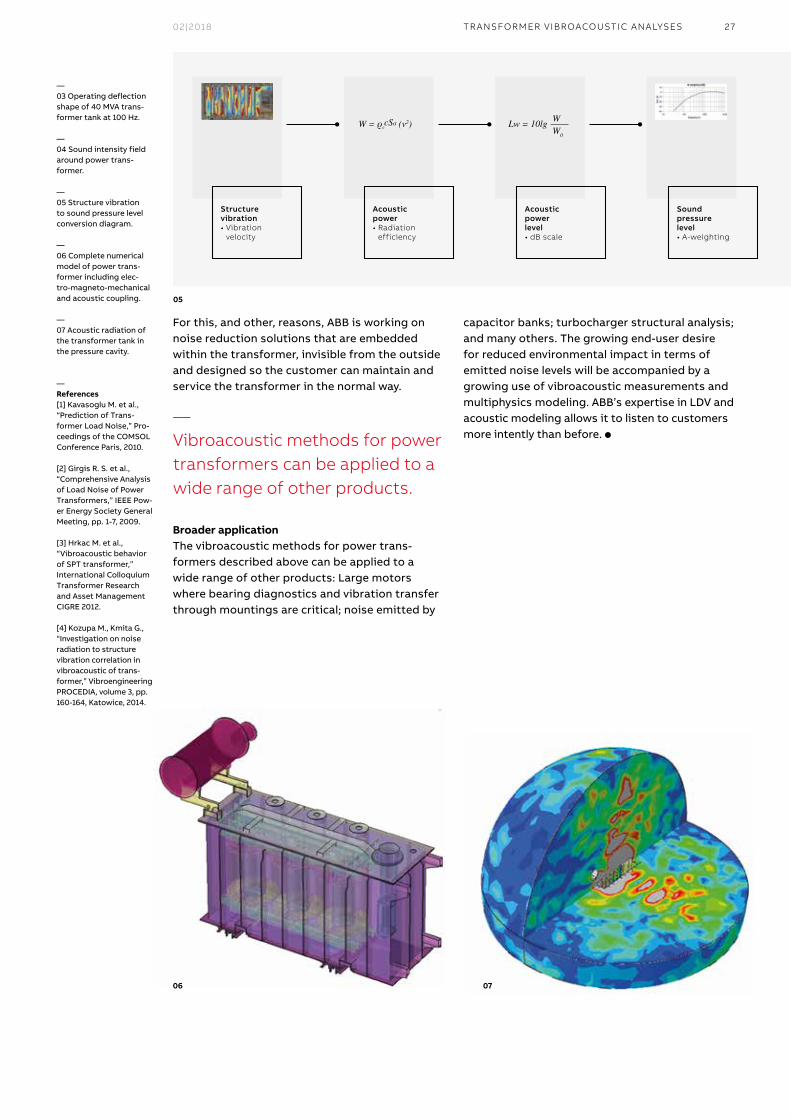
result, sound intensity probes are highly direc-tional and thus less prone to interference from background noise. A sound intensity scan is a very efficient sound source localization method when a grid is set up to define a surface and meas-urements normal to the surface are made from a number of equally spaced points. The results are then used to calculate the sound power over the grid or to create intensity contour maps. By interpolation, iso-intensity lines can be drawn for a single frequency or an overall level →4.
EXCELLENCE IN DESIGN
—LDV allows continuous high- resolution 3-D scanning and can deliver thousands of vibration measurement points and detailed deflection data in a very short time.
01
50
40
30
20
10
0
Frequency (Hz)
So
un
d p
ress
ure
leve
l (d
BA
)
0 100 200 300 400 500 600 700 800 900 1,000 1,100 1,200 1,300 1,400
Load noise
No-load noise
02|2018 25
Vibration-to-noise correlationA good understanding of how energy is converted from vibration to noise is needed when analyzing transformer acoustic images and vibration patterns. →5 describes the main steps in the
conversion of structural vibration to audible noise. The acoustic power radiated by the structure can be calculated by knowing its surface dimensions, radiation efficiency and vibration velocity.
The decibel-scale conversion is done according to the acoustic power level formula. Because the transformer noise is measured in units of A-weighted sound pressure level, the vibration velocity is also presented in A-weighting [3,4].
Multiphysics numerical modelingNumerical analysis not only assists in an understanding of the noise generation itself but also provides a tool to evaluate the efficacy of potential noise attenuation solutions: Virtual prototyping, which saves time and money, is enabled, as is testing prior to final implementa-tion and validation.
02
—01 Load and no-load acoustic noise spectrum comparison for a power transformer.
—02 Laser Doppler vibra-tion measurements.
TR ANSFORMER VIBROACOUSTIC ANALYSES
—Numerical analysis also provides a tool to evaluate the efficacy of potential noise attenuation solutions.
26 ABB REVIEW
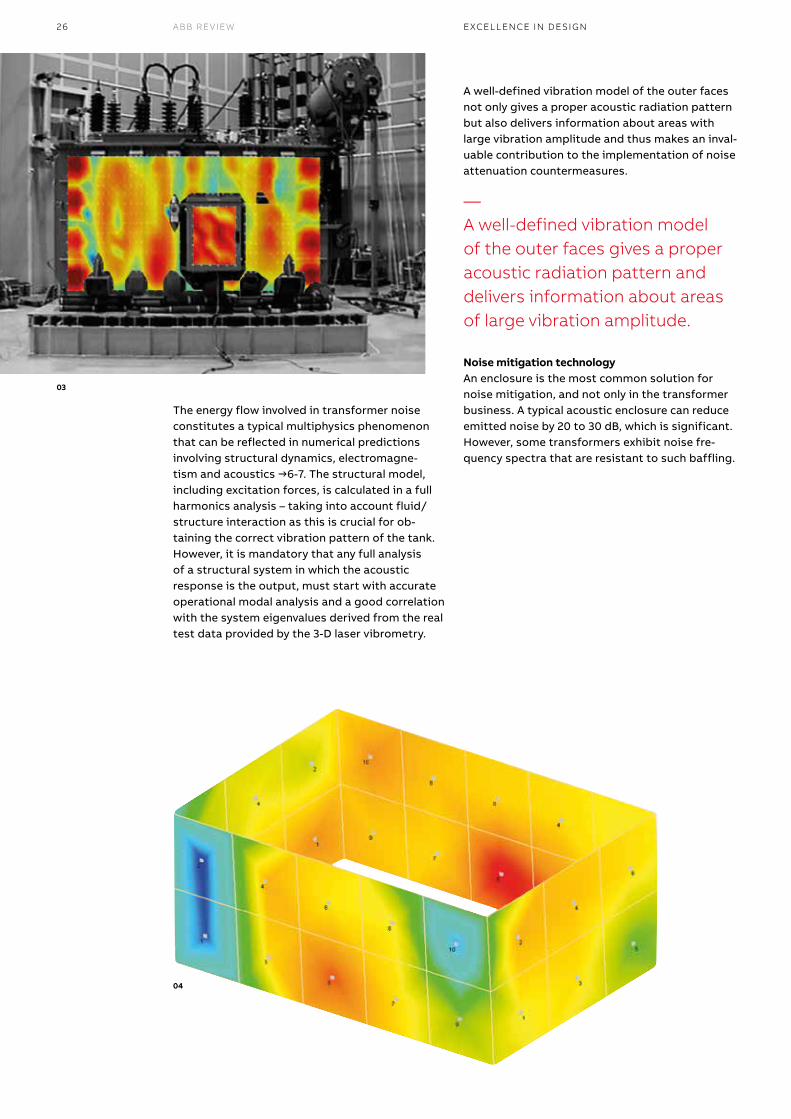
The energy flow involved in transformer noise constitutes a typical multiphysics phenomenon that can be reflected in numerical predictions involving structural dynamics, electromagne-tism and acoustics →6-7. The structural model, including excitation forces, is calculated in a full harmonics analysis – taking into account fluid/structure interaction as this is crucial for ob-taining the correct vibration pattern of the tank. However, it is mandatory that any full analysis of a structural system in which the acoustic response is the output, must start with accurate operational modal analysis and a good correlation with the system eigenvalues derived from the real test data provided by the 3-D laser vibrometry.
A well-defined vibration model of the outer faces not only gives a proper acoustic radiation pattern but also delivers information about areas with large vibration amplitude and thus makes an inval-uable contribution to the implementation of noise attenuation countermeasures.
Noise mitigation technologyAn enclosure is the most common solution for noise mitigation, and not only in the transformer business. A typical acoustic enclosure can reduce emitted noise by 20 to 30 dB, which is significant. However, some transformers exhibit noise fre-quency spectra that are resistant to such baffling.
03
04
EXCELLENCE IN DESIGN
—A well-defined vibration model of the outer faces gives a proper acoustic radiation pattern and delivers information about areas of large vibration amplitude.
02|2018 27
capacitor banks; turbocharger structural analysis; and many others. The growing end-user desire for reduced environmental impact in terms of emitted noise levels will be accompanied by a growing use of vibroacoustic measurements and multiphysics modeling. ABB’s expertise in LDV and acoustic modeling allows it to listen to customers more intently than before. l
For this, and other, reasons, ABB is working on noise reduction solutions that are embedded within the transformer, invisible from the outside and designed so the customer can maintain and service the transformer in the normal way.
Broader applicationThe vibroacoustic methods for power trans-formers described above can be applied to a wide range of other products: Large motors where bearing diagnostics and vibration transfer through mountings are critical; noise emitted by
—03 Operating deflection shape of 40 MVA trans-former tank at 100 Hz.
—04 Sound intensity field around power trans-former.
—05 Structure vibration to sound pressure level conversion diagram.
—06 Complete numerical model of power trans-former including elec-tro-magneto-mechanical and acoustic coupling.
—07 Acoustic radiation of the transformer tank in the pressure cavity.
— References[1] Kavasoglu M. et al., “Prediction of Trans-former Load Noise,” Pro-ceedings of the COMSOL Conference Paris, 2010.
[2] Girgis R. S. et al., “Comprehensive Analysis of Load Noise of Power Transformers,” IEEE Pow-er Energy Society General Meeting, pp. 1-7, 2009.
[3] Hrkac M. et al., “Vibroacoustic behavior of SPT transformer,” International Colloquium Transformer Research and Asset Management CIGRE 2012.
[4] Kozupa M., Kmita G., “Investigation on noise radiation to structure vibration correlation in vibroacoustic of trans-former,” Vibroengineering PROCEDIA, volume 3, pp. 160-164, Katowice, 2014.
06 07
05
TR ANSFORMER VIBROACOUSTIC ANALYSES
—Vibroacoustic methods for power transformers can be applied to a wide range of other products.
W = ρ0cSσ (v2) Lw = 10lg W
W0
Structure vibration• Vibration velocity
Acousticpower• Radiation efficiency
Acousticpower level• dB scale
Sound pressurelevel• A-weighting

28 ABB REVIEW
46
— Digital systems and analytics
38
02|2018 29
58
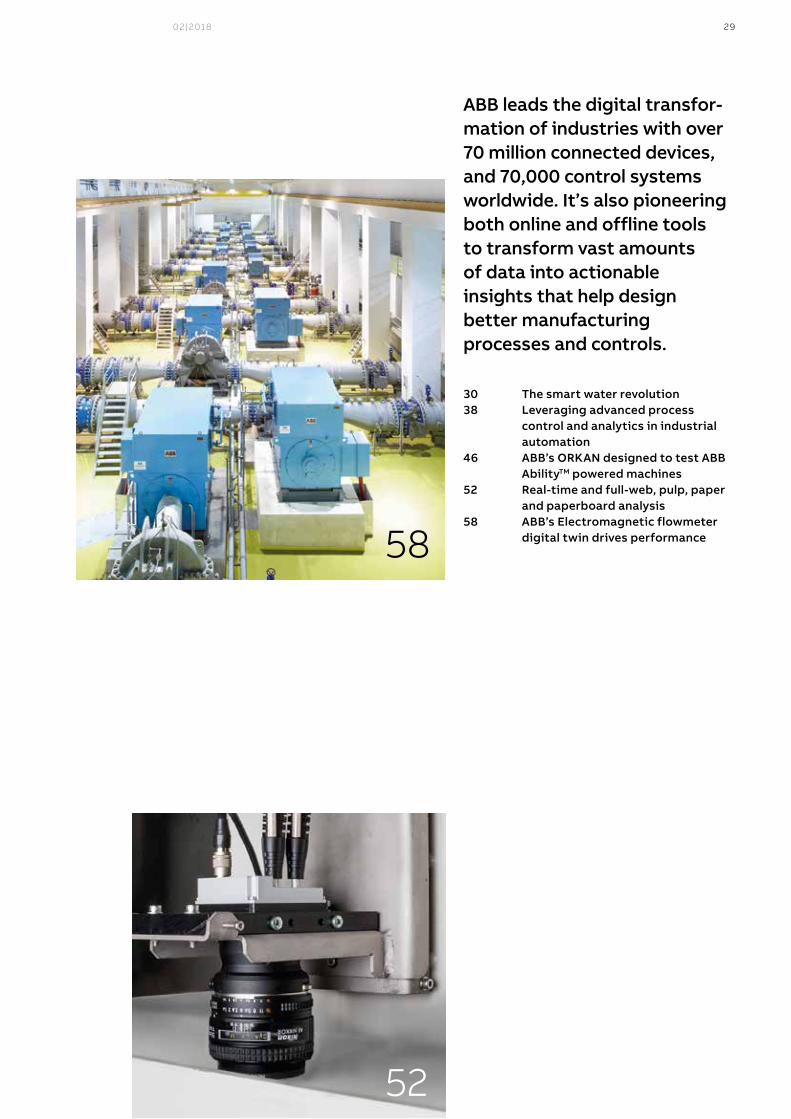
ABB leads the digital transfor-mation of industries with over 70 million connected devices, and 70,000 control systems worldwide. It’s also pioneering both online and offline tools to transform vast amounts of data into actionable insights that help design better manufacturing processes and controls.
30 Thesmartwaterrevolution38 Leveragingadvancedprocess control and analytics in industrial automation46 ABB’sORKANdesignedtotestABB AbilityTM powered machines52 Real-timeandfull-web,pulp,paper and paperboard analysis58 ABB’sElectromagneticflowmeter digital twin drives performance
— Digital systems and analytics
52

30 ABB REVIEW
— EXCELLENCE IN DESIGN
The smart water revolution External innovators can lend great impetus to new product development. By teaming up with just such an external partner – TaKaDu – ABB can now, in addition to its existing water busi-ness portfolio, offer water utilities solutions that leverage the full potential of digitization.
Hugh Courtney, President of the International Partnership of Business Schools, a consortium of leading business institutions that aims to elevate global business education, is credited with saying, “in a globally competitive economic environment, the only source of sustained competitive advan-tage has to come through innovation.” Traditional-ly, the innovation that is so vital for new business development came from inside the business. In
recent years, however, the speed, depth and com-plexity of technological development have forced enterprises to rethink their approach to innovation and seek inspiration from outside the company. In many cases, collaboration with external agents has become an indispensable strategy when trying to stay ahead of the competition. ABB has long followed such a path, with notable success.
In 2009, external collaboration was taken to a new level with the formation of ABB Technology Ventures (ATV), ABB’s strategic venture capital investment arm [1]. Based in Zurich, Switzerland, Silicon Valley and Chennai, India, ATV partners and invests in breakthrough technology startups that drive strategic value for ABB.
ATV’s partnership with TaKaDu, which dates from 2012, provides a perfect example of how an ATV investment can lead to a better offering and new customers.
—The World Bank estimates global water loss due to leaks and bursts at 25 to 30 percent, representing a $20 billion cost savings opportunity.
Victoria LiethaABB Technology Ventures Zurich, Switzerland
3102|2018
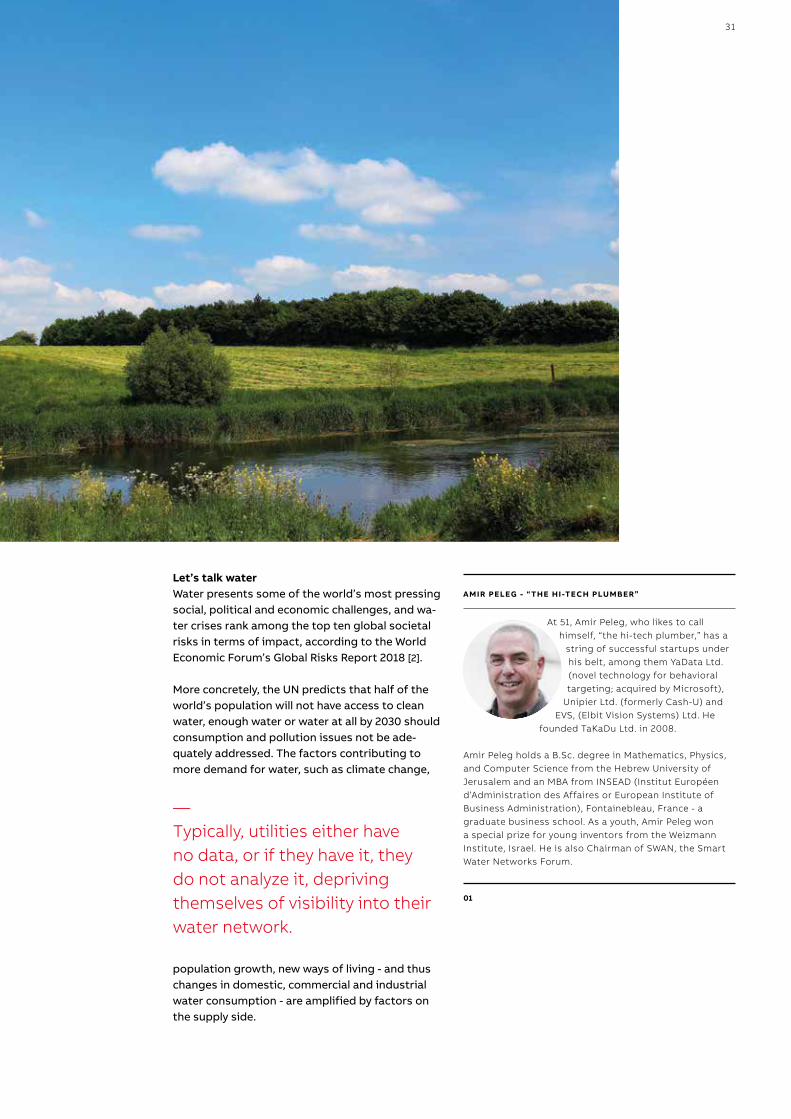
Let’s talk waterWater presents some of the world’s most pressing social, political and economic challenges, and wa-ter crises rank among the top ten global societal risks in terms of impact, according to the World Economic Forum’s Global Risks Report 2018 [2].
More concretely, the UN predicts that half of the world’s population will not have access to clean water, enough water or water at all by 2030 should consumption and pollution issues not be ade-quately addressed. The factors contributing to more demand for water, such as climate change,
population growth, new ways of living - and thus changes in domestic, commercial and industrial water consumption - are amplified by factors on the supply side.
—Typically, utilities either have no data, or if they have it, they do not analyze it, depriving themselves of visibility into their water network.
AMIR PELEG - “THE HI-TECH PLUMBER”
At 51, Amir Peleg, who likes to call himself, “the hi-tech plumber,” has a
string of successful startups under his belt, among them YaData Ltd. (novel technology for behavioral targeting; acquired by Microsoft),
Unipier Ltd. (formerly Cash-U) and EVS, (Elbit Vision Systems) Ltd. He
founded TaKaDu Ltd. in 2008.
Amir Peleg holds a B.Sc. degree in Mathematics, Physics, and Computer Science from the Hebrew University of Jerusalem and an MBA from INSEAD (Institut Européen d’Administration des Affaires or European Institute of Business Administration), Fontainebleau, France - a graduate business school. As a youth, Amir Peleg won a special prize for young inventors from the Weizmann Institute, Israel. He is also Chairman of SWAN, the Smart Water Networks Forum.
01
32 ABB REVIEW
On top of inadequate infrastructure investment, the World Bank estimates global water loss due to leaks and bursts at 25 to 30 percent, representing a $20 billion annual cost savings opportunity. Typi-cally, utilities either have no data, or if they have it, they do not analyze it, depriving themselves of vis-ibility into their water network. Repairs are carried out reactively and rarely in a planned way. Often, the first indication of trouble is when a concerned citizen reports water flowing down the street.
TaKaDu technology to save the dayThe good news is that new technologies can help to solve the problem. By using digital technologies, data analytics and algorithms based on artificial intelligence (AI), utilities and cities are better equipped to manage demand for, and supply of, clean water and thus extract more value from their physical water infrastructure. Amongst the pioneers introducing these new technologies into the water industry is an Israeli company with which ABB’s ATV has gone into partnership: TaKaDu [1].
According to Amir Peleg, Founder and CEO of TaKaDu, no one takes water for granted in Israel – a country in which water is in very short supply indeed →1. In fact, about 50 percent of Israel’s drinking water comes from desalination plants – an expensive option – with agriculture irrigation using recycled wastewater (over 85 percent of Israel’s wastewater is reused, the highest percent-age in the world).
The trigger for Amir Peleg’s venture into the water industry came around the time in summer 2008 when he had to reduce his own water consumption due to regional drought. He then found out that the local utilities were losing 15 to 20 percent of the water they were pumping into the network. On top of this, a chance conversation with an engineer brought home to Amir the realization of the inef-ficient situation in which many water utilities find themselves: Though they lose, on average, 25 to 30 percent of their water and collect a substantial quantity of raw data pertaining to their leaky wa-ter networks, very little use is made of this data to provide insight into the state of the water system or to support decision making. From this epiphany, TaKaDu was born.
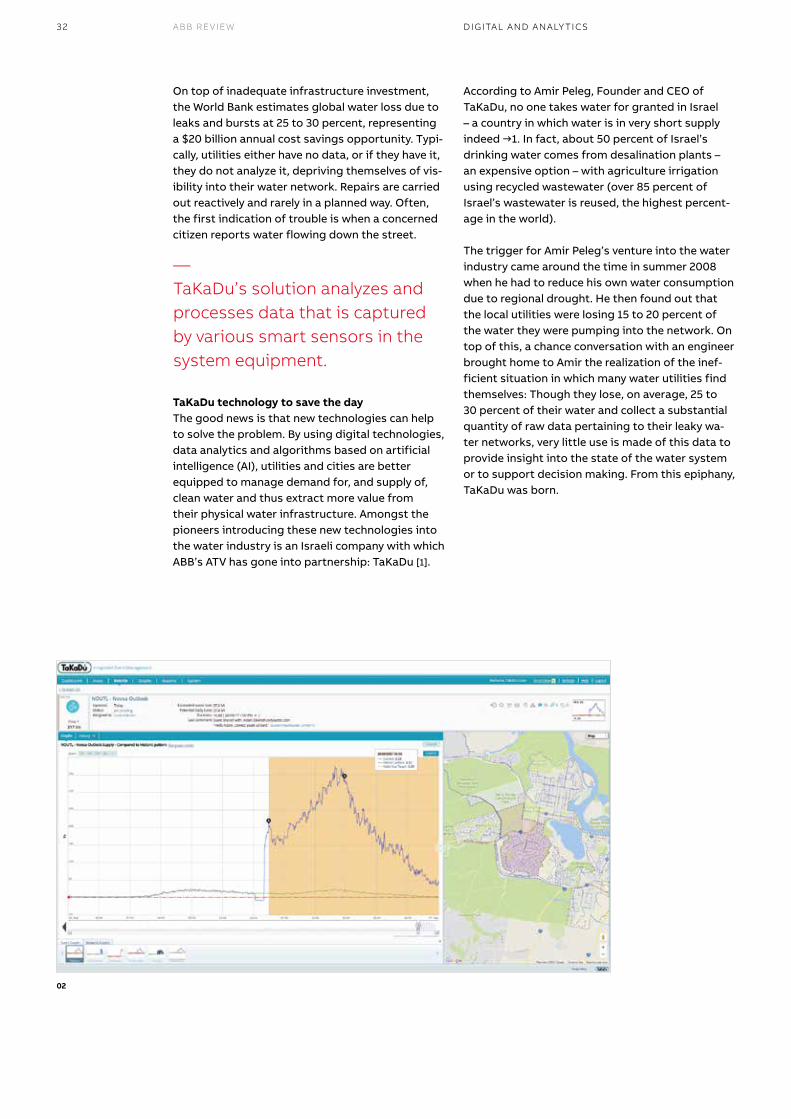
—TaKaDu’s solution analyzes and processes data that is captured by various smart sensors in the system equipment.
02
DIGITAL AND ANALY TICS
02|2018 33WATER UTILIT Y CULTURE CHANGE
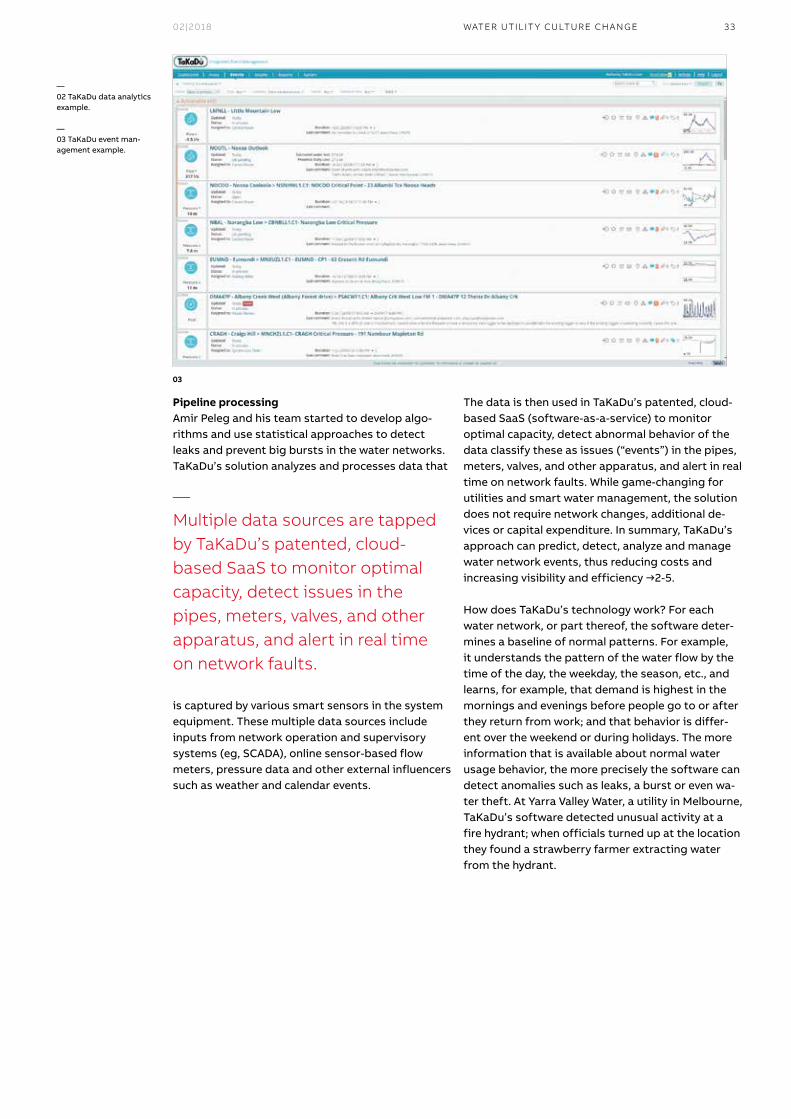
Pipeline processingAmir Peleg and his team started to develop algo-rithms and use statistical approaches to detect leaks and prevent big bursts in the water networks. TaKaDu’s solution analyzes and processes data that
is captured by various smart sensors in the system equipment. These multiple data sources include inputs from network operation and supervisory systems (eg, SCADA), online sensor-based flow meters, pressure data and other external influencers such as weather and calendar events.
The data is then used in TaKaDu’s patented, cloud-based SaaS (software-as-a-service) to monitor optimal capacity, detect abnormal behavior of the data classify these as issues (“events”) in the pipes, meters, valves, and other apparatus, and alert in real time on network faults. While game-changing for utilities and smart water management, the solution does not require network changes, additional de-vices or capital expenditure. In summary, TaKaDu’s approach can predict, detect, analyze and manage water network events, thus reducing costs and increasing visibility and efficiency →2-5.
How does TaKaDu’s technology work? For each water network, or part thereof, the software deter-mines a baseline of normal patterns. For example, it understands the pattern of the water flow by the time of the day, the weekday, the season, etc., and learns, for example, that demand is highest in the mornings and evenings before people go to or after they return from work; and that behavior is differ-ent over the weekend or during holidays. The more information that is available about normal water usage behavior, the more precisely the software can detect anomalies such as leaks, a burst or even wa-ter theft. At Yarra Valley Water, a utility in Melbourne, TaKaDu’s software detected unusual activity at a fire hydrant; when officials turned up at the location they found a strawberry farmer extracting water from the hydrant.
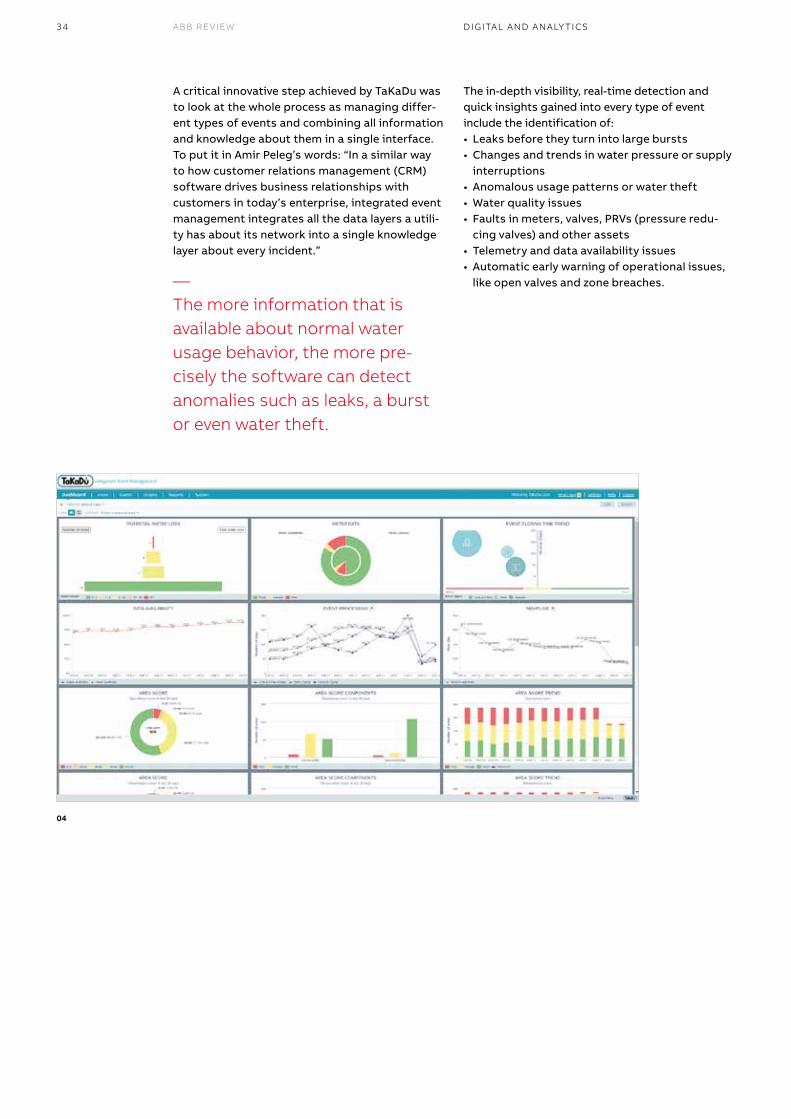
—02 TaKaDu data analytics example.
—03 TaKaDu event man-agement example.
—Multiple data sources are tapped by TaKaDu’s patented, cloud-based SaaS to monitor optimal capacity, detect issues in the pipes, meters, valves, and other apparatus, and alert in real time on network faults.
03
34 ABB REVIEW
A critical innovative step achieved by TaKaDu was to look at the whole process as managing differ-ent types of events and combining all information and knowledge about them in a single interface. To put it in Amir Peleg’s words: “In a similar way to how customer relations management (CRM) software drives business relationships with customers in today’s enterprise, integrated event management integrates all the data layers a utili-ty has about its network into a single knowledge layer about every incident.”
The in-depth visibility, real-time detection and quick insights gained into every type of event include the identification of:• Leaks before they turn into large bursts• Changes and trends in water pressure or supply
interruptions• Anomalous usage patterns or water theft• Water quality issues• Faults in meters, valves, PRVs (pressure redu-
cing valves) and other assets• Telemetry and data availability issues• Automatic early warning of operational issues,
like open valves and zone breaches.—The more information that is available about normal water usage behavior, the more pre-cisely the software can detect anomalies such as leaks, a burst or even water theft.
04
DIGITAL AND ANALY TICS
02|2018 35WATER UTILITY CULTURE CHANGE
“TaKaDu’s AI-based solution enables the water industry to catch the wave of digitalization for their sector just in time,” says Kurt Kaltenegger, Head of Technology at ATV. “By partnering with TaKaDu we can show the full potential of advanced automation and the use of data to our customers in the water industry.” While TaKaDu’s solution helps to convert raw data into knowledge, ABB’s long experience, established technology and broad customer base offer TaKaDu access and reach.
The powerful ABB/TaKaDu symbiosis is being put to work, for example, in a massive urban project to increase efficiency, reduce water leakage, prevent disruptions and ensure everyone has access to clean water in Ho Chi Minh City – a city that currently loses nearly 50 percent of its potable water to leaking and damaged pipes.
According to Amir Peleg, many utilities are in a gray zone – they have some sensors and some analytics, and they ask why they should put in more sensors. But once they see the power of TaKaDu’s product, they change their minds. The tailwind they get kicks off a positive feedback investment cycle.
Ho Chi Minh CityComplementing ABB’s automation portfolio for the water sector, TaKaDu provides its field-proven monitoring system, which has been adopted by water utilities around the world. TaKaDu’s innova-tions allow ABB’s customers to produce, trans-port, distribute, treat and utilize water efficiently, reducing energy consumption, minimizing losses and improving reliability.
—Complementing ABB’s auto-mation portfolio for the water sector, TaKaDu gives ABB access to its field-proven monitoring system, which has been widely adopted by water utilities.
05
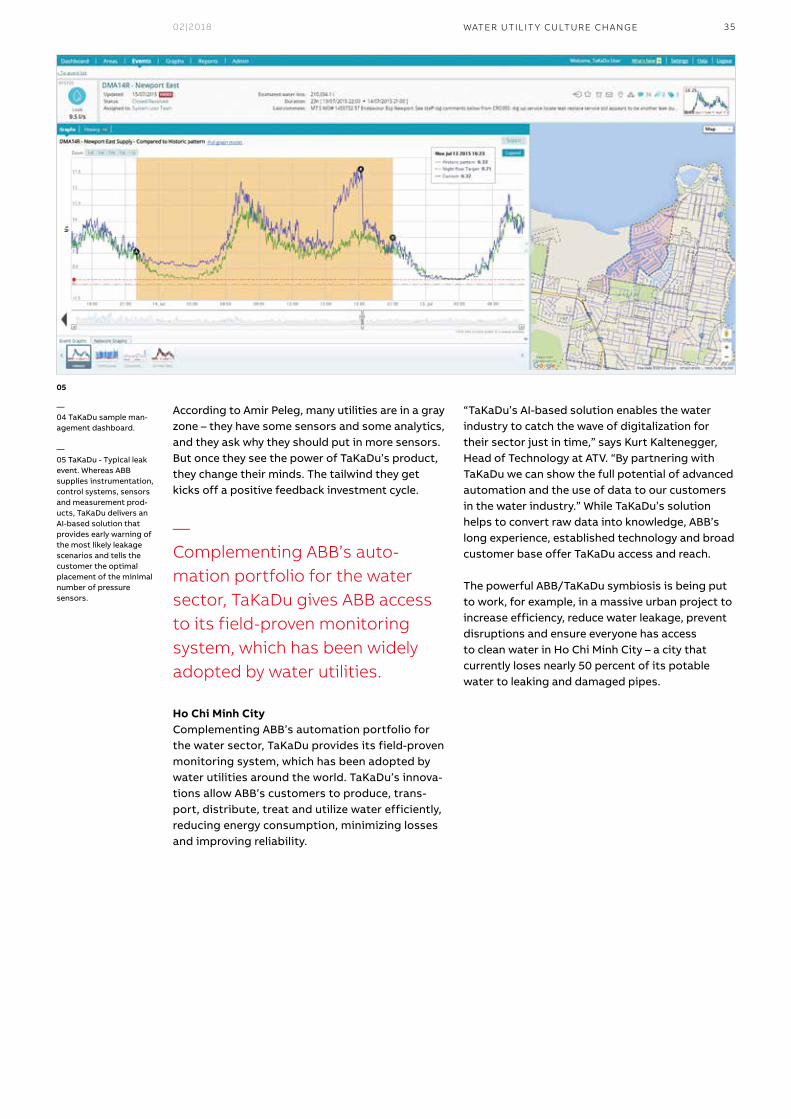
—04 TaKaDu sample man-agement dashboard.
—05 TaKaDu - Typical leak event. Whereas ABB supplies instrumentation, control systems, sensors and measurement prod-ucts, TaKaDu delivers an AI-based solution that provides early warning of the most likely leakage scenarios and tells the customer the optimal placement of the minimal number of pressure sensors.
36 ABB REVIEW
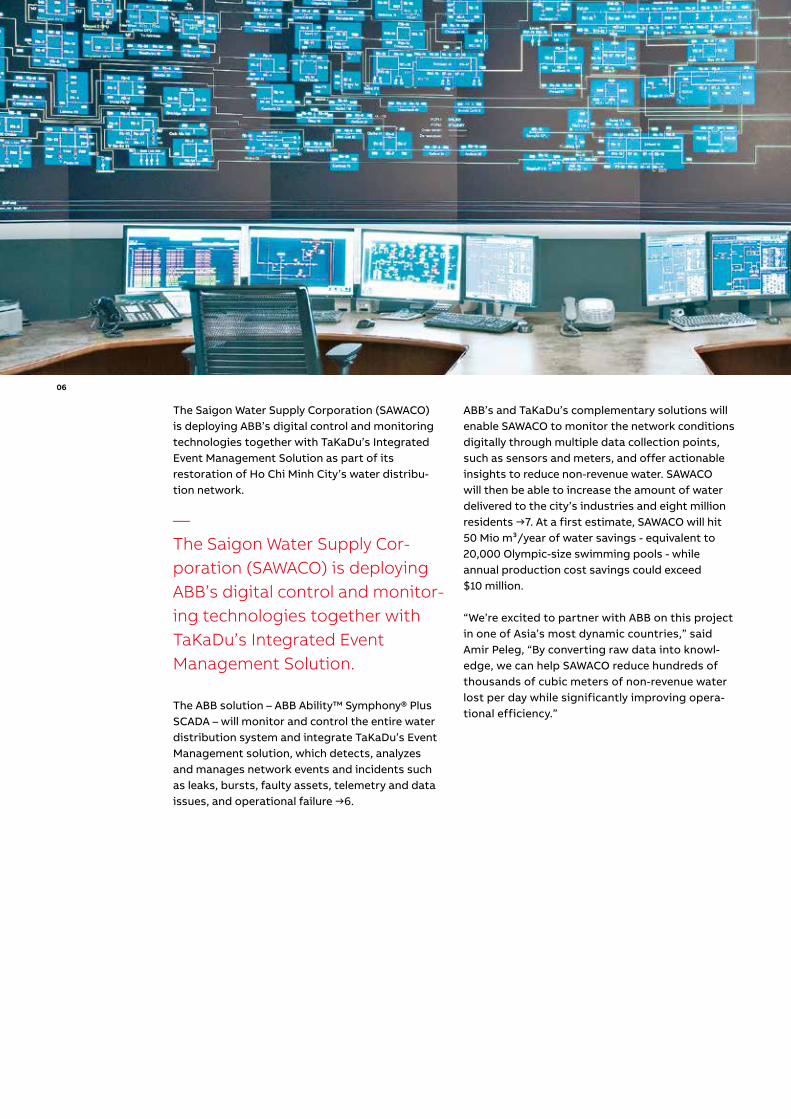
The Saigon Water Supply Corporation (SAWACO) is deploying ABB’s digital control and monitoring technologies together with TaKaDu’s Integrated Event Management Solution as part of its restoration of Ho Chi Minh City’s water distribu-tion network.
The ABB solution – ABB Ability™ Symphony® Plus SCADA – will monitor and control the entire water distribution system and integrate TaKaDu’s Event Management solution, which detects, analyzes and manages network events and incidents such as leaks, bursts, faulty assets, telemetry and data issues, and operational failure →6.
ABB’s and TaKaDu’s complementary solutions will enable SAWACO to monitor the network conditions digitally through multiple data collection points, such as sensors and meters, and offer actionable insights to reduce non-revenue water. SAWACO will then be able to increase the amount of water delivered to the city’s industries and eight million residents →7. At a first estimate, SAWACO will hit 50 Mio m³/year of water savings - equivalent to 20,000 Olympic-size swimming pools - while annual production cost savings could exceed $10 million.
“We’re excited to partner with ABB on this project in one of Asia’s most dynamic countries,” said Amir Peleg, “By converting raw data into knowl-edge, we can help SAWACO reduce hundreds of thousands of cubic meters of non-revenue water lost per day while significantly improving opera-tional efficiency.”
—The Saigon Water Supply Cor-poration (SAWACO) is deploying ABB’s digital control and monitor-ing technologies together with TaKaDu’s Integrated Event Management Solution.
06
02|2018 37WATER UTILITY CULTURE CHANGE
—06 Water network man-agement is just one appli-cation of SCADA. Over the years, ABB’s SCADA has evolved to fit specific business needs in many different areas.
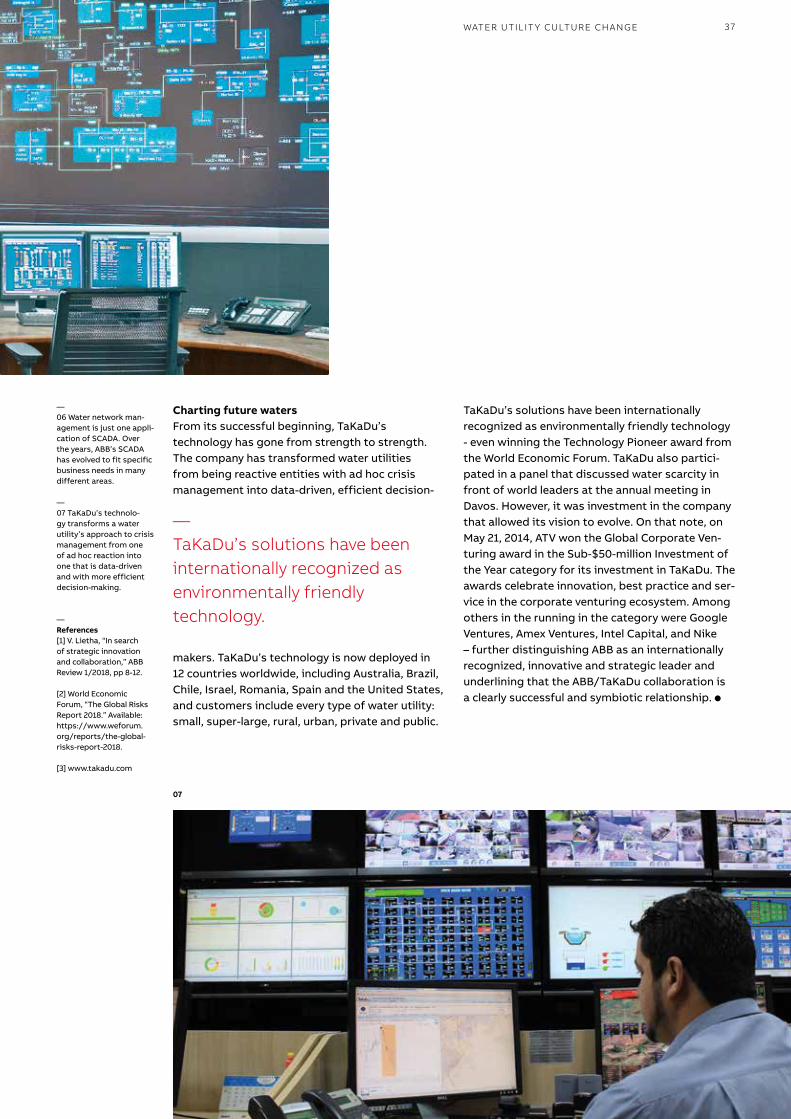
—07 TaKaDu’s technolo-gy transforms a water utility’s approach to crisis management from one of ad hoc reaction into one that is data-driven and with more efficient decision-making.
— References[1] V. Lietha, “In search of strategic innovation and collaboration,” ABB Review 1/2018, pp 8-12.
[2] World Economic Forum, “The Global Risks Report 2018.” Available: https://www.weforum.org/reports/the-global-risks-report-2018.
[3] www.takadu.com
TaKaDu’s solutions have been internationally recognized as environmentally friendly technology - even winning the Technology Pioneer award from the World Economic Forum. TaKaDu also partici-pated in a panel that discussed water scarcity in front of world leaders at the annual meeting in Davos. However, it was investment in the company that allowed its vision to evolve. On that note, on May 21, 2014, ATV won the Global Corporate Ven-turing award in the Sub-$50-million Investment of the Year category for its investment in TaKaDu. The awards celebrate innovation, best practice and ser-vice in the corporate venturing ecosystem. Among others in the running in the category were Google Ventures, Amex Ventures, Intel Capital, and Nike – further distinguishing ABB as an internationally recognized, innovative and strategic leader and underlining that the ABB/TaKaDu collaboration is a clearly successful and symbiotic relationship. l
Charting future watersFrom its successful beginning, TaKaDu’s technology has gone from strength to strength. The company has transformed water utilities from being reactive entities with ad hoc crisis management into data-driven, efficient decision-
makers. TaKaDu’s technology is now deployed in 12 countries worldwide, including Australia, Brazil, Chile, Israel, Romania, Spain and the United States, and customers include every type of water utility: small, super-large, rural, urban, private and public.
—TaKaDu’s solutions have been internationally recognized as environmentally friendly technology.
07
38 ABB REVIEW DIGITAL AND ANALY TICS
— DIGITAL AND ANALY TICS
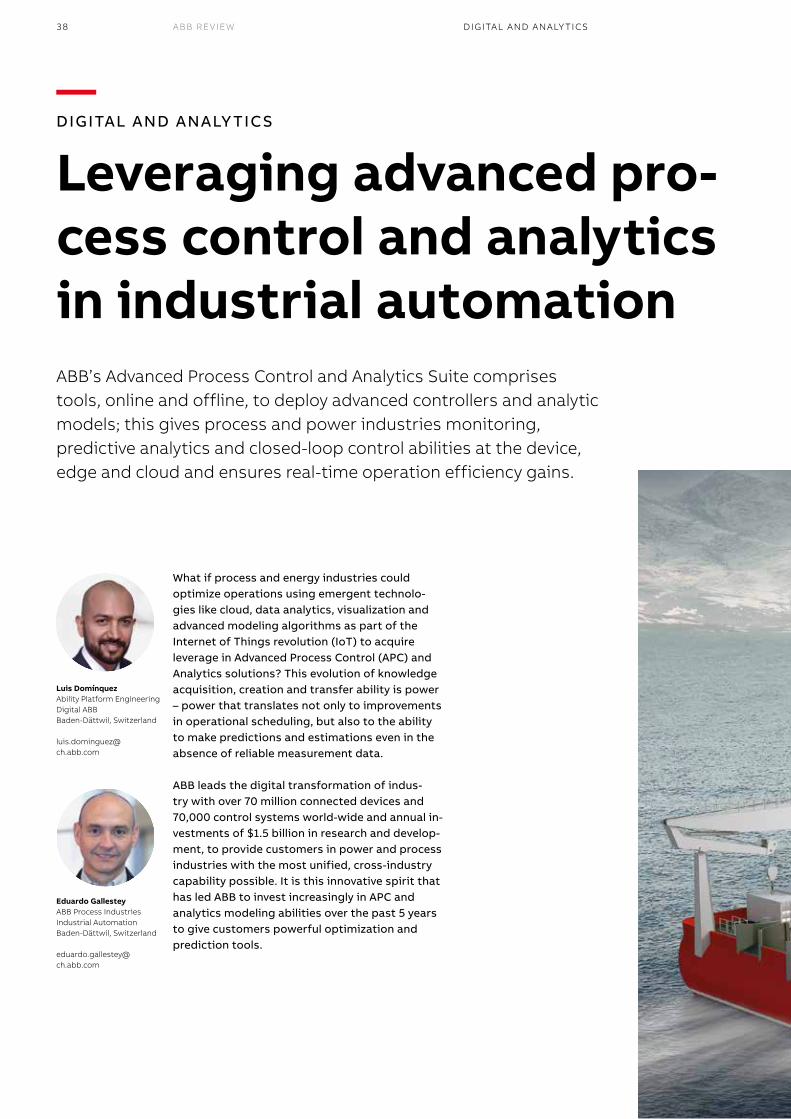
Leveraging advanced pro-cess control and analytics in industrial automationABB’s Advanced Process Control and Analytics Suite comprises tools, online and offline, to deploy advanced controllers and analytic models; this gives process and power industries monitoring, predictive analytics and closed-loop control abilities at the device, edge and cloud and ensures real-time operation efficiency gains.
Luis DomínquezAbility Platform EngineeringDigital ABBBaden-Dättwil, Switzerland
luis.dominguez@ ch.abb.com
Eduardo GallesteyABB Process IndustriesIndustrial AutomationBaden-Dättwil, Switzerland
eduardo.gallestey@ ch.abb.com
What if process and energy industries could optimize operations using emergent technolo-gies like cloud, data analytics, visualization and advanced modeling algorithms as part of the Internet of Things revolution (IoT) to acquire leverage in Advanced Process Control (APC) and Analytics solutions? This evolution of knowledge acquisition, creation and transfer ability is power – power that translates not only to improvements in operational scheduling, but also to the ability to make predictions and estimations even in the absence of reliable measurement data.
ABB leads the digital transformation of indus-try with over 70 million connected devices and 70,000 control systems world-wide and annual in-vestments of $1.5 billion in research and develop-ment, to provide customers in power and process industries with the most unified, cross-industry capability possible. It is this innovative spirit that has led ABB to invest increasingly in APC and analytics modeling abilities over the past 5 years to give customers powerful optimization and prediction tools.
02|2018 39
01
LEVER AGING ADVANCED PROCESS CONTROL
Typically, process industries and energy companies integrate APC in distributed control systems (DCSs) such as ABB Ability™ 800xA and ABB Ability™ Symphony Plus, which allows indus-try users to benefit from distributed resource allocation, redundancy, and communication as well as the intrinsic cybersecurity infrastructure of these modern DCSs.
As APC technology continues to evolve with new components and features, ABB scientists and engineers are exploring the potential of artificial intelligence (AI) with the use of reinforcement learning neural networks as well as edge and cloud technologies for digital analytics and opti-mization for operational services in the process and power industries.
Traditionally, APC relies on model predictive control and moving horizon estimation strategies that use either a linear or non-linear mathematical
model of the industrial plant and smart algo-rithms to estimate unmeasured states and control process variables. APC helps industries attain operational and financial targets by increasing throughput and reducing energy use.
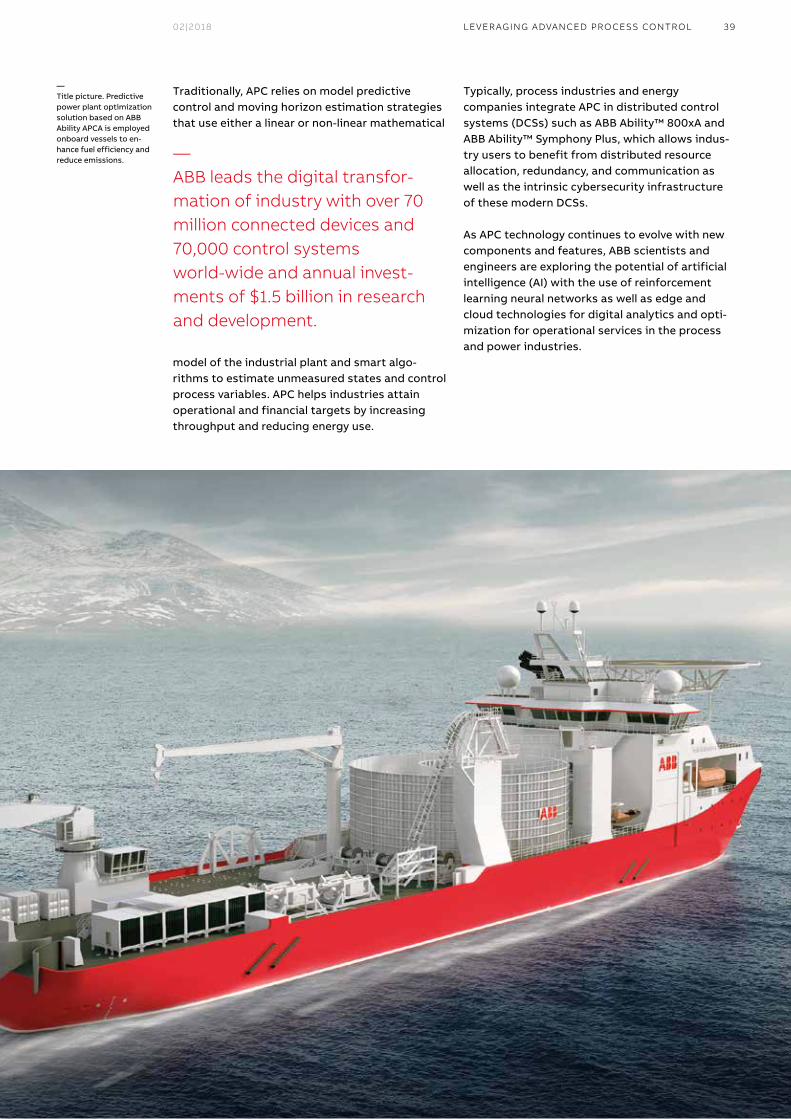
—Title picture. Predictive power plant optimization solution based on ABB Ability APCA is employed onboard vessels to en-hance fuel efficiency and reduce emissions. —
ABB leads the digital transfor-mation of industry with over 70 million connected devices and 70,000 control systems world-wide and annual invest-ments of $1.5 billion in research and development.
40 ABB REVIEW
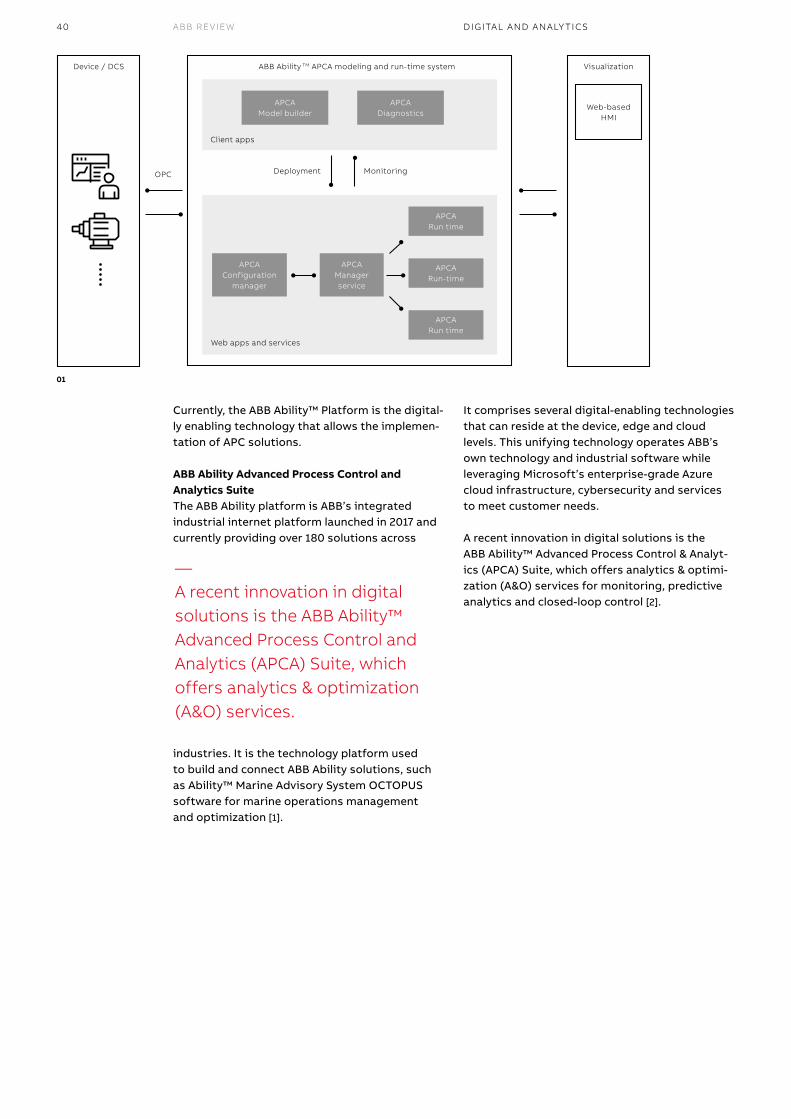
Currently, the ABB Ability™ Platform is the digital-ly enabling technology that allows the implemen-tation of APC solutions.
ABB Ability Advanced Process Control and Analytics SuiteThe ABB Ability platform is ABB’s integrated industrial internet platform launched in 2017 and currently providing over 180 solutions across
industries. It is the technology platform used to build and connect ABB Ability solutions, such as Ability™ Marine Advisory System OCTOPUS software for marine operations management and optimization [1].
It comprises several digital-enabling technologies that can reside at the device, edge and cloud levels. This unifying technology operates ABB’s own technology and industrial software while leveraging Microsoft’s enterprise-grade Azure cloud infrastructure, cybersecurity and services to meet customer needs.
A recent innovation in digital solutions is the ABB Ability™ Advanced Process Control & Analyt-ics (APCA) Suite, which offers analytics & optimi-zation (A&O) services for monitoring, predictive analytics and closed-loop control [2].
01
DIGITAL AND ANALY TICS
—A recent innovation in digital solutions is the ABB Ability™ Advanced Process Control and Analytics (APCA) Suite, which offers analytics & optimization (A&O) services.
Device / DCS Visualization
APCAModel builder
APCAConfiguration
manager
APCAManagerservice
APCARun time
Web-basedHMI
APCARun-time
APCARun time
APCA Diagnostics
ABB Ability TM APCA modeling and run-time system
Client apps
OPC Deployment Monitoring
Web apps and services
02|2018 41
Developing and analyzing advanced controllers offlineThe advantage of developing advanced control-lers and analytics offline in APCA Model builder is that the client’s applications data can be readily leveraged by carrying out modeling and controller design tasks and analysis before deploying the solutions. Users can import large data sets and perform advanced data processing tasks like res-ampling, interpolation, and filtering in addition to open and closed-loop simulations. These capabili-ties deliver true operational advantages.
Security is one of the greatest challenges for in-dustries reliant on data analytics and control and APCA Model builder provides a solution. Ability APCA issues certificates to authorized users to control the authenticity and integrity of the ana-lytic models and advanced controllers developed in APCA Model builder. Thus, only models and controllers with valid certificates originating from authorized users will be digitally signed in APCA Model builder and can then be exported to the APCA Configuration manager. By removing the human decision-making component, security is refined and improved.
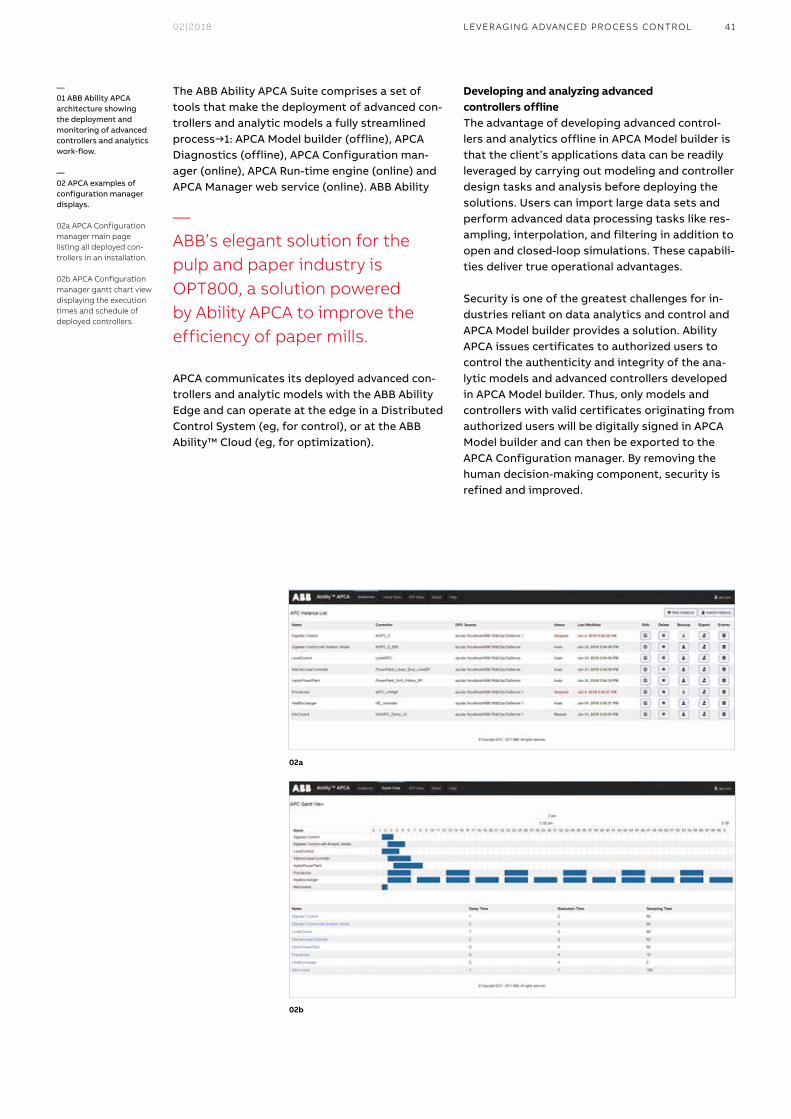
The ABB Ability APCA Suite comprises a set of tools that make the deployment of advanced con-trollers and analytic models a fully streamlined process→1: APCA Model builder (offline), APCA Diagnostics (offline), APCA Configuration man-ager (online), APCA Run-time engine (online) and APCA Manager web service (online). ABB Ability
APCA communicates its deployed advanced con-trollers and analytic models with the ABB Ability Edge and can operate at the edge in a Distributed Control System (eg, for control), or at the ABB Ability™ Cloud (eg, for optimization).
—01 ABB Ability APCA architecture showing the deployment and monitoring of advanced controllers and analytics work-flow.
—02 APCA examples of configuration manager displays.
02a APCA Configuration manager main page listing all deployed con-trollers in an installation.
02b APCA Configuration manager gantt chart view displaying the execution times and schedule of deployed controllers.
02a
02b
LEVER AGING ADVANCED PROCESS CONTROL
—ABB’s elegant solution for the pulp and paper industry is OPT800, a solution powered by Ability APCA to improve the efficiency of paper mills.
42 ABB REVIEW
Furthermore, with APCA Diagnostics, users can analyze the performance of deployed controllers by visualizing the controller actions history from log files. Estimated values of the process varia-bles and the quality of predictions can be com-pared with the data received from the plant, thus allowing control engineers to easily troubleshoot abnormal situations.
Deploying and monitoring advanced controllers and analytics onlineAdvanced controllers can be created, edited, imported, exported or deleted by users in a web-application known as an APC Configuration manager →2a, which also verifies the signature
once any controller file is imported; this process is similar to the model builder security process. Error messages are generated in cases of invalid files or missing signatures, thereby maintaining security.
A key feature of this online system is the ability to include industrial communication standards (eg, OPC) that allow users to connect to a plant, cre-ate or configure tags and map them to imported controller variables. Security is established with authentication and encryption techniques; usually the secure web socket communications (HTTPS), certificate-based security (SSL) and transport layer security (TLS) are used.
DIGITAL AND ANALY TICSM7075 T1 18.02.07 ABB Review 2/2018 [Type here]
/3a
/3b
03a
03b
03c
02|2018 43
Applications in industrial automationABB Ability APCA supports business units within ABB’s industrial automation division with optimi-zation and analytic technology to address conse-quential challenges in its industries.
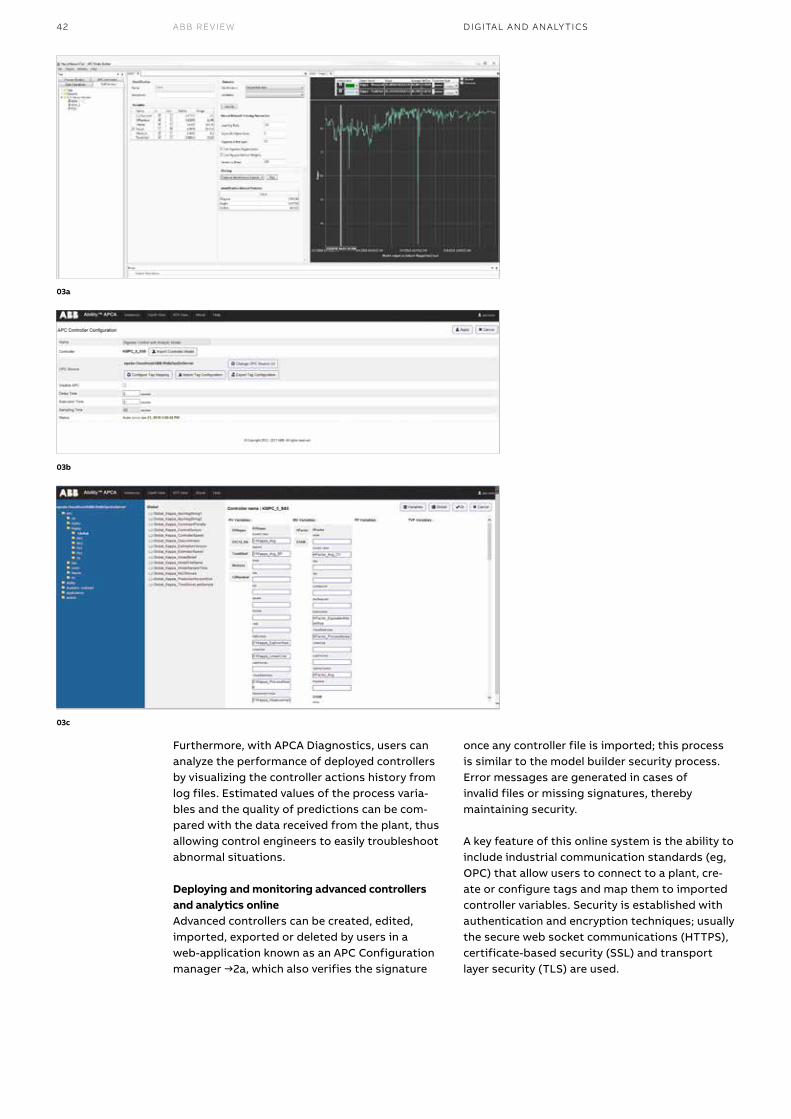
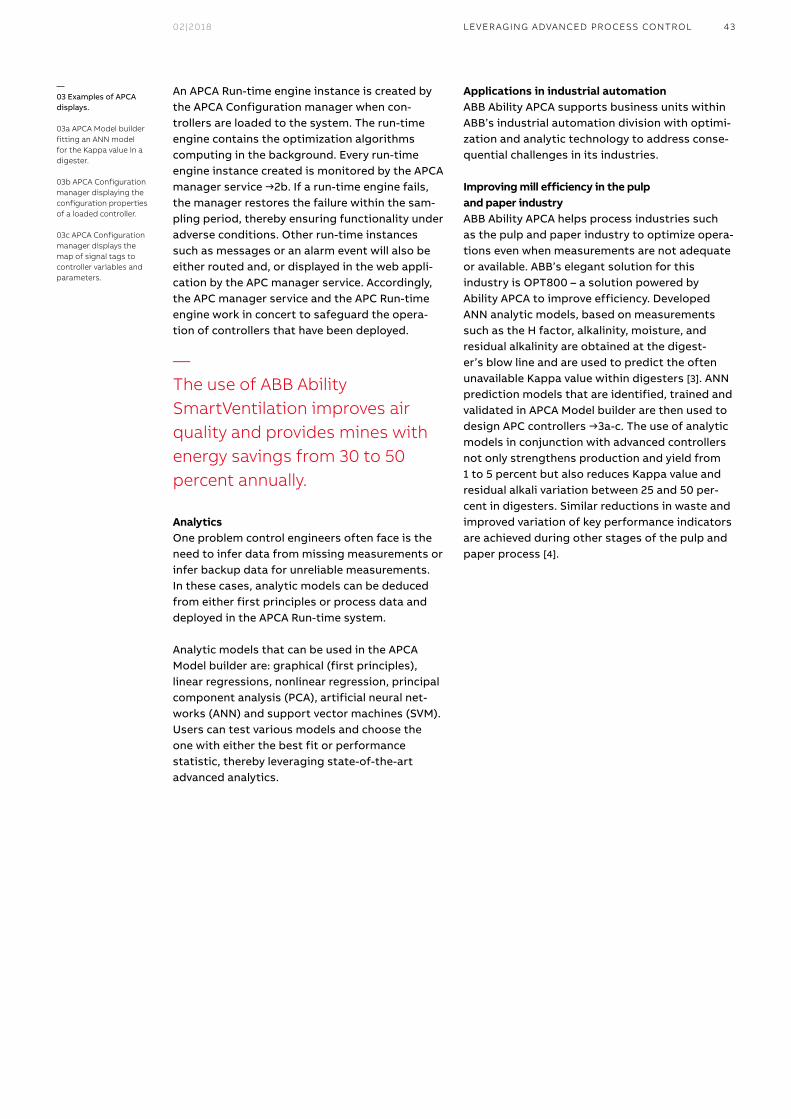
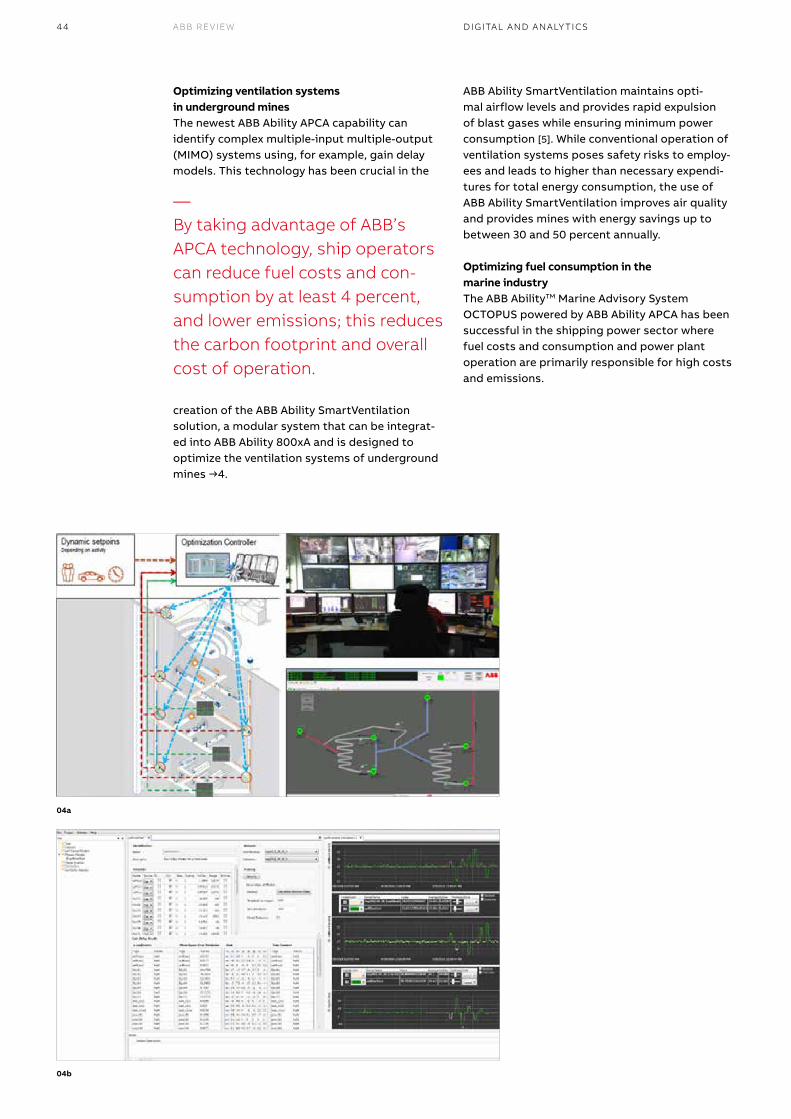
Improving mill efficiency in the pulp and paper industryABB Ability APCA helps process industries such as the pulp and paper industry to optimize opera-tions even when measurements are not adequate or available. ABB’s elegant solution for this industry is OPT800 – a solution powered by Ability APCA to improve efficiency. Developed ANN analytic models, based on measurements such as the H factor, alkalinity, moisture, and residual alkalinity are obtained at the digest-er’s blow line and are used to predict the often unavailable Kappa value within digesters [3]. ANN prediction models that are identified, trained and validated in APCA Model builder are then used to design APC controllers →3a-c. The use of analytic models in conjunction with advanced controllers not only strengthens production and yield from 1 to 5 percent but also reduces Kappa value and residual alkali variation between 25 and 50 per-cent in digesters. Similar reductions in waste and improved variation of key performance indicators are achieved during other stages of the pulp and paper process [4].
An APCA Run-time engine instance is created by the APCA Configuration manager when con-trollers are loaded to the system. The run-time engine contains the optimization algorithms computing in the background. Every run-time engine instance created is monitored by the APCA manager service →2b. If a run-time engine fails, the manager restores the failure within the sam-pling period, thereby ensuring functionality under adverse conditions. Other run-time instances such as messages or an alarm event will also be either routed and, or displayed in the web appli-cation by the APC manager service. Accordingly, the APC manager service and the APC Run-time engine work in concert to safeguard the opera-tion of controllers that have been deployed.
AnalyticsOne problem control engineers often face is the need to infer data from missing measurements or infer backup data for unreliable measurements. In these cases, analytic models can be deduced from either first principles or process data and deployed in the APCA Run-time system.
Analytic models that can be used in the APCA Model builder are: graphical (first principles), linear regressions, nonlinear regression, principal component analysis (PCA), artificial neural net-works (ANN) and support vector machines (SVM). Users can test various models and choose the one with either the best fit or performance statistic, thereby leveraging state-of-the-art advanced analytics.
LEVER AGING ADVANCED PROCESS CONTROL
—The use of ABB Ability SmartVentilation improves air quality and provides mines with energy savings from 30 to 50 percent annually.
—03 Examples of APCA displays.
03a APCA Model builder fitting an ANN model for the Kappa value in a digester.
03b APCA Configuration manager displaying the configuration properties of a loaded controller.
03c APCA Configuration manager displays the map of signal tags to controller variables and parameters.
44 ABB REVIEW
ABB Ability SmartVentilation maintains opti-mal airflow levels and provides rapid expulsion of blast gases while ensuring minimum power consumption [5]. While conventional operation of ventilation systems poses safety risks to employ-ees and leads to higher than necessary expendi-tures for total energy consumption, the use of ABB Ability SmartVentilation improves air quality and provides mines with energy savings up to between 30 and 50 percent annually.
Optimizing fuel consumption in the marine industryThe ABB AbilityTM Marine Advisory System OCTOPUS powered by ABB Ability APCA has been successful in the shipping power sector where fuel costs and consumption and power plant operation are primarily responsible for high costs and emissions.
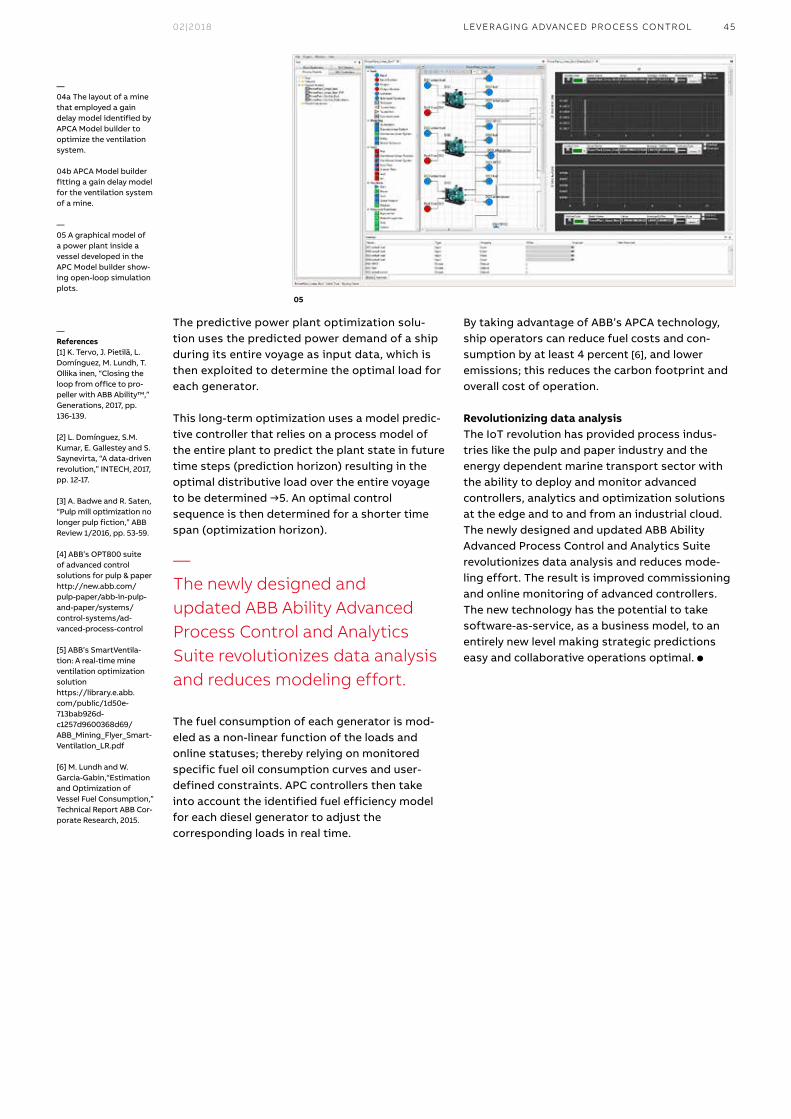
Optimizing ventilation systems in underground minesThe newest ABB Ability APCA capability can identify complex multiple-input multiple-output (MIMO) systems using, for example, gain delay models. This technology has been crucial in the
creation of the ABB Ability SmartVentilation solution, a modular system that can be integrat-ed into ABB Ability 800xA and is designed to optimize the ventilation systems of underground mines →4.
DIGITAL AND ANALY TICS
—By taking advantage of ABB’s APCA technology, ship operators can reduce fuel costs and con-sumption by at least 4 percent, and lower emissions; this reduces the carbon footprint and overall cost of operation.
M7075 T1 18.02.07 ABB Review 2/2018 [Type here]
/4b
/5
M7075 T1 18.02.07 ABB Review 2/2018 [Type here]
/3c
/4a04a
04b
02|2018 45
By taking advantage of ABB’s APCA technology, ship operators can reduce fuel costs and con-sumption by at least 4 percent [6], and lower emissions; this reduces the carbon footprint and overall cost of operation.
Revolutionizing data analysisThe IoT revolution has provided process indus-tries like the pulp and paper industry and the energy dependent marine transport sector with the ability to deploy and monitor advanced controllers, analytics and optimization solutions at the edge and to and from an industrial cloud. The newly designed and updated ABB Ability Advanced Process Control and Analytics Suite revolutionizes data analysis and reduces mode-ling effort. The result is improved commissioning and online monitoring of advanced controllers. The new technology has the potential to take software-as-service, as a business model, to an entirely new level making strategic predictions easy and collaborative operations optimal. l
The predictive power plant optimization solu-tion uses the predicted power demand of a ship during its entire voyage as input data, which is then exploited to determine the optimal load for each generator.
This long-term optimization uses a model predic-tive controller that relies on a process model of the entire plant to predict the plant state in future time steps (prediction horizon) resulting in the optimal distributive load over the entire voyage to be determined →5. An optimal control sequence is then determined for a shorter time span (optimization horizon).
The fuel consumption of each generator is mod-eled as a non-linear function of the loads and online statuses; thereby relying on monitored specific fuel oil consumption curves and user- defined constraints. APC controllers then take into account the identified fuel efficiency model for each diesel generator to adjust the corresponding loads in real time.
05
LEVER AGING ADVANCED PROCESS CONTROL
M7075 T1 18.02.07 ABB Review 2/2018 [Type here]
/4b
/5
—The newly designed and updated ABB Ability Advanced Process Control and Analytics Suite revolutionizes data analysis and reduces modeling effort.
—04a The layout of a mine that employed a gain delay model identified by APCA Model builder to optimize the ventilation system.
04b APCA Model builder fitting a gain delay model for the ventilation system of a mine.
—05 A graphical model of a power plant inside a vessel developed in the APC Model builder show-ing open-loop simulation plots.
— References[1] K. Tervo, J. Pietilä, L. Domínguez, M. Lundh, T. Ollika inen, “Closing the loop from office to pro-peller with ABB Ability™,” Generations, 2017, pp. 136-139.
[2] L. Domínguez, S.M. Kumar, E. Gallestey and S. Saynevirta, “A data-driven revolution,” INTECH, 2017, pp. 12-17.
[3] A. Badwe and R. Saten, “Pulp mill optimization no longer pulp fiction,” ABB Review 1/2016, pp. 53-59.
[4] ABB’s OPT800 suite of advanced control solutions for pulp & paper http://new.abb.com/pulp-paper/abb-in-pulp-and-paper/systems/control-systems/ad-vanced-process-control
[5] ABB’s SmartVentila-tion: A real-time mine ventilation optimization solution https://library.e.abb.com/public/1d50e-713bab926d-c1257d9600368d69/ABB_Mining_Flyer_Smart-Ventilation_LR.pdf
[6] M. Lundh and W. Garcia-Gabin,“Estimation and Optimization of Vessel Fuel Consumption,” Technical Report ABB Cor-porate Research, 2015.
46 ABB REVIEW
— DIGITAL AND ANALY TICS
ABB’s ORKAN designed to test ABB AbilityTM
powered machinesABB’s advanced multipurpose test rig for ABB AbilityTM-powered machines provides capabilities in advanced control methods, condition monitoring design and evaluation of industrial compression systems – contributing to breakthrough technologies that are important for the oil, gas and chemical sector.
Nowadays, modern manufacturing is undergoing a renaissance – the Internet of Things (IoT) – connected factory is not only linked with devices, systems, computers and humans to attain height-ened levels of monitoring, information gathering, analysis, processing and communication in real-time but is also intrinsically connected to informa-tion platforms that leverage data and advanced analytics for optimization, decision - making and predictions →1. The proper interaction of all these aspects translates to improvements in efficiency, throughput and overall cost of operations for
industry customers. Nevertheless, industrial equip-ment, which ranges from relatively simple devices to complex machines, must cope with diverse processes such as physical, electrical, mechanical as well as parts responsible for process regulation eg, controllers.
This ever-growing interconnectivity and variety of functions that operate simultaneously mean that today’s equipment function reliably and efficiently even under demanding conditions. It is no small wonder that the increase in mutual interactions causes confusion that not only results in additional costs but can lead to equipment or installation failure.
There are many modern production facilities and installations that use drivetrain systems, IT infra-structure and devices that might be susceptible to failure or disturbances originating in the power grid. In many cases, equipment that is critical for plant production processes may be also the root cause of anomalies and adversely influence the power supply itself. The cost of these power qual-ity disturbances for a plant may be dramatic and prohibitive and have a significant adverse impact. Therefore, unplanned severe system shutdowns should always be avoided.
The ability to analyze electric systems is a prereq-uisite for industries to protect their equipment from grid disturbances and ensure proper func-tioning within complex systems. Consequently, measures must be taken to mitigate the effects of grid disturbances. Such an approach will establish the possibility of critical ride through capabilities,
—If centrifugal compressor peak head capability and minimum flow limits are reached, instability ensues and surge will occur – a serious threat to the compressor and the entire installation.
Piotr LipnickiDaniel LewandowskiABB Corporate ResearchKraków, Poland
piotr.lipnicki@ [email protected]
Diego PareschiABB BVRotterdam, Netherlands
diego.pareschi@ nl.abb.com
DIGITAL AND ANALY TICS
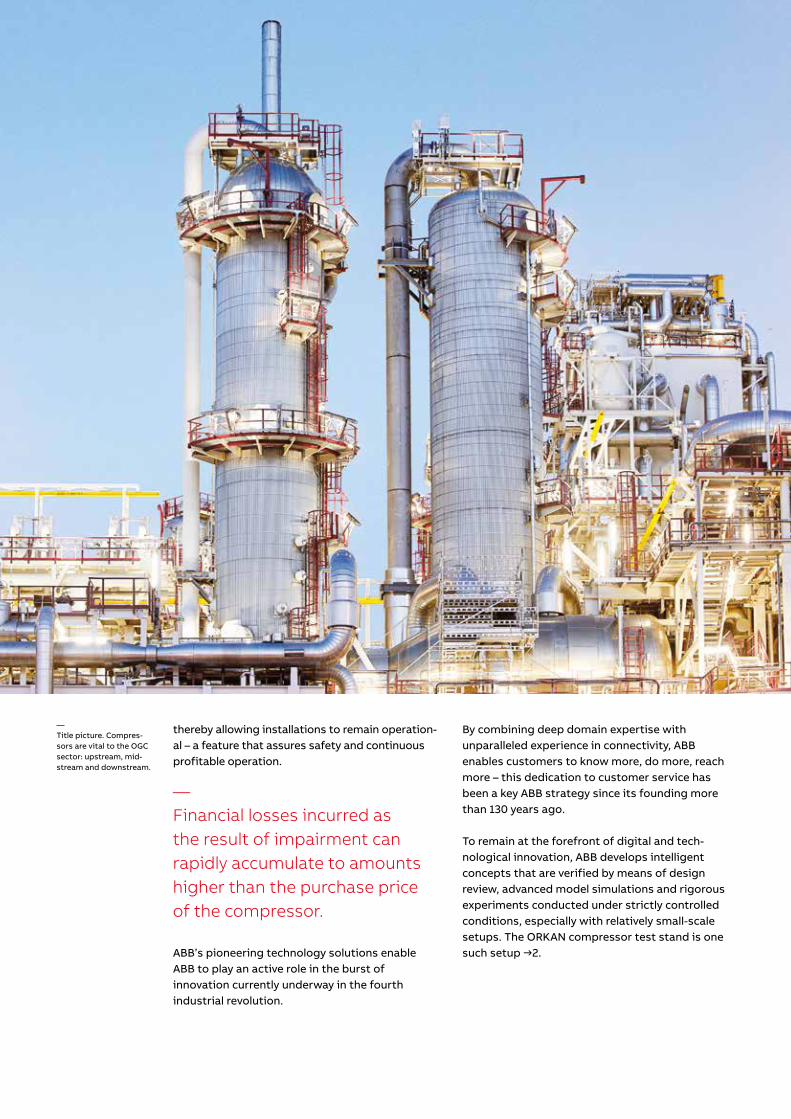
02|2018 47
— DIGITAL AND ANALYTICS
ABB’s ORKAN designed to test ABB AbilityTM
powered machines
thereby allowing installations to remain operation-al – a feature that assures safety and continuous profitable operation.
ABB’s pioneering technology solutions enable ABB to play an active role in the burst of innovation currently underway in the fourth industrial revolution.
By combining deep domain expertise with unparalleled experience in connectivity, ABB enables customers to know more, do more, reach more – this dedication to customer service has been a key ABB strategy since its founding more than 130 years ago.
To remain at the forefront of digital and tech-nological innovation, ABB develops intelligent concepts that are verified by means of design review, advanced model simulations and rigorous experiments conducted under strictly controlled conditions, especially with relatively small-scale setups. The ORKAN compressor test stand is one such setup →2.
ORK AN TESTS ABB ABILIT Y TM POWERED MACHINES
—Financial losses incurred as the result of impairment can rapidly accumulate to amounts higher than the purchase price of the compressor.
—Title picture. Compres-sors are vital to the OGC sector: upstream, mid-stream and downstream.
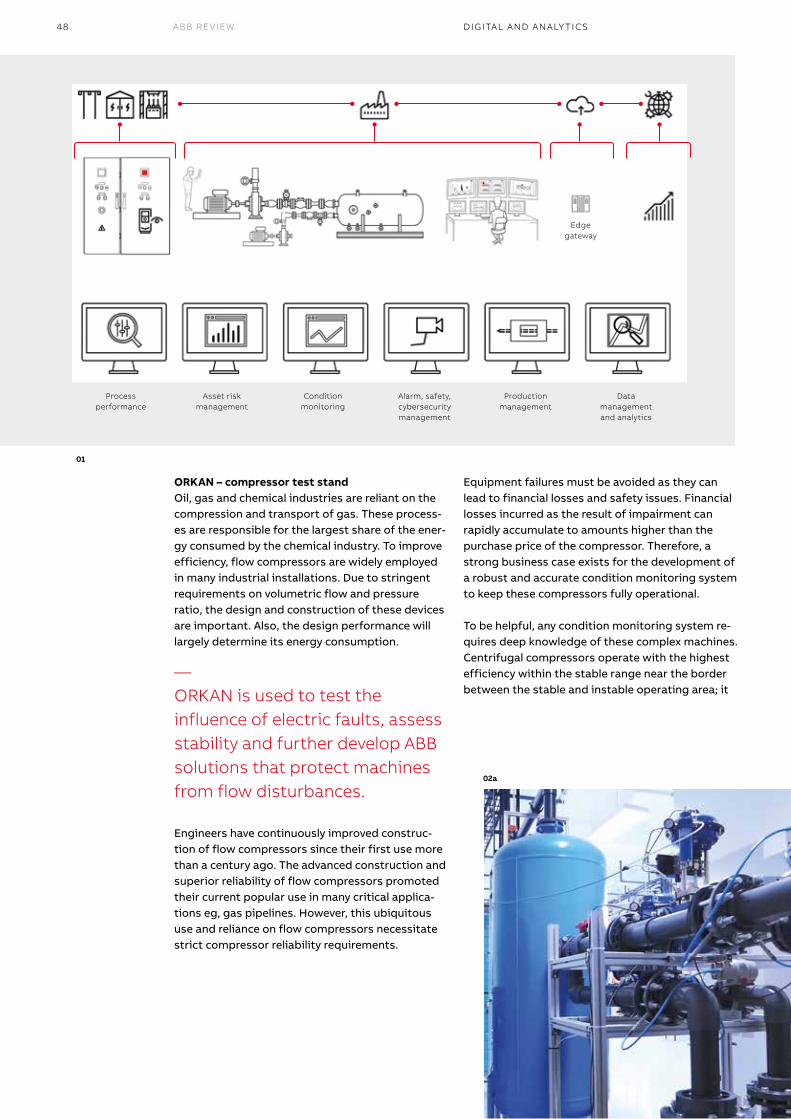
48 ABB REVIEW
ORKAN – compressor test standOil, gas and chemical industries are reliant on the compression and transport of gas. These process-es are responsible for the largest share of the ener-gy consumed by the chemical industry. To improve efficiency, flow compressors are widely employed in many industrial installations. Due to stringent requirements on volumetric flow and pressure ratio, the design and construction of these devices are important. Also, the design performance will largely determine its energy consumption.
Engineers have continuously improved construc-tion of flow compressors since their first use more than a century ago. The advanced construction and superior reliability of flow compressors promoted their current popular use in many critical applica-tions eg, gas pipelines. However, this ubiquitous use and reliance on flow compressors necessitate strict compressor reliability requirements.
Equipment failures must be avoided as they can lead to financial losses and safety issues. Financial losses incurred as the result of impairment can rapidly accumulate to amounts higher than the purchase price of the compressor. Therefore, a strong business case exists for the development of a robust and accurate condition monitoring system to keep these compressors fully operational.
To be helpful, any condition monitoring system re-quires deep knowledge of these complex machines. Centrifugal compressors operate with the highest efficiency within the stable range near the border between the stable and instable operating area; it
02a
01
—ORKAN is used to test the influence of electric faults, assess stability and further develop ABB solutions that protect machines from flow disturbances.
DIGITAL AND ANALY TICS
Processperformance
Asset riskmanagement
Conditionmonitoring
Alarm, safety, cybersecurity management
Productionmanagement
Data managementand analytics
Edge gateway
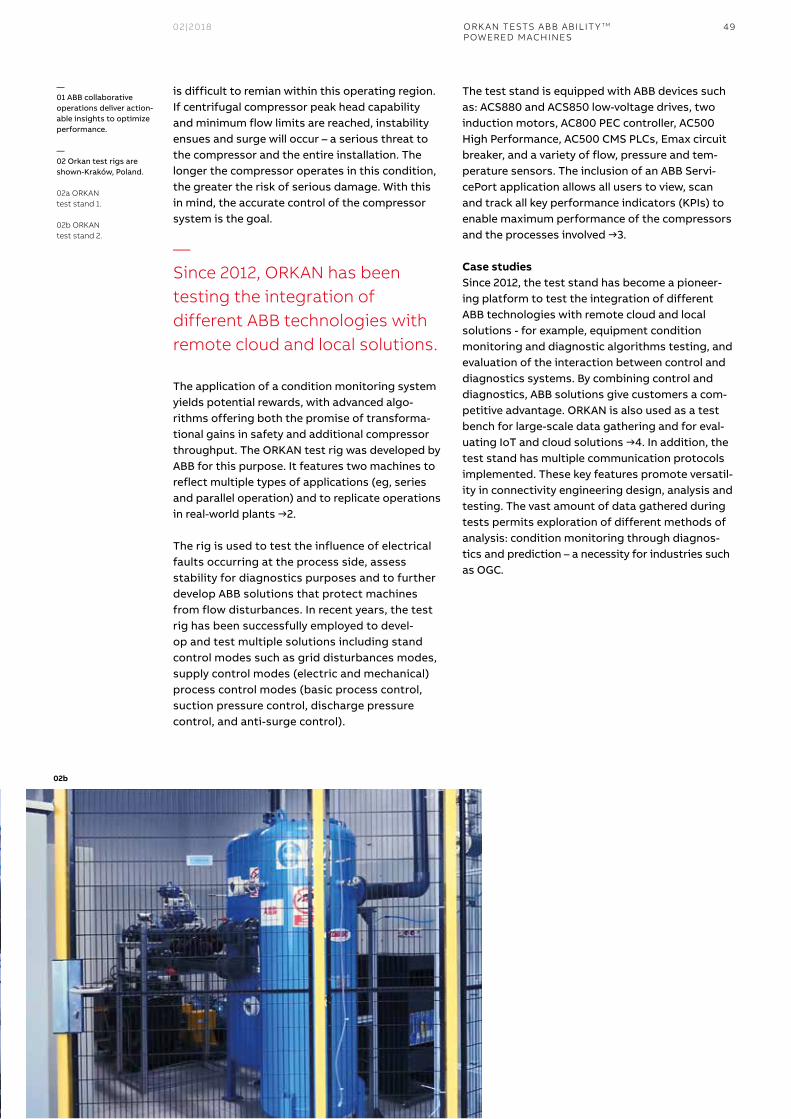
02|2018 49
is difficult to remian within this operating region. If centrifugal compressor peak head capability and minimum flow limits are reached, instability ensues and surge will occur – a serious threat to the compressor and the entire installation. The longer the compressor operates in this condition, the greater the risk of serious damage. With this in mind, the accurate control of the compressor system is the goal.
The application of a condition monitoring system yields potential rewards, with advanced algo-rithms offering both the promise of transforma-tional gains in safety and additional compressor throughput. The ORKAN test rig was developed by ABB for this purpose. It features two machines to reflect multiple types of applications (eg, series and parallel operation) and to replicate operations in real-world plants →2.
The rig is used to test the influence of electrical faults occurring at the process side, assess stability for diagnostics purposes and to further develop ABB solutions that protect machines from flow disturbances. In recent years, the test rig has been successfully employed to devel-op and test multiple solutions including stand control modes such as grid disturbances modes, supply control modes (electric and mechanical) process control modes (basic process control, suction pressure control, discharge pressure control, and anti-surge control).
The test stand is equipped with ABB devices such as: ACS880 and ACS850 low-voltage drives, two induction motors, AC800 PEC controller, AC500 High Performance, AC500 CMS PLCs, Emax circuit breaker, and a variety of flow, pressure and tem-perature sensors. The inclusion of an ABB Servi-cePort application allows all users to view, scan and track all key performance indicators (KPIs) to enable maximum performance of the compressors and the processes involved →3.
Case studiesSince 2012, the test stand has become a pioneer-ing platform to test the integration of different ABB technologies with remote cloud and local solutions - for example, equipment condition monitoring and diagnostic algorithms testing, and evaluation of the interaction between control and diagnostics systems. By combining control and diagnostics, ABB solutions give customers a com-petitive advantage. ORKAN is also used as a test bench for large-scale data gathering and for eval-uating IoT and cloud solutions →4. In addition, the test stand has multiple communication protocols implemented. These key features promote versatil-ity in connectivity engineering design, analysis and testing. The vast amount of data gathered during tests permits exploration of different methods of analysis: condition monitoring through diagnos-tics and prediction – a necessity for industries such as OGC.
02b
—01 ABB collaborative operations deliver action-able insights to optimize performance.
—02 Orkan test rigs are shown-Kraków, Poland.
02a ORKAN test stand 1. 02b ORKAN test stand 2.
—Since 2012, ORKAN has been testing the integration of different ABB technologies with remote cloud and local solutions.
ORK AN TESTS ABB ABILIT Y TM POWERED MACHINES
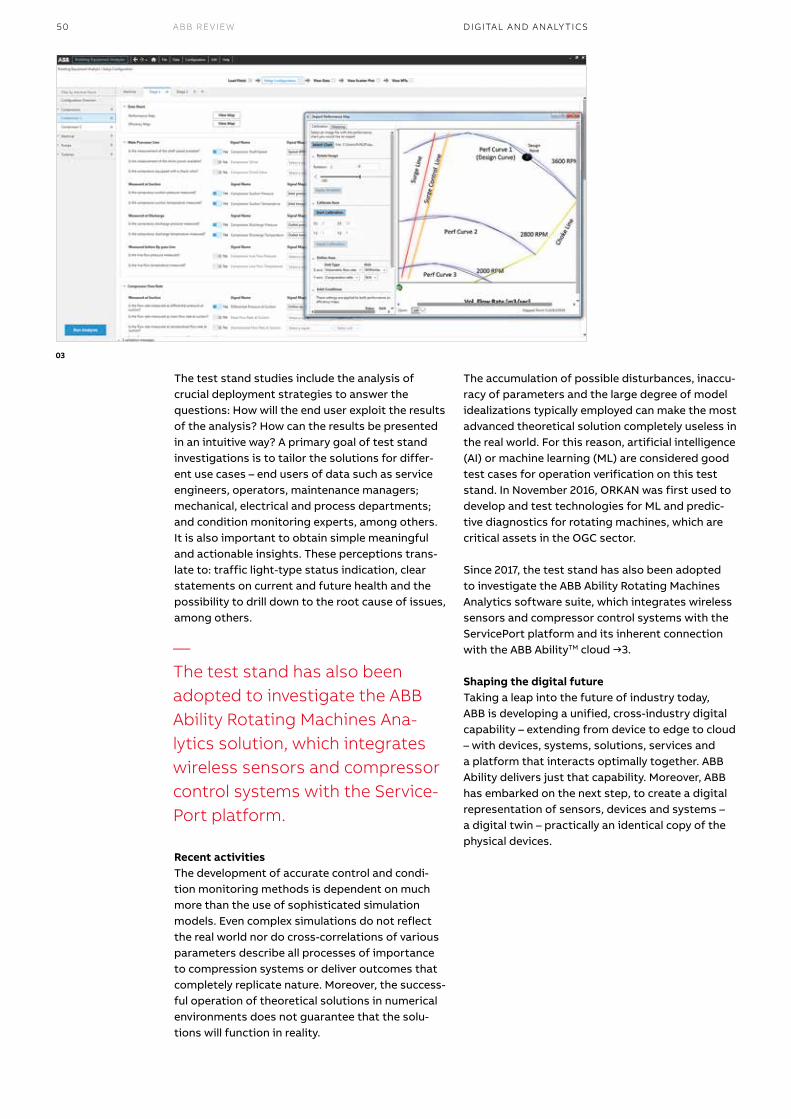
50 ABB REVIEW
The test stand studies include the analysis of crucial deployment strategies to answer the questions: How will the end user exploit the results of the analysis? How can the results be presented in an intuitive way? A primary goal of test stand investigations is to tailor the solutions for differ-ent use cases – end users of data such as service engineers, operators, maintenance managers; mechanical, electrical and process departments; and condition monitoring experts, among others. It is also important to obtain simple meaningful and actionable insights. These perceptions trans-late to: traffic light-type status indication, clear statements on current and future health and the possibility to drill down to the root cause of issues, among others.
Recent activitiesThe development of accurate control and condi-tion monitoring methods is dependent on much more than the use of sophisticated simulation models. Even complex simulations do not reflect the real world nor do cross-correlations of various parameters describe all processes of importance to compression systems or deliver outcomes that completely replicate nature. Moreover, the success-ful operation of theoretical solutions in numerical environments does not guarantee that the solu-tions will function in reality.
The accumulation of possible disturbances, inaccu-racy of parameters and the large degree of model idealizations typically employed can make the most advanced theoretical solution completely useless in the real world. For this reason, artificial intelligence (AI) or machine learning (ML) are considered good test cases for operation verification on this test stand. In November 2016, ORKAN was first used to develop and test technologies for ML and predic-tive diagnostics for rotating machines, which are critical assets in the OGC sector.
Since 2017, the test stand has also been adopted to investigate the ABB Ability Rotating Machines Analytics software suite, which integrates wireless sensors and compressor control systems with the ServicePort platform and its inherent connection with the ABB AbilityTM cloud →3.
Shaping the digital futureTaking a leap into the future of industry today, ABB is developing a unified, cross-industry digital capability – extending from device to edge to cloud – with devices, systems, solutions, services and a platform that interacts optimally together. ABB Ability delivers just that capability. Moreover, ABB has embarked on the next step, to create a digital representation of sensors, devices and systems – a digital twin – practically an identical copy of the physical devices.
—The test stand has also been adopted to investigate the ABB Ability Rotating Machines Ana-lytics solution, which integrates wireless sensors and compressor control systems with the Service-Port platform.
DIGITAL AND ANALY TICS
03
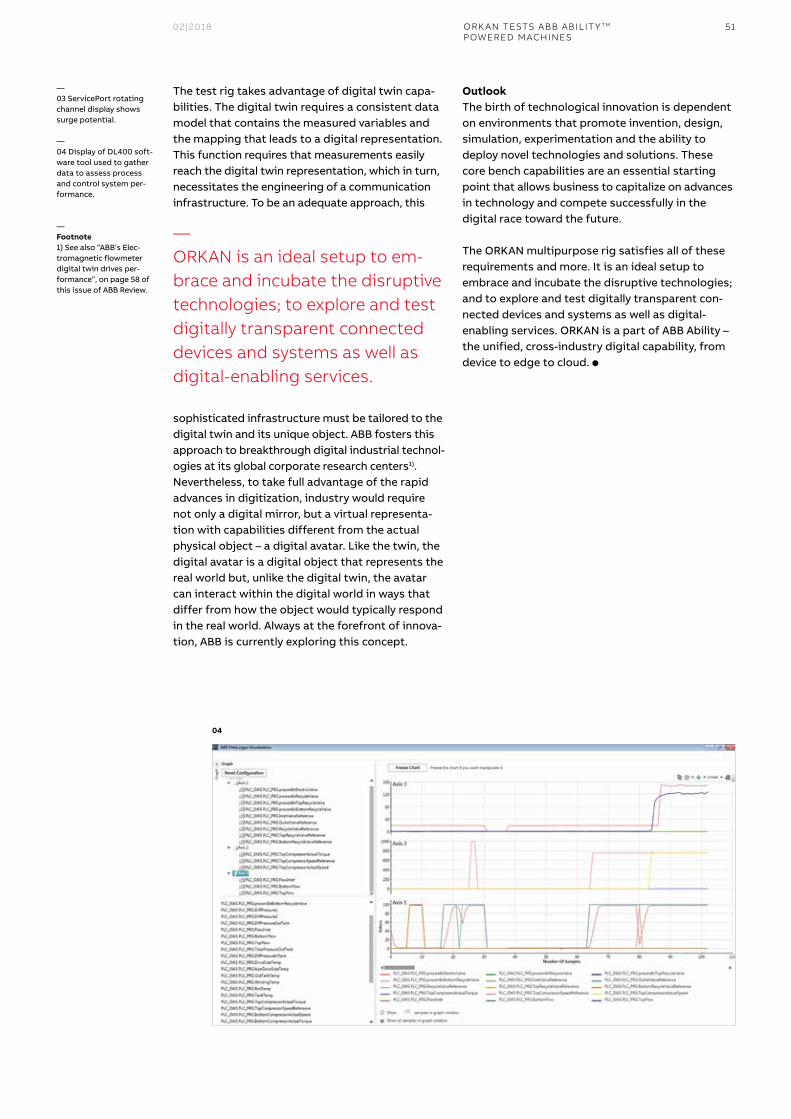
02|2018 51
The test rig takes advantage of digital twin capa-bilities. The digital twin requires a consistent data model that contains the measured variables and the mapping that leads to a digital representation. This function requires that measurements easily reach the digital twin representation, which in turn, necessitates the engineering of a communication infrastructure. To be an adequate approach, this
sophisticated infrastructure must be tailored to the digital twin and its unique object. ABB fosters this approach to breakthrough digital industrial technol-ogies at its global corporate research centers1).Nevertheless, to take full advantage of the rapid advances in digitization, industry would require not only a digital mirror, but a virtual representa-tion with capabilities different from the actual physical object – a digital avatar. Like the twin, the digital avatar is a digital object that represents the real world but, unlike the digital twin, the avatar can interact within the digital world in ways that differ from how the object would typically respond in the real world. Always at the forefront of innova-tion, ABB is currently exploring this concept.
OutlookThe birth of technological innovation is dependent on environments that promote invention, design, simulation, experimentation and the ability to deploy novel technologies and solutions. These core bench capabilities are an essential starting point that allows business to capitalize on advances in technology and compete successfully in the digital race toward the future.
The ORKAN multipurpose rig satisfies all of these requirements and more. It is an ideal setup to embrace and incubate the disruptive technologies; and to explore and test digitally transparent con-nected devices and systems as well as digital- enabling services. ORKAN is a part of ABB Ability – the unified, cross-industry digital capability, from device to edge to cloud. l
—03 ServicePort rotating channel display shows surge potential.
—04 Display of DL400 soft-ware tool used to gather data to assess process and control system per-formance.
— Footnote1) See also “ABB’s Elec-tromagnetic flowmeter digital twin drives per-formance”, on page 58 of this issue of ABB Review.
—ORKAN is an ideal setup to em-brace and incubate the disruptive technologies; to explore and test digitally transparent connected devices and systems as well as digital-enabling services.
ORK AN TESTS ABB ABILIT Y TM POWERED MACHINES
04
52 ABB REVIEW
— DIGITAL AND ANALY TICS
Real-time and full- web, pulp, paper and paperboard analysisHow can the latest imaging technology be used to analyze more and smaller details on high-speed, high-quality web product machines? And how can full-web data be processed to enhance product quality evaluation and improve manufacturing process monitoring and control?
A web imaging system (WIS) →1 is mainly used for quality analysis, ie, the detection of defects and other undesired abnormalities. Holes, spots and dirt particles are examples of discrete defects, while wrinkles, streaks, and slime spots are examples of so-called weak defects. Both types of defect should be detected to ensure an adequate product quality.
In many cases, evaluation of the quality of web product emerging from today’s high-speed and high-quality machines relies on remote laborato-ry measurements or online measurement results that are derived from only small portions of the product area. Recently, however, ABB introduced new methods for analyzing large numbers of inter-esting target regions of a web product in real time – and over the whole product area.
These new methods and derived measurements allow pulp and paper manufacturers to:• Monitor the overall quality factors of a
product online• React immediately to improve the product
manufacturing process• Evaluate the overall product quality• Classify the manufactured product areas based
on specific customer requirements
These measures deliver significant savings compared to cases where a poor-quality measurement of a portion of the web leads to the discarding or downgrading of large amounts of good-quality product.
Tommi HuotilainenSeppo RiikonenABB OyHelsinki, Finland
tommi.huotilainen@ fi.abb.comseppo.riikonen@ fi.abb.com
Myron LasterABB Industrial AutomationAtlanta, GA., United States
—A web imaging system is mainly used for online quality analysis - ie, the detection of defects andother undesired abnormalities - of a product such as pulp or paper.
DIGITAL AND ANALY TICS
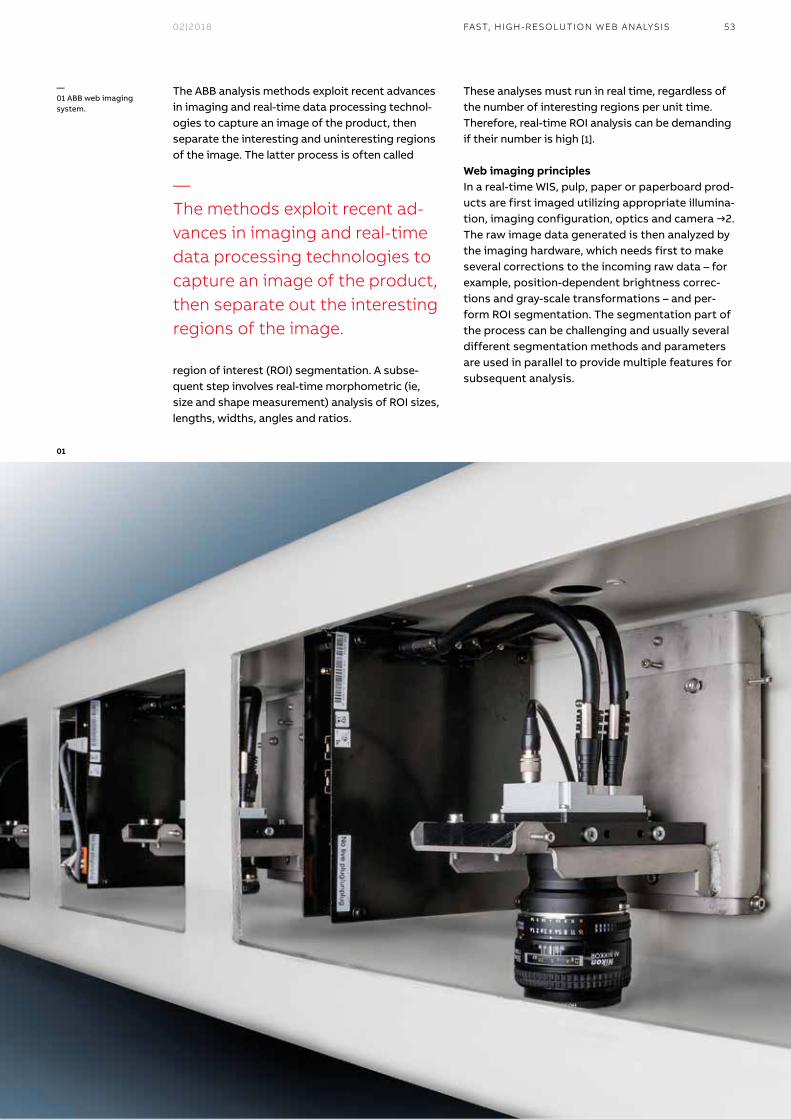
02|2018 53FAST, HIGH-RESOLUTION WEB ANALYSIS
The ABB analysis methods exploit recent advances in imaging and real-time data processing technol-ogies to capture an image of the product, then separate the interesting and uninteresting regions of the image. The latter process is often called
region of interest (ROI) segmentation. A subse-quent step involves real-time morphometric (ie, size and shape measurement) analysis of ROI sizes, lengths, widths, angles and ratios.
These analyses must run in real time, regardless of the number of interesting regions per unit time. Therefore, real-time ROI analysis can be demanding if their number is high [1].
Web imaging principlesIn a real-time WIS, pulp, paper or paperboard prod-ucts are first imaged utilizing appropriate illumina-tion, imaging configuration, optics and camera →2. The raw image data generated is then analyzed by the imaging hardware, which needs first to make several corrections to the incoming raw data – for example, position-dependent brightness correc-tions and gray-scale transformations – and per-form ROI segmentation. The segmentation part of the process can be challenging and usually several different segmentation methods and parameters are used in parallel to provide multiple features for subsequent analysis.
—The methods exploit recent ad-vances in imaging and real-time data processing technologies to capture an image of the product, then separate out the interesting regions of the image.
—01 ABB web imaging system.
01
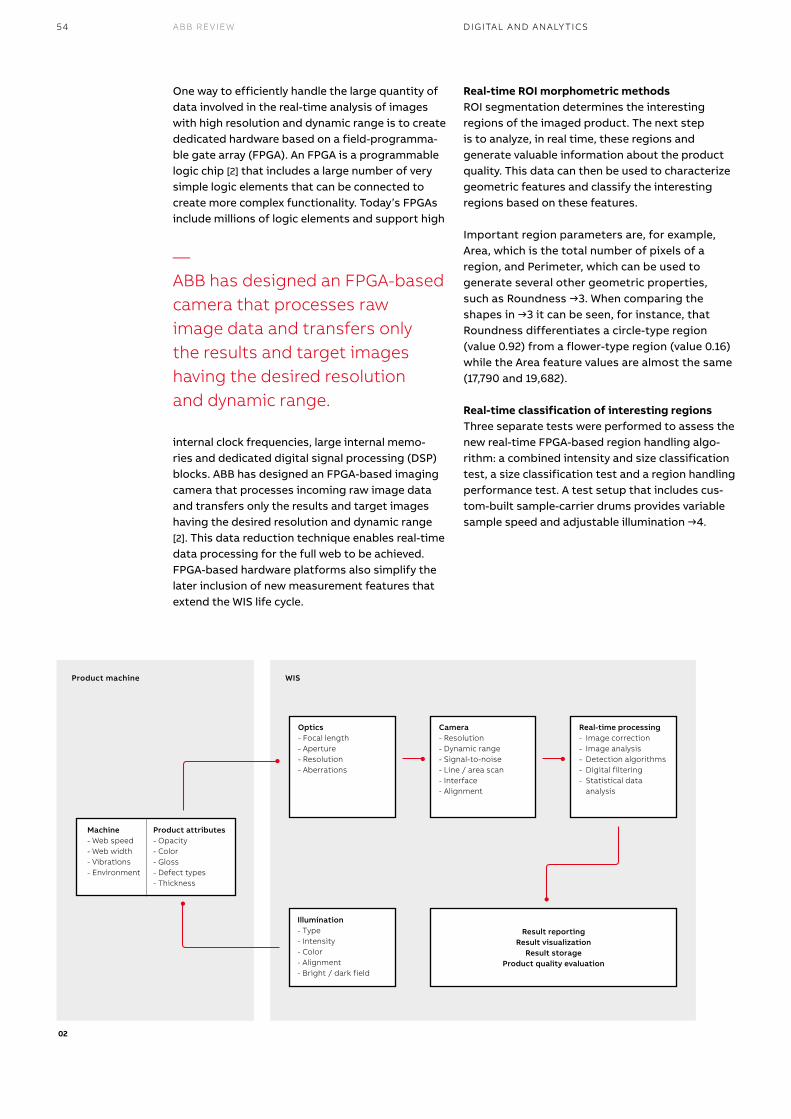
54 ABB REVIEW
Real-time ROI morphometric methodsROI segmentation determines the interesting regions of the imaged product. The next step is to analyze, in real time, these regions and generate valuable information about the product quality. This data can then be used to characterize geometric features and classify the interesting regions based on these features.
Important region parameters are, for example, Area, which is the total number of pixels of a region, and Perimeter, which can be used to generate several other geometric properties, such as Roundness →3. When comparing the shapes in →3 it can be seen, for instance, that Roundness differentiates a circle-type region (value 0.92) from a flower-type region (value 0.16) while the Area feature values are almost the same (17,790 and 19,682).
Real-time classification of interesting regionsThree separate tests were performed to assess the new real-time FPGA-based region handling algo-rithm: a combined intensity and size classification test, a size classification test and a region handling performance test. A test setup that includes cus-tom-built sample-carrier drums provides variable sample speed and adjustable illumination →4.
One way to efficiently handle the large quantity of data involved in the real-time analysis of images with high resolution and dynamic range is to create dedicated hardware based on a field-programma-ble gate array (FPGA). An FPGA is a programmable logic chip [2] that includes a large number of very simple logic elements that can be connected to create more complex functionality. Today’s FPGAs include millions of logic elements and support high
internal clock frequencies, large internal memo-ries and dedicated digital signal processing (DSP) blocks. ABB has designed an FPGA-based imaging camera that processes incoming raw image data and transfers only the results and target images having the desired resolution and dynamic range [2]. This data reduction technique enables real-time data processing for the full web to be achieved.FPGA-based hardware platforms also simplify the later inclusion of new measurement features that extend the WIS life cycle.
02
—ABB has designed an FPGA-based camera that processes raw image data and transfers only the results and target images having the desired resolution and dynamic range.
Product machine WIS
Optics- Focal length- Aperture- Resolution- Aberrations
Real-time processing- Image correction- Image analysis- Detection algorithms- Digital filtering- Statistical data analysis
Result reportingResult visualization
Result storageProduct quality evaluation
Illumination- Type- Intensity- Color- Alignment- Bright / dark field
Camera- Resolution- Dynamic range- Signal-to-noise- Line / area scan- Interface- Alignment
Machine- Web speed- Web width- Vibrations- Environment
Product attributes- Opacity- Color- Gloss- Defect types- Thickness
DIGITAL AND ANALY TICS
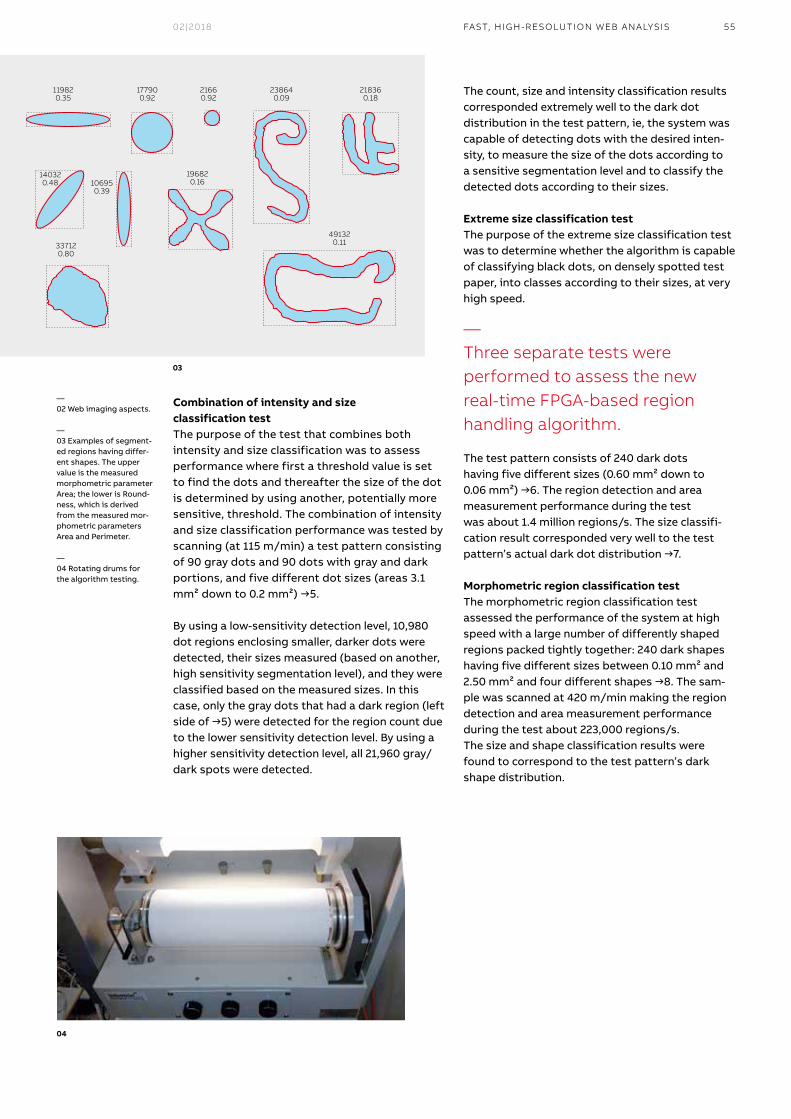
02|2018 55
The count, size and intensity classification results corresponded extremely well to the dark dot distribution in the test pattern, ie, the system was capable of detecting dots with the desired inten-sity, to measure the size of the dots according to a sensitive segmentation level and to classify the detected dots according to their sizes.
Extreme size classification test The purpose of the extreme size classification test was to determine whether the algorithm is capable of classifying black dots, on densely spotted test paper, into classes according to their sizes, at very high speed.
The test pattern consists of 240 dark dots having five different sizes (0.60 mm² down to 0.06 mm²) →6. The region detection and area measurement performance during the test was about 1.4 million regions/s. The size classifi-cation result corresponded very well to the test pattern’s actual dark dot distribution →7.
Morphometric region classification testThe morphometric region classification test assessed the performance of the system at high speed with a large number of differently shaped regions packed tightly together: 240 dark shapes having five different sizes between 0.10 mm² and 2.50 mm² and four different shapes →8. The sam-ple was scanned at 420 m/min making the region detection and area measurement performance during the test about 223,000 regions/s. The size and shape classification results were found to correspond to the test pattern’s dark shape distribution.
Combination of intensity and size classification testThe purpose of the test that combines both intensity and size classification was to assess performance where first a threshold value is set to find the dots and thereafter the size of the dot is determined by using another, potentially more sensitive, threshold. The combination of intensity and size classification performance was tested by scanning (at 115 m/min) a test pattern consisting of 90 gray dots and 90 dots with gray and dark portions, and five different dot sizes (areas 3.1 mm² down to 0.2 mm²) →5.
By using a low-sensitivity detection level, 10,980 dot regions enclosing smaller, darker dots were detected, their sizes measured (based on another, high sensitivity segmentation level), and they were classified based on the measured sizes. In this case, only the gray dots that had a dark region (left side of →5) were detected for the region count due to the lower sensitivity detection level. By using a higher sensitivity detection level, all 21,960 gray/dark spots were detected.
—02 Web imaging aspects.
—03 Examples of segment-ed regions having differ-ent shapes. The upper value is the measured morphometric parameter Area; the lower is Round-ness, which is derived from the measured mor-phometric parameters Area and Perimeter.
—04 Rotating drums for the algorithm testing.
03
04
—Three separate tests were performed to assess the new real-time FPGA-based region handling algorithm.
119820.35
140320.48
337120.80
491320.11
106950.39
196820.16
177900.92
21660.92
238640.09
218360.18
FAST, HIGH-RESOLUTION WEB ANALYSIS
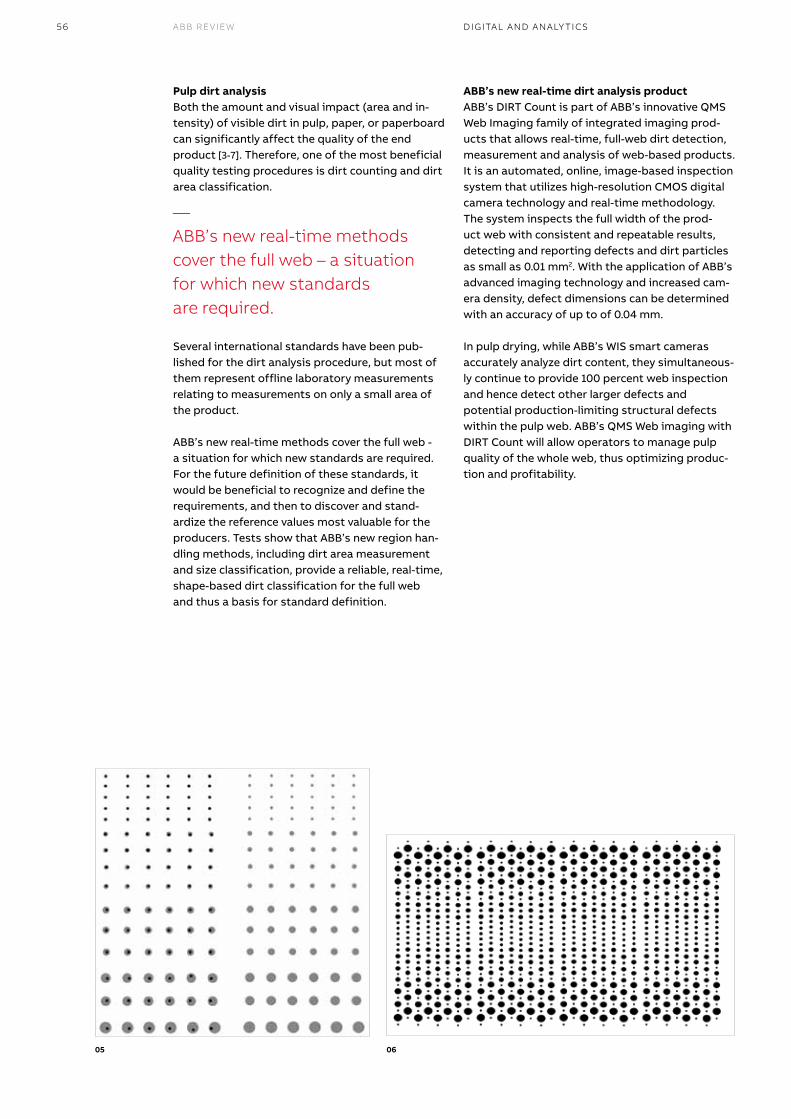
56 ABB REVIEW
ABB’s new real-time dirt analysis productABB’s DIRT Count is part of ABB’s innovative QMS Web Imaging family of integrated imaging prod-ucts that allows real-time, full-web dirt detection, measurement and analysis of web-based products. It is an automated, online, image-based inspection system that utilizes high-resolution CMOS digital camera technology and real-time methodology. The system inspects the full width of the prod-uct web with consistent and repeatable results, detecting and reporting defects and dirt particles as small as 0.01 mm2. With the application of ABB’s advanced imaging technology and increased cam-era density, defect dimensions can be determined with an accuracy of up to of 0.04 mm.
In pulp drying, while ABB’s WIS smart cameras accurately analyze dirt content, they simultaneous-ly continue to provide 100 percent web inspection and hence detect other larger defects and potential production-limiting structural defects within the pulp web. ABB’s QMS Web imaging with DIRT Count will allow operators to manage pulp quality of the whole web, thus optimizing produc-tion and profitability.
Pulp dirt analysisBoth the amount and visual impact (area and in-tensity) of visible dirt in pulp, paper, or paperboard can significantly affect the quality of the end product [3-7]. Therefore, one of the most beneficial quality testing procedures is dirt counting and dirt area classification.
Several international standards have been pub-lished for the dirt analysis procedure, but most of them represent offline laboratory measurements relating to measurements on only a small area of the product.
ABB’s new real-time methods cover the full web - a situation for which new standards are required. For the future definition of these standards, it would be beneficial to recognize and define the requirements, and then to discover and stand-ardize the reference values most valuable for the producers. Tests show that ABB’s new region han-dling methods, including dirt area measurement and size classification, provide a reliable, real-time, shape-based dirt classification for the full web and thus a basis for standard definition.
—ABB’s new real-time methods cover the full web – a situation for which new standards are required.
05 06
DIGITAL AND ANALY TICS
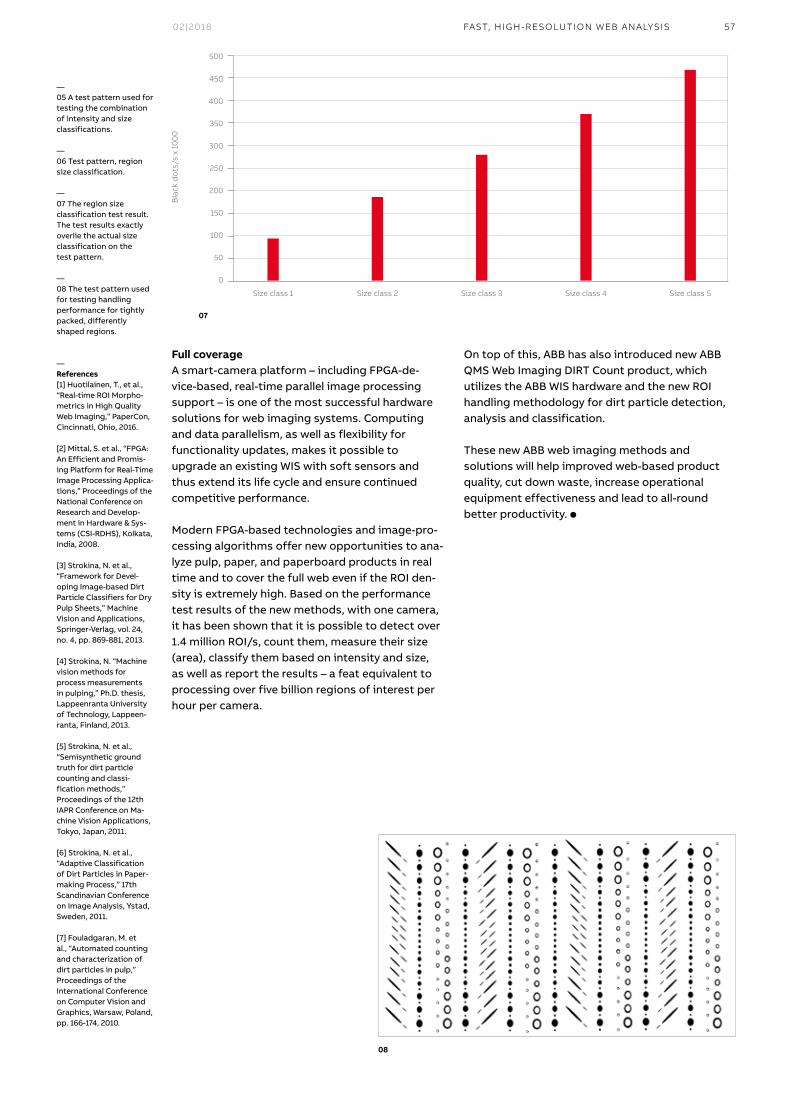
02|2018 57
08
Full coverageA smart-camera platform – including FPGA-de-vice-based, real-time parallel image processing support – is one of the most successful hardware solutions for web imaging systems. Computing and data parallelism, as well as flexibility for functionality updates, makes it possible to upgrade an existing WIS with soft sensors and thus extend its life cycle and ensure continued competitive performance.
Modern FPGA-based technologies and image-pro-cessing algorithms offer new opportunities to ana-lyze pulp, paper, and paperboard products in real time and to cover the full web even if the ROI den-sity is extremely high. Based on the performance test results of the new methods, with one camera, it has been shown that it is possible to detect over 1.4 million ROI/s, count them, measure their size (area), classify them based on intensity and size, as well as report the results – a feat equivalent to processing over five billion regions of interest per hour per camera.
On top of this, ABB has also introduced new ABB QMS Web Imaging DIRT Count product, which utilizes the ABB WIS hardware and the new ROI handling methodology for dirt particle detection, analysis and classification.
These new ABB web imaging methods and solutions will help improved web-based product quality, cut down waste, increase operational equipment effectiveness and lead to all-round better productivity. l
—05 A test pattern used for testing the combination of intensity and size classifications.
—06 Test pattern, region size classification.
—07 The region size classification test result. The test results exactly overlie the actual size classification on the test pattern.
—08 The test pattern used for testing handling performance for tightly packed, differently shaped regions.
— References[1] Huotilainen, T., et al., “Real-time ROI Morpho-metrics in High Quality Web Imaging,” PaperCon, Cincinnati, Ohio, 2016.
[2] Mittal, S. et al., “FPGA: An Efficient and Promis-ing Platform for Real-Time Image Processing Applica-tions,” Proceedings of the National Conference on Research and Develop-ment in Hardware & Sys-tems (CSI-RDHS), Kolkata, India, 2008.
[3] Strokina, N. et al., “Framework for Devel-oping Image-based Dirt Particle Classifiers for Dry Pulp Sheets,” Machine Vision and Applications, Springer-Verlag, vol. 24, no. 4, pp. 869-881, 2013.
[4] Strokina, N. “Machine vision methods for process measurements in pulping,” Ph.D. thesis, Lappeenranta University of Technology, Lappeen-ranta, Finland, 2013.
[5] Strokina, N. et al., “Semisynthetic ground truth for dirt particle counting and classi-fication methods,” Proceedings of the 12th IAPR Conference on Ma-chine Vision Applications, Tokyo, Japan, 2011.
[6] Strokina, N. et al., “Adaptive Classification of Dirt Particles in Paper-making Process,” 17th Scandinavian Conference on Image Analysis, Ystad, Sweden, 2011.
[7] Fouladgaran, M. et al., “Automated counting and characterization of dirt particles in pulp,” Proceedings of the International Conference on Computer Vision and Graphics, Warsaw, Poland, pp. 166-174, 2010.
FAST, HIGH-RESOLUTION WEB ANALYSIS
07
500
450
400
350
300
250
200
150
100
50
0
Bla
ck d
ots
/s x
10
00
Size class 1 Size class 2 Size class 3 Size class 4 Size class 5
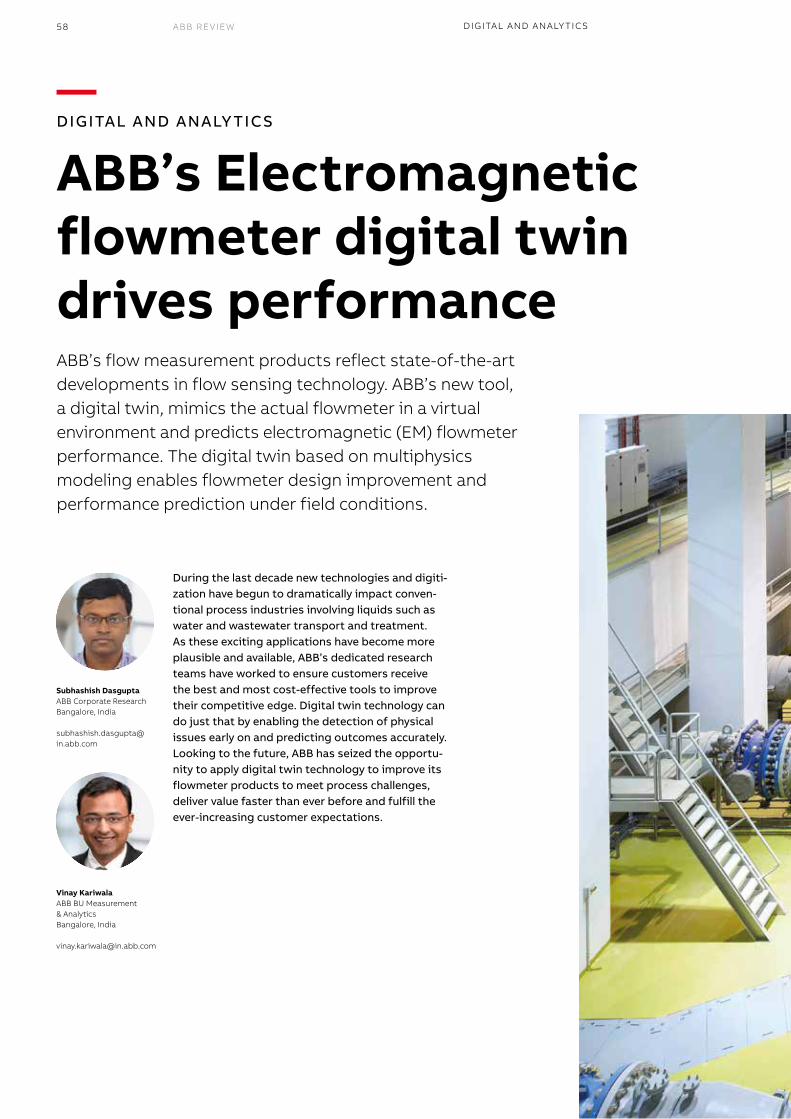
58 ABB REVIEW DIGITAL AND ANALY TICS
— DIGITAL AND ANALY TICS
ABB’s Electromagnetic flowmeter digital twin drives performanceABB’s flow measurement products reflect state-of-the-art developments in flow sensing technology. ABB’s new tool, a digital twin, mimics the actual flowmeter in a virtual environment and predicts electromagnetic (EM) flowmeter performance. The digital twin based on multiphysics modeling enables flowmeter design improvement and performance prediction under field conditions.
During the last decade new technologies and digiti-zation have begun to dramatically impact conven-tional process industries involving liquids such as water and wastewater transport and treatment. As these exciting applications have become more plausible and available, ABB’s dedicated research teams have worked to ensure customers receive the best and most cost-effective tools to improve their competitive edge. Digital twin technology can do just that by enabling the detection of physical issues early on and predicting outcomes accurately. Looking to the future, ABB has seized the opportu-nity to apply digital twin technology to improve its flowmeter products to meet process challenges, deliver value faster than ever before and fulfill the ever-increasing customer expectations.
Subhashish DasguptaABB Corporate ResearchBangalore, India
Vinay KariwalaABB BU Measurement & AnalyticsBangalore, India
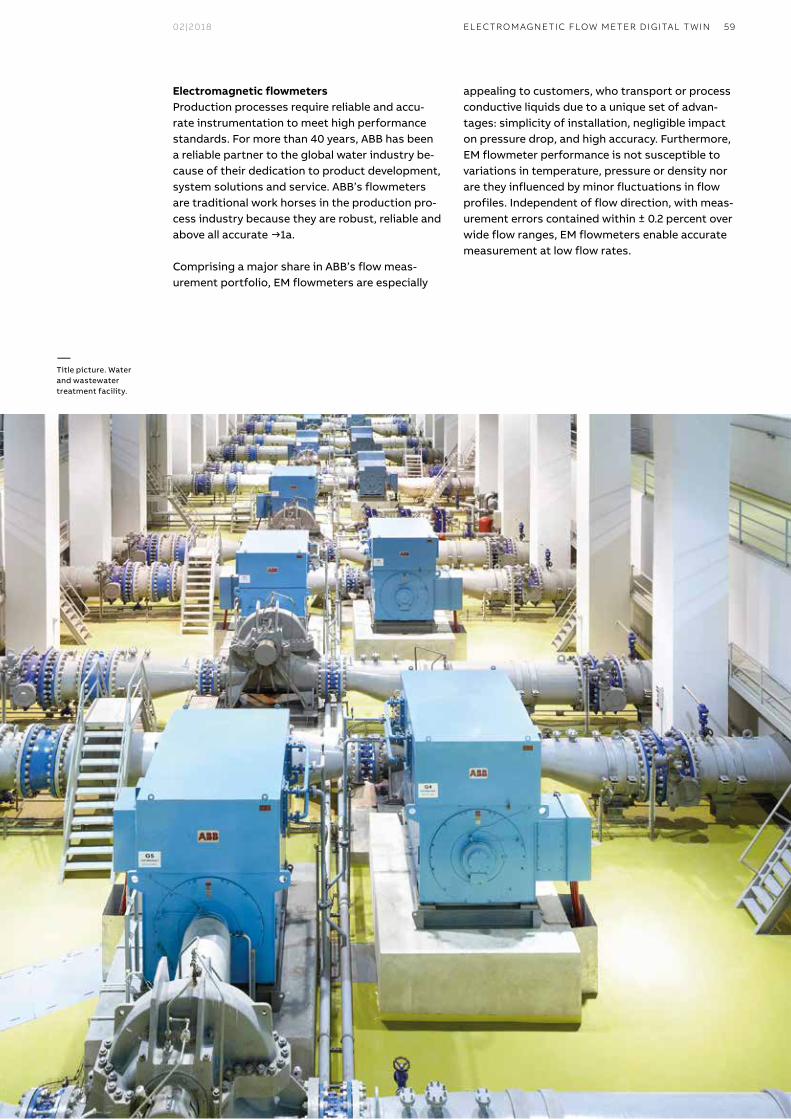
02|2018 59ELECTROMAGNETIC FLOW METER DIGITAL T WIN
Electromagnetic flowmetersProduction processes require reliable and accu-rate instrumentation to meet high performance standards. For more than 40 years, ABB has been a reliable partner to the global water industry be-cause of their dedication to product development, system solutions and service. ABB’s flowmeters are traditional work horses in the production pro-cess industry because they are robust, reliable and above all accurate →1a.
Comprising a major share in ABB’s flow meas-urement portfolio, EM flowmeters are especially
appealing to customers, who transport or process conductive liquids due to a unique set of advan-tages: simplicity of installation, negligible impact on pressure drop, and high accuracy. Furthermore, EM flowmeter performance is not susceptible to variations in temperature, pressure or density nor are they influenced by minor fluctuations in flow profiles. Independent of flow direction, with meas-urement errors contained within ± 0.2 percent over wide flow ranges, EM flowmeters enable accurate measurement at low flow rates.
—Title picture. Water and wastewater treatment facility.
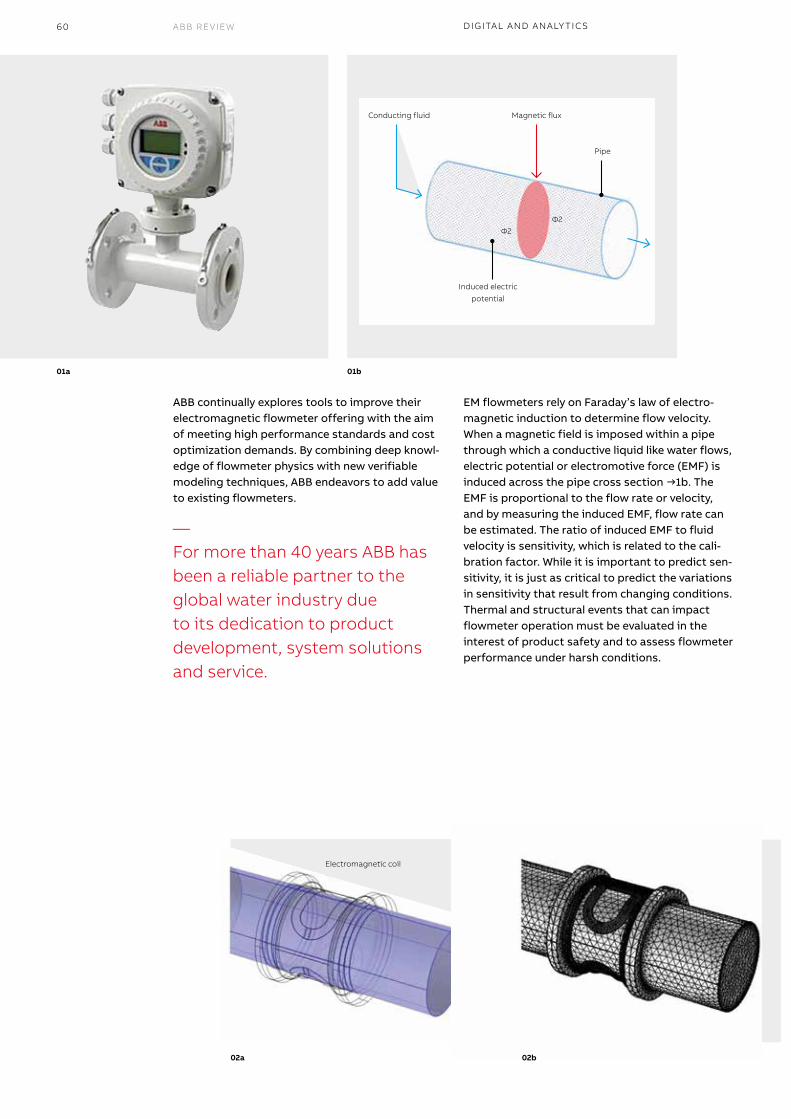
60 ABB REVIEW DIGITAL AND ANALY TICS
ABB continually explores tools to improve their electromagnetic flowmeter offering with the aim of meeting high performance standards and cost optimization demands. By combining deep knowl-edge of flowmeter physics with new verifiable modeling techniques, ABB endeavors to add value to existing flowmeters.
EM flowmeters rely on Faraday’s law of electro-magnetic induction to determine flow velocity. When a magnetic field is imposed within a pipe through which a conductive liquid like water flows, electric potential or electromotive force (EMF) is induced across the pipe cross section →1b. The EMF is proportional to the flow rate or velocity, and by measuring the induced EMF, flow rate can be estimated. The ratio of induced EMF to fluid velocity is sensitivity, which is related to the cali-bration factor. While it is important to predict sen-sitivity, it is just as critical to predict the variations in sensitivity that result from changing conditions. Thermal and structural events that can impact flowmeter operation must be evaluated in the interest of product safety and to assess flowmeter performance under harsh conditions.
01a 01b
02a 02b
—For more than 40 years ABB has been a reliable partner to the global water industry due to its dedication to product development, system solutions and service.
Magnetic flux
Induced electric
potential
Pipe
Ф2Ф2
Conducting fluid
Electromagnetic coil
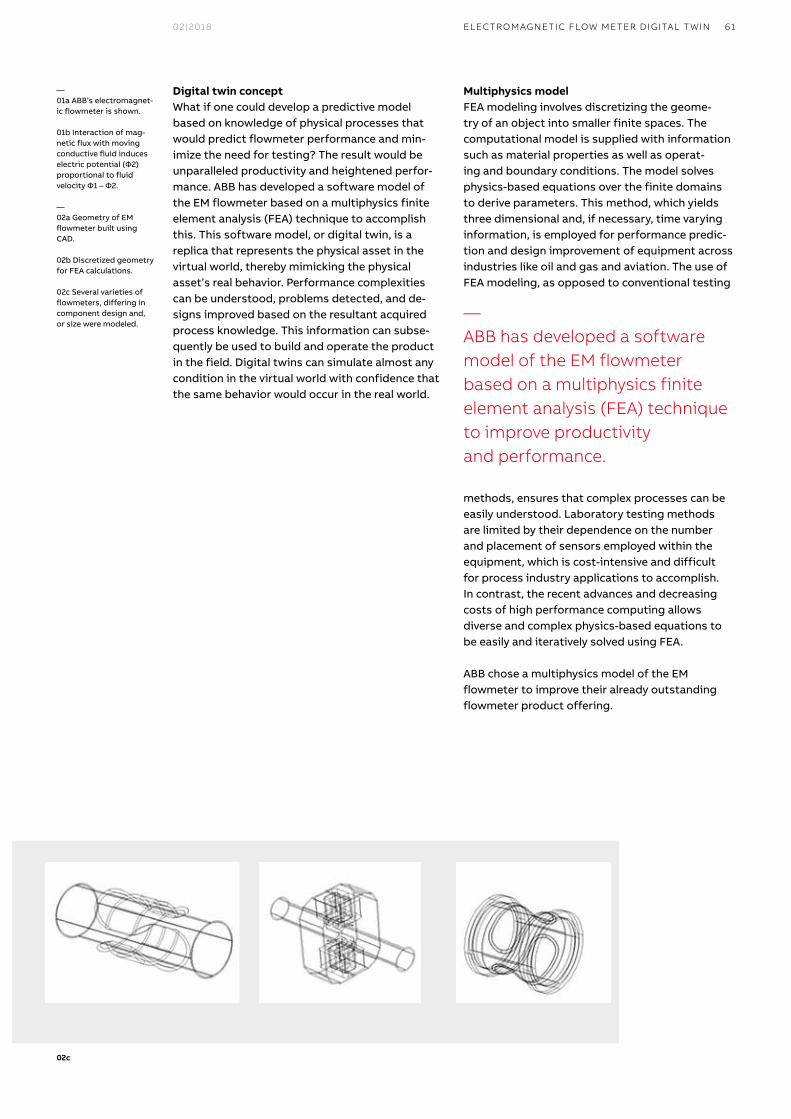
02|2018 61ELECTROMAGNETIC FLOW METER DIGITAL T WIN
Digital twin conceptWhat if one could develop a predictive model based on knowledge of physical processes that would predict flowmeter performance and min-imize the need for testing? The result would be unparalleled productivity and heightened perfor-mance. ABB has developed a software model of the EM flowmeter based on a multiphysics finite element analysis (FEA) technique to accomplish this. This software model, or digital twin, is a replica that represents the physical asset in the virtual world, thereby mimicking the physical asset’s real behavior. Performance complexities can be understood, problems detected, and de-signs improved based on the resultant acquired process knowledge. This information can subse-quently be used to build and operate the product in the field. Digital twins can simulate almost any condition in the virtual world with confidence that the same behavior would occur in the real world.
Multiphysics model FEA modeling involves discretizing the geome-try of an object into smaller finite spaces. The computational model is supplied with information such as material properties as well as operat-ing and boundary conditions. The model solves physics-based equations over the finite domains to derive parameters. This method, which yields three dimensional and, if necessary, time varying information, is employed for performance predic-tion and design improvement of equipment across industries like oil and gas and aviation. The use of FEA modeling, as opposed to conventional testing
methods, ensures that complex processes can be easily understood. Laboratory testing methods are limited by their dependence on the number and placement of sensors employed within the equipment, which is cost-intensive and difficult for process industry applications to accomplish. In contrast, the recent advances and decreasing costs of high performance computing allows diverse and complex physics-based equations to be easily and iteratively solved using FEA.
ABB chose a multiphysics model of the EM flowmeter to improve their already outstanding flowmeter product offering.
—ABB has developed a software model of the EM flowmeter based on a multiphysics finite element analysis (FEA) technique to improve productivity and performance.
—01a ABB’s electromagnet-ic flowmeter is shown.
01b Interaction of mag-netic flux with moving conductive fluid induces electric potential (Ф2) proportional to fluid velocity Ф1 – Ф2.
—02a Geometry of EM flowmeter built using CAD.
02b Discretized geometry for FEA calculations.
02c Several varieties of flowmeters, differing in component design and, or size were modeled.
02c
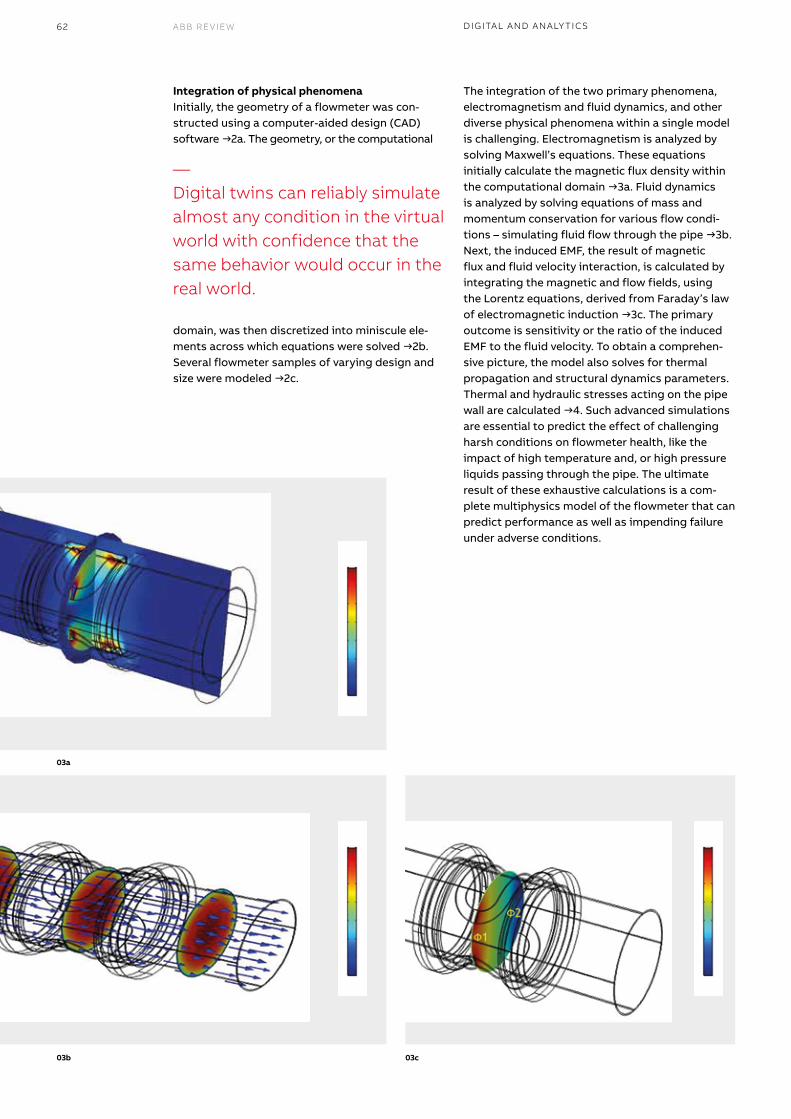
62 ABB REVIEW DIGITAL AND ANALY TICS
Integration of physical phenomenaInitially, the geometry of a flowmeter was con-structed using a computer-aided design (CAD) software →2a. The geometry, or the computational
domain, was then discretized into miniscule ele-ments across which equations were solved →2b. Several flowmeter samples of varying design and size were modeled →2c.
The integration of the two primary phenomena, electromagnetism and fluid dynamics, and other diverse physical phenomena within a single model is challenging. Electromagnetism is analyzed by solving Maxwell’s equations. These equations initially calculate the magnetic flux density within the computational domain →3a. Fluid dynamics is analyzed by solving equations of mass and momentum conservation for various flow condi-tions – simulating fluid flow through the pipe →3b. Next, the induced EMF, the result of magnetic flux and fluid velocity interaction, is calculated by integrating the magnetic and flow fields, using the Lorentz equations, derived from Faraday’s law of electromagnetic induction →3c. The primary outcome is sensitivity or the ratio of the induced EMF to the fluid velocity. To obtain a comprehen-sive picture, the model also solves for thermal propagation and structural dynamics parameters. Thermal and hydraulic stresses acting on the pipe wall are calculated →4. Such advanced simulations are essential to predict the effect of challenging harsh conditions on flowmeter health, like the impact of high temperature and, or high pressure liquids passing through the pipe. The ultimate result of these exhaustive calculations is a com-plete multiphysics model of the flowmeter that can predict performance as well as impending failure under adverse conditions.
03a
03b 03c
—Digital twins can reliably simulate almost any condition in the virtual world with confidence that the same behavior would occur in the real world.
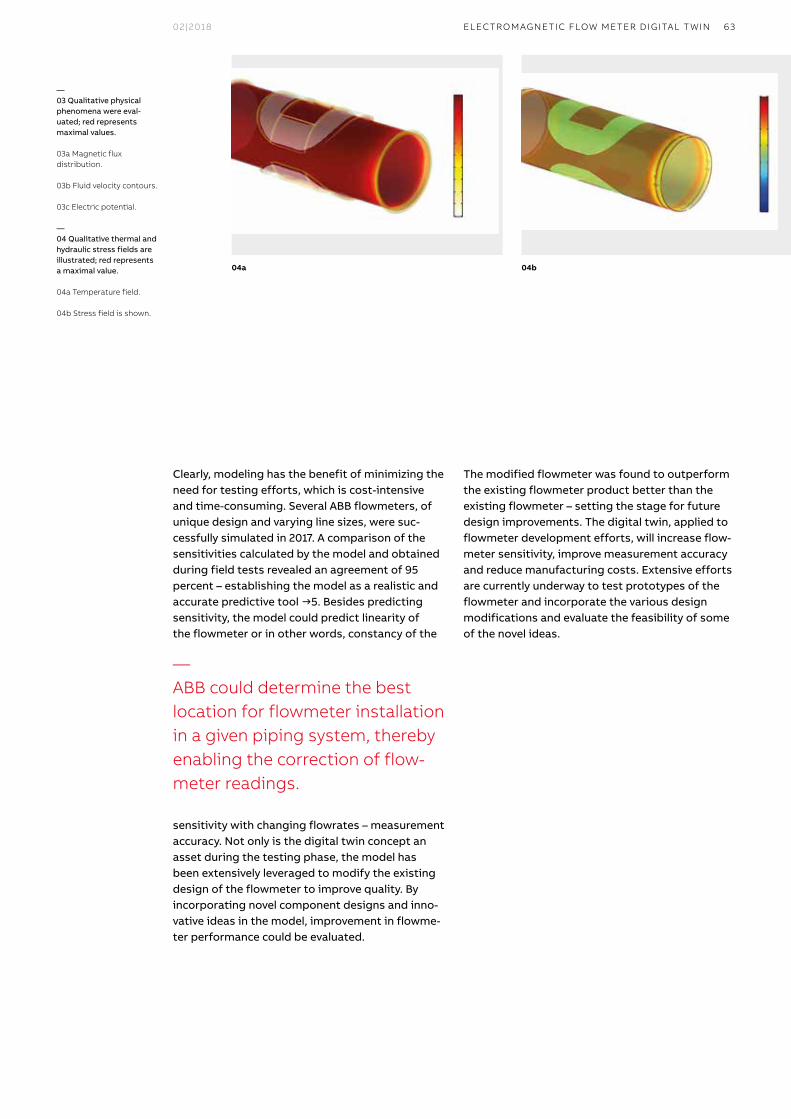
02|2018 63ELECTROMAGNETIC FLOW METER DIGITAL T WIN
Clearly, modeling has the benefit of minimizing the need for testing efforts, which is cost-intensive and time-consuming. Several ABB flowmeters, of unique design and varying line sizes, were suc-cessfully simulated in 2017. A comparison of the sensitivities calculated by the model and obtained during field tests revealed an agreement of 95 percent – establishing the model as a realistic and accurate predictive tool →5. Besides predicting sensitivity, the model could predict linearity of the flowmeter or in other words, constancy of the
sensitivity with changing flowrates – measurement accuracy. Not only is the digital twin concept an asset during the testing phase, the model has been extensively leveraged to modify the existing design of the flowmeter to improve quality. By incorporating novel component designs and inno-vative ideas in the model, improvement in flowme-ter performance could be evaluated.
The modified flowmeter was found to outperform the existing flowmeter product better than the existing flowmeter – setting the stage for future design improvements. The digital twin, applied to flowmeter development efforts, will increase flow-meter sensitivity, improve measurement accuracy and reduce manufacturing costs. Extensive efforts are currently underway to test prototypes of the flowmeter and incorporate the various design modifications and evaluate the feasibility of some of the novel ideas.
—03 Qualitative physical phenomena were eval-uated; red represents maximal values.
03a Magnetic flux distribution.
03b Fluid velocity contours.
03c Electric potential.
—04 Qualitative thermal and hydraulic stress fields are illustrated; red represents a maximal value.
04a Temperature field.
04b Stress field is shown.
—ABB could determine the best location for flowmeter installation in a given piping system, thereby enabling the correction of flow-meter readings.
04a 04b
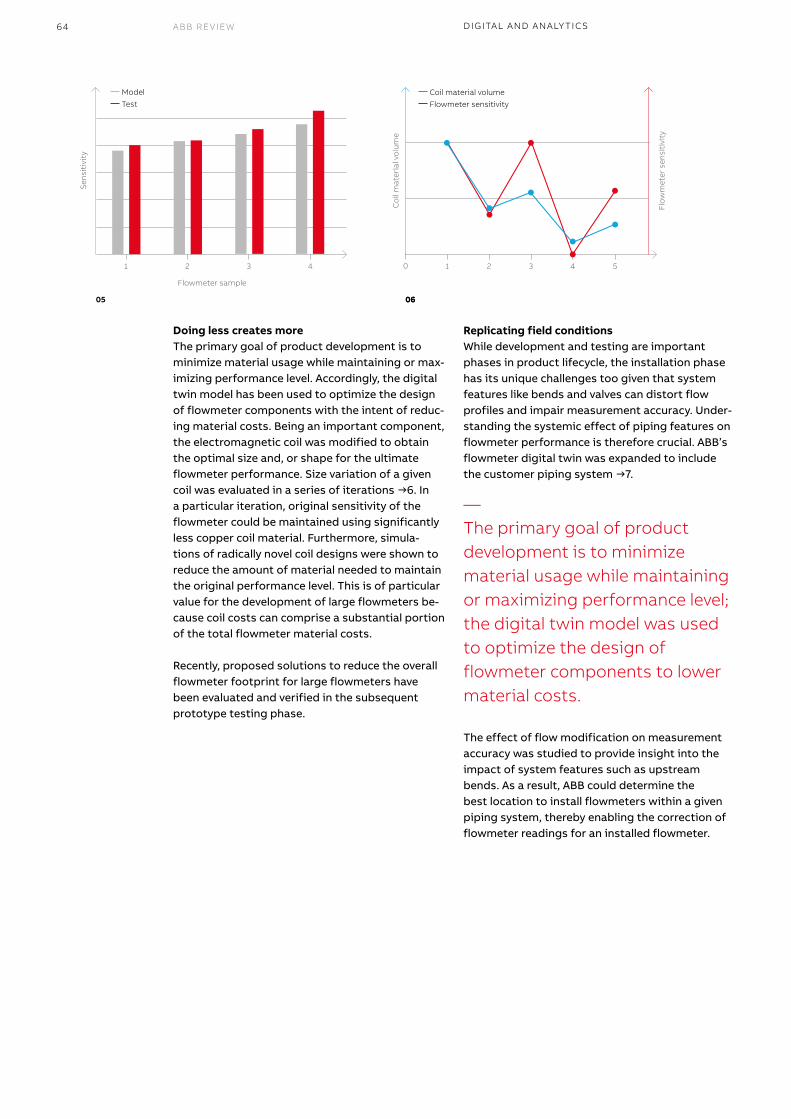
64 ABB REVIEW DIGITAL AND ANALY TICS
Doing less creates more The primary goal of product development is to minimize material usage while maintaining or max-imizing performance level. Accordingly, the digital twin model has been used to optimize the design of flowmeter components with the intent of reduc-ing material costs. Being an important component, the electromagnetic coil was modified to obtain the optimal size and, or shape for the ultimate flowmeter performance. Size variation of a given coil was evaluated in a series of iterations →6. In a particular iteration, original sensitivity of the flowmeter could be maintained using significantly less copper coil material. Furthermore, simula-tions of radically novel coil designs were shown to reduce the amount of material needed to maintain the original performance level. This is of particular value for the development of large flowmeters be-cause coil costs can comprise a substantial portion of the total flowmeter material costs.
Recently, proposed solutions to reduce the overall flowmeter footprint for large flowmeters have been evaluated and verified in the subsequent prototype testing phase.
Replicating field conditionsWhile development and testing are important phases in product lifecycle, the installation phase has its unique challenges too given that system features like bends and valves can distort flow profiles and impair measurement accuracy. Under-standing the systemic effect of piping features on flowmeter performance is therefore crucial. ABB’s flowmeter digital twin was expanded to include the customer piping system →7.
The effect of flow modification on measurement accuracy was studied to provide insight into the impact of system features such as upstream bends. As a result, ABB could determine the best location to install flowmeters within a given piping system, thereby enabling the correction of flowmeter readings for an installed flowmeter.
05 06
—The primary goal of product development is to minimize material usage while maintaining or maximizing performance level; the digital twin model was used to optimize the design of flowmeter components to lower material costs.
Sen
siti
vity
Flowmeter sample
1 2 3 4
Model
Test
06
Co
il m
ater
ial v
olu
me
0 1 2 3 4 5
Coil material volume
Flowmeter sensitivity
Flo
wm
eter
sen
siti
vity

6502|2018 ELECTROMAGNETIC FLOW METER DIGITAL T WIN
To date, the tool has demonstrated veracity to predict flowmeter performance and enabled engineers to improve the design of flowmeters. The expansion of the model to simulate the manner in which flowmeter operations influence the flow profiles of customer piping systems also
opens up new avenues for the improvement of measurement accuracy. The digital twin technolo-gy can also be employed to serve as a useful guide for flowmeter installation in the field, which enabled industries like water management facilities to improve their flow control systems in the interest of radically enhancing industrial process performance.
Extensive research at ABB concentrates on developing the digital twin model for use in other process industries to provide customers with the most advanced digital means of reach-ing unparalleled productivity and performance. ABB focuses on maximizing value and producing products with fewer defects, ensuring optimal operation, bringing products quickly to market and improved operation. l
07
—The digital twin technology can be employed to serve as a useful guide for flowmeter installation in the field thereby enabling industries like water manage-ment facilities to improve their flow control systems.
—05 Several flowmeter varieties were modeled and compared with test data.
—06 Iterative modeling performed for optimal coil design.
—07 Modeling of EM flowmeter installed in customer piping system to predict field perfor-mance under distorted flow conditions.
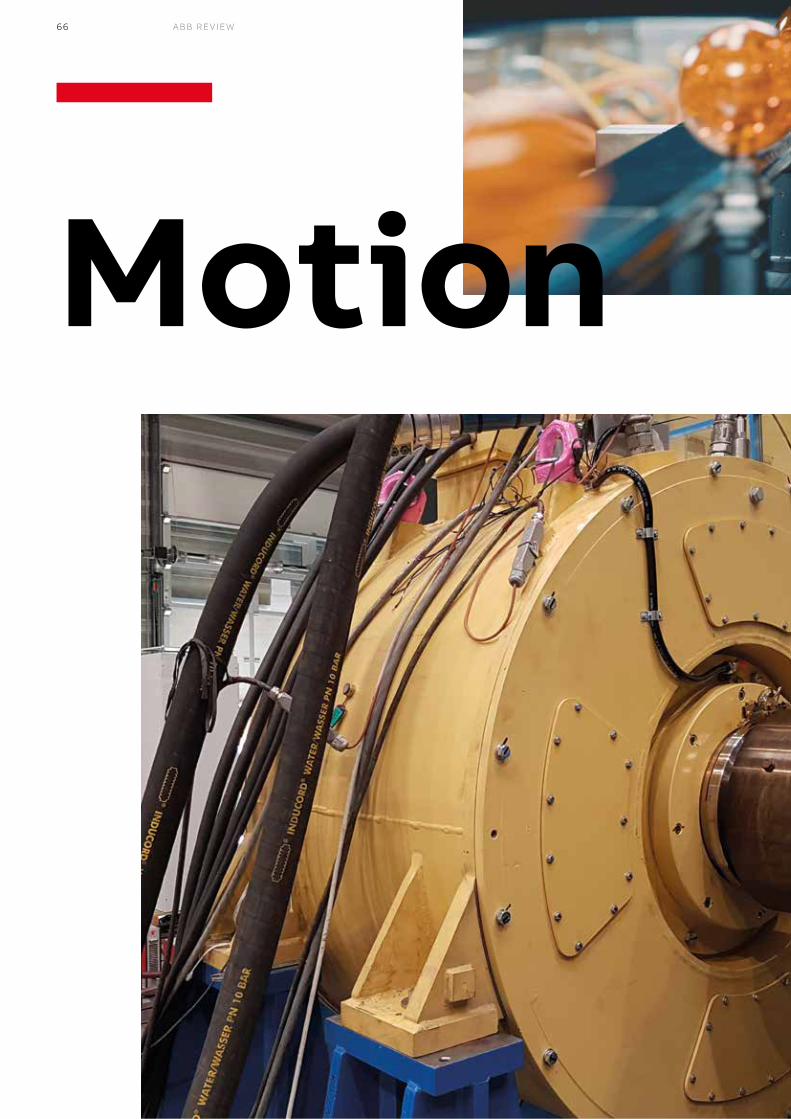
66 CHAPTER 01ABB REVIEW
— Motion
02|2018 67
Designing how devices move, where and when they interact, and what they touch or build is made even more challenging by the variability of different operational parameters, and the insertion of sensing and intelligent technologies into the equation. It’s also made more promising.
68
76
68 Intelligenttransportfor production lines74 Aflexibleapproachtomass customization76 Gearlessdrivesformedium-power belt conveyors
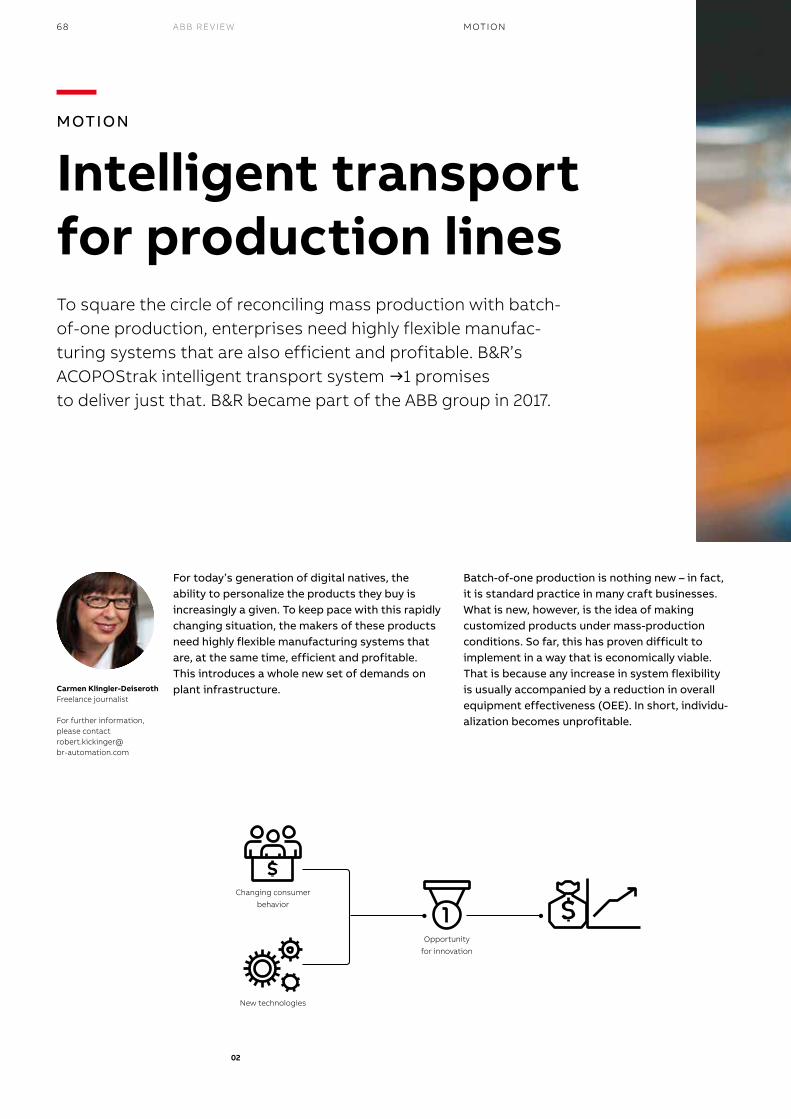
68 ABB REVIEW MOTION
For today’s generation of digital natives, the ability to personalize the products they buy is increasingly a given. To keep pace with this rapidly changing situation, the makers of these products need highly flexible manufacturing systems that are, at the same time, efficient and profitable. This introduces a whole new set of demands on plant infrastructure.
— MOTION
Intelligent transport for production linesTo square the circle of reconciling mass production with batch-of-one production, enterprises need highly flexible manufac-turing systems that are also efficient and profitable. B&R’s ACOPOStrakintelligenttransportsystem →1promises to deliver just that. B&R became part of the ABB group in 2017.
Batch-of-one production is nothing new – in fact, it is standard practice in many craft businesses. What is new, however, is the idea of making customized products under mass-production conditions. So far, this has proven difficult to implement in a way that is economically viable. That is because any increase in system flexibility is usually accompanied by a reduction in overall equipment effectiveness (OEE). In short, individu-alization becomes unprofitable.
Carmen Klingler-DeiserothFreelance journalist
For further information, please contact robert.kickinger@ br-automation.com
02
Changing consumer
behavior
New technologies
Opportunity
for innovation
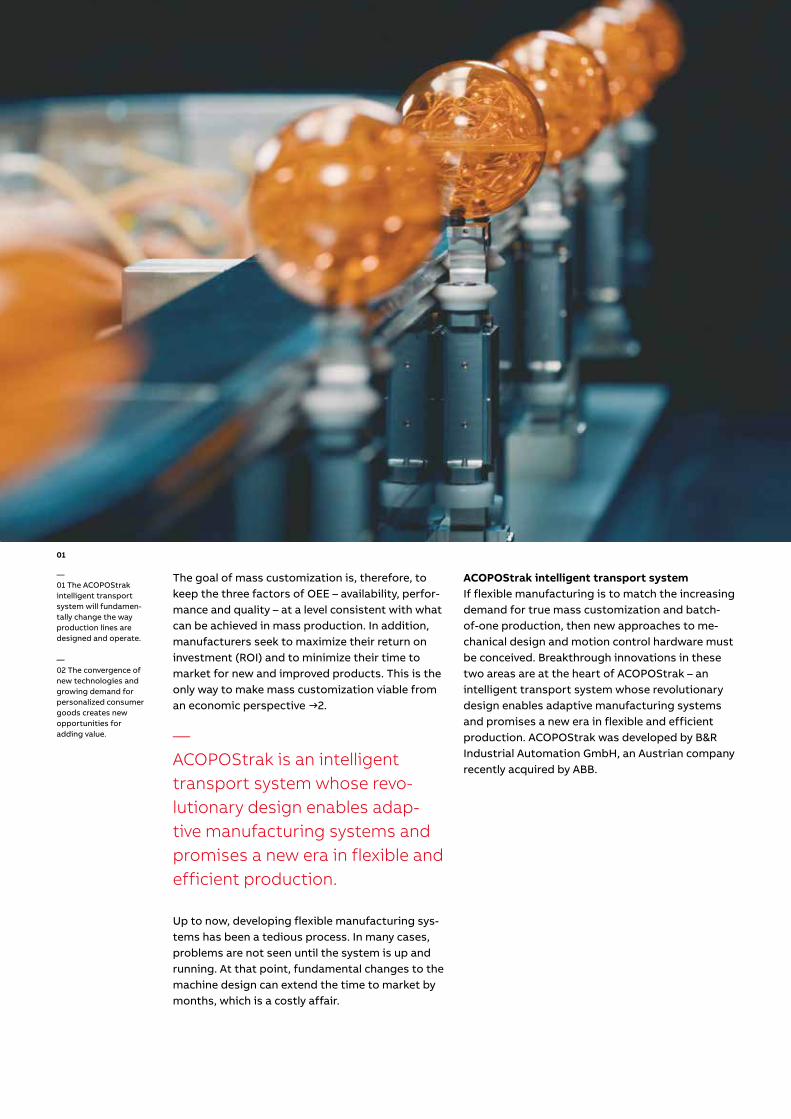
ARTICLE TITLE02|2018 6902|2018 69INTELLIGENT PRODUCT TR ANSPORT ON TRACK
—ACOPOStrak is an intelligent transport system whose revo-lutionary design enables adap-tive manufacturing systems and promises a new era in flexible and efficient production.
The goal of mass customization is, therefore, to keep the three factors of OEE – availability, perfor-mance and quality – at a level consistent with what can be achieved in mass production. In addition, manufacturers seek to maximize their return on investment (ROI) and to minimize their time to market for new and improved products. This is the only way to make mass customization viable from an economic perspective →2.
Up to now, developing flexible manufacturing sys-tems has been a tedious process. In many cases, problems are not seen until the system is up and running. At that point, fundamental changes to the machine design can extend the time to market by months, which is a costly affair.
ACOPOStrak intelligent transport systemIf flexible manufacturing is to match the increasing demand for true mass customization and batch-of-one production, then new approaches to me-chanical design and motion control hardware must be conceived. Breakthrough innovations in these two areas are at the heart of ACOPOStrak – an intelligent transport system whose revolutionary design enables adaptive manufacturing systems and promises a new era in flexible and efficient production. ACOPOStrak was developed by B&R Industrial Automation GmbH, an Austrian company recently acquired by ABB.
01
—01 The ACOPOStrak intelligent transport system will fundamen-tally change the way production lines are designed and operate.
—02 The convergence of new technologies and growing demand for personalized consumer goods creates new opportunities for adding value.
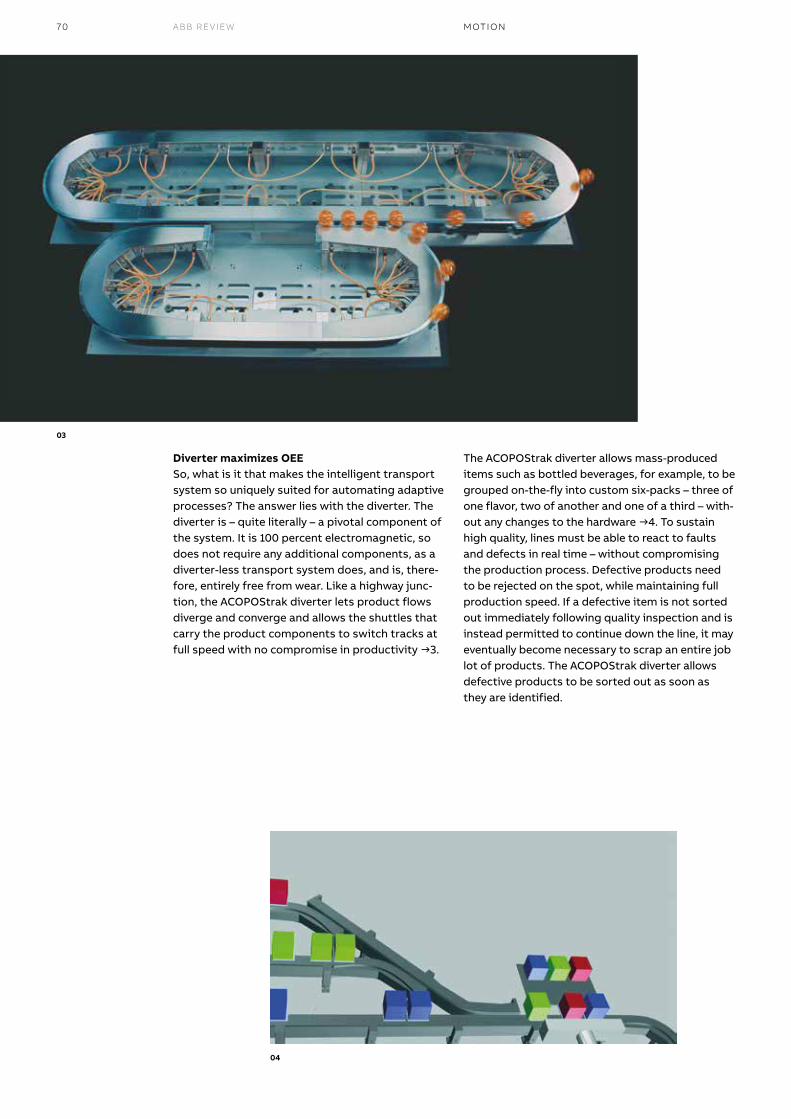
70 ABB REVIEW
Diverter maximizes OEESo, what is it that makes the intelligent transport system so uniquely suited for automating adaptive processes? The answer lies with the diverter. The diverter is – quite literally – a pivotal component of the system. It is 100 percent electromagnetic, so does not require any additional components, as a diverter-less transport system does, and is, there-fore, entirely free from wear. Like a highway junc-tion, the ACOPOStrak diverter lets product flows diverge and converge and allows the shuttles that carry the product components to switch tracks at full speed with no compromise in productivity →3.
The ACOPOStrak diverter allows mass-produced items such as bottled beverages, for example, to be grouped on-the-fly into custom six-packs – three of one flavor, two of another and one of a third – with-out any changes to the hardware →4. To sustain high quality, lines must be able to react to faults and defects in real time – without compromising the production process. Defective products need to be rejected on the spot, while maintaining full production speed. If a defective item is not sorted out immediately following quality inspection and is instead permitted to continue down the line, it may eventually become necessary to scrap an entire job lot of products. The ACOPOStrak diverter allows defective products to be sorted out as soon as they are identified.
03
04
MOTION
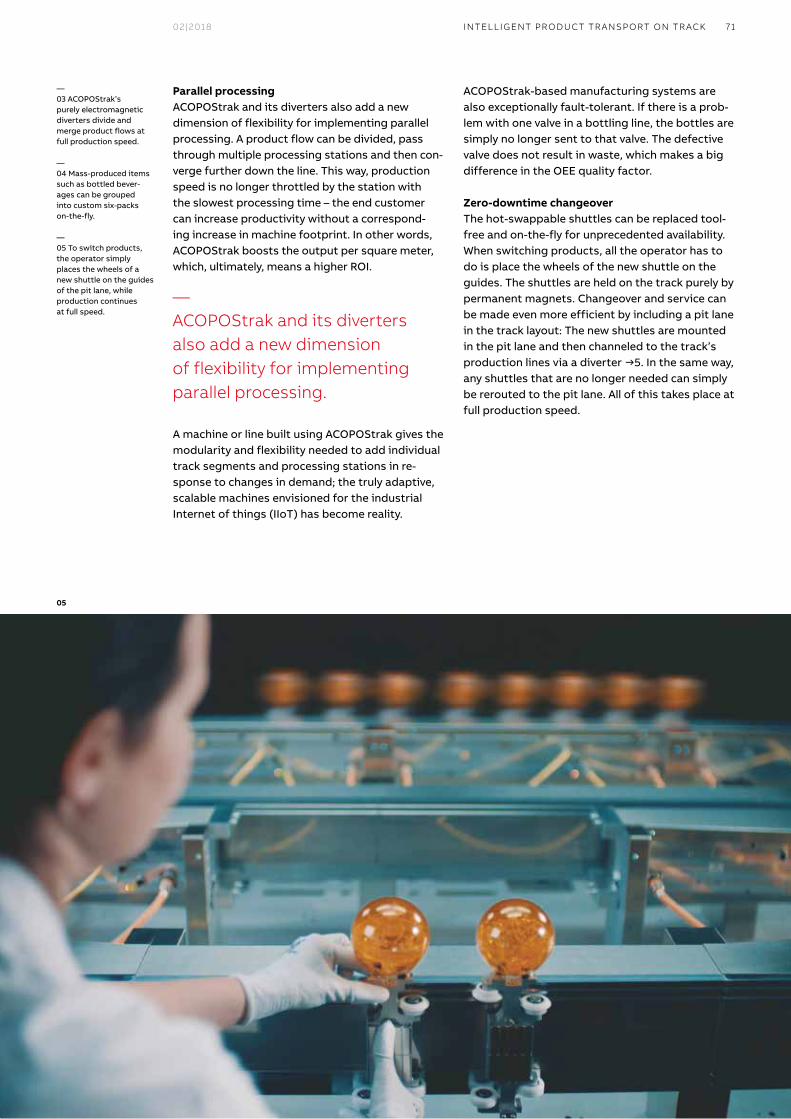
02|2018 71
Parallel processingACOPOStrak and its diverters also add a new dimension of flexibility for implementing parallel processing. A product flow can be divided, pass through multiple processing stations and then con-verge further down the line. This way, production speed is no longer throttled by the station with the slowest processing time – the end customer can increase productivity without a correspond-ing increase in machine footprint. In other words, ACOPOStrak boosts the output per square meter, which, ultimately, means a higher ROI.
A machine or line built using ACOPOStrak gives the modularity and flexibility needed to add individual track segments and processing stations in re-sponse to changes in demand; the truly adaptive, scalable machines envisioned for the industrial Internet of things (IIoT) has become reality.
ACOPOStrak-based manufacturing systems are also exceptionally fault-tolerant. If there is a prob-lem with one valve in a bottling line, the bottles are simply no longer sent to that valve. The defective valve does not result in waste, which makes a big difference in the OEE quality factor.
Zero-downtime changeoverThe hot-swappable shuttles can be replaced tool-free and on-the-fly for unprecedented availability. When switching products, all the operator has to do is place the wheels of the new shuttle on the guides. The shuttles are held on the track purely by permanent magnets. Changeover and service can be made even more efficient by including a pit lane in the track layout: The new shuttles are mounted in the pit lane and then channeled to the track’s production lines via a diverter →5. In the same way, any shuttles that are no longer needed can simply be rerouted to the pit lane. All of this takes place at full production speed.
—03 ACOPOStrak’s purely electromagnetic diverters divide and merge product flows at full production speed.
—04 Mass-produced items such as bottled bever-ages can be grouped into custom six-packs on-the-fly.
—05 To switch products, the operator simply places the wheels of a new shuttle on the guides of the pit lane, while production continues at full speed.
05
—ACOPOStrak and its diverters also add a new dimension of flexibility for implementing parallel processing.
INTELLIGENT PRODUCT TR ANSPORT ON TRACK
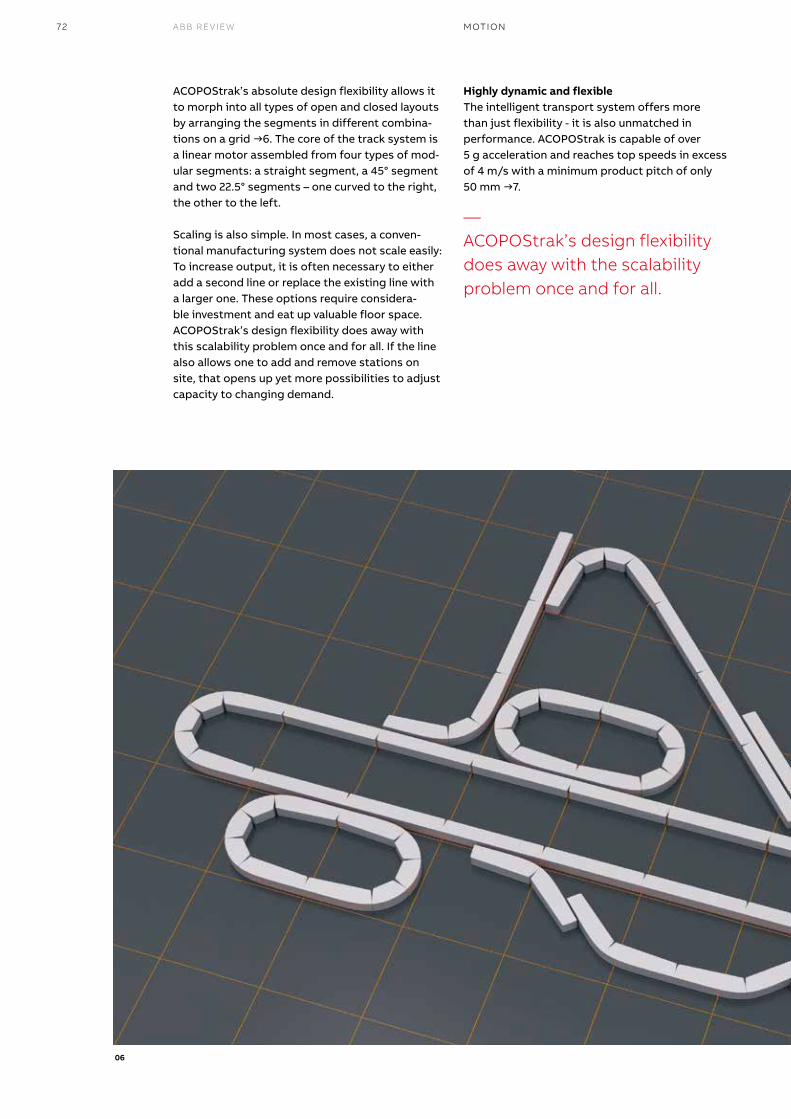
ABB REVIEW 72 MOTION
ACOPOStrak’s absolute design flexibility allows it to morph into all types of open and closed layouts by arranging the segments in different combina-tions on a grid →6. The core of the track system is a linear motor assembled from four types of mod-ular segments: a straight segment, a 45° segment and two 22.5° segments – one curved to the right, the other to the left.
Scaling is also simple. In most cases, a conven-tional manufacturing system does not scale easily: To increase output, it is often necessary to either add a second line or replace the existing line with a larger one. These options require considera-ble investment and eat up valuable floor space. ACOPOStrak’s design flexibility does away with this scalability problem once and for all. If the line also allows one to add and remove stations on site, that opens up yet more possibilities to adjust capacity to changing demand.
Highly dynamic and flexibleThe intelligent transport system offers more than just flexibility - it is also unmatched in performance. ACOPOStrak is capable of over 5 g acceleration and reaches top speeds in excess of 4 m/s with a minimum product pitch of only 50 mm →7.
06
—ACOPOStrak’s design flexibility does away with the scalability problem once and for all.
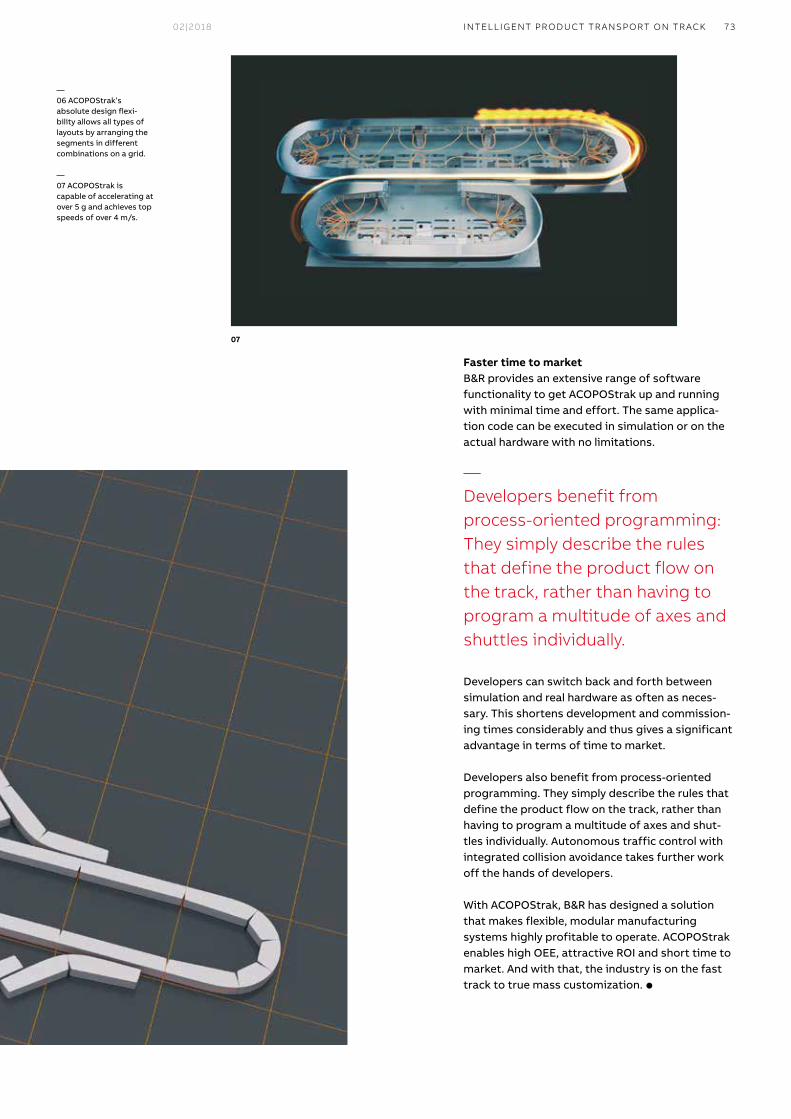
02|2018 73INTELLIGENT PRODUCT TR ANSPORT ON TRACK
Faster time to marketB&R provides an extensive range of software functionality to get ACOPOStrak up and running with minimal time and effort. The same applica-tion code can be executed in simulation or on the actual hardware with no limitations.
Developers can switch back and forth between simulation and real hardware as often as neces-sary. This shortens development and commission-ing times considerably and thus gives a significant advantage in terms of time to market.
Developers also benefit from process-oriented programming. They simply describe the rules that define the product flow on the track, rather than having to program a multitude of axes and shut-tles individually. Autonomous traffic control with integrated collision avoidance takes further work off the hands of developers.
With ACOPOStrak, B&R has designed a solution that makes flexible, modular manufacturing systems highly profitable to operate. ACOPOStrak enables high OEE, attractive ROI and short time to market. And with that, the industry is on the fast track to true mass customization. l
07
—06 ACOPOStrak’s absolute design flexi-bility allows all types of layouts by arranging the segments in different combinations on a grid.
—07 ACOPOStrak is capable of accelerating at over 5 g and achieves top speeds of over 4 m/s.
—Developers benefit from process-oriented programming: They simply describe the rulesthat define the product flow on the track, rather than having to program a multitude of axes and shuttles individually.
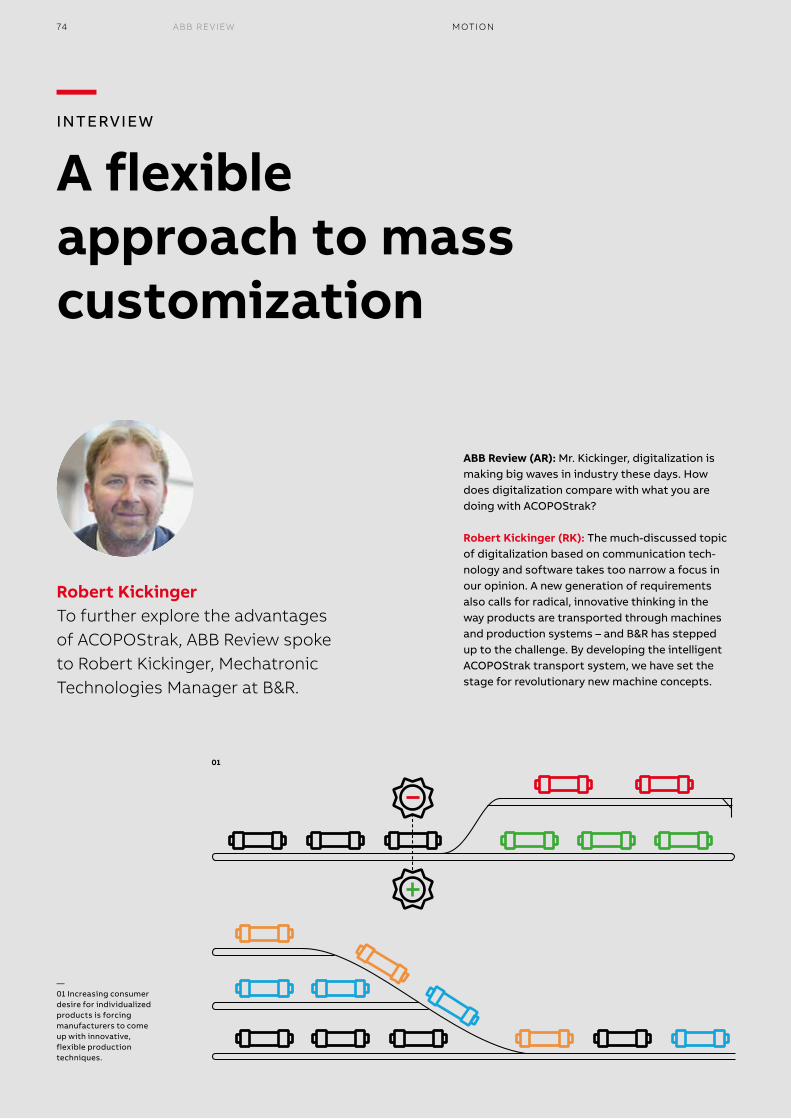
74 CHAPTER 01ABB REVIEW 74 ABB REVIEW MOTION
— INTERVIEW
A flexible approach to mass customization
Robert Kickinger To further explore the advantages of ACOPOStrak, ABB Review spoke to Robert Kickinger, Mechatronic Technologies Manager at B&R.
ABB Review (AR): Mr. Kickinger, digitalization is making big waves in industry these days. How does digitalization compare with what you are doing with ACOPOStrak?
Robert Kickinger (RK): The much-discussed topic of digitalization based on communication tech-nology and software takes too narrow a focus in our opinion. A new generation of requirements also calls for radical, innovative thinking in the way products are transported through machines and production systems – and B&R has stepped up to the challenge. By developing the intelligent ACOPOStrak transport system, we have set the stage for revolutionary new machine concepts.
01
—01 Increasing consumer desire for individualized products is forcing manufacturers to come up with innovative, flexible production techniques.
ARTICLE TITLE02|2018 757502|2018
The diverter seems to be a central piece of kit in ACOPOStrak. What are its advantages?
The high-speed diverter is the key to ACOPOS-trak’s flexibility. The shuttles that carry the com-ponents can pass through the diverter at product pitches slightly higher than shuttle sizes and still be successfully channeled. The diverter also allows defective product to be taken out of the flow immediately, rather than carrying on to the end of the line. That is a big plus for effectiveness.
Does the diverter have other advantages?
It’s not only products that can be defective, how-ever. If, say, a valve in a bottling line stops working, the automation system should react intelligent-ly by no longer sending bottles to that part of the line, while the process as a whole continues uninterrupted. Traditionally, there have been two options in such a scenario: Either I let the process keep running and scrap all the products affected by the faulty valve, or I stop production altogether. From an economic perspective, neither alternative is particularly attractive.
And what happens if you want to change a shuttle - for example, if you need another workpiece carri-er for a different product?
With ACOPOStrak you would have a pit lane – just like the pits in motor racing or the bench in ice hockey. That way, you can take the shuttles out of the main circulation and work on them at your leisure. There’s no need to slow down the main production line.
Is the user constrained at all in the production layouts he can construct?
Only insofar as he is limited by the four types of modular segments: the straight segment, the 45° segment and the two right- and left-curved 22.5° segments. These give as many layout possibilities as any producer could want. It is also eminently scalable. In other words, ACOPOStrak adapts per-fectly to any production site. And at the same time, it opens up completely new machine designs that have never before been possible.
How would you summarize the impact of ACOPOS-trak?
When you combine the performance numbers we’re seeing with the benefits of the diverters and the extreme design flexibility you get a total pack-age the like of which the market has never seen before. ROI, OEE and time to market are the main economic factors underpinning all manufacturing operations and, in this context, both the builders and operators of machinery and plants just have to rise to the challenge of increasing production flexibility. Fail to take this seriously and you will find yourself at a big competitive disadvantage. Remember, mass-customized products have been shown to achieve higher margins than their conventional counterparts. Successful implemen-tation, however, stands or falls with key advance-ments in plant infrastructure.
In summary, I’d say that, with ACOPOStrak, the industry is on the verge of a generational leap in productivity and accelerated ROI for individualized products and small batches.
Robert Kickinger, thank you for your time today. l
AR
RK
AR
RK
AR
RK
AR
RK
AR
RK
AR
Disclaimer: ACOPOStrak is not available for sale into the United States of America until September 2018. Nothing herein constitutes an offer to sell, or a solicitation of an offer to buy. This article is for informational purposes only.
FLEXIBLE MASS CUSTOMIZATION
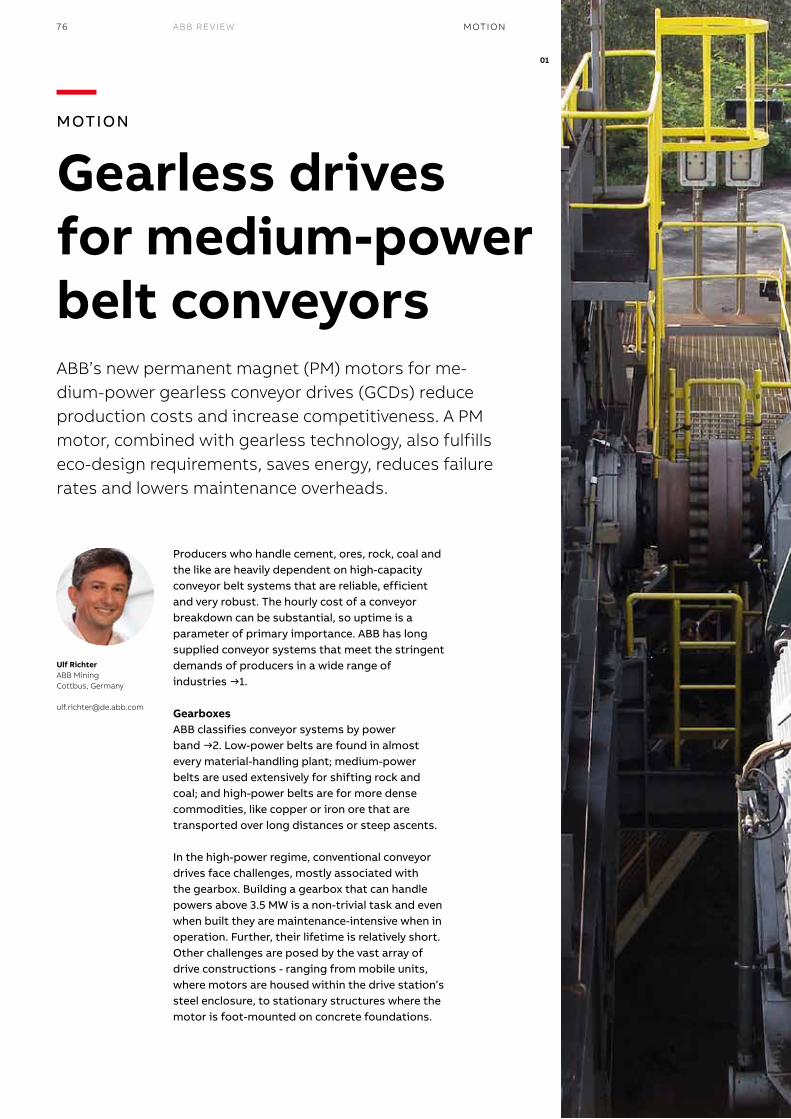
76 ABB REVIEW MOTION
Producers who handle cement, ores, rock, coal and the like are heavily dependent on high-capacity conveyor belt systems that are reliable, efficient and very robust. The hourly cost of a conveyor breakdown can be substantial, so uptime is a parameter of primary importance. ABB has long supplied conveyor systems that meet the stringent demands of producers in a wide range of industries →1.
GearboxesABB classifies conveyor systems by power band →2. Low-power belts are found in almost every material-handling plant; medium-power belts are used extensively for shifting rock and coal; and high-power belts are for more dense commodities, like copper or iron ore that are transported over long distances or steep ascents.
In the high-power regime, conventional conveyor drives face challenges, mostly associated with the gearbox. Building a gearbox that can handle powers above 3.5 MW is a non-trivial task and even when built they are maintenance-intensive when in operation. Further, their lifetime is relatively short. Other challenges are posed by the vast array of drive constructions - ranging from mobile units, where motors are housed within the drive station’s steel enclosure, to stationary structures where the motor is foot-mounted on concrete foundations.
ABB’s new permanent magnet (PM) motors for me-dium-power gearless conveyor drives (GCDs) reduce production costs and increase competitiveness. A PM motor, combined with gearless technology, also fulfills eco-design requirements, saves energy, reduces failure rates and lowers maintenance overheads.
01
Ulf RichterABB MiningCottbus, Germany
— MOTION
Gearless drives for medium-power belt conveyors
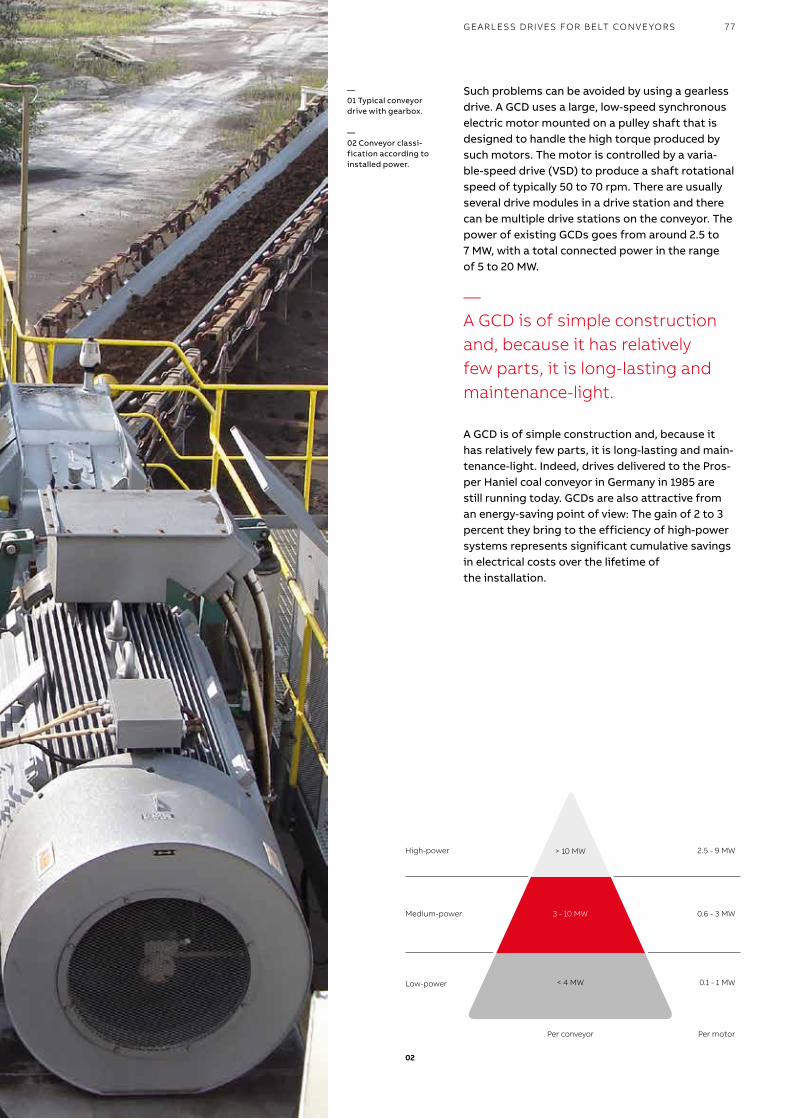
02|2018 77GEARLESS DRIVES FOR BELT CONVEYORS
Such problems can be avoided by using a gearless drive. A GCD uses a large, low-speed synchronous electric motor mounted on a pulley shaft that is designed to handle the high torque produced by such motors. The motor is controlled by a varia-ble-speed drive (VSD) to produce a shaft rotational speed of typically 50 to 70 rpm. There are usually several drive modules in a drive station and there can be multiple drive stations on the conveyor. The power of existing GCDs goes from around 2.5 to 7 MW, with a total connected power in the range of 5 to 20 MW.
A GCD is of simple construction and, because it has relatively few parts, it is long-lasting and main-tenance-light. Indeed, drives delivered to the Pros-per Haniel coal conveyor in Germany in 1985 are still running today. GCDs are also attractive from an energy-saving point of view: The gain of 2 to 3 percent they bring to the efficiency of high-power systems represents significant cumulative savings in electrical costs over the lifetime of the installation.
—A GCD is of simple construction and, because it has relatively few parts, it is long-lasting andmaintenance-light.
02
—01 Typical conveyor drive with gearbox.
—02 Conveyor classi-fication according to installed power.
> 10 MW
0.6 - 3 MW
0.1 - 1 MW
High-power 2.5 - 9 MW
Medium-power
Low-power
Per conveyor Per motor
3 - 10 MW
< 4 MW
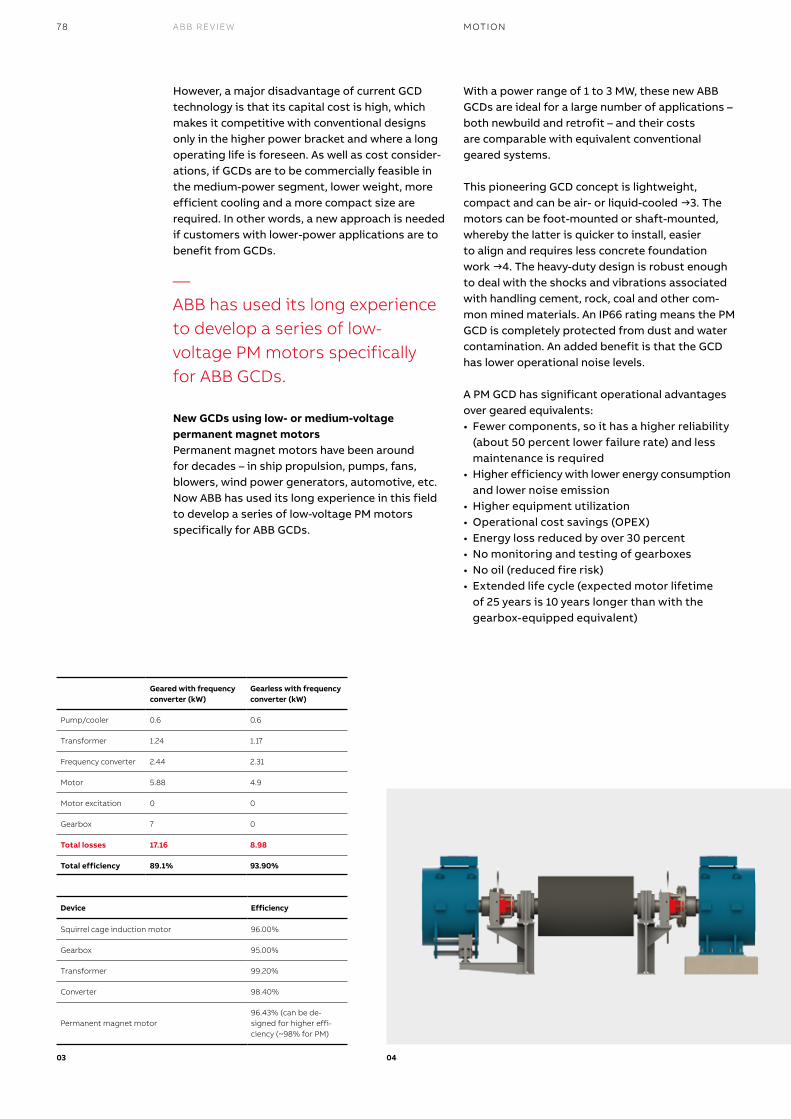
78 ABB REVIEW MOTION
However, a major disadvantage of current GCD technology is that its capital cost is high, which makes it competitive with conventional designs only in the higher power bracket and where a long operating life is foreseen. As well as cost consider-ations, if GCDs are to be commercially feasible in the medium-power segment, lower weight, more efficient cooling and a more compact size are required. In other words, a new approach is needed if customers with lower-power applications are to benefit from GCDs.
New GCDs using low- or medium-voltage permanent magnet motorsPermanent magnet motors have been around for decades – in ship propulsion, pumps, fans, blowers, wind power generators, automotive, etc. Now ABB has used its long experience in this field to develop a series of low-voltage PM motors specifically for ABB GCDs.
With a power range of 1 to 3 MW, these new ABB GCDs are ideal for a large number of applications – both newbuild and retrofit – and their costs are comparable with equivalent conventional geared systems.
This pioneering GCD concept is lightweight, compact and can be air- or liquid-cooled →3. The motors can be foot-mounted or shaft-mounted, whereby the latter is quicker to install, easier to align and requires less concrete foundation work →4. The heavy-duty design is robust enough to deal with the shocks and vibrations associated with handling cement, rock, coal and other com-mon mined materials. An IP66 rating means the PM GCD is completely protected from dust and water contamination. An added benefit is that the GCD has lower operational noise levels.
A PM GCD has significant operational advantages over geared equivalents:• Fewer components, so it has a higher reliability
(about 50 percent lower failure rate) and less maintenance is required
• Higher efficiency with lower energy consumption and lower noise emission
• Higher equipment utilization• Operational cost savings (OPEX)• Energy loss reduced by over 30 percent• No monitoring and testing of gearboxes• No oil (reduced fire risk)• Extended life cycle (expected motor lifetime
of 25 years is 10 years longer than with the gearbox-equipped equivalent)
—ABB has used its long experience to develop a series of low- voltage PM motors specifically for ABB GCDs.
03 04
Geared with frequency converter (kW)
Gearless with frequency converter (kW)
Pump/cooler 0.6 0.6
Transformer 1.24 1.17
Frequency converter 2.44 2.31
Motor 5.88 4.9
Motor excitation 0 0
Gearbox 7 0
Total losses 17.16 8.98
Total efficiency 89.1% 93.90%
Device Efficiency
Squirrel cage induction motor 96.00%
Gearbox 95.00%
Transformer 99.20%
Converter 98.40%
Permanent magnet motor96.43% (can be de-signed for higher effi-ciency (~98% for PM)
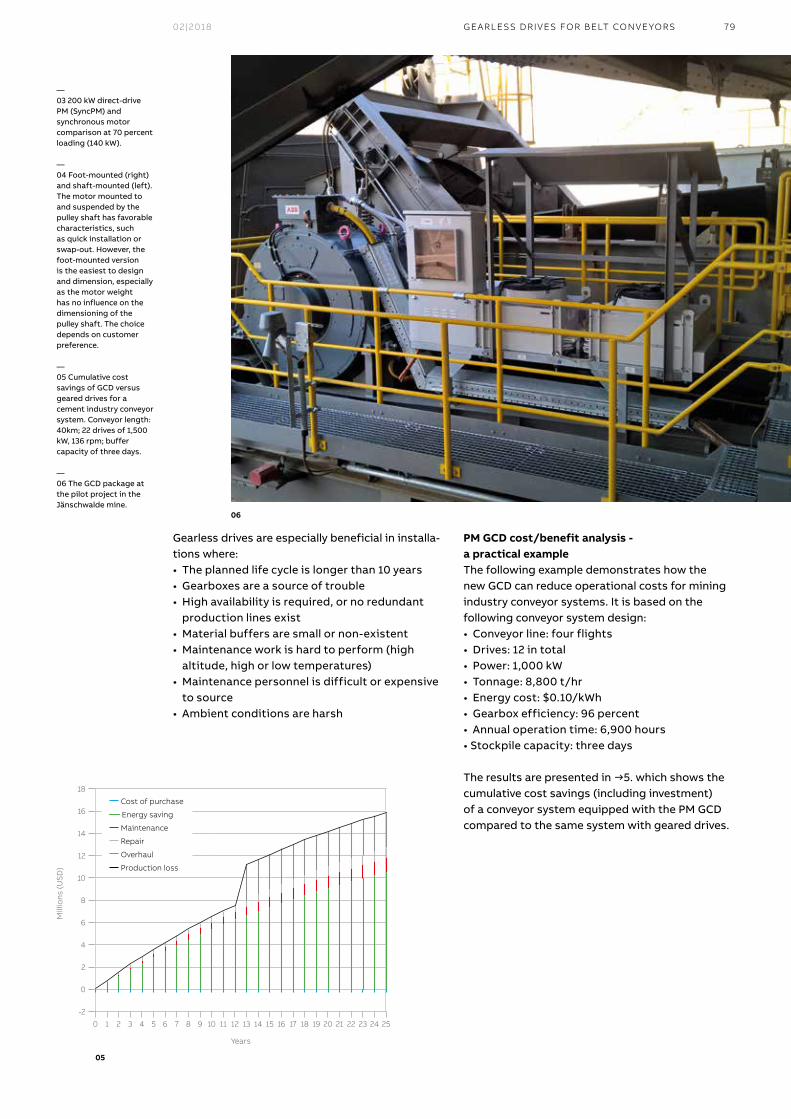
02|2018 79GEARLESS DRIVES FOR BELT CONVEYORS
Gearless drives are especially beneficial in installa-tions where:• The planned life cycle is longer than 10 years• Gearboxes are a source of trouble• High availability is required, or no redundant
production lines exist• Material buffers are small or non-existent • Maintenance work is hard to perform (high
altitude, high or low temperatures)• Maintenance personnel is difficult or expensive
to source• Ambient conditions are harsh
PM GCD cost/benefit analysis - a practical exampleThe following example demonstrates how the new GCD can reduce operational costs for mining industry conveyor systems. It is based on the following conveyor system design:• Conveyor line: four flights• Drives: 12 in total• Power: 1,000 kW• Tonnage: 8,800 t/hr• Energy cost: $0.10/kWh• Gearbox efficiency: 96 percent• Annual operation time: 6,900 hours• Stockpile capacity: three days
The results are presented in →5. which shows the cumulative cost savings (including investment) of a conveyor system equipped with the PM GCD compared to the same system with geared drives.
06
—03 200 kW direct-drive PM (SyncPM) and synchronous motor comparison at 70 percent loading (140 kW).
—04 Foot-mounted (right) and shaft-mounted (left). The motor mounted to and suspended by the pulley shaft has favorable characteristics, such as quick installation or swap-out. However, the foot-mounted version is the easiest to design and dimension, especially as the motor weight has no influence on the dimensioning of the pulley shaft. The choice depends on customer preference.
—05 Cumulative cost savings of GCD versus geared drives for a cement industry conveyor system. Conveyor length: 40km; 22 drives of 1,500 kW, 136 rpm; buffer capacity of three days.
—06 The GCD package at the pilot project in the Jänschwalde mine.
05
Mill
ion
s (U
SD
)
Years
0 1 2 3 4 5 6 7 8 9 10 11 12 13 14 15 16 17 18 19 20 21 22 23 24 25
18
16
14
12
10
8
6
4
2
0
-2
Cost of purchase
Energy saving
Maintenance
Repair
Overhaul
Production loss
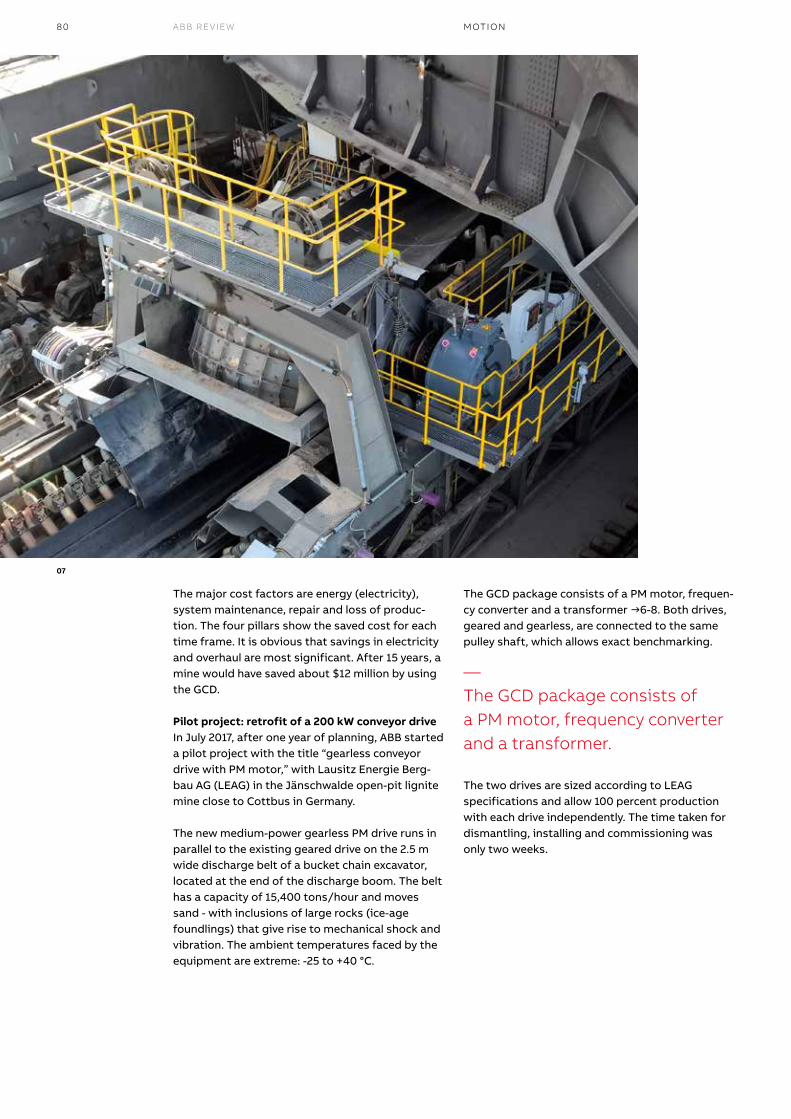
80 ABB REVIEW MOTION
The major cost factors are energy (electricity), system maintenance, repair and loss of produc-tion. The four pillars show the saved cost for each time frame. It is obvious that savings in electricity and overhaul are most significant. After 15 years, a mine would have saved about $12 million by using the GCD.
Pilot project: retrofit of a 200 kW conveyor driveIn July 2017, after one year of planning, ABB started a pilot project with the title “gearless conveyor drive with PM motor,” with Lausitz Energie Berg-bau AG (LEAG) in the Jänschwalde open-pit lignite mine close to Cottbus in Germany.
The new medium-power gearless PM drive runs in parallel to the existing geared drive on the 2.5 m wide discharge belt of a bucket chain excavator, located at the end of the discharge boom. The belt has a capacity of 15,400 tons/hour and moves sand - with inclusions of large rocks (ice-age foundlings) that give rise to mechanical shock and vibration. The ambient temperatures faced by the equipment are extreme: -25 to +40 °C.
The GCD package consists of a PM motor, frequen-cy converter and a transformer →6-8. Both drives, geared and gearless, are connected to the same pulley shaft, which allows exact benchmarking.
The two drives are sized according to LEAG specifications and allow 100 percent production with each drive independently. The time taken for dismantling, installing and commissioning was only two weeks.
—The GCD package consists of a PM motor, frequency converter and a transformer.
07
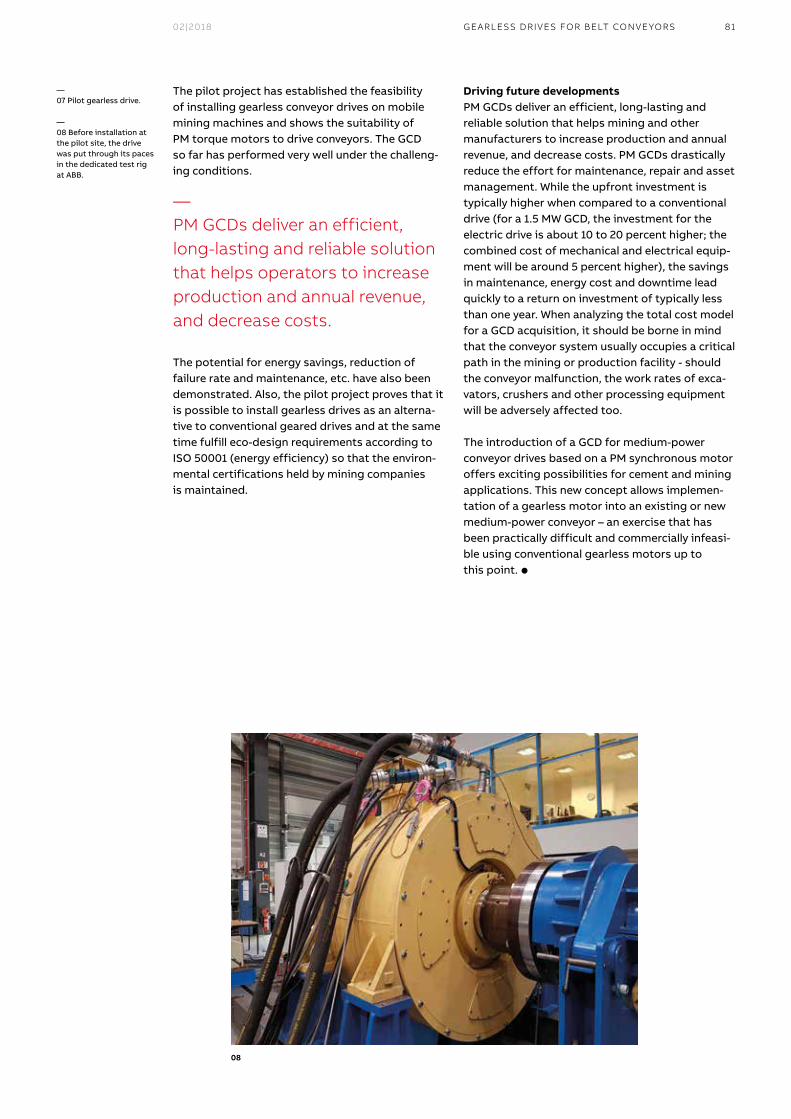
02|2018 81GEARLESS DRIVES FOR BELT CONVEYORS
The pilot project has established the feasibility of installing gearless conveyor drives on mobile mining machines and shows the suitability of PM torque motors to drive conveyors. The GCD so far has performed very well under the challeng-ing conditions.
The potential for energy savings, reduction of failure rate and maintenance, etc. have also been demonstrated. Also, the pilot project proves that it is possible to install gearless drives as an alterna-tive to conventional geared drives and at the same time fulfill eco-design requirements according to ISO 50001 (energy efficiency) so that the environ-mental certifications held by mining companies is maintained.
Driving future developmentsPM GCDs deliver an efficient, long-lasting and reliable solution that helps mining and other manufacturers to increase production and annual revenue, and decrease costs. PM GCDs drastically reduce the effort for maintenance, repair and asset management. While the upfront investment is typically higher when compared to a conventional drive (for a 1.5 MW GCD, the investment for the electric drive is about 10 to 20 percent higher; the combined cost of mechanical and electrical equip-ment will be around 5 percent higher), the savings in maintenance, energy cost and downtime lead quickly to a return on investment of typically less than one year. When analyzing the total cost model for a GCD acquisition, it should be borne in mind that the conveyor system usually occupies a critical path in the mining or production facility - should the conveyor malfunction, the work rates of exca-vators, crushers and other processing equipment will be adversely affected too.
The introduction of a GCD for medium-power conveyor drives based on a PM synchronous motor offers exciting possibilities for cement and mining applications. This new concept allows implemen-tation of a gearless motor into an existing or new medium-power conveyor – an exercise that has been practically difficult and commercially infeasi-ble using conventional gearless motors up to this point. l
—PM GCDs deliver an efficient, long-lasting and reliable solution that helps operators to increase production and annual revenue, and decrease costs.
08
—07 Pilot gearless drive.
—08 Before installation at the pilot site, the drive was put through its paces in the dedicated test rig at ABB.

82 ABB REVIEW
— Energy
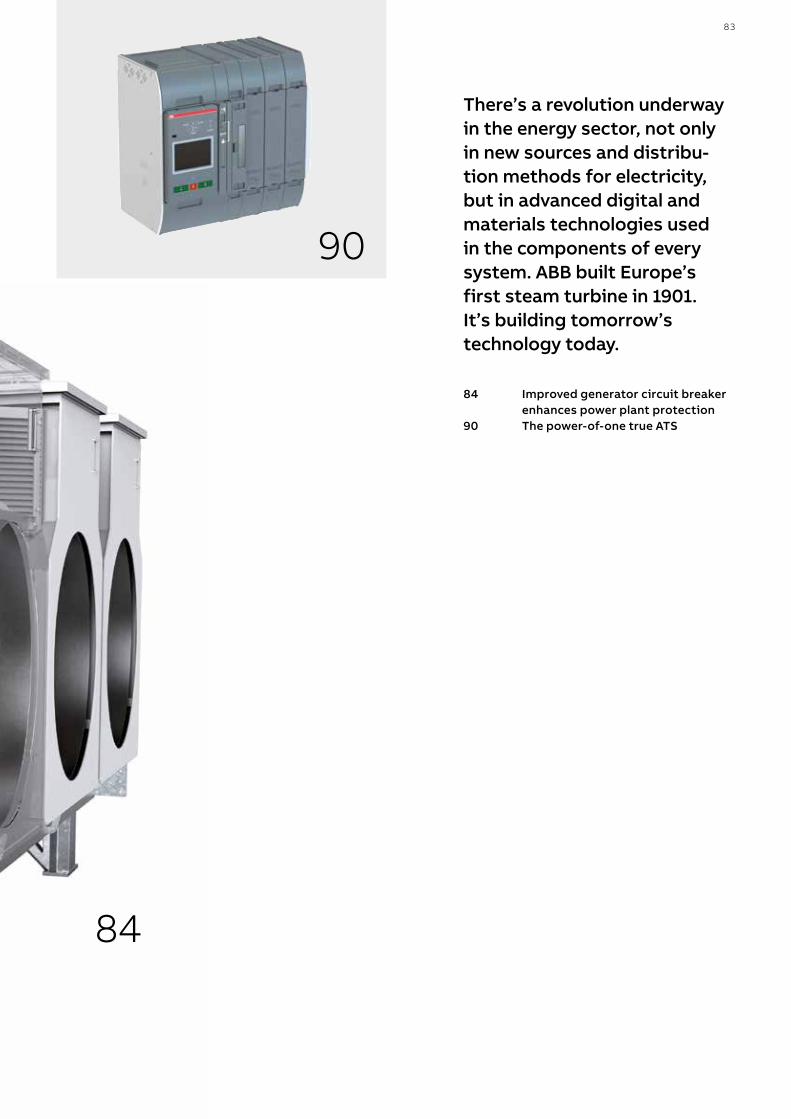
02|2018 83
There’s a revolution underway in the energy sector, not only in new sources and distribu-tion methods for electricity, but in advanced digital and materials technologies used in the components of every system. ABB built Europe’s first steam turbine in 1901. It’s building tomorrow’s technology today.
84 Improvedgeneratorcircuitbreaker enhances power plant protection90 Thepower-of-onetrueATS
84
90
— Energy

84 ABB REVIEW
A GCB plays an important part in switching the circuit between the generator and the transformer in a power plant. The GCB protects key equip-ment while simplifying operational procedures to improve power plant availability. ABB’s GCBs have been protecting all types of power plants since 1954 and more than 8,000 are installed in over 100 countries. ABB offers the widest and most modern portfolio of GCBs in SF6 and vacuum technology with a range of short-circuit currents from 50 kA to 300 kA and nominal currents from 3 kA to 50 kA. To meet the most stringent standards and customers’ needs, ABB continues to invest in GCB research and development.
In the late 1990s, for the high-end segment, ABB introduced the GCB type HEC 7/8, which caters for short-circuit currents up to 210 kA. In 2012, HEC 9 – the world’s largest GCB for power plants up to 2,000 MW – was launched.
— ENERGY
Improved generator circuit breaker enhances power plant protectionA generator circuit breaker (GCB) plays a vital role in power plants: It protects key equipment and increases plant availability. ABB’s successor to the HEC 7/8 – the HEC 10 GCB – offers additional benefits, eg, improved switching capability, lower SF6 volume andleakagerate,extendedlifetimeandasmallerfootprint →1.
Mirko PalazzoAlejandro MarmolejoOliver FritzStefan ArndtABB Switzerland Ltd.Zurich, Switzerland
mirko.palazzo@ [email protected]@[email protected]
—To meet the most stringent standards and customers’ needs, ABB continues to invest in GCB research and development.
ENERGY
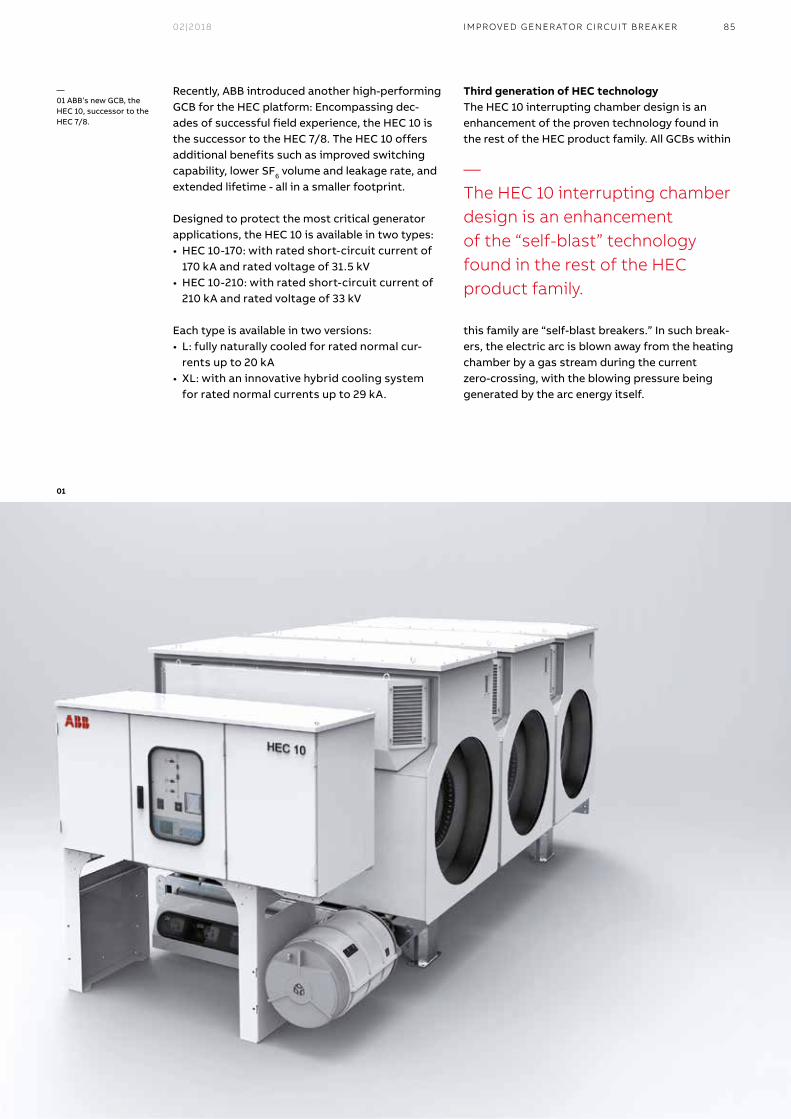
02|2018 85
Recently, ABB introduced another high-performing GCB for the HEC platform: Encompassing dec-ades of successful field experience, the HEC 10 is the successor to the HEC 7/8. The HEC 10 offers additional benefits such as improved switching capability, lower SF6 volume and leakage rate, and extended lifetime - all in a smaller footprint.
Designed to protect the most critical generator applications, the HEC 10 is available in two types:• HEC 10-170: with rated short-circuit current of
170 kA and rated voltage of 31.5 kV• HEC 10-210: with rated short-circuit current of
210 kA and rated voltage of 33 kV
Each type is available in two versions:• L: fully naturally cooled for rated normal cur-
rents up to 20 kA• XL: with an innovative hybrid cooling system
for rated normal currents up to 29 kA.
Third generation of HEC technologyThe HEC 10 interrupting chamber design is an enhancement of the proven technology found in the rest of the HEC product family. All GCBs within
this family are “self-blast breakers.” In such break-ers, the electric arc is blown away from the heating chamber by a gas stream during the current zero-crossing, with the blowing pressure being generated by the arc energy itself.
—The HEC 10 interrupting chamber design is an enhancement of the “self-blast” technology found in the rest of the HEC product family.
—01 ABB’s new GCB, the HEC 10, successor to the HEC 7/8.
01
IMPROVED GENER ATOR CIRCUIT BREAKER
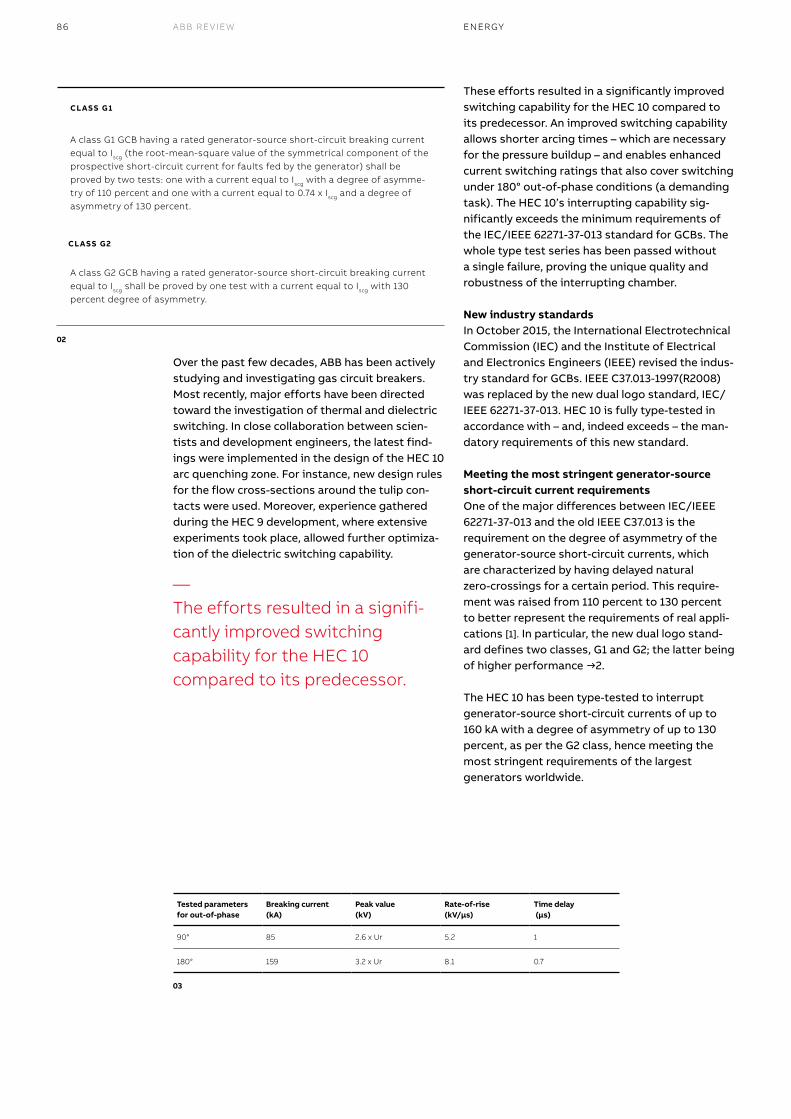
86 ABB REVIEW
Over the past few decades, ABB has been actively studying and investigating gas circuit breakers. Most recently, major efforts have been directed toward the investigation of thermal and dielectric switching. In close collaboration between scien-tists and development engineers, the latest find-ings were implemented in the design of the HEC 10 arc quenching zone. For instance, new design rules for the flow cross-sections around the tulip con-tacts were used. Moreover, experience gathered during the HEC 9 development, where extensive experiments took place, allowed further optimiza-tion of the dielectric switching capability.
These efforts resulted in a significantly improved switching capability for the HEC 10 compared to its predecessor. An improved switching capability allows shorter arcing times – which are necessary for the pressure buildup – and enables enhanced current switching ratings that also cover switching under 180° out-of-phase conditions (a demanding task). The HEC 10’s interrupting capability sig-nificantly exceeds the minimum requirements of the IEC/IEEE 62271-37-013 standard for GCBs. The whole type test series has been passed without a single failure, proving the unique quality and robustness of the interrupting chamber.
New industry standardsIn October 2015, the International Electrotechnical Commission (IEC) and the Institute of Electrical and Electronics Engineers (IEEE) revised the indus-try standard for GCBs. IEEE C37.013-1997(R2008) was replaced by the new dual logo standard, IEC/IEEE 62271-37-013. HEC 10 is fully type-tested in accordance with – and, indeed exceeds – the man-datory requirements of this new standard.
Meeting the most stringent generator-source short-circuit current requirements One of the major differences between IEC/IEEE 62271-37-013 and the old IEEE C37.013 is the requirement on the degree of asymmetry of the generator-source short-circuit currents, which are characterized by having delayed natural zero-crossings for a certain period. This require-ment was raised from 110 percent to 130 percent to better represent the requirements of real appli-cations [1]. In particular, the new dual logo stand-ard defines two classes, G1 and G2; the latter being of higher performance →2.
The HEC 10 has been type-tested to interrupt generator-source short-circuit currents of up to 160 kA with a degree of asymmetry of up to 130 percent, as per the G2 class, hence meeting the most stringent requirements of the largest generators worldwide.
—The efforts resulted in a signifi-cantly improved switching capability for the HEC 10 compared to its predecessor.
02
A class G1 GCB having a rated generator-source short-circuit breaking current equal to Iscg (the root-mean-square value of the symmetrical component of the prospective short-circuit current for faults fed by the generator) shall be proved by two tests: one with a current equal to Iscg with a degree of asymme-try of 110 percent and one with a current equal to 0.74 x Iscg and a degree of asymmetry of 130 percent.
A class G2 GCB having a rated generator-source short-circuit breaking current equal to Iscg shall be proved by one test with a current equal to Iscg with 130 percent degree of asymmetry.
CLASS G1
CLASS G2
03
Tested parameters for out-of-phase
Breaking current (kA)
Peak value (kV)
Rate-of-rise (kV/µs)
Time delay (µs)
90° 85 2.6 x Ur 5.2 1
180° 159 3.2 x Ur 8.1 0.7
ENERGY
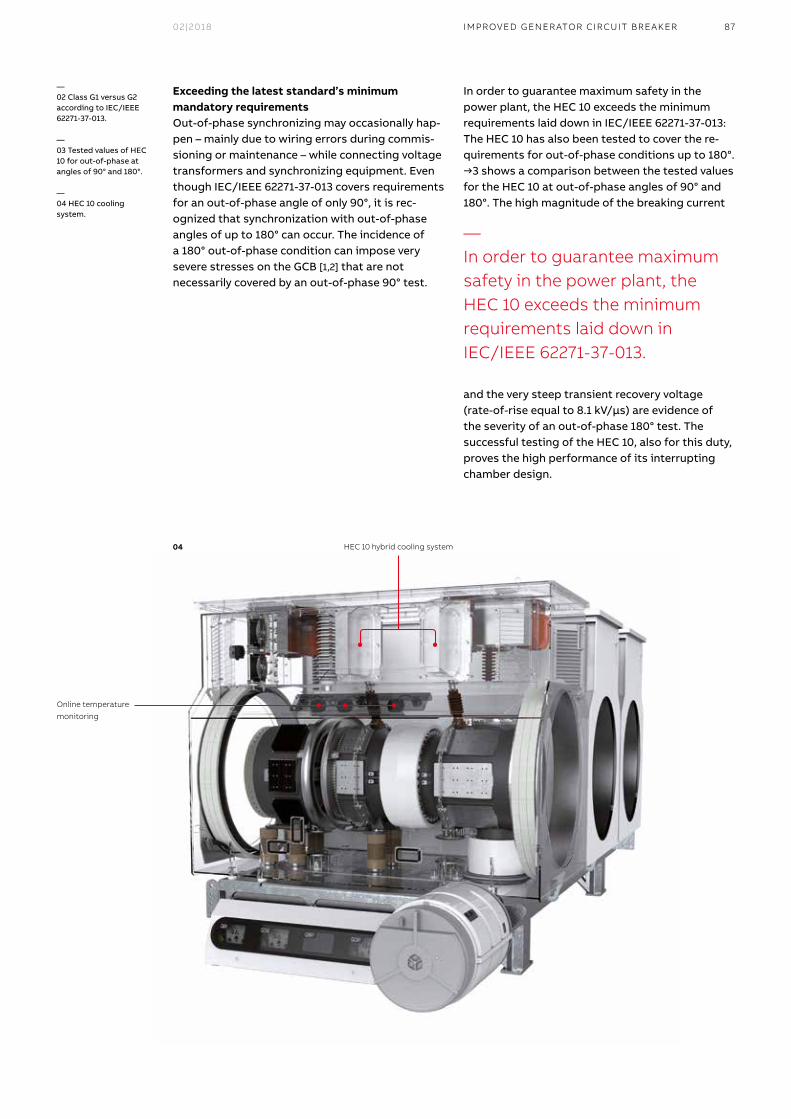
02|2018 87
Exceeding the latest standard’s minimum mandatory requirementsOut-of-phase synchronizing may occasionally hap-pen – mainly due to wiring errors during commis-sioning or maintenance – while connecting voltage transformers and synchronizing equipment. Even though IEC/IEEE 62271-37-013 covers requirements for an out-of-phase angle of only 90°, it is rec-ognized that synchronization with out-of-phase angles of up to 180° can occur. The incidence of a 180° out-of-phase condition can impose very severe stresses on the GCB [1,2] that are not necessarily covered by an out-of-phase 90° test.
In order to guarantee maximum safety in the power plant, the HEC 10 exceeds the minimum requirements laid down in IEC/IEEE 62271-37-013: The HEC 10 has also been tested to cover the re-quirements for out-of-phase conditions up to 180°. →3 shows a comparison between the tested values for the HEC 10 at out-of-phase angles of 90° and 180°. The high magnitude of the breaking current
and the very steep transient recovery voltage (rate-of-rise equal to 8.1 kV/µs) are evidence of the severity of an out-of-phase 180° test. The successful testing of the HEC 10, also for this duty, proves the high performance of its interrupting chamber design.
—In order to guarantee maximum safety in the power plant, the HEC 10 exceeds the minimumrequirements laid down in IEC/IEEE 62271-37-013.
—02 Class G1 versus G2 according to IEC/IEEE 62271-37-013.
—03 Tested values of HEC 10 for out-of-phase at angles of 90° and 180°.
—04 HEC 10 cooling system.
04 HEC 10 hybrid cooling system
Online temperature
monitoring
IMPROVED GENER ATOR CIRCUIT BREAKER
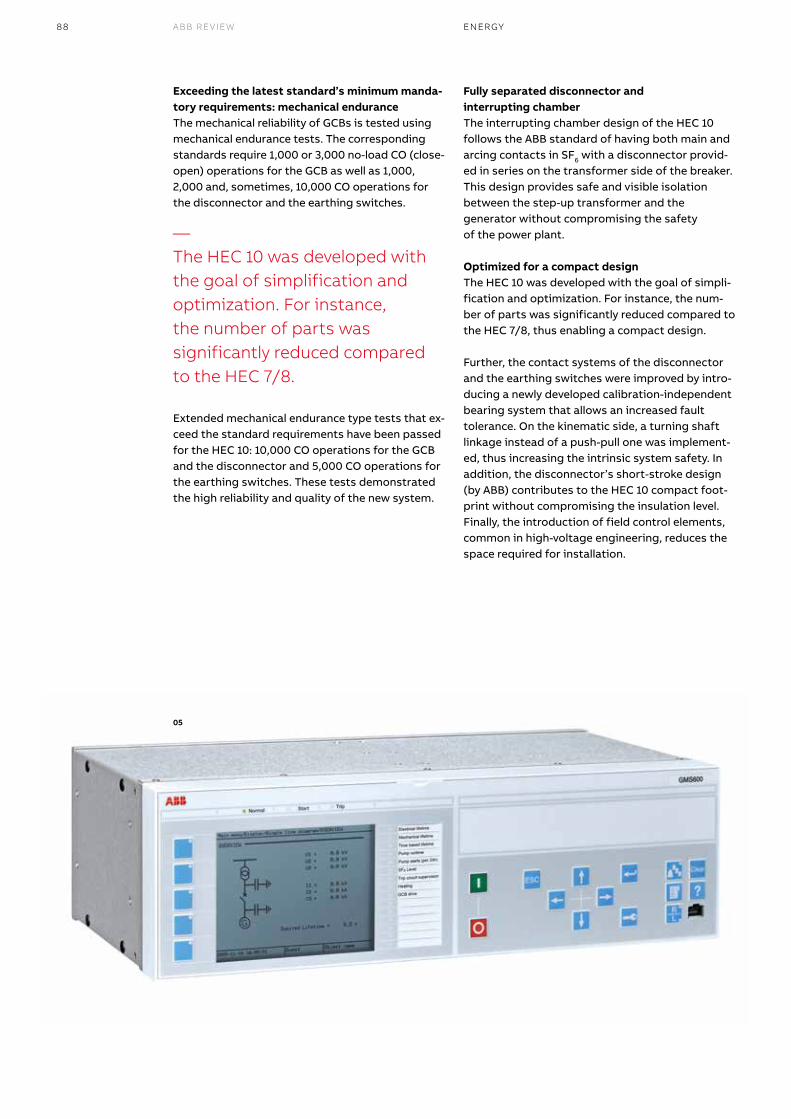
88 ABB REVIEW
Exceeding the latest standard’s minimum manda-tory requirements: mechanical enduranceThe mechanical reliability of GCBs is tested using mechanical endurance tests. The corresponding standards require 1,000 or 3,000 no-load CO (close-open) operations for the GCB as well as 1,000, 2,000 and, sometimes, 10,000 CO operations for the disconnector and the earthing switches.
Extended mechanical endurance type tests that ex-ceed the standard requirements have been passed for the HEC 10: 10,000 CO operations for the GCB and the disconnector and 5,000 CO operations for the earthing switches. These tests demonstrated the high reliability and quality of the new system.
Fully separated disconnector and interrupting chamberThe interrupting chamber design of the HEC 10 follows the ABB standard of having both main and arcing contacts in SF6 with a disconnector provid-ed in series on the transformer side of the breaker. This design provides safe and visible isolation between the step-up transformer and the generator without compromising the safety of the power plant.
Optimized for a compact design The HEC 10 was developed with the goal of simpli-fication and optimization. For instance, the num-ber of parts was significantly reduced compared to the HEC 7/8, thus enabling a compact design.
Further, the contact systems of the disconnector and the earthing switches were improved by intro-ducing a newly developed calibration-independent bearing system that allows an increased fault tolerance. On the kinematic side, a turning shaft linkage instead of a push-pull one was implement-ed, thus increasing the intrinsic system safety. In addition, the disconnector’s short-stroke design (by ABB) contributes to the HEC 10 compact foot-print without compromising the insulation level. Finally, the introduction of field control elements, common in high-voltage engineering, reduces the space required for installation.
—The HEC 10 was developed with the goal of simplification and optimization. For instance,the number of parts was significantly reduced compared to the HEC 7/8.
05
ENERGY
02|2018 89
An innovative cooling systemAn efficient cooling scheme guarantees the safe and reliable operation of the GCB. Based on ac-curate simulation studies, the cooling scheme of the HEC 10-XL was chosen to be a hybrid system consisting of passive heat pipes and heat sinks equipped with simple and redundant low-main-tenance fans that allow the GCB to operate with normal currents of up to 29 kA →4. This innovative cooling system enables temperature and fan oper-ation to be fully monitored online using a GMS600 monitoring system, thus allowing condition-based maintenance.
By avoiding the use of SF6 cooling radiators, the HEC 10 provides the highest reliability. And with an SF6 leakage rate of less than 0.1 percent per year, the HEC 10 comes in well below the maximum allowed by the standards. When needed, the fans can be easily exchanged online without shutdown of the generator, thus ensuring maximum power plant availability.
Additional safety featuresThe integration of the main drive train into the longitudinal supports of the pole frame is part of the comprehensive HEC 10 layout optimization strategy. The resulting combination of the struc-tural components with the protective functions provides a simple and robust design. Special care in the pole frame design assures protection from unintended access to moving parts between the operating mechanism and the switching com-ponents, and thus provides the highest levels of safety for operation and maintenance engineers.
Digital monitoring via GMS600The HEC 10 is fully integrated with the ABB GCB digital monitoring system, GMS600 →5. The GMS600 can perform many functions – for example, data logging, disturbance recording, drive supervision, and temperature and SF6 density monitoring. The long-term operation of the hybrid cooling system is also monitored by constantly comparing the fans’ speeds against expected values.
Key cooling system data is logged by the GMS600 and thereby made available for regular analysis in order to give the customer additional information on the safe operation of the GCB. Customers who opt for remote monitoring support from ABB will regularly receive reports about the status of their equipment. Data logged through the GMS600 can be connected via the cloud to appropriate ABB AbilityTM tools. ABB Ability is a unified, cross- industry digital capability - extending from device to edge to cloud - with devices, systems, solutions, services and a platform that enables more knowledge of the system, more capabilities and improved performance delivered by the connectivity of ABB Ability enabled equipment, including GCBs. l
—An efficient cooling scheme guarantees the safe and reliable operation of the GCB.
—05 The ABB GCB digital monitoring system, GMS600.
— References[1] M. Palazzo and M. Delfanti, “New Requirements for the application of generator circuit breakers,” IPST Vancouver, Canada, July 18-20, 2013.
[2] M. Palazzo, et al., “Revision of TRV requirements for the application of generator circuit breakers,” Electric Power Systems Research, volume 138, pages 66–71, September 2016.
—Customers who opt for remote monitoring support from ABB will regularly receive reports about the state of their equipment.
IMPROVED GENER ATOR CIRCUIT BREAKER
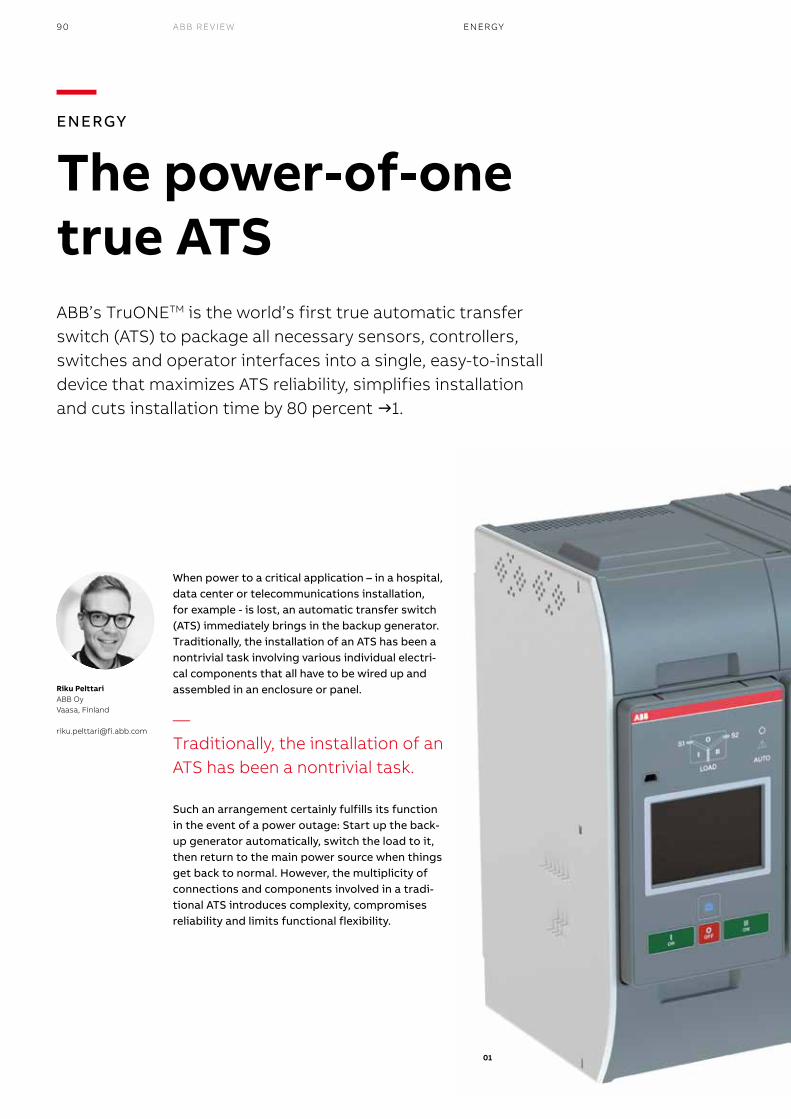
90 ABB REVIEW
— ENERGY
The power-of-one true ATSABB’s TruONETM is the world’s first true automatic transfer switch (ATS) to package all necessary sensors, controllers, switches and operator interfaces into a single, easy-to-install device that maximizes ATS reliability, simplifies installation andcutsinstallationtimeby80percent →1.
Riku PelttariABB OyVaasa, Finland
When power to a critical application – in a hospital, data center or telecommunications installation, for example - is lost, an automatic transfer switch (ATS) immediately brings in the backup generator. Traditionally, the installation of an ATS has been a nontrivial task involving various individual electri-cal components that all have to be wired up and assembled in an enclosure or panel.
Such an arrangement certainly fulfills its function in the event of a power outage: Start up the back-up generator automatically, switch the load to it, then return to the main power source when things get back to normal. However, the multiplicity of connections and components involved in a tradi-tional ATS introduces complexity, compromises reliability and limits functional flexibility.
01
—Traditionally, the installation of an ATS has been a nontrivial task.
ENERGY
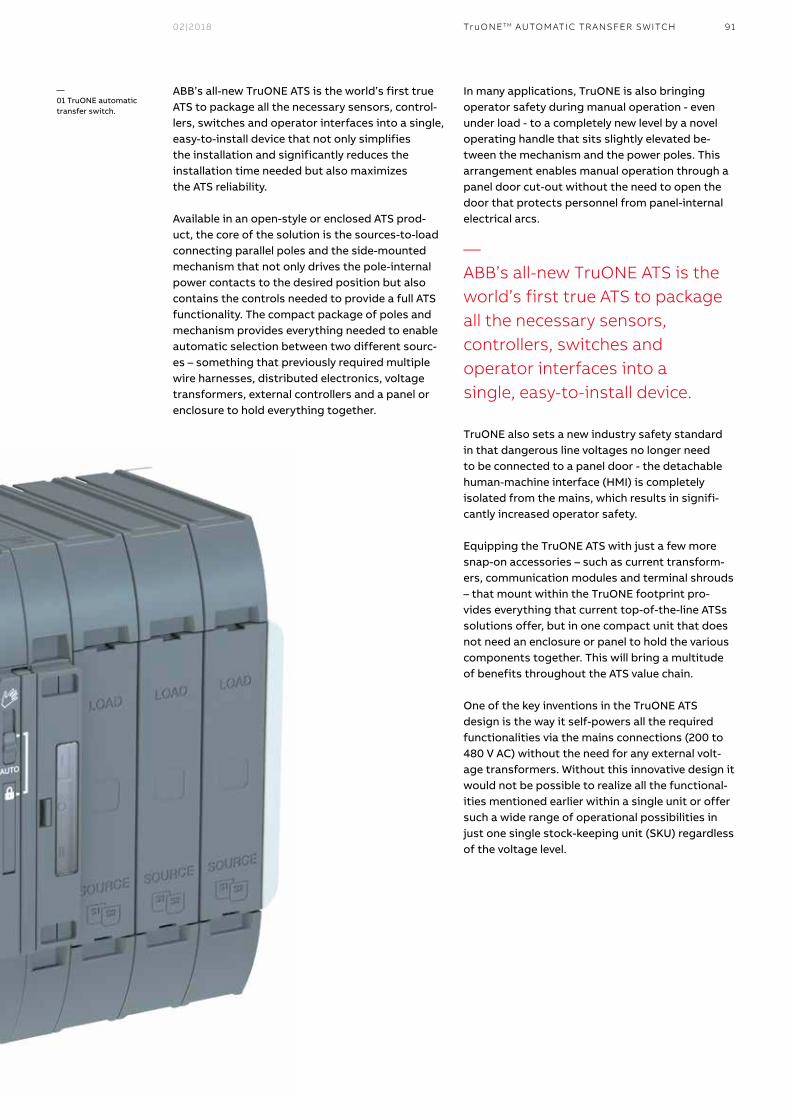
02|2018 91
ABB’s all-new TruONE ATS is the world’s first true ATS to package all the necessary sensors, control-lers, switches and operator interfaces into a single, easy-to-install device that not only simplifies the installation and significantly reduces the installation time needed but also maximizes the ATS reliability.
Available in an open-style or enclosed ATS prod-uct, the core of the solution is the sources-to-load connecting parallel poles and the side-mounted mechanism that not only drives the pole-internal power contacts to the desired position but also contains the controls needed to provide a full ATS functionality. The compact package of poles and mechanism provides everything needed to enable automatic selection between two different sourc-es – something that previously required multiple wire harnesses, distributed electronics, voltage transformers, external controllers and a panel or enclosure to hold everything together.
In many applications, TruONE is also bringing operator safety during manual operation - even under load - to a completely new level by a novel operating handle that sits slightly elevated be-tween the mechanism and the power poles. This arrangement enables manual operation through a panel door cut-out without the need to open the door that protects personnel from panel-internal electrical arcs.
TruONE also sets a new industry safety standard in that dangerous line voltages no longer need to be connected to a panel door - the detachable human-machine interface (HMI) is completely isolated from the mains, which results in signifi-cantly increased operator safety.
Equipping the TruONE ATS with just a few more snap-on accessories – such as current transform-ers, communication modules and terminal shrouds – that mount within the TruONE footprint pro-vides everything that current top-of-the-line ATSs solutions offer, but in one compact unit that does not need an enclosure or panel to hold the various components together. This will bring a multitude of benefits throughout the ATS value chain.
One of the key inventions in the TruONE ATS design is the way it self-powers all the required functionalities via the mains connections (200 to 480 V AC) without the need for any external volt-age transformers. Without this innovative design it would not be possible to realize all the functional-ities mentioned earlier within a single unit or offer such a wide range of operational possibilities in just one single stock-keeping unit (SKU) regardless of the voltage level.
—01 TruONE automatic transfer switch.
—ABB’s all-new TruONE ATS is the world’s first true ATS to package all the necessary sensors, controllers, switches and operator interfaces into a single, easy-to-install device.
TruONE TM AUTOMATIC TRANSFER SWITCH
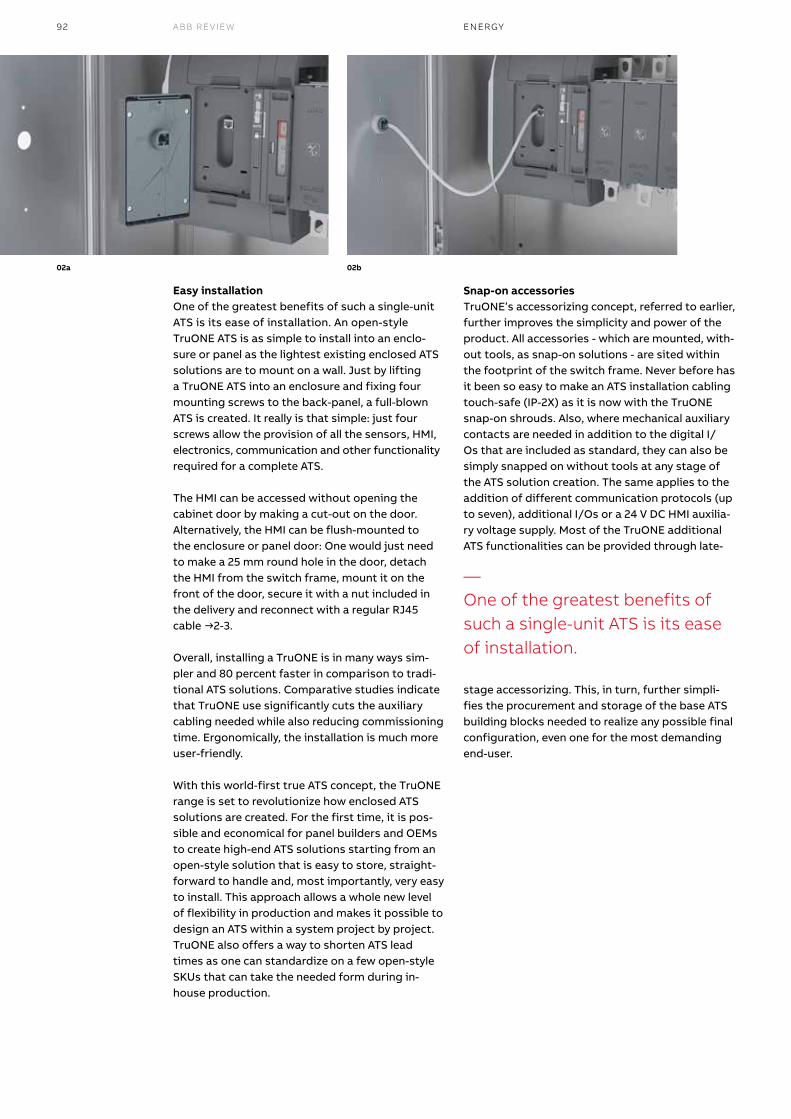
92 ABB REVIEW
Easy installationOne of the greatest benefits of such a single-unit ATS is its ease of installation. An open-style TruONE ATS is as simple to install into an enclo-sure or panel as the lightest existing enclosed ATS solutions are to mount on a wall. Just by lifting a TruONE ATS into an enclosure and fixing four mounting screws to the back-panel, a full-blown ATS is created. It really is that simple: just four screws allow the provision of all the sensors, HMI, electronics, communication and other functionality required for a complete ATS. The HMI can be accessed without opening the cabinet door by making a cut-out on the door. Alternatively, the HMI can be flush-mounted to the enclosure or panel door: One would just need to make a 25 mm round hole in the door, detach the HMI from the switch frame, mount it on the front of the door, secure it with a nut included in the delivery and reconnect with a regular RJ45 cable →2-3.
Overall, installing a TruONE is in many ways sim-pler and 80 percent faster in comparison to tradi-tional ATS solutions. Comparative studies indicate that TruONE use significantly cuts the auxiliary cabling needed while also reducing commissioning time. Ergonomically, the installation is much more user-friendly.
With this world-first true ATS concept, the TruONE range is set to revolutionize how enclosed ATS solutions are created. For the first time, it is pos-sible and economical for panel builders and OEMs to create high-end ATS solutions starting from an open-style solution that is easy to store, straight-forward to handle and, most importantly, very easy to install. This approach allows a whole new level of flexibility in production and makes it possible to design an ATS within a system project by project. TruONE also offers a way to shorten ATS lead times as one can standardize on a few open-style SKUs that can take the needed form during in-house production.
Snap-on accessoriesTruONE’s accessorizing concept, referred to earlier, further improves the simplicity and power of the product. All accessories - which are mounted, with-out tools, as snap-on solutions - are sited within the footprint of the switch frame. Never before has it been so easy to make an ATS installation cabling touch-safe (IP-2X) as it is now with the TruONE snap-on shrouds. Also, where mechanical auxiliary contacts are needed in addition to the digital I/Os that are included as standard, they can also be simply snapped on without tools at any stage of the ATS solution creation. The same applies to the addition of different communication protocols (up to seven), additional I/Os or a 24 V DC HMI auxilia-ry voltage supply. Most of the TruONE additional ATS functionalities can be provided through late-
stage accessorizing. This, in turn, further simpli-fies the procurement and storage of the base ATS building blocks needed to realize any possible final configuration, even one for the most demanding end-user.
—One of the greatest benefits of such a single-unit ATS is its ease of installation.
02a 02b
ENERGY
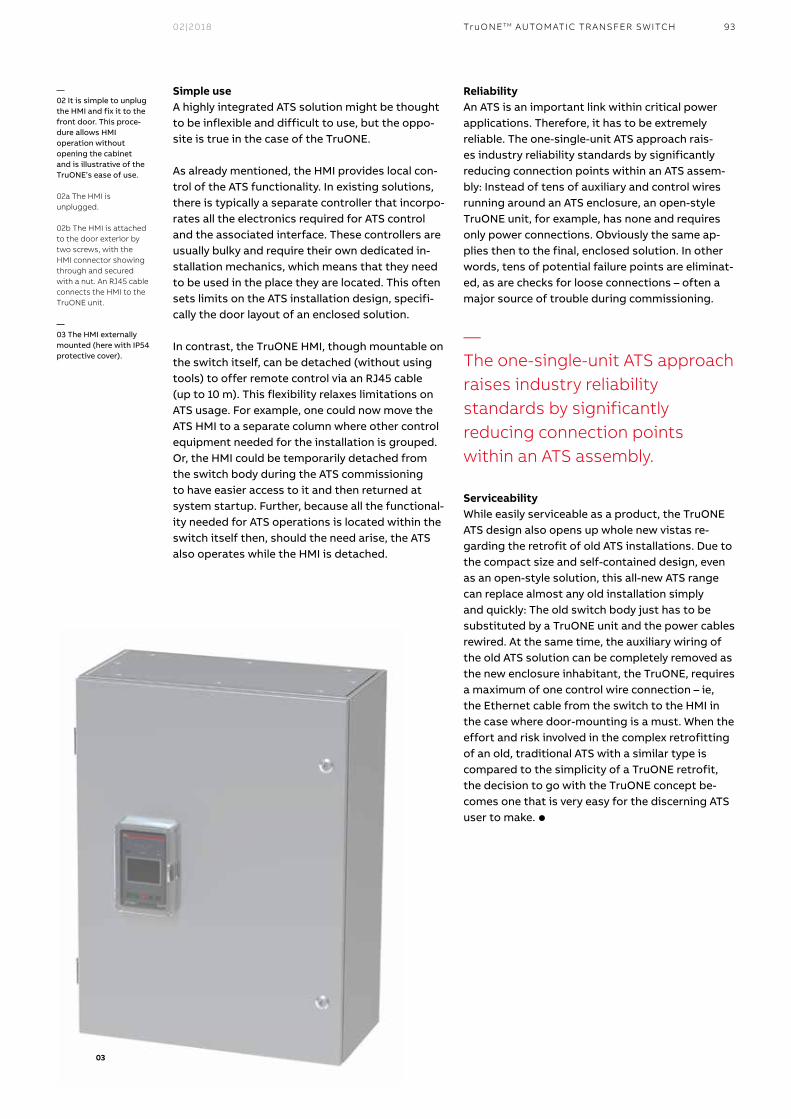
02|2018 93
Simple useA highly integrated ATS solution might be thought to be inflexible and difficult to use, but the oppo-site is true in the case of the TruONE.
As already mentioned, the HMI provides local con-trol of the ATS functionality. In existing solutions, there is typically a separate controller that incorpo-rates all the electronics required for ATS control and the associated interface. These controllers are usually bulky and require their own dedicated in-stallation mechanics, which means that they need to be used in the place they are located. This often sets limits on the ATS installation design, specifi-cally the door layout of an enclosed solution.
In contrast, the TruONE HMI, though mountable on the switch itself, can be detached (without using tools) to offer remote control via an RJ45 cable (up to 10 m). This flexibility relaxes limitations on ATS usage. For example, one could now move the ATS HMI to a separate column where other control equipment needed for the installation is grouped. Or, the HMI could be temporarily detached from the switch body during the ATS commissioning to have easier access to it and then returned at system startup. Further, because all the functional-ity needed for ATS operations is located within the switch itself then, should the need arise, the ATS also operates while the HMI is detached.
ReliabilityAn ATS is an important link within critical power applications. Therefore, it has to be extremely reliable. The one-single-unit ATS approach rais-es industry reliability standards by significantly reducing connection points within an ATS assem-bly: Instead of tens of auxiliary and control wires running around an ATS enclosure, an open-style TruONE unit, for example, has none and requires only power connections. Obviously the same ap-plies then to the final, enclosed solution. In other words, tens of potential failure points are eliminat-ed, as are checks for loose connections – often a major source of trouble during commissioning.
ServiceabilityWhile easily serviceable as a product, the TruONE ATS design also opens up whole new vistas re-garding the retrofit of old ATS installations. Due to the compact size and self-contained design, even as an open-style solution, this all-new ATS range can replace almost any old installation simply and quickly: The old switch body just has to be substituted by a TruONE unit and the power cables rewired. At the same time, the auxiliary wiring of the old ATS solution can be completely removed as the new enclosure inhabitant, the TruONE, requires a maximum of one control wire connection – ie, the Ethernet cable from the switch to the HMI in the case where door-mounting is a must. When the effort and risk involved in the complex retrofitting of an old, traditional ATS with a similar type is compared to the simplicity of a TruONE retrofit, the decision to go with the TruONE concept be-comes one that is very easy for the discerning ATS user to make. l
—02 It is simple to unplug the HMI and fix it to the front door. This proce-dure allows HMI operation without opening the cabinet and is illustrative of the TruONE’s ease of use.
02a The HMI is unplugged.
02b The HMI is attached to the door exterior by two screws, with the HMI connector showing through and secured with a nut. An RJ45 cable connects the HMI to the TruONE unit.
—03 The HMI externally mounted (here with IP54 protective cover).
—The one-single-unit ATS approach raises industry reliability standards by significantly reducing connection points within an ATS assembly.
03
TruONE TM AUTOMATIC TRANSFER SWITCH
94 CHAPTER 01ABB REVIEW 94 ABB REVIEW BUZZWORD DEMYSTIFIER
— BUZZWORD DEMYSTIFIER
Digital twin – virtually identical?The fourth installment of ABB Review’s Buzzword Demystifier explores the meaning of the term, term, “digital twin.”
Christopher GanzGroup Service R&D ManagerZurich, Switzerland
christopher.ganz@ ch.abb.com
Diagnostics: Observation of the digital twin, for example in a 3-D visualization, can support trouble-shooting. Virtual-reality glasses can provide field technicians with an overlay over the real equip-ment to visualize parameters. Simulations can add non-observable data, such as temperatures of non-accessible parts or material stress.
Prediction: Past and present operational and sensor data in combination with predictive algorithms provide insights into the condition of equipment and the likelihood of different failure modes. This helps plan rational maintenance and reduce unplanned downtime.
Advanced services: If all the advanced service parameters (IoT connectivity, analytics algorithms, etc) are preconfigured in the digital twin, they can be enabled when the equipment is installed and the customer subscribes to these services. In the optimal case, no further engineering is required.
A typical modern industrial device already creates a formidable digital data-trail. This includes CAD drawings and simulations during the design phase, information on location, connected equipment and configuration from the integration phase, as well as subsequently collected utilization, diagnostic and maintenance data. In addition to such defin-able, measurable or observable data, algorithms can calculate or simulate non-observable parame-ters, both actual and predicted.
These data and algorithms typically already exist in various locations or formats. If they could be accessed from one virtual directory – the digital twin – this would provide a comprehensive digital image of the physical equipment. More than being just a static description, this information can be used to simulate the behavior of the physical object. 3-D visualization tools also allow virtual inspection and observation of the equipment and enhance understanding and insight.
Applications of a digital twin include:
Design: Simulation and visualization during the design phase can be used to verify and inspect the overall 3-D design and make sure all parts fit together. Simulations include mechanical, thermal and electrical as well as interrelationships between these aspects.
System integration: 3-D visualizations on a system level can verify constraints such as spatial foot-print and physical connections. By connecting to the digital twins of other components, interac-tions can be simulated, including data transfer and control functionality as well as mechanical and electrical behavior and what-if scenarios. Integra-tion effort on site and the associated downtime for the customer is reduced.

ARTICLE TITLE02|2018 9502|2018 ARTICLE TITLE 95
The key to these diverse aspects of a digital twin is the capability to refer to data stored in different places from one common digital twin directory. The digital twin is capable of providing the data required for the different use cases by accessing data from elsewhere in the product lifecycle.
In summary, a digital twin is a complete and oper-ational virtual representation of an asset, subsys-tem or system, combining digital aspects of how
the equipment is built (PLM data, design models, manufacturing data) with real-time aspects of how it is operated and maintained.
The digital twin allows the consistent collection and distribution of information across the physical asset’s complete lifecycle to maximize business outcomes, optimize operations and investment (for both customer and ABB) through data pro-cessing (eg, simulation, advanced analytics).
— Editorial Board
Bazmi HusainChief Technology OfficerGroup R&D and Technology
Adrienne WilliamsSenior Sustainability Advisor
Christoph SiederHead of Corporate Communications
Reiner SchoenrockTechnology and Innovation Communications
Roland WeissR&D Strategy ManagerGroup R&D and Technology
Andreas MoglestueChief Editor, ABB [email protected]
—PublisherABB Review is published by ABB Group R&D and Technology.
ABB Switzerland Ltd.ABB ReviewSegelhofstrasse 1K CH-5405 [email protected]
ABB Review is published four times a year in English, French, German and Spanish. ABB Review is free of charge to those with an interest in ABB’s tech nology and objectives.
For a sub scription, please contact your nearest ABB representative or subscribe online at www.abb.com/abbreview
Partial reprints or reproductions are per mitted subject to full acknowledgement. Complete reprints require the publisher’s written consent.
Publisher and copyright ©2018ABB Switzerland Ltd.Baden/Switzerland
— PrinterVorarlberger Verlagsanstalt GmbH6850 Dornbirn/Austria
— LayoutDAVILLA AGZurich/Switzerland
— ArtworkKonica Minolta Marketing ServicesWC1V 7PB London,United Kingdom
— DisclaimerThe information contained herein reflects the views of the authors and is for informational purposes only. Readers should not act upon the information contained herein without seeking professional advice. We make publications available with the understanding that the authors are not rendering technical or other professional advice or opinions on specific facts or matters and assume no liability whatsoever in connection with their use.
The companies of the ABB Group do not make any warranty or guarantee, or promise, expressed or implied, concerning the content or accuracy of the views expressed herein.
ISSN: 1013-3119
http://www.abb.com/abbreview
— Imprint
Tablet edition ABB Review is also available for your tablet.
Please visit abb.com/abbreview
Stay informed . . .Have you ever missed a copy of ABB Review? Sign up for the email alert at abb.com/abbreview and never miss another edition.
Please note that when you register for this alert, you will receive an email with a confirmation link. Please ensure that you have confirmed your registration.

Affix address label here
— Next 03/2018 Material matters Materials are undergoing a revolution, both in the ways traditional materials can be used, and in new materials that redefine those traditions. These changes are driven by smarter methods and algorithms, making knowledge a structural building block. The next issue of ABB Review will explore the far-ranging applications and implications for this evolving area via examples from ABB’s products, and those developed in partnership with its customers.