Embed Size (px)
Citation preview

Direct and Indirect Cost-and-Benefit Assessment ofClimate Adaptation Strategies for Housing for
Extreme Wind Events in QueenslandMark G. Stewart1; Xiaoming Wang2; and Garry R. Willgoose3
Abstract: The intensity of tropical cyclones and severe storms is likely to increase due to climate change. Brisbane and the northeast coast ofQueensland are regions where design wind specifications may be inadequate under either current or likely future climate conditions. Anappropriate adaptation strategy may be one that increases wind classifications for new houses, which leads to a reduced vulnerability of newconstruction. The present paper will assess the damage risks, adaptation costs, and cost-effectiveness of these adaptation measures for res-idential construction in Cairns, Townsville, Rockhampton, and South East Queensland, assuming time-dependent changes in the frequencyand intensity of cyclonic and noncyclonic winds to 2100. Loss functions are also developed for direct and indirect losses. It was found thatincreasing design wind loads for new houses in Brisbane and South East Queensland will lead to a net benefit [net present value (NPV)] of upto $10.5 billion by 2100, assuming a discount rate of 4%, which includes approximately 95% of a direct benefit and 5% of an indirect benefit.The benefits are highest for Brisbane due to its large population and the high vulnerability of existing residential construction, and have a90–100% likelihood of achieving a net benefit by 2100. DOI: 10.1061/(ASCE)NH.1527-6996.0000136. © 2014 American Society of CivilEngineers.
Author keywords: Risk; Climate change; Climate adaptation; Housing; Cyclones; Wind; Decision making; Cost-benefit analysis.
Introduction
Losses from tropical cyclones and thunderstorms in Australia aresignificantly higher than from other natural hazards [Bureau ofTransport Economics (BTE) 2001], and most damage caused byrecent cyclones arose from damage to houses built before enhancedbuilding standards were implemented in North Queensland fromthe early to mid-1980s (Ginger et al. 2007). Climate change re-searchers suggest that significant alteration in severe wind intensityand frequency is possible within the lifetime of existing buildingsand infrastructure [e.g., Commonwealth Scientific and IndustrialResearch Organisation (CSIRO) 2007; Abbs 2010]. More extremewind events will result in more severe damage to infrastructure,particularly housing, considering that current design practice as-sumes a stationary climate. This is an international trend becauseclimate change is predicted to increase wind-related losses fromhurricanes in the United States and Europe by up to 75% by2080 and 38% by 2100, respectively [Association of BritishInsurers (ABI) 2005; Donat et al. 2011].
Relatively little attention has been paid to quantifying thecosts and benefits of climate adaptation strategies (retrofitting,
strengthening, and enhanced designs to reduce vulnerability of newand existing infrastructure), and assessing at what point in timeclimate adaptation becomes economically viable. Importantly,there has also been significantly more emphasis on impact (lossand consequence) modeling than climate adaptation engineeringmodeling. This has led the Australian Academy of TechnologicalSciences and Engineering (ATSE) to conclude that there “is aneed to assess the impact of climate change on Australia’s physicalinfrastructure on a regional basis by using risk assessment methodsto provide overviews of the likelihood, consequence, risk andadaptation capacity of Australia’s physical infrastructure” and that“information in the form of probability distributions is requiredfor the capacity of infrastructure components after adaptation”(ATSE 2008). For this reason, there is a need for system andprobabilistic modeling that integrates the engineering performanceof infrastructure with stochastic modeling, structural reliability,and decision theory.
A large body of research has focused on predicting the impact(damage risks) of cyclones assuming a stationary climate(e.g., Harper 1999; Huang et al. 2001; Jain and Davidson 2007;Cechet et al. 2010; Waters et al. 2010). Stewart et al. (2003)and Stewart (2003) developed a cost-benefit analysis decision-making framework to assess the economic viability of strengthenedconstruction and other damage mitigation strategies for U.S. andAustralian wind hazards. Recent work has looked at climate change(e.g., Nishijima et al. 2012), and Stewart and Li (2010), Li andStewart (2011), and Bjarnadottir et al. (2011a, b) have assessedthe cost-effectiveness of retrofitting old construction for housesin North Queensland and Florida, subject to tropical cyclones orhurricanes for climate scenarios to 2050.
The Australian standard AS 4055-2006, “Wind Loads forHouses,” (Standards Australia 2006) is based on the Australianstandards for wind loads AS 1170.2 (Standards Australia 2002)and AS/NZS 1170.2:2011 (Standards Australia 2011) and is usedto determine the appropriate wind classification for the design of
1Australian Professorial Fellow, Professor and Director, Centre forInfrastructure Performance and Reliability, Univ. of Newcastle, New SouthWales, Callaghan 2308, Australia (corresponding author). E-mail: [email protected]
2Principal Scientist and Theme Leader, Sustainable Cities and Coasts,Commonwealth Scientific and Industrial Research Organisation ClimateAdaptation Flagship, Highett 3190, Australia.
3Professor and Director, Centre for Climate Impact Management(C2IM), Univ. of Newcastle, New South Wales, Callaghan 2308, Australia.
Note. This manuscript was submitted on August 27, 2012; approved onJune 4, 2013; published online on December 18, 2013. Discussion periodopen until November 18, 2014; separate discussions must be submitted forindividual papers. This paper is part of the Natural Hazards Review,© ASCE, ISSN 1527-6988/04014008(12)/$25.00.
© ASCE 04014008-1 Nat. Hazards Rev.
Nat. Hazards Rev. 2014.15.
Dow
nloa
ded
from
asc
elib
rary
.org
by
Cal
ifor
nia
Stat
e U
nive
rsity
- L
ong
Bea
ch o
n 04
/16/
15. C
opyr
ight
ASC
E. F
or p
erso
nal u
se o
nly;
all
righ
ts r
eser
ved.

residential (domestic) housing. An appropriate adaptation strategymay be one that increases wind classifications for new houses, lead-ing to reduced vulnerability of new construction. Stewart and Wang(2011a, b) have assessed the damage risks, adaptation costs, andcost-effectiveness of this adaptation strategy for residential con-struction in the North Queensland cities of Cairns, Townsville,and Rockhampton and Brisbane in South East Queensland, assum-ing time-dependent changes in the frequency and intensity ofcyclonic and noncyclonic winds to 2100. Advanced spatial andtemporal stochastic simulation methods were used to include theuncertainty and variability of climate and building vulnerabilityon damage risks. Costs of adaptation, timing of adaptation, dis-count rates, future growth in new housing, and the time-dependentincrease in wind speeds were also included in the analysis. Thecriteria for cost-effectiveness were (1) net present value (NPV)or net benefit equal to benefits minus cost; (2) probability thatNPV > 0; and (3) benefit-to-cost ratio (BCR). The analysis onlyconsidered direct damage to housing, i.e., structural damage andcontent losses. A key innovation is the use of stochastic methodsto derive the 10th and 90th percentiles of NPV and the probabilitythat NPV > 0.
Most existing studies consider direct losses related to structuraldamage and content losses. Although these direct costs can besubstantial, indirect losses caused by business interruption, cleanup, loss during reconstruction, extra demands on social services,changes to the demand and supply of intermediate consumptiongoods, and postdisaster inflation can also be significant, particu-larly for major natural disasters [e.g., National Academy of Scien-ces (NAS) 1999; Lindell and Prater 2003; Hallegatte 2008]. Thepresent paper will assess how the consideration of these indirectcosts into the risk assessment developed by Stewart and Wang(2011a, b) will influence the cost-effectiveness of climate adapta-tion measures. A review of the literature is used to propose an indi-rect cost ratio (ICR), defined as the ratio of indirect-to-direct costs,and then a loss function that combines direct and indirect losses,which in turn is a function of wind vulnerability. Stewart and Wang(2011a, b) assumed adaptation costs for houses with timber floors,whereas adaptation costs will be less for concrete floors, which arethe dominant construction type in Australia. These new inclusionswill improve the net benefit. Considering the uncertainties in de-fining the trend of changes in tropical cyclones and current bestknowledge about the trend, four wind scenarios are considered,ranging from no change to poleward shift in cyclones to South EastQueensland. This will help provide practical advice to policy mak-ers to help future proof built infrastructure for a changing climate.
Climate Change Projections of Wind Speeds
A generalized Pareto distribution is used to model the annual prob-ability of exceedance of cyclonic winds, i.e., winds associated withtropical cyclones, and a shifted exponential distribution is usedto model noncyclonic, i.e., winds not associated with tropicalcyclones, gust speed (Wang and Wang 2009). The cumulativedistribution function for the annual maximum gust speed is thus(Stewart and Wang 2011a)
FvðV; tÞ ¼�1−λ½1þ γFðtÞ�
�1− kp
�v=½1þ γcycðtÞ�−up
σp
��1=kp
�
×
�1− exp
�ve− v=½1þ γmeanðtÞ�
σe
��ð1Þ
where v = peak gust wind speed at a 10-m height; λ = annual fre-quency of cyclonic winds; γFðtÞ = time-dependent percentage
change to frequency λ; γcycðtÞ = percentage increase in meancyclonic wind speed; σp and kp = scale and shape parameters forcyclonic winds; up = threshold value; γmeanðtÞ = time-dependentpercentage increase in noncyclonic gust wind speed; and ve andσe = location and scale parameters for noncyclonic winds. Climatechange projections will influence γFðtÞ, γcycðtÞ, and γmeanðtÞ(Stewart et al. 2012). It is recognized that the uncertainty of thewind field was not considered in the paper, and projections are sen-sitive to probabilistic model selection (Wang et al. 2013).
In Australia, there is a strong tendency for a decrease in cyclonefrequency, and it is also expected that there is an increasing like-lihood for extreme wind speed from tropical cyclones (Abbs 2010).However, there is also low confidence in the projection of the spe-cific change in intensity of tropical cyclones in Australia (Knutson2011). Wind climate projections suggest that it is likely that theglobal mean intensity of cyclones may increase by 2–11%, butthe globally averaged frequency will decrease by 6–34% by2100 (Knutson et al. 2010). Meanwhile, CSIRO (2007) suggestedthat the annual mean wind speed is projected to increase up to 6%in Brisbane by 2070, with 10th and 90th percentiles to be −2 and19%, respectively, for the high A1FI emission scenario [Intergov-ernmental Panel on Climate Change (IPCC) 2000]. Another pos-sible consequence of enhanced greenhouse conditions is a 2–5°poleward shift of tropical cyclones (CSIRO 2007), so regions his-torically less subject to cyclones, e.g., Brisbane and other areas inSouth East Queensland, may be more vulnerable to more damagingwind speeds in the future. A poleward shift of cyclones will havea negligible effect on the wind field characteristics for Cairns,Townsville, and Rockhampton (Wang et al. 2013). Because thereare still many uncertainties to properly define the future trend ofextreme winds in Australia, four wind scenarios are considered1. No change: no change in climate.2. Moderate change: a 25% reduction in cyclone frequency;
10% increase in cyclonic and noncyclonic wind speeds byt ¼ 2100; γFðtÞ ¼ –25%; γcycðtÞ ¼ 10%; and γmeanðtÞ ¼ 10%.
3. Significant change: no change in cyclone frequency; 20% in-crease in cyclonic and noncyclonic wind speeds by t ¼ 2100;γFðtÞ ¼ 0%; γcycðtÞ ¼ 20%; and γmeanðtÞ ¼ 20%.
4. Poleward shift: a 4° poleward shift in cyclones to South EastQueensland by t ¼ 2100.
Information is scarce on time-dependent changes in wind speed.A time-dependent linear increase of wind speed and cyclone fre-quency seems appropriate while recognizing that there can be con-siderable interdecadal and intradecadal variabilities in this trend.The effect of a nonlinear time-dependent increase in wind speedon the results will be assessed as part of the sensitivity analysis.Fig. 1 shows the peak gust wind speed at a 10-m height at2100 as a function of the return period. Moderate and significantchange scenarios increase the 95th percentile noncyclonic windspeed for Brisbane by 6.0 and 13.3%, respectively. The variabilityof peak wind speeds is significant, with a coefficient of variation(COV) of up to 50%.
Exposure to Wind Hazards
The Australian standard for wind loads, AS 1170.2 (StandardsAustralia 2002), is the reference standard for the design of all struc-tures, including housing. In this case, residential housing isdesigned to resist ultimate limit state wind speeds, with an annualprobability of exceedance of 1 in 500. The standard AS 4055-2006classifies design loads on houses into Categories N1–N6 andC1–C4 for noncyclonic and cyclonic regions, respectively(Table 1). Each increase in wind classification, C1–C2, raises
© ASCE 04014008-2 Nat. Hazards Rev.
Nat. Hazards Rev. 2014.15.
Dow
nloa
ded
from
asc
elib
rary
.org
by
Cal
ifor
nia
Stat
e U
nive
rsity
- L
ong
Bea
ch o
n 04
/16/
15. C
opyr
ight
ASC
E. F
or p
erso
nal u
se o
nly;
all
righ
ts r
eser
ved.

the design wind speed, which is equivalent to at least a 50% in-crease in design wind pressure, and internal pressure coefficientswill increase for cyclonic regions. These wind classifications arethen called up by the Building Code of Australia to determineappropriate deemed-to-comply sizing and detailing requirementsfor residential construction. Houses built in North Queensland after1980 have been built to this enhanced wind-resistant standard(Walker 1980). The standard AS 4055-2006 is used herein todetermine terrain and shielding effects for houses in an urban envi-ronment for foreshore (500 m from the coast) and nonforeshore(more than 500 m from the coast) exposure categories (Table 1).The risk assessment is conducted on a regional scale so local topo-graphic features are not considered.
The number of houses in each region is estimated on the basis ofhousing information at statistical local areas (SLAs) from the na-tional exposure information system (NEXIS), which was developedby Geoscience Australia. The number of existing houses in Cairns,Townsville, Rockhampton, and South East Queensland are 48,000,56,000, 27,000, and 966,000, respectively. The Australian Bureauof Statistics shows that the proportional increase in population issimilar for Brisbane and the rest of Queensland. The AustralianBureau of Statistics also reports that the number of residentialbuildings undertaking alterations and additions, which may resultin the creation of new dwelling units, is approximately 15% of newhousing numbers. All alterations will be assumed on those ofolder pre-1980 construction. The building stock increases linearlywith time, based on medium growth population projections, withthe total number of alterations and new houses increasing to92,000, 107,000, 52,000, and 2,025,000 for Cairns, Townsville,Rockhampton, and South East Queensland, respectively, by2100. Approximately 5% of the houses were located in foreshore
locations in 2010, and this proportion is constant for 2100.Although 50% of houses were of pre-1980 construction in2010, this proportion will reduce to less than 5% of total housingstock by 2100. The Australian Bureau of Statistics reports thatthe average cost per new house, including contents, in Queenslandwas CI ¼ $320,000 in 2010–2011. Stewart et al. (2012) providesmore details.
Wind Vulnerability
A wind vulnerability function expresses building damage or lossas a function of wind speed. Several vulnerability models for windhazard have been developed (G. R. Walker, personal communica-tion, 1994; Unanwa et al. 2000; Khanduri and Morrow 2003;Pinelli et al. 2004; Jain et al. 2005; Henderson and Ginger2007). More recently, a suite of vulnerability curves are beingdeveloped by Geoscience Australia and James Cook University(Wehner et al. 2010). A suite of six vulnerability curvesrepresentative of typical Australian building types were developedfrom a workshop attended by members of the Australian windengineering community. Other experts were then asked to refinethese curves for 203 housing types, considering a wide varietyof housing types, construction, and age. Many of these curvesare proprietary, however, Wehner et al. (2010) and Ginger et al.(2010) describe some details. Because there is uncertainty of windvulnerability, it is assumed that (1) there is full confidence about thewind speed to cause negligible and maximum damage, and (2) thevariability increases linearly with wind speed and reaches a maxi-mum when vulnerability is 50%. Wind vulnerability expressed as apercentage of expected damage (insured value) is
Fig. 1. Wind gust at 2100 for considered wind scenarios for (a) Cairns; (b) South East Queensland; wind field characteristics for Rockhampton andTownsville are very similar to those of Cairns
Table 1. Terrain Category, Terrain Multiplier, and Current and Proposed Wind Classification (Standards Australia 2006)
LocationTerrain
multiplier Kt
Proposed increasein wind classification
Existing designgust wind speed (m=s)
Proposed designgust wind speed (m=s)
Adaptationcost Cadapt (dollars)
Cairns, Townsville, and RockhamptonForeshore 0.97 C2–C3 61 74 4,530Nonforeshore 0.90 C1–C2 50 61 3,610
South East Queensland (Brisbane, Sunshine, and Gold Coasts)Foreshore 0.94 N2–C1 40 50 2,680Nonforeshore 0.83 N2–C1 40 50 2,680
© ASCE 04014008-3 Nat. Hazards Rev.
Nat. Hazards Rev. 2014.15.
Dow
nloa
ded
from
asc
elib
rary
.org
by
Cal
ifor
nia
Stat
e U
nive
rsity
- L
ong
Bea
ch o
n 04
/16/
15. C
opyr
ight
ASC
E. F
or p
erso
nal u
se o
nly;
all
righ
ts r
eser
ved.
VulðvÞ ¼ 100
�1 − exp
�−�KtKsv
eβ
�ð1=αÞ��
þ CI VulðvÞ ≤ 100% ð2Þ
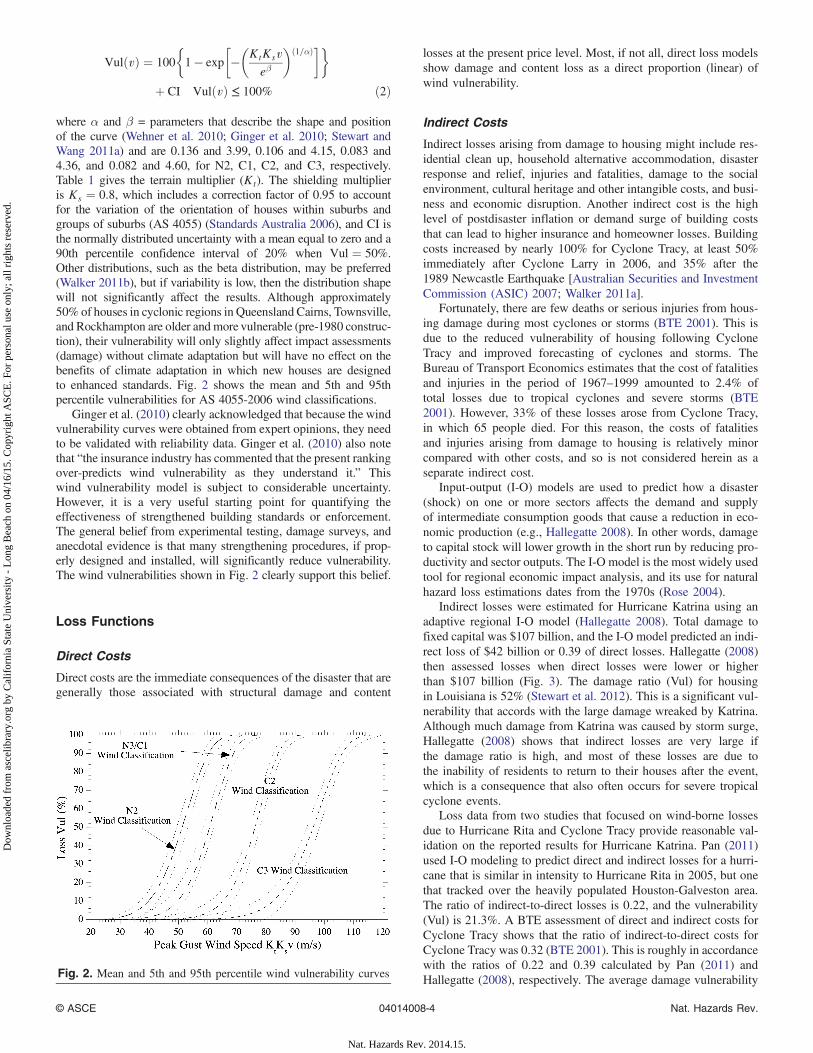
where α and β = parameters that describe the shape and positionof the curve (Wehner et al. 2010; Ginger et al. 2010; Stewart andWang 2011a) and are 0.136 and 3.99, 0.106 and 4.15, 0.083 and4.36, and 0.082 and 4.60, for N2, C1, C2, and C3, respectively.Table 1 gives the terrain multiplier (Kt). The shielding multiplieris Ks ¼ 0.8, which includes a correction factor of 0.95 to accountfor the variation of the orientation of houses within suburbs andgroups of suburbs (AS 4055) (Standards Australia 2006), and CI isthe normally distributed uncertainty with a mean equal to zero and a90th percentile confidence interval of 20% when Vul ¼ 50%.Other distributions, such as the beta distribution, may be preferred(Walker 2011b), but if variability is low, then the distribution shapewill not significantly affect the results. Although approximately50% of houses in cyclonic regions in Queensland Cairns, Townsville,and Rockhampton are older andmore vulnerable (pre-1980 construc-tion), their vulnerability will only slightly affect impact assessments(damage) without climate adaptation but will have no effect on thebenefits of climate adaptation in which new houses are designedto enhanced standards. Fig. 2 shows the mean and 5th and 95thpercentile vulnerabilities for AS 4055-2006 wind classifications.
Ginger et al. (2010) clearly acknowledged that because the windvulnerability curves were obtained from expert opinions, they needto be validated with reliability data. Ginger et al. (2010) also notethat “the insurance industry has commented that the present rankingover-predicts wind vulnerability as they understand it.” Thiswind vulnerability model is subject to considerable uncertainty.However, it is a very useful starting point for quantifying theeffectiveness of strengthened building standards or enforcement.The general belief from experimental testing, damage surveys, andanecdotal evidence is that many strengthening procedures, if prop-erly designed and installed, will significantly reduce vulnerability.The wind vulnerabilities shown in Fig. 2 clearly support this belief.
Loss Functions
Direct Costs
Direct costs are the immediate consequences of the disaster that aregenerally those associated with structural damage and content
losses at the present price level. Most, if not all, direct loss modelsshow damage and content loss as a direct proportion (linear) ofwind vulnerability.
Indirect Costs
Indirect losses arising from damage to housing might include res-idential clean up, household alternative accommodation, disasterresponse and relief, injuries and fatalities, damage to the socialenvironment, cultural heritage and other intangible costs, and busi-ness and economic disruption. Another indirect cost is the highlevel of postdisaster inflation or demand surge of building coststhat can lead to higher insurance and homeowner losses. Buildingcosts increased by nearly 100% for Cyclone Tracy, at least 50%immediately after Cyclone Larry in 2006, and 35% after the1989 Newcastle Earthquake [Australian Securities and InvestmentCommission (ASIC) 2007; Walker 2011a].
Fortunately, there are few deaths or serious injuries from hous-ing damage during most cyclones or storms (BTE 2001). This isdue to the reduced vulnerability of housing following CycloneTracy and improved forecasting of cyclones and storms. TheBureau of Transport Economics estimates that the cost of fatalitiesand injuries in the period of 1967–1999 amounted to 2.4% oftotal losses due to tropical cyclones and severe storms (BTE2001). However, 33% of these losses arose from Cyclone Tracy,in which 65 people died. For this reason, the costs of fatalitiesand injuries arising from damage to housing is relatively minorcompared with other costs, and so is not considered herein as aseparate indirect cost.
Input-output (I-O) models are used to predict how a disaster(shock) on one or more sectors affects the demand and supplyof intermediate consumption goods that cause a reduction in eco-nomic production (e.g., Hallegatte 2008). In other words, damageto capital stock will lower growth in the short run by reducing pro-ductivity and sector outputs. The I-O model is the most widely usedtool for regional economic impact analysis, and its use for naturalhazard loss estimations dates from the 1970s (Rose 2004).
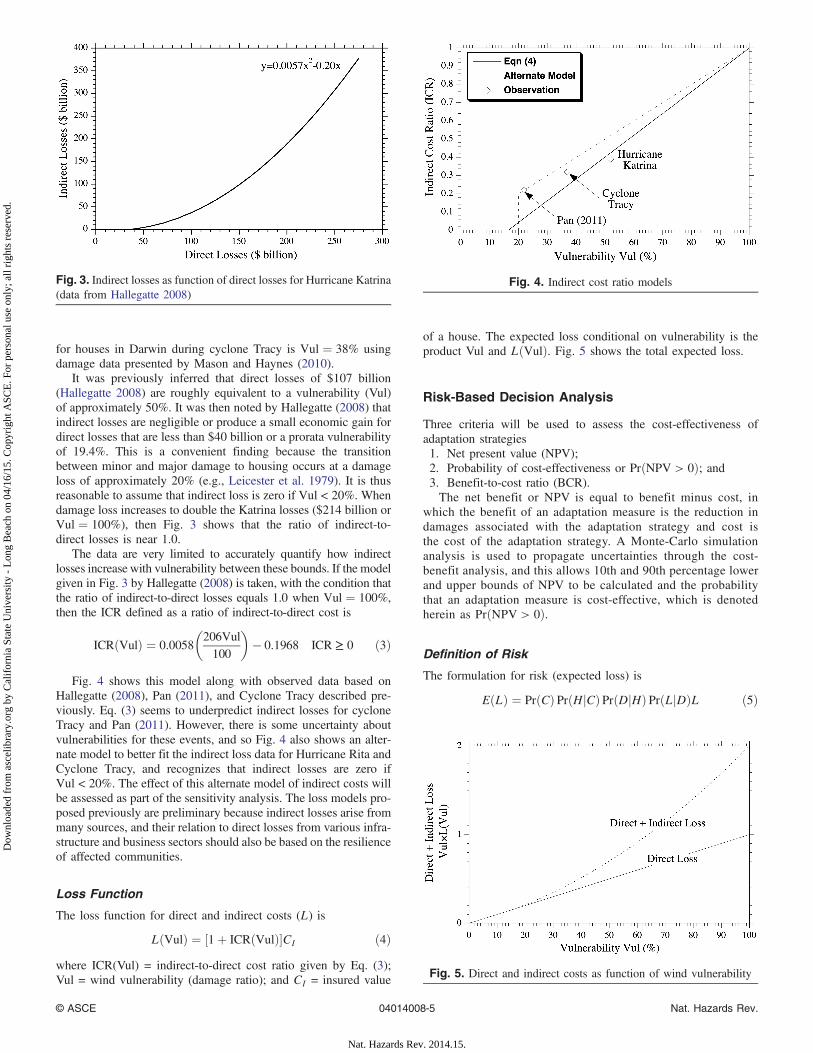
Indirect losses were estimated for Hurricane Katrina using anadaptive regional I-O model (Hallegatte 2008). Total damage tofixed capital was $107 billion, and the I-O model predicted an indi-rect loss of $42 billion or 0.39 of direct losses. Hallegatte (2008)then assessed losses when direct losses were lower or higherthan $107 billion (Fig. 3). The damage ratio (Vul) for housingin Louisiana is 52% (Stewart et al. 2012). This is a significant vul-nerability that accords with the large damage wreaked by Katrina.Although much damage from Katrina was caused by storm surge,Hallegatte (2008) shows that indirect losses are very large ifthe damage ratio is high, and most of these losses are due tothe inability of residents to return to their houses after the event,which is a consequence that also often occurs for severe tropicalcyclone events.
Loss data from two studies that focused on wind-borne lossesdue to Hurricane Rita and Cyclone Tracy provide reasonable val-idation on the reported results for Hurricane Katrina. Pan (2011)used I-O modeling to predict direct and indirect losses for a hurri-cane that is similar in intensity to Hurricane Rita in 2005, but onethat tracked over the heavily populated Houston-Galveston area.The ratio of indirect-to-direct losses is 0.22, and the vulnerability(Vul) is 21.3%. A BTE assessment of direct and indirect costs forCyclone Tracy shows that the ratio of indirect-to-direct costs forCyclone Tracy was 0.32 (BTE 2001). This is roughly in accordancewith the ratios of 0.22 and 0.39 calculated by Pan (2011) andHallegatte (2008), respectively. The average damage vulnerabilityFig. 2. Mean and 5th and 95th percentile wind vulnerability curves
© ASCE 04014008-4 Nat. Hazards Rev.
Nat. Hazards Rev. 2014.15.
Dow
nloa
ded
from
asc
elib
rary
.org
by
Cal
ifor
nia
Stat
e U
nive
rsity
- L
ong
Bea
ch o
n 04
/16/
15. C
opyr
ight
ASC
E. F
or p
erso
nal u
se o
nly;
all
righ
ts r
eser
ved.
for houses in Darwin during cyclone Tracy is Vul ¼ 38% usingdamage data presented by Mason and Haynes (2010).
It was previously inferred that direct losses of $107 billion(Hallegatte 2008) are roughly equivalent to a vulnerability (Vul)of approximately 50%. It was then noted by Hallegatte (2008) thatindirect losses are negligible or produce a small economic gain fordirect losses that are less than $40 billion or a prorata vulnerabilityof 19.4%. This is a convenient finding because the transitionbetween minor and major damage to housing occurs at a damageloss of approximately 20% (e.g., Leicester et al. 1979). It is thusreasonable to assume that indirect loss is zero if Vul < 20%. Whendamage loss increases to double the Katrina losses ($214 billion orVul ¼ 100%), then Fig. 3 shows that the ratio of indirect-to-direct losses is near 1.0.
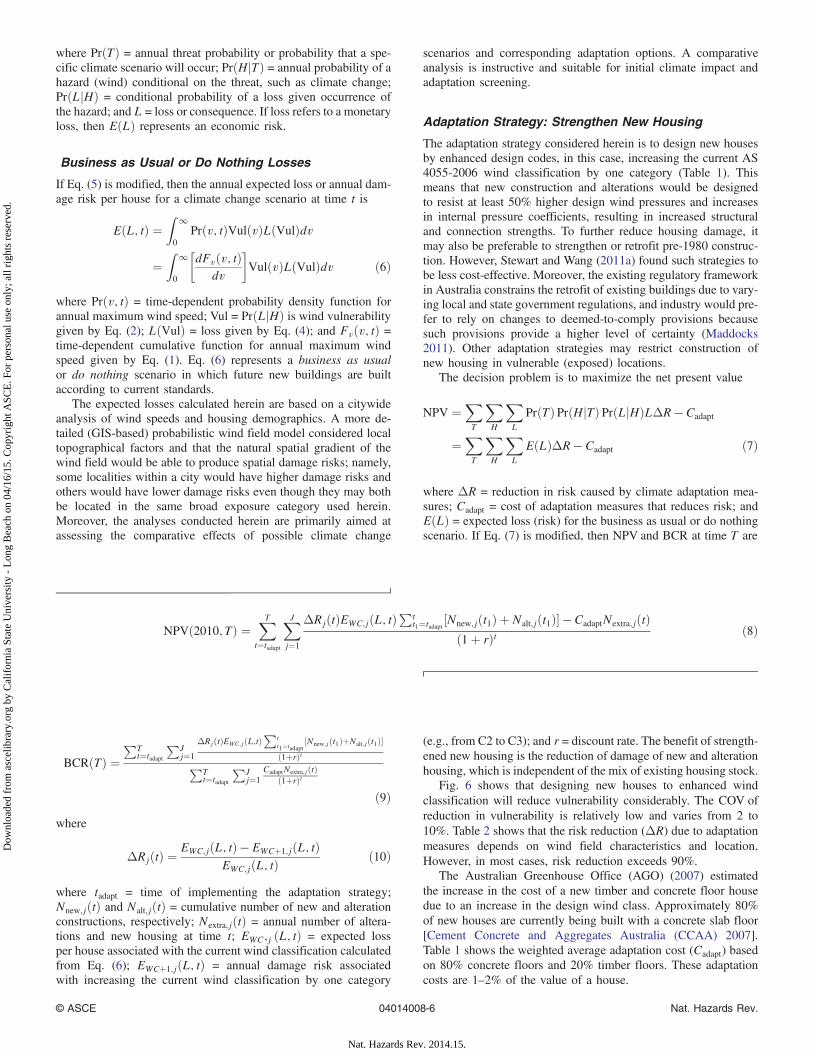
The data are very limited to accurately quantify how indirectlosses increase with vulnerability between these bounds. If the modelgiven in Fig. 3 by Hallegatte (2008) is taken, with the condition thatthe ratio of indirect-to-direct losses equals 1.0 when Vul ¼ 100%,then the ICR defined as a ratio of indirect-to-direct cost is
ICRðVulÞ ¼ 0.0058
�206Vul100
�− 0.1968 ICR ≥ 0 ð3Þ
Fig. 4 shows this model along with observed data based onHallegatte (2008), Pan (2011), and Cyclone Tracy described pre-viously. Eq. (3) seems to underpredict indirect losses for cycloneTracy and Pan (2011). However, there is some uncertainty aboutvulnerabilities for these events, and so Fig. 4 also shows an alter-nate model to better fit the indirect loss data for Hurricane Rita andCyclone Tracy, and recognizes that indirect losses are zero ifVul < 20%. The effect of this alternate model of indirect costs willbe assessed as part of the sensitivity analysis. The loss models pro-posed previously are preliminary because indirect losses arise frommany sources, and their relation to direct losses from various infra-structure and business sectors should also be based on the resilienceof affected communities.
Loss Function
The loss function for direct and indirect costs (L) is
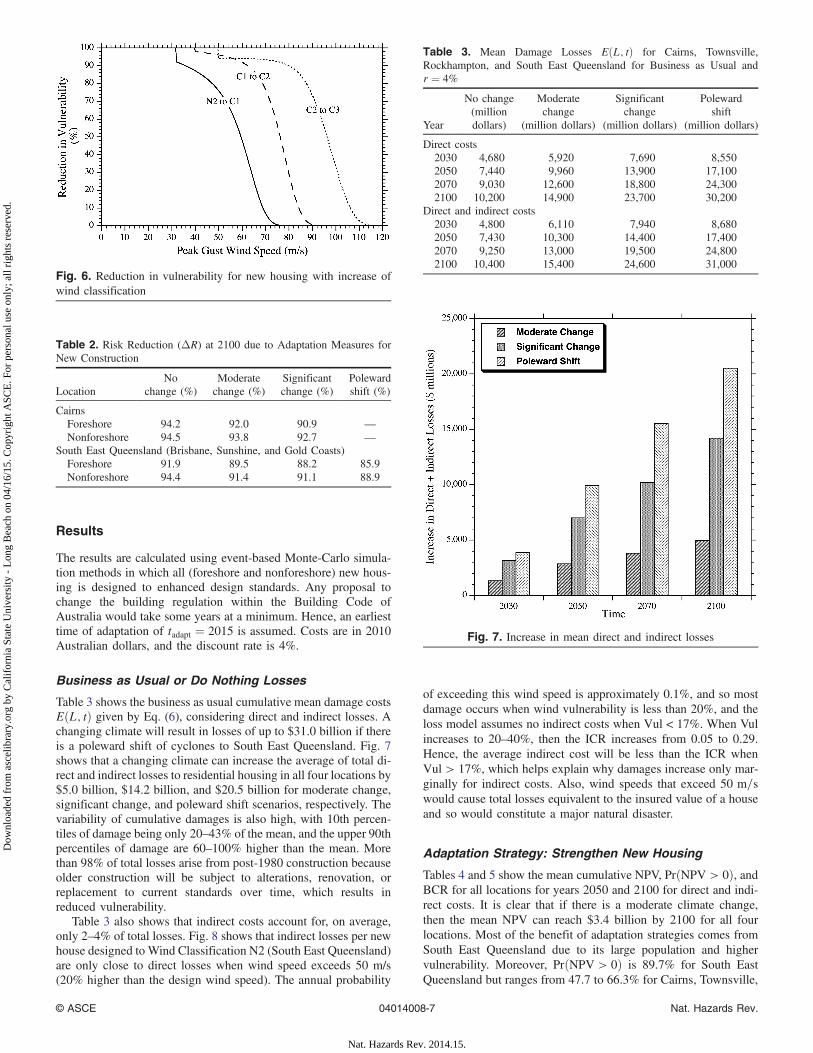
LðVulÞ ¼ ½1þ ICRðVulÞ�CI ð4Þwhere ICR(Vul) = indirect-to-direct cost ratio given by Eq. (3);Vul = wind vulnerability (damage ratio); and CI = insured value
of a house. The expected loss conditional on vulnerability is theproduct Vul and LðVulÞ. Fig. 5 shows the total expected loss.
Risk-Based Decision Analysis
Three criteria will be used to assess the cost-effectiveness ofadaptation strategies1. Net present value (NPV);2. Probability of cost-effectiveness or PrðNPV > 0Þ; and3. Benefit-to-cost ratio (BCR).The net benefit or NPV is equal to benefit minus cost, in
which the benefit of an adaptation measure is the reduction indamages associated with the adaptation strategy and cost isthe cost of the adaptation strategy. A Monte-Carlo simulationanalysis is used to propagate uncertainties through the cost-benefit analysis, and this allows 10th and 90th percentage lowerand upper bounds of NPV to be calculated and the probabilitythat an adaptation measure is cost-effective, which is denotedherein as PrðNPV > 0Þ.
Definition of Risk
The formulation for risk (expected loss) is
EðLÞ ¼ PrðCÞ PrðHjCÞPrðDjHÞ PrðLjDÞL ð5Þ
Fig. 3. Indirect losses as function of direct losses for Hurricane Katrina(data from Hallegatte 2008)
Fig. 4. Indirect cost ratio models
Fig. 5. Direct and indirect costs as function of wind vulnerability
© ASCE 04014008-5 Nat. Hazards Rev.
Nat. Hazards Rev. 2014.15.
Dow
nloa
ded
from
asc
elib
rary
.org
by
Cal
ifor
nia
Stat
e U
nive
rsity
- L
ong
Bea
ch o
n 04
/16/
15. C
opyr
ight
ASC
E. F
or p
erso
nal u
se o
nly;
all
righ
ts r
eser
ved.
where PrðTÞ = annual threat probability or probability that a spe-cific climate scenario will occur; PrðHjTÞ = annual probability of ahazard (wind) conditional on the threat, such as climate change;PrðLjHÞ = conditional probability of a loss given occurrence ofthe hazard; and L = loss or consequence. If loss refers to a monetaryloss, then EðLÞ represents an economic risk.
Business as Usual or Do Nothing Losses
If Eq. (5) is modified, then the annual expected loss or annual dam-age risk per house for a climate change scenario at time t is
EðL; tÞ ¼Z ∞0
Prðv; tÞVulðvÞLðVulÞdv
¼Z ∞0
�dFvðv; tÞ
dv
�VulðvÞLðVulÞdv ð6Þ
where Prðv; tÞ = time-dependent probability density function forannual maximum wind speed; Vul = PrðLjHÞ is wind vulnerabilitygiven by Eq. (2); LðVulÞ = loss given by Eq. (4); and Fvðv; tÞ =time-dependent cumulative function for annual maximum windspeed given by Eq. (1). Eq. (6) represents a business as usualor do nothing scenario in which future new buildings are builtaccording to current standards.
The expected losses calculated herein are based on a citywideanalysis of wind speeds and housing demographics. A more de-tailed (GIS-based) probabilistic wind field model considered localtopographical factors and that the natural spatial gradient of thewind field would be able to produce spatial damage risks; namely,some localities within a city would have higher damage risks andothers would have lower damage risks even though they may bothbe located in the same broad exposure category used herein.Moreover, the analyses conducted herein are primarily aimed atassessing the comparative effects of possible climate change
scenarios and corresponding adaptation options. A comparativeanalysis is instructive and suitable for initial climate impact andadaptation screening.
Adaptation Strategy: Strengthen New Housing
The adaptation strategy considered herein is to design new housesby enhanced design codes, in this case, increasing the current AS4055-2006 wind classification by one category (Table 1). Thismeans that new construction and alterations would be designedto resist at least 50% higher design wind pressures and increasesin internal pressure coefficients, resulting in increased structuraland connection strengths. To further reduce housing damage, itmay also be preferable to strengthen or retrofit pre-1980 construc-tion. However, Stewart and Wang (2011a) found such strategies tobe less cost-effective. Moreover, the existing regulatory frameworkin Australia constrains the retrofit of existing buildings due to vary-ing local and state government regulations, and industry would pre-fer to rely on changes to deemed-to-comply provisions becausesuch provisions provide a higher level of certainty (Maddocks2011). Other adaptation strategies may restrict construction ofnew housing in vulnerable (exposed) locations.
The decision problem is to maximize the net present value
NPV ¼XT
XH
XL
PrðTÞPrðHjTÞ PrðLjHÞLΔR − Cadapt
¼XT
XH
XL
EðLÞΔR − Cadapt ð7Þ
where ΔR = reduction in risk caused by climate adaptation mea-sures; Cadapt = cost of adaptation measures that reduces risk; andEðLÞ = expected loss (risk) for the business as usual or do nothingscenario. If Eq. (7) is modified, then NPV and BCR at time T are
NPVð2010;TÞ ¼XTt¼tadapt
XJj¼1
ΔRjðtÞEWC;jðL; tÞP
tt1¼tadapt ½Nnew;jðt1Þ þ Nalt;jðt1Þ� − CadaptNextra;jðtÞ
ð1þ rÞt ð8Þ
BCRðTÞ ¼P
Tt¼tadapt
PJj¼1
ΔRjðtÞEWC;jðL;tÞP
tt1¼tadapt
½Nnew;jðt1ÞþNalt;jðt1Þ�ð1þrÞtP
Tt¼tadapt
PJj¼1
CadaptNextra;jðtÞð1þrÞt
ð9Þwhere
ΔRjðtÞ ¼EWC;jðL; tÞ − EWCþ1;jðL; tÞ
EWC;jðL; tÞð10Þ
where tadapt = time of implementing the adaptation strategy;Nnew;jðtÞ and Nalt;jðtÞ = cumulative number of new and alterationconstructions, respectively; Nextra;jðtÞ = annual number of altera-tions and new housing at time t; EWC;j ðL; tÞ = expected lossper house associated with the current wind classification calculatedfrom Eq. (6); EWCþ1;jðL; tÞ = annual damage risk associatedwith increasing the current wind classification by one category
(e.g., from C2 to C3); and r = discount rate. The benefit of strength-ened new housing is the reduction of damage of new and alterationhousing, which is independent of the mix of existing housing stock.
Fig. 6 shows that designing new houses to enhanced windclassification will reduce vulnerability considerably. The COV ofreduction in vulnerability is relatively low and varies from 2 to10%. Table 2 shows that the risk reduction (ΔR) due to adaptationmeasures depends on wind field characteristics and location.However, in most cases, risk reduction exceeds 90%.
The Australian Greenhouse Office (AGO) (2007) estimatedthe increase in the cost of a new timber and concrete floor housedue to an increase in the design wind class. Approximately 80%of new houses are currently being built with a concrete slab floor[Cement Concrete and Aggregates Australia (CCAA) 2007].Table 1 shows the weighted average adaptation cost (Cadapt) basedon 80% concrete floors and 20% timber floors. These adaptationcosts are 1–2% of the value of a house.
© ASCE 04014008-6 Nat. Hazards Rev.
Nat. Hazards Rev. 2014.15.
Dow
nloa
ded
from
asc
elib
rary
.org
by
Cal
ifor
nia
Stat
e U
nive
rsity
- L
ong
Bea
ch o
n 04
/16/
15. C
opyr
ight
ASC
E. F
or p
erso
nal u
se o
nly;
all
righ
ts r
eser
ved.
Results
The results are calculated using event-based Monte-Carlo simula-tion methods in which all (foreshore and nonforeshore) new hous-ing is designed to enhanced design standards. Any proposal tochange the building regulation within the Building Code ofAustralia would take some years at a minimum. Hence, an earliesttime of adaptation of tadapt ¼ 2015 is assumed. Costs are in 2010Australian dollars, and the discount rate is 4%.
Business as Usual or Do Nothing Losses
Table 3 shows the business as usual cumulative mean damage costsEðL; tÞ given by Eq. (6), considering direct and indirect losses. Achanging climate will result in losses of up to $31.0 billion if thereis a poleward shift of cyclones to South East Queensland. Fig. 7shows that a changing climate can increase the average of total di-rect and indirect losses to residential housing in all four locations by$5.0 billion, $14.2 billion, and $20.5 billion for moderate change,significant change, and poleward shift scenarios, respectively. Thevariability of cumulative damages is also high, with 10th percen-tiles of damage being only 20–43% of the mean, and the upper 90thpercentiles of damage are 60–100% higher than the mean. Morethan 98% of total losses arise from post-1980 construction becauseolder construction will be subject to alterations, renovation, orreplacement to current standards over time, which results inreduced vulnerability.
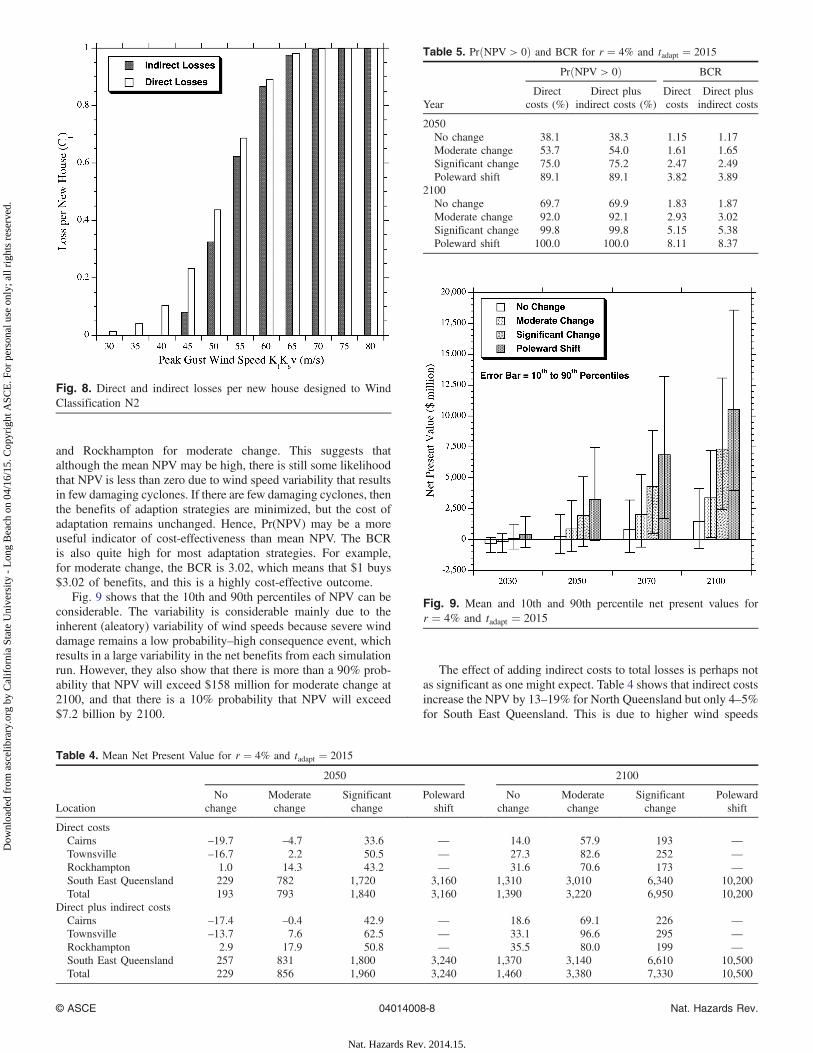
Table 3 also shows that indirect costs account for, on average,only 2–4% of total losses. Fig. 8 shows that indirect losses per newhouse designed to Wind Classification N2 (South East Queensland)are only close to direct losses when wind speed exceeds 50 m/s(20% higher than the design wind speed). The annual probability
of exceeding this wind speed is approximately 0.1%, and so mostdamage occurs when wind vulnerability is less than 20%, and theloss model assumes no indirect costs when Vul < 17%. When Vulincreases to 20–40%, then the ICR increases from 0.05 to 0.29.Hence, the average indirect cost will be less than the ICR whenVul > 17%, which helps explain why damages increase only mar-ginally for indirect costs. Also, wind speeds that exceed 50 m=swould cause total losses equivalent to the insured value of a houseand so would constitute a major natural disaster.
Adaptation Strategy: Strengthen New Housing
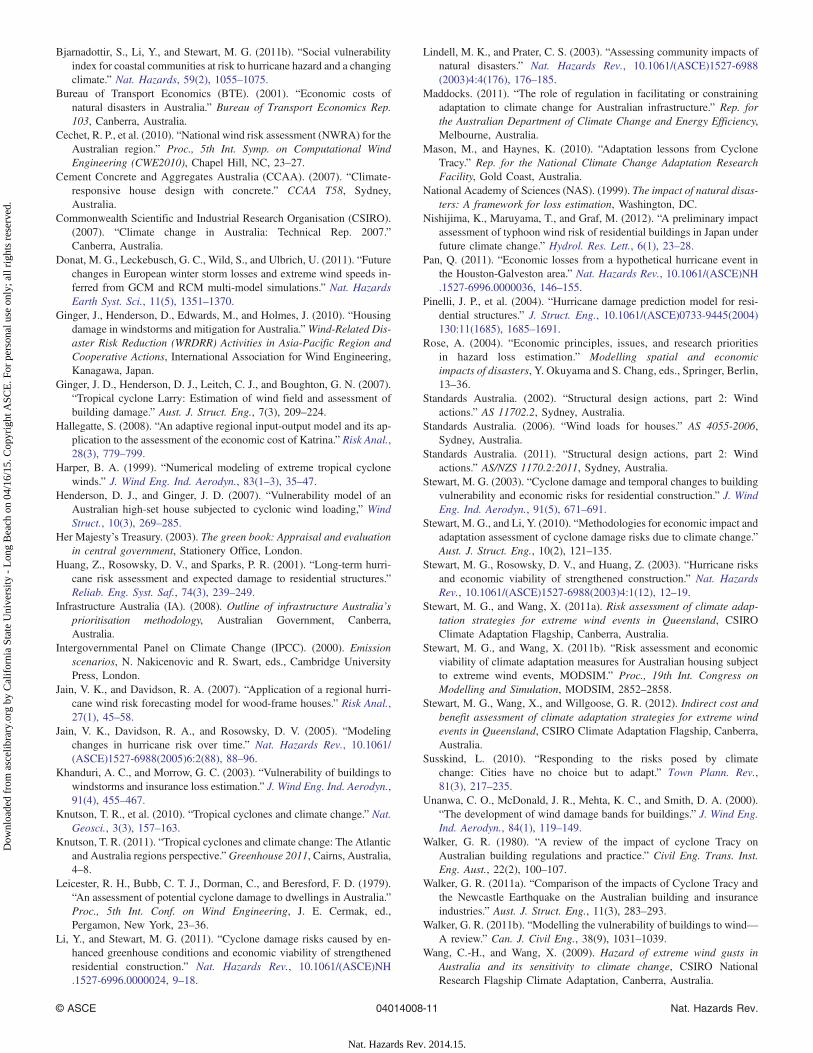
Tables 4 and 5 show the mean cumulative NPV, PrðNPV > 0Þ, andBCR for all locations for years 2050 and 2100 for direct and indi-rect costs. It is clear that if there is a moderate climate change,then the mean NPV can reach $3.4 billion by 2100 for all fourlocations. Most of the benefit of adaptation strategies comes fromSouth East Queensland due to its large population and highervulnerability. Moreover, PrðNPV > 0Þ is 89.7% for South EastQueensland but ranges from 47.7 to 66.3% for Cairns, Townsville,
Fig. 6. Reduction in vulnerability for new housing with increase ofwind classification
Table 2. Risk Reduction (ΔR) at 2100 due to Adaptation Measures forNew Construction
LocationNo
change (%)Moderatechange (%)
Significantchange (%)
Polewardshift (%)
CairnsForeshore 94.2 92.0 90.9 —Nonforeshore 94.5 93.8 92.7 —
South East Queensland (Brisbane, Sunshine, and Gold Coasts)Foreshore 91.9 89.5 88.2 85.9Nonforeshore 94.4 91.4 91.1 88.9
Table 3. Mean Damage Losses EðL; tÞ for Cairns, Townsville,Rockhampton, and South East Queensland for Business as Usual andr ¼ 4%
Year
No change(milliondollars)
Moderatechange
(million dollars)
Significantchange
(million dollars)
Polewardshift
(million dollars)
Direct costs2030 4,680 5,920 7,690 8,5502050 7,440 9,960 13,900 17,1002070 9,030 12,600 18,800 24,3002100 10,200 14,900 23,700 30,200
Direct and indirect costs2030 4,800 6,110 7,940 8,6802050 7,430 10,300 14,400 17,4002070 9,250 13,000 19,500 24,8002100 10,400 15,400 24,600 31,000
Fig. 7. Increase in mean direct and indirect losses
© ASCE 04014008-7 Nat. Hazards Rev.
Nat. Hazards Rev. 2014.15.
Dow
nloa
ded
from
asc
elib
rary
.org
by
Cal
ifor
nia
Stat
e U
nive
rsity
- L
ong
Bea
ch o
n 04
/16/
15. C
opyr
ight
ASC
E. F
or p
erso
nal u
se o
nly;
all
righ
ts r
eser
ved.
and Rockhampton for moderate change. This suggests thatalthough the mean NPV may be high, there is still some likelihoodthat NPV is less than zero due to wind speed variability that resultsin few damaging cyclones. If there are few damaging cyclones, thenthe benefits of adaption strategies are minimized, but the cost ofadaptation remains unchanged. Hence, Pr(NPV) may be a moreuseful indicator of cost-effectiveness than mean NPV. The BCRis also quite high for most adaptation strategies. For example,for moderate change, the BCR is 3.02, which means that $1 buys$3.02 of benefits, and this is a highly cost-effective outcome.
Fig. 9 shows that the 10th and 90th percentiles of NPV can beconsiderable. The variability is considerable mainly due to theinherent (aleatory) variability of wind speeds because severe winddamage remains a low probability–high consequence event, whichresults in a large variability in the net benefits from each simulationrun. However, they also show that there is more than a 90% prob-ability that NPV will exceed $158 million for moderate change at2100, and that there is a 10% probability that NPV will exceed$7.2 billion by 2100.
The effect of adding indirect costs to total losses is perhaps notas significant as one might expect. Table 4 shows that indirect costsincrease the NPV by 13–19% for North Queensland but only 4–5%for South East Queensland. This is due to higher wind speeds
Fig. 8. Direct and indirect losses per new house designed to WindClassification N2
Table 4. Mean Net Present Value for r ¼ 4% and tadapt ¼ 2015
Location
2050 2100
Nochange
Moderatechange
Significantchange
Polewardshift
Nochange
Moderatechange
Significantchange
Polewardshift
Direct costsCairns –19.7 –4.7 33.6 — 14.0 57.9 193 —Townsville –16.7 2.2 50.5 — 27.3 82.6 252 —Rockhampton 1.0 14.3 43.2 — 31.6 70.6 173 —South East Queensland 229 782 1,720 3,160 1,310 3,010 6,340 10,200Total 193 793 1,840 3,160 1,390 3,220 6,950 10,200
Direct plus indirect costsCairns –17.4 –0.4 42.9 — 18.6 69.1 226 —Townsville –13.7 7.6 62.5 — 33.1 96.6 295 —Rockhampton 2.9 17.9 50.8 — 35.5 80.0 199 —South East Queensland 257 831 1,800 3,240 1,370 3,140 6,610 10,500Total 229 856 1,960 3,240 1,460 3,380 7,330 10,500
Table 5. PrðNPV > 0Þ and BCR for r ¼ 4% and tadapt ¼ 2015
Year
PrðNPV > 0Þ BCR
Directcosts (%)
Direct plusindirect costs (%)
Directcosts
Direct plusindirect costs
2050No change 38.1 38.3 1.15 1.17Moderate change 53.7 54.0 1.61 1.65Significant change 75.0 75.2 2.47 2.49Poleward shift 89.1 89.1 3.82 3.89
2100No change 69.7 69.9 1.83 1.87Moderate change 92.0 92.1 2.93 3.02Significant change 99.8 99.8 5.15 5.38Poleward shift 100.0 100.0 8.11 8.37
Fig. 9. Mean and 10th and 90th percentile net present values forr ¼ 4% and tadapt ¼ 2015
© ASCE 04014008-8 Nat. Hazards Rev.
Nat. Hazards Rev. 2014.15.
Dow
nloa
ded
from
asc
elib
rary
.org
by
Cal
ifor
nia
Stat
e U
nive
rsity
- L
ong
Bea
ch o
n 04
/16/
15. C
opyr
ight
ASC
E. F
or p
erso
nal u
se o
nly;
all
righ
ts r
eser
ved.
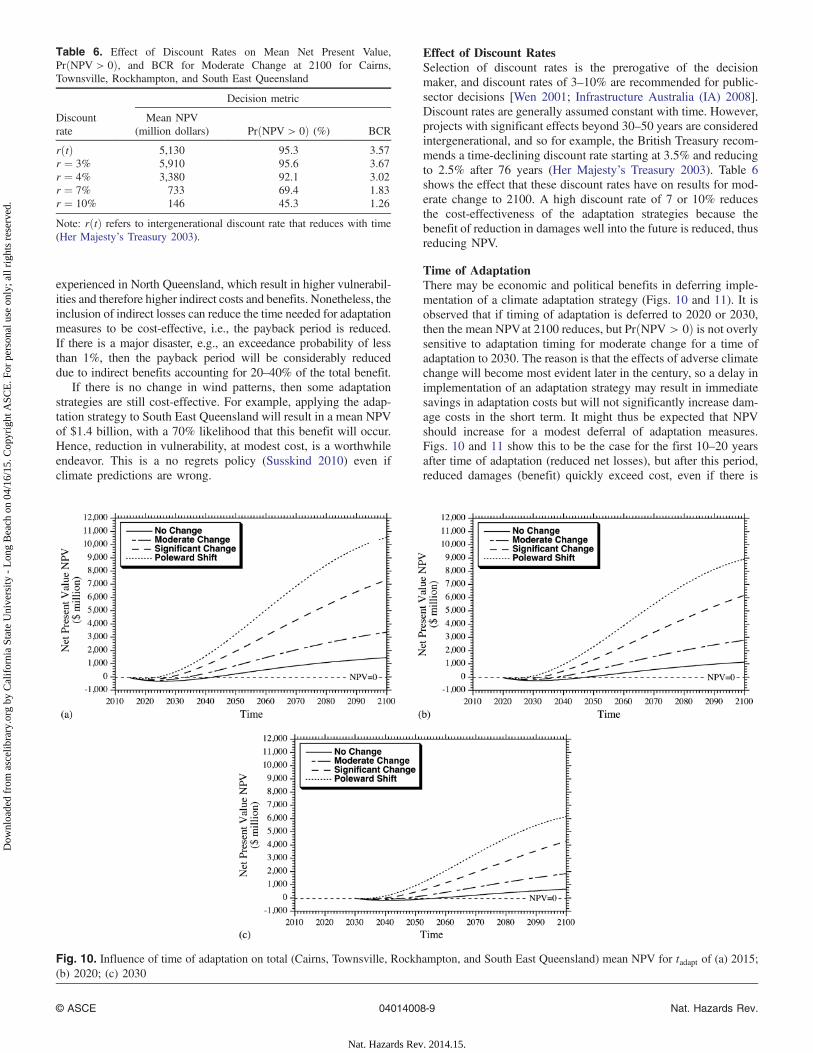
experienced in North Queensland, which result in higher vulnerabil-ities and therefore higher indirect costs and benefits. Nonetheless, theinclusion of indirect losses can reduce the time needed for adaptationmeasures to be cost-effective, i.e., the payback period is reduced.If there is a major disaster, e.g., an exceedance probability of lessthan 1%, then the payback period will be considerably reduceddue to indirect benefits accounting for 20–40% of the total benefit.
If there is no change in wind patterns, then some adaptationstrategies are still cost-effective. For example, applying the adap-tation strategy to South East Queensland will result in a mean NPVof $1.4 billion, with a 70% likelihood that this benefit will occur.Hence, reduction in vulnerability, at modest cost, is a worthwhileendeavor. This is a no regrets policy (Susskind 2010) even ifclimate predictions are wrong.
Effect of Discount RatesSelection of discount rates is the prerogative of the decisionmaker, and discount rates of 3–10% are recommended for public-sector decisions [Wen 2001; Infrastructure Australia (IA) 2008].Discount rates are generally assumed constant with time. However,projects with significant effects beyond 30–50 years are consideredintergenerational, and so for example, the British Treasury recom-mends a time-declining discount rate starting at 3.5% and reducingto 2.5% after 76 years (Her Majesty’s Treasury 2003). Table 6shows the effect that these discount rates have on results for mod-erate change to 2100. A high discount rate of 7 or 10% reducesthe cost-effectiveness of the adaptation strategies because thebenefit of reduction in damages well into the future is reduced, thusreducing NPV.
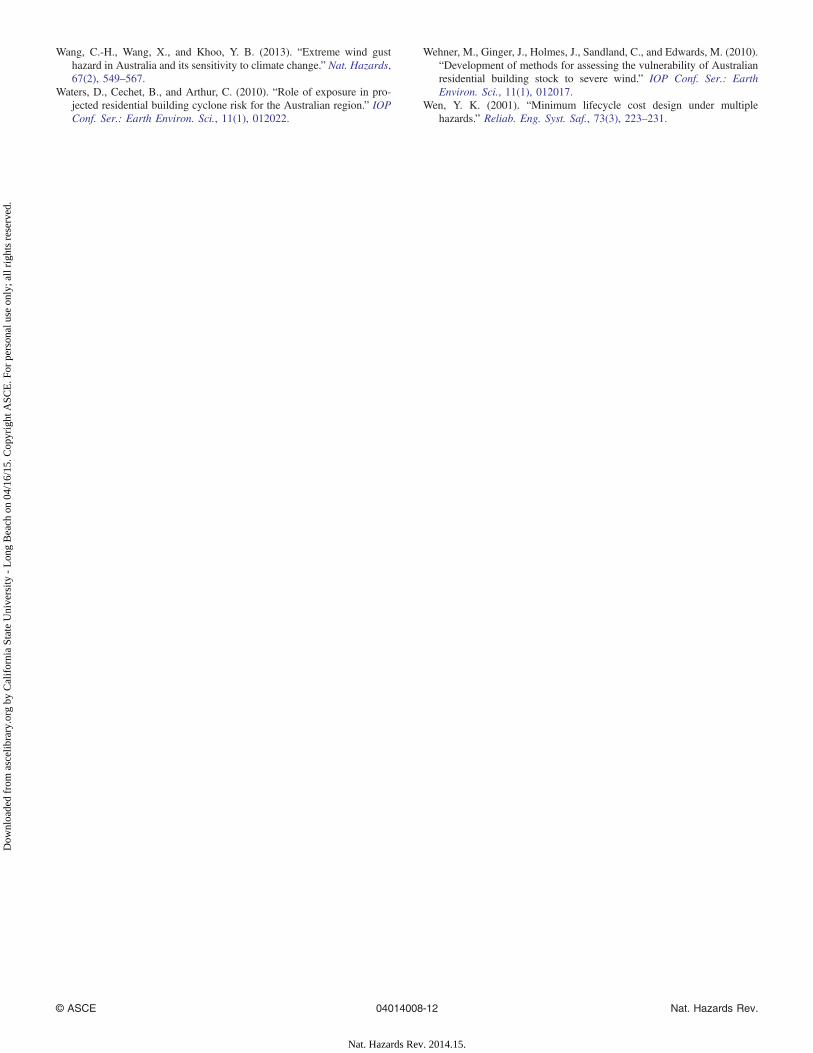
Time of AdaptationThere may be economic and political benefits in deferring imple-mentation of a climate adaptation strategy (Figs. 10 and 11). It isobserved that if timing of adaptation is deferred to 2020 or 2030,then the mean NPVat 2100 reduces, but PrðNPV > 0Þ is not overlysensitive to adaptation timing for moderate change for a time ofadaptation to 2030. The reason is that the effects of adverse climatechange will become most evident later in the century, so a delay inimplementation of an adaptation strategy may result in immediatesavings in adaptation costs but will not significantly increase dam-age costs in the short term. It might thus be expected that NPVshould increase for a modest deferral of adaptation measures.Figs. 10 and 11 show this to be the case for the first 10–20 yearsafter time of adaptation (reduced net losses), but after this period,reduced damages (benefit) quickly exceed cost, even if there is
Table 6. Effect of Discount Rates on Mean Net Present Value,PrðNPV > 0Þ, and BCR for Moderate Change at 2100 for Cairns,Townsville, Rockhampton, and South East Queensland
Discountrate
Decision metric
Mean NPV(million dollars) PrðNPV > 0Þ (%) BCR
rðtÞ 5,130 95.3 3.57r ¼ 3% 5,910 95.6 3.67r ¼ 4% 3,380 92.1 3.02r ¼ 7% 733 69.4 1.83r ¼ 10% 146 45.3 1.26
Note: rðtÞ refers to intergenerational discount rate that reduces with time(Her Majesty’s Treasury 2003).
Fig. 10. Influence of time of adaptation on total (Cairns, Townsville, Rockhampton, and South East Queensland) mean NPV for tadapt of (a) 2015;(b) 2020; (c) 2030
© ASCE 04014008-9 Nat. Hazards Rev.
Nat. Hazards Rev. 2014.15.
Dow
nloa
ded
from
asc
elib
rary
.org
by
Cal
ifor
nia
Stat
e U
nive
rsity
- L
ong
Bea
ch o
n 04
/16/
15. C
opyr
ight
ASC
E. F
or p
erso
nal u
se o
nly;
all
righ
ts r
eser
ved.

no change in climate. Moreover, because NPV is calculated at2100, then adaptation after 2015 results in less time for benefitsto accrue.
Costs of AdaptationIf the adaptation costs given in Table 1 are increased by 50%,the total NPV reduces from $3.4 billion to $2.6 billion, andPrðNPV > 0Þ reduces from 92.0 to 79.0% for moderate change.For significant change, the effect of changes in the cost of adapta-tion is less apparent.
Sensitivity AnalysisThe results are not particularly sensitive to changes in the cyclonefrequency, confidence interval of wind vulnerability, and nonlin-ear time-dependent increase in wind speed. Finally, the influenceof the indirect cost model is also not significant, with a lessthan 2% difference in mean NPV and a negligible effect onPrðNPV > 0Þ and BCR for the alternate indirect cost modelshown in Fig. 4. Stewart et al. (2012) provides more details ofthe sensitivity analyses.
The NPV will increase if other direct and indirect costs ofhousing damage are included. Significant damage to housing willalso place extra demands on social services, relocation of workersto other regions, and production losses in other regions, and somecompanies may lose customers permanently or even go bankrupt.Because losses are underestimated, then the benefits of climateadaptation strategies will also be underestimated. Hence, theactual NPV, PrðNPV > 0Þ, and BCR will be higher than thosecalculated herein, leading to improved cost-effectiveness of adap-tation strategies.
Conclusions
To reduce losses from damage to residential construction due toextreme wind, an increase in the housing design wind classificationspecified by AS 4055-2006 was selected as a potential climateadaptation strategy. The economic viability of this climate adapta-tion strategy was assessed using a probabilistic risk-based frame-work that considered the effect of climate change on wind fieldcharacteristics, uncertainty of wind vulnerability of houses, costsof adaptation, timing of adaptation, discount rates, future growthin new housing, time-dependent increase in wind speeds, and directand indirect losses. Loss functions were developed for direct lossesand indirect losses. The inclusion of indirect losses can increasethe NPV by up to 20% and reduce the time needed for adaptation
measures to be cost-effective. The probabilistic risk assessmentfound that increasing the wind classification for the design ofnew housing for all cities can produce a mean cumulative NPV(net benefit) of up to $10.5 billion by 2100, assuming a 4% dis-count rate. The benefits are highest for South East Queenslanddue to its large population and the relatively high vulnerabilityof existing residential construction. It was shown that the benefitsof adaptation strategies are maximized if they are implementedpromptly, but deferral to 2020 or even 2030 will still result in anet benefit to society, albeit at a reduced level when comparedto immediate implementation.
Acknowledgments
The first author appreciates the financial support of the CSIROClimate Adaptation Flagship Collaboration Research Fund, andthe second author is supported by South East Queensland ClimateAdaptation Initiatives (SEQ-CARI). The authors would like tothank Krishina Nadimpalli, Mark Dunford, Bob Cechet, MartinWehner, and Augusto Sanabria from Geoscience Australia; YongBing Khoo, Anne Leitch, Chi-Hsiang Wang, Kevin Hennessey,Debbie Abbs, and Bob Leicester from CSIRO; and Xiaoqian Dingfrom Newcastle.
References
Abbs, D. (2010). “The impact of climate change on the climatology oftropical cyclones in Australian region.” CSIRO Climate AdaptationFlagship Working Paper No. 11, CSIRO Marine and AtmosphericResearch, Canberra, Australia.
Association of British Insurers (ABI). (2005). Financial risks of climatechange, London.
Australian Academy of Technological Sciences and Engineering (ATSE).(2008). Assessment of Impacts of Climate Change on Australia’sPhysical Infrastructure, Parkville, Australia.
Australian Greenhouse Office (AGO). (2007). “An assessment of the needto adapt buildings for the unavoidable consequences of climate change.”Final Rep., Canberra, Commonwealth of Australia.
Australian Securities and Investment Commission (ASIC). (2007).“Making home insurance better.” Rep. 89, Sydney, Australia.
Bjarnadottir, S., Li, Y., and Stewart, M. G. (2011a). “A probabilistic-basedframework for impact and adaptation assessment of climate change onhurricane damage risks and costs.” Struct. Saf., 33(3), 173–185.
Fig. 11. Influence of time of adaptation on (a) total mean NPV; (b) Pr(NPV>0) at 2100
© ASCE 04014008-10 Nat. Hazards Rev.
Nat. Hazards Rev. 2014.15.
Dow
nloa
ded
from
asc
elib
rary
.org
by
Cal
ifor
nia
Stat
e U
nive
rsity
- L
ong
Bea
ch o
n 04
/16/
15. C
opyr
ight
ASC
E. F
or p
erso
nal u
se o
nly;
all
righ
ts r
eser
ved.
Bjarnadottir, S., Li, Y., and Stewart, M. G. (2011b). “Social vulnerabilityindex for coastal communities at risk to hurricane hazard and a changingclimate.” Nat. Hazards, 59(2), 1055–1075.
Bureau of Transport Economics (BTE). (2001). “Economic costs ofnatural disasters in Australia.” Bureau of Transport Economics Rep.103, Canberra, Australia.
Cechet, R. P., et al. (2010). “National wind risk assessment (NWRA) for theAustralian region.” Proc., 5th Int. Symp. on Computational WindEngineering (CWE2010), Chapel Hill, NC, 23–27.
Cement Concrete and Aggregates Australia (CCAA). (2007). “Climate-responsive house design with concrete.” CCAA T58, Sydney,Australia.
Commonwealth Scientific and Industrial Research Organisation (CSIRO).(2007). “Climate change in Australia: Technical Rep. 2007.”Canberra, Australia.
Donat, M. G., Leckebusch, G. C., Wild, S., and Ulbrich, U. (2011). “Futurechanges in European winter storm losses and extreme wind speeds in-ferred from GCM and RCM multi-model simulations.” Nat. HazardsEarth Syst. Sci., 11(5), 1351–1370.
Ginger, J., Henderson, D., Edwards, M., and Holmes, J. (2010). “Housingdamage in windstorms and mitigation for Australia.”Wind-Related Dis-aster Risk Reduction (WRDRR) Activities in Asia-Pacific Region andCooperative Actions, International Association for Wind Engineering,Kanagawa, Japan.
Ginger, J. D., Henderson, D. J., Leitch, C. J., and Boughton, G. N. (2007).“Tropical cyclone Larry: Estimation of wind field and assessment ofbuilding damage.” Aust. J. Struct. Eng., 7(3), 209–224.
Hallegatte, S. (2008). “An adaptive regional input-output model and its ap-plication to the assessment of the economic cost of Katrina.” Risk Anal.,28(3), 779–799.
Harper, B. A. (1999). “Numerical modeling of extreme tropical cyclonewinds.” J. Wind Eng. Ind. Aerodyn., 83(1–3), 35–47.
Henderson, D. J., and Ginger, J. D. (2007). “Vulnerability model of anAustralian high-set house subjected to cyclonic wind loading,” WindStruct., 10(3), 269–285.
Her Majesty’s Treasury. (2003). The green book: Appraisal and evaluationin central government, Stationery Office, London.
Huang, Z., Rosowsky, D. V., and Sparks, P. R. (2001). “Long-term hurri-cane risk assessment and expected damage to residential structures.”Reliab. Eng. Syst. Saf., 74(3), 239–249.
Infrastructure Australia (IA). (2008). Outline of infrastructure Australia’sprioritisation methodology, Australian Government, Canberra,Australia.
Intergovernmental Panel on Climate Change (IPCC). (2000). Emissionscenarios, N. Nakicenovic and R. Swart, eds., Cambridge UniversityPress, London.
Jain, V. K., and Davidson, R. A. (2007). “Application of a regional hurri-cane wind risk forecasting model for wood-frame houses.” Risk Anal.,27(1), 45–58.
Jain, V. K., Davidson, R. A., and Rosowsky, D. V. (2005). “Modelingchanges in hurricane risk over time.” Nat. Hazards Rev., 10.1061/(ASCE)1527-6988(2005)6:2(88), 88–96.
Khanduri, A. C., and Morrow, G. C. (2003). “Vulnerability of buildings towindstorms and insurance loss estimation.” J. Wind Eng. Ind. Aerodyn.,91(4), 455–467.
Knutson, T. R., et al. (2010). “Tropical cyclones and climate change.” Nat.Geosci., 3(3), 157–163.
Knutson, T. R. (2011). “Tropical cyclones and climate change: The Atlanticand Australia regions perspective.”Greenhouse 2011, Cairns, Australia,4–8.
Leicester, R. H., Bubb, C. T. J., Dorman, C., and Beresford, F. D. (1979).“An assessment of potential cyclone damage to dwellings in Australia.”Proc., 5th Int. Conf. on Wind Engineering, J. E. Cermak, ed.,Pergamon, New York, 23–36.
Li, Y., and Stewart, M. G. (2011). “Cyclone damage risks caused by en-hanced greenhouse conditions and economic viability of strengthenedresidential construction.” Nat. Hazards Rev., 10.1061/(ASCE)NH.1527-6996.0000024, 9–18.
Lindell, M. K., and Prater, C. S. (2003). “Assessing community impacts ofnatural disasters.” Nat. Hazards Rev., 10.1061/(ASCE)1527-6988(2003)4:4(176), 176–185.
Maddocks. (2011). “The role of regulation in facilitating or constrainingadaptation to climate change for Australian infrastructure.” Rep. forthe Australian Department of Climate Change and Energy Efficiency,Melbourne, Australia.
Mason, M., and Haynes, K. (2010). “Adaptation lessons from CycloneTracy.” Rep. for the National Climate Change Adaptation ResearchFacility, Gold Coast, Australia.
National Academy of Sciences (NAS). (1999). The impact of natural disas-ters: A framework for loss estimation, Washington, DC.
Nishijima, K., Maruyama, T., and Graf, M. (2012). “A preliminary impactassessment of typhoon wind risk of residential buildings in Japan underfuture climate change.” Hydrol. Res. Lett., 6(1), 23–28.
Pan, Q. (2011). “Economic losses from a hypothetical hurricane event inthe Houston-Galveston area.” Nat. Hazards Rev., 10.1061/(ASCE)NH.1527-6996.0000036, 146–155.
Pinelli, J. P., et al. (2004). “Hurricane damage prediction model for resi-dential structures.” J. Struct. Eng., 10.1061/(ASCE)0733-9445(2004)130:11(1685), 1685–1691.
Rose, A. (2004). “Economic principles, issues, and research prioritiesin hazard loss estimation.” Modelling spatial and economicimpacts of disasters, Y. Okuyama and S. Chang, eds., Springer, Berlin,13–36.
Standards Australia. (2002). “Structural design actions, part 2: Windactions.” AS 11702.2, Sydney, Australia.
Standards Australia. (2006). “Wind loads for houses.” AS 4055-2006,Sydney, Australia.
Standards Australia. (2011). “Structural design actions, part 2: Windactions.” AS/NZS 1170.2:2011, Sydney, Australia.
Stewart, M. G. (2003). “Cyclone damage and temporal changes to buildingvulnerability and economic risks for residential construction.” J. WindEng. Ind. Aerodyn., 91(5), 671–691.
Stewart, M. G., and Li, Y. (2010). “Methodologies for economic impact andadaptation assessment of cyclone damage risks due to climate change.”Aust. J. Struct. Eng., 10(2), 121–135.
Stewart, M. G., Rosowsky, D. V., and Huang, Z. (2003). “Hurricane risksand economic viability of strengthened construction.” Nat. HazardsRev., 10.1061/(ASCE)1527-6988(2003)4:1(12), 12–19.
Stewart, M. G., and Wang, X. (2011a). Risk assessment of climate adap-tation strategies for extreme wind events in Queensland, CSIROClimate Adaptation Flagship, Canberra, Australia.
Stewart, M. G., and Wang, X. (2011b). “Risk assessment and economicviability of climate adaptation measures for Australian housing subjectto extreme wind events, MODSIM.” Proc., 19th Int. Congress onModelling and Simulation, MODSIM, 2852–2858.
Stewart, M. G., Wang, X., and Willgoose, G. R. (2012). Indirect cost andbenefit assessment of climate adaptation strategies for extreme windevents in Queensland, CSIRO Climate Adaptation Flagship, Canberra,Australia.
Susskind, L. (2010). “Responding to the risks posed by climatechange: Cities have no choice but to adapt.” Town Plann. Rev.,81(3), 217–235.
Unanwa, C. O., McDonald, J. R., Mehta, K. C., and Smith, D. A. (2000).“The development of wind damage bands for buildings.” J. Wind Eng.Ind. Aerodyn., 84(1), 119–149.
Walker, G. R. (1980). “A review of the impact of cyclone Tracy onAustralian building regulations and practice.” Civil Eng. Trans. Inst.Eng. Aust., 22(2), 100–107.
Walker, G. R. (2011a). “Comparison of the impacts of Cyclone Tracy andthe Newcastle Earthquake on the Australian building and insuranceindustries.” Aust. J. Struct. Eng., 11(3), 283–293.
Walker, G. R. (2011b). “Modelling the vulnerability of buildings to wind—A review.” Can. J. Civil Eng., 38(9), 1031–1039.
Wang, C.-H., and Wang, X. (2009). Hazard of extreme wind gusts inAustralia and its sensitivity to climate change, CSIRO NationalResearch Flagship Climate Adaptation, Canberra, Australia.
© ASCE 04014008-11 Nat. Hazards Rev.
Nat. Hazards Rev. 2014.15.
Dow
nloa
ded
from
asc
elib
rary
.org
by
Cal
ifor
nia
Stat
e U
nive
rsity
- L
ong
Bea
ch o
n 04
/16/
15. C
opyr
ight
ASC
E. F
or p
erso
nal u
se o
nly;
all
righ
ts r
eser
ved.
Wang, C.-H., Wang, X., and Khoo, Y. B. (2013). “Extreme wind gusthazard in Australia and its sensitivity to climate change.” Nat. Hazards,67(2), 549–567.
Waters, D., Cechet, B., and Arthur, C. (2010). “Role of exposure in pro-jected residential building cyclone risk for the Australian region.” IOPConf. Ser.: Earth Environ. Sci., 11(1), 012022.
Wehner, M., Ginger, J., Holmes, J., Sandland, C., and Edwards, M. (2010).“Development of methods for assessing the vulnerability of Australianresidential building stock to severe wind.” IOP Conf. Ser.: EarthEnviron. Sci., 11(1), 012017.
Wen, Y. K. (2001). “Minimum lifecycle cost design under multiplehazards.” Reliab. Eng. Syst. Saf., 73(3), 223–231.
© ASCE 04014008-12 Nat. Hazards Rev.
Nat. Hazards Rev. 2014.15.
Dow
nloa
ded
from
asc
elib
rary
.org
by
Cal
ifor
nia
Stat
e U
nive
rsity
- L
ong
Bea
ch o
n 04
/16/
15. C
opyr
ight
ASC
E. F
or p
erso
nal u
se o
nly;
all
righ
ts r
eser
ved.


