Embed Size (px)
Citation preview

minerals
Article
Evaluation of Frother Types for Improved FlotationRecovery and Selectivity
Qingqing Huang 1,*, Xinbo Yang 2 and Rick Q. Honaker 2
1 Department of Mining Engineering, West Virginia University, Morgantown, WV 26506, USA2 Department of Mining Engineering, University of Kentucky, Lexington, KY 40508, USA;
[email protected] (X.Y.); [email protected] (R.Q.H.)* Correspondence: [email protected]; Tel.: +1-304-293-3456
Received: 15 August 2019; Accepted: 25 September 2019; Published: 28 September 2019�����������������
Abstract: A laboratory study was conducted to evaluate and compare the effectiveness of ninedifferent frother types when used in a three-phase, continuously operating froth flotation system. Thefrothers included several that are commonly used in the industry (e.g., MIBC, 2EH, and F-1) as wellas unique frother types (e.g., F-3). The tests were conducted in a 5-cm diameter laboratory flotationcolumn that provided near plug-flow mixing conditions due to a length-to-diameter ratio of around50:1. Test results indicate that F-1, MIBC, and MPC (in order of decreasing effectiveness) provided theweakest performance in terms of combustible recovery while F-2, MAC, and 2EH were the top threegenerating the highest separation efficiencies. When processing ultrafine coal, the ash content of theflotation concentrate ranged from 10% to 15% while recovering over 80% of the combustible material.F-3, F-4, and DIBC provided over 80% recovery of combustibles at the expense in the amount ofhydraulic entrainment. The flotation performances were also closely examined in accordance withthe fundamental properties of the nine tested frothers, and their correlations were addressed in detail.
Keywords: frothers; column flotation; recovery; selectivity; entrainment
1. Introduction
The froth flotation process commonly requires the use of a multitude of chemical reagentsincluding collectors, frothers, surface modifiers, and pH-regulators. Frothers play an essential role indetermining the bubble size distribution as well as the stability and mobility of the froth phase [1,2]. Thefundamental properties of frothers have been extensively investigated over the past several decades. Itis widely acknowledged that frothers preferentially accumulate at the water–gas interface and interactwith the collectors absorbed on the solids, which facilitates the solid-bubble collection process [3–6].Furthermore, frothers impose a significant influence on bubble size distribution, which further affectsthe superficial bubble surface area flux and the ultimate flotation recovery [7–12]. It has been foundthat the way frothers affect the bubble size is through both surface tension reduction and the preventionof bubble coalescence for concentrations above the critical coalescence concentration [7,13–15]. Mineralparticles report to the froth flotation product either because of the selective attachment of hydrophobicparticles or water entrainment of non-selective hydrophilic particles [13,16]. The entrained hydrophilicparticles that are recovered to the final flotation product are undesired gangue minerals. As such,entrainment greatly deteriorates the selectivity of the froth flotation process [17,18]. The amount ofhydrophilic entrainment associated with a flotation unit is believed to be affected by the amount ofwater carried in the froth [19–24], which is closely related to the frothing properties of the frother usedin the process.
Froth stability and mobility are important factors that affect flotation recovery and grade. A froththat is too stable may prevent adequate drainage of the entrained material and is difficult to handle
Minerals 2019, 9, 590; doi:10.3390/min9100590 www.mdpi.com/journal/minerals

Minerals 2019, 9, 590 2 of 17
while an unstable froth is least desirable due to the negative effect on recovery and selectivity [25]. Thefrothers that are more efficient in reducing bubble size have been observed to produce more stablefoams [6–8,13]. Laskowski [26] was able to characterize frothers based on their ability to reduce bubblesize and increase froth stability. The study distinguished the frothers known as being selective fromthose being identified as powerful. In a review paper authored by Khoshdast and Sam [1] on theproperties of frothers, it was concluded that bubble size, and stability and mobility of the froth phaseplay a significant role in the kinetic viability of the process. The overall flotation recovery and grade aremainly driven by the physical properties of the frothers such as molecular weight, hydrophile–lipophilebalance (HLB), dynamic frothability, and critical coalescence concentration [1].
The froth is established not only by frothers but also by the presence of solid particles [13]. Theparticle size, shape, and surface hydrophobicity have been reported to greatly affect the performanceof a froth flotation process [27–32]. Overall, the behavior of solids particles and the interaction withfrothers is a critical but poorly understood step in industrial froth flotation, which often leads torecovery losses in the froth phase [33]. Therefore, to better understand the interaction mechanismsin a froth flotation system driven by the characteristics of the frother types, a laboratory flotationcolumn was utilized in the present study to evaluate the properties of nine frothers in a three-phase(liquid–gas–solid) system. Fundamental properties of the frothers including surface tension andfrothing abilities were measured and correlated with their molecular weights and HLB values alongwith the findings of the flotation tests, which were obtained as a function of frother concentration.Optimum flotation performances were identified for each frother type as a function of recovery,concentrate quality, and process selectivity.
2. Experimental
2.1. Coal Sample
Run-of-mine coal samples were collected from an active coal preparation plant located in Grafton,West Virginia. The coal was extracted from the Lower Kittanning coal seam, which ranks as high-volatilebituminous coal. Upon receiving the samples, the coal was crushed using a laboratory jaw crusherfollowed by a hammer mill to a top size of approximately 6 mm. The entire sample was thenhomogeneously split using a riffler into separate sample lot sizes of approximately 0.5 kg, placed intostorage bags, and stored in a freezer to prevent oxidation until the time needed for the flotation tests.Prior to each test, a 0.5 kg sample was ground using a laboratory pulverizer to achieve a top particlesize of 210 micrometers.
2.2. Chemicals
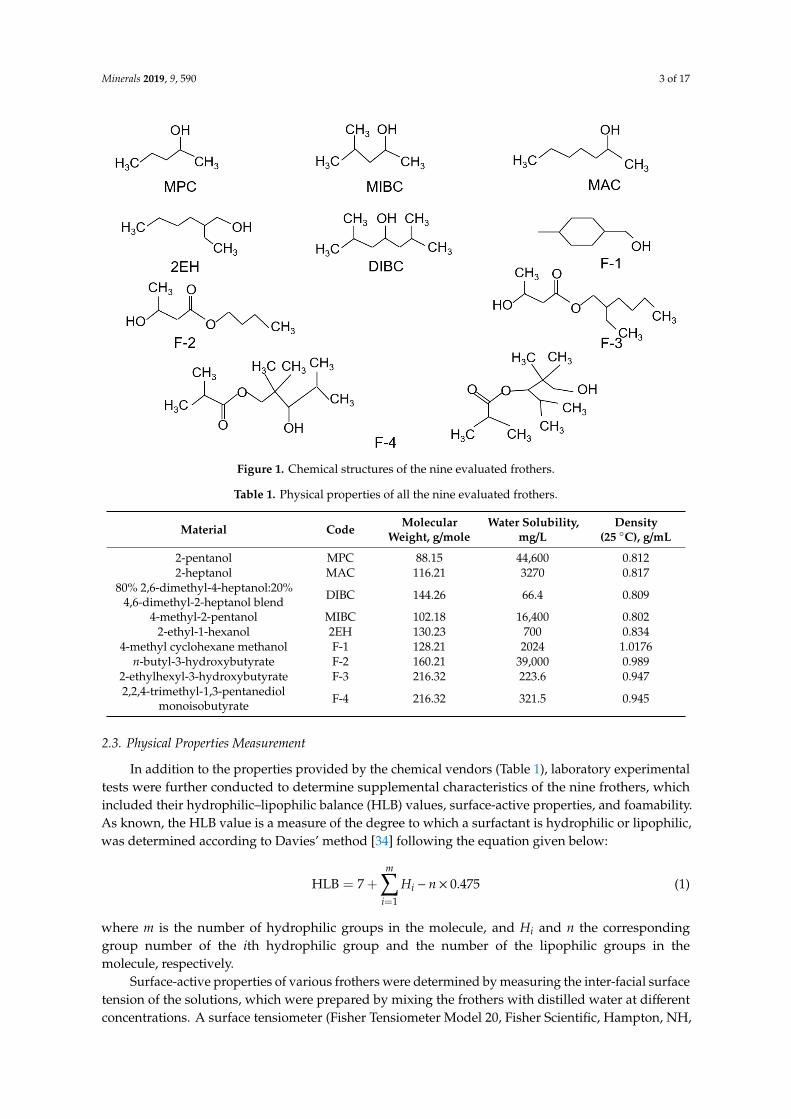
A total of nine alcohol-based frothers including MPC, MIBC, MAC, 2EH, DIBC, F-1, F-2, F-3, andF-4 were evaluated in the present study. Of the nine frothers, MPC, MAC, 2EH, MIBC, and DIBCwere purchased from Sigma-Aldrich with reagent purity greater than 98%, 97%, 99.6%, 98%, and80%, respectively. The remaining frothers were directly provided by the manufacturers. The chemicalstructures of all nine test frother types are shown in Figure 1. Their physical properties includingtheir compositions, molecular weights, solubility in water, and densities are shown in Table 1. Thewater solubility values are of significant importance. The data indicates that DIBC, F3, and F4 haveexceptionally low values in the range of 66.4 to 321.5 mg/L (ppm). The relative difference between thewater solubility values and the frother solution concentration had a significant impact on the resultsobtained in the present study. Therefore, the frother concentration of the dilute solution that was fedinto the flotation unit ranged from 22 ppm to 66 ppm, which was slightly lower than the lowest watersolubility among the nine evaluated frothers. In addition to the frothers, fuel oil No. 2 was used as acollector throughout the whole study. Hydrochloric acid and sodium hydroxide of analytical gradeswere used for the pH adjustment.
Minerals 2019, 9, 590 3 of 17
Figure 1. Chemical structures of the nine evaluated frothers.
Table 1. Physical properties of all the nine evaluated frothers.
Material Code Molecular Weight, g/mole
Water Solubility, mg/L
Density (25 °C), g/mL
2-pentanol MPC 88.15 44,600 0.812 2-heptanol MAC 116.21 3270 0.817
80% 2,6-dimethyl-4-heptanol:20% 4,6-dimethyl-2-heptanol blend DIBC 144.26 66.4 0.809
4-methyl-2-pentanol MIBC 102.18 16,400 0.802 2-ethyl-1-hexanol 2EH 130.23 700 0.834
4-methyl cyclohexane methanol F-1 128.21 2024 1.0176 n-butyl-3-hydroxybutyrate F-2 160.21 39,000 0.989
2-ethylhexyl-3-hydroxybutyrate F-3 216.32 223.6 0.947 2,2,4-trimethyl-1,3-pentanediol
monoisobutyrate F-4 216.32 321.5 0.945
2.3. Physical Properties Measurement
In addition to the properties provided by the chemical vendors (Table 1), laboratory experimental tests were further conducted to determine supplemental characteristics of the nine frothers, which included their hydrophilic–lipophilic balance (HLB) values, surface-active properties, and foamability. As known, the HLB value is a measure of the degree to which a surfactant is hydrophilic or lipophilic, was determined according to Davies’ method [34] following the equation given below:
HLB = 7 + 𝐻 − n × 0.475 (1)
where m is the number of hydrophilic groups in the molecule, and Hi and n the corresponding group number of the ith hydrophilic group and the number of the lipophilic groups in the molecule, respectively.
Surface-active properties of various frothers were determined by measuring the inter-facial surface tension of the solutions, which were prepared by mixing the frothers with distilled water at different concentrations. A surface tensiometer (Fisher Tensiometer Model 20, Fisher Scientific,
Figure 1. Chemical structures of the nine evaluated frothers.
Table 1. Physical properties of all the nine evaluated frothers.
Material Code MolecularWeight, g/mole
Water Solubility,mg/L
Density(25 ◦C), g/mL
2-pentanol MPC 88.15 44,600 0.8122-heptanol MAC 116.21 3270 0.817
80% 2,6-dimethyl-4-heptanol:20%4,6-dimethyl-2-heptanol blend DIBC 144.26 66.4 0.809
4-methyl-2-pentanol MIBC 102.18 16,400 0.8022-ethyl-1-hexanol 2EH 130.23 700 0.834
4-methyl cyclohexane methanol F-1 128.21 2024 1.0176n-butyl-3-hydroxybutyrate F-2 160.21 39,000 0.989
2-ethylhexyl-3-hydroxybutyrate F-3 216.32 223.6 0.9472,2,4-trimethyl-1,3-pentanediol
monoisobutyrate F-4 216.32 321.5 0.945
2.3. Physical Properties Measurement
In addition to the properties provided by the chemical vendors (Table 1), laboratory experimentaltests were further conducted to determine supplemental characteristics of the nine frothers, whichincluded their hydrophilic–lipophilic balance (HLB) values, surface-active properties, and foamability.As known, the HLB value is a measure of the degree to which a surfactant is hydrophilic or lipophilic,was determined according to Davies’ method [34] following the equation given below:
HLB = 7 +m∑
i=1
Hi − n× 0.475 (1)
where m is the number of hydrophilic groups in the molecule, and Hi and n the correspondinggroup number of the ith hydrophilic group and the number of the lipophilic groups in themolecule, respectively.
Surface-active properties of various frothers were determined by measuring the inter-facial surfacetension of the solutions, which were prepared by mixing the frothers with distilled water at differentconcentrations. A surface tensiometer (Fisher Tensiometer Model 20, Fisher Scientific, Hampton, NH,
Minerals 2019, 9, 590 4 of 17
USA) that employed the ring method was used to conduct the tests. A platinum-iridium ring wasutilized during the measurement at a controlled temperature of 25 ◦C. The tensiometer was calibratedwith pure methanol solutions of various concentrations and known surface tensions. The accuracywas further checked using distilled water. The surface-active properties of the tested frothers wereexpressed as their capability to reduce the air-water interfacial surface tension in mN/m per ppm ofthe tested frother. Furthermore, the foamability of the frothers were studied in accordance with themethod described by Gupta et al. [5] using a graduated glass burette (2.5 cm in diameter and 50 cm inheight), which was fitted with a glass frit and connected to a mercury manometer and air compressor.Detailed operating procedures can be referred to the early study by Gupta et al. [5], and the foamabilityof the tested frothers are expressed as the froth height generated per unit concentration in mm/ppm.
2.4. Column Flotation Apparatus
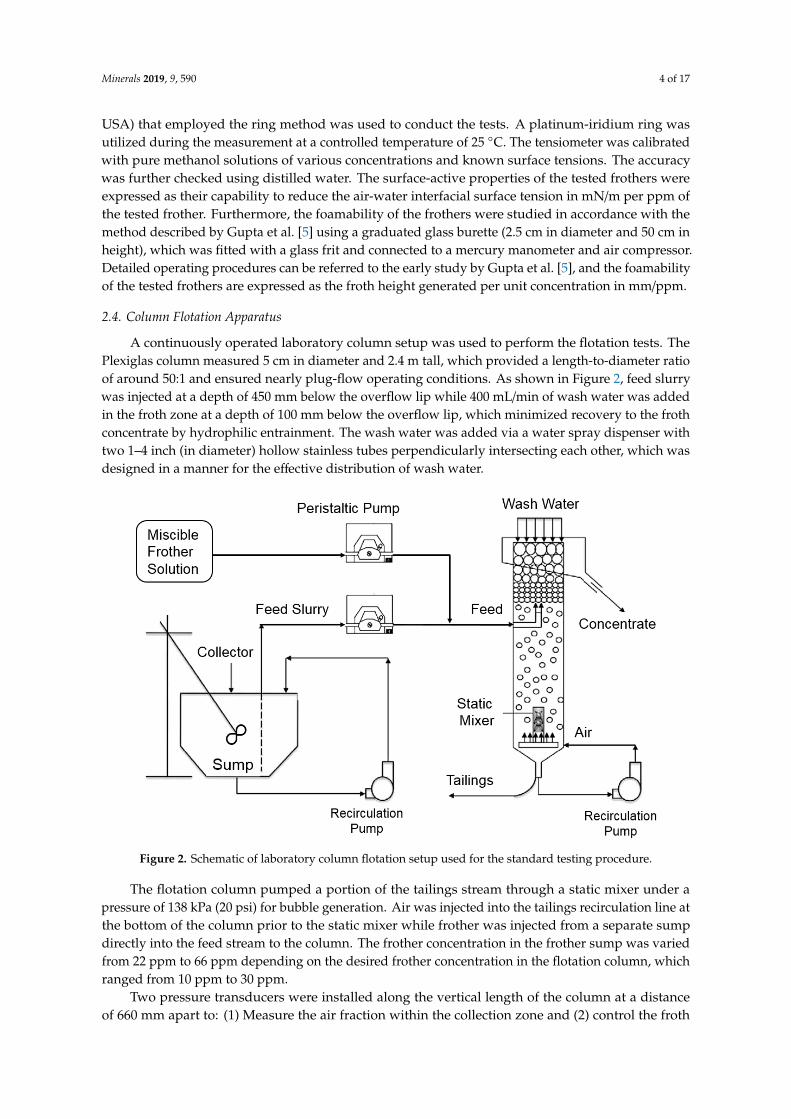
A continuously operated laboratory column setup was used to perform the flotation tests. ThePlexiglas column measured 5 cm in diameter and 2.4 m tall, which provided a length-to-diameter ratioof around 50:1 and ensured nearly plug-flow operating conditions. As shown in Figure 2, feed slurrywas injected at a depth of 450 mm below the overflow lip while 400 mL/min of wash water was addedin the froth zone at a depth of 100 mm below the overflow lip, which minimized recovery to the frothconcentrate by hydrophilic entrainment. The wash water was added via a water spray dispenser withtwo 1–4 inch (in diameter) hollow stainless tubes perpendicularly intersecting each other, which wasdesigned in a manner for the effective distribution of wash water.
Figure 2. Schematic of laboratory column flotation setup used for the standard testing procedure.
2.5. Flotation Release Analysis
A flotation release analysis was conducted on a representative coal sample to establish the ultimate separation performance achievable by froth flotation. For this test, Fuel Oil No. 2 was used as a collector and MIBC was used as the frother. The test was conducted in two phases. The first phase involved floating the coal in a laboratory batch Denver conventional cell until all o f the floatable material was recovered. The tailings from the first stage of flotation were stored in a bucket and the concentrate placed back into the flotation cell to repeat the process. Three stages of flotation were used in the first phase to eliminate all of the hydraulically entrainable particles.
In the second phase, the final concentrate obtained from the first phase was floated under starvation conditions using low aeration rates and agitation speeds. The concentrate collected under this condition contained the lowest amount of ash-bearing material. The air rate was slightly increased along with the impeller speed to collect the next fraction, which contained a higher amount of ash material. This process was repeated to produce a sufficient number of data points to generate a recovery versus product ash relationship under the ultimate flotation condition.
The release analysis results for the Lower Kittanning coal are shown in Table 2. The data suggest that the coal is relatively easy-to-float and has good liberation characteristics as indicated by a relatively consistent low ash product over a range of mass yield values. The flotation data indicated that the ultimate performance would yield a clean coal concentrate containing 9.4% ash while recovering 79.2% of the combustible material.
Table 2. Release analysis results for ultrafine Lower Kittanning coal.
Sample I.D.
Incremental Cumulative
Weight (%) Ash (%) Weight (%) Ash (%) Combustible
Recovery (%) P1 2.48 5.57 2.48 5.57 4.54 P2 3.50 5.60 5.98 5.59 10.94 P3 6.76 6.00 12.74 5.81 23.25 P4 5.04 6.02 17.79 5.87 32.43 P5 6.04 6.36 23.82 5.99 43.37 P6 5.29 7.50 29.11 6.27 52.85
Figure 2. Schematic of laboratory column flotation setup used for the standard testing procedure.
The flotation column pumped a portion of the tailings stream through a static mixer under apressure of 138 kPa (20 psi) for bubble generation. Air was injected into the tailings recirculation line atthe bottom of the column prior to the static mixer while frother was injected from a separate sumpdirectly into the feed stream to the column. The frother concentration in the frother sump was variedfrom 22 ppm to 66 ppm depending on the desired frother concentration in the flotation column, whichranged from 10 ppm to 30 ppm.
Two pressure transducers were installed along the vertical length of the column at a distanceof 660 mm apart to: (1) Measure the air fraction within the collection zone and (2) control the froth
Minerals 2019, 9, 590 5 of 17
depth at a constant value of 356 mm. The air fraction of the collection zone was calculated according toEquation (2):
ε = 1−ρwater × ∆h
ppulp × L(2)
where ε is the air fraction, pwater the density of water, ppulp the density of slurry pulp, ∆h the differencein the pressure transducer readings in millimeters of the water head, and L the physical distancebetween the two transducers.
The lower transducer, which was located 1420 mm below the column overflow lip, provided ameasurement of pressure that reflected the froth zone level in the column. A controller received thesignal from the transducer and controlled a pinch valve located in the column tailings line to maintainthe froth level at the pre-set value of 356 mm. Measurements were taken of the tailings volumetric flowrate during each experiment to allow a calculation of the percentage of the wash water reporting to thetailings stream (i.e., bias factor, BF) according to Equation (3):
BF =QT −QF
QW× 100 (3)
where QT, QF, and QW are the volumetric flow rate of tailings, feed, and wash water, separately. A biasfactor of 60% is typically used to minimize the negative impacts of hydraulic entrainment. If the biasfactor was too low, an increase in froth depth was required. However, it was desired to keep the frothdepth and the collection zone volume constant for the entire test program. By maintaining a constantfroth depth of 356 mm, bias factor variations occurred that reflected the characteristics of the frothertype due to the influence on the bubble size distribution and froth stability.
2.5. Flotation Release Analysis
A flotation release analysis was conducted on a representative coal sample to establish the ultimateseparation performance achievable by froth flotation. For this test, Fuel Oil No. 2 was used as acollector and MIBC was used as the frother. The test was conducted in two phases. The first phaseinvolved floating the coal in a laboratory batch Denver conventional cell until all of the floatablematerial was recovered. The tailings from the first stage of flotation were stored in a bucket and theconcentrate placed back into the flotation cell to repeat the process. Three stages of flotation were usedin the first phase to eliminate all of the hydraulically entrainable particles.
In the second phase, the final concentrate obtained from the first phase was floated understarvation conditions using low aeration rates and agitation speeds. The concentrate collected underthis condition contained the lowest amount of ash-bearing material. The air rate was slightly increasedalong with the impeller speed to collect the next fraction, which contained a higher amount of ashmaterial. This process was repeated to produce a sufficient number of data points to generate a recoveryversus product ash relationship under the ultimate flotation condition.
The release analysis results for the Lower Kittanning coal are shown in Table 2. The data suggestthat the coal is relatively easy-to-float and has good liberation characteristics as indicated by a relativelyconsistent low ash product over a range of mass yield values. The flotation data indicated that theultimate performance would yield a clean coal concentrate containing 9.4% ash while recovering 79.2%of the combustible material.
Minerals 2019, 9, 590 6 of 17
Table 2. Release analysis results for ultrafine Lower Kittanning coal.
Sample I.D.Incremental Cumulative
Weight (%) Ash (%) Weight (%) Ash (%) CombustibleRecovery (%)
P1 2.48 5.57 2.48 5.57 4.54P2 3.50 5.60 5.98 5.59 10.94P3 6.76 6.00 12.74 5.81 23.25P4 5.04 6.02 17.79 5.87 32.43P5 6.04 6.36 23.82 5.99 43.37P6 5.29 7.50 29.11 6.27 52.85P7 3.23 8.73 32.35 6.51 58.57P8 2.12 10.04 34.47 6.73 62.27P9 3.34 12.32 37.81 7.22 67.93P10 7.32 20.45 45.13 9.37 79.22P11 8.17 42.64 53.30 14.47 88.30P12 0.35 76.07 53.65 14.87 88.46P13 9.44 77.74 63.09 24.28 92.53
Tailing 36.91 89.55 100.00 48.37 100.00
Total 100.00 48.37
2.6. Column Flotation Tests
Prior to each test, the frother solution was prepared by adding the near pure frother into tap waterat a quantity that provided a concentration ranging from 22 ppm to 66 ppm (dependent on the finalfrother concentration target) followed by mixing in a high shear blender. The blended dilute frothersolution was then added to the frother sump shown in Figure 2.
Initial froth flotation tests involved identifying the volumetric feed flow rate that resulted in anear optimum separation performance (i.e., maximum coal recovery and ash rejection). The feed flowrate was varied from 300 mL/min to 2000 mL/min at a constant feed solids concentration of 5% byweight. The optimum feed volumetric flow rate was determined to be 1000 mL/min. As such, all of thefrother evaluation experiments were conducted at a constant feed volumetric flow rate of 1000 mL/minand solids content of 5% by weight.
The feed coal slurry was conditioned with fuel oil No. 2 at a concentration of 0.125 kg/t fora period of 15 min. The test was initiated by turning on the gas flow to the column to achieve asuperficial gas velocity of 1.67 cm/s. As aforementioned, it was desired to maintain a constant frothdepth (356 mm) as well a superficial gas velocity (1.67 cm/s) for the purpose of assessing the effectsof various frothers on the froth flotation performance. It is understood that in practice, an optimumseparation can be achieved by plant operators by varying the froth depth and superficial gas velocity.Wash water was then added at a rate of 400 mL/min to fill the column. When the column was full,the bubble generation pump was turned on and the speed adjusted to achieve a 138 kPa (20 psi) feedpressure into the static mixer. The controller was set to achieve the desired froth level. Next, the feedslurry and frother pumps were started and adjusted to provide a combined flow rate of 1000 mL/minentering the column through the feed port. Steady-state operation was ensured before taking samplesof the concentrate and tailings by allowing a time equal to three volumetric retention times after anychange to the column operation. After collecting the samples, the tailings flow rate was measured andthe bias factor was calculated and recorded. The pressure transducers’ readings were also recorded toquantify the air fraction within the collection zone. Detailed operational parameters for the laboratorycolumn flotation tests are summarized in Table 3.
Minerals 2019, 9, 590 7 of 17
Table 3. Operational parameters for laboratory column flotation tests.
Feed Flow Rate 1000 mL/min
Wash Water Flowrate 400 mL/minSolids Content 5 wt. %
Superficial Air Velocities 1.67 cm/sFroth Height 356 mm
Collector Dosage 0.125 kg/tSolution pH ~7
Samples of the feed, clean coal concentrate, and tailings were collected, filtered, dried, andweighed. The dried samples were analyzed for ash content using a LECO proximate analyzer (St.Joseph, MI, USA). Mass yield was determined using the two-product equation, which was based onmass and component balance equations and the ash content of the three streams. Combustible and ashrecovery values were determined from the yield and ash contents while the differences in the recoveryvalues represented the separation efficiency.
3. Results and Discussion
3.1. Physical Properties Evaluation
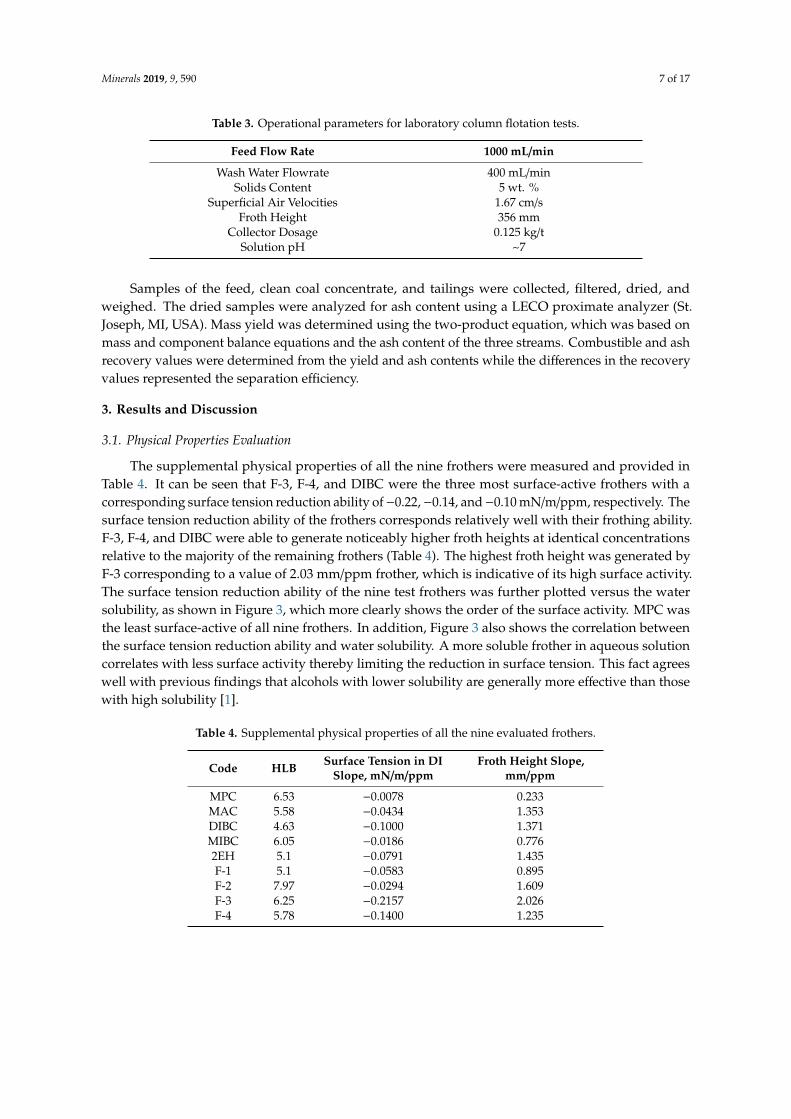
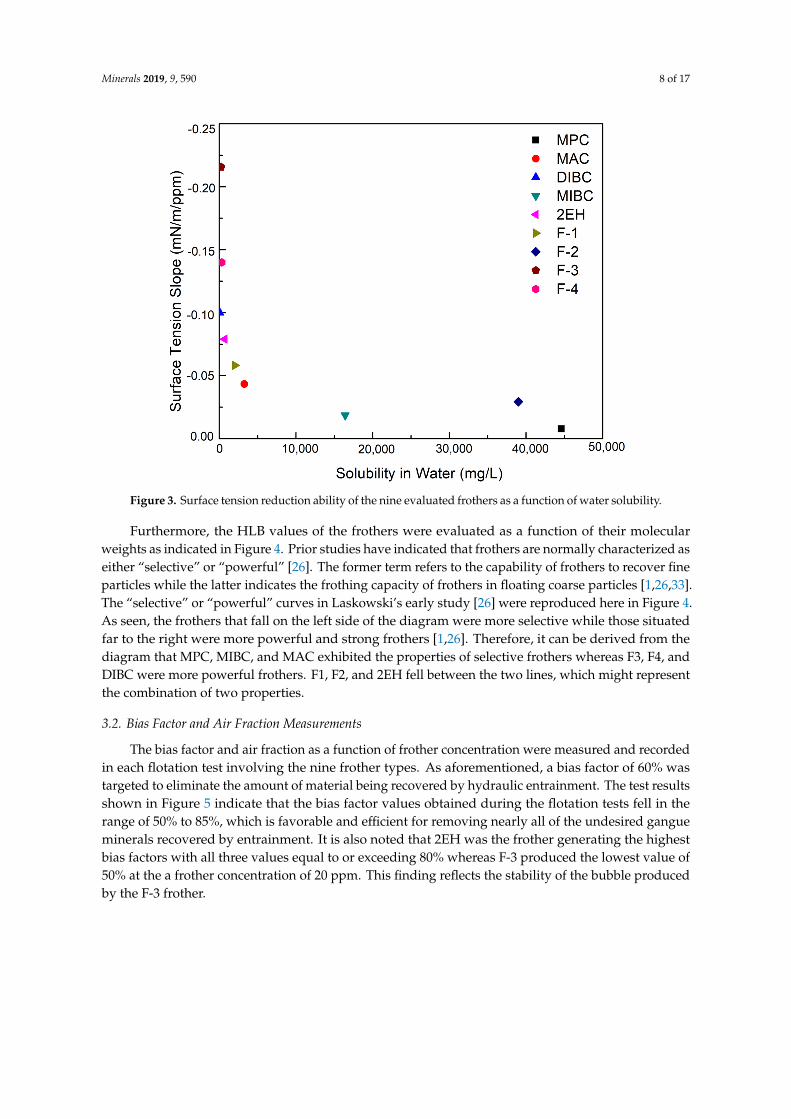
The supplemental physical properties of all the nine frothers were measured and provided inTable 4. It can be seen that F-3, F-4, and DIBC were the three most surface-active frothers with acorresponding surface tension reduction ability of−0.22,−0.14, and−0.10 mN/m/ppm, respectively. Thesurface tension reduction ability of the frothers corresponds relatively well with their frothing ability.F-3, F-4, and DIBC were able to generate noticeably higher froth heights at identical concentrationsrelative to the majority of the remaining frothers (Table 4). The highest froth height was generated byF-3 corresponding to a value of 2.03 mm/ppm frother, which is indicative of its high surface activity.The surface tension reduction ability of the nine test frothers was further plotted versus the watersolubility, as shown in Figure 3, which more clearly shows the order of the surface activity. MPC wasthe least surface-active of all nine frothers. In addition, Figure 3 also shows the correlation betweenthe surface tension reduction ability and water solubility. A more soluble frother in aqueous solutioncorrelates with less surface activity thereby limiting the reduction in surface tension. This fact agreeswell with previous findings that alcohols with lower solubility are generally more effective than thosewith high solubility [1].
Table 4. Supplemental physical properties of all the nine evaluated frothers.
Code HLB Surface Tension in DISlope, mN/m/ppm
Froth Height Slope,mm/ppm
MPC 6.53 −0.0078 0.233MAC 5.58 −0.0434 1.353DIBC 4.63 −0.1000 1.371MIBC 6.05 −0.0186 0.7762EH 5.1 −0.0791 1.435F-1 5.1 −0.0583 0.895F-2 7.97 −0.0294 1.609F-3 6.25 −0.2157 2.026F-4 5.78 −0.1400 1.235
Minerals 2019, 9, 590 8 of 17
Figure 3. Surface tension reduction ability of the nine evaluated frothers as a function of water solubility.
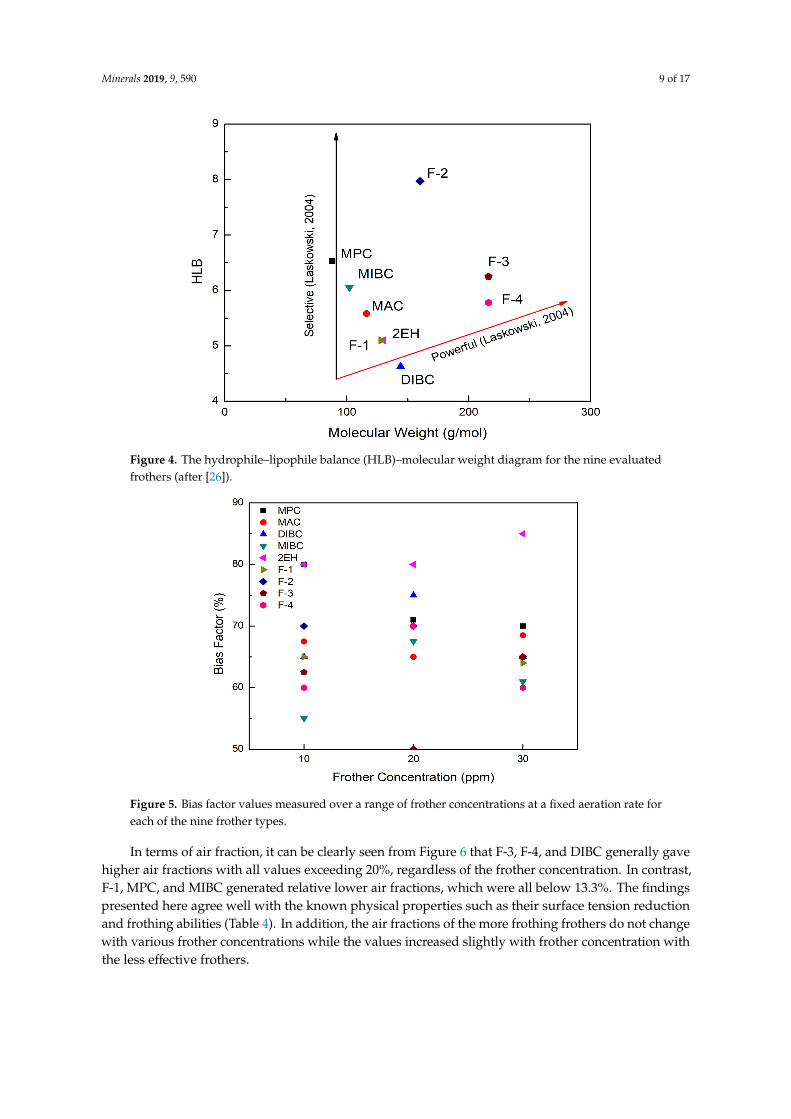
Furthermore, the HLB values of the frothers were evaluated as a function of their molecular weights as indicated in Figure 4. Prior studies have indicated that frothers are normally characterized as either “selective” or “powerful” [26]. The former term refers to the capability of frothers to recover fine particles while the latter indicates the frothing capacity of frothers in floating coarse particles [1,26,33]. The “selective” or “powerful” curves in Laskowski’s early study [26] were reproduced here in Figure 4. As seen, the frothers that fall on the left side of the diagram were more selective while those situated far to the right were more powerful and strong frothers [1,26]. Therefore, it can be derived from the diagram that MPC, MIBC, and MAC exhibited the properties of selective frothers whereas F3, F4, and DIBC were more powerful frothers. F1, F2, and 2EH fell between the two lines, which might represent the combination of two properties.
Figure 3. Surface tension reduction ability of the nine evaluated frothers as a function of water solubility.
Furthermore, the HLB values of the frothers were evaluated as a function of their molecularweights as indicated in Figure 4. Prior studies have indicated that frothers are normally characterized aseither “selective” or “powerful” [26]. The former term refers to the capability of frothers to recover fineparticles while the latter indicates the frothing capacity of frothers in floating coarse particles [1,26,33].The “selective” or “powerful” curves in Laskowski’s early study [26] were reproduced here in Figure 4.As seen, the frothers that fall on the left side of the diagram were more selective while those situatedfar to the right were more powerful and strong frothers [1,26]. Therefore, it can be derived from thediagram that MPC, MIBC, and MAC exhibited the properties of selective frothers whereas F3, F4, andDIBC were more powerful frothers. F1, F2, and 2EH fell between the two lines, which might representthe combination of two properties.
3.2. Bias Factor and Air Fraction Measurements
The bias factor and air fraction as a function of frother concentration were measured and recordedin each flotation test involving the nine frother types. As aforementioned, a bias factor of 60% wastargeted to eliminate the amount of material being recovered by hydraulic entrainment. The test resultsshown in Figure 5 indicate that the bias factor values obtained during the flotation tests fell in therange of 50% to 85%, which is favorable and efficient for removing nearly all of the undesired gangueminerals recovered by entrainment. It is also noted that 2EH was the frother generating the highestbias factors with all three values equal to or exceeding 80% whereas F-3 produced the lowest value of50% at the a frother concentration of 20 ppm. This finding reflects the stability of the bubble producedby the F-3 frother.
Minerals 2019, 9, 590 9 of 17
Figure 4. The hydrophile–lipophile balance (HLB)–molecular weight diagram for the nine evaluated frothers (after [26]).
3.2. Bias Factor and Air Fraction Measurements
The bias factor and air fraction as a function of frother concentration were measured and recorded in each flotation test involving the nine frother types. As aforementioned, a bias factor of 60% was targeted to eliminate the amount of material being recovered by hydraulic entrainment. The test results shown in Figure 5 indicate that the bias factor values obtained during the flotation tests fell in the range of 50% to 85%, which is favorable and efficient for removing nearly all of the undesired gangue minerals recovered by entrainment. It is also noted that 2EH was the frother generating the highest bias factors with all three values equal to or exceeding 80% whereas F-3 produced the lowest value of 50% at the a frother concentration of 20 ppm. This finding reflects the stability of the bubble produced by the F-3 frother.
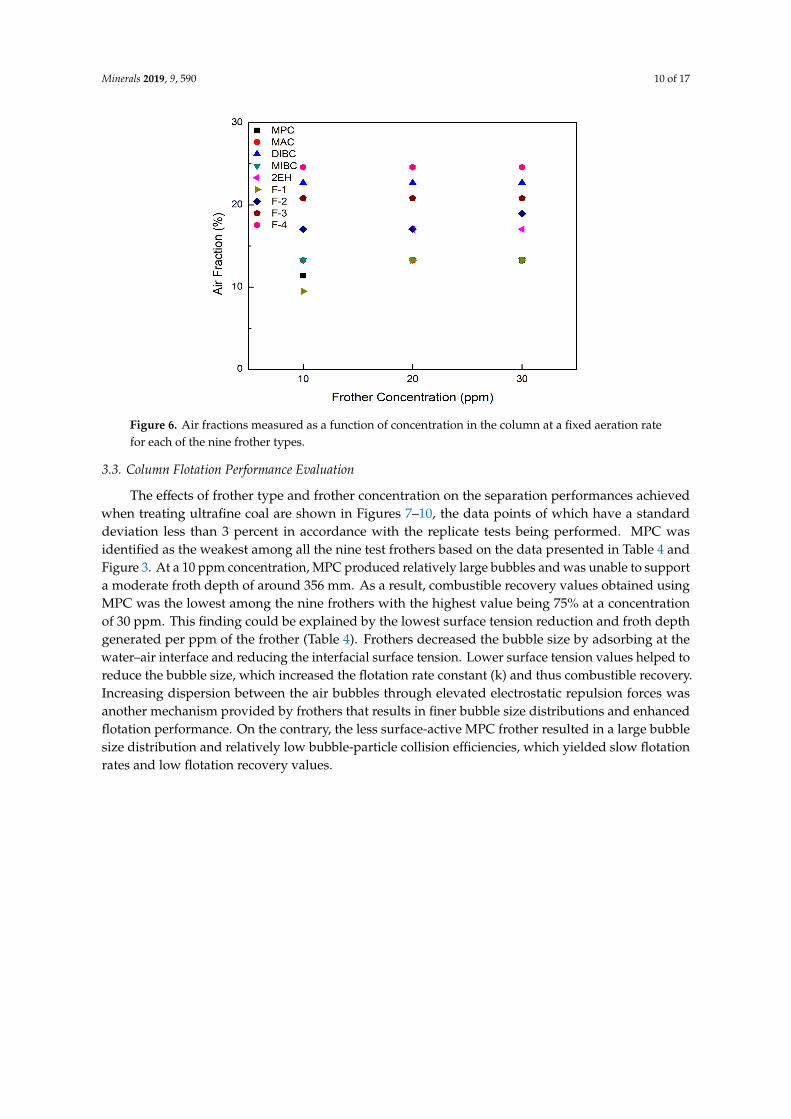
In terms of air fraction, it can be clearly seen from Figure 6 that F-3, F-4, and DIBC generally gave higher air fractions with all values exceeding 20%, regardless of the frother concentration. In contrast, F-1, MPC, and MIBC generated relative lower air fractions, which were all below 13.3%. The findings presented here agree well with the known physical properties such as their surface tension reduction and frothing abilities (Table 4). In addition, the air fractions of the more frothing frothers do not change with various frother concentrations while the values increased slightly with frother concentration with the less effective frothers.
Figure 4. The hydrophile–lipophile balance (HLB)–molecular weight diagram for the nine evaluatedfrothers (after [26]).
Figure 5. Bias factor values measured over a range of frother concentrations at a fixed aeration rate for each of the nine frother types.
Figure 6. Air fractions measured as a function of concentration in the column at a fixed aeration rate for each of the nine frother types.
3.3. Column Flotation Performance Evaluation
The effects of frother type and frother concentration on the separation performances achieved when treating ultrafine coal are shown in Figures 7–10, the data points of which have a standard deviation less than 3 percent in accordance with the replicate tests being performed. MPC was identified as the weakest among all the nine test frothers based on the data presented in Table 4 and
Figure 5. Bias factor values measured over a range of frother concentrations at a fixed aeration rate foreach of the nine frother types.
In terms of air fraction, it can be clearly seen from Figure 6 that F-3, F-4, and DIBC generally gavehigher air fractions with all values exceeding 20%, regardless of the frother concentration. In contrast,F-1, MPC, and MIBC generated relative lower air fractions, which were all below 13.3%. The findingspresented here agree well with the known physical properties such as their surface tension reductionand frothing abilities (Table 4). In addition, the air fractions of the more frothing frothers do not changewith various frother concentrations while the values increased slightly with frother concentration withthe less effective frothers.
Minerals 2019, 9, 590 10 of 17
Figure 5. Bias factor values measured over a range of frother concentrations at a fixed aeration rate for each of the nine frother types.
Figure 6. Air fractions measured as a function of concentration in the column at a fixed aeration rate for each of the nine frother types.
3.3. Column Flotation Performance Evaluation
The effects of frother type and frother concentration on the separation performances achieved when treating ultrafine coal are shown in Figures 7–10, the data points of which have a standard deviation less than 3 percent in accordance with the replicate tests being performed. MPC was identified as the weakest among all the nine test frothers based on the data presented in Table 4 and
Figure 6. Air fractions measured as a function of concentration in the column at a fixed aeration ratefor each of the nine frother types.
3.3. Column Flotation Performance Evaluation
The effects of frother type and frother concentration on the separation performances achievedwhen treating ultrafine coal are shown in Figures 7–10, the data points of which have a standarddeviation less than 3 percent in accordance with the replicate tests being performed. MPC wasidentified as the weakest among all the nine test frothers based on the data presented in Table 4 andFigure 3. At a 10 ppm concentration, MPC produced relatively large bubbles and was unable to supporta moderate froth depth of around 356 mm. As a result, combustible recovery values obtained usingMPC was the lowest among the nine frothers with the highest value being 75% at a concentrationof 30 ppm. This finding could be explained by the lowest surface tension reduction and froth depthgenerated per ppm of the frother (Table 4). Frothers decreased the bubble size by adsorbing at thewater–air interface and reducing the interfacial surface tension. Lower surface tension values helped toreduce the bubble size, which increased the flotation rate constant (k) and thus combustible recovery.Increasing dispersion between the air bubbles through elevated electrostatic repulsion forces wasanother mechanism provided by frothers that results in finer bubble size distributions and enhancedflotation performance. On the contrary, the less surface-active MPC frother resulted in a large bubblesize distribution and relatively low bubble-particle collision efficiencies, which yielded slow flotationrates and low flotation recovery values.
Minerals 2019, 9, 590 11 of 17
Figure 3. At a 10 ppm concentration, MPC produced relatively large bubbles and was unable to support a moderate froth depth of around 356 mm. As a result, combustible recovery values obtained using MPC was the lowest among the nine frothers with the highest value being 75% at a concentration of 30 ppm. This finding could be explained by the lowest surface tension reduction and froth depth generated per ppm of the frother (Table 4). Frothers decreased the bubble size by adsorbing at the water–air interface and reducing the interfacial surface tension. Lower surface tension values helped to reduce the bubble size, which increased the flotation rate constant (k) and thus combustible recovery. Increasing dispersion between the air bubbles through elevated electrostatic repulsion forces was another mechanism provided by frothers that results in finer bubble size distributions and enhanced flotation performance. On the contrary, the less surface-active MPC frother resulted in a large bubble size distribution and relatively low bubble-particle collision efficiencies, which yielded slow flotation rates and low flotation recovery values.
The selectivity provided by the MPC frother was excellent as indicated by the proximity of the separation performances to the ideal performance (release analysis) curve in Figure 9. This finding is likely due to low water recovery and low bubble-particle attachment efficiencies, which limited recovery to the highest grade particles. Similarly, MIBC produced relatively high grade concentrates with an ash content of around 8% and low recovery values. The combustible recovery value was below 80% when using MIBC at a 30 ppm frother concentration. Dry, brittle foams were observed during the column tests with MIBC, which were not ideal optimum flotation performances. It should be noted, however, that the performances of both MIBC and MPC were comparable to the ideal performance when producing low ash concentrates. This corresponds well with the fact that both MPC and MIBC were categorized by Laskowski’s classification [26] as “selective” (Figure 3). The results presented were also consistent with the fact that the aliphatic alcohol frothers containing 5–8 carbon atoms (Figure 1) tended to produce less persistent but more selective froth compared to other alcohol mixtures [1]. Lower volumetric feed flow rates would produce recovery values similar to the other seven frother types. However, weak frothers like MPC and MIBC lead to lower recovery values at high feed rates due to kinetic and carrying capacity limiting conditions.
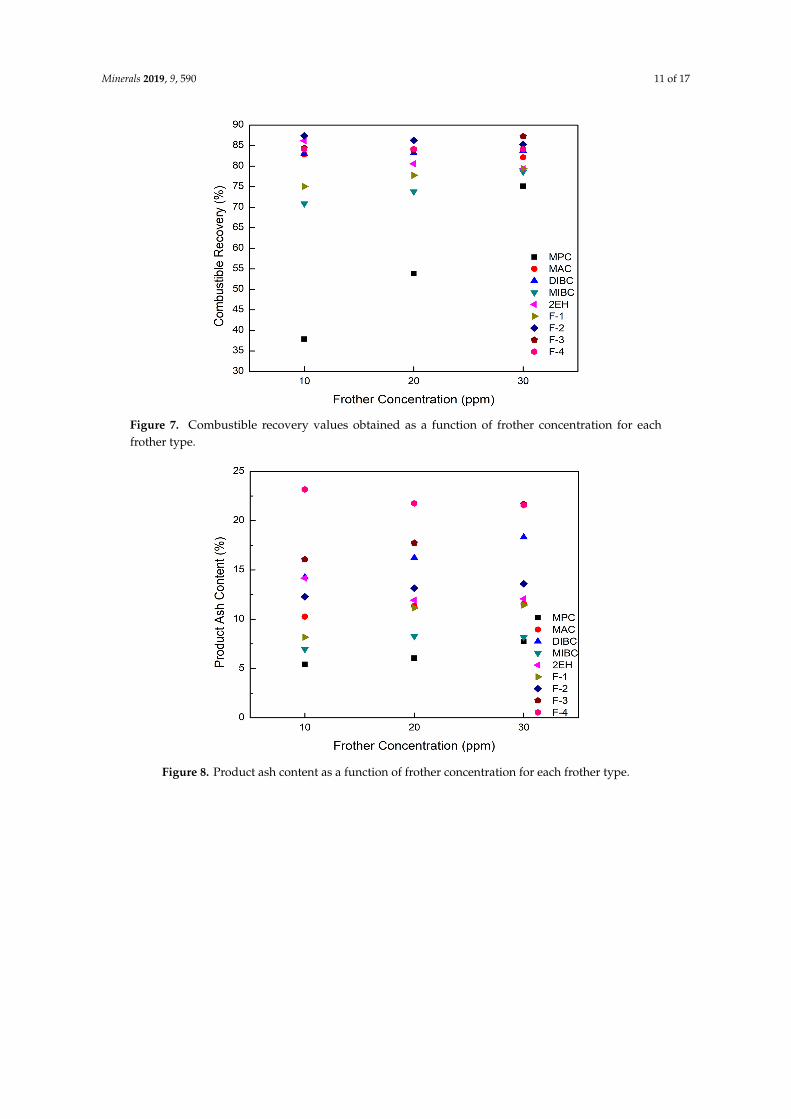
Figure 7. Combustible recovery values obtained as a function of frother concentration for each frother type.
Figure 7. Combustible recovery values obtained as a function of frother concentration for eachfrother type.
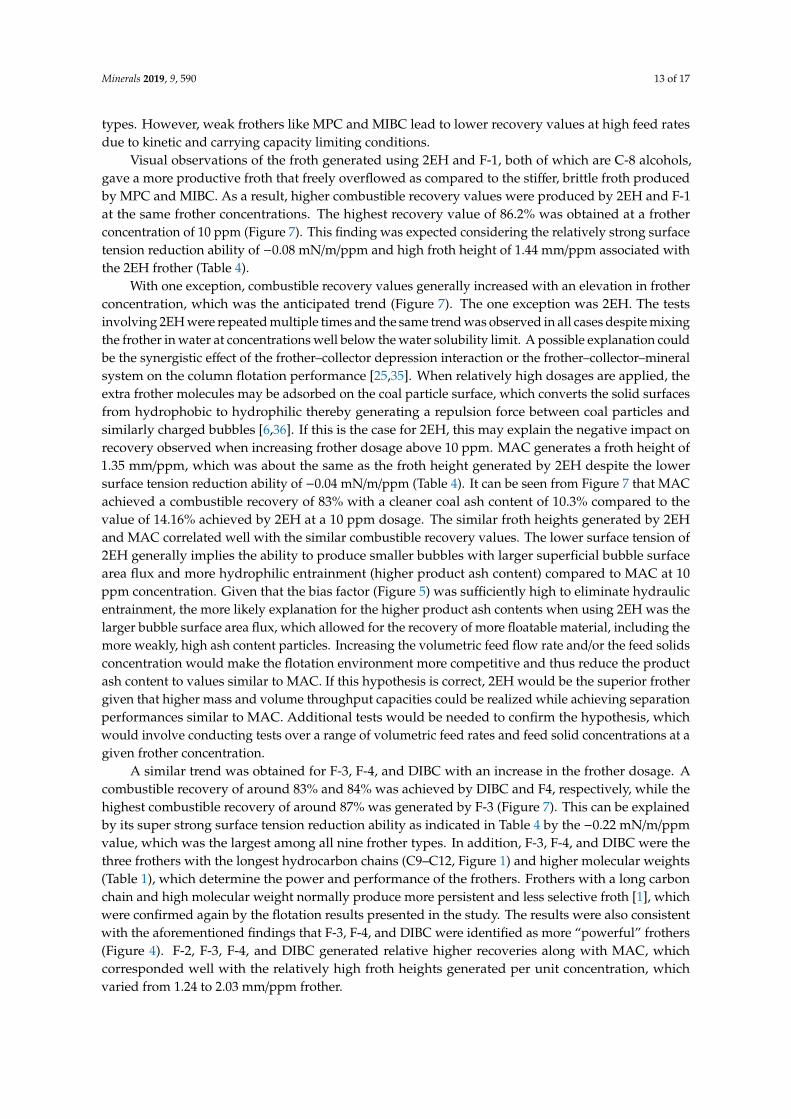
Figure 8. Product ash content as a function of frother concentration for each frother type.
Visual observations of the froth generated using 2EH and F-1, both of which are C-8 alcohols, gave a more productive froth that freely overflowed as compared to the stiffer, brittle froth produced by MPC and MIBC. As a result, higher combustible recovery values were produced by 2EH and F-1 at the same frother concentrations. The highest recovery value of 86.2% was obtained at a frother concentration of 10 ppm (Figure 7). This finding was expected considering the relatively strong surface tension reduction ability of −0.08 mN/m/ppm and high froth height of 1.44 mm/ppm associated with the 2EH frother (Table 4).
Figure 9. Combustible recovery of evaluated frothers as a function of clean coal ash; the solid line represents the results obtained from release analysis using MIBC as a frother.
Figure 8. Product ash content as a function of frother concentration for each frother type.

Minerals 2019, 9, 590 12 of 17
Figure 8. Product ash content as a function of frother concentration for each frother type.
Visual observations of the froth generated using 2EH and F-1, both of which are C-8 alcohols, gave a more productive froth that freely overflowed as compared to the stiffer, brittle froth produced by MPC and MIBC. As a result, higher combustible recovery values were produced by 2EH and F-1 at the same frother concentrations. The highest recovery value of 86.2% was obtained at a frother concentration of 10 ppm (Figure 7). This finding was expected considering the relatively strong surface tension reduction ability of −0.08 mN/m/ppm and high froth height of 1.44 mm/ppm associated with the 2EH frother (Table 4).
Figure 9. Combustible recovery of evaluated frothers as a function of clean coal ash; the solid line represents the results obtained from release analysis using MIBC as a frother.
Figure 9. Combustible recovery of evaluated frothers as a function of clean coal ash; the solid linerepresents the results obtained from release analysis using MIBC as a frother.
tests while the highest yields (>54%) were produced by F-2, F-3, and F-4. It is also noticed that F-2 and MAC produced a higher mass yield at the same clean coal ash content (<15%). In addition, the separation efficiency values achieved when using the nine frother types at different concentrations are shown in Figure 11 with the error bars representing one standard deviation of three replicate tests. The highest separation efficiency of around 72% was realized when using F-2 and MAC. A concentration of 10 ppm with 2EH performed in the same manner; however, a further increase in the dosage depressed both the recovery and separation efficiency.
Figure 10. Mass yield of evaluated frothers as a function of clean coal ash.
Figure 11. Separation efficiency of evaluated frothers as a function of frother concentration; error bars represent one standard deviation of three replicate tests.
Figure 10. Mass yield of evaluated frothers as a function of clean coal ash.
The selectivity provided by the MPC frother was excellent as indicated by the proximity of theseparation performances to the ideal performance (release analysis) curve in Figure 9. This findingis likely due to low water recovery and low bubble-particle attachment efficiencies, which limitedrecovery to the highest grade particles. Similarly, MIBC produced relatively high grade concentrateswith an ash content of around 8% and low recovery values. The combustible recovery value was below80% when using MIBC at a 30 ppm frother concentration. Dry, brittle foams were observed during thecolumn tests with MIBC, which were not ideal optimum flotation performances. It should be noted,however, that the performances of both MIBC and MPC were comparable to the ideal performancewhen producing low ash concentrates. This corresponds well with the fact that both MPC and MIBCwere categorized by Laskowski’s classification [26] as “selective” (Figure 3). The results presented werealso consistent with the fact that the aliphatic alcohol frothers containing 5–8 carbon atoms (Figure 1)tended to produce less persistent but more selective froth compared to other alcohol mixtures [1].Lower volumetric feed flow rates would produce recovery values similar to the other seven frother
Minerals 2019, 9, 590 13 of 17
types. However, weak frothers like MPC and MIBC lead to lower recovery values at high feed ratesdue to kinetic and carrying capacity limiting conditions.
Visual observations of the froth generated using 2EH and F-1, both of which are C-8 alcohols,gave a more productive froth that freely overflowed as compared to the stiffer, brittle froth producedby MPC and MIBC. As a result, higher combustible recovery values were produced by 2EH and F-1at the same frother concentrations. The highest recovery value of 86.2% was obtained at a frotherconcentration of 10 ppm (Figure 7). This finding was expected considering the relatively strong surfacetension reduction ability of −0.08 mN/m/ppm and high froth height of 1.44 mm/ppm associated withthe 2EH frother (Table 4).
With one exception, combustible recovery values generally increased with an elevation in frotherconcentration, which was the anticipated trend (Figure 7). The one exception was 2EH. The testsinvolving 2EH were repeated multiple times and the same trend was observed in all cases despite mixingthe frother in water at concentrations well below the water solubility limit. A possible explanation couldbe the synergistic effect of the frother–collector depression interaction or the frother–collector–mineralsystem on the column flotation performance [25,35]. When relatively high dosages are applied, theextra frother molecules may be adsorbed on the coal particle surface, which converts the solid surfacesfrom hydrophobic to hydrophilic thereby generating a repulsion force between coal particles andsimilarly charged bubbles [6,36]. If this is the case for 2EH, this may explain the negative impact onrecovery observed when increasing frother dosage above 10 ppm. MAC generates a froth height of1.35 mm/ppm, which was about the same as the froth height generated by 2EH despite the lowersurface tension reduction ability of −0.04 mN/m/ppm (Table 4). It can be seen from Figure 7 that MACachieved a combustible recovery of 83% with a cleaner coal ash content of 10.3% compared to thevalue of 14.16% achieved by 2EH at a 10 ppm dosage. The similar froth heights generated by 2EHand MAC correlated well with the similar combustible recovery values. The lower surface tension of2EH generally implies the ability to produce smaller bubbles with larger superficial bubble surfacearea flux and more hydrophilic entrainment (higher product ash content) compared to MAC at 10ppm concentration. Given that the bias factor (Figure 5) was sufficiently high to eliminate hydraulicentrainment, the more likely explanation for the higher product ash contents when using 2EH was thelarger bubble surface area flux, which allowed for the recovery of more floatable material, including themore weakly, high ash content particles. Increasing the volumetric feed flow rate and/or the feed solidsconcentration would make the flotation environment more competitive and thus reduce the productash content to values similar to MAC. If this hypothesis is correct, 2EH would be the superior frothergiven that higher mass and volume throughput capacities could be realized while achieving separationperformances similar to MAC. Additional tests would be needed to confirm the hypothesis, whichwould involve conducting tests over a range of volumetric feed rates and feed solid concentrations at agiven frother concentration.
A similar trend was obtained for F-3, F-4, and DIBC with an increase in the frother dosage. Acombustible recovery of around 83% and 84% was achieved by DIBC and F4, respectively, while thehighest combustible recovery of around 87% was generated by F-3 (Figure 7). This can be explainedby its super strong surface tension reduction ability as indicated in Table 4 by the −0.22 mN/m/ppmvalue, which was the largest among all nine frother types. In addition, F-3, F-4, and DIBC were thethree frothers with the longest hydrocarbon chains (C9–C12, Figure 1) and higher molecular weights(Table 1), which determine the power and performance of the frothers. Frothers with a long carbonchain and high molecular weight normally produce more persistent and less selective froth [1], whichwere confirmed again by the flotation results presented in the study. The results were also consistentwith the aforementioned findings that F-3, F-4, and DIBC were identified as more “powerful” frothers(Figure 4). F-2, F-3, F-4, and DIBC generated relative higher recoveries along with MAC, whichcorresponded well with the relatively high froth heights generated per unit concentration, whichvaried from 1.24 to 2.03 mm/ppm frother.

Minerals 2019, 9, 590 14 of 17
It can be seen from Figure 8 that the corresponding clean coal ash of DIBC, F-3, and F-4 wasrelatively high ranging from 14.3% to 23.2%. This finding was likely due to the strong surface activityassociated with these three frother types (Table 4), which greatly reduced the bubble size and increasedthe superficial bubble surface area flux as explained for the 2EH frother. Visual observations indicatedthat these frother types produced the smallest bubble distributions, which was confirmed by thehighest air fraction values in the collection zone ranging from 20.8% to 24.6% (Figure 6). The relativelylower bias factors varying from 50% to 75% (Figure 5) suggests the stability of the froth produced bythose frother types. F-2 and MAC generated relatively cleaner coal products with ash content valuesranging from 10.3% to 13.6% while maintaining a high level of combustible recovery between 82% and87%. The flotation performances achieved when testing F-2 and MAC approached the release curveperformance as shown in Figure 9. The mass yield versus clean coal ash curve shown in Figure 10further indicates that MPC generated the lowest yield among all the tests while the highest yields(>54%) were produced by F-2, F-3, and F-4. It is also noticed that F-2 and MAC produced a highermass yield at the same clean coal ash content (<15%). In addition, the separation efficiency valuesachieved when using the nine frother types at different concentrations are shown in Figure 11 withthe error bars representing one standard deviation of three replicate tests. The highest separationefficiency of around 72% was realized when using F-2 and MAC. A concentration of 10 ppm with 2EHperformed in the same manner; however, a further increase in the dosage depressed both the recoveryand separation efficiency.
tests while the highest yields (>54%) were produced by F-2, F-3, and F-4. It is also noticed that F-2 and MAC produced a higher mass yield at the same clean coal ash content (<15%). In addition, the separation efficiency values achieved when using the nine frother types at different concentrations are shown in Figure 11 with the error bars representing one standard deviation of three replicate tests. The highest separation efficiency of around 72% was realized when using F-2 and MAC. A concentration of 10 ppm with 2EH performed in the same manner; however, a further increase in the dosage depressed both the recovery and separation efficiency.
Figure 10. Mass yield of evaluated frothers as a function of clean coal ash.
Figure 11. Separation efficiency of evaluated frothers as a function of frother concentration; error bars represent one standard deviation of three replicate tests. Figure 11. Separation efficiency of evaluated frothers as a function of frother concentration; error barsrepresent one standard deviation of three replicate tests.
The F-3, F-4, and DIBC frother types produced the highest product ash values among the ninefrothers tested. Given that the bias factors are well above the value that was considered critical foreliminating hydraulic entrainment (Figure 5), it was likely that the high bubble surface area fluxrates generated by using F-3, F-4, and DIBC resulted in the flotation of weakly hydrophobic, highash particles. To reject these particles, retention time could be reduced by increasing feed volumetricflow rate and higher feed solid concentrations could be introduced to the system to create a morecompetitive bubble-particle attachment environment. In other words, the use of F-3, F-4, or DIBC
Minerals 2019, 9, 590 15 of 17
frother types have the potential to increase the volumetric and mass throughput capacity of a givenflotation system while maintaining high recovery values. Further tests are needed to provide evidenceof this potential technical and economic benefit. Besides, it should be kept in mind that the flotationdifferences for various frothers were generated under the constrained experimental conditions (e.g.,fixed froth depth and superficial gas velocity) with one particular high-quality bituminous coal. Thedifferences could be overcome by varying the operating conditions to achieve optimum performancein terms of the mass yield and clean coal grade. Additional tests may be needed when switching to adifferent coal feedstock, which is of considerable significance from the practical standpoint; however, itis not the scope of the presented work.
4. Conclusions
The results of our study showed that MPC and MIBC produced the poorest performance among allthe nine frother types evaluated due to their weak froth properties. Test results also indicated F-1 was arelatively weak frother and higher concentrations than those tested were needed to boost its separationperformance. F-2 and MAC were proven to be excellent frother types providing optimum separationperformances at the mass and volumetric feed flow rates utilized in the test program. 2EH provideda comparable performance as F-2 and MAC at a concentration of 10 ppm. However, higher frotherconcentrations deteriorated performance as quantified by recovery and separation efficiency values.DIBC, F-3, and F-4 also proved to be excellent frothers as indicated by relatively high air fractionsin the collection zone, which resulted in a high level of recovery. However, the three frother typesproduced the highest clean coal ash content values among the nine frothers. Given that the bias factormeasured during each test involving the frother was sufficient to eliminate hydraulic entrainment, itmay be concluded that the high product ash contents were due to an excessive bubble surface areaflux, which resulted in the ability to float weakly hydrophobic, low grade particles. This finding meansthat flotation systems will be capable of treating higher volume and mass feed flow rates using DIBC,F-3, and F-4 compared to the other frothers. Furthermore, the separation performances achieved whenusing F-3 and F-4 frother types are far to the right of the MAC and F-2 performances on the recoveryversus product ash curve, which implies that the mass and volume feed flow rates will be significantlyhigher when using F-3 or F-4 frother types.
Specific findings from the present study are summarized as follows:
(1) The frothers that provided the weakest performances in terms of combustible recovery wereF-1, MIBC, and MPC in order of decreasing effectiveness.
(2) F-2 was consistently the stronger frother among the nine frothers tested over a 10 to 30 ppmconcentration range followed by 2EH and F-3.
(3) The tests with 2EH were repeated multiples times. In all cases, recovery decreased withan elevation in frother concentration. This response was obtained despite the froth concentrationbeing significantly below the water solubility limit. The performance at 10 ppm, however, yielded acombustible recovery value comparable to F-2.
(4) In regards to selectivity, F-2 and MAC provided the highest separation efficiency values, whichagreed well with Laskowski’s HLB–molecular weight diagram [26], according to which F-2 and MACare classified as more selective frothers.
(5) DIBC and F-3 frothers provided high recovery values. However, the product ash valuesobtained when using these two frothers were among the highest of the nine tested. The F-4 frotherprovided the highest ash content values. In the case of the three frothers, the bias factors weregenerally above 60%, which should be sufficient to eliminate the hydraulically entrained material.This is supported by the proximity of the separation performances to the ideal performance curvegenerated by release analyses. As such, we could conclude that the DIBC, F-3, and F-4 frothers mightprovide separation efficiency performances comparable to F-2 and MAC if the volumetric feed ratewas increased above the 1000 mL/min value used throughout the test program. If this hypothesis weretrue, the DIBC, F-3, and F-4 frothers provide the potential for higher volumetric throughput capacities,
Minerals 2019, 9, 590 16 of 17
which is important for retention time constrained flotation systems. Based on a relative comparison ofthe separation performance with the ideal recovery-product ash (release analysis) curve, the F-3 hasthe potential for treating the highest volumetric throughput capacities.
Author Contributions: Conceptualization, Q.H., X.Y. and R.Q.H.; methodology, Q.H., X.Y. and R.Q.H.; formalanalysis, Q.H., X.Y. and R.Q.H.; resources, Q.H., X.Y. and R.Q.H.; writing—original draft preparation, Q.H. andX.Y.; writing—review and editing, Q.H., X.Y. and R.Q.H.; supervision, R.Q.H.
Funding: This research received no external funding.
Conflicts of Interest: The authors declare no conflict of interest.
References
1. Khoshdast, H.; Sam, A. Flotation frothers: Review of their classifications, properties and preparation. OpenMiner. Process. J. 2011, 4, 25–44. [CrossRef]
2. Tan, Y.H.; Zhang, W.; Finch, J.A. Frother structure-property relationship: Effect of polyethylene glycols onbubble rise velocity. Miner. Eng. 2018, 116, 56–61. [CrossRef]
3. Leja, J.; Schulman, J.H. Flotation theory: Molecular interactions between frothers and collectors atsolid–liquid–air interfaces. Trans. AIME 1954, 199, 221–228.
4. Leja, J. Mechanisms of Collector Adsorption and Dynamic Attachment of Particles to Air Bubbles as Derivedfrom Surface-Chemical Studies. Trans. IMM 1956, 66, 425–437.
5. Gupta, A.K.; Banerjee, P.K.; Mishra, A.; Satish, P. Effect of alcohol and polyglycol ether frothers on foamstability, bubble size and coal flotation. Int. J. Miner. Process. 2007, 82, 126–137. [CrossRef]
6. Drzymala, J.; Kowalczuk, P. Classification of flotation frothers. Minerals 2018, 8, 53. [CrossRef]7. Cho, Y.S.; Laskowski, J.S. Effect of flotation frothers on bubble size and foam stability. Int. J. Miner. Process.
2002, 64, 69–80. [CrossRef]8. Cho, Y.S.; Laskowski, J.S. Bubble Coalescence and its effect on dynamic foamability. Can. J. Chem. Eng. 2002,
80, 299–305. [CrossRef]9. Laskowski, J.S. Fundamental properties of flotation frothers. In Proceedings of the 22nd International
Mineral Processing Congress, Cape Town, South Africa, 29 September 2003; Volume 2, pp. 788–797.10. Laskowski, J.S.; Cho, Y.S.; Ding, K. Effect of frothers on bubble size and foam stability in potash ore flotation
systems. Can. J. Chem. Eng. 2003, 81, 63–69. [CrossRef]11. Laskowski, J.S.; Tlhone, T.; Williams, P.; Ding, K. Fundamental properties of the polyoxypropylene alkyl
ether flotation frothers. Int. J. Miner. Process. 2003, 72, 289–299. [CrossRef]12. Grau, R.A.; Heiskanen, K. Bubble size distribution in laboratory scale flotation cells. Miner. Eng. 2005, 18,
1164–1172. [CrossRef]13. Melo, F.; Laskowski, J.S. Fundamental properties of flotation frothers and their effect on flotation. Miner. Eng.
2006, 19, 766–773. [CrossRef]14. Finch, J.A.; Nesset, J.E.; Acuña, C. Role of frother on bubble production and behaviour in flotation. Miner.
Eng. 2008, 21, 949–957. [CrossRef]15. Szyszka, D. Critical Coalescence Concentration (CCC) for surfactants in aqueous solutions. Minerals 2018, 8,
431. [CrossRef]16. Savassi, O.N.; Alexander, D.J.; Franzidis, J.P.; Manlapig, E.V. An empirical model for entrainment in industrial
flotation plants. Miner. Eng. 1998, 11, 243–256. [CrossRef]17. Yianatos, J.B.; Finch, J.A.; Laplante, A.R. Selectivity in column flotation froths. Int. J. Miner. Process. 1988, 23,
279–292. [CrossRef]18. Wang, L.; Peng, Y.; Runge, K. Entrainment in froth flotation: The degree of entrainment and its contributing
factors. Powder Technol. 2016, 288, 202–211. [CrossRef]19. Engelbrecht, J.A.; Woodburn, E.T. The Effects of Froth Height, Aeration Rate, and Gas Precipitation on Flotation;
Mintek: Randburg, South Africa, 1975.20. Lynch, A.J.; Johnson, N.W.; Manlapig, E.V.; Thorne, C.G. Mineral and Coal Flotation Circuits; Elsevier:
Amsterdam, The Netherlands, 1981; Volume 65, p. 305.21. Maachar, A.; Dobby, G.S. Measurement of feed water recovery and entrainment solids recovery in flotation
columns. Can. Metall. Q. 1992, 31, 167–172. [CrossRef]
Minerals 2019, 9, 590 17 of 17
22. Rahal, K.; Manlapig, E.; Franzidis, J.P. Effect of frother type and concentration on the water recovery andentrainment recovery relationship. Miner. Metall. Proc. 2001, 18, 138–141. [CrossRef]
23. Wang, L.; Peng, Y.; Runge, K. The mechanism responsible for the effect of frothers on the degree of entrainmentin laboratory batch flotation. Miner. Eng. 2017, 100, 124–131. [CrossRef]
24. Kursun, H. The influence of frother types and concentrations on fine particles’ entrainment using columnflotation. Sep. Sci. Technol. 2017, 52, 722–731. [CrossRef]
25. Subrahmanyam, T.V.; Forssberg, E. Froth stability, particle entrainment and drainage in flotation—A review.Int. J. Miner. Process. 1988, 23, 33–53. [CrossRef]
26. Laskowski, J.S. Testing flotation frothers. Fizykochem. Probl. Miner./Physicochem. Probl. Mi. 2004, 38, 13–22.27. Ata, S.; Ahmed, N.; Jameson, G.J. Collection of hydrophobic particles in the froth phase. Int. J. Miner. Process.
2002, 64, 101–122. [CrossRef]28. Ata, S.; Ahmed, N.; Jameson, G.J. A study of bubble coalescence in flotation froths. Int. J. Miner. Process.
2003, 72, 255–266. [CrossRef]29. Ata, S.; Ahmed, N.; Jameson, G.J. The effect of hydrophobicity on the drainage of gangue minerals in flotation
froths. Miner. Eng. 2004, 17, 897–901. [CrossRef]30. Bournival, G.; Souza, L.D.O.; Ata, S.; Wanless, E.J. Effect of alcohol frothing agents on the coalescence of
bubbles coated with hydrophobized silica particles. Chem. Eng. Sci. 2015, 131, 1–11. [CrossRef]31. Honaker, R.Q.; Saracoglu, M.; Huang, Q. Application of hydrophobic and magnetic plastic particles for
enhanced flotation recovery. Miner. Eng. 2016, 98, 223–231. [CrossRef]32. Honaker, R.; Saracoglu, M.; Huang, Q. Evaluation of a novel coal flotation improvement approach with the
addition of hydrophobic magnetic particles. Int. J. Coal Prep. Util. 2017, 1–17. [CrossRef]33. Pugh, R.J. Experimental techniques for studying the structure of foams and froths. Adv. Colloid Interfac. 2005,
114, 239–251. [CrossRef]34. Davies, J.T. A quantitative kinetic theory of emulsion type. I. Physical chemistry of the emulsifying agent.
In Proceedings of the International Congress of Surface Activity, London, UK, 8–12 April 1957; Volume 1,pp. 426–438.
35. El-Shall, H.; Abdel-Khalek, N.A.; Svoronos, S. Collector–frother interaction in column flotation of Floridaphosphate. Int. J. Miner. Process. 2000, 58, 187–199. [CrossRef]
36. Bueno-Tokunaga, A.; Pérez-Garibay, R.; Martínez-Carrillo, D. Zeta potential of air bubbles conditioned withtypical froth flotation reagents. Int. J. Miner. Process. 2015, 140, 50–57. [CrossRef]
© 2019 by the authors. Licensee MDPI, Basel, Switzerland. This article is an open accessarticle distributed under the terms and conditions of the Creative Commons Attribution(CC BY) license (http://creativecommons.org/licenses/by/4.0/).


