Embed Size (px)
Citation preview
Evaluating the impacts of longwall mine subsidence on vineyards in the Broke Region of New South Wales: The
challenges of analysing multi-scale field data
J. A. Thompson, Precision Agriculture Research Group, University of New England
P. S. Frazier, Precision Agriculture Research Group, University of New England
D. W. Lamb, Precision Agriculture Research Group, University of New England
Summary
This paper explores the impacts of longwall mine subsidence on vineyards in the Broke region
of the Upper Hunter Valley. The Broke region is a recognized viticultural subregion of the
Upper Hunter known for its white wine varietals of Chardonnay and Semillon and for its red
wine varietals of Cabernet Sauvignon, Merlot and Shiraz. Bulga Coal Management was
granted, the right to extend its extraction activities to seams beneath several vineyards in the
Region. The first vineyards were undermined in 2005, and by end of the mining lease, 9
vineyards totalling some 119 ha of vines will eventually be undermined several times. In 2003,
a long-term project was established to monitor the impacts of longwall mining on these
vineyards. Data were collected at different scales and at different times of year. As such, the
dataset is both multi-scaled and multi-temporal with at least 2 years of pre-mining records and
2 years post-mining records. In this paper we present the data collection strategy and proposed
analysis methods. The challenges of dealing with a highly variable, multi-temporal and multi-
scale data set are highlighted with particular attention given to the delineation of likely impact
zones resulting from subsidence.
1. Introduction
Situated near Singleton in the Upper Hunter
Valley and the villages of Broke and Bulga
is the Broke-Fordwich viticultural region.
This region was amongst the first areas to be
formally recognized as a separate
viticultural sub-region of the Hunter Valley.
In wine circles, it is known for its cv.
Chardonnay and cv. Semillon white
varietals and for its cv. Cabernet Sauvignon,
cv. Merlot and cv. Shiraz red varietals. In
recent years, several of its vineyards have
been singled out and recognized for their
award winning wines (Broke Fordwich
Tourism Association 2007).
In addition to being a unique sub-region of
the Hunter, the Broke-Fordwich region is
also unique in that viticultural activities
occur in close proximity to longwall coal
mining. Some nine vineyards in the region
are situated over active longwall mining
activities. In 2003, subterranean mining at
the Beltana Number 1 mine commenced,
and in 2005 the first vineyards were
undermined.
A long-term monitoring project designed to
monitor the impacts of longwall mine
subsidence (LWMS) on viticultural
production in the undermined vineyards also
commences in 2003. Monitoring data have
been collected at various scales and at
different times of the year, the data forming
a multi-scaled, multi-temporal data set. In
this paper we present: the design and
techniques associated with collecting the
monitoring data collection: results from the
exploratory phase of data analysis; and a
discussion of analysis procedures at the
vineyard block and whole vineyard scales.
2. Study Area
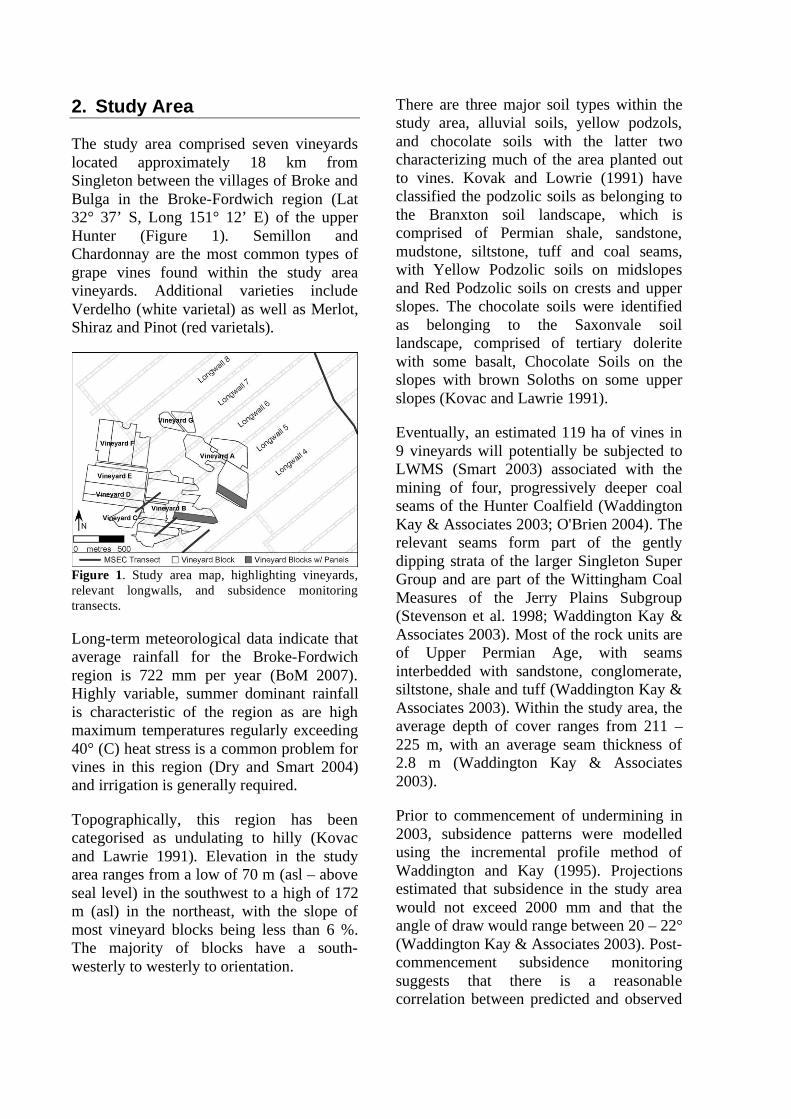
The study area comprised seven vineyards
located approximately 18 km from
Singleton between the villages of Broke and
Bulga in the Broke-Fordwich region (Lat
32° 37’ S, Long 151° 12’ E) of the upper
Hunter (Figure 1). Semillon and
Chardonnay are the most common types of
grape vines found within the study area
vineyards. Additional varieties include
Verdelho (white varietal) as well as Merlot,
Shiraz and Pinot (red varietals).
Figure 1. Study area map, highlighting vineyards,
relevant longwalls, and subsidence monitoring
transects.
Long-term meteorological data indicate that
average rainfall for the Broke-Fordwich
region is 722 mm per year (BoM 2007).
Highly variable, summer dominant rainfall
is characteristic of the region as are high
maximum temperatures regularly exceeding
40° (C) heat stress is a common problem for
vines in this region (Dry and Smart 2004)
and irrigation is generally required.
Topographically, this region has been
categorised as undulating to hilly (Kovac
and Lawrie 1991). Elevation in the study
area ranges from a low of 70 m (asl – above
seal level) in the southwest to a high of 172
m (asl) in the northeast, with the slope of
most vineyard blocks being less than 6 %.
The majority of blocks have a south-
westerly to westerly to orientation.
There are three major soil types within the
study area, alluvial soils, yellow podzols,
and chocolate soils with the latter two
characterizing much of the area planted out
to vines. Kovak and Lowrie (1991) have
classified the podzolic soils as belonging to
the Branxton soil landscape, which is
comprised of Permian shale, sandstone,
mudstone, siltstone, tuff and coal seams,
with Yellow Podzolic soils on midslopes
and Red Podzolic soils on crests and upper
slopes. The chocolate soils were identified
as belonging to the Saxonvale soil
landscape, comprised of tertiary dolerite
with some basalt, Chocolate Soils on the
slopes with brown Soloths on some upper
slopes (Kovac and Lawrie 1991).
Eventually, an estimated 119 ha of vines in
9 vineyards will potentially be subjected to
LWMS (Smart 2003) associated with the
mining of four, progressively deeper coal
seams of the Hunter Coalfield (Waddington
Kay & Associates 2003; O'Brien 2004). The
relevant seams form part of the gently
dipping strata of the larger Singleton Super
Group and are part of the Wittingham Coal
Measures of the Jerry Plains Subgroup
(Stevenson et al. 1998; Waddington Kay &
Associates 2003). Most of the rock units are
of Upper Permian Age, with seams
interbedded with sandstone, conglomerate,
siltstone, shale and tuff (Waddington Kay &
Associates 2003). Within the study area, the
average depth of cover ranges from 211 –
225 m, with an average seam thickness of
2.8 m (Waddington Kay & Associates
2003).
Prior to commencement of undermining in
2003, subsidence patterns were modelled
using the incremental profile method of
Waddington and Kay (1995). Projections
estimated that subsidence in the study area
would not exceed 2000 mm and that the
angle of draw would range between 20 – 22°
(Waddington Kay & Associates 2003). Post-
commencement subsidence monitoring
suggests that there is a reasonable
correlation between predicted and observed
subsidence under vineyards, with observed
values being less than the maximum
predicted subsidence in all cases (MSEC
2007). With the exceptions of longwalls 6
and 7, the actual draw angles were within
the predicted range. For longwalls 6 and 7,
the angles of draw were 26.5° and 28°
respectively (MSEC 2007).
3. Methods
To monitor the impacts of LWMS on
viticultural production a multi-scale, mutli-
temporal monitoring regime was developed
and implemented. A technical reference
group, consisting of mining company
representatives, academics, government
regulators and vignerons, designed the
survey regime (O'Brien 2004). As a result,
the study methodology encapsulates a
combination of industry standard viticultural
metrics, rigorous scientific methods, and
emerging research technologies. A sliding
window approach to data collection was
adopted, whereby data would be collected
for at least 2 years before and 2 years after
blocks were to be undermined. Hence, in
2003, two years before the first vineyards
blocks were undermined, data collection
commenced.
3.1. Vineyard Block Scale
Data were collected at the scale of
individual vineyard blocks. Monitoring at
this scale, hitherto referred to as panel
sampling, consisted of in-situ sampling of a
‘representative’ vine from every 2 - 3 panels
in ten adjacent rows for descriptors of grape
productivity including yield, 50 berry-
weight (50BW), number of bunches per vine
(2006 onwards), total soluble solids (°Brix),
titrateable acidity (TA) and pH. Descriptors
of vine biomass were also measured at
pruning time, including trunk diameter
(2005 onwards), mass of pruned foliage,
number of canes removed and number of
buds retained.
Initially, two vineyard blocks were selected
for monitoring; one comprised of cv.
Chardonnay (Vineyard A) and the other of
cv. Shiraz (Vineyard B). The cv.
Chardonnay block is located on a gently
sloped hillside (5% gradient) with a
vertically-shoot-positioned (VSP) trellising
system, while the cv. Shiraz is located on a
relatively flat block (1% gradient) with a
single-wire trellising system (Frazier et al.
2005). From each block, vines from ten
consecutive rows were selected and spatially
located using a differential global
positioning system (dGPS – Pro-XL,
Trimble, Sunnyvale, California USA). Vines
were selected based upon their relative
location to expected subsidence contours,
with care taken to ensure that areas between
the minium subsidence of the chain-pillars
and maximum subsidence associated with
the centre of longwall panels were well
represented. From 2006, panel data were
collected from three additional vineyard
sites (all belonging to Vineyard G), in
accordance with the sliding window
methodology described above.
3.2. Vineyard Scale
Continuous data were also collected at the
scale of entire vineyards. On-the-go yield
maps were acquired using a Braud self-
propelled grape harvester equipped with an
onboard FarmscanTM
yield monitor
(Farmscan, Perth, Western Australia,
Australia) and following the protocol of
Bramley and Williams (2001). In spite of
the fact that vine yield is seasonally
dependent, Bramley and Hamilton (2004)
have suggested that yield patterns in
vineyards may be temporally stable, in that
independent of the quality of the season,
some areas within a vineyard tend to be
better (or worse) producers in relation to
other areas.
Electromagnetic (EM38) soil surveys were
also conducted during both vine dormancy
(June) and post-harvest (February – March).
The apparent soil conductivity (ECa)
measured by the EM38 (Geonics, Ontario,
Canada) survey equipment have been
related to soil physical properties, and have
been used by Carpenter (1997) to map
longwall mining induces subsidence
fractures and Johnson et al. (2001) have
suggested ECa is well suited for the
temporal monitoring of soil ecological
trends. As vineyard trellising is known to
distort ECa measurements, all EM38 data
were acquired using the protocol of Lamb et
al. (2005).
3.3. Regional Scale
Regional scale data were collected in the
form of satellite images. With an individual
image encapsulating 64 km2, Digital
Globe’s Quickbird satellite platform was
selected as it could capture the entire Broke-
Fordwich region in one pass. Quickbird
imagery was also selected, as it currently
has the highest spatial resolution
commercially available from a space-based,
optical sensor platform. The panchromatic
and multispectral bands of Digital Globe’s
Basic Imagery Product were radiometrically
corrected and were supplied with sensor
attitude, ephemeris, and camera information,
making them suitable for advanced
photogrammetric processing (Digital Globe
2006). The work of Hall et al. (2003)
established a link between photosynthically
active biomass (PAB) and vine canopy
reflectance. With this relationship and with
a pixel resolution ranging from 2.44 – 2.88
m and 0.61 – 0.71 m, these multi-spectral
and panchromatic images should be capable
of both identifying vines and monitoring
variability in vine vigour across the study
region.
4. Data Exploration
The connection between longwall mining
and the above ground vineyards is complex
and poses numerous analytical challenges in
terms of the field data collected.
It is reasonable to expect that the finite
spatial extent of longwall mining would
impart some form of spatial limitation on
the above ground effects in terms of
viticultural production, as subsidence and
ensuing ground ‘strain’ are not uniformly
distributed across undermined areas. Since
grape vines are deep rooting plants, it is
reasonable to expect some form of
differences in the growing environment
before and after mining, with the transition
between the relatively undisturbed areas of
the chain-pillars and the areas of a
maximum subsidence of the longwall
potentially being the most heavily impacted.
This is due to the fact that this region
encompasses both the maximum and
minimum induced strain, which could
impact the roots either by compacting or
sheering them.
Because actual subsidence values were not
uniformly available across the vineyards
(note the considerable distance between
subsidence monitoring transects and
vineyards in Figure 1), a series of
subsidence zones were identified within
undermined vineyards. The subsidence
monitoring data of Mine Subsidence
Engineering Consultants (2007) were used
to construct zones of minimal subsidence
associated with chain-pillars (CP), zones of
maximal subsidence associated with the
longwall (LW), and a zone corresponding to
the transition (TR) between them. These
zones were identified longwall by longwall
and were designed to encapsulate both the
maximum and minimum mine-induced
strain. The survey points corresponding with
maximum and minimum strain were
identified and the survey point 20 m either
side of these points were selected as the
starting or ending point for the zone (Figure
2).
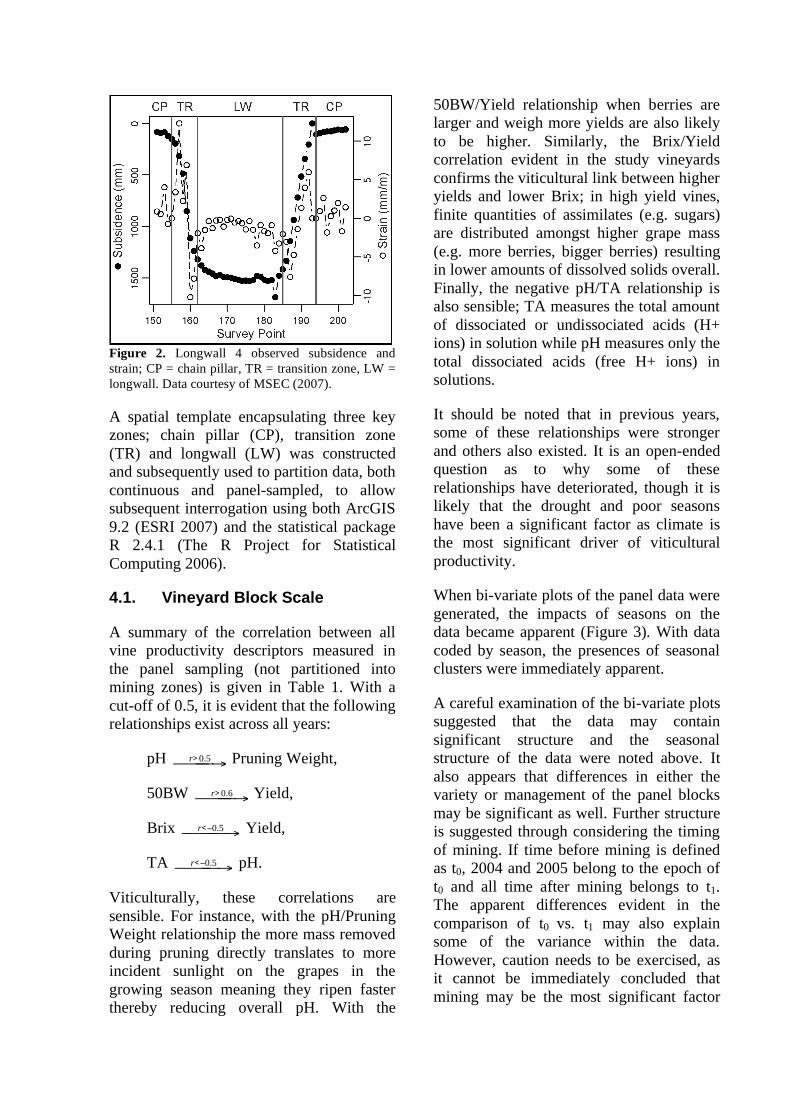
Figure 2. Longwall 4 observed subsidence and
strain; CP = chain pillar, TR = transition zone, LW =
longwall. Data courtesy of MSEC (2007).
A spatial template encapsulating three key
zones; chain pillar (CP), transition zone
(TR) and longwall (LW) was constructed
and subsequently used to partition data, both
continuous and panel-sampled, to allow
subsequent interrogation using both ArcGIS
9.2 (ESRI 2007) and the statistical package
R 2.4.1 (The R Project for Statistical
Computing 2006).
4.1. Vineyard Block Scale
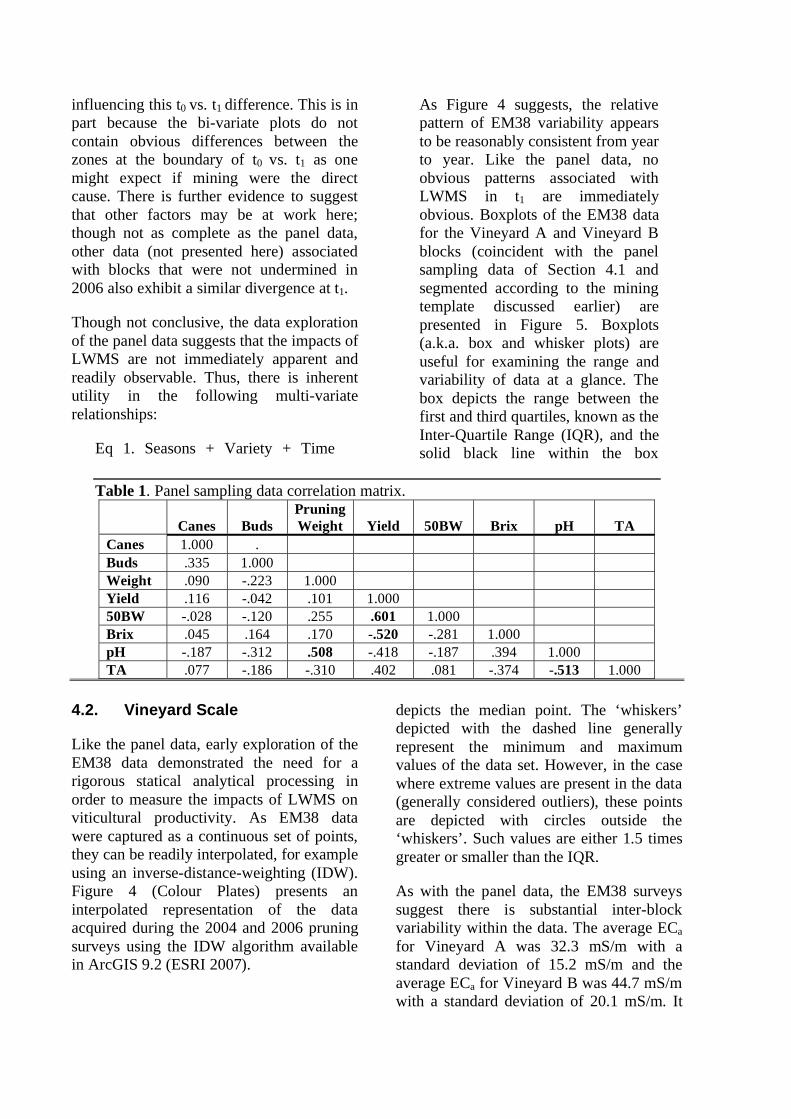
A summary of the correlation between all
vine productivity descriptors measured in
the panel sampling (not partitioned into
mining zones) is given in Table 1. With a
cut-off of 0.5, it is evident that the following
relationships exist across all years:
pH r>0.5 Pruning Weight,
50BW r>0.6 Yield,
Brix r< 0.5 Yield,
TA r< 0.5 pH.
Viticulturally, these correlations are
sensible. For instance, with the pH/Pruning
Weight relationship the more mass removed
during pruning directly translates to more
incident sunlight on the grapes in the
growing season meaning they ripen faster
thereby reducing overall pH. With the
50BW/Yield relationship when berries are
larger and weigh more yields are also likely
to be higher. Similarly, the Brix/Yield
correlation evident in the study vineyards
confirms the viticultural link between higher
yields and lower Brix; in high yield vines,
finite quantities of assimilates (e.g. sugars)
are distributed amongst higher grape mass
(e.g. more berries, bigger berries) resulting
in lower amounts of dissolved solids overall.
Finally, the negative pH/TA relationship is
also sensible; TA measures the total amount
of dissociated or undissociated acids (H+
ions) in solution while pH measures only the
total dissociated acids (free H+ ions) in
solutions.
It should be noted that in previous years,
some of these relationships were stronger
and others also existed. It is an open-ended
question as to why some of these
relationships have deteriorated, though it is
likely that the drought and poor seasons
have been a significant factor as climate is
the most significant driver of viticultural
productivity.
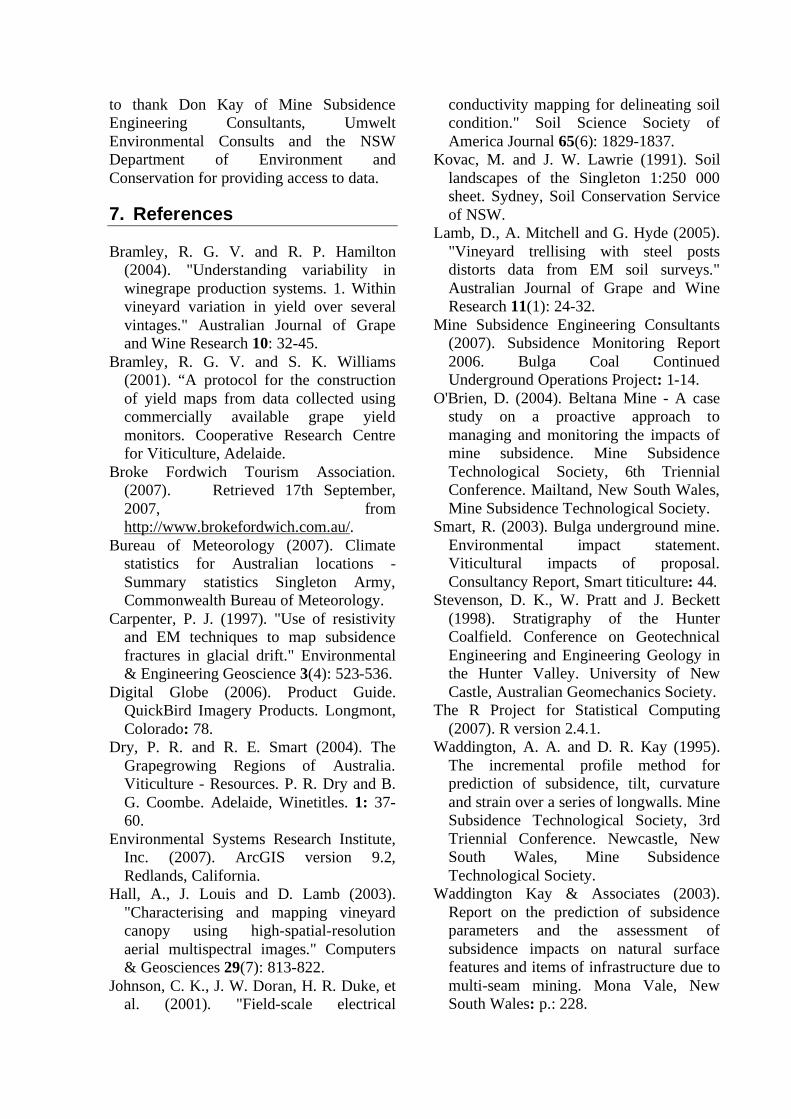
When bi-variate plots of the panel data were
generated, the impacts of seasons on the
data became apparent (Figure 3). With data
coded by season, the presences of seasonal
clusters were immediately apparent.
A careful examination of the bi-variate plots
suggested that the data may contain
significant structure and the seasonal
structure of the data were noted above. It
also appears that differences in either the
variety or management of the panel blocks
may be significant as well. Further structure
is suggested through considering the timing
of mining. If time before mining is defined
as t0, 2004 and 2005 belong to the epoch of
t0 and all time after mining belongs to t1.
The apparent differences evident in the
comparison of t0 vs. t1 may also explain
some of the variance within the data.
However, caution needs to be exercised, as
it cannot be immediately concluded that
mining may be the most significant factor
influencing this t0 vs. t1 difference. This is in
part because the bi-variate plots do not
contain obvious differences between the
zones at the boundary of t0 vs. t1 as one
might expect if mining were the direct
cause. There is further evidence to suggest
that other factors may be at work here;
though not as complete as the panel data,
other data (not presented here) associated
with blocks that were not undermined in
2006 also exhibit a similar divergence at t1.
Though not conclusive, the data exploration
of the panel data suggests that the impacts of
LWMS are not immediately apparent and
readily observable. Thus, there is inherent
utility in the following multi-variate
relationships:
Eq 1. Seasons + Variety + Time
As Figure 4 suggests, the relative
pattern of EM38 variability appears
to be reasonably consistent from year
to year. Like the panel data, no
obvious patterns associated with
LWMS in t1 are immediately
obvious. Boxplots of the EM38 data
for the Vineyard A and Vineyard B
blocks (coincident with the panel
sampling data of Section 4.1 and
segmented according to the mining
template discussed earlier) are
presented in Figure 5. Boxplots
(a.k.a. box and whisker plots) are
useful for examining the range and
variability of data at a glance. The
box depicts the range between the
first and third quartiles, known as the
Inter-Quartile Range (IQR), and the
solid black line within the box
Table 1. Panel sampling data correlation matrix.
Canes Buds
Pruning
Weight Yield 50BW Brix pH TA
Canes 1.000 .
Buds .335 1.000
Weight .090 -.223 1.000
Yield .116 -.042 .101 1.000
50BW -.028 -.120 .255 .601 1.000
Brix .045 .164 .170 -.520 -.281 1.000
pH -.187 -.312 .508 -.418 -.187 .394 1.000
TA .077 -.186 -.310 .402 .081 -.374 -.513 1.000
4.2. Vineyard Scale
Like the panel data, early exploration of the
EM38 data demonstrated the need for a
rigorous statical analytical processing in
order to measure the impacts of LWMS on
viticultural productivity. As EM38 data
were captured as a continuous set of points,
they can be readily interpolated, for example
using an inverse-distance-weighting (IDW).
Figure 4 (Colour Plates) presents an
interpolated representation of the data
acquired during the 2004 and 2006 pruning
surveys using the IDW algorithm available
in ArcGIS 9.2 (ESRI 2007).
depicts the median point. The ‘whiskers’
depicted with the dashed line generally
represent the minimum and maximum
values of the data set. However, in the case
where extreme values are present in the data
(generally considered outliers), these points
are depicted with circles outside the
‘whiskers’. Such values are either 1.5 times
greater or smaller than the IQR.
As with the panel data, the EM38 surveys
suggest there is substantial inter-block
variability within the data. The average ECa
for Vineyard A was 32.3 mS/m with a
standard deviation of 15.2 mS/m and the
average ECa for Vineyard B was 44.7 mS/m
with a standard deviation of 20.1 mS/m. It
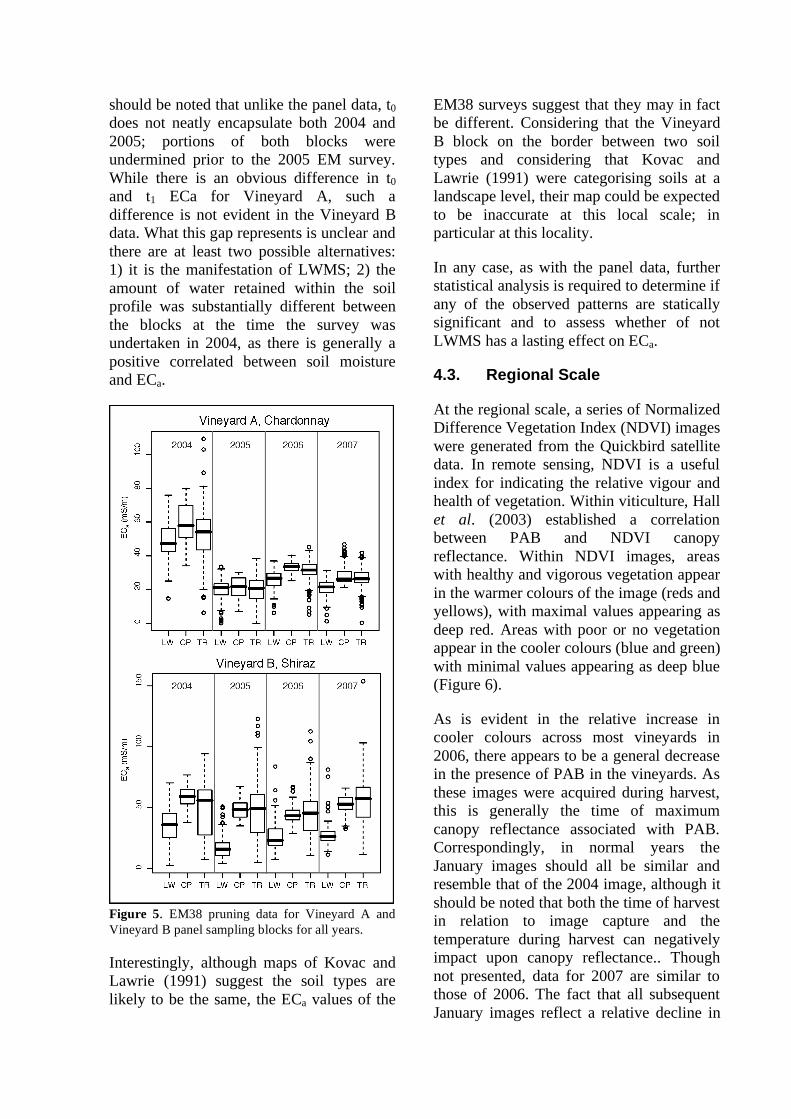
should be noted that unlike the panel data, t0
does not neatly encapsulate both 2004 and
2005; portions of both blocks were
undermined prior to the 2005 EM survey.
While there is an obvious difference in t0
and t1 ECa for Vineyard A, such a
difference is not evident in the Vineyard B
data. What this gap represents is unclear and
there are at least two possible alternatives:
1) it is the manifestation of LWMS; 2) the
amount of water retained within the soil
profile was substantially different between
the blocks at the time the survey was
undertaken in 2004, as there is generally a
positive correlated between soil moisture
and ECa.
Figure 5. EM38 pruning data for Vineyard A and
Vineyard B panel sampling blocks for all years.
Interestingly, although maps of Kovac and
Lawrie (1991) suggest the soil types are
likely to be the same, the ECa values of the
EM38 surveys suggest that they may in fact
be different. Considering that the Vineyard
B block on the border between two soil
types and considering that Kovac and
Lawrie (1991) were categorising soils at a
landscape level, their map could be expected
to be inaccurate at this local scale; in
particular at this locality.
In any case, as with the panel data, further
statistical analysis is required to determine if
any of the observed patterns are statically
significant and to assess whether of not
LWMS has a lasting effect on ECa.
4.3. Regional Scale
At the regional scale, a series of Normalized
Difference Vegetation Index (NDVI) images
were generated from the Quickbird satellite
data. In remote sensing, NDVI is a useful
index for indicating the relative vigour and
health of vegetation. Within viticulture, Hall
et al. (2003) established a correlation
between PAB and NDVI canopy
reflectance. Within NDVI images, areas
with healthy and vigorous vegetation appear
in the warmer colours of the image (reds and
yellows), with maximal values appearing as
deep red. Areas with poor or no vegetation
appear in the cooler colours (blue and green)
with minimal values appearing as deep blue
(Figure 6).
As is evident in the relative increase in
cooler colours across most vineyards in
2006, there appears to be a general decrease
in the presence of PAB in the vineyards. As
these images were acquired during harvest,
this is generally the time of maximum
canopy reflectance associated with PAB.
Correspondingly, in normal years the
January images should all be similar and
resemble that of the 2004 image, although it
should be noted that both the time of harvest
in relation to image capture and the
temperature during harvest can negatively
impact upon canopy reflectance.. Though
not presented, data for 2007 are similar to
those of 2006. The fact that all subsequent
January images reflect a relative decline in
healthy vineyard vegetation across all
vineyard blocks regardless of the presence
of LWMS perhaps suggests that prolonged
drought is beginning to have a significant
effect on viticultural production in the
Broke-Fordwich Region.
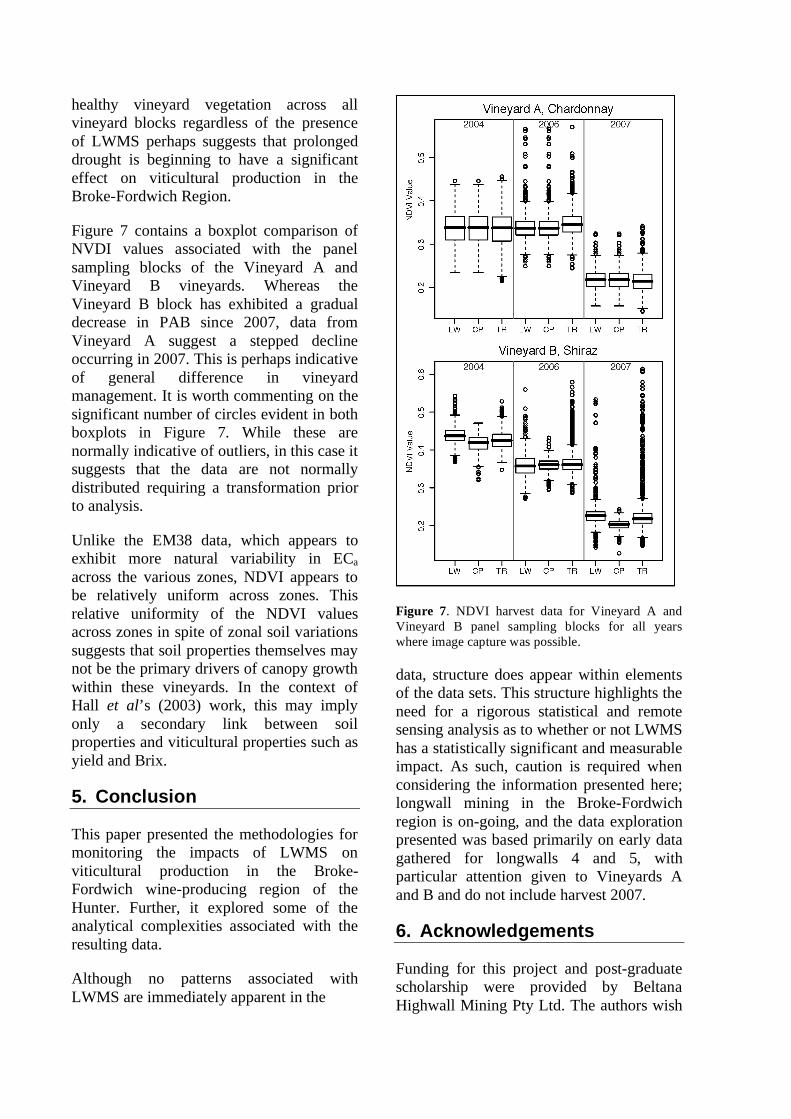
Figure 7 contains a boxplot comparison of
NVDI values associated with the panel
sampling blocks of the Vineyard A and
Vineyard B vineyards. Whereas the
Vineyard B block has exhibited a gradual
decrease in PAB since 2007, data from
Vineyard A suggest a stepped decline
occurring in 2007. This is perhaps indicative
of general difference in vineyard
management. It is worth commenting on the
significant number of circles evident in both
boxplots in Figure 7. While these are
normally indicative of outliers, in this case it
suggests that the data are not normally
distributed requiring a transformation prior
to analysis.
Unlike the EM38 data, which appears to
exhibit more natural variability in ECa
across the various zones, NDVI appears to
be relatively uniform across zones. This
relative uniformity of the NDVI values
across zones in spite of zonal soil variations
suggests that soil properties themselves may
not be the primary drivers of canopy growth
within these vineyards. In the context of
Hall et al’s (2003) work, this may imply
only a secondary link between soil
properties and viticultural properties such as
yield and Brix.
5. Conclusion
This paper presented the methodologies for
monitoring the impacts of LWMS on
viticultural production in the Broke-
Fordwich wine-producing region of the
Hunter. Further, it explored some of the
analytical complexities associated with the
resulting data.
Although no patterns associated with
LWMS are immediately apparent in the
Figure 7. NDVI harvest data for Vineyard A and
Vineyard B panel sampling blocks for all years
where image capture was possible.
data, structure does appear within elements
of the data sets. This structure highlights the
need for a rigorous statistical and remote
sensing analysis as to whether or not LWMS
has a statistically significant and measurable
impact. As such, caution is required when
considering the information presented here;
longwall mining in the Broke-Fordwich
region is on-going, and the data exploration
presented was based primarily on early data
gathered for longwalls 4 and 5, with
particular attention given to Vineyards A
and B and do not include harvest 2007.
6. Acknowledgements
Funding for this project and post-graduate
scholarship were provided by Beltana
Highwall Mining Pty Ltd. The authors wish
to thank Don Kay of Mine Subsidence
Engineering Consultants, Umwelt
Environmental Consults and the NSW
Department of Environment and
Conservation for providing access to data.
7. References
Bramley, R. G. V. and R. P. Hamilton
(2004). "Understanding variability in
winegrape production systems. 1. Within
vineyard variation in yield over several
vintages." Australian Journal of Grape
and Wine Research 10: 32-45.
Bramley, R. G. V. and S. K. Williams
(2001). “A protocol for the construction
of yield maps from data collected using
commercially available grape yield
monitors. Cooperative Research Centre
for Viticulture, Adelaide.
Broke Fordwich Tourism Association.
(2007). Retrieved 17th September,
2007, from
http://www.brokefordwich.com.au/.
Bureau of Meteorology (2007). Climate
statistics for Australian locations -
Summary statistics Singleton Army,
Commonwealth Bureau of Meteorology.
Carpenter, P. J. (1997). "Use of resistivity
and EM techniques to map subsidence
fractures in glacial drift." Environmental
& Engineering Geoscience 3(4): 523-536.
Digital Globe (2006). Product Guide.
QuickBird Imagery Products. Longmont,
Colorado: 78.
Dry, P. R. and R. E. Smart (2004). The
Grapegrowing Regions of Australia.
Viticulture - Resources. P. R. Dry and B.
G. Coombe. Adelaide, Winetitles. 1: 37-
60.
Environmental Systems Research Institute,
Inc. (2007). ArcGIS version 9.2,
Redlands, California.
Hall, A., J. Louis and D. Lamb (2003).
"Characterising and mapping vineyard
canopy using high-spatial-resolution
aerial multispectral images." Computers
& Geosciences 29(7): 813-822.
Johnson, C. K., J. W. Doran, H. R. Duke, et
al. (2001). "Field-scale electrical
conductivity mapping for delineating soil
condition." Soil Science Society of
America Journal 65(6): 1829-1837.
Kovac, M. and J. W. Lawrie (1991). Soil
landscapes of the Singleton 1:250 000
sheet. Sydney, Soil Conservation Service
of NSW.
Lamb, D., A. Mitchell and G. Hyde (2005).
"Vineyard trellising with steel posts
distorts data from EM soil surveys."
Australian Journal of Grape and Wine
Research 11(1): 24-32.
Mine Subsidence Engineering Consultants
(2007). Subsidence Monitoring Report
2006. Bulga Coal Continued
Underground Operations Project: 1-14.
O'Brien, D. (2004). Beltana Mine - A case
study on a proactive approach to
managing and monitoring the impacts of
mine subsidence. Mine Subsidence
Technological Society, 6th Triennial
Conference. Mailtand, New South Wales,
Mine Subsidence Technological Society.
Smart, R. (2003). Bulga underground mine.
Environmental impact statement.
Viticultural impacts of proposal.
Consultancy Report, Smart titiculture: 44.
Stevenson, D. K., W. Pratt and J. Beckett
(1998). Stratigraphy of the Hunter
Coalfield. Conference on Geotechnical
Engineering and Engineering Geology in
the Hunter Valley. University of New
Castle, Australian Geomechanics Society.
The R Project for Statistical Computing
(2007). R version 2.4.1.
Waddington, A. A. and D. R. Kay (1995).
The incremental profile method for
prediction of subsidence, tilt, curvature
and strain over a series of longwalls. Mine
Subsidence Technological Society, 3rd
Triennial Conference. Newcastle, New
South Wales, Mine Subsidence
Technological Society.
Waddington Kay & Associates (2003).
Report on the prediction of subsidence
parameters and the assessment of
subsidence impacts on natural surface
features and items of infrastructure due to
multi-seam mining. Mona Vale, New
South Wales: p.: 228.
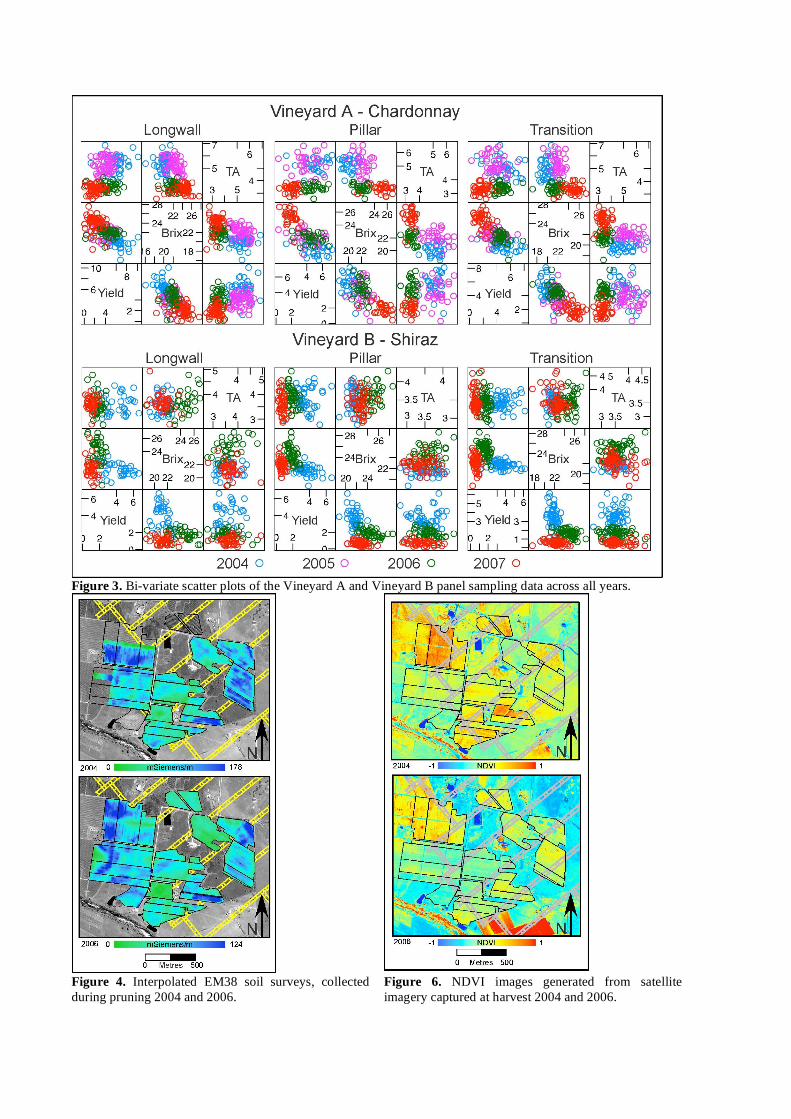
Figure 3. Bi-variate scatter plots of the Vineyard A and Vineyard B panel sampling data across all years.
Figure 4. Interpolated EM38 soil surveys, collected
during pruning 2004 and 2006. Figure 6. NDVI images generated from satellite
imagery captured at harvest 2004 and 2006.


