Embed Size (px)
Citation preview
EUROPEAN CHEMICAL INDUSTRY AND ITS INNOVATION POLICY WITH FOCUS ON LARGE CHEMICAL COMPANIES.
Supriyo Das
Dipòsit Legal: T 1295-2015
ADVERTIMENT. L'accés als continguts d'aquesta tesi doctoral i la seva utilització ha de respectar els drets
de la persona autora. Pot ser utilitzada per a consulta o estudi personal, així com en activitats o materials d'investigació i docència en els termes establerts a l'art. 32 del Text Refós de la Llei de Propietat Intel·lectual (RDL 1/1996). Per altres utilitzacions es requereix l'autorització prèvia i expressa de la persona autora. En qualsevol cas, en la utilització dels seus continguts caldrà indicar de forma clara el nom i cognoms de la persona autora i el títol de la tesi doctoral. No s'autoritza la seva reproducció o altres formes d'explotació efectuades amb finalitats de lucre ni la seva comunicació pública des d'un lloc aliè al servei TDX. Tampoc s'autoritza la presentació del seu contingut en una finestra o marc aliè a TDX (framing). Aquesta reserva de drets afecta tant als continguts de la tesi com als seus resums i índexs. ADVERTENCIA. El acceso a los contenidos de esta tesis doctoral y su utilización debe respetar los
derechos de la persona autora. Puede ser utilizada para consulta o estudio personal, así como en actividades o materiales de investigación y docencia en los términos establecidos en el art. 32 del Texto Refundido de la Ley de Propiedad Intelectual (RDL 1/1996). Para otros usos se requiere la autorización previa y expresa de la persona autora. En cualquier caso, en la utilización de sus contenidos se deberá indicar de forma clara el nombre y apellidos de la persona autora y el título de la tesis doctoral. No se autoriza su reproducción u otras formas de explotación efectuadas con fines lucrativos ni su comunicación pública desde un sitio ajeno al servicio TDR. Tampoco se autoriza la presentación de su contenido en una ventana o marco ajeno a TDR (framing). Esta reserva de derechos afecta tanto al contenido de la tesis como a sus resúmenes e índices. WARNING. Access to the contents of this doctoral thesis and its use must respect the rights of the author. It
can be used for reference or private study, as well as research and learning activities or materials in the terms established by the 32nd article of the Spanish Consolidated Copyright Act (RDL 1/1996). Express and previous authorization of the author is required for any other uses. In any case, when using its content, full name of the author and title of the thesis must be clearly indicated. Reproduction or other forms of for profit use or public communication from outside TDX service is not allowed. Presentation of its content in a window or frame external to TDX (framing) is not authorized either. These rights affect both the content of the thesis and its abstracts and indexes.
0
Supriyo Das
European chemical industry and its innovation
policy with focus on large chemical companies
DOCTORAL THESIS
Supervised by: Dr. D. Ignasi Brunet Icart
Facultad de Economía y Empresa
Departamento de Gestión de Empresas
UNIVERSITAT ROVIRA I VIRGILI
REUS 2015
UNIVERSITAT ROVIRA I VIRGILI EUROPEAN CHEMICAL INDUSTRY AND ITS INNOVATION POLICY WITH FOCUS ON LARGE CHEMICAL COMPANIES. Supriyo Das Dipòsit Legal: T 1295-2015

1
UNIVERSITAT ROVIRA I VIRGILI EUROPEAN CHEMICAL INDUSTRY AND ITS INNOVATION POLICY WITH FOCUS ON LARGE CHEMICAL COMPANIES. Supriyo Das Dipòsit Legal: T 1295-2015
2
Acknowledgement
I would like to thank Dr. D. Ignasi Brunet Icart, director of this thesis, for his guidance,
inspiration, continuing technical and moral support all throughout the dissertation
without which this thesis would not have been possible.
I will like to thank “Universidad Rovira i Virgili” and specially “Facultat de Ciencias
Economicas y Empresariales” and “Departmento de Gastion de Empresas” for this
unique opportunity.
I will like to show thanks to Mr. Jesus Nieto and Dr. Venkatesh Jambhunathan for their
help and support. Thanks to my wife, Arundhati Das, whose patience and mental
support kept me moving forward in my dissertation. Lastly, I offer my sincere regards
to all that supported me during the whole work.
UNIVERSITAT ROVIRA I VIRGILI EUROPEAN CHEMICAL INDUSTRY AND ITS INNOVATION POLICY WITH FOCUS ON LARGE CHEMICAL COMPANIES. Supriyo Das Dipòsit Legal: T 1295-2015

3
UNIVERSITAT ROVIRA I VIRGILI EUROPEAN CHEMICAL INDUSTRY AND ITS INNOVATION POLICY WITH FOCUS ON LARGE CHEMICAL COMPANIES. Supriyo Das Dipòsit Legal: T 1295-2015
4
Preface
The chemical industry is one of the European Union’s most internationally competitive
and successful industries, embracing a wide field of processing and manufacturing
activities. This research studies the current state of the European chemical industry and
compares with chemical industry from other regions of the world. The study also covers
the innovation trend, innovation policy of large chemical companies headquartered in
Europe and various financial and non-financial factors that is affecting such policy.
With a workforce of 1.2 million and sales of €642 billion, it is one of the biggest
industrial sectors. Output from the EU chemical industry covers a wide range of
chemical products, supplying virtually to all sectors of the economy and providing a
significant contribution to EU net exports. But the European chemicals industry is
currently facing unprecedented challenges arising from strong competition from
emerging countries, notably in Asia, the Middle East and Russia. R&D and innovation
is the only way to bring the competitive edge of this industry in Europe. The European
chemical industry’s share of world chemical sales declined from 29.8 % in 2001 to 19.6
% in 2011 which translates into 34 % decline over a period of 10 years. As the global
economy emerges from the financial crisis of 2007-2009, the chemical industry finds
itself passing through a period of profound transformation. Profit margins have been
shrinking; return on capital has been in steady decline while Asian chemical production
in 2011 surpassed that of the rest of the world chemicals turnover.
Data for 2012 confirms that a significant recovery of the European chemicals industry
occurred during the year. The European chemical industry, including the European
Union and the Rest of Europe, is still in a strong position, posting sales of €642 billion
in 2011 which is 23.4 per cent of world chemicals sales in value terms. Although
Europe is losing its position in terms of global chemical sell, in terms of trade balance is
doing well with export being 7 % higher than import. EU still leads the race with 19 out
of top 50 global companies headquatered here, followed by Asia with 16. In terms of
individual company’s sale, BASF has almost double of chemical sales to that of its
nearest competitor. Another trend, which is emerging is that the traditional oil
companies such as Shell and Total are now investing heavily in chemical business and
thus playing a significant role in the world chemical business.
UNIVERSITAT ROVIRA I VIRGILI EUROPEAN CHEMICAL INDUSTRY AND ITS INNOVATION POLICY WITH FOCUS ON LARGE CHEMICAL COMPANIES. Supriyo Das Dipòsit Legal: T 1295-2015
5
In order to reach the objective of the current research, five hypotheses were tested.
Based on the recommendation of previous researches, patent volume was taken as the
metric for measuring innovation. In Europe, mechanical engineering has the highest
number of granted patent while chemistry and electrical engineering were close second.
In case of companies, BASF, Bayer and LyondellBasel are the top European patent
applicants. It is seen in case of most European companies, 50 % of the first patent is
applied in EU which can be due to the fact that the research is coming out of the
laboratories in EU or the companies see higher value to protect their technology in the
EU market. It is also interesting to see that in case of BASF, there is a steady fall of the
EU´s share of the total first patent, which can be due to the effect of growth and
subsequent shifting of focus on the emerging economies.
In case of EU, even though the Research & Development (R&D) spending in absolute
term has remained almost the same over the years, it’s percentage to total sale has fallen
from 8.2 % in 1991 to 1.5 % in 2012. In case of china in 2012, there has been threefold
increase of R&D investment in compared to that of 2006, while for other regions, the
R&D spending has slightly increased. BASF has the largest R&D spending followed by
Bayer as distant second. BASF is the largest chemical company and this high spending
on R&D justifies its enormous R&D infrastructure. Bayer invests heavily in research
specially in its pharmaceutical and crop science division. Syngenta showed highest
percentage increase of R&D expenses in 2012 compared to it in 2007. Arkema and
Linde both had a fall in R&D expenses in 2012 compared to 2007 and surprising Yara
had very small R&D spending budget for both the years. Syngenta has the highest R&D
intensity followed by Bayer and DSM. BASF has been investing in R&D in human
capital by increasing the number of people in that department especially just after the
financial crisis that hit in 2008, thus showing their clear strategy of R&D expansion.
Merger and Acquisition (M&A) is another factor that we evaluated during this study.
Highest number of merger and acquisitions deals in chemical industry for last ten years
were done in Asia followed by Europe and North America. For the last five years, EU
chemical industry acquired a large number of non-chemical companies. It depicts a
typical intent of these companies for diversification and acquiring knowledge which is
not part of their core competencies. For most companies such as BASF, Air Liquide,
Ineos, Evonik and Solvay, there is a strong inclination for acquisition of European
UNIVERSITAT ROVIRA I VIRGILI EUROPEAN CHEMICAL INDUSTRY AND ITS INNOVATION POLICY WITH FOCUS ON LARGE CHEMICAL COMPANIES. Supriyo Das Dipòsit Legal: T 1295-2015
6
companies while for some other companies such as Bayer, DSM and Arkema, there is a
tendency to do acquisition more globally.
From the various data analyzed, it is seen that all the top European chemical companies
actively participate in EU funded projects. The data for the last 20 years shows BASF is
leader in participating in EU funded project followed by Bayer, Air Liquide and Evonik.
Although the top chemical companies participate in lot of EU funded projects, there is a
general tendency that they want to be a participant rather than be the coordinator. This
may be due to the fact that this involves significant investment in resource to co-
ordinate EU projects. There has been a significant redirection of skilled, sometimes
highly skilled personnel in firms from R&D and innovation-related activities to
compliance work as a result of the implementation of the REACH Regulation.
Moreover, this regulation resulted in an increase in expenditure in R&D and related
innovative activities. Rate of return from R&D investment was negatively impacted by
REACH compliance costs. REACH regulation generated scope of innovative activities
to include more work on new substances, particularly among large firms, who are also
responsible for most innovation in the industry, but barriers to R&D and innovation in
new substances still remain.
Europe has over three hundred chemical production sites, the majority of which are
located in clusters and Germany hosts the largest 47 % of all European chemical
clusters. There is a direct relation between the number of clusters in a particular country
and number of granted EU patents in chemistry and chemical engineering. The big
exception to the above stated relation is Switzerland. It has two chemical clusters but
accounts for over 10 % of the granted EU patents which can be due to the fact that a lot
of their research is done in specialized institutes and universities.
Chemical industry is a conservative industry and when starting the research, there was
strong doubt that this industry will be slow to adopt digitalization. But it was observed
during the study that the consumer pull, technology push and economic benefit that
digitalization brings led the larger chemical companies, particularly in Europe to adapt
digitalization in their main stream of business. The drivers of operational digitalization
in larger chemical companies are: very complex supply chain, drive to innovate at very
high pace, employee inclined to new technologies, new regulatory requirements such as
UNIVERSITAT ROVIRA I VIRGILI EUROPEAN CHEMICAL INDUSTRY AND ITS INNOVATION POLICY WITH FOCUS ON LARGE CHEMICAL COMPANIES. Supriyo Das Dipòsit Legal: T 1295-2015
7
REACH and very fast information technology growth. The digitalization index study
positioned chemical industry in Europe in seventh position among all growing
industries in terms of adapting new digital tool in business. The study also positioned
them at the fifth position in the growth rate which is higher than average. Another
significant point that came out from the study is that the digital innovation in chemical
industry has not happened smoothly across whole of Europe. The current study shows
that digital marketing has taken innovation in marketing by storm. It is playing a key
role in influencing purchasing decision both in case of business-to-consumer (B2C) and
business-to-business (B2B) business model. The chemical companies which have been
selling through traditional channels are moving to online tools. Several of the large
companies we studied have an ecommerce website where they are selling their products.
All the companies we studied have a very detailed website and every effort is being
made to capture the traffic through search engine optimization (SEO). Although being
late, the chemical industry is catching up in case of social media marketing. Every
company we researched is present in more than one social media in order to promote
their product apart from using blogs and article marketing which are two other
innovative tools for marketing.
In the figures, graphs and tables, comma is used as the decimal separator while dot is
used as thousand separators typical as in Spanish system.
UNIVERSITAT ROVIRA I VIRGILI EUROPEAN CHEMICAL INDUSTRY AND ITS INNOVATION POLICY WITH FOCUS ON LARGE CHEMICAL COMPANIES. Supriyo Das Dipòsit Legal: T 1295-2015
8
Contents
Chapter 1: Introduction ............................................................ 20
1.1 Introduction .......................................................................................................... 21
1.2 Background of the current project ....................................................................... 21
1.3 Motivation for current research ........................................................................... 24
1.4 Research objective ................................................................................................ 26
1.5 Impact of Innovation on Chemical Industry ......................................................... 28
1.6 Structure of the thesis .......................................................................................... 29
1.7 Summary ............................................................................................................... 33
1.8 Bibliography .......................................................................................................... 35
Chapter 2: Literature review .................................................... 36
2.1 Introduction: ......................................................................................................... 37
2.2 Overview of the current literature review............................................................ 37
2.3 Literature analysis ................................................................................................. 40
2.3.1 Fundamentals of innovation for chemical and other manufacturing sectors ........... 41
2.3.2 Inputs for innovation .................................................................................................. 49
2.3.2.1 R&D: Spending .................................................................................................... 49
2.3.2.2 Organizational structure ..................................................................................... 51
2.3.2.3 Human capital investment .................................................................................. 52
2.3.2.4 Geography and chemical company clusters ....................................................... 53
2.3.2.5 REACH and other chemical regulations .............................................................. 54
2.3.2.6 Organization size ................................................................................................. 56
2.3.3 Activities for innovation ............................................................................................. 57
2.3.3.1 Patent activities ................................................................................................... 58
2.3.3.2 Inter-industry activities ....................................................................................... 60
2.3.3.3 Industry-Academia collaboration ........................................................................ 61
2.3.3.4 Business strategy ................................................................................................. 63
2.3.3.5 Merger and Acquisition for innovation .............................................................. 65
2.3.4 Output and impact of innovation ............................................................................... 68
2.3.4.1 R&D Tax benefit .................................................................................................. 68
2.3.4.2 Higher productivity and profitability .................................................................. 70
2.3.4.3 Greener chemistry ............................................................................................... 71
2.3.5 Barriers to innovation ................................................................................................ 74
2.3.5.1 What are barriers to innovation? ........................................................................ 74
2.3.5.2 How to overcome barrier to innovation? ........................................................... 76
2.3.6 Marketing Innovation ................................................................................................. 76
UNIVERSITAT ROVIRA I VIRGILI EUROPEAN CHEMICAL INDUSTRY AND ITS INNOVATION POLICY WITH FOCUS ON LARGE CHEMICAL COMPANIES. Supriyo Das Dipòsit Legal: T 1295-2015
9
2.4. Summary: ............................................................................................................. 80
2.5 Bibliography .......................................................................................................... 82
3. Innovation and the hypotheses for the research ............... 100
3.1 Introduction ........................................................................................................ 101
3.2 Innovation in an industrial environment ............................................................ 101
3.3 Objectives and Sources of innovation ................................................................ 103
3.4 The impact of innovations on the performance of the enterprise ..................... 104
3.5 Hypothesis for this study .................................................................................... 105
3.6 How to test the hypotheses? .............................................................................. 106
3.7 Summary ............................................................................................................. 109
3.8 Bibliography ........................................................................................................ 110
4. European chemical industry and the top European
chemical companies .................................................................. 113
4.1 Introduction ........................................................................................................ 114
4.2 Global chemical industry .................................................................................... 114
4.3 Recent Economic crisis and its effect on global chemical industry .................... 116
4.4 Overview of European chemical industry ........................................................... 117
4.4. 1 Chemical sales ......................................................................................................... 119
4.4.2 Intercontinental chemical trade ............................................................................... 123
4.4.3 R&D in chemical industry ......................................................................................... 125
4.4.4 Structure of European chemical industry................................................................ 126
4.5 European top chemical companies ..................................................................... 127
4.6 Analysis of each company of the top EU chemical company ............................. 132
4.7 Conclusions ........................................................................................................ 146
4.8 Bibliography ...................................................................................................... 147
5. Methodologies to perform this research ............................ 149
5.1 Introduction: ....................................................................................................... 150
5.2 Data Collection .................................................................................................... 151
5.2.1 Patent ....................................................................................................................... 151
5.2.2 Research and Development Spending ..................................................................... 152
5.2.3 Business Deals: Merger and Acquisition .................................................................. 153
5.2.4 Collaboration with other companies & university for research ................ 155
5.2.5 Impact of chemical Regulation on Innovation of EU chemical Companies .............. 157
UNIVERSITAT ROVIRA I VIRGILI EUROPEAN CHEMICAL INDUSTRY AND ITS INNOVATION POLICY WITH FOCUS ON LARGE CHEMICAL COMPANIES. Supriyo Das Dipòsit Legal: T 1295-2015
10
5.2.6 Cluster ...................................................................................................................... 160
5.2.7 Digital Innovation and digital marketing innovation in EU large chemical companies
........................................................................................................................................... 162
5.3 Data analysis ....................................................................................................... 163
5.4 Summary ............................................................................................................. 164
5.5 Bibliography ........................................................................................................ 166
6. Innovation trend of the top European chemical companies
.................................................................................................... 167
6.1 Introduction ........................................................................................................ 168
6.2 Patent process .................................................................................................... 168
6.3 Patent Data Analysis ........................................................................................... 171
4.4 Conclusion ........................................................................................................... 183
4.5 Bibliography ........................................................................................................ 184
7.R&D spending of the top European chemical companies 185
7.1 Introduction: ....................................................................................................... 186
7.2 R&D Spending ..................................................................................................... 186
7.3 Further R&D spending studies for specific companies ....................................... 193
7.4 Conclusion ........................................................................................................... 194
7.5 Bibliography ........................................................................................................ 195
8. Innovation through Merger and Acquisition .................... 197
8.1 Introduction ........................................................................................................ 198
8.2 Merger, Acquisition and innovation matrix ........................................................ 199
8.3 Acquisitions and Mergers of European of chemical companies around the world
.................................................................................................................................. 201
8.4 Top European companies acquisition strategy................................................... 203
8.5 Individual company analysis ............................................................................... 205
8.6 Conclusion ........................................................................................................... 218
8.7 Bibliography ........................................................................................................ 220
9. Industries, Universities and Research organization
collaboration to drive innovation ........................................... 221
9.1 Introduction ........................................................................................................ 222
UNIVERSITAT ROVIRA I VIRGILI EUROPEAN CHEMICAL INDUSTRY AND ITS INNOVATION POLICY WITH FOCUS ON LARGE CHEMICAL COMPANIES. Supriyo Das Dipòsit Legal: T 1295-2015
11
9.2 Industry – University collaboration: A driver toward innovation ....................... 222
9.3 Research collaborations ...................................................................................... 223
Collaborative research .............................................................................................. 225
Coordination between national research programmes .............................................. 225
Joint Technology Initiatives ...................................................................................... 226
Technology Platforms ............................................................................................... 226
9.4 Participation of the top European Chemical companies in EU funded projects 227
9.5 Conclusion ........................................................................................................... 232
9.6 Bibliography ........................................................................................................ 234
10. Impact of chemical regulation on innovation of European
Company ................................................................................... 235
10.1 Introduction: ..................................................................................................... 236
10.2 The new chemical regulation in Europe: REACH .............................................. 236
10.3 Research Survey ................................................................................................ 238
10.4 Data Evaluation and analysis ............................................................................ 240
10.5 Discussion based on the survey ........................................................................ 243
10.6 Conclusion ......................................................................................................... 246
10.7 Bibliography ...................................................................................................... 247
11. European chemical cluster and geographical distribution:
An impact on innovation ......................................................... 248
11.1 Introduction ...................................................................................................... 249
11.2 Components of European Chemical Cluster ..................................................... 249
11.3 Distribution of European chemical cluster ....................................................... 251
11.4 Impact of chemical cluster on European Innovation ........................................ 254
11.4.1 Case Study I: Tarragona Chemical Cluster .............................................................. 254
11.4.2 Case Study II: Axelera chemical cluster .................................................................. 260
11.4.3 Case Study III Port of Antwerp Chemical Cluster ................................................... 262
11.4.4 Geographical distribution of chemical cluster and its impact on innovation ........ 265
11.5 Conclusion ......................................................................................................... 266
11.6 Bibliography ...................................................................................................... 270
UNIVERSITAT ROVIRA I VIRGILI EUROPEAN CHEMICAL INDUSTRY AND ITS INNOVATION POLICY WITH FOCUS ON LARGE CHEMICAL COMPANIES. Supriyo Das Dipòsit Legal: T 1295-2015
12
12. Digitalization of the Chemical Industry and marketing
innovation .................................................................................. 270
12.1 Introduction ...................................................................................................... 273
12.2 Digitalization of business .................................................................................. 273
12.3 Digitalization of chemical industry ................................................................... 279
12.4 Digitalization drivers and Trends in chemical industry ..................................... 280
12.4.1 Complexity of Supply Chain .................................................................................... 280
12.4.2 Need to Innovate .................................................................................................... 281
12.4.3 Human Factor ......................................................................................................... 281
12.4.4 Regulatory Requirements ...................................................................................... 281
12.4.5 Technical Drivers and Trends ................................................................................. 282
12.4.6 Embrace Innovation ............................................................................................... 282
12.5 Digitalization of the European chemical industry............................................. 284
12.6 Innovation in Marketing in Chemical companies: Digital Marketing ............... 287
12. 7 Innovation in Marketing: Digital Marketing Strategy ...................................... 289
12.8 Information technology challenges faced by the Chemical Industry in Europe299
12.9 Conclusion ......................................................................................................... 300
13. Conclusions ......................................................................... 304
14. Recommendation for future work .................................... 312
UNIVERSITAT ROVIRA I VIRGILI EUROPEAN CHEMICAL INDUSTRY AND ITS INNOVATION POLICY WITH FOCUS ON LARGE CHEMICAL COMPANIES. Supriyo Das Dipòsit Legal: T 1295-2015

13
UNIVERSITAT ROVIRA I VIRGILI EUROPEAN CHEMICAL INDUSTRY AND ITS INNOVATION POLICY WITH FOCUS ON LARGE CHEMICAL COMPANIES. Supriyo Das Dipòsit Legal: T 1295-2015
14
List of the figures
Figure 1: The product mix of European chemical Industry ........................................................ 22
Figure 2: Contribution of each region to global chemical sell for the year 2001 and 2011 ........ 23
Figure 3: R & D spending and R & D Spending as a percentage of total sales .......................... 24
Figure 4: Impact of innovation on chemical industry value chain .............................................. 28
Figure 5: The structure of the thesis ............................................................................................ 33
Figure 6: The matrix of the field of publications as found in the current literature review ........ 40
Figure 7: Objectives of innovation in the European chemical industry (Eurostat, 2001) ........... 41
Figure 8: Different form of innovations in a large organization ................................................. 42
Figure 9: Different form of innovations in a large organization ................................................. 42
Figure 10: The innovation matrix for the chemical industry innovation ..................................... 43
Figure 11: Sequence of innovation in large chemical company.................................................. 44
Figure 12: Innovators and networks for innovation in petrochemical processes (based on various
interviews) ................................................................................................................................... 45
Figure 13: Trend of publication and citation with word innovation in title (10000 social science
articles were studied) ................................................................................................................... 46
Figure 14: Large chemical industry transitioning from closed innovation to open innovation .. 46
Figure 15: Challenges and new business growth strategy in the European chemical industry ... 48
Figure 16: A simplified procedure for innovation in petrochemical processes (based on
interviews; feedbacks between various steps are omitted) .......................................................... 49
Figure 17: R&D spending in different regions for 1000 innovative chemical companies .......... 50
Figure 18: Major Chemical Clusters in Europe ........................................................................... 54
Figure 19: Average profit margin of UK manufacturing firms between 1972 and 1983 ............ 71
Figure 20: The green chemistry patent in US over the years ...................................................... 72
Figure 21: The barriers to innovation .......................................................................................... 75
Figure 22: The various types of innovation in a firm .................................................................. 78
Figure 23: Ten different types of innovation in any business ................................................... 102
Figure 24: Chemical output in the developed region ................................................................ 114
Figure 25: Chemical output in the developing region ............................................................... 115
Figure 26: Chemical product sell distribution over different region ......................................... 116
Figure 27: Dow Jones Industrial Index for last ten years .......................................................... 117
Figure 28: Trend of the DOW Jones Chemical Index ............................................................... 117
Figure 29: The chart showing the percentage of output of EU chemical industry consumed by
customer sector .......................................................................................................................... 119
Figure 30: World chemical production ..................................................................................... 120
Figure 31: Top ten chemical producer for the year 2011 .......................................................... 121
Figure 32: EU Chemical sales and EU share of world market in percentage ........................... 122
Figure 33: Sales of each country in Europe and percentage sales ............................................. 123
Figure 34: The export and import of chemical products over different regions ....................... 123
Figure 35: Extra EU-trade balances for various product families ............................................. 124
Figure 36: Production volume growth or decline year over year .............................................. 125
Figure 37: R&D intensity of EU, USA and Japan over a period of 19 years ............................ 126
UNIVERSITAT ROVIRA I VIRGILI EUROPEAN CHEMICAL INDUSTRY AND ITS INNOVATION POLICY WITH FOCUS ON LARGE CHEMICAL COMPANIES. Supriyo Das Dipòsit Legal: T 1295-2015
15
Figure 38: Distribution of world´s top 50 chemical companies according to geographical
regions. ...................................................................................................................................... 127
Figure 39: The percentage of sales of the top 50 chemical companies to total sales in particular
region......................................................................................................................................... 128
Figure 40: The chemical sales for the top 19 chemical companies in Europe .......................... 129
Figure 41: Chemical sell as a percentage of total sales of top European chemical companies . 130
Figure 42: Operating profit as obtained from chemical sales.................................................... 131
Figure 43: Chemical Assets and chemical assets as a percentage of total asset ........................ 131
Figure 44: Total employees of the top 19 chemical companies (included in this chart are
employees assigned to different business sector apart from chemical industry) ....................... 132
Figure 45: The share price trend for last ten years of BASF as recorded by ETR stock exchange
................................................................................................................................................... 133
Figure 46: Royal Dutch Shell share price for last 10 years as recorded at NYSE .................... 134
Figure 47: Bayer share price for last ten years as recorded at OTCMKTS ............................... 135
Figure 48: Share Price of Akzo Nobel for ten years as recorded at AMS stock exchange. ...... 136
Figure 49: The share Price trend as recorded by EPA stock exchange ..................................... 137
Figure 50: Share Price trend of Solvay S A as recorded at EBR stock exchange ..................... 139
Figure 51: Share price trend of Linde AG as recorded at ETR stock exchange ....................... 139
Figure 52: Share Price trend of Yara International ASA as recorded at OTCMKTS stock
Exchange ................................................................................................................................... 140
Figure 53: Share Price trend of DSM N. V. as recorded at AMS stock Exchange ................... 141
Figure 54: Share Price trend of Lanxess AG as recorded at ETR stock Exchange ................... 142
Figure 55: Share Price trend of Syngenta AG as recorded at VTX stock exchange ................. 143
Figure 56: Share Price trend of Total as recorded at NYSE stock exchange ............................ 144
Figure 57: Share Price trend of Eni SpA as recorded at BIT stock Exchange .......................... 145
Figure 58: Share Price trend of Arkema SA as recorded at EPA stock exchange .................... 145
Figure 59: The search window for selecting the patent offices on Thomson Innovation ......... 152
Figure 60: Screen shot of Thomson one database containing data of M&A ............................. 154
Figure 61: M&A deals as divided in different geographical region .......................................... 154
Figure 62: European Union funded project information database search screen ...................... 156
Figure 63: Chemical cluster information as obtained from the chemical park website ............ 161
Figure 64: The European Cluster Observatory showing the chemical clusters in Europe ........ 161
Figure 65: Example of the modeling functionality and data fit of the JMP Software ............... 164
Figure 66: US patenting process flow chart .............................................................................. 170
Figure 67: Number of patent granted at European Patent Office in various sectors ................. 171
Figure 68: Patent granted at European Patent Office for various subsector for chemistry for the
year 2013 ................................................................................................................................... 172
Figure 69: Granted US patent for the top European chemical companies for the last 14 years 174
Figure 70: Global patent application and patent related document publication ........................ 175
Figure 71: Global patent application and patent related document publication ........................ 176
Figure 72: Granted patent of the top chemical companies at the important patent offices ....... 177
Figure 73: Total granted patent for the top chemical companies for the last 10 years .............. 178
Figure 74: The trend of patent granted of the specific companies ............................................ 178
Figure 75: Ratio of application to granted patent for the top chemicals of Europe .................. 180
Figure 76: Sales per unit of granted patent ............................................................................... 181
UNIVERSITAT ROVIRA I VIRGILI EUROPEAN CHEMICAL INDUSTRY AND ITS INNOVATION POLICY WITH FOCUS ON LARGE CHEMICAL COMPANIES. Supriyo Das Dipòsit Legal: T 1295-2015
16
Figure 77: Sales per unit of granted patent for the companies whose ratio value is small........ 182
Figure 78: Percentage of patent first published in EU compared to total patent published first
time ............................................................................................................................................ 182
Figure 79: Comparative study of R&D spending and R&D intensity of chemical industry in
different regions of the world .................................................................................................... 187
Figure 80: R&D spending and R&D spending as a percentage of total sales ........................... 188
Figure 81: R&D spending of different geographical region in 2012 compared to 2006........... 189
Figure 82: Investment in R&D for the top European chemical companies .............................. 190
Figure 83: R&D intensity of top chemical companies of Europe ............................................. 190
Figure 84: Bivariate Fit of R&D spending 2012 By Patent 2013 ............................................. 191
Figure 85: Patent intensity ratio ................................................................................................ 192
Figure 86: Number of people working in R&D in BASF ......................................................... 193
Figure 87: Various reasons and strategy for acquisition of companies ..................................... 199
Figure 88: Number of deals for last 10 years with the location of the acquirer and the target
companies .................................................................................................................................. 201
Figure 89: Geographical distribution of the target chemical companies when the acquirer
company is located in Europe ................................................................................................... 202
Figure 90: Percentage of deals in which European companies being the acquirer and the target
companies are non-chemical companies ................................................................................... 202
Figure 91: Geographical distribution of acquisition of top chemical companies around Europe,
Asia and North America ............................................................................................................ 204
Figure 92: Percentage of non-chemical companies acquired by the top chemical companies for
the last 10 years ......................................................................................................................... 204
Figure 93: The budgeted execution of EU FP7 research funding ............................................. 225
Figure 94: European funded project themes.............................................................................. 227
Figure 95: Total number of EU projects for last 20 years in which the top European chemical
companies participated .............................................................................................................. 228
Figure 96: The private company and government partners in the EU projects in which top
European chemical companies are involved ............................................................................. 230
Figure 97: Percentage of private companies in the EU projects ............................................... 230
Figure 98: Percentage of EU projects in which the top chemical companies participated and in
which they are the coordinator of the project ............................................................................ 231
Figure 99: Number patents filed jointly by the top 4 base companies with rest of the top
European chemical companies .................................................................................................. 232
Figure 100: The timeline of the REACH registration process .................................................. 238
Figure 101: Four main drivers of chemical clusters .................................................................. 250
Figure 102: Various components of a cluster ............................................................................ 251
Figure 103: The chemical cluster in Europe ............................................................................. 252
Figure 104: Key components of a mega-cluster ........................................................................ 252
Figure 105: Europe´s chemical megaclusters ............................................................................ 253
Figure 106: Number of chemical clusters in each European country ....................................... 253
Figure 107: The components of Tarragona Chemical cluster ................................................... 255
Figure 108: Number of granted EU patents in chemistry and chemical engineering for the last
five years ................................................................................................................................... 265
Figure 109: Innovation star rating of various chemical clusters in Europe according to chemical
observatory ................................................................................................................................ 268
UNIVERSITAT ROVIRA I VIRGILI EUROPEAN CHEMICAL INDUSTRY AND ITS INNOVATION POLICY WITH FOCUS ON LARGE CHEMICAL COMPANIES. Supriyo Das Dipòsit Legal: T 1295-2015
17
Figure 110: Innovation star rating of plastics producing companies in EU chemical clusters . 269
Figure 111: The value and impact of digital ............................................................................. 276
Figure 112: Digital model ......................................................................................................... 277
Figure 113: Flow of digital information in a manufacturing ..................................................... 278
Figure 114: The various component of digital .......................................................................... 279
Figure 115: The various technological advances as seen by the chemical industry over the years
................................................................................................................................................... 283
Figure 116: Digitalization Index for several companies. .......................................................... 285
Figure 117: Industry digitization index change 2011–2012 ...................................................... 286
Figure 118: Industry digitalization index by European region ................................................. 287
Figure 119: New customer dynamics ........................................................................................ 288
Figure 120: Various components of digital marketing strategy of a chemical company .......... 291
Figure 121: The steps which the blog undertake to achieve marketing goals ........................... 292
Figure 122: Website with blog web page .................................................................................. 293
Figure 123: Article and publication web pages of the top chemical companies. ...................... 294
Figure 124: E-commerce web page of the top chemical companies ......................................... 296
Figure 125: Facebook likes of various chemical companies ..................................................... 299
UNIVERSITAT ROVIRA I VIRGILI EUROPEAN CHEMICAL INDUSTRY AND ITS INNOVATION POLICY WITH FOCUS ON LARGE CHEMICAL COMPANIES. Supriyo Das Dipòsit Legal: T 1295-2015
18
List of tables
Table 1: The top 19 chemical companies in Europe for the year 2012 based on total sells in
chemical products ........................................................................................................................ 27
Table 2: Important data of European chemical industry ........................................................... 118
Table 3: Number of European chemical enterprises according to their size and number of
persons employed ...................................................................................................................... 127
Table 4: The top 19 chemical companies in Europe for the year 2012 ..................................... 127
Table 5: Top applicants for organics fine chemistry patent application at European Patent Office
................................................................................................................................................... 172
Table 6: Extract of the table showing the ranking of the top European chemical companies in the
total ranking of top 100 companies in terms of highest patent application at the European Patent
Office for 2013 .......................................................................................................................... 173
Table 7: R&D spending of BASF in several segments ............................................................. 193
Table 8: R&D Spending of Bayer in different segments .......................................................... 194
Table 9: Company size of respondents by category in terms of employees.............................. 238
Table 10: Response to the question: Please indicate in what role you will be answering this
questionnaire ............................................................................................................................. 239
Table 11: Respone to the question: How many chemical substances did you place in the market
in 2010 (including substances contained in articles)? ............................................................... 240
Table 12: Survey question: What would you say the sources of your innovations are in general?
If more than one, please rank in importance (1st as most important, 3rd as least important) ... 240
Table 13: Survey question: Has the development of, or access to, any of the following sources
of information acted as a stimulus to product conception and innovation in your organisation?
................................................................................................................................................... 241
Table 14: Was the additional cost for testing of new substances (as opposed to the situation for
existing substances) a disincentive to innovation for you before the REACH Regulation was
implemented? ............................................................................................................................ 241
Table 15: What has been the effect of the placing of substances on the authorisation list for your
firm? .......................................................................................................................................... 242
Table 16: Overall, what would you say has been the effect of REACH on innovation at your
firm to the present, as compared to the pre-REACH situation? ................................................ 242
Table 17: Do you see the position changing in the future? ....................................................... 243
Table 18: The companies of Tarragona chemical cluster .......................................................... 255
Table 19: Products of the Tarragona chemical cluster .............................................................. 257
Table 20: Other important components of the Tarragona chemical cluster ............................. 259
Table 21: Main companies in the port of Antwerp cluster ........................................................ 263
Table 22: The cluster and granted EU patent for 2013 distribution over different European
company .................................................................................................................................... 266
Table 23: Chemicals digital value chain ................................................................................... 283
Table 24: Digital Landscape in chemical Industry .................................................................... 284
Table 25: Trend in customer engagement to increase sells ....................................................... 288
Table 26: Sub-components of the digital marketing relevant to chemical industry .................. 291
Table 27: Active involvement of social media channels by the top European chemical
companies .................................................................................................................................. 297
UNIVERSITAT ROVIRA I VIRGILI EUROPEAN CHEMICAL INDUSTRY AND ITS INNOVATION POLICY WITH FOCUS ON LARGE CHEMICAL COMPANIES. Supriyo Das Dipòsit Legal: T 1295-2015
19
Table 28: Degree of engagement of top chemical companies in various social media channels
................................................................................................................................................... 298
UNIVERSITAT ROVIRA I VIRGILI EUROPEAN CHEMICAL INDUSTRY AND ITS INNOVATION POLICY WITH FOCUS ON LARGE CHEMICAL COMPANIES. Supriyo Das Dipòsit Legal: T 1295-2015
20
Chapter 1: Introduction
Contents
1.1 Introduction .............................................................................................................................21
1.2 Background of the current project ..................................................................................21
1.3 Motivation for current research .......................................................................................24
1.4 Research objective .................................................................................................................26
1.5 Impact of Innovation on Chemical Industry ................................................................28
1.6 Structure of the thesis ..........................................................................................................29
1.7 Summary ...................................................................................................................................33
1.8 Bibliography .............................................................................................................................35
UNIVERSITAT ROVIRA I VIRGILI EUROPEAN CHEMICAL INDUSTRY AND ITS INNOVATION POLICY WITH FOCUS ON LARGE CHEMICAL COMPANIES. Supriyo Das Dipòsit Legal: T 1295-2015
21
1.1 Introduction
According to Arora et al. (1998), the chemical industry is one of the largest and most
R&D- intensive manufacturing sectors in all advanced economies, and its innovative
patterns and productivity growth process can have profound impacts on economic
growth as a whole. The chemical industry is present everywhere in our daily lives.
Modern society and its life style are unthinkable without its products. More than any
other manufacturing sector, this industry provides the technical basis for other economic
activities, both in traditional sectors such as agriculture, construction, textiles, clothing
footwear, and in technologically advanced industries ranging from automobiles, modern
healthcare to electronics and oil & gas. The European chemical industry is facing major
challenges as value chains increasingly move eastward, drawn by economic growth and
market opportunities in Asia. Europe cannot base its growth on inexpensive resources
and labour. Its major asset is knowledge, and innovation is therefore essential, for
building a knowledge-based competitive economy and growth. The process through
which resources spent in research and development (R&D) generates new ideas and the
process of their diffusion are at the heart of the growth mechanism of modern market
economies. In the recent study by Tullo (2013), out of the 50 top global chemical
companies, 19 are headquartered in Europe (Table 1). They consist of 14, 5 % of Global
chemical sale. The objectives of this research are to develop a comprehensive analysis
of: 1. the innovation trend of the European chemical industry with special focuss on
nineteen large chemical companies headquatered in Europe 2. the innovation policy that
drive their new product development and growth. First part of the research consists of
literature review and study of state of European chemical industry. In order to achieve
the research objectives, five hypotheses have been laid down. The later part of the
research tests these five hypotheses while the last part consists of further analysis of the
findings and draws up conclusions. In this thesis report, in the figures, graphs and
tables, comma is used as the decimal separator while dot is used as thousand separators.
1.2 Background of the current project
The European chemical industry is key for economic development and wealth,
providing modern products and materials and enabling technical solutions in virtually
UNIVERSITAT ROVIRA I VIRGILI EUROPEAN CHEMICAL INDUSTRY AND ITS INNOVATION POLICY WITH FOCUS ON LARGE CHEMICAL COMPANIES. Supriyo Das Dipòsit Legal: T 1295-2015
22
all sectors of the economy. With a workforce of 1.2 million and sales of €642 billion, it
is one of the biggest industrial sectors and an important source of direct and indirect
employment in many regions of the European Union (Cefic, 2013). The European
Union accounts for 19.6 % of the total sales of chemicals in the world (Cefic, 2013).
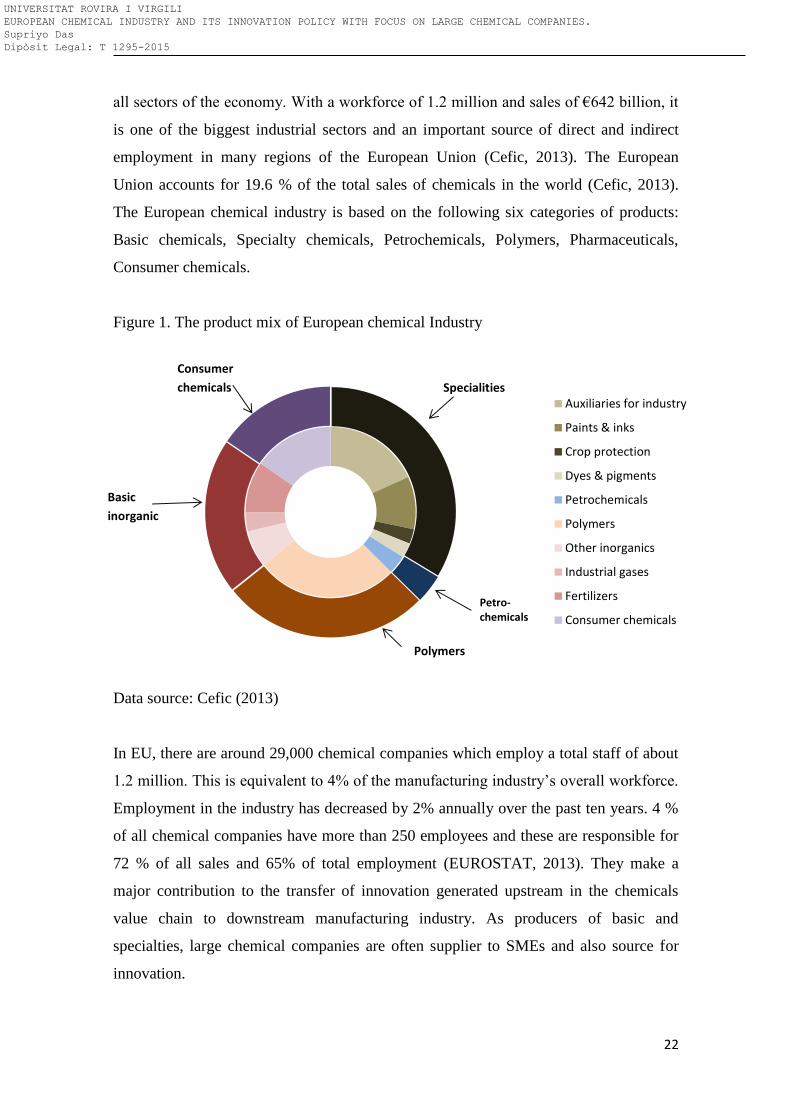
The European chemical industry is based on the following six categories of products:
Basic chemicals, Specialty chemicals, Petrochemicals, Polymers, Pharmaceuticals,
Consumer chemicals.
Figure 1. The product mix of European chemical Industry
Data source: Cefic (2013)
In EU, there are around 29,000 chemical companies which employ a total staff of about
1.2 million. This is equivalent to 4% of the manufacturing industry’s overall workforce.
Employment in the industry has decreased by 2% annually over the past ten years. 4 %
of all chemical companies have more than 250 employees and these are responsible for
72 % of all sales and 65% of total employment (EUROSTAT, 2013). They make a
major contribution to the transfer of innovation generated upstream in the chemicals
value chain to downstream manufacturing industry. As producers of basic and
specialties, large chemical companies are often supplier to SMEs and also source for
innovation.
Auxiliaries for industry
Paints & inks
Crop protection
Dyes & pigments
Petrochemicals
Polymers
Other inorganics
Industrial gases
Fertilizers
Consumer chemicals
Specialities
Petro- chemicals
Polymers
Basic
inorganic
Consumer
chemicals
UNIVERSITAT ROVIRA I VIRGILI EUROPEAN CHEMICAL INDUSTRY AND ITS INNOVATION POLICY WITH FOCUS ON LARGE CHEMICAL COMPANIES. Supriyo Das Dipòsit Legal: T 1295-2015
23
Over the years, the European chemical industry has shown considerable resilience,
strength and adaptability. In 2007, 12 out of the leading 30 chemical companies in the
world were headquartered in Europe, representing 10 percent of world chemical sales
for that year while in 2012, 11 of the top 30 global chemical companies were from
Europe (Cefic, 2013). Like virtually every other industry worldwide, the European
chemical industry has felt an enormous impact from the recent global recession. At its
lowest point in March of 2009, the industry saw a monthly year-on-year decline of 13.2
percent, a figure that if annualized would represent an output decline of approximately
EUR56 billion (Cefic, 2013). In Europe, the chemical industry saw massive reductions
in demand for plastics, paint and man-made fibers, especially in key markets such as
automotive and construction. This fall in demand led to a severe destocking by many
companies, with some companies (particularly in the base chemicals, polymers and
specialty chemicals sectors) watching their own output decline by 30 to 60 percent. The
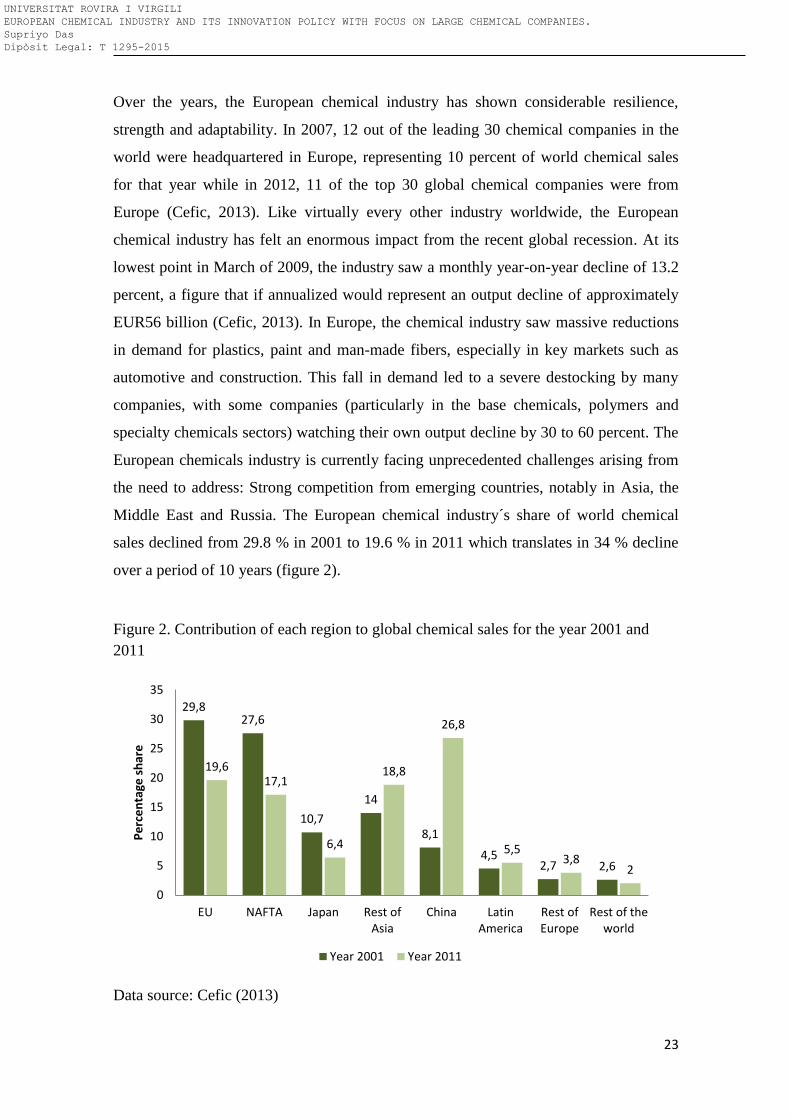
European chemicals industry is currently facing unprecedented challenges arising from
the need to address: Strong competition from emerging countries, notably in Asia, the
Middle East and Russia. The European chemical industry´s share of world chemical
sales declined from 29.8 % in 2001 to 19.6 % in 2011 which translates in 34 % decline
over a period of 10 years (figure 2).
Figure 2. Contribution of each region to global chemical sales for the year 2001 and
2011
Data source: Cefic (2013)
29,8 27,6
10,7
14
8,1
4,5 2,7 2,6
19,6 17,1
6,4
18,8
26,8
5,5 3,8
2
0
5
10
15
20
25
30
35
EU NAFTA Japan Rest ofAsia
China LatinAmerica
Rest ofEurope
Rest of theworld
Pe
rce
nta
ge s
har
e
Year 2001 Year 2011
UNIVERSITAT ROVIRA I VIRGILI EUROPEAN CHEMICAL INDUSTRY AND ITS INNOVATION POLICY WITH FOCUS ON LARGE CHEMICAL COMPANIES. Supriyo Das Dipòsit Legal: T 1295-2015
24
Many of the challenges faced by the chemicals industry affect economic activity and
society as a whole and manufacturing industry across the board. Innovation is
indispensable to overcome these challenges and ensure the industry’s further success.
The chemicals industry has a key role through its enabling function for the entire
economy. It shapes economic activities in other sectors. It is an irreplaceable provider of
innovation to ‘downstream’ industries and an essential component of value chains that
end with the great majority of consumer products. This means that the industry will
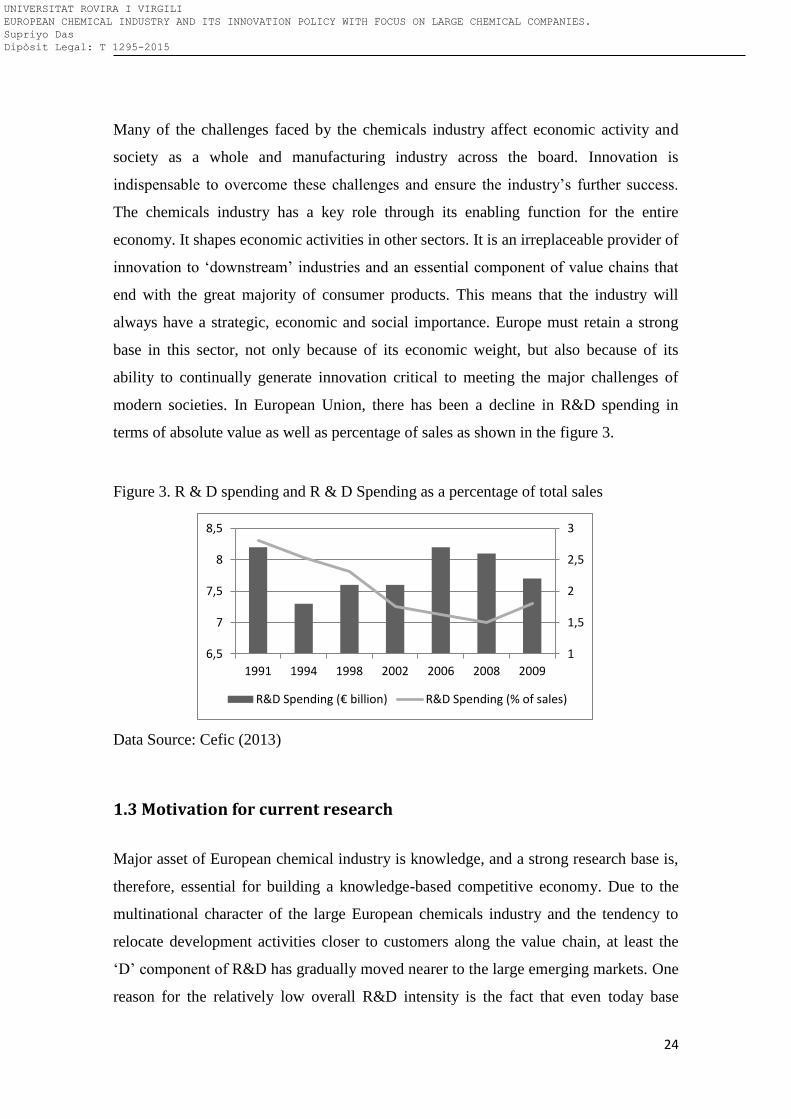
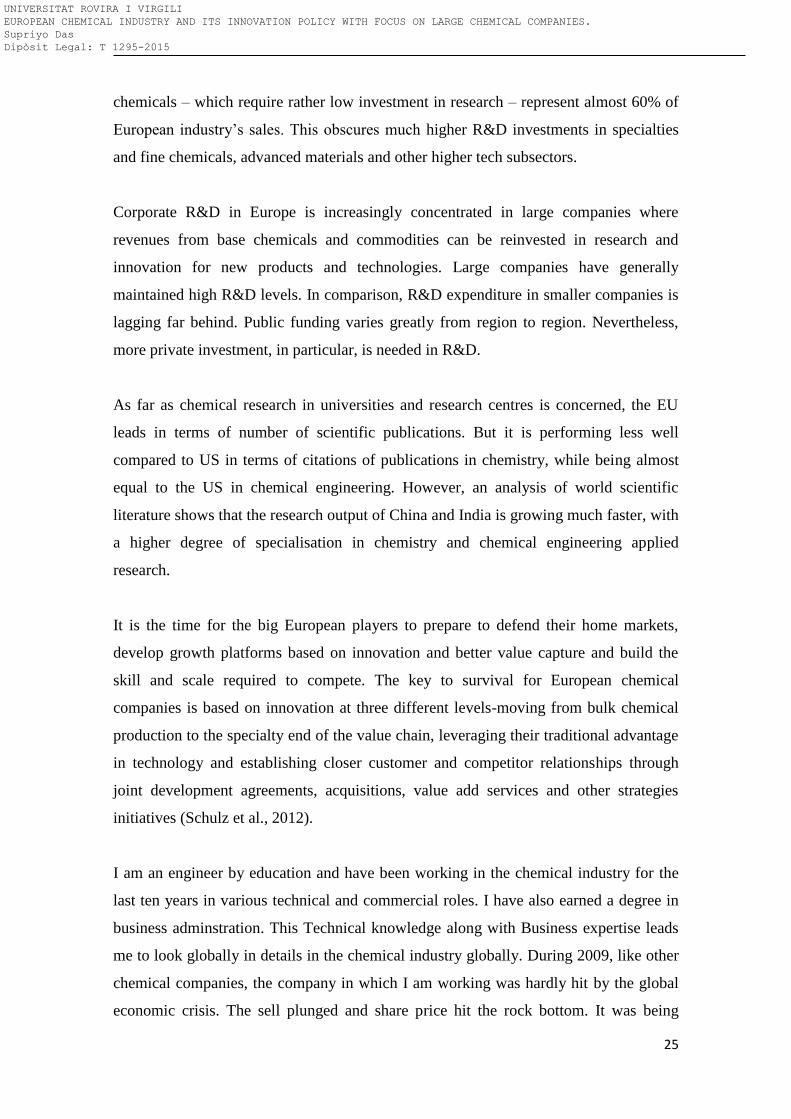
always have a strategic, economic and social importance. Europe must retain a strong
base in this sector, not only because of its economic weight, but also because of its
ability to continually generate innovation critical to meeting the major challenges of
modern societies. In European Union, there has been a decline in R&D spending in
terms of absolute value as well as percentage of sales as shown in the figure 3.
Figure 3. R & D spending and R & D Spending as a percentage of total sales
Data Source: Cefic (2013)
1.3 Motivation for current research
Major asset of European chemical industry is knowledge, and a strong research base is,
therefore, essential for building a knowledge-based competitive economy. Due to the
multinational character of the large European chemicals industry and the tendency to
relocate development activities closer to customers along the value chain, at least the
‘D’ component of R&D has gradually moved nearer to the large emerging markets. One
reason for the relatively low overall R&D intensity is the fact that even today base
1
1,5
2
2,5
3
6,5
7
7,5
8
8,5
1991 1994 1998 2002 2006 2008 2009
R&D Spending (€ billion) R&D Spending (% of sales)
UNIVERSITAT ROVIRA I VIRGILI EUROPEAN CHEMICAL INDUSTRY AND ITS INNOVATION POLICY WITH FOCUS ON LARGE CHEMICAL COMPANIES. Supriyo Das Dipòsit Legal: T 1295-2015
25
chemicals – which require rather low investment in research – represent almost 60% of
European industry’s sales. This obscures much higher R&D investments in specialties
and fine chemicals, advanced materials and other higher tech subsectors.
Corporate R&D in Europe is increasingly concentrated in large companies where
revenues from base chemicals and commodities can be reinvested in research and
innovation for new products and technologies. Large companies have generally
maintained high R&D levels. In comparison, R&D expenditure in smaller companies is
lagging far behind. Public funding varies greatly from region to region. Nevertheless,
more private investment, in particular, is needed in R&D.
As far as chemical research in universities and research centres is concerned, the EU
leads in terms of number of scientific publications. But it is performing less well
compared to US in terms of citations of publications in chemistry, while being almost
equal to the US in chemical engineering. However, an analysis of world scientific
literature shows that the research output of China and India is growing much faster, with
a higher degree of specialisation in chemistry and chemical engineering applied
research.
It is the time for the big European players to prepare to defend their home markets,
develop growth platforms based on innovation and better value capture and build the
skill and scale required to compete. The key to survival for European chemical
companies is based on innovation at three different levels-moving from bulk chemical
production to the specialty end of the value chain, leveraging their traditional advantage
in technology and establishing closer customer and competitor relationships through
joint development agreements, acquisitions, value add services and other strategies
initiatives (Schulz et al., 2012).
I am an engineer by education and have been working in the chemical industry for the
last ten years in various technical and commercial roles. I have also earned a degree in
business adminstration. This Technical knowledge along with Business expertise leads
me to look globally in details in the chemical industry globally. During 2009, like other
chemical companies, the company in which I am working was hardly hit by the global
economic crisis. The sell plunged and share price hit the rock bottom. It was being
UNIVERSITAT ROVIRA I VIRGILI EUROPEAN CHEMICAL INDUSTRY AND ITS INNOVATION POLICY WITH FOCUS ON LARGE CHEMICAL COMPANIES. Supriyo Das Dipòsit Legal: T 1295-2015
26
observed that the European chemical industry is losing its ground both in market and
also in total sales. Due to higher labor cost, stringent environmental regulation, and
higher cost of production, the chemical production has been moving to Asia and Far
East.
So, in perspective of the chemical industry scenario in Europe, the study is even more
relevant. Moreover innovation is key for a sustainable and healthy European chemicals
industry. The project starts with understanding the Euopean and global chemical
industry. It then studies the innovation that this industry has seen in the recent past.
There is also an intent to understand the trend and the factors that influence such
innovation in nineteen large chemical companies headquartered in Europe.
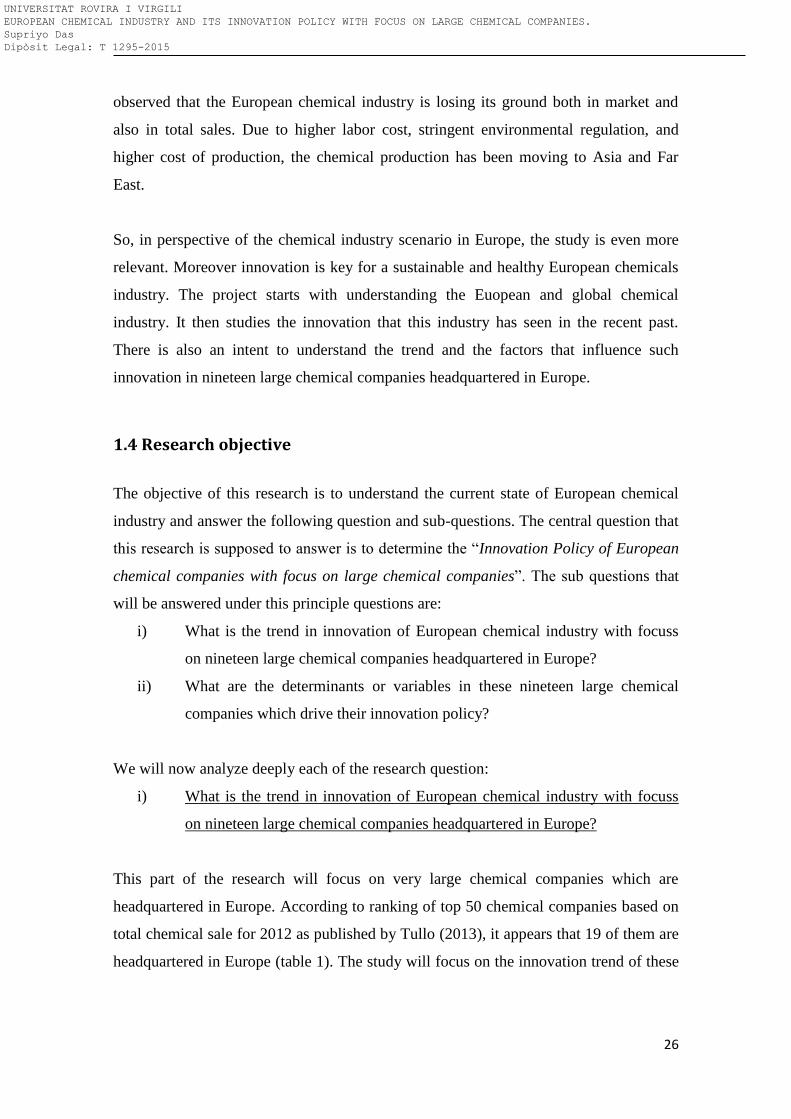
1.4 Research objective
The objective of this research is to understand the current state of European chemical
industry and answer the following question and sub-questions. The central question that
this research is supposed to answer is to determine the “Innovation Policy of European
chemical companies with focus on large chemical companies”. The sub questions that
will be answered under this principle questions are:
i) What is the trend in innovation of European chemical industry with focuss
on nineteen large chemical companies headquartered in Europe?
ii) What are the determinants or variables in these nineteen large chemical
companies which drive their innovation policy?
We will now analyze deeply each of the research question:
i) What is the trend in innovation of European chemical industry with focuss
on nineteen large chemical companies headquartered in Europe?
This part of the research will focus on very large chemical companies which are
headquartered in Europe. According to ranking of top 50 chemical companies based on
total chemical sale for 2012 as published by Tullo (2013), it appears that 19 of them are
headquartered in Europe (table 1). The study will focus on the innovation trend of these
UNIVERSITAT ROVIRA I VIRGILI EUROPEAN CHEMICAL INDUSTRY AND ITS INNOVATION POLICY WITH FOCUS ON LARGE CHEMICAL COMPANIES. Supriyo Das Dipòsit Legal: T 1295-2015
27
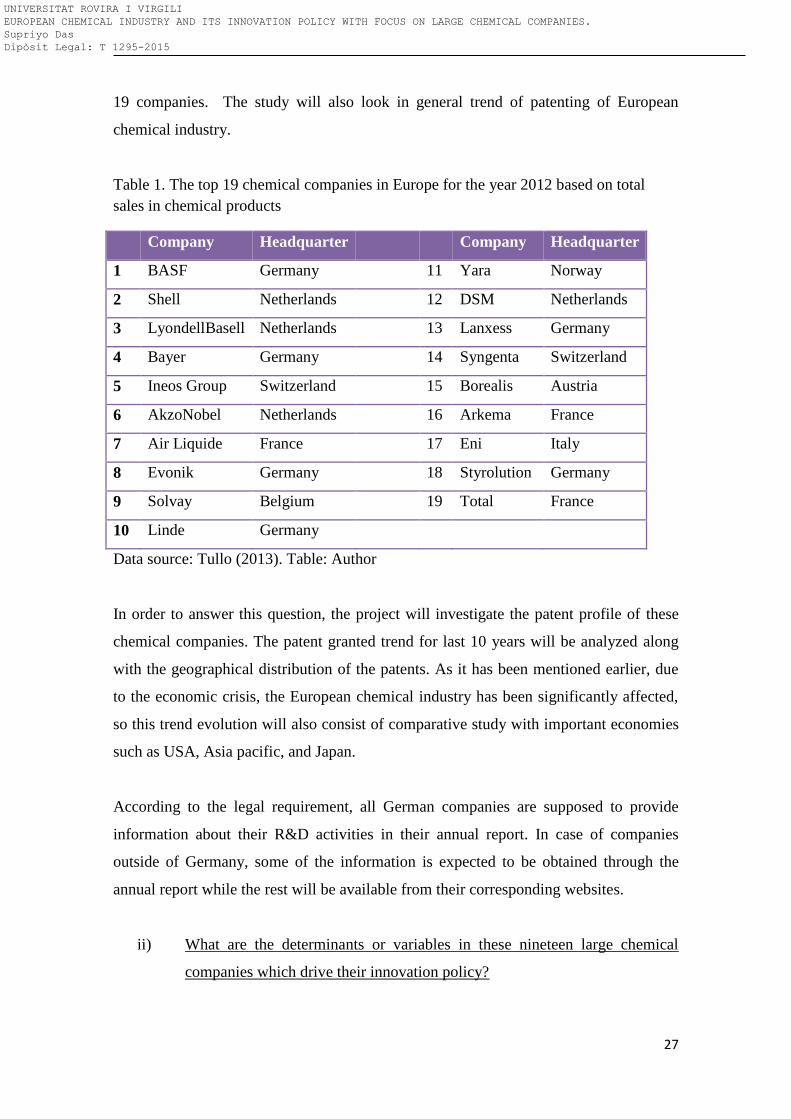
19 companies. The study will also look in general trend of patenting of European
chemical industry.
Table 1. The top 19 chemical companies in Europe for the year 2012 based on total
sales in chemical products
Company Headquarter Company Headquarter
1 BASF Germany 11 Yara Norway
2 Shell Netherlands 12 DSM Netherlands
3 LyondellBasell Netherlands 13 Lanxess Germany
4 Bayer Germany 14 Syngenta Switzerland
5 Ineos Group Switzerland 15 Borealis Austria
6 AkzoNobel Netherlands 16 Arkema France
7 Air Liquide France 17 Eni Italy
8 Evonik Germany 18 Styrolution Germany
9 Solvay Belgium 19 Total France
10 Linde Germany
Data source: Tullo (2013). Table: Author
In order to answer this question, the project will investigate the patent profile of these
chemical companies. The patent granted trend for last 10 years will be analyzed along
with the geographical distribution of the patents. As it has been mentioned earlier, due
to the economic crisis, the European chemical industry has been significantly affected,
so this trend evolution will also consist of comparative study with important economies
such as USA, Asia pacific, and Japan.
According to the legal requirement, all German companies are supposed to provide
information about their R&D activities in their annual report. In case of companies
outside of Germany, some of the information is expected to be obtained through the
annual report while the rest will be available from their corresponding websites.
ii) What are the determinants or variables in these nineteen large chemical
companies which drive their innovation policy?
UNIVERSITAT ROVIRA I VIRGILI EUROPEAN CHEMICAL INDUSTRY AND ITS INNOVATION POLICY WITH FOCUS ON LARGE CHEMICAL COMPANIES. Supriyo Das Dipòsit Legal: T 1295-2015
28
This question will investigate the various industrial, financial and economic factors that
influence significantly the innovation trend that was observed earlier. In order to answer
this question, the R&D investment of these companies for the last 5 years will be
analyzed. Along with that, we will measure several financial and non-financial
indicators such as the intensity of R&D, collaboration with universities and
environmental regulations.
By answering these two questions, we should be able to obtain the research objective of
the current project which is to establish the innovation policy of these nineteen large
chemical companies that are headquartered in Europe.
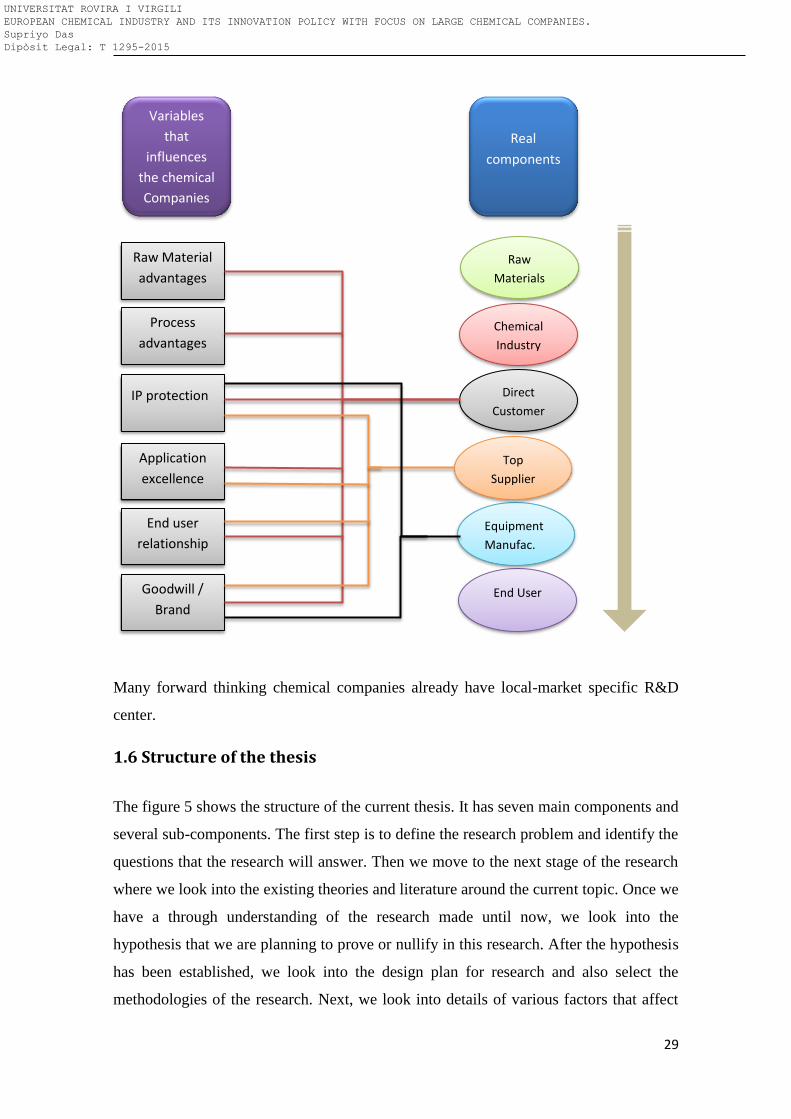
1.5 Impact of Innovation on Chemical Industry
Innovative solutions will help the chemical industry transition from a traditional
supplier role of being paid by the ton of material to play a more important and
indispensable role in the industry value chain. There are several ways to meet this goal.
As shown in figure 4 below, every value chain component has sweet spots that
companies can use, to control the development of the industry and earn above average,
sustainable returns. In chemical industry, these include materials advantage, process
excellence, IP protection and application know-how and they reach far beyond the
chemical industry to have an impact on end users.
Innovation is the platform that has driven the chemical industry throughout its entire
history. With these trends in place, we have seen many established market chemical
companies over the last ten years drive an increased focus on research and technology
applications, moving ever further towards the speciality end and consumer of the value
chain.
Figure 4. Impact of innovation on chemical industry value chain
UNIVERSITAT ROVIRA I VIRGILI EUROPEAN CHEMICAL INDUSTRY AND ITS INNOVATION POLICY WITH FOCUS ON LARGE CHEMICAL COMPANIES. Supriyo Das Dipòsit Legal: T 1295-2015
29
Many forward thinking chemical companies already have local-market specific R&D
center.
1.6 Structure of the thesis
The figure 5 shows the structure of the current thesis. It has seven main components and
several sub-components. The first step is to define the research problem and identify the
questions that the research will answer. Then we move to the next stage of the research
where we look into the existing theories and literature around the current topic. Once we
have a through understanding of the research made until now, we look into the
hypothesis that we are planning to prove or nullify in this research. After the hypothesis
has been established, we look into the design plan for research and also select the
methodologies of the research. Next, we look into details of various factors that affect
Process
advantages
Goodwill /
Brand
End user
relationship
IP protection
Raw Material
advantages
Application
excellence
End User
Equipment
Manufac.
Direct
Customer
Chemical
Industry
Raw
Materials
Top
Supplier
Variables
that
influences
the chemical
Companies
across the
Real
components
UNIVERSITAT ROVIRA I VIRGILI EUROPEAN CHEMICAL INDUSTRY AND ITS INNOVATION POLICY WITH FOCUS ON LARGE CHEMICAL COMPANIES. Supriyo Das Dipòsit Legal: T 1295-2015
30
the innovation trend of large European companies. Once the data is collected, it is
analyzed for understanding the trends and impact. From the analyzed data we will make
conclusion and further recommendation for future research. The research is written in
fourteen chapters. The following section gives an overview what each of the chapter
covers:
Chapter 1: The first chapter explains the problem that the current European chemical
industry is facing and justifies why innovation is the only way for them to regain their
position as the leader in world in terms of production and sell of chemical product. This
chapter also explains the motivation of the current project and the objective that the
project supposed to achieve.
Chapter 2: The second chapter consists of literature review and critical analysis of the
scholarly publication. The literature review covers not only the publications relating to
chemical industry but also innovation in certain other manufacturing sector. It is divided
into six broad categories.
Chapter 3: The third chapter covers the fundamental concepts of innovation and the
objectives that drive innovation in a company. The later part of the chapter establishes
the five hypotheses for the current research that will be tested in the later and justifies
the selection of such hypothesis.
Chapter 4: The fourth chapter talks about the global chemical industry and compares the
European chemical industry with the chemical industry from other region in terms of
various economic metrics. It also shows how the recent global economic crisis has
affected the chemical industry. It explains the composition of European chemical
industry and gives an overview of each of the nineteen companies which we are
studying in this research.
Chapter 5: The fifth chapter covers the methodologies that will be followed for doing
the current research. It consists of two broad sections, the first one covering various
sources for data collection. The second part consists of explaining the tools that will be
used for data analysis.
UNIVERSITAT ROVIRA I VIRGILI EUROPEAN CHEMICAL INDUSTRY AND ITS INNOVATION POLICY WITH FOCUS ON LARGE CHEMICAL COMPANIES. Supriyo Das Dipòsit Legal: T 1295-2015
31
Chapter 6: The sixth chapter talks about the innovation trend of the top European
chemical companies. It explains the patenting trend of the chemical industry in general
and makes deep analysis of various patenting metrics of the top chemical companies
headquartered in Europe.
Chapter 7: The seventh chapter deals with the research and development spending of the
European chemical industry over the years. It also makes analysis of the R&D
investment of the chemical companies which are under study.
Chapter 8: The eighth chapter explains the concept and reason for merger and
acquisition. It shows analysis of the M&A trend of the European chemical industry and
the companies under study. The last part of this chapter gives examples of cases where
the companies went for M&A to acquire innovation.
Chapter 9: The ninth chapter covers the joint development work that companies
undertake among themselves or with specialized research centers. The chapter focusses
on the various European research partnerships and analyses the data of various EU level
research collaborations.
Chapter 10: The tenth chapter explains the REACH environmental regulation and its
impact on the innovation of European chemical industry. The chapter analyses the
survey data obtained by a previous research done by EU chemical agency in order to
understand the impact of chemical regulation on innovation.
Chapter 11: The eleventh chapter talks about the various chemical clusters existing in
Europe and their compositions. It also gives examples of cases where chemical cluster
has played a significant role in driving innovation among its member companies. This
chapter also builds up a relation between geographical distribution of the chemical
companies in Europe and its impact on patenting trend.
Chapter 12: The twelfth chapter explains the trend of digitalization in various functions
in chemical industry. The second part of this chapter focusses on digital marketing and
explains in details the digital marketing strategy the top European chemical companies
are pursuing in order to gain access to a larger customer base.
UNIVERSITAT ROVIRA I VIRGILI EUROPEAN CHEMICAL INDUSTRY AND ITS INNOVATION POLICY WITH FOCUS ON LARGE CHEMICAL COMPANIES. Supriyo Das Dipòsit Legal: T 1295-2015
32
Chapter 13: The thirteenth chapter concludes the findings of the current research. It
revisits the five hypotheses that we established earlier and makes explanation if we
accept or reject those hypotheses.
Chapter 14: The fourteenth chapter is the last chapter of this research and talks about the
future studies that need to take place based on the current learnings and conclusions.
UNIVERSITAT ROVIRA I VIRGILI EUROPEAN CHEMICAL INDUSTRY AND ITS INNOVATION POLICY WITH FOCUS ON LARGE CHEMICAL COMPANIES. Supriyo Das Dipòsit Legal: T 1295-2015
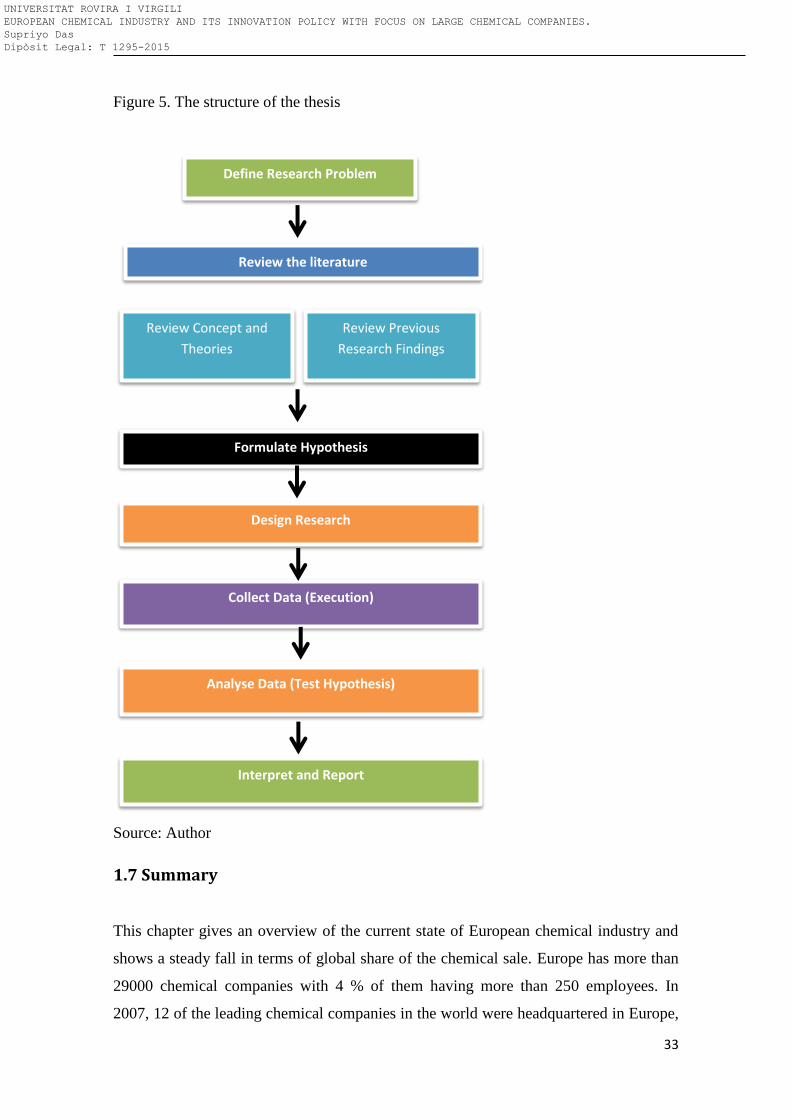
33
Figure 5. The structure of the thesis
Source: Author
1.7 Summary
This chapter gives an overview of the current state of European chemical industry and
shows a steady fall in terms of global share of the chemical sale. Europe has more than
29000 chemical companies with 4 % of them having more than 250 employees. In
2007, 12 of the leading chemical companies in the world were headquartered in Europe,
Interpret and Report
Formulate Hypothesis
Design Research
Collect Data (Execution)
Analyse Data (Test Hypothesis)
Review Concept and
Theories
Review Previous
Research Findings
Define Research Problem
Review the literature
UNIVERSITAT ROVIRA I VIRGILI EUROPEAN CHEMICAL INDUSTRY AND ITS INNOVATION POLICY WITH FOCUS ON LARGE CHEMICAL COMPANIES. Supriyo Das Dipòsit Legal: T 1295-2015
34
representing 10 percent of world chemical sales while in 2012, 11 out of the 30
companies were from Europe. It also states that the chemical industry in Europe is in
difficult situation and only innovation can bring it to the top position which it once
enjoyed. The impact of the innovation on chemical industry has also been explained in
details along with the motivation for the current project. It is stated that large companies
headquartered in Europe are preparing their home markets, develop growth platforms
based on innovation and better value capture and build the skill and scale required to
compete. The objective of the project is explained by addressing the research questions
and sub-questions. The last part of the chapter describes the structure of the current
thesis and its seven main stages. It also gives an overview of the content of each chapter
of the thesis.
UNIVERSITAT ROVIRA I VIRGILI EUROPEAN CHEMICAL INDUSTRY AND ITS INNOVATION POLICY WITH FOCUS ON LARGE CHEMICAL COMPANIES. Supriyo Das Dipòsit Legal: T 1295-2015
35
1.8 Bibliography
Arora A., Landau R. and Rosenberg N. (1998). Chemicals and Long Term Economic
Growth. New York: John Wiley and Sons.
Tullo, A. (2013). Global Top 50 C&EN’s 2013 survey shows leading chemical firms
are pausing after a period of growth. C&EN Chemical Engineering News, 91 (30), 13-
16.
Cefic. (2013). The European Chemical Industry Council: Facts and Figures 2012.
Retrieved from http://www.cefic.org/Facts-and-Figures/
EUROSTAT. (2013). Manufacture of chemicals and chemical products statistics -
NACE Rev. 2. Retrieved from European Union, Brussels website:
http://epp.eurostat.ec.europa.eu/statistics_explained/index.php/Manufacture_of_chemic
als_and_chemical_products_statistics_-_NACE_Rev._2
Schulz, O., Rings, T., Forrest, R., Hoyningen-Huene, J. (2012). Chemical industry
vision 2030: European perspective, Chicago. Retrieved from
http://www.atkearney.com/chemicals/ideas-insights/article/-
/asset_publisher/LCcgOeS4t85g/content/chemical-industry-vision-2030-a-european-
perspective/10192
UNIVERSITAT ROVIRA I VIRGILI EUROPEAN CHEMICAL INDUSTRY AND ITS INNOVATION POLICY WITH FOCUS ON LARGE CHEMICAL COMPANIES. Supriyo Das Dipòsit Legal: T 1295-2015
36
Chapter 2: Literature review
Contents
2.1 Introduction: ............................................................................................................................37
2.2 Overview of the current literature review ...................................................................37
2.3 Literature analysis .................................................................................................................40
2.3.1 Fundamentals of innovation for chemical and other manufacturing
sectors ...........................................................................................................................................41
2.3.2 Inputs for innovation ....................................................................................................49
2.3.2.1 R&D: Spending ........................................................................................................49
2.3.2.2 Organizational structure .....................................................................................51
2.3.2.3 Human capital investment ..................................................................................52
2.3.2.4 Geography and chemical company clusters ...............................................53
2.3.2.5 REACH and other chemical regulations .......................................................54
2.3.2.6 Organization size ....................................................................................................56
2.3.3 Activities for innovation ..............................................................................................57
2.3.3.1 Patent activities ......................................................................................................58
2.3.3.2 Inter-industry activities .......................................................................................60
2.3.3.3 Industry-Academia collaboration ....................................................................61
2.3.3.4 Business strategy ...................................................................................................63
2.3.3.5 Merger and Acquisition for innovation ........................................................65
2.3.4 Output and impact of innovation .............................................................................68
2.3.4.1 R&D Tax benefit ......................................................................................................68
2.3.4.2 Higher productivity and profitability ............................................................70
2.3.4.3 Greener chemistry .................................................................................................71
2.3.5 Barriers to innovation ..................................................................................................74
2.3.5.1 What are barriers to innovation? .....................................................................74
2.3.5.2 How to overcome barrier to innovation?......................................................76
2.3.6 Marketing Innovation ...................................................................................................76
2.4. Summary: .................................................................................................................................80
2.5 Bibliography .............................................................................................................................82
UNIVERSITAT ROVIRA I VIRGILI EUROPEAN CHEMICAL INDUSTRY AND ITS INNOVATION POLICY WITH FOCUS ON LARGE CHEMICAL COMPANIES. Supriyo Das Dipòsit Legal: T 1295-2015
37
2.1 Introduction
A literature review is an account of what has been published on a topic by accredited
scholars and researchers. The aim of the current literature review is to find out various
concepts and ideas of the past research relevant to the current project, then critically
evaluate, analyze and connect or disconnect them in order to have a flow of thoughts
and ideas for the current research. The literature review has been done with the focus on
understanding various theories and common practices in terms of innovation especially
for large companies with emphasis on chemical industry and also consists of critical
evaluation of each of the literatures in order to understand the gaps in those studies.
Even though we have witnessed fall and subsequent rise of innovation in Chemical
industry, theoretical understanding of the input variables and financial – and non-
financial determinants of this innovation trend in large chemical companies is largely
underdeveloped. The literatures available in this area have been divided into several
groups as shown in the following matrix in figure 6. Dividing the literatures into various
groups and sub-groups helps us to look deep into each of them. Innovation has been a
topic for discussion and research for the last 25 years and organizing them according to
the direction of research is a daunting task. Although internet has been a great source of
information with most scholarly literature available online, the hard copy version
available from the university library was also taken into consideration during this
exercise.
2.2 Overview of the current literature review
The six subjects or groups in which the whole literature review was divided into are:
1. Fundamental understanding of innovation
2. Input variables for innovation
3. Activities for innovation
4. Output variables for innovation and its impact
5. Barrier to innovation.
6. Digital innovation in marketing
Although the main focus of this literature review is on the chemical industry , in
particular, large chemical industries in Europe, detailed attention is also given to
literatures from other manufacturing sector as their experience can be incorporated in
the future innovation strategy of large chemical companies.
UNIVERSITAT ROVIRA I VIRGILI EUROPEAN CHEMICAL INDUSTRY AND ITS INNOVATION POLICY WITH FOCUS ON LARGE CHEMICAL COMPANIES. Supriyo Das Dipòsit Legal: T 1295-2015
38
The literature review on fundamental understanding focusses on:
Innovation definition and general understanding of innovation process
Innovation process in chemical industry
Innovation process in other manufacturing sectors
The publications around input variable for innovation consist of the following sub
topics:
Investment in R&D
Organizational structure that influence innovation
Investment in human capital
Training and development of the employee to carter innovation
Environmental regulations in Europe such as REACH which influences the
innovation path
Size of the organization
Geographical distribution of innovation activities and cluster effect
The third section consists of literatures focusing on activities under taken during the
innovation process and it comprises of four sub topics:
Patent activities such as searching previous patents and writing new patents for
the current invention
Inter-industry R&D collaboration
Collaboration of industry with academia such as universities and research
institutes
Business strategies specially for large chemical industries and other
manufacturing sectors which encourage innovation
The fourth section consists of publication around output variables of an innovation
process and its impact on the company which is again sub-divided into:
R&D tax benefit
Increase in productivity and sale
Increase in profitability
Increased research in greener chemistry
UNIVERSITAT ROVIRA I VIRGILI EUROPEAN CHEMICAL INDUSTRY AND ITS INNOVATION POLICY WITH FOCUS ON LARGE CHEMICAL COMPANIES. Supriyo Das Dipòsit Legal: T 1295-2015
39
The fifth section of this literature review focusses on two questions around the barrier to
innovation as faced by the companies:
What are the barriers to innovation?
How to avoid such barriers?
The last section of the literature review focusses on marketing innovation with emphasis
on digital marketing.
UNIVERSITAT ROVIRA I VIRGILI EUROPEAN CHEMICAL INDUSTRY AND ITS INNOVATION POLICY WITH FOCUS ON LARGE CHEMICAL COMPANIES. Supriyo Das Dipòsit Legal: T 1295-2015
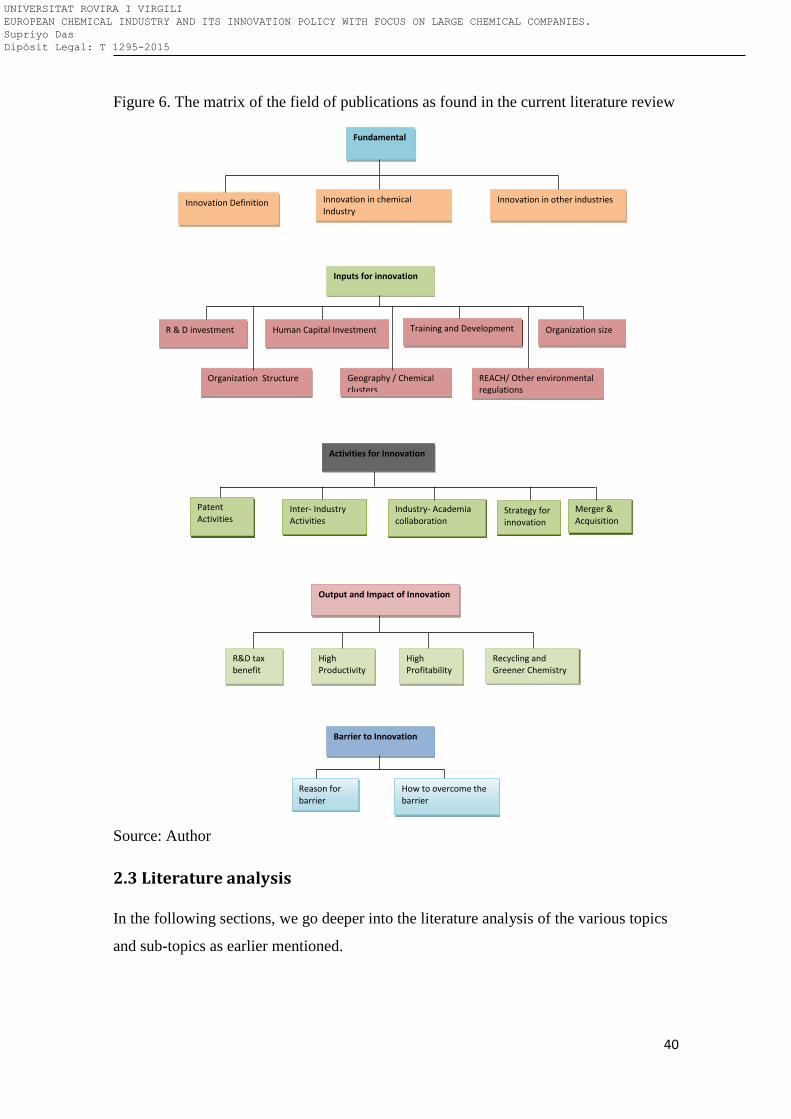
40
Figure 6. The matrix of the field of publications as found in the current literature review
Source: Author
2.3 Literature analysis
In the following sections, we go deeper into the literature analysis of the various topics
and sub-topics as earlier mentioned.
Fundamental
Innovation Definition Innovation in chemical Industry
Innovation in other industries
Inputs for innovation
Human Capital Investment R & D investment Training and Development Organization size
Organization Structure REACH/ Other environmental regulations
Activities for Innovation
Inter- Industry Activities
Patent Activities
Industry- Academia collaboration
Strategy for innovation
Output and Impact of Innovation
R&D tax benefit
High Productivity
High Profitability
Recycling and Greener Chemistry
How to overcome the barrier
Barrier to Innovation
Reason for barrier
Geography / Chemical clusters
Merger & Acquisition
UNIVERSITAT ROVIRA I VIRGILI EUROPEAN CHEMICAL INDUSTRY AND ITS INNOVATION POLICY WITH FOCUS ON LARGE CHEMICAL COMPANIES. Supriyo Das Dipòsit Legal: T 1295-2015
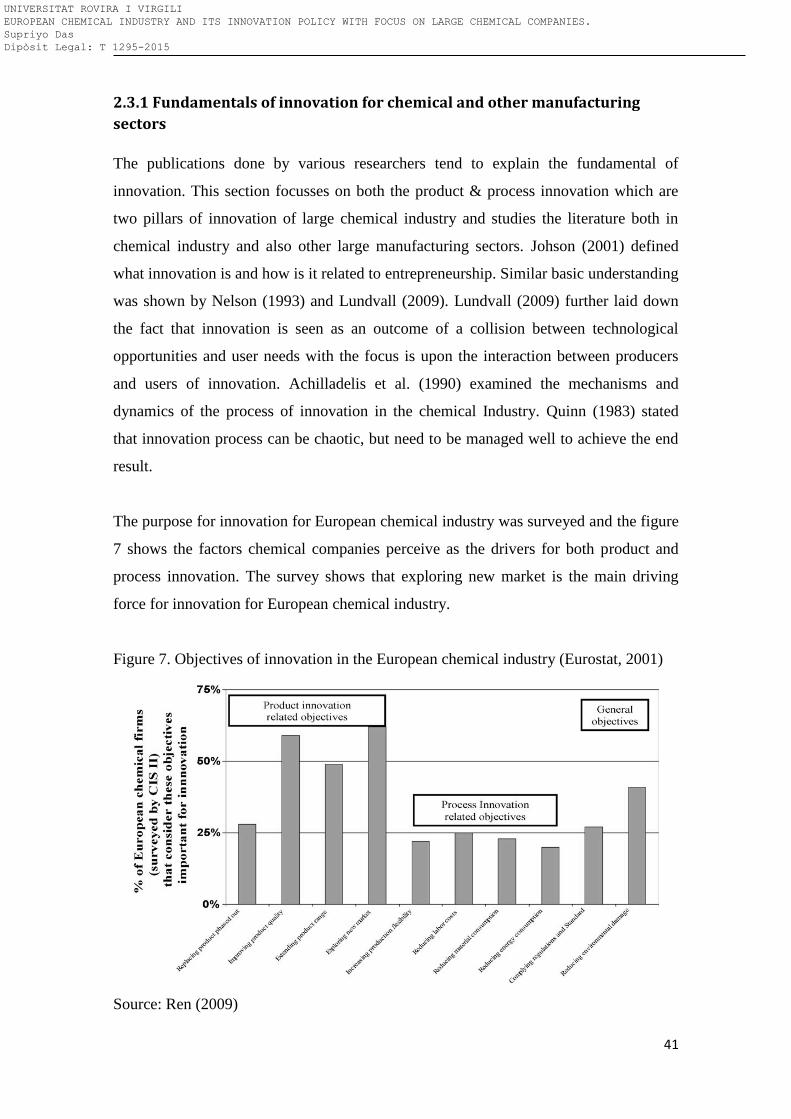
41
2.3.1 Fundamentals of innovation for chemical and other manufacturing
sectors
The publications done by various researchers tend to explain the fundamental of
innovation. This section focusses on both the product & process innovation which are
two pillars of innovation of large chemical industry and studies the literature both in
chemical industry and also other large manufacturing sectors. Johson (2001) defined
what innovation is and how is it related to entrepreneurship. Similar basic understanding
was shown by Nelson (1993) and Lundvall (2009). Lundvall (2009) further laid down
the fact that innovation is seen as an outcome of a collision between technological
opportunities and user needs with the focus is upon the interaction between producers
and users of innovation. Achilladelis et al. (1990) examined the mechanisms and
dynamics of the process of innovation in the chemical Industry. Quinn (1983) stated
that innovation process can be chaotic, but need to be managed well to achieve the end
result.
The purpose for innovation for European chemical industry was surveyed and the figure
7 shows the factors chemical companies perceive as the drivers for both product and
process innovation. The survey shows that exploring new market is the main driving
force for innovation for European chemical industry.
Figure 7. Objectives of innovation in the European chemical industry (Eurostat, 2001)
Source: Ren (2009)
UNIVERSITAT ROVIRA I VIRGILI EUROPEAN CHEMICAL INDUSTRY AND ITS INNOVATION POLICY WITH FOCUS ON LARGE CHEMICAL COMPANIES. Supriyo Das Dipòsit Legal: T 1295-2015
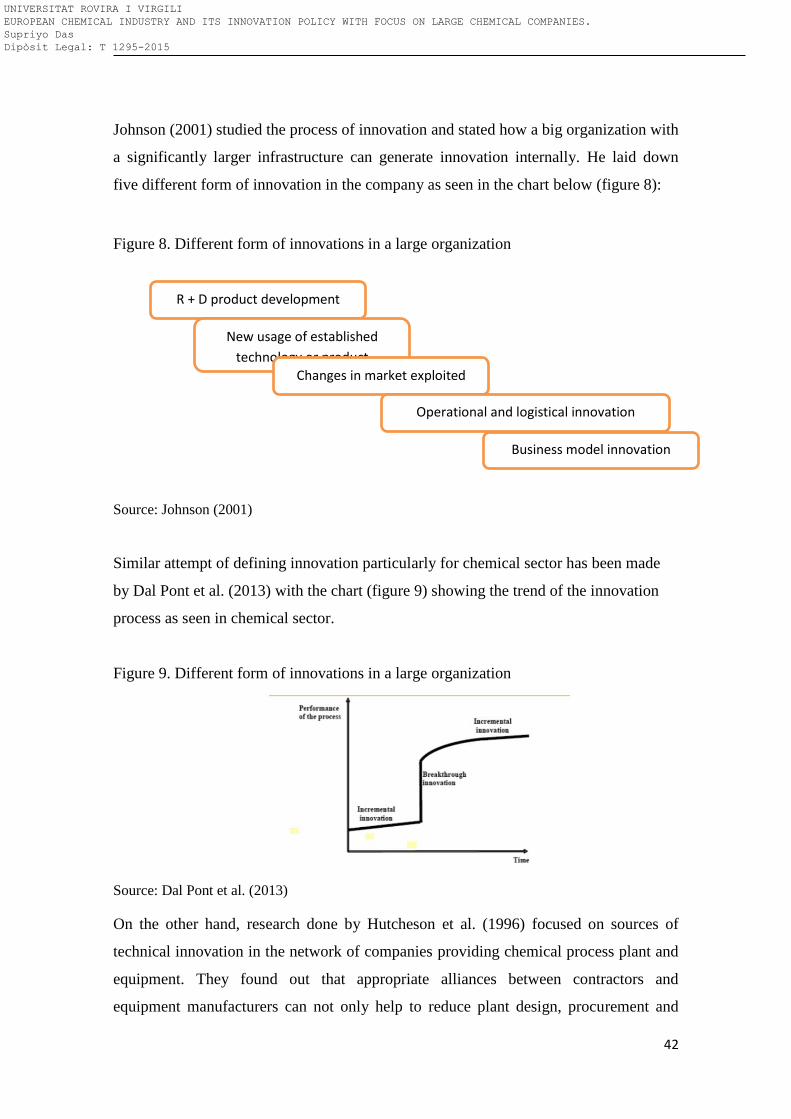
42
Johnson (2001) studied the process of innovation and stated how a big organization with
a significantly larger infrastructure can generate innovation internally. He laid down
five different form of innovation in the company as seen in the chart below (figure 8):
Figure 8. Different form of innovations in a large organization
Source: Johnson (2001)
Similar attempt of defining innovation particularly for chemical sector has been made
by Dal Pont et al. (2013) with the chart (figure 9) showing the trend of the innovation
process as seen in chemical sector.
Figure 9. Different form of innovations in a large organization
Source: Dal Pont et al. (2013)
On the other hand, research done by Hutcheson et al. (1996) focused on sources of
technical innovation in the network of companies providing chemical process plant and
equipment. They found out that appropriate alliances between contractors and
equipment manufacturers can not only help to reduce plant design, procurement and
R + D product development
New usage of established
technology or product Changes in market exploited
Operational and logistical innovation
Business model innovation
UNIVERSITAT ROVIRA I VIRGILI EUROPEAN CHEMICAL INDUSTRY AND ITS INNOVATION POLICY WITH FOCUS ON LARGE CHEMICAL COMPANIES. Supriyo Das Dipòsit Legal: T 1295-2015
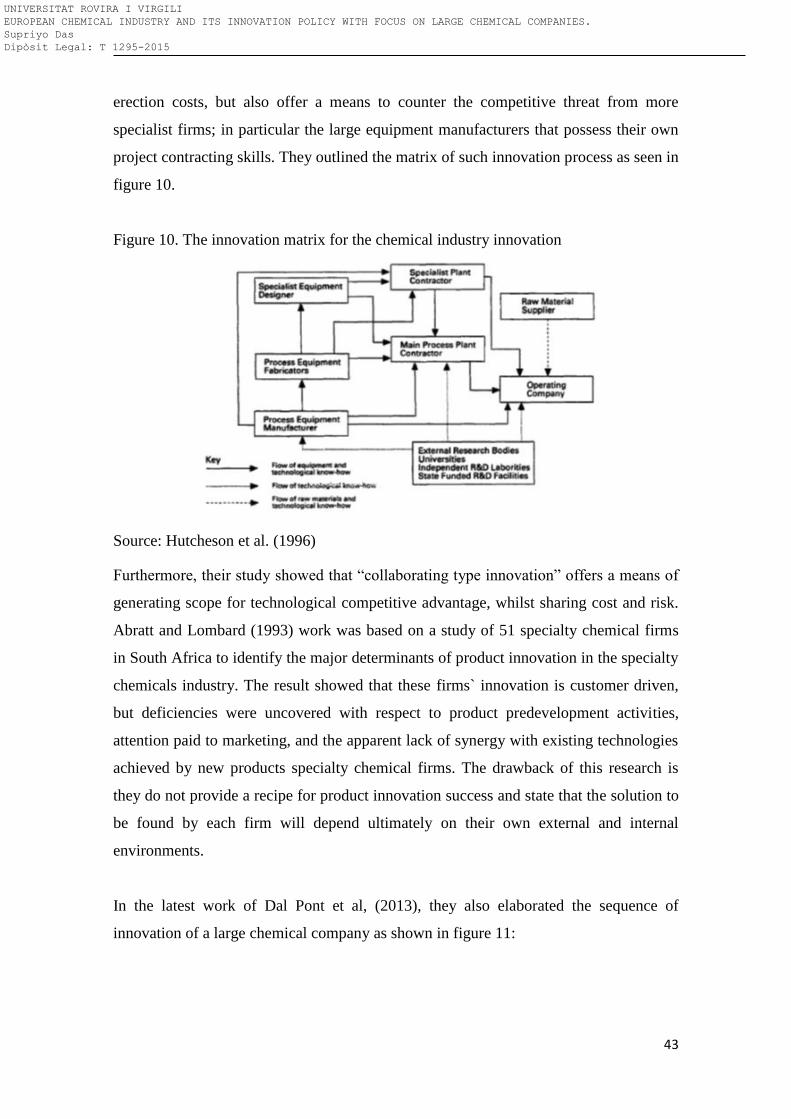
43
erection costs, but also offer a means to counter the competitive threat from more
specialist firms; in particular the large equipment manufacturers that possess their own
project contracting skills. They outlined the matrix of such innovation process as seen in
figure 10.
Figure 10. The innovation matrix for the chemical industry innovation
Source: Hutcheson et al. (1996)
Furthermore, their study showed that “collaborating type innovation” offers a means of
generating scope for technological competitive advantage, whilst sharing cost and risk.
Abratt and Lombard (1993) work was based on a study of 51 specialty chemical firms
in South Africa to identify the major determinants of product innovation in the specialty
chemicals industry. The result showed that these firms` innovation is customer driven,
but deficiencies were uncovered with respect to product predevelopment activities,
attention paid to marketing, and the apparent lack of synergy with existing technologies
achieved by new products specialty chemical firms. The drawback of this research is
they do not provide a recipe for product innovation success and state that the solution to
be found by each firm will depend ultimately on their own external and internal
environments.
In the latest work of Dal Pont et al, (2013), they also elaborated the sequence of
innovation of a large chemical company as shown in figure 11:
UNIVERSITAT ROVIRA I VIRGILI EUROPEAN CHEMICAL INDUSTRY AND ITS INNOVATION POLICY WITH FOCUS ON LARGE CHEMICAL COMPANIES. Supriyo Das Dipòsit Legal: T 1295-2015
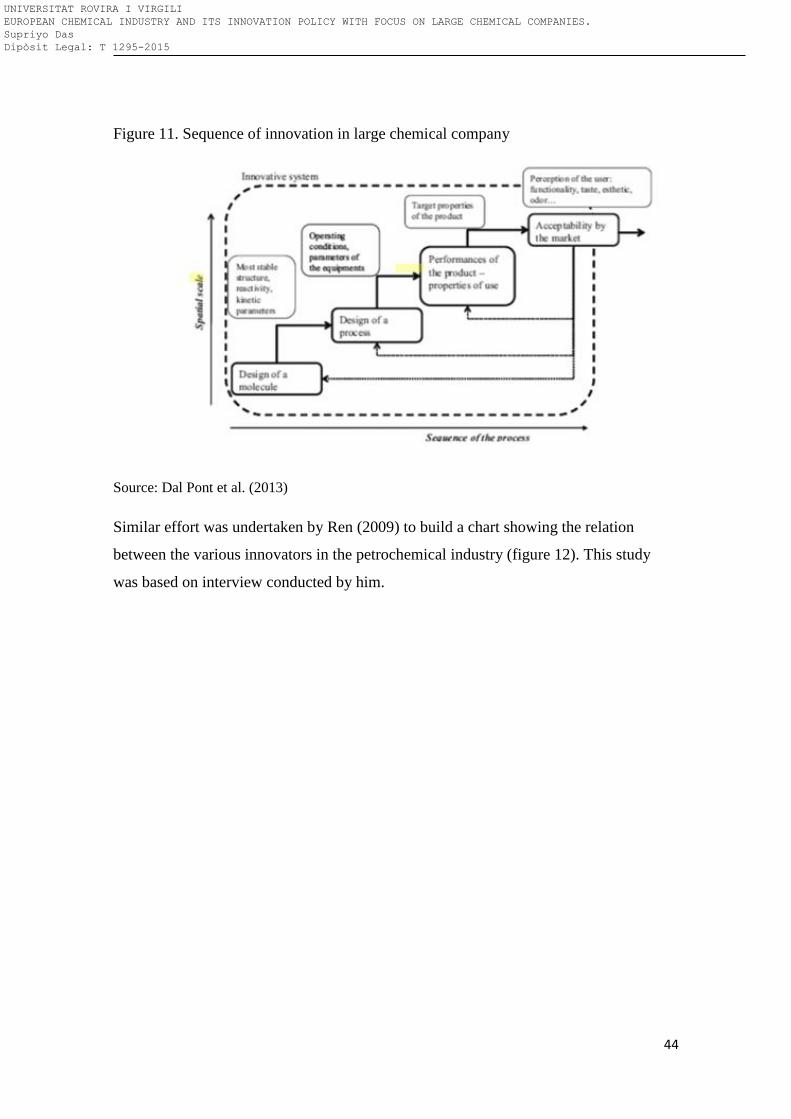
44
Figure 11. Sequence of innovation in large chemical company
Source: Dal Pont et al. (2013)
Similar effort was undertaken by Ren (2009) to build a chart showing the relation
between the various innovators in the petrochemical industry (figure 12). This study
was based on interview conducted by him.
UNIVERSITAT ROVIRA I VIRGILI EUROPEAN CHEMICAL INDUSTRY AND ITS INNOVATION POLICY WITH FOCUS ON LARGE CHEMICAL COMPANIES. Supriyo Das Dipòsit Legal: T 1295-2015
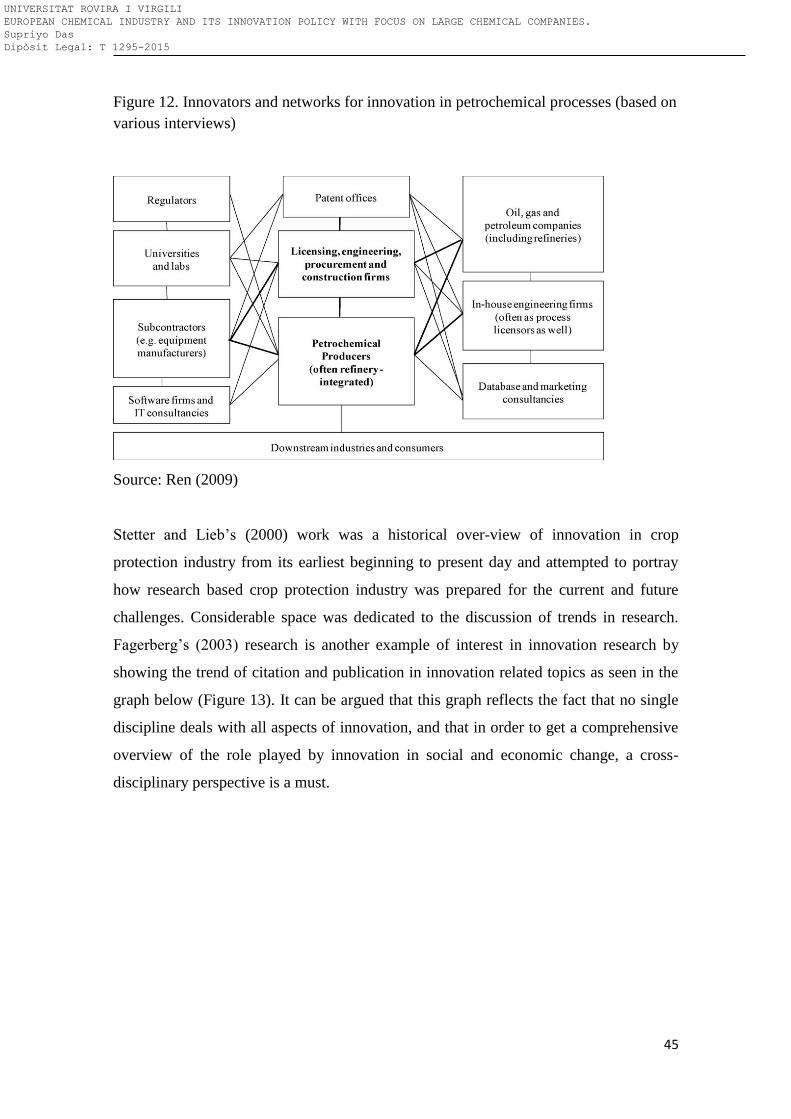
45
Figure 12. Innovators and networks for innovation in petrochemical processes (based on
various interviews)
Source: Ren (2009)
Stetter and Lieb’s (2000) work was a historical over-view of innovation in crop
protection industry from its earliest beginning to present day and attempted to portray
how research based crop protection industry was prepared for the current and future
challenges. Considerable space was dedicated to the discussion of trends in research.
Fagerberg’s (2003) research is another example of interest in innovation research by
showing the trend of citation and publication in innovation related topics as seen in the
graph below (Figure 13). It can be argued that this graph reflects the fact that no single
discipline deals with all aspects of innovation, and that in order to get a comprehensive
overview of the role played by innovation in social and economic change, a cross-
disciplinary perspective is a must.
UNIVERSITAT ROVIRA I VIRGILI EUROPEAN CHEMICAL INDUSTRY AND ITS INNOVATION POLICY WITH FOCUS ON LARGE CHEMICAL COMPANIES. Supriyo Das Dipòsit Legal: T 1295-2015
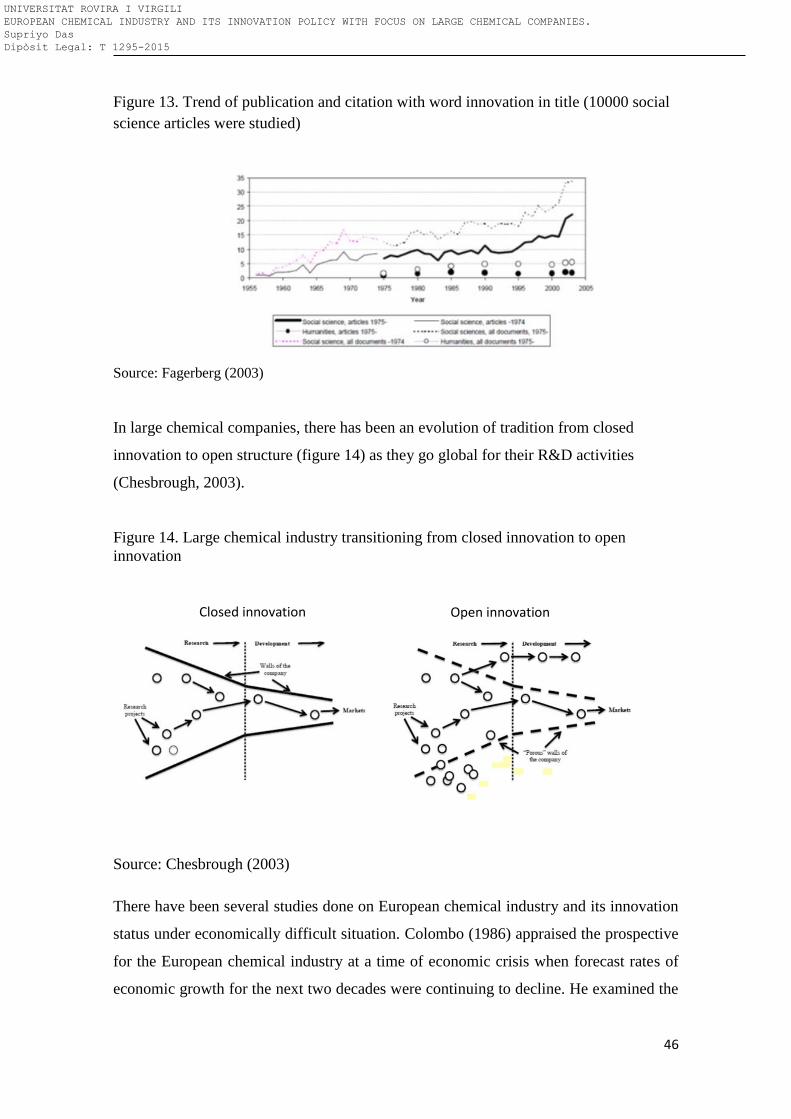
46
Figure 13. Trend of publication and citation with word innovation in title (10000 social
science articles were studied)
Source: Fagerberg (2003)
In large chemical companies, there has been an evolution of tradition from closed
innovation to open structure (figure 14) as they go global for their R&D activities
(Chesbrough, 2003).
Figure 14. Large chemical industry transitioning from closed innovation to open
innovation
Source: Chesbrough (2003)
There have been several studies done on European chemical industry and its innovation
status under economically difficult situation. Colombo (1986) appraised the prospective
for the European chemical industry at a time of economic crisis when forecast rates of
economic growth for the next two decades were continuing to decline. He examined the
Closed innovation Open innovation
UNIVERSITAT ROVIRA I VIRGILI EUROPEAN CHEMICAL INDUSTRY AND ITS INNOVATION POLICY WITH FOCUS ON LARGE CHEMICAL COMPANIES. Supriyo Das Dipòsit Legal: T 1295-2015
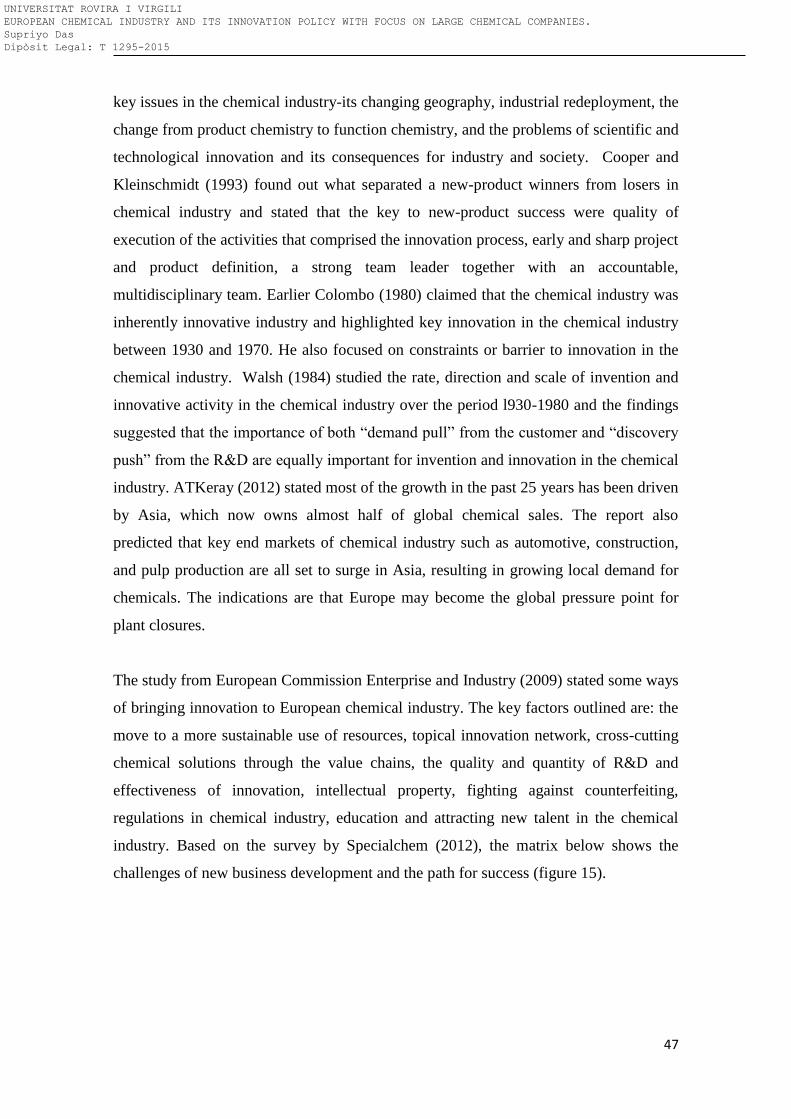
47
key issues in the chemical industry-its changing geography, industrial redeployment, the
change from product chemistry to function chemistry, and the problems of scientific and
technological innovation and its consequences for industry and society. Cooper and
Kleinschmidt (1993) found out what separated a new-product winners from losers in
chemical industry and stated that the key to new-product success were quality of
execution of the activities that comprised the innovation process, early and sharp project
and product definition, a strong team leader together with an accountable,
multidisciplinary team. Earlier Colombo (1980) claimed that the chemical industry was
inherently innovative industry and highlighted key innovation in the chemical industry
between 1930 and 1970. He also focused on constraints or barrier to innovation in the
chemical industry. Walsh (1984) studied the rate, direction and scale of invention and
innovative activity in the chemical industry over the period l930-1980 and the findings
suggested that the importance of both “demand pull” from the customer and “discovery
push” from the R&D are equally important for invention and innovation in the chemical
industry. ATKeray (2012) stated most of the growth in the past 25 years has been driven
by Asia, which now owns almost half of global chemical sales. The report also
predicted that key end markets of chemical industry such as automotive, construction,
and pulp production are all set to surge in Asia, resulting in growing local demand for
chemicals. The indications are that Europe may become the global pressure point for
plant closures.
The study from European Commission Enterprise and Industry (2009) stated some ways
of bringing innovation to European chemical industry. The key factors outlined are: the
move to a more sustainable use of resources, topical innovation network, cross-cutting
chemical solutions through the value chains, the quality and quantity of R&D and
effectiveness of innovation, intellectual property, fighting against counterfeiting,
regulations in chemical industry, education and attracting new talent in the chemical
industry. Based on the survey by Specialchem (2012), the matrix below shows the
challenges of new business development and the path for success (figure 15).
UNIVERSITAT ROVIRA I VIRGILI EUROPEAN CHEMICAL INDUSTRY AND ITS INNOVATION POLICY WITH FOCUS ON LARGE CHEMICAL COMPANIES. Supriyo Das Dipòsit Legal: T 1295-2015
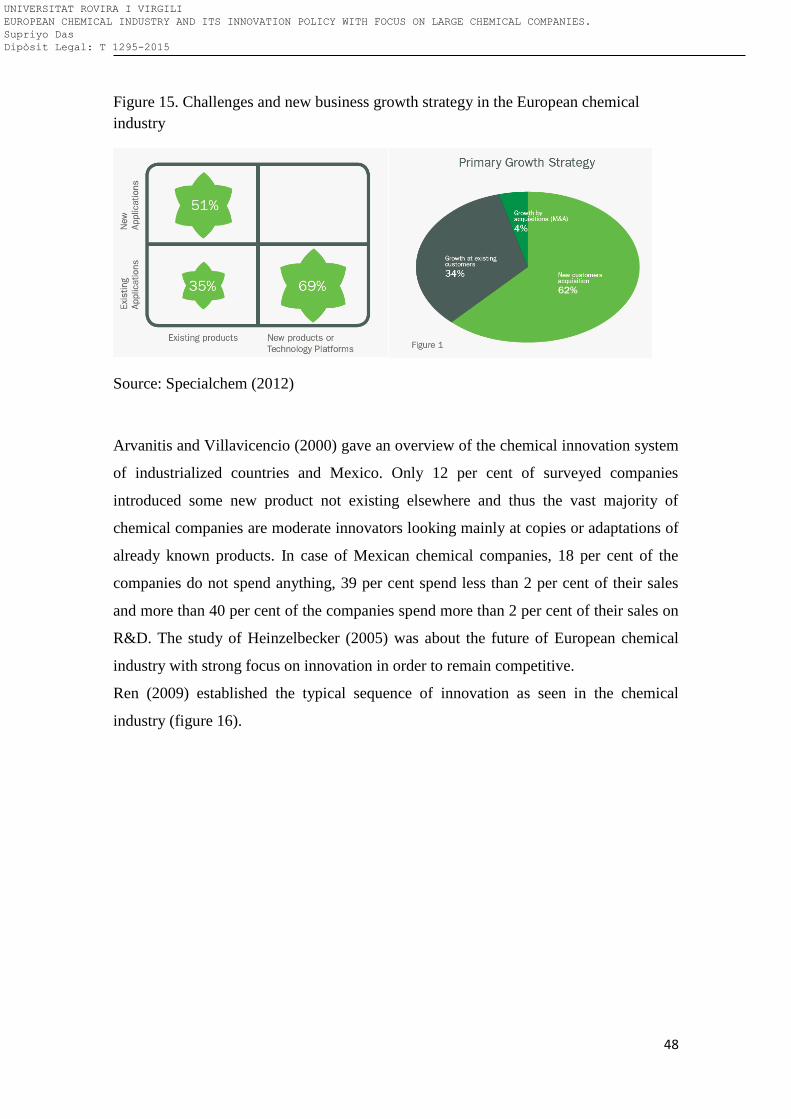
48
Figure 15. Challenges and new business growth strategy in the European chemical
industry
Source: Specialchem (2012)
Arvanitis and Villavicencio (2000) gave an overview of the chemical innovation system
of industrialized countries and Mexico. Only 12 per cent of surveyed companies
introduced some new product not existing elsewhere and thus the vast majority of
chemical companies are moderate innovators looking mainly at copies or adaptations of
already known products. In case of Mexican chemical companies, 18 per cent of the
companies do not spend anything, 39 per cent spend less than 2 per cent of their sales
and more than 40 per cent of the companies spend more than 2 per cent of their sales on
R&D. The study of Heinzelbecker (2005) was about the future of European chemical
industry with strong focus on innovation in order to remain competitive.
Ren (2009) established the typical sequence of innovation as seen in the chemical
industry (figure 16).
UNIVERSITAT ROVIRA I VIRGILI EUROPEAN CHEMICAL INDUSTRY AND ITS INNOVATION POLICY WITH FOCUS ON LARGE CHEMICAL COMPANIES. Supriyo Das Dipòsit Legal: T 1295-2015
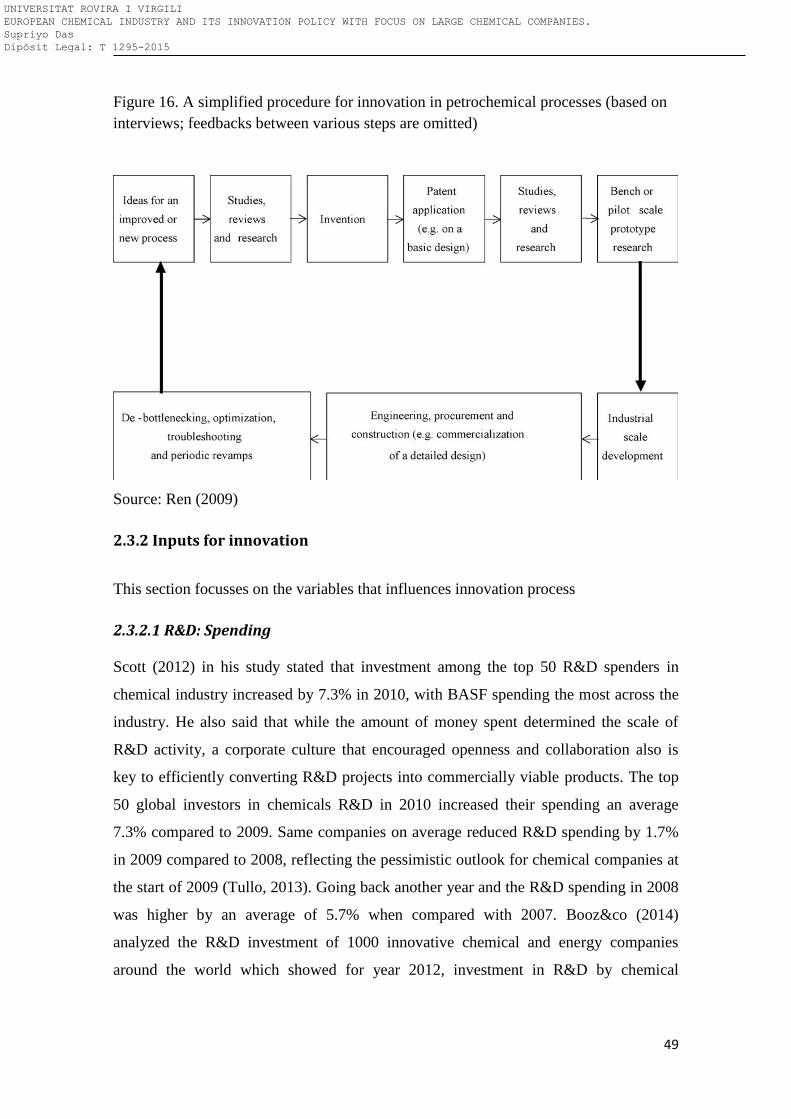
49
Figure 16. A simplified procedure for innovation in petrochemical processes (based on
interviews; feedbacks between various steps are omitted)
Source: Ren (2009)
2.3.2 Inputs for innovation
This section focusses on the variables that influences innovation process
2.3.2.1 R&D: Spending
Scott (2012) in his study stated that investment among the top 50 R&D spenders in
chemical industry increased by 7.3% in 2010, with BASF spending the most across the
industry. He also said that while the amount of money spent determined the scale of
R&D activity, a corporate culture that encouraged openness and collaboration also is
key to efficiently converting R&D projects into commercially viable products. The top
50 global investors in chemicals R&D in 2010 increased their spending an average
7.3% compared to 2009. Same companies on average reduced R&D spending by 1.7%
in 2009 compared to 2008, reflecting the pessimistic outlook for chemical companies at
the start of 2009 (Tullo, 2013). Going back another year and the R&D spending in 2008
was higher by an average of 5.7% when compared with 2007. Booz&co (2014)
analyzed the R&D investment of 1000 innovative chemical and energy companies
around the world which showed for year 2012, investment in R&D by chemical
UNIVERSITAT ROVIRA I VIRGILI EUROPEAN CHEMICAL INDUSTRY AND ITS INNOVATION POLICY WITH FOCUS ON LARGE CHEMICAL COMPANIES. Supriyo Das Dipòsit Legal: T 1295-2015
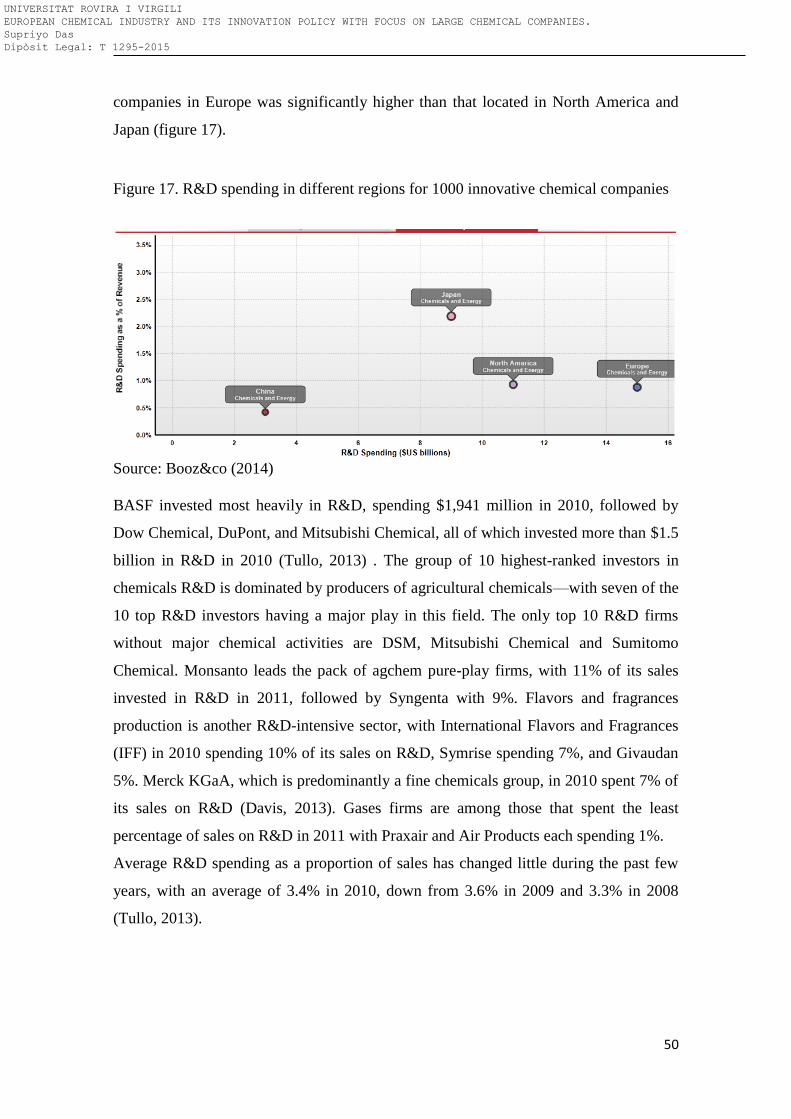
50
companies in Europe was significantly higher than that located in North America and
Japan (figure 17).
Figure 17. R&D spending in different regions for 1000 innovative chemical companies
Source: Booz&co (2014)
BASF invested most heavily in R&D, spending $1,941 million in 2010, followed by
Dow Chemical, DuPont, and Mitsubishi Chemical, all of which invested more than $1.5
billion in R&D in 2010 (Tullo, 2013) . The group of 10 highest-ranked investors in
chemicals R&D is dominated by producers of agricultural chemicals—with seven of the
10 top R&D investors having a major play in this field. The only top 10 R&D firms
without major chemical activities are DSM, Mitsubishi Chemical and Sumitomo
Chemical. Monsanto leads the pack of agchem pure-play firms, with 11% of its sales
invested in R&D in 2011, followed by Syngenta with 9%. Flavors and fragrances
production is another R&D-intensive sector, with International Flavors and Fragrances
(IFF) in 2010 spending 10% of its sales on R&D, Symrise spending 7%, and Givaudan
5%. Merck KGaA, which is predominantly a fine chemicals group, in 2010 spent 7% of
its sales on R&D (Davis, 2013). Gases firms are among those that spent the least
percentage of sales on R&D in 2011 with Praxair and Air Products each spending 1%.
Average R&D spending as a proportion of sales has changed little during the past few
years, with an average of 3.4% in 2010, down from 3.6% in 2009 and 3.3% in 2008
(Tullo, 2013).
UNIVERSITAT ROVIRA I VIRGILI EUROPEAN CHEMICAL INDUSTRY AND ITS INNOVATION POLICY WITH FOCUS ON LARGE CHEMICAL COMPANIES. Supriyo Das Dipòsit Legal: T 1295-2015
51
2.3.2.2 Organizational structure
An organizational structure is such activities as task allocation, coordination and
supervision, which are directed towards the achievement of organizational aims.
Previous studies have shown a close relation between organization structure and
innovational activities. The key contributors to R&D outcomes and innovation were
found to be managerial and strategies that relate to each of the three elements; posture
and direction, systems, and adjustment processes (Roberts and Bellotti, 2002).
Based on data from 32 Taiwanese companies, Jung and Wu (2003) found that there is a
direct and positive link between a style of leadership that has been labeled as
‘‘transformational’’ and organizational innovation. They also indicated that
transformational leadership has significant and positive relations with both
empowerment and an innovation-supporting organizational climate. The former is
found to have a significant but negative relation with organizational innovation, while
the latter has a significant and positive relationship. The study of better understanding
of business-driven innovations towards more sustainable chemical products and
processes by Visser et al. (2008) showed that the objective of business-driven
innovation was to place more sustainable products in upcoming markets. Commercial
managers played an important role in the innovation processes, whereas environmental
managers hardly played a role at all. Most innovations are indirectly triggered by new
regulations in frontrunner countries, which were regarded as indications of future
market changes.
Argyres and Silverman (2004) studied the relation between a firm’s organizations of
research —specifically, its choice to operate a centralized or decentralized R&D
structure —and the type of innovation it produces. The study proposed that by reducing
the internal transaction costs associated with R&D, coordination across units,
centralized R&D will generate innovations that have a larger and broader impact.
Pisano (1991) suggested that various governance structures such as forward vertical
integration, backward integration and various form of collaboration between new and
established firms helps to generate innovation.
UNIVERSITAT ROVIRA I VIRGILI EUROPEAN CHEMICAL INDUSTRY AND ITS INNOVATION POLICY WITH FOCUS ON LARGE CHEMICAL COMPANIES. Supriyo Das Dipòsit Legal: T 1295-2015
52
2.3.2.3 Human capital investment
Human capital, generally seen as a set of knowledge, abilities and skills of the
individuals, used in the activities that stimulate economic growth and development, was
considered to be a stimulus of the innovation process. In most economic literatures that
were reviewed, it was mentioned the existence of three types of human capital: firm-
specific human capital, industry-specific human capital and individual-specific human
capital. Because the first two types of human capital refer to the abilities and
knowledge valuable only within a specific firm or industry, they have a limited impact
on the innovative activity within a region or state. In contrast with these two,
individual-specific human capital implies knowledge that is applicable to a large range
of firms and industries (Schultz, 1961). Considering that individuals abilities and skills
that can be improved and so they can change the way they act, human capital is seen to
be an important source of competitive advantage to individuals, organizations and even
to societies, having a huge capacity of innovation induction. Regarding the decision to
innovate or not that firm must initially make, Landry et al. (2002) have provided strong
evidence that diverse forms of human capital influence this decision. Hoecker and
Nettelbreker (2004) focused on accelerating the process of innovation through New
Bonus system as seen in Degussa.
Based on longitudinal data from thirty-five UK organization, Shipton et al. (2005)
showed that there was growing evidence available that suggest that effective HRM
systems – incorporating sophisticated approaches to recruitment and selection,
induction, appraisal and training – were key to organizational innovation in products
and production technology. The study further showed that organizational innovation
was enhanced where there was a supportive learning climate, and inhibited (for
innovation in production processes) where there is a link between appraisal and
remuneration. Bontir and Fitz-ez (2002) study also established the same result that there
is a strong relationship between human capital management and innovation and
business development.
Two large French and Swedish firms were studied between 1987 -1993 by Ballot et al.
(2001) in order to understand the effects of human and technological capital on
productivity. They constructed measures of a firm’s human capital stock, based on their
past and present training expenditures and confirmed that firm-sponsored training and
UNIVERSITAT ROVIRA I VIRGILI EUROPEAN CHEMICAL INDUSTRY AND ITS INNOVATION POLICY WITH FOCUS ON LARGE CHEMICAL COMPANIES. Supriyo Das Dipòsit Legal: T 1295-2015
53
R&D expenditure are significant inputs in the two countries, although to a different
extent, and have high returns. However, except for managers and engineers in France,
they did not find evidence of positive interactions between these two types of capital.
Sterlacchini (2008) examined the relationship between the economic growth of
European regions and their knowledge and human capital endowments. The share of
adult population with tertiary education and the intensity of R&D expenditures in value-
added emerge as the most effective factors enhancing the growth of GDP per capita
recorded, during 1995–2002, by the regions belonging to twelve countries of the former
EU15. Moreover, remarkable disparities arise among the regions of different countries.
In particular, only within North European countries there is a significant relationship
between regional growth and the intensity of R&D and higher education. Bottazi and
Peri (2003) using R&D and patent data for European Regions in the 1977–1995 period
found that spillovers are much localized and exist only within a distance of 300 km.
However the size of these spillovers is small, so doubling R&D spending in a region
would increase the output of new ideas in other regions within 300 km only by 2–3%,
while it would increase the innovation of the region itself by 80–90%.
Popescu and Diaconu (2008) stated that there is a double way relation between the
capacity of innovation induction and the stock of human capital. The practice generated
by innovation may imply the construction of some connections that involves a better
knowledge, training and a support for the continuing preparation process. The
competition generates innovation among firms but it also primes a process of human
capital accumulation, at an individual level. In order to cope in the innovative
environment, the employees need to make efforts in accumulation and developing their
own innovative capacities.
2.3.2.4 Geography and chemical company clusters Successful companies in many industries are concentrated in a moderate number of
locations, rather than being distributed evenly across different geographies. Europe
continues to be a large market for chemical products. While other markets, particularly
in Asia, register strong growth, the absolute size of the European market continues to
provide a strong basis for European clusters serving customers in this region. The figure
18 below shows the prominent clusters of chemical companies in Europe.
UNIVERSITAT ROVIRA I VIRGILI EUROPEAN CHEMICAL INDUSTRY AND ITS INNOVATION POLICY WITH FOCUS ON LARGE CHEMICAL COMPANIES. Supriyo Das Dipòsit Legal: T 1295-2015
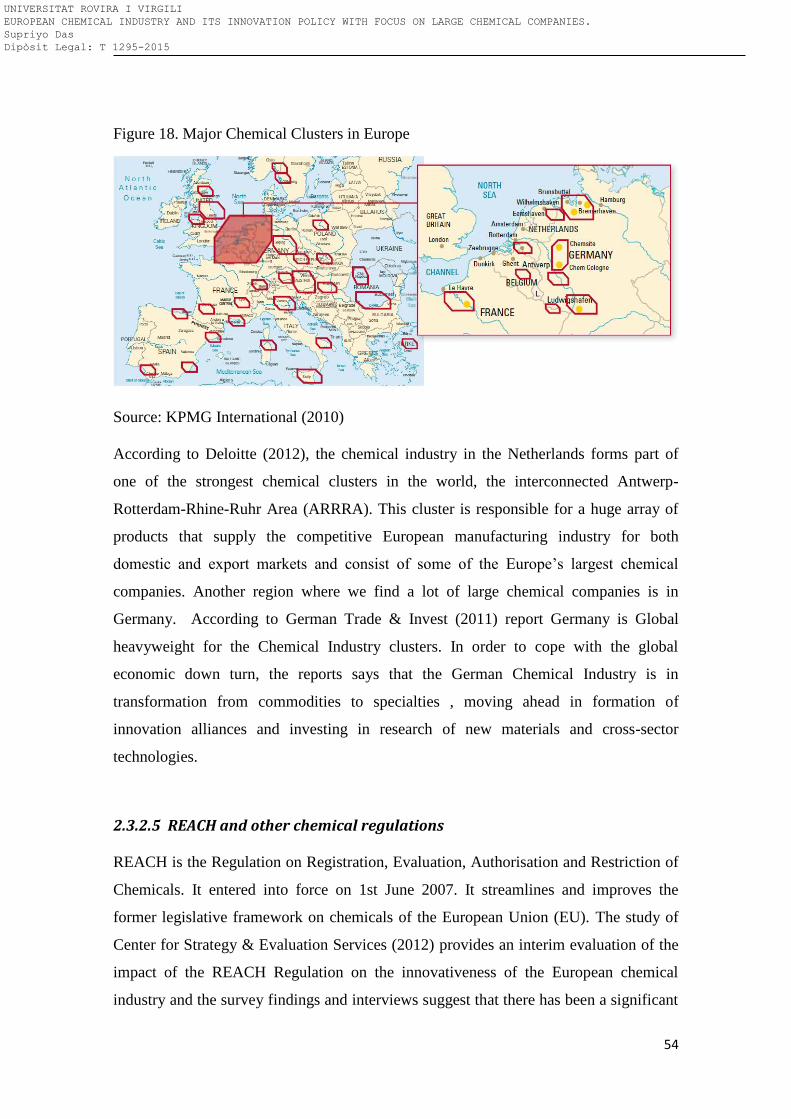
54
Figure 18. Major Chemical Clusters in Europe
Source: KPMG International (2010)
According to Deloitte (2012), the chemical industry in the Netherlands forms part of
one of the strongest chemical clusters in the world, the interconnected Antwerp-
Rotterdam-Rhine-Ruhr Area (ARRRA). This cluster is responsible for a huge array of
products that supply the competitive European manufacturing industry for both
domestic and export markets and consist of some of the Europe’s largest chemical
companies. Another region where we find a lot of large chemical companies is in
Germany. According to German Trade & Invest (2011) report Germany is Global
heavyweight for the Chemical Industry clusters. In order to cope with the global
economic down turn, the reports says that the German Chemical Industry is in
transformation from commodities to specialties , moving ahead in formation of
innovation alliances and investing in research of new materials and cross-sector
technologies.
2.3.2.5 REACH and other chemical regulations
REACH is the Regulation on Registration, Evaluation, Authorisation and Restriction of
Chemicals. It entered into force on 1st June 2007. It streamlines and improves the
former legislative framework on chemicals of the European Union (EU). The study of
Center for Strategy & Evaluation Services (2012) provides an interim evaluation of the
impact of the REACH Regulation on the innovativeness of the European chemical
industry and the survey findings and interviews suggest that there has been a significant
UNIVERSITAT ROVIRA I VIRGILI EUROPEAN CHEMICAL INDUSTRY AND ITS INNOVATION POLICY WITH FOCUS ON LARGE CHEMICAL COMPANIES. Supriyo Das Dipòsit Legal: T 1295-2015
55
redirection of skilled, sometimes highly skilled, personnel in firms from R&D and
innovation-related activities to compliance work as a result of the implementation of the
Regulation. One of main drivers of the REACH Regulation has been the view that the
gathering, capture and dissemination of data from the chemical industry will act as a
spur to product conception, development and marketing (Bergkamp, 2013). The
evidence from the fieldwork also suggests that links with universities and networks
developed by companies have tended to focus on the compliance/ regulatory elements
of REACH. As to the effect of the REACH regulation on the availability external
funding from the private sector, there have not been, as far as we could identify, any
funds launched or targeted specifically to support innovation or substitution initiatives
(or compliance costs) under REACH (Kefford, 2013). Respondents to a survey as well
as some firms interviewed indicate that there has been some long term shift in the
orientation of R&D and innovative activities towards more HSE related goals linked to
REACH, however this is usually not just related to REACH but part of a general
appreciation of movements in the market (Bergkamp, 2013). There has been some
widening in the scope of innovative activities as a result of the Regulation to include
more work on new substances, particularly among large firms, who are also responsible
for most innovation in the industry, but barriers to R&D and innovation in new
substances still remain (Gubbels et al., 2013). Another survey respondent – think that
REACH has not provided enough IPP to promote innovation and the fieldwork has
confirmed that extensive activity in the areas of product, process, marketing and
innovation change is occurring as a result of the implementation of the Regulation
(Kamptmann, 213). However, in many instances companies have considered these
activities to ensure compliance with the Regulation as a distraction from their normal,
planned innovation activities and to be unintended consequences of the Regulation. A
point that has been made often about the effect of the Regulation is that the issues
around compliance and related costs and constraints do make some non-EU locations
more attractive for undertaking innovative activities and based on the evidence
provided, it appears that some such delocalisation of innovative activities has occurred,
although REACH may not always have been the only or even the main driver (Schenk
et al., 2013).
Petry et al. studied in 2006 that REACH could pose a challenge to the operation of the
market economy in the EU and all stakeholders support the broad objectives of REACH
UNIVERSITAT ROVIRA I VIRGILI EUROPEAN CHEMICAL INDUSTRY AND ITS INNOVATION POLICY WITH FOCUS ON LARGE CHEMICAL COMPANIES. Supriyo Das Dipòsit Legal: T 1295-2015
56
but the different stakeholders cannot agree on the proposed content and design of the
REACH system. Further findings from Bronckers and Van Gerven (2009) are the
provisions are often unclear and ambiguous, and, probably, unworkable in its current
form. In view of its scope, the impact of these regulations will be experienced by most
manufacturing businesses in the EU.
The study done by Angere et al. (2006) gives no indication that REACh adoption will
bring significant drawbacks to companies. This also states that the emerging regulation
will bring challenges for individual companies, especially for small and medium-sized
ones, but for the European chemical industry as a whole, there is no question that it will
be able to cope with REACh burdens without losing its global competitiveness. Askham
et al. (2012) presented in their paper how REACH aspects can be considered at the same
time as environmental and economic performance indicators. Presentation of several
indicators at once enhances the ability of product developers to understand complex
trade-offs between different health and environmental aspects in the product
development process. Green chemistry technologies are emerging slowly, but the
relatively low proportion of green chemistry patents to all other chemical patents
indicates that many industrial sectors are not rapidly moving toward greener chemistry-
based process and manufacturing strategies. More effort and focus on green chemistry
by these industrial sectors is needed to enable sustainable practices (Kerton and Marriot,
2013).
2.3.2.6 Organization size
Koberg et al. (2002) showed that different mixes of environmental and organizational
variables were significant predictors of incremental and radical innovation. According
to them, factors that favored incremental innovation included environmental dynamism,
age and size of the firm, intra-firm structural linkages, and the age of the CEO. On the
other hand, Damanpour (1992) stated that the factors that favor radical innovation
include environmental dynamism, intra-firm linkages, experimentation, and
transitioning or sequencing from one project or product to another. Acs and Audretsch
(1988) presented a model suggesting that innovative output is influenced by R&D and
market structure characteristics and also stated that the total number of innovations is
negatively related to concentration and unionization, and positively related to R&D,
UNIVERSITAT ROVIRA I VIRGILI EUROPEAN CHEMICAL INDUSTRY AND ITS INNOVATION POLICY WITH FOCUS ON LARGE CHEMICAL COMPANIES. Supriyo Das Dipòsit Legal: T 1295-2015
57
skilled labor, and the degree to which large firms comprise the industry; and these
determinants have significant effects on large and small firms.
Syeonidis’ (1996) surveys showed that there is little evidence in support of the
Schumpeterian hypothesis that market power and large firms stimulate innovations.
R&D spending seems to rise more or less proportionally with firm size after a certain
threshold level has been passed, and there is little evidence of a positive relationship
between R&D intensity and concentration in general. However he further stated,
positive linkages between concentration/size and innovative activity can occur when
certain conditions are met, including high sunk costs per individual project, economies
of scale and scope in the production of innovation rents.
Vaccaro et al. (2012) showed that due to prominent role within organizations, top
management has the ability to greatly influence innovation. The study also indicates that
smaller, less complex, organizations benefit more from transactional leadership in
realizing management innovation. On the other hand, larger organizations need to draw
on transformational leaders to compensate for their complexity and allow innovation to
flourish. Similar finding were obtained by Damanpour and Schneider (2006). They
found that organizational characteristics and top managers’ attitudes toward innovation
have a stronger influence than environmental and top managers’ demographic
characteristics and also found no difference in the direction of effects of any antecedent,
but did find differences in the significance of effects of several antecedents, on the
phases of innovation adoption. Contradictory results were obtained by Camison-
Zornoza et al. (2004) in their study as they confirmed the existence of a significant and
positive correlation between size of an organization and innovation.
2.3.3 Activities for innovation
This section consists of activities undertaken in order to achieve the desired innovation
for the company. The sub-topic under this topic is dealt in details in the following
section.
UNIVERSITAT ROVIRA I VIRGILI EUROPEAN CHEMICAL INDUSTRY AND ITS INNOVATION POLICY WITH FOCUS ON LARGE CHEMICAL COMPANIES. Supriyo Das Dipòsit Legal: T 1295-2015
58
2.3.3.1 Patent activities
Research productivity or innovation capacity is typically measured by the ratio of
patents to R&D activities. A patent is a set of exclusive rights granted by a sovereign
state to an inventor or their assignee for a limited period of time, in exchange for the
public disclosure of the invention. An invention is a solution to a specific technological
problem, and may be a product or a process. Patents are a form of intellectual property.
Research productivity at the firm level is inversely related to patent quality and the level
of demand, as predicted by theory and patent quality is positively associated with the
stock market value of firms (Lanjouw and Mark Schankerman, 2002). The procedure
for granting patents, requirements placed on the patentee, and the extent of the exclusive
rights vary widely between countries according to national laws and international
agreements. Typically, however, a patent application must include one or more claims
that define the invention. These claims must meet relevant patentability requirements,
such as novelty and non-obviousness. The exclusive right granted to a patentee in most
countries is the right to prevent others from making, using, selling, or distributing the
patented invention without permission (Krestel, 1997). Another innovation indicator,
the propensity rates equal the percentage of innovations for which a patent application is
made. Arundel and Kabla’s (1998) study stated the propensity rates for product
innovations average 35.9%, varying between 8.1% in textiles and 79.2% in
pharmaceuticals. The average for process innovations is 24.8%, varying from 8.1% in
textiles to 46.8% for precision instruments. Only four sectors have patent propensity
rates, for both product and process innovations combined, that exceed 50%:
pharmaceuticals, chemicals, machinery, and precision instruments. Regression results
that control for the effect of industry sector show that patent propensity rates increase
with firm size and are higher among firms that find patents to be an important method
for preventing competitors from copying both product and process innovations (Scherer,
1965). The effect of secrecy is not so straightforward. Firms that find secrecy to be an
important protection method for product innovations are less likely to patent, as
expected, but secrecy has little effect on the propensity to patent process innovations
(Arundel, 2004). The R&D intensity of the firm has no effect on patent propensity rates
for both product and process innovations and the sector of activity has a strong
influence on product patent propensities but very little effect on process patent
propensities, after controlling for the effect of other factors. The low rate in many
UNIVERSITAT ROVIRA I VIRGILI EUROPEAN CHEMICAL INDUSTRY AND ITS INNOVATION POLICY WITH FOCUS ON LARGE CHEMICAL COMPANIES. Supriyo Das Dipòsit Legal: T 1295-2015
59
sectors, indicates that great caution must be taken when using patents as a measure of
innovative output, particularly when these rates are adjusted downwards by another
30% to account for the percentage of patent applications that are rejected or withdrawn
(Arundel and Kabla, 1998). Patents are a particularly poor measure of innovativeness in
sectors such as food and tobacco, petroleum refining, basic metals, automobiles, and
other transport equipment. In these sectors, the large majority of innovations are not
patented. On the other hand, in chemical industry, patent is a very good indicator of
innovation. Patents could still be used to compare the innovativeness of firms within
specific sectors if the most economically valuable patents were still patented (Pavitt,
1984). On the other hand, Macdonald (2003) stated that the patent is supposed to be a
means to an end, that end being innovation. Whether the innovation comes from the
protection the patent affords the inventor, or from the dissemination of the information
of invention the patent allows, the patent is not meant to be an end in itself.
Chen and Chang (2007) examined the relationships between corporate market value and
four patent quality indicators – relative patent position (RPP), revealed technology
advantage (RTA), Herfindahl–Hirschman Index of patents (HHI of patents), and patent
citations – in the US pharmaceutical industry. The results showed that RPP and patent
citations were positively associated with corporate market value, but HHI of patents was
negatively associated with it, while RTA was not significantly related to it. Arora
(1997) stated how firms use patents depends upon industry structure, and in turn, affects
industry structure. In the 19th century, market leaders in the chemical industry
combined patents and secrecy to deter entry. In bulk organic chemicals and
petrochemicals, chemical producers use licensing as an important means of generating
revenue from process innovations. Moreover, instead of being associated with discrete
innovations, patents are more typically associated with technological areas, and firms
often patent to Wall off those areas. The history of the chemical industry also shows
that the role of patents is much broader than merely excluding competitors, and has
changed in response to changes in industry structure. Patents were used to facilitate
technology transactions within cartels, and were used to stabilize cartels by preventing
entry into new markets by non-cartel firms. More generally, patents play a crucial role
in facilitating a market for technology because the strength and scope of patents affect
not only the incentive to invest in research, but also the efficiency with which new
knowledge is transferred to others.
UNIVERSITAT ROVIRA I VIRGILI EUROPEAN CHEMICAL INDUSTRY AND ITS INNOVATION POLICY WITH FOCUS ON LARGE CHEMICAL COMPANIES. Supriyo Das Dipòsit Legal: T 1295-2015
60
Webb and Dernis (2005) presented a preliminary set of European and international
citation data tables designed to enable researchers to become familiar with the subject
and undertake a range of analyses. Squicciarini et al. (2013) contributed to the
definition and measurement of patent quality. They proposed a wide array of indicators
capturing the technological and economic value of patented inventions, and the possible
impact that these might have on subsequent technological developments. The measures
proposed build extensively upon recent literature, rely on information contained in the
patent documents, and are calculated on patent cohorts defined by the combination of
the technology field and the year of filing of patents. Guellec and Potterie’s (2001)
paper presented three new patent-based indicators of internationalisation of technology
reflecting international cooperation in research and the location of research facilities of
multinational firms. They witnessed both an increasing trend towards the globalisation
of technology in the OECD area and large cross-country differences in the extent of
internationalisation. Nordic countries have a particularly high propensity to collaborate
together. Dernis and Khan (2004) stated that patents taken in various countries to
protect inventions can be linked together to build triadic patent families: a set of patents
taken at the European Patent Office (EPO), the Japanese Patent Office (JPO), and the
US Patent and Trademark Office (USPTO) that share one or more priorities. Thomson
Reuter (2013) explains the methodology used to determine the 2012 Top 100 Global
Innovators, developed by Thomson Reuters and approved by several leading IP-centric
organizations. The data used for this ranking was calculated and analyzed from
Thomson Reuters Derwent World Patents Index® (DWPISM), Derwent Patents
Citation IndexTM, Quadrilateral Patent Index™, and Thomson Innovation®, the IP
intelligence and collaboration platform.
2.3.3.2 Inter-industry activities
Firms establish alliances for many reasons. Salient among the incentives to collaborate
is the possibility of bringing together complementary assets owned by different
organizations (Nohria and Garcia Pont, 1991; Gulati, 1995). For instance, two
companies may establish an alliance when each one possesses strength in a different
stage in a product's value chain, such as when one firm has manufacturing expertise and
a second one controls a distribution channel. Second, firms may form coalitions to
UNIVERSITAT ROVIRA I VIRGILI EUROPEAN CHEMICAL INDUSTRY AND ITS INNOVATION POLICY WITH FOCUS ON LARGE CHEMICAL COMPANIES. Supriyo Das Dipòsit Legal: T 1295-2015
61
defray costs and share risk when they undertake high-cost (capital- or development-
intensive) projects or very speculative strategic initiatives (Hagedoorn, 2002). It has
also been suggested that the resources acquired from an alliance partner can facilitate a
firm’s efforts to alter its competitive position (Kogut, 1988), as well as that corporations
in concentrated industries utilize alliances to collude or to gain market power at the
expense of other competitors (Pfeffer and Nowak, 1976).
Empirically, researchers have observed an association between the propensity to enter
into alliances and a variety of organizational attributes, including firm size, age, scope,
and resources (Shan, Walker, and Kogut, 1994). Stuart stated that large firms and those
that possess leading edge technological resources are positioned to be the most valuable
associates. The paper also argued that alliances are at once pathways for the exchange
of resources and signals that convey social status and recognition. Particularly when one
of the firms in an alliance is a young or small organization or, more generally, an
organization of equivocal quality, alliances are tantamount to inter organizational
endorsements: they build public confidence in the value of an organization’s products
and services and thereby facilitate the firm’s efforts to attract risk adverse customers.
The investigation of Wallsten (2000) showed that firms with more employees and that
appear to do more research win more grants, but the grants do not affect employment.
Semitiel-Garcia and Noguera-Mendez (2012) did a case study for Spain of the structure
of inter-industry systems and the diffusion of innovations for a period over a thirty- five
year period. They concluded that interconnectivity among different actors (persons,
countries, firms, etc.) generally implies multiple and overlapping linkages making up
complex networks and allowing for a wide range of flows (ideas, affects, goods,
technology, etc.). Firms interact with other business and non business institutions,
implying learning processes and also material and immaterial flows making up
networks and innovation.
2.3.3.3 Industry-Academia collaboration
Accelerated transfer of knowledge, technology, know-how, and people from university
to industry is a subject of great interest to academics, industry leaders, and policymakers
in recent years. Of particular interest is what role (if any) the research university can and
should play in the post-Cold War economy (Branscomb, 1993). Meanwhile, the
institutions of higher education are under pressure to increase the flow of new
UNIVERSITAT ROVIRA I VIRGILI EUROPEAN CHEMICAL INDUSTRY AND ITS INNOVATION POLICY WITH FOCUS ON LARGE CHEMICAL COMPANIES. Supriyo Das Dipòsit Legal: T 1295-2015
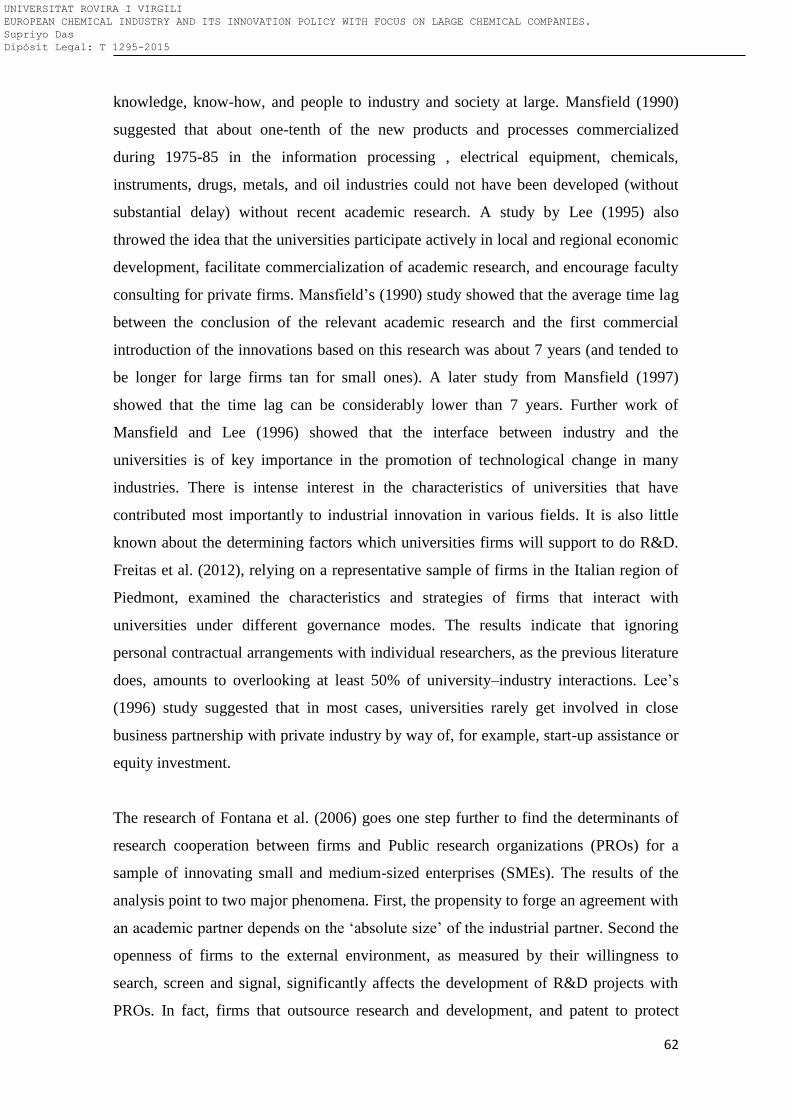
62
knowledge, know-how, and people to industry and society at large. Mansfield (1990)
suggested that about one-tenth of the new products and processes commercialized
during 1975-85 in the information processing , electrical equipment, chemicals,
instruments, drugs, metals, and oil industries could not have been developed (without
substantial delay) without recent academic research. A study by Lee (1995) also
throwed the idea that the universities participate actively in local and regional economic
development, facilitate commercialization of academic research, and encourage faculty
consulting for private firms. Mansfield’s (1990) study showed that the average time lag
between the conclusion of the relevant academic research and the first commercial
introduction of the innovations based on this research was about 7 years (and tended to
be longer for large firms tan for small ones). A later study from Mansfield (1997)
showed that the time lag can be considerably lower than 7 years. Further work of
Mansfield and Lee (1996) showed that the interface between industry and the
universities is of key importance in the promotion of technological change in many
industries. There is intense interest in the characteristics of universities that have
contributed most importantly to industrial innovation in various fields. It is also little
known about the determining factors which universities firms will support to do R&D.
Freitas et al. (2012), relying on a representative sample of firms in the Italian region of
Piedmont, examined the characteristics and strategies of firms that interact with
universities under different governance modes. The results indicate that ignoring
personal contractual arrangements with individual researchers, as the previous literature
does, amounts to overlooking at least 50% of university–industry interactions. Lee’s
(1996) study suggested that in most cases, universities rarely get involved in close
business partnership with private industry by way of, for example, start-up assistance or
equity investment.
The research of Fontana et al. (2006) goes one step further to find the determinants of
research cooperation between firms and Public research organizations (PROs) for a
sample of innovating small and medium-sized enterprises (SMEs). The results of the
analysis point to two major phenomena. First, the propensity to forge an agreement with
an academic partner depends on the ‘absolute size’ of the industrial partner. Second the
openness of firms to the external environment, as measured by their willingness to
search, screen and signal, significantly affects the development of R&D projects with
PROs. In fact, firms that outsource research and development, and patent to protect
UNIVERSITAT ROVIRA I VIRGILI EUROPEAN CHEMICAL INDUSTRY AND ITS INNOVATION POLICY WITH FOCUS ON LARGE CHEMICAL COMPANIES. Supriyo Das Dipòsit Legal: T 1295-2015
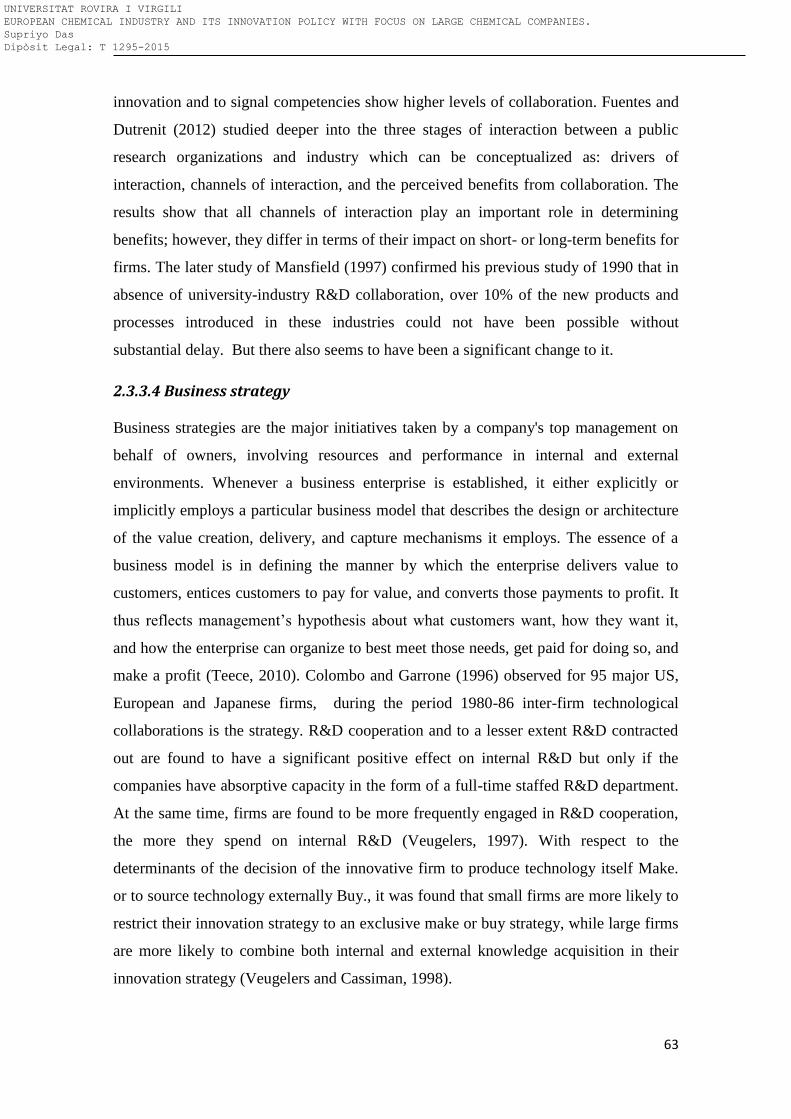
63
innovation and to signal competencies show higher levels of collaboration. Fuentes and
Dutrenit (2012) studied deeper into the three stages of interaction between a public
research organizations and industry which can be conceptualized as: drivers of
interaction, channels of interaction, and the perceived benefits from collaboration. The
results show that all channels of interaction play an important role in determining
benefits; however, they differ in terms of their impact on short- or long-term benefits for
firms. The later study of Mansfield (1997) confirmed his previous study of 1990 that in
absence of university-industry R&D collaboration, over 10% of the new products and
processes introduced in these industries could not have been possible without
substantial delay. But there also seems to have been a significant change to it.
2.3.3.4 Business strategy
Business strategies are the major initiatives taken by a company's top management on
behalf of owners, involving resources and performance in internal and external
environments. Whenever a business enterprise is established, it either explicitly or
implicitly employs a particular business model that describes the design or architecture
of the value creation, delivery, and capture mechanisms it employs. The essence of a
business model is in defining the manner by which the enterprise delivers value to
customers, entices customers to pay for value, and converts those payments to profit. It
thus reflects management’s hypothesis about what customers want, how they want it,
and how the enterprise can organize to best meet those needs, get paid for doing so, and
make a profit (Teece, 2010). Colombo and Garrone (1996) observed for 95 major US,
European and Japanese firms, during the period 1980-86 inter-firm technological
collaborations is the strategy. R&D cooperation and to a lesser extent R&D contracted
out are found to have a significant positive effect on internal R&D but only if the
companies have absorptive capacity in the form of a full-time staffed R&D department.
At the same time, firms are found to be more frequently engaged in R&D cooperation,
the more they spend on internal R&D (Veugelers, 1997). With respect to the
determinants of the decision of the innovative firm to produce technology itself Make.
or to source technology externally Buy., it was found that small firms are more likely to
restrict their innovation strategy to an exclusive make or buy strategy, while large firms
are more likely to combine both internal and external knowledge acquisition in their
innovation strategy (Veugelers and Cassiman, 1998).
UNIVERSITAT ROVIRA I VIRGILI EUROPEAN CHEMICAL INDUSTRY AND ITS INNOVATION POLICY WITH FOCUS ON LARGE CHEMICAL COMPANIES. Supriyo Das Dipòsit Legal: T 1295-2015
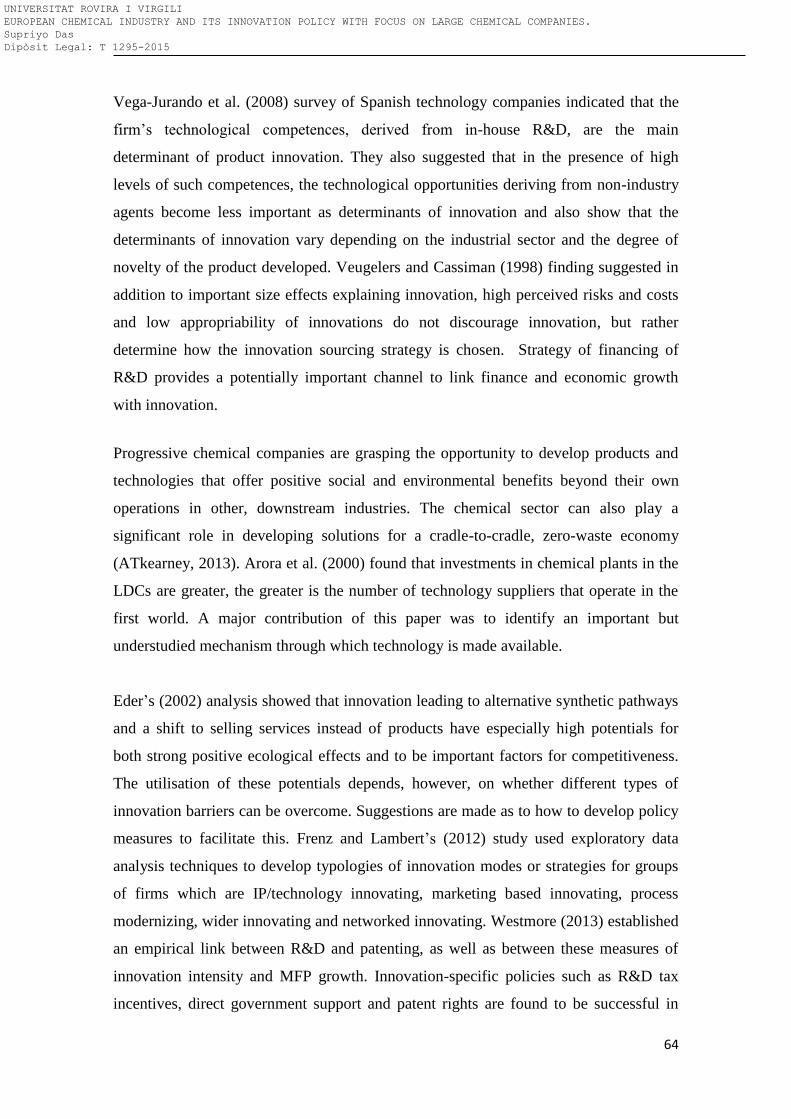
64
Vega-Jurando et al. (2008) survey of Spanish technology companies indicated that the
firm’s technological competences, derived from in-house R&D, are the main
determinant of product innovation. They also suggested that in the presence of high
levels of such competences, the technological opportunities deriving from non-industry
agents become less important as determinants of innovation and also show that the
determinants of innovation vary depending on the industrial sector and the degree of
novelty of the product developed. Veugelers and Cassiman (1998) finding suggested in
addition to important size effects explaining innovation, high perceived risks and costs
and low appropriability of innovations do not discourage innovation, but rather
determine how the innovation sourcing strategy is chosen. Strategy of financing of
R&D provides a potentially important channel to link finance and economic growth
with innovation.
Progressive chemical companies are grasping the opportunity to develop products and
technologies that offer positive social and environmental benefits beyond their own
operations in other, downstream industries. The chemical sector can also play a
significant role in developing solutions for a cradle-to-cradle, zero-waste economy
(ATkearney, 2013). Arora et al. (2000) found that investments in chemical plants in the
LDCs are greater, the greater is the number of technology suppliers that operate in the
first world. A major contribution of this paper was to identify an important but
understudied mechanism through which technology is made available.
Eder’s (2002) analysis showed that innovation leading to alternative synthetic pathways
and a shift to selling services instead of products have especially high potentials for
both strong positive ecological effects and to be important factors for competitiveness.
The utilisation of these potentials depends, however, on whether different types of
innovation barriers can be overcome. Suggestions are made as to how to develop policy
measures to facilitate this. Frenz and Lambert’s (2012) study used exploratory data
analysis techniques to develop typologies of innovation modes or strategies for groups
of firms which are IP/technology innovating, marketing based innovating, process
modernizing, wider innovating and networked innovating. Westmore (2013) established
an empirical link between R&D and patenting, as well as between these measures of
innovation intensity and MFP growth. Innovation-specific policies such as R&D tax
incentives, direct government support and patent rights are found to be successful in
UNIVERSITAT ROVIRA I VIRGILI EUROPEAN CHEMICAL INDUSTRY AND ITS INNOVATION POLICY WITH FOCUS ON LARGE CHEMICAL COMPANIES. Supriyo Das Dipòsit Legal: T 1295-2015
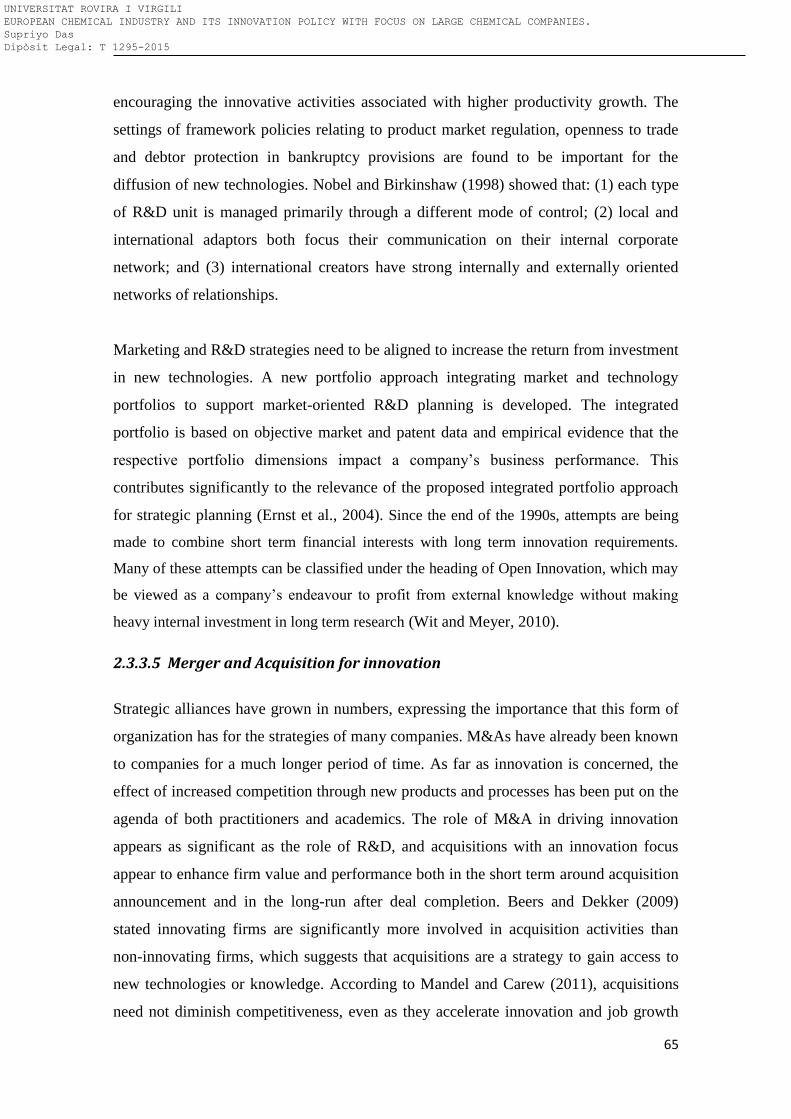
65
encouraging the innovative activities associated with higher productivity growth. The
settings of framework policies relating to product market regulation, openness to trade
and debtor protection in bankruptcy provisions are found to be important for the
diffusion of new technologies. Nobel and Birkinshaw (1998) showed that: (1) each type
of R&D unit is managed primarily through a different mode of control; (2) local and
international adaptors both focus their communication on their internal corporate
network; and (3) international creators have strong internally and externally oriented
networks of relationships.
Marketing and R&D strategies need to be aligned to increase the return from investment
in new technologies. A new portfolio approach integrating market and technology
portfolios to support market-oriented R&D planning is developed. The integrated
portfolio is based on objective market and patent data and empirical evidence that the
respective portfolio dimensions impact a company’s business performance. This
contributes significantly to the relevance of the proposed integrated portfolio approach
for strategic planning (Ernst et al., 2004). Since the end of the 1990s, attempts are being
made to combine short term financial interests with long term innovation requirements.
Many of these attempts can be classified under the heading of Open Innovation, which may
be viewed as a company’s endeavour to profit from external knowledge without making
heavy internal investment in long term research (Wit and Meyer, 2010).
2.3.3.5 Merger and Acquisition for innovation
Strategic alliances have grown in numbers, expressing the importance that this form of
organization has for the strategies of many companies. M&As have already been known
to companies for a much longer period of time. As far as innovation is concerned, the
effect of increased competition through new products and processes has been put on the
agenda of both practitioners and academics. The role of M&A in driving innovation
appears as significant as the role of R&D, and acquisitions with an innovation focus
appear to enhance firm value and performance both in the short term around acquisition
announcement and in the long-run after deal completion. Beers and Dekker (2009)
stated innovating firms are significantly more involved in acquisition activities than
non-innovating firms, which suggests that acquisitions are a strategy to gain access to
new technologies or knowledge. According to Mandel and Carew (2011), acquisitions
need not diminish competitiveness, even as they accelerate innovation and job growth
UNIVERSITAT ROVIRA I VIRGILI EUROPEAN CHEMICAL INDUSTRY AND ITS INNOVATION POLICY WITH FOCUS ON LARGE CHEMICAL COMPANIES. Supriyo Das Dipòsit Legal: T 1295-2015
66
and periods of high levels of acquisition have also been periods of rapid job growth.
Their findings are when done correctly, acquisitions in the technology sector can and
have encouraged innovation by bringing new products to market faster and more
effectively; and acquisitions and innovation in the technology sector are positively
associated with economic growth and job creation.
Using a panel of 535 European, American, and Japanese firms for the years 1987-1997
Arora et al. (2000) found restructuring to be an important component in the observed
changes in R&D intensity. They showed that restructuring affects R&D both through
changes in size and through changes in the composition of business portfolios, and that
these effects differ across industry segments. Hagedoorn and Duysters (2002) explored
the preferences that companies have as they use alternative external sources of
innovative competencies such as strategic technology alliances, mergers and
acquisitions, or a mix of these. The analysis demonstrates that these options are
influenced by both different environmental conditions and firm specific circumstances,
such as those related to protecting core businesses. Walsh and Lodorfos (2002) focused
on strategies of chemical companies on mergers, acquisitions, de-mergers and
divestments as the mechanism to move out of their traditional chemical boundary and to
diversify into, or increase their reliance on, higher value-added areas such as drugs,
agrochemicals, designer crops, specialty chemicals, advanced materials and catalysts,
with an increased R&D focus on the life sciences, IT and biotechnology, and of
genomics, proteomics and bioinformatics.
Sevilir and Tian (2011) found a significant positive association between the M&A
volume of a firm and both the number and the significance of the patents the firm
obtains subsequent to its M&A. The results show the target firm’s R&D intensity as
well as its patent outcomes prior to the acquisition are positively related to the
acquirer’s contemporaneous as well as subsequent innovation output. These results
suggest that acquiring innovative firms enhances the innovation output of the acquirer
and the positive association between M&A and innovation output is more pronounced
for mature and older firms. To the extent that such firms face greater difficulty in
organizing and undertaking innovation internally due to incentive problems, this result
suggests that acquiring innovation may be a more efficient strategy for such firms than
UNIVERSITAT ROVIRA I VIRGILI EUROPEAN CHEMICAL INDUSTRY AND ITS INNOVATION POLICY WITH FOCUS ON LARGE CHEMICAL COMPANIES. Supriyo Das Dipòsit Legal: T 1295-2015
67
investing in it internally and M&A activity leads to superior long-term stock price
performance if the target firm is more innovative.
Mergers and acquisitions (M&A) in the chemical industry will increase, from a low in
2012, driven by favorable financing conditions, geographic expansion, Asian
consolidation, and favorable feedstock conditions in Canada, the United States, and
Mexico (ATkearney, 2013). The investor will be those with strong balance sheets,
growing home markets, access to financing, and the confidence to invest despite an
uncertain global economic outlook. This report presents a review of M&A activity,
based on an analysis of all completed deals in the chemical industry in the period 2001-
2012 and provides an outlook for 2013 (KPMG, 2013). M&A will remain a strategic
instrument in the industry; however, chemicals players need to make it an integral part of
their business strategy. To succeed in this environment, they must build the right
capabilities along the full M&A life cycle and move toward the largely unknown territory
of cross-regional deals (Boo&co, 2014). Cefis and Sabidussi´s (2011) results showed that
M&A activities performed in the previous 3-5 years have a positive and significant
effect on all innovation dimensions we have investigated with the exception of the R&D
and innovation efficiencies in terms of new products for the market. Acquisition
motivated by knowledge barriers in the innovation process affect the probability of
positive innovative sales positively while acquisitions motivated by other reasons than
innovation barriers affect this probability negatively (Beers and Dekker 2009).
Using a large and unique patent-merger dataset over the period 1984 to 2006, Bena and
Li (2013) showed that companies with large patent portfolios and low R&D expenses
are acquirers, while companies with high R&D expenses and slow growth in patent
output are target firms. M&A activity has significantly shaped the chemical industry
landscape in the recent past, and it will continue to do so. Chemicals companies are
constantly in quest of growth in an industry that offers ever-fewer and ever-smaller
attractive growth segments and where incumbents face greater competition from
upstarts in developing markets (Booz&co, 2014). Further, technological overlap
between any two firms has a positive effect on transaction incidence, and this effect is
reduced for firm pairs that overlap in product markets. We also show that acquirers with
prior technological linkage to their target firms produce more patents afterwards. Beers
and Dekker (2009) concluded that synergies obtained from combining innovation
UNIVERSITAT ROVIRA I VIRGILI EUROPEAN CHEMICAL INDUSTRY AND ITS INNOVATION POLICY WITH FOCUS ON LARGE CHEMICAL COMPANIES. Supriyo Das Dipòsit Legal: T 1295-2015
68
capabilities are important drivers of acquisitions. Beers and Dekker (2009) states lack of
knowledge as a barrier to innovate increases the chance of acquiring assets of other
firms although not significantly while lack of finance as a barrier to innovate increases
significantly the chance of divesting assets.
Non-technological M&As appear to have a negative impact on the acquiring firm’s
post-M&A innovative performance. With respect to technological M&As, a large
relative size of the acquired knowledge base reduces the innovative performance of the
acquiring firm (Cloodt et al., 2006). The absolute size of the acquired knowledge base
only has a positive effect during the first couple of years after which the effect turns
around and we see a negative effect on the innovative performance of the acquiring
firm. The relatedness between the acquired and acquiring firms’ knowledge bases has a
curvilinear impact on the acquiring firm’s innovative performance. This indicates that
companies should target M&A ‘partners’ that are neither too unrelated nor too similar in
terms of their knowledge base (Beers and Dekker, 2009).
2.3.4 Output and impact of innovation
This section deals with the literature around the output variables of innovation and its
impact on the company pursuing innovation strategy.
2.3.4.1 R&D Tax benefit
In an effort to increase their level of innovation many countries have turned to
fiscal incentives for R&D, often involving substantial sums of taxpayers’ money.
Economists, however, have generally been skeptical of the efficacy of tax incentives.
One cause of this skepticism is the view that R&D is not very sensitive to changes in its
(after tax) Price. Tax incentives are effective in increasing R&D intensity. This is true
even after allowing for permanent country-specific characteristics, world macro shocks
and other policy influences (Bloom et al., 2000). Ernst and Spengel (2011) came to
similar conclusión that tax Incentives has a very positive impact on research and
development and patent Applications. As large firms maintain offices in various
countries, they are in the best position to optimally divide their R&D activities and
patent earnings to take advantage of tax benefits. They also mention that targeted tax
incentives would strengthen Germany’s position as a center for research and it is
UNIVERSITAT ROVIRA I VIRGILI EUROPEAN CHEMICAL INDUSTRY AND ITS INNOVATION POLICY WITH FOCUS ON LARGE CHEMICAL COMPANIES. Supriyo Das Dipòsit Legal: T 1295-2015
69
particularly important for chemical industry which will improve business
competitiveness while also creating and securing jobs. An analysis of twenty
industrialized countries showed that reducing the combined corporate income tax rate
by ten percentage points increases the average number of patent applications filed by a
firm in these countries by 0.09 which means that for every 1,000 patent applications, 90
additional applications would be filed (Hall and Reenen, 2000).
Many countries are promoting optimization of R&D operations including re-location as
part of their innovation-led economic development strategies. R&D tax incentives are
an important component of these strategies and countries offering R&D tax incentives
are often regarded as a favourable location for internationally-mobile R&D (Deloitte,
2012). The report by Hall and Reenen (2000) give country by country R&D tax
incentives and also states that a few regimes offer tax benefits for capital investments in
R&D, while most offer incentives for operational costs, i.e., wages, supplies and
contractor fees. Some countries offer particularly lucrative incentives, subject to few
restrictions on the location of the qualified research activity, funding of R&D,
ownership of IP, etc.; while others offer basic incentives with significant limitations,
including eligible industries, qualified costs, and applications procedures. Most research
incentives are designed to encourage companies to maintain a certain level of R&D,
with additional incentives for increased research spending (Russo, 2004).
The study from KPMG (2012) stated that many EMEA countries that may once have
inadvertently discouraged investment in R&D by requiring expenditure to be capitalized
now permit a current tax deduction for the cost of R&D activities. Many also allow
enhanced deduction and/or social tax credit for R&D cost. The net cost of performing
R&D should be considered in conjunction with the strategy for managing the potential
IP created by successful research. Short term measures implemented by governments as
economic stimulus package in response to the global financial crisis, such as accelerated
deduction programs for investment intangible depreciable assets are worth taking into
account as these may top up existing benefits delivered through R&D incentives
(Lokshin and Mohnen, 2013).
UNIVERSITAT ROVIRA I VIRGILI EUROPEAN CHEMICAL INDUSTRY AND ITS INNOVATION POLICY WITH FOCUS ON LARGE CHEMICAL COMPANIES. Supriyo Das Dipòsit Legal: T 1295-2015
70
2.3.4.2 Higher productivity and profitability
Innovation is vital to a healthy, competitive economy and is one of the principal drivers of
growth. Innovative economies are more productive and grow faster. Innovation is the
secret to competitive advantage in today's rapidly changing environment, but how does
a company ensure an innovative environment (Higgins, 2009)? Similar thought was
expressed by Lengnick-Hall (1992) and states innovation, technology advances, and
competitive advantage are connected by complex and multidimensional relationships.
The study conducted by Abernathy (1985) showed the capacity of an innovation to
influence the established systems of production and marketing. The paper brought
together fresh analytical thinking and evidence to inform policy and emphasised the
need to focus on facilitating collaboration between organisations, driving innovation
across all sectors of the economy, maximising the effectiveness and connectivity of the
innovation ecosystem and transforming the public sector into a major driver of
innovation.
The report from NESTA (2009) presented the pilot version of NESTA’s Innovation Index.
The aim of the Innovation Index project is to provide a basis for better policymaking about
innovation by developing and deploying significantly improved measures of innovation in
the UK. Nås and Leppãlahti (1997) studied the relationships between innovative
activity, profitability and firm growth in Norwegian industry in 1992 and showed that
there is a close positive relationship between the three. Geroski et al. (1993) study
showed that the number of innovations produced by a firm has a positive effect on its
profitability, but the effect is, on average, only rather modest in size and it is, of course,
possible that this kind of reward is commensurate with the efforts made by the firms
themselves. They also observed that although innovators seem to enjoy higher profit
margins because of the specific innovations they introduce, substantial permanent
differences in the profitability of innovating and non-innovating firms also exist that are
not closely timed with the introduction of specific innovations as seen the graph in
figure 19.
UNIVERSITAT ROVIRA I VIRGILI EUROPEAN CHEMICAL INDUSTRY AND ITS INNOVATION POLICY WITH FOCUS ON LARGE CHEMICAL COMPANIES. Supriyo Das Dipòsit Legal: T 1295-2015
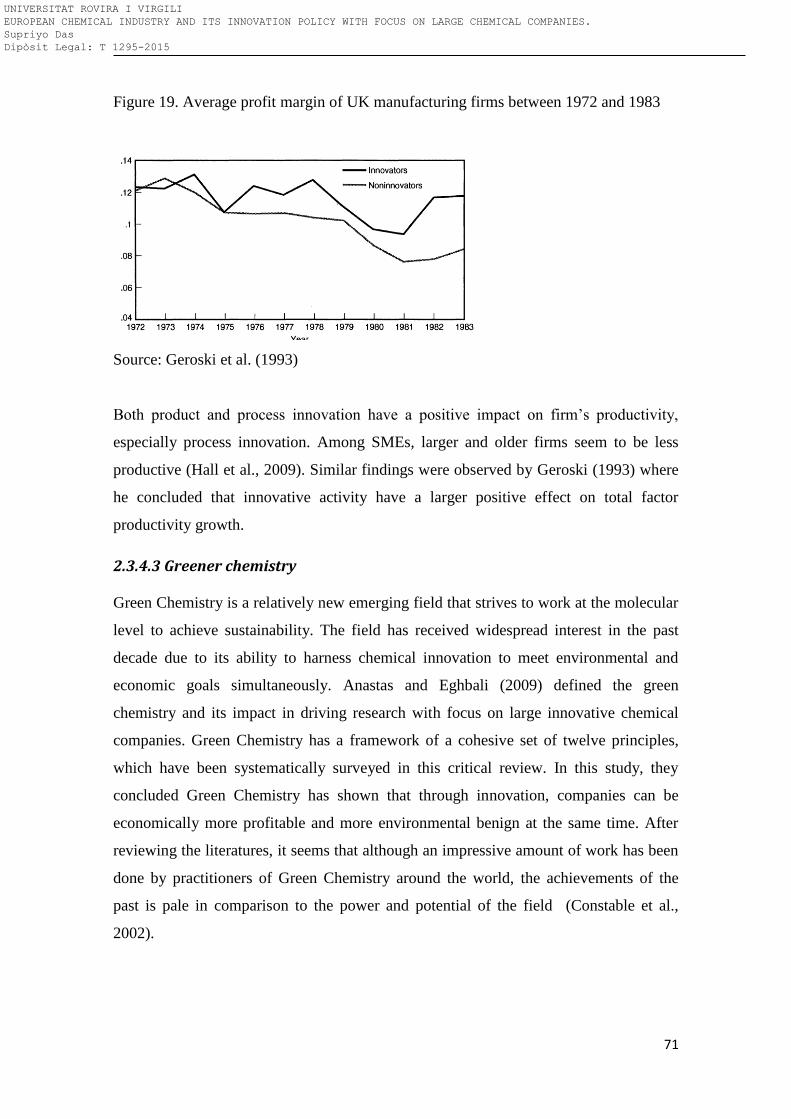
71
Figure 19. Average profit margin of UK manufacturing firms between 1972 and 1983
Source: Geroski et al. (1993)
Both product and process innovation have a positive impact on firm’s productivity,
especially process innovation. Among SMEs, larger and older firms seem to be less
productive (Hall et al., 2009). Similar findings were observed by Geroski (1993) where
he concluded that innovative activity have a larger positive effect on total factor
productivity growth.
2.3.4.3 Greener chemistry
Green Chemistry is a relatively new emerging field that strives to work at the molecular
level to achieve sustainability. The field has received widespread interest in the past
decade due to its ability to harness chemical innovation to meet environmental and
economic goals simultaneously. Anastas and Eghbali (2009) defined the green
chemistry and its impact in driving research with focus on large innovative chemical
companies. Green Chemistry has a framework of a cohesive set of twelve principles,
which have been systematically surveyed in this critical review. In this study, they
concluded Green Chemistry has shown that through innovation, companies can be
economically more profitable and more environmental benign at the same time. After
reviewing the literatures, it seems that although an impressive amount of work has been
done by practitioners of Green Chemistry around the world, the achievements of the
past is pale in comparison to the power and potential of the field (Constable et al.,
2002).
UNIVERSITAT ROVIRA I VIRGILI EUROPEAN CHEMICAL INDUSTRY AND ITS INNOVATION POLICY WITH FOCUS ON LARGE CHEMICAL COMPANIES. Supriyo Das Dipòsit Legal: T 1295-2015
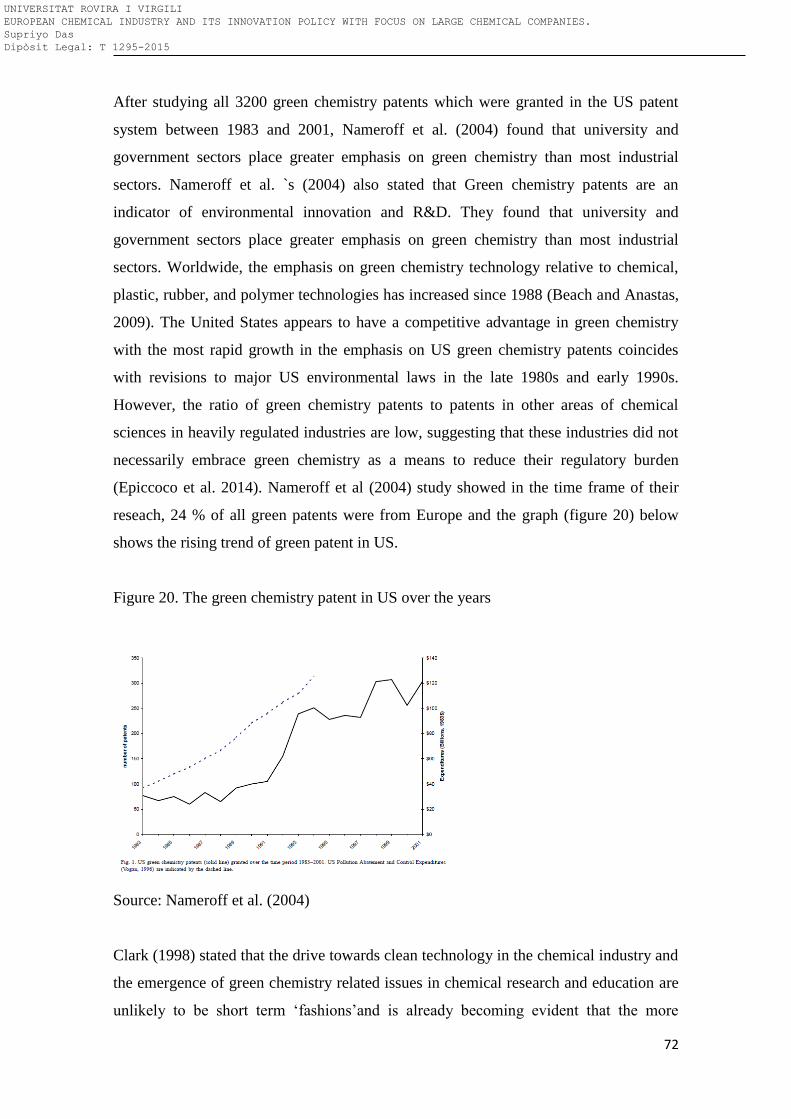
72
After studying all 3200 green chemistry patents which were granted in the US patent
system between 1983 and 2001, Nameroff et al. (2004) found that university and
government sectors place greater emphasis on green chemistry than most industrial
sectors. Nameroff et al. `s (2004) also stated that Green chemistry patents are an
indicator of environmental innovation and R&D. They found that university and
government sectors place greater emphasis on green chemistry than most industrial
sectors. Worldwide, the emphasis on green chemistry technology relative to chemical,
plastic, rubber, and polymer technologies has increased since 1988 (Beach and Anastas,
2009). The United States appears to have a competitive advantage in green chemistry
with the most rapid growth in the emphasis on US green chemistry patents coincides
with revisions to major US environmental laws in the late 1980s and early 1990s.
However, the ratio of green chemistry patents to patents in other areas of chemical
sciences in heavily regulated industries are low, suggesting that these industries did not
necessarily embrace green chemistry as a means to reduce their regulatory burden
(Epiccoco et al. 2014). Nameroff et al (2004) study showed in the time frame of their
reseach, 24 % of all green patents were from Europe and the graph (figure 20) below
shows the rising trend of green patent in US.
Figure 20. The green chemistry patent in US over the years
Source: Nameroff et al. (2004)
Clark (1998) stated that the drive towards clean technology in the chemical industry and
the emergence of green chemistry related issues in chemical research and education are
unlikely to be short term ‘fashions’and is already becoming evident that the more
UNIVERSITAT ROVIRA I VIRGILI EUROPEAN CHEMICAL INDUSTRY AND ITS INNOVATION POLICY WITH FOCUS ON LARGE CHEMICAL COMPANIES. Supriyo Das Dipòsit Legal: T 1295-2015
73
successful chemical manufacturing companies of the future will be those that can
exploit the economic, legislative and public image advantages that a clean technology
approach to chemical manufacturing can provide. The term ‘Green Chemistry’ was first
coined by the US Environmental Protection Agency (EPA) in the early 1990s and major
interest in green chemistry in the US began in earnest with the passage of the ‘Pollution
Prevention Act’ of 1990 (Constable et al., 2002). Thus Green Chemistry becoming a
formal focus of the EPA in 1991. Kerton and Marriot (2013) in their book emphasized
that the more successful chemistry researchers and educationalists will be those that can
appreciate the value of green chemistry in innovation, application and teaching. While
Liu et al. (2013) states that many exciting new greener chemical processes are being
developed it is clear that a far greater number of challenges lie ahead. In two of the
largest generic areas of chemistry, acid catalysis and partial oxidations, there are
countless processes operated by almost every type of chemical manufacturing company,
producing products of incalculable value yet also producing almost immeasurable
volumes of hazardous waste (Liu et al., 2013) and so new greener chemistry is needed.
The drive towards clean technology in the chemical industry with an increasing
emphasis on the reduction of waste at source requires a level of innovation and new
technology that the chemical industry is beginning to adopt (Kidwai and Mohan, 2005).
The green chemistry revolution provides an enormous number of opportunities to
discover and apply new synthetic approaches using alternative feedstocks; ecofriendly
reaction conditions, energy minimizations and the design of less toxic and inherently
safer chemicals. It focusses on examples of interest of green chemistry in industry,
education, Atom efficiency, energy conservation and also suggests several green
alternative chemicals in place of currently used non-green chemical products and
process (Kerton and Marriot, 2013).
Jimenez-Gonzalez et al (2011) presented a number of different green metrics that can be
used to assess a chemical process or system in the Pharmaceutical Industry, but can be
extended to other type of chemical enterprises. It should have become clear that there is
not one unified metric available to measure the ‘greenness’ of a chemical process. The
green metrics one chooses to use must be adapted for their context and continuously
evaluated as to their utility, applicability and appropriateness. They should also be
tested and validated regularly to ensure that they are successfully driving towards the
UNIVERSITAT ROVIRA I VIRGILI EUROPEAN CHEMICAL INDUSTRY AND ITS INNOVATION POLICY WITH FOCUS ON LARGE CHEMICAL COMPANIES. Supriyo Das Dipòsit Legal: T 1295-2015
74
desired goals set by the organization (Androas, 2005). Schwarzmann and Wilson (2009)
criticized the US chemical policy and identified three gaps in the Toxic Substances
Control Act of 1976 (TSCA). They also mentioned several regulations and states that
Chemicals policy should be comprehensive, transparent, market driven, functioning
governance, cross-disciplinary, new science and systems-thinking which at the end will
drive innovation. They also discussed about the EU regulation to control the toxic
chemicals.
2.3.5 Barriers to innovation
This section deals with the literature around barriers to innovation and also the ways to
overcome such barrier.
2.3.5.1 What are the barriers to innovation?
Barriers to industrial innovation have been studied extensively in other technological
areas. GE’s 2013 Global Innovation Barometer returned results that indicated that over
90% of global executives and 88% of U.S. executives believe that innovation is a
strategic priority and that 92% said that it was the main ingredient for a more
competitive economy (GE, 2013). At the same time, over 90% of all new products
introduced to the U.S. market every year fail, and the U.S. ranks only 10th in innovation
behind countries such as Finland and Hong Kong (Curtis, 2013).
A recent European Union study on the barriers to efficiency identified economic,
behavioral, and organizational barriers, such as tax incentives, accountancy practices,
and the low status of managers in some organizations (Foxen, 2002). Hadjimanolis
(1999) conducted in Cyprus, a small less developed country, a research on barrier to
innovation. The study provided some interesting clues to the innovation practice in
small less developed countries. Some barriers similar to industrialized countries (e.g. in
supply of finance and skilled labour) were found, but many differences as well noticed,
as expected from the peculiar environment of a less technologically developed country.
The role of Government policies was of particular importance. The finding from the
study conducted by Madrid-Guijarro et al. (2009) could be used in the development of
public policy aimed at supporting and encouraging the innovation among SMEs in
UNIVERSITAT ROVIRA I VIRGILI EUROPEAN CHEMICAL INDUSTRY AND ITS INNOVATION POLICY WITH FOCUS ON LARGE CHEMICAL COMPANIES. Supriyo Das Dipòsit Legal: T 1295-2015
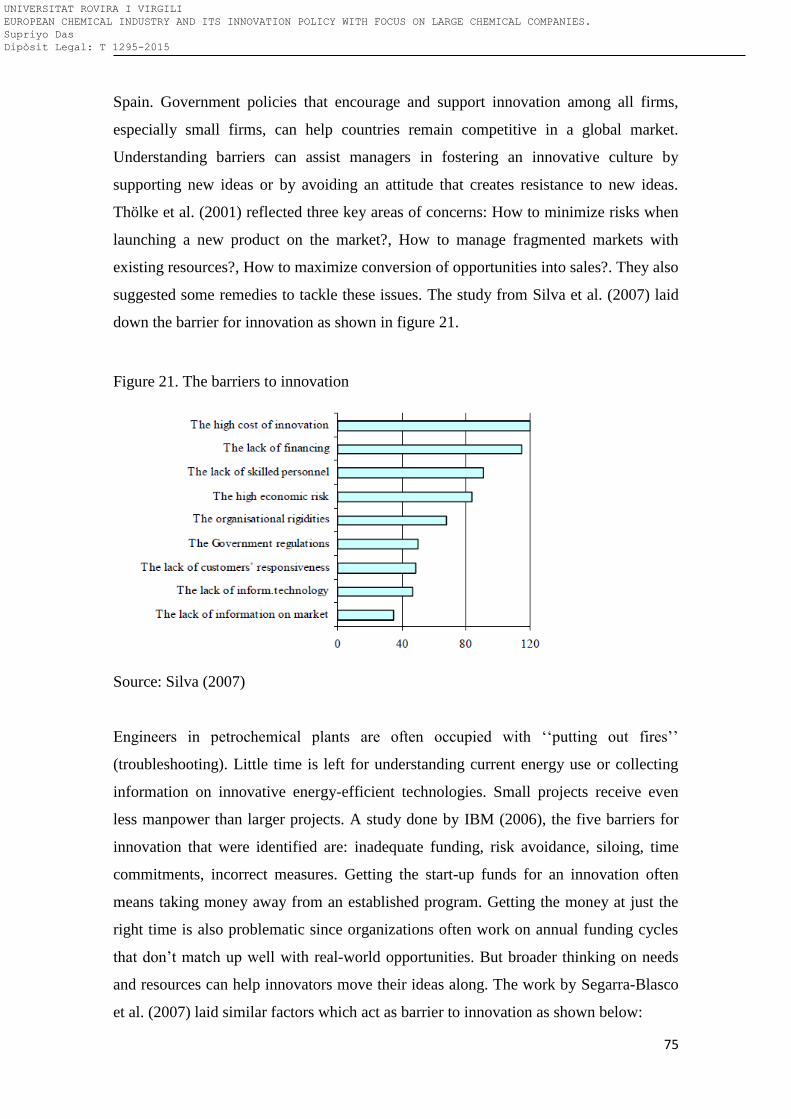
75
Spain. Government policies that encourage and support innovation among all firms,
especially small firms, can help countries remain competitive in a global market.
Understanding barriers can assist managers in fostering an innovative culture by
supporting new ideas or by avoiding an attitude that creates resistance to new ideas.
Thölke et al. (2001) reflected three key areas of concerns: How to minimize risks when
launching a new product on the market?, How to manage fragmented markets with
existing resources?, How to maximize conversion of opportunities into sales?. They also
suggested some remedies to tackle these issues. The study from Silva et al. (2007) laid
down the barrier for innovation as shown in figure 21.
Figure 21. The barriers to innovation
Source: Silva (2007)
Engineers in petrochemical plants are often occupied with ‘‘putting out fires’’
(troubleshooting). Little time is left for understanding current energy use or collecting
information on innovative energy-efficient technologies. Small projects receive even
less manpower than larger projects. A study done by IBM (2006), the five barriers for
innovation that were identified are: inadequate funding, risk avoidance, siloing, time
commitments, incorrect measures. Getting the start-up funds for an innovation often
means taking money away from an established program. Getting the money at just the
right time is also problematic since organizations often work on annual funding cycles
that don’t match up well with real-world opportunities. But broader thinking on needs
and resources can help innovators move their ideas along. The work by Segarra-Blasco
et al. (2007) laid similar factors which act as barrier to innovation as shown below:
UNIVERSITAT ROVIRA I VIRGILI EUROPEAN CHEMICAL INDUSTRY AND ITS INNOVATION POLICY WITH FOCUS ON LARGE CHEMICAL COMPANIES. Supriyo Das Dipòsit Legal: T 1295-2015
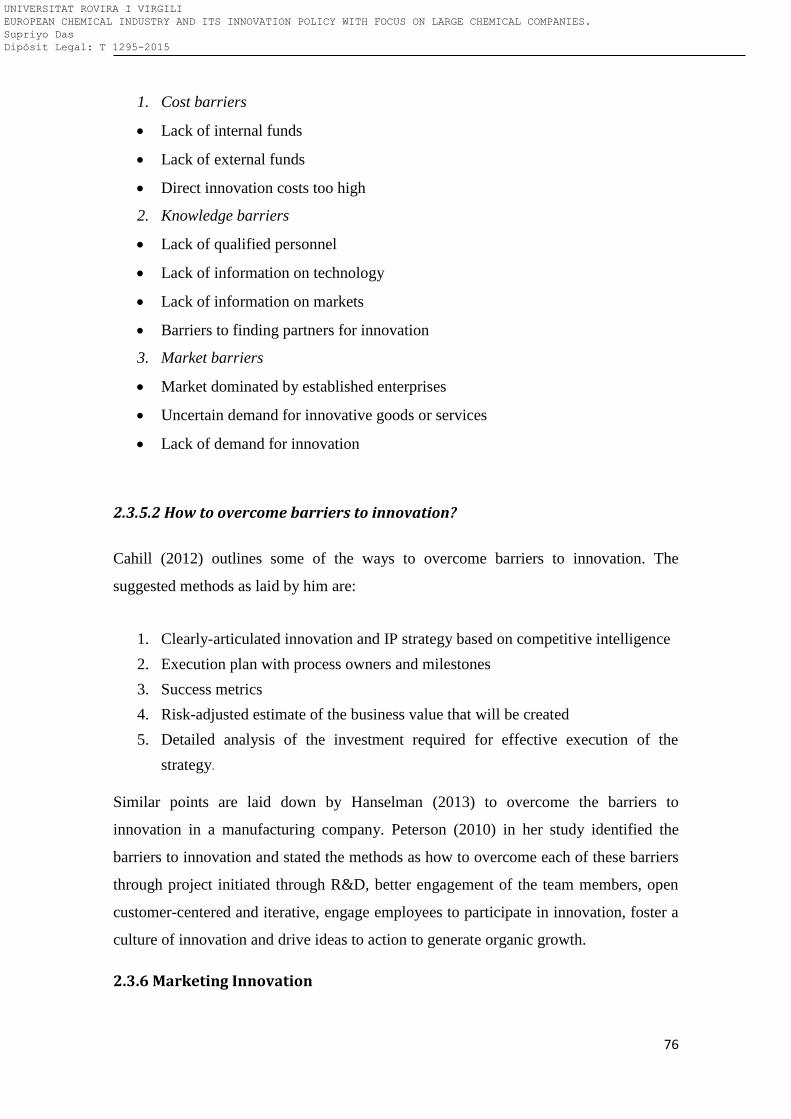
76
1. Cost barriers
Lack of internal funds
Lack of external funds
Direct innovation costs too high
2. Knowledge barriers
Lack of qualified personnel
Lack of information on technology
Lack of information on markets
Barriers to finding partners for innovation
3. Market barriers
Market dominated by established enterprises
Uncertain demand for innovative goods or services
Lack of demand for innovation
2.3.5.2 How to overcome barriers to innovation?
Cahill (2012) outlines some of the ways to overcome barriers to innovation. The
suggested methods as laid by him are:
1. Clearly-articulated innovation and IP strategy based on competitive intelligence
2. Execution plan with process owners and milestones
3. Success metrics
4. Risk-adjusted estimate of the business value that will be created
5. Detailed analysis of the investment required for effective execution of the
strategy.
Similar points are laid down by Hanselman (2013) to overcome the barriers to
innovation in a manufacturing company. Peterson (2010) in her study identified the
barriers to innovation and stated the methods as how to overcome each of these barriers
through project initiated through R&D, better engagement of the team members, open
customer-centered and iterative, engage employees to participate in innovation, foster a
culture of innovation and drive ideas to action to generate organic growth.
2.3.6 Marketing Innovation
UNIVERSITAT ROVIRA I VIRGILI EUROPEAN CHEMICAL INDUSTRY AND ITS INNOVATION POLICY WITH FOCUS ON LARGE CHEMICAL COMPANIES. Supriyo Das Dipòsit Legal: T 1295-2015
77
Marketing is a well-developed methodological science and is constantly changing its
rules according to the needs and developments taking place in and around it. To
establish itself in the new era, it has begun adapting the new methods of virtues to come
to terms with the new paradigms of business. The role of marketing in the development
of business is intact but the way it was executed is radically changing due to
contributions made by satellite communication and extensively developed scientific
devices.
According to UNESCO (2012), marketing Innovation is implementation of a new
marketing method involving significant changes in product design or packaging,
product placement, product promotion or pricing. It also states that it includes better
addressing customer needs, opening up new markets, or newly positioning a firm’s
product on the market thus increasing firm’s sales; Marketing method such as digital
marketing that was not previously used for part of a new marketing concept or strategy.
There have been several books and publications focussing on marketing innovation in
the field of digital marketing but none has been focussing on the chemical industry. It
makes use of electronic devices (computers) such as personal computers, smartphones,
cellphones, tablets and game consoles to engage with stakeholders. Similar comments
are made by Chaffey and Ellis-Chadwick (2012) that digital marketing applies
technologies or platforms such as websites, e-mail, apps (classic and mobile) and social
networks.
UNESCO (2012) stated that in a firm there are four types of innovation: Product,
Process, Organizational and Marketing. It also commented that innovation in marketing
many a times is over looked (figure 22).
UNIVERSITAT ROVIRA I VIRGILI EUROPEAN CHEMICAL INDUSTRY AND ITS INNOVATION POLICY WITH FOCUS ON LARGE CHEMICAL COMPANIES. Supriyo Das Dipòsit Legal: T 1295-2015
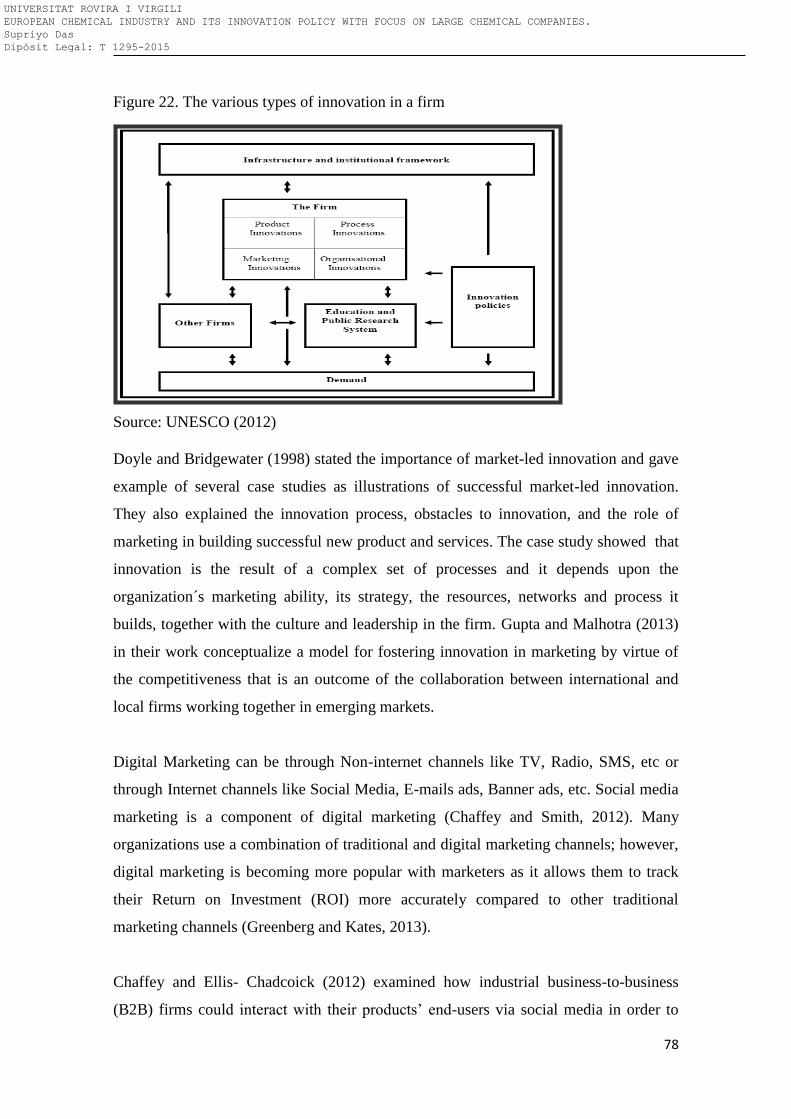
78
Figure 22. The various types of innovation in a firm
Source: UNESCO (2012)
Doyle and Bridgewater (1998) stated the importance of market-led innovation and gave
example of several case studies as illustrations of successful market-led innovation.
They also explained the innovation process, obstacles to innovation, and the role of
marketing in building successful new product and services. The case study showed that
innovation is the result of a complex set of processes and it depends upon the
organization´s marketing ability, its strategy, the resources, networks and process it
builds, together with the culture and leadership in the firm. Gupta and Malhotra (2013)
in their work conceptualize a model for fostering innovation in marketing by virtue of
the competitiveness that is an outcome of the collaboration between international and
local firms working together in emerging markets.
Digital Marketing can be through Non-internet channels like TV, Radio, SMS, etc or
through Internet channels like Social Media, E-mails ads, Banner ads, etc. Social media
marketing is a component of digital marketing (Chaffey and Smith, 2012). Many
organizations use a combination of traditional and digital marketing channels; however,
digital marketing is becoming more popular with marketers as it allows them to track
their Return on Investment (ROI) more accurately compared to other traditional
marketing channels (Greenberg and Kates, 2013).
Chaffey and Ellis- Chadcoick (2012) examined how industrial business-to-business
(B2B) firms could interact with their products’ end-users via social media in order to
UNIVERSITAT ROVIRA I VIRGILI EUROPEAN CHEMICAL INDUSTRY AND ITS INNOVATION POLICY WITH FOCUS ON LARGE CHEMICAL COMPANIES. Supriyo Das Dipòsit Legal: T 1295-2015
79
receive new ideas, feedback and solutions to improve their innovation process. They
proposed a framework to assess how social media and crowdsourcing can be integrated
in an industrial B2B context. The results of this work reveal significant practical
challenges to overcome before social media can be effectively utilized in the industrial
B2B sector as a fully functioning crowdsourcing enabler.
Two big changes in digital world are social and mobile. Social media has already
revolutionized marketing and mobile marketing has finally become mainstream.
According to Kalpan (2012), other key components of digital marketing are content
marketing, digital body language, inbound marketing, marketing automation,
remarketing, earned, owned and paid media, the Ladder of Engagement and many more.
With additional digital marketing channels and platforms, the complexity of manging e-
marketing has become more challenging.
The study from Damian (2014) showed that despite the wonderful new tools available
to marketers (many of which are free or cost-effective), overall, that customers are still
confronted with an awful lot of sloppy marketing. Web site that underperform;
Facebook questions or comments that aren´t answered; telephone or email leads that
aren´t followed up; poor integration with offline communications that complicate or
even contradict basic marketing principles. Time-compressed, information-fatigued
customers are angry and statisfaction levels are wavering.
Chaffey and Smith (2012) give examples where companies have achieved success with
digital marketing tools. It is relatively easy to give customers the attention they deserve.
It is easier to learn about customer needs. It´s also easier to tailor and target relevant
content and relevant products and services to the right customer. Its a question of
systems- organizing processes and systems and resources in a more cost-effective
manner.
Damian (2014) forecasted that customers would start to consolidate their choices too
fewer, better, added-value sites and services. Many have not implemented or refined
many of the core digital marketing capabilities while many have not implemented or
refined many of the core digital marketing techniques, such as search engine
optimization, partner marketing, personalized web recommendation, A/B and
multivariate testing and automated email contact strategies.
UNIVERSITAT ROVIRA I VIRGILI EUROPEAN CHEMICAL INDUSTRY AND ITS INNOVATION POLICY WITH FOCUS ON LARGE CHEMICAL COMPANIES. Supriyo Das Dipòsit Legal: T 1295-2015
80
Wymbs (2011) proposed that there is a need for a radical redesign of the marketing
curriculum as the rapidly emerging digital economy is challenging the relevance of
existing marketing practices. This article described the need for a fundamental change
in the teaching of marketing in today’s environment, performs a curriculum audit of
existing digital marketing initiatives, and then details a new curriculum reflective of
marketing in a digital age and an approach to implement it. Royle and Laing (2014)
suggested that there are digital marketing skills gaps in industry, but these skills gaps
are not clearly identified. The research aims to specify any digital marketing skills gaps
encountered by professionals working in communication industries. From the study they
found that a lack of specific technical skills; a need for best practice guidance on
evaluation metrics, and a lack of intelligent future proofing for dynamic technological
change and development are skills gaps currently challenging the communication
industry. It was also identified that there are challenges of integrating digital marketing
approaches with established marketing practice due to key skills gap.
2.4. Summary:
The current literature review gives a very comprehensive picture about the research in
the field of innovation especially in manufacturing sector. The literature review shows
that there has been considerable amount of research done in innovation. Various aspects
of innovation have also been studied in details covering various industries. Some of the
methodologies which have been used for previous study for other industry can be used
for the current project. Even though we have witnessed fall and subsequent rise of
innovation in Chemical industry, theoretical understanding of the input variables and
financial – and non-financial determinants of this innovation trend in large chemical
companies is largely underdeveloped. As a result this current research is even more
interesting. The literature research shows that there have been several discussions and
concerns about the European chemical industry losing its ground but none of them talks
about the strategy the companies are taking to overcome the challenging situation. Some
literatures talk about the innovation matrix of both chemical and petro chemical
industry. There was significant evidence from the literature that large chemical
companies are transitioning from a closed to open innovation strategy. There has been
UNIVERSITAT ROVIRA I VIRGILI EUROPEAN CHEMICAL INDUSTRY AND ITS INNOVATION POLICY WITH FOCUS ON LARGE CHEMICAL COMPANIES. Supriyo Das Dipòsit Legal: T 1295-2015
81
concern shown by several researchers about the new product development process in
chemical industry. They also suggested by reducing the internet transaction costs
associated with R&D, coordination across units, centralized R&D will generate
innovations that have a larger and broader impact. Most of the research emphasized on
human capital and a double way relation between the capacity of innovation and the
stock of human chemical. Many previous researches have shown that successful
companies in many sectors are concentrated in a moderate number of locations, rather
than being distributed evenly across geography. There have been several researches
done on the impact of the new chemical regulation REACH on the European chemical
industry. In many instances companies have considered the activities around the
compliance with the Regulation as a distraction from their normal, planned innovation
activities and to be unintended consequence of the regulation. Most researches focused
on the quality rather than volume of the patent, but still argued that patent is a key
indicator of R&D activities and innovation. Accelerated transfer of knowledge,
technology, know-how, and people from university to industry is a subject of great
interest to academics, industry leaders and policy makers in recent years.
UNIVERSITAT ROVIRA I VIRGILI EUROPEAN CHEMICAL INDUSTRY AND ITS INNOVATION POLICY WITH FOCUS ON LARGE CHEMICAL COMPANIES. Supriyo Das Dipòsit Legal: T 1295-2015
82
2.5 Bibliography
Abernathy, W. (1985). Innovation: Mapping the winds of creative destruction. Research
Policy, 14 (1), 3–22.
Abratt,R., Lombert van Altena, A. (1993). Determinants of Product Innovation in
Speciality Chemical Companies. Industrial Marketing Managemen, 22, 169-175.
Achilladelis, B., Schwarzkopf, A. and Cines, M. (1990). The dynamics of technological
innovation : the case of the chemical industry. Research policy : policy and
management studies of science, technology and innovation, 19 (1), 1-34.
Acs, J.and Audretsch, D. (1988). Innovation in Large and Small Firms: An Empirical
Analysis. The American Economic Review, 78 (4), 678-690.
Anastas, P. and Eghbali, N. (2010). Green Chemistry: Principles and Practice. Chemical
Society Review, 39, 301–312.
Androas, J. (2005). Unification of Reaction Metrics for Green Chemistry: Applications
to Reaction Analysis. Organic Process Research and Development, 9 (2), 149–163.
Andyhanselman, (2013). Overcoming The 10 Common Barriers To Maximising
Innovation In Your Business. Retrieved from Businesszone website
http://www.businesszone.co.uk/blogs/andyhanselman/compete-or-get-beat/overcoming-
10-common-barriers-maximising-innovation-your-bus
Angerer, G., Nordbeck,R., Sartorius, C. (2008). Impacts on industry of Europe’s
emerging chemicals policy REACH . Journal of Environmental Management, 86, 636–
647.
Argyres, N., Silverman, S. (2004). R&D, Organization structure and the Development
of CorporateTechnological Knowledge. Strategic Management Journal, 25, 929–958.
UNIVERSITAT ROVIRA I VIRGILI EUROPEAN CHEMICAL INDUSTRY AND ITS INNOVATION POLICY WITH FOCUS ON LARGE CHEMICAL COMPANIES. Supriyo Das Dipòsit Legal: T 1295-2015
83
Arora, A., Ceccagnoli, M., Rin, Da, M. (2000). Corporate Restructuring and R&D: A
Panel Data Analysis for the Chemical Industry.
Arora, A., Gambardell, A. (2011). Accelerating Energy Innovation: Insights A multi-
level framework of determinants and opportunities for future research. Journal of
Business Research , 55, 163– 176.
Arora,A . (1997). Patent, Licencing, and market structure in the chemical industry.
Research Policy, 26, 391-403.
Arora,A ., Fosfuri,A., Gambardella,A. (2001). Specialized technology suppliers,
international spillovers and investment: evidence from the chemical industry. Journal of
Development Economics, 65, 31–54.
Arundel,A., Kabla,I. (1998). What percentage of innovations are patented? Empirical
estimates for European firms. Research Policy, 27, 127–141.
Arvanitis, R. and Villavicencio, D. (2000). Learning and Innovation in the Chemical
Industry. Developing Innovation Systems: London, Continuum.
Askham, C., Gade, A. and Hanssen, O. (2012) Combining REACH, environmental and
economic performance indicators for strategic sustainable product development.
Journal of Cleaner Production, 35, 71 – 78. doi:10.1016/j.jclepro.2012.05.015
ATKearney. (2012). Emerging and Established Markets Coverage. Retrieved from
ATKearney website https://www.atkearney.com/mergers-acquisitions/ideas-
insights/featured-article/-/asset_publisher/4rTTGHNzeaaK/content/emerging-and-
established-markets-converge/10192
ATKearney. (2013). Chemicals Executive M&A Report 2013. Retrieved from
ATKearney website http://www.atkearney.com/chemicals/ideas-insights/chemicals-
executive-report-2013
UNIVERSITAT ROVIRA I VIRGILI EUROPEAN CHEMICAL INDUSTRY AND ITS INNOVATION POLICY WITH FOCUS ON LARGE CHEMICAL COMPANIES. Supriyo Das Dipòsit Legal: T 1295-2015
84
Ballot, G., Fakhfakh, F., Taymaz,E. (2001). Firms’ human capital, R&D and
performance: a study on French and Swedish firms. Labour Economics, 8, 443-462.
Beers, van C., Dekker, R. (2009). Acquisitions, Divestitures and Innovation
Performance in the Netherlands. Retrieved from http://mpra.ub.uni-
muenchen.de/13464/1/MPRA_paper_13464.pdf
Bena, J., LI, Kai. (2013). Corporate Innovations and Mergers and Acquisitions. The
Journal of Finance, Retrieved from
http://onlinelibrary.wiley.com/doi/10.1111/jofi.12059/pdf
Bergkamp, L. (2013). The European Union REACH Regulation for Chemicals Law and
Practice. New York: Oxford University Press.
Bloom, N., Griffith, R. and Van Reenen, J. (2002). Do R&D tax credits work? Evidence
from a panel of countries 1979–1997. Journal of Public Economics, 85, 1–31.
Bontis, N. and Fitz-ez, J. (2002). Intellectual capital ROI: a causal map of human capital
antecedents and consequents. Journal of Intellectual Capital, 3 (3), 223 – 247.
Bottazzi,L., Peric, G. (2003). Innovation and spillovers in regions: Evidence from
European patent data. European Economic Review, 47, 687 – 710.
Branscomb, L. (1993). Empowering Technology: Implementing a U.S. Strategy. MIT
press.
Bronckers, M.and Van Gerven, Y. (2009). Legal Remedies Under the EC's New
Chemical Legislation REACH: Testing a New Model of European Governance.
Common Market Law Review, 46 (6), 1823-1871.
Burgers, W., Hill, W. and Kim, W. (2006) A theory of global strategic alliances: The
case of the global auto industry. Strategic Management Journal, 14(6), pp. 419–432.
UNIVERSITAT ROVIRA I VIRGILI EUROPEAN CHEMICAL INDUSTRY AND ITS INNOVATION POLICY WITH FOCUS ON LARGE CHEMICAL COMPANIES. Supriyo Das Dipòsit Legal: T 1295-2015
85
Cahill, J. (2012). Overcoming Barriers to Innovation and IP Creation – PART 5:
Finding budget. Retrieved from Ip Capital Group
http://www.ipcg.com/?file=Overcoming_Barriers_Pt_5
Camisón-Zornoza, C., Lapiedra-Alcamí, R., Segarra-Ciprés, M. and Boronat-Navarro,
M. (2004). A Meta-analysis of Innovation and Organizational Size. Organization
Studies, 25 (3), 331–361.
Cefis, E. and Sabidussi, A. (2011, April). Innovation in potentially dominant firms: the
role of M&A. Paper presented at DIME Final Conference, Maastricht. Retrieved from
http://final.dime-eu.org/files/Cefis_Sabidussi_B1.pdf
Center for Strategy & Evaluation Services. (2012). Interim Evaluation: Impact of the
REACH Regulation on the innovativeness of the EU chemical industry. Retrieved from
http://ec.europa.eu/enterprise/sectors/chemicals/files/reach/review2012/innovation-
final-report_en.pdf
Chaffey, D. and Ellis- Chadcoick, F. (2012). Digital Marketing: Strategy,
Implementation and Practice. Essex: Pearson Education Limited.
Chaffey, D. and Smith P. (2012). Emarketing Excellence: Planning and Optimizing
your Digital Marketing. New York: Routledge.
Chen , Yu-Shan., Chang, Ke-Chiun. (2010).The relationship between a firm's patent
quality and its market value-The case of US pharmaceutical industry. Technological
Forecasting & Social Change , 77, 20–33.
Chesbrough, H. (2006). Open Innovation: The New Imperative for Creating And
Profiting from Technology. Harvard Business School Publishing Corporation.
Clark, J. (1999). Green chemistry: challenges and opportunities. Green Chemistry. 1,
1999, 1-8.
UNIVERSITAT ROVIRA I VIRGILI EUROPEAN CHEMICAL INDUSTRY AND ITS INNOVATION POLICY WITH FOCUS ON LARGE CHEMICAL COMPANIES. Supriyo Das Dipòsit Legal: T 1295-2015
86
Cloodt , M, Hagedoorn, J, Kranenburg,H, V. (2006). Mergers and acquisitions: Their
effect on the innovative performance of companies in high-tech industries. Research
Policy, 35 , 642–654.
Constable, D., Curzons, A. and Cunningham, V. (2002). Metrics to ‘green’ chemistry—
which are the best? Green Chemistry, 4, 521–527.
Colombo, M.,Garrone, P. (1996).Technlogical cooperative agreements and firm’s R&D
intensity: A note on causality relations. Research Policy, 25, 923-932.
Colombo,U. (1980). A viewpoint on innovation and the chemical industry. Research
Policy, 9, 204-231.
Colombo,U. (1986). Research, Innovation and Renewal in the chemical industry.
Futures, 18(2), 170-177. doi:10.1016/0016-3287(86)90096-0
Cooper,G,R., Kleinschmidt,J,E. (1993). New-Product Success in the Chemical Industry.
lndustrial Marketing Management, 22, 85-99.
Curtis, J. (2013). The Barriers To Innovation, And How To Break Through. Forbes.
Retrieved from http://www.forbes.com/sites/onmarketing/2013/04/10/the-barriers-to-
innovation-and-how-to-break-through/
Dal Pont, J., Potier, O. and Camargo, M. (2013). Process Engineering and Industrial
Management (pp. 371-396). Wiley.
Damanpour, F. (1992). Organizational Size and Innovation. Organization Studies, 13
(3), 375-402.
Damanpour,F., and Schneider,M. (2006). Phases of the Adoption of Innovation in
Organizations: Effects of Environment, Organization and Top Managers. British
Journal of Management, 17, 215–236.
UNIVERSITAT ROVIRA I VIRGILI EUROPEAN CHEMICAL INDUSTRY AND ITS INNOVATION POLICY WITH FOCUS ON LARGE CHEMICAL COMPANIES. Supriyo Das Dipòsit Legal: T 1295-2015
87
Davis, N. (2013). ICIS Top 100 chemical companies. Retreived from ICIS Chemical
Business website http://img.en25.com/Web/ICIS/FC0211_CHEM_201309.pdf
Damian, R. (2014) Understanding Digital Marketing: Marketing Strategies for
Engaging the Digital Generation. London: Kogan Page limited.
Deloitte. (2012). The Chemical Industry in the Netherlands: World leading today and in
2030–2050. Retrived from http://www.heeftdechemietoekomst.nl/images/2012-03/vnci-
deloitte-visie2030-2050.pdf
Deloitte1, (2012). 2012 Global Survey of R&D Tax Incentives. Retreived from
http://www.deloitte.com/assets/Dcom-
Canada/Local%20Assets/Documents/Tax/EN/2012/ca_en_tax_Global_SurveyR&D_Ta
x_incentives_September_2012.PDF
Dernis, H. and Khan, M. (2004). Triadic Patent Families Methodology. OECD Science,
Technology and Industry Working Papers, OECD Science, Technology and Industry
Working Papers 2004/02.
Doyle, P. and Bridgewater, S. (1998). Innovation in marketing. New York: Routledge.
Eder, P. (2003). Expert inquiry on innovation options for cleaner production in the
chemical industry. Journal of Cleaner Production, 11(4), 347–364.
Epicoco, M. (2014). Knowledge dynamics and sources of eco-innovation: Mapping the
Green Chemistry community. Technological Forecasting and Social Change, 81, pp.
388–402.
Ernst, C. and Spengel, C. (2011). Taxation, R&D Tax Incentives and Patent Application
in Europe. Retrived from ZEW - Centre for European Economic Research Discussion
Paper No. 11-024 website http://papers.ssrn.com/sol3/papers.cfm?abstract_id=1805762
UNIVERSITAT ROVIRA I VIRGILI EUROPEAN CHEMICAL INDUSTRY AND ITS INNOVATION POLICY WITH FOCUS ON LARGE CHEMICAL COMPANIES. Supriyo Das Dipòsit Legal: T 1295-2015
88
European Commission Enterprise and Industry (2009). Retreived from
http://ec.europa.eu/enterprise/index_en.htm
Fagerberg, J. (2003). Innovation: A Guide to the Literature. Oxford Handbook of
Innovation. Oxford University Press.
Fontana R., Geunab, A., Matt, M. (2006). Factors affecting university–industry R&D
projects: The importance of searching, screening and signaling. Research Policy, 35,
309-323.
Foxon, T. (2002). Technological and institutional ‘lock-in’ as a barrier to sustainable
innovation. ICCEPT Working Paper. Retreived from
http://www3.imperial.ac.uk/pls/portallive/docs/1/7294726.PDF
Freitas, I., Geunac, A. and Rossie, F. (2013). Finding the right partners: Institutional and
personal modes of governance of university–industry interactions. Research Policy, 42,
50– 62.
Fuentesa, C. and Dutrénit, G. (2012). Best channels of academia–industry interaction
for long-term benefit. Research Policy, 41, 1666–1682.
GE. (2013). GE Global innovation barometer, Global Research Findings & Insight.
Retreived from http://www.ge.com/sites/default/files/Innovation_Overview.pdf
Germany Trade and Invest. (2011). The Chemical Industry in Germany. Retreived from
http://www.gtai.de/GTAI/Content/EN/Invest/_SharedDocs/Downloads/GTAI/Industry-
overviews/industry-overview-chemical-industry-in-germany.pdf
Geroski, P., Machin, S. and Van Reenen, J. (1993). The Profitability of Innovating
Firms. The RAND Journal of Economics, 24(2), 198-211.
Gubbels, I., Pelkmans, J. and Schrefler, L. (2013). REACH: A killer whale for SMEs?.
CEPS Policy Brief No. 307. Retreived from http://www.ceps.eu/book/reach-killer-
whale-smes
UNIVERSITAT ROVIRA I VIRGILI EUROPEAN CHEMICAL INDUSTRY AND ITS INNOVATION POLICY WITH FOCUS ON LARGE CHEMICAL COMPANIES. Supriyo Das Dipòsit Legal: T 1295-2015
89
Greenberg, E. and Kates, A. (2013) Strategic Digital Marketing: Top Digital Experts
Share the Formula for Tangible Returns on Your Marketing Investment. USA:
McGrawHill.
Guellec, D., Van Pottelsberghe, B. de la Potterie. (2001). The internationalization of
technology analyzed with patent data. Research Policy, 30, 1253–1266.
Gulati, R. (1995). Social Structure and Alliance Formation Patterns: A Longitudinal
Analysis. Administrative Science Quarterly, 40(4), 619-652.
Gupta, S. and Malhotra, N. (2013). Marketing innovation: a resource‐based view of
international and local firms, Marketing Intelligence & Planning, 31(2), 111 – 126.
Hadjimanolis, A. (1999). Barriers to innovation for SMEs in a small less developed
country (Cyprus). Technovation. 19(9), 561–570.
Hagedoorn, J. (2002). Inter-firm R&D partnerships: an overview of major trends and
patterns since 1960. Research Policy, 31 (4), 477–492.
Hagedoorn, J., Duysters, G. (2002). External Sources of Innovative Capabilities: The
Preference For Strategic Alliances or Mergers and Acquisitions.Journal of Management
Studies, 39(2), 2200-2380.
Hall, B. and Van Reenen, J. (2000). How effective are fiscal incentives for R&D? A
review of the evidence. Research Policy, 29, 449–469.
Hall, B., Francesca Lotti, F. and Mairesse, J. (2008). Innovation and Productivity in
SMEs: Empirical Evidence for Italy. Retreived from
http://www.nber.org/papers/w14594.pdf
Heinzelbecker, K. (2005). Futuring in the European Chemical Industry. Journal of
Business Chemistry, 2(1).
UNIVERSITAT ROVIRA I VIRGILI EUROPEAN CHEMICAL INDUSTRY AND ITS INNOVATION POLICY WITH FOCUS ON LARGE CHEMICAL COMPANIES. Supriyo Das Dipòsit Legal: T 1295-2015
90
Higgins, J. (1995). Innovation: The core competence. Strategy & Leadership, 23(6), 32
– 36.
Höcker, H. and Nettelnbreker, H. (2004). Accelerating the Processes of Innovation:
Degussa's New Bonus System Creates Innovation Incentives for Creavis Employees.
Journal of Business Chemistry, 1(1), 21-24.
Hutcheson, P., Pearson, A,W.,Ball, D,F. (1996). Sources of technical innovation in the
network of companies providing chemical process plant and equipment. Research
Policy, 25, 25-41.
IBM. (2006). Five barriers to innovation: Key questions and answers. Retreived from
http://www-935.ibm.com/services/uk/igs/pdf/g510-6342-00-5barriers-etr.pdf
Jaruzelski, B., Loehr, J. and Holman, R. (2014). The 2013 Global Innovation 1000
Study: Navigating the Digital Future. Retreived from Booz&co website
http://www.booz.com/global/home/what-we-think/global-innovation-1000
Jimenez-Gonza, C., Constable, D. and Pondera, C. (2012). Evaluating the Greenness of
chemical processes and products in the pharmaceutical industry—a green metrics
primer. Chemical Society Review, 41, 1485–1498.
Johnson D. (2001). What is Innovation and enterpreneurship? Lessons for larger
organizations. Industrial and Commercial Training, 33(4), 135-140.
Jung, D,I., Chow, C., Wu, A . (2003).The role of transformational leadership in
enhancing organizational innovation: Hypotheses and some preliminary findings. The
Leadership Quarterly , 14 , 525–544.
Kamptmann, S. (2013). REACH Compliance: The Great Challenge for Globally Acting
Enterprises. John Wiley & Sons, Inc.
Kalpan, A. (2012). If you love something, let it go mobile: Mobile marketing and
mobile social media 4x4, Business Horizons, 55(2), 129–139.
UNIVERSITAT ROVIRA I VIRGILI EUROPEAN CHEMICAL INDUSTRY AND ITS INNOVATION POLICY WITH FOCUS ON LARGE CHEMICAL COMPANIES. Supriyo Das Dipòsit Legal: T 1295-2015
91
Kerton, F. and Marriott, R., (2013). Alternative Solvents for Green Chemistry. The
Cambridge: The Royal Society of Chemistry.
Ketels, C. (2007). The Role of Clusters in the Chemical Industry. EPCA at 41st Annual
Meeting. Retreived from https://epca.eu/media/f8bc41b0-26d0-46d4-a72b-
7f7eeece8581/-
360904056/library/publications/ThinkTankReports/EPCAHarvardclusters.pdf
Kidmani, M. and Mohan, R. (2005). Green Chemistry: An Innovative Technology.
Foundations of Chemistry, 7(3), 269-287.
Koberg, C., Detienne, D., Heppard, K. (2003). An empirical test of environmental,
organizational, and process factors affecting incremental and radical innovation.
Journal of High Technology Management Research, 14, 21–45.
Kogut, B. (1988). Joint ventures: Theoretical and empirical perspectives. Strategic
Management Journal, 9(4), 319–332.
KPMG. (2009). The Future of the European Chemical Industry. Retreived from
http://www.kpmg.com/BE/en/IssuesAndInsights/ArticlesPublications/Documents/2010
01%20EuroChem_Europe_Final.pdf
KPMG International. (2010). The Future of the European Chemical Industry. Retreived
from
http://www.kpmg.com/BE/en/IssuesAndInsights/ArticlesPublications/Documents/2010
01%20EuroChem_Europe_Final.pdf
Krestel, H. (2010). Filing the European Application. Munich European Patent Office.
Retreived from
http://www.epa.ee/ul/doc/seminarid/Filing_the_European_Application.pdf
Landry, R., Amara, N., Lamari M. (2002). Does social capital determine innovation? To
what extent?. Technological Forecasting & Social Change., 69, 681-701.
UNIVERSITAT ROVIRA I VIRGILI EUROPEAN CHEMICAL INDUSTRY AND ITS INNOVATION POLICY WITH FOCUS ON LARGE CHEMICAL COMPANIES. Supriyo Das Dipòsit Legal: T 1295-2015
92
Lanjouw, J.and Schankermann, M. (2002). Research Productivity and Patent Quality:
Measurement with Multiple Indicators. Discussison Paper No.EI/32. Retrived from
http://eprints.lse.ac.uk/3729/1/Research_Productivity_and_Patent_Quality_Measuremen
t_with_Multiple_Indicators.pdf
Lee, Y. (1996). Technology Transfer’ and the research university: a search for the
boundaries of university-industry collaboration. Research Policy, 25, 843-863.
Lengnick-Hall, C. (1992). Innovation and Competitive Advantage: What We Know and
What We Need to Learn. Journal of Management, 18(2), 399-429.
Liu, X., He, L., Liu, Y. and Cao, Y. (2013). Supported Gold Catalysis: From Small
Molecule Activation to Green Chemical Synthesis. Accounts of Chemical Research.
Retreived from http://pubs.acs.org/doi/abs/10.1021/ar400165j
Lokshin, B. and Mohnen, P. (2013). Do R&D tax incentives lead to higher wages for
R&D workers? Evidence from The Netherlands. Research Polic,. 42(3), 823–830.
Lundvall, B. (2009). Innovation as an Interactive Process: User-Producer Interaction to
the National System of Innovation. African Journal of Science, Technology, Innovation
and Development, 1 (2&3), 10-34.
Macdonald, S. (2004). When means become ends: considering the impact of patent
strategy on innovation. Information Economics and Policy, 16, 135–158.
Madrid-Guijarro, A., Garcia, D. and Van Auken, H. (2009). Barriers to Innovation
among Spanish Manufacturing SMEs. Journal of Small Business Management, 47(4),
465–488.
Mandel, M. and Carew, D. (2011). Innovation by Acquisition: New Dynamics of High-
Tech Competition, Progressive Policy Institute.
UNIVERSITAT ROVIRA I VIRGILI EUROPEAN CHEMICAL INDUSTRY AND ITS INNOVATION POLICY WITH FOCUS ON LARGE CHEMICAL COMPANIES. Supriyo Das Dipòsit Legal: T 1295-2015
93
Mansfield, E. (1990). Academic research and industrial innovation . Research Policy,
20, 1-12.
Mansfield, E. (1998). Academic research and industrial innovation: An update of
empirical findings. Research Policy, 26, 773-776.
Nameroff, T., Garant, R. and Albert, M. (2004). Adoption of green chemistry: an
analysis based on US patents. Research Policy, 33, 959–974.
Nås, S. and Leppälahti. (1997). Innovation, firm profitability and growth. Retreived
from http://www.nifu.no/files/2012/11/STEPrapport1-1997.pdf
Nelson, R. (1993). National Innovation Systems: A Comparative Analysis. New York:
Oxford University Press.
NESTA. (2009). The Innovation Index: Measuring the UK’s investment in innovation
and its effects. London. Retreived from
http://www.nesta.org.uk/sites/default/files/innovation_index_2009.pdf
Nobel, R., Birkinshaw, J. (1998). Innovation in Multinational Corporations: Control and
Communication patterns in International R&D Operations. Strategic Management
Journal, 19, 479–496.
Nohria, N., and Garcia-Pont, C. (2007). Global strategic linkages and industry structure.
Strategic Management Journal, 12 (S1), 105–124.
Pasino, G. (1991). The governance of innovation: Vertical integration and collaborative
arrangements in the biotechnology industry. Research Policy, 20, 237-249.
Pavitt, K. (1986). Patent statistics as indicators of innovative activities: Possibilities and
Problems. Seientometrics, 7 (1-2), 77-99.
Petersen, T. (2010). How to overcome barriers to innovation: An empirical analysis of
the relationship between personal power bases and behavior in different barrier
UNIVERSITAT ROVIRA I VIRGILI EUROPEAN CHEMICAL INDUSTRY AND ITS INNOVATION POLICY WITH FOCUS ON LARGE CHEMICAL COMPANIES. Supriyo Das Dipòsit Legal: T 1295-2015
94
situations. Retreived from
http://www2.druid.dk/conferences/viewpaper.php?id=500650&cf=44
Petry, T., Ruth, K. and Meads, R. (2006). An analysis of the proposed REACH
regulation. Regulatory Toxicology and Pharmacology, 44, 24–32.
Pfeffer, J. and Nowak, P. (1976). Joint Ventures and Interorganizational
Interdependence. Administrative Science Quarterly, 21 (3), 398-418.
Popescu, C. and Diaconu, L. (2008). Human Capital and Innovation. Retreived from
http://steconomiceuoradea.ro/anale/volume/2007/1/124.pdf
Quinn, J. (1985). Managing Innovation: Controlled Chaos. Harvard Business Review.
Retreived from http://papers.ssrn.com/sol3/papers.cfm?abstract_id=1504499
Ren, T. (2009). Barriers and drivers for process innovation in the petrochemical
industry: A case study. Journal of Engineering and Technology Management. 26(4), pp.
285-304.
Roberts, B,E., Bellotti,P,R. (2002). Managerial determinants of industrial R&D
performance :An analysis of the global chemicals/ materials industry. Technological
Forecasting & Social Change. 69, 129–152.
Royle, J. and Laing, A. (2014). The digital marketing skills gap: Developing a Digital
Marketer Model for the communication industries. International Journal of
Information Management, 34(2014), 65-73.
Russo, B. (2004). A Cost-Benefit Analysis of R&D Tax Incentives. The Canadian
Journal of Economics / Revue canadienne d'Economique, 37(2), 313-335.
Schenk, L., Deng, U. and Johanson, G. (2013). How consistent are the Derived No-
Effect Levels (DNELs) in the European REACH legislation?. 52nd annual meeting of
Society of Toxicolog. Retreived from http://www.diva-
portal.org/smash/record.jsf?pid=diva2:675577
UNIVERSITAT ROVIRA I VIRGILI EUROPEAN CHEMICAL INDUSTRY AND ITS INNOVATION POLICY WITH FOCUS ON LARGE CHEMICAL COMPANIES. Supriyo Das Dipòsit Legal: T 1295-2015
95
Schultz, T. (1961). Investment in human capital. American Economic Review, 51(1), 1-
17.
Schulz, O., Forrest, R., Ring, T., Von Hoyningen, J. (2012). Chemical Industry Vision
2030: An European perspective. Retreived from ATKeraney website
http://www.atkearney.com/documents/10192/536196/Chemical+Industry+Vision+2030
+A+European+Perspective.pdf/7178b150-22d9-4b50-9125-1f1b3a9361ef
Scott, A. (2012). R&D: Spending Goes Up, IHS Chemical Week. Retreived from
http://www.chemweek.com/sections/cover_story/R-and-D-Spending-Goes-
Up_39832.html
Schwarzmann, M. and Wilson, M. (2009). Toward a New U.S. Chemicals Policy:
Rebuilding the Foundation to Advance New Science, Green Chemistry, and
Environmental Health. Environ Health Perspect, 117(8), 1202–1209
Segarra-Blasco, A., García-Quevedo, J. and Teruel-Carrizosa, M. (2007). Barriers to
Innovation and Public Policy in Catalonia. Working Papers / Xarxa de Referència en
Economia Aplicada (XREAP), Number XREAP2007-10. Retreived from
http://dialnet.unirioja.es/descarga/articulo/2484101.pdf
Semitiel-García, M. and Noguera-Méndez, P. (2012). The structure of inter-industry
systems and the diffusion of innovations: The case of Spain. Technological Forecasting
& Social Change, 79, 1548–1567.
Sevilir, M. and Tian, X. (2011). Acquiring Innovation. Retreived from
http://papers.ssrn.com/sol3/papers.cfm?abstract_id=1731722
Shan, W., Walker, G. and Kogut, B. (1994). Research Notes and Communication
Interfirm cooperation and startup innovation in the biotechnology industry. Strategic
Management Journal, 15(5), 387–394.
UNIVERSITAT ROVIRA I VIRGILI EUROPEAN CHEMICAL INDUSTRY AND ITS INNOVATION POLICY WITH FOCUS ON LARGE CHEMICAL COMPANIES. Supriyo Das Dipòsit Legal: T 1295-2015
96
Shipton, H., Fay, D., West, M., Patterson, M., Birdi, K. (2005). Managing People to
Promote Innovation. Creativity And Innovation Management, 15(2), 118-128.
Silva, M., Leitao, J. and Raposo, M. (2007). Barriers to Innovation faced by
Manufacturing Firms in Portugal: How to overcome it? MPRA Paper No. 5408.
Reteived from http://mpra.ub.uni-muenchen.de/5408/1/MPRA_paper_5408.pdf
Specialchem. (2012). The universal source of chemicals. Retreived from
http://www.specialchem.com/
Squicciarini, M., Dernis, H. and Criscuolo,C. (2013). Measuring Patent Quality,
Indicators of technological and economic value. OECD Science, Technology and
Industry Working Papers 2013/03. Retreived from
http://www.oecd.org/officialdocuments/publicdisplaydocumentpdf/?cote=DSTI/DOC(2
013)3&docLanguage=En
Stendahl, M. and Roos, A. (2009). Antecedents and Barriers to Product Innovation – a
Comparison between Innovating and Non-Innovating Strategic Business Units in the
Wood Industry. Silvia Fennica, Vol. 42(4). Available from:
http://www.metla.fi/silvafennica/full/sf42/sf424659.pdf [Accessed 17 November 2013].
Sterlacchini, A. (2008). R&D, higher education and regional growth: Uneven linkages
among European regions. Research Policy, 37, 1096-1107.
Stetter,J., Lieb,F. (2000). Innovation in Crop Protection: Trends in Research.
Angewandte, 39, 1724-1744.
Stuart, T. (2000). Inter organizational alliances and the performance of firms: A study of
growth and innovation rates in a high-technology industry. Strategic Management
Journal, 21(8), 791-811.
Symeonidis, G. (1996). Innovation, firm size and market structure: Schumpeterian
hypothesis and some new themes. Retreived from Economics department working
UNIVERSITAT ROVIRA I VIRGILI EUROPEAN CHEMICAL INDUSTRY AND ITS INNOVATION POLICY WITH FOCUS ON LARGE CHEMICAL COMPANIES. Supriyo Das Dipòsit Legal: T 1295-2015
97
papers: Organization for economic cooperation and development website
http://www.oecd.org/regreform/reform/2496562.pdf
Teece, D. (2010). Business Models, Business Strategy and Innovation. Long Range
Planning , 43, 172-194.
Thölke, J., Hultinka, E. and Robbenb, H. (2001). Launching new product features: a
multiple case examination. Journal of Product Innovation Management, 18(1), 3–14.
Thomson Reuter. (2013). Thomson Reuter Top 100 Global Innovators. Retreived from
http://top100innovators.com/top100-2013.pdf
Tullo, A. (2013). Global Top 50 C&EN’s 2013 survey shows leading chemical firms
are pausing after a period of growth. C&EN Chemical Engineering News, 91 (30), 13-
16.
UNESCO. (2012). Measuring innovation: Main definitions & indicators. Retreived
from
http://www.uis.unesco.org/SiteCollectionDocuments/Measuring%20innovation.ppt
Vaccaro, I., Jansen, J., Bosch,F. and Volberda, H. (2012). Management Innovation and
Leadership: The Moderating Role of Organizational Size. Journal of Management
Studies, 49(1), 28 – 51.
Vega- Jurado, J., Gutierrez - Gracia, A., Fernandez-de-Lucio, I., Manjarres-Henrıquez,
L. (2008). The effect of external and internal factors on firms’ product innovation.
Research Policy, 37, 616-632.
Veugelers , R., Cassiman, B. (1999). Make and buy in innovation strategies: evidence
from Belgian manufacturing firms. Research Policy, 28, 63-80.
Veugelers, R. (1997). Internal R&D expenditures and external technology sourcing.
Research Policy, 26, 303-315.
UNIVERSITAT ROVIRA I VIRGILI EUROPEAN CHEMICAL INDUSTRY AND ITS INNOVATION POLICY WITH FOCUS ON LARGE CHEMICAL COMPANIES. Supriyo Das Dipòsit Legal: T 1295-2015
98
Veugelers, R., Cassiman, B. (1999). Make and buy in innovation strategies: evidence
from Belgian manufacturing firms. Research Policy, 28, 63-80.
Visser, R., Jongen, M., Zwetsloot,G. (2008). Business-driven innovations towards more
sustainable chemical product. Journal of Cleaner Production, 16(S1), S85-S94.
Wallsten, J,S. (2000). The effects of government-industry R&D programs on private
R&D: the case of the Small Business Innovation Research program. The RAND
Journal of Economics, 31,(1) , 82-100.
Walsh, V., Lodorfos, G. (2002). Technological and Organizational Innovation. MPRA
Paper No. 11539. Retreived from http://mpra.ub.uni-muenchen.de/11539/1/
Walsh,V. (1984). Invention and innovation in the chemical industry: Demand-pull or
discovery-push?. Research Policy, 13, 211-234.
Wikipedia (2014) Digital Marketing. Retreived from
http://en.wikipedia.org/wiki/Digital_marketing
Wit, B. and Meyer, R. (2010). Strategy: Process, Content, Context : an International
Perspective. Cengage Learning EMEA Higher Education.
Wymbs, C. (2011). Digital Marketing: The Time for a New “Academic Major” Has
Arrived”, Journal of Marketing Education, 33(1), 93-106.
UNIVERSITAT ROVIRA I VIRGILI EUROPEAN CHEMICAL INDUSTRY AND ITS INNOVATION POLICY WITH FOCUS ON LARGE CHEMICAL COMPANIES. Supriyo Das Dipòsit Legal: T 1295-2015

99
UNIVERSITAT ROVIRA I VIRGILI EUROPEAN CHEMICAL INDUSTRY AND ITS INNOVATION POLICY WITH FOCUS ON LARGE CHEMICAL COMPANIES. Supriyo Das Dipòsit Legal: T 1295-2015
100
3. Innovation and the hypotheses for the research
Contents
3.1 Introduction ............................................................................................................................... 101
3.2 Innovation in an industrial environment ....................................................................... 101
3.3 Objectives and Sources of innovation .............................................................................. 103
3.4 The impact of innovations on the performance of the enterprise........................ 104
3.5 Hypothesis for this study ...................................................................................................... 105
3.6 How to test the hypotheses? ............................................................................................... 106
3.7 Summary ..................................................................................................................................... 109
3.8 Bibliography .............................................................................................................................. 110
UNIVERSITAT ROVIRA I VIRGILI EUROPEAN CHEMICAL INDUSTRY AND ITS INNOVATION POLICY WITH FOCUS ON LARGE CHEMICAL COMPANIES. Supriyo Das Dipòsit Legal: T 1295-2015
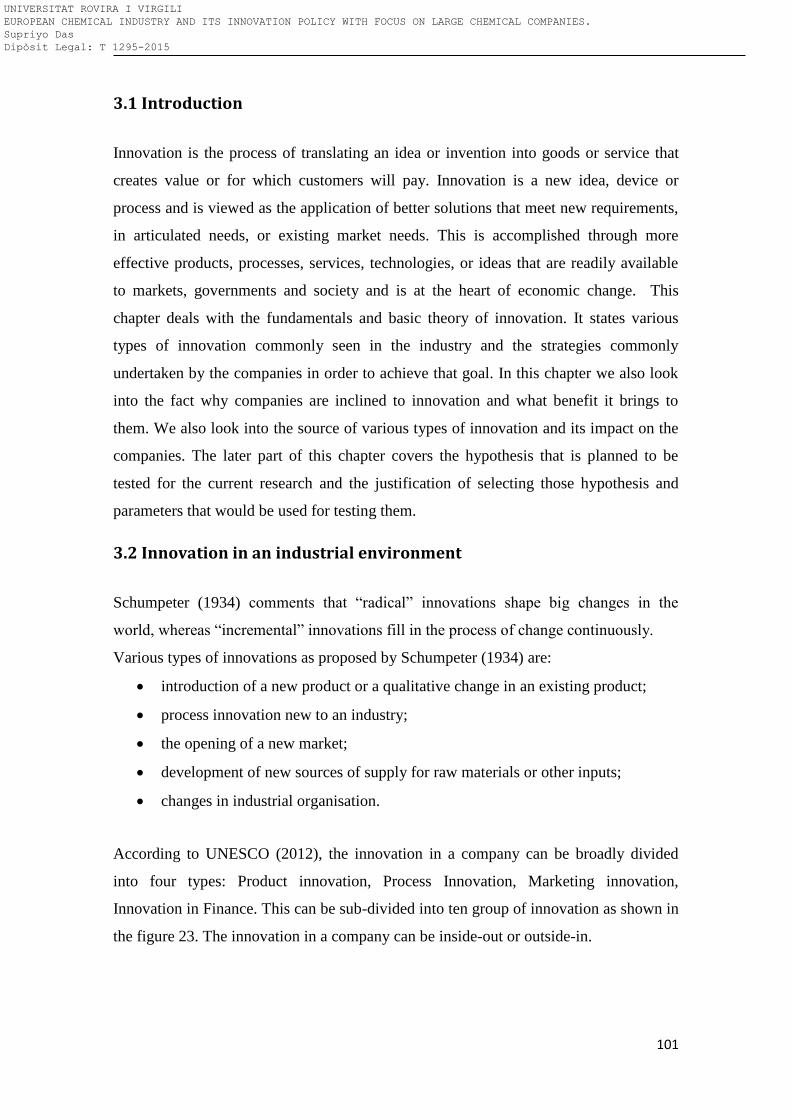
101
3.1 Introduction
Innovation is the process of translating an idea or invention into goods or service that
creates value or for which customers will pay. Innovation is a new idea, device or
process and is viewed as the application of better solutions that meet new requirements,
in articulated needs, or existing market needs. This is accomplished through more
effective products, processes, services, technologies, or ideas that are readily available
to markets, governments and society and is at the heart of economic change. This
chapter deals with the fundamentals and basic theory of innovation. It states various
types of innovation commonly seen in the industry and the strategies commonly
undertaken by the companies in order to achieve that goal. In this chapter we also look
into the fact why companies are inclined to innovation and what benefit it brings to
them. We also look into the source of various types of innovation and its impact on the
companies. The later part of this chapter covers the hypothesis that is planned to be
tested for the current research and the justification of selecting those hypothesis and
parameters that would be used for testing them.
3.2 Innovation in an industrial environment
Schumpeter (1934) comments that “radical” innovations shape big changes in the
world, whereas “incremental” innovations fill in the process of change continuously.
Various types of innovations as proposed by Schumpeter (1934) are:
introduction of a new product or a qualitative change in an existing product;
process innovation new to an industry;
the opening of a new market;
development of new sources of supply for raw materials or other inputs;
changes in industrial organisation.
According to UNESCO (2012), the innovation in a company can be broadly divided
into four types: Product innovation, Process Innovation, Marketing innovation,
Innovation in Finance. This can be sub-divided into ten group of innovation as shown in
the figure 23. The innovation in a company can be inside-out or outside-in.
UNIVERSITAT ROVIRA I VIRGILI EUROPEAN CHEMICAL INDUSTRY AND ITS INNOVATION POLICY WITH FOCUS ON LARGE CHEMICAL COMPANIES. Supriyo Das Dipòsit Legal: T 1295-2015
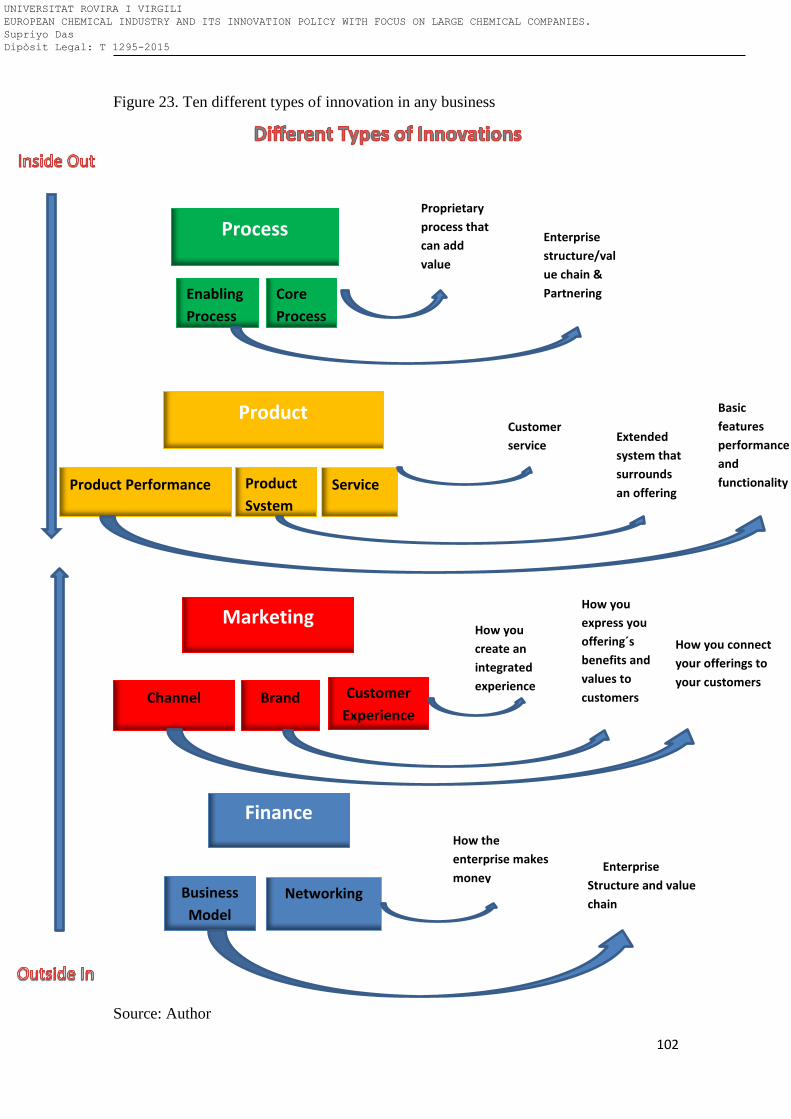
102
Figure 23. Ten different types of innovation in any business
Source: Author
Core
Process
Enabling
Process
Process
Product Performance Product
System
Service
Product
Proprietary
process that
can add
value
Basic
features
performance
and
functionality
Extended
system that
surrounds
an offering
Customer
service
Enterprise
structure/val
ue chain &
Partnering
Marketing
Channel Brand Customer
Experience
Finance
Business
Model
Networking
How you connect
your offerings to
your customers
How you
express you
offering´s
benefits and
values to
customers
How you
create an
integrated
experience
for
How the
enterprise makes
money
Enterprise
Structure and value
chain
UNIVERSITAT ROVIRA I VIRGILI EUROPEAN CHEMICAL INDUSTRY AND ITS INNOVATION POLICY WITH FOCUS ON LARGE CHEMICAL COMPANIES. Supriyo Das Dipòsit Legal: T 1295-2015
103
The options open to a firm which wants to innovate are of three kinds: strategic, R&D
and non-R&D (European Commission, 2010):
Strategic: To make decisions about the types of markets they serve, or seek to
create, and the types of innovations they will attempt there.
R&D: Some of the options relate to R&D are:
undertake basic research to extend its knowledge of fundamental processes related
to what it produces;
develop product concepts to judge whether they are feasible and viable, a stage
which involves prototype design, development and testing; and further research to
modify designs or technical functions.
Non-R&D: The firm may engage in many other activities that do not have any
straightforward relation to R&D, and are not defined as R&D, yet play a major role in
corporate innovation and performance:
it can identify new product concepts and production technologies via its marketing
side;
3.3 Objectives and Sources of innovation
It is recommended that a firm’s reasons for engaging in innovation activity should be
identified via its economic objectives in terms of products and markets, and how it rates
a number of goals that process innovation can bring within reach. The question should
relate to all of its innovation activities.
The main objectives for innovation are (European Commission, 2010):
Replace products being phased out through:
extend product range:
develop environment-friendly products;
Maintain market share through:
increase market share;
open up new markets (abroad or new domestic target groups)
UNIVERSITAT ROVIRA I VIRGILI EUROPEAN CHEMICAL INDUSTRY AND ITS INNOVATION POLICY WITH FOCUS ON LARGE CHEMICAL COMPANIES. Supriyo Das Dipòsit Legal: T 1295-2015
104
Improve production flexibility and lower production costs;
Improve product quality and Improve working conditions;
Reduce environmental damage.
There are various sources for innovation as laid down below:
Internal sources within the firm or business group:
in-house research and development;
production;
marketing;
other internal sources.
External market/commercial sources:
competitors;
clients or customers;
acquisition of disembodied technology;
consultancy firms;
patent disclosures;
professional conferences, meetings and journals;
fairs and exhibitions.
3.4 The impact of innovations on the performance of the enterprise
Metrics can be important levers of innovation – for driving behavior, as well as
evaluating the results of specific initiatives. Companies like 3M and Google have had
innovation metrics for years – the most noteworthy that 10% of employees’ time is
dedicated for experimentation with new opportunities. Defining the right metrics for
any business can be tricky. There’s generally no one right answer and agreeing on what
to measure can feel more like art than science.
The heart of the problem is that today’s competitive environment is radically different
from the industrial environment in which traditional innovation metrics were born.
Because most metrics programs begin with benchmarks of established companies that
UNIVERSITAT ROVIRA I VIRGILI EUROPEAN CHEMICAL INDUSTRY AND ITS INNOVATION POLICY WITH FOCUS ON LARGE CHEMICAL COMPANIES. Supriyo Das Dipòsit Legal: T 1295-2015
105
have been successful with new products, metrics tend to revert back to traditional
measures of R&D or technology investment and effectiveness.
Various indicators can be used to measure the impact of innovations on the performance
of the firm. These indicators are:
Number of patents filed in the past year
Annual R&D budget as a percentage of annual sales
Percentage of sales from products introduced in the past X year(s)
The proportion of sales due to technologically new or improved products;
The results of innovation effort
The impact of innovation on the use of factors of production.
Number of active projects
Number of ideas submitted by employees or number patent applications
3.5 Hypothesis for this study
In the current research, we will like to accept or reject some of the hypothesis related to
innovation in chemical Company in Europe. The five hypotheses that we want to test
are:
Hypothesis 1: Chemical companies in Europe, particularly large chemical companies
have over the years a positive upward trend in innovation.
Hypothesis 2: Large chemical companies are focusing on research and development by
increasing R&D spending.
Hypothesis 3: Large chemical companies in Europe are using re-organization in terms
of merger & acquisition and also university collaborations to promote their innovation.
Hypothesis 4: Innovation in European chemical industry is influenced by chemical
clusters, geographical distribution of the chemical companies and by new chemical
regulation (REACH).
UNIVERSITAT ROVIRA I VIRGILI EUROPEAN CHEMICAL INDUSTRY AND ITS INNOVATION POLICY WITH FOCUS ON LARGE CHEMICAL COMPANIES. Supriyo Das Dipòsit Legal: T 1295-2015
106
Hypothesis 5: Chemical industry in Europe is stepping into digitalization to bring
innovation in marketing.
3.6 How to test the hypotheses?
Now we will explain the approaches that will be taken to test these hypotheses.
Hypothesis 1: Chemical companies in Europe, particularly large chemical companies
have over the years a positive upward trend in innovation.
Although both industrial and academic researchers have tried to measure significance or
impact of innovations using several methods, there is no commonly accepted way to
measure innovation. Some authors have used qualitative data such as expert or manager
interviews to determine the most radical innovations in the industry (see for example
Achilladelis et al., 1990; Green et al., 1995; Henderson, 1993). Anderson and Tushman
(1990) combine qualitative methods with quantitative data. These measures of
innovation have two main drawback. First, in many studies evaluation of radicality is
based on subjective assessments by managers, industry experts, or customers and
reliability of these measures is context-dependent. Second, collecting this qualitative
data is time- and resource-consuming.
The two weaknesses of innovation measures discussed above can be, however,
addressed by patent-based measures as described in this study. First, by definition,
patents provide a relatively objective measure of new knowledge. Patents are required
to describe something novel and not obvious; to be patented "an invention must be
something not already known from prior publication, or not a part of the experience of
those skilled in the art" (Walker, 1995). Patents thus provide a good measure of
technologically new knowledge as defined above. Several studies have recently used
patents as a measure of innovation performance (Dutta and Weiss, 1997; Henderson and
Cockburn, 1994).
According to Arundel and Kabla (1998), for chemical and pharmaceutical industry,
there is a good relationship between innovations and patenting which is not be the same
UNIVERSITAT ROVIRA I VIRGILI EUROPEAN CHEMICAL INDUSTRY AND ITS INNOVATION POLICY WITH FOCUS ON LARGE CHEMICAL COMPANIES. Supriyo Das Dipòsit Legal: T 1295-2015
107
for other industry. The evidence from empirical study from Acs et al. (2001) suggests
that patents provide a fairly reliable measure of innovative activity. Similar view is
represented by the study by Thomson Reuter (2013), where they used patents as the
indicator to rank top 100 innovative companies in the world. For our current research,
we will consider number of patents applied and granted as the indicator of innovation.
The study by Breiztman (2013) shows that large firms have a higher percentage of both
granted patents and patent applications than small companies and this is especially
noticeable during the recession of 2008-09.
Second, in addition to the methodological strengths of patent-based measures, also the
availability of patent data motivates the use and research on patent-based measures of
innovation. Electronic access to patent data through for example EPO and US Patent
and Trademark Office databases has increased the use of patents in industrial and
academic research (Pavitt, 1988; Walker, 1995). Arora and Gambardella (1994) further
argue that the importance of patents as innovation appropriability mechanisms will be
increasing in many industries in the future as several technological disciplines become
more universal and the knowledge will be easier to articulate for patenting. Thus,
patents are even more likely to be used as measures of innovation in future research.
Based on these previous researches, patent data was selected as the metric for current
research for measuring the innovation trend of the large chemical companies
headquartered in Europe. In the first hypothesis we want to test if there is a proper trend
in innovation of the European chemical industry and large companies in particular.
Hypothesis 2: Large chemical companies are focusing on research and development by
increasing R&D spending
R&D is an activity involving significant transfers of resources among units,
organisations and sectors and especially between government and other performers.
R&D expenditure refers to resources actually spent in R&D activities, rather than only
budgeted. Expenditures for research and development are current and capital
expenditures (both public and private) on creative work undertaken systematically to
increase knowledge, including knowledge of humanity, culture, and society, and the use
of knowledge for new applications. R&D covers basic research, applied research, and
UNIVERSITAT ROVIRA I VIRGILI EUROPEAN CHEMICAL INDUSTRY AND ITS INNOVATION POLICY WITH FOCUS ON LARGE CHEMICAL COMPANIES. Supriyo Das Dipòsit Legal: T 1295-2015
108
experimental development. The second hypothesis will test if the large European
chemical companies are focussing more on R&D by increasing allotment for R&D
spending.
Hypothesis 3: Large chemical companies is using re-organization in terms of Merger
& Acquisition and also university collaborations to promote their innovation.
Beers and Dekker (2009) stated innovating firms are significantly more involved in
acquisition activities than non-innovating firms, which suggests that acquisitions are a
strategy to gain access to new technologies or knowledge. Mandel and Carew (2011),
state that acquisitions accelerate innovation and job growth while Arora et al. (2001)
find restructuring to be an important component in the observed changes in R&D
intensity. So the first part of this hypothesis tests if the merger and acquisition has any
impact on innovation of large chemical companies of Europe.
Mansfield (1990) suggested that about one-tenth of the new products and processes
commercialized during 1975-85 in the information processing , electrical equipment,
chemicals, instruments, drugs, metals, and oil industries could not have been developed
(without substantial delay) without recent academic research. The second part of the
hypothesis tests the impact of university and research institute collaboration in driving
innovation for the companies under study.
Hypothesis 4: Innovation in European chemical industry is influenced by chemical
clusters, geographical distribution of the chemical companies and by new chemical
regulation (REACH).
A business cluster is a geographic concentration of interconnected businesses, suppliers,
and associated institutions in a particular field. Clusters are considered to increase the
productivity with which companies can compete, nationally and globally. Clusters are
also very important aspects of strategic management. The first part of this hypothesis
test the impact of chemical clusters on innovation tendency of European chemical
industry.
REACH is a regulation of the European Union, adopted to improve the protection of
human health and the environment from the risks that can be posed by chemicals, while
UNIVERSITAT ROVIRA I VIRGILI EUROPEAN CHEMICAL INDUSTRY AND ITS INNOVATION POLICY WITH FOCUS ON LARGE CHEMICAL COMPANIES. Supriyo Das Dipòsit Legal: T 1295-2015
109
enhancing the competitiveness of the EU chemicals industry. It also promotes
alternative methods for the hazard assessment of substances in order to reduce the
number of tests on animals. Second part of the hypothesis tests the impact of REACH
on innovation of the chemical industry in Europe.
Hypothesis 5: Chemical industry in Europe is stepping into digitalization to bring
innovation in marketing.
Companies across industries are racing to migrate from "analog" approaches to
customers, products, services, and operating models to an always-on, real-time, and
information rich marketplace. Some leaders are redesigning their capabilities and
operating models to take full advantage of digital technologies to keep step with the
"connected" consumer and attract talent. Others are creating qualitatively new business
models — and tremendous value — around disruptive digital opportunities. In doing so,
these companies secure not only continued relevance, but also superior returns. Digital
marketing is marketing that makes use of electronic devices (computers) such as
personal computers, smartphones, cellphones, tablets and game consoles to engage with
stakeholders. Social Media Marketing is a component of digital marketing. Many
organizations use a combination of traditional and digital marketing channels. This
hypothesis test whether the European chemical industry has already adopted
digitalization in their business and specially in marketing.
3.7 Summary
Innovation is defined as a better solution which has significant impact to business in
improving its position and profitability. There are ten different types of innovation
available. We will test five hypothesis related to innovation in large chemical
companies which are head quartered in Europe. The first hypothesis will test the trend
of innovation in large chemical companies head quartered in Europe while the
remaining four will test the impacting factors of such innovation trend.
UNIVERSITAT ROVIRA I VIRGILI EUROPEAN CHEMICAL INDUSTRY AND ITS INNOVATION POLICY WITH FOCUS ON LARGE CHEMICAL COMPANIES. Supriyo Das Dipòsit Legal: T 1295-2015
110
3.8 Bibliography
Acs, Z., Anselin, L. and Varga, A. (2002). Patents and innovation counts as
measures of regional production of new knowledge. Research Policy, 30, 1069-
1085.
Achilladelis, B., Schwarzkopf, A., and Cenes, M. (1990). The dynamics of
technological innovation: The case of the chemical industry. Research Policy, 19, 1-34.
Anderson, P., and Tushman, M. (1990). Technological discontinuities and dominant
design: A cyclical model of technological change. Administrative Science Quarterly, 35,
604-633.
Arora, A., and Gambardella, A. (1994). The changing technology of technological
change: General and abstract knowledge and the division of innovative labor. Research
Policy, 23 (5), 523-532.
Arora,A ., Fosfuri,A., Gambardella,A. (2001). Specialized technology suppliers,
international spillovers and investment: evidence from the chemical industry. Journal of
Development Economics, 65, 31–54.
Arundel, A., and Kabla, I. (1998). What percentage of innovations are patented?
Empirical estimates for European firms. Research Policy, 27, 127-141.
Beers, van C., Dekker, R. (2009). Acquisitions, Divestitures and Innovation
Performance in the Netherlands. Retreived from: http://mpra.ub.uni-
muenchen.de/13464/1/MPRA_paper_13464.pdf
Breitzman, A. (2013). Patent Trends among Small and Large Innovative Firms during
the 2007-2009 Recession. Retreived from
https://www.sba.gov/sites/default/files/rs411tot.pdf
UNIVERSITAT ROVIRA I VIRGILI EUROPEAN CHEMICAL INDUSTRY AND ITS INNOVATION POLICY WITH FOCUS ON LARGE CHEMICAL COMPANIES. Supriyo Das Dipòsit Legal: T 1295-2015
111
Christensen, C. M., and Rosenbloom, R. S. (1995). Explaining the attacker's advantage:
Technological paradigms, organizational dynamics, and the value network. Research
Policy, 24 (2), 233-257.
Dutta, S., and Weiss, A. (1997). The relationships between a firm’s level of
technological innovativeness and its pattern of partnership agreements. Management
Science, 43 (3), 343-356.
European Commission. (2010). Proposed guidelines for collecting and interpreting
technological innovation data: Oslo Manuel. Retreived from
http://www.oecd.org/science/inno/2367580.pdf
Green, S., Gavin, M., and Aiman-Smith, L. (1995). Assessing a multidimensional
measure of radical technological innovation. IEEE Transactions on Engineering
Management, 42 (3), pp 203-214.
Henderson, R. (1993). Underinvestment and incompetence as responses to radical
innovation: Evidence from the photolithographic alignment equipment industry. Rand
Journal of Economics, 24 (2), 248-270.
Henderson, R., and Cockburn, I. (1994). Measuring competence? Exploring firm effects
in pharmaceutical research. Strategic Management Journal, 15, 63-84.
Mandel, M. and Carew, D. (2011). Innovation by Acquisition: New Dynamics of High-
Tech Competition, Progressive Policy Institute. Retrieved from
http://www.progressivepolicy.org/issues/economy/innovation-by-acquisition-new-
dynamics-of-high-tech-competition-2/
Mansfield, E. (1990). Academic research and industrial innovation . Research Policy,
20, 1-12.
Pavitt, K. (1988). Handbook of Quantitative Studies of Science and Technology.
Elsevier.
UNIVERSITAT ROVIRA I VIRGILI EUROPEAN CHEMICAL INDUSTRY AND ITS INNOVATION POLICY WITH FOCUS ON LARGE CHEMICAL COMPANIES. Supriyo Das Dipòsit Legal: T 1295-2015
112
Schumpeter, J. (1934). The Theory of Economic Development. Cambridge,
Massachusetts: Harvard University Press.
UNESCO. (2012). Measuring innovation: Main definitions & indicators. Retrieved
from
http://www.uis.unesco.org/SiteCollectionDocuments/Measuring%20innovation.ppt
Walker, R. (1995). Patents as scientific and technical literature. The Scarecrow Press.
Wikipedia. (2014). Innovation. Retreived from http://en.wikipedia.org/wiki/Innovation
UNIVERSITAT ROVIRA I VIRGILI EUROPEAN CHEMICAL INDUSTRY AND ITS INNOVATION POLICY WITH FOCUS ON LARGE CHEMICAL COMPANIES. Supriyo Das Dipòsit Legal: T 1295-2015
113
4. European chemical industry and the top European
chemical companies
Contents
4.1 Introduction .......................................................................................................................... 114
4.2 Global chemical industry .................................................................................................. 114
4.3 Recent Economic crisis and its effect on global chemical industry ................. 116
4.4 Overview of European chemical industry ................................................................. 117
4.4. 1 Chemical sales ............................................................................................................. 119
4.4.2 Intercontinental chemical trade ............................................................................ 123
4.4.3 R&D in chemical industry ........................................................................................ 125
4.4.4 Structure of European chemical industry ......................................................... 126
4.5 European top chemical companies .............................................................................. 127
4.6 Analysis of each company of the top EU chemical company .............................. 132
4.7 Conclusions ............................................................................................................................ 146
4.8 Bibliography .......................................................................................................................... 147
UNIVERSITAT ROVIRA I VIRGILI EUROPEAN CHEMICAL INDUSTRY AND ITS INNOVATION POLICY WITH FOCUS ON LARGE CHEMICAL COMPANIES. Supriyo Das Dipòsit Legal: T 1295-2015
114
4.1 Introduction
The global chemicals industry has grown rapidly over the past several decades. Within
the last decade in particular, this growth has been driven primarily by dramatic growth
in developing countries and countries with economies in transition. The industry is
undergoing dynamic change, with a range of external factors presenting industry
executives with vastly divergent challenges in different regions of the world.
Fundamentally, the industry continues to be driven by two main factors: Global GDP
dependence, which necessitates vastly different behaviors in emerging markets which
continue to expand (albeit at volatile rates); Europe, where embedded structural issues
point to long-term stagnation; and the US where a sustained economic recovery seems
to be taking hold; and Global issues including population growth and middle class
expansion; food and water shortage; energy and climate change, all of which drive
demand for chemical products under the mantra of making life better and our planet
healthier – continuing to drive the march downstream and the search for higher value,
science-based chemical products. This chapter gives an overview of the global and
European chemical industry and explains how the industry was affected by global
economic crisis. In the later part of the chapter, we talk in details each of the nineteen
chemical companies under current study.
4.2 Global chemical industry
The global chemicals industry has grown steadily over the past several decades.
Chemical industry data cited by OECD indicate that global chemical industry output
was valued at US$ 171 billion in 1970. In 2010, industry sources valued
Global output at US$ 4.12 trillion. The figure 24 shows as how the output of the
chemical companies is increasing steadily for last 40 years in the developed economy. It
is seen in the graph that the largest growth has happened in the last decade with Western
Europe playing a significant role.
Figure 24. Chemical output in the developed region
UNIVERSITAT ROVIRA I VIRGILI EUROPEAN CHEMICAL INDUSTRY AND ITS INNOVATION POLICY WITH FOCUS ON LARGE CHEMICAL COMPANIES. Supriyo Das Dipòsit Legal: T 1295-2015
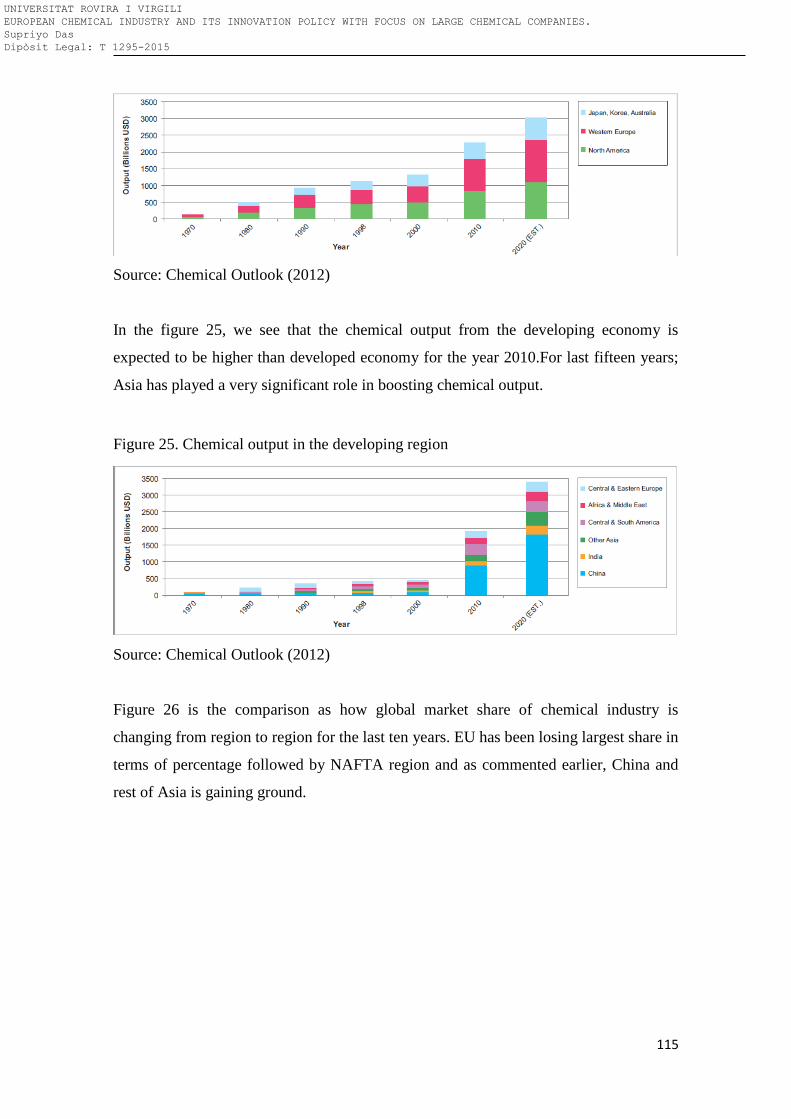
115
Source: Chemical Outlook (2012)
In the figure 25, we see that the chemical output from the developing economy is
expected to be higher than developed economy for the year 2010.For last fifteen years;
Asia has played a very significant role in boosting chemical output.
Figure 25. Chemical output in the developing region
Source: Chemical Outlook (2012)
Figure 26 is the comparison as how global market share of chemical industry is
changing from region to region for the last ten years. EU has been losing largest share in
terms of percentage followed by NAFTA region and as commented earlier, China and
rest of Asia is gaining ground.
UNIVERSITAT ROVIRA I VIRGILI EUROPEAN CHEMICAL INDUSTRY AND ITS INNOVATION POLICY WITH FOCUS ON LARGE CHEMICAL COMPANIES. Supriyo Das Dipòsit Legal: T 1295-2015
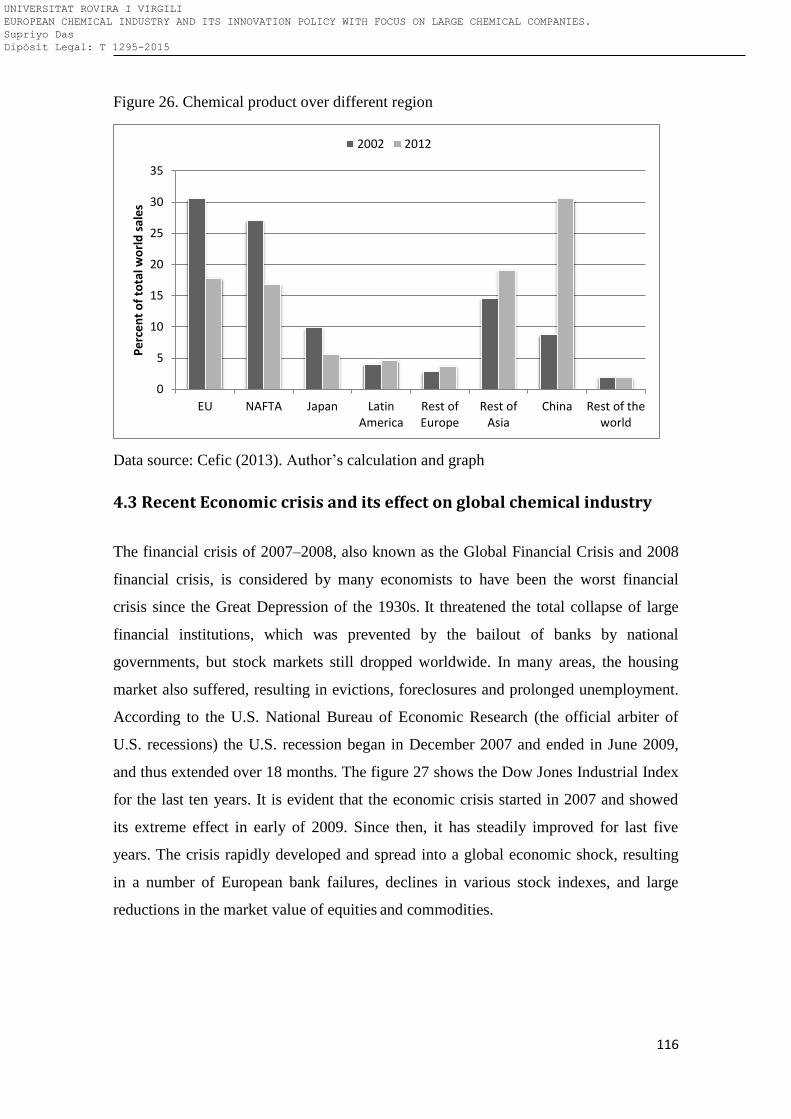
116
Figure 26. Chemical product over different region
Data source: Cefic (2013). Author’s calculation and graph
4.3 Recent Economic crisis and its effect on global chemical industry
The financial crisis of 2007–2008, also known as the Global Financial Crisis and 2008
financial crisis, is considered by many economists to have been the worst financial
crisis since the Great Depression of the 1930s. It threatened the total collapse of large
financial institutions, which was prevented by the bailout of banks by national
governments, but stock markets still dropped worldwide. In many areas, the housing
market also suffered, resulting in evictions, foreclosures and prolonged unemployment.
According to the U.S. National Bureau of Economic Research (the official arbiter of
U.S. recessions) the U.S. recession began in December 2007 and ended in June 2009,
and thus extended over 18 months. The figure 27 shows the Dow Jones Industrial Index
for the last ten years. It is evident that the economic crisis started in 2007 and showed
its extreme effect in early of 2009. Since then, it has steadily improved for last five
years. The crisis rapidly developed and spread into a global economic shock, resulting
in a number of European bank failures, declines in various stock indexes, and large
reductions in the market value of equities and commodities.
0
5
10
15
20
25
30
35
EU NAFTA Japan LatinAmerica
Rest ofEurope
Rest ofAsia
China Rest of theworld
Pe
rce
nt
of
tota
l wo
rld
sal
es
2002 2012
UNIVERSITAT ROVIRA I VIRGILI EUROPEAN CHEMICAL INDUSTRY AND ITS INNOVATION POLICY WITH FOCUS ON LARGE CHEMICAL COMPANIES. Supriyo Das Dipòsit Legal: T 1295-2015
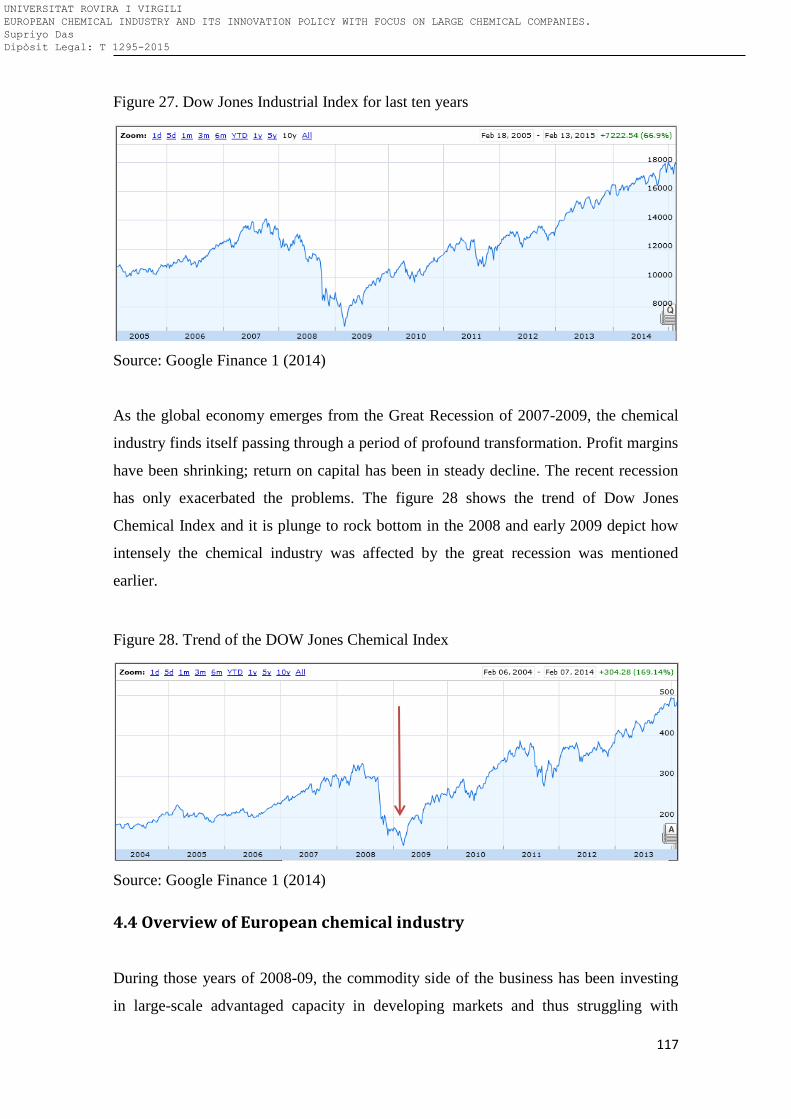
117
Figure 27. Dow Jones Industrial Index for last ten years
Source: Google Finance 1 (2014)
As the global economy emerges from the Great Recession of 2007-2009, the chemical
industry finds itself passing through a period of profound transformation. Profit margins
have been shrinking; return on capital has been in steady decline. The recent recession
has only exacerbated the problems. The figure 28 shows the trend of Dow Jones
Chemical Index and it is plunge to rock bottom in the 2008 and early 2009 depict how
intensely the chemical industry was affected by the great recession was mentioned
earlier.
Figure 28. Trend of the DOW Jones Chemical Index
Source: Google Finance 1 (2014)
4.4 Overview of European chemical industry
During those years of 2008-09, the commodity side of the business has been investing
in large-scale advantaged capacity in developing markets and thus struggling with
UNIVERSITAT ROVIRA I VIRGILI EUROPEAN CHEMICAL INDUSTRY AND ITS INNOVATION POLICY WITH FOCUS ON LARGE CHEMICAL COMPANIES. Supriyo Das Dipòsit Legal: T 1295-2015
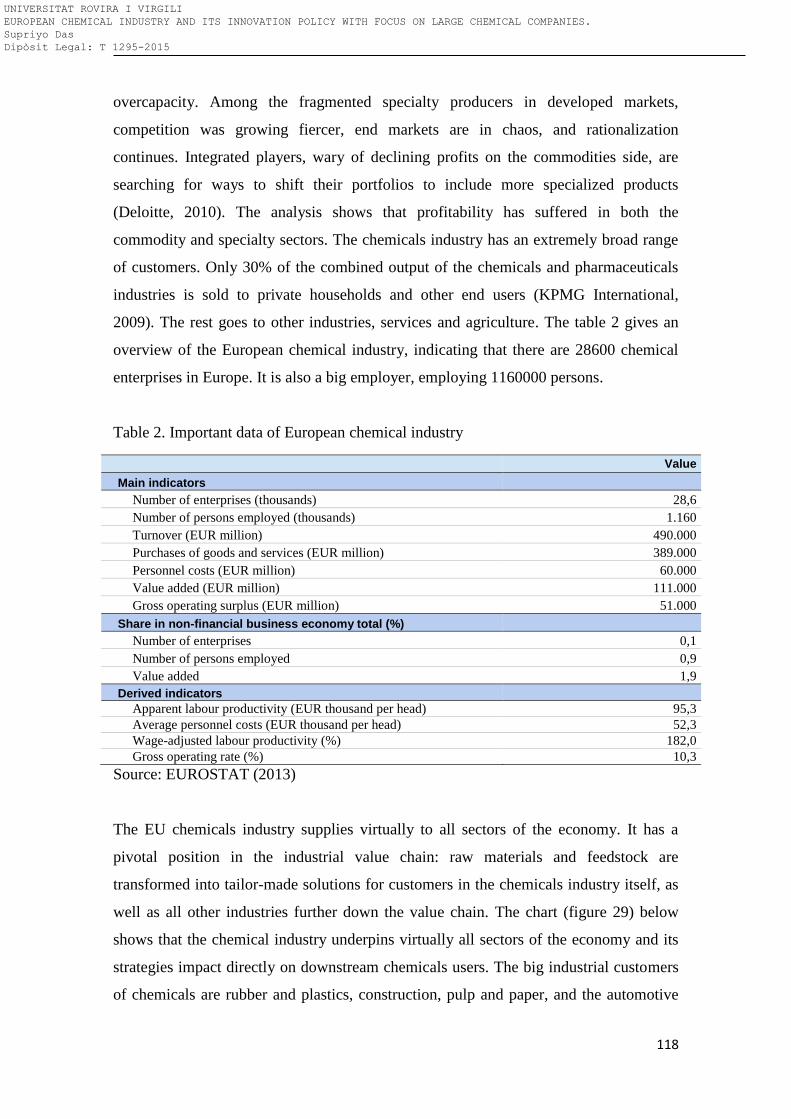
118
overcapacity. Among the fragmented specialty producers in developed markets,
competition was growing fiercer, end markets are in chaos, and rationalization
continues. Integrated players, wary of declining profits on the commodities side, are
searching for ways to shift their portfolios to include more specialized products
(Deloitte, 2010). The analysis shows that profitability has suffered in both the
commodity and specialty sectors. The chemicals industry has an extremely broad range
of customers. Only 30% of the combined output of the chemicals and pharmaceuticals
industries is sold to private households and other end users (KPMG International,
2009). The rest goes to other industries, services and agriculture. The table 2 gives an
overview of the European chemical industry, indicating that there are 28600 chemical
enterprises in Europe. It is also a big employer, employing 1160000 persons.
Table 2. Important data of European chemical industry
Value
Main indicators
Number of enterprises (thousands) 28,6
Number of persons employed (thousands) 1.160
Turnover (EUR million) 490.000
Purchases of goods and services (EUR million) 389.000
Personnel costs (EUR million) 60.000
Value added (EUR million) 111.000
Gross operating surplus (EUR million) 51.000
Share in non-financial business economy total (%)
Number of enterprises 0,1
Number of persons employed 0,9
Value added 1,9
Derived indicators
Apparent labour productivity (EUR thousand per head) 95,3
Average personnel costs (EUR thousand per head) 52,3
Wage-adjusted labour productivity (%) 182,0
Gross operating rate (%) 10,3
Source: EUROSTAT (2013)
The EU chemicals industry supplies virtually to all sectors of the economy. It has a
pivotal position in the industrial value chain: raw materials and feedstock are
transformed into tailor-made solutions for customers in the chemicals industry itself, as
well as all other industries further down the value chain. The chart (figure 29) below
shows that the chemical industry underpins virtually all sectors of the economy and its
strategies impact directly on downstream chemicals users. The big industrial customers
of chemicals are rubber and plastics, construction, pulp and paper, and the automotive
UNIVERSITAT ROVIRA I VIRGILI EUROPEAN CHEMICAL INDUSTRY AND ITS INNOVATION POLICY WITH FOCUS ON LARGE CHEMICAL COMPANIES. Supriyo Das Dipòsit Legal: T 1295-2015
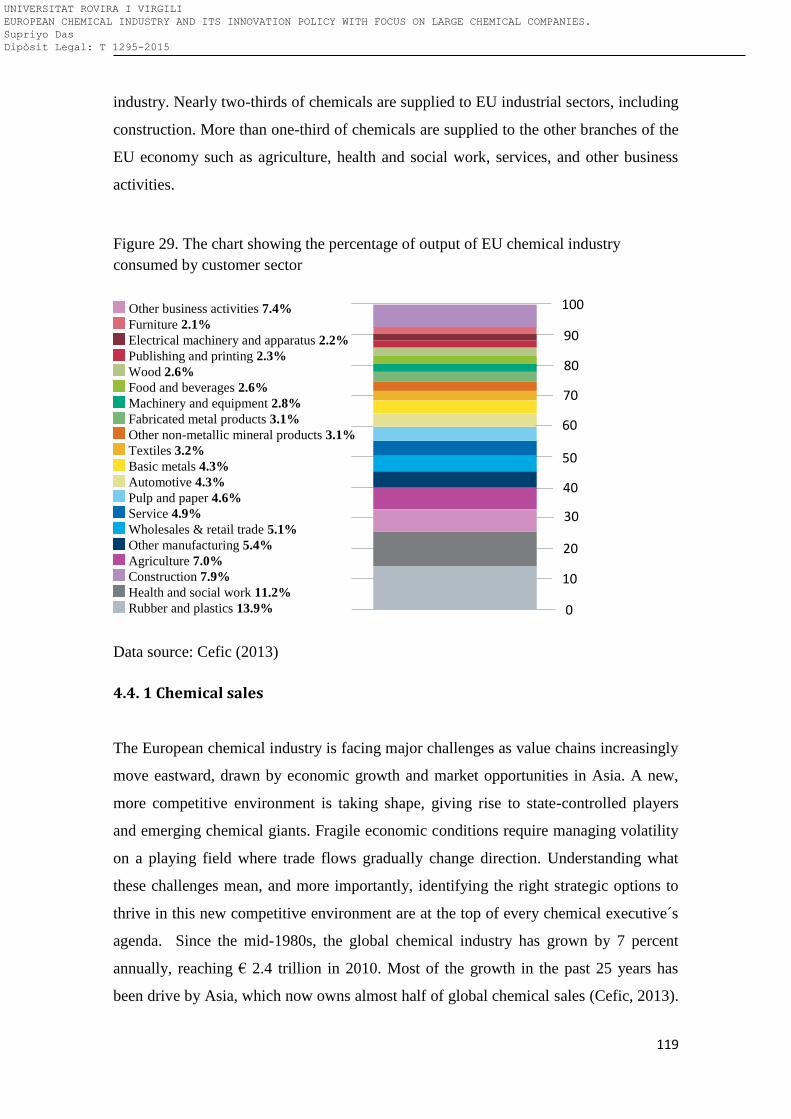
119
industry. Nearly two-thirds of chemicals are supplied to EU industrial sectors, including
construction. More than one-third of chemicals are supplied to the other branches of the
EU economy such as agriculture, health and social work, services, and other business
activities.
Figure 29. The chart showing the percentage of output of EU chemical industry
consumed by customer sector
Other business activities 7.4% Furniture 2.1% Electrical machinery and apparatus 2.2% Publishing and printing 2.3% Wood 2.6% Food and beverages 2.6% Machinery and equipment 2.8% Fabricated metal products 3.1% Other non-metallic mineral products 3.1% Textiles 3.2% Basic metals 4.3% Automotive 4.3% Pulp and paper 4.6% Service 4.9% Wholesales & retail trade 5.1% Other manufacturing 5.4% Agriculture 7.0% Construction 7.9% Health and social work 11.2% Rubber and plastics 13.9%
Data source: Cefic (2013)
4.4. 1 Chemical sales
The European chemical industry is facing major challenges as value chains increasingly
move eastward, drawn by economic growth and market opportunities in Asia. A new,
more competitive environment is taking shape, giving rise to state-controlled players
and emerging chemical giants. Fragile economic conditions require managing volatility
on a playing field where trade flows gradually change direction. Understanding what
these challenges mean, and more importantly, identifying the right strategic options to
thrive in this new competitive environment are at the top of every chemical executive´s
agenda. Since the mid-1980s, the global chemical industry has grown by 7 percent
annually, reaching € 2.4 trillion in 2010. Most of the growth in the past 25 years has
been drive by Asia, which now owns almost half of global chemical sales (Cefic, 2013).
100
90
80
70
60
50
0 40
0 30
0 20
10
0 0
UNIVERSITAT ROVIRA I VIRGILI EUROPEAN CHEMICAL INDUSTRY AND ITS INNOVATION POLICY WITH FOCUS ON LARGE CHEMICAL COMPANIES. Supriyo Das Dipòsit Legal: T 1295-2015
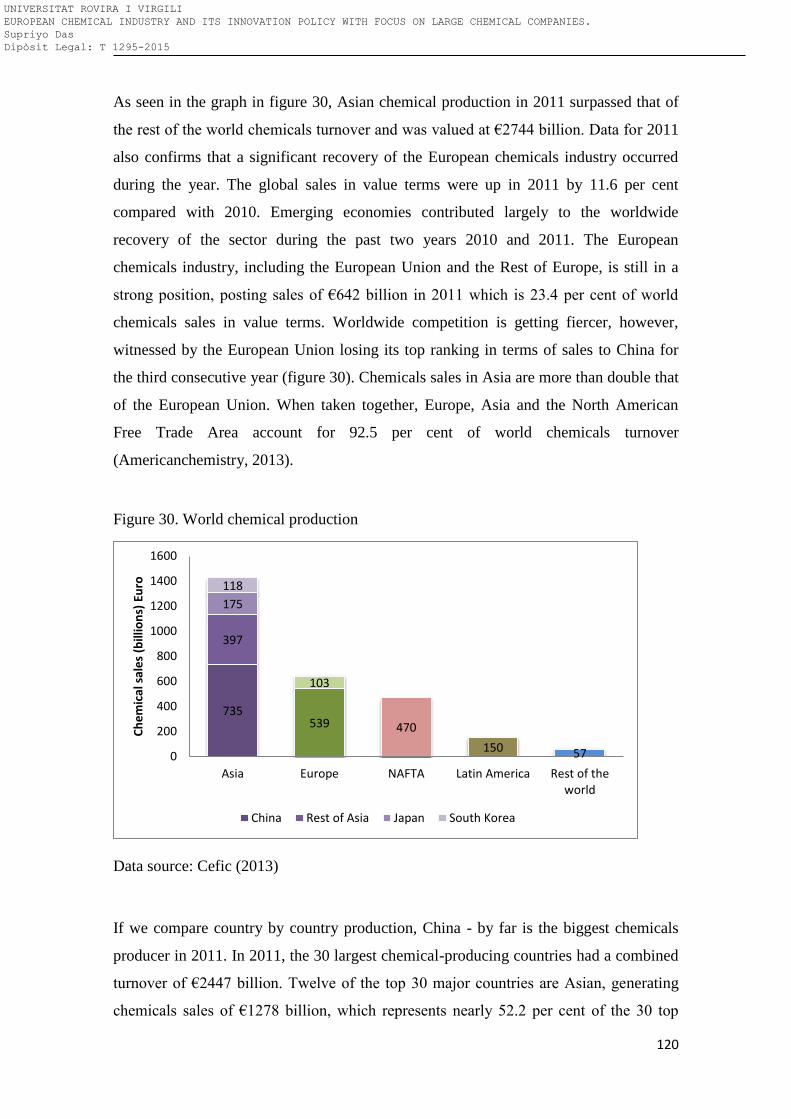
120
As seen in the graph in figure 30, Asian chemical production in 2011 surpassed that of
the rest of the world chemicals turnover and was valued at €2744 billion. Data for 2011
also confirms that a significant recovery of the European chemicals industry occurred
during the year. The global sales in value terms were up in 2011 by 11.6 per cent
compared with 2010. Emerging economies contributed largely to the worldwide
recovery of the sector during the past two years 2010 and 2011. The European
chemicals industry, including the European Union and the Rest of Europe, is still in a
strong position, posting sales of €642 billion in 2011 which is 23.4 per cent of world
chemicals sales in value terms. Worldwide competition is getting fiercer, however,
witnessed by the European Union losing its top ranking in terms of sales to China for
the third consecutive year (figure 30). Chemicals sales in Asia are more than double that
of the European Union. When taken together, Europe, Asia and the North American
Free Trade Area account for 92.5 per cent of world chemicals turnover
(Americanchemistry, 2013).
Figure 30. World chemical production
Data source: Cefic (2013)
If we compare country by country production, China - by far is the biggest chemicals
producer in 2011. In 2011, the 30 largest chemical-producing countries had a combined
turnover of €2447 billion. Twelve of the top 30 major countries are Asian, generating
chemicals sales of €1278 billion, which represents nearly 52.2 per cent of the 30 top
735 539 470
150 57
397
103
175
118
0
200
400
600
800
1000
1200
1400
1600
Asia Europe NAFTA Latin America Rest of theworld
Ch
em
ical
sal
es
(bill
ion
s) E
uro
China Rest of Asia Japan South Korea
UNIVERSITAT ROVIRA I VIRGILI EUROPEAN CHEMICAL INDUSTRY AND ITS INNOVATION POLICY WITH FOCUS ON LARGE CHEMICAL COMPANIES. Supriyo Das Dipòsit Legal: T 1295-2015
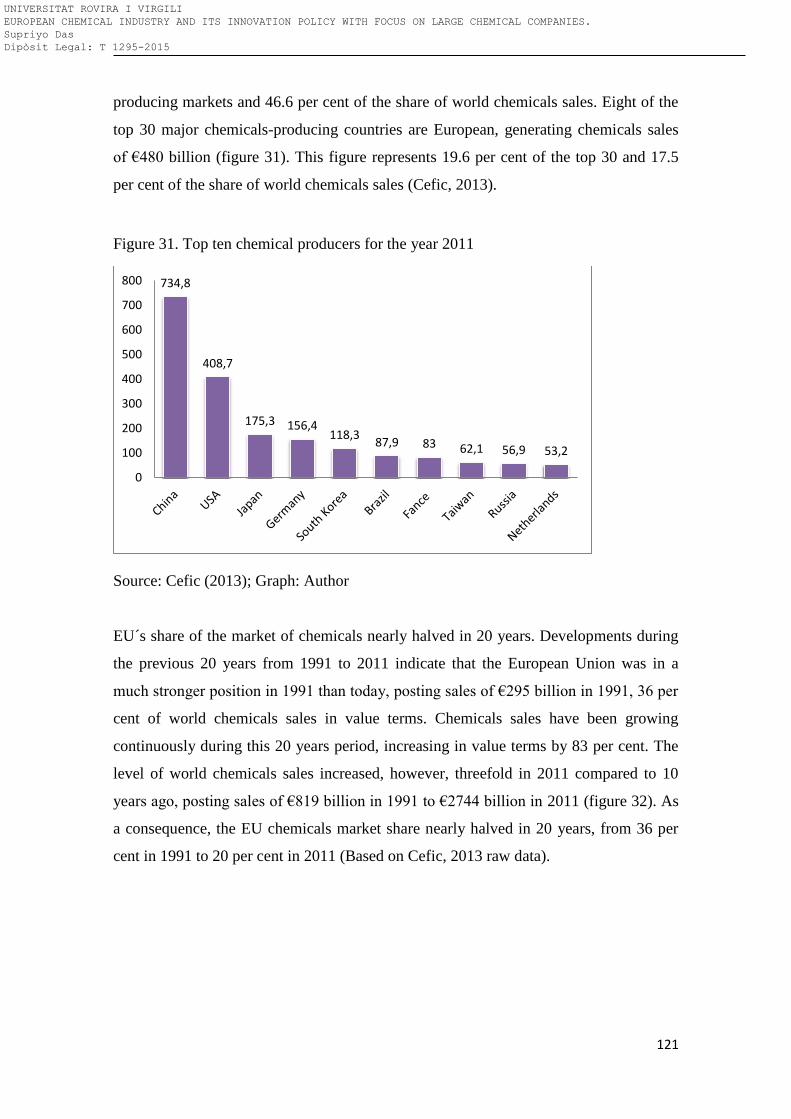
121
producing markets and 46.6 per cent of the share of world chemicals sales. Eight of the
top 30 major chemicals-producing countries are European, generating chemicals sales
of €480 billion (figure 31). This figure represents 19.6 per cent of the top 30 and 17.5
per cent of the share of world chemicals sales (Cefic, 2013).
Figure 31. Top ten chemical producers for the year 2011
Source: Cefic (2013); Graph: Author
EU´s share of the market of chemicals nearly halved in 20 years. Developments during
the previous 20 years from 1991 to 2011 indicate that the European Union was in a
much stronger position in 1991 than today, posting sales of €295 billion in 1991, 36 per
cent of world chemicals sales in value terms. Chemicals sales have been growing
continuously during this 20 years period, increasing in value terms by 83 per cent. The
level of world chemicals sales increased, however, threefold in 2011 compared to 10
years ago, posting sales of €819 billion in 1991 to €2744 billion in 2011 (figure 32). As
a consequence, the EU chemicals market share nearly halved in 20 years, from 36 per
cent in 1991 to 20 per cent in 2011 (Based on Cefic, 2013 raw data).
734,8
408,7
175,3 156,4 118,3
87,9 83 62,1 56,9 53,2
0
100
200
300
400
500
600
700
800
UNIVERSITAT ROVIRA I VIRGILI EUROPEAN CHEMICAL INDUSTRY AND ITS INNOVATION POLICY WITH FOCUS ON LARGE CHEMICAL COMPANIES. Supriyo Das Dipòsit Legal: T 1295-2015
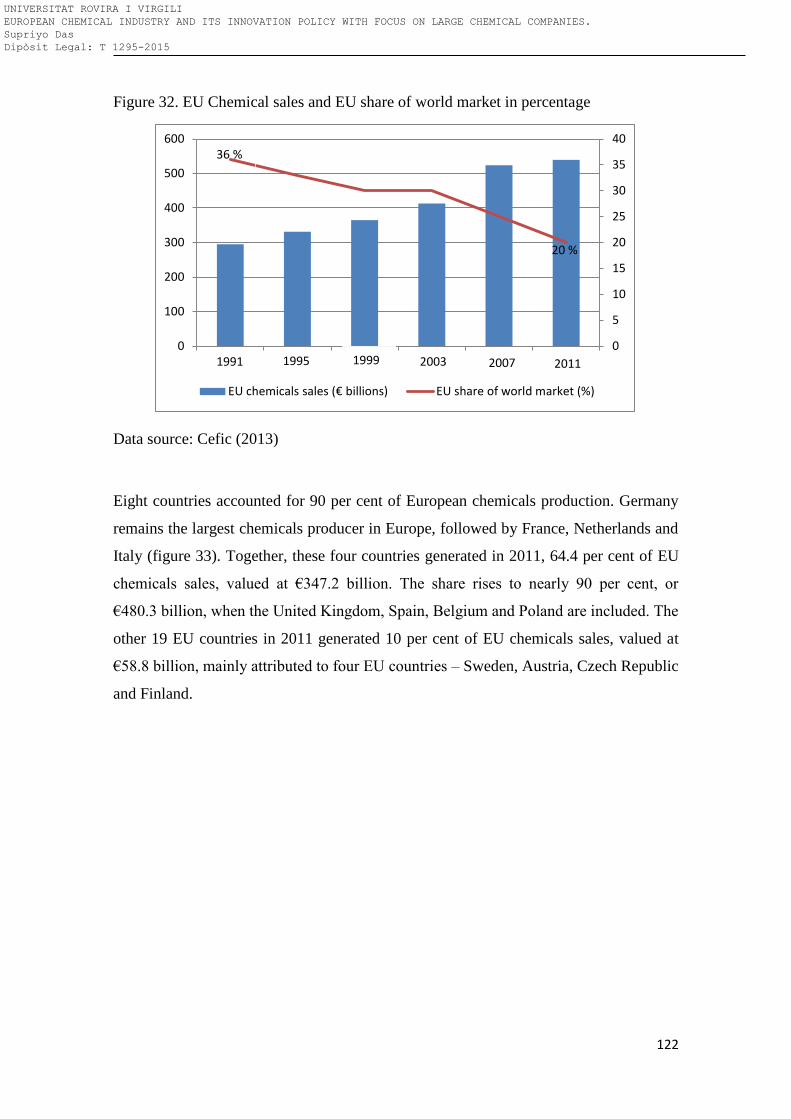
122
Figure 32. EU Chemical sales and EU share of world market in percentage
Data source: Cefic (2013)
Eight countries accounted for 90 per cent of European chemicals production. Germany
remains the largest chemicals producer in Europe, followed by France, Netherlands and
Italy (figure 33). Together, these four countries generated in 2011, 64.4 per cent of EU
chemicals sales, valued at €347.2 billion. The share rises to nearly 90 per cent, or
€480.3 billion, when the United Kingdom, Spain, Belgium and Poland are included. The
other 19 EU countries in 2011 generated 10 per cent of EU chemicals sales, valued at
€58.8 billion, mainly attributed to four EU countries – Sweden, Austria, Czech Republic
and Finland.
0
5
10
15
20
25
30
35
40
0
100
200
300
400
500
600
1 2 3 4 5 6
EU chemicals sales (€ billions) EU share of world market (%)
1991 1995 2003 2007 2011 1999
36 %
20 %
NL 10.3 %
ES 7.2 % BE
6.4 % PL 2.5 %
Others 10.9 %
FR 15.4 %
DE 29 %
Others 3.1 %
DK 0.7 % PT
0.8 % HU 0.9 %
FI 1.2 %
CZ 1.3 % AT
1.3 %
SE 1.6 %
UNIVERSITAT ROVIRA I VIRGILI EUROPEAN CHEMICAL INDUSTRY AND ITS INNOVATION POLICY WITH FOCUS ON LARGE CHEMICAL COMPANIES. Supriyo Das Dipòsit Legal: T 1295-2015
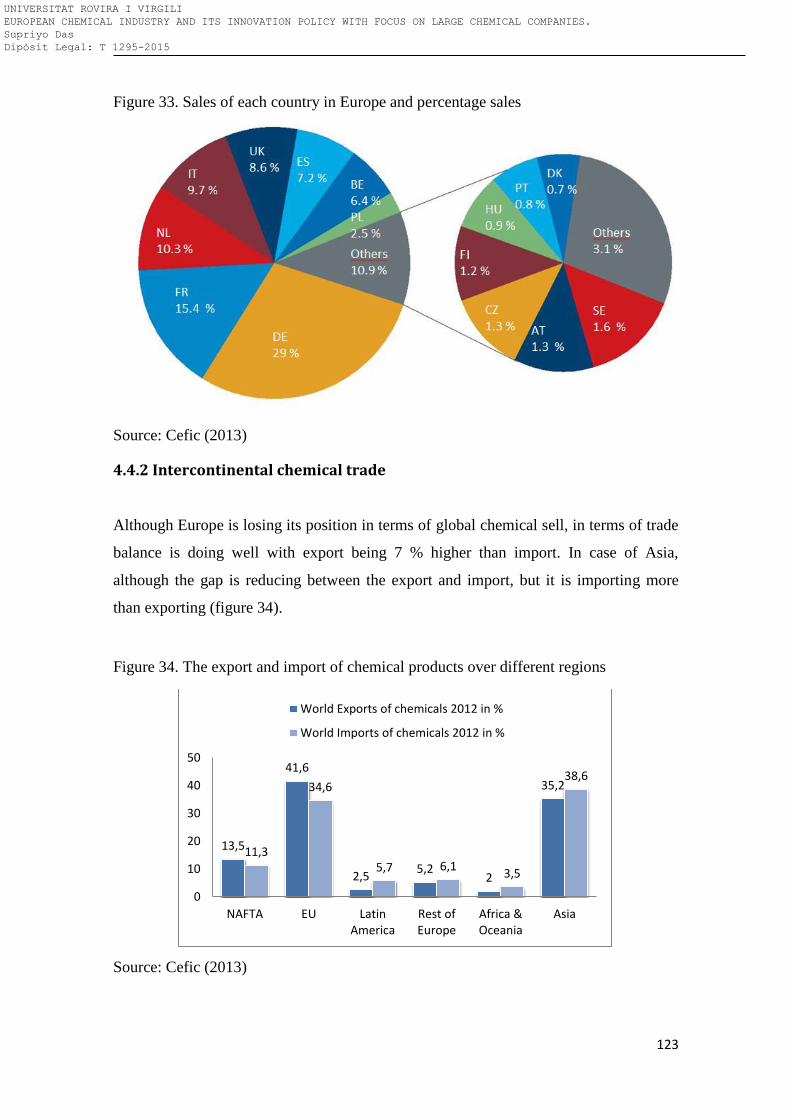
123
Figure 33. Sales of each country in Europe and percentage sales
Source: Cefic (2013)
4.4.2 Intercontinental chemical trade
Although Europe is losing its position in terms of global chemical sell, in terms of trade
balance is doing well with export being 7 % higher than import. In case of Asia,
although the gap is reducing between the export and import, but it is importing more
than exporting (figure 34).
Figure 34. The export and import of chemical products over different regions
Source: Cefic (2013)
13,5
41,6
2,5 5,2
2
35,2
11,3
34,6
5,7 6,1 3,5
38,6
0
10
20
30
40
50
NAFTA EU LatinAmerica
Rest ofEurope
Africa &Oceania
Asia
World Exports of chemicals 2012 in %
World Imports of chemicals 2012 in %
UNIVERSITAT ROVIRA I VIRGILI EUROPEAN CHEMICAL INDUSTRY AND ITS INNOVATION POLICY WITH FOCUS ON LARGE CHEMICAL COMPANIES. Supriyo Das Dipòsit Legal: T 1295-2015
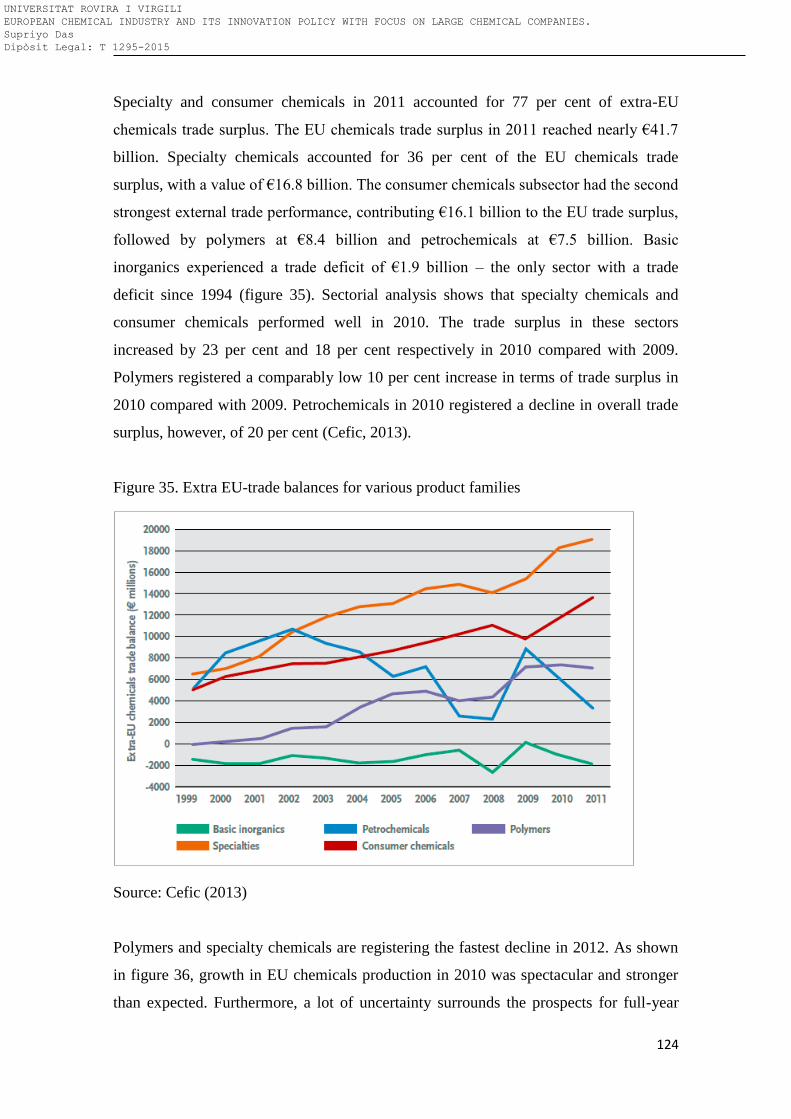
124
Specialty and consumer chemicals in 2011 accounted for 77 per cent of extra-EU
chemicals trade surplus. The EU chemicals trade surplus in 2011 reached nearly €41.7
billion. Specialty chemicals accounted for 36 per cent of the EU chemicals trade
surplus, with a value of €16.8 billion. The consumer chemicals subsector had the second
strongest external trade performance, contributing €16.1 billion to the EU trade surplus,
followed by polymers at €8.4 billion and petrochemicals at €7.5 billion. Basic
inorganics experienced a trade deficit of €1.9 billion – the only sector with a trade
deficit since 1994 (figure 35). Sectorial analysis shows that specialty chemicals and
consumer chemicals performed well in 2010. The trade surplus in these sectors
increased by 23 per cent and 18 per cent respectively in 2010 compared with 2009.
Polymers registered a comparably low 10 per cent increase in terms of trade surplus in
2010 compared with 2009. Petrochemicals in 2010 registered a decline in overall trade
surplus, however, of 20 per cent (Cefic, 2013).
Figure 35. Extra EU-trade balances for various product families
Source: Cefic (2013)
Polymers and specialty chemicals are registering the fastest decline in 2012. As shown
in figure 36, growth in EU chemicals production in 2010 was spectacular and stronger
than expected. Furthermore, a lot of uncertainty surrounds the prospects for full-year
UNIVERSITAT ROVIRA I VIRGILI EUROPEAN CHEMICAL INDUSTRY AND ITS INNOVATION POLICY WITH FOCUS ON LARGE CHEMICAL COMPANIES. Supriyo Das Dipòsit Legal: T 1295-2015
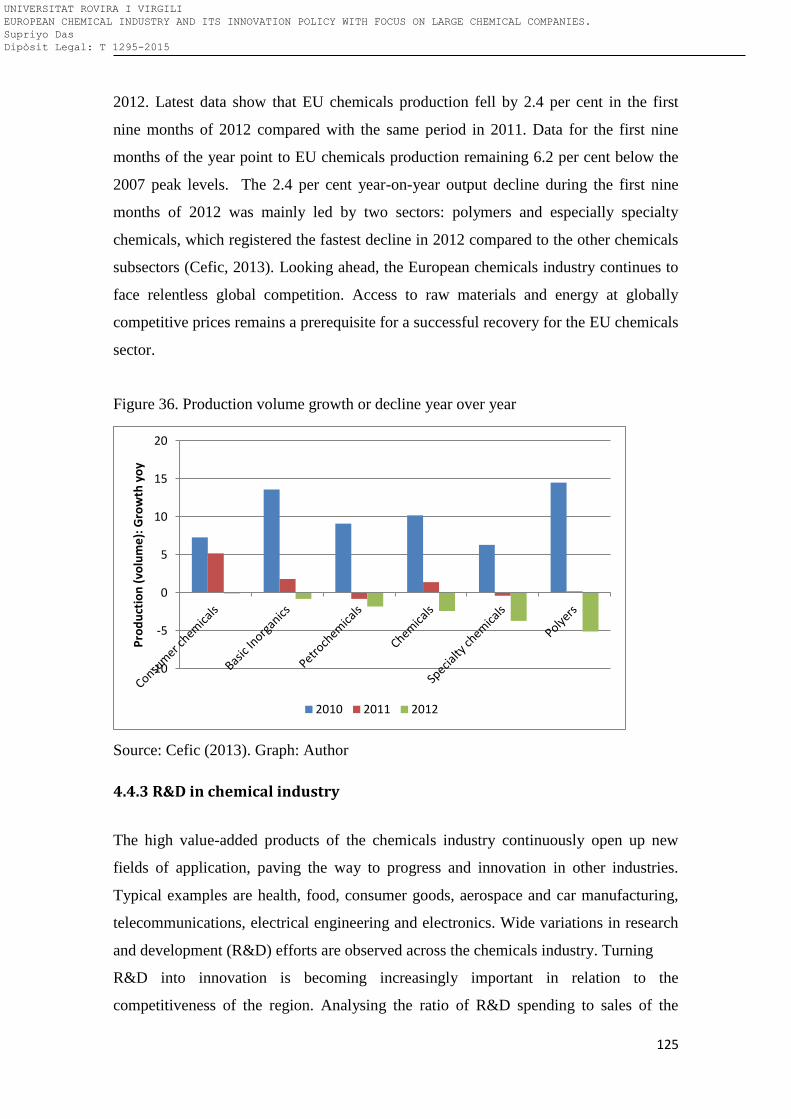
125
2012. Latest data show that EU chemicals production fell by 2.4 per cent in the first
nine months of 2012 compared with the same period in 2011. Data for the first nine
months of the year point to EU chemicals production remaining 6.2 per cent below the
2007 peak levels. The 2.4 per cent year-on-year output decline during the first nine
months of 2012 was mainly led by two sectors: polymers and especially specialty
chemicals, which registered the fastest decline in 2012 compared to the other chemicals
subsectors (Cefic, 2013). Looking ahead, the European chemicals industry continues to
face relentless global competition. Access to raw materials and energy at globally
competitive prices remains a prerequisite for a successful recovery for the EU chemicals
sector.
Figure 36. Production volume growth or decline year over year
Source: Cefic (2013). Graph: Author
4.4.3 R&D in chemical industry
The high value-added products of the chemicals industry continuously open up new
fields of application, paving the way to progress and innovation in other industries.
Typical examples are health, food, consumer goods, aerospace and car manufacturing,
telecommunications, electrical engineering and electronics. Wide variations in research
and development (R&D) efforts are observed across the chemicals industry. Turning
R&D into innovation is becoming increasingly important in relation to the
competitiveness of the region. Analysing the ratio of R&D spending to sales of the
-10
-5
0
5
10
15
20
Pro
du
ctio
n (
volu
me
): G
row
th y
oy
2010 2011 2012
UNIVERSITAT ROVIRA I VIRGILI EUROPEAN CHEMICAL INDUSTRY AND ITS INNOVATION POLICY WITH FOCUS ON LARGE CHEMICAL COMPANIES. Supriyo Das Dipòsit Legal: T 1295-2015
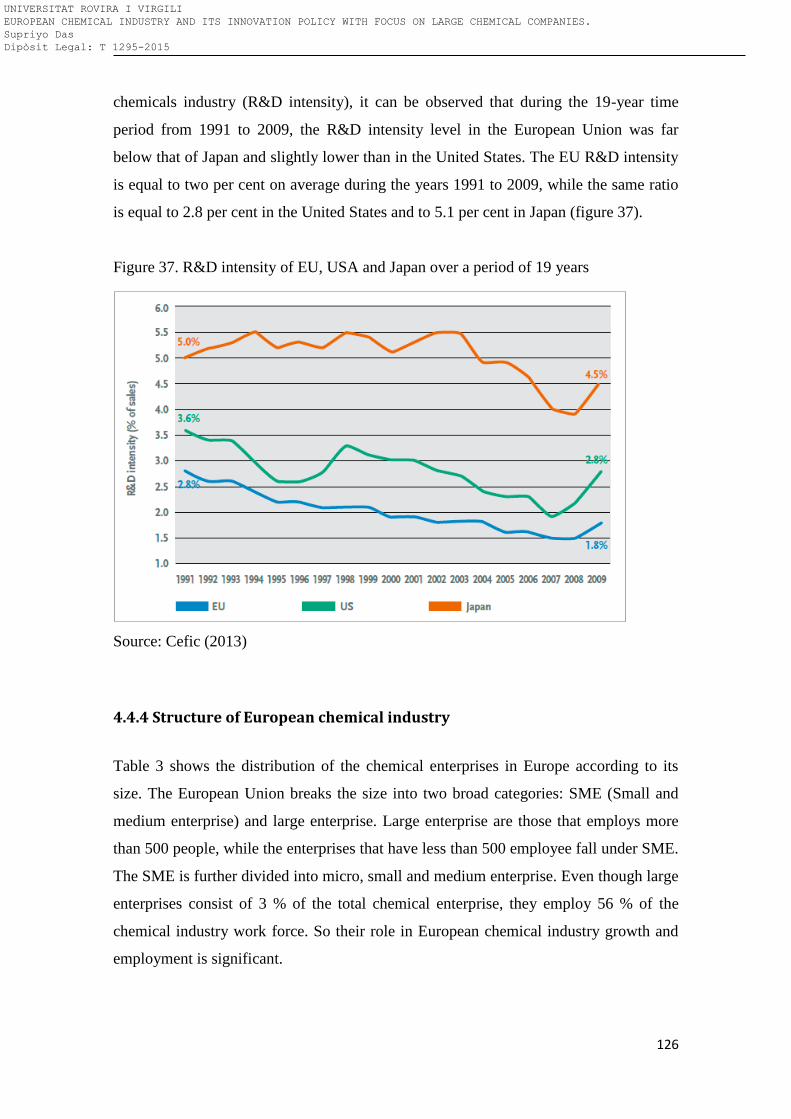
126
chemicals industry (R&D intensity), it can be observed that during the 19-year time
period from 1991 to 2009, the R&D intensity level in the European Union was far
below that of Japan and slightly lower than in the United States. The EU R&D intensity
is equal to two per cent on average during the years 1991 to 2009, while the same ratio
is equal to 2.8 per cent in the United States and to 5.1 per cent in Japan (figure 37).
Figure 37. R&D intensity of EU, USA and Japan over a period of 19 years
Source: Cefic (2013)
4.4.4 Structure of European chemical industry
Table 3 shows the distribution of the chemical enterprises in Europe according to its
size. The European Union breaks the size into two broad categories: SME (Small and
medium enterprise) and large enterprise. Large enterprise are those that employs more
than 500 people, while the enterprises that have less than 500 employee fall under SME.
The SME is further divided into micro, small and medium enterprise. Even though large
enterprises consist of 3 % of the total chemical enterprise, they employ 56 % of the
chemical industry work force. So their role in European chemical industry growth and
employment is significant.
UNIVERSITAT ROVIRA I VIRGILI EUROPEAN CHEMICAL INDUSTRY AND ITS INNOVATION POLICY WITH FOCUS ON LARGE CHEMICAL COMPANIES. Supriyo Das Dipòsit Legal: T 1295-2015
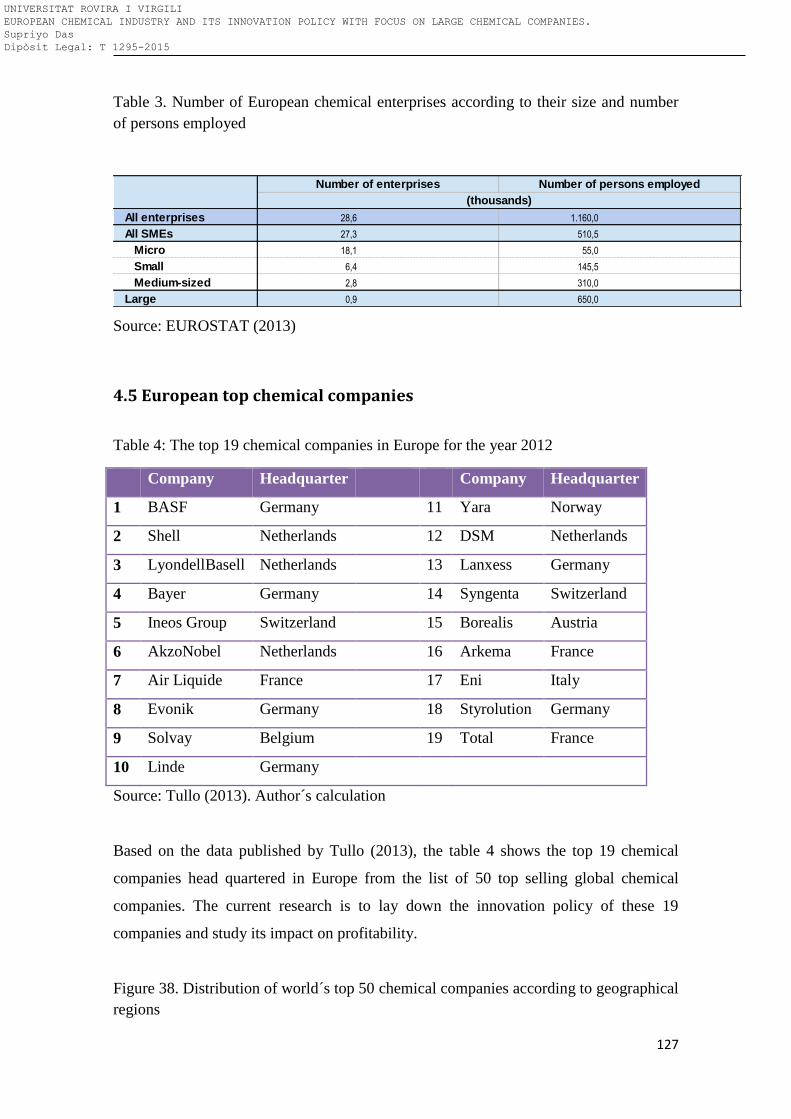
127
Table 3. Number of European chemical enterprises according to their size and number
of persons employed
Source: EUROSTAT (2013)
4.5 European top chemical companies
Table 4: The top 19 chemical companies in Europe for the year 2012
Company Headquarter Company Headquarter
1 BASF Germany 11 Yara Norway
2 Shell Netherlands 12 DSM Netherlands
3 LyondellBasell Netherlands 13 Lanxess Germany
4 Bayer Germany 14 Syngenta Switzerland
5 Ineos Group Switzerland 15 Borealis Austria
6 AkzoNobel Netherlands 16 Arkema France
7 Air Liquide France 17 Eni Italy
8 Evonik Germany 18 Styrolution Germany
9 Solvay Belgium 19 Total France
10 Linde Germany
Source: Tullo (2013). Author´s calculation
Based on the data published by Tullo (2013), the table 4 shows the top 19 chemical
companies head quartered in Europe from the list of 50 top selling global chemical
companies. The current research is to lay down the innovation policy of these 19
companies and study its impact on profitability.
Figure 38. Distribution of world´s top 50 chemical companies according to geographical
regions
Number of enterprises Number of persons employed
All enterprises 28,6 1.160,0
All SMEs 27,3 510,5
Micro 18,1 55,0
Small 6,4 145,5
Medium-sized 2,8 310,0
Large 0,9 650,0
(thousands)
UNIVERSITAT ROVIRA I VIRGILI EUROPEAN CHEMICAL INDUSTRY AND ITS INNOVATION POLICY WITH FOCUS ON LARGE CHEMICAL COMPANIES. Supriyo Das Dipòsit Legal: T 1295-2015
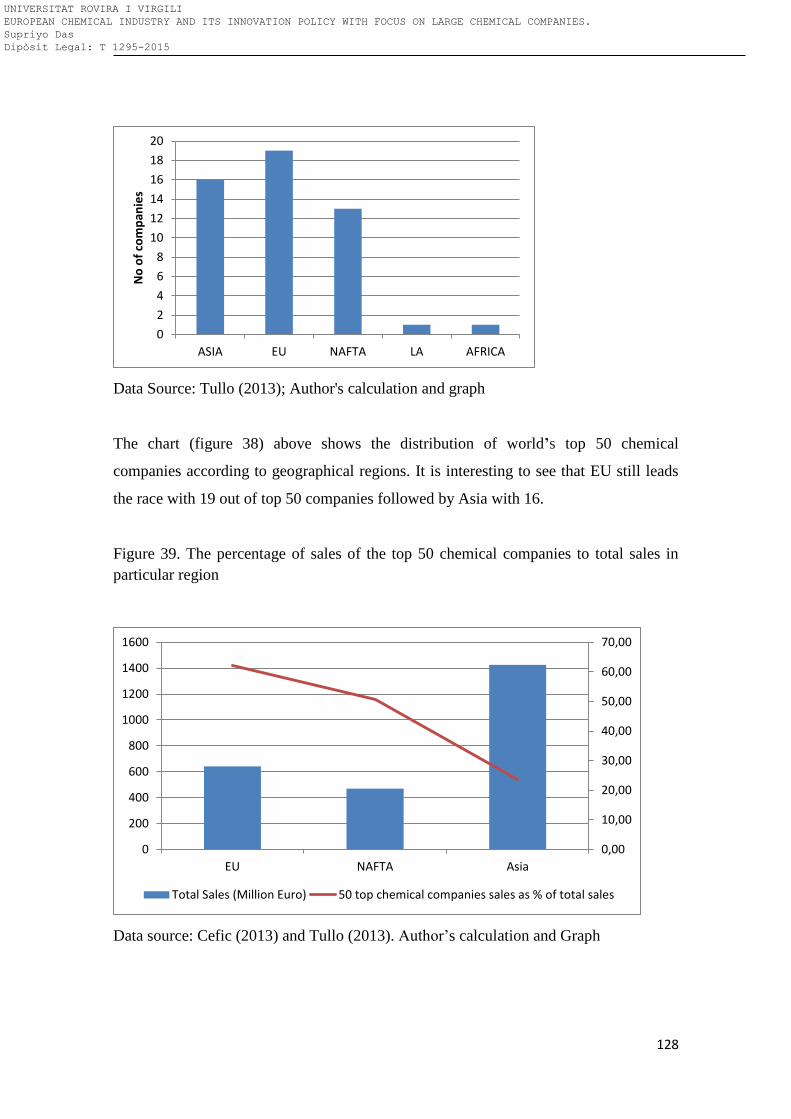
128
Data Source: Tullo (2013); Author's calculation and graph
The chart (figure 38) above shows the distribution of world’s top 50 chemical
companies according to geographical regions. It is interesting to see that EU still leads
the race with 19 out of top 50 companies followed by Asia with 16.
Figure 39. The percentage of sales of the top 50 chemical companies to total sales in
particular region
Data source: Cefic (2013) and Tullo (2013). Author’s calculation and Graph
0
2
4
6
8
10
12
14
16
18
20
ASIA EU NAFTA LA AFRICA
No
of
com
pan
ies
0,00
10,00
20,00
30,00
40,00
50,00
60,00
70,00
0
200
400
600
800
1000
1200
1400
1600
EU NAFTA Asia
Total Sales (Million Euro) 50 top chemical companies sales as % of total sales
UNIVERSITAT ROVIRA I VIRGILI EUROPEAN CHEMICAL INDUSTRY AND ITS INNOVATION POLICY WITH FOCUS ON LARGE CHEMICAL COMPANIES. Supriyo Das Dipòsit Legal: T 1295-2015
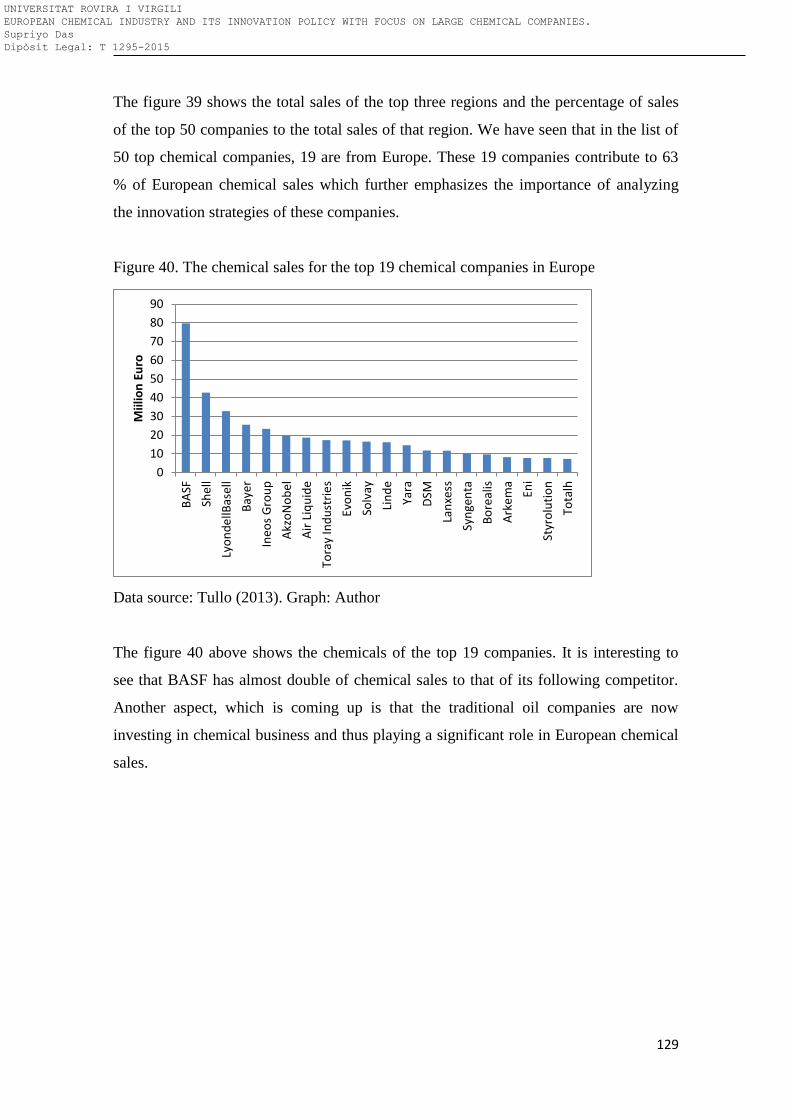
129
The figure 39 shows the total sales of the top three regions and the percentage of sales
of the top 50 companies to the total sales of that region. We have seen that in the list of
50 top chemical companies, 19 are from Europe. These 19 companies contribute to 63
% of European chemical sales which further emphasizes the importance of analyzing
the innovation strategies of these companies.
Figure 40. The chemical sales for the top 19 chemical companies in Europe
Data source: Tullo (2013). Graph: Author
The figure 40 above shows the chemicals of the top 19 companies. It is interesting to
see that BASF has almost double of chemical sales to that of its following competitor.
Another aspect, which is coming up is that the traditional oil companies are now
investing in chemical business and thus playing a significant role in European chemical
sales.
0
10
20
30
40
50
60
70
80
90
BA
SF
She
ll
Lyo
nd
ellB
asel
l
Bay
er
Ineo
s G
rou
p
Akz
oN
ob
el
Air
Liq
uid
e
Tora
y In
du
stri
es
Evo
nik
Solv
ay
Lin
de
Yara
DSM
Lan
xess
Syn
gen
ta
Bo
real
is
Ark
em
a
Eni
Styr
olu
tio
n
Tota
lh
Miil
ion
Eu
ro
UNIVERSITAT ROVIRA I VIRGILI EUROPEAN CHEMICAL INDUSTRY AND ITS INNOVATION POLICY WITH FOCUS ON LARGE CHEMICAL COMPANIES. Supriyo Das Dipòsit Legal: T 1295-2015
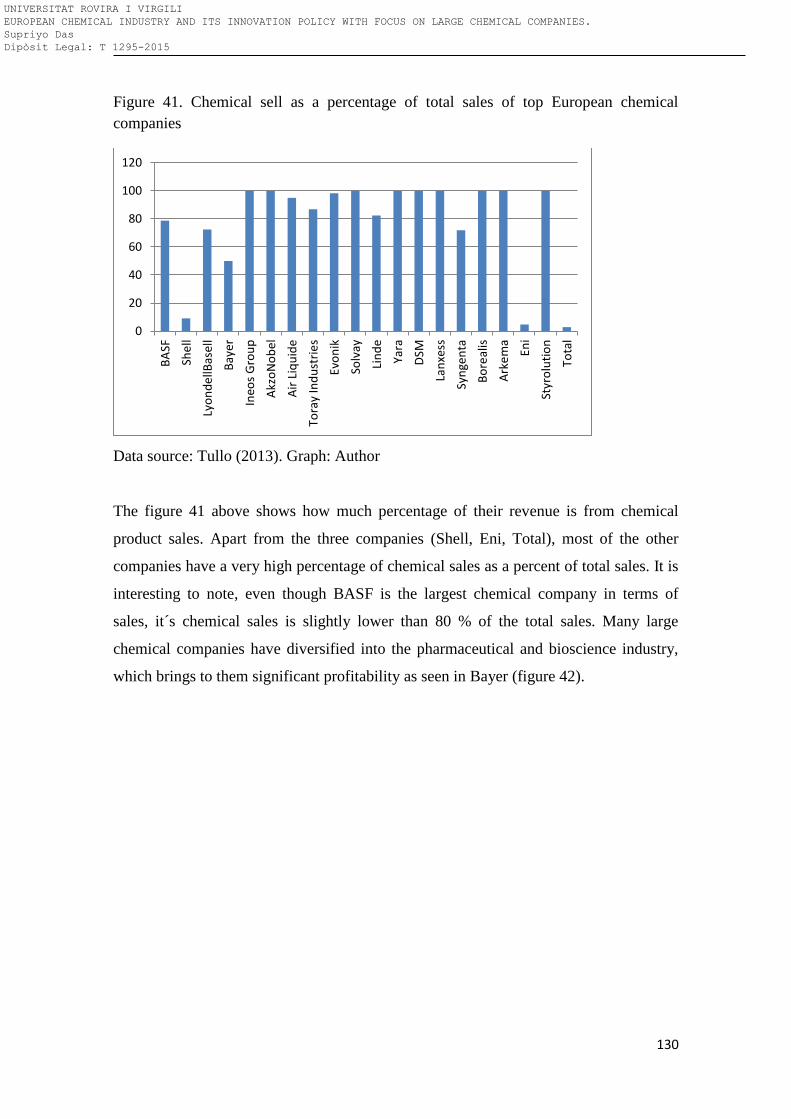
130
Figure 41. Chemical sell as a percentage of total sales of top European chemical
companies
Data source: Tullo (2013). Graph: Author
The figure 41 above shows how much percentage of their revenue is from chemical
product sales. Apart from the three companies (Shell, Eni, Total), most of the other
companies have a very high percentage of chemical sales as a percent of total sales. It is
interesting to note, even though BASF is the largest chemical company in terms of
sales, it´s chemical sales is slightly lower than 80 % of the total sales. Many large
chemical companies have diversified into the pharmaceutical and bioscience industry,
which brings to them significant profitability as seen in Bayer (figure 42).
0
20
40
60
80
100
120B
ASF
She
ll
Lyo
nd
ellB
asel
l
Bay
er
Ineo
s G
rou
p
Akz
oN
ob
el
Air
Liq
uid
e
Tora
y In
du
stri
es
Evo
nik
Solv
ay
Lin
de
Yara
DSM
Lan
xess
Syn
gen
ta
Bo
real
is
Ark
em
a
Eni
Styr
olu
tio
n
Tota
l
UNIVERSITAT ROVIRA I VIRGILI EUROPEAN CHEMICAL INDUSTRY AND ITS INNOVATION POLICY WITH FOCUS ON LARGE CHEMICAL COMPANIES. Supriyo Das Dipòsit Legal: T 1295-2015
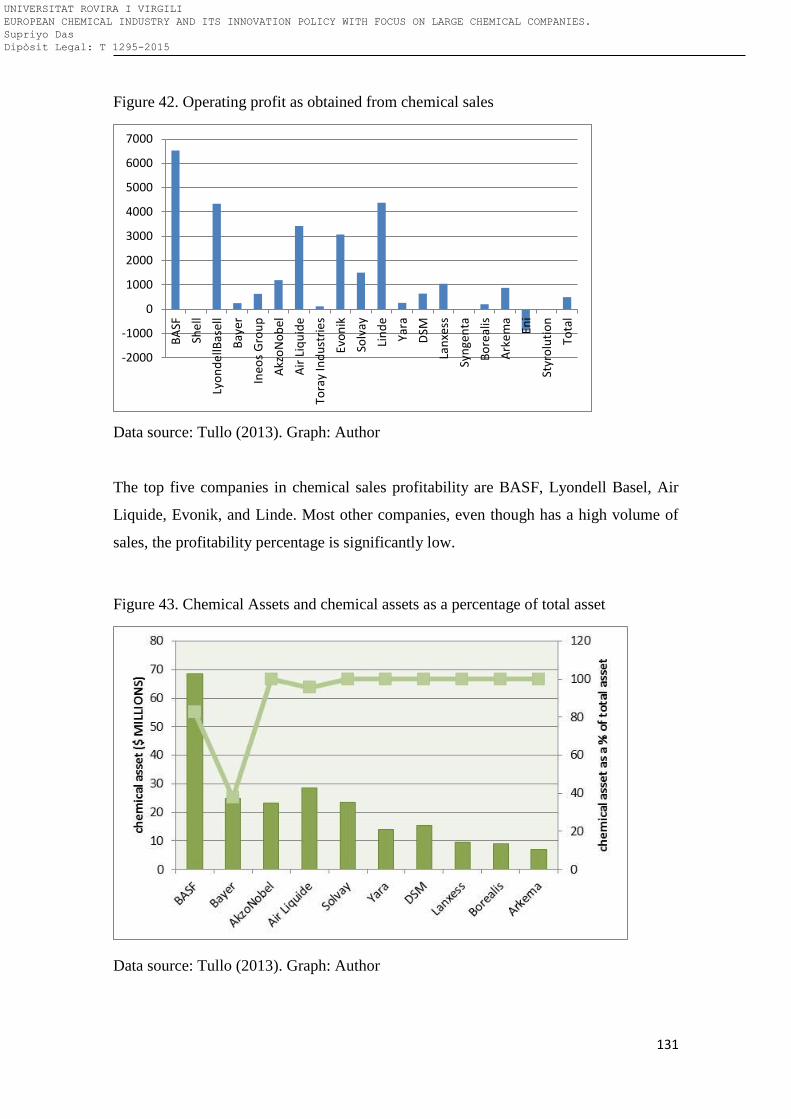
131
Figure 42. Operating profit as obtained from chemical sales
Data source: Tullo (2013). Graph: Author
The top five companies in chemical sales profitability are BASF, Lyondell Basel, Air
Liquide, Evonik, and Linde. Most other companies, even though has a high volume of
sales, the profitability percentage is significantly low.
Figure 43. Chemical Assets and chemical assets as a percentage of total asset
Data source: Tullo (2013). Graph: Author
-2000
-1000
0
1000
2000
3000
4000
5000
6000
7000
BA
SF
She
ll
Lyo
nd
ellB
asel
l
Bay
er
Ineo
s G
rou
p
Akz
oN
ob
el
Air
Liq
uid
e
Tora
y In
du
stri
es
Evo
nik
Solv
ay
Lin
de
Yara
DSM
Lan
xess
Syn
gen
ta
Bo
real
is
Ark
em
a
Eni
Styr
olu
tio
n
Tota
l
UNIVERSITAT ROVIRA I VIRGILI EUROPEAN CHEMICAL INDUSTRY AND ITS INNOVATION POLICY WITH FOCUS ON LARGE CHEMICAL COMPANIES. Supriyo Das Dipòsit Legal: T 1295-2015
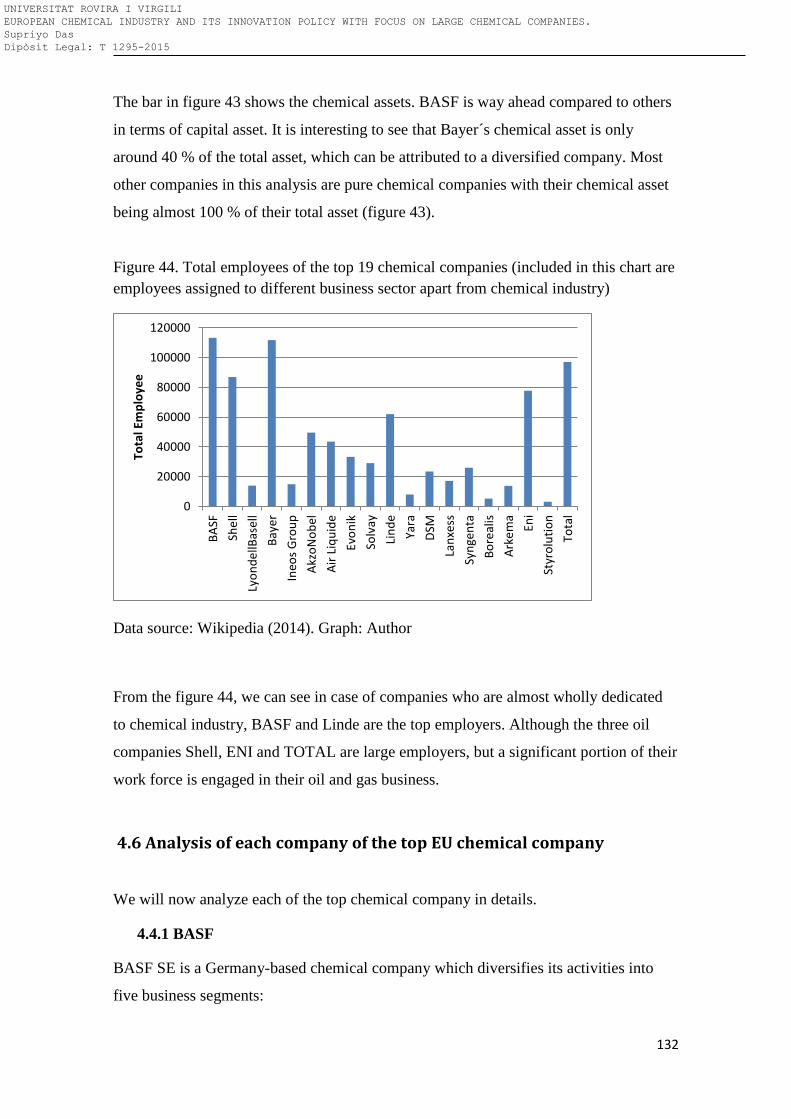
132
The bar in figure 43 shows the chemical assets. BASF is way ahead compared to others
in terms of capital asset. It is interesting to see that Bayer´s chemical asset is only
around 40 % of the total asset, which can be attributed to a diversified company. Most
other companies in this analysis are pure chemical companies with their chemical asset
being almost 100 % of their total asset (figure 43).
Figure 44. Total employees of the top 19 chemical companies (included in this chart are
employees assigned to different business sector apart from chemical industry)
Data source: Wikipedia (2014). Graph: Author
From the figure 44, we can see in case of companies who are almost wholly dedicated
to chemical industry, BASF and Linde are the top employers. Although the three oil
companies Shell, ENI and TOTAL are large employers, but a significant portion of their
work force is engaged in their oil and gas business.
4.6 Analysis of each company of the top EU chemical company
We will now analyze each of the top chemical company in details.
4.4.1 BASF
BASF SE is a Germany-based chemical company which diversifies its activities into
five business segments:
0
20000
40000
60000
80000
100000
120000
BA
SF
She
ll
Lyo
nd
ellB
asel
l
Bay
er
Ineo
s G
rou
p
Akz
oN
ob
el
Air
Liq
uid
e
Evo
nik
Solv
ay
Lin
de
Yara
DSM
Lan
xess
Syn
gen
ta
Bo
real
is
Ark
em
a
Eni
Styr
olu
tio
n
Tota
l
Tota
l Em
plo
yee
UNIVERSITAT ROVIRA I VIRGILI EUROPEAN CHEMICAL INDUSTRY AND ITS INNOVATION POLICY WITH FOCUS ON LARGE CHEMICAL COMPANIES. Supriyo Das Dipòsit Legal: T 1295-2015
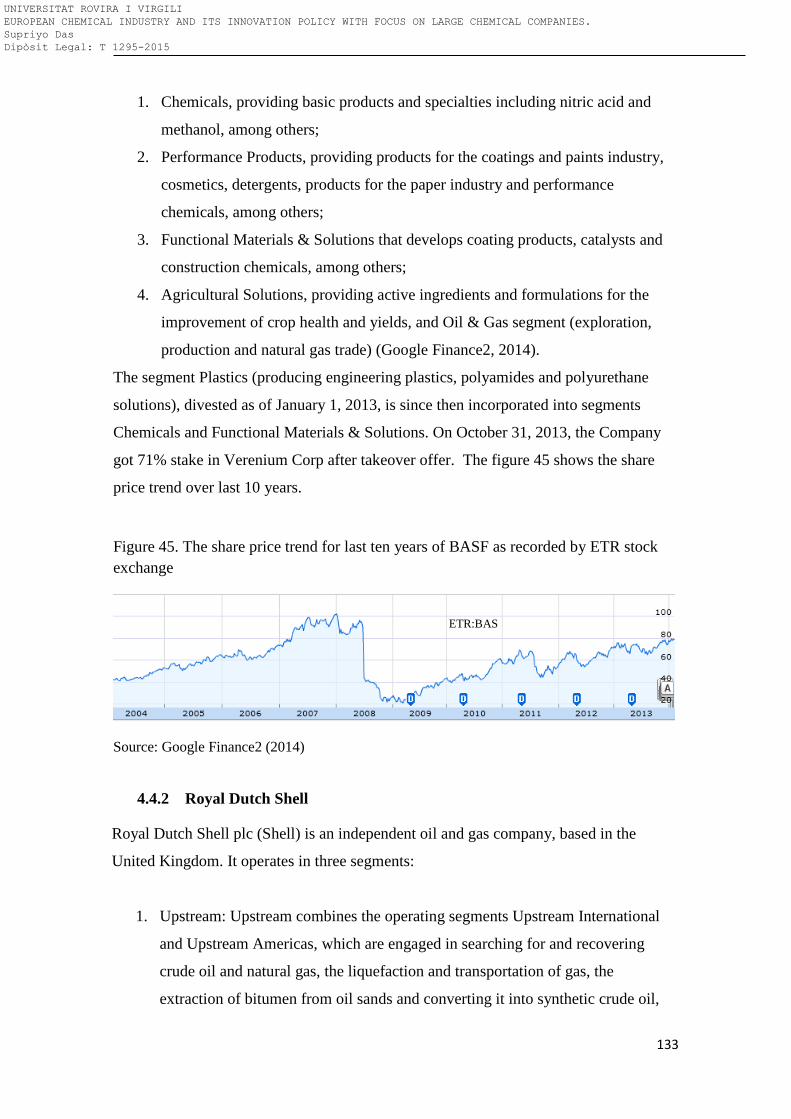
133
1. Chemicals, providing basic products and specialties including nitric acid and
methanol, among others;
2. Performance Products, providing products for the coatings and paints industry,
cosmetics, detergents, products for the paper industry and performance
chemicals, among others;
3. Functional Materials & Solutions that develops coating products, catalysts and
construction chemicals, among others;
4. Agricultural Solutions, providing active ingredients and formulations for the
improvement of crop health and yields, and Oil & Gas segment (exploration,
production and natural gas trade) (Google Finance2, 2014).
The segment Plastics (producing engineering plastics, polyamides and polyurethane
solutions), divested as of January 1, 2013, is since then incorporated into segments
Chemicals and Functional Materials & Solutions. On October 31, 2013, the Company
got 71% stake in Verenium Corp after takeover offer. The figure 45 shows the share
price trend over last 10 years.
Figure 45. The share price trend for last ten years of BASF as recorded by ETR stock
exchange
Source: Google Finance2 (2014)
4.4.2 Royal Dutch Shell
Royal Dutch Shell plc (Shell) is an independent oil and gas company, based in the
United Kingdom. It operates in three segments:
1. Upstream: Upstream combines the operating segments Upstream International
and Upstream Americas, which are engaged in searching for and recovering
crude oil and natural gas, the liquefaction and transportation of gas, the
extraction of bitumen from oil sands and converting it into synthetic crude oil,
ETR:BAS
UNIVERSITAT ROVIRA I VIRGILI EUROPEAN CHEMICAL INDUSTRY AND ITS INNOVATION POLICY WITH FOCUS ON LARGE CHEMICAL COMPANIES. Supriyo Das Dipòsit Legal: T 1295-2015
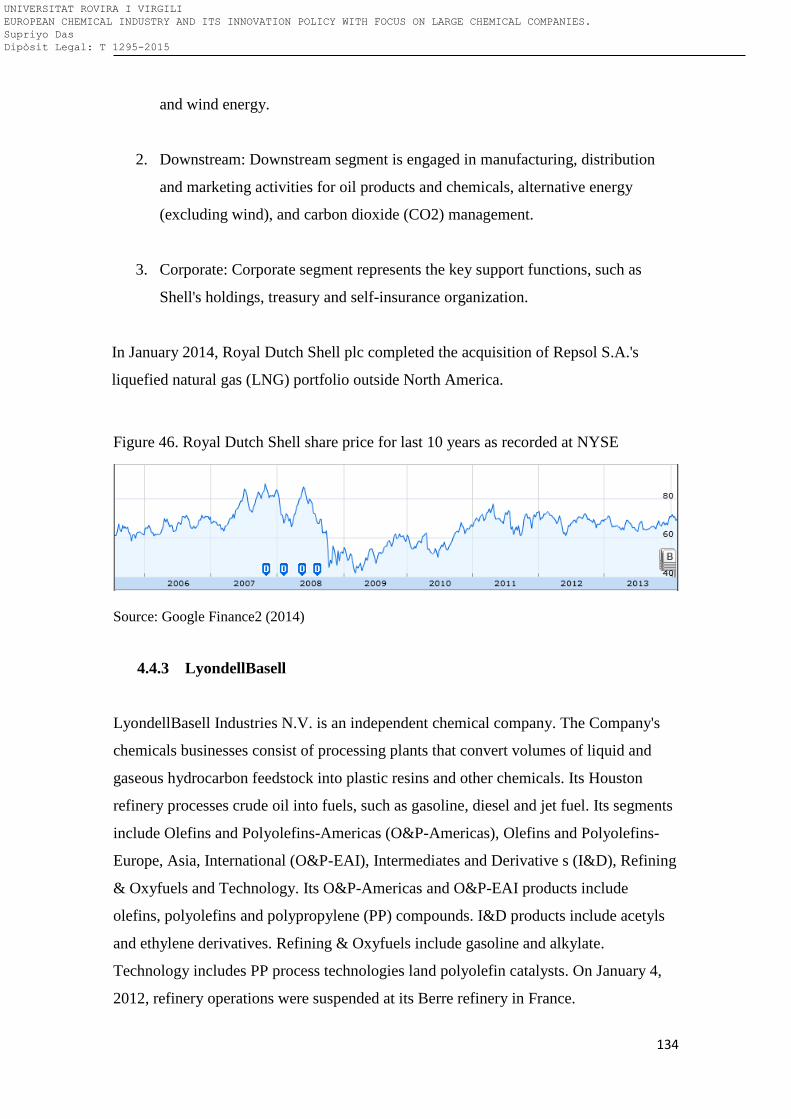
134
and wind energy.
2. Downstream: Downstream segment is engaged in manufacturing, distribution
and marketing activities for oil products and chemicals, alternative energy
(excluding wind), and carbon dioxide (CO2) management.
3. Corporate: Corporate segment represents the key support functions, such as
Shell's holdings, treasury and self-insurance organization.
In January 2014, Royal Dutch Shell plc completed the acquisition of Repsol S.A.'s
liquefied natural gas (LNG) portfolio outside North America.
Figure 46. Royal Dutch Shell share price for last 10 years as recorded at NYSE
Source: Google Finance2 (2014)
4.4.3 LyondellBasell
LyondellBasell Industries N.V. is an independent chemical company. The Company's
chemicals businesses consist of processing plants that convert volumes of liquid and
gaseous hydrocarbon feedstock into plastic resins and other chemicals. Its Houston
refinery processes crude oil into fuels, such as gasoline, diesel and jet fuel. Its segments
include Olefins and Polyolefins-Americas (O&P-Americas), Olefins and Polyolefins-
Europe, Asia, International (O&P-EAI), Intermediates and Derivative s (I&D), Refining
& Oxyfuels and Technology. Its O&P-Americas and O&P-EAI products include
olefins, polyolefins and polypropylene (PP) compounds. I&D products include acetyls
and ethylene derivatives. Refining & Oxyfuels include gasoline and alkylate.
Technology includes PP process technologies land polyolefin catalysts. On January 4,
2012, refinery operations were suspended at its Berre refinery in France.
UNIVERSITAT ROVIRA I VIRGILI EUROPEAN CHEMICAL INDUSTRY AND ITS INNOVATION POLICY WITH FOCUS ON LARGE CHEMICAL COMPANIES. Supriyo Das Dipòsit Legal: T 1295-2015
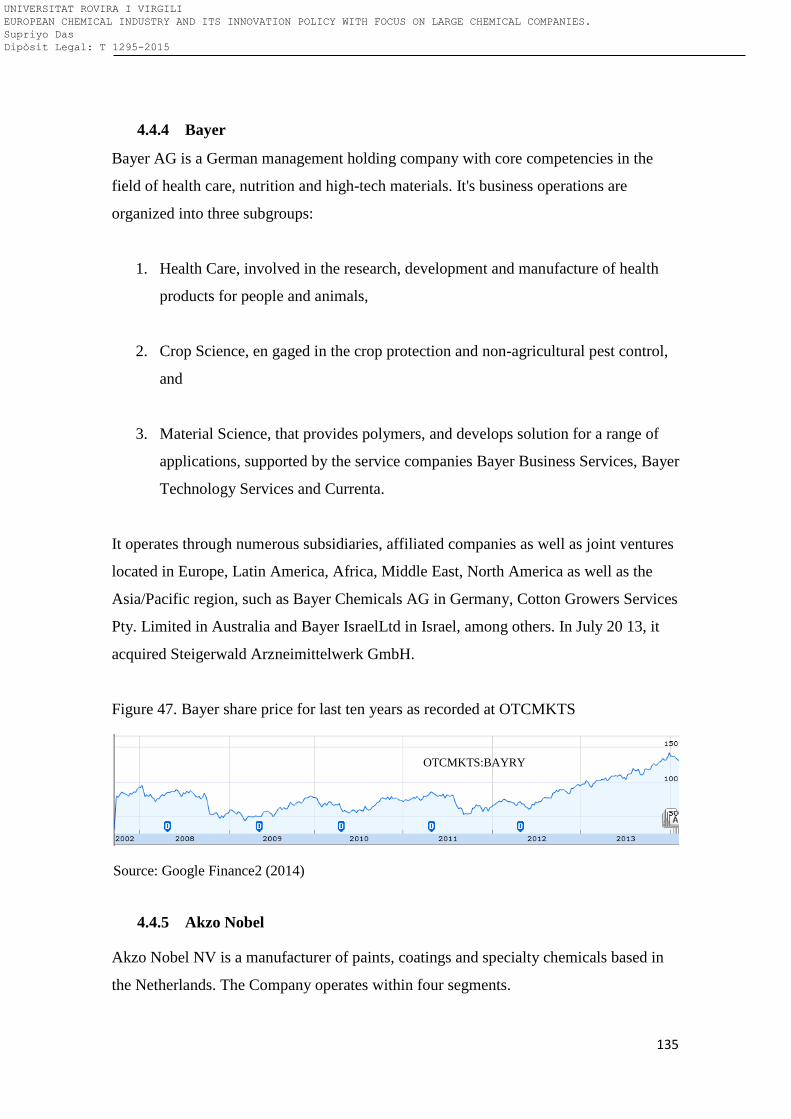
135
4.4.4 Bayer
Bayer AG is a German management holding company with core competencies in the
field of health care, nutrition and high-tech materials. It's business operations are
organized into three subgroups:
1. Health Care, involved in the research, development and manufacture of health
products for people and animals,
2. Crop Science, en gaged in the crop protection and non-agricultural pest control,
and
3. Material Science, that provides polymers, and develops solution for a range of
applications, supported by the service companies Bayer Business Services, Bayer
Technology Services and Currenta.
It operates through numerous subsidiaries, affiliated companies as well as joint ventures
located in Europe, Latin America, Africa, Middle East, North America as well as the
Asia/Pacific region, such as Bayer Chemicals AG in Germany, Cotton Growers Services
Pty. Limited in Australia and Bayer IsraelLtd in Israel, among others. In July 20 13, it
acquired Steigerwald Arzneimittelwerk GmbH.
Figure 47. Bayer share price for last ten years as recorded at OTCMKTS
Source: Google Finance2 (2014)
4.4.5 Akzo Nobel
Akzo Nobel NV is a manufacturer of paints, coatings and specialty chemicals based in
the Netherlands. The Company operates within four segments.
OTCMKTS:BAYRY
UNIVERSITAT ROVIRA I VIRGILI EUROPEAN CHEMICAL INDUSTRY AND ITS INNOVATION POLICY WITH FOCUS ON LARGE CHEMICAL COMPANIES. Supriyo Das Dipòsit Legal: T 1295-2015
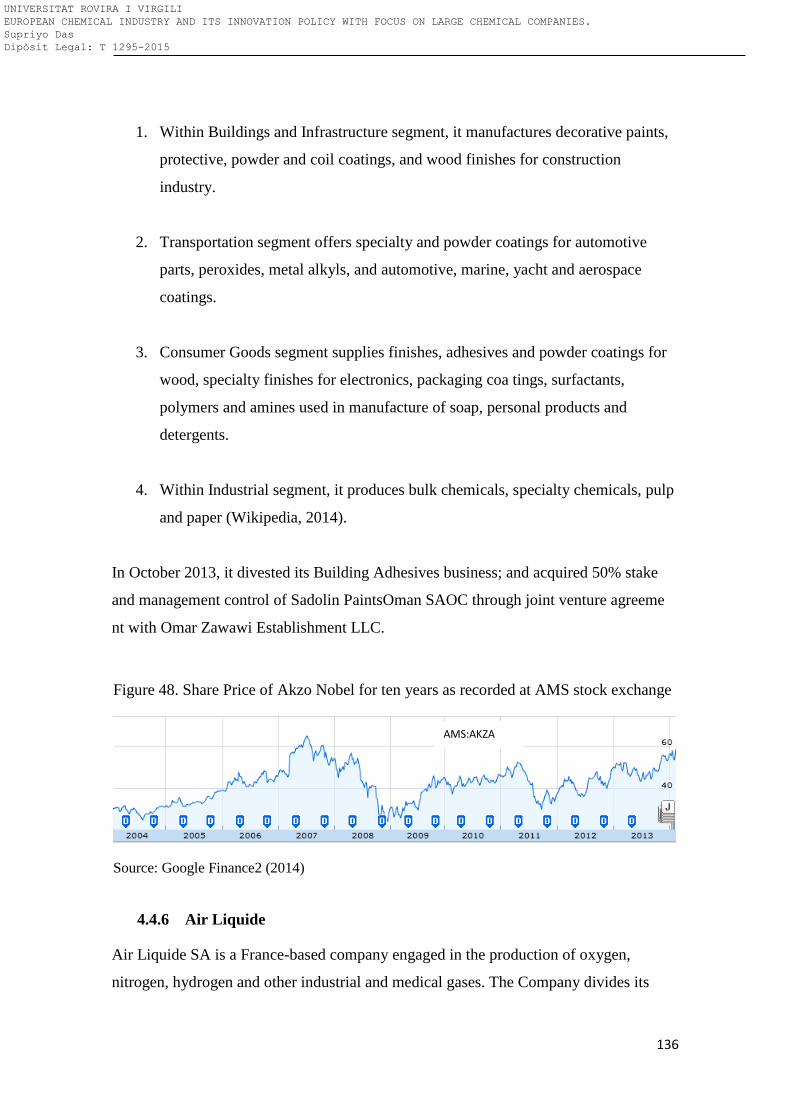
136
1. Within Buildings and Infrastructure segment, it manufactures decorative paints,
protective, powder and coil coatings, and wood finishes for construction
industry.
2. Transportation segment offers specialty and powder coatings for automotive
parts, peroxides, metal alkyls, and automotive, marine, yacht and aerospace
coatings.
3. Consumer Goods segment supplies finishes, adhesives and powder coatings for
wood, specialty finishes for electronics, packaging coa tings, surfactants,
polymers and amines used in manufacture of soap, personal products and
detergents.
4. Within Industrial segment, it produces bulk chemicals, specialty chemicals, pulp
and paper (Wikipedia, 2014).
In October 2013, it divested its Building Adhesives business; and acquired 50% stake
and management control of Sadolin PaintsOman SAOC through joint venture agreeme
nt with Omar Zawawi Establishment LLC.
Figure 48. Share Price of Akzo Nobel for ten years as recorded at AMS stock exchange
Source: Google Finance2 (2014)
4.4.6 Air Liquide
Air Liquide SA is a France-based company engaged in the production of oxygen,
nitrogen, hydrogen and other industrial and medical gases. The Company divides its
AMS:AKZA
UNIVERSITAT ROVIRA I VIRGILI EUROPEAN CHEMICAL INDUSTRY AND ITS INNOVATION POLICY WITH FOCUS ON LARGE CHEMICAL COMPANIES. Supriyo Das Dipòsit Legal: T 1295-2015
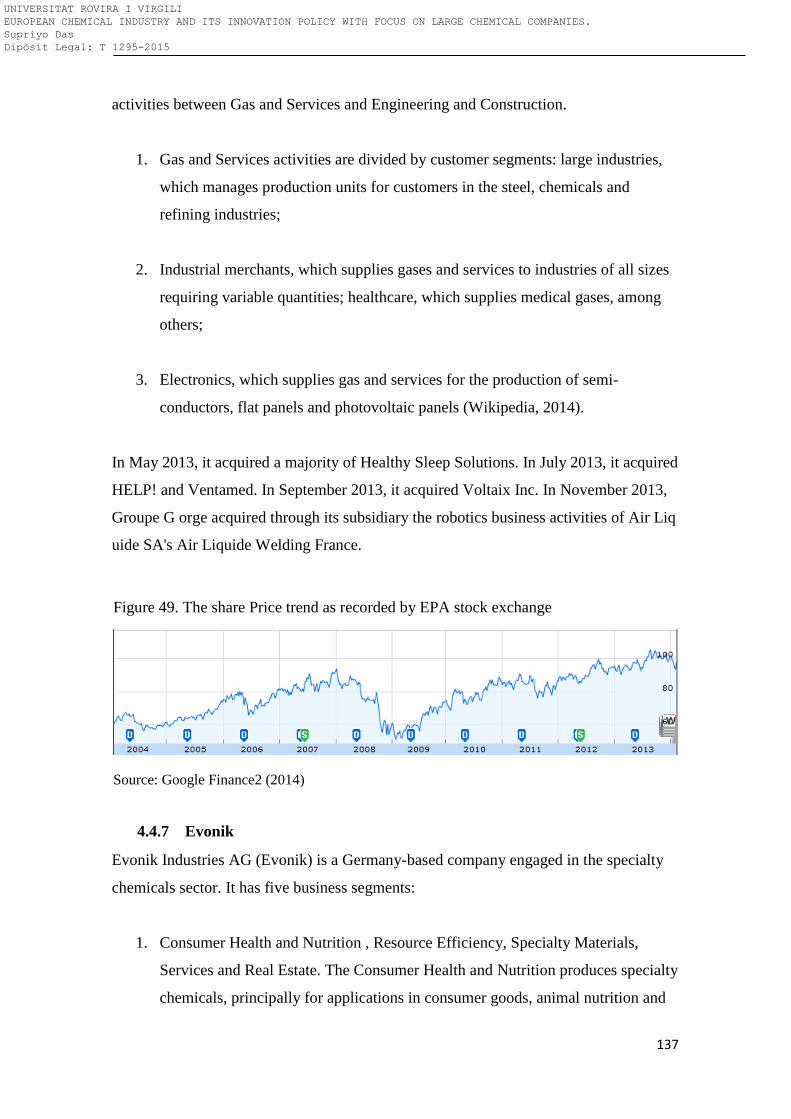
137
activities between Gas and Services and Engineering and Construction.
1. Gas and Services activities are divided by customer segments: large industries,
which manages production units for customers in the steel, chemicals and
refining industries;
2. Industrial merchants, which supplies gases and services to industries of all sizes
requiring variable quantities; healthcare, which supplies medical gases, among
others;
3. Electronics, which supplies gas and services for the production of semi-
conductors, flat panels and photovoltaic panels (Wikipedia, 2014).
In May 2013, it acquired a majority of Healthy Sleep Solutions. In July 2013, it acquired
HELP! and Ventamed. In September 2013, it acquired Voltaix Inc. In November 2013,
Groupe G orge acquired through its subsidiary the robotics business activities of Air Liq
uide SA's Air Liquide Welding France.
Figure 49. The share Price trend as recorded by EPA stock exchange
Source: Google Finance2 (2014)
4.4.7 Evonik
Evonik Industries AG (Evonik) is a Germany-based company engaged in the specialty
chemicals sector. It has five business segments:
1. Consumer Health and Nutrition , Resource Efficiency, Specialty Materials,
Services and Real Estate. The Consumer Health and Nutrition produces specialty
chemicals, principally for applications in consumer goods, animal nutrition and
UNIVERSITAT ROVIRA I VIRGILI EUROPEAN CHEMICAL INDUSTRY AND ITS INNOVATION POLICY WITH FOCUS ON LARGE CHEMICAL COMPANIES. Supriyo Das Dipòsit Legal: T 1295-2015
138
pharmaceutical sectors.
2. The Resource Efficiency segment provides solutions for environment-friendly
and energy-efficient products.
3. The Specialty Materials produces polymer materials and their preproducts, and
additives.
4. The Services segment mainly provides services for Evonik's chemicals segments
and Corporate Center, but also serves third parties.
5. The Real Estate segment comprises Evonik's portfolio of residential real estate
and a 50% stake in THS (Wikipedia, 2014).
4.4.8 Solvay
Solvay SA, (Solvay), is a Belgium-based, internationally operating chemical industrial
group.
1. Solvay's Chemicals division produces materials for high tech applications such
as electronics, barium and strontium compounds, calcium chloride, caustic soda,
chlorinated products, magnesium products, peroxygen products, polyglycerols,
precipitated calcium carbonate, soda ash and sodium bicarbonate.
2. The Plastics division produces specialty polymers for the aerospace, energy,
automotive and healthcare industries, among others. The Plastics division further
includes vinyls for building & construction, consumer goods, healthcare and wire
& cable, and plastic pipes and fittings (Pipelife).
3. The Rhodia division focuses on fostering strategic technologies through research
and development, partnering with other companies, supporting start-ups a nd
investments in venture capital funds (Solvay, 2014).
UNIVERSITAT ROVIRA I VIRGILI EUROPEAN CHEMICAL INDUSTRY AND ITS INNOVATION POLICY WITH FOCUS ON LARGE CHEMICAL COMPANIES. Supriyo Das Dipòsit Legal: T 1295-2015
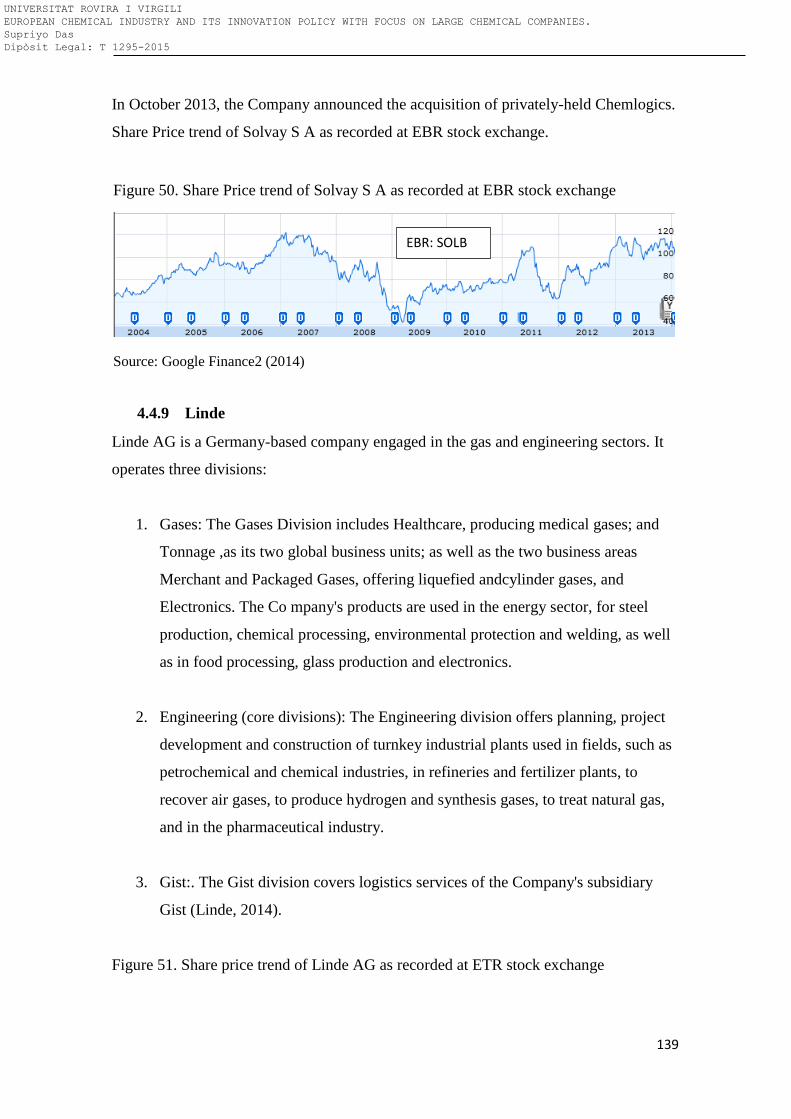
139
In October 2013, the Company announced the acquisition of privately-held Chemlogics.
Share Price trend of Solvay S A as recorded at EBR stock exchange.
Figure 50. Share Price trend of Solvay S A as recorded at EBR stock exchange
Source: Google Finance2 (2014)
4.4.9 Linde
Linde AG is a Germany-based company engaged in the gas and engineering sectors. It
operates three divisions:
1. Gases: The Gases Division includes Healthcare, producing medical gases; and
Tonnage ,as its two global business units; as well as the two business areas
Merchant and Packaged Gases, offering liquefied andcylinder gases, and
Electronics. The Co mpany's products are used in the energy sector, for steel
production, chemical processing, environmental protection and welding, as well
as in food processing, glass production and electronics.
2. Engineering (core divisions): The Engineering division offers planning, project
development and construction of turnkey industrial plants used in fields, such as
petrochemical and chemical industries, in refineries and fertilizer plants, to
recover air gases, to produce hydrogen and synthesis gases, to treat natural gas,
and in the pharmaceutical industry.
3. Gist:. The Gist division covers logistics services of the Company's subsidiary
Gist (Linde, 2014).
Figure 51. Share price trend of Linde AG as recorded at ETR stock exchange
EBR: SOLB
UNIVERSITAT ROVIRA I VIRGILI EUROPEAN CHEMICAL INDUSTRY AND ITS INNOVATION POLICY WITH FOCUS ON LARGE CHEMICAL COMPANIES. Supriyo Das Dipòsit Legal: T 1295-2015
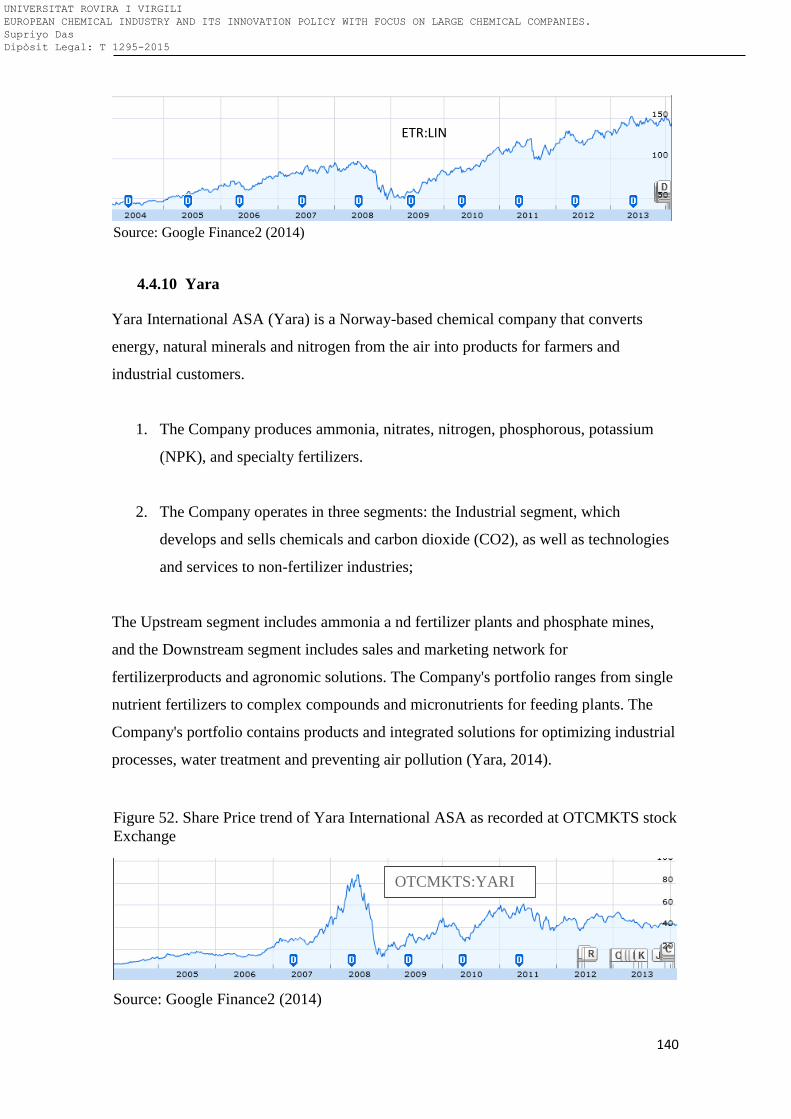
140
Source: Google Finance2 (2014)
4.4.10 Yara
Yara International ASA (Yara) is a Norway-based chemical company that converts
energy, natural minerals and nitrogen from the air into products for farmers and
industrial customers.
1. The Company produces ammonia, nitrates, nitrogen, phosphorous, potassium
(NPK), and specialty fertilizers.
2. The Company operates in three segments: the Industrial segment, which
develops and sells chemicals and carbon dioxide (CO2), as well as technologies
and services to non-fertilizer industries;
The Upstream segment includes ammonia a nd fertilizer plants and phosphate mines,
and the Downstream segment includes sales and marketing network for
fertilizerproducts and agronomic solutions. The Company's portfolio ranges from single
nutrient fertilizers to complex compounds and micronutrients for feeding plants. The
Company's portfolio contains products and integrated solutions for optimizing industrial
processes, water treatment and preventing air pollution (Yara, 2014).
Figure 52. Share Price trend of Yara International ASA as recorded at OTCMKTS stock
Exchange
Source: Google Finance2 (2014)
ETR:LIN
OTCMKTS:YARI
Y
UNIVERSITAT ROVIRA I VIRGILI EUROPEAN CHEMICAL INDUSTRY AND ITS INNOVATION POLICY WITH FOCUS ON LARGE CHEMICAL COMPANIES. Supriyo Das Dipòsit Legal: T 1295-2015
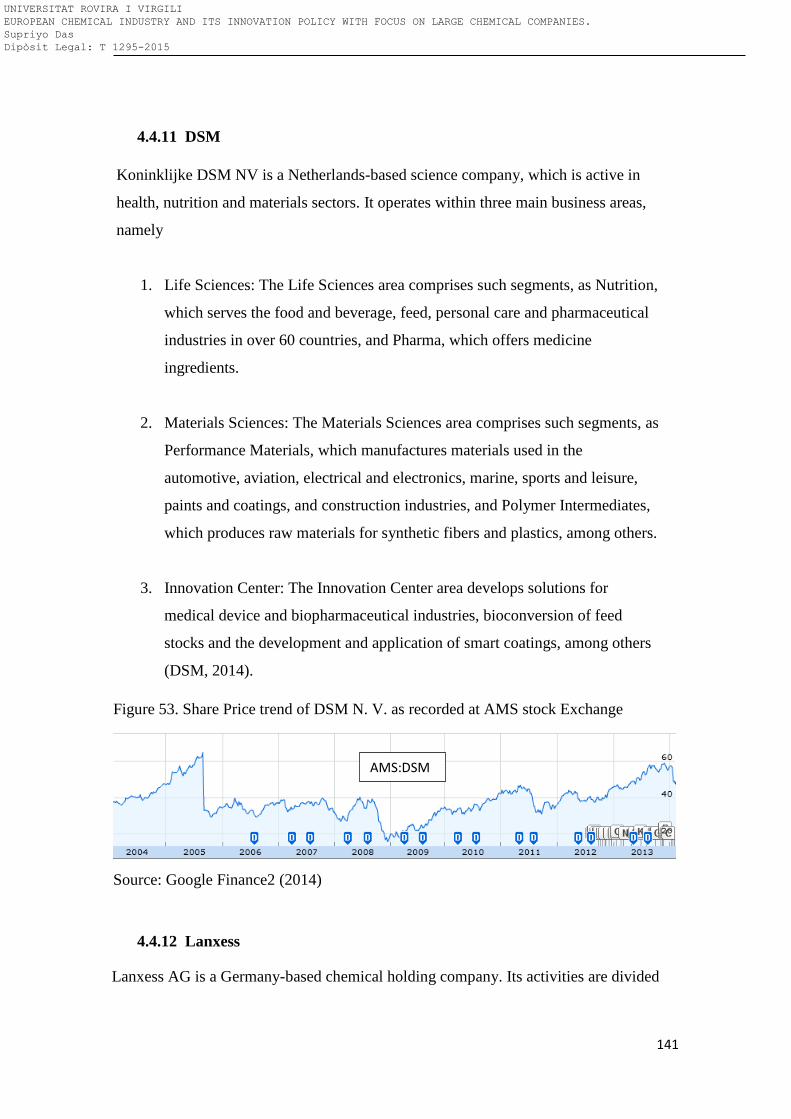
141
4.4.11 DSM
Koninklijke DSM NV is a Netherlands-based science company, which is active in
health, nutrition and materials sectors. It operates within three main business areas,
namely
1. Life Sciences: The Life Sciences area comprises such segments, as Nutrition,
which serves the food and beverage, feed, personal care and pharmaceutical
industries in over 60 countries, and Pharma, which offers medicine
ingredients.
2. Materials Sciences: The Materials Sciences area comprises such segments, as
Performance Materials, which manufactures materials used in the
automotive, aviation, electrical and electronics, marine, sports and leisure,
paints and coatings, and construction industries, and Polymer Intermediates,
which produces raw materials for synthetic fibers and plastics, among others.
3. Innovation Center: The Innovation Center area develops solutions for
medical device and biopharmaceutical industries, bioconversion of feed
stocks and the development and application of smart coatings, among others
(DSM, 2014).
Figure 53. Share Price trend of DSM N. V. as recorded at AMS stock Exchange
Source: Google Finance2 (2014)
4.4.12 Lanxess
Lanxess AG is a Germany-based chemical holding company. Its activities are divided
AMS:DSM
UNIVERSITAT ROVIRA I VIRGILI EUROPEAN CHEMICAL INDUSTRY AND ITS INNOVATION POLICY WITH FOCUS ON LARGE CHEMICAL COMPANIES. Supriyo Das Dipòsit Legal: T 1295-2015
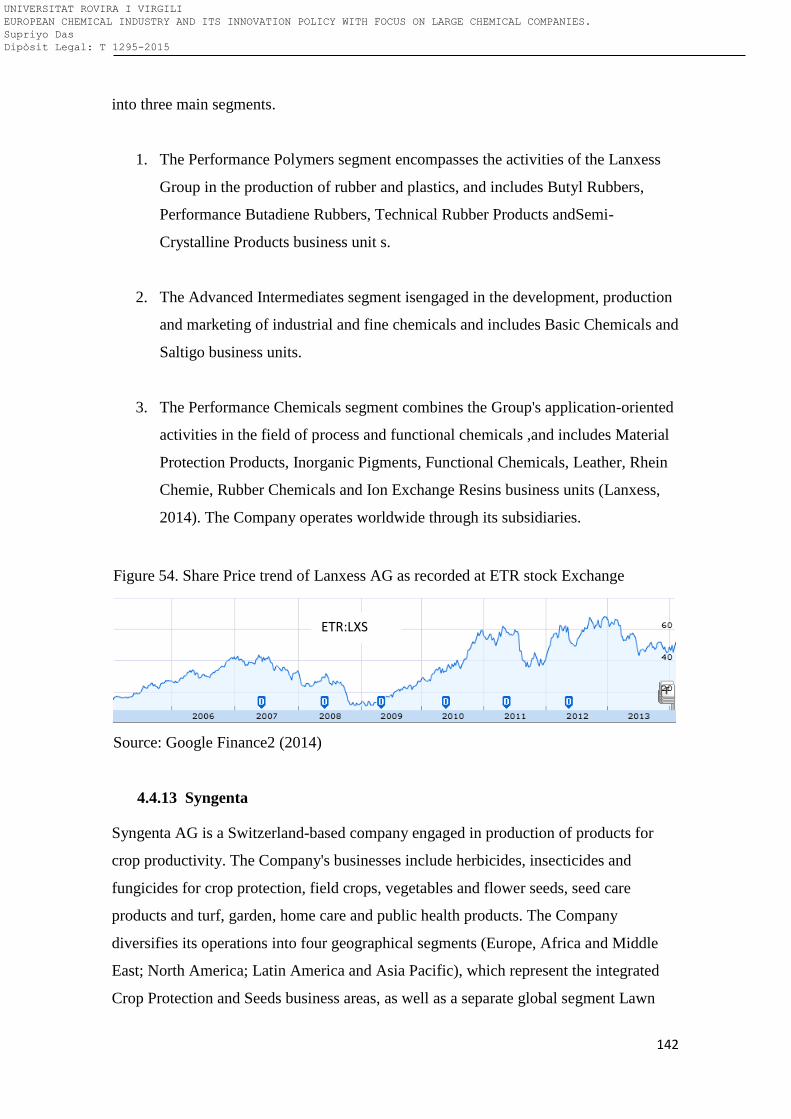
142
into three main segments.
1. The Performance Polymers segment encompasses the activities of the Lanxess
Group in the production of rubber and plastics, and includes Butyl Rubbers,
Performance Butadiene Rubbers, Technical Rubber Products andSemi-
Crystalline Products business unit s.
2. The Advanced Intermediates segment isengaged in the development, production
and marketing of industrial and fine chemicals and includes Basic Chemicals and
Saltigo business units.
3. The Performance Chemicals segment combines the Group's application-oriented
activities in the field of process and functional chemicals ,and includes Material
Protection Products, Inorganic Pigments, Functional Chemicals, Leather, Rhein
Chemie, Rubber Chemicals and Ion Exchange Resins business units (Lanxess,
2014). The Company operates worldwide through its subsidiaries.
Figure 54. Share Price trend of Lanxess AG as recorded at ETR stock Exchange
Source: Google Finance2 (2014)
4.4.13 Syngenta
Syngenta AG is a Switzerland-based company engaged in production of products for
crop productivity. The Company's businesses include herbicides, insecticides and
fungicides for crop protection, field crops, vegetables and flower seeds, seed care
products and turf, garden, home care and public health products. The Company
diversifies its operations into four geographical segments (Europe, Africa and Middle
East; North America; Latin America and Asia Pacific), which represent the integrated
Crop Protection and Seeds business areas, as well as a separate global segment Lawn
ETR:LXS
UNIVERSITAT ROVIRA I VIRGILI EUROPEAN CHEMICAL INDUSTRY AND ITS INNOVATION POLICY WITH FOCUS ON LARGE CHEMICAL COMPANIES. Supriyo Das Dipòsit Legal: T 1295-2015
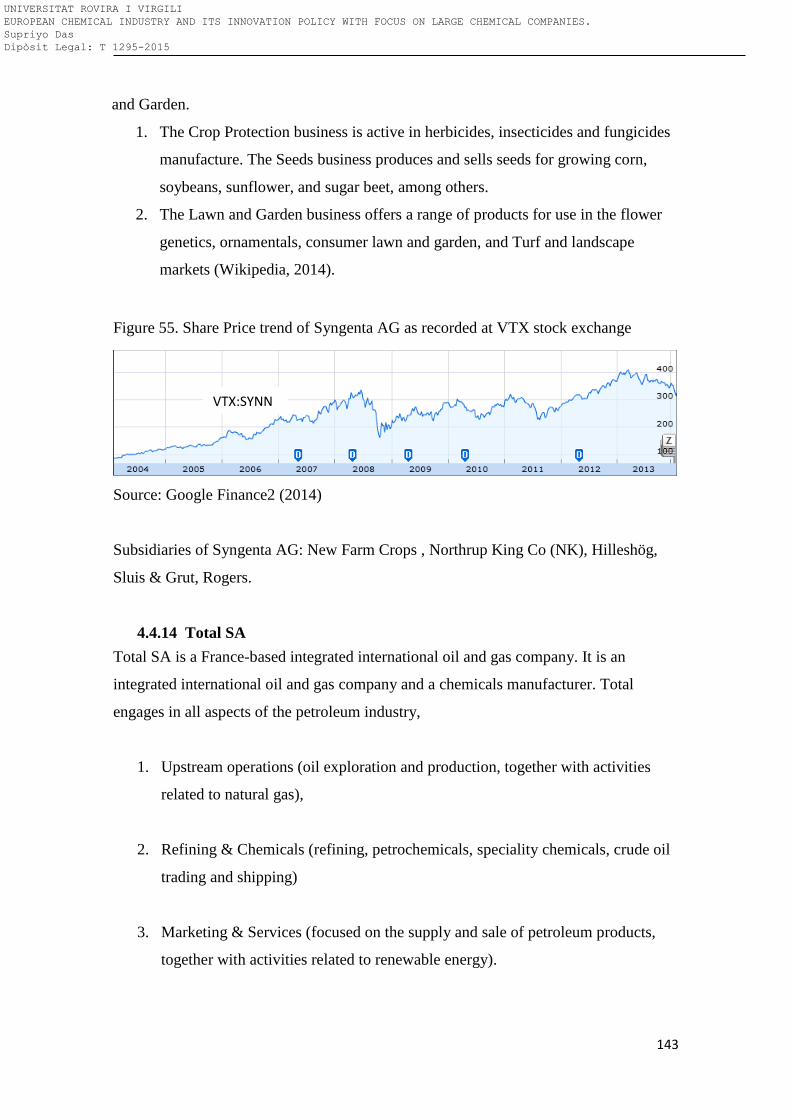
143
and Garden.
1. The Crop Protection business is active in herbicides, insecticides and fungicides
manufacture. The Seeds business produces and sells seeds for growing corn,
soybeans, sunflower, and sugar beet, among others.
2. The Lawn and Garden business offers a range of products for use in the flower
genetics, ornamentals, consumer lawn and garden, and Turf and landscape
markets (Wikipedia, 2014).
Figure 55. Share Price trend of Syngenta AG as recorded at VTX stock exchange
Source: Google Finance2 (2014)
Subsidiaries of Syngenta AG: New Farm Crops , Northrup King Co (NK), Hilleshög,
Sluis & Grut, Rogers.
4.4.14 Total SA
Total SA is a France-based integrated international oil and gas company. It is an
integrated international oil and gas company and a chemicals manufacturer. Total
engages in all aspects of the petroleum industry,
1. Upstream operations (oil exploration and production, together with activities
related to natural gas),
2. Refining & Chemicals (refining, petrochemicals, speciality chemicals, crude oil
trading and shipping)
3. Marketing & Services (focused on the supply and sale of petroleum products,
together with activities related to renewable energy).
VTX:SYNN
UNIVERSITAT ROVIRA I VIRGILI EUROPEAN CHEMICAL INDUSTRY AND ITS INNOVATION POLICY WITH FOCUS ON LARGE CHEMICAL COMPANIES. Supriyo Das Dipòsit Legal: T 1295-2015
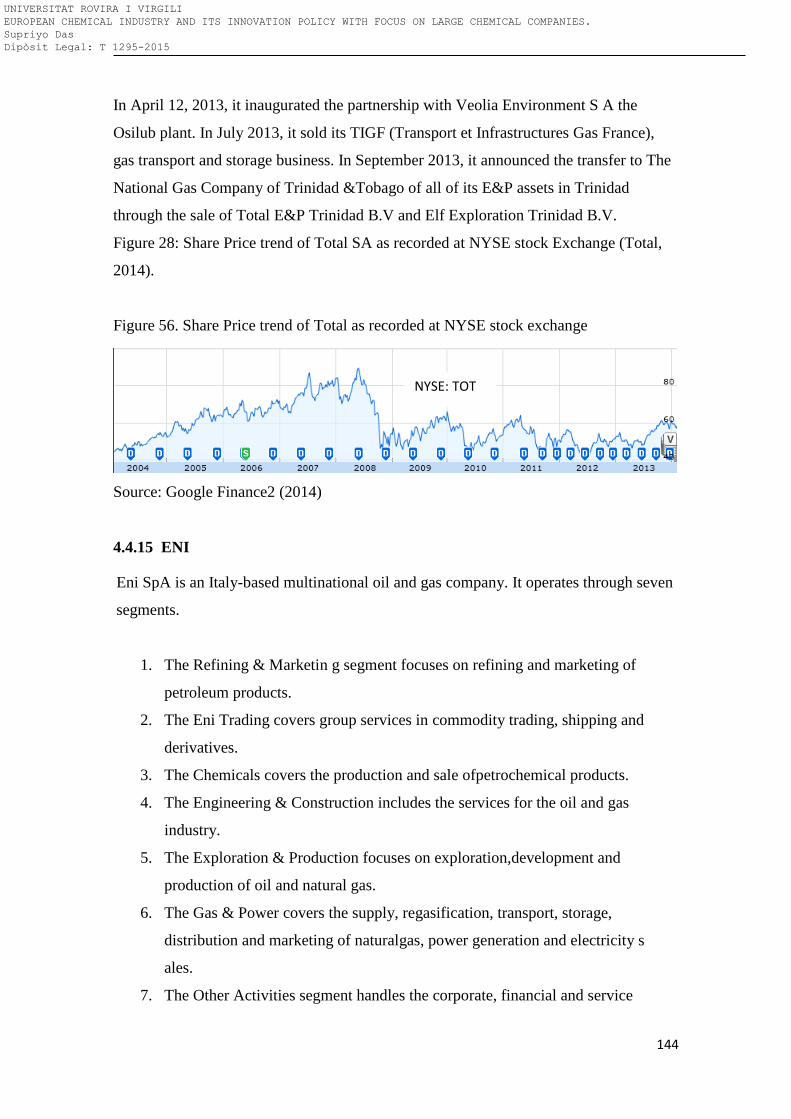
144
In April 12, 2013, it inaugurated the partnership with Veolia Environment S A the
Osilub plant. In July 2013, it sold its TIGF (Transport et Infrastructures Gas France),
gas transport and storage business. In September 2013, it announced the transfer to The
National Gas Company of Trinidad &Tobago of all of its E&P assets in Trinidad
through the sale of Total E&P Trinidad B.V and Elf Exploration Trinidad B.V.
Figure 28: Share Price trend of Total SA as recorded at NYSE stock Exchange (Total,
2014).
Figure 56. Share Price trend of Total as recorded at NYSE stock exchange
Source: Google Finance2 (2014)
4.4.15 ENI
Eni SpA is an Italy-based multinational oil and gas company. It operates through seven
segments.
1. The Refining & Marketin g segment focuses on refining and marketing of
petroleum products.
2. The Eni Trading covers group services in commodity trading, shipping and
derivatives.
3. The Chemicals covers the production and sale ofpetrochemical products.
4. The Engineering & Construction includes the services for the oil and gas
industry.
5. The Exploration & Production focuses on exploration,development and
production of oil and natural gas.
6. The Gas & Power covers the supply, regasification, transport, storage,
distribution and marketing of naturalgas, power generation and electricity s
ales.
7. The Other Activities segment handles the corporate, financial and service
NYSE: TOT
UNIVERSITAT ROVIRA I VIRGILI EUROPEAN CHEMICAL INDUSTRY AND ITS INNOVATION POLICY WITH FOCUS ON LARGE CHEMICAL COMPANIES. Supriyo Das Dipòsit Legal: T 1295-2015
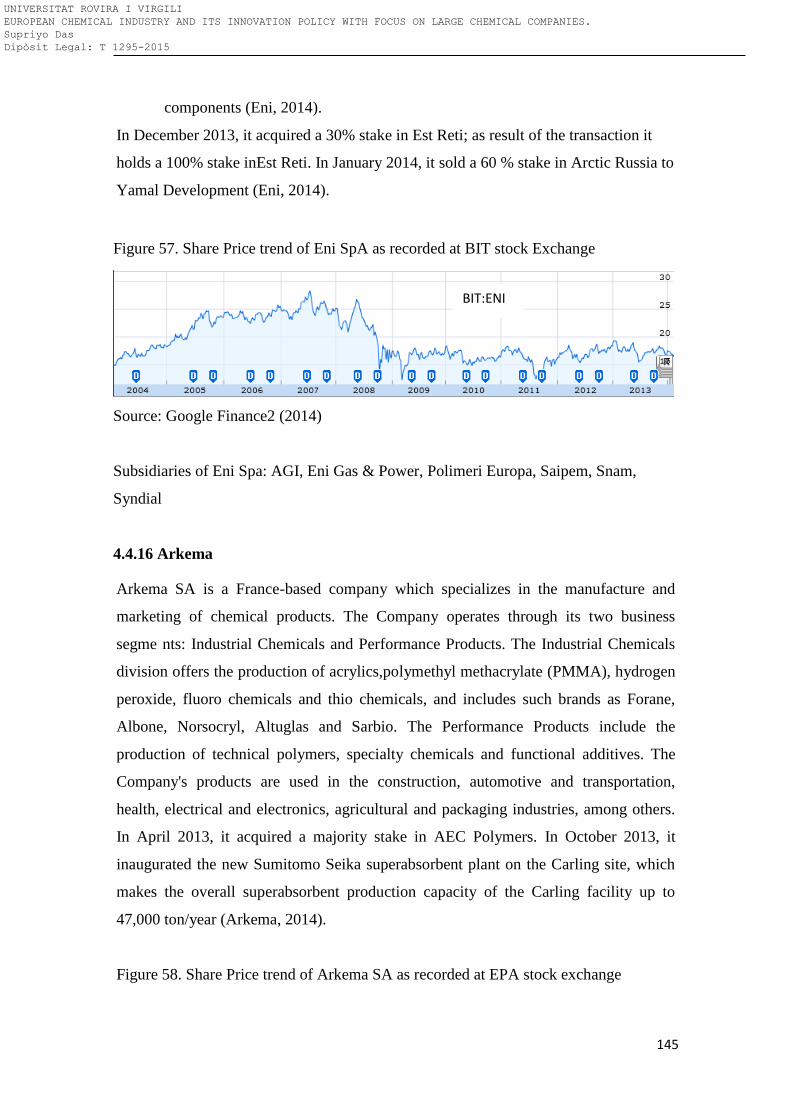
145
components (Eni, 2014).
In December 2013, it acquired a 30% stake in Est Reti; as result of the transaction it
holds a 100% stake inEst Reti. In January 2014, it sold a 60 % stake in Arctic Russia to
Yamal Development (Eni, 2014).
Figure 57. Share Price trend of Eni SpA as recorded at BIT stock Exchange
Source: Google Finance2 (2014)
Subsidiaries of Eni Spa: AGI, Eni Gas & Power, Polimeri Europa, Saipem, Snam,
Syndial
4.4.16 Arkema
Arkema SA is a France-based company which specializes in the manufacture and
marketing of chemical products. The Company operates through its two business
segme nts: Industrial Chemicals and Performance Products. The Industrial Chemicals
division offers the production of acrylics,polymethyl methacrylate (PMMA), hydrogen
peroxide, fluoro chemicals and thio chemicals, and includes such brands as Forane,
Albone, Norsocryl, Altuglas and Sarbio. The Performance Products include the
production of technical polymers, specialty chemicals and functional additives. The
Company's products are used in the construction, automotive and transportation,
health, electrical and electronics, agricultural and packaging industries, among others.
In April 2013, it acquired a majority stake in AEC Polymers. In October 2013, it
inaugurated the new Sumitomo Seika superabsorbent plant on the Carling site, which
makes the overall superabsorbent production capacity of the Carling facility up to
47,000 ton/year (Arkema, 2014).
Figure 58. Share Price trend of Arkema SA as recorded at EPA stock exchange
BIT:ENI
UNIVERSITAT ROVIRA I VIRGILI EUROPEAN CHEMICAL INDUSTRY AND ITS INNOVATION POLICY WITH FOCUS ON LARGE CHEMICAL COMPANIES. Supriyo Das Dipòsit Legal: T 1295-2015
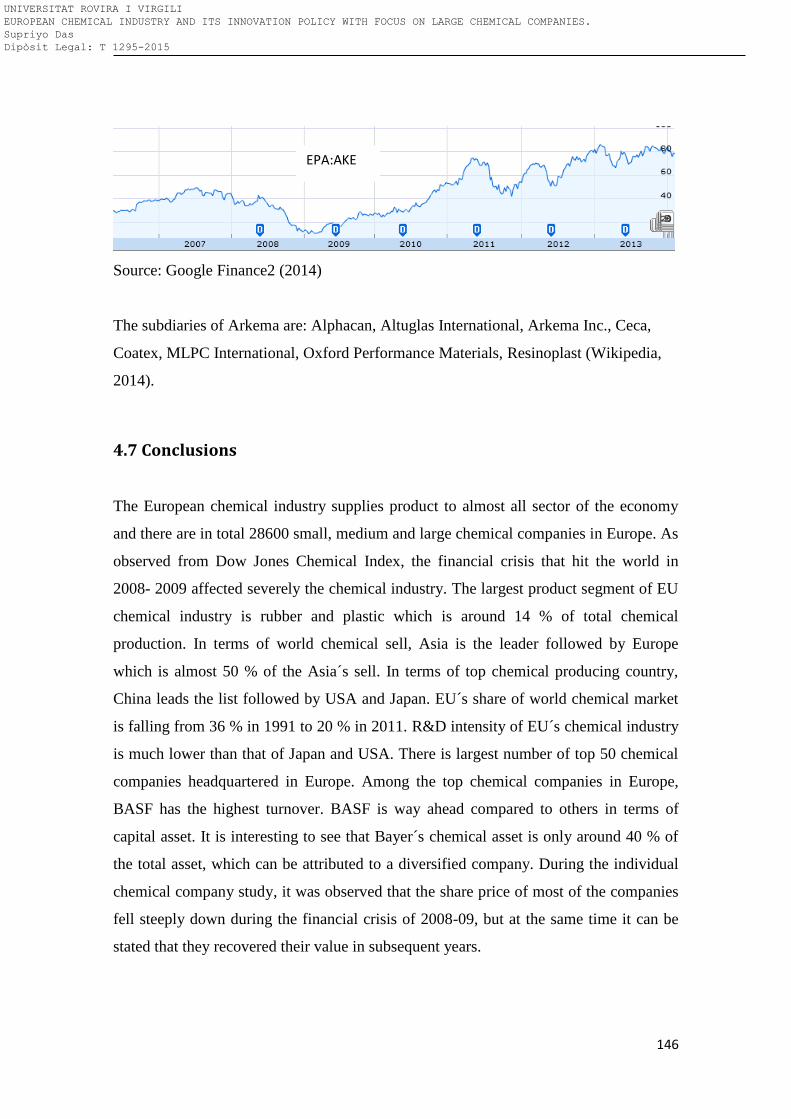
146
Source: Google Finance2 (2014)
The subdiaries of Arkema are: Alphacan, Altuglas International, Arkema Inc., Ceca,
Coatex, MLPC International, Oxford Performance Materials, Resinoplast (Wikipedia,
2014).
4.7 Conclusions
The European chemical industry supplies product to almost all sector of the economy
and there are in total 28600 small, medium and large chemical companies in Europe. As
observed from Dow Jones Chemical Index, the financial crisis that hit the world in
2008- 2009 affected severely the chemical industry. The largest product segment of EU
chemical industry is rubber and plastic which is around 14 % of total chemical
production. In terms of world chemical sell, Asia is the leader followed by Europe
which is almost 50 % of the Asia´s sell. In terms of top chemical producing country,
China leads the list followed by USA and Japan. EU´s share of world chemical market
is falling from 36 % in 1991 to 20 % in 2011. R&D intensity of EU´s chemical industry
is much lower than that of Japan and USA. There is largest number of top 50 chemical
companies headquartered in Europe. Among the top chemical companies in Europe,
BASF has the highest turnover. BASF is way ahead compared to others in terms of
capital asset. It is interesting to see that Bayer´s chemical asset is only around 40 % of
the total asset, which can be attributed to a diversified company. During the individual
chemical company study, it was observed that the share price of most of the companies
fell steeply down during the financial crisis of 2008-09, but at the same time it can be
stated that they recovered their value in subsequent years.
EPA:AKE
UNIVERSITAT ROVIRA I VIRGILI EUROPEAN CHEMICAL INDUSTRY AND ITS INNOVATION POLICY WITH FOCUS ON LARGE CHEMICAL COMPANIES. Supriyo Das Dipòsit Legal: T 1295-2015
147
4.8 Bibliography
Americanchemistry. (2013). Economics and Statistics. Retrieved from
http://www.americanchemistry.com/Jobs/EconomicStatistics
American Chemistry Council (2011). 2011 Guide to the Business of Chemistry, Table
4.1, 44.
Arkema. (2014). Products. Retrieved from
http://www.arkema.com/en/products/index.html
Cefic. (2013). Facts and Figures 2012. Retrieved from http://www.cefic.org/Facts-and-
Figures/
Deloitte. (2010). The chemical multiverse: Preparing for quantum changes in the global
chemical industry. Retreived from https://www.deloitte.com/assets/Dcom-
Italy/Local%20Assets/Documents/Pubblicazioni/The%20chemical%20multiverse%20re
port_FINAL_v2.pdf
DSM. (2014). Product. Retreived from http://www.dsm.com/corporate/markets-
products/products-markets.html
Eni. (2014). Products. Retreived from https://www.eni.com/en_IT/products-
services/products.shtml?home_2010_it_tab=navigation_menu
EUROSTAT. (2013). Manufacture of chemicals and chemical products statistics -
NACE Rev. 2. Retreived from
http://epp.eurostat.ec.europa.eu/statistics_explained/index.php/Manufacture_of_chemic
als_and_chemical_products_statistics_-_NACE_Rev._2
Google Finance 1. (2014). Dow Jones U.S. Chemicals Index: INDEXDJX:DJUSCH.
Retreived from
https://www.google.com/finance?q=Dow+jones+chemical+index&ei=TW8AU5j0KqW
PwAOdxgE
UNIVERSITAT ROVIRA I VIRGILI EUROPEAN CHEMICAL INDUSTRY AND ITS INNOVATION POLICY WITH FOCUS ON LARGE CHEMICAL COMPANIES. Supriyo Das Dipòsit Legal: T 1295-2015
148
Google Finance2. (2014). Company: Summary. Retreived from
https://www.google.com/finance?q=ETR%3ABAS&sq=basf&sp=1&ei=VYsAU5jID6
WPwAOdxgE
KPMG International. (2009). The Future of the European Chemical Industry. Retreived
from
http://www.kpmg.com/BE/en/IssuesAndInsights/ArticlesPublications/Documents/2010
01%20EuroChem_Europe_Final.pdf
Lanxess. (2014). Products & Solutions. Retreived from
http://lanxess.com/en/corporate/products-solutions/products-solutions/
Linde. (2014). Welcome to Linde Worldwide. Available from: http://www.linde-
worldwide.com/en/index.html
Solvay. (2014). Market. Retreived from http://www.solvay.com/en/markets-and-
products/index.html
Total. (2014). Integrated, Interrelated Expertise in Energy and Production Processes.
Retreived from http://total.com/en/energies-expertise
Tullo, A. (2013). Global Top 50 C&EN’s 2013 survey shows leading chemical firms
are pausing after a period of growth. C&EN Chemical Engineering News, 91 (30), 13-
16.
Wikipedia. (2014). Chemical industry. Retreived from
https://en.wikipedia.org/wiki/Chemical_companies
OECD. (2001). OECD Environmental Outlook for the Chemicals Industry. Retreived
from Organisation for Economic Development website
http://www.oecd.org/env/chemicalsafetyandbiosafety/2375538.pdf.
UNIVERSITAT ROVIRA I VIRGILI EUROPEAN CHEMICAL INDUSTRY AND ITS INNOVATION POLICY WITH FOCUS ON LARGE CHEMICAL COMPANIES. Supriyo Das Dipòsit Legal: T 1295-2015
149
5. Methodologies to perform this research
Contents
5.1 Introduction ........................................................................................................... 150
5.2 Data Collection ....................................................................................................... 151
5.2.1 Patent ..................................................................................................................................... 151
5.2.2 Research and Development Spending .................................................................................... 152
5.2.3 Business Deals: Merger and Acquisition ................................................................................. 153
5.2.4 Collaboration with other companies & universities for research ................ 155
5.2.5 Impact of chemical Regulation on Innovation of EU chemical Companies ............................ 157
5.2.6 Cluster ..................................................................................................................................... 160
5.2.7 Digital Innovation and digital marketing innovation in EU large chemical companies........... 162
5.3 Data analysis .......................................................................................................... 163
5.4 Summary ............................................................................................................... 164
5.5 Bibliography ........................................................................................................... 166
UNIVERSITAT ROVIRA I VIRGILI EUROPEAN CHEMICAL INDUSTRY AND ITS INNOVATION POLICY WITH FOCUS ON LARGE CHEMICAL COMPANIES. Supriyo Das Dipòsit Legal: T 1295-2015
150
5.1 Introduction
It is vital to pick right methodologies for a particular research. The research will dictate
the kind of research methodology to use to underpin the work and methods to use in
order to collect data. The current research will consist of three broad steps: Main data
collection, Accessory data collection, Data analysis. Each of the broad steps can consist
of several activities. The first step, which is the main data collection, consists of
collecting the historical data of patent and other financial data from the existing
literature, databases and documents. The second step, which consists of accessory data
collection, is to collect data from already concluded interviews with various government
agencies and chemical companies regarding innovation and its trend. The third step or
data analysis step, consists of statistical analysis of the available data to draw
conclusions. This section explains how this data will be collected and how it will be
analyzed.
UNIVERSITAT ROVIRA I VIRGILI EUROPEAN CHEMICAL INDUSTRY AND ITS INNOVATION POLICY WITH FOCUS ON LARGE CHEMICAL COMPANIES. Supriyo Das Dipòsit Legal: T 1295-2015
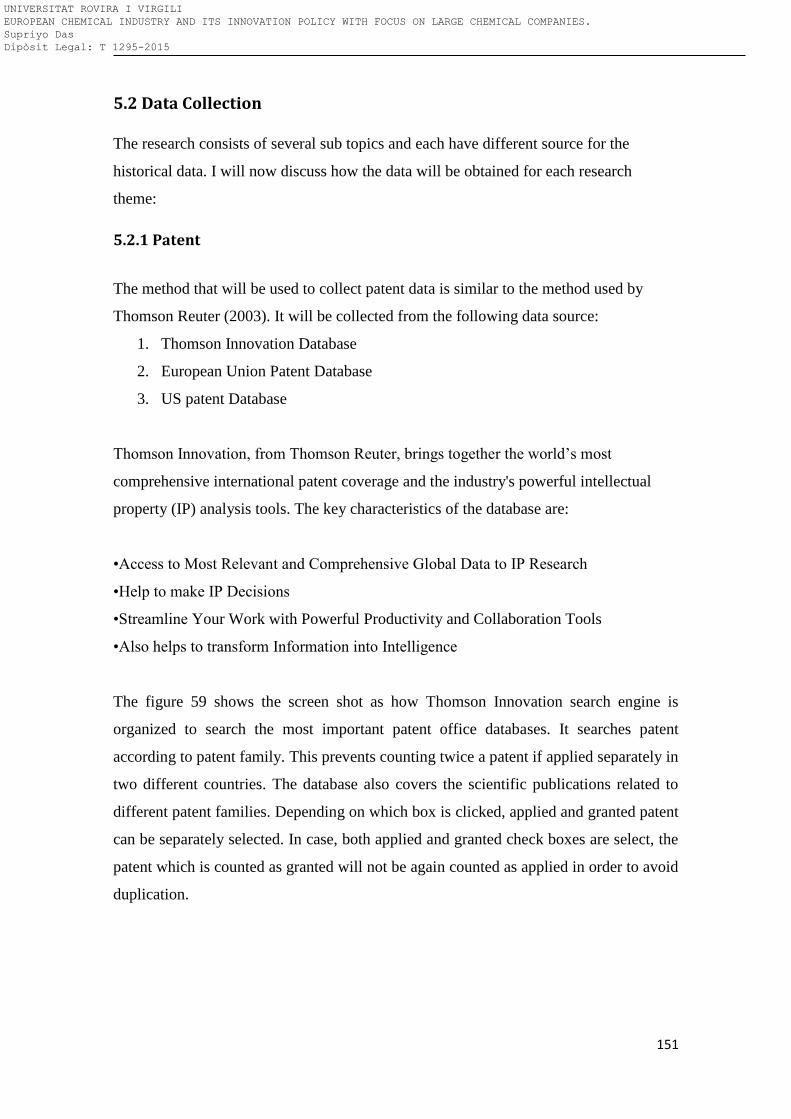
151
5.2 Data Collection
The research consists of several sub topics and each have different source for the
historical data. I will now discuss how the data will be obtained for each research
theme:
5.2.1 Patent
The method that will be used to collect patent data is similar to the method used by
Thomson Reuter (2003). It will be collected from the following data source:
1. Thomson Innovation Database
2. European Union Patent Database
3. US patent Database
Thomson Innovation, from Thomson Reuter, brings together the world’s most
comprehensive international patent coverage and the industry's powerful intellectual
property (IP) analysis tools. The key characteristics of the database are:
•Access to Most Relevant and Comprehensive Global Data to IP Research
•Help to make IP Decisions
•Streamline Your Work with Powerful Productivity and Collaboration Tools
•Also helps to transform Information into Intelligence
The figure 59 shows the screen shot as how Thomson Innovation search engine is
organized to search the most important patent office databases. It searches patent
according to patent family. This prevents counting twice a patent if applied separately in
two different countries. The database also covers the scientific publications related to
different patent families. Depending on which box is clicked, applied and granted patent
can be separately selected. In case, both applied and granted check boxes are select, the
patent which is counted as granted will not be again counted as applied in order to avoid
duplication.
UNIVERSITAT ROVIRA I VIRGILI EUROPEAN CHEMICAL INDUSTRY AND ITS INNOVATION POLICY WITH FOCUS ON LARGE CHEMICAL COMPANIES. Supriyo Das Dipòsit Legal: T 1295-2015
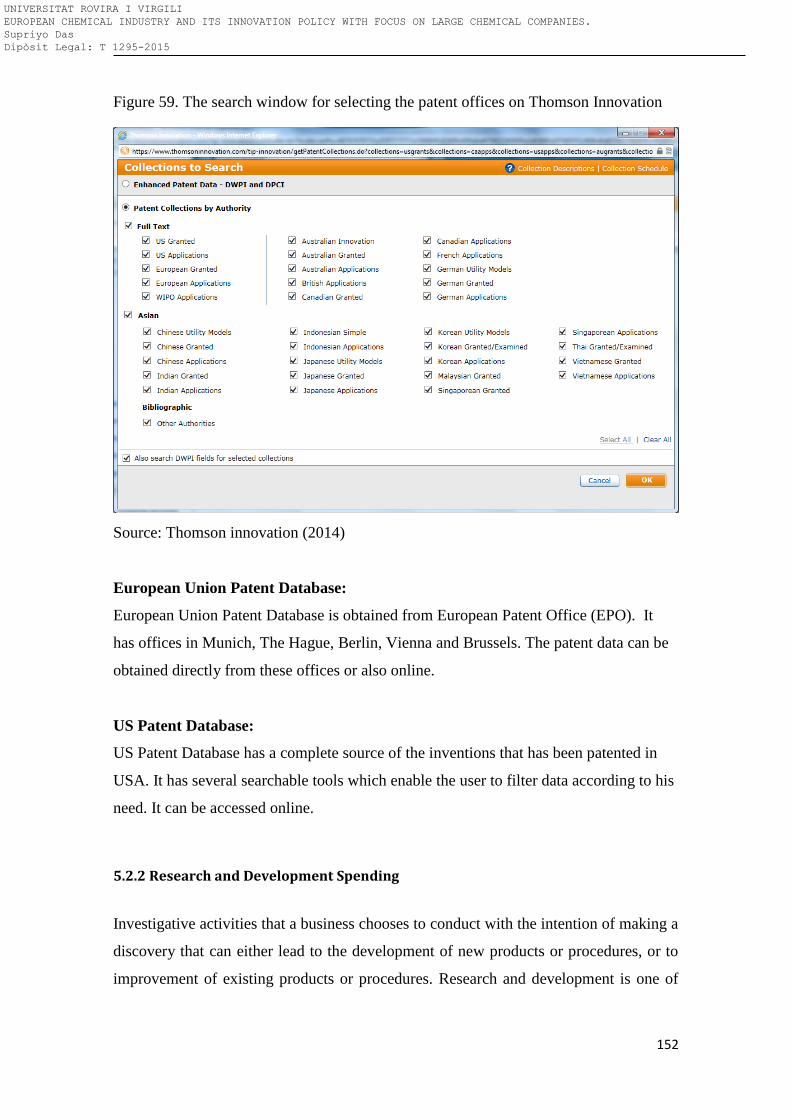
152
Figure 59. The search window for selecting the patent offices on Thomson Innovation
Source: Thomson innovation (2014)
European Union Patent Database:
European Union Patent Database is obtained from European Patent Office (EPO). It
has offices in Munich, The Hague, Berlin, Vienna and Brussels. The patent data can be
obtained directly from these offices or also online.
US Patent Database:
US Patent Database has a complete source of the inventions that has been patented in
USA. It has several searchable tools which enable the user to filter data according to his
need. It can be accessed online.
5.2.2 Research and Development Spending
Investigative activities that a business chooses to conduct with the intention of making a
discovery that can either lead to the development of new products or procedures, or to
improvement of existing products or procedures. Research and development is one of
UNIVERSITAT ROVIRA I VIRGILI EUROPEAN CHEMICAL INDUSTRY AND ITS INNOVATION POLICY WITH FOCUS ON LARGE CHEMICAL COMPANIES. Supriyo Das Dipòsit Legal: T 1295-2015
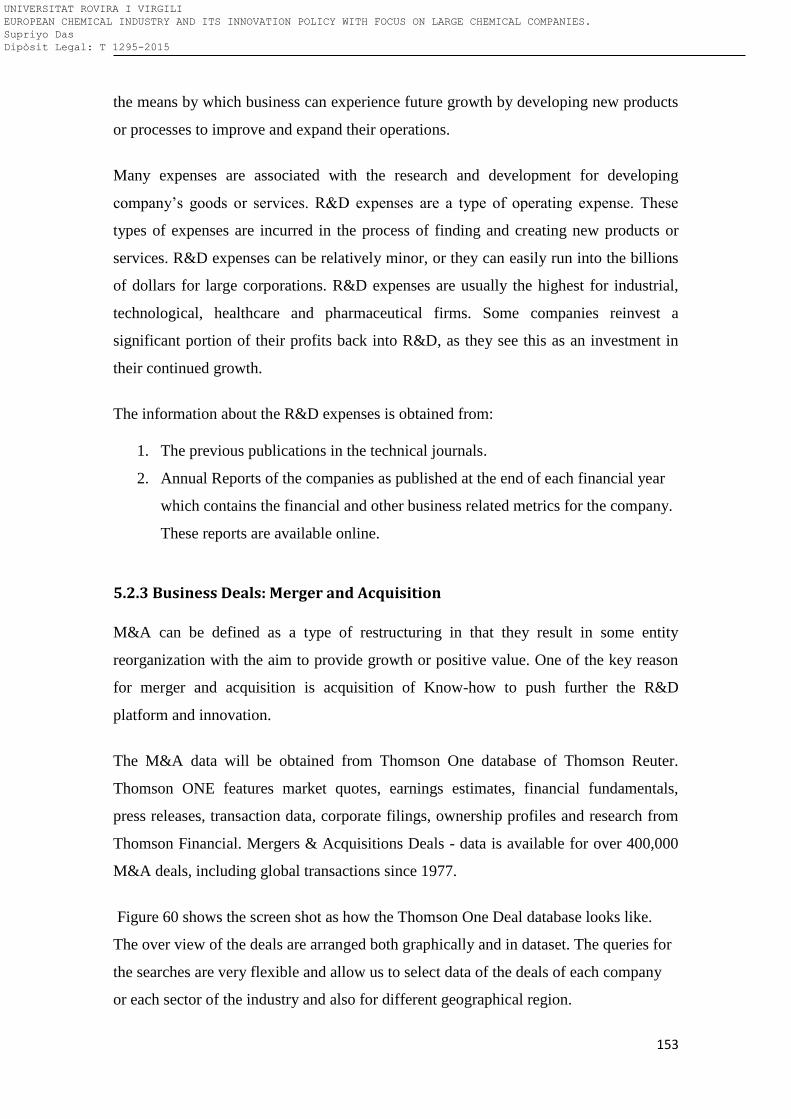
153
the means by which business can experience future growth by developing new products
or processes to improve and expand their operations.
Many expenses are associated with the research and development for developing
company’s goods or services. R&D expenses are a type of operating expense. These
types of expenses are incurred in the process of finding and creating new products or
services. R&D expenses can be relatively minor, or they can easily run into the billions
of dollars for large corporations. R&D expenses are usually the highest for industrial,
technological, healthcare and pharmaceutical firms. Some companies reinvest a
significant portion of their profits back into R&D, as they see this as an investment in
their continued growth.
The information about the R&D expenses is obtained from:
1. The previous publications in the technical journals.
2. Annual Reports of the companies as published at the end of each financial year
which contains the financial and other business related metrics for the company.
These reports are available online.
5.2.3 Business Deals: Merger and Acquisition
M&A can be defined as a type of restructuring in that they result in some entity
reorganization with the aim to provide growth or positive value. One of the key reason
for merger and acquisition is acquisition of Know-how to push further the R&D
platform and innovation.
The M&A data will be obtained from Thomson One database of Thomson Reuter.
Thomson ONE features market quotes, earnings estimates, financial fundamentals,
press releases, transaction data, corporate filings, ownership profiles and research from
Thomson Financial. Mergers & Acquisitions Deals - data is available for over 400,000
M&A deals, including global transactions since 1977.
Figure 60 shows the screen shot as how the Thomson One Deal database looks like.
The over view of the deals are arranged both graphically and in dataset. The queries for
the searches are very flexible and allow us to select data of the deals of each company
or each sector of the industry and also for different geographical region.
UNIVERSITAT ROVIRA I VIRGILI EUROPEAN CHEMICAL INDUSTRY AND ITS INNOVATION POLICY WITH FOCUS ON LARGE CHEMICAL COMPANIES. Supriyo Das Dipòsit Legal: T 1295-2015
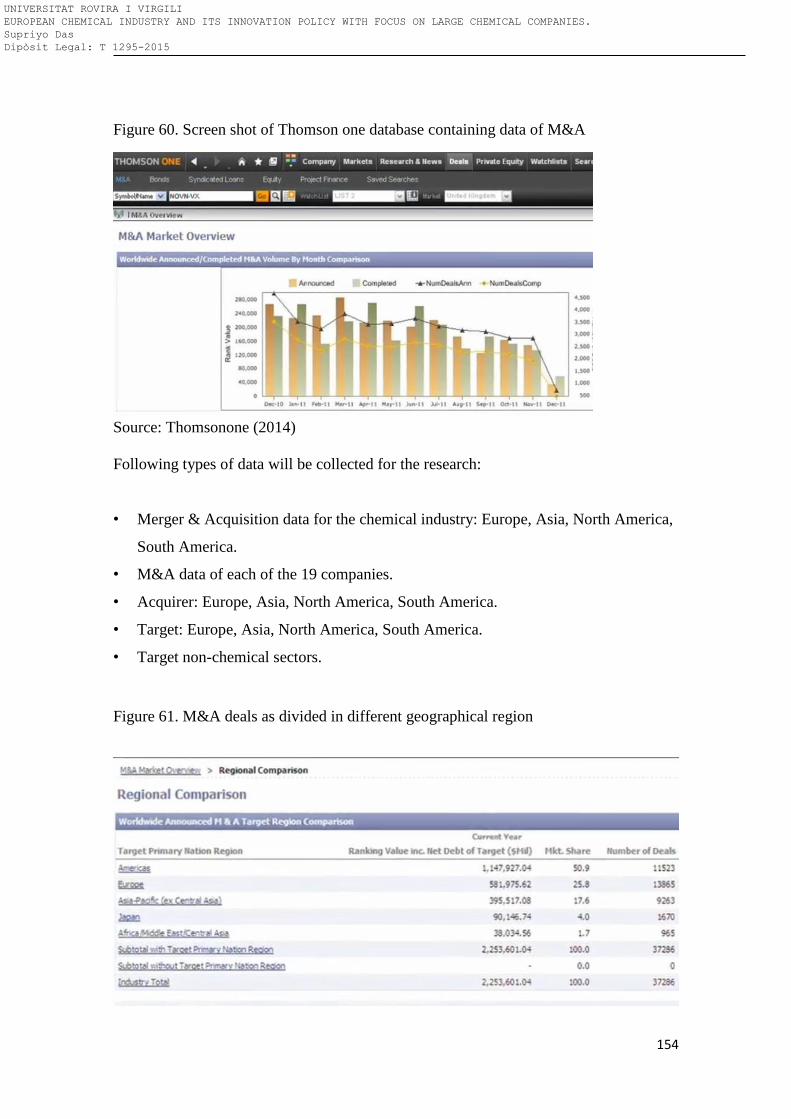
154
Figure 60. Screen shot of Thomson one database containing data of M&A
Source: Thomsonone (2014)
Following types of data will be collected for the research:
• Merger & Acquisition data for the chemical industry: Europe, Asia, North America,
South America.
• M&A data of each of the 19 companies.
• Acquirer: Europe, Asia, North America, South America.
• Target: Europe, Asia, North America, South America.
• Target non-chemical sectors.
Figure 61. M&A deals as divided in different geographical region
UNIVERSITAT ROVIRA I VIRGILI EUROPEAN CHEMICAL INDUSTRY AND ITS INNOVATION POLICY WITH FOCUS ON LARGE CHEMICAL COMPANIES. Supriyo Das Dipòsit Legal: T 1295-2015
155
Source: Thomsonone (2014)
5.2.4 Collaboration with other companies & universities for research The current project focuses on European Union funded project to understand the
collaborations that are happening in research and development between the industries
on one hand and industries with academia on the other hand.
The details about the projects will be available from Community Research and
Development Information Service. It has a database where the Europe Union supported
projects are recorded. For this study we will consider the F5, F6 and F7 framework
project.
UNIVERSITAT ROVIRA I VIRGILI EUROPEAN CHEMICAL INDUSTRY AND ITS INNOVATION POLICY WITH FOCUS ON LARGE CHEMICAL COMPANIES. Supriyo Das Dipòsit Legal: T 1295-2015
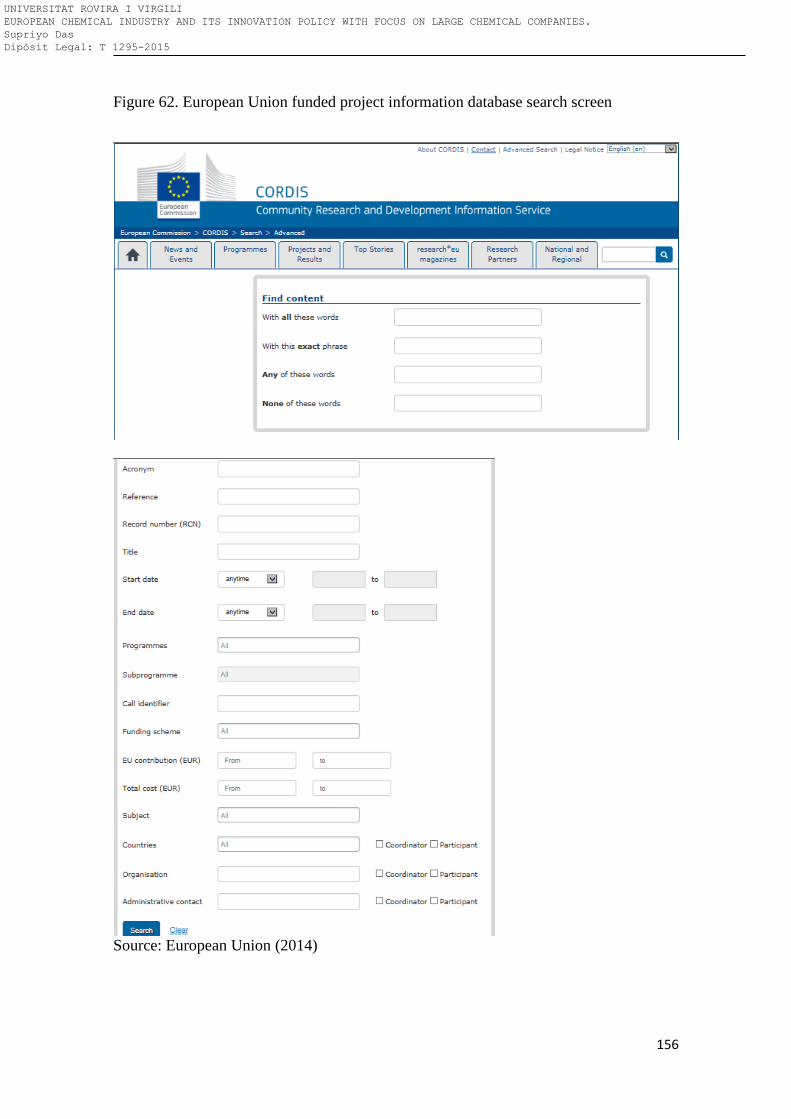
156
Figure 62. European Union funded project information database search screen
Source: European Union (2014)
UNIVERSITAT ROVIRA I VIRGILI EUROPEAN CHEMICAL INDUSTRY AND ITS INNOVATION POLICY WITH FOCUS ON LARGE CHEMICAL COMPANIES. Supriyo Das Dipòsit Legal: T 1295-2015
157
5.2.5 Impact of chemical Regulation on Innovation of EU chemical Companies
REACH is the Regulation on Registration, Evaluation, Authorization and Restriction of
Chemicals. It entered into force on 1st June 2007. It streamlines and improves the
former legislative framework on chemicals of the European Union (EU). The main aims
of REACH are to ensure a high level of protection of human health and the environment
from the risks that can be posed by chemicals, the promotion of alternative test
methods, the free circulation of substances on the internal market and enhancing
competitiveness and innovation. The data for REACH is obtained from a survey done
by Center for Strategy and Evaluation Study (CSES), UK in 2011. The question was so
formulated in order to understand the impact of chemical regulation, REACH on the
innovation of European Chemical industry.
The survey was launched in September 2011 and remained open for six weeks.
Respondents were given the opportunity to answer in terms of a given role as defined by
the REACH regulation:
- Manufacturer of chemical substances or preparations
- Importer of chemical substances or preparations
- Producer of articles that contain chemical substances
- Importers of articles that contain chemical substances
- Formulator (mixer) of chemical substances or preparations
- End users of chemical substances or preparations in professional activities or in
industrial activities where substances or preparations are used as processing aid and do
not form part of the final product
- Distributor/ retailer of chemical substances, preparations or articles that contain
chemical substances intended to be released
- Other roles
The survey questionnaire was translated into the 22 official EU languages, and
respondents accessed the survey through a single web page. The link to the survey was
distributed through various European, national and regional associations and
organisations that CSES identified and who were asked to forward the link to their
UNIVERSITAT ROVIRA I VIRGILI EUROPEAN CHEMICAL INDUSTRY AND ITS INNOVATION POLICY WITH FOCUS ON LARGE CHEMICAL COMPANIES. Supriyo Das Dipòsit Legal: T 1295-2015
158
member associations and companies. The Commission services and ECHA also
promoted the survey through their communication channels.
There were 577 responses. The largest group of respondents were manufacturers of
chemical substances (33.3%) followed by formulators (mixers) of chemical substances
(21%). The remaining responses were relatively evenly spread between the other roles.
Some of the questions that were put on the survey are as follows (CESE Survey, 2012):
Q1. Please indicate in what role you will be answering this questionnaire.
Q2. In which sector of the economy is your firm mainly active?
Q3. Chemicals and chemical products (subdivisions) you are mainly dealing with.
Q4. In which country is your business located?
Q5. How many chemical substances did you place in the market in 2010 (including
substances contained in articles)?
Q6. Company size.
Q7. Please indicate what kind of business you are in and where yours headquarter is
based.
Q9. Approximately what percentage of your turnover was spent on Research &
Development (R&D) in 2010?
Q10. What would you say the sources of your innovations are in general? If more than
one, please rank in importance (1st as most important, 3rd as least important).
Q11. Has the development of, or access to, any of the following sources of information
acted as a stimulus to product conception and innovation in your organisation?
UNIVERSITAT ROVIRA I VIRGILI EUROPEAN CHEMICAL INDUSTRY AND ITS INNOVATION POLICY WITH FOCUS ON LARGE CHEMICAL COMPANIES. Supriyo Das Dipòsit Legal: T 1295-2015
159
Q12. Was the additional cost for testing of new substances (as opposed to the situation
for existing substances) a disincentive to innovation for you before the REACH
Regulation was implemented?
Q13. Statistics on successfully completed PPORDs per year
Q14. What percentage of resource is diverted from innovation to REACH compliance?
Q15. Filling in knowledge of gaps on existing substances and/ or uses, uncovering
hidden potential?
Q16. The REACH Regulation has shifted the centre of gravity in terms of the safety
assessment of existing chemicals to manufacturers/industry. Has it upheld certain
barriers for research activities on new substances? Have changes impacted the balance
of interests for research activities and what is the current centre of interest (new
substances vs. new uses for old substances)?
Q17. What has the experience of various measures within the Regulation to support
R&D been?
Q18. What has been the effect of measures in the Regulation intended to limit the
number of animals used in testing stages? Did the requirements related to the reduction
of animal tests impact the industry capacity to introduce new substances or to develop
new uses for existing substances?
Q20. Are there any implications for the supply of laboratory capacity?
Q21. What has been the impact of REACH on the development of business cases for
innovation projects (e.g. rates of return, risk, uncertainty).
Q22. Have these factors led to better products?
Q23. The cost of REACH and its impact on the landscape of innovative companies
UNIVERSITAT ROVIRA I VIRGILI EUROPEAN CHEMICAL INDUSTRY AND ITS INNOVATION POLICY WITH FOCUS ON LARGE CHEMICAL COMPANIES. Supriyo Das Dipòsit Legal: T 1295-2015
160
Q24. Toll manufacturing strategy
Q25. REACH impacts on the costs of setting up new companies (start-ups / spin-offs).
The data obtained from this survey as reported by CSES will be further analyzed in
order to evaluate the impact of REACH on innovation of large chemical companies.
5.2.6 Cluster
A business cluster is a geographic concentration of interconnected businesses, suppliers,
and associated institutions in a particular field. Clusters are considered to increase the
productivity with which companies can compete, nationally and globally. Clusters are
also very important aspects of strategic management.
The data from cluster is obtained from:
1. The previous published literatures which contain specific case studies of the
innovation of some the bigger EU chemical clusters.
2. The websites relating to chemical clusters which provides information and data
around those clusters and updates around them.
There are several websites which give significant information about the chemical
clusters. They are the following:
1. Chemical Parks in Europe:
The chemical park in Europe is rich source of information of all the chemical clusters in
Europe. The data is provided by European chemical site promotion platform. The
website also updates regularly the news and investments at various clusters (figure 63).
UNIVERSITAT ROVIRA I VIRGILI EUROPEAN CHEMICAL INDUSTRY AND ITS INNOVATION POLICY WITH FOCUS ON LARGE CHEMICAL COMPANIES. Supriyo Das Dipòsit Legal: T 1295-2015
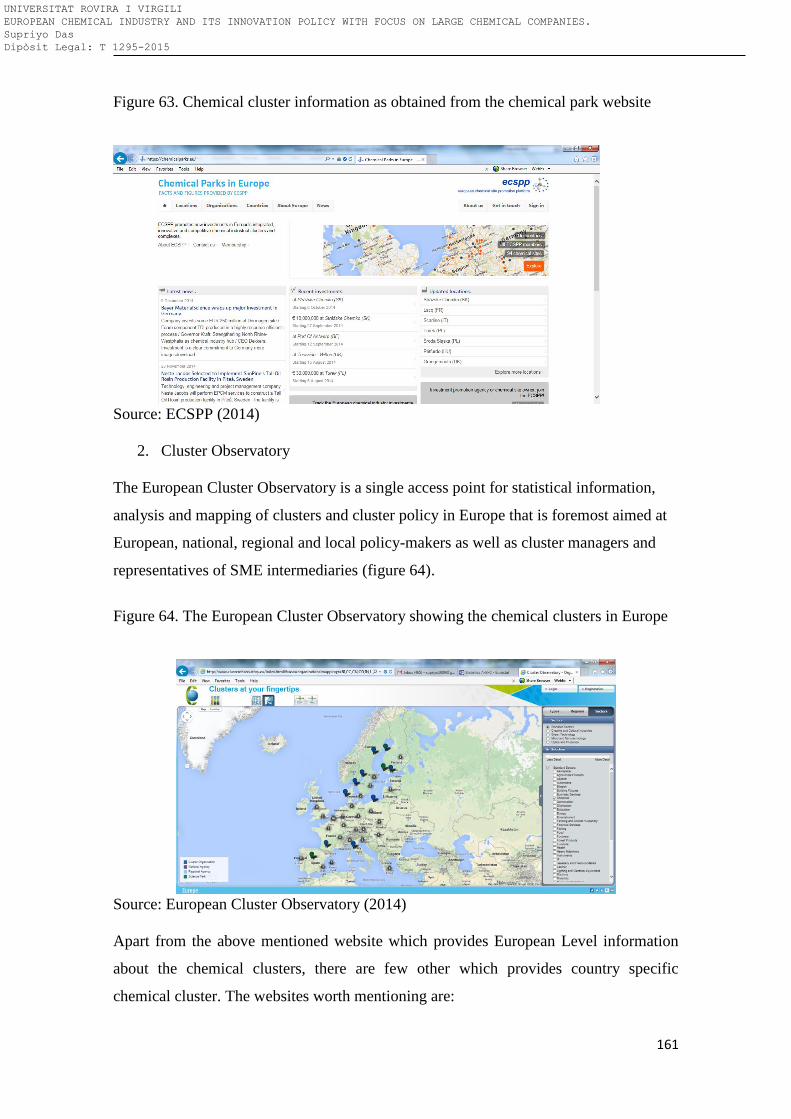
161
Figure 63. Chemical cluster information as obtained from the chemical park website
Source: ECSPP (2014)
2. Cluster Observatory
The European Cluster Observatory is a single access point for statistical information,
analysis and mapping of clusters and cluster policy in Europe that is foremost aimed at
European, national, regional and local policy-makers as well as cluster managers and
representatives of SME intermediaries (figure 64).
Figure 64. The European Cluster Observatory showing the chemical clusters in Europe
Source: European Cluster Observatory (2014)
Apart from the above mentioned website which provides European Level information
about the chemical clusters, there are few other which provides country specific
chemical cluster. The websites worth mentioning are:
UNIVERSITAT ROVIRA I VIRGILI EUROPEAN CHEMICAL INDUSTRY AND ITS INNOVATION POLICY WITH FOCUS ON LARGE CHEMICAL COMPANIES. Supriyo Das Dipòsit Legal: T 1295-2015
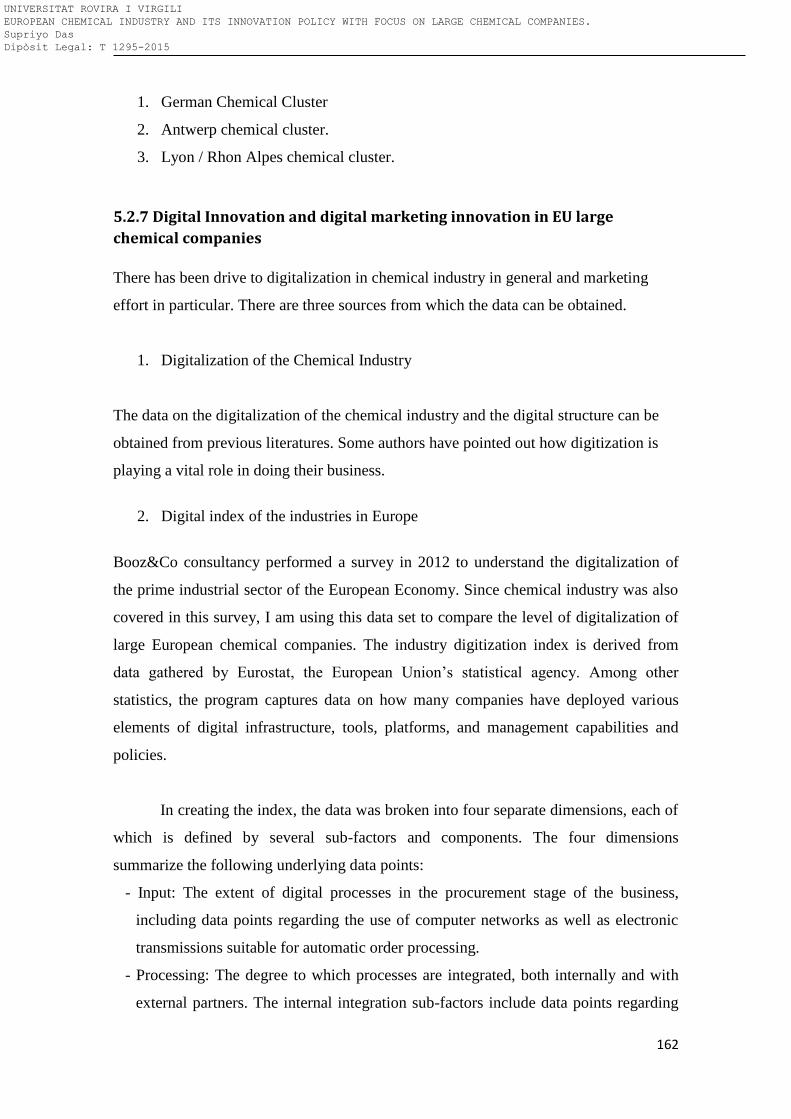
162
1. German Chemical Cluster
2. Antwerp chemical cluster.
3. Lyon / Rhon Alpes chemical cluster.
5.2.7 Digital Innovation and digital marketing innovation in EU large
chemical companies
There has been drive to digitalization in chemical industry in general and marketing
effort in particular. There are three sources from which the data can be obtained.
1. Digitalization of the Chemical Industry
The data on the digitalization of the chemical industry and the digital structure can be
obtained from previous literatures. Some authors have pointed out how digitization is
playing a vital role in doing their business.
2. Digital index of the industries in Europe
Booz&Co consultancy performed a survey in 2012 to understand the digitalization of
the prime industrial sector of the European Economy. Since chemical industry was also
covered in this survey, I am using this data set to compare the level of digitalization of
large European chemical companies. The industry digitization index is derived from
data gathered by Eurostat, the European Union’s statistical agency. Among other
statistics, the program captures data on how many companies have deployed various
elements of digital infrastructure, tools, platforms, and management capabilities and
policies.
In creating the index, the data was broken into four separate dimensions, each of
which is defined by several sub-factors and components. The four dimensions
summarize the following underlying data points:
- Input: The extent of digital processes in the procurement stage of the business,
including data points regarding the use of computer networks as well as electronic
transmissions suitable for automatic order processing.
- Processing: The degree to which processes are integrated, both internally and with
external partners. The internal integration sub-factors include data points regarding
UNIVERSITAT ROVIRA I VIRGILI EUROPEAN CHEMICAL INDUSTRY AND ITS INNOVATION POLICY WITH FOCUS ON LARGE CHEMICAL COMPANIES. Supriyo Das Dipòsit Legal: T 1295-2015
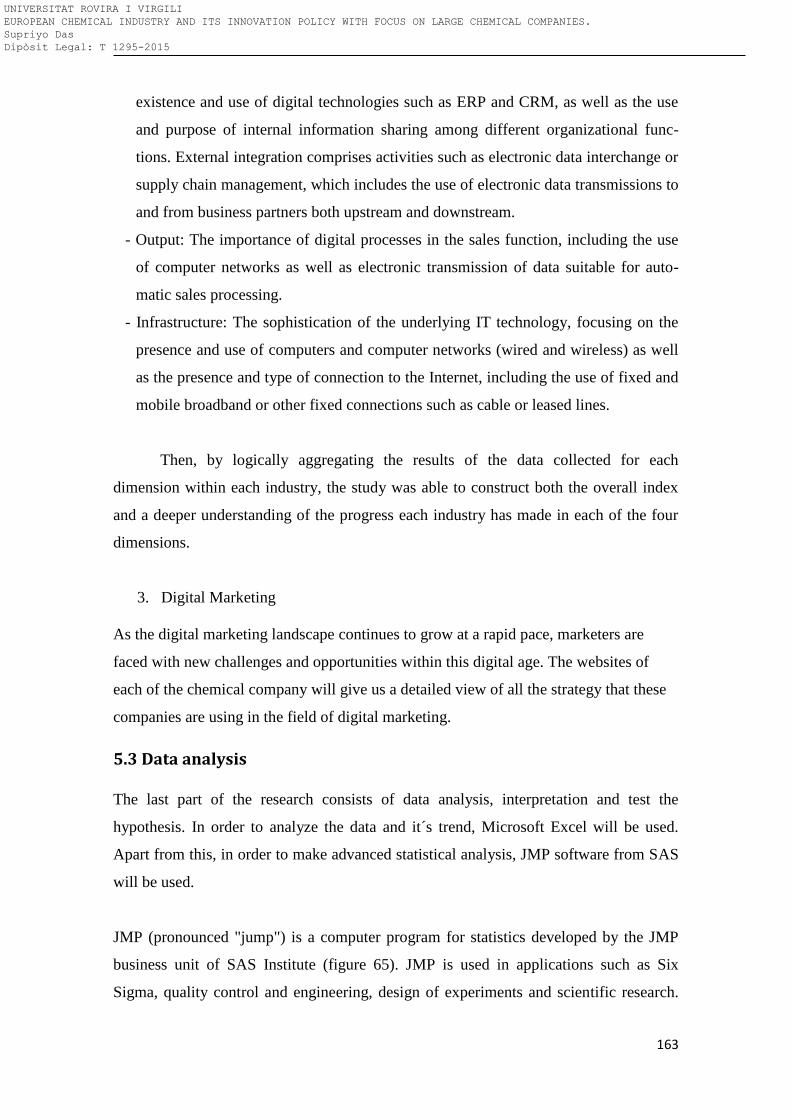
163
existence and use of digital technologies such as ERP and CRM, as well as the use
and purpose of internal information sharing among different organizational func-
tions. External integration comprises activities such as electronic data interchange or
supply chain management, which includes the use of electronic data transmissions to
and from business partners both upstream and downstream.
- Output: The importance of digital processes in the sales function, including the use
of computer networks as well as electronic transmission of data suitable for auto-
matic sales processing.
- Infrastructure: The sophistication of the underlying IT technology, focusing on the
presence and use of computers and computer networks (wired and wireless) as well
as the presence and type of connection to the Internet, including the use of fixed and
mobile broadband or other fixed connections such as cable or leased lines.
Then, by logically aggregating the results of the data collected for each
dimension within each industry, the study was able to construct both the overall index
and a deeper understanding of the progress each industry has made in each of the four
dimensions.
3. Digital Marketing
As the digital marketing landscape continues to grow at a rapid pace, marketers are
faced with new challenges and opportunities within this digital age. The websites of
each of the chemical company will give us a detailed view of all the strategy that these
companies are using in the field of digital marketing.
5.3 Data analysis
The last part of the research consists of data analysis, interpretation and test the
hypothesis. In order to analyze the data and it´s trend, Microsoft Excel will be used.
Apart from this, in order to make advanced statistical analysis, JMP software from SAS
will be used.
JMP (pronounced "jump") is a computer program for statistics developed by the JMP
business unit of SAS Institute (figure 65). JMP is used in applications such as Six
Sigma, quality control and engineering, design of experiments and scientific research.
UNIVERSITAT ROVIRA I VIRGILI EUROPEAN CHEMICAL INDUSTRY AND ITS INNOVATION POLICY WITH FOCUS ON LARGE CHEMICAL COMPANIES. Supriyo Das Dipòsit Legal: T 1295-2015
164
The software is focused on exploratory analytics, whereby users investigate and explore
data, rather than to just confirm a hypothesis.
Figure 65. Example of the modeling functionality and data fit of the JMP Software
Source: Author
5.4 Summary
As explained above, there is a detailed plan to obtain the data for various components of
the research. The research consists of first giving an overview of current situation of
European chemical industry and then testing five hypotheses around innovation
focusing on large chemical companies head quartered in Europe. The data around
European chemical industry and the global perspective is obtained from databases and
publications of the various government agencies in the field of chemical industry. The
data around patents will be obtained from the Thomson Innovation and patent offices.
R&D data is obtained from previous publications and annual reports of the companies.
Merger and Acquisition (M&A) deals data is obtained from Thomson One database.
The university and industry collaboration information is obtained from European Union
research website. The data of REACH impact on nnovation is obtained from survey
conducted by CSES. The information about the clusters are obtained form previous
literature and the websites. The information around innovation in marketing through
digitalization is obtained through individual company website and also through market
research. As explained earlier, there is a detailed plan to obtain the data for various
UNIVERSITAT ROVIRA I VIRGILI EUROPEAN CHEMICAL INDUSTRY AND ITS INNOVATION POLICY WITH FOCUS ON LARGE CHEMICAL COMPANIES. Supriyo Das Dipòsit Legal: T 1295-2015
165
components of the research. Based on the data collected, there will further statistical
analysis of the data into order to test the hypotheses that were laid down in earlier
chapter.
UNIVERSITAT ROVIRA I VIRGILI EUROPEAN CHEMICAL INDUSTRY AND ITS INNOVATION POLICY WITH FOCUS ON LARGE CHEMICAL COMPANIES. Supriyo Das Dipòsit Legal: T 1295-2015

166
5.5 Bibliography
ECSPP. (2014). Chemical Parks in Europe. Retreived from
https://chemicalparks.eu/sites
European Cluster Observatory. (2014). Clusters at your finger tips. Retreived from
http://www.clusterobservatory.eu/index.html
European Union. (2014). Community research and development information service.
Retreived from http://cordis.europa.eu/search/advanced_en?projects
Thomson Innovation 2014. (2014). Thomson Innovation Database: Thomson Reuter
[Data file and database]. Retreived from: https://www.thomsoninnovation.com/login
Thomson Reuter. (2013). Thomson Reuter Top 100 Global Innovators. Retreived from
http://top100innovators.com/top100-2013.pdf
Thomsonone 2014. (2014). Thomson One Database: Thomson Reuter [Data file and
database]. Retreived from https://www.thomsonone.com/DirectoryServices/2006-04-
01/Web.Public/Login.aspx?brandname=www.thomsonone.com&version=3.7.9.18833&
protocol=0
UNIVERSITAT ROVIRA I VIRGILI EUROPEAN CHEMICAL INDUSTRY AND ITS INNOVATION POLICY WITH FOCUS ON LARGE CHEMICAL COMPANIES. Supriyo Das Dipòsit Legal: T 1295-2015
167
6. Innovation trend of the top European chemical companies
Contents
6.1 Introduction ............................................................................................................................... 168
6.2 Patent process........................................................................................................................... 168
6.3 Patent Data Analysis ............................................................................................................... 171
4.4 Conclusion .................................................................................................................................. 183
4.5 Bibliography .............................................................................................................................. 184
UNIVERSITAT ROVIRA I VIRGILI EUROPEAN CHEMICAL INDUSTRY AND ITS INNOVATION POLICY WITH FOCUS ON LARGE CHEMICAL COMPANIES. Supriyo Das Dipòsit Legal: T 1295-2015
168
6.1 Introduction
Patent is defined as a government authority or license conferring a right or title for a set
period, especially the sole right to exclude others from making, using, or selling an
invention. It may be granted to a firm, individual or public body by a national patent
office. Patent propensity rate is a potentially valuable indicator for innovative activities.
Patents are undoubtedly one of the instruments that firms use to capture values from
innovation and R&D activities. Among the few available indicators of technology
output, patent-based indicators are probably the most frequently used. As explained in
chapter 2, most of the researchers support the idea of using patent data as the metrics of
measuring innovation. This chapter will test the first hypothesis of this research, i.e. test
if there is a positive trend in innovation of large chemical companies headquartered in
Europe. The patent data will be extensively used for this analysis.
6.2 Patent process
The most commonly used indicators are counts of patent family that share a number of
common elements. This section focuses on patent landscape of the top chemical
companies in Europe. The list of the top nineteen chemical companies includes three oil
companies. So as not to mix up chemical patents with other patents, these three
companies are ignored in this study.
The patent process (Inventor basics, 2013) as according to the US Patent office consist
the following broad steps (figure 66):
Step 1, Applicant - Has the invention already been patented?
If already patented, end of process
If not already patented, continue to Step 2
Step 2, Applicant - What type of Application is being filed?
Design Patent or Plant Patent or Utility Patent
Step 3, Applicant - Determine Filing Strategy
Step 4, Applicant - Which type of Utility Patent Application to file?
Provisional or Non provisional
Step 5, Applicant - Consider expedited examination
Prioritized or Accelerated or First Action Interview program
UNIVERSITAT ROVIRA I VIRGILI EUROPEAN CHEMICAL INDUSTRY AND ITS INNOVATION POLICY WITH FOCUS ON LARGE CHEMICAL COMPANIES. Supriyo Das Dipòsit Legal: T 1295-2015
169
Step 6, Applicant - Who Should File?
File yourself (Pro Se) or Use a Registered Attorney or Agent
Step 7, Applicant - Prepare for electronic filing
Application processing fees and Apply for a Customer Number and
Digital Certificate
Step 8, Applicant - Apply for Patent using Electronic Filing System as a
Registered e-Filer
Step 9, USPTO - USPTO examines application
Check Application Status
Allowed?
Yes, go to Step 12
No, continue to Step 10
Step 10, Applicant - Applicant files replies requests for reconsideration, and
appeals as necessary
Step 11, USPTO - If objections and rejection of the examiner are overcome,
USPTO sends Notice of Allowance and Fee(s) due
Step 12, Applicant - Applicant pays the issue fee and the publication fee
USPTO Grants Patent
UNIVERSITAT ROVIRA I VIRGILI EUROPEAN CHEMICAL INDUSTRY AND ITS INNOVATION POLICY WITH FOCUS ON LARGE CHEMICAL COMPANIES. Supriyo Das Dipòsit Legal: T 1295-2015
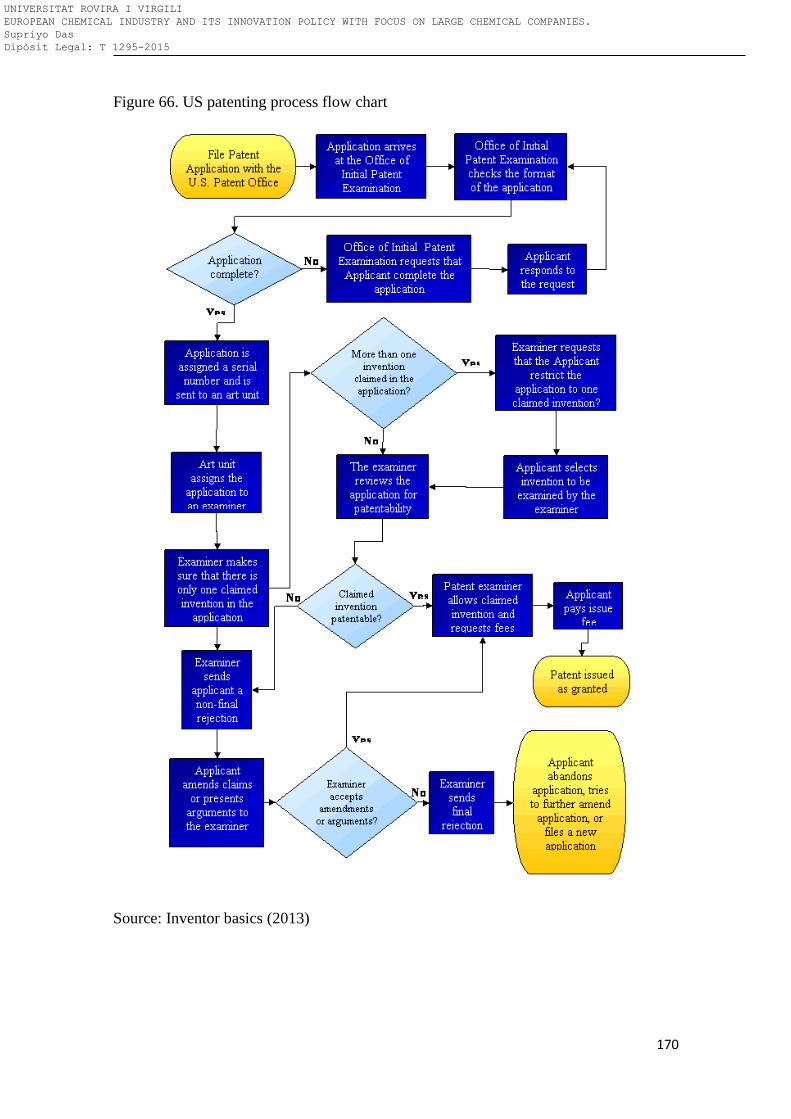
170
Figure 66. US patenting process flow chart
Source: Inventor basics (2013)
UNIVERSITAT ROVIRA I VIRGILI EUROPEAN CHEMICAL INDUSTRY AND ITS INNOVATION POLICY WITH FOCUS ON LARGE CHEMICAL COMPANIES. Supriyo Das Dipòsit Legal: T 1295-2015
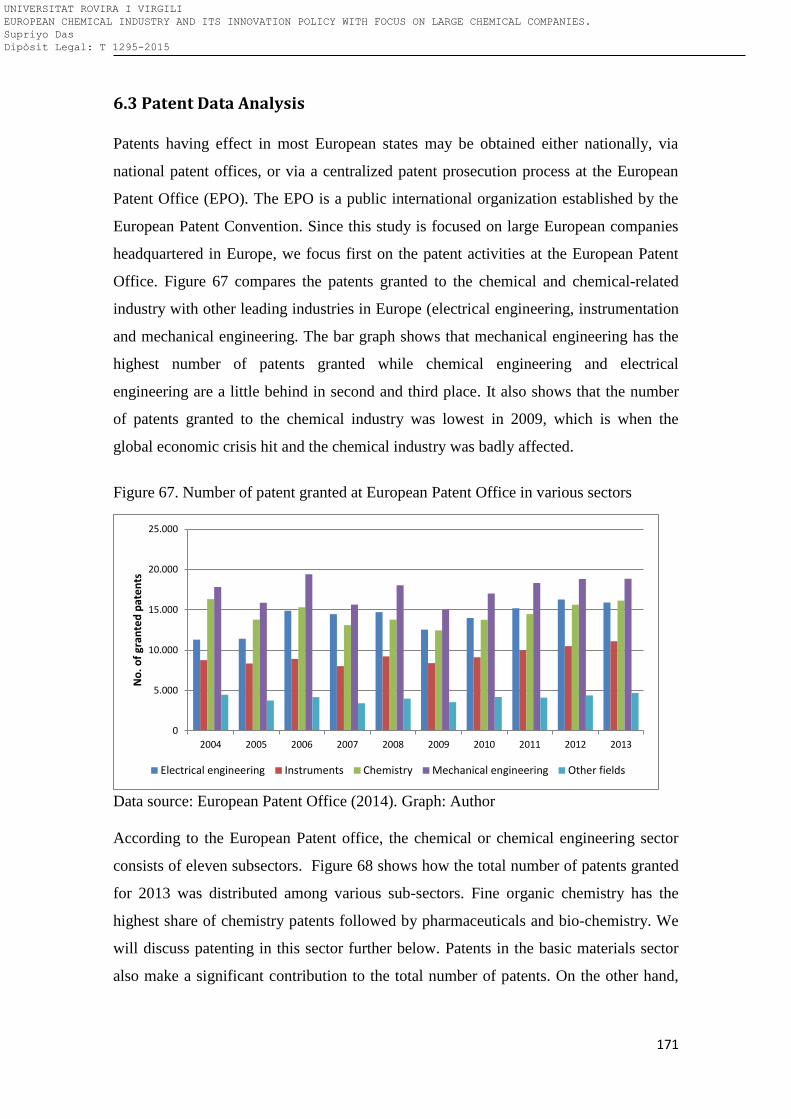
171
6.3 Patent Data Analysis
Patents having effect in most European states may be obtained either nationally, via
national patent offices, or via a centralized patent prosecution process at the European
Patent Office (EPO). The EPO is a public international organization established by the
European Patent Convention. Since this study is focused on large European companies
headquartered in Europe, we focus first on the patent activities at the European Patent
Office. Figure 67 compares the patents granted to the chemical and chemical-related
industry with other leading industries in Europe (electrical engineering, instrumentation
and mechanical engineering. The bar graph shows that mechanical engineering has the
highest number of patents granted while chemical engineering and electrical
engineering are a little behind in second and third place. It also shows that the number
of patents granted to the chemical industry was lowest in 2009, which is when the
global economic crisis hit and the chemical industry was badly affected.
Figure 67. Number of patent granted at European Patent Office in various sectors
Data source: European Patent Office (2014). Graph: Author
According to the European Patent office, the chemical or chemical engineering sector
consists of eleven subsectors. Figure 68 shows how the total number of patents granted
for 2013 was distributed among various sub-sectors. Fine organic chemistry has the
highest share of chemistry patents followed by pharmaceuticals and bio-chemistry. We
will discuss patenting in this sector further below. Patents in the basic materials sector
also make a significant contribution to the total number of patents. On the other hand,
0
5.000
10.000
15.000
20.000
25.000
2004 2005 2006 2007 2008 2009 2010 2011 2012 2013
No
. o
f gr
ante
d p
ate
nts
Electrical engineering Instruments Chemistry Mechanical engineering Other fields
UNIVERSITAT ROVIRA I VIRGILI EUROPEAN CHEMICAL INDUSTRY AND ITS INNOVATION POLICY WITH FOCUS ON LARGE CHEMICAL COMPANIES. Supriyo Das Dipòsit Legal: T 1295-2015
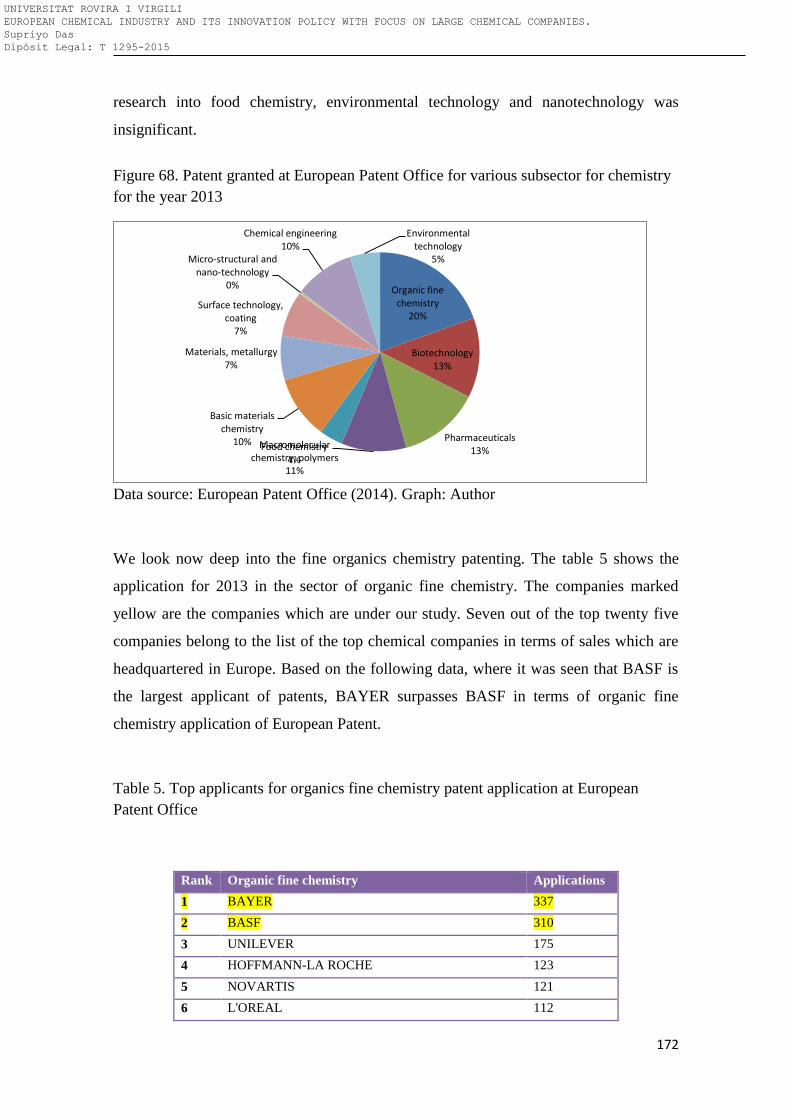
172
research into food chemistry, environmental technology and nanotechnology was
insignificant.
Figure 68. Patent granted at European Patent Office for various subsector for chemistry
for the year 2013
Data source: European Patent Office (2014). Graph: Author
We look now deep into the fine organics chemistry patenting. The table 5 shows the
application for 2013 in the sector of organic fine chemistry. The companies marked
yellow are the companies which are under our study. Seven out of the top twenty five
companies belong to the list of the top chemical companies in terms of sales which are
headquartered in Europe. Based on the following data, where it was seen that BASF is
the largest applicant of patents, BAYER surpasses BASF in terms of organic fine
chemistry application of European Patent.
Table 5. Top applicants for organics fine chemistry patent application at European
Patent Office
Rank Organic fine chemistry Applications
1 BAYER 337
2 BASF 310
3 UNILEVER 175
4 HOFFMANN-LA ROCHE 123
5 NOVARTIS 121
6 L'OREAL 112
Organic fine chemistry
20%
Biotechnology 13%
Pharmaceuticals 13%
Macromolecular chemistry, polymers
11%
Food chemistry 4%
Basic materials chemistry
10%
Materials, metallurgy 7%
Surface technology, coating
7%
Micro-structural and nano-technology
0%
Chemical engineering 10%
Environmental technology
5%
UNIVERSITAT ROVIRA I VIRGILI EUROPEAN CHEMICAL INDUSTRY AND ITS INNOVATION POLICY WITH FOCUS ON LARGE CHEMICAL COMPANIES. Supriyo Das Dipòsit Legal: T 1295-2015
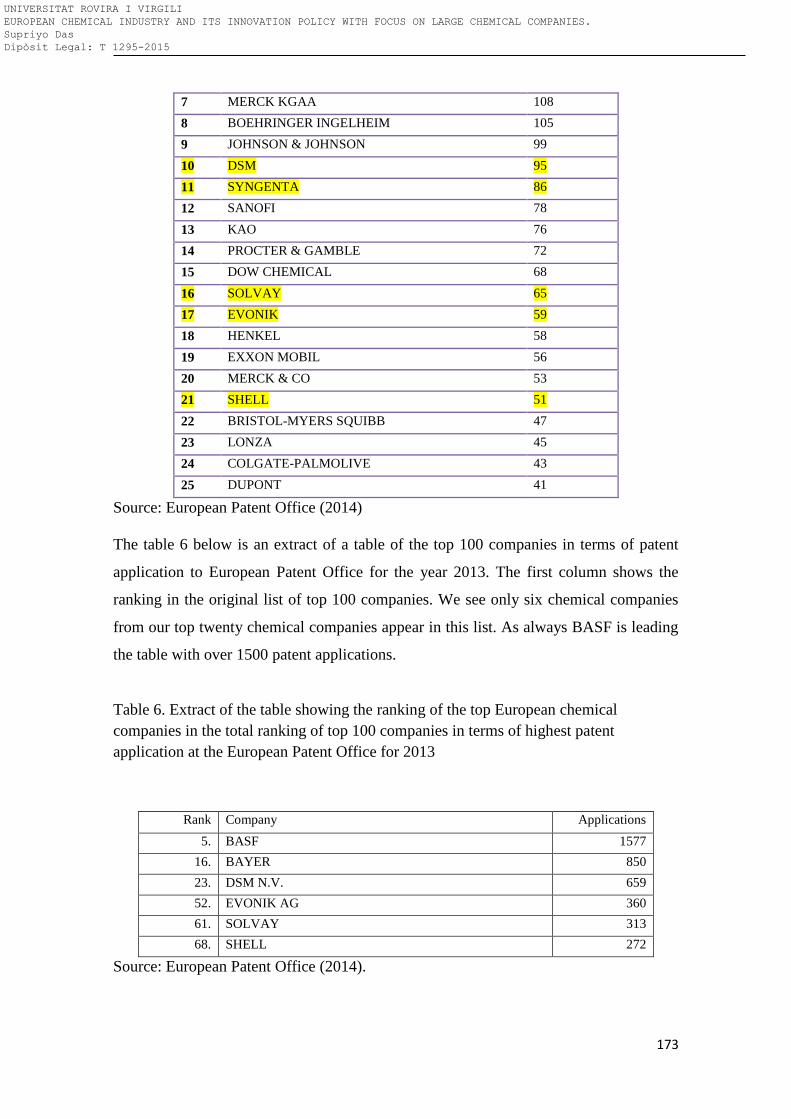
173
7 MERCK KGAA 108
8 BOEHRINGER INGELHEIM 105
9 JOHNSON & JOHNSON 99
10 DSM 95
11 SYNGENTA 86
12 SANOFI 78
13 KAO 76
14 PROCTER & GAMBLE 72
15 DOW CHEMICAL 68
16 SOLVAY 65
17 EVONIK 59
18 HENKEL 58
19 EXXON MOBIL 56
20 MERCK & CO 53
21 SHELL 51
22 BRISTOL-MYERS SQUIBB 47
23 LONZA 45
24 COLGATE-PALMOLIVE 43
25 DUPONT 41
Source: European Patent Office (2014)
The table 6 below is an extract of a table of the top 100 companies in terms of patent
application to European Patent Office for the year 2013. The first column shows the
ranking in the original list of top 100 companies. We see only six chemical companies
from our top twenty chemical companies appear in this list. As always BASF is leading
the table with over 1500 patent applications.
Table 6. Extract of the table showing the ranking of the top European chemical
companies in the total ranking of top 100 companies in terms of highest patent
application at the European Patent Office for 2013
Rank Company Applications
5. BASF 1577
16. BAYER 850
23. DSM N.V. 659
52. EVONIK AG 360
61. SOLVAY 313
68. SHELL 272
Source: European Patent Office (2014).
UNIVERSITAT ROVIRA I VIRGILI EUROPEAN CHEMICAL INDUSTRY AND ITS INNOVATION POLICY WITH FOCUS ON LARGE CHEMICAL COMPANIES. Supriyo Das Dipòsit Legal: T 1295-2015
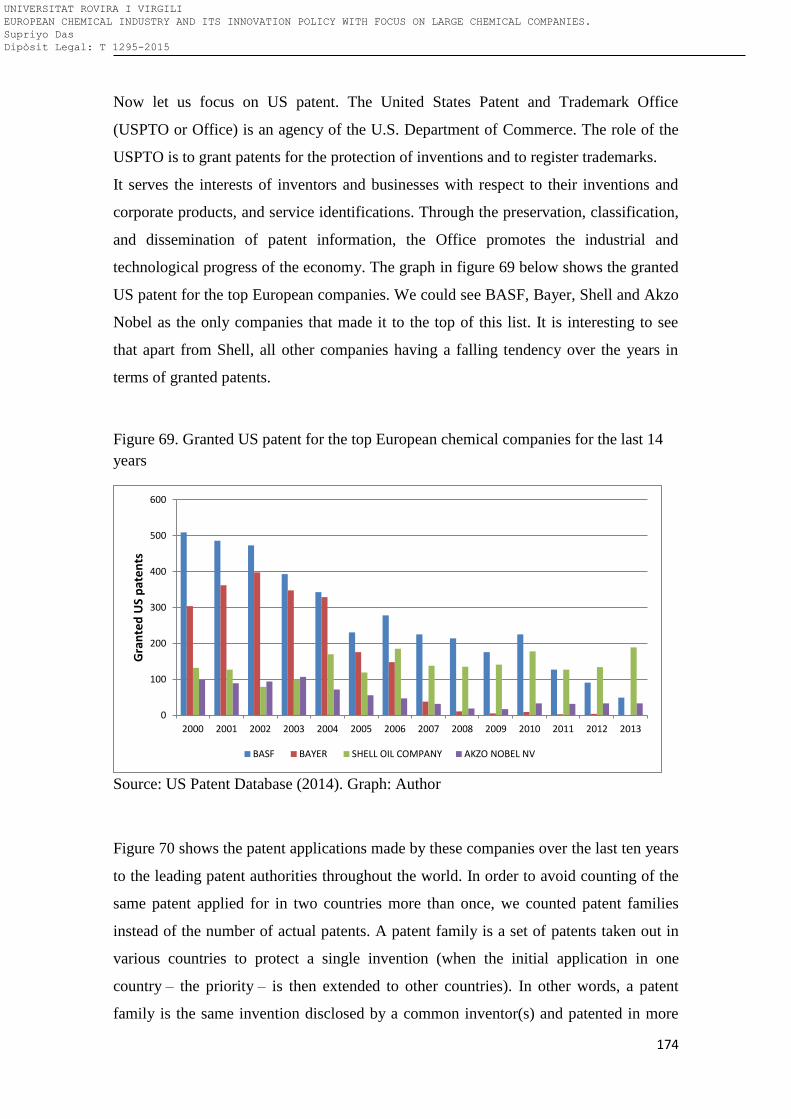
174
Now let us focus on US patent. The United States Patent and Trademark Office
(USPTO or Office) is an agency of the U.S. Department of Commerce. The role of the
USPTO is to grant patents for the protection of inventions and to register trademarks.
It serves the interests of inventors and businesses with respect to their inventions and
corporate products, and service identifications. Through the preservation, classification,
and dissemination of patent information, the Office promotes the industrial and
technological progress of the economy. The graph in figure 69 below shows the granted
US patent for the top European companies. We could see BASF, Bayer, Shell and Akzo
Nobel as the only companies that made it to the top of this list. It is interesting to see
that apart from Shell, all other companies having a falling tendency over the years in
terms of granted patents.
Figure 69. Granted US patent for the top European chemical companies for the last 14
years
Source: US Patent Database (2014). Graph: Author
Figure 70 shows the patent applications made by these companies over the last ten years
to the leading patent authorities throughout the world. In order to avoid counting of the
same patent applied for in two countries more than once, we counted patent families
instead of the number of actual patents. A patent family is a set of patents taken out in
various countries to protect a single invention (when the initial application in one
country – the priority – is then extended to other countries). In other words, a patent
family is the same invention disclosed by a common inventor(s) and patented in more
0
100
200
300
400
500
600
2000 2001 2002 2003 2004 2005 2006 2007 2008 2009 2010 2011 2012 2013
Gra
nte
d U
S p
ate
nts
BASF BAYER SHELL OIL COMPANY AKZO NOBEL NV
UNIVERSITAT ROVIRA I VIRGILI EUROPEAN CHEMICAL INDUSTRY AND ITS INNOVATION POLICY WITH FOCUS ON LARGE CHEMICAL COMPANIES. Supriyo Das Dipòsit Legal: T 1295-2015
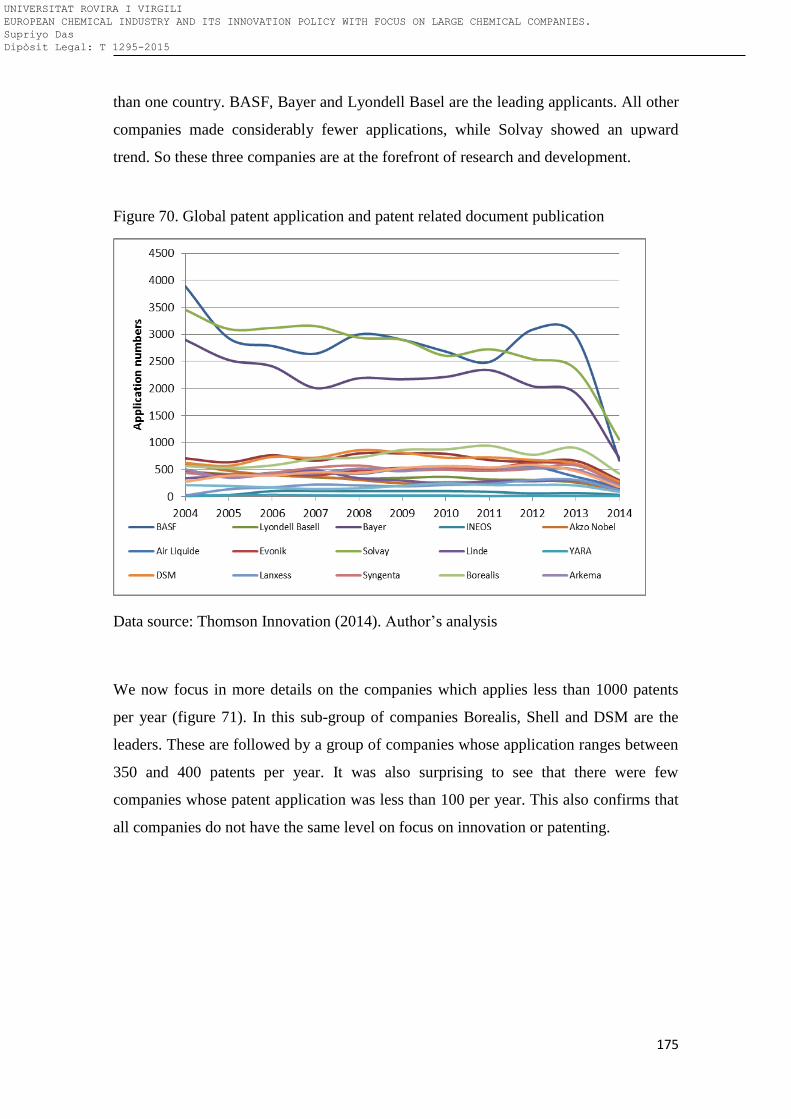
175
than one country. BASF, Bayer and Lyondell Basel are the leading applicants. All other
companies made considerably fewer applications, while Solvay showed an upward
trend. So these three companies are at the forefront of research and development.
Figure 70. Global patent application and patent related document publication
Data source: Thomson Innovation (2014). Author’s analysis
We now focus in more details on the companies which applies less than 1000 patents
per year (figure 71). In this sub-group of companies Borealis, Shell and DSM are the
leaders. These are followed by a group of companies whose application ranges between
350 and 400 patents per year. It was also surprising to see that there were few
companies whose patent application was less than 100 per year. This also confirms that
all companies do not have the same level on focus on innovation or patenting.
UNIVERSITAT ROVIRA I VIRGILI EUROPEAN CHEMICAL INDUSTRY AND ITS INNOVATION POLICY WITH FOCUS ON LARGE CHEMICAL COMPANIES. Supriyo Das Dipòsit Legal: T 1295-2015
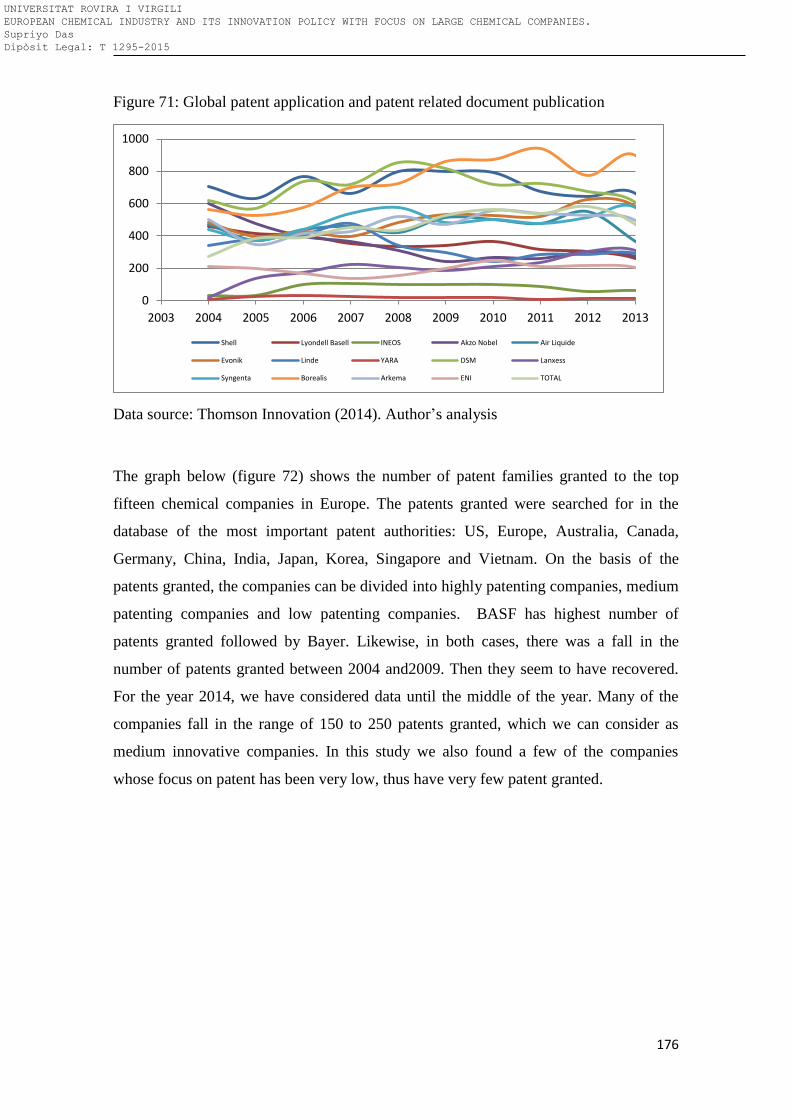
176
Figure 71: Global patent application and patent related document publication
Data source: Thomson Innovation (2014). Author’s analysis
The graph below (figure 72) shows the number of patent families granted to the top
fifteen chemical companies in Europe. The patents granted were searched for in the
database of the most important patent authorities: US, Europe, Australia, Canada,
Germany, China, India, Japan, Korea, Singapore and Vietnam. On the basis of the
patents granted, the companies can be divided into highly patenting companies, medium
patenting companies and low patenting companies. BASF has highest number of
patents granted followed by Bayer. Likewise, in both cases, there was a fall in the
number of patents granted between 2004 and2009. Then they seem to have recovered.
For the year 2014, we have considered data until the middle of the year. Many of the
companies fall in the range of 150 to 250 patents granted, which we can consider as
medium innovative companies. In this study we also found a few of the companies
whose focus on patent has been very low, thus have very few patent granted.
0
200
400
600
800
1000
2003 2004 2005 2006 2007 2008 2009 2010 2011 2012 2013
Shell Lyondell Basell INEOS Akzo Nobel Air Liquide
Evonik Linde YARA DSM Lanxess
Syngenta Borealis Arkema ENI TOTAL
UNIVERSITAT ROVIRA I VIRGILI EUROPEAN CHEMICAL INDUSTRY AND ITS INNOVATION POLICY WITH FOCUS ON LARGE CHEMICAL COMPANIES. Supriyo Das Dipòsit Legal: T 1295-2015
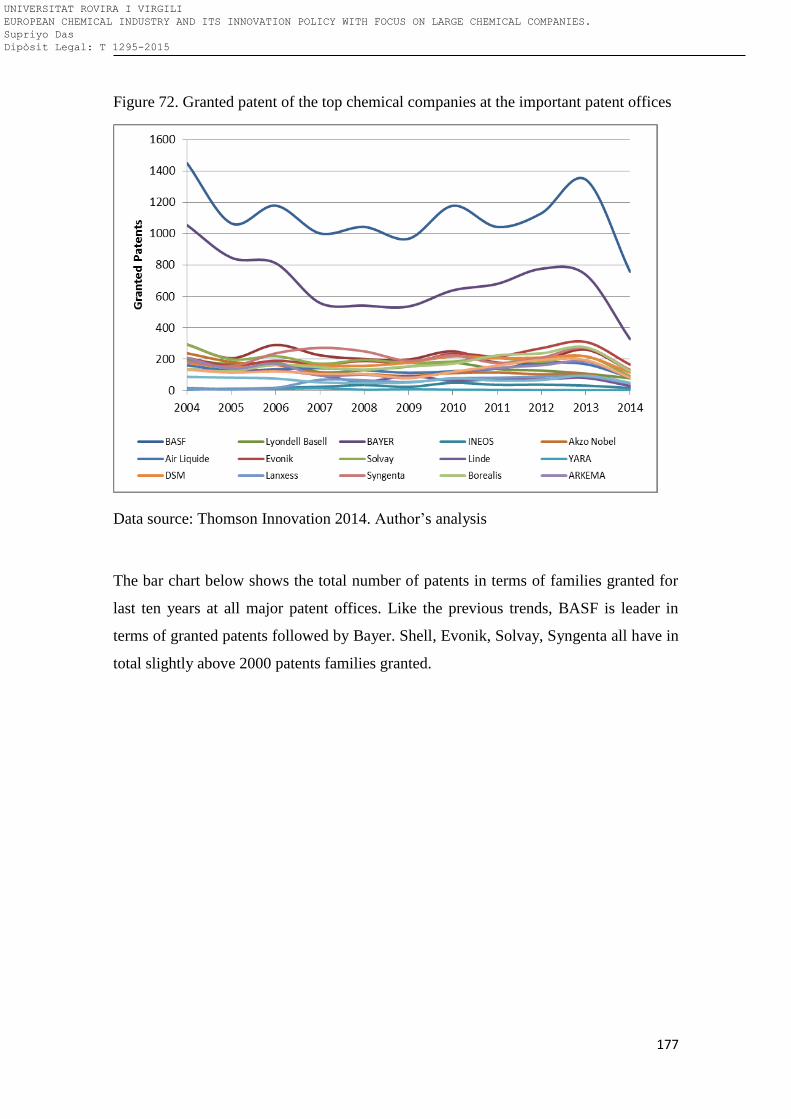
177
Figure 72. Granted patent of the top chemical companies at the important patent offices
Data source: Thomson Innovation 2014. Author’s analysis
The bar chart below shows the total number of patents in terms of families granted for
last ten years at all major patent offices. Like the previous trends, BASF is leader in
terms of granted patents followed by Bayer. Shell, Evonik, Solvay, Syngenta all have in
total slightly above 2000 patents families granted.
UNIVERSITAT ROVIRA I VIRGILI EUROPEAN CHEMICAL INDUSTRY AND ITS INNOVATION POLICY WITH FOCUS ON LARGE CHEMICAL COMPANIES. Supriyo Das Dipòsit Legal: T 1295-2015
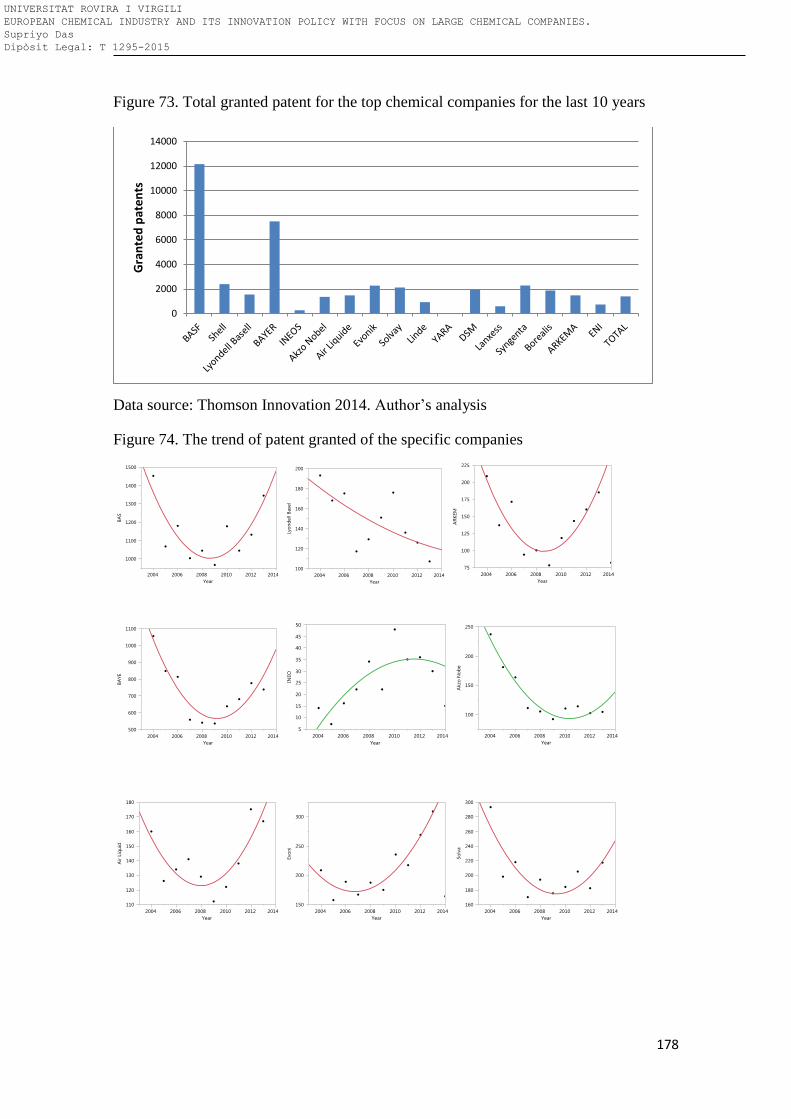
178
Figure 73. Total granted patent for the top chemical companies for the last 10 years
Data source: Thomson Innovation 2014. Author’s analysis
Figure 74. The trend of patent granted of the specific companies
0
2000
4000
6000
8000
10000
12000
14000G
ran
ted
pat
en
ts
UNIVERSITAT ROVIRA I VIRGILI EUROPEAN CHEMICAL INDUSTRY AND ITS INNOVATION POLICY WITH FOCUS ON LARGE CHEMICAL COMPANIES. Supriyo Das Dipòsit Legal: T 1295-2015
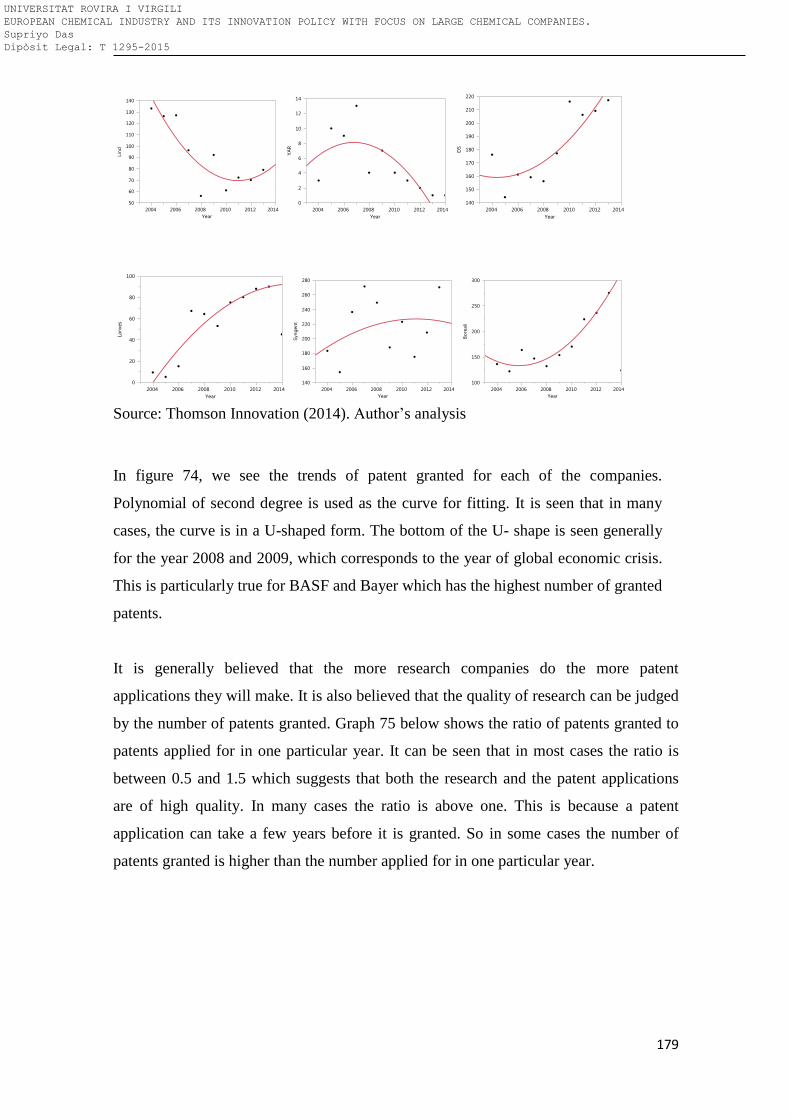
179
Source: Thomson Innovation (2014). Author’s analysis
In figure 74, we see the trends of patent granted for each of the companies.
Polynomial of second degree is used as the curve for fitting. It is seen that in many
cases, the curve is in a U-shaped form. The bottom of the U- shape is seen generally
for the year 2008 and 2009, which corresponds to the year of global economic crisis.
This is particularly true for BASF and Bayer which has the highest number of granted
patents.
It is generally believed that the more research companies do the more patent
applications they will make. It is also believed that the quality of research can be judged
by the number of patents granted. Graph 75 below shows the ratio of patents granted to
patents applied for in one particular year. It can be seen that in most cases the ratio is
between 0.5 and 1.5 which suggests that both the research and the patent applications
are of high quality. In many cases the ratio is above one. This is because a patent
application can take a few years before it is granted. So in some cases the number of
patents granted is higher than the number applied for in one particular year.
UNIVERSITAT ROVIRA I VIRGILI EUROPEAN CHEMICAL INDUSTRY AND ITS INNOVATION POLICY WITH FOCUS ON LARGE CHEMICAL COMPANIES. Supriyo Das Dipòsit Legal: T 1295-2015
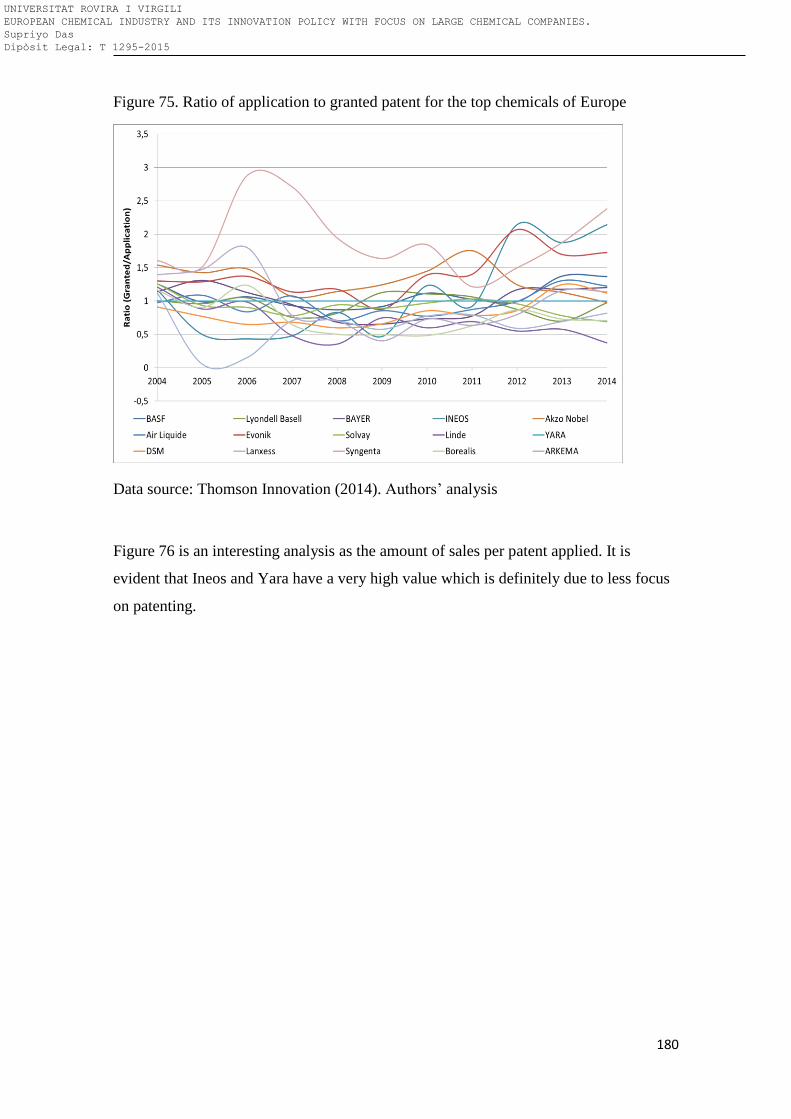
180
Figure 75. Ratio of application to granted patent for the top chemicals of Europe
Data source: Thomson Innovation (2014). Authors’ analysis
Figure 76 is an interesting analysis as the amount of sales per patent applied. It is
evident that Ineos and Yara have a very high value which is definitely due to less focus
on patenting.
UNIVERSITAT ROVIRA I VIRGILI EUROPEAN CHEMICAL INDUSTRY AND ITS INNOVATION POLICY WITH FOCUS ON LARGE CHEMICAL COMPANIES. Supriyo Das Dipòsit Legal: T 1295-2015
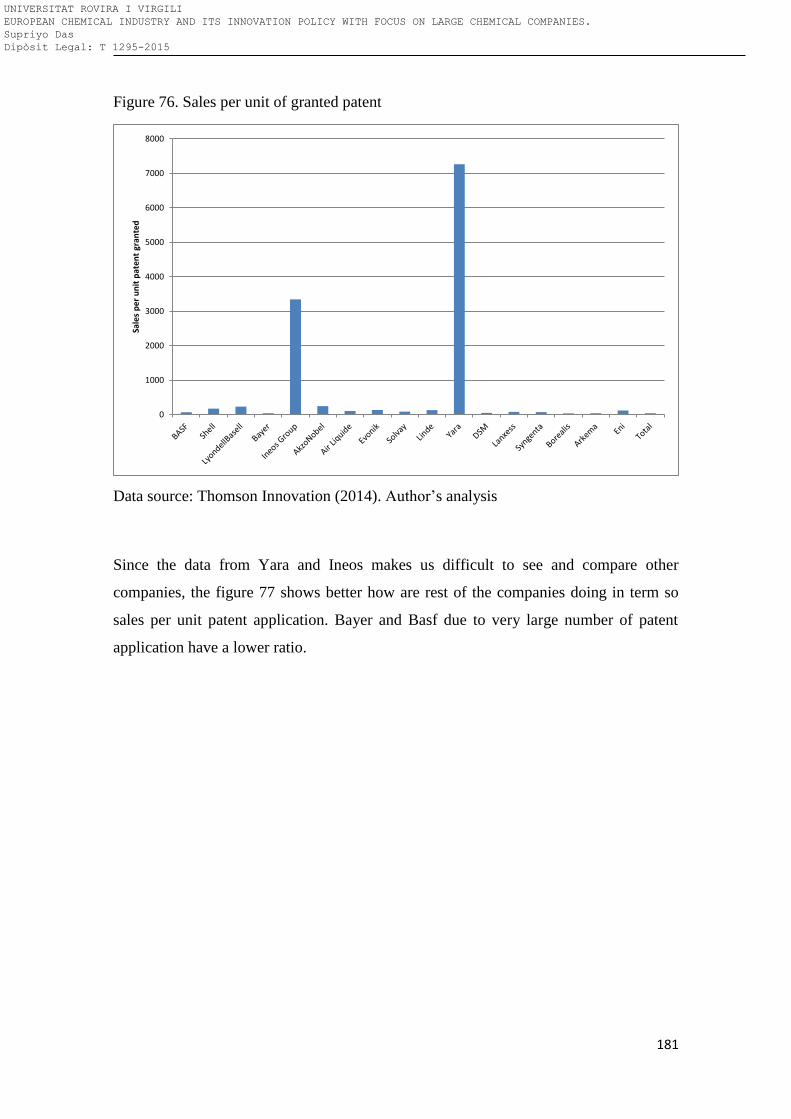
181
Figure 76. Sales per unit of granted patent
Data source: Thomson Innovation (2014). Author’s analysis
Since the data from Yara and Ineos makes us difficult to see and compare other
companies, the figure 77 shows better how are rest of the companies doing in term so
sales per unit patent application. Bayer and Basf due to very large number of patent
application have a lower ratio.
0
1000
2000
3000
4000
5000
6000
7000
8000Sa
les
per
un
it p
aten
t gr
ante
d
UNIVERSITAT ROVIRA I VIRGILI EUROPEAN CHEMICAL INDUSTRY AND ITS INNOVATION POLICY WITH FOCUS ON LARGE CHEMICAL COMPANIES. Supriyo Das Dipòsit Legal: T 1295-2015
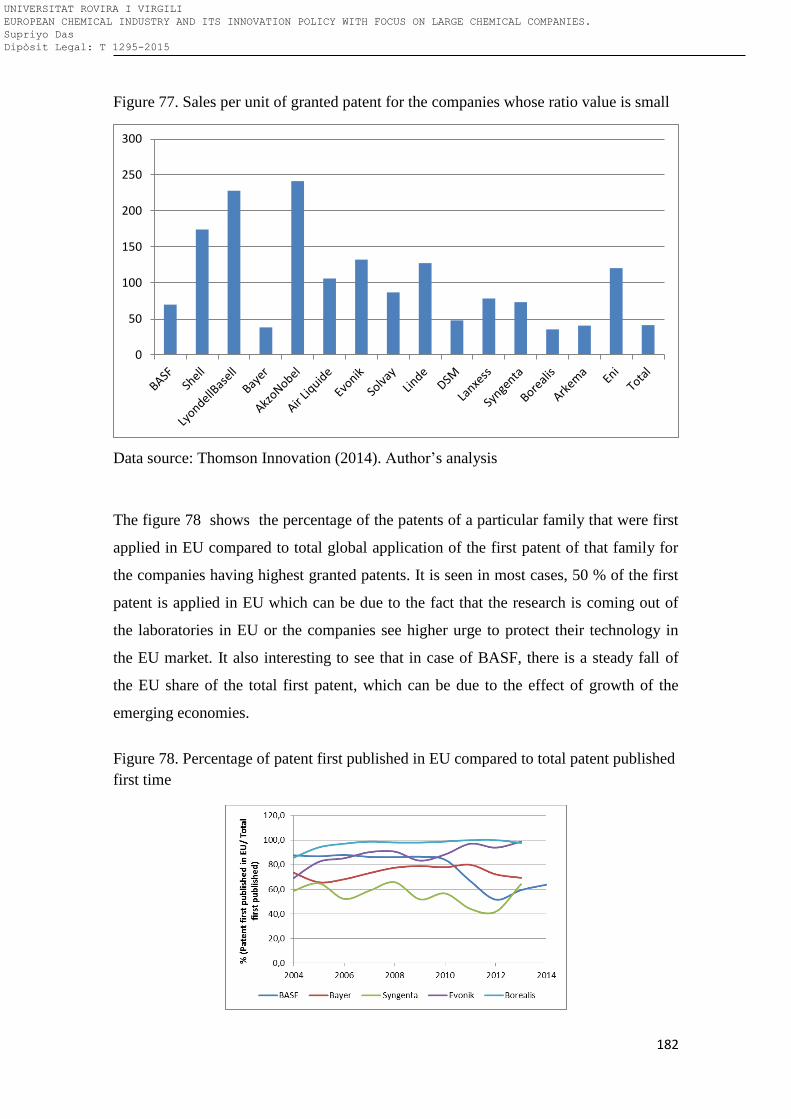
182
Figure 77. Sales per unit of granted patent for the companies whose ratio value is small
Data source: Thomson Innovation (2014). Author’s analysis
The figure 78 shows the percentage of the patents of a particular family that were first
applied in EU compared to total global application of the first patent of that family for
the companies having highest granted patents. It is seen in most cases, 50 % of the first
patent is applied in EU which can be due to the fact that the research is coming out of
the laboratories in EU or the companies see higher urge to protect their technology in
the EU market. It also interesting to see that in case of BASF, there is a steady fall of
the EU share of the total first patent, which can be due to the effect of growth of the
emerging economies.
Figure 78. Percentage of patent first published in EU compared to total patent published
first time
0
50
100
150
200
250
300
UNIVERSITAT ROVIRA I VIRGILI EUROPEAN CHEMICAL INDUSTRY AND ITS INNOVATION POLICY WITH FOCUS ON LARGE CHEMICAL COMPANIES. Supriyo Das Dipòsit Legal: T 1295-2015
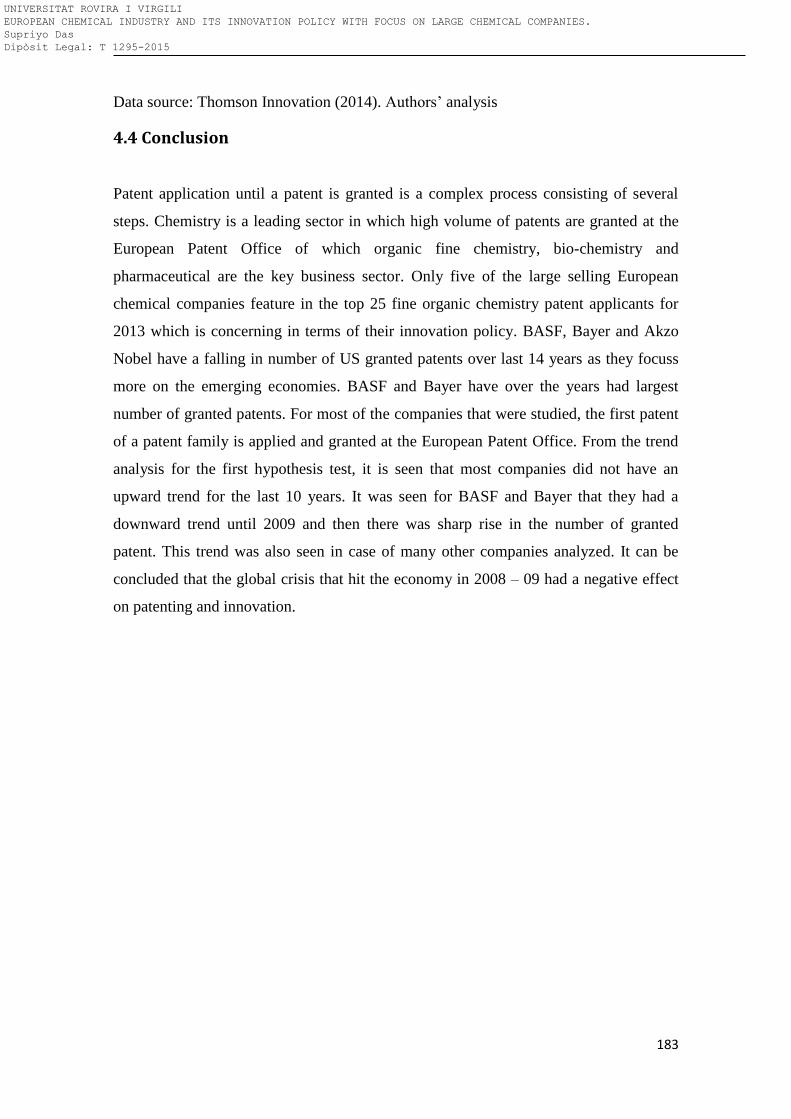
183
Data source: Thomson Innovation (2014). Authors’ analysis
4.4 Conclusion
Patent application until a patent is granted is a complex process consisting of several
steps. Chemistry is a leading sector in which high volume of patents are granted at the
European Patent Office of which organic fine chemistry, bio-chemistry and
pharmaceutical are the key business sector. Only five of the large selling European
chemical companies feature in the top 25 fine organic chemistry patent applicants for
2013 which is concerning in terms of their innovation policy. BASF, Bayer and Akzo
Nobel have a falling in number of US granted patents over last 14 years as they focuss
more on the emerging economies. BASF and Bayer have over the years had largest
number of granted patents. For most of the companies that were studied, the first patent
of a patent family is applied and granted at the European Patent Office. From the trend
analysis for the first hypothesis test, it is seen that most companies did not have an
upward trend for the last 10 years. It was seen for BASF and Bayer that they had a
downward trend until 2009 and then there was sharp rise in the number of granted
patent. This trend was also seen in case of many other companies analyzed. It can be
concluded that the global crisis that hit the economy in 2008 – 09 had a negative effect
on patenting and innovation.
UNIVERSITAT ROVIRA I VIRGILI EUROPEAN CHEMICAL INDUSTRY AND ITS INNOVATION POLICY WITH FOCUS ON LARGE CHEMICAL COMPANIES. Supriyo Das Dipòsit Legal: T 1295-2015
184
4.5 Bibliography
European Patent Office. (2014). European patents and patent applications - 2013
statistics. Retrieved from http://www.epo.org/about-us/annual-reports-
statistics/statistics.html
Inventor Basics. (2014). Inventor Bascics. Retrieved from
http://www.inventorbasics.com/Patent%20Process.htm
Thomson Innovation 2014. (2014). Thomson Innovation Database: Thomson Reuter.
Retrieved from https://www.thomsoninnovation.com/login
US Patent Agency. (2014). Statistics. Retrieved from http://www.uspto.gov/about/stats/
Wikipedia. (2014). Innovation. Retrieved from http://en.wikipedia.org/wiki/Innovation
Wikipedia1. (2014), Patent. Retrieved from http://en.wikipedia.org/wiki/Patent
UNIVERSITAT ROVIRA I VIRGILI EUROPEAN CHEMICAL INDUSTRY AND ITS INNOVATION POLICY WITH FOCUS ON LARGE CHEMICAL COMPANIES. Supriyo Das Dipòsit Legal: T 1295-2015
185
7.R&D spending of the top European chemical companies
Contents
7.1 Introduction: ........................................................................................................................ 186
7.2 R&D Spending ..................................................................................................................... 186
7.3 Further R&D spending studies for specific companies ....................................... 193
7.4 Conclusion ............................................................................................................................ 194
7.5 Bibliography ........................................................................................................................ 195
UNIVERSITAT ROVIRA I VIRGILI EUROPEAN CHEMICAL INDUSTRY AND ITS INNOVATION POLICY WITH FOCUS ON LARGE CHEMICAL COMPANIES. Supriyo Das Dipòsit Legal: T 1295-2015
186
7.1 Introduction:
European leadership in science, research and technology is the pillar to becoming a key
player in the field of innovation. While innovation is more than research and
development, the link between research in chemistry (and related sciences) and
innovation is particularly strong in the chemicals industry. Overall, it is necessary to
increase the quantity of research. Excellence in science and research must get more
opportunities to unfold its inherent impact on open innovation along technology driven
paths. In general, companies are urged to review their R&D plans and to extend
corporate research programmes to medium and long term objectives. In this chapter we
will test the second hypothesis of this research, i.e. if the large chemical companies
which are headquartered in Europe are increasing their R&D activities by spending
more in R&D. The R&D spending is studied both globally over different regions in the
chemical sector. Then a deep drill is made to understand the R&D spending and R&D
intensity of the companies under study. A bivariate analysis is made to see if there is
any relationship between patent application and R&D spending.
7.2 R&D Spending
Product innovation, competitiveness, sustainability and resource efficiency provide
important opportunities for differentiation and, potentially, growth. Innovation will have
high positive impacts in economic terms such as improving the performance and
competitiveness of existing industries, the development of new industries and solutions
as in products and services; in social terms, such as keeping and creating new high
value-added jobs and leading to healthier and more comfortable lives; and in
environmental terms such as reducing the pressure on our resources by increased
efficiency through optimised production processes and products.
UNIVERSITAT ROVIRA I VIRGILI EUROPEAN CHEMICAL INDUSTRY AND ITS INNOVATION POLICY WITH FOCUS ON LARGE CHEMICAL COMPANIES. Supriyo Das Dipòsit Legal: T 1295-2015
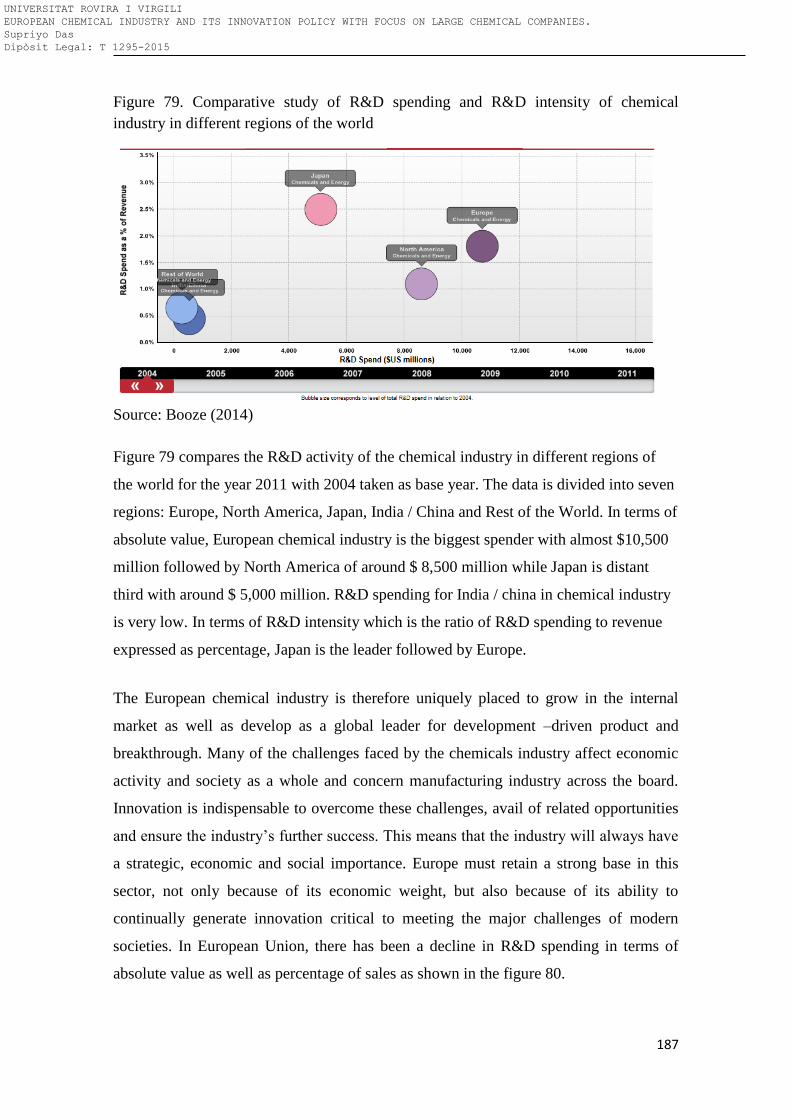
187
Figure 79. Comparative study of R&D spending and R&D intensity of chemical
industry in different regions of the world
Source: Booze (2014)
Figure 79 compares the R&D activity of the chemical industry in different regions of
the world for the year 2011 with 2004 taken as base year. The data is divided into seven
regions: Europe, North America, Japan, India / China and Rest of the World. In terms of
absolute value, European chemical industry is the biggest spender with almost $10,500
million followed by North America of around $ 8,500 million while Japan is distant
third with around $ 5,000 million. R&D spending for India / china in chemical industry
is very low. In terms of R&D intensity which is the ratio of R&D spending to revenue
expressed as percentage, Japan is the leader followed by Europe.
The European chemical industry is therefore uniquely placed to grow in the internal
market as well as develop as a global leader for development –driven product and
breakthrough. Many of the challenges faced by the chemicals industry affect economic
activity and society as a whole and concern manufacturing industry across the board.
Innovation is indispensable to overcome these challenges, avail of related opportunities
and ensure the industry’s further success. This means that the industry will always have
a strategic, economic and social importance. Europe must retain a strong base in this
sector, not only because of its economic weight, but also because of its ability to
continually generate innovation critical to meeting the major challenges of modern
societies. In European Union, there has been a decline in R&D spending in terms of
absolute value as well as percentage of sales as shown in the figure 80.
UNIVERSITAT ROVIRA I VIRGILI EUROPEAN CHEMICAL INDUSTRY AND ITS INNOVATION POLICY WITH FOCUS ON LARGE CHEMICAL COMPANIES. Supriyo Das Dipòsit Legal: T 1295-2015
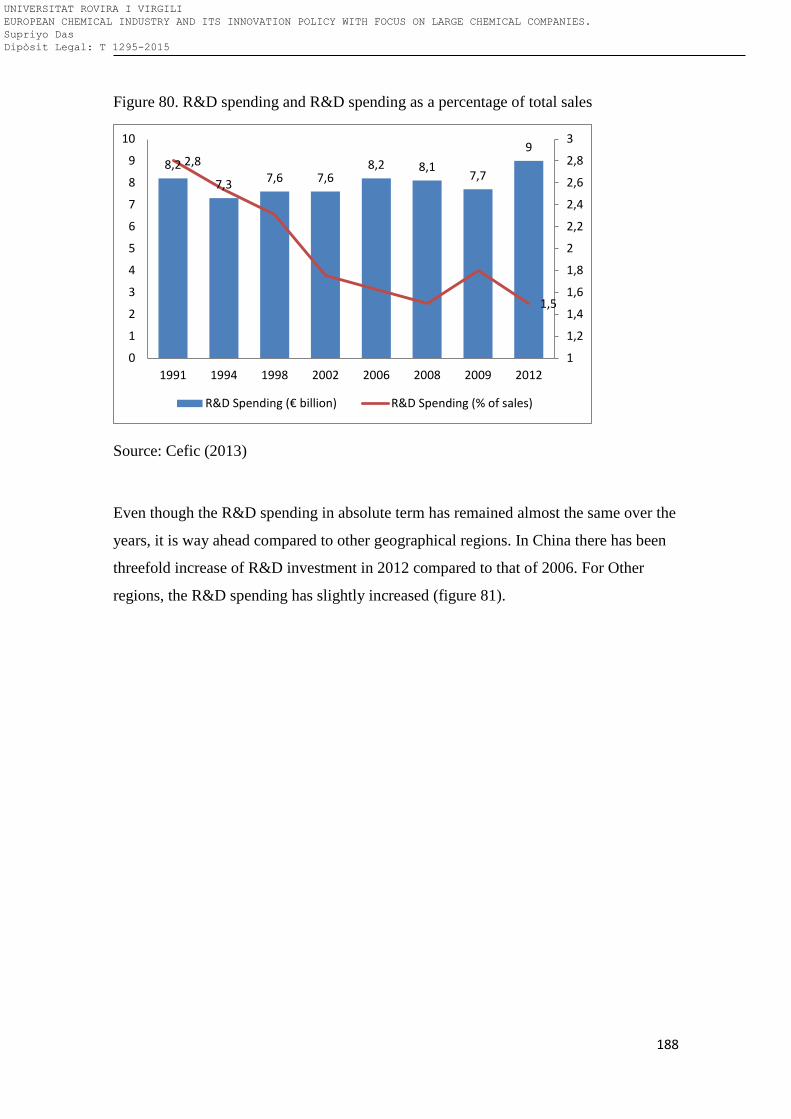
188
Figure 80. R&D spending and R&D spending as a percentage of total sales
Source: Cefic (2013)
Even though the R&D spending in absolute term has remained almost the same over the
years, it is way ahead compared to other geographical regions. In China there has been
threefold increase of R&D investment in 2012 compared to that of 2006. For Other
regions, the R&D spending has slightly increased (figure 81).
8,2
7,3 7,6 7,6 8,2 8,1
7,7
9 2,8
1,5
1
1,2
1,4
1,6
1,8
2
2,2
2,4
2,6
2,8
3
0
1
2
3
4
5
6
7
8
9
10
1991 1994 1998 2002 2006 2008 2009 2012
R&D Spending (€ billion) R&D Spending (% of sales)
UNIVERSITAT ROVIRA I VIRGILI EUROPEAN CHEMICAL INDUSTRY AND ITS INNOVATION POLICY WITH FOCUS ON LARGE CHEMICAL COMPANIES. Supriyo Das Dipòsit Legal: T 1295-2015
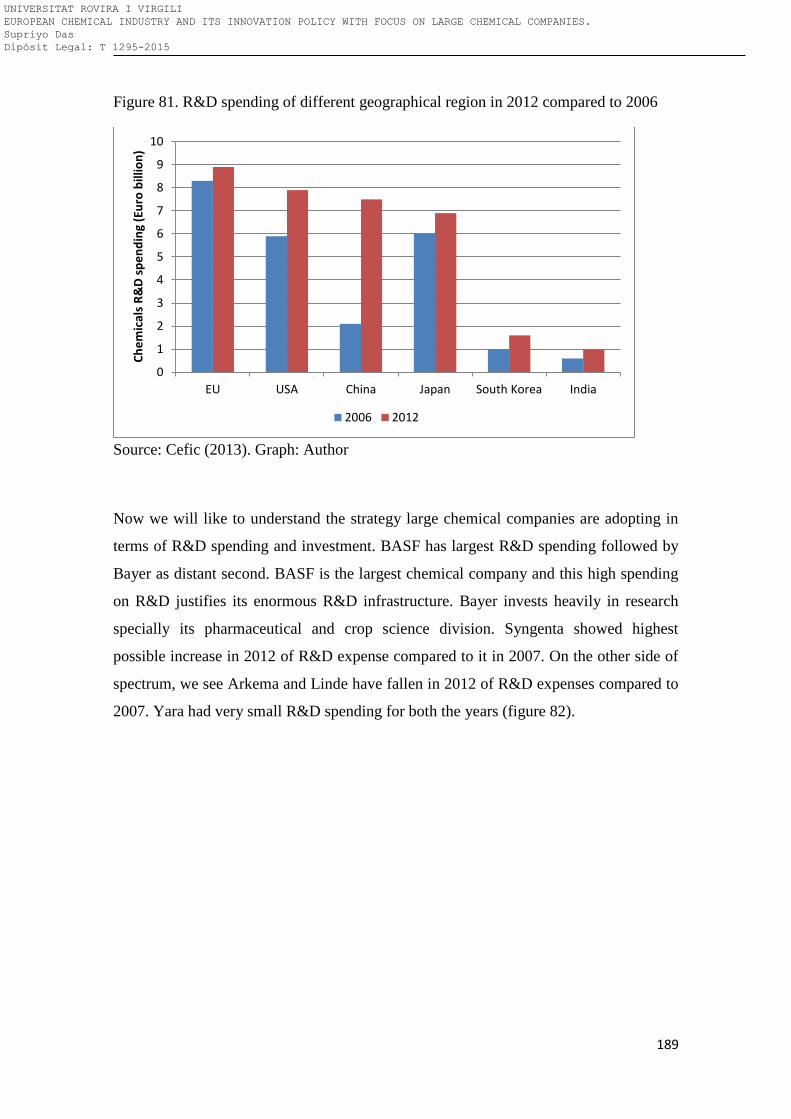
189
Figure 81. R&D spending of different geographical region in 2012 compared to 2006
Source: Cefic (2013). Graph: Author
Now we will like to understand the strategy large chemical companies are adopting in
terms of R&D spending and investment. BASF has largest R&D spending followed by
Bayer as distant second. BASF is the largest chemical company and this high spending
on R&D justifies its enormous R&D infrastructure. Bayer invests heavily in research
specially its pharmaceutical and crop science division. Syngenta showed highest
possible increase in 2012 of R&D expense compared to it in 2007. On the other side of
spectrum, we see Arkema and Linde have fallen in 2012 of R&D expenses compared to
2007. Yara had very small R&D spending for both the years (figure 82).
0
1
2
3
4
5
6
7
8
9
10
EU USA China Japan South Korea India
Ch
em
ical
s R
&D
sp
en
din
g (E
uro
bill
ion
)
2006 2012
UNIVERSITAT ROVIRA I VIRGILI EUROPEAN CHEMICAL INDUSTRY AND ITS INNOVATION POLICY WITH FOCUS ON LARGE CHEMICAL COMPANIES. Supriyo Das Dipòsit Legal: T 1295-2015
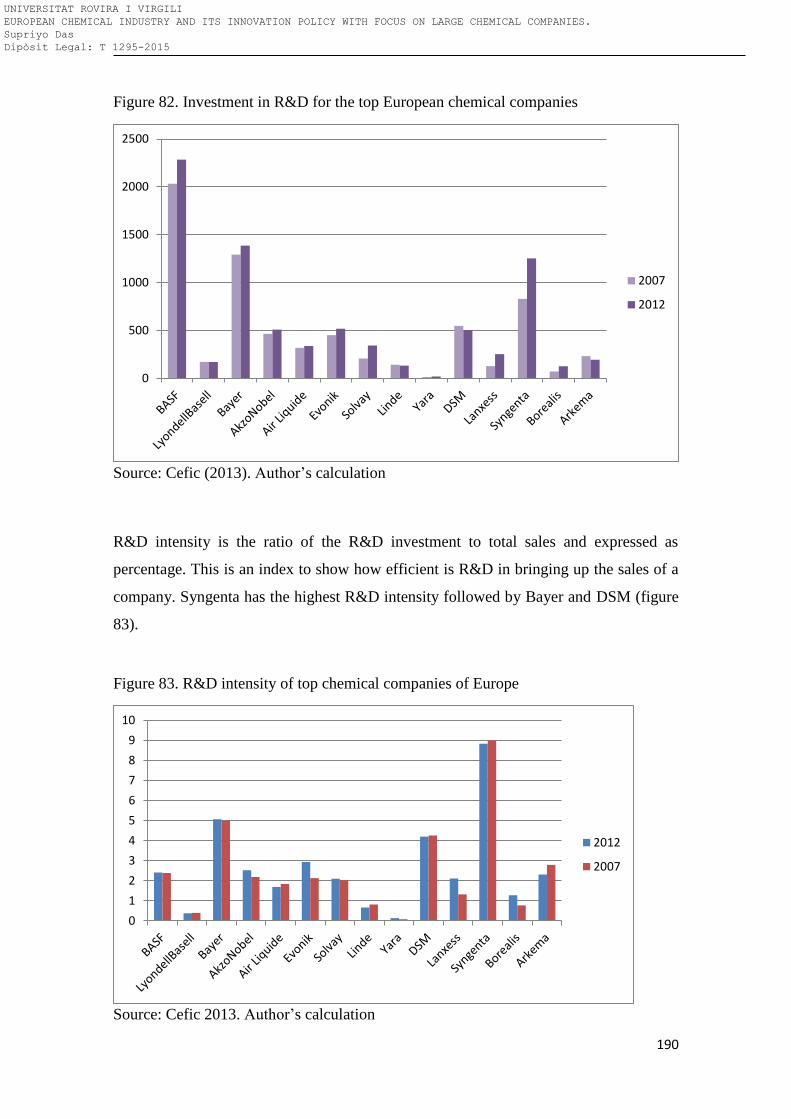
190
Figure 82. Investment in R&D for the top European chemical companies
Source: Cefic (2013). Author’s calculation
R&D intensity is the ratio of the R&D investment to total sales and expressed as
percentage. This is an index to show how efficient is R&D in bringing up the sales of a
company. Syngenta has the highest R&D intensity followed by Bayer and DSM (figure
83).
Figure 83. R&D intensity of top chemical companies of Europe
Source: Cefic 2013. Author’s calculation
0
500
1000
1500
2000
2500
2007
2012
0
1
2
3
4
5
6
7
8
9
10
2012
2007
UNIVERSITAT ROVIRA I VIRGILI EUROPEAN CHEMICAL INDUSTRY AND ITS INNOVATION POLICY WITH FOCUS ON LARGE CHEMICAL COMPANIES. Supriyo Das Dipòsit Legal: T 1295-2015
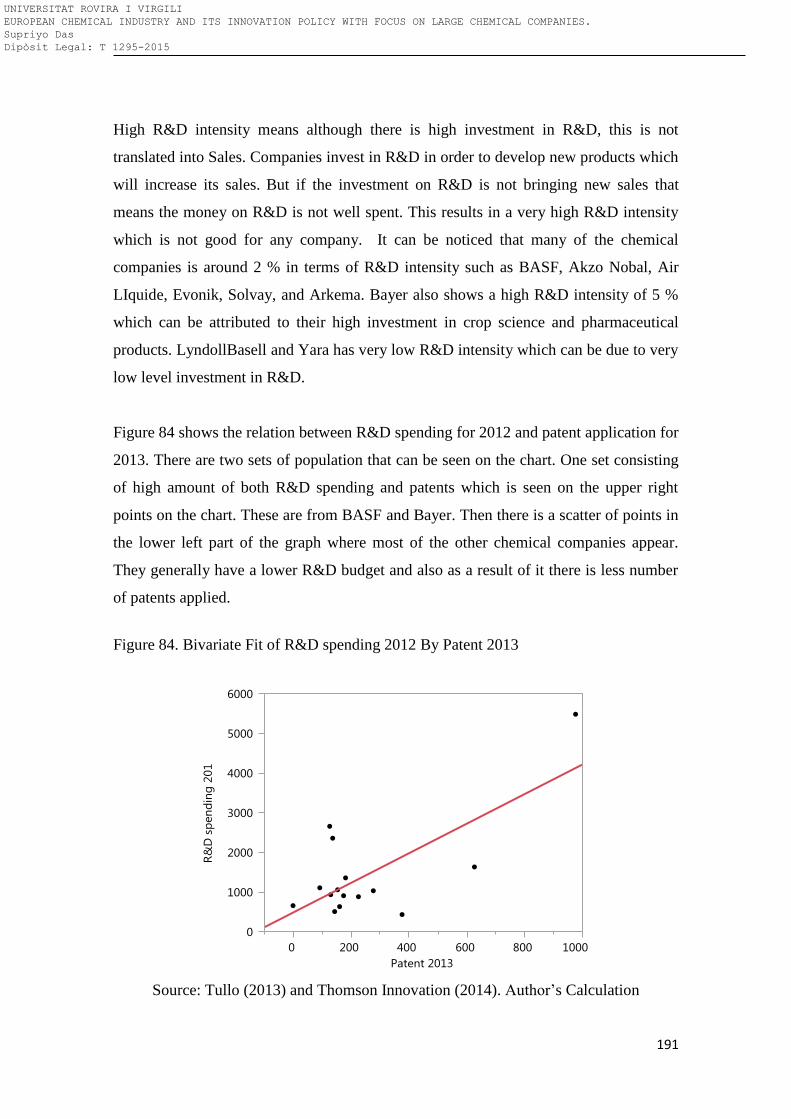
191
High R&D intensity means although there is high investment in R&D, this is not
translated into Sales. Companies invest in R&D in order to develop new products which
will increase its sales. But if the investment on R&D is not bringing new sales that
means the money on R&D is not well spent. This results in a very high R&D intensity
which is not good for any company. It can be noticed that many of the chemical
companies is around 2 % in terms of R&D intensity such as BASF, Akzo Nobal, Air
LIquide, Evonik, Solvay, and Arkema. Bayer also shows a high R&D intensity of 5 %
which can be attributed to their high investment in crop science and pharmaceutical
products. LyndollBasell and Yara has very low R&D intensity which can be due to very
low level investment in R&D.
Figure 84 shows the relation between R&D spending for 2012 and patent application for
2013. There are two sets of population that can be seen on the chart. One set consisting
of high amount of both R&D spending and patents which is seen on the upper right
points on the chart. These are from BASF and Bayer. Then there is a scatter of points in
the lower left part of the graph where most of the other chemical companies appear.
They generally have a lower R&D budget and also as a result of it there is less number
of patents applied.
Figure 84. Bivariate Fit of R&D spending 2012 By Patent 2013
Source: Tullo (2013) and Thomson Innovation (2014). Author’s Calculation
UNIVERSITAT ROVIRA I VIRGILI EUROPEAN CHEMICAL INDUSTRY AND ITS INNOVATION POLICY WITH FOCUS ON LARGE CHEMICAL COMPANIES. Supriyo Das Dipòsit Legal: T 1295-2015
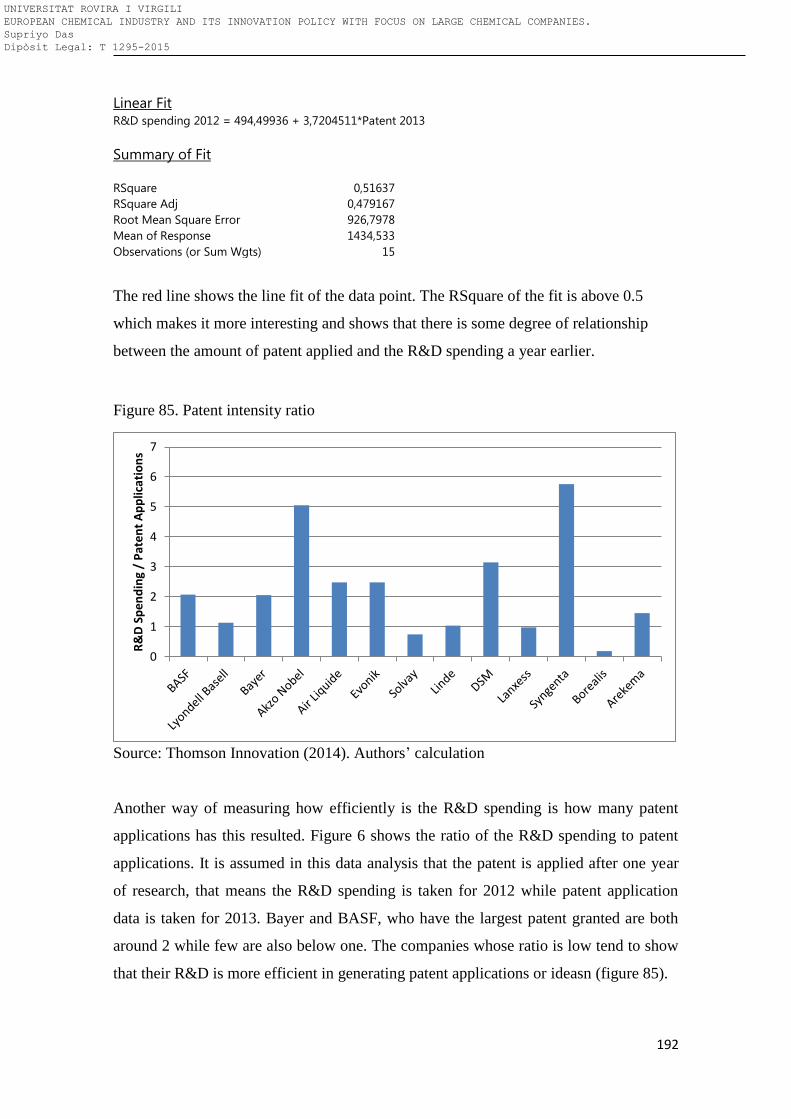
192
Linear Fit R&D spending 2012 = 494,49936 + 3,7204511*Patent 2013
Summary of Fit
RSquare 0,51637
RSquare Adj 0,479167
Root Mean Square Error 926,7978
Mean of Response 1434,533
Observations (or Sum Wgts) 15
The red line shows the line fit of the data point. The RSquare of the fit is above 0.5
which makes it more interesting and shows that there is some degree of relationship
between the amount of patent applied and the R&D spending a year earlier.
Figure 85. Patent intensity ratio
Source: Thomson Innovation (2014). Authors’ calculation
Another way of measuring how efficiently is the R&D spending is how many patent
applications has this resulted. Figure 6 shows the ratio of the R&D spending to patent
applications. It is assumed in this data analysis that the patent is applied after one year
of research, that means the R&D spending is taken for 2012 while patent application
data is taken for 2013. Bayer and BASF, who have the largest patent granted are both
around 2 while few are also below one. The companies whose ratio is low tend to show
that their R&D is more efficient in generating patent applications or ideasn (figure 85).
0
1
2
3
4
5
6
7
R&
D S
pe
nd
ing
/ P
ate
nt
Ap
plic
atio
ns
UNIVERSITAT ROVIRA I VIRGILI EUROPEAN CHEMICAL INDUSTRY AND ITS INNOVATION POLICY WITH FOCUS ON LARGE CHEMICAL COMPANIES. Supriyo Das Dipòsit Legal: T 1295-2015
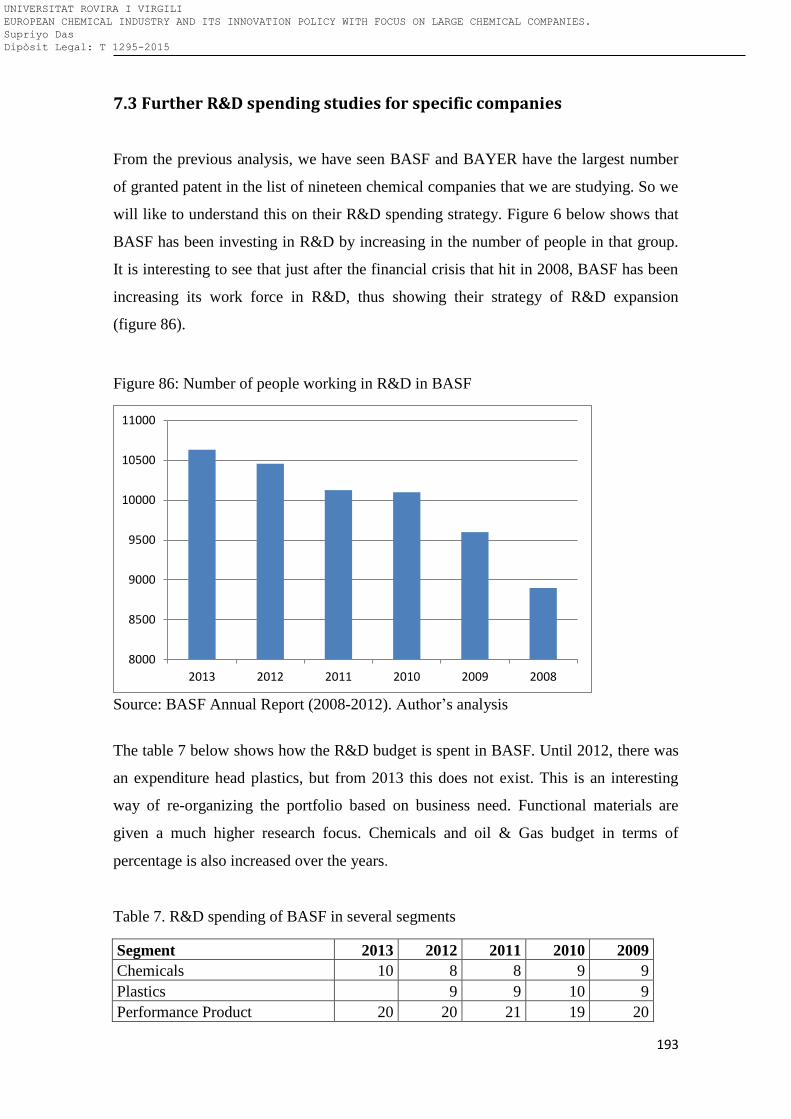
193
7.3 Further R&D spending studies for specific companies
From the previous analysis, we have seen BASF and BAYER have the largest number
of granted patent in the list of nineteen chemical companies that we are studying. So we
will like to understand this on their R&D spending strategy. Figure 6 below shows that
BASF has been investing in R&D by increasing in the number of people in that group.
It is interesting to see that just after the financial crisis that hit in 2008, BASF has been
increasing its work force in R&D, thus showing their strategy of R&D expansion
(figure 86).
Figure 86: Number of people working in R&D in BASF
Source: BASF Annual Report (2008-2012). Author’s analysis
The table 7 below shows how the R&D budget is spent in BASF. Until 2012, there was
an expenditure head plastics, but from 2013 this does not exist. This is an interesting
way of re-organizing the portfolio based on business need. Functional materials are
given a much higher research focus. Chemicals and oil & Gas budget in terms of
percentage is also increased over the years.
Table 7. R&D spending of BASF in several segments
Segment 2013 2012 2011 2010 2009
Chemicals 10 8 8 9 9
Plastics 9 9 10 9
Performance Product 20 20 21 19 20
8000
8500
9000
9500
10000
10500
11000
2013 2012 2011 2010 2009 2008
UNIVERSITAT ROVIRA I VIRGILI EUROPEAN CHEMICAL INDUSTRY AND ITS INNOVATION POLICY WITH FOCUS ON LARGE CHEMICAL COMPANIES. Supriyo Das Dipòsit Legal: T 1295-2015
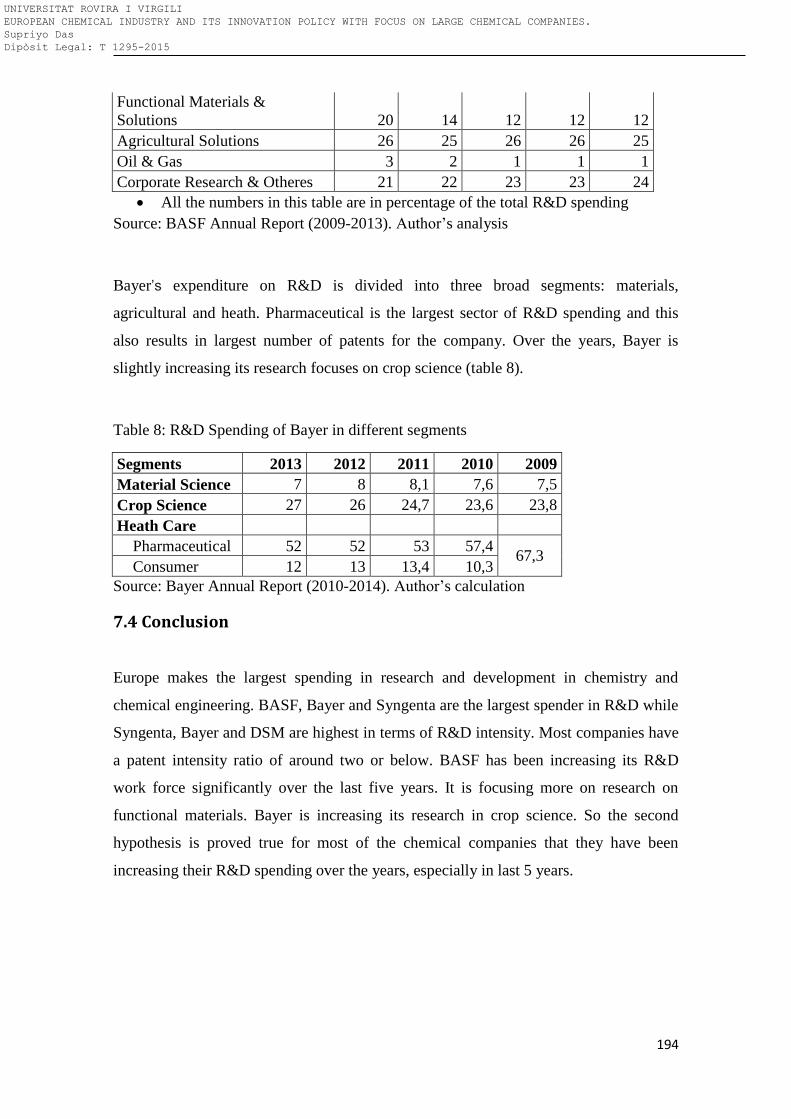
194
Functional Materials &
Solutions 20 14 12 12 12
Agricultural Solutions 26 25 26 26 25
Oil & Gas 3 2 1 1 1
Corporate Research & Otheres 21 22 23 23 24
All the numbers in this table are in percentage of the total R&D spending
Source: BASF Annual Report (2009-2013). Author’s analysis
Bayer’s expenditure on R&D is divided into three broad segments: materials,
agricultural and heath. Pharmaceutical is the largest sector of R&D spending and this
also results in largest number of patents for the company. Over the years, Bayer is
slightly increasing its research focuses on crop science (table 8).
Table 8: R&D Spending of Bayer in different segments
Segments 2013 2012 2011 2010 2009
Material Science 7 8 8,1 7,6 7,5
Crop Science 27 26 24,7 23,6 23,8
Heath Care
Pharmaceutical 52 52 53 57,4 67,3
Consumer 12 13 13,4 10,3
Source: Bayer Annual Report (2010-2014). Author’s calculation
7.4 Conclusion
Europe makes the largest spending in research and development in chemistry and
chemical engineering. BASF, Bayer and Syngenta are the largest spender in R&D while
Syngenta, Bayer and DSM are highest in terms of R&D intensity. Most companies have
a patent intensity ratio of around two or below. BASF has been increasing its R&D
work force significantly over the last five years. It is focusing more on research on
functional materials. Bayer is increasing its research in crop science. So the second
hypothesis is proved true for most of the chemical companies that they have been
increasing their R&D spending over the years, especially in last 5 years.
UNIVERSITAT ROVIRA I VIRGILI EUROPEAN CHEMICAL INDUSTRY AND ITS INNOVATION POLICY WITH FOCUS ON LARGE CHEMICAL COMPANIES. Supriyo Das Dipòsit Legal: T 1295-2015
195
7.5 Bibliography
Booz & Co. (2014). The 2014 Global Innovation 1000: Proven paths to innovation
success. Retrieved from http://www.strategyand.pwc.com/global/home/what-we-
think/global-innovation-
1000?utm_source=VanityURL&utm_content=innovation1000&utm_medium=redirect
&utm_campaign=inov1000
Cefic. (2013). The European Chemical Industry Council: Facts and Figures 2012.
Retrieved from: http://www.cefic.org/Facts-and-Figures/
Thomson Innovation 2014. (2014). Thomson Innovation Database: Thomson
Reuter[Data file and database]. Retrieved from
https://www.thomsoninnovation.com/login
Tullo, A. (2013). Global Top 50 C&EN’s 2013 survey shows leading chemical firms
are pausing after a period of growth. C&EN Chemical Engineering News, 91 (30), 13-
16.
UNIVERSITAT ROVIRA I VIRGILI EUROPEAN CHEMICAL INDUSTRY AND ITS INNOVATION POLICY WITH FOCUS ON LARGE CHEMICAL COMPANIES. Supriyo Das Dipòsit Legal: T 1295-2015

196
UNIVERSITAT ROVIRA I VIRGILI EUROPEAN CHEMICAL INDUSTRY AND ITS INNOVATION POLICY WITH FOCUS ON LARGE CHEMICAL COMPANIES. Supriyo Das Dipòsit Legal: T 1295-2015
197
8. Innovation through Merger and Acquisition
Contents
8.1 Introduction ............................................................................................................................... 198
8.2 Merger, Acquisition and innovation matrix .................................................................. 199
8.3 Acquisitions and Mergers of European of chemical companies around the world
................................................................................................................................................................ 201
8.4 Top European companies acquisition strategy ........................................................... 203
8.5 Individual company analysis............................................................................................... 205
8.6 Conclusion .................................................................................................................................. 218
8.7 Bibliography .............................................................................................................................. 220
UNIVERSITAT ROVIRA I VIRGILI EUROPEAN CHEMICAL INDUSTRY AND ITS INNOVATION POLICY WITH FOCUS ON LARGE CHEMICAL COMPANIES. Supriyo Das Dipòsit Legal: T 1295-2015
198
8.1 Introduction
An extensive body of research establishes that firms spend considerable amount of
resources to acquire other firms in order to promote growth, improve efficiency, achieve
risk reduction, and secure competitive advantage with respect to competitors in the
product market. Both Merger and Acqusition (M&A) and innovation are instruments for
growth and competitive advantage. Therefore they are fundamental to each firm’s
competitive strategy. Usually, both instruments have been studied separately, but much
less in conjunction. Although we have a detailed understanding of these traditional
motives of M&A, there has been relatively little research on the effect of M&A activity
on the innovation output of a firm This is unfortunate as both processes – the process of
innovation and the process of mergers and acquisitions - are intimately connected. The
impact of mergers on innovation can only be rigorously assessed, if the converse
direction of influence - mergers caused by innovation - is accounted for. Therefore this
review tries to take a balanced view on both processes and to point out links between
them. Nevertheless, the focus is on the impact of mergers on innovation. In this chapter
we will test the third hypothesis of this research that is if the large chemical companies
take M & A to acquire innovation.
UNIVERSITAT ROVIRA I VIRGILI EUROPEAN CHEMICAL INDUSTRY AND ITS INNOVATION POLICY WITH FOCUS ON LARGE CHEMICAL COMPANIES. Supriyo Das Dipòsit Legal: T 1295-2015
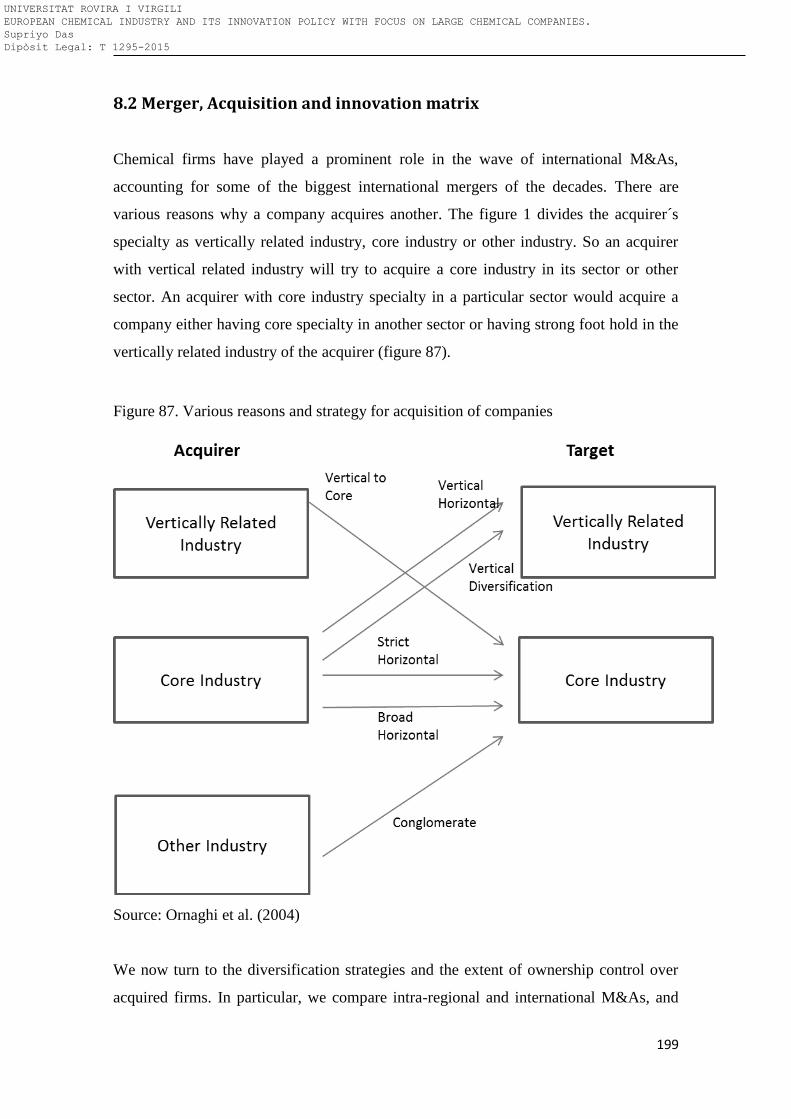
199
8.2 Merger, Acquisition and innovation matrix
Chemical firms have played a prominent role in the wave of international M&As,
accounting for some of the biggest international mergers of the decades. There are
various reasons why a company acquires another. The figure 1 divides the acquirer´s
specialty as vertically related industry, core industry or other industry. So an acquirer
with vertical related industry will try to acquire a core industry in its sector or other
sector. An acquirer with core industry specialty in a particular sector would acquire a
company either having core specialty in another sector or having strong foot hold in the
vertically related industry of the acquirer (figure 87).
Figure 87. Various reasons and strategy for acquisition of companies
Source: Ornaghi et al. (2004)
We now turn to the diversification strategies and the extent of ownership control over
acquired firms. In particular, we compare intra-regional and international M&As, and
UNIVERSITAT ROVIRA I VIRGILI EUROPEAN CHEMICAL INDUSTRY AND ITS INNOVATION POLICY WITH FOCUS ON LARGE CHEMICAL COMPANIES. Supriyo Das Dipòsit Legal: T 1295-2015
200
attempt to provide explanations for these differences when they exist. We pay particular
attention to the R&D intensity of the industries. Using standard industrial code (SIC
code) of the target and the acquiring companiesand the distinction between core
chemicals and vertically related industries, we identified six different diversition
strategy as explained earlier in the figure above. When both companies belong to core
chemicals, there are two types of acqusitions: Strict and Broad horizontal. When the
acquirer had a product line in core chemicals and the target firm belongs to one of the
vertically related industries, we get vertical integration. Vertical-Horizontal is the case
when the acquiring company was already present in the target firm´s industry and
vertical diversification is the opposite of it. Figure 88 breaks down the acquisition deals
over the last 10 years involving chemical companies according to region. The dark
green bars show the number of deals in which the acquirer was located in a particular
geographical region. The fact that the acquirer is located in a particular geographical
region does not mean that the target is also located there. The light green bars show the
geographical location of the target company.
Most of the deals were in Asia followed by Europe and North America. As we have
already discussed, the purpose of the acquisition is to grow in the current market or
diversify in the newer market. In many of the deals the target companies are active in
sectors other than the chemical sector. So, apart from market diversification, the
purpose of these deals is to gain R&D knowledge about the target companies’ products.
This is another way of innovating faster than by internal development.
UNIVERSITAT ROVIRA I VIRGILI EUROPEAN CHEMICAL INDUSTRY AND ITS INNOVATION POLICY WITH FOCUS ON LARGE CHEMICAL COMPANIES. Supriyo Das Dipòsit Legal: T 1295-2015
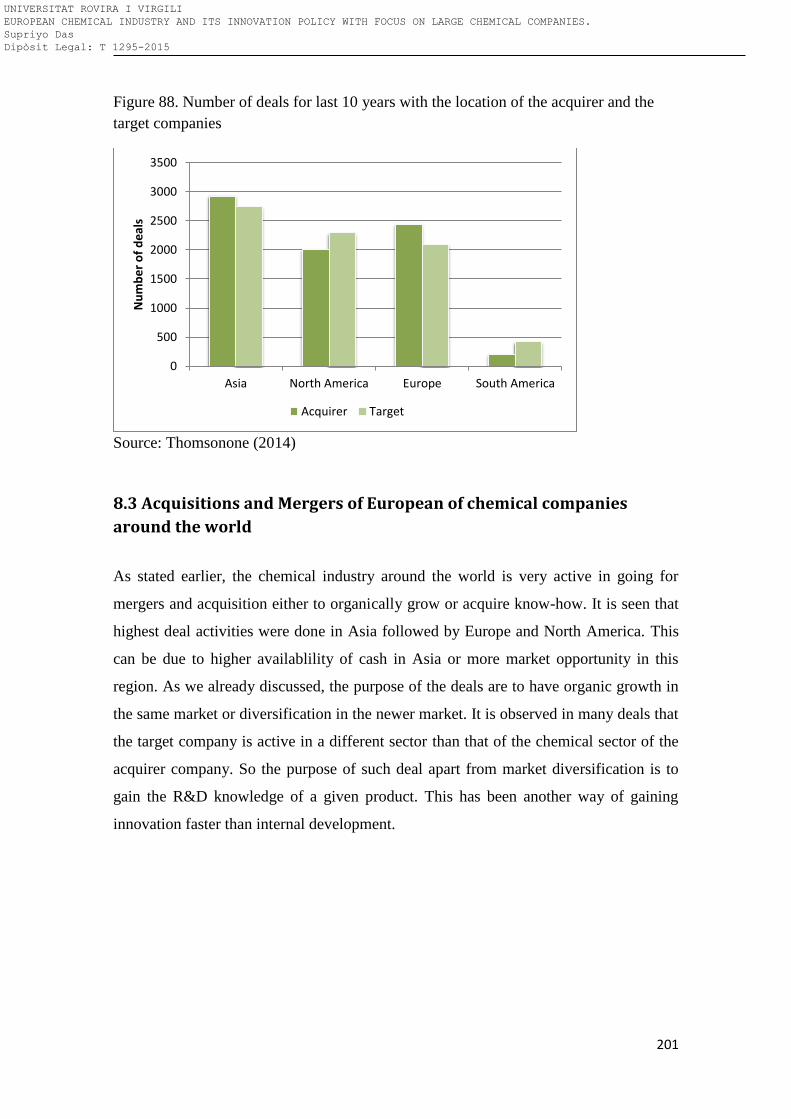
201
Figure 88. Number of deals for last 10 years with the location of the acquirer and the
target companies
Source: Thomsonone (2014)
8.3 Acquisitions and Mergers of European of chemical companies
around the world
As stated earlier, the chemical industry around the world is very active in going for
mergers and acquisition either to organically grow or acquire know-how. It is seen that
highest deal activities were done in Asia followed by Europe and North America. This
can be due to higher availablility of cash in Asia or more market opportunity in this
region. As we already discussed, the purpose of the deals are to have organic growth in
the same market or diversification in the newer market. It is observed in many deals that
the target company is active in a different sector than that of the chemical sector of the
acquirer company. So the purpose of such deal apart from market diversification is to
gain the R&D knowledge of a given product. This has been another way of gaining
innovation faster than internal development.
0
500
1000
1500
2000
2500
3000
3500
Asia North America Europe South America
Nu
mb
er
of
de
als
Acquirer Target
UNIVERSITAT ROVIRA I VIRGILI EUROPEAN CHEMICAL INDUSTRY AND ITS INNOVATION POLICY WITH FOCUS ON LARGE CHEMICAL COMPANIES. Supriyo Das Dipòsit Legal: T 1295-2015
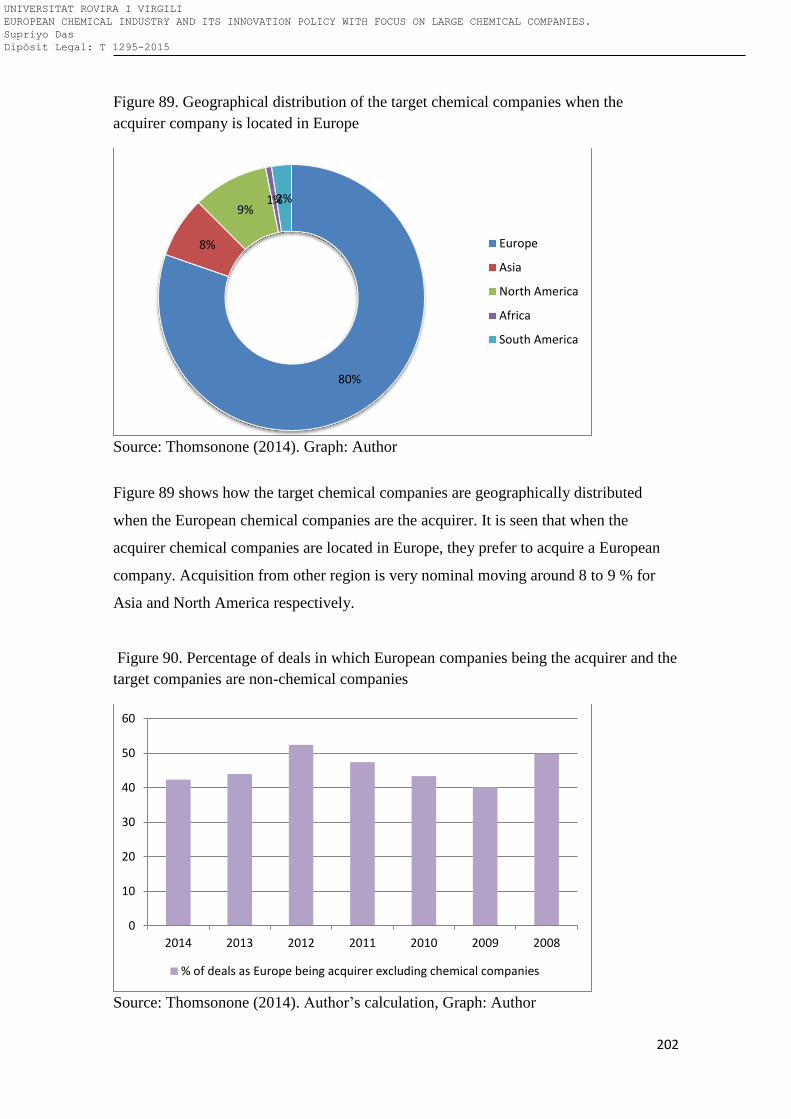
202
Figure 89. Geographical distribution of the target chemical companies when the
acquirer company is located in Europe
Source: Thomsonone (2014). Graph: Author
Figure 89 shows how the target chemical companies are geographically distributed
when the European chemical companies are the acquirer. It is seen that when the
acquirer chemical companies are located in Europe, they prefer to acquire a European
company. Acquisition from other region is very nominal moving around 8 to 9 % for
Asia and North America respectively.
Figure 90. Percentage of deals in which European companies being the acquirer and the
target companies are non-chemical companies
Source: Thomsonone (2014). Author’s calculation, Graph: Author
80%
8%
9% 1% 2%
Europe
Asia
North America
Africa
South America
0
10
20
30
40
50
60
2014 2013 2012 2011 2010 2009 2008
% of deals as Europe being acquirer excluding chemical companies
UNIVERSITAT ROVIRA I VIRGILI EUROPEAN CHEMICAL INDUSTRY AND ITS INNOVATION POLICY WITH FOCUS ON LARGE CHEMICAL COMPANIES. Supriyo Das Dipòsit Legal: T 1295-2015
203
If we see in details the acquiring strategy of European chemical companies over the last
five years (figure 90), it is observed that a huge percentage of acquisition is done for
non-chemical companies. It depicts a typical intent of these companies for
diversification and acquiring know-how which is not part of their core competencies.
8.4 Top European companies’ acquisition strategy
The figure 91 shows the acquisition strategy of the top chemical companies
headquartered in Europe. It shows a mixed strategy of acquisition over various
geographical regions. For most companies such as BASF, Air Liquide, Ineos, Evonik
and Solvay, there is a strong inclination for acquisition of European companies. On the
other side, for some other companies such as Bayer, DSM and Arkema, there is a
tendency to do acquisition more globally.
UNIVERSITAT ROVIRA I VIRGILI EUROPEAN CHEMICAL INDUSTRY AND ITS INNOVATION POLICY WITH FOCUS ON LARGE CHEMICAL COMPANIES. Supriyo Das Dipòsit Legal: T 1295-2015
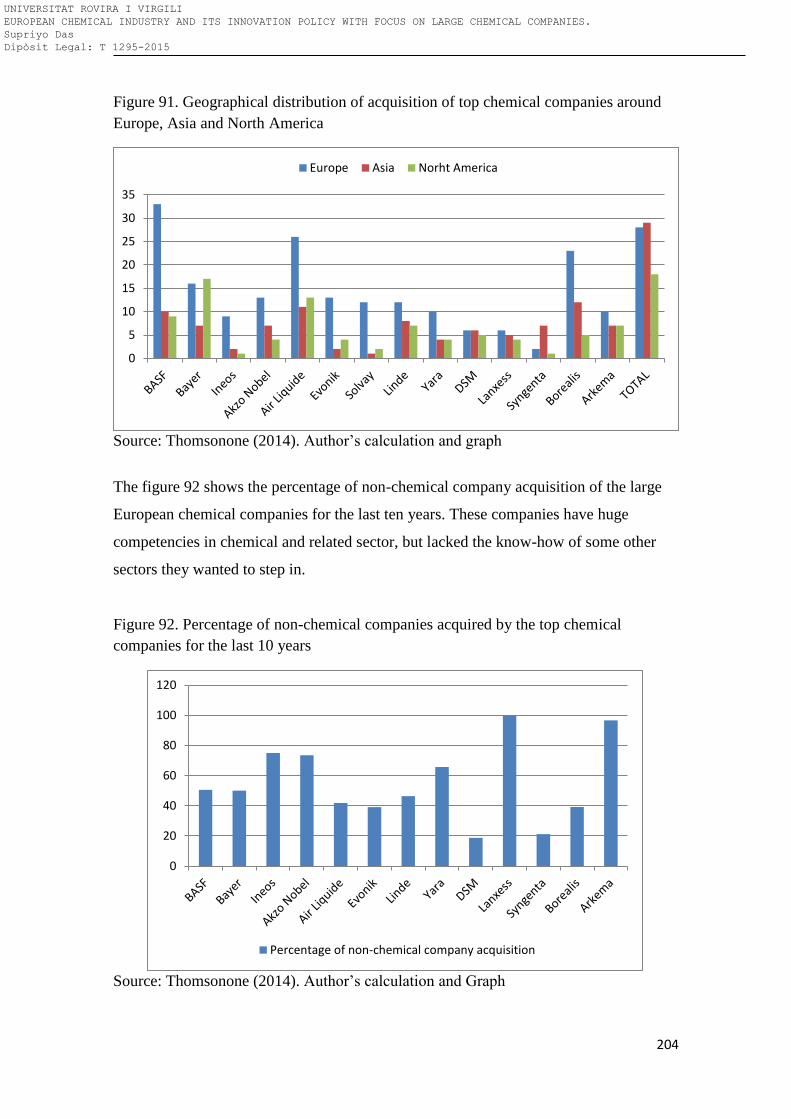
204
Figure 91. Geographical distribution of acquisition of top chemical companies around
Europe, Asia and North America
Source: Thomsonone (2014). Author’s calculation and graph
The figure 92 shows the percentage of non-chemical company acquisition of the large
European chemical companies for the last ten years. These companies have huge
competencies in chemical and related sector, but lacked the know-how of some other
sectors they wanted to step in.
Figure 92. Percentage of non-chemical companies acquired by the top chemical
companies for the last 10 years
Source: Thomsonone (2014). Author’s calculation and Graph
0
5
10
15
20
25
30
35
Europe Asia Norht America
0
20
40
60
80
100
120
Percentage of non-chemical company acquisition
UNIVERSITAT ROVIRA I VIRGILI EUROPEAN CHEMICAL INDUSTRY AND ITS INNOVATION POLICY WITH FOCUS ON LARGE CHEMICAL COMPANIES. Supriyo Das Dipòsit Legal: T 1295-2015
205
So they acquired companies from other sector to quickly gain the technical knowledge
and thus accelerate the innovation. It is seen Lanxess and Arkema mainly stick its
acquisition strategy for chemical company, while for BASF which is the largest
chemical company of the world, almost 50 % of their acquisition were outside chemical
sector. A similar trend was observed for Bayer, who published one of the highest
number of patents for the last ten years. They acquired 50 % of the companies outside
their core competences of chemical and pharmaceutical. So it is seen that most of the
large chemical companies in Europe are using acquisition as a tool for acquiring the
know-how and knowledge from sectors where they did not have core competency.
8.5 Individual company analysis
We will now study in details some of the deals that the top chemical companies under
took in recent past and the reasons for such deals. We have picked up those deals whose
purpose was to acquire a new product development or a new process or technology. The
basic deal information was taken from Thomsonone 2014 database, and it is followed
by further analysis in order to justify the main cause of such deal. For each deal, the first
statement states the details of the deal while the second statement states the actual
reason for the acquisition (Thomsonone, 2014).
1. BASF
1. BASF New Business GmbH a unit of BASF SE, acquired the entire share capital
of Deutsche Nanoschicht GmbH, a Rheinbach- based provider of coating
technologies services, in a leveraged buyout transaction. 06/06/2013
GERMANY
- The purpose of the transaction for BASF SE was to bring new innovative
technology to market.
2. BASF AS (BASF), a wholly-owned subsidiary of BASF SE, completed a tender
offer to acquire the entire share capital of Pronova BioPharma ASA. 11/21/2012
NORWAY
- The purpose of the transaction was for BASF AS to strengthen its position in the
market for omega-3 fatty acids.
UNIVERSITAT ROVIRA I VIRGILI EUROPEAN CHEMICAL INDUSTRY AND ITS INNOVATION POLICY WITH FOCUS ON LARGE CHEMICAL COMPANIES. Supriyo Das Dipòsit Legal: T 1295-2015

206
3. BASF SE of Germany acquired Becker Underwood Inc (Becker), an American
based manufacturer and wholesaler of specialty bio-agronomic and colorant
chemical products. 09/20/2012 US
- The purposes of the transaction were for BASF SE and Becker Underwood Inc
to develop and market new types of products for agriculture and expand their
business particularly in the seed treatment market, to create a global business
unit with the integration of their businesses, and to create value for their
customers.
4. BASF SE of Germany acquired ITWC Inc, a Malcom- based manufacturer of
polyurethane systems and polyester polyols solutions. 07/03/2012 US
- The purposes of the transaction were for BASF SE to expand market in North
America, to offer new products and to strengthen its operations.
5. BASF SE acquired Equateq Ltd, a London-based manufacturer of chemicals.
05/09/2012 UK
- The purpose of the transaction was for BASF SE to extend its omega-3 products
for the pharmaceutical and dietary supplement industries.
2. Bayer
1. Bayer AG acquired the entire share capital of STEIGERWALD
Arzneimittelwerk GmbH, a Darmstadt-based manufacturer of pharmaceutical
products. 05/16/2013 GERMANY
- The transaction was for Bayer AG to strengthen its position on the pharmacy
products manufacturers market.
2. Evelyn Acquisition Co, a special purpose acquisition vehicle formed by Bayer
HealthCare LLC, a majority- owned unit of Bayer AG's Bayer Healthcare AG
subsidiary, completed its tender offer to acquire the entire share capital of
Conceptus Inc (Conceptus), a Mountain View-based manufacturer and
wholesaler of permanent birth control devices. 04/29/2013 US
- The purpose of the transaction was for Bayer HealthCare LLC to broaden its
portfolio in the field of contraception and to offer new products to its clients.
UNIVERSITAT ROVIRA I VIRGILI EUROPEAN CHEMICAL INDUSTRY AND ITS INNOVATION POLICY WITH FOCUS ON LARGE CHEMICAL COMPANIES. Supriyo Das Dipòsit Legal: T 1295-2015
207
3. Bayer CropScience AG, a unit of Bayer AG, agreed to acquire PROPHYTA
Biologischer Planzenschutz GmbH, a Malchow-based provider of biotechnology
research services. 01/08/2013 GERMANY
- The purposes of the transaction were for Bayer CropScience AG to strengthen
its fruits and vegetables business and to allow new products and solutions into
its portfolio.
4. Bayer HealthCare LLC, a majority-owned unit of Bayer AG's Bayer Healthcare
AG subsidiary, acquired Teva Animal Health Inc, a Saint Joseph-based
manufacturer and wholesaler of animal health products, from Teva
Pharmaceutical Industries Ltd. 09/14/2012 US
- The purpose of the transaction was for Bayer HealthCare LLC to offer new
products and services to their clients.
5. Bayer CropScience AG of Germany, a unit of Bayer AG, acquired AgraQuest
Inc, a Davis-based biotechnology company. 07/03/2012 US
- The purposes of the transaction were for Bayer CropScience AG to build a
leading technology platform for green products, to create synergies and value to
the company and its customers, to strengthen its strategically important fruits
and vegetables business and to expand its existing biological pest control
portfolio.
3. Ineos Group
1. INEOS Enterprises Ltd of UK, a unit of INEOS Group AG, agreed to acquire
two production facilities of Sasol Solvents Germany GmbH, a Hamburg-based
manufacturer of solvents and a unit of Sasol Ltd. 12/17/2013 GERMANY
- The purpose of the transaction was for INEOS Enterprises Ltd to expand its
product portfolio.
2. Ineos Barex AG, a unit of INEOS Group AG of Switzerland, agreed to acquire
the Polyacrylonitriles Business owned by Mitsui Chemicals Inc, a Minato,
Tokyo-based manufacturer and wholesaler of chemical products. 05/27/2013
Japan
UNIVERSITAT ROVIRA I VIRGILI EUROPEAN CHEMICAL INDUSTRY AND ITS INNOVATION POLICY WITH FOCUS ON LARGE CHEMICAL COMPANIES. Supriyo Das Dipòsit Legal: T 1295-2015
208
- The purposes of the transaction were for Ineos Barex AG to create synergies and
strengthen its operations.
3. INEOS Group AG of Switzerland signed a Letter of Intent to merge its
European chlorvinyls activities with the European chlorvinyls activities of
Solvay SA, in the formation of a joint venture. Upon completion, INEOS was to
own 50% and Solvay the remaining 50% interest of the joint venture.
05/07/2013 BELGIUM
- The purpose of the transaction for INEOS Group AG was to strengthen its
operations and create synergies, for Solvay SA was to focus on its core assets.
4. Ineos ChlorVinyl of the UK, a unit of Kerling PLC, acquired PVC business of
Tessenderlo Chemie NV, a Tessenderlo-based manufacturer of inorganic
chemicals, for EUR 110 mil (USD 158.914 mil) in cash. The transaction was to
include VCM, Chlor-Alkali, part of Organic Chlorine Derivatives in Belgium,
Netherlands and France. 06/14/2011 BELGIUM
- The purposes of the transaction were for Tessenderlo Chemie NV to transform
itself into a specialty group and for Ineos ChlorVinyl to strengthen its
operations.
5. INEOS Nitriles of the US, a unit of INEOS Group Ltd, acquired the Teesside
located Seal Sands Site of BASF SE of Germany, a Ludwigshafen-based
manufacturer of chemical products. 03/13/2008 UK
- The purpose of the transaction for BASF SE was to divest its Seal Sands Site as
part of its strategy and to focus on the core assets of its polyamide value chain.
4. Akzo Nobel
1. Salvador AG, a wholly-owned subsidiary of Akzo Nobel NV (Akzo), completed
a tender offer by acquiring the remaining 29.5% stake, or 5.872 mil ordinary
shares, which it did not already own, in Schramm Holding AG (Schramm), an
Offenbach-based manufacturer of coating solutions, for EUR 7.318 (USD
10.101) in cash per share, or a total value of EUR 42.972 mil (USD 59.313 mil).
UNIVERSITAT ROVIRA I VIRGILI EUROPEAN CHEMICAL INDUSTRY AND ITS INNOVATION POLICY WITH FOCUS ON LARGE CHEMICAL COMPANIES. Supriyo Das Dipòsit Legal: T 1295-2015
209
Concurrently, Akzo agreed to acquire a 70.5% interest in Schramm. 06/30/2011
GERMANY
- The purposes of the transaction were for Akzo Nobel NV to expand its presence
in Ania and to strengthen its operations on the speciality coatings market.
2. - Akzo Nobel NV (Akzo) of the Netherlands acquired the carved-out coatings
business of SSCP Co Ltd, a Seongnam-based manufacturer of coating materials,
for an amended total value of KRW 52 bil (USD 44.876 mil). Originally, Akzo
agreed to acquire the carved-out coatings business of SSCP Co Ltd, a
Seongnam- based manufacturer of coating materials, for a total value of KRW
54.25 bil (USD 50.995 mil). 06/30/2011 SOUTH KOREA
- The purpose of the transaction was for Akzo Nobel NV to strengthen operations
in specialty plastic coatings.
3. Akzo Nobel NV (Akzo) of the Netherlands acquired a 70.5% interest, or 14.033
mil ordinary shares, in Schramm Holding AG (Schramm), an Offenbach-based
manufacturer of coating solutions, from SSCP Co Ltd, for EUR 142 mil (USD
205.197 mil) in cash. Concurrently, Akzo launched a tender offer to acquire the
remaining 29. 5% interest in Schramm. Upon completion, Scramm will be
delisted from Hong Kong Stock Exchange. 06/30/2011 GERMANY
- The purposes of the transaction were for Akzo Nobel NV to expand its presence
in Asia and to strengthen its operations on the specialty coatings market.
4. Akzo Nobel Industrial Finishes AB of Sweden, a unit Akzo Nobel NV, acquired
the wood adhesives activities of Kronochem GmbH (KG), located in the Czech
Republic, Romania, Bulgaria and Slovakia, a Bischweier- based manufacturer of
chemicals. KG was a unit of Kronospan GmbH. 04/28/2009 CZECH
REPUBLIC
- The purposes of the transaction were to strengthen Akzo Nobel Industrial
Finishes AB's portfolio and boost its technological capability.
5. - Akzo Nobel Farbe & Heimtex GmbH, a unit of Akzo Nobel NV's Akzo Nobel
Deco GmbH unit, acquired Joh Peters sen GmbH & Co KG, a Viersen-based
manufacturer of paints, wallpapers, carpets. 01/14/2009 GERMANY
UNIVERSITAT ROVIRA I VIRGILI EUROPEAN CHEMICAL INDUSTRY AND ITS INNOVATION POLICY WITH FOCUS ON LARGE CHEMICAL COMPANIES. Supriyo Das Dipòsit Legal: T 1295-2015
210
- The purpose of the transaction for Akzo Nobel Farbe & Heimtex GmbH was to
strengthen its business.
5 Air Liquide
1. Air Liquide SA to acquire Plug Power Inc for USD 2.60 million
- The purpose of the transaction was for Plug Power Inc to strengthen its
operations.
2. Schuelke & Mayr GmbH of Austria, a unit of Air Liquide SA, acquired Merz
Hygene GmbH, a Frankfurt am Main-based manufacturer of disinfenction
products, from Merz GmbH & Co KGaA. 05/03/2013 GERMANY
- The purpose of the transaction was for Air Liquide SA to strengthen its position
on the hygiene products market.
3. Air Liquide Canada acquired Arrow Welding & Industrial Supplies Inc, a
Edmonton-based wholesaler of industrial equipment. 01/22/2013 CANADA
- The purpose of the transaction is to strengthen and expand the presence of
Arrow Welding in its primary market.
4. Societe d'Exploitation de Produits Pour les Industries Chimiques SA, a unit of
Air Liquide SA, acquired BiotechMarine SAS, a Pontrieux-based manufacturer
and designer of cosmetics products. Terms were not disclosed. 01/07/2013
FRANCE
- The purpose of the transaction was for Air Liquide SA to reinforce its position
in the field of healthcare specialty ingredients.
5. Air Liquide Industrial US LP, a unit of Air Liquide SAs American Air Liquide
Holdings Inc, acquired Progressive Resources Inc, an Elk City-based provider of
oil field services. 01/03/2013 US
- The purpose of the transaction was for Air Liquide Industrial US LP to expand
its product offering and operations to its clients.
6. Evonik
UNIVERSITAT ROVIRA I VIRGILI EUROPEAN CHEMICAL INDUSTRY AND ITS INNOVATION POLICY WITH FOCUS ON LARGE CHEMICAL COMPANIES. Supriyo Das Dipòsit Legal: T 1295-2015
211
1. Evonik Industries AG of Germany, a unit of RAG- Siftung, acquired SurModics
Pharmaceuticals Inc, a Birmingham-based manufacturer of pharmaceuticals,
from SurModics Inc, for USD 30 mil in cash. 11/01/2011 US
- The purposes of the transaction were for SurModics Inc to focus on its full
resources to advance its core Medical Device and IVD businesses and to
strengthen SurModics' company profile.
2. Evonik Industries AG of Germany, a unit of RAG- Siftung, acquired the Solsilc
plant of of Fesil AS, a Ranheim-based manufacturer and wholesaler of
ferrosilicon (FeSi) and silicon metal (SiMetal). 10/31/2011 NORWAY
- The purpose of the transaction was to further develop and industrialize the
Solsilc-process.
3. Evonik Industries AG (Evonik), a subsidiary of RAG-Stiftung, acquired the
entire share capital of Hanse chemie AG, a Geesthacht-based manufacturer of
chemical products. Concurrently, Evonik planned to acquire Nanoresins AG.
03/25/2011 GERMANY
- The purpose of the transaction was for Evonik Industries AG to strengthen its
operations on the chemical specialities market.
4. Evonik Industries AG (Evonik), a subsidiary of RAG-Stiftung, acquired the
entire share capital of nanoresins AG, a Geesthacht- based manufacturer of
nanoparticles. Terms were not disclosed. Concurrently, Evonik acquired hanse
chemie AG. 03/25/2011 GERMANY
- The purpose of the transaction was for Evonik Industries AG to strengthen its
operations on the chemical specialities market.
5. Evonik Industries AG, a subsidiary of Rag- Stiftung agreed to acquire Resomer
business of Boehringer Ingelheim Pharma GmbH & Co KG. 01/14/2011
GERMANY
- The purpose of transaction was for Evonik Industries AG will complement the
EUDRAGIT business of Evonik - functional excipients for oral dosage forms -
and will strengthen Evoniks pharmaceuticals market segment in line with its
UNIVERSITAT ROVIRA I VIRGILI EUROPEAN CHEMICAL INDUSTRY AND ITS INNOVATION POLICY WITH FOCUS ON LARGE CHEMICAL COMPANIES. Supriyo Das Dipòsit Legal: T 1295-2015
212
stated strategic intent. Additionally Evonik will be able to expand its expertise in
new pharmaceutical application areas.
7. Solvay
1. Solvay SA of Belgium acquired Chemlogics Group LLC, a Paso Robles-based
manufacturer of specialty chemicals, for USD 1.345 bil in cash. 10/07/2013 US
- The purposes of the transaction were for Solvay SA to strengthen its Novecare
business and other key operations, offer new products, and expand geographical
and market presence. As a result of the acquisition, synergies is expected to be
accretive.
2. Rhodia Inc, a unit of Solvay's SA Rhodia SA subsidiary, agreed to merge its
certain assets with certain assets of OAO "SIBUR Holding", a Saint Petersburg-
based manufacturer of petrochemical products, and unit of SIBUR Ltd, to form a
joint venture named Ruspav. Upon completion, Rhodia is to own 50% and
SIBUR HOLDING the remaining 50% of the joint venture. 10/09/2012 RUSSIA
- The purpose of the transaction was for OAO "SIBUR Holding" to allow to offer
new products and services to its clients as well as to expand presence in selected
markets.
3. Solvay SA of Belgium acquired a fluorspar mine, from N&N Group. 01/13/2011
BULGARIA
- The purpose of the transaction was for Solvay SA to extend development of its
fluorinated chemicals business.
4. Solvay SA of Belgium acquired a 13% stake in ACAL Energy Ltd, a Cheshire-
based manufacturer of fuel cell system. 12/03/2008 UK
- The purpose of the transaction was for ACAL Energy Ltd to accelerate the
development of its fuel cell technology FlowCath.
5. Solvay Pharmaceuticals SA to acquire Innogenetics NV for USD 340.46 million
- The purpose of the transaction was to continually develop and expand Solvay
Pharmaceuticals SA's diagnostic business.
8. Linde
UNIVERSITAT ROVIRA I VIRGILI EUROPEAN CHEMICAL INDUSTRY AND ITS INNOVATION POLICY WITH FOCUS ON LARGE CHEMICAL COMPANIES. Supriyo Das Dipòsit Legal: T 1295-2015
213
1. Linde AG of Germany agreed to acquire Calea France SAS, a Sevres-based
provider of home health care services. 12/17/2012 FRANCE
- The purpose of the transaction was for Linde AG to improve position on the
French homecare market.
2. Linde Canada Ltd, a unit of Linde AG, acquired Contact Welding Supplies Ltd,
a London-based manufacturer and wholesaler of industrial, medical and
specialty gasses and related welding products. 10/02/2012 CANADA
- The purpose of the transaction was for Linde Canada Ltd to strengthen its
market in the southwestern Ontario.
3. Linde AG acquired the Continental-European homecare business of Air
Products & Chemicals Inc, an Allentown-based manufacturer and wholesaler of
gases and chemicals. 01/09/2012 GERMANY
- The purposes of the transaction were for Linde AG to expand its competencies
and scale up its product and service offering.
4. BOC Ltd, a wholly-owned unit of the BOC New Zealand Holdings Ltd
subsidiary of Linde AG's BOC Group PLC unit, acquired the remaining 50%
interest, which it did not already own, in Elgas Ltd, a liquefied petroleum gas
{LPG} manufacturer and wholesaler, from its joint venture partner, AGL
Energy Ltd. 10/02/2008 AUSTRALIA
- The purpose of the transaction was for Linde AG to further achieve synergies in
its gas production and distribution operations.
9. YARA
1. Yara International ASA of Norway agreed to acquire H+H Umwelt-und
Industrietechnik GmbH, a Hargesheim-based manufacturee and wholesaler of
catalytic reduction systems. 01/13/2014 GERMANY
- The purpose of the transaction was for Yara International ASA to develop its
portfolio of NOx reduction systems.
UNIVERSITAT ROVIRA I VIRGILI EUROPEAN CHEMICAL INDUSTRY AND ITS INNOVATION POLICY WITH FOCUS ON LARGE CHEMICAL COMPANIES. Supriyo Das Dipòsit Legal: T 1295-2015
214
2. Yara International ASA of Norway agreed to acquire ZIM Plant Technology
GmbH, a Hennigsdorf-based manufacturer of irrigation monitoring products.
11/18/2013 GERMANY
- The purpose of the transaction was for Yara International ASA to improve its
position within the growing fertigation segment.
3. Yara International ASA agreed to raise its stake to 35% from 30% by acquiring
a further 5% stake in Burrup Holdings Ltd, an ammonia manufacturer, from Mr.
Pankaj Oswal. 09/16/2008 AUSTRALIA
- The purposes of the transaction were to increase Yara International ASA's
position in a low-cost gas area and to strengthen its contractual rights to
downstream upgrading and marketing from Burrup Holdings Ltd in an
interesting market for both its industrial and fertilizer products.
4. Yara International ASA acquired Saskferco Products Inc (SP), a manufacturer of
nitrogen fertilizers, from Mosaic Co (MC) and Investment Saskatchewan Inc
(IS), for an estimated 1.6 bil Canadian dollars ($1.59 bil US). 07/14/2008
CANADA
- The purpose of the transaction was for Mosaic Co to focus on their core potash
and phosphate businesses, with the proceeds from the sale to be used for the
planned expansions of their Saskatchewan potash mines and other non US
assets.
5. Yara International ASA of Norway acquired the remaining 65% interest, which
it did not already own, in Phosyn Ltd, a manufacturer of pesticides and
chemicals. 03/22/2006 UK
- The purpose of the transaction was for Yara International ASA to expand its
specialty plant nutrition business
10. DSM
1. DSM Venturing BV of the Netherlands, a unit of Koninklijke DSM NV,
acquired an undisclosed minority stake in Viocare Inc, a Princeton- based
developer of wellness and nutrition-based software. 09/13/2011 US
UNIVERSITAT ROVIRA I VIRGILI EUROPEAN CHEMICAL INDUSTRY AND ITS INNOVATION POLICY WITH FOCUS ON LARGE CHEMICAL COMPANIES. Supriyo Das Dipòsit Legal: T 1295-2015
215
- The purpose of the transaction was for Viocare Inc to further expand and mature
its business.
2. DSM Venturing & Business Development of the Netherlands, a unit of Royal
DSM NV, acquired an undisclosed minority stake in Bioprocess Control AB, a
Lund- based manufacturer of automation equipment for biogas producers.
01/11/2010 SWEDEN
- The purpose of the transaction was to optimize the production efficiency of
biogas processes of the companies.
3. DSM Venturing & Business Development of the Netherlands, a unit of Royal
DSM NV, acquired Segetis Inc, a Golden Valley-based manufacturer of
monomers. 01/07/2010 US
- The purpose of the transaction was to increase DSM Venturing & Business
Development's focus on exploiting synergy between its Life Sciences and
Material Sciences activities.
4. DSME E&R Ltd, a majority-owned unit of Daewoo Shipbuilding & Marine
Engineering Co Ltd, acquired an 80% interest in Sunshin Exploration & Mining
Co Ltd, a Seoul-based gold mining company. 11/10/2009 SOUTH KOREA
- The purpose of the transaction was for DSME E&R to step into gold mine
business.
11. Lanxess
1. Lanxess AG of Germany acquired PCTS Specialty Chemicals Pte Ltd, a
manufacturer and wholesaler of speciality chemicals, from Nipsea Technologies
Pte Ltd, a unit of Nippon Paint Co Ltd. 04/05/2013 SINGAPORE
- The purposes of the transaction were for Lanxess AG to gain access to a
complementary portfolio of biocides and to expand the business in Asia-Pacific
region.
2. LANXESS AG acquired Bond-Laminates GmbH, a Brilon- based manufacturer
of carbonfibre strengthened plastics from Ringstad Cato AS. Terms were not
disclosed. 09/12/2012 GERMANY
UNIVERSITAT ROVIRA I VIRGILI EUROPEAN CHEMICAL INDUSTRY AND ITS INNOVATION POLICY WITH FOCUS ON LARGE CHEMICAL COMPANIES. Supriyo Das Dipòsit Legal: T 1295-2015
216
- The purpose of the transaction for LANXESS AG was to strengthening its
innovative product portfolio of lightweight materials to the automotive industry.
3. - LANXESS AG of Germany acquired an undisclosed minority stake in
BioAmber Inc, a Plymouth-based manufacturer of organic chemicals.
02/22/2012 US
- The purpose of the transaction was for LANXESS AG to strengthen its
operations in the renewable raw materials market.
4. Lanxess Corp, a subsidiary of Lanxess AG, acquired Verichem Inc, a
Pittsburgh-based manufacturer of biocides. Terms were not disclosed.
11/10/2011 US
- The purposes of the transaction were to broaden global biocide manufacturing
platform and strengthening focus on megatrend urbanization.
5. Rhein Chemie Rheinau GmbH, a wholly-owned subsidiary of LANXESS AG,
acquired the tire release agent business of Wacker Chemie AG, a Munich-based
manufacturer and wholesaler of chemicals. 07/08/2011 GERMANY
- The purpose of the transaction was for Rhein Chemie Rheinau GmbH to
concentrate on its core business through streamlining its portfolio of products
and solutions.
12. Syngenta
1. Cimo Compagnie Industrielle de Monthey SA, a unit of Basf SE and
Syngenta AG, agreed to acquire a power plant in Monthey from Alpiq
Holding AG, a Lausanne-based provider of electric utility services.
12/13/2013 SWITZERLAND
- The purpose of transaction was for Cimo Compagnie Industrielle de
Monthey SA to strengthen its operations in the field of electricity production.
2. Syngenta Crop Protection AG of Switzerland, a unit of Syngenta AG,
completed a tender offer to acquire the entire share capital of Devgen NV, a
Ghent- based manufacturer of biotechnology products. 09/21/2012
BELGIUM
UNIVERSITAT ROVIRA I VIRGILI EUROPEAN CHEMICAL INDUSTRY AND ITS INNOVATION POLICY WITH FOCUS ON LARGE CHEMICAL COMPANIES. Supriyo Das Dipòsit Legal: T 1295-2015
217
- The purposes of the transaction were for Syngenta AG to reinforce its
position in global rice market, to expand its toolbox for development of
integrated rice offers and to expand RNAi technology for new biological
insect control solutions. The purposes of the transaction were for Devgen
NV to reach growers more quickly, enabling vital improvements in crop
productivity and protection.
3. Syngenta AG acquired Pasteuria Bioscience Inc, an Alachua-based
biotechnology company. 09/19/2012 US
- The purpose of the transaction was to allow Pasteuria Bioscience to sell its
products to the global market.
4. Syngenta AG of Switzerland agreed to acquire the Professional Products
insecticide business of El du Pont de Nemours & Co Inc {DuPont}, a
Wilmington-based manufacturer of chemical and electronic products.
08/29/2012 US
- The purposes of the transaction were for Syngenta AG to expand their
presence, increase their portfolio in the US, and create synergies with
DuPont-Professional Prod Bus.
5. Syngenta Seeds Inc, a wholly owned unit of Syngenta AG acquired the
remaining 50% interest, which it did not already own, in GreenLeaf Genetics
LLC, an Omaha-based provider of research and development services, from
its joint venture partner, Pioneer Hi-Bred International Inc and a wholly
owned unit of El du Pont Nemours & Co. Terms were not disclosed.
11/08/2010 US
- The purposes of the transaction were for Syngenta Seeds Inc to pursue
independent licensing strategies for corn and soybean genetics and
biotechnology traits ,to enhanced offer for independent seed companies and
to expand its portfolio of traits and germplasm.
13. Arkema
UNIVERSITAT ROVIRA I VIRGILI EUROPEAN CHEMICAL INDUSTRY AND ITS INNOVATION POLICY WITH FOCUS ON LARGE CHEMICAL COMPANIES. Supriyo Das Dipòsit Legal: T 1295-2015
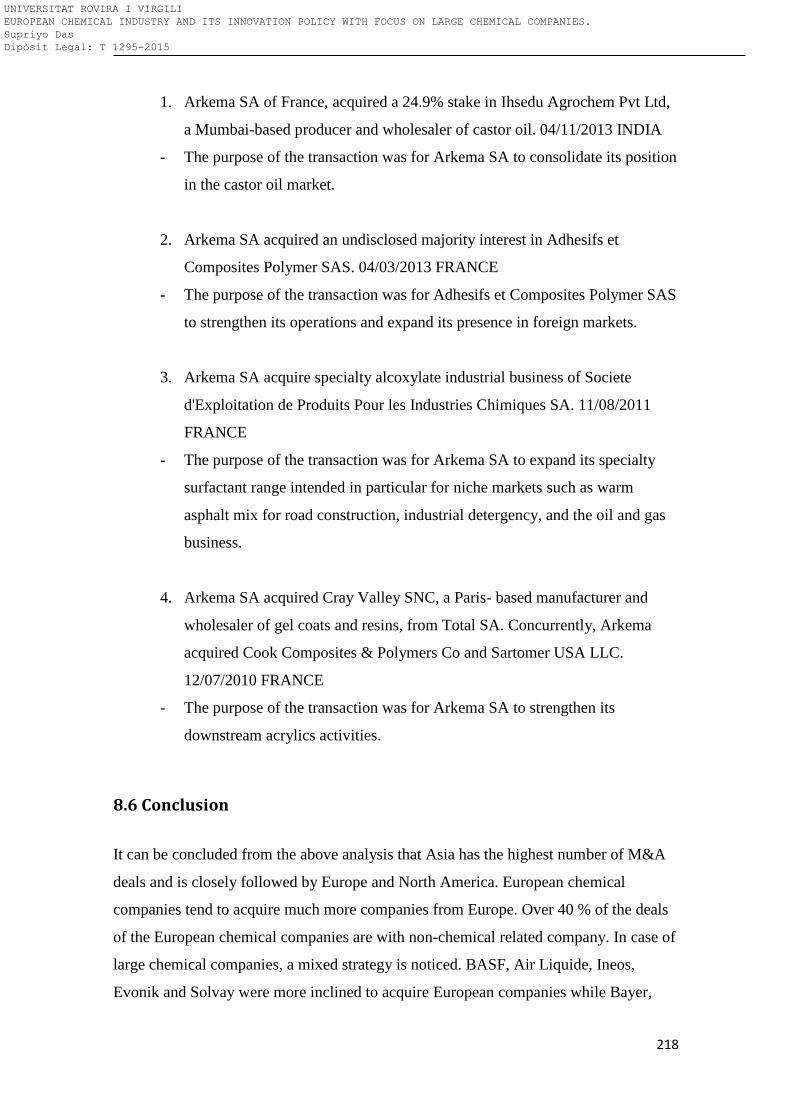
218
1. Arkema SA of France, acquired a 24.9% stake in Ihsedu Agrochem Pvt Ltd,
a Mumbai-based producer and wholesaler of castor oil. 04/11/2013 INDIA
- The purpose of the transaction was for Arkema SA to consolidate its position
in the castor oil market.
2. Arkema SA acquired an undisclosed majority interest in Adhesifs et
Composites Polymer SAS. 04/03/2013 FRANCE
- The purpose of the transaction was for Adhesifs et Composites Polymer SAS
to strengthen its operations and expand its presence in foreign markets.
3. Arkema SA acquire specialty alcoxylate industrial business of Societe
d'Exploitation de Produits Pour les Industries Chimiques SA. 11/08/2011
FRANCE
- The purpose of the transaction was for Arkema SA to expand its specialty
surfactant range intended in particular for niche markets such as warm
asphalt mix for road construction, industrial detergency, and the oil and gas
business.
4. Arkema SA acquired Cray Valley SNC, a Paris- based manufacturer and
wholesaler of gel coats and resins, from Total SA. Concurrently, Arkema
acquired Cook Composites & Polymers Co and Sartomer USA LLC.
12/07/2010 FRANCE
- The purpose of the transaction was for Arkema SA to strengthen its
downstream acrylics activities.
8.6 Conclusion
It can be concluded from the above analysis that Asia has the highest number of M&A
deals and is closely followed by Europe and North America. European chemical
companies tend to acquire much more companies from Europe. Over 40 % of the deals
of the European chemical companies are with non-chemical related company. In case of
large chemical companies, a mixed strategy is noticed. BASF, Air Liquide, Ineos,
Evonik and Solvay were more inclined to acquire European companies while Bayer,
UNIVERSITAT ROVIRA I VIRGILI EUROPEAN CHEMICAL INDUSTRY AND ITS INNOVATION POLICY WITH FOCUS ON LARGE CHEMICAL COMPANIES. Supriyo Das Dipòsit Legal: T 1295-2015
219
DSM and Arkema have been making acquisition globally. For most of the large
chemical companies, a big percentage of companies acquired did not deal directly with
basic chemicals. From the above analysis and specific examples of the deals, we test
positive the hypothesis that large chemical companies take M&A as a route to acquire
innovation.
UNIVERSITAT ROVIRA I VIRGILI EUROPEAN CHEMICAL INDUSTRY AND ITS INNOVATION POLICY WITH FOCUS ON LARGE CHEMICAL COMPANIES. Supriyo Das Dipòsit Legal: T 1295-2015
220
8.7 Bibliography
Thomsonone 2014. (2014). Thomson One Database: Thomson Reuter [Data file and
database]. Retreived from https://www.thomsonone.com/DirectoryServices/2006-04-
01/Web.Public/Login.aspx?brandname=www.thomsonone.com&version=3.7.9.18833&
protocol=0
Ornaghi, C., Marin, P. and Siotis, G. (2004). Merger and acquisitions in the chemical
industry: Similarities and dissimilarities across the atlantic. In Cesaroni, F.,
Gambardella, A. and Garcia-Fontes, W. (Eds). R&D, Innovation and Competitiveness in
the European Chemical Industry (pp. 45-68)
UNIVERSITAT ROVIRA I VIRGILI EUROPEAN CHEMICAL INDUSTRY AND ITS INNOVATION POLICY WITH FOCUS ON LARGE CHEMICAL COMPANIES. Supriyo Das Dipòsit Legal: T 1295-2015
221
9. Industries, Universities and Research organization collaboration to drive innovation
Contents
9.1 Introduction ............................................................................................................................... 222
9.2 Industry – University collaboration: A driver toward innovation ....................... 222
9.3 Research collaborations ........................................................................................................ 223
Collaborative research ............................................................................................................. 225
Coordination between national research programmes .............................................. 225
Joint Technology Initiatives .................................................................................................... 226
Technology Platforms ............................................................................................................... 226
9.4 Participation of the top European Chemical companies in EU funded projects
................................................................................................................................................................ 227
9.5 Conclusion .................................................................................................................................. 232
9.6 Bibliography .............................................................................................................................. 234
UNIVERSITAT ROVIRA I VIRGILI EUROPEAN CHEMICAL INDUSTRY AND ITS INNOVATION POLICY WITH FOCUS ON LARGE CHEMICAL COMPANIES. Supriyo Das Dipòsit Legal: T 1295-2015
222
9.1 Introduction
When companies and universities work in tandem to push the frontiers of knowledge,
they become a powerful engine for innovation and economic growth. Silicon Valley is a
dramatic example. For over five decades, a dense web of rich and long-running
collaborations in the region have given rise to new technologies at a breakneck pace,
and transformed industries while modernizing the role of the university. Similar
activities are also observed in chemical industry in Europe. Technologies from different
industries are also increasingly being combined to create new products and services. A
fundamental challenge for the successful development of these inter-industry
innovations is to combine the previously unconnected technologies in entirely new
product architecture. The development of the required architectural knowledge is
especially challenging in an inter-industry setting. This section covers various research
collaborations happening in European chemical industry between industries and
Universities or Research center and test the hypothesis if such collaboration is
impacting the innovation trend of the companies.
9.2 Industry – University collaboration: A driver toward innovation
For an elite group of world-class research universities, this kind of strategic
collaboration is top priority. The most productive collaborations are strategic and long-
term, according to the practitioners. They are built around a shared research vision and
may continue for a decade or beyond, establishing deep professional ties, trust and
shared benefits that work to bridge the sharp cultural divide between academia and
industry. Strategic partnerships between companies designed to run for five to ten years
delivering greater and often unanticipated benefits to all parties through a virtuous circle
of interactions. For the university, they provide a longer stream of secure funding that
can bolster academic strength. Creating more strategic industry-university partnerships
would substantially improve Europe’s climate for innovation. The modernization of
Europe’s higher-education systems is a priority to strengthen the links between higher
education, research and business to drive innovation. The European Commission
launched a number of initiatives to enhance closer and more effective ties between the
three corners of the knowledge triangle, including the European Institute for Innovation
UNIVERSITAT ROVIRA I VIRGILI EUROPEAN CHEMICAL INDUSTRY AND ITS INNOVATION POLICY WITH FOCUS ON LARGE CHEMICAL COMPANIES. Supriyo Das Dipòsit Legal: T 1295-2015
223
and Technology (EIT), the Knowledge Alliances pilot project and the University-
Business Forum.
The aim of such initiate is to complement – and add more of a business perspective to –
a growing body of academic studies on the state of European industry-university
partnerships.
The increased incentives (and pressures) to collaborate with industry have controversial
side effects on the production of scientific research itself. Nelson (2004) argues that
industry involvement might delay or suppress scientific publication and the
dissemination of preliminary results, endangering the “intellectual commons” and the
practices of “open science” (Dasgupta and David, 1994). Florida and Cohen (1999)
claim that industry collaboration might come at the expense of basic research: growing
ties with industry might be affecting the choice of research projects, “skewing”
academic research from a basic towards an applied approach.
9.3 Research collaborations
There are specific programme on 'Cooperation' supports covering all types of research
activities carried out by different research bodies in trans-national cooperation and aims
to gain or consolidate leadership in key scientific and technology areas.
The main types of such cooperation as supported by various government organizations
are:
1. European Union Research Funded Projects
a. FP 7
b. FP 6
c. FP 5
d. Other (FP 4, FP 3, FP 2, FP 1, CIP, EAEC, ECSC, ENG, ENV, JRC etc.)
2. German Government Funded Projects
a. The Federal Ministry of Education and Research (BMBF)
b. The Federal Ministry for Economic Affairs and Energy (BMWi)
c. The Federal Ministry of Food and Agriculture (BMEL),
d. The Federal Ministry of Health (BMG),
UNIVERSITAT ROVIRA I VIRGILI EUROPEAN CHEMICAL INDUSTRY AND ITS INNOVATION POLICY WITH FOCUS ON LARGE CHEMICAL COMPANIES. Supriyo Das Dipòsit Legal: T 1295-2015
224
e. The Federal Ministry for the Environment, Nature Conservation,
Building and Nuclear Safety (BMUB)
f. The Federal Ministry of Labour and Social Affairs (BMAS)
3. The French National Research Agency
4. Dutch Government Funded Projects
a. NWO
b. The Technology Foundation STW
c. SenterNovem
5. Spanish Government Funded Projects
For our current study, we will focus on the European Union funded research projects.
There are three prime EU funded research projects as stated above: FP7, FP 6, FP 5. Let
us now try understanding in details of these funding platforms.
European Union Funded Projects:
The budget of the European Union Research Funding is devoted in supporting
cooperation between universities, industry, research centers and public authorities
throughout the EU and beyond. The Cooperation programme is sub-divided into ten
distinct themes. Each theme is operationally autonomous but aims to maintain
coherence within the Cooperation Programme and allowing for joint activities cutting
across different themes, through, for example, joint calls. The ten identified themes
reflect the most important fields of knowledge and technology where research
excellence is particularly important to improve Europe’s ability to address its social,
economic, public health, environmental and industrial challenges of the future.
Important themes identified in the Strategic Research Agendas (SRAs) developed by the
ETPs are therefore covered by the Cooperation programme. The last EU funded project,
FP7 allocated EUR 32 413 million to the Cooperation programme.
UNIVERSITAT ROVIRA I VIRGILI EUROPEAN CHEMICAL INDUSTRY AND ITS INNOVATION POLICY WITH FOCUS ON LARGE CHEMICAL COMPANIES. Supriyo Das Dipòsit Legal: T 1295-2015
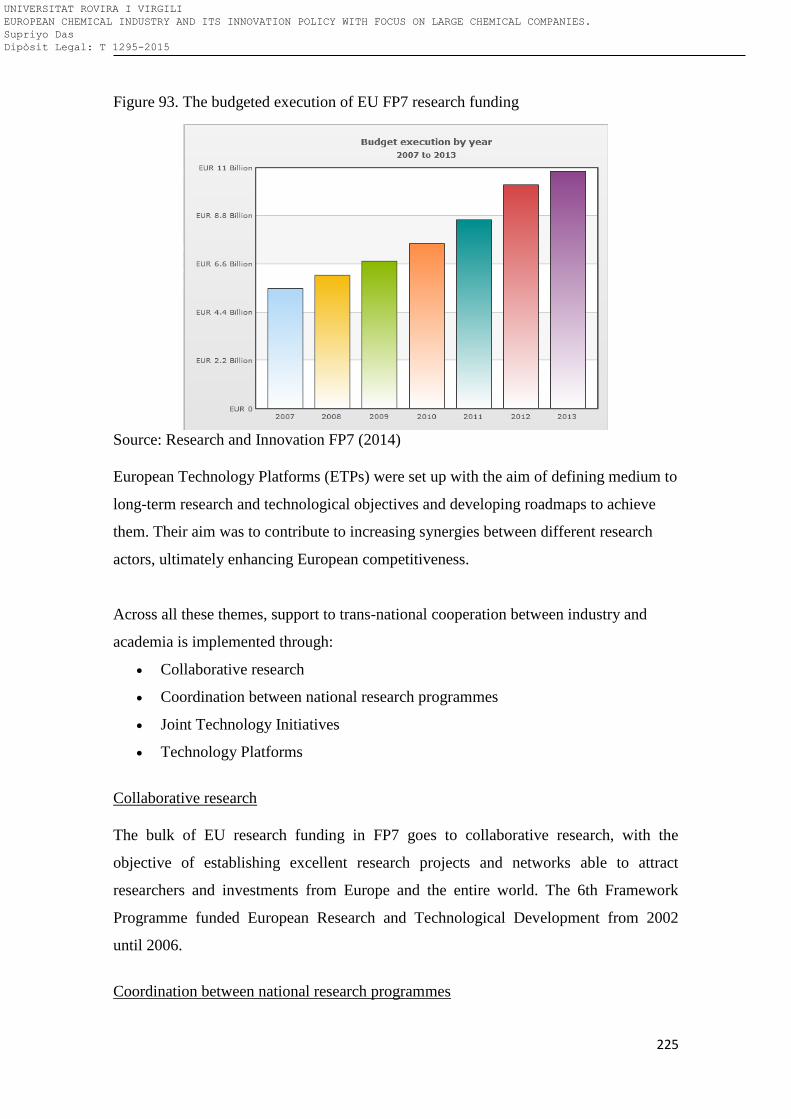
225
Figure 93. The budgeted execution of EU FP7 research funding
Source: Research and Innovation FP7 (2014)
European Technology Platforms (ETPs) were set up with the aim of defining medium to
long-term research and technological objectives and developing roadmaps to achieve
them. Their aim was to contribute to increasing synergies between different research
actors, ultimately enhancing European competitiveness.
Across all these themes, support to trans-national cooperation between industry and
academia is implemented through:
Collaborative research
Coordination between national research programmes
Joint Technology Initiatives
Technology Platforms
Collaborative research
The bulk of EU research funding in FP7 goes to collaborative research, with the
objective of establishing excellent research projects and networks able to attract
researchers and investments from Europe and the entire world. The 6th Framework
Programme funded European Research and Technological Development from 2002
until 2006.
Coordination between national research programmes
UNIVERSITAT ROVIRA I VIRGILI EUROPEAN CHEMICAL INDUSTRY AND ITS INNOVATION POLICY WITH FOCUS ON LARGE CHEMICAL COMPANIES. Supriyo Das Dipòsit Legal: T 1295-2015
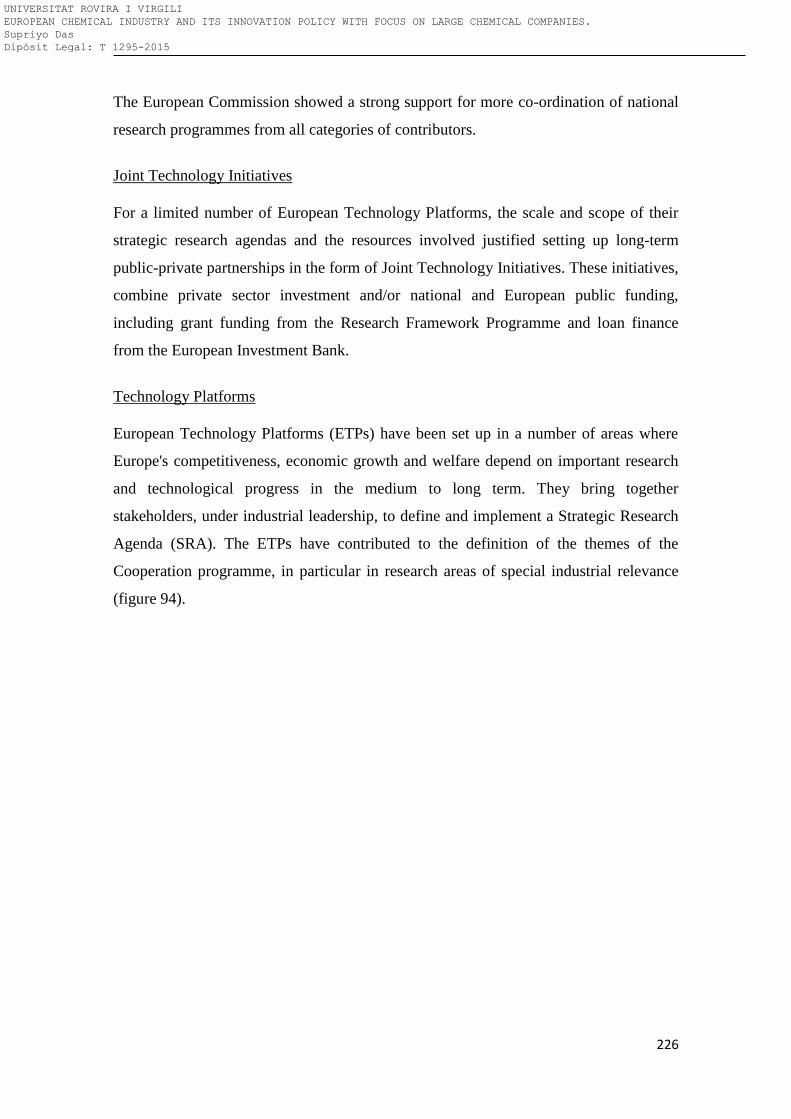
226
The European Commission showed a strong support for more co-ordination of national
research programmes from all categories of contributors.
Joint Technology Initiatives
For a limited number of European Technology Platforms, the scale and scope of their
strategic research agendas and the resources involved justified setting up long-term
public-private partnerships in the form of Joint Technology Initiatives. These initiatives,
combine private sector investment and/or national and European public funding,
including grant funding from the Research Framework Programme and loan finance
from the European Investment Bank.
Technology Platforms
European Technology Platforms (ETPs) have been set up in a number of areas where
Europe's competitiveness, economic growth and welfare depend on important research
and technological progress in the medium to long term. They bring together
stakeholders, under industrial leadership, to define and implement a Strategic Research
Agenda (SRA). The ETPs have contributed to the definition of the themes of the
Cooperation programme, in particular in research areas of special industrial relevance
(figure 94).
UNIVERSITAT ROVIRA I VIRGILI EUROPEAN CHEMICAL INDUSTRY AND ITS INNOVATION POLICY WITH FOCUS ON LARGE CHEMICAL COMPANIES. Supriyo Das Dipòsit Legal: T 1295-2015
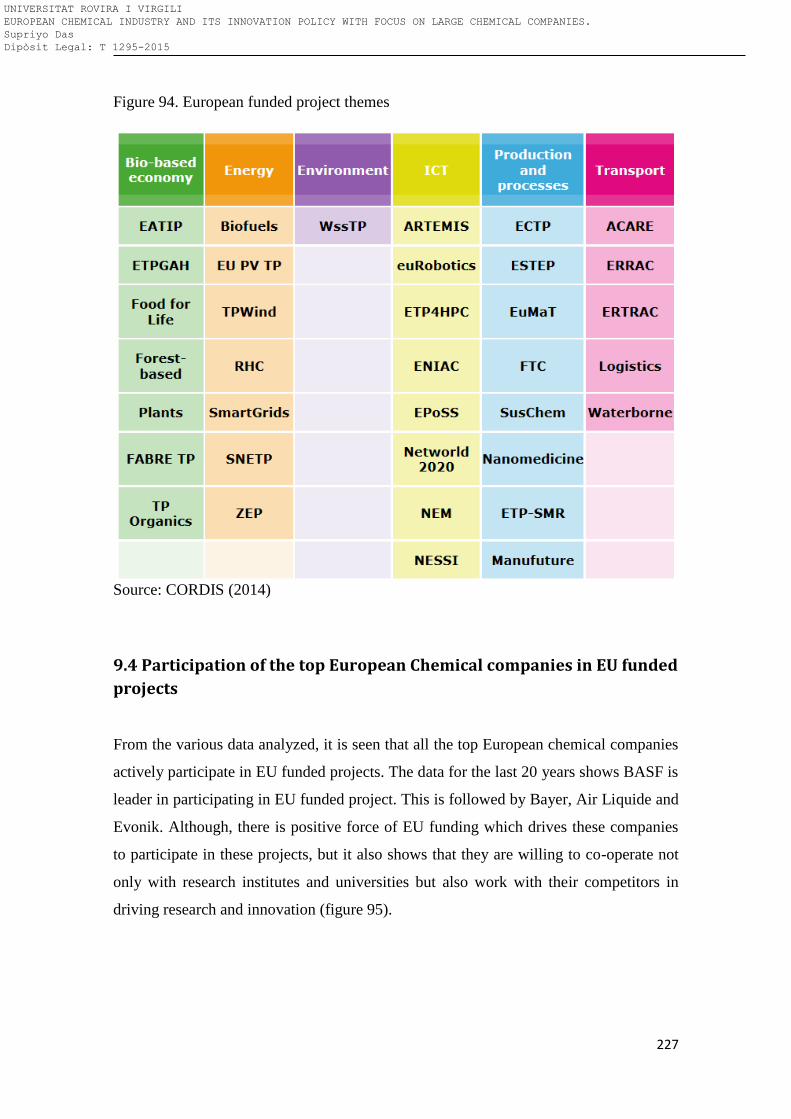
227
Figure 94. European funded project themes
Source: CORDIS (2014)
9.4 Participation of the top European Chemical companies in EU funded
projects
From the various data analyzed, it is seen that all the top European chemical companies
actively participate in EU funded projects. The data for the last 20 years shows BASF is
leader in participating in EU funded project. This is followed by Bayer, Air Liquide and
Evonik. Although, there is positive force of EU funding which drives these companies
to participate in these projects, but it also shows that they are willing to co-operate not
only with research institutes and universities but also work with their competitors in
driving research and innovation (figure 95).
UNIVERSITAT ROVIRA I VIRGILI EUROPEAN CHEMICAL INDUSTRY AND ITS INNOVATION POLICY WITH FOCUS ON LARGE CHEMICAL COMPANIES. Supriyo Das Dipòsit Legal: T 1295-2015
228
Figure 95. Total number of EU projects for last 20 years in which the top European
chemical companies participated
Data Source: CORDIS1 (2014). Author’s calculation and graph
Each of the project in which these companies took part was further analyzed in order to
get detailed understanding of the type of projects and the partners. Although the type of
project theme varies, but in cases where companies are involved, they tend to be more
application oriented. Let us take example of an EU funded research project: A common
European approach to the regulatory testing of nanomaterials. The project falls under
FP7 framework with total cost of 49 Million Euro. It has 63 partners including top
chemical companies: BASF, Bayer, Arkema. Over 75 % of the participants are
government institute or universities. In terms of private companies involved in this
project, they were selected based on their speciality areas such as Veneto Nanotech Spa
from Italy who are specialized in Nano-technology. This type of projects drives research
and innovation forward but the results are highly unlikely to be patented, given the
number of partners and also due to openness of such projects. Another example of
BASF´s participation in EU project which involves fundamental research is
“Developing the Next Generation of Biocatalysts for Industrial Chemical Synthesis”. A
collaboration of industrial and academic partners had identified the key technology
fields of amine synthesis, polymers from renewable resources, glycoscience and wider
oxidase application as four key areas where the next generation of biocatalysts that will
lead to improvements in both economic and environmental performance of the chemical
manufacturing industries. Most of the partners of this project are universities, but there
0
10
20
30
40
50
60
70Total No. Of EU projects
UNIVERSITAT ROVIRA I VIRGILI EUROPEAN CHEMICAL INDUSTRY AND ITS INNOVATION POLICY WITH FOCUS ON LARGE CHEMICAL COMPANIES. Supriyo Das Dipòsit Legal: T 1295-2015
229
are some private companies as partners also. Most of the private companies are small,
but very specialized in the field of the project.
In some cases, two different entities of the same company can be a partner of a project
as seen in the project, “The Plant Cell Wall Training Consortium” where Bayer
Bioscience and Bayer Cropscience are two separate partners. It is seen as a common
phenomenon that these big chemical companies do not partner in these projects with a
single entity, rather they participate either as a individual business or individual location
entity.
If we look further into how these companies are participating, we see a distinct trend.
Some companies are participating more with government organizations while others are
in project which has good distribution of private and government organizations. By
government organization, we mean universities, colleges and publicly funded research
institutes. The figure 96 shows the distribution of the private and government identities
in terms of the total participants.
UNIVERSITAT ROVIRA I VIRGILI EUROPEAN CHEMICAL INDUSTRY AND ITS INNOVATION POLICY WITH FOCUS ON LARGE CHEMICAL COMPANIES. Supriyo Das Dipòsit Legal: T 1295-2015
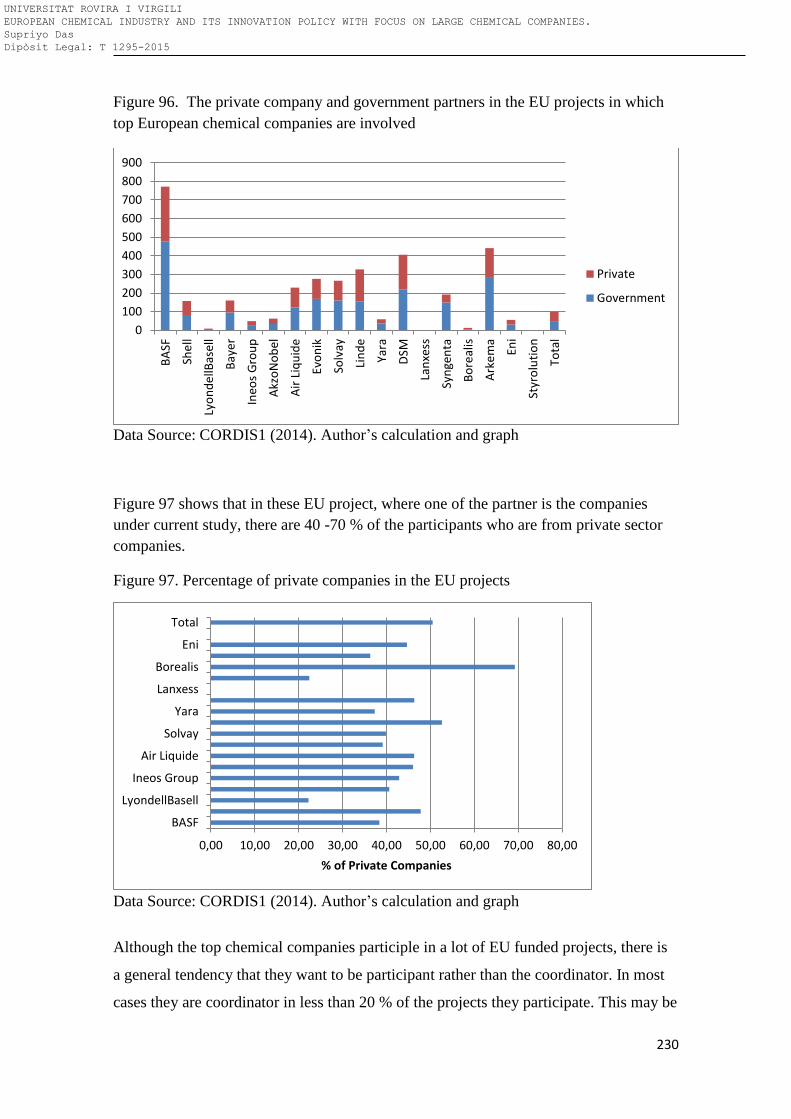
230
Figure 96. The private company and government partners in the EU projects in which
top European chemical companies are involved
Data Source: CORDIS1 (2014). Author’s calculation and graph
Figure 97 shows that in these EU project, where one of the partner is the companies
under current study, there are 40 -70 % of the participants who are from private sector
companies.
Figure 97. Percentage of private companies in the EU projects
Data Source: CORDIS1 (2014). Author’s calculation and graph
Although the top chemical companies participle in a lot of EU funded projects, there is
a general tendency that they want to be participant rather than the coordinator. In most
cases they are coordinator in less than 20 % of the projects they participate. This may be
0
100
200
300
400
500
600
700
800
900B
ASF
She
ll
Lyo
nd
ellB
asel
l
Bay
er
Ineo
s G
rou
p
Akz
oN
ob
el
Air
Liq
uid
e
Evo
nik
Solv
ay
Lin
de
Yara
DSM
Lan
xess
Syn
gen
ta
Bo
real
is
Ark
em
a
Eni
Styr
olu
tio
n
Tota
l
Private
Government
0,00 10,00 20,00 30,00 40,00 50,00 60,00 70,00 80,00
BASF
LyondellBasell
Ineos Group
Air Liquide
Solvay
Yara
Lanxess
Borealis
Eni
Total
% of Private Companies
UNIVERSITAT ROVIRA I VIRGILI EUROPEAN CHEMICAL INDUSTRY AND ITS INNOVATION POLICY WITH FOCUS ON LARGE CHEMICAL COMPANIES. Supriyo Das Dipòsit Legal: T 1295-2015
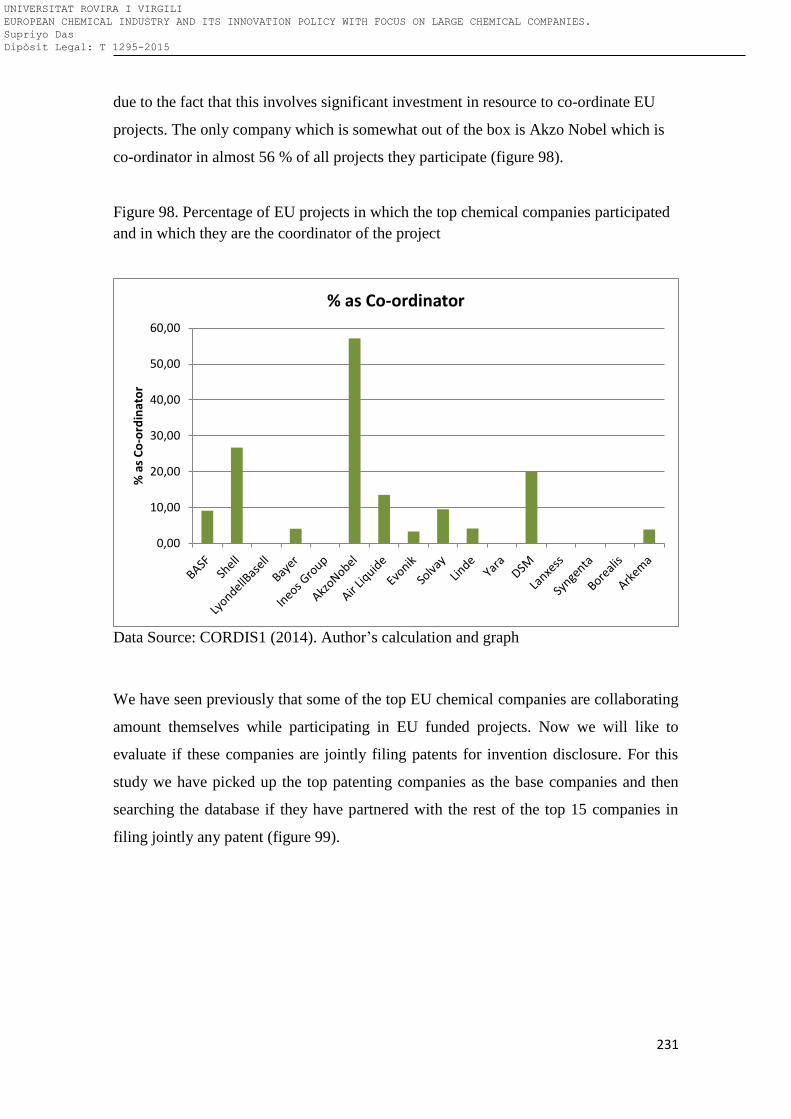
231
due to the fact that this involves significant investment in resource to co-ordinate EU
projects. The only company which is somewhat out of the box is Akzo Nobel which is
co-ordinator in almost 56 % of all projects they participate (figure 98).
Figure 98. Percentage of EU projects in which the top chemical companies participated
and in which they are the coordinator of the project
Data Source: CORDIS1 (2014). Author’s calculation and graph
We have seen previously that some of the top EU chemical companies are collaborating
amount themselves while participating in EU funded projects. Now we will like to
evaluate if these companies are jointly filing patents for invention disclosure. For this
study we have picked up the top patenting companies as the base companies and then
searching the database if they have partnered with the rest of the top 15 companies in
filing jointly any patent (figure 99).
0,00
10,00
20,00
30,00
40,00
50,00
60,00
% a
s C
o-o
rdin
ato
r
% as Co-ordinator
UNIVERSITAT ROVIRA I VIRGILI EUROPEAN CHEMICAL INDUSTRY AND ITS INNOVATION POLICY WITH FOCUS ON LARGE CHEMICAL COMPANIES. Supriyo Das Dipòsit Legal: T 1295-2015
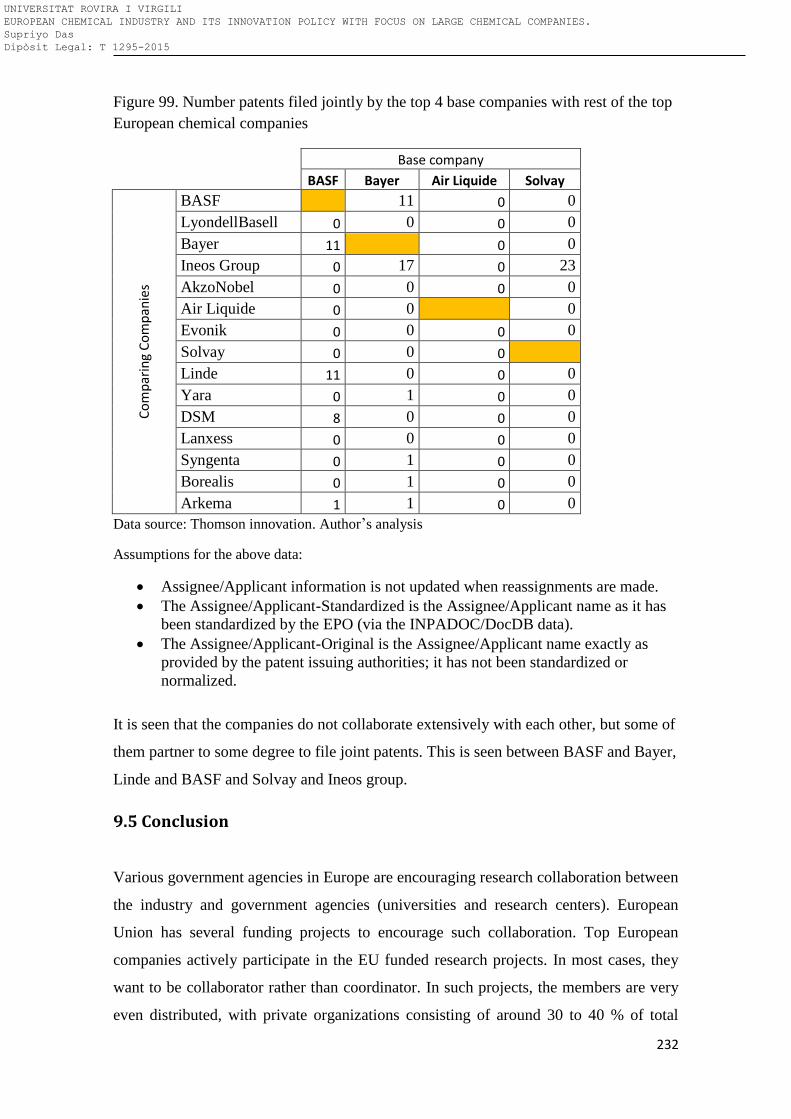
232
Figure 99. Number patents filed jointly by the top 4 base companies with rest of the top
European chemical companies
Base company
BASF Bayer Air Liquide Solvay
Co
mp
arin
g C
om
pan
ies
BASF 11 0 0
LyondellBasell 0 0 0 0
Bayer 11 0 0
Ineos Group 0 17 0 23
AkzoNobel 0 0 0 0
Air Liquide 0 0 0
Evonik 0 0 0 0
Solvay 0 0 0
Linde 11 0 0 0
Yara 0 1 0 0
DSM 8 0 0 0
Lanxess 0 0 0 0
Syngenta 0 1 0 0
Borealis 0 1 0 0
Arkema 1 1 0 0
Data source: Thomson innovation. Author’s analysis
Assumptions for the above data:
Assignee/Applicant information is not updated when reassignments are made.
The Assignee/Applicant-Standardized is the Assignee/Applicant name as it has
been standardized by the EPO (via the INPADOC/DocDB data).
The Assignee/Applicant-Original is the Assignee/Applicant name exactly as
provided by the patent issuing authorities; it has not been standardized or
normalized.
It is seen that the companies do not collaborate extensively with each other, but some of
them partner to some degree to file joint patents. This is seen between BASF and Bayer,
Linde and BASF and Solvay and Ineos group.
9.5 Conclusion
Various government agencies in Europe are encouraging research collaboration between
the industry and government agencies (universities and research centers). European
Union has several funding projects to encourage such collaboration. Top European
companies actively participate in the EU funded research projects. In most cases, they
want to be collaborator rather than coordinator. In such projects, the members are very
even distributed, with private organizations consisting of around 30 to 40 % of total
UNIVERSITAT ROVIRA I VIRGILI EUROPEAN CHEMICAL INDUSTRY AND ITS INNOVATION POLICY WITH FOCUS ON LARGE CHEMICAL COMPANIES. Supriyo Das Dipòsit Legal: T 1295-2015
233
number of participants. There is very little collaboration between these top companies in
terms of filing new patents. From the above analysis it is seen that university and
research institute collaboration results in various successful R&D projects both in
fundamental science and applied research. Such research may necessarily not result in
patent application but definitely result in moving forward innovation and R&D. Thus
the second part of the third hypothesis that industry and academia has impact on
innovation is tested positive in this chapter.
UNIVERSITAT ROVIRA I VIRGILI EUROPEAN CHEMICAL INDUSTRY AND ITS INNOVATION POLICY WITH FOCUS ON LARGE CHEMICAL COMPANIES. Supriyo Das Dipòsit Legal: T 1295-2015
234
9.6 Bibliography
CORDIS 1. (2014). The primary information source for EU-funded projects since 1990.
Retrieved from http://cordis.europa.eu/projects/home_en.html
CORDIS. (2014). Individual European Technology Platform. Retrieved from
http://cordis.europa.eu/technology-platforms/individual_en.html
Dasgupta, P. and David, P.A. (1994). Toward a new economics of science. Research
Policy. 23 (5), 487—521.
Florida, R. and W.M. Cohen. (1999). Engine or Infrastructure? The University Role in
Economic Development. Industrializing Knowledge: University–Industry Linkages in
Japan and the United States. London: MIT Press.
Nelson, R. (2004). The market economy, and the scientific commons. Research Policy,
33(3), 455-471.
Research & Innovation. (2014). Budget execution by year and by theme. Retrieved from
http://ec.europa.eu/research/fp7/index_en.cfm?pg=budget
Research and Innovation FP7. (2014). Budgets. Retrieved from
http://ec.europa.eu/research/fp7/index_en.cfm?pg=budget
UNIVERSITAT ROVIRA I VIRGILI EUROPEAN CHEMICAL INDUSTRY AND ITS INNOVATION POLICY WITH FOCUS ON LARGE CHEMICAL COMPANIES. Supriyo Das Dipòsit Legal: T 1295-2015
235
10. Impact of chemical regulation on innovation of European Company
Contents
10.1 Introduction: ........................................................................................................................... 236
10.2 The new chemical regulation in Europe: REACH ..................................................... 236
10.3 Research Survey .................................................................................................................... 238
10.4 Data Evaluation and analysis ........................................................................................... 240
10.5 Discussion based on the survey ...................................................................................... 243
10.6 Conclusion ............................................................................................................................... 246
10.7 Bibliography............................................................................................................................ 247
UNIVERSITAT ROVIRA I VIRGILI EUROPEAN CHEMICAL INDUSTRY AND ITS INNOVATION POLICY WITH FOCUS ON LARGE CHEMICAL COMPANIES. Supriyo Das Dipòsit Legal: T 1295-2015
236
10.1 Introduction
Chemical companies designing new or redesigning existing products in Europe today
need to consider both regulatory and environmental performance requirements in their
strategy development, as well as during their product development processes. Economic
aspects are also very important in order for a business to achieve financially sustainable
product development. REACH is a regulation of the European Union, adopted to
improve the protection of human health and the environment from the risks that can be
posed by chemicals, while enhancing the competitiveness of the EU chemicals industry.
It also promotes alternative methods for the hazard assessment of substances in order to
reduce the number of tests on animals. In principle, REACH applies to all chemical
substances; not only those used in industrial processes but also in our day-to-day lives,
for example in cleaning products, paints as well as in articles such as clothes, furniture
and electrical appliances. Therefore, the regulation has an impact on most companies
across the EU. The aim of this chapter is to describe the impact of the new chemical
regulation (REACH) on R&D and innovation activities of the chemical companies of
Europe.
10.2 The new chemical regulation in Europe: REACH
The directive for Registration, Evaluation, Authorisation and Restriction of Chemicals
(REACH) was adopted by the European Union (EU) in December 2006, and requires
companies importing or producing chemicals (>1 tonnes/year) in the EU and EEA
regions to register these chemicals with the EU’s Chemicals Agency (ECHA). REACH
requirements are relevant for both individual substances and substances in mixtures
(e.g. paint), although the registration demand is for substances only. Companies
manufacturing or importing substances are required to register the substance’s identity,
classification and labelling, test results and propose further toxicity tests for the
substance, exposure potential to humans and different environmental compartments, and
recommendations for safe use. The requirements for REACH increase with quantities of
chemicals imported, or produced. Quantities greater than 10 tonnes/year/producer or
importer mean that a risk assessment (“Chemical Safety Report”, CSR) is required for
the substance. If a chemicals company does not comply with REACH, it cannot sell its
UNIVERSITAT ROVIRA I VIRGILI EUROPEAN CHEMICAL INDUSTRY AND ITS INNOVATION POLICY WITH FOCUS ON LARGE CHEMICAL COMPANIES. Supriyo Das Dipòsit Legal: T 1295-2015
237
products in the markets of the European Union or the European Economic Area
(Commission of the European Communities, 2007).
Firms have also reported that in recent years they are also often busy implementing a
wide range of chemical industry and related initiatives both of EU and industry origin,
for example: CLP, revision of the Seveso Directive, RoHS, Responsible Care and the
Global Product Strategy, IPPC Directive, etc. in addition to REACH.
REACH places the responsibility on industry to carry out chemical safety assessments
and manage the risks that chemicals may pose to health and the environment. REACH
entered into force on 1st June 2007 to streamline and improve the EU’s former
legislative framework on chemicals. The aims of REACH are (ECHA, 2010; van
Leeuwen and Vermeire, 2007): to improve the protection of human health and the
environment from the risks that can be posed by chemicals; to enhance the
competitiveness of the EU chemicals industry; to promote alternative methods for the
assessment of hazards of substances; and to ensure the free circulation of substances
within the internal market of the EU. The figure 100 below shows the timeline of the
REACH implementation. The REACH regulation came into force on 1st of June, 2008.
Although the pre-registration need to be finished by 1st of December, 2008 the first
stage of registration needed to be completed by 30.11.2010. This was an important date
as the companies who could not satisfy the registration process of the product could not
sell them any more. There were a subsequent registration date and the final one in May
of 2018.
UNIVERSITAT ROVIRA I VIRGILI EUROPEAN CHEMICAL INDUSTRY AND ITS INNOVATION POLICY WITH FOCUS ON LARGE CHEMICAL COMPANIES. Supriyo Das Dipòsit Legal: T 1295-2015
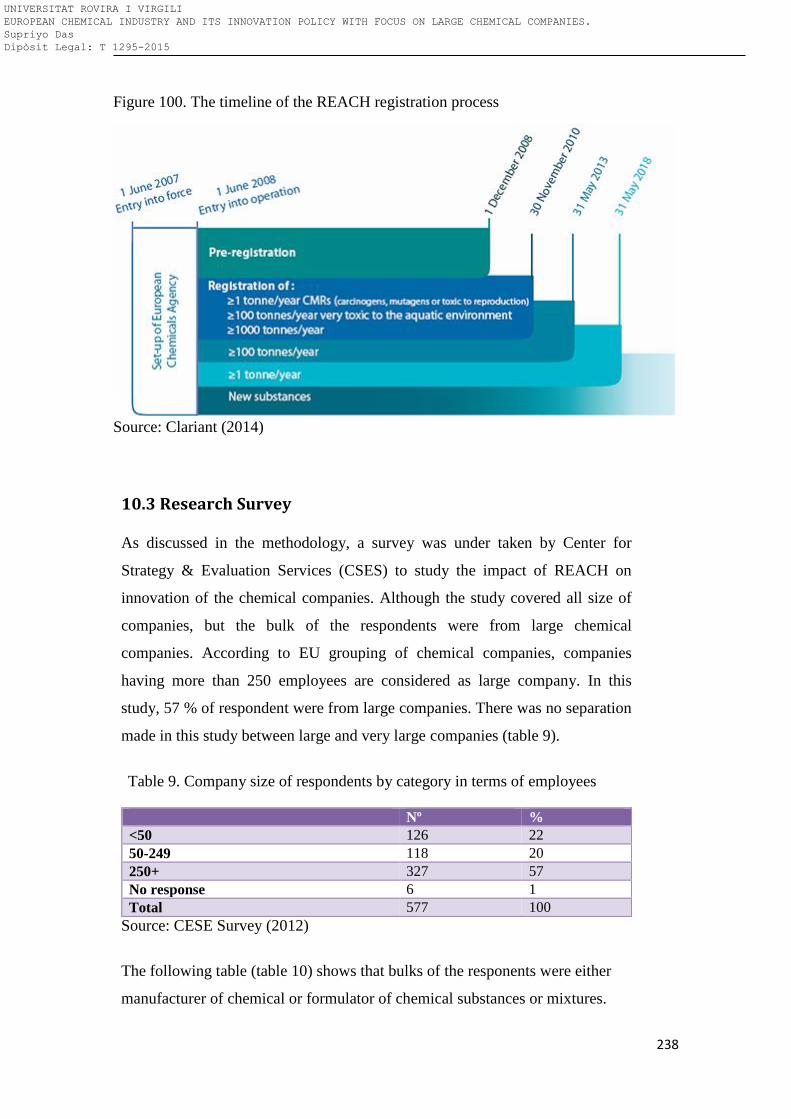
238
Figure 100. The timeline of the REACH registration process
Source: Clariant (2014)
10.3 Research Survey
As discussed in the methodology, a survey was under taken by Center for
Strategy & Evaluation Services (CSES) to study the impact of REACH on
innovation of the chemical companies. Although the study covered all size of
companies, but the bulk of the respondents were from large chemical
companies. According to EU grouping of chemical companies, companies
having more than 250 employees are considered as large company. In this
study, 57 % of respondent were from large companies. There was no separation
made in this study between large and very large companies (table 9).
Table 9. Company size of respondents by category in terms of employees
Nº %
<50 126 22
50-249 118 20
250+ 327 57
No response 6 1
Total 577 100
Source: CESE Survey (2012)
The following table (table 10) shows that bulks of the responents were either
manufacturer of chemical or formulator of chemical substances or mixtures.
UNIVERSITAT ROVIRA I VIRGILI EUROPEAN CHEMICAL INDUSTRY AND ITS INNOVATION POLICY WITH FOCUS ON LARGE CHEMICAL COMPANIES. Supriyo Das Dipòsit Legal: T 1295-2015
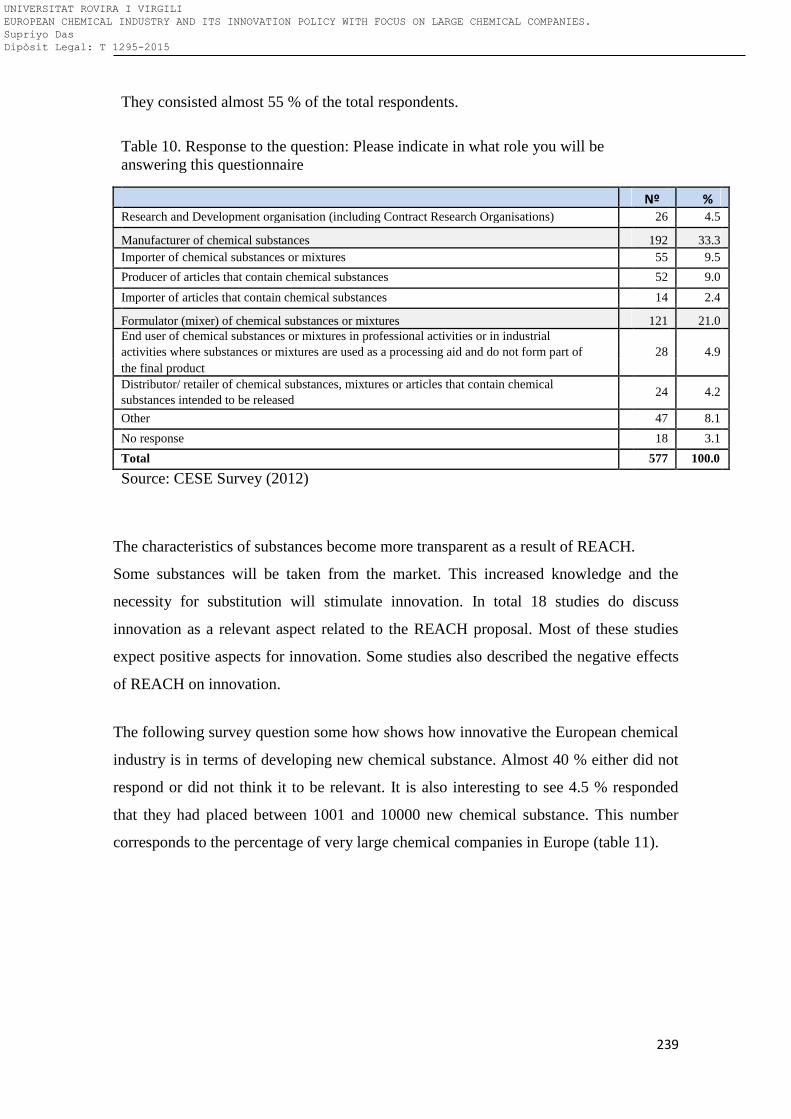
239
They consisted almost 55 % of the total respondents.
Table 10. Response to the question: Please indicate in what role you will be
answering this questionnaire
Nº %
Research and Development organisation (including Contract Research Organisations) 26 4.5
Manufacturer of chemical substances 192 33.3
Importer of chemical substances or mixtures 55 9.5
Producer of articles that contain chemical substances 52 9.0
Importer of articles that contain chemical substances 14 2.4
Formulator (mixer) of chemical substances or mixtures 121 21.0
End user of chemical substances or mixtures in professional activities or in industrial
activities where substances or mixtures are used as a processing aid and do not form part of 28 4.9
the final product
Distributor/ retailer of chemical substances, mixtures or articles that contain chemical 24
4.2
substances intended to be released
Other 47 8.1
No response 18 3.1
Total 577 100.0
Source: CESE Survey (2012)
The characteristics of substances become more transparent as a result of REACH.
Some substances will be taken from the market. This increased knowledge and the
necessity for substitution will stimulate innovation. In total 18 studies do discuss
innovation as a relevant aspect related to the REACH proposal. Most of these studies
expect positive aspects for innovation. Some studies also described the negative effects
of REACH on innovation.
The following survey question some how shows how innovative the European chemical
industry is in terms of developing new chemical substance. Almost 40 % either did not
respond or did not think it to be relevant. It is also interesting to see 4.5 % responded
that they had placed between 1001 and 10000 new chemical substance. This number
corresponds to the percentage of very large chemical companies in Europe (table 11).
UNIVERSITAT ROVIRA I VIRGILI EUROPEAN CHEMICAL INDUSTRY AND ITS INNOVATION POLICY WITH FOCUS ON LARGE CHEMICAL COMPANIES. Supriyo Das Dipòsit Legal: T 1295-2015
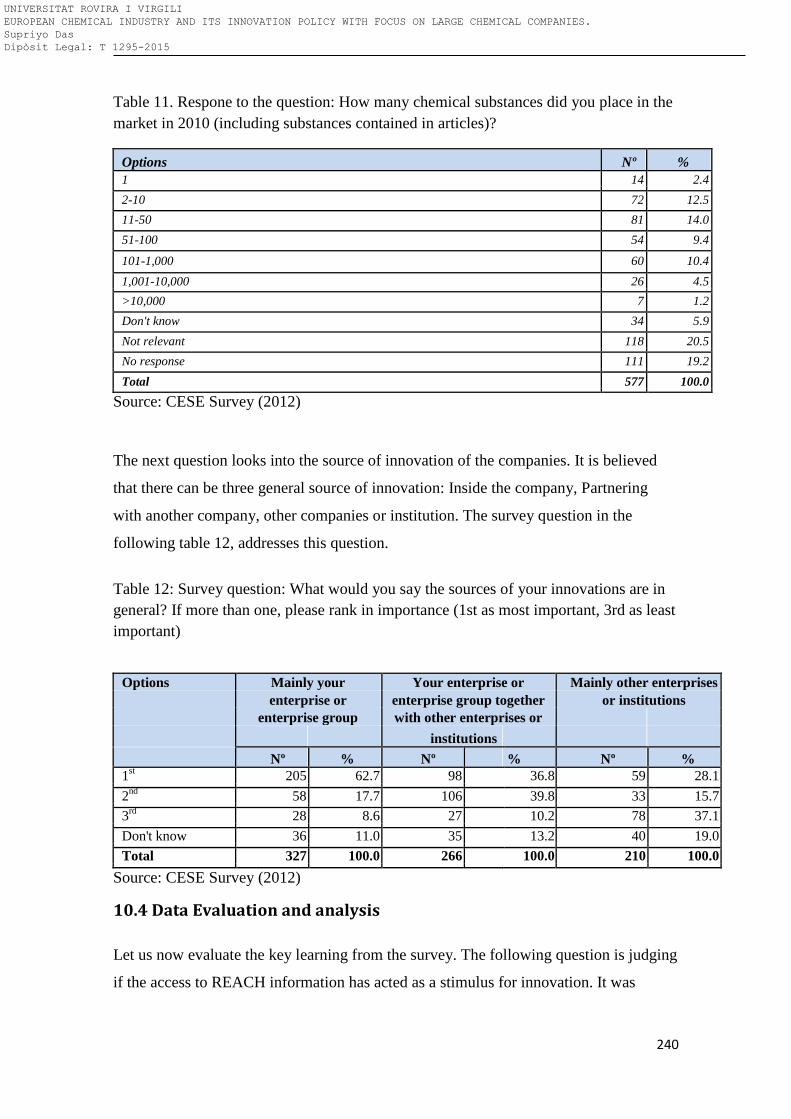
240
Table 11. Respone to the question: How many chemical substances did you place in the
market in 2010 (including substances contained in articles)?
Options Nº % 1 14 2.4
2-10 72 12.5
11-50 81 14.0
51-100 54 9.4
101-1,000 60 10.4
1,001-10,000 26 4.5
>10,000 7 1.2
Don't know 34 5.9
Not relevant 118 20.5
No response 111 19.2
Total 577 100.0
Source: CESE Survey (2012)
The next question looks into the source of innovation of the companies. It is believed
that there can be three general source of innovation: Inside the company, Partnering
with another company, other companies or institution. The survey question in the
following table 12, addresses this question.
Table 12: Survey question: What would you say the sources of your innovations are in
general? If more than one, please rank in importance (1st as most important, 3rd as least
important)
Options Mainly your Your enterprise or Mainly other enterprises
enterprise or enterprise group together or institutions enterprise group with other enterprises or
institutions
Nº % Nº % Nº % 1
st 205 62.7 98 36.8 59 28.1
2nd 58 17.7 106 39.8 33 15.7
3rd 28 8.6 27 10.2 78 37.1
Don't know 36 11.0 35 13.2 40 19.0
Total 327 100.0 266 100.0 210 100.0 Source: CESE Survey (2012)
10.4 Data Evaluation and analysis
Let us now evaluate the key learning from the survey. The following question is judging
if the access to REACH information has acted as a stimulus for innovation. It was
UNIVERSITAT ROVIRA I VIRGILI EUROPEAN CHEMICAL INDUSTRY AND ITS INNOVATION POLICY WITH FOCUS ON LARGE CHEMICAL COMPANIES. Supriyo Das Dipòsit Legal: T 1295-2015
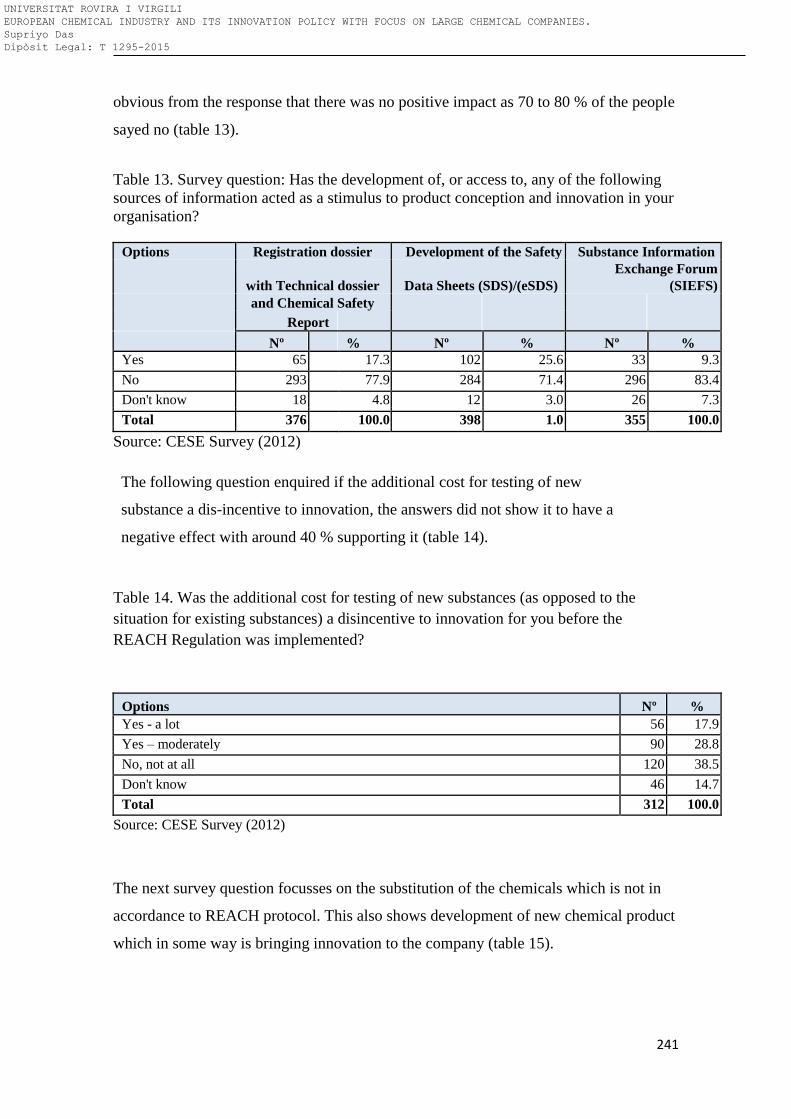
241
obvious from the response that there was no positive impact as 70 to 80 % of the people
sayed no (table 13).
Table 13. Survey question: Has the development of, or access to, any of the following
sources of information acted as a stimulus to product conception and innovation in your
organisation? Options Registration dossier Development of the Safety Substance Information
with Technical dossier Data Sheets (SDS)/(eSDS) Exchange Forum
(SIEFS) and Chemical Safety
Report
Nº % Nº % Nº % Yes 65 17.3 102 25.6 33 9.3
No 293 77.9 284 71.4 296 83.4
Don't know 18 4.8 12 3.0 26 7.3
Total 376 100.0 398 1.0 355 100.0 Source: CESE Survey (2012)
The following question enquired if the additional cost for testing of new
substance a dis-incentive to innovation, the answers did not show it to have a
negative effect with around 40 % supporting it (table 14).
Table 14. Was the additional cost for testing of new substances (as opposed to the
situation for existing substances) a disincentive to innovation for you before the
REACH Regulation was implemented?
Options Nº % Yes - a lot 56 17.9
Yes – moderately 90 28.8
No, not at all 120 38.5
Don't know 46 14.7
Total 312 100.0
Source: CESE Survey (2012)
The next survey question focusses on the substitution of the chemicals which is not in
accordance to REACH protocol. This also shows development of new chemical product
which in some way is bringing innovation to the company (table 15).
UNIVERSITAT ROVIRA I VIRGILI EUROPEAN CHEMICAL INDUSTRY AND ITS INNOVATION POLICY WITH FOCUS ON LARGE CHEMICAL COMPANIES. Supriyo Das Dipòsit Legal: T 1295-2015
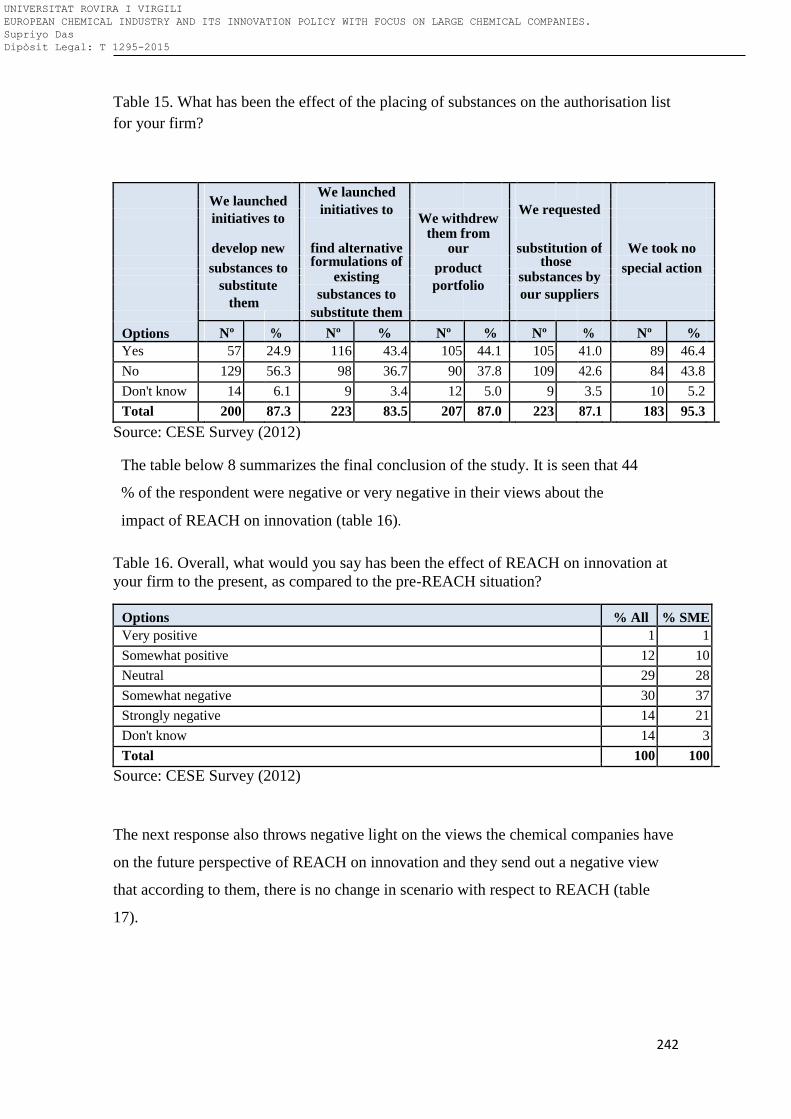
242
Table 15. What has been the effect of the placing of substances on the authorisation list
for your firm?
We launched We launched
initiatives to
We requested
initiatives to
We withdrew
find alternative
substitution of
develop new
them from our We took no
substances to formulations of
product those special action
existing
substances by
substitute
portfolio
substances to
our suppliers
them
substitute them
Options Nº % Nº % Nº % Nº % Nº %
Yes 57 24.9 116 43.4 105 44.1 105 41.0 89 46.4
No 129 56.3 98 36.7 90 37.8 109 42.6 84 43.8
Don't know 14 6.1 9 3.4 12 5.0 9 3.5 10 5.2
Total 200 87.3 223 83.5 207 87.0 223 87.1 183 95.3
Source: CESE Survey (2012)
The table below 8 summarizes the final conclusion of the study. It is seen that 44
% of the respondent were negative or very negative in their views about the
impact of REACH on innovation (table 16).
Table 16. Overall, what would you say has been the effect of REACH on innovation at
your firm to the present, as compared to the pre-REACH situation?
Options % All % SME
Very positive 1 1
Somewhat positive 12 10
Neutral 29 28
Somewhat negative 30 37
Strongly negative 14 21
Don't know 14 3
Total 100 100
Source: CESE Survey (2012)
The next response also throws negative light on the views the chemical companies have
on the future perspective of REACH on innovation and they send out a negative view
that according to them, there is no change in scenario with respect to REACH (table
17).
UNIVERSITAT ROVIRA I VIRGILI EUROPEAN CHEMICAL INDUSTRY AND ITS INNOVATION POLICY WITH FOCUS ON LARGE CHEMICAL COMPANIES. Supriyo Das Dipòsit Legal: T 1295-2015
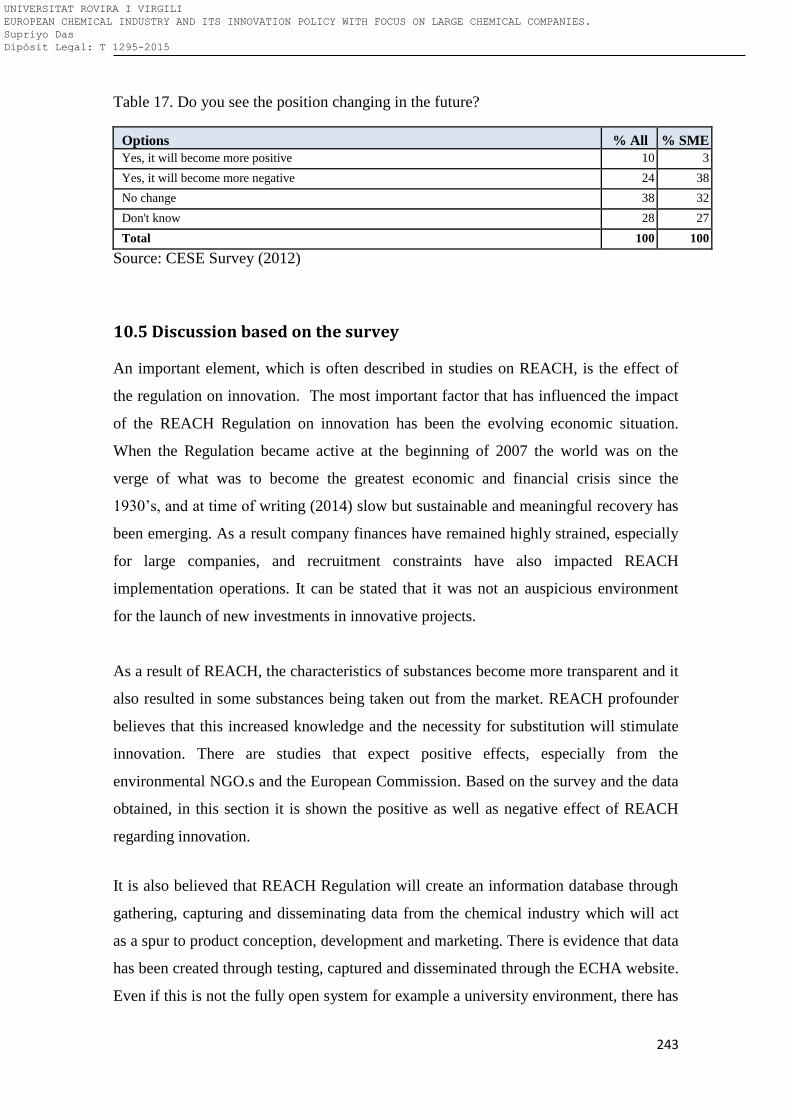
243
Table 17. Do you see the position changing in the future?
Options % All % SME Yes, it will become more positive 10 3
Yes, it will become more negative 24 38
No change 38 32
Don't know 28 27
Total 100 100
Source: CESE Survey (2012)
10.5 Discussion based on the survey
An important element, which is often described in studies on REACH, is the effect of
the regulation on innovation. The most important factor that has influenced the impact
of the REACH Regulation on innovation has been the evolving economic situation.
When the Regulation became active at the beginning of 2007 the world was on the
verge of what was to become the greatest economic and financial crisis since the
1930’s, and at time of writing (2014) slow but sustainable and meaningful recovery has
been emerging. As a result company finances have remained highly strained, especially
for large companies, and recruitment constraints have also impacted REACH
implementation operations. It can be stated that it was not an auspicious environment
for the launch of new investments in innovative projects.
As a result of REACH, the characteristics of substances become more transparent and it
also resulted in some substances being taken out from the market. REACH profounder
believes that this increased knowledge and the necessity for substitution will stimulate
innovation. There are studies that expect positive effects, especially from the
environmental NGO.s and the European Commission. Based on the survey and the data
obtained, in this section it is shown the positive as well as negative effect of REACH
regarding innovation.
It is also believed that REACH Regulation will create an information database through
gathering, capturing and disseminating data from the chemical industry which will act
as a spur to product conception, development and marketing. There is evidence that data
has been created through testing, captured and disseminated through the ECHA website.
Even if this is not the fully open system for example a university environment, there has
UNIVERSITAT ROVIRA I VIRGILI EUROPEAN CHEMICAL INDUSTRY AND ITS INNOVATION POLICY WITH FOCUS ON LARGE CHEMICAL COMPANIES. Supriyo Das Dipòsit Legal: T 1295-2015
244
been an increased level of openness and scrutiny as a result, and some benefits have
been evident, contributing to data generation and creation of IP. In case of large
chemical companies, the Material Safety Data Sheet (MSDS) seems to have made the
strongest contribution to stimulating new product conception.
Every company has their own IP strategies which depend on the role of IP in their
business and costs of protection of IP. Feedback from interviews and the innovation
survey so far suggest that whether or not a patent is filed for, the costs of IPP related to
REACH can be challenging or even prohibitive.
Many large companies complained that a higher share of turnover was spent on R&D
than average due to REACH. Since there is now the compliance aspects that has to be
considered by firms, there are grounds to expect that what may be the “normal” time lag
for innovation to occur as a result of an external factor such as regulation, may be
extended, and it is probably too early to be able to assess the full impact of the
Regulation on innovation.
It was observed from the survey that there has been a significant redirection of skilled,
sometimes highly skilled, personnel in firms from R&D and innovation-related
activities to compliance work as a result of the implementation of the Regulation. It was
particularly true for large companies and they think the shift will be permanent. More
than half of survey respondents reported that as a result there has been an increase in
expenditure on R&D and related innovative activities. Interviews with large firms
suggest those that were not financially constrained increased expenditure to maintain
R&D activity.
In case of large companies, the evidence from the fieldwork also suggests that links
with universities and networks developed tended to focus on the compliance/ regulatory
elements of REACH rather than pure research and there is a great deal of activity
throughout the EU in this respect. This resulted many firms establishing external
relationships, most of which have been with various service providers, especially
consultants, but these have not contributed particularly to innovation. Many companies
have had to fund the extra cost requirements related to implementing the Regulation
UNIVERSITAT ROVIRA I VIRGILI EUROPEAN CHEMICAL INDUSTRY AND ITS INNOVATION POLICY WITH FOCUS ON LARGE CHEMICAL COMPANIES. Supriyo Das Dipòsit Legal: T 1295-2015
245
from their usual sources, and feedback from interviews suggests that this is easier for
larger firms than smaller ones, especially in the current economic environment.
Rate of return from R&D investment was negatively impacted by REACH compliance
costs, while uncertainties about actual costs and their timing in the case of innovation
projects have not helped financing decision-making in general. REACH regulation
generated scope of innovative activities to include more work on new substances,
particularly among large firms, who are also responsible for most innovation in the
industry, but barriers to R&D and innovation in new substances still remain.
The several steps for substitution mechanisms within REACH: registration, the
candidate list, authorisation and restriction, have had various impacts on innovative
activities. Registration costs can have an impact on the decision to register a new
substance or use, or use of an existing substance in innovative ways and this can in turn
also influence the availability of substances within supply chains for future use in
innovation. It has also been observed that companies carry out product changes purely
with a view to avoiding regulatory burdens of REACH. It seems that the return on
investment in new registrations needs to be more certain and possibly higher to
compensate for increases in costs, risks and uncertainties.
Due to increased openness and scrutiny driven by the Regulation, it is a concern of the
companies over the ability to protect IP. The fieldwork has confirmed that extensive
activity in the areas of product, process, marketing and innovation change is occurring
as a result of the implementation of the Regulation. Firms also often think that the
additional costs placed on requesting IPP are too high, especially when the requests may
not be granted. Large firms that use patents to protect IP do not consider REACH patent
friendly. There are also widely held views that the protection of CBI within REACH
remains insufficient.
In many instances companies have considered the activities to ensure compliance with
the Regulation as a distraction from their normal, planned innovation activities (also
organizational and marketing innovation) and to be unintended consequences of the
Regulation. Increases in time-to-market as a result of the Regulation and increased
supply chain rigidities resulting from changes in toll manufacturing arrangements have
UNIVERSITAT ROVIRA I VIRGILI EUROPEAN CHEMICAL INDUSTRY AND ITS INNOVATION POLICY WITH FOCUS ON LARGE CHEMICAL COMPANIES. Supriyo Das Dipòsit Legal: T 1295-2015
246
not been supportive of innovation. Additonally, they thought it would worsen in the
future than would improve.
Due to complexity of REACH regulation and cost, it has been argued that some non-EU
locations are getting more attractive for undertaking innovative activities. Based on the
data provided, it appears that some such delocalisation of innovative activities has
occurred, although REACH may not always have been the only or even the main driver.
10.6 Conclusion
The chemical regulation (REACH) has a big impact on R&D activities of the chemical
companies in Europe. The chemical products which have not been pre-registered before
the due date could not be sold any more until they go through the registration process.
The bulk of the respondent of the survey carried out by CSES was from the large
chemical companies who are manuafcturer of chemical product. According to the
survey, there is a very strong negative effect of REACH on innovation. High amount of
R&D resources is being used for REACH compliance need. The compliance cost of
REACH has negative effect on further investment for R&D. There is a great concern for
IP due to more openness of the Information.
It can be concluded from above survey and following studies that indicated that they
had found knowledge generated stimulated product conception and innovation, larger
firms were less positive than SMEs. Among survey respondents that indicated a
“substantial” shift in resources from R&D and innovative activity to REACH
compliance, the share of small firms was high (compared to the overall presence of such
firms in the survey), especially in the case of formulators, and also for medium-sized
firms, although the increase was not as marked. More SMEs also saw this shift as
permanent than large firms, and indicated the response as one of having increasing
expenditure on R&D to compensate for this in the long run.
UNIVERSITAT ROVIRA I VIRGILI EUROPEAN CHEMICAL INDUSTRY AND ITS INNOVATION POLICY WITH FOCUS ON LARGE CHEMICAL COMPANIES. Supriyo Das Dipòsit Legal: T 1295-2015
247
10.7 Bibliography
CESE Survey. (2012). Interim Evaluation: Impact of the REACH Regulation on the
innovativeness of the EU chemical industry. Retrieved from
http://ec.europa.eu/enterprise/sectors/chemicals/files/reach/review2012/innovation-
final-report_en.pdf
Clariant. (2014). Welcome to Industrial and consumer specialities. Retrieved from
http://www.latam.clariant.com/C12576720021BF8F/vwWebPagesByID/DC6BB862C2
75200FC12577990010C00D
UNIVERSITAT ROVIRA I VIRGILI EUROPEAN CHEMICAL INDUSTRY AND ITS INNOVATION POLICY WITH FOCUS ON LARGE CHEMICAL COMPANIES. Supriyo Das Dipòsit Legal: T 1295-2015
248
11. European chemical cluster and geographical distribution: An impact on innovation
Contents
11.1 Introduction ............................................................................................................................................. 249
11.2 Components of European Chemical Cluster ............................................................................... 249
11.3 Distribution of European chemical cluster ................................................................................. 251
11.4 Impact of chemical cluster on European Innovation .............................................................. 254
11.4.1 Case Study I: Tarragona Chemical Cluster …………………………………………………254
11.4.2 Case Study II: Axelera chemical cluster …………………………………………………260
11.4.3 Case Study III Port of Antwerp Chemical Cluster ……………………………………..262
11.4.4 Geographical distribution of chemical cluster and its impact on innovation……265
11.4.5 Innovation ranking of the clusters in different region……………………………………….265
11.5 Conclusion ................................................................................................................................................ 266
11.6 Bibliography ............................................................................................................................................ 270
UNIVERSITAT ROVIRA I VIRGILI EUROPEAN CHEMICAL INDUSTRY AND ITS INNOVATION POLICY WITH FOCUS ON LARGE CHEMICAL COMPANIES. Supriyo Das Dipòsit Legal: T 1295-2015
249
11.1 Introduction
According to Porter (1998), clusters are geographic concentrations of interconnected
companies and institutions in a particular field. Clusters encompass an array of linked
industries and other entities important to competition. It is geographically limited
concentration of mutually related Business units, associations and public or private
organizations centering on a specific economic focus (Gordon and McCann, 2003). A
high concentration of manufacturing companies and Service providers, but also
associations and public or private organization that engage to create an environment for
production, innovation and the creation of new business development. Clusters include,
for example, suppliers of specialized raw material, suppliers of components, machinery,
and services, and providers of specialized infrastructure such as water, electricity or
firefighting support. This section explains the structure and geographical distribution of
European chemical cluster and its impact on innovation.
11.2 Components of European Chemical Cluster
Clusters normally extend both vertically and horizontally in value chain. Clusters also
often extend downstream to channels and customers and laterally to manufacturers of
complementary products and to companies in industries related by skills, technologies,
or common inputs. In such clusters there is outsourcing of related services attracting
third party investments in transportation, warehousing, general services, waste
treatment, and a wide range of utilities. Finally, many clusters include governmental and
other institutions-such as universities, standards-setting agencies, think tanks, vocational
training providers, and trade associations-that provide specialized training, education,
Information, research, and technical Support.
UNIVERSITAT ROVIRA I VIRGILI EUROPEAN CHEMICAL INDUSTRY AND ITS INNOVATION POLICY WITH FOCUS ON LARGE CHEMICAL COMPANIES. Supriyo Das Dipòsit Legal: T 1295-2015
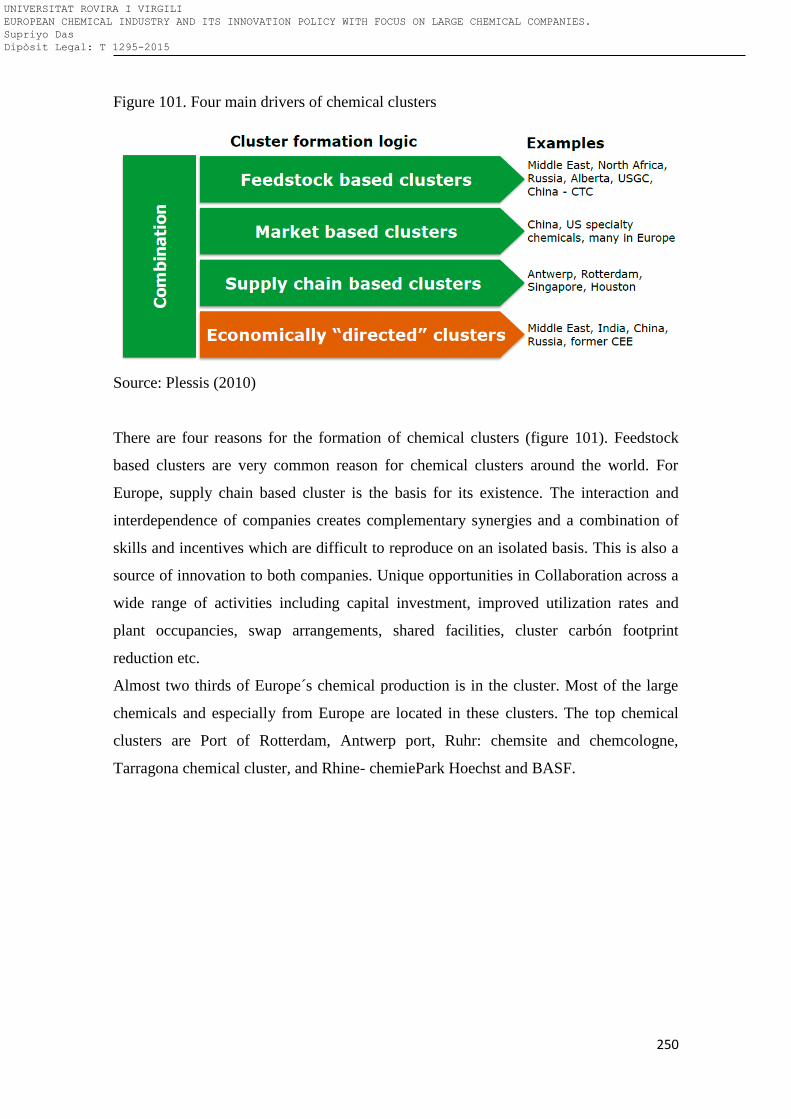
250
Figure 101. Four main drivers of chemical clusters
Source: Plessis (2010)
There are four reasons for the formation of chemical clusters (figure 101). Feedstock
based clusters are very common reason for chemical clusters around the world. For
Europe, supply chain based cluster is the basis for its existence. The interaction and
interdependence of companies creates complementary synergies and a combination of
skills and incentives which are difficult to reproduce on an isolated basis. This is also a
source of innovation to both companies. Unique opportunities in Collaboration across a
wide range of activities including capital investment, improved utilization rates and
plant occupancies, swap arrangements, shared facilities, cluster carbón footprint
reduction etc.
Almost two thirds of Europe´s chemical production is in the cluster. Most of the large
chemicals and especially from Europe are located in these clusters. The top chemical
clusters are Port of Rotterdam, Antwerp port, Ruhr: chemsite and chemcologne,
Tarragona chemical cluster, and Rhine- chemiePark Hoechst and BASF.
UNIVERSITAT ROVIRA I VIRGILI EUROPEAN CHEMICAL INDUSTRY AND ITS INNOVATION POLICY WITH FOCUS ON LARGE CHEMICAL COMPANIES. Supriyo Das Dipòsit Legal: T 1295-2015
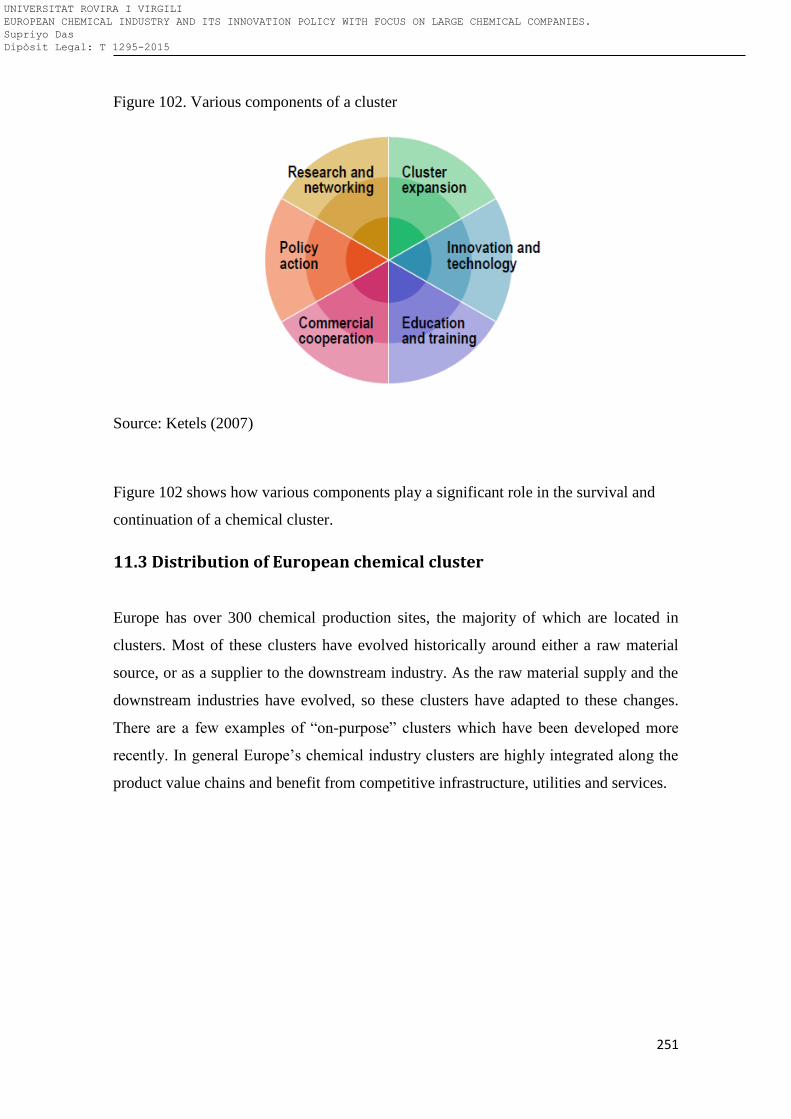
251
Figure 102. Various components of a cluster
Source: Ketels (2007)
Figure 102 shows how various components play a significant role in the survival and
continuation of a chemical cluster.
11.3 Distribution of European chemical cluster
Europe has over 300 chemical production sites, the majority of which are located in
clusters. Most of these clusters have evolved historically around either a raw material
source, or as a supplier to the downstream industry. As the raw material supply and the
downstream industries have evolved, so these clusters have adapted to these changes.
There are a few examples of “on-purpose” clusters which have been developed more
recently. In general Europe’s chemical industry clusters are highly integrated along the
product value chains and benefit from competitive infrastructure, utilities and services.
UNIVERSITAT ROVIRA I VIRGILI EUROPEAN CHEMICAL INDUSTRY AND ITS INNOVATION POLICY WITH FOCUS ON LARGE CHEMICAL COMPANIES. Supriyo Das Dipòsit Legal: T 1295-2015
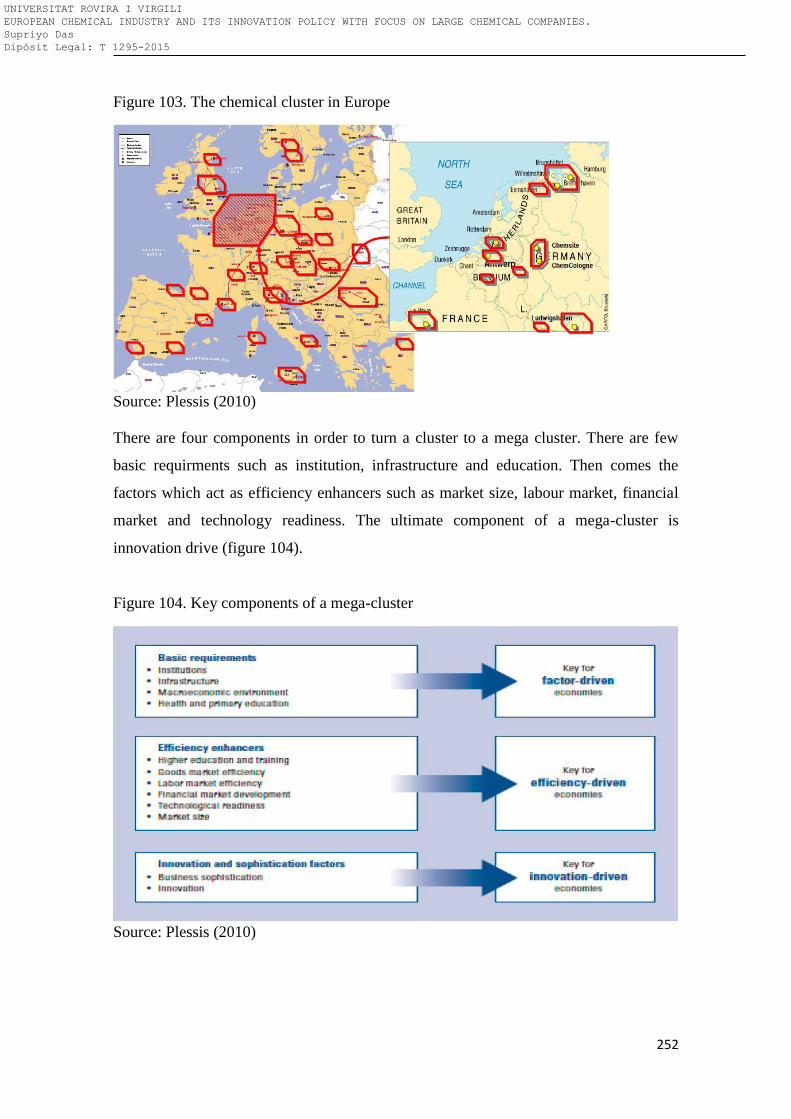
252
Figure 103. The chemical cluster in Europe
Source: Plessis (2010)
There are four components in order to turn a cluster to a mega cluster. There are few
basic requirments such as institution, infrastructure and education. Then comes the
factors which act as efficiency enhancers such as market size, labour market, financial
market and technology readiness. The ultimate component of a mega-cluster is
innovation drive (figure 104).
Figure 104. Key components of a mega-cluster
Source: Plessis (2010)
UNIVERSITAT ROVIRA I VIRGILI EUROPEAN CHEMICAL INDUSTRY AND ITS INNOVATION POLICY WITH FOCUS ON LARGE CHEMICAL COMPANIES. Supriyo Das Dipòsit Legal: T 1295-2015
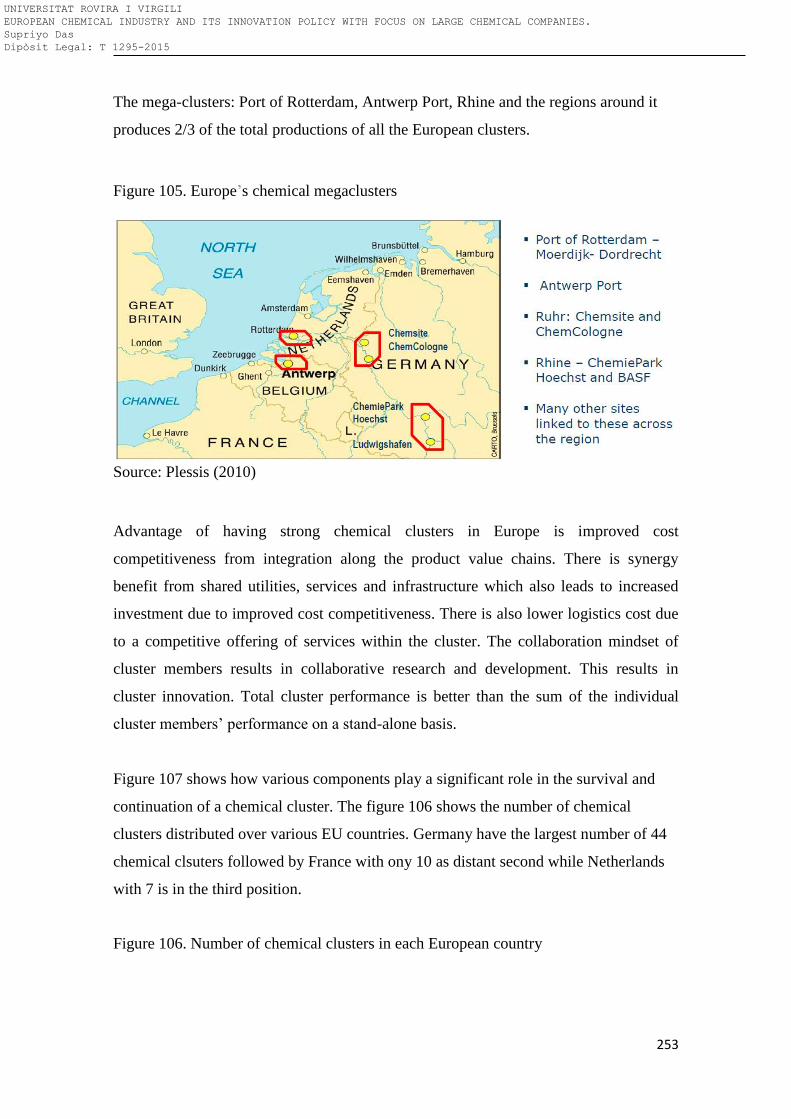
253
The mega-clusters: Port of Rotterdam, Antwerp Port, Rhine and the regions around it
produces 2/3 of the total productions of all the European clusters.
Figure 105. Europe’s chemical megaclusters
Source: Plessis (2010)
Advantage of having strong chemical clusters in Europe is improved cost
competitiveness from integration along the product value chains. There is synergy
benefit from shared utilities, services and infrastructure which also leads to increased
investment due to improved cost competitiveness. There is also lower logistics cost due
to a competitive offering of services within the cluster. The collaboration mindset of
cluster members results in collaborative research and development. This results in
cluster innovation. Total cluster performance is better than the sum of the individual
cluster members’ performance on a stand-alone basis.
Figure 107 shows how various components play a significant role in the survival and
continuation of a chemical cluster. The figure 106 shows the number of chemical
clusters distributed over various EU countries. Germany have the largest number of 44
chemical clsuters followed by France with ony 10 as distant second while Netherlands
with 7 is in the third position.
Figure 106. Number of chemical clusters in each European country
UNIVERSITAT ROVIRA I VIRGILI EUROPEAN CHEMICAL INDUSTRY AND ITS INNOVATION POLICY WITH FOCUS ON LARGE CHEMICAL COMPANIES. Supriyo Das Dipòsit Legal: T 1295-2015
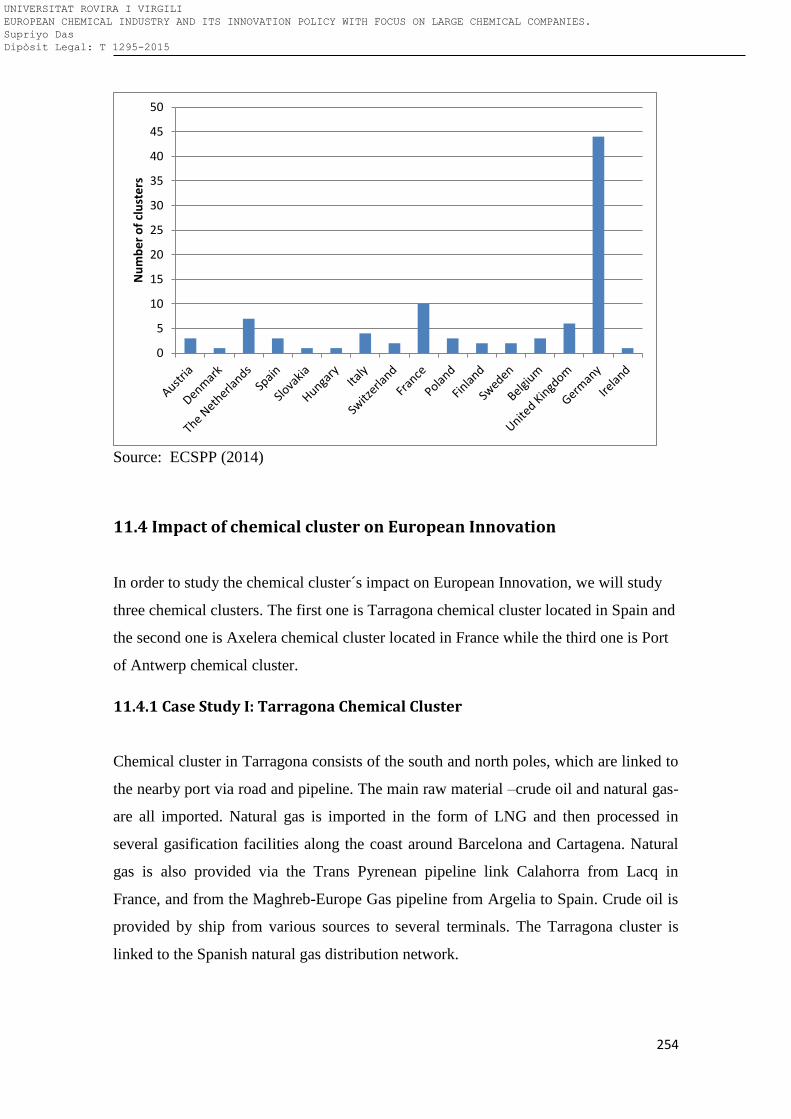
254
Source: ECSPP (2014)
11.4 Impact of chemical cluster on European Innovation
In order to study the chemical cluster´s impact on European Innovation, we will study
three chemical clusters. The first one is Tarragona chemical cluster located in Spain and
the second one is Axelera chemical cluster located in France while the third one is Port
of Antwerp chemical cluster.
11.4.1 Case Study I: Tarragona Chemical Cluster
Chemical cluster in Tarragona consists of the south and north poles, which are linked to
the nearby port via road and pipeline. The main raw material –crude oil and natural gas-
are all imported. Natural gas is imported in the form of LNG and then processed in
several gasification facilities along the coast around Barcelona and Cartagena. Natural
gas is also provided via the Trans Pyrenean pipeline link Calahorra from Lacq in
France, and from the Maghreb-Europe Gas pipeline from Argelia to Spain. Crude oil is
provided by ship from various sources to several terminals. The Tarragona cluster is
linked to the Spanish natural gas distribution network.
0
5
10
15
20
25
30
35
40
45
50
Nu
mb
er
of
clu
ste
rs
UNIVERSITAT ROVIRA I VIRGILI EUROPEAN CHEMICAL INDUSTRY AND ITS INNOVATION POLICY WITH FOCUS ON LARGE CHEMICAL COMPANIES. Supriyo Das Dipòsit Legal: T 1295-2015
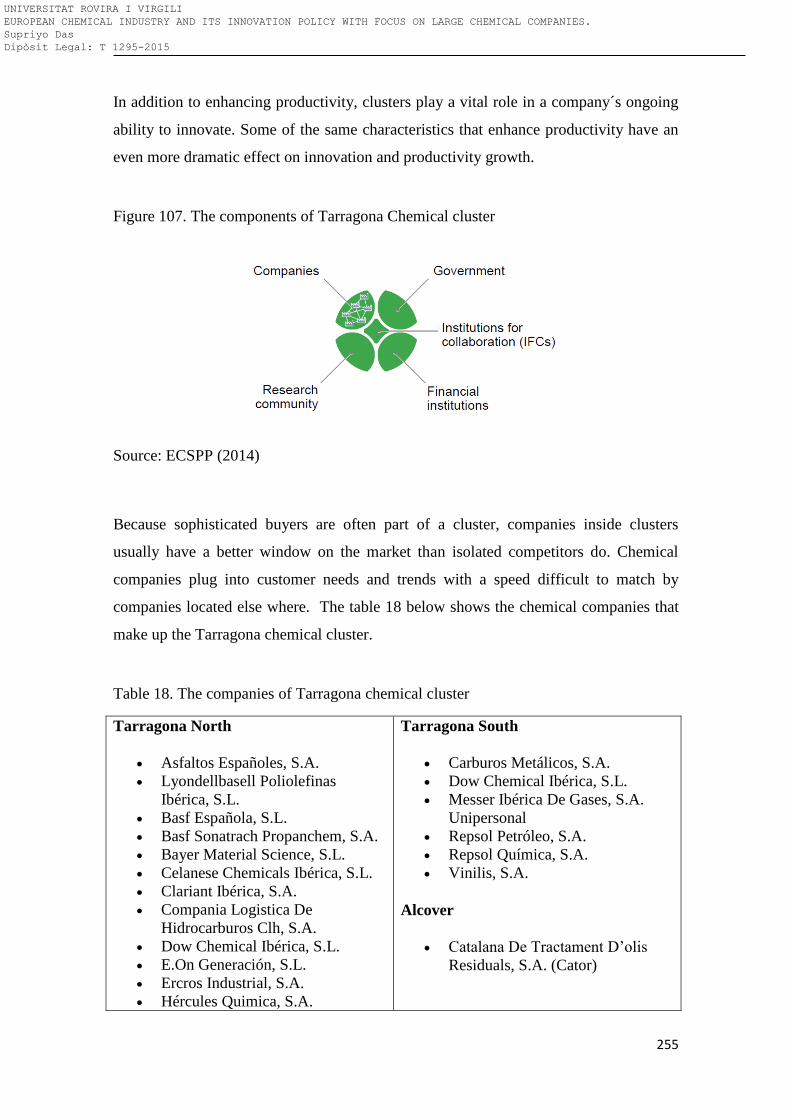
255
In addition to enhancing productivity, clusters play a vital role in a company´s ongoing
ability to innovate. Some of the same characteristics that enhance productivity have an
even more dramatic effect on innovation and productivity growth.
Figure 107. The components of Tarragona Chemical cluster
Source: ECSPP (2014)
Because sophisticated buyers are often part of a cluster, companies inside clusters
usually have a better window on the market than isolated competitors do. Chemical
companies plug into customer needs and trends with a speed difficult to match by
companies located else where. The table 18 below shows the chemical companies that
make up the Tarragona chemical cluster.
Table 18. The companies of Tarragona chemical cluster
Tarragona North
Asfaltos Españoles, S.A.
Lyondellbasell Poliolefinas
Ibérica, S.L.
Basf Española, S.L.
Basf Sonatrach Propanchem, S.A.
Bayer Material Science, S.L.
Celanese Chemicals Ibérica, S.L.
Clariant Ibérica, S.A.
Compania Logistica De
Hidrocarburos Clh, S.A.
Dow Chemical Ibérica, S.L.
E.On Generación, S.L.
Ercros Industrial, S.A.
Hércules Quimica, S.A.
Tarragona South
Carburos Metálicos, S.A.
Dow Chemical Ibérica, S.L.
Messer Ibérica De Gases, S.A.
Unipersonal
Repsol Petróleo, S.A.
Repsol Química, S.A.
Vinilis, S.A.
Alcover
Catalana De Tractament D’olis
Residuals, S.A. (Cator)
UNIVERSITAT ROVIRA I VIRGILI EUROPEAN CHEMICAL INDUSTRY AND ITS INNOVATION POLICY WITH FOCUS ON LARGE CHEMICAL COMPANIES. Supriyo Das Dipòsit Legal: T 1295-2015
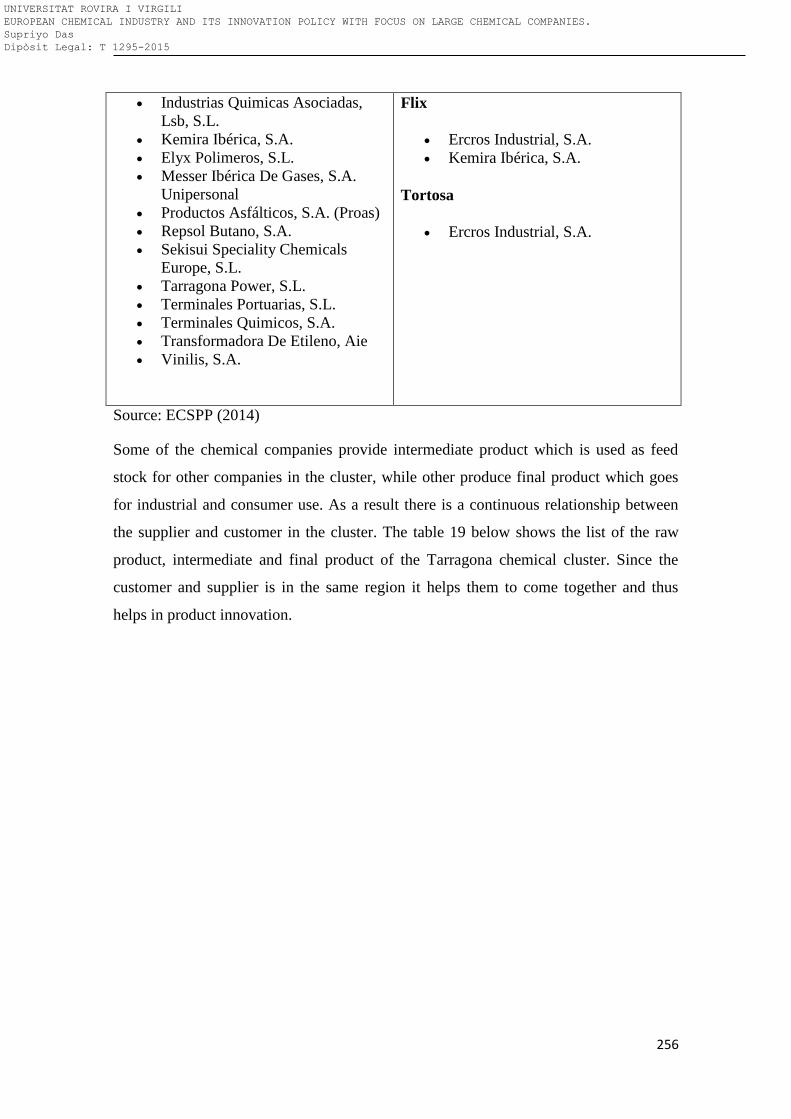
256
Industrias Quimicas Asociadas,
Lsb, S.L.
Kemira Ibérica, S.A.
Elyx Polimeros, S.L.
Messer Ibérica De Gases, S.A.
Unipersonal
Productos Asfálticos, S.A. (Proas)
Repsol Butano, S.A.
Sekisui Speciality Chemicals
Europe, S.L.
Tarragona Power, S.L.
Terminales Portuarias, S.L.
Terminales Quimicos, S.A.
Transformadora De Etileno, Aie
Vinilis, S.A.
Flix
Ercros Industrial, S.A.
Kemira Ibérica, S.A.
Tortosa
Ercros Industrial, S.A.
Source: ECSPP (2014)
Some of the chemical companies provide intermediate product which is used as feed
stock for other companies in the cluster, while other produce final product which goes
for industrial and consumer use. As a result there is a continuous relationship between
the supplier and customer in the cluster. The table 19 below shows the list of the raw
product, intermediate and final product of the Tarragona chemical cluster. Since the
customer and supplier is in the same region it helps them to come together and thus
helps in product innovation.
UNIVERSITAT ROVIRA I VIRGILI EUROPEAN CHEMICAL INDUSTRY AND ITS INNOVATION POLICY WITH FOCUS ON LARGE CHEMICAL COMPANIES. Supriyo Das Dipòsit Legal: T 1295-2015
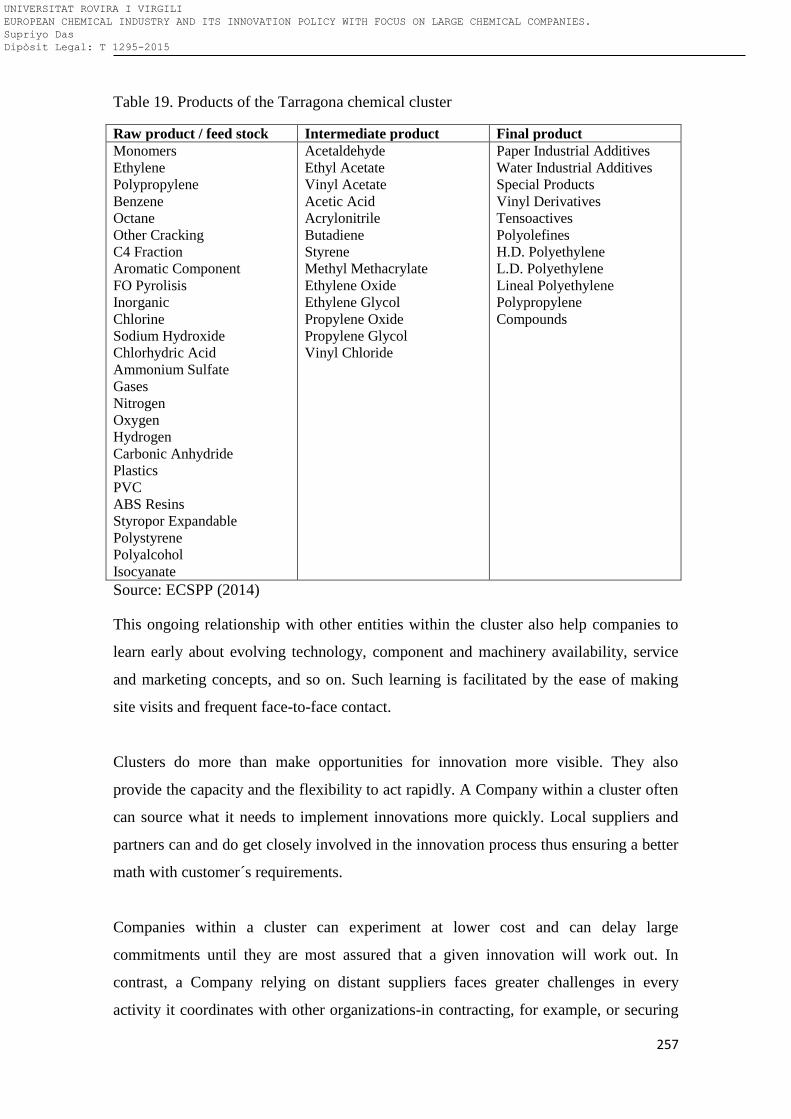
257
Table 19. Products of the Tarragona chemical cluster
Raw product / feed stock Intermediate product Final product
Monomers
Ethylene
Polypropylene
Benzene
Octane
Other Cracking
C4 Fraction
Aromatic Component
FO Pyrolisis
Inorganic
Chlorine
Sodium Hydroxide
Chlorhydric Acid
Ammonium Sulfate
Gases
Nitrogen
Oxygen
Hydrogen
Carbonic Anhydride
Plastics
PVC
ABS Resins
Styropor Expandable
Polystyrene
Polyalcohol
Isocyanate
Acetaldehyde
Ethyl Acetate
Vinyl Acetate
Acetic Acid
Acrylonitrile
Butadiene
Styrene
Methyl Methacrylate
Ethylene Oxide
Ethylene Glycol
Propylene Oxide
Propylene Glycol
Vinyl Chloride
Paper Industrial Additives
Water Industrial Additives
Special Products
Vinyl Derivatives
Tensoactives
Polyolefines
H.D. Polyethylene
L.D. Polyethylene
Lineal Polyethylene
Polypropylene
Compounds
Source: ECSPP (2014)
This ongoing relationship with other entities within the cluster also help companies to
learn early about evolving technology, component and machinery availability, service
and marketing concepts, and so on. Such learning is facilitated by the ease of making
site visits and frequent face-to-face contact.
Clusters do more than make opportunities for innovation more visible. They also
provide the capacity and the flexibility to act rapidly. A Company within a cluster often
can source what it needs to implement innovations more quickly. Local suppliers and
partners can and do get closely involved in the innovation process thus ensuring a better
math with customer´s requirements.
Companies within a cluster can experiment at lower cost and can delay large
commitments until they are most assured that a given innovation will work out. In
contrast, a Company relying on distant suppliers faces greater challenges in every
activity it coordinates with other organizations-in contracting, for example, or securing
UNIVERSITAT ROVIRA I VIRGILI EUROPEAN CHEMICAL INDUSTRY AND ITS INNOVATION POLICY WITH FOCUS ON LARGE CHEMICAL COMPANIES. Supriyo Das Dipòsit Legal: T 1295-2015
258
delivery or obtaining associated Technical and Service Support. Innovation can be even
harder in vertically integrated companies, especially in those that face difficult trade-
offs if the innovation erodes the value of in-house assets of current products or
processes must be maintained while new ones are developed. In this cluster, also belong
several research institute and the Tarragona university. There is a close cooperation with
these reach centers and the university with the chemical companies belonging to the
cluster.
Chemistry Technology Centre (CTQ)
Institute of Chemical Research of Catalonia (ICIQ)
Rovira i Virgili University (URV)
Catalan Government Department of Education (Secondary Schools: Comte de
Rius; Pere Martell; Vidal i Barraquer)
Chambers of Commerce, Industry and Navigation of Reus, Tarragona, Tortosa
Chamber of Commerce and Industry of Valls
There are also several opportunities of the doctoral research of the Tarragona university
at the companies located in the cluster. The university provides analytical and other
capabilities which many of these chemical companies might be lacking for research.
Reinforcing the other advantages for innovation is the sheer pressure-competitive
pressure, peer pressure, constant comparison-that occurs in a cluster. For all these
reasons, Tarragona chemical cluster can remain centers of innovation for decades.
If companies in a cluster are too inward looking, the whole cluster suffers from a
collective inertia, making it harder for individual companies to embraces new ideas,
much less perceive the need for radical innovation. The government organizations play
a critical role in this collaboration for innovation and R&D. The list below lays down
the government organization that participate in Tarragona cluster build-up.
Catalan Government - Tarragona Delegation
Council of Tarragona
Spanish Government – Tarragona Delegation
City Councils: Alcover, La Canonja, Constantí, Flix, El Morell, Perafort, La
Pobla de Mafumet, Reus, Tarragona, Tortosa, Salou, Valls, Vila-seca
UNIVERSITAT ROVIRA I VIRGILI EUROPEAN CHEMICAL INDUSTRY AND ITS INNOVATION POLICY WITH FOCUS ON LARGE CHEMICAL COMPANIES. Supriyo Das Dipòsit Legal: T 1295-2015
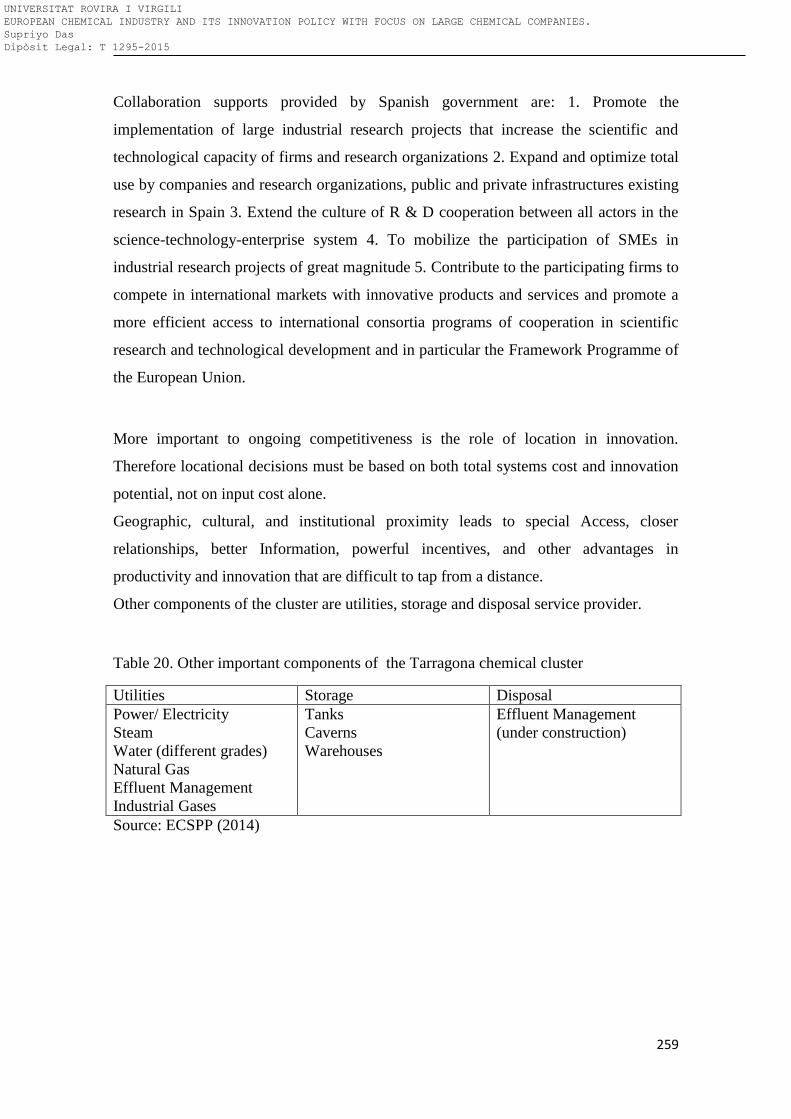
259
Collaboration supports provided by Spanish government are: 1. Promote the
implementation of large industrial research projects that increase the scientific and
technological capacity of firms and research organizations 2. Expand and optimize total
use by companies and research organizations, public and private infrastructures existing
research in Spain 3. Extend the culture of R & D cooperation between all actors in the
science-technology-enterprise system 4. To mobilize the participation of SMEs in
industrial research projects of great magnitude 5. Contribute to the participating firms to
compete in international markets with innovative products and services and promote a
more efficient access to international consortia programs of cooperation in scientific
research and technological development and in particular the Framework Programme of
the European Union.
More important to ongoing competitiveness is the role of location in innovation.
Therefore locational decisions must be based on both total systems cost and innovation
potential, not on input cost alone.
Geographic, cultural, and institutional proximity leads to special Access, closer
relationships, better Information, powerful incentives, and other advantages in
productivity and innovation that are difficult to tap from a distance.
Other components of the cluster are utilities, storage and disposal service provider.
Table 20. Other important components of the Tarragona chemical cluster
Utilities Storage Disposal
Power/ Electricity
Steam
Water (different grades)
Natural Gas
Effluent Management
Industrial Gases
Tanks
Caverns
Warehouses
Effluent Management
(under construction)
Source: ECSPP (2014)
UNIVERSITAT ROVIRA I VIRGILI EUROPEAN CHEMICAL INDUSTRY AND ITS INNOVATION POLICY WITH FOCUS ON LARGE CHEMICAL COMPANIES. Supriyo Das Dipòsit Legal: T 1295-2015
260
11.4.2 Case Study II: Axelera chemical cluster
This case study focuses on one cluster, Axelera to identify the role it plays in innovation
and, in particular in REACH-related innovation. Axelera – a Pôle de compétitivité à
vocation mondiale Chimie-Environnement Lyon & Rhône-Alpes, was created in 2005
with the aim to “accelerate the development of sustainable chemistry at national and
international levels. With 307 members in 2014, Axelera has demonstrated both its
attractiveness and its ability to bring people together. Two third of the network is made
up of large sized companies. There are 200 R&D programmes being conducted, for a
total budget of over €627 million. Members include private companies (from very small
SMEs to some of the largest global multi-nationals), research organisations, training and
education organisations and institutional actors. With 126,000 students across the urban
area, more than 500 public and private research laboratories, 10,000 researchers and 18
higher education establishments, the Lyon urban area offers world-class training and
research potential in a variety of sectors, including chemistry and engineering, life
sciences, information sciences, human and social sciences, etc.
The case study starts by looking at the role of chemical clusters in general, identify the
difference between clusters in general and the slight variations in the structures of
“pôles de compétitivité” before looking at Axelera’s activities. It will then go on
reviewing some of the projects related to substitution of chemicals. In addition to
looking at individual organisms and companies involved in innovation, the case study
also looks at the dynamics of the cluster and the impact REACH has had (if any) in its
capacity to generate innovative solutions and products.
The pole’s main research interests are (Business Greater Lyon, 2014):
•chemistry in the service of the great societal challenges: sustainable building,
renewable energy, vehicles, electronics;
•preservation of natural habitat: air, water, soil, agrochemicals;
•total recyclability of materials;
•chemicals from vegetable material;
•the factory of the future and eco-designed processes
The impact of REACH on R&D and innovation in Axelera
UNIVERSITAT ROVIRA I VIRGILI EUROPEAN CHEMICAL INDUSTRY AND ITS INNOVATION POLICY WITH FOCUS ON LARGE CHEMICAL COMPANIES. Supriyo Das Dipòsit Legal: T 1295-2015
261
At Axelera, some research projects have emerged that are specifically aimed at
substitution within the framework of REACH. Rather than having a purely ‘chemical’
approach to the issue surrounding substitution, Axelera has developed a holistic
approach to REACH in particular and the regulatory framework in general.
Some of Axelera’s projects are thus not aimed purely at substitution in the way
generally understood when talking about the regulation but at a wider reflection on the
need of the substance. The current approach has been developed by the synergies
created by having chemical engineers working alongside professionals from other
sectors with a more intimate knowledge of the issues they face.
The largest number of projects funded in Axelera is funded by the ANR (Agence
Nationale de laRecherche), a national organisation proposing calls for research projects
in France which launches regular calls of projects in the chemical sector. At first,
projects including elements of innovation and substitution relating to the regulation
were not branded as “REACH” projects. This is the case, for instance, of a project on
solvents. While the results can be used to substitute substances either placed on the
candidate list or restricted, it was ‘independent’ of REACH. It is nevertheless likely that
the regulation did play a role in the development and thinking behind it. In recent years,
projects and calls for projects with a clear ‘REACH-related’ label especially focussed
on substitution have emerged.
A final interesting aspect of Axelera with regard to the REACH Regulation is the
development of a regional testing platform to conduct toxicological and eco-
toxicological testing on substances. This testing platform is expected to play an
important role in the innovative capacity of the region and structure the research,
development and innovation processes of the pole and the wider region.
Specific project examples
Axelera is typical of the clusters approaching the new regulatory framework REACH as
an opportunity to develop new innovative solutions with different types of partners
rather than seeing it as a burden. NESOREACH (New “eco-friendly” Solvent for
REACH substitution) is a project aiming at substituting existing solvent with
alternatives with less hazardous properties. The project’s aim is to develop predicting
methods for solvents within the framework of the REACH regulation. The project is
UNIVERSITAT ROVIRA I VIRGILI EUROPEAN CHEMICAL INDUSTRY AND ITS INNOVATION POLICY WITH FOCUS ON LARGE CHEMICAL COMPANIES. Supriyo Das Dipòsit Legal: T 1295-2015
262
specifically related to certain types of enameling varnishes which use large amounts of
toxic solvents such as N-methylpyrrolidone, phenol and cresol. In the current process,
those solvents are burned during the glazing process and thus release potentially toxic
products. The project investigates mechanisms involved in the polymerisation process
and carry out polycondensation reactions to evaluate the properties of the new non-toxic
solvents for the said applications.
Another interesting project that has taken place at Axelera is the “intensification des
procédés”. The project’s aim was to set up new and innovative tools including
environmental efficiency, manufacture performance and adequacy of the processes. The
project developed lab tools to optimise energy efficiency, a pilot reactor to gather basic
data allowing for a more efficient industrial extrapolation. This allows tests on new
substances to be developed in parallel and identify any issues that would prevent the
commercialization of substances at an early stage, thus reducing the cost of non-viable
substances and increasing the efficiency of research.
The projects taking place in Axelera are interesting and innovative in that they are not
only purely chemistry-related but have a wider scope, including studies on the research
and innovation processes and therefore approach issues in a global fashion. This
approach is embedded in the strategy objectives of the pole.
11.4.3 Case Study III Port of Antwerp Chemical Cluster
The cluster, the Port of Antwerp (table 21), is considered a world‐scale refinery and the
largest chemical refinery in Europe. The port has historically and organically grown
rather than emerged from a direct clustering initiative, therefore it is not considered a
typical plug and play environment. The Port of Antwerp functions through an open
market concept where companies are not governed or spurred on by associations. There
is a high degree of integration between business processes within the port; however
each company is ultimately driven individually.
UNIVERSITAT ROVIRA I VIRGILI EUROPEAN CHEMICAL INDUSTRY AND ITS INNOVATION POLICY WITH FOCUS ON LARGE CHEMICAL COMPANIES. Supriyo Das Dipòsit Legal: T 1295-2015
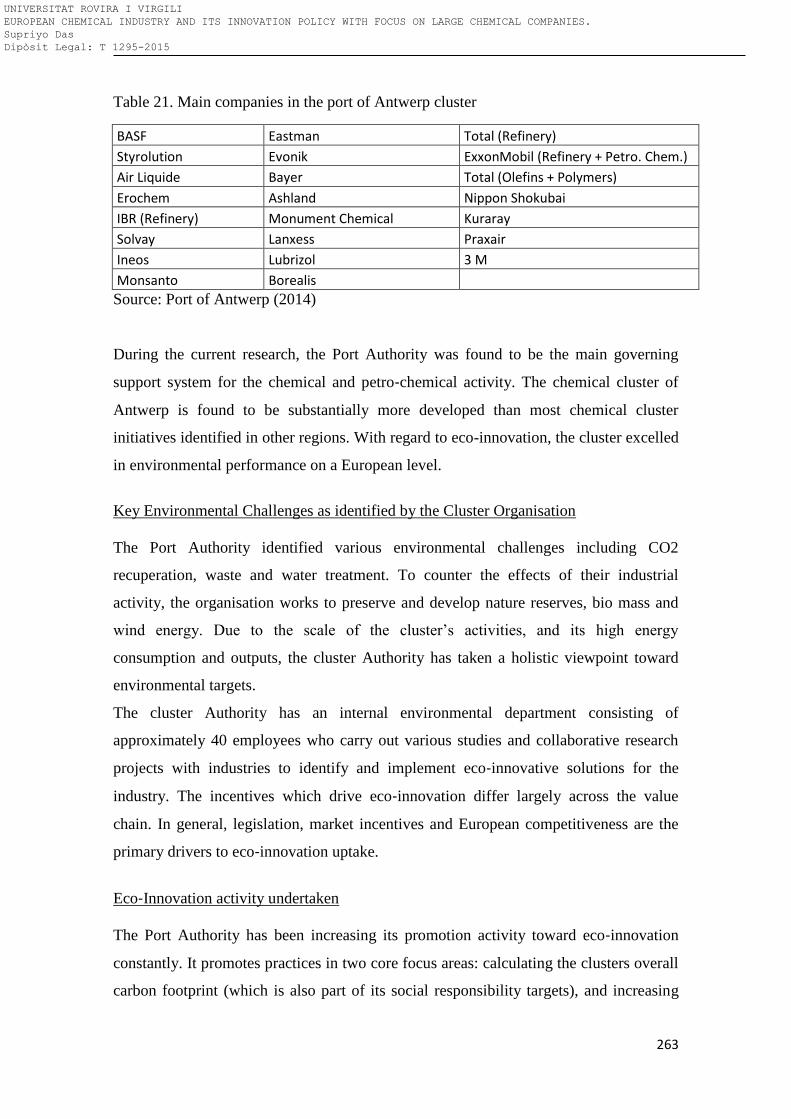
263
Table 21. Main companies in the port of Antwerp cluster
BASF Eastman Total (Refinery)
Styrolution Evonik ExxonMobil (Refinery + Petro. Chem.)
Air Liquide Bayer Total (Olefins + Polymers)
Erochem Ashland Nippon Shokubai
IBR (Refinery) Monument Chemical Kuraray
Solvay Lanxess Praxair
Ineos Lubrizol 3 M
Monsanto Borealis
Source: Port of Antwerp (2014)
During the current research, the Port Authority was found to be the main governing
support system for the chemical and petro‐chemical activity. The chemical cluster of
Antwerp is found to be substantially more developed than most chemical cluster
initiatives identified in other regions. With regard to eco-innovation, the cluster excelled
in environmental performance on a European level.
Key Environmental Challenges as identified by the Cluster Organisation
The Port Authority identified various environmental challenges including CO2
recuperation, waste and water treatment. To counter the effects of their industrial
activity, the organisation works to preserve and develop nature reserves, bio mass and
wind energy. Due to the scale of the cluster’s activities, and its high energy
consumption and outputs, the cluster Authority has taken a holistic viewpoint toward
environmental targets.
The cluster Authority has an internal environmental department consisting of
approximately 40 employees who carry out various studies and collaborative research
projects with industries to identify and implement eco‐innovative solutions for the
industry. The incentives which drive eco‐innovation differ largely across the value
chain. In general, legislation, market incentives and European competitiveness are the
primary drivers to eco‐innovation uptake.
Eco‐Innovation activity undertaken
The Port Authority has been increasing its promotion activity toward eco‐innovation
constantly. It promotes practices in two core focus areas: calculating the clusters overall
carbon footprint (which is also part of its social responsibility targets), and increasing
UNIVERSITAT ROVIRA I VIRGILI EUROPEAN CHEMICAL INDUSTRY AND ITS INNOVATION POLICY WITH FOCUS ON LARGE CHEMICAL COMPANIES. Supriyo Das Dipòsit Legal: T 1295-2015
264
energy diversity to reduce the industry’s high dependency on oil. The petrol chemical
industry relies heavily on oil prices. As oil is a rather fluctuant and volatile product, it
needs to stabilize this overall cost using independent energy source which are more
stable by nature (in terms of pricing).
The cluster approaches companies individually to promote such initiatives ‐ since the
Port Authority is an independent entity, it is not perceived as a competitor ‐ and they are
able to collaborate effectively using a one‐on‐one approach. Within the European
context, the cluster organisation collaborates with other ports on various eco-innovative
projects and environmental standard setting. An example of this is a project setup to
initiate CO2 recuperation through the European Shipping Index.
The cluster’s core targets for the coming five years clearly place emphasis on increasing
efficiency and research into optimization, targets include:
1. Mobility – Large‐scale redevelopment of infrastructural work is planned to gain
efficiency and reduce logistics;
2. Expansion – The cluster needs to constantly develop itself to remain competitive.
Expansion possibilities focus on land procurement or optimization of existing land;
3. Environment – The main focus is to tackle the carbon footprint of the industry as a
whole by increasing sustainability. This is a generic goal which entails widespread
research and a diverse approach toward eco‐innovation solutions.
An example of innovation of Antwerp port cluster
The Antwerp Port Authority, in early 2010, in collaboration with the Left Bank
Corporation unveiled their plans to develop a large wind farm in the port area in
collaboration with private internal and external partners. The port was identified by the
Flemish Wind Energy Association (VWEA) and the Flemish Minister of Energy as
being a suitable location for wind farming along with a current plan to develop a bio‐
mass power plant, are concrete steps taken by the Port Authority to maximize on the
potential for renewable energy development within the port. These are strong examples
UNIVERSITAT ROVIRA I VIRGILI EUROPEAN CHEMICAL INDUSTRY AND ITS INNOVATION POLICY WITH FOCUS ON LARGE CHEMICAL COMPANIES. Supriyo Das Dipòsit Legal: T 1295-2015
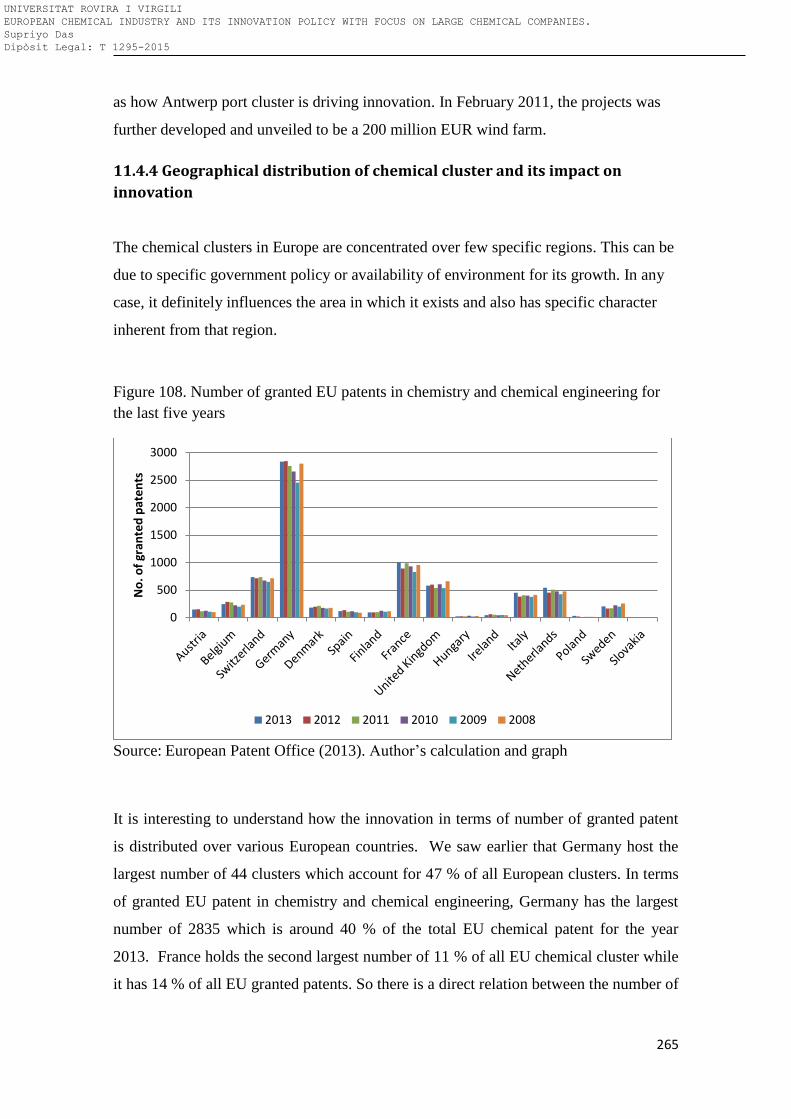
265
as how Antwerp port cluster is driving innovation. In February 2011, the projects was
further developed and unveiled to be a 200 million EUR wind farm.
11.4.4 Geographical distribution of chemical cluster and its impact on
innovation
The chemical clusters in Europe are concentrated over few specific regions. This can be
due to specific government policy or availability of environment for its growth. In any
case, it definitely influences the area in which it exists and also has specific character
inherent from that region.
Figure 108. Number of granted EU patents in chemistry and chemical engineering for
the last five years
Source: European Patent Office (2013). Author’s calculation and graph
It is interesting to understand how the innovation in terms of number of granted patent
is distributed over various European countries. We saw earlier that Germany host the
largest number of 44 clusters which account for 47 % of all European clusters. In terms
of granted EU patent in chemistry and chemical engineering, Germany has the largest
number of 2835 which is around 40 % of the total EU chemical patent for the year
2013. France holds the second largest number of 11 % of all EU chemical cluster while
it has 14 % of all EU granted patents. So there is a direct relation between the number of
0
500
1000
1500
2000
2500
3000
No
. of
gran
ted
pat
en
ts
2013 2012 2011 2010 2009 2008
UNIVERSITAT ROVIRA I VIRGILI EUROPEAN CHEMICAL INDUSTRY AND ITS INNOVATION POLICY WITH FOCUS ON LARGE CHEMICAL COMPANIES. Supriyo Das Dipòsit Legal: T 1295-2015
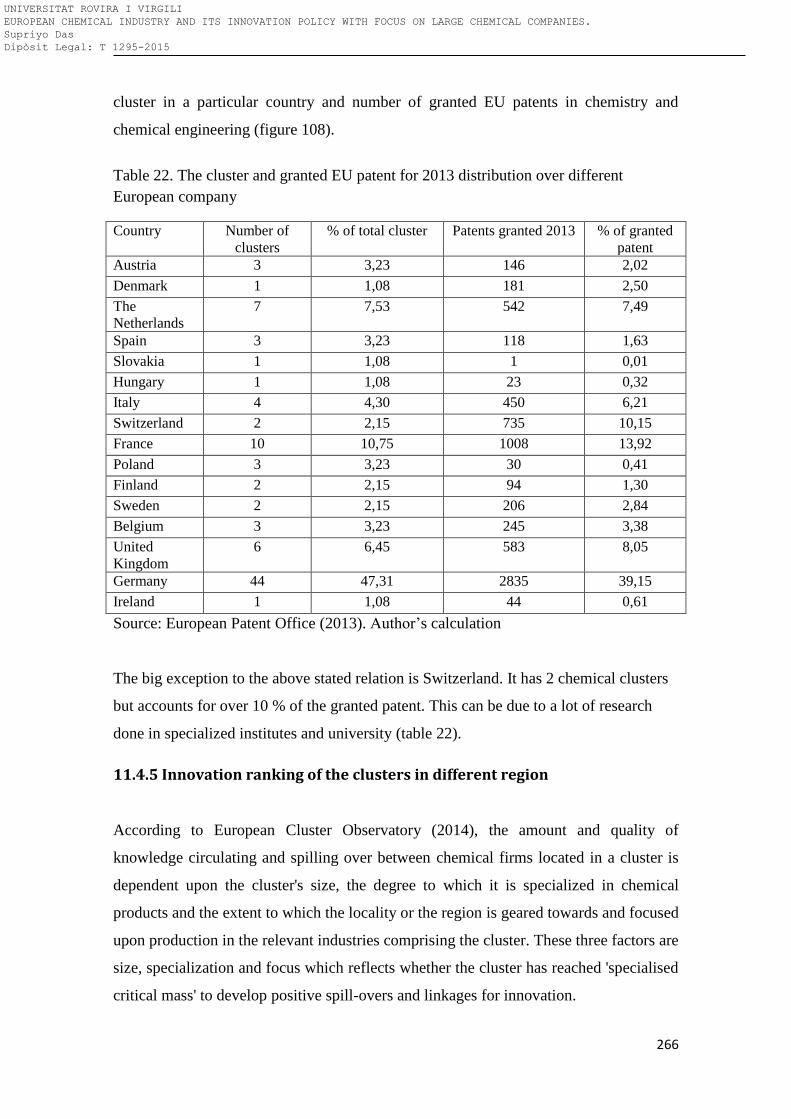
266
cluster in a particular country and number of granted EU patents in chemistry and
chemical engineering (figure 108).
Table 22. The cluster and granted EU patent for 2013 distribution over different
European company
Country Number of
clusters
% of total cluster Patents granted 2013 % of granted
patent
Austria 3 3,23 146 2,02
Denmark 1 1,08 181 2,50
The
Netherlands
7 7,53 542 7,49
Spain 3 3,23 118 1,63
Slovakia 1 1,08 1 0,01
Hungary 1 1,08 23 0,32
Italy 4 4,30 450 6,21
Switzerland 2 2,15 735 10,15
France 10 10,75 1008 13,92
Poland 3 3,23 30 0,41
Finland 2 2,15 94 1,30
Sweden 2 2,15 206 2,84
Belgium 3 3,23 245 3,38
United
Kingdom
6 6,45 583 8,05
Germany 44 47,31 2835 39,15
Ireland 1 1,08 44 0,61
Source: European Patent Office (2013). Author’s calculation
The big exception to the above stated relation is Switzerland. It has 2 chemical clusters
but accounts for over 10 % of the granted patent. This can be due to a lot of research
done in specialized institutes and university (table 22).
11.4.5 Innovation ranking of the clusters in different region
According to European Cluster Observatory (2014), the amount and quality of
knowledge circulating and spilling over between chemical firms located in a cluster is
dependent upon the cluster's size, the degree to which it is specialized in chemical
products and the extent to which the locality or the region is geared towards and focused
upon production in the relevant industries comprising the cluster. These three factors are
size, specialization and focus which reflects whether the cluster has reached 'specialised
critical mass' to develop positive spill-overs and linkages for innovation.
UNIVERSITAT ROVIRA I VIRGILI EUROPEAN CHEMICAL INDUSTRY AND ITS INNOVATION POLICY WITH FOCUS ON LARGE CHEMICAL COMPANIES. Supriyo Das Dipòsit Legal: T 1295-2015
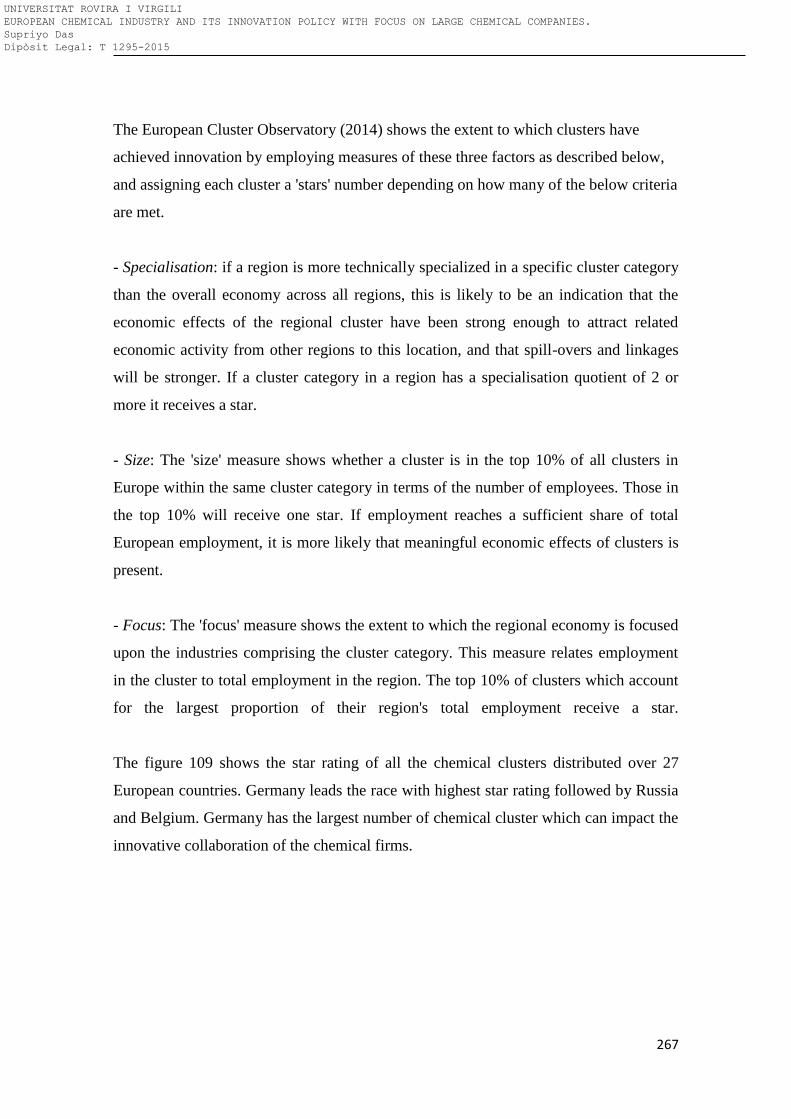
267
The European Cluster Observatory (2014) shows the extent to which clusters have
achieved innovation by employing measures of these three factors as described below,
and assigning each cluster a 'stars' number depending on how many of the below criteria
are met.
- Specialisation: if a region is more technically specialized in a specific cluster category
than the overall economy across all regions, this is likely to be an indication that the
economic effects of the regional cluster have been strong enough to attract related
economic activity from other regions to this location, and that spill-overs and linkages
will be stronger. If a cluster category in a region has a specialisation quotient of 2 or
more it receives a star.
- Size: The 'size' measure shows whether a cluster is in the top 10% of all clusters in
Europe within the same cluster category in terms of the number of employees. Those in
the top 10% will receive one star. If employment reaches a sufficient share of total
European employment, it is more likely that meaningful economic effects of clusters is
present.
- Focus: The 'focus' measure shows the extent to which the regional economy is focused
upon the industries comprising the cluster category. This measure relates employment
in the cluster to total employment in the region. The top 10% of clusters which account
for the largest proportion of their region's total employment receive a star.
The figure 109 shows the star rating of all the chemical clusters distributed over 27
European countries. Germany leads the race with highest star rating followed by Russia
and Belgium. Germany has the largest number of chemical cluster which can impact the
innovative collaboration of the chemical firms.
UNIVERSITAT ROVIRA I VIRGILI EUROPEAN CHEMICAL INDUSTRY AND ITS INNOVATION POLICY WITH FOCUS ON LARGE CHEMICAL COMPANIES. Supriyo Das Dipòsit Legal: T 1295-2015
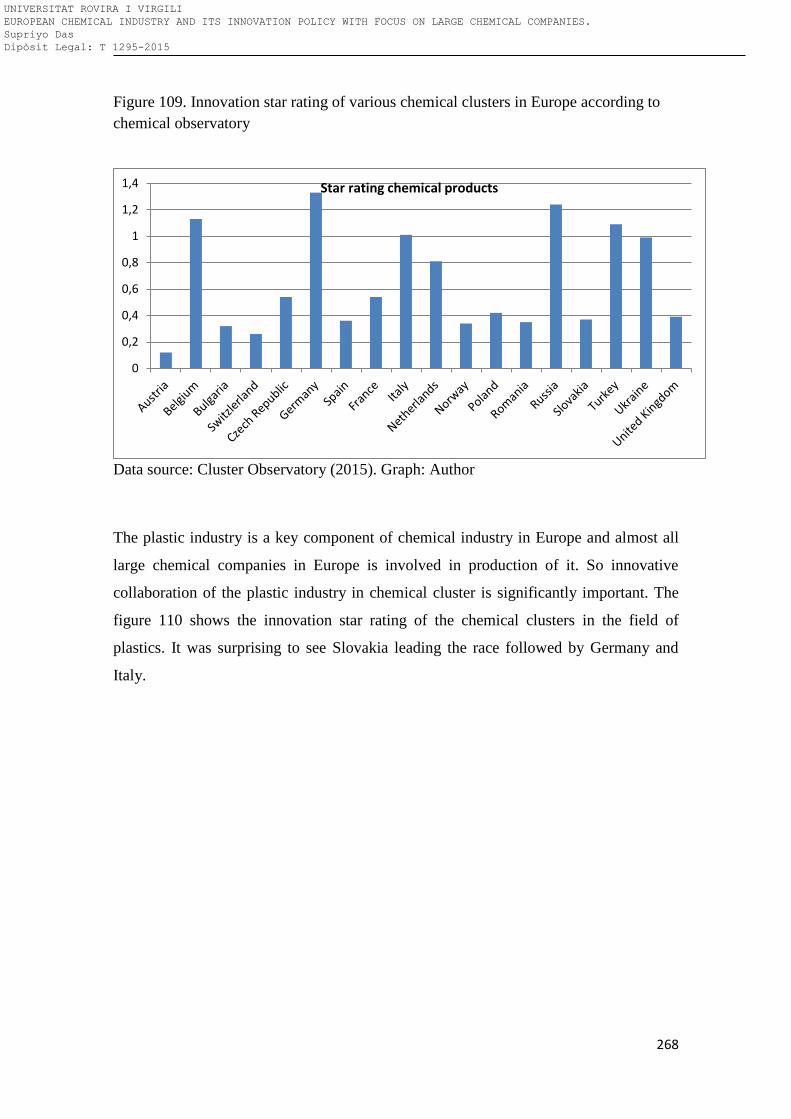
268
Figure 109. Innovation star rating of various chemical clusters in Europe according to
chemical observatory
Data source: Cluster Observatory (2015). Graph: Author
The plastic industry is a key component of chemical industry in Europe and almost all
large chemical companies in Europe is involved in production of it. So innovative
collaboration of the plastic industry in chemical cluster is significantly important. The
figure 110 shows the innovation star rating of the chemical clusters in the field of
plastics. It was surprising to see Slovakia leading the race followed by Germany and
Italy.
0
0,2
0,4
0,6
0,8
1
1,2
1,4 Star rating chemical products
UNIVERSITAT ROVIRA I VIRGILI EUROPEAN CHEMICAL INDUSTRY AND ITS INNOVATION POLICY WITH FOCUS ON LARGE CHEMICAL COMPANIES. Supriyo Das Dipòsit Legal: T 1295-2015
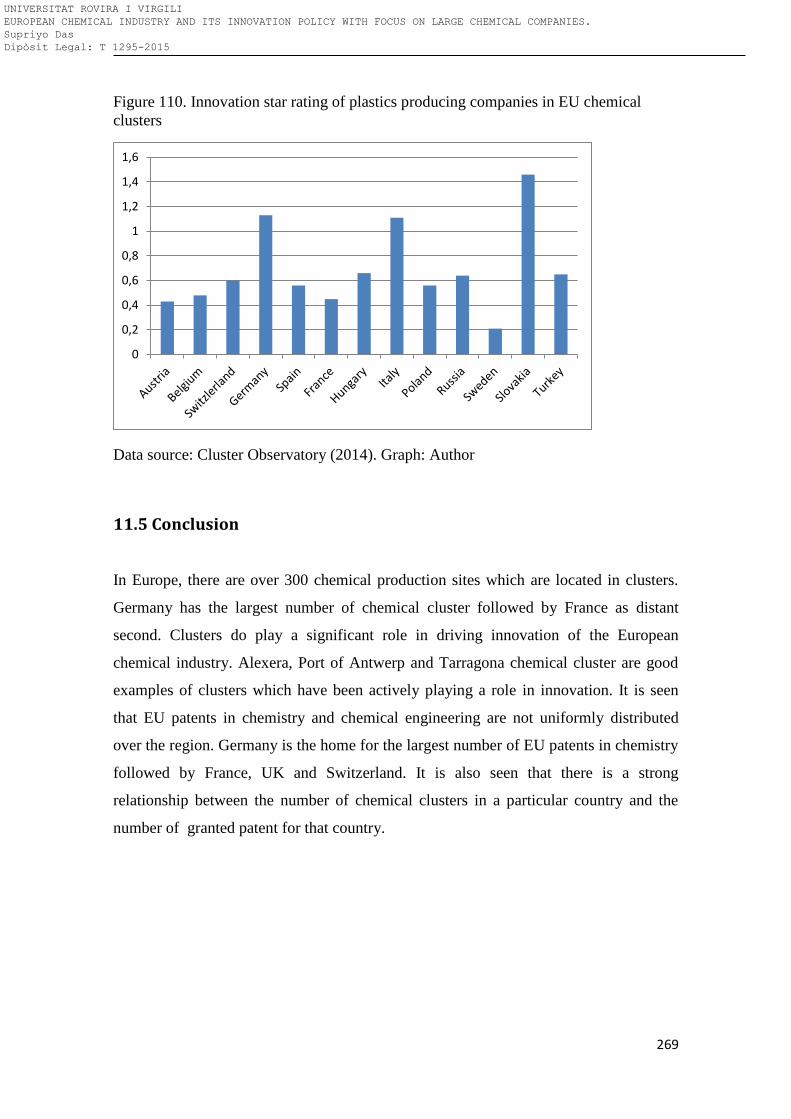
269
Figure 110. Innovation star rating of plastics producing companies in EU chemical
clusters
Data source: Cluster Observatory (2014). Graph: Author
11.5 Conclusion
In Europe, there are over 300 chemical production sites which are located in clusters.
Germany has the largest number of chemical cluster followed by France as distant
second. Clusters do play a significant role in driving innovation of the European
chemical industry. Alexera, Port of Antwerp and Tarragona chemical cluster are good
examples of clusters which have been actively playing a role in innovation. It is seen
that EU patents in chemistry and chemical engineering are not uniformly distributed
over the region. Germany is the home for the largest number of EU patents in chemistry
followed by France, UK and Switzerland. It is also seen that there is a strong
relationship between the number of chemical clusters in a particular country and the
number of granted patent for that country.
0
0,2
0,4
0,6
0,8
1
1,2
1,4
1,6
UNIVERSITAT ROVIRA I VIRGILI EUROPEAN CHEMICAL INDUSTRY AND ITS INNOVATION POLICY WITH FOCUS ON LARGE CHEMICAL COMPANIES. Supriyo Das Dipòsit Legal: T 1295-2015
270
11.6 Bibliography
Business Greater Lyon. (2014). The greater Lyon Business Website. Retrieved from
http://www.business.greaterlyon.com/home.1.0.html?L=1
ECSPP. (2014). Chemical Parks in Europe. Retrieved from
https://chemicalparks.eu/sites
European Cluster Observatory. (2014). Clusters at your finger tips. Retreived from
http://www.clusterobservatory.eu/index.html
European Patent Office. (2013). European Patent Office Statistics – 2013. Retrieved
from http://www.epo.org/about-us/annual-reports-statistics/statistics.html
Gordon, I. and McCann, P. (2003). Clusters, Innovation and Regional Development.
Retrieved from http://dev3.cepr.org/meets/wkcn/2/2334/papers/gordon.pdf
Ketels, C. (2007). The Role of Clusters in the Chemical Industry. Retrieved from
EPCA website https://epca.eu/media/f8bc41b0-26d0-46d4-a72b-7f7eeece8581/-
360904056/library/publications/ThinkTankReports/EPCAHarvardclusters.pdf
Plessis, F. (2010) “Clusters, Innovation and Regional Development”, VIII.
ChemieForum . Cologne, Germany, 24 February. SABIC.
Port of Antwerp. (2014). The chemical cluster. Retreived from
http://www.portofantwerp.com/en/chemical-cluster
UNIVERSITAT ROVIRA I VIRGILI EUROPEAN CHEMICAL INDUSTRY AND ITS INNOVATION POLICY WITH FOCUS ON LARGE CHEMICAL COMPANIES. Supriyo Das Dipòsit Legal: T 1295-2015
271
Porter, M. (1998). Clusters and the new economic of competition. Harvard Business
Review, Nov.-Dec., 77-90.
UNIVERSITAT ROVIRA I VIRGILI EUROPEAN CHEMICAL INDUSTRY AND ITS INNOVATION POLICY WITH FOCUS ON LARGE CHEMICAL COMPANIES. Supriyo Das Dipòsit Legal: T 1295-2015
272
12. Digitalization of the Chemical Industry and
marketing innovation
Contents
11.1 Introduction ............................................................................................................................................. 273
11.2 Digitalization of business ................................................................................................................... 273
11.3 Digitalization of chemical industry ................................................................................................ 279
11.4 Digitalization drivers and Trends in chemical industry ........................................................ 280
11.4.1 Complexity of Supply Chain ...................................................................................................... 280
11.4.2 Need to Innovate ........................................................................................................................... 281
11.4.3 Human Factor ................................................................................................................................. 281
11.4.4 Regulatory Requirements .......................................................................................................... 281
11.4.5 Technical Drivers and Trends .................................................................................................. 282
11.4.6 Embrace Innovation ..................................................................................................................... 282
11.5 Digitalization of the European chemical industry .................................................................... 284
11.6 Innovation in Marketing in Chemical companies: Digital Marketing ............................... 287
11. 7 Innovation in Marketing: Digital Marketing Strategy ............................................................ 289
11.8 Information technology challenges faced by the Chemical Industry in Europe .......... 299
11.9 Conclusion ................................................................................................................................................ 300
UNIVERSITAT ROVIRA I VIRGILI EUROPEAN CHEMICAL INDUSTRY AND ITS INNOVATION POLICY WITH FOCUS ON LARGE CHEMICAL COMPANIES. Supriyo Das Dipòsit Legal: T 1295-2015
273
12.1 Introduction
Economic and business trends are making it crucial for manufacturers to find new
method for managing their operations and their business. As an example, chemical
manufacturers and oil refiners face complex global supply chains, increased and
dynamic regulatory requirements, rising costs of feedstock and energy, and mergers and
acquisitions that result in disconnected computer systems. One way to achieve new
efficiencies that can help address these business challenges is to leverage new
developments and trends in technology to establish a unified set of information
technology (IT) architecture principles.
On the other side, the rapid development of new interactive media such as on-line and
the World Wide Web has taken most consumer marketers by surprise. Many are
struggling to ‘‘guesstimate’’ the likely impact of interactive media on consumer
marketing, wondering what they should do and how they should go about doing it.
Those who move forward do so with mixed success. A recent analysis (Westerman et
al., 2012) of nearly a hundred web sites of Fortune 500 consumer marketing companies
shows that most of today’s interactive media marketing applications are very inspiring.
There is emerging evidence that new media represent both a tremendous opportunity
and a serious threat for marketers today. This section covers few important topics: how
is digitalization part of chemical industry, for whom does digital marketing represent an
important opportunity, what elements are included in the digital marketing program, and
how should the digital marketing organization be designed? At the end we will test the
fifth hypothesis of the research, i.e. if the chemical companies are moving toward
digitalization and also to digital marketing.
12.2 Digitalization of business
Digitalization is an emerging business model that includes the extension and support of
electronic channels, content and transactions. Companies are embracing this strategy to
transform their businesses, while balancing electronic capabilities with traditional
business practices (hard-copy documents and correspondence, face-to-face interactions,
and call center volume).
UNIVERSITAT ROVIRA I VIRGILI EUROPEAN CHEMICAL INDUSTRY AND ITS INNOVATION POLICY WITH FOCUS ON LARGE CHEMICAL COMPANIES. Supriyo Das Dipòsit Legal: T 1295-2015
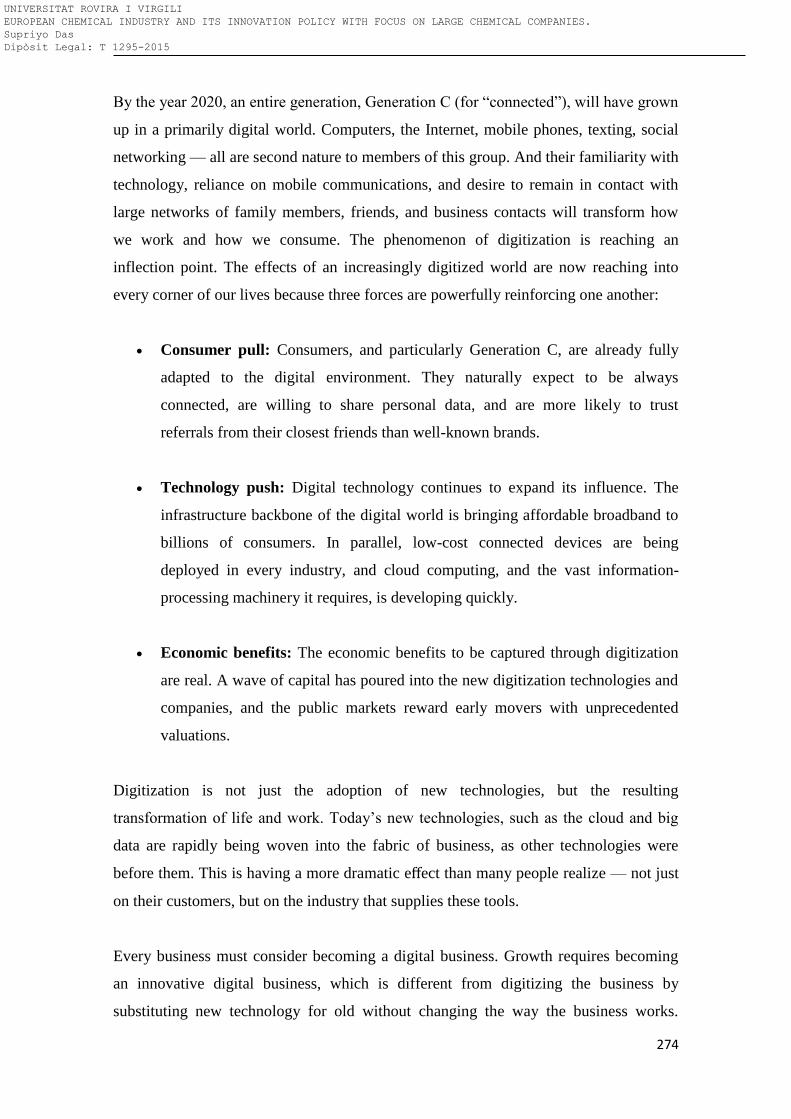
274
By the year 2020, an entire generation, Generation C (for “connected”), will have grown
up in a primarily digital world. Computers, the Internet, mobile phones, texting, social
networking — all are second nature to members of this group. And their familiarity with
technology, reliance on mobile communications, and desire to remain in contact with
large networks of family members, friends, and business contacts will transform how
we work and how we consume. The phenomenon of digitization is reaching an
inflection point. The effects of an increasingly digitized world are now reaching into
every corner of our lives because three forces are powerfully reinforcing one another:
Consumer pull: Consumers, and particularly Generation C, are already fully
adapted to the digital environment. They naturally expect to be always
connected, are willing to share personal data, and are more likely to trust
referrals from their closest friends than well-known brands.
Technology push: Digital technology continues to expand its influence. The
infrastructure backbone of the digital world is bringing affordable broadband to
billions of consumers. In parallel, low-cost connected devices are being
deployed in every industry, and cloud computing, and the vast information-
processing machinery it requires, is developing quickly.
Economic benefits: The economic benefits to be captured through digitization
are real. A wave of capital has poured into the new digitization technologies and
companies, and the public markets reward early movers with unprecedented
valuations.
Digitization is not just the adoption of new technologies, but the resulting
transformation of life and work. Today’s new technologies, such as the cloud and big
data are rapidly being woven into the fabric of business, as other technologies were
before them. This is having a more dramatic effect than many people realize — not just
on their customers, but on the industry that supplies these tools.
Every business must consider becoming a digital business. Growth requires becoming
an innovative digital business, which is different from digitizing the business by
substituting new technology for old without changing the way the business works.
UNIVERSITAT ROVIRA I VIRGILI EUROPEAN CHEMICAL INDUSTRY AND ITS INNOVATION POLICY WITH FOCUS ON LARGE CHEMICAL COMPANIES. Supriyo Das Dipòsit Legal: T 1295-2015
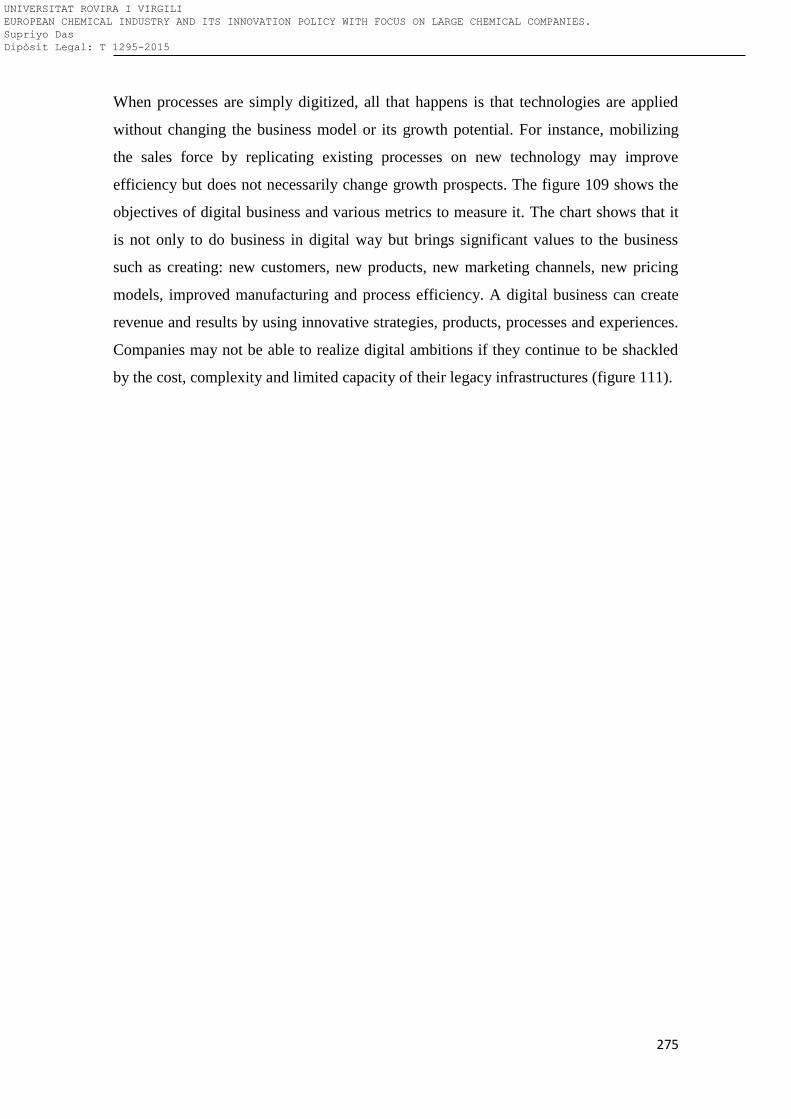
275
When processes are simply digitized, all that happens is that technologies are applied
without changing the business model or its growth potential. For instance, mobilizing
the sales force by replicating existing processes on new technology may improve
efficiency but does not necessarily change growth prospects. The figure 109 shows the
objectives of digital business and various metrics to measure it. The chart shows that it
is not only to do business in digital way but brings significant values to the business
such as creating: new customers, new products, new marketing channels, new pricing
models, improved manufacturing and process efficiency. A digital business can create
revenue and results by using innovative strategies, products, processes and experiences.
Companies may not be able to realize digital ambitions if they continue to be shackled
by the cost, complexity and limited capacity of their legacy infrastructures (figure 111).
UNIVERSITAT ROVIRA I VIRGILI EUROPEAN CHEMICAL INDUSTRY AND ITS INNOVATION POLICY WITH FOCUS ON LARGE CHEMICAL COMPANIES. Supriyo Das Dipòsit Legal: T 1295-2015
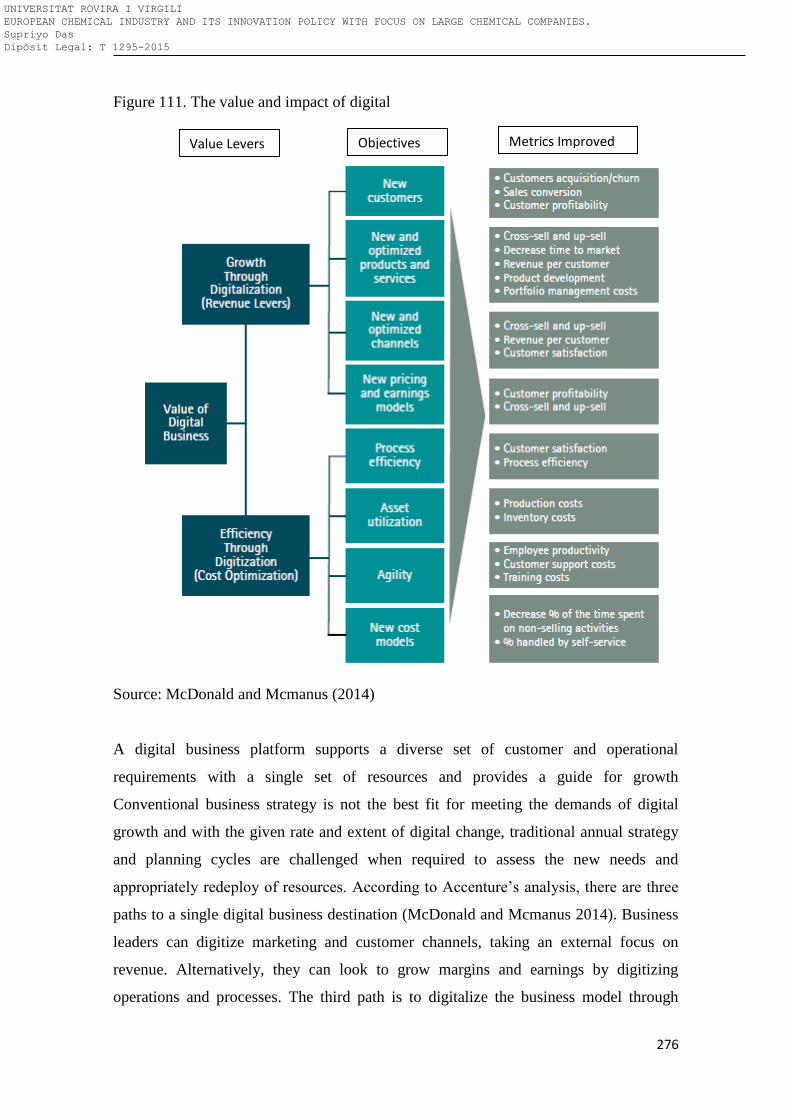
276
Figure 111. The value and impact of digital
Source: McDonald and Mcmanus (2014)
A digital business platform supports a diverse set of customer and operational
requirements with a single set of resources and provides a guide for growth
Conventional business strategy is not the best fit for meeting the demands of digital
growth and with the given rate and extent of digital change, traditional annual strategy
and planning cycles are challenged when required to assess the new needs and
appropriately redeploy of resources. According to Accenture’s analysis, there are three
paths to a single digital business destination (McDonald and Mcmanus 2014). Business
leaders can digitize marketing and customer channels, taking an external focus on
revenue. Alternatively, they can look to grow margins and earnings by digitizing
operations and processes. The third path is to digitalize the business model through
Value Levers Objectives Metrics Improved
UNIVERSITAT ROVIRA I VIRGILI EUROPEAN CHEMICAL INDUSTRY AND ITS INNOVATION POLICY WITH FOCUS ON LARGE CHEMICAL COMPANIES. Supriyo Das Dipòsit Legal: T 1295-2015
277
combinations of both revenue and margin enhancement. Continued digitizing of either
marketing or operations in isolation eventually can create real difficulties such as digital
marketing without digital operations can cause companies to rely on old or duplicate
operations to support new revenues (figure 112).
Figure 112. Digital model
Source: McDonald and Mcmanus (2014)
Figure 113 shows various components that typically exist due to digitalization of
companies in manufacturing sector. The process starts with a person in shop floor
entering the information related to quality and production. The information entered is
taken by the analytics tools and send in real-time to various end users who gets a total
picture of the manufacturing process at any given point in time. In this way, through
digitalization, the top management is updated with the operation on shop floor.
Revenue
External Focus
Internal Focus Margin
Digital Business
Digitize Operations
Digitize Marketing
UNIVERSITAT ROVIRA I VIRGILI EUROPEAN CHEMICAL INDUSTRY AND ITS INNOVATION POLICY WITH FOCUS ON LARGE CHEMICAL COMPANIES. Supriyo Das Dipòsit Legal: T 1295-2015
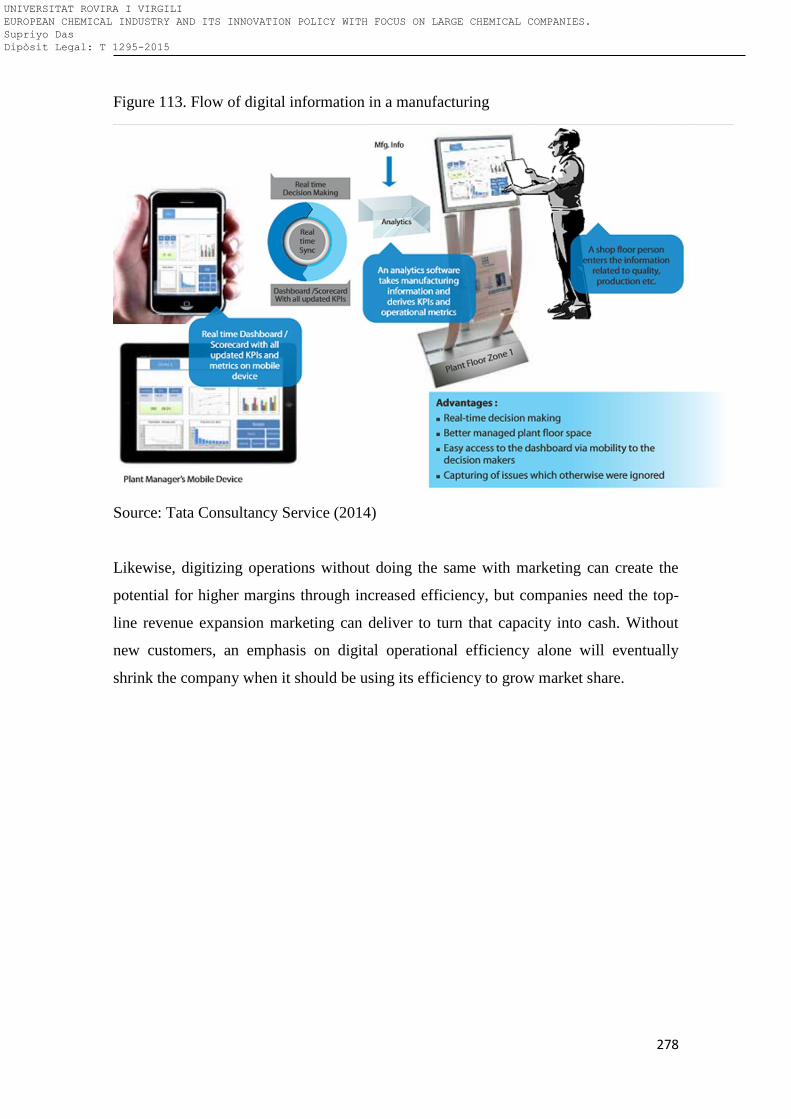
278
Figure 113. Flow of digital information in a manufacturing
Source: Tata Consultancy Service (2014)
Likewise, digitizing operations without doing the same with marketing can create the
potential for higher margins through increased efficiency, but companies need the top-
line revenue expansion marketing can deliver to turn that capacity into cash. Without
new customers, an emphasis on digital operational efficiency alone will eventually
shrink the company when it should be using its efficiency to grow market share.
UNIVERSITAT ROVIRA I VIRGILI EUROPEAN CHEMICAL INDUSTRY AND ITS INNOVATION POLICY WITH FOCUS ON LARGE CHEMICAL COMPANIES. Supriyo Das Dipòsit Legal: T 1295-2015
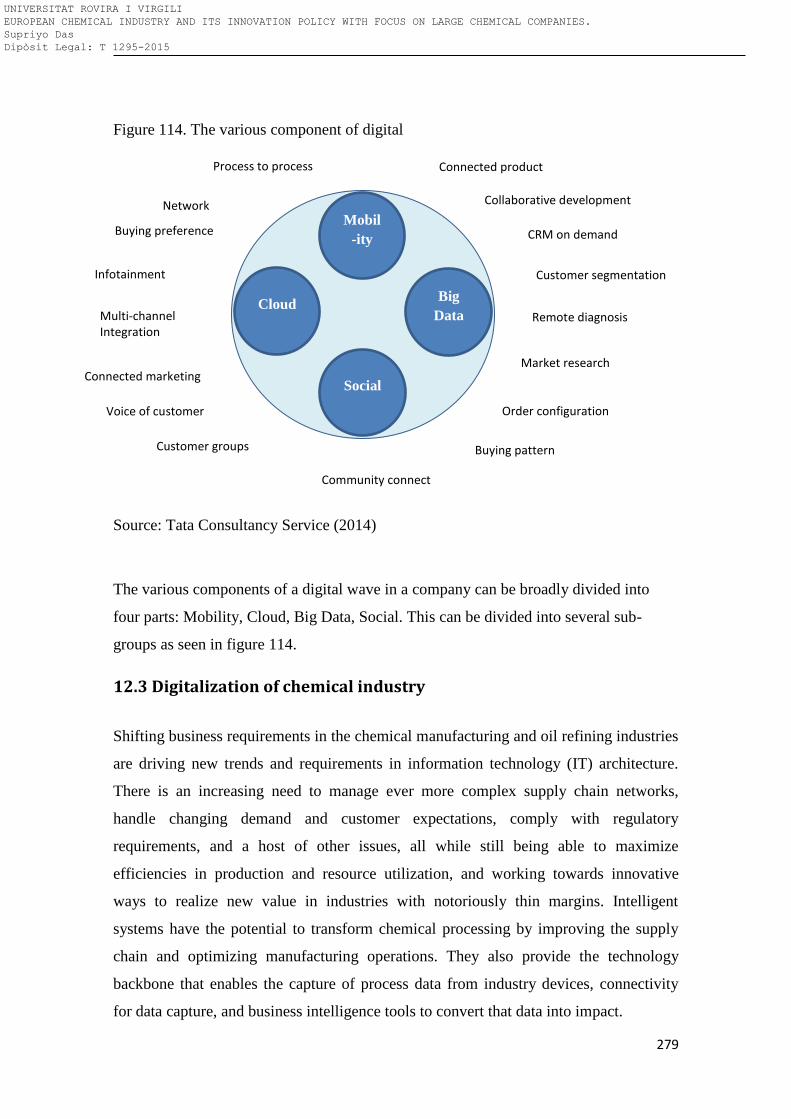
279
Figure 114. The various component of digital
Source: Tata Consultancy Service (2014)
The various components of a digital wave in a company can be broadly divided into
four parts: Mobility, Cloud, Big Data, Social. This can be divided into several sub-
groups as seen in figure 114.
12.3 Digitalization of chemical industry
Shifting business requirements in the chemical manufacturing and oil refining industries
are driving new trends and requirements in information technology (IT) architecture.
There is an increasing need to manage ever more complex supply chain networks,
handle changing demand and customer expectations, comply with regulatory
requirements, and a host of other issues, all while still being able to maximize
efficiencies in production and resource utilization, and working towards innovative
ways to realize new value in industries with notoriously thin margins. Intelligent
systems have the potential to transform chemical processing by improving the supply
chain and optimizing manufacturing operations. They also provide the technology
backbone that enables the capture of process data from industry devices, connectivity
for data capture, and business intelligence tools to convert that data into impact.
Cloud
Social
Big
Data
Mobil
-ity
Connected product
Collaborative development
CRM on demand
Customer segmentation
Remote diagnosis
Market research
Order configuration
Buying pattern
Community connect
Customer groups
Voice of customer
Connected marketing
Multi-channel Integration
Infotainment
Buying preference
Network
Process to process
UNIVERSITAT ROVIRA I VIRGILI EUROPEAN CHEMICAL INDUSTRY AND ITS INNOVATION POLICY WITH FOCUS ON LARGE CHEMICAL COMPANIES. Supriyo Das Dipòsit Legal: T 1295-2015
280
Chemical and oil refining businesses rely on the ability to process and manage vast
amounts of data, extract the needed information from it, and make that information
available to those who need it, when they need it. This data includes: dynamic pricing of
raw materials, supply chain data, inventory levels, research and product development,
weather data, manufacturing operations data, demand data, customer data, and much
more. This data flows among multiple systems within an organization and in many
cases across different organizations. This vast and complex data flow is further
complicated by mergers and acquisitions that require integrating different businesses
and the systems they use. Traditionally, such data flows were built as point-to-point
integrations, leading to very complex integration architectures that were costly, difficult
to maintain, and often returned little value for the investment.
12.4 Digitalization drivers and Trends in chemical industry
Supply chain complexities, changing geopolitical landscape, and natural or man-made
disasters can have significant impact on the supply of feedstock or crude oil needed to
keep these industries running on schedule. In today’s global economy and connected
world, organizations must work hard to keep customer loyalty. At the same time,
companies want to realize profitable growth, both organic and inorganic, and maintain a
high focus on pricing and margin management. One way to achieve the balance between
profitable growth and customer loyalty is by providing the best quality products at
competitive prices.
12.4.1 Complexity of Supply Chain
Managing demand is crucial to optimizing the supply chain in chemical manufacturing
and oil refining, so building a solid demand plan is essential for a successful business.
Such planning is the basis for production, inventory, and the overall supply chain costs.
Therefore, chemical manufacturers and refining companies have begun investing
heavily in this area, moving away from spreadsheets to sophisticated tools, statistical
models, and real-time data analyses. This approach helps companies achieve several
capabilities, including: more accurate demand forecasts, optimized product mixes, and
efficient order processing.
UNIVERSITAT ROVIRA I VIRGILI EUROPEAN CHEMICAL INDUSTRY AND ITS INNOVATION POLICY WITH FOCUS ON LARGE CHEMICAL COMPANIES. Supriyo Das Dipòsit Legal: T 1295-2015
281
12.4.2 Need to Innovate
Managing innovation requires a culture that nurtures creative ideas and a process that
funnels the large pool of ideas down to the viable ones that can evolve into product
designs. This type of work requires extensive collaboration, sometimes across different
geographies. Some of the major trends in innovation management in chemical company
include the need to perform research and development (R&D) work by globally
dispersed teams, working with business partners outside the company to collaborate on
new ideas, and increased concerns around protecting intellectual property.
These trends make it imperative to have powerful collaborative solutions involving
social networks to capture ideas and requests from co-workers, designers, suppliers, and
customers, and evolve such ideas in the innovation funnel.
12.4.3 Human Factor
People working in manufacturing, especially in fields like chemicals and oil and gas,
accrue a lot of expertise over the years. They know how to handle certain situations
intuitively based on experience, for example, when and how to maintain certain pieces
of equipment, or when to change the mixture of materials entering production based on
certain conditions. However, in the past, with the lack of ways to capture and store
people’s knowledge and experiences, such knowledge was lost when people left the
workforce. Today, new technologies provide ways to gather and share knowledge and
experience, but many workers nearing retirement are not comfortable using such
technologies. On the other hand, younger workers entering the workforce have grown
up with modern technology through consumer products, such as video games, smart
phones, and social networks.
12.4.4 Regulatory Requirements
There are strict regulatory requirements for process manufacturing in general, including
chemical manufacturing and oil refining. Producing or processing chemicals is
inherently dangerous. Mixing the wrong chemicals, or the wrong amounts of chemicals,
could lead to explosive reactions, release of toxic fumes, fires, environmental releases,
UNIVERSITAT ROVIRA I VIRGILI EUROPEAN CHEMICAL INDUSTRY AND ITS INNOVATION POLICY WITH FOCUS ON LARGE CHEMICAL COMPANIES. Supriyo Das Dipòsit Legal: T 1295-2015
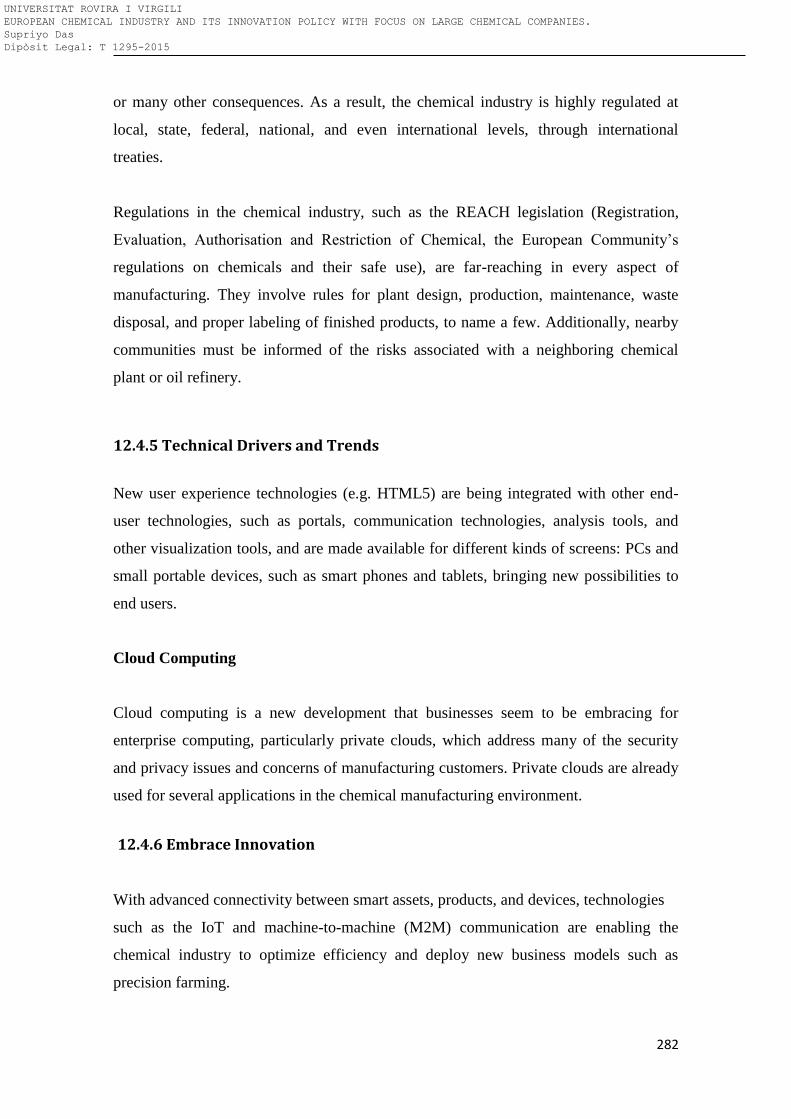
282
or many other consequences. As a result, the chemical industry is highly regulated at
local, state, federal, national, and even international levels, through international
treaties.
Regulations in the chemical industry, such as the REACH legislation (Registration,
Evaluation, Authorisation and Restriction of Chemical, the European Community’s
regulations on chemicals and their safe use), are far-reaching in every aspect of
manufacturing. They involve rules for plant design, production, maintenance, waste
disposal, and proper labeling of finished products, to name a few. Additionally, nearby
communities must be informed of the risks associated with a neighboring chemical
plant or oil refinery.
12.4.5 Technical Drivers and Trends
New user experience technologies (e.g. HTML5) are being integrated with other end-
user technologies, such as portals, communication technologies, analysis tools, and
other visualization tools, and are made available for different kinds of screens: PCs and
small portable devices, such as smart phones and tablets, bringing new possibilities to
end users.
Cloud Computing
Cloud computing is a new development that businesses seem to be embracing for
enterprise computing, particularly private clouds, which address many of the security
and privacy issues and concerns of manufacturing customers. Private clouds are already
used for several applications in the chemical manufacturing environment.
12.4.6 Embrace Innovation
With advanced connectivity between smart assets, products, and devices, technologies
such as the IoT and machine-to-machine (M2M) communication are enabling the
chemical industry to optimize efficiency and deploy new business models such as
precision farming.
UNIVERSITAT ROVIRA I VIRGILI EUROPEAN CHEMICAL INDUSTRY AND ITS INNOVATION POLICY WITH FOCUS ON LARGE CHEMICAL COMPANIES. Supriyo Das Dipòsit Legal: T 1295-2015
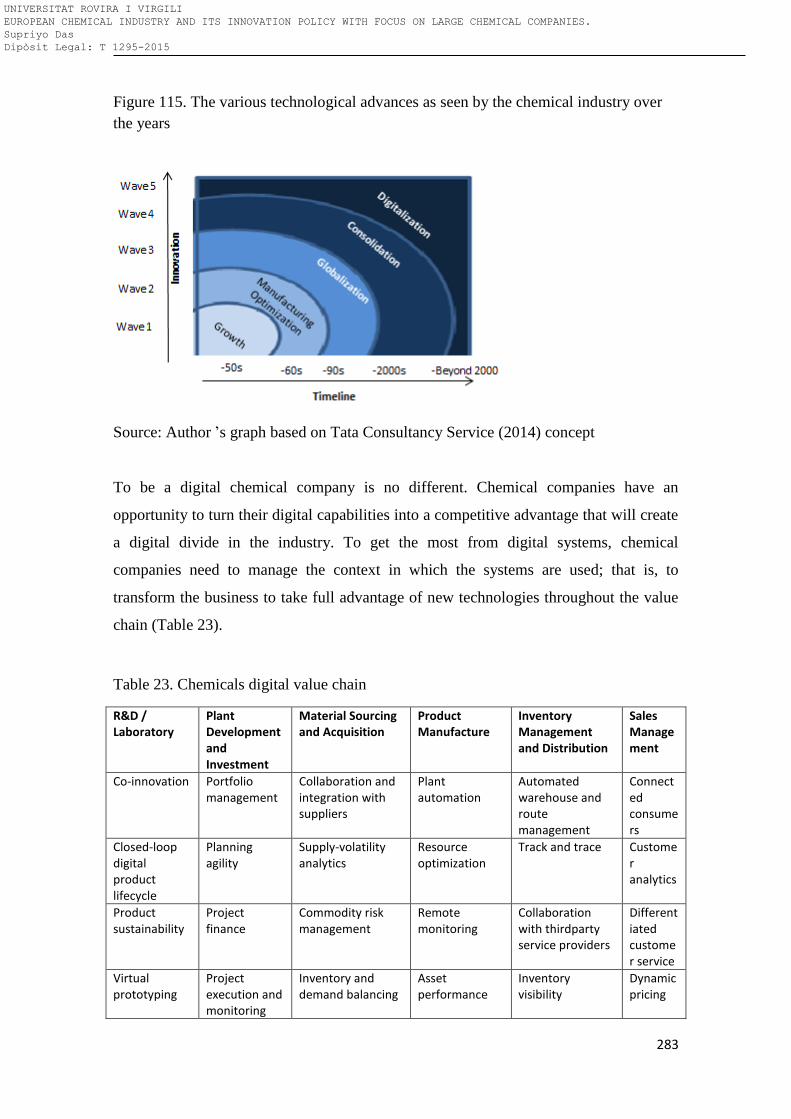
283
Figure 115. The various technological advances as seen by the chemical industry over
the years
Source: Author ’s graph based on Tata Consultancy Service (2014) concept
To be a digital chemical company is no different. Chemical companies have an
opportunity to turn their digital capabilities into a competitive advantage that will create
a digital divide in the industry. To get the most from digital systems, chemical
companies need to manage the context in which the systems are used; that is, to
transform the business to take full advantage of new technologies throughout the value
chain (Table 23).
Table 23. Chemicals digital value chain
R&D / Laboratory
Plant Development and Investment
Material Sourcing and Acquisition
Product Manufacture
Inventory Management and Distribution
Sales Management
Co-innovation Portfolio management
Collaboration and integration with suppliers
Plant automation
Automated warehouse and route management
Connected consumers
Closed-loop digital product lifecycle
Planning agility
Supply-volatility analytics
Resource optimization
Track and trace Customer analytics
Product sustainability
Project finance
Commodity risk management
Remote monitoring
Collaboration with thirdparty service providers
Differentiated customer service
Virtual prototyping
Project execution and monitoring
Inventory and demand balancing
Asset performance
Inventory visibility
Dynamic pricing
UNIVERSITAT ROVIRA I VIRGILI EUROPEAN CHEMICAL INDUSTRY AND ITS INNOVATION POLICY WITH FOCUS ON LARGE CHEMICAL COMPANIES. Supriyo Das Dipòsit Legal: T 1295-2015
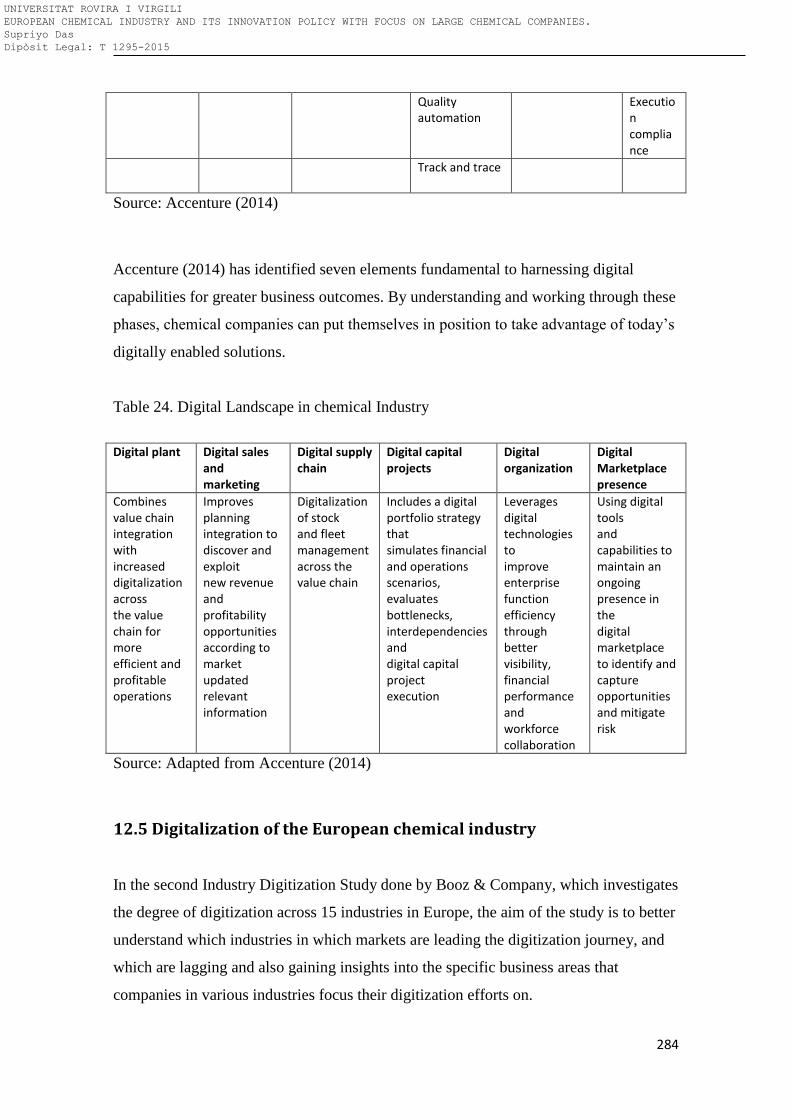
284
Quality automation
Execution compliance
Track and trace
Source: Accenture (2014)
Accenture (2014) has identified seven elements fundamental to harnessing digital
capabilities for greater business outcomes. By understanding and working through these
phases, chemical companies can put themselves in position to take advantage of today’s
digitally enabled solutions.
Table 24. Digital Landscape in chemical Industry
Digital plant Digital sales and marketing
Digital supply chain
Digital capital projects
Digital organization
Digital Marketplace presence
Combines value chain integration with increased digitalization across the value chain for more efficient and profitable operations
Improves planning integration to discover and exploit new revenue and profitability opportunities according to market updated relevant information
Digitalization of stock and fleet management across the value chain
Includes a digital portfolio strategy that simulates financial and operations scenarios, evaluates bottlenecks, interdependencies and digital capital project execution
Leverages digital technologies to improve enterprise function efficiency through better visibility, financial performance and workforce collaboration
Using digital tools and capabilities to maintain an ongoing presence in the digital marketplace to identify and capture opportunities and mitigate risk
Source: Adapted from Accenture (2014)
12.5 Digitalization of the European chemical industry
In the second Industry Digitization Study done by Booz & Company, which investigates
the degree of digitization across 15 industries in Europe, the aim of the study is to better
understand which industries in which markets are leading the digitization journey, and
which are lagging and also gaining insights into the specific business areas that
companies in various industries focus their digitization efforts on.
UNIVERSITAT ROVIRA I VIRGILI EUROPEAN CHEMICAL INDUSTRY AND ITS INNOVATION POLICY WITH FOCUS ON LARGE CHEMICAL COMPANIES. Supriyo Das Dipòsit Legal: T 1295-2015
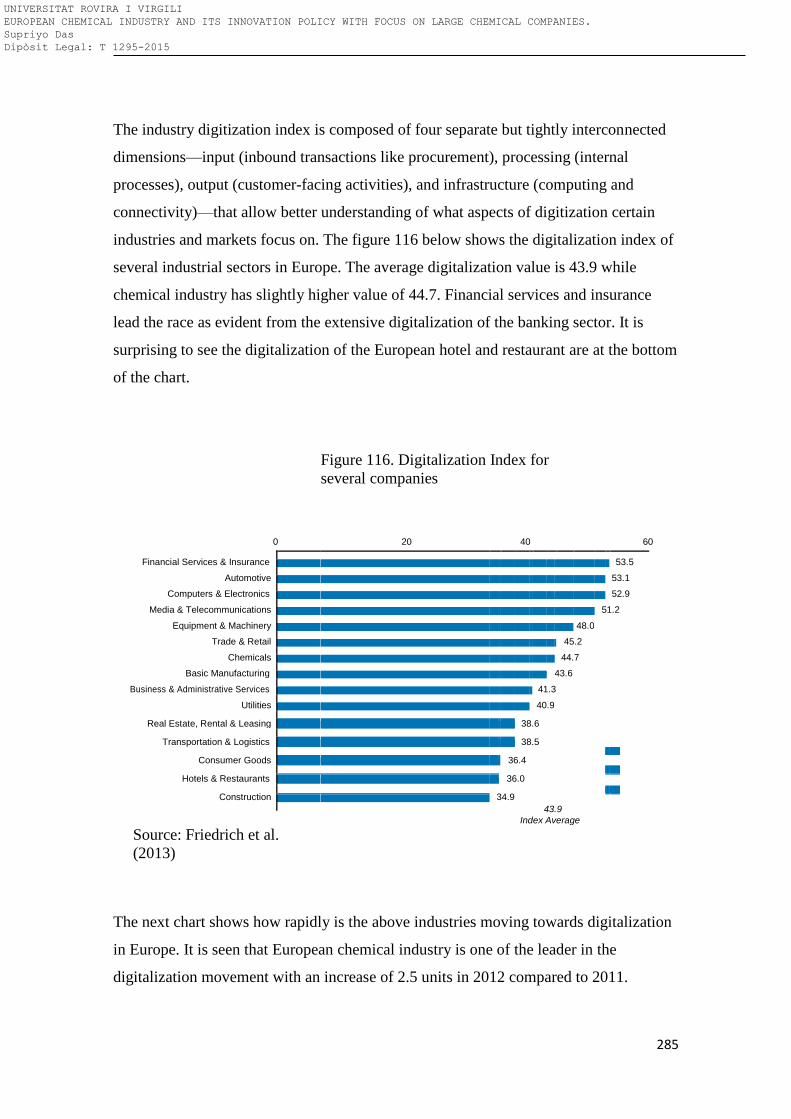
285
The industry digitization index is composed of four separate but tightly interconnected
dimensions—input (inbound transactions like procurement), processing (internal
processes), output (customer-facing activities), and infrastructure (computing and
connectivity)—that allow better understanding of what aspects of digitization certain
industries and markets focus on. The figure 116 below shows the digitalization index of
several industrial sectors in Europe. The average digitalization value is 43.9 while
chemical industry has slightly higher value of 44.7. Financial services and insurance
lead the race as evident from the extensive digitalization of the banking sector. It is
surprising to see the digitalization of the European hotel and restaurant are at the bottom
of the chart.
Figure 116. Digitalization Index for
several companies
0 20 40
60
1 (1)
Financial Services & Insurance
53.5
Automotive
53.1 2 (4)
Computers & Electronics
52.9 3 (2)
Media & Telecommunications
51.2 4 (3)
Equipment & Machinery
48.0
5 (5)
Trade & Retail
45.2
6 (6)
Chemicals
44.7
7 (7)
Basic Manufacturing
43.6
8 (9)
Business & Administrative Services
41.3
9 (10)
Utilities
40.9
10 (8)
Real Estate, Rental & Leasing
38.6
Transportation & Logistics
38.5
Consumer Goods
36.4
Hotels & Restaurants
36.0
Construction
34.9
43.9
Index Average
Source: Friedrich et al.
(2013)
The next chart shows how rapidly is the above industries moving towards digitalization
in Europe. It is seen that European chemical industry is one of the leader in the
digitalization movement with an increase of 2.5 units in 2012 compared to 2011.
UNIVERSITAT ROVIRA I VIRGILI EUROPEAN CHEMICAL INDUSTRY AND ITS INNOVATION POLICY WITH FOCUS ON LARGE CHEMICAL COMPANIES. Supriyo Das Dipòsit Legal: T 1295-2015
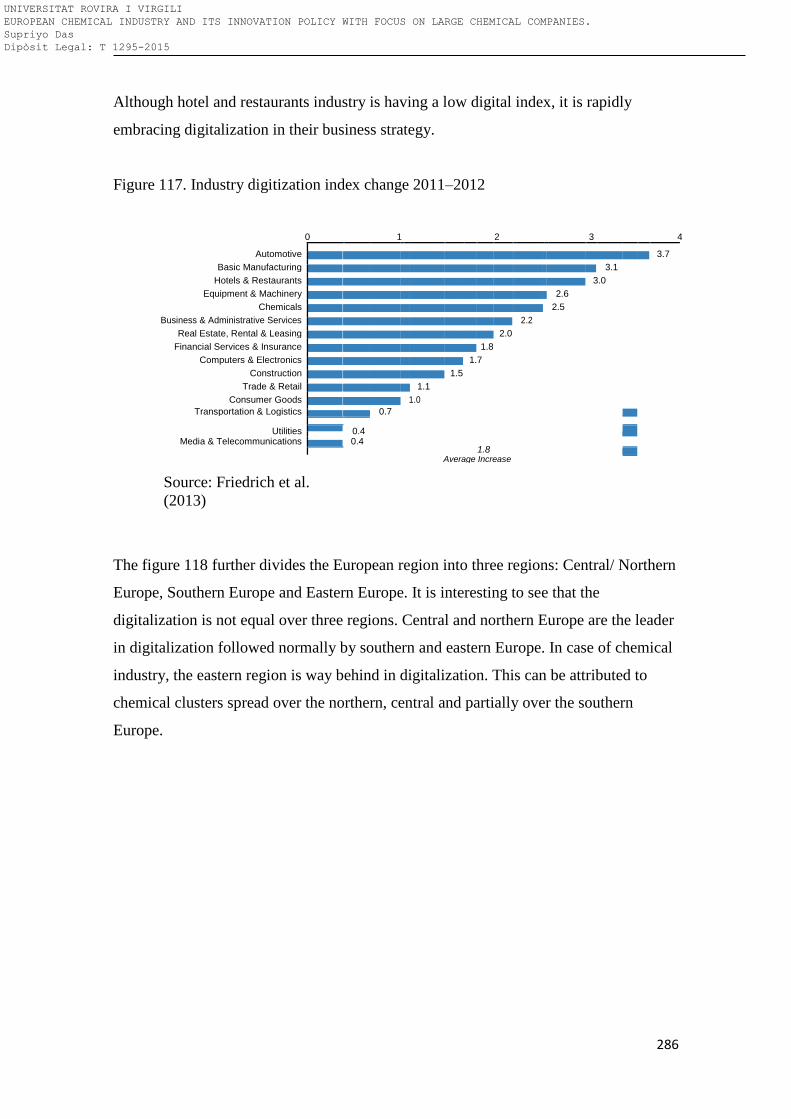
286
Although hotel and restaurants industry is having a low digital index, it is rapidly
embracing digitalization in their business strategy.
Figure 117. Industry digitization index change 2011–2012
0 1 2 3 4
Automotive
3.7
Basic Manufacturing
3.1
Hotels & Restaurants
3.0
Equipment & Machinery
2.6
Chemicals
2.5
Business & Administrative Services
2.2
Real Estate, Rental & Leasing
2.0
Financial Services & Insurance
1.8
Computers & Electronics
1.7
Construction
1.5
Trade & Retail
1.1
Consumer Goods
1.0
Transportation & Logistics
0.7
Utilities
0.4
Media & Telecommunications
0.4
1.8
Source: Friedrich et al.
(2013)
Average Increase
The figure 118 further divides the European region into three regions: Central/ Northern
Europe, Southern Europe and Eastern Europe. It is interesting to see that the
digitalization is not equal over three regions. Central and northern Europe are the leader
in digitalization followed normally by southern and eastern Europe. In case of chemical
industry, the eastern region is way behind in digitalization. This can be attributed to
chemical clusters spread over the northern, central and partially over the southern
Europe.
UNIVERSITAT ROVIRA I VIRGILI EUROPEAN CHEMICAL INDUSTRY AND ITS INNOVATION POLICY WITH FOCUS ON LARGE CHEMICAL COMPANIES. Supriyo Das Dipòsit Legal: T 1295-2015
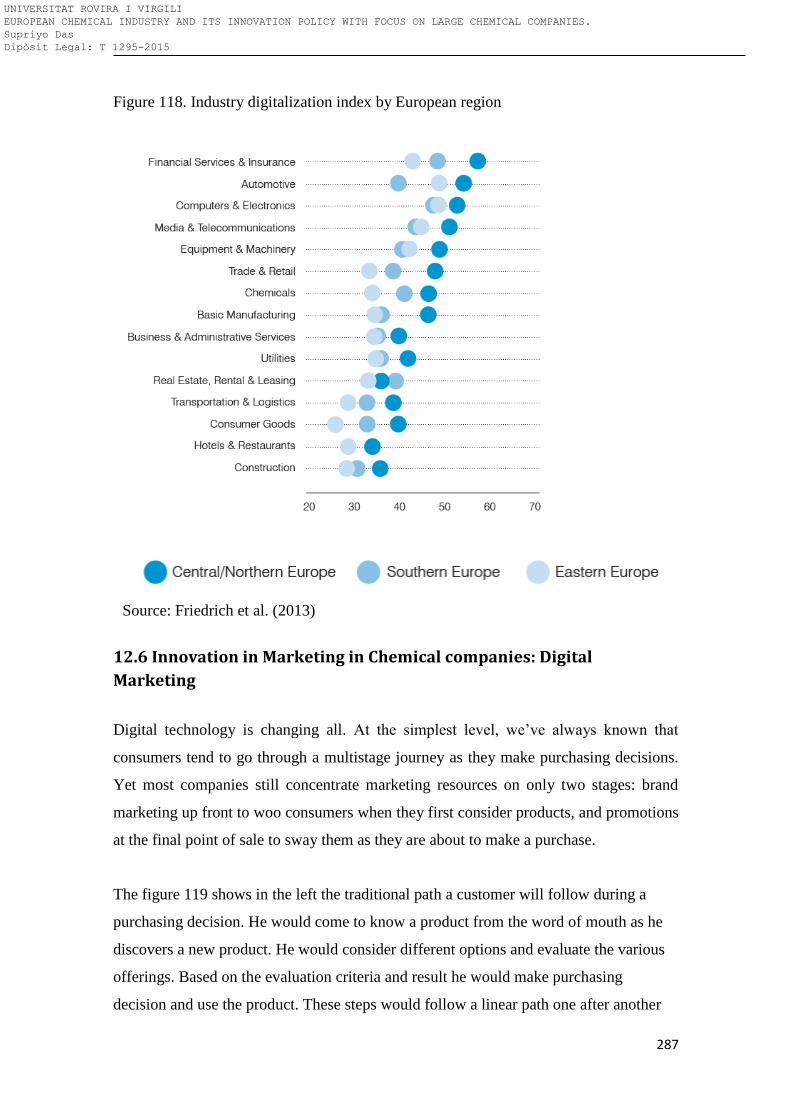
287
Figure 118. Industry digitalization index by European region
Source: Friedrich et al. (2013)
12.6 Innovation in Marketing in Chemical companies: Digital
Marketing
Digital technology is changing all. At the simplest level, we’ve always known that
consumers tend to go through a multistage journey as they make purchasing decisions.
Yet most companies still concentrate marketing resources on only two stages: brand
marketing up front to woo consumers when they first consider products, and promotions
at the final point of sale to sway them as they are about to make a purchase.
The figure 119 shows in the left the traditional path a customer will follow during a
purchasing decision. He would come to know a product from the word of mouth as he
discovers a new product. He would consider different options and evaluate the various
offerings. Based on the evaluation criteria and result he would make purchasing
decision and use the product. These steps would follow a linear path one after another
UNIVERSITAT ROVIRA I VIRGILI EUROPEAN CHEMICAL INDUSTRY AND ITS INNOVATION POLICY WITH FOCUS ON LARGE CHEMICAL COMPANIES. Supriyo Das Dipòsit Legal: T 1295-2015
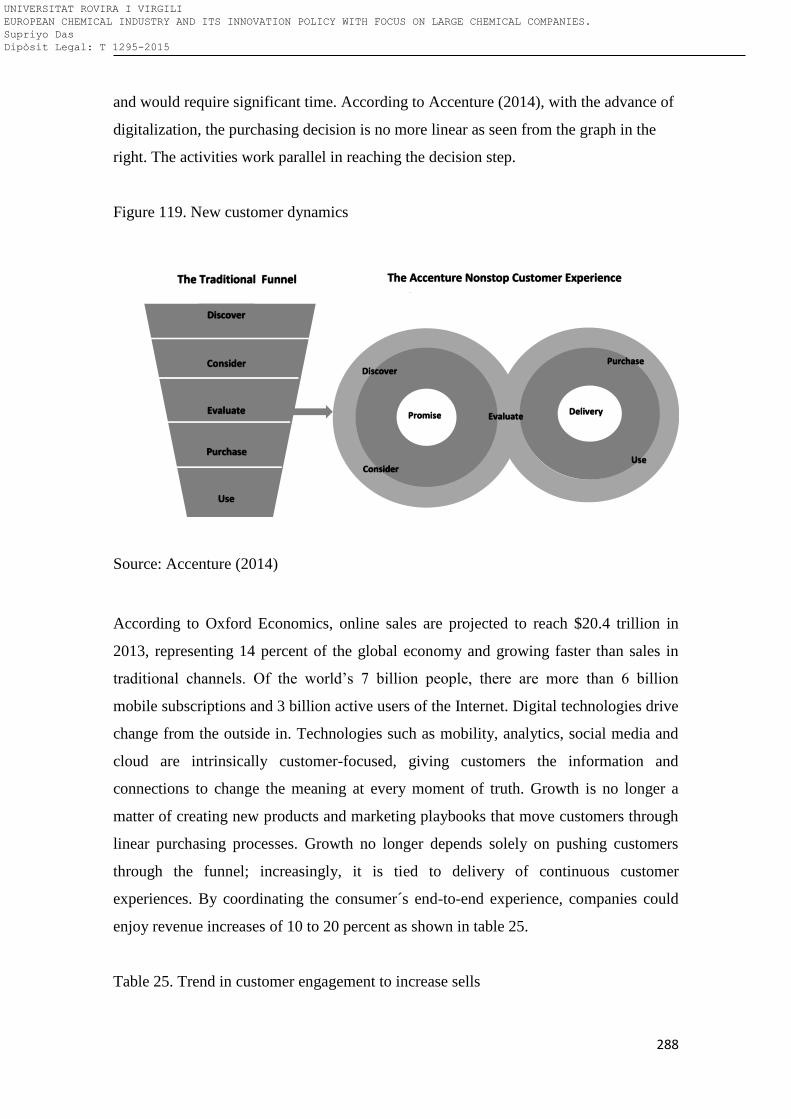
288
and would require significant time. According to Accenture (2014), with the advance of
digitalization, the purchasing decision is no more linear as seen from the graph in the
right. The activities work parallel in reaching the decision step.
Figure 119. New customer dynamics
Source: Accenture (2014)
According to Oxford Economics, online sales are projected to reach $20.4 trillion in
2013, representing 14 percent of the global economy and growing faster than sales in
traditional channels. Of the world’s 7 billion people, there are more than 6 billion
mobile subscriptions and 3 billion active users of the Internet. Digital technologies drive
change from the outside in. Technologies such as mobility, analytics, social media and
cloud are intrinsically customer-focused, giving customers the information and
connections to change the meaning at every moment of truth. Growth is no longer a
matter of creating new products and marketing playbooks that move customers through
linear purchasing processes. Growth no longer depends solely on pushing customers
through the funnel; increasingly, it is tied to delivery of continuous customer
experiences. By coordinating the consumer´s end-to-end experience, companies could
enjoy revenue increases of 10 to 20 percent as shown in table 25.
Table 25. Trend in customer engagement to increase sells
Discover
Consider
Evaluate
Purchase
Use
The Traditional Funnel The Accenture Nonstop Customer Experience
Mode
UNIVERSITAT ROVIRA I VIRGILI EUROPEAN CHEMICAL INDUSTRY AND ITS INNOVATION POLICY WITH FOCUS ON LARGE CHEMICAL COMPANIES. Supriyo Das Dipòsit Legal: T 1295-2015
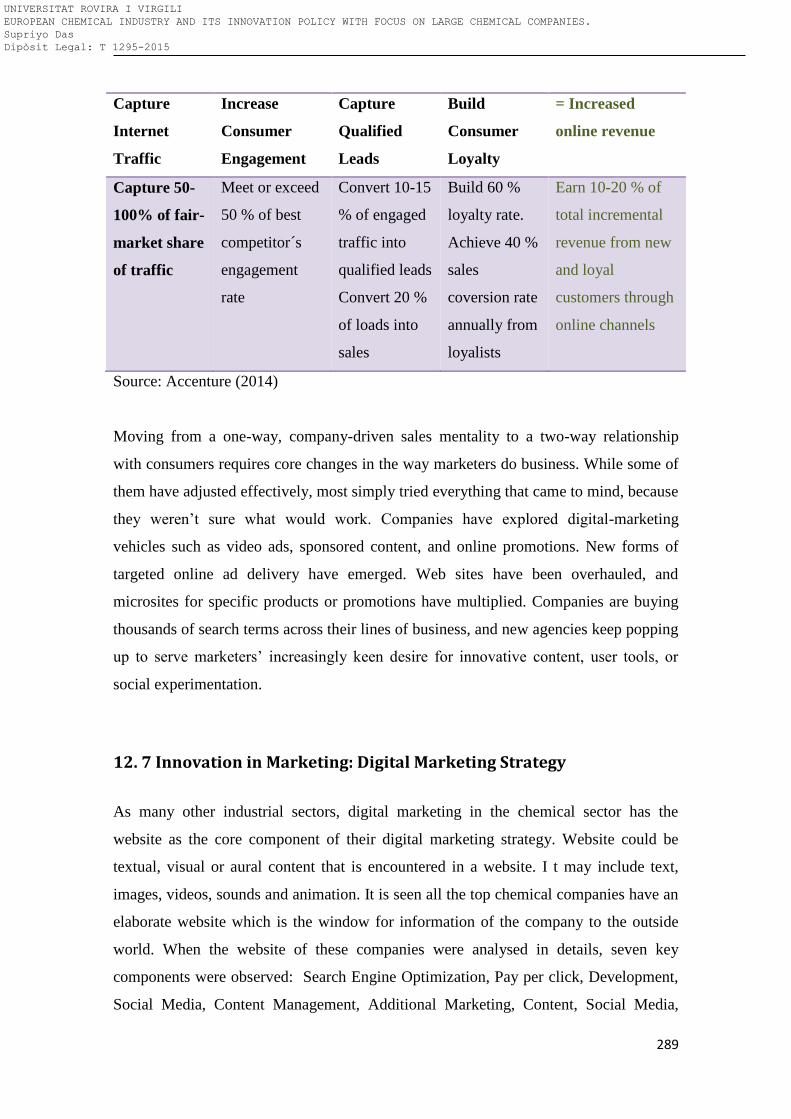
289
Capture
Internet
Traffic
Increase
Consumer
Engagement
Capture
Qualified
Leads
Build
Consumer
Loyalty
= Increased
online revenue
Capture 50-
100% of fair-
market share
of traffic
Meet or exceed
50 % of best
competitor´s
engagement
rate
Convert 10-15
% of engaged
traffic into
qualified leads
Convert 20 %
of loads into
sales
Build 60 %
loyalty rate.
Achieve 40 %
sales
coversion rate
annually from
loyalists
Earn 10-20 % of
total incremental
revenue from new
and loyal
customers through
online channels
Source: Accenture (2014)
Moving from a one-way, company-driven sales mentality to a two-way relationship
with consumers requires core changes in the way marketers do business. While some of
them have adjusted effectively, most simply tried everything that came to mind, because
they weren’t sure what would work. Companies have explored digital-marketing
vehicles such as video ads, sponsored content, and online promotions. New forms of
targeted online ad delivery have emerged. Web sites have been overhauled, and
microsites for specific products or promotions have multiplied. Companies are buying
thousands of search terms across their lines of business, and new agencies keep popping
up to serve marketers’ increasingly keen desire for innovative content, user tools, or
social experimentation.
12. 7 Innovation in Marketing: Digital Marketing Strategy
As many other industrial sectors, digital marketing in the chemical sector has the
website as the core component of their digital marketing strategy. Website could be
textual, visual or aural content that is encountered in a website. I t may include text,
images, videos, sounds and animation. It is seen all the top chemical companies have an
elaborate website which is the window for information of the company to the outside
world. When the website of these companies were analysed in details, seven key
components were observed: Search Engine Optimization, Pay per click, Development,
Social Media, Content Management, Additional Marketing, Content, Social Media,
UNIVERSITAT ROVIRA I VIRGILI EUROPEAN CHEMICAL INDUSTRY AND ITS INNOVATION POLICY WITH FOCUS ON LARGE CHEMICAL COMPANIES. Supriyo Das Dipòsit Legal: T 1295-2015
290
software. For our current study, we have focused on three digital marketing tools which
are being extensively used in chemical industry: Blogging, Article Marketing, E-
commerce, social Media Marketing.
UNIVERSITAT ROVIRA I VIRGILI EUROPEAN CHEMICAL INDUSTRY AND ITS INNOVATION POLICY WITH FOCUS ON LARGE CHEMICAL COMPANIES. Supriyo Das Dipòsit Legal: T 1295-2015
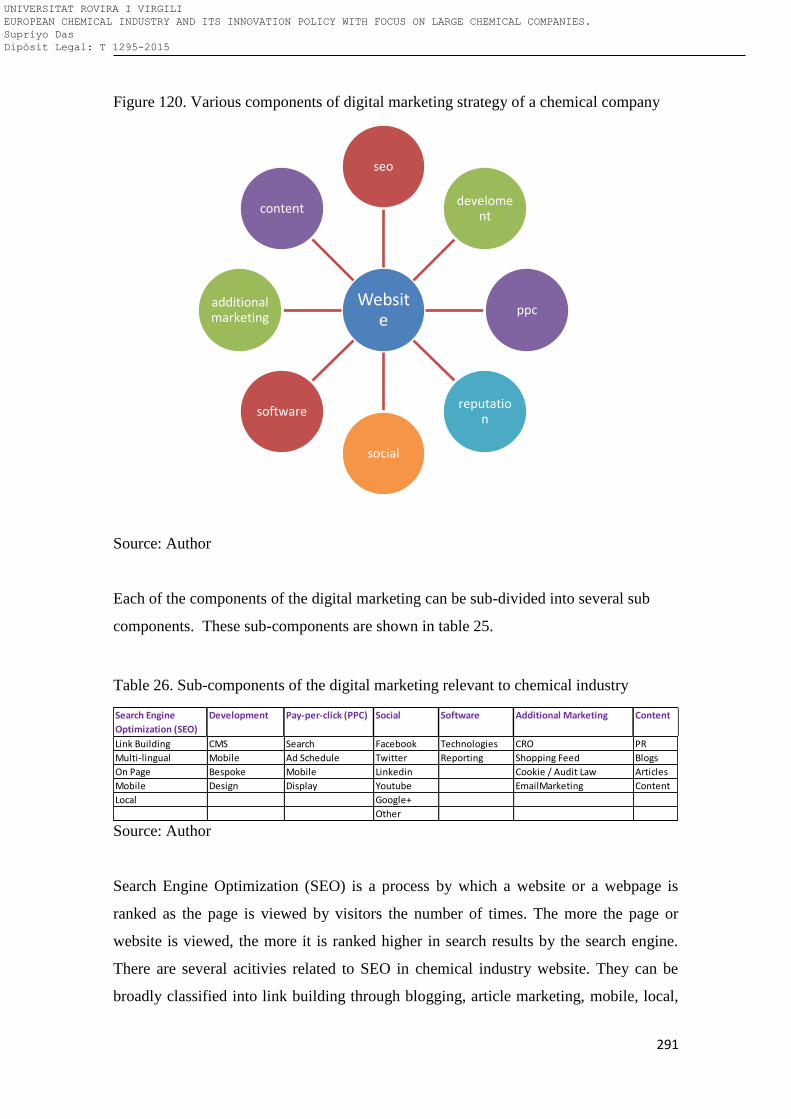
291
Figure 120. Various components of digital marketing strategy of a chemical company
Source: Author
Each of the components of the digital marketing can be sub-divided into several sub
components. These sub-components are shown in table 25.
Table 26. Sub-components of the digital marketing relevant to chemical industry
Source: Author
Search Engine Optimization (SEO) is a process by which a website or a webpage is
ranked as the page is viewed by visitors the number of times. The more the page or
website is viewed, the more it is ranked higher in search results by the search engine.
There are several acitivies related to SEO in chemical industry website. They can be
broadly classified into link building through blogging, article marketing, mobile, local,
Website
seo
develoment
ppc
reputation
social
software
additional marketing
content
Search Engine
Optimization (SEO)
Development Pay-per-click (PPC) Social Software Additional Marketing Content
Link Building CMS Search Facebook Technologies CRO PR
Multi-lingual Mobile Ad Schedule Twitter Reporting Shopping Feed Blogs
On Page Bespoke Mobile Linkedin Cookie / Audit Law Articles
Mobile Design Display Youtube EmailMarketing Content
Local Google+
Other
UNIVERSITAT ROVIRA I VIRGILI EUROPEAN CHEMICAL INDUSTRY AND ITS INNOVATION POLICY WITH FOCUS ON LARGE CHEMICAL COMPANIES. Supriyo Das Dipòsit Legal: T 1295-2015
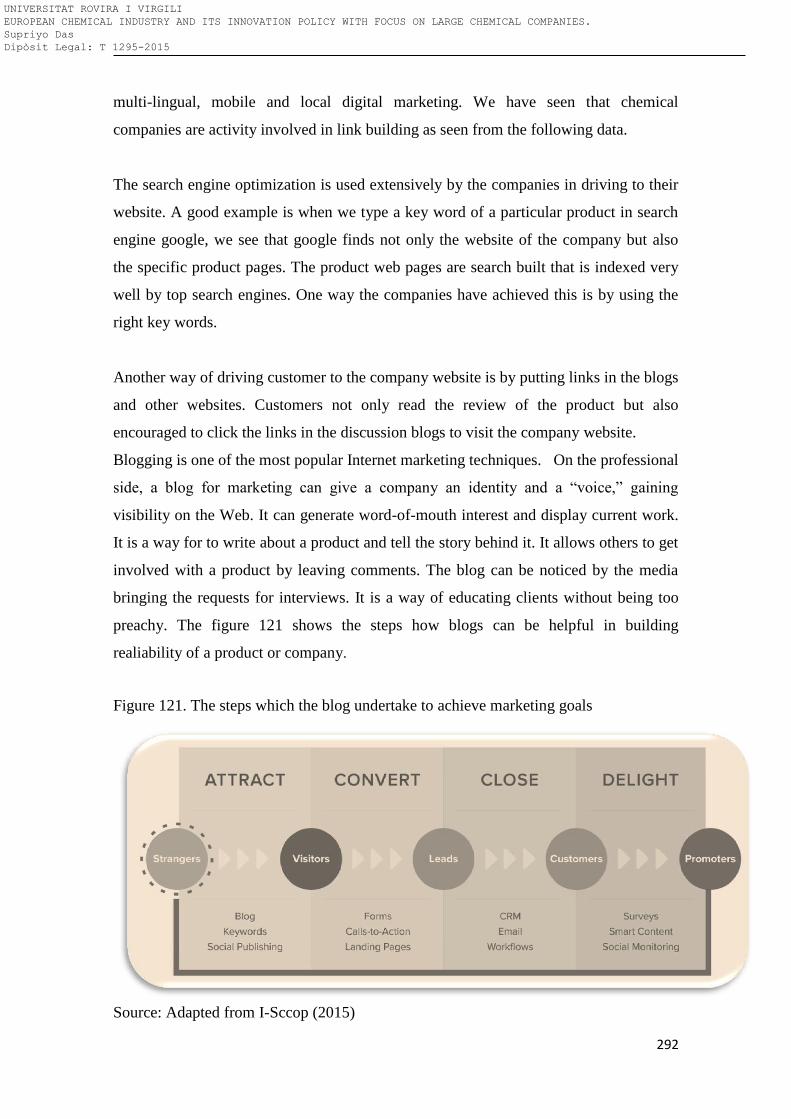
292
multi-lingual, mobile and local digital marketing. We have seen that chemical
companies are activity involved in link building as seen from the following data.
The search engine optimization is used extensively by the companies in driving to their
website. A good example is when we type a key word of a particular product in search
engine google, we see that google finds not only the website of the company but also
the specific product pages. The product web pages are search built that is indexed very
well by top search engines. One way the companies have achieved this is by using the
right key words.
Another way of driving customer to the company website is by putting links in the blogs
and other websites. Customers not only read the review of the product but also
encouraged to click the links in the discussion blogs to visit the company website.
Blogging is one of the most popular Internet marketing techniques. On the professional
side, a blog for marketing can give a company an identity and a “voice,” gaining
visibility on the Web. It can generate word-of-mouth interest and display current work.
It is a way for to write about a product and tell the story behind it. It allows others to get
involved with a product by leaving comments. The blog can be noticed by the media
bringing the requests for interviews. It is a way of educating clients without being too
preachy. The figure 121 shows the steps how blogs can be helpful in building
realiability of a product or company.
Figure 121. The steps which the blog undertake to achieve marketing goals
Source: Adapted from I-Sccop (2015)
UNIVERSITAT ROVIRA I VIRGILI EUROPEAN CHEMICAL INDUSTRY AND ITS INNOVATION POLICY WITH FOCUS ON LARGE CHEMICAL COMPANIES. Supriyo Das Dipòsit Legal: T 1295-2015
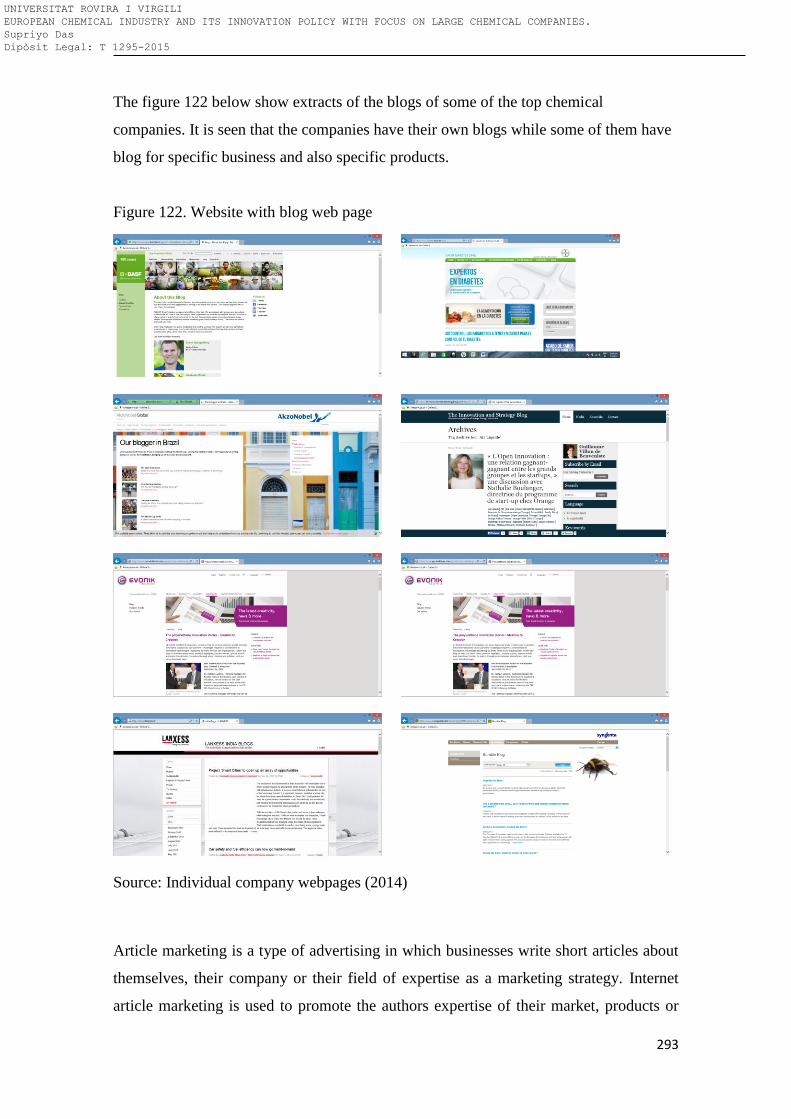
293
The figure 122 below show extracts of the blogs of some of the top chemical
companies. It is seen that the companies have their own blogs while some of them have
blog for specific business and also specific products.
Figure 122. Website with blog web page
Source: Individual company webpages (2014)
Article marketing is a type of advertising in which businesses write short articles about
themselves, their company or their field of expertise as a marketing strategy. Internet
article marketing is used to promote the authors expertise of their market, products or
UNIVERSITAT ROVIRA I VIRGILI EUROPEAN CHEMICAL INDUSTRY AND ITS INNOVATION POLICY WITH FOCUS ON LARGE CHEMICAL COMPANIES. Supriyo Das Dipòsit Legal: T 1295-2015
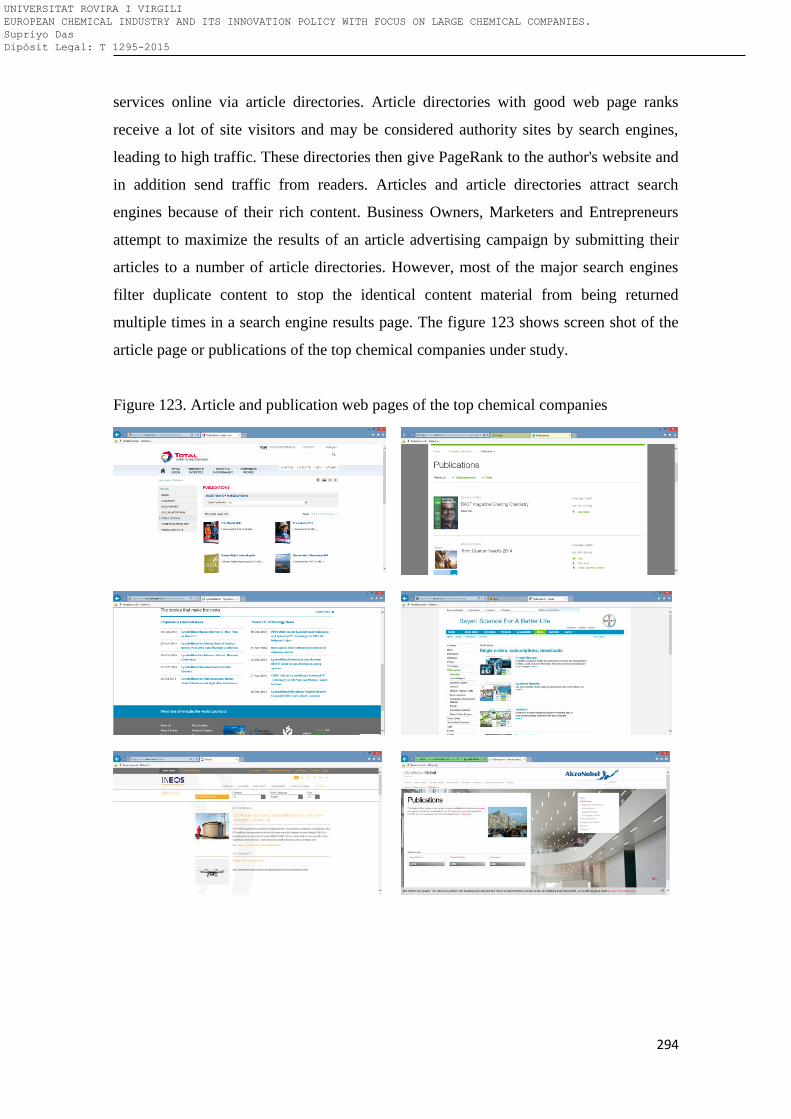
294
services online via article directories. Article directories with good web page ranks
receive a lot of site visitors and may be considered authority sites by search engines,
leading to high traffic. These directories then give PageRank to the author's website and
in addition send traffic from readers. Articles and article directories attract search
engines because of their rich content. Business Owners, Marketers and Entrepreneurs
attempt to maximize the results of an article advertising campaign by submitting their
articles to a number of article directories. However, most of the major search engines
filter duplicate content to stop the identical content material from being returned
multiple times in a search engine results page. The figure 123 shows screen shot of the
article page or publications of the top chemical companies under study.
Figure 123. Article and publication web pages of the top chemical companies
UNIVERSITAT ROVIRA I VIRGILI EUROPEAN CHEMICAL INDUSTRY AND ITS INNOVATION POLICY WITH FOCUS ON LARGE CHEMICAL COMPANIES. Supriyo Das Dipòsit Legal: T 1295-2015
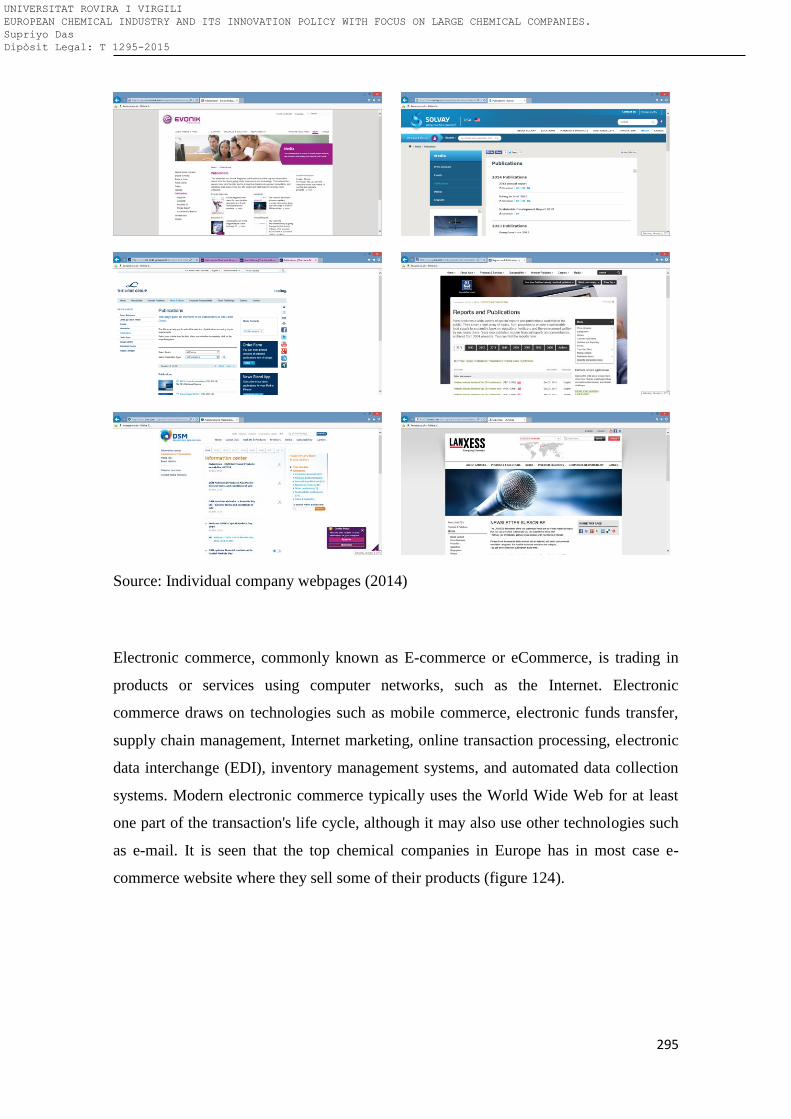
295
Source: Individual company webpages (2014)
Electronic commerce, commonly known as E-commerce or eCommerce, is trading in
products or services using computer networks, such as the Internet. Electronic
commerce draws on technologies such as mobile commerce, electronic funds transfer,
supply chain management, Internet marketing, online transaction processing, electronic
data interchange (EDI), inventory management systems, and automated data collection
systems. Modern electronic commerce typically uses the World Wide Web for at least
one part of the transaction's life cycle, although it may also use other technologies such
as e-mail. It is seen that the top chemical companies in Europe has in most case e-
commerce website where they sell some of their products (figure 124).
UNIVERSITAT ROVIRA I VIRGILI EUROPEAN CHEMICAL INDUSTRY AND ITS INNOVATION POLICY WITH FOCUS ON LARGE CHEMICAL COMPANIES. Supriyo Das Dipòsit Legal: T 1295-2015
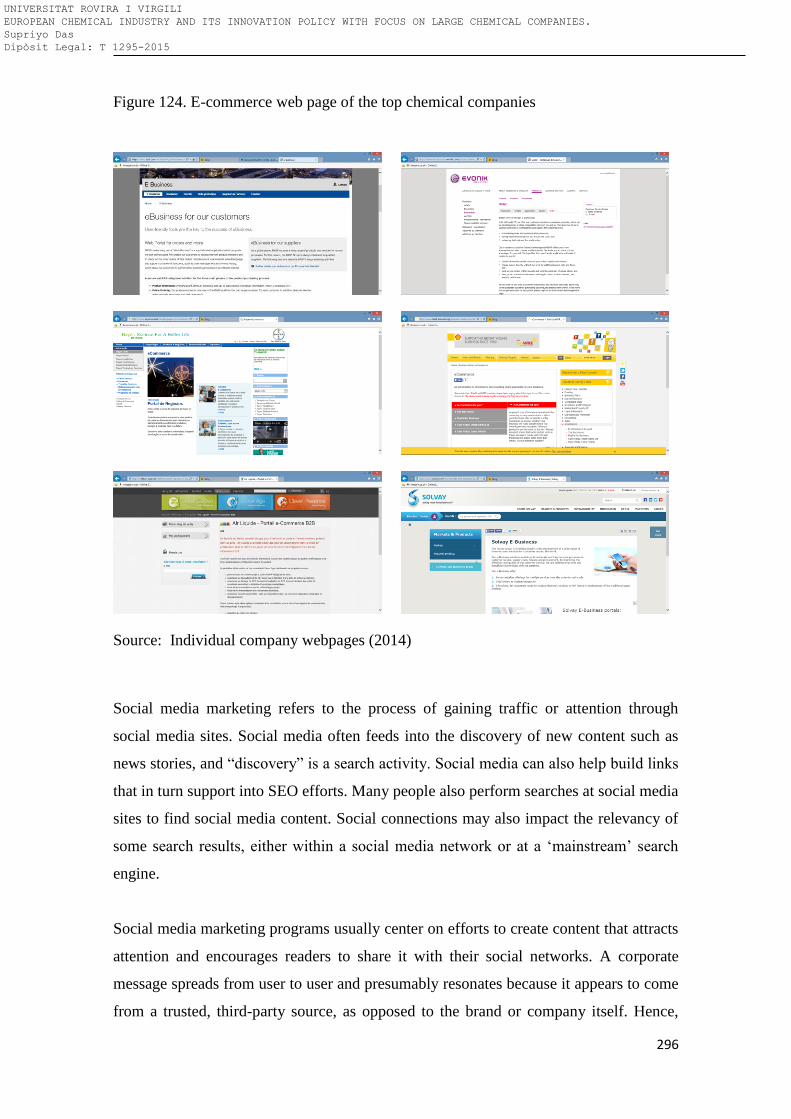
296
Figure 124. E-commerce web page of the top chemical companies
Source: Individual company webpages (2014)
Social media marketing refers to the process of gaining traffic or attention through
social media sites. Social media often feeds into the discovery of new content such as
news stories, and “discovery” is a search activity. Social media can also help build links
that in turn support into SEO efforts. Many people also perform searches at social media
sites to find social media content. Social connections may also impact the relevancy of
some search results, either within a social media network or at a ‘mainstream’ search
engine.
Social media marketing programs usually center on efforts to create content that attracts
attention and encourages readers to share it with their social networks. A corporate
message spreads from user to user and presumably resonates because it appears to come
from a trusted, third-party source, as opposed to the brand or company itself. Hence,
UNIVERSITAT ROVIRA I VIRGILI EUROPEAN CHEMICAL INDUSTRY AND ITS INNOVATION POLICY WITH FOCUS ON LARGE CHEMICAL COMPANIES. Supriyo Das Dipòsit Legal: T 1295-2015
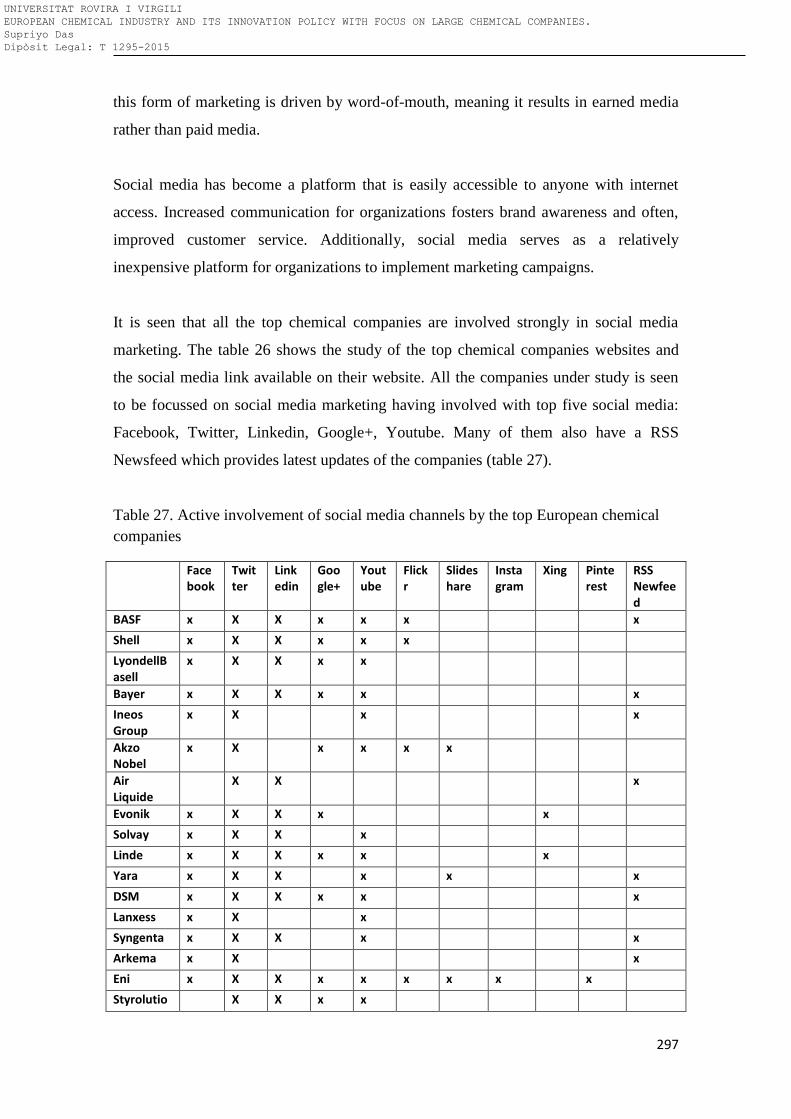
297
this form of marketing is driven by word-of-mouth, meaning it results in earned media
rather than paid media.
Social media has become a platform that is easily accessible to anyone with internet
access. Increased communication for organizations fosters brand awareness and often,
improved customer service. Additionally, social media serves as a relatively
inexpensive platform for organizations to implement marketing campaigns.
It is seen that all the top chemical companies are involved strongly in social media
marketing. The table 26 shows the study of the top chemical companies websites and
the social media link available on their website. All the companies under study is seen
to be focussed on social media marketing having involved with top five social media:
Facebook, Twitter, Linkedin, Google+, Youtube. Many of them also have a RSS
Newsfeed which provides latest updates of the companies (table 27).
Table 27. Active involvement of social media channels by the top European chemical
companies
Google+
Youtube
Flickr
Slideshare
Xing Pinterest
RSS Newfeed
BASF x X X x x x x
Shell x X X x x x
LyondellBasell
x X X x x
Bayer x X X x x x
Ineos Group
x X x x
Akzo Nobel
x X x x x x
Air Liquide
X X x
Evonik x X X x x
Solvay x X X x
Linde x X X x x x
Yara x X X x x x
DSM x X X x x x
Lanxess x X x
Syngenta x X X x x
Arkema x X x
Eni x X X x x x x x x
Styrolutio X X x x
UNIVERSITAT ROVIRA I VIRGILI EUROPEAN CHEMICAL INDUSTRY AND ITS INNOVATION POLICY WITH FOCUS ON LARGE CHEMICAL COMPANIES. Supriyo Das Dipòsit Legal: T 1295-2015
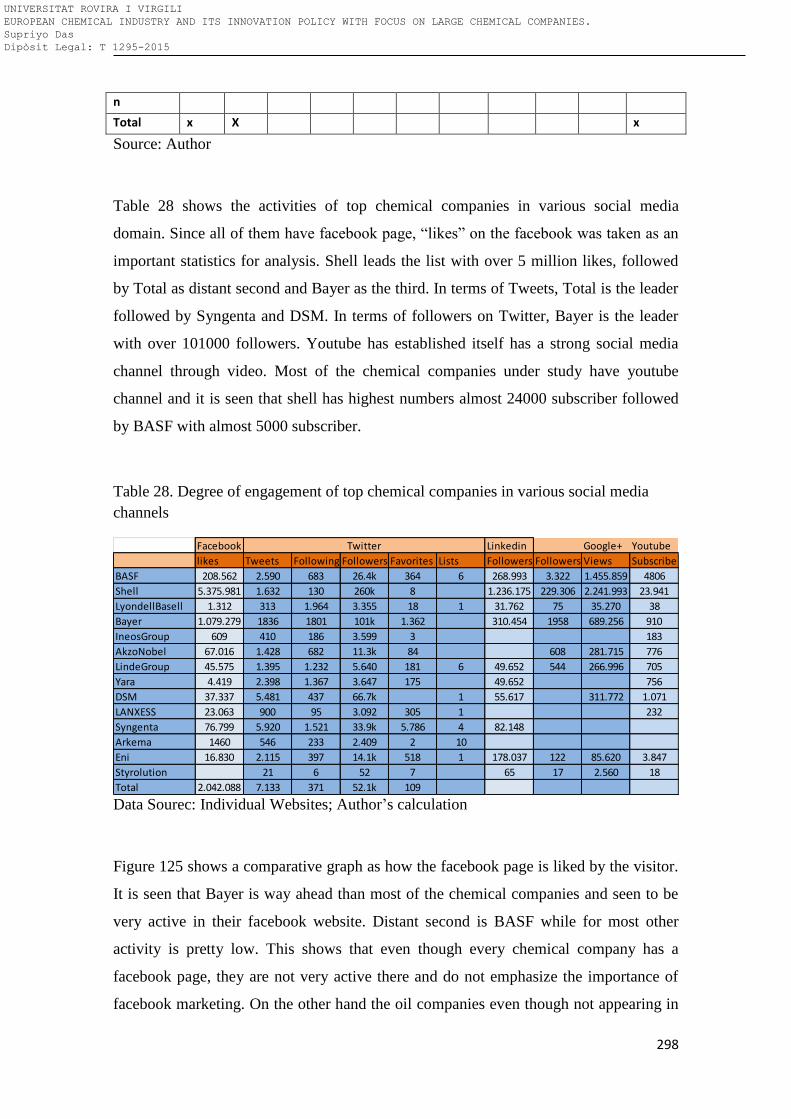
298
n
Total x X x
Source: Author
Table 28 shows the activities of top chemical companies in various social media
domain. Since all of them have facebook page, “likes” on the facebook was taken as an
important statistics for analysis. Shell leads the list with over 5 million likes, followed
by Total as distant second and Bayer as the third. In terms of Tweets, Total is the leader
followed by Syngenta and DSM. In terms of followers on Twitter, Bayer is the leader
with over 101000 followers. Youtube has established itself has a strong social media
channel through video. Most of the chemical companies under study have youtube
channel and it is seen that shell has highest numbers almost 24000 subscriber followed
by BASF with almost 5000 subscriber.
Table 28. Degree of engagement of top chemical companies in various social media
channels
Data Sourec: Individual Websites; Author’s calculation
Figure 125 shows a comparative graph as how the facebook page is liked by the visitor.
It is seen that Bayer is way ahead than most of the chemical companies and seen to be
very active in their facebook website. Distant second is BASF while for most other
activity is pretty low. This shows that even though every chemical company has a
facebook page, they are not very active there and do not emphasize the importance of
facebook marketing. On the other hand the oil companies even though not appearing in
Facebook Linkedin Google+ Youtube
likes Tweets Following Followers Favorites Lists Followers Followers Views Subscribe
BASF 208.562 2.590 683 26.4k 364 6 268.993 3.322 1.455.859 4806
Shell 5.375.981 1.632 130 260k 8 1.236.175 229.306 2.241.993 23.941
LyondellBasell 1.312 313 1.964 3.355 18 1 31.762 75 35.270 38
Bayer 1.079.279 1836 1801 101k 1.362 310.454 1958 689.256 910
IneosGroup 609 410 186 3.599 3 183
AkzoNobel 67.016 1.428 682 11.3k 84 608 281.715 776
LindeGroup 45.575 1.395 1.232 5.640 181 6 49.652 544 266.996 705
Yara 4.419 2.398 1.367 3.647 175 49.652 756
DSM 37.337 5.481 437 66.7k 1 55.617 311.772 1.071
LANXESS 23.063 900 95 3.092 305 1 232
Syngenta 76.799 5.920 1.521 33.9k 5.786 4 82.148
Arkema 1460 546 233 2.409 2 10
Eni 16.830 2.115 397 14.1k 518 1 178.037 122 85.620 3.847
Styrolution 21 6 52 7 65 17 2.560 18
Total 2.042.088 7.133 371 52.1k 109
UNIVERSITAT ROVIRA I VIRGILI EUROPEAN CHEMICAL INDUSTRY AND ITS INNOVATION POLICY WITH FOCUS ON LARGE CHEMICAL COMPANIES. Supriyo Das Dipòsit Legal: T 1295-2015
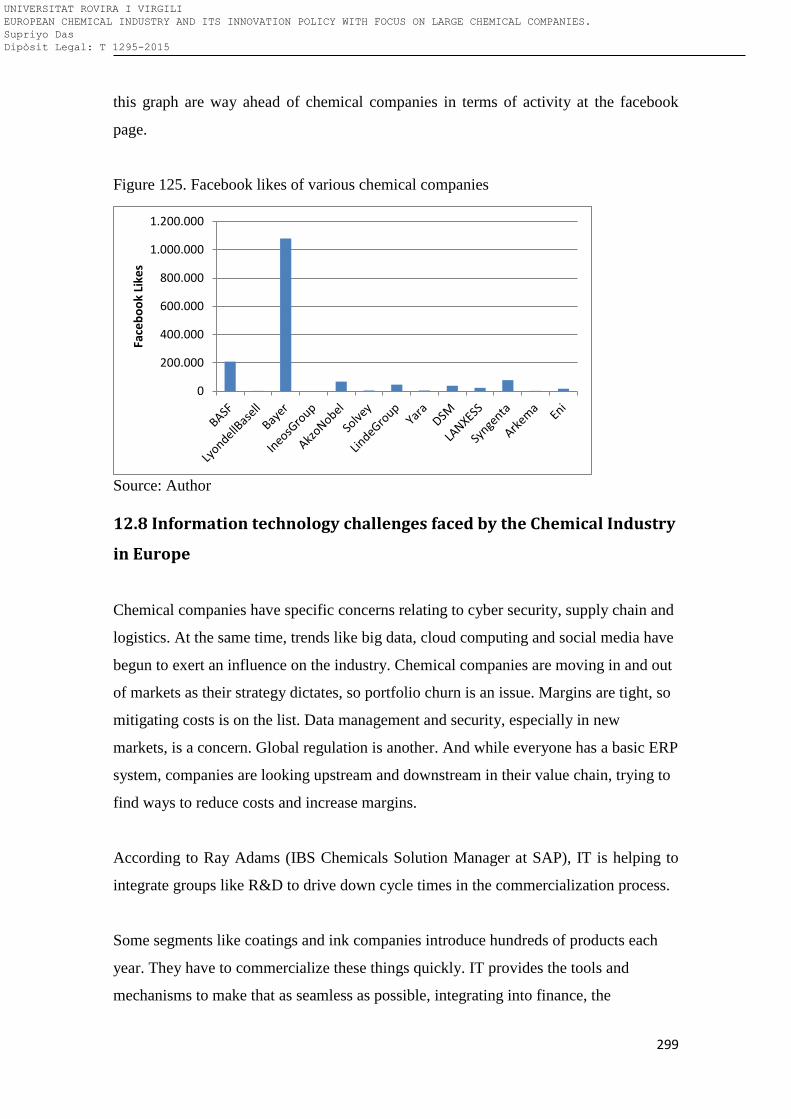
299
this graph are way ahead of chemical companies in terms of activity at the facebook
page.
Figure 125. Facebook likes of various chemical companies
Source: Author
12.8 Information technology challenges faced by the Chemical Industry
in Europe
Chemical companies have specific concerns relating to cyber security, supply chain and
logistics. At the same time, trends like big data, cloud computing and social media have
begun to exert an influence on the industry. Chemical companies are moving in and out
of markets as their strategy dictates, so portfolio churn is an issue. Margins are tight, so
mitigating costs is on the list. Data management and security, especially in new
markets, is a concern. Global regulation is another. And while everyone has a basic ERP
system, companies are looking upstream and downstream in their value chain, trying to
find ways to reduce costs and increase margins.
According to Ray Adams (IBS Chemicals Solution Manager at SAP), IT is helping to
integrate groups like R&D to drive down cycle times in the commercialization process.
Some segments like coatings and ink companies introduce hundreds of products each
year. They have to commercialize these things quickly. IT provides the tools and
mechanisms to make that as seamless as possible, integrating into finance, the
0
200.000
400.000
600.000
800.000
1.000.000
1.200.000
Face
bo
ok
Like
s
UNIVERSITAT ROVIRA I VIRGILI EUROPEAN CHEMICAL INDUSTRY AND ITS INNOVATION POLICY WITH FOCUS ON LARGE CHEMICAL COMPANIES. Supriyo Das Dipòsit Legal: T 1295-2015
300
regulatory environment, into environmental health and safety databases, and flowing
into the manufacturing environment.
12.9 Conclusion
From the above study it can be concluded that chemical industry in Europe is adapting
digitalization in a fast pace compared to many other sectors. The digitalization has
increased profitability by 10 – 20 %. Digital marketing has become integral part of
marketing strategy of the top chemical companies in Europe. Blogging and article
marketing is being extensively used to educate the customer and promote their products.
The companies under study are extensively involved in social media marketing and
video channels.
UNIVERSITAT ROVIRA I VIRGILI EUROPEAN CHEMICAL INDUSTRY AND ITS INNOVATION POLICY WITH FOCUS ON LARGE CHEMICAL COMPANIES. Supriyo Das Dipòsit Legal: T 1295-2015
301
12.10 Bibliography
Accenture, 2014. The Digital Chemical Company. Retrieved from
http://www.accenture.com/SiteCollectionDocuments/PDF/Accenture-The-Digital-
Chemical-Company-Infographic.pdf
Air Liquide. (2015). Welcome> Air Liquide in China. Retrieved from
http://www.cn.airliquide.com/en/welcome.html
AkzoNobel. (2014). Planet Possible: Our commitment to doing more with less.
Retrieved from https://www.akzonobel.com/sustainability/planet_possible/
Arkema. (2015). The Arkema group – a partner of the oil and gas industry. Retrieved
from http://www.arkema.com/en/products/markets-overview/oil-and-gas/index.html
BASF. (2015). Strategy and Organization. Retrieved from
https://www.basf.com/en/company/about-us/strategy-and-organization.html
Bayer. (2015). Bayer’s Products for Humans,Animals and Plants. Retrieved from
http://www.bayer.com/en/Products.aspx
DSM. (2015). Bright Science. Brighter Living. Retrieved from
http://www.dsm.com/corporate/about/bright-science-brighter-living.html
Eni. (2015). Eni Boosts Norway Exploration Activity with 2 New Licenses - Analyst
Blog
Retrieved from http://www.nasdaq.com/article/eni-boosts-norway-exploration-activity-
with-2-new-licenses-analyst-blog-cm435717#ixzz3V8vtTYEA
Evonik Industries. (2015). The polyurethane innovation stories - Ideation to Creation.
Retrieved from https://www.pu-additives.com/product/pu-
additives/en/creativity/blog/pages/blog.aspx
UNIVERSITAT ROVIRA I VIRGILI EUROPEAN CHEMICAL INDUSTRY AND ITS INNOVATION POLICY WITH FOCUS ON LARGE CHEMICAL COMPANIES. Supriyo Das Dipòsit Legal: T 1295-2015
302
Friedrich, R., Koster, A., Groene, F. and Maekelburger, B, 2013. The 2012 Industry
Digitization Index. Retreived from Booz&co corporate website
http://www.strategyand.pwc.com/global/home/what-we-think/digitization
Ineos Group. (2015). INEOS Bio. Retrieved from
http://www.bayer.com/en/Products.aspx
I-Scoop. (2015). Corporate blogging guide: strategy and tips. Retrived from
http://www.i-scoop.eu/corporate-blogging-business-blogging/
Lanxess. (2015). Green Chemistry to be Discussed by Lanxess and Zenith in Hong
Kong . Retrieved from http://www.blcleathertech.com/blog/green-chemistry-to-be-
discussed-by-lanxess-and-zenith-in-hong-kong/2015/02/19/
LindeGroup. (2015). Clean Energy – A Global Megatrend. Retrieved from
http://www.the-linde-group.com/en/clean_technology/clean_energy/index.html
Lyonell Basell.(2014). LyondellBasell Remains on Track with Ethylene Expansion -
Analyst Blog. Retrieved from http://www.nasdaq.com/article/lyondellbasell-remains-on-
track-with-ethylene-expansion-analyst-blog-cm456845#ixzz3V8YuyEeK
McDonald, M. and McManus, R, 2014. Growth Strategies for a digital World. New
York, Accenture. Retrieved from: http://www.accenture.com/us-en/Pages/insight-
growth-strategies-digital-world.aspx
Shell Global. (2015). The Shell global homepage. Retrieved from
http://blogs.shell.com/climatechange/
Solvey. (2015). Innovation: Solvay. Retrieved from
http://www.solvay.com/en/innovation/index.html
UNIVERSITAT ROVIRA I VIRGILI EUROPEAN CHEMICAL INDUSTRY AND ITS INNOVATION POLICY WITH FOCUS ON LARGE CHEMICAL COMPANIES. Supriyo Das Dipòsit Legal: T 1295-2015
303
Styrolution. (2015). Corporate Governance- styrolution. Retrieved from
https://www.styrolution.com/portal/en_US/web/guest/corporate-governance
Syngenta. (2015). Syngenta helps growers around the world farm more productively
with a broad range of innovative products. Retrieved from
http://www.syngenta.com/global/corporate/en/products-and-innovation/Pages/products-
and-innovation.aspx
Tata Consultancy Service. (2015). Digitalization The way Forward for Automotive
Industries. Retreived from
http://www.tcs.com/SiteCollectionDocuments/White%20Papers/Digitization-Way-
Forward-For-Auto-Companies-0913-1.pdf
Total. (2015). The Total Homepage-Oil, Natural and Solar Energy Company. Retrieved
from http://www.total.com/en/
Yara. (2015). Research and development. Retrieved from
http://www.yara.com/about/research/index.aspx
UNIVERSITAT ROVIRA I VIRGILI EUROPEAN CHEMICAL INDUSTRY AND ITS INNOVATION POLICY WITH FOCUS ON LARGE CHEMICAL COMPANIES. Supriyo Das Dipòsit Legal: T 1295-2015
304
13. Conclusions
The chemical industry is one of the European Union’s most internationally competitive,
innovative and successful industries, embracing a wide field of processing and
manufacturing activities while supplier of raw material to almost all industry of
European Union. The chemical industry underpins most sectors of the economy, and
accounts for over 7% of EU manufacturing output and with a workforce of 1.2 million,
29000 chemical companies and sales of €642 billion, it is one of the biggest industrial
sectors and an important source of direct and indirect employment in many regions of
the European Union. This is equivalent to 4% of the manufacturing industry’s overall
workforce. Output from the EU chemical industry covers a wide range of chemical
products, supplying virtually all sectors of the economy and providing a significant
contribution to EU net exports. Following are the conclusions obtained from the current
research:
1. The European chemical industry is in difficult situation and is facing unprecedented
challenges from other regions of the world.
The manufacture of chemical products is increasingly moving eastward, drawn by the
economic growth and market opportunities in Asia, the Middle East and Russia.
Production is getting more expensive due to costs of labor and resources. The European
chemical industry´s share of world chemical sales declined from 29.8% in 2001 to
19.6% in 2011, which translates into 34% decline over a period of 10 years. The value
of the stock over the last ten years shows that the financial crisis of 2007-08 has
severely affected the chemical industry and particularly the European chemical industry.
Since the European chemical industry supplies all EU industrial sectors, including
construction, its strategies impact directly on downstream chemical users.
2. Europe still plays a key role in the global chemical industry
The EU is still the leading world force in the chemical industry: it is home to 19 of the
top 50 global chemical companies. Asia is in second place with 16. Data for 2013-14
UNIVERSITAT ROVIRA I VIRGILI EUROPEAN CHEMICAL INDUSTRY AND ITS INNOVATION POLICY WITH FOCUS ON LARGE CHEMICAL COMPANIES. Supriyo Das Dipòsit Legal: T 1295-2015
305
confirms that the European chemical industry has made a significant recovery. Although
China has emerged as the biggest chemical producer, 8 of the top 30 major chemical-
producing countries are European, generating chemical sales of EUR 480 billion. In
Europe, Germany is the largest producer of chemicals, followed by France, Netherlands
and Italy. The European chemical industry is moving towards speciality and consumer
chemicals, which in 2011 accounted for 77% of the extra-EU chemical trade surplus. In
Europe, even though large companies are only 3% of the total number of chemical
companies, they employ 56 % of the work force. BASF is the largest chemical company
in terms of sales, almost double those of its nearest European competitor.
3. The traditional oil companies are now investing in chemical business in Europe while
many chemical companies are investing in non chemical businesses.
Apart from the three oil companies (Shell, Eni, Total), most of the other companies
have a very high percentage of chemical sales as a percent of total sales. Although
BASF is the largest chemical company in terms of sales, its chemical sales is slightly
lower than 80 % of the total sales. Many large chemical companies have diversified into
the pharmaceutical and bioscience industry, which brings to them significant
profitability as seen in Bayer. BASF is way ahead compared to others in terms of capital
asset. It is interesting to see that Bayer’s chemical asset is only around 40 % of the total
asset, which can be attributed to a diversified company. Most other companies in this
analysis are pure chemical companies with their chemical asset being almost 100 % of
their total asset. In case of companies who are almost wholly dedicated to chemical
industry, BASF and Linde are the top employers. Although the three oil companies
Shell, ENI and TOTAL are large employers, but a significant portion of their work force
is engaged in their oil and gas business, since chemical business is not prime business.
UNIVERSITAT ROVIRA I VIRGILI EUROPEAN CHEMICAL INDUSTRY AND ITS INNOVATION POLICY WITH FOCUS ON LARGE CHEMICAL COMPANIES. Supriyo Das Dipòsit Legal: T 1295-2015
306
4. Patent as an innovation indicator did not show upward trend for most of the
companies
Chemistry is the leading technical sector in terms of the number of patents granted by
the European Patent Office. The areas that have most patents granted are fine organic
chemistry, biochemistry and pharmaceuticals. Only five of the top selling European
chemical companies feature in the list of the top 25 patent applications for fine organic
chemistry in 2013, which suggests that they are moving into speciality chemicals. The
number of patents granted to BASF, Bayer and Akzo Nobel has fallen over the last 14
years, which shows that they are not interested in protecting their technology in this
market. Over the years BASF and Bayer have had the largest number of patents granted,
which clearly shows their strategy of using patenting as a key tool for innovation and
the protection of their technology. For most of the companies that were studied, the first
patent of a patent family is applied for and granted by the European Patent Office. Some
companies had very few patents granted, thus showing that not all companies have the
same focus on innovation or patenting. From the trend analysis for the first hypothesis
test, it is seen that most companies did not have an upward trend for the last ten years.
BASF and Bayer had a downward patenting trend until 2009 and then there was sharp
rise in the number of patents granted. This trend was also seen for many other
companies analyzed. It can be concluded that the global crisis that hit the economy in
2007–08 had a negative effect on patenting and innovation. So it can be concluded that
the first hypothesis of this study is proved false that the companies under study have a
positive trend in terms of innovation over the years.
5. The quality of research in case of most chemical companies is very high.
The large chemical companies have well-developed research and development
departments. In most cases the ratio of patents applied for to patents granted for a
particular year is between 0.5 and 1.5, which suggests that patent applications are high
quality and are readily granted. Research, then, is of a high level.
6. Although the EU chemical industry is shrinking its R&D spending almost every large
chemical companies have been increasing their R&D expenditure.
UNIVERSITAT ROVIRA I VIRGILI EUROPEAN CHEMICAL INDUSTRY AND ITS INNOVATION POLICY WITH FOCUS ON LARGE CHEMICAL COMPANIES. Supriyo Das Dipòsit Legal: T 1295-2015
307
In the European Union, there has been a decline in R&D spending in terms of both
absolute value and percentages of sales but it is still way ahead of other geographical
regions. In China there was a threefold increase in R&D investment in 2012 compared
to 2006, showing that R&D was being given high priority. For other regions, R&D
spending has slightly increased. BASF spends the most on R&D followed by Bayer as a
distant second. BASF is the largest chemical company and this high spending on R&D
justifies its enormous R&D infrastructure. Bayer invests heavily in research, especially
in the pharmaceutical and crop science division. In 2012, Syngenta increased its R&D
expenditure compared to 2007 while Arkema and Linde both decreased their R&D
expenditure. Yara spent very little on R&D in both the years. Syngenta has the highest
R&D intensity followed by Bayer and DSM. In most chemical companies, R&D
intensity is around 2% (for example, BASF, AkzoNobal, Air Liquide, Evonik, Solvay,
and Arkema). Bayer also shows a high R&D intensity of 5% which can be attributed to
their high investment in crop science and pharmaceutical products. LyondellBasell and
Yara have very low R&D intensities, which maybe due to a very low level of
investment in R&D.
Bayer and BASF have a ratio of R&D spending to patent application of around 2 while
some companies have a ratio of below one. Companies whose ratio is low tend to show
that their R&D is more efficient at generating patent applications or ideas. BASF has
been investing in R&D by increasing the number of people devoted to it. It should be
noted that just after the financial crisis that hit in 2008, BASF increased its work force
in R&D, thus showing their strategy of R&D expansion. Thus the second hypothesis of
this research could proven partially true as all companies understudy did not over the
years show upward trend in R&D investment .
7. All the large chemical companies is using Merger & Acquisition (M&A) to gain
access to innovation.
Most merger and acquisition (M&A) deals were entered into in Asia followed by
Europe and North America. Apart from market diversification, the purpose of these
deals is to gain R&D knowledge about particular products. This is another way of
gaining innovation faster than by internal development. When the acquiring chemical
companies are located in Europe, they prefer to acquire companies that are also in
Europe. Acquisition in other regions such as Asia and North America stands at a
UNIVERSITAT ROVIRA I VIRGILI EUROPEAN CHEMICAL INDUSTRY AND ITS INNOVATION POLICY WITH FOCUS ON LARGE CHEMICAL COMPANIES. Supriyo Das Dipòsit Legal: T 1295-2015
308
nominal 8 to 9%.Over the last five years, acquisition has largely focused on non-
chemical companies, which shows that these companies are trying to diversify and
acquire know-how which is not part of their core competencies. Such companies as
BASF, Air Liquide, Ineos, Evonik and Solvay are strongly inclined to acquire European
companies while others such as Bayer, DSM and Arkema tend to acquire more globally.
The companies have considerable expertise in the chemical industry and related sectors,
but lack the know-how of the other sectors they wish to enter. So they acquire
companies from other sectors to quickly gain technical knowledge and accelerate
innovation. Lanxess and Arkema mainly stick to a strategy of acquiring other chemical
companies. BASF, however, the largest chemical company in the world, is making 50%
of its acquisitions outside the chemical sector. A similar trend has been observed for
Bayer: recently the company was granted the highest number of patents for the last ten
years. And 50% of the companies they acquired were outside their sector of expertise
(chemicals and pharmaceuticals). So it is seen that most of the large chemical
companies in Europe are using acquisition as a tool for acquiring the know-how and
knowledge from sectors where they did not have core competency and so proves the
hypothesis to be true. This proves the third hypothesis true that M&A decisions are
influenced by innovation policy of the companies.
8. Industry-academia collaboration is a way to generate innovation in chemical
industry in Europe
All the top European chemical companies actively participate in EU-funded projects.
The data for the last 20 years shows that BASF is the company that most participates in
EU-funded projects followed by Bayer, Air Liquide and Evonik. Although funding acts
as a stimulus for companies to take part in EU projects, they are also willing to co-
operate not only with research institutes and universities but also with their competitors
to drive research and innovation. Over 75% of the participants in EU projects are
government institutes or universities. It is common for large chemical companies not to
participate in these projects with a single entity; rather they participate either as an
individual business or as same company from different region (for example, BASF
Agro, BASF SE etc.). Some companies participate more with government organizations
while others participate with both private and government organizations such as
universities, colleges and publicly funded research institutes. Although the top chemical
UNIVERSITAT ROVIRA I VIRGILI EUROPEAN CHEMICAL INDUSTRY AND ITS INNOVATION POLICY WITH FOCUS ON LARGE CHEMICAL COMPANIES. Supriyo Das Dipòsit Legal: T 1295-2015
309
companies participate in a lot of EU-funded projects, they generally want to be
participants rather than the coordinators. In most cases they coordinate less than 20% of
the projects they participate in. This may be due to the fact that coordination of EU
projects involves a significant investment in resources. The only company which is
somewhat the exception is Akzo Nobel, the coordinator of almost 56% of all the
projects they participate in. Thus the second part of the third hypothesis is also proven
true.
9. Although the European environmental regulation (REACH) profounder believed that
REACH will stimulate innovation, most of the chemical companies believe that REACH
is having a negative impact on innovation.
Initially it was believed that as a result of REACH, the characteristics of substances
become more transparent and that this increased knowledge and the necessity for
substitution will stimulate innovation. It was also believed that REACH Regulation will
create an information database through gathering, capturing and disseminating data
from the chemical industry which would act as a motivaion to product development and
marketing. Feedback from interviews and the innovation survey suggested that the costs
of IPP related to REACH can be challenging or even prohibitive to innovation. Many
large companies had a higher share of turnover spent on R&D than average due to
REACH. There has been delay in innovation as a result of an external factor such as
regulation. In case of large companies, the evidence from the fieldwork also suggested
that links with universities and networks developed tended to focus on the compliance
and regulatory elements of REACH rather than pure research and there is a great deal of
activity throughout the EU in this respect. The several steps for substitution mechanisms
within REACH: registration, the candidate list, authorisation and restriction, have had
various impacts on innovative activities. It has been observed that companies carry out
product changes purely with a view to avoiding regulatory burdens of REACH, or
perfectly harmless eco-friendly substances are withdrawn because of registration costs.
Registration costs have an impact on the decision to register a new substance or use, or
use of an existing substance in innovative ways and this turn also influence the
availability of substances within supply chains for future use in innovation. In many
instances companies have considered the activities to ensure compliance with the
Regulation as a distraction from their normal, planned innovation activities (also
UNIVERSITAT ROVIRA I VIRGILI EUROPEAN CHEMICAL INDUSTRY AND ITS INNOVATION POLICY WITH FOCUS ON LARGE CHEMICAL COMPANIES. Supriyo Das Dipòsit Legal: T 1295-2015
310
organizational and marketing innovation) and to be unintended consequences of the
Regulation. Increases in time-to-market as a result of the Regulation and increased
supply chain rigidities resulting from changes in toll manufacturing arrangements have
not been supportive of innovation. So the last part of the fourth hypothesis that the new
environmental regulation is influencing the innovation policy of the chemical
companies is proven true.
10. Chemical clusters and geographical distribution of the chemical companies play a
significant role in generating innovation.
In Europe, there are over 300 chemical production sites which are located in clusters.
Germany has the largest number of chemical clusters followed by France in a distant
second place. Clusters do play a significant role in driving innovation inthe European
chemical industry. Alexera, Port of Antwerp and Tarragona are good examples of
clusters which have been actively playing a role in innovation. EU patents in chemistry
and chemical engineering are not uniformly distributed over the region. Germany is
home tothe largest number of EU patents in chemistry followed by France, UK and
Switzerland. There is also a strong relationship between the number of chemical clusters
in a particular country and the number of patents granted for that country.
11. Large chemical companies are adopting digitalization at very high pace.
The consumer pull, technology push and economic benefit digitalization brings led the
larger chemical companies, particularly in Europe to adapt it in their main stream of
business. The two pillars of digitalization of a company are digital operation and digital
marketing. The drivers for the operational digitalization in larger chemical companies
are: very complex supply chain, drive to innovate at very high pace, employee inclined
to new technologies, new regulatory requirements such as REACH and very fast
information technology growth. The digital value chain in chemical industry has
become very complex starting from R&D laboratory and ending in sales management.
The digitalization index study from Booz & Co. positioned chemical companies in
Europe in seventh position among all growing industry in terms of adapting new digital
tool in the business. It also scored higher than the average of the study and was
positioned in fifth position in the growth rate. Another significant point came out from
UNIVERSITAT ROVIRA I VIRGILI EUROPEAN CHEMICAL INDUSTRY AND ITS INNOVATION POLICY WITH FOCUS ON LARGE CHEMICAL COMPANIES. Supriyo Das Dipòsit Legal: T 1295-2015
311
the study that the digitalization in chemical industry has not happened smoothly over
whole of Europe. Eastern Europe is lagging behind to south and central / Northern
Europe. It is worth to mention that most of the large chemical companies studied in
research have headquarters or very concentrated in central and south of Europe. This
proves true for the fifth hypothesis of this research.
12. The larger chemical companies in Europe have adapted digital marketing as the
innovative method of promoting their products and services
The current study shows that digital marketing is playing a key role in chemical
industry in influencing purchasing decision both in case of business-to-consumer (B2C)
and business-to-business (B2B). The study also showed that the purchasing decision no
more follows a vertical stereotype path and follows a more inter-active route until the
decision is made. The chemical companies which have been selling through traditional
methods are moving to online tools. Several of the large companies we studied have an
ecommerce website where they are selling their products. It should be mentioned here
that the business to business sell is still done in the conventional method while business
to consumer sell is moving more towards online. All the companies we studied have a
very detailed website and every effort is being made to capture the internet traffic.
Software tool such as search engine optimization (SEO) is used extensively by these
companies to drive more traffic to their websites which can eventually lead to increase
in consumer engagement, capture qualified leads, build consumer loyalty and ultimately
bring in sell. Although being late, the chemical industry is catching up in case of social
media marketing. Every company we researched is involved in more than one social
media in order to promote their product. Facebook has been the first choice for most of
the companies and have on youtube a dedicated video channel which is regularly
updated with product or company related promotional video. We also found that these
social media channels have a huge fan following, but it was difficult to know if they
were employees or dedicated customers or just general public. Another aspect of digital
marketing they all are focused on are blogs and article marketing.
UNIVERSITAT ROVIRA I VIRGILI EUROPEAN CHEMICAL INDUSTRY AND ITS INNOVATION POLICY WITH FOCUS ON LARGE CHEMICAL COMPANIES. Supriyo Das Dipòsit Legal: T 1295-2015
312
14. Recommendation for future work
The current research focused on the European chemical industry. During the study we
found that like Europe, North America has been affected by the global financial crisis
and its chemical industry is under same pressure as European chemical industry. It
would be interesting to study the innovation policy of North America chemical industry
as many of the largest and most innovative chemical companies are located in this
region.
The rising oil price in the end of last decade has resulted in higher feed stock price for
the chemical industry which has resulted negatively their profitability. It would be
interesting to study the impact of oil price and performance of the chemical companies
in terms of R&D and innovation.
There has been a boom of shale gas in US for last five years which has also impacted
the North American chemical industry. It has resulted in new chemical projects starting
in NA and rejuvenated the chemical industry of that region. It will be interesting to
study the impact of shale gas on the innovation of North American chemical industry.
Although Middle East has cheap source of oil, we do not see too many big chemical
companies in this region and the level of innovation is considerably low. It will be also
interesting to have a deep drill of the innovation policies of the companies in this
region.
The literature research of the current Project even though showed that there has been
several work done in the field of innovation, but very little research was available over
cross business innovation policy and how learning of one sector is implemented in
another sector.
UNIVERSITAT ROVIRA I VIRGILI EUROPEAN CHEMICAL INDUSTRY AND ITS INNOVATION POLICY WITH FOCUS ON LARGE CHEMICAL COMPANIES. Supriyo Das Dipòsit Legal: T 1295-2015

313
UNIVERSITAT ROVIRA I VIRGILI EUROPEAN CHEMICAL INDUSTRY AND ITS INNOVATION POLICY WITH FOCUS ON LARGE CHEMICAL COMPANIES. Supriyo Das Dipòsit Legal: T 1295-2015


