Embed Size (px)
Citation preview

This article was downloaded by: [USGS Libraries Program]On: 27 March 2013, At: 08:14Publisher: Taylor & FrancisInforma Ltd Registered in England and Wales Registered Number: 1072954 Registered office: Mortimer House,37-41 Mortimer Street, London W1T 3JH, UK
Hydrological Sciences JournalPublication details, including instructions for authors and subscription information:http://www.tandfonline.com/loi/thsj20
Estimating groundwater recharge using the chloridemass-balance method in the West Bank, PalestineA. Marei a , S. Khayat a , S. Weise b , S. Ghannam a , M. Sbaih a & S. Geyer ba Department of Earth and Environmental Sciences, Al Quds University, Jerusalem, PO Box20002, Palestineb Helmholtz Centre for Environmental Research-UFZ, Leipzig/Halle, GermanyVersion of record first published: 05 Jul 2010.
To cite this article: A. Marei , S. Khayat , S. Weise , S. Ghannam , M. Sbaih & S. Geyer (2010): Estimating groundwaterrecharge using the chloride mass-balance method in the West Bank, Palestine, Hydrological Sciences Journal, 55:5, 780-791
To link to this article: http://dx.doi.org/10.1080/02626667.2010.491987
PLEASE SCROLL DOWN FOR ARTICLE
Full terms and conditions of use: http://www.tandfonline.com/page/terms-and-conditions
This article may be used for research, teaching, and private study purposes. Any substantial or systematicreproduction, redistribution, reselling, loan, sub-licensing, systematic supply, or distribution in any form toanyone is expressly forbidden.
The publisher does not give any warranty express or implied or make any representation that the contentswill be complete or accurate or up to date. The accuracy of any instructions, formulae, and drug doses shouldbe independently verified with primary sources. The publisher shall not be liable for any loss, actions, claims,proceedings, demand, or costs or damages whatsoever or howsoever caused arising directly or indirectly inconnection with or arising out of the use of this material.

Estimating groundwater recharge using the chloride mass-balancemethod in the West Bank, Palestine
A. Marei1, S. Khayat1, S. Weise2, S. Ghannam1, M. Sbaih1 & S. Geyer2
1Department of Earth and Environmental Sciences, Al Quds University, Jerusalem, PO Box 20002, [email protected]
2Helmholtz Centre for Environmental Research-UFZ, Leipzig/Halle, Germany
Received 9 April 2009; accepted 31 March 2010; open for discussion until 1 January 2011
Citation Marei, A., Khayat, S., Weise, S., Ghannam, S., Sbaih, M. & Geyer, S. (2010) Estimating groundwater recharge using thechloride mass-balance method in the West Bank, Palestine. Hydrol. Sci. J. 55(5), 780–791.
Abstract The quantification of natural recharge rate is a prerequisite for efficient and sustainable groundwaterresources management. Since groundwater is the only source of water supply in the West Bank, it is of utmostimportance to estimate the rate of replenishment of the aquifers. The chloride mass-balance method was used toestimate recharge rates at different sites representing the three groundwater basins of theMountain Aquifer in theWestBank. The recharge rate for the Eastern Basinwas calculated as between 130.8 and 269.7mm/year, with a total averagereplenishment volume of 290.3 � 106 m3/year. For the Northeastern Basin, the calculated recharge rate rangedbetween 95.2 and 269.7 mm/year, with a total average recharge volume of 138.5� 106 m3/year. Finally, the rechargerate for the Western Basin was between 122.6 and 323.6 mm/year, with a total average recharge volume of324.9 � 106 m3/year. The data reveal a replenishment potential within the estimated replenishment volumes ofprevious studies for the same area. Also, the range was between 15 and 50% of total rainfall, which is still within therange of previous studies. The geological structure and the climate conditions of the western slope were clearly play animportant role in the increment of total volume. In some cases, such as the geological formations in the NortheasternBasin, the interaction between Eocene and Senonian chalk formations result in minimum recharge rates.
Key words mountain aquifer; chloride-mass balance; recharge rate; groundwater replenishment
Estimation de la recharge hydrogéologique par la méthode du bilan massique des chlorures en Cisjordanie,PalestineRésumé La quantification de la recharge naturelle est un pré-requis pour une gestion efficace et durable desressources en eaux souterraines. Puisque l’eau souterraine est la seule source pour l’alimentation en eau de laCisjordanie, il est primordial d’estimer le taux de renouvellement des aquifères. Nous avons utilisé la méthode dubilan de masse des chlorures afin de calculer la recharge en différents sites du Mountain Aquifer en Cisjordanie,représentatifs des trois bassins hydrogéologiques. La recharge du bassin Est a été estimée entre 130.8 et 269.7 mm/an,avec un volume total de 290.3� 106m3/an. Pour le bassin Nord-Est, la recharge se situe entre 95.2 et 269.7mm/an, avecun volume total de 138.5� 106m3/an. La recharge du bassin Ouest, finalement, s’échelonne entre 125.7 et 323.6 mm/anavec un volume de 324.9 � 106 m3/an. Ces données révèlent un potentiel de renouvellement plus important que lesvolumes estimés lors d’études antérieures dans la même région. La structure géologique et les conditions climatiques surle versant ouest jouentmanifestement un rôle important pour la contribution significative de ce versant au volume total derecharge. Dans certains cas, les formations géologiques, comme la craie Eocène et Sénonienne du bassin Nord-Est, nefavorisent pas la recharge ce qui se traduit par valeurs inférieures.
Mots clefs aquifère de montagne; bilan massique des chlorures; recharge; renouvellement des eaux souterraines
1 INTRODUCTION
Groundwater is themain source of water for Palestiniansin the West Bank; rainfall harvesting is a secondarysource. Limited natural water resources, over-exploitation,salinization and contamination of the groundwaterresources are critical management issues. Three
hundred springs and 60 groundwater wells drain fresh-water from carbonate rocks of Upper Cretaceousand Tertiary age, with a total discharge of about130 � 106 m3/year (GTZ report, 1995; Nasser Eddin& Nuseibeh, 1995; Palestinian Water Authority,2003).
Hydrological Sciences Journal – Journal des Sciences Hydrologiques, 55(5) 2010780
ISSN 0262-6667 print/ISSN 2150-3435 online© 2010 IAHS Pressdoi: 10.1080/02626667.2010.491987http://www.informaworld.com
Dow
nloa
ded
by [
USG
S L
ibra
ries
Pro
gram
] at
08:
14 2
7 M
arch
201
3

The amount of water used for domestic purposes inthe West Bank in 2003 was estimated at 64.7� 106 m3
(Palestinian Water Authority, 2003). The PalestinianCentral Bureau of Statistics estimated the population ofthe West Bank as 2 313 609 in 2003 (PCBS, 2004),which means an average water share at 86 L per capitaper day, assuming zero water losses. This volume issmall in comparison with the 150 L per capita dayrecommended by the World Health Organization. Inaddition to this shortage, 257 Palestinian communitiesare still not connected to the water networks. Taking intoconsideration the natural population growth, additionalwater networks need to be constructed. The annual watershortage in the West Bank reached 60� 106 m3 in 2003(Palestinian Water Authority, 2003). To satisfy theincreasing demand, new wells have been drilled duringthe last 10 years, in addition to many illegal shallowwells (up to 150 m depth) that were drilled in theNortheastern and Eastern basins, in the Jenin andJericho areas in particular. While the natural replenish-ment of the aquifer systems in theWest Bank depends onthe recharge rate from rainfall, identifying this compo-nent is of key importance to the aquifer’s sustainability.The objective of this study is to estimate recharge rates atdifferent sites of the West Bank by using the chloridemass-balance method.
2 HYDROGEOLOGY
Groundwater recharge is defined as the movementof moisture downwards through the unsaturated zoneto the saturated zone. It can influence the groundwaterbody and can, in certain circumstances, also bededuced from the discharge rate of local springs(Freeze & Cherry, 1979). Quantification of therecharge rate in different geographical locations isone of the basic requirements for proper managementand protection of groundwater resources.
The West Bank Mountain Aquifer extends fromnorth to south and is mainly composed of limestone,dolomite and chalk of Upper Cretaceous to Tertiaryage (Fig. 1). The Jordan Rift Valley is the largeststructural feature in the area. Tal A’sur is the highestpoint in the northern West Bank, with an elevation of1022 m above sea level (ARIJ, 1996). The Dead Sea isthe lowest part and has an elevation of 410 m belowsea level. The surface water divide runs parallel to thenorth–south axis of the mountain ridge. The change inclimate from semi-humid on the western slopes of themountains to semi-arid and arid on the eastern slopesand on the Dead Sea shore, respectively, reflects therainfall distribution that exceeds 600 mm/year on themountain ridge and is less than 100 mm/year on the
Fig. 1 Geological map of the West Bank (source Rofe and Raffety, 1963).
Estimating groundwater recharge using the chloride mass-balance method in the West Bank, Palestine 781
Dow
nloa
ded
by [
USG
S L
ibra
ries
Pro
gram
] at
08:
14 2
7 M
arch
201
3

Dead Sea shore (Arad &Michaeli, 1967; Husary et al.,1995; Palestinian Water Authority, 2006). Rain occursmainly during the winter and spring seasons, while theintensity of rainfall varies from 1 year to another. Ingeneral, 75% of the rain falls between November andMarch. When the rainfall intensity exceeds 50 mm perday or reaches 70 mm in 48 hours there is surfacerunoff (Rofe and Raffety, 1963, 1965).
Based on the groundwater movement in the moun-tain area, three groundwater basins were identified in theWest Bank: theWestern Basin, the Eastern Basin and theNortheastern Basin (Fig. 1). The surface catchment areaof the Eastern Basin is about 2473 km2 extending fromthe top to the foot of the mountain in the Jordan Valley(Table 1). The rainfall ranges from650mmat the summitto 150 mm in the Jericho area (Arad & Micheali, 1967;Husary et al., 1995; Palestinian Water Authority, 2006).Limestone, dolomite, chalky limestone and chalk ofUpper Cretaceous to Tertiary age cover the catchmentarea. The Plio-Pleistocene aquifer system in the JordanValley is part of this basin and consists of gravel, sand,silt, clay and evaporites (Begin, 1974). In places withless than 200 mm annual rainfall, the direct recharge isneglected as most of the rainfall evaporates due to thehigh temperatures. Recharge to this aquifer depends onthe occurrence of wadi flooding, where floodwatercrosses the alluvial deposits of the wadi floor duringthe winter months (Marei & Vengosh, 2001).
The Northeastern Basin, which is shared betweenthe Palestinians and Israelis, has a catchment areaof about 976.8 km2 inside the West Bank boundary.Upper Cretaceous limestone, and chalky limestone,and Tertiary chalky limestone and chalk cover thecatchment area, which receives an annual rainfall of500–600 mm. There are two aquifer systems in thisbasin: the Eocene and the Turonian-Cenomanian aquifer.
The catchment area of the Western Basin extendswestward from the mountain ridge to the coastal areaover the political boundaries of the West Bank. Thecatchment area covers about 1771.9 km2 inside theWest Bank (Table 1). Limestone and dolomite cover
most of the catchment area, which receives an annualrainfall of 650 mm on the mountain top to 450 mm inthe coastal area.
Blake & Goldschmidt (1947) made the first esti-mate of recharge for the region; their estimate rangesbetween 22 and 25% of annual rainfall. Rofe andRaffety (1965) estimated the West Bank recharge bysubtracting the average annual runoff and evapotran-spiration from the total rainfall, resulting in valuesranging from 20 to 55% of total rainfall (Table 2).
3 METHODOLOGY
3.1 Data collection and analysis
An average rainfall contour map generated by thePalestinian Water Authority indicates the evolution overthe last 20 years during which rainfall was measured at63 weather stations in the study area (PalestinianWater Authority, 2006). This map was used to estimatethe recharge rate as an input component (Fig. 2).
A total of 118 rainfall samples were collected forchemical analyses during the hydrological years from2001/02 to 2004/05 at the weather station at AQU, andother samples from Ramallah, Hizma, Hebron andNablus in the years 2006, 2007 and 2008. Water sam-ples were collected directly during the rainfall eventsand filtered through 0.45-mm filters and then stored at4�C. Table 3 presents the weighted average of chlorideconcentration at the different stations. Additionalinformation about chloride contents in rainwater wasextracted from Herut et al. (1994) who state that theaverage chloride concentration in the rainwater of theJudea area is 9.06 mg/L.
Groundwater samples were collected from59 sampling sites across the three groundwater basins(Fig. 3). Within each basin, areas of different rockformations were distinguished and the related areawas calculated using ArcGIS 9.0 software (Table 1).The recharge rates and volumes were calculated for
Table 1 Formation outcropping in the three groundwaterbasins in the West Bank (km2).
EasternBasin
NortheasternBasin
WesternBasin
Total
Eocene andQuaternary
178.3 560.2 139.3 877.8
Senonian 890.9 169.3 202.0 1262.2Cretaceous 1403.8 247.3 1430.6 3081.7Total 2473.0 976.8 1771.9 5221.7
Table 2 Recharge rates estimated by different studies.
Study % of rainfall
ANTEA (1998) 20CDM & Morganti (1997) 20–30Tahal (1995) 25–60Scarpa (1994) 20Arad & Michaeli (1967) 6–48Rofe and Raffety (1963, 1965) 20–55Goldschmidt & Jacobs (1959) 34Blake & Goldschmidt (1947) 22–25Our calculation (2008) 15–50
782 A. Marei et al.
Dow
nloa
ded
by [
USG
S L
ibra
ries
Pro
gram
] at
08:
14 2
7 M
arch
201
3

each formation, after which the recharge volume wasestimated for each basin. Impermeable chalky forma-tions of Senonian age and the Quaternary Lisan for-mation were excluded from the calculation.
Chloride and bromide values were measuredby ion chromatography. Nitrate concentration wasmeasured in groundwater samples using the spectro-photometric method, in order to identify pollutionsources. Sodium concentration in groundwater wasmeasured by flame photometry. In the case of thepresence of high NO3
- concentrations (indicative of
contamination), additional chloride was excludedusing the Cl-/Br- molar ratio, as Br- is a conservativeanion in the water cycle. Excess chloride values werecalculated using the Cl-/Br- molar ratio for both rain-water and groundwater, where the ratio for the latterwas estimated to be 300 (Rosenthal, 1987).
Variations in the amount of rainfall from one yearto another have a slight impact on the average chloridecontent because it depends on the intensity and dura-tion of the rainfall events, rather than the precipitationtotal for the hydrological year.
Fig. 2 Average annual rainfall (mm/year) distribution in the West Bank (source Palestinian Water Authority, 2006).
Table 3 Weighted average of chloride concentration in rainwater in the West Bank.
Weather station Date Chloride (mg/L) No. of samples
Al-Quds Univ. 2001/2002 6.95 23Al-Quds Univ. 2002/2003 9.12 28Al-Quds Univ. 2003/2004 12.81 24Al-Quds Univ. 2004/2005 11.54 21Kefar ha wardim1 Herut et al. (1994) 7.87 1Qazrin Herut et al. (1994) 4.08 1Akhziv Herut et al. (1994) 12.34 2Bet Yannay Herut et al. (1994) 6.38 2Mizpe Ramon Herut et al. (1994) 11.56 1Ramallah 2006/2007 9.30 6Hizma-Jerusalem 2006/2007 6.62 6Nablus 2008 8.53 5Hebron 2008 9.57 5Average 8.97
Estimating groundwater recharge using the chloride mass-balance method in the West Bank, Palestine 783
Dow
nloa
ded
by [
USG
S L
ibra
ries
Pro
gram
] at
08:
14 2
7 M
arch
201
3

3.2 Recharge estimation
3.2.1 Chloride mass-balance method Chlorideis regarded as a suitable environmental tracer since itis highly soluble, conservative and not substantiallyabsorbed by vegetation. The chloride mass-balancemethod is convenient and inexpensive because of itssimple data requirements. Recharge can be estimated by:
R ¼ P � Cl-PCl-gw
(1)
where R is recharge (mm/year); P is rainfall (mm/year);Cl-P is weighted average chloride concentration in rain-fall (mg/L); and Cl-gw is average chloride concentrationin groundwater (mg/L).
The weighted average (Cl-P) is calculated accord-ing to the following equation:
Cl-P ¼ P1 � C1 þ � � � þ Pn � Cn
P1 þ � � � þ Pn
where P1 is the first rainfall event (mm) and C1 is thecorresponding chloride concentration in the rainfall(mg/L), for 1 to n events.
To determine the weighted chloride average foreach hydrological year, the chloride concentration ofeach rainfall event is first multiplied by the amount ofrainfall. The summation of these individual compo-nents is then divided by the total annual rainfall.
Table 3 shows the weighted average chloride con-centrations for each hydrological year from 2001/02 to2004/05 at AQU station, with values ranging between6.95 and 12.81 mg/L, and for the stations Ramallah,Hizma, Nablus, and Hebron, which are 9.30, 6.62, 8.53and 9.57, respectively.
Previously average chloride concentrations in theprecipitation in the Judea area was estimated at9.06 mg/L (Herut et al., 1994). Table 4 shows Cl-,Na+ and NO3
- concentrations as well as Na/Cl Br/Clmolar ratios of the groundwater sampling sites in thedifferent West Bank locations.
Fig. 3 Groundwater sampling sites.
784 A. Marei et al.
Dow
nloa
ded
by [
USG
S L
ibra
ries
Pro
gram
] at
08:
14 2
7 M
arch
201
3

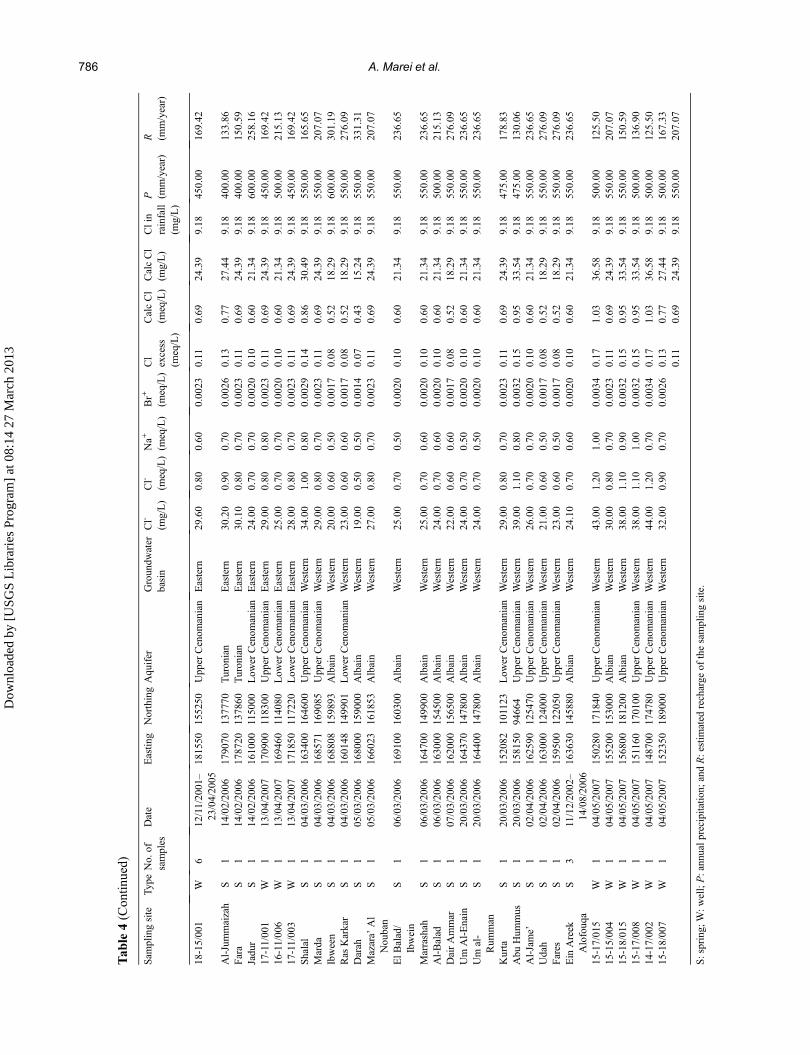
Tab
le4Groundw
ater
samplingsites,hydrochemicalvalues,rainfalland
correspondingcalculated
recharge
estim
ates
fortheWestB
ank.
Sam
plingsite
Type
No.
ofsamples
Date
Eastin
gNorthingAquifer
Groundw
ater
basin
Cl-
(mg/L)
Cl-
(meq/L)Na+
(meq/L)
Br+
(meq/L)Cl
excess
(meq/L)
CalcCl
(meq/L)
CalcCl
(mg/L)
Clin
rainfall
(mg/L)
P (mm/year)
R (mm/year)
Ham
deh
S1
10/03/20
0617
0544
166622
Low
erCenom
anian
Northeastern
29.00
0.80
0.83
0.0023
0.11
0.69
24.39
9.18
550.00
207.07
Zakaria
S1
10/03/2006
167800
191100
Eocene
Northeastern
35.00
1.00
0.91
0.0029
0.14
0.86
30.49
9.18
475.00
143.06
Zaw
ateh
S1
10/03/2006
171650
183940
Eocene
Northeastern
25.00
0.70
0.61
0.0020
0.10
0.60
21.34
9.18
550.00
236.65
BeitE
baS
110/03/2006
170015
182665
Eocene
Northeastern
32.00
0.90
0.80
0.0026
0.13
0.77
27.44
9.18
550.00
184.06
Saqi
S1
10/03/20
0617
1000
166000
Low
erCenom
anian
Northeastern
34.00
1.00
1.00
0.0029
0.14
0.86
30.49
9.18
550.00
165.65
Ras
Al-Ein
S1
12/03/2006
174310
180210
Eocene
Northeastern
25.00
0.70
0.70
0.0020
0.10
0.60
21.34
9.18
500.00
215.13
Harun
S1
12/03/2006
169500
185780
Eocene
Northeastern
23.00
0.60
0.60
0.0017
0.08
0.52
18.29
9.18
500.00
250.99
Al-Sharqiyah
S1
12/03/20
0617
4080
176620
Eocene
Northeastern
20.00
0.60
0.30
0.0017
0.08
0.52
18.29
9.18
550.00
276.09
Ein
Sidra
S27
28/12/20
02–
30/07/20
05179950
185490
Eocene
Northeastern
36.00
1.00
0.90
0.0029
0.14
0.86
30.49
9.18
550.00
165.65
Ein
Baida
S36
26/03/20
04–
30/07/20
05180120
185320
Eocene
Northeastern
37.90
1.10
0.90
0.0032
0.15
0.95
33.54
9.18
550.00
150.59
Ein
Ham
adS
3626
/03/20
04–
30/07/20
05180110
185325
Eocene
Northeastern
36.90
1.10
0.80
0.0032
0.15
0.95
33.54
9.18
550.00
150.59
Ein
Qudeeri
S36
26/03/2004–
30/07/20
05180130
185280
Eocene
Northeastern
38.00
1.10
0.80
0.0032
0.15
0.95
33.54
9.18
550.00
150.59
Ein
Al-Jeser
S36
26/03/20
04–
30/07/20
05180370
185100
Eocene
Northeastern
38.60
1.10
0.90
0.0032
0.15
0.95
33.54
9.18
550.00
150.59
Ein
Tabb
anS
3626
/03/20
04–
30/07/20
05180420
184820
Eocene
Northeastern
37.40
1.10
0.80
0.0032
0.15
0.95
33.54
9.18
550.00
150.59
Ein
Sub
ian
S35
8/01
/200
4–30
/07/20
05180440
184420
Eocene
Northeastern
39.60
1.10
0.80
0.0032
0.15
0.95
33.54
9.18
550.00
150.59
Ein
Dlaib
S36
26/03/20
04–
30/07/20
05182000
187950
Eocene
Northeastern
59.40
1.70
1.20
0.0049
0.24
1.46
51.83
9.18
550.00
97.44
Ein
Faria
S40
28/12/20
02–
30/07/20
05182400
188400
Eocene
Northeastern
55.70
1.60
1.10
0.0046
0.22
1.38
48.78
9.18
550.00
103.53
16-19/012
W1
10/04/20
0716
9460
193410
Upp
erCenom
anian
Northeastern
37.00
1.00
1.00
0.0029
0.14
0.86
30.49
9.18
550.00
165.65
17-11/002
W1
10/04/2007
175000
198320
Eocene
Northeastern
27.00
0.80
0.70
0.0023
0.11
0.69
24.39
9.18
550.00
207.07
Mesleh
S1
14/04/20
0616
0364
1109
37Albain
Eastern
38.00
1.10
0.70
0.0032
0.15
0.95
33.54
9.18
600.00
164.28
BeitJalah
S1
14/04/20
0616
7299
124114
Upp
erCenom
anian
Eastern
34.00
1.00
0.80
0.0029
0.14
0.86
30.49
9.18
600.00
180.71
Wayko
kiS
116
/03/20
0615
8804
103710
Low
erCenom
anian
Eastern
37.00
1.00
0.60
0.0029
0.14
0.86
30.49
9.18
550.00
165.65
Al-Balad
S1
14/04/20
0616
0014
1143
43Upp
erCenom
anian
Eastern
37.00
1.00
0.70
0.0029
0.14
0.86
30.49
9.18
600.00
180.71
Al-Liban
ashrqiya
S1
20/02/20
0617
3000
164000
Albain
Eastern
23.00
0.60
0.60
0.0017
0.08
0.52
18.29
9.18
550.00
276.09
Turmusava
S1
20/02/2006
177000
161000
Low
erCenom
anian
Eastern
23.00
0.60
0.60
0.0017
0.08
0.52
18.29
9.18
550.00
276.09
Saleh
S1
20/02/20
0616
5900
121000
Low
erCenom
anian
Eastern
28.00
0.80
0.60
0.0023
0.11
0.69
24.39
9.18
550.00
207.07
Jaljo
ulia
S1
20/02/20
0517
0500
155400
Albain
Eastern
22.50
0.60
0.50
0.0017
0.08
0.52
18.29
9.18
550.00
276.09
Al-kabeerah
S1
25/02/20
0617
1600
151200
Albain
Eastern
21.00
0.60
0.50
0.0017
0.08
0.52
18.29
9.18
500.00
250.99
Al-magharah
S1
25/02/20
0617
1550
151050
Albain
Eastern
21.00
0.60
0.50
0.0017
0.08
0.52
18.29
9.18
500.00
250.99
Al-daraj
S1
25/02/20
0617
1600
151150
Albain
Eastern
22.00
0.60
0.50
0.0017
0.08
0.52
18.29
9.18
500.00
250.99
Majur
S1
25/02/20
0616
8150
150550
Albain
Eastern
22.00
0.60
0.50
0.0017
0.08
0.52
18.29
9.18
550.00
276.09
(Contin
ued)
Estimating groundwater recharge using the chloride mass-balance method in the West Bank, Palestine 785
Dow
nloa
ded
by [
USG
S L
ibra
ries
Pro
gram
] at
08:
14 2
7 M
arch
201
3
Tab
le4(Contin
ued)
Sam
plingsite
Type
No.
ofsamples
Date
Eastin
gNorthingAquifer
Groundw
ater
basin
Cl-
(mg/L)
Cl-
(meq/L)Na+
(meq/L)
Br+
(meq/L)Cl
excess
(meq/L)
CalcCl
(meq/L)
CalcCl
(mg/L)
Clin
rainfall
(mg/L)
P (mm/year)
R (mm/year)
18-15/001
W6
12/11/20
01–
23/04/20
0518
1550
155250
Upp
erCenom
anian
Eastern
29.60
0.80
0.60
0.0023
0.11
0.69
24.39
9.18
450.00
169.42
Al-Jummaizah
S1
14/02/20
0617
9070
137770
Turon
ian
Eastern
30.20
0.90
0.70
0.0026
0.13
0.77
27.44
9.18
400.00
133.86
Fara
S1
14/02/20
0617
8720
137860
Turon
ian
Eastern
30.10
0.80
0.70
0.0023
0.11
0.69
24.39
9.18
400.00
150.59
Jadu
rS
114
/02/20
0616
1000
1150
00Low
erCenom
anian
Eastern
24.00
0.70
0.70
0.0020
0.10
0.60
21.34
9.18
600.00
258.16
17-11/00
1W
113
/04/20
0717
0900
1183
00Upp
erCenom
anian
Eastern
29.00
0.80
0.80
0.0023
0.11
0.69
24.39
9.18
450.00
169.42
16-11/00
6W
113
/04/20
0716
9460
1140
80Low
erCenom
anian
Eastern
25.00
0.70
0.70
0.0020
0.10
0.60
21.34
9.18
500.00
215.13
17-11/00
3W
113
/04/20
0717
1850
1172
20Low
erCenom
anian
Eastern
28.00
0.80
0.70
0.0023
0.11
0.69
24.39
9.18
450.00
169.42
Shalal
S1
04/03/20
0616
3400
164600
Upp
erCenom
anian
Western
34.00
1.00
0.80
0.0029
0.14
0.86
30.49
9.18
550.00
165.65
Marda
S1
04/03/20
0616
8571
169085
Upp
erCenom
anian
Western
29.00
0.80
0.70
0.0023
0.11
0.69
24.39
9.18
550.00
207.07
Ibween
S1
04/03/20
0616
8808
159893
Albain
Western
20.00
0.60
0.50
0.0017
0.08
0.52
18.29
9.18
600.00
301.19
Ras
Karkar
S1
04/03/20
0616
0148
149901
Low
erCenom
anian
Western
23.00
0.60
0.60
0.0017
0.08
0.52
18.29
9.18
550.00
276.09
Darah
S1
05/03/20
0616
8000
159000
Albain
Western
19.00
0.50
0.50
0.0014
0.07
0.43
15.24
9.18
550.00
331.31
Mazara’
Al
Nou
ban
S1
05/03/20
0616
6023
161853
Albain
Western
27.00
0.80
0.70
0.0023
0.11
0.69
24.39
9.18
550.00
207.07
ElB
alad/
Ibwein
S1
06/03/20
0616
9100
160300
Albain
Western
25.00
0.70
0.50
0.0020
0.10
0.60
21.34
9.18
550.00
236.65
Marrashah
S1
06/03/20
0616
4700
149900
Albain
Western
25.00
0.70
0.60
0.0020
0.10
0.60
21.34
9.18
550.00
236.65
Al-Balad
S1
06/03/20
0616
3000
154500
Albain
Western
24.00
0.70
0.60
0.0020
0.10
0.60
21.34
9.18
500.00
215.13
DairAmmar
S1
07/03/20
0616
2000
156500
Albain
Western
22.00
0.60
0.60
0.0017
0.08
0.52
18.29
9.18
550.00
276.09
Um
Al-Enain
S1
20/03/20
0616
4370
147800
Albain
Western
24.00
0.70
0.50
0.0020
0.10
0.60
21.34
9.18
550.00
236.65
Um
al-
Rum
man
S1
20/03/20
0616
4400
147800
Albain
Western
24.00
0.70
0.50
0.0020
0.10
0.60
21.34
9.18
550.00
236.65
Kurta
S1
20/03/20
0615
2082
101123
Low
erCenom
anian
Western
29.00
0.80
0.70
0.0023
0.11
0.69
24.39
9.18
475.00
178.83
Abu
Hum
mus
S1
20/03/20
0615
8150
94664
Upp
erCenom
anian
Western
39.00
1.10
0.80
0.0032
0.15
0.95
33.54
9.18
475.00
130.06
Al-Jame’
S1
02/04/20
0616
2590
125470
Upp
erCenom
anian
Western
26.00
0.70
0.70
0.0020
0.10
0.60
21.34
9.18
550.00
236.65
Udah
S1
02/04/20
0616
3000
124000
Upp
erCenom
anian
Western
21.00
0.60
0.50
0.0017
0.08
0.52
18.29
9.18
550.00
276.09
Fares
S1
02/04/20
0615
9500
122050
Upp
erCenom
anian
Western
23.00
0.60
0.50
0.0017
0.08
0.52
18.29
9.18
550.00
276.09
Ein
Areek
Alofouq
aS
311/12/20
02–
14/08/20
0616
3630
145880
Albian
Western
24.10
0.70
0.60
0.0020
0.10
0.60
21.34
9.18
550.00
236.65
15-17/015
W1
04/05/20
0715
0280
171840
Upp
erCenom
anian
Western
43.00
1.20
1.00
0.0034
0.17
1.03
36.58
9.18
500.00
125.50
15-15/004
W1
04/05/20
0715
5200
153000
Albian
Western
30.00
0.80
0.70
0.0023
0.11
0.69
24.39
9.18
550.00
207.07
15-18/015
W1
04/05/20
0715
6800
181200
Albian
Western
38.00
1.10
0.90
0.0032
0.15
0.95
33.54
9.18
550.00
150.59
15-17/008
W1
04/05/20
0715
1160
170100
Upp
erCenom
anian
Western
38.00
1.10
1.00
0.0032
0.15
0.95
33.54
9.18
500.00
136.90
14-17/002
W1
04/05/20
0714
8700
174780
Upp
erCenom
anian
Western
44.00
1.20
0.70
0.0034
0.17
1.03
36.58
9.18
500.00
125.50
15-18/007
W1
04/05/20
0715
2350
189000
Upp
erCenom
anian
Western
32.00
0.90
0.70
0.0026
0.13
0.77
27.44
9.18
500.00
167.33
0.11
0.69
24.39
9.18
550.00
207.07
S:spring;
W:w
ell;P:annualp
recipitatio
n;andR:estim
ated
recharge
ofthesamplingsite.
786 A. Marei et al.
Dow
nloa
ded
by [
USG
S L
ibra
ries
Pro
gram
] at
08:
14 2
7 M
arch
201
3

The assumptions necessary for successful appli-cation of the chloride mass-balance method are:
1 The absence of additional chloride sources such asdissolution of minerals, use of road salts and anypotential source of pollution like wastewater.
2 Chloride is of a conservative nature in the systemmeaning that the ion neither leaches from, nor isabsorbed by, aquifer sediments and does not parti-cipate in any particular chemical reaction.
3 The depth of the groundwater table should be deepenough to prevent groundwater evaporation.
4 Surface runoff should be minimal.
The first assumption is almost impossible, espe-cially in the case of the Western and Northeastern basinareas. A large amount of wastewater is generated by thecommunities in the upper mountains and drains downthrough wadi flow, which makes the opportunity forfresh sewage water mixing high. Moreover, the Jordanrift valley formations, which cover a large part of theEastern basin, contain a high quantity of salty rocks. Allof the previous factors make the presence of excesschloride unavoidable, and this amount of excess chlor-ide should be taken into account in calculations. In ourstudywe used the Br/Clmolar ratios in rain and ground-water to calculate any addition of chloride to therecharged water during its pathway. Both Cl- and Br-
behave conservatively. Rosenthal has suggested theCl-/Br- molar ratio in the groundwater of the studyarea is 300 (Rosenthal, 1987). The relative ratio forthe rainwater in our data was taken into account,where these values were used to approximate theamount of any additional chloride compared to themeasured values in the rainwater, and the valueassumed for groundwater by Rosenthal (1987).
The chloridemass-balancemethod has been appliedby various authors (Allison & Hughes, 1978; Edmunds& Walton, 1980; Allison & Stone, 1985; Sharma, 1989;Lerner et al., 1990; Abdulghaffar et al., 1996; Selaolo,1998; Simmers & de Vries, 2002). Note that Edmundset al. (1988) conclude that the amount of chlorideremoved through vegetation is usually balanced by theamounts released by plant decomposition.
Subyani (2004) used the chloride mass-balancemethod in Wadi Tharad, western Saudi Arabia, andestimated that the recharge rate was around 11% of theeffective annual rainfall. Bazuhair & Wood (1995)also used the method in the wadi systems of the Asirand Hijaz mountains. In general, recharge was foundto be between 3 and 4% of precipitation. They con-clude that the chloride mass-balance method appears
to be a useful technique to rapidly estimate ground-water recharge, or constrain estimates of groundwaterrecharge in certain arid areas.
In their paper, Simmers & de Vries (2002) summar-ize the current understanding of recharge processes,identify recurring recharge-evaluation problems, andreport on some recent advances in estimation techniques.Emphasis is placed on semi-arid regions because this iswhere the need for information is greatest. The paperconcludes that multiple tracer approaches (Cl-, 3H) prob-ably offer the best potential for reliable results in localstudies that require “at-point” information.
Kerh et al. (1998) adopted the chloride mass-balance method to estimate groundwater recharge inthe Pingtung Plain, Taiwan. Based on the measuredand calculated results for all sites, groundwaterrecharge was estimated at 15% of the annual rainfall,excluding recharge from additional irrigation water.They conclude that this information can improve theaccuracy of future groundwater simulation and man-agement models in the plain.
Unfortunately, few studies were found to haveapplied this method in Palestine. According to theCoastal Aquifer Management Program in theIntegrated Aquifer Management Plan (PalestinianWater Authority, 2000) the Water Resources ActionProgram estimated recharge coefficients in areas ofdune sand and clayey soil. The coefficients obtainedwere 55–65% and 15%, respectively. Using thesevalues and applying long-term average rainfall datafor various stations in Gaza, the total estimatedrecharge was calculated to be 46 � 106 m3/year inthe Gaza Strip. Another study (Ghanem, 1999) usedthemethod to calculate the annual recharge in the FariaDrainage Basin in the West Bank. The estimatedrecharge was found to be 77.2 mm/year in the phreaticaquifer and 76.2 mm/year in the confined aquifer.
3.3 Empirical relations
The natural recharge of aquifers is a function of pre-cipitation, along with many other factors such as geol-ogy, soils, vegetation, land use, climatic conditions,topography, land form and groundwater conditions.Based on studies of the correlation between rainfalland natural recharge, a number of empirical relationshave been identified. Goldschmidt & Jacobs (1959)developed a relationship between rainfall and baseflow data in the period between 1943/44 and 1953/54.Since there was very little well abstraction at the time,
Estimating groundwater recharge using the chloride mass-balance method in the West Bank, Palestine 787
Dow
nloa
ded
by [
USG
S L
ibra
ries
Pro
gram
] at
08:
14 2
7 M
arch
201
3

the total annual spring flow was considered equal to theannual recharge to the basin. The formula applied is:
R ¼ 0:86� P � 360ð Þ (2)
where R is the recharge in mm/year; P is the annualrainfall in mm/year.
Instead of 0.86, Mandel & Shiftan (1981) used0.90 as a coefficient in equation (2) for recharge inMediterranean climates.
The following equations were used as the basisfor the development of annual recharge estimates byGuttman & Zukerman (1995):
R ¼ 0:8� P � 360ð Þ P> 650mm (3)
R ¼ 0:534� P � 216ð Þ 300 < P< 650mm (4)
R ¼ 0:15� P P < 300mm (5)
These equations were later modified by the SUSMAQproject team (Abu Sa’da et al., 2004) to give:
R ¼ 0:6� P � 285ð Þ P > 700mm (6)
R ¼ 0:46� P � 159ð Þ 456 < P < 700mm (7)
R ¼ 0:3� P P < 456mm (8)
Other more complicated formulas for empiricalrelationships between precipitation and recharge havealso been developed. For example, Sinha & Sharma(1988) developed an equation better known as theCheeturvedi formula:
R ¼ 50:8� P
25:4� 15P> 380mm=year (9)
Fig. 4 Recharge rates estimated for the West Bank using the chloride mass-balance method.
788 A. Marei et al.
Dow
nloa
ded
by [
USG
S L
ibra
ries
Pro
gram
] at
08:
14 2
7 M
arch
201
3

Note that in equation (9) there is a lower rainfall limitbelow which recharge is zero. The lower rainfall limitin equation (9) may account for the soil moisturedeficit, interception losses and potential evaporation.
4 RESULTS AND DISCUSSION
The weighted average of chloride contents in the rain-water samples collected at the five sampling sitesrange between 6.95 and 12.81, with an average9.30 mg/L. This value is close to the value of9.06 mg/L estimated by Herut et al. (1994). We imple-ment a new chloride average value of 8.97 mg/Ltaking into consideration our measurements and thevalues of Herut et al. (1994). Table 4 and Fig. 4summarize the recharge rate estimation results afterapplication of the chloride mass-balance method.
4.1 Eastern Basin
A total of 19 groundwater samples were collectedfrom this basin. The chloride concentration rangedfrom 21 to 38 mg/L (values from the Plio-Pleistoceneaquifer in the Jordan Valley are excluded), and theNa+/Cl- ratio ranged from 0.86 to 1.0, which isclose to the marine value. The nitrate concentrationranged from 4.0 to 16 mg/L. The excess chloridewas calculated using the Cl-/Br- molar ratio, andranged from 15 to 20% of the measured chloride forthe three basins. The land use in the recharge area isprimarily grazing, with some rainfed crops, includingwheat and olive trees. However, it is mostly used as
rangeland. Recharge rates calculated by various authorsrange between 130.2 and 259.3 mm/year. The chloridemass-balance method shows that the annual rechargerate is between 130.8 and 269.7 mm/year (Table 5), anda recharge volume of 290.3 � 106 m3/year (Table 6).
4.2 Northeastern Basin
A total of 19 groundwater samples were collected fromthis basin. The chloride concentration Ranges from20.0 to 59.4 mg/L and the Na+/Cl- ratio ranged from0.86 to 1.0. The nitrate concentrations were5.3–19.5 mg/L. The high chloride contents in somesamples can be ascribed to the low permeabilitychalky limestone formation and the thick soil horizonin some areas (Rofe and Raffety, 1963); the percentageof excess chloride reached 2% of measured chloride inthese samples. Most of the land is used for agriculturalpurposes (mainly olive trees) and relies on rainfall. Inthe northern part of the basin, some of the land is alsoirrigated and vegetables are cultivated. The source ofnitrate in groundwater samples is related to nitrifica-tion of organic matter in the soil horizon as well aspercolation of irrigation water (Hem, 1970).
Rofe and Raffety (1965) calculated the averageactual recharge to range between 50 and 250 mm/year(Table 2). Our calculation of the recharge rate using thechloride mass-balance method shows slightly differentresults. According to this method, the average annualrecharge rate of the Northeastern Basin lies between95.2 and 269.7 mm/year (Table 5), and a rechargevolume of 138 � 106 m3/year (Table 6).
Table 5 Recharge rate in mm/year in groundwater basins of the West Bank.
Study Western Basin Northeastern Basin Eastern Basin
Goldschmidt & Jacob (1959) 263.7 247.7Mandel & Shiftan (1981) 276.0 259.3Tahal (1995) 245.3 230.7Cheeturvedi (Sinha & Sharma, 1988) 133.7 130.2Our estimation 122.6–323.6 95.2–269.7 130.8–259.7
Table 6 Estimated recharge volume (106 m3/year).
Study Northeastern Basin Eastern Basin Western Basin Total
WRAP (1994) 140.0 125.0 335.0 600.0Rofe and Raffety (1963–1965) 124.0 213.3 375.9 713.2Our estimation 138.0 290.3 324.9 753.2
Estimating groundwater recharge using the chloride mass-balance method in the West Bank, Palestine 789
Dow
nloa
ded
by [
USG
S L
ibra
ries
Pro
gram
] at
08:
14 2
7 M
arch
201
3

4.3 Western Basin
A total of 19 groundwater samples were collected fromthis basin. The general groundwater flow direction iswest (Fig. 3). The chloride concentration ranged from19.0 to 43.0 mg/L, and the Na+/Cl- ratio rangedbetween 0.86 and 1. The highest chloride concentra-tions were found in the coastal area, where the soilhorizon is a few metres thick and irrigation activitiesare widely distributed. The average nitrate content con-centration ranged from 2.0 to 39.0 mg/L. According toour chloride mass-balance calculation, the estimatedrecharge rate in this area ranges from 122.6 to323.6 mm/year (Table 5), and a recharge volume of324.9 � 106 m3/year (Table 6).
4.4 Comparison with previous estimation
Table 6 shows our estimates of recharge volume for theWest Bank Mountains aquifers, and the previous esti-mation frommany other studies. The data reveal higherreplenishment potential volume (753.2 � 106 m3/year)than previous studies for the same area (Table 6). Also,the range was between 15 and 50% of total rainfall,which is still within the range of previous studies.
5 CONCLUSIONS
Recharge in semi-arid regions like theWest Bank can beestimated using the chloride mass-balance method. Anaverage chloride concentration in rainfall of 8.97 mg/Lwas applied for the calculations. Recharge areas coveredin impermeable chalk and Quaternary formations alongthe Jordan rift valley were excluded from the calculationof the total recharge volume. Recharge rates range from15 to 50% of rainfall, which is still within the range ofprevious studies records. Low recharges rates werefound in areas of chalky limestone in the NortheasternBasin, and along the western margin of the easternslopes of the Mountain Aquifer.
In most of the samples the Na+/Cl- ratio is lessthan 1 and close to the marine ratio, and the NO3
-
concentration ranges from 5.3 to 24.0 mg/L. Thesetwo parameters were applied to identify pollutionsources. The Br-/Cl- ratio was used to calculate excesschloride, which was excluded in the recharge estima-tion. According to this method the total estimatedrecharge volume in the three groundwater basins(without the shallow Plio-Plistocene aquifer in thelower Jordan Valley) is 753.73 � 106 m3/year.
Acknowledgements This research was conducted aspart of the Groundwater Availability and the Fate ofPesticide Input research project (GAPI) funded by theGermanMinistry of Education and Research (BMBF).
REFERENCES
Abdulghaffar, S., Bazuhair, A. &Wood, W. W. (1996) Chloride mass-balance method for estimating ground water recharge in aridareas: examples from western Saudi Arabia. J. Hydrol. 186,153–159.
Abu Sa’da,M.,Aliewi, A., Kalbouneh,A.,Messerschmid, C.&Yassin, R.(2004) Monthly recharge estimation in Wadi Natuf, Palestine.SUSMAQ Project, PWA Internal Report, Ramallah-Palestine.
Allison, G. B. & Hughes, M. W. (1978) The use of environmentalchloride and tritium to estimate total recharge to an unconfinedaquifer. Aust. J. Soil Res. 16, 181–195.
Allison, G. B. & Stone, W. J. (1985) Recharge through karst and duneelements of a semiarid landscape. J. Hydrol. 76, 1–25.
ANTEA (Palestinian Hydrology Group and Palestinian WaterAuthority) (1998) Geological sketch in well developmentstudy of the Eastern Aquifer Basin, Northern Districts ofPalestine, vol. 1: interim report. Conceptual model. Ramallah,Palestine
Arad, A. & Michaeli, A. (1967) Hydrogeological investigation in thewestern catchment of the Dead Sea. Israel J. Earth Sci. 16,181–196.
ARIJ (Applied Research Institute) (1996) Environmental Profile forthe West Bank: Ramallah District. Bethlahem, Palestine. Vol. 4.
Bazuhair, A. & Wood, W. (1995) Chloride mass balance method forestimating groundwater recharge in arid areas: examples fromwestern Saudi Arabia. J. Hydrol. 186, 153–159.
Begin, Z. B. (1974) The geological map of Israel, Sheet 9-III: Jericho,1:50 000. Explanatory note. Geological Survey of Israel.
Blake, G. S.&Goldschmidt,M. J. (1947)Geology andWater Resourcesof Palestine. Jerusalem, Israel: Government of Palestine,Department of Land Settlement and Water Commissioner.
CDM & Morganti (1997) Comprehensive planning framework forPalestine water resources development – Final Report, PWA –Ramallah.
Edmunds, W. M., Darling, W. G. & Kinniburgh, D. G. (1988) Soluteprofile techniques for recharge in semi-arid and arid terrain. In:Estimation of Natural Groundwater Recharge (ed. by I.Sommers), 139–158. NATO ASI Series C222. Dordrecht:Reidel.
Edmunds, W. M. & Walton, N. R. G. (1980) A geochemical andisotopic approach to recharge evaluation in semi-arid zones –past and present. In: Arid Zone Hydrology: Investigations withIsotope Techniques, 47–68. Vienna: IAEA.
Freeze, R. A. & Cherry, J. A. (1979) Groundwater. Englewood Cliffs,NJ: Prentice-Hall.
Ghanem, M. (1999) Hydrogeology and hydrochemistry of the Fariadrainage basin/West Bank. PhD Thesis, TU BergakademieFreiberg, Germany.
Goldschmidt, M. J. & Jacobs, M. (1959) Precipitation over andReplenishment of the Yarkon and Nahal HatteninimUnderground Catchments. Ministry of Agriculture – WaterAuthority, Hydrological Service Jarusalem, Palestine.
GTZ Report (1995) Middle East regional study on water supply anddemand development. Revised draft report phase I, Eschborn,Germany.
790 A. Marei et al.
Dow
nloa
ded
by [
USG
S L
ibra
ries
Pro
gram
] at
08:
14 2
7 M
arch
201
3

Guttman, J. & Zukerman, H. (1995) Flow Model in the Eastern Basinof the Judea and Samaria Hills. Tel-Aviv: Tahal ConsultingEngineers Ltd., 01/95/66.
Hem, J. D. (1970) Study and interpretation of the chemical characteristicsof the natural water.USGeol. SurveyWater Supply Paper 197, 363.
Herut, B., Spiro, B., Starinsky, A. & Katz, A. (1994) Source of sulfurin rainwater as indicated by isotopic � 34 data and chemicalcomposition, Israel. Atmos. Environ. 29(7), 851–857.
Husary, S., Najjar, T. & Aliewi, A. S. (1995) Analysis of secondarysource rainfall data from the northern West Bank. WaterResources Management: West Bank and Gaza Strip, Reportno. WARMP/TEC/J/07. University of Newcastle upon Tyne,UK, and the Palestinian Hydrology Group, Palestine.
Kerh, T., Ting, C. S. & Liao, C. J. (1998) Estimation of groundwaterrecharge using the chloride-mass balance method, PingtungPlain, Taiwan. Hydrogeol. J. 6, 282–292.
Lerner, D. N., Issar, A. & Simmers, I. (1990) Groundwater Recharge;a Guide to Understanding and Estimating Natural Recharge.International Contributions to Hydrogeology. Vol. 8. Hannover:Heise.
Mandel, S. & Shiftan, Z. L. (1981) Groundwater Resources:Investigation and Development. London: Academic Press.
Marei, A. & Vengosh, A. (2001) Source of salinity in groundwaterfrom Jericho area, Jordan Valley.Ground Water 39(2), 240–248.
Nasser Eddin, T. & Nuseibeh, M. (1995) Palestinian Fresh WaterSprings Description, Flow & Water Quality Data 1970–1994.Jerusalem, Israel: Palestinian Consultancy Group (PCG), TheCommercial Press.
Palestinian Water Authority (2000) Coastal aquifer management pro-gram. Integrated Aquifer Management Plan (Task 3) Report,Internal Report, PWA, Ramallah, Palestine.
Palestinian Water Authority (2003) Water supply in the West Bank.Palestinian Water Authority (2006) Internal database 2006.
Unpublished, Internal Report, PWA, Ramallah, Palestine.
PCBS (Palestinian Central Bureau of Statistics) (2004) Populationstatistics report, Annual Report, Ramallah, Palestine.
Rofe and Raffety (1963) West Bank. Hashemite Kingdom of Jordan.Central Water Authority. Westminster, London: Rofe andRaffety Consulting Engineers.
Rofe and Raffety (1965) West Bank. Hashemite Kingdom of Jordan.Central Water Authority. Westminster, London: Rofe andRaffety Consulting Engineers.
Rosenthal, E. (1987) Chemical composition of rainfall and ground-water in recharge areas of the Bet Shean-HarodMultiple Aquifersystem, Israel. J. Hydrol. 89, 329–352.
Scarpa, D. J. (1994) Eastward groundwater flow from the MountainAquifer. In:Water and Peace in the Middle East (ed. by J. Isaac& H. Shuval), 193–203. Amsterdam: Elsevier Science, B.V.
Selaolo, E. T. (1998) Tracer studies and groundwater recharge assess-ment in the eastern fringe of the Botswana Kalahari. PhD Thesis,Free University Amsterdam, The Netherlands.
Sharma, M. L. (1989) Recharge estimation from the depth-distributionof environmental chloride in the unsaturated zone – WesternAustralia examples. In: Estimation of Natural GroundwaterRecharge (ed. by I. Simmers), 159–173. Dordrecht: Reidel.
Simmers, I. & de Vries, J. (2002) Groundwater recharge: an overviewof processes and challenges. Hydrogeol. J. 10, 5–17.
Sinha, B. P. & Sharma, S. K. (1988) Natural groundwater rechargeestimation methodologies in India. In: Estimation of NaturalGroundwater Recharge (ed. by I. Simmers), 301–311. NATO,ASI Series. Dordrecht: Reidel.
Subyani, A. (2004) Use of chloride mass-balance an environmentalisotopes for evaluation of groundwater recharge in the alluvialaquifer, Wadi Tharad, western Saudi Arabia. Environ. Geol.46, 741–749.
WRAP (Water Resources Action Programme) (1994) PalestinianWater Resources, a Rapid Interdisciplinary Sector Review andIssues Paper. Ramallah: The WRAP Taskforce.
Estimating groundwater recharge using the chloride mass-balance method in the West Bank, Palestine 791
Dow
nloa
ded
by [
USG
S L
ibra
ries
Pro
gram
] at
08:
14 2
7 M
arch
201
3


