Embed Size (px)
Citation preview
- 229 -
Mireles, M.C., Ortega, J.A. & Fuentes, J.A. Páginas 229 a 243
Píxel-Bit. Revista de Medios y Educación. Nº 52 Enero 2018. ISSN: 1133-8482.e-ISSN: 2171-7966. doi: http://dx.doi.org/10.12795/pixelbit.2018.i52.16
EQUIPMENT, EDUCATIONAL LEVEL, USES OF MOBILE PHONE OFDOCTORAL STUDENTS FROM PEDAGOGIC EXPERIMENTAL
LIBERTADOR UNIVERSITYEQUIPAMIENTO, FORMACIÓN Y USOS DEL TELÉFONO MÓVIL EN
ESTUDIANTES DE DOCTORADO DE LA UNIVERSIDADPEDAGÓGICA EXPERIMENTAL LIBERTADOR
Miriam del Carmen Mireles1
[email protected]é Antonio Ortega Carrillo2
[email protected] Antonio Fuentes Esparrell2
(1) Universidad Pedagógica Experimental Libertador. Venezuela.(2) Facultad de Ciencias de la Educación. Dpto. de Didáctica y Organización Escolar. Universidad de
Granada
Abstract: This article is part of a quantitative and descriptive investigation, whose main objective was toclassify doctoral students from Pedagogic Experimental Libertador University (UPEL), working asteachers in different education subsystems in Venezuela. The investigation focused on the following elementsfrom e-learning and m-learning: equipment, educational level, personal and educational use of mobilephone. As part of the methodology, multivariate analysis techniques were used: Categorical PrincipalComponents Analysis (CATPCA) and Cluster Analysis. The results show that the doctoral students wereequipped and used ICT and mobile phone in their daily lives. However, only 4% of the sample wasinnovative in the educational use of mobile phone, while 26% of the sample was not creative in the use ofICT on the Internet, and they did not use the mobile phone for the learning process. Likewise, 14% of thedoctorates samples use very little technology in their educational practice. 98% did not have an educationallevel in m-learning, their only knowledge, in this area, was self-taught. They do not know in depth theeducational use of ICT, and in particular, the learning opportunities offered by the mobile phone.Keywords: Higher education; postgraduate education; e-learning; m-learning; multivariate analysisResumen: Este artículo es una investigación que forma parte de un proyecto, cuyo objetivo principal esclasificar los estudiantes doctorandos de la Universidad Pedagógica Experimental Libertador, quienestrabajan como docentes en los diferentes subsistemas de la educación venezolana. La investigación estáfocalizada a partir de los elementos: equipamiento, formación y uso personal y educativo, que conformanel proceso de m-aprendizaje (usando telefonía móvil). Como parte de la metodología se utilizaron técnicasde análisis estadístico multivariado: el Análisis de Componentes Principales Categóricos (CATPCA) yAnálisis Cluster. Los resultados revelan que los doctorandos están equipados y usan las TIC y el móvil ensu vida cotidiana; del mismo modo, el 14% de las muestras de doctorado utilizan muy poca tecnología ensu práctica educativa. El 98% no tenían formación en m-learning, su único conocimiento, eran autodidactan.No conocen a profundidad el uso educativo de las TIC y en particular, de las oportunidades de aprendizajeque ofrece el teléfono móvil.Palabras clave: Educación superior; postgrado; e-learning; m-learning;análisis multivariado
- 230 -
Mireles, M.C., Ortega, J.A. & Fuentes, J.A. Páginas 229 a 243
Píxel-Bit. Revista de Medios y Educación. Nº 52 Enero 2018. ISSN: 1133-8482.e-ISSN: 2171-7966. doi: http://dx.doi.org/10.12795/pixelbit.2018.i52.16
1. Introduction.
The use of mobile devices in numerousareas of life has led important universities totake advantage of them as learning tools(Johnson, Adams, Estrada & Freeman, 2015;Benítez, Ramirez, Zamora & Delgadillo, 2015;and Sharples, Kloos, Dimitriadis, Garlatti &Specht, 2015). Also, there are expectations inthese institutions that e-learning contributesto the creation and distribution of content,as well as the user adaptation to his / herlearning pace, restrictions of time andgeographical location (Navarro, Molina, Re-dondo, & Juárez, 2015; Area & Adell, 2009).
In this regard, Sharples, Arnedillo-Sánchez,Milrad & Vavoula (2009) and Kukulska-Hulme, et al. (2011) reflect on the broadcontext in which the current man participates,gets involved or exemplifies, in anincreasingly mobile lifestyle: physical spacemobility; technology mobility; mobility inconceptual space; and social space mobility.
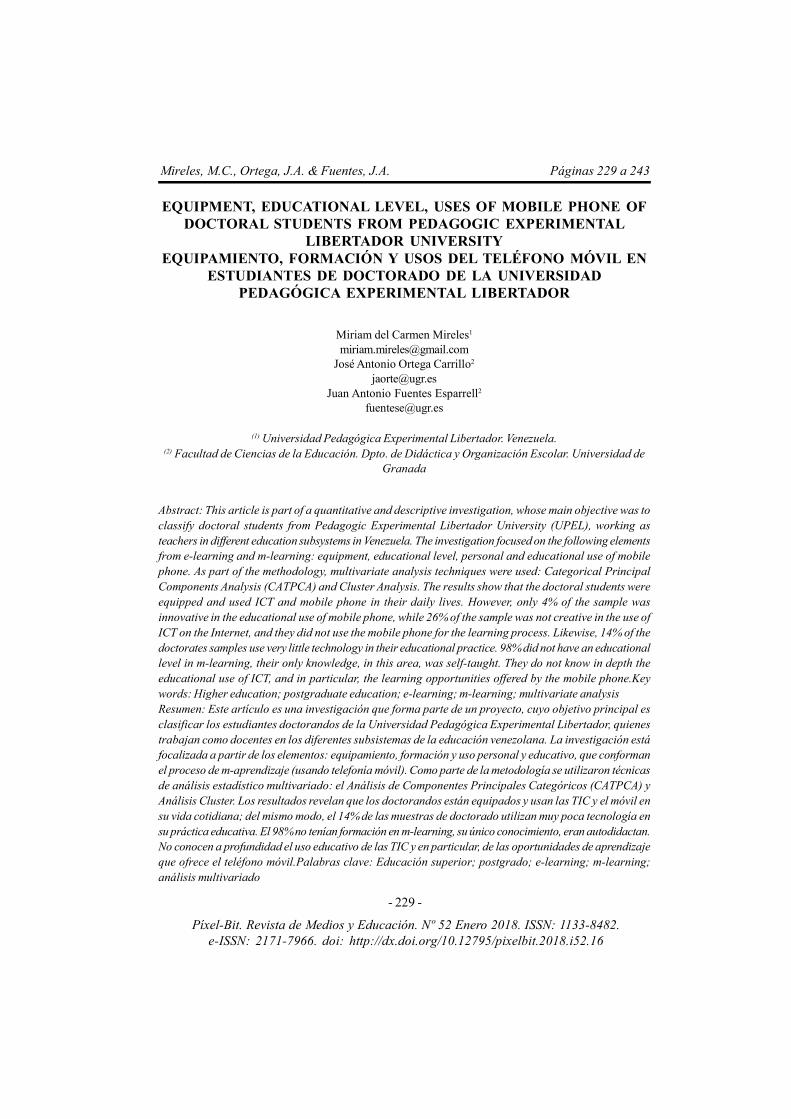
In this matter, mobile technology offers aparticularly promising way to train newteachers, to build capacities among practicingeducators, and to support the teachers’ workboth inside and outside the classroom(UNESCO, 2013). In order to carry out these,two aspects were considered: The use of ICTin the academic field to promote learning, andthe use of mobile phones in educational praxis.These two aspects are relevant, and giventhe high percentage of mobile phonediffusion in the world population, whoseusers represent nearly 7 trillion subscriptions,could be opportune their use, close with ICT,to promote the learning process. It is also tomention important to mention that inVenezuela´s case the diffusion of mobilephones exceeded 100% (see Figure 1).
Adjoined with these aspects mentionedpreviously, as well the demands of theknowledge society intervene, in such a waythat the competencies, qualities and effectivefulfillment of the teacher, who participates inthe educational process, and specifically inm-learning, have great implications. Thesethat have to do with the success or the failureof the students, participants of his/heractions, where the geographical, time andmobility limitations are overstep (Garcia, etal., 2010, Castaño & Cabero, 2013, Yot &Marcelo, 2013; and Hernández, García, &Navarrete, 2015).
All the more, the educational institutionsneed to solve problems in their differenteducational levels, which are increasinglydifficult and complex. The training and thefundamental educational processes of theprofessoriate need to be developed whenchanges in the educational praxis withtechnology are suggested. In this sense,Morles (2004) sustains that many of theseproblems require new or increasingknowledge, skills, techniques, andtechnologies. Consequently, it is convenientto remember that doctoral studies, immersedin postgraduate education, are of the highestlevel and can be considered as one of themost effective ways to face these situationswhen developing more advanced andsophisticated educational processes.
In this regard, is very important to considerthe possibilities of using specific data fromthe doctoral students’ characteristics referredto ICT and mobile phone: equipment, personaluse, education use, access to Internet,education level. Besides, the knowing thehow they customize their e-learning or m-learning platforms. These elements could giveinformation to help recommend (rigorously)
- 231 -
Mireles, M.C., Ortega, J.A. & Fuentes, J.A. Páginas 229 a 243
Píxel-Bit. Revista de Medios y Educación. Nº 52 Enero 2018. ISSN: 1133-8482.e-ISSN: 2171-7966. doi: http://dx.doi.org/10.12795/pixelbit.2018.i52.16
resources, strategies, educational levelcourses to doctoral students, in the same waythat companies do recommendations to theircustomers (Johnson, et al., 2015).
Thus, the objective of the presentinvestigation was classify, in the m-learning,the Doctoral students from PedagogicExperimental Libertador University.
2. Methodology
This is a quantitative research, with adescriptive focus, whose population´s rangewas composed by the doctoral students ofthe Introductory Course 2011 fromPedagogic Experimental LibertadorUniversity (UPEL), Maracay campus,Venezuela. The number of subjects (N) wassixty (N=60). Given that the population wassmall and controllable, the sample of size (n)was fifty (n=50). The sample was selected bynon-probability, directed sampling, asindicated by Hernández, Fernández, &Baptista (2010). It was appropriate to clarifythat the sample was comprised by fifty (50)out of the sixty (60) individuals, since the
researchers rejected ten questionnairesbecause they were incomplete. Fifty doctoralstudents participated in this study, whichallowed working with a representative sampleof the study population (83.33%). It isimportant to indicate that the questionnaires,that were answered anonymously, werenumbered.
The main objective of this research was toclassify doctoral students from the followingconstituents: equipment, educational level,and personal and educational use, which areconstituent elements from the e-learning andm-learning processes (with the use of mobilephones).
A set of three (3) questionnaires was usedas a technique for collecting information. Thisset of questionnaires consisted of closedquestions grouped into thematic blocks:
· Personal equipment (at home) inrelation to ICT.
· Classroom equipment or workingenvironment in relation to ICT for educationalpurposes.
· Personal equipment in relation to themobile phone.
Figure 1. Mobile phone users in Venezuela (CONATEL, 2016)
- 232 -
Mireles, M.C., Ortega, J.A. & Fuentes, J.A. Páginas 229 a 243
Píxel-Bit. Revista de Medios y Educación. Nº 52 Enero 2018. ISSN: 1133-8482.e-ISSN: 2171-7966. doi: http://dx.doi.org/10.12795/pixelbit.2018.i52.16
· Access to ICT.· Educational level in relation to ICT (e-
learning).· Educational level in relation to the
mobile phone (m-learning).· Personal use in relation to ICT.· Personal use in relation to the mobile
phone.· Use related to ICT in education.· Use related to mobile phone in
education.In order to know the content validity of
this set of questionnaires, an expert panel,consisted in three experts, carried out theevaluation. They used a validation form,where the congruence, clarity and bias ofeach item were reviewed. All three expertsconsidered the instrument presented to bevalid.
To measure the first instrument reliability,the Kuder-Richardson formula was used anda reliability KR-20 = 0.8383 was obtained.Therefore, this instrument was high reliable.To measure the second and third instruments,Cronbach’s Alpha was used, which lead to á= 0.96. This represented a high reliability.
All items with positive numbers werecoded to prepare them for the subsequentmultivariate analysis (Hernández et al., 2010).Regarding the implemented methodology,multivariate analysis techniques were used.This method allowed to reduce a high numberobserved variables collected, in the set ofinstruments previously mentioned, into amuch smaller number and to be able to identifya group of new variables (synthetic mega-variables) also referred as components,factors or dimensions that are formed fromthe combination of the original variables(Vicente-Villardón, 2002; Molina & Espinosade los Monteros, 2010; Díaz, 2002; andEtxeberría & Tejedor, 2005).
These variables were first transformed bythe method called optimal scaling. Then, newvariables were generated, and thecomponents with the highest variances wereselected. A component with a greater varianceimplies that it contains a greater amount ofinformation (Vicente-Villardón, 2002; andMeulman & Heiser, 1989). This statisticalanalysis used is called Categorical PrincipalComponent Analysis (CATPCA). Theoriginal data set was replaced by a new«smaller» data set with a minimal loss ofinformation (Cuadras, 1991; Pla, 1986; andJohnson, 1998).
This investigation was complemented byanother analysis known as multivariatestatistical method of automatic classification.This method is called cluster analysis, allowedto enrich the information, obtained throughthe components, to reach the plannedobjective (Anderberg, 2014; Zaveri &Jariwala, 2016; and Dutt, Ismail, & Herawan,2017).
Categorical Principal ComponentAnalysis (CATPCA)
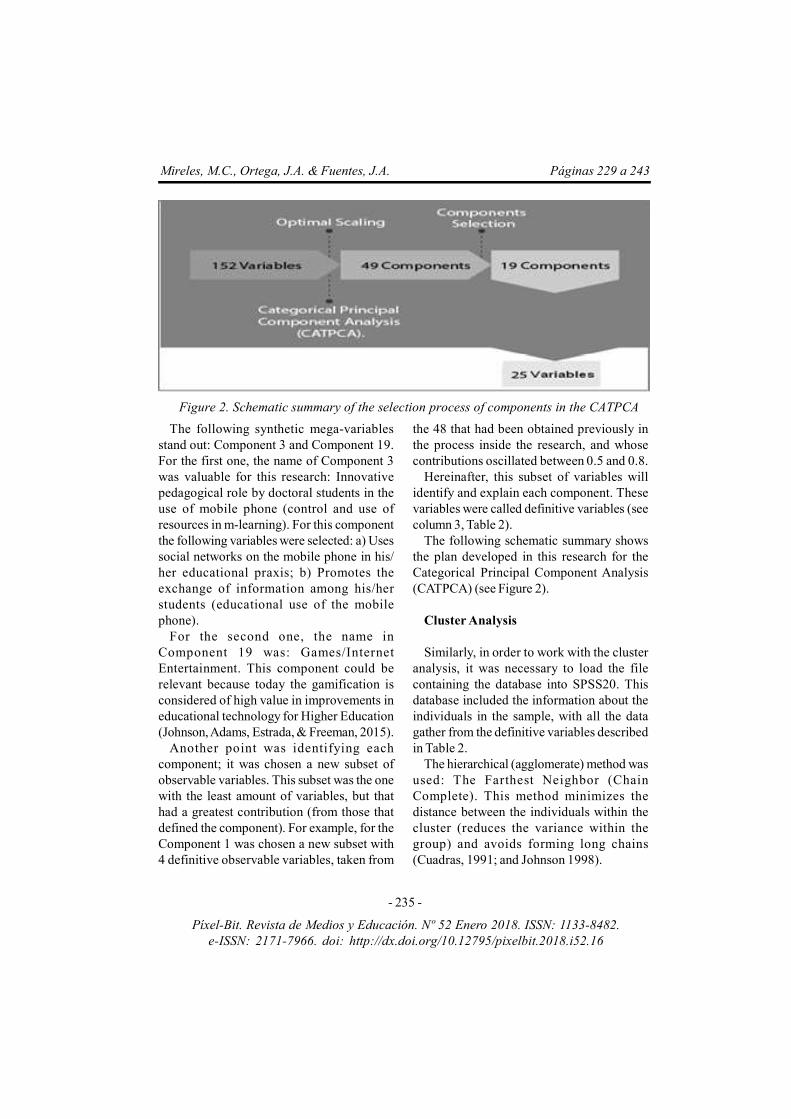
To work with CATPCA, the file containingthe database was loaded into the programSPSS 20, which included information aboutthe individuals in the sample with all datacollected. It was possible to reduce from onehundred fifty-two (152) original variables(observable) to forty-nine (49) components(non-observable, synthetic or mega-variables). Out of these, nineteen (19) wereselected that meet the criteria mentioned byLopez, 2013; Bojórquez, López, Hernández,& Jiménez, 2013; Porras, 2013; Mendoza, 2011;Molina & Espinosa de los Monteros 2010;Morales, 2004; Bernal, Martínez & Sánchez,2004; González-Martin, Díaz-Pascual, Torres-
- 233 -
Mireles, M.C., Ortega, J.A. & Fuentes, J.A. Páginas 229 a 243
Píxel-Bit. Revista de Medios y Educación. Nº 52 Enero 2018. ISSN: 1133-8482.e-ISSN: 2171-7966. doi: http://dx.doi.org/10.12795/pixelbit.2018.i52.16
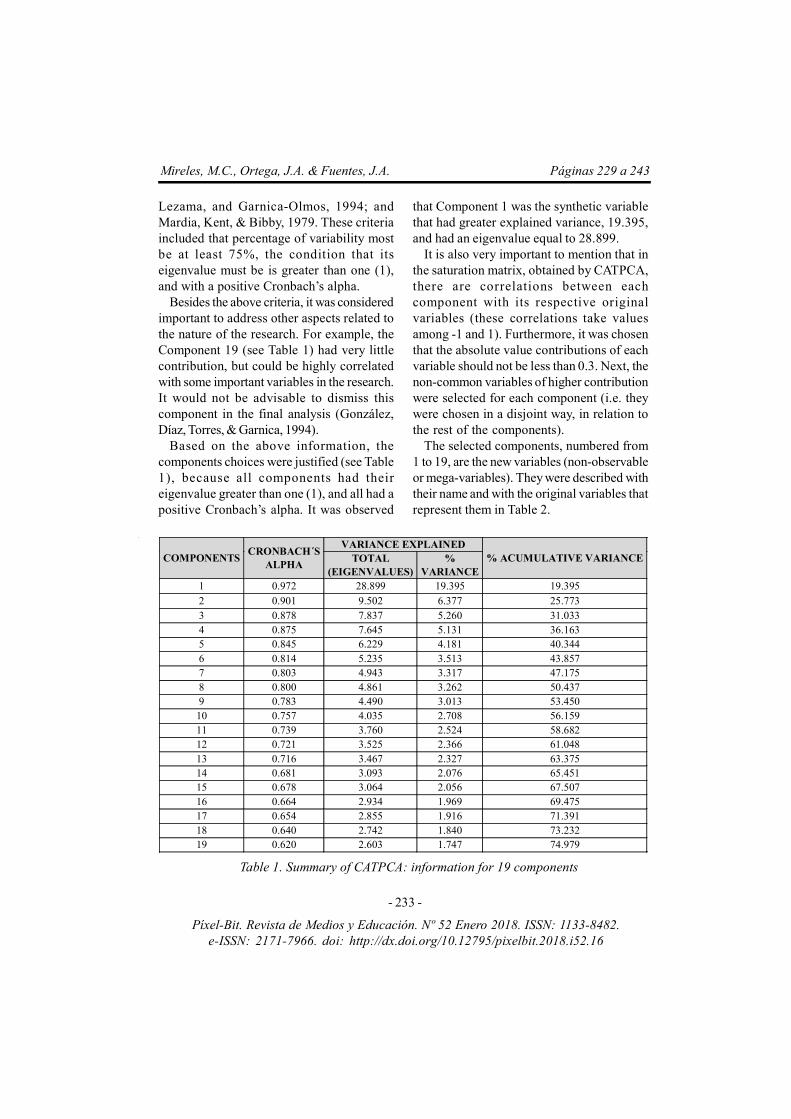
Lezama, and Garnica-Olmos, 1994; andMardia, Kent, & Bibby, 1979. These criteriaincluded that percentage of variability mostbe at least 75%, the condition that itseigenvalue must be is greater than one (1),and with a positive Cronbach’s alpha.
Besides the above criteria, it was consideredimportant to address other aspects related tothe nature of the research. For example, theComponent 19 (see Table 1) had very littlecontribution, but could be highly correlatedwith some important variables in the research.It would not be advisable to dismiss thiscomponent in the final analysis (González,Díaz, Torres, & Garnica, 1994).
Based on the above information, thecomponents choices were justified (see Table1), because all components had theireigenvalue greater than one (1), and all had apositive Cronbach’s alpha. It was observed
that Component 1 was the synthetic variablethat had greater explained variance, 19.395,and had an eigenvalue equal to 28.899.
It is also very important to mention that inthe saturation matrix, obtained by CATPCA,there are correlations between eachcomponent with its respective originalvariables (these correlations take valuesamong -1 and 1). Furthermore, it was chosenthat the absolute value contributions of eachvariable should not be less than 0.3. Next, thenon-common variables of higher contributionwere selected for each component (i.e. theywere chosen in a disjoint way, in relation tothe rest of the components).
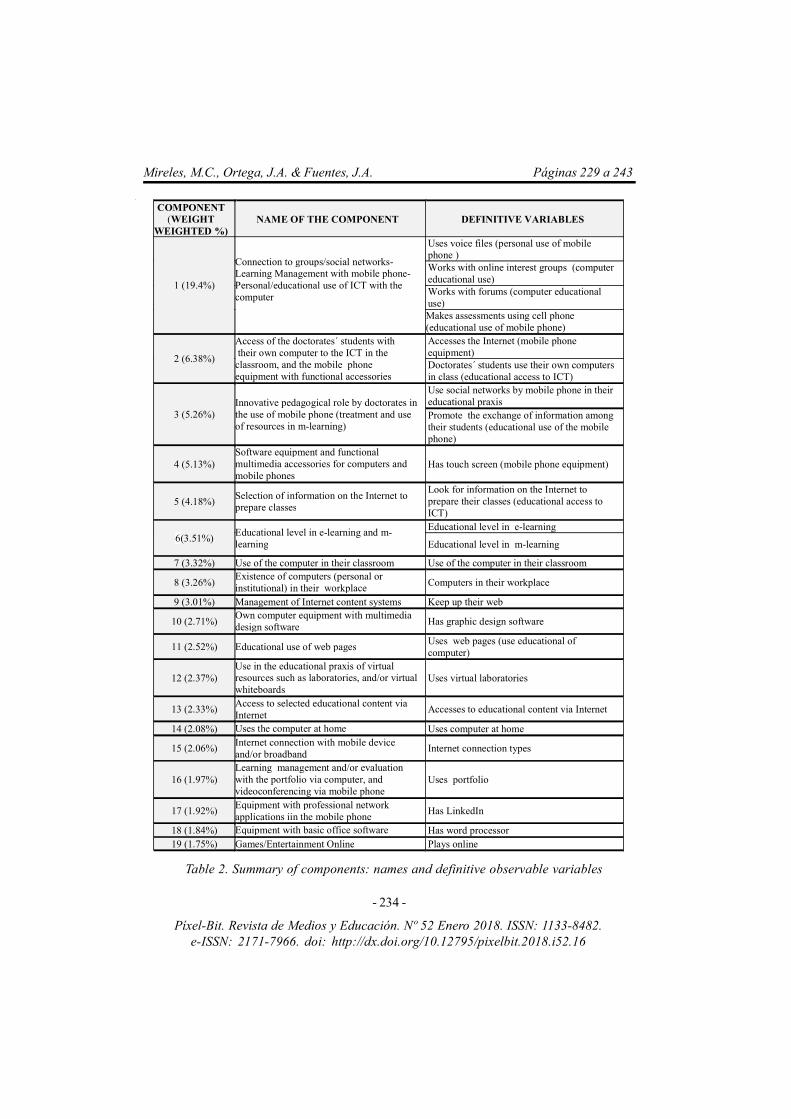
The selected components, numbered from1 to 19, are the new variables (non-observableor mega-variables). They were described withtheir name and with the original variables thatrepresent them in Table 2.
COMPONENTS CRONBACH´S
ALPHA
VARIANCE EXPLAINED % ACUMULATIVE VARIANCE TOTAL
(EIGENVALUES) %
VARIANCE 1 0.972 28.899 19.395 19.395 2 0.901 9.502 6.377 25.773 3 0.878 7.837 5.260 31.033 4 0.875 7.645 5.131 36.163 5 0.845 6.229 4.181 40.344 6 0.814 5.235 3.513 43.857 7 0.803 4.943 3.317 47.175 8 0.800 4.861 3.262 50.437 9 0.783 4.490 3.013 53.450 10 0.757 4.035 2.708 56.159 11 0.739 3.760 2.524 58.682 12 0.721 3.525 2.366 61.048 13 0.716 3.467 2.327 63.375 14 0.681 3.093 2.076 65.451 15 0.678 3.064 2.056 67.507 16 0.664 2.934 1.969 69.475 17 0.654 2.855 1.916 71.391 18 0.640 2.742 1.840 73.232 19 0.620 2.603 1.747 74.979
Table 1. Summary of CATPCA: information for 19 components
- 234 -
Mireles, M.C., Ortega, J.A. & Fuentes, J.A. Páginas 229 a 243
Píxel-Bit. Revista de Medios y Educación. Nº 52 Enero 2018. ISSN: 1133-8482.e-ISSN: 2171-7966. doi: http://dx.doi.org/10.12795/pixelbit.2018.i52.16
Table 2. Summary of components: names and definitive observable variables
COMPONENT (WEIGHT
WEIGHTED %) NAME OF THE COMPONENT DEFINITIVE VARIABLES
1 (19.4%)
Connection to groups/social networks-Learning Management with mobile phone- Personal/educational use of ICT with the computer
Uses voice files (personal use of mobile phone ) Works with online interest groups (computer educational use) Works with forums (computer educational use) Makes assessments using cell phone (educational use of mobile phone)
2 (6.38%)
Access of the doctorates´ students with their own computer to the ICT in the classroom, and the mobile phone equipment with functional accessories
Accesses the Internet (mobile phone equipment) Doctorates´ students use their own computers in class (educational access to ICT)
3 (5.26%) Innovative pedagogical role by doctorates in the use of mobile phone (treatment and use of resources in m-learning)
Use social networks by mobile phone in their educational praxis Promote the exchange of information among their students (educational use of the mobile phone)
4 (5.13%) Software equipment and functional multimedia accessories for computers and mobile phones
Has touch screen (mobile phone equipment)
5 (4.18%) Selection of information on the Internet to prepare classes
Look for information on the Internet to prepare their classes (educational access to ICT)
6(3.51%) Educational level in e-learning and m-learning
Educational level in e-learning
Educational level in m-learning
7 (3.32%) Use of the computer in their classroom Use of the computer in their classroom
8 (3.26%) Existence of computers (personal or institutional) in their workplace Computers in their workplace
9 (3.01%) Management of Internet content systems Keep up their web
10 (2.71%) Own computer equipment with multimedia design software Has graphic design software
11 (2.52%) Educational use of web pages Uses web pages (use educational of computer)
12 (2.37%) Use in the educational praxis of virtual resources such as laboratories, and/or virtual whiteboards
Uses virtual laboratories
13 (2.33%) Access to selected educational content via Internet
Accesses to educational content via Internet
14 (2.08%) Uses the computer at home Uses computer at home
15 (2.06%) Internet connection with mobile device and/or broadband
Internet connection types
16 (1.97%) Learning management and/or evaluation with the portfolio via computer, and videoconferencing via mobile phone
Uses portfolio
17 (1.92%) Equipment with professional network applications iin the mobile phone
Has LinkedIn
18 (1.84%) Equipment with basic office software Has word processor 19 (1.75%) Games/Entertainment Online Plays online
- 235 -
Mireles, M.C., Ortega, J.A. & Fuentes, J.A. Páginas 229 a 243
Píxel-Bit. Revista de Medios y Educación. Nº 52 Enero 2018. ISSN: 1133-8482.e-ISSN: 2171-7966. doi: http://dx.doi.org/10.12795/pixelbit.2018.i52.16
The following synthetic mega-variablesstand out: Component 3 and Component 19.For the first one, the name of Component 3was valuable for this research: Innovativepedagogical role by doctoral students in theuse of mobile phone (control and use ofresources in m-learning). For this componentthe following variables were selected: a) Usessocial networks on the mobile phone in his/her educational praxis; b) Promotes theexchange of information among his/herstudents (educational use of the mobilephone).
For the second one, the name inComponent 19 was: Games/InternetEntertainment. This component could berelevant because today the gamification isconsidered of high value in improvements ineducational technology for Higher Education(Johnson, Adams, Estrada, & Freeman, 2015).
Another point was identifying eachcomponent; it was chosen a new subset ofobservable variables. This subset was the onewith the least amount of variables, but thathad a greatest contribution (from those thatdefined the component). For example, for theComponent 1 was chosen a new subset with4 definitive observable variables, taken from
the 48 that had been obtained previously inthe process inside the research, and whosecontributions oscillated between 0.5 and 0.8.
Hereinafter, this subset of variables willidentify and explain each component. Thesevariables were called definitive variables (seecolumn 3, Table 2).
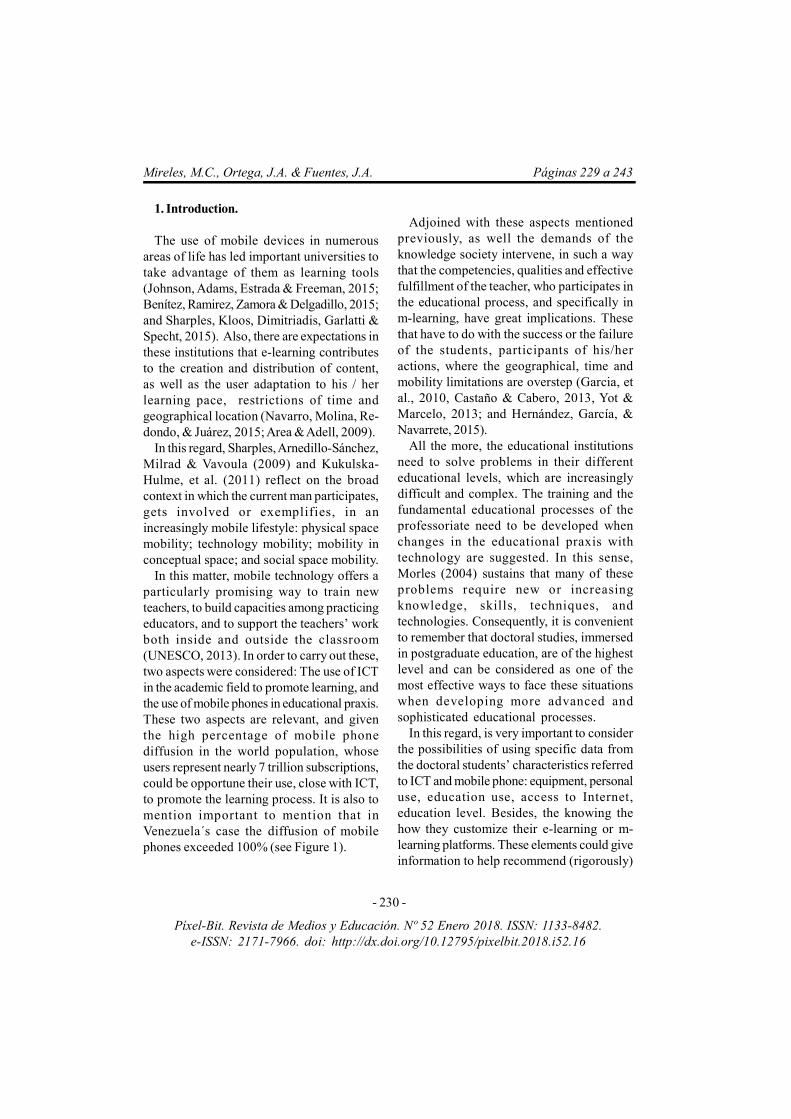
The following schematic summary showsthe plan developed in this research for theCategorical Principal Component Analysis(CATPCA) (see Figure 2).
Cluster Analysis
Similarly, in order to work with the clusteranalysis, it was necessary to load the filecontaining the database into SPSS20. Thisdatabase included the information about theindividuals in the sample, with all the datagather from the definitive variables describedin Table 2.
The hierarchical (agglomerate) method wasused: The Farthest Neighbor (ChainComplete). This method minimizes thedistance between the individuals within thecluster (reduces the variance within thegroup) and avoids forming long chains(Cuadras, 1991; and Johnson 1998).
Figure 2. Schematic summary of the selection process of components in the CATPCA
- 236 -
Mireles, M.C., Ortega, J.A. & Fuentes, J.A. Páginas 229 a 243
Píxel-Bit. Revista de Medios y Educación. Nº 52 Enero 2018. ISSN: 1133-8482.e-ISSN: 2171-7966. doi: http://dx.doi.org/10.12795/pixelbit.2018.i52.16
Also, the measure used, given that the dataare not quantitative, was the chi-squarestatistic c2, known as the Pearson’s correlationcoefficient.
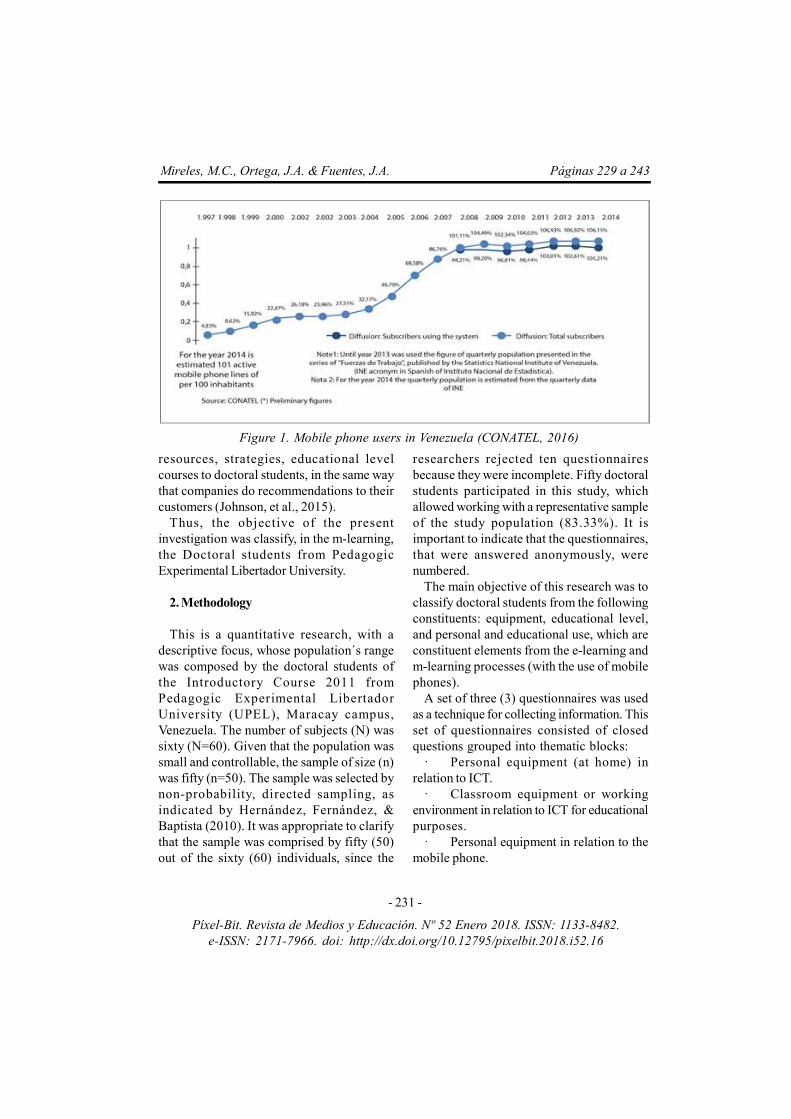
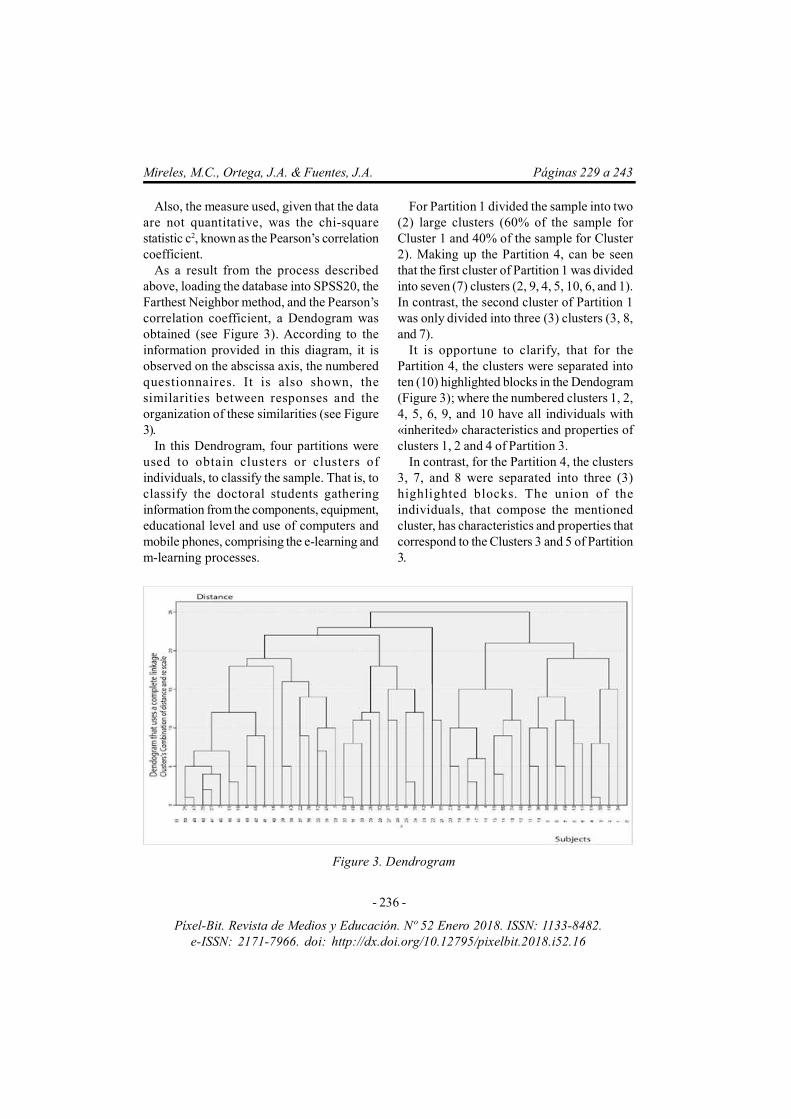
As a result from the process describedabove, loading the database into SPSS20, theFarthest Neighbor method, and the Pearson’scorrelation coefficient, a Dendogram wasobtained (see Figure 3). According to theinformation provided in this diagram, it isobserved on the abscissa axis, the numberedquestionnaires. It is also shown, thesimilarities between responses and theorganization of these similarities (see Figure3).
In this Dendrogram, four partitions wereused to obtain clusters or clusters ofindividuals, to classify the sample. That is, toclassify the doctoral students gatheringinformation from the components, equipment,educational level and use of computers andmobile phones, comprising the e-learning andm-learning processes.
For Partition 1 divided the sample into two(2) large clusters (60% of the sample forCluster 1 and 40% of the sample for Cluster2). Making up the Partition 4, can be seenthat the first cluster of Partition 1 was dividedinto seven (7) clusters (2, 9, 4, 5, 10, 6, and 1).In contrast, the second cluster of Partition 1was only divided into three (3) clusters (3, 8,and 7).
It is opportune to clarify, that for thePartition 4, the clusters were separated intoten (10) highlighted blocks in the Dendogram(Figure 3); where the numbered clusters 1, 2,4, 5, 6, 9, and 10 have all individuals with«inherited» characteristics and properties ofclusters 1, 2 and 4 of Partition 3.
In contrast, for the Partition 4, the clusters3, 7, and 8 were separated into three (3)highlighted blocks. The union of theindividuals, that compose the mentionedcluster, has characteristics and properties thatcorrespond to the Clusters 3 and 5 of Partition3.
Figure 3. Dendrogram

- 237 -
Mireles, M.C., Ortega, J.A. & Fuentes, J.A. Páginas 229 a 243
Píxel-Bit. Revista de Medios y Educación. Nº 52 Enero 2018. ISSN: 1133-8482.e-ISSN: 2171-7966. doi: http://dx.doi.org/10.12795/pixelbit.2018.i52.16
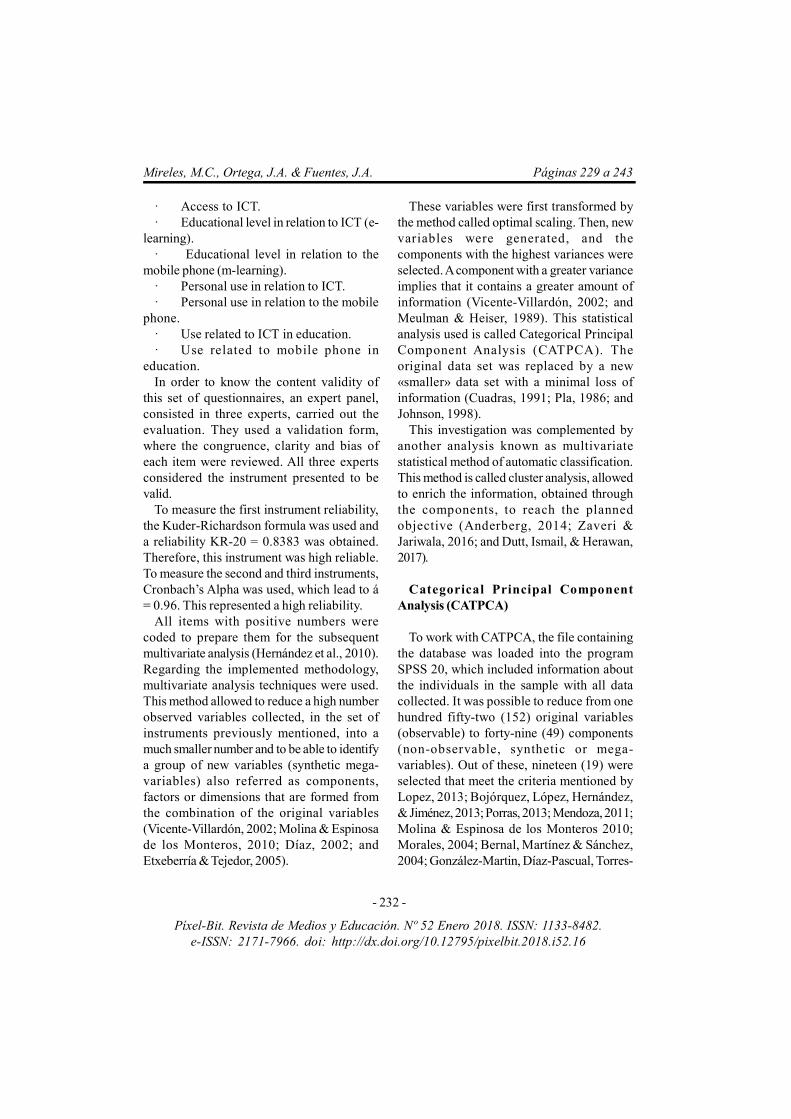
The figure below, was elaborated withdetails from the Dendrogram, and it has a treestructure (see Figure 4), where each Partitionn, with n = 2, 3, 4, is contained in all Partitionsi with i = 1, 2, ..., (n-1). In this case, the«inheritances» of Partitions 2, 3, 4 are shownstarting from Partition 1. The percentages ofeach cluster by partition are also shown inthis figure. Besides, this tree structure willhelp to understand the classification of thesample.
In order to achieve the objective of thisresearch and to establish the characterizationof the variables per cluster, in each of thefour (4) partitions, several processes wereused. These variables obtained were calledsorter variables.
It is also important to point out that agraphing process took place. These graphicswere histograms, each one with welldifferentiated columns, and they were builtapplying the statistical value Mode, for eachvariable per cluster. As part of theseprocesses, several criteria were included toselect the variables that classify eachpartition.
Criterion 1The variables that define Partition 1 must
be separate from the rest and do not definePartitions 2, 3, and 4; similar process wasfollowed for each partition. In other words,partitions should not have common variables.
· Criterion 2In each partition, the Mode value of each
variable per cluster was checked. If they weredifferent, that variable was pre-selected.
· Criterion 3Variables were chosen by clusters that fulfill
the condition of «heritability» betweenpartitions. Next, the selected variables werespecified by partition and their respectiveMode was given for each cluster. It isnecessary to clarify that on the cases wherethe variables of some cluster do not haveMode, since its corresponding column is notin these graphs, and it was decided that thevalues of the scale, that the members of thecluster responded for each variable, wouldbe used.
In summary, the sorter variables for eachpartition were selected using the Mode asthe statistic value, the histograms, and the
Figure 4. Tree structure of 4 partitions
- 238 -
Mireles, M.C., Ortega, J.A. & Fuentes, J.A. Páginas 229 a 243
Píxel-Bit. Revista de Medios y Educación. Nº 52 Enero 2018. ISSN: 1133-8482.e-ISSN: 2171-7966. doi: http://dx.doi.org/10.12795/pixelbit.2018.i52.16
criteria mentioned before. The sorter variablesobtained were called:
· Uses voice files with mobile phone· Works with online interest groups· Works with forums· Uses social networks in their
educational praxis by mobile phone· Promotes the exchange of information
among their students with the mobile phone· Internet connection (mobile) with
broadband/with mobile device· Plays online· Keeps up their web current· Uses virtual laboratories· Uses web page in their educational
praxis· Uses portfolio· Has graphic design software· Uses computers/Has own computer/
Has institutional computer in their workplace· Has touch screen (mobile phone)· Has LinkedIn (mobile phone)· Educational level in e-learning· Educational level in m-learning· Doctoral students use their own
computers in class (educational access toICT)
· Makes evaluation using mobile phone
3. Results and Conclusions
In the results stand out the ones obtainedin Table 2, where the components representthe processes that revitalize the behavior,such as: the personal and educational use ofthe technologies, ICT access, and doctoralstudents’ equipment, in terms of theircontribution to the total variance (weight bycomponent in %).
Therefore, using these components, theclassification of doctoral students was donein correspondence with the similarity/
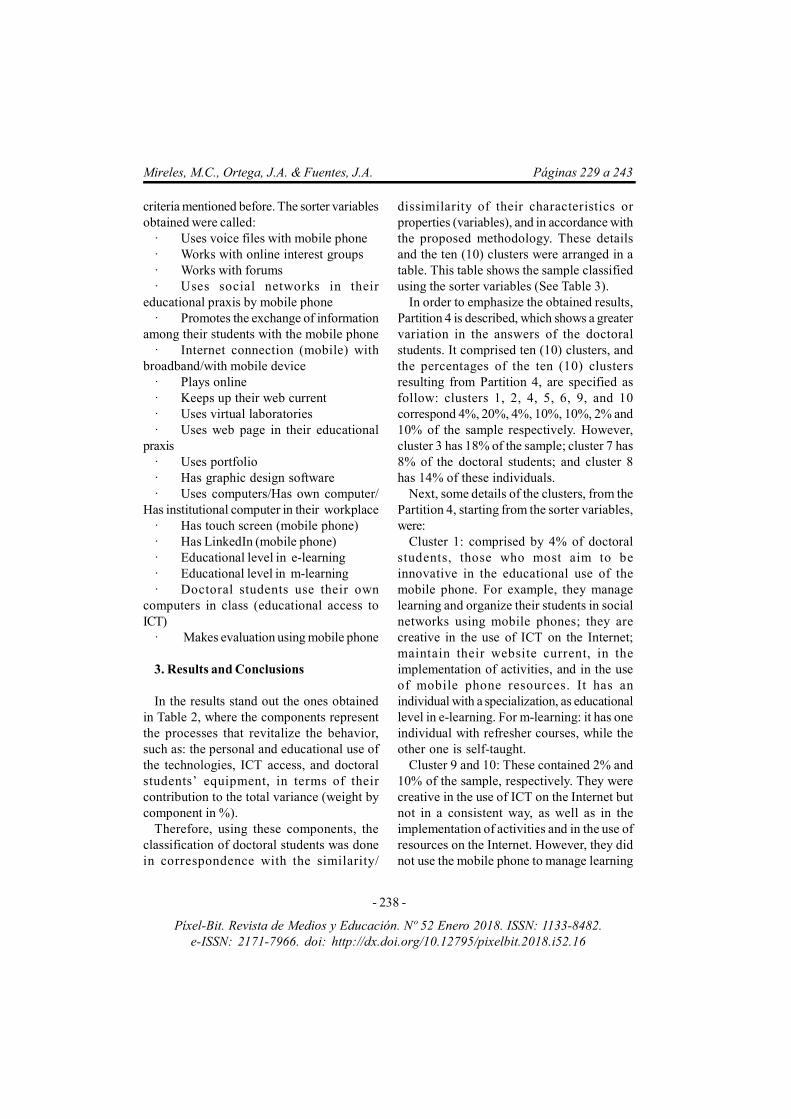
dissimilarity of their characteristics orproperties (variables), and in accordance withthe proposed methodology. These detailsand the ten (10) clusters were arranged in atable. This table shows the sample classifiedusing the sorter variables (See Table 3).
In order to emphasize the obtained results,Partition 4 is described, which shows a greatervariation in the answers of the doctoralstudents. It comprised ten (10) clusters, andthe percentages of the ten (10) clustersresulting from Partition 4, are specified asfollow: clusters 1, 2, 4, 5, 6, 9, and 10correspond 4%, 20%, 4%, 10%, 10%, 2% and10% of the sample respectively. However,cluster 3 has 18% of the sample; cluster 7 has8% of the doctoral students; and cluster 8has 14% of these individuals.
Next, some details of the clusters, from thePartition 4, starting from the sorter variables,were:
Cluster 1: comprised by 4% of doctoralstudents, those who most aim to beinnovative in the educational use of themobile phone. For example, they managelearning and organize their students in socialnetworks using mobile phones; they arecreative in the use of ICT on the Internet;maintain their website current, in theimplementation of activities, and in the useof mobile phone resources. It has anindividual with a specialization, as educationallevel in e-learning. For m-learning: it has oneindividual with refresher courses, while theother one is self-taught.
Cluster 9 and 10: These contained 2% and10% of the sample, respectively. They werecreative in the use of ICT on the Internet butnot in a consistent way, as well as in theimplementation of activities and in the use ofresources on the Internet. However, they didnot use the mobile phone to manage learning
- 239 -
Mireles, M.C., Ortega, J.A. & Fuentes, J.A. Páginas 229 a 243
Píxel-Bit. Revista de Medios y Educación. Nº 52 Enero 2018. ISSN: 1133-8482.e-ISSN: 2171-7966. doi: http://dx.doi.org/10.12795/pixelbit.2018.i52.16
process. These characteristics contrast withthe fact that they are self-taught (autodidact)or did not have educational level in neither e-learning nor in m-learning.
Cluster 2, 4, 5, and 6 are represented 20%,4%, 10%, and 10% of the sample,respectively. They were not creative in theuse of ICT on the Internet, for example theydid not maintain a website current; they didnot use the mobile phone to teach; andsometimes they carry out activities and usetechnological resources in education. It isimportant to highlight, in Cluster 4, that anindividual has refresher courses in e-learning.Also, they were Internet players, which madethem potential candidates to be trained asteachers in the process of gamification. Theyhad high probabilities of overcoming thebarriers that affect the incorporation of the
teaching staff to an innovative educationalprocess.
Cluster 3 and 7: represented 18% and 8%of the sample, respectively. They were notcreative in the use of ICT on the Internet;they did not use the mobile phone to teach;and they use the technology very little in theireducational practice. The individuals of theCluster 3 were all autodidact in e-learning.However, it is important to note that thedoctoral students, who comprise Cluster 7,have a Master Degree in e-learning, that is,they have the highest educational levelamong the sample, but it does notshow on how they use technology in theireducational praxis. All of them are autodidactin m-learning.
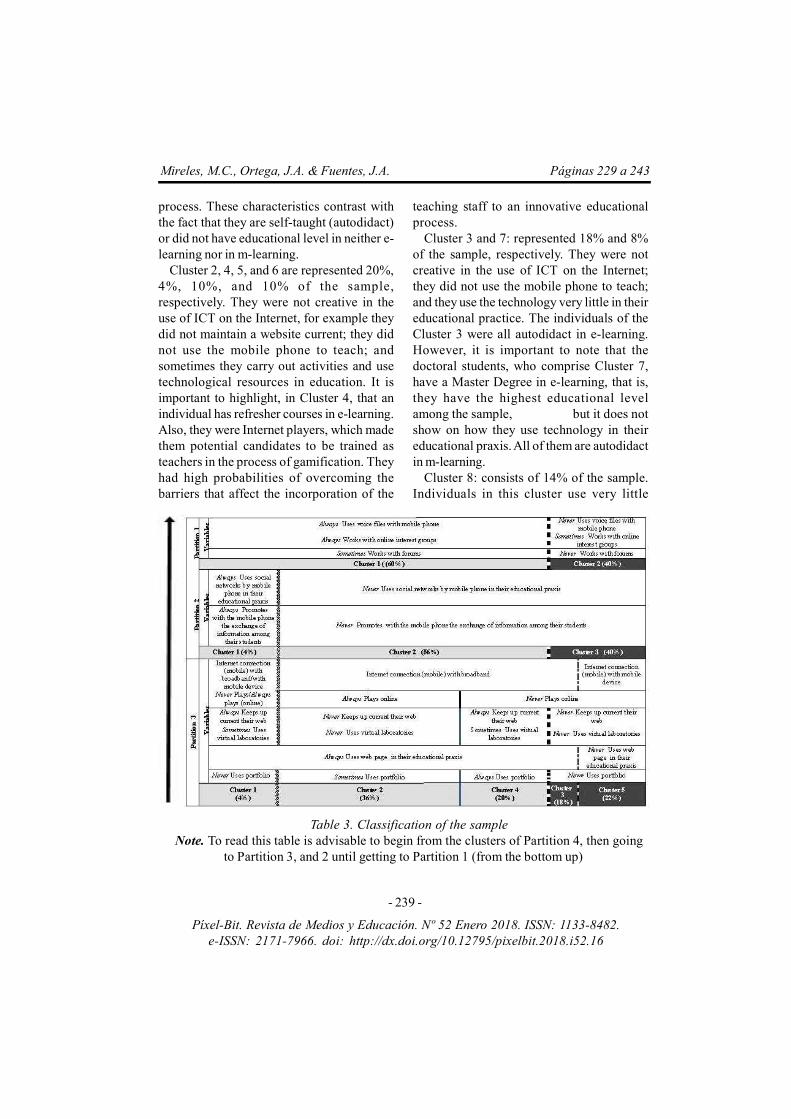
Cluster 8: consists of 14% of the sample.Individuals in this cluster use very little
Table 3. Classification of the sampleNote. To read this table is advisable to begin from the clusters of Partition 4, then going
to Partition 3, and 2 until getting to Partition 1 (from the bottom up)
- 240 -
Mireles, M.C., Ortega, J.A. & Fuentes, J.A. Páginas 229 a 243
Píxel-Bit. Revista de Medios y Educación. Nº 52 Enero 2018. ISSN: 1133-8482.e-ISSN: 2171-7966. doi: http://dx.doi.org/10.12795/pixelbit.2018.i52.16
technology in their educational practice. Thiscluster is the only one whoseindividuals do not use the mobile phone toevaluate. All of them are autodidact in e-learning and m-learning processes.
It is important to emphasize that theclassification of the sample was organized ina table (See Table 3). It explains itself in termsof the relevant variables that classified eachcluster. In order to read the table, it is essentialto do it from the bottom up, starting from theclusters of Partition 4, then going to Partition3 and 2 until getting to Partition 1 (see Notein Table 3).
In the classification of the sample (see Table3) stand out the following: only 4% of thesample was innovative in the educational useof mobile phone, while 26% of the sample
was not creative in the use of ICT on theInternet, and they did not use the mobilephone in the learning process. Likewise, 14%of the sample uses very little technology intheir educational practice. On the other hand,98% did not have an educational level in m-learning, their only knowledge, in this area,was self-taught.
They do not know in depth the educationaluse of ICT, and in particular, the learningopportunities offered by the mobile phone.
4. Recommendations
Considering the results mentioned above,it is recommended to increase the possibilitiesto create and organize projects using e-learning and m-learning, to take advantage
Table 3 (Continuation). Classification of the sampleNote. To read this table is advisable to begin from the clusters of Partition 4, then going
to Partition 3, and 2until getting to Partition 1 (from the bottom up)
- 241 -
Mireles, M.C., Ortega, J.A. & Fuentes, J.A. Páginas 229 a 243
Píxel-Bit. Revista de Medios y Educación. Nº 52 Enero 2018. ISSN: 1133-8482.e-ISSN: 2171-7966. doi: http://dx.doi.org/10.12795/pixelbit.2018.i52.16
of the potentialities of the doctorates, in orderto improve creativity/innovation in the useof ICT with computers and mobile phones.Furthermore, it is recommended to contribute,in the different groups of doctoral students,to the development of investigations indidactic lines in the areas of e-learning andm-learning. Besides, it is recommended thecharacterization and classification ofteachers, who do not belong to the sample ofthe present investigation, starting from theinformation the sorter variables that appearcontained in Table 3.
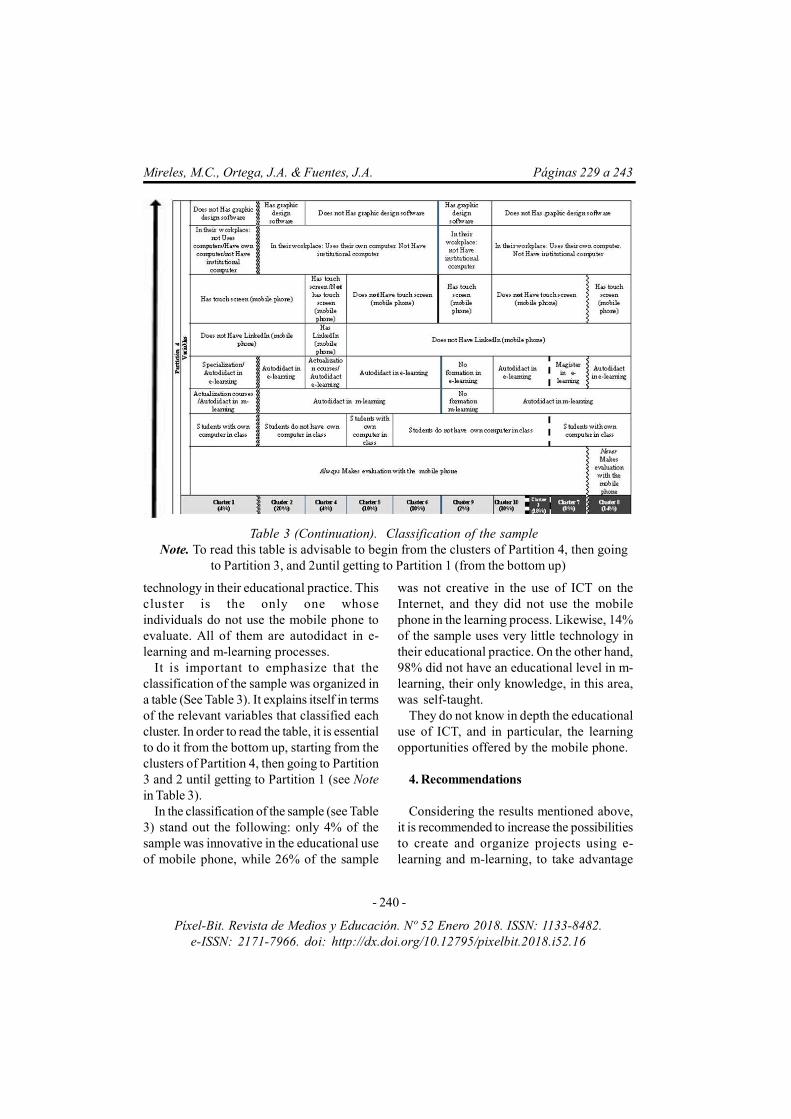
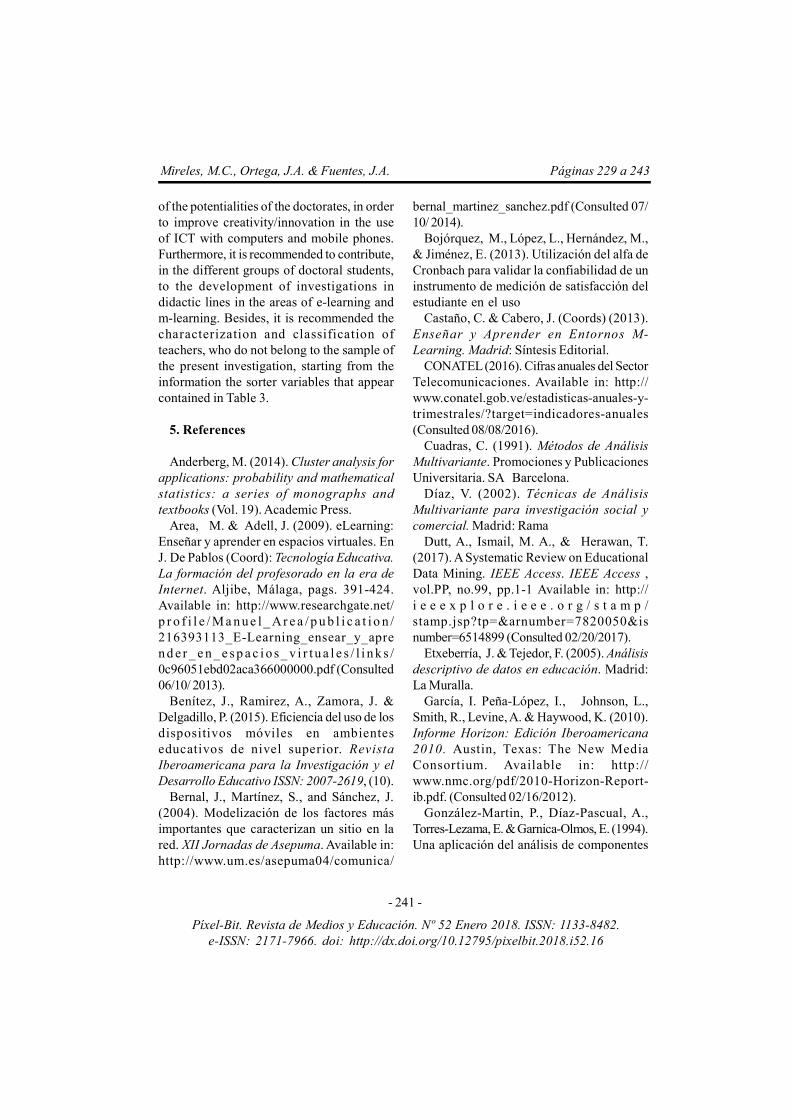
5. References
Anderberg, M. (2014). Cluster analysis forapplications: probability and mathematicalstatistics: a series of monographs andtextbooks (Vol. 19). Academic Press.
Area, M. & Adell, J. (2009). eLearning:Enseñar y aprender en espacios virtuales. EnJ. De Pablos (Coord): Tecnología Educativa.La formación del profesorado en la era deInternet. Aljibe, Málaga, pags. 391-424.Available in: http://www.researchgate.net/p r o f i l e / M a n u e l _ Ar e a / p u b l i c a t i o n /216393113_E-Learning_ensear_y_apren d e r _ e n _ e s p a c i o s_ v i r t u a l e s / l i n k s /0c96051ebd02aca366000000.pdf (Consulted06/10/ 2013).
Benítez, J., Ramirez, A., Zamora, J. &Delgadillo, P. (2015). Eficiencia del uso de losdispositivos móviles en ambienteseducativos de nivel superior. RevistaIberoamericana para la Investigación y elDesarrollo Educativo ISSN: 2007-2619, (10).
Bernal, J., Martínez, S., and Sánchez, J.(2004). Modelización de los factores másimportantes que caracterizan un sitio en lared. XII Jornadas de Asepuma. Available in:http://www.um.es/asepuma04/comunica/
bernal_martinez_sanchez.pdf (Consulted 07/10/ 2014).
Bojórquez, M., López, L., Hernández, M.,& Jiménez, E. (2013). Utilización del alfa deCronbach para validar la confiabilidad de uninstrumento de medición de satisfacción delestudiante en el uso
Castaño, C. & Cabero, J. (Coords) (2013).Enseñar y Aprender en Entornos M-Learning. Madrid: Síntesis Editorial.
CONATEL (2016). Cifras anuales del SectorTelecomunicaciones. Available in: http://www.conatel.gob.ve/estadisticas-anuales-y-trimestrales/?target=indicadores-anuales(Consulted 08/08/2016).
Cuadras, C. (1991). Métodos de AnálisisMultivariante. Promociones y PublicacionesUniversitaria. SA Barcelona.
Díaz, V. (2002). Técnicas de AnálisisMultivariante para investigación social ycomercial. Madrid: Rama
Dutt, A., Ismail, M. A., & Herawan, T.(2017). A Systematic Review on EducationalData Mining. IEEE Access. IEEE Access ,vol.PP, no.99, pp.1-1 Available in: http://i e e e x p l o r e . i e e e . o r g / s t a m p /stamp.jsp?tp=&arnumber=7820050&isnumber=6514899 (Consulted 02/20/2017).
Etxeberría, J. & Tejedor, F. (2005). Análisisdescriptivo de datos en educación. Madrid:La Muralla.
García, I. Peña-López, I., Johnson, L.,Smith, R., Levine, A. & Haywood, K. (2010).Informe Horizon: Edición Iberoamericana2010. Austin, Texas: The New MediaConsortium. Available in: http://www.nmc.org/pdf/2010-Horizon-Report-ib.pdf. (Consulted 02/16/2012).
González-Martin, P., Díaz-Pascual, A.,Torres-Lezama, E. & Garnica-Olmos, E. (1994).Una aplicación del análisis de componentes
- 242 -
Mireles, M.C., Ortega, J.A. & Fuentes, J.A. Páginas 229 a 243
Píxel-Bit. Revista de Medios y Educación. Nº 52 Enero 2018. ISSN: 1133-8482.e-ISSN: 2171-7966. doi: http://dx.doi.org/10.12795/pixelbit.2018.i52.16
principales en el área educativa. Economía,9, 55-72.
Hernández, G., García, C., & Navarrete, M.(2015). Inclusión de las TICS en el trabajoacadémico de los profesores universitarios.Revista Iberoamericana de ProducciónAcadémica y Gestión Educativa. 2. Availablein: http://www.pag.org.mx/index.php/PAG/article/view/238/284. (Consulted 11/30/2015).
Hernández, R., Fernández, S., & Baptista,P. (2010). Metodología de la investigación.McGraw-Hill México.
Johnson, D. E. (1998). Appliedmultivariate methods for data analysts.Duxbury.
Johnson, L., Adams, S., Estrada, V., &Freeman, A. (2015). NMC Horizon Report:Edición Educación Superior 2015. Austin,Texas: The New Media Consortium.. Availablein: http://cdn.nmc.org/media/2015-nmc-horizon-report-HE-ES.pdf (Consulted 01/14/2016).
Kukulska-Hulme, A., Sharples, M., Milrad,M., Arnedillo-Sánchez , I., & Vavoula, G.(2011). The genesis and development ofmobile learning in Europe. In: Parsons, Davided. Combining E-Learning and M-Learning:New Applications of Blended EducationalResources. Hershey, PA: Information ScienceReference (an imprint of IGI Global), 151–177.Available in: http://www.igi-global.com/bookstore/titledetails.aspx?TitleId=47399(Consulted 07/08/2012).
López, P. (2013). Redes para lasocialización: una experiencia en enseñanzasecundaria. Doctoral thesis. MurciaUniversit. Spain.
Mardia, K., Kent, J., & Bibby, J. (1979).Multivariate Analysis. London. AcademicPress, Inc.
Mendoza, M. (2011). Elaboración yvalidación del cuestionario:»Desempeños
profesionales de directivos y profesores enpro de una educación creativa: evaluación yautoevaluación desde la perspectivadocente». Docencia e Investigación: Revistade la Escuela Universitaria de Magisteriode Toledo, 36 (21), 51-70.
Meulman, J. & Heiser, W. (1989). SPSSCategories 20. Chicago: SPSS. Available in:ftp://public.dhe.ibm.com/software/analytics/spss/documentation/statistics/20.0/es/client/Manuals/ IBM_SPSS_Categories .pdf(Consulted el 07/18/2012).
Molina, O., & Espinosa de los Monteros,E. (2010). Rotación en análisis decomponentes principales categórico: un casopráctico. Metodología de encuestas, 12, 63-88.
Morales, J. (2004). Aplicación einterpretación de técnicas de reducción dedatos según escalamiento óptimo:(Análisisde correspondencia múltiple y análisis decomponentes principales categóricos).University of Chile.
Morles, V. (2004). La Educación dePostgrado en Venezuela. [Online document].Available in: http//www.iesalc-u ne s c o . o r g . ve /E s t ud i o s r e g io n a le s .(Consulted 05/18/2012).
Navarro, C., Molina, A., Redondo, M., &Juárez, R. (2015). «Framework para EvaluarSistemas M-learning: Un EnfoqueTecnológico y Pedagógico» VAEP-RITAV 1(3), 38-45. Available in: http://repositorio.grial.eu/bitstream/grial/399/1/2 0 1 5 0 3 - u p l o a d s - V A E P -RITA.2015.V3.N1.A7.pdf. (Consulted 11/28/2015).
Pla, L. (1986). Análisis Multivariado:Método de Componentes Principales.Instituto Interamericano de Estadística. Sec.General de la OEA Washington, D.C. 89 p.
- 243 -
Mireles, M.C., Ortega, J.A. & Fuentes, J.A. Páginas 229 a 243
Píxel-Bit. Revista de Medios y Educación. Nº 52 Enero 2018. ISSN: 1133-8482.e-ISSN: 2171-7966. doi: http://dx.doi.org/10.12795/pixelbit.2018.i52.16
Porras, E. (2013). Implantación del sistemade gestión de la calidad en las institucionespúblicas de educación preescolar, básica ymedia del municipio de Villavicencio(Colombia): estudio de casos múltiples.Doctoral Thesis. Universidad Nacional deEducación a Distancia. España. Available in:h t t p : / / e - s p a c i o . u ne d . e s / f e z / e s e r v /t e s i s u n e d : E d u c a c i o n - E p o r r a s /Documento.pdf (Consulted 08/01/2013).
Sharples, M., Arnedillo-Sánchez, I., Milrad,M., & Vavoula, G. (2009). Mobile Learning.Technology-Enhanced Learning, 233-249.
Sharples, M., Kloos, C. D., Dimitriadis, Y.,Garlatti, S., & Specht, M. (2015). Mobile andAccessible Learning for MOOCs. Journal ofinteractive media in education, 2015(1), Art-4. Available in: http://jime.open.ac.uk/jms/article/view/jime.ai/556 (Consulted 05/10/2015).
UNESCO (2013). UNESCO PolicyGuidelines for Mobile Learning. Available in:http://unesdoc.unesco.org/images/0021/002196/219662S.pdf (Consulted 06/07/2014).
Vicente-Villardón, J. (2002). Análisis decomponentes principales. Cataluña: UOC,Departamento de Estadística. Available in:http://benjamindespensa.tripod.com/spss/ACP.pdf (Consulted 04/14/2012).
Yot, C. & Marcelo, C. (2013). Tareas ycompetencias del tutor online.ProfesoradoRevista de Currículum yFormación de Profesorado [en línea] 17(2),305-325. Available in: http://www.uacm.kir j . redalyc .reda lyc .org /articulo.oa?id=56729526018. (Consulted 12/012015).
Zaveri, S. H., & Jariwala, D. R. (2016).Analysis of Students Enrollment inGovernment And Private Schools in IndiaUsing Classification Mining. Global JournalFor Research Analysis, 5(4).
Fecha de recepción: 20-07-2017Fecha de evaluación: 03-10-2017Fecha de aceptación: 09-10-2017


