Embed Size (px)
Citation preview

ENHANCING THE RELIABILITY OF FUNCTIONAL MRI ANDMAGNETOENCEPHALOGRAPHY FOR PRESURGICAL
MAPPING
by
M. Tynan R. Stevens
Submitted in partial fulfillment of therequirements for the degree of
Doctor of Philosophy
at
Dalhousie UniversityHalifax, Nova Scotia
July 2015
© Copyright by M. Tynan R. Stevens, 2015

Table of Contents
List of Tables . . . . . . . . . . . . . . . . . . . . . . . . . . . . . . . . . . . vi
List of Figures . . . . . . . . . . . . . . . . . . . . . . . . . . . . . . . . . . vii
Abstract . . . . . . . . . . . . . . . . . . . . . . . . . . . . . . . . . . . . . . ix
List of Abbreviations and Symbols Used . . . . . . . . . . . . . . . . . . x
Acknowledgements . . . . . . . . . . . . . . . . . . . . . . . . . . . . . . . xii
Chapter 1 Introduction . . . . . . . . . . . . . . . . . . . . . . . . . . 1
1.1 Surgical Treatment of Brain Tumors . . . . . . . . . . . . . . . . . . 2
1.2 Pre-Surgical Mapping . . . . . . . . . . . . . . . . . . . . . . . . . . . 3
1.3 Single-Subject Imaging . . . . . . . . . . . . . . . . . . . . . . . . . . 5
1.4 Research Objectives . . . . . . . . . . . . . . . . . . . . . . . . . . . . 7
Chapter 2 Theory . . . . . . . . . . . . . . . . . . . . . . . . . . . . . . 8
2.1 Functional MRI . . . . . . . . . . . . . . . . . . . . . . . . . . . . . . 82.1.1 Signal Generation . . . . . . . . . . . . . . . . . . . . . . . . . 82.1.2 Image Formation . . . . . . . . . . . . . . . . . . . . . . . . . 12
2.2 Magnetoencephalography . . . . . . . . . . . . . . . . . . . . . . . . . 142.2.1 Signal Generation . . . . . . . . . . . . . . . . . . . . . . . . . 142.2.2 Image Formation . . . . . . . . . . . . . . . . . . . . . . . . . 16
2.3 Statistical Images and Thresholding . . . . . . . . . . . . . . . . . . . 20
2.4 The ROC-r Framework . . . . . . . . . . . . . . . . . . . . . . . . . . 222.4.1 Motivation and Background . . . . . . . . . . . . . . . . . . . 222.4.2 ROC-r Algorithm . . . . . . . . . . . . . . . . . . . . . . . . . 232.4.3 Simulation . . . . . . . . . . . . . . . . . . . . . . . . . . . . . 262.4.4 Repeatability, Reliability, and Accuracy . . . . . . . . . . . . 282.4.5 Summary . . . . . . . . . . . . . . . . . . . . . . . . . . . . . 28
Chapter 3 Manuscript 1: Thresholds in fMRI Studies: Reliable forSingle Subjects? . . . . . . . . . . . . . . . . . . . . . . . . 30
3.1 Motivation . . . . . . . . . . . . . . . . . . . . . . . . . . . . . . . . . 30
ii

3.2 Abstract . . . . . . . . . . . . . . . . . . . . . . . . . . . . . . . . . . 31
3.3 Introduction . . . . . . . . . . . . . . . . . . . . . . . . . . . . . . . . 313.3.1 Background . . . . . . . . . . . . . . . . . . . . . . . . . . . . 313.3.2 Classification Reliability . . . . . . . . . . . . . . . . . . . . . 333.3.3 Research Objectives . . . . . . . . . . . . . . . . . . . . . . . 35
3.4 Methods . . . . . . . . . . . . . . . . . . . . . . . . . . . . . . . . . . 353.4.1 Participants . . . . . . . . . . . . . . . . . . . . . . . . . . . . 353.4.2 MRI Acquisition Details . . . . . . . . . . . . . . . . . . . . . 353.4.3 Functional Task . . . . . . . . . . . . . . . . . . . . . . . . . . 363.4.4 Functional MRI Analysis . . . . . . . . . . . . . . . . . . . . . 363.4.5 Reliability Calculations . . . . . . . . . . . . . . . . . . . . . . 373.4.6 Threshold Optimization . . . . . . . . . . . . . . . . . . . . . 39
3.5 Results . . . . . . . . . . . . . . . . . . . . . . . . . . . . . . . . . . . 413.5.1 Group Analysis . . . . . . . . . . . . . . . . . . . . . . . . . . 413.5.2 Group Average Threshold-Reliability Dependence . . . . . . . 413.5.3 Individual Variability . . . . . . . . . . . . . . . . . . . . . . . 433.5.4 Analysis of Poor Datasets . . . . . . . . . . . . . . . . . . . . 52
3.6 Discussion . . . . . . . . . . . . . . . . . . . . . . . . . . . . . . . . . 543.6.1 Group-level Reliability . . . . . . . . . . . . . . . . . . . . . . 543.6.2 Single-subject Reliability . . . . . . . . . . . . . . . . . . . . . 543.6.3 Threshold Optimization . . . . . . . . . . . . . . . . . . . . . 55
3.7 Conclusion . . . . . . . . . . . . . . . . . . . . . . . . . . . . . . . . . 57
Chapter 4 Manuscript 2: Fully Automated Quality Assurance andLocalization of Volumetric MEG for Potential use in Pre-Surgical Mapping . . . . . . . . . . . . . . . . . . . . . . . 59
4.1 Motivation . . . . . . . . . . . . . . . . . . . . . . . . . . . . . . . . . 59
4.2 Abstract . . . . . . . . . . . . . . . . . . . . . . . . . . . . . . . . . . 61
4.3 Introduction . . . . . . . . . . . . . . . . . . . . . . . . . . . . . . . . 61
4.4 Methods . . . . . . . . . . . . . . . . . . . . . . . . . . . . . . . . . . 634.4.1 Data Collection . . . . . . . . . . . . . . . . . . . . . . . . . . 634.4.2 MNS Paradigm . . . . . . . . . . . . . . . . . . . . . . . . . . 634.4.3 Data Pre-processing . . . . . . . . . . . . . . . . . . . . . . . 644.4.4 Source Localization . . . . . . . . . . . . . . . . . . . . . . . . 644.4.5 Anatomical Template . . . . . . . . . . . . . . . . . . . . . . . 654.4.6 Quality Assurance Analysis . . . . . . . . . . . . . . . . . . . 654.4.7 ROC-r Thresholding . . . . . . . . . . . . . . . . . . . . . . . 66
iii

4.4.8 Localization Comparison . . . . . . . . . . . . . . . . . . . . . 67
4.5 Results . . . . . . . . . . . . . . . . . . . . . . . . . . . . . . . . . . . 674.5.1 Sensory Evoked Fields . . . . . . . . . . . . . . . . . . . . . . 674.5.2 Beamformer Reliability and Quality Assurance . . . . . . . . . 674.5.3 Source Localization and Thresholding . . . . . . . . . . . . . . 71
4.6 Discussion . . . . . . . . . . . . . . . . . . . . . . . . . . . . . . . . . 714.6.1 The MNS SEF . . . . . . . . . . . . . . . . . . . . . . . . . . 734.6.2 ROC-reliability for Quality Assurance . . . . . . . . . . . . . . 754.6.3 ROC-r Thresholding to Localize MEG Sources . . . . . . . . . 764.6.4 Data Quality Influences Co-localization Accuracy . . . . . . . 77
4.7 Conclusion . . . . . . . . . . . . . . . . . . . . . . . . . . . . . . . . . 77
Chapter 5 Manuscript 3: Improving fMRI Reliability in Pre-surgicalMapping for Brain Tumors . . . . . . . . . . . . . . . . . 78
5.1 Motivation . . . . . . . . . . . . . . . . . . . . . . . . . . . . . . . . . 78
5.2 Abstract . . . . . . . . . . . . . . . . . . . . . . . . . . . . . . . . . . 80
5.3 Introduction . . . . . . . . . . . . . . . . . . . . . . . . . . . . . . . . 815.3.1 Pre-surgical Mapping Validity and Reliability . . . . . . . . . 815.3.2 Thresholds for Pre-surgical Mapping . . . . . . . . . . . . . . 825.3.3 The ROC-reliability (ROC-r) Framework . . . . . . . . . . . . 83
5.4 Methods . . . . . . . . . . . . . . . . . . . . . . . . . . . . . . . . . . 835.4.1 Participants . . . . . . . . . . . . . . . . . . . . . . . . . . . . 835.4.2 MRI Acquisition Details . . . . . . . . . . . . . . . . . . . . . 855.4.3 Functional MRI Analysis . . . . . . . . . . . . . . . . . . . . . 855.4.4 ROC-reliability Analysis . . . . . . . . . . . . . . . . . . . . . 875.4.5 Cortical Stimulation . . . . . . . . . . . . . . . . . . . . . . . 885.4.6 Spatial Correspondence Measurements . . . . . . . . . . . . . 88
5.5 Results . . . . . . . . . . . . . . . . . . . . . . . . . . . . . . . . . . . 895.5.1 Reliability . . . . . . . . . . . . . . . . . . . . . . . . . . . . . 895.5.2 Pipeline Optimization . . . . . . . . . . . . . . . . . . . . . . 895.5.3 Spatial Correspondence with CS . . . . . . . . . . . . . . . . . 905.5.4 Automatic Thresholding . . . . . . . . . . . . . . . . . . . . . 91
5.6 Discussion . . . . . . . . . . . . . . . . . . . . . . . . . . . . . . . . . 955.6.1 Reliability of Pre-surgical fMRI . . . . . . . . . . . . . . . . . 955.6.2 ROC-r Pre-processing Optimization . . . . . . . . . . . . . . . 955.6.3 Clinical Utility of ROC-reliability Analysis . . . . . . . . . . . 96
5.7 Conclusion . . . . . . . . . . . . . . . . . . . . . . . . . . . . . . . . . 98
iv

Chapter 6 Manuscript 4: A Unified Framework to Optimize fMRIand MEG Processing for Push-button Pre-surgical Map-ping . . . . . . . . . . . . . . . . . . . . . . . . . . . . . . . . 99
6.1 Motivation . . . . . . . . . . . . . . . . . . . . . . . . . . . . . . . . . 99
6.2 Abstract . . . . . . . . . . . . . . . . . . . . . . . . . . . . . . . . . . 100
6.3 Introduction . . . . . . . . . . . . . . . . . . . . . . . . . . . . . . . . 101
6.4 Methods . . . . . . . . . . . . . . . . . . . . . . . . . . . . . . . . . . 1036.4.1 Processing Pipeline Optimization . . . . . . . . . . . . . . . . 1036.4.2 Subjects . . . . . . . . . . . . . . . . . . . . . . . . . . . . . . 1046.4.3 Stimulation Paradigm . . . . . . . . . . . . . . . . . . . . . . 1056.4.4 MRI Acquisition . . . . . . . . . . . . . . . . . . . . . . . . . 1056.4.5 MRI Processing . . . . . . . . . . . . . . . . . . . . . . . . . . 1056.4.6 MEG Recording . . . . . . . . . . . . . . . . . . . . . . . . . . 1066.4.7 MEG Processing . . . . . . . . . . . . . . . . . . . . . . . . . 1066.4.8 Intraoperative Mapping . . . . . . . . . . . . . . . . . . . . . 107
6.5 Results . . . . . . . . . . . . . . . . . . . . . . . . . . . . . . . . . . . 1086.5.1 Pre-processing Optimization . . . . . . . . . . . . . . . . . . . 1086.5.2 Automated Thresholding . . . . . . . . . . . . . . . . . . . . . 1106.5.3 Patient Case . . . . . . . . . . . . . . . . . . . . . . . . . . . . 110
6.6 Discussion . . . . . . . . . . . . . . . . . . . . . . . . . . . . . . . . . 114
6.7 Conclusion . . . . . . . . . . . . . . . . . . . . . . . . . . . . . . . . . 117
Chapter 7 Conclusions . . . . . . . . . . . . . . . . . . . . . . . . . . . 118
7.1 Summary . . . . . . . . . . . . . . . . . . . . . . . . . . . . . . . . . 118
7.2 Future Work . . . . . . . . . . . . . . . . . . . . . . . . . . . . . . . . 120
7.3 Conclusion . . . . . . . . . . . . . . . . . . . . . . . . . . . . . . . . . 122
References . . . . . . . . . . . . . . . . . . . . . . . . . . . . . . . . . . . . . 123
v

List of Tables
4.1 Correlation Between Goodness-of-fit and ROC-r Reliable Fraction 70
5.1 Patient characteristics . . . . . . . . . . . . . . . . . . . . . . . 84
5.2 Functional Task Battery . . . . . . . . . . . . . . . . . . . . . . 86
5.3 ROC Contingency Table . . . . . . . . . . . . . . . . . . . . . . 89
5.4 Optimized Pre-processing Pipeline Frequencies . . . . . . . . . 92
vi

List of Figures
1.1 Functional MRI . . . . . . . . . . . . . . . . . . . . . . . . . . 4
1.2 Magnetoencephalography . . . . . . . . . . . . . . . . . . . . . 4
2.1 MR Relaxation . . . . . . . . . . . . . . . . . . . . . . . . . . 9
2.2 Field Offsets Around a Blood Vessel . . . . . . . . . . . . . . . 11
2.3 General Linear Model . . . . . . . . . . . . . . . . . . . . . . . 13
2.4 MEG Evoked Response . . . . . . . . . . . . . . . . . . . . . . 14
2.5 MEG Signal . . . . . . . . . . . . . . . . . . . . . . . . . . . . 15
2.6 MEG Forward Solution . . . . . . . . . . . . . . . . . . . . . . 17
2.7 ROC Curve Calculation . . . . . . . . . . . . . . . . . . . . . 23
2.8 ROC-r AUC Plot . . . . . . . . . . . . . . . . . . . . . . . . . 25
2.9 Dependence of ROC-r Method on SNR and Activation Extent 27
3.1 Test-retest Overlap Schematic . . . . . . . . . . . . . . . . . . 38
3.2 ROC-r Calculation Schematic . . . . . . . . . . . . . . . . . . 40
3.3 Group fMRI Maps of Finger Tapping . . . . . . . . . . . . . . 41
3.4 Group Mean Test-retest Overlap . . . . . . . . . . . . . . . . . 42
3.5 Variability of Single-subject ROC-r . . . . . . . . . . . . . . . 43
3.6 Variability of Single-subject Overlap . . . . . . . . . . . . . . 45
3.7 Optimized Thresholding for Highly Reliable Data . . . . . . . 47
3.8 Optimized Thresholding for Moderately Reliable Data . . . . . 48
3.9 Optimized Thresholding for Unreliable Data: 1 . . . . . . . . 49
3.10 Optimized Thresholding for Unreliable Data: 2 . . . . . . . . 50
3.11 Group-level Overlap of Reliability Optimized Thresholded Maps 51
3.12 Subject-specific Pre-processing for Enhanced Reliability . . . . 53
4.1 ROC-r Output Schematic . . . . . . . . . . . . . . . . . . . . 66
vii

4.2 Sensory Evoked Field Butterfly Plots and Sensor Topographies 68
4.3 MEG Dipole Goodness-of-fit Compared to ROC-reliability . . 69
4.4 Example Co-localization of Dipole and Thresholded Beamformer 72
4.5 Co-localization Accuracy Histogram . . . . . . . . . . . . . . . 73
4.6 Dependence of Co-localization Accuracy on Quality Metrics . 74
5.1 Patient vs. Controls Reliability Histograms . . . . . . . . . . . 90
5.2 Patient Reliability With/Without Pipeline Optimization . . . 91
5.3 CS to fMRI Distance vs. Threshold . . . . . . . . . . . . . . . 92
5.4 Co-localization of ROC-r Thresholded fMRI Maps and CS Results 93
5.5 Sensitivity and Specificity of ROC-r Localization . . . . . . . . 94
6.1 ROC-r Schematic . . . . . . . . . . . . . . . . . . . . . . . . . 104
6.2 fMRI Reliability by Pipeline . . . . . . . . . . . . . . . . . . . 109
6.3 MEG Reliability by Pipeline . . . . . . . . . . . . . . . . . . . 111
6.4 Example ROC-r Localization for fMRI and MEG . . . . . . . 112
6.5 ROC-r Group Overlap for fMRI and MEG . . . . . . . . . . . 113
6.6 Patient Example of ROC-r Optimization for fMRI and MEG . 114
viii

Abstract
Pre-surgical mapping has become a crucial tool in the preparation and planning forbrain tumor resection since the development of widely available non-invasive imag-ing technologies like functional magnetic resonance imaging (fMRI) and magnetoen-cephalography (MEG). Strategies for dealing with single-subject analysis are key toovercome issues surrounding individual variability and inter-rater reliability. In thisthesis, a receiver operating characteristic reliability (ROC-r) framework for evaluatingand optimizing the reliability of pre-surgical mapping is developed and implementedin a variety of applications. ROC-r allows for fully automated, yet individualizedprocessing of single-subject data, directly addressing both the issues of individualvariability and inter-rater reliability for fMRI and MEG.
A series of four manuscripts form the foundation of this thesis. The first, “Thresh-olds in fMRI studies: Reliable for single subjects?”, shows the impact of individualvariability on the reliability of fMRI activation maps, and demonstrates the use ofROC-r for evaluating reliability and selecting activation thresholds. The second pa-per, “Fully automated quality assurance and localization of volumetric MEG for pre-surgical mapping”, establishes the use of ROC-r for quality assurance and automatedlocalization in MEG. The third study, “Improving fMRI reliability in pre-surgicalmapping for brain tumors”, shows the primary clinical application of ROC-r in pre-surgical mapping. This paper demonstrates that although patient data are less re-liable than controls, this can be compensated for by optimization of pre-processingpipelines. Furthermore, this manuscript compared the fMRI results to cortical stimu-lation mapping, showing that more reliable datasets were better at identifying criticaleloquent brain regions. In the fourth and final manuscript, “A unified framework tooptimize fMRI and MEG processing for push-button pre-surgical mapping”, we explic-itly evaluate ROC-r as a unified framework for push-button individualized analysisof fMRI and MEG data.
Overall, this thesis demonstrates that ROC-r enhances the reliability of pre-surgical mapping by both fMRI and MEG, by providing quantitative measures forselecting reliable pre-processing pipelines, and determining data-driven thresholds forlocalizing reliable activation foci. The ROC-r method improves pre-surgical map-ping capabilities by introducing clinically relevant quality assurance parameters andfacilitating push-button production of reliable activation maps.
ix

List of Abbreviations and Symbols Used
ACC autocorrelation correction
AFNI analysis of functional neuroimages
AUC area under the curve
α flip angle
BEM boundary element method
BOLD blood oxygen level dependent
CBF cerebral blood flow
CBV cerebral blood volume
CMRO2 cerebral metabolic rate of oxygen consumption
CS cortical stimulation
ECD equivalent current dipole
EOG electro-oculargraphy
FR Reliable Fraction
fMRI functional magnetic resonance imaging
FDR false discovery rate
FN false negatives
FOV field of view
FP false positives
FPR false positive rate
FWHM full width half maximum
GLM general linear model
GoF goodness-of-fit
GRF gaussian random field
HRF hemodynamic response function
ICA independent component analysis
ICC intraclass correlation
MEG magnetoencephalography
MNI montreal neurological institute
MNS median nerve stimulation
x
MPR motion parameter regression
MP-FLASH magnetization prepared fast low angle shot
MRI magnetic resonance imaging
NPAIRS nonparametric prediction, activation, influence, and reproducibility resampling
RJ Jaccard overlap
RR Rombouts overlap
ROC receiver operator characteristic
ROC-r receiver operator characteristic reliability
ROI region of interest
SEF sensory evoked fields
SNR signal-to-noise ratio
SSS signal space separation
TE echo time
TI inversion time
TN true negatives
TP true positives
TPR true positive rate
TR repetition time
tSSS temporal signal space separation
WHO world health organization
xi

Acknowledgements
There are many people who I would like to thank for helping to make this work
possible. My mentors Ryan D’Arcy, Steven Beyea, Gerhard Stroink, and David
Clarke for giving me the opportunity to work in this fantastic field, and helping
me complete the various works described in this thesis. Also a special thanks to Tim
Bardouille, who provided invaluable feedback on my MEG manuscripts.
I want to acknowledge the support offered by my peers throughout my tenure at
Dalhousie. Especially to Steve Patterson for many insightful conversations, and a
memorable trip through Tasmania. To Eva Gunde for always lending a willing ear,
and encouraging me to ’focus!’. Also to Josh Bray, Erin Mazerolle, Kim Brewer, and
Jodie Gawryluk. These individuals were my early role models as graduate students,
and their influence has not gone unappreciated.
There have been a host of supportive staff both at the lab and within the hospital
that have been vital to conducting these research projects. Perhaps chief among them
is Ron Hill, who provided endless assistance in working with the clinical facilities.
Maggie Clarke for conducting my MEG scans, and both Dave McAllindon and Careesa
Liu for running my fMRI experiments.
And last, but certainly not least to my family and friends for supporting me
through all the hard work. Of course none more so than my loving wife Alice, for the
many pots of tea, the early morning breakfasts, and shoveling snow when I was too
busy writing. You have kept me focussed on my goals, and always weighed in when
I was wrestling with words.
xii

Chapter 1
Introduction
This thesis examines the challenges of pre-surgical functional mapping by functional
MRI (fMRI) and magnetoencephalography (MEG), and in particular addresses the
difficulties associated with single-subject analyses. Pre-surgical mapping is increas-
ingly used to obtain patient-specific information on the location of critical functional
zones, in order to provide insights into the risk/benefit tradeoffs of surgical interven-
tion. The production of robust activation maps and the reduction of subjectivity in
data processing are vital in order to consistently provide the best possible pre-surgical
information. Three significant challenges in implementing a pre-surgical mapping pro-
gram are:
• Identifying data quality issues
• Selecting data processing pipelines
• Setting activation thresholds
This thesis demonstrates a novel method of receiver operating characteristic re-
liability (ROC-r) analysis for robust and automated pre-surgical mapping for brain
tumor surgery. The use of ROC-r addresses each of these three challenges by gener-
ating quantitative quality assurance parameters, optimizing the pre-processing steps
used to produce functional maps, and providing data-driven thresholding of the re-
sulting images. In order to understand the context of the capabilities of ROC-r, a
brief introduction to pre-surgical mapping will be given, and motivation for the need
for an automated yet individualized approach to image production will be presented.
This will be followed in chapter 2 by a discussion of some of the key theoretical under-
pinnings of fMRI and MEG mapping, along with a detailed description of the ROC-r
algorithm. Chapter 3 will demonstrate the application of ROC-r analysis to fMRI
data, and a comparison to other overlap-based analyses. Chapter 4 outlines the appli-
cation of ROC-r for MEG processing, with a comparison to equivalent current dipole
1

2
localization for validation. In chapter 5, a patient cohort is examined to demonstrate
how reliability improvements translate into improved pre-surgical localization. Fi-
nally, chapter 6 explicitly shows that ROC-r can be used to optimize pre-processing
pipelines and automatically select activation thresholds using a unified approach for
fMRI and MEG.
1.1 Surgical Treatment of Brain Tumors
Surgical resection is one of the primary treatment options for brain tumors, along with
radiation therapy and chemotherapy. Resection provides immediate benefits in terms
of symptom control, especially in rapidly growing tumors, by reducing intracranial
pressure through debulking [1, 2]. Surgical treatment also provides the opportunity
for tumor biopsy, providing vital histological information. Additionally, tumors often
contain hypoxic cells with inadequate vascular supply, which respond poorly to radia-
tion and chemotherapy, and removal of bulk tumor can therefore increase the efficacy
of other treatment options. Most importantly, complete surgical resection correlates
with increased survival times compared to partial resection or biopsy alone [1–5].
Excision of brain tumors becomes more challenging when located in or next to
eloquent cortex (i.e. critical functional zones), which may be the case for more than
half of all tumors [6]. Surgeons must therefore balance the desire to achieve gross total
resection with the need to respect critical cortical structures and avoid post-operative
morbidity. The primary tool at a surgeon’s disposal in these cases is direct electrical
stimulation of the cortex (i.e. cortical stimulation or CS). Popularized by Wilder
Penfield and colleagues in the mid 20th century [7–9], cortical stimulation can be
used to produce involuntary motor responses, elicit somatic sensations, or temporarily
disrupt language functions. The intraoperative mapping of brain functions afforded
by CS increases the ability to achieve gross total resection with minimal post-operative
deficits [10, 11].
While cortical stimulation remains the gold standard for individualized functional
mapping [3], there are several obvious drawbacks to this technique. Firstly, CS is
unavailable until the time of surgery, rendering it unsuitable for pre-operative plan-
ning or post-operative assessment. CS is also clearly unethical for research studies in

3
healthy controls, restricting our knowledge of its effects in humans to diseased pop-
ulations. Even in patients, CS requires highly cooperative individuals, may extend
operating room times, and comes with a risk of inducing seizures [12]. Furthermore,
it has recently been argued that the effects of CS are more complex than generally ac-
knowledged, including current spread, potentially distant remote effects, and complex
behavioural responses [13]. Moreover, large areas of the cerebrum can not be mapped
by cortical stimulation, which is not typically able to map sites deep to the cortex, or
areas not exposed by the craniotomy. Nonetheless, CS mapping is indispensable for
avoiding post-operative morbidity in the context of significant individual variability of
functional anatomy, especially in the presence of potential reorganization in response
to pathology [11, 13,14].
1.2 Pre-Surgical Mapping
In the last few decades, potential non-invasive alternatives to CS have arisen in the
form of functional magnetic resonance imaging (fMRI) and magnetoencephalography
(MEG). Functional MRI was first demonstrated by Ogawa et al. (Figure 1.1) [15],
and has generated an incredible level of interest both from the neuroscience and
clinical communities, due to its ability to generate high resolution images of brain
function [16]. Modern MEG scanners, with large arrays of sensors that provide whole-
brain coverage and millisecond temporal resolution, appeared around the same time
as the first fMRI experiments (Figure 1.2) [17]. Other functional mapping techniques
like electroencephalography (EEG) or positron emission tomography (PET) are also
available, but are outside the scope of this thesis.
The advent of non-invasive functional imaging has revolutionized the practice of
pre-surgical mapping. While both MEG and fMRI have been demonstrated exten-
sively for pre-surgical mapping, MEG has not achieved the same popularity as fMRI
for pre-surgical mapping. This is likely due to the lesser availability of MEG scanners
as compared to MRI machines, as MRI scanners are ubiquitous due to their anatom-
ical imaging capabilities. In any case, both fMRI and MEG offer non-invasive means
to perform whole-brain functional mapping. This confers the advantages of being
safe, repeatable, and acceptable for use in research studies on healthy controls.

4
Figure 1.1: The 4 Tesla Varian fMRI scanner used in this thesis (left), a typical rawfMRI signal for a single task-responding voxel (middle), and the resulting activationmap produced by a finger tapping task (right).
Figure 1.2: The 306-channel Elekta MEG scanner used in this thesis (left), typicalaccumulated sensor-level data (middle), and the resulting activation map producedby median nerve stimulation (right).
The use of fMRI and MEG for pre-surgical mapping has been validated by com-
parisons with CS. MEG validation studies have focussed primarily on somatosensory
mapping [18–30], along with a number of studies on motor mapping [24, 28, 30–33],
and relatively few for language mapping protocols [34,35]. For fMRI, the majority of
comparisons with CS have focussed on motor [29,36–46] and language [37,42,44,47–54]
mapping, with less attention to somatosensory localization [55].
The agreement between the non-invasive mapping modalities and CS is highest for
simple functions like primary sensory and motor, whereas for language localization
the results are more equivocal. For example, motor mapping by fMRI can achieve

5
92% sensitivity [43], with lower bounds around 77% [45]. MEG can obtain very
high sensitivity (98%) and specificity (94%) [31] for sensorimotor mapping, with up
to 77% of MEG localizations being within 3 mm of CS locations [25]. However,
larger discrepancies have been reported, in some cases greater than 12 mm on average
[27]. Importantly, the MEG detection rate was unaffected by the presence of tumors
[31], whereas fMRI signal is known to be suppressed near high-grade gliomas [56].
Korvenoja et al. found that MEG was more sensitive than fMRI for mapping the
sensorimotor cortex, but notably used sensory mapping for MEG and a motor task
for fMRI [29]. A recent report argues that CS remains a more reliable tool than fMRI
for mapping the primary motor cortex, due to potential false negatives by fMRI [45].
Nonetheless, fMRI appears to be more reliable than anatomical MR imaging alone
for identifying the primary motor area in the presence of pathological cortex, as
demonstrated by Wengeroth et al. [46].
For language mapping, fMRI studies have shown a distinct trade-off between sen-
sitivity and specificity. For instance, Roux et al. [51] found 91-97% specificity with
59-66% sensitivity, whereas Rutten et al. [50] found high sensitivity (100%) with lower
specificity (61%). These seemingly contradictory results show that sensitivity can be
traded for specificity depending on the methodology employed. Indeed, Rutten et al.
used the conjunction of several language tasks in order to increase sensitivity, which
clearly also decreases specificity. For MEG, no comparisons of language mapping
to CS have been reported with sample sizes large enough to calculate sensitivity or
specificity, but case reports indicate high concordance with CS [34,35]. Overall, there
is considerable room for improvement of language mapping techniques in terms of
predicting the location of eloquent cortex [57].
1.3 Single-Subject Imaging
One of the greatest challenges for functional MRI and MEG in pre-surgical mapping
is performing robust imaging at the single-subject level. Single-subject imaging is
clearly needed for clinical functional mapping, as we are interested in where a partic-
ular brain function is located in an individual patient - not in making generalizations
to populations. However, single-subject mapping is difficult due to the inherently
low signal-to-noise for both fMRI and MEG (see chapter 2). This is compounded

6
by artifacts associated with both intrinsic physiological signals (e.g. heart beat) or
extrinsic issues, like subject motion. Many of these issues are amplified in patient pop-
ulations, and additional issues arise with task compliance or performance associated
with impacts of pathology.
There is a wealth of pre-processing tools available for fMRI and MEG to help deal
with data quality issues or artifacts, but this places a burden on the user to determine
the best pipeline for a given data set. While it is generally accepted that motion
correction and spatial smoothing improves the reliability of fMRI maps, the impact
of other pre-processing options is less clear [58–61]. This has led to the development
of quantitative quality assurance metrics like ROC-r and NPAIRS (Nonparametric
Prediction, Activation, Influence and Reliability), which are capable of evaluating the
impact of pre-processing choices on a case-by-case basis. Previously, no analogous
tool has been available for volumetric MEG source mapping, although goodness-of-fit
parameters are routinely used to determine the quality of MEG dipole localizations,
and automated processing of sensor level MEG data has been demonstrated [62, 63].
Even using individualized pre-processing strategies, the issue of thresholding func-
tional maps to reveal the task-related areas is a significant challenge at the single-
subject level. While threshold strategies for multiple-comparison control in group
level analyses are well developed [64–67], these methods are not flexible enough to
accommodate the significant inter-individual differences in activation. Even within
individuals, significant variations in activation strength can be seen from run to run,
including well known habituation effects. ROC-r provides an alternative method of
individualized, data-driven thresholding by enforcing requirements on spatial relia-
bility and placing minimal assumptions on the underlying data distributions.
ROC-r was developed for data quality assessment, pipeline optimization, and
threshold selection based on spatial reliability of activation maps. Because this
method operates on the final product of the pre-surgical mapping process (i.e. ac-
tivation maps), and because the activation map is the common link between fMRI
and MEG source imaging, ROC-r provides a unified approach to optimizing both
modalities.

7
1.4 Research Objectives
In this thesis, we will demonstrate the utility of ROC-r across a variety of experimental
conditions. We will convey the importance of taking an individualized approach to the
analysis of pre-surgical mapping data, in order to produce the most reliable results.
ROC-r will be shown to provide effective control of data quality for both MEG and
fMRI, and the capabilities of this approach will be demonstrated in situ for pre-
surgical mapping in patients with brain tumors. This thesis will consist primarily of
a series of four manuscripts, addressing the following research objectives:
• Manuscript 1: Demonstrate validity of ROC-r as a measure of fMRI image
reproducibility that is sensitive to individual variability (Ch. 3).
• Manuscript 2: Demonstrate the application of ROC-r for quality assurance and
automated localization of volumetric MEG maps (Ch. 4).
• Manuscript 3: Show that ROC-r quality assurance and optimization improves
the ability of pre-surgical fMRI to localize critical eloquent cortex (Ch. 5).
• Manuscript 4: Illustrate ROC-r as a common framework for processing opti-
mization and automated thresholding of both MEG and fMRI images (Ch. 6).
Throughout these manuscripts, the themes of data quality assessment, optimiza-
tion of pre-processing pipelines, and automated thresholding for the production of
robust functional maps will be stressed.

Chapter 2
Theory
In this chapter, a brief discussion of the theoretical underpinnings of fMRI and MEG
mapping will be presented. The generation of the relevant signals will be discussed,
and the basic steps involved in the formation of statistical maps are outlined. A
summary of the available techniques for thresholding statistical maps will be given,
and finally a detailed description of the motivation behind and implementation of the
ROC-r framework is presented.
2.1 Functional MRI
2.1.1 Signal Generation
Magnetic resonance imaging (MRI) is a non-invasive imaging technique, based on
the interaction of the magnetic dipole moment of (typically hydrogen) nuclei in the
body with a strong static magnetic field ( �B0). The torque experienced by the nuclear
magnetic moment in this field leads to precession at the ‘Larmor frequency’ (ω0),
given by:
ω0 = γB0 (2.1)
where γ is the gyromagnetic ratio (42.6 MHz/Telsa for Hydrogen). Macroscopically,
this equilibrium state does not create an observable signal, as the bulk magnetiza-
tion ( �M) is constant in time due to a lack of (transverse) phase coherence of the
precessing dipoles. The application of an orthogonal magnetic field in the form of a
radio-frequency pulse tips this bulk magnetization vector into the transverse plane,
and introduces the necessary phase coherence. This magnetization then produces
an observable signal as it rotates and relaxes back to its equilibrium state (Figure
2.1). This relaxation is described by a longitudinal relaxation rate governing return
to equilibrium (R1), and an apparent rate of signal loss (R2*) due to loss of transverse
phase coherence.
8

9
Figure 2.1: MR relaxation. After a radio-frequency excitation pulse, the magnetiza-tion vector �M is shown in the transverse plane. This proceeds to precess and relaxback towards the equilibrium (longitudinal) state. The rate of return to equilibrium(R1) is typically longer than the rate of signal loss (R2*) due to loss of transversephase coherence.
Functional MRI exploits endogenous contrast produced by the sensitivity of MR
relaxation to the molecular environment of hydrogen protons. The most common
fMRI techniques use the Blood Oxygen Level Dependent (BOLD) contrast generation
first described by Ogawa et al. [15]. BOLD contrasts arises from changes in the trans-
verse relaxation rate (R2*) of the MR signal caused by changes in the relative concen-
tration of oxygenated and deoxygenated hemoglobin. Deoxygenated hemoglobin is
paramagnetic, and increases the local magnetic susceptibility of blood when present.
This in turn induces local field offsets compared to the static field around an idealized
cylindrical blood vessel, (ΔB) given by:
ΔB = 2πΔχ(1− Y )B0sin2(θ)
(ar
)2
cos(2φ) (2.2)
outside of the blood vessel, where Δχ is the susceptibility difference between fully oxy-
genated and deoxygenated blood, (1-Y) is the fraction of deoxygenated hemoglobin
in the blood, B0 is the main magnetic field, θ is the angle of the blood vessel to the
main magnetic field, a is the radius of the vessel, r is the distance from the center of
the vessel, and φ is the polar angle about the vessel (Figure 2.2a). Inside the blood

10
vessel, a constant field offset of:
ΔB = 2πΔχ(1− Y )B0(3cos2(θ)− 1)/3 (2.3)
is present (Figure 2.2). These intra-voxel field inhomogeneities lead to more rapid
transverse relaxation of the MR signal as individual spins gain or lose phase due to
precession in their local magnetic field.
The physiological links between BOLD contrast and brain function are complex
[69], but essentially relate to increases in cerebral blood volume (CBV), cerebral blood
flow (CBF), and cerebral metabolic rate of oxygen consumption (CMRO2) following
neuronal activity. The change in deoxyhemoglobin concentration inside a vessel (ΔY )
can be shown to be:
ΔY = (1− Y )
(ΔCBF/CBF −ΔCMRO2/CMRO2
ΔCBF/CBF + 1
)(2.4)
where Y is the baseline deoxyhemoglobin concentration. To some degree, these effects
counteract each other as increases in CBV and CMRO2 both increase local deoxyhe-
moglobin concentration, whereas increased CBF washes away deoxyhemoglobin, re-
placing it with fresh oxygenated blood. The dominating response is typically the CBF
increase, which leads to a seemingly paradoxical overall increase in local blood oxy-
genation following neuronal activity (and therefore increased signal on a R2* weighted
image) [68].
The time-course of the BOLD response to neural activity is referred to as the
hemodynamic response function (HRF). The HRF is important to consider as it is
needed for the analysis of fMRI images (Figure 2.3), and typically limits the temporal
resolution of fMRI experiments. The main BOLD response, corresponding to the
peak in the HRF, occurs approximately 5 seconds post-stimulus, with a full-width-
half-maximum of 4-5 seconds. This is usually followed by a post-stimulus undershoot,
which may take tens of seconds to fully return to baseline. An initial negative BOLD
dip is sometimes observed as the CMRO2 changes preceding the CBF and CBV
responses, but is not robust enough to be used for functional mapping. The temporal
sampling achieved in typical whole-brain fMRI studies (1-3 seconds) is thus sufficient
to sample the main HRF components.

11
Figure 2.2: a) Idealized blood vessel represented as a uniform cylinder of radius ‘a’,at an angle (θ) to the static magnetic field (B0). b) Field offsets in and around thevessel caused by magnetic susceptibility of deoxygenated hemoglobin in the blood.Adapted from [68].

12
2.1.2 Image Formation
Typical fMRI analysis pipelines include a variety of pre-processing steps including
rigid-body co-registration of the fMRI images to initially correct for motion within the
scanning session. Affine transformations are typically employed using the anatomical
image as a template, in order to correct for geometric distortion. High-pass filtering
is commonly performed to remove low-frequency drift from the fMRI signal, although
this step can alternatively be incorporated into the general linear model (GLM, see
below). Image smoothing is also commonly performed in the pre-processing pipeline,
in order to increase the power for detection of activation, albeit at the cost of spatial
resolution.
At the heart of fMRI analysis is the general linear model (Figure 2.3). For the
GLM approach, the expected fMRI time-course is modelled by the convolution of a
canonical HRF with the experimental timing (e.g. the stimuli, responses, or some
contrast of predictors). The recorded voxel timecourse (ya(t)) of an active voxel is
assumed to follow the predicted timecourse (f(t)), plus additive effects of noise (n(t)),
polynomial baseline variation (Pa(t)), and any other modelled sources of signal (m(t),
e.g. motion):
ya(t) = α0f(t) + Pa(t) +m(t) + n(t) (2.5)
whereas an inactive voxel timecourse (yi(t)) will not exhibit any task-related signal:
yi(t) = Pi(t) +m(t) + n(t) (2.6)
where α0 estimates the magnitude of the task regressor in that particular voxel, and
the polynomial baseline function (Pi(t)) is not necessarily the same as in the active
case (although in practice the difference is typically small). By finding the value of
α0 that minimizes the sum-of-squares residuals, the magnitude of the task response
is estimated for every voxel. Finally, a goodness-of-fit statistic for each voxel is
calculated, for instance, by taking the ratio of the effect size (α0) to a measure of the
residual error:
t∗ =α
MSE(XTX)−1(2.7)
Where MSE is the mean squared residual error, and X is the design matrix, specified

13
by the stimulus timing and nuisance regressors. In this work, the t- or z-statistic is
used.
There are additional pre-processing options that can be implemented at the time
of the GLM analysis. As alluded to previously, one of these options is the number of
polynomial terms included in the baseline model of the GLM. Typically this is limited
to quadratic or cubic terms, depending on the length of the fMRI experiment. The
translation and rotation timecourses determined during rigid body motion correction
are also frequently incorporated into the GLM model, a process called motion pa-
rameter regression (MPR). This procedure can be used to account for residual signal
variation that correlates with subject motion, however it must be applied with caution
as even small amounts of task-correlated motion may cause MPR to suppress fMRI
sensitivity dramatically. Finally, auto-correlation correction (ACC), or pre-whitening,
is frequently used to correct t-values for residual timecourse correlations that were
not accounted for in the original GLM.
Figure 2.3: Example setup of a general linear model. Top left: canonical hemody-namic response function. Middle left: task block design convolved with HRF. Bottomleft: polynomial terms for baseline model. Right: Voxel displaying high correlationto the GLM task model. Raw timecourse in yellow, fit voxel response in pink.

14
2.2 Magnetoencephalography
2.2.1 Signal Generation
Magnetoencephalography is also a non-invasive method of detecting brain function,
but unlike fMRI, it is a passive recording technique. MEG measures the natural mag-
netic fields resulting from the coherent activity of small patches of cortex containing
millions of neurons. The field strengths produced are incredibly small (tens to hun-
dreds of femtoTesla, or about one billionth of the earth’s field). It is thus necessary
to perform MEG experiments in magnetically shielded environments, in order to sup-
press signals originating from outside the body. Even still, in typical experiments it
is necessary to average the responses to many stimuli together in order to achieve
sufficient signal-to-noise, producing an ‘evoked response’ (Figure 2.4).
Figure 2.4: Representative MEG data from median nerve stimulation. a) Raw dataepochs. The evoked response is not visible in single epochs. b) Averaged evokedresponse for the planar gradiometers (top) and axial magnetometers (bottom). c)Sensor topographies for the main deflection in the evoked response at 36 ms. Thedipolar pattern is obvious on the magnetometers, corresponding to a source in theright parietal lobe.
The MEG signal arises primarily from excitatory post-synaptic input to the den-
drites of cortical neurons [70] (Figure 2.5). Excitatory input causes small current
inflow to the dendrites, which can be modelled as a current dipole. The coherent
summation of many of these microscopic post-synaptic potentials produces the ob-
served evoked response, and constitutes what is called the primary current source.

15
As the brain is by nature an electrically conductive medium, there are passive macro-
scopic ohmic return currents that ensure no net build-up of charge occurs. As we
are interested in imaging only the primary currents, it is useful to formalize this
distinction:
�J(�r) = �Jp(�r) + σ(�r) �E(�r) (2.8)
where �J(�r) is the total current density, �Jp(�r) is the primary current, σ(�r) is the
conductivity of the medium, and �E(�r) is the macroscopic electric field.
Figure 2.5: Diagram of the generation of the MEG signal. a) The MEG signalarises from post-synaptic potentials of cortical neurons. b) pyramidal neurons receivevarious inputs (green) along the dendrites, which propagate towards the cell body(red). c) the post-synaptic dendrite opens ion channels, allowing an influx of charge,and causing the primary current flow (yellow). Return currents (blue) ensure chargeequilibrium. d) the primary current source (yellow) creates magnetic field that canbe measured outside the head.
In order to localize the primary current density, it is necessary to understand the
signal that is induced by both the primary and return currents, beginning with the
magnetic field produced by these currents (the forward solution, Figure 2.6). It can

16
be shown that the return currents only contribute to the measured magnetic field
where there is a gradient in electrical conductivity. Typically the head is assumed
to be a piecewise homogeneous conductor, in which case the magnetic field can be
shown to be:
�B(�r) = �Bp(�r) +μ0
4π
∑ij
(σi − σj)
∫Sij
V (�r′)�R
R3× �dS ′
ij (2.9)
where �Bp(�r) is the field caused by the primary current, μ0 is the permeability of
free space, Sij is the surface between compartments ‘i’ and ‘j’, V (�r′) is the electric
potential, and �R is the vector from a position on the surface (�r′) to the point of mea-
surement (�r). This formula allows for the calculation of the magnetic field produced
at the sensors by an arbitrary primary current source by calculating the potentials
on compartment boundary surfaces. This procedure is commonly referred to as the
boundary element method (BEM) [71]. Alternatively, a homogeneous sphere model
can be employed, which is computationally simpler. The homogeneous sphere model
gives adequate results in certain situations, but should not be used when highly ac-
curate localization is required [72].
A closely related quantity to the forward solution is the lead field (�L(�r)), which
describes the sensitivity of the MEG detectors to a unit dipole at location �r. This
formalism thus includes the orientation and type of MEG detector used in order to
relate the fields produced by the dipoles to the signal induced on the sensors. By
summing over all source locations in the brain volume, the MEG signal (m) for an
arbitrary source configuration can be calculated:
m =
∫�L(�r′) · �J(�r′)d3r′ (2.10)
In practice, the leadfield is a discretized matrix L, relating ‘m’ sensor readings to ‘n’
discrete brain locations.
2.2.2 Image Formation
Prior to image formation, there are an array of pre-processing steps that are com-
monly performed on MEG data. Removal of non-biomagnetic field components is

17
Figure 2.6: Normal component of the magnetic fields produced by a unit currentdipole (1 Am) located in a cortical sulcus between the two field extrema (pointed inthe anterior direction, tangential to the nearby head surface).
accomplished using either signal space separation techniques (SSS or tSSS), or refer-
ence sensor approaches. The raw data are usually band-pass filtered (e.g. 1-70 Hz),
in order to restrict the spectral content to the range of typical brain signals. Down-
sampling is frequently employed in order to reduce computational load. Independent
component analysis (ICA) or other decomposition techniques (e.g. SSS) can also be
used in order to separate the MEG signals into additive components. By correlat-
ing these components with known sources of artifact (e.g. eye blink or heart beat
recordings), sources of noise can be pre-emptively removed from the raw data.
Many inverse solution / source mapping techniques are available for MEG. The
earliest and most thoroughly investigated is the equivalent current dipole (ECD) [70],
in which a single dipole is placed at the location and orientation that explains as
much as possible of the observed field pattern. This point source technique is robust
in many cases, but when distributed activations are expected, require the a-priori
specification of the number of dipoles to model. For this reason, ‘dipole scanning’
techniques have been introduced, in which the dipolar source strength is estimated

18
independently for each location in a pre-defined grid.
Dipole scanning techniques find a unique solution to the MEG signal equation:
M = LY+ ε (2.11)
independently for each spatial location on the source reconstruction grid (where M
is the measured signal across the sensors, L is the discretized lead field, Y is the grid
of source strengths, and ε is additive noise). Beamformers are a particularly popular
form of dipole scanning techniques, in which the amount of cross-talk to each location
on the mapping grid is minimized (e.g. by enforcing a minimum variance constraint,
or by increasingly penalizing contributions from other spatial locations based on their
euclidean distance to the current point of interest) [73, 74]. While beamformers are
not strictly speaking imaging techniques (as the extent of a beamformer ‘activation’
has no well defined meaning), they do produce a 3D estimate of source strengths,
which in many ways resembles an activation map. More formally, only the peak
locations of a beamformer map can be interpreted to represent a source localization.
Alternatively, true ‘imaging’ techniques for MEG source mapping attempt to find
a full inversion of the matrix equation 2.11 [74]. As the number of sensors (m)
is typically much less than the number of source points (n) in the reconstruction
grid, this inversion is ill-posed, and some constraints must be introduced to find a
unique solution. The most common constraints are the minimum norm or minimum
current estimates (MNE and MCE respectively) [74, 75]. In these cases the solution
with the least source power (MNE) or least total current (MCE) are found (i.e.
minimizing the �2 or �1 norm respectively). While these solutions are attractive in the
simplicity of their constraining assumptions, they typically result in very superficial
source estimates, as a weaker source near the cortical surface (and therefore the
sensors) would produce the same field as a stronger source further from the sensors.
Less surface-biased solutions can be achieved by introducing depth weighting to the
inversion matrix, or by adopting a noise-normalized approach like dynamic statistical
parametric mapping (dSPM) or standardized low resolution brain electromagnetic
tomography (sLORETA) [74, 76, 77]. In both of the latter two imaging approaches,
the noise covariance is projected to each location on the source grid, and is used to
normalize the source estimates. It has been shown that both depth weighting and

19
noise normalization can reduce the surface bias of MEG imaging approaches [78].
In this thesis, MEG source mapping is performed primarily by the linearly con-
strained minimum variance (LCMV) beamformer spatial filtering approach [73]. In
general, LCMV beamformer spatial filters attempt to find a set of weights (WTr0)
for the sensor data that project unity power to a voxel of interest (r0), and minimal
source variance elsewhere. The output of the spatial filter (y(�r, t)):
y(�r, t) = WTr0(�r)m(t) (2.12)
is ideally equal to zero everywhere except the point of interest. The weights matrix
is that which minimizes the total source power (Pr0):
Pr0 = tr(WT
r0CmWr0
)(2.13)
where tr is the trace, and Cm is the covariance matrix for the data. The weights are
subject to unity gain at the point of interest:
WTr0Lr0 = I (2.14)
It can be shown that the minimum variance beamformer solution is:
WTr0= C−1
m Lr
(LT
r C−1m Lr
)−1(2.15)
and thus:
Pr0 = tr([
LTr0C−1
m Lr0
]−1)
(2.16)
This procedure is repeated for each voxel in the source space, producing a map of
source power. However, as MEG noise projects non-uniformly throughout the brain,
the source estimates must be normalized to the projected noise power (Nr0 , e.g. from
a pre-stimulus period):
Nr0 = tr([
LTr0C−1
n Lr0
]−1)
(2.17)
where Cn is the sensor noise covariance matrix. Thus the final beamformer output is

20
a ‘pseudo-Z’ statistical map:
Z2r0=
tr([
LTr0C−1
m Lr0
]−1)
tr([
LTr0C−1
n Lr0
]−1)
=Pr0
Nr0
(2.18)
The beamformer output may be calculated for each time-point of the evoked response
separately, in order to reconstruct dynamic (i.e. 4D) MEG source ‘images’.
2.3 Statistical Images and Thresholding
The fMRI and MEG image formation methods used in this thesis all result in sta-
tistical maps of brain activity - that is an estimate of signal strength relative to the
variance or noise at that location. The final step in taking a pre-processed functional
image and producing a fully processed activation map is thresholding the image into
active and inactive areas. This introduces a fundamental issue for functional mapping
- deciding what level of significance is appropriate for identifying active brain regions.
Simple fixed error rates approaches are insufficient, due to the large number of brain
voxels tested in typical functional mapping studies. For example, with 64x64x20 vox-
els, more than 80,000 tests are performed and a naive p < 0.05 significance threshold
would result in more than 4000 false positive voxels.
Simple multiple comparison corrections like the Bonferroni correction are not suit-
able alternatives [66, 67], as the corrected p-values (pB) assume that all voxels (V )
represent an independent test:
pB =p
V(2.19)
As there is some degree of spatial correlation in functional images (e.g. regions of
activity are not typically single voxels), the number of truly independent tests is much
lower, and the Bonferroni correction is overly strict. An improved approach is to use
gaussian random field (GRF) theory to estimate the image smoothness and determine
the true number of independent tests that are available [64].
An alternative strategy is to specify an acceptable false discovery rate (FDR)

21
[65,79], which is the proportion of false positives (FP) amongst the active voxels:
FDR =FP
FP + TP(2.20)
where TP is the number of true positives. The significance level that satisfies this
criteria (pG) can be found by incrementally increasing the number of active voxels ‘i’,
and finding the maximum number of voxels for which the i’th p-value (pi) satisfies
the relation:
pG = max
{i : pi ≤ iFDR
V
}≤ iFDR
V(2.21)
The FDR and GRF approaches offer some degree of data-driven adaptation, and are
widely used for group level studies. Both of these approaches are focussed on avoiding
false positives, which may not be ideal in the context of clinical functional imaging,
where false negatives are of greater concern in order to avoid incorrectly identifying
a region of cortex as being safe to resect [80].
The above approaches specifying desired p-value levels of statistical significance
all suffer from being essentially fixed-threshold techniques, which are unable to adapt
sufficiently to individual variability in activation maps. One recently developed alter-
native is the adaptive thresholding method [80], which models image histograms as
a combination of gaussian noise, and gamma activation/de-activation distributions.
This approach is flexible to different levels of activation and noise, but does not in-
corporate the rich spatial information available in imaging. For MEG, thresholding
methods based on permutation testing [81, 82] have been suggested, but in practice
manual adjustment of threshold levels are still common, as no broadly accepted proce-
dure has emerged. In general, data-driven methods are more suitable for dealing with
individual variability than fixed significance or multiple comparison based methods,
as the latter do not typically adjust to differing levels of noise or activation.
In this thesis, we present a data-driven thresholding strategy based on spatial
reliability of activation maps. This technique will be shown to provide robust thresh-
olded images for single-subject mapping. Furthermore, measuring reliability allows
for evaluation of the pre-processing choices made to produce these maps, and for
quality control of the activation images. This method of guiding functional image
formation is described in detail in the following section.
22
2.4 The ROC-r Framework
2.4.1 Motivation and Background
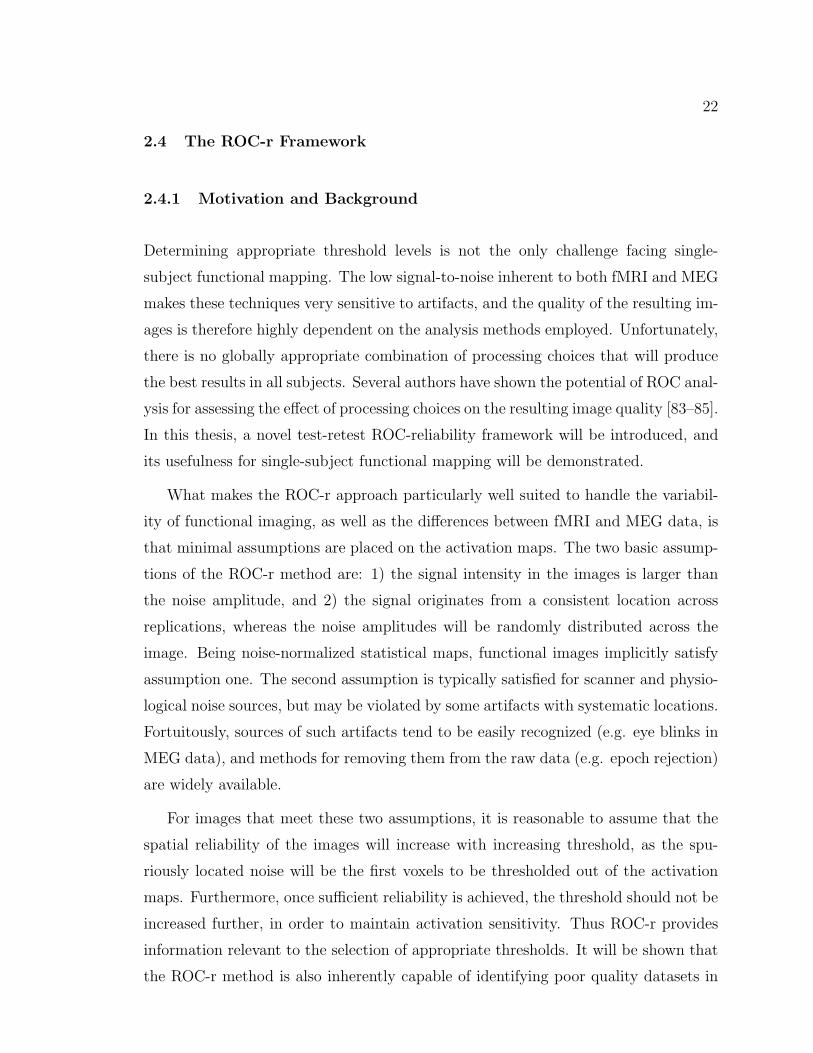
Determining appropriate threshold levels is not the only challenge facing single-
subject functional mapping. The low signal-to-noise inherent to both fMRI and MEG
makes these techniques very sensitive to artifacts, and the quality of the resulting im-
ages is therefore highly dependent on the analysis methods employed. Unfortunately,
there is no globally appropriate combination of processing choices that will produce
the best results in all subjects. Several authors have shown the potential of ROC anal-
ysis for assessing the effect of processing choices on the resulting image quality [83–85].
In this thesis, a novel test-retest ROC-reliability framework will be introduced, and
its usefulness for single-subject functional mapping will be demonstrated.
What makes the ROC-r approach particularly well suited to handle the variabil-
ity of functional imaging, as well as the differences between fMRI and MEG data, is
that minimal assumptions are placed on the activation maps. The two basic assump-
tions of the ROC-r method are: 1) the signal intensity in the images is larger than
the noise amplitude, and 2) the signal originates from a consistent location across
replications, whereas the noise amplitudes will be randomly distributed across the
image. Being noise-normalized statistical maps, functional images implicitly satisfy
assumption one. The second assumption is typically satisfied for scanner and physio-
logical noise sources, but may be violated by some artifacts with systematic locations.
Fortuitously, sources of such artifacts tend to be easily recognized (e.g. eye blinks in
MEG data), and methods for removing them from the raw data (e.g. epoch rejection)
are widely available.
For images that meet these two assumptions, it is reasonable to assume that the
spatial reliability of the images will increase with increasing threshold, as the spu-
riously located noise will be the first voxels to be thresholded out of the activation
maps. Furthermore, once sufficient reliability is achieved, the threshold should not be
increased further, in order to maintain activation sensitivity. Thus ROC-r provides
information relevant to the selection of appropriate thresholds. It will be shown that
the ROC-r method is also inherently capable of identifying poor quality datasets in

23
Figure 2.7: Demonstration of the ROC-r calculation of retest ROC curves. Left: ROCcurve for an example template image thresholded at t=3. Right: Example template(red) and retest (blue) images for increasing retest image thresholds. Intermediatethresholds provide the optimal test-retest overlap (purple). This color scheme will beused extensively for showing ROC-r thresholded test-retest images.
which the above assumptions are not met, as the expected reliability versus thresh-
old behaviour will not be observed (i.e. thresholding will not improve reliability due
to lack of signal or presence of spurious artifacts). Finally, ROC-r can be used to
guide pre-processing decisions, in order to improve the spatial reliability of activation
maps. The ROC-r method is the only technique available that combines quantita-
tive quality assurance metrics, pre-processing pipeline optimization, and automated
individualized thresholding in a single package.
2.4.2 ROC-r Algorithm
The ROC-r algorithm calculates ROC curves based on the overlap of test-retest func-
tional maps as a function of image thresholds. For the ROC-r calculation, one image
(e.g. the ‘test’ image) is taken as the activation template for the ROC ‘gold standard’.
The ROC curve (Figure 2.7) is defined as a plot of the true and false positive rates
(TPR and FPR respectively), as a function of retest image threshold (t2), at a fixed

24
template image threshold (t1):
TPR(t2) =TP (t2)
TP (t2) + FN(t2)
FPR(t2) =FP (t2)
FP (t2) + TN(t2)
(2.22)
where TP is the number of true positives (voxels active in both images, A1,2), TN
is the true negatives (voxels inactive in both images I1,2), FP is the number of false
positives (active in only the retest image A2), and FN is the number of false negatives
(active in only the template image A1). The area under the ROC curve is calculated
as a function of t1 (i.e. AUC(t1)), and used as the ROC-r indicator of retest reliability.
The number of retest thresholds evaluated should be sufficient to produce accurate
estimates of the retest ROC curves (typically ∼20 threshold levels).
The retest ROC curves are highly dependent on the choice of template thresh-
old. The ROC-r algorithm therefore explicitly evaluates the effect of the template
threshold on retest image quality, by repeating the ROC and AUC calculation for all
possible template image thresholds (Figure 2.8). This ensures that the resulting esti-
mates of image reliability are not dependent on the choice of template threshold, and
additionally allows one to determine threshold levels that produce robust template
images directly. The basic output of a ROC-r analysis is thus a plot of the retest
AUC as a function of template image threshold.
Overall reliability can be reduced to a quantitative metric for quality assurance
purposes, and for determining the best analysis pipeline for a particular dataset. The
metric of choice is the ‘reliable fraction’ (FR), which is calculated as the fraction of
the threshold range for which the activation pattern obtained is reliable (Figure 2.8):
FR =Δtreliable
Δtreliable +Δtunreliable(2.23)
where the criteria for reliability is for the AUC to be above the ‘mid-range’ value (i.e.
AUCmid, half way between the minimum and maximum AUC values):
AUCmid =AUCf + AUCi
2(2.24)

25
This metric is particularly attractive as it measures how quickly the retest AUC
(i.e. reliability) increases with template image threshold, and thus how much of the
threshold range is reliable activation. For small activated regions, assuming random
uncorrelated background noise, FR is related to the image signal-to-noise ratio (SNR,
see Figure 2.9).
The ROC-r AUC plots can also be used to determine data-driven thresholds. The
approach taken in this work is to balance the desire for a high retest AUC with the
diminishing returns observed at high thresholds. This is accomplished by defining
the equivalent ‘linear-rate’ of AUC increase with threshold (AUC ′lin) as the slope of
the line connecting the initial and final AUC values:
AUC ′lin =
AUCf − AUCi
tf − ti(2.25)
This provides a data-driven average rate of AUC increase with threshold (Figure
2.8). In order to balance the desire for high reliability with high sensitivity, the first
threshold for which the AUC is above the mid-range value, and the rate of change
drops below the linear-rate is identified as the ROC-r threshold. In earlier works (3)
these cut-off parameters were determined from a group AUC plot, to take advantage
Figure 2.8: The output of the ROC-r analysis is a plot of the retest area under thecurve (AUC) as a function of template image threshold (left). Overall reliability ismeasured by the fraction of the threshold range for which the AUC is above themid-range value. The corresponding retest ROC curves for a variety of templatethresholds is shown on the right.

26
of the stability provided by using the average ROC-r curves. However, in later works,
these cut-offs are calculated directly from the individual ROC-r AUC plots, to offer
greater individual adaptability. Two additional parameters can be introduced to
fine-tune the ROC-r thresholds. The first such parameter, α, is used to increase or
decrease the AUC cut-off value:
AUCthresh = αAUCf + AUCi
2(2.26)
A second tuning parameter, β, can be introduced to allow variation of the conserva-
tiveness of the threshold levels:
AUC ′thresh = β
AUCf − AUCi
tf − ti(2.27)
Normally, both α and β are set to unity, unless otherwise noted. In chapter 5, the α
and β parameters will be adjusted to increase the sensitivity of ROC-r thresholds in
a patient group.
2.4.3 Simulation
A proof of concept for the ROC-r algorithm can be accomplished using a simple sim-
ulation (Figure 2.9). In this simulation, the images are represented using a 1D signal
plus noise model. The signal was modeled by a gaussian distribution of varying full-
width-half-maxima to represent different percent activation extents. The background
noise was modelled by uncorrelated gaussian distributions of varying amplitude, to
simulate different SNR levels. The noise magnitude was additionally scaled inversely
to the amount of signal present in a given ‘voxel’, in order to represent a noise-
normalized statistical map. For each SNR and activation extent, two 1D ‘images’
were simulated and submitted to a ROC-r analysis.
The initial AUC of the resulting ROC-r curves increases with activation extent,
as a larger and larger proportion of the voxels are reliable at any threshold (Figure
2.9c). Thus the initial value of the AUC is not always 0.5, as would be expected for
an image that is predominantly noise. The initial AUC value is thus indicative of the
extent of the activation present in the images. The limiting cases of noise only images
(AUC=0.5) and identical images (AUC=1.0) are also shown. Increasing the SNR does

27
Figure 2.9: Simulated 1D signal for varying percent active voxels (a) and noise magni-tude (b), and corresponding ROC-r analyses in (c) and (d), respectively. The ROC-rreliable fraction depends linearly on SNR, and is nearly independent of activationextent (e). The ROC-r thresholds increase with increasing noise levels, independentof activation extent (f).

28
not change the initial AUC value, but results in faster increase in AUC with threshold
(Figure 2.9d). As a result, the reliable fraction increases with SNR, and is essentially
independent of activation extent, especially for less than smaller percentages of active
voxels (i.e. <=10%). Likewise, the optimal threshold is independent of activation
extent, but adapts for increasing noise levels, in order to isolate the reliable signal.
2.4.4 Repeatability, Reliability, and Accuracy
The ROC-r method is based on assessment of the test-retest reliability of functional
maps. It should thus be emphasized that throughout this thesis, the term reliability
is thus used in the same conceptual sense as repeatability or reproducibility of the
functional images. It should also be noted that the repeatability of a test does not
ensure validity of the result, although it can be considered a necessary - if not always
sufficient - condition for the usefulness of a measurement. However, in general, a test
is only considered valid if it is both repeatable and accurate.
While repeatability of functional imaging is relatively easy to assess, the accuracy
of these maps is much more difficult to define, as there is no true gold standard
measure for localization of brain function. In this thesis, several surrogates are used
as standards for assessing the accuracy of ROC-r results. In cases where individual
results are expected to be relatively homogenous, a group map can be used as a
form of baseline expectations. In this case, accuracy is operationally defined as the
closeness of individual results to the mean. In other cases, an established method
for localization is available, and can be used to validate the ROC-r results, such as
equivalent current dipoles for MEG. Finally, for the patient studies in this thesis,
cortical stimulation is used as the gold standard for localization of brain function.
While cortical stimulation has its drawbacks as a comparator for volumetric image-
based methods, it is able to identify critical functional regions that must be spared
during surgery, and is routinely used intraoperatively.
2.4.5 Summary
The ROC-r algorithm provides a quantitative method of assessing the reliability of
activation maps. We will show that ROC-r provides a valuable tool in three distinct

29
roles for individual functional mapping: as a quality assurance indicator, for select-
ing of optimal pre-processing pipelines, and for determining data-driven thresholds.
Because it only requires the activation maps as input, it is equally well suited to
MEG and fMRI source mapping and providing a unified framework for push-button
processing of both modalities. This thesis will demonstrate that these qualities pro-
vide enhanced pre-surgical mapping characteristics, by ensuring that the best possible
results are produced from the available data, on an individualized basis.

Chapter 3
Manuscript 1: Thresholds in fMRI Studies: Reliable for
Single Subjects?
Authors: Tynan Stevens, Ryan D’Arcy, Gerhard Stroink, David B. Clarke, Steven
Beyea.
Status: Published
Journal: Journal of Neuroscience Methods
Volume: 219
Pages: 312-323
Date: 2013
Contribution: Conceptualization, Data Analysis, Primary Author
Copyright: Rights retained to include in thesis, no permission required.
3.1 Motivation
The following manuscript examines how the reliability of individual level mapping
depends on thresholding. This manuscript introduces the ROC-r method, and com-
pares it to an established method of evaluating test-retest overlap/reliability. This
paper shows that production of reliable images requires data-driven thresholding, as
there is a large variability in image reliability at a given threshold both between and
within subjects. The ROC-r method of threshold selection is shown to control for
image reliability effectively, and the potential for using ROC-r to guide pre-processing
decisions to maximize the quality of activation maps is established. This manuscript
lays the groundwork for the ROC-r method.
30

31
3.2 Abstract
Many studies have investigated test-retest reliability of active voxel classification for
fMRI, which is increasingly important for emerging clinical applications. The im-
plicit impact of voxel-wise thresholding on this type of reliability has previously been
under-appreciated. This has had two detrimental effects: 1) reliability studies use dif-
ferent fixed thresholds, making comparison of results challenging; 2) typical studies
do not assess reliability at the individual level, which could provide information for
selecting activation thresholds. To show the limitations of traditional fixed-threshold
approaches, we investigated the threshold dependence of fMRI reliability measures,
with the goal of developing an automated threshold selection routine. For this pur-
pose, we demonstrated threshold dependence of both novel (ROC-reliability or ROC-
r) and established (Rombouts overlap or RR) reliability measures. Both methods
rely minimally on statistical assumptions, and provide a data-driven summary of
the threshold-reliability relationship. We applied these methods to data from eight
subjects performing a simple finger tapping task across repeated fMRI sessions. We
showed that the reliability measures varied dramatically with threshold. This vari-
ation depended strongly on the individual tested. Finally, we demonstrated novel
procedures using ROC-r and overlap analysis to optimize thresholds on a case-by-
case basis. Ultimately, a method to determine robust individual-level activation maps
represents a critical advance for fMRI as a diagnostic tool.
3.3 Introduction
3.3.1 Background
Functional MRI has emerged as a major diagnostic tool in human neuroscience. Most
functional MRI maps reflect the statistical goodness-of-fit of a predicted response
model to the signal measured in each voxel [86]. This process is used to overcome
the noisy nature of the fMRI signal, but is hampered by the difficulty in defining
an appropriate statistical threshold [64–67, 87]. In particular, differences between
tasks, individuals, and scanners may not be properly accounted for in the statistical
models used in fixed-threshold techniques (i.e. with pre-specified p-value levels) [88].
These problems are only made worse by sources of physiological noise and task-related

32
artifacts. As the threshold process is intended to separate the ‘active’ from ‘inactive’
voxels, it will clearly impact the reliability of the observed activation [89,90].
Given that we cannot easily determine if a voxel is ‘truly’ active or inactive,
measuring reliability through repeated scanning (e.g. within or between sessions) is
one possible way to increase our confidence in the activation maps [39,91]. However,
there are many reliability measures to choose from [92], and each method is sensitive to
different aspects of fMRI data. Furthermore, each method will be affected differently
by decisions made during analysis (e.g. response model selection, spatial and temporal
smoothing, etc: [84, 93]).
It is useful to divide the available approaches into two general categories: 1) mag-
nitude and 2) classification reliability. Whereas reliability of activation strength or
magnitude is investigated at the voxel level (e.g. with t-value scatter plots [94–98], or
intra-class correlation coefficients [97–102]), reliability of active/inactive classification
is assessed at the image level after application of a significance threshold. As we are
principally interested in what effect the threshold has on fMRI mapping, we will focus
on the latter, hereafter referred to as classification reliability.
Classification reliability has been shown to differ greatly between individuals [98,
103]. Despite this high individual variability, significant differences have been found
between select patient and control groups [104]. Reliability has been shown to vary
with functional tasks [105] and brain regions [97], two issues that are inevitably
interrelated [97,106]. Task-based and resting state fMRI can achieve similar reliability
results [107], although task-based designs appear to be more robust when rest periods,
rather than control states, are used as baseline [98]. The classification reliability also
varies with threshold used to define the active/inactive voxels. This dependence is
commonly characterized by either the test-retest true and false positive rates [88], or
test-retest overlap coefficients [103].
We have developed data-driven methods to calculate classification reliability for
individual subjects, using a test-retest framework. These methods alleviate the need
for many task replications to accurately fit parameters in the traditional model-based
approaches [108]. Our methods are designed to overcome large inter-individual dif-
ferences in reliability that are observed when fixed thresholds are used in individual
subjects. We will show that meaningful fMRI maps can be produced by optimizing

33
reliability of active/inactive voxel classification at the individual level.
3.3.2 Classification Reliability
The two most common ways to assess classification reliability for fMRI are overlap
coefficients [97, 103, 105, 106, 109–114] and receiver operating characteristic (ROC)
analysis [85, 88, 104,107,108,115]. These two approaches differ in several ways.
Overlap Coefficients
Overlap coefficients are calculated directly from two thresholded activation maps.
Therefore they are empirical measures of reliability. The two most common overlap
indices are the Rombouts coefficient (‘RR’) [103], and the Jaccard overlap coefficient
(‘RJ ’) [113,116]. RR is the ratio of the number of voxels active on both replications to
the average number active on each replication. RJ is the proportion of voxels active in
either replication that are active in both replications. Both RR and RJ vary between
0 and 1, and are particularly attractive reliability metrics because of their simplicity.
In this paper we will focus on RR, as it is the more popular of the two metrics.
Overlap coefficients depend on the threshold used to classify active and inactive
voxels [89, 90]. Rombouts et al. showed that the overlap coefficient is high at very
low thresholds, and low at very high thresholds [89], as expected. While the report of
Rombouts et al. demonstrated a local maximum in overlap at intermediate thresh-
olds, a later study [90] did not reproduce this result. The variation in overlap was
substantial in both studies: 0.0 to 0.7 in Rombouts et al. [89], and 0.21 ± 0.05 to
0.64 ± 0.03 in Duncan et al. [90], depending on the threshold used. It has recently
been shown that adaptive thresholding can improve reliability beyond what is possible
using a fixed threshold approach [80].
While the dependence of RR on threshold has been known since shortly after
its original demonstration [89], the majority of reliability studies focus on a single
reliability threshold. Moreover, the thresholding level used varies from study to study.
This has led to dramatic variation in the range of overlap reported by individual
studies (average RR from 0.230 to 0.856) [92].

34
ROC Analysis
The ROC curve is a plot of true positive and false positive rates (TPR, FPR; some-
times called ‘hits’ and ‘false alarms’) as a function of the classification threshold. ROC
reliability can be summarized by the area under the curve (AUC). The AUC may vary
from 0.0 (no true positives at any false positive rate) to 1.0 (no false negatives at any
false positive rate). However, in practice it is rare for the AUC to be less than 0.5,
as this is 50% classification accuracy, and could be obtained by randomly assigning
active and inactive voxels. The AUC is useful for comparisons between experimental
conditions, or with other reliability measures like RR [104].
The most popular ROC analysis for fMRI data were developed by Genovese et
al. [88], and further investigated by others [104, 107, 115, 117]. The Genovese ROC
method uses a model-based approach to estimate the true and false positive rates. In
their model, they asserted that for a series of ‘M’ test-retest replications, the number
of times a voxel is found above a particular threshold, ‘n’, is drawn from a mixture
of true and false positive detection probabilities (PA, PI) in proportion to underlying
fraction of active voxels (λ):
n = λBinomial(M,PA) + (1− λ)Binomial(M,PI) (3.1)
By calculating ‘n’ for all voxels, they are able to estimate PA, PI , and λ. They then
repeat this method for many threshold values to estimate an ROC curve (i.e. use PA,
PI to approximate TPR and FPR). A drawback of this process is that it depends on
the availability of a large number of task replications to produce accurate estimates
of PA, PI , and λ [108].
An alternative, test-retest method of ROC estimation was proposed by Le and
Hu [85]. Le and Hu used a long fMRI experiment with a conservative (p < 0.0005)
statistical threshold to estimate a true positive map. An ROC curve was then gener-
ated by varying the threshold on the second fMRI dataset, and calculating the TPR
and FPR at each threshold. In this method, the TPR and FPR are calculated from
overlapping/non-overlapping regions of the two images, and therefore operates using
a similar framework to other empirical overlap coefficients. These are more accu-
rately described as ‘test-retest positive’ and ‘test-retest negative’ rates, however we

35
will maintain the standard nomenclature of TPR and FPR. The impact of varying
the threshold used to estimate the true positive map was not reported.
3.3.3 Research Objectives
We aim to compare the effects of threshold on both the established overlap coefficient
(RR) and novel ROC-reliability (ROC-r) analyses. For this purpose, we will inves-
tigate eight healthy individuals across two sessions (test-retest), using a standard
finger tapping task. We will show that threshold dependence and individual vari-
ability leads to two outcomes: 1) reliability studies using different thresholds should
not be directly compared, and 2) reliability should be measured and controlled for at
the individual level to better ensure replicable results. Finally we will demonstrate
new techniques for optimizing fMRI threshold selection using ROC-r analysis. These
techniques produce automated, data-driven thresholds, resulting in robust activation
maps at the individual level.
3.4 Methods
3.4.1 Participants
Eight healthy volunteers were recruited for this study (4 males, 4 females, 24.4 ± 3.5
years of age). All participants were right hand dominant according to the Edinburgh
Handedness Inventory [118]. The subjects all spoke English as their first language,
and had either normal or corrected-to-normal vision. The subjects had no known
prior neurological conditions. Subjects were each scanned at 4 Tesla, using a simple
motor task. Test-retest imaging was performed in separate scanning sessions 1-7 days
apart. The study was approved by the local research ethics board (Capital District
Health Authority REB, Halifax, NS), and all subjects provided informed consent.
3.4.2 MRI Acquisition Details
All eight volunteers were scanned twice with a 4 Tesla scanner (Varian INOVA, Palo
Alto, California), for a total of 16 scanning sessions. During each session, both
structural and functional images were acquired. The structural images were collected
with an MP-FLASH sequence with the following parameters: TI = 500 ms, TR = 10

36
ms, TE = 5 ms, α = 11◦, 256 x 256 matrix, 64 slices, and 0.94 x 0.94 x 3 mm voxels
(FOV = 24 x 24 x 19 cm). Functional images were collected with a single-shot spiral
out sequence, using TR = 2 s, TE = 15 ms, α = 90◦, 64 x 64 matrix, 22 slices, and
3.75 x 3.75 x 5 mm voxels, with a 0.5 mm gap (FOV = 24 x 24 x 12 cm).
3.4.3 Functional Task
Each participant performed a finger tapping task that utilized a block design, consist-
ing of 20-second alternating blocks of stimulation and rest. Left and right hand as-
cending/descending thumb-to-digit tapping blocks were interspersed with rest blocks
(4 blocks/condition). Pace was fixed at 2 Hz using four circles (for four fingers) to con-
trol for finger tapping order and timing. Active block order was pseudo-randomized,
with a rest block before and after each active block, for a total time of 5 minutes
and 40 seconds (170 volumes). Stimuli were presented using E-Prime (Psychology
Software Tools Inc.) via a projector in the MR console room. Subjects viewed the
stimuli on a screen through a mirror mounted on the head coil. Task practice was
done before each session to ensure optimal task performance.
3.4.4 Functional MRI Analysis
Functional MRI analysis was performed using the AFNI software package [119]. Data
were first motion corrected by rigid body transformation to align all images with the
first image of that time series. Segmentation was performed to remove the skull
from both the functional and anatomical images. The high-resolution anatomical
images were down-sampled to the functional image resolution prior to calculating a
registration transformation (12 parameter affine). Functional MRI data were spatially
smoothed (Gaussian kernel of 6 mm FWHM) prior to statistical analysis.
For statistical analysis, a standard boxcar function was convolved with the default
AFNI hemodynamic response. Constant, linear, and quadratic terms were included
in the baseline model to account for low frequency drifts. For each unique linear
combination of the task regressors, the 3dDeconvolve program [119] was used to
estimate the goodness-of-fit of the task activation model, and a t-statistic map was
created. Group level activation maps for each contrast were created using a t-test
after registration to the MNI-152 brain, and thresholded at FDR corrected q = 0.01

37
(approximately p = 2×10⁻⁵ uncorrected).
3.4.5 Reliability Calculations
In this work, both overlap coefficients and ROC-reliability (ROC-r) curves were cal-
culated from pairs of test-retest images. Reproducibility analysis routines were pro-
grammed in Python and performed in individual space. Analysis was restricted to
positive task correlations only, as we observed that the negative task correlations were
substantially less reliable (by either overlap or ROC-r evaluation - data not shown).
The number of unique voxels classified active in only the first image (A1) and only the
second image (A2) were calculated (for independently varying thresholds t1 and t2).
I1 and I2 were then calculated as the number of unique inactive voxels in each image,
at the same pair of thresholds. I1,2 denoted the number of shared voxels declared
inactive (i.e. inactive in both images), and A1,2 the voxels classified active on both
images (Figure 3.1).
Overlap Coefficients
In terms of the active/inactive voxel counts defined above, the Rombouts overlap was
calculated as RR = 2A1,2/[A1+2A1,2+A2]) [92]. For each image pair, for each subject,
RR was calculated as a function of the threshold applied to both the test image (t1)
and retest image (t2). Group results were obtained by averaging RR produced at the
individual level.
ROC-reliability
Our ROC-reliability estimation procedure (ROC-r) was based on the method outlined
by Le and Hu [85]. We defined true positives as the voxels that were declared active in
both images (i.e. TP = A1,2). Those which were below threshold in both images were
counted as true negatives (TN = I1,2). False positives were counted from the voxels
active in the retest image that were not active in the template (FP = A2), and vice-
versa for false negatives (i.e. FN = A1). The true and false positive rates were then
calculated in the usual fashion (TPR = A1,2/[A1,2+A1], FPR = A2/[A2+I1,2]). The
TPR and FPR were calculated for all values of t2 at a fixed value of t1 to produce

38
Figure 3.1: Schematic of test-retest overlap regions. Both the Rombouts coefficientand the true/false positive rates used for the ROC-r analysis are calculated from theoverlapping/non-overlapping regions of fMRI images. Here A1 and A2 are the uniquevolumes classified active in only the first and only the second image respectively, A1,2
is the shared activated volume, and I1,2 is the common inactive volume (adapted fromRombouts [103]).

39
an ROC curve. These true and false positive rate estimates are based purely on
test-retest measures, as the ‘true’ activity state of fMRI voxels cannot be obtained.
Whereas Le and Hu used a restrictive threshold level for t1, for the ROC-r methods
we repeated the ROC calculation for all values of t1. The effect of restricting or
expanding the template activation was then assessed quantitatively by plotting the
AUC against t1. As we used identical procedures to obtain our test and retest images,
the designation of one image as the template is arbitrary. For this reason both images
were assessed as the template, resulting in two AUC plots for each test-retest pair.
This procedure, and the subsequent analyses in section 3.5.2 we refer to as ROC-r,
and is demonstrated in Figure 3.2.
3.4.6 Threshold Optimization
We developed an automated and empirical threshold optimization procedure using
the ROC-r framework described in Figure 3.2. As exemplified in Figure 3.2, the AUC
tends to increase monotonically as a function of template threshold. As the majority
of inactive voxels are removed from the template image with increasing threshold,
the rate of AUC increase declines. In order to balance the aims of achieving a high
test-retest AUC (i.e. high reliability) and maintaining sensitivity to activation, we
designed optimization procedures that consider both the AUC value and its rate of
increase.
The AUC plots produced by the ROC-r analysis were fit with a smoothed cubic
spline to obtain a smooth estimate of the first derivative. Optimal thresholds were
taken as the first threshold for which the following two conditions were satisfied: 1)
the AUC has increased to at least half of its maximum value (i.e. AUC > = [AUCi +
AUCf ]/2) and 2) the AUC derivative has dropped below its average value (i.e. AUC’
< = [AUCf - AUCi]/[tf - ti]). Where AUCi and AUCf are the initial and final AUC
values taken from the group mean. For comparison, we will also determine reliability
optimized thresholds from the Rombouts overlap analysis by identifying local maxima
in RR as optimal threshold combinations.

40
Figure 3.2: Schematic of the ROC-r method. At a given pair of image thresholds (t1,t2), the TPR and FPR are calculated from the overlapping/non-overlapping regions.Repeating this for all t2 values at a fixed t1 produces an ROC curve, from which theAUC is calculated. This is repeated for all t1 values to produce a plot of AUC vs.t1. The roles of the two images are then reversed to create both an AUC vs. t1 andAUC vs. t2 plot.

41
3.5 Results
3.5.1 Group Analysis
The right hand tapping condition of the motor task produced left-lateralized activa-
tion of the pre- and post-central gyri, supplementary motor areas, posterior cingulate
gyri, striatum, and thalamus. Activity was also observed bilaterally in the visual
cortex (occipital pole and lateral occipital cortex), and in the left cerebellum (Figure
3.3a). The left hand condition of the finger tapping task produced a similar distri-
bution of activation, with more bilateral activation than that identified in the right
hand condition (Figure 3.3b). Subject 6 was excluded from the group map due to
motion issues.
Figure 3.3: Group fMRI results (n=7). Group mean thresholded at t >= 5 (FDRcorrected q <= 0.01): a) right hand contrasted to rest, b) left hand contrasted to rest(shown in radiological convention). The slices shown highlight the most extensiveactivated regions, and correspond to the axial slices indicated on the right. See thetext for a full description of the corresponding anatomical locations.
3.5.2 Group Average Threshold-Reliability Dependence
Overlap Coefficient
Mean reproducibility was measured by averaging RR across individuals (figure 3.4a).
This grand average shows a trend of decreasing reproducibility as the threshold is
increased, dropping rapidly from RR=1.0 to RR=0.67 ± 0.03 as the threshold is

42
increased from t = 0 to t = 2.6 (approximately uncorrected p = 0.01). The average
overlap coefficient then continues to decrease at a slower rate for higher analysis
thresholds. This creates the appearance of an extended ‘tail’ region to the overlap
plot, which in the group average occurs at equal analysis thresholds t1 and t2. This
tail region is highly variable across the group (figure 3.4b). From t = 2.6 to t = 6.6
(i.e. approximately uncorrected p = 0.01 to p = 1×10⁻⁶), the overlap decreases from
0.67 ± 0.03 to 0.56 ± 0.03
Figure 3.4: Group mean overlap coefficient (a), and standard deviation (b) as afunction of independent image thresholds. The group averaged result obfuscatesmany phenomenon that may be observed at the individual level, as evidenced by thehigh subject-to-subject variability at high thresholds.
ROC-r
In the ROC-r analysis, the average of the single-subject AUC curves was found to
increase monotonically with threshold on the template image (figure 3.5). This in-
crease is initially rapid, as more and more inactive voxels are thresholded out of the
test-image. From t1 = 0 to t1 = 5, the average AUC increases from 0.69 ± 0.01 to
0.87 ± 0.01, and then more slowly thereafter. Note that an AUC of 0.5 is the same
as random classification, so by this measure the classification reliability is reasonably
above chance even at low thresholds. As the test-image becomes more representative

43
of the true active voxel distribution, the retest AUC increases more slowly, approach-
ing 1.0 asymptotically. The average AUC varied from 0.78 ± 0.01 to 0.91 ± 0.02 as
the analysis threshold was varied over the typical analysis range (p = 0.05 to p =
1×10⁻⁶ uncorrected).
Figure 3.5: Individual ROC-reliability results (average ± standard deviation of test-retest AUC): The AUC generally increases with test-image threshold, rapidly at firstand then to diminishing returns. Subjects 2 and 6 are identified as having significantlybelow average AUC, whereas subjects 5 and 7 have above average reliability by theROC-r analysis.
3.5.3 Individual Variability
Overlap Coefficient
At the individual level, the overlap-threshold relationship was more featured, and
highly variable (Figure 3.6). Many subjects demonstrated local maxima, and these
were frequently off-diagonal (i.e. not on the line t1 = t2). In some cases multiple
local maxima were observed. The variability in the location of these local maxima

44
contributed to their averaging out at the group level, producing the plateau region
observed in Figure 3.4. Therefore the group result likely does not represent a consis-
tent trend, but rather a lack of consistent behaviour at the individual level. Subject
6 had the lowest overlap coefficients in the tail region, in agreement with the ROC-r
analysis discussed below. Subjects 5 and 7 were identified as above average by the
AUC plots, and also appear to have above average overlap coefficients in the tail re-
gion. These two subjects demonstrated overlap maxima at extremely high threshold
levels, suggesting the presence of a few strongly activated, and highly reliable voxels.
ROC-r
Although qualitatively the ROC-r AUC plots looked very similar, significant quanti-
tative differences were found between individual subjects, and between single subjects
and the group mean (Figure 3.5). In particular, the AUC for subject 7 is significantly
greater than the mean over all test-image thresholds tested. The AUC for subjects 4
and 5 begin below average but at t≈4.0 intersect the average, and thereafter is above
the group mean. Subject 2 exhibits the opposite trend, beginning above average and
crossing to below average for higher thresholds. Subject 6 is the clear outlier, exhibit-
ing below average AUC over all test-image thresholds. This subject also exhibited an
early plateau in the AUC plot, and downward spikes around t = 17. This subject re-
quired substantial motion correction (∼1 mm displacement), suggesting that motion
artifact may be contributing to the reduced reliability.
Threshold Optimization
The ROC-r threshold optimization successfully identified reliable activation in all but
the least reliable subject (i.e. subject 6). For the seven subjects in which ROC-
r based optimization succeeded, the resulting thresholds were t̄ROCr = 6.1 ± 1.3,
resulting in n = 1600 ± 1200 active voxels (means ± st.dev.). These optimized
thresholds are slightly higher than the Bonferroni corrected threshold of tbonf = 5.2
(i.e. corrected p = 0.01), and significantly higher than the FDR corrected threshold
of tFDR = 3.6 (i.e. q = 0.01). The number of voxels declared active were therefore
less than either the FDR (n = 3900 ± 2000) or Bonferroni (n = 2200 ± 1200) fixed-
threshold approaches. The average thresholds were slightly higher for images from

45
Figure 3.6: Individual rombouts overlap results: The overlap generally decreaseswith increasing threshold. Subject 6 is identified as having lower reliability thanother subjects by inspection of the RR plots, and subjects 5 and 7 demonstrated thehighest overlap coefficients. Several subjects demonstrate local maxima on the RR
plots, although the location of these maxima are highly variable.

46
the first session (t̄ROCr,1 = 6.3) than the second session (t̄ROCr,2 = 5.9), however this
difference was not significant. No difference was observed for the left and right hand
conditions.
Optimal thresholds were additionally determined by finding local maxima in the
overlap plots. As not all subjects exhibited local maxima, this was possible in only
11 of 16 cases, as opposed to the 14 of 16 datasets that could be optimized using the
ROC-r approach. Additionally, in 6 of 16 datasets, there were multiple local maxima,
with 20 local maxima found in total. It was observed that these local maxima were
typically at much higher thresholds than the ROC-r optimized thresholds (t̄RR= 13.5
± 5.0), with only a few occurring at thresholds below t = 10. The RR maxima below
t=10 were typically similar to the Bonferroni corrected threshold (n = 4; t̄ = 5.1 ±0.5).
Demonstrative examples of a) highly reliable data, b) average, and c) poorly
reproduced datasets are shown in figures 3.7, 3.8, 3.9, and 3.10. Subject 5 (right
hand condition shown in figure 3.7) produced above average reliability by both the
Rombouts and ROC-r methods. In this case, there are multiple local maxima in the
Rombouts plot, and a clear point of diminishing returns in the AUC. The ROC-r
optimized thresholds are just slightly above the Bonferroni level, and near a local
maxima in the Rombouts overlap. The additional maxima in the Rombouts overlap
occur at much higher thresholds, and produce highly specific maps of the primary
motor region (i.e. hand knob). Representative examples of the activation maps
produced at these optimized thresholds are shown as well.
Figure 3.8 shows the results from subject 3 for the left hand condition. This
dataset is very near to the average by both reliability measures. No clear local maxima
in the Rombouts overlap were observed, however the ROC-r method was still able to
predict optimal thresholds of t1 = 5.6 and t2 = 5.9. The resulting activation maps
produce very high overlap, and identify all key regions identified in the group level.
This subject demonstrates that even when no local maxima in the overlap are present,
the ROC-r automated thresholds typically lay within the ‘tail’ region of the overlap
plot, and thus identify reliable activation patterns.
Figures 3.9 and 3.10 illustrates two of the least reliable datasets obtained in this
experiment (subject 4, right hand and subject 2, right hand). It is readily seen from

47
Figure 3.7: Threshold optimization for a highly reliable dataset (subject 5, right handvs. rest): a) ROC-r AUC, b) Rombouts overlap, and c) thresholded activation maps(red = image 1; blue = image 2; purple = overlap). Squares: ROC-r optimizedthresholds; circles, triangles, stars, and diamonds: thresholds for local RR maxima.FDR corrected (q <= 0.01, solid lines) and Bonferroni corrected (p <= 0.01, dashedlines) thresholds are also shown.

48
Figure 3.8: Threshold optimization for a moderately reliable dataset (subject 3, lefthand vs. rest): a) ROC-r AUC, b) Rombouts overlap, and c) ROC-r thresholdedactivation maps (red = image 1; blue = image 2; purple = overlap). Squares: ROC-roptimized thresholds. FDR corrected (q <= 0.01, solid lines) and Bonferroni cor-rected (p <= 0.01, dashed lines) thresholds are also shown.
the Rombouts plot that the optimal thresholds will be different for the two images
in both cases. As a result, the use of a fixed-threshold approach results in very poor
test-retest reliability. This can also be seen on the ROC-r plots, as the threshold
required to achieve the same AUC is different for the two images. However, there are
local maxima present in the Rombouts overlap at high thresholds (t1 = 18.4, t2 =
13.4 for subject 4 and t1 = 14.8, t2 = 19.3 for subject 2). Both of these threshold
pairs restrict activation to the hand knob of the primary motor region. The ROC-r
optimized thresholds produce much lower thresholds in both cases (t1 = 7.8, t2 = 4.5
for subject 4, t1 = 3.3, t2 = 5.6 for subject 2), and include most of the group-level
activated regions. Either reliability-based threshold method reduces the test-retest
activation extent differences observed with fixed thresholds.
The reliability optimized thresholds were applied to each individual’s activation

49
Figure 3.9: Threshold optimization for a low reliability dataset (subject 4, right handvs. rest): a) ROC-r AUC, b) Rombouts overlap, and c) thresholded activation maps(red = image 1; blue = image 2; purple = overlap). Squares: ROC-r optimizedthresholds; circles: thresholds for local RR maxima. FDR corrected (q <= 0.01, solidlines) and Bonferroni corrected (p <= 0.01, dashed lines) thresholds are also shown.The maximal test-retest overlap occurred for unequal thresholds t1 and t2, so the useof fixed thresholds results in more unreliable activation.

50
Figure 3.10: Threshold optimization for a low reliability dataset (subject 2, righthand vs. rest): a) ROC-r AUC, b) Rombouts overlap, and c) thresholded activationmaps (red = image 1; blue = image 2; purple = overlap). Squares: ROC-r optimizedthresholds; circles: thresholds for local RR maxima. FDR corrected (q <= 0.01, solidlines) and Bonferroni corrected (p <= 0.01, dashed lines) thresholds are also shown.The maximal test-retest overlap occurred for unequal thresholds t1 and t2, so the useof fixed thresholds results in more unreliable activation.

51
maps, and the results across the group were compared to the traditional group anal-
ysis in figure 3.3. The resulting group activation patterns are shown in figure 3.11,
displayed as a percent of individuals for whom a given voxel was active. It is clear that
in the majority of cases, the ROC-r analysis reproduces activation at the individual
level in the key regions identified at the group level. However, activation of the sub-
cortical regions observed at the group level, is not reliably present at the individual
level. This is due to a combination of some subjects lacking activation in this region,
and inconsistent location of these activations when present. The overlap-maximized
thresholds typically produced activation in the primary motor region only, with some
subjects displaying activation in the cerebellum as well.
Figure 3.11: Reliability-optimized group fMRI results. Individual images thresholdedusing the automated ROC-r procedure (a-b) or Rombouts overlap maxima (c-d).Both the right hand (a,c) and left hand (b,d) contrasts to rest are displayed. Thecolor scale corresponds to the percentage of subjects activating each voxel. Whenmultiple local maxima were present, the lowest non-zero threshold was selected forthe group map for maximal sensitivity.

52
3.5.4 Analysis of Poor Datasets
Subject 6 produced unreliable activation maps when compared with the other subjects
(see Figures 3.5 and 3.6). We observed that this subject exhibited a large amount
of motion, especially during the retest scan, resulting in significant image artifacts.
Although standard motion correction (re-alignment) was performed for every subject,
this was not sufficient for such large motion events. As the motion time-course for
subject 6 was not strongly task-correlated, we attempted to correct for this artifact
by using the motion correction parameters as regressors of no interest in the fMRI
response model.
The resulting activation maps for subject 6 were much more reliable after inclu-
sion of the motion parameters in the null model. This is evidenced by the Rombouts
plot exhibiting an extended ‘tail’ (Figure 3.12c) that was not present using the stan-
dard analysis pipeline (Figure 3.12b). Furthermore, the AUC recovered to within or
above normal ranges (Figure 3.12a). There was still some discrepancy in the acti-
vation magnitude between the first and second scans, which rendered the standard
fixed-threshold approaches inappropriate (figure 3.12d). However, using the ROC-r
approach we were now able to determine optimal thresholds for this subject, which
recovered similar activation patterns to those seen at the group level.
This pre-processing step was not beneficial in all subjects, as low-amplitude mo-
tion did not produce noticeable artifact, and when task-correlated, inclusion of these
regressors in the null model reduced sensitivity to true activation. Thus at the group
level, inclusion of motion regressors cause a modest, but significant (p < 0.01), re-
duction of both the maximum and mean (above threshold, FDR corrected p < 0.01)
t-statistic values (12% and 5% respectively). Using an FDR or Bonferroni approach
to threshold these datasets resulted in a significant reduction of active voxels after
motion regression by 32% or 36% respectively. However, the reduction in active vox-
els decreased to 9% when ROC-reliability based thresholding was used, and was no
longer statistically significant (p > 0.05). This demonstrates the utility of reliability-
based thresholds for mitigating the sensitivity loss that could otherwise occur when
using motion regression.

53
Figure 3.12: Effects of motion parameter regression (MPR) for enhanced reliabil-ity of a problematic dataset (subject 6, right hand vs. rest): a) ROC-r AUCwith/without MPR, b) RR without MPR, c) RR with MPR, d) thresholded acti-vation maps. Squares: ROC-r optimized thresholds; stars: FDR corrected thresholdswithout MPR; circles: FDR thresholds with MPR. FDR corrected (q <= 0.01, solidlines) and Bonferroni corrected (p <= 0.01, dashed lines) thresholds are also shown.The group map for approximately the same locations is shown for reference.

54
3.6 Discussion
3.6.1 Group-level Reliability
We have shown that classification reliability varies dramatically with threshold using
both overlap and ROC-r approaches. This calls into question the usefulness of us-
ing single, fixed thresholds when reporting reliability, an issue that deserves special
attention given the lack of a consensus on appropriate threshold strategies. In order
to provide a more complete picture of fMRI reliability, reliability should be reported
as a continuous function of image thresholds, and these reliability plots should form
the basis of comparison between studies. The ROC-r framework is particularly well
suited to this task, as quantitative differences between groups (e.g. between patient
groups or across multiple pre-processing pipelines) can be assessed using plots of the
group mean and standard error. This will ensure that differences in reliability between
groups are not simply the result of fortuitous choice of threshold.
3.6.2 Single-subject Reliability
The threshold-reliability relationship we observed was highly individual, and the
group-level reliability was a poor predictor of reliability at the individual level. These
simple statements have profound implications for adaptation of fMRI as a diagnos-
tic technique. The use of a significance threshold is intended to separate spuriously
correlated voxels from those that are truly modulated by the task. However, it has
been shown that family-wise error control (i.e. Bonferroni and FDR corrections) does
not produce optimal reliability at the group level [120], and it is clear from this work
that it will not ensure reliable results at the individual level either. Moreover, even
well validated, robust fMRI paradigms are suspect to poorly performing subjects. Is-
sues such as task-related artifact, physiological noise, compliance, and habituation all
likely contribute to this problem. It is therefore paramount that test-retest reliability
is checked at the individual level for clinical applications.
The finding that the use of a fixed threshold is not optimal for obtaining relia-
bility estimates parallels advances with fMRI lateralization measures. Lateralization
indices are known to depend strongly on the significance threshold used, and so several

55
strategies for incorporating this information have arisen [121,122]. Notably, the gener-
ation of laterality vs. threshold curves has become established practice [121,123–125].
These curves have been used to show large variations in lateralization between sub-
jects and tasks [124,126], and have even been used to determine the best threshold to
use for calculating laterality indices [121]. We similarly recommend reporting reliabil-
ity as a function of analysis threshold, in order to avoid drawing conclusions that are
threshold-specific. This is especially important when assessing individual subjects, as
reliable activation may be overlooked by poor choice of threshold.
In such applications, reliability should be assessed through test-retest imaging,
and as a continuous function of image thresholds. Both the Rombouts overlap and
ROC-r approaches have relative merits in this context: overlap coefficients are highly
intuitive and therefore easily interpreted, whereas the ROC-r approach provides an
easier framework for comparing subjects quantitatively, by reducing the results to
a 1D plot. Thus for clinical applications, qualitative inspection of the Rombouts
overlap plots, followed by a quantitative comparison of individual ROC-r plots to
a normative group mean is ideal. The latter is similar to the approach taken by
Abbott et al. [124] to separate typical from atypical lateralization curves. Practically
speaking, this requires a pilot group be employed to establish normative reliability-
threshold plots (i.e. means and standard deviations) for a given task/scanner. Ideally
this is already being done prior to any clinical fMRI studies.
3.6.3 Threshold Optimization
One of the primary aims of our study was to investigate means of using reliability to
determine optimal thresholds for individual fMRI studies. Several authors have in-
dependently concluded that reproducibility of fMRI results could provide meaningful
insights for active voxel identification [91,117,127]. From the outset, the potential of
these methods for optimizing threshold selection has been identified [88]. Meanwhile
other studies have used a mixture-model approach to determine adaptive thresholds,
and then used overlap reliability plots as a standard to assess their results [80]. The
data-driven methods used in this work may have advantages in this context to model-
based approaches, especially when the input images do not conform to the assump-
tions of these models (e.g. presence of artifacts, scanning order effects, physiological

56
noise).
The most obvious caveat to reliability-based threshold optimization method is
that it requires at least somewhat reliable input data in order to produce meaningful
threshold estimates. It is clear that this will not always be the case, as a variety of
factors will impact the fMRI reliability (e.g. compliance, scanner stability, movement,
etc.). However outlying datasets are easily identified (Figures 3.5 and 3.6), and opti-
mal pre-processing settings can be determined on a subject-by-subject basis (Figure
3.12). One potential limitation of these methods is the possibility of persistent arti-
facts across test-retest sessions being interpreted as reliable activation. Edge-artifacts
associated with task-correlated head motion may be particularly problematic in this
regard, warranting caution when analyzing tasks that induce significant head mo-
tion. For this reason, we explored motion regression for the elimination of motion
artifacts. In general, motion regression decreased fMRI sensitivity in the presence of
task-correlated motion. However, the loss in sensitivity was greatly diminished using
reliability-based thresholds, suggesting that the same areas were reliably detected,
albeit at lower thresholds.
While pre-processing strategies, such as motion regression, may help with specific
artifacts, in order to obtain the best results, general strategies that maximize test-
retest reliability should be adopted in the experimental design. For example, for
well-learned tasks such as simple motor movements, it has been shown that reliability
within sessions is higher than between sessions [128]. For higher cognitive functions,
more complicated task repetition effects may need to be taken into account [129,130].
In the clinical setting, it is typically more reasonable to perform single-session test-
retest experiments than to ask patients to return for multiple scanning sessions, which
should result in slightly higher reliability estimates.
As other research groups have illustrated, ROC estimation is improved by collect-
ing more test-retest replications [88, 108, 113]. However, the extra imaging required
will need to be traded off against running fewer tasks per subject or fewer subjects
for the same amount of scanner time. In the ROC-r framework, the collection of more
test-retest datasets may be used to form more accurate template maps, for instance
by averaging together individual runs [84]. When session time must be kept to an
absolute minimum (i.e. no test-retest is available), a compromise to individual level

57
optimization may be necessary. For example, a pilot group activation map may be
used to optimize subsequent individual-level maps using the ROC-r framework.
We explored two reliability-based thresholding strategies. In the first, thresholds
were chosen from the Rombouts plots using local maxima of the test-retest overlap,
which are easily interpreted as providing maximal overlap of the test-retest images. In
the second, AUC plots were optimized by balancing test-retest accuracy (i.e. AUC),
against the diminishing returns observed at high thresholds. This approach produced
a better balance between sensitivity and specificity than the overlap-maximization
approach, which tended to result in very limited activation extent. The overlap-
maximization approach may thus be suitable when very high specificity is desired
(e.g. to isolate the primary motor cortex), however this method was possible in fewer
subjects than ROC-r based optimization.
On average, the ROC-r determined thresholds were more conservative than tra-
ditional fixed-threshold approaches of the FDR or Bonferroni corrections. This is in
contrast with the findings of Thirion et al. at the group level that reliability opti-
mized thresholds were somewhat lower than either of the fixed error rate correction
schemes [120]. However, our method allows for tuning of the optimization parameters
(i.e. AUC and AUC’ cutoffs) to alter the sensitivity/specificity tradeoffs. The best
optimization strategy will thus depend on the target application, and the particular
risks associated with false positive or negative results. Ultimately, the advantage
of these methods is the extra confidence obtained through reliability optimization,
which will be particularly advantageous in clinical settings.
3.7 Conclusion
There is mounting evidence for moving beyond strict interpretation of p-values for
significance of fMRI results [80,88,91,131,132]. These studies suggest that reliability
of activation may be more informative than activation magnitude alone. With this
in mind, we developed data-driven methods for evaluating the reliability-threshold
relationship. Critically, we demonstrated automated procedures for producing robust
activation maps by optimization of individual thresholds. These thresholds were
shown to reliably identify critical task-related regions at the single subject level. We
also showed that whereas fixed threshold approaches resulted in loss of sensitivity with

58
motion regression enabled, reliability-based thresholding mitigated the differences in
activation extent with or without motion regression. The ability to produce activation
maps using an entirely automated analysis pipeline is an important advance for fMRI.
We expect these methods to be especially useful wherever individual level analyses
are conducted, such as in clinical, diagnostic, and assessment applications.

Chapter 4
Manuscript 2: Fully Automated Quality Assurance and
Localization of Volumetric MEG for Potential use in
Pre-Surgical Mapping
Authors: Tynan Stevens, Tim Bardouille, Gerhard Stroink, Shaun Boe, Steven Beyea.
Status: Submitted (under review)
Journal: Journal of Clinical Neurophysiology
Contribution: Conceptualization, Data Analysis, Primary Author
4.1 Motivation
One of the strengths of ROC-r analysis for functional mapping is the use of minimal
assumptions about the underlying data distributions. Because of this, ROC-r is
equally well suited for quality assurance and automated processing of volumetric MEG
source images. In this manuscript, we therefore use a very well known stimulation
paradigm for MEG (median nerve stimulation), and show that the quality assurance
and localization provided by ROC-r analysis of volumetric MEG maps parallels that
offered for more traditional equivalent current dipole (point source) mapping methods.
The introduction of a quality assurance metric for volumetric MEG images provides
a critical tool that was previously unavailable.
Median nerve stimulation (MNS) is a well known MEG mapping paradigm, which
uses peripheral electrical stimulation to evoke a controlled sensory response. The
sensory evoked field (SEF) response to MNS has been shown to peak at at least
three distinct latencies: the N20m, P35m, and P60m [133]. Most clinical studies have
focussed on the N20 [23,29,134], however the P35 and P60 are typically stronger, and
therefore easier to detect [133, 135]. A recent study of tumor and epilepsy patients
using MNS found that the strongest SEF occurred at an average latency of 56 ms [136].
This study also reported a large degree of between-subject variability in the latency
59

60
of peak SEF response (22-162 ms). In this study, we will use ROC-r to automatically
identify the location of the P35m source.
The only requirement to perform a ROC-r analysis is the availability of at least
two estimates of the activation map. However, this manuscript uses ROC-r without
performing explicit test-retest imaging. Instead, we take advantage of the typical
MEG experimental design, which consists of many independent units (epochs), which
can be straight-forwardly divided into independent split-halves. We use these split-
halves to form pseudo test-retest datasets. A similar approach can be taken for
fMRI mapping, although more care must be taken in the generation of split-half
maps, as fMRI does not have the discrete sub-units of MEG because of the long
HRF. Nonetheless, single-run ROC-r has the obvious benefit of not requiring repeated
imaging during the scanning session. This is especially important in clinical settings,
as patients may fatigue quickly, and in pediatric populations, as children are not
typically able to sit still for long periods of time. Furthermore, single-run ROC-
r avoids the potential errors introduced by co-registration, and can produce large
samples of pseudo test-retest images, paradoxically allowing us to calculate more
accurate ROC-reliability estimates.
In this work, MEG mapping is performed using beamformer inverse solutions.
As beamformers are dipole scanning techniques, there are some subtleties to the
interpretation of these maps that must be considered. The most crucial caveat is
that beamformer spatial extent can not be interpreted as the spatial extent of the
underlying sources - indeed spatial resolution is proportional to SNR for MEG beam-
formers [137]. Therefore, strictly speaking, only the peaks (i.e. local maxima) of
beamformer clusters should be relied on for localization. Nonetheless, there are many
low-amplitude local maxima which are simply the result of measurement noise, and
are highly unreliable in their spatial configuration. Thus ROC-r can still be used to
determine: a) if there are reliably localized MEG sources in the beamformer map (i.e.
to assess data quality), and b) what threshold should be used to distinguish the reli-
able and unreliable peaks in the MEG source map. Respecting the caveats described
above, only the peaks of the reliable clusters should be utilized for localization.

61
4.2 Abstract
This paper demonstrates an automated procedure for both quality assurance and
data-driven thresholding of volumetric MEG images using receiver operating charac-
teristic reliability (ROC-r). These methods are ideally suited for presurgical mapping,
where repeatability and spatial accuracy are crucial. To demonstrate ROC-r, so-
matosensory evoked fields (SEFs) were mapped in 18 healthy subjects using bilateral
median nerve stimulation (MNS). Equivalent current dipole (ECD) and beamformer
inverse solutions were calculated. The ROC-r reliable fraction (FR) was compared to
the ECD goodness-of-fit (GoF) for use as a quality assurance parameter. The peak
locations and latencies of clusters defined by ROC-r thresholds were compared to the
ECD for co-localization accuracy. The predominant component of the SEF response
occurred around 35 ms, contralateral to the MNS. The ROC-r reliable fraction and
ECD GoF were highly correlated (mean 0.66; 95% CI 0.32-0.85). There was no dif-
ference in the latency of the peak GoF (35.0 ± 0.6 ms) and FR (35.5 ± 0.8 ms).
The ECD fits and ROC-r peaks co-localized to within a mean (median) distance of
8.3 ± 5.9 mm (6.2 mm). ROC-r analysis of volumetric source maps provides auto-
mated quality assurance capabilities, comparable to those offered by GoF for ECD
modelling. Furthermore, ROC-r thresholding was shown to co-localize closely to the
gold standard of ECD. This analysis can be added to any whole-brain MEG source
imaging, and is especially useful for pre-surgical mapping, providing automated lo-
calization with built-in quality assurance. The development of a ROC-r analogue to
GoF for beamformer imaging is a critical improvement to volumetric source mapping
for clinical applications.
4.3 Introduction
Pre-surgical mapping with magnetoencephalography (MEG) localizes functional neu-
roanatomy based on relatively direct measurements of cortical electrical activity.
Among the most successful applications of MEG to pre-surgical mapping is local-
ization of the somatosensory cortex [18]. The most ubiquitous paradigms are median
nerve stimulation (MNS) [23,29], vibrotactile stimulation [138], and pneumatic stim-
ulation [28], all of which elicit sensory evoked fields (SEF) from the contralateral

62
primary somatosensory cortex. MNS is also used intra-operatively to map the central
sulcus via phase reversal of surface electrocorticography [23].
Most localization studies use the equivalent current dipole (ECD) model [133,135,
139], which has been validated in a number of pre-surgical mapping studies [18, 23,
29, 134, 136]. The ECD model is attractive because of its simplicity and well-defined
goodness-of-fit (GoF) parameter for quality assurance (i.e. the percent of the sensor
variance explained by a single dipolar source). It is common to see GoF as a criterion
for selecting dipoles in pre-surgical mapping with ECD [134]. However, the validity of
the ECD model is suspect for distributed cortical activity or multiple cortical sources
with more complicated evoked fields. Models using multiple dipoles are available, but
require a priori specification of the number of dipoles. This makes them challenging
for clinical practice due mainly to poor inter-rater reliability.
More recently, studies have used volumetric source models to overcome limitations
of the ECD model [30,31,33,74–76,140]. Volumetric source models like beamformers
generate whole-brain source maps capable of describing multiple or distributed corti-
cal sources, alleviating the need to specify the number of dipoles. Despite increasing
use in pre-surgical mapping, there is no established method for quality assurance of
volumetric source models. Additionally, thresholding of single-subject maps is often
based on a priori expectations for the clinically relevant activation patterns, under-
mining improvements in inter-rater reliability achieved by moving away from ECD
models. A method to assess the quality of volumetric source maps and determine
appropriate threshold levels is needed.
We have thus developed methods for quality assurance and automated thresh-
olding of volumetric MEG source maps to improve the reproducibility of the source
modelling process. Our approach uses a receiver operating characteristic reliability
(ROC-r) framework previously demonstrated for fMRI mapping [141]. The advan-
tages of ROC-r are two-fold. Firstly, ROC-r provides quantitative measures of source
map reliability, increasing confidence in localization results. Secondly, ROC-r iden-
tifies optimal data-driven thresholds, facilitating push-button processing of volumet-
ric source maps. This reduces the reliance on ad hoc thresholding and decreases
inter-rater variability. The addition of ROC-r analysis to whole-brain MEG mapping
enhances pre-surgical mapping capabilities.

63
In this study, we validate the ROC-r method for the case of beamformer mapping
of the MNS SEF, by means of a comparison to the well established ECD model. The
MNS paradigm makes an ideal test case as it generally provides robust localization
of the early SEF response in single subjects. We will show that ROC-r provides
quality assurance metrics for whole-brain MEG mapping analogous to the GoF of the
ECD model. Furthermore, we will show that ROC-r automated thresholds identify
brain areas well-matched to those determined using ECD. These findings establish the
utility of ROC-r for pre-surgical MEG mapping, by introducing quantitative measures
of data quality and automated methods for detecting significant areas of activity.
4.4 Methods
4.4.1 Data Collection
Eighteen healthy volunteers participated in this study (10 females; age 19-29, mean
24 years). The study was approved by the local ethics board, and subjects pro-
vided informed consent. Each participant received an MEG scan during which the
somatosensory cortices were localized using bilateral MNS. Head position indicator
coils placed on both the left and right temples and mastoids monitored head po-
sition throughout the MEG scan. The nasion, left/right pre-auriculars, and scalp
surface were digitized for source modelling. Electro-oculargraphy (EOG) electrodes
were placed above and below the left eye and lateral to each eye for the removal of
artifacts. MEG and EOG data were collected at 1000 Hz sampling frequency, with
an in-line 0.1-330 Hz filter using a whole-head 306 channel Neuromag system (Elekta
AB, Stockholm, SE).
4.4.2 MNS Paradigm
Both primary somatosensory cortices were mapped using bilateral MNS. Motor thresh-
olds were determined by applying supra-threshold stimulation, and reducing the stim-
ulation strength until thumb twitches were no longer discernible. Sub-threshold stim-
ulation was delivered in single 0.5 ms pulses 1-2 s apart. Eighty to one-hundred
stimuli were applied to each side in random order.

64
4.4.3 Data Pre-processing
MEG data were pre-processed to create the SEF responses to left and right MNS.
Following environmental noise reduction with temporal signal space separation [142],
a low-pass filter was applied (70 Hz), and data were down-sampled to 250 Hz. In-
dependent component analysis was performed to remove components correlated with
the EOG signals. The data were segmented into epochs relative to the left or right
MNS onset (-200 < t < 200 ms), and baseline corrected for the -100 to 0 ms period.
The epoched MEG data were averaged for left and right MNS separately to generate
SEF responses.
4.4.4 Source Localization
ECD Modelling
Source localization using the ECD model was achieved using the xfit software (Elekta
AB, Stockholm, SE). A spherical model was employed based on the head shape col-
lected prior to MEG acquisition. At each time-point in the SEF, the location, orien-
tation, and strength of the single dipole that provided the best GoF was determined.
The latency of the peak GoF nearest to the P35m was identified, and the location at
this latency defined the localization of primary somatosensory cortex.
Beamformer Mapping
Volumetric source mapping was performed using the beamformer spatial filter method
on the epoched MEG data. The epochs were divided into split-halves prior to com-
puting a dynamic beamformer (Elekta AB, Stockholm, SE), to facilitate subsequent
ROC-r analysis (i.e. half of the trials were randomly selected to form one beamformer
map, and the remaining half for a second beamformer). The dynamic beamformer
produced whole brain activation maps for each time-point of the SEF. For each lo-
cation in the brain, the dipole direction was chosen to maximize source power, and
the pseudo-z statistic was calculated by taking the ratio of the source power to the
projected noise covariance at that same location. Covariances were calculated from
each split-half evoked response for the -200 to 0 ms (baseline) period, and the 0 to
200 ms (active) period. The beamformer forward solution was calculated using the

65
same spherical model employed for ECD localization. Independent spatial maps were
calculated for left and right MNS, and for each split-half of the data. This process was
repeated for 8 different randomized split-halves, generating sixteen SEF maps (i.e. 8
split-half pairs) for each participant and each side of stimulation. A final source map
for each participant/side was obtained by averaging the 16 split-half maps.
4.4.5 Anatomical Template
The MNI152 template MRI [143] was used as an anatomical frame of reference for
localization. The Isotrak head digitization was manually registered to the MNI head
shape using a translation and rotation transformation. Applying this transformation
to the MNI152 template produced an anatomical image in the individuals’ head coor-
dinates. This was used to interpret dipole locations, and to construct the beamformer
source grids. The template brain was down-sampled to 4 mm to provide a reasonable
source grid resolution. Beamformer source estimates were produced for each voxel in
this grid.
4.4.6 Quality Assurance Analysis
Beamformer reliability was assessed using ROC-r (see Stevens et al., 2013 for more
details [141]), and compared to the ECD GoF. The ROC-r algorithm takes as input
two source maps, and outputs the ROC area under the curve (AUC) as a function of
threshold for each map. Overall reliability of the source maps is summarized using
the reliable-fraction (FR), which is the fraction of the threshold range for which the
AUC is above its mid-range (Figure 4.1). High FR indicates that reliability increases
quickly with increasing threshold, and remains high for a large range of thresholds.
Reliability was assessed for each time point from -200 to 200 ms, using each split-
half map pair as ROC-r inputs (i.e. each split-half produces two source maps, and
these can be used to generate a ROC-r analysis). The FR was then averaged across the
8 split-half pairs, producing a time-dependent estimate of the beamformer reliability
for each subject/hand. The mean and variance of the FR was compared to the GoF
for the baseline and active periods, and the time courses of the FR and GoF were
compared via the correlation coefficient to demonstrate validity of the FR metric.
The latency of the peak FR nearest to the P35m was also identified, and compared

66
to the latency of the peak GoF via a paired t-test to ensure both methods identified
the same evoked response.
Figure 4.1: Diagram of the ROC-r output. The thick solid line shows the ROC areaunder the curve as a function of image threshold. The mid-range value (dash-dottedline), and the ‘linear rate’ (dashed line) are shown. The reliable fraction is the fractionof the threshold range for which the AUC is above the mid-range value (i.e. FR =2.5/3.0 = 0.833). The optimal threshold is the lowest threshold for which the AUCis above the mid-range value and the slope is equal to or less than the linear rate.
4.4.7 ROC-r Thresholding
ROC-r was also used to compute thresholds to identify clusters of significant activity
in the beamformer maps. First, beamformer maps were extracted from 24 to 44 ms
to capture the 35 ms peak. Each split-half pair was submitted to ROC-r analysis,
resulting in 8 pairs of AUC versus threshold curves. Optimal thresholds were deter-
mined as the lowest threshold for which the AUC was above mid-range, and the AUC
rate of change dropped below the ‘linear rate’ ([AUCmax-AUCmin]/[tmax-tmin], see
Figure 4.1), providing a balance between high reliability and high sensitivity. Finally,
the average ROC-r threshold across the 16 AUC curves was applied to the average

67
beamformer map.
4.4.8 Localization Comparison
ROC-r beamformer localizations were validated by comparison with ECD locations.
Thus for each thresholded beamformer map, activation was divided into contiguous
clusters (i.e. adjacent voxels in space or time), and the largest cluster was identified.
The peak location and latency of the largest cluster was extracted and compared
to the ECD location at the same latency. Co-localization accuracy was measured
as the euclidean distance between the two locations. Distances and displacements
in the left/right, anterior/posterior, and superior/inferior directions were also calcu-
lated. Finally, we examined the relationship between data quality (GoF/FR) and
co-localization accuracy to investigate possible sources of co-localization error.
4.5 Results
4.5.1 Sensory Evoked Fields
SEF responses to median nerve stimulation were detected from the contralateral hemi-
sphere of all subjects. Figure 4.2 shows the group averaged SEFs. The first SEF peak
occurred at stimulus onset - an artifact of the electrical stimulation. A small 20 ms
peak (N20m) was observed in the group average, but was not detectable in all in-
dividual subjects. The 35 ms peak (P35m) was the most prominent deflection, and
was easily discernible in most subjects. Later responses (50-120 ms) of similar magni-
tude to the P35m were common, although exact latencies were subject-specific. The
group level sensor topographies shown in Figure 4.2 were consistent with contralateral
dipolar sources from 20 to 120 ms.
4.5.2 Beamformer Reliability and Quality Assurance
ROC-r successfully measured reliability of the beamformer source maps in all sub-
jects. Representative FR and GoF time-courses are shown in Figure 4.3. Both FR and
GoF were lower during the baseline period (0.10 ± 0.04 and 0.37 ± 0.14 respectively)
than from 20-120 ms post-stimulus (0.53 ± 0.25 and 0.68 ± 0.19). The change in
quality scores between the baseline and active periods was larger for FR (factor of

68
Figure
4.2:
Butterflyplots
(left)
andsensory
topographies(right)
ofthegrou
paverageSEFto
mediannerve
stim
ulation
:a)
righ
tmediannerve,grad
iometers;
b)righ
tmediannerve,magnetom
eters;
c)left
mediannerve,grad
iometers;
d)left
median
nerve,magnetom
eters.
Adipolar
fieldpattern
contralateral
totheMNSsideis
observab
lefrom
20-120
mspost-stim
ulus,
peakingarou
nd35
ms.

69
5.3) than GoF (factor of 1.8), indicating that the ROC-r measure of data quality is
more sensitive than GoF. Variance of the FR was significantly less than GoF during
baseline. The ROC-r FR exhibited a peak at the time of stimulation, as the electrical
stimulation device produced a reliable field pattern on the sensors, which in turn pro-
duces a characteristic beamformer solution. This field pattern was not well described
by a single equivalent dipole, and thus the dipole GoF was low despite the FR peak.
Figure 4.3: Dipole goodness-of-fit and ROC-r reliable-fraction over time for a repre-sentative subject. The mean and variance of the GoF during the baseline period (-200to 0 ms) is higher than the FR. The peak values and latencies of FR are similar tothose of the GoF, with the exception of the stimulus artifact. Overall there is a highcorrelation between the GoF and FR, indicating that ROC-r FR provides a successfulanalogue to GoF for quality assurance of beamformer source maps.
Across the group, ROC-r and ECD modelling identified the same latency for
the P35m (tROC−r = 35.5 ± 0.8 ms, tECD = 35.0 ± 0.6 ms; p = 0.46). There
was significant correlation between the FR and GoF time-courses, indicating that the
ROC-r quality assurance metric parallels the information provided by ECD GoF. The
mean correlation coefficient between the FR and GoF was 0.66 (95% CI: 0.32-0.85).
Table 4.1 shows the correlation between FR and GoF for each dataset.
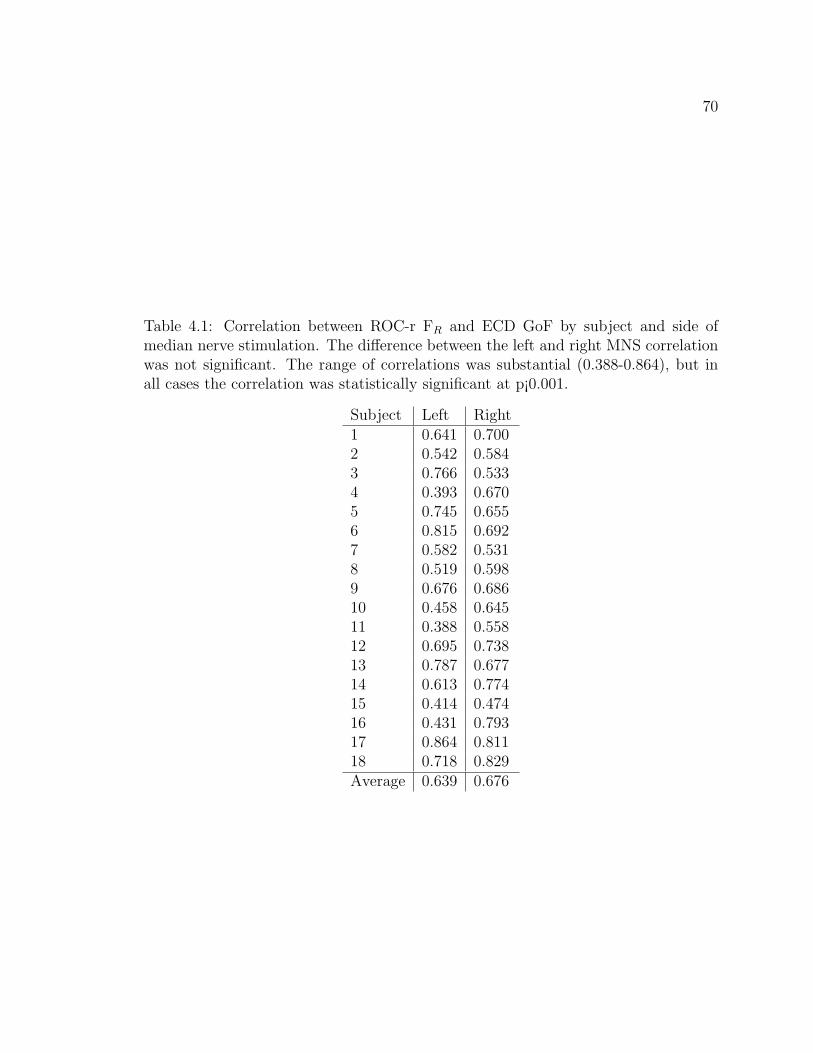
70
Table 4.1: Correlation between ROC-r FR and ECD GoF by subject and side ofmedian nerve stimulation. The difference between the left and right MNS correlationwas not significant. The range of correlations was substantial (0.388-0.864), but inall cases the correlation was statistically significant at p¡0.001.
Subject Left Right1 0.641 0.7002 0.542 0.5843 0.766 0.5334 0.393 0.6705 0.745 0.6556 0.815 0.6927 0.582 0.5318 0.519 0.5989 0.676 0.68610 0.458 0.64511 0.388 0.55812 0.695 0.73813 0.787 0.67714 0.613 0.77415 0.414 0.47416 0.431 0.79317 0.864 0.81118 0.718 0.829Average 0.639 0.676

71
4.5.3 Source Localization and Thresholding
ECD localization between 24 and 44 ms was possible in 33/36 MNS datasets. ROC-
r thresholds ranged from a pseudo-z of 0.56 to 1.34, with a mean of 0.92 ± 0.19,
identifying significant clusters for 32/36 datasets. Seven of the beamformer maps
contained multiple clusters in the selected latency window. Datasets for which either
method failed to achieve localization (i.e. no beamformer clusters were identified, or
no dipole fit was possible) were excluded from co-localization analysis, resulting in 31
ECD and ROC-r beamformer peak comparisons.
Typical ECD and beamformer localizations are shown in Figure 4.4. The mean
dipole to beamformer peak distance was 8.3 ± 5.9 mm. The distribution was skewed
by a few datasets with large (> 15 mm) separation between the dipoles and beam-
former peaks (Figure 4.5), rendering the median (6.2 mm) more representative of
typical co-localization (e.g. Figure 4.4b). Dipole locations were frequently within
the boundaries of the ROC-r beamformer clusters, but sometimes localized between
multiple beamformer clusters (e.g. Figure 4.4a).
The mean distance between the ECD and beamformer locations was greatest in
the left/right (4.6 ± 0.8 mm), followed by anterior/posterior (4.3 ± 0.6 mm), and
then the superior/inferior directions (3.2 ± 0.6 mm). Displacement in the left/right
and anterior/posterior directions did not differ significantly from zero (0.5 ± 1.1 mm
and 0.1 ± 1.0 mm respectively). However, the beamformer peaks were displaced
significantly in the superior direction compared to the ECD locations (2.1 ± 0.7 mm;
p = 0.008).
Co-localization accuracy tended to be better for datasets with higher GoF and FR,
indicating that higher quality data were more likely to produce consistent localization
results. FR explained more variance in the dipole to beamformer distance (R = -0.612)
than GoF (R = -0.591), but both were significant predictors of accuracy (Figure 4.6).
4.6 Discussion
We demonstrated ROC-r analysis for quality assurance and automated thresholding
of beamformer MEG source maps on a single-subject basis in a well-known pre-
surgical mapping paradigm. The reliable-fraction metric paralleled the goodness-of-fit

72
Figure 4.4: Representative dipole/beamformer co-localizations. a) ROC-r thresholdedbeamformer map (red-yellow) and ECD (crosshairs) for a subject with co-localization(8.2 mm between ECD and ROC-r peak) similar to the group mean (8.3 ± 5.9 mm).b) ROC-r map and ECD location for a subject with co-localization (5.89 mm) rep-resentative of the group median (6.2 mm). In both of these subjects, the ECDs werelocated within beamformer source clusters.

73
Figure 4.5: Histogram of the distance between the ECD and beamformer cluster lo-cations. The distribution is skewed by a small number of datasets with high distancesbetween the ECD and cluster peaks, resulting in a higher mean (8.3 ± 5.9 mm) thanmedian (6.2 mm) distance. No obvious difference between left and right MNS wasobserved.
from ECD modelling, and automated thresholding co-localized with the gold-standard
ECD locations. Overall, ROC-r analysis enhances MEG for pre-surgical mapping
by reducing the need for expert intervention in the production and assessment of
volumetric images.
4.6.1 The MNS SEF
We observed a robust P35m peak in most subjects, with more variable peaks between
50-120 ms. Notably, we did not reliably observe the N20m peak, which is frequently
used in clinical mapping studies [29]. Our failure to produce an N20m peak was likely
due to the number of stimuli used in this study. The N20m peak is known to have less
than half the amplitude of the P35m, and most studies reporting the N20m use 200
to 500 stimuli to produce the SEF [23, 139]. With more stimuli, we would expect an
enhanced N20m. Likewise, Sutherland et al. [144] showed that the later latencies of
the SEF (i.e. > 50-60 ms) produce bilateral sources, although the ipsilateral sources
were much weaker, and were therefore not observed in this work.

74
Figure 4.6: Relationship of a) ROC-r reliable-fraction and b) ECD goodness-of-fitto the distance between the ECD and beamformer peak locations. Co-localizationaccuracy increases with increasing GoF or FR, suggesting that data with high beam-former reliability and strong dipolar field patterns co-localize closely. FR was a slightlystronger predictor (R = -0.612) of accuracy than GoF (R = -0.591).

75
We also observed SEF peaks at later latencies (60-120 ms) than those typically
described in MEG MNS studies (20-60 ms), but agreeing with Huttunen et al. [133],
who described a late negative deflection in the SEF (∼60-120 ms). Indeed, a recent
pre-surgical mapping study using MNS found the largest SEF peak occurred as late
as 162 ms in some subjects, and that this component also localized to the post-central
gyrus [136].
4.6.2 ROC-reliability for Quality Assurance
The lack of established quality assurance metrics has been an issue for clinical imple-
mentation of beamformer imaging, as unreliable source images are potentially dele-
terious. We validated the ROC-r FR as a quantitative metric suitable for quality
assurance of single-subject MEG beamformer maps. The development of an analogue
to ECD GoF for beamformer imaging is a major step forward for applying volumetric
source maps in the clinical theatre.
While correlation between FR and GoF was generally high, there were exceptions.
For example, the FR values and variability were lower then the GoF during the
baseline period. We consider this an advantage for ROC-r, as we expect no evoked
activity during the pre-stimulus period, and thus the reliability of source localization
during this time should be low. Additionally, low variability during baseline/inactive
intervals makes it easier to discern later latencies with robust evoked responses. We
also observed that low dipole GoF does not rule out the potential for a reliable
beamformer solution, which will be advantageous in the case of mapping brain activity
with complex field patterns. For MNS mapping, the later latency evoked responses
have been shown to be consistent with bilateral sources [144], and we may therefore
expect to see a divergence of the dipole GoF and ROC-r FR in this case. That we did
not observe this mismatch between the GoF and FR at later latencies (> 50 ms) is
possibly due to the relatively low number of trials rendering the ipsilateral response
indiscernible from the background noise.
It is thus likely that ROC-r quality assurance will provide the most improvement
over GoF for multiple or distributed cortical sources, such as pre-surgical mapping
of language [145, 146]. In these cases, the evoked field patterns may not be dipolar
in form, but still reflect true neural activity. While a multiple dipole model could be
76
employed, this would require a priori specification of the number of dipoles, requiring
expert user intervention and introducing inter-rater variability. ROC-r could be used
in these cases to quantitatively determine the latencies of reliable sources.
4.6.3 ROC-r Thresholding to Localize MEG Sources
While some beamformer thresholding approaches have been described previously [82,
147, 148], threshold selection is still often adjusted manually on an ad hoc basis,
to isolate desired source peaks. For example Alikhanian et al. manually specified
different thresholds for each frequency band in their data to avoid bias towards higher
signal power at lower frequencies [149]. However, we have shown that data-driven
methods can provide the flexible threshold levels needed to reliably localize MEG
sources, while also eliminating inter-rater variability.
It is important to acknowledge that the spatial extent of beamformer clusters
is not an accurate representation of the spatial extent of the underlying sources.
Nonetheless, ROC-r is able to determine appropriate threshold levels for separating
the reliable and unreliable clusters, with the assumption that this correspondingly
separates neural sources from noise. Therefore, for beamformer maps only the peaks
of the reliable clusters should strictly be used for localization. However, other MEG
localization techniques that are sensitive to spatial extent like dynamic statistical
parametric mapping (dSPM [76]) or maximum entropy on the mean (MEM [150])
could potentially bypass these issues, but are outside the scope of this manuscript.
The ROC-r beamformer cluster peaks co-localized closely to the ECD locations.
The most comparable beamformer/ECD co-localization study in the literature was
reported by Cheyne et al. [140]. They found the N20m localized by an event-related
beamformer and ECD were on average 6.3 ± 2.3 mm apart for right MNS and 5.5
± 2.0 mm for left MNS. Our study produced similar co-localization accuracy with
entirely automated methods, albeit using a different beamformer implementation and
SEF component.
ROC-r produced multiple clusters for approximately 20% of datasets. This demon-
strates the potential advantage of whole-brain source reconstruction methods over
ECD fitting, as these clusters were recovered without a priori specification of their
77
number or configuration. Examples of ECD dipoles located between multiple beam-
former peaks (e.g. Figure 4.4a) suggest that co-localization accuracy can be poor
due to mislocalization of the ECD dipoles in the presence of multiple sources. This
hypothesis could be tested through simulations.
4.6.4 Data Quality Influences Co-localization Accuracy
We showed that both GoF and FR were significant predictors of co-localization ac-
curacy. Of course localization by either method is suspect when the respective qual-
ity assurance metric is low. However, we unexpectedly observed 2/36 datasets with
strong ECD fits, for which there was no reliable beamformer activity. The beamformer
calculation relies primarily on accurate data and noise covariance calculations, so it is
possible that changing the covariance windows could produce a reliable beamformer
in these cases.
4.7 Conclusion
The addition of ROC-r analysis to beamformer imaging offers crucial benefits in the
clinical environment, integrating push-button mapping with built-in quality assur-
ance. We showed that ROC-r reliable-fraction is a suitable quality assurance metric
for volumetric MEG source maps, with high correlation to the GoF used routinely
for ECD modelling. Furthermore, the ability of ROC-r analysis to determine data-
driven thresholds was demonstrated with MEG data for the first time, and validated
by co-localization with the standard ECD model. While we demonstrated ROC-r
analysis for beamformer imaging of MNS, we expect these methods to generalize to
other stimulation paradigms and volumetric imaging techniques. The greatest bene-
fit of this method will likely be for paradigms that elicit concurrent cortical sources,
due to the ability to detect multiple source clusters without a priori specification of
the number of sources or threshold levels. The introduction of a quality assurance
metric for volumetric MEG source maps provides a much-needed tool for the clinical
environment.

Chapter 5
Manuscript 3: Improving fMRI Reliability in Pre-surgical
Mapping for Brain Tumors
Authors: Tynan Stevens, David B. Clarke, Gerhard Stroink, Steven Beyea, Ryan
D’Arcy.
Status: Published (online)
Journal: Journal of Neurology Neurosurgery and Psychiatry
Contribution: Conceptualization, Data Collection, Data Analysis, Primary Author
Copyright: Open access, no permission required.
5.1 Motivation
The following manuscript applies the ROC-r method in a group of patients undergo-
ing surgical treatment for brain tumors. This paper focusses on the ability of ROC-r
to classify datasets as reliable or unreliable, and to determining pre-processing steps
that can be used to increase the quality of the pre-surgical maps. The ability to iden-
tify unreliable datasets is crucial in the clinical environment, as poor quality images
will provide misleading information on localization of brain function. By showing that
datasets that have high ROC-r FR scores are also better at predicting the location
of critical eloquent cortical regions, we demonstrate that the ROC-r metrics provide
clinically meaningful quality assurance of pre-surgical maps. Furthermore, by auto-
matically identifying the best pre-processing options, including activation thresholds,
reliable activation maps can be produced without user-intervention. This eliminates
the influence of inter-rater variability on the result of the functional mapping process,
and thus provides a standardized and yet flexible approach to pre-surgical mapping.
In this manuscript, the locations of cortical activation identified by fMRI will be
compared to cortical stimulation in order to provide an external reference standard
for eloquent cortex. Cortical stimulation (CS) is frequently used as the gold standard
for critical functional cortex [57], as the elicitation or disruption of brain function
78

79
using CS is predictive of post-operative morbidity associated with surgical resection
of a section of cortex. While the use of CS as a gold standard is ubiquitous in the
literature, in several ways it is not ideal as a reference standard for fMRI. Firstly, CS
is a point-stimulation technique, and can only be used to map the relatively small
surgically exposed portion of the cortex. Furthermore, while the electric current used
for stimulation propagates a few millimetres into the cortex [52], deep sites are gen-
erally inaccessible by CS. Thus there are many regions which may be identified by
pre-surgical mapping as responding to a task that can not be evaluated intraopera-
tively. In addition, while it is typically assumed that cortical stimulation effects are
localized to the patch of cortex under the stimulating probe, evoked potentials in
distant cortical regions have been reported [13], and these distant effects are difficult
to predict and rarely monitored.
In this paper, the fMRI activation maps produced through ROC-r optimization
are assessed in terms of their ability to predict the location of critical eloquent cortex,
as measured by CS. Two metrics are used for this purpose: the fMRI to CS distance,
and the sensitivity/specificity of the fMRI results. The fMRI to CS distance is the
simplest outcome measure for the presurgical maps, and is calculated from the CS
point to the centre of the nearest active voxel on the fMRI map. When the fMRI to
CS distance is low, eloquent cortex is likely to be located near or within the borders
of the fMRI activations, and thus the utility of the presurgical maps for guiding the
CS process is high.
In order to calculate sensitivity and specificity, studies typically establish small
search volumes around each eloquent location to define the ‘true’ critical functional
regions. The presence or absence of fMRI activity within these true critical regions
then defines the sensitivity of the pre-surgical paradigm. Likewise, the remaining ar-
eas of exposed cortex are defined as non-eloquent cortex, and are used to measure the
specificity of the pre-surgical protocol. This analysis allows one to distinguish a tech-
nique with high sensitivity due to over-estimation of activation (i.e. low specificity)
from one with high sensitivity and a low false positive rate (i.e. high specificity).
Larger search ranges around each CS location inherently produce higher sensitivity
and lower specificity, and while there is no consensus on the best search range to
use, typical values range from 0 mm (direct matching only) to 15 mm. Higher search

80
ranges may be more appropriate for an augmentative pre-surgical protocol, whereas
lower search ranges are suitable for assessing a technique as a potential replacement
for CS.
The two CS based metrics thus provide a clinically relevant context for evaluating
the success of a pre-surgical mapping protocol. Low fMRI to CS distance is required
for fMRI to be suitable in guiding cortical stimulation investigations, while sensitiv-
ity/specificity analysis allows one to distinguish between co-localization achieved by
chance (i.e. with low specificity) from a truly predictive technique. Furthermore,
the search range used to achieve a certain level of sensitivity can help to distinguish
a pre-surgical protocol suitable for replacing CS (i.e. high sensitivity even for very
small search ranges) from one that is best suited to augmentative use (larger search
ranges needed for high sensitivity).
5.2 Abstract
Purpose: Functional MRI is becoming increasingly integrated into clinical practice
for pre-surgical mapping. Current efforts are focused on validating data quality, with
reliability being a major factor. In this paper, we demonstrate the utility of a recently
developed approach that uses Receiver Operating Characteristic-reliability (ROC-r)
to: 1) identify reliable vs. unreliable datasets; 2) automatically select pre-processing
options to enhance data quality; and 3) automatically select individualized thresholds
for activation maps.
Methods: Pre-surgical fMRI was conducted in 16 patients undergoing surgical treat-
ment for brain tumors. Within-session test-retest fMRI was conducted, and ROC-
reliability of the patient group was compared to a previous healthy control cohort.
Individually optimized pre-processing pipelines were determined to improve reliabil-
ity. Spatial correspondence was assessed by comparing the fMRI results to intraop-
erative cortical stimulation mapping, in terms of the distance to the nearest active
fMRI voxel.
Results: The average ROC-reliability for the patients was 0.58 ± 0.03, as compared
to 0.72 ± 0.02 in healthy controls. For the patient group, this increased significantly
to 0.65 ± 0.02 by adopting optimized pre-processing pipelines. Co-localization of the
fMRI maps with cortical stimulation was significantly better for more reliable versus

81
less reliable datasets (8.3 ± 0.9 mm versus 29 ± 3 mm, respectively).
Conclusion: We demonstrated ROC-r analysis for identifying reliable fMRI datasets,
choosing optimal pre-processing pipelines, and selecting patient-specific thresholds.
Datasets with higher reliability also showed closer spatial correspondence to cortical
stimulation. ROC-r can thus identify poor fMRI data at time of scanning, and allow
for repeat scans when necessary. ROC-r analysis provides optimized and automated
fMRI processing for improved pre-surgical mapping.
5.3 Introduction
5.3.1 Pre-surgical Mapping Validity and Reliability
Functional magnetic resonance imaging (fMRI) is increasingly being used to map
eloquent cortex prior to surgical treatment for brain tumors [57, 151]. The goal
of pre-surgical mapping is to identify functional brain regions near the tumor, to
plan surgical approach, identify risks, and potentially render intra-operative electro-
cortical stimulation (CS) unnecessary. Functional MRI is attractive for this purpose
due to non-invasiveness, repeatability, high spatial resolution, and broad availabil-
ity [16, 152].
Validated pre-surgical fMRI protocols were demonstrated first for sensory-motor
function [36], followed by language localization [37, 47], and more recently memory
mapping [153]. These validation studies compare fMRI localization with a gold stan-
dard measure such as CS. The concordance of fMRI and CS is influenced by the
matching criteria used [49], field strength [57], pre-surgical tasks employed [51], and
by the threshold used during fMRI analysis [154]. A recent review asserts that this
heterogeneity has led to widely varying estimates of the accuracy of fMRI compared
with CS [57].
Functional MRI results have a high degree of variability [92,98,155], and although
inter-subject variability is higher than intra-subject variability, a single scan fMRI
experiment includes a substantial amount of false positives and false negatives. Re-
peating scans is thus useful in order to produce more reliable activation maps for an
individual patient. For example, Beisteiner et al. [39] restricted fMRI activity to only
those voxels that survived high correlation thresholds in all repetitions of a motor

82
task. This resulted in fewer active voxels, with improved reliability and closer spatial
correspondence to CS results.
Variability in fMRI can also be mitigated by using individualized data-driven pre-
processing strategies. Gonzalez-Ortiz et al. [156] showed that built-in scanner analysis
software was often sufficient for pre-surgical mapping, but 3rd party packages offered
superior flexibility, reduced noise, and were preferred by radiologists. However, they
were unable to provide quantitative guidelines for determining the best pipeline for a
given fMRI dataset. Quality assessment tools are clearly needed in order to objectively
determine the optimal pre-processing settings on a case-by-case basis.
In this context, tools such as NPAIRS (Non-parametric Prediction, Activation,
Influence and Reproducibility reSampling), [61,157,158] and empirical ROC analysis
(Receiver Operating Characteristic) [88, 132, 141] are used to determine optimized,
subject-specific pre-processing pipelines. These techniques are especially important
in patient populations, as clinical disorders generally decrease fMRI reliability [92,
110,159].
5.3.2 Thresholds for Pre-surgical Mapping
In fMRI analysis, statistical thresholds are used to estimate the extent of activation,
impacting reliability and accuracy of the resulting maps [67]. It has been argued
that fixed statistical thresholds do not account for individual variability, differences
in scanning hardware or software strategies, functional tasks or modalities, or habit-
uation to testing conditions [51,57,154,160]. Our group also showed that fixed error
rate thresholds do not provide optimal reliability for individual subjects [141], and
validation studies of concordance with CS have demonstrated that optimal thresholds
vary between individuals and functional tasks [51,154].
In practice, manual adjustment of threshold levels is often used, with implicit
risks of inter-rater differences. Data-driven thresholds address this problem by using
quantitative and reproducible methods [80, 88, 141]. These methods are sensitive
to variations in fMRI activation levels, and have demonstrated reliable fMRI results
across a variety of experimental conditions. Crucially, these approaches can be applied
at the individual patient level.

83
5.3.3 The ROC-reliability (ROC-r) Framework
We recently introduced a ROC-reliability analysis framework (ROC-r) [141], which
summarizes test-retest reliability through plots of the area under the ROC curve
(AUC) versus analysis threshold (e.g. Figure 5.4c). We demonstrated that ROC-r
is useful for assessing fMRI reliability, selecting pre-processing pipelines, and deter-
mining optimal analysis thresholds [141]. The ROC-r method is uniquely capable
of automating the production of activation maps, thereby producing reliable push-
button results.
In this study, we will demonstrate the application of ROC-r fMRI analysis to a
group of patients who also received intraoperative CS mapping. The study was de-
signed to address the following three hypotheses: 1) ROC-reliability will be lower for
patients compared to healthy controls [92]; 2) reliability of single-subject maps will
be improved by optimizing analysis pipelines; and 3) comparing the ROC-r optimized
fMRI activations with CS mapping results, we expect higher spatial correspondence
in data sets with higher reliability. We expect ROC-r to be beneficial for pre-surgical
mapping by combining clinically relevant quality assurance with push-button activa-
tion map production in a single framework.
5.4 Methods
5.4.1 Participants
Sixteen patients (39 ± 13 years of age; 9 female, 7 male; 13 right-, 2 left-, 1 mixed-
handed) receiving surgical intervention for brain tumors volunteered for the fMRI
study. All volunteers underwent pre-surgical fMRI, and most received cortical stim-
ulation during surgery (n = 13). This study was done in compliance with the local
research ethics board (Capital District Health Authority REB, Halifax, NS), and sub-
jects provided informed consent prior to enrollment. Tumor types and locations were
heterogeneous. For a complete list of age, sex, handedness, tumor location, and type
refer to table 5.1. A control group (n = 8) for this study was previously described,
and performed both the finger tapping and sentence reading tasks (see below) [141].
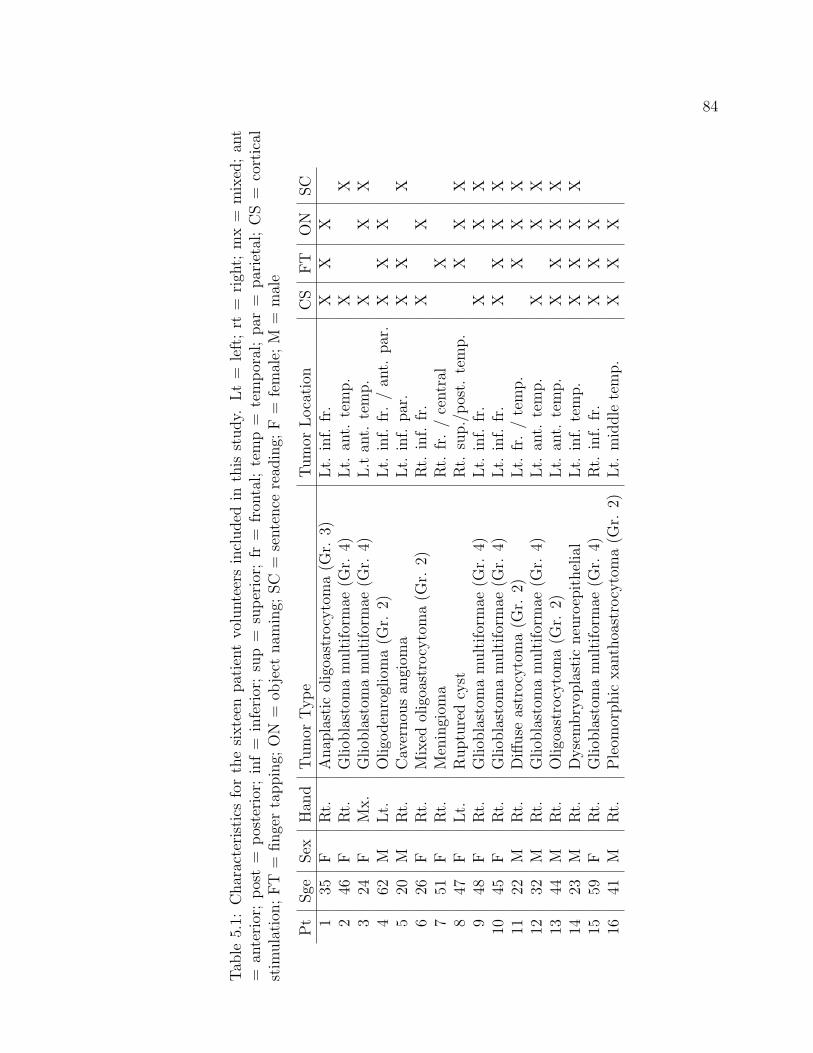
84
Tab
le5.1:
Characteristicsforthesixteen
patientvolunteersincluded
inthis
study.
Lt=
left;rt
=righ
t;mx=
mixed;an
t=
anterior;post=
posterior;inf=
inferior;sup=
superior;
fr=
fron
tal;temp=
temporal;par
=parietal;CS=
cortical
stim
ulation
;FT
=fingertapping;
ON
=ob
ject
nam
ing;
SC
=sentence
read
ing;
F=
female;
M=
male
Pt
Sge
Sex
Han
dTumor
Type
Tumor
Location
CS
FT
ON
SC
135
FRt.
Anap
lastic
oligoastrocytoma(G
r.3)
Lt.
inf.
fr.
XX
X2
46F
Rt.
Gliob
lastom
amultiformae
(Gr.
4)Lt.
ant.
temp.
XX
324
FMx.
Gliob
lastom
amultiformae
(Gr.
4)L.tan
t.temp.
XX
X4
62M
Lt.
Oligo
denroglioma(G
r.2)
Lt.
inf.
fr./an
t.par.
XX
X5
20M
Rt.
Cavernou
san
giom
aLt.
inf.
par.
XX
X6
26F
Rt.
Mixed
oligoastrocytoma(G
r.2)
Rt.
inf.
fr.
XX
751
FRt.
Meningiom
aRt.
fr./central
X8
47F
Lt.
Rupturedcyst
Rt.
sup./post.
temp.
XX
X9
48F
Rt.
Gliob
lastom
amultiformae
(Gr.
4)Lt.
inf.
fr.
XX
X10
45F
Rt.
Gliob
lastom
amultiformae
(Gr.
4)Lt.
inf.
fr.
XX
XX
1122
MRt.
Diffuse
astrocytoma(G
r.2)
Lt.
fr./temp.
XX
X12
32M
Rt.
Gliob
lastom
amultiformae
(Gr.
4)Lt.
ant.
temp.
XX
X13
44M
Rt.
Oligoastrocytoma(G
r.2)
Lt.
ant.
temp.
XX
XX
1423
MRt.
Dysembryop
lastic
neuroepithelial
Lt.
inf.
temp.
XX
XX
1559
FRt.
Gliob
lastom
amultiformae
(Gr.
4)Rt.
inf.
fr.
XX
X16
41M
Rt.
Pleom
orphic
xan
thoastrocytoma(G
r.2)
Lt.
middle
temp.
XX
X
85
5.4.2 MRI Acquisition Details
All 16 volunteers were scanned using a 4 T scanner (Varian INOVA, Palo Alto, Cal-
ifornia). Structural images were collected with an MP-FLASH sequence: TI = 500
ms, TR = 10 ms, TE = 5 ms, α = 11◦, 256 x 256 matrix, 190 slices, and 0.94 x
0.94 x 1 mm voxels (FOV = 24 x 24 x 19 cm). Functional images were collected
with a two-shot spiral out sequence, using TR = 2 s, TE = 15 ms, α = 90◦, 64 x 64
matrix, 22-25 slices, and 3.75 x 3.75 x 4.0 mm voxels, with a 0.5 mm gap (FOV =
24 x 24 x 10-11 cm). Test-retest imaging was performed within-session. A variety of
tasks were included in this study, depending on the brain tumor location and planned
CS investigations for each patient (Table 5.2). The finger tapping task was used for
patients with tumors near the primary motor cortex (i.e. central sulcus region) or
secondary motor cortex (i.e. pre-central sulcus). The object naming task was used
preferentially for patients with tumors in the inferior frontal lobe (Broca’s area), or
the inferior central sulcus region, and occasionally included for temporal lobe lesions.
The sentence reading task was used for patients with tumors in either the temporal
lobe or inferior frontal lobe.
5.4.3 Functional MRI Analysis
Functional MRI analysis was performed using the AFNI software package [119], in
combination with tools written in the Python programming language. Initial pre-
processing steps were applied universally, including rigid body motion correction.
Segmentation isolated the brain from both the functional and anatomical images.
Down-sampled anatomical images were registered to the functional image using a 12
parameter affine transformation.
The remaining pre-processing options were optimized individually, including: 1)
spatial smoothing (3, 6, and 9 mm FWHM), 2) motion parameter regression (MPR:
on/off), and 3) auto-correlation correction (ACC: on/off). All combinations (n = 12)
of these options were analyzed using the ROC-r methodology described below. The
default pipeline (6 mm smoothing, no MPR, and no ACC) was used unless significant
reliability improvements were observed with an alternative combination. Statistical
analysis was carried out using 3dDeconvolve/3dREMLfit in AFNI. Low frequency
signal fluctuations were removed by 2nd order polynomial regression.

86
Tab
le5.2:
Summaryof
thefunctional
tasksusedin
thisstudy.
Avarietyof
taskswereincluded
inthisstudy,
includingboth
langu
agean
dmotor
tasks,withvariou
sblock
andscan
lengths,usingbothactive
andpassive
control
conditions.
M=
motor;
L=
langu
age.
*http://wiki.cnbc.cmu.edu/Objects**http://wiki.cnbc.cmu.edu/Novel_Objects.
Task
Type
ActiveCon
dition
Blocks
Con
trol
Con
dition
Blocks
Fixation
Con
dition
Blocks
Block
Length
Total
Duration
Finger
tapping
MFou
r-fingerascend-
ing/descending
paced
(2Hz)
tap-
ping
4N/A
0Fixation
cross
520s
180s
Object
nam
ing
LOvert
object
nam
-ingof
3Dcolorim
-ages,8/block*
63D
non
-sense
im-
ages**
6Fixation
cross
716s
304s
Sentence
Reading
LCorrect/incorrect
written
sentences
(e.g.
‘She
swept
the
floor
with
asand’),4/block
6Correct/incorrect
math
statem
ents
(e.g.
‘2+2=
5’vs.
‘2+2=
4’)
6Fixation
cross
718s
342s

87
5.4.4 ROC-reliability Analysis
ROC-r analysis measures test-retest reliability in terms of the overlap of active/inactive
regions in the activation maps as a function of image thresholds. Briefly, one of the
images is designated as the template image, acting as a measure of the true activa-
tion pattern. At a fixed threshold on the template image, the retest image is assessed
against the template for true and false positive detections, and the resulting true-
positive and false-positive rates are calculated as a function of retest image threshold.
This creates an ROC-reliability curve for the retest image, and this is repeated for
each template image threshold (in increments of 0.1). From this, the retest area under
the curve (AUC) is plotted as a function of template threshold, and the procedure is
repeated with the roles as template and retest image reversed. Currently, the ROC-r
calculation takes only a few seconds on typical fMRI images.
The ROC-r metric ‘reliable fraction’ (FR) was used to measure overall dataset
reliability. The FR is the proportion of the image t-value range for which the AUC
is more than the mid-range (i.e. AUC > [AUCmax+AUCmin]/2). FR was measured
for each pre-processing pipeline, and the best pipeline was identified for each dataset
based on this reliable fraction. Changes in reliability with pipeline optimization were
assessed with paired t-tests at the group level, whereas comparisons between controls
and patients used independent samples t-tests. Images were divided into ‘reliable’
and ‘unreliable’ categories based on whether the reliable fraction was above or below
the (patient) group mean respectively.
ROC-r was also used for automated threshold selection. The threshold was set
where the AUC curve satisfied two conditions: 1) above average AUC (i.e. AUC
> α[AUCmax+AUCmin]/2), and 2) below average AUC derivative (i.e. dAUC/dt
< β[AUCmax-AUCmin]/[tmax-tmin]). The tuning parameters α and β can be used
to increase or decrease the ROC-r thresholds (higher α values tend to increase the
threshold levels, whereas higher β values tend to decrease threshold levels). Herein
they were set to 1 and 1.5 respectively, which provided similar average threshold levels
to the previous control group. [141]

88
5.4.5 Cortical Stimulation
CS mapping was performed using an Ojemann OCS-1 cortical stimulator with a
bipolar probe (5 mm spacing) using 0.2-0.5 ms duration pulses. Current levels were
increased incrementally from 4 mA (peak-to-peak) in steps of 2-6 mA to a maximum
of 20 mA or until a response was elicited. Sensorimotor mapping used 5 Hz pulse-
rate, whereas language investigation used 60 Hz, in accordance with standard clinical
practice.
For sensorimotor investigations, involuntary movements and/or reported sensa-
tions were recorded. Language mapping used counting, reciting days of the week,
reciting months of the year, and object naming. Locations that consistently produced
a response were recorded either as sensorimotor or language CS-positive (CS+) result.
Areas that produced no effect were recorded as CS-negative (CS-) locations.
5.4.6 Spatial Correspondence Measurements
To facilitate quantitative spatial comparisons between the pipeline-optimized fMRI
and CS, each stimulation location was digitized in MRI coordinates using a neuro-
navigation system. A digitization of the cortical surface was obtained using the
neuro-navigation system at approximately 0.5 cm spacing across the exposed patch
of cortex. Brain shift was corrected for using iterative closest-point registration, in
order to minimize the sum-of-squares distance between the digitized cortical surface
and the brain surface extracted from the anatomical MRI [161]. This approach is
used routinely for co-registering 3D surfaces [162].
Correspondence was measured by the distance from each CS+/CS- site to the
centre of the nearest active fMRI voxel (using the relevant language or sensorimotor
maps). This was calculated as a function of fixed thresholds, and maps with above
and below average FR were compared. Only CS points at least 1 cm apart were used
to avoid oversampling the CS data, which is typically assumed to deposit current in
approximately a 5-10 mm radius [50].
ROC curves were calculated from the CS-fMRI distances at the ROC-r optimized
thresholds. Sensitivity and specificity were defined in terms of whether or not there
was fMRI activity within a spherical ROI around each CS+/CS- location (see table
5.3). The ROC curves were then calculated by varying the ROI search range criteria

89
Table 5.3: Sensitivity (TP/[TP+FN]) and specificity (1-FP/[FP+TN]) were calcu-lated from the CS-fMRI separation distances. TP = True positive, FP = false-positive; TN = true-negative; FN = False-negative.
CS+ CS-fMRI within search range TP FPNo fMRI in search range FN TN
from 0-40 mm, which was more than sufficient to capture the 0-20 mm search ranges
reported in similar studies [57].
5.5 Results
5.5.1 Reliability
The mean FR for the patient group (0.59 ± 0.03) was significantly smaller (p =
1×10⁻⁴) than our previous control group (0.72 ± 0.02). Figure 5.1a shows a normal-
ized histogram of the reliable fraction for each group, revealing a higher proportion
of datasets with reliable fractions below 0.4 for the patient group (20% vs. 3%). This
included three images for which no reliable activation was detected. Likewise, there
were fewer datasets in the highest FR range for patients (15% vs 33%), although the
maximum FR was similar for both groups (0.91 vs. 0.89). There was also a signifi-
cant reliability difference between finger tapping and the language tasks, as shown in
Figure 5.1b.
5.5.2 Pipeline Optimization
The mean reliability increased to 0.65 ± 0.02 after pipeline optimization (figure 5.2a).
This was a significant improvement over the default pipeline (p = 7×10⁻⁷), although
still significantly lower than the control group (p = 8×10⁻³). The smallest gains were
made for the finger tapping task (figure 5.2b), although this difference was statistically
significant (p = 0.043). The sentence reading and object naming tasks had more
significant reliability improvements (p = 4×10⁻⁵ and p = 8×10⁻⁴, respectively).
The default pipeline was optimal most frequently (n = 16), followed by 9 mm
smoothing (n = 12), and 9 mm smoothing with MPR (n = 10). The remaining
frequencies are shown in table 5.4. Overall the three smoothing kernels (3 mm, 6

90
Figure 5.1: Reliability of pre-surgical fMRI measured with the ROC-r reliable fraction:a) Reliable fraction histograms of patients and controls. b) The FR by task. FT =finger tapping; ON = object naming; SC = sentence reading.
mm, 9 mm) were chosen 16, 28, and 24 times respectively. MPR was used for 24 of
68 datasets, and ACC were applied to 10 the 68 images.
5.5.3 Spatial Correspondence with CS
CS data were obtained from 11 of 13 patients. In one patient CS had no effect, and
for one other the available CS data were not relevant to the available fMRI datasets.
These 11 patients provided 28 CS+ tags (9 motor, 19 language), and 53 CS- tags.
There were 38 fMRI images that provided relevant comparisons with the CS data (6
motor, 32 language).
The fMRI to CS+ distance increases monotonically with threshold, reaching 10
mm on average at t = 3.4 (figure 5.3). The reliable and unreliable images (i.e. above
and below the group-mean FR) datasets had significantly different spatial correspon-
dence with CS for thresholds between t = 2.5 and t = 16. Co-localization was better
than 10 mm for t < 6.1 for reliable images, as opposed to t < 2.9 for unreliable ones.

91
Figure 5.2: Effects of pipeline optimization in the patient reliability: a) the histogramshows a shift towards higher reliability following pipeline optimization. b) The ma-jority of the improvement came from the initially less reliable sentence reading (SC),and object naming (ON) tasks.
For a fixed analysis threshold of t = 6.0, the mean fMRI-CS+ distance was 9.9 ± 0.9
mm for reliable maps, and 41 ±5 mm for unreliable datasets.
5.5.4 Automatic Thresholding
The average ROC-r automated thresholds were 6.1 ± 0.1. The average ROC-r thresh-
olds were higher for the unreliable datasets (6.3 ± 0.2) than the reliable datasets (5.7
± 0.2). Representative thresholded fMRI/CS datasets for typical patients are shown
in figure 5.4, for both a reliable motor and language image. The language data shown
are from the object naming task, which was the least reliable of the pre-surgical tasks.
Nonetheless the example shown was above average when compared to the group mean.
Figure 5.5 shows the sensitivity and specificity of the automated thresholds for
detecting eloquent cortex for search ranges from 0 to 40 mm. For a search range of 10
mm, overall sensitivity/specificity was higher for the ROC-r thresholds (50%/87%)

92
Table 5.4: Optimized pre-processing pipelines. A wide range of pipelines were usedbased on their ROC-r FR scores. MPR = motion parameter regression; ACC =autocorrelation correction.
Smoothing MPR ACC Freq.3 mm On On 03 mm Off On 23 mm On Off 63 mm Off Off 86 mm On On 26 mm Off On 46 mm On Off 66 mm Off Off 169 mm On On 09 mm Off On 29 mm On Off 109 mm Off Off 12
Figure 5.3: Average CS+ to fMRI distance as a function of analysis threshold. Theseparation between the CS+ and nearest fMRI activation increases with threshold.At very high thresholds, there is little-to-no activation remaining, resulting in veryhigh CS-to-fMRI distances. The spatial correspondence is better for the more reliabledatasets for most of the threshold range.

93
Figure 5.4: Example reliable thresholded activation maps for a) finger tapping and b)the object naming tasks. Corresponding ROC-r curves and thresholds are indicatedin c) and d) respectively. Activation maps are shown for the test (blue) and retest(red) with overlap in purple. The CS+ (green circles) and CS- (red circles) locationsare also shown. In a) the CS+ locations produced: 1,2) right hand twitch; 3,4) rightwrist flexion. In b) the CS+ locations produced: 1-3) babbled speech; 4) speechinterruption; 5) tingling sensation in lips. The ROC-r plots also show the meanROC-r curves for each task from the patient group (black). For the object namingdata shown, substantial motion was present (∼ 1 mm), as is typical for this task. Inthis case, motion regression did not improve the reliability of the activation mapping.

94
than fixed thresholds (t = 6.0; 42%/84%). Increasing the search range to 15 mm
produced 64%/76% sensitivity/specificity, whereas decreasing it to 5 mm produced
29% sensitivity and 94% specificity.
Figure 5.5: a) ROC curves and b) sensitivity (solid lines)/specificity (dashed lines)versus search range for localization of eloquent cortex (i.e. CS sites) using ROC-rthresholded maps. As the search range around each CS location is increased from 0 to40 mm, the sensitivity increases and specificity decreases. The reliable datasets havehigher sensitivity than the unreliable datasets for a given search range. Converselythe same sensitivity and specificity can be obtained using a smaller search range forthe reliable datasets than the unreliable ones.
Reliable datasets were more sensitive but less specific than unreliable ones. For a
15 mm search range the sensitivity/specificity was 89%/59% and 44%/87% for reliable
and unreliable images respectively. The reliable datasets were somewhat more sensi-
tive and significantly more specific (p < 0.05, two-proportion z-test) when thresholded
using the ROC-r algorithm (89%/59%) than fixed thresholds (82%/47%), whereas
there was little difference in the two approaches for unreliable datasets (47%/85% vs.
42%/89%).

95
5.6 Discussion
5.6.1 Reliability of Pre-surgical fMRI
We found that the reliability of pre-surgical fMRI in brain tumor patients was lower
than that of healthy controls (Hypothesis 1). In the case of brain tumor patients, this
may be related to issues including difficulty with task performance due to functional
deficits, and increased propensity for motion during scanning. However, this result
is likely not specific to brain tumors. Lower reliability has previously been shown
using intraclass correlation (ICC) in schizophrenia [163], although later no significant
difference was seen using test-retest overlap [164]. Decreased patient reliability was
also observed for multiple sclerosis [110], and mild cognitive impairment [159]. While
the situation is not as clear for stroke patients, Kimberley et al. [99] and Eaton et
al. [165] found increased between-subject variability falsely inflated the individual
ICCs. Reliability measures using only within-subjects factors may therefore be more
appropriate for comparing patient populations.
We observed higher reliability for finger-tapping compared to language tasks. This
agrees with the review of Bennet and Miller [92], which showed that sensory/motor
tasks are more reliable than higher cognitive tasks. The higher rate of false pos-
itive/negative voxels for cognitive tasks likely relates to the smaller fMRI signal
changes typically evoked by these tasks, resulting in noisier time-course data.
5.6.2 ROC-r Pre-processing Optimization
We demonstrated optimization of individualized pre-processing pipelines using ROC-
r analysis (Hypothesis 2). There was a high degree of heterogeneity between subjects,
which agrees with previous reports on pipeline optimization [58, 158]. Only spatial
smoothing and rigid motion correction have been found to be widely beneficial across
subjects [58, 61, 158], which agrees with our results. The least reproducible pipelines
were those that included both MPR and ACC, suggesting that over-fitting the data is
detrimental to reproducibility of the activation maps. In the context of pre-surgical
mapping, these results make it clear that advanced analysis strategies should only
be adopted on an as-needed basis, and only in the presence of empirical evidence
supporting their use.

96
The cognitive tasks benefitted the most from pipeline optimization. Partly, this
represents a ceiling effect for the finger-tapping task, which was highly reliable with
the default pre-processing pipeline. Motion parameter regression was used more fre-
quently for the object naming task (12/26) than the finger tapping task (4/22), likely
because of task-induced motion. A bias towards low smoothing (3 mm FWHM) for
the sentence reading task (10/20) compared with the other tasks (6/48) was observed,
which is consistent with smaller activation foci. With sufficient sample size, similar
differences could be observed for other task comparisons, and reflect the lack of a ‘one
size fits all’ approach to analysis of neuroimaging data. ROC-r analysis improves clin-
ical fMRI methodology by selecting the most appropriate pipeline on a case-by-case
basis, with the additional benefit of reduced reliance on expert intervention in the
production of fMRI maps.
5.6.3 Clinical Utility of ROC-reliability Analysis
Datasets with higher reliable fractions were shown to have a better spatial correspon-
dence to CS results (Hypothesis 3). This extends the earlier findings of Beisteiner et
al. [39], which showed that reliably activated voxels co-localized with CS+ results. By
identifying images unlikely to produce useful results as soon as the scan is completed,
ROC-r analysis can guide decisions on data rejection and scan repetition. Conversely,
datasets with high ROC-r reliable fractions can be used for pre-surgical mapping with
enhanced confidence. This has clear clinical utility, as the risk of false-negative find-
ings due to poor quality scans is reduced.
The sensitivity/specificity to CS depended on the search range used for matching
CS results, as has been shown previously [54]. For a conventional 10 mm search
radius, our overall sensitivity (50%) and specificity (87%) were similar to those found
by Roux et al. [51] in 2003 (45-54% and 95% respectively). Overall, the sensitivity
of the fMRI results suggests that the use of intra-operative mapping is still vital
to guide surgical resection, in agreement with outcome based studies such as Spena
et al. [166]. Nonetheless, ROC-r optimization improves the predictive power of the
fMRI results, and therefore increases the utility of the pre-surgical mapping. The
addition of ROC-r analysis to an fMRI protocol helps to ensure that the best results
are produced from the available data.

97
Other studies have found higher sensitivity than specificity for pre-surgical fMRI
[47, 51, 154], but frequently employ multiple tasks to increase the likelihood of a
positive prediction. For instance, Rutten et al. [154] found 22-70% sensitivity and
73-93% specificity depending on the language task used, but increased sensitivity to
92% and decreased specificity to 61% by combining five tasks. Roux et al. [51] also
used multiple tasks to increase sensitivity from approximately 50% to 66%, at the
cost of decreased specificity (from 95% to 91%). In our study we only compared
single tasks to CS. While we could achieve higher sensitivity by combining tasks, the
clinical fMRI time constraints often limit the number of tasks and repetitions possible.
These results show that task repetition is an alternative approach to enhance both
sensitivity and specificity of fMRI pre-surgical mapping.
Another methodological consideration is the threshold levels used in previous stud-
ies, which are often lower than those determined by the ROC-r method. Rutten et
al. [154] showed a decrease in sensitivity from 99% to 47% when the thresholds were
increased from t = 2.5 to t = 4.5. They observed a concomitant increase in specificity
from 23% to 80%. Higher sensitivity is desirable for pre-surgical fMRI to avoid false
negatives, so future investigation could focus on optimizing the ROC-r α and β pa-
rameters to lower the threshold levels. This will provide the benefits of individualized
thresholds with increased sensitivity.
There are several variables affecting fMRI-CS correspondence that we were un-
able to explore due to sample size and heterogeneity. For example, Pouratian et
al. [49] found 33-70% specificity depending on the region of the brain being mapped
(frontal/temporal). Bizzi et al. [54] showed that both sensitivity and specificity were
higher for motor tasks (88% and 87% respectively) than language tasks (80% and
78%). This study also showed that sensitivity was higher for WHO grades II and III
gliomas (93%) than grade IV (67%), whereas specificity showed the opposite depen-
dence (76-79% versus 93% respectively). We had a high number of grade IV gliomas
in our study, which likely contributed to the overall sensitivity. Larger sub-samples
would be required to confirm this hypothesis.
Importantly, no previous study has demonstrated metrics available at the time of
scanning that correlate with co-localization of fMRI and CS. We found higher sen-
sitivity for datasets identified by ROC-r as reliable (66% for a 10 mm search range)

98
than unreliable (36%). This difference was even more dramatic using larger search
ranges (e.g. 89% vs. 44% at 15 mm). While specificity was higher for unreliable
images, this was accompanied by unacceptable false-negative rates (> 50%), likely
because there was little to no activation above threshold in these images. Further-
more, for any fixed sensitivity level above 50%, the specificity of the reliable datasets
was actually higher than the unreliable images, as a smaller search range can be used
(Figure 5.5). The ability of ROC-r to predict useful fMRI images provides a critically
needed quantitative tool for assessing fMRI image quality in a clinically meaningful
way.
5.7 Conclusion
We demonstrated that ROC-r is sensitive to differences in reliability between patient
and control groups. The FR quantifies the effects of pre-processing pipelines, en-
abling subject-specific strategies, and is especially beneficial for difficult applications
like cognitive tasks and subject motion. ROC-r metrics were shown to predict co-
localization, and can potentially be used to guide decisions regarding data rejection
and scan repetition at the time of the scan. Finally, ROC-r can determine automated
threshold levels, with higher sensitivity and specificity for eloquent cortex than a fixed
threshold approach. In combination, these capabilities allow for fully automated and
individualized fMRI processing. By facilitating push-button, yet individualized anal-
ysis, ROC-r reduces the need for expert intervention in data processing, increasing
usability in the clinic, and furthering the impact of pre-surgical fMRI.

Chapter 6
Manuscript 4: A Unified Framework to Optimize fMRI and
MEG Processing for Push-button Pre-surgical Mapping
Authors: Tynan Stevens, Ryan D’Arcy, David B. Clarke, Daniel McNeely, Tim Bar-
douille, Gerhard Stroink, Steven Beyea.
Status: Prepared for Submission
Journal: NeuroImage
Contribution: Conceptualization, Data Collection, Data Analysis, Primary Author
6.1 Motivation
The final manuscript of this thesis ties together the previous works. So far, ROC-r
has been demonstrated to provide quantitative quality assurance for MEG and fMRI,
to be useful for determining optimal pre-processing pipelines, and to produce robust
individualized thresholding for single-subject imaging. In this paper, we directly
evaluate ROC-r as a unified framework for reliable single-subject MEG and fMRI
mapping. This work shows that by using optimized single-subject pipelines, similarly
robust fMRI and MEG maps can be obtained automatically. This is an important
result, as the use of fixed analysis pipelines could bias the comparison of fMRI and
MEG reliability, and we have demonstrated that there is no universally best set of
processing choices. In this paper, we include a patient case showing verification of the
automated MEG and fMRI maps by co-localization with cortical stimulation. This
manuscript thus shows that the ROC-r analysis framework leads to a unified approach
to robust, push-button, and individualized processing of single-subject fMRI/MEG
mapping.
99

100
6.2 Abstract
Purpose: Both functional MRI (fMRI) and Magnetoencephalography (MEG) have
demonstrated potential as methods for pre-surgical mapping of brain function, and
present unique technological and clinical benefits and drawbacks. Objective compar-
ison of these technologies is hampered by the difficulty in comparing data processing
pipelines and analysis choices at the single-subject level. We have evaluated a receiver
operating characteristic reliability (ROC-r) based approach that solves this problem
through an automated and data-driven approach. ROC-r quantitatively optimizes
pre-processing pipelines and determines data-driven thresholds for both fMRI and
MEG, using a unified approach across scanning modalities.
Methods: We demonstrated ROC-r for optimizing both functional MRI (fMRI)
and magnetoencephalography (MEG) mapping of the primary motor cortex in 20
healthy controls. For fMRI, we tested two general linear models, with/without auto-
correlation corrections, and with/without motion parameter regression. For MEG,
we tested two trigger sources, with/without independent component analysis for ar-
tifact removal, and with/without low-pass filtering. Automated thresholds were de-
termined for each subject using the optimally pre-processed data. We demonstrated
our approach in a patient case, by comparing the pre-surgical mapping locations to
intraoperative measurements.
Results: A wide variety of optimal pipelines were identified across subjects. MEG
reliability depended more strongly on the pre-processing pipeline than fMRI, but the
reliability of the optimal pipelines were similar for fMRI (0.69 ± 0.02) and MEG (0.71
± 0.03). ROC-r optimized thresholds identified activation near the central sulcus for
all fMRI datasets and 28/32 MEG datasets. The peak overlap of the individual level
maps occurred in the primary sensorimotor cortices, reaching 88% overlap for fMRI
and 80% overlap for MEG. The patient case demonstrated that the ROC-r automated
mapping co-localized with the primary motor cortex as identified intra-operatively.
Conclusion: ROC-r optimization of fMRI and MEG pre-processing pipelines pro-
vided robust pre-surgical mapping, including automated data-driven thresholding,
as demonstrated by co-localization with intra-operative measures. ROC-r allows for
push-button analysis, streamlining the clinical implementation of functional map-
ping, and removing the need for manual intervention and selection of pre-processing

101
pipelines. Crucially, ROC-r permits a more fair comparison of functional mapping
data quality in fMRI and MEG by removing the variability due to subjective data
analysis decisions.
6.3 Introduction
Functional magnetic resonance imaging (fMRI) and magnetoencephalography (MEG)
are safe and non-invasive means of localizing brain function, and thus attractive op-
tions for pre-surgical mapping [23, 29, 167, 168]. MEG is considered the more direct
technique, measuring the magnetic fields produced by synchronous post-synaptic po-
tentials [70], whereas fMRI measures brain activity indirectly through hemodynamic
coupling [69]. This fundamental difference leads to the unique strengths and weak-
nesses of each technology. For example, spatial resolution is considered superior for
fMRI, whereas the temporal resolution of MEG is advantageous when the dynamics
of neural activity are of interest [169]. The two modalities are complementary, and
getting the most out of their combined use is crucial for applications like pre-surgical
mapping [169–182].
There are a vast number of methods available for analyzing fMRI and MEG data
[183]. This is both an advantage, as it offers flexibility in extracting information
from neuroimaging data, but also a burden, as the quality of the resulting maps will
depend on the analysis methods chosen. The wide range of analysis strategies provides
a particular challenge in single-subject studies encountered in clinical applications,
as both fMRI and MEG are accompanied by a significant amount of inter-subject
variability [155, 158, 184–188]. Individually tailored analysis strategies are required
to overcome differences like subject motion during scanning, physiological noise from
heart or breathing rhythms, and modulation of the cortical response by attention or
arousal during the scan [60]. For example, motion regression can eliminate motion
correlated signals, but in some cases this may result in unacceptable reduction of
sensitivity. Manual evaluation of all pre-processing options is overwhelmingly time
consuming, and the selection of appropriate analysis strategies on a single-subject
level is therefore a formidable task [158,186].
To address the difficulty of creating individualized data processing strategies in

102
fMRI and MEG, we recently developed a method of automatically selecting subject-
specific processing pipelines using test-retest receiver operating characteristic relia-
bility (ROC-r) [141]. This method can be applied to any volumetric source mapping
pipeline, and optimization can be performed by selecting the pipeline with the highest
within-subject reliability. ROC-r evaluates pre-processing pipelines solely in terms of
the final activation maps, which forms the common link between fMRI and MEG
source imaging. Therefore, unlike previous methods of fMRI pre-processing pipeline
optimization like NPAIRS (nonparametric prediction, activation, influence and repro-
ducibility resampling) [58, 61, 157, 158], ROC-r works without modification for MEG
mapping. Additionally, this analysis produces threshold-dependent reliability esti-
mates, which in turn can be used to determine data-driven thresholds, allowing for
fully automated production of activation maps. ROC-r is highly advantageous in clin-
ical settings as it eliminates the influence of the experimenter on the final activation
maps, and provides a unified framework for optimizing fMRI and MEG processing
choices.
In this study, we evaluate our unified approach to automated pipeline selection
and activation thresholding for fMRI and MEG using ROC-r analysis. We applied
this method to pre-surgical mapping of primary sensorimotor cortex by using identical
stimulation paradigms in MEG and fMRI, including both a group of healthy controls
and a demonstrative patient case. For the patient volunteer, we demonstrated the
non-invasive mapping results by comparison with electrophysiological measurements
performed during surgery. Importantly, by using data-driven analysis pipelines, we re-
duce the potential for missing important activation due to sub-optimal pre-processing
strategies. Furthermore, by working within an automated analysis environment, we
eliminate the need for expert intervention in the process. By introducing a common
framework for optimization of fMRI and MEG pre-processing pipelines, we ensure
that comparisons of the fMRI and MEG results are not biased due to poor choices in
the data analysis chain.

103
6.4 Methods
6.4.1 Processing Pipeline Optimization
ROC-r analysis was used for pre-processing pipeline optimization and adaptive thresh-
olding of both fMRI and MEG maps. ROC-r measures reliability by calculating the
amount of overlap in the active/inactive regions of test-retest maps as a function of
analysis threshold. This is summarized by plotting the ROC area-under-the-curve
(AUC) as a function of image threshold (Figure 6.1). To permit ROC-r analysis,
three runs of the functional task were performed within both the fMRI and MEG
sessions, and all six pairings (i.e. all combinations of each of the three images as tem-
plate for the other two) of the three runs were submitted to a ROC-r analysis. This
produced six AUC plots for each pre-processing pipeline (see below) applied to the
data. While more repetitions of the functional task could have been used to further
average the ROC-r estimates, three repetitions provided adequate balance between
convergence and scanning time. The ROC-r methodology is described in detail in
Stevens et al. [141].
The reliable-fraction (FR) metric was used to measure overall test-retest reliability
from the AUC versus threshold plots. This is calculated as the fraction of the thresh-
old range for which the AUC is above its mid-range (i.e. 0.5[AUCmax+AUCmin], see
Figure 6.1). Reliable fraction is bounded by 0 and 1, with high values indicating that
reliability increases quickly with image threshold. The reliable fraction was calculated
for the six test-retest pairings, and an average for each pipeline was determined. The
pipeline with the highest reliable fraction was selected on a subject specific basis. At
the group level, differences between the pipelines were assessed using ANOVA (p <
0.01).
After pipeline optimization, ROC-r adaptive thresholds were determined for each
MEG and fMRI map. The thresholds were selected from the AUC plots as the lowest
threshold with an AUC above the mid-range, and a rate of AUC increase below the
‘linear rate’ (i.e. [AUCmax-AUCmin]/[tmax-tmin]). This provides a balance between
the high test-retest reliability and high sensitivity, by avoiding the diminishing returns
in reliability at high thresholds (Figure 6.1). The ROC-r thresholds were determined
for each of the six test-retest pairings, and the average threshold was applied to

104
Figure 6.1: Schematic of the ROC-r output parameters. The mean ± standard de-viation of the AUC versus threshold for the six image pairings is shown (solid linewith error bars), along with the mid-range value (dashed lines) and the ‘linear-rate’(dotted line). The ROC-r optimized threshold is identified as the lowest threshold forwhich the AUC is above the mid-range, and the rate of AUC increase drops belowthe linear-rate (dash-dotted lines).
the average of the three maps to produce a final activation map. To demonstrate
robustness, the thresholded maps were transformed into standard space, and the
number of single-subject datasets that identified activity in each voxel was summed.
Areas with high values in this group overlap map were thus consistently detected
across subjects.
6.4.2 Subjects
Twenty healthy controls (33 ± 13 years of age; 12 females; 17 right handed) volun-
teered for this study. All participants provided informed consent, and the study was
performed in compliance with the local research ethics board (Capital District Health
Authority REB, Halifax, NS). A patient case with planned intraoperative electrical
stimulation mapping was also studied to demonstrate the application of these methods
to pre-surgical mapping directly. All participants performed within-session test-retest
fMRI and MEG imaging, and the order of the two modalities was counterbalanced

105
across subjects.
6.4.3 Stimulation Paradigm
Both MEG and fMRI mapping were performed using an identical stimulation paradigm
for localization of the primary sensorimotor cortex. The task consisted of word pairs
presented in serial order, which were either semantically related (50%) or unrelated
(50%) to one another. The subjects were asked to respond by squeezing their left
or right hand for related and unrelated word-pairs respectively, using a grip-force
response device. The task was presented in a series of six task (40 s) and seven
rest (20 s) blocks, for a total time of 6 minutes 20 seconds. The tasks blocks were
made longer than the rest blocks in order to increase the number of stimuli per run,
which increases the SNR of the MEG evoked responses (see below). Within each task
block, 15 word-pairs were presented, with each word appearing for 600-800 ms, and
a 900-1800 ms inter-stimulus interval (ISI) between word pairs. The duration of the
stimuli, the ISIs, and the order of the related/unrelated pairs were randomized to
avoid anticipatory effects. The rest blocks consisted of simple fixation on a central
target. The task was repeated three times within each session to facilitate ROC-r
analysis. No words were repeated across the task repetitions.
6.4.4 MRI Acquisition
Participants were scanned using a 4 Tesla MRI system (Varian INOVA). Anatomical
scans were acquired using a T1-weighted MP-FLASH sequence (TE = 5 ms; TR = 11
ms; 256 x 256 x 128 grid at 1 x 1 x 2 mm resolution). Functional scans used a spiral
pulse sequence (TE = 15 ms; TR = 2 s; α = 60◦; 64 x 64 x 31 grid at 4 x 4 x 3.5 mm
resolution; 0.5 mm slice gap). The grip-force device was recorded from continuously
to monitor participants’ responses. Deviations from baseline greater than 10% of the
device’s dynamic range were marked as response events.
6.4.5 MRI Processing
The anatomical MRI was segmented using Freesurfer [189]. The resulting brain-only
image was used for registration with the fMRI data, and the outer head surface was
subsequently used to setup the MEG forward solution. Functional MRI registration

106
used within-run rigid body motion correction, followed by between-run rigid body
alignment, and finally affine transformation to register to individual anatomical space.
Functional MRI maps were produced using the general linear model (GLM) ap-
proach with FSL software [190]. Eight fMRI pre-processing pipelines were investi-
gated, including: 1) using the stimulus (related vs. unrelated pairs) or response (left
vs. right hand squeeze) timing for GLM analysis, 2) with or without motion parame-
ter regression in the GLM, and 3) with or without auto-correlation correction (ACC).
Both GLM contrast choices were designed to produce a single image in which the
left and right hand appeared as positive and negative task correlation respectively,
in order to produce maps with high specificity to the primary sensorimotor cortices.
The related versus unrelated word stimuli contrast is only expected to work well
when subjects’ response accuracy is high. All pre-processing pipelines used a 6 mm
FWHM smoothing kernel and a 100 s high-pass filter. Each pre-processing pipeline
was analyzed with ROC-r, and the pipeline with the highest reliability was chosen.
6.4.6 MEG Recording
Head position was monitored during MEG scanning using head position indicator
(HPI) coils placed on the left/right temples and mastoids. The head surface, HPI
coil locations, left/right pre-auricular points, and the nasion were digitized using an
Isotrak system (Polhemus Inc., Colchester, USA). Surface electrodes pairs were placed
above and below the left eye to record eye blinks, and on the left and right flexor carpi
radialis to record the EMG at movement onset. MEG data were collected at 1000
Hz sampling frequency, using a Neuromag (Elekta AB, Stockholm, SE) 306 channel
whole-head system. The grip-force device was recorded from continuously, as in the
fMRI experiment. HPI coils were recorded continuously to monitor head movement
during the MEG scans.
6.4.7 MEG Processing
MEG data were band-pass filtered (1-60 Hz), and down-sampled to 500 Hz. The
following pre-processing pipeline choices were analyzed using ROC-r analysis: 1)
with or without independent component analysis (ICA) for removal of artifacts, 2)
epoch extraction relative to either force onset or EMG onset, and 3) with or without

107
an additional low-pass filter (20 Hz). Force onsets were detected by thresholding the
grip-force signal at 10% maximum, and EMG onset detection additionally employed
a band-pass filter (2-4 Hz) after rectification, in order to isolate the envelope of the
EMG signal. For ICA denoising, components were removed if they satisfied any of the
following conditions: a) correlation greater than 0.4 with the vertical eye electrode
signal, b) frequency matching the heart rate range, or c) amplitude outside of the
physiological range (i.e. greater than 7.5×10⁻¹¹ Tesla/cm for planar gradiometers or
2×10⁻¹² Tesla for the magnetometers).
Source mapping was performed using a dynamic (i.e. 3D+time) beamformer.
Epochs were extracted for the left and right hand separately from -1000 ms to +500
ms relative to the EMG/force onset triggers. Unlike the fMRI analysis, this procedure
produces independent images of the left and right hand, as specificity of the MEG
maps can be achieved by exploiting the temporal resolution. Epochs were baseline
corrected for -1000 to -500 ms, and the baseline covariance was calculated from the
same time range. Sensor covariances for the active period were taken from the -100
to +100 ms window for the force-triggered epochs and +100 to +300 ms for the
EMG trigger, as the largest evoked field was observed near the center of these latency
ranges. The forward solution was calculated according to the boundary element
method (openMEEG software), using the external head surface boundary produced
during Freesurfer segmentation. The MEG and anatomical data were registered semi-
manually (manual alignment to Isotrak anatomical landmarks, followed by iterative
closest point registration of the head shape). Within this head-shaped boundary, a
4 mm grid was constructed, and the beamformer solution was calculated for each
location on this grid, matching the spatial resolution used in the fMRI acquisition.
The latency with the largest source amplitude in the pre- or post-central gyri was
extracted as the final source map.
6.4.8 Intraoperative Mapping
For the patient case, intra-operative mapping was also performed to validate the
non-invasive techniques. A linear strip of six subdural electrodes was used both for
detecting phase reversal of sensory evoked potentials in response to electrical stimula-
tion of the contralateral ulnar nerve, and to elicit EMG activity in the abductor digiti

108
minimi or adductor hallucis brevis by stimulating between pairs of electrodes (2-10
mA, 60 Hz, 0.5 ms pulses). Results of the intraoperative mapping were recorded onto
the patient’s pre-surgical MRI image using a StealthStation (Medtronic, Minneapolis,
USA) neuro-navigation system.
6.5 Results
We successfully mapped the primary motor cortex by both fMRI and MEG in the
majority of subjects. Four subjects were excluded, due either to compliance issues
during scanning (N = 3) or incidental findings on the MRI in the vicinity of the
motor cortex (N = 1). Reliability of the fMRI and MEG maps was generally high,
although more strongly dependent on the pre-processing pipeline for MEG. After
pipeline optimization, the reliability of fMRI (FR = 0.69 ± 0.02) and MEG maps
were similar (FR = 0.71 ± 0.03). ROC-r automated thresholding produced robust
localization of the primary motor cortex for both fMRI and MEG in the majority of
healthy controls, and this localization was confirmed in a patient case using intra-
operative electrocortical mapping methods.
6.5.1 Pre-processing Optimization
On average, there was no significant difference in reliability between the fMRI pipelines
(Figure 6.2a). However, the pipeline using the response-based GLM, with ACC but
without MPR, had the highest reliability more than twice as often as any other
pipeline (Figure 6.2b). Seven of the eight fMRI pre-processing pipelines were optimal
for at least one of the 16 healthy control datasets. There was a clear tendency for the
response-based GLM model to provide more reliable maps than the stimulus-based
model (13/16), as the stimulus based model assumes response accuracy, and is less
time-locked to the responses. While accuracy was in general high (95 ± 5 percent),
the response based model was still superior in general. The use of ACC (10/16) or
MPR (6/16) produced more equivocal results, suggesting that despite their common
use in fMRI analysis pipelines, neither are universally beneficial to the production of
robust fMRI maps.
For MEG, 7/8 pipelines tested were optimal for at least one dataset. Maps using
the force-onset trigger were significantly more reliable (FR = 0.57 ± 0.02) than those

109
Figure 6.2: a) Average reliability of the fMRI maps by pre-processing pipeline. Therewas no significant difference between the pre-processing pipelines at the group levelfor fMRI. b) The number of individual fMRI datasets for which each pipeline hadthe highest ROC-r FR. At the individual level the best pre-processing choices werehighly subject dependent, and all but one pipeline was optimal at least once. Theresponse-based GLM was best in the majority (13/16) of datasets, whereas otherpre-processing options produced more variable results.

110
produced using the EMG-onset trigger (FR = 0.39 ± 0.02). However, pipelines using
the EMG-onset trigger were optimal for 7/32 datasets (Figure 6.3). Pipelines with
ICA artifact removal produced significantly lower reliability (0.45 ± 0.02) than those
without ICA (0.51 ± 0.02), and ICA was rarely selected by individual-level pipeline
optimization (5/32). Pipeline optimization improved the reliability significantly com-
pared to any of the fixed analysis pipelines (p < 0.05). The most common optimal
pipelines for the MEG data thus used the force-onset trigger, without ICA artifact
removal, with (8/32) or without (13/32) low-pass filtering.
6.5.2 Automated Thresholding
A representative automated thresholding result is shown in Figure 6.4. ROC-r thresh-
olds maps identified activity around the central sulcus for all 16 fMRI maps, 13/16
left hand MEG maps, and 15/16 right hand MEG maps. The datasets which failed
to identify activity had significantly lower reliability (0.48 ± 0.05 vs. 0.78 ± 0.03). In
one case, this was associated with a moderate amount of subject motion (∼1-2 mm),
but in other cases we could determine no obvious explanation. Threshold levels were
much higher for fMRI (4.0 ± 0.3) than MEG (0.22 ± 0.06), as the two modalities used
different statistical measures (z-statistic versus pseudo-z), with different magnitude
scales. For MEG, localization was consistent with the primary motor cortex in the
pre-central gyrus, whereas the fMRI activity tended to localize just posterior to the
hand knob, in the primary sensory cortex of the post-central gyrus (Figure 6.5). MEG
locations were somewhat more variable than fMRI, resulting in lower between-subject
overlap for MEG (80%) than fMRI (88%).
6.5.3 Patient Case
A right handed female patient (56 years of age) with a tumor in the left supplemen-
tary cortex performed the same fMRI and MEG protocol, to demonstrate the validity
of the automated ROC-r processing approach in the context of intra-operative stimu-
lation mapping. The patient presented with seizures involving repetitive speech and
expressive aphasia. Complete resection of the tumor was achieved during surgery,
after which the patient experienced transient aphasia and right hemiparesis. The pa-
tient was discharged two weeks after surgery, and underwent six weeks of rehabilitative

111
Figure 6.3: a) Average reliability of the MEG maps by pre-processing pipeline. Force-onset triggering produced more reliable results than EMG-onset triggering, and ICAartifact removal was associated with a decrease in reliability of MEG maps. Pipelineoptimization provided a significant improvement in reliability across the group. b)The number of individual MEG datasets for which each pipeline had the highestROC-r FR. The force-onset triggered pipelines were best in the majority (25/32) ofdatasets, and ICA denoising was recommended rarely (5/32 datasets), in agreementwith the overall reliability trends.

112
Figure 6.4: Single-subject ROC-r reliable fraction averaged across image pairings(top), automated threshold selection (middle), and the resulting activation maps(bottom). The fMRI contrast used (left vs right hand) produced a single map withactivity in both hemispheres (a), whereas for MEG the left (b) and right (c) handepochs were mapped separately. For fMRI, the best pipeline in this case used theresponse-based GLM, with MPR and ACC corrections. For MEG, the best pipelinewas different for the left hand (force trigger, without ICA but with low-pass filtering)and right hand (force trigger, with neither ICA nor low-pass filtering). Both the fMRIand MEG activation in this subject straddled the central sulcus, at the level of thehand-knob.
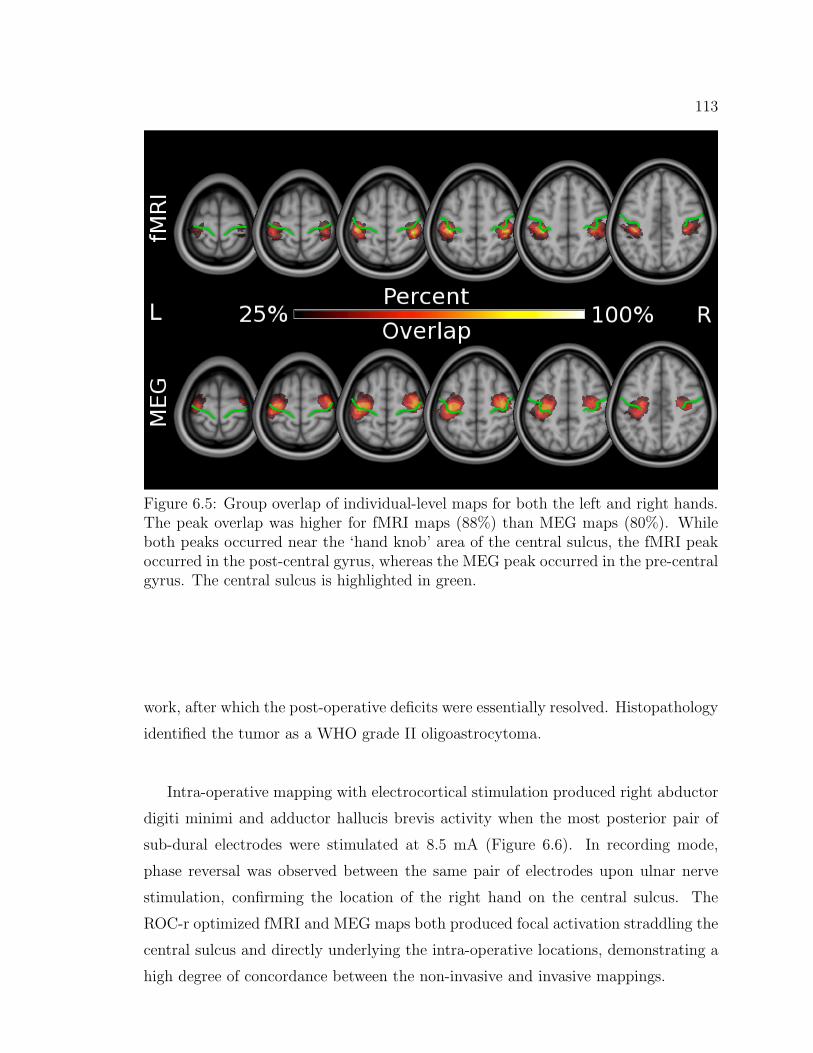
113
Figure 6.5: Group overlap of individual-level maps for both the left and right hands.The peak overlap was higher for fMRI maps (88%) than MEG maps (80%). Whileboth peaks occurred near the ‘hand knob’ area of the central sulcus, the fMRI peakoccurred in the post-central gyrus, whereas the MEG peak occurred in the pre-centralgyrus. The central sulcus is highlighted in green.
work, after which the post-operative deficits were essentially resolved. Histopathology
identified the tumor as a WHO grade II oligoastrocytoma.
Intra-operative mapping with electrocortical stimulation produced right abductor
digiti minimi and adductor hallucis brevis activity when the most posterior pair of
sub-dural electrodes were stimulated at 8.5 mA (Figure 6.6). In recording mode,
phase reversal was observed between the same pair of electrodes upon ulnar nerve
stimulation, confirming the location of the right hand on the central sulcus. The
ROC-r optimized fMRI and MEG maps both produced focal activation straddling the
central sulcus and directly underlying the intra-operative locations, demonstrating a
high degree of concordance between the non-invasive and invasive mappings.

114
Figure 6.6: Patient case demonstrating correspondence of the non-invasive mappingresults with gold-standard intraoperative measurements. The ROC-r optimized fMRI(left) and MEG (right) mapping of both the left (yellow-red) and right (blue-green)hand are shown. A strip of 6 subdural electrodes (red and green circles) was used tomap the primary sensorimotor cortex intraoperatively. Electrical stimulation betweenthe two red circles produced EMG activity in the right abductor digiti minimi andadductor hallucis brevis, and ulnar nerve stimulation produced phase reversal betweenthe same electrode pair, thus localizing the central sulcus. The MEG and fMRI mapswere highly co-localized, and both provided accurate prediction of the location of thehand representation in the primary sensorimotor cortex.
6.6 Discussion
We successfully demonstrated ROC-r analysis as a unified framework for automated
optimization of subject-specific fMRI and MEG pre-processing pipelines. On aver-
age, MEG reliability was more dependent on the pre-processing pipeline than fMRI.
However, pipeline optimization was still beneficial for fMRI analysis, as demonstrated
by the wide variety of optimal pipelines at the single-subject level. It is known that
there is an interaction between the functional task paradigm employed and the effect
of pre-processing options [157,183]. Therefore, even though the use of MPR was often
not recommended in our study, this likely depends on the amount of subject motion,
and the degree of correlation between head motion and the task timing. Additionally,

115
while ICA is commonly used to remove eye-blink artifacts from MEG data, we did
not observe obvious eye blink artifacts in the evoked responses in our study, and ICA
was not usually recommended. Using ROC-r for pipeline optimization, ambiguity in
the best approach for a particular dataset can be resolved directly in terms of reli-
ability of the resulting maps. The adoption of data-driven pre-processing pipelines
facilitates comparisons between fMRI and MEG results, as the best results of each
modality are put forward.
Using explicit evaluation of pre-processing pipelines, we found that some com-
monly employed analysis strategies were not recommended for our data. For example,
averaging to force-onset was generally preferable to averaging to EMG-onset for the
MEG source mapping. This is contrary to the methodology typically employed in
mapping primary motor cortex in MEG studies [32,191], which usually employ EMG
triggering. Partly, this discrepancy may be related to small oscillations on the EMG
signal that were observable approximately 100-200 ms prior to the force onset, likely
caused by anticipatory pre-movement muscle activity. Furthermore, some subjects
had difficulties relaxing their muscles completely between stimuli, resulting in some
tonic activity on the EMG sensors. These undesired oscillations made the detection
of EMG onset more dependent on the specific frequency filter and threshold used
to define the trigger, and introduced variability in the trigger latencies. The fidelity
of the grip-force signal was higher, making it more robust for detecting the latency
of force-onset. This further illustrates the importance of quantitative evaluation of
pre-processing choices, as the best results are highly dependent on the details of the
task paradigm, data acquisition, and subject performance.
The pipelines investigated here only represent a small fraction of the potential
pre-processing choices that are made routinely during analysis of fMRI and MEG
images. Inevitably there are other fMRI pre-processing choices that will have a more
significant impact on reliability, and these need to be assessed on a case-by-case basis.
Ultimately, the more pipelines included in a ROC-r analysis, the greater the potential
benefit in terms of activation reliability.
ROC-r analysis not only determines optimal subject-specific pre-processing pipelines,

116
but also produces data-driven thresholds for automated localization of activated re-
gions. In many cases, the thresholded fMRI and MEG maps overlapped in the ‘hand-
knob’ of the primary motor cortex, however the MEG maps tended to reach maximum
in the pre-central gyrus (the primary motor cortex), whereas the fMRI maps tended
to peak in the post-central gyrus (the primary somatosensory cortex). This discrep-
ancy is likely due to sensory feedback from the hand-squeeze combined with the low
temporal resolution of fMRI compared to MEG. The slow hemodynamic response of
fMRI essentially acts as a low-pass temporal filter, taking up to six seconds to peak.
As the motor cortex activation and subsequent sensory feedback are likely to occur
in very close succession, these signals cannot be distinguished from one another by
fMRI. The forceful hand-squeeze movement used in this study is particularly likely
to evoked a strong sensory response. In contrast, the millisecond temporal resolution
of MEG produces motor and sensory signals that are easily separated in the evoked
response. Additionally, with the evoked responses being time-locked to the EMG or
grip-force signal, the later sensory response is less likely to produce a strong average
due to latency variability.
Both fMRI and MEG were generally successful at identifying the primary senso-
rimotor cortex, as demonstrated explicitly with the patient case presented. In this
case, we were able to identify with high specificity the hand representation in the
primary sensorimotor areas. This case showed that, although at the group level
there were slight differences in the fMRI and MEG localization, in individual sub-
jects this was not necessarily true. The recommendation of one scanning modality
or the other would likely be decided by patient-specific details rather than the dif-
ferences in localization (e.g. in the case of a high grade glioma, fMRI contrast may
be affected [56, 192, 193], rendering MEG preferable). This may not generalize to
other task paradigms, as fundamental differences in fMRI and MEG sensitivity may
come into play (e.g. lack of sensitivity to radial sources in MEG or difficulty imaging
near air-tissue interfaces in fMRI). ROC-r provides an objective means of determin-
ing which areas are reliably detected, which provides guidance for recommending
scanning modalities for pre-surgical mapping.
The automated thresholding algorithm provided robust localization at the single-
subject level. The few MEG datasets in which localization was not possible had

117
very low reliability even for the best available pre-processing pipelines. This is likely
a reflection on the data quality for these datasets, as the evoked responses were
weak in these cases, possibly because of the relatively low number of stimuli used
in this study. Ongoing work by many research groups improving task paradigms,
acquisition strategies, and analysis procedures will ultimately improve the quality of
activation maps, making ROC-r an even more valuable tool for pipeline optimization
and automated localization.
By providing the best data analysis chain for a given dataset, and automatically
thresholding to include only reliably detected brain areas, ROC-r allows for com-
parison of fMRI and MEG localization on equal footing. This is beneficial both for
comparing experimental techniques in healthy controls, and for optimizing results in
the clinical setting, where producing the highest quality results is most important.
6.7 Conclusion
ROC-r analysis uses quantitative reliability measures to achieve fully automated acti-
vation mapping, including pipeline optimization and image thresholding, on a single
subject basis. ROC-r provides a critical tool for non-invasive pre-surgical mapping,
as it allows for subject-specific processing strategies without the need for manual
intervention. This reduces the risk of missing important functional activity due to
sub-optimal analysis strategies, eliminates the influence of subjective decision making
in the production of activation maps, and streamlines the process for integration into
a clinical setting. We demonstrated ROC-r as a unified framework for push-button
fMRI and MEG studies, thus dramatically improving our ability to study relative dif-
ferences in pre-surgical functional neuroimaging technologies, and ensuring the best
possible pre-surgical maps are produced.

Chapter 7
Conclusions
7.1 Summary
The purpose of this thesis was to evaluate the benefit of ROC-r analysis for improving
the production of single-subject activation maps. First, it was shown in manuscript
one (ch. 3) that the reliability of single-subject maps is highly dependent on the
threshold used and on the pre-processing steps employed. This is of course a large
part of the motivation for performing individualized analysis for single-subject map-
ping. Nonetheless, it is important to demonstrate that the tool we plan to use to
address the issues of individual variability is sensitive to differences between subjects,
task repetitions, and pre-processing pipelines. ROC-r thresholding was shown to be
responsive to different levels of activation between subjects or within subjects between
runs, and the first use of ROC-r to select subject-specific pre-processing strategies was
demonstrated to improve activation reliability. The high degree of variability at the
single-subject level is inherent given the noisy nature of fMRI and MEG signals, and
cannot be ignored without jeopardizing the quality of the activation maps.
One of the greatest strengths of the ROC-r method is the minimal assumptions
placed on the underlying data distributions. The basic assumptions are simply: 1)
the image signal is higher in amplitude than the noise, and 2) that the signal is consis-
tently located in space whereas the noise is not. Additionally, the ROC-r calculation
only requires functional maps as input, and because the functional map forms the
common link between fMRI and MEG imaging, ROC-r is by nature cross-modal. It
is worth noting that it is crucial in this context that the MEG source images are
noise-normalized, as the sensor noise projects non-uniformly in space, with higher
noise projecting in areas of high sensor sensitivity (e.g. near the sensors). This would
invalidate the second assumption of the ROC-r method, and thus in this work, only
noise-normalized MEG source maps were used.
118

119
In manuscript two (ch. 4), we demonstrated the ROC-r method for MEG vol-
umetric source imaging with a noise-normalized beamformer. We showed that the
ROC-r reliable fraction provided analogous quality assurance to the equivalent cur-
rent dipole goodness-of-fit used for dipole source models. Furthermore, we verified the
automated thresholding and localization of MEG signals by ROC-r by co-localization
of the beamformer peaks with the dipole locations.
The primary application of ROC-r analysis we have identified is pre-surgical map-
ping, where single-subject imaging is clearly necessary. While there are other in-
stances where single-subject imaging is important - such as the assessment of brain
injury - we used the pre-surgical mapping scenario in manuscript three (ch. 5) to
demonstrate the tangible benefits of using the ROC-r methodology. This section of
the thesis showed that reliability of patient images is generally lower than that of
healthy controls, either due to direct influence of pathology on the functional imaging
signal, or due to factors affecting patient performance of the tasks. ROC-r pre-
processing pipeline optimization was able to improve reliability of the patient data,
even using the limited number of pre-processing pipelines investigated.
Crucially, this paper showed that the ROC-r reliable fraction was correlated with
better prediction of critical eloquent cortex, and that ROC-r automated threshold-
ing was better at localizing these critical brain regions than fixed-significance levels.
While the more reliable datasets on average produced activation closer to the critical
cortical areas, it was still necessary to use moderate search ranges (10-15 mm) around
each CS location to achieve high sensitivity. This suggests that the fMRI protocols
demonstrated in this thesis are better suited to an augmentative pre-surgical map-
ping role than as a direct replacement to CS. It is likely that the motor maps would
achieve higher sensitivity at lower search ranges than the language maps, but there
was not sufficient data available to test this hypothesis quantitatively. While there is
still substantial room for improvement of the predictive power of fMRI for presurgical
mapping of language in particular, the ROC-r method helps to get the most out of
the available data.
The final manuscript (ch. 6) included in this thesis showcased the capabilities of
ROC-r analysis as a unified framework for improving the reliability of single-subject
fMRI and MEG mapping. This paper brings together the facets introduced by each

120
of the preceding papers by including quality assurance, pre-processing optimization,
and automated threshold selection for functional mapping by both modalities. As this
paper shows, the use of fixed pre-processing pipelines could misleadingly conclude that
one scanner produces more reliable results than the other, whereas in reality these
data could produce reliable activation maps with the use of alternative processing
strategies. While it was true for that experiment that the fMRI results were on average
less sensitive to the pre-processing pipeline chosen, this result depends on the task
employed and participant population being investigated (e.g. patients vs controls).
ROC-r thus facilitates the comparison of fMRI and MEG results by ensuring that the
best available methods are selected for processing each dataset individually.
7.2 Future Work
Further improvements of the ROC-r algorithm will initially focus on the generation
of single-run analyses. Single-run ROC-r was demonstrated in manuscript two for
MEG datasets by generating split-half maps from half of the available epochs and
iterating over different randomized split-halves. A similar technique for single-run
ROC-r using fMRI data is being developed and will offer the enhanced pre-surgical
mapping capabilities of the ROC-r analysis, without the additional data collection
requirements of retest imaging. An additional benefit of the single-run version is the
ability to perform reliability analyses in real-time, with the potential to inform the
acquisition system when a robust activation map had been obtained. This would allow
individually tailored scan durations, thereby reducing scanning times. Ultimately,
ROC-r is intended as a clinical utility, and thus would ideally be either directly
integrated into the acquisition console, or implemented on the post-processing station,
in order to automate the processing of activation maps into a format ready for review
(e.g. by the radiologist, neuropsychologist, neurosurgeon, etc.).
For MEG, an important avenue for future research will be to compare the results
of ROC-r for beamformer mapping to imaging approaches like dSPM, sLORETA and
MNE. There are interesting questions to address in this context in terms of the re-
lationship between mapping reliability and localization accuracy. In particular, the
MNE solution is generally accepted as being quite robust, however it tends to have a

121
localization bias towards superficial locations, due to the MEG sensor sensitivity pro-
file [78]. When cortical stimulation (which is generally restricted to surface mapping)
is used as the ‘gold standard’ for localization, this may result in better co-localization
for MNE solutions, even when the true sources are located deeper within the cor-
tical sulci. Additionally, there are many inverse solution constraints that were not
employed in this work, such as restriction of sources to the cortical grey matter, and
constraints on source orientation to be normal to the cortical surface. The effect of
these additional a-priori localization constraints on the reliability and accuracy of
MEG mapping should be explored in the future.
Another area of future investigation will be the use of ROC-r for functional con-
nectivity analyses and resting state functional mapping. For example, components of
interest in a decomposition-based resting state analysis (e.g. ICA) could be identified
using ROC-r by comparing them with a number of pre-defined activation templates
(e.g. derived by a group analyses of task-based mapping). The most similar ICA
component to a given functional network could be determined as the one with the
highest ROC-r FR.
Modelling of the ROC-r output also deserves further attention, as the method of
cubic spline fitting, while robust, is does not produce meaningful fitting parameters.
One option would be to use a Gompertz function (g(x)):
g(x) = a+ be−ce−dx
(7.1)
which is widely used for fitting data that has a general sigmoidal shape. The pa-
rameters of this function allow for varying the initial (a) and final (b) values, along
with the point at which the AUC begins to increase (c), and the rate of increase
(d). Alternatively, a functional form could be derived by modelling the underlying
statistical distributions, and computing a theoretical form for the true and false pos-
itive rates. In this case, the parameters governing the final result will be the mean
activation/deactivation/noise magnitudes and variances. This would have the added
advantage of being able to use the intensity distributions in the images (i.e. the im-
age histograms) to inform the curve fitting process. Either of these choices would
confer the advantage of producing curve fitting parameters that are meaningful in
terms of understanding the underlying data, or determining the image reliability and

122
informing the choice of activation thresholds.
Finally, while several reference standards were used in this thesis to evaluate the
efficacy of the ROC-r approach to activation mapping (e.g. dipole fitting for MEG,
cortical stimulation as ’ground truth’, etc), it would be important moving forward
to assess patient outcomes. Patient outcomes are likely the best gold standard for
determining whether pre-surgical mapping successfully identified the key areas to
respect during surgery, as the ultimate test of whether these functions were spared
or not.
7.3 Conclusion
Overall, this thesis has demonstrated the utility of ROC-r analysis for reliable single-
subject functional mapping. The ROC-r method addresses the issue of individual
variability by producing a flexible solution to the selection of both individualized
pre-processing pipelines and activation thresholds. ROC-r also eliminates inter-rated
variability, as the production of activation maps is a fully automated process. The
production of robust, push-button single-subject mapping is a vital step forward for
fMRI and MEG, especially in the context of pre-surgical mapping.

References
[1] Perry Black. Management of malignant glioma: role of surgery in relation tomultimodality therapy. Journal of NeuroVirology, 4:227–236, 1998.
[2] Ashok R. Asthagiri, Nader Pouratian, Jonathan Sherman, Galal Ahmed, andMark E. Shaffrey. Advances in brain tumor surgery. Neurologic Clinics,25(4):975–1003, 2007-11.
[3] Nader Sanai and Mitchel S. Berger. Recent surgical management of gliomas.In Glioma, pages 12–25. Springer, 2012.
[4] Ilker Y. Eypoglu, Michael Buchfelder, and Nic E. Savaskan. Surgical resec-tion of malignant gliomasrole in optimizing patient outcome. Nature ReviewsNeurology, 9(3):141–151, 2013-01-29.
[5] Ashok R. Asthagiri, Gregory A. Helm, and Jason P. Sheehan. Current con-cepts in management of meningiomas and schwannomas. Neurologic Clinics,25(4):1209–1230, 2007-11.
[6] Hugues Duffau and Laurent Capelle. Preferential brain locations of low-gradegliomas: Comparison with glioblastomas and review of hypothesis. Cancer,100(12):2622–2626, 2004-06-15.
[7] Wilder Penfield and Edwin Boldrey. Somatic motor and sensory representationin the cerebral cortex of man as studied by electrical stimulation. OriginalArticles and Clinical Cases, pages 389–444, 1937.
[8] Wilder Penfield. Some observations on the functional organization of the humanbrain. Proceedings of the American Philosophical Society, pages 293–297, 1954.
[9] Wilder Penfield and Phanor Perot. The brains record of auditory and visualexperience a final summary and discussion. Brain, 86(4):595–696, 1963.
[10] R. Andrew Danks, Linda S. Aglio, Lavern D. Gugino, and Peter McL Black.Craniotomy under local anesthesia and monitored conscious sedation for the re-section of tumors involving eloquent cortex. Journal of neuro-oncology, 49:131–139, 2000.
[11] Nader Sanai, Zaman Mirzadeh, and Mitchel S. Berger. Functional outcomeafter language mapping for glioma resection. New England Journal of Medicine,358(1):18–27, 2008.
[12] H. Duffau. Contribution of cortical and subcortical electrostimulation in brainglioma surgery: Methodological and functional considerations. NeurophysiologieClinique/Clinical Neurophysiology, 37(6):373–382, 2007-12.
123

124
[13] Svenja Borchers, Marc Himmelbach, Nikos Logothetis, and Hans-Otto Karnath.Direct electrical stimulation of human cortexthe gold standard for mappingbrain functions? Nature Reviews Neuroscience, 13(1):63–70, 2011.
[14] Alfredo Quiones-Hinojosa, Steven G. Ojemann, Nader Sanai, William P. Dil-lon, and Mitchel S. Berger. Preoperative correlation of intraoperative corticalmapping with magnetic resonance imaging landmarks to predict localization ofthe broca area. Journal of neurosurgery, 99(2):311–318, 2003.
[15] S. Ogawa, R. S. Menon, D. W. Tank, S. G. Kim, H. Merkle, J. M. Eller-mann, and K. Ugurbil. Functional brain mapping by blood oxygenation level-dependent contrast magnetic resonance imaging. a comparison of signal char-acteristics with a biophysical model. Biophysical journal, 64(3):803–812, 1993.
[16] Suzanne Tharin and Alexandra Golby. Functional brain mapping and its ap-plications to neurosurgery. Neurosurgery, 60(4):185–202, 2007.
[17] A I Ahonen, M S Hmlinen, M J Kajola, J E T Knuutila, P P Laine, O VLounasmaa, L T Parkkonen, J T Simola, and C D Tesche. 122-channel squidinstrument for investigating the magnetic signals from the human brain. PhysicaScripta, 1993(T49A):198, 1993.
[18] W. W. Sutherling, P. H. Crandall, T. M. Darcey, D. P. Becker, M. F. Levesque,and D. S. Barth. The magnetic and electric fields agree with intracranial local-izations of somatosensory cortex. Neurology, 38(11):1705–1705, 1988.
[19] T.P.L. Roberts, E. Zusman, M. McDermott, N. Barbaro, and H.A. Rowley.Correlation of functional magnetic source imaging with intraoperative corti-cal stimulation in neurosurgical patients. Journal of Image Guided Surgery,1(6):339–347, 1995.
[20] Christopher C. Gallen, David Sobel, Thomas Waltz, Maung Aung, BrianCopeland, Barry Schwartz, Eugene Hirschkoff, and Floyd Bloom. Noninvasivepresurgical neuromagnetic mapping of somatosensory cortex. Neurosurgery,33(2):260–268, 1993.
[21] Oliver Ganslandt, Ralf Steinmeier, Helmut Kober, Jurgen Vieth, Jan Kassubek,Johann Romstock, Christian Straus, and Rudolph Fahlbusch. Magnetic sourceimaging combined with image-guided frameless stereotaxy: A new method insurgery around the motor strip. Neurosurgery, 41(3):621–628, 1995.
[22] Christopher C. Gallen, Barry J. Schwartz, Richard D. Bucholz, Ghaus Malik,Gregory L. Barkley, Joseph Smith, Howard Tung, Brian Copeland, LeonardBruno, Sam Assam, and others. Presurgical localization of functional cortexusing magnetic source imaging. Journal of neurosurgery, 82(6):988–994, 1995.

125
[23] Takashi Inoue, Hiroaki Shimizu, Nobukazu Nakasato, Toshihiro Kumabe, andTakashi Yoshimoto. Accuracy and limitation of functional magnetic resonanceimaging for identification of the central sulcus: comparison with magnetoen-cephalography in patients with brain tumors. Neuroimage, 10(6):738–748, 1999.
[24] Oliver Ganslandt, Rudolf Fahlbusch, Christopher Nimsky, Helmut Kober, Mar-tin Mller, Ralf Steinmeier, Johann Romstck, and Jrgen Vieth. Functionalneuronavigation with magnetoencephalography: outcome in 50 patients withlesions around the motor cortex. Journal of neurosurgery, 91(1):73–79, 1999.
[25] Timothy PL Roberts, Paul Ferrari, David Perry, Howard A. Rowley, andMitchel S. Berger. Presurgical mapping with magnetic source imaging: compar-isons with intraoperative findings. Brain tumor pathology, 17(2):57–64, 2000.
[26] R. Firsching, I. Bondar, H.-J. Heinze, H. Hinrichs, T. Hagner, J. Heinrich, andA. Belau. Practicability of magnetoencephalography-guided neuronavigation.Neurosurgical Review, 25(1):73–78, 2002-03.
[27] Hagen Schiffbauer, Mitchel S. Berger, Paul Ferrari, Dirk Freudenstein,Howard A. Rowley, and Timothy PL Roberts. Preoperative magnetic sourceimaging for brain tumor surgery: a quantitative comparison with intraoperativesensory and motor mapping. Journal of neurosurgery, 97(6):1333–1342, 2002.
[28] Eduardo M Castillo, Panagiotis G Simos, James W Wheless, James E Baum-gartner, Joshua I Breier, Rebecca L Billingsley, Shirin Sarkari, Michele EFitzgerald, and Andrew C Papanicolaou. Integrating sensory and motor map-ping in a comprehensive MEG protocol: Clinical validity and replicability. Neu-roImage, 21(3):973–983, 2004-03.
[29] Antti Korvenoja, Erika Kirveskari, Hannu J. Aronen, Sari Avikainen, AnttiBrander, Juha Huttunen, Risto J. Ilmoniemi, Juha E. Jaaskelainen, Tero Ko-vala, Jyrki P. Makela, and others. Sensorimotor cortex localization: Compar-ison of magnetoencephalography, functional MR imaging, and intraoperativecortical mapping 1. Radiology, 241(1):213–222, 2006.
[30] Elizabeth W. Pang, James M. Drake, Hiroshi Otsubo, Allison Martineau,Samuel Strantzas, Douglas Cheyne, and William Gaetz. Intraoperative con-firmation of hand motor area identified preoperatively by magnetoencephalog-raphy. Pediatric Neurosurgery, 44(4):313–317, 2008.
[31] Srikantan Nagarajan, Heidi Kirsch, Peter Lin, Anne Findlay, Susanne Honma,and Mitchel S. Berger. Preoperative localization of hand motor cortex by adap-tive spatial filtering of magnetoencephalography data. 2008.

126
[32] William Gaetz, Douglas Cheyne, James T. Rutka, James Drake, Mony Benifla,Samuel Strantzas, Elysa Widjaja, Stephanie Holowka, Zulma Tovar-Spinoza,Hiroshi Otsubo, and Elizabeth W. Pang. Presurgical localization of primarymotor cortex in pediatric patients with brain lesions by the use of spatiallyfiltered magnetoencephalography. Neurosurgery, 64:ons177–ons186, 2009-03.
[33] Phiroz E. Tarapore, Matthew C. Tate, Anne M. Findlay, Susanne M. Honma,Danielle Mizuiri, Mitchel S. Berger, and Srikantan S. Nagarajan. Preoper-ative multimodal motor mapping: a comparison of magnetoencephalographyimaging, navigated transcranial magnetic stimulation, and direct cortical stim-ulation: Clinical article. Journal of neurosurgery, 117(2):354–362, 2012.
[34] Panagiotis G Simos, Joshua I Breier, William W. Maggio, William B. Gormley,George Zouridakis, L. James Willmore, James W Wheless, Jules EC Constanti-nou, and Andrew C Papanicolaou. Atypical temporal lobe language representa-tion: MEG and intraoperative stimulation mapping correlation. NeuroReport,10:139–142, 1999.
[35] Eduardo M Castillo, Panagiotis G Simos, Vijay Venkataraman, Joshua I Breier,James W Wheless, and Andrew C Papanicolaou. Mapping of expressive lan-guage cortex using magnetic source imaging. Neurocase, 7:419–422, 2001.
[36] Clifford R. Jack Jr, Richard M. Thompson, R. Kim Butts, Frank W. Shar-brough, Patrick J. Kelly, Dennis P. Hanson, Stephen J. Riederer, Richard L.Ehman, Nicholas J. Hangiandreou, and Gregory D. Cascino. Sensory motorcortex: correlation of presurgical mapping with functional MR imaging andinvasive cortical mapping. Radiology, 190(1):85–92, 1994.
[37] F. Zerrin Yetkin, Wade M. Mueller, George L. Morris, Timothy L. McAuliffe,John L. Ulmer, Robert W. Cox, David L. Daniels, and Victor M. Haughton.Functional MR activation correlated with intraoperative cortical mapping.American Journal of Neuroradiology, 18(7):1311–1315, 1997.
[38] Javier Fandino, Spyros S. Kollias, Heinz G. Wieser, Anton Valavanis, and Ya-suhiro Yonekawa. Intraoperative validation of functional magnetic resonanceimaging and cortical reorganization patterns in patients with brain tumors in-volving the primary motor cortex. Journal of neurosurgery, 91(2):238–250,1999.
[39] R. Beisteiner, R. Lanzenberger, K. Novak, V. Edward, C. Windischberger,M. Erdler, R. Cunnington, A. Gartus, B. Streibl, E. Moser, and others. Im-provement of presurgical patient evaluation by generation of functional mag-netic resonance risk maps. Neuroscience letters, 290(1):13–16, 2000.

127
[40] Stphane Lehricy, Hugues Duffau, Philippe Cornu, Laurent Capelle, BernardPidoux, Alexandre Carpentier, Stphanie Auliac, Stphane Clemenceau, Jean-Pierre Sichez, Ahmed Bitar, and others. Correspondence between functionalmagnetic resonance imaging somatotopy and individual brain anatomy of thecentral region: comparison with intraoperative stimulation in patients withbrain tumors. Journal of neurosurgery, 92(4):589–598, 2000.
[41] F. E. Roux, K. Boulanouar, D. Ibarrola, M. Tremoulet, F. Chollet, and I. Berry.Functional MRI and intraoperative brain mapping to evaluate brain plasticityin patients with brain tumours and hemiparesis. Journal of Neurology, Neuro-surgery & Psychiatry, 69(4):453–463, 2000.
[42] Reinhard J. Tomczak, Arthur P. Wunderlich, Yang Wang, Veit Braun, Gre-gor Antoniadis, Johannes Grich, Hans-Peter Richter, and Hans-Jrgen Brambs.fMRI for preoperative neurosurgical mapping of motor cortex and language in aclinical setting. Journal of computer assisted tomography, 24(6):927–934, 2000.
[43] Franck-Emmanuel Roux, Danielle Ibarrola, Michel Tremoulet, Yves Lazorthes,Patrice Henry, Jean-Christophe Sol, and Isabelle Berry. Methodological andtechnical issues for integrating functional magnetic resonance imaging data ina neuronavigational system. Neurosurgery, 49(5):1145–1157, 2001.
[44] Chikashi Fukaya, Yoichi Katayama, Yoshihiro Murata, Kazutaka Kobayashi,Masahiko Kasai, Takamitsu Yamamoto, and Kaoru Sakatani. Localization ofeloquent area utilize to functional MRI in patients with brain tumor. In Inter-national Congress Series, volume 1232, pages 763–767. Elsevier, 2002.
[45] Robert Barto, R. Jech, J. Vymazal, P. Petrovicky, P. Vachata, A. Hejcl, A. Zo-lal, and M. Sames. Validity of primary motor area localization with fMRIversus electric cortical stimulation: A comparitive study. Acta Neurochirurgica,151:1071–1080, 2009.
[46] Martina Wengenroth, M. Blatow, J. Guenther, M. Akbar, V.M. Tronnier, andC. Stippich. Diagnostic benefits of presurgical fMRI in patients with braintumours in the primary sensorimotor cortex. European radiology, 21:1517–1525,2011.
[47] David B. FitzGerald, G. Rees Cosgrove, Steven Ronner, Hong Jiang, Brad R.Buchbinder, John W. Belliveau, Bruce R. Rosen, and Randall R. Benson.Location of language in the cortex: a comparison between functional MRimaging and electrocortical stimulation. American Journal of Neuroradiology,18(8):1529–1539, 1997.
[48] Joseph Lurito, Mark Lowe, Carl Sartorius, and Mathews Vincent. Comparisonof fmri and intraoperative direct cortical stimulation in localization of receptivelanguage areas. Journal of Computer Assisted Tomography, 24(1):99–105, 2000.
128
[49] Nader Pouratian, Susan Y. Bookheimer, David E. Rex, Neil A. Martin, andArthur W. Toga. Utility of preoperative functional magnetic resonance imag-ing for identifying language cortices in patients with vascular malformations.Journal of neurosurgery, 97(1):21–32, 2002.
[50] G. J. M. Rutten, N. F. Ramsey, P. C. Van Rijen, H. J. Noordmans, and C. W. M.Van Veelen. Development of a functional magnetic resonance imaging protocolfor intraoperative localization of critical temporoparietal language areas. Annalsof neurology, 51(3):350–360, 2002.
[51] Franck-Emmanuel Roux, Kader Boulanouar, Jean-Albert Lotterie, Mehdi Mej-doubi, James P. LeSage, and Isabelle Berry. Language functional magneticresonance imaging in preoperative assessment of language areas: correlationwith direct cortical stimulation. Neurosurgery, 52(6):1335–1347, 2003.
[52] S. Larsen, R. Kikinis, I.-F. Talos, D. Weinstein, W. Wells, and A. Golby. Quan-titative comparison of functional MRI and direct electrocortical stimulation forfunctional mapping. The international journal of medical robotics and computerassisted surgery, 3(3):262–270, 2007.
[53] Nicole M. Petrovich Brennan, Stephen Whalen, Daniel de Morales Branco,James P. O’Shea, Isaiah H. Norton, and Alexandra J. Golby. Object nam-ing is a more sensitive measure of speech localization than number counting:converging evidence from direct cortical stimulation and fMRI. Neuroimage,37:S100–S108, 2007.
[54] Alberto Bizzi, Valeria Blasi, Andrea Falini, Paolo Ferroli, Marcello Cadioli, UgoDanesi, Domenico Aquino, Carlo Marras, Dario Caldiroli, and Giovanni Broggi.Presurgical functional MR imaging of language and motor functions: Validationwith intraoperative electrocortical mapping 1. Radiology, 248(2):579–589, 2008.
[55] Warren Boling, Michael Parsons, Michal Kraszpulski, Carrie Cantrell, and AinaPuce. Whole-hand sensorimotor area: cortical stimulation localization and cor-relation with functional magnetic resonance imaging. Journal of Neurosurgery,2008.
[56] Bob L. Hou, Michelle Bradbury, Kyung K. Peck, Nicole M. Petrovich, Philip H.Gutin, and Andrei I. Holodny. Effect of brain tumor neovasculature defined byrCBV on BOLD fMRI activation volume in the primary motor cortex. Neu-roImage, 32(2):489–497, 2006-08.
[57] Carlo Giussani, Frank-Emmanuel Roux, Jeffrey Ojemann, Erik Pietro Sganz-erla, David Pirillo, and Costanza Papagno. Is preoperative functional magneticresonance imaging reliable for language areas mapping in brain tumor surgery?review of language functional magnetic resonance imaging and direct corticalstimulation correlation studies. Neurosurgery, 66(1):113–120, 2010.
129
[58] Nathan W. Churchill, Anita Oder, Herv Abdi, Fred Tam, Wayne Lee, Christo-pher Thomas, Jon E. Ween, Simon J. Graham, and Stephen C. Strother. Opti-mizing preprocessing and analysis pipelines for single-subject fMRI. i. standardtemporal motion and physiological noise correction methods. Human BrainMapping, 33(3):609–627, 2012-03.
[59] Nathan W. Churchill, Grigori Yourganov, Anita Oder, Fred Tam, Simon J. Gra-ham, and Stephen C. Strother. Optimizing preprocessing and analysis pipelinesfor single-subject fMRI: 2. interactions with ICA, PCA, task contrast and inter-subject heterogeneity. PLoS ONE, 7(2):e31147, 2012-02-27.
[60] J.W. Evans, R.M. Todd, M.J. Taylor, and S.C. Strother. Group specific op-timisation of fMRI processing steps for child and adult data. NeuroImage,50(2):479–490, 2010-04.
[61] Jing Zhang, Jon R. Anderson, Lichen Liang, Sujit K. Pulapura, Lael Gatewood,David A. Rottenberg, and Stephen C. Strother. Evaluation and optimization offMRI single-subject processing pipelines with NPAIRS and second-level CVA.Magnetic resonance imaging, 27(2):264–278, 2009.
[62] Giulia Barbati, Camillo Porcaro, Filippo Zappasodi, Paolo Maria Rossini, andFranca Tecchio. Optimization of an independent component analysis approachfor artifact identification and removal in magnetoencephalographic signals.Clinical Neurophysiology, 115(5):1220–1232, 2004-05.
[63] D. Mantini, R. Franciotti, G.L. Romani, and V. Pizzella. Improving MEGsource localizations: An automated method for complete artifact removal basedon independent component analysis. NeuroImage, 40(1):160–173, 2008-03-01.
[64] Karl J. Friston, Andrew Holmes, Jean-Baptiste Poline, Cathy J. Price, andChristopher D. Frith. Detecting activations in PET and fMRI: levels of inferenceand power. Neuroimage, 4(3):223–235, 1996.
[65] Christopher R. Genovese, Nicole A. Lazar, and Thomas Nichols. Thresholdingof statistical maps in functional neuroimaging using the false discovery rate.NeuroImage, 15(4):870–878, 2002-04.
[66] Thomas Nichols and Satoru Hayasaka. Controlling the familywise error rate infunctional neuroimaging: a comparative review. Statistical Methods in MedicalResearch, 12(5):419–446, 2003-10-01.
[67] Brent R. Logan and Daniel B. Rowe. An evaluation of thresholding techniquesin fMRI analysis. NeuroImage, 22(1):95–108, 2004-05.
[68] David G. Norris. Principles of magnetic resonance assessment of brain function.Journal of Magnetic Resonance Imaging, 23(6):794–807, 2006-06.

130
[69] Nikos K. Logothetis. The underpinnings of the BOLD functional magneticresonance imaging signal. The Journal of Neuroscience, 23(10):3963–3971, 2003.
[70] M. Hamalainen, R. Hari, R. Ilmoniemi, J. Knuutila, and O. Lounasmaa. Mag-netoencephalography - theory, instrumentation, and applications to noninvasivestudies of the working human brain. Review of Modern Physics, 65(2):413–505,1993.
[71] R.N. Henson, J. Mattout, C. Phillips, and K.J. Friston. Selecting forwardmodels for MEG source-reconstruction using model-evidence. 46(1):168–176.
[72] Olaf Steinstrter, Stephanie Sillekens, Markus Junghoefer, Martin Burger, andCarsten H. Wolters. Sensitivity of beamformer source analysis to deficiencies inforward modeling. 31(12):1907–1927.
[73] Barry D. Van Veen, Wim Van Drongelen, Moshe Yuchtman, and AkifumiSuzuki. Localization of brain electrical activity via linearly constrained mini-mum variance spatial filtering. Biomedical Engineering, IEEE Transactions on,44(9):867–880, 1997.
[74] Olaf Hauk. Keep it simple: a case for using classical minimum norm estimationin the analysis of EEG and MEG data. 21(4):1612–1621.
[75] K. Uutela, M. Hamalainen, and E. Somersalo. Visualization of magnetoen-cephalographic data using minimum current estimates. 10:173–180.
[76] Anders M. Dale, Arthur K. Liu, Bruce R. Fischl, Randy L. Buckner, John W.Belliveau, Jeffrey D. Lewine, and Eric Halgren. Dynamic statistical parametricmapping: combining fMRI and MEG for high-resolution imaging of corticalactivity. 26(1):55–67.
[77] Sarang S. Dalal, Johanna M. Zumer, Adrian G. Guggisberg, Michael Trumpis,Daniel D. E. Wong, Kensuke Sekihara, and Srikantan S. Nagarajan. MEG/EEGsource reconstruction, statistical evaluation, and visualization with NUTMEG.2011:1–17.
[78] Fa-Hsuan Lin, Thomas Witzel, Seppo P. Ahlfors, Steven M. Stufflebeam,John W. Belliveau, and Matti S. Hmlinen. Assessing and improving the spa-tial accuracy in MEG source localization by depth-weighted minimum-normestimates. 31(1):160–171.
[79] Yoav Benjamini and Yosef Hochberg. On the adaptive control of the falsediscovery rate in multiple testing with independent statistics. 25(1):60.
[80] Krzysztof J. Gorgolewski, Amos J. Storkey, Mark E. Bastin, and Cyril R. Per-net. Adaptive thresholding for reliable topological inference in single subjectfMRI analysis. Frontiers in Human Neuroscience, 6, 2012.

131
[81] Dimitrios Pantazis, Thomas E. Nichols, Sylvain Baillet, and Richard M. Leahy.Spatiotemporal localization of significant activation in MEG using permutationtests. In Information Processing in Medical Imaging, pages 512–523. Springer,2003.
[82] Garreth Prendergast, Sam R. Johnson, Mark Hymers, Will Woods, andGary G.R. Green. Non-parametric statistical thresholding of baseline free MEGbeamformer images. NeuroImage, 54(2):906–918, 2011-01.
[83] Douglas C. Noll, Christopher R. Genovese, Leigh E. Nystrom, Alberto L.Vazquez, Steven D. Forman, William F. Eddy, and Jonathan D. Cohen. Esti-mating test-retest reliability in functional MR imaging II: Application to motorand cognitive activation studies. Magnetic Resonance in Medicine, 38(3):508–517, 1997.
[84] Pawel Skudlarski, R. Todd Constable, and John C. Gore. ROC analysis ofstatistical methods used in functional MRI: individual subjects. Neuroimage,9(3):311–329, 1999.
[85] T.H. Le and X. Hu. Methods for assessing accuracy and reliability in functionalMRI. NMR in Biomedicine, 10(160), 1997.
[86] Karl J. Friston, Andrew P. Holmes, Keith J. Worsley, J.-P. Poline, Chris D.Frith, and Richard SJ Frackowiak. Statistical parametric maps in functionalimaging: a general linear approach. Human brain mapping, 2(4):189–210, 1994.
[87] S. Suresh Anand and Vitali Zagorodnov. Retrospective cluster size threshold-ing for MRF-based detection of activated regions in fMRI. In Biomedical andPharmaceutical Engineering, 2006. ICBPE 2006. International Conference on,pages 44–47. IEEE, 2006.
[88] Christopher R. Genovese, Douglas C. Noll, and William F. Eddy. Estimat-ing test-retest reliability in functional MR imaging i: Statistical methodology.Magnetic Resonance in Medicine, 38(3):497–507, 1997.
[89] Serge ARB Rombouts, Frederik Barkhof, Frank GC Hoogenraad, MichielSprenger, and Philip Scheltens. Within-subject reproducibility of visual ac-tivation patterns with functional magnetic resonance imaging using multisliceecho planar imaging. Magnetic resonance imaging, 16(2):105–113, 1998.
[90] Keith J. Duncan, Chotiga Pattamadilok, Iris Knierim, and Joseph T. Devlin.Consistency and variability in functional localisers. Neuroimage, 46(4):1018–1026, 2009.
[91] Michelle Liou, Hong-Ren Su, Alexander N. Savostyanov, Juin-Der Lee, John ADAston, Cheng-Hung Chuang, and Philip E. Cheng. Beyond p-values: Averagedand reproducible evidence in fMRI experiments. Psychophysiology, 46(2):367–378, 2009.

132
[92] Craig M. Bennett and Michael B. Miller. Issue: The year in cognitive neuro-science. The Year in Cognitive Neuroscience, 1124:133, 2010.
[93] Gordon E. Sarty and Ron Borowsky. Functional MRI activation maps fromempirically defined curve fitting. Concepts in Magnetic Resonance Part B:Magnetic Resonance Engineering, 24B(1):46–55, 2005-02.
[94] Stephen C. Strother, N. Lange, J. R. Anderson, K. A. Schaper, K. Rehm,Lars Kai Hansen, and D. A. Rottenberg. Activation pattern reproducibility:Measuring the effects of group size and data analysis models. Human brainmapping, 5(4):312–316, 1997.
[95] Carola Tegeler, Stephen C. Strother, Jon R. Anderson, and Seong-Gi Kim.Reproducibility of BOLD-based functional MRI obtained at 4 t. Human BrainMapping, 7(4):267–283, 1999.
[96] G. Fernandez, K. Specht, S. Weis, I. Tendolkar, M. Reuber, J. Fell, P. Klaver,J. Ruhlmann, J. Reul, and C. E. Elger. Intrasubject reproducibility of presurgi-cal language lateralization and mapping using fMRI. Neurology, 60(6):969–975,2003.
[97] Karsten Specht, Klaus Willmes, N. Jon Shah, and Lutz Jncke. Assessmentof reliability in functional imaging studies. Journal of Magnetic ResonanceImaging, 17(4):463–471, 2003.
[98] M. Raemaekers, M. Vink, B. Zandbelt, R. J. A. Van Wezel, R. S. Kahn, andN. F. Ramsey. Testretest reliability of fMRI activation during prosaccades andantisaccades. Neuroimage, 36(3):532–542, 2007.
[99] Teresa Jacobson Kimberley, Gauri Khandekar, and Michael Borich. fMRI re-liability in subjects with stroke. Experimental brain research, 186(1):183–190,2008.
[100] Teresa Jacobson Kimberley, Dana D. Birkholz, Renee A. Hancock, Sarah M.VonBank, and Teresa N. Werth. Reliability of fMRI during a continuous motortask: assessment of analysis techniques. Journal of Neuroimaging, 18(1):18–27,2008.
[101] Alejandro Caceres, Deanna L. Hall, Fernando O. Zelaya, Steven CR Williams,and Mitul A. Mehta. Measuring fMRI reliability with the intra-class correlationcoefficient. Neuroimage, 45(3):758–768, 2009.
[102] Michael M. Plichta, Adam J. Schwarz, Oliver Grimm, Katrin Morgen, DanielaMier, Leila Haddad, Antje Gerdes, Carina Sauer, Heike Tost, ChristineEsslinger, and others. Testretest reliability of evoked BOLD signals from acognitiveemotive fMRI test battery. Neuroimage, 60(3):1746–1758, 2012.

133
[103] S. A. Rombouts, Frederik Barkhof, F. G. Hoogenraad, Michiel Sprenger, JaapValk, and Philip Scheltens. Test-retest analysis with functional MR of theactivated area in the human visual cortex. American journal of neuroradiology,18(7):1317–1322, 1997.
[104] E. Elinor Chen and Steven L. Small. Testretest reliability in fMRI of language:group and task effects. Brain and language, 102(2):176–185, 2007.
[105] Joseph A. Maldjian, Paul J. Laurienti, Lance Driskill, and Jonathan H. Bur-dette. Multiple reproducibility indices for evaluation of cognitive functionalMR imaging paradigms. American journal of neuroradiology, 23(6):1030–1037,2002.
[106] Greg S. Harrington, Sarah Tomaszewski Farias, Michael H. Buonocore, and An-drew P. Yonelinas. The intersubject and intrasubject reproducibility of FMRIactivation during three encoding tasks: implications for clinical applications.Neuroradiology, 48(7):495–505, 2006.
[107] Peter Mannfolk, Markus Nilsson, Henrik Hansson, Freddy Stahlberg, PeterFransson, Andreas Weibull, Jonas Svensson, Ronnie Wirestam, and Johan Ol-srud. Can resting-state functional MRI serve as a complement to task-basedmapping of sensorimotor function? a test-retest reliability study in healthyvolunteers. Journal of Magnetic Resonance Imaging, 34:511–517, 2011.
[108] Ranjan Maitra, Steven R. Roys, and Rao P. Gullapalli. Test-retest reliabilityestimation of functional MRI data. Magnetic Resonance in Medicine, 48(1):62–70, 2002.
[109] John H. Brannen, Behnam Badie, Chad H. Moritz, Michelle Quigley, M. Eliza-beth Meyerand, and Victor M. Haughton. Reliability of functional MR imagingwith word-generation tasks for mapping broca’s area. American Journal ofNeuroradiology, 22(9):1711–1718, 2001.
[110] Rose Bosnell, C. Wegner, Z. T. Kincses, T. Korteweg, F. Agosta, Olga Cic-carelli, Nicola De Stefano, A. Gass, J. Hirsch, Heidi Johansen-Berg, and others.Reproducibility of fMRI in the clinical setting: implications for trial designs.Neuroimage, 42(2):603–610, 2008.
[111] G. Fesl, B. Braun, S. Rau, M. Wiesmann, M. Ruge, P. Bruhns, J. Linn,T. Stephan, J. Ilmberger, J.-C. Tonn, and others. Is the center of mass (COM)a reliable parameter for the localization of brain function in fMRI? Europeanradiology, 18(5):1031–1037, 2008.

134
[112] Viktoria-Eleni Gountouna, Dominic E. Job, AndrewM. McIntosh, T. William J.Moorhead, G. Katherine L. Lymer, Heather C. Whalley, Jeremy Hall, Gor-don D. Waiter, David Brennan, David J. McGonigle, and others. Func-tional magnetic resonance imaging (fMRI) reproducibility and variance compo-nents across visits and scanning sites with a finger tapping task. Neuroimage,49(1):552–560, 2010.
[113] Ranjan Maitra. A re-defined and generalized percent-overlap-of-activation mea-sure for studies of fMRI reproducibility and its use in identifying outlier acti-vation maps. NeuroImage, 50:124–135, 2010.
[114] Javier Gonzalez-Castillo and Thomas M. Talavage. Reproducibility of fMRIactivations associated with auditory sentence comprehension. Neuroimage,54(3):2138–2155, 2011.
[115] Rao P. Gullapalli, Ranjan Maitra, Steve Roys, Gerald Smith, Gad Alon, andJoel Greenspan. Reliability estimation of grouped functional imaging data usingpenalized maximum likelihood. Magnetic resonance in medicine, 53(5):1126–1134, 2005.
[116] P Jaccard. Etude comparative de la distribution florale dans une portion desalpes et des jura. Bulletin de la Socit Vaudoise des Sciences Naturelles, 37:547–579, 1901.
[117] Ranjan Maitra. Assessing certainty of activation or inactivation in testretestfMRI studies. Neuroimage, 47(1):88–97, 2009.
[118] R.C. Oldfield. The assessment and analysis of handedness: The edinburghinventory. Neuropsychologia, 9:97–113, 1971.
[119] Robert W. Cox. AFNI: software for analysis and visualization of functional mag-netic resonance neuroimages. Computers and Biomedical research, 29(3):162–173, 1996.
[120] Bertrand Thirion, Philippe Pinel, Sbastien Mriaux, Alexis Roche, StanislasDehaene, and Jean-Baptiste Poline. Analysis of a large fMRI cohort: Statisticaland methodological issues for group analyses. Neuroimage, 35(1):105–120, 2007.
[121] Mohamed L. Seghier, Franois Lazeyras, Alan J. Pegna, Jean-Marie Annoni, IvanZimine, Eugne Mayer, Christoph M. Michel, and Asaid Khateb. Variability offMRI activation during a phonological and semantic language task in healthysubjects. Human Brain Mapping, 23(3):140–155, 2004-11.
[122] Ryan CN D’arcy, Timothy Bardouille, Aaron J. Newman, Sean R. McWhinney,Drew DeBay, R. Mark Sadler, David B. Clarke, and Michael J. Esser. SpatialMEG laterality maps for language: Clinical applications in epilepsy. Humanbrain mapping, 34(8):1749–1760, 2013.

135
[123] I.M. Ruff, N.M. Petrovich Brennan, K.K. Peck, B.L. Hou, V. Tabar, C.W. Bren-nan, and A.I. Holodny. Assessment of the language laterality index in patientswith brain tumor using functional MR imaging: Effects of thresholding, task se-lection, and prior surgery. American Journal of Neuroradiology, 29(3):528–535,2008-03-01.
[124] David F. Abbott, Anthony B. Waites, Leasha M. Lillywhite, and Graeme D.Jackson. fMRI assessment of language lateralization: An objective approach.NeuroImage, 50(4):1446–1455, 2010-05.
[125] Kayako Matsuo, Shen-Hsing Annabel Chen, and Wen-Yih Isaac Tseng. AveLI:A robust lateralization index in functional magnetic resonance imaging us-ing unbiased threshold-free computation. Journal of Neuroscience Methods,205(1):119–129, 2012-03.
[126] Maria Strandberg, Christina Elfgren, Peter Mannfolk, Johan Olsrud, Lars Sten-berg, Danielle van Westen, Elna-Marie Larsson, Ia Rorsman, and Kristina Klln.fMRI memory assessment in healthy subjects: a new approach to view later-alization data at an individual level. Brain Imaging and Behavior, 5(1):1–11,2011-03.
[127] Babak Afshin-Pour, Gholam-Ali Hossein-Zadeh, Stephen C. Strother, andHamid Soltanian-Zadeh. Enhancing reproducibility of fMRI statistical mapsusing generalized canonical correlation analysis in NPAIRS framework. Neu-roImage, 60(4):1970–1981, 2012-05.
[128] Isabelle Loubinoux, Christophe Carel, Flamine Alary, Kader Boulanouar, GrardViallard, Claude Manelfe, Olivier Rascol, Pierre Celsis, and Franois Chollet.Within-session and between-session reproducibility of cerebral sensorimotor ac-tivation: A test-retest effect evidenced with functional magnetic resonance im-age. Journal of Cerebral Blood Flow & Metabolism, 21:592–607, 2001.
[129] Steven E. Petersen, Hanneke Van Mier, Julie A. Fiez, and Marcus E. Raichle.The effects of practice on the functional anatomy of task performance. Proceed-ings of the National Academy of Sciences, 95(3):853–860, 1998.
[130] Hubertus Lohmann, Michael Deppe, Andreas Jansen, Wolfram Schwindt, andStefan Knecht. Task repetition can affect functional magnetic resonanceimaging-based measures of language lateralization and lead to pseudoincreasesin bilaterality. Journal of Cerebral Blood Flow & Metabolism, 24(2):179–187,2004.
[131] Michelle Liou, Hong-Ren Su, Juin-Der Lee, Philip E. Cheng, Chien-Chih Huang,and Chih-Hsin Tsai. Bridging functional MR images and scientific inference:reproducibility maps. Journal of Cognitive Neuroscience, 15(7):935–945, 2003.

136
[132] Michelle Liou, Hong-Ren Su, Juin-Der Lee, John AD Aston, Arthur C. Tsai,and Philip E. Cheng. A method for generating reproducible evidence in fMRIstudies. NeuroImage, 29(2):383–395, 2006.
[133] Juha Huttunen, Soile Komssi, and Leena Lauronen. Spatial dynamics of pop-ulation activities at s1 after median and ulnar nerve stimulation revisited: AnMEG study. NeuroImage, 32(3):1024–1031, 2006-09.
[134] M. Oishi, M. Fukuda, S. Kameyama, T. Kawaguchi, H. Masuda, and R. Tanaka.Magnetoencephalographic representation of the sensorimotor hand area in casesof intracerebral tumour. Journal of Neurology, Neurosurgery & Psychiatry,74(12):1649–1654, 2003.
[135] Yung-Yang Lin, Wei-Ta Chen, Kwong-Kum Liao, Tzu-Chen Yeh, Zin-An Wu,Low-Tone Ho, and Liang-Shong Lee. Differential generators for n20m and p35mresponses to median nerve stimulation. NeuroImage, 25(4):1090–1099, 2005-05.
[136] Ajay Niranjan, Erika J.C. Laing, Fahad J. Laghari, R. Mark Richardson, andL. Dade Lunsford. Preoperative magnetoencephalographic sensory cortex map-ping. Stereotactic and Functional Neurosurgery, 91(5):314–322, 2013.
[137] J Gross, L Timmermann, J Kujala, R Salmelin, and A Schnitzler. Propertiesof MEG tomographic maps obtained with spatial filtering. 19(4):1329–1336.
[138] T. Bardouille and B. Ross. MEG imaging of sensorimotor areas using inter-trialcoherence in vibrotactile steady-state responses. NeuroImage, 42(1):323–331,2008-08.
[139] A. Kanno, N. Nakasato, Y. Nagamine, and T. Tominaga. Non-transcallosalipsilateral area 3b responses to median nerve stimulus. Journal of ClinicalNeuroscience, 11(8):868–871, 2004-11.
[140] Douglas Cheyne, Andreea C. Bostan, William Gaetz, and Elizabeth W. Pang.Event-related beamforming: A robust method for presurgical functional map-ping using MEG. Clinical Neurophysiology, 118(8):1691–1704, 2007-08.
[141] M. Tynan R. Stevens, Ryan CN DArcy, Gerhard Stroink, David B. Clarke,and Steven D. Beyea. Thresholds in fMRI studies: Reliable for single subjects?Journal of neuroscience methods, 219(2):312–323, 2013.
[142] S Taulu and J Simola. Spatiotemporal signal space separation method forrejecting nearby interference in MEG measurements. Physics in Medicine andBiology, 51(7):1759–1768, 2006-04-07.

137
[143] Gnther Grabner, AndrewL. Janke, MarcM. Budge, David Smith, Jens Pruess-ner, and D.Louis Collins. Symmetric atlasing and model based segmentation:An application to the hippocampus in older adults. In Rasmus Larsen, MadsNielsen, and Jon Sporring, editors, Medical Image Computing and Computer-Assisted Intervention MICCAI 2006, volume 4191 of Lecture Notes in Com-puter Science, pages 58–66. Springer Berlin Heidelberg, 2006.
[144] Matthew T. Sutherland and Akaysha C. Tang. Reliable detection of bilateralactivation in human primary somatosensory cortex by unilateral median nervestimulation. 33(4):1042–1054.
[145] Susan M. Bowyer, Toya Fleming, Margaret L. Greenwald, John E. Moran,Karen M. Mason, Barbara J. Weiland, Brien J. Smith, Gregory L. Barkley, andNorman Tepley. Magnetoencephalographic localization of the basal temporallanguage area. Epilepsy & Behavior, 6(2):229–234, 2005-03.
[146] N. Tanaka, H. Liu, C. Reinsberger, J. R. Madsen, B. F. Bourgeois, B. A. Dworet-zky, M. S. Hamalainen, and S. M. Stufflebeam. Language lateralization rep-resented by spatiotemporal mapping of magnetoencephalography. AmericanJournal of Neuroradiology, 34(3):558–563, 2013-03-01.
[147] Kensuke Sekihara, Maneesh Sahani, and Srikantan S. Nagarajan. Localizationbias and spatial resolution of adaptive and non-adaptive spatial filters for MEGsource reconstruction. NeuroImage, 25(4):1056–1067, 2005-05.
[148] Massimo Fornasier and Francesca Pitolli. Adaptive iterative thresholding al-gorithms for magnetoencephalography (MEG). Journal of Computational andApplied Mathematics, 221(2):386–395, 2008-11.
[149] Hooman Alikhanian, J. Douglas Crawford, Joseph F. X. DeSouza, Douglas O.Cheyne, and Gunnar Blohm. Adaptive cluster analysis approach for functionallocalization using magnetoencephalography. Frontiers in Neuroscience, 7, 2013.
[150] C. Amblard, E. Lapalme, and J.-M. Lina. Biomagnetic source detection bymaximum entropy and graphical models. 51(3):427–442.
[151] J. J. Pillai. The evolution of clinical functional imaging during the past 2decades and its current impact on neurosurgical planning. American Journalof Neuroradiology, 31(2):219–225, 2010.
[152] Christoph Stippich, Maria Blatow, and Karsten Krakow. Presurgical functionalMRI in patients with brain tumors. In Christoph Stippich, editor, Clinicalfunctional MRI: Presurgical functional neuroimaging, pages 88–126. Springer-Verlag, 2007.

138
[153] Kuan H. Kho, Geert-Jan M. Rutten, Frans SS Leijten, Arjen van der Schaaf,Peter C. van Rijen, and Nick F. Ramsey. Working memory deficits after re-section of the dorsolateral prefrontal cortex predicted by functional magneticresonance imaging and electrocortical stimulation mapping: Case report. Jour-nal of Neurosurgery: Pediatrics, 106(6):501–505, 2007.
[154] G.J.M. Rutten, Nick F. Ramsey, P.C. van Rijen, and C.W.M. van Veelen. Re-producibility of fMRI-determined language lateralization in individual subjects.Brain and language, 80:421–437, 2002.
[155] David J. McGonigle. Testretest reliability in fMRI: or how i learned to stopworrying and love the variability. NeuroImage, 62(2):1116–1120, 2012.
[156] S. Gonzalez-Ortiz, L. Oleaga, T. Pujol, S. Medrano, J. Rumia, L. Caral, T. Bo-get, J. Capellades, and N. Bargallo. Simple fMRI postprocessing suffices fornormal clinical practice. American Journal of Neuroradiology, 34(6):1188–1193,2013-06-01.
[157] Stephen C. Strother, Jon Anderson, Lars Kai Hansen, Ulrik Kjems, Rafal Kus-tra, John Sidtis, Sally Frutiger, Suraj Muley, Stephen LaConte, and David Rot-tenberg. The quantitative evaluation of functional neuroimaging experiments:the NPAIRS data analysis framework. NeuroImage, 15(4):747–771, 2002.
[158] Stephen La Conte, Jon Anderson, Suraj Muley, James Ashe, Sally Frutiger,Kelly Rehm, Lars Kai Hansen, Essa Yacoub, Xiaoping Hu, David Rottenberg,and Stephen Strother. The evaluation of preprocessing choices in single-subjectBOLD fMRI using NPAIRS performance metrics. NeuroImage, 18:10–27, 2003.
[159] Janusch Blautzik, Daniel Keeser, Albert Berman, Marco Paolini, Valerie Kirsch,Sophia Mueller, Ute Coates, Maximilian Reiser, Stefan J. Teipel, and ThomasMeindl. Long-term test-retest reliability of resting-state networks in healthyelderly subjects and patients with amnestic mild cognitive impairment. Journalof Alzheimer’s Disease, 34(3):741–754, 2013.
[160] James T. Voyvodic, Jeffrey R. Petrella, and Allan H. Friedman. fMRI activa-tion mapping as a percentage of local excitation: Consistent presurgical motormaps without threshold adjustment. Journal of Magnetic Resonance Imaging,29(4):751–759, 2009-04.
[161] Tynan Stevens, Ryan D’Arcy, Steven Beyea, and David Clarke. Retrospectiveregistration for improved localization of cortical stimulation on mr images. InInternational Society for Magnetic Resonance in Medicine, 2012.
[162] PJ Besl and ND McKay. A method for registration of 3-d shapes. IEEE Trans-actions on Pattern Analysis and Machine Intelligence, 14(2):239–256, 1992.

139
[163] Dara S. Manoach, Elkan F. Halpern, Todd S. Kramer, Yuchiao Chang, Don-ald C. Goff, Scott L. Rauch, David N. Kennedy, and Randy L. Gollub. Test-retest reliability of a functional MRI working memory paradigm in normal andschizophrenic subjects. American Journal of Psychiatry, 158(6):955–958, 2001.
[164] Olivier Maza, Bernard Mazoyer, Pierre-Yves Herv, Annick Razafimandimby,Sonia Dollfus, and Nathalie Tzourio-Mazoyer. Reproducibility of fMRI activa-tions during a story listening task in patients with schizophrenia. Schizophreniaresearch, 128(1):98–101, 2011.
[165] Kenneth P. Eaton, Jerzy P. Szaflarski, Mekibib Altaye, Angel L. Ball, Brett M.Kissela, Christi Banks, and Scott K. Holland. Reliability of fMRI for studies oflanguage in post-stroke aphasia subjects. Neuroimage, 41(2):311–322, 2008.
[166] Giannantonio Spena, Antonella Nava, Fabrizio Cassini, Antonio Pepoli, Mar-cella Bruno, Federico DAgata, Franco Cauda, Katiuscia Sacco, Sergio Duca,Laura Barletta, and Pietro Versari. Preoperative and intraoperative brain map-ping for the resection of eloquent-area tumors. a prospective analysis of method-ology, correlation, and usefulness based on clinical outcomes. 152(11):1835–1846.
[167] Peter Grummich, Christopher Nimsky, Elisabeth Pauli, Michael Buchfelder,and Oliver Ganslandt. Combining fMRI and MEG increases the reliability ofpresurgical language localization: A clinical study on the difference betweenand congruence of both modalities. NeuroImage, 32(4):1793–1803, 2006-10.
[168] Helmut Kober, Christopher Nimsky, Martin Mller, Peter Hastreiter, RudolfFahlbusch, and Oliver Ganslandt. Correlation of sensorimotor activation withfunctional magnetic resonance imaging and magnetoencephalography in presur-gical functional imaging: A spatial analysis. NeuroImage, 14(5):1214–1228,2001-11.
[169] K Singh. Task-related changes in cortical synchronization are spatially coinci-dent with the hemodynamic response. NeuroImage, 16(1):103–114, 2002-05.
[170] John Sanders, Jeffrey D. Lewine, and William Orrison. Comparison of pri-mary motor cortex localization using functional magnetic resonance imagingand magnetoencephalography. Human Brain Mapping, 4:47–57, 1996.
[171] Hiroaki Shimizu, Nobukazu Nakasato, Kazuo Mizoi, and Takashi Yoshimoto.Localizing the central sulcus by functional magnetic resonance imaging andmagnetoencephalography. Clinical Neurology and Neurosurgery, 99:235–238,1997.
[172] Christoph Stippich, Peter Freitag, Jan Kassubek, Helmut Kober, Klaus Schef-fler, Rudiger Hopfengartner, Deniz Bilecen, Ernst Radu, and Jurgen Vieth.Motor, somatosensory and auditory cortex localization by fMRI and MEG.NeuroReport, 9:1953–1957, 1998.

140
[173] Timothy PL Roberts, Elizabeth A. Disbrow, Heidi C. Roberts, and Howard A.Rowley. Quantification and reproducibility of tracking cortical extent of activa-tion by use of functional MR imaging and magnetoencephalography. Americanjournal of neuroradiology, 21(8):1377–1387, 2000.
[174] F. Moradi, L.C. Liu, K. Cheng, R.A. Waggoner, K. Tanaka, and A.A. Ioannides.Consistent and precise localization of brain activity in human primary visualcortex by MEG and fMRI. NeuroImage, 18(3):595–609, 2003-03.
[175] Pasi I Tuunanen, Martin Kavec, Veikko Jousmki, Jussi-Pekka Usenius, RiittaHari, Riitta Salmelin, and Risto A Kauppinen. Comparison of BOLD fMRI andMEG characteristics to vibrotactile stimulation. NeuroImage, 19(4):1778–1786,2003-08.
[176] M. Brunetti, P. Belardinelli, M. Caulo, C. Del Gratta, S. Della Penna, A. Fer-retti, G. Lucci, A. Moretti, V. Pizzella, A. Tartaro, K. Torquati, M. Olivetti Be-lardinelli, and G.L. Romani. Human brain activation during passive listeningto sounds from different locations: An fMRI and MEG study. Human BrainMapping, 26(4):251–261, 2005-12.
[177] Rebecca L. Billingsley-Marshall, Trustin Clear, W. Einar Mencl, Panagiotis G.Simos, Paul R. Swank, Disheng Men, Shirin Sarkari, Eduardo M. Castillo, andAndrew C. Papanicolaou. A comparison of functional MRI and magnetoen-cephalography for receptive language mapping. Journal of Neuroscience Meth-ods, 161(2):306–313, 2007-04.
[178] Kyousuke Kamada, Yutaka Sawamura, Fumiya Takeuchi, Shinya Kuriki, Ken-suke Kawai, Akio Morita, and Tomoki Todo. Expressive and receptive lan-guage areas determined by a non-invasive reliable method using functionalmagnetic resonance imaging and magnetoencephalography. Neurosurgery,60(2):296???306, 2007-02.
[179] Mia Liljestrm, Annika Hultn, Lauri Parkkonen, and Riitta Salmelin. ComparingMEG and fMRI views to naming actions and objects. Human Brain Mapping,30(6):1845–1856, 2009-06.
[180] Elizabeth W. Pang, Frank Wang, Marion Malone, Darren S. Kadis, and Eliza-beth J. Donner. Localization of broca’s area using verb generation tasks in theMEG: Validation against fMRI. Neuroscience Letters, 490(3):215–219, 2011-03.
[181] Yingying Wang, Scott K. Holland, and Jennifer Vannest. Concordance of MEGand fMRI patterns in adolescents during verb generation. Brain Research,1447:79–90, 2012-04.
[182] Silke Klamer, Adham Elshahabi, Holger Lerche, Christoph Braun, Michael Erb,Klaus Scheffler, and Niels K. Focke. Differences between MEG and high-densityEEG source localizations using a distributed source model in comparison tofMRI. Brain Topography, 28(1):87–94, 2015-01.

141
[183] Stephen C. Strother. Evaluating fMRI preprocessing pipelines. Engineering inMedicine and Biology Magazine, IEEE, 25(2):27–41, 2006.
[184] Joshua I. Breier, Panagiotis G. Simos, George Zouridakis, and Andrew C. Pa-panicolaou. Lateralization of activity associated with language function usingmagnetoencephalography: a reliability study. Journal of Clinical Neurophysi-ology, 17(5):503–510, 2000.
[185] Krzysztof J. Gorgolewski, Amos J. Storkey, Mark E. Bastin, Ian Whittle, andCyril Pernet. Single subject fMRI testretest reliability metrics and confoundingfactors. Neuroimage, 69:231–243, 2013.
[186] Dongwook Lee, Stephen M. Sawrie, Panagiotis G. Simos, Jeff Killen, andRobert C. Knowlton. Reliability of language mapping with magnetic sourceimaging in epilepsy surgery candidates. Epilepsy & Behavior, 8(4):742–749,2006-06.
[187] Panagiotis G. Simos, Shirin Sarkari, Eduardo M. Castillo, Rebecca L.Billingsley-Marshall, Ekaterina Pataraia, Trustin Clear, and Andrew C. Papan-icolaou. Reproducibility of measures of neurophysiological activity in wernicke’sarea: A magnetic source imaging study. Clinical Neurophysiology, 116(10):2381–2391, 2005-10.
[188] Rebecca L. Billingsley-Marshall, Panagiotis G. Simos, and Andrew C. Papani-colaou. Reliability and validity of functional neuroimaging techniques for iden-tifying language-critical areas in children and adults. Developmental neuropsy-chology, 26(2):541–563, 2004.
[189] Bruce Fischl, David H. Salat, Evelina Busa, Marilyn Albert, Megan Dieterich,Christian Haselgrove, Andre van der Kouwe, Ron Killiany, David Kennedy,Shuna Klaveness, Albert Montillo, Nikos Makris, Bruce Rosen, and Anders M.Dale. Whole brain segmentation: automated labeling of neuroanatomical struc-tures in the human brain. Neuron, 33(3):341–355, 2002-01-31.
[190] Mark Jenkinson, Christian F. Beckmann, Timothy E. J. Behrens, Mark W.Woolrich, and Stephen M. Smith. FSL. NeuroImage, 62(2):782–790, 2012-08-15.
[191] Elizabeth W. Pang, William Gaetz, James M. Drake, Samuel Strantzas,Matthew J. MacDonald, Hiroshi Otsubo, and O. Carter Snead. Patient withpostcentral gyrectomy demonstrates reliable localization of hand motor areausing magnetoencephalography. Pediatric Neurosurgery, 45(4):311–316, 2009.
[192] Andrei I. Holodny, Michael Schulder, Wen Ching Liu, Joseph A. Maldjian, andAndrew J. Kalnin. Decreased BOLD functional MR activation of the motor andsensory cortices adjacent to a glioblastoma multiforme: implications for image-guided neurosurgery. American journal of neuroradiology, 20(4):609–612, 1999.

142
[193] Axel Schreiber, Ulrich Hubbe, Sargon Ziyeh, and Jrgen Hennig. The influence ofgliomas and nonglial space-occupying lesions on blood-oxygen-leveldependentcontrast enhancement. American journal of neuroradiology, 21(6):1055–1063,2000.


