Embed Size (px)
Citation preview

ONU-DTCD OLA DE CEE
ENERGY BALANCES
IN TERMS OF USEFUL ENERGY
{BEEU)
OLADE METHODOLOGY FOR THE
ELABORA TION OF

41
40
39 37 36 34
32 32
26
18
18
16
15
14 12 11
10
4 4
Page
i
3.4. Useful Consumption 3.3. Total Final Consumption 3.2. Transformation Centers 3.1. Total Internal Supply
3. Equilibrium Equations 2. Treatment of Other Transformations l. General Structure of the Balance
CHAPTER 11 GENERAL STRUCTURE OF THE BALANCE AND METHOD OF CALCULATION
4.2. Energy Sources 4.1. Transformation Centers
4. Transformation Centers and Energy Sources Considered
3.2. End-Uses Considered for Each Consumption Sector
3.1. Basic Categories 3. Disaggregation by End-Uses
2.2. Disaggregation by Subsectors 2.1. Disaggregation by Sectors
2. Disaggregation of Final Energy Consumption l. Definition of Useful Energy
CHAPTER I DEFINITIONS AND BASIC CONCEPTS
INTRODUCTION
BASE DOCUMENT
INDEX
147
144
144
138
135
133
132
123
123
121
118
117
117
115
114
113
112
112
110
109
109
106
102
99
99
99
iií
Analysis of Existing Information 2.
l. Data-Collecting Form
Database Formation CHAPTER II
5.
BEEU Applied toan Industrial Unit
BEEU Applied to the Industrial Sector 4. 3.
Disaggregation by End-Uses
Final Energy, Useful Energy and Efficiencies 2.
Disaggregation by Subsectors l.
Definitions and Basic Concepts CHAPTER I
INDUSTRIAL SECTOR SECTORAL APPENDIX 11
2. The Case of Colombia
General Considerations l.
CHAPTER III - Applications
Efficiencies 4. Sea 3.
Raíl and Air 2.
River l.
Database Formation - Non-Road Transportation B)
6.
5, Efficiencies General Scheme for a Road Transportation Database
Permanent Features fixed variables 4.
3.
Mileage Utilization Factor (Factor of Occupation)
2.
Specific Consumption l.
A)
cHAPTER II - DATABASE FORMATION Database Formation - Road Transportation
ii
95 General Flow for the Balance of Useful Energy (BEEU) in the Transportation, Sector
4. 89 Final Energy, Useful Energy and Efficiencies 3. 88 Disaggregation by End-Uses 2. 84 Disaggregation by Subsectors l. 82 Definitions and Basic Concepts CHAPTER I
TRANSPORTATION SECTOR SECTORAL APPENDIX I
A P P E N D I C E S S E C T O R A L
77 2. Energy Efficiencies 69 l. Energy Equivalencies 69 ENERGY EQUIVALENCIES AND EFFICIENCIES CHAPTER VI
59 GLOSSARY CHAPTER V
57 4. Alternative Solutions 56 3. Limitations 55 2. Advantages 55 l. Charact~ristics 55 GENERAL CONSIDERATIONS - CHAPTER IV
53 2. Formation of Databases and Processing of
Information
52 1.3 Polls and Surveys 52 1.2 Historical Linkages 51 1.1 Information Assessment 51 l. Organization and Treatment of Information 51 CHAPTER III - INFORMATION AND DATA PROCESSING.
271
269
264
262 263
262
262
255
250
250
247 249 249
247
247
244
244
242
229
228
225
225
225
221
V
Survey Forms 4.
Guidelines for Data Processing and Sample Expansion
3.
Analysis of Exísting Information and Guide- lines for Sample Design
2.
Agricultutal Subsector Miníng Subsector
1.1. l. 2.
Data-Collecting Form l.
Database Formation CHAPTER II
Energy Balance Applied to a Unit 4. Final Energy, Useful Energy and Efficiencies 3. 2.2 Sectoral
Agricultural Subsector Fishing Subsector Mining Subsector
2.1.1. 2.1.2. 2.1.3.
2.1 Subsectoral
Disaggregation by End-Uses 2.
Disaggregation by Subsectors l.
Definitions and Basic Concepts CHAPTER I
SECTORAL APPENDIX V - AGRICULTURE-FISHING-MINING SECTOR
Guidelínes for Data Processing and Sample Expansion
4.
Guidelines for Sample Design 3.
Analysis of Existing Information 2.
Data-Collecting Form l.
Database Formation CHAPTER II
Final Energy, Useful Energy and Efficiencies 3.
220
215
215
213
205
205
205
192
182
179
177
177
175
173
169
168
168
168
166
163
160
158
158
153
150
iv
Disaggregation by End-Uses 2.
Definitions and Basic Concepts Disaggregation by Subsectors l.
CHAPTER I COMMERCIAL-SERVICES-PUBLIC SECTOR SECTORAL APPENDIX IV
The Case of Brazil 2. General Consideratíons l.
CHAPTER III - Applications
Data-Collecting Instrument 4. Sampling Methods 3.
l. Significance of Sample Surveys
2. Previous Study of the Universe of Consumers
Database Formation CHAPTER II
5. BEEU Applied to a Resídential Unit (Household) BEEU Applied to the Residential Sector
4. 3. Final Energy, Useful Energy and Efficiencies
2. Disaggregation by End-Uses
Definitions and Basic Concepts l. Dísaggregatíon by Subsectors
CHAPTER I SECTORAL APPENDIX III - RESIDENTIAL SECTOR
3. The Case of Brazil
2. The Case of Colombia
l. General Considerations
CHAPTER III - Applicatíons
Guídelínes for Data Processíng and Sample Expansion 4.
Guídelínes for Sample Design 3.
vii
The cancepts of rational use of energy, substitution among energy sources, and projectíon and analysis af energy demand merít in- depth accounting of the energy lasses occurring during the pro- cesses of transformation and actual consumption, í.e., determína- tion of the "useful energy" available in the processes of pro- duction of goods and services, as well as that destined far satisfying household needs.
The current matrix of the BEEF-OLADE' has been enhanced dueto the needs of economic and energy analyses at the national and region- al levels. Recent trends in energy palicy call far more detailed knowledge about the amount of energy actually used both in pro- ducing energy and in satisfying the needs of final consumers.
The OLADE methodology far elaboratíon of BEEF has been adequate for the requírements of information indispensable for analysis of the energy sector. However, given the need to broaden the energy picture and to delve into greater depth in certaín aspects of importance far system management, the energy balance requires an evolution compatible with the infrastructure and basic re quirements far information in the regían.
In the current state of development of the BEEF-OLADE, the sour- ces of energy are converted into their energy equivalent from the primary level up through final energy consumption. In other words, they do not cover losses at the level of final consumers.
Currently, 25 of the OLADE Member Countries have an hístorical time series of energy balances, which has been of great utílity especíally in those countries in which this tool of analysis and energy planníng had not been available previously.
Along thís veín, and ín arder to comply wíth the ministerial mandate expressed in Panama, OLADE developed a methodology far the elabaration of energy balances in terms of final energy (BEEF) far the Latín American and Caribbean area, far the purpose of unifying criteria and facilitating, in addition, the work of technicians and researchers in the field of energy; thís methodolagy has been developed fundamentally far use by the countries of the regían and far the region itself, but it can obviously be applied at the subregional and continental levels.
The scope and signifícance of this program was widely accepted, and it constitutes an indispensable element far fostering energy planning in the Member Countries, thus facilitating their cooperatíon and integratíon.
The uneven development of energy planning instruments observed in Latín America led OLADE to propase the execution of a program of energy balances far the region, at the X Meeting of Ministers, held in Panama in December 1979.
INTRODUCTION
vi
320 Guidelines far the Design and Expansion of Samples
3. 318 Analysis of Existing Information 2. 317
Data-Collecting Form l. 317 Database Formation CHAPTER II
4. 313
315
Final Energy, Useful Energy and Efficiencies Energy Balance Applied to a Unit
3. 312
2. Disaggregation by End-Uses 310
310 Definitions and Basic Concepts l. Disaggregation by Subsectors
CHAPTER I 308 SECTORAL APPENDIX VII - OTHERS SECTOR
304 l. The Case of Brazil
302 CHAPTER III - Applications
299 CHAPTER II Database Forrnation
4. 294
296
Final Energy, Useful Energy and Efficiencies BEEU Applied to a Unit
3. 293 Disaggregation by End-Uses 2.
290
290
Definitions and Basic Concepts Disaggregation by Subsectors l.
CHAPTER I 287 AUTO-CONSUMPTION SECTOR SECTORAL APPENDIX VI
ix
It is worthwhile to note that the methodology presented herewith, the consolidated format, and the common unit of aggregation do not intend to limit the fíeld of action of the different coun- tries in the elaboration of their natíonal balances. Obviously,
In summary, although the BEEU in themselves do not constitute a direct instrument for the above-mentioned actions, the data needed for their elaboration, together with other information, provide the basis for analyses that will permit suitable actions. The advantage of energy balances, and particularly BEEU, is their organized presentation, which calls for controlled coherence in the data, thus permítting the relatíon with other systems for describing economíc reality such as the national accounts; under certain conditions, international comparísons; and construction of a database or coherent information system with the objectives of the proposed analysis.
For the elaboration of policies such as those for pricíng, substitution among sources, conservation and rational use, the BEEU facilitate analysis and permita better definition of the spheres in which such policies would have an effect by providíng more refined and homogeneous consumption aggregates.
With respect to rational use of energy, the measures to be imple- mented at the level of sectors, subsectors or establishments require much more detailed information, which normally does not appear in the balance. However, this is the only instrument apt for detecting the demand aggregates most sensitive to programs of rational use and the impact that such programs would have at the national or regional level.
transformation of these aggregates into useful energy con- and losses takes on importance when what is desired is in evidence the policy of substitution among sources, use of energy and the analysis and projection of demand.
effort to be made in preparing BEEU is thus intimately tied to the scope of the instruments of analysis and projection of needs which are available to a country. Therefore, an important amount of information contained in the BEEU will be indispensa- ble, but there will also be another type of information, not contained in the BEEU (which has been compiled for their prepara-
which is also indispensable. For the sake of illustra- mention can be made of any type of demand analysis done
aggregated or disaggregated), the consumption of the different branches of industry, by units of physical production,
of value added, specific consumption in Kcal/inhabitant to geographical regions, income levels, urban or rural
zones, etc.
at BEEU, two stages must necessarily be completed: the is the disaggregation of final consumption by subsectors
by uses and, the second, is the assignation of efficiencies these aggregates. Without doubt, the first stage leads to detailed knowledge about final energy consumption and,
, is an instrument of great utility for demand projections.
viíi
Although BEEU have a broader scope than BEEF-- since . seen, they disaggregate the t 1 ' as will be sec ora consumption of th d"ff energy sources by subsect e l erent only provide part of t~rs,. fenergy.uses and equipment-- they
1 . e in ormation required f p anning, since the latter 1 11 or energy . f . a so ca s for an th t in ormation, on both the o er ype of systern as a whole Act llenergfy system and the socioeconomic · ua y, rom the standpo· t f h system, for the analysis of d d . in o te energy information on consumption . d:man' it may be necessary to have in icators informati d . case studies, information on th b h . on erived from and inforrnation o f an Lns t í. t t. el e av i.o r of economic variables u lona nature. In the assessment phase a 1· . sítuation and the past e~ol ~-exp ~ca~ive analysís of the current well as of its relatio ~t· hionho te energy system is done, as · ns wi te overall syste BE instrument which permit th . m , EU are an necks and/or constraintss· ;hdetection of the principal bottle- which may be bas d in .e energy system, the solutions for e on special studies on d d ( explicative variables d . . eman analysis of modules ) 1 ' eterm1n1ng factors, homogeneous ' · · • ' supp Y, energ 1 · · . . the productive system and thy ~o ~c~es, th: institutional system,
e ec1s1on-making process.
Energy balances constitute one of the instrume .. and presenting part of the infor t' d nts for organizing ning If h ma ion nee ed for energy 1 . . te planning process is broken d . pan- gathering and organization f . f . own into the stages of . o in ormation energy preparation of projections and ff . ' . assessment, the future s an e ective planning process for
d d ystem, energy balances are then found in the f" an secon stages. irst
An attempt was made t d 1 energy balances . o eve opa methodology for elaborating the . in terms of useful ener (BEE) instrument which would serve as a gy U, these being an its 1 . basis for energy planning and re ations with rational use of sources. energy and substitution among
Therefore, headway must be made in meth d 1 · d b o o ogical efforts in or er to roaden the current structure of the OLADE anee and to be able to satisfy th . energy bal- ff . e present requirements of e ective energy analysis through the cal . more
energy as a function of the eq . culation of useful uipment used and the sumed in each one of the end-us f h. h .sources eon- es or w ic energy is required. The methodology presented herein was the f professionals from the Member C t . e fort of a group of . . oun ries and from t' 1 international organizations which have na ion~ and methodology for the incorporation of usefu~een devel~ping a energy balance. It also includes the :nergy into the the International Seminar for the P observ~tions made during Methodology for Elaboration of E Brelsentation of the OLADE E h 1 nergy a anees in Terms of U f 1 nergy, e din Sao Paulo in August-1986 Th" h se u method that not only consi"d h . l~ as resulted in a
d ers te experience g · d · en eavors but which 1 aine in past defin1"t1·ons and a so goes further, to incorporate new treatments.

1
BASE DOCUMENT
What is desired is to provide a broad, common methodology for all of the countries of Latín America, permitting preparation of a "consolidated regional balance" and, thus, to facilitate the task of comparisons within the area and with other regions of the world, while formulating a methodology flexible enough to be applicable to the dífferent characteristics and particularitíes of the energy systems of the Latín American countries.
each country is free to adopt a greater or lesser degree of disaggregation than that proposed, or any other unit other than the one given.

41
40
39
37
36
34 32
26
18
18
16
15
14
12
11
10
4
Page
2
Useful Consumption 3.4
Total Final Consumption 3.3
Transformation Centers 3.2
3.1 Total Internal Supply 3. Equilibrium Equations
2. Treatment of Other Transformations
l. General Structure of the Balance
GENERAL STRUCTURE OF THE BALANCE AND METHOD OF CALCULATION
Energy Sources
Transformation Centers
CHAPTER II
4.2 4.1
4. Transformation Centers and Energy Sources Considered
3.2 End-Uses Considered for Each Consumption Sector
Basic Categories 3.1
3. Disaggregation by End-Uses
Disaggregation by Subsectors
Disaggregation by Sectors
2.2
2.1
2. Disaggregation of Final Energy Consumption l. Definition of Useful Energy
DEFINITIONS AND BASIC CONCEPTS
BASE DOCUMENT
INDEX
CHAPTER I
INTRODUCTION
4
(*) Energy transformation ar conversion is understood as "energy production with a modification of the physical state of the energy agent11•
(**) "World Energy Conference Glossary af Energy Balances and Accounting,11 Pergamon Press, page 5. This definition can also be found in EUROSTAT, 11Useful Energy Balance-Sheets 1975", Belgium 1979, page 22.
(2) the existence of SYSTEMS OF USE for the different forms of intermediate energy.
(1) the existence of OTHER PROCESSES which occur between the last conversion and the useful energy available and which, althaugh do nat entail modifications in the physical state, do generate losses; and
Far the concept of useful energy which will be used in the OLADE methodology, it was considered worthwhile to add to the foregoing defínition other elements which should be taken into account:
"the energy available to the consumer after its final con- versíon" (**).
in of the most widely accepted definitions of useful energy specialized literature is:
One the
The fact that there is no unique and universally accepted defini- tion for useful energy led to the consideration of the different options which exist, befare finally arriving at the one adopted by the present methodalogy.
Although it is universally accepted that Final Energy (FE) is that which is put at the disposal of the cansurner, the energy saurce in question must almost always undergo sorne transfarmation in arder to attain the farm af energy suitable far the use re- quired by the cansumer. It is alsa known that the end-uses of energy are to do work ar obtain heat for given physical and chemical processes. Each one of the sources of energy apt for these end-uses is obtained by means of simple or complex trans- formations (*) of Final Energy.
terms the
The methodology to be used in preparing energy balances in of useful energy (BEEU) must necessarily begin by defining cancept of Useful Energy (UE) which will be adapted.
Definition of Useful Energy l.
DEFINITIONS AND BASIC CONCEPTS
CHAPTER I
3
77 2. Energy Efficiencies 69
ENERGY EQUIVALENCIES AND EFFICIENCIES l. Energy Equivalencies
CHAPTER VI
GLOSSARY CHAPTER V
57 4, Alternative Solutions 56 3. Limitations 55 2. Advantages 55 l. Characteristics
GENERAL CONSIDERATIGNS CHAPTER IV
53
Formation of Databases and p rocessing of Information 2.
52 Polls and Surveys l. 3
52 Historical Linkages 1.2
51 Information Assessment 1.1 51 Organization and Treatment of Information l.
CHAPTER III - INFORMATION AND DATA PROCESSING
6
It is considered that only the optíon which incorporates the four phases (FE)-(A)-(B)-(C) is appropriate for :alculating the en:r- gy which is really incorporated into the final productor which provides the required service. Only by going through these four phases of the diagram would it be possible to arrive at knowledge about useful energy with the scope of the definition adopted in this methodology.
Considering the section (A)--~ (B)~ losses in the conversion systems would incorporate those originating in other processes, the respective efficiencies of which give rise to what in this methodology has been termed EFFICIENCY OF PRODUCTION.
Alternatives (A) and (Aj, which take into account only the energy sources and conversion systems, provide knowledge about one stage of Intermediate Energy. For sorne methodologies (for example, that of the OECD), this option already constitutes Useful Energy.
keeping must be
To express the foregoing in terrns of useful energy, in with the definitions presented above, alternatives recognized.
For the balances of Final Energy Consumption (whether primary or secondary sources), energy accounting can establish the amounts of each source consumed far each use. For that purpose, it is only necessary to disaggregate consumption by sectors of economic or social activity, according to consumption by end-uses.
FE-----------------~ CONVERS ION------? (Final Energy Source)
of Final Use-----------~ (C) 1'~ ........ I ...............
........... I '"'""" ..._ ...... .._ I .............. ~
(A') 1B) 1' 1' I I I I I I I I
(A)-------)> OTHER PROCESSES
Systems
FIGURE 2
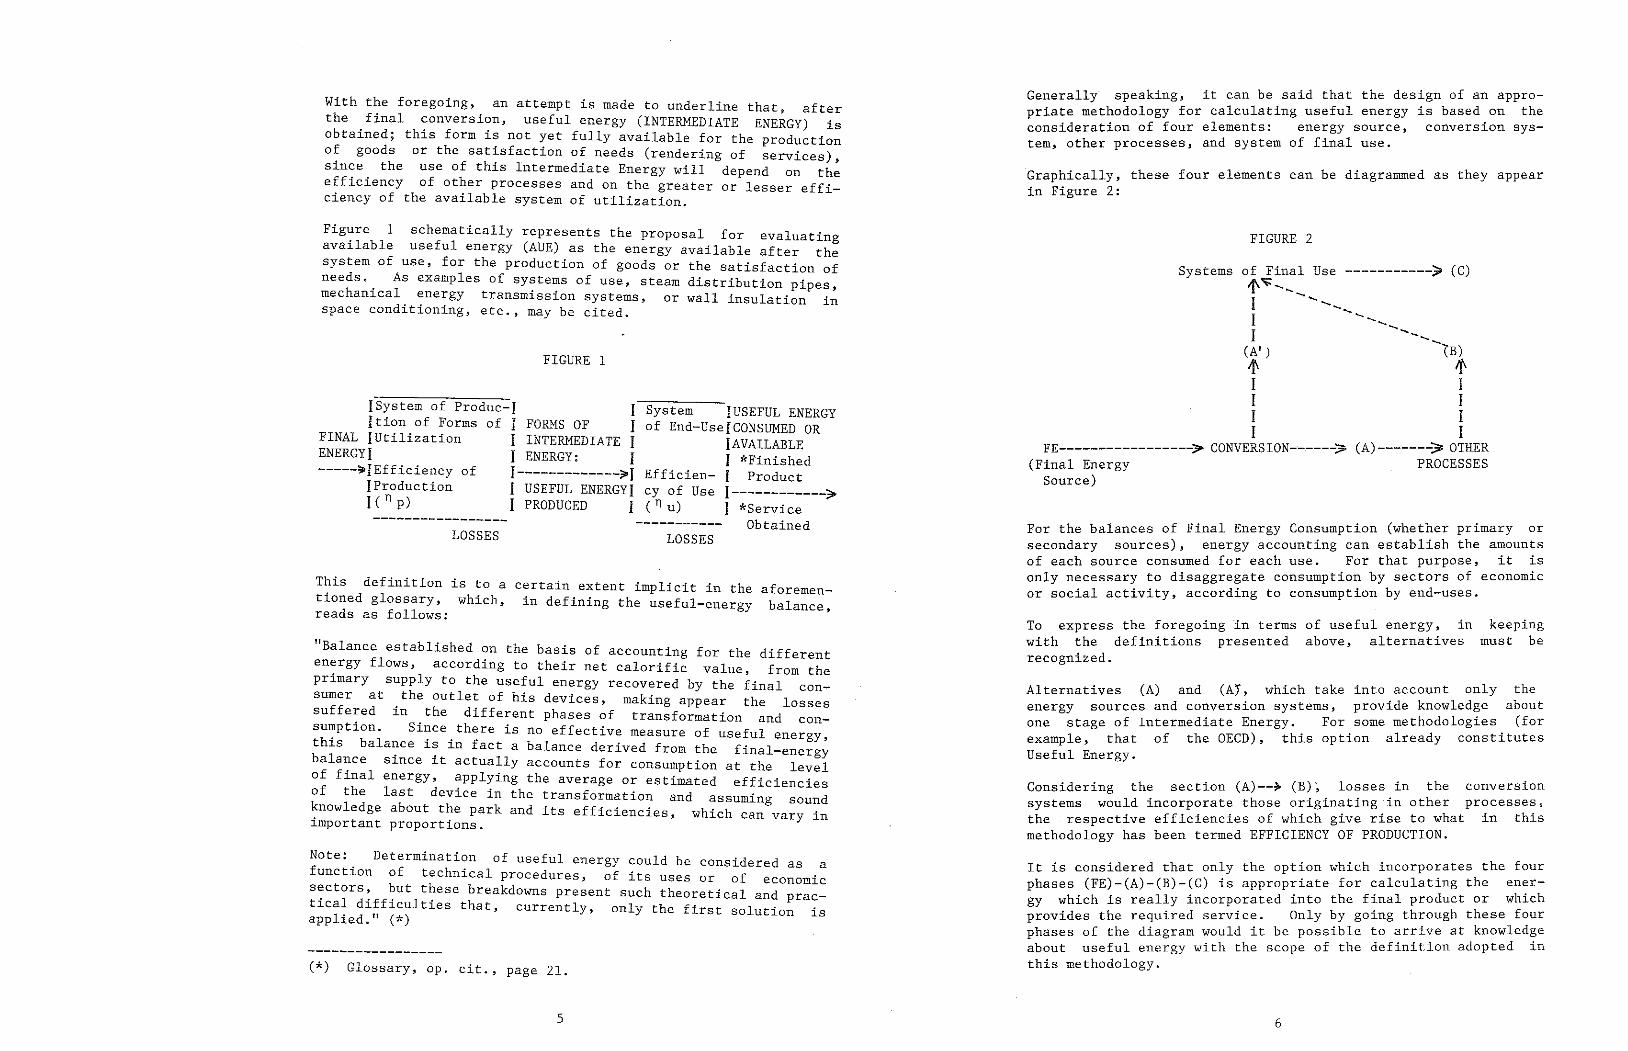
Graphically, these four elements can be diagramrned as they appear in Figure 2:
Generally speaking, it can be said that the design of an appro- priate methodology far calculating useful energy is based on the consideration of four elements: energy source, conversion sys- tem, other processes, and system of final use.
5
(*) Glossary, op. cit., page 21.
Note: Determination of useful energy could be considered as a function of technical procedures, of its uses or of economic sectors, but these breakdowns present such theoretical and prac- tical difficulties that, currently, only the first solution is applied. 11 (*)
"Balance established on the basis of accounting for the different energy flows, according to their net calorific value, from the primary supply to the useful energy recovered by the final con- sumer at the outlet of his devices, making appear the losses suffered in the different phases of transformation and con- sumption. Since there is no effective measure of useful energy, this balance is in fact a balance derived from the final-energy balance since it actually accounts for consumption at the level of final energy, applying the average or estimated efficiencies of the last device in the transformation and assuming sound knowledge about the park and its efficiencies, which can vary in important proportions.
This definition is to a certain extent implicit in the aforemen- tioned glossary, which, in defining the useful-energy balance, reads as follows:
LOSSES LOS SES
Efficien- cy of Use ( n u)
System !USEFUL ENERGY of End-UsefCONSUMED OR
IAVAILABLE l *Finished I Product !------------;;. I *Service
Obtained -------------~---
ISystern of Produc-I I Ition of Forrns of I FORMS OF I
FINAL IUtilization I INTERMEDIATE I ENERGYI 1 ENERGY: I -----~IEfficiency of I-------------~I
IProduction l USEFUL ENERGYI 1 ( n p) l PRODUCED I
FIGURE 1
Figure 1 schematically represents the proposal for evaluating available useful energy (AUE) as the energy available after the system of use, for the production of goods or the satisfaction of needs, As examples of systems of use, steam distribution pipes, mechanical energy transmission systems, or wall insulation in space conditioning, etc., rnay be cited.
With the foregoing, an attempt is made to underline that, after the final conversion, useful energy (INTERMEDIATE ENERGY) is obtained; this form is not yet fully available far the production of goods or the satisfaction of needs (rendering of services), since the use of this Intermediate Energy will depend on the efficiency of other processes and on the greater or lesser effi- ciency of the available system of utilization.
8
CONSUMPTION OF THE USEFUL ENERGY OF AN ENERGY SOURCE X IN A CONSUMPTION SECTOR J
EFFICIENCY D4 E4 F4
EFFICIENCY Az Bz c2
EFFICIENCY A4 B4 C4
EFFICIENCY A3 B3 C3
.EQUIPMENT X4 Y4 Z4
USE 4
FINAL CONSUMPTION BY ENERGY SOURCE
FIGURE 3-1
{ EFFICIENCY D1 E1 F1 nu: efficiency
of use
np:efficiency off JEFFICIENCY production k-1 B1 C1
USE 1
7
the determination of equipment efficiency and i)
To calculate useful energy, it is necessary to resolve two basic questions:
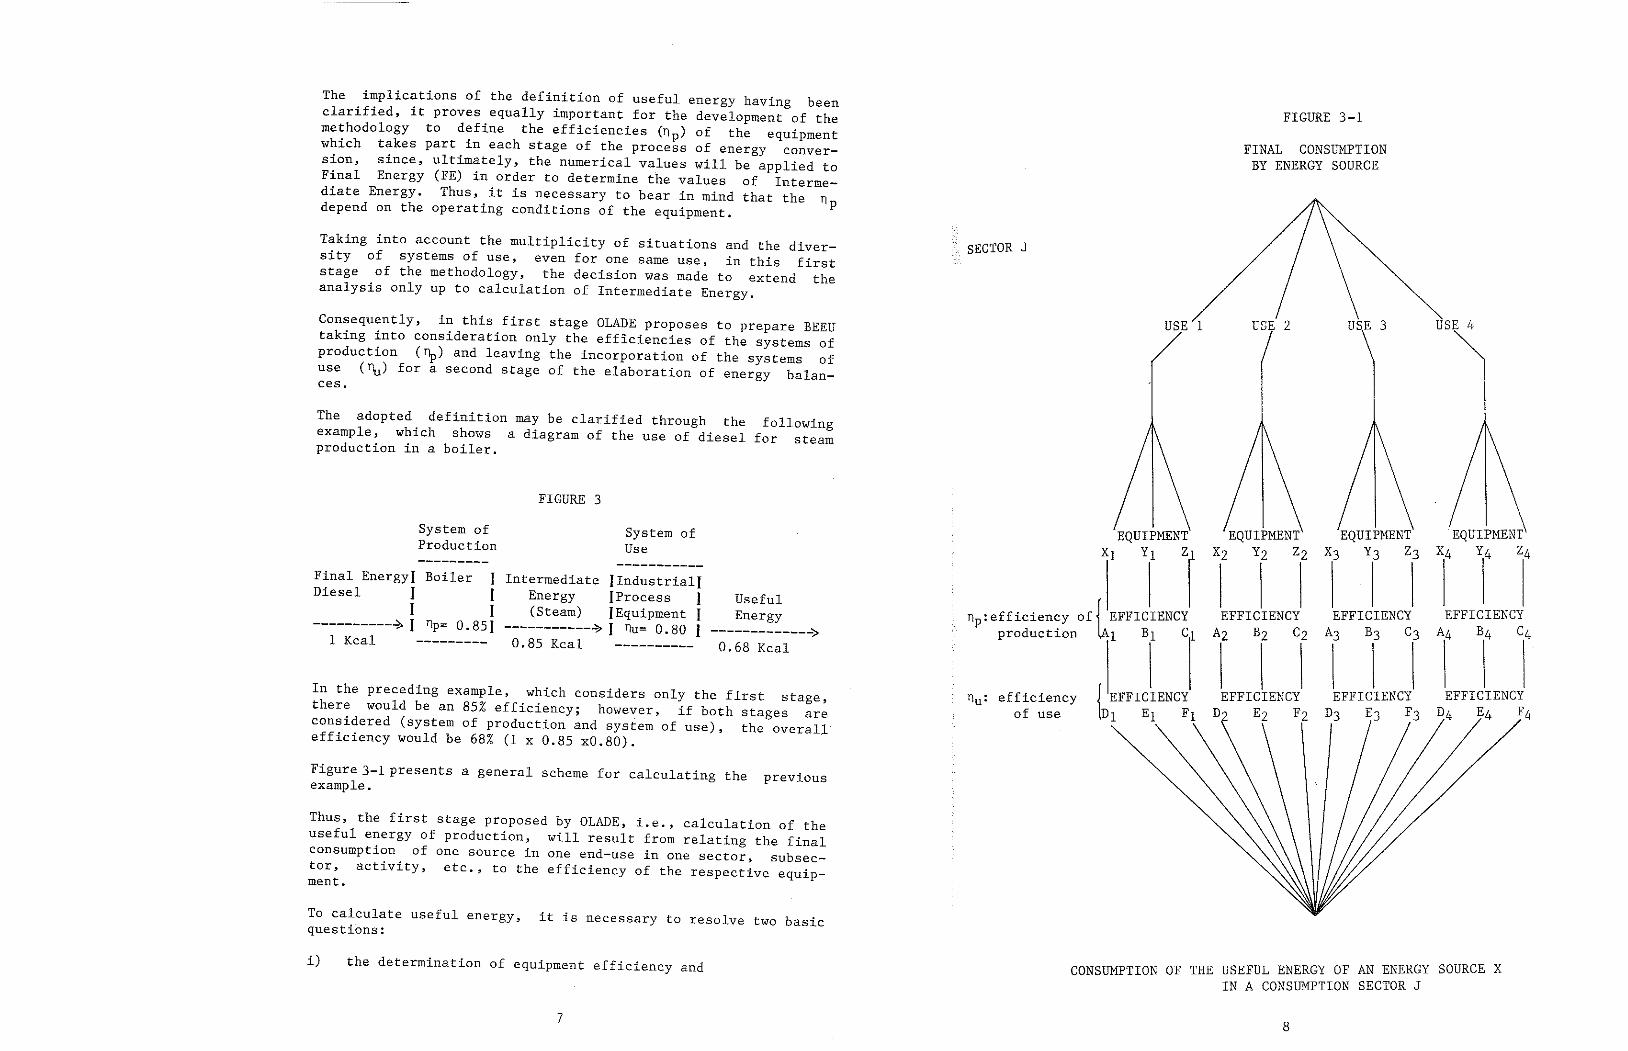
Thus, the first stage proposed by OLADE, i.e., calculation of the useful energy of production, will result from relating the final consumption of one source in one end-use in one sector, subsec- tor, activity, etc., to the efficiency of the respective equip- ment.
Figure)-1 presents a general scheme for calculating the previous example.
In the preceding example, which considers only the first stage, there would be an 85% efficiency; however, if both stages are considered (system of production and system of use), the overall efficiency would be 68% (1 x 0.85 x0.80).
Final EnergyJ Boiler 1 Intermedia te findustriall Diesel I 1 Energy fProcess 1 Useful 1 1 (Steam) IEquipment 1 Energy ----------~ 1 np= 0.851 -----------..:;> 1 nu= 0.80 1 -------------> 1 Kcal --------- 0.85 Kcal ---------- 0.68 Kcal
System of Use
System of Production
FIGURE 3
The adopted definition may be clarified through the following example, which shows a diagram of the use of diesel far steam production in a boiler.
Consequently, in this first stage OLADE propases to prepare BEEU taking into consideration only the efficiencies of the systems of production (rp) and leaving the incorporation of the systems of use (nu) for a second stage of the elaboration of energy balan- ces.
Taking into account the multiplicity of situations and the diver- sity of systems of use, even for one same use, in this first stage of the methodology, the decision was made to extend the analysis only up to calculation of Intermediate Energy.
The implications of the definitíon of useful energy having been clarified, it proves equally important for the development of the methodology to define the efficiencies (np) of the equipment which takes part in each stage of the process of energy conver- sion, since, ultimately, the numerical values will be applied to Final Energy (FE) in order to determine the values of Interme- diate Energy. Thus, it is necessary to bear in mind that the np depend on the operating conditions of the equipment.
10
these are detailed As far the sectors and subs:ctors considered, under points 2.1 and 2.2 which follow.
secondary for satis-
Final Energy Consumption
Referring to the total amount of .primary and d b all of the consumption sectors, products use Y
fying their energy needs.
for
Of total final energy consumption can A first disaggregation done at the level of:
Final Non-Energy Consumption . the volumes of energy products which are used
Including . 11 of the consumption sectors. non-energy purposes in a
be Disaggregation of Energy Consumption 2.
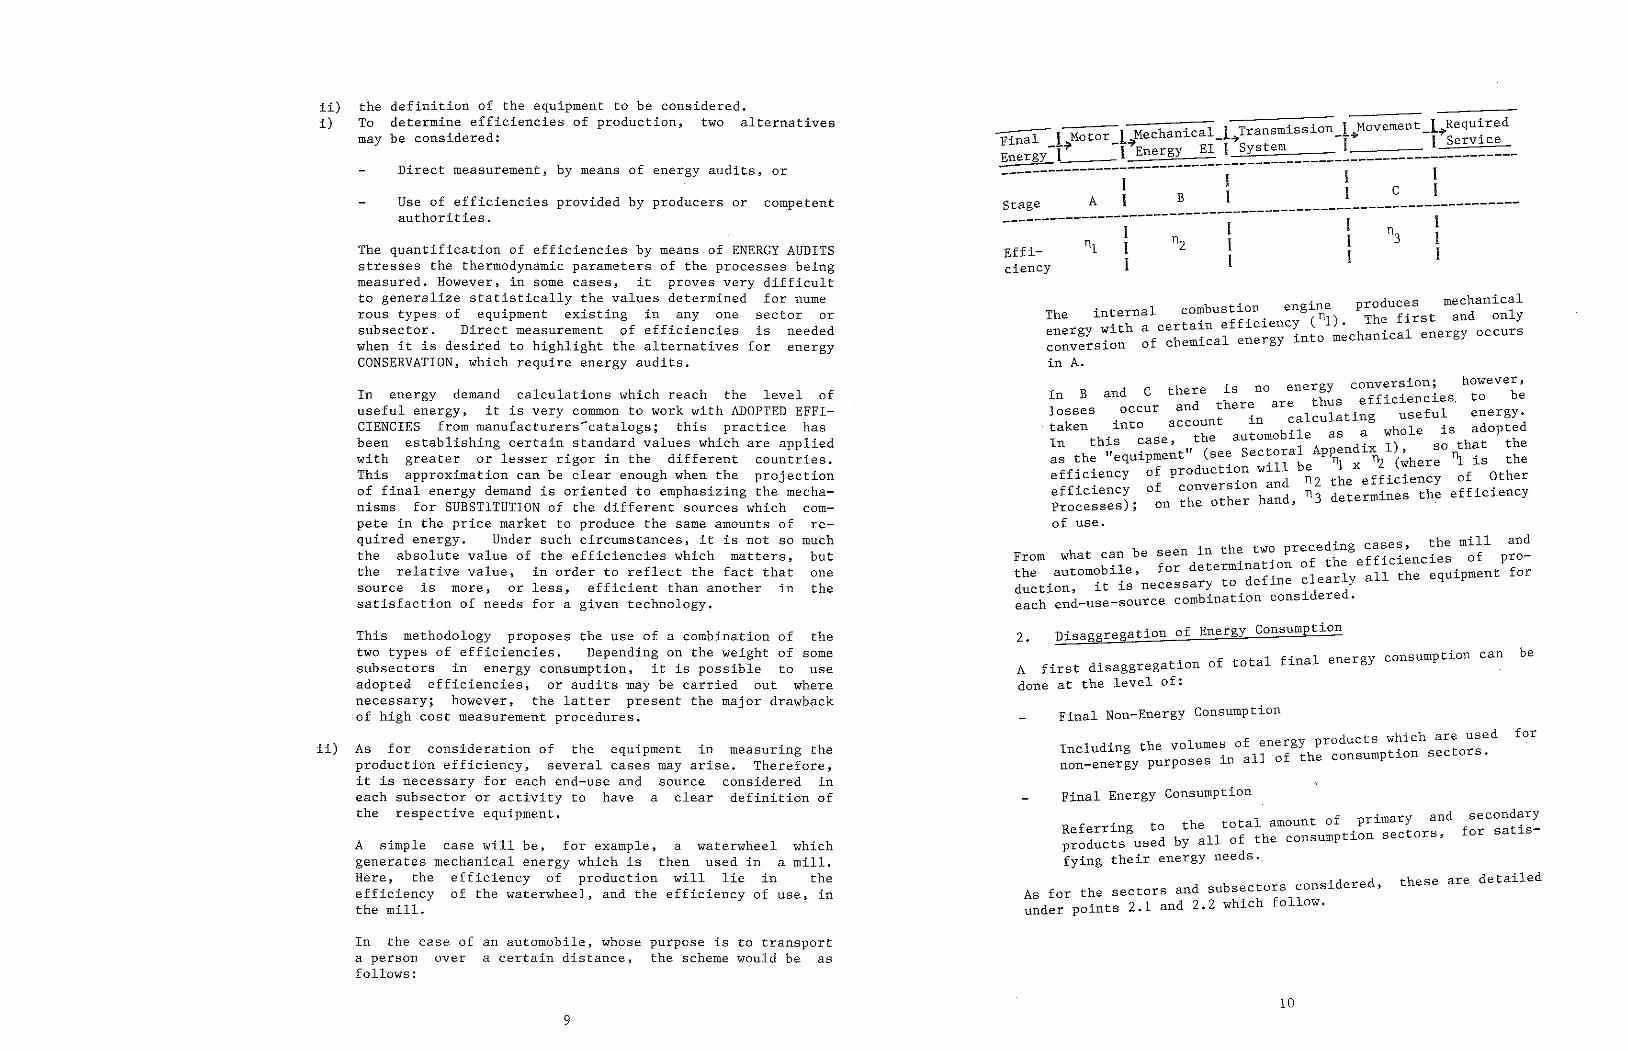
From what can be seen in the automobile, far determination of the d t . ;t is necessary to define clearly uc ion, ~ ·¿ d each end-use-source combination consi ere .
the mill and the two preceding cases, effíciencies of pro- all the equipment far
;0n· however, and e there is no energy convers~ ' In B and there are thus efficiencies. to be losses occur f 1 energy nt in calculating use u • taken into accou is adopted In this case, the automobile as ~ whole so that the
11 • · n t " (see Sectoral Appendix 1)' as the equipme . . 11 be n1 x 12 (where nl is the ff . · of production wi h e iciency . d n2 the efficiency of Ot er ff . · of conversion an e t.c i.ency h d n3 determines the effictency Processes); on the other an' .
of use.
. mbustion engine produces mechanical The internal co. . . ( nl) The first and only energy with a certain efficiency .
Of Chemical energy into mechanical energy occurs conversion in A.
ciency Effi-
e 1 I
I l
""Final 1 Motor_l}1echanical_l~Transmission_lI)1ovement_t~~:~~~::ª Energy-f~ 1 Energy EI 1 System - ---------------------- ---------------¡------------!-------
A I B I Stage ----------------------------------------------- ---------------1-- I l n3 I
n1 I n2 I I I I I I I
9
In the case of an automobile, whose purpose is to transport a person over a certain distance, the scheme would be as follows:
A simple case will be, for example, a waterwheel which generates mechanical energy which is then used in a mill. Here, the efficiency of production will líe in the efficiency of the waterwheel, and the efficiency of use, in the mill.
íi) As for consideration of the equipment in measuring the production efficiency, several cases may arise. Therefore, it is necessary for each end-use and source considered in each subsector or activity to have a clear definition of the respective equipment.
This methodology propases the use of a combination of the two types of efficiencies. Depending on the weíght of sorne subsectors in energy consumptíon, ít is possible to use adopted efficiencies, or audits may be carried out where necessary; however, the latter present the majar drawback of high cost measurement procedures.
In energy demand calculations which reach the level of useful energy, it is very common to work with ADOPTED EFFI- CIENCIES from manufacturers;catalogs; this practice has been establishing certain standard values which are applied with greater or lesser rigor in the different countries. This approximation can be clear enough when the projection of final energy demand is oriented to emphasizing the mecha- nisms far SUBSTITUTION of the different sources which com- pete in the price market to produce the same amounts of re- quired energy. Under such circumstances, it is not so much the absolute value of the efficiencies which matters, but the relative value, in arder to reflect the fact that one source is more, or less, efficient than another in the satisfaction of needs for a given technology.
The quantification of efficiencies by means of ENERGY AUDITS stresses the thermodynamic parameters of the processes being measured. However, in some cases, it proves very difficult to generalize statistically the values determined for nume rous types of equipment existing in any one sector or subsector. Direct measurement of efficiencies is needed when it is desired to highlight the alternatives for energy CONSERVATION, which require energy audits.
Use of efficiencies provided by producers or competent authorities.
Direct measurement, by means of energy audits, or
ii) the definition of the equipment to be considered. i) To determine efficiencies of production, two alternatives
may be considered:
12
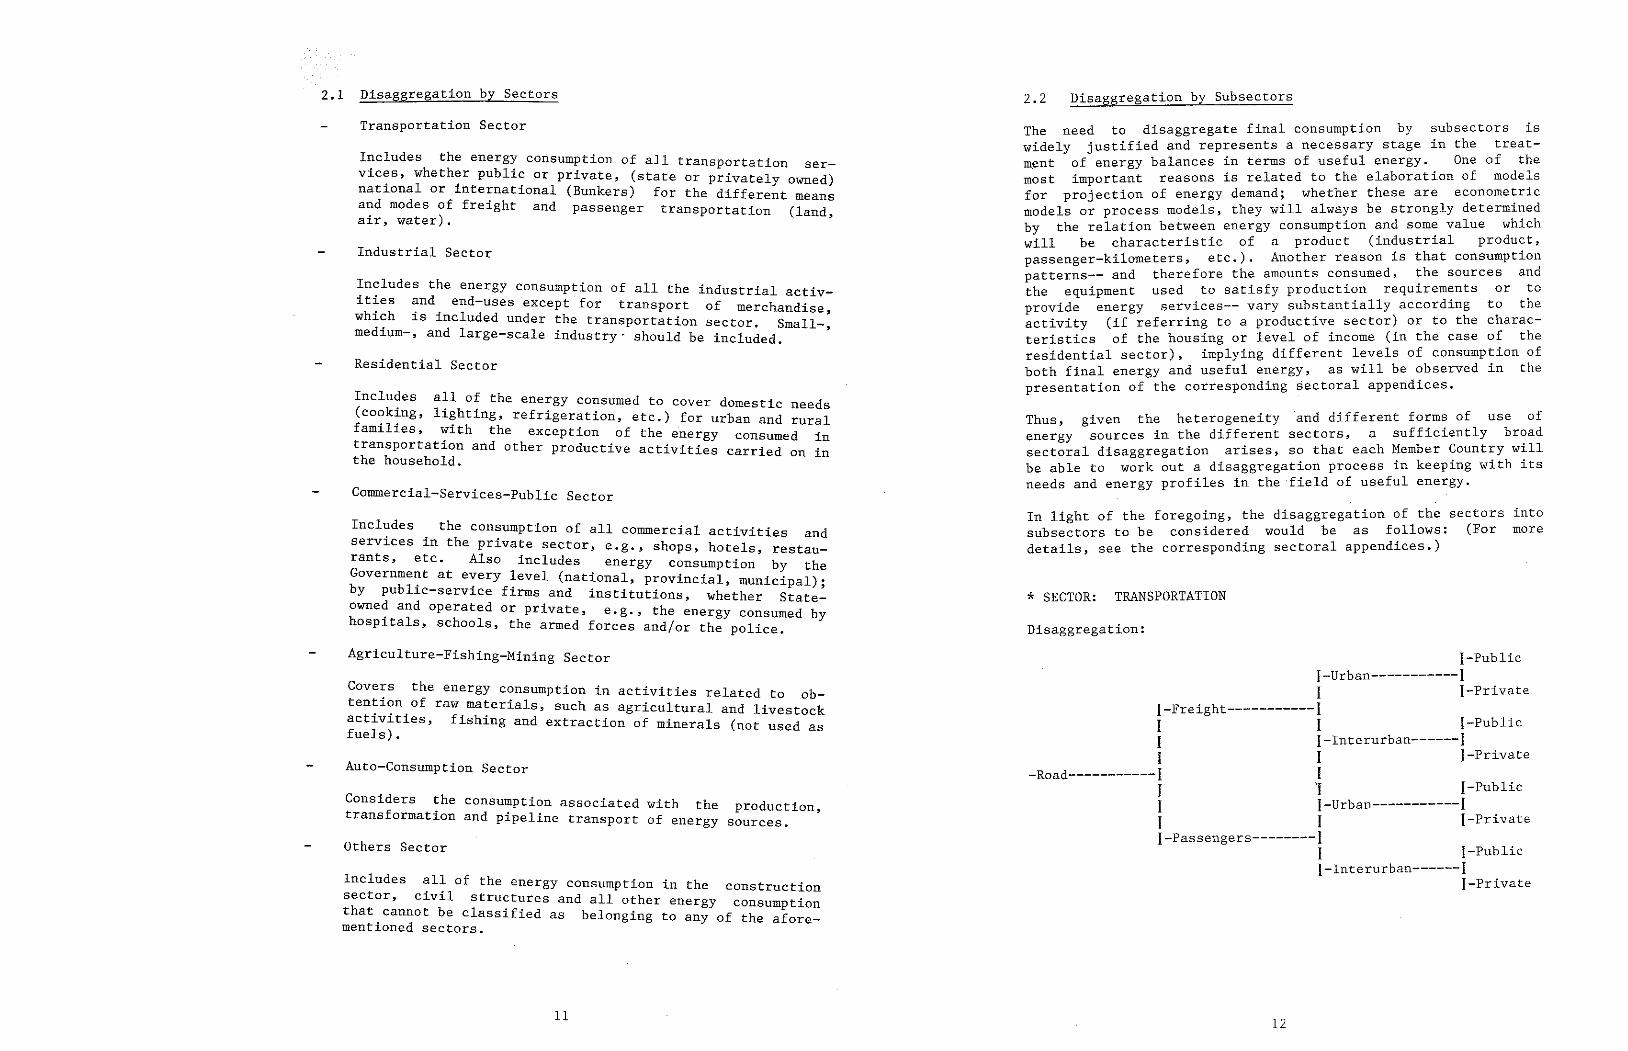
[-Public I-Urban-----------1 I 1-Private
l-Freight-----------1 I I I-Public 1 I-Interurban------1 I I 1-Private
-Road-----------I 1 I I 1-Public 1 I-Urban-----------1 I I 1-Private l-Passengers--------1
1 I-Public 1-Interurban------I
1-Private
Disaggregation:
*SECTOR: TRANSPORTATION
into more
In light of the foregoing, the disaggregation of the sectors subsectors to be considered would be as follows: (For details, see the corresponding sectoral appendices.)
The need to disaggregate final consumption by subsectors is widely justified and represents a necessary stage in the treat- ment of energy balances in terms of useful energy. One of the most important reasons is related to the elaboration of models far projection of energy demand; whether these are econome:ric models ar process models, they will always be strongly determined by the relation between energy consumption and sorne value which will be characteristic of a product (industrial product, passenger-kilometers, etc.). Another reason is that consumption patterns-- and therefore the amounts consumed, the sources and the equipment used to satisfy production requirements or to provide energy services-- vary substantially according to the activity (if referring to a productive sector) orto the charac- teristics of the housing or level of íncome (in the case of the residential sector), implying different levels of consumption of both final energy and useful energy, as will be observed in the presentation of the corresponding sectoral appendices.
Thus, given the heterogeneity and different forms of use of energy sources in the different sectors, a sufficiently broad sectoral disaggregation arises, so that each Member Country will be able to work out a disaggregation process in keeping wíth its needs and energy profiles in the field of useful energy.
Disaggregation by Subsectors 2.2
11
Includes all of the energy consumptíon in the construction sector, civil structures and all other energy consumption that cannot be classified as belonging to any of the afore- mentioned sectors.
Others Sector
Considers the consumption associated with the production, transformation and pipeline transport of energy sources.
Auto-Consumption Sector
Covers the energy consumption in activíties related to ob- tention of raw materials, such as agricultural and livestock actívities, fishing and extraction of minerals (not used as fuels).
Includes the consumption of all cornmercial activities and services in the prívate sector, e.g., shops, hotels, restau- rants, etc. Also includes energy consumption by the Governme~t at e;ery ~evel (national, provincial, municipal); by publ1c-serv1ce firms and institutions, whether State- owned and operated or prívate, e.g., the energy consumed by hospitals, schools, the armed forces and/or the police.
Agriculture-Fishing-Mining Sector
Commercial-Services-Public Sector
Includes all of the energy consumed to cover domestic needs (cooking, lighting, refrigeration, etc.) for urban and rural families, with the exceptíon of the energy consumed in transportation and other productive activitíes carried on in the household.
Residential Sector
Includes the energy consumptíon of all the industrial actív- ities and end-uses except for transport of merchandise whích is included under the transportation sector. Small-' medium-, and large-scale industry· should be included. '
Industrial Sector
Includes the energy consumption of all transportation ser- vices, whether publicar prívate, (state ar privately owned) national ar international (Bunkers) for the different means and modes of freight and passenger transportation (land, air, water).
Transportation Sector
Disaggregation by Sectors
14
In different kinds of work in which energy consumption is broker down by end-uses, a group of quite different categories is used at the level of each sector and then these are grouped unde~ large headings which, in one way or another, are related to the basic categories of physics in relation to energy in the form or heat and work.
of final consumption under the dífferent end-uses in determining energy consumption in terms of
Disaggregatíon is fundamental useful energy.
3. Disaggregation by End-Uses
Construction Broad Zero Groupíng of the ISIC Code Unclassifíed Consumption
Disaggregation:
*SECTOR: OTHERS
Production Transformation Pipelines
Disaggregatíon:
*SECTOR: AUTO-CONSUMPTION
Agriculture Fishing Mining
Disaggregation:
*SECTOR: AGRICULTURE-FISHING-MINING
Public Services Commerce, Transport, Storage and Communicatíon Restaurants Hotels Financial Establishments, Insurance, Real Estate and Company Services Public Administration, Defense, Government Public Health Other Services
Disaggregation:
*SECTOR: COMMERCIAL-SERVICES-PUBLIC
13
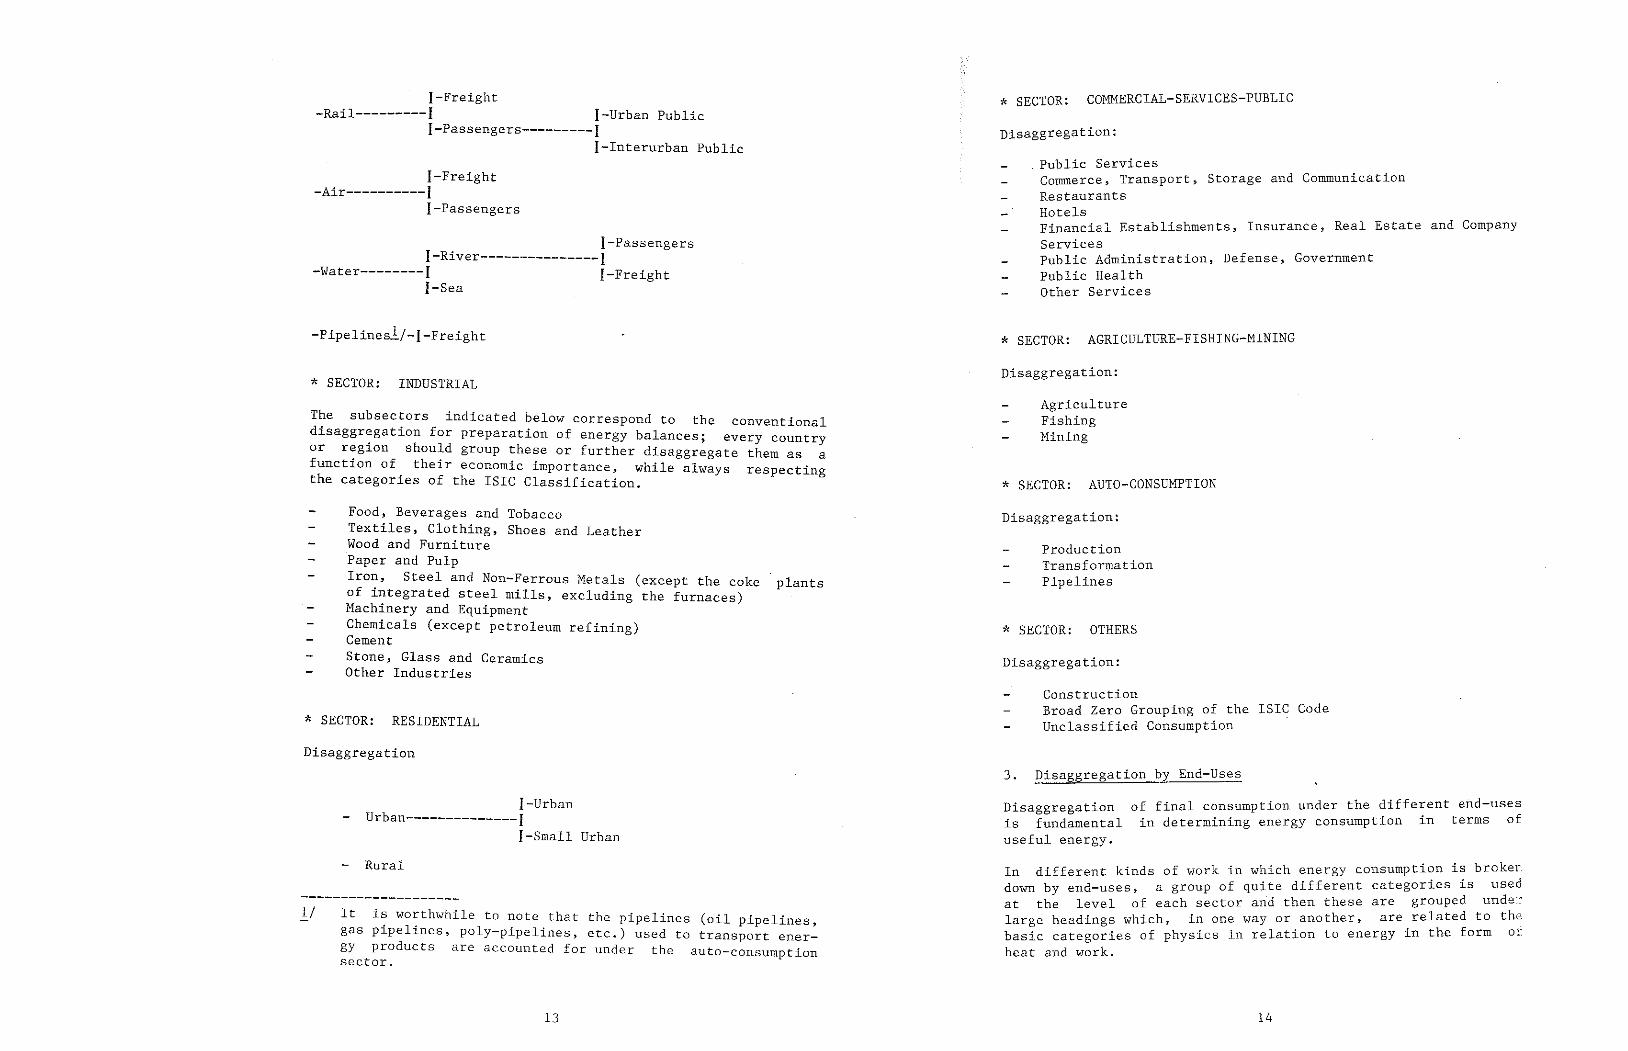
ll It is worthwhile to note that the pipelines (oil pipelines, gas pipelines, poly-pipelines, etc.) used to transport ener- gy products are accounted for under the auto-consumptíon sector.
------~------------- Rural
1-Urban Urban--------------1
J-Small Urban
Disaggregation
*SECTOR: RESIDENTIAL
Food, Beverages and Tobacco Textiles, Clothing, Shoes and Leather Wood and Furniture Paper and Pulp Iron, Steel and Non-Ferrous Metals (except the cake plants of integrated steel mills, excluding the furnaces) Machinery and Equipment Chemicals (except petroleum refining) Cement Stone, Glass and Ceramics Other Industries
The subsectors indicated below correspond to the conventional disaggregation far preparation of energy balances; every country or regían should group these or further disaggregate them as a function of their economic importance, while always respecting the categories of the ISIC Classification.
*SECTOR: INDUSTRIAL
-Pipelinesl/-1-Freight
1-Passengers I-River---------------I
-Water--------1 I-Freight !-Sea
1-Freight -Air----------1
I-Passengers
I-Freight -Rail---------1 1-Urban Public
1-Passengers---------I 1-Interurban Public
16
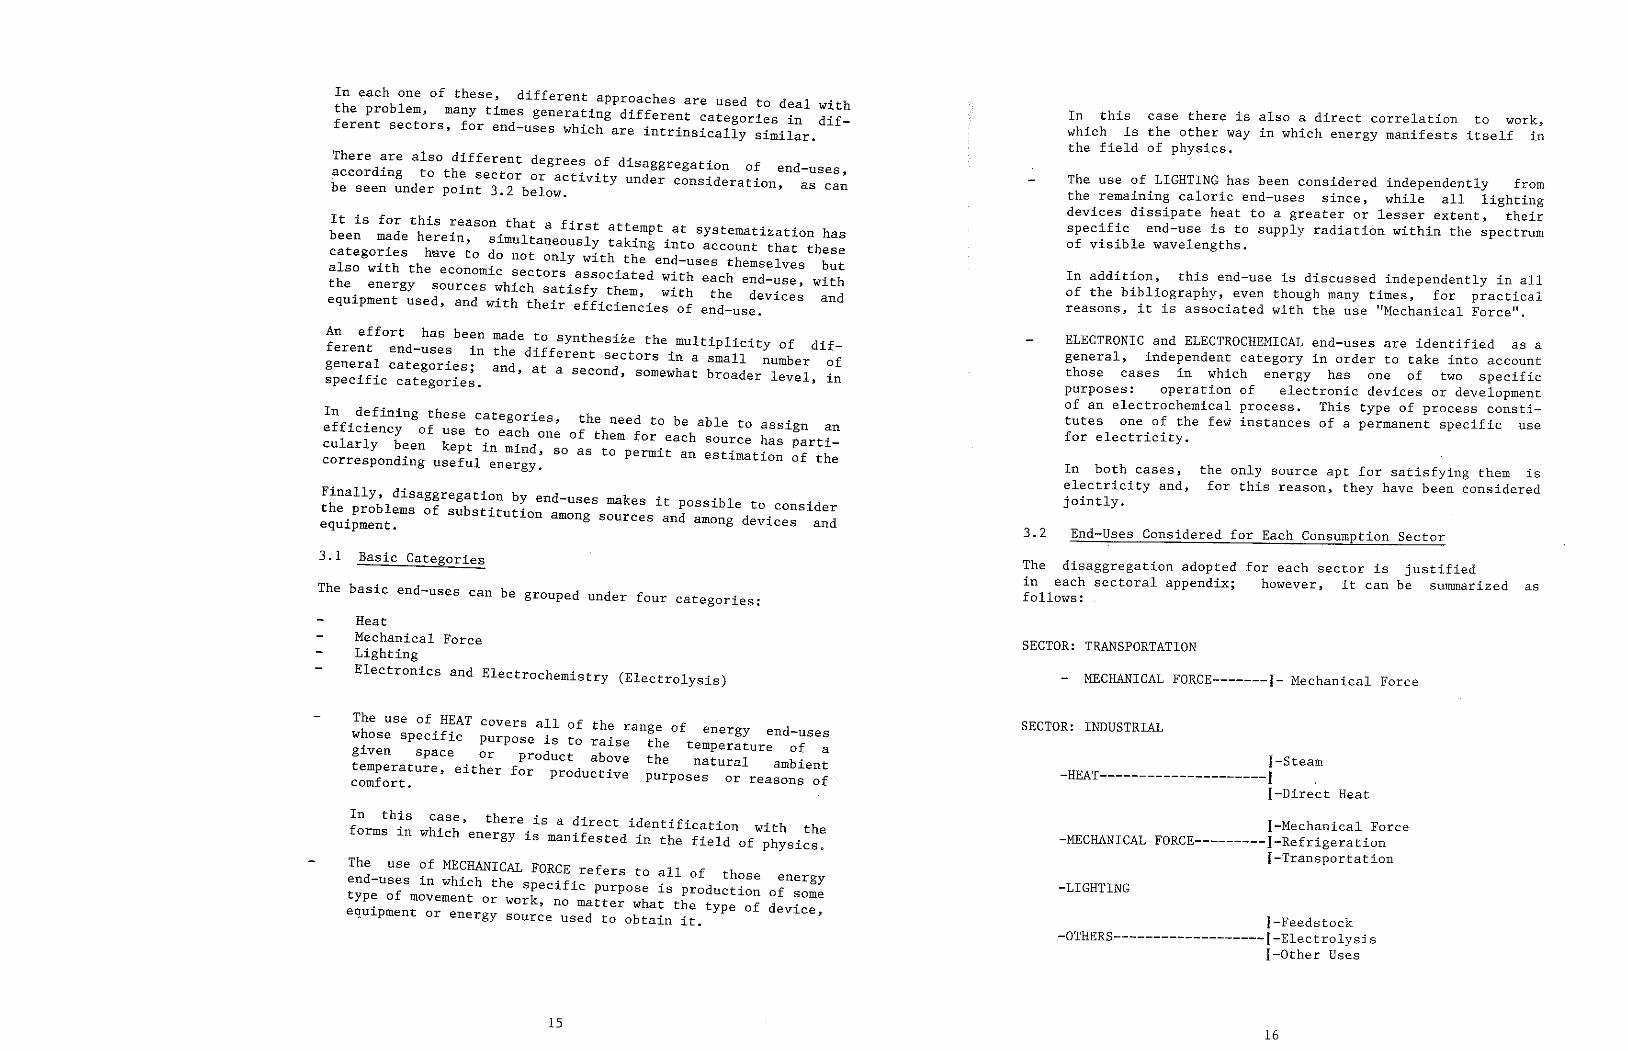
J-Feedstock -OTHERS-------------------1-Electrolysis
1-0ther Uses
-LIGHTING
1-Mechanical Force -MECHANICAL FORCE---------J-Refrigeration
1-Transportation
I-Steam -HEAT---------------------1
1-Direct Heat
SECTOR: INDUSTRIAL
MECHANICAL FORCE-------{- Mechanical Force
SECTOR: TRANSPORTATION
as for each sector is justified however, it can be summarized
The disaggregation adopted in each sectoral appendix; follows:
End-Uses Considered for Each Consumption Sector 3.2
the only source apt for satisfying them is for this reason, they have been considered
In both cases, electricity and, jointly.
ELECTRONIC and ELECTROCHEMICAL end-uses are identified as a general, independent category in arder to take into account those cases in which energy has one of two specific purposes: operation of electronic devices or development of an electrochemical process. This type of process consti- tutes one of the few instances of a permanent specific use for electricity.
In addition, this end-use is discussed independently in all of the bibliography, even though many times, for practical reasons, it is associated with the use "Mechanical Force11•
The use of LIGHTING has been considered independently from the remaining caloric end-uses since, while all lighting devices dissipate heat to a greater or lesser extent, their specific end-use is to supply radiation within the spectrum of visible wavelengths.
case there is also a direct correlation to work, the other way in which energy manifests itself in of physics.
In this which is the field
15
The use of MECHANICAL FORCE refers to all of those energy end-uses in which the specific purpose is production of sorne type of movement or work, no matter what the type of device, equipment or energy source used to obtain it.
In this case, there is a direct identification with the forms in which energy is manifested in the field of physics.
The use of HEAT covers all of the range of energy end-uses whose specific purpose is to raise the temperature of a given space or product above the natural ambient temperature, either for productive purposes or reasons of comfort.
Heat Mechanical Force Lighting Electronics and Electrochemistry (Electrolysis)
The basic end-uses can be grouped under four categories:
3.1 Basic Categories
Finally, disaggregation by end-uses makes it possible to consider the problems of substitution among sources and among devices and equipment.
In defining these categories, the need to be able to assign an efficiency of use to each one of them for each source has parti- cularly been kept in mind, so as to permitan estimation of the corresponding useful energy.
An effort has been made to synthesize the multiplicity of dif- ferent end-uses in the different sectors in a small number of general categories; and, ata second, somewhat broader level, in specific categories.
It is for this reason that a first attempt at systematization has been made herein, simultaneously taking into account that these categories hsve to do not only with the end-uses themselves but also with the economic sectors associated with each end-use, with the energy sources which satisfy them, with the devices and equipment used, and with their efficiencies of end-use.
There are also different degrees of disaggregation of end-uses, according to the sector or activity under consideration, as can be seen under point 3.2 below.
In each one of these, different approaches are used to <leal with the problem, many times generating different categories in dif- ferent sectors, for end-uses which are intrinsically similar.
18
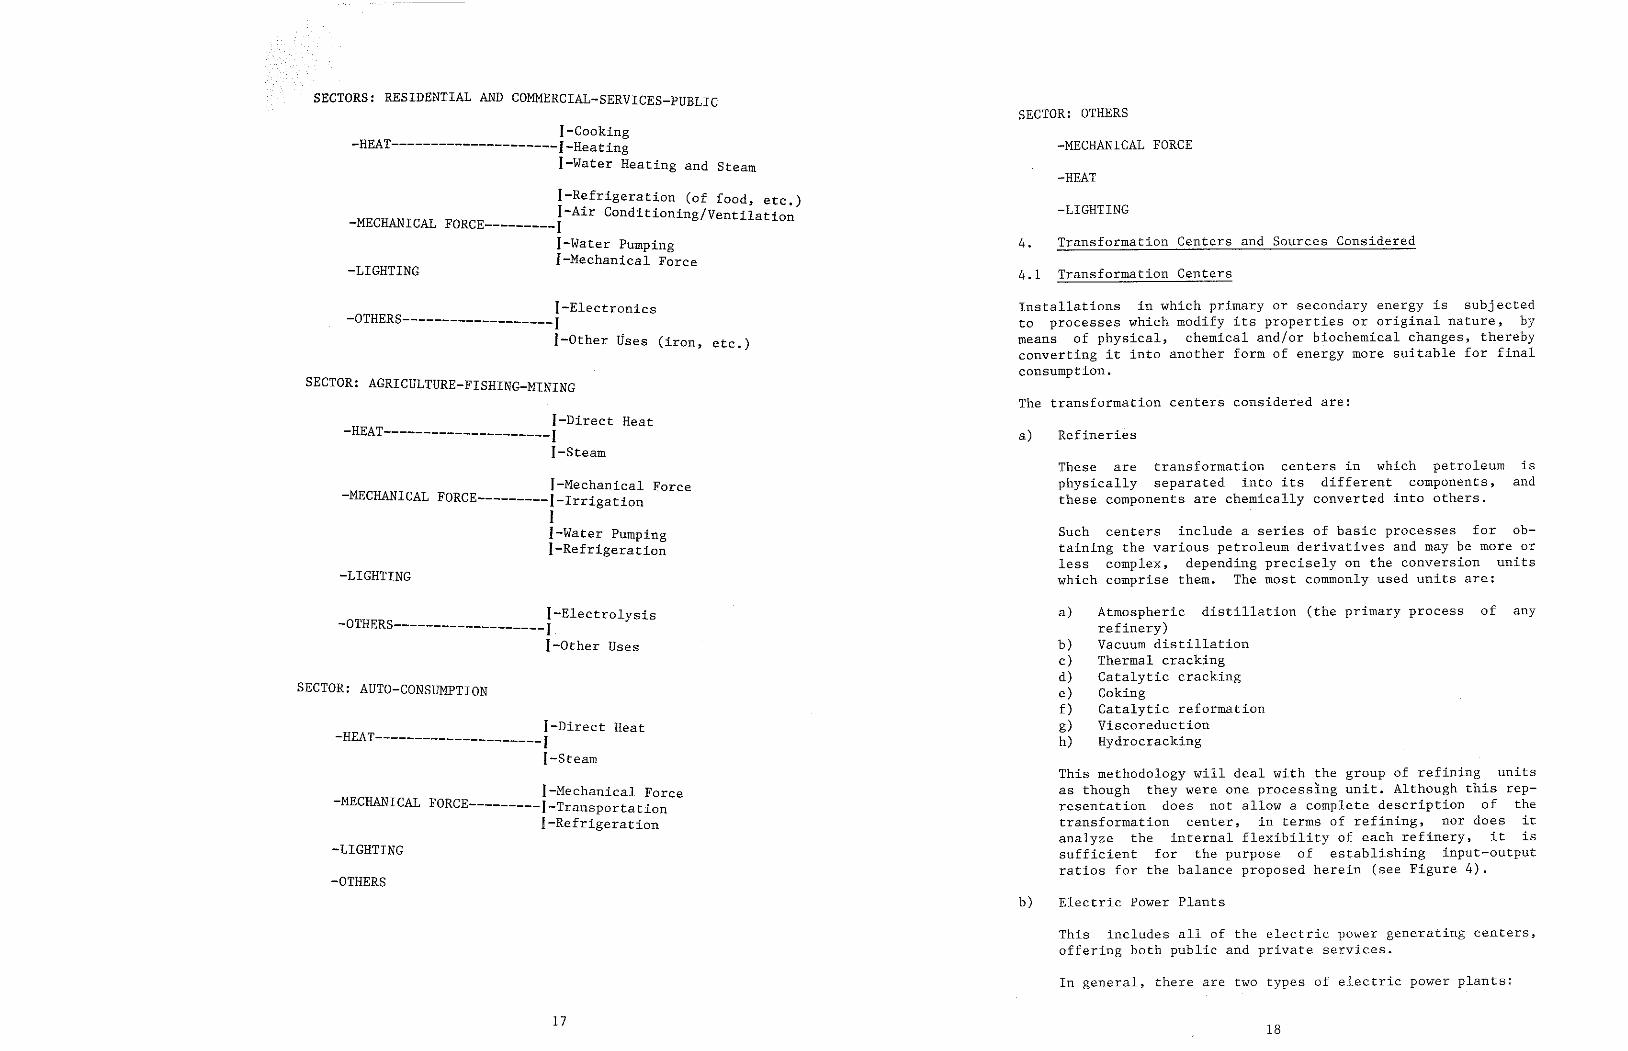
In general, there are two types of electric power plants:
This includes all of the electric power generating centers, offering both public and prívate services.
b) Electric Power Plants
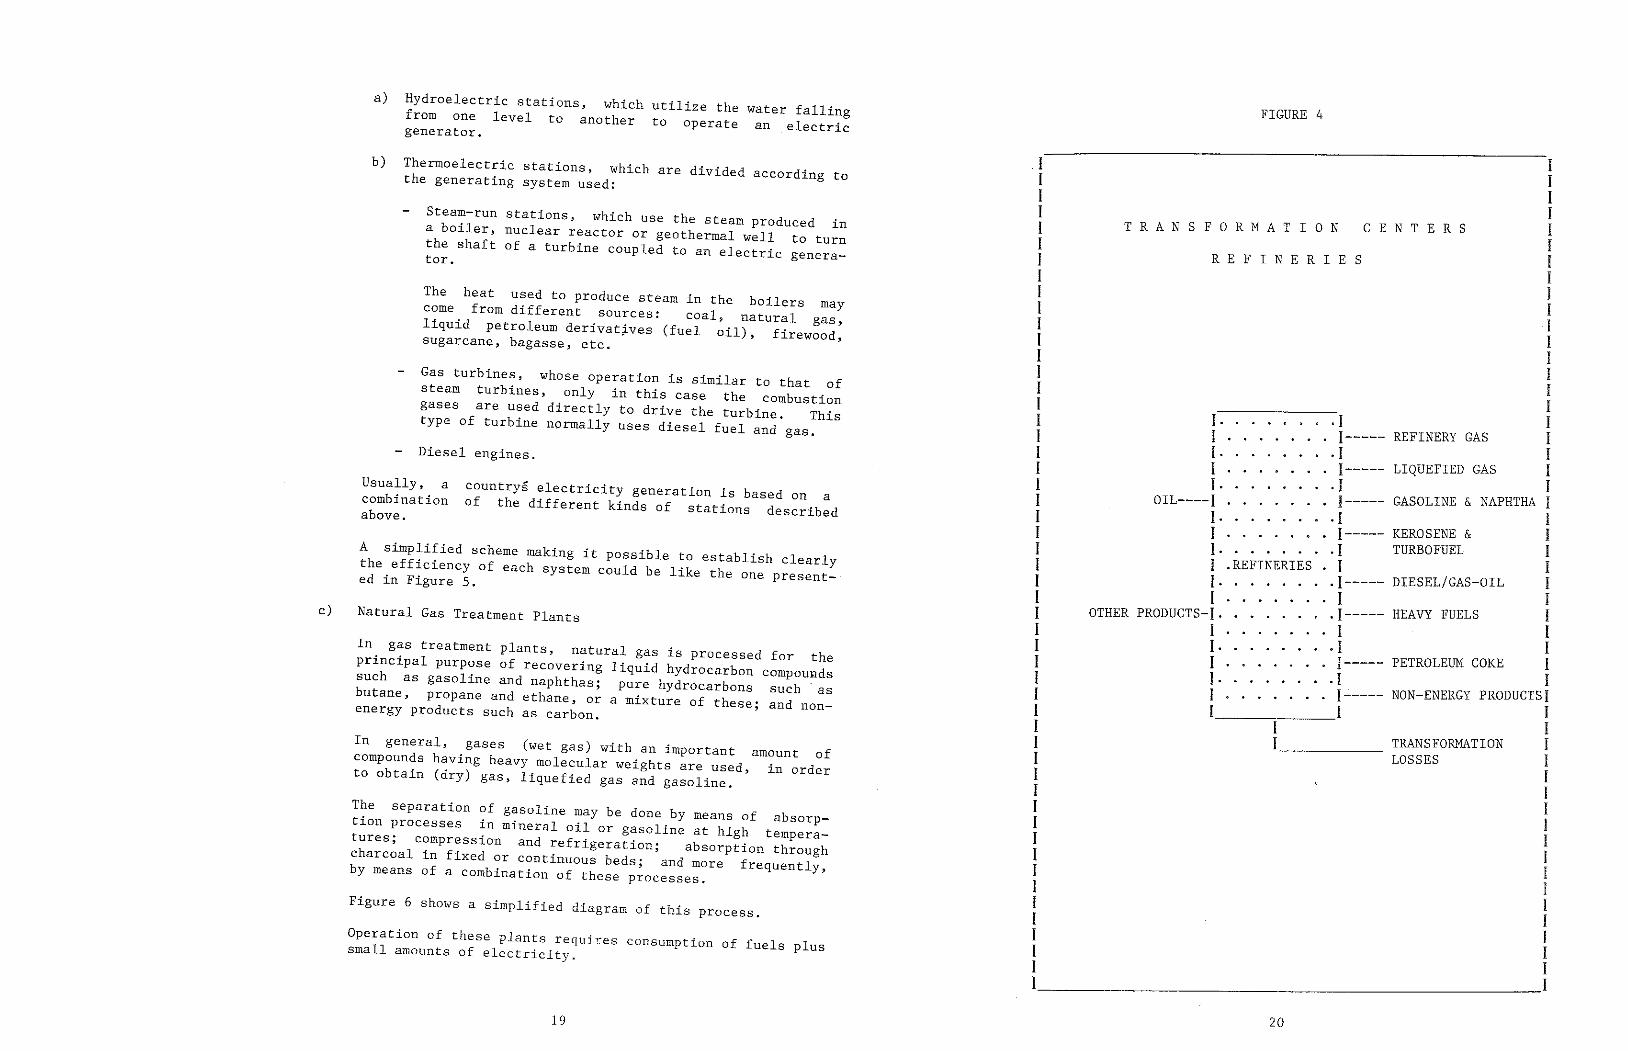
This methodology will <leal with the group of refining units as though they were one processing unit. Although this rep- resentation <loes not allow a complete description of the transformation center, in terms of refining, nor does it analyze the internal flexibility of each refinery, it is sufficient for the purpose of establishing input-output ratios for the balance proposed herein (see Figure 4).
b) c) d) e) f) g) h)
Atmospheric distillation (the primary process of any refinery) Vacuum distillation Thermal cracking Catalytic cracking Coking Catalytic reformation Viscoreduction Hydrocracking
a)
Such centers include a series of basic processes far ob- taining the various petroleum derivatives and rnay be more or less complex, depending precisely on the conversion units which comprise them. The most commonly used units are:
These are transformation centers in which petroleum is physically separated into its different components, and these components are chemically converted into others.
Refineries a)
The transformation centers considered are:
Installations in which primary or secondary energy is subjected to processes which rnodify its properties or original nature, by means of physical, chemical and/or biochemical changes, thereby converting it into another form of energy more suitable far final consumption.
Transformation Centers 4.1
Transformation Centers and Sources Considered 4.
-LIGHTING
-HEAT
-MECHANICAL FORCE
SECTOR: OTHERS
17
-OTHERS
-LIGHTING
1-Mechanical Force FORCE---------1-Transportation
I-Refrigeration -MECHANICAL
1-Direct Heat -HEAT---------------------1
1-Steam
SECTOR: AUTO-CONSUMPTION
1-Electrolysis -OTHERS-------------------1 f-Other Uses
-LIGHTING
1-Mechanical Force -MECHANICAL FORCE---------1-Irrigation
1 !-Water Pumping 1-Refrigeration
1-Direct Heat -HEAT---------------------1
1-Steam
SECTOR: AGRICULTURE-FISHING-MINING
1-Electronics -OTHERS-------------------1
1-0ther Uses (iron, etc.)
-LIGHTING
1-R~frigeration (of food, etc.) 1-Air Conditioning/Ventilation
FORCE---------1 1-Water Pumping 1-Mechanical Force
-MECHANICAL
I-Cooking -HEAT---------------------1-Heating
}-Water Heating and Steam
SECTORS: RESIDENTIAL AND COMMERCIAL-SERVICES-PUBLIC
20
~~~~~~~~~~~~~~~~~( I I I 1 I I 1 N e E N T E R S 1 I T R A N S F O R M A T I O I
l R E F I N E R I E S l I I I 1 1 -1 1 I 1 I I I I I I I I I I I · · · · · · · · I
I . . . . . . . I ----- REFINERY GAS I I I I I . . . . . . . · I I ..... o • I----- LIQUEFIED GAS I I I
I I ' . ' . . . . . ! GASOLINE & NAPHTHA l 1 OIL----1 ¡----- I I I. . . . . . . . I I
I 1----- KEROSENE & : ¡ ( Tl!RBOFUEL : 1 I .REFINERIES • I 1 1. . . . . . .. I----- DIESEL/GAS-OIL ~ 1 1 . . . . . . . 11 HEAVY FUELS I I OTHER PRODUCTS- 1 · · • · · · · · ----- 1 l I . . . . . . . I I 1 1 . . . . . . . . I I I I I----- PETROLEUM COKE I 1 I . . . . . . . . I I
I 1----- NON-ENERGY PRODUCTS 1 1 I I 1 I I I I TRANSFORMATION I I ----- 1 LOSSES I 1 1 I 1 I 1 I I l I I 1 I I I 1 1 1 I I I I I I I 1 I [~~~~~~~~~~~~~~~~~
FIGURE 4
19
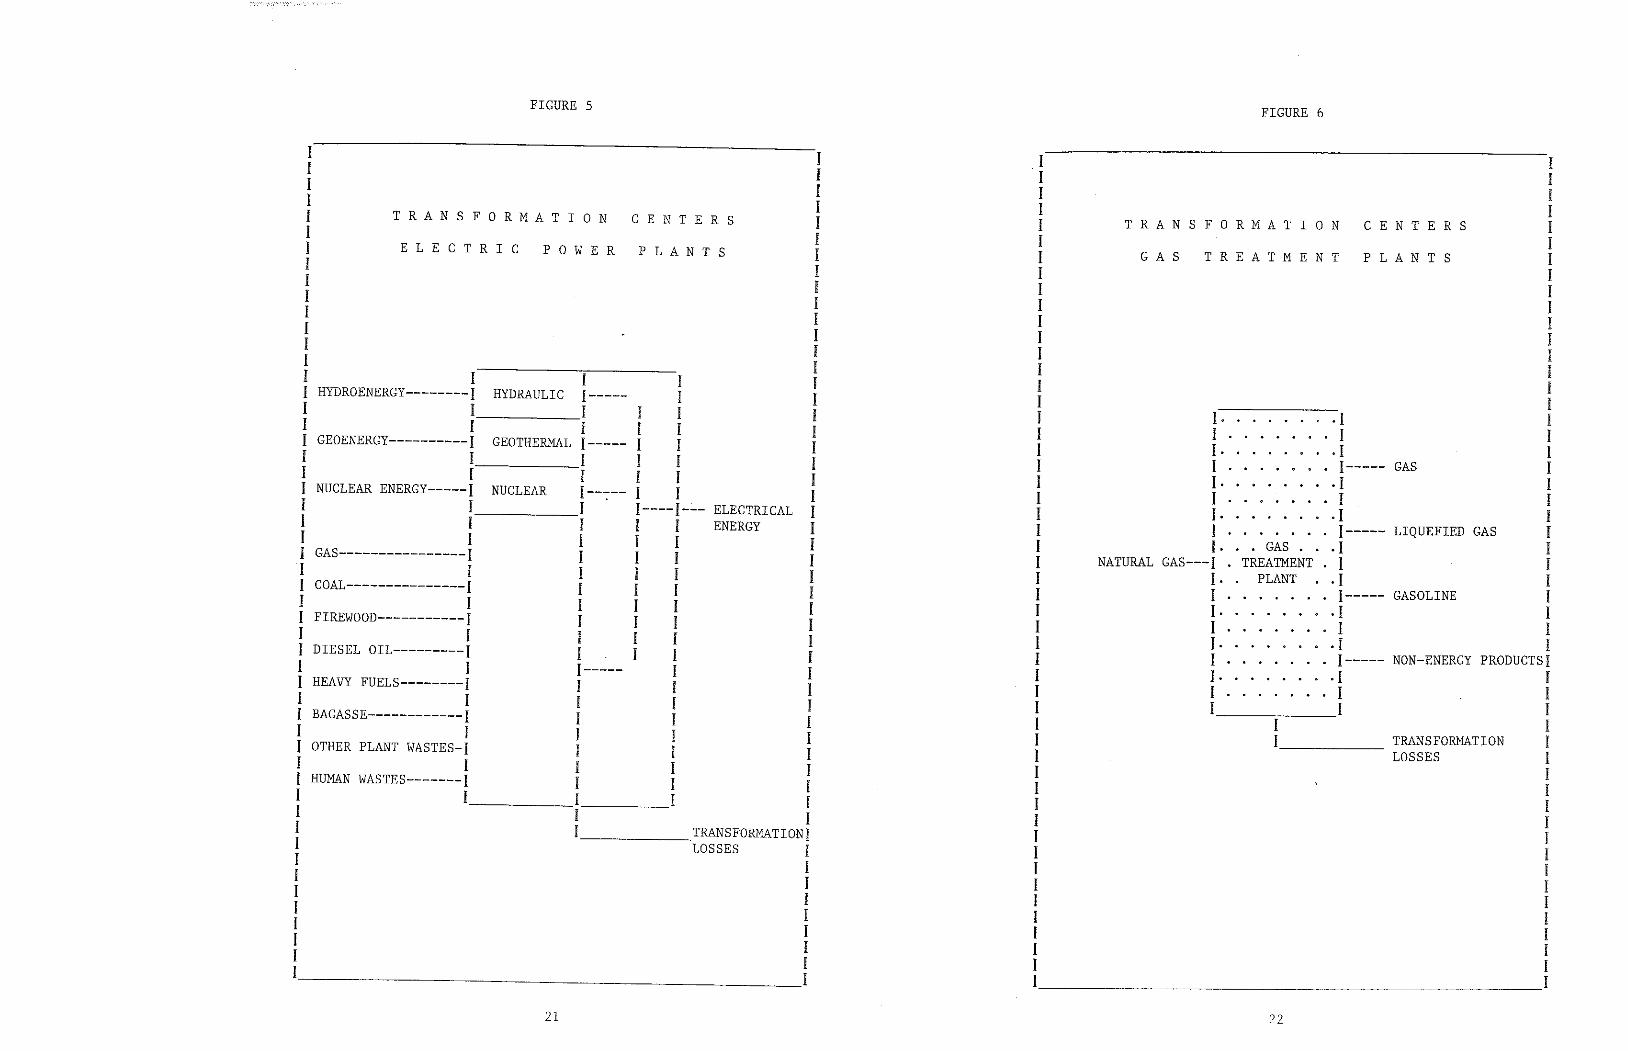
Operation of these plants requ]res consumption of fuels plus small amounts of electricíty.
Figure 6 shows a sirnplified diagrarn of this process.
The separation of gasoline rnay be done by means of absorp- tion processes in mineral oíl or gasoline at high ternpera- tures; compression and refrigeration; absorption through charcoal in fixed or continuous beds; and more frequently, by rneans of a combination of these processes.
In general, gases (wet gas) with an important amount of compounds having heavy molecular weights are used, in arder to obtain (dry) gas, liquefied gas and gasoline.
In gas treatment plants, natural gas is processed for the principal purpose of recovering liquid hydrocarbon compounds such as gasoline and naphthas; pure hydrocarbons such as butane, propane and ethane, ora mixture of these; and non- energy products such as carbon.
Natural Gas Treatment Plants e)
A simplified scheme making it possible to establish clearly the efficiency of each system could be like the one present- ed in Figure 5.
countrys electricity generation is based on a of the different kinds of stations described
Usually, a combination above.
Diesel engínes.
Gas turbínes, whose operation is similar to that of steam turbines, only in this case the combustion gases are used directly to drive the turbíne. This type of turbine normally uses diesel fuel and gas.
The heat used to produce steam in the boílers may come from different sources: coal, natural gas, liquid petroleum derivat~ves (fuel oíl), firewood, sugarcane, bagasse, etc.
Steam-run stations, which use the steam produced in a boiler, nuclear reactor or geothermal well to turn the shaft of a turbine coupled toan electric genera- tor.
b) Thermoelectric stations, which are divided according to the generating system used:
a) Hydroelectric stations, which utilize the water falling from one level to another to operate an electric generator.
I 1 1 I I I I I I 1 I I I I 1 I I T R A N S F O R M A T I O N C E N T E R S I I T R A N S F O R M A T I O N C E N T E R S I I I I I I E L E c T R I c P O W E R P L A N T S I 1 G A S T R E A T M E N T P L A N T S I I I I 1 I I I I I I I I I I I I I I I I I I I I 1 I I I I I I I I 1 I I HYDROENERGY--------I HYDRAULIC I----- I I 1 I I I I I I I I I. . . . . I I I I I I I I I 1 . . . . . . I I I GEOENERGY----------1 GEOTHERMAL I----- I I I I I . . . . . . . I I I I I I I I I I . . . . . . I----- GAS I I I I I I 1 I 1 • . . . . . . I 1 I NUCLEAR ENERGY-----1 NUCLEAR I---:--- I I I 1 1 . . . . . 1 I I I I I----I--- ELECTRICAL I I I. . . . . . . I I I I I i I ENERGY 1 I I . . . . . . I----- LIQUEFIED GAS I 1 I I I I I 1 I . . . GAS . . . I I j GAS----------------I 1 I 1 I I NATURAL GAS---1 . TREATMENT. I I I I I 1 I I I I. . PLANT . . I I I COAL---------------1 I I I I I I . . . . . . I ----- GASOLINE l l I I I f 1 1 1 • . . . . . . I I 1 FIREWOOD-----------J I I I 1 I 1 . . . . . 1 I I I I 1 I 1 I I. . . . . . . I I I DIESEL OIL---------1 I I l I 1 I . . . . !----- NON-ENERGY PRODUCTSI 1 I 1----- I I 1 I . . . . . . . . I I J HEAVY FUELS--------I I I 1 I I I I I 1 I I I I I I I I BAGASSE------------I 1 I I I I I I I I I I I I TRANSFORMATION I l OTHER PLANT WASTES-I I I f 1 LOS SES I I 1 I I I 1 I 1 HUMAN WASTES-------1 1 I I I 1 I I I I I I I I I I 1 I I I TRANSFORMATIONI I I 1 LOS SES I I I I I 1 1 I I I I 1 I 1 I I I I 1 I 1 1 1 1 I 1 I I 1 I I 1 I 1 I
21 22
FIGURE 6 FIGURE 5
~~~~~~~~~~~~~~~~! I I I I I I 1 T R A N s F o R M A T I O N C E N T E R S I 1 1 1 e o K E P L A N T S I l I I I 1 I 1 I 1 I 1 I 1 1 1 I 1 l 1 l I 1 . . . . . . I l 1 l . . . II - I 1 l • • . . • . . . I
I J----- COKE GAS ~ I . . · · · I ~ I I . . . . . . l I 1 1 . . . . • . . I l 1 1 . . . . .. I----- COKE I l 1 . . • . . I 1 I l .COKE PLANTS. I I I COAL------I. · · · · · .¡ 1 I I . . . . . . I ----- TAR I I I . . . . l I 1 I . . • . • I I I ~· ' ·I----- NON-ENERGY PRODUCTSI I 1 •......• I (BENZOIL) I[ I l I 1 l l I l 1 1 <
l l TRANSFORMATION 1 l LOS SES 1 I I I I 1 1 1 l 1 I 1 I 1 I l l I I I I I I I I I I I I l
FIGURE 8
I I 1 I I I 1 I 1 T R A N S F O R M A T I O N C E N T E R S J I 1 1 e H A R e o A L p L A N T s I 1 1 I I 1 I I I 1 1 1 I I I 1 1 I 1 1 1 · · · . . . . 1 I 1 1 · · . . . . I 1 1 I . . . . . . . . 1 VOLATILE I 1 1 I~ COMPOUNDS I 1 I · · . . . . . . 1 I I 1 · . . . . . 1 I 1 1 · · · . . . . . I 1 1 1 . . . . . . . 1 1 1 J. . . . . . . 1 1 1 FIREWOOD-----1 . CHARCOAL. 1----- CHARCOAL 1 I J ••• PLANTS •• J I 1 1 . · . . . . . I 1 1 f. · ..... J----- TAR l I I . . . . . . I I 1 1 . . . . . . . . 1 1 l l · · · · .. 1----- NON-ENERGY PRODUCTSI 1 1 . · . . . . . I 1 1 1 • • • . 1 1 I I I I 1 1 1 I 1 TRANSFORMATION I 1 LOS SES 1 1 I I I 1 I 1 I I I I 1 1 I I 1 1 1 1 1 1 1 1 1 1 I I~~~~~~~~~~~~~--~~~~~-~~I
FIGURE 7
26
Crude Oíl Natural Gas (Free and Associated) Hydroenergy Geoenergy Fission Fuels Coal Firewood
methodology
Primary Energy
. is understood as the different sources of Primary energy . din nature, whether directly as energy as they are obtaine . following a process of in the case of hydro ar solar energyl, coal geo t he rma..
. the case of petra uem, ' f extraction, as in h h t nthesis, as in the case o etc.; or throug Po os~ energy, and other vegetable or plant fuels. firewood
rimar energy sources c~nsidered in this !~: l~sted ~elow and defined in the glossary.
i)
4.2 Energy Sources
energy such is included Chapter II
Other Transformations
energy recycling related to sorne sources of The li uefied gas, naphthas, etc., as furnace gas, q . . en this tapie in here; detailed treatment is giv point 2.
h)
from wooc-º and animal
Other Transforrnation Centers
Processing centers which yield producerb gals Those . from other vegeta e burning gasogenes and biogas fuels are included here.
g)
in presented
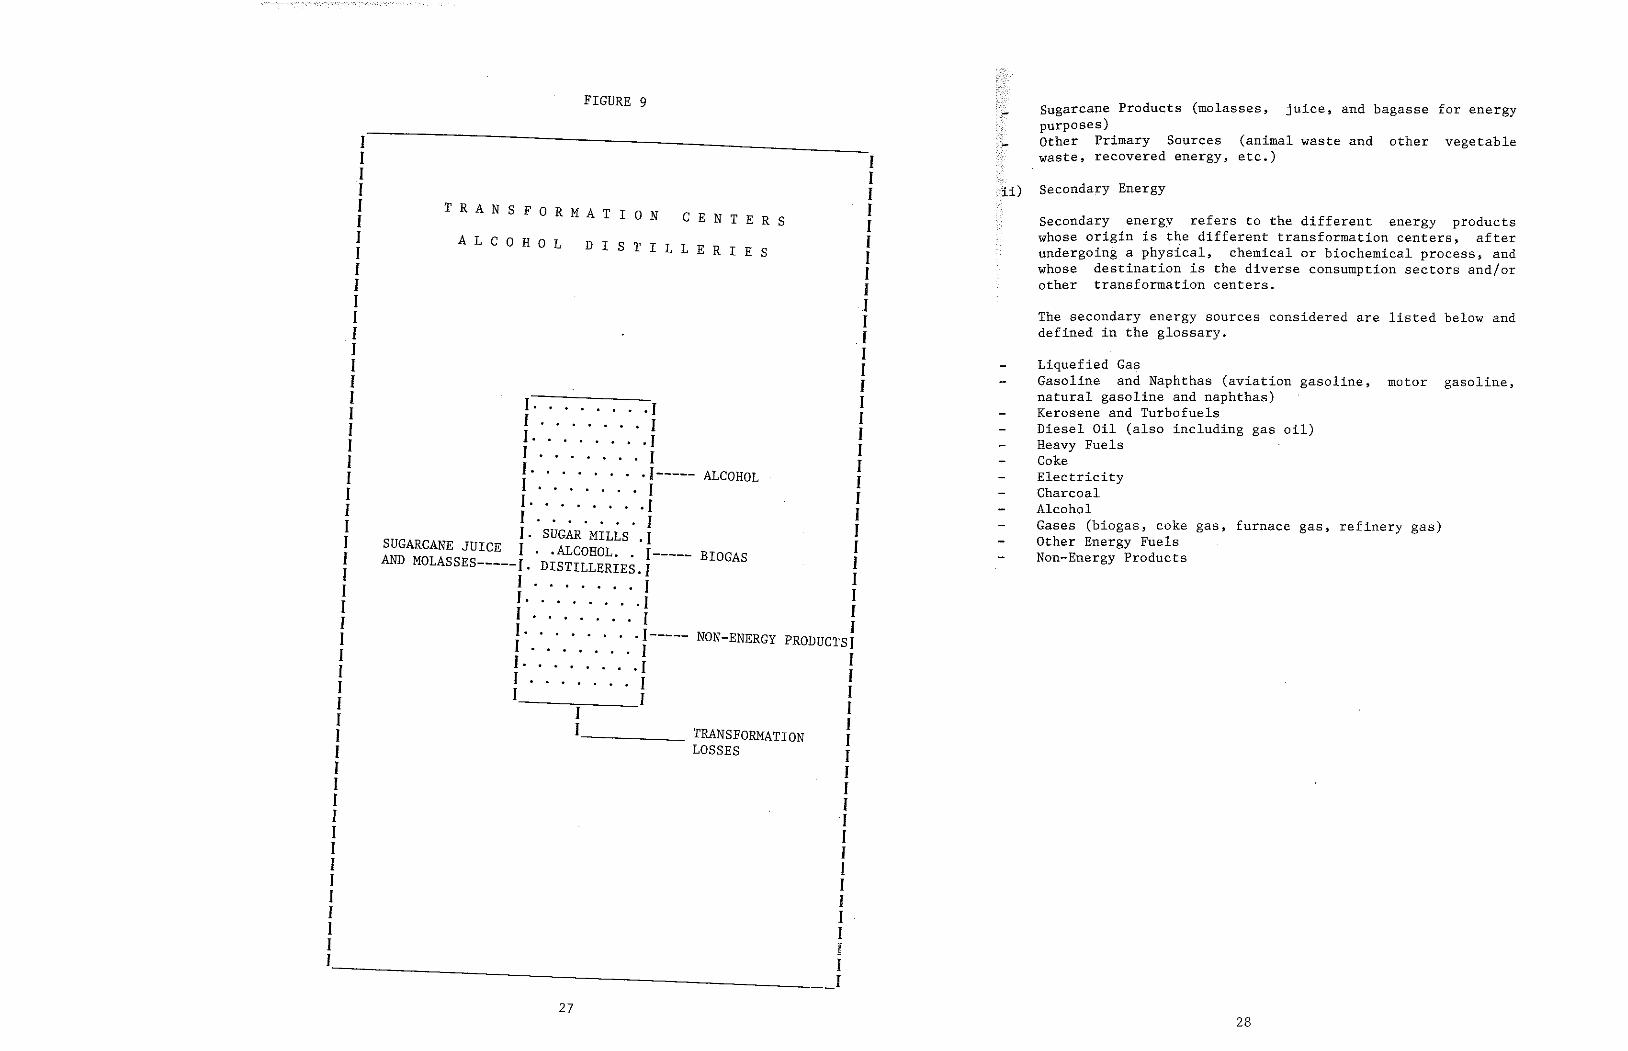
of largest amount This is the stage which consumes.the ired for alcohol production. energy requ
A more generalized diagram of this center is Figure 9.
D h d tion· this consists of the Distill~tion anld h ~ir~: the.ferrnented mass, its puri- separation of a ca o fication and dehydration.
this consists of microbiologica~ conver- Fermentation: alcohol and carbon gas with heat sion of the hexoses in release.
. h will undergo enzymatic hydrol- extract the st~rch,lw~~~ fermentable sugars. For cel- ysis _to obtaindssoa~id hydrolysis is required previous- lulosic compoun , ly.
25
Preparation of the fermentable solution: when dealing with solutions having a high sugar content, a solution is prepared with a given concentration and clarified by sedimentation and/or centrifugation; this solution should be sterilized in order to reduce the fermentation risk. For rnaterials rich in starch, the feedstock should be peeled, washed and ground in arder later to
In general, the obtention of alcohol requires three impor- tant steps:
These are transformation centers where sugarcane products are treated to produce bagasse and alcohol (ethane), They should also include the alcohol distilleries which process other feedstock such as beet, cassava or other products having a high starch or cellulose content.
Alcohol Distilleries f)
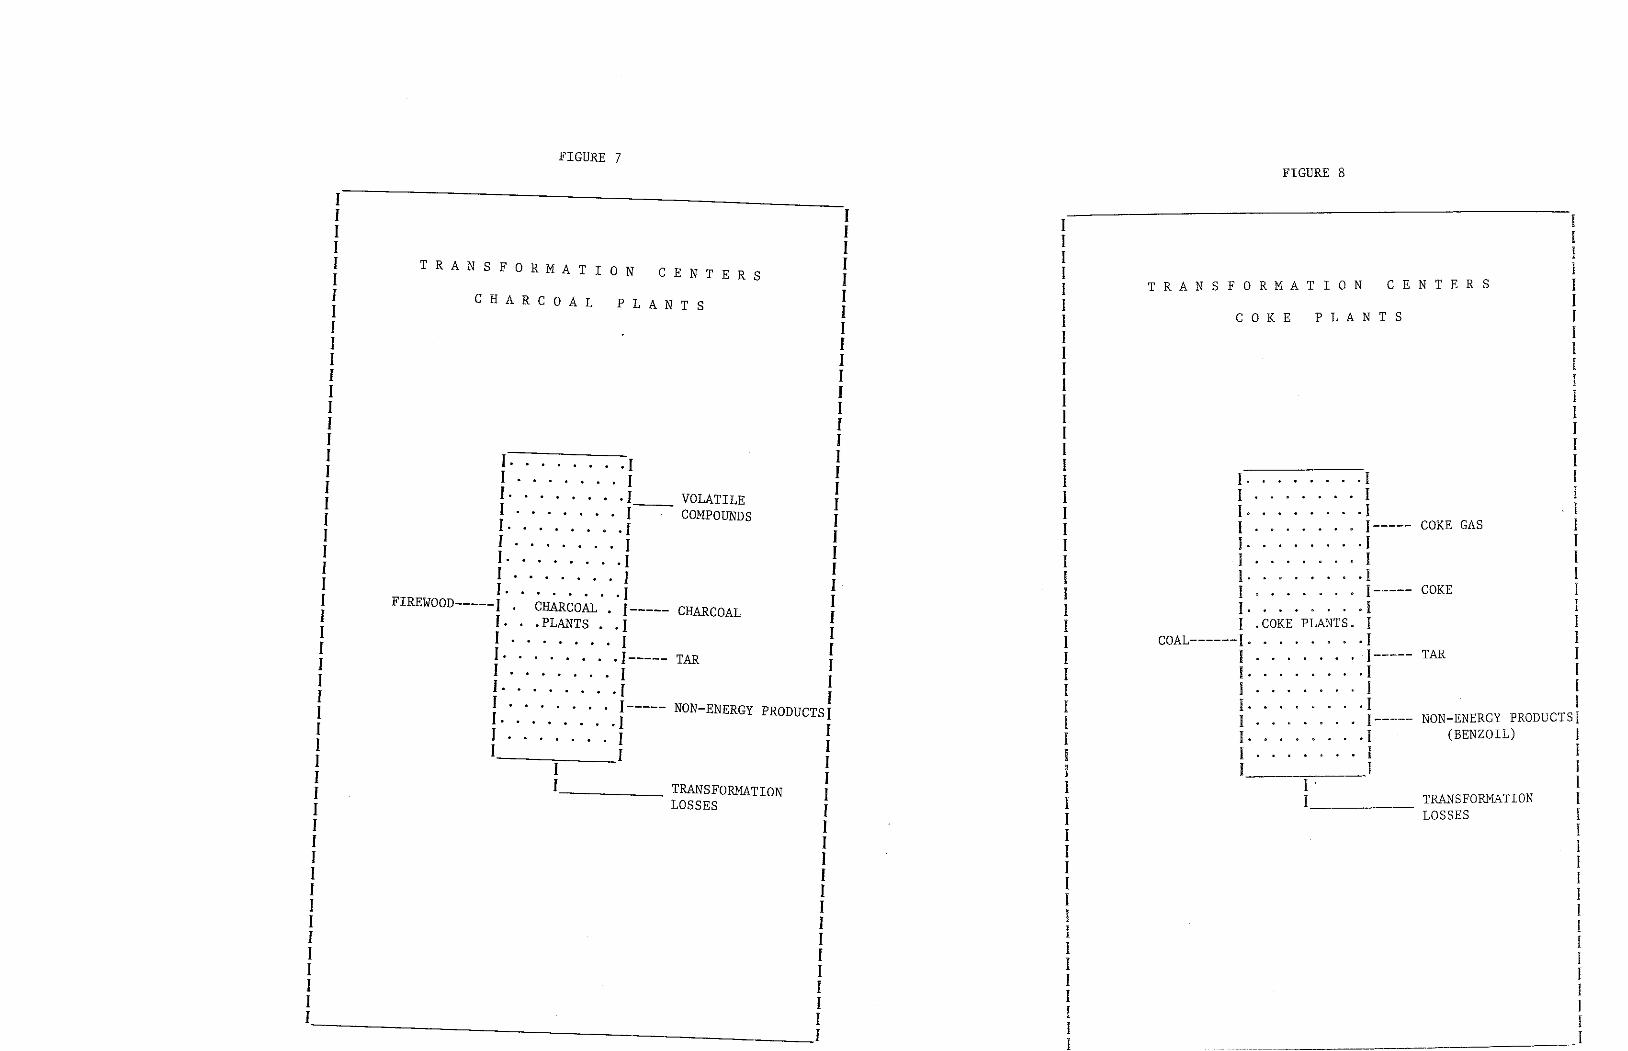
Figure 8 shows a simplified diagrarn of this transformation center.
This type of center may also consume srnall arnounts of elec- tricity.
The mechanism for coking based on carbonization of coal is cornplex and includes a series of chemical and physical phenomena. In cake plants, from the coal which enters the transformation center, coke, coke gas, tars and non-energy products (benzols, etc,) are produced, A good part of the cake produced in this center usually goes to furnaces; and much of the tar produced is consumed in the process itself, although most times its production is not recorded and its value is included in the losses ar as part of the non-energy output.
Cake Plants e)
These units (see Figure 7) are seldorn very efficient since, precisely because combustion is incomplete, a great <leal of heat is lost, leaving charcoal ~n the ash. Heat recovery in these centers varíes between 25 and 40% of the heat fed into the production unit.
These are ovens and furnaces where the incomplete combustion of firewood takes place to produce charcoal, volatile products and non-energy products; the latter two are not usually utilized.
treated products balance
These are biomass transformation centers which are separately due to the relative importance of the which participate in this process within the energy of most of the Latín American countries.
Charcoal Plants d)
28
Liquefied Gas Gasoline and Naphthas (aviation gasoline, motor gasoline, natural gasoline and naphthas) Kerosene and Turbofuels Diesel Oil (also including gas oíl) Heavy Fuels Cake Electricity Charco al Alcohol Gases (biogas, coke gas, furnace gas, refinery gas) Other Energy Fuels Non-Energy Products
The secondary energy sources considered are listed below and defined in the glossary.
Secondary energy refers to the different energy products whose origin is the different transformation centers, after undergoing a physical, chemical or biochemical process, and whose destination is the diverse consumption sectors and/or other transformation centers.
Secondary Energy
Sugarcane Products (molasses, juice, and bagasse far energy purposes) Other Primary Sources (animal waste and other vegetable waste, recovered energy, etc.)
27
I~~~~~~~~~~~~~~- 1 1 1 l 1 1 : T R A N S F O R M A T I O N C E N T E R S : 1 A L C O H o L D l J I S T I L L E R I E S J 1 1 1 I I 1 1 1 1 . I I 1 I 1 1 1 : 1 . . . . . . . . 1 : 1 1 . . . . . . . 1 1 1 1 . . . . . . . . 1 1 I 1 . . . . . . . 1 1 1 1 . . . . . . . . I ----- ALCOHOL I I 1 . . . . . . . I 1 1 1 . . . . . . . . 1 1 1 1 . . . . . . . 1
J. SUGAR MILLS J 1 1 SUGARCANE JUICE J •• ALCOHOL .. ·!----- f I AND BIOGAS J MOLASSES-----J. DISTILLERIES.J : 1 · · · . . . . I : I I. . . . . . . . I 1 I 1 . . . . . . . 1 1 J J. ' ' · · ' · .J----- NON-ENERGY PRODUCTSJ 1 I . . . . . . . I 1 1 1 . . . . . . . . 1 1 I 1 . . . . . . 1 1 I I 1 1 1 1 1 J l TRANSFORMATION 1 J LOS SES 1 1 1 1 I l I I ·1 1 1 1 I 1 I I 1 I I 1 I 1 1 I I 1 I
I
FIGURE 9
- ! -
UJ
..J
u
o
z
c..
o
z
30
u,
z
z ..J
111
u
o o
z
111
o
o
z
--------------~-- ---.....------------------ ------~---_-..- -----¡-
- -n::- - - - -
1-
z
u
o
z
.·¡; u
'::---~
_I~ -~~
111
c..
e .,
o
-~- 1-
---_:t----
u.
z
..J
,_--- -- ..... - ~--~ ---- - -
z ---o---
29
0 L
------- -c
z
111
u.
o -~-
~--..._._
a..
>-
z - u- - - - -
u
z
a:: ____ J,J,1 __
z
- -- - - ->-- - o
(/)
------ --m----- ____ !!:f _
>- 0::
< o z
-----O-- u
w ------- --------
>- - - -~ 15- -
a:: ----.W--
z
---- ---·- -----
32
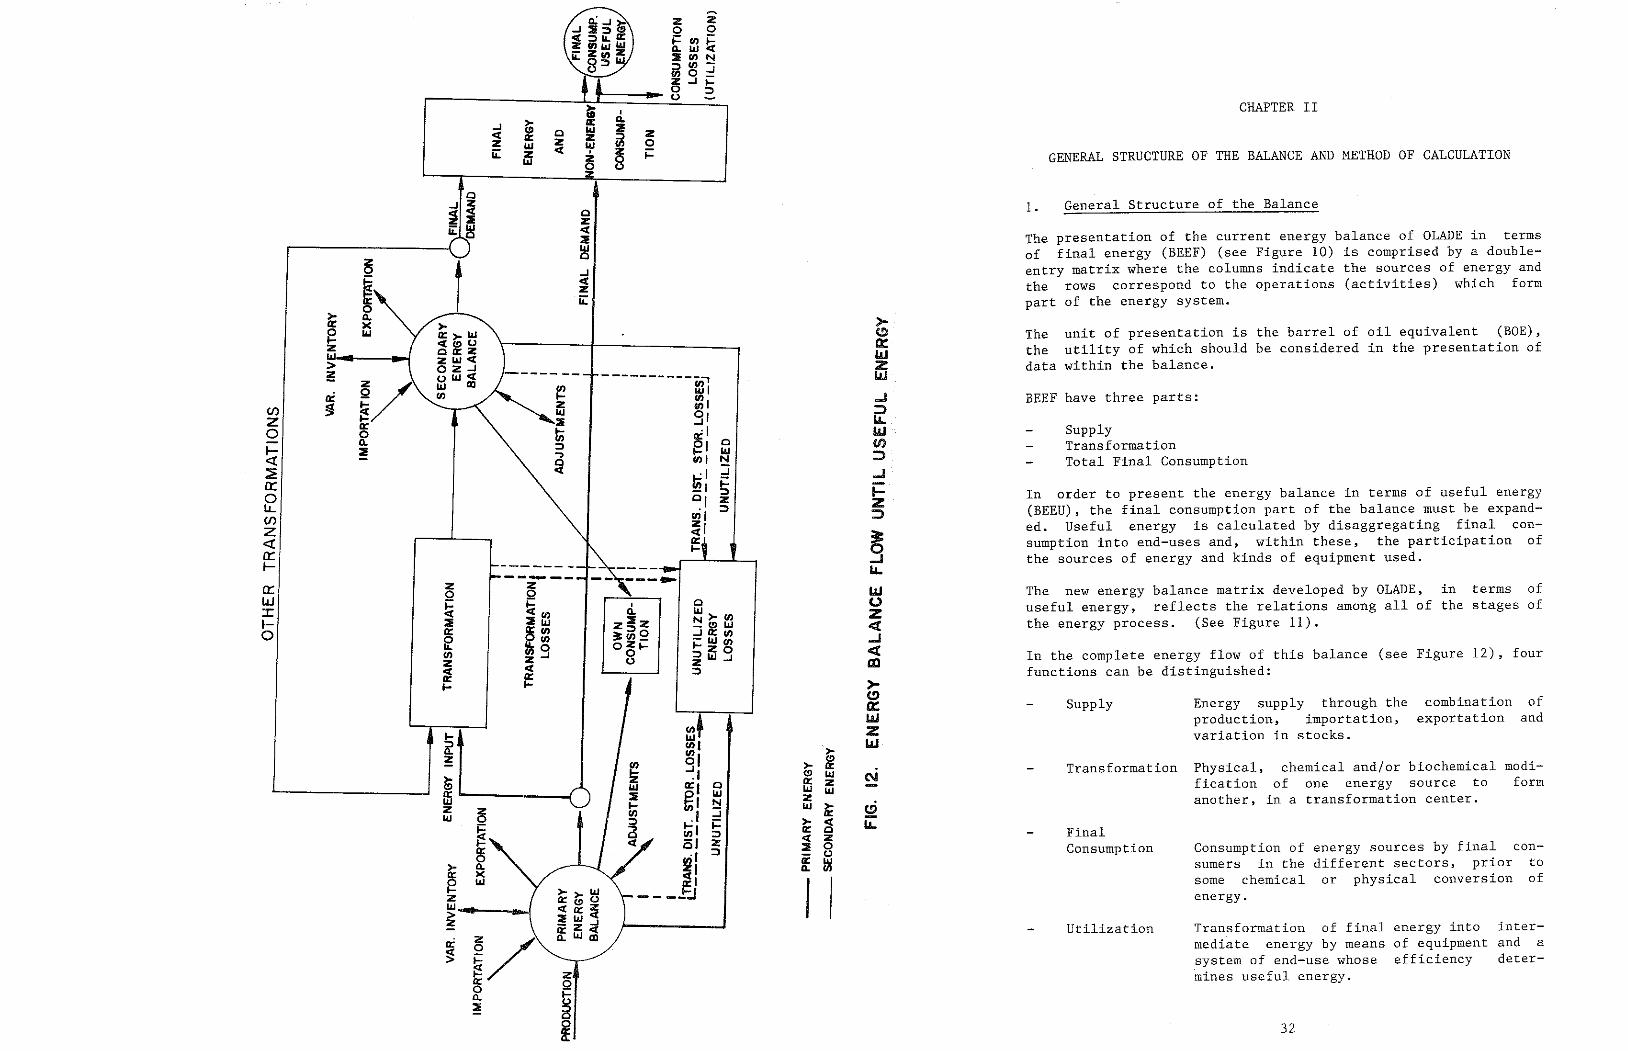
inter- and a de ter-
energy into of equipment efficiency
Transformation of final mediate energy by means system of end-use whose mines useful energy.
Utilization
con- to of
Consumption of sumers in the sorne chemical energy.
energy sources by final different sectors, prior or physical conversion
Final Consumption
Transformation Physical, chemical and/or biochemical modi- fication of one energy source to form another, in a transformation center.
combination of exportation and
Energy supply through the production, importation, variation in stocks.
Supply
In the complete energy flow of this balance (see Figure 12), four functions can be distinguished:
in terms of the stages of
The new energy balance matrix developed by OLADE, useful energy, reflects the relations among all of the energy process. (See Figure 11).
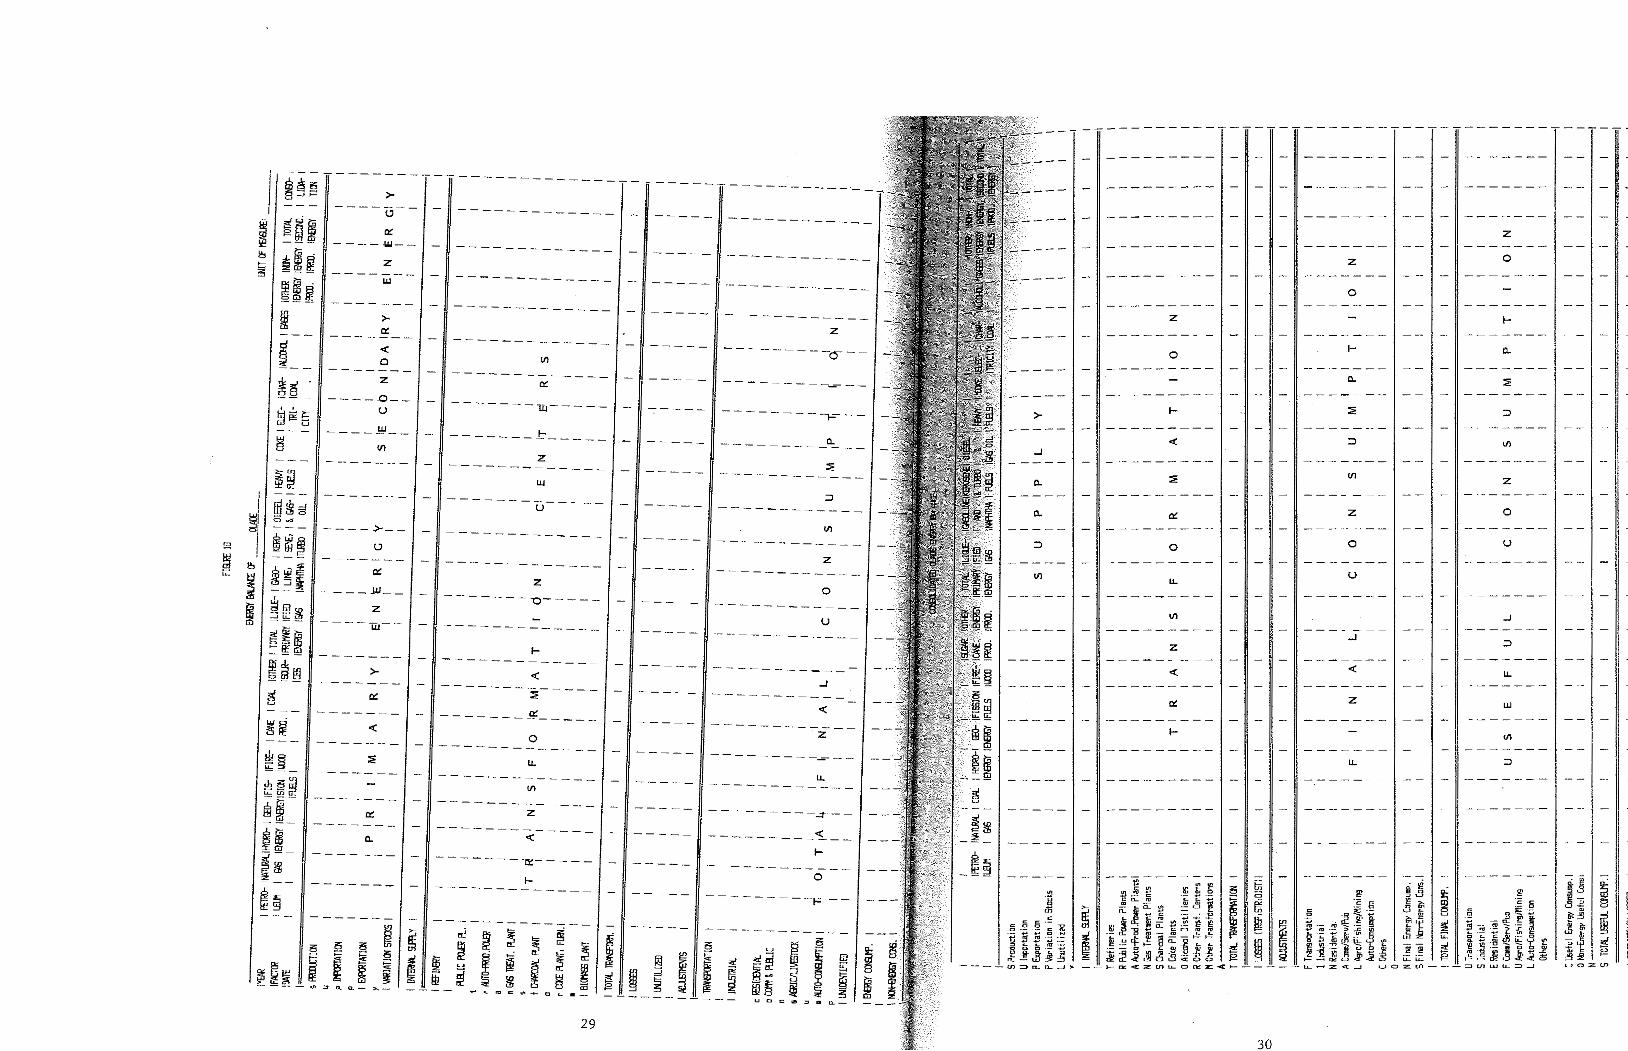
In order to present the energy balance in terms of useful energy (BEEU), the final consumption part of the balance must be expand- ed. Useful energy is calculated by disaggregating final con- sumption into end-uses and, within these, the participation of the sources of energy and kinds of equipment used.
Supply Transformation Total Final Consumption
BEEF have three parts:
The unit of presentation is the barrel of oil equivalent (BOE), the utility of which should be considered in the presentation of data within the balance.
The presentation of the current energy balance of OLADE in terms of final energy (BEEF) (see Figure 10) is comprised by a double- entry matrix where the columns indicate the sources of energy and the rows correspond to the operations (activities) which form part of the energy system.
l. General Structure of the Balance
GENERAL STRUCTURE OF THE BALANCE AND METHOD OF CALCULATION
CHAPTER II
-----------;:, ~ fil 1
ffi ~I :E g1 t; ·J :) ~I o ..., Ll.J o U) 1 ~ et t;;l ..J
§ _1 ºI z "'1
:)
:i 1
~ a:: .....
------ - LL z z LLJ o o ~ fi 1 o o a. LIJ z :E :E f3 z2z N >- en
- ~ Ll.J <t o:: ~~
:t :::)º ..J U) e U)_ - LIJ CI) ..J oZt- ..... z o et en z ..J o :) 11.J ..J z o z ca ~
<( :) a:: ..... 1- >-
C) o: 0+ LLJ
1- z ¡( ~. >- LLJ z ~I (!)
~I >- a::
~ (!) LIJ N
a:: 1 o a:: z a: 11.J 11.J 11.J 11.J ~I N z z
~ :J LIJ ~ !2 LIJ .1 fi ~I ~ >- <( LL
:::) a:: o ¡...:: i5 f z <t z s :E o
·1 :::) u a:: m >- a. !1 a.. ~
X Ll.J ~I
1 z - - __ ::J LIJ > z o:: ~/ ~
z a:: Q o a. § 2
~
t
o z et :E ~ ..J et z ¡¡:
..J et z ¡¡:
> a:: ~ z > ~ ti
U) ~ z o 1- <t: :E a::: o LL U) z <t: a: 1-
a::: w ::t: 1- o

34
to For the purpose of illustration, an attempt is made below demonstrate the treatment that should be given these.
In the new summary matrix of OLADE, there is a row in the TRANS- FORMATION submatrix termed nOTHER TRANSFORMATIONS,n which serves to account for secondary energy sources which are products of a primary transformation and which are used in other secondary transformation processes, as in the cases of gas production in furnaces and reformed products in the petrochemical industry.
Treatment of Other Transformations 2.
To obtain a set of statistics which can be computer- processed. This implies consistency in the rows and columns of the balance matrix.
To treat the energy flows, from production up through end- use, explicitly indicating the intermediate operations (transformation, transportation, consumption).
To consider operations only at the national level, in the event that there is a transfer of energy products over the borders of neighboring countries. Any loss occurring on either side of the border is not considered in the balance of the country under study.
To use a common unit of measure, which will be general and applícable to all sources of energy and all forras of energy use (heat, radiation, etc.) in arder to be able to tabulate the columns and rows of the balance. In this case, the barrel of oíl equivalent (BOE) rnay be used, or any caloric unit (Teracalorie).
To treat all the energy sources with the same criteria. This calls for uniform application of precise equivalencies, conversion factors, and the balance (accounting) system itself.
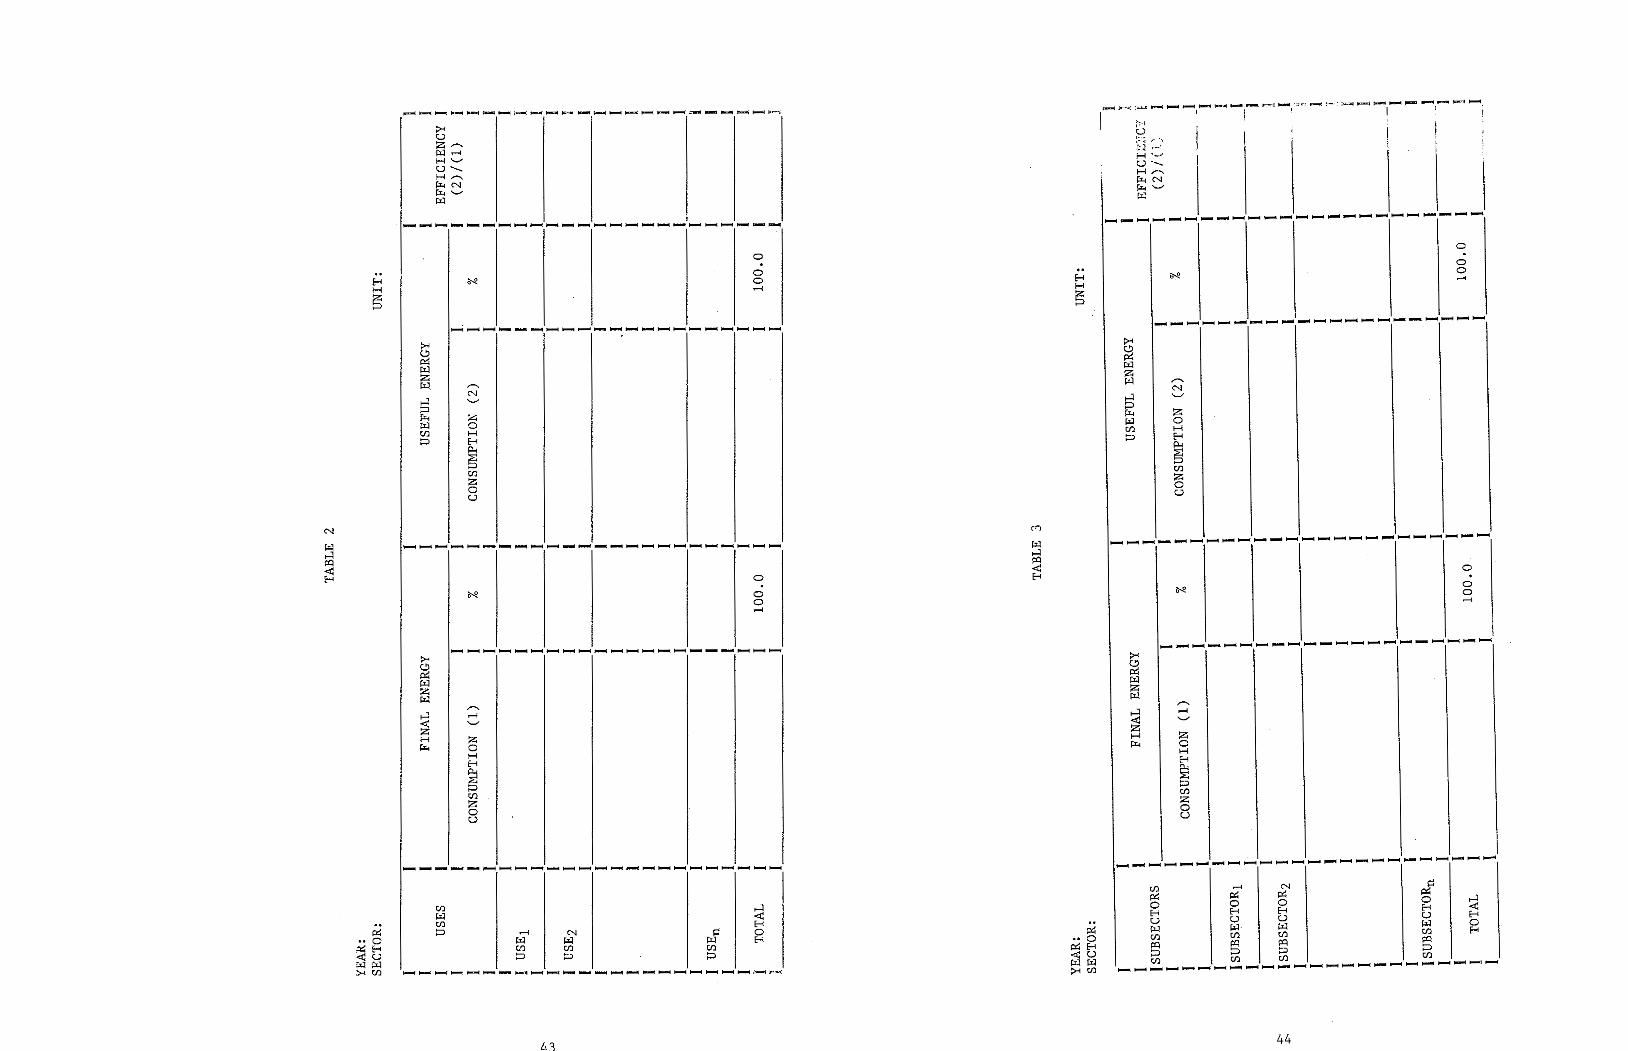
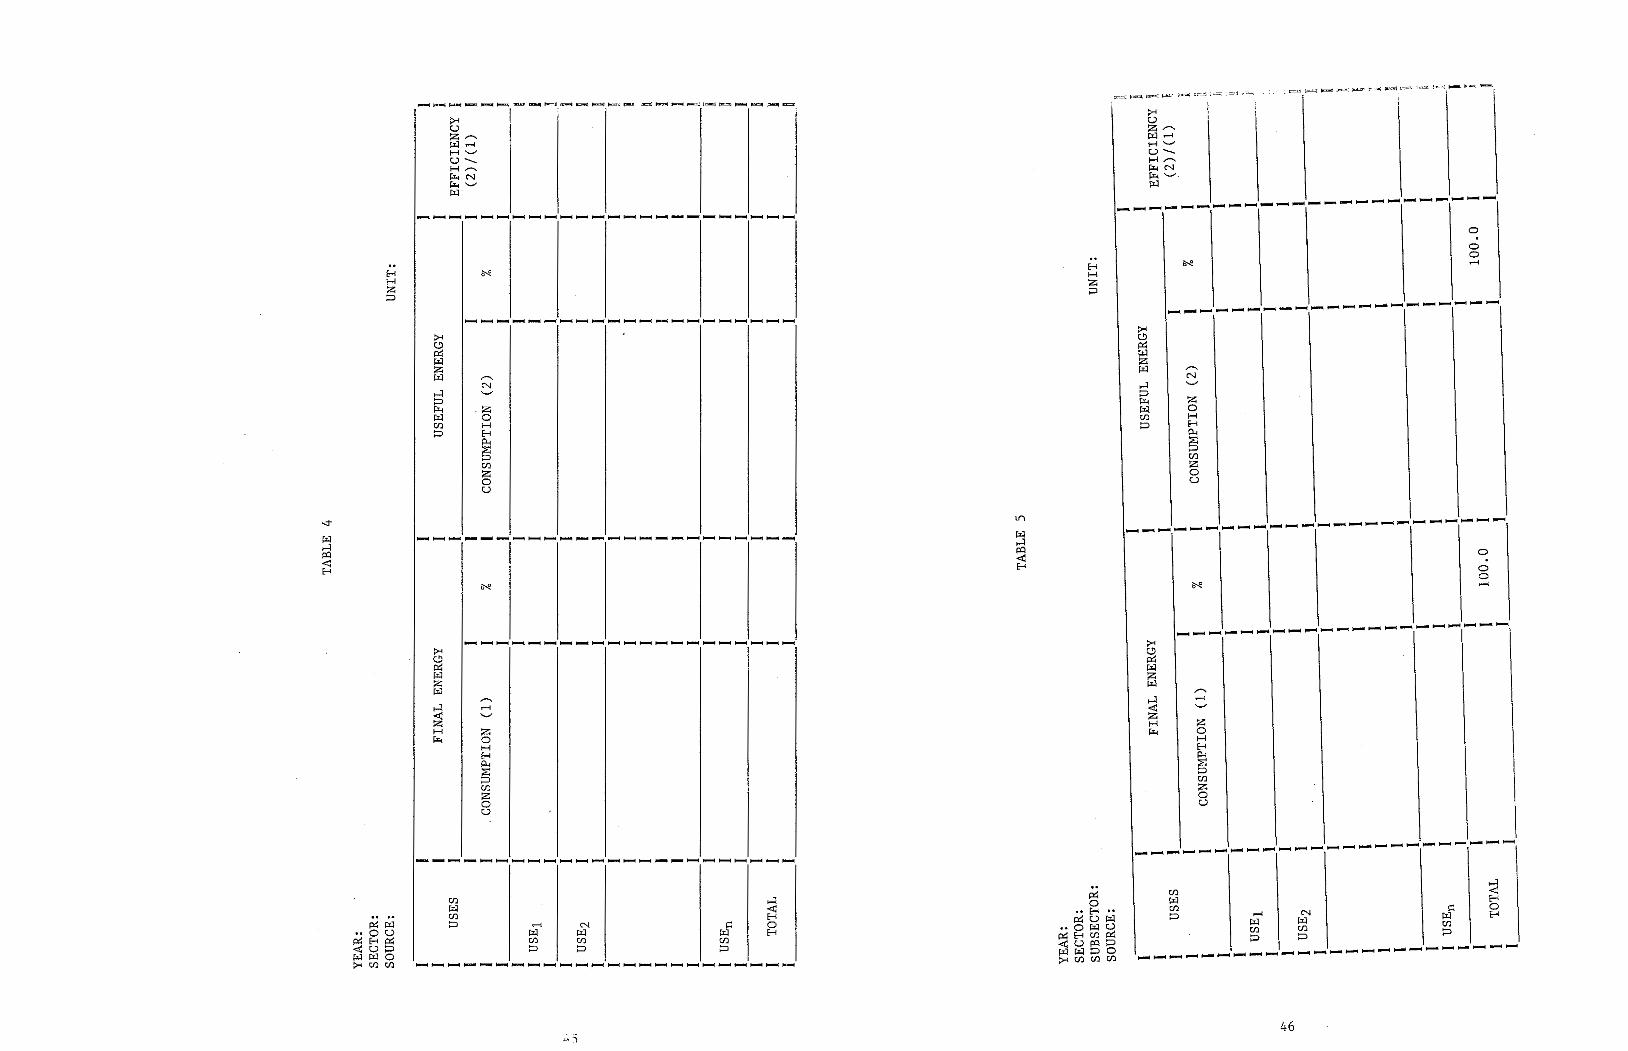
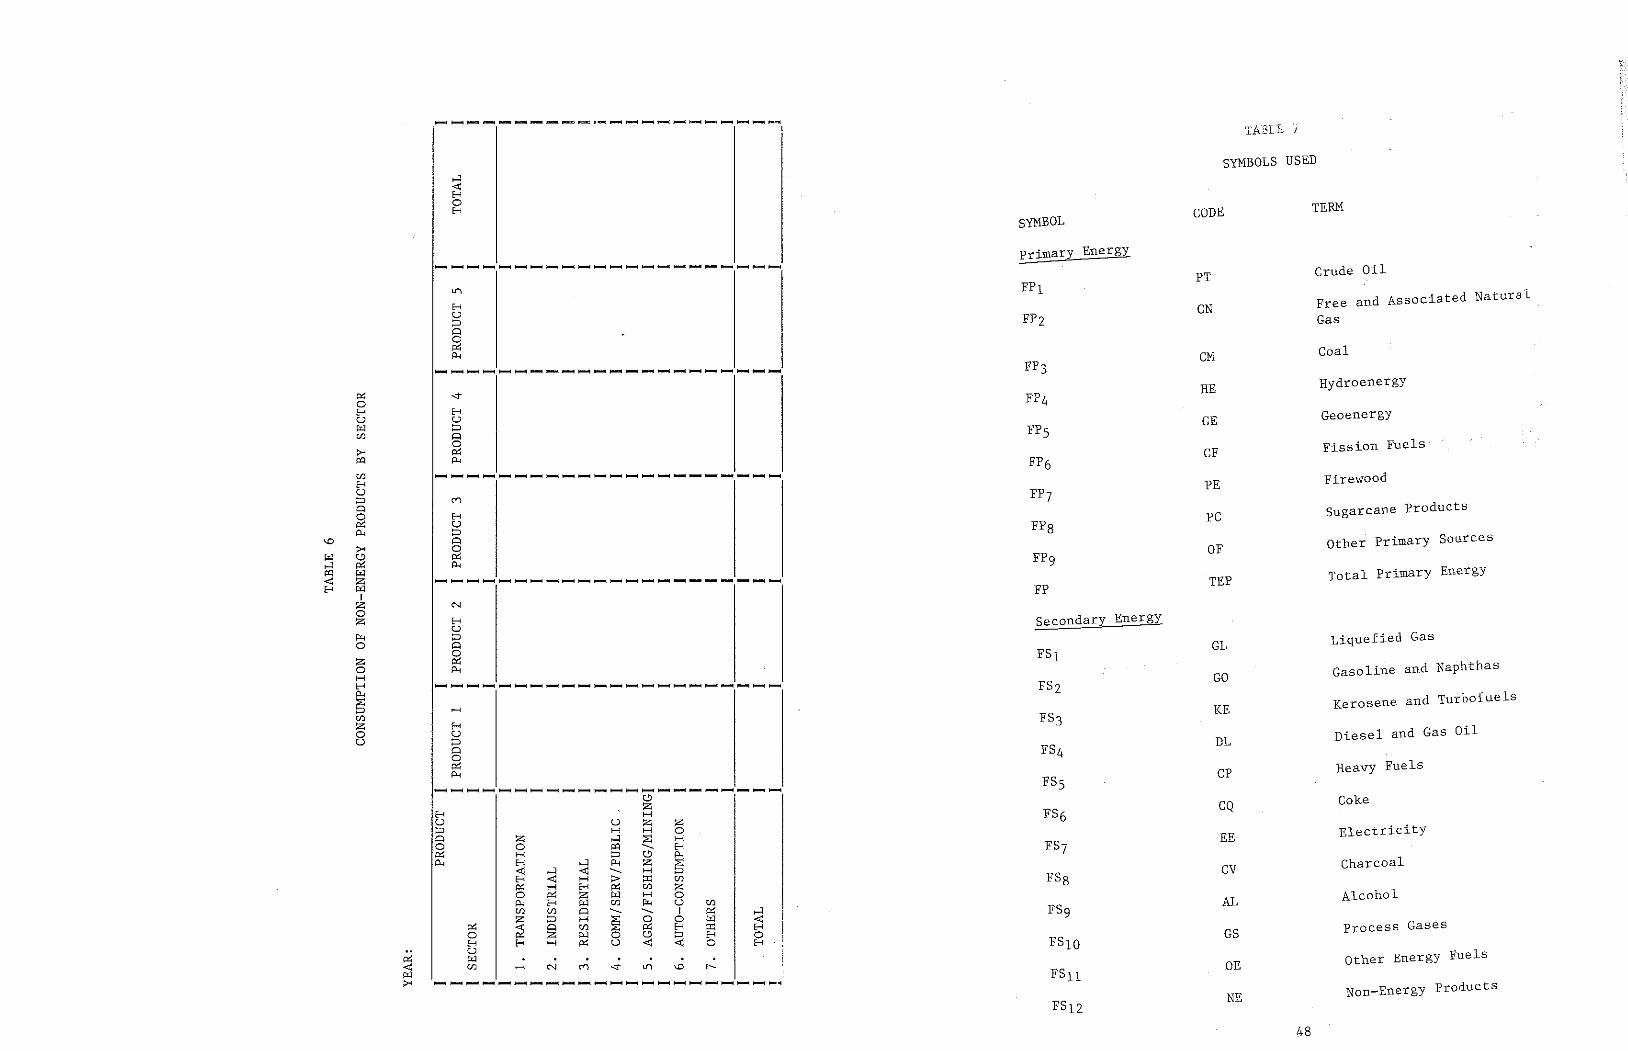
It is suggested that the information be grouped by energy source and by sector in the so-called main sectoral data sheets, as shown in Tables 1 to 6.
In preparing the useful-energy balance or the main data sheets in terms of useful energy, it is necessary to be aware of the fol- lowing basic principles:
To observe the first law of thermodynamics, which states that the energy in a closed system is constant, i.e.: input
product + losses. Since the balance is a closed system, the consumer cannot obtain more energy than what is avail- able to him.
33
It should be taken into account that the format in which the balances will ultimately be presented can never be completed directly, but rather through certain intermediate steps.
It is useful to organize the collected data so as to facilitate final preparation of the balance. For the final consumption sectors as well as the auto-consumption sector (all of the trans- formation centers), it is suggested that the sectoral balance sheets presented in the corresponding appendices be used.
Befare attempting the aforementioned steps, it must be kept ,in mind that preliminary data-gathering is necessary for con- struction of BEEU; this consists of collecting all of the infor- mation published on the tapie, whether systematically or not, in the original formats.
application of the efficiencies of the different types of equipment for each end-use in each subsector.
disaggregation of final consumption by subsectors and by end-uses;
preparation of BEEF;
Preparation of BEEU depends on compliance with the following steps:
Under secondary sources, "Alcohol" and "Other Fuels" were included. These cover secondary energy products not consid- ered under other previous definitions.
Under primary sources was added rrüther Primary Energy Sour- ces," which includes the products of the productive pro- cesses which have an energy content and which are not con- sidered in any other part of the balance, e.g., black liquor, stillage, plant and animal fuels, wind energy, solar energy, etc.
The primary and secondary energy sources have included new energy sources:
All of the final consumption sectors have been disaggregated into subsectors and uses, the breakdown of which is detailed in the correspondíng appendices.
It should be pointed out that in the BEEF final consumption has been modified by replacing the Agricultural/Livestock Sector with the Agriculture-Fishing-Mining Sector, and by replacing "Unidentified" with "Others". Auto-Consumption of the energy sector has also been added.
36
3. Equilibrium Equations
For each one of the four parts compr1s1ng the energy balance and the basic functions defined in the OLADE Methodology for Elabora- tion of BEEF, equilibrium equations are provided to permit veri- fication of the consistency of the inforrnation presented. The following equilibrium equations have been defined:
---------------------------------------------------------------- 70
I 1 l
Final Non-Energy Consumption
-----------------------~----------------------------------------- o 5 10 15
I Other I Transformationsl -30
----------------------------------------------------------------- TRANSFORM.
LOS SES OTHER ENERGY
GASOLINE LIQUEFIED GAS
OURCES INAPHTHA ACTIVITIE 1
---------------------------------------------------------------
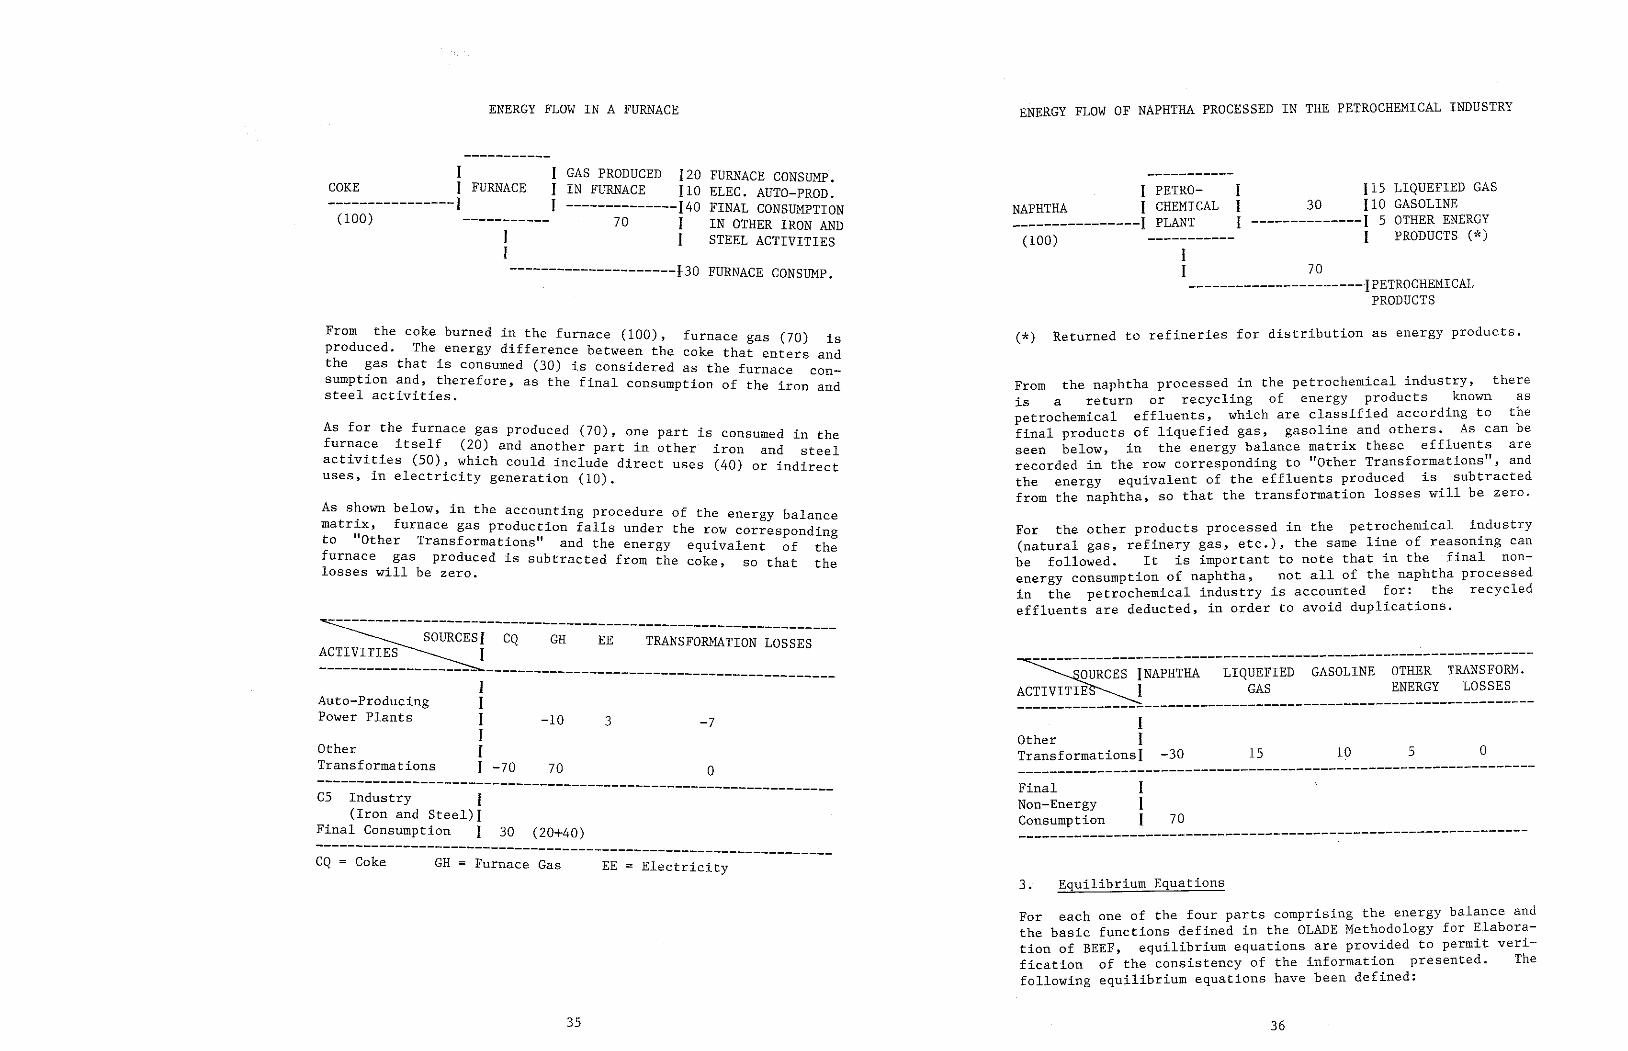
For the other products processed in the petrochemical industry (natural gas, refinery gas, etc.), the same line of reasoning can be followed. It is important to note that in the final non- energy consurnption of naphtha, not all of the naphtha processed in the petrochemical industry is accourtted far: the recycled effluents are deducted, in arder to avoid duplications.
From the naphtha processed in the petrochernical industry, there is a return or recycling of energy products known as petrochemical effluents, which are classífied according to the final products of liquefied gas, gasoline and others. As can be seen below, in the energy balance matrix these effluents are recorded in the row corresponding to "Other Transforrnations", and the energy equivalent of the effluents produced is subtracted from the naphtha, so that the transformation losses will be zero.
(*) Returned to refíneries for distribution as energy products.
I 1 70 ----------------------{PETROCHEMICAL
PRODUCTS
LIQUEFIED GAS GASOLINE OTHER ENERGY PRODUCTS (*)
I 115 1 30 110 1 --------------1 5
l
I PETRO- NAPHTHA l CHEMICAL ----------------! PLANT (100) -----------
ENERGY FLOW OF NAPHTHA PROCESSED IN THE PETROCHEMICAL INDUSTRY
35
EE = Electricity GH = Furnace Gas CQ = Cake -----------------------------------------------------------------
----------------------------------------------------------------- C5 Industry 1 (Iron and Steel)I
Final Consurnption I 30 (20+40)
I Auto-Producing 1 Power Plants 1 -10 3 -7
I Other 1 Transforrnations 1 -70 70 o
-------------------------------------------- TRANSFORMATION LOSSES EE GH CQ
---------------------------------------------
As shown below, in the accounting procedure of the energy balance matrix, furnace gas production falls under the row corresponding to "Other Transformations" and the energy equivalent of the furnace gas produced is subtracted from the coke so that the losses will be zero. '
As for the furnace gas produced (70), one part is consumed in the furnace itself (20) and another part in other iron and t 1 . . . ( ) s ee act1v1t1es 50, which could include direct uses (40) or indirect uses, in electrícity generation (10).
Frorn the cake burned in the furnace (100), furnace gas (70) is produced. The energy difference between the cake that enters and the gas that is consumed (30) is considered as the furnace con- sumption and, therefore, as the final consumption of the iron and steel activitíes.
FURNACE CONSUMP.
1 I ---------------------f30
FURNACE CONSUMP. ELEC. AUTO-PROD. FINAL CONSUMPTION IN OTHER IRON AND STEEL ACTIVITIES
1 GAS PRODUCED 120 J IN FURNACE 110 I --------------140
70 I 1
1 COKE J FURNACE ----------------! (100)
ENERGY FLOW IN A FURNACE
38
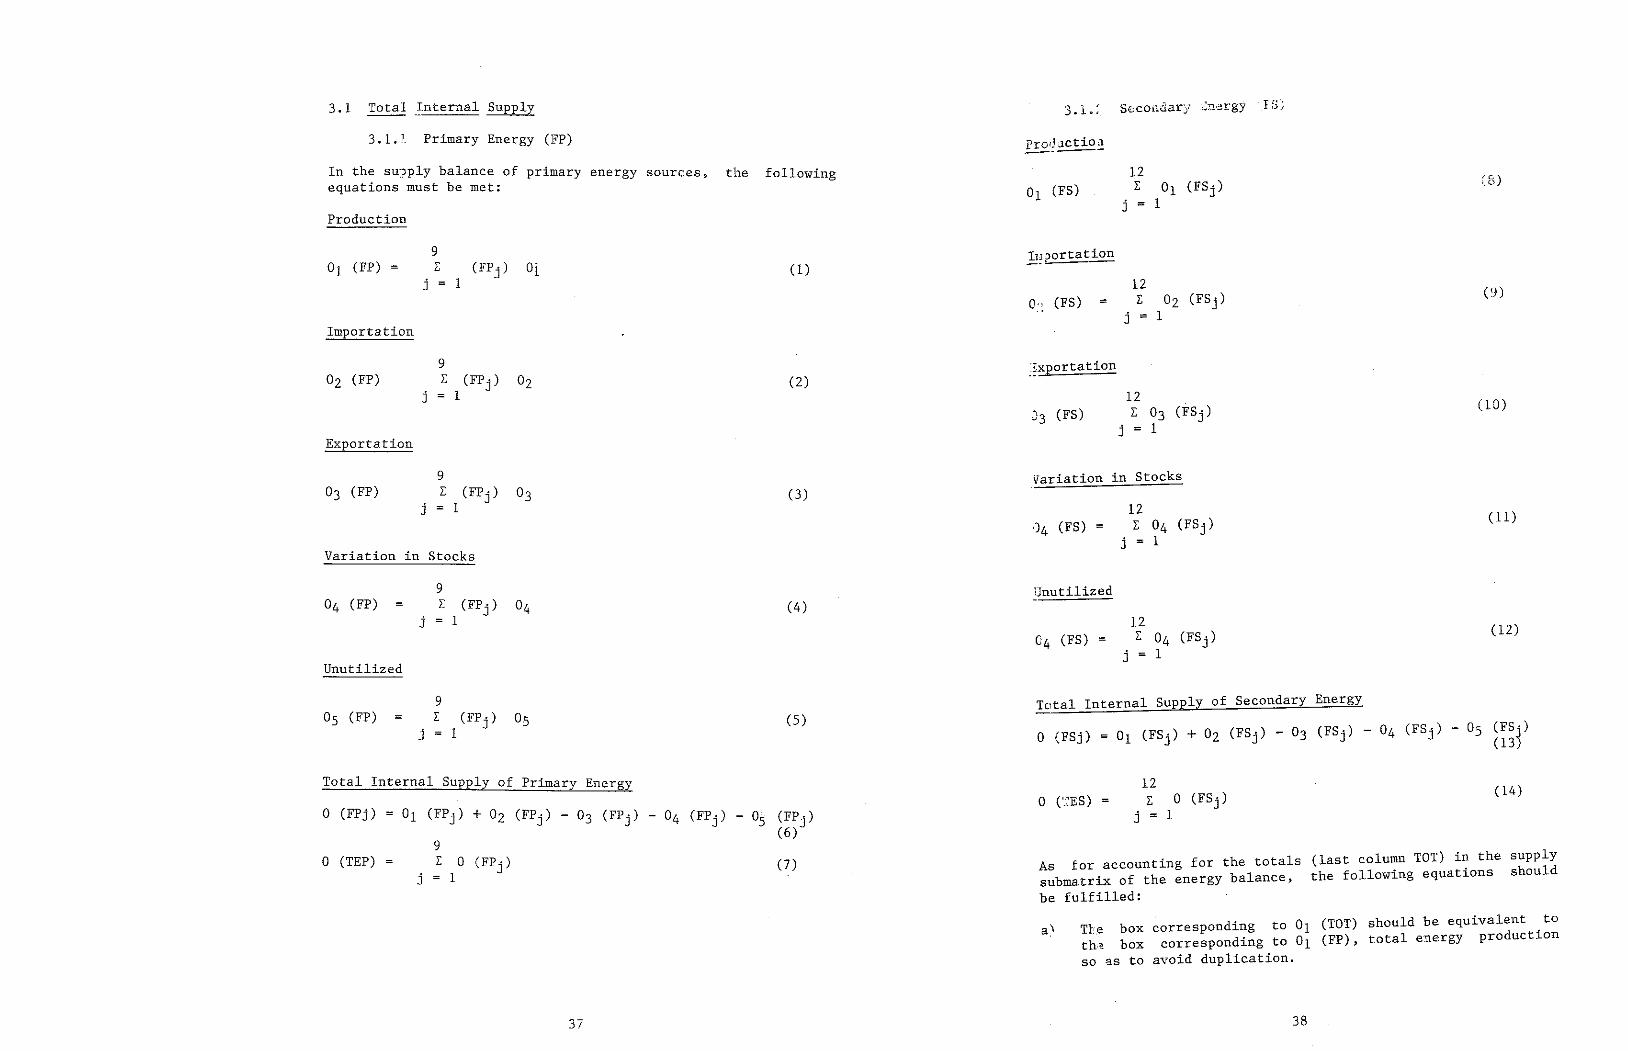
ª' Tl.e box corresponding to 01 (TOT) should be equivalent to th'! box corresponding to 01 (FP), total energy production so ~s to avoid duplication.
As far accounting for the totals (last column TOT) in the supply submatrix of the energy balance, the following equations should be fulfilled:
(14) O ('_~ES)
Total Internal Supply of Secondary Energy
(12) 12 ¿; 04 (FSj)
j = 1
(11)
C4 (FS)
Unutilized
12 04 (FS) = ¿; 04 (FSj)
j = l
Variation in Stocks
(10) 12 I 03 (FSj)
j = 1
(9) 12 L: Oz (FSj)
j = 1 =
(8)
J3 (FS)
~~xportation
12 o1 (FS) ¿; 01 (FSj)
j = 1
Prod JC tío :1 ---- 3. 1. ~ Secorrdary ¿n,i!rgy I ;{:
37
O (FPj) = 01 (FPj) + Oz (FPj) - 03 (FPj) - 04 (FPj) - Os (FPj) 9
(6)
O (TEP) ¿; o (FPj) j 1
(7)
Total Internal Supply of Primary Energy
(5)
(4)
(3)
(2)
(1) 9
01 (FP) z (FPj) Oí j = 1
Importation
9 Oz (FP) ¿; (FPj) Oz
j 1
Exportation
9 03 (FP) z (FPj) 03
j 1
Variation in Stocks
9 04 (FP) ¿; (FPj) 04
j 1
Unutilized
9 05 (FP) z (FPj) 05
j 1
Production
the following In the supply balance of primary en ergy sources, equations must be met:
3.1.I. Primary Energy (FP)
3.1 Total Internal Supply
40
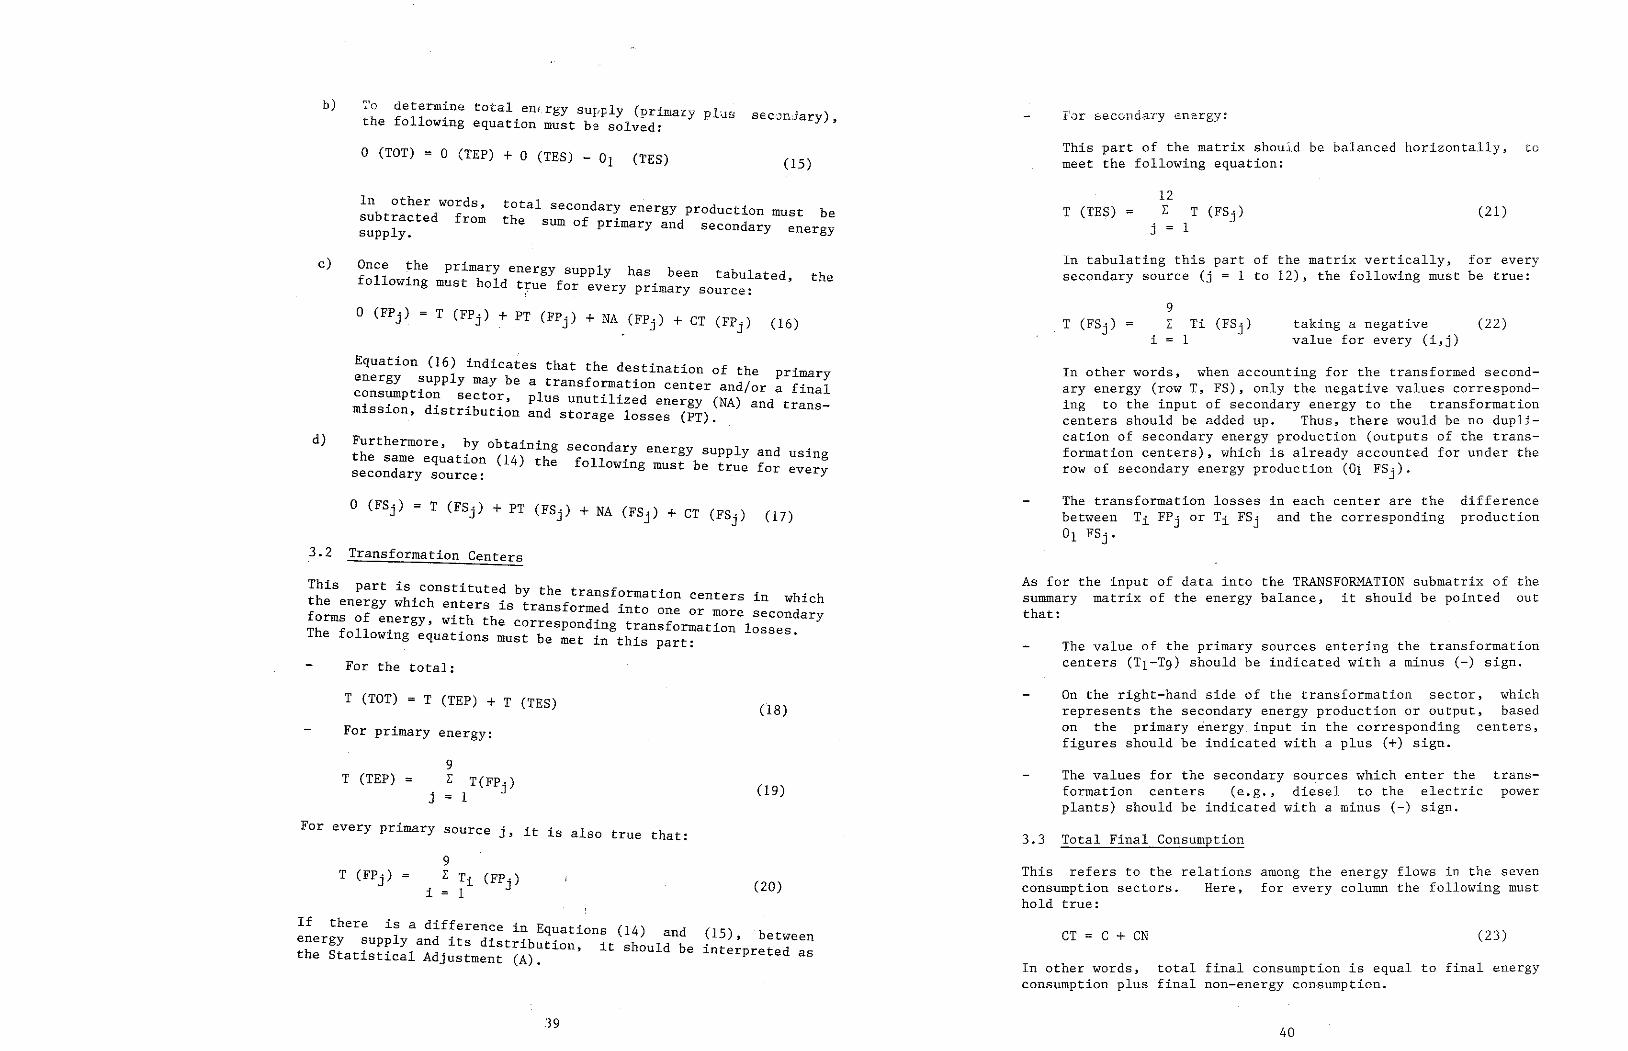
In other words, total final consumption is equal to final energy consumption plus final non-energy consumption .
(23) CT = C + CN
This refers to the relations among the energy flows in the seven consumption sectors. Here, for every column the following must hold true:
3.3 Total Final Consumption
The values for the secondary sources which enter the trans- formation centers (e.g., diesel to the electric power plants) should be indicated with a minus (-) sign.
On the right-hand side of the transforrnation sector, which represents the secondary energy production ar output, based on the primary energy input in the corresponding centers, figures should be indicated with a plus (+) sign.
The value of the primary sources entering the transformation centers (T1-T9) should be indicated with a minus (-) sígn.
As far the input of data into the TRANSFORMATION subrnatrix of the summary matrix of the energy balance, it should be pointed out that:
The transformation losses in each center are the difference between Ti FPj or Ti FSj and the corresponding production O¡ FSj.
In other words, when accounting for the transformed second- ary energy (row T, FS), only the negative values correspond- ing to the input of secondary energy to the transformation centers should be added up. Thus, there would be no dupli- cation of secondary energy production (outputs of the trans- formation centers), which is already accounted for under the row of secondary energy production (Oi FSj).
taking a negative (22) value for every (i,j)
9 ¿: Ti (FSj)
i 1
In tabulating this part of the matrix vertically, for every secondary source (j = 1 to 12), the following must be true:
(21) T (TES)=
This part of the matrix shouid be balanced horizontally, to meet the following equation:
F0r secondary energy:
.'39
If there is a differertce in Equations (14) and (15), between energy supply and its distribution, it should be interpreted as the Statistical Adjustment (A).
(20) T (FPj)
Far every primary source j, it is also true that:
(19) T (TEP) =
For primary energy: (18)
T (TOT) = T (TEP) + T (TES) For the total:
This part is.constituted by the transformation centers in which the energy which e~ters is transformed into one or more secondary forms of energy, with the corresponding transformation losses The following equations must be met in this part: '
3.2 Transformation Centers
Equation (16) indicates that the destination of the primary energy supply may be a transformation center and/or a final consumption sector, plus unutilized energy (NA) and trans- mission, distribution and storage losses (PT).
Furthermore, by obtaining secondary energy supply and using the same equation (14) the following must be true for secondary source: every
d)
Once the primary energy supply has been tabulated, following must hold t7ue for every primary source: the
e)
total secondary energy production must be the sum of primary and secondary energy
In other words, subtracted from supply.
(15) O (TOT) =O (TEP) +O (TES) - 01 (TES)
'.":.'o determine total enr rgy supp Iy (prímary p Lus ) t .._ .L u~ seccJndary , the following equation must be solved: b)
42
------------------------
~ ~ ¡;.:¡ z ¡;.:¡ ,,.......
~ .....¡ ......,
H z µ:.. o H E-< p.., s U) z o u
:>-< c.!) ~ ¡;.:¡ z ¡;.:¡
........ ,_;¡ N p ......, ~ z ¡;.:¡ U) o p H
E-< p.., s U) z o u
G z,-, ¡;.:¡ .....¡ H .._, U- H...-.. µ:..N ~'-' ¡;.:¡
.....¡
41
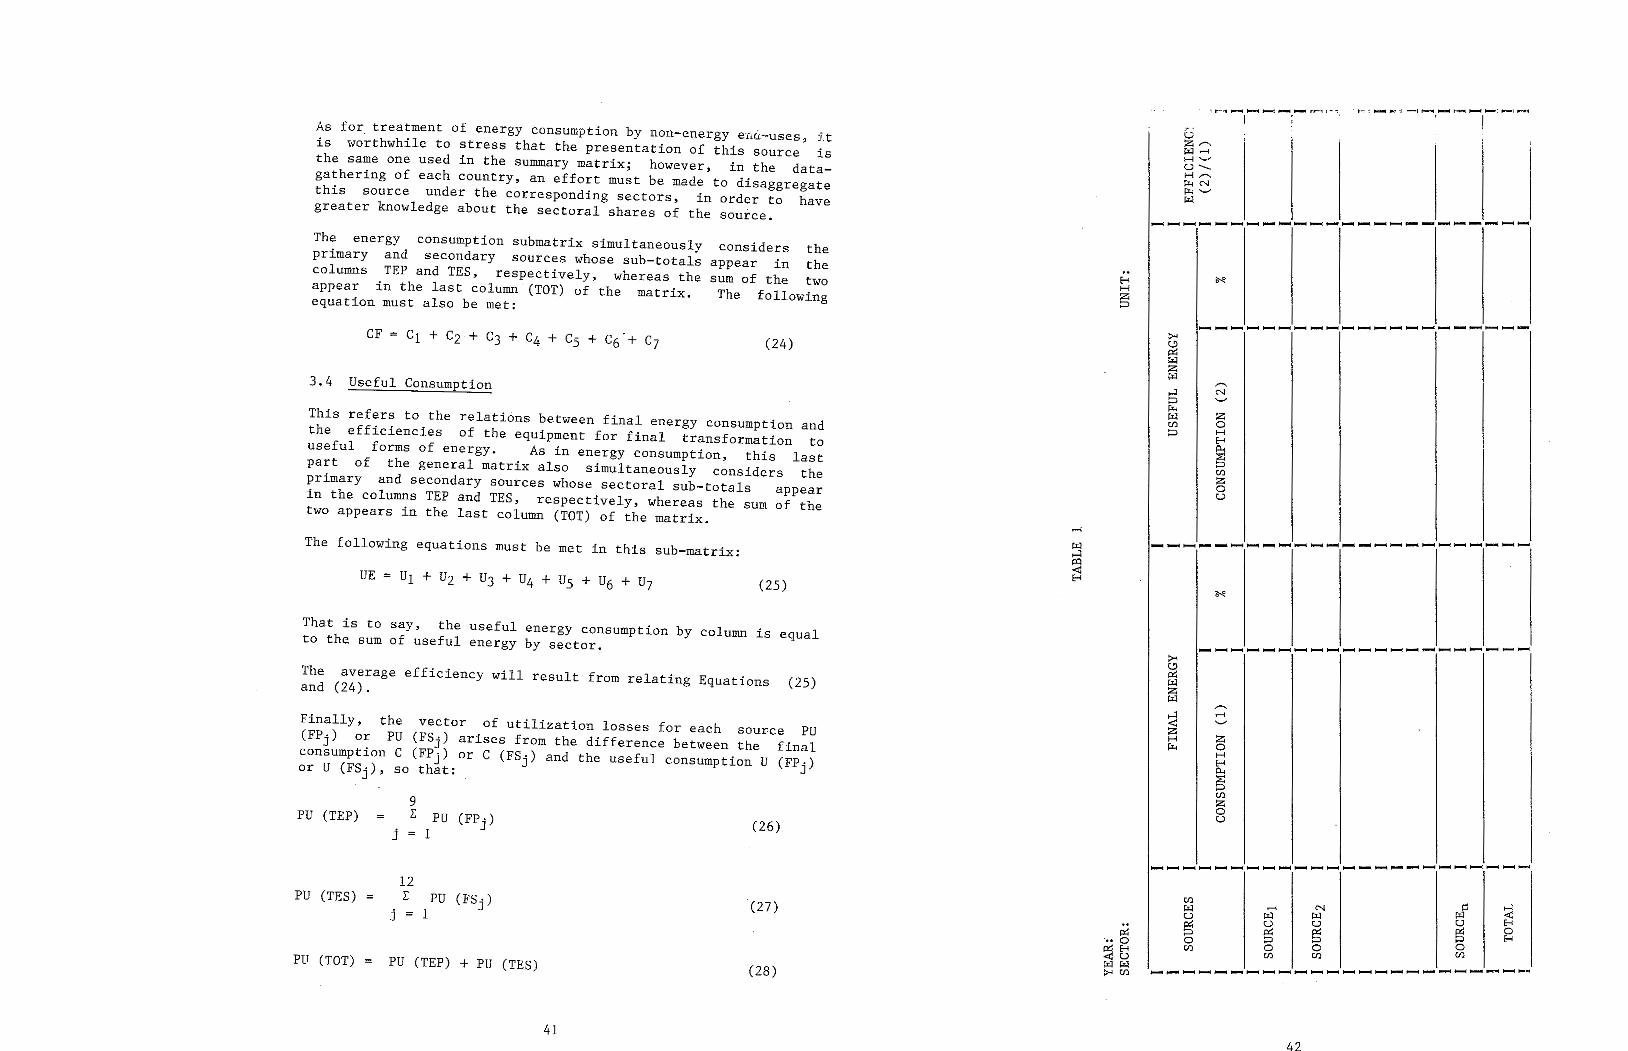
(28)
(27)
(26)
9 PU (TEP) ¿; PU (FPj)
j 1
12 PU (TES) z PU (FSj)
j = 1
PU (TOT) PU (TEP) +PU (TES)
Finally, the vector of utilizatíon losses for each source PU (FPj) or PU (FSj) arises from the difference between the final consumption C (FPj) or C (FSj) and the useful consumption U (FPj) or U (FSj), so that:
The average efficiency will result from relating Equations (25) and (24).
That is to say, the useful energy consumption by column is equal to the sum of useful energy by sector.
(25)
The following equations must be met in this sub-matrix:
This refers to the relations between final energy consumption and the efficiencies of the equipment for final transformatíon to useful forms of energy. As in energy consumption, this last part of the general matrix also simultaneously considers the primary and secondary sources whose sectoral sub-totals appear in the columns TEP and TES, respectively, whereas the sum of the two appears in the last column (TOT) of the matrix.
3.4 Useful Consumption
(24)
consíders the appear in the sum of the two The following
The energy consumption submatrix simultaneously primary and secondary sources whose sub-totals columns TEP and TES, respectively, whereas the appear in the last colum.n (TOT) of the matrix. equatíon must also be met:
As fer treatment of energy consumption by non-energy en~-uses, 1.t is worthwhile to stress that the presentation of this source is the same one used in the summary matrix; however, in the data- gathering of each country, an effort must be made to disaggregate this source under the corresponding sectors, in order to have greater knowledge about the sectoral shares of the source.
44
-------~---------------- .......
µ;¡ C.') p
Cf.l w 00 p
>' :>-< (.!;) 0 IZ IZ µ;¡ µ;¡ z z µ;¡ w ,-.... ....... ';2 ....... ';2 .......
'-' ...__.. z z H z H z ~ o ~ o
H H H H p., p., ~ ~ p p Cf.l ti) z z o o u u
o o o .......
o o o .......
>' >' (.!;)
~ IZ µ:¡ ~ z z µ;¡ ,-.... µ;¡ .......
N N ,...:¡ .._, ....:¡ '-' p p Jí.< z ~ z w o µ;¡ o ti) H ti) H p H p H
p.,
~ s ti) ti)
z z o o u u
:>-< u z,-.... µ;¡ ....... H'-' u-...... H,-.... ~N Í%-< .._, ~
~~~.- ... ~~ ..... ·~..-:......ci=· ~"'"""'~......-!fllllllQl.......C~~""""'4
I~ ~~ ~""'--Jl ¡......¡..... 1 1 -~~ ~- ! ! .
~-1
P. 1 t1 ~--:· H '·-/
u --- H ,,--.. ~N ~ ......... µ;¡
o o
o o H ~ o H ~ o H ....... H
....... z z p p
---~--------------~----- '
46
------------------------ lf.J (l:l
H (/)
-::e: t> ,.....¡ N ¡j
E--1
(l:l ¡:,::¡ o
C/l Cf.l ¡;;.:¡ E--1 U)
t> p p
u:i ~ (l:l Ul
E-1
p ,.....¡ N ¡j o
(l:l (l:l (l:l E-1
Ul U) Ul
t> p p
~ (l:l z
,.-....
(l:l
.......
,......
'-" ~
,.....¡ ..._,
z :z :z
o H
H
~ o
H
H
p.,
E--1
::<:: ~
p o:
p
z Ul
o z
u
o u
o o o ,.....¡
>-< ~ c..'J p:: ¡:,::¡
p::
z ¡;;.:¡
µ:¡ ,-....
z N
¡;;.:¡ ,-....
....,:¡ ..._, N
p
,_.::¡ '--"
¡:,:., z t> z
(l:l o µ..
lf.J H
(l:l o
p H
u:i H
p..,
t> H
s p.., s
u:i z u:i
o z
u
o u
o
H
o
e-e ~
o
H
E--1 ,.....¡
z H
p
z p
- -:- - -!- - _,, - -- - '""" - u z,-.... ¡:,::¡,.....¡ H "-' U- H,-.... ~N ~'-' (l:l
48
Non-Energy Products NE
Other Energy Fuels OE
Process Gases GS
Alcohol AL
Charco al cv
Electrícíty EE
Coke CQ
Heavy Fuels CP
Diesel and Gas Oil DL
Kerosene and Turbofuels KE
Gasoline and Naphthas GO
Liquefíed Gas GL
PT Crude Oíl
GN Free and Associated Natural Gas
CM Goal
HE Hydroenergy
GE Geoenergy
CF Fission Fuels
PE Fírewood
PC Sugarcane Products
OF Other Primary Sources
TEP Total Primary Energy
TERM CODE
SYMBOLS USED
TABLE 'j
FP3
Fl'4
FP5
FP6
FP7
FP3
FP9 FP Secondary Energy
FS1
FS2
FS3
FS4
FS5
FS6
FS7
FSs
FS9
FS10
FSll
FS12
FPz
Primary Energy SYMBOL
z o H E-< p.., s sr: z o u
1 o E-< :::i <i:
~ o E-<
~ o E-< u µ¡ t:/)
:>-< p:¡
t:/) E-< u :::i ¡:::::¡
~ p.., -o l:;i::l
:;.... C-' ,...:¡ ~
p:¡ l:;i::l <el z E-< l:;i::l
1 z o z ¡;,:. o z o H E-< p.., s t:/) z o u
Utilization Losses PUT
Total Useful Consumption CUT
Useful Non-Energy Consump- tion
CNU
Useful Energy Consumption CEU
Useful Others OTR
Useful Auto-Consumption CFU
Useful Agriculture-Fishing- Mining
APM
Useful Commercial-Services- Public
CSP
Useful Residential RES
Useful Industrial IND Useful Transportation TRS
49
Industrial
Transportation
Adjustments
Unutilized Energy PU
Transmission, Distribution and Storage Losses
u Total Transformation
UN Other Transformations UE Other Transformation Centerp
Alcohol Distilleries
Cake Plants
Charcoal Plants
Gas Plants
Auto-Producing Power Plants
Public Power Plants Uz Refineries
Useful Energy Consumptíon
Total Final Consumption CFT
Final Non-Energy Consumptíon CFN
Final Energy Consumption CFE
Others OTR
Auto-Consumption CFP
Agriculture-Fishing-Mining APM
Comme r c í.a Lc-Se rv Lc.e s+Pub Ld c CSP
Residential RES
TERH CODE
Supply CT Unutilized
- Variation in Stocks CF Exportation C7 Importation
Production
nMDOL TERM Total Secondary Energy
Total '&
IND
TRS Final Energy Consumption
AJ NA
PET
TRT
OTR
OCT
DEA
COQ
CAR
PLG
CEA
CEP
REF
01
NA VI
EX
IM
PR
TOT
TES CODE
A
NA
PT
T
T9
Transformation
Supply
FT FS
SYMBOL
52
I thi·s case a poll is a method consísting of intervíews with n ' . · · ht to adequate
Persons or institutíons that can provide insig s as . d · a· t ) Polls are character1ze estimators (efficiencies, au Lt s , e e: . . . . . a and by the fact that they are done in a fairly indiscriminate w y
The non-existent and surveys.
polls 1.3 Polls and Surveys
information should be generated through
By applying these criteria and proce:sing the information, the latter can become consistent.
As for the non-systematic ínformation, the years.that are m~ss~:~ can be completed by estimates, at least up to ~ina: ene~ii'1t k- consístency is verífied. Non-existent information.is.sti ac ing and should be worked out with appropriate statistical methods.
non-consistent
1.2 Historical Linkages
h · there should be logical historical behavior, so For eac series, h í ·11 k ít possi- h h ·11 be no discontinuities. T is w1 ma e t at t ere wi h h ben unspecified bl to handle those cases in which t ere ave e . e i"n the criteria for compiling the exísting information. changes
O 11 of the independently consistent statistícal serie~ .ºn nce a 1 bl "t ho ld be verified primary and secondary energy are avai a e, i s u that the efficiencies of the transformation.center~ (en:rgy sec= tor) and those of the transformation equipment in final ~onl sumption (final consumption sectors) fall within the :echnicad limits which correspond to the respective installat1ons an transformation equipment.
If ercentages are assígned to the foregoíng scheme, in.keepi~g ·rhpthe first effort at completing the sheets, this defin~s ~O~
~1·r·a1 stage For example, inítially a country may have on.y 1n1 i • . . t atic and consistent 30% of the existing information in sys em 90% fo;m, but at the end of the exercise should have at least . º . h To accomplísh this, it will be necessary to establist t at way. b" h information certain criteria for consistency and to su JeCt te to these.
TOTAL INFORMATION I I ___ I _
I I Existing Non-Existent
____ I _ I I
Systematic Non-Systematíc I _
1--- I Consistent Non-Consistent
51
it is very useful according to the
In the task of compiling the main data sheets, to assess the information and to classify it following scheme:
1.1 Information Assessment
It is suggested that the information be grouped by energy source and by sector in the so-called main sectoral data sheets, such as those shown in Chapter II (Tables 1 through 6).
It should be stressed that the format in whích the balances are ultimately presented can never be completed directly but rather through certain intermediate steps.
It is convenient to organize the collected data so as to facili- tate final preparation of the balance for the final consumption sectors, as well as for the auto-consumption sector. Thís is a fundamentally qualitative stage, where the compiled information is transcribed into special formats, respecting certain rules of compilation.
The important thing in this phase is to be certaín that all written data have been detected; so that the collected inforrna- tion is really what exists.
The first stage in construction of BEEU is preliminary data collectíon, which consísts of gathering all of the data published on the subject of useful energy, whether systematic or not, and in the original formats.
l. Organízation and Treatment of Information
The experience in development of balances methodologies and their consequent application (as in the case of the OLADE balances) has not been accompanied by a similar systematic development of energy information systems, permitting refinement of consumption at the subsectoral level and, withín each subsector, by uses and sources.
energy proposed ínforma- type of
Preparation of an energy balance in terms of useful (BEEU); on the basis of a methodology such as the one herein, requires a series of both energy and non-energy tion, the availability of which varies accordíng to the data and the country being studied.
INFORMATION AND DATA PROCESSING
CHAPTER III
54
In summary, an exhaustive investigation should be rnade into the possibilities for available computers, languages and software packages. The opportune selection of languages and formats will avoid difficulties and will shorten processing time, and at the same time these software packages will permít interaction with the users, thereby enabling greater control of processing.
The experience in the software existing on the rnarket has not been positive in terms of its use far data management using data-gathering forms such as those proposed for each sector. Nevertheless, given the fact that the market of computer packages is so vast and evolves so rapidly, it cannot be affirmed that no solutions are available, espe- cially taking into account that the new generation of rnicro- computers makes almost daily progress, both in terms of memory capcity and package supplies.
One difficulty in entering data in forrnats which are exactly like the original forrn-- which can be resolved by rneans of programming-- is that the available statistical packages in charge of constructing partial balances are not very flexi- ble in terms of the data-reading formats and, in general, they cannot be read in formats such as those that are being proposed. It is thus necessary to have an INTERPHASE PROGRAM to transform the MANAGEMENT FORMAT into a READING FORMAT.
It can be said that it is highly useful (and one could dare to say indispensable) for the data to be entered into the computer in the sarne form in which they were collected. This is equivalent to generating an empty file with the same structure of the original form which, by means of an inter- active program, progressively requests and enters data. This method requires a certain prograrnming effort, but it offers the great advantage that the entering, correction and in general everything relative to data rnanagement can be done without the participation of arbitrary codes.
If processing is computerized, it is convenient to rnake the following clarifications:
The manual or computerized processing should always guarantee the coherence and consistency of the data obtained on the basis of survey forms (presented for the sake of reference for each sec- tor), which later aid in preparing partial balances, whether these be for an industrial plant ora mining establishment, for each subsector of a particular sector.
Another important step in the treatment of information is constituted by the data processing obtained through surveys. In this case, also, auxiliary and main data sheets are presented for each sector, for the elaboration of sectoral balances, as well as the treatrnent of possible sources of error.
53
It is worthwhile to point out here that the guidelines presented in each sector for formation of the database may be a first step of prime importance for construction of a NATIONAL and/or REGIONAL INFORMATION SYSTEM. Obviously, it is rnerely stated here that it may be a first step, since the development of an informa- tion systern goes beyond the scope of this rnethodology; but it is just as true that the availability of such a system may accel- erate the application of this rnethodolagy.
Given the heterogeneity presented by the consumption sectors, the guidelines for forming a database show uneven development, proper ta each sector, with different alternatives, according to the previous knowledge available on sectaral energy consumption. Different is the case of the auto-consumption sector which, awing to its nature, entails census-taking ip all of the activities which cornprise the sector, except for the charcoal plants, far quantification of the useful auto-consurnption and the trans- formation losses.
2. Formation of Databases and Processing of Information
Thus arises the need to CREATE INFORMATION which, under the title DATABASE FORMATION, is included in Chapter II of each sector presented, with the sole aim of providing a frame of reference or general guidelines far its formulation.
Thus, given the lack of such systems, it is necessary to present the different alternatives which, for each sector, will permit quan-tification o f useful energy consumption. This quantifica- tion, as can be observed in the corresponding appendices, differs according to the subsectors, end-uses and sources considered, generating in each case, and in light of the different possibili- ties for knowledge about energy consump t Lon, different methods of information-gathering, census and samples, and in these, dif- ferent types of designs.
Nonetheless, the quantification of useful energy consumption requires a greater disaggregation of sectoral consumption, as well as consumption by end-uses, types of equipment, sources and efficiencies; in most of the countries of the region, this ínfor- mation can be classified as non-existent.
The information assessment can render account of what exists and is consistent; it can be affirmed that, on the basis of the systematic publication of the OLADE balances, the consumption of final energy by sector, as well as the information referring to the supply sector of the balance, forms part of this classification.
If the foregoing <loes not obtain results, a statistical design is made both for sampling and for analysis of the results, and surveys are taken; these are treated by sector in the sectoral appendices.
without a previous design.
56
constitute, in addition toan medium for strengthening the
The development o~BEEU should also element of planftTng, an effective the ínformation apparatus.
Although at the regional level OLADE has made ;e_fforts to generate the mínimum available infdrmation in the field of planning, as in the case of the elaboration of the BEEF and ·,in the technical sphere, the inítiation of resource inventaries in the regían, the truth is that there is no coherent, integral regional information system.
and taking into 'account the energy . an attempt will be made to adopt a the methodology in keeping with the subregional and national energy
Under these circumstances p.rofile of Latín America, mechanism for transfering features of regional, development.
Thís uneven development ín the countries~energy structures calls for different treatme~t in terms of methodology application, given that the emphasis 'on energy policy is different far each country. In other words, the energy exporters foresee the energy prospects or problems differently than the importers do. Furthermore, in those cóuntries where the rural sector and non- conventional sources (firewood, plant and animal wastes, etc.) hold greater importance with respect to final energy consumption, there is a tendency to concentrate on policies related to this field.
As for application of the methodology, there are still sorne limitations, which range from the diversity and heterogeneity of the energy profiles of the Member Countries up to the same difficulties encountered far structuring and availability of a reliable database.
3. Limitations
The methodology, as a, theoretical instrument, provides elements to facilitate more in-depth analytical applications wíthout leav- ing aside those applícations of partíal scope which could provide a minimal basis for evaluation. In other words, an effort is made to seek a ~onceptual equilibrium in which the aim of obtain- ing Íllllllediate results'does not contradict the long-term objec- tives of application and analysis.
auempted to elaborate the concept of the efficiency of final energy use, which is indispensable for determining policíes for rational use of energy. However, it must be kept in mind that ín order to arrive at this level of development in the disaggregation of the balance, it is necessary to know beforehand the useful energy up to efficiency of production. Far that reason, a cutoff point is being adopted in the matrix of the BEEU-OLADE, up to efficiency of productíon, letting each country adopt the particular type of evaluation which would coincide with íts needs and characterístics, in order to arrive at the efficiency of use.
55
also has its present state of development in The methodology
In its more disaggregated state, based on final consumption, as proposed in this methodology, the BEEU mak~ ít possible to visualize the complete energy flow from supply and consumption up to utilization after the last transformation _to a useful state. Knowledge about, and mastery of the final consumption "equipment" forms the basis for the analytical principle concerning the possibilities far substitution and competition of rates and prices of different energy sources. It also permits calculation of certaín ratios for efficiency, penetration and substítution of technologíes, as well as preparation of as ses s smerrt s of the global energy situation of a country, subregíon or region. Nevertheless, only through its relatíon to other socioeconomic variables can BEEU become an invaluable ínstrument of energy planning.
It is important to keep in mind sorne of ,the advantages of the BEEU as a tool which facilitates overall energy planning. Taken in isolation, the BEEF only offer a picture of the physical flows and relations of the energy system within a g.i.ven period.
2. Advantages
This methodology also has the merit of lending itself to application no matter what the state of the art of each sector of the useful-energy balance of each country, as well a~ the cost and information benefits which it offers. Therefore, applications of diverse scope are envisaged.
physical of each made to audits,
On both levels, special care has be~n taken with the concepts of useful energy and the general efficiencies subsector. As far application, an attempt has been highlight statistical methods such as surveys and energy for the formation and/or expansion of the database.
no effort has been spared in the field of attempt to establish a coherent conceptual
the difficulties that the subject of useful in terms of application and analysis.
In that connection, definitions, in an framework, despite energy presents both
The methodology presented herein is aimed at covering the theo- retical needs of the elaboration of the BEEU in all of the countries of the regían. The methodology is valid to the extent that it can be progressively implemented, from the elaboration of a preliminary balance up to the use o~ a database.
l. Characteristics
GENERAL CONSIDERATIONS
CHAPTER Iv
5i3
To agree facilita te elaboration the search development
on the most appropriate mechanisms and procedures to integral transfer of the OLADE methodology for the of the BEEU will undoubtedly be a determíníng step in far the institutional coordination indispensable for of this program in the short, medium and long terms.
In arder to facilitate the means of an institutional nature for the application of this methodology, the gaps existing in the national information teams and systems must be identifíed so as to take advantage of the transfer of this methodology and in thís way guarantee viability and effective implementation.
In the exchange of information and experiences.
by model In the realization of possible training courses countries; and,
preparation horizontal
for from
1985/1986' national
of prelimínary BEEU cooperation and support
In the through teams;
In the solution of doubts and clarifications growing out of the analysis and a_ssessment of the document by each count ry ;
Through horizontal cooperation, a TRAINING PROGRAM is proposed by subregion or model country, making it possible to begin to pre- pare the BEEF and the BEEU in the Member Countries. OLADE considers that theír success will come from the transfer of knowledge which the members of the work group formalized to prepare the methodology will be able to offer and provide within the following criteria far aid and support:
Under these circumstances, in addition to the reconcilíation of criteria in the methodological and conceptual areas, development of the methodology also requires decided political support from the Member Countries in order to achieve the goals and objectives which are geared, above all, to overcomíng the limitations dis- cussed above.
The present document, which contains the OLADE Methodology for the Elaboration of Energy Balances in Terms of Useful Energy, s~eks to stímulate discussions and analyses by the Member Countries and ínternational organizations, in order to initiate and implement this instrument which also intends to propitiate national coordination of energy sector informatíon up to the level of the consumer and to make available greater knowledge about the components of energy demand.
for planning and an Lmpe r a t í.ve component in national information systems in the Member
another instrument the formation of Countries.
57
It is evident that there are obstacles in terms of the transfer and application of the methodology in a short period of time, as
4. Alternative Solutions
A very common obstacle, and one dífficult to overcome is the lack ~f financing far implementation of thís type of p;oject in the field of energy, as in the case of BEEU, 'which call for surveys and audits as a fundamental means of aggregating the information which will permit more in-depth analysis of the p~oble~s of useful energy. It should be underlined that, in a f:rst instance of ~ethodology application, the exísting informa- tio~ may be used in combinatíon with partial investigations and estimates. However, what is desirable is to cover · f . , inso ar as p~ssib~e, the full methodological range; this implies having a finan~ial c~mponent permittíng the development and implementation of this proJect.
system in field of approach
are modi- require-
Few countries in Latín America have an information charge of general coordination and direction in the energy; rather, it can be seen that the institutions this aspect independently and following criteria which fied or adapted in keeping with the circumstances or ments.
structure.
for the establishment of to assure the cycle of information available a nationally centralized institutional organization and system
The lack of control mechanisms calls information systems in arder transfer as well as to make
as a principle of
In national and regional institutions, it is common to encounter a dispersion.of energy information generation and management. In sorne .countri~s, the lack of institutional response to the need for .information becomes evident in the fact that information is considered as a phenomenon outside the institution.
To overcome the obstacles in the area of energy information is no easy task, if ít is kept in mind that, in addition toan aggres- sive process of appraisal of its importance and value, it will be necessary to ~or~ on the search for a solid institutíonal infra- structure. Within the process of institutional development for energy in the.Member Countríes, energy information is unfor- ~una~ely. not given a definite place but left marginal withín the 1ns71tutional structure of the organizations which direct energy policy, thus hindering suitable coordination and, as a conse- quence, overall system management,
This wou~d be sufficient justification for following a systematic proce~s in the a~ea of energy information. It is well known that 7he implementation o: an information system is a complex task in itself and that, besides a methodological structure in line with the_n~eds of the ~ountr~es of the region, ít requires politícal decisio~ ~n~ backing, with a view to accomplishing concrete goals and activities.
This is the energy which is obtained directly from f cr e st,
resources. It includes tree trunks and branches and waste from
Firewood
This is the energy obtained from uranium ore, following processes of purification, conversion and/or enrichrnent.
Fission Fuels
Geotherrnal energy is the energy which is stored under the earths surface in the form of heat and which can be transmitted to the surface by a fluid in contact with the hot rock. This fluid is usually water in a liquid state, steam, ora mixture of the two.
Geoenergy
This is the potential energy frorn a waterflow.
Hydroenergy
This is a precursor of coal and is formed by the chemical and bacterial decomposition of dead vegetable matter. Be- cause of the action of heat, pressure and other phenornena, peat is transformed into different types of coal.
Peat
This is found in a less advanced stage of carbonization and has an NCV of 4125 Kcal/kg, on an ash-free, hurnidity-free basis.
Lignite
This is the coal which has completed an advanced or medium stage of carbonization, with a net calorific value (NCV) of 5100-8500 Kcal/kg, on an ash-free, humidity-free basis.
Anthracite and Bituminous Coal
This. is a salid combustible mineral, black or b r own in color and conta1n1ng essentially carbon, as well as small amounts of hydrogen and oxygen, nitrogen, sulphur and other elements, as a result of the degradation of the remains of plant organisms over long periods, due to the action of heat, pressure and other physical and chernical phenomena.
Dueto the fact that there are different degrees of change in the process, coal is nota uniform mineral; it can be classified by ranges, according to the degree of metamorphosis in series going from lignites to anthracites, which present considerable differences in terrns of volatile rnatter content, fixed carbon and calorific value.
::oal
the gaseous fuel mixture which comes from This is well.
Associated Natural Gas
This is that gaseous fuel mixture constituted primarily by the methane obtained from gas fields.
Free Natural Gas
This is a mixture of gaseous fuels and includes both free natural gas and associated natural gas, present in coal mines or geopres- sure zones. Herein, both (the net free and associated gas produced) are placed under the same heading dueto their similar nature and uses.
Natural Gas
Crude oíl is used as a feedstock in refineries, where it is processed to obtain derivatives.
This is a complex mixture of hydrocarbons having different mole- cular weights, in which there is usually a small proportion of cornpounds containing sulphur and nitrogen. The composition of petroleum is variable and may be divided into three types, according to distillation residues: paraffin, asphalt or a mixture of the two.
Crude Oil
"Primary energy" is understood as the different sources of energy, as they are obtained from nature, whether directly, as in the case of hydro or solar energy, or after a process of extraction, as in the case of petroleum, coal, geothermal energy, etc., or through photosynthesis, as in the case of firewood and other vegetable or plant fuels. The following primary sources have been considered:
PRIMARY ENERGY
preparation of useful-energy the specific connotations to be unify the technical criteria of
used in the below, with in order to
A glossary of terms balances is presented given to these terms the countries.
G L O S S A R Y
CHAPTER V
62
Diesel/Gas Oíl
These are liquid fuels obtained from the atmospheric distillation of petroleum between 200 and 380 degrees Centigrade; they are heavier than kerosene and are used in diesel engines and other compression-ignition motors.
Turbofuels are which has a lower used in reaction
refining, They are
a kerosene with a specíal degree of freezing point than regular kerosene. and turbopropeller engines.
These are liquid fuels constituted by the fraction of petroleum which is distilled between 150 and 300 degrees Centigrade. Kerosene is used as a fuel far cooking, lighting, and running engines, and as a solvent in shoe polish and insectícides for household use.
Kerosene and Turbofuels
Naphthas
These are volatile liquids obtained from petroleum and/or natural gas processing and used as feedstock in refineri:s, as a solvent in paint and varnish factories, as a cleaning agent, and also in petrochemicals and fertilizers.
Natural Gasoline
This is a product of the processing of natural gas and it is used as feedstock for industrial (petrochemical) processes and refineries or in direct mixtures with naphthas.
This is a complex mixture of relatively volatile hydrocar- bons which, with or without additives (such as tetra- ethyl lead), is used to operate internal combustion engines.
Motor Gasoline
This is a mixture of reformed naphthas having ~ ~igh octane number, high degree of volatile matter and stab~lity, an~ a low freezing point; it is used in propeller aircraft with piston engines.
Aviation Gasoline
This group includes:
Gasolines and Naphthas
This is a mixture of light liquid hydrocarbons obtained from l refining and/or the treatment of natural gas, whose petro eum 30 d 200 degrees boiling range is generally found between an
Centigrade.
61
This consists of light hydrocarbons, principally propane and butane, alone or in combination, obtained from the distillatLn
Liquefied Petroleum Gas (LPG)
The forms of secondary energy considered are as follows:
"Secondary energy11 is the term used for the different energ_; products which originate from the various transformation centen: and the destination of which is the different consumption sectors and/or other transformation centers.
SECONDARY ENERGY
These include wind and solar energy and any other primary source not included in the foregoing descriptions but rele- vant in the energy structure of the country.
Other Energy Sources
Substances with an energy content produced in industrial plants as a by-product of the production process, for exam- ple, furnace gas, black liquor, etc.
Recovered Energy
These refer to the residues of agricultural/livestock activ- ities and urban wastes. They can be used directly as fuel in a dry form or converted into biogas through a process of fermentation ora method of decomposition.
Animal Fuels
Here are included all of the agricultural wastes (except sugarcane bagasse), e.g., rice husks, coffee husks, coconut shells, etc., wastes from sawmills (not included under the concept of firewood nor bagasse), etc., for energy purposes,
These are the energy resources obtained from agroindustrial and forestry resídues.
Vegetable or Plant Fuels
This concept includes:
Other Primary Energy Sources
This includes the sugarcane products which are used for energy purposes; among these are bagasse, cane liquor (juice) and molasses.
Sugarcane Products
sawnrí Ll.Lng activities, all of which fall under the de f í,r, ··u_on of "other plant and animal fuels" used for energy purposes.
Non-Energy Products
h roducts which are not used for energy These are te p have a considerable energy content; purposes although they . d h lt lubricating oils an¿ among these can be mentione aspa , greases, etc.
roducts which have not been These are the secondary energ~ ~ . d hich take part in included in the preceding definitions an w the energy structure of the country.
Other Energy Fuels
d d both energy and non-energy products. Here are inclu e
Other Fuels
the from obtained
Biogas
This is the gas, principally methane, anaerobic fermentation of biomass waste.
b · das a by-product liquid hydrocarbons o taine ªne butane of natural gas (ethane, prop '
This includes from the treatment and pentane).
Condensed Gas
Coke Gas
. roduced as a secondary product in the This is the gas p k ith a mixture of air and . h ting of coal orco e, w "d intense. ea It is composed of carbon monoxi e, steam in coke plants. f h drogen and carbon dioxide. nitrogen and small amounts o y
d a by-product from steel-making This is a gas obtaine as f h t• in d is generally used or ea ing activities in furnaces an
such plants.
Furnace Gas
non-condensable gas obtained from crude oi! consists mainly of hydrogen, met~ane, an
1 . the refining process itself. used most Y in This is the refining; it ethane and is
Refinery Gas
. the aseous fuels obtained as by-products This category includes . g k lants and furnaces, as well as f ctivities in refineries, co e p o a obtained from biodigesters. the gas
Process Gases
63
Methanol is also a colorless liquid that can be produced from various raw materials, such as firewood, vegetable waste, methane, natural gas, charcoal, etc, It is also used in combus- tion engines.
Ethanol is a colorless liquid which can be produced by means of fermentation of vegetable matter having a high sugar content, such as sugarcane liquor ar molasses; vegetable matter with a high starch content, such as cassava, corn, etc.; and matter with a high cellulose or pulp content, e.g., firewood and plant residues. It can be used as anhydrous or hydrous alcohol, mixed with gasoline or alone, in interna! combustion engines.
This includes both ethanol (ethyl alcohol) and methanol (methyl alcohol) used as fuels.
Alcohol it which from vary according to the wood may These features
is derived.
This is the fuel obtained from the destructive distillation of the wood from charcoal plants, in the absence of oxygén~. This product absorbs humidity rapidly, so that it usually has a moisture content of 10-15%, in addition to O. 5-1. 0% hydrogen and . 2-3% ash, with a net calorific value of around 6500Kcal/kg.
Charco al
This is the energy composed of electrical charges in motion. It includes the electric energy generated from any resource, whether primary or secondary, in hydroelectric, thermoelectric, geothermal or nuclear plants.
Electricity
The general term of coke is applied toan unmeltable salid fuel with a large carbon content, obtained from the destructive distillation of coal, petroleum and other carbon materials. There are different types of cake, and these are usually identified by adding to their name, the name of the material from which they originated: for example, petroleum coke. This definition includes petroleum coke and coke plant products.
Cake -
This is the residue of petroleum refining and comprises all of the heavy products, which are generally used in boilers, electric power plants and navigation.
Heavy .l:í'u1:!ls _(Fuel 0..:..1.)
66
This heading includes:
This part includes all of the energy flows grouped according socioeconomic sectors in which they are consumed.
to TOTAL FINAL CONSUMPTION
The statistical differences between the two variables and all of the adjustments are included here. These adjustments should not exceed 5%.
Statistical adjustments constitute a measure of the statistical soundness of the information, by permitting compatibility between the double flow of information, Energy Supply/Consumption, meas- ured independently and avoiding, insofar as possible, the cal- culation of one variable as a function of the other.
Adjustments
Losses in the transformation centers are not included, since they are treated separately.
losses are those which occur in the transmission and of electricity, in the storage and pipeline hydrocarbons, in the distribution of gas, etc.
Examples of distribution transport of
These refer to the amount of energy lost in the activities of storage, transportation and distribution of the primary and secondary energy products, from the centers of production to the centers of consumption.
Los ses
This refers to the primary and secondary energy flows that enter and leave the group of transformation centers, respectively. Physical or chemical transformation is understood as the change of one source of energy into another, by means of any one of the transformation centers included in the matrix.
TRANSFORMATION
This is the amount of primary and secondary energy available to satisfy the energy needs of the country, both in terms of final consumption and transformation centers.
TOTAL SUPPLY
Differences between the mass of steam and/or water extracted from a geothermal well and the mass of steam that feeds into a power plant or other installation.
Overflows in hydroelectric stations.
Flared gas (natural or refinery gas).
Spilled petroleum.
technical and/or due to d€mand of energy are:
energy which, dueto for exploitation or Examples of this type
This L s th e amount of economic constraints conditions, is not used.
This is the difference b the etween the stocks at th b .. end of ayear, for each form of e eginning and at s:condary; an increase . energy, whether primary or sign, and vice versa. in stocks is indicated with a plus (+)
Unutilized Energy
Variation in Stocks
for This includes the primary d external supplies. an secondary energy allocated
Exportation
and and
primary borders
flows, both the countrys
This includes secondary, entering to
all of th e energy originating from outside form part of the supply.
For secondary energy, 11 transformatíon centers :re ~!n:~~e~~~put f:ows from the national recyclíng and auto-consumption. , prior to accounting for
Importation
from extracted the volumes When dealing with primary energy national sources are considered. '
This refers to th e energy produced within the national territory.
Production
energy available for this concept, the followng
This te f rm re ers to the total amount of consumption in the country. Within variables have been considered:
ENERGY SUPPLY
Thís is 1 a so id hydrocarbon wíth . brown or black in color which . ba .colloidal structure, a distillation proces~ . is o tained as a residue from atmospheric distillation oinf a vacuum, of the residues of the petroleum.
Bítumen
wax of
These are visco~E and obtained by petroleum between
liquía. nydr ocs.r bons ri. ch Ln - paraffin means of the atmospheríc distillation 380 and 500 degrees céntigrade.
Lubrícants

LO
-------------------- (***) EUROSTAT - 11Useful Energy Balance Sheets 1975,11 Belgium, 1978.
íts
Economic Communíty(***) Euro pean
Useful energy is the energy available to the consumer after final conversíon.
sectors, but these practical difficulties is beíng applied.
of useful energy could be consídered as a its use and the economic
such theoretical and only the first solutíon
Note: function
Determination of technical procedures,
breakdowns present that, currently,
tíon at the level of final energy, by applyíng average or con~~:~ed effíciencíes far the last apparatus in th: trans:o:ma- e~t1 and assuming a sound knowledge of the park and its effic1en- t1on . . . . . cíes, which can vary in s1gn1f1cant proportions.
67
(*) Concepts and Methods in Energy Statistics, with special reference to energy accounts and balances. United Nations Series F, No. 29. (**) World Energy Conference Glossary on Energy Balances and Accounting, Pergamon Press, pg. 5,
--------------------
this final
is no effective measure of useful energy, in fact a balance derived from the balance of
Since there balance is
A useful-energy balance is a balance established on the basis of accounting of the different energy flows according to their real calorific value, from the primary supply to the useful energy recovered by the final consumer at the outlet of his devices, thus considering the losses suffered in the different pha~es of transformation and consumption.
This is the energy which is available to the consumer after its final conversion.
World Energy Conference(**)
Useful energy is effectively transformed into useful work, in the equipment and processes corresponding to the different end-uses, such as the power obtained in an automobile, the light from a bulb, or fluorescent tube, or the heat from the steam produced when fossil fuels are burned. These amounts of useful work reflect the combined effects of the theoretical efficiency of the device, the equipment or the process, as well as the intensity of operation and the form of utilization.
United Nations(*)
Far the sake of comparison with definitions from other organizations, the differences in useful energy adopted by other international organizations are presented below.
USEFUL ENERGY
This is all of the energy del1vered to the consumption sectors, for both energy and non-energy purposes.
Total Final Consumption
This includes the volumes of products which are used for non-energy purposes in all of the final consumption sectors.
Final Non-Energy Consumption
This ítem refers to the total amount of primary and secon- dary products used by all of the consumption settors to satisfy their energy needs.
Final Energy Consumption
70
The calorific values of the energy sources presented in the OLADE balance vary according to their origin, composition, humidity content, volatile matter content, etc., far which reason each country should use its own information, obtained from the analysís of the energy sources used. The countries should períodically review these values and make the necessary modifications; thus, the importance of remitting, along with the balance, the information corresponding to the calorific values
From the theoretical standpoínt, any conventíon may be adopted in the national energy balance, as long as it explicítly specifies the corresponding conversion factors for the purposes of analysis and comparison with other balances.
It <loes not artificially increase the real structure of internal energy demand.
5.
It does not distort the rel,ative share of the prímary sour- ces in a country's energy supp Ly ; such distortion becomes more accentuated when gaseous and plant fuels weigh more in the energy structure.
4.
decision-making wíth re- based on heat per unit of
It permits a clearer picture for spect to inter-fuel substitution, mass.
3.
It facilitates economic comparisons among fuels, for the calculation of relative prices.
2.
It reflects the exact amount of heat contained in each fuel that may be used by the consumer.
l.
The NCV has been adopted because:
The BEEF of OLADE, in their current state, evaluate liquid and gaseous fuels according to the net calorific value (NCV), which discounts the latent heat of the condensation of water vapor contained in the combustíon gases, which, in practice, is not utilized.
The Convention Adopted by OLADE
The difference between the GCV and the NCV becomes more important when going from gaseous fuels to light liquid fuels, and from the latter to heavy liquid fuels. The dry-base difference in dry fuels may be 10% and in heavy liquid fuels 1%.
Enthalpy of water at 15 C Number of hydrogen atoros
H X
where:
NCV = GCV - 9 (xH) (H20) 15 e
The NCV is calculated by means of in water vapor condensation. the following formula:
69
Generally speaking, before putting the energy balance matrix into any unit, it is necessary to quantify the calorific value of each energy source. This will be defined by means of adiabatic cal- orie me~ers, with which the heat given off during energy com- b0stion 1s.measured taking into account the condensation of water vapcr. Th1s value is known as the upper or gross calorific value (.cv). With knowledge of the GCV, the lower ar net calorifü:: ''a.be (NCV) can be caJ_culated; it does not include the heat u s ad
l Joule 0.2388 calories 1 TJ 0.2388 Tcal 1 Tcal 4.186 TJ l TOE 10 Kcal l BOE 0.1387 TOE
Thus, we have that:
It would be advisable to compile the sectoral balances (ma-Ln sheets) in terms of a common unit, which could be the Joule (kilo or tera) _or the ca~orie, and which could be systematically con- verted 1nto BOE 1n the overall presentation of the national or regional energy balance.
To assure coherence in the bas í,c data, it is important that bo r ', the main sheets and the auxiliary sheets of the useful-energy balance follow the same norms.
The sheets which comprise the national balance are usually pre- pared in the original units; in other words, solid sources in metric tons, gases in cubic meters, and electricity in kilowatt- hours (kWh), etc.
159 liters 7.206 barrels of oíl equivalent (BOE) 0.2082 tons of coal equivalent (TCE)
1 bbl 1 TOE 1 BOE
The OLADE energy balance is presented in barrels of oíl equiva- lent (BOE), which have the following equivalencies based on the calorific value of oil: 1 kg ~ 10,000 Kcal.
Th: flo~s which ma~e up the energy balance are usually measured us1ng d1fferent un1ts. However, in order to clase the overall balance and enable the comparative analysis of data and the review of the energy structures in a country, it is useful and necessary to unify the units of measore for the different sources of energy by using a common unit.
Energy Equivalencies l.
¿, ~.sJ~Y E:/U0-VALENCIES AND EFFIGIENCIES
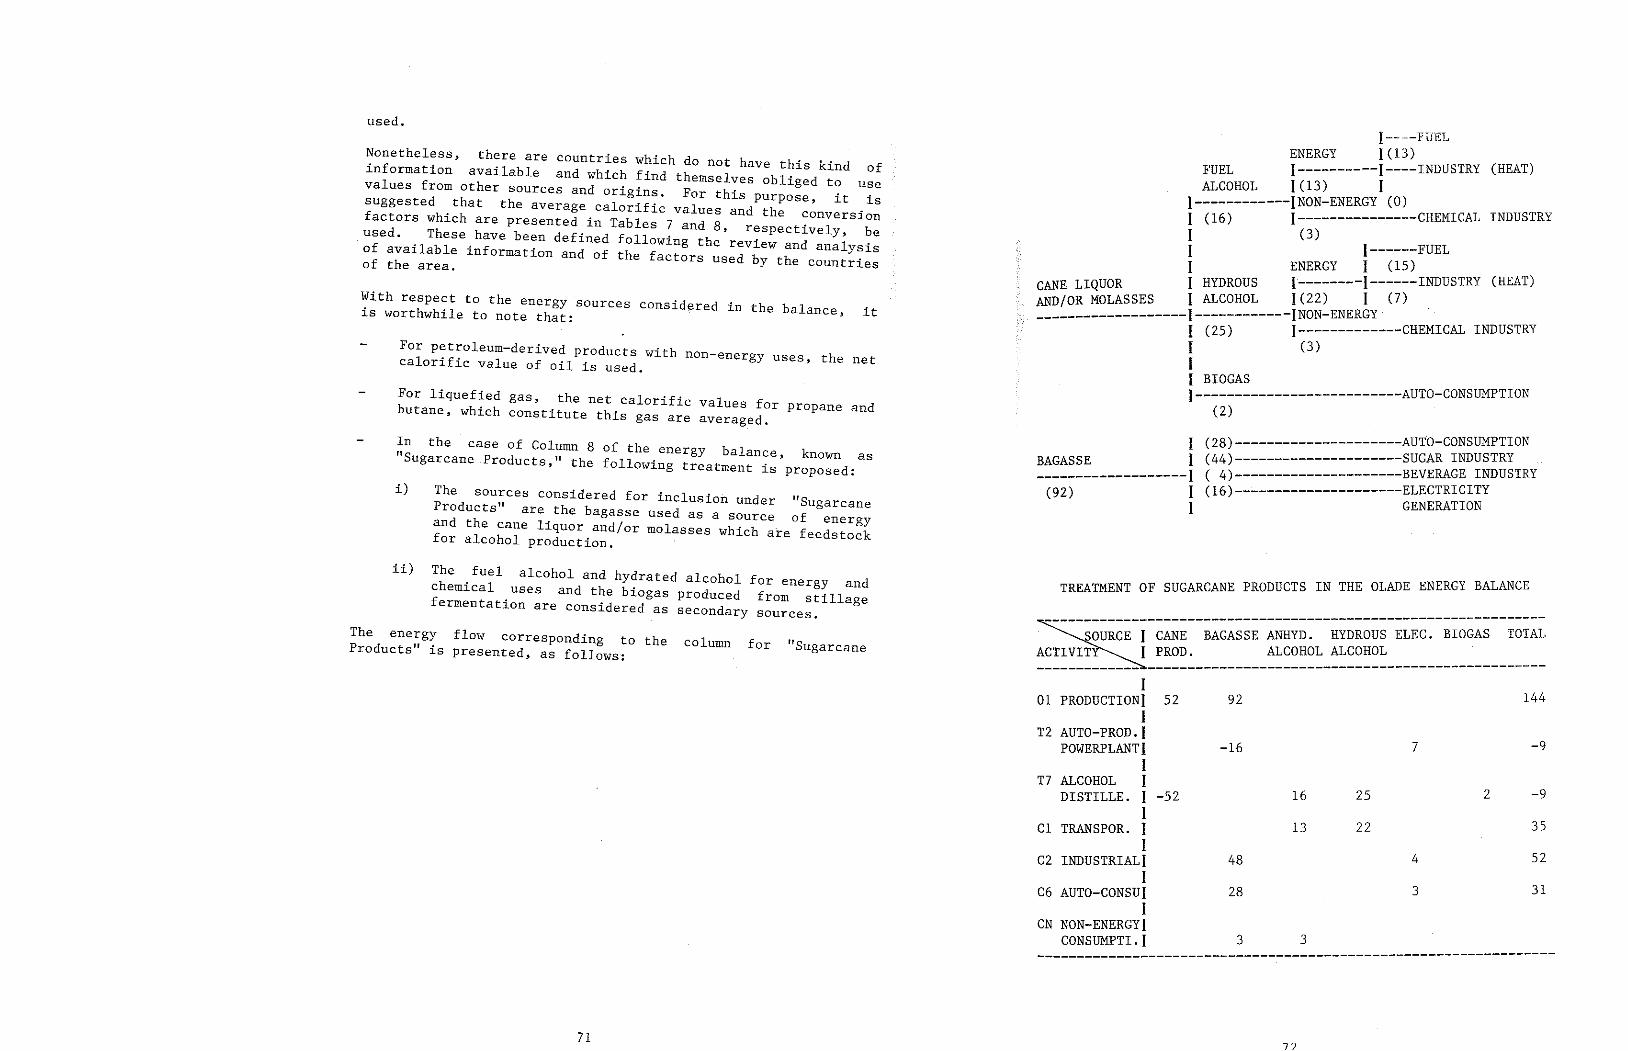
7?
------~~- ----------------------------------- ---------------------
31
52
35
-9 2
-9
144 52 92
-16 7
-52 16 25
13 22
48 4
28 3
3 3
1 01 PRODUCTIONI
1 T2 AUTO-PROD. 1
POWERPLANTI 1
T7 ALCOHOL 1 DISTILLE. 1
1 Cl TRANSPOR. 1
1 C2 INDUSTRIAL!
1 C6 AUTO-CONSUI
I CN NON-ENERGYI
CONSUMPTI.I
---------------------------- ------------------------ TOTAL OURCE l GANE BAGASSE ANHYD. HYDROUS ELEC. BIOGAS 1 PROD. ALCOHOL AL~~~~~----------------- -------------------------
PRODUCTS IN THE OLADE ENERGY BALANCE TREATMENT OF SUGARCANE
1 BAGAS SE 1 -------------------1
(92) 1 1
I ~-~-FUEL ENERGY l (13)
FUEL l----------1----INDUSTRY (HEAT) ALCOHOL 1 (13) 1
1------------JNON-ENERGY (O) INDUSTRY I (l6) J---------------CHEMICAL 1 (3) I J------FUEL 1 ENERGY l (15) I HYDROUS l--------1------INDUSTRY (HEAT) CANE LIQUOR 1 (22) 1 (7) AND/OR MOLASSES 1 ALCOHOL
-------------1------------JNON-ENERGY INDUSTRY ------ I (25) 1-------------CHEMICAL 1 (3) 1
~-~:~~~~-------------------AUTO-CONSUMPTION (2)
(2S)---------------------AUTO-CONSUMPTION (44)---------------------SUGAR INDUSTRY ( 4)---------------------BEVERAGE INDUSTRY (l6)---------------------ELECTRICITY
GENERATION
71
The energy flow corresponding to the column for "Sugarcane Products" is presented, as follows:
ií) The fuel alcohol and hydrated alcohol for energy and chemical uses and the biogas produced from stillage fermentation are considered as secondary sources.
í) The sources considered for inclusion under "Sugarcane Products" are the bagasse used as a source of energy and the cane líquor and/or molasses whích are feedstock for alcohol production.
In the case of Column 8 of the energy balance, known as "Sugarcane Products," the following treatment is proposed:
For liquefíed gas, the net calorific values for propane and butane, which constitute this gas are averaged.
For petroleum-derived products with non-energy uses, the net calorific value of oíl is used.
With respect to the energy sources considered in the balance, it is worthwhile to note that:
Nonetheless, there are countries which do not have this kind of information available and which find themselves obliged to use values from other sources and origins. For this purpose, it is suggested that the average calorific values and the conversion factors which are presented in Tables 7 and 8, respectively, be used. These have been defined following the review and analysis of available information and of the factors used by the countries of the area.
used.
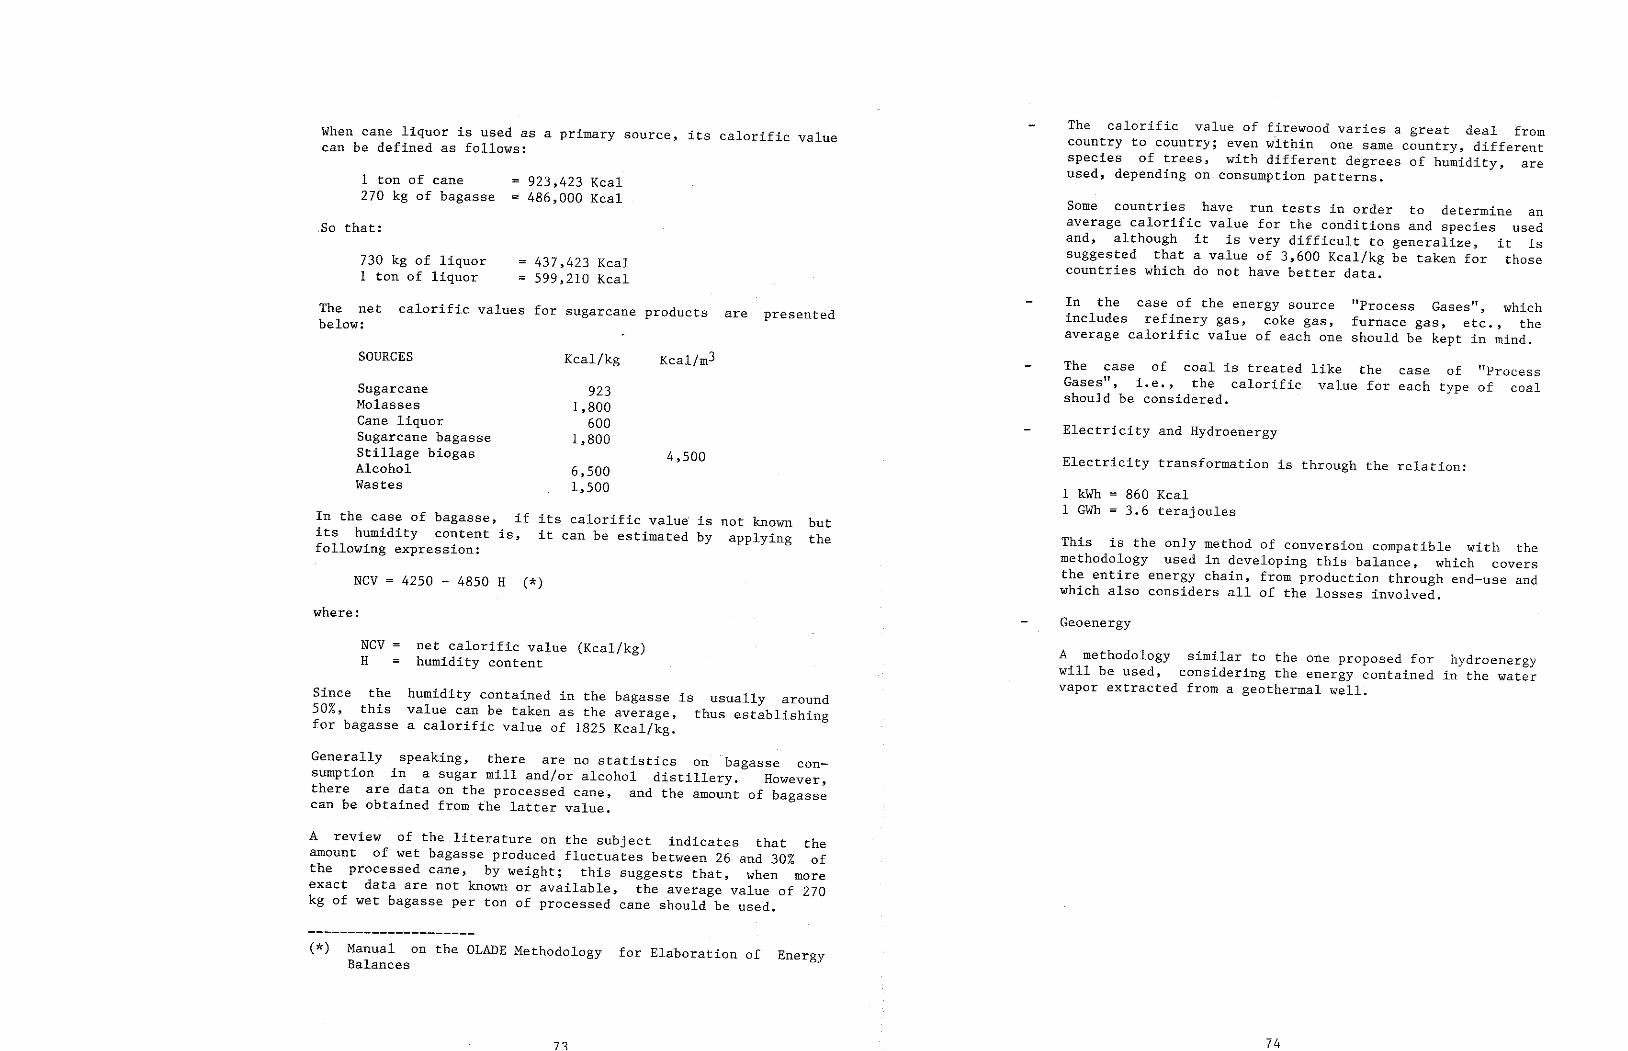
74
hydroenergy in the water
A methodology similar to the one proposed for will be used, considering the energy contained vapor extracted from a geothermal well.
Geoenergy
This is the only method of conversion compatible with the methodology used in developing this balance, which covers the entire energy chain, frorn production through end-use and which also considers all of the losses involved.
860 Kcal 3.6 terajoules
1 kWh 1 GWh
Electricity transforrnation is through the relation:
Electricity and Hydroenergy
The case of coal is treated like the case of "Process Gasesn, i.e., the calorific value for each type of coal should be considered.
"Process Gases", which furnace gas, etc., the should be kept in mind.
In the case of the energy source includes refinery gas, coke gas, average calorific value of each one
Sorne countries have run tests in order to determine an average calorific value fot the conditions and species used and, although it is very difficult to generalize, it is suggested that a value of 3,600 Kcal/kg be taken for those countries which do not have better data.
The calorific value of firewood varíes a great <leal from country to country; even within one same country, different species of trees, with different degrees of humidity, are used, depending on consumption patterns.
(*) Manual on the OLADE Methodology for Elaboration of Energy Balances
the of
more 270
A review of the literature on the subject indicates that amount of wet bagasse produced fluctuates between 26 and 30% the processed cane, by weight; this suggests that, when exact data are not known or available, the average value of kg of wet bagasse per ton of processed cane should be used.
Generally speaking, there are no statistics on bagasse con- sumption in a sugar mill and/or alcohol distillery. However, there are data on the processed cane, and the amount of bagasse can be obtained from the latter value.
Since the humidity contained in the bagasse is usually around 50%, this value can be taken as the average, thus establishing for bagasse a calorific value of 1825 Kcal/kg.
net calorific value (Kcal/kg) humidity content
NCV H
where:
NCV = 4250 - 4850 H (*)
but the
if its calorific value is not known is, it can be estimated by applying
In the case of bagasse, its humidity content following expression:
6,500 1,500
4,500
923 1,800 600
1,800
Sugarcane Molas ses Cane liquor Sugarcane bagasse Stillage biogas Alcohol Wastes
Kcal/m3 Kcal/kg SOURCES
presented are calorific values for sugarcane products The net below:
437,423 Kcal 599,210 Kcal
730 kg of liquor 1 ton of liquor
So that:
923,423 Kcal 486,000 Kcal
1 ton of cane 270 kg of bagasse
When cane liquor is used as a primary source, its calorific value can be defined as follows:
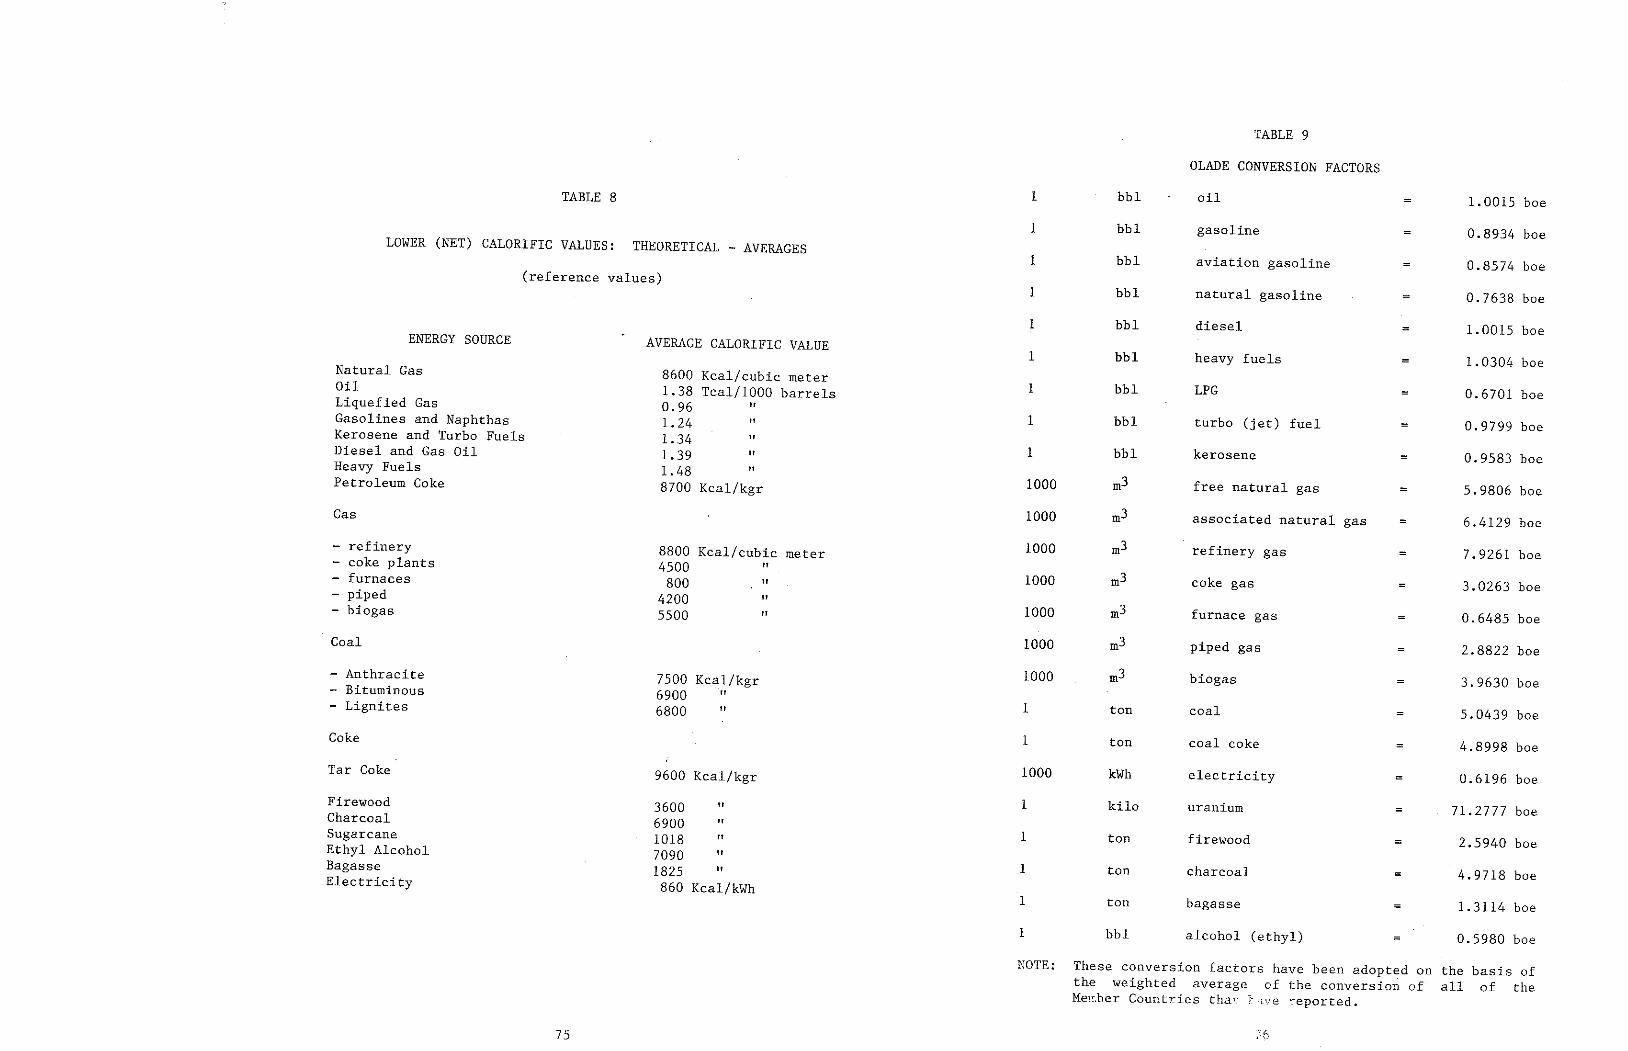
.. (.. .. \_)
NOTE: These conversíon factors have been adopted on the basis of the weighted average of the conversion of all of the Hen.be r Countries t har ]:- ·tve ·~eported .
0.5980 boe alcohol (ethyl) 1.3114 boe bagas se 4.9718 boe charcoal 2.5940 boe firewood
71.2777 boe uranium 0.6196 boe electricity 4.8998 boe coal coke 5.0439 boe coal 3. 9630 boe biogas 2.8822 boe piped gas 0.6485 boe furnace gas 3.0263 boe coke gas 7.9261 boe refinery gas 6.4129 boe associated natural gas 5.9806 boe free natural gas 0.9583 boe kerosene 0.9799 boe turbo (jet) fuel 0.6701 boe LPG 1.0304 boe heavy fuels 1.0015 boe die sel 0.7638 boe natural gasoline 0.8574 boe aviation gasoline 0.8934 boe gasoline l. 0015 boe oíl
OLADE CONVERSION FACTORS
TABLE 9
bbl 1
ton 1
ton 1
ton 1
kilo 1
kWh 1000
ton 1
ton 1
1000
1000
1000
1000
1000
1000
1000
bbl 1
bbl 1
bbl 1
bbl 1
bbl 1
bbl 1
bbl 1
bbl 1
bbl 1
75
9600 Kcal/kgr
3600 11
6900 " 1018 11
7090 " 1825 ti
860 Kcal/kWh
7500 Kcal/kgr 6900 " 6800 lt
8800 Kcal/cubic meter 4500 11
800 11
4200 11
5500 11
8600 Kcal/cubic meter 1.38 Tcal/1000 barrels 0.96 " 1.24 11
1 . 34 11
l. 39 " l. 48 " 8700 Kcal/kgr
AVERAGE CALORIFIC VALUE
(reference values)
Firewood Charcoal Sugarcane Ethyl Alcohol Bagas se Electricity
Tar Coke
Coke
- Anthracite Bituminous
- Lignites
Coal
- refinery coke plants
- furnaces piped
- biogas
Gas
Natural Gas Oíl Liquefied Gas Gasolines and Naphthas Kerosene and Turbo Fuels Diesel and Gas Oíl Heavy Fuels Petroleum Coke
ENERGY SOURCE
LOWER (NET) CALORIFIC VALUES: THEORETICAL - AVERAGES
TABLE 8
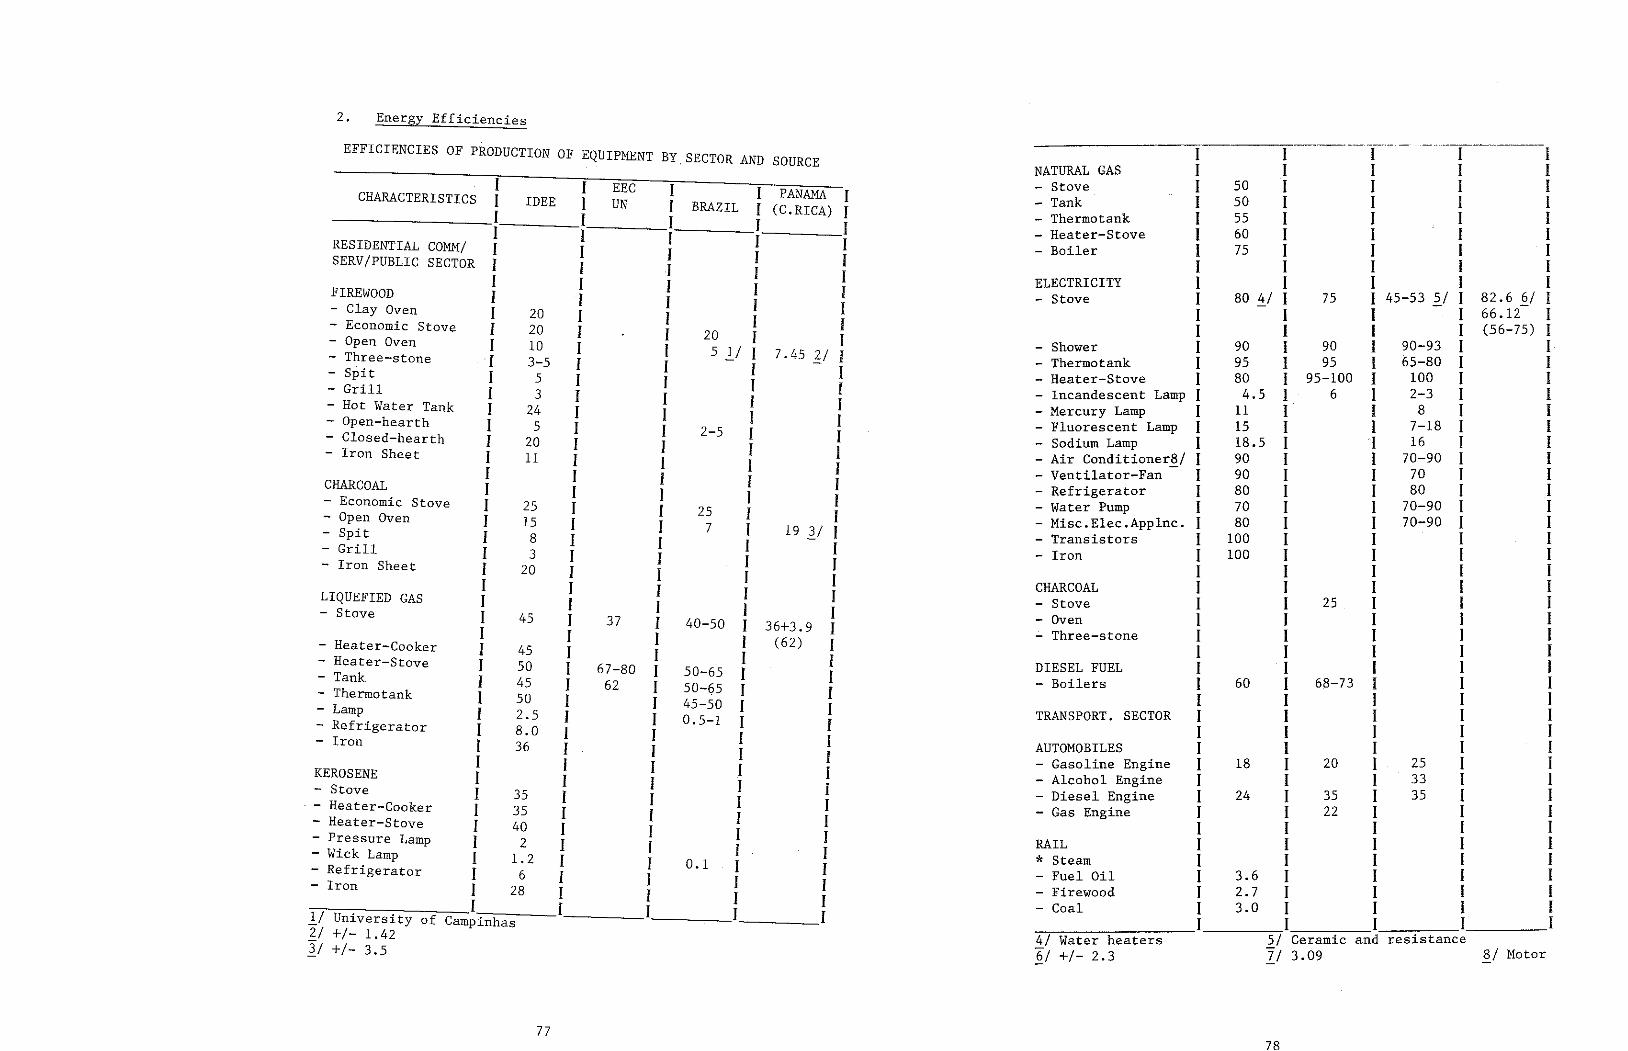
78 77
Ener~~ Efficiencies -----·--- __ _.._._ ..... ..._ _________
I
2.
1 1 1 1 I I1 1 I
EFFICIENCIES OF PRODUCTION OF EQUIPMENT BY SECTOR AND SOURCE NATURAL GAS I I1 50 I 1 - Stove I 1 1 50 I 1
I 1 EEC I I PANAMA I - Tank I 1 I I
CHARACTERISTICS 1 IDEE I UN 1 BRAZIL I (C.RICA) I - Thermotank 1 55 1 1 1 1
1 I I I I _ Heater-Stove I 60 1 75 1 1 1
1 1 I I I - Boiler 1 1 I I
RESIDENTIAL COMM/ 1 l 1 I I 1 1 l1 I
SERV/PUBLIC SECTOR 1 I l I I ELECTRICITY 1 1 45-53 5/ 1 82.6 !!_! I 1 80 4/ 1 75 1
I I 1 I l - Stove 1 1 66 .12 1
FIREWOOD 1 1 1 1 I 1 1 1 (56-75) I 1
- Clay Oven 1 20 I 1 I I 1 1 90-93 1 1 1 90 1 90 1
- Economic Stove 1 20 1 I 20 I I - Shower 65-80 1 I 1 95 1 95 I
- Open Oven I 10 I I 5 Jj 1 7.45 ]:/ I - Thermotank 1 95-100 I 100 I I
- Three-stone 1 3-5 1 1 1 I - Heater-Stove 1 80 I4.5 I 6 1 2-3 I
- Sp í t I 5 I I 1 I - Incandescent Lamp 1 I1 1 8 I
- Grill I 3 I I I I - Mercury Lamp 1 11 7-18 1 I1 1
- Hot Water Tank 1 24 1 I I 1 _ Fluorescent Lamp 1 15 l I·1 16
- Open-hearth I 5 I I 2-5 I 1 - Sodium Lamp 1 18.5 1 70-90 I I
- Closed-hearth 1 20 1 I I I - Air Conditioner~/ 1 90 1 1 1 1 1 70 1
- Iron Sheet I 11 I 1 I I _ Ventilator-Fan 1 90 1 1 1 80 I
I I l I I - Refrigerator 1 80 1 70 1 I 70-90 I
CHARCOAL 1 1 1 1 I - Water Pump 1 70-90 I 1
- Economic Stove I 25 I 1 25 1 I - Misc.Elec.Applnc. 1 80 1 1 II 1 1
- Open Oven 1 15 I I 7 I 19 ;}_/ 1 - Transistors 1 100 1 1
- Spit I 8 l 1 I 1 - !ron I 100 I 1 I 1 l 1
- Grill 1 3 1 1 1 1 1 1 I
- Iron Sheet 1 20 I I I 1 CHARCOAL 1 1 l 1 I 25 1 1
1 1 l I 1 - Stove 1 1 1 1 1 1
LIQUEFIED GAS 1 I 1 I 1 - Oven 1 1 1 1 1
- Stove 1 45 1 37 I 40-50 I 36+3.9 I .;.. Three-stone 1 I
1 1 1 1 (62) 1 1 1 1 I1 1 1
- Heater-Cooker 1 45 1 1 1 I DIESEL FUEL 1 1 1 60 1 68-73 I 1
- Heater-Stove 1 50 I 67-80 1 50-65 1 I - Boilers 1 1 1 1
- Tank 1 45 I 62 1 50-65 1 I I 1 1
- Thermotank 1 50 I 1 45-50 1 i TRANSPORT. SECTOR 1 1 1 I1 1 1
- Lamp I 2.5 I 1 0.5-1 1 I 1 I I 1 1
- Refrigerator 1 8.0 1 I I 1 AUTOMOBILES 1 25 1 I
- Iron 1 36 I 1 I I - Gasoline Engine 1 18 1 20 1 1 1 1 33 1
1 1 l I I - Alcohol Engine 1 1 24 1 35 1 35 1
KEROSENE I 1 1 1 I - Diesel Engine 1 1 1 1 22 I
- Stove I 35 1 1 1 1 - Gas Engine 1 1 1
- Heater-Cooker 1 35 I 1 I 1 1 1 1 1 I 1
- Heater-Stove I 40 I 1 I I RAIL 1 1 1 1 l
- Pressure Lamp 1 2 1 I I I * Steam 1 1 1 1
- Wick Lamp 1 l. 2 1 I o .1 I I - Fuel Oil 1 3.6 1 l 1 l 1
- Refrigerator I 6 1 I I I - Firewood 1 2.7 1 1 I1
- Iron 1 28 I 1 I 1 - Coal 1 3.0 1 1 I
I 1 I I I 1 1 1 and resistance
1/ University of Campinhas 4/ Water heaters 5/ Ceramic
8/ Motor 2¡ +/- l. 42
6¡ +/- 2.3 Jj 3.09 3¡ +/- 3.5
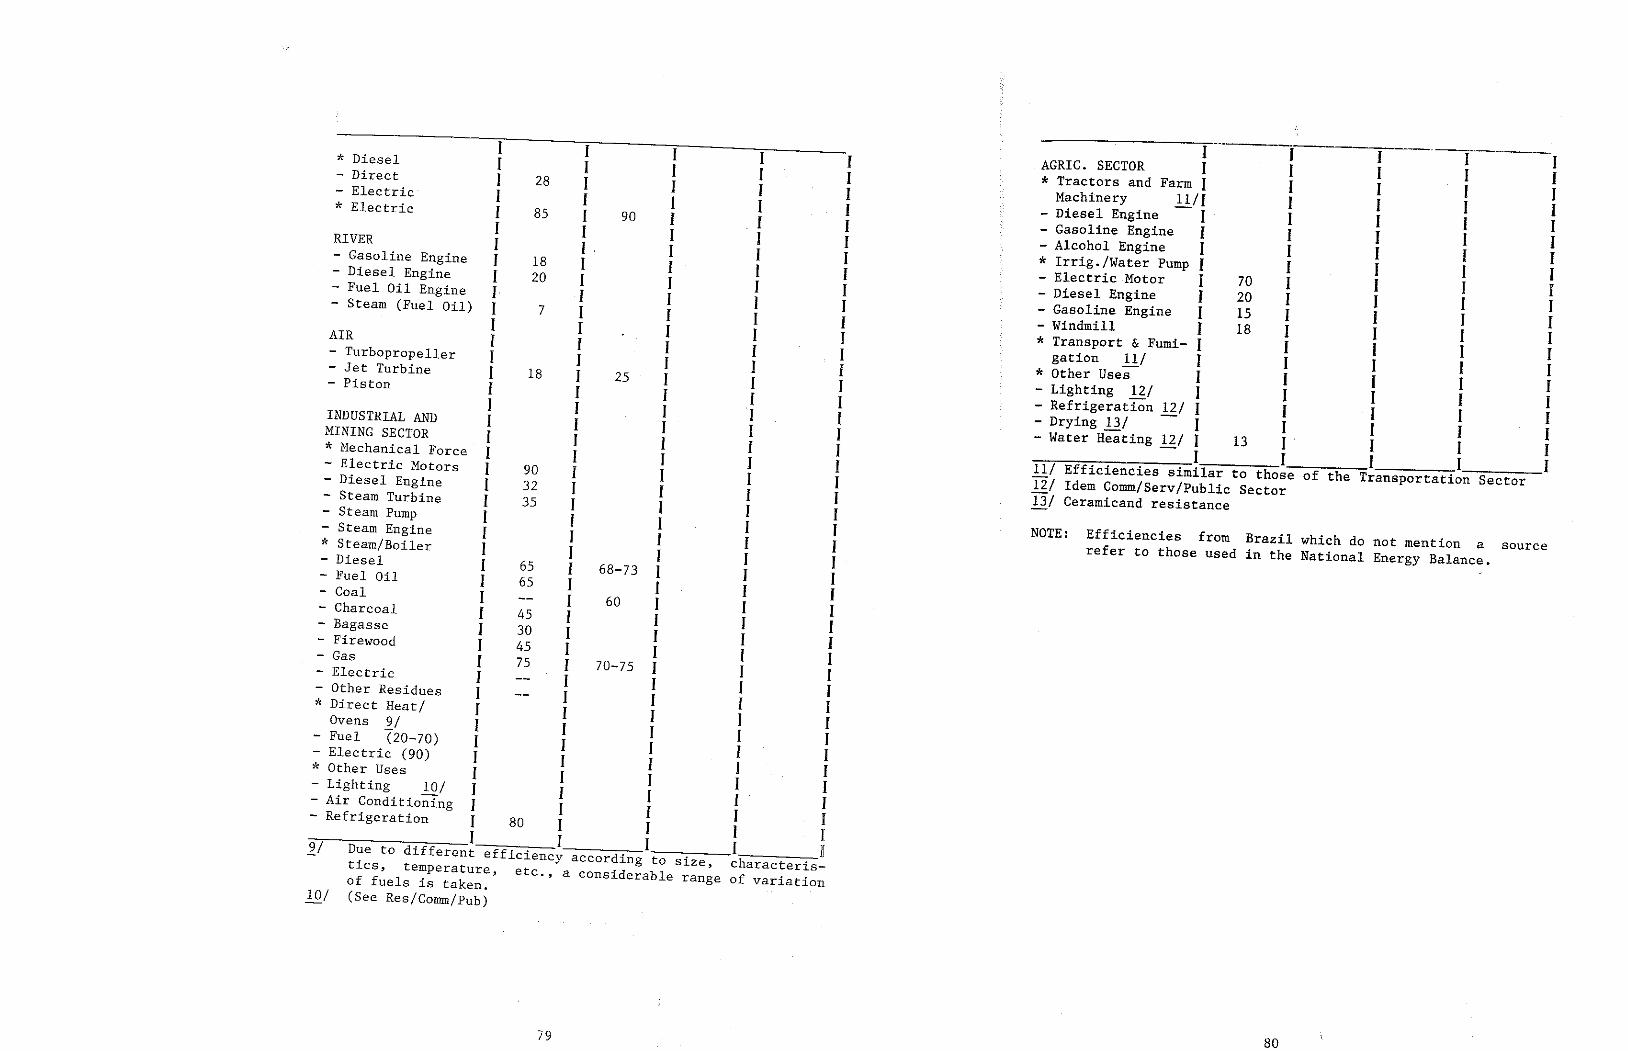
80 79
1 i 1 ·¡--·- 1 1 1 1 1 I . AGRIC. SECTOR 1 1 1 1 I
*Diesel I 1 1 1 I * Tractors and Farm 1 1 I 1 1 - Direct I 28 I I 1 1 Machinery l!.11 1 1 1 1 - Electric 1 I I I 1 - Diesel Engine 1 1 1 1 I * Electric 1 85 1 90 1 1 1 - Gasoline Engine 1 I 1 1 1
I 1 1 1 1 - Alcohol Engine 1 1 1 I 1 RIVER 1 1 . 1 I I * Irrig./Water Pump 1 I I I 1 - Gasoline Engine I 18 I 1 1 I - Electric Motor I 70 1 1 I 1 - Diesel Engine 1 20 I 1 I 1 - Diesel Engine 1 20 1 I I 1 - Fuel Oíl Engine 1 1 I I I - Gasoline Engine 1 15 1 1 1 I - Steam (Fuel Oil) I 7 1 I 1 1 - Windmill 1 18 I I 1 1
I I I 1 I * Transport & Fumi- 1 1 I 1 I AIR 1 I I I I gation 11/ I 1 I 1 I - Turbopropeller 1 I 1 I 1 * Other Uses I 1 I 1 I - Jet Turbíne I 18 I 25 1 1 l - Lighting 12/ 1 1 I 1 I - Pistan 1 I 1 I 1 - Refrigeration 11_/ I 1 1 1 1
I I 1 I 1 - Drying !:.11 I I 1 I I INDUSTRIAL AND I 1 1 I 1 - Water Heating 11_/ 1 13 1 . 1 1 I MINING SECTOR 1 I I I 1 1 I 1 1 I * Mechanical Force I 1 I I 1 11/ Effíciencies similar to those of the Transportation Sector - Electric Motors 1 90 1 1 1 1 12; Idem Comm/Serv/Public Sector - Diesel Engine I 32 1 I 1 1 13/ Ceramicand resistance - Steam Turbine I 35 1 l I I - Steam Pump 1 I 1 1 1 NOTE: Efficiencies from Brazil which do not mentían a source - Steam Engine I 1 1 1 1 refer to those used in the National Energy Balance. * Steam/Boiler 1 1 I 1 1 - Diesel I 65 1 68-73 1 1 I - Fuel Oíl I 65 I 1 1 1 - Coal 1 1 60 I 1 1 - Charcoal I 45 1 1 I l - Bagasse 1 30 1 I I I - Firewood 1 45 1 1 1 I - Gas 1 75 1 70-75 1 1 I - Electric 1 1 1 l 1 - Other Residues 1 1 1 1 I * Direct Heat/ I 1 1 1 1 Ove ns J_I 1 1 1 1 1 - Fuel (20-70) 1 1 1 1 1 - Electric (90) 1 1 I I 1 * Other Uses 1 I I 1 1 - Lighting 10/ I 1 I 1 1 - Air Conditioning 1 1 1 1 I - Refrigeration I 80 I I 1 I I 1 I I )[ !]_! Dueto different efficiency according to size, characteris- tics, temperature, etc., a considerable range of variation of fuels is taken.
l.QI (See Res/Comm/Pub)

81
I - TRANSPORTATION SECTOR
II - INDUSTRIAL SECTOR
III - RESIDENTIAL SECTOR
IV - COMMERCIAL-SERVICES-PUBLIC SECTOR
V - AGRICULTURE-FISHING-MINING SECTOR
VI - AUTO-CONSUMPTION SECTOR
VII - OTHERS SECTOR
A F P E N D I C E S S E C T O R A L

82
SECTORAL APPENDIX 1
TRANSPORTATION SECTOR

118
117
115
114
113
112
110
109
109
106
102
99
95
89
88
84
83
2. The Case of Colombia
l. General Considerations
CHAPTER III - APPLICATIONS
Efficiencies 4. Sea 3.
Raíl and Air 2.
River l.
B) DATABASE FORMATION - NON-ROAD TRANSPORTATION
General Scheme for a Road Transportation Database 6. Efficiencies 5.
Fixed Features 4. Utilization Factor 3. Mileage 2.
Specific Consumption l.
A) DATABASE FORMATION - ROAD TRANSPORTATION
CHAPTER II
General Flow for the Useful Energy Balance (BEEU) in the Transportation Sector
4.
Final Energy, Useful Energy and Efficiencies 3.
Disaggregation by End-Uses 2.
Disaggregation by Subsectors l.
GENERAL DEFINITIONS CHAPTER I
TRANSPORTATION SECTOR
INDEX
85
Urban Prívate (motorcycles, automobiles, campers, pick-up trucks) Urban Public (taxis, large and small buses) Interurban Prívate (automobiles, campers, pick-up trucks) Interurban Public (taxis, buses)
Passengers
ROAD
The following disaggregation, in 15 groups, can be considered:
Consequently, it is better to adopta more practical attitude, without losing sight of theoretical consistency. The relative weight of the groups in a disaggregated balance should be kept in mind, and the aptitude of this disaggregation to propase conser- vation and substitution policies of relevance.
the number of subsectors would increase to 144, with the problem that one same type of vehicle would appear in several groups and then the unit of information would in turn have to be subdivided into groups. Stated in this way, the problem would be endless and would become more and more complicated, although this growing complication would not contribute any substantial amount of precision to knowledge about energy in the transportation sector.
Light Heavy
If one continued to add dimensions to the classification, far example:
Up to this point, there would be 6 x 2 x 2 x 3 = 72 subsectors Even with these 72 subsectors there would still be fairly hetero- geneous groups, e.g., the official-urban-passenger-road transpor- tation would include vehicles as heterogeneous as motorcycles and large buses.
(d) BY TYPE OF SERVICE (3) Public Priva te Official
(e) BY NATURE OF SERVICE (2) Urban Interurban
84
(a) BY MODE OF TRANSPORTATION (6) Road Raíl Air River Sea Pipelines
So, it is necessary to devise a classification in which every vehicle can be placed without error. At first sight, it can be seen that the tree organization is not adequate. In testing a matrix organization in several dimensions, there would be various classifications:
~ithout doubt, the suitable response is: THE VEHICLE, since it is the energy-consuming unit which performs the function of transporting passengers and freight from one place to another.
WHAT IS THE UNIT OF INFORMATION TO CONSTRUCT A DATABASE PERMIT- TING PREPARATION OF USEFUL-ENERGY BALANCES IN THE TRANSPORTATION SECTOR?
To follow an equally rigorous treatment in the transportation sector, one begins by asking:
The industrial sector has a tree structure and thus lends itself well to a classification of the ISIC type, where the first digit represents the trunk arid the remainder are associated with pro- gressively thinner branches, so that it is possible to arrive at a four- or even six-digit disaggregation. The unit of informa- tion -- in this case, the industrial plant-- can be located with no uncertainty on sorne branch of the tree; and it is on the basis of this organizational approach that databases are pre- pared, sample designs are formulated and statistical estimators and their levels of reliability are determined.
No sector offers so many difficulties for disaggregation as <loes the Transportation Sector. It is convenient to examine the problem first from an exclusively theoretical standpoint, in order to recognize all of the subsectoring possiblities which could be analyzed, and then to adopta disaggregation "for prac- t . l 11 ica. ~urposes to construct useful-e"nergy balances (BEEU), with sufficient generality to cover all of the countries of the area. This practical disaggregation should undoubtedly be based on common sense, avoiding both useless repetitions and the inclusion of subsectors whose order of magnitude is irrelevant.
Disaggregation by Subsectors l.
(b) BY OBJECT TRANSPORTED (2) GENERAL DEFINITIONS AND BASIC CONCEPTS Passengers Freight
CHAPTER I
87
The examples given above are only a few of the ones for which the proposed disaggregation by subsectors does not perrnit adequate discrirnination; many others could be found without much effort. To resolve the particular cases in question, the general criterion will always be valid: it consists of comparing the cost of a more detailed .separation, whenever feasible, with the information benefit it would contribute. The ability to dif- ferentiate the primary from the secondary will save on useless efforts and prevent any doubts.
(d) In certain cases, the distinction between passenger trans- port and freight transport is notas clear as it would seem at first sight; in the rural areas of sorne countries, it is common to see trucks transporting passengers on top of packages and buses which, together with the passengers, carry significant amounts of freight. It is not easy to handle rigorously if the Ministry of Transportation <loes not have appropriate rnechanisms of separation. What is most advisable for the energy sector is to follow the same guide- lines as for the transportation sector and to adopta disag- gregation by subsectos which; although it may not be per- fect, is well-founded from both the inforrnation and insti- tutional standpoints.
(c) Sorne countries have a considerable park of boats devoted to nautical sports. and, in the proposed disaggregation, these will be confused with river or sea transport. Without overlooking the fact that a given country may successfully survey these units, it has not been thought convenient to include them as a specific group in a general rnethodology meant to serve a considerable number of countries.
(b) Small prívate aircraft, helicopters and recreational or testing planes will form part of the passenger air service without much concern for finer distinctions. Since all of these will be consumers of aviation gasoline, the quantities of which are known precisely, no majar difficultuies are foreseen in determining consurnption, although it would be more difficult to fínd out about the number of passengers transported without devoting great efforts to a specifíc survey which, far the mornent, is deemed unnecessary. With respect to the devices used for fumigation, the proposal is that they forrn part of the agricultura! sector and not the transportation sector, so that in this case the effort to separate them is merited.
"official vehicles" with respect to prívate transportation, and it can be expected that the operating features of the automobiles assigned to official service far the central or municipal government will be different from the rest of the fleet. Nevertheless, these are MARGINAL SUBPOPULATIONS which, while not specified individually, will be represented in the database if there is a sample framework which covers them so that their (scant) representativity within the population will be transferred to the sample.
86
(a) In the transportation of passengers by road, the services provided (schools, factories) are not specified and are th:refore confus~d with public service. It is likely that this transportation, which could be called "prívate- bl' 11 " · 1 b 1 . 11 • pu ic or specia -pu ic; will have features different from those of strictly public transportation, both in terms of the type of vehicle as well as mileage and utilization factors. The same thing would occur with the so-called
asirle It can be argued that the division presented herein leaves innumerable specifications; for example:
This classification is sufficient for disaggregating the useful- energy bal~nces of the countries of Latín Am.erica. It could even be excessive for many countries and hence can be considered a ~aximum disaggregation. However, it could easily be regrouped into two large categories; PASSENGERS and FREIGHT and each one subdivided into modes. This forrn of presentati~n offers the a~va~tage of establishing two practically unsubstitutable within which modes can be substituted. groups
Freight
PIPELINES
Freight
SEA
Freight
Passengers
RIVER
Freight
Passengers
AIR
Freight
Urban Public (trains; subways) Interurban Public (trains)
Passengers
RAIL
Urban (pick-up trucks; trucks) Interurban (trucks, trailers)
Freight
89
c P dx
(3) n = (W/g) v dv
In this hypothetical world, measure the magnitudes which concern us. expressed by means of the weight W and the have:
it would prove simple to define and If the mass mis now gravity g, we would
t Useful energy and where it is clear that the numerator represen s the denominator final energy, both of which are elementary.
c P dx
(2) T\ = m v dv
Under these circumstances, cal energy into kinetic energy is:
the efficiency of transforming chemi-
Once the vehicle has attained what could be called its cruising velocity (this would be v = 80 km/hr), ~o force.is n~eded to keep it in movement, according to the princ1ple of 1nertia. ~o, the load could be transferred to any point in the w~rld, w1th no effort. When close to its destination, it must s1mply be remem- bered that, in order to return the vehicle to its.resting posi- tion, a force equal but opposite to the former w1ll have to be applied, to do an equivalent amount of work, but this time in arder to decelerate. Since there are no frictional forces, the driver will not be able to apply the brakes (actually, the concept of braking would not exist in this world), but would have to do something similar when turning on the motor and going into reverse, like an airplane when landing. To do the work_2Fdx, the vehicle has a combustion engine which consumes c l1ters per kilometer of a fuel whose calorific value is P; therefore, the energy expended to increase or decrease the velocity by dv is cPdx.
(1) F dx = m v dv
In any case, it is convenient to contrast the energy each type of engine within each subsector, so that group thus constituted there is constant efficiency.
3. Final Energy, Useful Energy and Efficiencies
In a flat world without frictional forces, to move a vehicle and its load, the joint mass of which is "m", over an e Lement a ry distance"dx", requires a force "f". When applying this force, the speed of the vehicle increases by "dv", so that the work done will be equal to the incremental kinetic energy:
products and within each
force, account
end-use of steam but rather under the use of mechanical and where the efficiency of production also takes into the efficiency of the boilers.
88
However, these examples do not merita greater disaggregation of end-use. It can thus be accepted that the type of engine and, therefore, its efficiency, is determined exclusively by ~ontrasting product.with subsector. At least this is always true ~n road transportat1on, which, dueto its large relative weight, is the.means of transportation which has oriented the development of this methodology. There is only one end-use in the transportation sector and it yields only one form of useful energy, known in this methodology as "mechanical force". In this respect there is consistency with the methodology presented for the industrial sector, in which the end-use of steam consumed by the steam turbines to produce movement <loes not appear under the
When cross-referencing disaggregation by subsectors and by pro- duct~, ~i:h a few possible exceptions,all the types of engines are 1dent1f1ed. For example, the diesel oíl which is feedstock in raíl transportation could in principle be used in steam en- gines (the case is very rare in practice) or in diesel-electric motors.
Other marginal uses such as lighting, air conditíoning and heat- ing of vehicles will not be taken into consíderation, ~ince they would be of slight importance against mechanícal energy.
Road transportation has the largest value in practically all of the countries and, to date, it uses only internal combustion or injection engines, because the electric motor is still in the :xperimental s:ag:. The internal combustion engine uses gasoline in the vast maJority of cases, while in recent times the use of other :uels.such as alcohol (methanol or ethanol), liquefied gas and l1quef1ed natural gas has been initiated. These different fuels can result in changes in the respective efficiencies.
count.
all of these engines produce mechanical force, they do so different effíciencies and, when inter-fuel substitutions
examíned, these differences will have to be taken into ac-
While with are
Internal combustion engines Injection engines Steam engines Electríc motors Diesel-electric motors Gas turbines
From the physical point of view, the useful energy corresponding to the transportation sector is mechanical force. Accordingly, the only use would be for the transportation of persons and goods through the development of mechanical work and kinetic energy. (This topic is amply discussed under the next point of this same chapter.) However, this single use can in turn be disaggregated into sub-uses, depending on what kind of motor is in charge of producing the force. Thus, there are:
2. Disaggregation by End-Uses
91
improvements in the road system, meaning that the same trip can be made with a smaller consumption; etc.
changes in the load factor of the vehicles, meaning that more (or fewer) passengers or tons can be transported with the same amount of energy output;
represent the overall unit consumption of this mode of transpor- tation. However, these coefficients should not be called '1effi- ciencies" but rather, more appropriately, 0elasticities". Ac- tually, € and s can vary from year to year, dueto:
changes in specific consumption c, when there are altera- tions in the composition of the fleet;
or (6) Z/X € = Z/X
Specific consumption e in gallons or liters per kilometer is considered as the basic information input. With it can be calcu- lated the total consumption Z for a particular means of transpor- tation (subsector), during one year. The useful energy € is calculated as € z , where is a typical efficiency which de- pends on the type of engine. If X is the TKM or PKM transported by this means during the year, the relations:
Alternative I
Nonetheless, it is also common to hear that an internal com- bustion engine has an efficiency of 14.5% anda diesel engine of 18%, so that an injection engine is 25% more efficient than a combustion engine. What do these values mean? To what useful energy do they refer? What relation is there between these efficiencies and specific consumption to ton- and passenger- kilometers? There is more than one possible answer.
In fact, the "utility" of a transport vehicle, whether an automo- bile, truck, plane, train or ship, is to "transport11 passengers or vehicles in the real world, so that it is necessary to work against the fríctional forces-- but not just against those for- ces, but rather all of the obstacles which present themselves in the real world. The magnitude transported is commonly expressed in ton-kilometers TKM or passenger-kilometers, PKM; and it is evident that the end-use of the sector is represented by these magnitudes, justas the industrial sector is represented by the value added or physical production. There can thus be an energy consumption per TKM or PKM or value added to compare means of transportation or industrial production technologies among them- selves. This is the traditional approach to the problem, without going into the details of more rigorous definitions, which are often confusing.
This means that, for each kilometer traveled, it is to do at least enough work to overcome the frictional
kilometer. necessary forces.
90
It can also be understood that in the real world" useful energy" and, therefore, "efficiency" prove much more dífficult to define. Hence, what is common is to express consumption in terms of final energy, as a specific consumption e in liters or gallons per
The final energy consumed to do the work will continue to be cPdx, but now it will not be used just to accelerate or decele- rate but also to overcome the frictional forces, so that even when the vehicle is traveling at a constant speed, energy continues to be consumed and this consumption is proportional to the distance traveled. For this reason, the real world expends more energy than the hypothetical world of the example,
where 8 is the friction coe f f í.c Lent , whf.ch de d pen son numerous factors.
(5) Fdx = m v dv - 8 v2 dx
What happens in the real world? Things are much more compli- cated. Let us continue with the hypothesis of a flat surface but adding friction forces, mainly the ones which affect the movement of the wheels against the ground, and air drag. Assuming that such forces depend on velocity squared, the work needed to take the vehicle plus its load to a certain speed, and to keep it there, will now be:
This exarnple makes it possible to establish a very important concept: "the efficiency of a vehicle on a flat road and in the absence of frictional forces depends solely on acceleration; the usefu~ energy is the kinetic energy of the vehicle plus its load, and final energy corresponds to the fuel consurned in accelerating or declerating.11
From an energy standpoint, it would be a very economical world, since both passengers and freight could travel long distances while consuming little fuel in the first and last meters of the trip. Even in the case in which transit became more complicated and it proved necessary to increase or decrease velocity along the way, the energy consumption would increase but would return to zero if velocity were kept constant.
we can see that efficiency will depend only on the acceleration dv/dt of the vehicle, whether to take it from a standing position to the cruising velocity or vice versa. If this acceleration is constant, the efficiency will be too.
c P dt C p dt V
(4) (W/g) dv n = (W/g) v dv
The preceding formula permits calculation of the instantaneous efficiency for transporting W tons over dx kilometers and, by integrating, we would obtain average efficiency. Furthermore introducing the time interval dt (v = dx), in which the change~ are: dt
93
Experience clearly shows that to transport the same load between
In a second stage, there will be EFFICIENCY OF USE, which will provide an idea of how the useful force produced is employed, under real operating conditions. First, these conditions are examined: (1) the terrain may not be paved or the pavement may be in poor condition; (2) the streets and highways may not be flat, but rather may have ups and downs; (3) a greater amount.of traffic calls for slower speeds and stops with the motor running (for example, at traffic lights); (4) etc.
In other words, it will depend only on the vehicle design and maintenance features, justas the efficiency of steam production in industry depends on the boiler design and maintenance parame- ters.
The condition of the engine-carburator The condition of the auxiliary system (ignition-injection) The transrnission system The design and condition of tires The aerodynamic design of the vehicle
The useful energy of production is then defined as the production of useful force capable of modifying vehicle velocity and of maintaining it against the friction of the ground, water and/or air. Sorne criterion should be decided on as to what type of ground friction is being considered at this point in the process, since the useful force will be quite different according to the type of terrain. It is proposed that, strictly speaking, one should say: "friction against a flat surface with standard pave- ment"• Hence, efficiency of production in road transportation (and analagously in other means of transportation) depends on:
in of
when working with values such as the ones used I, reference is being made to efficiency
To delve into greater depth in these concepts:
Undoubtedly, Alternative production.
where cP, or the consumption in calories per kilometer has the dimension of a force which can be called "final force" and which is quite a bit larger than the other "useful force" due to (1) enthropic losses in the heat cycle of the engine; (2) losses due to friction in the engine; (3) frictional losses in the transmission system; (4) other losses such as the ones in the ignition or injection system, etc. So, the fricti~n ~ithin the device is manifested in these losses whereas the friction of the device in its totality against the ground and the air drag are manifested in the useful energy. Therefore, this efficiency stated as a coefficient of forces could well be defined as EFFICIENCY OF PRODUCTION.
c P c P dx (7)
F F dx n
92
According to this alternative, the efficiency is:
In doing horizontal work against frictional forces, it is necessary to develop a force known as the horizontal thrust, which is much srnaller than the weight of the object to be moved. This is the force which must be placed in Equation (5) where Fdx in the expression for useful energy. This is then defined as "the work necessary to accelerate and keep in movement a vehicle plus its load in a field of friction forces." Note that if the rnovement were no longer horizontal, but rather sloped, gravitational forces would also be in play.
Alternative II
To take kinetic energy as useful energy in the real world <loes not offer any interest from the physical standpoint, since the mere inclusion of the forces of inertia (associated with kinetic energy) <loes not permit adequate expression of the work required to transport an object from one point to another; it is also necessary for frictional forces to take part, as can be seen below.
In this alternative, n has a reference value and is associated with an efficiency of production (of rnechanical force). It is useful only for the sake of cornparisons between engines at the level of useful energy production, under the assumption that the use of that energy <loes not depend on the type of engine.
Traditionally, E , as defined by Equation (6), is called energy efficiency. However, according to the preceding definition, the term "elasticity11 is more appropriate" ,and the term "efficien- cy" is reserved for , as defined by Equation (2).
Alternative I thus corresponds to pragmatic definitions of final energy, useful energy, efficiency and elasticity, without wor- rying about the intimate nature of these concepts, and it permits resolution of the energy planning problems of the transportation sector with acceptable rigor. As can be observed in the fol- lowing chapter, the coefficient c, which determines final energy, can be calculated by means of surveys, as a function of all of the variables desired, so that very detailed models can be con- structed for the bahavior of the sector.
So, E: will come from a regression (whether linear or not} between Z and X, justas regressions are done in the industrial sector to determine the consumption/value added elasticity. It would also be an elasticity which captures, in econometric form, the effects of a better or worse 11efficiency" in the transportation of pas- sengers and freight and, as such, it is a coefficient apt for making demand projections incorporating the effects of conserva- tion, automobile import policies, increases in the utilízation factor, etc. E: also takes into account the thermodynamic and mechanical efficiency of a given type of engíne and lends itself to expressing fuel substitutions among the different modes of transportation.
95
Source Sub sector
Final Energy and Useful Energy for each
As for the BEEU for the entire sector, ít will contain:
In the first stage of application of the methodology, what is proposed is to use the first alternative, so that only the effi- ciency of mechanical energy production, i.e., the engine, is covered. In later stages, as a function of the specific inte- rests in each country in terms of detailed sector knowledge, Alternatives II and III, which consider efficiencies of use of transportation vehicles, could be taken into account.
Intermedia te Available JEfficiencyl Energy or {Efficiencyl Energy or
Final 1 of 1 Useful 1 of I Useful Energy [P'roduc tLon] Energy J Use I Energy ----1 1---...,,----.__::;_:;_,_47 r------...;,~ Produced 1 1 Consumea
First of all, BEEU applied toan automotive unit (vehicle) follow a two-stage scheme: one where the final energy. is transformed into the mechanical force produced, anda second where the latter is used under particular traffic conditions in arder to provide useful energy. If Alternative I is adopted, only the first stage will be taken into account, whereas Alternatives II and III consider both.
On the basis of the preceding definitions, it is possible to determine the structure of the BEEU for the transportation sector and to define, at the same time, the flows and the equations which relate them. The following chapters will specifically discuss the procedures for collecting and processing data which are proposed for calculating such flows.
4. General Flow for the Balance of Useful Energy (BEEU) in the Transportation Sector
The drawback to this alternative, which basically means taking as efficiency of production the efficiency of an engine operating without a load (as though it were a stationary engine) is that this efficiency would depend only on the engine-transmission technology, leaving for the efficiency of use of aerodynamic drag and friction of the tire against the ground.
with the velocity at which the wheels turn during testing without a load), but with the vehicle standing still. This useful force available in the rotating shaft is used when the vehicle is started up under real traffic conditions, and its consumption is e-:
(7)
94
Along the same lines of Alternative II, the separation of production and use is done beforehand. Useful energy of production is the force necessary to accelerate the engine and to keep it turning atan angular speed w (which can be associated
Alternative III
In other words, n2 is defined as the relation between final force under ideal traffic conditions and the same force under real conditions. The advantage of this treatment is that ít separates overall efficiency into two factors: one called efficiency of production, which depends on vehicle technology and maintenance, and another called efficiency of use, which depends on traffic conditions and road design.
(9) e
where n1 is the efficiency of production defined by Equation and n2 , the efficiency of use, is:
(8) F
a long unit
Likewise, it can be assumed that a vehicle which moves under real traffic conditions requires more final force per of useful force. Overall efficiency is defined as:
Take a stationary electric engine which consumes an amount of electricity e to produce mechanicaÍ energy E in the shaft. This energy is equal to the kinetic energy of rotation plus the work done against the frictíonal forces to keep the .shaft rotating. The example is equivalent to keeping a vehicle in movement under ideal conditions, since the stationary engine rotates and the vehicle moves along a smooth surface (moving engine). Now by connecting the engine to any mechanism such asan agitator or a cutting instrument, so that, because of the type of process, the engine must accelerate, decelerate and even stop several times, the electricity consumption will have increased to c~ owing to the utilization of useful force F.
the same points under these conditions, a final force c··p larger than cP is now needed, and the new energy consumption can be measured. What occurs with useful force is not so clear, how- ever. Take the same vehicle which under ideal conditions con- sumed a final force cP and produced a useful force F: what useful force should be associated with it when the final force is c~P? Theoretically, a new force F; equal to the work necessary to transport the vehicle plus its load under the new conditions, could be defined and measured. This force will usually be great- er than F. Nevertheless, it is preferable that a concept índe pendent of F~be worked out, by following a similar approach as to what was done with mechanical force, in the industrial sector.
97
This is applied maínly to interurban transportation, where the procedure for using a widespread s~rvey to.count all _of t~e vehicles whích travel the highways is becoming popularized in many countries. Vehicle-kilometers are obtained from a sample mechanism known as AVERAGE DAILY TRAFFIC COUNTS and can be car- ried out manually ar through automatization. If this information is available (far it is usually prepared by the inspection agen- cies of the Ministry of Transportation), it is of great utility in determining mileage and interurban utilization factors as an alternative method to the determination of the park. Note, for instance; that when Equation (12} is divided by the total number of the park, mileage is abtained.
(12) N L V
In Equations (10) and (11), except for N and sometimes Q, the other variables are random varibales for which the surveys should pravide expected values and standard error.
Another reference universe other than the park, which is taking on growing importance, is the one known as vehicle-kilometers; it can thus be defined as:
( 11} N Q L ~ X
To handle passenger- and ton-kilometers properly, mileage, avail- able capacity Q and utilization factor are used:
(10) N c L z
To separate final consumption Z by fuel and by subsector and category of vehicle, mileage and specific consumption are needed:
The three basic parameters which should always be determined through specific surveys are:
Specific consumption, in liters or gallons per kilometer. Annual mileage L. Utilization factor.~
within the park and also for establishing regionalization, since many surveys will call for regional sampling.
Of all these characteristics, only the first, i.e., number of units within each category, can be measured through a census. The others can be obtained by means of more or less complicated surveys and, generally speaking, the same sur~eys can be u~e~ to measure aperational parameters (primarily, mileage and utiliza- tion factors, as seen further on), complemented by others.
96
The license plate number is essential for identifying each unit
A good data bank on the vehicle park should contain at least the features enumerated above, although within each category there ro.ay be other features which could be of more interest far the transportation sector than for the energy sector, in order to provide for inspection functions (color, number of owners, acci- dents, etc.)
The type of service, whether prívate, official or public.
The type of fuel, which will usually be gasaline, diesel, LPG, or alcohol.
The model or age of each unit within each category.
The transport capacity offered, measured by the number of seats if it is a passenger vehicle, or by tonnage if it is far freight. It is also convenient to knaw the weight of the automotive units themselves.
The cylinder capacity or engine size in cubic centimeters or inches, for each category. It is frequently possible to determine cylinder capacity from the car make and model.
The vehicles in circulatian: care should be taken that N represents the real number of vehicles in operation and not simply the number of registered tlbirths". If there is uncertainty in this regard, sorne mortality model should be applied to remove the units that are no longer in service dueto age.
The type of vehicle: it is necessary to know N far each category, such as motorcycles, prívate automobiles, taxis, pick-up trucks, campers, trucks, vans, buses, etc.
The reference unive.rse far the subsectors which comprise road transportation is the number of vehicles N which form the vehicle park, together with their most impartant features. Amang these, mentían can be made of:
Work will begin by identifying the fundamental parameters of the sector, taking road transportation as a basis since it entails the greatest degree of complexity. The findings of this analy- sis can easily be extended to other mades of transportation.
It is clear, then, that it will be necessary to design procedures for collecting and processing data in order to make it possible to disaggregate consumption as discussed above. Additionally, and so that this consumption structure will s~rve the purposes of planning, it is useful to express passenger-kilometers and ton- kilometers with an identical disaggregation. While the latter figures do not form part of the BEEU, they are an indispensable complement to it; among other reasons, in order to provide knowl- edge on elasticities.

99
In order to counteract these problems and substantially reduce
The sampling frame to be applied is an exclusively random sample without replacement of the universe of vehicles in groups or subpopulations. This is not very simple to do and sometimes unresolvable difficultíes are encountered. Assuming that the universe in question is avaílable on a computer disk, with which half of the problems would be taken care of; it would be possible to extracta random sample using random numbers. No matter how great the difficulties in extracting this sample, these seem small in comparison with the logistical problems which arise from here on. Only two will be mentioned as examples. (1) Having selected a vehicle frorn a computer file oran ordered pile of forms <loes not mean that the owner can easily be located; only if the file is very up-to-date will it also contain data on the last owner and, in most cases, the owners wíll be scattered over different parts of the country and in remote towns and cities. To do a previous sample of towns and cities would complicate the procedure unnecessarily and would raise the processing costs. (2) The fact of having located the owners, no matter how compli- cated it may be to do so, does not mean that they will be willing to subject themselves toan experiment which would cause upsets in their daily life and which would not entail any benefit for them. The use of force is impossible in these cases, since there are no appropriate legal instruments, as in the case of popula- tion censuses, which are backed by law.
From the beginning, the technical and operational variables to be measured in the experiment must be soundly selected, taking into account the fact that the remaining ones will form part of the data dispersion around the expected specific consumption values. In order to be able to come up with a good design, it is neces- sary to have a good assessment and for that it is necessary to do: (a) an exhaustive review of existing information and (b) a pilot survey permitting calibration of the order of magnitude with whích the variables in play will influence consumption.
An attempt is made to learn about the average energy expenditure in a category or group of vehicles under real operating condi- tions and then to relate this expenditure to the technical and operational variables which determine it. Far this purpose, it is necessary to designa random experiment known as a FOLLOW-UP SURVEY, whích consists of monitoring vehicle behavior over a certain amount of time and of measuring consumption.
l. Specific Consumption
ROAD TRANSPORTATION
DATABASE FORMATION
CHAPTER II
98
G~nerally speaking, it can be said that BEEU in the transporta- ~ion sector should begin by using avaílable information (if there is any) and then, on the basis of its analysis, the decision will ?e made. as to whether it would be worthwhile to improve the information through successive-approximation surveys. What fol- lows is the way a particular country (Colombia) solved the data- base problem; the aim of its presentation is to provide a reference supported by practica! results.
The amount of data-gathering procedures which exists in the transportation sector, whether permanent or specific, are so varied that here, more than anywhere else, it is necessary to have a good appraísal of information prior to the surveys which will be carried out.
Below, general criteria for taking basic energy surveys on road transportation are provided, remembering that the aim of this document is not to present the results of a case study from a specifíc country, but instead to establish methodological guidelines of general validity, based on the experience gained in sorne countries.
101
Once the model of conditional expectations and its variances has been gauged, by means of the functíon g, the next s~ep is to determine the probability of the conditional expectations •. For this purpose, it is necessary first to analyze the covaria~ces among the explanatory variables, in arder to detect possible multicolínearity effects among them. After we are sure that all of the variables included in the function g are índependent, the expected consumption is calculated as a function of the .margi~al distribution functions of these variables. These funct1ons w1ll come either from knowledge about the universe or from sorne other survey. The following should be kept in mind: befare including sorne explanatory variable in the model, it is nece~sary ~o ascertain that the marginal distribution of this variable. 1s known or can be known through some sampling procedure; otherw1se, ít is preferable to discard it.
Knowledge and control of conditíonal variance is important for the following reason: the experimentas desígned captures (1) technological variables and (2) traffic variables, but d?es .not capture (3) maíntenance variables such as motor synchron1zat1on, condition of the tires, if the motor has been overhauled or not, etc. All of these uncaptured variables form part of the conditional varíance and there is no reason why thís cannot be consídered as constant (homocedasticity hypothesis). The size ?f this variance will tell us if the chosen sample size 1s sufficient to obtain good reliability despite having considered (3) as negligible.
The explanatory variables may have more or less weíg~t, according to each case and the countries under study. Something that has been observed in the work done so far is that there is no correlation between consumption and mileage; therefore, the lat- ter variable can be discounted, with great advantages for mathe- matical treatment.
(14)
The function g can be found by means of a regression analy~is or ranges equivalent to a stratífied sample or .ª sample ~1~hout fixed effects. It is also important to determine the cond1t1onal variance.
Once it is certain that the data are consistent, they can be analyzed by means of sorne model responding to the type.
E(c/Kp• E: • L, v, T ) = g(c/Kp, E ' L, v, Ti) (13)
logging errors. In order to avoid the accumulation of inconsis- tencies, it is necessary to carry a detailed control of the surveys, as they are done, and to repeat them whenever deemed convenient. A team of well-trained intervíewers is the best guarantee for resolving the multiple problems which will undoubt- edly aríse.
100
The data clean-up process is a very important stage, in which it is necessary to detect the anomalies which usually_ arise from
The discontínuous variables are expressed by means of "dummy" functions (Ti).
Consumption (c) Cylinder capacity (Kp) Age ( E )
Average annual mileage (L) Average velocity during the trip (v), together with number of stops with the motor running Type of terrain, paved or dirt, whichever is predominant Dominant slope: inclines, declines or indifferent; this variable is of interest in interurban transport and the sections should be chosen well so that there is a dominant slope Height above sea level, which can be expressed as more than 1500 meters or less than 1500 meters Hour at which the trip ís made: thís is of interest for the urban mode and can be expressed ín terms of peak hours or non-peak hours
The variables to be treated are:
The survey consists of monitoring the vehicle during one or more typical trips, filling the tank with fuel at the beginning and at the end of the run, in arder to measure consumption, The secon- dary uníts of information are the trips and not the vehicles, and one same unit may appear more than once in the survey, extracted from a universe of trips. The greatest success is obtained when the interviewer travels in the surveyed vehicle and takes the readings himself. It is difficult for the driver to record variables such as number of stops with the motor running (traffic lights, loading and unloading of passengers).
surveys can be done on every type of vehicle and variations in execution, depending on the type of whether or not consumption is in urban or ínter-
The follow-up can show slight vehicle and on urban areas.
sampling costs, what has heen called a pseudo-random frame has been used; it consists of selecting a group of vehicles whose owners are willing to carry out the proposed experiment, trying to cover the features of the automotive vehicles (model, cylinder capacity, age, representation by cities, te.) in proportions comparable to those of the universe. For buses, trucks or taxis working through prívate firms for providing public service, it is necessary for the firms to instruct their drivers to cooperate in the experiment. This type of sample works very well when, as in this case, the results are expressed by means of a model of conditional expectations, usually calculated by a regression analysis as a function of the variables observed, in order later to do weighting based on the proportíons in which the variables take part in the universe,
103
No matter how complicated the aforementioned procedure proves to be in measuring mileage, there is no other option; its success calls for a suitable combination of refinement in data-gathering together with statistical sample control. The follow-up method like the one used for consumption is not possible in this case, for several reasons :. first of all, be cause in order to obtain good results the monitoríng time would be too long, since the sarnple unit cannot be the trip but rather a group of trips overa given time; furthermore, it is necessary to rely on the odometer, since there is no other measurement procedure. Finally, the vehicles which do not have an odometer would have to have one installed, and this would entaíl heavy increases in costs and legal and logistical problems. Experience has shown that the
testing, in able to do
Great skill is needed in handling the hypothesis order to judge the quality of the samples and be statistical analyses of crossed correlations.
Given all of the aforesaid, it is foreseeable that the mileage surveys will have a high degree of rejects. This <loes not constitute a problem as long as there is no significant correlation between negative responses and sorne other important variable; this can be analyzed through hypothesis testing with the covariance. It is also useful to analyze the hypothesis of a possible correlation between mileage and age, in the sense that older cars have shorter runs. If this correlation exists, much more care must be taken in sampling in order not to bias the share of older cars.
In public-service vehicles, whether these are taxis, trucks or buses, the drivers or firms to which they belong can provide good responses on each vehicle,; the mileage here is more regular and care must be taken to verify how much time during the year each unit has been out of use dueto repairs or other causes. Prívate cars without mileage gauges are, without doubt, the most dif- ficult group to deal with.
Then we have the vehicles which do not have odometers orones in which these have not been working for sorne time. In these cases. the only way is to find out about the daily, weekly or monthly mileage and to take as valid, the responses which coincides. One question which always works well is weekly or monthly f~el con- sumption, from which it is possible to obtain mileage by dividing by specific consumption, which is calculated by means of the follow-up survey.
how many times the device has runa full cycle (there are usually 100,000 km per full cycle).
whose verify
vehicles which already have a certain age and gauges are working properly, it is necessary to
For the mileage
the odometer method average year with
population.
the universe with respect to annual mileage, would be giving the average mileage for an respect to the age of the individuals in the
102
Mileage is a very difficult parameter to measure in practice and there is no one unique method which works with one hundred per- cent certaínty in every case. When it is certain that the odometer has worked correctly all the time-- and this happens primarily in relatively new vehicles-- this device can be used to measure the annual mileage. There . are several drawbacks wh í ch must be resolved by the interviewers. As has already been noted, the first thing that must be done is to verify if the odometer has always functioned properly; if the driver cannot answer, it is better to o.mit the interview. If the odometer really reflects the cumulative mileage, knowing the model of the automobile (and the month in which it began to work, in the case of the newest automobiles), the annual mileage can be calculated by a quotient. When doing this quotient, the average mileage is being calculated for the years of life of the vehicle, without any possibility of distinguishing different mileages from year to year. If there had been significant changes in the behavior of the vehicles of
Every vehicle in the universe travels a given number of kilome- ters in the course of ayear, and these are cumulative during its lifetime. The average populational expectation (probability) of mileage is unknown and, by means of the survey discussed under this point, the population expectation can be estimated on the basis of a conveniently designed sample.
2. Mileage
It is worthwhile to stress that with this rnethod, which is not very expensive, a very detailed structural rnodel of consumption is obtained as a function of technological features and traffic conditions; all of these are policy variables in long~term plan- ning, which for the first time ever would have explicit, reliable measurements.
A satisfactory sample size for the follow-up samples is not very large, although it depends on the number of variables selected. The survey begins to yield good results starting with a size of approximately 50 cases when only one variable is selected, and can reach a maximum size of 250 samples for a greater number of variables.
The standard error in the consumption estimator calculated in this way is the square root of its variance.and this is the sum o f the variance of conditiorial expe ct at Lons plus the probability of conditional variance.
For the variables of discreet nature such as Ti, the integrals are transformed into summations.
(15)
E .v ,
The following formula is applied:
105
A CITY, LINES-COMPANIES and BUS SURVEY can be handled very well by means of a multi-stage sample where: (1) the city sampling is stratified; (2) the sampling of lines and companies can be systematic or stratified, taking the sample of a universe of lines ordered according to the number of buses which they have; (3) within each line chosen, there can be a census or systematic sampling of buses and their mileage can be checked through the company or the driver.
Fina1ly, there is a bus sample far each stratum of the cities and the respective estimates of mileage per stratum must be made.
Befare concluding the mileage aspect, it is convenient to develop the already cited method of measurement by means of weekly .ºr monthly fuel consumption a little more. This procedure, which can sometimes be more accurate than the direct measurement of L,
on city exist) or
The case of taxis, whose mileage also depends heavily size, can be obtained through taxi companies (if these through service stations.
For the buses involved in urban passenger service, it is not necessary to apply such an intricate sample frame as for the service station survey, and it is much better to recur to a sample of equal probabilities. This is not difficult, since these buses are usually concentrated in firms and/or lines in the different cities. Thus it is important, as a first step, to sample the cities, because mileage may depend significantly on city size.
and urban míleage is taken as the dífference between the total míleage estimated on the basis of the service station survey.
N
(17) V
In order to learn about the interurban part of mileage, it is necessary to apply a different method, based on a COUNTING STA- TION SURVEY. On a road map, counting these from a certain point at the city limits, measurement stations are set up to capture the vehicle flow without indeterminates far any section of high- way included between bifurcations, in a way similar to the procedures commonly used to determine vehicle-kilomete~s. By counting all of the vehicles which pass through the stations and multiplying by the distance between stations, interurban vehicle- kilometers are obtained. For this purpose, it is necessary to
Ld d ti • L" ( take samples on given days of the year consi ere typica a survey of days can be done and distribution analyzed). Míleage is then:
en- the
scope of this document. It can be consulted in an article titled "Service Station Surveys," which appeared in one of issues of OLADEs Energy Magazine.
104
so that if_f~r every vehicle which has appeared in the sample this probab1l1ty can be estimated by means of a probability p· depending only on the sample, the problem will have been solve~~ We have shown that, in fact, P can be estimated a posteriori and that the mil:age estimator thus constructed is asymptotically unbiased. This demonstration is complex and goes beyond the
(16)
A
== E L · /P · ' l l NE (L)
The average populational mileage is estimated as:
As for the secondary sample units, which are the vehicles, a sample of REPLACEMENT AND UNEVEN PROBABILITIES is taken. This means that if the universe is of a size N, the sample size n can be mue~ ~arger than N and will tend to be infinite. As for the probability P that a vehicle of mileage L will be chosen th' . h h. h ' l.S increases te ig er the mileage, since a vehicle which cir- culates more kilometers in ayear will have to fuel up more often. Of course, this probability will not depend only on m~leage but also on other factors such as specific consumption, size of the fuel tank, and the habits according to which a driver fuels up with only part of the capacity of the tank,
For the case of determining total mileage (urban plus inter- urban), a method known as the SERVICE STATION SURVEY has been developed; it consists of interviewing vehicles when they go through gasoline stations to fuel up. The method is inexpensive since the mobilization of the interviewers is reduced to a min- imum. The underlying idea is that every active vehicle must necessarily visit sorne service station with sorne frequency.
T~e fir~t step consists of sampling stations, which is quite simple s í.nc e these are well distributed in the cities and on the , highways, precisely at those points where traffic is most intense, so that, with a good geographical distribution of sta- tions, all types of vehicles will be captured.
When this is not true, other mechanisms must be applied.
As for the sample frame, the procedure of a household survey for prívate cars has been discounted dueto the high cost. Even though from a statistical standpoint it is an adequate frame, it has the drawback that when a visit is paid to the home, the automo~ile ~ay not be there. The best thing is to investigate cars in their natural environment, i.e., streets and highways There are countr~es which, dueto the organization imposed by th; payment of registration fees and license plates, offer good conceptual frameworks which could be used to advantage. This occurs, for examp~e, w~en there are certain set dates and places to make payments, in which case these meeting places could easily be converted into representative samples of a given universe,
opportunely. yields good results when the stages are planned biases which could appear are dealt with
procedure and the
spot well
107
For urban passenger transport, there can be other approximations other than this survey, depending on the quality and quantity of previous information which can be gathered. A CENSUS ar RECORDS SURVEY of firms and offices whích inspect transportation can provide new universes of reference such as the number of tickets sold. Also, rnileage and utilization factors can be verified in this way, and from the analysis of the ínformation gathered, a need, and the method, for carrying out complementary surveys will appear.
In sampling of thís kínd, it is convenient to do hypothesis testing to prove ar disprove assumed relations between the utili- zation factor and the large number of variables that could affect it. Occasionally, a previous ranking survey can be conducted to study the hypothesis and, with those results, a final design can be formulated for the sample. This two-stage procedure can reduce the costs of the final sample design based on a sounder knowledge of the phenomenon.
Far urban passenger buses, a more refined version of the BUSLINES SURVEY is used. First, a city sample is run and then a sample of lines and buses, in the same way that the mileage survey was done. Then, a monitoring survey is conducted in the buses at different hours, with the interviewer traveling in the bus and countíng the number of passengers present at different (fixed) points along the way. For example, 10%, 20% •.. 100% of the bus route. Then, it is possible to calculate a weighted average of hours, according to the volume of traffic (known) for each líne. In reality, the utilization factor for public urban service has a double frequency distribution as a function of hours and the route covered. It is also possible to incorporate the variable workday/non-workday and to do the corresponding weighting.
The expected value is obtained as the simple sample mean, which can also be weighted by volumes of traffic, according to the type of sampling applied. To calculate the standard error of the estímate, it is convenient not to restrict the application of the hypothesis of normality and to use the broad hypothesis of Tche- bitcheff, which calls for larger sample sizes but which is valid for any type of distribution. In this case, it is safer and cheap:r to take more sa~ples than to study the probability of the mean in all of the possible samples given the risk that this will be influenced by the distribution of the frequency with which the vehicles form lines at the lights.
through a pilot sample it is shown that the utilization factor <loes not depend on the location of the traffic light nor on the hour, a simple random sample is satisfactory.
The survey consists of counting the passengers for each type of vehicle, when these stop ata red light. Thus. very numerous sample sizes are obtained far prívate cars, taxis, campers, pick- up trucks, in a sample with replacement. Sizes of 500 to 1000 per category are satisfactory.
106
For light passenger vehicles in urban transport, a TRAFFIC LIGHT SURVEY is applied. Previously, a city sample should be done, even though no strong dependence between the utilization factor and city size is expected. Within the cities, traffic lights are selected with an adequate geographical distribution and for each traffic light samples are taken on a work-day and on a non- workday and at different hours, so that there will be a good representation of peak hours and off-hours. If it is desired (and it is possible) to be more rigorous, it would be wise to typify the stoplight-day-hour by volumes of traffic; although this ínformation is not always available in sufficient quantity and quality. When it is not possíble, there should be a "s í.ght " distribution of the traffic lights and hours.in order to have a good idea of the volumes of traffic. The aid of specialized personnel from the offices of the Ministry of Transportation is of great value in obtaining a good sample. In addition, if
An effort must be made to estímate the expected value in the population for different subsectors and types of vehicle, by means of sampling.
(18) q, = q/Q
Take Q as the transport capacity for an automotive unit, measured in tons for freight and number of seats far passengers, and take q as the amount of freight or passengers actually transported. The vehicle utilization factor is defined as:
3. Utilization Factor
Another procedure for measuring mileage that should be mentioned is the one related to oíl changes, in those cases where dates and vehicle mileage are recorded at the time of the previous change. This works only when most of the interviewed users keep such records and it depends on the customs of each coutnry.
This entails more complex mathematical maneuvers which, although not unsolvable, certainly call far greater care and knowledge in the treatment of the variables involved.
E(L) =E ( cL /c)
consístes of deterrníníng through sampling the product cL in gallons per week or per month, by rneans of consumption divided by price. While measurement rnay prove easier, the statistical inference of average annual mileage is more complicated. In the first place, weekly or monthly consumption may not be constant throughout the year, since the user responds to the question of how much he uses when the car is in circulation, without taking into account the time which the unit is not in use because of repairs, family vacations, etc. Additional questions related to such times aid in interpreting the results. Another difficulty is that the estimator far expected mileage and its variance will be the expectation and variance of the quotient of two random variables:
109
5. Efficiencies If Alternative 1 is adopted, it is sufficient t~ multíply consumption by subsectors and by type of fuel, according to an efficiency of reference which will depend only on the type of engíne and the type of fuel, but not on the design features of the vehicle. Supposing, fer the sake of simplicit~, that there are only two fuels and two kinds of engines-- gasol1ne for co~- bustion engines and diesel for injecti~n engines-- an~ that the1~ respective efficiencies are n and n ' in Alternat1ve I all o the vehicles whether cars, buses or trucks, would have the s~me efficiency if they use the same fuel. The specific consumpt1~n will obviously vary not only by type of engine but also by v:h1-
Take e and c~as gasoline and diesel consumpt1on ele category. 11 b within a homogeneous group. Useful energy per kilometer wi e:
d Of the fact that in the interurban Mentían has already been ma e mode, the fixed features can be obtained jointly wi:h the u:ili- zation factor in the sampling by groups at the count:ng :tat1~n~. For urban buses, the survey of lines and firrns permits 1dent1~1- cation of the type of bus.
More delicate can be the case of the light-vehicle fleet and although the survey of service stations is a perfectly adequate framework far the fixed features, the sample size demanded by mileage is not sufficient to yield frequency estimators.
PARKING LOT SURVEYS have been designed; Far this last case, these consist of visitng sites in which vehicles are parked and recording the make and model. Far the latter, even though it is not always possible to know the exact year, ranges can be estab- lished by the make of the vehicles. For this survey to be successful, there should be a previous, detailed classification
d b the most visible details which of the park, with knowle ge a out make it possible to characterize the vehicles using only the instrument of sight inspection.
l . d capac~ty, make and age, frequency estima- For capacity, cy in er .L
d for type Of fuel, estimators of bi- or tors are sought; an multi-nominal proportion.
4. Fixed Features
The type of fuel, capacity for transport, make and model, c~lin- der capacity and age are fixed features of the park and the.1deal thing would be to learn about these as part of the census 1nfor- mation. When this <loes not occur, it is possible to :ur~ to surveys geared to measuring the operational features-- pr1nc1pal- ly mileage and the utilization factor-- to obtain estimators for these elements.
countries.
is by installing a system of scales, either automatic or These systems are becoming increasingly popular in many weight
manual.
108
Insofar as the passenger surveys, the measurement is reduced to a problem of counting people; in the case of freight, the sítuation is more delicate and only in very well organized systems will it be possible toread the weight of the load on the control sheets which the driver carries. Otherwise, the only way to verify
Care must be taken in conducting this survey so as to erisu re that the destination of the freight is not interurban, i.e., that the truck whose freight is picked up at sorne point in the city will not pass through any counting station for the interurban survey, in which case it would be computed as Ln t e rurban .
The transport of urban freíght, if it leaves aside prívate freight, can be covered by means of a SURVEY OF FIRMS. The most important urban freight vehicles correspond to foodstuffs (espe- cially beverages), construction materials and furniture, trans- ported in regular-size trucks which are generally grouped in types. Consultation with the firrns chosen in the sample can solve the problern. The universe of firms should be known (institute of statistics, social security, mercantile registers) together with the number of employees and, if possible, the fleet of trucks and their characteristics. A stratified ar systematic sample can be done, as a function of the number of employees or the number of trucks.
Ratio and regression estimators can be used advantageously when certain variables which determine the experiment (for example, the number of counting stations by groups or strata of the popu- lation) are not correlated to the characteristics which are being measured. Hypothesis and correlation testing is a tool of great value in selectíng the estimator best adapted to the experiment.
The statistical processing of a survey of groupings preves quite complicated and demands an in-depth analysís of the different unbiased estimators with those which have the least variance; it is often convenient to use biased estimators whose bias rapidly approaches zero if certain conditions are fulfilled. It is then fundamental to look into the particular conditions in which the experiment is done (these can vary a. great deal from case to case) and to propose adequate estimators far these.
For the interurban mode for freight and passengers, and for all types of vehicles, the COUNTING STATION SURVEY is applíed. As mentioned before, the best technique for doing this type of survey is a multi-stage sample by groups. At the same time that míleage and the utilization factor are beíng ínvestígated, the fixed features, cylinder capacity, make, and model, age and type of fuel can be asked about if they are not known on the basis of a census of the vehicle park. Once a sample of the universe of counting stations has been selected, within it, a systematic vehicle count is taken and the number of passengers is counted. For this purpose, it is necessary to stop the vehicles and the only practical way of doing this is with the help of the highway patrols. The sample sizes are very large, on the arder of 100,000 and above, in order to obtain small errors of estimation.
111
reference sample sizes far the dif- For the sake of reference,
After the surveys have been done and broken down for consurnption, passenger- and ton-kilometers per subsector, it is necessary.to
aggregate consumption figures with the co:respond~ng compare d' 'b .. f example service station information on fuel 1str1 ution, or • .. sales plus direct distributors. Both figures should coincide withín the statistical error resulting from the standard erro:s far the different estimators used. If the fit is no: good, this will be dueto biases in the sampling procedures applied. ~f the bias is very large, the reason will usually be detected easily.
The sample sizes of the surveys presented do not depend on the size of the population (number of vehicles in. the .par~), but rather on the number of variables desired far inclusion in each test. As a consequence, the cost of setting upa d~tab~se on road transportation will be independent of the economic si:e of the country, except to the extent that in a larger country it may be necessary to include more variables in arder to have adequate estimators. For example, if the mileage in sorne vehicle.c~teg~ry
d 't 'ze in a large country a finer strat1f1cat1on <lepen s on c r, y si , . will be required and the sample size will be larger than in a small country.
Groups of Vehicles ~~~~~-~~;~~-----~;~;------;~;~;;~;~---;~~~----~;~=;~;~---;~~;----
CEVE ESLI EDEC EDEC Interurb.light CEVE EDLE/CEVE ESBU EDLE EDLE Urban buses
Interurb.buses CEVE/EDEC EDEC/CEVE ESBI EDEC EDEC CEVE EDEM/CEVE ESCU EDEM EDEM Urban trucks
Interurb.trucks CEVE/EDEC EDEC/CEVE ESCI EDEC EDEC --------------------------------- --------------------------------
----------------------------------------------------------------- Park Fixed Specific Mileage Utiliz.
Features Consump. Factor
The following chart detaíls the interaction between these surveys and the parameters noted:
CEVE Vehicle Census ESLI Monitoring Survey of Light Vehicles ESBU Monitoring Survey of Urban Buses ESBI Monitoring Survey of Interurban Buses ESCU Monitoring Survey of Urban Trucks ESCI = Monitoring Survey of Interurban Trucks EDES = Service Station Surveys EDSE Traffic Light Survey ECPA Parking Lot Survey EDEC Counting Station Survey EDEM = Company Survey (Urban Trucks) EDLE Company Lines Survey
they between these and the respective parameters which relation determine.
llO
For the purposes of summarization, the surveys discussed in this chapter are listed below in arder to show more effectively the
6. General Scheme for a Road Transportation Database
The aspects related to effícíency of production are left to <leal with, by adopting the same reference values for Alternative I, or by attempting to develop a more in-depth treatment of the infor- mation. Even though the experíence gained so far <loes not yet permit definitive answers, it is evident that the subject opens up interesting prospects for the treatment of useful energy in the transportation sector. It can be imagined that efficiency of production <loes not only depend on the type of engine but also on the type of vehicle and its mechanical and aerodynamic design. Consultations with vehicle manufacturers and even the laboratory tests measuring the horizontal thrust force that appears in Equation (7) for vehicles of different types, can shed new light on knowledge about one of the most important parameters on planning in t r aruspo r t a t í.on sector.
Thus, we have seen how the specifíc consumption survey will at the same time make ít possible to resolve the problem of effi- ciency of use.
Efficiency of use is given by a consumption ratio as indicated in Equation (9). What is this consumption? Equation (13) provides the answer: if the parameters corresponding to travel on a flat paved highway under ideal traffic conditions are put into this equation, consumption under ideal conditions is obtained in ap- proximate form. If the parameters corresponding to real condi- tions are not used, greater consumption is obtained. The ratio between the two results in the efficiency of use. A practical rule, but one which makes a lot of sense in theory, is that for one same vehicle, the effíciency of use is obtained as the quotient of highway consumptíon and consumption in the cíty. To be more precise, we would say "highway consumption under ideal conditions".
vu c (20) . z
If Alternative III is adopted, there will be two efficiencies; for ease of recording, the one for production will be written as V and the one for use asµ . Useful energy will now be:
It must be kept in mind that if an efficiency is adopted for the combustion engine, let us say n 0.145. the other efficiency is automatically fixed by Equation (19), at n~= 0.18 the injection engine. Furthermore, Equation (19), which equates the useful energy produced by different motors, serves as a check on consis- tency far the specific consumption surveys and it is expected that the conditional expectations of these, for the same explana- tory variables, will have a relation approximately equal to the inverse of the efficiencies.
(19) n c . z
113
For consurnption Z it must be kept in mind that in the case of trains, it refers only to locomotives or motor-coaches. Through regressions or quotients of X and Z, the elasticities define~ by Equation (6) can be calculated, and this will permita cornpar1son between the energy expended per unit transported under this mode and the others.
(23)
per known, the utilization factor is:
passengers) X is also
transport capacity x~is calculated in tons (or kilometer. Since the real amount transported
The
The number of units deployed, as measured in coaches far trains and subways, and in units of aircraft are known, as well as the transport capacity in tons and in number of seats, and the trips made, in terms of number and rnileage.
These modes of transportation are treated in a similar way and it is usually not necessary to do surveys, since both the information on consumption as well as on passengers and tons transported is available.
2. Raíl and Air
Once the expectations and variances in the basic pararneters are known, one returns to the fundamental e qua.t í.ons (10) and {11) and takes expectations and variances in arder to obtain the estimator for consumption Z and far passenger- and ton-kilorneters X, wíth which all of the information required on river transportatíon is generated.
mean, estirnator far the conversion factor O will be the sample since it will rnost likely not be correlated to anything.
The
In both equations, the marginal distribution function for Q. f (Qi), is known from information on the park.
(22) A
E(L)
If there is a correlation between L and Q, the estimator for Lis analagous to that for e:
(21)
The specific consumption e is, without doubt, a function of Q and nothing more than Q and its most suitable estimator is:
extracted. Then it is possible to investigate the likelihood of a correlation between L and Q, which will usually indicate that the large vessels cover more kilometers per year than the - small ones do. If this correlation exists, there will be two or more rnileage estimators per capacity range o, there rnay even be a continuous regression between L and Q.
112
The first three items define a more numerous sample, from which the estimator far rnileage L for each group of capacity Q can be
Number of routes covered (ports of origin and destination) Capacity Number of trips per year made in each route Fuel consumption for one of these trips Freight and passengers transported on one of these trips
The shipments are usually recorded in a few port offices corresponding to given river basins, so that the geographical movement of these is reduced to justa few navegable rivers which are perfectly identifiable. It thus suffices to take a sample of SHIPMENTS in the port offices which are representative of the characteristics of the park. What would be ideal· is that the greatest possible number of shipments from an office could pro- vide the following information:
The park N should be known through a census or shipping record, which should also provide the number of shipments per: {a) type of fuel (gasoline, diesel, fuel oíl); (b) passengers, freight, or mixed; (e) transport capacity Q.
A survey on specific consumption A survey on mileage A survey on utilization factors
This mode-- which would only be of interest to the countries which have large rivers-- is dealt with in a way analagous to that of roadways, and Equations (10) and (11) are applied to calculate consumption, passenger- and ton-kilometers. To resolve these, it is necessary to have:
River l.
NON-ROAD TRANSPORTATION
Obviously, the sample size will be larger, the smaller the confi- dence interval required for the estimates; and it must be kept in mind that, in calculating total consumption and passenger- and ton-kilometers, variances and confidence itnervals increase. In general, it is quite satisfactory to have a confidence interval of more or less 10%, and acceptable to have one of more or less 15% for Z and X.
ESBU, ESBI, ESCU, ESCI: between 40 and 200 between 500 and 4000 betwen 1000 and 10,000 between 500 and 2000 between 2000 and 6000 between 50,000 and 200,000
ESLI, EDES: EDSE: EDEM: EDLE: EDEC:
ferent surveys are given below:
115
cases in without doubt, sea and air transportation are, River,
. . is recommended that Alternative I For non-road transportation, it 1 ting to the traffic be used, since there is no :oncepth r: ah an efficiency of use f d t nsportation to w ic conditions o roa ra . . ht be however, railways, where can be applied. One exc:ptionl migt f, friction against which ·1 the main e emen o d the rai s are d lt . true that a raílroa can frictiona forces are deve~o~e. d ~~at this will affect the be in good or bad cond1t1on, alnl . g the trains to travel at h · e by not a owin · quality of te servic i hich useful energy has been maximum speed. Given the w~y nf;ictional forces under ideal defined-- the work done again~t d r to have a unit efficiency conditions-- it is clear thatl,h in~~ ~e ideal and optimal; it is the speed of trave s ou . r of use, . h ·11 be the least final consumpt1on pe the one for wh1ch t ere w1 . is efficiency of At this point of operation, there be kilometer. d an later increase in consumption can production an y . in the efficiency of use. Thus, there attributed to a reduct1on . t' raíl transportation . 1 . pediments in trea ing are no theoretica im . 1 'nt of view however, . III From the practica poi • . . with Alternative · . rveys to measure specific raíl transportation does not require sub . stified for these to . d •t would perhaps not e JU . consumpt1on, an i . . of use The subject remains be done just to measure eff1c1encyd be.resolved in the future, d . . n however an can . 1 open to i~cussio.' ~ that sorne country in particu ar, without d1scounting the option nt to undertake a deeper with a well-developed raíl system, may wa study in the near future~
4. Efficiencies
. transportation can rely on accurate Generally speaking, maritime . also up to date d f ht If there are information on transporte rei~t . can be treated like air f 1 consumption records, i k·1 t s ue . coastal transport in ton- 1 oeme er transportation, expressing . In the latter case, there and international transpo:t in t~ns. 'th bunker in different e also times when ships fue up w1 . ar . according to the convenience of pr1ces. countr1es,
in sorne countries is constituted .by :he A very special case of these ships can be real float1ng :n- fishing fleets; sorne ·1 h transport. There are countries dustries which process wh1 e~ ey. the agricultural and físhíng which place fishing consumpt1on in d from the
and this consurnption should then be separate sector, general coastal fleet.
not usually be necessary to survey sea transportat~on in It will . ·1· r· n factors, but surveys may e re- order to est1mate ut1 iza :o d ileage on inland waterways, . d f ecific consurnption an m . - quire or sp ·11 b the same as for river trans in which case the procedure w1 e t the fuel consumed is . In international transpor, .
1 portat1on. 1 h' h because it has a spec1a - almost exclusively bunker fue,. wh ic t, . ty Once all of the . . is known wit cer a1n · ized destination, . h b solved through records, possible information problems aveh ~~:r or not the information the decision will be rnade as t~o~s~mption and mileage. still lacking merits surveys on
114
Then, it is necessary to determine whether or not there are "specialized fleets" such as the ones which transport petroleum products, iron, cement, etc., and differentiate them from the general fleets. The first are easy to distinguish becaµse this information is recorded.
First of all, it is necessary to differentiate between transport along the coast and international transport; the former is dealt with in ton-kilometers and the latter in tons transported.
The state of organization of the information on this mode of transportation depends a great deal on the countries and, befare any data-gathering procedure is applied, an intensive diagnostic study should be done, without eliminating the possibility of sorne surveying.
3. Sea
As for prívate aircraft, the ones which operate as air taxis are grouped in companies which are usually controlled by the civil aviation authoríties through flying licenses. Knowing how many and which ones the companies are, it is possible to consult their records or even the airport records or the civil aviation re- cords. The group of small prívate aircraft belonging to com- panies or prívate .individuals will still be left bu t , since it is slight in number, it is not recommended that a survey be conducted.
As mentioned previously, fumigation belongs to the agricultural sector and obtention of the respective information should be handled as part of the information of the database for that sector. For such purposes, a survey may be necessary, whether done on farms and/or by fumigation companies.
Fortunately, the fuels in use in aviatíon-- aviation gasoline and jet fuel (JPl and JP4)-- are specifíc, so that, when the sales of both products on the market are known, the total consumption in air transportation in known. Jet fuel is used in its totality in commercial aviation although a small part might be earmarked for the armed forces. Aviation gasoline is divided into: (1) conunercial aviation; (2) fumigation; (3) prívate aviation (small aircraft for prívate transportation, air taxis); (4) armed forces. The consumption of commercial aviation is assumed to be known through company records or surveys.
International air transport is expressed in passengers and tons (without kilometers), entering and leaving the country, and com- pared with the respective fuel consumption. Mileage here is not a determiníng factor because aircraft orient their fueling for return trips to the countries where fuel is cheaper, wíthin the technical possibílities of their flight schedule. The relation between Z and the number of passengers plus international freight will capture this preference of conunercial firms, which can vary a great deal from one country to another, according to the respective prícing policies.
117
The 10 above-mentioned categories correspond to the partic- ular way in which the automotive vehicles in Colombia w~re divided and which has been used for surveys and presentation of the following parameters:
Prívate Cars Campers/Pick-ups Small Buses (P 300) Buses (P 600) Buses (P 900) Light Trucks Heavy-Duty Trucks (2 axles) Heavy-Duty Trucks (More than 2 axles) Motorcycles
The expected values for the parameters in the road transpor- tation mode are summarized in the table attached herewith, for the following types of vehicles:
e)
Interurban Prívate Passengers Urban Prívate Passengers Interurban Public Passengers Urban Public Paasengers Urban Freight Interurban Freight Road Transportation Air Transportation River Transportation Sea Transportation Raíl Transportation
b) Disaggregatíon by subsectors is:
Coal Motor Gasoline Kerosene and Jet Fuel Diesel Oíl Fuel Oíl Non-Energy Products
a) Disaggregation by energy sources considers the following products:
As an application of the methodology discussed in thís document, the case of Colombia is presented asan example of a country where rnost of the surveys mentioned in the previous chapters have actually been carried out.
l. General Consíderations
APPLICATIONS
CHAPTER III
116
It would be worthwhíle to delve further and expand the bibliogra- phy by adding data that the countries rnight have asan outgrowth of their own experíences.
3.6% 2.7% 3.0%
28.0% 85.0% 7.0%
18.0% 18.0%
Stearn locomotives using fuel oíl Steam locomotives using fírewood Steam locomotíves usíng coal Díesel-electric trains Electric traíns Seagoíng vessels using fuel oíl Seagoing vessels using díesel Jet turbínes
I, the are
As efficiencíes of reference for applícation of Alternatíve some. values taken from a bíbliographic compílation done by Institute of Energy Economícs at the Bariloche Foundation presented below:
whích effícíency of use, although ít can be defined as a theore- tical concept, has no practical meaning sínce the fríctional forces occur against natural envíronments whose conditíons cannot be changed.
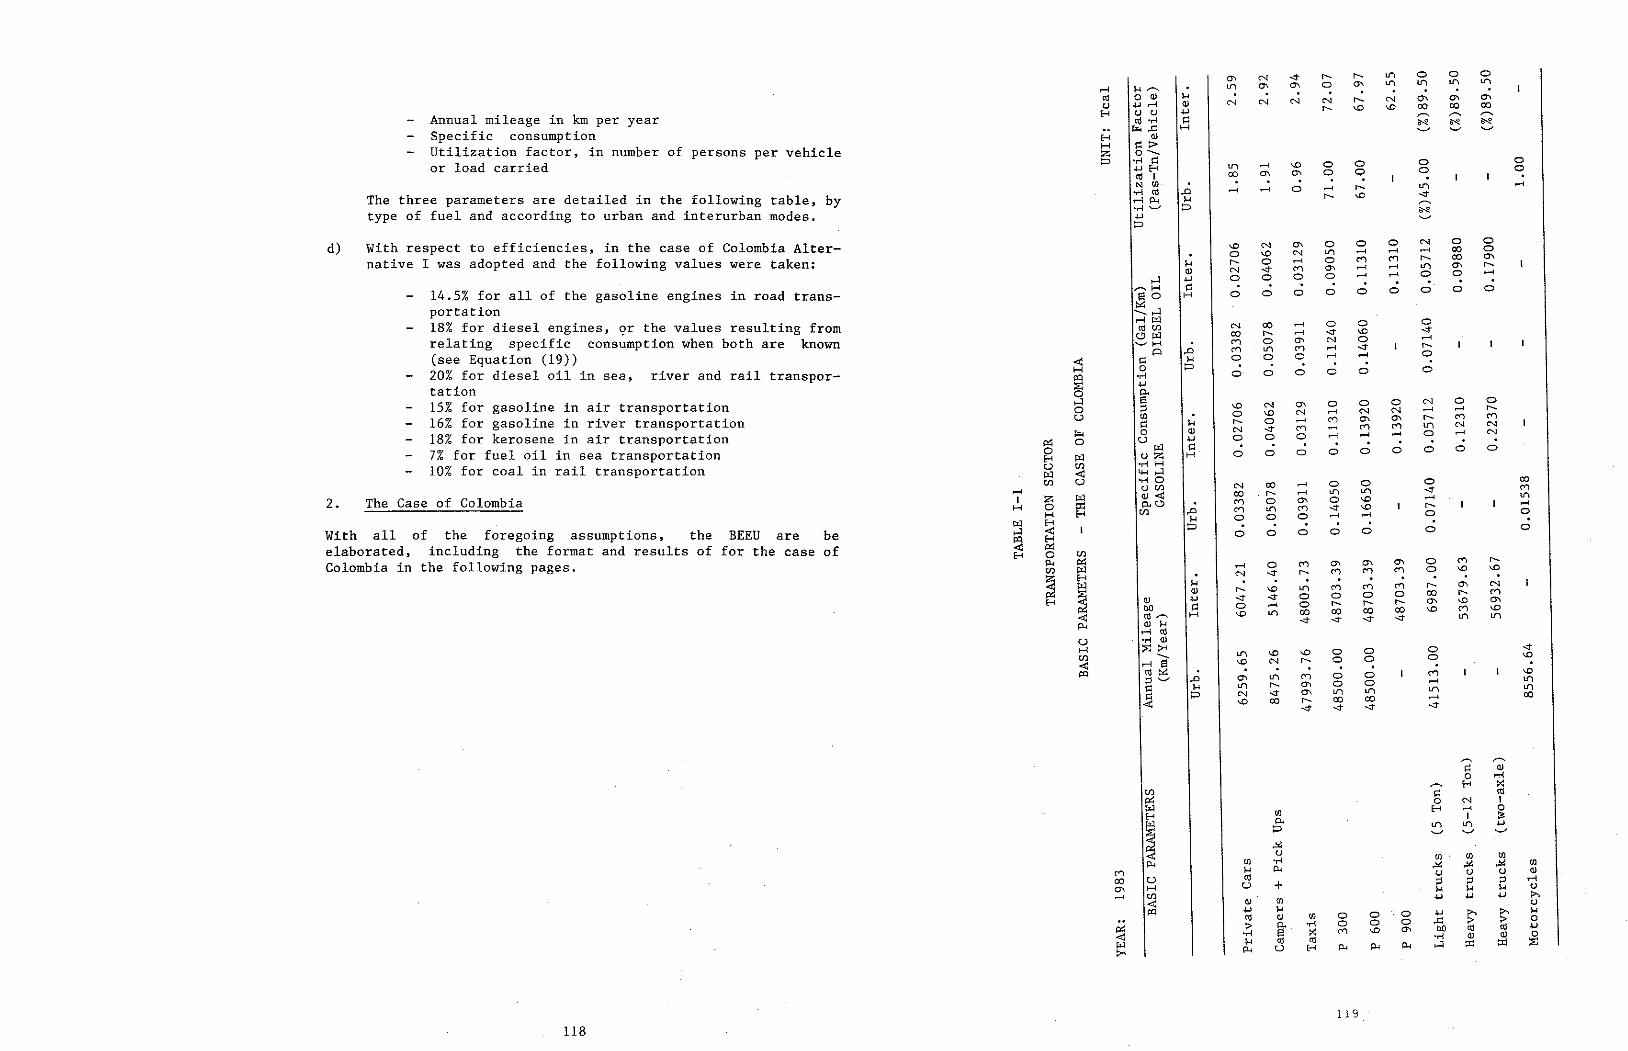
,,__ ,-... ¡:::: cJ.) o ,...,.!
,-... E-1 ~ \'./) ¡:;: ('(! ~ o N 1 µ.:¡
C/l E-1 ..... o E-1 1 ::;: [l:l. o. l./") Vi .µ
~
o ._, .._, '-'
~ u lll (1) (1)
p.., C/l ·.-l ~ ~ ~ (1)
M ¡..,¡ p.., cJ (.) (.) el)
co u (1j ;:l ;::l ::1 ,....¡ O\ H u + ¡..,¡ 1-1 1-1 (.)
.-4 U) .µ .µ .µ :>-. <l1 el) C/l cJ p::i .µ ¡..,¡ o o .µ ~ :;.., 1-1
('(! el) {/) o ..e:: :;> :;> o :> ~
·.-l o o o ('(! .µ
~ '° °' 00 td ·.-l ~ M •.-l (l.) el) ~ µ.:¡ H td p.., ,...:¡ ::e: ::e:
>"' p.., u H p.., p..,
119
118
O\ N -:t r-. r-. Ui o o o Ui O\ O\ o °' Ui Ui Ui II\
r-1 ¡..,¡ ,-... td o el) H
N N N r-. N °' O\ °' .µ r-1 cJ.) N cJ r-. <o \O 00 00 00 E-1 cJ cJ .µ ,,...... ,....., ,..... Annual mileage in km per year t'll ·.-l ¡::: ~ ~ ~ ~..e:: H ........ '-' ........ Specific consumption E-1 el)
Utilization factor, in number of persons per vehicle H ¡::: :;:> z o- load carried o ·.-l ¡:::
..-1 -o o o o o or .µ E-1 111 o td 1 00 O\ O"I o o o . ~ C/l o ..-1 r-, Ui ......
•.-l td .o .... .... r-- -o -er The three parameters are detailed in the following table, by r-1 p.., H ,....... ·.-l '-' o s-e type of fuel and according to urban and interurban modes. .µ '-' o
d) With efficiencies, in the of Colombia Alter- '° N O"I o o o N o o respect to case o \O N Ui .... .... .... 00 o 00 °' native I was adopted and the following values taken: H r-- o .... o ("') ('11 ¡-.... were -.::t ("') O\ ,.....¡ ,.....¡ il) O\ r--
el) N o o .... ,...:¡ .µ o o o o ....... .-1
14.5% for all of the gasoline ,-...H ¡:::: o o o o o o o o o engines in road trans- so H
portation ::.e:: -,...:¡
18% for diesel engines, the values resulting r-1 µ.:¡ N 00 ...... o o o 9r from td Cf.l 00 r-. .... -:t \O -::t
relating specific consumption when both are known C) µ.:¡ ("') o °' N o ,.....¡
'--' H . -::t r-... .o M lf') ("') .-1 p o (see Equation (19)) ¡..,¡ o o o ,.....¡ .... < ¡::
20% H o o o o o o o for diesel oíl in sea, river and raíl transpor- l::t:l ·.-l o ~
.µ tation o. 15% for gasoline in air transportation ,...:¡ i3 \O N O\ o o o N o o o ::1 N ,.....¡ .-1 ¡-....
o \O N ,.....¡ N u C/l C") O\ °' r-... ('11 ("') 16% for gasoline in river transportation H r-, o .-1 ¡:::: ("') ..-1 ("') M Ui N N o el) N -er ...... N 18% far kerosene in air transportation ~ o o o ,....; .... .-1 o
¡z o u .µ
7% for fuel oil o µ.:¡ i:l o o o o o o o o in sea transportation E-1 µ.:¡ (.) z H o 10% far coal in raíl transportation u U) •.-l H
IJJ < 44 ,...:¡ Cf.l u ·.-lo ..-1 o o o eo
N 00 ("'") .... cJ Cf.l ,......¡ Ui Ui -er cJ.) < 00 r-. lf'\ 2. The Case of Colombia 1 z IJJ ("I') o °' o -o ...... O.él ..-1 H o ::e: M Ui ("') -:t \O r--
E-1 Cf.l .o o o H ¡..,¡ o o o ..-1 .... IJJ E-1 o o ,...:¡ < o o o o o With all of the foregoíng assumptions, the BEEU are be l::t:l ~
o elaborated, including the format and results of far the case of < E-1 o Cf.l
p.., ~ o M O\ O'\ O\ o (") ¡-.... Colombia in the followíng pages. .... U) IJJ -:t r-... ("'") ("') M o '° '° N
~ E-1 ¡..,¡ O\ N IJJ Ui (") ("') (") r-.
el) r-. '° C")
~ -::!" o o o o 00 r-.
el) .µ -:t °' .c °' E-1 o ,......¡ o r-- r-- r-.
00 i:l Ui 00 00 00 00 \O (") '° < td ,...._ H '° Ui Ui -:t -.:t -::t -:t
p.., CJ.l H r-1 td
u •.-l (!)
H ::;;:: >"' -o o o o -:t lI'\ '° '° Cf.l - o o o
< ....-l s '° N r-... l::t:l td ::.e:: o o ("') \O
::1 <:» .o O\ Ui (") Ui o o .... i:l ¡..,¡ Ui r-, °' lI'\ o N -::!" O\ lI'\ U"'\ Ui 00 ~ \O 00 r-... 00 00 .-4
-er -::!" -er -:t
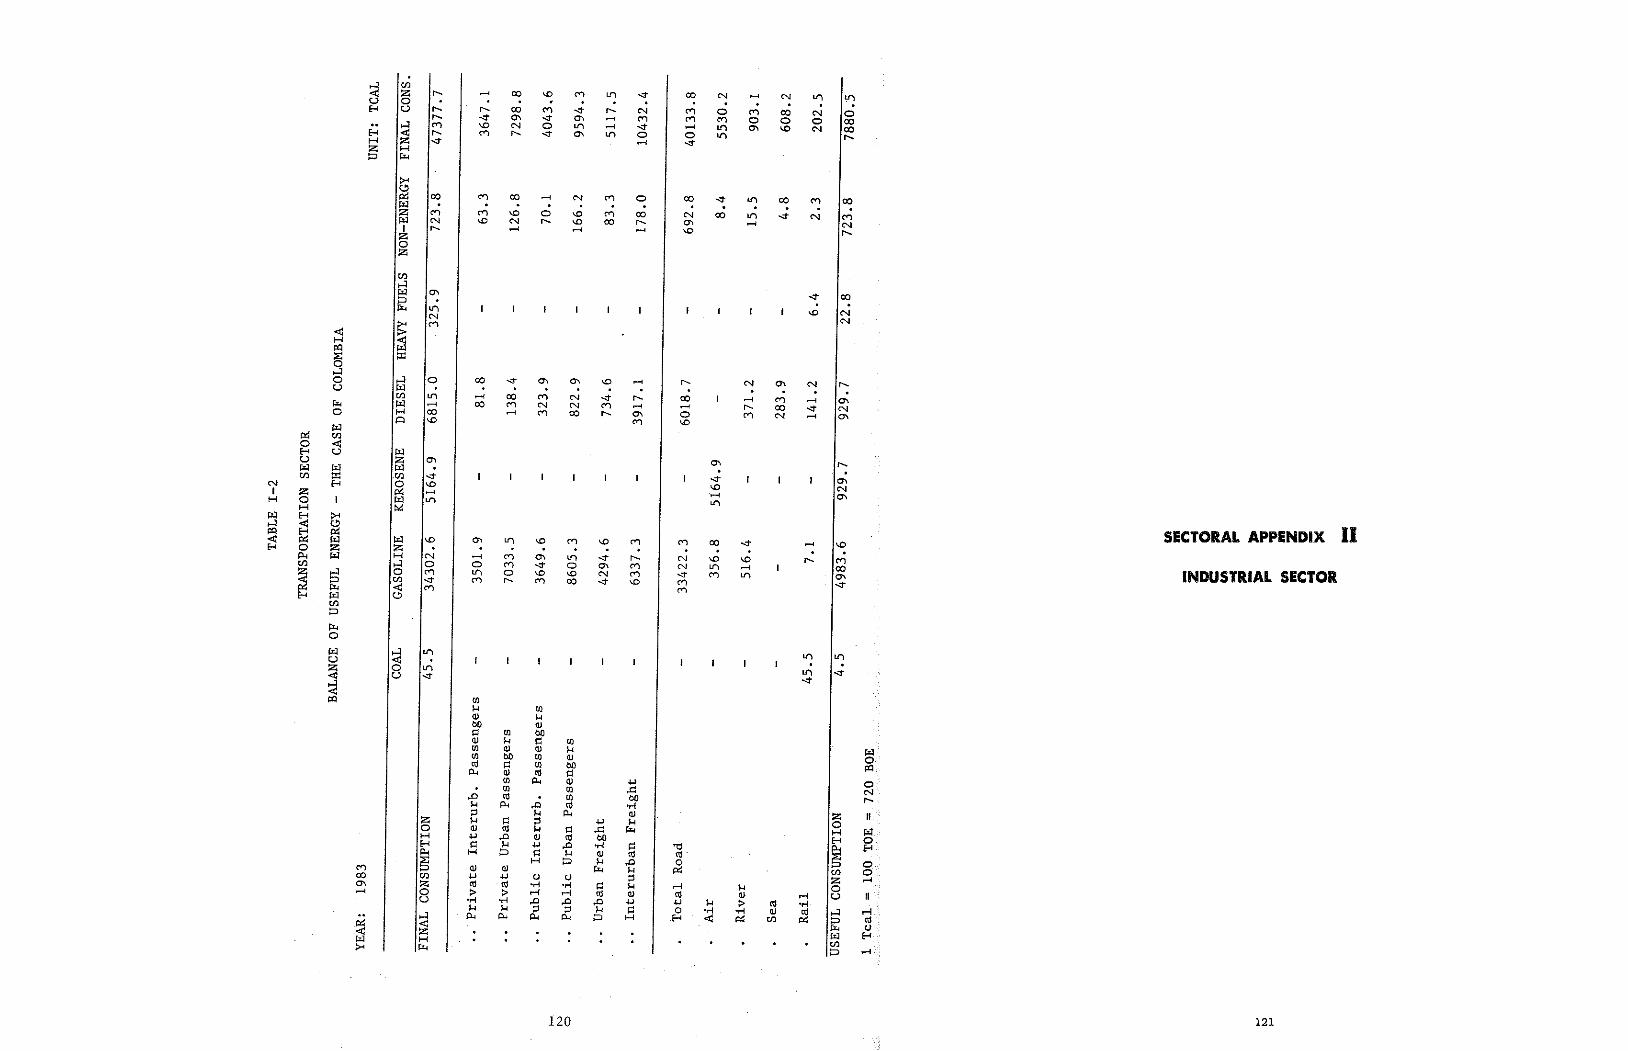
121 120
,_:¡ U)
< z ,.... ...... 00 -o M IJ"\ ...::I" 00 N ...... N LI"\ U"! u o . . H u r-, ,.... 00 M ...::I" ,.... N (") o (") 00 N o ,.... -e °' ...::!" O\ ...... M e'") (") o o o 00 ~ M "' N o IJ"\ ...... ...;t ...... tri °' \O N 00 H ,.... ("I') r-, -e °' LI"\ o o LI"\ ,..._
H z -.:t ....... ...;t z H :::i i::c..
~ 00 M 00 ....... N M o 00 -.:t LI"\ 00 M 00 w z M M \O o '° M 00 N 00 LI"\ ...;t N ("") l'.zl N \O N r-, \O 00 ,.... °' ....... N t ,..._ ..... ..... ...... '° r-, z o z U) ,_:¡ l'.zl O\ -e- 00 ::i í-1< IJi
'° N N N
~ M < H
f:Q l'.zl e ::r:: ,_:¡ o ,_:¡ o 00 ...::I" O\ O\ \O ...... ,..._ N O\ N ,..._ u ¡,;:¡
Ul l/"\ ....... 00 (") N ...::!" ,..._ 00 ..... (") ..... O\ i::c.. rz,;¡ ..... 00 M N N M ...... ...... r-, 00 ...::!" N o H 00 ...... M 00 r-, O\ o M N ...... O\ ¡:::¡ \O M -o l'.zl p:: tlJ o < H u w u z O\ O\ ,.... l'.zl l'.zl µ:¡ U) ::r:: r.n ...::!" ...::I" O\ N H o \O \O N 1 z p:: ...... . ...... O\ H o 1 µ:¡ IJi LI"\ H ~ µ:¡
~ ~ 11 ,_:i
SECTORAL APPENDIX ~ < µ:¡ w \O o- tri '° M \O M (") 00 ...::!" ..... \O H o z z p., l'.zl H N ..... M O\ LI"\ -.:t ,.... N \O \O r-, e") r.n ,_:¡ o o M -er o °' e") N IJ"\ ..... 00 INDUSTRIAL SECTOR ~ s o M IJi o \O \O N M <r e") U"\ O\ r.n -e- (") r-, M 00 -sr \O M -e- i::c.. -e (") M H l'.zl o r.n ::i í-1< o l'.zl ~ U"\ LI"\ U"\ u . ~ o IJi IJi -.:t u -.:t ...::!" ~ i:t:I (1)
H (1) QJ H bO QJ r::: (1) O() QJ H ¡:::: CI) CI) QJ QJ H (I] O() CI) QJ tÚ ¡:::: (I] OD p.., QJ tÚ ¡::::
fil p.., QJ .¡.J fil fil .i::: ..c tÚ [J) ee !-< p.., ..c tÚ •.-!
::1 !-< p.., QJ z z !-< ¡:::: ::1 .¡.J !-< o o QJ <U !-< i::: .i::: i::c.. H H .¡.J ..c QJ en 00 H H r::: H .µ ..c •rl ¡:::: -e p.., p.., H ::i r::: H QJ <U tÚ s s H ::i H ,.o o M QJ QJ í-1< H p:: U) 00 U) .¡.J .u {.) {.) ::1 z O\ z en <d -rl ·.-! ¡:::: !-< ,..-j H o ..... o > > ,..-j ,..-j <d (1) ctl Cll M u u -rl •rl ..c .e ,.o .µ .u !-< > tÚ •r-4 1...1 H ::1 ;:l 1...1 ¡:::: o ·.-! ·.-! QJ <d ,_:¡
~ p.., p.., p.., p.., :::i H H < p:: ti) i:>:: ~ i:>:: < w w H ti) >< í-1< :::>

122
The Case of Brazil 163 3.
The Case of Colombia 160 2.
158 General Consideratíons l.
CHAPTER III - APPLICATIONS
153 4. Guidelines for Data Processing and Sample
Expansion
Guidelines for Sample Design 150 3.
Analysis of Existing Information 147 2.
Data-Collecting Form 144 l.
CHAPTER Il - DATABASE FORMATION
BEEU Applied to the Industrial Sector 138 5.
135 BEEU Applíed toan Industrial Unit 4. Final Energy, Useful Energy and Efficiencies 133 3.
Disaggregation by Uses 132 2.
Disaggregation by Subsectors 123 l.
CHAPTER I - DEFINITIONS AND BASIC CONCEPTS
INDUSTRIAL SECTOR
INDEX

123
With reference to Table II.l, it can be observed that for 7 of the groups there is direct correspondence between the energy balance and the two-digit ISIC. These are:
Table II.1 schematizes the classification proposed in this meth- odology (Groups I), its correspondence to the ISIC and the respective nomenclature. Chart II.2 includes a summary breakdown of the four-digit !SIC classification for the industrial sector.
It is thought that a two-digit system is the mi.nimum for the current state of energy information in Latín America, and that it would permit OLADE to work out a common pattern for comparisons, which could include all of the Member C9untries.
There is no reason of a theoretical nature to reject the maximum 4-digit classification; furthermore, sorne countries in the region already have information on energy consumption at this level, at least for sorne products. The difficulty of working with four digits, and even with three, líes in the sample de.sign, the size of which is excessive and very costly.
The ISIC classification cannot, however, be translated mechani- cally ínto the energy balance. The system is composed of four digits, the first of which indicates the branch of economic activity and the last three of which characterize the finer divisions of the branch.
As a result, the problem of disaggregating consumption is undoubtedly tied to natíonal accounts. Since these are usually based on the international classification - ISIC, then this system wíll also be used as the methodological basis for disag- gregatíng consumptíon.
The need to disaggregate final consumption in industry by subsec- tors is amply justified, and it represents a logical stage in theevolution of energy balances. One of the most important ~easons why, is related to the preparation of models for energy demand projection: whether these are econometric or analytical process models, they are always heavily dete~mined by the relation be-tween energy consumption and some value which is characteristic of industrial production. In the industrial sector, value added is the most commonly used indicator far these purposes. Theconcept of the elasticity of consumption/value added or energy content thus appears in different definitions, for this is oneway to express energy consumption per economic unit generated byindustrial production activities.
l. Disaggregation by Subsectors
DEFINITIONS AND BASIC CONCEPTS
CHAPTER I
125
For the energy genous demand, cíated supply.
In most countries, both the energy consumption and value added of the cement plants is several times larger than those for lime and laster. In a first approximation, it could then be accepte~ that
~roup 1.7 includes only cement consumption and that t~is is Pared with the value added of all of Subgroup 3692, with the com . 'tt d awareness that a slight error is being commi e·
In a second approximation, lime and plaster consumption can be G I 7 so that its comparison with economic added to roup . ,
parameters would not offer any difficulties.
One of the most complicated groups to deal with, ~espite :he fact that there are no discrepancies with the two-digit ISIC is I.8, "Iron Steel and Non-Ferrous Metals." It specifically refers to Coke ~lants and Furnaces, the usual practice in the OLADE ~alan7e being to place both kinds of installations on the supply side (in transforamtion centers) and to express the flows by means of a double recycling, which proves to be a little vague.
The way in which the problem has now been solved-- and it is not the only way-- consists of leaving coke plan~s on the supply side and of passing furnaces to the demand side. This approximation is adopted for the following reasons:
From the point of view of the value added of the group, furnaces are very significant; coke plants are not. There-
ept the fore, by leaving furnaces in the group, we can acc value added justas it comes from the national ac:ounts, considering as negligible the slight error that removing the coke plants would imply.
· of the double recycling in one trans- The complication formation center at the level of supply then disappears.
planner, the furnace is a problem of exo- whereas the coke plant constitutes the asso-
124
Group I. 6, "Cemerrt , 11 corresponds to 3692 of the four-digit ISIC, and Group I. 7, "St cne s , Glass and Ceramics," to ISIC 36, except for the subgroup corresponding to Cement. This separation is highly useful since cement-making is one of the heaviest. energy consumers, where substitution processes are the most evident. Furthermore, what remains of the ISIC 36 after taking out cement will also account for a very large consumption; so, the practice in sorne countries is increasingly tending toward separation. One difficulty arises, however, with the ISIC subgroup 3692, which includes not only cement but also lime and plaster, and with the naiional accounts classified a~cording to the ISIC Version II. There is no other way to separate cement from lime and plaster.
With the same críterion, it is necessary to eliminate coal dis- tillation in coke furnaces ·from the "Chenrí.ca Ls " .gr'oup (other than in iron and steel manufacturing) ; however, in most cases its low relative weight will not increase the enormous effort that separation would entail. If coal liquefaction and gasifica- tion installations were to take on importance, ·they should be given the same treatment as refineries. Alcohol distílleries using vegetable feedstock receive the same treatment, as can be seen in Chapter II of the Base Document.
In these cases, it is recommended that an effort be made to separate consumption and value added and to place refineries under "supply" and petrochemicals under "demand". When the re- fining sector of a country is being planned, this should be done using a special technique proper to supply models. Otherwise, petrochemical consumption is treated as a case of demand projec- tion and thus must be separated.
In Group I.5, "Chemicals," the subgroup 3530 corresponding to petroleum refineries, is excluded because the energy balance computes these under the supply sector and also because they must be subtracted from the value added when it is desired to cal- culate elasticities. In sorne countries, this may produce a certain amount of confusion, especially in the cases in which the petrochemical facilities are integrated into refineries.
It should be pointed out that the sector "Wood and Furniture" will present very low levels of energy consumption in most countries, and in these cases could be added to "Machinery and Equipment," whose consumption will be of an intermediate magni- tude. From the conceptual standpoínt, the furniture industry and its raw material, wood, can be considered as manufacture of non- metallic equipment, so that there would be no problem in in- cluding it under Group I.9 if such consumption were very low.
Metals
and Leather I 1 Food, Beverages and Tobacco I 2 Textiles, Clothing, Footwear I 3 Wood and Furniture I 4 Paper and Pulp I 8 Iron, Steel and Non-Ferrous I 9 Machinery and Equipment I 10 Unspecified
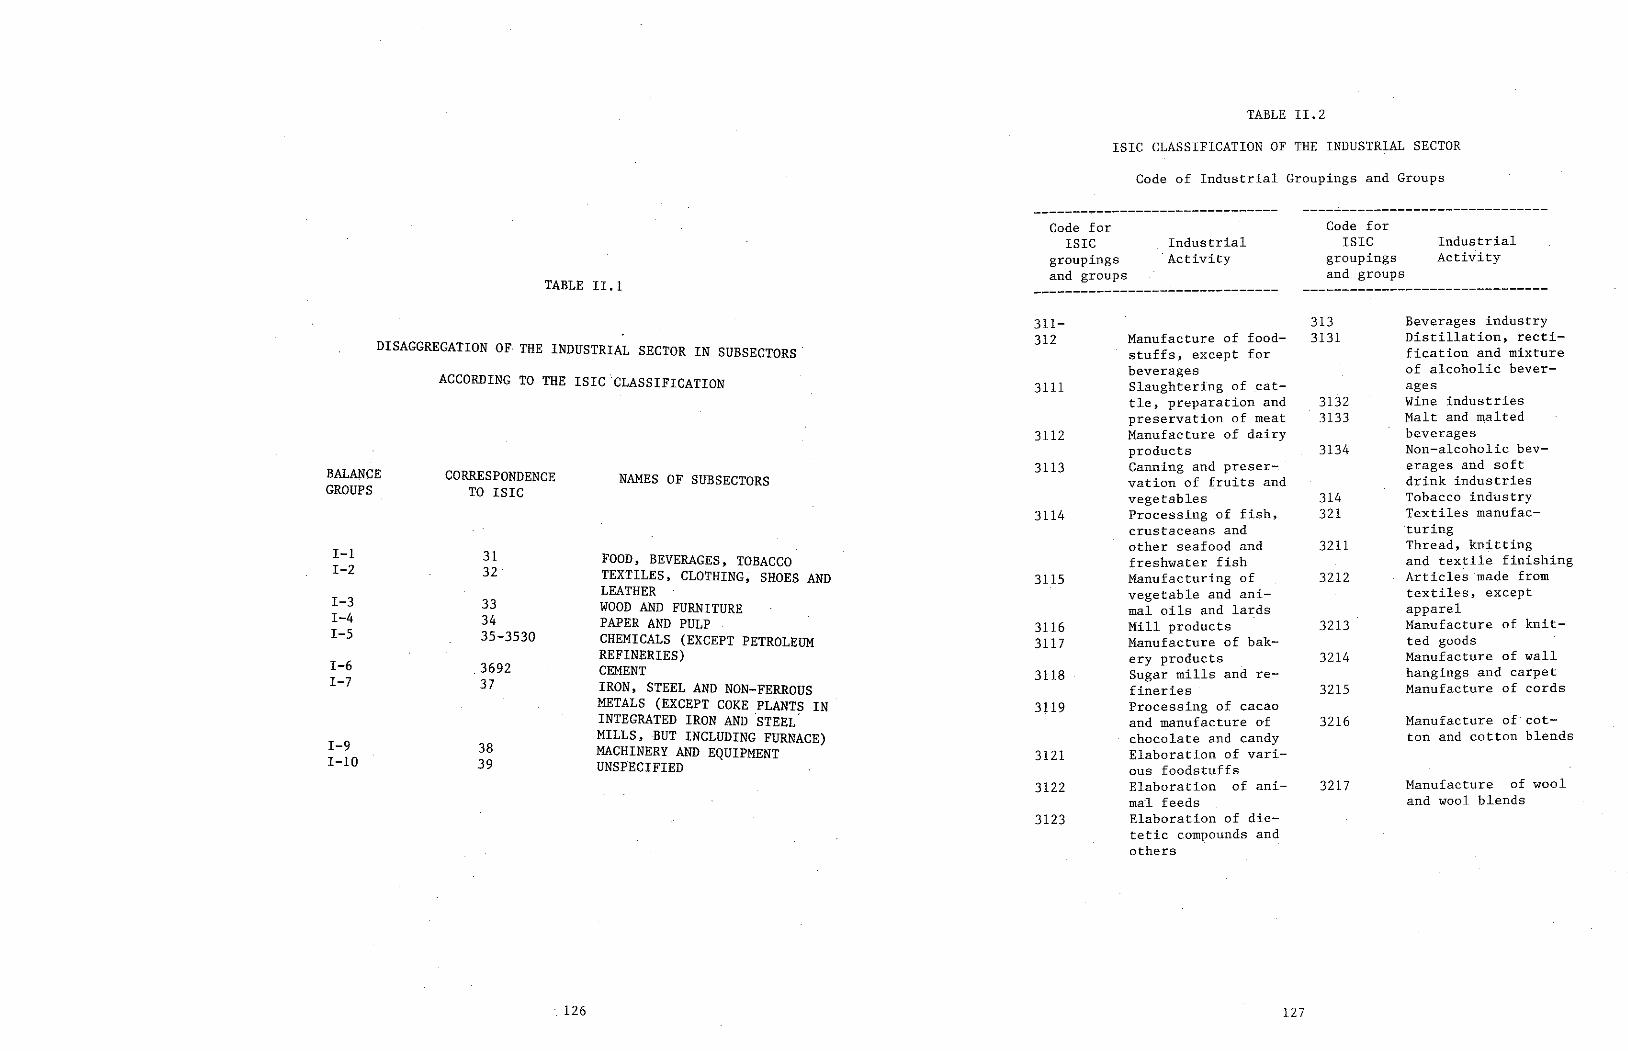
127
Manufacture of wool and woo 1 b lends
3217
Manufacture of cot- ton and cotton blends
3216
3215
3214
3213
3212
3211
314 321
3134
3132 3133
Beverages industry Distillation, recti- fication and mixture of alcoholic bever- ages Wine industries Malt and ma Lt ed beverages Non-alcoholic bev- erages and soft drink industries Tobacco industry Textiles rnanufac- ·turing Thread, knitting and textile finishing Article~ made from textiles, except apparel Manufacture of knit- ted goods Manufacture of wall hangings and carpet Manufacture of cords
313 3131
Industrial Ac t í.v í t y
Code far ISIC
groupings and groups
----~--------------------------
3123
3122
3121
3119
3118
3116 3117
3115
3114
3113
3112
3111
Manufacture of food- stuffs, except for beverages Slaughtering of cat- tle, preparation and preservation of meat Manufacture of dairy products Canning and preser- vation of fruits and vegetables Processing of fish, crustaceans and other seafood and freshwater fish Manufacturing of vegetable and ani- mal oils and lards Mill products Manufacture of bak- ery products Sugar rnills and re- fineries Processing of cacao and manufacture o·f chocolate and candy Elaboration of vari- ous foodstuffs Elaboration of ani- mal feeds Elaboration of die- tetic compounds and others
311- 312
------------------------------- Industrial
· Activity Code far
ISIC groupings and groups
Code of Industrial Groupings and Groups
ISIC CLASSIFICATION OF THE INDUSTRIAL SECTOR
TABLE II. 2
126
38 39
1-9 l-10
FOOD, BEVERAGES, TOBACCO TEXTILES, CLOTHING, SHOES AND LEATHER WOOD AND FURNITURE PAPER AND PULP CHEMICALS (EXCEPT PETROLEUM REFINERIES) CEMENT IRON, STEEL AND NON-FERROUS METALS (EXCEPT COKE PLANTS IN INTEGRATED IRON AND .STEEL. MILLS, -BUT INCLUDING FURNACE) MACHINERY AND EQUIPMENT UNSPECIFIED
I-1 31 I-2 32 I-3 33 I-4 34 I-5 35-3530 I-6 3692 I-7 37
NAMES OF SUBSECTORS CORRESPONDENCE TO ISIC
BALANCE GROUPS
DISAGGREGATION OF THE INDUSTRIAL SECTOR IN SUBSECTORS.
ACCORDING TO THE ISIC CLASSIFICATION
TABLE II. l
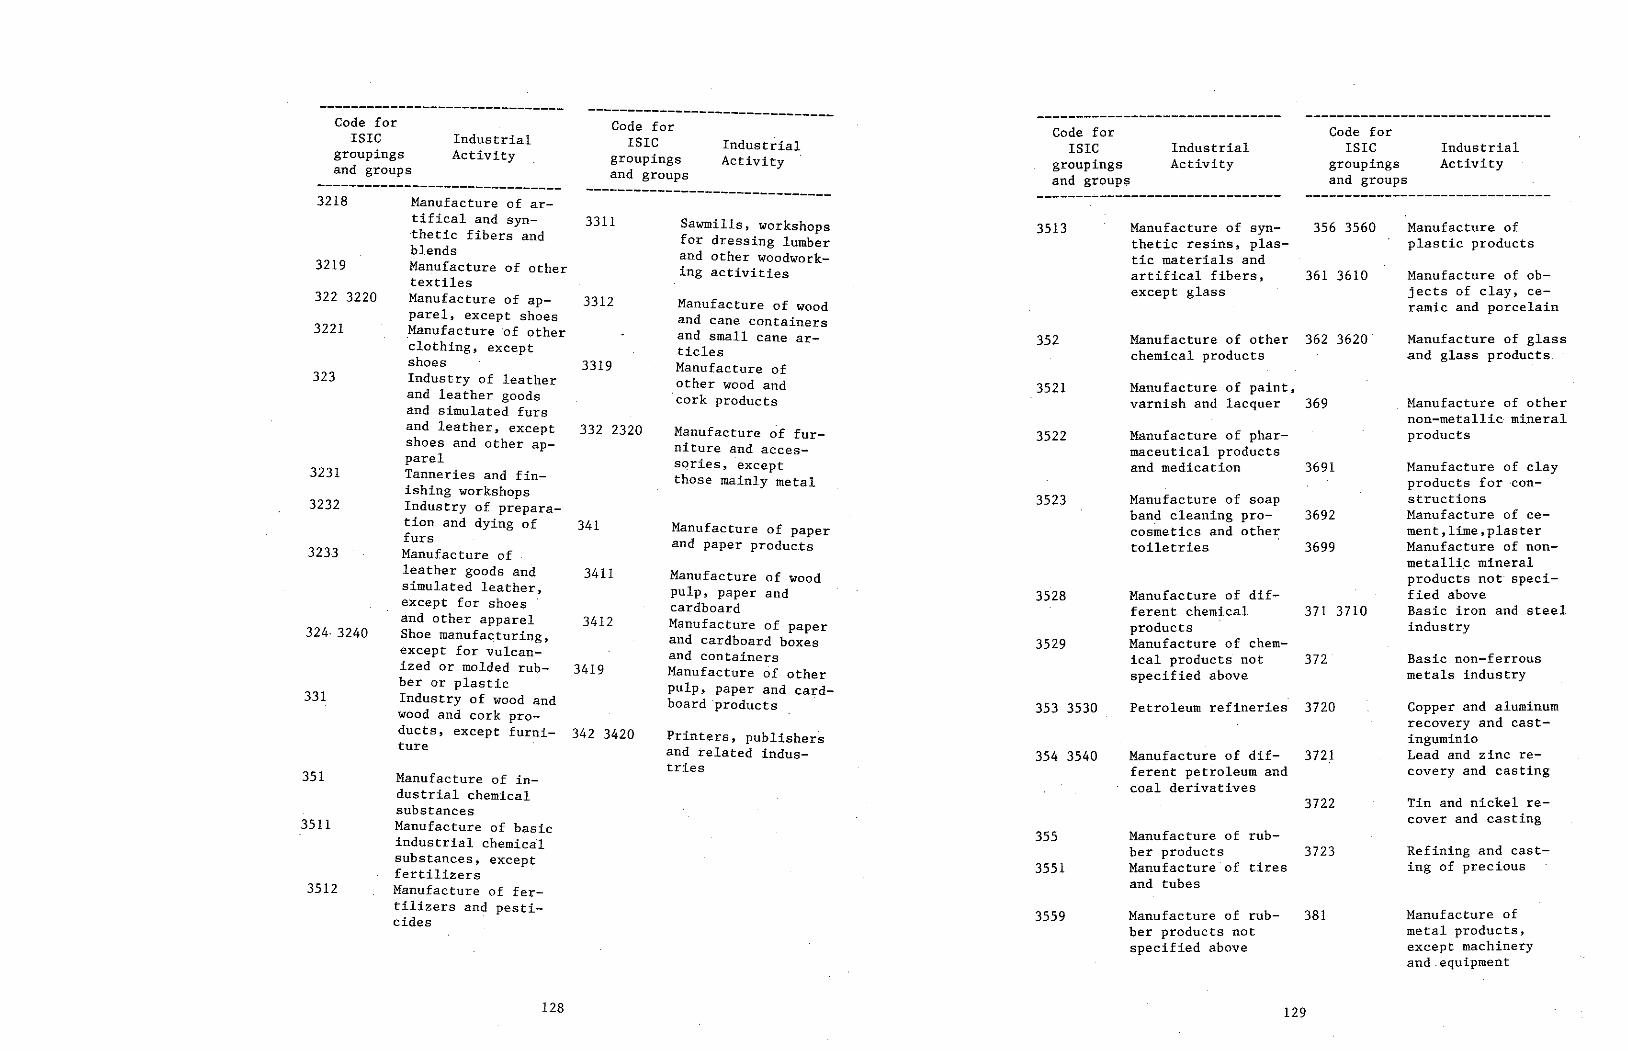
129
Manufacture of metal products, except machinery and.equiprnent
Refining and cast- ing of precious
Tin and nickel re- cover and casting
Copper and aluminum recovery and cast- inguminio Lead and zinc re- covery and casting
353 3530 Petroleum refineries 3720
354 3540 Manufacture of dif- 3721 ferent petroleum and coal derivatives
3722
355 Manufacture of rub- ber products 3723
3551 Manufacture of tires and tubes
3559 Manufacture of rub- 381 her products not specified above
3529 Basic non-ferrous metals industry
Manufacture of dif- ferent chernical 371 3710 products Manufacture of chem- ical products not 372 specified above
3528
Manufacture of soap band cleaning pro- 3692 cos~etics and other toiletries 3699
3523
Manufacture of clay products for ·con- structions Manufacture of ce- ment,lime,plaster Manufacture of non- metallic mineral products not speci- fied above Basic iron and steel industry
Manufacture of phar- maceutical products and medication 3691
3522
Manufacture of other non-metallic mineral products
Manufacture of paint, varnish and lacquer 369
3521
Manufacture of glass and glass products
Manufacture of other 362 3620. chemical products
352
Manufacture of plastic products
Manufacture of ob- jects of clay, ce- ramic and porcelain
Manufacture of syn- 356 3560 thetic resins, plas- tic materials and artifical fibers, 361 3610 except glass
3513 -------~----------------~------
Industrial Activity
Industrial Activity
Code for ISIC
groupings and groups
Code for ISIC
groupings and groups
Printers, publishers and related indus- tries
Manufacture of wood pulp, paper and cardboard Manufacture of paper and cardboard boxes and containers Manufacture of other pulp, paper and card- board products .
Manufacture of paper and paper produc.ts
Manufacture of fur- niture and acces- sories, except those mainly metal
Manufacture of wood and cane containers and small canear- ticles Manufacture of other wood and ·cork products
Sawmills, workshops for dressing lumber and other woodwork- ing activitíes
128
3512
3511
Manufacture of in- dustrial chemical substances Manufacture of basic industrial cherriical substances, except fertilizers Manufacture of fer- tilizers and pesti- cides
351
331
324· 3240
3233
3232
3231
323
3221
322 3220
3219
Manufacture of ar- tifical and syn- 3311 thetic fibers and blends Manufacture of other textiles Manufacture of ap- 3312 parel, except shoes _Manufacture of other clothing, except shoes 3319 Industry of leather and leather goods and simulated furs and leather, except 332 2320 shoes and other ap- parel Tanneries and fin- ishing workshops Industry of prepara- tion and dying of 341 furs Manufacture of leather goods and 3411 simulated leather, except for shoes and other apparel 3412 Shoe manufacturing, except for vulcan- ized or molded rub- 3419 her or plastic Industry of wood and wood and cork pro- ducts, except furni- 342 3420 ture
3218 ------------------------------- ------------------------------- Industrial Activíty
Code for ISIC
groupings and groups
Industrial Activity
Code for ISIC
groupings and groups
------------------------------- -------------------------------
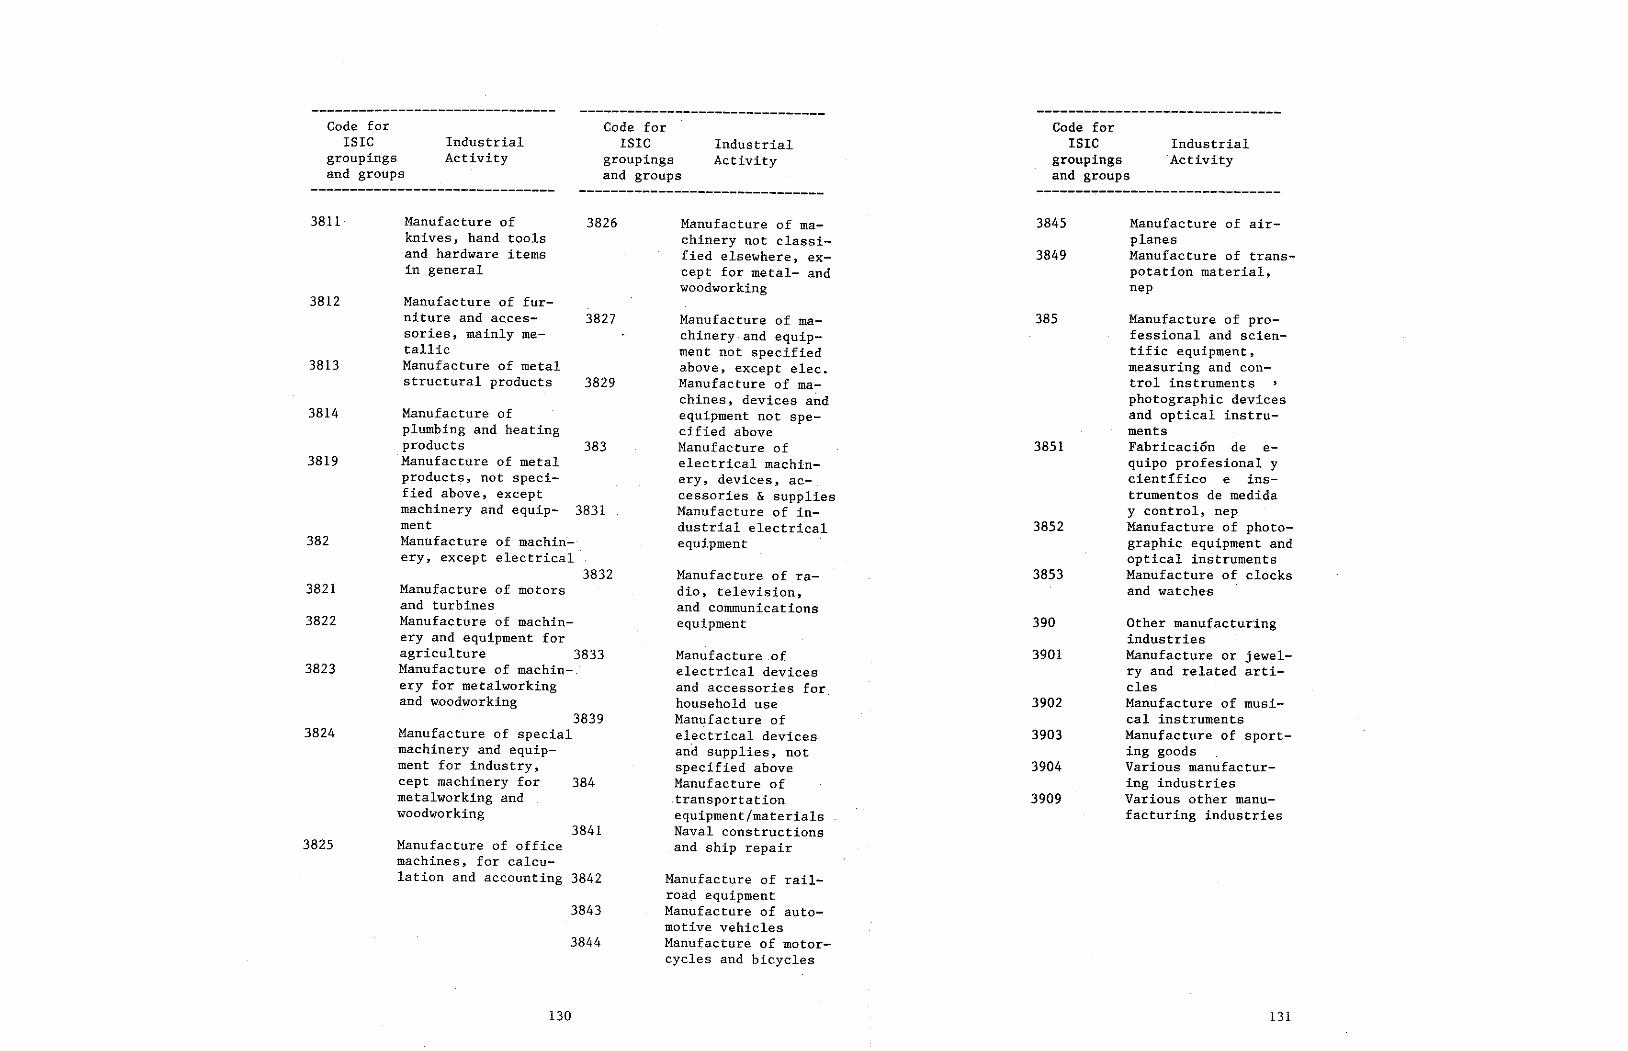
131
3909
3904
3903 3902
3901 Other manufacturing industries Manufacture or jewel- ry and related arti- cles Manufacture of musi- cal instruments Manufacture of sport- ing goods Various manufactur- ing industries Various other manu- facturing industries
390
3853
3852
3851
Manufacture of pro- fessional and scien- tific equipment, measuring and con- trol instruments photographic devices and optical instru- ments Fabricación de e- quipo profesional y científico e ins- trumentos de medida y control, nep Manufacture of photo- graphic equipment and optical instruments Manufacture of clocks and watche-s
385
3849
Manufacture of air- planes Manufacture of trans- potation material, nep
3845
Industrial Activity
Code for !SIC
groupings and groups
Manufacture of rail- road equipment Manufacture of auto- motive vehicles Manufacture of motor- cycles and bicycles
Manufacture af electrical devices and accessories far household use Manufacture of electrical devices and supplies, not specified above Manufacture of
. transportation equipment/materials Naval constructions
.and ship repair
Manufacture of ra- dio, television, and communications equipment
Manufacture of ma- chinery and equip- ment not specified above, except elec. Manufacture of ma- chines, devices and equipment not spe- cified above Manufacture of electrical machin- ery, devices, ac- cessories & supplies Manufacture of in- dustrial electrical equipment
Manufacture of ma- chinery not classi- fied elsewhere, ex- cept far metal- and waodworking
130
3844
3843
Manufacture of office machines, far calcu- lation and accounting 3842
3825 3841
Manufacture of special machinery and equip- ment far industry, cept machinery far 384 metalwarking and woodworking
3824 3839
3823
3822
Manufacture of motors and turbines Manufacture of machin- ery and equipment far agriculture 3833 Manufacture of machin- ery for metalworking and woodworking
3821 3832
382
3819
Manufacture of plumbing and heating products 383 Manufacture of metal products, not speci- fied above, except machinery and equip- 3831 ment Manufacture of machin- ery, except electrical
3814
3813
Manufacture of fur- niture and acces- 3827 sories, mainly me- tallic Manufacture of metal structural products 3829
3812
3826 Manufacture of knives, hand tools and hardware items in general
------------------------------- 3811
Industrial Activity
Code for ISIC
graupings and groups
Industrial Activity
Code for ISIC
groupings and groups
-------------------------------
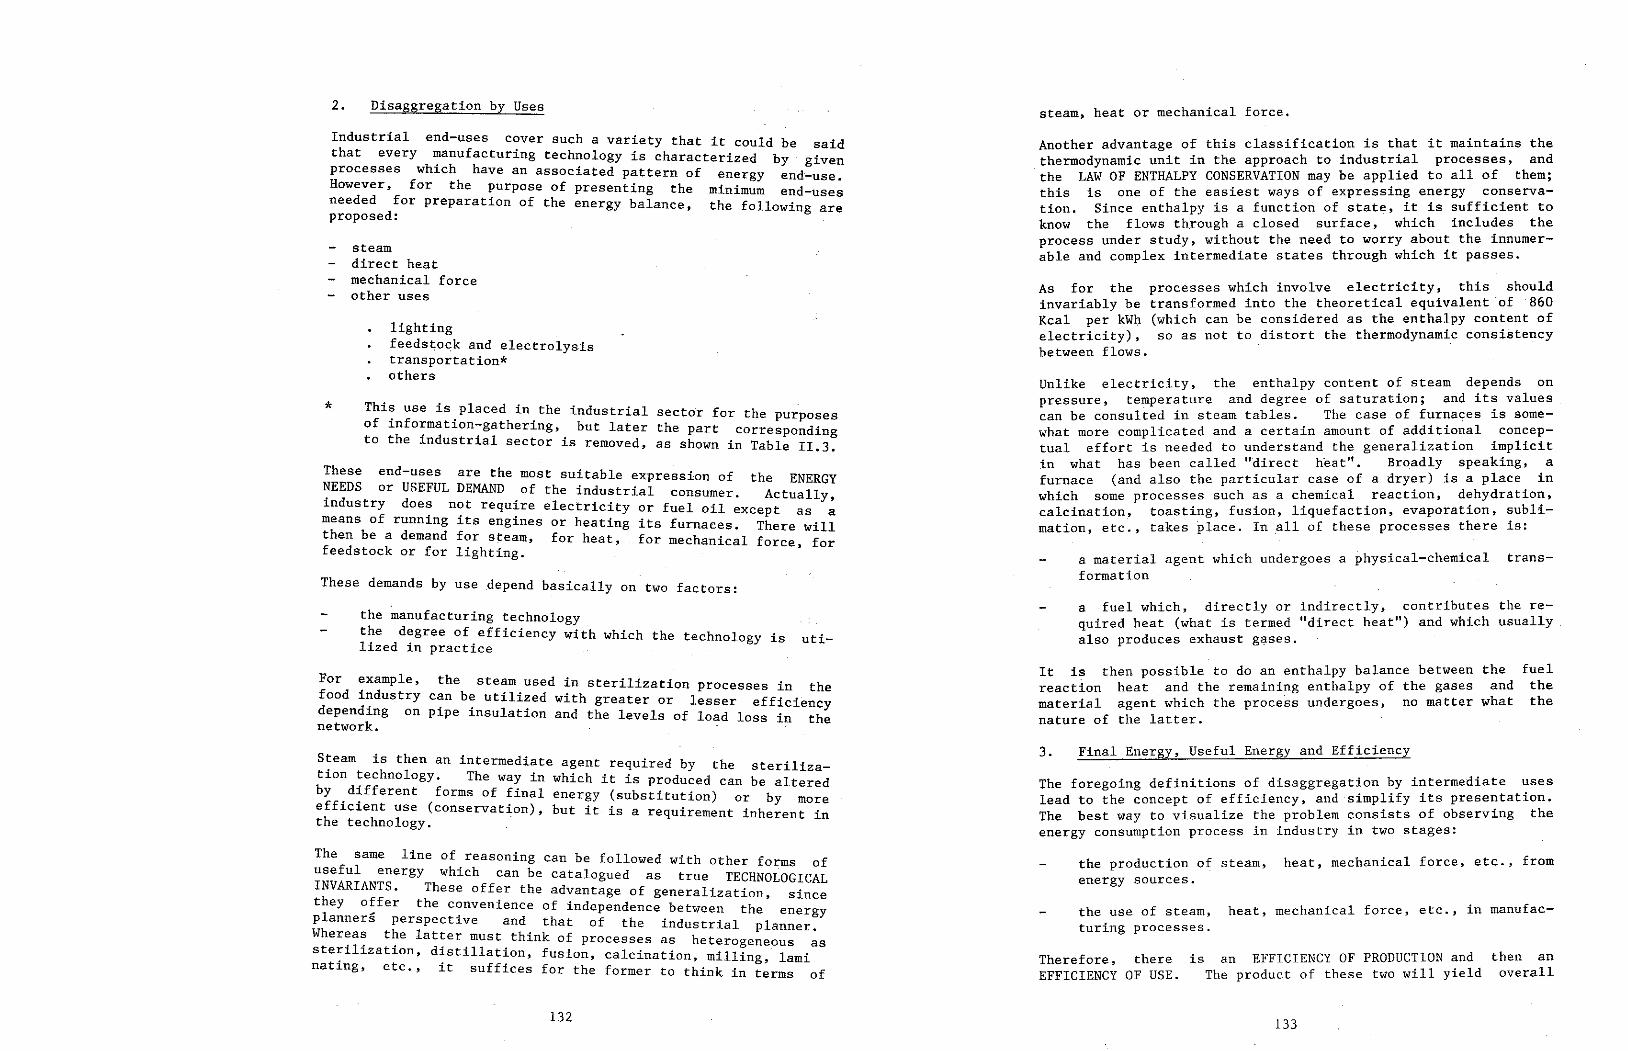
133
then an overall
is an EFFICIENCY OF PRODUCTION and The product of these two wíll yield
Therefore, there EFFICIENCY OF USE.
the use of steam, heat, rnechanical force, etc., in manufac- turing processes.
the production of steam, heat, mechanical force, etc., from energy sources.
The foregoing definitions of disaggregation by intermediate uses lead to the concept of efficiency, and simplify its presentation. The best way to visualize the problem consists of observing the energy consurnptíon process in industry in two stages:
3. Final Energy, Useful Energy and Efficiency
fuel the the
It is then possible to do an enthalpy balance between the reaction heat and the remaining enthalpy of the gases and material agent which the process undergoes, no matter what nature of the latter.
a fuel which, directly or índirectly, contributes the re- quired heat (what is termed "direct heat") and which usually also produces exhaust g?ses.
a material agent which undergoes a physical-chemical trans- formation
Unlike electricity, the enthalpy content of steam depends on pressure, temperature and degree of saturation; and its values can be consulted in steam tables. The case of furnaces is some- what more complicated anda certain amount of additional concep- tual effort is needed to understand the generalization implicit in what has been called "dírect heat". Broadly speakíng, a furnace (and also the particular case of a dryer) is a place in which sorne processes such as a chemical reaction, dehydration, calcination, toasting, fusion, liquefaction, evaporation, subli- mation, etc., takes place. In all of these processes there is:
processes which involve electricity, this should transformed into the theoretical equivalent of 860 (which can be considered as the enthalpy content of so as not to distort the t.he rmodyuam Lc consistency
As for the invariably be Kcal per kWl). electricity), between flows.
Another advantage of thís classífication is that ít maintains the thermodynamic unit in the approach to industrial processes, and the LAW OF ENTHALPY CONSERVATION may be applied to all of them; this is one of the easiest ways of expressing energy conserva- tion. Since enthalpy is a function of state, it is sufficient to know the flows th.rough a closed surface, which includes the process under study, without the need to worry about the innumer- able and complex intermediate states through which it passes.
steam, heat or mechanical force.
132
The same line of reasoning can be followed with other forms of useful energy which can be catalogued as true TECHNOLOGICAL INVARIANTS. These offer the advantage of generalization, since they offer the convenience of independence between the energy planners perspective and that of the industrial planner. Whereas the latter must think of processes as heterogeneous as ste~ilization, distillation, fusion, calcination, milling, lamí nat1ng, etc., it suffices for the former to think in terms of
Steam is then an intermediate agent required by the steriliza- tion technology. The way in which it is produced can be altered by different forms of final energy (substitution) or by more efficient use (conservation), but it is a requirement inherent in the technology.
the steam used in sterilization processes in the can be utilized with greater or lesser efficiency pipe insulation and the levels of load loss in the
For example, food industry depending on network.
the manufacturing technology the degree of efficiency with which the technology is uti- lized in practice
These demands by use .depend basically on two factors:
industry does not require electricity means of running its engines or heating then be a demand for steam, far heat, feedstock or far lighting.
consumer. Actually, or fuel oíl except as a its furnaces. There will for mechanical force, for
ENERGY the end-uses are the most suitable expression of or USEFUL DEMAND of the industrial
These NEEDS
This use is placed in the industrial sector for the purposes of information-gathering, but later the part corresponding to the industrial sector is removed, as shown in Table II.3.
*
lighting feedstock and electrolysis transportation* others
steam direct heat mechanical force other uses
Industrial end-uses cover such a variety that it could be said that every manufacturing technology is characterized by given processes which have an associated pattern of energy end-use. However, for the purpose of presenting the mínimum end-uses needed for preparation of the energy balance, the following are proposed:
Disaggregation by Uses 2.
135
First of all, it is possible to develop the concept of NET ENERGY INPUT (NEI), which is defined as the energy which enters the plant, disaggregated by sources, without any duplication. In many cases, the NEI will be equal to the energy bought but, in order for the treatment to be completely general, the following should be kept in mind:
4. BEEU Applied toan Industrial Unit
Here an attempt is made to apply the technique of FLOW DIAGRAMS, to ~h~ units of industrial manufacturing, following the guide- lines of the principle of energy conservation. This is the same technique used to design the energy balance for a country or region. The industrial diagram is presented in Figure II.l.
In general terms, an industrial plant performs t~e dual function of buying and producing energy, in the form of pr1mary and secon- dary sources, which are later transformed into useful forms ~uch as those defined under Point 2 (steam, direct heat, mechanical force and other uses). The ENERGY BOUGHT is disaggregated by source, according to those presented in the energy balance ma- trix.
In the case of transportation (outside the plant), no comments wiil be made here, because its consumption <loes not correspond to the industrial sector.
In the case of direct heat, something similar occurs: production takes place in a furnace having a characteristic efficiency, but the discharge gases and the agent which receives the heat are energy sources which are utilized to a greater or lesser extent (heat recycling), and which characterize an efficiency of use.
With respect to other end....,uses, it is worthwhile to note that:
There could be a good deal of argumentas to the efficiency of lighting, and values range from 6% to 100%, according to the criteria used. Feedstock, electrolysis, cleaning, etc., should have a fictitious efficiency of 100%, since they do not corre- spond to a truly energy use. All of these end-uses are unsubstitutable with respect to soutces, and they do not lend themselves to major conservation programs.
and is used, for example, in a process to cut metal pieces or in a fluid agitator.
Frequently, the motor and the mechanism of use (such as the agitator or cutting piece) will be integrated into a single unit but, when overall efficiency is being studied, a conceptual separation can be made between the instrument which produces energy and the one which uses it. Continuing with this examp Le , the motor may be efficient because its magnetic circuits are in good condition but the worn blades of the agitator ~ay dis~ipat~ energy; therefore, there are two possible causes of 1neffic1ency. one in production and another in use.
134
Mechanical force is produced in the shaft of motors and turbines
not
The two efficiencies which have been defined (production and use) are visualized in the three basic energy uses: the case of steam is the simplest, since it is produced in a boiler and clearly shows that production and use are physically separate. In the case of mechanical force and direct heat, the separation is physical but rather conceptual.
It is thought that this approximation is sufficient when demand projection focuses on emphasizing the mechanisms of SUBSTITUTION among the various sources which compete in price on a market, to produce the same arnounts of intermediate dernand, Under these circurnstances, it is not so much the absolute value of efficien- cies which is of interest but rather their relative value, to reflect the fact that one source is either more or less efficient than another in satisfying the needs of a given technology.
Sornetimes it is possible to work with MEASURED EFFICIENCIES, which, although they are preferable to adopted efficiencies, entail the major drawback of high costs for measurement proce- dures. The only way to rneasure efficiencies is through ENERGY AUDITS, which reveal thermodynamic parameters far the industrial plants. Even so, it is very difficult to generalize these values statistically far a nurnerous group of industries. It ·becomes necessary to work with measured efficiencies when what is desired is to express the mechanisms for CONSERVATION or RATIONAL USE OF ENERGY (RUE), because these entail the need to do audits.
The problem of determining efficiencies deserves special comment, It is very common in the work on energy dernand that reaches the level of.useful energy to use ADOPTED EFFICIENCIES from manufac- turing catalogs; this practice has been establíshing certain standard values which are applied with more or less rigor in different countries.
If only the first of the two efficiencies is known, i.e., pro- duction, when it is multiplied by final demand, the useful demand at the level of production, or inter~ediate demand, ís obtained, In summary, it can be said that final energy is that which is measured at the beginning of the process and useful energy· at the end. Both of these can be disaggregated by subsectors, by products, and by end-uses.
As recommended in the Base Document and the other sectoral appendices, the first stage of application of the methodology suggests the determination of useful energy, in response to efficiency of production. The determination of efficiency of use and the application of overall process efficiency have been left for a second stage of development.
s. l 11 f f í • " If imp y e 1c1ency. energy is now multiplied energy. or final demand by overall effíciency, is,obtained and the dífference between the two losses. This method is adopted for each end-use.
efficiency or by source of useful demand constitutes the
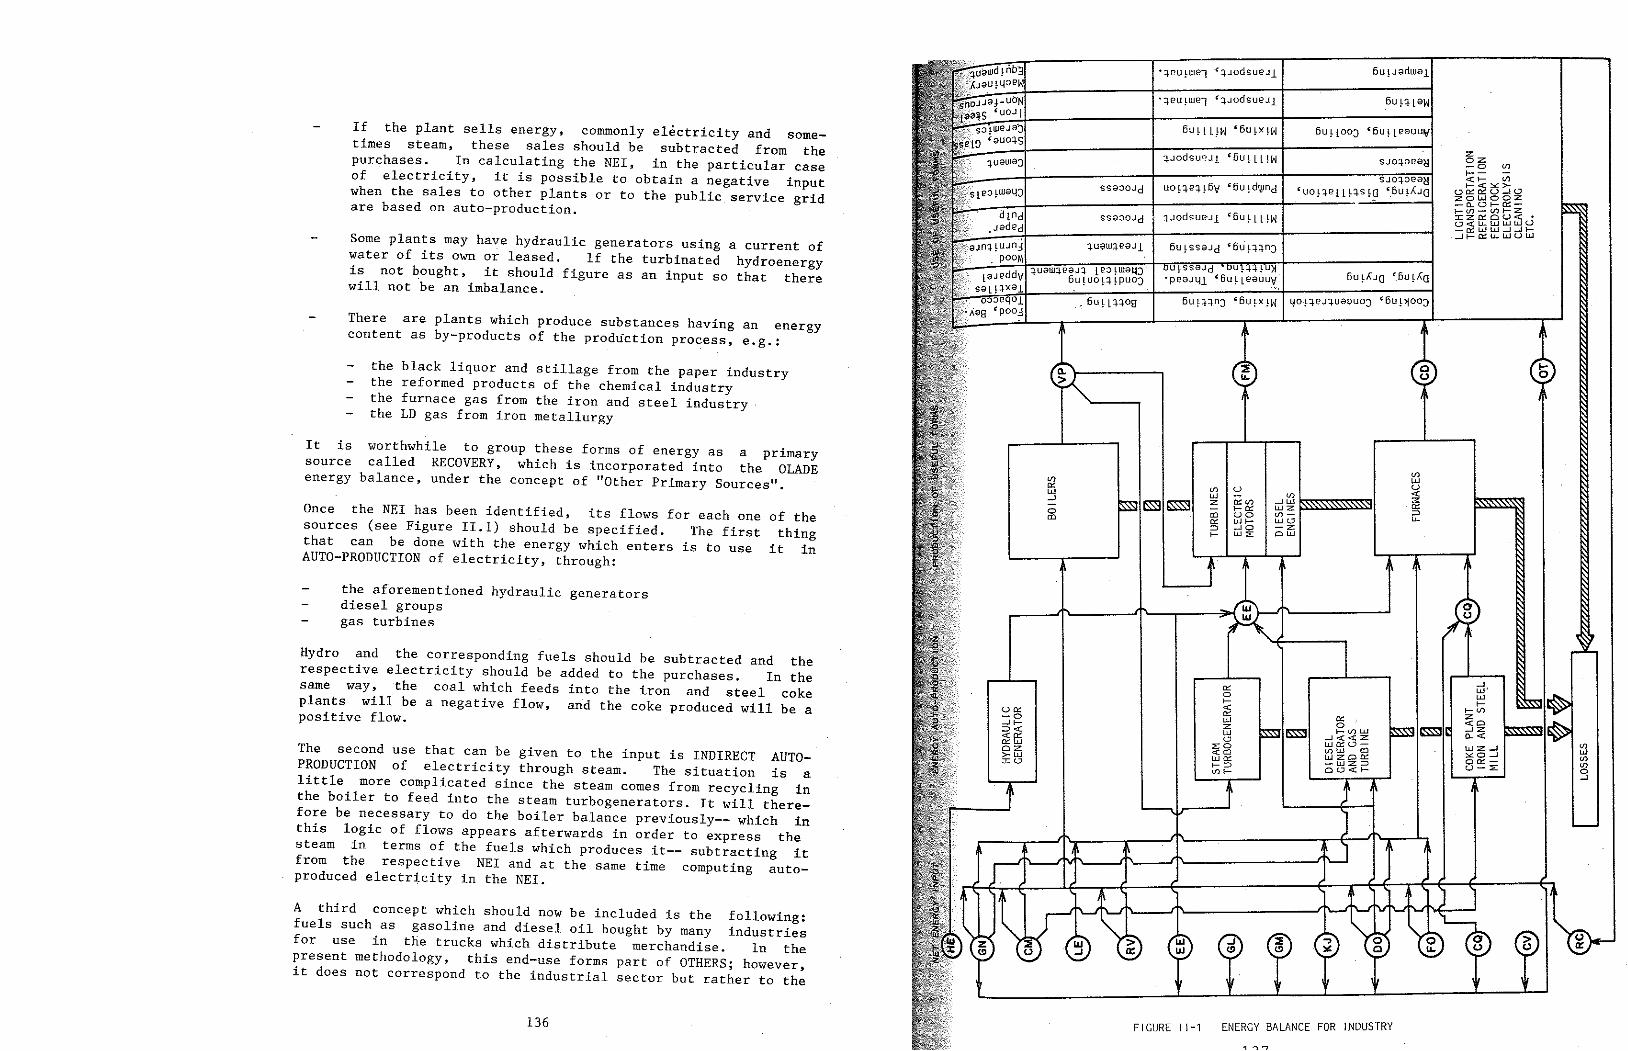
F 1 GURE 1 l -1 ENERGY BALANCE FOR INDUSTRY
<I) LLl <I) u o::
<I) u -c LLl w <I) ~ _J ~ ~ z o:: <I) ....JW a;: 1- o:: wz :::> o a) uo <I) - L!.. co et: LLl 1- WQ
::) ...JO -z 1- wz ow
o o
o33eqo1 , 5u~Lnog 'poo3
UfSSaJd u.++~~~. ·peaJ41 '6u~leauuv,_
fUJn3 +uaw+eaJl pOOM
+Jodsu~Jl '6u~LlfW sJ0+3eaci sJo:peaci
_J o:: W' o w 1- 1- < 1- <I) uo:: o:: o:: z -o w o <O --.11- z ~ _J z :::>< w ~ 1- <I) LLl o..< _J..:;< z ~e:¡ Q wo::o- LLl z _J jJ zo <I) w a)
::.<:O -l oz <CO
WZ:ClO:: U) >-W LLl o:: -WZ:::J oo::- U) :co 1- :::>
Cl c.;l ..X: 1- u-z o <I) 1- _¡
136
A third concept which should now be included is the following: fuels such as gasoline and diesel oíl bought by many industries for use in the trucks which distribute merchandise. In the present methodology, this end-use forms part of OTHERS; however, it <loes not correspond to the industrial sector but rather to the
The second use that can be given to the input is INDIRECT AUTO- PRODUCTION of electricity through steam. The situation is a little more complicated since the steam comes from recycling in the boiler to feed into the steam turbogenerators. It will there- fore be necessary to do the boiler balance previously-- which in thís logic of flows appears afterwards in order to express the steam in terms of the fuels which produces it-- subtracting it frorn the respective NEI and at the same time computing auto- produced electrícity in the NEI.
Hydro and the corresponding fuels should be subtracted and the respective electricity should be added to the purchases. In the same way, the coal which feeds into the iron and steel cake plants will be a negative flow, and the cake produced will be a positive flow.
the afrirementioned hydraulic generators diesel groups gas turbines
of the thing
it in
Once the NEI has been identified, its flows for each one sources (see Figure II.l) should be specified. The first that can be done with the energy which enters is to use AUTO-PRODUCTION of electricity, through:
It is worthwhile to group these forrns of energy as a primary source called RECOVERY, which is incorporated into the OLADE energy balance, under the concept of "Other Primary Sources".
the black liquor and stillage from the paper industry the reformed products of the chemical industry the furnace gas from the iron and steel industry · the LD gas from iron metallurgy
There are plants which produce substances having an energy contentas by-products of the production process, e.g.:
Sorne plants may have hydraulic generators using a current of water of its own or leased. If the turbinated hydroenergy is not bought, it should figure asan input so that there will not be an imbalance.
If the plant sells energy, commonly electricity and some- times steam, these sales should be subtracted from the purchases. In calculating the NEI, in the particular case of electricity, it is possible to obtain a negative input when the sales to other plants orto the public service grid are based on auto-production.
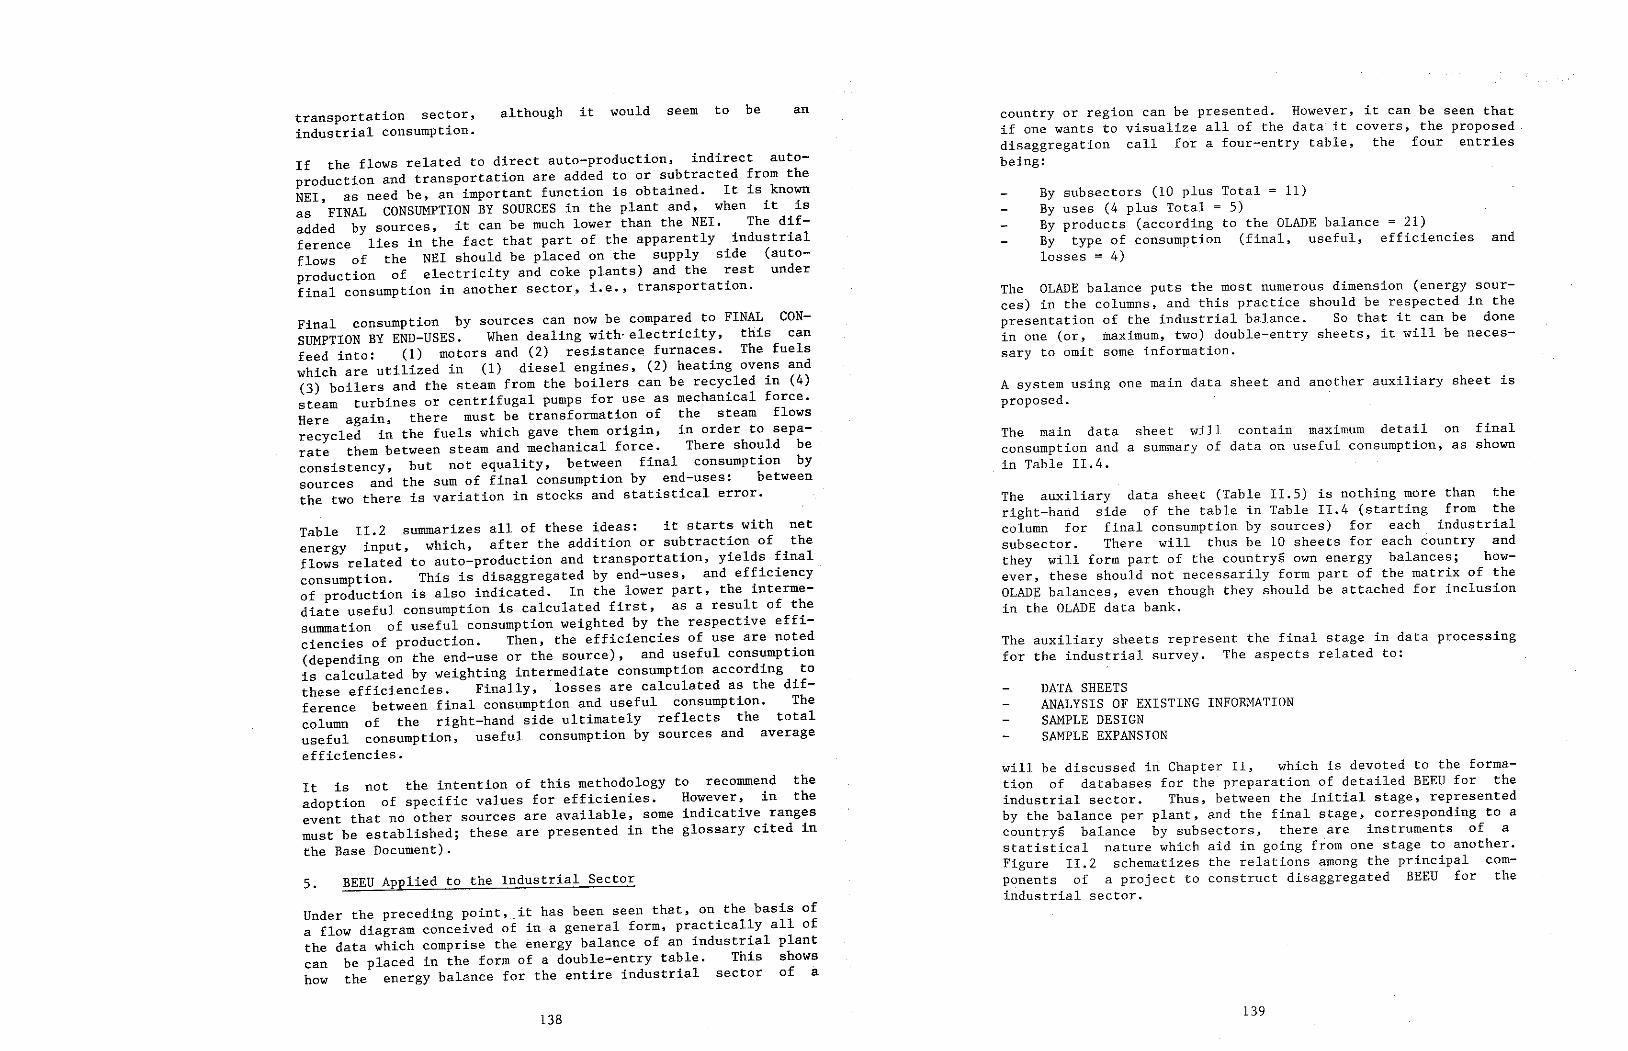
139
will be discussed in Chapter II, which is devoted to the forma- tion of databases for the preparation of detaíled BEEU for the industrial sector. Thus, between the initial stage, represented by the balance per plant, and the final stage, corresponding to a countrys balance by subsectors, there are instruments of a s:atistical nature which aid in going from one stage to another. Figure II.2 schematizes the relations among the principal com- ponents of a project to construct disaggregated BEEU for the industrial sector.
DATA SHEETS ANALYSIS OF EXISTING INFORMATION SAMPLE DESIGN SAMPLE EXPANSION
The auxiliary sheets represent the final stage in data processing for the industrial survey. The aspects related to:
The auxiliary data sheet (Table II.5) is nothing more than the right-hand side of the table in Table II.4 (starting from the column f or final consumption by sources) far each industrial subsector. There will thus be 10 sheets for each country and they will form part of the countrys own energy balances; how- ever, these should not necessarily form part of the matrix of the OLADE balances, even though they should be attached for inclusion in the OLADE data bank.
The main data sheet will contain maximum detail on final consumption anda summary of data on useful consumption, as shown in Table II.4.
A system using one main data sheet and another auxiliary sheet is proposed.
The OLADE balance puts the most numerous dimension (energy sour- ces) in the columns, and this practice should be respected in the presentation of the industrial balance. So that it can be done in one (or, maximum, two) double-entry sheets, it will be neces- sary to omit sorne information.
By subsectors (10 plus Total= 11) By uses (4 plus Total= 5) By products (according to the OLADE balance= 21) By type of consumption (final, useful, efficiencies and losses = 4)
country or region can be presented. However, it can be seen that if one wants to visualize all of the data it covers, the proposed disaggregation call for a four-entry table, the four entries being:
138
Under the preceding point, it has been seen that, on the basis of a flow diagram conceived of in a general form, practically all of the data which comprise the energy balance of an industrial plant can be placed in the form of a double-entry table. This shows how the energy balance for the entire industrial sector of a
5. BEEU Applied to the Industrial Sector
It is not the intention of this methodology to recommend the adoption of specific values for efficienies. However, in the event that no other sources are available, sorne indicative ranges must be established; these are presented in the glossary cited in the Base Document).
Table II. 2 sununarizes all of these ideas: it starts with net energy input, which, after the addition or subtraction of the flows related to auto-production and transportation, yields final consumption. This is disaggregated by end-uses, and efficiency of production is also indicated. In the lower part, the interme- diate useful consumption is calculated first, as a result of the summation of useful consumption weighted by the respective effi- ciencies of production. Then, the efficiencies of use are noted (depending on the end-use or the source), and useful consumption is calculated by weighting intermediate consumption according to these efficiencies. Finally, losses are calculated as the dif- ference between final consumption and useful consumption. The column of the right-hand side ultimately reflects the total useful consumption, useful consumption by sources and average efficiencies.
Final consumption by sources can now be compared to FINAL CON- SUMPTION BY END-USES. When dealing with·electricity, this can feed into: (1) motors and (2) r e s í.at ance furnaces. The fuels which are utilized in (1) diesel engines, (2) heating ovens and (3) boilers and the steam from the boilers can be recycled in (4) steam turbines or centrifugal pumps for use as mechanical force. Here again, there must be transformation of the steam flows recycled in the fuels which gave them origin, in arder to sepa- rate them between steam and mechanical force. There should be consistency, but not equality, between final consumption by sources and the sum of final consumption by end-uses: between the two there is variation in stocks and statistical error.
If the flows related to direct auto-production, indirect auto- production and transportation are added to or subtracted from the NEI, as need be, an important function is obtained. It is known as FINAL CONSUMPTION BY SOURCES in the plant and, when it is added by sources, it can be much lower than the NEI. The dif- ference lies in the fact that part of the apparently industrial flows of the NEI should be placed on the supply side (auto- production of electricity and coke plants) and the rest under final consumption in another sector, i.e., transportation.
transportation sector, industrial consumption.
an although it would seem to be
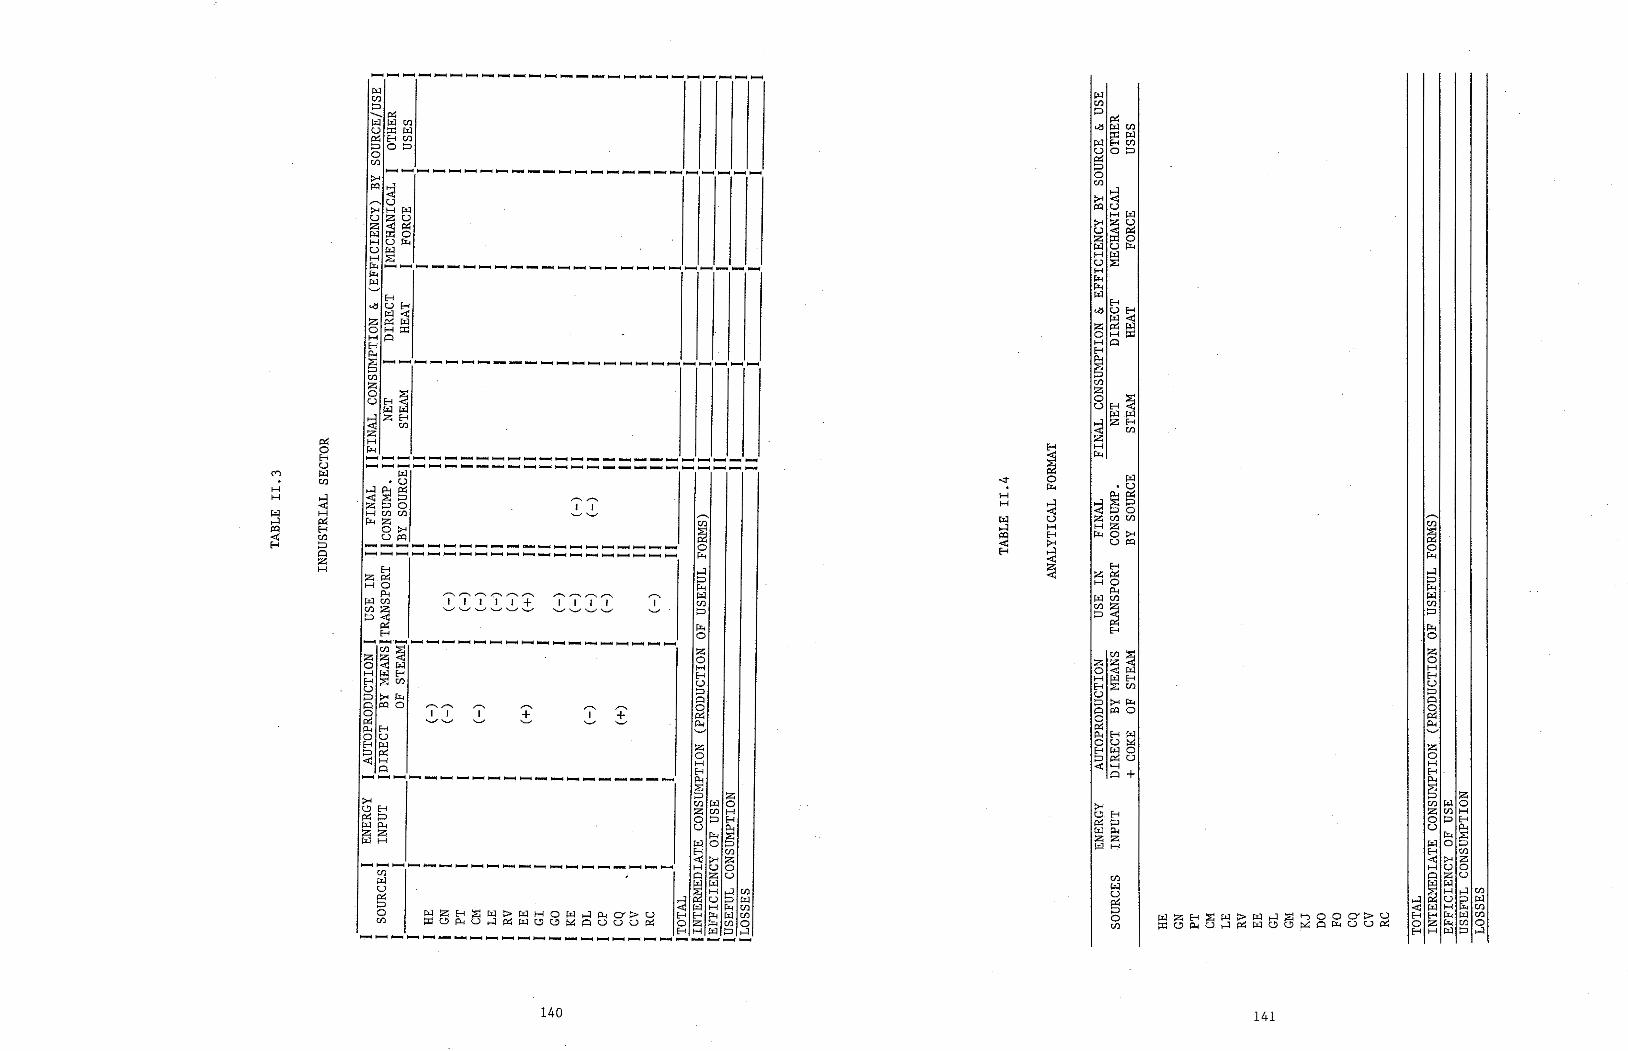
,......_ ti)
~ o r.r.. ,_:¡ ;:::> µ., w ti) :::i µ., o z o H H u ;:::> ¡::::¡
~ p.., ..._,
z o H H p.., ::<:J ;:::> u:i µ;¡ z t:f.l o ;:::> u
141
µ;¡ ti) :::i p::¡
"" w ::i:: w H u o
IZ ;:::> o t:f.l
>< ~ J:Q u
H ><
~ u z ¡;,,.;¡ u H
~ u H í:« í:« w
140
,-... 1
,-... ,...._ r J
...-...,-.......-..~.-..... ........... r 1 1 1 1 + ...__.,...._.,..._,,..._...\,,..../..._...
...... ,_... .....,..¡ .,._ ......................... i--1 .......- ......,¡ ..... ~ ....... ~ ................ ~ ..................... .................................................................................................................................................
,--, ,...._ 1 J
H ""u H W<tl z p::¡ µ;¡ O H ::t:: H ¡::::¡ E-1 p., s~~~~ ........ ~~~~i--1~~~ ................................. ~ ........................................
ti) z o u
p::¡ o H u
('") ¡;,,.;¡ ti)
H H
~ w H ,_:¡ p::¡ ¡:q H <tl ti) H :::i ¡::::¡
z H
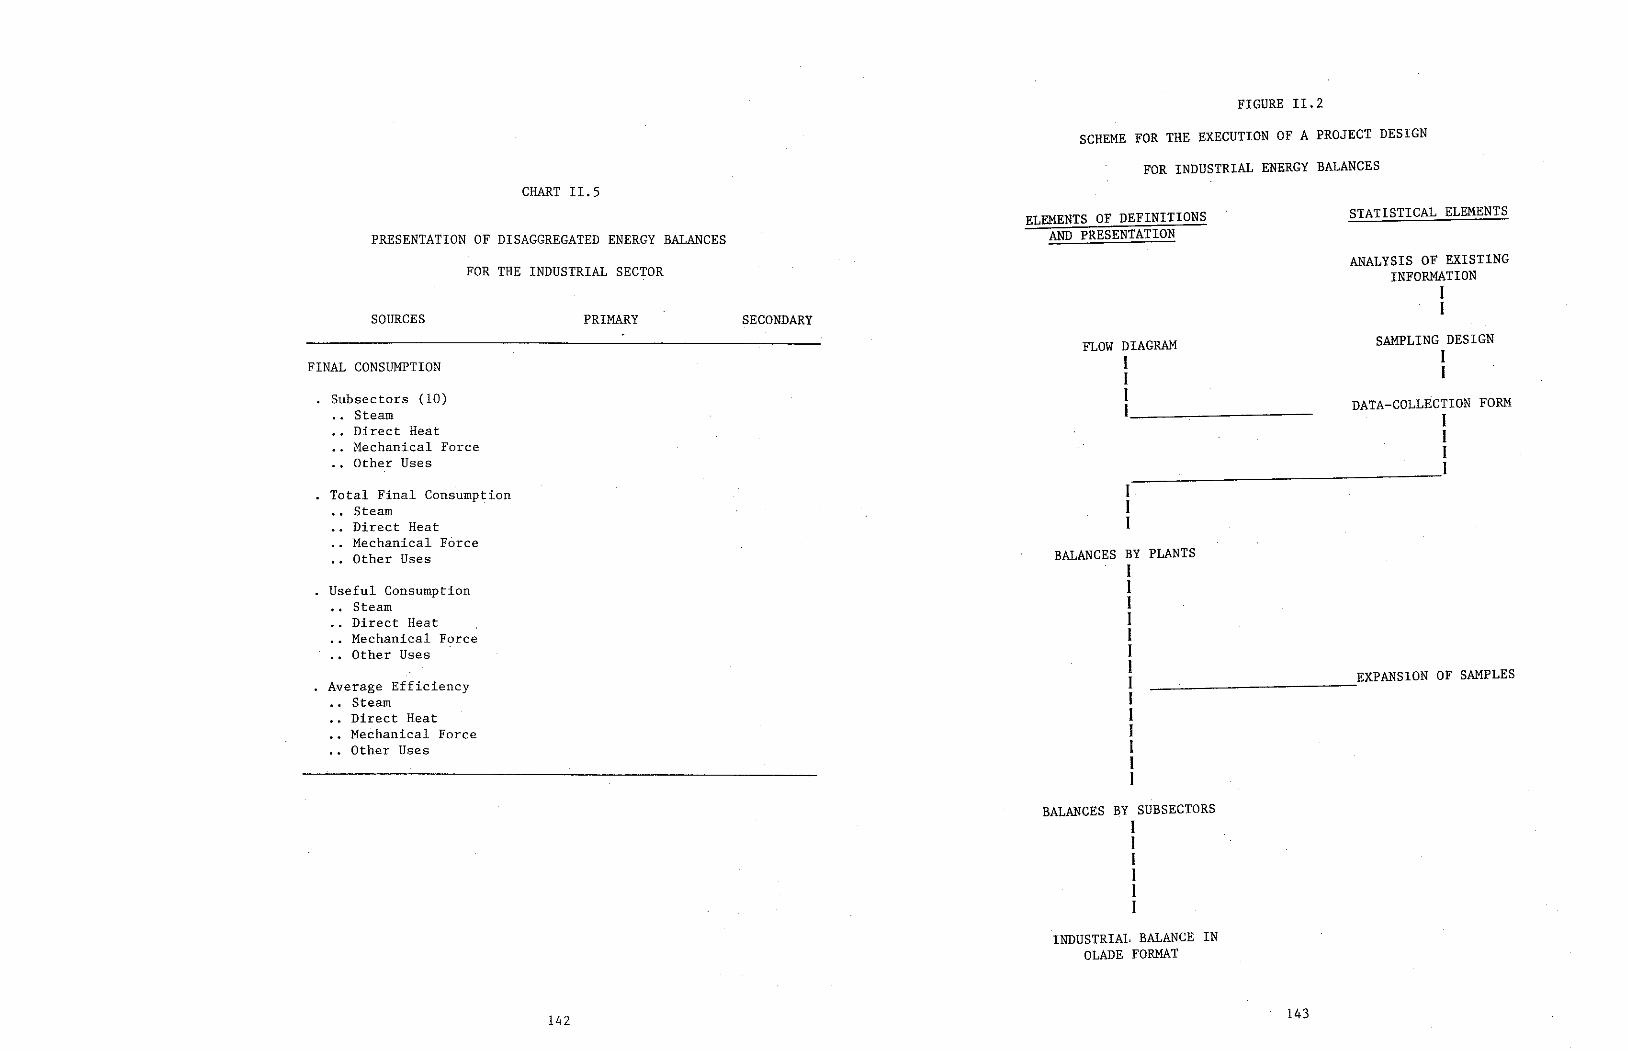
143
INDUSTRIAL BALANCE IN OLADE FORMAT
BALANCES BY SUBSECTORS 1 1 1 l 1 1
EXPANSION OF SAMPLES ~__:.~~~~~~~~~~
1 1 1
BALANCES BY PLANTS l 1 1 1 1 1 1 1 l 1 I 1 l 1
DATA-COLLECTION FORM 1 1 1
~~~~~~~~~~~~~~~~!
SAMPLING DESIGN l 1
FLOW DIAGRAM 1 I 1 I~~~~~~~~~-
ANALYSIS OF EXISTING INFORMATION
1 1
STATISTICAL ELEMENTS ELEMENTS OF DEFINITIONS AND PRESENTATION
FOR INDUSTRIAL ENERGY BALANCES
SCHEME FOR THE EXECUTION OF A PROJECT DESIGN
FIGURE II.2
142
Average Efficiency Steam Direct Heat Mechanical Force Other Uses
. Useful Consumption Steam Direct Heat Mechanical Force Other Uses
Total Final Consumption Steam Direct Heat Mechanical Force Other Uses
Subsectors (10) Steam Direct Heat Mechanical Force Other Uses
FINAL CONSUMPTION
SECONDARY PRIMAR Y SOURCES
FOR THE INDUSTRIAL SECTOR
PRESENTATION OF DISAGGREGATED ENERGY BALANCES
CHART II. 5
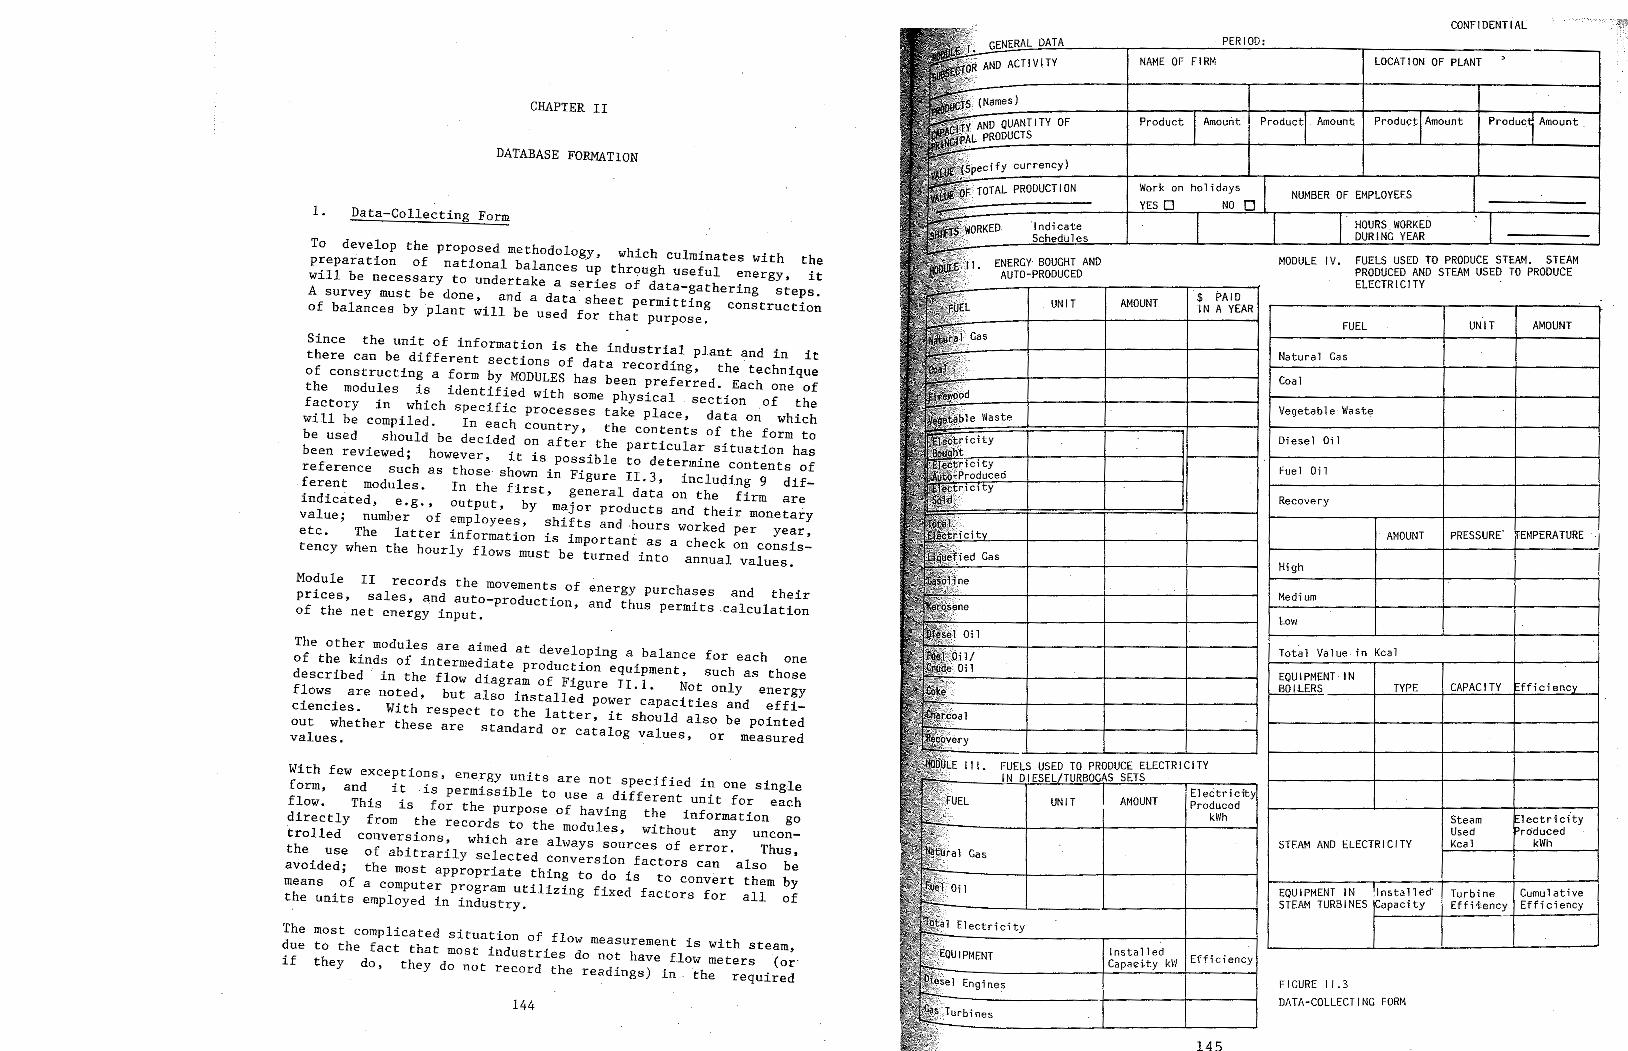
145
FIGURE 11. 3 DATA-COLLECTING FORM
Efficiency lnstalled Capac~ty kW
1 t 11 d' Turbine Cumul ative EQUIPMENT IN .ms a. e Efficiency STEAM TURB 1 NES ~C:a~pa:c~1~t::Y_~E:..:f...:.f...:.i_:_~·.::.en:...c.:..:Y~----~
l Electricity
STEAM ANO ELECTRICITY Steam U sed Kcal
El ec t r í city UNIT AMOUNT Produced kWh
EQUlPMENT·IN TYPE CAPACITV fficienc BO ILERS __ -+~~!=._-f~~:..'....!..~~~....::.;.;.;:_,¡__I
lectricity ro'duced
kWh
Total Value-in Kcal
Low
Medium
· AMOUNT PRESSURE. EMPERA TURE . ·
High
Recovery
Fuel o: 1
Diesel Oi 1
Gas
Vegetable· Waste
Coal Natural Gas
FUEL AMOUNT UNIT
$ PAID IN AYEAR UNIT AMOUNT
FUELS USED TO PRODUCE STEAM. STEAM PRODUCED ANO STEAM USED TO PRODUCE ELECTRICITY .
MODULE IV.
HOURS WORKED DURING VEAR
ENERGY· BOUGHT AND AUTO-PRODUCED
lndicate Schedules
Work on holidays YES 0 NO 0
Amount· Product Amount Product Amount Product
NUMBER OF EMPLOYEES
~A~LJD~AL~L---r=~~~=!P~E!R~IO!D~: GL~O~C;hl~l~O;N~O;F~~~~;:~:-E-N~T-l_~_· ~r~ NAME OF FIRM · AND ACT 1 VITY
144
most complicated situatíon of flow measurement is with steam, to the fact that most industries do not have flow meters (or they do, they do not record the readings) in ~he required
The due if
With few exceptions, energy units are not specifíed in one sing.le form, and it is permissible to use a different unit for each flow. This is for the purpose of having the information go directly from the records to the modules, without any uncon- trolled conversions, which are always sources of error. Thus, the use of abitrarily selected conversion factors can also .be avoided; the most appropriate thing to do is to convert them by means of a computer program utílizing fíxed factors for all of the units employed in industry.
The other modules are aimed at developing a balance for each one of the kinds of intermedíate productíon equipment, such as those described in the flow diagram of Figure II.l. Not only energy flows are noted, but also installed power capacities and effi- ciencies. With respect to the latter, it should also be pointed out whether these are standard or catalog values, or measured values.
Module II records the movements of energy purchases and their prices, sales, ~nd auto-production, and thus permits calculation of the net energy input.
Since the unit of information is the industrial plantan.din itthere can be different sections of data recording, the technique of constructing a form by MODULES has been preferred. Each one ofthe modules is identified with some physical section of thefactory in which specific processes take place, data on whichwill be compiled. In each country, the contents of the form tobe used should be decided on after the particular situation hasbeen reviewed; however, it is possible to determine contents of reference such as those shown in Figure II.3, including 9 dif-ferent modules. In the first, general data on the fírm are indicated, e.g., output, by major products and their monetaryvalue; number of employees, shifts and -hours worked per year, etc. The latter information is important as a check on consis- tency when the hourly flows must be turned into annual values.
To develop the proposed methodology, which culminates with thprepaiation of national balances up through useful energy, iwill be necessary to undertake a series of data-gathering steps.A survey must be done, anda data sheet permitting construction of balances by plant will be used for that purpose.
l. Data-Collecting Form
DATABASE FORMATION
CHAPTER II
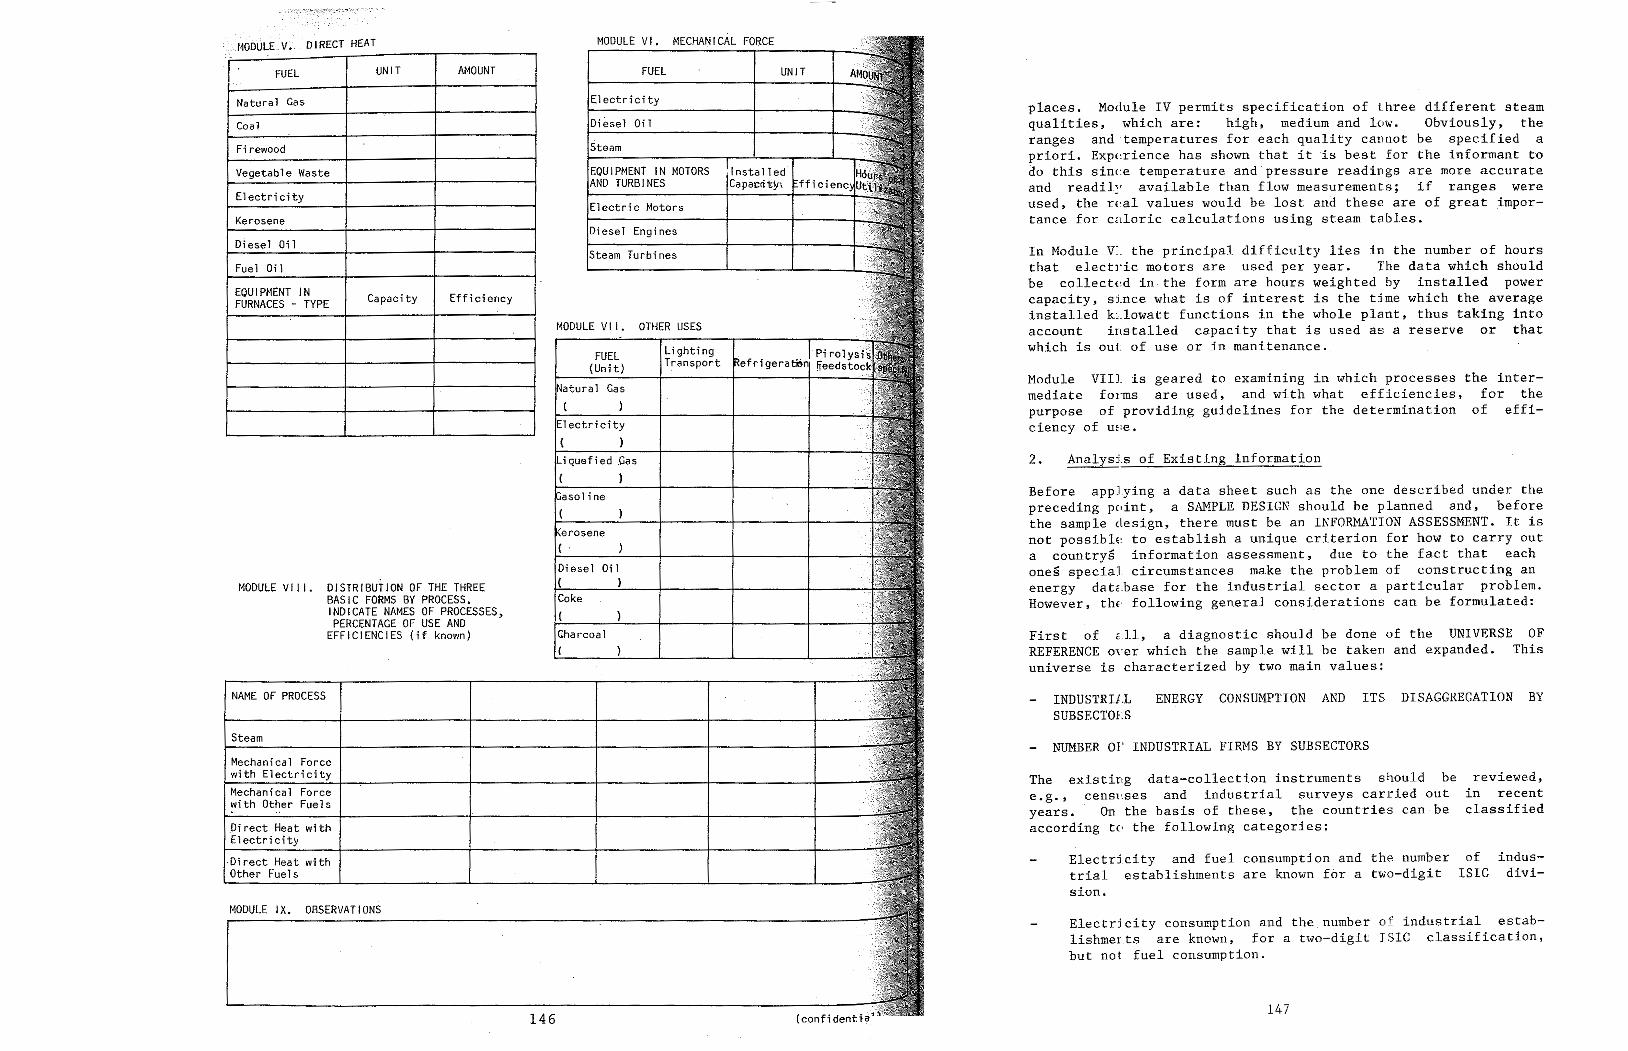
147
Electrjcity consumption and the number of industrial estab- lishmerts are known, for a two-digit ISIC classification, but not fuel consumption.
indus- divi-
of ISIC
Electricity and fuel consumption and the number trial establishments are known for a two-digit sion.
reviewed, in recent classified
The existing data-collection instruments should be e.g., censFses and industrial surveys carried out years. On the basis of these, the countries can be according te· the following categories:
NUMBER 01' INDUSTRIAL FIRMS BY SUBSECTORS
ENERGY CONSUMPTION AND ITS DISAGGREGATION BY INDUSTRií.L SUBSECTOF~S
First of ~11, a diagnostic should be done of the UNIVERSE OF REFERENCE oyer which the sample will be taken and expanded. This universe is characterized by two main values:
Befare applying a data sheet such as the one described under the preceding pC>int, a SAMPLE DESIGN should be planned and, before the sample clesign, there must be an INFORMATION ASSESSMENT. It is not possible to establish a unique criterion for how to carry out a countrys information assessment, dueto the fact that each ones special circumstances make the problem of constructing an energy dat s.ba se for the industrial sector a particular problem. However, t he- followíng general considerations can be formulated:
Analysis of Existing Information 2.
Module VIIJ_ is geared to examining in which processes the inter- mediate forms are used, and with what efficiencies, for the purpose of providing guidelines for the determination of effi- ciency of une ,
In Module v:_ the principal difficulty líes in the number of hours that e Lec t rLc motors are used per year. The data which should be co l.Lectx.d in the form are hours weighted by installed power capacity, s í.nc e what is of interest is the time which the average installed kr.Lowa t t functions in the whole p Larrt , thus taking into account installed capacity that is used as a reserve or that which is out of use or in manitenance.
places. Module IV permíts specificatíon of three different steam qualities, whích are: high, medium and low. Obviously, the ranges and temperatures for each quality cannot be specified a priori. Experr í.enc e has shown that it is best for the informant to do this sinc:e temperature and pressure readings are more accurate and r ead í Ly available than flow measurements; if ranges were use d , the r e.a.L values would be lost and these are of great ímpor- tance for caloric calculations using steam tables.
146
MODULE IX. OBSERVATIONS
·Direct Heat with Other Fuels
. Di rect Heat wi th Electricity
Mechanical Force with Other Fuels - ..
Mechanical Force with Electricity
Steam
NAME OF PROCESS
Charcoal
Coke
Di ese l Oil ( )
{ '
asoline
Liquefied Gas
Electricity
ef r í qer-atén FUEL Lighting. {Unit) Tr~nsport
atura] Gas
MODULE VII. OTHER USES
Steam Turbines Diesel Engines Electric Motors
· lnstal led Capacñty'i
EQUIPMENT IN MOTORS ANO TURBINES
Steam Diesel Oil
UNIT FUEL
Electricity
MODULE VI. MECHANICAL FORCE
MODULE VI 1 l. DISTRIBUTlON OF THE THREE BASIC FORMS BY PROCESS. INDICATE NAMES OF PROCESSES, PERCENTAGE OF USE ANO
EFFICIENCfES {if known)
·- - FUEL UNJT AMOUNT
Natural Gas Coal Firewood Vegetable Waste Electricity Kerosene Di ese l Oil Fuel Oil EQUlPMENT IN Capacity Efficiency FURNACES - TYPE
· . MODULE V~ . D 1 RECT HEA T
149
This rule of assymetry varíes, however, when applied to the different branches of industry; the largest assymetries appear in the most numerous subsectors, e.g., food, textiles or chemicals. In subsectors represented by a few large-capacity units, such as cement or iron, the curves approach the diagonal, reflecting the fact that consumption per establishment has a similar order of magnitude. When the subsectors are joined, the most numerous ones nevertheless impose asymmetry on the group as a whole and this property is tapped to make a sample design providing good representativity, overall and by branches.
These figures, which are only of an indicative nature and may vary from country to country, nevertheless express the order of magnitude of a widely accepted rule which, due to linguistic simplicity, may be termed the LAW OF ASYMMETRIC PROPORTIONS. Thís means that the distribution function of the two properties which characterize the population is totally asymmetric and can be located in the upper part of the diagonal, as observed in Figure II.4.
1% of the establishments account for 60% of electricity consumption, 70% of diesel consumption, and 90% of fuel oil and coal consumption
10% of the establishments account for 95% of total con- sumption
1% of the establishments account for 80% of total con- sumption
148
As for the universe of reference, it is of interest to investi- gate the relation between energy consumption and number of estab- lishments. The experience of most of the countries is that just a few establishments account for relatively high percentages of industrial consumptíon; these percentages increase a lot in the beginning when more establishments are added, and much less later on. This is true because heavy equípment (large boilers, furnaces, heavy-duty engines) is concentrated in relatively few MACROCONSUMERS. Thus, if the industrial plants of the universe are ordered according to decreasing consumption, a distribution like the one shown below is obtained:
It is worthwhile to comment here on a fact which frequently arises, and which should be the subject of a good assessment in order to focus the design of an industrial survey on energy uses successfully. We refer to the situation in which there is knowl- edge about the sales of energy companies to industrial clients by subsectors (two-digit ISIC). The sales are not strictly consumption, but they are very similar. Besides, the most common case is for this information not to be complete; instead, only sorne distributing firms have it, or have it for only sorne products. If this information is partial, it cannot be taken as the universe; however, it may constitute a SUBUNIVERSE OR SUBPOPULATION, the use of which can be of great utility for the design and expansion of energy samples. No general technique can be offered for dealing with with subpopulations, sínce in most cases they must be treated invidually. An attempt is only made to stress the fact that, many times, they serve as a very suitable tool for indicating a sound approach; the good criteria and experience of the specialist will do the rest.
It does not go without saying that, if there are countries which do not have this basic information of an economic nature for their industrial sector, they should begin to gather it before doing an energy survey of a specific nature-- with a form like the one discussed in the preceding point-- since it is not possi- ble to design or expanda sample when the characteristics of the universe from which the sample is to be extracted is unknown. For such countries, the recommendation is to start with an industrial census of a general nature and to collect data on electricity and fuel consumption.
The third case is the most frequent in the countries of the Latín American region; in most of them periodical industrial surveys of an economic nature are carried out, according to which industrial plants are identified for the national accounts and information on production, value added, number of employees, etc. is gath- ered. These surveys form the basis for the preparation of input- output matrices sufficiently generalized to suppose that all of the countries of the area will have this instrument available.
Consumption by subsectors is not known, but the number of establishments is.
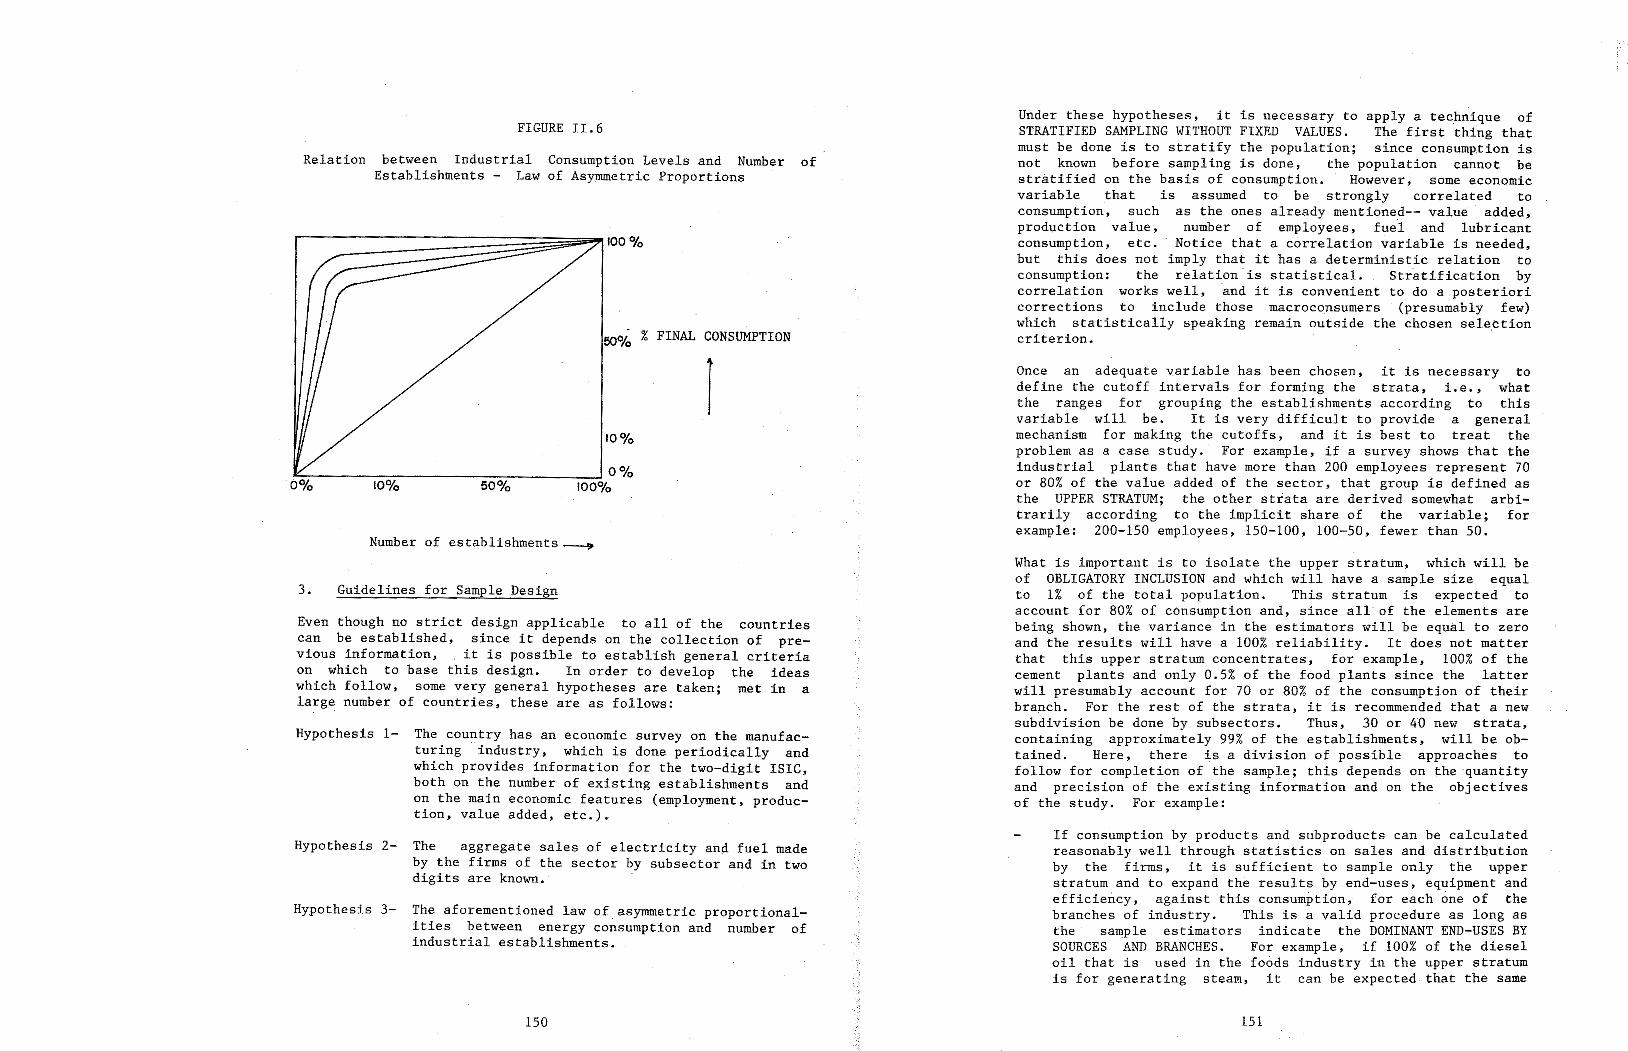
151
If consumption by products and subproducts can be calculated reasonably well through statistics on sales and distrib.ution by the firms, it is sufficient to sample only the upper stratum and to expand the results by end-uses, equipment and efficiency, against this consumption, for each one of the branches of industry. This is a valid procedure as long as the · sample estimators indicate the DOMINANT END-USES BY SOURCES AND BRANCHES. For exarnple, if 100% of the diesel oil that is used in the foods industry in the upper stratum is far generating steam, it can be expected that the same
What is important is to isolate the upper stratum, which will be of OBLIGATORY INCLUSION and which will have a sample size equal to 1% of the total population. This stratum is expected to account for 80% of cónsumption and, since all of the elements are being shown, the variance in the estimators will be equal to zero and the results will have a 100% reliability. It does not matter that this upper stratum concentrates, far example, 100% of the cement plants and only 0.5% of the food plants since the latter will presumably account for 70 or 80% of the consumption of their branch. For the rest of the strata, it is recommended that a new subdivision be done by subsectors. Thus, 30 or 40 new strata, containing approximately 99% of the establishments, will be ob- tained. Here, there is a division of possible approaches to follow for completion of the sample; this depends on the quantity and prec1s1on of the existing information and on the objectives of the study. For exarnple:
Once an adequate variable has been chosen, it is necessary to define the cutoff intervals for forming the strata, i.e., what the ranges far grouping the establishments according to this variable will be. It is very difficult to provide a general mechanism for making the cutoffs, and it is best to treat the problemas a case study. Far example, if a survey shows that the industrial plants that have more than 200 employees represent 70 or 80% of the value added of the sector, that group is defined as the UPPER STRATUM; the other strata are derived somewhat arbi- trarily according to the irnplicit share of the variable; far example: 200-150 employees, 150-100, 100-50, fewer than 50.
Under these hypotheses, it is necessary to apply a technique of STRATIFIED SAMPLING WITHOUT FIXED VALUES. The first thing that must be done is to stratify the population; since consumpr í on is not known befare sampling is done, the population cannot be stratified on the basis of consumption. However, sorne economic variable that is assurned to be strongly correlated to consumption, such as the ones already mentioned-- value· added, production value, number o f employees, fue.1 and lubricant consumption, etc. Notice that a correlation variable is needed, but this <loes not imply that it has a deterministic relation to consumption: the relation is s t at í.s t í.ca L, St ra t.Lf Lcat.Lon by correlation works well, .and it is convenient to do a posteriori corrections to include those mac ro consutae r s (presumably few) which statistically speaking remain outside the chosen se Lec t Lon criterion.
150
Hypothesis 3- The aforementioned law ofasymmetric proportional- ities between energy consumption and number of industrial establishments.
Hypothesis 2- The aggregate sales of electricity and fuel made by the firms of the sector by subsector and in two digits are known. ·
Hypothesis 1- The cou~try has an economic survey on the manufac- turing industry, which is done periodically and which provides information far the two-digit ISIC, both on the number of existing establishments and on the main economic features (employment, produc- tion, value added, etc.).
Even though no strict design applícable to all of the countries can be established, since it depends on the collection of pre- vious information, it is possible to establish general criteria on which to base this design. In arder to develop the ideas which follow, sorne very general hypotheses are taken; met in a large number of countries, these are as follows:
3. Guidelines for Sample Design
Number of establishments--....
10%
r
50o/o % FINAL CONSUMPTION
Relation between Industrial Consumption Levels and Number of Establishments - Law of Asymmetric Proportions
FIGURE II. 6
153
Take manual consistency processing for all of the physical flows at the level of final consumption, or take the input flows into
The facilities and drawbacks presented by computerized processing were described in Chapter IV of the Base Document; it only re- mains to be mentioned that an exhaustive investigation should be carried out on the possibilities of the computers, languages and packages available, as well as of the administrative and reading formats.
In order to guarantee the consistency of the data gather~d with a forro like the one in Figure II.3, an energy balance must be done for each p Lant , using a forro like the one in Table II. 3, and preferably using a computer program.
4. Guidelines for Data Processing and Sample Expansion
In any case, a good sample design is necessary, but not sufficient, for success. lt is also necessary to assure that the collected data are correct, and this is done through visits by specialized surveyors to the industrial plants. These survey-
.ors should preferably be chernical, mechanical or process engi- neers and, only through dialogue with their colleagues in the industry, will they be able to transforma not always .well- organized mass of data into the systematic .information require- ments of the data sheet.
As has been se en , the execut Lon of a stratified sample depends on the possibility of orderíng the industrial establishments of the population according to a criterion which is expressed by sorne variable correlated .t o consumption. In this stage of sample design, utmost care must be taken and we can affirm that, if a good stratification is attained, the resultíng sample sízes wíll fluctuate between 1% and 2% of the individuals of the universe, with levels of reliability between 90 and 95% for the main varia- bles.
The methodology explaíned thus far can be applied conveh- íently to a centralized industry. In general, the.so-called rural industry (bakeríes, brickmakers, boilers, block brown- sugar factories, fermented beverage plants, etc.) do not form part of the systems of economíc surveys nor of national accounts. This type of industries, which many times consume large amounts of low-efficiency, non-commercial energy, con- stitutes a special subpopulation, about which nothing is usually known. The survey to be done therein can usually be dealt wíth by applying only Module V (direct heat), since it comprises furnaces· which operate with díscontinuous loads (batches). The production value is estimated on the basis of the number of loads produced in ayear. In the case of these industries, the sample designs should be based on the features of more remote settlements, such as production of bricks, bread or lime in artesan-level un í t s , and one shou Ld proceed with pilot surveys and investigations in order to gauge the order of magnitude prior to sampling per se.
152
Later th t• , e es imators are calculat d b b to the guidelines for stratif. de y .ranches, according the . ie sampling and t· 1 se estimators are included . . • ina ly, tory inclusion. The f1· 1 ~1th1n the stratum of obliga- .f na variance by br h . 1 the estímate is reliable, anc es will decide
~sf long as this possibilíty exists it is in er consumption by subsectors by ' f preferable to sur h means o a more _vey tan the survey of end-uses which is numerous th1s study. This is achieved by adding M d 1 the subject of energy to th o u e II of bo ht e survey or econo . ug sector, which is theoreticalm1c census of the industrial country. Th. d 1 . ly supposed to exist in the is mo u e is very simple d d the visit of specializaed an oes not require ization which is carrying survehyors. Hence, the same organ- d out te economi an process the data. This will .c su:vey can gather population and subpopulations bef provide. information on end-uses, the execution f ~re apply1ng the survey of complicated and costly. o wh1ch would be much more
If it is desired also to have a . . uses at the regional le 1 ( .n ~stimate of consumption and . . ve w1th1n a co t ) reg1onal1zation should also f un ry' the chosen thus increasing the number o~rm part of the stratification, cost of sampling and processing~roups and, therefore, the
thing will occur in the other str t the cases of DOMINANT END-USES a a. After examining all of remain, because the 1 ' sorne doubtful cases may· . ower stratum · 11 h differently from the upper one. Th. wi ave behaved through a . · is can be dealt with very simple qualitative necessary, may be quite nu survey, which, if
.1 merous. For instan r oi used more in boilers 0 . f ce: s diesel f . d. r in urnaces? D d' in ings, a quantitat' . epen ing on the . ave sample may be taken. ~f there is no knowledge b h a out consumption by subsect i.e., te preceding hypothesis would not be met b ors, sumption is known for all of the sources for ,theut con- industrial sector d entire , an the subsectoral consum . precisely ascertained through th• ption can he to take sa 1 is survey, it is ne . mp es on each one of the 30 or 40 cessary which the population is divided strata into will no longer be consum t• . The universe of reference establishments in each gr pion~ but rather the number of 30 or 40 subpopulations o~~rª:h.work will then be done with be estimated by energy ~o ~ch.average consumption will
. 1 urce. Within each str t . simp e or systematic random 1 a um, either a 1 u samp e may be take f examp e, 1% o f the individuals . n o , for
variance of the estimato . in the subpopulation• If the t rs is unacceptably 1 wo approaches: to íncrease th . arge, there are the sarne stratification or t e ~1ze of the sample, keeping giving a smaller ran' o ma e the latter more refined utilized, ge to the stratification variabl~
155
Since these coefficients are stable over time, at least while there are no substantial changes in the industrial production processes, they provide both a basis for sample expansion through historical time series, anda tool for forecasting future demand. In this methodology, it is of interest to underscore their capac- ity for end-use in sample expansion.
It is thus important to be able to characterize all of the sample by means of a MATRIX OF PARTICIPATION COEFFICIENTS of minimal variance and to do a diagnostic of sample data. Until one is sure that these coefficients are capturing the homogeneity, if necessary, they can be tested or rejected by applying more or less complicated statistical tests, according to the situations.
Example: if 70% of the natural gas and fuel oíl is earmarked for steam, this percentage continues to be valid even though the gas has increased to 4% annually and fuel oíl has declined to 10% over the last ten years. The coefficient expresses end-use under given conditions of supply: if fuel oíl is consumed, 70% is used in steam; if gas is consumed, 70% also goes to steam, but it does not matter how much of either fuel is consumed.
In general, these participation coefficienct~ for sources in end- uses will be independent of the size of the plant and they will actually reflect the characteristics of the transformation pro- cesses in groups of plants that work with given energy needs for given manufacturing technologies. They will not depend on substi- tution among energy sources, and they may be applied toan his- torical time series of consumption by energy sources.
From the statistical point of view, the foregoing values repre- sent SAMPLE MATHEMATICAL EXPECTATIONS and will be taken as POPULATION EXPECTATION ESTIMATORS, whenever the ESTIMATED VARI..,. ANCE of these estimators is low. In other words, to produce the value added of the group, the members distribute the sources among the end-uses in a similar way, at least in a gíven region where there is sufficient supply of this energy. When the energy endowment among the end-uses in a group is not very uniform, it is because the group is not homogeneous. In general, heterogeneity disappears the more refined the classification. Further refinement should be sought by incorporating a third or fourth digit of the ISIC classification.
in machinery and equipment, 65% of the electricity goes into mechanical force, 20% into heat, and 15% into lighting, etc.
in the foods industry, 70% of the fuel oil goes into steam, .20% into heat, and 10% into mechanical force
100% of the natural gas in the cement industry is used for heat
These coefficients, through hypothetical examples, express that:
154
It is useful to work with the AVERAGE PARTICIPATION COEFFICIENTS for each source in each end-use for each subsector.
The second stage consists of expansion of the sample by means of the application of inferential statistical techniques to deter- mine the population estimators of the energy balances. Here again there is an option for approaches, depending on the charac- teristics of the country under study. Rather than doing a case study under hypothetical conditions, only general processing guidelines can be given.
The efficiencies of end-use adopted are in line with the results yielded by the energy·audits, in the event that these have been done. Otherwise, standard patterns can be adopted or 100% can simply be taken until there is better knowledge about the problem.
have the
The measured or adopted efficiencies of production acceptable. values, in keeping with the technology of transformation equipment.
Industrial final consumption for each source is approximate- ly equal to the sum of final consumption by end-uses.
The net energy input for each source is equal to the sum of: direct or indirect auto-production, non-industrial final consumption, and industrial final consumption.
The energy balance by plant indicates whether the survey under analysis is corrector not. There are two types of sources of error: ERRORS IN DATA COLLECTION AND ERRORS IN DATA HANDLING. The former are solved by resampling and the latter are detected by means of a consistency program. Once all of the errors have been detected and taken care of, there are consistent surveys, in which ·the following can be verified:
the transformation equipment. As for the output flows, which correspond to what has been defined as intermediate useful con~ sumption, these should be checked together with the efficiencies of production. Furthermore, it is very probable that in most cases the output flows of direct heat, mechanical force and steam will not be calculated on the basis of adopted efficiencies, since there are no registers at the exit of the transformation equipment. A careful analysis of the efficiencies declared by the industrialists should therefore be done, and all of those values which fall outside the range should be rejected. It is sometimes better to adopt average efficiencies for groups of industries having transformation equipment using similar technol- ogies and to apply these to the ind~vidual plants .. By appl~ing these efficiencies to final consumption ~y use, the 1ntermed1ate useful consumption is obtained. Then, the efficiencies of use of the intermediate forms are analyzed to obtain useful consumption and losses.
157
For reconstruction of historical time series by subsectors, assuming the industrial consumption by sources of energy to be known, it is recommended that the following resource be used: when taking the complete sample for a given year, questions can also be asked about historical information, only for Modules 11 and III and the part of electric power auto-production with steam in Module IV. Hence, an historical estímate can be made of net energy input and its components for the groups of firms which provide this information. With this, annual participation is obtained by sources and by subsectors, and these are applied to industrial consumption by sources.
of 200,000. The error is dueto the large variance and this is in turn dueto insufficient stratification. It is to be expected that a more refined stratification would lead to sorne per capita consumption which would yield a distribution by subsectors, the sum of which would be close to more than 200,000 barrels, but there would always be a difference to be corrected. What is important is to set a limit of acceptability between the dis- tributed sum and the real value and then to accept the latter as the sum, maintaining the shares suggested by the sample. Rela- tively large errors can be accepted, since they will only affect 20% of consumption, whereas the remaining 80% is exact.
156
The most general procedure, and the most complicated, consists of following the guidelines of stratified sampling. Given its particularity for trying to explain a large variety of situations which can arise, it is indicated by means of a very simplified example. Let us suppose that in a country there are 10,000 industrial establishments whose fuel oil consumption is 1,000,000 barrels; that 200 units have been sampled, of which 100 belong to the stratum of obligatory inclusion, and the other 100 to a second stratum. The first stratum yields a sample consumption (equal to the population) of 800,000 barrels, whích are redistributed equally by subsectors. There are then 200,000 barrels left for distribution. The sample consumption of the second stratum shows given consumption per capita by subsector, which when multiplied by the respective number of establish- ments, and added yield a consumption of 350,000 barrels instead
The sample provides final consumption by sources and subsectors. Togo froni there to final consumption for the population, several expansion methodologies may be applíed, depending on the parti- cular circumstances of the country under analysis. The simplest case is to suppose that the sample distribution is applied to the entire population, and then the total consumption by sources is multiplíed by the sample shares for the sources in the subsec- tors. This simple method yields good approximations when the sample has covered 90% or more of consumption, but it has the drawback that it cannot be used to reconstruct an historical series, since one could hardly sustain that if the same sample had been taken five years before, the percentages by subsectors would have been the same. Unlike what happens with the partici- pation of end-uses within a subsector, these are not stable over time, since the historical evolution of the branches of industry is not usually homogeneous. Application of another resource con- sisting of the search for sorne relation between the expanded consumption for the year in which the survey was done and sorne economic indicator of industrial production by• subsectors is commonly used, for which there are hístorical data and the historical series of consumption is thus reconstructed. The drawback is that the consumption series and the indicators need to be correlated in arder to determine the parameters which will be used in the demand projection models.
If the country does not have a series, one should be constructed on the basis of the survey discussed herein and then the same procedure of multiplication by the participation coefficients is followed. Now we are facing a more complícated problem, which could be stated as follows: simultaneous expansion of uses and consumption by subsectors, assuming that total consumption by sources is known. ·
If the country has an historical series of consumption by sources and subsectors, it will then be sufficient to multiply these series by the respective coefficients in order to draw up series of final consumption by end-uses and useful consumption by sources and by end-uses. The problem of expanding end-use on the basis of known consumption is thus resolved.

159
The base data come in both cases from a broad survey plan carried out in the respective countries.
Through a computer program, the information from the two files is read and combined, and the form for the useful-energy balances for the industrial sector are prepared.
the the
generation of as many files as subsectors containing coefficients of participation by sources and uses and levels of adopted efficiencies.
generation · of a file containing final consumption by subsectors and by sources
The treatment gíven to the two cases examined is exactly the same and consists of:
It is possible that there have been errors of interpretation in the. assignation of subsectors and products, which could be corrected after the review of the preliminary document with a view to a final version.
Gas Coque de carvao mineral Electricídade Carvao vegetal Bagaco de canha Outras fontes primarias e se- cundarias
Industrial Gases Coke Electrícity Charcoal Vegetable Waste Recovery
158
Gas Natural Carvao Vapor Lenha Oleo diesel Oleo combustível Gas licuado Naftas (considered negligible) Kerosene
Natural Gas Cóal Firewood Diesel Oil Fuel Oil Liquefied Gas Gasoline Kerosene
the following equivalencies have In relation to energy products, been taken:
Químicos Alimentos, ... Textil, ... Ceramica Out ros
Machinery Chemicals Foods, •.. Textiles, ... Paper, ... Others
Cemento Ferroguca e Ago, Ferroligas, Mineracao e Pelotizacao
Cement Iron
Sorne differences were found with respect to the proposed methodology in terms of disaggregation by subsec:ors and sorne values assigned to efficiencies. For example, it can be seen that the case of Brazil does not register consumption in the subsector "Wood and Furniture11. Furthermore, the subsector 11Machinery and Equipment11 does not appear clearly in the balance included in the aforementioned publication and the sector "Others", .unlike in Colombia, where it appears with very significant levels of consumption. In order to offer elements for clearer criticism, the adopted disaggregation is detailed in the following table:
from the Balance" the case of Brazil were taken
Report on the Useful-Energy The data for analyzing publication "Preliminary (August 1984).
This chapter applies the methodology presented previously to some specific countries. As examples, the cases of Colombia and Brazil a.re presented, since they are two countries of widely available information on the topic. The case of Colombia is obviously very closely tied to this met~odolog~, since its m~st · d Lat.e antecedent is the study on industrial surveys car r í.ed imme · · 1 out within the Energy Information System (EIS) of the Nationa Energy Study (NES).
l. General Considerations
APPLICATIONS
CHAPTER III
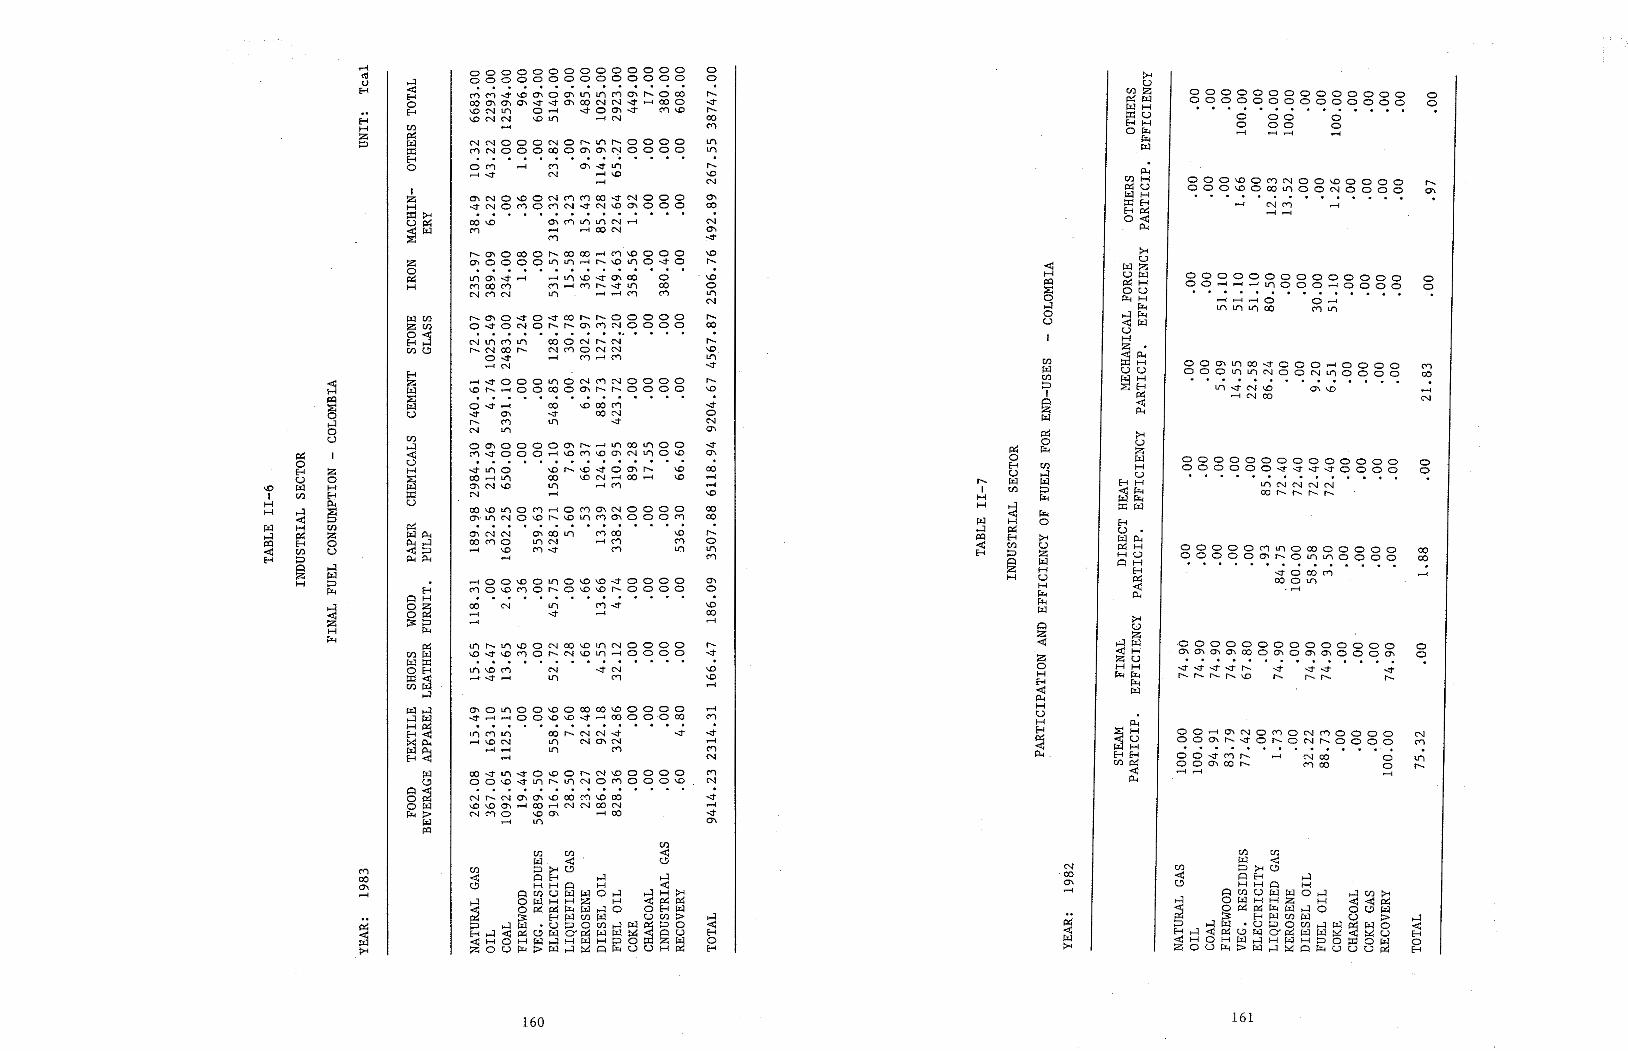
o o
o o
('") 00
o o
o o
o o .......
161
,_:¡ t-1 o,_:¡
H o ~ H ,_:¡H ~0 Z<r: ou
N 00 C""') 00
00.-10'\NOC"lONC"lOOOO ooo-.r--..;tor--oNr--0000
.o o o o o o o o o o o o o o O\O"IO\O"I0000'\00'\0\0000\
00 o o o C"l U"\ o 0000 o o o OOOOOO'll'-Otr\U"\0000
..;t O 00 M 00 o tr\ .......
ºººººººººººººº 000000-.::r-.::r-.::t-.::tooo
U"\N N N N 00 r-, r-- ...... r--
OOO\lf"lco-.::rooo,...;oooo OOOU"\tr\NOONU"\0000
ºººººººººººººº 00..-1.-<.-1t.J"\000.-10000
000\.00MN00\.00000 O O 01.00 001.J"\O O NO O O O
o o .......
ºº 00 ,....¡ .......
o o ,....¡
ºººººººººººººº ºººººººººººººº
N 00 O\ .......
<e: H ¡:Q ;:;;:: o ,_:¡ o u
~ o H u w tr.l
r-.. 1
H H
O'\ o so 00 .......
-.::t o N
°' -.::t
°' 00 ....... .......
'° 00 00
r-- 0 tr\ M
r-.. 00
o o
'° \O
160
~ p H ,_:¡ <e: H zo
. . . Nf'-.N0\0\1.0CO l.Ol.00\.-!00.-IN N MO \.00\
....... U")
oo-.::ttr\..;tO'-OOf'-.N\00000 00\.0-.::tlflf'-.tr\NOC"lOOO\D
O\Otr\00\.0000CJ:Jl.00000 -.::t ,...... ..-1 O O 1.0 -o ..;t ,....¡ 00 O O ·O 00
N tr\
tr\ t--.tr\ \.O O N 00 l.Otr\N O O O O \.O-.::tl.OC"lOr-..N'-Olf"l,....¡0000
.-100\.00tr'\O\O\D..;tOOOO MO\.OC"lOf'-.0..0\.0f'-.0000
00\.0tr\OM.-IOC"lO'\NOOOO O'I· tr\ N O \O r-, 1.0 lf"l M O\ O O O C"1
\.Of'-.\.0""'1'00'lr-.. 00 \DN.-100.-1 lfl ....... (""') .......
o -e ....... ..;t O\ r-, M N lf"l
OO\OOOOO"lr--.-1tr\OOU"lOO M..;t000.-1\.0M..OO'INU")O\.O
co ..;t U")
N U"l M U"l r-.. N 00 r-..
0-.::t ..-! N
.-1 ..;t O O O U"lO N M N 0 O 00 l.Ot--.-1000000'\f'-.f'-.0000
OOONr-..N NC""lO NN ..-! <") ,....¡ M
r--O"IO-.::tO..;tCOr--r--.00000 0-.::tONOr--.r--.O"IMNOOOO
o 00 C"l
. . . ....... tr\ l.O ..;t O\ 00 M ..-! C"l ....._ -<t U") tr\ ,....¡ ....... <")
r--.O\OOOOf'-.0000..-!C"l\.OOOO O"IOOOOlf"llfl.-!f'-.\.OlflO..;tO
co '° C"l
O\NO\.OONMMOO..;tNOOO ..;tNOMOC""lN-d"N\.00\000
C"l N
N NO 00 NO f'-.1/"lf'-. O 000 C"lNOOOOOOO"IO\NOOOO
ºººººººººººººº ºººººººººººººº . .. . . . C"lC""l..;t\.00\00"ltr\lflC"lO\r--OOO OOO\O"IO"l..;t-.::tO"ICONN..;t.-1000 \.ONtr\ O.-! -d"OO"l-d" C"l\.O \.ONN \.OU"l .-IN
z o ~ H
C"l 00 O\ .......
z o H H p.. s tll z o u ,_:¡ w p Pt<
~ H Pt<
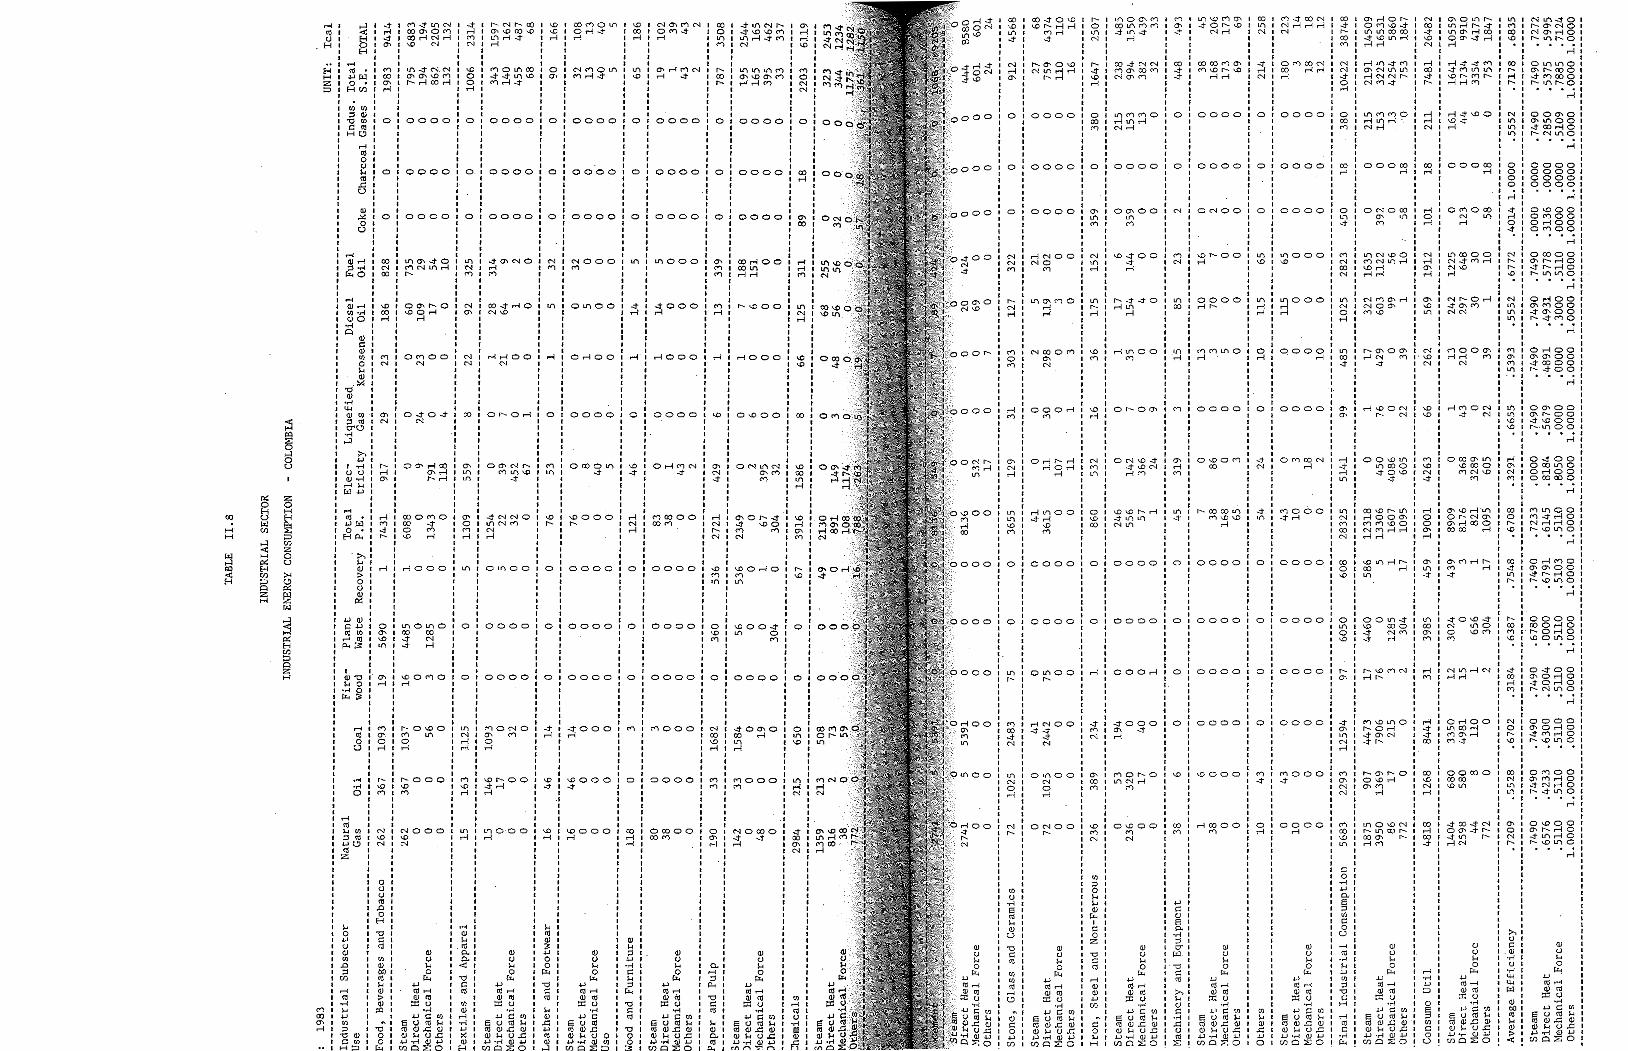
1
' ' 1
' ' >--. 1 ()' i::' (!)
~ a) 1 u •.-4 J ¡_.. () 1 o
..... 1 ¡;,.. ...... 1 .µ "-' 1 ro ..... ~ 1 <lJ ro
1 ::r: () Q) 1 •r-1 bOI .µC:<fl <111 SU<ilk .... roaJ.CQJ GJI QJ;...(),C :;,.1.µ ..... Q),_, < ! u:iO::EO
º~ºº O'> o r-l o ~Or-lO r--N"10
,..;
0000 co O.-! O r-0.--1 o '°º"'o
.--1
o -:too o 00 U") o Or-!00 000000
o O' o o O"\ r-- o o ~'°ºº r--U'\OO
Or-!00 <l'"' o o -:too o o r--~oo
00000 °' r-. r-{ o ~r-r-!O r--<t'IU"\01
1 ,..; 1
1 1
' ' 1 1
' 1 1
' ' J
' 1 rl 1
1 1 1 1 1 1 1 1
,..; r
' 1 1 1
' 1 1
.--1 1 J 1 1 1 1 1 1
.-l 1 1 1 1
' 1 1
ºººº ºººº 0000 ºººº .--1
º'°ºº o (")00 o r-100 OMOO .--1
ºº°'º °'<f'IOO -:tOO..-lO r--N<f'ID
r1
.-l
01.f)1.f)0 °' r-. 00 o ~ f'")CQO r-- <{'\ r-. o
.--1
LI) 1 C"'} 1 co 1 '° 1 1
1
' ro 1 ,..._ 1 .-l 1 r- 1
1 1
' ' NI U'\. 1.f) 1 1.f) 1
' 1 1 1
01 º' º' 01 1
r-1 1
' ~· r1 1
º' -:t 1 1 1 1
NI ,.... 1 ,.... 1
'° 1 1 1 1
N 1 U'1 1 l/"\' 1.f) 1
' ' 1 1
C"l 1 °' 1 C"'}' .,., 1 1 1 1 1 1
U'1 1 "'1 '° 1
'° ' ' 1 1 1
,..; ' "'' NI MI
' ' ' 1 00 1 01 ,.... 1 "'1 1
1 1
' ro 1 -:t 1 l/"\' r- 1
' 1 1 1 1
r- ' 00 ' MI
'° ' 1 1 1 1
-:t 1 00 1 ,..; 1 <'l 1
1 1 1 1
N 1 01 r- 1 '° 1 ' 1
1 1
00 1 NI .,., ' .,.,
r-1 ·.-! .u :::i
o 9 {/]
e o
c.:>
00 .--1 00 -:t
00000 00 00 '° 1.f)
Nl.f'>.--IN .-l .-l
.-l"°lON -:t N
o...., o 00 N 1.f) .-l
00000 .-1
' 1 ~: N 1
' 1 1
' • 00 J .--1 1
' 1 1 1 1
r-l• o 1 .--! 1
1 1
' ' N 1 r-{ 1 O"\ 1
1 .--! J 1 1 1 1 1 1 1"'1 1 '° 1 ' 1.f) 1 1 1 1 1 1 1 1 1 1 1 1 N t 1 · \-O t 1 N 1 1 1 1 1 1 ' 1 1 1 1 1 J 1 '° 1 1 '° ' 1 1
1 1 1 1 1 ""'1 '° 1 N 1 ~' ' 1 1
' r-1 1 o 1 01 O"\ J ,....¡'
1 1 1
"' 1 U") 1 -:t 1
1 1 1 1
'
0000 C"'} U"\0'-0N .--1 C() f-1.f)(I)r- "° 000'\ f'-.. 1.f) r-1 C"'}
0000
ºººº
<'1000 ~.--1
0000
ºººº .--1
:::lººº .-l
1 1 r
' ' l/"\' .-l' .-l 1
1 1 1 J 1
º' .--1 1 1 1 1 1 1 1 1
º' 1
' 1
' ' 1 1
~I NI
1 1 1 1 1 1
~I U"\ 1
1 1 1 1 1 1
01
' ' 1
' 1 1
' 1 o 1
' 1
' 1 1 1
' o' 1 1
' 1 1
' 1
º' ' 1
' 1 1 J 1
C"'} 1 -:t 1
1 1 1 1 1 1
º' .--1 1 1
' 1 1
' ' ' 1
' 1
' 1 1 1 1
' '
'-'>000
'°
(l) () ¡.. o ¡;,..
0000 o
0000 o
001!'\~ '° 00 o ~ NM -:t .--1
o o -.O<f'I 1.f)C()Q -:to'° ~
ONOOO "' I!) r'l
00000 .-l
0000 o
O r'l CON 00 r-1 .--1 .-l
("'l")..j"roN100t N .-l r-! r-1 1 -:t 1 N f r- l
1 00 1 1 M 1 ' 1 ' 1 1 N 1 1 N 1 1 ~' 1 o 1 1 .--1 1 1 1 1 1 1 1 1 o' 1 00 1 1 M 1 1 1 ' 1
' ' 1 ' ' ' ' 00 1 ' .-l 1 ' 1 1 1 1 1 1 1 1 1 Jo' 1 .,., 1 1 ~ 1 ' 1 1 1 1 1 ' 1 1 C"'} 1 1 N 1 ' 00 1 1 N 1 1 1 ' 1 ' l 1 1.f) 1 1 N 1 1 o' 1 .--1 1 1 1
' 1 1 1 ' 1 ' .,., 1 1 00 1 1 ~' 1 1 1 1 1 1
.•. J
1 ' ' ' ' °' 1 ' °' 1 1 1
' ' 1 1 1 1 1 ' 1 ' 1 .--1 1 1 -:t 1 1 r-1 1 1,,., 1 1 1 1 1 1 1 1 1 1 .,., 1 1 N 1 'C"'} 1 1 00 1 1 N 1 ' 1 ' 1 1 ' co 'º 1 '° 1 1 1
' 1 J 10 1 1.f)
'º 1 '° 1 1
.u e ' a) s "'" ·ri ;:l O"' w
. 'O e ro :>-, k QJ e ..... '5 ro :E:
.-l 000 o M
'°ººº
ºººº
0000
0000
0000
o'°º <'l 00
ºººº
0000 .--1 r-
º""ºº
0000
0000
Lf'"'l -...o rr"l O'I 1 ca -:to r-- '° J .,.,
N.--1 1 N 1 1-
1 1 1 1
' ' O"\ 1 r-1' <'l 1
1 1 1 1 1
I!) 1 -:t'
1 1 1 1 1 1
º' 1 1 1
' ' 1
' ' 1 o 1 1 1
' ' 1 1 1 1 1 1 ' t 1 1 • o 1
' 1 ' 1 1 1 1 1 1 1 . ' 1 1 1 o 1 1 ' 1 1
1 ' 1 ' 1 1
1 ' 1 1 ' '° 1 ' 1
' 1 1
' 1 1 00 1 M 1 t 1
'
~ J e:: 1
º' ;... ' H 1
"' g ¡.. ¡.. (l)
¡:.,
' e o z
'O e C\1
rl (!) (!) .._,
(/)
º"'ºº M N
'° M N
~ººº "' ~ .-l
000.--1
0000 o
0000 o
o '° 00
.--11.f'>OO M
º"'ºº lf\ C"'}
0000 o
o 00 C"'}
"100"\M 1 M OCl Ll'it'•"') ("") 1 O'\ ~<()-:t ·~
.--1 1 1
' 1 1 00
:j 1 1 1 1
' 'º 1 1 1 J 1 1 1 'º 1 1 1 1 1 1 t N
' 1 1 1
' 1 1 <"'> IN 1 1 1 1 1 1 I!) 1 CX) 1 1 1 1
' 1
: :::¡ ' 1 1
' 1 1 1 1 C"'}
,.... o I!) N
~ 1 Q)' CI o 1 .µ 1 (/) '
ONOO r-,
0"100 N o .--1
.-INDO ~-:t
-:t N
0'-">00 r-,
0000
0000
000.--1 C"'}
NC:OOC"'l
"' N
0000
0000
ººº·º
(l) e o !>.,
1 1
' 1 U)
' r- 1 1 1 1 1
' ' <'l 1 co ·~ 1 N 1 1 1 1 1 .,., 1 N
'º 1 rl 1 1 1 1 1 N 1 r-, 1 1 1
' 1 1
' 1 1 {I} 1 o J .....
' @ ¡.. (l) u
~ 00
°' IN
J ,,., 1 .-l 1 NI
1 1 1 1. 1 1
1 ' r-. 1 -o 1
' 1 1 1 1 1 ID 1
' 1 1 1 1 1 10 1 1 1 1 J 1 1 10 1 U'\ 1 '° 1 1
CX)
.,., N ,....¡
ººº
ººº
o.-l~IOOI ooON 1 '-O 1 U"'I '° 1 Lr'l ' 00 1 ~ 1
1 1
1 ' 1 ' 1 N 1 ' .-1 1 1 O"\ J ' 1 1 1 1 1 1 1 1 1 1 o 1 ' 1 1 ' 1 ' 1 1 1 ' 1 1 ' 1 1 o' 1 1 1 1 1 1 1 1 1 1 1 1 1 o' 1 1 ' 1 1 ' 1 1
' ' IN 1 N ' C"'} 1
' ' ' 1 r-- 1 N 1 ,..; 1 1 1 1 1 1 r'l 1 1 o 1 1 <"'> 1 1 1 1 ' ' 1 ' 1 1 ' 1 1 ' .-1 1 1 M t
' ' 1 1 1 1 1 1 1 1 1 1 1 "'1 1 N 1 1 .--1 1 1 1
1 ' 1 1 1 1 1 1 1 .,., ' 1 U'\ 1 ' '° 1 ' <'l' 1 1 ' 1 1 1
1 ' Jo J ' 1 1 1 1 1 1 1
DI
' 1 1 1
' 1
o
NOOOO ~ ~ .--1
º' "' 1 .--('
' 1
' 1 1 1 1 1 1 1 1 1 1
' 1 1 1
' e, ' ...... 1 ;::I'
p..,'
' -o ' CI <1j'
1 ¡.. 1 QJ 1
"' 1 <!I 1 o..'
<'1000 .....,
~º°'º 00 .--1 ,,., .--1
ºººº
º"'ºº ' t ' 1
<o 1
' 1 1 1 1
1 1
1 ' 1 O"\ l.ONLl"IC"J i C"J 1 O" M 1 ~ 1 C"'} 1 1 ' 1 1 1 1 r 1 ' 1 ,...¡. 1 N 1 1 r- 1 1 N 1 1 1 1 1 1 1 1 1 ' <o 1 ' <"'>' 1 1.f)' ' 1 J 1
1 1 1 r º''°ºº~ '° 1 lf\ o <'l 1 <'l
' 1 1 1 1
º' 1 1
' ' 1 1
.--1000
ºººº
0000 ' ' 'º 1 1 .. 1 1 1
'º 1 1 1 1 1 1 1 O"\ 1 "" J <'l
' 1 1 1 1 C"'}
' .--1 1 1 1
'
0000 o
00 o 1.f) C"'}
~1.f)C'Jl"'-' °' ~\O'-O"°ll.--1 lf\ .--1 ~ r'l ' rl N 1 \O
1 1
' 1 <"I ID 1 N 1 N
' ' 1 1 'º 1 1
' 1 1 1
' 1 00 '.--1 1
' 1 1
' J °' ' 00 ' 1 1
' 1 1 .-1 1 .--1 ' <'l
1
' 1 1 1 N 1 co 1 '° 1 .--1 1 1 1 1 1 <"'> J <"'>
' 1 1 1 1 1 1 1
' 1 1
' 1 1
' 1 1 1 1
' 1 1 1 1 1 1 1 1 1 1 1
' 1
' J
' 1 1
' 1 1
00000 co r'l
1 1 1
' 1 1 1
00 1 .--1 1 .--1 1
1 1
' ' ' J
' 1 1 1 1 1 1
' QJ 1
~ ~. .µ ' ..... 1 e 1 kl ;::I' ¡;,.. 1
1 -o 1
§ : 1
-o ' Ot ~:
0000 o
!"1000
ºººº
ºººº
ºººº
"10000 00 r<i
0000 o
.--1000
~ººº .--1
lf\000
ºººº
0000
J 1
' 1 1 1
º' 1 1
' ' ' J
º' 1 1 1 1 1 1
1.f) 1 1
' ' 1 1 1 ~· .--1 1 1 1 1
' 1 1
.--1· 1 1 1 1
' 1 J
'
0000 o
1 1
J 1 1 1 1 1 1 o 1 1 1 1 1
1 ' ' 1 ' ' 1 1 1 1 1 1 1 o 1 1 1 1 1 1 1
1 ' ' ' 1 t
' 'º
'°ººº ~
~ººº r-{
ºººº 1 1
' 01
' 1 1 1 1 1 1 ~· .--1' 1
' 1
' 1 1 1 1 1 .. 1 1
' ' '° 1 .--1 1 1 1 1 1 1 1 1
' 1
ºººº o
ºººº o
'°ººº ,....
o co o 1.f) ~
0000
0.--100
t
' 1
' • 1 .--1 1
1 1 1 1 1 1
' J 01
1 1 1 1 1 1 1
<"I 1 ..,.., 1
'
0"100
NOOO C"'}
ºººº o
0000 o
0000 o
ll'lOOO .--1
0000
0000
0'-'>00
N N
004 .--1 o N\O
o o.o.o
ºººº
0000
• 1 1 1
' ' 1 1
' ' 1
' ' ..... 1 (l) 1 ¡... 1 ro 1
"' 1 ~· -o e ro {I} QJ rl ..... .u :.: (l)
H
1 1 1 1 1 1 1 1 °' 1 l/"\ 1,,., 1 1
' 1 1
' °' 'º 1 r<i 1 .--1 1 1 1
' 1 1.f) • J
' 1 1 1 1 ' 1 1 1 1 'o 1
' ' 1 1
J ' 1 1 1 1
1 ' ' 1 1 o' t ' 1 1 1 1 ' . J 1 J 1
' 1 1 1.f) 1 1 N 1 1 .--1 1 1 .-l 1
' 1
' ' ' ....., ' -o .-l
1 ~ 1
-o 1 01
º' ¡;,.. 1
NOOO -o N
l'-000 '° .....,
l/'lOl/'lO eo eo ~ N ~ rl
.--1000
º~º~ N
0<"'")00 N
..... ro
-.-4 ¡.. ,_, Ul ;::I -o QJ e ui
H:::>
rl <il o u
1 QJ -o ¡.. o
..... o ~:;o
r-- .--1 1 O' 1
1
' ' ' ' .--1 1 C"'} 1 ~· r-- 1
1 1
' 1 r-{ 1
' 1 1 1 1 1
' ' º' °' 1 <o J 1.f) 1
1 1 1 1 °' 1 . .--1 1 1
' 1
' 1 1
C"'} 1 o- 1 o 1 .--1 1
1 t 1
' ..... r-- 1 •M \.O t o • ....., 1
' 1 1 1 1 1 1 ' 1 1 1 N 1 1 '° 1 1 N 1 1 J
' ' 1 1 J 1 t 1 1 o ' ' o ' 1 <J 1 1 <11 1 1 .o 1 1 o 1 1 H 1 1 1 1 -o ' 1 e 1 • ro 1 • 1 1 "'1 1 QJ 1 1 (>!) 1 1 ro 1 1 k' 1 QJ 1 1 > 1 1 QJ 1 1 t:Q 1 1 1
' 1 1 1
' ' 1 1 1 1 1 1
' ' 1
' ' 1 1
' 1 1 1 1 ' ¡.. t o 1 ,_, 1 <J ' QJ 1 {I} 1 .o 1 ;::I 1 (/) 1 1 1
' <") 1 co 1 O' 1 .--1 1
1 1 1
' 1 >. 1 ,_,' 1 '.,....¡ 1 () <J 1 QJ •.-4 1 ..... ¡.. 1 W-1-l
' 1
' ' 1 1 1 1
' ' ' 1 1
' 1 1 1 1 1 1
' 1 1 1
'
< H
~ o u
1 1 1 1 1 1 1 1 1 1 1 1 1 1 1 ..... 1 QJ ..... 1 ;::l •.-4 ·~o 1 1
' 1 • ' 1 1 1 1 1 1
..... "' . .._, µ:¡ o • HUl
H H z :::i
.--1 ro u H tl
~:;¡:~(i!:~;;:;:;¡: l~ICOrlNr-11"11 t Ct1 1 \O N 1 N J
H i 1 J 1 1 1 ' 1 1 1 f 1 1 C"") J U'1 ...'f' N_N 1 '-D 1 10010\0\-.0!"1101 :;::;:r--r-1oor-1:;:i: 1 1 r 1 1 J 1 1 1 ' 1 J 1 1 t ' 1010000101 1 1 r 1 1 1 1 1 1 r 1 1
r-1 1 f 1 1 Clj J 1 ' f o l 1 J u 1 1 l ¡... 1 o ' o o o o 1 o. «! 1 1 1 .e 1 1 J u 1 1 1
1 ' 1 1 1 1
~:0:0000:0 o i 1 1 u 1 1 r 1 1 1 1 1 J ' 1 J 1 1 1 10011.f)0-~011.f) INIC"")C".liñr-11.N 1 00 ' ........ 1 !"') 1 1 1 1 1 1 1 1 1 ''° 00>r--01N 1 00 -c>Or-1 O' 1 r-1 r-1 1 1 1 1 1 1 <"1
N
ca 1-1· H
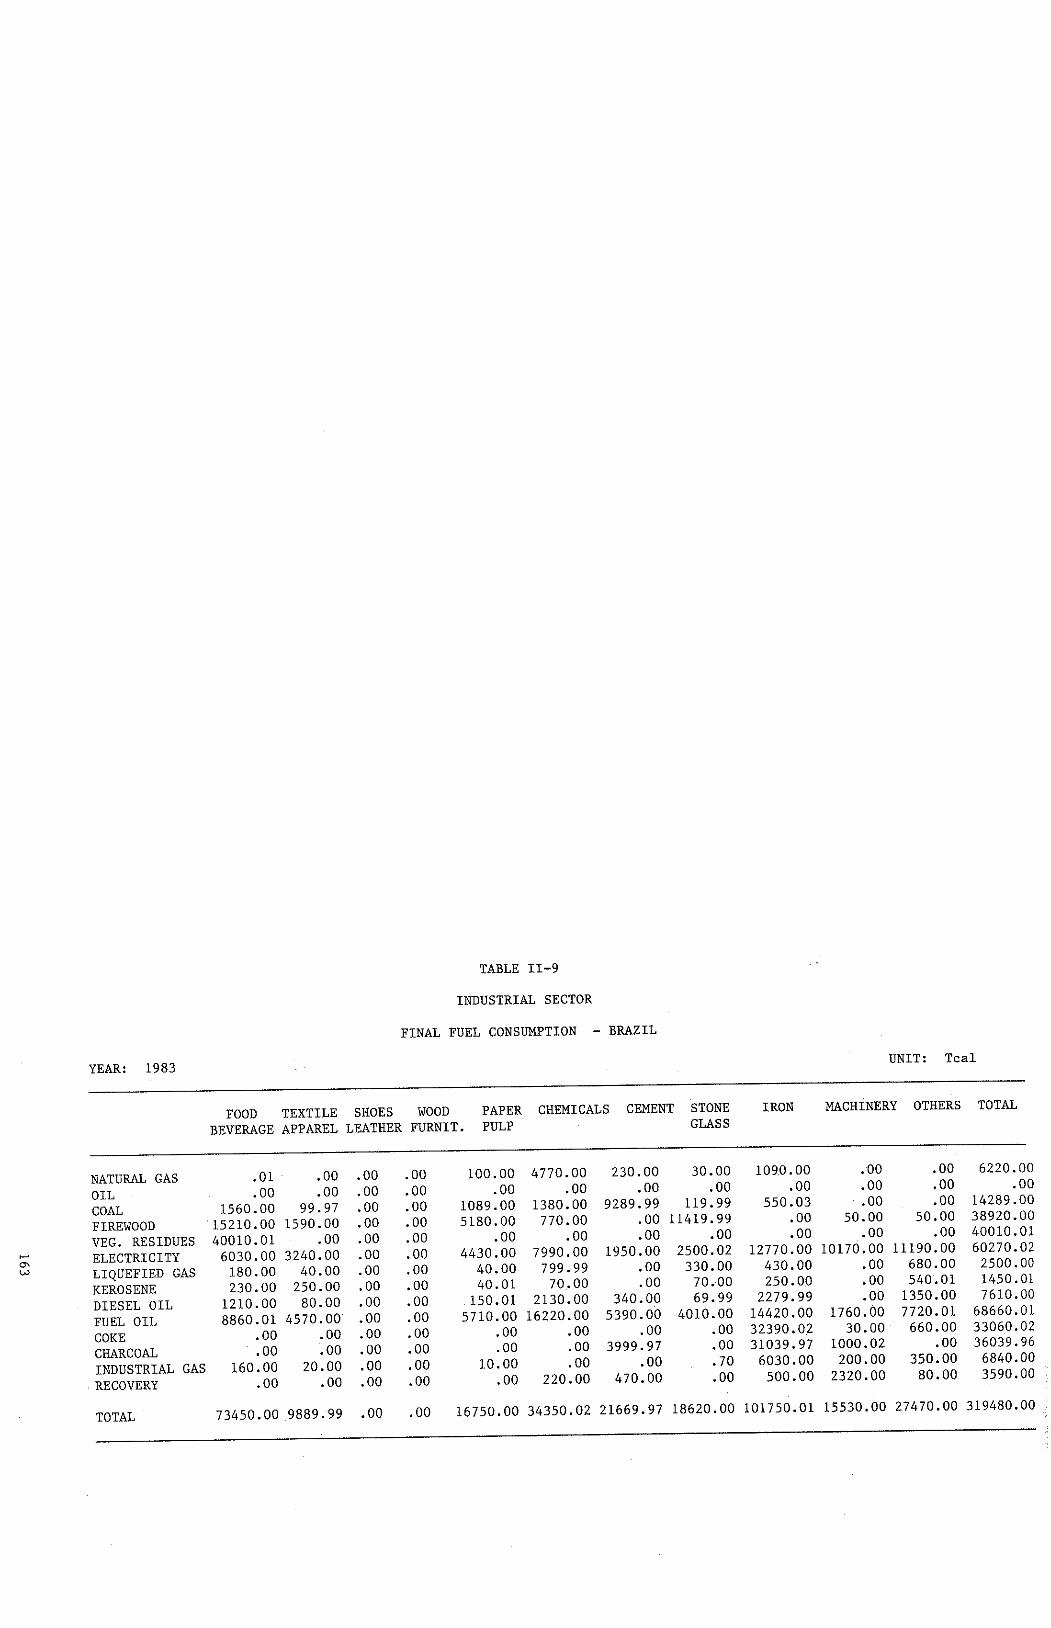
°' °' °' 00 00
°' o o o lJl ~ ('") r-
o o o o
r- 0'\
°' '° l.O ,....¡ N
N
o o l('\ r"j ..;:!" M
o o o t.n r- '° ,....¡
o o o N
'° 00 ,....¡
o l('\ r- ...... o .....
o o o ("') l('\ in ,....¡
o o o 00 ..;:!"
°' ,....¡ C")
o o o r- ..;t r- N
163
o N
o ,....¡ o N
N
.-1000..-l0000 ...... 0000
ºººººººººººººº ºººººººº
o \.O
..-<r-lC'iO
OM
.-1\.0 \O
t!
JN
OO
..-<NN
OO
...-<
.-1.r'lO\.O
...... ao
,....¡ ...;¡- ººººº ...;¡-
..;:!" lf"I 00 r-
N
N
tr'l M
..;t
oo
r-00
00
00
000
00
ºº°'ººººººººººº
ºººººººººººººº ºººººººººººººº
ºººººººººººººº ºººººººººººººº
°'º 00
00 0..-l ,....¡ tr'l
0000000 ............ 00000
ºººººººººººººº o o ......
º°'ººº O'\O'\r-r"iN ov
r-, .-IN
r-
N
l.O
...... ºº 00
r- M
r- ..-l
ºººººº°'ººººººº ºººººº°'ººººººº
ºº ~ °' M
M
lf"I
o l.f)
°' ...... °' 00 N
°'
O
O
O'\O
O 00
O o
O O r-O O
ºº°'ºººººººº°'ºº o C
") N
O
00'\ O'\ON O
O
O
'\ O
O O O
O
ºº°'°'ºººº°'ºººr-0 o M
o°'ºº°'º o
lf')r-NO
'\MM
O
N
N
..;:t-('<)00 tr'l
N
..;:!" N
.....<..O
,....¡ M
C'1
o °' o ......
O O M 000 O 00'\ ON r-O O
..-l ºººººººº°'ºº°'ºº
o
ººººº l.OC"'lOON r-
ON C
"i .....<
....¡ N
·o r- ...... o ,....¡
oooooooooooNOO ºººººººººººººº 00
l.f) 00
M
ºººººº 0'\00..;:t"tr\N
\O
...... <o tr'l
C"i
r-, '° ......
,....¡ r- ......
0000000..-<0.....;0000
ºººººººººººººº
0000.-!N0..-<0.--<N
\000
ººººººººººº°'ºº o°'ºººººººº°'ºº N
CON.-1r-Ol/"l.-l'.01.0M..;:l"O'\ N
N
O">O
Nlf"l..;:l"-.0\000C
Olf"I
-o ..;tO
OO
ON
,....;r-OO
M-.0\0M
..-<M
..;t\O
\OC
'iC'i
E-.; z ~ u
M
00 O
'\ ,....¡
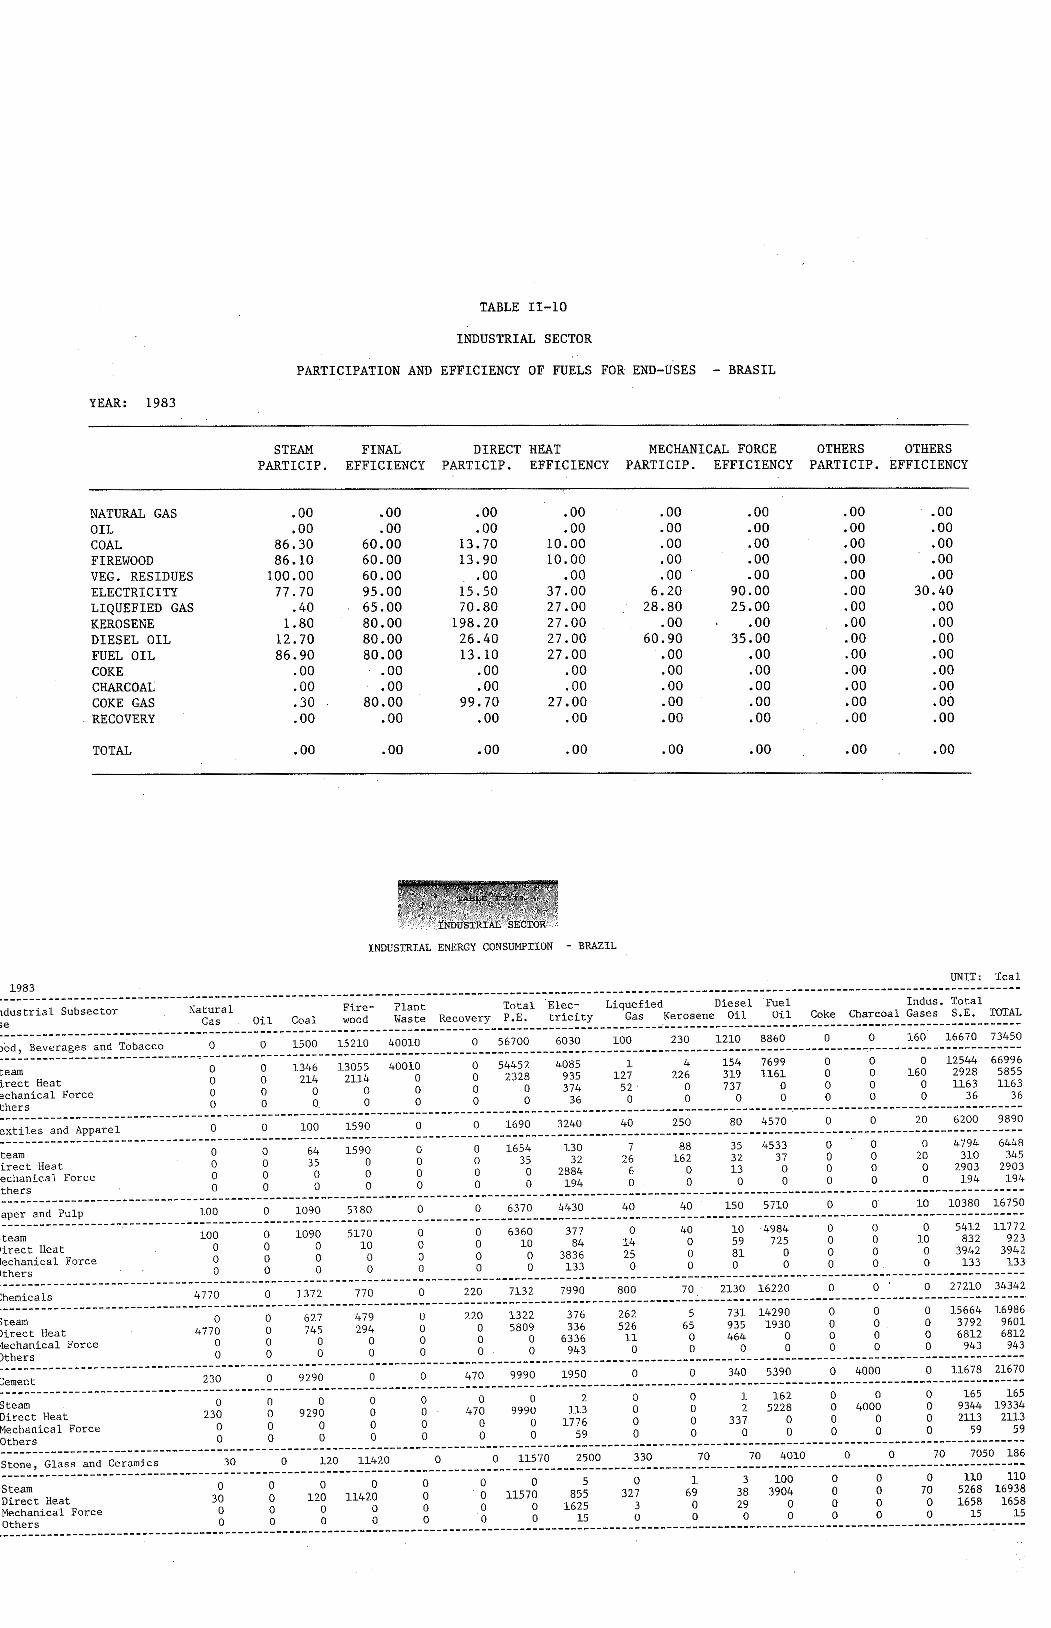
1 1 1 1 ' , . 1 1 1 1 1 1 ' l 1 1 1 1 1 1 ' l 1 1 1 1 1 J 1 1 1 1 1 1 1 1 1 1 1 ' ' 1 1 1 1 1 1 1 ' ' 1 1 1 1 1 1 1 ' 1 1 ' 1 1 1 1 1 1 1 1 l 1 1 1 1 1 1 ' ' 1 ' 1 1 1 1 J 1 1 l 1 1 1 1 1 1 ' 1 1 1 1 1 1 1 1 ' 1 1 1 1 1 1
~ 1
Q)
1 ¡:::
1 0
1 .._,' <f.¡
1 ' ºººº ""
ºººº
ºººº N r-1
ºººº N
-:t
~
ºººº
ºººº
ºººº ,.._ <[\
~
O.j-00
ºº r-1
a> <")
ºººº
0000
0000 ,.._
ºººº ,.._ ,.._ -""
ºººº
°'-""o o
,.._ °' .j"N
ºººº
ºººº N
N
"'"'ºº N
O
<'1 ro
r-1 L
!)
ºººº
ºººº
ºººº
<D.-iN
M
1 O
t·L
!)-:t<'lCl'
1 l
CO
Or-i...-t1r-1...Prr")M
l/"tt 1
O"-.D
C00'\11..01.-lrt)r-l
t 1
\O&
t\.O
ll"""'ll ""'~
1 1
H
!NI
r-1 1
1 1
1 lo
1 1
1 1
lf"l 1
1 ce
i lf"I ..::t rri
O"\
1 o
1 1r-t\.O
..;:tr-lL!)1
r- 1
1 '° 1
r-1 C111"""'"'I 1
1
: ~
~ O
\N
: :
1 1
' 1
1 1
1 o j
1 1
1 r-
1
'º'ºººº' 1
1 1
' l
1 1
1 l
1 1
1 1
' '
l 1
1 1
1 1
1 1
1 ó'
1 1
1 1
'º'ºººº' 1
to¡ o
1 1
: ~: ~
: :
1 1
1 1
f l
1 o
1 1
s 1
1
'º'ºººº' 1
1 1
1 '
' 1
1 1
1 1
1 1
1 1
t 1
1 1
1 o
1 1
1 1
r-i 1
¡QINOCJOOIOI 1
O'"\ 1
\..O N
l -T
1 1
M
1 rlN
1
1 IL
!\I U
i 1
1 l
1 1
1 1
] 1
o 1
1 1
1 r-
1 101M
Nr-O
I 1
1 ...:t
1 C""")
1 l
1 ("'")
1 ('o")
1 1
1 1
l 1
1 1
1 1
[ 1
1 1
1 '
1 o
1 1
¡ l
r-, 1
10100001 1
1 1
1 1
l 1
1 1
1 t
1 1
1 1
1 i
1 1
1 1
• 1
1 1
1 '
1 o 1
1 1
1 M
¡
10100001"'11 1
1 1
1 1
1 1
1 1
1 l
l 1
1 t
1 l
1 1
1 1
1 1
o 1
1 1
1 o 1
1 o
1 C
'l ("'"") "° O"'I 1
U'1
i 1
L/'"l 1
r--1_ r- LJI
1 N
1
:~: ,...¡:=i
: :
1 1
1 l
l 1
l t
1 '
1 o 1
1 1
1 r-
1 10
100
00
1m1
1 O
"I 1
O'
1 ..-1.
t 1
()"\ l
"" 1
r-t 1
1 O
' '
O'\
1 1
1 1
1 1
1 1
1 t
1 1
1 o
1 1
.. 1
1 10
100
00
1 1
i t-
1 r-
1 1
1 -""
1 -""
1 1
1 t
1 1
1 1
1 1
l 1
l t
1 t
1 1
1 1
1 o
1 1
1 1
º'ºººº' '
1 1
1 l
1 '
1 '
1 1
1 1
1 1
1 1
1 o 1
1 1
N
1
º:ºººº:;::;: 1
1 .--1'
1 1
1 1
' 1
1 1
1 ,
to 1
1 1
N
1· 0
100
00
1.--11 (j'I
1 °'
' 1
N
t N
1
1 m
1
'7' 1
1 1
1 1
1 1
1 J
'o 1
' 1
1 0
1000
01
1 '
1 1
1 '
' 1
' '
1 1
1
' '
1 t
lo 1
1 1
("l"'J 1
º'ºººº' 1
n 1
("f") 1
1 N
t
N
t 1
' 1
' 1
' l
1 1
1 1
' 1
1 1
1
' 1
' '
1 1
l ~
VJ 1
1 1
() 1
1 1
•M.
1
~ ~ ~ :
1 '
~ 1
1 1
(l) t
1 1
u 1
[ 1
1 1
'O
' 1
e:' 1
oj 1
l 1
[ tll' 1
<IJ' 1
'1l 1
1 .-1'
1 {!)
l
' 1
' ' 1 1 1 '
Ni
-"" 1
""1 -""' M
1 1 '
~: N
1
,.._ 1
N
1 1 ' 1 º'
1 1 1 ' ' 1 ' º'
1 1 1 1 1 1 01 ' 1
1 1
1 1
1 1
' 1
1 o
1 l
N
1 1
N
1 1
\!) '
1 r-1
l 1
1 '
1 1
o 1
' C'1
1 1
.-i 1
l N
1
1 1
1 '
1 l
1 1
1 o
1 1
,.._ 1
1 1
' 1
' 1
1 1
1 1
1 1
1 1
1 o
1 1
o' 1
ro 1
' 1
1 1
1 1
1 l
1 '
1 o
1 1
"'1 1 °'
1 '
r--. 1
1 1
1 1
1 '
1 1
1 N
1
'C'1 1
1 r-1
1 '
r--' 1
' '
1 l
1 1
1 1
o 1
1 N
1
1 N
1
1 1
1 1
1 1
' 1
1 1
1 '
1 o
1 l
1 '
1 1
1 1
1 '
1 '
l '
1 1
o 1
1 ,.._
1 1
,.._ 1
1 1
1 '
' 1
1 '
1 1
1 N
1
1 r-,
1 '
C'1 1
1 r-1
1 1
1
' '
1 '
1 1
1 o
1 1
1 1
1 1
1 1
1
' '
' 1
' 1
o 1
,.._ 1
,.._ 1
-"" 1 1 1 1 1 1 1 1 1 1 ' 1 1 1
ºººº o r1
ºººº
ºººº "' o .-i
º·ººº ,.._ r1 r1 L
!)
ºººº
ºººº
ºººº '° .-1 "" '°
ºººº -""
ºººº
ºººº
ºººº r-1
º' <[\
1 ,.._' \!)
1 r-1
1 1 1
º' <X
) 1
C'1 1
o 1
r1 ' 1 1 1
::1 : 1 1 1 1 ' l º'
1 1 1 1 ' 1 o
1 ' 1 ' 1 1 1
~: ,.._' L!)'
1 1 1 01 U"1
1 .-i
1 1 1 1 1 1
:1: l 1 ' 1 ' l 1
º' -"" 1 • 1 1 1 ' 1
01 C'1
1 -:t
1 -:t' ' 1 ' 1 º'
j--, 1
C'1 1
'° 1 1 1 ' 1
01
1 1 1 ' 1 1 ' 1 º'
1 1 1 1 1 1 1 0
1 ro 1 r-1
1 L
!) 1 ' 1 1 1
º' "' 1
01
r1 1 1 1 1 1
º' 1 1 1 ' 1 ' '
º' ~: 1 1 1 1 1 1 1 1 1 1 1 1 1 1 1 1 1 1
p.. 1
.-1 1
:o\' p_,
1 1 "O
1
e: 1
<1l 1 1
H
1 Q
) 1
p.'
<1l 1
ºººº
ºººº
ºººº °' L!) r-1
ºººº
ºººº
roNOO O()'° r1
ºººº
ºººº
ºººº N
rou-i<'1.j" 1
-""-:to°' 1
.j"C'10'.-i'
\O
N
1 1 1 1 1 1 1 1 1 r l 1 1 1 1 ' 1 1 ' 1 ' 1 1 1 1 1 1 ' 1 1 1 1 1 1 1 1 ' 1 1 1 1 1 1 1 1 1 1 1 1 1 1 ' 1 ' 1 ' 1 1 1 1 1 ' 1 ' 1 1 1 1 1 1 ' ' 1 1 1 1 1 1 1 1 r 1 1 1 ' 1 ' 1 ' ' ' 1 1 J 1 ' ' ' 1 1 1 1 1 ' ' 1 ' 1 1 t 1 1 ' ' 1 1 1 1 1 1 ' 1 1 ' 1 1 ººººo
ºººº
ºººº r-1
o o -:t
ºººº
.-it--NO
N
L!) r-1
-""'°o o
N
N
ºººº
ºººº
ºººº '° r-1
1 1 r 1 l l 1 1 1 1 1 1 ' ' ' ' 1 ' ' 1 1 1 1 l r 1 ' 1
1 1 1 1 1 1 1 l 1 ' 1 1 1 r ' 1 r 1 1 1 ' 1 l 1 1 r r ' 1 1 ' 1 r 1 1 1 1 1 1 1 1 1 1 1 ' 1 ' 1 1 1 1 1 1 ' 1 1 ' 1 r r r 1 1 ' 1 1 1 1 r 1 1 1 1 1 ' 1
1 ' 1 1 1 l 1 1 1 1 ' 1 ' l l 1 l ' 1 1 1 1 l 1 ,. 1 1 1 1 1 1 ' ' 1 1 ' 1 1 1 1 1 ' (/]' Q
) '
oa s <1l
1 $...>
1 (¡)
1 ;>
1 Q)'
cQ
H: a : ~
1 1
1.... 1
~:sw:~ s:~<ñ:~
1 '
r-1
1 1
1 ~
tlJ 1
: .g ~ : o
1 e:
'1l 1 '°
1 H
t!l
1· r1
1 '
1 r-1
l 1
o) 1
1 o
1 '
u l
' ¡._¡'o
1 o)
1
: o:
1 '
' 1
1 Q
) 1
' ~·º
: 8:
' 1
1 1
' 1
1 T""'"4M
1
1 Q
) • .-;
1 o
l ~o l '°
1 µ.,
1 ro
1 1
ro 1
1 1
..... 1
1 Q
) .....
' •
m•rl
1 o
1 Q
) o 1
r1 1
•..-1 1
N
l ¡::¡
l r1
: ~:
l Q
) 1
1 (/]
1 '
oto 1
l--1 1
(""')
: ª:N '
'O
1 1
Q)
' l.,-;
1 1
~ {/)
1 1
(L) o)
1 1~(.!)10 '
O"
1 o
1 ·r-1
1 r-1
1 ....¡
1 1
1 1
' '
>. 1 l
.._, l
l 1
·r-1 1
o t
u tJ
1 ('o')
1 Q
)·rl' o
1r-lHl\O
1
~ .._,'
'. 1
1 1
1 r-1
1 l
o) 1
o 1
.._,~ 1
o J
o •
1 r-,
1 H
P-.
1 '° 1
' L
!) '
1 l
>.' 1
H
1 1
Q)
l o
' ;>
' 1
o 1
' u
1 '
Q) 1
1 p::'
' 1
1 l
1 .,w.
(l) 1
l e:.._,
lo '
'1l <IJ'
.-i 1
..... t1l
1 o
1 p_, 3:
1 o
1 1
-"" 1
'
' '
1 '
l : e '8 : ~ 1
•.-1 0
IN
: =>: ::.1
1 1
1 1
1 1
1 ..-t
1 o
l tll
1 o
1 o
1 lf'l
, u
1 r1
1 '
1 1
' 1
1 .....
1 1
• .-; lo
1 o
1 l
1 1
1
' '
1 .....
' '
t1l l
1 H
<IJ
l 1
~ t1l'
o 1
.Ut:/I
1 oj
1 ,
z '
' 1
' '
' '
1 1
' .•
o 1
1 u
1 1
u
1 '
oj '
1 .o
1 1
o 1
1 H
1
>-< '
1 o
j 'd
l .¡J
' e:
1 u
1
'1l 1
Q) l
' <IJ
1
: 3 :
1 o:
' '
1 1
..... 1
1 oj
l 1
•..-4 E
M
1 ~
1 ro
1 .,w.
1
~: ~
: .,; : 1
"O
Q) 1 .o
' '
r. rt;
1 D
1
-.0L!)C'1-.010
O"\ t.r"l \O
('1 ¡
Q'I
Cl'<X
>r-1 1<
X>
-.O
L!)r-1 1 °'
'° l l 1 'º 'º l N
' '° 1 1 1 1 10 1N
1 1 1 1 1 1
1 1
o 1
1 l
1 '
1 1
1 1
1 1
' '
1 o
1 1
1 1
1 1
1 1
1 1
1 1
1 1
o 1
' ,.._
1 1
L!) 1
1 -""
1 1
1 1
1 1
1 1
o 1
1 <X
) 1
l l
' '
1 1
1 1
1 1
1 1
1 o
l 1
L!) l
1 N
1
' 1
1 1
1 1
1 1
1 1
r '
1 o
r 1
-"" r
1 1
1 '
1 1
1 '
1 '
1 l
: :1: 1
N
r 1
C'1 1
1 1
' 1
1 '
1 '
1 o 1
l o-
1
' '° l
1 r-1
1 1
1 1
1 1
1 r
' lo
1 '
l 1
1 1
1 '
1 1
1 1
1 l
1
' '
1 o
1 l
1 '
l '
1 1
1 1
1
' '
l '
'o l
' °'
' 1
L!)' '
r-1 1
1 1
1 '
' 1
1 '
1 o
1 1
o'
1 r-1
1 1
' 1
1 1
1 '
1 1
1 1
o'
' 1
1 '
1 1
1 1
1 1 '
o o o o o o o o o o o o o o o o
ºººººººººººººº 0
0<"1---lO
t'--~C::Ot'--O
\
ºººººººººººººº ºººººººººººººº
00 o U"'\
ll) oºº o
'° <o <o O
\ l.O
00
00 00
00
ºººººººººººººº O
Or--O
'\Olf)
OON"°
...-lOO
t'--0
r-, N
00 ...-l
...-l
ºººººººººººººº ºººººººººººººº
ºººººººººººººº O
O O
O O
N 00 O
G\0000 O
l.O 00
o N
l.O
o o o o· o
o o o o
o o o
o o ºººººººººººººº
o ,_,.,,
,_,.,, CTI
N
(")
ºººººººººººººº ºººººººººººººº
ºººººººººººººº ººººº"'ºººººººº
o (")
o ...-l 1 H
H
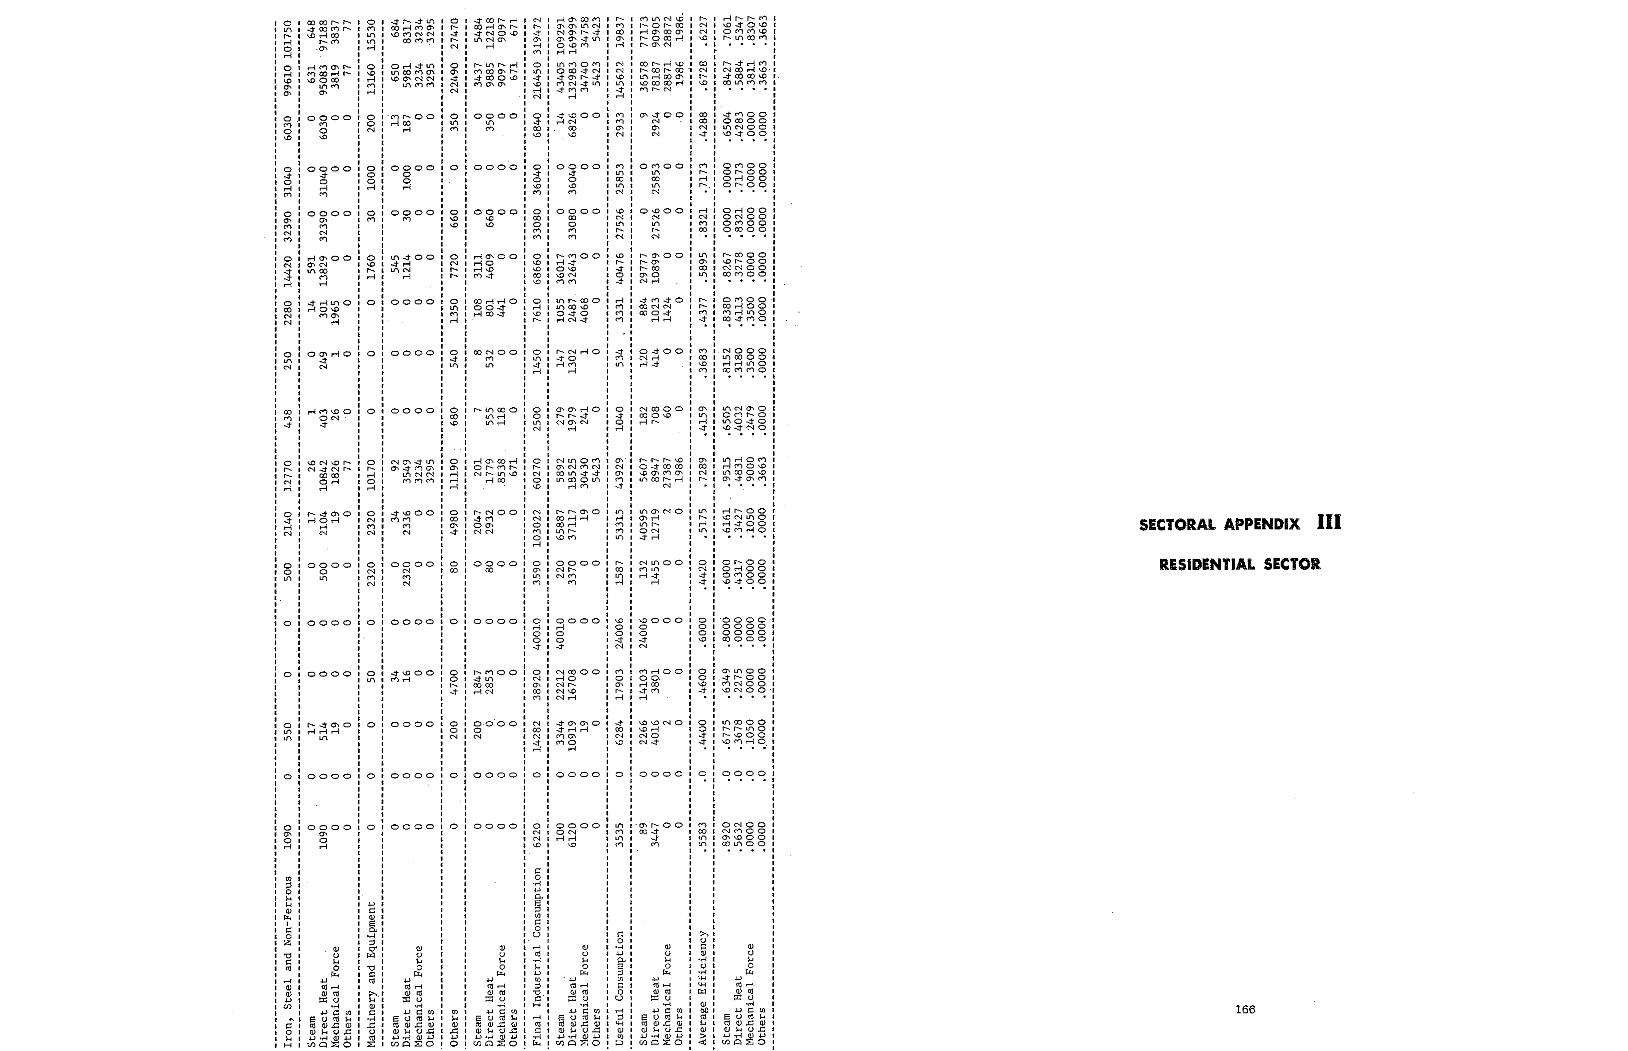
166
RESIDENTIAL SECTOR
111 SECTORAL APPENDIX
ONOO Nr"lOO "''° 00 <úll'IOO
' 1
' ' 1
' \"'")' 00 1 <l"l 1
"' 1 1 1 1 1 1 1 1
' 1 1
' ' 1 >.. 1 () 1 ¡::: 1 Q)
•.-l ()
·.-l ..... ..... [l:]
~ <ll \.< Q)
~
ºººº' o
o o -'!' ..:t
o 0'11'100 o -:tr-oo \O M NO o· 4 \ONOO
o ·oooo o 0000 oºººº '° .00 o o o
or-oo 0.-100 Or"lOO \0-'l'OO
o "' ..:t -'!'
"' 00 N r-
"' .,., ..-! -'!'
NOOO inoooo .-! .-! LO O O'.Jr"lr"lO
\"'") 00 -o r"l
º""'ºº OO.-! O O !").-!LO O oo ..:t \"'")o
0.-!00 ONOO
º""'ºº ocooo
\"'") º"'"'ºº r-, or-oo .-! 0.-!00 r-. o r- o o
.-!r-r-M
..0-'!'0-0 O r"lM\O r-, <l"l 00"'
j--, N N
'°
' ' ' 1 1 1
¡:: 1
º' ·.-l 1 WI o, 1 81 :l' "'' ¡::' o 1
U1 1
,..., 1 :l
4-< Q) eo ::o
ºººº o
-'!' OC) N -c
M.-!00 oo. .-! 00 -'t<'l .-!
M o "' r-, .-!
'°ººº o o 4 N
'° o o ~
r-, 00 :::¡
NOOOO O'.) o'° .-! r-,
0400 N.-1 .-14
4 r"l <l"l
r-a-.oo r- o- ,._ 00
"'º N.-!
º'°ºº N LI) ,._ N
Or"lOO lf) O'.) U) N
r-. M (X)
"' ..-!
...... <ll
·.-l \.< .u tn :l 'O e H
0000 ON e--l r-l
"'
ºººº
N O'.) N
' ;::¡ 1 1 1 10 1 1 1 1 1 1 1
'º 1 "'' 1 N 1 1 '° 1 l. 1
1 1
C• º' ·.-l 1 WI e, 1
ª' :l 1 U) 1 ¡::: o u
oºººº ,....¡ ..-! o o o o -T -'!'
ºººº Nl'- NM
M
o "' "' ""
N N o "' o .-!
o r-, N o '°
o o LI) N
0000 00 o "' M
o (X) o M
"'
ºººº g .o "'
o ..:t o '° ""
.-10'>00<""> O'> O'> in N N <:?> r-, 4 O'><:T>-T<n o'°"' ..-! r-l
inMO<'l O 00 -:t N -:ta-.,._ ..:t C"lN..;tlf) ..:t r"l <'l
.-!
"' \.< (1)
,.::: w o
ºººº o
ºººº o
0·000 o N
o o N
O r-MOO o ..:tin .... 00 O'.) -:t .-! N
o 0000
ºººº 00 o O'.)
r-NOO -'!'M
º°' NN
J 1 1
01 O'.) 1 -o 1
1 1 1
·I 1
o' °' 1 ....; 1 ,...; 1 r-l 1
1 1
' º' O'.) 1 °' 1 -'!' 1 l
OONOO ..., lf)
o ..:t LI)
o U) ..., ..-!
o N r-, r-
0000
"' '° o '° "'
º'ºººº
ºººº U) M
o LI) M
ºººº o
ºººº o
ºººº o
-'f'\000 M.-1
o LI)
ºººº o
ºººº N ..., N
o N 1 M N
o N ..., N
o r-. .-! o ..-!
0000· o
ºººº o
ºººº o
o '° ,._ ..-!
ºººº M o ...,
ºººº s .-!
o o ~
'C"">l'-00 .-! 00
.-1
o o N
o ..., LI)
"' e-l
.-1 Q) Q) W1 CJ) 1
1 ~ 1
CI o 1 \.< 1
H 1
ºººº °' o .-1
ºººº o
o LI) LI)
ºººº o
ºººº o
ºººº o LI)
o o LI)
r-..:tcr-0 .-!O.-! ,....¡
N
o ..:t .-1 N
o ,._ ,._ N ..-!
o LI) N
o 00 N N
o N
1 .-1
ºººº °' M N M
ºººº ..:t o ..-! ...,
o ..:t o ..-! M
ºººº ""' o '°
01 LI) 1 ,._ 1 ..-! 1 01 ..-! 1
1
º' ..-! 1 '° 1
"'' "'1 1 1 1
o .1 M 1 o' "' 1 1
1 1

205
205
177
179
182
192
168
168
169
173
175
167
General Consideratíons
The Case of Brazil
l.
2.
CHAPTER III - APPLICATIONS
Significance of Research through Sampling
Prevíous Study of the Universe of Consumers
Samplíng Methods
Data-Gathering Instrument
l.
2.
3.
4.
DATABASE FORMATION CHAPTER II
Disaggregation by Subsectors
Disaggregation by End-Uses
Final Energy, Useful Energy and Efficiencies
Energy Balance Applied to a Household
Energy Balance Applíed to the Resídential Sector
l.
2.
3.
4. 5.
DEFINITIONS AND BASIC CONCEPTS CHAPTER I
RESIDENTIAL SECTOR
INDEX
169
1. s that consumed in the home to satisfy given needs • Final energy whích may be lightíng, food refrigeration, water heating, etc. The problems related to final energy appear in the ~is~ggre~ati~n of this consumption by end-uses, since there are d1ff1cult1es in
Final Energy, Useful Energy and Efficiencies 3.
Energy used in electrical equipment and others. Others
Radio-Electronícs Energy used in laser, conununications and information equip- ment such as televisions, radios, micro-computers, etc.
Lighting Energy consumed in internal and external lighting far homes, in incandescent , fluorescent or vapor (mercury or sodium) lamps. gas or kerosene-vapor lamps, wick lamps using kerosene or other oils, lanterns, battery-run lamps, candles, etc.
1 · f 1 run motors far Energy used to operate e ectr1c or ue - different types of equipment, such as water pumps, blend- ers, waxers, vacuum cleaners, etc.
pumps (electrical appliances, water Mechanical Force and others)
Refrigeration Energy consumed to refrigerate food in electric or fuel-run refrigerators, freezers, etc.
Water Heating Energy whose destination is heating water for personal or household use, in electrical showers, cumulative or flow- feed heaters, whether electric or run on fuel.
11 d f Cook1·ng on or in stoves, burners, Energy a acate or isolated conventional or mícrowave ovens, immersion heaters, etc. whether electric or run on fuels.
Cooking
fans, units, Energy used to run electric air-conditioning air circulators, etc.
Air Conditíoning/Ventilation
heaters, coal heaters, etc.
168
Energy consumed for space heating in homes, hot-water radia- tors, electric radiant heaters coupled with fans or not, gas
Heating
Within the subsectors under consideration, energy is consumed to meet the different needs of equipment using quite diversified sources. The present document will consider disaggregation by the following energy end-uses and equipment associated with these end-uses:
2. Disaggregation by End-Uses
It is worthwhile to note that the subsectors proposed herein are not made up of homogeneous groups of consumers and, furthermore, there are large disparities in consumption within these, as a function of levels of income.
At any rate, it is important far the definition of subsectors to be the one adopted in each country for carrying out censuses or household surveys, since this considerably facilitates making data compatible and probably reduces the need far field investi- gations.
Eventually, it will be possible to opt for greater disaggrega- tion: ínto urban, small urban, and rural subsectors, which might be more in line with the features of populatíon distribution in a given country.
For their part, the rnigratory movements from rural areas to urban areas have a heavy impact on the demand for controlled energy (such as electrícity and liquified petroleum gas) and thus con- stitute an important planning parameter.
The urban residentíal sector uses more energy sources whose productíon, distríbution and prícing are controlled by large enterprises and by the State, whereas rural residential con- sumption is more intensive in the use of uncontrolled. forras of energy such as firewood, charcoal, agricultural wastes, etc.
From the standpoint of energy planning, the need to disaggregate the residential sector into Rural and Urban subsectors is justi- fied on the basis of consumption profiles differentiated accord- ing to energy sources and on the basis of the reality of the large mígratory movements in a rural-to-urban dírection currently exísting in the regían.
Disaggregation by Subsectors l.
DEFINITIONS AND BASIC CONCEPTS
CHAPTER I
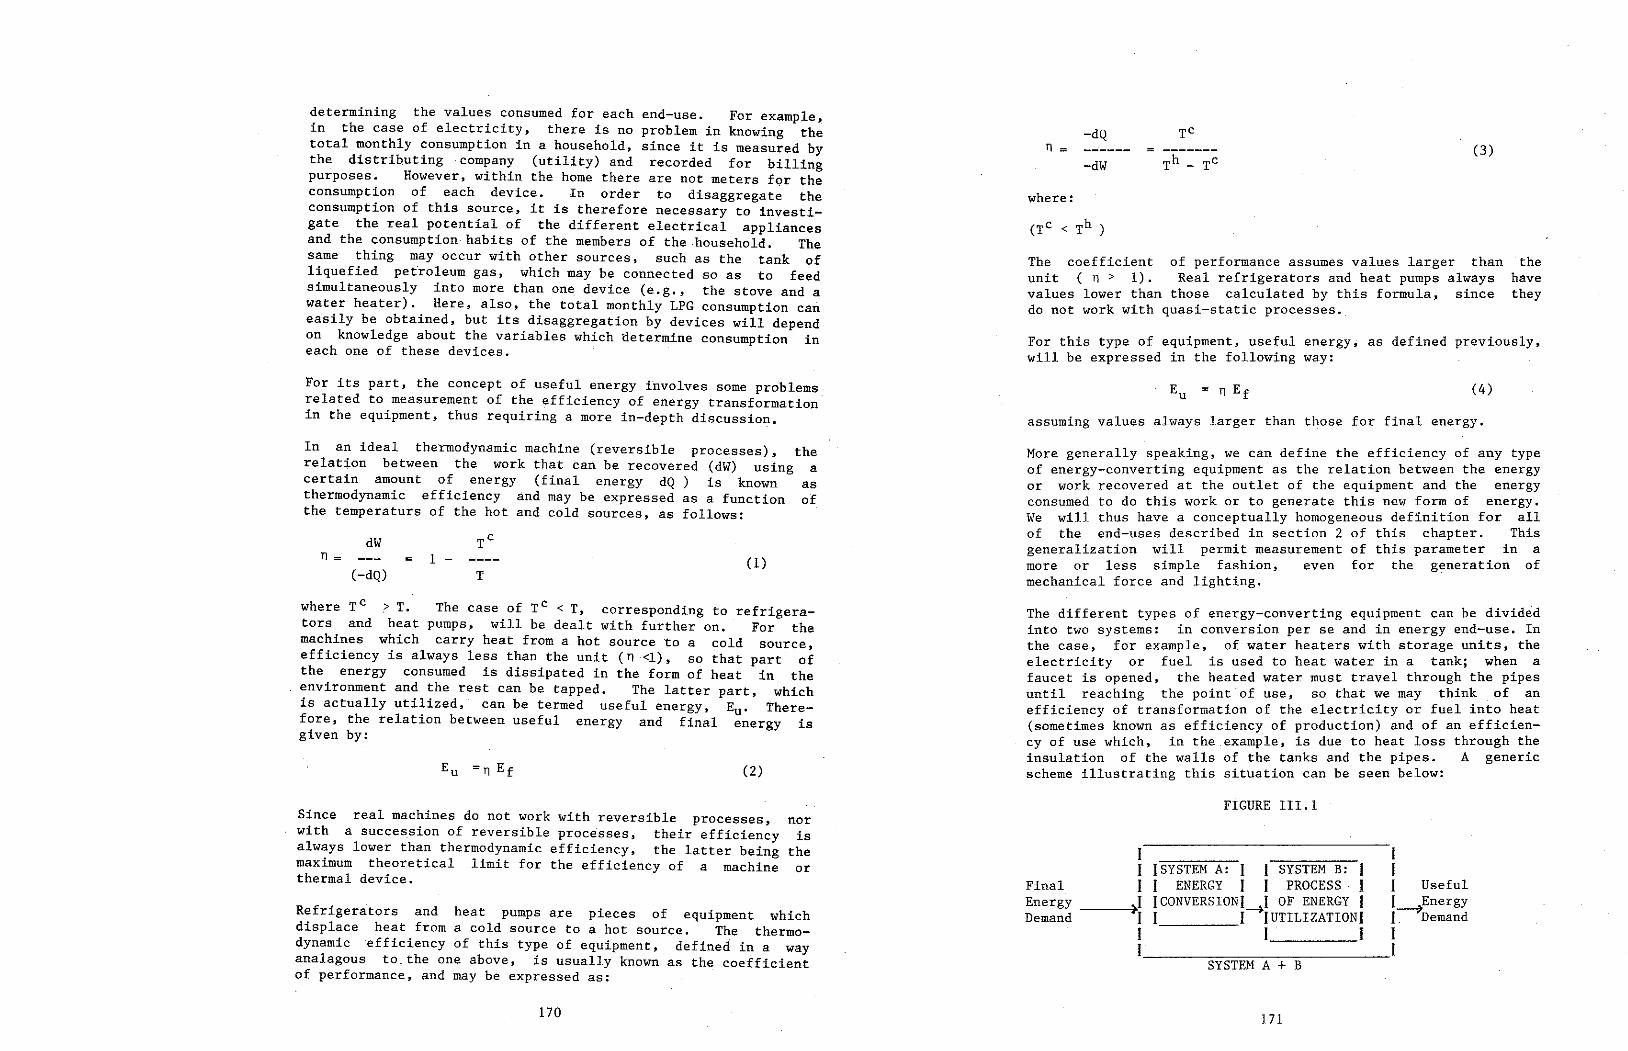
171
SYSTEM A+ B
1 1 1 JSYSTEM A: 1 SYSTEM B: f 1 1 1 ENERGY 1 1 PROCESS 1 1 Useful
--~>I 1 CONVERSIONl~I OF ENERGY f J--?'Energy 1 J J JUTILIZATIONJ l. Dernand I 1 I 1 l~~~~~~~~~~~~I
Final Energy Demand
FIGURE III. 1
The different types of energy-converting equípment can be divided into two systems: in conversion per se and in energy end-use. In the case, for example, of water heaters with storage units, the electricity or fuel is used to heat water in a tank; when a faucet is opened, the heated water must travel through the pipes until reaching the point of use, so that we may think of an efficiency of transformation of the electricity or fuel into heat (sometimes known as effíciency of production) and of an efficien- cy of use which, in the example, is dueto heat loss through the insulation of the walls of the tanks and the pipes. A generic scherne illustrating this situation can be seen below:
More generally speaking, we can define the efficiency of any type of energy-converting equipment as the relatíon between the energy or work recovered at the outlet of the equipment and the energy consumed to do this work orto generate this new form of energy. We will thus have a conceptually homogeneous definition for all of the end-uses described in section 2 of this chapter. This generalization will permit measurement of this parameter in a more or less simple fashion, even for the generation of mechanical force and lighting.
assuming values always larger than those for final energy.
(4)
For this type of equipment, useful energy1 as defined previously, will be expressed in the following way:
the have they
of performance assumes values larger than Real refrigerators and heat pumps always those calculated by this formula, since
quasi-static processes.
The coefficient uní t ( 11 > 1) . values lower than do not work with
where:
-dW (3) n =
-dQ
170
Refrigerators and heat pumps are pieces of equipment which displace heat from a cold source to a hot source. The thermo- dynamic efficiency of thís type of equipment, defíned in a way analagous to the one above, is usually known as the coefficient of performance, and may be expressed as:
Since real machines do not work with reversible processes, nor with a succession of reversible processes, their efficiency is always lower than thermodynamic efficiency, the latter being the maximum theoretical limit for the efficiency of a machine or thermal device.
(2)
where T e > T. The case of Te < T, corresponding to refrigera- tors and heat pumps, will be dealt with further on. For the machines which carry heat from a hot source to a cold source, efficiency is always less than the unit (n <l), so that part of the energy consumed is dissipated in the form of heat in the environment and the rest can be tapped. The latter part, which is actually utilized, can be termed useful energy, Eu· There- fore, the relation between useful energy and final energy is given by:
T (-dQ) (1) 1 - n
dW
the a
as of
In an ideal thermodynamic machine (reversible processes), relation between the work that can be recovered (dW) using certain amount of energy (final energy dQ) is known therrnodynamic efficiency and may be expressed as a function the temperaturs of the hot and cold sources, as follows:
For its part, the concept of useful energy involves sorne problems related to measurement of the efficiency of energy transformation in the equipment, thus requiring a more in-depth discussion.
determining the values consumed for each end-use. For example, in the case of electricíty, there is no problem in knowing the total monthly consumption in a household, sínce it is measured by the dístributing ·company (utility) and recorded for billing purposes. However, within the home there are not meters fqr the consumption of each device. In order to disaggregate the consumption of this source, it is therefore necessary to investi- gate the real potential of the different electrical appliances and the consumption habits of the members of the household. The same thing may occur with other sources, such as the tank of liquefied petroleum gas, which may be connected so as to feed simultaneously into more than one device (e.g., the stove anda water heater). Here, also, the total monthly LPG consumption can easily be obtained, but its disaggregation by devices will depend on knowledge about the variables which determine consumption in each one of these devices.
173
The analytical procedure for carrying out the above is il- lustrated in Figure III.2. Work s t ar t s with final consumption by sources, which should be coherent with the disaggregation of consumption by end-uses. In the lower part of the figure, the totals for final consumption by end-use and useful consumption are calculated as the sum of final consumption weighted by the respective effíciencies of production. Finally, losses are cal- culated as the differences between final and useful consurnption.
Final consumption by sources can be related to final consumption by end-uses. The consumption of the electrical devices which account for the different end-uses of energy in the home (refrigeration, space conditioning, lighting, mechanical force, etc.) will be aggregated and related to the final electricity consumption which appears on the electric power bill; in the same way, fuels should be considered according to the different end- uses and related to final household consumption.
The NEI can. be considered equal to the final consumption by sources since in rnost cases there are no stocks; when these exist, they are negligible with respect to the energy consumed annually.
energy products of major con- all of the sources considered in in the residential energy con-
includes only those although practically balance could appear
This list surnption, the OLADE sumption.
LE Firewood RV - Vegetable Wastes EE - Electricity GL - Liquefied Gas KJ - Kerosene CV Charcoal
etc.
Energy is bought, gathered (in sorne cases, such as firewood and vegetable wastes) and occasionally generated (in a few cases within the rural subsector), thus forming the Net Energy Input (NEI), which is the energy that enters the household, disaggre- gated into several sources and then transformed into useful forms. For those households which also render small services or produce goods that dernand energy, this consumption should be subtracted from the NEI and transferred to the corresponding sector, so as not to create errors in the determination of the sectors consumption. The NEI will be disaggregated into the following sources:
4. Energy Balance Applied to a Residential Unit (Household)
manufacturers. Since it is impossible to measure this perfor- mance, it is preferable to use the information available in studies carried out previously or, when this is lacking, informa- tion from technical literature at the level of manufacturers. Sorne indicative values are presented in Table III.l.
172
The first two requirements are the subject of analysis in Chapter 2 of this sector document. The efficiencies of the devices can be the subject of specific research in each country, in víew of the fact that experience shows that the real values encountered in practice are frequently different from those indicated by
the efficiencies of these devices under normal operating conditions.
the amounts of final energy really consumed in these de- vices; and,
the main types of devices used by final energy consumers;
In order to determine useful energy, it is necessary to know:
Therefore, as in the case of the Resid.ential Sector, the effi- ciency of the equipment used (on side A of the figure for System "A + B") can be determined in a relatively simple way with lab- oratory measurements, and it is possible to include this informa- tion in the OLADE balance, taking the efficiency of conversion as though it were the overall equiprnent efficiency.
It is even possible to include a rneasurernent of the additional · losses derived from the habits of equipment use, defined as the relation between equipment consumption under ideal and real conditions. In practice, this relation can be taken as equal to the unit for most end-uses, excluding perhaps cooking and space- conditioning equipment, due. to this "poor use" which could entail a substantial increase in energy consumption. The concrete conditions for preparing the balances for each country will indicate up to what point the measurement of efficiencies should go. In any case, it is suggested that in the first stage of application of the methodology only efficiencies of production be applied, leaving for later stages the determination of efficiencies of use and the application of overall efficiency.
Several types of energy-conversion equipment , in practice, ar~ separated into two systems: conversion and application or use of energy. The difficulties in measuring the efficiency of System "A + B" have led to the preparation of sorne useful-energy balan- ces which include only the effíciency of System A, sometímes known as the first transformation (in the case of the balance of the OECD, for instance, where useful energy is defined as that recovered by the final consumer at the outlet of the conversion devices). When this limit is taken for the system to be meas- ured, various simplifications are possible , the most important of which are those related to refrigerators, air conditioners,. and heat pumps, where the efficiency of electric motors and not that of refrigeration systems as a whole is measured; similarly, for the equipment which generates mechanical force, the measure- ment is concentrated in the motors, ómitting the information related to the efficiency of the equipment for application of the mechanical force, such as the blades. of a fan ora water pump, etc.
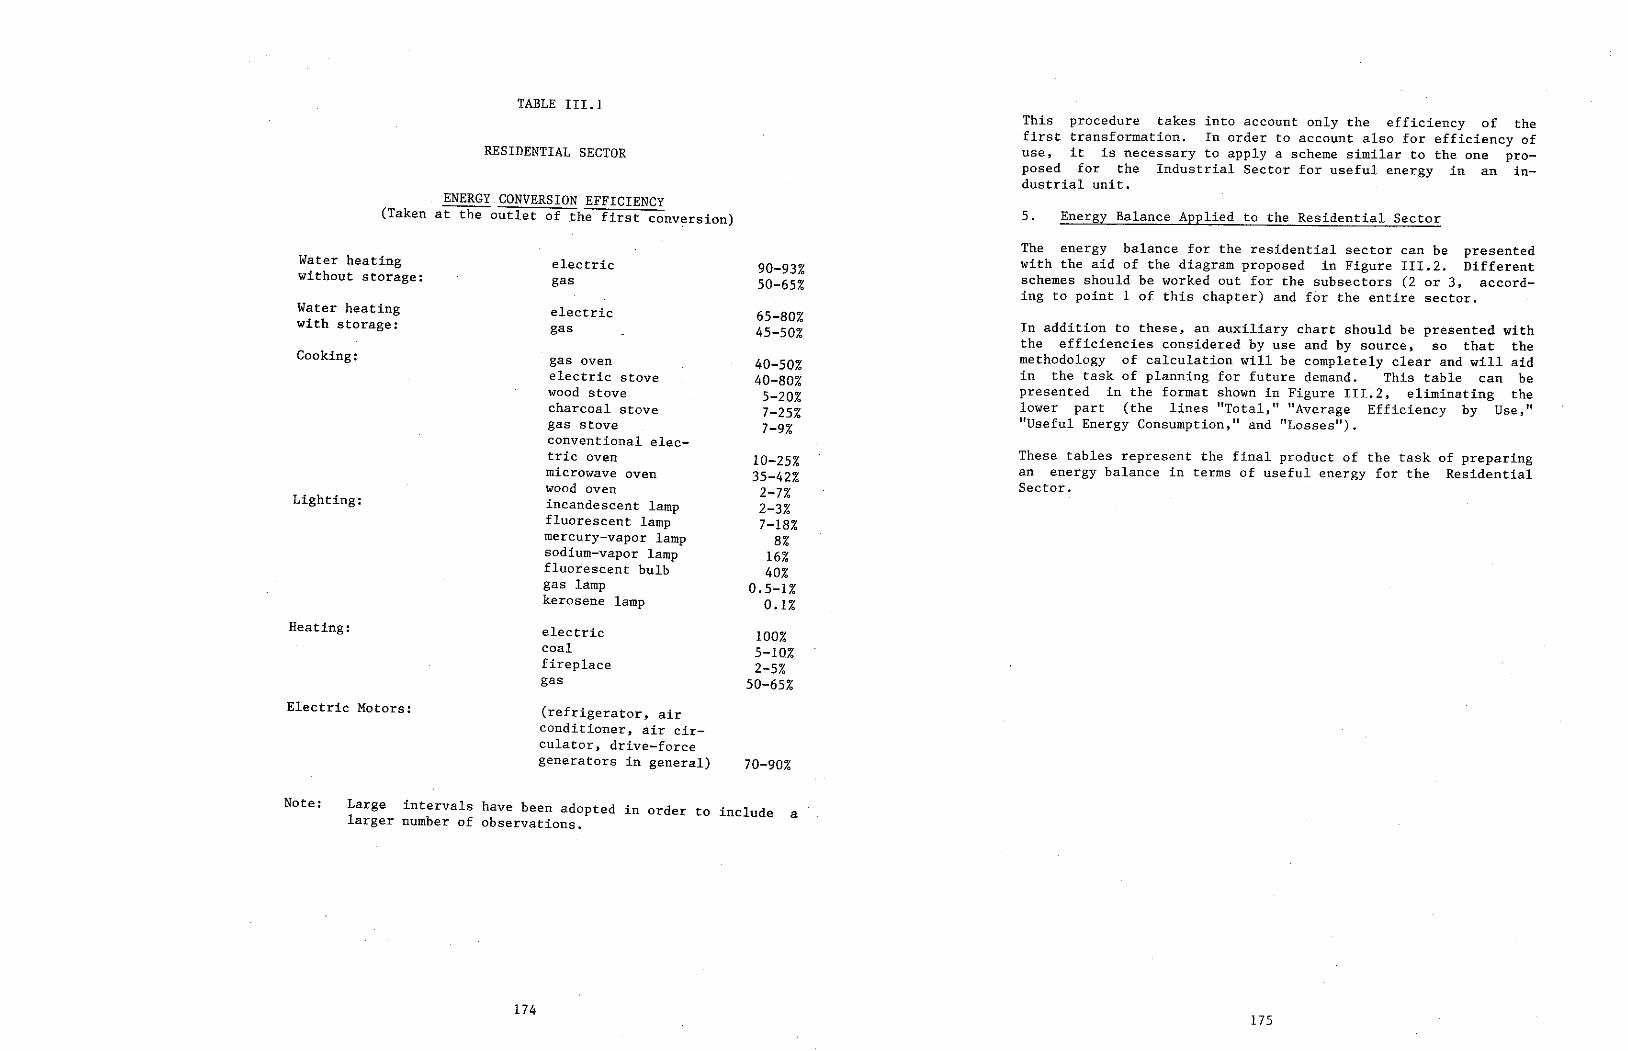
175
These tables represent the final product of the task of preparing an energy balance in terms of useful energy for the Residential Sector.
In addition to these, an auxiliary chart should be presented with the efficiencies considered by use and by source, so that the rnethodology of calculation will be cornpletely clear and will aid in the task of planning for future dernand. This table can be presented in the forrnat shown in Figure III.2, elirninating the lower part (the lines "Total," uAverage Efficiency by Use," "Useful Energy Consumption," and "Losses").
The energy balance for the residential sector can be presented with the aid of the diagram proposed in Figure III.2. Different schemes should be worked out for the subsectors (2 or 3, accord- ing to point 1 of this chapter) and for the entire sector.
Energy Balance Applied to the Residential Sector 5.
This procedure takes into account only the efficiency of the first transformation, In arder to account also for efficiency of use, it is necessary to apply a scheme similar to the one pro- posed for the Industrial Sector for useful energy in an in- dustrial unit.
174
a Large intervals have been adopted in arder to include larger nurnber of observations.
70-90%
100% 5-10% 2-5%
50-65%
10-25% 35-42% 2-7% 2-3% 7-18%
8% 16% 40%
0.5-1% 0.1%
40-50% 40-80% 5-20% 7-25% 7-9%
65-80% 45-50%
90-93% 50-65%
Note:
(refrigerator, air conditioner, air cir- culator, drive-force generators in general)
Electric Motors:
electric coal fireplace gas
Heating:
Lighting:
gas oven electric stove wood stove charcoal stove gas stove conventional elec- tric oven microwave oven wood oven incandescent lamp fluorescent lamp rnercury-vapor lamp sodiurn-vapor lamp fluorescent bulb gas lamp kerosene lamp
Cooking:
electric gas
Water heating with storage:
electric gas
Water heating without storage:
ENERGY CONVERSION EFFICIENCY (Taken at the outlet of the first conversion)
RESIDENTIAL SECTOR
TABLE III. l
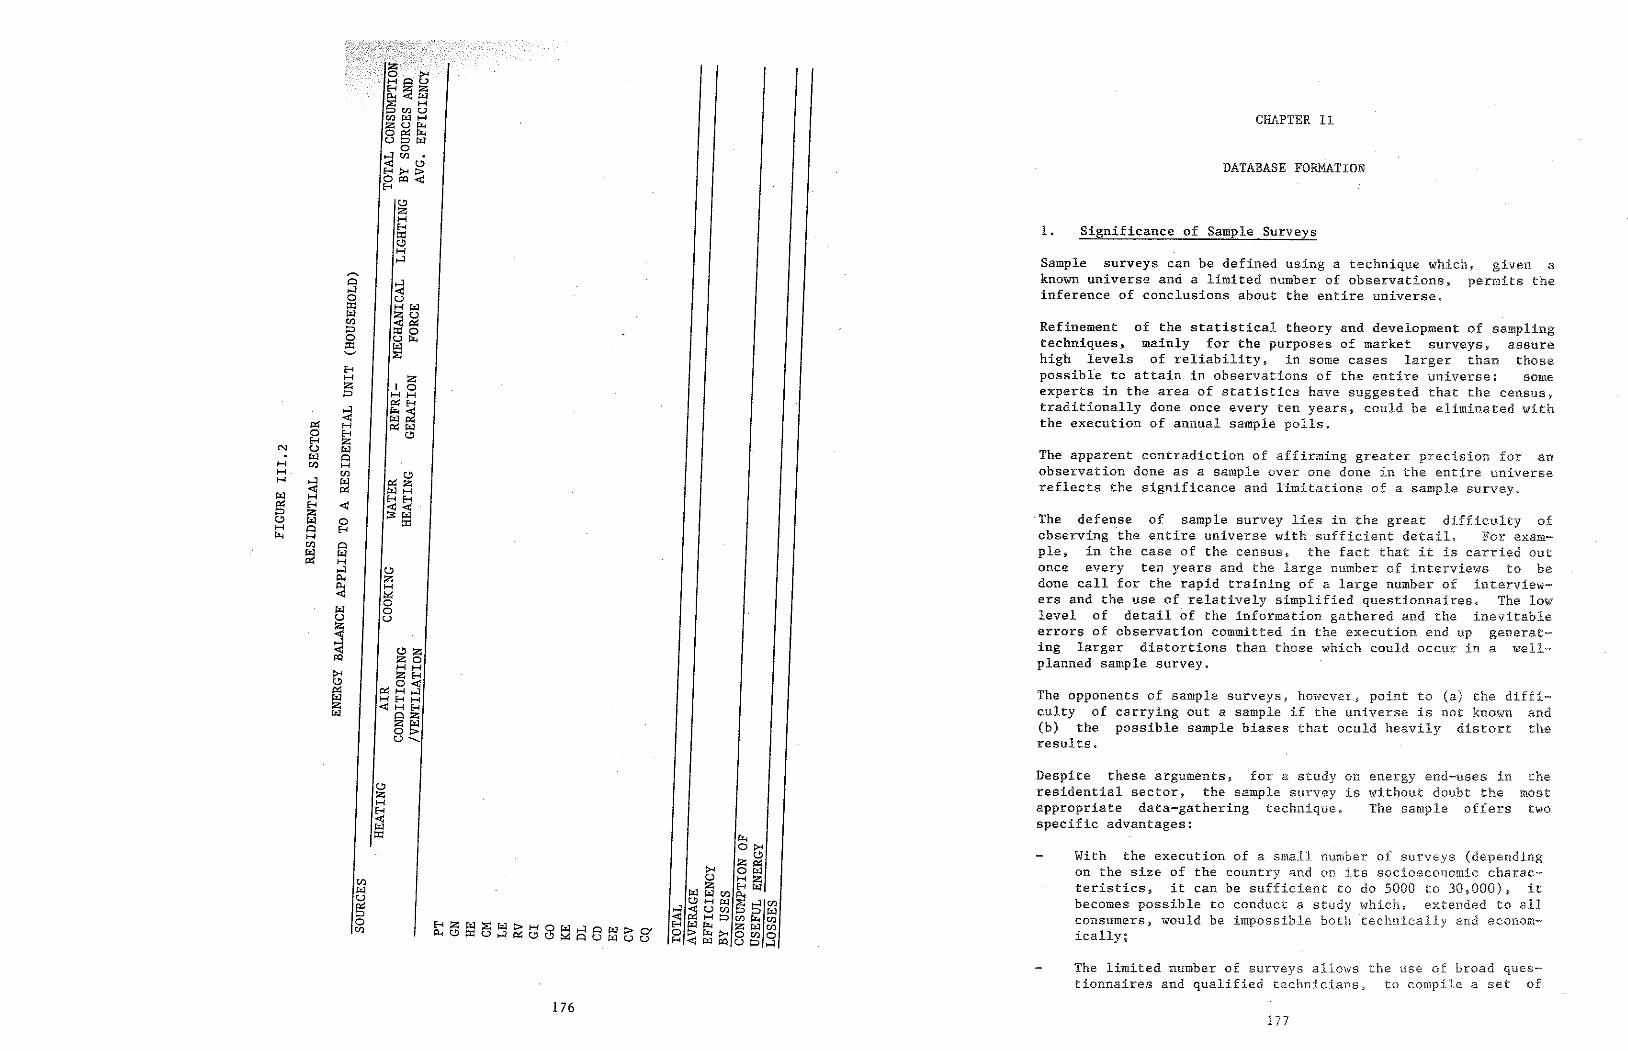
177
The limited number of surveys allows the use of broad ques- · tionnaires and qualified technicians, to compile a set of
With the execution of a small number of surveys (depending on the size of the country and on its socioeconomic charac- teristics, it can be sufficient to do 5000 to 30,000), it becomes possíble to conducta study which, extended to all consumers, would be impossible both technically and econom- Lca Ll.y ;
the most two
energy end-uses in without doubt the The sample offers
Despíte these arguments, for a study on residential sector, the sample survey is appropriate data-gathering technique, specific advantages:
The opponents of sample surveys, however, point to (a) the díffi- culty of carrying out a sample if the universe is not known and (b) the possible sample biases that oculd heavily distort the results.
The defense of sample survey líes in the great difficulty of observing the entíre universe with sufficient detail. For exam~ ple, in the case of the census. the fact that it is carríed out once every ten years and the large number of interviews to be done call for the rapid training of a large number of interview- ers and the use of relatively simplifíed questionnaires. The low level of detail of the information gathered and the inevitable errors of observation committed in the execution end up generat~ ing larger distortions than those which could occur in a well- planned sample survey.
The apparent contradiction of affirming greater precision for an observation done as a sample over one done in the entíre universe reflects the sígnificance and limitations of a sample survey,
Refinement of the statistical theory and development of sampling techniques, mainly for the purposes of market surveys, assure high levels of reliability, in sorne cases larger than those possible to attain in observations of the entire universe: some experts in the area of statistics have suggested that the census, traditionally done once every ten years, could be eliminated with the executíon of annual sample polls.
Sample surveys can be defined using a technique which; given a known universe anda limited number of observations, permits the inference of conclusions about the entire universe.
l. Significance of Sample Surveys
DATABASE FORMATION
CHAPTER II
{.!) z H f..¡ ::r: c.!) H ,_:¡
,-.. ¡:::¡ ,_.;¡ ,_:¡ < o u ::r: H ¡:,;:¡ ~
~~ 00 :=ic o ui:x.. ::el ¡:,;:¡ '-" ~ f..¡ H z z 10 /::::) HH
~ ~E-1
~ f:1 ~ H ~¡:,;:¡ o E-1 c.!)
E-1 z N u µ;¡ ¡:,:¡ ¡:::¡
H U) H H U) c.!) H
~ ¡:,:¡ ~z
¡:,;:¡ ~ WH H E-IH g5 E-1 < ~ 25 z c.!) ¡:,;:¡ o ::e: H ¡::¡ E-1 ¡:,;,. H U) Q ¡:,;:¡ ¡:,;:¡ ~ H
,_:¡ c.!) p.¡ z p.., H < ~ ¡:;,;¡ o o u u ~ ~ c.!) z ~ zo :>-t HH
ZE-1 c.!) o< ~ ~ H ,_:¡ ¡:,:¡ H E-1 H z < H E-1 ¡:,;:¡ ª ffi o l> u-......
c.!) z H E-1 < w ::e:
U) ¡:;,;¡ u ~ :=ic o U)
179
It is impossible to enumerate all of the sources of knowledge about the universe, since these vary from country to country and from region to regían, but they can be grouped into three diffe- rent categories:
2. Previous Study of the Universe of Consumers
Research stratification <loes not only refer to the need to be aware of the largest energy consumption recorded; it also implies the need to have better knowledge about the mechanisms of end- use. In fact, low energy consumption reflects end-uses aimed at covering the basic requirements of housing, lighting and cooking. To cover these, there is little variation: the pace of living and eating patterns tend to be constant. As consumption in- creases, other demands are covered and there is greater variation in equiprnent and costs. The larger number of surveys to be carried out with the increase in consumption serves precísely to assure that this varíation is taken into account.
This highlights the fact that, whenever possible, the investiga- tion should be with a stratified selection of energy consumption.
In a sample survey, assurance of the representativity of a modest part of the population becomes eitremely difficult, because it calls for a notable increase in the number of observatíons to be
· analyzed. Continuing with the example of Sao Paulo, if the survey had not been stratified far consumption but done linearly for the number of households, it would have been necessary to do more than 10,000 interviews in arder to obtain statistical repre- sentativity among the major consumers. Through stratification, the selection was able to ensure the same margin of error with only 800 interviews.
In countries having very highly-stratified income, as in Latín America, energy consumption (especially comrnercial energy such as electricity and petroleum products) can be concentrated in a small fraction of the countrys population: from 10 to 20% of the population can be responsible for more than 50% of the total consumption of the residential sector.
Generally speaking, it can be said that in the life of a house- hold, energy enters as a source which permits the functioning of more or less complicated equipment involved in day-to-day living. Therefore, copnsumption is tied to having equipment and to the pace and style of the populations way of life. The variable which most affects consumption is the income of the consuming unit, since it is what determines the possibility of owning equipment, what the lifestyle will be and, ultimately, what resources will be available to pay for the energy consumed.
cient to cite the fact that, for the condominiums of the city of Sao Paulo (Brazil), the average additional consumption per family among the residents of the apartments is 50 kWh/month, i.e., only a little more than 30% of the average household consumption citywide (154 kWh/month).
178
As for characterization of a ·d i 1 survey on res1 ent a energy consumption, it is opportune to note sorne comments on the parti- cular features of this type of toal. The first refers to the unit which is the subject of the survey. Given the very definition of 11residential," the subject of the study is con- sumption in the home; the unit of investigation will therefore be the household. It should be remembered that, in given situa- tions,. ~he units of observation can be different. For example, condom1n1ums presentan energy consumption which must be broken down among many households; furthermore, there can be situations in which consumption must be analyzed in the broadest terms, as in the case of collective residences (boarding houses) or com- munes. According to the country, it is necessary to anticípate different levels of observers, so as to guarantee adequate significance in the data. In order to have an idea of the weight that phenomena of this type can have in a survey, it is suffi-
The second indication is the need for a previous study of the universe to be surveyed. The sources whi~h keep a record of data of. great significance for the study of residential energy consumpt1~n are scant. When beginning a survey without a pre- vious rev1ew of data, the risk is run of improperly dimensioning the sample and preparing an insufficient questionnaire.
The first indication is the recommendation that any survey to be conducted has the support of a statistical expert operating in the country and, insofar as possible, methods and subsamples coherent with those used in the countrys compilation of official statistics. This recornmendatiori is important not only in assuring the technical quality of the project but essential in permitting a reliable test of the results of the investigation: i~ ~s preferable to lose the detail of the geographical d1str1bution of energy consumption in non-homogeneous regions than to generate a consumption distribution in areas in which there are no disaggregated demographic data to verify the validity of the sample.
It would be impossible in a few short pages to discuss the diffe- rent techniques used, the exhaustive treatment of which would demanda separate document. Consequently, the present document limits itself to providing sorne specific indications and to underscoring the main elements which characterize a sample survey in the area of energy end-uses in the residential sector.
The major dífficulty in the execution of a sample survey líes, as noted by its critics, in the danger of introducing systematic selection (drawing) biases which could in turn introduce serious distortions in the results, or even invalidate them. The only way of reducing errors to a mínimum are (a) previous study of the universe, permitting the review of the results, and therefore discovering possible distortions and (b) elaboration of simple and reliable selection techniques.
data whích it would not be viable to gather wíth larger surveys.
181
These surveys, despite the fact that they do not supply data homogeneous with those of official surveys, may perrnit the con- struction of consumer profiles and relate the possessíon of specific electrical appliances to family income. In market surveys in general, the different variables are analyzed on a regional basis, making it possible to complement census data.
From the quantitative point of view, it is possible to review the statistics on production or importation available in public entities and commercial establishments. The latter sometimes have available market surveys and consumer profiles to support their marketing policies.
Residential energy consumption depends to a great extent on the equipment utilized. Knowledge about the availability and quality of the equipment used in the country is essential far permitting a preliminary overview of the country and far facilitating the preparation of the respective file. The survey on availability of household appliances can be divided into two parts: one quantitative and one qualitative.
2.3 Source of Information on Equipment
It is important to remember that all of the information gathered prior to the investigation will make it possible to better dimen- sion the sample and to orient the questionnaire in the most appropriate way.
The use of biomass at the residential level is usually dif- ficult data to obtain. In any case, it is important that offi- cial sources such as the Ministry of Agriculture or the offices in charge of forest supervision be consulted.
The firms which distribute electricity and petroleum products, whether public or prívate, can supply data on residential con- sumption in a more detailed form. It is important to have access to these data and to the occasional surveys conducted by the firms, because they usually give a substantially more detailed disaggregation than the one available at the national level.
petroleum permitting and space and other
Distribution and consumption of energy sources of origin for residential end-uses, in sorne cases identification of cooking, lighting, water heating, mainly by sources such as LPG, kerosene fuels.
con- elec-
Percentage of residences with electric power, average sumption of such residences, and total consumption of tricity in the residential sector;
180
For the commercial sources of energy in general, annual BEEF are publ~shed by the corresponding ministries or secretariats (ac- cording to the country: Mines and Energy, Energy, Industry and Trade). The data are usually available with different levels of territorial aggregation or by sources.
2.2 Sources of Energy Information
out by entities detailed
Local sample surveys which are generally carried local authorities such as prefectures, by regional and by development organizations and .. which provide data on given regions.
National sample surveys on the economic situation and cost o~ living. These usual~y collect data on energy consump- ~1on per househol~ ~nd on the weight of energy consumption ~n the cost of living and the family budget. They are important not only because of the data which they contain but also because they offer a proven model for sampling i~ the country. Whenever possible, it is convenient to use the sarne teclmiques, both because they have been preven effective in the country and because they offer elements for verifying the quality of the results.
Besides the censu~,. which is the primary source of information, there can be spec1f1c surveys which are indispensable for obtain- ing better knowledge about the universe. The surveys which are done most frequently are:
The construction of a series of synthetic census charts accom- panied by preliminary hypotheses on energy consumption 'permits an initial picture of the country and the tentative p;eparation of a series of sampling models.
The primary source of information is constituted by population censuses, which are carried out in almost all the countries every ten years. No matter how synthesized, the census offers at the very least, a ~ene:al picture of the consistency and dist;ibution of the population in the territory, including number of families number of households, number of members of the family, age ran: ges, floor space or number of rooms. One essential element present in most censuses, is the distribution of families as ~ f~nct~on ~f income. This element is of great utility because the d1str1but1on of energy consurnption shows a strong correlation to income. This data can therefore be used to construct a seri f li · h es o pre minary ypotheses on energy consumption distribution.
2.1 General Sources 2.2 Sources of Information on Energy The cross-referencing of socioeconomic data extracted from the 2.3 Sources of Information on Equipment e en sus with the consumption data supplied by territory normally
gives a good indication of the energy profile of the country, ·with sorne details on residential consumption by energy source, 2 .1 General Sources thus permitting the reconstruction of elements such as:
183
Once there is preliminary knowledge about this stratum, it is possible to prepare a sampling plan which, in keeping with the specific conditions of the country, can follow a typological criterion, with selection of typical agglomerations in which the patterns of use are analyzed, ora random sampling criterion on a geographical basis.
The second subuniverse, of the residences connected to the elec- tric power grid, usually represents the least economically de- veloped stratum, the farthest away from the large centers. This is the essential feature of the stratum, so it is important for its homogeneity to be verified. In fact, in sorne regions there can be relatively well-to-do residences not connected to the electric power network. To proceed with identification, it is possible to do a preliminary test studying the importance of specific equipment such as absorption refrigerators run on LPG or kerosene, stationary generators and similar devices.
The first subuniverse, of residences with electric power, usually represents the most advanced sector of the economy, near the large centers of production and consumption. Lists available from utilities provide preliminary knowledge which facilitates the survey and permits irnmedíate identification of consumers. This sector represents the degree of evolution which will be attaíned by the second sector when it enters the phase of elec- trification.
When there is more information and the electrífication index is higher than 50%, it is always preferable to conduct a survey dividing the universe into two subuniverses: residences with electric power and those without. This division corresponds to the possibility of using different sampling systems and to an effective difference in the nature of the two subuniverses, which even calls far use of different questionnaires.
A sample of the entire universe may appear to be preferable. However, in reality, it is a complex survey which can demanda long time for execution anda great deal of experience in sam- pling. Its execution could be justified only in countries in which statistical information is scarce and the electrification index is lower than 50%. Under these conditions, execution would become more complex, equivalent to a preliminary census.
Typological survey, using an intentional selection, choos- ing homogeneous groups of consumers and attempting to out- line the energy consumption profile.
Survey of the universe having electric power, using the lists provided by the utilities.
Survey of all of the residential universe on a geographícal basis.
possible to follow three basic approaches to surveys and selec- tions:
182
Depending on the availability of data and/or resources, it is
After the data on the situation of a country in general, and its energy situation in particular, have been compiled and analyzed, plans far samples and selection techniques can begin to be studied.
3. Sampling Methods
Once the investigation has been concluded, a comparison of the consumption of the different types of equipment can permit pre- paration of technical standards for production, thereby assuring less energy consumption, or the modification of import laws with a view to providing incentives for the entry of more efficient devices.
Sunnnarized in a table, the characteristícs of the principal equipment marketed in the country can serve as support in the preparation of the questionnaire and in the residential field survey.
In testing, it is important to take into account the variables existing in user behavior that might affect energy consumption because these variables should be checked during an interview i~ arder to obtain more reliable responses. For example, in the case of an automatic washing machine, it is not important to ask about the duration of the wash, which could vary according to the load or the waters intake pressure. Most models have a fixed specific consumption, depending on the cycle used.
The execution of a qualitative analysis of equipment can be entrusted to a university research laboratory or another accre- dited institutíon. In the case of imported equipment, it is possible to request data from the efficiency tests which are run in most of the industrialízed countries. The most important types of equipment to be tested are those related to lighting. refrigeration, water heating and space conditioning. It is worthwhile to note that the measurements taken in laboratories do ~ot supply data directly applicable to the field; in general, it is necessary to introduce correction factors in arder to adapt them to local éonditions such as temperature, grid tension, and calorific value of the petroleum products used.
A qualitative analysis of marketed equipment offers two juBtifi- cations: to facilitate preparation of the questionnaíre and data-gathering and to permit preparation of specific recommenda- tions for the reduction of energy consumption, once the survey has been concluded.
Historical data on equipment sales, associated with estimates of useful lifetime, can permít the construction of prelimínary hypo- theses about the possession of equipment, to be confirmed in the survey, and other hypotheses on the distribution of energy con- sumption among the equipment.
185
3.2 Listing Survey
In a list of electricity consumers, selection is mu~h easier than d t is that all of in the geographical survey. The first a van age _
the universe is included in the list and, there:ore, the se~ec tion can be made using a mathematical method, with the.certain:y of covering the entire universe. The second advantage is that it
Therefore, whenever energy sources, it energy consumption by region. are not very reliable, the monetary used as a weighting factor.
there are data on regional consumption of is recommendable to weight the sample for
If such data are not available or income of the region could be
Once the other secondary units of the sample have been estab- lished a similar procedure is followed until reaching the units of the,last stage, represented by the households, which will also be selected in random fashion, accor<ling to the number of inter- views to be done.
This sampling mechanism, conceptually simple but of complex .ªP- plicatión, can entail sorne constraints for the surv:ys of f:nal energy use, especially when the sample is small. This technique assures a proportional sample with the consistency of the popula- tion, since the subject of the survey is energy consumption, which can have strong variance. With random selection of the population interviews, it is possible to underestimate the co~- sumption of sorne strata of the population. The phenomenon is especially serious in Latín America, where the heavy con~entra- tion of income tends to generate large imbalances. in the distríbution of energy consumption. In Guatemala, for instance, 0.1% of the families are responsible for 3% of t~e total e~ergy consumption, and 7% of the families are responsible for 35% of the electricity consumption. In a sample survey, ~o collect the details on consumption distribution among population strata of this arder of magnitude demands working with margi~s of e~ror on the order of 1% or less, thereby excessively increasing the number of interviews.
The solution for reducing the number of interviews is to try to stratify the selection in the regions having the largest energy consumption. Data on consumption distributíon on a geographical basis are therefore essential, even disaggregated by ~ource if possible. Using as a parameter the sum of the consumption ~f all of the energy sources, we can obtain distortions as a func~1~n of the different efficiencies recorded among sources: t rad Lt Lona L fuels mainly firewood, offer a relatively low efficiency. Add- ing ~ogether the traditional and commercial fuels, w~ can ease the differencies in the patterns of end-use. Returning to the example of Guatemala: 7% of the population accounts for 35% _of the electricity consumption. If the balance is done including all of the sources, this figure drops to 12% of the total residential energy consumption. There is obviously a profound difference between a high consumption of traditional fuels and a high consumption of commercial energy sources.
184
In dividing the territory into large regions, the primary unit of sampling can be the minimal administrative unit, probably muncipalities, which should be grouped according to size. In general, within the municipalities, those having a population larger than 100,000 inhabítants or regional capitals are consid- ered self-representative, thus making the probability of selec- tion equal to l. In the other municipal groups, selection will be random.
The complexity of the construction of a sample of this type líes in the need to have previous knowledge of the universe, in order· to assure respresentativity. One essential element in assuring representativity is that the units of sampling and subsampling be perfectly identifiable, possibly coinciding with the headings used for the demographic census.
generating permit the successive
The basic criterion for the sampling plan consists of a series of primary and subsample units which will drawing of a fixed number of observations through random selections
In the following pages, it is worthwhile to discuss the basic principle of surveying and its influence on the study of energy problems.
Otherwise, it is recommended that the methodological bibliography presented herewith be studied, because it would be impossible to go into detail on this aspect injusta few short pages.
The most commonly used technique for the plan of sampling, selec- tion and estimation is the self-weighted selection in multiple stages, which was disseminated during .the 19608 for household surveys. This technique was consolidated in 1969 by the United States Census Department, in a publciation entitled: "Atlantida: A Case Study on Household Sample Surveys·," which presents the base methodology for sample surveys in any country. During that decade, the United States Agency for International Development and the Inter-American Institute of Statistics provided many Latín American countries with methodological support for the implantation of a system of continuous household polling. There- fore, it is a fairly well-known methodology, of fairly widespread application. If a sampling system of this type has been implant- ed, what is suggested is that the survey on energy .consumption follow this methodology.
A sample survey based on the geography of a country, region or city entails the basic difficulty of needing to have a clear picture of population distribution in the territory (and some- times its features) so that it will permit the distribution of surveys in the different areas and establish homogeneous random selection criteria for the households to be surveyed.
3.1 Survey on a Geographical Basis
187
A comparison of the three columns allows us to visualize the advantages of each type of selection. In the linear sample, the consumers have an equal probability of being selected. There- fore, the greatest representativity~ is attai~ed fo~ the strata with the largest numerical share; 63% of the 1nterv1ews are done among the consumers which show little variation in their con- sumption patterns, without sufficient coverage of the last and
-----------------------------------------------------------------
30 293 326 56 30
735
29 469 224
17 3
735
77 571 1 208 350 587 444
45 123 7 774
1 926 262
o 300 31 200
201 500 501 - 1000
+ - 1000 T O T A L
-----------------------------------------------------------------
Model 2 ~~~~~~~-~~~:::~=------~~~:~--------~~:::~----------;~~~:~~:~----- tion Stratum Universe Sample Newman Distribution
Continuing with the example of the survey run in the city of Sao Paulo, the following interview distributions were obtained, using a linear selection ar a corrected version of the optimal Newman distribution, to assure representativity in the first and last strata:
With a selection of this type, the probability that each stratum will be drawn is equal to its frequency in the list, so that the sample is self-representative.
Despite the advantage of self-representativity, a sample of this type offers the disadvantage of a large series of surveys among the average consumers (which usually show little variance in their energy consumption patterns) and a limited number of
1 Consumers (which have a large variance). surveys among arge
The most suitable way to carry out a stratified selection consists of assuming two variables: (a) numerical consistency of consumers per stratum and (b) consumption, thus increasing the representativity of the consumers having the largest monthly consumption.
n = total number of consumers in the list number of surveys to be selected
N where:
Once the sample size (n) of N consumers has been determined~ the selection can be done sequentially within the list, choosing a consumer X after a random result r, with O [ r [ n,
Selection
186
Sizing of the sample should take into account two different elements: availability of trained personnel and of funds to carry out the survey with the desired degreé of precision. It is important that these operations be carried out with the support of a statistical expert; there are specific indications regarding this methodology under numbers 1 and 5 of the bibliography far this chapter.
Once the distribution of consumers by ranges of consumption within the universe is known, it is possible to proceed with the selection of the size of the sample and with the random selection.
In a stratified universe, in which the distribution of events is not balanced, the quadratic deviation offers only an indication of variance.
The monthly consumption used to order the consumers merits com- ment. In countries in which there is a marked seasonal varia- tion, consumption should be calculated as the average of the consumption over the last twelve months. When there is not a notable change in seasons, consumption can be calculated on the basis of the consumption of the last three to six months. There- fore, it is convenient always to use an average consumption in order to avoid biases in the reading of the meters or temporary situations registered in residential consumption. After selec- tion of the households to be surveyed, it is useful to extracta list of the monthly consumption of each resid~nce over the last twelve months.
JTotal No. IConsumers I
!Average Consump- ftion kWh/month 1
ITotal Consump- ltion MWh/month 1
Number of Consumers
Monthly 1 Consump-J tion kWhJ
Model 1
It is a good rule to carry out a preliminary study of the list before proceeding with the selection. Especially if the list is stored in an electronic system, it is worthwhile to extract randomly selected lists according to the main variables, to order these (lower to higher) by average monthly consumption, and to include -total sums with the numerical consistency of the con- sumers by consumption stratum, The list may follow the model shown below:
permits previous detailed knowledge because it makes available elements such as recent consumption, historical consumption, type of connection, and supply tension; and in sorne cases it is possible to record other variables such as type of construction, location (urban or rural area) and type of use (agricultural, residential, mixed).
189
In arder to define the problem, befare anulling the survey, ít is necessary for the ínterviewer to visit the address three times, at different hours and on different days of the week, even in periods outside the normal working hours.
Impossibility of Locating the Interviewee (not found at home)
Impossibility of Locating the Address
With the aid of the utility company, using the person who reads the meters or the respective maps, it becomes easier to identify addresses.
insisting on the confidentiality of the data; undertaking a campaign of clear information on the im- portance of the survey; givíng prizes or donations to the persons who attend the interviews.
The person refuses to be interviewed. Since there is no possibility for forcing him, there can be a reduction in the number of refusals by:
Refusals
In the execution of a field survey, there are always consumers selected which, for one reason or another, cannot possibly be surveyed. There are many reasons why, but the most frequent cases are as follows:
Reserves
The advantage of distributing the universe a posterior! is that it permits evaluation of information not contained in the list, e.g., consumption per household, division of consumption into urban and rural areas or by apartments and houses, or even other variables not used in the selection phase.
The Expansion Factor
Model 9, obtained from the sum of 8 and 7 and 5 (added in the stratum of monthly consumption per household), shows the situa- tion of household consumption.
Model 8, obtained from the difference between 3 and 4 and 6, shows the situation of the meters which serve one single family.
serve and
the meters which leve! of meters,
Models 6 and 7 present the situation of slum areas, dealt with first at the secondly at the level of households.
Models 4 and 5 present the situation of shared meters, dealt with first at the level of meters, and secondly at the leve! of house- holds.
188
Model 3 reproduces the characteristics of the stratified meters by range of monthly consumption. The right-hand side incorporates the data from the interviews done; the left-hand side, their expansion for the city of Sao Paulo.
The treatment given the data can be seen in the sequence of Models 3 through 9.
In the Sao Paulo survey, it was found that the meters (and there- fore the universe represented by the list) had two biases: a meter can serve only one family or more than one. From a sociological point of view, it interests us to know consumption per household and not per meter. When the survey was concluded, the consumers were divided into two subuniverses: one with meters serving one single family and another with meters serving more than one.
The concept will be best clarified by using a practica! example:
If in the course of the survey a new feature were found, which would divide the universe into two subuniverses, the expansion should be done using a weighting factor which would indicate the proportion of consumers in each subuniverse and subsample.
expansion factor number of consumers in the nth stratum for the nth stratum =-------------------------------------- (2)
number of interviews
If the interviewing is stratified, there is an expansion factor per stratum; thus:
number of interviews (1)
Expansion factor total number of consumers
In the case of a linear selection over the.number of consumers, there is direct correspondence with the universe: the features covered in each survey correspond to the characteristics of a number of consumers equal to the relation between the sample size and the number of consumers in the universe.
Once the survey has been conducted, the expansion of the results is determined by the chosen selection mechanism.
Expansion and Certification of Results
Using a corrected version of the optimal Newman distribution, the interviews decrease among the average consumers and greater re- presentativity among those of largest consumption is assured, thus guaranteeing representativity in all strata.
next-to-the-last strata, which account for more than 10% of energy consumption.
191
the environmental impact of the consumption of local sour- ces, primarily the effects on plant cover and possible energy shortages;
i)
Once the population has been grouped by homogeneous areas, one or two localities in each area are selected for surveying. The locality having been chosen in keeping with the number of resi- dences, there can be total coverage ar a sample survey. In any case, the results of the survey will yield a series of types which constitute merely an indication of the pattern of end-use, not a total balance of the energy consumption of the population. Even so, especially when the energy source in use is native, the analysis permits a fairly realistic picture of the orientation of energy consumption and aids in understanding the two most serious problems of indigenous sources: ·
Residential energy consumption can be strongly influenced by the local availability of energy sources,. The variables which should be taken into account are the existence of native plants, the existence of reforestation and, indirectly, the size and type of land management. In areas of intensive cultivation or small farms, ar even in semi-desert areas, there is a tendency to see a notable reduction in the avaílability of firewood, which significantly affects energy consumption. These variables, like the ones above, should be used in the distribution of the previ- ously defined regions.
Variables for Availability of Traditional Energy
Geographical variables should be used for a second stratification of the defined regions. For example, it may become necessary to divide a homogeneous coffee-growing area of small farms into two regions, as a function of the climatic variations recorded in two different areas.
Average temperature and humidity are the two variables which most affect residential energy demand, primarily in terms of space conditioning and the demand for hot water for the purposes of hygiene. It is important to separate these variables, to which a third can be added: altitude. In fact, the higher the altitude, the greater the thermal variations to which the climate is subject, thus generating greater demand for energy in heating processes. This phenomenon is especially perceivable in the use of water for cleanliness; in the higher regions, there is a tendency to heat water more frequently.
Climatic Variables
of re- other
homogeneous areas. Whenever possible, in the definition gions, it is opportune to maintain the groups used by entities, e.g., by the Mínistry of Agriculture.
190
The essential elements are represented by the categorization of economic activity under headings such as agriculture, livestock- raising, vegetable and mineral extraction.
Within these variables, it is important to define elements such as size of farms, type of crops, and type of management. Far example, there is a huge difference between the surface area of colonists~large farms anda small farm, or between a region of extensive cattle-raising and another of intensive coffee-raising. A mining region has features different from those of an agri- cultural zone. Therefore, the regíons of a country should be grouped as a function of these variables, in an attempt to define
Socioeconomic Variables.
For the sake of example of the variables to be treated, assume a survey to be taken in a rural area of a hypothetical country in which rural electrification is less than 10%. The part with electric power can best be approached on the basis of a list from the utílity company. In the area without electric power, it is important to analyze the social and geographical variables which might affect energy consumption.
·rt is possible to group the relevant variables into three different categories: socioeconomic variables, climatic variables and energy availability variables.
A typological survey may representan adequate mechanism far learning about the universe, without the need to recur to com- plex statistical sampling on a territorial basis.
In this case, it is necessary to·define the universe clearly and to study the variables so that the results, despite the fact that they wíll not permit expansion, will permit visualization of the relation of the sample to the universe. The study of the varia- bles depends strictly on the socioeconomic and geographic charac- teristics of the country; therefore, it is left up to the criteria of the analyst, who should have an in-depth knowledge about the universe to be surveyed.
3.3 Typological Survey (Cluster Analysis)
This type of analysis can be applied when there is no list far the universe, as in the case of the residences not connected to the electric power grid, or when there is a homogeneous class of consumers, e.g., the residents of low-income housing developments around large cities.
As a rule, it is convenient to avoid substituting interviews not conducted because systematic biases can be introduced, which would alter the quality of the findings or could offer a dis- torted picture of the uníverse; for example, representativity could perhaps not be assured among the types of consumers which live in isolated areas or areas of difficult access or among families iri which all of the members work.

193
RESIDENTIAL SECTOR
SURVEY FORM
192
One last observation should be made in relation to the units of measure of firewood consumed in the home. Experience has shown that fírewood and other biomass fuels are gathered or marketed in regional units which should be the subject of a previous survey in arder to determine their equivalencíes with conventional met- ric units. Such a survey will enormously facilitate the work of completing the questíonnaire and will substantially reduce the level of error in the responses.
In addition, it should be noted that the questionnaire proposed here should be applied to households; another supplementary one should therefore be prepared to <leal with the problem of collec- tive consumption in condominiums and community residences. This can be formulated with questions on the existing equípment and the amounts paid on the collective gas and light bills. The distribution of the global consumption among the apartments can be done in the same way as the dístribution of the expenses of the condominium, i.e., according to the percentage of surface area of the dwelling in relation to the overall area of the condominium.
A good questionnaire depends on a sound assessment andona good pilot survey by which to gauge it. Tbe questionnaire presented herewith should be taken as indicative, since, respecting the first affirmation of this paragraph, the final format should be a function of the assessment and pilot survey·carried out in each country or region. Several of the questions in the first module can be answered from existing surveys.
4. Data-Gathering Instrument
Finally, the typological survey makes it possible to compile information not usually available on the type and efficiency of the equipment which consumes traditional energy.
ii) the potential demand for commercial energy, principally electricity and oil derivatives, in the case of an expansion of the distribution networks.

194
2 to 5 MS ....•. 15 to 20 MS . (MS = minimum salaries)
1 to 2 MS . 5 to 15 MS ...•.. More than 20 MS .....•
1.10 What is the familys monthly income?
1.9 How many permanent residents are there in the home? •....
1.8 At what altitude is the residence located? .••......•.....
e in summer e in winter ..•...
1.7 What is the average ambient temperature?
1.6 What is the predominant activity in the area where the residenc~ is located? .••...•.....•.•..•.•....••.•...••.•..
.•.... water? gas? ....•. electricity? do you have a power meter? does the meter serve other homes?
1.3 What is the a rea of the residence? .••••. m(2)
1.4 How many rooms does the residence have?
..... ~ living room ...... bedrooms • o •• "' • kitchen
...... bathroom ...... garage a • • • ., • others
l. 5 Are yo u served by public networks of:
1.2 Do you carry on sorne economic activity in the home which would influence energy consumption? If so, what?
1.1 Location of the residence.
l. Characteristics of the consumers residence and of the region.
GENERAL INFORMATION
MODULE 1
State: Neighborhood:
District: City:
QUESTIONNAIRE
RESIDENTIAL CONSUMPTION OF USEFUL ENERGY
SURVEY
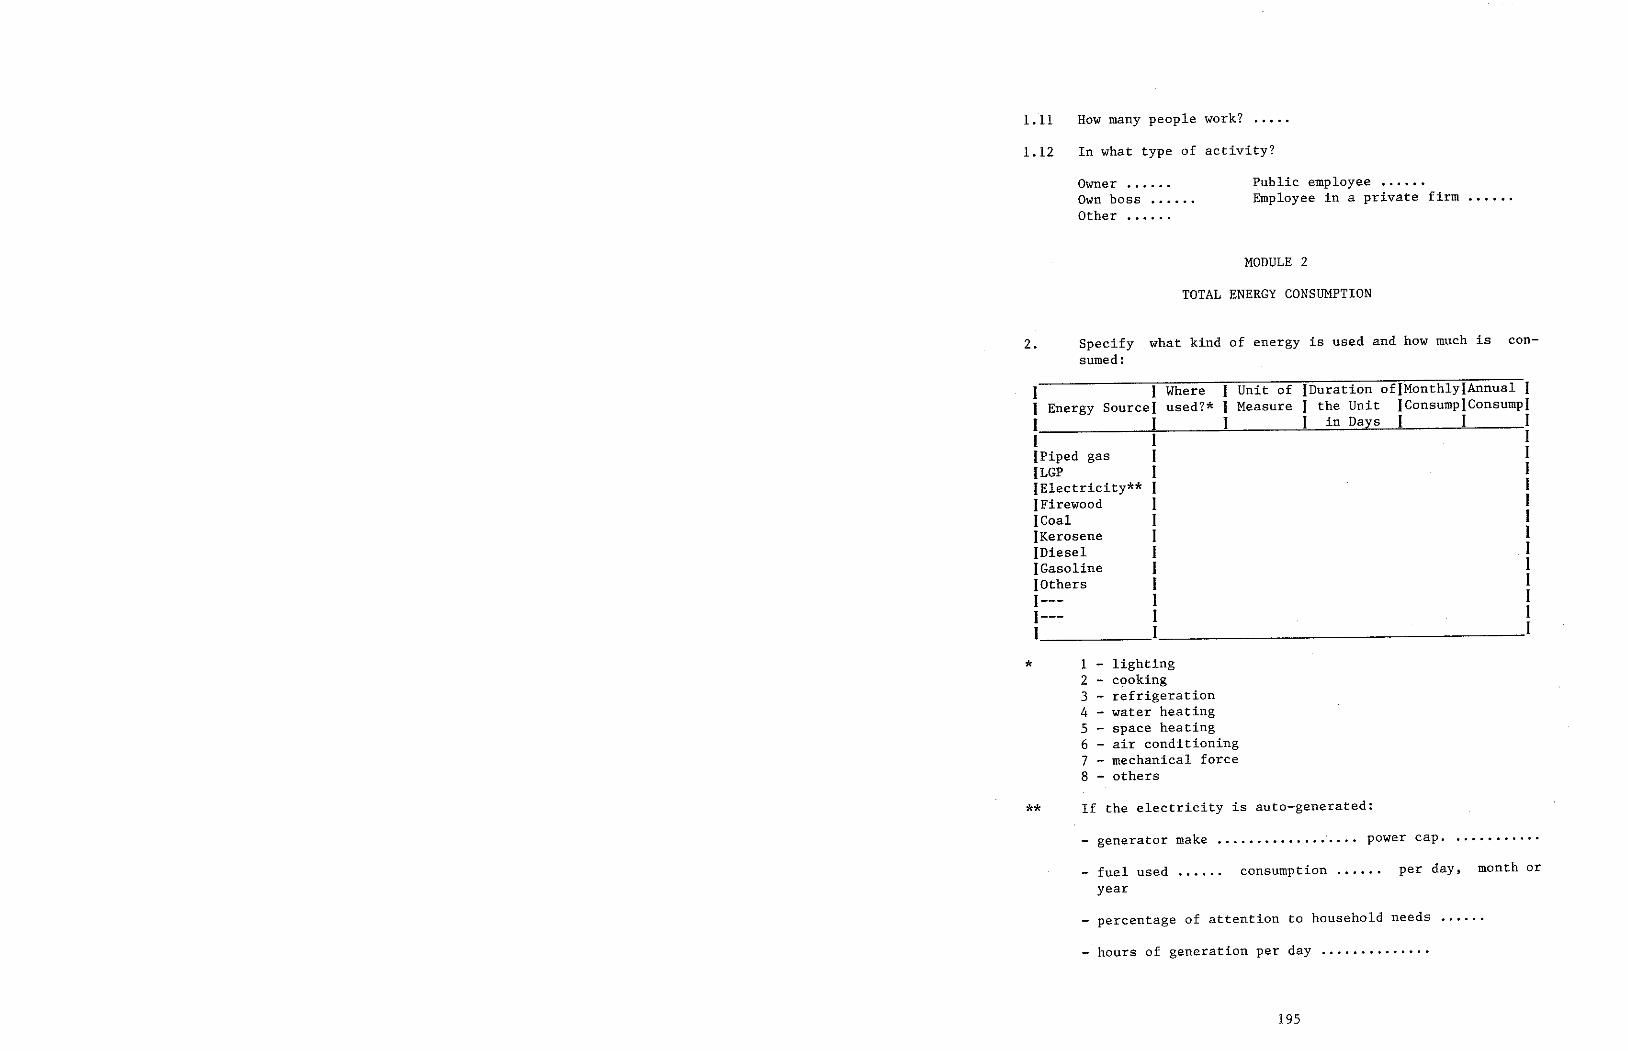
195
- hours of generation per day .•••.•.•.•.•.•
- percentage of attention to household needs
month or per day, consumption ...••• - fuel used ye ar
- genera tor make •...•.••••.••• ·. . • • power cap. . •..•.•.... ** If the electricity is auto-generated:
* 1 - lighting 2 - cooking 3 - refrigeration 4 - water heatíng 5 - space heating 6 - air conditioning 7 - mechanical force 8 - others
1 1 Where 1 Unit of IDuration of}MonthlylAnnual l 1 Energy Sourcel used?* 1 Measure 1 the Unit }ConsumpJConsumpl 1 1 1 1 in Dal1_S 1 1 I 1 1 1 IPiped gas 1 1 ILGP 1 1 )Electricity** 1 1 )Firewood 1 1 ICoal 1 1 )Kerosene 1 I )Diesel 1 1 (Gasoline 1 1 (Others I 1 1--- l 1 I--- 1 1 1 1 1
2. Specify what kind of energy is used and how much is con- sumed:
TOTAL ENERGY CONSUMPTION
MODULE 2
Public employee •.•••• Employee in a prívate firm
Owner •.•... Own boss •••••• Other .•••..
1.12 In what type of activity?
1.11 How many people work? •••..
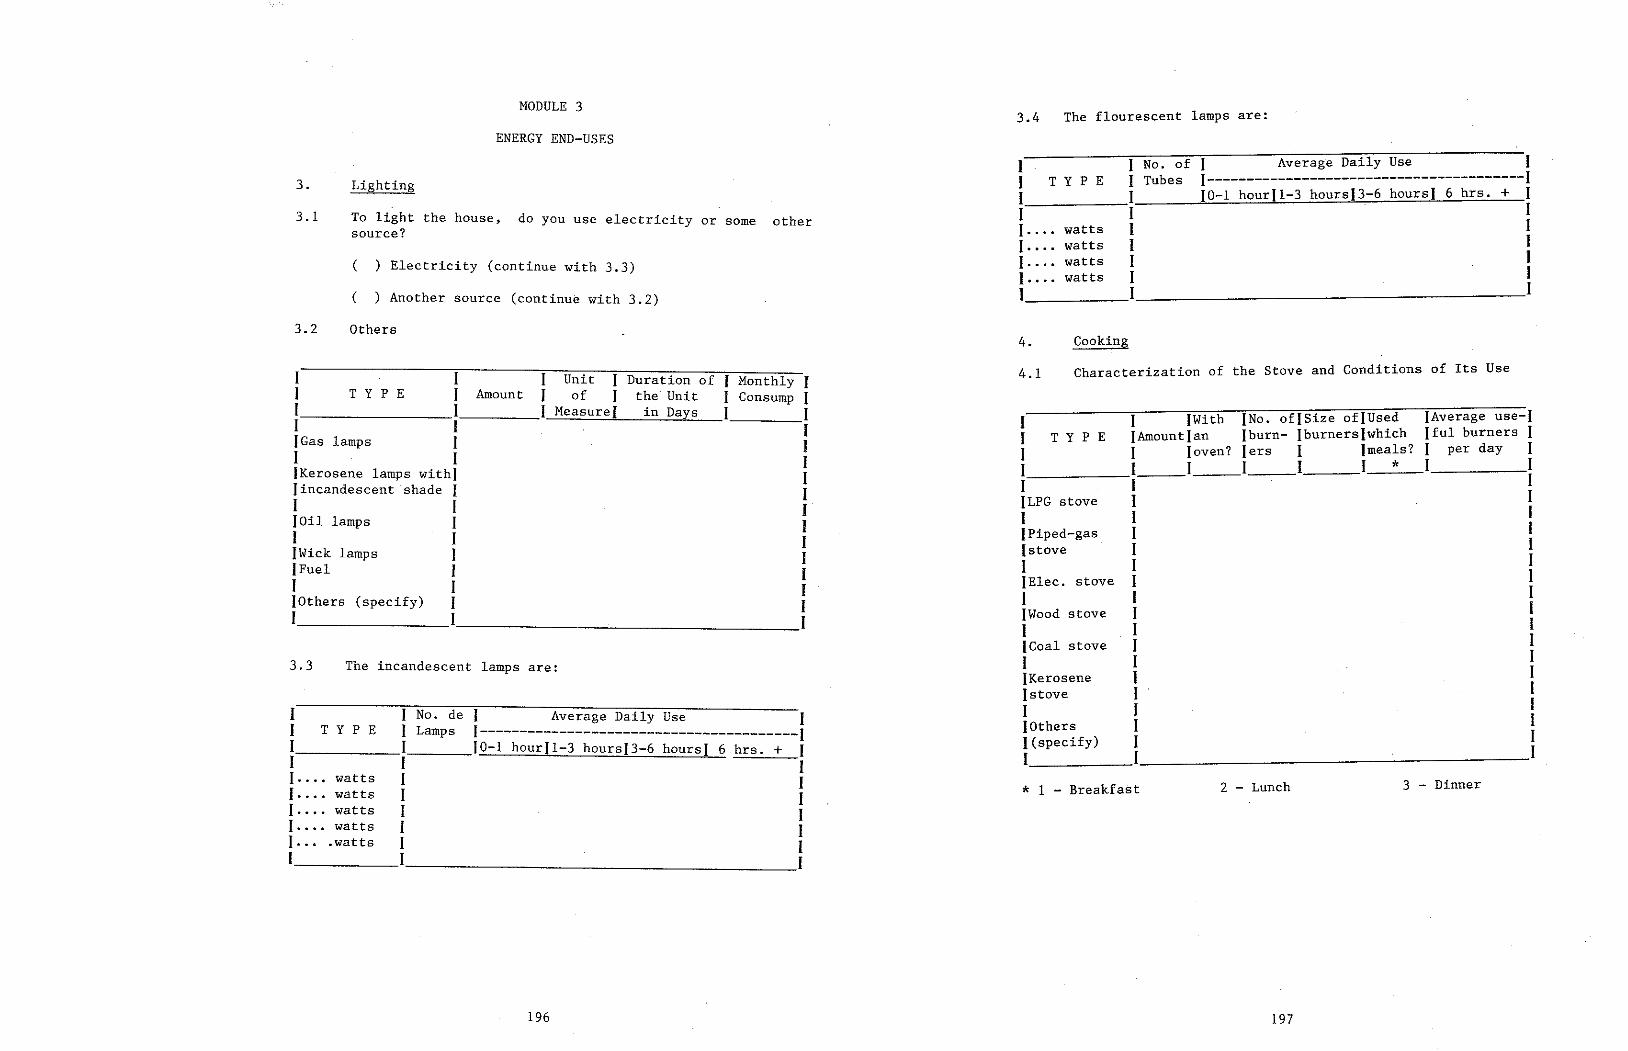
197
3 - Dinner 2 - Lunch * 1 - Breakfast
I 1 IWith }No. of(Size of}Used }Average use-1 1 T Y P E IAmount}an Jburn- Jburners}which 1 ful burners 1 1 1 {oven? Jers 1 Jmeals? 1 per day 1 1 I 1 1 1 1 * 1 l 1 1 1 ILPG stove 1 1 1 1 1 IPiped-gas 1 1 {stove I 1 1 1 1 IElec. stove 1 1 1 1 1 fWood stove I 1 1 1 1 (Goal stove 1 1 1 1 1 !Kerosene 1 1 Jstove 1 1 1 1 1 }Others 1 1 l(specify) 1 1 1 1 1
4.1 Characterization of the Stove and Conditions of Its Use
l 1 1 1 1
----------------------------__:_----------~I
I Average Daily Use 1 I----------------------------------------1 10-1 hourll-3 hoursf3-6 hoursl 6 hrs. + 1
4. Cooking
I 1 No. of 1 T Y P E I Tubes 1 1 1 1 I .... watts I 1 .... watts I 1 .... watts I 1 ..... watts 1 1 1
3.4 The flourescent lamps are:
196
1 Average Daily Use J 1----------------------------------------1 10-1 hourfl-3 hoursl3-6 hoursl 6 hrs. + I
1 I 1 1 1 I ~~~~~~~~~~~~~~~-¡
1 1 No. de 1 T Y P E 1 Lamps 1 1 I 1 1 .... watts 1 1 .... watts I 1 .... watts 1 I .... watts 1 1 ... .watts I 1 I
1 1 1 Unit I Duration of 1 Monthly I 1 T Y P E I Amount 1 of 1 the Unit 1 Consump 1 1 1 I MeasureI in Days 1 1 1 1 1 [Cas lamps 1 1 1
1 )Kerosene lamps wíthJ 1 lincandescent · shade I I 1 1
1 Jüil lamps 1
I 1 1
1 IWick lamps I
1 JFuel I
1
1 I 1
lüthers (specify) 1 I
1 1 1 1
3.3 The incandescent lamps are:
( ) Another source (continue with 3.2) 3.2 Others
( ) Electricity (continue with 3.3)
other do you use electrícity or sorne To light the house, source?
3. 1
Lighting 3.
ENERGY END-USES
MODULE 3
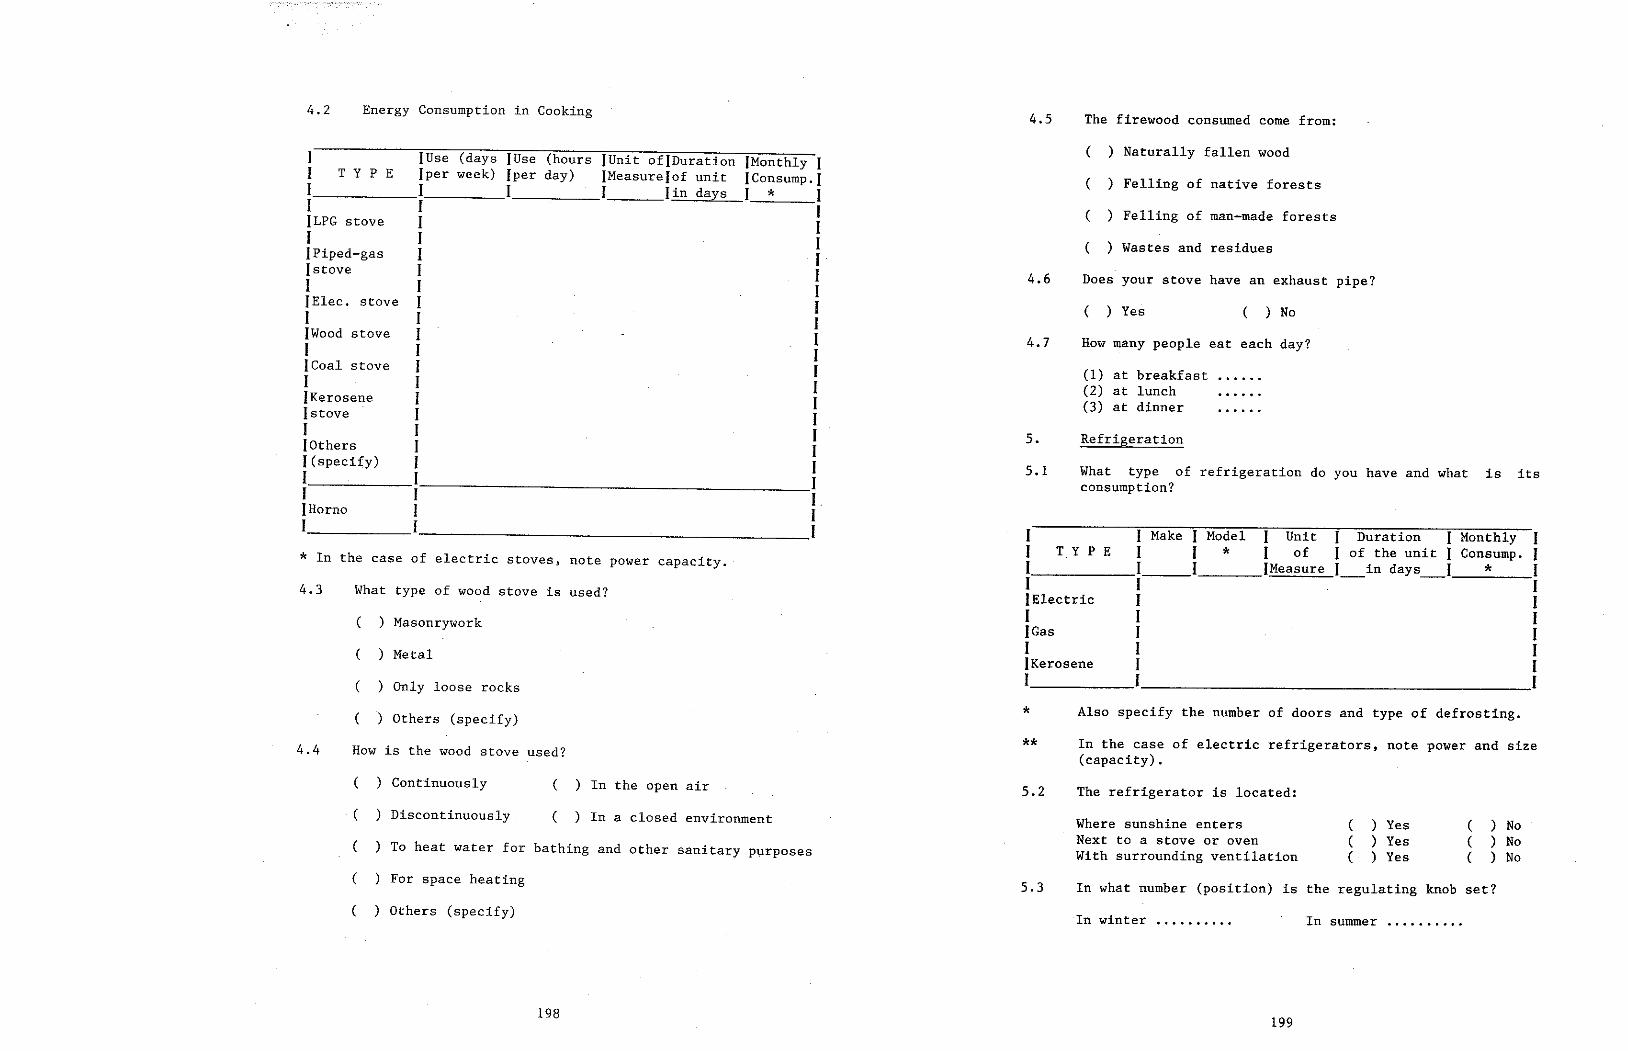
199
In summer ........•. .In winter ••...•..••
5.3 In what number (positíon) is the regulating knob set?
( ) No ( ) No ( ) No
( ) Yes ( ) Yes ( ) Yes
Where sunshine entera Next to a stove or oven With surrounding ventilation
5.2 The refrigerator is located:
In the case of electric refrigerators, note power and size (capacity). **
* Also specify the number of doors and type of defrosting.
1 1 Make 1 Model 1 Unit 1 Duration 1 Monthly 1 1 T.Y PE 1 1 * 1 of 1 of the unit 1 Consump. 1 1 I 1 IMeasure 1 in days __ 1 * 1 -- 1 1 1 (Electric 1 I 1 1 1 )Gas 1 1 1 1 1 )Kerosene 1 1 1 I 1
5.1 What type of refrigeration do you have and what is its consumption?
5. Refrigeration
How many people eat ea ch day? (1) at breakfast ...... (2) at lunch ...... (3) at dinner ......
4.7 ( ) No ( ) Yes
( ) Naturally fallen wood ( ) Felling of native forests ( ) Fellíng of rnan-made forests ( ) Wastes and residues
Does your stove have an exhaust pipe? 4.6
The firewood consumed come from: 4.5
198
e ) Continuously ( ) In the open air ( ) Discontinuously ( ) In a closed environment ( ) To heat water for bathing and other sanitary purposes ( ) For space heating ( ) Others (specify)
4.4
What type of wood stove is used? ( ) Masonrywork
( ) Metal ( ) Only loase rocks ( ) Others (specify)
How is the wood stove used?
4.3
1 fUse (days !Use (hours {Unit of}Duration IMonthly 1 1 T Y P E fper week) fper day) IMeasurefof unit IConsump.J 1 1 1 1 lin days 1 * 1 1 1 1 ILPG stove I 1 1 1 I JPiped-gas 1 1 lstove 1 1 1 1 I JElec. stove 1 I 1 1 1 IWood stove 1 1 1 I 1 {Coal stove 1 f I 1 1 !Kerosene 1 1 lstove 1 1 1 1 1 lüthers 1 1 l(specify) 1 1 1 1 1 I 1 l. IHorno 1 1 1 I 1 *In the case of electric stoves, note power capacity.
Energy Consumption in Cooking 4.2

1 1 1 1 Time of Use 1 Months of Usel 1 Make 1 Number 1 Power 1 per Day 1 per Day 1 1 1 1 1 1 1 1 1 1 1 1 1 1 1 1 1 1 1 1 1 1 1 1 1 I 1 1
200
What type of electric faucets do you have?
INumber of I Months of year connected/power I Average 1 Jbaths per 1---------------------------------1 duration 1 1 week 1 Maximum 1 Mínimum (each bath 1 1 1 1 f(minutes) 1 ----- 1 1 1 1 1 1 1 1 1 1 1 1 1 1
1 1 No. 1 I 1 I 1 1 1 2 1 1 3 1
6.3
6.2 How are the showers used?
Maximum power Unstored gas
Mínimum powe r •••... (*) (**)
1 I 1 1 1 1 1 No. 1 Electric(*) 1 Gas (**) 1 Make 1 Model 1 1 1 1 1 1 1 1 1 1 1 1 1 1 1 1 1 1 2 1 1 1 1 1 I 3 1 1 1 I 1
6.1 What kinds of showers do you have?
6. Water Heating
Horizontal .....• Capacity: . . • • . . Vertical . Months of use per year: ....•.
Make: Model:
5.4 Freezer
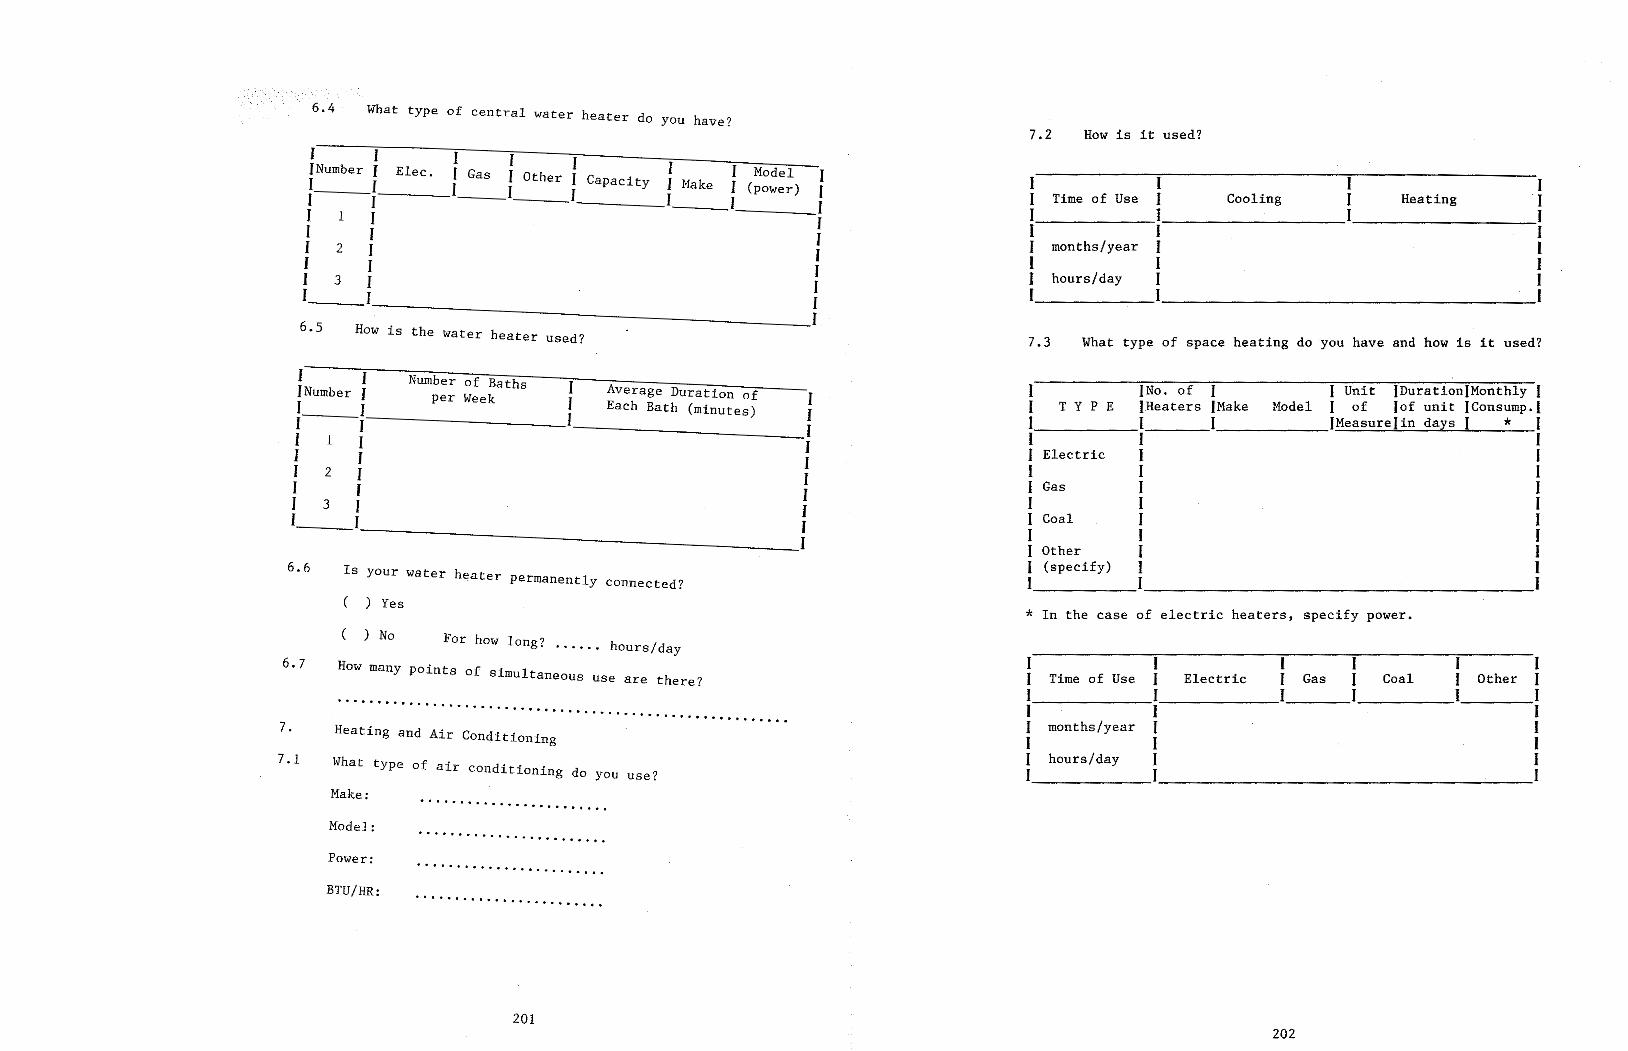
202
*In the case of electric heaters, specify power.
1 1 1 1 1 1 Other 1
1 1 Gas 1 Coal 1 Time of Use 1 Electric
I 1 1 1 1 1
1 1 1
1 1 months/year J 1 1 1 1 1 hours/day 1 I 1 1
I Unit IDurationJMonthly I 1 }No. of 1 Model 1 of Jof unit IConsump.f 1 T Y p E JHeaters [Hake [Hea sur e ] in days 1 * 1 I 1 I_____ 1 1-----1--- 1 I Electric 1 ) 1 l 1 I Gas 1 1 I 1 1 1 Coal 1 1 1 1 1 I Other 1 1 I (specify) 1 ( 1 !~~~~~~~~~~~~~
heating do you have and how is it used? What type of space 7.3
7.2 How is it used?
1 1 1 1 1 Heating 1 Time of Use 1 Cooling
1 1
I I 1 1 I 1 1 I months/year 1 1 I 1 1 1 hours/day 1 1 1 1
201
........................ BTU/HR: ........................ Power: . "' • . Model: ........................ Make:
7.1 What type of air conditioning do you use?
7. Heating and Air Conditioning .........................................................
I l Number of Baths I Average Duration of I }Number 1 per Week l Each Bath (minutes) 1 1 I I 1 I l I I 1 I I I 1 1 l 2 1 I l 1 I l 3 I 1 l I I
6.6 Is your water h~ater permanently connected? ( ) Yes ( ) No Far how long? ...... hours/day
6.7 How many points of simultaneous use are there?
6.5 How is the water heater used?
l I I I I 1 Model I I Elec. I Gas l Other I Capacity I Make I (power) l 1 1 I I I I I 1 I 1 1 I 1 I 1 l 1 I 1 I I
I fNumber I _ 1 I 1 I I 2 l I 3 I _
What type of central water heater do you have?
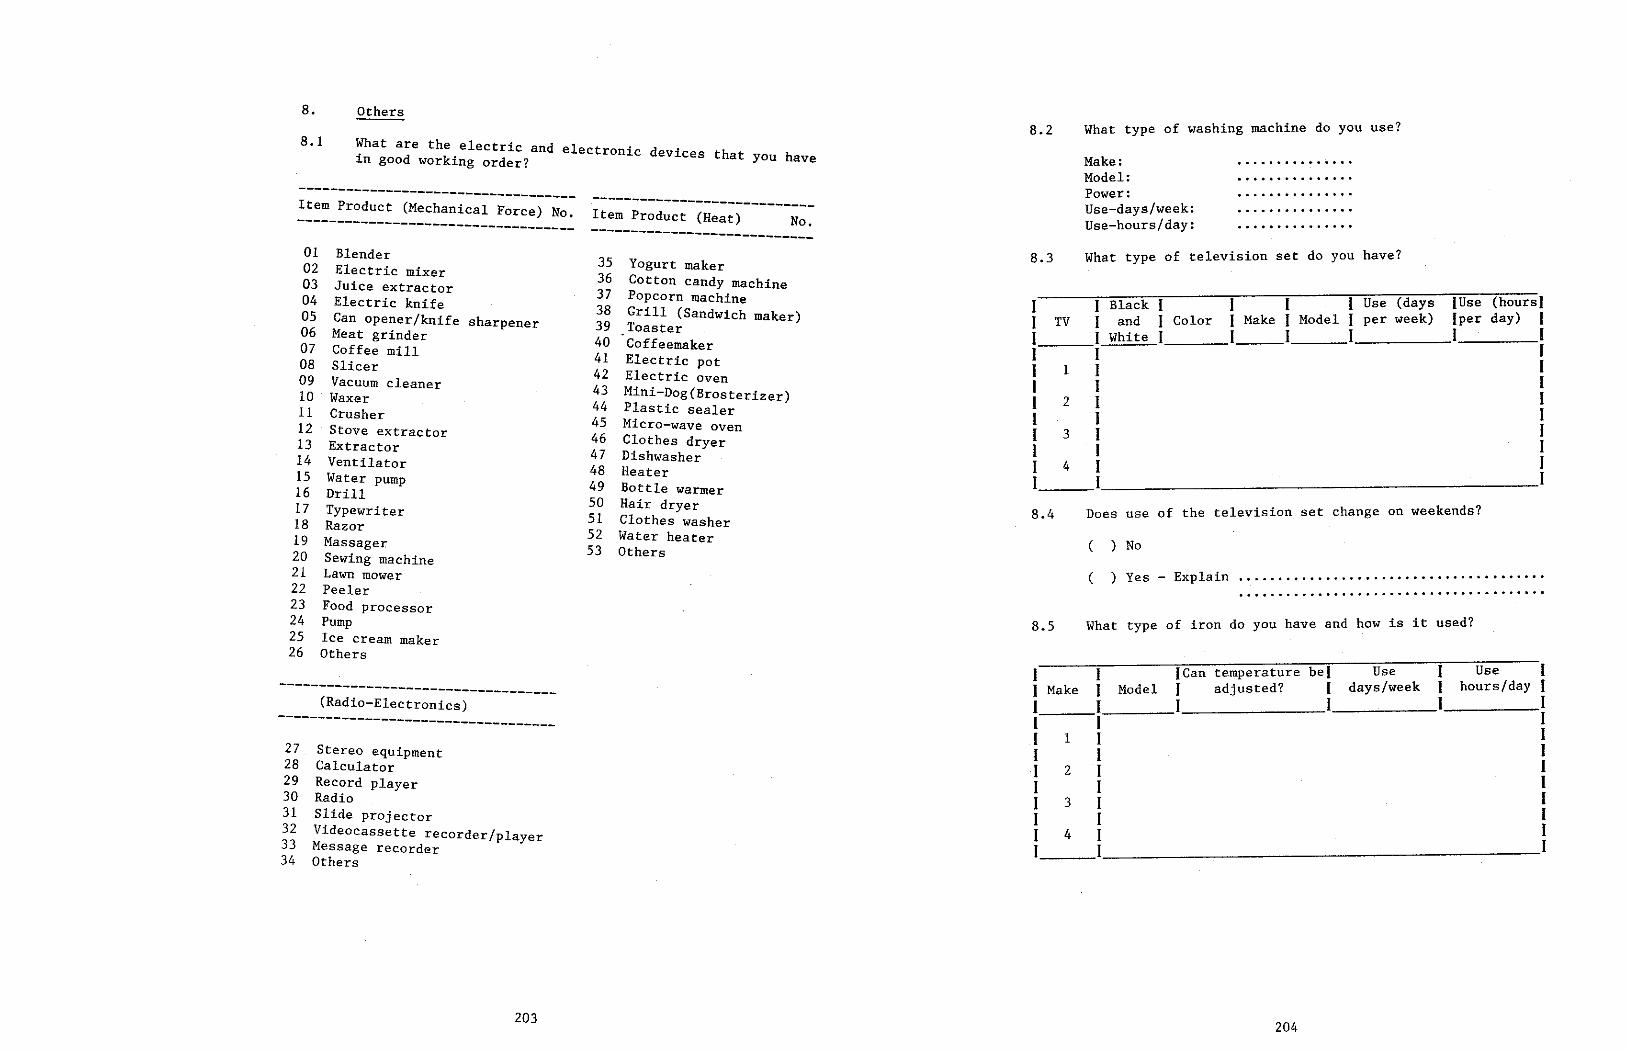
204
What type of iron do you have and how is it used?
....................................... .......................................... ) Yes - Explain (
( ) No
Does use of the television set change on weekends?
1 Black 1 1 1 1 Use (days fUse (hoursJ 1 and 1 Color 1 Make 1 Model I per week) (per day) l 1 White 1 I 1 1 1 1 1 1 1 1 1 1 1 1 1 1 1 1 1 1 1 1 1 1
8.5
1 1 Make 1 1 1 1 1 1 2 1 1 3 1 1 4 1
1 1 TV 1 1 1 1 l 1 2 1 1 3 1 1 4 l
8.4
1 (Can temperature bel Use 1 Use 1 1 Model 1 adjusted? 1 days/week 1 hours/day 1 l I 1 1 1 1 ------ ------"'"--¡ 1 1 1 1 1 1 1 1 l 1 l 1 1 1
_____ I 1
What type of television set do you have?
................
. . ....... " .
................. Make: Model: Power: Use-days/week: Use-hours/day:
What type of washing machine do you use?
8.3
8.2
Yogurt maker Cotton candy machine Popcorn machine Gríll (Sandwich maker) Toas ter Coffeemaker Electric pot Electric oven Mini-Dog(Brosterizer) Plastic sealer Micro-wave oven Clothes dryer Dishwasher Heater Bottle warmer Hair dryer Clothes washer Water heater Others
35 36 37 38 39 40 41 42 43 44 45 46 47 48 49 50 51 52 53
-------------- Item Product (~:~~)--------- No. ----------------------------
203
Stereo equipment Calculator Record player Radio Slíde projector Videocassette recorder/player Message recorder Others
27 28 29 30 31 32 33 34
-----(;~~~~=;~:~~~~:~~:) _ --------------------- --------------
Food processor Pump Ice creara rnaker Others
sharpener
Blender Electric mixer Juice extractor Electric knife Can opener/knife Meat grinder Coffee mill Slicer Vacuum cleaner Waxer Crusher Stove extractor Extractor Ventilator Water pump Drill Typewriter Razor Massager Sewing machine Lawn rnower Peeler
01 02 03 04 05 06 07 08 09 10 11 12 13 14 15 16 17 18 19 20 21 22 23 24 25 26
What are the electríc and 1 . in good working order? e ectronic devices that you have 8.1
8. Others

206
. n for Selected General End- Destination of Final Consumpt10 't' of Useful Energy Uses, Their Efficiency and the Composi ion
Share of Each Energy Its Efficiency and the
Table nr. 4
Table III. 3 Consolidated BEEF, Indicating. the
. Fi'nal Energy Consumpt1on. Source in Composition of Useful Energy
205
Average Efficiencies of Energy Sources in End-Uses
Table III. 2
Destination of Final Consumption of the Different Energy Sources for Selected End-Uses
Table III.1
Although the results of the Brazilian balance are aggregated in a different form, it was possible to disaggregate them according to the end-uses considered in the methodology proposed by OLADE, as shown in Tables 111.l to 111.4:
The balance was prepared using studies developed previously in the country, i.e., there was no consumer survey.
determination of useful energy by multiplying final energy consumed by the respective efficiency (efficiency of produc- tion, as conceived of under the methodology proposed by OLADE).
evaluation of the destination of final energy in the differ- ent end-uses; and
identification of the consumption equipment used and assess- ment of its efficiency;
of the end-uses of the various energy
reference for bibliographical by interested
resulta ob- Ministry of
identification sources;
The BEEU basically covers the following stages:
2. The Case of Brazil
presented herein can serve ·as a of the proposed methodology. Sorne
are also included for consultation
The results application references countries.
This chapter wíll present the Residential Sector tained from the BEEU prepared for Brazil by the Mines and Energy (MME).
l. General Considerations
APPLICATIONS
CHAPTER lII
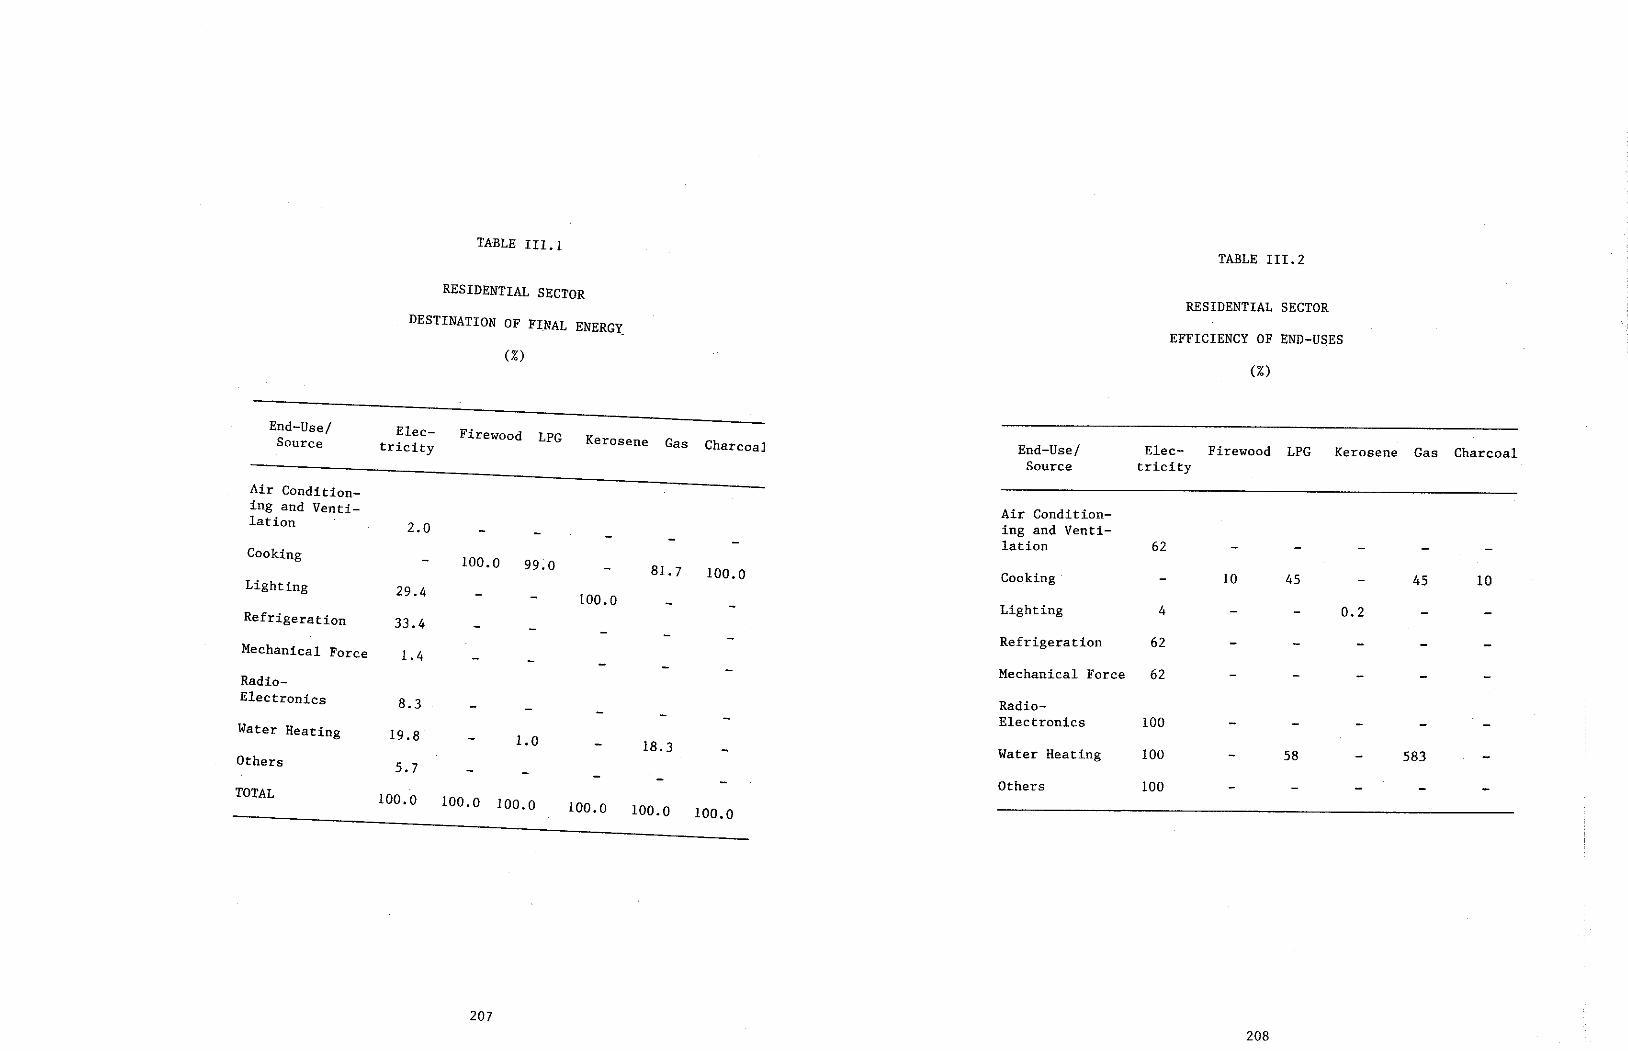
207 208
End-Use/ Ele e- Firewood LPG Kerosene Gas Charco al End-Use/ Ele e- Firewood LPG Kerosene Gas Charcoal Source tricity Source tricity
Air Condition- Air Condition- ing and Venti- ing and Ven ti- lation 2.0 lation 62 Cooking 100.0 99;0 81. 7 100.0 Cooking 10 45 45 10 Lighting 29.4 100.0 Lighting 4 0.2 Refrigeration 33.4 Refrigeration 62 Mechanical Force 1.4 Mechanical Force 62 Radio- Radio- Electronics 8.3 Electronics 100 Water Heating 19.8 1.0 18.3 Water Heating 100 58 583 Others 5.7 Others 100 TOTAL 100.0 100.0 100.0 100.0 100.0 100.0
(%) (%)
EFFICIENCY OF END-USES DESTINATION OF FINAL ENERG~
RESIDENTIAL SECTOR RESIDENTIAL SECTOR
TABLE III.2 TABLE III. l
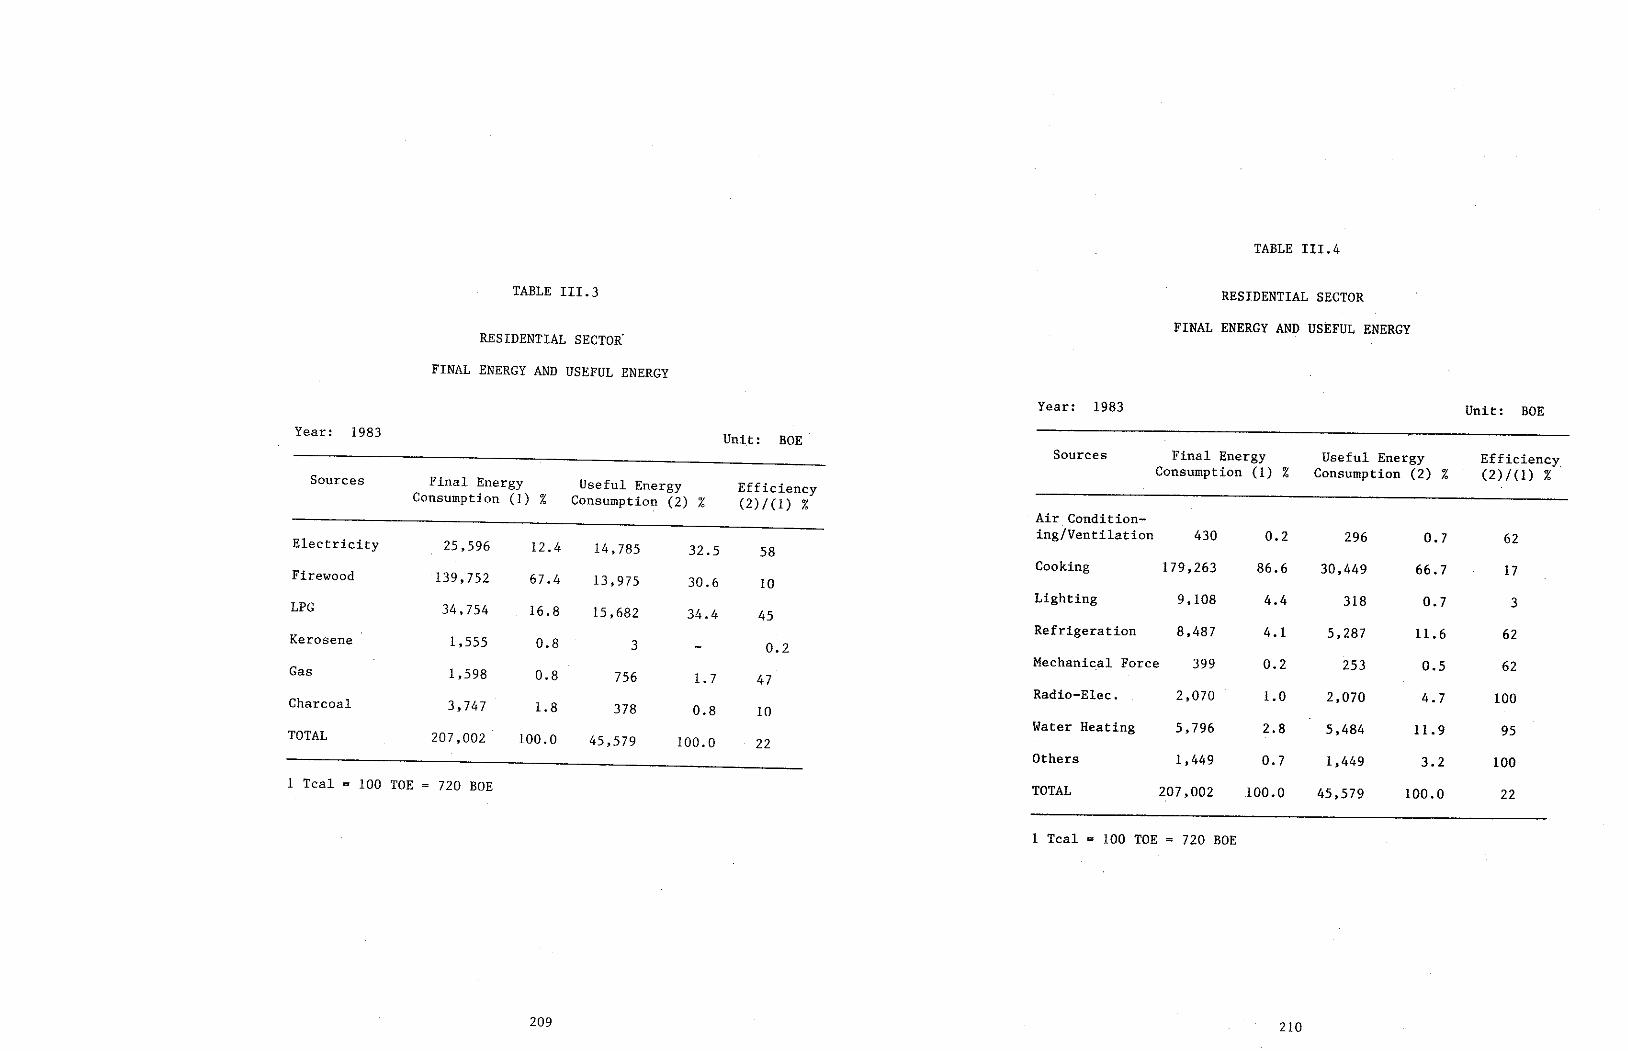
210
100.0 45,579 3.2 1,449
11. 9 5,484 4.7 2,070
0.5 253
11. 6 5,287
0.7 318
66.7 30,449
1 Tcal = 100 TOE= 720 BOE
22
100
95 100
62
62
3
17
62 0.7 296
100.0
0.7
2.8
1.0
0.2
4. 1
4.4
86.6
0.2
207,002
1,449
5,796
2,070
399
TOTAL
Others
Water Heating
Radio-Elec.
Refrigeration 8,487
Mechanic.al Force
Lighting 9,108
Cooking 179,263 430
Air Condition- ing/Ventilation
Efficiency_ (2)/(1) %
Useful Energy Consumption (2) %
Final Energy Consumption (1) %
Unit: BOE
Sources
FINAL ENERGY AND USEFUL ENERGY
RESIDENTIAL SECTOR
TABLE III.4
Year: 1983
22
10
47
0.2
45 10
209
100.0
0.8
l. 7
34.4
30.6
Electricity 25,596 12.4 14,785 Firewood 139,752 67.4 13,975 LPG 34,754 16.8 15,682 Kerosene 1,555 0.8 3 Gas 1,598 0.8 756 Charcoal 3,747 1.8 378 TOTAL 207,002 100.0 45,579
1 Tcal 100 TOE 720 BOE
58 32.5
Efficiency (2)/(1) %
Useful Energy Consumption (2) %
Final Energy Consumption (1) %
Unit: BOE
Sources
Year: 1983
FINAL ENERGY AND USEFUL ENERGY
RESIDENTIAL SECTOR.
TABLE III.3
212
- Aparelhos - Producoes
R9 - CESP - COMPANHIA ENERGETICA DE SAO PAULO - SP Elétricos: Potencias - Demandas - Consumos Depto. Comercial. Sao Paulo, Novembro/1982, 64pp.
R8 - ABINEE/SINAEES - Gerencia Económica - Departamento de Esta- dística - Tabela de Vendas de Aparelhos Eletrodomésticos. série histórica de 1975 a 1980. Sao Paulo, 1984, 3 pp.
211
Gás Natural Erminio de
R7 - CONFEDERACAO NACIONAL DA INDUSTRIA - COASE. Fonte de Suprimento Energético - colecao José Moraes (Vol. 3). Sao Paulo, Dezembro/1982.
R6 - BRASIL - Fundacao IBGE - Tabulacoes Avancadas do Censo Demo- gráfico - 1980. Río de Janeiro, Vol. 1, Tomo 2.
RS - BOA NOVA. (Antonio Carlos). La Consommation Résidentielle D'Energie au Brésil - UNESCO - Sao Paulo, 1981, 6lpp.
R4 - BRASIL. Fundacao IBGE - Estudo Nacional da Despesa Familiar - ENDEF - Brasil - (año base 1974). 1981, 98 pp.
R3 - CESP - Companhia Energética de Sao Paulo - SP. Avaliacao de Impacto da Introducao de Produtos "Saving Energy" no Consumo de Energía do Brasil e do Estado de Sao Paulo - Setor Resi- dencial. 1983, 10 pp.
ROSA (Luiz P.). Residencial no de Alimentos.
R2 - AROUCA (Mauricio C.). GOMES (Federico B.M.). Estructura da Demanda de Energía no Setor Brasil e urna Avaliacao da Energía para Coccao Rio de Janeiro, COPPE/UFRJ, 1983, 26pp.
Rl - BRASIL. Fundacao IBGE. Censo Demografico; familias e domici~ líos. 1980 (XI Recensamento Geral do Brasil 1980). Serie nacional, Vol. 1, Tomo 6, Numero 1, RJ.
BIBLIOGRAPHICAL REFERENCES
7. Etude des Curbes de Charge dans l'Economie Eletrique. Manual de Theorie et de methodologie pratique, París, 1972.
6. International Union of Producers and Distribution of Elec- trical Energy, Vienna Congress. ''Studies of the Load Curves of Domestic Consumers Carried out in Italy,11 Vienna, 1976.
S. CODI (Comite Brasileiro de Distribucao). Recomendacoes para pesquisas de habitas de consumo. Relatório scsc.26.02, Rio de Janeiro, 1982.
4. Metodología do Censo. Ria de Janeiro, 1982.
3. Instituto Brasileiro de Geografía y Estadistica. Metodología de Pesquisa Nacional por Amostras. Rio de Janeiro, 1981.
2. U.S. Bureau of the Census. Atlantida: A Case Study in Sam- ple Household Surveys. Washington, 1969.
l. Hansen, Hurwrite and Medow. Sample Methods and Theory. New York, 1956.
BIBLIOGRAPHY (Chapter 111)

213
SECTORAL APPENDIX IV
COMMERCIAL-SERVICES·PUBLIC SECTOR

239
225 225 228
229
215
220 221
214
CHAPTER 111 - APPLICATIONS l. The Case of El Salvador
Data-Collecting Form
Analysis of Existing lnformation
Guidelines for Sample Design
Guidelines for Data Processing and Sample Expansion
l.
2.
3. 4.
DATABASE FORMATlON CHAPTER II
Disaggregation by Subsectors
Disaggregation by End-Uses
Final Energy, Useful Energy and Efficiencies
l.
2. 3.
- DEFINITIONS AND BASIC CONCEPTS CHAPTER I
COMERCIAL-SERVICES-PUBLIC SECTOR
INDEX
216
disaggregation of those activities whose relative evolution
relative homogeneity insofar as the type of energy used in each subsector.
The criteria on which the groupings or disaggregation of the activities were fundamentally decided are as follows:
The same table also shows the correspondence between the proposed subsectors and the headings of the ISIC.
As a function of these considerations and in an attempt to reduce to a mínimum the number of subsectors, what is proposed is the disaggregation of the sector as shown in Table IV.2.
In addition to the potable water service, included under Division 42, the energy consumption derived from Public Lighting should be made explicit, because these do not correspond directly to any Heading or Group under the ISIC Classification, but are included under Divisíon 91, together with the rest of Public Administra- tíon and Defense.
To the extent that the useful forms of energy (steam, hot water) are not produced by the end-user but rather integrated into a transformation center, intermediate demand becomes confused with the final demand for a new energy source: steam or hot water.
According to the definition of useful energy in the Base Docu- ment, the process of energy consumption by the end-user usually consists of two consecutive stages: production of useful forms of energy, and their subsequent use, with the intermediate energy demand servíng as the link between these two stages.
This is clear enough insofar as electricity and gas (Groups 4101 and 4102), but with respect to Group 4103 (Steam and Hot Water Supplies), it should be noted that, when this service exists, both the distributed steam and hot water should be treated as just another secondary source, for the purposes of the balance
Division 4, only Division 42 (Waterworks and Water is considered to form part of the sector, since Divi- (Electricity, Gas and Steam and Hot Water Supplies) treated within the energy-producing activities.
In Majar Supplíes) sían 41 should be
Table IV.1 details the activities included in Majar Divisions 4. 6; 7, 8 and 9 of the ISIC Classification- Rev. 2, which, general- ly speaking, constitute the Commercial, Services, and Public Sector. The inclusion of Majar Division 7 responds to the fact that the Divisions, Headings and Groups comprised therein give rise to energy consumption not accounted for under other sectors, particularly under the Transportation Sector: energy consumption in offices, establishments, etc., dedicated to Transportation and Communications should be accounted for under this sector,
of the aims of the database design.
215
For example, in sorne countries a large part of the commercial activity is not tied to the formal infrastructure but takes place informally in the streets. To the extent that these activities require energy consumption, this will not usually be recorded in the information systems; its detection should therefore be one
Even though this classification covers the wide range of activi- ties which constitute the sector, it is necessary to point out that the information usually recorded in the statistical systems (both energy and socioeconomic) is circumscribed to formally established services and <loes not cover the informal activities which in sorne countries of the regían may be relevant.
But no matter what the method used in future analyses for fore- casting, it seems highly convenient to define the subsectors on the basis of an international classification which all of the countries can respect in their information systems. For that purpose, justas in the case of the industrial sector, the propo- sal is to base the sector breakdown on the ISIC classification.
Precisely dueto the diversity of activities encompassed herein, this is an especially difficult sector in which to determine an indicative variable for the level of activity, in arder to best explain the characteristics of energy consumption.
The definition of the subsectors should thus necessarily be tied to the organization of the macroeconomic information, given the fact that any analysis for forecasting energy demand necessarily requires linkages between energy consumption and the level 9f activity in the branch being dealt with.
Furthermore, both the BEEU and the energy assessment constitute a point of departure for demand forecasting analyses.
This proves to be of fundamental Lmpo r t artc e in explaining the variations produced in the energy consumption of the sector.
To the extent that the intention is to u~e BEEU as a tool for energy assessment, it becomes ímperative to disaggregate the sector in a set of relatively homogeneous activities, both inso- far as energy requirements and the evolution of their level of activity.
of are
a variety consumption
The Commercial-Services-Public Sector activities in which the features of substantially different.
includes energy
l. Disaggregation by Subsectors
DEFINITIONS AND BASIC CONCEPTS
CHAPTER I
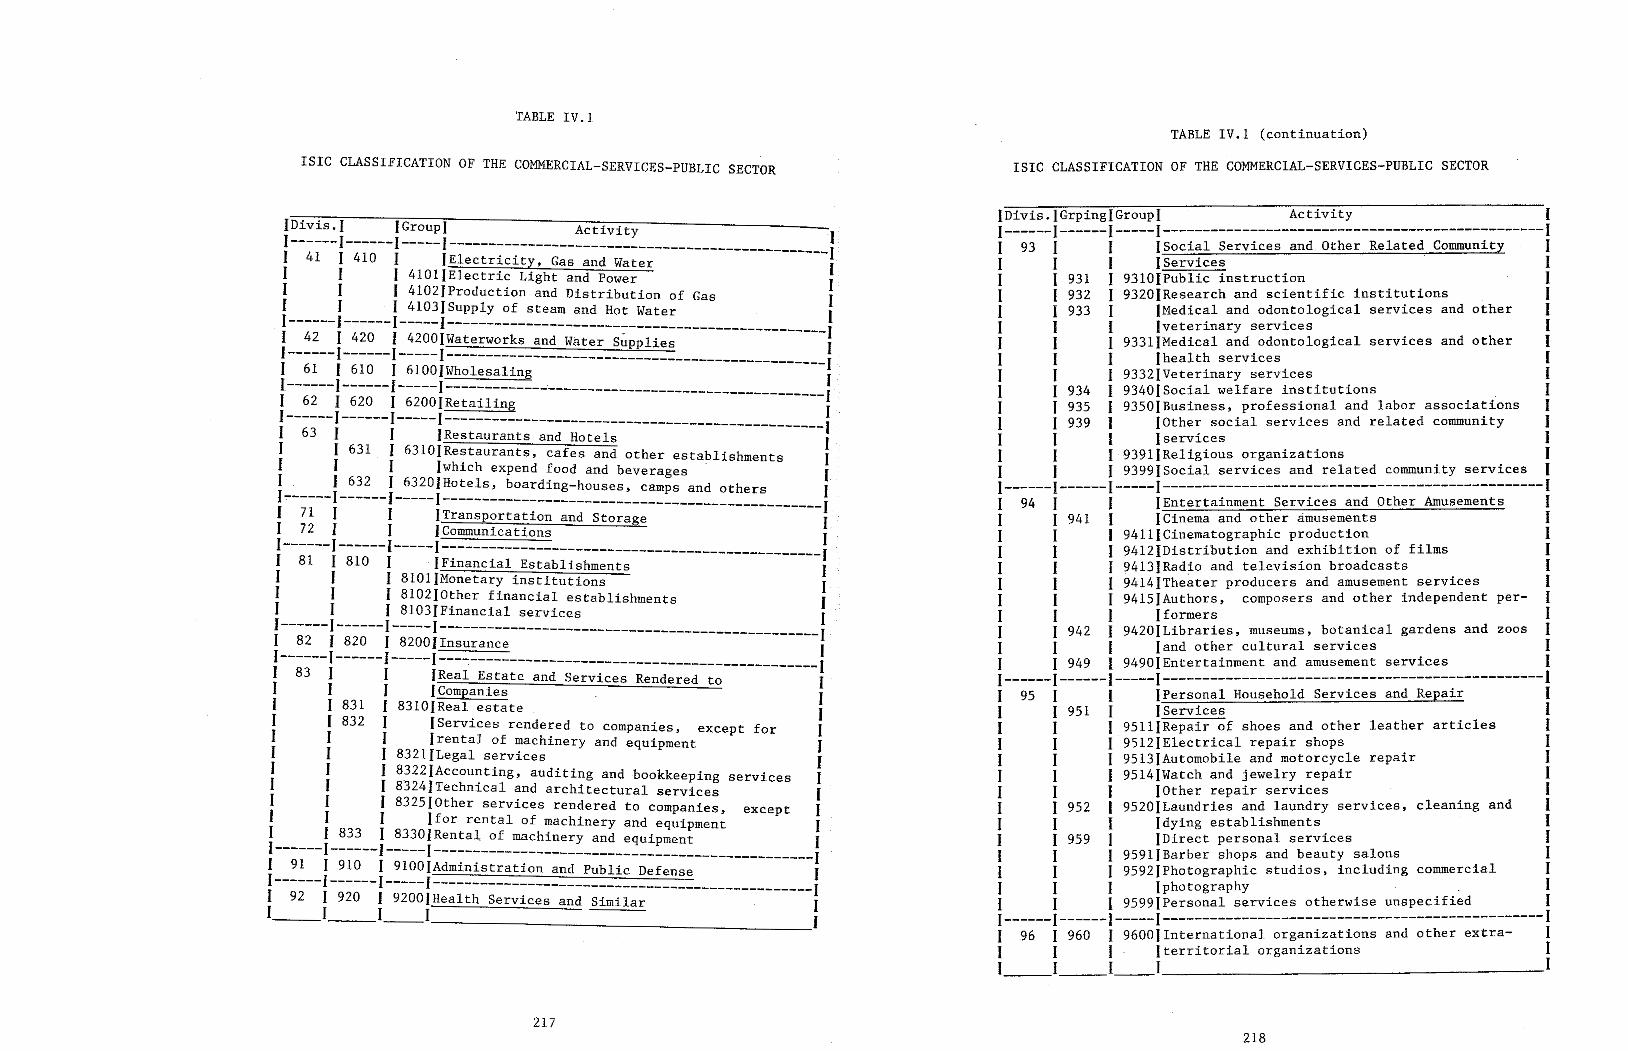
218
IDivis.JGrpingJGroupl Activity 1 1------1------1-----1------------------------------------------------1 I 93 I 1 1 Social Services and Other Related Community 1 1 1 1 IServices 1 I 1 931 I 93101Publíc instruction 1 I I 932 I 93201Research and scientífic institutions I I I 933 I )Medical and odontological services and other 1 1 I 1 )veterinary services 1 1 1 1 93311Medical and odontological services and other 1 1 I 1 (health services 1 1 1 I 93321Veterinary services 1 1 I 934 1 93401Social welfare institutions 1 J I 935 I 9350JBusiness, professional and labor associations l I I 939 I IOther social services and related community 1 1 I 1 1 servíces 1 1 1 1 939l1Religious organizations 1 1 1 1 93991Social services and related community services 1 1------1------1-----1------------------------------------------------1 I 94 I 1 IEntertainment Services and Other Amusements 1 I 1 941 I ICinema and other amusements 1 I I 1 94lllCinematographic production 1 I I 1 9412lDistribution and exhibition of films 1 I I I 94131Radio and television broadcasts 1 I 1 1 9414JTheater producers and arnusement services 1 1 I I 9415JAuthors, composers and other independent per- 1 1 1 1 lformers 1 J 1 942 I 9420ILibraries, rnuseums, botanical gardens and zoos 1 I I I Iand other cultural services 1 1 I 949 1 94901Entertainment and amusement services I 1------1------1-----1------------------------------------------------1 1 95 1 I !Personal Household Services and Repair 1 1 1 951 1 IServices 1 1 1 I 95111Repair of shoes and other leather articles 1 1 1 I 95121Electrical repair shops 1 1 1 I 9513JAutomobile and motorcycle repair 1 1 1 1 95141Watch and jewelry repair 1 I 1 J IOther repair services 1 I 1 952 1 9520JLaundries and laundry services, cleaning and 1 I 1 1 fdying establishments 1 1 1 959 I IDirect personal services 1 I 1 1 9591IBarber shops and beauty salons 1 I I 1 9592(Photographic studios, including comrnercial I I I 1 lphotography 1 1 1 I 95991Personal services otherwise unspecified 1 1------1------1-----1------------------------------------------------1 1 96 1 960 1 96001International organizations and other extra- 1 1 I 1 }territorial organizations I I I 1 1 1
ISIC CLASSIFICATION OF THE COMMERCIAL-SERVICES-PUBLIC SECTOR
TABLE IV.l (continuation)
217
[Df.v í.s , ] IGroupl Activity . 1------1------1-----1------ 1 1 41 1 410 I JElectr~~~~;~-~::-::~-;:~~~----------------------: 1 1 1 4101JElectri~ Light and Power 1 1 1 1 41021Production and Distribution of Gas I 1 1 1 4103fSupply of steam and Hot Water 1 1------1------1-----1---------- ------------------------------------ 1 1 42 I 420 1 42001Waterworks and Water S~pplies --1 1------1------1-----1-------------------------- I 61 1 610 1 6100JWholesaling ----------------------~ l------1------1-----1-------------'------------- I 62 I 620 1 62001Retailing ----------------------~ 1------1------1-----1---------------------------------------------- 1 1 63 1 1 )Restaurants and Hotels --1 1 1 631 I 63101Restaurants, cafes and other establishments 1 1 1 1 [wh í.ch expend food and beverages · 1 1 1 632 1 6320JHotels, boarding-houses, camps and others 1 1~-----1------1-----1------------------------------------------------1 1 71 1 1 ITransportation and Storage 1 1 72 1 1 1 Communications I 1------1------1-----1------------------------------------------------1 f 81 f 810 1 · IFinancial Establishments 1 1 1 1 810l}Monetary ínstitutions 1 1 1 1 810210ther financia! establishments 1 1 1 1 8103IFinancial servíces 1 1------1------1-----1------ ------------------------------------------1 1 82 1 820 1 8200IInsurance 1 1------1------1-----1---~--------------------------------------------1 1 83 I I JReal Estate and Services Rendered to 1 1 1 1 1 Companies 1 1 1 831 1 8310JReal. estate 1 1 1 832 1 1 Se rv í.ce s rende red to companLas , except for J 1 1 1 frental of machinery and equipment 1 1 1 1 8321fLegal services 1 I 1 1 8322JAccounting, auditing and bookkeeping services J 1 1 1 8324}Technical and architectural services f 1 1 1 832510ther services rendered to companies, except 1 I 1 1 lfor rental of machinery and equipment 1 1 1 833 1 83301Rental of machinery and equipment 1 I------I------I-----I------------------------------------------------1 1 91 1 910 1 9100IAdminístration and Public Defense 1 1------1------1-----I -----------------------------------------------! 1 92 I 920 I 9200fHealth Services and Similar 1 1 I l __ I 1
ISIC CLASSIFICATION OF THE COMMERCIAL-SERVICES-PUBLIC SECTOR
TABLE IV.l
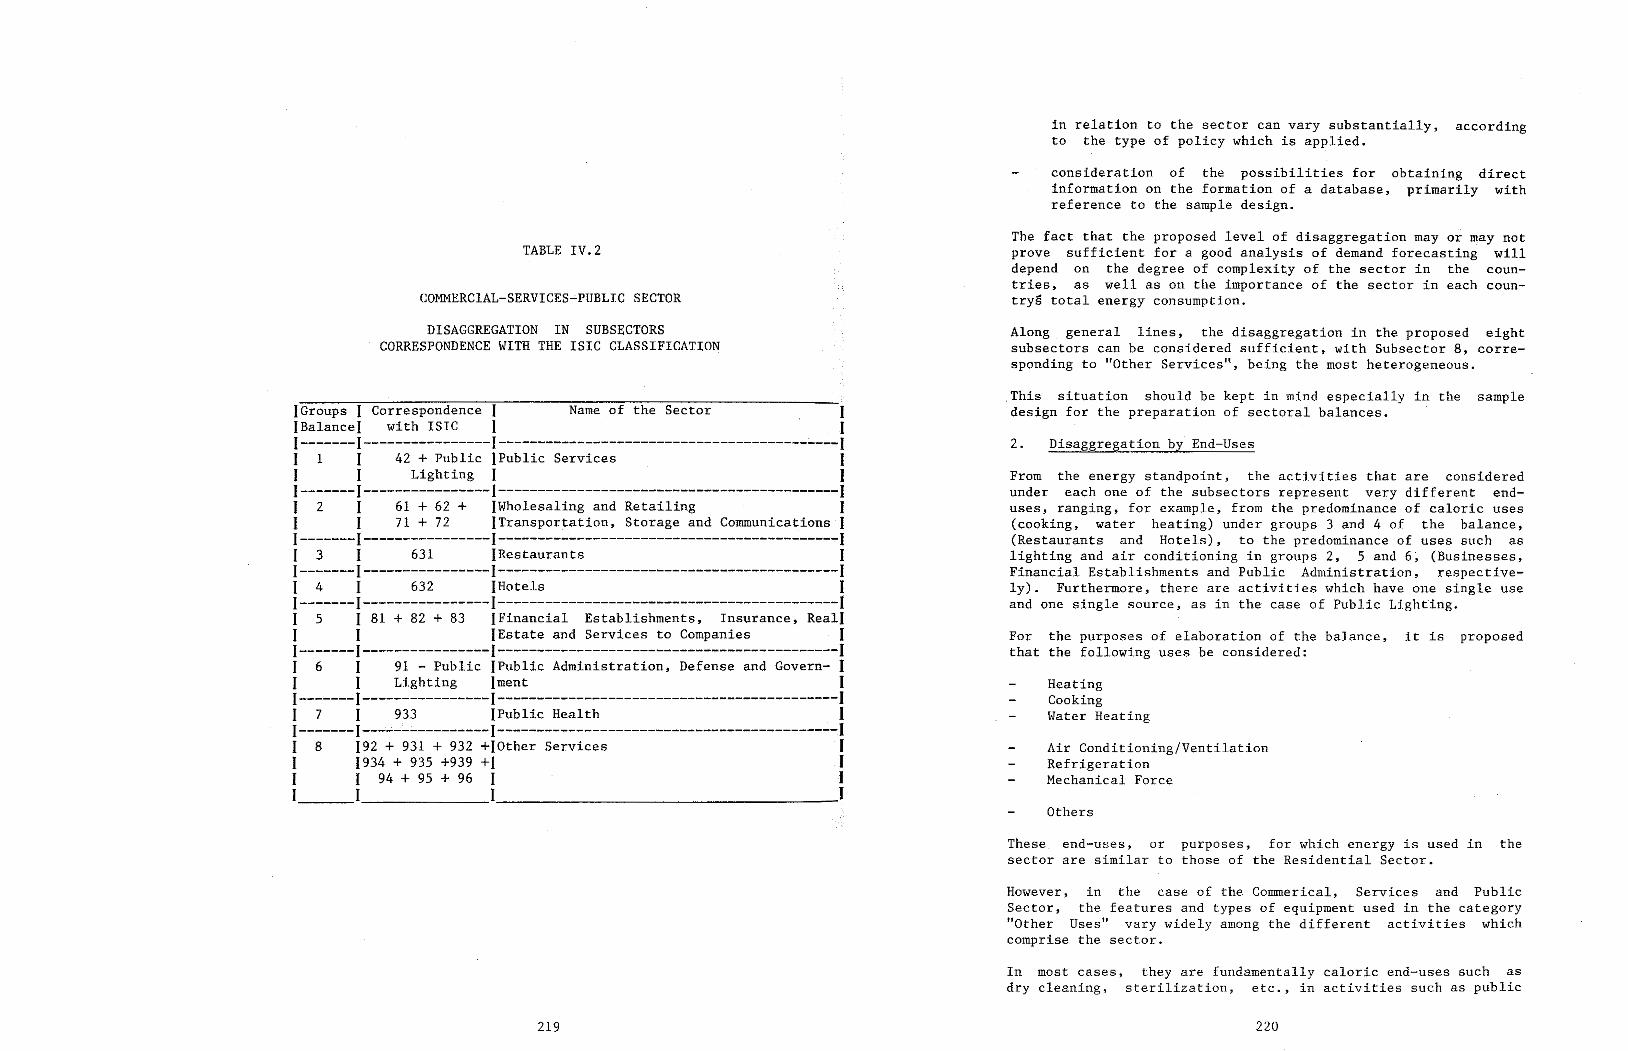
220
In most cases, they are fundamentally caloric end-uses such as dry cleaning, sterilization, etc., in activities such as public
However, in the case of the Comrnerical, Services and Public Sector, the features and types of equipment used in the category "Ot he r Uses11 vary widely arnong the different activities which comprise the sector.
These end-uses, or purposes, for which energy is used in the sector are similar to those of the Residential Sector.
Others
Air Conditioning/Ventilation Refrigeration Mechanical Force
Heating Cooking Water Heating
For the purposes of elaboration of the balance, it is proposed that the following uses be considered:
From the energy standpoint, the activities that are considered under each one of the subsectors represent very different end- uses, ranging, for example, from the predominance of caloric uses (cooking, water heating) under groups 3 and 4 of the balance, (Restaurants and Hotels), to the predominance of uses such as lighting and air conditioning in groups 2, 5 and 6, (Businesses, Financial Establishments and Public Administration, respective- ly). Furthermore, there are activities which have one single use and one single source, as in the case of Public Lighting.
2. Disaggregation by End-Uses
IGroups 1 Correspondence ( Name of the Sector 1 Balance} with ISIC 1 fI-------I----------------1---------------------------------------~---f J 1 1 42 + Public [Pub Lf,c Services f1 1 Lighting l l-------I----------------1-------------------------------------------t1 2 I 61 + 62 + (Wholesaling and Retailing . lI 1 71 + 72 JTransportation, Storage and Communications l1-------1----------------1------------------------------------------.,..¡> 1 3 I 631 !Restaurants 1-------1----------------1-------------------------------------------r1 4 1 632 1 Hotels 1-------1----------------1-------------------------------------------vI 5 1 81 + 82 + 83 IFinancial Establishments, Insurance, Real[I I }Estate and Services to Companies [I-------I----------------1-------------------------------------------12 1 6 I 91 - Public IPublic Administration, Defense and Govern- F1 1 Lighting [ment; l-------I---...;------------1-------------------------------------------1 7 1 933 }Public Health l1 -------1---'-'-'~----------1 -------------------------------------------:l:1 8 192 + 931 + 932 +}Other Services 1 1934 + 935 +939 +I f1 1 94 + 9s + 96 1 1 1 1
. This situation should be kept in rnind especially in the sample design far the preparation of sectoral balances.
Along general lines, the disaggregation in the proposed eight subsectors can be considered sufficient, with Subsector 8, corre- sponding to "Other Services11, being the rnost heterogeneous .
DISAGGREGATION IN SUBSECTORS CORRESPONDENCE WITH THE ISIC CLASSIFICATION
COMMERCIAL-SERVICES~PUBLIC SECTOR
The fact that the proposed level of disaggregation mayor may not prove sufficient for a good analysis of demand forecasting will depend on the degree of complexity of the sector in the coun- tries, as well as on the importance of the sector in each coun- trys total energy consurnption.
TABLE IV.2
consideration of the possibilities for obtaining direct information on the formation of a database, primarily with reference to the sample design.
in relation to the sector can vary substantially, according to the type of policy which is applied.
219
222
production compiled by which were used in the
Table IV.3 presents sorne efficiencies of the Institute of Energy Economics (IDEE), preparation of a Regional BEEU.
In any case, and only for those end-uses which represent an important consumptíon and in which efficiency of use is much l:ss than the unit, it·is recommended that the different methods which would lead toan estímate of that efficiency be analyzed.
As described in the Base Document, in a first stage of prepara- tion of BEEU, only the efficiencies of production of the dif- ferent end-uses are accounted for; the elements conducive to evaluating the efficiencies of use are not included.
Although efficiency of end-use is very difficult to measure, and given the heterogeneity of the univer~e, it wo~l~ not seem appropriate to propase, a priori, that it be quantified by.mea~s of an energy audit (of the industrial type). Sorne countries in which the consumption of heating or air conditioning is impor- tant have implemented information-gathering systems at the level of building insulation, not only far the Commercial, Services and Public Sector, but also for the Residential Sector.
To preserve food or medicine through refrigeration, the degree of utilization of the cold produced is also associated with envi- ronmental conditions, given that the efficiency of the cold- producing equipment varíes with ambient temperature and the fre- quency with which the doors of the equipment are opened and closed.
the production of the necessary heat or cold and
the degree of utilization of that heat or cold, given the insulation of the spaces.
air and
heating or are clear
In the case of space conditioning (whether conditioning/ventilation), the two stages correspond to:
221
The overall efficiency of energy end-use will be given by the product of the efficíency of each one of these stages (efficiency of productíon and efficiency of use).
use made of heat, cold, mechanical force, etc., in each activity
production of heat, cold, mechanical force, etc., on the basis of energy sources and
Following the conceptual scheme set forth in the definition of useful energy in the Base Document, which consists of observing the energy consumption process in two stages:
3. Final Energy, Useful Energy and Efficiencies
In this regard, there is great similarity between this sector and the Residential Sector.
the efficiency with which the equipment is used.
the level of comfort and/or mechanization and
Useful demand in the Commercial, Services and Public Sector therefore depends on two factors:
To the extent that human energy is not included in the energy balances, considerable disparity can appear in the useful demand far mechanical force. This fact demands special care .Ln the sample design.
Unlike the productive sectors, where the energy needs or useful demand of the user is always determined by production processes, in the case of the Commercial, Services and Public Sector, the useful demand of the user in many cases is associated with the level of comfort ar mechanization of the different activities.
will be form of heating
Consequently, just as in the productive sectors, it necessary to determine the flows of hot water (useful energy produced in the boiler) destined both far water and space heating.
This is a situation similar to the one discussed under the Industrial Sector, in connection with the production of steam in a boiler far different purposes or end-uses (supplying the steam requirements of production processes, electric power auto- production, mechanical force).
In some cases, the production of useful forros of energy can serve more than one energy end-use ar purpose; for instance, one single boiler can be used for space heating and far water heating for sanitary purposes.
health (hospitals).
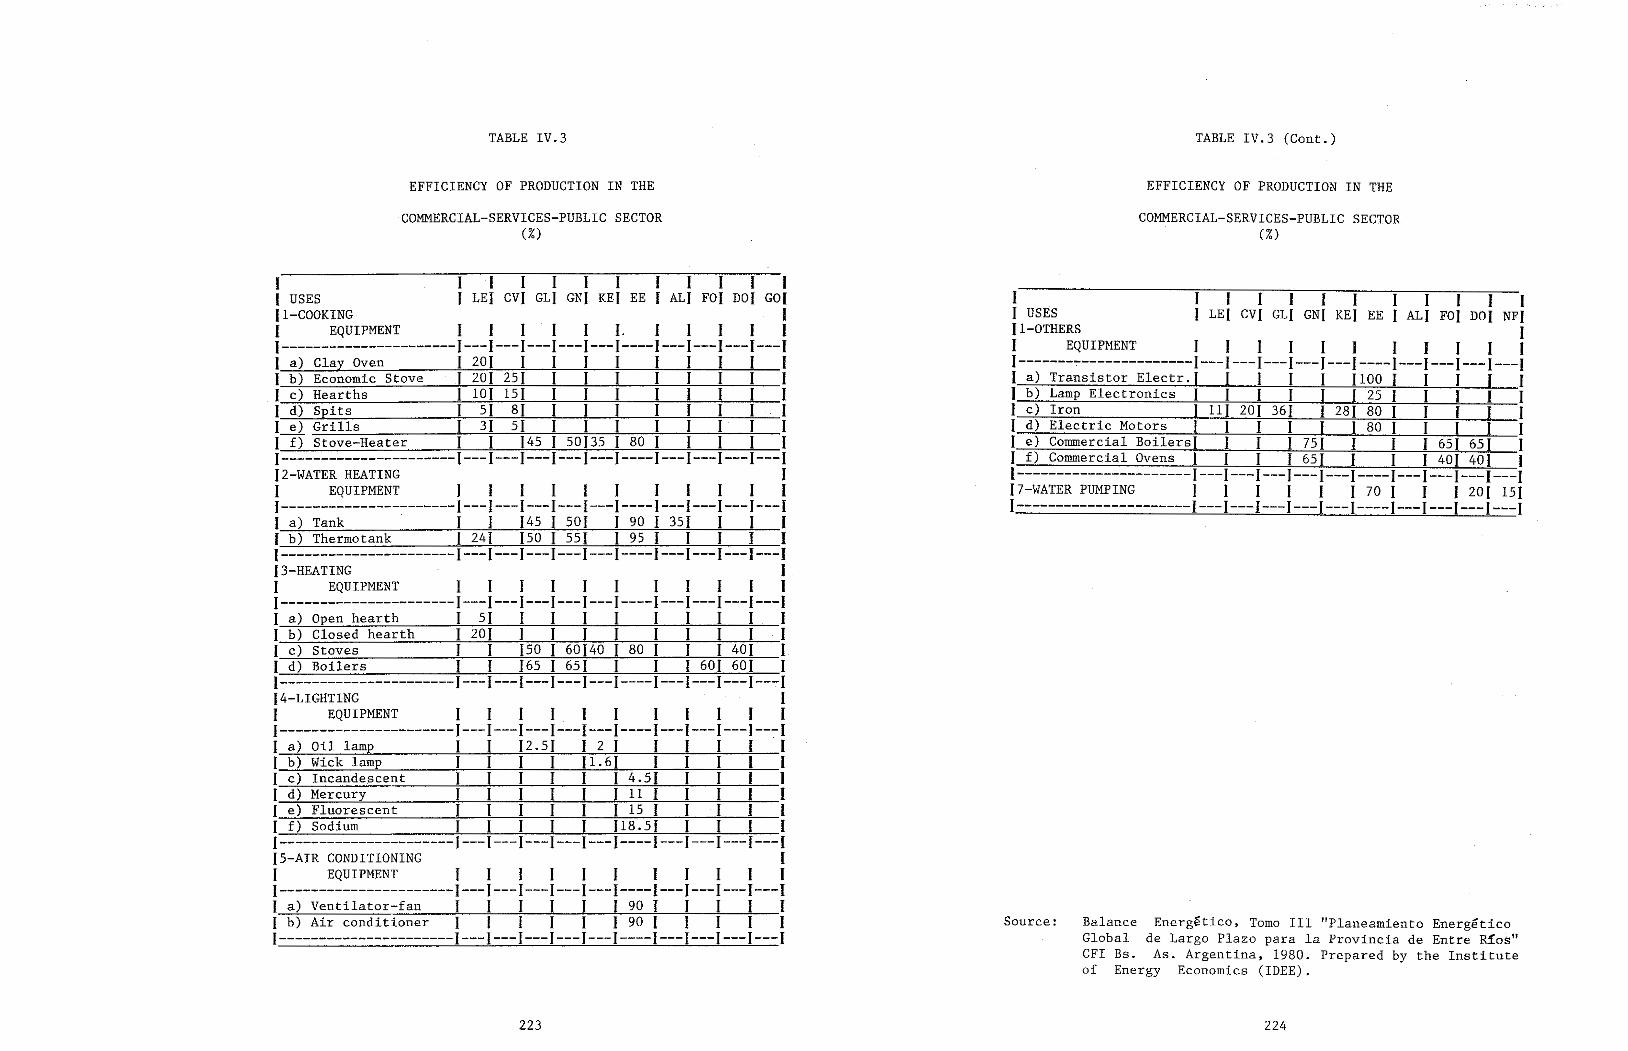
224
Source: Balance Energético, Tomo III "Planeamiento Energético Global de Largo Plazo para la Provincia de Entre RíoE:" CFI Bs. As. Argentina, 1980. Prepared by the Institute of Energy Economics (IDEE).
1 1 1 1 1 1 1 1 1 1 1 1 1 USES 1 LEI CVI GLI GNI KEI EE 1 ALI FOI DOI NFI Jl-OTHERS 1 I EQUIPMENT 1 1 1 1 1 1 1 I 1 1 1 1----------------------1---1---1---1---1---1----1---1---1---1---1 1 a) Transistor Electr.J 1 I I 1 1100 I 1 1 I 1 1 b) Lamp Electronics 1 1 I 1 1 I 25 I 1 1 1 1 1 c) Iron 1 111 201 361 I 281 80 1 1 1 I 1 1 d) Electric Motors 1 I I 1 1 1 80 1 1 1 1 1 1 e) Commercial BoilersJ 1 1 1 751 1 1 1 651 6Sl 1 1 f) Commercial Ovens I 1 1 I 6S 1 1 1 1 401 401 1 l----------------------1---1---1---l---l---l----l---I---I---I---I 17-WATER PUMPING 1 1 1 1 1 1 70 1 1 J 201 151 1----------------------1---1---1---1---1---1----1---1---1---1---1
COMMERCIAL-SERVICES-PUBLIC SECTOR (%)
EFFICIENCY OF PRODUCTION IN THE
TABLE IV.3 (Cont.)
223
1 1 1 1 1 1 1 1 1 1 1 1 1 USES 1 LEI CVI GLI GNI KEI EE 1 ALI FOI DOI GOi 11-COOKING I 1 EQUIPMENT 1 1 1 1 1 L 1 1 1 1 I 1----------------------1---1---1---1---1---1----1---1---1---1---1 1 a) Clay Oven 1 201 1 1 1 1 1 1 1 1 I 1 b) Economic Stove 1 201 251 1 1 1 1 I 1 1 1
. 1 c) Hearths 1 101 151 1 1 1 1 l 1 1 1 1 d) Spits 1 51 81 1 1 1 1 1 1 1 1 1 e) Grills 1 31 51 1 1 1 1 1 1 1 1 ¡--¡¡ Stove-Heater 1 1 145 1 50135 1 80 1 1 1 1 1 1----------------------I---l---l---l---I---I----l---I---l---l---I J 2-WATER HEATING 1 1 EQUIPMENT 1 1 I 1 1 1 1 1 1 1 1 1----------------------1---1---1---I---l---I----I---l---l---I---I I a) Tank 1 1 145 I 501 1 90 1 351 I 1 1 f b) Thermotank 1 241 150 1 551 1 95 I 1 I 1 1 I----------------------1---1---1---l---l---l----l---l---I---I---I 13-HEATING J 1 EQUIPMENT 1 1 I 1 1 1 1 1 1 1 1 1----------------------1---1---I---I---I---l----l---l---l---l---I 1 a) Open hearth 1 SI I I 1 1 1 1 1 1 1 1 b) Closed hearth I 201 1 1 1 1 1 1 1 1 1 1 c) Stoves 1 I ISO I 60140 1 80 1 1 1 401 1 1 d) Boilers 1 1 }65 1 651 1 1 1 601 601 1 1----------------------1---1---1---1---1---1----1---1---1---1---1 14-LIGHTTNG 1 1 EQUIPMENT 1 1 I 1 . 1 1 1 1 1 1 1 I----------------------1---1---l---l---I---I----l---l---l---l--~I 1 a) Oíl lamp 1 1 12.51 1 2 1 1 1 1 1 1 1 b) Wick lamp 1 1 1 1 J 1. 6 I 1 1 1 1 1 1 c) Incandescent 1 1 1 1 1 1 4.51 1 1 1 1 1 d) Mercury 1 1 1 I 1 1 11 1 1 1 1 l 1 e) Fluorescent 1 1 1 1 1 l 15 1 1 1 1 1 1 f) Sodíum 1 1 1 1 1 118.51 1 1 1 1 l----------------------1---1---l---l---I---I----l---I---l---l---I 15-AIR CONDITIONING 1 1 EQUIPMENT I 1 1 1 1 1 1 1 1 1 1 I----------------------1---1---l---l---l---I----l---l---l---l---I la) Ventilator-fan 1 1 1 I 1 l 90 1 1 1 1 1 1 b) Air conditioner 1 1 1 1 1 1 90 1 l 1 1 1 1----------------------1---1---l---l---l---l----l---I---I---l---I
COMMERCIAL-SERVICES-PUBLIC SECTOR (%)
EFFICIENCY OF PRODUCTION IN THE
TABLE IV.3
226
The third case may be the least frequent for the countries of Latín America; a more frequent case would be the second; and the most common would be the first, as long as there are records on total sectoral consumption (either because they were already
Energy consumption by subsector is known.
The consumption of electricíty supplied by Public Services is known, bUt the amount of fuels for each subsector is not.
Energy consumption by subsector is not known, but energy consump t í.on for the en tire sector is.
As for the information which should be available to define the universe of reference, i.e., the energy consumption of the Commercial, Services and Public Sector, and the number of establishments in each subsector, work begins with a fairly logical assumption, which is knowledge about this last piece of information. The state of energy information can offer the following variations:
In any case, this type of survey should have broad coverage; it is very simple to carry out and is usually inexpensive.
The majar problem líes in commercial sources whose distribution is not through fixed networks (e.g.,liquefied gas, gas oíl, etc.) and in non-commercial sources.
The same thing occurs with sorne fuels, as in the case of natural gas or piped gas, which are billable sources with consumption records for the sector and/or subsector in the producing and/or distributing firms.
Even though the record of information on electricity is included, it can be omitted far a large number of establishments since its origin is Public Service; consumption by subsector can be ob- tained from the records of the firms which render services.
The survey on total consumption should contain only Chapters II and III of the sheet presented above, concerning the consumption of electricity and fuels. This survey should have as a frame of reference the type of sample used for censuses in the Servíces Sector, or other type of sample surveys normally done in the sector.
If the aim is to determine the total consumption of this sector, prior to launching the proposed survey on uses detailed under the following point, a more numerous survey should be undertaken, the objective of which would be to quantify the energy consumption of the sector (and/or subsector).
If on the basis of the methodology presented herein the consumption of the Resídential Sector has been quantified prior to the consumption of the Commercial-Services-Public Sector, the formers consumption will have béen defined.
225
This presentation does not mean that sorne countríes cannot main- tain the informatíon for each sector separately. If this has not been done, it should be disaggregated.
The information on energy consumption in this sector, at least what is presented in the BEEF-OLADE, appears aggregated with the consumption of the Residential Sector, under the name Residential, Commercial and Public Sector.
The type of form discussed above will fundamentally depend on the sample desígn which must be implemented, and on a diagnostic o f the · existing information.
2. Analysis of Existing Information
It is necessary to note that, in many cases, it may be convenient to add the brand name of the equipment when power output or capacity is difficult to register.
Finally, the last chapter refers to the control and revision of surveys.
Chapter IV disaggregates consumption by uses, detaíls types of equipment, and revíews the terminology for each case.
informatíon on electríc power to be of equipment for auto-productíon, sales The same procedure is used for fuels in
Chapter II details the recorded: origin, types to third parties, etc. the following chapter.
Chapter I refers to gen- of activity, location, of activities, number of
The form is divided into five chapters. eral data on the establishment: type surface area, economic data and regimen employees, etc.
For warm countries in which the use of heating is marginal or non-existent, or in the sectors where cooking does not take part, etc., such uses should not be included.
The contents of a data-gathering sheet should be gauged according to the particularities of each country. The contents of the form which is presented herewith can be used for the sake of refer- ence, since it is of a more or less general nature; and correc- tions can eventually be made in the end-uses under consideration.
Data-Collecting Form l.
DATABASE FORMATION
CHAPTER II
228
made up of from the
Stratum (A), of obligatory inclusion in the sample, the large energy-consuming establishments, working
The formation of the strata will include:
Keeping in mind the observations made under point 1, regarding the heterogeneity of activities, and given the need for a varia- ble correlated with consumption to stratify the population, it has been thought convenient to adopt the number of employees as a stratification variable, since this is the most closely represen- tative variable in energy consumption. However, there may be others such as surface area of the establishment, to be corre- lated with consumption in lighting and climatization (heating or air conditioning); the nurnber of beds in a hospital, to be corre- lated with total hospital consumption; value added, etc.
Before going on to the formation of strata, it is necessary to specífy that there will be certain activities in sorne subsectors which will not form part of the sample. Such is the case of PUBLIC LIGHTING included in Subsector 1, sínce electrícity con- sumption can be obtained directly from the energy companies, or from those public or prívate establishments for which energy consumption is known by sources (schools, hospitals, publicad- ministration, etc.); and the case of DEFENSE, including Subsector 5, the consumption of which is usually highly confidential. In this case, it is most probable that this consumption will figure in the Sector OTHERS or in Adjustments.
In dividing the population under study into subsectors which, from the energy standpoint, have a certain degree of homogeneity, and in presenting a certain concentration of consumption in those establishments considered "large," it is proposed that a strati- fíed sample be done.
The guidelines for designing a consumption sample by END-USES will be based on the assumption that sectoral energy consumptíon is known and that the number of establishments per subsector is known, together with the most relevant economic variables: value added, number of employees, etc.
3. Guidelines for Sample Design
Finally, by taking the consumption of commercial sources in the legally formal activities, i.e., in the establishments in this sector which contribute to the formation of the gross domestic product, it can be observed that in many activities there is a relative concentration of consumption in establishments which can be considered "large" but, unlike in other sectors such as the Industrial Sector, for example, the curve of distribution inequality or asyrnm.etric proportion can approach the diagonal more.
this does not seem to occur from the since its incidence is quite marginal.ar
economic activity, energy standpoint, non-existent.
227
e)
Other types of informal services such as portable market stands, in which the products are transported to the place of sale, thereby generating the consurnption of- comrnercial energy, should be captured under the transportation sector on the basis of surveys designed far freight transportation:
Even though the level of "informal activity" in sorne coun- tries can reach important magnitudes in the general level of
d)
If such consumption is detected, it should be accounted for under the Commercial, Services and Public Sector, and sub- tracted from the Residential Sector.
There may be sorne services, such as the sale of foodstuffs which have to be cooked, the energy consumption of which will have to be estimated. Given the characteristics of this type of activity, the most advisable thing to do is to have the survey in the Residential Sector capture that consumption (actually, the form presented in this sector foresees this type of problem), since that survey will surely be able to do so much more reliably than the one designed for this sector.
c)
of con- does
Most of these types of services are devoted to the sale finished product t · . s, no generating any type of energy sumption, in which case the failure to consider them not create any problem.
b)
The number of "establishments" or "employees" is not known; therefore, the universe is unknown, thus implying the impos- sibility of any sample whatsoever.
a)
One particular case of analysis is constituted by the so-called INFORMAL SERVICES, about which littie is recorded from both the energy and non-energy points of view. In general, it can be affirmed that:
The second case implies the existence of records on the basis of which the electricity billed to each subsector can be known, together with sorne inforrnation on fuel sales rnade to certain establishments in the sector. These records constitute invaluable in:o:mation.for.the sample design, especially in the case of electr1c1ty, which in turn constitutes a basic element of control for the expansion of the sample done on energy end-uses.
One last alternative with respect to the state of information is that for any of the eight subsectors considered there are records for sorne of the activities presented; thus, for example in Subsecto: 7, "Public Health~" there may ~e records on e~ergy ~ons~mpt~on by sources in hosp1tals or public and/or prívate aid 1nst1tut1ons, as may occur for the financial establishments of the States, public or prívate schools, etc.
con- available or because the above-mentioned survey on total sumption in the sector has been conducted).
230
use. In the event that of use, these consumption, so as
audl'ts are done to provide energy should be related to useful to obtain overall efficiencies of
efficiencies intermedia te
. for shares in subsectoral final consump- By applying the matri~ , 1 be obtained by end-uses and by tion, final consumption w1l . . of production (measured or sources. When related to effic1enc1des thi's will yield useful h in each en -use, adopted) for eac source d b end-use, measured at intermediate consumption by source ~n y the level of efficiencies of production.
. t'f'ed sample is to form strata One of the objectives of the stra 1 i . h' but heteroge- as possible from wit in, which are as homogeneous , , pected that on the basis h lves Hence, it is ex • . . neous among t emse • . f the sources~participat1on in d d sign the matrix o d of a goo e ' . 't in each subsector un er d i·11 have a certain homogenei y en -uses w consideration.
determination of whether or to testing the variances of
stratum, by testing the The not there is heterogeneity is
the sample averages ob- hypotheses to be defined equivalent
tained for each in each case.
. th. ample averages as t . is prepared by considering es These This ma rix ~ t" parameters, f the populations expecta ion . estimators o , will give a certain . n the basis of their variances, estimates, o "t within each stratum considered. idea of heterogene1 Y
III of the ~urvey form presented. . . the sample is expanded to the popu- Using statistical 7nference, 1 d stimators. This expansion
1 . the bas1s of the ana yze e . f at1on on f le taken and on the propert1es o will depend on the type o samp the estimators.
the aim of the study is to measure useful energy consump- Since . ase it will be necessary to determine tion by end-uses, in everyhc f each source in each end-use in a matrix for the average s are o each subsector.
229
If these measurements are not available, one practical way of solving this allocation is through monthly or seasonal consumption records, according to the specifications of Chapter
The way to match energy consumption to these shared end-uses is based on determination of the flows of hot water (useful form of energy produced in the boiler) earmarked for water heating and space heating.
In the processing of the sector surveys, some cases of shared end-uses, i.e., consumptions covered by one same source and device, may appear. Even though this case <loes not occur in many countries or activities, it is necessary to clarify that ít may arise in the end-uses of hot water and heating produced by a boiler.
No details will be given with respect to data management in terms of: errors in data-gathering, data loads, errors in data hand- ling, consistency of ínformation, etc.
4. Guidelines for Data Processing and Sample Expansion
Later on, the estimators for each activity are calculated, ac- cording to the formulas provided by the stratified sample, and they are treated jointly with the estimators for the stratum of obligatory inclusion (A); from this will result in a second analysis of the variations to ascertain the soundness of the est~mate.
ii) to make stratification more refined, with a range of varia- tion smaller than the stratification variable utilized.
i) to increase the size of the sample, keeping the same strati- fication.
Given that one of the working hypotheses is lack of knowledge about subsectoral consumption, in order to complete the design it will be necessary to sample in each one of the 20 or 30 strata into which the population was divided. The universe of reference will no longer be the establishments in ~ach group, but rather the 20 or 30 subpopulations, for which average consumption will be estimated far each source of energy. Within each stratum, the same simple or systematic random sample may be taken, far exam- ple, of 1% of the components of the subpopulation. If the vari- ances in the estimators prove unacceptable, there are two possi- ble approaches far continuing the process:
The remaining strata, in which there will be a division according to subsectors, i.e., there will be a series of new strata (Bi) containing a considerable number of establishments.
whose 600,
those (400,
that large energy consumers will be employees will surpass a given figure
hypothesis number of etc.).

231
SURVEY FORM
COMMERCIAL, SERVICES AND PUBLIC SECTOR

232
Schedule~--------- Days per week
*No. of months worked per year * Specify months not worked
students
- Regimen of activities
- Gross income
- Clients per day patients: internal
external
No. of persons served (complete the information for each activity)
Permanently Temporarily Total
No. of persons employed:
1.4 Economic Data and Regimen of Activities
NO YES
Is it connected to the sewage disposal system?
Area _
Number: __ City:
Beauty Salon Hospital or Sanitarium School Public Office
NO YES
Does the establishment have running water?
No. of rooms
1.3 Characteristics of the Building
Street: Phone:
1.2 Address
Restaurant Hotel Bar or Cafetería Rotisserie Laundry or Dry Cleaner
l. l Activity
1. GENERAL DATA
COMMERCIAL, SERVICES AND PUBLIC SECTOR
SURVEY FORM
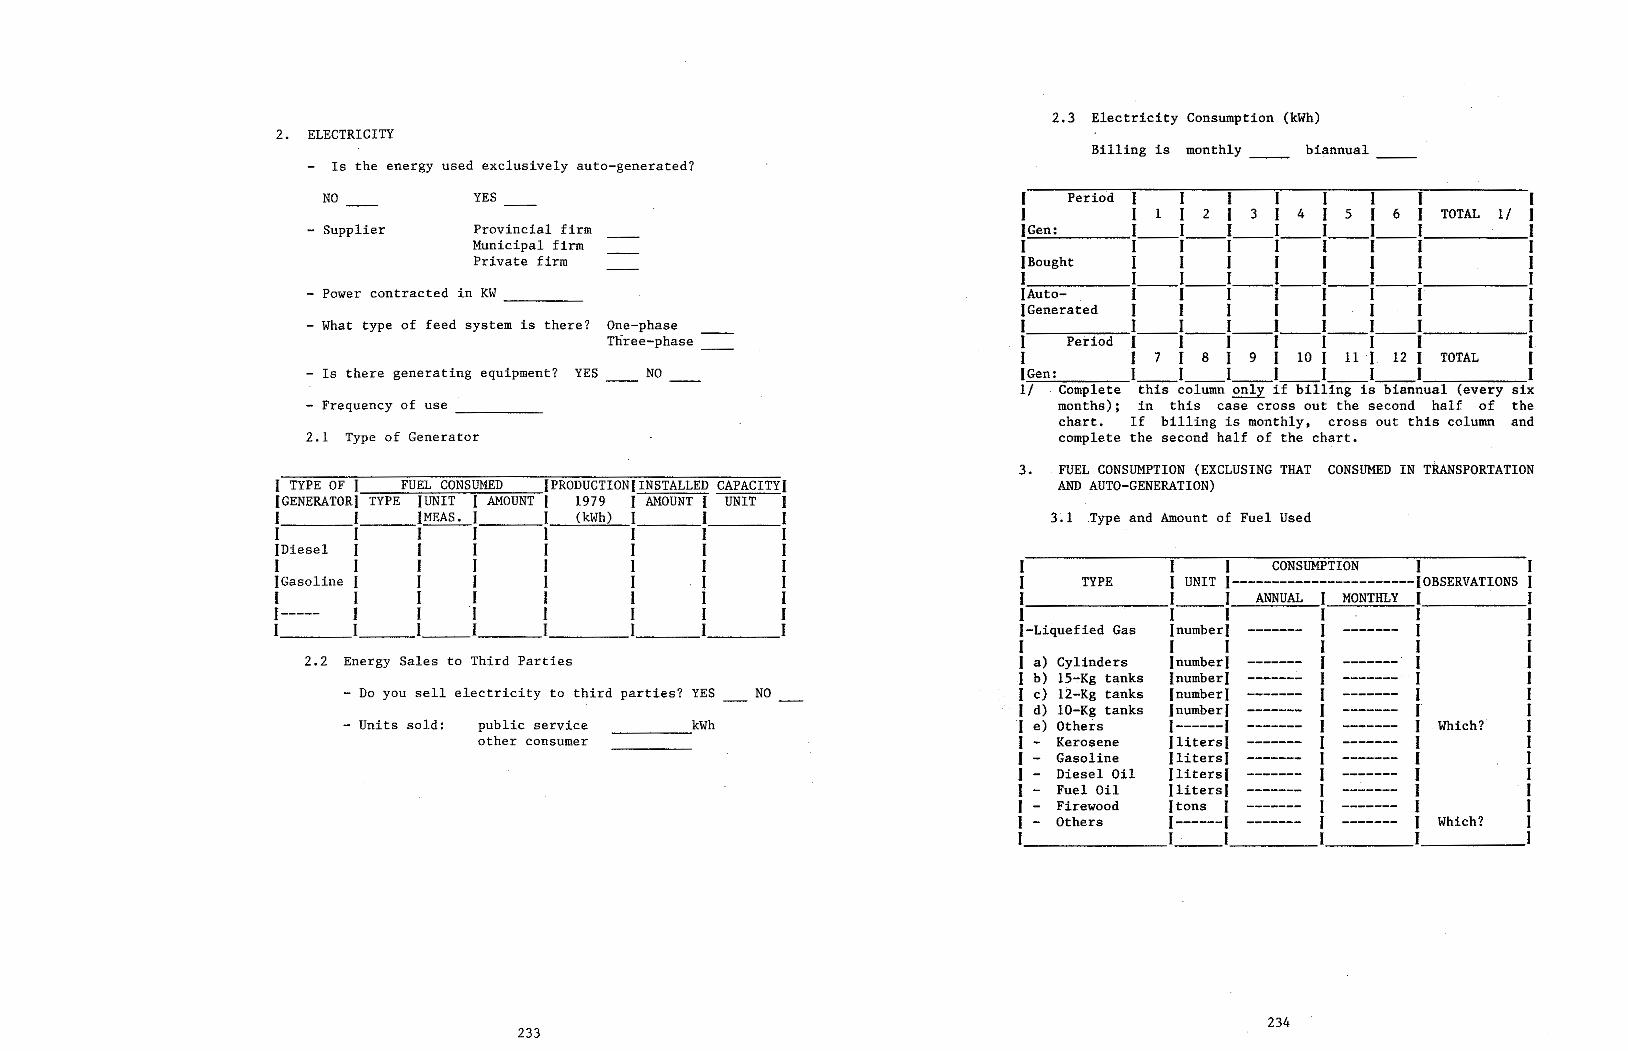
234
1 1 1 CONSUMPTION 1 1 1 TYPE 1 UNIT 1-----------------------JOBSERVATIONS 1 1 1 1 ANNUAL 1 MONTHLY 1 1 1 1 1 1 1 1 1-Liquefied Gas JnumberI ------- 1 ------- 1 1 1 I 1 1 1 1 1 a) Cylínders JnumberI ------- 1 ------- I 1 1 b) 15-Kg tanks lnumberl ------- 1 ------- 1 1 1 c) 12-Kg tanks InumberJ ------- 1 ------- 1 1 1 d) 10-Kg tanks lnumberl ------- 1 ------- l 1 I e) Others 1------1 ------- 1 ------- 1 Which? 1 1 - Kerosene Jliters) ------- 1 ------- 1 1 1 - Gasoline llitersl ------- 1 ------- 1 1 1 - Diesel Oil [Lí.t er s ] ------- 1 ------- 1 1 1 Fuel Oíl llitersl ------- 1 ------- 1 . 1 1 - Firewood ftons 1 ------- 1 ------- 1 1 1 - Others 1------1 ------- 1 ------- 1 Which? 1 1 1 1 1 1 1
3.1 Type and Amount of Fuel Used
FUEL CONSUMPTION (EXCLUSING THAT CONSUMED IN TRANSPORTATION AND AUTO-GENERATION)
3.
1 Period 1 1 1 1 1 1 1 1 1 1 1 1 2 1 3 1 4 1 5 1 6 l TOTAL 1/ J l..::...Ge_n-'-: I l __ l __ I __ I 1 1 1 1 1 1 1 1 1 1 1 1 JBought 1 1 1 1 1 1 1 1 1 l __ l __ l __ I __ I 1 1 1 IAuto- 1 1 1 1 1 1--1 1 )Generated 1 1 1 1 1 1 1 1 1 l __ l __ l __ I I __ l __ I 1 1 Period 1 1 1 1 1 1 1 1 1 J 7 1 8 J 9 1 1 O 1 11 · J . 12 J TOTAL ( (Gen: l __ l __ l __ l __ I_· _I __ . 1 1 1/ Complete thís column only if billing is biannual (every six
months); in this case cross out the second half of the chart. If billing is monthly, cross out this column and complete the second half of the chart.
biannual Billing is monthly __
2.3 Electricity Consumption (kWh)
233
kWh ----- public service other consumer
- Units sold:
- Do you sell electricity to third parties? YES NO
2.2 Energy Sales to Third Parties
1 TYPE OF l F_UE ...... L_C_O_NS_,UM,.--E_D __ IPRODUCTIONIINSTALLED CAPACITYI IGENERATORI TYPE IUNIT 1AMOUNT1 1979 1 AMOUNT 1 UNIT 1 1 1 IMEAS. l I (kWh) 1 I 1 1 1--1 1 I 1 1 1 [Df.e se I I 1 1 1 1 1 1 1 1 1 1 I 1 1 1 1 Gasoline 1 1 1 1 1 1 1 1 1 1 I 1 I 1 1 1----- 1 1 1 1 1 1 1 I l I I. I __ ~_I l I
2.1 Type of Generator
Frequency of use _ NO - Is there generating equipment? YES
One-phase Tlíree-phase
- What type of feed system is there?
- Power contracted in KW -----
Provincial firm Municipal firm Prívate firm
- Supplier
YES NO
Is the energy used exclusively auto-generated?
2. ELECTRICITY
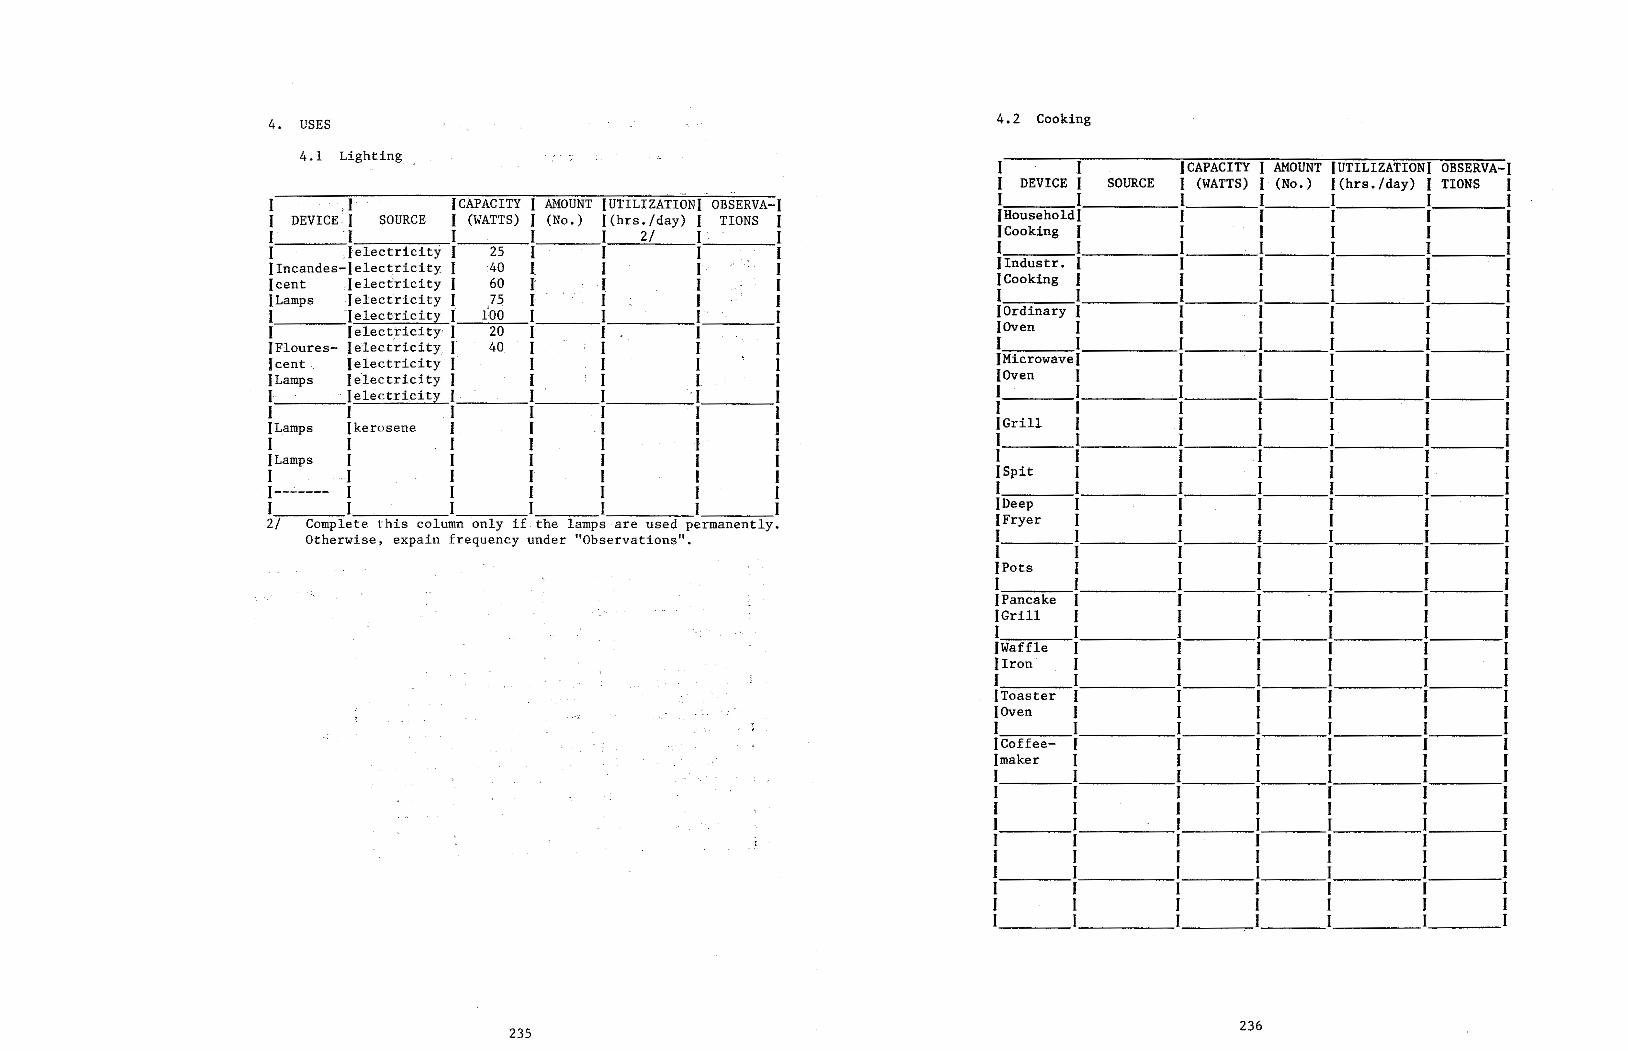
236 235
4. USES 4.2 Cooking
4 .1 Lighting 1 1 JCAPACITY J AMOUNT JUTILIZATIONJ OBSERVA-) 1 DEVICE J SO URCE 1 (WATTS) J (No.) l{hrs. /day) I TIONS 1 ·~ .
1 .r lCAPACITY 1 AMOUNT J UTILIZATION J OBSERVA-J I 1 1 1 I I 1 1 DEVICE.• J SO URCE 1 (WATTS) I (No.) J(hrs./day) 1 TIONS 1 IHouseholdl 1 1 1 1 1 1 . 1 1 I 1 2/ 1 I JCooking 1 1 1 1 1 1 1 _ (electricity I 25 1 1 1 1 1 1 1 1 1 I 1 }Incandes~Jelectrícity 1 ·40 l. 1 1 1 flndustr. 1 1 1 f 1 1 (cent .1 electricity 1 60 f 1 1 1 }Cooking 1 1 1 1 1 1 JLamps 1 electricity I 75 I 1 1 1 1 I I I 1 1 1 1 Jelectricit~ I {OO 1 I 1 1 JOrdinary 1 1 1 1 1 1 1 ( electricity· 1 20 1 1 1 1 )Oven 1 1 1 I I 1 IFloures- Jelectrícity 1 40 1 1 1 1 I 1 1 1 I 1 1 1 cent -. Jelectricity 1 I 1 1 I JMicrowavef 1 1 1 1 1 JLamps Jelectricity I 1 1 1 1 (Oven 1 1 1 1 1 1 I ·· lelectricit~ I 1 I I 1 1 1 1 1 1 I 1 1 1 1 1 1 1 1 1 1 1 1 1 1 1 JLamps Jkerosene 1 1 I 1 1 f Grill 1 1 1 1 1 1 1 1 1 1 1 1 1 1 I I I 1 1 I JLamps 1 1 1 1 1 1 1 1 1 1 1 1 1 1 1 1 1 1 1 1 JSpit 1 1 1 1 I 1 , __ ..;. ____ 1 1 1 1 1 1 1 1 1 1 I I 1 1 1 1 I 1 1 1 IDeep 1 1 1 1 1 1 2/ Complete this column only if the lamps are used permanently. fFryer I 1 1 1 1 1 Otherwise, expain frequency under "Observations". I 1 1 1 1 1 1
1 1 1 1 1 1 1 IPots I 1 1 1 1 1 1 I 1 1 1 I 1 IPancake 1 1 1 1 1 1 JGrill 1 1 1 J 1 1 1 1 I 1 1 1 1 fWaffle 1 1 1 1 1 1 Jiron 1 1 1 1 1 1 1 1 1 1 I 1 1 }Toas ter I 1 1 1 I 1 (Oven 1 1 1 1 1 1 ."f 1 1 1 1 1 1 I e
JCoffee- 1 1 1 1 1 1 lmaker 1 1 1 1 1 1 1 1 1 I 1 1 1 1 1 1 1 1 1 1 1 1 1 1 1 1 1 1 1 1 1 1 1 1 1 1 1 1 1 1 1 1 1 1 1 1 1 1 1 1 1 1 1 1 1 1 1 1 1 1 1 I 1 1 1 1 1 1 1 I I I 1 I 1 1
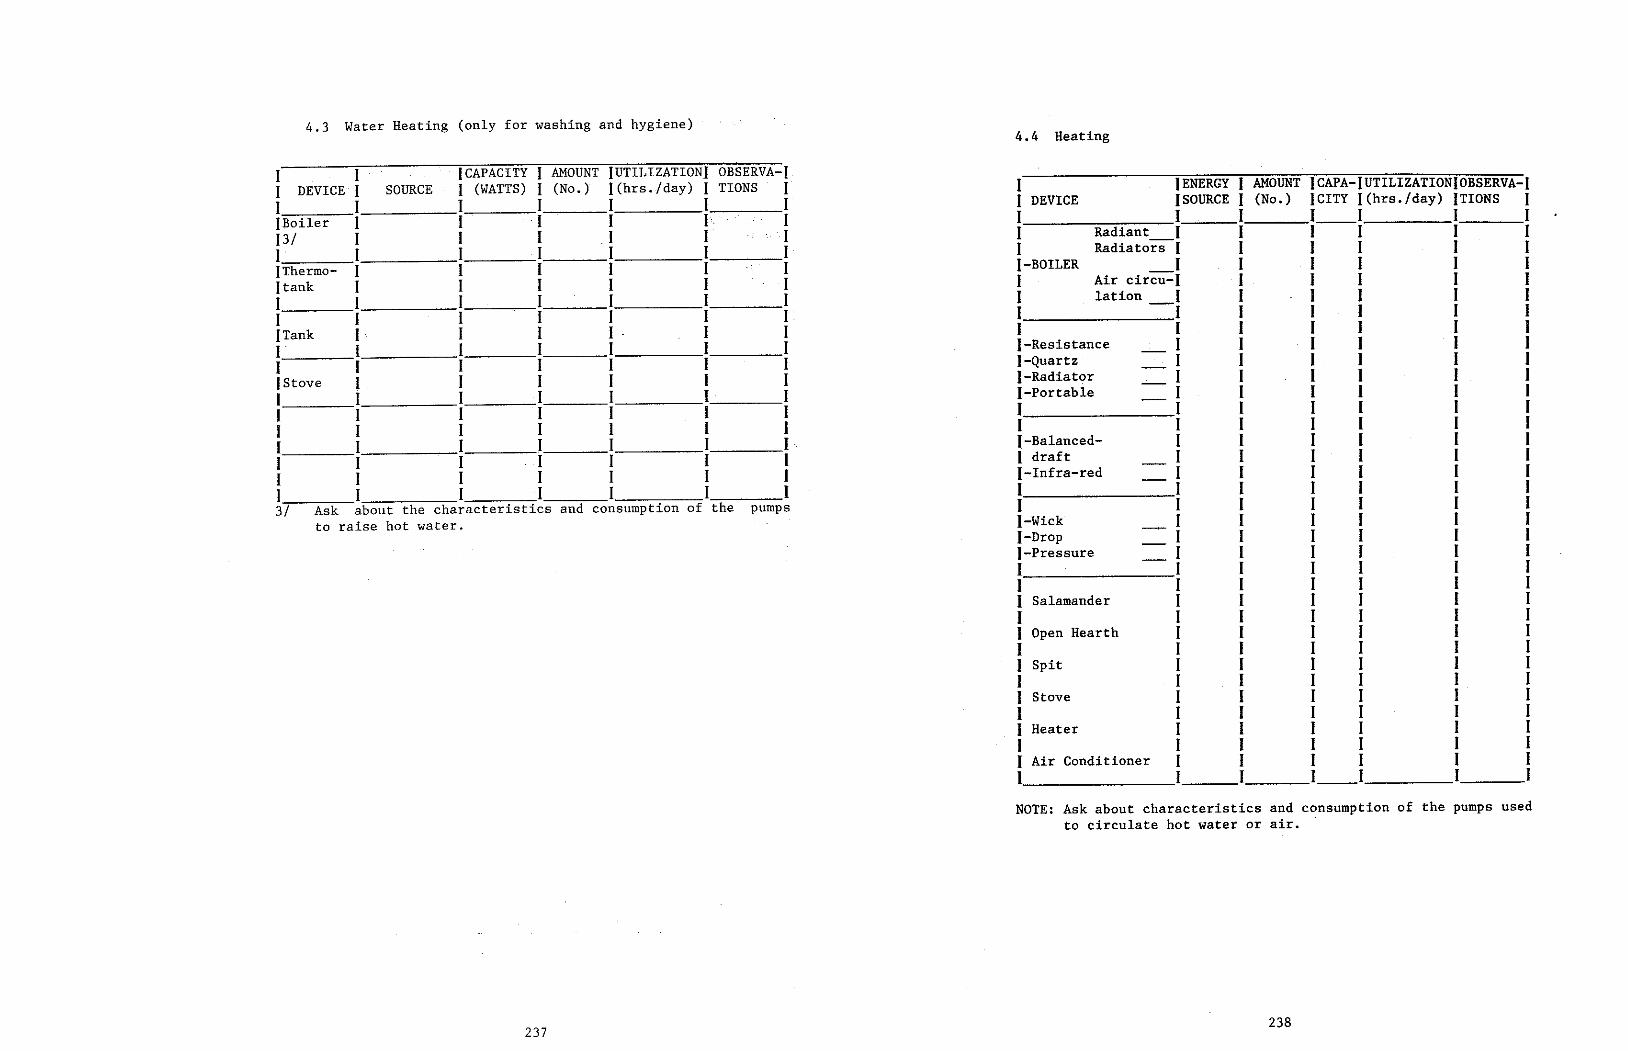
238 237
4.3 Water Heating (only for washing and hygiene) 4.4 Heating
1 1 · 1 CAPACITY 1 AMOUNT IUTILIZATION} OBSERVA-1 1 DEVICE I SO URCE 1 (WATTS) 1 (No.) l(hrs./day) 1 TIONS I 1 )ENERGY 1 AMOUNT ICAPA-JUTILIZATIONfOBSERVA-1 1 I I 1 1 1 r 1 DEVICE JSOURCE 1 (No.) )CITY J(hrs./day) fTIONS 1 {Boiler I 1 1 1 1 1 1 1 1 l __ I 1 1 13/ 1 1 1 1 1 1 1 Radiant 1 1 1 1 1 1 1 1 1 1 1 1 1 1 Radiators 1 1 1 1 1 1 fThermo- 1 1 1 1 1 1 1-BOILER 1 1 1 1 1 1 Jtank 1 1 1 1 1 1 1 Air circu-1 1 1 1 1 1 1 1 1 1 1 1 1 1 lation _I 1 1 1 1 1 1 I 1 1 1 1 1 1 I 1 1 1 1 1 JTank 1 1 1 1 . 1 1 1 1 1 1 1 1 1 1 1 1 1 1 1 1 1-Resistance 1 1 1 1 1 1 1 1 1 1 1 1 1 1-Quartz 1 1 l 1 1 1 JStove 1 1 1 1 1 1 1-Radiator 1 1 1 1 1 1 1 1 1 I 1 1 1 1-Portable I 1 1 1 1 1 1 1 1 1 1 1 1 1 1 1 1 1 1 1 1 1 1 1 1 1 1 1 1 1 1 1 1 1 1 1 1 1 1 1 1 )-Balanced- 1 1 1 1 1 1 1 1 1 1 1 1 1 l draft 1 1 1 1 l 1 1 1 1 1 1 1 1 1-Infra-red 1 1 I 1 1 1 1 I 1 1 1 1 1 1 1 1 1 1 l 1 3/ Ask about the characteristics and consumption of the pumps 1 1 1 1 1 1 1
to raise hot water. 1-Wick 1 1 1 1 1 1 1-Drop 1 1 1 1 1 1 1-Pressure 1 1 I 1 1 1 1 1 1 1 1 1 1 1 1 1 1 1 1 1 1 Salamander 1 1 1 1 1 1 1 1 1 I 1 1 1 1 Open Hearth 1 1 1 1 1 1 1 1 1 1 I 1 1 1 Spit 1 1 1 1 1 1 1 1 1 1 1 1 1 1 Stove 1 1 1 1 1 1 1 1 1 1 1 1 1 1 Heater 1 1 1 1 1 1 1 1 1 1 1 1 1 1 Air Conditioner 1 . 1 1 1 1 1 1 1 1 1 1 1 1
NOTE: Ask about characteristics and consumption of the pumps used to circulate hot water or air.
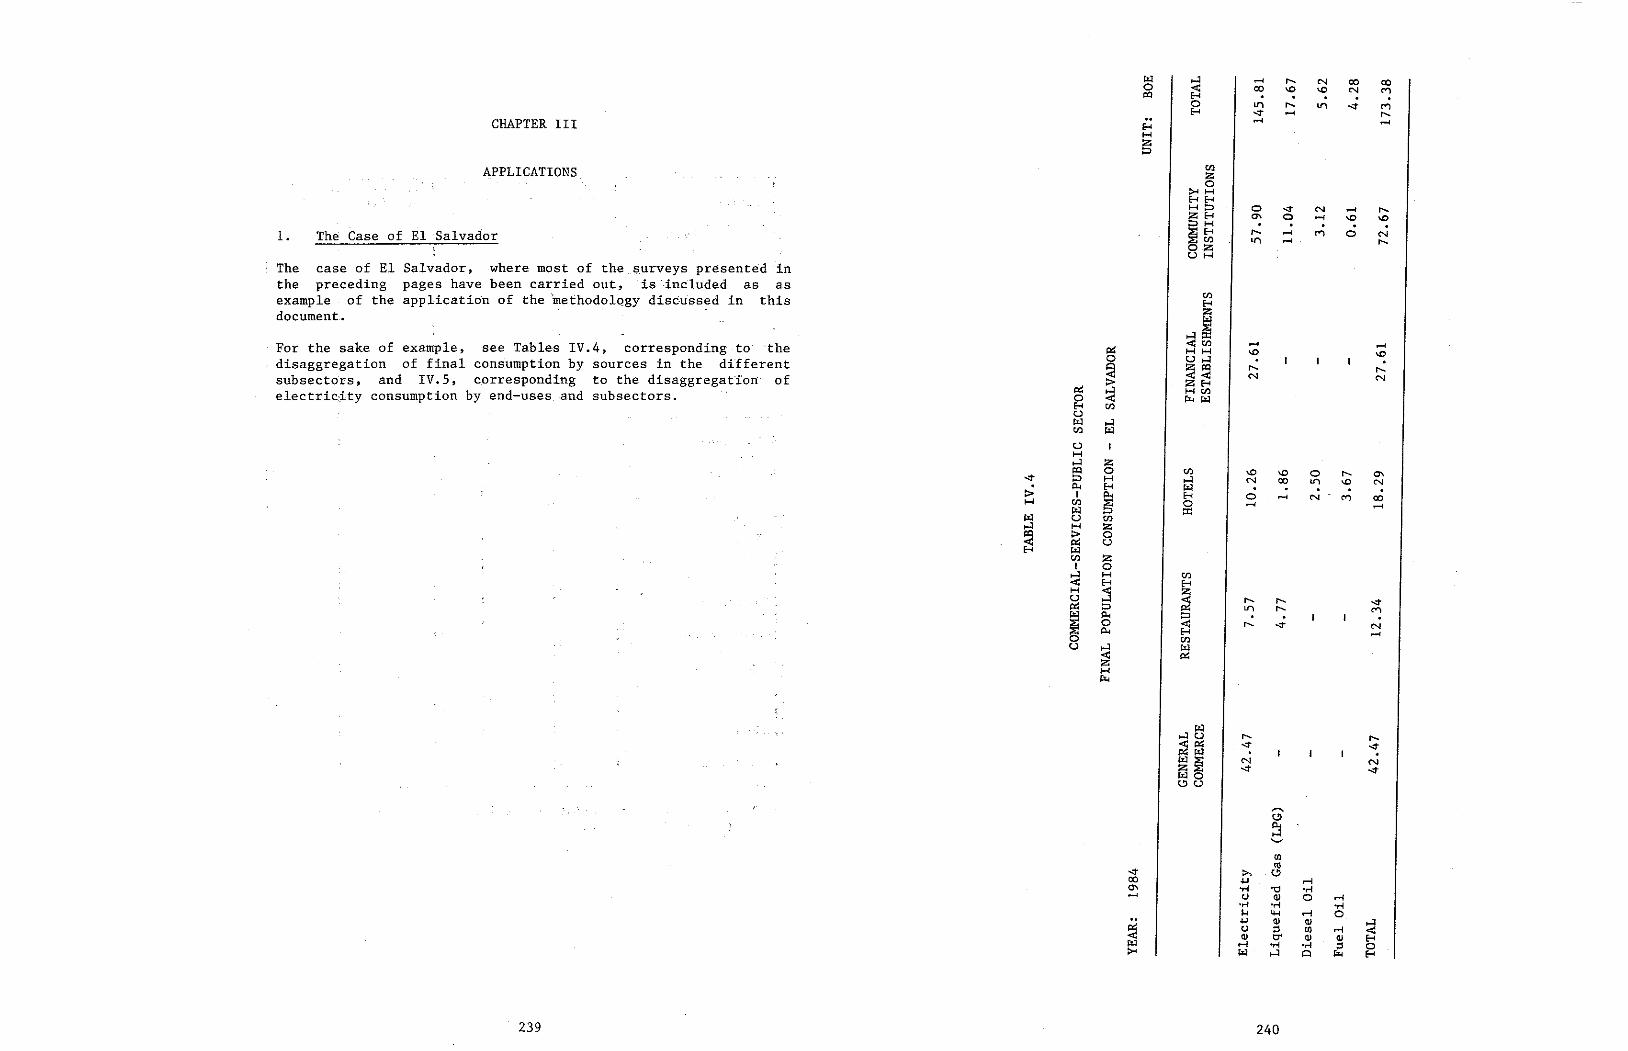
240 239
w ....1U ,.... ,.... ~~ -.:t -.:t . . ~~ N N
-.:t -.:t wo t.!>U
........ t.!> ~ ,..:¡ ...... {I) td -.:t >. {.!)
00 .µ ..-l O\ .,..¡ -e ·.-i ...... u al o ..-l
•.-i ·.-i .,..¡ ~ '+.l ..-l o .. .µ al al ~ ~ u ;:I ti) ,...¡ < al O" al al H ~ ..-l •.-i o,-i ;:I o >< w ,_::i CI µ.. H
w ...;¡ .... ,.... N 00 00 o ~ 00 \O '° N e") ~ . . . . o ll"'I ,.... ll"'I -.:t e") H -.:t .... ,....
CHAPTER III .... .... H 1-1 z ::::::>
APPLICATIONS tll z o >< 1-1 HH 1-1::::::> o -.:t N .... r-,
~~ O\ o .... '° \O . . . . l. The Case of El Salvador ~~
,.... .... ("') o N l./) .... ,.... oz u 1-1
The case of El Salvador, where most of the surveys presented in the preceding pages have been carried out, is included as as example of the applícation of the me thodo Logy disC:Ussed in this tll
H document. z w
...;¡~ For the sake of exattíple, Tables IV.4, corresponding to the < tll .... .... see ~ 1-1 1-1 -o "' disaggregation of final consUmption by in the different o u..;¡ . sources
~ ~~ ,.... ,....
subsectors, and IV.5, c.orresponding to the disaggregatfon· of N N ZH electric,ity consumption by end-uses and subsectors. ~
~ 1-1 tll o p;.. w H tll u w ...;¡ tll w u 1-1 ...;¡ z ~ o tll '° \O o ,.... O\ -.:t :::> 1-1 ...;¡ N 00 l./) \O N . ¡:i.¡ H w . . > 1 ¡:i.¡ H o .... N ("') 00 1-1 tll
~ o .... .... w II:: w u tll ...;¡ 1-1 z ~
> o ~ u w ti) z
1 o ~ 1-1 tll
H H 1-1 <
~ ~ ...;¡ ,.... ,.... -.:t :::> ll"'I r-, e") w ¡:i.¡ :::> .
~ o ~
,.... -.:t N ¡:i.¡ .... tfl u ...;¡ ~
~ ~ 1-1 p;..
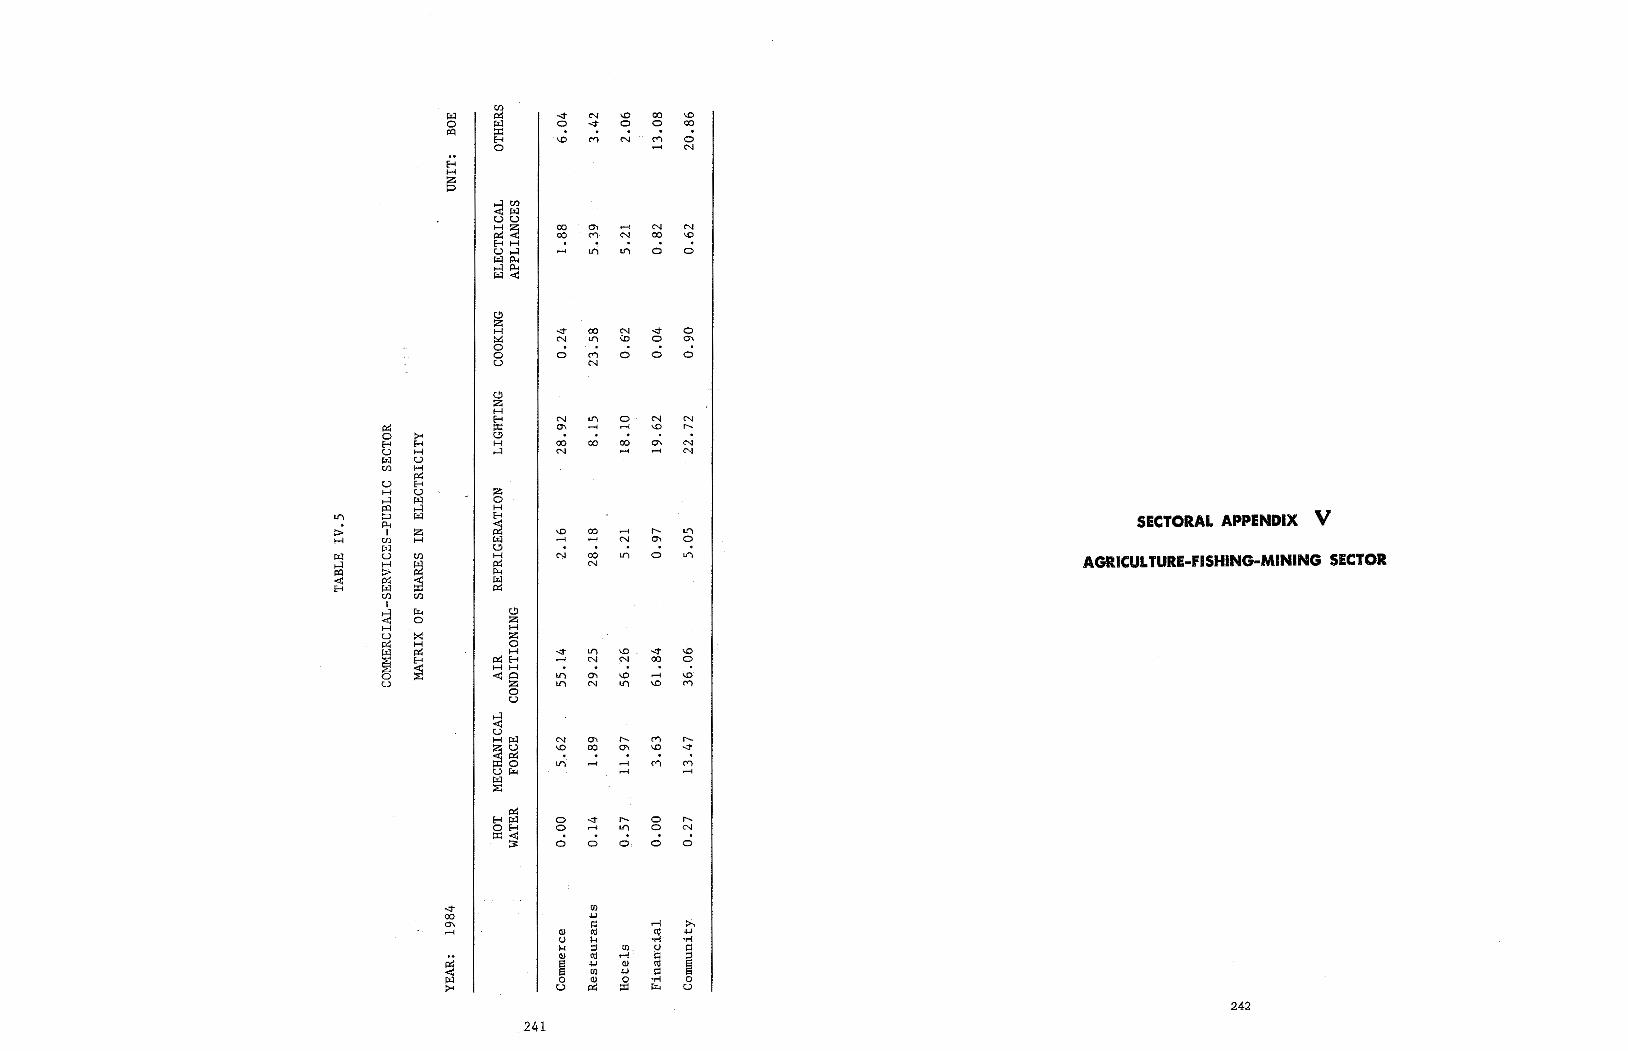
...:;t 1)) 00 .L.J
°' i::: ,...; :>.. ...... OJ cu C\l .L.J o ¡..,¡ ·.-l ·.-l k ::l OO. (.) ¡::: .. OJ cu ,...; i:::
~ ~ ~ .L.J (l) Có 1)) .L.J ¡:::
o OJ o ·rol o :>-< u ~ ::i::: µ., u
242 241
U)
w ~ ...:;t N '° 00 \O o w o ...:;t o o 00 ¡::q ::e . . . H '° C""I N (""') o o ...... N
H H z p
,_:¡ U) <d w u u ~~ 00 O'l ...... N N
00 C""I N 00 \O HH . u,_:¡ ...... ll"\ U"'! o o w p.., ,_:¡p.., w <d
C.!) z H ...:;t 00 N ...:;t o ~ N U"'! co o O'l o . o o C""I o o o u N
C.!) z H E-1 N ll"\ o· N N
r:i:: ::e O'l ....... ...... <o r-, o :>-< {.!) H H H 00 00 00 O'l N u H ,_:¡ N ....... ...... N w u tJ1 H ~ u H H u z ,_:¡ w o ¡::q ,_:¡ H
ll"\ p w H V . p._, ~ SECTORAL APPENDIX :> 1 z \O 00 ...... ...... ll"\
H tJ1 H w ....... ...... N O'l o w o . . w u U) H N 00 lli o lli ,_:¡ H ~ r:i:: N AGRICUL TURE-FISHINGmMINING SECTOR ¡::q :> µ.. <d p:: :2 µ.:¡ H µ.:¡ p::
ti) tJ1 1
~ µ.. C.!) o z
H H u :X: z p:: H o w ~ H ...:;t ll"\ '° ...:;t -o ~
H ~H ...... N .N 00 o ~
H H o <d CI l/) O'l -o ....... \O u z ll"\ N ll"\ \O C") o u
~ u HW N O'l ...... C""I ......
~~ \O 00 O\ <o ...:;t
U"'! ....... ....... (""') M uµ.. ...... ...... w ::;:::
~ HW o ...:;t r-.. o r-.. OH o ...... ll"\ o N ::e <d . . . . .
:3 o o o, o o

271
269
264
262 263
262
262
255 250
250
247 249 249
247 247 244 244
243
Survey Forms 4. Guidelines for Data Processing and Sample Expansion 3.
Analysis of Existing Information and Guidelines for Sample Design
2.
1.1 Agriculture Subsector 1.2 Mining Subsector
Data-Collecting Form l.
CHAPTER II - DATABASE FORMATION
BEEU Applied to a Unit 4. Final Energy, Useful Energy and Efficiencies 3. 2.2 Sectoral
Agriculture Subsector Fishing Subsector Mining Subsector
2.1.1 2.1.2 2.1.3
2.1 Subsectoral
Disaggregation by End-Uses 2.
Disaggregation by Subsectors l.
DEFINITIONS AND BASIC CONCEPTS CHAPTER I
AGRICULTURE-FISHING-MINING SECTOR
INDEX
Statistical
(*) See United Nations Off ice of Statistics. Reports. Series M No. 4, ISIC Rev. 2, page 16.
(**) See United Nations Off ice of Statistics. Reports. Series M No. 4, ISIC Rev. 2, PP• 16-17.
245
Statistical
Heading 122 (Wood Extraction) of the Agriculture Subsector will contaín exclusively "sawmilling camps, lumberjack contractors and lumberyards devoted rnainly to cutting wood and producing logs ..• etc." (*)
uThe operations of lumber and firewood extraction carried out in combination with sawmills, pulp factories and other transformation establishments which cannot be stated sepa- rately, are classified in Groups 3311 (Sawmills), 3411 (Wood Pulp Paper and Cardboard) or 3511 (Manufacture of Basic
, 11 (**) Industrial Chemicals), respectively.
a) Agriculture Subsector This will include the activities of Divisions 11 and 12 of the ISIC Classification, with the following clarifications:
Heading 121 (Silviculture), related to "exploitation of forests; sapling nurseries; planting, repopulation and con- servation of forests, etc.," contemplates the possibility of including charcoal production when it is done within the forest. It would be convenient to separate such production and to include that consumpt-ion under the pertinent Trans- formation Center.
should be considered in the pertinent subsector corresponding to the Industrial Sector. However, given that from an energy standpoint-- e.g., substi- tution among sources, projection of consumption and energy con- servation-- the designation of this consumption has very di~- similar characteristics depending on the sector to which it is assigned, the following reordering is proposed at the subsectoral level:
from agroindustries the fishing industry metallurgy
agriculture fishing from mining from
Therefore, "the establishment or unit according to the type of activity should be classified in the group of the ISIC which includes the goods or services that constitute the bulk of the gross product. Thus, for example, an establishment which com- bines the cutting of trees with a sawmill will be classified as a sawmill and the clay quarry combined with a brick factory will be classified as a brick factory." (*)
According to this criterion, the energy consumption associated with the activities of establishments which cannot be separated:
244
On the basis of groups, the ISIC classification considers the possibility of determining the principal activity or groups of principal activities, However, in practíce there is vertical integration of activities (examples given previously), which makes it impossible to obtain ínformation (value added, number of employees, etc.) for each product, service or group.
In addition to this problem of distribution of consumption among sectors, there are others regarding the treatment of information (specifically the universe of reference of the sample frame).
This sector is perhaps one of the most controversia! in terms of the problem of assignation of energy consumption among sectors, since the information concerning many of the productive activi- ties does not in principle seem to be duly separated as to what is strictly primary (and therefore attributable to Agriculture, Fishing and Mining) and what undergoes a process of transforma- tion (attributable to the Industrial Sector). For the sake of example, let us cite: the mining-metallurgy complexes; the ex- traction of wood combined with the manufacture of paper pulp; fishing and processing of fish products, etc.
This sector will only include direct energy consumption, i.e., not the energy content of the inputs, equipment and materials used in the units of exploitation, since these are accounted for under the Industrial Sector. For example, the energy equivalent of ínorganic fertilizers íncorporated into agriculture will not be counted, nor will the explosives used in mining.
refine other other sec-
Just as in the industrial sector, it is necessary to certain activities which might be accounted far under matrices of the energy balance (supply) or included in consumption sectors, orto include consumption from other tors.
Table V.2 presents the proposed classification far disaggrega- tion of the three subsectors to be incorporated into the present methodology, as well as the codes far the headings to be consid- ered under each subsector.
This sector groups the activities related to the primary production corresponding to the Major Divisions l and 2 of the ISIC Classification: on the one hand, Agriculture, Hunting, Forestry and Fishing and, on the other, Exploitation of Mines and Quarries, the divisions and headings far which are presented in Table V. l.
Disaggregation by Subsectors l.
DEFINITIONS AND BASIC CONCEPTS
CHAPTER I
247
the use of water (from surface or subsurface irrigation can be thraugh motorpumps run on
Irrigation: sources) far
ii)
harvesters, plant- farm machinery which
The type of equipment includes tractors, ers, etc., i.e., primarily motor-driven consumes mostly conventianal fuels.
i) Farrning activities: these correspond to preparation of the soil (plowing, disking, hoeing, etc.), planting, clearing, supervision, protection and harvesting. Depending on the production methods used, these tasks can be carried out using only hand labor, by combining hand labor with animals or with farm machinery, or by combining hand labor, ani- mals, and farm machinery.
This includes all of the tasks carried out in agriculture for farming, livestock-raisíng and forestry. The principal tasks are detailed belaw:
2.1.1 Agriculture Subsector
The disaggregation of energy consumption into end-uses presents such different features-- according to the subsector, technology, equipment and source being dealt with-- that it is necessary to detail the production processes or tasks of each subsector in order to quantify the useful energy resulting from each end-use.
2.1 Subsectoral
2. Disaggregation by End-Uses
Divisions 21 (Exploitation of Coal Mines) and 22 of Crude Oíl and Natural Gas) will be excluded, energy consumption associated with these activities for under the Energy Sector (supply).
Furtherrnore, (Production because the is accounted
to exclude metal refining, recovery and forging, as well as the production of ingots, bars, billets, tubes, etc., in isolated (non-integrated) establishments included in Divi- sion 372 (copper, aluminum, lead, etc.) of the Industrial Sector.
to exclude the iron and steel industry (incorporated into the Industrial Sector)
to include all of the energy consumption of the integrated complexes.
Therefore, in addition to the energy consumption pertinent to this subsector, it is proposed:
Thus, it clearly appears that for integrated establishments, ít will prove extremely difficult to disaggregate energy consumption between what is strictly Mining and what is strictly Industrial (Metallurgy).
246
Thus, whereas in Large Mining most of the.establishments have integrated processes including the three stages, in Medium-size and Small Mining the first two can appear together or separately.
EXTRACTION-------[ ENRICHMENT----------[ METALLURGY
In addition, different types of establishments can be presented, generally classified under Large Mining, Medium-size Mining and Small Mining, devoted to mining-metallurgy activitíes which can cover different stages of the production process.
In mining activity, the stage of extraction culminates with the obtention of the ore for which purpose, in certain cases, it is necessary to remove variable amounts of sterile products. The ore treated in the enrichment plants makes it possible to obtain concentrates; the percentage of mineral increases in different concentration ratios according to later treatrnent (rnetallurgy).
The exploitation of mines and quarries includes the extraction, preparation and enrichment of minerals, as well as complementary activities (crushing, cribbing, lixiviation, fusion, etc.) to prepare and enrich ores and other raw minerales, in arder to facilitate their later marketing.
c) Mining Subsector
In the event that these stages cannot be separated, it would be convenient for the consumption originated by these to be in- cluded within this subsector.
The ISIC classification establishes that: 11the processing ships that are devoted exclusively to the elaboration of fish products and that can be considered as isolated establishments are classi- fied under Group 3114 (elaboration of fish, shellfish, ... )11, so that if this is the case of a given country, the respective energy consumption is accounted for under the Industrial Sector. In practice, it can prove extremely complex to separate the activities of capture and manufacturing and, therefore, the ener- gy consumption related to each one of these stages.
It will cover energy consumption in commercial fishing, including that done by the processing ships and fleets devoted to fishing and elaboration of fish products.
In sorne countries this subsector is quite difficult to express. In such a case it is proposed that it not be disaggregated from the Agriculture Subsector.
Fishing Subsector b)
Therefore, in order to account for the energy consumption associated with Group 122, it will be necessary to subtract that accounted for in the above-mentioned industrial groups.
249
Ventilation (extractors and ventilators)
Lighting (electric, batteries, carbide, etc.)
Mechanical Force (drills, mechanícal shovels, rakes, conveyor belts and rails, elevators, pumps, etc.)
i) Extractíon
The activities carried out in the productive process of this subsector demand the consideration of different end-uses according to the stages of extraction, enrichment, and metallurgy in reference. In the case of TRANSPORTATION. it is necessary to clarify that the movement of minerals and/or materials within the mine will be accounted foras Mechanical Force (conveyor belts, rails, etc.); on the other hand, transport through pípelines from the mines storage area to the outside will be accounted for under the Transportation Sector.
Mining Subsector 2.1.3
Steam (sterilization, etc.) Refrigeration (refrígerators, freezers, etc.) Direct heat (water heating, drying, cooking)
In the second case, it will also be necessary to add:
Mechanical Force (cranes, mills, etc.) Transportation (displacement to and from the place of capture)
In the first case, the end-uses will be:
The energy end-uses to be accounted for under this subsector may be broken down according to whether or not the ships are devoted only to fishing or if they also do processing.
2.1.2 Fishing Subsector
Tractors and Farro Machinery Irrigation and Water Pumping Transportation and Fumigation Others
Lighting Refrigeration. Drying Water Heating and Space Heating Mechanical Force
It is proposed that this list be grouped as follows:
Lighting Transportation Fumigation
248
Movable Mechanical Force (Tractors and Farm Machinery) Stationary Mechanical Force (Stationary Motors) Irrigation Water Pumping Refrigeration Thermics
Heating Water Heating Drying
Thus, the end-uses associated with these tasks would be:
ix) Treatment with agrochemicals: this is the use of pesti- cides, herbicides, insecticides, etc., in pre- and post- planting on farms and plantations and in livestock-raising. Energy consumption is included in í) except for that related to aerial fumigation carried out by the unít itself.
The resídues and excrements may come from the crops and livestock on the farro into whose soil they are incorporated. In thís case, the energy consumption for that incorporation (e.g., through plowing) is included under a) and no energy consumption should therefore be added in.
viii) Organíc enrichers: this is the organic rnatter incorporated into the soil through crop resídues and animal excrements.
vii) Inorganic fertilizer: this is the incorporation of inor- ganic nutrients ínto the soil. The energy consumption of this activity is included under i) and v).
vi) Support transport for marketing: this is what occurs be- tween the unit of production and the centers of storage or sale, whether through automotive vehicles or manpower.
this is what is needed through automotive vehi-
Support transport for production: for productive processes, whether eles, pack animals or manpower.
v)
Livestock-raising activíties, workshops, and lighting: these refer to the breeding and fattening of livestock in specific installations, as well as the extraction, cooling and treatment of milk prior to commercialization or domestic industrialization; and to the repair of machinery and tools in the unit of production. These activities may require direct energy consumption in motors and specific equipment, and in lighting for the facilities.
iv)
iii) Water pumping: for livestock troughs. The alternative end- uses are listed under ii).
fuel or electricity, windmills, manual pumps, animal force, waterwheels or simply by gravity.
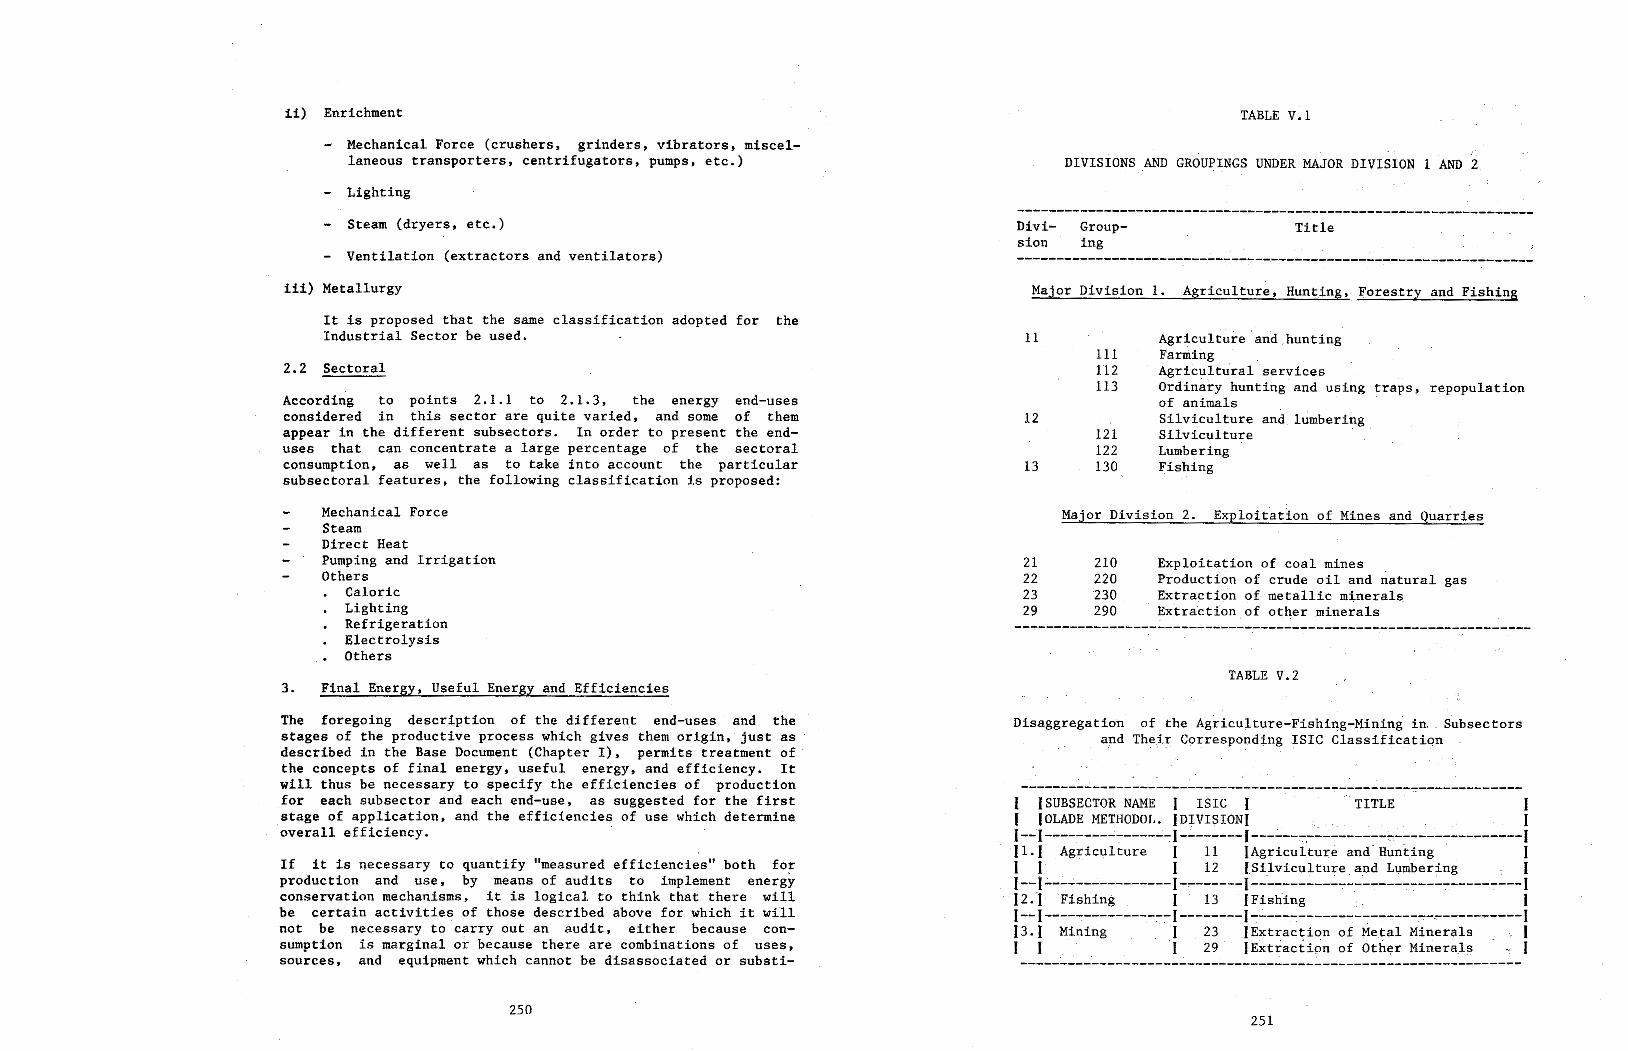
251
f (SUBSECTOR NAME 1 ISIC 1 TITLE 1 f IOLADE METHODOL. }DIVISIONI . . . . . . . 1 I-~l--------------~"."1-~------1---.:...---:-~~--------:-"'."-------"."--------I 11. I Agriculture 1 .11 [Ag r í.cu Lt.ure and Hunt Lng · 1 1 1 1 12 lSilvículture and Lumbe r í.ng 1 I -- I __ .:_ ~-----..,.--- 1-=-------1--·--------~..,..:...-:-·...,-:-----:--:----..,.-----.-:----1 f z.j Fishing . 1 13 · [Fd shí.ng . · 1 1--1--------------..,.-1--------1-----~--------..,.--:-----~-~-----~----1 f 3. 1 Minirig . ·• 1 23 JExtraction of Me.tal Minerals . 1 1 1 1 29 [Ext rac t Lon of Other Mineralf> ~ 1 ,. ---------------------------------------------------------------
Disaggregatioh · of the Agriculture-Fishing-Mining in Subsectors and TheLr Correspo~ding ISIC C'Las s í.f Lca t Lon
TABLE V.2
----------------------------------------------------------------- . . .
210 220 230 290
Exploitation of coa! mines Production of crude oíl and natural gas Extraction of metallic m:i,neral$ Extractfon.of other minerals
21 22 23 29
Majar Division 2. Exploitation of Mines and Quarries
121 122 130 13
12
111 112 113
Agriculture and hunting Fa rm Lng . Agricultura! services Ordinary hunting and using traps, repopulation of animals · Silviculture and lumbering Sil v í.cu L ture Lumbering
.Fishing
11
Majar Division l. Agriculture, Hunting, Forestry and Fishing --------------------------------.---------------------------------
Title Group- ing
Divi- sion -----------------------------------------------------------------
DIVISIONS AND GROUPINGS UNDER MAJOR DIVISION 1 AND 2.
TABLE V.l
250
If it is necessary to quantify "measured efficiencies" both fo! production and use, by means of audits to implement energy conservation mechanisms, it is logical to think that there will be certain activities of those described above for which it wi11 not be necessary to carry out an audit, either because con- sumption is marginal or because there are combinations of uses, sources, and equipment which cannot be disassociated or substi-
The foregoing description of the different end-uses and the stages of the productive process which gives them origin, justas described in the Base Document (Chapter I), permits treatnient of the concepts of final energy, useful energy, and efficiency. It will thus be necessary to specify the efficiencies of production for each subsector and each end-use, as suggested for the first stage of application, and the efficiencies of use which determine overall efficiency.
3. Final Energy, Useful Energy and Efficiencies
Mechanical Force Steam Direct Heat Pumping and Irrigation Others
Caloric Lighting Refrigeration Electrolysis Others
According to points 2.1.1 to 2.1.3, the energy end-uses considered in this sector are quite varied, and some of them appear in the different subsectors. In arder to present the end- uses that can concentrate a large percentage of the sectoral consumption, as well as to take into account the particular subsectoral features, the following classification is proposed:
2.2 Sectoral
It is proposed that the same classification adopted for the Industrial Sector be used.
iii) Metallurgy
Ventilation (extractors and ventilators)
- Steam (dryers, etc.)
Lighting
Mechanical Force (crushers, grinders, vibrators, miscel- laneous transporters, centrifugators, pumps, etc.)
ii) Enrichment
253
Expression (2), in technical units, takes the form:
V (2) F = ------------
p • Ri
iii) The value for F can also be calculated on.the basis of motor output (P), mechanical efficiency (R¡)_ and plowing speed (V):
This is the work that would be required in the drawbar.
T = 1080 kg x 8333.3 m = 9 x 10⁶ kgm = 33,3 CVh
the.distance covered in plowing one hectare with a width of 1.20 mis d = 10 000 m2/l.20 m = 8333.3 m
In the example above, if the surface to be plowed were one hectare (ha), then:
T = Fdx (1)
ii} As in the case of the Transportation Sector, the work here would be:
F = 1800 cm2 x 0.6kg/cm2=1080 kg
traction
120 cm x 15 cm= 1800 cin2
surface area of plowed section:
4 x 12" = 4x 0.30 cm= 1.20 m
tilling width
Therefore, if what is desired is to measure the traction required by a plow with·four 1211 disks plowing 15 cm deep in a soil whose tilling coefficient is 0.6 kg/cm2:
The tilling coefficient depends, fitst of all, on soil conditions; it is higher in· soils which are irrigated by infiltration than in those irrigated by aspersion. Other factors which influence the value of this coef(icient are the specific weight of the soil, the weight of the plow, the speed of plowing, the humidity of the soil and the design of the plow.
For the sake of example, sorne values are presented in Table V.4.
252
The drag developed by the tractor· is known as "t ract í.on" and the unit of measure will be kg of force. The farming activ- ity which can best serve to illustrate the different factors which have a bearing on traction force is plowing. Special- ized literature discusses the concept of the 11tilling coef- ficient" which refers to the traction needed 'par uriit of surface area of the plowed section (kg/dm2 or kg/cm2). This coéfficient is determined experimentally in each country or region and is usually tabulated for different types of soil.
i)
Just as in the Transportation Sector, quantification of overall efficiency in the case of the use of FARM MACHINERY AND T~CTORS deserves come clarifications related to the concept of work and the end-use of mechanical ' · · force cor responddng to farming activities. An att:empt is made to. provide a method for quantifying EFFICIENCY. OF USE, for · which purpose the analysis will be limited to the case of ttactors used in plowing.
In·this case, an attempt is made to separate FARM MACHINERY AND TRACTORS from the rest of the. end-uses, since they constitt.ite the principal consumer of direct energy in this subsector and since the rest of the end-uses (refrigeration, drying, water . heating, etc.~- i.e.. the . "proceas" uses) merita treatment similar to that of any industrial process.
Agriculture Subsector
. In the case of transportation in fishing per se, there is no practica! significance for measuring efficiency of use since it has been Lnc Luded under the Transportation Sector.
Evidently, it will be more important.to consider efficiency of use .in integrated processes such as mining and metallurgy and fishing and the fishing industry tban in small mining (low degree of mechanizatioti and, therefore, very low energy corisumption of irtanimate sources) or in fishing. In the two cases cited for integrated processes, the type of measure- ment to be taken is identical toan industrial audit, since the end-uses under consideration are similar •.
Mining and Fishing Subsectors:
To measure efficiency of use, it will be necessary to analyze the st~ges of the productiva process of the three subsectors consid- ared , which can be· sumamriz.ed as follows: ·
con- which·
the
·Furthermore, the efforts to carry out energy audits should centrate on thosé stages of thé productive process for there are no specific uses for a source, as well as on enetgy-intensive nature of the product~
tuted for (wind energy in windmills for pumping drinking water to animal troughs).
255
Of the three subsectors analyzed, Mining is perhaps the one which entails the greatest difficulty in terms of allocation of con- sumption, for its later transfer into the energy balance. Hence,
BEEU Applied to a Unit 4.
Only in uses other than mechanical force, basically in the ca- loric uses or processes described under point 2.1.1 of this chapter, it is feasible to take into account the measurement of the efficiencies of use, in which case an indispensable condition will be to analyze the importance that energy consumption has for the end-uses in consideration.
On the basis of points i) through v), particularly point iv), it is possible to deduce that in the case of the agricultura! sec- tor, the efficiencies of use cannot always be measured for farm machinery and tractors, since the efficiency (Rl) is basically determined by soil conditions, which can be modified very little and do not lend thémselves to any implementation of energy con- servation whatsoever.
(6) p R1 R2
F ------------------- V
where F will be:
CKdx (5) R
Fdx
overall efficiency will be:
C - specific consumption (lt/km) K - calorific value of the fuel (Kcal/lt) dx - tractor displacement (m)
where:
(4) C K dx
Accepting that the final energy which is really used in the farming under consideration is:
Given that there is no heat engine which absorbs heat from a light bulb at one same ternperature and transforms it com- pletely into mechanical force, there will be an efficiency of production to be quantified in order to evaluate the resulting final energy.
needed to accelerate and keep in movement the tractor and farm machínery dragged along behind it, plus the work which comes into play dueto the drag force developed by the tractor."
254
The total force along the way will then be the work Fdx equal to useful energy, which could be defined as "the work
l. 20 m X 0. ]5
v)
E(CVh/ha) = ------------------------------------- = 44.4 CVh/ha 1080 kg x 0.037 (CVh/kgm)
Continuing with the example, the energy required in the motor will be a function of R1. Suppose a new field (R¡ = 0.75), the energy required in the motor will be:
This efficiency can well be considered asan EFFICIENCY OF USE since it is a function of the conditions of utilization. Table V.3 shows, asan example, some of the values for R¡ for different types of soil; it can be seen that, as the rolling resistance coefficient increases, the mechanical efficiency decreases for average traction.
iv) Power in the motor
(3) ---------------------- R¡ = Power in the bar
The relation between the power of the bar and that of the motor is known as the mechanical efficiency of the tractor or traction efficiency and it constitutes what was termed R¡ in the foregoing expression:
Skidding causes losses of power because it reduces the space covered. The greater the traction capacity, the lesser the skidding. The traction force is: 1) directly proportional to the weight of the wheels with drive; 2) direclty propor- tional to the diameter and width of the tires; 3) inversely proportional to the pressure of the tires on soft soil and 4) dependent on the type of tread.
The rolling resistance of the tractor is the power it needs to keep itself in movement ata given speed, without a load. lt depends on: a) the type and state of the soils; b) the load of the axis (the larger the ~oad, the greater the resistance); e) the pressure in the tires (in compacted roads resistance is inversely proportional to pressure, but on worked land it is directly proportional) and d) the size of the wheels, since the greater their diameter, the lesser the resistance (see Table V.3).
In referring to the output of a tractor, it is necessary to specify clearly what is being dealt with: motor output, measurements of the pulley or force intake or the measure- ments of the drawbar. The difference between the first and the second is dueto: a) losses dueto friction in the tractor transmission; b) rolling iesistance and c) skidding.
V(km/h) • 0.0037 (CVh/kgm) (21 ---------------------------- P(cv) . R¡
257
On the basis of these auxiliary sheets for each establishment, it is possible to generate final consumptíon and useful consumption by sources and end-uses in the subsector.
Table V.5 shows a type of auxiliary data sheet in: line with the disaggregation of energy sources in the OLADE methodology, and contains details on final consumption anda series of data for calculating useful energy.
Thís final consumption, when added by sources, can be lower than the NEI; the dífference is explained by the fact that part of these flows should form part of supply (case of auto-production) or part of another consumption sector (in this case, the Trans- portation Sector).
direct auto-productíon ihdirect auto-productíon transportatíon outside the complex.
256
Final consumption by sources will thus result from adding to, or subtracting from, the NEI, as necessary:
The fuels used in means of transportation outside the mining complex will be accounted for in the Transportation Sector. However, the energy used to move freight or passengers within the mining complex will be accounted for under ºMechanical Force" in this subsector.
Another example of the NEI may be the indirect auto-production through electricity based on steam. This steam comes from recy- cling in the boiler to feed into the steam turbogenerators; it is therefore necessary to do a boiler balance previously. In the flow diagram, this balance appears afterwards in order to be able to express the stearn in terms of the fuels that produce it, subtracting them from the respective NEI and adding the auto- produced electric power to the NEI.
Once the · NEI has been determined, the flows for each source should be identified according to the scheme presented in Figure V.1. The first destination of the energy that enters can be Direct Auto-Production of electricity through steam, whether in hydraulic generators, diese! groups or gas turbines. In this case, the hydroenergy and the corresponding energy sources should be subtracted and the electricity bought should be added to that purchased.
that the establishment may auto-produce electricity by means of a hydraulic generator, in which case, a1though the energy is not bought, ít should be accounted for in the balance.
that the establishment may sel! energy, in which case that energy should be subtracted from the purchases. If there is auto-produced electricity sold to third parties or delivered to the public grid, it inay occur that the NEI will be nega- tive. A similar situation may arise with steam.
The concept of Net Energy Input (NEI) responds to the energy that enters the establishment, disaggregated by sources. In many cases. the NEI will be equivalent to purcfiases but, in order to generalize the treatment, the two following situations should be kept in rnind:
In order to make this treatment general, let us begin by assuming that a mining plant-- particularly mining-rnetallurgical com- plexes-- can huy and produce energy, whether primary or secon- dary, for transformation into useful forms (steam, direct heat, mechanical force, etc.). These sources can be disaggregated according to the ones represented in the general summary matrix of the OLADE Energy Balance.
the application of flow diagrams for designing balances for one productive firm or unit is presented below only in the case of the Mining subsector.
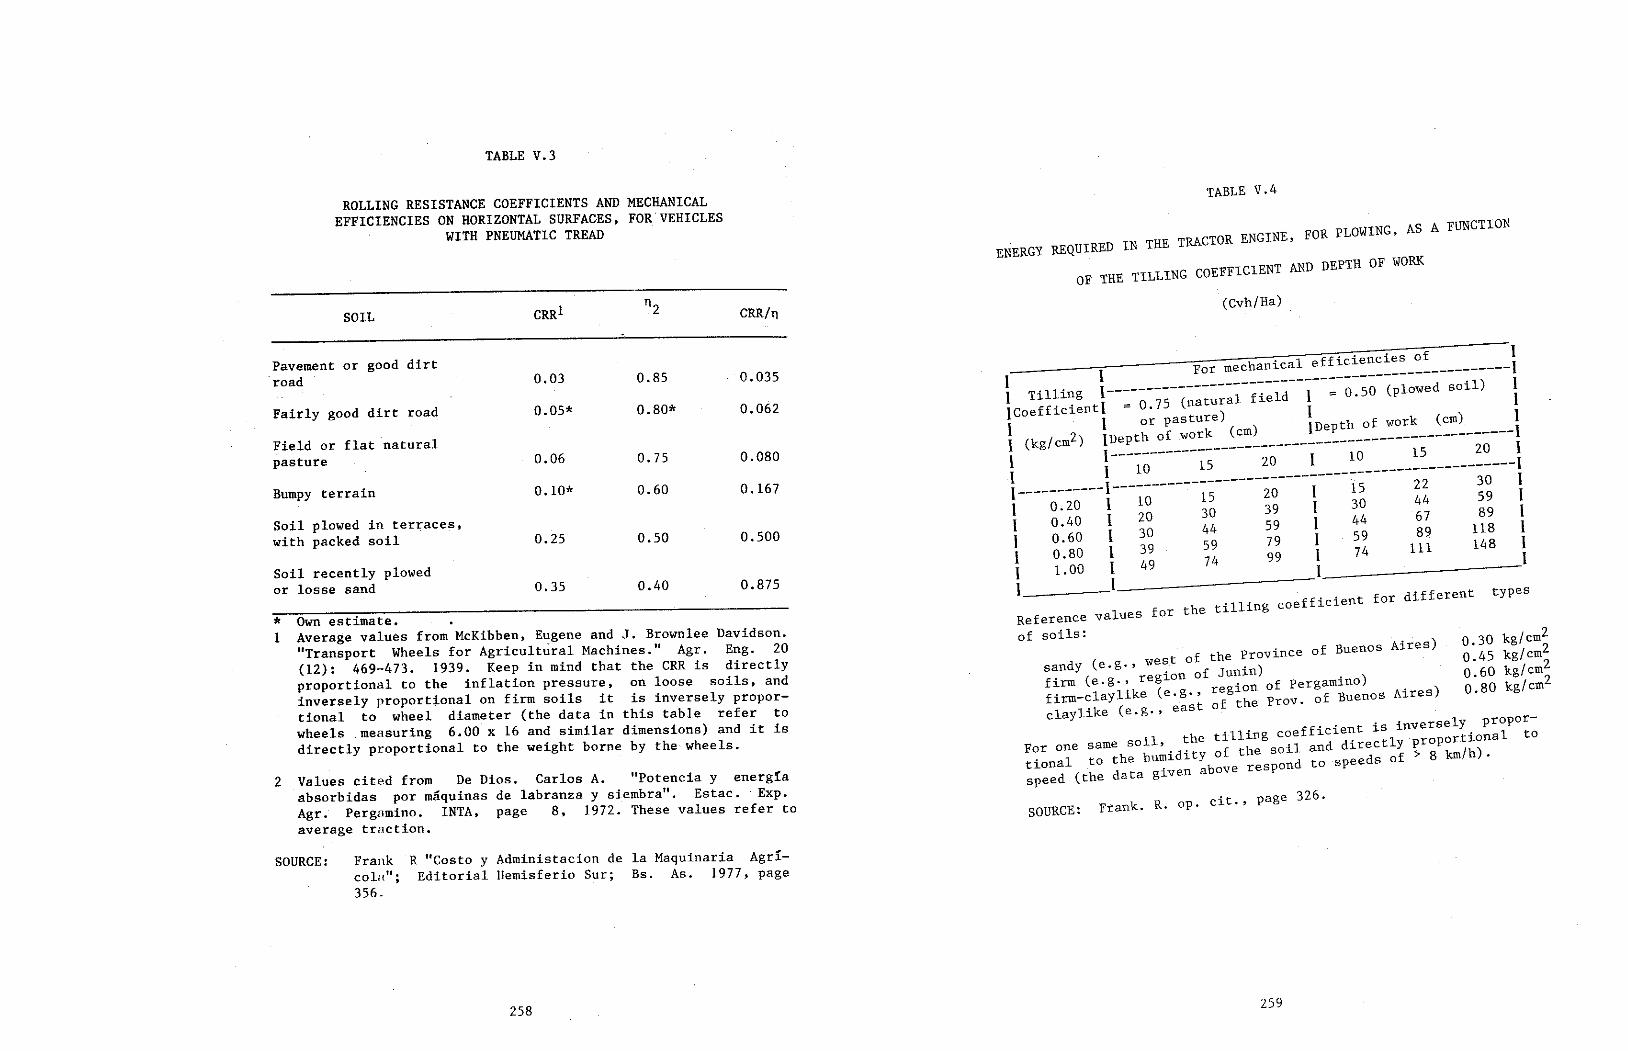
259
Frank. R. op. cit., page 326. SOURCE:
t of the Province of Buenos Aires) sandy (e.g., wes . ) . ( region of Junin firm e· g · • . . on of Pergamino) firm-claylike (e.g., regi p of Buenos Aires) claylike (e.g., east of the rov.
. tilling coefficient is inversely. propor- For one same soil, the ·1 d directly proportional to tional to the humidity of the soi an ds of > 8 km/h).
d given above respond to spee speed (the ata
0.30 kg/cm2 0.45 kg/cm2 o.60 kg/cm2 0.80 kg/cm2
types coefficient for different Values for the tillíng Reference
of soils:
I I For mechanic~=-~::=~=~~~=~~-~:_____ \ l Tilling ¡----------(------~-;~:~~ l = 0.50 (plowed soil) 11 JCoefficientl = 0.75 natura I l or pasture) De th of work (cm) 1 } (kg/cm2) JDepth of work (cm) ---~--~----------------------! 1 \---------------------- 10 15 20 1 1 ¡ 10 15 :~----~-------------------------1 1-----------1------------- 20 ¡ 15 22 30 l l o. 20 I 10 15 1 30 44 59 1 I o.40 l 20 30 39 1 44 67 89 I l 0.60 1 30 44 59 l 59 89 118 1 I o.so 1 39 59 79 1 74 111 148 1 1 l. 00 1 __ 4_9 ---7 4_. ---99 __ 1 l 1 1
ENGINE. FOR PLOWING, AS A FUNCTION ENERGY REQUIRED IN THE TRACTOR
OF THE TILLING COEFFICIENT AND DEPTH OF WORK (Cvh/Ha)
TABLE V.4
258
R "Costo y Administacion de la Maquinaria Agrí- Editorial Hemisferio Sur; Bs. As. 1977, page
Frank cola"; 356.
SOURCE:
2 Values cited from De Dios. Carlos A. 11Potencia y energía absorbidas por máquinas de labranza y siembra". Estac. · Exp. Agr. Pergamino. INTA, page 8, 1972. These values refer toaverage traction.
* Own estímate. 1 Average values from McKibben, Eugene and J. Brownlee Davidson.
"Transport Wheels for Agricultura! Machines." Agr. Eng. 20 (12): 469-473. 1939. Keep in mind that the CRR is directly proportional to the inflation pressure, on loose soils, and inversely proportional on firm soils it is inversely propor- tional to wheel diameter (the data in this table refer to wheels rneasuring 6.00 x 16 and similar dimensions) and it is directly proportional to the weight borne by thewheels.
Soil recently plowed or losse sand
Soil plowed in terraces, with packed soil
Bumpy terrain
Field or flat natural pasture
Fairly good dirt road
0.03 0.85 0.035
O.OS* 0.80* 0.062
0.06 0.75 0.080
0.10* 0.60 0.167
0.25 0.50 0.500
0.35 0.40 0.875
Pavement or good dirt ·road
CRR/ri SOIL
ROLLING RESISTANCE COEFFICIENTS AND MECHANICAL EFFICIENCIES ON HORIZONTAL SURFAGES; FOR.VEHICLES
WITH PNEUMATIC TREAD
TABLE V.3
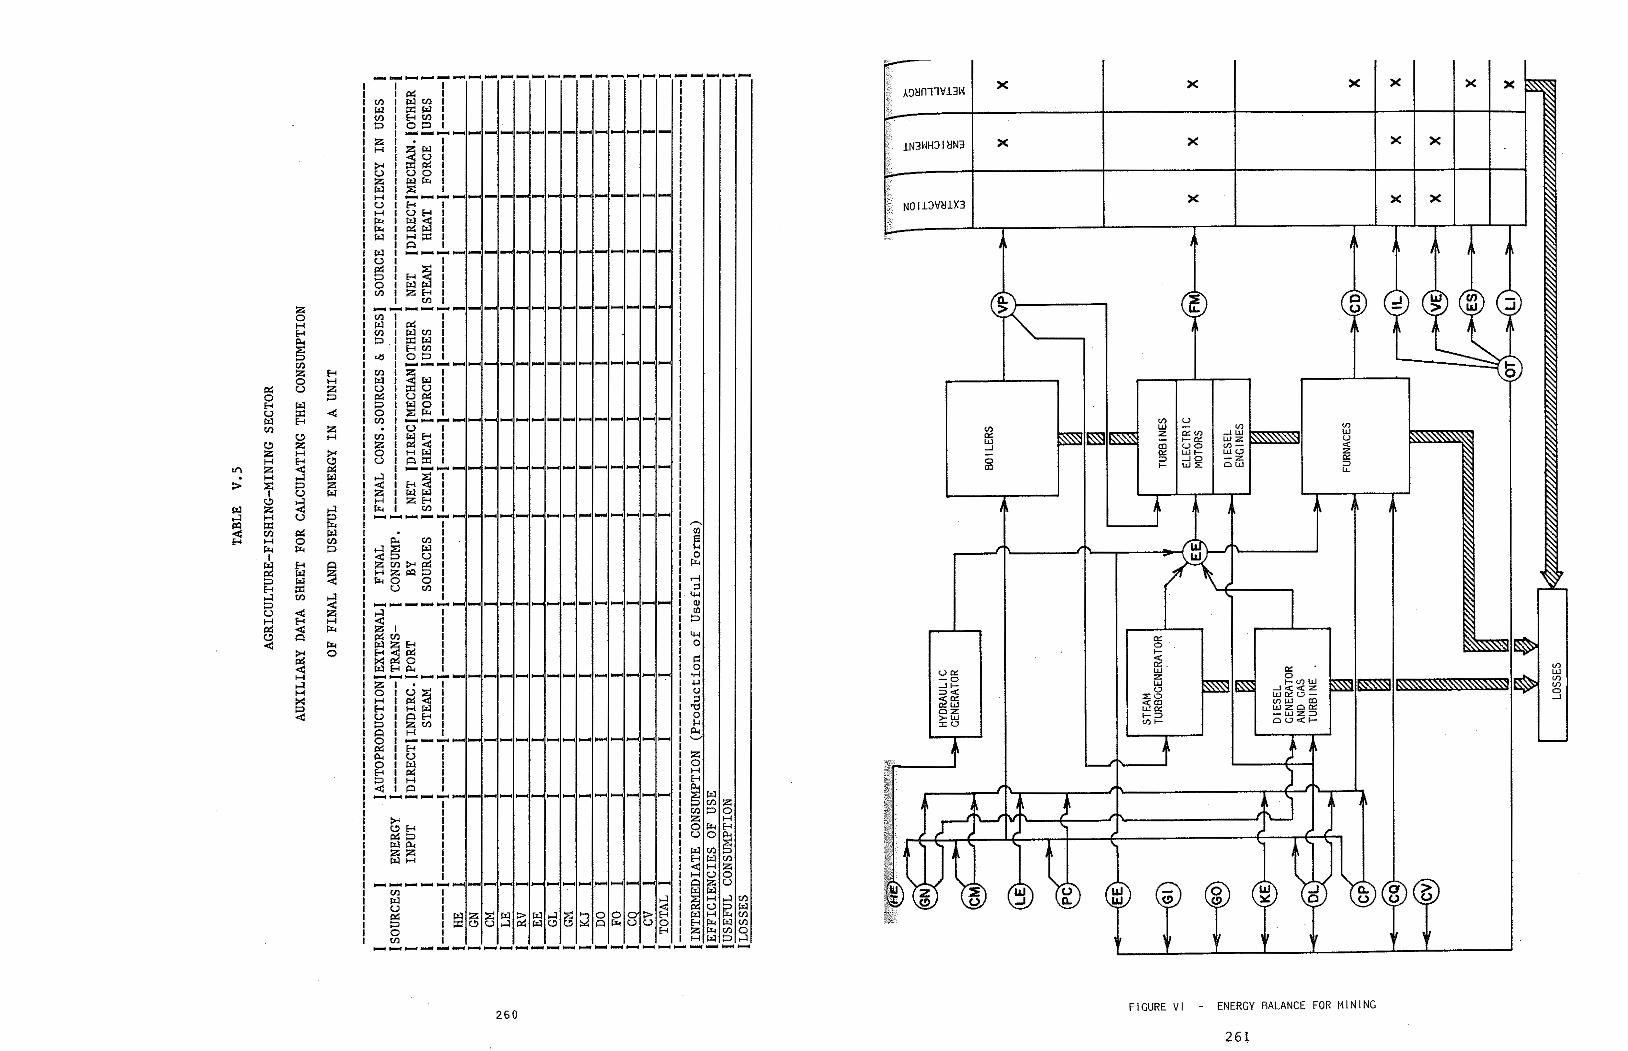
26t
ENERGY BALANCE FOR MlNlNG
V) lJ.J V) V) o _J
o:: o 1- <I) w
....l<C<CZ w e:: o - U') w al wzaet: -wz::i Q(.J<(I-
U') u (/) w (/) U')
o:: z o:: U') ...JW w w 1- o:: wz u _J CD c..>O U') - <C
a:: WI- w o z o ::i ...JO -z o:: al 1- w::;: QW ::i
u,
..J
FIGURE VI
o (!)
a:: o 1- <C ¡:}. z w LJ
::;:o <CCD wa:: 1- ::i U') 1-
X X
X
e (.)
X
X
X X
X
X
X
u a:: .-o _J 1- ::i <C <Ca:: c::w az >-W ::i: LJ
X 1N3WH'.)IMN3
NOID\fMlX3
X X A'.:JMílll\fl3W
260
'H o ¡::: o
~---- ....... ........:~ ...... ~ t ·r--4 .µ C)
.g o ~ p..
.............. ......- ...... 1 1 l 1 1 l 1 1 l 1
.......................................... 1 1 1 1 1 1
...... ~ .... -
z o H H
~ tll z H o H
ce; u z o ::::> H w u ::e: -e w H tll z
c.!) H c.!) z z H
~ H ~ t.f'\ z < . H ,._;¡ w > ~ ::::> z u w
c.!) ~ w z 5 ,._;¡ H u
~ ::e: r:<. tll ce; w
H H o tll µ.. µ.. ::::> 1 w H ¡::¡ ~ w ~ :::> w H ::i:: ,._;¡ tll ~ :::> u -e z H H H ~ < µ.. c.!) Q < µ..
~ o < H ,._;¡ H t><: ~

263
Furthermore, there is the possibility of recording information on the stages of industrialization or metallurgy mentioned under point 2.1.3 of the previous chapter, for the case in whi:h t~e surveyed establishment is integrated and energy consumption is included in this subsector. Thus, the following are incorpo- rated:
Fuels used in steam production and amount of steam produced. Direct heat.
Fuels used far electricity auto-production,
Modules II to IV records information on energy consumption by sources and end-uses. The disaggregation proposed for these is worthy of mentían:
Description of equipment in the mine and enrichment plant.
f 1 d · the mi'ne and enrichment Electricity and ue s consume in plant.
into and
of the survey far this subsector are divided of which the first refers to general data
The contenta five modules, productive activity.
1.2 Mining Subsector
The contents of the reference survey comprise three modules. The first two refer to non-energy data such as location, surface a:ea destined to production and under irrigation; volume of production by type of crop for a normal year (if the. year of the surve~ was nota normal year); productíon of animal and vegetable residues and their destination; livestock production; labor employed and time worked.
The third records energy consumption by end-uses and sources in the different types of equipment that can appear for each use. Unlike in the industrial sector, efficiency values are not in- cluded. However, power capacities and hours of use of the different types of equipment must be assigned.
With respect to hours of use, the recor~ does not offer any majar drawbacks in equipment using mechanical force, for ex~mple.tra7- tors and farm machinery. There may, however, be diff1cult1es in estimating hours far sorne end-uses such as irrigation .. In this case questions should be specified on: months of d~ration of the irrigation, flow, water consumption, etc., from which~ in refer- ring to a given crop, given soil conditions and a given power capacity, hours of use can be calculated.
The possibility of recording the consumption of aeria~ fumigation is included in point 5 of this module (other uses); it should be stressed that this consumption will always be accounted for when not contracted out to third parties.
262
(*) See "Survey on Energy Consumption in the Livestock Sector," Energy Sector Division, Costa Rica, December 1985.
As far the survey forro on agricultural/livestock activities, unlike other sectors, in the unit of information (establishment) there are not different sections with data recorded for each stage of the production process.
Even though the survey forms should be adapted to the reality of each country, what is presented is a questionnaire which can serve as a reference for agricultura! and livestock activities in general.
The contenta of the questionnaires for this subsector will be substantially different, depending on the activity dealt with, i.e., livestock-raising (*), farming or forestry. In fact, the information to be compiled on the different end-uses and equipment, as well as on non-energy variables, will be quite different depending on products such as coffee, bananas, poultry, milk, etc.
1.1 Agriculture Subsector
The contents of the sheets for the Agriculture and Mining subsec- tors will be detailed below; the Fishing subsector has not been included since, from the energy standpoint, it will basically cover the information contained in Modules III to VII of the form far the Industrial Sector.
11non-energy" in arder to developed in the design,
It also proves imperative to obtain information on variables far use later in statistical treatments relate energy consumption to the level of activity the subsector, as well as in the treatment of processing and expansion of the sample.
In general, it can be said that the contenta of the surveys forms are geared to obtaining information on energy consumption by sources and end-uses, and at the same time to detecting the types of equipment associated with that consumption,
In the case of the Agriculture-Fishing-Mining Sector, according to the preceding points, it will be necessary to prepare dif- ferent information-gathering sheets, given the particular fea- tures noted for each one of the subsectors.
l. Data-Collecting Form
DATABASE FORMATION
CHAPTER II
265
On this basis, what is proposed is to do a stratified sample, considering each subsector separately and, within these, to stra tify according to their particular characteristics(*). Actually, not only the importance of the participation of END-USES in the
The foregoing is also generally valid for the Industrial Sector in terms of the LAW OF ASYMMETRIC PROPORTIONS, in which a very low percentage of establishrnents accounts for a large percentage of consumption.
However, the guidelines for sample design which are proposed below for a survey on end-uses are valid if there is information on energy consumption by subsector, in addition to the non-energy information for each subsector which characterizes the level of economic activity.
It is also necessary to point out that, according to the informa- tion existing on the characteristics of the activity of each subsector and on the modes of production used, there can be more than one type of sample. Therefore, it can be affirmed that there will be experimental samples according to the universe of reference and the activities of each subsector; for example, there can be MECHANIZED and UNMECHANIZED; for the Agriculture subsector, IRRIGATED and UNIRRIGATED, etc., which means having different sampling alternatives.
Therefore, if records were not available on subsector con- sumption, the first step would be to quantify it through a survey much more numerous than the survey on end-uses. The design of a sample to quantify total consumption and consumption by so~rces in these three subsectors depends on the features of each coun- try, basically insofar as the importance of the subsector in the GDP, the type of activities developed in each subsector, etc. Likewise, the survey form will contain only questions referring to the consumption of cornmercial sources, of the type which figure in points III.6 for the Agriculture subsector and III. for the Mining subsector.
Necessarily, sectoral and/or subsectoral consumption must be known previously for application of a survey on END-USES, since what is definitely wanted is to quantify the SHARE of each SOURCE in each END-USE for each SUBSECTOR. Actually, as will be seen in greater detail under the next point, the measurement of useful energy consumption in physical quantities (TOE) consists of multiplying total subsectoral consumption (in absolute terms) by a matrix of participation coefficients (%).
The presentation of the BEEF prepared by the different countries that show aggregate consumption in these subsectors (which would be the first case presented above) <loes not necessarily mean that records will not be available wíth the corresponding disaggrega- tion. For those cases in which consumption seems to be aggre- gated, and therefore usually included in the Industrial Sector, it is inevítably necessary to proceed with disaggregation prior to the preparation of useful-energy balances.
264
The second case is what occurs in countries such as Chile and Peru (perhaps Bolivia also), where there are records on total ~nergy consumption in the Mining Subsector or mining-metallurgy; in the case of Peru also in the Fishing Subsector or fishing índustry; in the case of Uruguay in the Agriculture Subsector, etc., records which appear in the publication of the iespective national balances.
In the third case, total energy consumption will coincide with that of the universe of reference, in which case a design will have to be made to disaggregate total consumption by sources and end-uses.
subsectoral consumption is disaggregated into three subsec- tors.
energy consumption is known for only one of the subsectors.
subsectoral consumption is aggregated and usually included in the Industrial Sector.
As for total energy consumption in the subsectors, certain situations may arise because:
The basic information to which reference is made is constituted by the total energy consumption of each subsector, the number of productive establishments for the Agriculture and Mining subsectors, and the establishments as well as the fishing fleet and processing ships in the Fishing subsector.
The situation that may arise in terms of basic information, which is understood as the information which constitutes the Universe of Reference, varies according to what has been recorded in the countries but, even more, it varíes according to the importance that the three subsectors analyzed herein have in the national economy and according to the modes of production detected in each subsector.
To do an assessment of existing information obviously constitutes the first stage of any sample design. This diagnostic should be based on the analysis of information provided by agricultural censuses, general censuses on economic activity (including the Fishing and Mining subsectors), surveys usually done in these subsectors, special studies (even though partial), etc.
Analysis of Existing Information and Guidelines for Sample Design
2.
The end-uses incorporated in this case will therefore be those already described in Modules IV and VII of the Industrial Sector.
Mechanical force. Other uses~
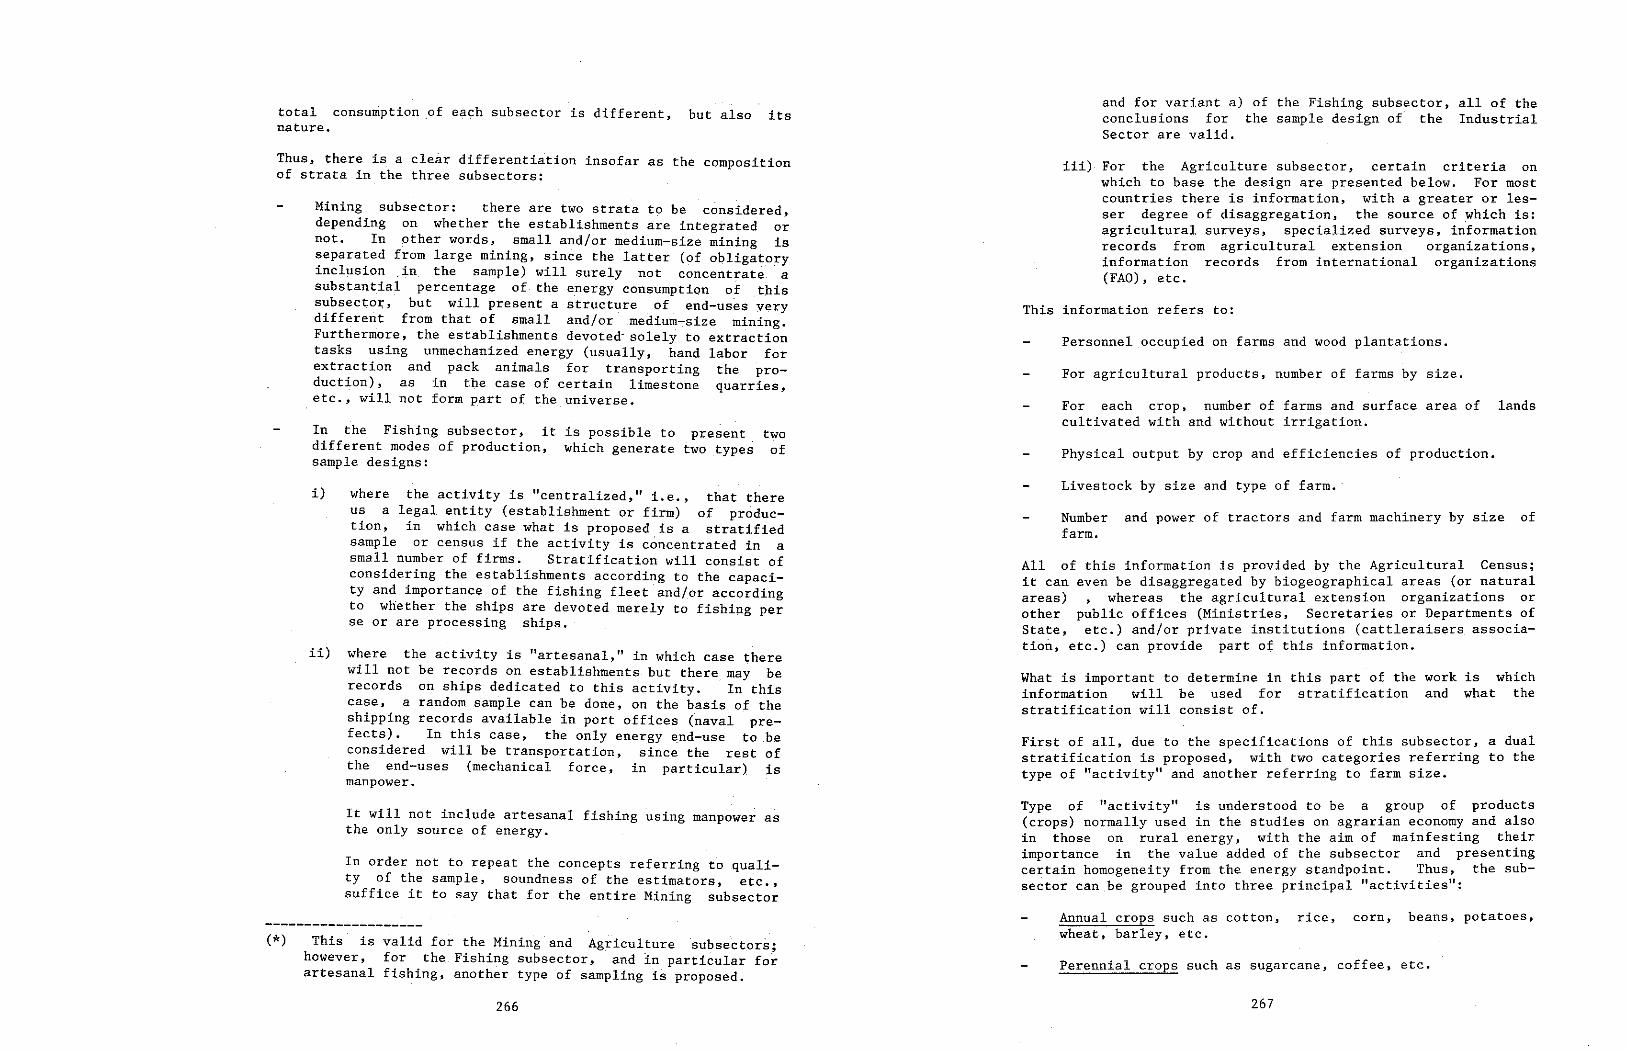
267
Perennial crops such as sugarcane, coffee, etc.
Annual crops such as cotton, rice, corn, beans, potatoes, wheat, barley, etc.
Type of 11activity" is understood to be a group of products (crops) normally used in the studies on agrarian economy and also in those on rural energy, with the aim of mainfesting their importance in the value added of the subsector and presenting certain homogeneity from the energy standpoint. Thus, the sub- sector can.be grouped into three principal 11activities11:
First of all, dueto the specifications of this subsector, a dual stratification is proposed, with two categories referring to the type of "activity" and another referring to farm size.
What is important to determine in this part of the work is information will be used for stratification and what stratification will consist of.
which the
All of this information is provided by the Agricultural Census; it can even be disaggregated by biogeographical areas (or natural areas) , whereas the agricultural extension organizations or other public offices (Ministries, Secretaries or Departments of State, etc.) and/or prívate institutions (cattleraisers associa- tion, etc.) can provide part of this information.
Number and power of tractors and farm machinery by size of farm.
Livestock by size and type of farm. ·
Physical output by crop and efficiencies of production.
Far each crop, number of farms and surface area of lands cultivated with and without irrigation.
For agricultural products, number of farms by size.
Personnel occupied on farms and wood plantations.
This information refers to:
iii) For the Agriculture subsector, certain criteria on which to base the designare presented below. For most countries there is information, with a greater orles- ser degree of disaggregation, the source of which is: agricultural surveys, specialized surveys, information records from agricultural extension organízations, information records from international organizations (FAO), etc.
and for variant a) of the Fishing subsector, all of the conclusions for the sample design of the Industrial Sector are valid.
266
(*) This is valid for the Mining.and Agriculture subsectors; however, for the Fishing subsector, and in particular for artesanal fishing, another type of sampling is proposed.
In arder not to repeat the concepts referring t~ ~uali- ty of the sarnple, soundness of the estimators, etc., suffice it to say that for the entire Mining subsector
It will not include artesanal fishing using manpower as the only source of energy.
ii) where the activity is "artesanal," in which case there will not be records on establishments but there may be records on ships dedicated to this activity. In this case, a random sample can be done, on the basis of the shipping records available in port offices (naval pre- fects). In this case, the only energy end-use to be considered will be transportation, since the rest of the end-uses (mechanical force, in particular) is manpower.
i) where the activity is "centralized," i. e., that there us a legal entity (establishment or firm) of produc- tion, in which case what is proposed is a stratified sample or census if the activity is concentrated in a small number of firms. Stratification will consist of considering the establishments according to the capaci- ty and importance of the fishing fleet and/or according to whether the ships are devoted merely to fishing per seor are processing ships.
In the Fishing subsector, it is possible to present. two different modes of production, which generate two types of sample designs:
Mining subsector: there are two strata to be cÓnsidered, depending on whether the establishments are integrated or not. In other words, small and/or medium-size mining is separated from large mining, since the latter (of obligatory inclusion .Ln the sample) will surely not concentrate · a substantial percentage of the energy consumption of this subsectoi;-, but will presenta structure. of end-uses yery different from that of small and/or medium-size mining. Furthermore, the establishments devoted· solely to extraction tasks using unmechanized energy (usually, hand labor for extraction and pack animals for transporting the pro- duction). as in the case of certain limestone quarries, etc., will not form part of the universe.
Thus, there is a clear differentiation insofar as the composition of strata in the three subsectors:
total consumption of each subsector is different, but also its nature.
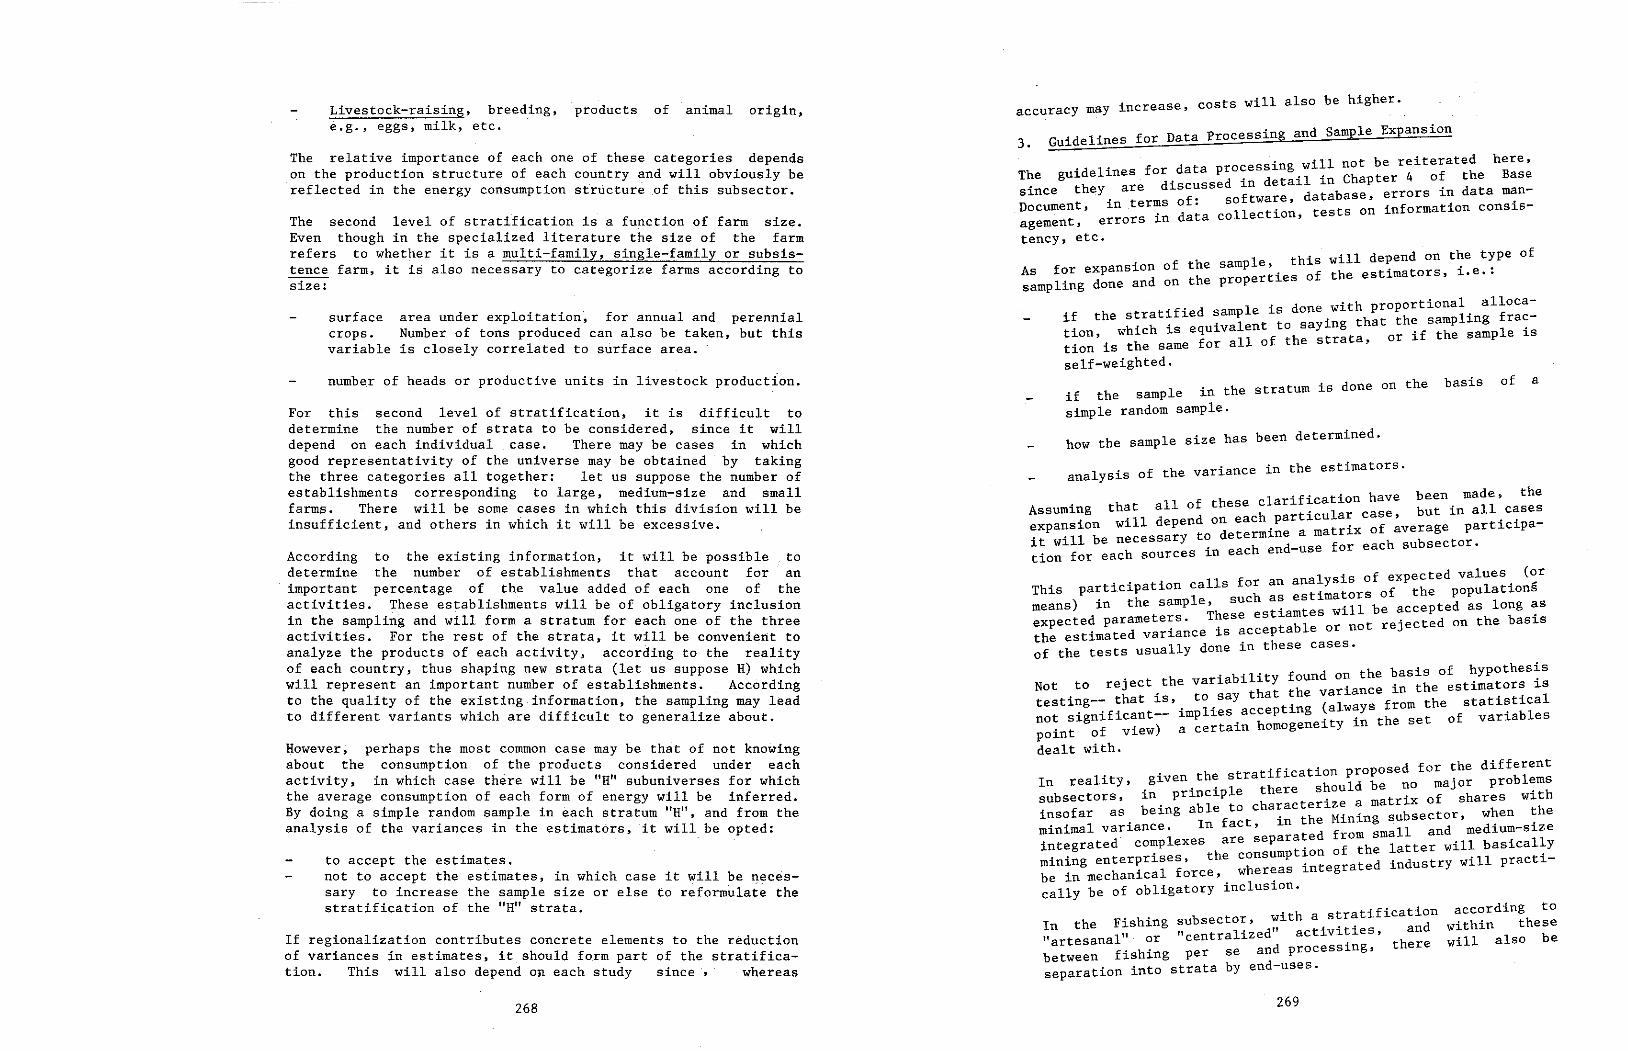
269
I the Fishing subsector, with .. n 111 or "centralized" activities, artesana .
f . hi·ng per se and processing, between is separation into strata by end-uses.
a stratification according to and within these
there will also be
given the stratification proposed for the diffebrlent In reality, there should be no major pro :ms
b t in principle h with su sec ors, characterize a rnatrix of s ares insofar as being able to in the Mining subsector, when the minimal variance. In fact, d f sma.11 and medium-size . 1 re separate rom integrated comp exes a . f the latter will basically mining enterprises, the consumpt:on o ted industry will practi- be in mechanical force,. wher:as integra cally be of obligatory inclusion.
d the basis of a · the stratum is one on if the sample in simple random sample.
how the sample size has been determined.
1 . of the variance in the estimators. ana ysis . h been made, the . that 11 of these clarification ave Assuming a . 1 e but in all cases 'on will depend on each particu arcas ' part1'cipa- expans1 . trix of average
it will be necessary t~ dete~i~:-~s:ªfor each subsector. tion for each sources in eac e
1 . of expected values (or This participation calls for an ana.ysitsrs of the populations
h le such as estima o means) in te samp ' ·11 be accepted as long as These estiamtes wi . expected paramete~s. . bl or not rejected on the basis the estimated variance is accepta e of the tests usually done in these cases.
. b'l't found on the basis of hypothesis Not to reject .the varia it~a~ the variance in the estimators is testing-- that is,. to.say i (always from the statistical not significant-- implies accept ng . . the set of variables point of view) a certain homogeneity in dealt with.
Of the sample, this will depend on the type of As for expansion · t i e · h Properties of the estima ors, , •. sampling done and on te
t' nal alloca- if the stratified sample is done.with proi~: ~~m ling frac- tion, which is equivallelntft;hsa~~~=t~hator if th~ sample is tion is the same for a o e ' self-weighted.
essin will not be reiterated here, The guidelines for data pro: d tg"l ·n Chapter 4 of the Base h discussed in e ai 1 since t ey are of·. software, database, errors in. data m~n- D ment in terms f onsis ocu , errors in data collection, tests on in ormation c - agement, tency, etc.
3.
may increase, costs will also be higher. accuracy Guidelines for Data Processin
268
If regionalization contributes concrete elements to the réduction of variances in estimates, itshould form part of the stratifica- tion. This will also depend on each study since, whereas
to accept the estimates. not to accept the estimates, in which case it will be neces- sary to increase the sample size or else to reformulate the stratification of the "H" strata.
However, perhaps the most common case may be that of not knowing about the consumption of the products considered under each activity, in which case there will be "H" subuniverses for which the average consumption of each form of energy will be inferred. By doing a simple random sample in each straturn "H11, and from the analysis of the variances in the estimators, it will be opted:
According to the existing information, it will be possible to determine the number of establishments that account for an important percentage of the value added of each one of the activities. These establishments will be of obligatory inclusion in the sampling and will forma stratum for each one of the three activities. For the rest of the strata, it will be conveniertt to analyze the products of each activity, according to the reality of each country, thus shaping new strata (let us suppose H) which will representan important number of establishments. According to the quality of the existing information, the sampling may lead to different variants which are difficult to generalize about.
For this second level of stratification, it is difficult to determine the number of strata to be considered, since it will depend on each individual case. There may be cases in which good representativity of the universe may be obtained by taking the three categories all together: let us suppose the number of establishments corresponding to large, medium-size and small farm$. There will be sorne cases in which this division will be insufficient, and others in which it will be excessive.
number of heads or productive units in livestock production.
area under exploitation, for annual and perennial Number of tons produced can also be taken, but this is closely correlated to súrface area.
surface crops. variable
The second level of stratification is a function of farm size. Even though in the specialized literature the size of the farm refers to whether it is a multi-family, single-family or subsis- tence farm, it is also necessary to categorize farms according to size:
The relative importance of each one of these categories depends on the production structure of each country and will obviously be ·reflected in the energy consumption structure of this subsector.
Livestock-raising, breeding, products of animal origin, e.g., eggs, milk, etc.

2'11
AGRICUL TURAL SUBSECTOR
SURVEY FORM
270
In any case, when the shares of the sources under the end-uses are related to efficiencies and strata consumption, the useful consumption of the sources will be obtained.
Once the participation matrix has been determined, for the calculation of useful energy, it should be kept in mind whether efficiencies of use are available or only efficiencies of pro- duction, whether measured or adopted.
Finally, in the Agriculture subsector, the dominant end-use of "annual cropsu and 11perennial crops" is in mecahnical force for farm machinery, although in sorne cases its use for irrigation purposes may. be important. As for livestock-raising, it is possible to have a certain amount of heterogeneity in end-uses, but it will depend on how diversified the activity is.

272
(*) This is the period to which the survey data will refer.
- Last normal season - Last season
The data in the following chart refer to:
cultivated and harvested or for the last normal farrning season was not
Indicate the area planted, for the last farming season farming season, if the last normal.
d)
rains, normal
excessive the last
If it was not normal (droughts, lack of labor, etc.), indicated farming season. YEAR:
e)
b) Was it normal frorn an agricultura! standpoint? YES NO
a) Farming season(*): YEAR:
2. Volume of Agricultura! Production
a) _ Farming season ( *) •.•.••...•...••..........••• years b) Total area under exploitation ...•.............. has. e) Area under cultivation ......•••.......•.•••• , •. has. d) Area in pasturelands .•.........••.•.......•..•• has. e) Area in forestlands •....•••.....•.••........... has. f) Area under irrigation •......•••••.......••••••. has. g) Area lying fallow or unutilized .•..•........••• has.
1. Rural Farm
II. FARM
Mailing Address Department
Landmark Locality Municipality
b) Geographical Location
• • • • • • • • • • • • • • • • • • • et .
a) Name of the establishment ••••.......••• , ••••• , , •••••.•.
I. GENERAL DATA
ACTIVITY: MIXED FARMING
AGRICULTURAL SUBSECTOR
SURVEY FORM
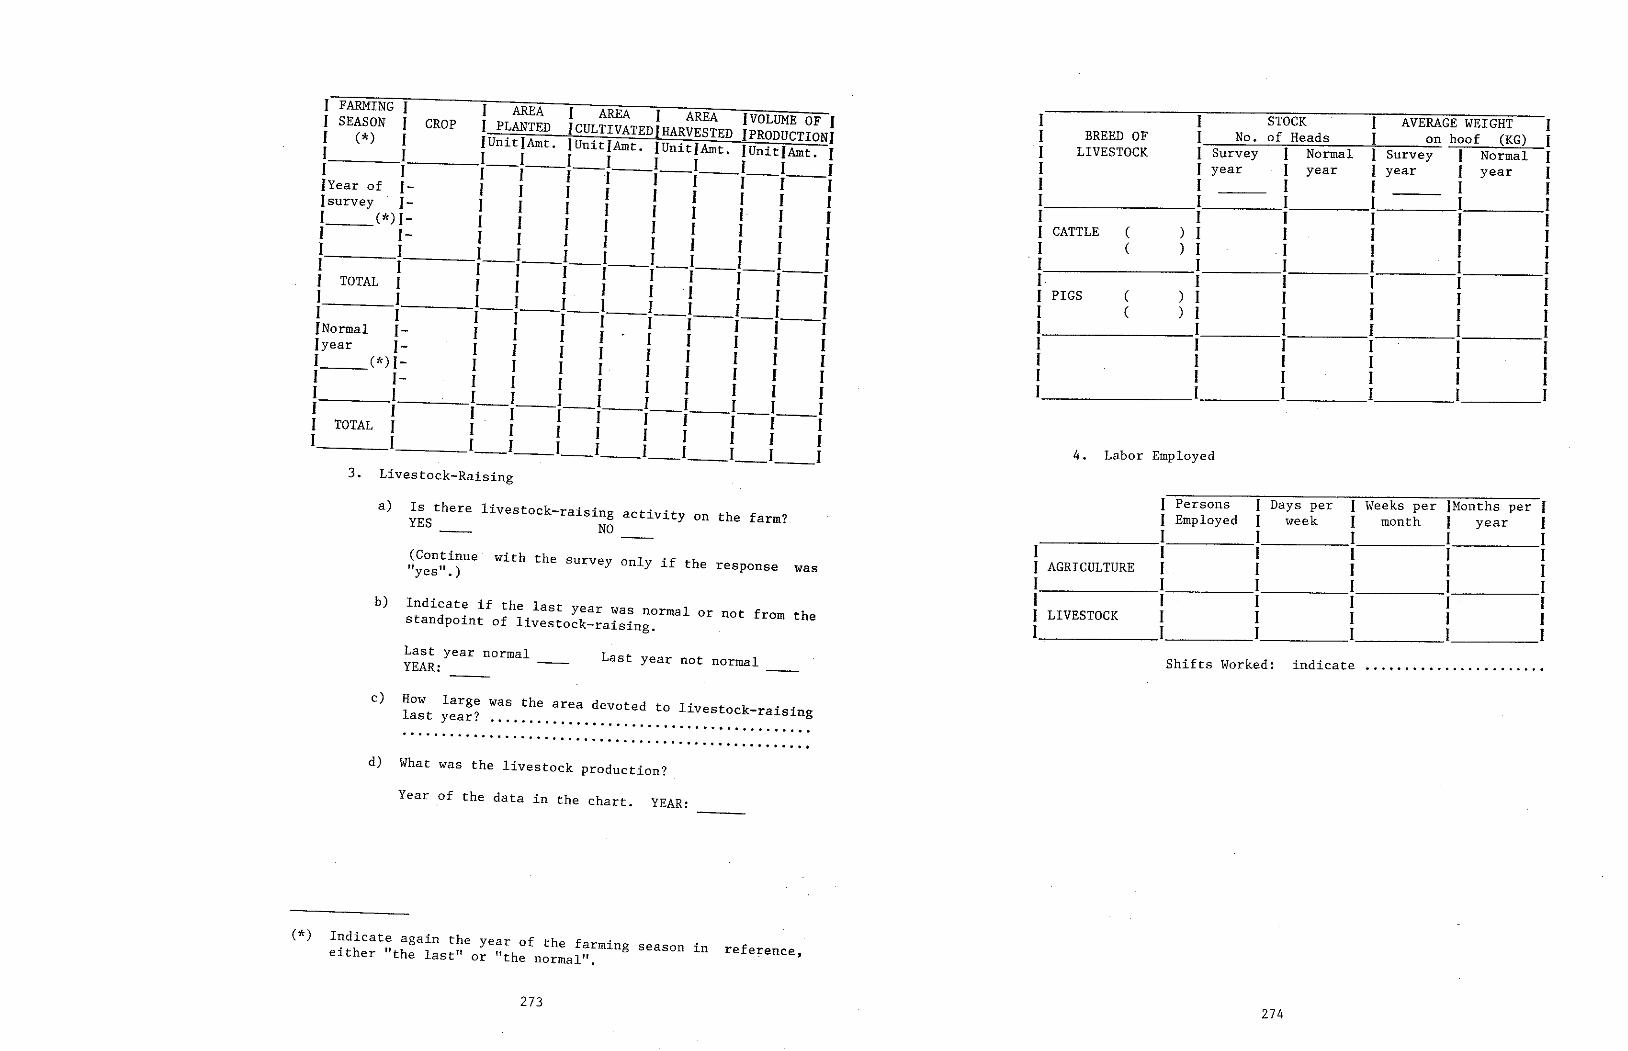
274
1 Persons 1 Days per 1 Weeks per JMonths per I 1 Employed 1 week I month 1 ye ar 1 1 1 1 1 1
1 1 1 1 1 1 I 1 AGRICULTURE 1 1 1 1
1 I 1 1 1 1 1 I 1 1 f 1
1 1 1 1 LIVESTOCK 1 1 I 1 1 1 1 1
Shifts Worked: indica te .... ! ••••••• " •••••••••••
4. Labor Employed
1 1 STOCK 1 AVERAGE WEIGHT I 1 BREED OF 1 No. of Heads 1 on hoof (KG) 1 1 1 Normal 1 1 LIVESTOCK 1 Survey 1 Normal Survey
1 1 ye ar 1 ye ar 1 ye ar 1 year 1 1 I 1 1 1 I
1 1 1 I 1 1 1 1 1 1 I 1
) 1 1 1 1 1 1 CATTLE ( 1 ( ) 1 1 1 1 1 . I 1 1 1 I 1
I 1 1 1 1 1 1 1 1 1 1 1 PIGS ( )
1 1 1 ( ) 1 1 1 1 1 1 1 1 1 1 1 1 1 1 1 1 1 1 1 I 1 1 1 1 1 1 1 1 I 1 1 1 1
273
(*) Indicate again the year of the farming season in reference, either "the last" or "the normal".
Year of the data in the chart. YEAR:
d) What was the livestock production? • • • • • • • • • • • • • • • • • • .. • .. • • • • • • • • • • • • • • • 11 .
last year? ••.•....•..•......•.•..•...•.•..•.•... , •. e) How large was the area devoted to livestock-raising
Last year not normal_ Last year normal YEAR:
b) Indicate if the last year was normal or not from the standpoint of livestock-raising.
(Continue with the survey only if the response was "yes". )
a) Is there livestock-raising activity on the farm? YES NO
3. Livestock-Raising
1 FARMING 1 1 AREA 1 AREA 1 AREA IVOLUME OF 1 1 SEASON 1 CROP 1 PLANTED JCULTIVATEDJHARVESTED fPRODUCTIONf 1 (*) 1 JUnitJAmt. JUnitlAmt. IUnitJAmt. JUnitJAmt. I 1 I 1_1 __ 1_1_1_1_1_1 __ 1 1 1 1 1 1 1 1 l 1 I 1 JYear of 1- 1 1 1 1 1 1 I 1 I lsurvey 1- 1 1 1 1 l 1 1 1 1 1 (*)l- 1 1 l l I 1 1 1 1 1 I- I 1 1 I 1 1 1 1 I 1 1 1_1 __ 1_1_1_1_1_1_1 1 1 1 1 I 1 I 1 1 I 1 1 TOTAL 1 1 1 I 1 I ·1 1 I 1 1 1 1_1 __ 1_1_1_1 ___ 1_1_1 1 1 1 1 I 1 1 I I I 1 [No rma I 1- 1 1 1 1 l 1 1 1 1 Jyear 1- I 1 1 1 I 1 1 1 1 1 (*)l- 1 1 1 l 1 1 1 I 1 1 1- 1 1 1 1 1 1 1 1 I 1 1 1_1 __ 1_1_1_1_1_1_1 1 I 1 1 1 1 1 1 1 1 1 1 TOTAL I 1 1 1 1 I 1 1 I 1 l 1 1_1 __ 1_1_1_1_1_1_1
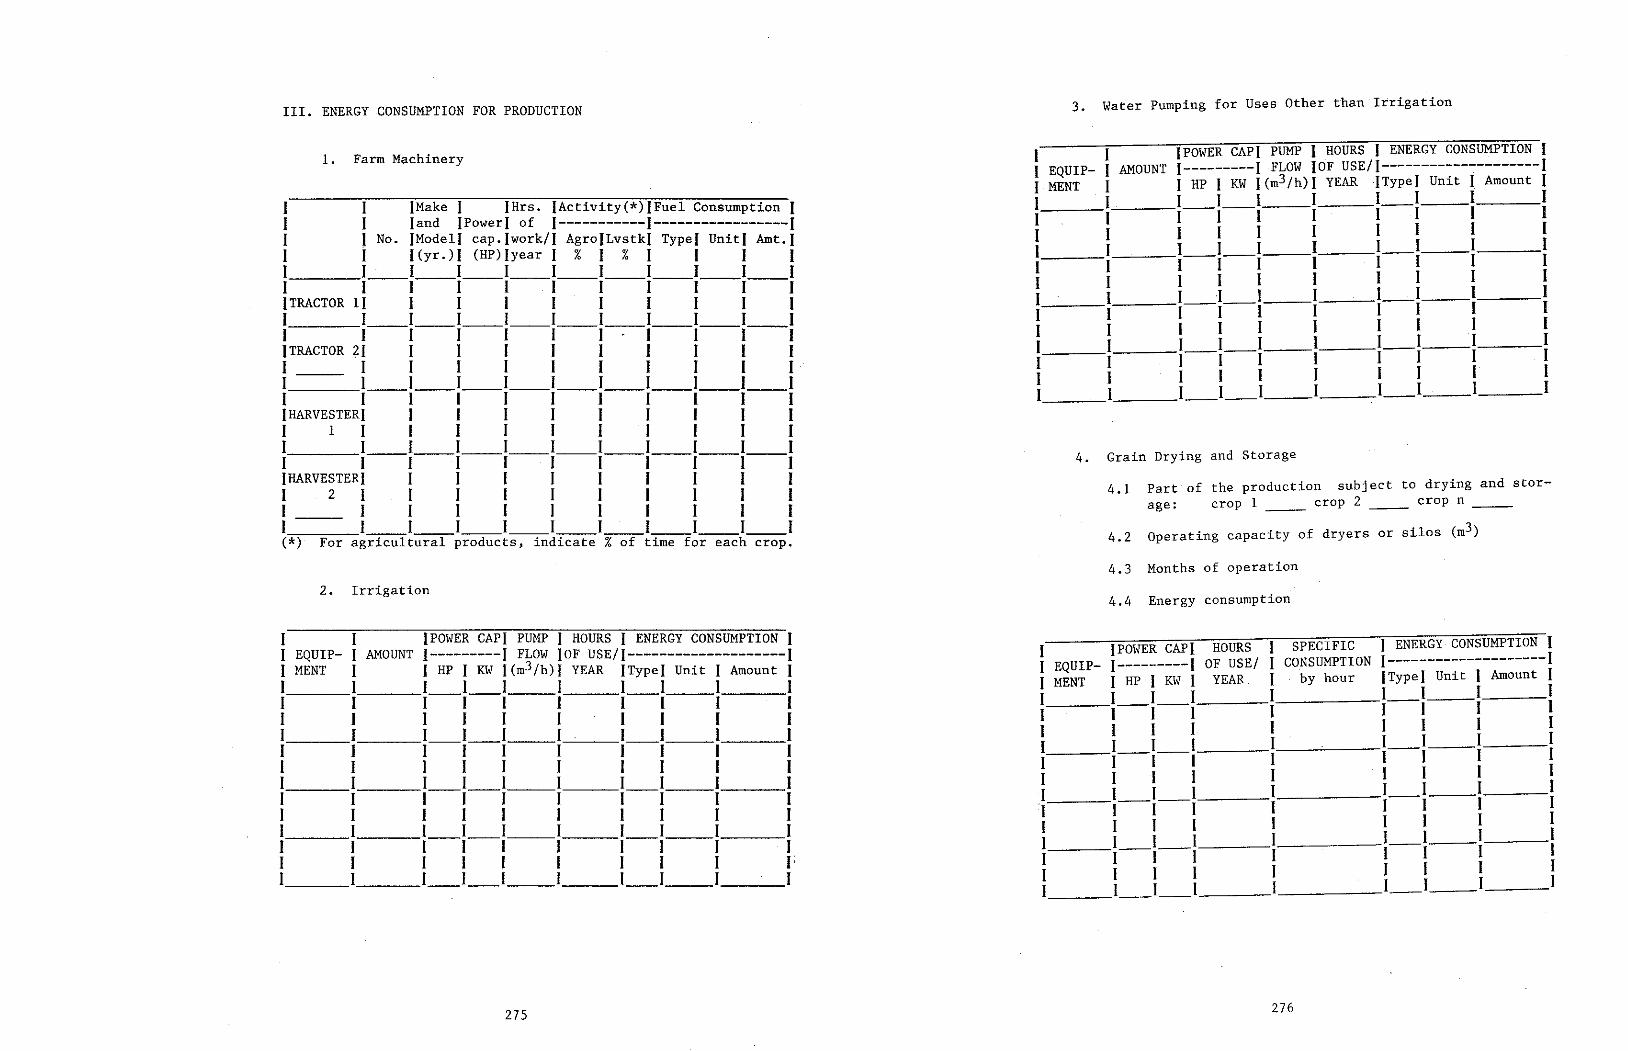
276
4. Grain Drying and Storage
4.1 Part of the produ~tion subject to drying and stor- age: crop 1 __ crop 2 __ c rop n
4.2 Operating capacity of dryers or silos (m3)
4.3 Months of operation
4.4 Energy consumption
1 IPOWER CAPI HOURS 1 SPECIFlC J ENERGY CONSUMPTlON J 1 EQUlP- I---------1 OF USE/ 1 CONSUMPTION 1--------------------1 J MENT 1 HP l KW 1 YEAR. 1 . by hour JTypeJ Unit 1 Amount 1 1 l_I_ 1 1 1 1 1 1 -- 1 1 1 1 1 1 1 1 1 1 1 1 1 1 1 1 1 1 1 l_I_ 1 1 1 1 1 1 -- 1 1 1 1 1 1 1 1 1 1 1 1 1 1 1 1 1 1 1 l_I_ 1 1 I_ 1 1 1 1 1 1 1 1 1 1 1 1 1 1 1 1 1 1 1 1 1 1 I_I_ 1 1 1 1 l 1 -- 1 I 1 1 1 1 1 1 1 1 1 1 1 I 1 1 1 1 1 l_l_ 1 1 1 I 1 l --
J J JPOWER CAP( PUMP f HOURS 1 ENERGY CONSUMPTlON 1 I EQUlP- 1 AMOUNT J---------1 FLOW )OF USE/1--------------------1 I MENT 1 I HP 1 KW l(m3/h)I YEAR ITypeJ Unit 1 Amount 1 1 I I l I I I 1 I 1 l 1--'----1-1-1 1 1-1 l 1 1 1 1 1 1 1 1 1 1 1 1 1 I 1 1 1 1 1 1 1 1 1 1-1-1 1 1-1 1 1 1 1 1 1 1 1 1 1 1 1 I I 1 -1 1 1 I .J 1 l 1 1 1-1-1 1 .-. 1 1 1 1 1 1 1 1 1 1 1 1 1 1 1 1 I 1 1 1 1 I 1 1 1-1-1 1 1-1 1 1 1 1 1 1 1 1 1 l 1 1 l 1 l_l_I 1 1 1 l I
3. Water Pumping for Uses Other than Irrigation
275
1 1 IPOWER CAPI PUMP 1 HOURS 1 ENERGY CONSUMPTlON J 1 EQUlP- 1 AMOUNT 1---------1 FLOW }OF USE/1--------------------J 1 MENT J 1HP1 KW l(m3/h)I YEAR ITypel Unit ( Amount 1 1 l l_I_I 1 1 1 1 1 I 1 1 1 1 1 1 1 1 1 1 1 1 1 1 1 1 1 1 1 1 1 I_l_I I l_I 1 1 1 1 1 1 1 1 1 1 1 1 1 1 1 1 1 1 1 1 1 1 1 1 l_I_I I l_I 1 1 1 1 1 1 1 1 1 1 1 1 1 1 1 1 l 1 1 1 1 1 1 1 l_l_I I 1 1 1 1 1 1 1 1 1 1 1 1 1 1 1 1 1 1 1 1 1 1 1 I; 1 1 l_l_I 1 l_I 1 1
2. Irrigation
1 1 [Hake 1 [Hr s , (Activity (*) IFuel Consumption 1 1 1 Jand IPowerl of 1-----------1-----------------I 1 1 No. JModell cap.fwork/l AgroJLvstkl TypeJ Unitl Amt.J 1 Í l(yr.)I (HP)lyear 1 % 1 % 1 1 1 1 : :--:--:--~--!--:--:--~--:--: ITRACTOR 11 1 1 1 1 1 1 1 1 J 1 I __ l __ l __ l __ I I 1 1 I 1 1 1 1 1 1 .--1-· -1--1--1 1 }TRACTOR 21 1 1 1 1 1 1 1 J J 1 1 1 1 1 1 1 1 1 1 1 1 l __ l __ I __ l __ l __ I I 1 I 1 1 1 1 1 1 1 1--1--1--1--1 (HARVESTERI 1 J 1 J 1 1 J f ( 1 1 1 1 1 1 I 1 1 1 1 1 1 l __ I __ l __ l __ I __ l __ I 1 1 1 1 1 1 1 1 1 1 1--,--.--1 IHARVESTERI 1 1 1 1 1 1 1 1 J 1 2 l 1 1 1 1 1 1 1 1 1 1 I 1 1 1 1 1 1 1 1 1 1 l __ l __ I __ l __ I __ l __ I 1 1 1 (*) For agricultural products, indicate % of time for each crop.
l. Farm Machinery
111. ENERGY CONSUMPTlON FOR PRODUCTlON
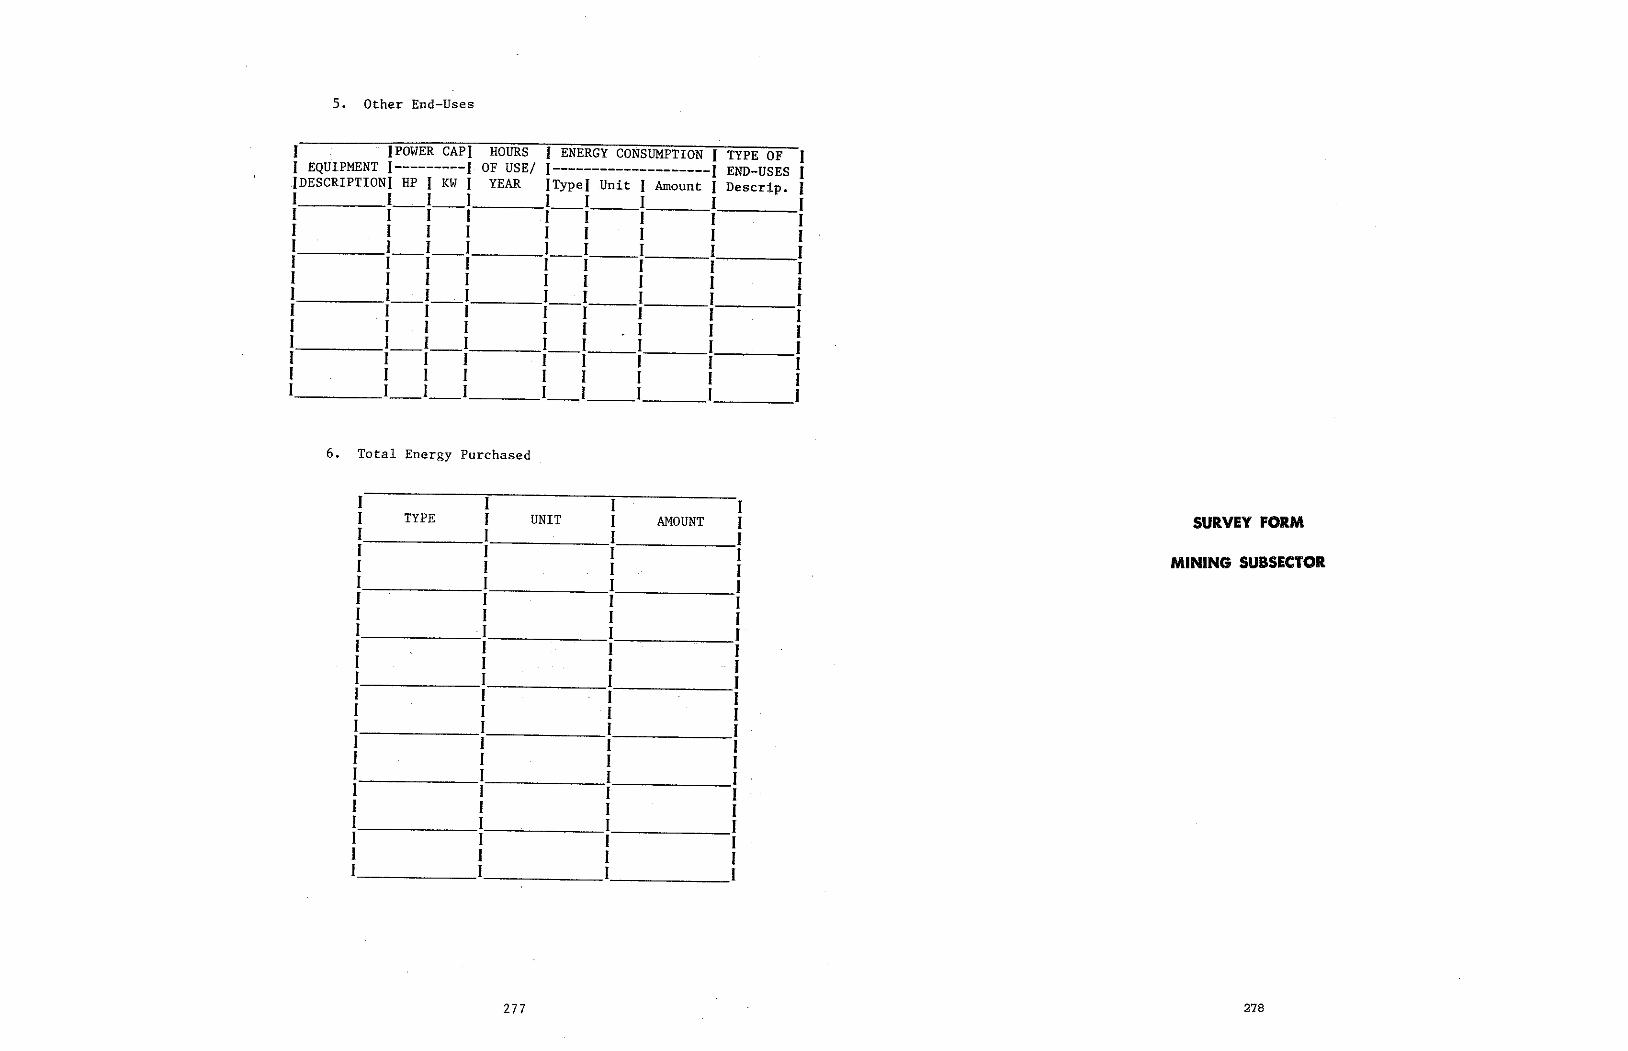
278 277
J JPOWER CAP} HOURS f ENERGY CONSUMPTION J TYPE OF J 1EQUIPMENT1---------J OF USE/ 1--------------------1 END-USES 1 JDESCRIPTIONf HP 1 KW 1 YEAR JTypef Unit J Amount 1 Descrip. f 1 I_. I_I l_I I 1 1 1 1 1 1 1 1 1 1 1 1 1 1 1 1 1 1 1 1 I I_l_I I_I 1 I 1 1 1 1 1 1 1 1 1 1 1 1 1 1 1 1 1 1 1 1 I_· I_. 1 I_I 1 1 1 1 1 1 1 1 I 1 1 1 1 1 1 1 1 1 1 1 1 1 I 1 1 I 1 1 1 1 1 1-1-1 .-1 1 1 1 1 1 1 1 1 1 1 1 1 I I_l_I l_I 1 1 1
5. Other End-Uses
6. Total Energy Purchased
1 1 1 1 SURVEY FORM 1 TYPE 1 UNIT 1 AMOUNT 1
I 1 I 1 1 1 1 1 MINING SUBSECTOR 1 1 1 1 1 1 I I 1 1 1 1 1 1 1 1 1 I 1 1 1 1 1 1 1 1 1 1 1 1 1 1 1 1 1 1 1 1 1 1 1 1 1 1 1 I l 1 1 1 1 1 1 1 1 1 1 1 1 1 1 1 1 1 1 1 1 1 1 1 1 1 1 1 1 1 1 1 I 1

279
3. Productive activity
l l 1 1 E X T R A C T I O N 1 E N R I C H M E N T 1 1 1 I 1 1 1 1 a) PRODUCT AMOUNT UNIT 1 PRODUCT AMOUNT UNIT 1 I l I 1 1 1 l b) Do you work on holidays? 1 Do you work on holidays? I 1 YES NO 1 YES NO I 1 1 1 1 1 1 1 e) Work schedule 1 Work schedule 1 1 - Holidays and weekends 1 - Holidays and weekends 1 1 - Workdays 1 - Workdays I 1 1 I 1 1 1 1 d) Number of employees 1 Number of employees 1 1 1 1 1 1 1
. . . .. . . . . . . . . . . . . . . . . . . . . . . . . . . . . . . . . . . . . . . . . . . . . . . . . . . . . 2. Address .
. . ' . .......................... " ... Name of the establishment l.
l. GENERAL DATA
Application Rocks Non-Metal BRANCH: Metal
MINING SUBSECTOR
SURVEY FORM
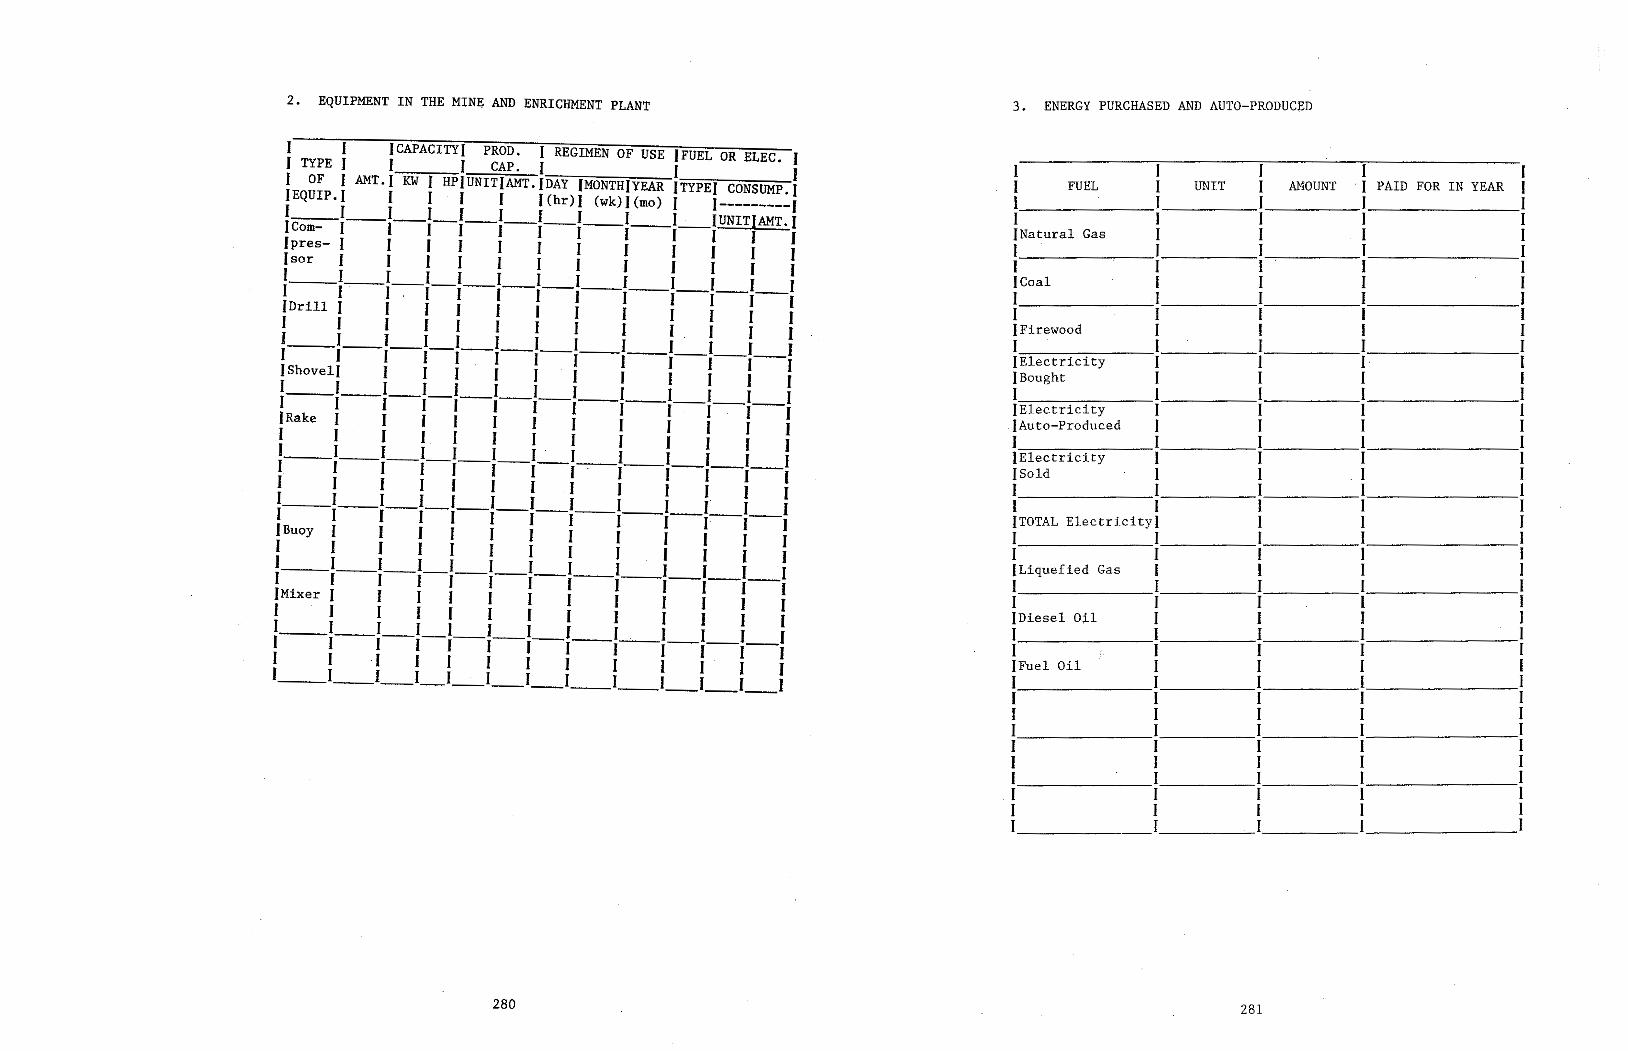
281
1 1 1 1 1 1 FUEL [ UNIT 1 AMOUNT 1 PAID FOR IN YEAR f 1 l l 1 1 1 1 1 1 1 fNatural Gas 1 1 1 1 1 1 I 1 1 1 1 l 1 1 1 Goal 1 1 - 1 1 1 1 1 1 l 1 1 1 1 1 IFirewood 1 1 1 1 l 1 I 1 1 IElectricity 1 1 I· 1 JBought 1 1 1 1 1 1 1 1 1 (Electricity 1 1 1 1
. JAuto-Produced 1 1 1 1 1 1 1 l 1 IElectricity I 1 1 1 J Sold 1 1 . 1 1 1 1 1 1 1 1 1 l 1 1 JTOTAL Electricityf 1 1 J 1 1 1 I 1 1 1 1 1 1 (Liquefíed Gas 1 1 1 1 l I 1 I 1 1 1 1 1 I !Diesel Oil 1 1 1 1 1 1 I 1 1 1 1 1 1 1 f Fuel Oíl I 1 1 1 1 1 1 l 1 1 1 1 1 1 1 1 1 1 1 1 l 1 1 1 1 1 1 1 1 1 1 1 1 I 1 J 1 1 1
.1 1 1 1 1 1 1 1 1 1 1 1 1 I I
3. ENERGY PURCHASED AND AUTO-PRODUCED
280
1 1 JCAPACITYI PROD. f REGIMEN OF USE (FUEL OR ELEC. f f TYPE 1 f 1 CAP. 1 f f 1 OF 1AMT.}KW1 HPIUNITfAMT.fDAY fMONTHfYEAR fTYPEf CONSUMP.I IEQUIP.J 1 I 1 1 f(hr)I (wk)l(mo) 1 1---------I llC 11--11-11-11_1_1_1 __ 1_1_- _IUNITJAMT.f
om- 1 1 1 1 1 1 1 1 fpres- 1 1 1 1 1 I 1 1 1 1 1 J }sor 1 1 1 1 I I 1 1 I 1 1 f 1 1_1_1_1_1_1_1 __ 1 1 1 1 1 1 1 J . 1 1 1 1 J l __ l_l_l_I JDrill 1 1 1 1 1 1 1 1 1 1 1 l 1 1 1 1 1 1 1 1 1 1 1 1 1 1 l __ l_I_l_l_l_I I 1 - 1 1 1 1 1 1 1 1 1 1 1-1-,-.-,-, fShovelf 1 1 1 1 1 · 1 1 ( I 1 1 1 1 __ 1_1_1_1_1_1 1 1 1 1 1 1 1 I 1 1 1 1 l-I-1_1_1_1 f Rake 1 1 1 1 1 1 1 1 1 1 1 1 1 1 1 1 1 1 1 1 1 1 1 1 1 1 l_l_l_l_l_I_- _l __ I 1 I I I 1 1 1 1 1 1 1 1 · 1_1_1_1_1 1 1 1 1 1 1 1 1 1 1 1 1 1 1 l_l_l_l_l_l_l __ I 1 l I J 1 1 1 1 1 1 1 1 1 1-,-_ -.-1 JBuoy 1 1 1 1 1 1 1 1 1 1 1 1 1 1 1 1 1 1 1 1 1 1 1 1 1 1 1_1_1_1_1_1_1 __ 1 1 1 1 1 1 . 1 1 1 I 1 1 1 1--,-1-1-1 }Mixer 1 1 1 1 1 1 1 1 1 1 1 1 1 r 1 1 1 1 1 1 1 1 1 1 1 11 1_1_1_1_1_1_1 __ 1-'--1 1 1 1
1 1 1 1 1 1 1 1 l_l_l_I 1 1 ·I 1 1 1 1 1 1 I 1 - 1 1 1 l_I_l_I_· l_l_I __ l_l_l_l_I
2. EQUIPMENT IN THE MINE AND ENRICHMENT PLANT
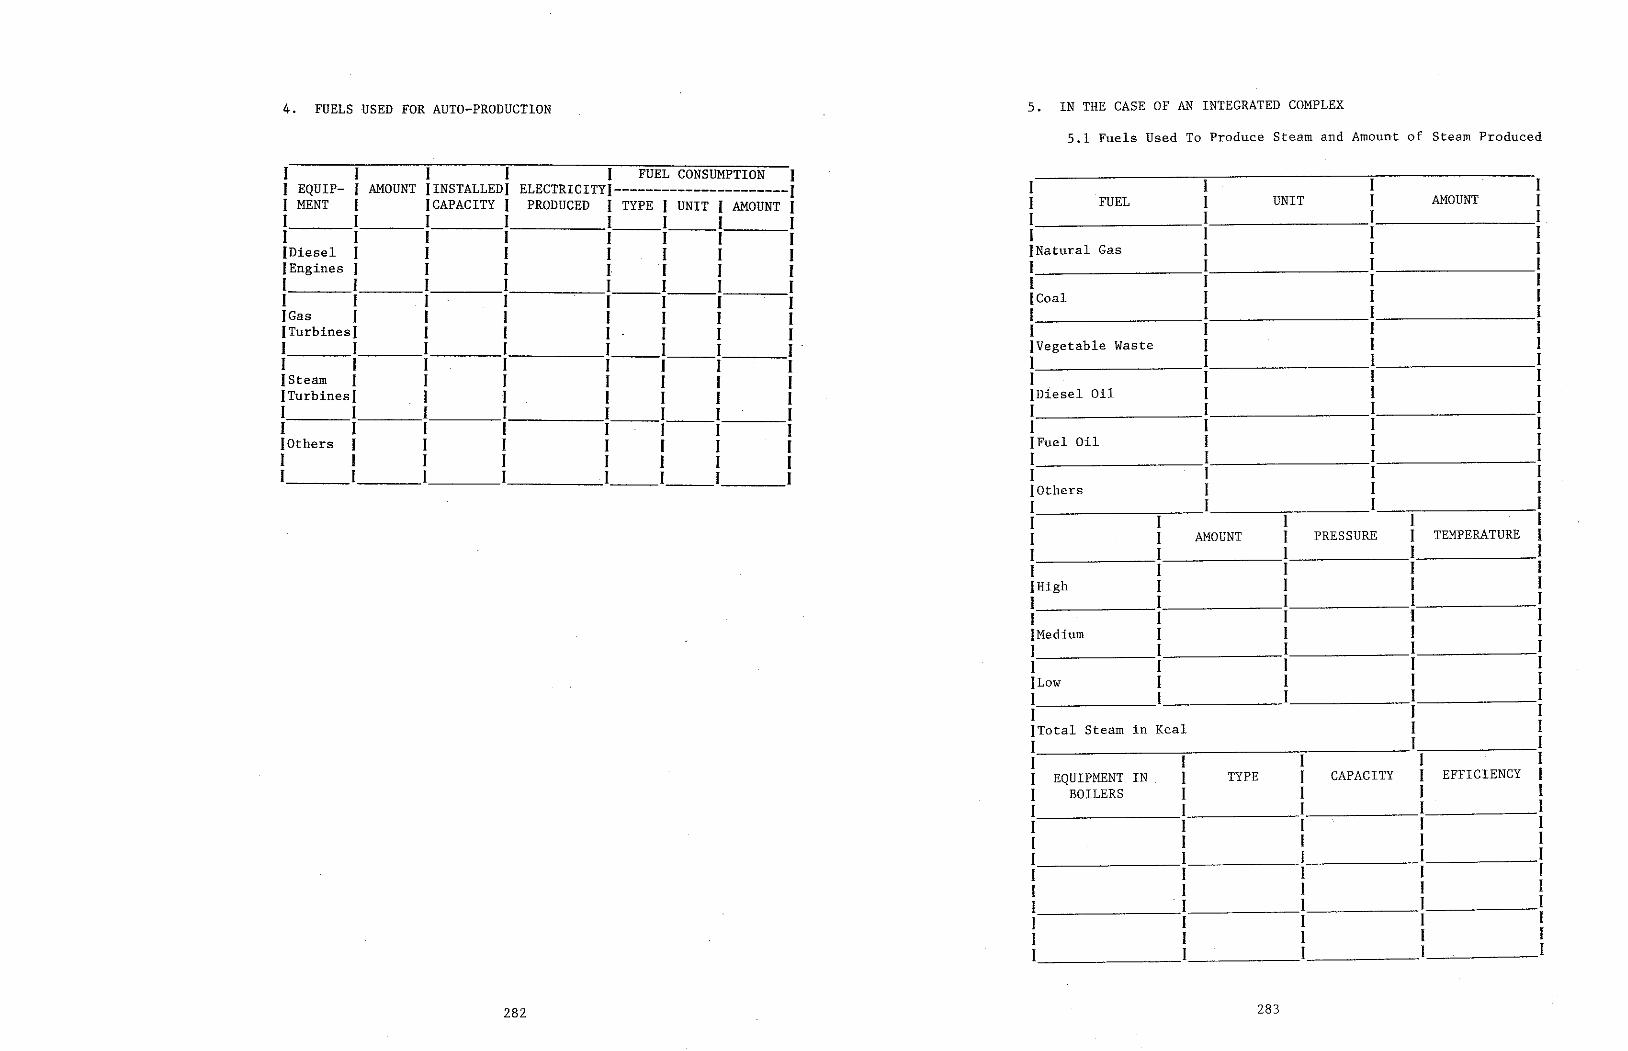
283 282
4. FUELS USED FOR AUTO-PRODUCTION 5. IN THE CASE OF AN INTEGRATED COMPLEX
5.1 Fuels Used To Produce Steam and Amount of Steam Produced
1 1 1 1 1 FUEL CONSUMPTION 1 1 EQUIP- 1 AMOUNT IINSTALLEDI ELECTRICITYJ----------------------1 1 l 1 1 1 MENT 1 JCAPACITY 1 PRODUCED 1TYPE1UNIT1 AMOUNT 1 1 FUEL 1 UNIT l AMOUNT 1 1 1 1 1 1 1 1 1 1 I I 1 1 1 1 1 1 1 1 1 1 1 1 1 IDiesel 1 1 1 1 1 1 1 }Natural Gas 1 1 1 JEngines 1 1 1 l 1 1 1 1 1 1 1 1 1 1 1 1 1 1 1 1 1 1 1 1 1 1 1 1 1 1 1 JCoal 1 1 I }Gas 1 1 1 1 1 1 1 1 1 1 I fTurbinesJ 1 1 1 1 1 1 1 1 1 1 I 1 1 1 1 1 1 1 - fVegetable Waste 1 1 l 1 1 1 1 1 1 1 1 1 1 1 1 JSteam 1 1 1 1 1 1 1 1 1 1 1 ITurbinesl 1 1 1 1 1 1 [D'í.e se L Oil 1 1 l 1 1 1 1 1 1 1 1 1 I 1 1 1 1 1 1 1 1 1 1 1 1 1 I }Others 1 1 1 1 1 1 1 IFuel Oíl l 1 I 1 1 1 1 1 1 1 1 1 I l 1 1 1 1 1 1 1 1 1 1 1 l 1
Jüthers I 1 1 1 I 1 1 1 1 1 1 1 1 1 AMOUNT 1 PRESSURE 1 TEMPERATURE l 1 1 I 1 I 1 1 1 1 I JHigh 1 1 1 1 1 1 1 1 1 1 1 1 I 1 IMedium 1 1 I 1 1 1 I 1 1 1 1 1 1 1 ILow 1 1 1 I I 1 I I 1 1 1 1 ITotal Steam in Kcal I I 1 I 1 1 1 1 1 1 1 EQUIPMENT IN 1 TYPE 1 CAPACITY 1 EFFICIENCY 1 1 BOILERS 1 1 1 l l 1 1 I l 1 1 1 l 1 1 1 1 1 1 l 1 1 1 1 1 I 1 1 1 1 I 1 1 I 1 1 I 1 1 1 1 1 1 1 [ 1 l 1 I 1 l I 1 I
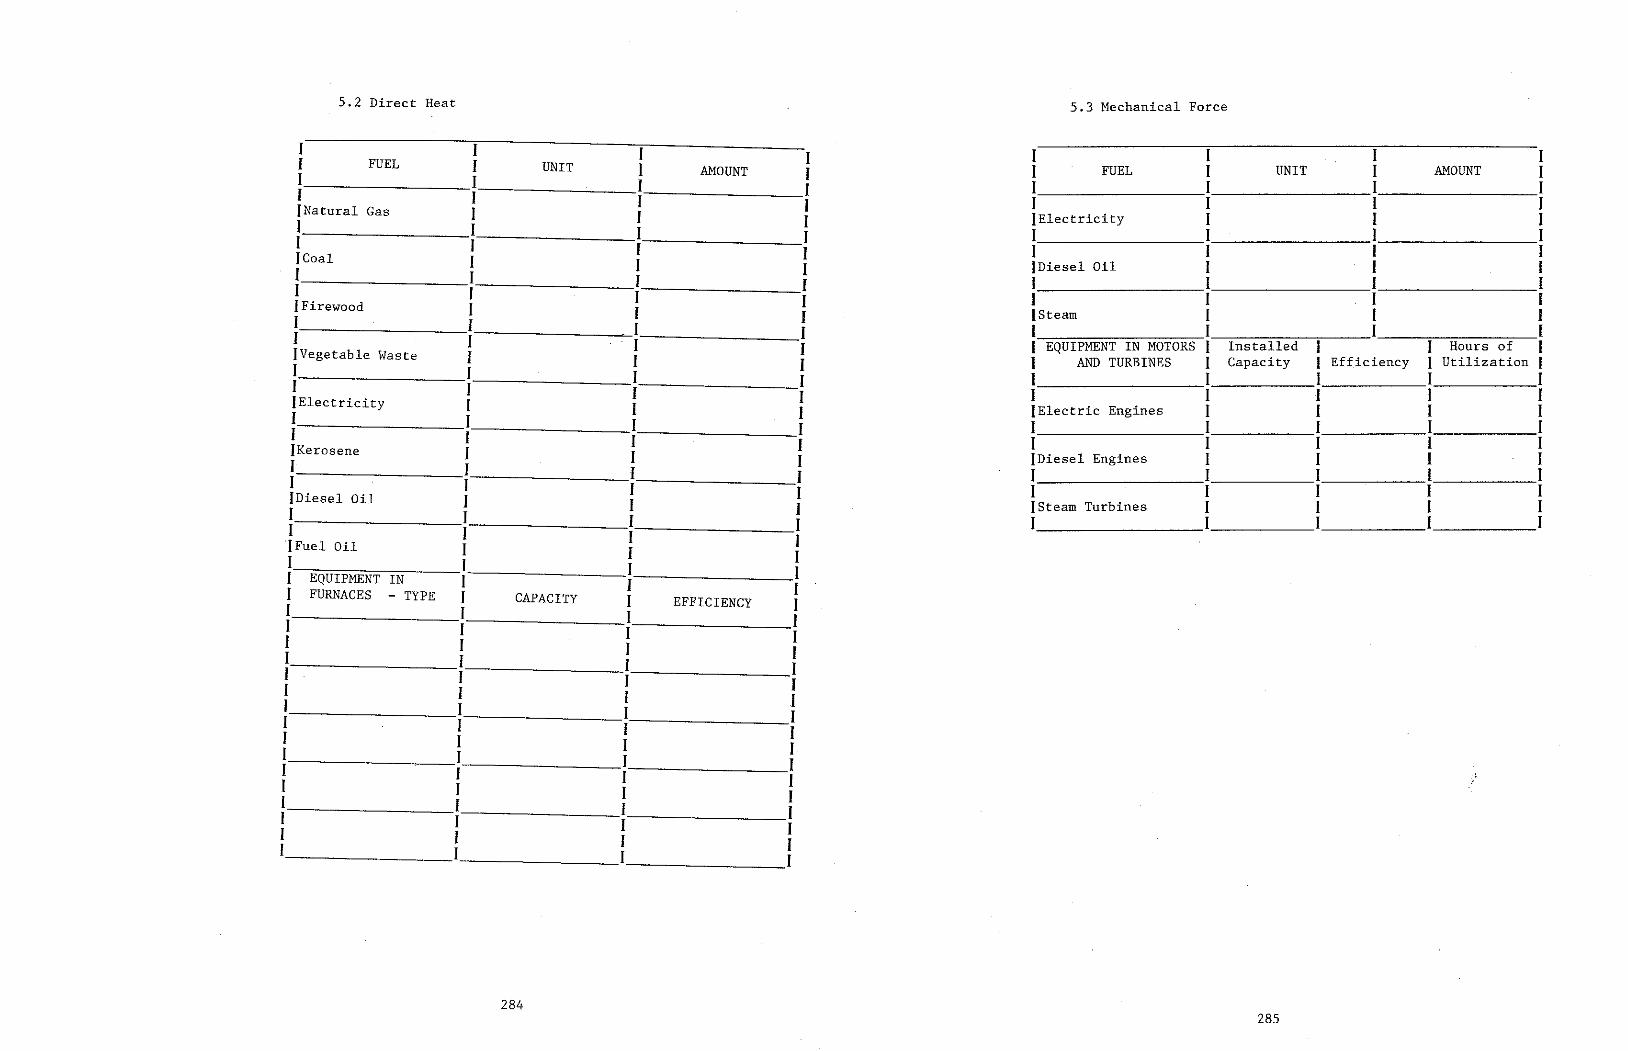
285 284
5.2 Direct Heat 5.3 Mechanical Force
1 1 1 1 1 1 1 1 1 FUEL I UNIT 1 AMOUNT 1 1 FUEL 1 UNIT 1 AMOUNT 1 I 1 1 I 1 I 1 I I I 1 1 1 1 1 1 !Natural Gas 1 1 1 IElectricity 1 1 1 I I 1 1 1 1 1 1 1 1 I 1 1 1 1 1 JCoal I 1 1 !Diesel Oil 1 1 1 1 I l 1 1 1 1 I 1 1 I 1 I 1 I 1 IFirewood 1 I I ISteam 1 1 1 1 I 1 I 1 1 1 I I I 1 Installed 1 1 Hours of 1 1 1 1 EQUIPMENT IN MOTORS IVegetable Waste 1 1 I 1 AND TURBINES 1 Capacity I Efficiency 1 Utilization 1 1 I I 1 1 1 l 1 1 1 1 1 1 1 1 I 1 1 IElectricity 1 I 1 IElectric Engines 1 1 1 1 I I I 1 1 1 I 1 1 1 1 1 1 1 1 1 1 1 }Kerosene 1 1 1 {Diesel Engines I 1 I 1 1 1 1 I 1 1 I I 1 1 I 1 1 1 1 1 1 I {Diesel Oíl 1 1 I JSteam Turbines 1 I 1 1 I 1 1 1 1 1 1 1 1 1 1 1 1 ·JFuel Oil 1 1 1 1 I I 1 1 EQUIPMENT IN 1 1 1 I FURNACES - TYPE 1 CAPACITY I EFFICIENCY 1 1 1 I 1 I I 1 1 1 1 1 1 I I 1 1 1 1 1 I I I I I I 1 I 1 I I 1 1 I 1 1 1 I I 1 1 1 1 1 1 1 1 1 1 1 1 1 1 I 1 1 I l I 1 1 I 1 I 1
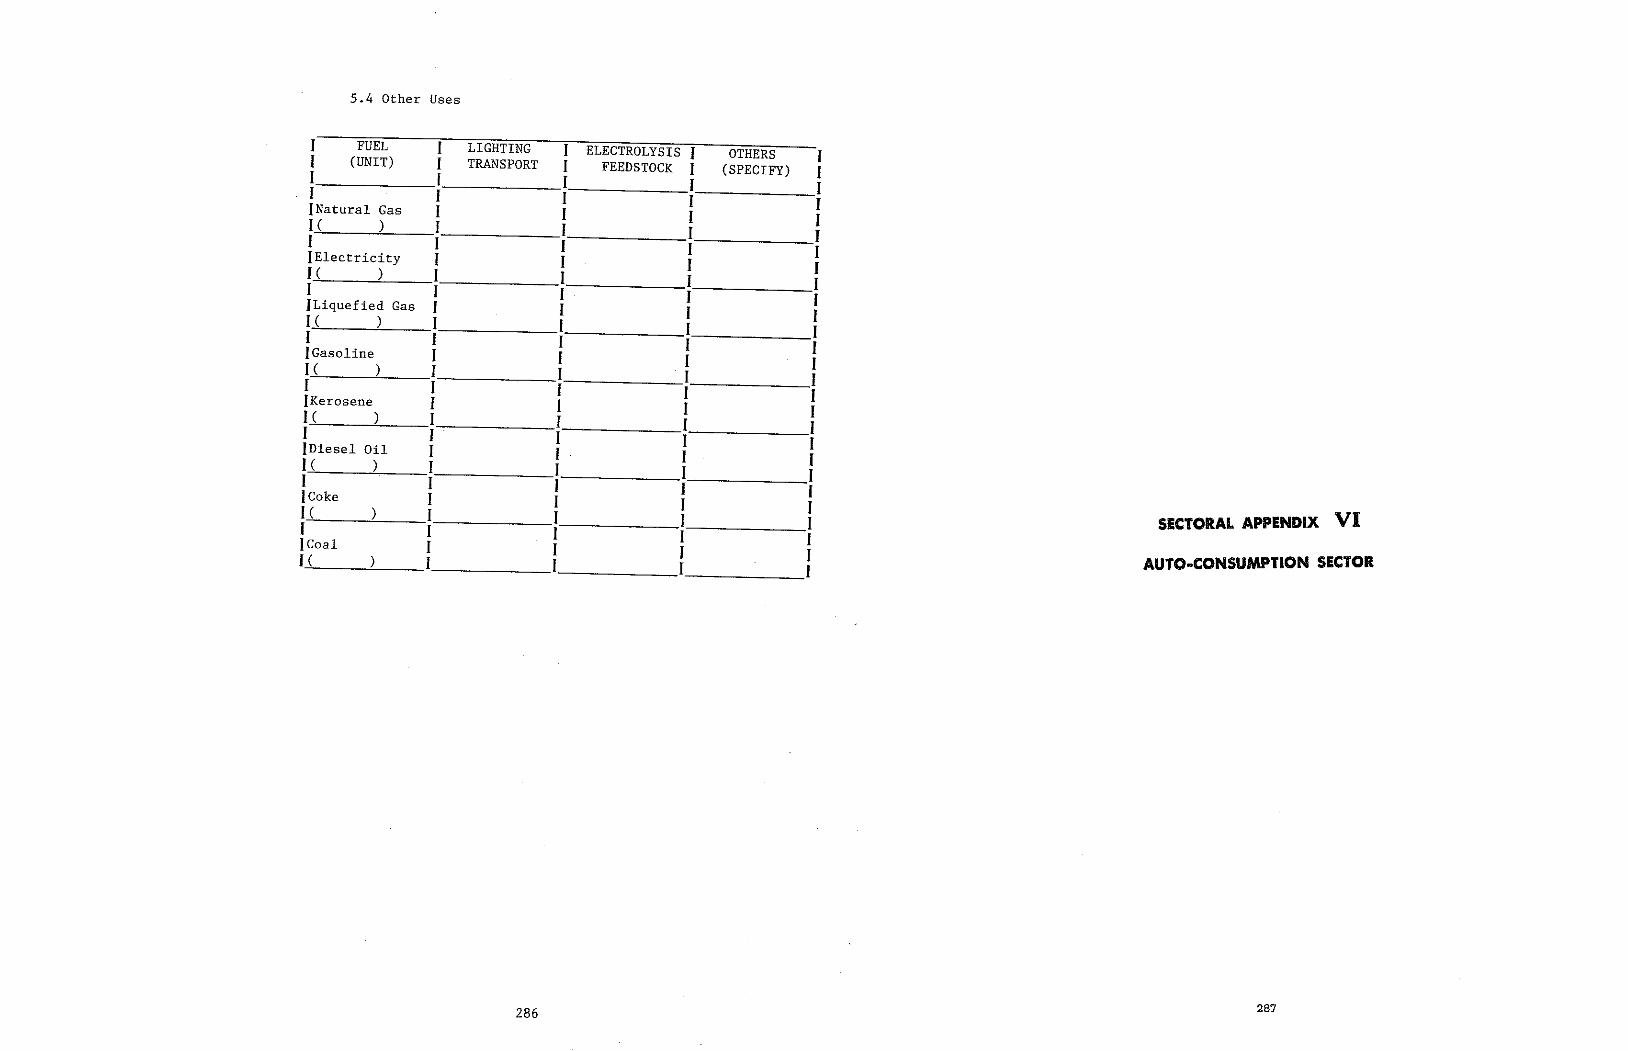
287 286
5.4 Other Uses
I FUEL 1 LIGHTING I ELECTROLYSIS J OTHERS 1 1 (UNIT) 1 TRANSPORT 1 FEEDSTOCK 1 (SPECIFY) 1 I 1 1 1 1 1 I 1 1 I !Natural Gas 1 1 1 1 1( ) I 1 1 1 1 1 1 1 1 JElectricity I I 1 I I ( ) 1 1 1 1 I 1 1 1 1 JLiquefied Gas 1 1 I 1 1 ( ) 1 1 1 1 1 1 1 1 1 IGasoline 1 1 1 1 I( ) I I . 1 1 1 1 1 1 1 }Kerosene I 1 1 1 1 ( ) 1 1 1 1 1 1 . 1 1 1 [D'í.e se I Oíl 1 1 1 1 1 ( ) I I 1 1 1 I I I 1 JCoke I 1 1 1 SECTORAL APPENDIX VI 1 ( ) I 1 I 1 1 1 1 1 1
AUTO·CONSUMPTION SECTOR JCoal I 1 I 1 1( ) 1 1 1 1

288
302
304 CHAPTER III - APPLICATIONS
l. The Case of Brazíl
299 DATABASE FORMATION CHAPTER II
290
293
294
296
Disaggregation by Subsectors
Disaggregation by End-Uses Final Energy, Useful Energy and Efficiencies
BEEU Applied to a Unit
l.
2.
3.
4.
DEFINITIONS AND BASIC CONCEPTS CHAPTER I
AUTO-CONSUMPTION SECTOR
INDEX
290
related to production, _transformation and energy sources through pipelines is considered
"The consumption transportation of auto-consumption.11
On the basis of the aforesaid, it may be concluded that:
The transmission of electricity <loes not entail auto-consumption since this form of energy moves freely along the tension lines, except usually for very small consumption in certain electrical control mechanisms which are sometimes installed in the lines. It is evident that the transmission of electricity implies large losses, just as the transportation of fuel in pipelines, ships and trucks also entails losses, although smaller ones than those in the case of electric power. But such losses-- which are included under another part of the balance-- should not be con- fused with auto-consumption; the concept of useful energy is not applicable to them since they are not associated with a given use or type of equipment. With respect to the ba Lance , these los ses function in the same way as the transformation losses. Energy prospecting also has auto-consumption, from a theoretical stand- point; however, given its small magnitude, it <loes not deserve to be considered .as such.
The transport of sorne energy products-- especially fuels-- also accounts for large arnounts of consumption. However, it must be kept in mind that the OLADE methodology does not consider hydro- carbon transportation by road, raíl ar water within the energy sector, but rather within the transportation sector, since it would otherwise be necessary toseparate the freight-carrying fleet by type of products; this would require an enormous data- base effort, whích would not make a highly relevant contribution to information and knowledge. In the case of hydrocarbons, only the pipelines are left; these constitute extremely specific means of transportation within the energy sector, and it is obvious that auto-consumption in the pumping stations and pipeline heat- ing systems should form part of this section of the useful-energy balance.
Another stage which can be a large consumer ís production of primary sources.
The energy sectors auto-consurnption occurs in different stages, one of which is transformation itself. There are important amounts of auto-consumption associated with conversion centers.
l. Disaggregation by Subsectors
In order to complete this díscussíon, it is worthwhile to clarífy another aspect which frequently leads to confusion: the flows entering the conversion units are considered as feedstock, as "what is transformed". For its part, auto-consumption (whether from a conversion center or not) is considered as "what is con- sumed". Therefore, it lends itself to being treated in terms of useful energy with the corresponding losses during use.
289
Insofar as the energy sector, the function of this methodology can be visualized as follows: to provide a more detailed treat- ment of transformation and to apply to auto-consumption a treat- ment analagous to that of industry or mining.
As for auto-consumption, the situation is different. From a methodological standpoint, auto-consumption can correspond to supply, given that. projection techniques correspond to supply models. When a refinery ora gas or oil well development site is designed, auto-consumption is the result of a selection of conversio~ and production technologies, and has little to do with th: techni~ues for projecting final demand. However, from the point ?f view of t~e energy balance, the auto-consumption sector c:specially for 011 and gas) is a large consumer and the guide- lines for end-use do not differ in any way from those of the in- dustrial or mining sector. Auto-consumption is thus of a dual nature, and the concept of useful energy is applicable in its role as a consumption sector. The present methodology has adopted the conventi~n of including the energy sectors own consumption as a consumption sector, as can be seen in the summary matrix of the balance.
With respect to transformation, the OLADE methodology-- and ac- tually any other methodology-- treats the conversion centers as a balance of input a~d output flows, out of which automati~ally e~erge transformation losses and efficiencies. In energy plan- ning, these transformation centers are dealt with as a typical pro~lem of supply, with techniques such as simulation or optirni- zation. Since efficiencies and losses are inherent to planning of energy supply, no additional concept such as useful energy is needed to.delve into greater depth. Nonetheless, there can be a better d~saggregation of efficiencies andan improvement of the database in arder to permit suitable estimates, since it would not make sense to be concerned with better energy utilization at the level of consumption sectors without paying due attention to what happens in the transfórmation centers. However no matter ~ow important it is, it is a traditional instrument for perfect- 1ng balances and does not require new concepts for 't i 1 . l s mp ementation.
treatment of the auto-consumption sector in the elaboration useful-energy balances (BEEU) has sorne particular features of own, with respect to the other sectors, since within the BEEU others cover demand, whereas this one forros part of supply.
T? f~cil~tate treatment, two netly differentiated parts should be d1st1ngu1shed: (1) TRANSFORMATION and (2) AUTO-CONSUMPTION.
The of its the
DEFINITIONS AND BASIC CONCEPTS
CHAPTER I
292
Oil Natural gas Coal Electricity Diesel oíl Fuel oíl Cake gas Refinery gas
The disaggregatíon of auto-consumption by energy sources (primary and secondary) is obvious, and corresponds to the colurnns of the OLADE balance. The most important auto-consumption will undoubtedly be found in the following products:
There is a clear distinction between what is production of pri- mary sources on the one hand and what is transformation of these into secondary sources on the other. These two processes consti- tute the large subsectors into which auto-consumption should be disaggregated. This treatment offers the advantage of dis- counting the tendency to open up new transformation centers, thereby introducing fictitious new secondary sources which are really treated primary sources. In the treatment of primary sources there may be (and there are in fact) transformations of a physical and chemical kind. This does not mean that they should be considered as transformation in the sense of the energy bal- ance; in other words, there is a secondary source with a clearly independent entity working at the level of demand and demand forecasting.
It is evident that the three primary sources mentioned above will account for most of the auto-consumption in production and pipe- line transportation. The other sources such as hydro, bagasse, firewood, etc., will register negligible or non-existent consumptíon and have therefore been grouped under "Others". One exception might be bagasse drying, if that technology were to come to play an important role in the future. The solar energy or fuel consumed would represent a considerable auto- consumption; but drying would not constitute a new transformation center (and neither would the preparation of nuclear fuels), since there is no clear correlation at the level of the secondary energy which could be generated on the basis of these operations.
Oil and gas Nuclear fuels Coal Others
(plus pipelines) subsector may be subdivided by of energy; the respective auto-consumption will subdivided by forms of energy, i.e.:
The production primary sources thus in turn be
tation of the respective flows and in arder to place the coun- tries in a homogeneous situation far the sake of comparisons.
291
and the auto-producing plants into:
Hydro Conventional steam turbines Gas turbines Diesel groups
Further breakdown of th 1 is undoubtedly ne e e :ctric power balance by . cessary in the OLADE type of plant imperative for BEEU, which sho ld balance, but it proves in homogeneous groupings T uf put the conversion technologies 90% . h d . rans ormatíon eff' . . º in y ropower plants tap in iciencies range from with gas turbines, and it isp bg.small heads up to 16% in those of the aggregate electric po~e~ioustthat the overall efficiency electricity production efficienc sec or ~acks significance for sub-balance be prepared for the r· ~t is thus proposed that a to resolve the uncertainty in the ectric power sector, in arder e current methodologys~ . t in erpre-
steam turbines Hydro Conventional Gas turbines Diesel groups Nuclear Others
following Public power plants should in types: turn be divided into the
Petroleum refineries Public power plants Auto-producing power plants Gas treatment plants Charcoal plants Coke plants Alcohol distilleries Other transformation centers Other transformations
type same
The transformation subsector of transformation is automatically subdivided b d
. cen t ar , and it is des. bl y isaggregat~on d i~a e to do th ~ un er auto-consumpt' e ion, i.e.:
associated and cannot
Production d · an pipelines may be combined in latter are not very important. countries where
I~ should be clarified that fuel s .. with sorne one of the th torage is generally th ree subsectors d f' d erefore be consider d e ine above e as a subsector in itself.
Transformation Production Pipelines
Therefore, the subsectors are:
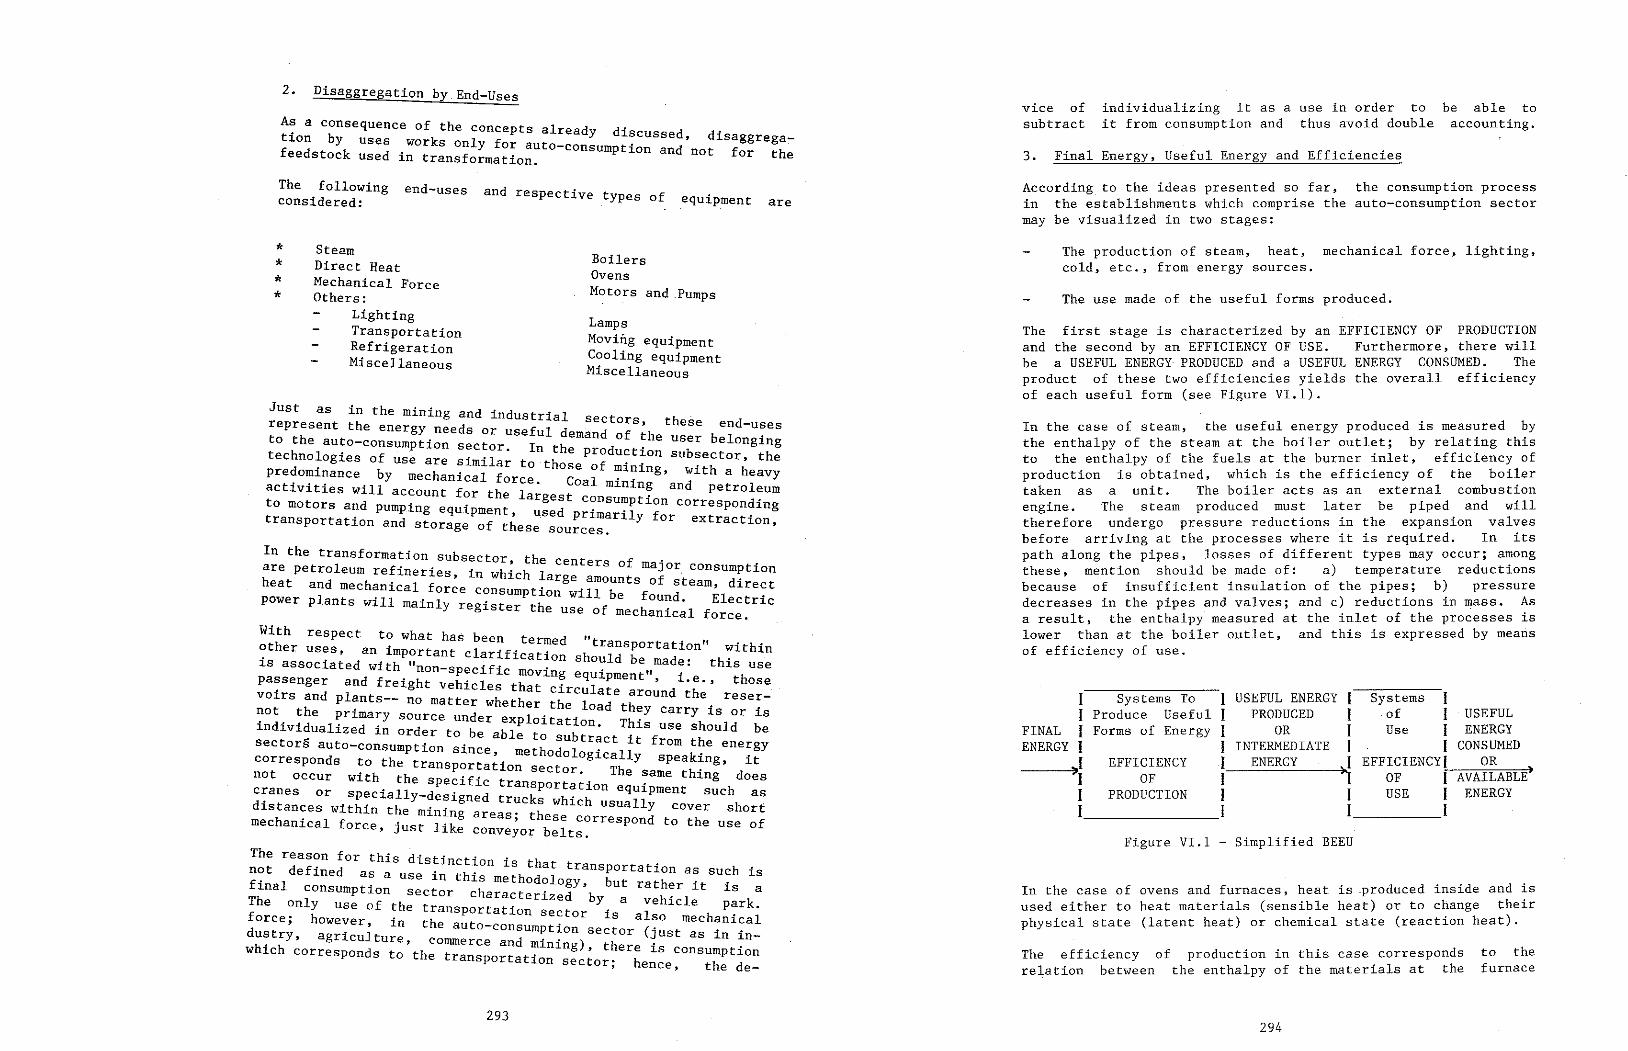
293
to the furnace
The efficiency of production in this case corresponds relation between the enthalpy of the rnaterials at the
In the case of ovens and furnaces, heat is .produced inside and is used either to heat materials (sensible heat) orto change their physical state (latent heat) or chemícal state (reaction heat).
1 Systerns To 1 USEFUL ENERGY 1 Systerns 1 1 Produce Use ful 1 PRODUCED 1 of 1 USEFUL
FINAL I Forms of Energy I OR 1 Use 1 ENERGY ENERGY 1 1 INTERMEDIATE 1 1 CONSUMED
~I EFFICIENCY I ENERGY ~
EFFICIENCYI OR 1 OF 1 OF 1 AVAILABLE> 1 PRODUCTION 1 1 USE 1 ENERGY 1 1 1 1
Figure VI.l - Sirnplífied BEEU
With respect to what has been termed 11
~ther uses, an important clarificati'on transportation" within is . d should be made: this use associate with "non-specífic movin e · 11 •
passenger and freight vehicles that ~ qulipment ' i.e., those va· d 1 circu ate around the irs an p ants-- no matter wheth h reser- not the primary source under ex er.t e_load they carry is or is individualized in arder to b blploitation. This use should be ~ e a e to subtract it f th sectors auto-consumption since . rom e energy corresponds to the transporta~· methodologically speaking, it not occur with the s 'f• ion sector. The same thing <loes c~anes or specially-d~:~~n~~ ~~:~~port~tion equipment such as distances within the mining areas· t~ which usually cover short mechanícal force J'ust li'k ' ese correspond to the use of • e conveyor belts. The reason for this d. t. . . not defined is.inct~on is that transportation as such is f' 1 as a use in this methodology but rather it . T~na consumption sector characterized 'by is a
e only use of the transportation . a vehicle park. force; however i'n the t sector is also mechanical • au o-consumpt' dustry, agriculture c d . ~on sector (justas in in- h . • ommerce an rnining) the . w·ich corresponds to th t . • re is consumption e ransportation sector; hence, the de-
In the transformation subsector the are petroleum refineries in h~ h 1 centers of majar consurnption heat and mechanical for~e co:s~~pti~~g:.~~o~ntsfof stearn, direct power plants '11 · 1 i e ound. Electric wi main y register the use of mechanical force.
In the case of steam, the useful energy produced is measured by the enthalpy of the steam at the boiler outlet; by relating this to the enthalpy of the fuels at the burner inlet, efficiency of production is obtained, which is the efficiency of the boiler taken as a unit. The boiler acts as an external combustion engine. The steam produced must later be piped and will therefore undergo pressure reductions in the expansíon valves befare arriving at the processes where it is required. In its path along the pipes, losses of different types may occur; among these, mentían should be made of: a) temperature reductions because of insufficient insulation of the pipes; b) pressure decreases in the pipes and valves; ande) reductions in mass. As a result, the enthalpy measured at the inlet of the processes is lower than at the boiler outlet, and this is expressed by rneans of efficiency of use.
Just as · th in e mining and industrial sectors . represent the energy needs or useful <lema ' these end-uses to the auto-consumption sector I nd of the user belonging technologies of use are simila; tont~~=ep~odu~t~on sub~ector, the predominance by mechanical force f 1'.ª~ing, with a heavy activities will account far the la; Coal minin~ and petroleum to motors and pumping equipment, u:::t ~~nsu~ption correspon~íng transportation and storage f th . p imarily for ext racc ton, o ese sources.
The first stage is characterized by an EFFICIENCY OF PRODUCTION and the second by an EFFICIENCY OF USE. Furtherrnore, there will be a USEFUL ENERGY PRODUCED anda USEFUL ENERGY CONSUMED. The product of these two efficiencies yields the overall efficiency o f each usefu1 forrn (see Figure VI. l).
Lamps Moviñg equipment Cooling equipment Miscellaneous
The use made of the useful forms produced.
Boilers Ove ns Motors and Pumps
The production of stearn, heat, rnechanícal force, líghting, cold, etc., frorn energy sources.
Steam Direct Heat Mechanical Force Others:
Lighting Transportation Refrigeration Míscellaneous
* * * *
equipment According to the ideas presented so far, the consumption process in the establishrnents which comprise the auto-consumption sector may be visualized in two stages:
are The following end-uses d an respective types of considered:
3. Final Energy, Useful Energy and Efficiencies
As a consequence of the concepts alread d' tion by uses .works only for auto-con~ump~~~~s=~~·no:isaggrega- feedstock used in transformation. far the
individualizing itas a use in order to it frorn consurnption and thus avoid double
vice of subtract
be able to accounting.
Disaggregation by End-Uses 2.
294
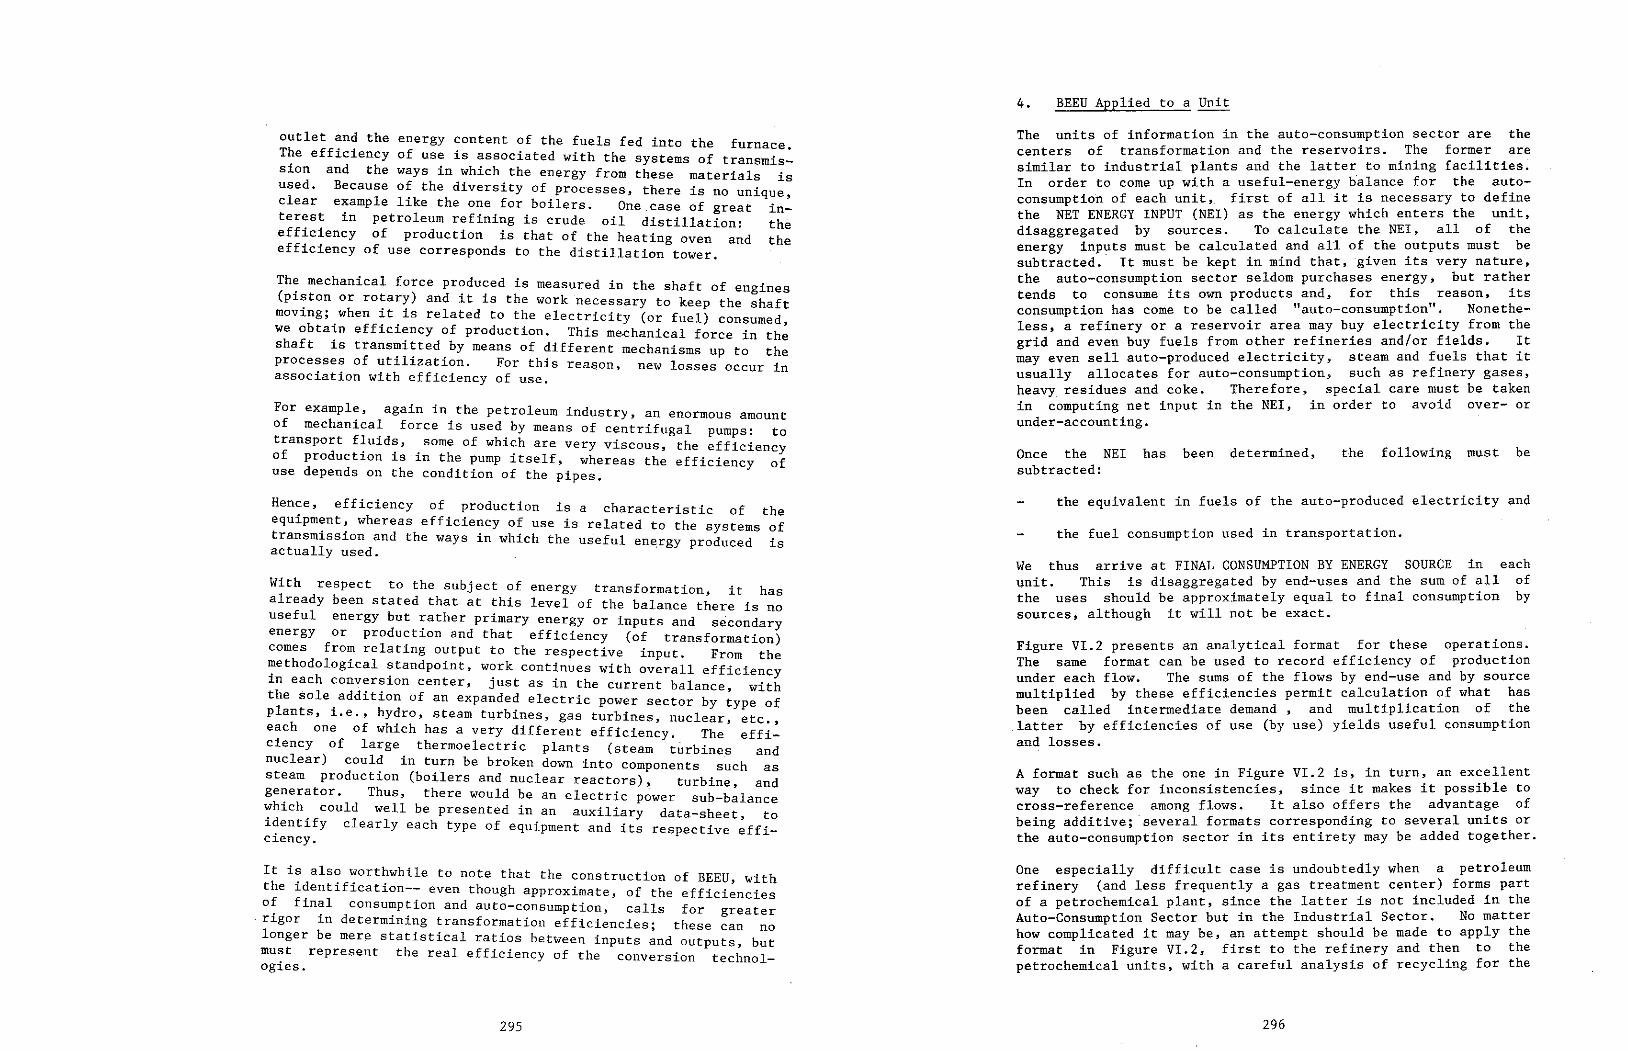
296
A format such as the one in Figure VI.2 is, in turn, an excellent way to check for inconsistencies, since it makes it possible to cross-reference among flows. It also offers the advanta~e of being additive; several formats corresponding to several units or the auto-consumption sector in its entirety may be added together.
One especially difficult case is undoubtedly when a petroleum refinery (and less frequently a gas treatment center) forms part of a petrochemical plant, since the latter is not included in the Auto-Consumption Sector but in the Industrial Sector. No matter how complicated it may be, an attempt should be made to apply the format in Figure VI.2, first to the refinery and th:n to the petrochemical units, with a careful analysis of recycling for the
We thus arrive at FINAL CONSUMPTION BY ENERGY SOURCE in unit. This is disaggregated by end-uses and the sum of all the uses should be approximately equal to final consumption sources, although it will not be exact.
Figure VI.2 presents an analytical format for these operatio~s. The same format can be used to record efficiency of production under each flow. The sums of the flows by end-use and by source multiplied by these efficiencies permit calculation of what has been called intermediate demand, and multiplication of ~he latter by efficiencies of use (by use) yields useful consumption and losses.
ea ch of by
the fuel consumption used in transportation.
Once the NEI has been determined, subtracted:
the equivalent in fuels of the auto-produced electricity and
the following must be
The units of information in the auto-consumption sector are the centers of transformation and the reservoirs. The former are similar to industrial plants and the latter to mining facilities. In arder to come up with a useful-energy balance for the auto- consumption of each unit, first of all it is necessary to define the NET ENERGY INPUT (NEI) as the energy which enters the unit, disaggregated by sources. To calculate the NEI, all of the energy inputs must be calculated and all of the ~utputs must be subtracted. It must be kept in mind that, given its very nature, the auto-consumption sector seldom purchases energy, but rather tends to consume its own products and, for this reason, its consumption has come to be called "auto-consumptio1:1": Nonethe- less, a refinery ora reservoir area may b~y electr1c1ty from the grid and even buy fuels from other refiner1es and/or fields. ~t may even sell auto-produced electricity, steam and fuels that it usually allocates for auto-consumption, such as refinery gases, heavy residues and coke. Therefore, special care m~st be taken in computing net input in the NEI, in order to avoid over- or under-accounting.
4. BEEU Applied to a Unit
295
It is also worthwhile to note that the construction of BEEU, wíth the ídentification-- even though approximate, of the efficiencies of final consumption and auto-consumption, calls for greater
. rigor in determiníng transformation effíciencies; these can no longer be mere statistical ratios between ínputs and outputs, but must represent the real efficiency of the conversion technol- ogies.
With respect to the subject of energy transformation, it has already been stated that at this level of the balance there is no useful energy but rather primary energy or inputs and secondary energy .or production and t ha t efficiency (of transformation) comes from relating output to the respective input. From the methodological standpoint, work continues with overall efficiency in each conversion center, justas in the current balance, with the sole addition of an expanded electric power sector by type of plants, i.e., hydro, steam turbines, gas turbines, nuclear, etc., each one of which has a very different efficiency. The effi- ciency of large thermoelectric plants (steam turbines and nuclear) could in turn be broken down into components such as steam production (boilers and nuclear reactors), turbine, and generator. Thus, there would be an electric power sub-balance which could well be presented in an auxiliary data-sheet, to identífy clearly each type of equipment and its respective effi- ciency.
Hence, efficiency of production is a characteristic of the equipment, whereas efficiency of use is related to the systems of transmission and the ways in which the useful en~rgy produced is actually used.
For example, again in the petroleum industry, an enormous amount of mechanical force is used by means of centrifugal pumps: to transport fluids, sorne of which are very viscous, the efficiency of production is in the pump itself, whereas the efficiency of use depends on the condition of the pipes.
The mechanical force produced is measured in the shaft of engines {pistan or rotary) and it is the work necessary to keep the shaft moving; when it is related to the electricity (or fuel) consumed, we obtain efficiency of production. This me~hanical force in the shaft is transmitted by means of different mechanisms up to the processes of utilization. For this reason, new losses occur in association with efficiency of use.
outlet and the energy content of the fuels fed into the furnace. The efficiency of use is associated with the systems of transmis- sion and the ways in which the energy from these materials is used. Because of the diversity of processes, there is no unique, clear example like the one for boilers. One.case of great in- terest in petroleum refining is crude oil distillation: the efficiency of production is that of the heating oven and the efficiency of use corresponds to the distillation tower.
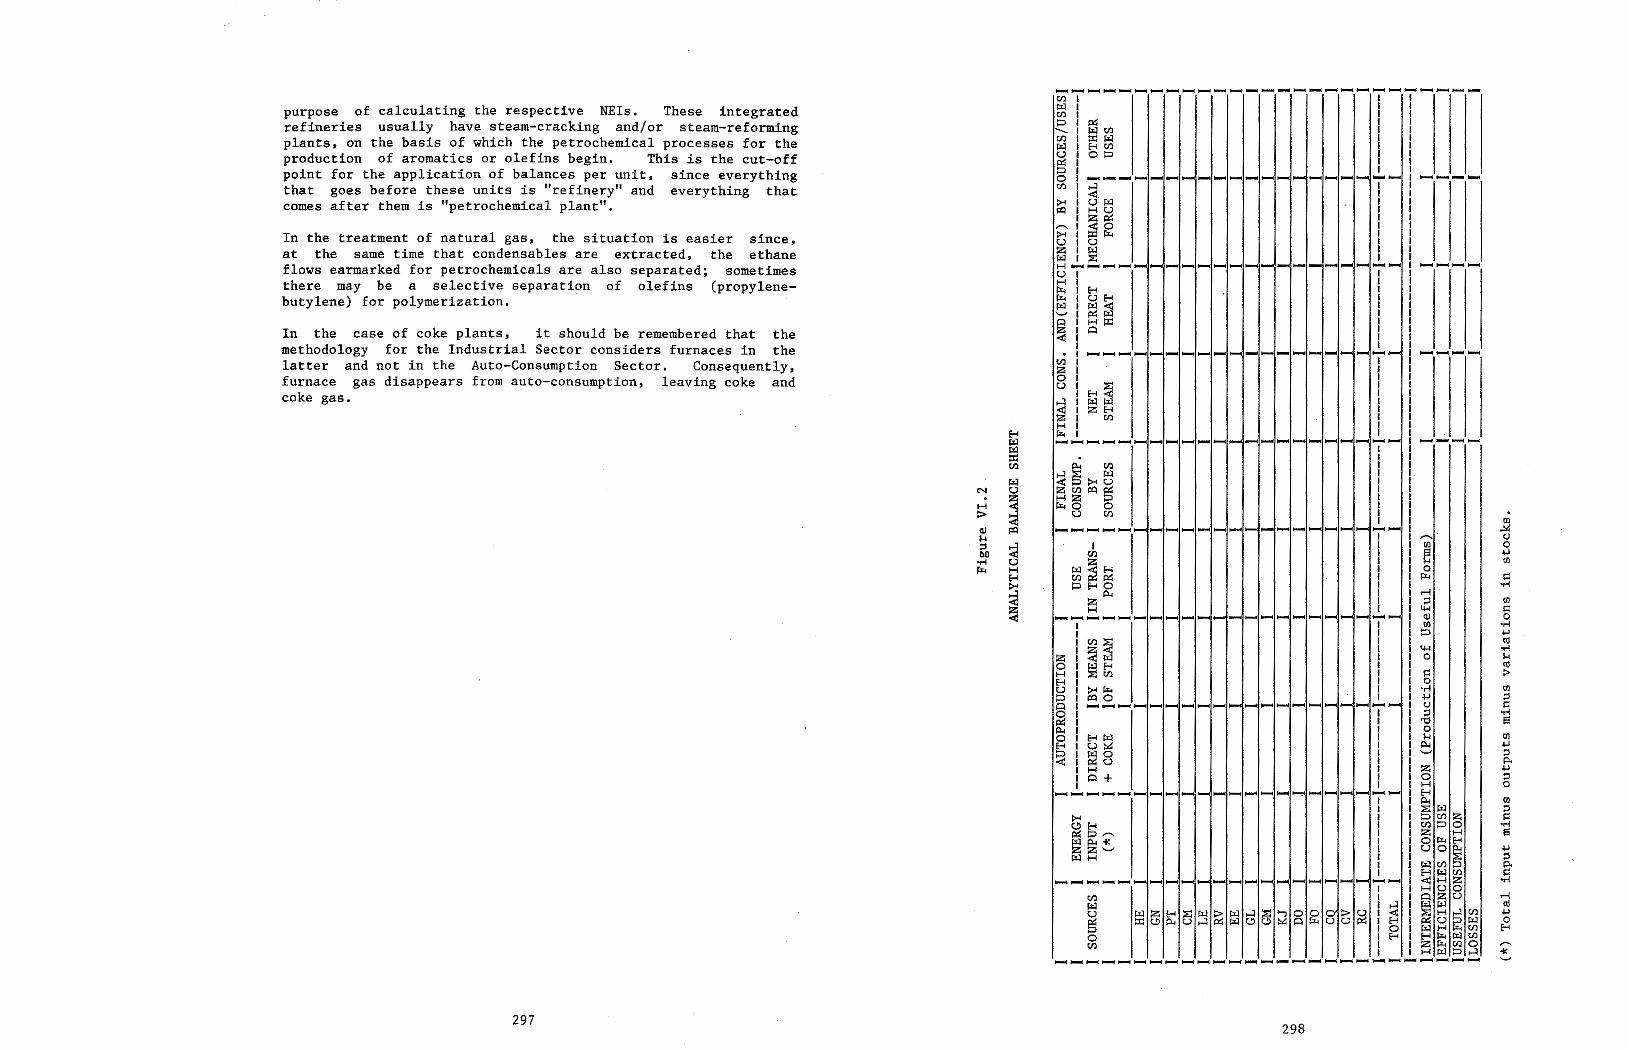
298
--....-.----~ ............ - ...................... _ ................................................ .......,..: ............. .-..ii..- Cf.l 1 1 1 r.tl 1 1 1 ti) 1 1 :;::;¡ 1 p::: 1 - 1 µ.:¡ U'.l 1 Ul l ::e: r.tl 1 r.tl 1 e-i tll 1 u 1 o :::i 1 p::: 1 1 :;::;¡ 1 1 o 1 ---- ...... ...... - - - - - - - - - - - - - -- ........................ {ll 1
~. 1
1 1 >o 1 u ¡:.:¡ 1 ¡:Q 1 H U l
1 z p::: 1 ,...... 1 ~~ 1
>o 1 1 u t u 1 z 1 r.tl 1 ¡;,::¡ 1 ~ 1 .......................... ......., ........ - - - - - - - - - - - - - - -- ............................... UI 1 HI 1 ~I e-i 1 ¡:... l u e-i 1 r.tl 1 iil < 1 '-' p::: ¡;,::¡ 1
~ H ::C: 1 o 1
1 1 ....................... - - - - - - - - - - - - - - -- ....................
Ul 1 z 1 o 1 u
E-1 ~ 1 1
~ µ::¡ ¡:.:¡ 1 z e-i 1 z Ul 1
H 1 ~ 1 ................................... - - - - - - - - - - - - - - -- ............ .....,¡ .......
1 1
~ tll 1
....,:¡ ~ 1 < >o u 1 Ztlli:i::i~ 1 HZ 1 ~o o 1
u {ll 1 1 (IJ
............................ .....,.¡ - - - - - - - - - - - - - - -- ~ 1 ,-.. CJ
1 1 (IJ o ti) 1 ~
.¡.,I 1 (IJ
µ::¡ ~ e-i 1 o tll p::: 1 ~ s:: :::i e-i o 1 •r-1
p., 1 r-l z 1 ;:I (IJ H 1 ~ s::
-.c ...................... - - - - - - - - - - - - - -- (U o 1 1 00 •r-1 1 1 ::=> +-1 1 Cf.l ~ 1 tll 1 1 ~ •r-1
z 1 :;¡¡ µ.:¡ 1 o ,.. o 1 ~~
1 1 ce H 1 1 1 s:: :> H 1 1 1 o u 1 >o ~ 1 1 ·r-1 (IJ :;::;¡ 1 ¡:Q o 1 1 +-1 ;:l o 1 ........ ..-ii.....c - - - - - - - - - - - - - - -- 1 CJ s:: o 1 1 1 ::l -r-1 p::: 1 1 1 'U E:! p., 1 1 1 o o 1 E-1 [..:¡ 1 1 ,.. (IJ
E-4 1 u~ 1 1 p., .¡.,I
~ 1 ~8 1 1 ..__. ;:l 1 1 1 p. 1 H 1 1 z .µ 1 o+ 1 1 o ;:I 1 1 1 H o
................ i--1 ... - - - - - - - - - - - - - - -- 1 E-1 1 1
~ (/)
1 1 [..:¡ ::l
~ e-i 1 1 U'.l z s:: 1 1 en o o •.-i
p::: ::=> ....... 1 1 z H s µ::¡ p.. iC 1 l o ¡:,;.. E-t ZZ'-" 1 1 u o p., .µ [..:¡ H 1 1 s ::l
1 J ~ ti) p. 1 1 E-1 r.tl U'.l ~
............ i-."""""'4~ - - - - - - - - - - - - - - -- 1 < H z .,..¡ 1 1 H u o
tll 1 1 o z ü .-1 [..:¡ 1 ,_:¡ 1 w w tll u r.tl (5 E-1 ~ w ~ ~ ,_:¡
~ ., o ~ :> ~ 1
E'.S 1 ~ H ....,:¡ U'.l +-1
g:j ::i:: p., ....,:¡ µ::¡ c..'} ::.: o ü u 1 1 u ~ w o 1 o 1 µ::¡ H {ll E-t
o 1 H 1 E-1 ~ ¡;,::¡ U'.l Ul 1 1 z Í1< U'.l o .......
1 1 H r.tl :::i ....,:¡ -te ~ ... ~~~~~~~~~~~~~~~~~~~~~~~~~ '-'
H r.tl r.tl ::e: {/)
r.tl N u H
~ > (U ¡:Q ,.. ;:I ~ OI)
-r-i u ~ H E-4 >o
~
297
In the case of coke plants, it should be remembered that the methodology for the Industrial Sector considers furnaces in the latter and not in the Auto-Consumption Sector. Consequently~ furnace gas disappears from auto-consumption, leaving coke and coke gas.
In the treatment of natural gas, the situation is easier since, at the same time that condensables are extracted, the ethane flows earmarked for petrochemicals are also separated; sometimes there may be a selective separation of olefins (propylene- butylene) for polymerization.
purpose of calculating the respective NEis. These integrated refineries usually have steam-cracking and/or steam-reforming plants. on the basis of which the petrochemical processes for the production of aromatics or olefins begin. This is the cut-off point for the application of balances per un~t. since everything that goes before these units is "refinery" and everything that comes after them is "petrochemical plant".
300 299
(*) For the contents related to energy, see modules II-VII of the Industrial Sector and modules III and IV of the. Mining Sector.
-------------------- This sub~ect could not go without mentían in thís methodol- ogy. As in the case of transformation losses, the electri- city t:ansmission and distribution losses must be accurately determined. The losses h. h · w ~c appear in a useful-energy balance should be real, since they occur in one of the
ii) Electricity Transmission Losses
In arder to do this, it is necessary to run industrial or mining surveys(*), as the case may be. The problem is thus not resolved within the energy sector but, on doing the industrial or mining surveys, the auto-consumption sector is included asan obligatory stratum. The intention here is not to repeat all of the statistical treatment of these surveys which are proper to industry and mining. It will simply be said that, as a result of these, the per-unit bal- ances of Figure VI.2. are obtained. Since it is assumed
For therrnoelectric plants, the best thing is to do a heat balance, assigning electricity an enthaply content of 860 Kcal per kWh. The different efficiencies can be found th:ough che?ks on the enthalpy flows at the outlet of the boiler, turb1ne and generator.
v) Disaggregation of Auto-Consumption Ex_ End-Uses
of relating density x
generator bars,
In hydropower stations, efficiency is the result potential energy at the site (flow x gravity x head) to the electricity produced in the both expressed in the same units.
The magnitude of auto-consumption by sources and by subsec- tors may usually be discovered by means of an investigation of productíon centers, pipelines and transformation centers. The energy companies almost always have this information and attention should be paid here too to the products wíth non- traditional names, in arder to avoíd underestimates.
iv) Auto-Consumption
BEEU aid in solving this problem, for they permita better estímate of charcoal and metallurgical cake consumption. With a sound determination of efficiency, it is possible to make a good estímate of the primary sources (firewood and coke) which feed into the charcoal and coke plants.
When installations are very complex, as in the case of certain pet:oleum refin:ries, it is necessary to adjust flow-accounting methods since over- and under-accounting are very frequent. Another stumbling-block is that numero flows of intermediate products which never reach the mark~: and.which are usually destined to auto-consumption receive a variety of names which do not coincide with the ones used in the balance. Nevertheless, in a mass balance every product as stran~e as it ma~ seem, should be compared to sorne one of the trad1tional derivatives, for which purpose it i· l·l ff · · s usua y su 1cient to compare API density ar, if more precision i desired, the range of distillation as well. s
iii) Efficiency in Non-Commercial Energy Transformation Centers
These rnainly refer to charcoal plants and cake plants on an artesanal level, where efficiency must be determined by means of surveys consisting of materials balances and meas- urements of calorific value in sorne selected units. There is no problem in estimating efficiency in this way, but it is much more difficult to determine installed capacity and therefore primary input and secondary production since the universe of units is usually unknown.
Efficienc of Commercial Ener y Transforrnation Centers
For refineries, alcohol distilleries, gas treatment plants and coke plants integrated into iron and steel plant a materials (mass) balance should be done plant by plant s~nd effi-cienc~ should be calculated as efficiency of mass and then efficiency of heat flows. The losses in these units are losses i·n rnass di 1 · ff . expresse n ca oric terms, as well as e i-ciency.
i)
There are countries in which apparent electricity transmis- sion and distriubution losses are far greater than admissi- ble technical limits, and there an effort must be made in the database, to upgrade the information without discounting the possibility of measurements in the field, or even a rigorous survey of the lines,
In order to arrive ata BEEU for the Auto-Consumption Sector a defi~ed in ~his methodology, there are information difficul~ie: of diverse k1nds. First of all, it can be said that the idea of a survey or general census should be discarded because of th diversity factor; it is better to group the problems by ty : to seek specific solutions. pean
DATABASE FORMATION
fields where there are greater possibilities applying con- servatíon measures rather than beíng concerned with effi- ciency of production and use in the consumption sectors. It is also worthwhile to mention the problem of clandestine connections which are often confused with losses but which in practice result in under-billing.
CHAPTER II

302
The results obtained in the Brazilian balance are presented in
Heating or Direct Heat: stoves and furnaces. Steam: boilers
all types of motors, electric or fuel- those used for refrigeration and pumping
Mechanical force: driven (including purposes).
The disaggregation by end-uses and the respective equipment was as follows:
The BEEU was essentially prepared using studies already avaialble in the country. Ata complementary level, a survey was done on the centers of petroleum refining and electric power plants, in order to determine the destination of the final energy consumed therein.
determination of useful energy consumption by multiplying final energy consumed by the respective efficiency (effi- ciency of production, according to the methodology proposed by OLADE).
evaluation of the destination of final energy, for selected end-uses;
identification of the consuming equipment and its efficien- cy;
identification of the end-uses of the different energy sources;
For the purposes of comparisons with the other consumption sec- tors, the useful-energy balance for this sector basically covers the following stages:
According to the conceptualization of the OLADE methodology, this useful-energy balance corresponds to energy auto-consumption in the transformation centers. In the Brazilian case, this repre- sents a little over 7% of final energy consumption. The results presented herewith aim to serve as a reference for the proposed methodology; bibliographical references are also included for their consultation by interested countries.
useful-energy for Brazil by
presents the results obtained for the the Auto-Consumption Sector prepared of Mines and Energy for 1983.
This chapter balance of the Ministry
APPLICATIONS
CHAPTER III
301
Given "that auto-consumption is concentrated in just a few large consumers, it is not foreseen that it will be neces- sary to apply sampling techniques, because all of the units will be in the sample.
sam- the
bal- anees.
that all of the units comprising the sector have been pled (at least the large consumers), the balance for sector as a whole will be the sum of,the individual
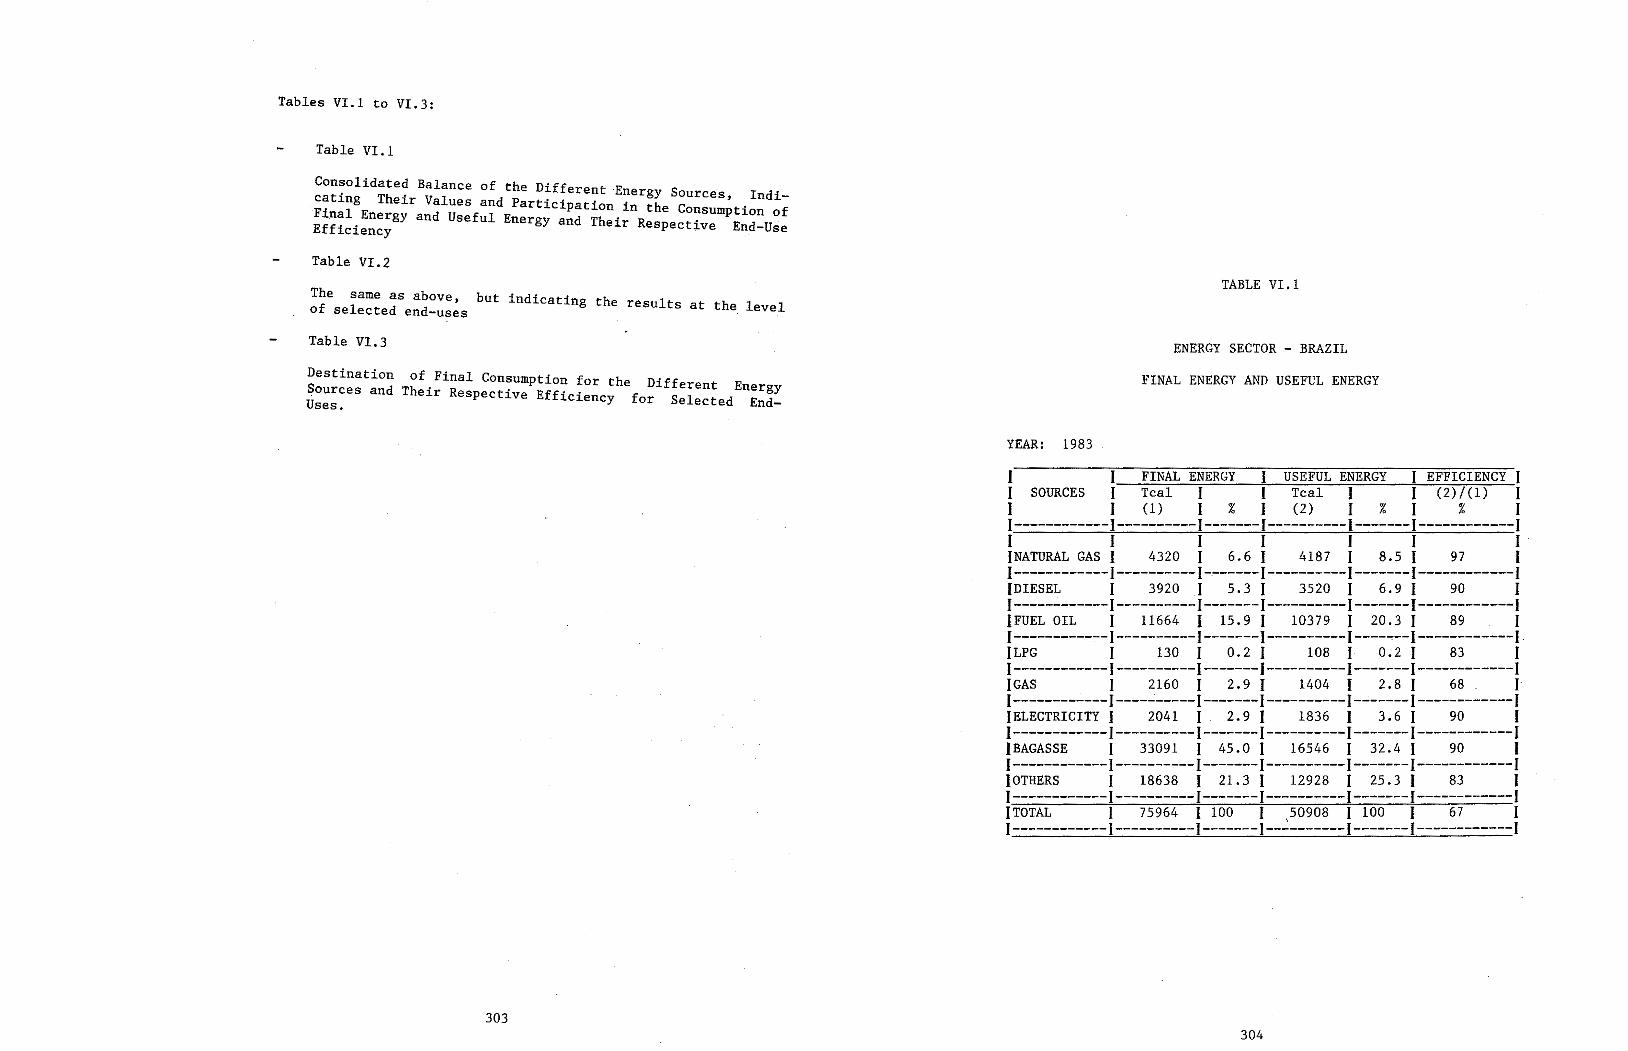
304
1 FINAL ENERGY J USEFUL ENERGY 1EFFICIENCY1 1 1 1 1 (2)/(1) 1 J SOURCES J Tcal 1 1 Tea ~ ~ I 1 1 (1) 1 % 11 ( 2) ----1·---~---:-----~------1 1 I----------1------- ------ 1 ------------ 1 1 1 1 1
87 11
8 5 1 97 1 JNATURAL GAS 1 4320 1 6.6 1 4l ' ------------( -1----------1-------1----------1-------1 :~~;;;~~--- 1 3920 _1 ::~-l----===~--l---:::_¡ :~------l 1------------1--------- 1 20 3 1 89 1 JFUEL OIL 1 11664 I 15.9 1 .10379 1 . . --------1 1----------1-------1----------1----~--1---- 1------------ 130 1 0.2 1 108 1 0.2 1 83 1 JLPG l----------l-------l----------J-------1------------1 :~~;---------: 2160 I :::_I =:~:~l-~c=:~-l----:~-~----l 1------------1----------1 1 3 6 1 90 1 JELECTRICITY 1 2041 1 2.9 1 l836 ·----~-- ------------I ¡~~~;;;-----¡~--;;~;~--:--:;~~-¡---~~;:~--: 32.4 l :~------l
I I----------1-------1 1------------1---------- ------- 25 3 1 83 1 JOTHERS J 18638 1 21.3 1 12928 1 · ------------I ¡;~;;;;:-------:---;;;~:--:-~~~---1--~;p;~;--:-~~~---1 :~------l
l 1 ------1----------1-------1 1------------ ---------- -
YEAR: 1983
ENERGY SECTOR - BRAZIL
FINAL ENERGY AND USEFUL ENERGY
TABLE VI. l
303
Destination of Final Consumption for the Different Energy Sources and Their Respective Efficiency for Selected End- Uses.
Table VI. 3
The same as abov a , but indicat.ing the results at the level of selected end-uses
Table VI.2
Consolidated Balance of the Different --Energy Sources, Indi- cating Their Values and Participation in the Consumption of Final Energy and Useful Energy and Their Respective End-Use Efficiency ·
Table VI. l
Tables VI.l to VI.3:
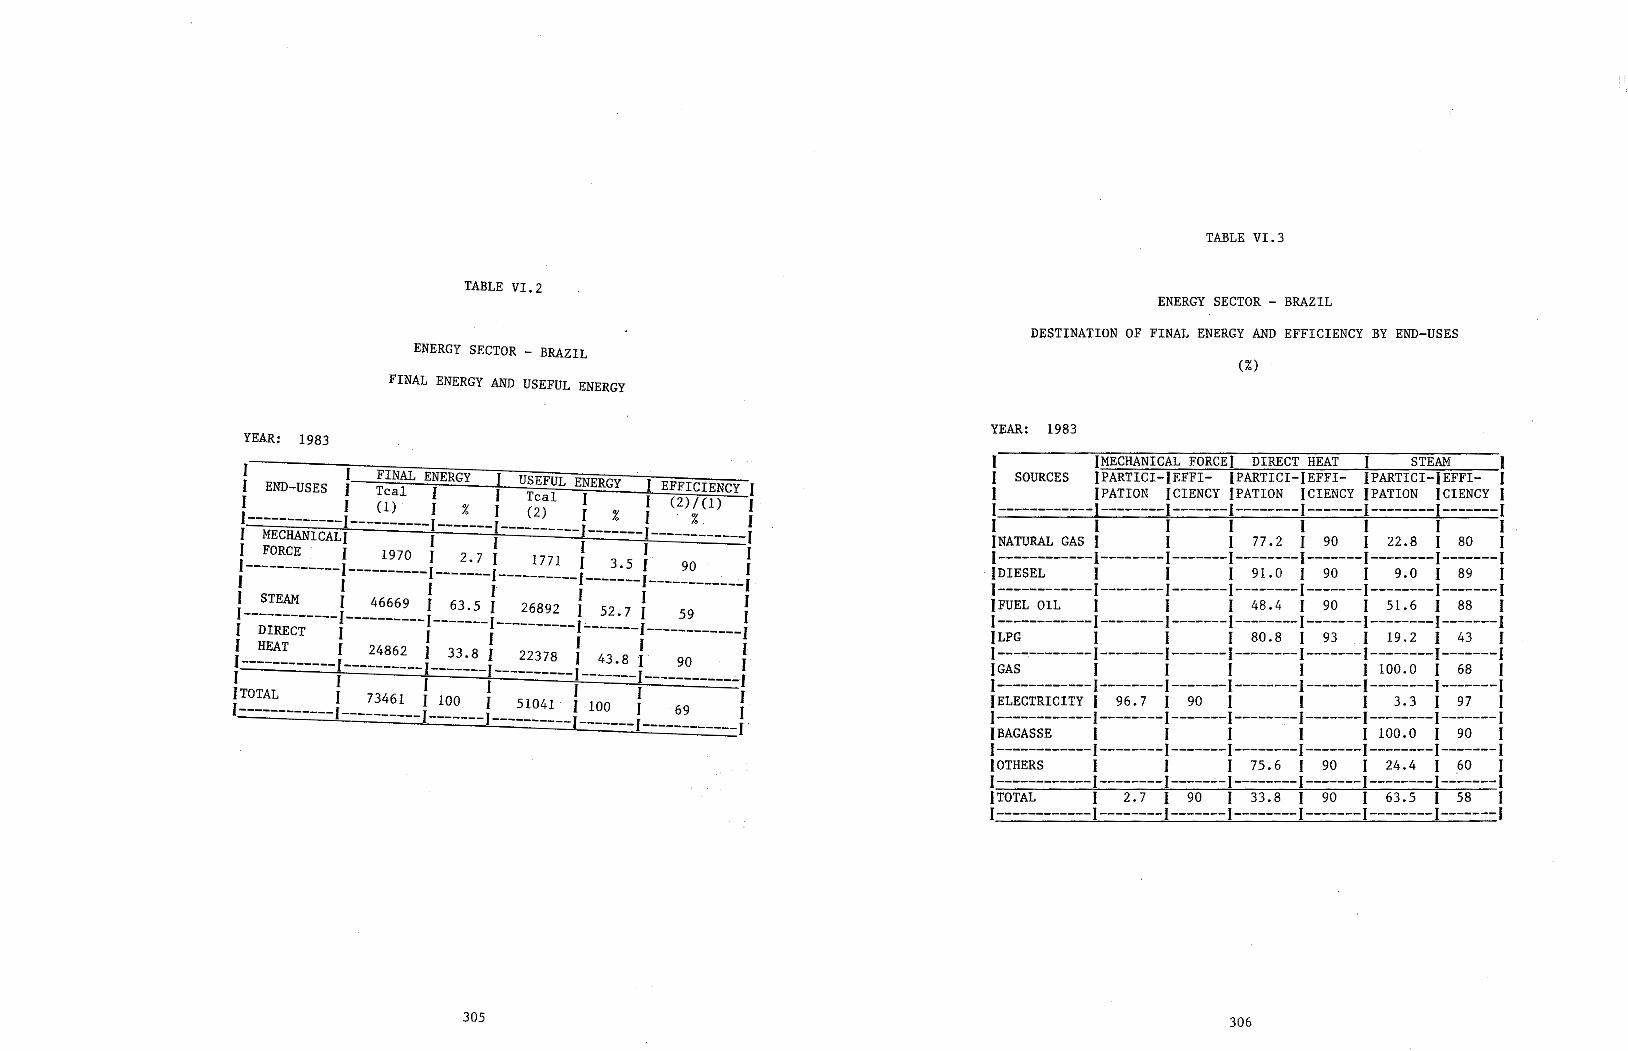
306
J IMECHANICAL FORCE! DIRECT HEAT 1 STEAM J 1 SOURCES IPARTICI-IEFFI- fPARTICI-IEFFI- IPARTICI-JEFFI- J 1 IPATION ICIENCY IPATION ICIENCY IPATION ICIENCY 1 1------------1--------1-------1--------1-------1--------1-------1 1 1 1 1 1 1 l 1 INATURAL GAS 1 1 1 77.2 1 90 1 22.8 1 80 1 1------------1--------1-------1--------1-------1--------1-------1
·!DIESEL 1 1 1 91.0 1 90 1 9.0 1 89 1 1------------1--------1-------1--------1-------1--------1-------1 JFUEL OIL 1 1 1 48.4 1 90 1 51.6 1 88 1 1------------1--------1-------1--------1---~---1--------1-------1 ILPG 1 1 1 80.8 1 93 1 19.2 1 43 1 1------------1--------1-------1--------1-------1--------1-------1 IGAS 1 1 1 1 1 100.0 1 68 1 l------------1--------1-------1--------l-------I--------l-------I IELECTRICITY 1 96.7 1 90 1 1 1 3.3 1 97 1 1------------1--------1-------1------~-1-------1--------1-------1 JBAGASSE ( 1 1 1 1 100.0 1 90 1 1------------1--------1-------1--------1-------1--------1-------1 JOTHERS 1 1 1 75.6 1 90 1 24.4 1 60 1 1------------1--------1 .;._1--------1-------1--------1 --·-----1 }TOTAL 1 2.7 1 90 1 33.8 1 90 1 63.5 1 58 1 1------------1--------1-------1--------1-------1--------1-------1
YEAR: 1983
(%)
DESTINATION OF FINAL ENERGY AND EFFICIENCY BY END-USES ENERGY SECTOR - BRAZIL
TABLE VI.3
305
YEAR: . 1983
1 . 1 FINAL ENERGY J USEFU . .
ENERGY SECTOR - BRAZIL
FINAL ENERGY AND USEFUL ENERGY
TABLE VI.2

308
OTHERS SECTOR
SECTOR APPENDIX VII
307
R7 - Ministerio de Minas y Energía - ELETROBRAS - Aprovechamiento Energético de los Residuos de la Agroindustria de la Caña de Azúcar. 1981.
R6 - PETROBRAS - Anuarios del Encuentro sobre Conservación de Energía en la Industria - Vol. I a IV. Rio de Janeiro. 1979.
R5 - Macedo. J.C. - Economía de Energía en Ingenios y Plantas de Alcohol. En: Congreso Brasileño de Energía - CETEC STI/MIC-110/81.
R4 - Comité Coordinador del Balance Energético Nacional - COBEN y Centrales Eléctricas de Servicio Público. Consumo de Ener- gía Eléctrica en los Centros de Transformación y Generación. 1981 y 1982. 10 pp.
R3 - Cabral (Ubirajara Qcuaranta). "Ingeniería Básica como Factor Determinante de la Optimización Energética en la Side- rurgia". Encuentro sobre Conservación de Energía en la In- dustria - Panel II (Río de Janeiro). 19}9. 44-59.
R2 - Silva (José de Anchieta Ribeiro). "Economía de Energía en la Refinación de Petróleo a través de Medidas Operacionales". Encuentro sobre Conservación de Energía en la Industria Panel IV (Ria de Janeiro). 1979. 78-92.
Rl - Brasil. CNP - Consejo de Petróleo - Brasilia. Anuario Esta- dístico - Año 1983 - DIPLAN - Junio 1983. 365 pp.
BIBLIOGRAPHICAL REFERENCES

309
3.
Analysis of Existing Information
Guidelines for Sample Design and Expansion
2. 317
318
320
CHAPTER II - DATABASE FORMATION
l. Data-Collecting Form
310
312
313
315
CHAPTER I DEFINITIONS ANO BASIC CONCEPTS
l. Disaggregation by Subsectors
2. Disaggregation by End-Uses
3. Final Energy, Useful Energy, and Efficiencies
4. Energy Balance Applied to a Unit
OTHERS SECTORS
INDEX
311
Thus:
Although this disaggregation would not be necessary from the energy standpoint, since there are no substantial differences for either end-uses or sources, there could be differences in terms of the formation of a database.
According to the organization of the information system, two activities can be distinguished in the construction subsector: public construction and prívate construction.
The work of construction, repairs and demolition carried out in auxiliary fashion by the personnel of a company for their own use is not included if the fírm is considered in another economic division; for example, when excavation, clean-up, gallery or well structuring activities are carried out as part of mining activities, etc., which are classified under the Division corre- sponding to Exploitaton of Mines and Quarries.
The construction of buildings to provide housing, services, or industrial facilities (including assembly of industrial equíp- ment), as well as public works in general, e.g., water dams, port facilities and roadways, transportation infrastructure, ship- yards, distilleries, etc., and any other type of construction done by prívate firms or public authorities.
Finally, the "Construction" subsector is cornputed in deterrnining value added:
The consideration of subsector "Major Division O of the ISIC" will be closely related to the weight that this activity holds in determining the GDP, since while the "zero" division is a corn- ponent in the GDP, its corresponding value added is seldom found. The subsector "Unclassified Consumption" is made up of those energy sources whose destínations are not clearly specified. Thus, even though no strict criterion can be expressed, there will be a reference variable (sales) which will later be broken down into sectors; if there were a difference, it would be assigned to this subsector.
Construction Majar Division O of the ISIC Unclassified Consumption
Hence, the subsectors to be considered in the Others Sector would be:
unclassified consumption, i.e., that which has not been attributed to any of the previously defined sectors.
consumption associated with unspecified activities which correspond to Major Division O of the ISIC classification.
There are also two additional components in the Others Sector:
310
{*) OLADE. Energy Balances for Latín America, F b Quito, Ecuador, page 24. e ruary 1985.
The new matrix presented in Figure 11 of the Base Document pre- sents a row corresponding to ADJUSTMENTS in · . convenient to include the differences be~ween :~!c~u;~lisbt~ought and the arnounts allocated to consumption sectors I yth~ anees the destination of the primary and/or seconda; n is way, detectad at the level of consumption sectors. y sources are
The method of d" expan 1ng the sectors used in this method l includes the consurnption associated with the residential o ~gy and the primary, secondary and tertiary sectors of th sec ~r systern of a co t e economic un ry, except for the CONSTRUCTION sector h. h corresponds to Major Division 5 of the ISI . : w.ic Therefore, the sector "Others" will h h C Class1f1cat1on. t or ave te Construction subsec- as one component.
detect energy
Thus, _it will be necessary to make the utmost effort to such im~erfections in the current systems for information. recording
Actually, the inclusion of Unidentified Consumpti b · fied in different ways: lack of fit bet on may e Justi- sumpti 1 ween supply and con- on va ues; consumption not considered und r sufficient control over the marketing destinatie a~y sector; in- ces, etc. on ° energy sour-
by the previous stage of the Met- "Includes that consumption which
of the information gathered cannot be l d, d . b d " , p ace es:r7 e· {*) This reflects the impossibili- eff1c1ency of production and of end-use.
The definition contributed hodology read as follows: given the nature under the sectors ty of calculating
Given that the intention · t 1 · is .º eva uate useful energy consumption and, for that purpose it by subsectors, end-uses, is necessary to have a disaggregation U sources, etc., the definition of nidentified Consumption would not allow therefore, it would not be possible such disaggregation; that definition were maintained. to calculate Useful Energy if
The OTHERS Set b CONSUMPTION . cor su stitutes for what was called UNIDENTIFIED in the OLADE Methodology as developed unti•l now.
Disaggregation by Subsectors
The energy consumption of this sector comprises that socioeconomic sect of the tions. ors not considered under previous disaggrega-
l.
DEFINITIONS AND BASIC CONCEPTS
CHAPTER I
313
In the case of the Others Sector, whether on the basis of the adopted disaggregation by END-USES or the fact that it is not an energy-intensive activity (considering total energy consumed by a
Furthermore, energy audits should concentrate on those energy- intensive areas for which there are no SPECIFIC USES by SOURCE.
The importance of measuring efficiency of use líes in the fact that it constitutes a fundamental element in implementing ENERGY CONSERVATION mechanisms, and thus calls for energy audtis which permit ~uanitifaction of efficiency.
The EFFICIENCY OF PRODUCTION will be related to the type of equipment and the source consumed under each end-use defined, whereas the EFFICIENCY OF USE will be related to the utilization process following production of this intermediate form of energy.
Overall efficiency will thus be given by the product of the efficiencies of each one of these stages: efficiency of pro- duction and efficiency of use.
use of heat, mechanical force, etc., in each activity.
production of heat, mechanical force, etc., by means of the different types of equipment which consume different forms of energy.
Following the conceptual scheme set forth in the definition of useful energy-- which consists of observing the process of energy consumption in two stages:
3. Final Energy, Useful Energy and Effíciencies
To the extent that human energy is not included in the energy balances, a considerable scatter may appear in useful demand far the uses of mechanical force; this calls far special care in sample design.
Just as in the other productive sectors, for which the energy needs or useful demand of the user are always determined by the production process, in this case they will also be associated with the level of mechanization in the different activities.
Finally, one particular case which deserves mention is that of integrated trucks and mixers which, in principle, could give rise to consideration of another end-use, in this case transportation, but they will not be considered as such, since they are incorporated into the use of mechanical force.
Other types of equipment such as compressors, used for fill-ins and reinforced concrete work under pressure, are obviously included under the use of mechanical force~
used for heating and preparation of the tar or asphalt to be used in a given project, with a relatively marginal importance.
312
As for ~ther end-uses,_ the case of lighting will be of greater or less:r.importance depending on the mode of production and on the conditions of the work under execution (for example, construction of ~n underground railway, exposed or not, or assembly of turb1nes and/or mounting of the powerhourse in reinforced con- crete for a hydroelectric dam, etc.) Direct heat is basically
The~e end-uses, or purposes, for which energy is used respond to inherent characteristics. Thus, for example, the use of mechani- cal force in the case of the Construction subsector and partic- ularly, in civil structures such as construction of ro~ds air- ports, etc., is tied to a special kind of machinery-- le~elers. mechanical.s~o;els: ro~lers, mixers, etc. In the case of prívate sector act1v7t1y, 1t w1ll be determined by a very small number of types of equ1pment, basically mixers and hoists.
mechanical force direct heat lighting
From the energy standpoint, the activities considered in the construction subsector have very similar end-uses, with the predominance of the use of mechanical force in both cases. How- ev~r, there are other uses such as lighting and direct heat, wh1ch,. with sorne differences between public and prívate con- struction, may take on a not-so-very-negligible difference.
For the purposes of preparation of the balance, it is proposed that the following end-uses be considered:
only in the case of construction, whose energy consumption can be significant, will it be possible to do sorne kind of expansion of the different uses.
the end-uses in subsector e) will not be considered, · h i. e.-~ tose in unclassified consumption.
Disaggregation by end-u~es depends heavily on_the importance that energy consumption has in each subsector considered in each case. Nonetheless, it can be put forward that:
Disaggregation by End-Uses 2.
P~BLIC CONSTRUCTION accounts for the consumption associated with the activities carried out by public authorities in any of their manifestations: national, provincial or muni- cipal governments, decentralized organs and firms (whether work carried out with their own personnel or by means of subcontracting done with prívate-capital companies).
PRIVATE CONSTRUCTION accounts for the consumption associated with the activities of the private firms which operate in the country, insofar as residential buildings and other non-public destinations. '
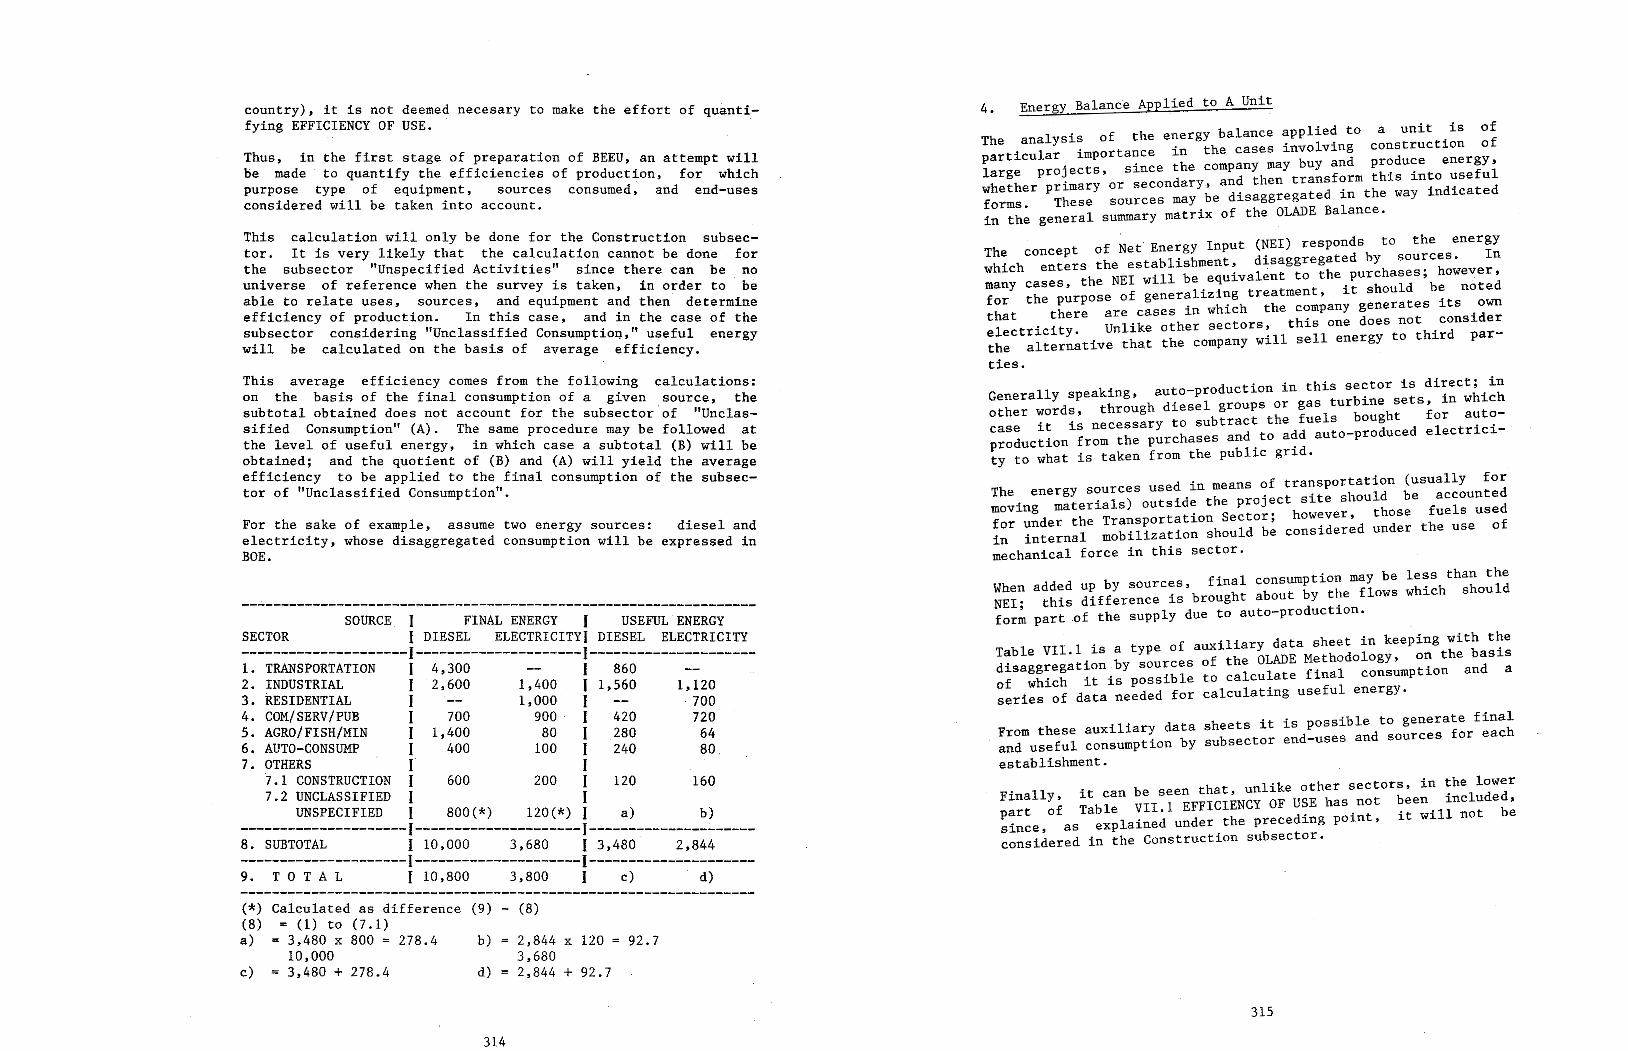
315
Finally, it can be seen that, unlike other sectors, in the lower part of Table VII.1 EFFICIENCY OF USE has not been included, since, as explained under the preceding point, it will not be considered in the Construction subsector.
From these auxilíary data sheets it is possible to generate final and useful consumption by subsector end-uses and sources for each establishment.
Table VII.lis a type of auxiliary data sheet in keeping with the disaggregation by sources of the OLADE Methodology, on the basis of which it is possible to calculate final consumption and a series of data needed for calculatíng useful energy.
When added up by sources, final consumption may be less than the NEI; this difference is brought about by the flows which should form part of the supply dueto auto-production.
The energy sources used in means of transportation (usually for moving materials) outside the project site should be accounted for under the Transportation Sector; however, those fuels used in interna! mobilization should be considered under the use of mechanical force in this sector.
Generally speaking, auto-production in this sector is direct; in other words, through diesel groups or gas turbine sets, in which case it is necessary to subtract the fuels bought for auto- production from the purchases and to add auto-produced electrici- ty to what is taken from the public grid.
The concept of Net Energy Input (NEI) responds to the energy which enters the establishment, disaggregated by sources. In many cases, the NEI will be equivalent to the purchases; however, for the purpose of generalizing treatment, it should be noted that there are cases in which the company generates its own electricity. Unlike other sectors, this one does not consider the alternative that the company will sell energy to third par- ties.
The analysis of the energy balance applied to a unit is of particular importance in the cases involving construction of large projects, since the company may huy and produce energy, whether primary or secondary., and then transform this into useful forros. These sources may be disaggregated in the way indicated in the general summary matrix of the OLADE Balance.
4. Energy Balance Applied to A Unit
314
d)
2,844 X 120 = 92.7 3,680 2,844 + 92.7
b)
::::::-------~~~;~;--1------;~;~~-;;;;~;---i----~~;;~~~;;;;~;---- ---------------------~-~=:::: :::~TRICITYI DIESEL ELECTRICITY l. TRANSPORTATION 1 4,300 -------:---;~~--------------- 2. INDUSTRIAL I 2,600 1,400 1 1,560 3. RESIDENTIAL J l,OOO I l,120 4. COM/SERV/PUB 1 700 · 700 5. AGRO/FISH/MIN 1 1,400
9~~. : 420 720
6. AUTO-CONSUMP 1 400 100 1 280 64 7. OTHERS 1 240 80 7.1 CONSTRUCTION 1 600 200 ~ 120 7.2 UNCLASSIFIED 1 I 160
UNSPECIFIED J 800(*) 120(*) I a) ---------------------1- b) 8. SUBTOTAL --~-----------------!--"'."------------------ ----------------- 1 10,000 3,680 1 3,480 2,844 ----1------------------- 1 :: __ :_~_:_~-~--------~-=~~~~~-----~~~~~--~~!----:)--------~)----- (*) Calculated as difference (9) (8) ---------------------- (8) = (1) to (7 .1) a) = 3,480 X 800 = 278.4
10, 000 e) = 3,480 + 278.4
This calculation ~ili only be done for the Construction subsec- ~~~· It is very11l1kely that the calculation cannot be done f
subsector Unspecified Activities" since there can b or universe of reference when the survey is taken in d e bno able to relate • or er to e uses, sources, and equipment and then d t · efficiency of production. In this case and i th e erm1ne s~bsector considering "Unclassified Con~umption:" u:e~~~e of the will be calculated on the basis of ave rage e.ffi . energy ciency.
This avera ff' · on the b g~ e 1c1en~y comes from the following calculations: as s of the final consumption of a given
=~~~~~alc:btained d?,es not account for the subsector :~ur~~~cl=:~ th 1 1 nsumpt1on (A). The same procedure may be followed at b~
1ev~. of useful ene:gy, in which case a subtotal (B) will be
o a ne, and the quotient of (B) and (A) will yield the average efficiency to be applied to the final consumption of the subsec- tor of "Unclassified Consumption".
For the sake of example, assume two 1
energy sources: diesel and e ectricity, whose disaggregated BOE. consumption will be expressed in
Thus, in the first stage of preparation of BEEU be made t 'f • an attempt will o quant1 y the efficiencies of production for which purp~se typ: of equipment, sources consumed~ ~nd end-uses considered will be taken into account.
country), it is not deemed necesary to make the f fying EFFICIENCY OF USE. e fort of quanti-
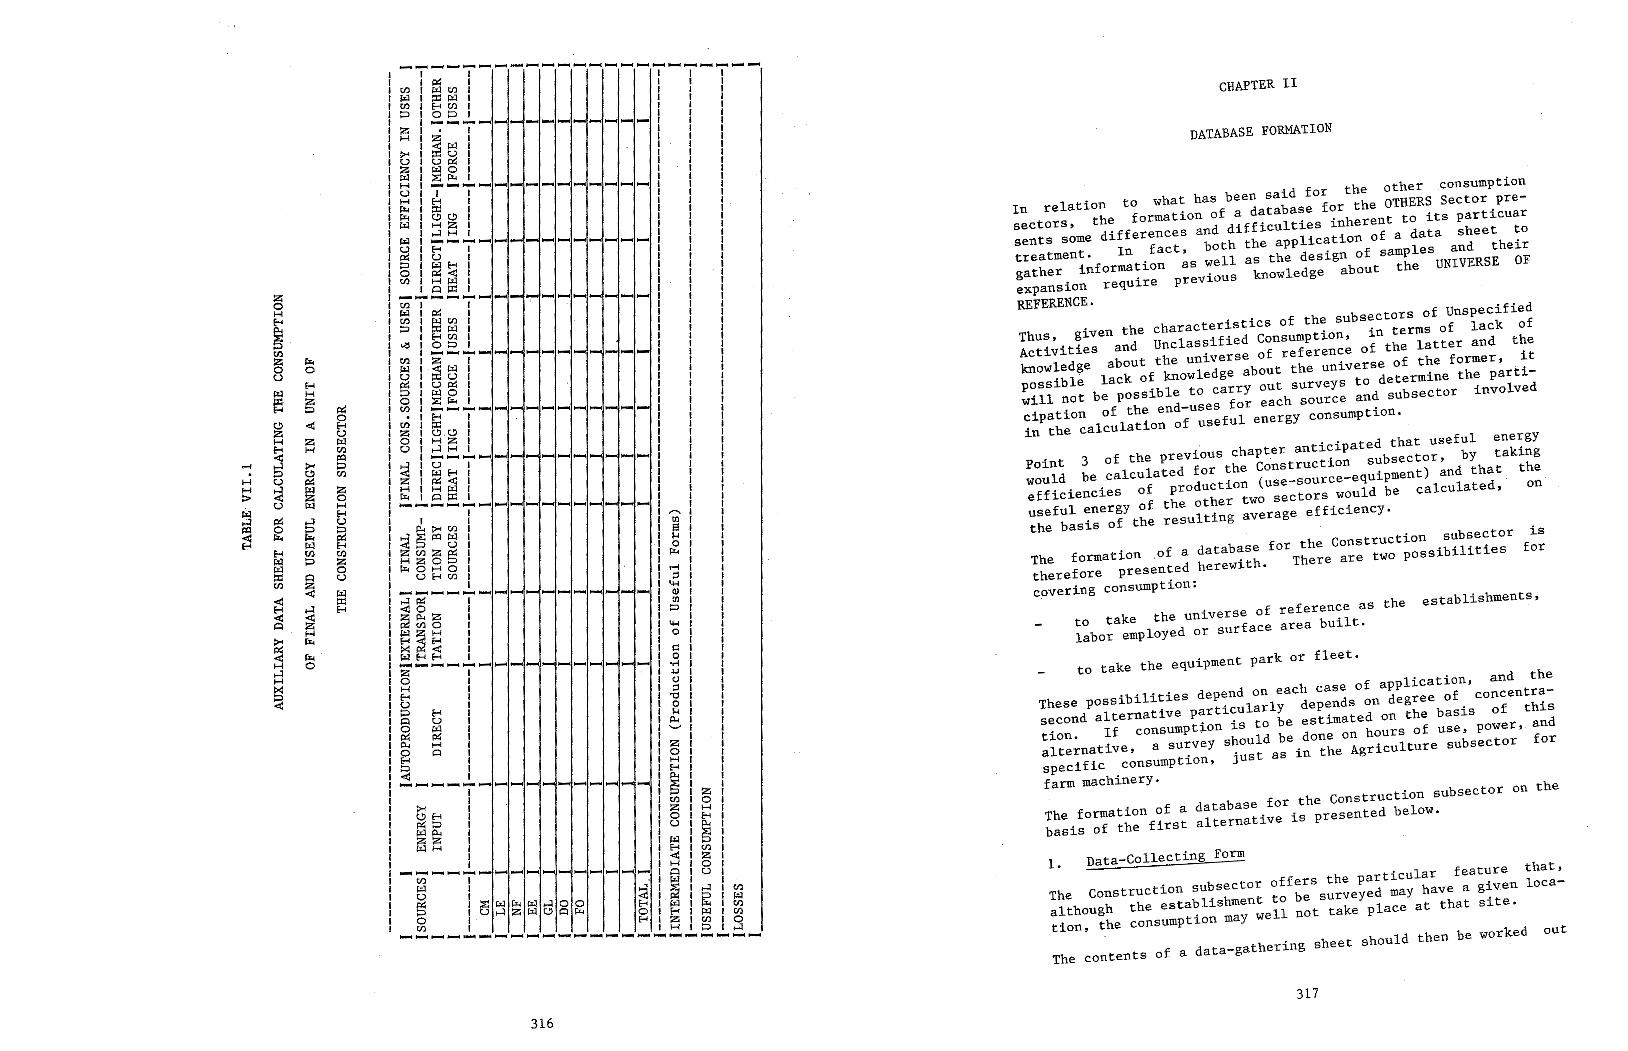
The contents of a data-gathering sheet should then be worked out
The Construction subsector offers the particular feature that, although the establishment to be surveyed may have a given loca- tion, the consumption may well not take place at that site.
1. Data-Collecting Forrn
The formation of a database for the Construction subsector on the basis of the first alternative is presented below.
These possibilities depend on each case of application, and the second alternative particularly depends on degree of concentra- tion. If consumption is to be estimated on the basis of this alternative, a survey should be done on hours of use, power, and specific consumption, justas in the Agriculture subsector for farm machinery.
to take the equipment park or fleet.
to take the universe of reference as the establishments, labor employed or surface area built.
The formation of a database for the Construction subsector is therefore presented herewith. There are two possibilities for covering consumption:
Point 3 of the previous chapter anticipated that useful energy would be calculated for the Construction subsector, by taking efficiencies of production (use-source-equipment) and that the useful energy of the other two sectors would be calculated, on the basis of the resulting average efficiency.
Thus, given the characteristics of the subsectors of Unspecified Activities and Unclassified Consumption, in terms of lack of knowledge about the universe of reference of the latter and the possible lack of knowledge about the universe of the former, it will not be possible to carry out surveys to determine the parti- cipation of the end-uses for each source Ond subsector involved in the calculation of useful energy consumption •
In relation to what has been said for the other consumption sectors, the formation of a database for the OTHERS Sector pre- sents some differences and difficulties inherent to its particuar treatment. In fact, both the application of a data sheet to gatber information as well as the design of samples and their expansion require previous knowledge about the UNIVERSE OF REFERENCE.
DATABASE FORMATION
CHAPTER II
317 316
-.---------~ . 1i:x: 1 ----------- tl)lµltlll 1 1 1 µ.;¡ 1 ::i:: µ.;¡ 1 1 1 1 ClllHClll 1 1 1 :::> i o:::i • ' 1 • 1----- 1 1 ¡::¡ 1 • 1 --------- 1 1 1
l ~ µ.;¡ 1 1 •• 1 >< 1 ::i:: u 1 1 1 u 1 u i:x: 1 1 l 1 ?.:.i 1 i:.tl o 1 1 1 1 ....,H 1 ;:E! f:%.< 1 1 1 1 ,____ 1 1
u 1 1 1 ---------- 1 1 1 ~ 1 ~ l 1 1 l µ.. 1 C.!H!> 1 1 l 1 f.>llH:ZI 1 1 1
1 ,_;¡ H 1 1 1 1 µ:ir----- 1 1 u1~ 1 ------ 1 1 i:x:1G
1 --1 1 1
:::> 1 W H t l 11 1 01i:x:<1 1 C/llHIJ:ll l 1 1
1 o ::e 1 1 1 1 -------- 1 1 1 ti) 1 1 "':""'------- 1 1 ' µ:¡ 1 i:x: l 1 1 tnlWClll l 1 1 :::> 1 ::i:: µ.¡ 1 ' 1 1
1 H tf.l t 1 1 «:i 'o:::i' l i i 1---- 1 1 1 Clll:Z 1 ----------· 1 1 Wl<!lf.>ll 1 11 1 u 1 ::i::u 1 1 ~1ui:x:1 1 1 1 OllJ:lOI 1 1 1 cnl~~~ 1 1 l
• 1 H 1 ---------- 1 1 1 C/l 1 ::i:: 1 - 1 1 1 z 1 C!).C!> 1 1 11 1 O 1 H :Z 1 1 U 1 ,_;¡ H 1 1 1 1
·--- 1 1 1 S;1 1 u 1 ----------- l ,1 1 ....., 1 ¡:,;:¡ H 1 1 I z 1 i:x: < 1 1 l 1 t!IHµ;¡I 1 1 1 ,....., 1 o ::i:: 1 1 ----- 1 1 1
1 --------- 1 1 1 1 1 __ , 1 1
~>'tf.ll 1-1
1 ~s~t3· 1~1: zcnzi:x:I 10• 1 Hz 0 p 1 1 ~ 1 1 µ..oHOI I 1 1
UE-IC/ll lr-11 1 1 1 1 --- 1 ;::! 1 1 ~ ~ -¡----------- 1 ~ l 1 zri.z l ¡0011 1 i:x: ti) o 1 1 :::> 1 i:.tl~H 1 ltl-ll 1 E-t~H 1 1 o1
1
rá H ~ 11 1 1 l ---- i::1 1 z ¡----------- 1 .~ 1 1 o 1 1 ~' 1 H 1 I C) 1 1 H
1 1 ;::s 1 1
u 1 1 "O 1 1 :::> H 1 1 o 1 1
~ ~ i i .t ¡ ¡ p., H 1 ¡~1 1 o o 1 1 z 1 1 H 1 1 O 1 1 ~ 1 1 H 1 1 ----- 1 H 1 1 ------- 1 p., 1 1 1 ---- ·::.:: 1 1 >< 1 1 :::> 1 z 1
C!>H 1 ltnlOI i:x: :::> 1 l s 1H1 ¡:,;:¡p.. 1 1 u 1 H 1 EJ z 1 1 ' ~ 1 H 1 r µ.;¡ r :::> 1 1 1 H 1 C/l 1
---- l<!ll:ZI Cll _I IHIOI
µ:¡ --101u1 u 1 - 1 µ.;¡ 1 1 i:x: 1 ,_;¡ 1 ~ 1 ¡.J 1 5 ¡c~~~68~ ~l¡:,;:¡l~I~ C/l o 1 E-r 1 µ.;¡ 1 Cll
----~--------- Hl~l~l3 ....... ._ ....
:z o H H u § H C/l s u
~ E-!
319
In most cases, the use of mechanical force is only supplíed by hand labor (manpower), in which case the failure to consider it does not create any problem. There is also the
These records constitute invaluable information design, especially in the case of electricity, constituting an elernent of basic control far the sample on energy end-uses. One particular case of analysis is the construction done to expand residences, about which little is recorded both from the energy and the non-energy standpoints. It can be foreseen that the energy consumption assocíated with these activities would not be accounted far because:
for the sample at the same time expansion of the
fuel There may also be the possibility of having information on consumption from the records of the distributors.
The second case implies the existence of records on the basis of which the electricity invoiced to each subsector is known, to- gether with sorne information on fuel sales made to certain estab- lishments in the subsector. As far electricity consumption, the mechanism for obtaining the information refers to the records on USERS SUCH AS CONSTRUCTION FIRMS, since this category of users is normally considered apart from the rest of the users (when. a construction begins on a lot without a meter, the construction firm requests the connection as a construction plant user, and this status ends when the final permit for outfitting the site has been granted).
iii) Energy consumption is known. The third case will most likely have to be discounted in the countries of Latín America, where the most common case may be the first and to a lesser extent, the second, as long as records can be obtai~ed on total subsector consumption (either because it is available or because the previously mentioned survey on total subsector consumption was carried out).
Consumption of electricity supplied by Public Services is known, but fuel consumption in the subsector is not.
ii)
i) Energy consumption is not known by subsector.
As for the information which should be available in arder to define the Universe of Reference, this is the energy consumption of Construction, and the number of establishments in each subgroup. Work starts from a fairly logical assumption, which is the knowledge about the latter. However, it is necessary to point out that usually the type of activ~ties developed.in the Construction subsector are carried on outside the establishment, so that it will be necessary to establish an information- gathering mechanism for non-energy information (basic~lly, labor employed). As for the energy information, the following alterna- tives may arise:
318
In any case, this type of survey should have broad coverage; it is easy to carry out and is usually inexpensive.
The same thing may occur with sorne fuels, as in the case of diesel, fuel oíl, gasoline, etc., for PUBLIC CONSTRUCTION, since they may appear in the records of the Public Administration or of the prívate contractor hired for execution of public works.
The record of information on electricity may be available since its origin is usually Public Services, and subsector consumption may be obtained from the records of the utilities companies. It should be clarified that this o~curs in most cases, but there are other cases derived from auto-production (e.g., the case of the large hydroelectric dams whose construction is far away from transmission or distribution lines).
If the objective is to determine total consumption in the Con- struction subsector, prior to the proposed survey of end-uses which is detailed under the following point, there should be a more numerous survey, the aim of which would be to quantify the subsectors energy consumption. The frame of the survey should be the economic censuses (which normally include Construction) or another type of survey of those usually run in the subsector.
This presentation does not insist that the countries have this information for each sector separately. However, if this were not the case, it should be disaggregated or identified.
Befare doing a sample design, it is necessary to carry out an exhaustive analysis of the existing information, and this implies preparation of a diagnostic. Such an assessment cannot be based on a common criterion which could be generalized to all of the countries. It will depend on each case of application. However, it can be said that the state of information on energy con- sumption in this subsector, at least as presented in the OLADE Energy Balance, appears to be either very aggregated with another sector (usually the Industrial Sector) or else corresponds to a part of the UNIDENTIFIED CONSUMPTION.
2. Analysis of Existing Information
Finally, Module IV disaggregates energy by END-USES.
The second and third modules attempt to account far the energy bought and auto-produced, as well as to characterize the auto- producing equipment and the fuels it consumes.
Module I provides general data on the establishment. Note that point c), corresponding to the location, could be substituted·for by "location of the construction site(s)".
specific features of a general format is
as can be seen in the
according to the type of activity and the the country of application. In any case, being presented here, with four modules, survey form for the Construction subsector.
321
By applying the participation matrix to final subsector consumption, final consumption by end-uses and sources will be obtained. When this is related to the efficiencies of production (measured or adopted) for each source in each end-use, the result will be the intermediate useful energy consumption by source and by end-use, measured at the level of efficiency of production.
To determine whether or not there is heterogeneity is equivalent to testing the variance in the sample means obtained for each stratum, by means of hypothesis testing to be defined for each case.
This matrix can be drawn up on the basis of the sample means for each end-use in the two subsectors, as estimators of population expectations. The estimates, based on their variance, will give a certain idea of the heterogeneity existing in each stratum considered.
Since the objective under consideration is to measure useful energy consumption by END-USES, in every case it will be necessary to determine an average participation matrix for each source in each use for the two subsectors.
On the basis of statistical inference, the sample is expanded to the population, using the estimators analyzed previously. The expansion will depend on the type of sample done and on the characteristics of the estimators.
Later on, estimators are calculated per activity, according to the formulas provided by the stratified sampling; and these are dealt with jointly with the estimators for the stratum of obliga- tory inclusion. From this will resulta second analysis of variance, in order to verify the quality of the estimation.
Given that one of the working hypotheses is the lack of knowledge about consumption needed to complete the design, it will be necessary to take samples in each one of the strata into which the population of the "Other Strata" was di':ided. The univer~e of reference will no longer be the establishments that are in each group, but rather the subpopulations, for which the average consumption for each source will be estimated, taking for each stratum a simple random sample. If the variance in the estima- tors preves unacceptable, the process may continue to increase the size of the sample, keeping the same stratification, or a more specific stratification can be done, with a smaller range of variation in the stratification variable utilized.
tors, i.e., there will be a series of new strata which will contain a considerable number of establishments.
320
If the total surface area built is known, it should be taken as a stratification variable, the universe of reference bei·ng square meters of construction. This information, in sorne cases of the two subpopulations, particularly prívate construction, can be obtained from records in the institutions which represent this activity: builders associations, professional associations, etc.
Nonetheless, the possibility that the information on the universe of reference will not be available at the level of total (2) built should not be overlooked. In this case, what is prop:sed is to adopt "labor employed" as a stratification variable.
The formation of the strata will depend on the degree of concen- tration presented by the two activities at the level of the contribution made to value added by the number of establishnients registered. In any case, in an attempt to generalize the guide- lines, it.is proposed that there be a division into two strata: o~e of obliga~ory inclusion in the sample, made up by the estab- lishment~ which are large energy consumers, working from the hypothesis that the large energy consumers will be those whose labor exceeds a given number of workers; and the rest of the strata, in which there will be a division according to subsec-
Befare forming the strata, it is necessary to specify that there will be certain activities which will not form part of the sampling. Such is the case of PUBLIC ENTITIES, e.g., those which are devoted to road construction (at the national or provincial level), for which energy consumption is known by sources• the TRANSNATIONAL COMPANIES, which usually operate under con~racts far large projects; and the aforementioned building onto ex-isting homes, for which there are no records on surface area or con- sumption.
The guidelines for designing a sample on consumption by END-USES will be based on the assumption that energy consumption is known by subsector and that the number of establishments is known by type of activity (public and private), together with the most relevant economic variables (value added, lab~r employed, etc.)
By dividing the population under study into two activities which are ~omogeneous from an energy standpoint, and by observing a c:rtain amount of concentration in the consumption of the estab- lishments termed "large", it is proposed to carry out a strati- fied sample. ·
employed" is This implies
or "labor is unknown.
The number of "establishments" unknown; therefore, the Universe the impossibility of any sampling.
3. Guidelines for Sample Design and Expansion
possibility that it can be covered by electricity (usually accounted for in the Residential Sector), but these cases are so few and far between that they will not merit any treatment.

322
SURVEY FORM
CONSTRUCTION SUBSECTOR

323
1 Fuel 1 Unít 1 Amount ( $ Paid Ln] 1 1 1 1 a year 1 1---------------------------------1--------1---------1----------1 1 Goal 1 1 1 1 I---------------------------------1--------1---------I----------I J Fírewood 1 1 1 1 1---------------------------------1--------1---------1----------1 1 Charcoal 1 1 1 1 1---------------------------------1--------1---------1----------1 IElectricity Bought 1 1 1 1 1~--------------------------------1--------1---------1----------1 IElectricity Auto-Produced 1 1 1 1 1---------------------------------1--------1---------1----------1 IElectricity TOTAL 1 1 J 1 1---------------------------------1--------1---------1----------1 ILiquefied Gas 1 1 1 1 1---------------------------------1--------1---------1----------1 1 Gas Oíl I I 1 1 1---------------------------------1--------1---------1----------1 1 Gasoline 1 1 1 1 1---------------------------------1--------1---------1----------1 I Fuel Oíl 1 1 1 1 1---------------------------------1--------1---------1----------1 [Ot he r s 1 1 1 1 1 1 1 1 1
II - ENERGY BOUGHT AND AUTO-PRODUCED
f) Hours worked per year .•.••••...••...•.. · ..........•.••.....
e) Work Shif ts • , .
d) Numbe r of Employees ...........••.••..••••.••••••.••.••••••••
e) Location .
b) Name of Firm •.••••••.••.••••••••.•• , ••••••••••• , • , .
a) Subsector !I' ••••
I - GENERAL DATA
CONSTRUCTION SUBSECTOR
SURVEY FORM
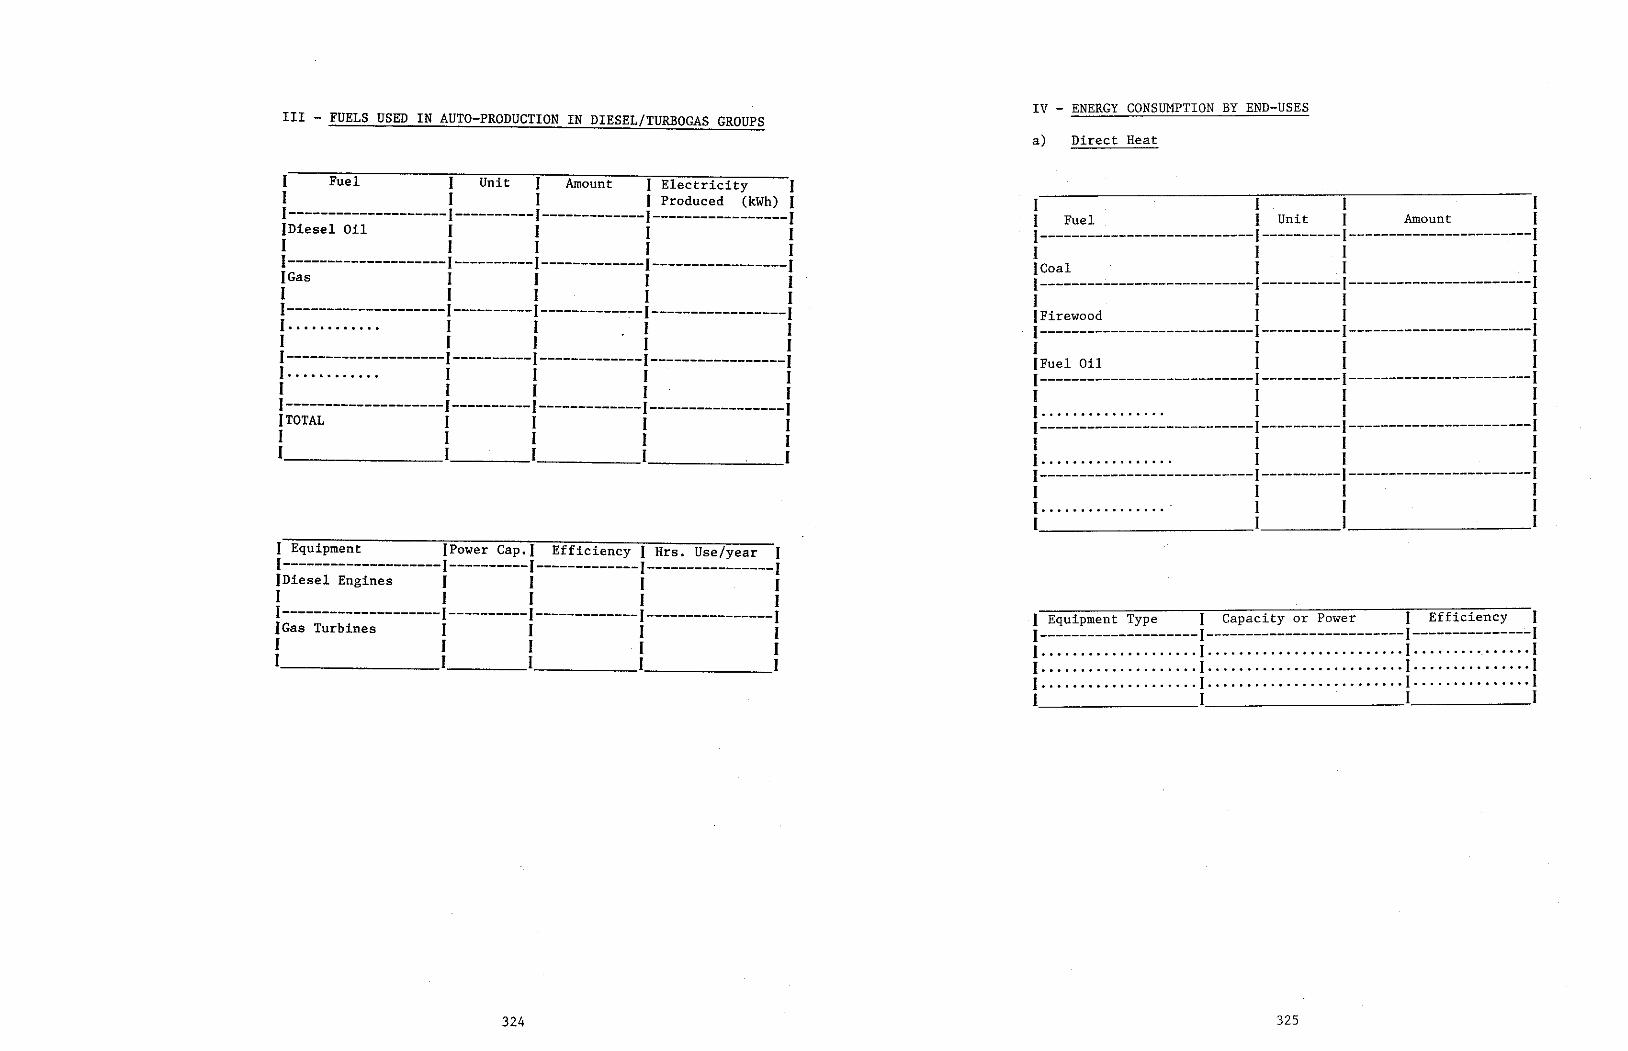
325 324
I Equipment Type 1 Capacity or Power 1 Efficiency 1 1--------------------1-------------------------1---------------1 1 1 · 1 ·- 1 1~ 1 1 1 1 1 ¡ ) 1····················1············ 1 1
1 Equipment (Power Cap.l Efficiency 1 Hrs. Use/year 1 1--------------------1----------1-------------1----------------1 JDiesel Engines 1 1 1 1 1 1 1 1 1 1--------------------1----------1-------------1----------------1 1 Gas Turbines 1 1 1 1 1 1 I 1 1 1 1 1 1 1
1 1 1 1 I Fue! 1 Unit 1 Amount 1 1---------------------------1----------1-----------------------1 I 1 1 1 1 Goal · 1 1 1 1---------------------------1----------1-----------------------1 1 1 1 1 f Firewood 1 1 1 1---------------------------1----------1-----------------------1 1 1 1 1 f Fuel Oil 1 1 1 1---------------------------1----------1-----------------------1 I 1 I 1 }................ 1 1 1 1---------------------------1----------1-----------------------1 I I 1 l 1 . . . . . . . . . . .. . . . . . . 1 l 1 1---------------------------1----------1-----------------------1 1 1 1 1 1 - I l 1 1 1 l 1
1 Fuel 1 Unit 1 Amount 1 Electricity 1 1 1 1 1 Produced (kWh) 1 1--------------------1----------1-------------1-----------------1 )Diesel Oil 1 1 1 1 1 1 1 1 1 1--------------------1----------1-------------1---------------~-1 [Gas 1 1 1 1 1 1 1 1 1 1--------------------1----------1-----------~-1-----------------1 1 .... ····· ... 1 1 1 1 1 1 1 1 1 1--------------------1----------1-------------1-----------------1 J............ 1 1 1 1 1 1 1 1 1 1--------------------1----------1-------------1-----------------1 f TOTAL 1 1 1 1 1 1 1 1 1 1 1 1 1 1
a) Direct Heat III - FUELS USED IN AUTO-PRODUCTION IN DIESEL/TURBOGAS GROUPS IV - ENERGY CONSUMPTION BY END-USES
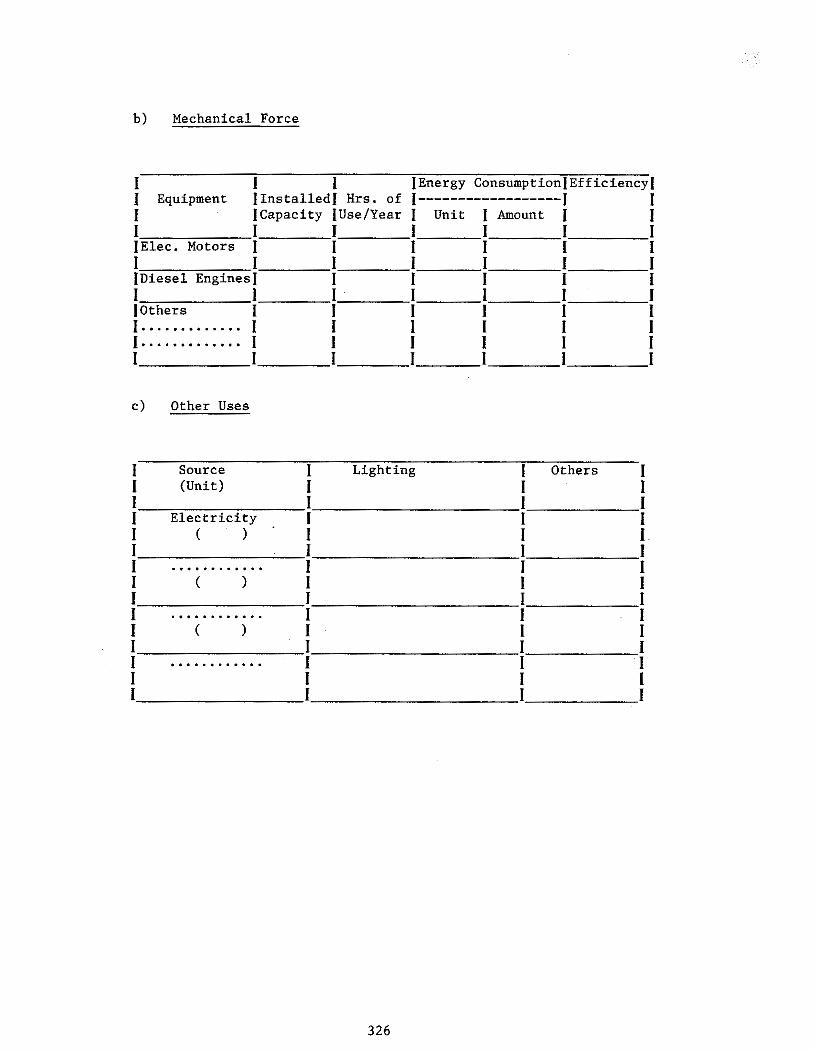
326
1 Source 1 Lighting 1 Others 1 1 (Unit) 1 1 1 1 1 1 1 1 Electricity 1 1 1 1 ( ) 1 1 l. 1 1 1 1 1 ............ 1 1 1 1 ( ) 1 1 1 1 1 1 1 1 ............. 1 1 1 I ( ) 1 1 1 1 l 1 1 1 ............ 1 1 1 1 I 1 1 1 1 1 1
e) Other Uses
b) Mechanical Force
I 1 l JEnergy Consumption)EfficiencyJ J Equipment JinstalledJ Hrs. of 1------------------1 1 1 JCapacity (Use/Year 1 Unit 1 Amount I 1 I 1 l I I 1 1 IElec. Motors 1 1 1 1 1 1 1 1 1 1 1 1 1 {Diesel EnginesJ 1 1 1 1 1 1 1 1· 1 1 1 1 IOthers 1 1 1 1 1 1 f 1 1 1 1 1 1 J I 1 1 1 1 1 1 1 1 1 1 1 1


