Embed Size (px)
Citation preview

Empirical Investigation of an Artificial CytokineNetwork
Mark Read1, Jon Timmis1,2, and Paul S. Andrews1
1 Department of Computer Science, University of York, UK, YO10 5DD{markread,jtimmis,psa}@cs.york.ac.uk
2 Department of Electronics, University of York, UK, YO10 5DD
Abstract. We present an empirical investigation of a mathematicalmodel of cytokine and cell interactions, as derived by Hone and vanden Berg, with the intention of ascertaining its potential for deploymentin an engineering context. The model’s behavioural robustness regardingvarious patterns of input is assessed, as is it’s scope for manipulationthrough parameter adjustments. Based on these observations we makean addition to the system and attempt to deliberately engineer partic-ular behavioural properties. Finally, the system’s suitability for use inengineering is assessed.
1 Introduction
Hone and van den Berg [1,2] presented and Artificial Cytokine Network (ACN), amathematical framework for the modelling of cytokines. Their framework utilisesordinary differential equations, and proposes mechanisms through which cells,cytokines, and external stimuli can be modelled and interact. We are interested inthe potential application of the ACN in an engineering context. Stepney et al [3]propose a structured framework for the exploitation of biology in the derivationof biologically inspired algorithms. We adhere to this framework’s methodology,and present here an initial empirical investigation of the ACN.
Our paper is structured as follows. In Section 2 a numerical instantiationof the ACN is introduced (hereafter referred to as ‘the system’), this is usedas the basis for our investigations. Section 3 details those properties of anysystem that we deem critical for deployment in an engineering domain. Section 4reports the ACN’s behaviour when perturbed with a variety of input patterns.In Section 5 we investigate the behavioural impacts of varying the system’sparameter values. Section 6 details our proposed additions to the system, andwe attempt to deliberately engineer particular behaviours. In Section 7 we assessthe system’s suitability for deployment in an engineering context. Finally, weconclude our work in Section 8.
2 Simple Cytokine Network
Hone and van den Berg’s work [2] presented a general framework for the instan-tiation of particular cytokine networks. The number of cytokines, cell, sources
P.J. Bentley, D. Lee, and S. Jung (Eds.): ICARIS 2008, LNCS 5132, pp. 340–351, 2008.c© Springer-Verlag Berlin Heidelberg 2008

Empirical Investigation of an Artificial Cytokine Network 341
of external stimuli, and their interactions may all be varied between instantia-tions, and the framework comprises a large number of parameters. The scopefor complexity is huge and an exhaustive study is not feasible, hence we adoptthe relatively simple ‘numerical instantiation’ presented in Section 4 and Figure4 of [2] as our baseline for these investigations.
The system comprises variable concentrations of a single cell type v, andtwo antagonistic cytokine types u1 and u2. Their dynamics are defined by thefollowing equations (we retain the symbols of the original paper).
u1 concentration change u̇1 = ψ1(u1, u2, s)v − ν1u1,u2 concentration change u̇2 = ψ2(u1, u2, s)v − ν2u2,cell concentration change v̇ = (φ(u1, u2, s) − μ)v,
cytokine secretion ψj(u1, u2, s) = ψ̄jS(∑
k=1,2 Wjkuk − θ̃j),cell proliferation φ(u1, u2, s) = s u2 exp(−γ u1), γ > 0sigmoid function S(x) = 1/(1 + exp{−x})
ψj denotes the secretion rate per cell of cytokine j, and is influenced by theconcentrations of cytokines and input stimulus in the system. Cytokine concen-tration increase through secretion is offset by decay, defined as a fixed proportionof the population by νj . Similar mechanisms control cell proliferation, φ repre-senting the number of offspring a single cell produces, which is offset against adecay rate μ. The maximum level of cytokine j secretion by any single cell isdenoted by ψ̄j . S(x) is a sigmoid function that determines what proportion ofψ̄j is secreted. Wjk represents an interaction matrix that denotes the effect thatthe presence of cytokine k has on the secretion of cytokine j. Threshold valuesθ̃j must be overcome before significant secretion of cytokine j can commence.Input stimulus s and presence of cytokine u2 promote cell proliferation, whileu1 hinders it. γ scales the effect of u2.
All the system’s parameters are listed in Table 1. During the course of the ex-perimentation carried out below, parameters take the default values in this tableunless otherwise stated. u1(0) designates a value at the start of the simulation.The interaction matrix W is set as follows:
W =(
W1 1 W1 2W2 1 W2 2
)
=(
−1 11 0
)
Hence, the presence of u1 strongly discourages its own secretion, presence ofboth u1 and u2 promote each others secretion, and the presence of u2 has noeffect on its own secretion.
The system can be perturbed by manipulating the amplitude and temporalproperties of the input stimulus s. The change in cell concentration is interpretedas the system’s output. It is the relations between inputs and outputs that formthe behaviours we investigate.
3 Criteria of Investigation
The following system properties and behaviours are deemed desirable for deploy-ment in an engineering context.

342 M. Read, J. Timmis, and P.S. Andrews
Table 1. Parameters, and their default values. Taken from [2], Section 4 and Figure4. The ‘standard system’ is a system with all parameters configured according to thistable.
Parameter Value Parameter Valueu1(0) 6.5 ψ̄1 1u2(0) 12.5 ψ̄2 1v(0) 12.5 W1 1 -1ν1 2 W1 2 1ν2 1 W2 1 1μ 10 W2 2 0θ̃1 6 γ 0.1θ̃2 11
Responsivity towards diverse inputs. A system that is reactive towards awide variety of inputs will be suitable for a diverse set of engineering domains.
Behavioural stability given input instability. The system should exhibitpredictable, stable, and recoverable behavioural changes to anomalies in itsinput stream, rather than becoming unstable and erratic.
Scope for behavioural change. It is important that the dynamics of the sys-tem can be altered. A system with one fixed behaviour will not be applicableto a diverse set of problem domains.
Scope for predictable behavioural adjustment. It is important that thesystem can be tailored towards a particular problem domain, thus we desirethat varying parameters have a reliable and predictable effect on the system’sbehaviour.
4 System Response to Input Patterns
The experiments carried out by Hone and van den Berg [2] utilised either acontinuous, or only two distinct inputs. It is fair to assume that in any onlinescenario the system will be perturbed with multiple, asynchronous input stimuliwhich vary in amplitude. We wish to ascertain the standard system’s stabilityand responsiveness to these more complex types of input pattern.
Though not as complex as a potential online application, the experiments thatfollow should collectively provide an indication of the system’s response to morecomplicated patterns. It should be noted that in these simulations the systemis always started with an input present. For convenience the period, duration,and amplitude of input stimulus s are denoted P , D , and A respectively. Unlessotherwise stated, D = 0.2 time units in all cases.
Square Wave InputsThe system remains responsive to inputs of P ≤ 2.3 and A = 8.0. For peri-ods greater than, or amplitudes less than, these values, system wide decay of all

Empirical Investigation of an Artificial Cytokine Network 343
variables ensues. Conversely, larger Awill extend the maximum period for whichthe system remains responsive, and smaller P will remain responsive despitesmaller A .
As P approaches D = 0.2, the height of cellular proliferation peaks decreases,and the height of proliferation troughs increases. For P = D , i.e. constant input,all variable concentrations experience initial fluctuations but converge on con-stant values. Maintaining P = D , A ≤ 3.2 induces system decay, whilst largervalues increase the post-fluctuation concentration levels.
Very small periods of P > 0.2 produce cell proliferation peaks for every inputevent. For 0.5 ≤ P ≤ 1.2 proliferation occurs for every other input, the remaininginputs inducing no response.
Square Waves with Linear Amplitude IncreaseThe input pattern utilised here has P = 2.0, D= 0.2, and an initial A= 8.0 whichis increased by some constant c with each successive input. For all constants c, thesystem reacts to the increasing stimulus with approximately linearly increasingconcentrations. However, when the inputs reach an amplitude of around 50 theproliferation peaks become erratic.
This phenomenon can be attributed to the nonlinear influence that u1 exertson the system. There will come a point (when A ≈ 50) when sufficient u1 stillresides in the system so as to prevent any cell proliferation from taking placewhen an input occurs. This in turn prevents cytokine concentration increase, andwhen the next input arrives the cytokine levels will be abnormally low resultingin an extremely large spike.
Square Waves with Exponential AmplificationThe system’s reaction to exponential increase in input amplitudes are similar tothose of linear increase. Increases in peak size correlating to the increase in inputamplitudes are observed, and erratic behaviour ensues once input magnitudes ofover 50 are reached.
Square Waves with Amplitude AnomalyThis input pattern is identical to the standard square waves above (P = 2.0,D = 0.2, A = 8.0), save for a single anomalous input whose amplitude can canbe varied. The experiments here are to examine how the system reacts to ananomaly in an otherwise regular and stable series of inputs. The anomaly is setto occur when the system has settled into a stable pattern.
An anomaly amplitude of 4.0 causes the system to decay immediately. Anamplitude of 5.0 causes some instability following the anomaly, and system de-cay follows shortly. An Amplitude of 5.3 allows system resuscitation, though itrequires time to return to the original stable pattern. Large anomaly amplitudesdo not cause decay, the system’s reaction is a large spike, which if sufficientlylarge causes temporary instability as result of the considerable quantities of u1generated.
344 M. Read, J. Timmis, and P.S. Andrews
5 Parameter Investigations
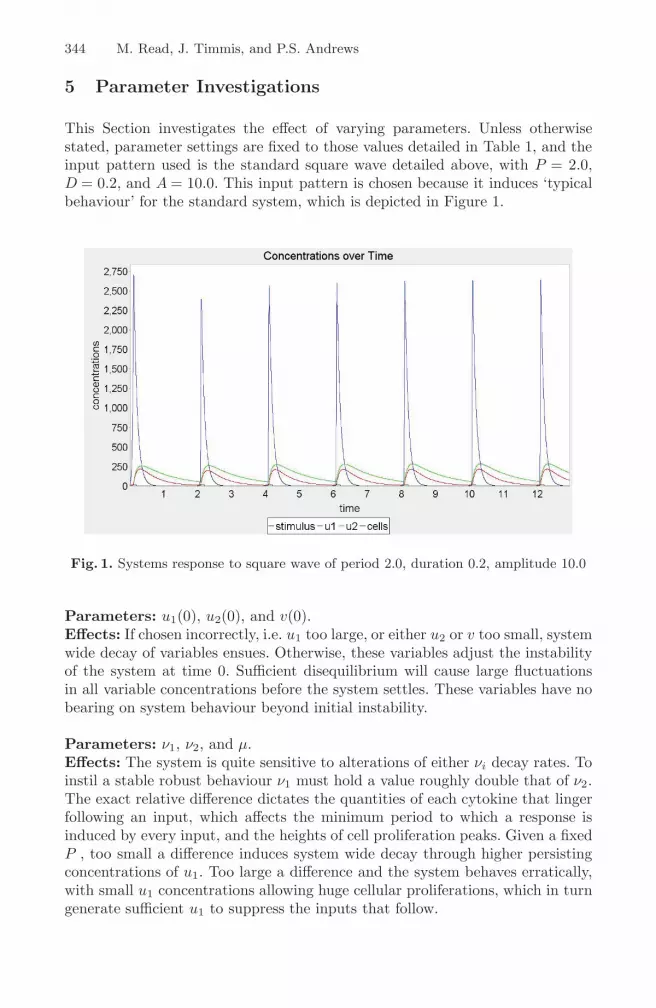
This Section investigates the effect of varying parameters. Unless otherwisestated, parameter settings are fixed to those values detailed in Table 1, and theinput pattern used is the standard square wave detailed above, with P = 2.0,D = 0.2, and A = 10.0. This input pattern is chosen because it induces ‘typicalbehaviour’ for the standard system, which is depicted in Figure 1.
Fig. 1. Systems response to square wave of period 2.0, duration 0.2, amplitude 10.0
Parameters: u1(0), u2(0), and v(0).Effects: If chosen incorrectly, i.e. u1 too large, or either u2 or v too small, systemwide decay of variables ensues. Otherwise, these variables adjust the instabilityof the system at time 0. Sufficient disequilibrium will cause large fluctuationsin all variable concentrations before the system settles. These variables have nobearing on system behaviour beyond initial instability.
Parameters: ν1, ν2, and μ.Effects: The system is quite sensitive to alterations of either νi decay rates. Toinstil a stable robust behaviour ν1 must hold a value roughly double that of ν2.The exact relative difference dictates the quantities of each cytokine that lingerfollowing an input, which affects the minimum period to which a response isinduced by every input, and the heights of cell proliferation peaks. Given a fixedP , too small a difference induces system wide decay through higher persistingconcentrations of u1. Too large a difference and the system behaves erratically,with small u1 concentrations allowing huge cellular proliferations, which in turngenerate sufficient u1 to suppress the inputs that follow.

Empirical Investigation of an Artificial Cytokine Network 345
μ adjusts the gradient of proliferation peaks, with small μ creating flatter‘sawtooth’ like patterns and very large μ inducing system wide decay, sincecells decay at such a rate that non remain to proliferate. Thus, μ adjusts themaximum period to which the system remains reactive, and the minimum periodfor which each individual input induces proliferation. Note that the effects of μ,ν1, and ν2 are linked; variable persisting cell concentrations induced by adjustingμ will affect cytokine concentrations through secretion, which in turn affect thenumber of cells that proliferate as a result of inputs. Hence, adjustments to μchange the height of proliferation peaks; smaller values will generally reduceheights. However, if alternate input reactions are suppressed by high levels oflingering u1, the height of the remaining peaks will be significantly greater.
Universally scaling values of ν1, ν2, and μ allows cytokines and cells to lingerin the system for adjusted periods of time. This can alter the periods for whichresponses can be mounted for every input, and the maximum period for whichthe system does not decay. Note that uniformly scaling these parameters doesnot maintain peak heights.
Examples: If ν1 < 1.8 system wide decay ensues, with smaller values inducingmore rapid decay. ν1 = 3 provides peaks that are an order of magnitude largerthan those produced by ν1 = 2. Values of ν1 > 4 causes notable initial insta-bility, and alternate proliferation peaks have an order of magnitude differencein height. At this setting the system lies near instability, a single anomalousinput of amplitude 20 as opposed the regular amplitude of 10 induces unstablebehaviour despite the normal inputs that follow. For ν1 = 4.2 the regular inputpattern induces exponential and unstable population explosion.
Small alterations to ν2 cause drastic changes in behaviour. At 1.3 gracefulsystem wide decay is induced. At 0.5 seemingly chaotic behaviour ensues, withmany orders of magnitude separating peaks prompted by identical inputs.
Values of μ ≥ 15 incite system wide decay. For sufficiently small values, forexample μ = 2.0, reactions to inputs can be suppressed.
Under the standard system an input of P= 4.0 quickly induces system wide de-cay. However, when all the decay rates are halved regular responses are achieved.Likewise, responses to every input of P = 1.0 can be achieved by doubling all de-cay parameter values; under standard system parameters a response is mountedto alternate inputs only.
Parameters: θ̃1 and θ̃2Effects: Reducing θ̃1 significantly, even to negative values, has little effect otherthan the speed with which the system settles; smaller values induce small initialproliferation peaks which take longer to stabilise. Large values cause large initialproliferation peaks, but the system always settles. Extremely large values induceerratic behaviour.
As with θ̃1, adjustments to θ̃2 cause initial instability. The heights of stableproliferation peaks can be slightly reduced with larger θ̃2. Very large values ofθ̃2 can incite system wide decay.

346 M. Read, J. Timmis, and P.S. Andrews
These parameters yield no significantly exploitable effects. Adjustments caninstil minor alterations to peak heights, and significant adjustments will induceeither erratic behaviour, else system decay. They dictate how quickly cells startproducing cytokines through manipulation of the input to the sigmoid functionS. To have any significant effect on behaviour, the system should be engineeredsuch that the outputs from S reside mainly between 0.0 and 1.0 rather than atthose values themselves. Engineering such a system is difficult, and changes toany of the other parameters will quickly throw S’s output back to the extremes.
Parameters: ψ̄1 and ψ̄2Effects: Significant reduction of ψ̄1 produces erratic behaviour, with huge fluc-tuations in cell proliferation peak heights. Smaller reduction induces proliferationpeaks of alternating heights. Larger values reduce peak heights, and may causesystem wide decay if set excessively large.
Very small values of ψ̄2 prevent sufficient u2 from entering the system, andsystem wide decay ensues. Large values can set the system off in an instability,which takes time to settle, and also cause alternating peak heights. Anomalousbut regular inputs of increased amplitude have differing effects on a systemexhibiting alternating peak heights. If the anomaly falls on what would be a tallpeak, the shorter peaks are completely suppressed and the remaining tall peaksthat follow experience amplification while the system settles into its previousbehaviour. If the anomaly calls on a short peak, all peak heights average outinitially, but return to their normal behaviour.
Maintaining equal, but larger values of ψ̄1 and ψ̄2 reduces the height of cellularproliferation peaks. Smaller values increase proliferation heights. These effectsare attributed to the nonlinear influence of u1.
Parameters: Wj k
Effects: The variables comprising the interaction matrix are highly complex,and system behaviour is collectively dependent on all of their values. They af-fect how much stimulus each cell receives regarding the secretion of a particularcytokine, which determines the rates at which cytokine concentrations can ac-celerate. These cytokine concentrations in turn affect the quantity of cells thereare that produce them. External stimuli have no direct impact on secretion; theonly variable terms in determining secretion rates are cytokine concentrationsthemselves. Thus the cytokine secretion rates are linked. It is easy to set up theinteraction matrix in such a manner that system wide decay ensues, howeverunbounded explosion is impossible: explosion in one cytokine concentration willsoon lead to explosion in the other.
In general, equal concentrations of the two cytokines will prevent cellularproliferation and can prompt system wide decay, because of u1’s nonlinear effect.For this reason, the initial concentration of u1 is lower, and its decay rate higher.Setups in which u2 accelerates more quickly (and from a higher concentration)than u1 allows for bursts of cell proliferation before u1 reaches a counteractingconcentration. As the two acceleration rates close on each other the height of

Empirical Investigation of an Artificial Cytokine Network 347
cell concentration peaks will reduce. If u1 acceleration is allowed to exceed thatof u2, system decay will usually follow.
Reducing u1 secretion stimulation though setting values of W1 1 to large nega-tive numbers (u1 suppresses itself) increases the size of peaks. Excessive negativevalues causes unstable behaviours to emerge, since the accelerations of the twocytokines are so far out of step that their concentrations experience very largefluctuations. Positive values yield no alteration in behaviour.
Small values of W1 2 < 1 provide taller peaks in cell proliferation; extend themaximum period for which the system can remain responsive; and make thesystem more responsive to inputs of shorter period, with discernable reactionsto every input as opposed to every few. However, these proliferations can varyin size considerably and do not display a stable pattern, indicating a shift to-wards erratic behaviour. Larger values of W1 2 > 1 are not as reactive for smallperiods as small values, but the resulting behaviours are more stable, otherwiseno significant effect is apparent.
Small values of W2 1 < 0.4 induce system wide decay, since initial thresholdsfor cytokine secretion are never sufficiently overcome; u1 discourages its ownsecretion, and u2 only receives stimulus from the presence of u1 (W2 2 = 0).Hence, if W2 1 is set too small, no bootstrapping occurs. Values of W2 1 > 1 haveno effect on the peak sizes, and do not significantly affect the maximum periodof responsiveness.
Setting W2 2 < −0.5 induces system wide decay, and W2 2 > 0.5 has no sig-nificant effect. Between these values, increasing W2 2 induces larger proliferationpeaks.
Scaling all Wj k values equally can slightly alter the height of peaks. Scalars≥ 1 converge towards relatively large but fixed peak heights. Small scalars affectpeak heights in a nonlinear manner; factors smaller than 0.3 cause decay, and afactor of 0.5 induces smaller peaks than factors of 0.3 and 0.7 do.
Parameter: γEffect: γ controls the effect that a particular concentration of u1 has on cel-lular proliferation. The system is highly sensitive to this parameter, very smalladjustments can drastically alter behaviour.
Large values of γ allow relatively small concentrations of u1 to strongly ham-per proliferation, thus reducing peak heights. Reduced proliferation peaks gener-ates fewer cytokines whose concentrations curtail sooner. Hence, larger γ reducesthe maximum period to which the system remains responsive, and also rendersthe system more responsive to small periods, with each input inciting prolif-eration. When perturbed with a single anomalous but regular input of greateramplitude large γ will provide a dampening effect on the resultant proliferation.
For smaller γ, the opposite applies. Sufficiently small γ will induce erraticresponses to equal and regular inputs.Examples: γ = 0.05 maintains stable responses at a period of 3.5, whereas theoriginal value of 0.1 quickly decays at this period. A value of 0.15 causes systemwide decay for a period of 2.0, while smaller values remain responsive.

348 M. Read, J. Timmis, and P.S. Andrews
When perturbed with an anomalous input of double the amplitude (20 as asopposed to 10) larger values of γ provides a dampening effect, reducing oscillationin proliferation peaks to later stimuli. Small values of γ are more sensitive tosuch anomalies, requiring more time to resettle into a stable output pattern, andexhibiting greater fluctuations in doing so.
6 Alterations to Model
Based on the parameter investigations carried out above, observations are madeabout the system’s behaviour and alterations are made to enhance its behaviourswith respect to the criteria of Section 3.
6.1 Excessive Decay Is Detrimental
A prominent facet of the system is it’s tendency to decay. If insufficient stimulusis provided over a period of time, cytokine and cell concentrations decay suchlevels that resurrection requires an abnormally strong input. From an engineeringperspective this behaviour is undesirable. We wish to induce a response to astandard input regardless of the delay preceding it. In other words, we wish forthe memory and behavioural dynamics provided by cytokines to have a boundedtemporal reach beyond which a default behaviour will ensue.
The most prominent amendment that will correct this behaviour is the intro-duction of baseline concentration levels. Any decay that will reduce a concen-tration to below this predetermined level is disregarded. Baselines for all threevariables are required: if either u2 or v concentrations drop too low, cellularresurrection becomes impractical; if u1 drops too low, then ensuring a defaultbehaviour is impossible since proliferation would go unchecked.
We set baseline values and initial concentrations to the same values. Thisprevents the creation of additional parameters for implementation, and startsthe system in ‘default behaviour’ rather than the frequent instabilities observedabove. It also removes any requirement that an input be present at systemstartup to prevent decay.
6.2 Engineering Cytokine Memory
With the addition of baseline concentrations, we attempt to manipulate theeffect of cytokine memory. Given an anomalous input arriving either early or latewith respect to an otherwise regular pattern, the effect of cytokines might be todampen or to amplify the system’s reaction to this anomalous input. Examplesof both these behaviours are demonstrated in Figures 2 and 3 respectively. Notethat the period used here is 4.0, longer than the system without baselines couldremain responsive towards. Following the regular input at time 16, an anomalousinput occurs after a delay of 1.6 time units (as opposed to 4.0). After this anomalyregular inputs of period 4.0 continue.
For the specific timing anomaly described, both the dampening and amplify-ing behaviours could be induced. ν1 was increased to 5.0 to provide amplification,

Empirical Investigation of an Artificial Cytokine Network 349
Fig. 2. Using concentration baselines to suppress reaction to early inputs. All param-eter hold default values.
the standard system already provides dampening. When these settings are in-vestigated in the context of other timing anomalies, the engineered behaviour isfound to be inconstant. For the dampening system an anomalous delay of 1.0induces no reaction. Increasing this delay causes a reaction of increasing mag-nitude, reaching a maximum for a delay of 2.4. Hereafter the system’s reactionreduces in size again, reaching a low at a delay of 3.2. At 3.6 all variables havedecayed to baseline values and default behaviour ensues.
For the amplification behaviour, at a delay of 0.4 or less no reaction is inducedby the anomalous input. As the delay preceding the anomalous input increasespast 0.6 an initially very small, but quickly increasing reaction is observed. By 0.8the anomalous reaction peak magnitude exceeds that of the default behaviour.However, by 1.4 this peak starts to decrease in size, and by 2.8 is half the sizeof default behaviour peaks. Thereafter an increase to default behaviour ensues.Closer examination of this dip in peak size for a period of 2.4 reveals that whenthe anomalous input arrives concentrations of cells and u1 have reached baselinelevels, while u2 resides at nearly 3 times its baseline level. One would expect thisto result a strong proliferation, but it instead serves to hamper the reaction. Theexplanation is that the high levels of u2 prompt speedy secretion of u1, whichprematurely stumps proliferation.
6.3 Realistic Decay Rates
The decay rates selected in the original paper, and utilised in the experimentsabove, are not biologically plausible. In vivo, cytokines decay at a significantlyquicker rate than that at which cells die. Preliminary experiments with the ratiosbetween cytokine and cell decay rates inverted yielded the following observations.
The temporal reach of cytokine memory is hugely reduced, and without base-line concentrations system wide decay is commonplace. Cellular proliferations ex-hibit very flat ‘sawtooth’ patterns. To avoid simply inciting ‘default behaviour’

350 M. Read, J. Timmis, and P.S. Andrews
Fig. 3. Using concentration baselines to amplify reaction to early inputs. ν1 = 5.0.
input periods must be very short, at which point cell proliferation peaks andtroughs are almost indistinguishable.
7 Suitability for Engineering
In this section we examine the system’s suitability for use in an engineeringcontext based on the experiments and alterations reported above and the criteriaof Section 3.
Early experiments reported system wide decay in all variables was possible by‘starving’ the system of sufficient input over time. This is generally undesirable.System wide decay could perhaps be harnessed in an anomaly detection setting,but one struggles to find additional value in employing this system over moreconventional means. The introduction of baseline concentrations corrected theproblem, providing a ‘default behaviour’ to late inputs, and ensuring reactivityto inputs of infinite delay. Conversely, reactivity to very short period inputs canbe tailored as described above. Behavioural stability following anomalies in theinput stream is possible, the extent to which is found to be largely dependenton the system’s particular parameter values.
Regarding the requirement that system behaviour be malleable by adjustmentof parameters, there does exist scope to affect system behaviour. However, thereis a significant level of redundancy and pleiotropism in the parameters them-selves. Adjustment of several parameters can bring about the same effect, forexample, the height of proliferation peaks can be adjusted through independentmanipulation of ν1, ν2, μ, ψ̄1, ψ̄2, W1,1, W1,2, W2,2, or γ. However, adjustment toany one of these parameters will have cascade effects such as altering the maxi-mum period for which the system remains responsive, the responsiveness to verylow period inputs, or the time taken for the system to reestablish a stable be-haviour following an anomalous input. Engineering an exact behaviour requiresadjustment of several, if not all, parameters simultaneously. Care must be taken
Empirical Investigation of an Artificial Cytokine Network 351
when adjusting certain parameters, such as γ or W2,1 as small adjustments haveyielded considerable behavioural change.
The system’s reaction to increasing inputs is initially good, with stable be-haviour ensuing. However, the erratic reactions that follow from inputs of mag-nitudes > 50 are unwelcome. Deployment in an engineering field would requireconsideration regarding the magnitude of inputs generated.
Concentrations of cytokines and cells in the system residing above the base-line values exert a short term memory, and the value of deploying such a systemfor engineering lies in the ability to tailor the effect of this memory. However, inits current format the system is too challenging to accurately engineer, with anabundance of parameters which simultaneously affect several aspects of systembehaviour. A reduction of the number of system parameters, and their cascadeeffects, through the replacement of finite predetermined constants with dynam-ically assessed ratios between system variable concentrations could potentiallycorrect this problem.
8 Conclusions and Further Work
In this paper we introduced the work of Hone and van den Berg [2], and an em-pirical investigation of the dynamics exhibited by their ‘numerical instantiation’was conducted. Analysis of the system’s reaction to various patterns of input,and parameter adjustments was reported. Given these results, the addition ofbaseline variable concentrations was deemed necessary. The system’s suitabilityfor deployment in an engineering context was assessed, and was not deemed to besuitable in its current standing. A potential avenue for correction has been sug-gested. Spatial constraints have prevented us from displaying all our empiricalevidence, these will be made available to interested parties on request.
The investigations carried out here are preliminary, and there is a great deal ofscope for further work. This could include deliberately engineering into the sys-tem other properties of cytokines: pleiotropism; redundancy; antagonism; andsynergy, which could prove useful for control systems which monitor multipledata sources. The addition of another cell type, and the system’s dynamics con-cerning context switching between the two (interpretable through cell prolifera-tions) presents an interesting path of investigation.
References
1. Hone, A., van den Berg, H.: In Silico Immunology. In: Mathematical Analysis ofArtificial Immune System Dynamics and Performance, pp. 351–374. Springer, Hei-delberg (2007)
2. Hone, A., van den Berg, H.: Modelling a cytokine network (special session: Founda-tions of artificial immune systems). In: FOCI, pp. 389–393. IEEE, Los Alamitos (2007)
3. Stepney, S., Smith, R.E., Timmis, J., Tyrrell, A.M., Neal, M.J., Hone, A.N.W.:Conceptual frameworks for artificial immune systems. International Journal of Un-conventional Computing 1(3), 315–338 (2005)


