Embed Size (px)
Citation preview
Emerging approaches for data-driven innovation in Europe
Sandbox experiments on the governance of data and
technology
Granell C., Mooney P., Jirka S., Rieke M., Ostermann F., van den Broecke J., Sarretta A., Verhulst S., Dencik L., Oost H., Micheli M., Minghini M., Kotsev A., Schade S.
2022
EUR 30969 EN

This publication is a Technical report by the Joint Research Centre (JRC), the European Commission’s science and knowledge service. It
aims to provide evidence-based scientific support to the European policymaking process. The scientific output expressed does not imply a policy position of the European Commission. Neither the European Commission nor any person acting on behalf of the Commission is responsible for the use that might be made of this publication. For information on the methodology and quality underlying the data used
in this publication for which the source is neither Eurostat nor other Commission services, users should contact the referenced source. The designations employed and the presentation of material on the maps do not imply the expression of any opinion whatsoever on the part of the European Union concerning the legal status of any country, territory, city or area or of its authorities, or concerning the delimitation
of its frontiers or boundaries. Contact information
Name: Alexander Kotsev Address: European Commission, Joint Research Centre, TP 263, Via E. Fermi 2749, 21027 Ispra (VA), Italy Email: [email protected]
Tel.: +39 0332 78 9096 EU Science Hub
https://ec.europa.eu/jrc
JRC127730 EUR 30969 EN
PDF ISBN 978-92-76-46937-7 ISSN 1831-9424 doi:10.2760/630723
Print ISBN 978-92-76-46936-0 ISSN 1018-5593 doi:10.2760/511775
Luxembourg: Publications Office of the European Union, 2022 © European Union, 2022
The reuse policy of the European Commission is implemented by the Commission Decision 2011/833/EU of 12 December 2011 on the reuse of Commission documents (OJ L 330, 14.12.2011, p. 39). Except otherwise noted, the reuse of this document is authorised under the Creative Commons Attribution 4.0 International (CC BY 4.0) licence (https://creativecommons.org/licenses/by/4.0/). This means that
reuse is allowed provided appropriate credit is given and any changes are indicated. For any use or reproduction of photos or other material that is not owned by the EU, permission must be sought directly from the copyright holders.
All content © European Union, 2022, except: Cover, photo by Headway on Unsplash. How to cite this report: Granell C., Mooney P., Jirka S., Rieke M., Ostermann F., van den Broecke J., Sarretta A., Verhulst S., Dencik L., Oost
H., Micheli M., Minghini M., Kotsev A., Schade S., Emerging approaches for data-driven innovation in Europe: Evaluation of sandbox experiments on the governance of data and technology. EUR 30969 EN, Publications Office of the European Union, Luxembourg, 2022, ISBN 978-92-76-46937-7, doi:10.2760/630723, JRC127730.
i
Contents
Abstract ....................................................................................................................................................................................................................................................................... 1
Acknowledgements .......................................................................................................................................................................................................................................... 2
Executive summary .......................................................................................................................................................................................................................................... 3
1 Evaluating novel approaches for data-driven innovation - introduction and policy context ............................................ 5
1.1 Introduction ....................................................................................................................................................................................................................................... 5
1.2 Aspects related to novel approaches for data-driven innovation................................................................................................. 6
1.3 Structure of the document ................................................................................................................................................................................................. 7
2 Storing and sharing large amounts of data - binary serialization for static and dynamic data .................................. 9
2.1 Introduction ....................................................................................................................................................................................................................................... 9
2.2 Background and related work....................................................................................................................................................................................... 10
2.2.1 Binary data serialization formats ........................................................................................................................................................... 11
2.2.2 Related work ............................................................................................................................................................................................................... 12
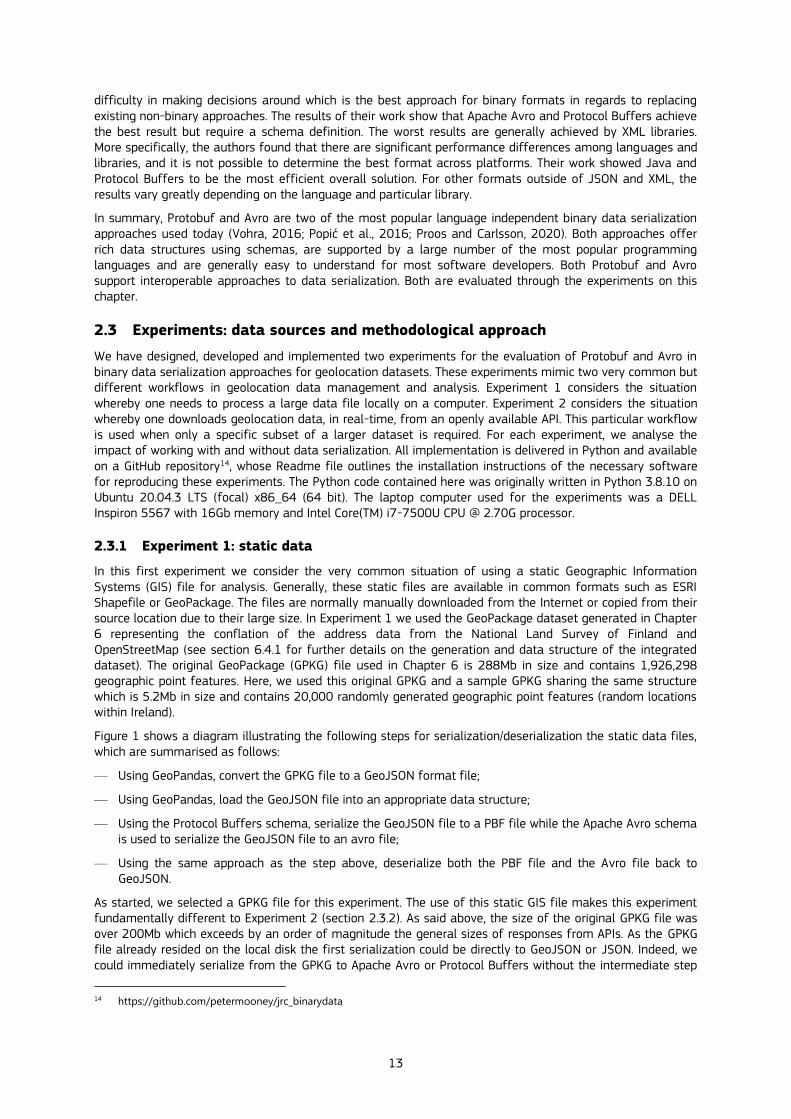
2.3 Experiments: data sources and methodological approach ............................................................................................................... 13
2.3.1 Experiment 1: static data ............................................................................................................................................................................... 13
2.3.2 Experiment 2: dynamic data ........................................................................................................................................................................ 15
2.4 Results ................................................................................................................................................................................................................................................ 16
2.5 Lessons learned and recommendations ............................................................................................................................................................ 18
2.5.1 Lessons learned – general observations ......................................................................................................................................... 18
2.5.2 Lessons learned – performance and scaling ............................................................................................................................... 19
2.5.3 Recommendations ................................................................................................................................................................................................. 20
3 Pushing data to its destination - event-driven architectures for data exchange .................................................................... 23
3.1 Introduction .................................................................................................................................................................................................................................... 23
3.2 Background: push- vs. pull-based data delivery ......................................................................................................................................... 24
3.3 Design and set up of the experiment.................................................................................................................................................................... 26
3.3.1 Data sources ............................................................................................................................................................................................................... 27
3.3.2 Implementation approach .............................................................................................................................................................................. 27
3.3.2.1 Receiving ADS-B signals .................................................................................................................................................................... 28
3.3.2.2 Server infrastructure ............................................................................................................................................................................. 28
3.3.3 Performance indicators .................................................................................................................................................................................... 31
3.4 Results ................................................................................................................................................................................................................................................ 31
3.4.1 Number of requests and data volume .............................................................................................................................................. 31
3.4.2 Data volume................................................................................................................................................................................................................ 33
3.4.3 Server load ................................................................................................................................................................................................................... 34
3.5 Lessons learned and recommendations ............................................................................................................................................................ 35
4 Processing data close to its origin - edge computing on IoT devices to detect noise pollution................................. 36
4.1 Introduction .................................................................................................................................................................................................................................... 36
4.2 Related work ................................................................................................................................................................................................................................. 38
ii
4.3 Design and set-up of the experiment ................................................................................................................................................................... 39
4.3.1 Deciding on a case study and application ...................................................................................................................................... 39
4.3.2 Materials: data, software, and hardware ........................................................................................................................................ 43
4.3.3 Overview of experimental workflow .................................................................................................................................................... 44
4.4 Initial implementation of the experiment ......................................................................................................................................................... 45
4.4.1 Pre-processing of input data....................................................................................................................................................................... 45
4.4.2 Adaptation of training process to new input data .................................................................................................................. 46
4.4.3 Refactoring of Arduino code ........................................................................................................................................................................ 46
4.4.4 Initial deployment to Arduino ..................................................................................................................................................................... 47
4.5 Retraining and evaluation ................................................................................................................................................................................................ 48
4.5.1 Retraining the model with different classes ................................................................................................................................ 48
4.5.2 Evaluation of the models’ performances ........................................................................................................................................ 50
4.6 Reporting detecting noise events via BLE and MQTT ............................................................................................................................ 50
4.7 Conclusions and lessons learned .............................................................................................................................................................................. 51
5 Enforcing automation in building, testing and deployment of software applications – the case of cloud-based data services ...................................................................................................................................................................................................................................... 53
5.1 Introduction .................................................................................................................................................................................................................................... 53
5.2 Context and technology...................................................................................................................................................................................................... 54
5.3 What is the software product? Tools and methods ................................................................................................................................. 55
5.4 How can the software product be used? Experiment setup ............................................................................................................ 57
5.4.1 Installation steps .................................................................................................................................................................................................... 57
5.4.2 Results .............................................................................................................................................................................................................................. 61
5.5 Why does the software product make a contribution? ........................................................................................................................ 61
6 Combining public sector and citizen-generated data - the case of addresses .......................................................................... 62
6.1 Introduction .................................................................................................................................................................................................................................... 62
6.2 Background: integration between authoritative and OpenStreetMap data ...................................................................... 63
6.3 Integration experiment: data sources ................................................................................................................................................................... 64
6.3.1 OpenStreetMap ........................................................................................................................................................................................................ 64
6.3.2 National Land Survey of Finland ............................................................................................................................................................. 65
6.3.3 Dutch cadastre of addresses and buildings ................................................................................................................................. 67
6.4 Integration experiment: approach and results ............................................................................................................................................. 68
6.4.1 Integration approach .......................................................................................................................................................................................... 68
6.4.1.1 Finland................................................................................................................................................................................................................. 68
6.4.1.2 The Netherlands......................................................................................................................................................................................... 70
6.4.1.3 Remarks on data licences ................................................................................................................................................................. 71
6.4.2 Results .............................................................................................................................................................................................................................. 71
6.4.2.1 Finland................................................................................................................................................................................................................. 71
6.4.2.2 The Netherlands......................................................................................................................................................................................... 73
6.5 Qualitative validation: interviews with experts and stakeholders ............................................................................................. 75
6.5.1 CNIG (Spain) ................................................................................................................................................................................................................ 75
iii
6.5.2 IGN (France) ................................................................................................................................................................................................................. 76
6.5.3 Piedmont (Italy) ....................................................................................................................................................................................................... 76
6.6 Conclusions and lessons learned .............................................................................................................................................................................. 77
7 Addressing public-private partnership for data supply – data collaboratives for air quality in cities ................. 79
7.1 Introduction .................................................................................................................................................................................................................................... 79
7.2 Background and literature review ............................................................................................................................................................................ 81
7.2.1 IoT sensors for gathering and monitoring air quality data in cities ...................................................................... 81
7.2.2 Data collaboratives for sharing air quality data ...................................................................................................................... 81
7.2.3 Challenges for IoT data collaboratives .............................................................................................................................................. 82
7.3 Methodology: Towards a canvas for IoT data collaboratives for air quality in cities ............................................. 83
7.4 Results ................................................................................................................................................................................................................................................ 87
7.5 Lessons learned and recommendations ............................................................................................................................................................ 91
7.5.1 Lessons learned ....................................................................................................................................................................................................... 91
7.5.2 Recommendations ................................................................................................................................................................................................. 91
8 Understanding demand for data-driven innovation in the public sector-the case of algorithmic processes93
8.1 Introduction .................................................................................................................................................................................................................................... 93
8.2 Literature review ....................................................................................................................................................................................................................... 93
8.2.1 Drivers for data-driven innovation ........................................................................................................................................................ 93
8.2.2 Demands for data sources............................................................................................................................................................................ 94
8.2.3 Implementation of data-driven innovation ................................................................................................................................... 95
8.2.4 Value underpinning data-driven innovation ................................................................................................................................. 95
8.3 Methods to research data-driven innovation ................................................................................................................................................ 96
8.4 Conclusions and lessons learned .............................................................................................................................................................................. 97
9 Aligning EU-level policies and local practices within the context of European data spaces ......................................... 99
9.1 Introduction .................................................................................................................................................................................................................................... 99
9.2 Exploring the local playing field in Europe ....................................................................................................................................................... 99
9.2.1 The need for a local perspective .......................................................................................................................................................... 100
9.2.2 The importance of active participation .......................................................................................................................................... 101
9.2.3 Barriers to investments ................................................................................................................................................................................. 101
9.2.4 Regulatory uncertainty ................................................................................................................................................................................... 103
9.2.5 Lack of agility and interoperability .................................................................................................................................................... 103
9.3 Exploring strategic angles as key enablers for local uptake ....................................................................................................... 103
9.3.1 Harmonize infrastructural agility and stability through Cloud-portability ................................................... 105
9.3.2 Align green and digital through (energy) efficiency in data processing ......................................................... 105
9.3.3 Optimize societal benefits and stakeholder engagement by balancing demand & supply ........ 108
9.3.4 Enhance data usability and availability through mechanisms for interoperability ............................. 109
9.3.5 Facilitate collaboration through continuous alignment of trends, practices and policy ................. 110
9.4 Conclusions.................................................................................................................................................................................................................................. 112
References .......................................................................................................................................................................................................................................................... 114

iv
List of abbreviations and definitions ........................................................................................................................................................................................ 124
List of boxes...................................................................................................................................................................................................................................................... 126
List of figures .................................................................................................................................................................................................................................................. 127
List of tables ..................................................................................................................................................................................................................................................... 128
Annexes ................................................................................................................................................................................................................................................................. 129
Annex 1. Air Quality IoT Sensor Categories................................................................................................................................................................ 129

1
Abstract
Europe’s digital transformation of the economy and society is one of the priorities of the current Commission and is framed by the European strategy for data. This strategy aims at creating a single market for data through the establishment of a common European data space, based in turn on domain-specific data spaces in strategic sectors such as environment, agriculture, industry, health and transportation. Acknowledging the key role that emerging technologies and innovative approaches for data sharing and use can play to make European data spaces a reality, this document presents a set of experiments that explore emerging technologies and tools for data-driven innovation, and also deepen in the socio-technical factors and forces that occur in data-driven innovation. Experimental results shed some light in terms of lessons learned and practical recommendations towards the establishment of European data spaces.

2
Acknowledgements
The authors acknowledge the support of the ELISE (European Location Interoperability Solutions for e-Government) Action1 of the ISA2 (Interoperability solutions for public administrations, businesses and citizens) Programme2. The authors express their sincere gratitude to the following JRC colleagues: Brooke Tapsall, Simon Vrecar, Silvia Sarti, Michael Lutz and Francesco Pignatelli from the Digital Economy Unit, Koen Jonkers, Dimitris Kyriakou and Pietro Moncada Paternò Castello from the JRC Editorial Review Board, Tanja Acuna from the Growth and Innovation Directorate, and to Luigi Spagnolo, and a second anonymous reviewer for their recommendations, which have greatly helped the authors improve the content.
The views expressed are purely those of the authors and may not in any circumstances be regarded as stating an official position of the European Commission. All errors remain the sole responsibility of the authors.
Authors
GRANELL, Carlos Universitat Jaume I de Castellón, Spain
MOONEY, Peter Maynooth University, Ireland
JIRKA, Simon 52°North Spatial Information Research GmbH, Germany
RIEKE, Matthes 52°North Spatial Information Research GmbH, Germany
OSTERMANN, Frank University of Twente, The Netherlands
VAN DEN BROECKE, Just OSGeo.nl, The Netherlands
SARRETTA, Alessandro National Research Council, Italy
VERHULST, Stefaan New York University, US
DENCIK, Lina Cardiff University, United Kingdom
OOST, Hillen Association of Dutch Municipalities / Futura Nova.eu, The Netherlands
MICHELI, Marina European Commission, DG Joint Research Centre
MINGHINI, Marco European Commission, DG Joint Research Centre
KOTSEV, Alexander European Commission, DG Joint Research Centre
SCHADE, Sven European Commission, DG Joint Research Centre
1 https://joinup.ec.europa.eu/collection/elise-european-location-interoperability-solutions-e-government 2 https://ec.europa.eu/isa2/home_en
3
Executive summary
Europe’s digital transformation of the economy and society is one of the priorities of the current Commission and is framed by the European strategy for data. This strategy aims at establishing a European single market for data ensuring the free flow of data, including personal and non-personal, across actors and sectors, to stimulate data-driven innovation and create value for the economy and society. The goal is to establish a common European data space based on domain-specific data spaces in strategic sectors such as environment, agriculture, industry, health and transportation. Europe’s vision is to capture the benefits of better use of data, leading to greater productivity and competitive markets, and improvements in health and well-being, environment, transparent governance and excellent public services.
The European strategy for data acknowledges the importance of all kinds of data, being produced by the public sector, private sector, academia and citizens. Combining and integrating data from different sources acquires primary importance for the successful establishment of data spaces. To this regard, emerging technologies and innovative approaches for data sharing and use become key enablers to speed up the process of digital transformation. However, today's technology landscape is very dynamic with new approaches, tools, and architectures constantly being developed. Therefore, the overall objective of this document is to explore and enhance the understanding of novel approaches and technology to data-driven innovation in support of the current political agenda towards the establishment of the European data spaces.
A sandbox approach is taken, so that the findings presented in the document are based on concrete empirical evidence, collected through a set of experiments, specifically designed and developed to explore emerging technologies and tools for data-driven innovation, and to investigate the socio-technical factors and forces that occur in data-driven innovation. As a result, this document recognises the gaps that still need to be addressed from a technological, organisational and social perspective. It also provides recommendations to address them to ultimately achieve the desired business and social objectives.
The successful implementation and added value of the European data spaces requires aligning EU policy developments with local, regional and commercial practices, to anticipate, facilitate and participate in the implementation of strategies based on mutual understanding. The exploratory body of research presented in this document sheds some light in terms of lessons learned and practical recommendations towards the establishment of European data spaces. In this context, data-driven innovation is investigated from several interrelated perspectives. First, from a technical point of view, several novel approaches for collecting, combining, and sharing data from heterogeneous sources are presented. Those intend to complement, and not substitute the more traditional and well-established data sharing techniques. The individual chapters are not to be seen in isolation, as there are synergies between the different approaches for encoding, processing and combining data. The findings summarise the feasibility of the described techniques alongside the possible challenges and drawbacks related to their uptake in different contexts and architectural settings along the cloud-edge continuum. A common denominator for the presented technical work is the extensive use of open source technology. The European technological landscape includes multiple small and medium enterprises combined with a healthy open source community of developers and early adopters. This potential can be harnessed and act as an enabler for the implementation of the European strategy for data.
The experiments with binary data encodings show that they have both advantages and disadvantages when compared to the de facto standards such as XML, JSON and GeoJSON. We see many opportunities for binary data formats to work in parallel to these established practices. Considering the exponential growth of IoT data, push-based delivery of near-real time data streams has the potential to generate benefits by improving communication efficiency and minimizing the latency of data arrival. The same applies to edge computing on IoT devices that can lead to improving the governance of data, for example by using AI to analyse sensor data to increase the quality of life. Then, regarding the automation in building, testing and deployment of software applications, a stack of open source components, organised on the cloud and governed through Git provides a powerful alternative to proprietary technology. Consequently, the successful integration of citizen-generated and authoritative data sheds light on understanding the complexity inherent to the process of integrating datasets that differ in nature, original purpose and content.
Second, the document addresses key organisational and social aspects of data-driven innovation in local communities and public sector organisations and argue that there is a dearth of empirical research on current practices. More research would allow fine-tuning canvas that guide practitioners and support sustainable and ethical data sharing between private sector entities, civic society and public actors. Empirical research would also enlighten about drivers, values, and clashes that characterise data innovation in public administrations, which describes a multi-method approach for researching the social demand for DDI. The document also distils the main lessons learned from all the contributions helping to bridge the gap between EU policy

4
developments and local practices. The the research and experiments presented in the report can inform the establishment of European data spaces from the particular perspective of cities and municipalities, which inevitably will play a key role in the next EU-policy developments and in making Europe fit for the digital age.
Finally, the nature of emerging technologies, architectures, standards and approaches covered in this document is crosscutting. They can be studied from multiple angles, including the social, economic and technological perspectives that can altogether inform the scoping of policies that can be operationalised and lead to data-driven innovation at scale. That is why, the Joint Research Centre of the European Commission, and specifically its Digital Economy Unit are uniquely positioned to provide insights related with the utilisation and sharing of data that are both scientifically relevant and have a strong policy dimension.

5
1 Evaluating novel approaches for data-driven innovation - introduction
and policy context
1.1 Introduction
The digital transformation of the economy and society is at the very core of the European Commission’s priorities for the period 2019-2024, centred around the twin need for a greener and more digital Europe (European Commission, 2019). This is also proven by the Recovery and Resilience Facility, recently established in response to the COVID-19 pandemic, which prescribes that at least 20% of the €672.5 billion provided to European Union (EU) Member States in loans and grants have to be used for the digital transformation (European Commission, 2021a). Clearly, no digital transformation can happen without data and, reflecting this, the European strategy for data (European Commission, 2020a) envisions Europe’s digital future
through the establishment of a European single market for data ensuring the free flow of data, including personal and non-personal, across actors and sectors, to stimulate data-driven innovation and create value for the economy and society.
The vision is to establish a common European data space based on domain-specific data spaces in
strategic sectors, such as environment, agriculture, industry, health and transportation. A data space is defined as a genuine single market for data, open to data from across the world and combining personal as well as non-personal data, including sensitive business data, boosting growth and creating value, while minimising the human carbon and environmental footprint (European Commission, 2020a). Europe’s vision is to capture the benefits of better use of data, leading to greater productivity and competitive markets, and improvements in health and well-being, environment, transparent governance and excellent public services. To achieve this goal, an ambitious set of legislative instruments to be released by 2024 will address a number of data-related issues such as availability, interoperability, quality, governance, cybersecurity, skills and literacy as well as the overarching data infrastructures.
Indeed, European Commission’s preparatory actions are underway within the Digital Europe Programme (DIGITAL3) to create a genuine single market guaranteeing high standards for data security while promoting easy access to a huge amount of high-quality data, boosting growth and creating value and bringing technology to business, citizens and public administrations. The European strategy for data acknowledges the importance of all kinds of data, being produced by the public sector, the private sector, academia and citizens. Hence, making it possible to combine and integrate data from different sources—by solving all the issues mentioned above—acquires primary importance for the successful establishment of any data space.
Technologies act as enablers that would to a large extent determine the overall success of the policy agenda described above. Innovative approaches for data sharing and use can speed up the process of digital transformation, thus providing significant benefits to European societies and economies. However, today's technology landscape is very dynamic with new approaches, tools, and architectures constantly being developed. That is why the overall objective of this document is to explore and improve understanding of
novel approaches to data-driven innovation in support of the current political agenda, most notably the DIGITAL programme and the European strategy for data towards the establishment of the common European data space.
The overall approach adopted in this report is based on experimentation. The work described here, to analyse state-of-the-art technology in the field of data-driven innovation and to inform on promising approaches, is driven by exploratory and "sandbox" experiments. Originally taken from the field of computing security to isolate untrusted programmes in virtual containers to be safely run, sandbox experiments are used here to design and conduct experiments that recreate “real world” conditions in a controlled environment – to explore emerging research questions related to technology and socio-technical understanding in the field of data-driven innovation. Although each of the following chapters designs, develops and discusses individual experiments, some relationships exist between the individual experiments - mainly in the case of reusing data sets generated in one experiment (chapter) in another. This does not compromise the sandboxing approach, since the experiments’ conditions and environments are different from each other, and the experiments simply take advantage of shared resources to accelerate their development.
3 https://digital-strategy.ec.europa.eu/en/activities/digital-programme
6
Overall, this report addresses a common theme that is shared by the wide range of actors involved in establishing European data spaces: bridging the gap between policy developments at the European level and local practices. Since the process of establishing European data spaces is still in the preparatory phases, this report recognises the gaps that still need to be addressed from a technological, organisational and
social perspectives, and provides recommendations to address them and achieve the desired business and social objectives.
The sandbox experiments and research described below illustrate that the successful implementation and added value of the European data spaces cannot be understood as a black and white process where a particular solution has only advantages or disadvantages, but on a wider spectrum. Local and regional authorities, as well as large companies, SMEs and NGOs are crucial actors with diverse needs, practices, objectives and relationships with emerging technology. Aligning EU policy developments with local, regional and commercial practices necessarily requires ways to anticipate, facilitate and participate in the implementation of strategies based on mutual understanding and an overview of the playing field. The exploratory body of research presented here sheds some light in terms of lessons learned and practical recommendations towards the establishment of European data spaces.
1.2 Aspects related to novel approaches for data-driven innovation
A first aspect relates to the way in which recent advances in technology have permeated our society, driven by the continuous influx of data and the drastic miniaturization and massive deployment of sensing technology, exemplified by the mainstream adoption of artificial intelligence, data-driven algorithms, the Internet of Things (IoT), and edge computing. These technologies can be explored from the perspective of optimizing data management and processing. Chapters 2 and 3 explore whether technologies for data management and transmission in terms of novel protocols, standards and APIs are well-suited to advance pilots and ongoing developments to leverage widely and efficient access to streams of large data sets. Chapter 4 discusses learning models and predictive models on the interaction of IoT devices and edge computing by examining their configurations and parameters in the case of urban environmental issues.
Data spaces are tightly coupled with emerging trends and developments pertinent to data storing, such as
cloud computing, cloud-based infrastructures and virtualisation. A robust and reliable cloud-based infrastructure can offer great benefits to address the growing demands for virtualized deployments, as well as regulatory agreements necessary to ensure data sovereignty and security. The theme of cloud uptake and sovereignty is taken up in Chapter 5. This chapter provides a synthesis of state-of-the-art cloud portability technology and containerisation tools to foster agile cloud-based deployment mechanisms for data-driven services and applications.
If data spaces are going to be at the heart of the digital transition in Europe, then we need to create the right conditions to allow data providers and consumers to seamlessly integrate data from diverse sources. Chapter 6 tackle this aspect by developing, through a nation-wide data integration experiment between authoritative geospatial datasets with datasets from the OpenStreetMap (OSM) project, a wider understanding of what data providers need to enrich their data repositories based on existing heterogeneous but complementary data sources. This could eventually lead to significant benefits for the delivery of improved public services and data market consolidation.
Another aspect that was investigated relates to the key participants and actors in a data space. As the European Commission will invest in common European data spaces in strategic economic areas of public interest, such as health, environment and transport, the pool of stakeholders is broad, ranging from local, regional and national governments to the wider private sector (including SMEs) as well as citizens, NGOs and civic associations. In general, the increased availability and access to data will influence to all sectors of the economy and society. Chapters 7 and 8 review the ongoing debate on the roles and interests of these stakeholders, especially the necessary public-private collaboration for cross-sector data sharing, and understanding the supply and demand sides for data-driven innovation.
Finally, recognising the barriers and limitations that cities and regions face in establishing data
ecosystems is key for the success of the European strategy for data. In this sense, Chapter 9 synthesises the main findings of all chapters of the document and provides recommendations and strategies for data-driven innovation to mitigate the misalignment between general EU policy initiatives and local practices regarding governmental, social and commercial aspects.
7
1.3 Structure of the document
The document is logically divided into two main parts. Part 1 includes chapters 2 to 6 and covers emerging technologies and tools for data-driven innovation. It draws attention on the governance with data through a series of experiments regarding IoT, edge computing, and emerging trends for data processing and transmission. Part 2 includes the last three chapters and covers the socio-technical understanding of
data-driven innovation from the perspective of emerging governance models of digital data (Craglia et al.,
2021).
Today, more users access data services through mobile devices and, for service providers, choosing the appropriate data serialisation format becomes an important decision to offer a service delivery that optimises the exchange of data between the client device and the server (services) in the most efficient way possible. Chapter 2 Storing and sharing large amounts of data - binary serialization for static and dynamic data, written by Peter Mooney, investigates the benefit of binary data serialisation to store and share large amounts of data in an interoperable way. Comparisons between JSON and two popular binary data formats, Protocol Buffers and Apache Avro for storing and sharing geographical data, are considered through two experiments to illustrate the advantages and disadvantages of both approaches.
Chapter 3 Pushing data to its destination - event-driven architectures for data exchange, written by Simon Jirka and Matthes Rieke, complements Chapter 2 by turning the focus on data exchange mechanisms to compare push-based against pull-based data exchange mechanisms. In addition, chapter 3 assesses the degree to which push-based mechanisms have reached a level of maturity to function as complementary building blocks for spatial information infrastructures, in particular, and data spaces in general.
Chapter 4 Processing data close to its origin - edge computing on IoT devices to detect noise pollution, written by Frank Ostermann, sets the current debate in the context of the application of edge computing, which is useful in cases where sending all recorded data by IoT devices to a central server is undesirable or even impossible, due to constraints related to transparency, security, and privacy preservation. After providing an overview of relevant techniques and a systematic description of hardware and its limitations to perform artificial intelligence on edge computing, the chapter describes the development and evaluation of a proof-of-concept experiment that uses IoT devices to detect noise pollution and tests learning and predictive models capabilities at the edge.
As cloud-related technology and infrastructure continue to evolve, ensuring minimal interoperability mechanisms through vendor-neutral and technology-agnostic tools for the deployment of cloud-based data services become a key driver for the data market consolidation. Chapter 5 Enforcing automation in building, testing and deployment of software applications – the case of cloud-based data services, written by Just van den Broecke, describes the development process for a cloud-based, INSPIRE-compliant data service. In particular, this chapter discusses a wide range of technology and tools for developing, maintaining, and deploying cloud-based, ready-to-use data resources and services. In addition, this chapter also describes a software product to enable the rapid deployment of digital data services on cloud infrastructures, which allows municipalities to meet their digital practices and needs in terms of growing data demand and data sovereignty.
The main purpose of Chapter 6 Combining public sector and citizen-generated data - the case of addresses, written by Alessandro Sarretta, is to establish a first step towards a comprehensive assessment of the enablers and barriers to integrating authoritative datasets from European National Mapping Agencies (NMAs) with crowd-sourced geographic information datasets from the OpenStreetMap project. This chapter describes a large-scale experiment in terms of geographical coverage to test the integration of address datasets from two European NMAs and from OSM, discussing key lessons learnt and technical pros and cons of the data integration process. Lastly, recommendations on interoperability aspects, not only semantic but also technical, organisational and legal, are proposed for a future full-scale experimentation that would ultimately guide the establishment of European data spaces.
Air quality is of particular importance because of the positive correlation between growing urbanisation and poor air quality. City governments and local communities are becoming increasingly more concerned about and are actively working to take steps to reduce air pollution levels. Chapter 7 by Stefaan Verhulst, titled Addressing public-private partnership for data supply – data collaboratives for air quality in cities discusses the opportunities (and challenges) offered by data collaboratives for setting up air quality monitoring systems in cities. Data collaboratives are “cross-sector (and public-private) collaboration initiatives aimed at data collection, sharing, or processing for the purpose of addressing a societal challenge” (Susha et al., 2017, p. 2691). Therefore, this term refers to emerging forms of collaboration between sectors established with the
8
goal to create additional value from data, especially public value. The chapter presents a set of “enabling conditions” and related “design requirements and success factors” concerning the governance, operational, scientific and capacity dimensions of data collaboratives. These factors are a first step for the creation of a canvas that guides policy makers in implementing IoT air quality data collaboratives in cities in an ethical, sustainable and effective way. The chapter examines four case studies and derives some lessons. The conclusions highlight the need of developing common “IoT governance frameworks'' between public sector, private actors and civic society for a trusted use of sensor data, as well as increasing empirical research to fine-tune canvas to guide practitioners, such as the one presented in the chapter.
Previous chapters focused on the supply-side of data-driven innovation and the possibilities that emerging technologies might provide. However, it is important to understand where the demand for this technology development is coming from, what the demand actually is, and whether that demand is met. Chapter 8 Understanding demand for data-driven innovation in the public sector – the case of algorithmic processes, written by Lina Dencik, draws implications for policy makers around considerations on the adoption of algorithmic processes and predictive analytics for the delivery of public services. The chapter reviews what kinds of drivers inform data-driven innovation in the public sector, such as: expectations that it assists decision-making, increase of efficiency, promises of prediction, public interest as well as private sector growth. Drawing from examples in areas of unemployment, benefits, welfare and social care, and policing, the chapter addresses tensions associated with the actual implementation of data-driven innovation in organisational settings and the values underpinning it. Lastly, the chapter also provides a quick overview of the different methods that can be employed to empirically research data-driven innovation in the public sector and what the foci of such an analysis should be.
The establishment of European data spaces represents an important step in joining the EU’s agendas on the twin green and digital strategies so as to create a single digital market. Regions and cities play a significant role in the successful rollout of these data spaces, but many struggle to bridge the gap between EU-policy developments and local practices. Aligning these perspectives requires ways to anticipate and facilitate the implementation of regulations and strategies as well as understanding of the playing field. Chapter 9 Aligning EU-level policies and local practices within the context of European data spaces, written by Hillen Oost, recaps the contributions of this report by revisiting the use cases and experiments provided in previous chapters from the local perspective of cities and regions. Taking European data spaces and cloud trends to provide a concrete context for application and validation, this chapter looks at the local scale and explores recommendations for local strategy development and data-driven innovation. We are still in the early days in our understanding of how best to facilitate and enable a promising future for European data spaces for all stakeholders. More research, exploration and full-scale experimentation is inevitably needed.
9
2 Storing and sharing large amounts of data - binary serialization for
static and dynamic data
2.1 Introduction
It is fair to say that Application Programming Interfaces (APIs) are an integral part of data sharing and exchange on the Internet today. APIs provide a standardised mechanism where software and systems can automatically share and exchange data for a myriad of different types of applications and services (Vaccari et al., 2020). By far the most popular data exchange formats in APIs in general usage today are based around XML (eXtensible Markup Language) or JSON (JavaScript Object Notation). There are a number of very important advantages to the usage of XML or JSON including that they are:
— human and machine-readable;
— very well-known within a large user base;
— supported by almost all popular software libraries and tools;
— open formats and standards-based;
— provide an interoperable means of data storage and sharing.
However, there are multiple limitations to both approaches. These limitations are primarily related to poor performance when dealing with large volumes of data and the time requirements coupled with high computational cost for parsing and processing4. Simply stated it is not operationally feasible or efficient to transport data in XML or JSON when the volume of data is likely to be large. With the arrival and ubiquity of the ‘big data’ age the requirement to transport large volumes of data quickly and efficiently between services and applications is critical. The focus in this chapter is on data with a geolocation component. Yet, the geospatial data domain has not really considered solutions to these issues despite their commonality. Most geospatial practitioners understand the problem of accessing large data stores, parsing or converting datasets, etc. In this chapter we consider the use of binary data serialization as an alternative to transportation of data in XML or JSON data formats. We have chosen to focus primarily on JSON as the vast majority of geographic data provided by APIs and other sources use JSON or GeoJSON as their chosen data format. Conceptually, it is useful to think of practicalities of replacing the JSON or XML outputs from APIs and other sources with binary data outputs, which are then directly consumed by client software.
Binary data serialization allows the storage and sharing of large amounts of data in an interoperable way. Other domains have been thinking about this problem for a long time and using binary data serialization approaches. Scientific communities such as the meteorological and astronomy communities have used binary data formats for many years (if not decades) due to the volumes of data involved. These binary data formats are usually only used by a small community of specialists. The European strategy for data (European Commission, 2020b) mentions specifically that cloud uptake in the European public sector is low. This may lead to less efficient digital public services, not only because of the clear potential to cut IT costs by cloud adoption, but also because governments need the scalability of cloud computing to deploy technologies like Artificial Intelligence. In order words, moving data around should not become a problem or barrier. In the period 2021-2027, the European Commission will invest in a High Impact Project on European data spaces and federated cloud infrastructures5. Now is the opportune time to find more efficient ways to transport data between services and applications, while taking advantage of cloud-based infrastructure. However, changing from XML and JSON to a binary data serialization approach is a massive undertaking. There is no one-size-fits-all serialization format — the best format for a specific use-case depends on many factors including the type/amount of data that is being serialized and the software that will be reading it. There is also the major challenge to overcome the widespread popularity of XML and JSON formats among software developers, service providers, scientists, and so on.
Anecdotally, a binary serialization approach is much more efficient in terms of processing requirements and overall computational costs. However, this does not always take into the account the additional overheads
4 In the light of these performance issues, alternative approaches have been developed to redistribute the processing load
between a server offering large volumes of non-binary data and the client consuming them. For more information, please
consult https://linkeddatafragments.org/ and https://semiceu.github.io/LinkedDataEventStreams 5 https://digital-strategy.ec.europa.eu/en/policies/strategy-data
10
connected to binary serialization, including the requirement for more specialist software development and the need for additional software (or files such as schema) on the client or destination device or machine. Very few API services exist, which directly provide binary encoding for consumption by client software. Interestingly, there are many technological options available, which indicate the benefit of binary data serialization to store and share large amounts of data in an interoperable way. However, these technical solutions have not been considered specifically in the context of managing location-based data and associated technology, since previous works appear to focus on computational efficiency for a particular application or problem.
Moving away from the widespread ubiquitous usage of XML and JSON to binary data encodings must deliver feasible and attractive answers to the following challenges:
— The computational performance challenges: Improvements in overall processing times, decreases in the amount of data storage required and the enhanced ability to exchange large datasets must be offset against other implementation factors and computational resources.
— The programming language support challenge: all modern programming languages usually recognise XML and JSON natively. Binary data serialization support is usually provided in the form of specialist libraries that must be installed and configured.
— Scalability and sustainability challenges: How can the success of XML and JSON be mirrored in binary approaches now and in the future? Multiple programming language support is required, interoperability and the ability to scale to large or big data. XML and JSON can be delivered by data providers secure in the knowledge that the client consuming these data will have the tools available to work effectively with these data formats. We must ensure that we avoid “lock-in” to proprietary systems and reduce dependencies on specific approaches. Preference in the execution of the use cases shall be given to open source technologies and working prototypes that can be reproduced and scaled.
— The challenge to measure and understand success: What factor of improvement or efficiency must be observed for a binary serialization approach to be considered a replacement for the de facto standards of XML or JSON? Is it feasible that both approaches work in parallel for the same service and, if so, what would the resource and cost requirements be?
The specific objective of this chapter is to investigate the benefit of binary data serialization to store and share large amounts of data in an interoperable way as an alternative to transportation of data in XML or JSON data formats. For data service providers, choosing the proper data serialization format has become increasingly difficult. Today, more users are accessing services using mobile devices. These devices have limited computational resources, most notably disk storage space and bandwidth speed. Therefore, it becomes very important in optimised service delivery that data exchange between the client device and server (services) is as efficient as possible. In this chapter, after introducing key concepts (complemented by Box 1) and related work to binary data serialization, we consider comparisons of JSON and two popular binary data formats called Protocol Buffers and Apache Avro for storing and sharing geographical data. Using two experiments, we illustrate the advantages and disadvantages of both approaches (see sections 2.3 and 2.4). In section 2.5, we deliver a set of practical recommendations around the potential for binary data serialization for interoperable data storage and sharing in the future.
Box 1. Main terminology as it is used in this chapter
Data serialization: A process to transform data structures of states of an object into a declarative, text-based format that can be transmitted (and/or stored) and reconstructed later.
Data deserialization: The opposite of data serialization, i.e., the process of reconstructing an object from a declarative, text-based format.
Binary data serialization: The same process as data serialization where the output is a binary stream rather than a text-based format.
2.2 Background and related work
One of the most important tasks of any platform for data processing is storing the data received. Different systems have different requirements for the storage formats of data, which raises the problem of choosing the optimal data storage format to solve the current problem. Serialization is the process of translating data structures or object states into a format that can be transmitted and reconstructed later. Therefore, serialization is the conversion of an object into a sequence of bytes, whereas deserialization is the
11
reconstruction of an object from a sequence of bytes. The smaller the size of the serialized object and the shorter the execution time involved, the more efficient the format. For geographic data, file sizes can be very large for specific datasets. In more recent times where geographic data has been accessed from Internet-based APIs the dataset sizes are generally smaller. However, there is usually other performance issues related to downloading geographic data from APIs including bandwidth considerations, client hardware device processing capabilities, and so on.
Binary serialization is the process of taking a complex data type (or object) and encoding it into a binary stream, changing to a persistent state, transporting, and then decoding (de-serialize) back into the original complex data type. Indeed, binary data serialization is being used in many situations in industry. A number of years ago the OpenStreetMap (OSM) project began using binary data serialization as a means of addressing the technical issues encountered due to the rapidly growing volume of data stored within the OSM database and being required by users. The OSM Wiki6 provides a detailed overview of their implementation of Protocol Buffers for binary serialization of OSM data. The Wiki states that Protocol Buffers is primarily intended as an alternative to the XML format. The Protocol Buffers format shows faster read and write times than compression of non-binary data and it supports future extensibility and flexibility. Binary data serialization is also used extensively in big data applications. Apache Hadoop7 is one such open source, software platform that manages data processing and storage for big data applications. Hadoop works by implementing a strategy of distributing large data sets and processing tasks across nodes in a computing cluster. Essentially, this breaks down tasks into smaller workloads that can be run in parallel. Hadoop can process structured and unstructured data and scale up reliably from a single server to thousands of machines. Apache Avro (see next section) is used as the data serialization language system for Hadoop in moving data between machines in these computing clusters. The Protocol Buffers format appeared in 20088 and is widely used internally at Google where it has been the default data format for serialization. In many senses, binary data serialization approaches such as Avro and Protocol Buffers are often unfamiliar to many users because they usually operate within computing environments far away from the public user interfaces for APIs.
2.2.1 Binary data serialization formats
As briefly introduced above, two of the most popular binary data serialization formats in widespread use today are Protocol Buffers and Apache Avro. Table 1 gives a brief overview comparison of Protocol Buffers and Apache Avro. Next, we describe the details each binary data serialization format.
Protocol Buffers (Protobuf)9 is an open source project developed by Google, to provide a language-neutral, platform-neutral and extensible mechanism for serializing structured data. Protocol Buffers have wide support in many popular languages such as C++, C#, Java and Python. This binary format enables applications to store as well as exchange structured data in an uncomplicated way, whereby software can even be written in different programming languages to read and write Protocol Buffers data. Structuring data with Protobuf requires one to define a schema (a file called the .proto file). One must then use the Protocol Buffers Compiler (protoc) on this schema file to generate the classes needed to read and write the Protobuf data. These classes can be generated for most popular languages as mentioned above. Messages, or what one can think of as objects, in Protobuf, can be composed of any number of fields, whereby the typical data types such as bool, int32, float, double, or string are available. When one is creating a Protobuf version of a JSON file, for example, it is necessary to map the object properties in the JSON file to the Protobuf schema. In summary, when using Protocol Buffers one must define the schema for the data (in the .proto file) and then use the Protoc10 compiler to generate source code (classes) in the target implementation language, such as Python, C++ or Java. If the original data source changes such as includes an additional field or property, then the Protobuf schema must be changed and the target source code classes must be recompiled. Binary data generated using Protocol Buffers is stored in a Protocolbuffer Binary Format (PBF) file with a .pbf extension.
Apache Avro11, like Protobuf, is a very popular schema-based binary data serialization technique. It is also a language-neutral approach which was originally developed for serializing data within Apache Hadoop. Apache Hadoop is an open source framework that is used to efficiently store and process large datasets ranging in
6 https://wiki.openstreetmap.org/wiki/PBF_Format 7 https://hadoop.apache.org/docs/stable 8 https://developers.google.com/protocol-buffers/docs/overview 9 https://developers.google.com/protocol-buffers 10 https://github.com/protocolbuffers/protobuf/releases/latest 11 https://avro.apache.org
12
size from gigabytes to petabytes of data. In Avro the schema is defined in an .avsc schema file which uses JSON for declaring the data structures. Avro does not require the use of a compiler to generate target source code classes. However, it is only supported officially by a number of languages including C++, Java and Python. When data is serialized to an Avro binary data file (with an .avro extension) its schema is also stored with it. To process the Avro binary data file one must have access to the schema at this time. Like Protobuf, if there are changes to the original data the Avro schema will need to be updated. Apache Avro provides support for all the primitive types. The primitive types supported by Avro are null, boolean, int, long, float, double, bytes, and string. When one changes the schema in Avro then it may be necessary to make changes to the implementation code using the schema. However, this is an easier process than Protobuf as the source code can be changed directly (if required) without the need for source code generation.
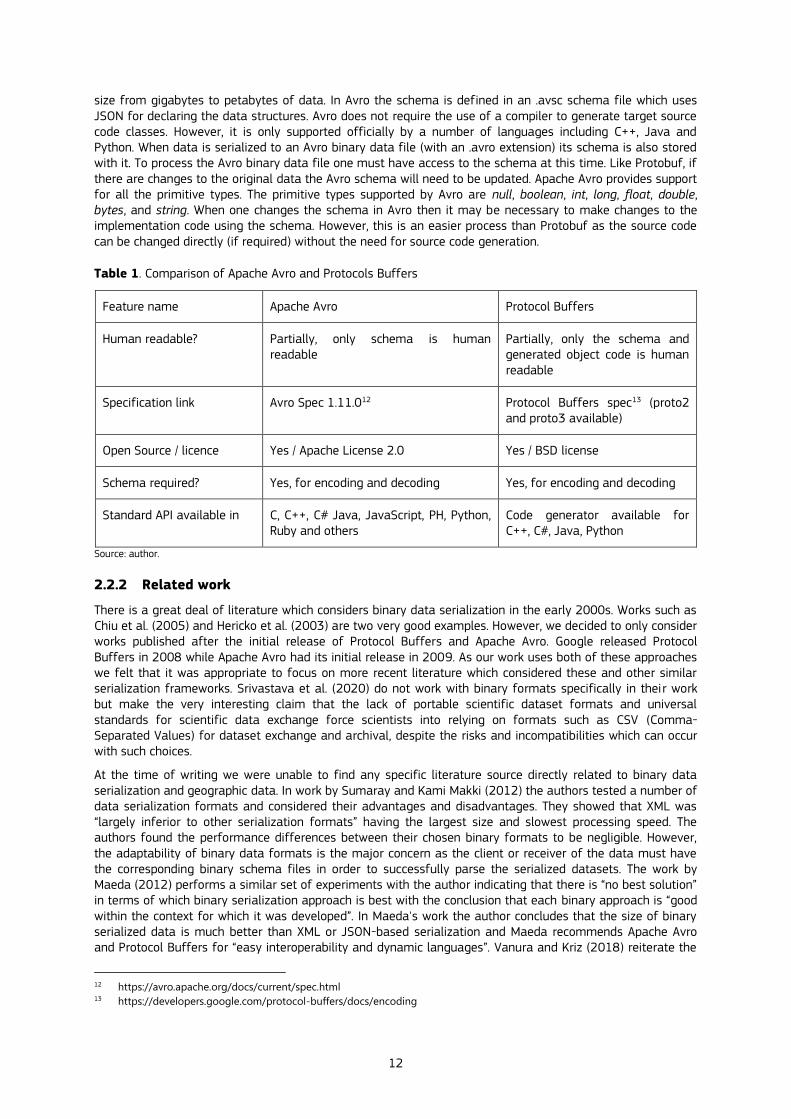
Table 1. Comparison of Apache Avro and Protocols Buffers
Feature name Apache Avro Protocol Buffers
Human readable? Partially, only schema is human readable
Partially, only the schema and generated object code is human readable
Specification link Avro Spec 1.11.012 Protocol Buffers spec13 (proto2 and proto3 available)
Open Source / licence Yes / Apache License 2.0 Yes / BSD license
Schema required? Yes, for encoding and decoding Yes, for encoding and decoding
Standard API available in C, C++, C# Java, JavaScript, PH, Python, Ruby and others
Code generator available for C++, C#, Java, Python
Source: author.
2.2.2 Related work
There is a great deal of literature which considers binary data serialization in the early 2000s. Works such as Chiu et al. (2005) and Hericko et al. (2003) are two very good examples. However, we decided to only consider works published after the initial release of Protocol Buffers and Apache Avro. Google released Protocol Buffers in 2008 while Apache Avro had its initial release in 2009. As our work uses both of these approaches we felt that it was appropriate to focus on more recent literature which considered these and other similar serialization frameworks. Srivastava et al. (2020) do not work with binary formats specifically in their work but make the very interesting claim that the lack of portable scientific dataset formats and universal standards for scientific data exchange force scientists into relying on formats such as CSV (Comma-Separated Values) for dataset exchange and archival, despite the risks and incompatibilities which can occur with such choices.
At the time of writing we were unable to find any specific literature source directly related to binary data serialization and geographic data. In work by Sumaray and Kami Makki (2012) the authors tested a number of data serialization formats and considered their advantages and disadvantages. They showed that XML was “largely inferior to other serialization formats” having the largest size and slowest processing speed. The authors found the performance differences between their chosen binary formats to be negligible. However, the adaptability of binary data formats is the major concern as the client or receiver of the data must have the corresponding binary schema files in order to successfully parse the serialized datasets. The work by Maeda (2012) performs a similar set of experiments with the author indicating that there is “no best solution” in terms of which binary serialization approach is best with the conclusion that each binary approach is “good within the context for which it was developed”. In Maeda's work the author concludes that the size of binary serialized data is much better than XML or JSON-based serialization and Maeda recommends Apache Avro and Protocol Buffers for “easy interoperability and dynamic languages”. Vanura and Kriz (2018) reiterate the
12 https://avro.apache.org/docs/current/spec.html 13 https://developers.google.com/protocol-buffers/docs/encoding
13
difficulty in making decisions around which is the best approach for binary formats in regards to replacing existing non-binary approaches. The results of their work show that Apache Avro and Protocol Buffers achieve the best result but require a schema definition. The worst results are generally achieved by XML libraries. More specifically, the authors found that there are significant performance differences among languages and libraries, and it is not possible to determine the best format across platforms. Their work showed Java and Protocol Buffers to be the most efficient overall solution. For other formats outside of JSON and XML, the results vary greatly depending on the language and particular library.
In summary, Protobuf and Avro are two of the most popular language independent binary data serialization approaches used today (Vohra, 2016; Popić et al., 2016; Proos and Carlsson, 2020). Both approaches offer rich data structures using schemas, are supported by a large number of the most popular programming languages and are generally easy to understand for most software developers. Both Protobuf and Avro support interoperable approaches to data serialization. Both are evaluated through the experiments on this chapter.
2.3 Experiments: data sources and methodological approach
We have designed, developed and implemented two experiments for the evaluation of Protobuf and Avro in binary data serialization approaches for geolocation datasets. These experiments mimic two very common but different workflows in geolocation data management and analysis. Experiment 1 considers the situation whereby one needs to process a large data file locally on a computer. Experiment 2 considers the situation whereby one downloads geolocation data, in real-time, from an openly available API. This particular workflow is used when only a specific subset of a larger dataset is required. For each experiment, we analyse the impact of working with and without data serialization. All implementation is delivered in Python and available on a GitHub repository14, whose Readme file outlines the installation instructions of the necessary software for reproducing these experiments. The Python code contained here was originally written in Python 3.8.10 on Ubuntu 20.04.3 LTS (focal) x86_64 (64 bit). The laptop computer used for the experiments was a DELL Inspiron 5567 with 16Gb memory and Intel Core(TM) i7-7500U CPU @ 2.70G processor.
2.3.1 Experiment 1: static data
In this first experiment we consider the very common situation of using a static Geographic Information Systems (GIS) file for analysis. Generally, these static files are available in common formats such as ESRI Shapefile or GeoPackage. The files are normally manually downloaded from the Internet or copied from their source location due to their large size. In Experiment 1 we used the GeoPackage dataset generated in Chapter 6 representing the conflation of the address data from the National Land Survey of Finland and OpenStreetMap (see section 6.4.1 for further details on the generation and data structure of the integrated dataset). The original GeoPackage (GPKG) file used in Chapter 6 is 288Mb in size and contains 1,926,298 geographic point features. Here, we used this original GPKG and a sample GPKG sharing the same structure which is 5.2Mb in size and contains 20,000 randomly generated geographic point features (random locations within Ireland).
Figure 1 shows a diagram illustrating the following steps for serialization/deserialization the static data files, which are summarised as follows:
— Using GeoPandas, convert the GPKG file to a GeoJSON format file;
— Using GeoPandas, load the GeoJSON file into an appropriate data structure;
— Using the Protocol Buffers schema, serialize the GeoJSON file to a PBF file while the Apache Avro schema is used to serialize the GeoJSON file to an avro file;
— Using the same approach as the step above, deserialize both the PBF file and the Avro file back to GeoJSON.
As started, we selected a GPKG file for this experiment. The use of this static GIS file makes this experiment fundamentally different to Experiment 2 (section 2.3.2). As said above, the size of the original GPKG file was over 200Mb which exceeds by an order of magnitude the general sizes of responses from APIs. As the GPKG file already resided on the local disk the first serialization could be directly to GeoJSON or JSON. Indeed, we could immediately serialize from the GPKG to Apache Avro or Protocol Buffers without the intermediate step
14 https://github.com/petermooney/jrc_binarydata
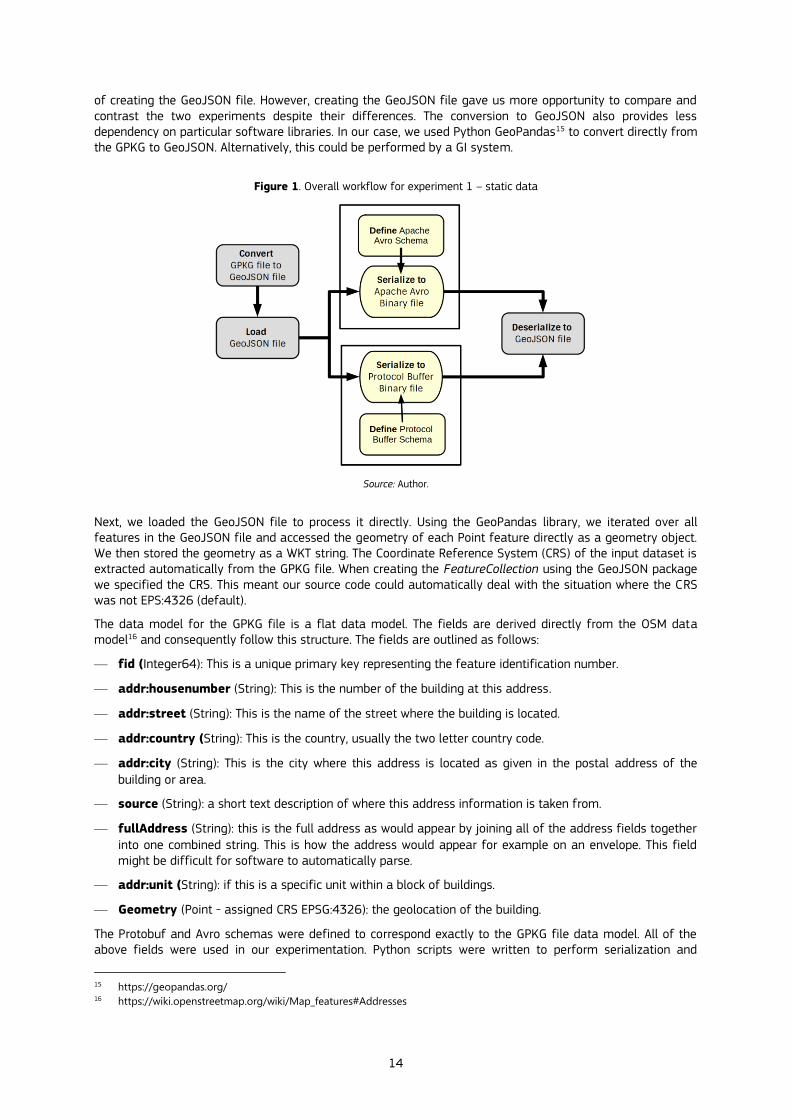
14
of creating the GeoJSON file. However, creating the GeoJSON file gave us more opportunity to compare and contrast the two experiments despite their differences. The conversion to GeoJSON also provides less dependency on particular software libraries. In our case, we used Python GeoPandas15 to convert directly from the GPKG to GeoJSON. Alternatively, this could be performed by a GI system.
Figure 1. Overall workflow for experiment 1 – static data
Source: Author.
Next, we loaded the GeoJSON file to process it directly. Using the GeoPandas library, we iterated over all features in the GeoJSON file and accessed the geometry of each Point feature directly as a geometry object. We then stored the geometry as a WKT string. The Coordinate Reference System (CRS) of the input dataset is extracted automatically from the GPKG file. When creating the FeatureCollection using the GeoJSON package we specified the CRS. This meant our source code could automatically deal with the situation where the CRS was not EPS:4326 (default).
The data model for the GPKG file is a flat data model. The fields are derived directly from the OSM data model16 and consequently follow this structure. The fields are outlined as follows:
— fid (Integer64): This is a unique primary key representing the feature identification number.
— addr:housenumber (String): This is the number of the building at this address.
— addr:street (String): This is the name of the street where the building is located.
— addr:country (String): This is the country, usually the two letter country code.
— addr:city (String): This is the city where this address is located as given in the postal address of the building or area.
— source (String): a short text description of where this address information is taken from.
— fullAddress (String): this is the full address as would appear by joining all of the address fields together into one combined string. This is how the address would appear for example on an envelope. This field might be difficult for software to automatically parse.
— addr:unit (String): if this is a specific unit within a block of buildings.
— Geometry (Point - assigned CRS EPSG:4326): the geolocation of the building.
The Protobuf and Avro schemas were defined to correspond exactly to the GPKG file data model. All of the above fields were used in our experimentation. Python scripts were written to perform serialization and
15 https://geopandas.org/ 16 https://wiki.openstreetmap.org/wiki/Map_features#Addresses
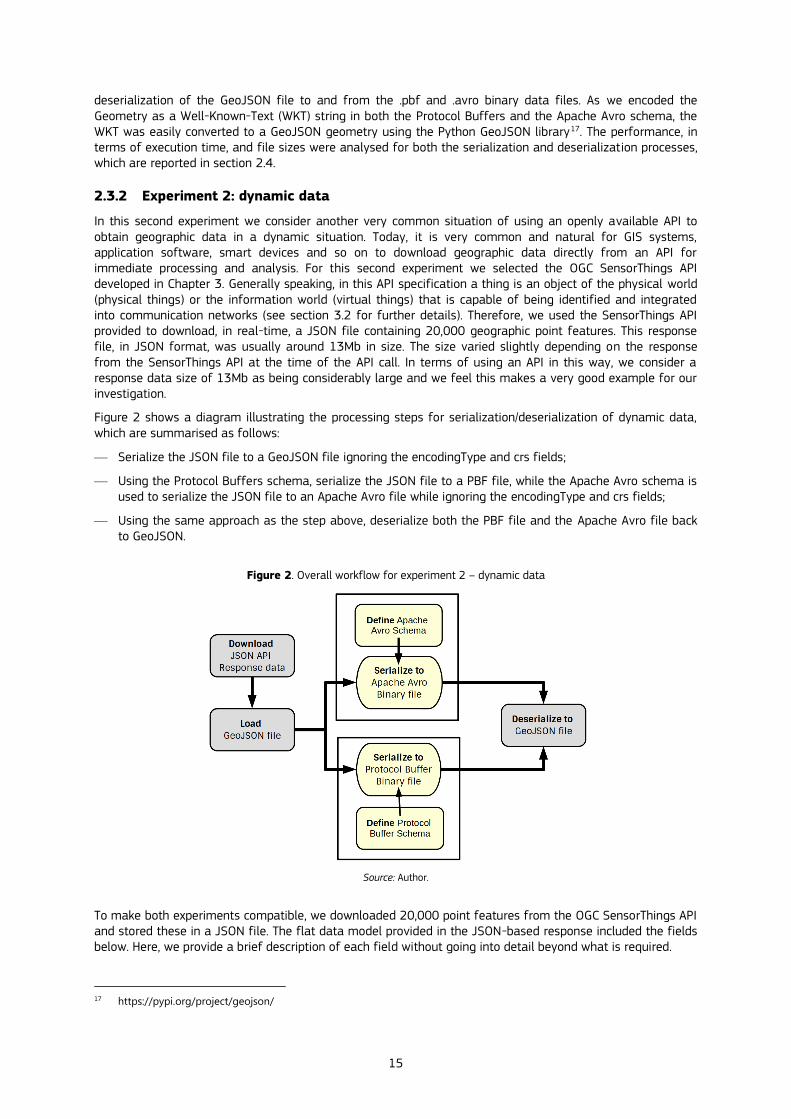
15
deserialization of the GeoJSON file to and from the .pbf and .avro binary data files. As we encoded the Geometry as a Well-Known-Text (WKT) string in both the Protocol Buffers and the Apache Avro schema, the WKT was easily converted to a GeoJSON geometry using the Python GeoJSON library17. The performance, in terms of execution time, and file sizes were analysed for both the serialization and deserialization processes, which are reported in section 2.4.
2.3.2 Experiment 2: dynamic data
In this second experiment we consider another very common situation of using an openly available API to obtain geographic data in a dynamic situation. Today, it is very common and natural for GIS systems, application software, smart devices and so on to download geographic data directly from an API for immediate processing and analysis. For this second experiment we selected the OGC SensorThings API developed in Chapter 3. Generally speaking, in this API specification a thing is an object of the physical world (physical things) or the information world (virtual things) that is capable of being identified and integrated into communication networks (see section 3.2 for further details). Therefore, we used the SensorThings API provided to download, in real-time, a JSON file containing 20,000 geographic point features. This response file, in JSON format, was usually around 13Mb in size. The size varied slightly depending on the response from the SensorThings API at the time of the API call. In terms of using an API in this way, we consider a response data size of 13Mb as being considerably large and we feel this makes a very good example for our investigation.
Figure 2 shows a diagram illustrating the processing steps for serialization/deserialization of dynamic data, which are summarised as follows:
— Serialize the JSON file to a GeoJSON file ignoring the encodingType and crs fields;
— Using the Protocol Buffers schema, serialize the JSON file to a PBF file, while the Apache Avro schema is used to serialize the JSON file to an Apache Avro file while ignoring the encodingType and crs fields;
— Using the same approach as the step above, deserialize both the PBF file and the Apache Avro file back to GeoJSON.
Figure 2. Overall workflow for experiment 2 – dynamic data
Source: Author.
To make both experiments compatible, we downloaded 20,000 point features from the OGC SensorThings API and stored these in a JSON file. The flat data model provided in the JSON-based response included the fields below. Here, we provide a brief description of each field without going into detail beyond what is required.
17 https://pypi.org/project/geojson/
16
— @iot.id (String): the unique identification.
— @iot.selfLink (String): the absolute URL of a thing that is unique among all other things.
— Name (String): a label for a thing, commonly a descriptive name.
— Description (String): the description about the thing.
— EncodingType (String - in our case is the prescribed encoding application/vnd.geo+json): the encoding type of the location property.
— location (String): the Apache Avro and Protobuf schemas encode the latitude and longitude of the location as two separate fields. An example of how it is provided in the JSON response is {"type": "Point", "coordinates": [7.01165, 51.66806], "crs": {"type": "name", "properties": {"name": "EPSG:4326"}}}.
— crs (String): the Coordinate Reference System. An example is EPSG:4326, as shown in the JSON response above.
— [email protected] (String): the relative or absolute URL that retrieves content of related things.
— [email protected] (String): a Thing’s HistoricalLocation entity set provides the times of the current (i.e., last known) and previous locations of the Thing.
We also took the original JSON file and converted it to a GeoJSON file prior to serialization and deserialization. As stated above, all of the fields were encoded as Strings. We decided to ignore the encodingType and crs fields when serializing this JSON file to a GeoJSON file with Python GeoPandas and both of the binary encodings. We believe in this experimental setup these two fields are redundant. The encodingType is set to "application/vnd.geo+json" for every feature in the JSON response while the crs field is set to {"type": "name", "properties": {"name": "EPSG:4326"}}} also for every feature. In this experiment the original format of the response data is JSON. In the JSON file the geometry is encoded as a valid geometry object but is part of a JSON array of objects rather than a feature collection. Indeed, this is different to experiment 1, where the geometry was stored as a WKT string. Subsequently, we decided to encode the two coordinates of the point geometry as separate fields in both the Protocol Buffers and Apache Avro schema. When the Protocol Buffers and Apache Avro files were deserialized back to GeoJSON we use the two coordinate fields to create a POINT Geometry object for the GeoJSON FeatureCollection. The performance, in terms of execution time, and file sizes were analysed for both the serialization and deserialization processes are reported next.
2.4 Results
The results of Experiments 1 and 2 are shown in Table 2 and Table 3, respectively. It is important to note that the processing times and file sizes reported in both tables should not be considered as contributing to an overall cumulative processing times or file sizes. Table 2 and Table 3 indicate the processing times required to serialize and deserialize geolocation data files to and from Protocol Buffers and Apache Avro formats. Each row in Table 2 and Table 3 corresponds to a component in the workflows outlined in Figure 1 and Figure 2, respectively. The processing steps carried out in Experiment 1 – static data (see Figure 1) – were repeated 10 times for both GPKG files (original and sample) in order to analyse the overall run times of each of the steps and obtain a distribution of overall run times with the same data and hardware specification. The results of this analysis are shown in Table 2 where we used the original GPKG with file size 288Mb and the smaller GPKG file to compare with Experiment 2 (dynamic data).
The disparity in file size between the original GeoJSON file (8,160Kb) and the deserialized GeoJSON file from both Apache Avro and Protocol Buffers (6,968Kb) appears to be down to a peculiarity of how GeoPandas converts the original GPKG file to GeoJSON and also the limitations of the Python GeoJSON library. The Python GeoJSON library will only allow precision 10 maximum decimal representation. The GeoJSON file produced by GeoPandas contains coordinates with up to 13 decimal places. Python GeoPandas also writes each feature in the GeoJSON file to a new line. When the GeoJSON is deserialized from both Protocol Buffers and Apache Avro this does not happen and the entire FeatureCollection is written on one line. We considered a few workarounds to this but none of them were satisfactory. We also felt that this would be developing a solution to a potential Python-specific problem. In our discussions in section 2.5, we use both the GeoJSON file generated by GeoPandas and the GeoJSON file(s) deserialized from both of the binary protocols.
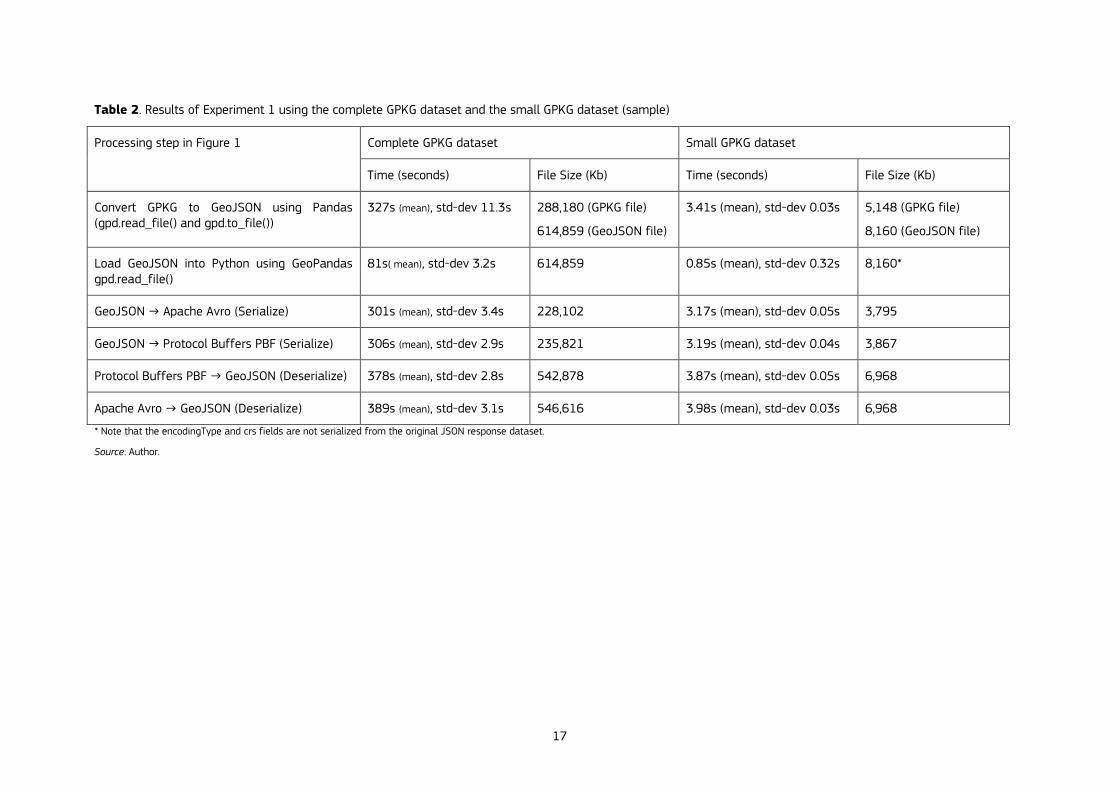
17
Table 2. Results of Experiment 1 using the complete GPKG dataset and the small GPKG dataset (sample)
Processing step in Figure 1 Complete GPKG dataset Small GPKG dataset
Time (seconds) File Size (Kb) Time (seconds) File Size (Kb)
Convert GPKG to GeoJSON using Pandas (gpd.read_file() and gpd.to_file())
327s (mean), std-dev 11.3s 288,180 (GPKG file)
614,859 (GeoJSON file)
3.41s (mean), std-dev 0.03s 5,148 (GPKG file)
8,160 (GeoJSON file)
Load GeoJSON into Python using GeoPandas gpd.read_file()
81s( mean), std-dev 3.2s 614,859 0.85s (mean), std-dev 0.32s 8,160*
GeoJSON → Apache Avro (Serialize) 301s (mean), std-dev 3.4s 228,102 3.17s (mean), std-dev 0.05s 3,795
GeoJSON → Protocol Buffers PBF (Serialize) 306s (mean), std-dev 2.9s 235,821 3.19s (mean), std-dev 0.04s 3,867
Protocol Buffers PBF → GeoJSON (Deserialize) 378s (mean), std-dev 2.8s 542,878 3.87s (mean), std-dev 0.05s 6,968
Apache Avro → GeoJSON (Deserialize) 389s (mean), std-dev 3.1s 546,616 3.98s (mean), std-dev 0.03s 6,968
* Note that the encodingType and crs fields are not serialized from the original JSON response dataset.
Source: Author.
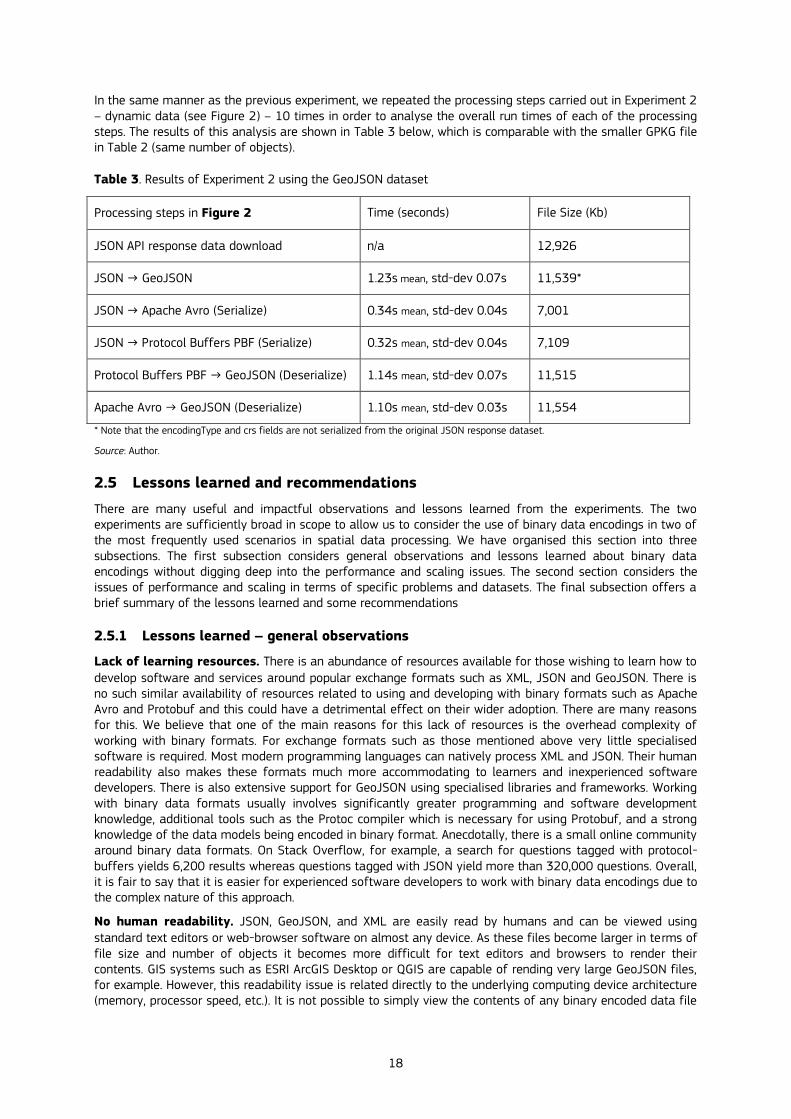
18
In the same manner as the previous experiment, we repeated the processing steps carried out in Experiment 2 – dynamic data (see Figure 2) – 10 times in order to analyse the overall run times of each of the processing steps. The results of this analysis are shown in Table 3 below, which is comparable with the smaller GPKG file in Table 2 (same number of objects).
Table 3. Results of Experiment 2 using the GeoJSON dataset
Processing steps in Figure 2 Time (seconds) File Size (Kb)
JSON API response data download n/a 12,926
JSON → GeoJSON 1.23s mean, std-dev 0.07s 11,539*
JSON → Apache Avro (Serialize) 0.34s mean, std-dev 0.04s 7,001
JSON → Protocol Buffers PBF (Serialize) 0.32s mean, std-dev 0.04s 7,109
Protocol Buffers PBF → GeoJSON (Deserialize) 1.14s mean, std-dev 0.07s 11,515
Apache Avro → GeoJSON (Deserialize) 1.10s mean, std-dev 0.03s 11,554
* Note that the encodingType and crs fields are not serialized from the original JSON response dataset.
Source: Author.
2.5 Lessons learned and recommendations
There are many useful and impactful observations and lessons learned from the experiments. The two experiments are sufficiently broad in scope to allow us to consider the use of binary data encodings in two of the most frequently used scenarios in spatial data processing. We have organised this section into three subsections. The first subsection considers general observations and lessons learned about binary data encodings without digging deep into the performance and scaling issues. The second section considers the issues of performance and scaling in terms of specific problems and datasets. The final subsection offers a brief summary of the lessons learned and some recommendations
2.5.1 Lessons learned – general observations
Lack of learning resources. There is an abundance of resources available for those wishing to learn how to
develop software and services around popular exchange formats such as XML, JSON and GeoJSON. There is no such similar availability of resources related to using and developing with binary formats such as Apache Avro and Protobuf and this could have a detrimental effect on their wider adoption. There are many reasons for this. We believe that one of the main reasons for this lack of resources is the overhead complexity of working with binary formats. For exchange formats such as those mentioned above very little specialised software is required. Most modern programming languages can natively process XML and JSON. Their human readability also makes these formats much more accommodating to learners and inexperienced software developers. There is also extensive support for GeoJSON using specialised libraries and frameworks. Working with binary data formats usually involves significantly greater programming and software development knowledge, additional tools such as the Protoc compiler which is necessary for using Protobuf, and a strong knowledge of the data models being encoded in binary format. Anecdotally, there is a small online community around binary data formats. On Stack Overflow, for example, a search for questions tagged with protocol-buffers yields 6,200 results whereas questions tagged with JSON yield more than 320,000 questions. Overall, it is fair to say that it is easier for experienced software developers to work with binary data encodings due to the complex nature of this approach.
No human readability. JSON, GeoJSON, and XML are easily read by humans and can be viewed using standard text editors or web-browser software on almost any device. As these files become larger in terms of file size and number of objects it becomes more difficult for text editors and browsers to render their contents. GIS systems such as ESRI ArcGIS Desktop or QGIS are capable of rending very large GeoJSON files, for example. However, this readability issue is related directly to the underlying computing device architecture (memory, processor speed, etc.). It is not possible to simply view the contents of any binary encoded data file
19
regardless of implementation choice. Specialist software is required to view the contents of binary encoded data files. Alternatively, programmers or developers can write software to view the contents of these files. This has a major impact for non-experts who would simply feel locked out of a binary data file due to these issues.
Schema definitions are required with binary formats. When an API provides responses in JSON,
GeoJSON, XML, and so on it is rarely the case that formal schema definitions are published or necessary. Very often a short readme type file or document can be supplied in order to describe the data model contained in the API response. Indeed, formal metadata could and should be provided for this purpose. However, in a minimal case a short description of the data model (object attributes or properties, allowable ranges of values for these attributes, and so on) will be sufficient. Indeed, many modern programming languages can consume JSON, GeoJSON, XML, and so on automatically and provide a listing of the object attributes or properties contained in the data file. Binary data protocols such as Avro or Protobuf are not self-describing protocols. It is necessary that whoever is publishing that API producing binary data responses must also publish the schema definition (usually a .proto file in the case of Protocol Buffers or an .avsc file in the case of Apache Avro), that can be consumed using the available software tools. Without the schema definition file (in the case of these two formats) the binary encoded data files are rendered almost unusable. It is possible for highly skilled software developers to reverse engineer schema from a raw API payload. However, this is very time consuming, requires an understanding of what the data should look like (many fields can be interpreted in multiple different ways, giving different results without the developer knowing which is correct), and one loses all of the semantic meaning (names, etc.). If the schema definition is supplied, then all of this is avoided. Where schemas are provided the data serialized into binary formats can be automatically validated by the code that is responsible to exchange them. While this is an additional and complex overhead, it does provide robust validation opportunities.
2.5.2 Lessons learned – performance and scaling
In this section we consider some of the performance and scaling issues from both Experiment 1 and Experiment 2. We will refer extensively to the numerical results available in the experimental results shown in Table 2 and Table 3.
Neither Protocol Buffers nor Apache Avro can encode the geometry of objects in a high level way as is represented in GeoJSON. The coordinates of a point object must be either stored in two separate variables or fields or stored in a string- or text-based representation such as Well Known Text. This introduces an additional overhead in the deserialization process that is potentially only really relevant as the datasets grow larger. Usage of a representation such as Well Known Text may require the usage of external libraries. This is available for Python via the GeoPandas library.
We cannot know exactly how GeoPandas converts from GPKG to GeoJSON where all features are written on a new line in the output GeoJSON file. We felt that it would be inefficient to try to mimic this in our approach. A few workarounds were considered but we felt that this might introduce a Python-specific fix which may not be easily replicated in a separate implementation in a different programming language.
File Sizes. As expected in both experiments the serialization of JSON and GeoJSON into the binary formats of Protocol Buffers and Apache Avro produced significantly smaller file sizes. This consolidates the understanding that the binary serialization would have a major impact on the overall file sizes. We provide a summary of the key points as follows:
— In Experiment 1, when processing the very large GPKG file the serialized binary format files were almost 20% smaller than the original file. For example, 288,180Kb (GPKG) against 235,821Kb (Protocol Buffer).
— In Experiment 1, when processing the smaller GPKG file the serialized binary format files were almost 25% smaller than the original randomly generated GPKG file. For example, 5,148Kb (GPKG) against 3,795Kb (Apache Avro).
— When the binary data formats were deserialized back to GeoJSON, the generated GeoJSON files were between 1.8 and 2.3 times larger than the corresponding binary format files.
— In Experiment 2, the serialized binary format files were almost 45% smaller than the original JSON API response data file. Both binary format files were almost 40% smaller than the GeoJSON file created directly from the original JSON API response data file.
20
Processing Times. The overall processing times for both experiments were also recorded and analysed. It is
likely that these times will vary depending on underlying hardware, operating system, and so on. The implementation in Python used standard programming best practices without trying to specifically implement code which could have a significant impact on overall processing times. The source code can be examined within the GitHub repository. There are a number of interesting observations from the analysis of overall processing times in both experiments. These observations are summarised as follows:
— In Experiment 1, when processing the very large GPKG file it was obvious that this caused a strain on the resources of the underlying machine. The conversion of the GPKG file to GeoJSON using Python GeoPandas took, on average, 327s to complete. To load the GeoJSON file for processing with Python using Python GeoPandas took an additional 81s. However, this is not very bad when compared against the overall average run times for the process of serializing GeoJSON to both binary data file formats. On average this took just over 6 minutes (300s).
— In Experiment 1 (very large GPKG file) there is almost 60s difference between the average processing times to serialize GeoJSON to binary and then binary to GeoJSON.
— In Experiment 1 (small GPKG file) we see a similar pattern in the average processing times. The conversion of the GPKG file to GeoJSON using Python GeoPandas took, on average, 3.4s to complete. To load the GeoJSON file for processing with Python using Python GeoPandas took an additional 0.85s. Again, as before, this is not very bad when compared against the overall average run times for the process of serializing GeoJSON to both binary data file formats. On average this took just over 3.1 seconds. It is interesting to note that there is also almost 60s difference between the average processing times to serialize GeoJSON to binary and then binary to GeoJSON. A similar difference exists for the very large GPKG file also.
— In Experiment 2 we observe similar patterns to the processing times in Experiment 1. The serialization of JSON to both binary data formats is, on average, approximately 3.7 times faster than the processing time required to serialize JSON to GeoJSON.
— In Experiment 2, as observed in Experiment 1, the deserialization of both binary data formats to GeoJSON takes considerably longer. Processing time is almost 1 second slower in total or approximately 3.7 times slower.
In both experiments we focus on the number of objects requiring serialization and then the processing times and generated file sizes. It would be interesting to undertake a deeper investigation around how the overall processing times are influenced by the number of objects, geometry types, number of properties for each object, and so on. We did not investigate this aspect of the work in this study. In both experiments the number of properties for each object are the same. In both experiments there are eight properties encoded in the schema definitions. Within many location datasets objects often have many attributes or properties. Some of these may not be of interest or relevant to all consumers of these datasets. Reducing the number of attributes or properties in the schema would reduce the overall message size. This also brings into focus the potential need for more functionality to allow users to choose their preferred attributes or properties for objects in a location dataset extracted from an API or otherwise. Overall, these issues were beyond the scope of the current study but provide very attractive and pertinent problems for investigation in future work.
2.5.3 Recommendations
The “no free lunch” challenge. As described above serialization to binary data formats is faster in all settings. Storage requirements for the binary data formats are significantly less than those for JSON and GeoJSON. While the serialization process to binary format is faster in all of the experimental analysis, the deserialization process (reversing the process from binary back to GeoJSON to JSON) is slower than serialization. Certainly, the decreases in storage requirements makes the binary data formats a very attractive option for data exchange. If binary data is used for data exchange one must consider that the client receiver for binary data must have the corresponding schema and protocol specific software code written to deserialize the data files. This a major concern for non-specialists and also requires data providers to provide protocol schemas with every data exchange.
— Our recommendation: Binary data formats could be used where the source datasets do not experience frequent changes to their data models. At this time, binary data formats could be made available to specialist clients who are capable of writing their own deserialization software code or executing pre-compiled software code. Given this situation, they do not appear to be ready for widespread usage.
21
Programming Language support. In the development for this study we found programming language
support to be very good. There are many resources available online for Python implementations using Protocol Buffers and Apache Avro. However, many of these resources are aimed at reasonably technically proficient programmers and software developers. For any of the major programming language implementations a strong working knowledge of the language is required before considering using binary data serialization.
— Our recommendation: There is a great deal of resources available for programming language support. However, there is still a small online community around binary data formats. This means that at this time it is easier for experienced software developers to work with binary data encodings than for those who are new to programming and development. More extensive support is required. This is where formats such as XML, JSON and GeoJSON have a major advantage today. Building a developer community takes time and interest from these communities will increase if more data sources are made available in binary data formats.
Scalability and sustainability. Experiment 1 and Experiment 2 considered two very different scenarios in terms of the size of the input datasets for the analysis. Both Protocol Buffers and Apache Avro were shown to scale very well from the smaller data sizes in both experiments to the very large GPKG dataset in Experiment 1. Updates to the data model of the original data sources will require updates to the Protocol Buffers schema and generated classes or the Apache Avro schema. For data models that are subject to changes over time updated schemas must be delivered at the same time. This could introduce issues around the maintenance of code, upgrading of existing software code, and so on. Another sustainability issue arises around the fact that binary data formats are not suitable for simple querying or searching like JSON or GeoJSON are. Many tools capable of handling JSON and GeoJSON provide the ability to query and search these files. This type of search and query capability is not in the original scope or definition. It seems unlikely, in the near future, that this capability would be added. However, it is possible that tools could be provided to perform basic query and search capabilities in binary files. At present, to perform querying or searching of a binary data file it is probably best to deserialize it to a well-known and well-supported format such as JSON or GeoJSON.
— Our recommendation: Both binary data formats scale very well as shown in our experimental analysis. They are very appropriate for the exchange of large datasets because they offer reduced file sizes. However, changes to the source data model of datasets can be problematic. The fact that these binary data file formats are best suited to the transport and exchange of data means that they have very limited query or search functionality. This could see some practitioners deciding to retain JSON or GeoJSON because of the more widespread availability of programming language support for querying or searching these formats. However, further developments in the future could see some binary data processing tools where some limited query or search functionality is provided for binary data files.
Measuring and understanding success. At the end of this work it is difficult to point to a clear set of
measures which indicate that binary data formats are overall a much better choice for data exchange than XML, JSON or GeoJSON. The situation is more complicated than this. There is no “one-size-fits-all” solution. Binary data formats offer faster processing and smaller file sizes as opposed to slower processing and larger file sizes for non-binary data. Binary data formats have very good expert level support in programming language implementations but non-binary data formats have almost universal levels of support in all major programming languages.
— Our overall recommendation: At the end there is no clear answer to the question of whether binary data formats should replace the de facto standards of XML, JSON, GeoJSON and so on. We see many opportunities for binary data formats to work in parallel to these established practices. One such example of this is the dissemination of OpenStreetMap data18 where Protocol Buffers files are provided alongside the very widely known ESRI Shapefile format and the OpenStreetMap XML format. Indeed, the OpenStreetMap use case here is very interesting but also a very successful one. Faced with the severe limitations of XML and ESRI Shapefile formats for distributing very large amounts of OSM data some alternative arrangement was required by the OpenStreetMap community. Some users of OSM data require the entire planet dataset while others required regional or country extracts. The provision of OSM data in binary format works very well for a number of reasons. Firstly, the overall file sizes are dramatically reduced. To access OSM data19 for a country such as Italy the Protocol Buffers encoded data
18 http://www.geofabrik.de/data/download.html 19 https://download.geofabrik.de/europe/italy.html

22
is 1.6Gb whereas the OSM XML version is 2.7Gb as a compressed file, at the time of writing. When uncompressed this file could grow to many multiples of this overall file size. Secondly, the OSM data model is reasonably static and does not change. This allows users and clients to build their own software solutions around the data model with confidence that the data model will remain fixed. Thirdly, the Protocol Buffers encoding of OSM data is made openly available and this has generated a very large number of software tools which can be used to process these files. For example, two well-known and widely used Python libraries available for processing OSM Protocol Buffers files are PyOsmium20 and the imposm.parser21. Other examples exist and there are many examples of implementations for other languages such as Java, C++, C#, R and so on. Such an arrangement is worthy of further investigation by major stakeholders and distributors of geographic data in Europe. The provision of both binary and non-binary data formats for large scale data exchange could make these binary formats more visible and eventually gain popularity and adoption among a wider audience.
20 https://osmcode.org/pyosmium 21 https://imposm.org/docs/imposm.parser/latest
23
3 Pushing data to its destination - event-driven architectures for data
exchange
3.1 Introduction
In many contexts such as the INSPIRE framework (European Parliament and Council, 2007), there is a broad range of data services available which enable access to (spatial) information. Example are catalogues (for discovering relevant resources), download services and viewing services. However, these existing types of services are generally based on a pull-based communication pattern, which means that a client submits a request to the server and the server sends back the corresponding response. However, as discussed in Rieke et al. (2018), consideration of push-based data delivery mechanisms could provide significant benefits, especially if spatial data infrastructures (Schade et al., 2020) and Digital Earth platforms (Marconcini et al., 2020) are increasingly managing and handling near-real time data (Wagemann et al., 2018). While there is still work to be done to integrate push mechanisms into spatial data infrastructures, this chapter intends to investigate this topic further.
For many applications, pull-based access patterns are highly suitable. For example, environmental scientists or decision makers may connect to download services to retrieve geospatial data about topics such as protected sites. After downloading the data, it would be available for further local processing and analysis. Another example are map/portrayal services (e.g., OpenStreetMap, Web Map Services) which offer rendered maps for download so that they can be embedded into web sites or mobile apps for lay users.
However, by enabling push-based (event-based) data delivery, it is possible to go further and enable more use cases. Examples for use cases where users can substantially benefit from push-based data delivery are:
— subscription to a catalogue or data spaces in general to receive notifications as soon as a new data set is published and meets their interests;
— live updates of (near-) real time delivery of observation data (e.g., a water level chart that is automatically updated as soon as new data has been measured);
— live tracking applications offering functionality such as following aircraft and vessel movements (e.g., for monitoring environmental impacts such as noise and air pollution);
— online dashboards for monitoring live-status information (e.g., traffic density, or water level data in flooding situations);
— efficient execution of asynchronous data processing tasks so that users are immediately notified as soon as the results of the (analysis) process are available.
From a user perspective, a significant benefit from push-based data delivery is a reduced latency until information reaches users. For example, a push-based data delivery pipeline could ensure that a piece of information such as a new water level reading is immediately sent to the relevant users without delay (e.g., waiting for the user to ask if there is an update). At the same time, Quality-of-Service (QoS) levels could be used to ensure reliable data delivery as well. This way, data producers could ensure that their datasets are delivered to all relevant users (e.g., ensure that a warning for dangerous weather has been received). If users were to actively pull such information on a regular basis, they are likely to miss it.
The implementation of such functionality is also possible with conventional pull-based techniques at the cost of partly putting the responsibility of pulling information on the user’s shoulders. Nevertheless, our hypothesis is that event-/push-based data delivery mechanisms would enable a more efficient implementation of the previously listed functionalities and use cases. While pull-based communication patterns would rely on a regularly checking if new data is available, push-communication can ensure an immediate transfer of the data, once it is available/ready, to client applications. As a hypothesis of our work, we expect that enabled push-based data delivery mechanisms can:
— reduce latency of information delivery;
— reduce the amount of communication data exchanged as only new information is transmitted and pull-based checks for data updates are no longer necessary;
— reduce server load by avoiding repetitive checks if new/updated information is available; this may especially become relevant in crisis situations when many users need to be kept up-to-date about the current situation (e.g., monitoring water levels in case of a flooding event);
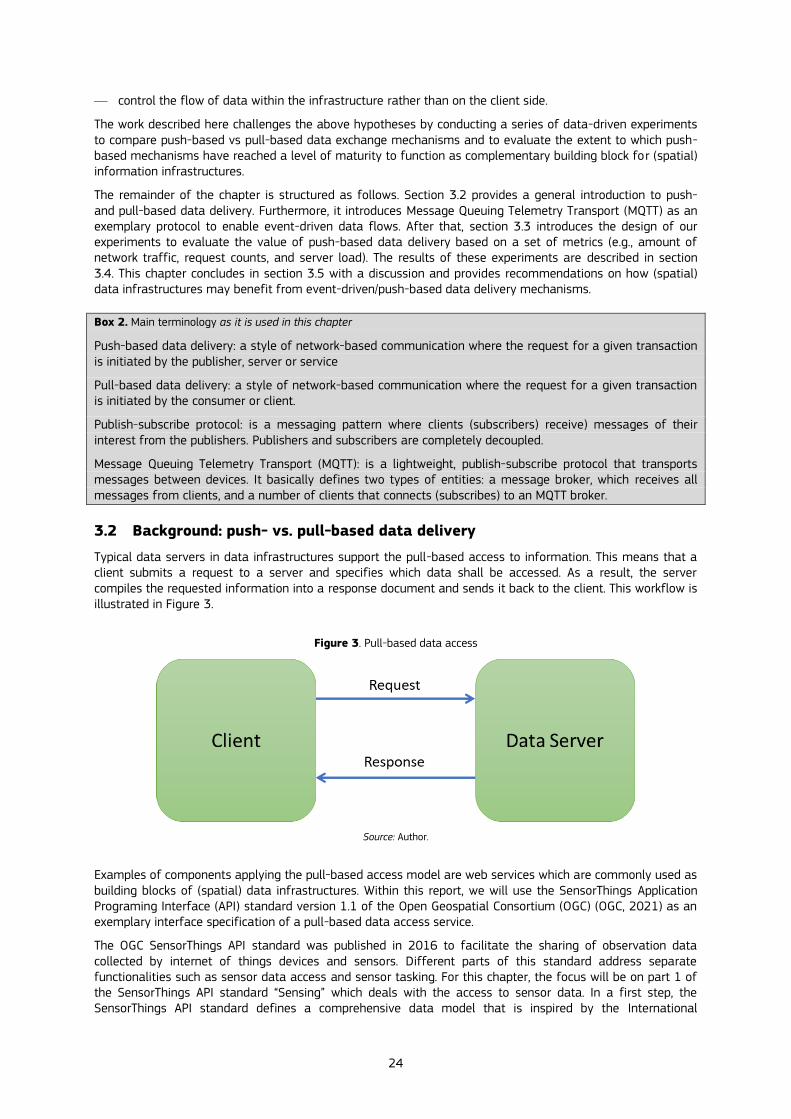
24
— control the flow of data within the infrastructure rather than on the client side.
The work described here challenges the above hypotheses by conducting a series of data-driven experiments to compare push-based vs pull-based data exchange mechanisms and to evaluate the extent to which push-based mechanisms have reached a level of maturity to function as complementary building block for (spatial) information infrastructures.
The remainder of the chapter is structured as follows. Section 3.2 provides a general introduction to push- and pull-based data delivery. Furthermore, it introduces Message Queuing Telemetry Transport (MQTT) as an exemplary protocol to enable event-driven data flows. After that, section 3.3 introduces the design of our experiments to evaluate the value of push-based data delivery based on a set of metrics (e.g., amount of network traffic, request counts, and server load). The results of these experiments are described in section 3.4. This chapter concludes in section 3.5 with a discussion and provides recommendations on how (spatial) data infrastructures may benefit from event-driven/push-based data delivery mechanisms.
Box 2. Main terminology as it is used in this chapter
Push-based data delivery: a style of network-based communication where the request for a given transaction is initiated by the publisher, server or service
Pull-based data delivery: a style of network-based communication where the request for a given transaction is initiated by the consumer or client.
Publish-subscribe protocol: is a messaging pattern where clients (subscribers) receive) messages of their interest from the publishers. Publishers and subscribers are completely decoupled.
Message Queuing Telemetry Transport (MQTT): is a lightweight, publish-subscribe protocol that transports messages between devices. It basically defines two types of entities: a message broker, which receives all messages from clients, and a number of clients that connects (subscribes) to an MQTT broker.
3.2 Background: push- vs. pull-based data delivery
Typical data servers in data infrastructures support the pull-based access to information. This means that a client submits a request to a server and specifies which data shall be accessed. As a result, the server compiles the requested information into a response document and sends it back to the client. This workflow is illustrated in Figure 3.
Figure 3. Pull-based data access
Source: Author.
Examples of components applying the pull-based access model are web services which are commonly used as building blocks of (spatial) data infrastructures. Within this report, we will use the SensorThings Application Programing Interface (API) standard version 1.1 of the Open Geospatial Consortium (OGC) (OGC, 2021) as an exemplary interface specification of a pull-based data access service.
The OGC SensorThings API standard was published in 2016 to facilitate the sharing of observation data collected by internet of things devices and sensors. Different parts of this standard address separate functionalities such as sensor data access and sensor tasking. For this chapter, the focus will be on part 1 of the SensorThings API standard “Sensing” which deals with the access to sensor data. In a first step, the SensorThings API standard defines a comprehensive data model that is inspired by the International
25
Organization for Standardization (ISO) and OGC Observations and Measurements (O&M) standard (OGC, 2013). This model comprises especially the following concepts:
— Datastream: Aggregation of observations of a specific sensor/thing (e.g., thermometer) and observed parameter (e.g., temperature);
— Observation: The actual data captured by a sensor/thing including timestamps, result value (e.g., flight level of an aircraft), and in case of the report also location;
— FeatureOfInterest: The geospatial objects to which observations are associated (e.g., a river, a measurement site, etc.);
— ObservedProperty: The parameter which is observed by a sensor (e.g., temperature, speed, altitude, etc.);
— Sensor: The device generating observations (e.g., a thermometer, a barometer, etc.);
— Thing: The object to which a sensor belongs (e.g., a weather station, an aircraft);
— Location and HistoricalLocations: The locations at which a Thing is/was located;
Based on this fundamental data model, the SensorThings API provides on the one hand JSON-based encodings for the different entity types. Furthermore, it defines how to create, read, update, and delete these entities via HTTP operations which results in the specification of a REST interface. Indeed, for the analysis performed in this chapter, REST/JSON-based functionality of the SensorThings API for accessing Datastreams and Observations will be especially relevant. In addition, the SensorThings API standard also offers an extension to use MQTT for feeding data into an SensorThings API server and for delivering this data to subscribers. Thus, the SensorThings API might also be considered as a bridge between both, push- and pull-based data delivery.
Complementary to this, Figure 4 illustrates the push-based delivery of data. In this chapter, the MQTT protocol will be used for the experimentation (Organization for the Advancement of Structured Information Standards, 2014). This protocol standard is maintained by the Organization for the Advancement of Structured Information Standards (OASIS)22 and has reached wide-spread acceptance within the Internet of Things community. Also, MQTT is used as part of the previously introduced OGC SensorThings API extension for enabling the push-based delivery of sensor data, so that it is well suited for a comparison of the two different delivery approaches. For enabling the data transmission, MQTT relies on the TCP protocol.
Core element of the MQTT protocol are message brokers and clients. A message broker has the responsibility to receive messages from clients (e.g., data producers) and to forward the incoming messages to the corresponding clients which are subscribed to these messages. In order to organise the transmitted information, MQTT relies on a hierarchical structure of topics. Box 3 shows an example of how the data of a weather station network could be organised in topics:
Box 3. Example of a MQTT topic structure for weather station data
myWeatherStationNetwork/station13434/temperature
The example in Box 3 shows three different topic levels: the first level comprises the whole network, the second level separates between the stations of the network and, finally, level 3 is used to distinguish between the different parameters measured at these stations.
In order to subscribe to messages, clients make use of this topic structure. If a client subscribes to the highest topic level (myWeatherStationNetwork), it will receive all messages (in this case: all measurements of the whole station network). If it subscribes to myWeatherStationNetwork/station13434/, it will receive all measurements of that station. And finally, when subscribing to myWeatherStationNetwork/station13434/temperature, just the temperature measurements of the selected station will be delivered. MQTT also supports wildcards, so the following subscription myWeatherStationNetwork/+/temperature will result in the delivery of temperature measurements of all stations in the network.
Another important feature of MQTT is the support of different QoS levels. In the simplest case, a message will just be sent once without any acknowledgement of reception. However, on the higher levels it can be ensured
22 https://www.oasis-open.org
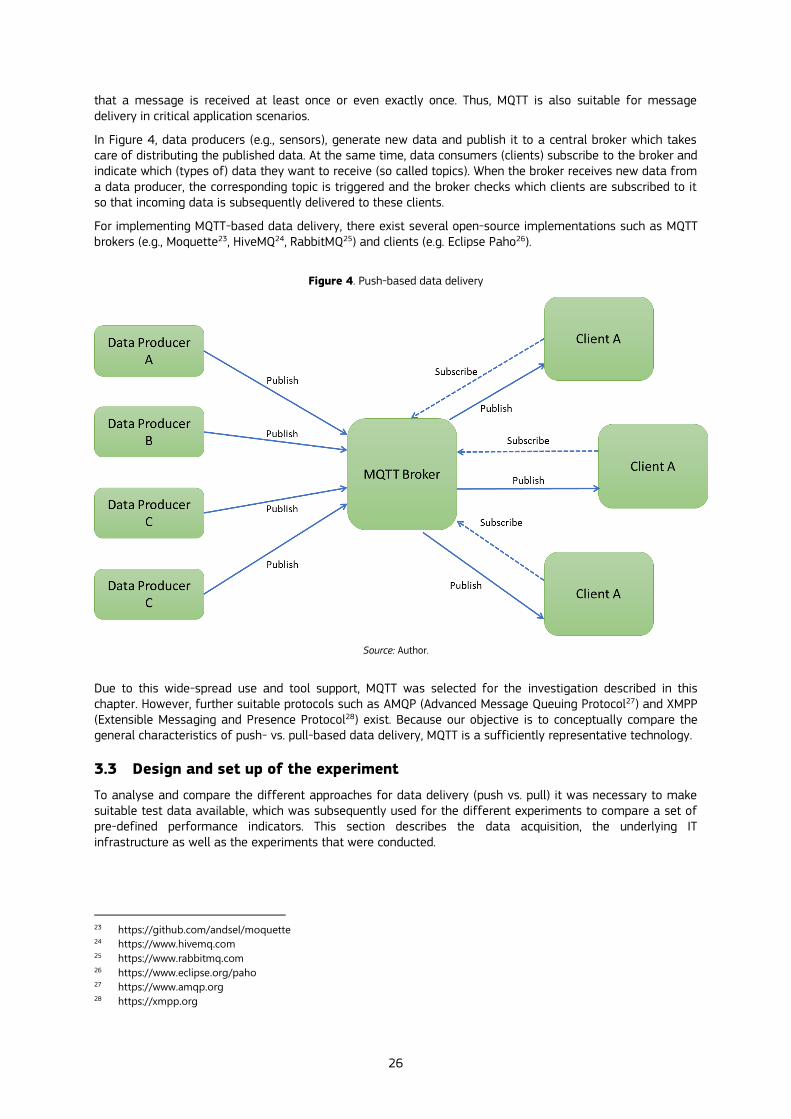
26
that a message is received at least once or even exactly once. Thus, MQTT is also suitable for message delivery in critical application scenarios.
In Figure 4, data producers (e.g., sensors), generate new data and publish it to a central broker which takes care of distributing the published data. At the same time, data consumers (clients) subscribe to the broker and indicate which (types of) data they want to receive (so called topics). When the broker receives new data from a data producer, the corresponding topic is triggered and the broker checks which clients are subscribed to it so that incoming data is subsequently delivered to these clients.
For implementing MQTT-based data delivery, there exist several open-source implementations such as MQTT brokers (e.g., Moquette23, HiveMQ24, RabbitMQ25) and clients (e.g. Eclipse Paho26).
Figure 4. Push-based data delivery
Source: Author.
Due to this wide-spread use and tool support, MQTT was selected for the investigation described in this chapter. However, further suitable protocols such as AMQP (Advanced Message Queuing Protocol27) and XMPP (Extensible Messaging and Presence Protocol28) exist. Because our objective is to conceptually compare the general characteristics of push- vs. pull-based data delivery, MQTT is a sufficiently representative technology.
3.3 Design and set up of the experiment
To analyse and compare the different approaches for data delivery (push vs. pull) it was necessary to make suitable test data available, which was subsequently used for the different experiments to compare a set of pre-defined performance indicators. This section describes the data acquisition, the underlying IT infrastructure as well as the experiments that were conducted.
23 https://github.com/andsel/moquette 24 https://www.hivemq.com 25 https://www.rabbitmq.com 26 https://www.eclipse.org/paho 27 https://www.amqp.org 28 https://xmpp.org
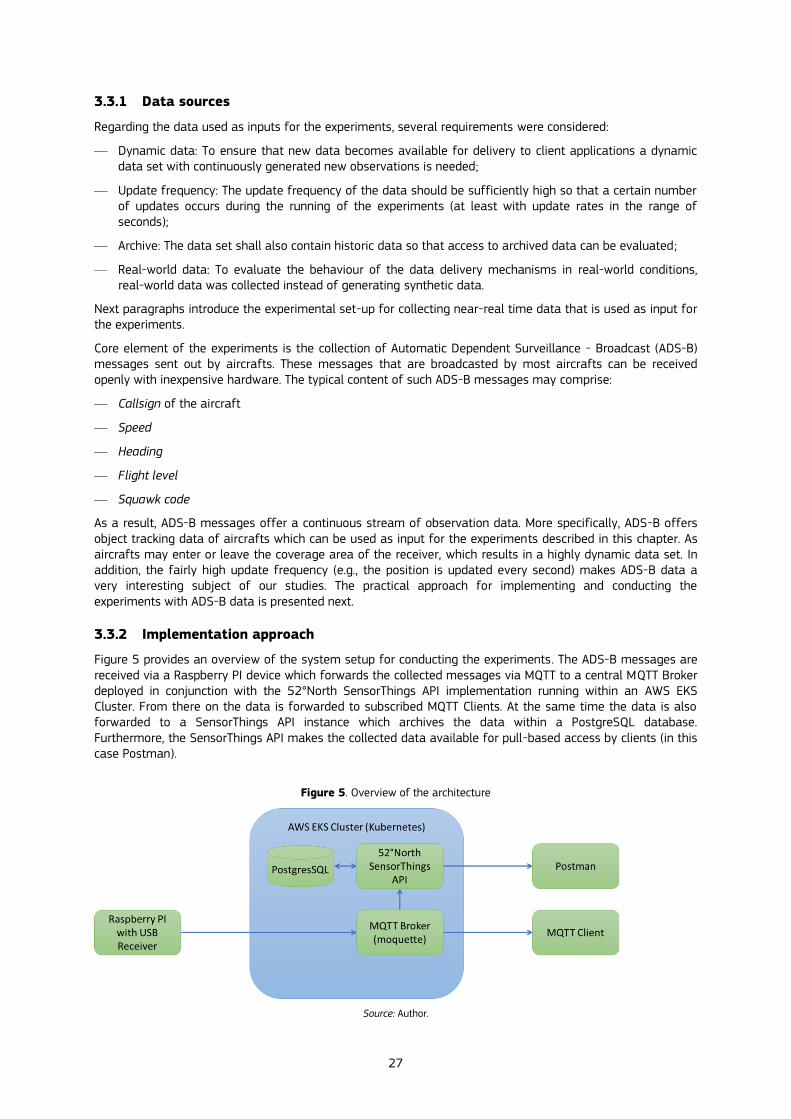
27
3.3.1 Data sources
Regarding the data used as inputs for the experiments, several requirements were considered:
— Dynamic data: To ensure that new data becomes available for delivery to client applications a dynamic data set with continuously generated new observations is needed;
— Update frequency: The update frequency of the data should be sufficiently high so that a certain number of updates occurs during the running of the experiments (at least with update rates in the range of seconds);
— Archive: The data set shall also contain historic data so that access to archived data can be evaluated;
— Real-world data: To evaluate the behaviour of the data delivery mechanisms in real-world conditions, real-world data was collected instead of generating synthetic data.
Next paragraphs introduce the experimental set-up for collecting near-real time data that is used as input for the experiments.
Core element of the experiments is the collection of Automatic Dependent Surveillance - Broadcast (ADS-B) messages sent out by aircrafts. These messages that are broadcasted by most aircrafts can be received openly with inexpensive hardware. The typical content of such ADS-B messages may comprise:
— Callsign of the aircraft
— Speed
— Heading
— Flight level
— Squawk code
As a result, ADS-B messages offer a continuous stream of observation data. More specifically, ADS-B offers object tracking data of aircrafts which can be used as input for the experiments described in this chapter. As aircrafts may enter or leave the coverage area of the receiver, which results in a highly dynamic data set. In addition, the fairly high update frequency (e.g., the position is updated every second) makes ADS-B data a very interesting subject of our studies. The practical approach for implementing and conducting the experiments with ADS-B data is presented next.
3.3.2 Implementation approach
Figure 5 provides an overview of the system setup for conducting the experiments. The ADS-B messages are received via a Raspberry PI device which forwards the collected messages via MQTT to a central MQTT Broker deployed in conjunction with the 52°North SensorThings API implementation running within an AWS EKS Cluster. From there on the data is forwarded to subscribed MQTT Clients. At the same time the data is also forwarded to a SensorThings API instance which archives the data within a PostgreSQL database. Furthermore, the SensorThings API makes the collected data available for pull-based access by clients (in this case Postman).
Figure 5. Overview of the architecture
Source: Author.
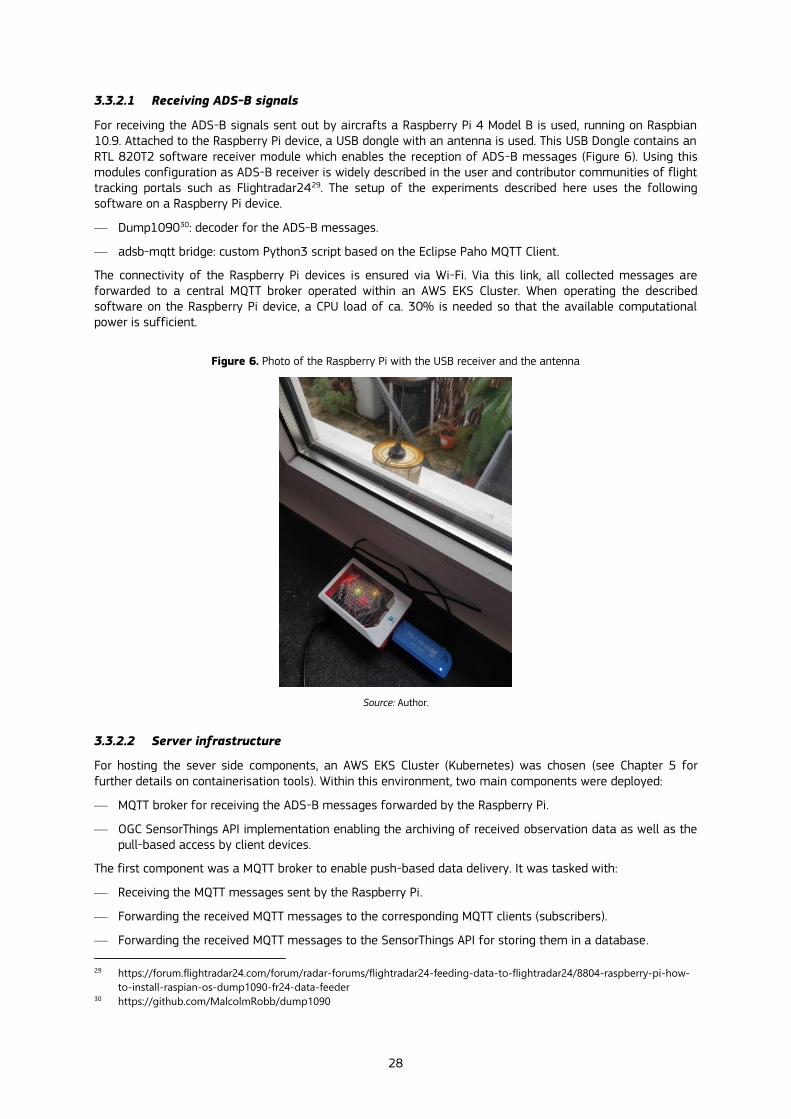
28
3.3.2.1 Receiving ADS-B signals
For receiving the ADS-B signals sent out by aircrafts a Raspberry Pi 4 Model B is used, running on Raspbian 10.9. Attached to the Raspberry Pi device, a USB dongle with an antenna is used. This USB Dongle contains an RTL 820T2 software receiver module which enables the reception of ADS-B messages (Figure 6). Using this modules configuration as ADS-B receiver is widely described in the user and contributor communities of flight tracking portals such as Flightradar2429. The setup of the experiments described here uses the following software on a Raspberry Pi device.
— Dump109030: decoder for the ADS-B messages.
— adsb-mqtt bridge: custom Python3 script based on the Eclipse Paho MQTT Client.
The connectivity of the Raspberry Pi devices is ensured via Wi-Fi. Via this link, all collected messages are forwarded to a central MQTT broker operated within an AWS EKS Cluster. When operating the described software on the Raspberry Pi device, a CPU load of ca. 30% is needed so that the available computational power is sufficient.
Figure 6. Photo of the Raspberry Pi with the USB receiver and the antenna
Source: Author.
3.3.2.2 Server infrastructure
For hosting the sever side components, an AWS EKS Cluster (Kubernetes) was chosen (see Chapter 5 for further details on containerisation tools). Within this environment, two main components were deployed:
— MQTT broker for receiving the ADS-B messages forwarded by the Raspberry Pi.
— OGC SensorThings API implementation enabling the archiving of received observation data as well as the pull-based access by client devices.
The first component was a MQTT broker to enable push-based data delivery. It was tasked with:
— Receiving the MQTT messages sent by the Raspberry Pi.
— Forwarding the received MQTT messages to the corresponding MQTT clients (subscribers).
— Forwarding the received MQTT messages to the SensorThings API for storing them in a database.
29 https://forum.flightradar24.com/forum/radar-forums/flightradar24-feeding-data-to-flightradar24/8804-raspberry-pi-how-
to-install-raspian-os-dump1090-fr24-data-feeder 30 https://github.com/MalcolmRobb/dump1090
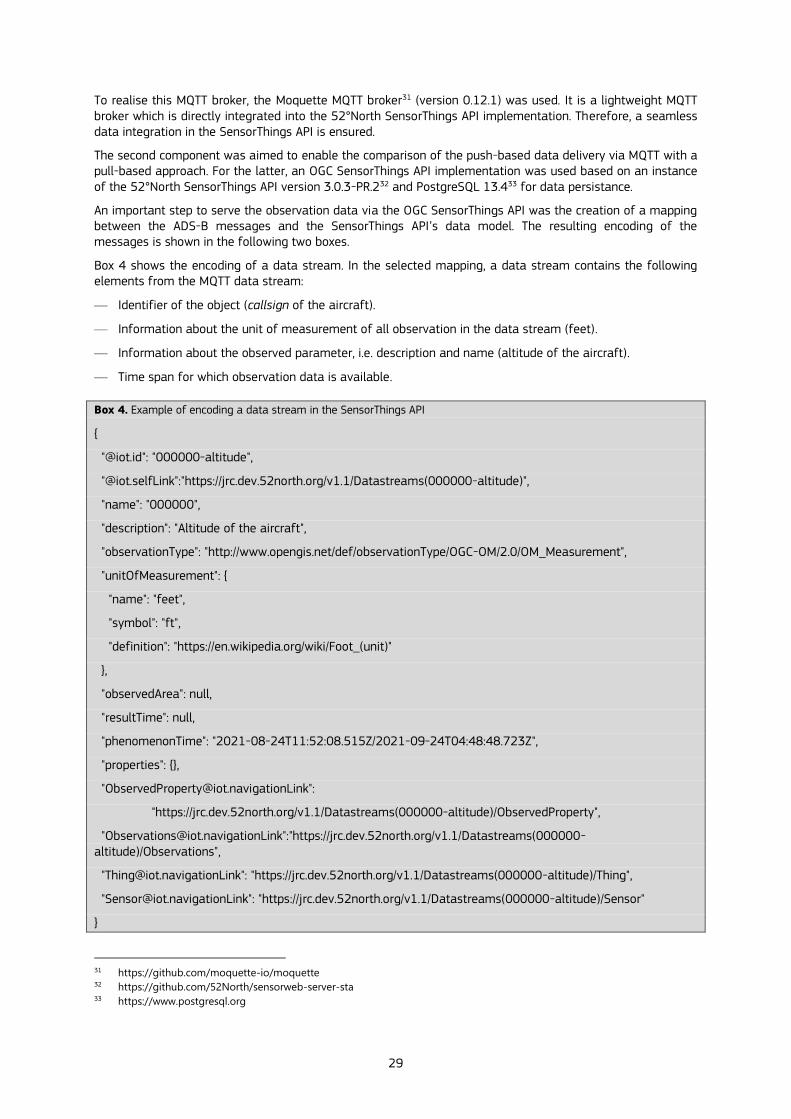
29
To realise this MQTT broker, the Moquette MQTT broker31 (version 0.12.1) was used. It is a lightweight MQTT broker which is directly integrated into the 52°North SensorThings API implementation. Therefore, a seamless data integration in the SensorThings API is ensured.
The second component was aimed to enable the comparison of the push-based data delivery via MQTT with a pull-based approach. For the latter, an OGC SensorThings API implementation was used based on an instance of the 52°North SensorThings API version 3.0.3-PR.232 and PostgreSQL 13.433 for data persistance.
An important step to serve the observation data via the OGC SensorThings API was the creation of a mapping between the ADS-B messages and the SensorThings API’s data model. The resulting encoding of the messages is shown in the following two boxes.
Box 4 shows the encoding of a data stream. In the selected mapping, a data stream contains the following elements from the MQTT data stream:
— Identifier of the object (callsign of the aircraft).
— Information about the unit of measurement of all observation in the data stream (feet).
— Information about the observed parameter, i.e. description and name (altitude of the aircraft).
— Time span for which observation data is available.
Box 4. Example of encoding a data stream in the SensorThings API
{
"@iot.id": "000000-altitude",
"@iot.selfLink":"https://jrc.dev.52north.org/v1.1/Datastreams(000000-altitude)",
"name": "000000",
"description": "Altitude of the aircraft",
"observationType": "http://www.opengis.net/def/observationType/OGC-OM/2.0/OM_Measurement",
"unitOfMeasurement": {
"name": "feet",
"symbol": "ft",
"definition": "https://en.wikipedia.org/wiki/Foot_(unit)"
},
"observedArea": null,
"resultTime": null,
"phenomenonTime": "2021-08-24T11:52:08.515Z/2021-09-24T04:48:48.723Z",
"properties": {},
"https://jrc.dev.52north.org/v1.1/Datastreams(000000-altitude)/ObservedProperty",
"[email protected]":"https://jrc.dev.52north.org/v1.1/Datastreams(000000-altitude)/Observations",
"[email protected]": "https://jrc.dev.52north.org/v1.1/Datastreams(000000-altitude)/Thing",
"[email protected]": "https://jrc.dev.52north.org/v1.1/Datastreams(000000-altitude)/Sensor"
}
31 https://github.com/moquette-io/moquette 32 https://github.com/52North/sensorweb-server-sta 33 https://www.postgresql.org
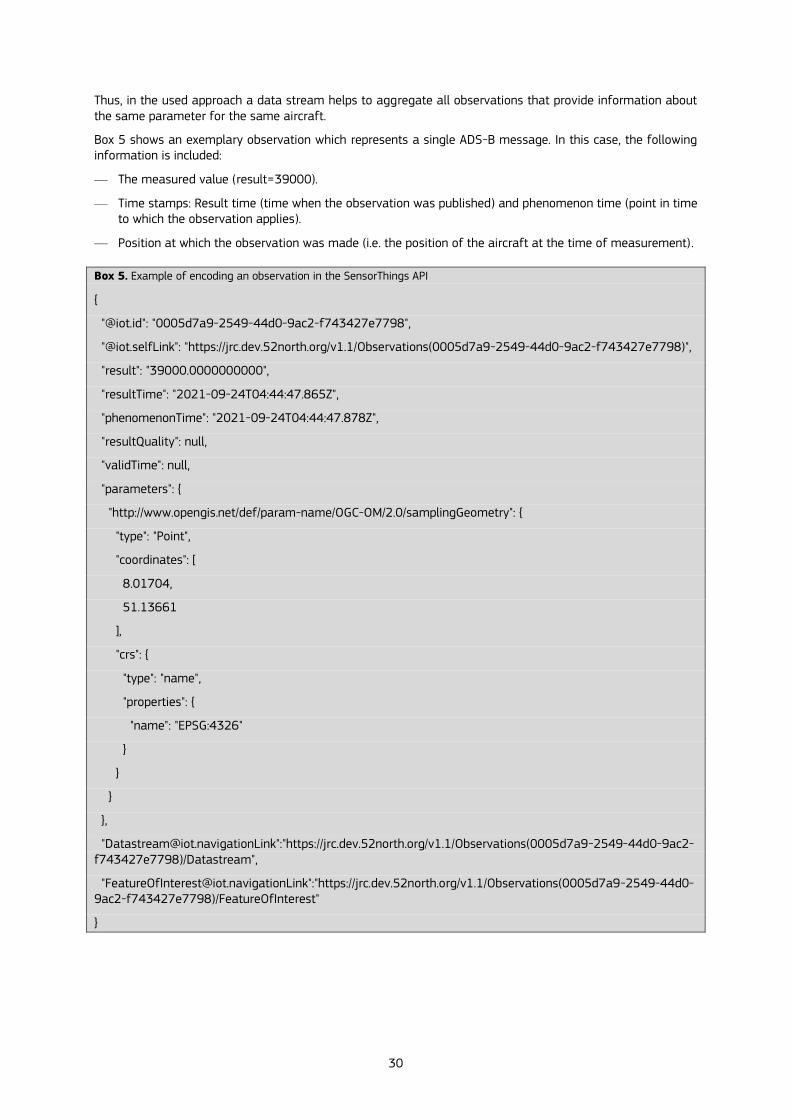
30
Thus, in the used approach a data stream helps to aggregate all observations that provide information about the same parameter for the same aircraft.
Box 5 shows an exemplary observation which represents a single ADS-B message. In this case, the following information is included:
— The measured value (result=39000).
— Time stamps: Result time (time when the observation was published) and phenomenon time (point in time to which the observation applies).
— Position at which the observation was made (i.e. the position of the aircraft at the time of measurement).
Box 5. Example of encoding an observation in the SensorThings API
{
"@iot.id": "0005d7a9-2549-44d0-9ac2-f743427e7798",
"@iot.selfLink": "https://jrc.dev.52north.org/v1.1/Observations(0005d7a9-2549-44d0-9ac2-f743427e7798)",
"result": "39000.0000000000",
"resultTime": "2021-09-24T04:44:47.865Z",
"phenomenonTime": "2021-09-24T04:44:47.878Z",
"resultQuality": null,
"validTime": null,
"parameters": {
"http://www.opengis.net/def/param-name/OGC-OM/2.0/samplingGeometry": {
"type": "Point",
"coordinates": [
8.01704,
51.13661
],
"crs": {
"type": "name",
"properties": {
"name": "EPSG:4326"
}
}
}
},
"[email protected]":"https://jrc.dev.52north.org/v1.1/Observations(0005d7a9-2549-44d0-9ac2-f743427e7798)/Datastream",
"[email protected]":"https://jrc.dev.52north.org/v1.1/Observations(0005d7a9-2549-44d0-9ac2-f743427e7798)/FeatureOfInterest"
}
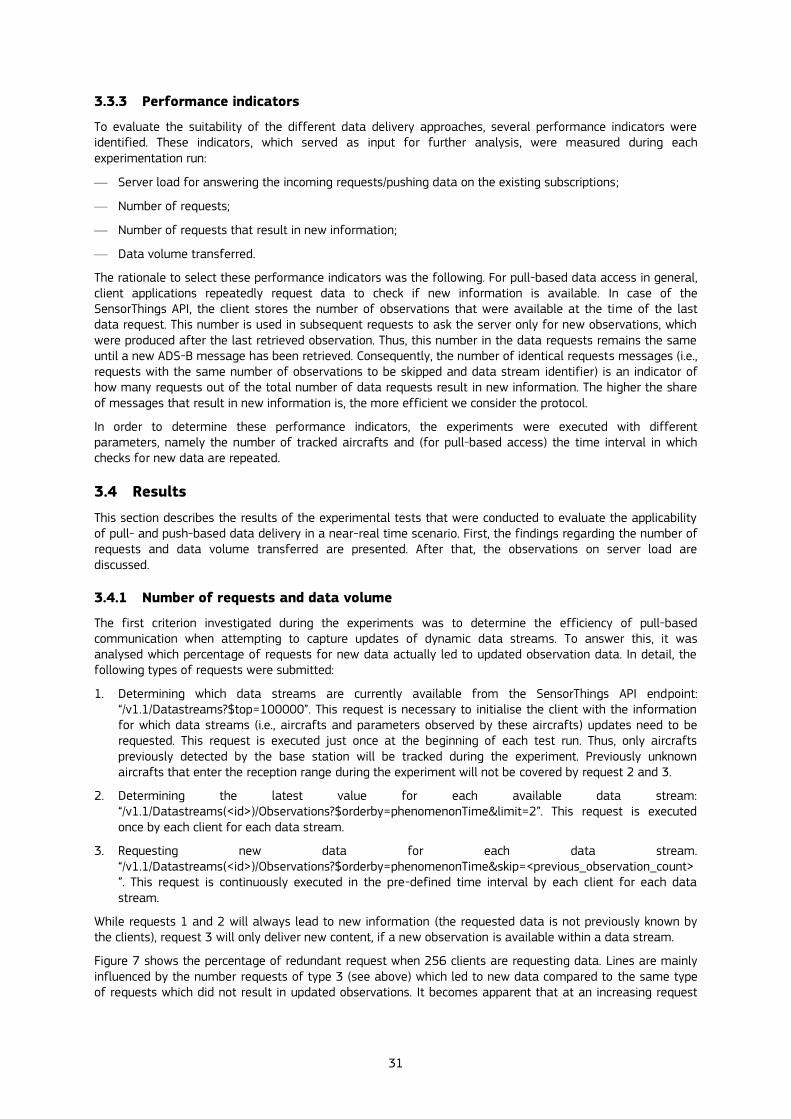
31
3.3.3 Performance indicators
To evaluate the suitability of the different data delivery approaches, several performance indicators were identified. These indicators, which served as input for further analysis, were measured during each experimentation run:
— Server load for answering the incoming requests/pushing data on the existing subscriptions;
— Number of requests;
— Number of requests that result in new information;
— Data volume transferred.
The rationale to select these performance indicators was the following. For pull-based data access in general, client applications repeatedly request data to check if new information is available. In case of the SensorThings API, the client stores the number of observations that were available at the time of the last data request. This number is used in subsequent requests to ask the server only for new observations, which were produced after the last retrieved observation. Thus, this number in the data requests remains the same until a new ADS-B message has been retrieved. Consequently, the number of identical requests messages (i.e., requests with the same number of observations to be skipped and data stream identifier) is an indicator of how many requests out of the total number of data requests result in new information. The higher the share of messages that result in new information is, the more efficient we consider the protocol.
In order to determine these performance indicators, the experiments were executed with different parameters, namely the number of tracked aircrafts and (for pull-based access) the time interval in which checks for new data are repeated.
3.4 Results
This section describes the results of the experimental tests that were conducted to evaluate the applicability of pull- and push-based data delivery in a near-real time scenario. First, the findings regarding the number of requests and data volume transferred are presented. After that, the observations on server load are discussed.
3.4.1 Number of requests and data volume
The first criterion investigated during the experiments was to determine the efficiency of pull-based communication when attempting to capture updates of dynamic data streams. To answer this, it was analysed which percentage of requests for new data actually led to updated observation data. In detail, the following types of requests were submitted:
1. Determining which data streams are currently available from the SensorThings API endpoint: “/v1.1/Datastreams?$top=100000”. This request is necessary to initialise the client with the information for which data streams (i.e., aircrafts and parameters observed by these aircrafts) updates need to be requested. This request is executed just once at the beginning of each test run. Thus, only aircrafts previously detected by the base station will be tracked during the experiment. Previously unknown aircrafts that enter the reception range during the experiment will not be covered by request 2 and 3.
2. Determining the latest value for each available data stream: “/v1.1/Datastreams(<id>)/Observations?$orderby=phenomenonTime&limit=2”. This request is executed once by each client for each data stream.
3. Requesting new data for each data stream. “/v1.1/Datastreams(<id>)/Observations?$orderby=phenomenonTime&skip=<previous_observation_count>”. This request is continuously executed in the pre-defined time interval by each client for each data stream.
While requests 1 and 2 will always lead to new information (the requested data is not previously known by the clients), request 3 will only deliver new content, if a new observation is available within a data stream.
Figure 7 shows the percentage of redundant request when 256 clients are requesting data. Lines are mainly influenced by the number requests of type 3 (see above) which led to new data compared to the same type of requests which did not result in updated observations. It becomes apparent that at an increasing request
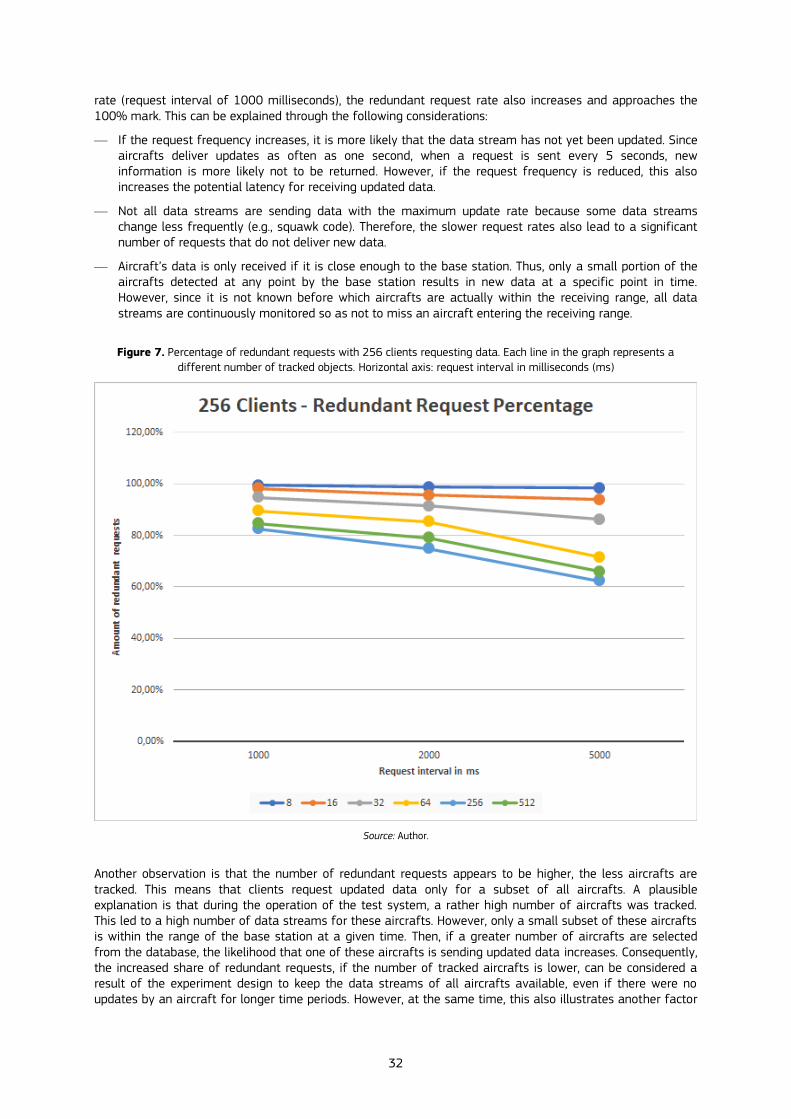
32
rate (request interval of 1000 milliseconds), the redundant request rate also increases and approaches the 100% mark. This can be explained through the following considerations:
— If the request frequency increases, it is more likely that the data stream has not yet been updated. Since aircrafts deliver updates as often as one second, when a request is sent every 5 seconds, new information is more likely not to be returned. However, if the request frequency is reduced, this also increases the potential latency for receiving updated data.
— Not all data streams are sending data with the maximum update rate because some data streams change less frequently (e.g., squawk code). Therefore, the slower request rates also lead to a significant number of requests that do not deliver new data.
— Aircraft’s data is only received if it is close enough to the base station. Thus, only a small portion of the aircrafts detected at any point by the base station results in new data at a specific point in time. However, since it is not known before which aircrafts are actually within the receiving range, all data streams are continuously monitored so as not to miss an aircraft entering the receiving range.
Figure 7. Percentage of redundant requests with 256 clients requesting data. Each line in the graph represents a
different number of tracked objects. Horizontal axis: request interval in milliseconds (ms)
Source: Author.
Another observation is that the number of redundant requests appears to be higher, the less aircrafts are tracked. This means that clients request updated data only for a subset of all aircrafts. A plausible explanation is that during the operation of the test system, a rather high number of aircrafts was tracked. This led to a high number of data streams for these aircrafts. However, only a small subset of these aircrafts is within the range of the base station at a given time. Then, if a greater number of aircrafts are selected from the database, the likelihood that one of these aircrafts is sending updated data increases. Consequently, the increased share of redundant requests, if the number of tracked aircrafts is lower, can be considered a result of the experiment design to keep the data streams of all aircrafts available, even if there were no updates by an aircraft for longer time periods. However, at the same time, this also illustrates another factor
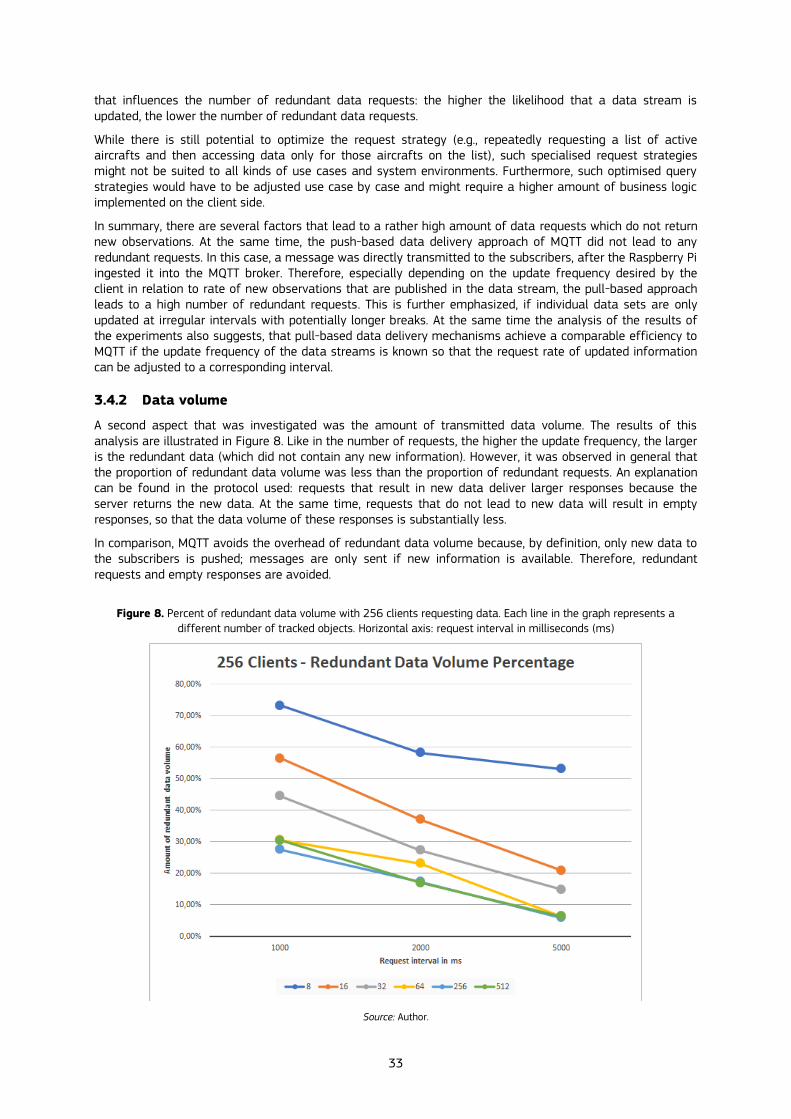
33
that influences the number of redundant data requests: the higher the likelihood that a data stream is updated, the lower the number of redundant data requests.
While there is still potential to optimize the request strategy (e.g., repeatedly requesting a list of active aircrafts and then accessing data only for those aircrafts on the list), such specialised request strategies might not be suited to all kinds of use cases and system environments. Furthermore, such optimised query strategies would have to be adjusted use case by case and might require a higher amount of business logic implemented on the client side.
In summary, there are several factors that lead to a rather high amount of data requests which do not return new observations. At the same time, the push-based data delivery approach of MQTT did not lead to any redundant requests. In this case, a message was directly transmitted to the subscribers, after the Raspberry Pi ingested it into the MQTT broker. Therefore, especially depending on the update frequency desired by the client in relation to rate of new observations that are published in the data stream, the pull-based approach leads to a high number of redundant requests. This is further emphasized, if individual data sets are only updated at irregular intervals with potentially longer breaks. At the same time the analysis of the results of the experiments also suggests, that pull-based data delivery mechanisms achieve a comparable efficiency to MQTT if the update frequency of the data streams is known so that the request rate of updated information can be adjusted to a corresponding interval.
3.4.2 Data volume
A second aspect that was investigated was the amount of transmitted data volume. The results of this analysis are illustrated in Figure 8. Like in the number of requests, the higher the update frequency, the larger is the redundant data (which did not contain any new information). However, it was observed in general that the proportion of redundant data volume was less than the proportion of redundant requests. An explanation can be found in the protocol used: requests that result in new data deliver larger responses because the server returns the new data. At the same time, requests that do not lead to new data will result in empty responses, so that the data volume of these responses is substantially less.
In comparison, MQTT avoids the overhead of redundant data volume because, by definition, only new data to the subscribers is pushed; messages are only sent if new information is available. Therefore, redundant requests and empty responses are avoided.
Figure 8. Percent of redundant data volume with 256 clients requesting data. Each line in the graph represents a
different number of tracked objects. Horizontal axis: request interval in milliseconds (ms)
Source: Author.
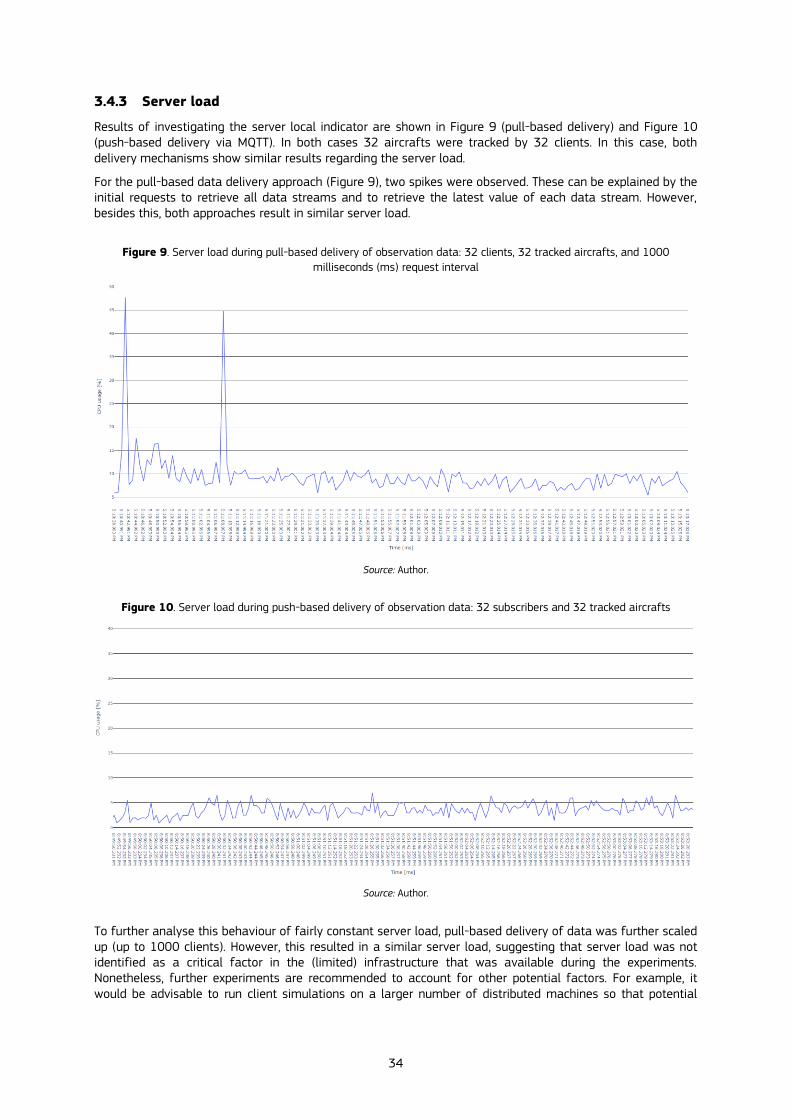
34
3.4.3 Server load
Results of investigating the server local indicator are shown in Figure 9 (pull-based delivery) and Figure 10 (push-based delivery via MQTT). In both cases 32 aircrafts were tracked by 32 clients. In this case, both delivery mechanisms show similar results regarding the server load.
For the pull-based data delivery approach (Figure 9), two spikes were observed. These can be explained by the initial requests to retrieve all data streams and to retrieve the latest value of each data stream. However, besides this, both approaches result in similar server load.
Figure 9. Server load during pull-based delivery of observation data: 32 clients, 32 tracked aircrafts, and 1000
milliseconds (ms) request interval
Source: Author.
Figure 10. Server load during push-based delivery of observation data: 32 subscribers and 32 tracked aircrafts
Source: Author.
To further analyse this behaviour of fairly constant server load, pull-based delivery of data was further scaled up (up to 1000 clients). However, this resulted in a similar server load, suggesting that server load was not identified as a critical factor in the (limited) infrastructure that was available during the experiments. Nonetheless, further experiments are recommended to account for other potential factors. For example, it would be advisable to run client simulations on a larger number of distributed machines so that potential
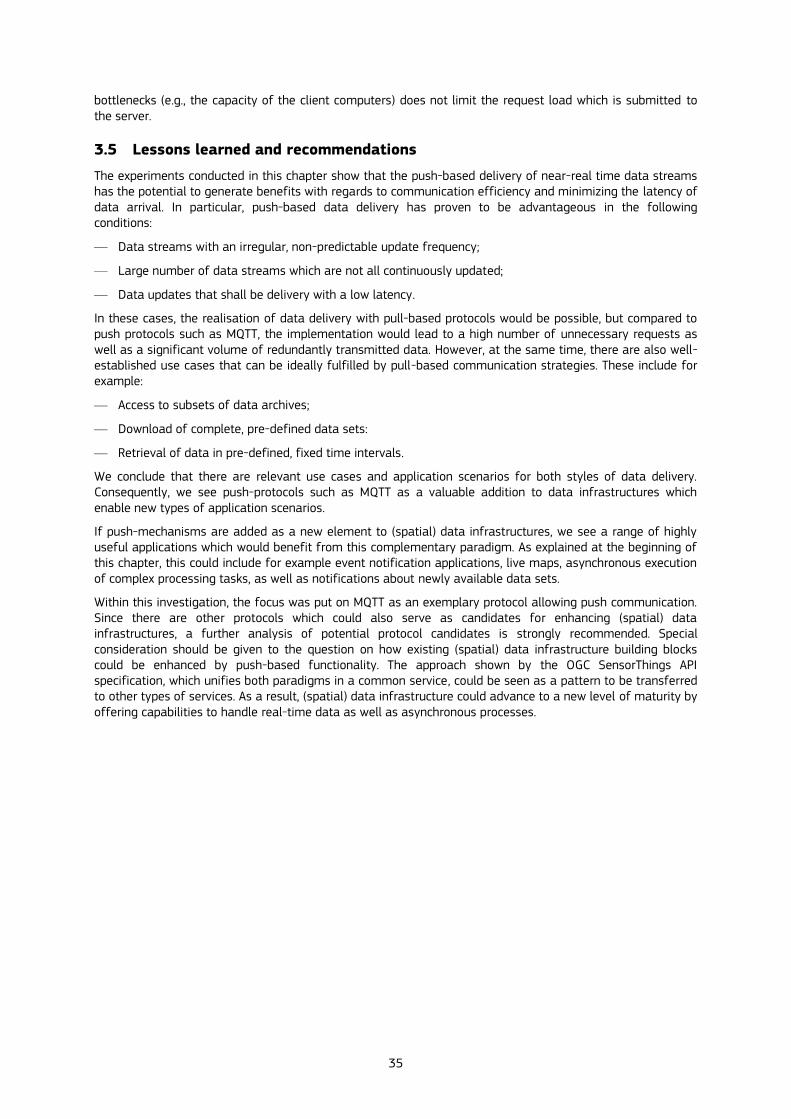
35
bottlenecks (e.g., the capacity of the client computers) does not limit the request load which is submitted to the server.
3.5 Lessons learned and recommendations
The experiments conducted in this chapter show that the push-based delivery of near-real time data streams has the potential to generate benefits with regards to communication efficiency and minimizing the latency of data arrival. In particular, push-based data delivery has proven to be advantageous in the following conditions:
— Data streams with an irregular, non-predictable update frequency;
— Large number of data streams which are not all continuously updated;
— Data updates that shall be delivery with a low latency.
In these cases, the realisation of data delivery with pull-based protocols would be possible, but compared to push protocols such as MQTT, the implementation would lead to a high number of unnecessary requests as well as a significant volume of redundantly transmitted data. However, at the same time, there are also well-established use cases that can be ideally fulfilled by pull-based communication strategies. These include for example:
— Access to subsets of data archives;
— Download of complete, pre-defined data sets:
— Retrieval of data in pre-defined, fixed time intervals.
We conclude that there are relevant use cases and application scenarios for both styles of data delivery. Consequently, we see push-protocols such as MQTT as a valuable addition to data infrastructures which enable new types of application scenarios.
If push-mechanisms are added as a new element to (spatial) data infrastructures, we see a range of highly useful applications which would benefit from this complementary paradigm. As explained at the beginning of this chapter, this could include for example event notification applications, live maps, asynchronous execution of complex processing tasks, as well as notifications about newly available data sets.
Within this investigation, the focus was put on MQTT as an exemplary protocol allowing push communication. Since there are other protocols which could also serve as candidates for enhancing (spatial) data infrastructures, a further analysis of potential protocol candidates is strongly recommended. Special consideration should be given to the question on how existing (spatial) data infrastructure building blocks could be enhanced by push-based functionality. The approach shown by the OGC SensorThings API specification, which unifies both paradigms in a common service, could be seen as a pattern to be transferred to other types of services. As a result, (spatial) data infrastructure could advance to a new level of maturity by offering capabilities to handle real-time data as well as asynchronous processes.

36
4 Processing data close to its origin - edge computing on IoT devices to
detect noise pollution
4.1 Introduction
Edge Computing as a concept has made a noticeable appearance in internet search (e.g., Google search trends34) and in scientific literature (e.g., Google Scholar35) since around 2015, followed by a sharp increase of search frequency and articles published. However, the origins of the concept are difficult to trace, and the English Wikipedia page for edge computing was created as early as 200636.The increased interest in edge computing is likely to be a result of new advances in hardware and fuelled by increased interest in the related concept of Internet of Things (IoT).
Edge computing is concerned with the network topology of distributed computing resources. As early as the late 1990’s, the increased reliance of many applications on internet services exposed them to the risk of latency and insufficient bandwidth. A response from a network topology point of view was to move computing and storage back towards the edges of network when possible. The primary objectives of edge computing were thus to save bandwidth and to improve response times. In contrast, the IoT is focused more on specific technologies and driven by decreasing cost of integrated microcontroller boards, sensors, and new wireless communication protocols. The IoT can be regarded as one instantiation of the edge computing architecture paradigm.
New sensors with higher measurement resolution and frequency again result in higher bandwidth usage, and improved computing performance increases required power consumption, while a dense network of low-cost sensor can raise concerns of privacy. Especially for audio and video data, IoT faces the challenges of power supply, bandwidth, and privacy preservation. For environmental monitoring data, e.g., for air pollution, these are less of a concern, because transmitting a sensor reading of a few bytes in payload size every minute is not putting a strain on bandwidth or power consumption, and at least not directly on privacy. Instead, such low-cost sensors frequently face the problem of limited accuracy, especially under adverse weather conditions.
For both applications (audio/video or sensor data), edge computing provides a potential solution by moving the computation and (intermediary) storage of data closer to the location where this data is created. For example, bandwidth required for high-throughput data can be reduced by reporting only predefined events or aggregated data. An additional advantage of reporting only pre-defined events is that if no sensor data is stored on the device, privacy is preserved. If an edge computing node is collecting sensor data from several devices, it can also monitor the state of those devices, compare sensor readings, and infer if a sensor needs additional calibration. If that should be the case, the edge computing node can initiate either that calibration on the IoT device, or correct known biases in the received data before sending a summary report to the central server.
These opportunities align very well with the European Commission’s strategy for data (European Commission, 2020a), which aims to put people first in the development of new technologies and preserve and promote European values. The proposed data governance act37 describes the main areas where improved data sharing and data-driven innovation can lead to improvements and savings: health, mobility, environment, agriculture, and public administration. In the same vein, the European Commission’s aim38 to ensure a human-centric development of artificial intelligence (AI), resulting in trustworthy AI, is closely linked with the data strategy. Both objectives will be addressed in the experiment described in this chapter.
Edge computing provides thus clear benefits for a wide range of applications. This chapter describes the development and evaluation of an experiment that uses a proof-of-concept system to test the mentioned concepts. After providing an overview of relevant techniques and a systematic description of hardware and its limitations, the remaining sections of this report chapter show several potential uses cases, of which one is chosen and implemented.
34 https://trends.google.com/trends/explore?date=all&q=edge%20computing 35 https://scholar.google.com/scholar?hl=en&q=edge+computing 36 https://en.wikipedia.org/w/index.php?title=Edge_computing&dir=prev&action=history 37 https://digital-strategy.ec.europa.eu/en/policies/data-governance-act 38 https://ec.europa.eu/commission/presscorner/detail/en/ip_20_273

37
Since the context of this work is data governance, the dimensions of transparency, security, and privacy preservation have very high priority. This suggests the use of microcontrollers without persistent storage or internet connection because these have fewer vulnerabilities via over-the-air-programming than fully-fledged, internet-connected computers, and they do not store any user data.
The terminology in the literature is complicated and often ambiguous, because of a multitude of new terms that can be (and are) combined frequently to generate new terms, e.g., edge intelligence or AI-driven fog computing. For clarity and reference, Box 6 offers short definitions of the main terminology as it is used in this chapter.
Box 6. Main terminology as it is used in this chapter
Arduino: An open-source hardware and software company, but frequently used synonymously with their family of single-board microcontrollers. A variety of microcontrollers is used as central processing unit. The experiment here uses a Nano 33 BLE Sense, which has several sensors onboard (including the required microphone), can use BLE wireless network, and is supported by Tensorflow Lite.
Artificial neural network (ANN): An approach to supervised machine learning that is inspired by biological neural networks such as the human brain. It consists of several layers of artificial neurons that are connected with each other and are activated based on weights learned from training data. The combined outputs of the activated artificial neurons create the network’s response, e.g., the classification of a new input into class A or class B. One example for artificial neural networks are deep neural networks (see Tensorflow Lite below).
Bluetooth Low Energy (BLE): A wireless network technology that is distinct from the “classic” Bluetooth technology and aims at reduced power consumption. Range is similar and up to 100 meters, but in practice highly dependent on the environment where it is deployed.
Edge computing: In a distributed computing environment, such as cloud computing, the data storage and associated computing and service components are moved closer to the edges of the network, i.e. away from centralised servers and the cloud. The network edge is where the data is collected, and the users interact with the services. The aims are to reduce bandwidth, improve reliability with unstable networks, decrease response times, and preserve privacy and security.
Internet of Things (IoT): A network of small, low-cost, physical sensors that can record various data, such as audio, movement, images, particulate matter and other pollutants in the air, and others. Most sensors are stationary but moving sensors that also record location via a global navigation satellite system (e.g., GPS) are possible. IoT devices transmit data via a variety of protocols, among them Bluetooth Low Energy (BLE), Wi-Fi, or LongRange low-power wide area network (LoRa).
Machine Learning (ML): Often conflated with artificial intelligence (AI), machine learning in this project is an algorithm that uses labelled training data to build a model that is able to predict the label (i.e., category) of new, unlabelled data. This approach is called supervised training. The parameters that govern the learning process are called hyperparameters.
Message Queue Telemetry Transport (MQTT): A network protocol that usually runs over the internet’s TCP/IP protocol and is designed to be lightweight. For that reason, it is often used in IoT settings. It is a publish-subscribe network, meaning that a publisher sends messages with a specific topic to a broker, which publishes them to any endpoint that has registered with the broker and subscribed to that topic. Chapter 3 expands on the MQTT protocol.
Microcontroller: Essentially a small computer on a single chip or board, containing at least one central processing unit, memory, and interface to peripherals. The related concept of systems on a chip adds persistent storage and wireless network technology for a fully contained microcomputer. Examples are the Arduino Nano and Raspberry Pi.
Raspberry Pi: A full, low-cost computer on a single board. It allows connection with multiple peripherals through USB and HDMI connections, as well as Wi-Fi and BLE. The experiment here uses a Raspberry 4B as receiver of noise events via BLE, and as publisher of those events via MQTT.
Tensorflow Lite: Tensorflow is a free and open-source library for training and inference with deep neural networks. The Lite version is designed specifically for using pre-trained models on mobile applications and adaptations for several microcontroller architectures exist, including Arduino.
38
4.2 Related work
There is a burgeoning body of literature on edge computing. A thorough review of literature is out of the scope of this chapter, but a few relevant studies at the cross-section of edge computing, IoT, and AI are mentioned below to contextualise the developed experiment.
Deng et al. (2020) differentiate between AI for and AI on edge computing. The former aims to improve edge computing by solving constrained optimization problems with AI, while the latter aims to improve insights generated from sensors, for instance, by running AI on edge computing devices. This latter understanding of AI on edge computing is also the direction of this research.
Zhou et al. (2019) use the term edge intelligence to describe AI on edge (IoT) devices. An important rationale for edge intelligence is to reduce latency and dependency on a network, e.g., for autonomous vehicles. They distinguish a “base layer” of cloud intelligence, in which all training and inference are implemented in the cloud, and six levels of edge intelligence: the lowest level implements some (but not all) inference on the IoT device, while the highest level implements all deep learning neural network training and inference on the IoT device. The work presented in this chapter is equivalent to level 3, or on-device inference: Although the ANN model is trained in the cloud (or if it is of lesser complexity, a standard workstation or laptop), the model runs on the IoT device where the inference (e.g., the classification of incoming sensor data) is implemented. No data is offloaded from the device to another node.
Merenda et al. (2020) describe several options for using ML and AI on IoT devices. They focus on how to implement neural networks in IoT and list algorithms and hardware options, including available wireless communication protocols. Most examples use a Raspberry Pi, with one example using a Sparkfun Edge (comparable to Arduino Nano). Regarding ML techniques, they state that advanced decision trees or ensembles such as random forests are not frequently used because of their required computational complexity, although there are implementations optimized for IoT, such as Bonsai39. Support vector machines are used quite frequently at the moment, but this seems likely to change towards neural networks. Neural networks require more computational power for training but significantly less for inference and application. In their work, privacy concerns are addressed only through adding noise to the data and by cryptographic techniques, but not by moving inference to the edge without storing any data persistently. The experiment described in this chapter follows the proposition by Merenda et al. (2020) by using neural networks as state-of-the-art method for inference on an IoT device, but additionally addresses the privacy concerns by not storing any data.
Garcia et al. (2020) showcase an experiment using a mobile edge cloud concept which is similar to cloudlets, i.e., creating a local cloud to address connectivity issues with the main (remote) cloud. However, the conceptual difference between cloud and edge computing easily blurs and needs some clarification.
Xu et al. (2020) have developed a proof-of-concept for cross-camera vehicle tracking and provide a useful definition of Device-Edge-Cloud. According to it, a Device is a low-cost platform (e.g., a Raspberry Pi and associated camera) with limited computational capability. The Edge is a multi-tenant micro-data centre housed in a small footprint location (e.g., central offices of telecommunication providers), expected to host up to a few server racks. Edge sites will be typically one (or few) network hop(s) away from the entities that they directly interact with. The Cloud is a multi-tenant data centre with virtually infinite resources. These definitions show the wide range of how terminology is used and the dependence on context, because in the experiment reported here, the Raspberry Pi fulfils the function of an Edge micro-data centre and broker instead of a Device, while the latter role is fulfilled by an Arduino Nano.
For a broader and more detailed overview of machine learning on the edge, the reader is encouraged to consult Murshed et al. (2022). While they provide an excellent overview of edge computing and machine learning, including many references on methods and applications, the survey revealed comparatively few IoT sensor applications. Most referenced research relates to deep learning on more powerful edge devices for computer vision and pattern/item recognition tasks. This shows that the research presented in this chapter is addressing a novel application field.
Edge computing and IoT devices can also play a crucial role for realizing the concepts of a Digital Earth (Granell et al., 2020) and its nervous system (De Longueville et al., 2010), as well as for distributed geospatial analysis purposes (Kamilaris and Ostermann, 2018).
39 https://github.com/Microsoft/EdgeML/wiki/Bonsai
39
Concerning the communication options used in this study, Herle and Blankenbach (2018; 2016) show an interesting approach to incorporate spatio-temporal queries into a push messenger like MQTT. While we do not use spatio-temporal queries (yet) in the experiment reported here, their work shows the feasibility of MQTT to support geospatial analysis over the internet. Future work could address modification of the Raspberry Pi node’s aggregation/handling of edge computing reports to fit user demands. In any case, the lightweight and simple implementation of MQTT is a suitable fit for an edge computing environment using small and potentially battery-powered IoT devices.
4.3 Design and set-up of the experiment
4.3.1 Deciding on a case study and application
As mentioned previously, the main motivation for edge computing is an application where it is undesirable or impossible to send all recorded data straight to a central server. Reasons can be preservation of bandwidth for critical services (or absence of sufficient bandwidth), limitations on the device’s power source, and preservation of privacy of users or those monitored.
With the network bandwidth constantly expanding and 8K video streaming making an appearance, the bandwidth issue is most prominent in more remote or less developed areas, but less so in more urban settings of the Global North, e.g., Europe. This leaves limited power supply and privacy preservation as most fitting application drivers for edge computing.
From a methodological point of view, an interesting concept to explore in edge computing is federated learning, especially for its opportunities with respect to privacy preservation (Yang et al., 2019). When using federated learning, a model is trained across multiple, decentralized edge devices or cloud servers. Each learning node only holds a local data sample without exchanging or pooling it with other devices. This enables multiple nodes to jointly build a machine learning model without sharing data, thus addressing critical issues such as privacy, security, and access rights. However, it also introduces the problem of reduced control over the training, potentially allowing malicious attacks through this vector, while at the same time making it harder to detect unwanted biases. Further, training a model using federated learning still requires sufficient memory and processing power on the devices and frequent communication of models and hyperparameters between learning nodes. For these reasons, it may not be the best option for the IoT applications envisaged here.
A more promising application is local event detection on the IoT device, using a pre-trained ANN: This requires little communication, helps to preserve privacy, and can still benefit from state-of-the-art machine learning techniques. In this context, Tensorflow was originally developed at Google and released to the public in 2015 as an open-source machine learning library. Since then, it has gathered a community of practice that has created numerous tutorials and examples on a wide range of applications. However, the initial aim to use Tensorflow on laptops with models trained in the cloud meant that its memory footprint (both RAM and disk) was too large for mobile applications.
As a response, Google started in 2017 the Tensorflow Lite40 project, which has fewer features, operations, and data types to reduce size and complexity. For example, training a new model with Tensorflow Lite is not possible but only running a model pre-trained by Tensorflow on a personal computer or in the cloud. The optimizations allow Tensorflow Lite to run with less than 1 megabyte of memory. Still, this proved to be too much for some microcontrollers and embedded devices, who frequently have only hundreds, if not tens, of kilobytes of memory. Further optimizations starting in 2018 led to Tensorflow Lite for Microcontrollers, which has been progressively adapted to several microcontrollers, among them Arduino Nano BLE Sense boards, which are very suitable as IoT device.
In terms of model quality, the biggest impact of the optimizations is to use integers instead of floating-point data with Tensorflow Lite. This conversion process is called quantization. To enable high-precision calculations, the model is initially trained with Tensorflow using 32-bit floating point numbers for weights and biases, which are then rescaled to 8-bit integers for Tensorflow Lite. This reduces overall accuracy somewhat, but also reduces memory requirements and execution time. The loss in accuracy is usually small and worth the trade-off. Nevertheless, Tensorflow Lite expects 32-bit processors.
40 https://www.tensorflow.org/lite

40
Warden and Situnayake (2019) demonstrate several experiments with Tensorflow and microcontrollers. These include:
— Listening to a microphone, detecting pre-defined wake words, and reacting on them (similar to a smartphone’s voice assistant, but running on much less powerful hardware);
— Detecting a person in an image captured with a camera module;
— Recognizing gestures from the gyroscope and accelerometer readings.
The same authors provide several universally helpful suggestions to help planning a project involving embedded machine learning on a IoT device. The first suggestion is to critically rethink whether a microcontroller is needed or whether a larger device could work as well. For example, a Raspberry Pi is a full desktop computer and other solutions offer dedicated GPU for training neural networks. The advantages of microcontrollers are their ability to work from a battery for long periods and to scale up easily because of their low-cost. As this section discusses below, these two criteria are of critical importance for most of the envisioned use cases. Another important consideration is whether the problem to be solved requires some more complex, higher-level “intelligence”, or comparatively simple pattern recognition. Most of the proposed application options in Table 4 require only the latter. Further, a recommendation is to learn from existing work and build on it, which in the case of training a neural network means the availability of training data sets. This has also guided the use case choice described below. Regarding the training data set, another suggestion is to spend more time on building a good training data set than improving the model architecture. Unfortunately, such time investment was beyond the scope of the piloting work presented here. However, good practice was followed, and all potential data sources were thoroughly screened, investigated, and, in the case of audio files, listened to.
After checking the requirements and available data, the first application case in Table 4 appeared the most suitable first step, since the amount of training data was less demanding and readily available, while on the hardware side no additional camera module was needed. A key requirement was that validation of the trained and deployed model was feasible within a lab, as there was insufficient time for field experiments.
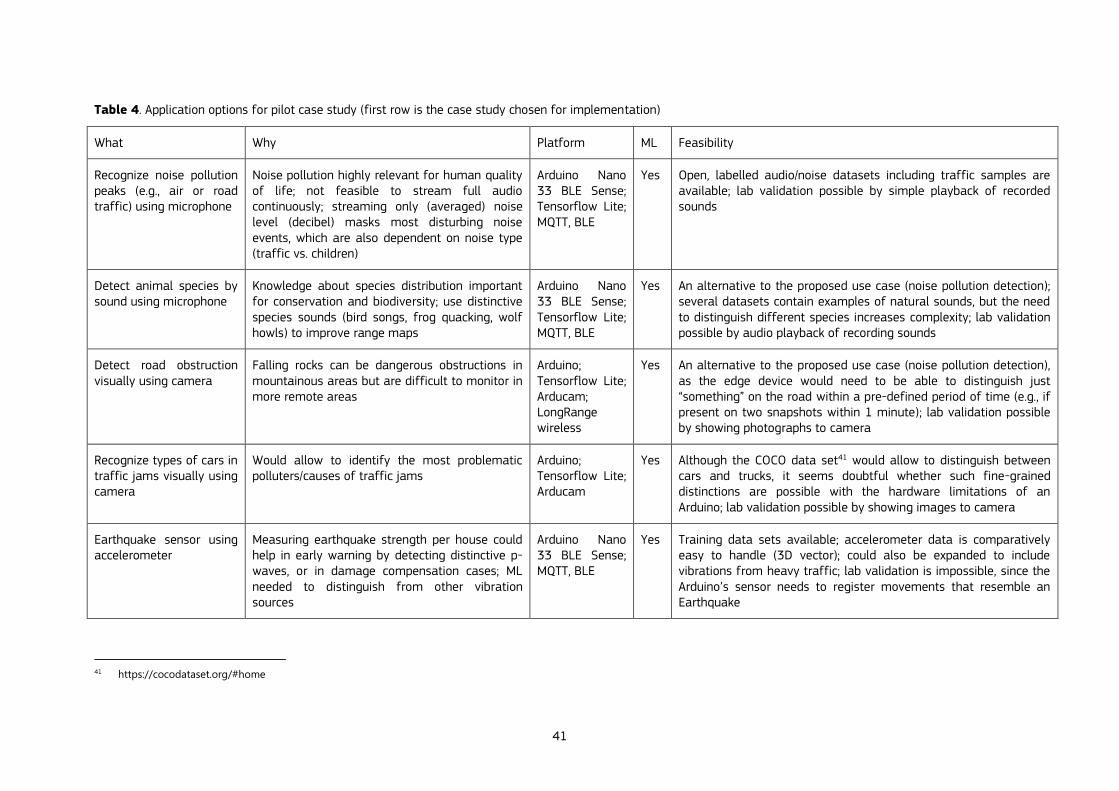
41
Table 4. Application options for pilot case study (first row is the case study chosen for implementation)
What Why Platform ML Feasibility
Recognize noise pollution peaks (e.g., air or road traffic) using microphone
Noise pollution highly relevant for human quality of life; not feasible to stream full audio continuously; streaming only (averaged) noise level (decibel) masks most disturbing noise events, which are also dependent on noise type (traffic vs. children)
Arduino Nano 33 BLE Sense; Tensorflow Lite; MQTT, BLE
Yes Open, labelled audio/noise datasets including traffic samples are available; lab validation possible by simple playback of recorded sounds
Detect animal species by sound using microphone
Knowledge about species distribution important for conservation and biodiversity; use distinctive species sounds (bird songs, frog quacking, wolf howls) to improve range maps
Arduino Nano 33 BLE Sense; Tensorflow Lite; MQTT, BLE
Yes An alternative to the proposed use case (noise pollution detection); several datasets contain examples of natural sounds, but the need to distinguish different species increases complexity; lab validation possible by audio playback of recording sounds
Detect road obstruction visually using camera
Falling rocks can be dangerous obstructions in mountainous areas but are difficult to monitor in more remote areas
Arduino; Tensorflow Lite; Arducam; LongRange wireless
Yes An alternative to the proposed use case (noise pollution detection), as the edge device would need to be able to distinguish just “something” on the road within a pre-defined period of time (e.g., if present on two snapshots within 1 minute); lab validation possible by showing photographs to camera
Recognize types of cars in traffic jams visually using camera
Would allow to identify the most problematic polluters/causes of traffic jams
Arduino; Tensorflow Lite; Arducam
Yes Although the COCO data set41 would allow to distinguish between cars and trucks, it seems doubtful whether such fine-grained distinctions are possible with the hardware limitations of an Arduino; lab validation possible by showing images to camera
Earthquake sensor using accelerometer
Measuring earthquake strength per house could help in early warning by detecting distinctive p-waves, or in damage compensation cases; ML needed to distinguish from other vibration sources
Arduino Nano 33 BLE Sense; MQTT, BLE
Yes Training data sets available; accelerometer data is comparatively easy to handle (3D vector); could also be expanded to include vibrations from heavy traffic; lab validation is impossible, since the Arduino’s sensor needs to register movements that resemble an Earthquake
41 https://cocodataset.org/#home
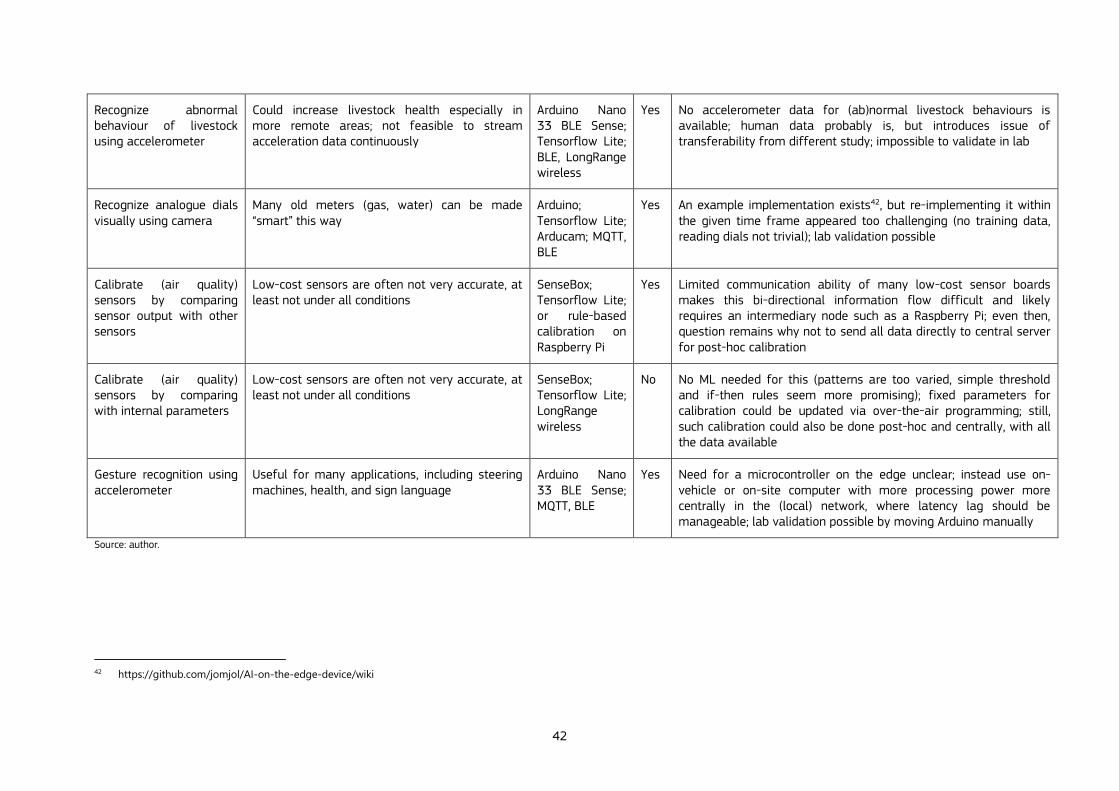
42
Recognize abnormal behaviour of livestock using accelerometer
Could increase livestock health especially in more remote areas; not feasible to stream acceleration data continuously
Arduino Nano 33 BLE Sense; Tensorflow Lite; BLE, LongRange wireless
Yes No accelerometer data for (ab)normal livestock behaviours is available; human data probably is, but introduces issue of transferability from different study; impossible to validate in lab
Recognize analogue dials visually using camera
Many old meters (gas, water) can be made “smart” this way
Arduino; Tensorflow Lite; Arducam; MQTT, BLE
Yes An example implementation exists42, but re-implementing it within the given time frame appeared too challenging (no training data, reading dials not trivial); lab validation possible
Calibrate (air quality) sensors by comparing sensor output with other sensors
Low-cost sensors are often not very accurate, at least not under all conditions
SenseBox; Tensorflow Lite; or rule-based calibration on Raspberry Pi
Yes Limited communication ability of many low-cost sensor boards makes this bi-directional information flow difficult and likely requires an intermediary node such as a Raspberry Pi; even then, question remains why not to send all data directly to central server for post-hoc calibration
Calibrate (air quality) sensors by comparing with internal parameters
Low-cost sensors are often not very accurate, at least not under all conditions
SenseBox; Tensorflow Lite; LongRange wireless
No No ML needed for this (patterns are too varied, simple threshold and if-then rules seem more promising); fixed parameters for calibration could be updated via over-the-air programming; still, such calibration could also be done post-hoc and centrally, with all the data available
Gesture recognition using accelerometer
Useful for many applications, including steering machines, health, and sign language
Arduino Nano 33 BLE Sense; MQTT, BLE
Yes Need for a microcontroller on the edge unclear; instead use on-vehicle or on-site computer with more processing power more centrally in the (local) network, where latency lag should be manageable; lab validation possible by moving Arduino manually
Source: author.
42 https://github.com/jomjol/AI-on-the-edge-device/wiki
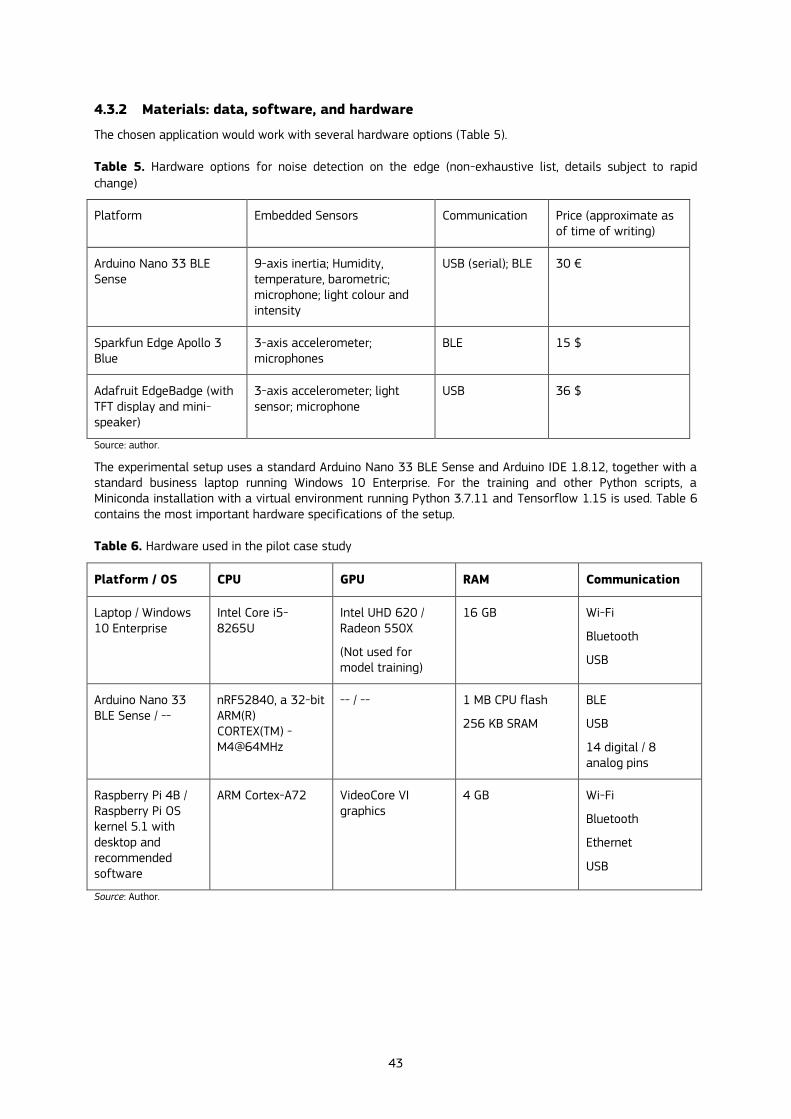
43
4.3.2 Materials: data, software, and hardware
The chosen application would work with several hardware options (Table 5).
Table 5. Hardware options for noise detection on the edge (non-exhaustive list, details subject to rapid
change)
Platform Embedded Sensors Communication Price (approximate as of time of writing)
Arduino Nano 33 BLE Sense
9-axis inertia; Humidity, temperature, barometric; microphone; light colour and intensity
USB (serial); BLE 30 €
Sparkfun Edge Apollo 3 Blue
3-axis accelerometer; microphones
BLE 15 $
Adafruit EdgeBadge (with TFT display and mini-speaker)
3-axis accelerometer; light sensor; microphone
USB 36 $
Source: author.
The experimental setup uses a standard Arduino Nano 33 BLE Sense and Arduino IDE 1.8.12, together with a standard business laptop running Windows 10 Enterprise. For the training and other Python scripts, a Miniconda installation with a virtual environment running Python 3.7.11 and Tensorflow 1.15 is used. Table 6 contains the most important hardware specifications of the setup.
Table 6. Hardware used in the pilot case study
Platform / OS CPU GPU RAM Communication
Laptop / Windows 10 Enterprise
Intel Core i5-8265U
Intel UHD 620 / Radeon 550X
(Not used for model training)
16 GB Wi-Fi
Bluetooth
USB
Arduino Nano 33 BLE Sense / --
nRF52840, a 32-bit ARM(R) CORTEX(TM) -M4@64MHz
-- / -- 1 MB CPU flash
256 KB SRAM
BLE
USB
14 digital / 8 analog pins
Raspberry Pi 4B / Raspberry Pi OS kernel 5.1 with desktop and recommended software
ARM Cortex-A72 VideoCore VI graphics
4 GB Wi-Fi
Bluetooth
Ethernet
USB
Source: Author.

44
Regarding the training data, at least three options are available:
— The ESC50 dataset43 has 50 classes and includes airplanes, among other urban, natural, and human sounds. All clips have all the same length and sampling frequency;
— The Urbansound8K dataset44 has only 10 classes without airplanes, but some traffic sounds. The clips are of different lengths;
— The FSD50K dataset45 has 200 classes including airplanes. Its large size might make it more difficult to handle;
The ESC50 data set provides the best combination of properties (classes, size, license) and was chosen for the experiment. For the classes to be predicted, it was decided to focus on the traffic-related classes (see Table 7 for full list).
4.3.3 Overview of experimental workflow
The workflow diagram in Figure 11 shows the most important steps of the entire development process of the experiment. More information on the individual steps can be found in the following sections. All code can be found in the corresponding GitHub repository46.
The three main inputs are the mentioned ESC50 data, the Tensorflow speech model training example47, and the Arduino Tensorflow Lite for Microcontrollers deployment example found in the Arduino Tensorflow Lite library48. All three inputs had to be modified before they could accomplish their role in the workflow. These modifications, including the model training itself, took place on a standard laptop. For slower laptops or computationally more demanding model training, Google Colab (link in training code) provides a free-of-charge option for cloud processing.
Once the training has been completed, the modified code, together with the trained model, is deployed to the Arduino Nano, which listens to ambient sound and sends a notification if something was detected. For testing purposes, this notification was initially only displayed in the serial monitor, before functionality was added to send these notifications via BLE to a Raspberry Pi node, which publishes the notification via MQTT to subscribers via the internet.
The evaluation of the deployment was performed by using a standard HiFi system to play back the original sound clips with normal background noise (office, living room).
The experiment followed three main phases: An initial deployment and testing of the setting (section 4.4), followed by a systematic evaluation of model performance and subsequent retraining and redeployment (section 4.5), and a final implementation of the communication with BLE and MQTT (section 4.6). The first important step was to test whether the core setup of model training and deployment on an Arduino Nano works as intended on the development machine. This was accomplished by following the exact steps of the micro speech / wake word example of Chapter 8 in Warden and Situnayake (2019).
43 https://github.com/karolpiczak/ESC-50 44 https://urbansounddataset.weebly.com/urbansound8k.html 45 https://zenodo.org/record/4060432 46 https://github.com/foost/EdgeComputingJRC 47 https://github.com/tensorflow/tflite-micro/tree/main/tensorflow/lite/micro/examples/micro_speech 48 https://www.arduino.cc/reference/en/libraries/arduino_tensorflowlite
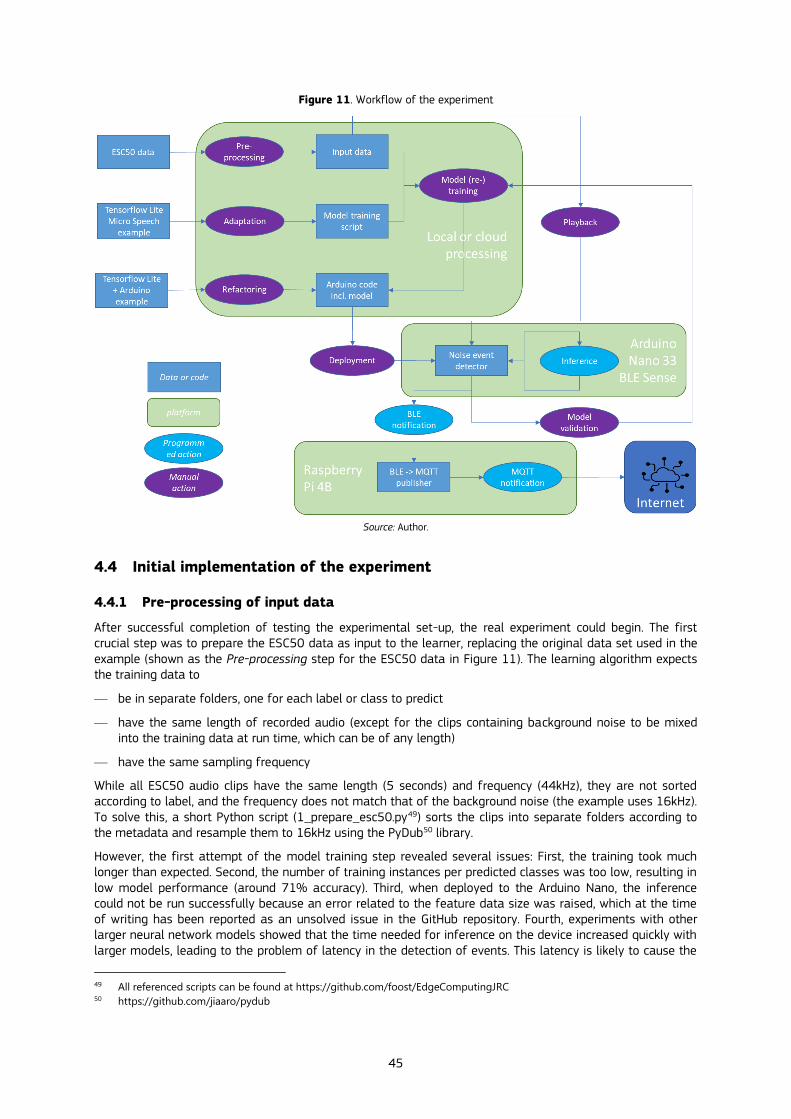
45
Figure 11. Workflow of the experiment
Source: Author.
4.4 Initial implementation of the experiment
4.4.1 Pre-processing of input data
After successful completion of testing the experimental set-up, the real experiment could begin. The first crucial step was to prepare the ESC50 data as input to the learner, replacing the original data set used in the example (shown as the Pre-processing step for the ESC50 data in Figure 11). The learning algorithm expects the training data to
— be in separate folders, one for each label or class to predict
— have the same length of recorded audio (except for the clips containing background noise to be mixed into the training data at run time, which can be of any length)
— have the same sampling frequency
While all ESC50 audio clips have the same length (5 seconds) and frequency (44kHz), they are not sorted according to label, and the frequency does not match that of the background noise (the example uses 16kHz). To solve this, a short Python script (1_prepare_esc50.py49) sorts the clips into separate folders according to the metadata and resample them to 16kHz using the PyDub50 library.
However, the first attempt of the model training step revealed several issues: First, the training took much longer than expected. Second, the number of training instances per predicted classes was too low, resulting in low model performance (around 71% accuracy). Third, when deployed to the Arduino Nano, the inference could not be run successfully because an error related to the feature data size was raised, which at the time of writing has been reported as an unsolved issue in the GitHub repository. Fourth, experiments with other larger neural network models showed that the time needed for inference on the device increased quickly with larger models, leading to the problem of latency in the detection of events. This latency is likely to cause the
49 All referenced scripts can be found at https://github.com/foost/EdgeComputingJRC 50 https://github.com/jiaaro/pydub
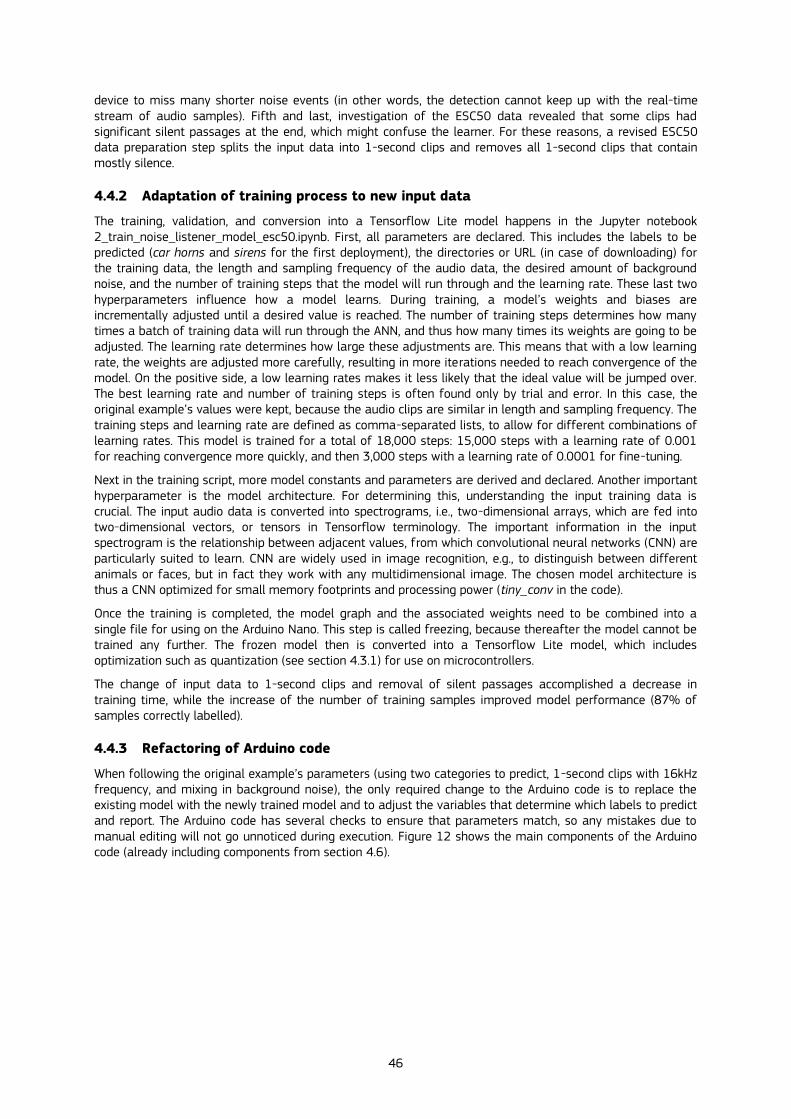
46
device to miss many shorter noise events (in other words, the detection cannot keep up with the real-time stream of audio samples). Fifth and last, investigation of the ESC50 data revealed that some clips had significant silent passages at the end, which might confuse the learner. For these reasons, a revised ESC50 data preparation step splits the input data into 1-second clips and removes all 1-second clips that contain mostly silence.
4.4.2 Adaptation of training process to new input data
The training, validation, and conversion into a Tensorflow Lite model happens in the Jupyter notebook 2_train_noise_listener_model_esc50.ipynb. First, all parameters are declared. This includes the labels to be predicted (car horns and sirens for the first deployment), the directories or URL (in case of downloading) for the training data, the length and sampling frequency of the audio data, the desired amount of background noise, and the number of training steps that the model will run through and the learning rate. These last two hyperparameters influence how a model learns. During training, a model’s weights and biases are incrementally adjusted until a desired value is reached. The number of training steps determines how many times a batch of training data will run through the ANN, and thus how many times its weights are going to be adjusted. The learning rate determines how large these adjustments are. This means that with a low learning rate, the weights are adjusted more carefully, resulting in more iterations needed to reach convergence of the model. On the positive side, a low learning rates makes it less likely that the ideal value will be jumped over. The best learning rate and number of training steps is often found only by trial and error. In this case, the original example’s values were kept, because the audio clips are similar in length and sampling frequency. The training steps and learning rate are defined as comma-separated lists, to allow for different combinations of learning rates. This model is trained for a total of 18,000 steps: 15,000 steps with a learning rate of 0.001 for reaching convergence more quickly, and then 3,000 steps with a learning rate of 0.0001 for fine-tuning.
Next in the training script, more model constants and parameters are derived and declared. Another important hyperparameter is the model architecture. For determining this, understanding the input training data is crucial. The input audio data is converted into spectrograms, i.e., two-dimensional arrays, which are fed into two-dimensional vectors, or tensors in Tensorflow terminology. The important information in the input spectrogram is the relationship between adjacent values, from which convolutional neural networks (CNN) are particularly suited to learn. CNN are widely used in image recognition, e.g., to distinguish between different animals or faces, but in fact they work with any multidimensional image. The chosen model architecture is thus a CNN optimized for small memory footprints and processing power (tiny_conv in the code).
Once the training is completed, the model graph and the associated weights need to be combined into a single file for using on the Arduino Nano. This step is called freezing, because thereafter the model cannot be trained any further. The frozen model then is converted into a Tensorflow Lite model, which includes optimization such as quantization (see section 4.3.1) for use on microcontrollers.
The change of input data to 1-second clips and removal of silent passages accomplished a decrease in training time, while the increase of the number of training samples improved model performance (87% of samples correctly labelled).
4.4.3 Refactoring of Arduino code
When following the original example’s parameters (using two categories to predict, 1-second clips with 16kHz frequency, and mixing in background noise), the only required change to the Arduino code is to replace the existing model with the newly trained model and to adjust the variables that determine which labels to predict and report. The Arduino code has several checks to ensure that parameters match, so any mistakes due to manual editing will not go unnoticed during execution. Figure 12 shows the main components of the Arduino code (already including components from section 4.6).
47
Figure 12. Main components of Arduino Nano 33 BLE Sense code
Source: Author’s design based on Warden and Situnayake (2019).
The main loop in Figure 12 first checks whether a connection with another device has been established via BLE (see section 4.6), and if not, initiates it. An audio provider function captures sound samples from the Arduino Nano’s microphone, which are then converted into spectrograms by the feature provider function. The main Tensorflow Lite inference is then applied to the spectrogram and the results are sent to the command recognizer function. This function decides based on user-defined threshold parameters whether a noise has been detected (a “command”) and then activates the command responder function, which activates the device’s LEDs and sends a notification via BLE.
4.4.4 Initial deployment to Arduino
After deploying, i.e., uploading the initial code without the BLE functionality to the Arduino Nano, the inference starts right away (represented by the “noise event detector” and “inference” boxes in Figure 11). To check the latency of the inference (see also section 4.4.1), an LED blinks each time an inference is run. While an initial test run with a larger model showed increased latency of 2-3 seconds per inference, the smaller model runs several inferences per second, which is sufficiently fast. Any detected noise events are shown by different, color-coded LEDs, as well as on the serial monitor. The testing of the model is accomplished through playback of the modified ESC50 on a standard Stereo HiFi system. Although this controlled lab setting should lead to a better performance than using new sounds (or even live ambient sounds), the performance is still significantly lower than during computational model validation: None of the car horn samples are recognized, and while no siren samples are misclassified, not all of them are recognized (i.e., false negatives), and the model produces a significant number of siren false positives.
The computational model validation’s confusion matrix (printed in the training script) shows that the high performance of 87% is mostly due to correctly identifying the many siren clips, while there are too few car horn clips as training instances. The many siren false positives are a result of the high frequency of inferences: When the model runs multiple inferences per second over 1-second time windows of recorded sound, then even a low false discovery rate of around 8% will cause frequent and regular false positives. Lastly, the specifics of the Arduino Nano’s microphone might cause significantly different spectral images of the replayed sounds.
To address the poor performance of the model, several options are possible:

48
— Modify the model’s hyperparameters: The training script allows to modify several model-related parameters, such as number of training steps and neural network type. For the moment, these were left at default, because the computational model’s performance was high enough; it was the lab performance that suffered.
— Decrease class imbalance: Although there are several methods established in the literature to address this, the most straightforward step is to use a different class with more available training samples, which can also address the next issue.
— Spectral similarity of classes: The required transformation of the sound waves into a spectral image might result in classes that are very similar, even if they are very distinct to human cognition, and thus are difficult to predict. Trying different classes is an option.
— Interference of background noise: the default background noise contains sounds similar to the predicted classes. Trying different background noise or none at all is another option.
— Tune the parameters of the command recognition function in the Arduino code: The model outputs are not simply translated into a recognized noise event. Instead, the outputs are averaged over a time window, and the model’s confidence is compared to a threshold value to reduce false alarms.
The following section systematically examines some of these options.
4.5 Retraining and evaluation
4.5.1 Retraining the model with different classes
The model was retrained several times, systematically varying the two parameters of a) classes to predict and b) usage of background noise. The main change to the latter was that for all models with background noise, only the white and pink noise samples were used.
The first retrained model used the distinctly different sound classes of siren and frogs without any background noise. The lab performance of the deployed model was similar to that of the computationally validated model (80% accuracy), with frog sounds reliably recognized and siren false alarms significantly reduced. This demonstrates the influence of chosen classes.
Further, the parameters in the audio recognition function in the Arduino code were changed so that fewer false alarms occurred, by raising the required threshold for model confidence and required number of detections per 1-second time window. The same settings were then used for all the following experiments, which used combinations of traffic-related sounds. Table 7 shows the model performance of each experiment:
1. Car horn and siren, with background noise (the initial model).
2. Airplane, car horn, helicopter, siren, and train, without (2a) and with (2b) background noise.
3. Airplane and siren, with background noise.
4. Helicopter and siren, with background noise.
5. Car horn, helicopter, and siren, without background noise.
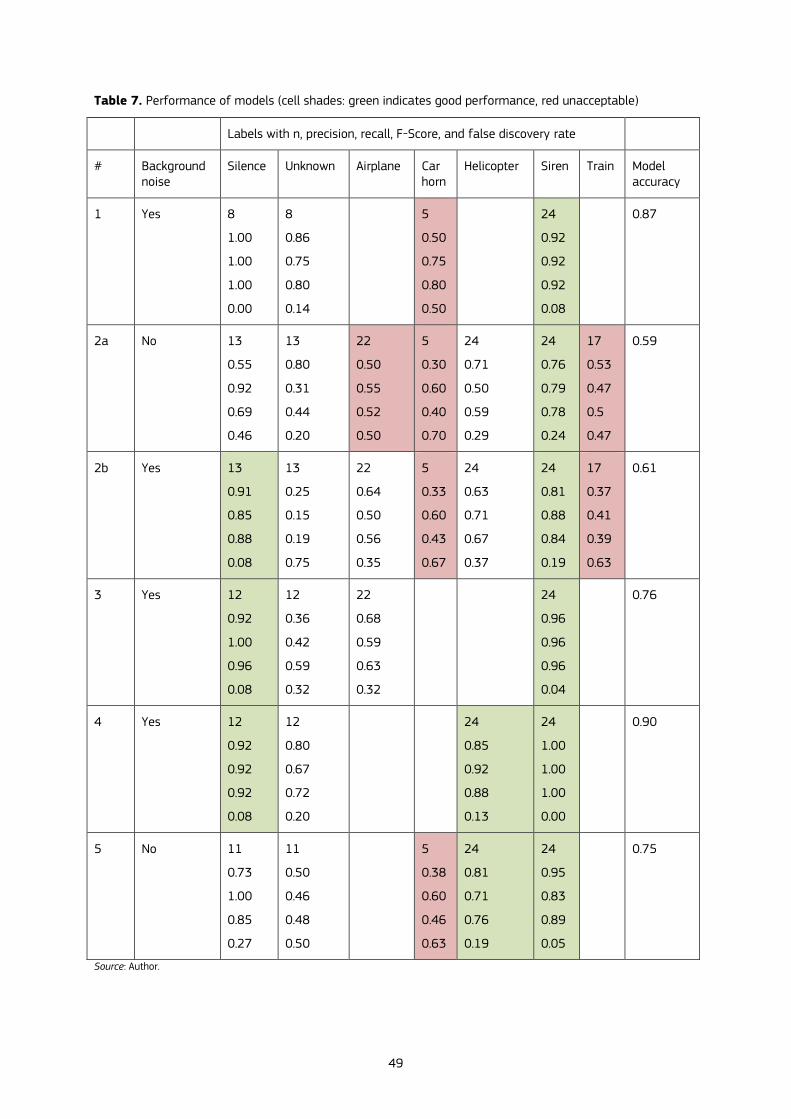
49
Table 7. Performance of models (cell shades: green indicates good performance, red unacceptable)
Labels with n, precision, recall, F-Score, and false discovery rate
# Background noise
Silence Unknown Airplane Car horn
Helicopter Siren Train Model accuracy
1 Yes 8
1.00
1.00
1.00
0.00
8
0.86
0.75
0.80
0.14
5
0.50
0.75
0.80
0.50
24
0.92
0.92
0.92
0.08
0.87
2a No 13
0.55
0.92
0.69
0.46
13
0.80
0.31
0.44
0.20
22
0.50
0.55
0.52
0.50
5
0.30
0.60
0.40
0.70
24
0.71
0.50
0.59
0.29
24
0.76
0.79
0.78
0.24
17
0.53
0.47
0.5
0.47
0.59
2b Yes 13
0.91
0.85
0.88
0.08
13
0.25
0.15
0.19
0.75
22
0.64
0.50
0.56
0.35
5
0.33
0.60
0.43
0.67
24
0.63
0.71
0.67
0.37
24
0.81
0.88
0.84
0.19
17
0.37
0.41
0.39
0.63
0.61
3 Yes 12
0.92
1.00
0.96
0.08
12
0.36
0.42
0.59
0.32
22
0.68
0.59
0.63
0.32
24
0.96
0.96
0.96
0.04
0.76
4 Yes 12
0.92
0.92
0.92
0.08
12
0.80
0.67
0.72
0.20
24
0.85
0.92
0.88
0.13
24
1.00
1.00
1.00
0.00
0.90
5 No 11
0.73
1.00
0.85
0.27
11
0.50
0.46
0.48
0.50
5
0.38
0.60
0.46
0.63
24
0.81
0.71
0.76
0.19
24
0.95
0.83
0.89
0.05
0.75
Source: Author.
50
One derived observation from the results is that the number of silence and unknown samples to be labelled depends on the number of samples in the other classes and is chosen by the training script (see there). Another observation related to the traffic-related classes is that car horn has by far the lowest number of samples. This is a result of the original ECS50 files containing only short car horn samples, with the remainder of the 5-second clips filled with silence.
4.5.2 Evaluation of the models’ performances
For evaluating the models’ performances, using the overall model accuracy is not enough. Two measures are most important: First, a low false discovery rate for the target labels (except for silence and unknown), to reduce false alarms. Second, high F-scores for all target labels except unknown, to ensure sufficient sensitivity and recall.
Some derived observations are:
— Train and airplane do not perform well in any model.
— Siren performs well consistently.
— Helicopter performance depends on other classes and background noise.
— Background noise improves performance of some classes.
— Even very low false discovery rates will cause many false alarms over time because of the high-frequency inference; this could be controlled somewhat by a longer suppression window.
— For the same reason above, high false discovery rates for unknown can decrease real-life performance because of blocking the inference.
— The deployed model performs worse in the lab than during computational training validation, possibly due to microphone issues (using sub-standard loudspeakers that can only reproduce an incomplete spectrum are also likely to cause issues).
For the last implementation step, the helicopter and siren model (#4) was used.
4.6 Reporting detecting noise events via BLE and MQTT
So far, the experiment only reported detected noise events via a flashing LED on the Arduino Nano and output on its serial port. To be useful in a real-world application, additional communication functionality is required. For a reliable measurement of noise pollution events in cities, several sensors in geographic proximity are desirable to capture the impact of urban morphology: For example, for a single building at least one sensor facing the street and another one facing the backyard. For other applications, multiple sensing locations with a denser coverage are highly desirable. With BLE having a maximum range of 100 meters outdoors, and newer specifications even more, a small BLE network with Arduino Nanos as edge devices and a Raspberry Pi as central node is feasible, especially since the transmitted data will be very small (only the occasional noise event label).
The experimental setup was therefore extended by adding BLE capabilities to the Arduino code: When an event is detected, the notification handler pushes a single message to a connected BLE device (in this case the Raspberry Pi).
On the Raspberry Pi, a simple MQTT publisher listens for incoming messages on the BLE connection and pushes them to the MQTT topic. This functionality is demonstrated in the script 3_BLE_MQTT_bridge.py. The last element is an MQTT subscriber to that topic, which can run on any device. The last script, 4_MQTT_ESC50_subscribe.py, demonstrates this.
Compared to the complexities of training and deploying a model with sufficient performance, the set-up of this simple network topology and message system is very simple, straightforward, and reliable. The experiment also tried to run the Arduino battery-powered with a standard power bank, outputting 5V at 1A. While the Arduino would boot, it did not show up in available Bluetooth devices. Debugging this problem was unfortunately out-of-scope for this experiment. For a purely battery-powered solution, the Sparkfun Edge board (compare Table 5) is another option due to its very low power consumption.
51
4.7 Conclusions and lessons learned
The experiment proved successful in demonstrating the feasibility of the concept but requires some additional work to be feasible in a real-world setting. While the chosen hardware is capable to run a small, pre-trained Tensorflow Lite ANN to detect specific noises relating to traffic situations and communicate those detections to subscribers anywhere in the world, the performance under lab conditions still produces many false positives and is likely to deteriorate outside the lab setting. It is important to note here that fine-tuning the model or comparative testing of different hardware options were outside the scope of this pilot project. To address the lower performance of the model in a real-world deployment, there are several options open for exploration to improve it.
First of all, an additional investment into new training data that fits the specific application case and in particular the hardware specifications (e.g., microphone characteristics), without overfitting and biasing the model, is likely to have a significant positive impact on the model performance. While creating new training data is always a labour-intensive task, parts of that work can be crowdsourced to interested citizens. They could record and submit ambient sound and label short sound clips that were generated automatically from the submitted ambient sound.
Second, the model itself can certainly be tuned further. At the moment, the trained model used the standard model hyperparameters from the example code, resulting in a model with a small memory footprint. While this is desirable from a resource-constrained perspective, the need to find a balance between resource constraints and model performance, in particular reducing false positives, might require revisiting this aspect.
Third, apart from changing model hyperparameters, one promising architecture option is to use a cascading design, i.e., a small model running inference with high frequency and lower energy-consumption, which - upon detecting a potential noise event - triggers a larger model that takes longer for completing inference and consumes more energy but is more accurate in its predictions and reduces false positives.
Future work on federated learning might be useful for training and calibrating low-cost sensors, when communication is less of an issue but still no actual data is supposed to leave the devices. For example, the calibration of sensor data on a local hub, e.g., a Raspberry Pi, could rely on low-cost sensors with BLE, Wi-Fi, LoRa or Zigbee communication modules sending local models to the main federated learning node, which uses a reference data set to test and validate the local models and update them if necessary. For the reference data in an air quality example, it could pull data from several web portals, e.g., OpenSenseMap51, Luftdateninfo52, and Samenmeten53, and use those to test the local models. In case of serious deviation between official and local data and poor model performance, the hub could send a command to retrain the models on the nodes with different parameters or even improved data. On the other hand, in case of multiple, confirming messages about abnormal data, this could hint at an extraordinary event, for which the hub could push event notifications via MQTT.
For an actual deployment in the wild, the privacy aspect also requires additional attention. If an attacker gains physical access to the edge device, the attacker can modify the code in such a way that the device could listen to other sounds secretly and transmit those to a different MQTT topic channel, or even package actual ambient sound into short clips and transmit those. The most promising countermeasures seem to use encryption with a keep-alive signal and to combine this with physical protection, e.g. placing the device in a simple physical encasing that prevents easy tampering and is secured with a circuit which the device monitors. If the case is opened, the device could transmit an alarm via BLE and remove locally stored encryption keys so that future, compromised messages can be identified. Alternatively, any interruption in BLE connection could be considered a potential breach and a compromised device, requiring attention from trusted personnel for inspection.
Another remaining challenge is supplying power for extended periods. However, a combination of research design (smart sampling of noise event listening) and engineering (reducing power consumption, add recharging from environment via solar power, etc.) should be able to address this. A different option would be to integrate such a noise-monitoring of public space with existing infrastructure, such as streetlamps, which are distributed comparatively homogeneously in urban areas (compare Mühlhäuser et al., 2020).
51 https://opensensemap.org 52 https://sensor.community/en 53 https://samenmeten.rivm.nl/dataportaal

52
For future work, Table 4 lists several options that are feasible to develop and implement by using the building blocks from this experiment, with the detection of animal species through sound and the detection of road obstructions through camera being the most promising in terms of feasibility and societal relevance.
In summary, the potentials of edge computing on IoT devices are substantial for improving governance of data, for example by using AI to analyse sensor data to increase quality of life through detection of pollution and increase biodiversity through monitoring of species occurrence. When the system architecture does not store any user data persistently and uses only open-source hardware and software, as this experiment shows, then such governance of data is respecting European ethical values and the resulting data-driven innovation is sustainable as well as scalable. The societal value of such solutions is manifold and contributes to making Europe Fit for the Digital Age as well as supporting the European Green Deal.
53
5 Enforcing automation in building, testing and deployment of software
applications – the case of cloud-based data services
5.1 Introduction
This chapter describes the development process for a cloud-based INSPIRE-compliant data service implemented as the OGC API Features Web Service54. The use of the OGC API Features (OAFeat) standard to provide EU-level geospatial and even spatiotemporal data services in real-world deployments is not an arbitrary choice. In the context of the INSPIRE framework (European Parliament and Council, 2007), good practices exist for the provision of INSPIRE-compatible (data) download services based on the OGC API Features standard (INSPIRE Expert Group, 2021). As such, OGC API Features (OAFeat) sets the scene for the work reported here, which attempts to experimentally shed some light to the following questions:
— What is a suitable “operational stack” in terms of available components and/or products to realize a live instance of an OAFeat endpoint? What is available in the Open Source arena to ensure transparency?
— What is a suitable “administrative stack”, next to the “operational stack”, to guarantee continuous insight in uptime and availability (QoS Monitoring) and to be able to visibly manage for example database data?
— How can continuous integration and deployment (CI/CD) best be realized as to minimize the effort needed to set up, install and maintain this live instance? What are the current best practices in CI/CD?
As such, the main output of this chapter is essentially a cloud-based live data service that utilizes the OAFeat. In a broader context, this development is framed by considering the cloud-related macroeconomic trends identified by the European Commission (see Chapter 9 for more details). Two of these trends, cloud uptake and emerging technologies, are especially relevant to the work reported here, as both can be viewed as cross-cutting trends that affect in one way or another all of the experiments included in this document. Therefore, the software product presented below represents a fundamental pillar to drive the need for cloud-based infrastructural agility for the consolidation of the cloud market towards the realization of European data spaces (European Commission, 2020b).
As a software product or implementation, the work here does not naturally fit in with the structure of the other chapters in the document. Consequently, the following sections cover the main aspects involved in software product descriptions, in the same vein of recent initiatives taken by renowned academic journals (Arribas-Bel et al., 2021).
Therefore, next section overviews related technology necessary to address the main questions posed above pertinent to the development and set up of a cloud-based data service. In the remaining three sections, we focus on the description of the software product, as a key research result comparable to other traditional research results like written documents and reports. These sections respond to the questions: what is the software product? (section 5.3), how can it be used in real cloud-based deployments? (section 5.4), and why does it make a contribution to the European Data Spaces? (section 5.5). For clarity and reference, Box 7 offers short definitions of the main terminology as it is used in this chapter.
Box 7. Main terminology as it is used in this chapter
Git: a distributed software framework for tracking changes in any set of (text-based) files. Here, it is seen as a distributed version control system to collaboratively enable software development.
GitHub: a cloud-based service for software development and version control using Git.
DevOps: a set of practices that combines software development (Dev) and IT operations (Ops) to improve workflow automation and rapid infrastructure and application configurations.
GitOps: a specialised form of DevOps using Git (for Ops).
Continuous integration and deployment (CI/CD): a set of practices to bridge the gap between software development (continuous integration) and software operation (continuous delivery or deployment) by enforcing automation in building, testing and deployment of software applications
54 https://inspire.ec.europa.eu/good-practice/ogc-api-%E2%80%93-features-inspire-download-service
54
5.2 Context and technology
We overview the state-of-the-art technology and relevant concepts for the three questions above in particular, and for the creation of cloud-based live data services in general.
Beginning with general aspects, these days most server-side software is deployed “in the Cloud” as containers, with Docker55 being the leading containerization technology. But Docker by itself does not suffice to cover the range of real-world situations and needs. For example, it is usual to find a form of container orchestration that is already in place in existing application deployments. In such cases, Kubernetes56 (K8s) is the leading tool. Despite its steep learning curve and that the existence of lighter forms of Docker orchestration, K8s is seen as the ultimate solution and “dot on the horizon” for many organizations. For example, Dutch Kadaster has recently migrated its Spatial Data Infrastructure (SDI), the national geo-portal PDOK that includes all INSPIRE endpoints, to K8s.
Looking at the three questions above, first, the operational stack is by far the most technology-oriented. A wide range of open source implementations for the OAFeat standard are already available. Examples are GeoServer57, pygeoapi58, LDProxy59, QGIS Server60, and GOAF61 (by Dutch Kadaster), just to name a few. They differ in programming language, ease-of-deployment, configuration conventions, number of OGC API specs implemented -- such as Records (metadata), Tiles, Maps, Coverages--, and the degree of adherence to the OGC specifications via CITE tests62. As the OGC reference implementation for OAFeat, the Python-based pygeoapi library is the tool of choice for the development of the software product.
Nevertheless, the implementation of an OAFeat server does not suffice alone; well-deployed services generally include front-end components that provide routing, secure access (SSL/HTTPS), CORS (Cross-origin resource sharing) and other necessary functionalities for a server to operate correctly. In the past, web servers like Apache63 and nginx64 were used for this purpose, but recently, cloud-native products have emerged. Of these, Traefik65, a proven, fast and reliable front-end component, and very flexible in terms of configurability (e.g. no reboots are required on configuration changes), is the front-end tool of choice for the software product development.
Data is also relevant, both in files and databases. For files OGC GeoPackage66 is a very suitable and versatile format, and for smaller datasets, GeoJSON67 is a well-supported option (See Chapter 2 for a full description of the trade-offs between text-based and binary data formats). For spatial databases PostGIS68, the spatial extension of the PostgreSQL69 database, is leading.
Second, the technology and tools included in the administrative stack are intended to monitor the uptime, availability and overall QoS of OGC Web Services, including OAFeat. In this sense, GeoHealthCheck70 is the main product, if not the only one, in the open source space. For managing data in PostGIS, PGAdmin471 is a good choice. Where previous versions were desktop-only, PGAdmin4 can be deployed as a web application too. Since all deployments will use Docker, Portainer72 is a good lightweight option for monitoring containers in a Docker context. For monitoring (Linux) systems, a combination of cAdvisor73, Prometheus74 with Grafana
55 https://www.docker.com 56 https://kubernetes.io 57 http://geoserver.org 58 https://pygeoapi.io 59 https://ldlink.nci.nih.gov 60 https://docs.qgis.org/3.10/es/docs/training_manual/qgis_server/index.html 61 https://github.com/PDOK/goaf 62 https://cite.opengeospatial.org/teamengine 63 https://httpd.apache.org 64 https://www.nginx.com 65 https://doc.traefik.io/traefik 66 https://www.geopackage.org 67 https://geojson.org 68 https://postgis.net 69 https://www.postgresql.org 70 https://geohealthcheck.org 71 https://www.pgadmin.org 72 https://www.portainer.io 73 https://github.com/google/cadvisor 74 https://prometheus.io
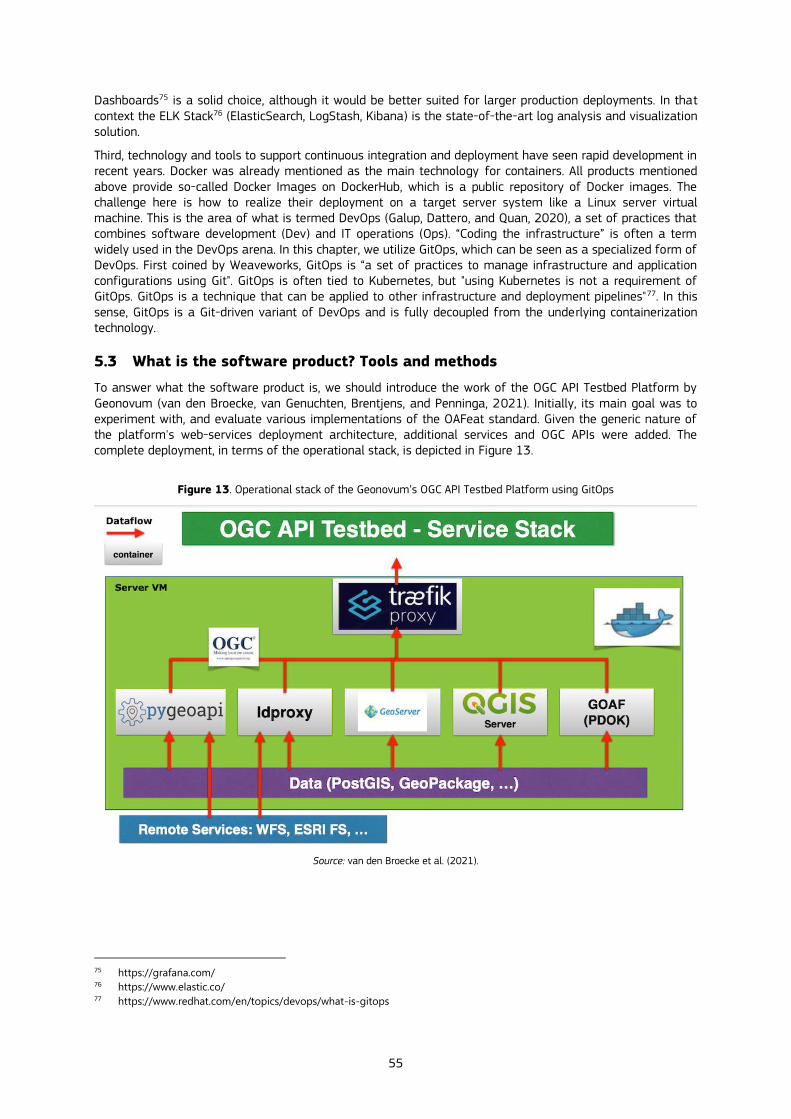
55
Dashboards75 is a solid choice, although it would be better suited for larger production deployments. In that context the ELK Stack76 (ElasticSearch, LogStash, Kibana) is the state-of-the-art log analysis and visualization solution.
Third, technology and tools to support continuous integration and deployment have seen rapid development in recent years. Docker was already mentioned as the main technology for containers. All products mentioned above provide so-called Docker Images on DockerHub, which is a public repository of Docker images. The challenge here is how to realize their deployment on a target server system like a Linux server virtual machine. This is the area of what is termed DevOps (Galup, Dattero, and Quan, 2020), a set of practices that combines software development (Dev) and IT operations (Ops). “Coding the infrastructure” is often a term widely used in the DevOps arena. In this chapter, we utilize GitOps, which can be seen as a specialized form of DevOps. First coined by Weaveworks, GitOps is “a set of practices to manage infrastructure and application configurations using Git". GitOps is often tied to Kubernetes, but "using Kubernetes is not a requirement of GitOps. GitOps is a technique that can be applied to other infrastructure and deployment pipelines"77. In this sense, GitOps is a Git-driven variant of DevOps and is fully decoupled from the underlying containerization technology.
5.3 What is the software product? Tools and methods
To answer what the software product is, we should introduce the work of the OGC API Testbed Platform by Geonovum (van den Broecke, van Genuchten, Brentjens, and Penninga, 2021). Initially, its main goal was to experiment with, and evaluate various implementations of the OAFeat standard. Given the generic nature of the platform's web-services deployment architecture, additional services and OGC APIs were added. The complete deployment, in terms of the operational stack, is depicted in Figure 13.
Figure 13. Operational stack of the Geonovum’s OGC API Testbed Platform using GitOps
Source: van den Broecke et al. (2021).
75 https://grafana.com/ 76 https://www.elastic.co/ 77 https://www.redhat.com/en/topics/devops/what-is-gitops
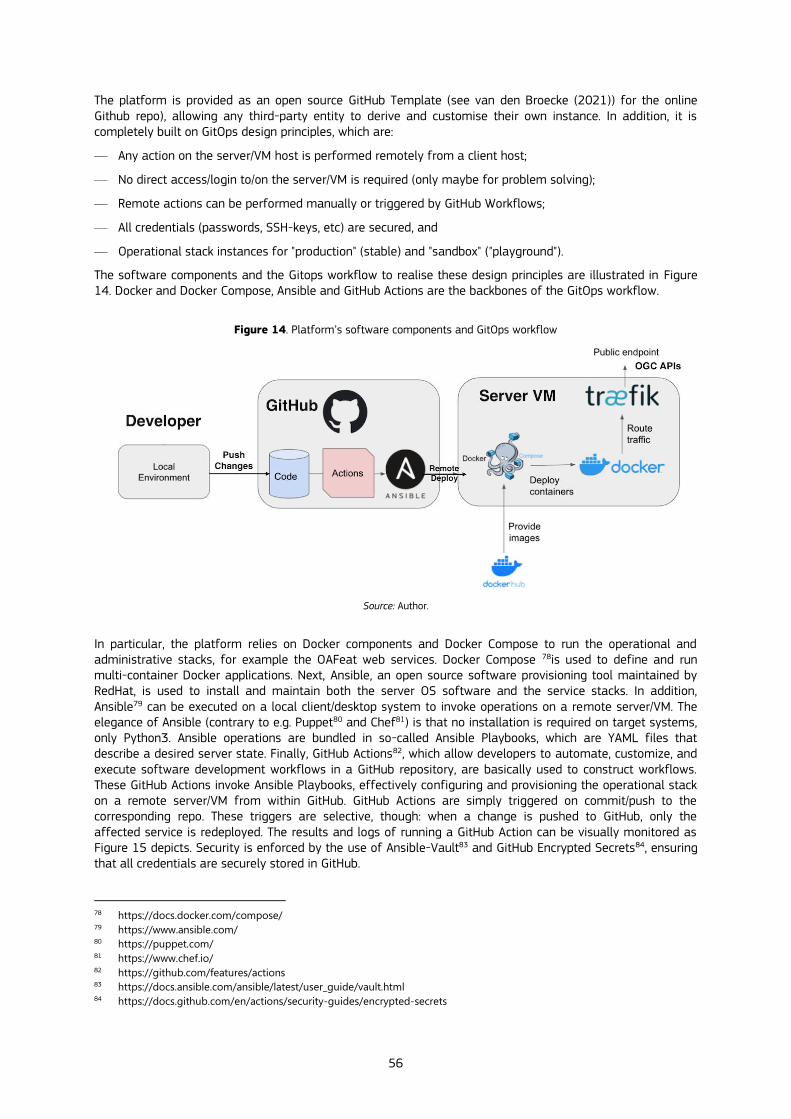
56
The platform is provided as an open source GitHub Template (see van den Broecke (2021)) for the online Github repo), allowing any third-party entity to derive and customise their own instance. In addition, it is completely built on GitOps design principles, which are:
— Any action on the server/VM host is performed remotely from a client host;
— No direct access/login to/on the server/VM is required (only maybe for problem solving);
— Remote actions can be performed manually or triggered by GitHub Workflows;
— All credentials (passwords, SSH-keys, etc) are secured, and
— Operational stack instances for "production" (stable) and "sandbox" ("playground").
The software components and the Gitops workflow to realise these design principles are illustrated in Figure 14. Docker and Docker Compose, Ansible and GitHub Actions are the backbones of the GitOps workflow.
Figure 14. Platform’s software components and GitOps workflow
Source: Author.
In particular, the platform relies on Docker components and Docker Compose to run the operational and administrative stacks, for example the OAFeat web services. Docker Compose 78is used to define and run multi-container Docker applications. Next, Ansible, an open source software provisioning tool maintained by RedHat, is used to install and maintain both the server OS software and the service stacks. In addition, Ansible79 can be executed on a local client/desktop system to invoke operations on a remote server/VM. The elegance of Ansible (contrary to e.g. Puppet80 and Chef81) is that no installation is required on target systems, only Python3. Ansible operations are bundled in so-called Ansible Playbooks, which are YAML files that describe a desired server state. Finally, GitHub Actions82, which allow developers to automate, customize, and execute software development workflows in a GitHub repository, are basically used to construct workflows. These GitHub Actions invoke Ansible Playbooks, effectively configuring and provisioning the operational stack on a remote server/VM from within GitHub. GitHub Actions are simply triggered on commit/push to the corresponding repo. These triggers are selective, though: when a change is pushed to GitHub, only the affected service is redeployed. The results and logs of running a GitHub Action can be visually monitored as Figure 15 depicts. Security is enforced by the use of Ansible-Vault83 and GitHub Encrypted Secrets84, ensuring that all credentials are securely stored in GitHub.
78 https://docs.docker.com/compose/ 79 https://www.ansible.com/ 80 https://puppet.com/ 81 https://www.chef.io/ 82 https://github.com/features/actions 83 https://docs.ansible.com/ansible/latest/user_guide/vault.html 84 https://docs.github.com/en/actions/security-guides/encrypted-secrets
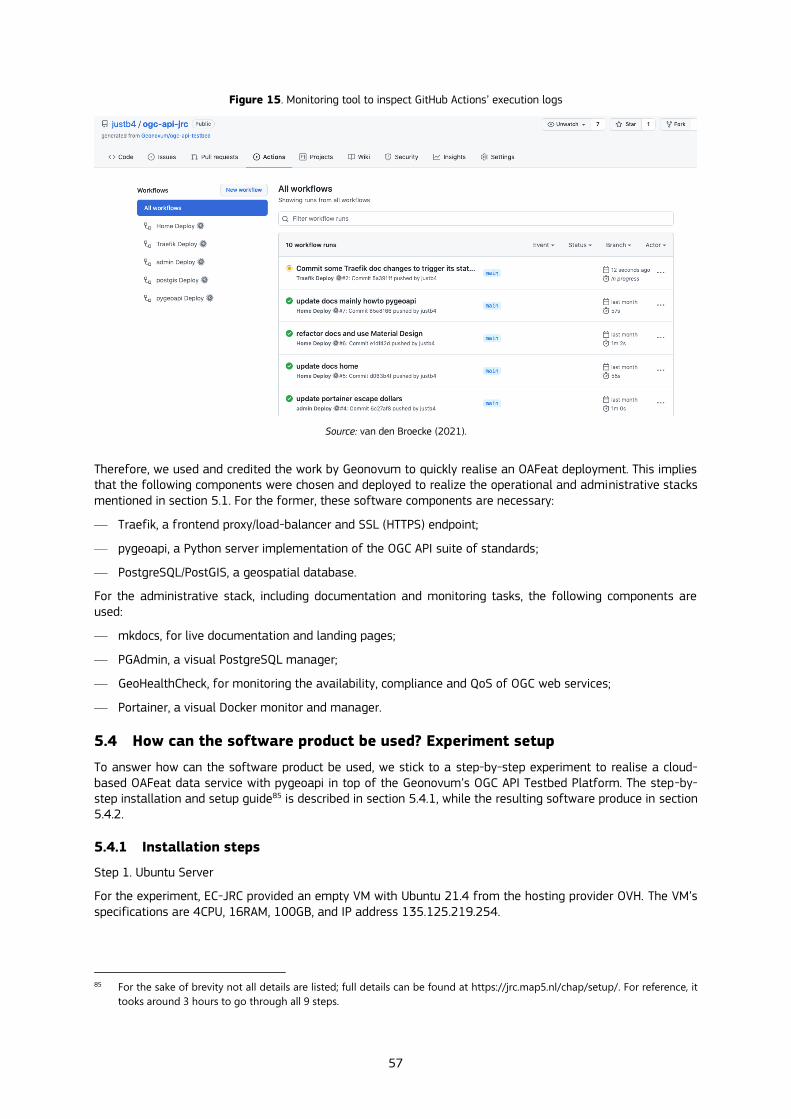
57
Figure 15. Monitoring tool to inspect GitHub Actions’ execution logs
Source: van den Broecke (2021).
Therefore, we used and credited the work by Geonovum to quickly realise an OAFeat deployment. This implies that the following components were chosen and deployed to realize the operational and administrative stacks mentioned in section 5.1. For the former, these software components are necessary:
— Traefik, a frontend proxy/load-balancer and SSL (HTTPS) endpoint;
— pygeoapi, a Python server implementation of the OGC API suite of standards;
— PostgreSQL/PostGIS, a geospatial database.
For the administrative stack, including documentation and monitoring tasks, the following components are used:
— mkdocs, for live documentation and landing pages;
— PGAdmin, a visual PostgreSQL manager;
— GeoHealthCheck, for monitoring the availability, compliance and QoS of OGC web services;
— Portainer, a visual Docker monitor and manager.
5.4 How can the software product be used? Experiment setup
To answer how can the software product be used, we stick to a step-by-step experiment to realise a cloud-based OAFeat data service with pygeoapi in top of the Geonovum’s OGC API Testbed Platform. The step-by-step installation and setup guide85 is described in section 5.4.1, while the resulting software produce in section 5.4.2.
5.4.1 Installation steps
Step 1. Ubuntu Server
For the experiment, EC-JRC provided an empty VM with Ubuntu 21.4 from the hosting provider OVH. The VM’s specifications are 4CPU, 16RAM, 100GB, and IP address 135.125.219.254.
85 For the sake of brevity not all details are listed; full details can be found at https://jrc.map5.nl/chap/setup/. For reference, it
tooks around 3 hours to go through all 9 steps.

58
Box 8. Preparation steps of the Ubuntu server VM
- DNS: create A-record jrc.map5.nl for IP address 135.125.219.254
- local user with full sudo rights e.g. sudo su -
- upgrade server to latest: apt-get update && apt-get -y upgrade
- uninstall Docker (will be reinstalled later in bootstrap)
- provide local user direct SSH root access via authorized_keys (needed for Ansible)
Step 2. Generate GitHub Repo
The process consists of creating a GitHub repo (van den Broecke, 2021) from the Geonovum Template repo (van den Broecke, van Genuchten, Brentjens, and Penninga, 2021), fully described online86. This is different from cloning, as a fresh starter repo is generated without the commit history of the Template repo.
Box 9. Actions to create a GitHub repository from the Template repo
- login on GitHub
- go to https://github.com/Geonovum/ogc-api-testbed
- above file list press green button "Use this template"
- follow the steps indicated, if you want to serve docs on a separate domain indicate "Include all branches"
- the newly created repo here is: https://github.com/justb4/ogc-api-jrc
Step 3. Prepare Local System
On the local system, Ansible and a Git client are required. Ansible can be installed using standard Python pip. Installing a Git client depends on the target system. Make sure the preferred Git client supports a command line git (CLI) tool.
Step 4. Prepare New GitHub Repo
Box 10. Command to clone the Git repo locally
git clone https://github.com/justb4/ogc-api-jrc.git
We will call the root directory of the cloned git repo on the local system “git/” from here.
Step 5. Setup Ansible
Most of the configuration that is specific to the new server is stored under:
— git/ansible/vars (variables and SSH keys).
— git/ansible/hosts (Ansible inventories).
Files under git/ansible/vars need to be always encrypted with Ansible Vault. There, specific (encrypted) versions of these encrypted files are needed.
86 https://github.com/Geonovum/ogc-api-testbed
59
Ansible Modules are also required. Also called as "Roles", Ansible Modules are third-party Ansible components that help with specific tasks.
Box 11. Command to install Ansible Modules
ansible-galaxy install --roles-path ./roles -r requirements.yml
The hostname is crucial for services to function. Two files are of vital importance:
— Ansible Inventory, the target remote system: git/ansible/hosts/prod.yml
— The environment file used by all services: git/services/env.sh
SSH Keys are used to invoke actions on the server both from GitHub Actions (via GitHub Secrets) and from the local Ansible setup. Plus a set of authorized_keys for the admin SSH user.
All credentials needed by the services are in a single file git/ansible/vars/vars.yml. This file is created from example vars.example.yml in that directory.
In the GitHub repo Settings, then Secrets and create these three Secrets:
— ANSIBLE_INVENTORY_PROD - content of prod.yml
— ANSIBLE_SSH_PRIVATE_KEY
— ANSIBLE_VAULT_PASSWORD
Encrypt Ansible vars files using ansible-vault so that they still can be stored in GitHub.This way, GitHub Secrets contain the Ansible Vault password. Nevertheless, it is a must to never commit unencrypted files for obvious security reasons.
Finally, we do not want GitHub Workflows to take effect immediately. So disable them temporarily by renaming the directory. Step 9 will enable them again.
Box 12. Actions to disable GitHub Workflows
- cd git/.github/workflows
- git mv workflows workflows.not
- git add .
- git commit -m "disable workflows"
- git push
Step 6. Remove Unneeded Services
Since Geonovum’s OGC API Testbed Platform already contains multiple OAFeat components from different projects, after generating the GitHub repo from the Geonovum Template (Step 2), all other services but pygeoapi are removed.

60
Box 13. Actions to disable GitHub Workflows
- remove git/docs (we are using /home service as landing page and documentation).
- under /services/ remove: /ldproxy, /geoserver, /qgis, /goaf, /pycsw
- under .github/workflows/ remove deploy.<service>.yml for these services
- in ansible/deploy.yml remove all tasks for these services
- add/commit/push all your above changes to the GitHub repo.
This running instance of pygeoapi comes with some sample data collections like a subset of Dutch Addresses and Windmills for demonstration purpose. Therefore, the default pygeoapi configuration87 allows to use the pygeoapi capability to connect to remote WFS services in real time like the Cultural Heritage Agency of the Netherlands88. For the experiment here, a sample of the GeoPackage dataset with Addresses (centered in Helsinki) generated in Chapter 5 was also added.
Step 7. Bootstrap/provision Server
Bootstrap (provision the server VM) in a single playbook. Save the logfile for analysis.
Box 14. Command to bootstrapping a Ansible playbook
ansible-playbook -v --vault-password-file ~/.ssh/ansible-vault/ogc-api-jrc.txt bootstrap.yml -i hosts/prod.yml > bootstrap.log 2>&1
Observe output for errors. In case of errors and after fixes, simply rerun the above Playbook. Site should be running at: https://jrc.map5.nl. Check with Portainer https://jrc.map5.nl/portainer/.
Notice that the site is always accessed via HTTPS. The Traefik frontend proxy/router has automatically obtained SSL-certificates from LetsEncrypt and will also renew automatically.
Step 8. Resolve Issues
These are typical issues found and resolved: make sure the gh-key.rsa.pub is present in both /root and /home/<admin user> .ssh/authorized_keys
Step 9. Enable GitHub Workflows
Box 15. Commands to enable GitHub Workflows by reaming the directory
- git mv workflows.not workflows
- git add .
- git commit -m "enable workflows"
- git push
These were the main steps taken. From here on services/site can be completely maintained via GitHub. As GitHub also has a web-based user interface that includes a text editor, it is not even required to have Git installed.
87 https://github.com/justb4/ogc-api-jrc/blob/main/services/pygeoapi/local.config.yml 88 http://www.e-rihs.eu/partners/rce-nl/
61
5.4.2 Results
Source code to make cloud-based data services based on OAFeat, bootstrapping and continuous integration/deployment (CI/CD) is available on the GitHub repo https://github.com/justb4/ogc-api-jrc. The online server can be accessed via the landing page https://jrc.map5.nl/ . That web site also includes documentation and access to other web apps like GeoHealthCheck and Portainer. PostGIS is not yet used by pygeoapi but may be in a later stage. The server provides direct secure access to PostGIS (port 5432), which can be easily managed with the pgAdmin4 tool.
The data-access endpoint via OAFeat provided by pygeoapi is accessible on https://jrc.map5.nl/pygeoapi/. Through this URL all data collections can be browsed. But the URL can also be used in OAFeat compatible applications like QGIS. In that case GeoJSON is the main data encoding standard.
5.5 Why does the software product make a contribution?
The main conclusion of this chapter is that using the Geonovum OGC API Testbed Template repository conveniently allowed us to setup a complete and secured server in just a few hours. If we would have to start from scratch and without GitOps automation, thus installing manually, this could well take in the order of days. In addition, server maintenance would have been more expensive in time. Also the automation and configuration of SSL-certificates via Traefik saved quite an amount of time. In summary the combined use of the lightweight GitOps method using GitHub Workflows and Ansible worked out very well.
The software product described here contains a single service instance without horizontal scaling, using basic Docker Compose for deployment. For more scalable and orchestrated service deployments, we recommend moving to Kubernetes while still maintaining the GitOps principles. When using K8s it is best to obtain Managed Kubernetes from a hosting provider. The main three are Google (GCP), Microsoft (AKS in Azure) and Amazon (EKS). For the sandbox experiment here, we opted for a local, well-reputed provider (OHV) indeed. Due to the short timescale for conducting this experiment, the availability of the Geonovum platform (June 2021) using K8s was not feasible.
62
6 Combining public sector and citizen-generated data - the case of
addresses89
6.1 Introduction
The European Commission, through the European strategy for data (European Commission, 2020a), envisions the Europe’s digital future through the establishment of a European single market for data ensuring the free flow of data, including personal and non-personal, across actors and sectors, to stimulate data-driven innovation and create value for the economy and society. This chapter addresses the topic of integrating data produced from the public sector and from citizens, with a focus on the geospatial domain and within a European dimension in mind. In the European strategy for data, data contributed by citizens—a phenomenon referred to as ‘data altruism’—play a central role and shall happen in full compliance with the General Data Protection Regulation (European Parliament and Council, 2016). The potential of citizen-generated data to improve policy making has been already widely recognised by the European Commission, e.g. in the fields of citizen science (European Commission, 2020b) and, more specific to the geospatial domain, Spatial Data Infrastructures (Schade et al., 2020), where citizen-generated data contributes to their evolution into modern geospatial data ecosystems (Kotsev et al., 2020).
This study explicitly focuses on citizen-generated data from OpenStreetMap (OSM), the most well-known and successful crowd-sourced geographic information project. Started in 2004 and currently (November 2021) counting more than 1.7 million unique contributors90, OSM consists of a global database of geospatial vector features available under the Open Database License (ODbL). Thanks to the freedom of use and open access ensured by the licence, as well as its richness and level of detail, the OSM database is currently used by a variety of actors, including governments, private companies and non-profit organisations (Mooney and Minghini, 2017). The OSM project is supported by the OpenStreetMap Foundation (OSMF)91, a not-for-profit organization that manages infrastructure (servers and services) and coordinates various working groups and national local chapters related to the project. The problem of integrating OSM with other datasets, mainly authoritative datasets produced by governmental National Mapping Agencies (NMAs)—which is discussed later in this chapter—has been addressed since the very early OSM literature in close connection with research on OSM quality; notable examples include Haklay (2010), Girres and Touya (2010) and Neis et al. (2012). Several experiments were carried out on specific features (roads, buildings, land use areas, etc.) and using OSM and authoritative data from many regions in the world. However, those experiences still appear isolated as they mostly describe specific use cases, are only tested on small (local or regional) areas, are bounded to particular authoritative datasets and often rely on data model-dependent procedures, which are hard, if not impossible, to generalise and replicate.
With this background, this chapter aims to be a first step towards a comprehensive assessment of the enablers and barriers to integrating authoritative datasets from European NMAs with datasets from OSM. The overall purpose is to provide a preliminary set of recommendations on interoperability aspects, not only semantic but also technical, organisational and legal, to ultimately guide the establishment of European data spaces. To achieve this, the study reported here proposes an experiment based on Free and Open Source Software for Geospatial (FOSS4G) to test the integration of country-wide address datasets from two European NMAs and the OSM project, discussing the outcomes and identifying lessons learnt and, mostly technical, pros/cons of the data integration process. To the best of the authors’ knowledge, this is the first attempt to integrate OSM and nationally authoritative datasets. Evaluating the quality of OSM is clearly a key and preliminary step for such integration, but it is outside the scope of this study; an extensive review on how OSM quality has been measured to date is available in Senaratne et al. (2017).
The remainder of the chapter is structured as follows. After an analysis of the state of the art on the integration between authoritative and OSM datasets provided in section 6.2, section 6.3 describes the data and section 6.4 the integration experiment applied to the address datasets of Finland and the Netherlands using FOSS4G technology. Section 6.5 presents three interviews with NMAs discussing the use of OSM data in their institutional activities. Drawing from the results of the experiment, section 6.6 closes the chapter by discussing implications of, and providing recommendations on, the integration of citizen-generated data (and OSM in particular) for the successful establishment of European data spaces.
89 This chapter draws on Sarretta and Minghini (2021) 90 https://wiki.openstreetmap.org/wiki/Stats 91 https://wiki.osmfoundation.org
63
Box 16. Main terminology as it is used in this chapter
Authoritative data: refers to (geographic) data provided and/or produced by governmental agencies and/or providers.
Citizen-generated data: refers to (geographic) data provided and/or produced by individuals.
OpenStreetMap (OSM): a collaborate, citizen-driven project to create a word-wide geographic database.
6.2 Background: integration between authoritative and OpenStreetMap data
Being a citizen-driven project, OSM has been studied—and sometimes questioned—since its very beginning in relation to the quality of its data. This aspect was first addressed by some early studies, e.g. Haklay (2010), and Girres and Touya (2010), who described and measured various quality parameters of OSM data through in-depth assessments, e.g. attribute, semantic, positional and temporal accuracy, logical consistency, completeness, lineage, purpose and usage. Quality assessment methods are not only relevant to OSM but, more generally, for all types of Volunteered Geographic Information (VGI) (Senaratne et al., 2017). Many studies investigated different quality elements, focusing on the semantic (Vandecasteele and Devillers, 2013) and positional (Cipeluch et al., 2010; Helbich et al., 2012) aspects, completeness (Koukoletsos et al., 2012), interoperability (Minghini et al., 2019) or, more frequently, on a combination of them, e.g. Fan et al. (2014).
Most of the available studies on OSM quality adopted an extrinsic approach, i.e. they compared OSM data with reference datasets produced by NMAs or local, national or international authoritative bodies that are considered as the ground truth. Fernandes et al. (2020) provided a bibliometric review of 37 studies on the integration between VGI and authoritative data, even if only 14 of them use OSM as the main VGI source. Among them, Du et al. (2012), Abdolmajidi et al. (2014), Fan et al. (2016) and Brovelli et al. (2017) developed and tested methodologies to evaluate the quality of OSM data by comparing it against their authoritative counterparts, using the road network as a use case applied at the local level (city or town) in different places around Europe (UK, Sweden, Germany and Italy, respectively). Instead of comparing OSM with authoritative datasets, others such as Barron et al. (2014), Minghini and Frassinelli (2019) and Madubedube et al. (2021) assessed OSM quality through intrinsic approaches, i.e. by only looking at the history of the OSM data itself (e.g. the update frequency or the total number and nature of contributors editing the same objects).
Nevertheless, just a few authors have focused their efforts on combining authoritative and/or OSM data together to produce integrated datasets. This conflation process involves different tasks, which can include updating, change detection, enhancement and integration of spatial data (Wiemann and Bernard, 2010). Pourabdollah et al. (2013) compared OSM and the British Ordnance Survey’s Vector Map District data on road network. Differently from many other authors, who focused their attention on geometrical accuracy and completeness, they focused on semantic information, conflating road names and reference codes with the main result to enrich the OSM dataset with authoritative information. Silva et al. (2021) analysed the potential contribution of OSM data to the growing number of mapped features in the authoritative data of the Brazilian road network, confirming OSM as a promising source of information in areas with missing or outdated map data. Zhou et al. (2015) presented instead an extensive method used to dynamically integrate OSM data from the neighbouring countries Vietnam and Pakistan into a common data model. Other studies focused on the semantic enrichment of authoritative datasets by extracting information from specific OSM tags related to building usage (residential/non-residential), e.g. Kunze and Hecht (2015). Similarly, Fonte et al. (2017a) developed an automated, FOSS4G-based application to convert OSM into land use/cover maps having the same nomenclature of authoritative products. This allowed not only to compare the OSM-derived products against the authoritative ones, but also to enrich the latter through the production of integrated datasets (Fonte et al., 2017b). However, the most frequent and structured case of integration between OSM and authoritative datasets to date is represented by so-called OSM imports, or bulk imports92. These consist of uploading external datasets, produced e.g. by governments or other institutions and having a licence compatible with the ODbL, into the OSM database. Imports are tricky operations and shall be performed
92 https://wiki.openstreetmap.org/wiki/Import
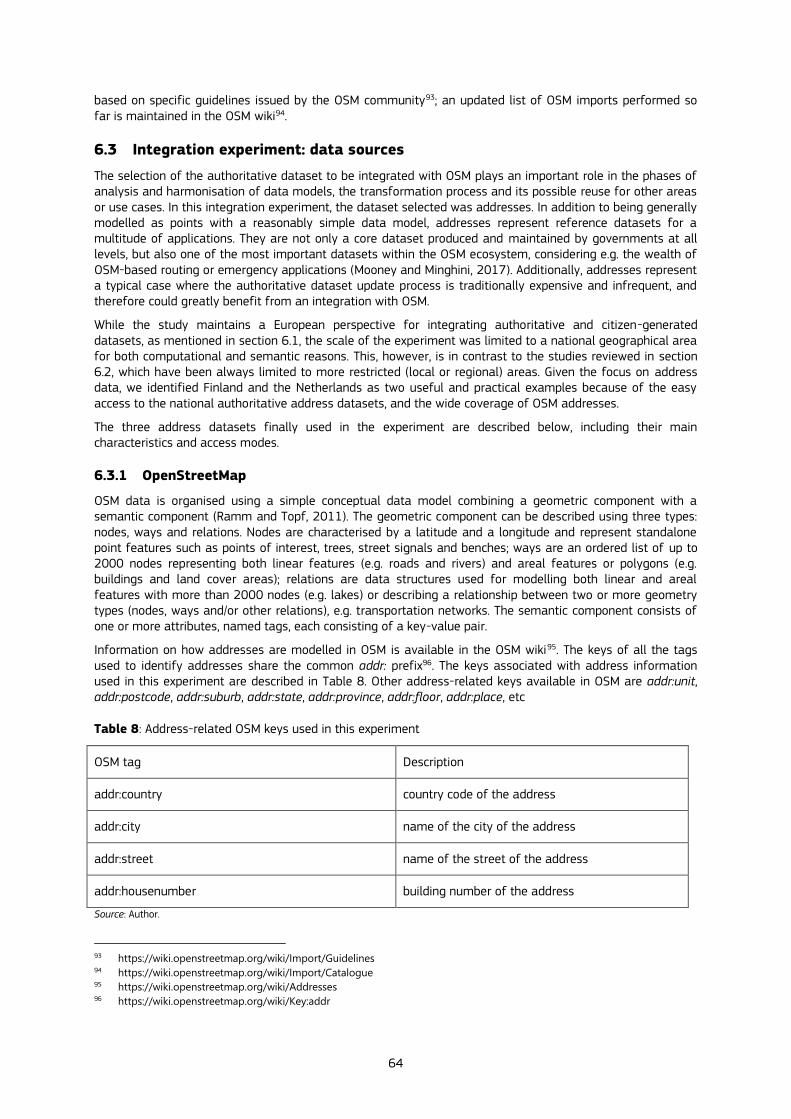
64
based on specific guidelines issued by the OSM community93; an updated list of OSM imports performed so far is maintained in the OSM wiki94.
6.3 Integration experiment: data sources
The selection of the authoritative dataset to be integrated with OSM plays an important role in the phases of analysis and harmonisation of data models, the transformation process and its possible reuse for other areas or use cases. In this integration experiment, the dataset selected was addresses. In addition to being generally modelled as points with a reasonably simple data model, addresses represent reference datasets for a multitude of applications. They are not only a core dataset produced and maintained by governments at all levels, but also one of the most important datasets within the OSM ecosystem, considering e.g. the wealth of OSM-based routing or emergency applications (Mooney and Minghini, 2017). Additionally, addresses represent a typical case where the authoritative dataset update process is traditionally expensive and infrequent, and therefore could greatly benefit from an integration with OSM.
While the study maintains a European perspective for integrating authoritative and citizen-generated datasets, as mentioned in section 6.1, the scale of the experiment was limited to a national geographical area for both computational and semantic reasons. This, however, is in contrast to the studies reviewed in section 6.2, which have been always limited to more restricted (local or regional) areas. Given the focus on address data, we identified Finland and the Netherlands as two useful and practical examples because of the easy access to the national authoritative address datasets, and the wide coverage of OSM addresses.
The three address datasets finally used in the experiment are described below, including their main characteristics and access modes.
6.3.1 OpenStreetMap
OSM data is organised using a simple conceptual data model combining a geometric component with a semantic component (Ramm and Topf, 2011). The geometric component can be described using three types: nodes, ways and relations. Nodes are characterised by a latitude and a longitude and represent standalone point features such as points of interest, trees, street signals and benches; ways are an ordered list of up to 2000 nodes representing both linear features (e.g. roads and rivers) and areal features or polygons (e.g. buildings and land cover areas); relations are data structures used for modelling both linear and areal features with more than 2000 nodes (e.g. lakes) or describing a relationship between two or more geometry types (nodes, ways and/or other relations), e.g. transportation networks. The semantic component consists of one or more attributes, named tags, each consisting of a key-value pair.
Information on how addresses are modelled in OSM is available in the OSM wiki95. The keys of all the tags used to identify addresses share the common addr: prefix96. The keys associated with address information used in this experiment are described in Table 8. Other address-related keys available in OSM are addr:unit, addr:postcode, addr:suburb, addr:state, addr:province, addr:floor, addr:place, etc
Table 8: Address-related OSM keys used in this experiment
OSM tag Description
addr:country country code of the address
addr:city name of the city of the address
addr:street name of the street of the address
addr:housenumber building number of the address
Source: Author.
93 https://wiki.openstreetmap.org/wiki/Import/Guidelines 94 https://wiki.openstreetmap.org/wiki/Import/Catalogue 95 https://wiki.openstreetmap.org/wiki/Addresses 96 https://wiki.openstreetmap.org/wiki/Key:addr
65
From the geometrical perspective, there is not a single way to model OSM addresses. The addr: keys can be associated to single nodes outside, inside or on the perimeter of a building footprint; or they can be directly associated to the ways representing building polygons. Such different mapping practices are usually agreed by local, regional or national OSM communities and may follow rules issued by national registry/statistical services. Address information in OSM can also be added to points of interest such as shops, museums, offices, etc., leading sometimes to duplicated addresses which are already available in other objects.
In the case of OSM addresses in Finland, all the approaches mentioned above are used and there does not seem to be specific internal rule agreed by the community on how to map this object category. In the Netherlands, the OSM community relies heavily on imports of authoritative data, so there are definitely fewer inconsistencies to deal with in the way addresses are included in the OSM database.
Data extraction and download from the OSM database can be done in different ways, depending on the user’s needs. The most popular include:
— APIs, e.g. the OSM API97 and the Overpass API98;
— Predefined OSM extracts, e.g. provided by GeoFabrik99 or the Humanitarian OpenStreetMap Team100; and
— Planet OSM, a weekly-updated copy of the whole OSM database101.
For the purpose of this work, OSM addresses were extracted and downloaded from the Planet OSM on July 26, 2021 using the binary Protocol Buffers File (PBF) (see Chapter 2 for details about PBF).
6.3.2 National Land Survey of Finland
The National Land Survey (NLS) of Finland is the Finnish National Mapping Agency (NMA)102. As such, it is the Finnish governmental provider of and responsible for the national geospatial information. The NLS has recently started to provide access to its geospatial datasets through the newly established OGC API - Features standard103, which provides an easy and developer-friendly way to both expose and consume geospatial vector features on the web. The OGC API - Features service endpoint for addresses104 followed the recently developed INSPIRE (European Parliament and Council, 2007) Good Practice for the provision of INSPIRE download services based on OGC API - Features105 and the address data exposed by the API were compliant with the INSPIRE Addresses data specifications (INSPIRE Thematic Working Group Addresses, 2014) and the INSPIRE UML-to-GeoJSON encoding rule106. The NLS address dataset was available in the WGS84 geographic coordinate reference system according to the OGC API - Features standard and the GeoJSON specification Internet Engineering Task Force (2016). The draft data model is also published107 and was refined during 2021. The NLS address dataset was available under CC BY 4.0 licence (Creative Commons, 2021a) and modelled as point features; among all the available attributes (which also include INSPIRE-specific information on e.g. identification and temporal context), those specifically related to addresses are listed in Table 9. During this work, the service was available in beta version, was open and free of charge and did not require registration, but both the service and related materials were only available for testing.
97 https://wiki.openstreetmap.org/wiki/API 98 https://wiki.openstreetmap.org/wiki/Overpass_API 99 https://download.geofabrik.de 100 https://export.hotosm.org/en/v3 101 https://planet.openstreetmap.org 102 https://www.maanmittauslaitos.fi/en 103 https://ogcapi.ogc.org/feature 104 https://beta-paikkatieto.maanmittauslaitos.fi/inspire-addresses/features/v1 105 https://github.com/INSPIRE-MIF/gp-ogc-api-features 106 https://github.com/INSPIRE-MIF/2017.2 107 https://tietomallit.suomi.fi/model/ostieto
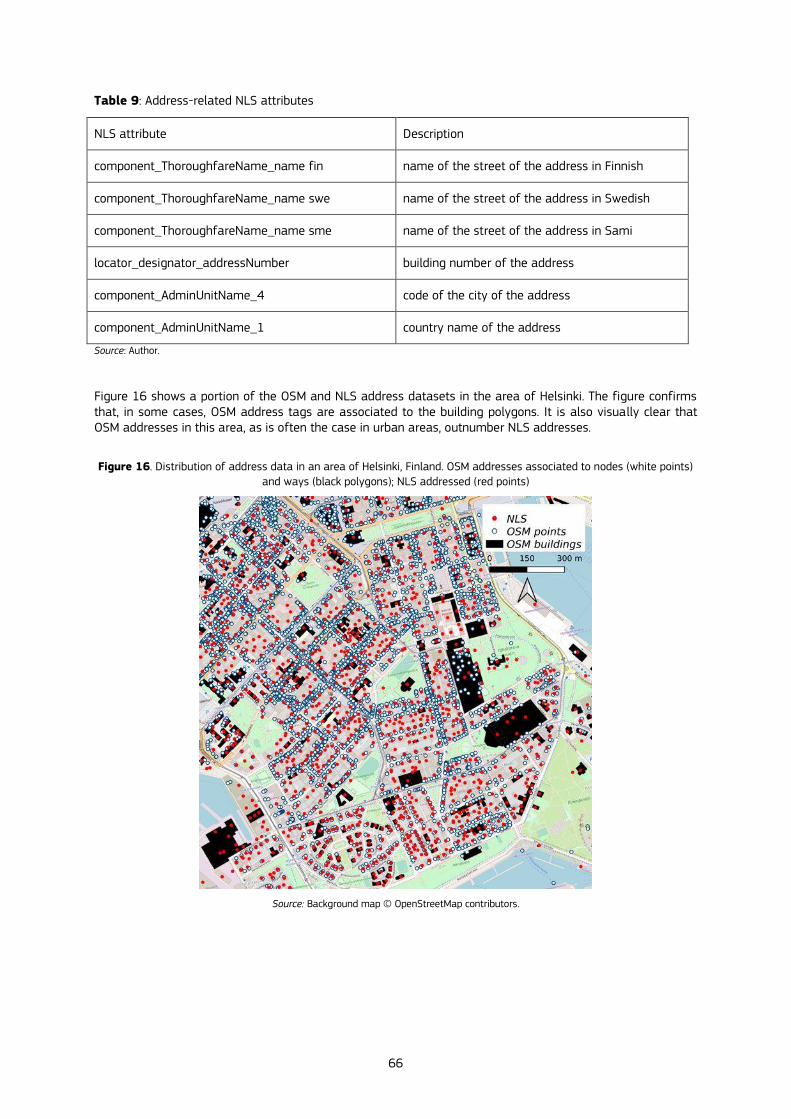
66
Table 9: Address-related NLS attributes
NLS attribute Description
component_ThoroughfareName_name fin name of the street of the address in Finnish
component_ThoroughfareName_name swe name of the street of the address in Swedish
component_ThoroughfareName_name sme name of the street of the address in Sami
locator_designator_addressNumber building number of the address
component_AdminUnitName_4 code of the city of the address
component_AdminUnitName_1 country name of the address
Source: Author.
Figure 16 shows a portion of the OSM and NLS address datasets in the area of Helsinki. The figure confirms that, in some cases, OSM address tags are associated to the building polygons. It is also visually clear that OSM addresses in this area, as is often the case in urban areas, outnumber NLS addresses.
Figure 16. Distribution of address data in an area of Helsinki, Finland. OSM addresses associated to nodes (white points)
and ways (black polygons); NLS addressed (red points)
Source: Background map © OpenStreetMap contributors.

67
6.3.3 Dutch cadastre of addresses and buildings
In the Netherlands, information on both addresses and buildings is managed through the Dutch cadastre of addresses and buildings (BAG: Basisregistratie Adressen en Gebouwen108), which is part of the government system of key registers. All municipalities are the source holders of the BAG and make data about addresses and buildings centrally available through the National Facility BAG (LV BAG).
In the INSPIRE Geoportal, two datasets are available109 in relation to the data theme Addresses, both providing view and download services:
— Adressen: this is the original BAG dataset containing both buildings and addresses. The format is a highly extended XML with complete change-history, which is quite complex to handle.
— Adressen (INSPIRE geharmoniseerd): this includes WFS and ATOM services with INSPIRE-harmonised address data, but the services are rate-limited to protect the infrastructure. Scripts can be developed to download the full national dataset with small bounding boxes and then concatenating results, but that was not feasible during this work.
The open source project NLExtract110 is available as an Extract-Transform-Load (ETL) tool for BAG and other main datasets (Topography, Cadastral Parcels, etc.) and Dutch addresses are also available as a single complete set in a CSV table. A webshop portal111 sells processed national datasets, including addresses in CSV and GeoPackage formats, providing significant discounts for non-commercial use (e.g. OpenStreetMap mappers and research institutions). Therefore, this option was chosen as an easier alternative to download the full BAG dataset. It is worth mentioning that the Dutch OSM community has been working since around 2014 to import BAG addresses into OSM. Information from BAG is imported in OSM including a few tags to allow future updates of the data, namely the tags source=BAG and source:date=YYYY-MM-DD. Table 10 shows BAG attributes closely related to addresses.
Table 10: Address-related BAG attributes
BAG attribute Description
openbareruimte public space
huisnummer house number
huisletter house letter
huisnummertoevoeging house number addition
postcode postal code
woonplaats Locality
gemeente municipality
provincie province
Source: Author.
108 https://www.kadaster.nl/zakelijk/registraties/basisregistraties/bag 109 https://inspire-geoportal.ec.europa.eu/results.html?country=nl&view=details&theme=ad 110 https://github.com/nlextract/NLExtract 111 https://geotoko.nl
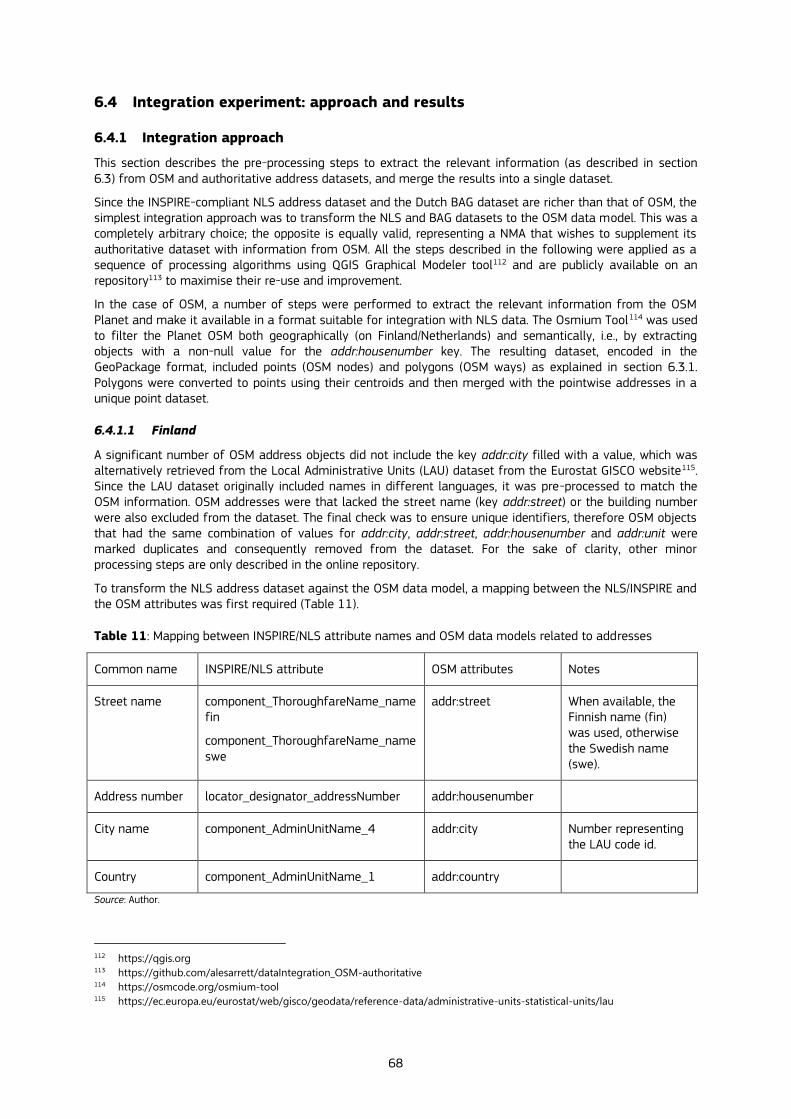
68
6.4 Integration experiment: approach and results
6.4.1 Integration approach
This section describes the pre-processing steps to extract the relevant information (as described in section 6.3) from OSM and authoritative address datasets, and merge the results into a single dataset.
Since the INSPIRE-compliant NLS address dataset and the Dutch BAG dataset are richer than that of OSM, the simplest integration approach was to transform the NLS and BAG datasets to the OSM data model. This was a completely arbitrary choice; the opposite is equally valid, representing a NMA that wishes to supplement its authoritative dataset with information from OSM. All the steps described in the following were applied as a sequence of processing algorithms using QGIS Graphical Modeler tool112 and are publicly available on an repository113 to maximise their re-use and improvement.
In the case of OSM, a number of steps were performed to extract the relevant information from the OSM Planet and make it available in a format suitable for integration with NLS data. The Osmium Tool114 was used to filter the Planet OSM both geographically (on Finland/Netherlands) and semantically, i.e., by extracting objects with a non-null value for the addr:housenumber key. The resulting dataset, encoded in the GeoPackage format, included points (OSM nodes) and polygons (OSM ways) as explained in section 6.3.1. Polygons were converted to points using their centroids and then merged with the pointwise addresses in a unique point dataset.
6.4.1.1 Finland
A significant number of OSM address objects did not include the key addr:city filled with a value, which was alternatively retrieved from the Local Administrative Units (LAU) dataset from the Eurostat GISCO website115. Since the LAU dataset originally included names in different languages, it was pre-processed to match the OSM information. OSM addresses were that lacked the street name (key addr:street) or the building number were also excluded from the dataset. The final check was to ensure unique identifiers, therefore OSM objects that had the same combination of values for addr:city, addr:street, addr:housenumber and addr:unit were marked duplicates and consequently removed from the dataset. For the sake of clarity, other minor processing steps are only described in the online repository.
To transform the NLS address dataset against the OSM data model, a mapping between the NLS/INSPIRE and the OSM attributes was first required (Table 11).
Table 11: Mapping between INSPIRE/NLS attribute names and OSM data models related to addresses
Common name INSPIRE/NLS attribute OSM attributes Notes
Street name component_ThoroughfareName_name fin
component_ThoroughfareName_name swe
addr:street When available, the Finnish name (fin) was used, otherwise the Swedish name (swe).
Address number locator_designator_addressNumber addr:housenumber
City name component_AdminUnitName_4 addr:city Number representing the LAU code id.
Country component_AdminUnitName_1 addr:country
Source: Author.
112 https://qgis.org 113 https://github.com/alesarrett/dataIntegration_OSM-authoritative 114 https://osmcode.org/osmium-tool 115 https://ec.europa.eu/eurostat/web/gisco/geodata/reference-data/administrative-units-statistical-units/lau
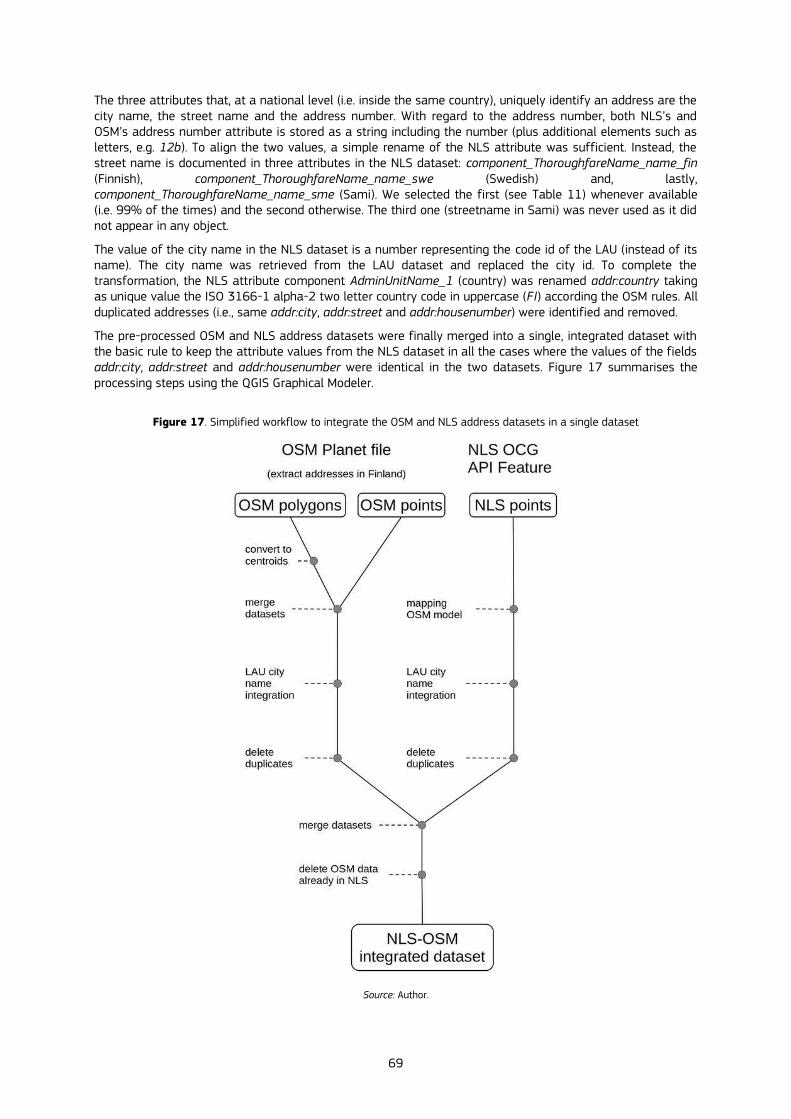
69
The three attributes that, at a national level (i.e. inside the same country), uniquely identify an address are the city name, the street name and the address number. With regard to the address number, both NLS’s and OSM’s address number attribute is stored as a string including the number (plus additional elements such as letters, e.g. 12b). To align the two values, a simple rename of the NLS attribute was sufficient. Instead, the street name is documented in three attributes in the NLS dataset: component_ThoroughfareName_name_fin (Finnish), component_ThoroughfareName_name_swe (Swedish) and, lastly, component_ThoroughfareName_name_sme (Sami). We selected the first (see Table 11) whenever available (i.e. 99% of the times) and the second otherwise. The third one (streetname in Sami) was never used as it did not appear in any object.
The value of the city name in the NLS dataset is a number representing the code id of the LAU (instead of its name). The city name was retrieved from the LAU dataset and replaced the city id. To complete the transformation, the NLS attribute component AdminUnitName_1 (country) was renamed addr:country taking as unique value the ISO 3166-1 alpha-2 two letter country code in uppercase (FI) according the OSM rules. All duplicated addresses (i.e., same addr:city, addr:street and addr:housenumber) were identified and removed.
The pre-processed OSM and NLS address datasets were finally merged into a single, integrated dataset with the basic rule to keep the attribute values from the NLS dataset in all the cases where the values of the fields addr:city, addr:street and addr:housenumber were identical in the two datasets. Figure 17 summarises the processing steps using the QGIS Graphical Modeler.
Figure 17. Simplified workflow to integrate the OSM and NLS address datasets in a single dataset
Source: Author.
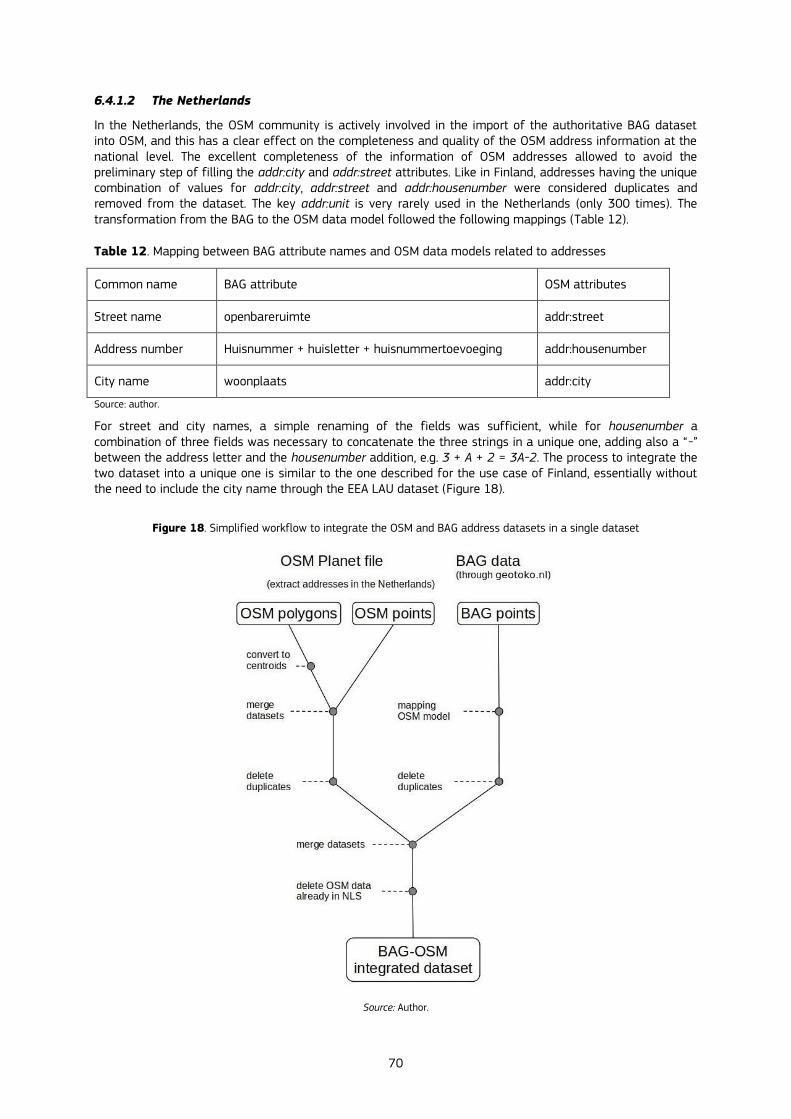
70
6.4.1.2 The Netherlands
In the Netherlands, the OSM community is actively involved in the import of the authoritative BAG dataset into OSM, and this has a clear effect on the completeness and quality of the OSM address information at the national level. The excellent completeness of the information of OSM addresses allowed to avoid the preliminary step of filling the addr:city and addr:street attributes. Like in Finland, addresses having the unique combination of values for addr:city, addr:street and addr:housenumber were considered duplicates and removed from the dataset. The key addr:unit is very rarely used in the Netherlands (only 300 times). The transformation from the BAG to the OSM data model followed the following mappings (Table 12).
Table 12. Mapping between BAG attribute names and OSM data models related to addresses
Common name BAG attribute OSM attributes
Street name openbareruimte addr:street
Address number Huisnummer + huisletter + huisnummertoevoeging addr:housenumber
City name woonplaats addr:city
Source: author.
For street and city names, a simple renaming of the fields was sufficient, while for housenumber a combination of three fields was necessary to concatenate the three strings in a unique one, adding also a “-” between the address letter and the housenumber addition, e.g. 3 + A + 2 = 3A-2. The process to integrate the two dataset into a unique one is similar to the one described for the use case of Finland, essentially without the need to include the city name through the EEA LAU dataset (Figure 18).
Figure 18. Simplified workflow to integrate the OSM and BAG address datasets in a single dataset
Source: Author.
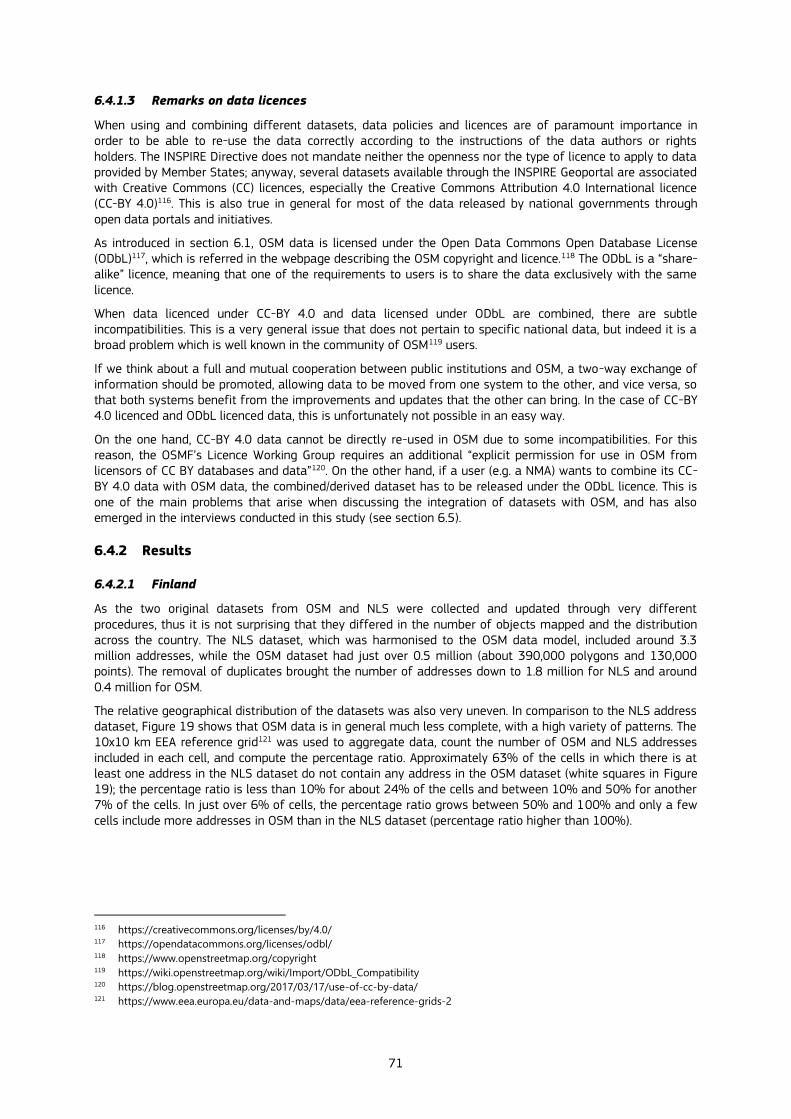
71
6.4.1.3 Remarks on data licences
When using and combining different datasets, data policies and licences are of paramount importance in order to be able to re-use the data correctly according to the instructions of the data authors or rights holders. The INSPIRE Directive does not mandate neither the openness nor the type of licence to apply to data provided by Member States; anyway, several datasets available through the INSPIRE Geoportal are associated with Creative Commons (CC) licences, especially the Creative Commons Attribution 4.0 International licence (CC-BY 4.0)116. This is also true in general for most of the data released by national governments through open data portals and initiatives.
As introduced in section 6.1, OSM data is licensed under the Open Data Commons Open Database License (ODbL)117, which is referred in the webpage describing the OSM copyright and licence.118 The ODbL is a “share-alike” licence, meaning that one of the requirements to users is to share the data exclusively with the same licence.
When data licenced under CC-BY 4.0 and data licensed under ODbL are combined, there are subtle incompatibilities. This is a very general issue that does not pertain to specific national data, but indeed it is a broad problem which is well known in the community of OSM119 users.
If we think about a full and mutual cooperation between public institutions and OSM, a two-way exchange of information should be promoted, allowing data to be moved from one system to the other, and vice versa, so that both systems benefit from the improvements and updates that the other can bring. In the case of CC-BY 4.0 licenced and ODbL licenced data, this is unfortunately not possible in an easy way.
On the one hand, CC-BY 4.0 data cannot be directly re-used in OSM due to some incompatibilities. For this reason, the OSMF’s Licence Working Group requires an additional “explicit permission for use in OSM from licensors of CC BY databases and data”120. On the other hand, if a user (e.g. a NMA) wants to combine its CC-BY 4.0 data with OSM data, the combined/derived dataset has to be released under the ODbL licence. This is one of the main problems that arise when discussing the integration of datasets with OSM, and has also emerged in the interviews conducted in this study (see section 6.5).
6.4.2 Results
6.4.2.1 Finland
As the two original datasets from OSM and NLS were collected and updated through very different procedures, thus it is not surprising that they differed in the number of objects mapped and the distribution across the country. The NLS dataset, which was harmonised to the OSM data model, included around 3.3 million addresses, while the OSM dataset had just over 0.5 million (about 390,000 polygons and 130,000 points). The removal of duplicates brought the number of addresses down to 1.8 million for NLS and around 0.4 million for OSM.
The relative geographical distribution of the datasets was also very uneven. In comparison to the NLS address dataset, Figure 19 shows that OSM data is in general much less complete, with a high variety of patterns. The 10x10 km EEA reference grid121 was used to aggregate data, count the number of OSM and NLS addresses included in each cell, and compute the percentage ratio. Approximately 63% of the cells in which there is at least one address in the NLS dataset do not contain any address in the OSM dataset (white squares in Figure 19); the percentage ratio is less than 10% for about 24% of the cells and between 10% and 50% for another 7% of the cells. In just over 6% of cells, the percentage ratio grows between 50% and 100% and only a few cells include more addresses in OSM than in the NLS dataset (percentage ratio higher than 100%).
116 https://creativecommons.org/licenses/by/4.0/ 117 https://opendatacommons.org/licenses/odbl/ 118 https://www.openstreetmap.org/copyright 119 https://wiki.openstreetmap.org/wiki/Import/ODbL_Compatibility 120 https://blog.openstreetmap.org/2017/03/17/use-of-cc-by-data/ 121 https://www.eea.europa.eu/data-and-maps/data/eea-reference-grids-2
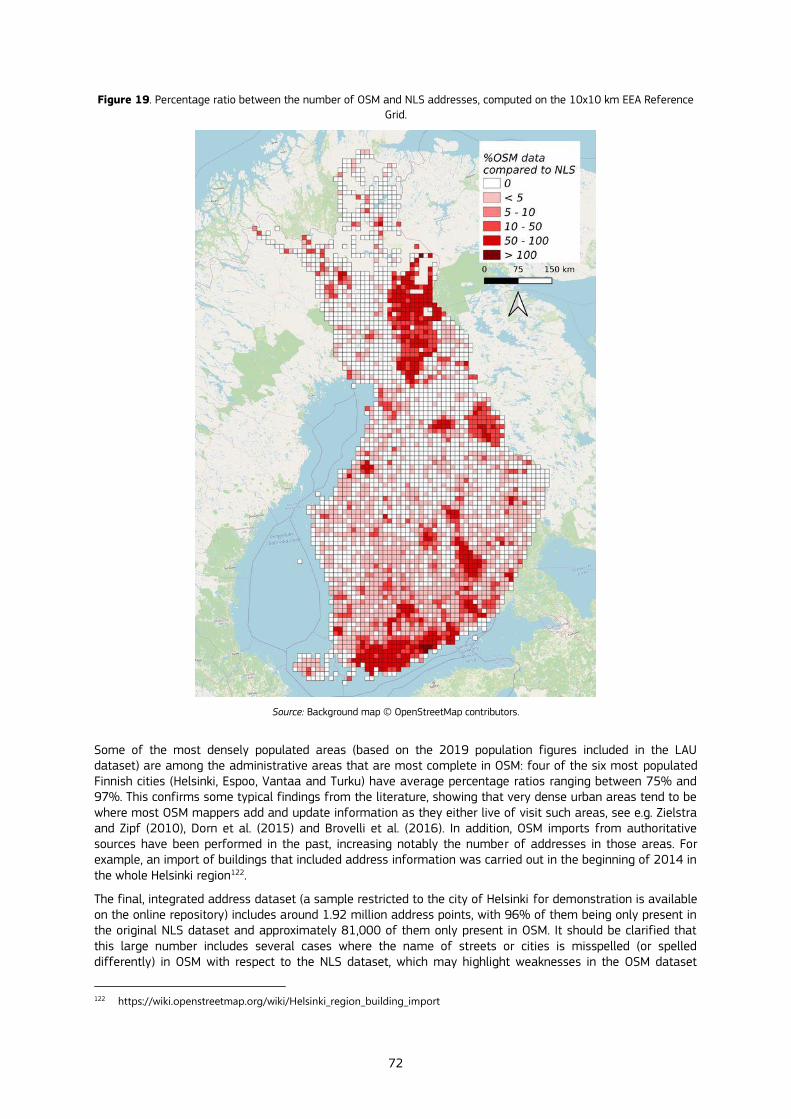
72
Figure 19. Percentage ratio between the number of OSM and NLS addresses, computed on the 10x10 km EEA Reference
Grid.
Source: Background map © OpenStreetMap contributors.
Some of the most densely populated areas (based on the 2019 population figures included in the LAU dataset) are among the administrative areas that are most complete in OSM: four of the six most populated Finnish cities (Helsinki, Espoo, Vantaa and Turku) have average percentage ratios ranging between 75% and 97%. This confirms some typical findings from the literature, showing that very dense urban areas tend to be where most OSM mappers add and update information as they either live of visit such areas, see e.g. Zielstra and Zipf (2010), Dorn et al. (2015) and Brovelli et al. (2016). In addition, OSM imports from authoritative sources have been performed in the past, increasing notably the number of addresses in those areas. For example, an import of buildings that included address information was carried out in the beginning of 2014 in the whole Helsinki region122.
The final, integrated address dataset (a sample restricted to the city of Helsinki for demonstration is available on the online repository) includes around 1.92 million address points, with 96% of them being only present in the original NLS dataset and approximately 81,000 of them only present in OSM. It should be clarified that this large number includes several cases where the name of streets or cities is misspelled (or spelled differently) in OSM with respect to the NLS dataset, which may highlight weaknesses in the OSM dataset
122 https://wiki.openstreetmap.org/wiki/Helsinki_region_building_import

73
rather than gaps in the NLS dataset. However, there are also cases where OSM actually includes more detailed or up-to-date information and, therefore, improves the authoritative NLS dataset. Figure 20 shows an area in Helsinki where addresses in the NLS dataset, each associated to a single building, correspond to multiple addresses in the OSM dataset, where the building numbers are complemented by letters (A, B, C, etc.) and have a more specific position, most probably associated with distinct building entrances.
Figure 20: Integrated address dataset in an area in Helsinki showing the origin of each address point: OSM dataset (red),
NLS dataset (black)
Source: Background map © OpenStreetMap contributors.
6.4.2.2 The Netherlands
As described in section 6.4.1.2, the Dutch OSM community routinely imports BAG data into the OSM database, keeping it very well updated with the authoritative source. The total number of addresses in the BAG database is about 9.4M, while in OSM is only 80,000 less (9.3M).
Similar to the case of Finland, the authoritative address dataset (BAG) was considered as the reference one and the relative percentage of OSM compared to BAG was calculated. Figure 21 shows that OSM data is in general very aligned with BAG, with around 2% of cells of the 10x10 km EEA reference grid where OSM data was less than 95% of BAG and more than 55% of cells having almost exactly the same amount of addresses in both datasets (class 99-101%). The fact that a few grid cells (30) show more addresses in OSM than in BAG is mainly due to camping areas where cottages still have addresses assigned in OSM, while their addresses were deleted from BAG in a revision of the database (see Figure 22).
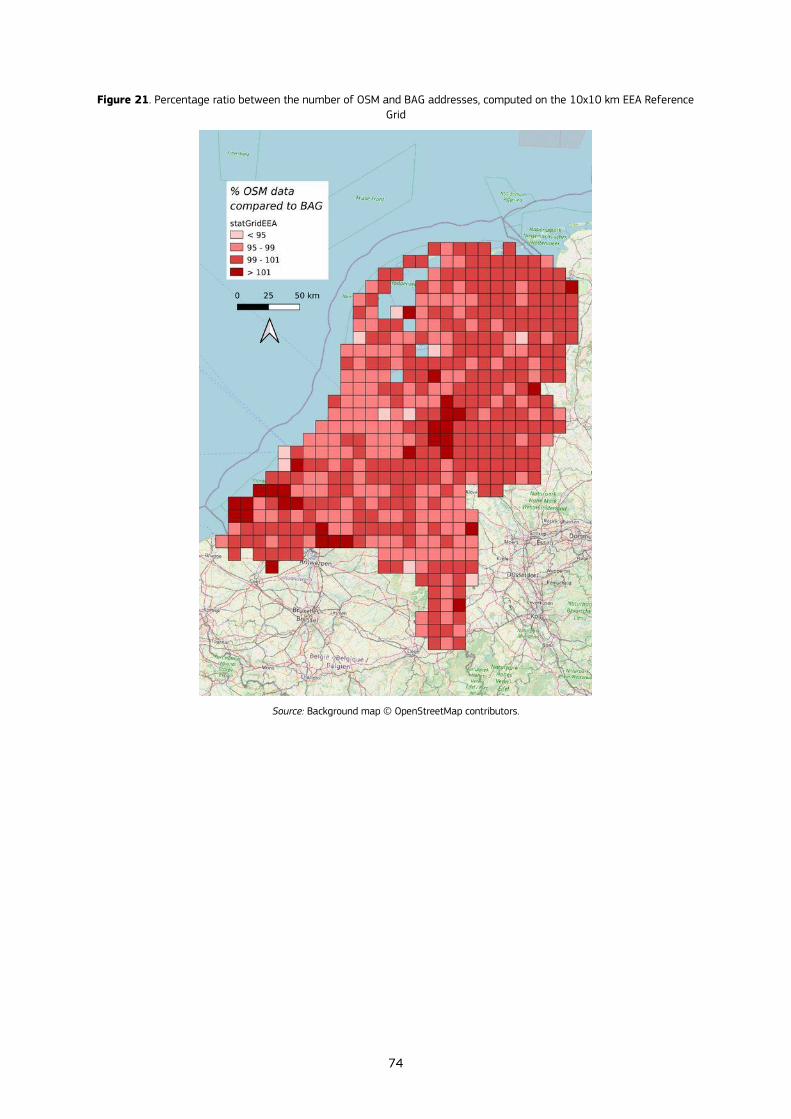
74
Figure 21. Percentage ratio between the number of OSM and BAG addresses, computed on the 10x10 km EEA Reference
Grid
Source: Background map © OpenStreetMap contributors.
75
Figure 22. A camping area in the integrated dataset where OSM address data is present while BAG is not
Source: Background map © OpenStreetMap contributors.
The final integrated dataset contains about 9.6M addresses, of which a little more than 180,000 are only present in the OSM database. It should be clarified that, in addition to the already mentioned cases of addresses in camping areas, more than 50,000 addresses are different in the two databases due to abbreviations in the street name. In general, the rule in OSM is to use extended words, while it seems that in BAG abbreviations are used more frequently (e.g. Doctor/Dr., Saint/St., Professor/Prof., Burgemeester/Burg./Monseigneur/Mgr., etc.). It is also worth to say that abbreviations both in OSM and BAG databases are not fully consistent. Many other discrepancies are due to small errors and typos, mainly in the street names.
6.5 Qualitative validation: interviews with experts and stakeholders
The process of integrating citizen-generated data with authoritative data involves solving not only technical problems, but also organisational and legal ones. Not infrequently, the latter may have an even greater impact on the feasibility of the integration than the technical ones.
To account for these organisational and legal aspects in this experiment, we interviewed three representatives of NMAs or institutional bodies who had experience in attempting to reuse and/or combine OSM data with their own authoritative geospatial information. All the interviews were organised with a non-structured series of questions related to the stakeholders’ knowledge and experiences with OSM data and its use in their institutional contexts.
6.5.1 CNIG (Spain)
Emilio Lopez Romero, Director of the Centro Nacional de Información Geográfica (CNIG)123 in Spain, described a past project that tested the reuse of OSM data and tools to improve the data exchange system between regional mapping agencies, the IGN (National Geographic Institute) and CNIG, and enable a collaborative multi-user process for the Transport Network (TN) data maintenance. In particular, three activities were tested:
— using OSM editing tools to modify TN data;
123 https://www.ign.es/web/ign/portal/inicio

76
— enriching Spanish OSM data with updated TN data;
— obtaining directions of the roads from OSM, to be imported in the TN database.
From a technical perspective, the tests carried out confirmed the feasibility of reusing OSM data model and tools, even if some performance issues arise during bulk updates of large data sets, along with the challenge to keep information synchronised due to the non-restrictive process to edit data in OSM. Despite this, the most critical issue was licence incompatibility between national open data (released under a CC-BY 4.0 licence) and the ODbL-licensed OSM data (see section 6.4.1.3).
An additional issue was the difficulty to establish a sustained communication between stakeholders and the OSM community in Spain since there is no OSMF Local Chapter124, which prevented having a contact point to discuss the technical and licencing problems that arose during the project.
In Romero’s words, the CNIG maintains a positive vision for future collaboration. In a medium-term horizon, the CNIG wants to widely promote the access and use of CNIG data to citizens. A plausible way to persuade people to do so is to include CNIG data in a global, open and widely used database like OSM.
6.5.2 IGN (France)
Benedicte Bucher, Ana-Maria Ramond, Frédéric Cantat, and Nicholas Py, all from the French National Institute for Geographic and Forestry Information (IGN)125, discussed various topics of interest about the possible connection between IGN data and OSM data. It should be noted that the French IGN has a long-standing research activity on crowdsourced geographic information, particularly in quality assessment and the evaluation of opportunities and barriers to integration.
A first element relates with the reuse of the editing tools used by the OSM mappers: OSM tools (in particular the in-browser editor iD126) are seen as simple and efficient means to potentially allow French citizens to contribute relevant information in case of quick updates, natural disasters, participatory projects. The interviewees also highlighted the importance of hydrography and buildings as geospatial features of high interest and for which a stronger collaboration with OSM would be very welcome, although some doubts were raised about the quality of the data in OSM compared to the authoritative datasets. On the integration of data, several questions emerged about procedures and tools for the aggregation and alignment of different contributions (including OSM), considering also metadata, and the possibility to promote a collaborative platform for sharing these alignments.
Again, the issue of incompatible licences came up and was identified as one of the main barriers to include OSM “back” into the national databases and to create stable synergies with the OSM community. Possible solutions for the licensing incompatibility could be adopting the ODbL licence by the institutional body, or discussing with the OSM Foundation the possibility to assign a dual licence to OSM data (a recent example from the Google Open buildings dataset goes in this direction127). Both hypotheses are currently theoretical, but could be a stimulus for a more in-depth discussion in the future.
6.5.3 Piedmont (Italy)
Stefano Campus (Piedmont Region, Italy) and Rocco Pispico (Regional Agency for the Protection of the Environment - ARPA Piedmont, Italy) discussed the possible collaboration between regional mapping agencies and OSM for the update of official regional map products.
The main issue discussed was again the licencing incompatibility between CC-BY 4.0 and ODbL, which prevents OSM data from easily including in regional geospatial databases. The open data managed by the Piedmont Region (shared under a CC-BY 4.0 licence) could integrate OSM data with official information; this information could be enriched and updated more quickly by OSM volunteer mappers, but these improvements cannot be easily included in the original regional database due to licence incompatibilities. They suggested as a workaround using the two datasets to calculate indices of the presence of specific features of interest (e.g. building footprints) to compare the degree of completeness of the datasets. In this way, the two datasets would not be integrated (therefore no licence-related issues would arise), but the comparison would allow the
124 https://wiki.osmfoundation.org/wiki/Local_Chapters 125 https://www.ign.fr 126 https://wiki.openstreetmap.org/wiki/ID 127 https://sites.research.google/open-buildings/

77
automated identification of areas where one dataset is less rich/updated than the other, thus giving the possibility to activate specific actions to improve it. A test at the regional level is underway, which could help to understand possible concrete effects of this approach.
6.6 Conclusions and lessons learned
The integration experiment presented in this chapter sheds some light on understanding the complexity inherent to the process of integrating datasets that differ in nature, original purpose and content. Next lessons learned help to formulate some recommendations for the successful establishment of the data spaces envisioned in the European strategy for data (European Commission, 2020b).
In general, any data integration process must be carefully prepared. This means that the datasets to be integrated should be well-known in terms of their creation/update process, geometric representation, encoding, semantic content and quality (measured, in principle, through all the parameters that are important for integration). If quality information is not available a priori, a preliminary quality assessment becomes the key first step.
This work deliberately assumed that the quality of the OSM address datasets in Finland and the Netherlands was such that a comparison and integration with authoritative counterparts was actually possible without a dedicated and in-depth quality assessment. This was mainly justified by the very local nature of OSM, which allows us to assume that the positional accuracy of OSM addresses is sufficiently high. In contrast, the possible low degree of completeness (i.e., the lack of addresses in some parts of a country) and semantic accuracy (i.e., incorrect or missing address information) of OSM addresses were indeed taken into account in the integration process.
From the purely technical perspective, which was a core aspect of the experiment, some conclusions can be drawn. The results show that the integration between the OSM and authoritative address datasets could improve both datasets, as the integrated dataset was achieved by ‘taking the best’ from both the initial ones.
— In the case of Finland, while authoritative data have a more homogeneous coverage and higher positional accuracy, OSM typically has uneven spatial coverage. Conversely, OSM has the potential to quickly include more up-to-date or detailed information, which authoritative datasets can only achieve, if possible, in a much longer time.
— In the case of the Netherlands, the integration process is somehow “underway” through the continuous updates undertaken by the national OSM community through imports from the BAG database. Given the relative complexity of the BAG database, which requires a deep knowledge of the data structure for the reuse of its information, OSM could be considered a much easier and more direct way to access address information through convenient access services that would be seamlessly aligned with authoritative data sources.
In overall, the whole is greater than the sum of its parts. Both the NMA and OSM communities could benefit from such integration process to improve their data. Such integration processes could be ideally automated and executed on a regular basis to achieve increasingly up-to-date and higher-quality datasets.
The two use cases analysed are representative of very different conditions both for the authoritative data and for OSM. The Finnish NLS dataset is served through an OGC API - Features service that provides data compliant with the official INSPIRE Addresses data specifications. However, there are subtle specific implementation details (i.e., street names in three languages and city names as ids instead of text (see section 6.4.1.1) that require adaptations in the ETL process. The BAG database is, on the contrary, complex to handle, does not compliant with the INSPIRE data specifications, and contains small errors in the abbreviations in street names that cause, in some cases, misalignment with the OSM data. With regard to OSM data, the way the two national communities handle address information is very different, as Finland has a very uneven contribution of mappers in the field and few local imports of data from authoritative sources. The Netherlands, though, exhibits a continuous process of extended imports that allows OSM to be constantly aligned with official source data.
If we extend these considerations to the whole of Europe, and also consider that only a few national address datasets can be downloaded from the INSPIRE Geoportal128 (and most of them are just samples), the inclusion
128 https://inspire-geoportal.ec.europa.eu/overview.html?view=themeOverview&theme=ad

78
of other countries in broader integration activities would most likely raise other issues and challenges, making the data theme of “addresses” less standardised than expected.
One of the main contributions of this work is that the integration process happened at the national level, in contrast to previous work that was focused on the regional or local scale (see section 6.2). The experiment also showed that, although integration procedures involving OSM data are generally difficulty to generalise due to the peculiar nature and characteristics of both citizen-generated and authoritative datasets involved (see again section 6.2), the interoperability ensured by INSPIRE would enable the process to be extended almost seamlessly to other INSPIRE-compliant address datasets available across the EU.
From the software perspective, the experiment described proved that FOSS4G, and the QGIS Graphical Modeler, is a fully suitable ETL tool to perform the data processing involved in the integration (section 6.4). However, given the focus on nationwide datasets, it is worth mentioning that the process required a minimum computational capacity as it dealt with huge amounts (millions) of address features, which—if extended to all Europe—would need a proper infrastructure in place. In addition to that, the integration of much larger datasets such as transport networks, hydrographic elements or buildings would involve more complex topological issues that would definitively increase the complexity of the integration processes.
The experiment is the first step within a broader framework to investigate enablers and barriers for the integration of authoritative and citizen-generated (OSM) datasets in Europe. As such, it only focused on some interoperability aspects (technical and semantic required for the integration) and partially addressed other aspects such as the organisational and legal and ones through interviews with key domain experts.
— Organisational interoperability within and across organisations (including governments and OSM communities) will be key to make data integration a common, standardised and policy-enabled process rather than an isolated and ad hoc exercise.
— Legal interoperability looks at dataset integration from the perspective of their licences and terms of use. While integration might be technically possible, the interviews have emphasised that lack of licence compatibility could represent a serious obstacle to the actual use of integrated datasets and a problem for efficient governance of data processes. Different options emerged from the interviews. First, NMAs could decide to modify their data policy by changing the data licence from CC-BY 4.0 directly to ODbL so that the integrated datasets are released under the same licence. However, this would be a risky decision, because it could be incompatible with other national policies and best practices or could cause additional potential incompatibilities with other authoritative datasets released under the CC-BY 4.0. Second, the possibility of changing the licence could be investigated again129 by the OSM Foundation and the community. A third option was to discuss the possibility to release OSM data using a dual licencing approach, allowing institutional authorities to combine their official data with OSM under a CC-BY 4.0 licence while maintaining ODbL as the community licence. It is clear that, at present, there is no ready-made solution for the legal interoperability problem and that a formal, wide-ranging discussion needs to be initiated between OSMF and interested NMAs to find integral and long-term solutions.
Regarding the use of open licences at the European level, the recently published Open Data Directive (European Parliament and European Council, 2019) has promoted the publication of so called ‘high-value datasets’ (i.e. data-sets whose re-use is associated with high economic and societal benefits) under open licences, which should favour the integration with other data sources such as OSM. The final list of high-value datasets, along with the requirements for their provision (including licencing), will be provided in a legal act foreseen for late 2021 or early 2022. In this context, more opportunities for interaction are also needed with national OSM communities and other data providers that collect high-value datasets or contribute to the data spaces envisaged by the European Data Strategy.
As a final note, readers should be aware that the definition of OSM as a citizen-generated database is increasingly being questioned. Not only have governments and other organisations contributed heavily to OSM through imports, but today more and more private companies using OSM for their business are heavily adding OSM data through their paid staff (Anderson et al., 2019). While still a citizen-driven initiative, OSM has grown into a vast and complex ecosystem with the need to refine its governance and to improve the maintenance of one of the world’s largest geospatial datasets.
129 A similar process to switch from CC-BY-SA to ODbL occurred in 2012 and took 4 years of laborious work
79
7 Addressing public-private partnership for data supply – data
collaboratives for air quality in cities
7.1 Introduction
At the beginning of 2020, we were embracing a new decade of promise. A few months into the year, however, our world transformed as countries rushed to enforce lockdowns and address the widespread global pandemic. COVID-19 brought a number of new public challenges, from the provision of adequate public healthcare and relief for large-scale financial losses to the need for contact tracing technology (Tsinaraki et al., 2021) and new methods of service provision. It would seem that there is not a single industry that has not adapted in one way or another to these new circumstances. In these times, the Internet of Things (IoT) emerged as an essential infrastructure to enable new solutions and provide rapid responses by interconnecting smart devices. IoT sensors and applications embedded in thermal cameras (Center for Devices and Radiological Health, 2021) and wearables (Ates et al., 2021) became key sources of real-time data needed to address the pandemic, while temperature sensors and parcel tracking systems (Hennigan and Park, 2020) are currently being implemented across the world to ensure the safe and effective delivery of life-saving vaccinations.
In addition to generating increased awareness of its potential and shaping the world’s response to COVID-19, the use of IoT in addressing the pandemic has also brought to the forefront some of the policy and operational challenges involved in sharing and governing data generated by IoT devices. This data is typically collected and operated by a variety of public and private actors, and stored in silos, which makes the challenge of governance especially difficult and critical. Cities, for example, will need to create ways to access and share data (Russo and Feng, 2020) in a more systematic, sustainable and responsible manner to ensure that they are harnessing the maximum potential of IoT benefits for themselves and their communities. Too often existing efforts do not scale beyond the pilot phase or are designed in a financially sustainable manner and with a clear understanding of the risks associated with collecting and using data. The challenge of governance is further exacerbated by the use of hyper-local sensors that monitor, for instance, movements of people and goods, noise levels, or air quality. In cities where this technology is being deployed, there are growing—and valid—concerns over privacy and security.
The issues of bridging data silos and asymmetries, and the increased privacy concerns are of course not unique to IoT. For the last few years, several advances have been made to develop ways to provide access to and leverage privately held data for public interest purposes. In 2015, we coined the concept of data collaboratives (Verhulst and Sangokoya, 2015) to capture a variety of such approaches.
Data collaboratives, when designed responsibly, can help to address today’s asymmetry between data supply and demand. They draw together otherwise siloed data — such as, for example, telecom data, satellite imagery, social media data, financial data — and a dispersed range of expertise. In the process, they help match supply and demand, and ensure that the appropriate institutions and individuals are using and analyzing data in ways that maximize the possibility of new, innovative social solutions. There exist a variety of operational and governance approaches associated with data collaboratives, each of which fall along a wide spectrum in terms of openness of the data and the level of collaboration involved. Data collaboratives include, for instance: data cooperatives; trusted intermediaries; research partnerships; and prizes and challenges; complemented by data portals, which provide access to intelligence products.
In what follows, key enabling conditions identified in earlier work conducted at the GovLab (New York University) on data collaboratives will be re-purposed to assess and address the underlying challenges and opportunities of using IoT in an urban setting, with a focus on the management of air quality monitoring systems. Air quality is of particular importance because of the positive correlation between growing urbanization and poor air quality. City governments and local communities are becoming increasingly more concerned about and are actively working to take steps to reduce air pollution levels in their communities.
As urban populations around the world have grown exponentially, so too have global greenhouse gas emissions. Although cities account for less than two percent of the Earth’s surface (United Nations, 2021), up to seventy percent of global greenhouse gas emissions can be directly attributed to cities as a result of their traffic, their industry and their energy needs (United Nations, 2019). In fact, cities consume nearly seventy-eight percent of the world’s energy (United Nations, 2021). Cities are generating air pollution at rapid rates, which is quickly becoming dangerously unhealthy for their communities. According to an analysis published by the WHO (World Health Organization, 2018), nine out of ten people worldwide breathe in air with pollutant levels that are well beyond any advisable threshold. In a number of European cities, nitrogen dioxide (NO2)

80
levels exceed the European Union’s recommended standards (Bottollier-Depois, 2019). London is at the top of the list, with an average annual concentration of 89 mcg/m3; followed by Paris (83), Stuttgart (82), Munich (80), Marseille (79), Lyon (71), Athens (70) and Rome (65).
The consequences of poor air quality are chilling. According to the earlier analysis by the WHO (World Health Organization, 2018), nearly seven million people die every year as a result of exposure to fine particles in polluted air. These fine particles are able to penetrate deep into the lungs and the cardiovascular system, and can cause a number of deadly diseases including strokes, heart disease, lung cancer, chronic obstructive pulmonary diseases, pneumonia and a range of other respiratory infections. In Europe alone, one in every eight deaths130 is linked to air pollution (Ganzleben and Marnane, 2020). In 2018, it was estimated that almost 379,000 premature deaths in Europe were a result of air pollution (European Environment Agency, 2020).
Thankfully, cities have the ability to greatly improve their air quality with a combination of technology and behavioural changes. The use of smart infrastructures or even simple measures like traffic regulations and incentives for pedestrians and cyclists have shown great success in lowering air pollution levels. For any of these measures to be effective, however, decision makers need to have an accurate understanding of where air pollution is worst and which interventions have the potential to drive the strongest impact. In order to develop this understanding of the situation, decision makers require detailed intelligence of how pollutant levels change over time in specific locations. This is when the promise of IoT sensors becomes relevant.
While reliable and sustainable air quality measurement is only one element of comprehensive air quality management, it serves as the foundation for many of the subsequent steps in the air quality management process World Bank (Awe et al., 2017). These steps include assessing the extent of and variations in pollution, identifying its source, understanding how it is transported and dispersed, identifying effective interventions, tracking their implementation, and assessing their impact.
The effectiveness of air quality management efforts can be greatly improved by enhancing actors’ access to data science expertise and their ability to generate and connect high quality datasets on air quality, the economic and social activities that drive emissions, and indicators of pollution’s consequences. Activism for greater investments in clean air infrastructure and services is helping to partially address gaps in air quality monitoring and diagnosis, as are technological improvements reducing the costs of pollution sensors131 and satellite capacity (McKinnon, 2017). Approaches that utilize machine learning (Khanna et al., 2019) to extract insight from some of the newer, more “noisy” data, or combinations of information on air pollution and emitting activities, hold great promise.
Yet, research is still nascent - and it must go beyond monitoring. Source attribution, the science of linking pollutants to their sources, is a particularly important gap. It requires three inputs in general: an inventory that tracks where and what volume of pollutants are emitted, a model that traces how emissions move with wind and interact with each other in the atmosphere, and pollution monitoring at various heights and places. Source apportionment analysis combines these components to triangulate the most likely sources of pollution for a given place. Furthermore, collecting this data is not enough—appropriate access and clear ownership of the information for environmental action is necessary for all relevant stakeholders, who need to be empowered to use the data.
As cities across the world move to become smart cities driven by data, we are focusing on air quality to leverage the promise of innovative data collection, collaboration, and analysis. To address the many policy—and other—challenges raised by the use of IoT in addressing air quality, we focus on the particular potential offered by data collaboratives, an emerging form of public-private partnership that permits inter-sectoral data sharing. We discuss the opportunities (and some challenges) offered by data collaboratives, with particular reference to four case studies. The conclusion ends with some key takeaways, and some thoughts on how the use of our canvas can help promote the ethical, sustainable and effective implementation of IoT to empower cities around the world.
130 https://www.dw.com/en/in-europe-1-in-8-deaths-linked-to-pollution-report/a-54847902 131 https://public.wmo.int/en/resources/meteoworld/advice-low-cost-air-pollution-sensors

81
7.2 Background and literature review
7.2.1 IoT sensors for gathering and monitoring air quality data in cities
IoT sensors can play a critical role in collecting and providing policymakers with real-time, reliable data to improve urban air quality. These sensors have evolved to monitor various types of air pollutants, such as fine particulate matter and gases, to provide a detailed understanding of air quality. In addition, sensors can also collect atmospheric and meteorological data, ambient noise levels, and sound vibrations. Increasingly sophisticated sensors, such as those used by the Chicago Array of Things project132 also include camera technology to gather information from pictures.
Pollution concerns are driving demand for hyper local sensors that can provide intelligence of patterns in urban air pollution. There is now a growing global market for municipal IoT-enabled air quality sensors (Guidehouse Insights, 2020) that reflects these trends. The private sector is not far behind. In recent years, many major industry players have emerged in this space, such as Aclima, AerNos, Aeroqual, Ambience Data, AQMesh, Breeze Technologies, Clarity, EarthSense Systems, eLichens and Libelium to name a few.
In addition to public-private IoT air quality initiatives, intergovernmental organizations have also joined in the efforts to address the challenge of air pollution and global climate change at large. For example, the Digital Europe Programme (DEP) is currently considering how it can best support the creation of a data space for climate-neutral and smart communities (European Commission, 2021b) This effort would fall under the common European Green Deal data space and would create important opportunities for collaboration and shared innovation. In an exciting development, private citizen efforts in tracking air quality have also shown promising results. In Europe, crowdsourced or citizen science efforts are growing in popularity. According to a report by the EEA (Lükewille, 2019), an increasing number of citizens are taking steps to monitor the air quality in their communities, using low-cost air quality sensors from the private sector or air quality measurement kits deployed by NGOs. One such initiative called the CurizeNeuzen Vlaanderen133 in Flanders even claims to be “the largest citizen science project on air quality to date”. The emphasis of IoT-focused projects across citizen, corporate, government, and international stakeholders demonstrates the importance and timeliness of IoT device and sensors for air quality monitoring and analysis.
7.2.2 Data collaboratives for sharing air quality data
While IoT data can play a powerful role in helping to improve air quality, policymakers—and other stakeholders—face a number of problems in accessing and making use of IoT-generated data. Foremost among these challenges is that the data generated by sensors is often privately held, stored in silos, and difficult to access. In addition, retaining data in secure servers and protecting individual privacy from undue surveillance requires ethical, responsible, and informed guidelines that are accepted by project stakeholders and the wider community.
As indicated earlier, many of these challenges can be addressed by greater use of data collaboratives. Data collaboratives are an emerging form of public-private partnership in which actors from across sectors exchange and analyse data, or provide data science insights and expertise to create new public value and generate fresh insights (Young and Verhulst, 2020). Although data collaborations can take on many different forms, the common goal across all operational models of data collaboration is to provide functional access to previously siloed data assets so that they can be leveraged in the public interest (Verhulst, Young, Winowatan, and Zahuranec, 2019). In some collaborative models, this might involve the direct exchange of pre-processed datasets; in others, it might involve only the sharing of data-driven insights.
Data collaboratives, when designed responsibly, offer a number of potential benefits for policymakers seeking to use IoT data in urban contexts. These include:
— Precise and Accurate Decision Making: Diversification of data (Hoffman et al., 2019) and filling information gaps on air quality can help solve problems of government response (Verhulst, Young, and Srinivasan, 2021) and drive environmental, urban planning, and service design policies. IoT information remains concentrated in the hands of private actors; opening data access to governments allows for increased functionality of information and more precise and accurate decision making.
132 https://arrayofthings.github.io 133 https://curieuzeneuzen.be/
82
— Informed Research, Prediction, and Forecasting: Through diverse, integrated, and increased data access, stakeholders can put forth mitigative solutions and proactive policies to tackle air pollution crises before they occur (Hoffman, Boral, and Olukoya, 2019).
— Data-Driven Monitoring and Evaluation: Shared access to sensor datasets can help stakeholders monitor and evaluate policy outcomes to iterate and adapt quickly and efficiently.
— Collaborative Multi-Stakeholder Culture: Data collaboratives demonstrate cooperation and mutual trust (Verhulst, Young, and Srinivasan, 2021) between corporations, governments, research institutions, and citizens improve public perception and buy-in of new policies.
7.2.3 Challenges for IoT data collaboratives
Our desk research and literature review also indicates that, while we see an increase in demand for IoT sensors and the (air quality) data they produce, as well as numerous pilots to monitor air quality, many cities have failed to develop IoT data collaboratives that are systematic, sustainable and responsible in adequately serving the public good, which rests at the center of the data collaborative. In particular, the following challenges were emphasized:
— Cost and scaling-up: Cities are struggling to design partnerships with IoT market players, such as private device manufacturers, cloud service providers, data platforms, and others generating air quality data (Liu et al., 2017). Many initiatives fail to provide actionable insights, are often not financially sustainable, and lack strategies toward broader adoption of innovative technologies in a responsible manner.
— Lack of interoperability / fragmentation: In part, the challenge is related to fragmentation resulting from a lack of interoperability (Kotsev et al., 2016; Rubí and Gondim, 2021). Many market players and cities collect, store, and publish data in a manner that makes it difficult for other stakeholders to share and act on these insights. It limits the ability of policymakers to pull data together from a variety of sources and incorporate diverse input in policy making. Additionally, fragmentation between city services reinforces silos in data-driven initiatives and hinders cross-cutting policy actions.
— Quality and Choice: There are also a plethora of several categories of low-cost sensors available (e.g. electrochemical or optical sensors; photo ionization or optical particle detectors) with various levels of quality (Gerboles, Spinelle, and Borowiak, 2017). Many of these sensors are at the early stage of development and typically require caution and good planning, according to Lükewille (2019). There are also different sensors for different particles, which makes the widespread adaptability of these partnerships difficult. In addition, for the air quality data from sensors to successfully complement official data, cities need to ensure that the quality of the sensor data satisfies the EU Air Quality Directives. This requires the active participation of the public sector in designing and facilitating the structure of these partnerships to ensure that data standards are satisfied and that the data collected across platforms is consistent. Data quality influences the credibility of the initiative but local administrations lack technical knowledge about different sensors and have limited ability to choose between different makes and models.
— Inclusive Governance and Transparency: Residents and other actors often have little or no transparency as to what happens to data collected by IoT devices, a problem that persists throughout the IoT value chain, elevating public concerns regarding city surveillance and data justice. A lack of continuous public oversight and accountability mechanisms can deviate from the original mission of the IoT data collaborative—which is to inform local policies for the public good and create contradicting value propositions. Responsible governance is further challenged by projects that share data across municipalities, nations, and international groups where different and often conflicting governance frameworks and expectations reside.
In order to leverage the opportunities and mitigate IoT data sharing challenges, cities can turn to the below roadmap or canvas on how to structure data collaboratives that can help them tackle real world problems (such as air pollution) using IoT sensors.
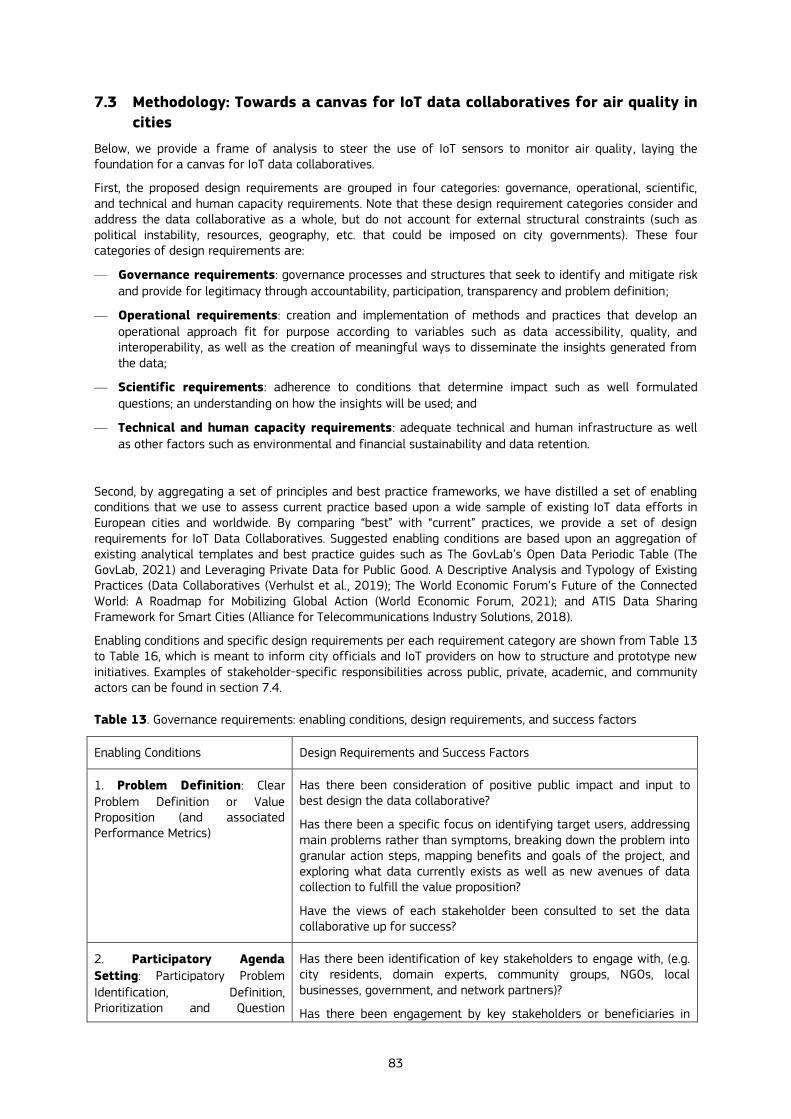
83
7.3 Methodology: Towards a canvas for IoT data collaboratives for air quality in
cities
Below, we provide a frame of analysis to steer the use of IoT sensors to monitor air quality, laying the foundation for a canvas for IoT data collaboratives.
First, the proposed design requirements are grouped in four categories: governance, operational, scientific, and technical and human capacity requirements. Note that these design requirement categories consider and address the data collaborative as a whole, but do not account for external structural constraints (such as political instability, resources, geography, etc. that could be imposed on city governments). These four categories of design requirements are:
— Governance requirements: governance processes and structures that seek to identify and mitigate risk and provide for legitimacy through accountability, participation, transparency and problem definition;
— Operational requirements: creation and implementation of methods and practices that develop an operational approach fit for purpose according to variables such as data accessibility, quality, and interoperability, as well as the creation of meaningful ways to disseminate the insights generated from the data;
— Scientific requirements: adherence to conditions that determine impact such as well formulated questions; an understanding on how the insights will be used; and
— Technical and human capacity requirements: adequate technical and human infrastructure as well as other factors such as environmental and financial sustainability and data retention.
Second, by aggregating a set of principles and best practice frameworks, we have distilled a set of enabling conditions that we use to assess current practice based upon a wide sample of existing IoT data efforts in European cities and worldwide. By comparing “best” with “current” practices, we provide a set of design requirements for IoT Data Collaboratives. Suggested enabling conditions are based upon an aggregation of existing analytical templates and best practice guides such as The GovLab’s Open Data Periodic Table (The GovLab, 2021) and Leveraging Private Data for Public Good. A Descriptive Analysis and Typology of Existing Practices (Data Collaboratives (Verhulst et al., 2019); The World Economic Forum’s Future of the Connected World: A Roadmap for Mobilizing Global Action (World Economic Forum, 2021); and ATIS Data Sharing Framework for Smart Cities (Alliance for Telecommunications Industry Solutions, 2018).
Enabling conditions and specific design requirements per each requirement category are shown from Table 13 to Table 16, which is meant to inform city officials and IoT providers on how to structure and prototype new initiatives. Examples of stakeholder-specific responsibilities across public, private, academic, and community actors can be found in section 7.4.
Table 13. Governance requirements: enabling conditions, design requirements, and success factors
Enabling Conditions Design Requirements and Success Factors
1. Problem Definition: Clear Problem Definition or Value Proposition (and associated Performance Metrics)
Has there been consideration of positive public impact and input to best design the data collaborative?
Has there been a specific focus on identifying target users, addressing main problems rather than symptoms, breaking down the problem into granular action steps, mapping benefits and goals of the project, and exploring what data currently exists as well as new avenues of data collection to fulfill the value proposition?
Have the views of each stakeholder been consulted to set the data collaborative up for success?
2. Participatory Agenda
Setting: Participatory Problem
Identification, Definition, Prioritization and Question
Has there been identification of key stakeholders to engage with, (e.g. city residents, domain experts, community groups, NGOs, local businesses, government, and network partners)?
Has there been engagement by key stakeholders or beneficiaries in

84
Development to ensure equitable benefits
formulating the questions, including the public-at-large?
Has there been stakeholder-centered decision-making roundtables to incorporate opinions and address concerns prior to, during, and post implementation of target groups?
3. Risk assessment: A rigorous risk-based assessment and mitigation approach across the data life cycle
Is there a tiered data use system that classifies data sensitivity and risk of data use dependent on the particular use cases and datasets in question (Tier 1: no identifying information; Tier 2: identifying ability dependent on context; Tier 3: highly sensitive data collection requiring an ethical/legal review prior to project use?
Is there standardized risk assessment and principle adherence?
Are there IoT system regulations that need to be complied with?
Is there routine review of standards and policies that inform the responsible collection and use of data?
Is there transparent and explainable decision provenance across the data life cycle?
4. Accountability: Legitimate oversight to mitigate risks and promote equitable benefits
Has there been continuous oversight to catch and correct risks across the data life cycle?
Are there robust data security processes?
Are there privacy-by-design data collection methods?
Have pre-project risk assessments of data collected been shared with the public?
5. Transparency: IoT Data Collection is done in a transparent and publicly aware and acceptable manner (using signalling and/or trustmarks)
Are there public awareness campaigns on how, why, and where data will be collected in clear language?
Is there adoption of industry norms that strengthen transparency and trust?
6. Engagement: With domain experts, local corporations, citizen and community groups, and governing bodies
Has there been internal consultation with stakeholders and domain experts across different groups (see Bertelsmann Foundation and The GovLab (2018) to identify and distill groups)?
Has there been an effort to curate and source external expert opinions?
Have there been frequent open calls for IoT Innovation and Collaboration Hub and an IoT Data Collaboration Assembly?
Source: Author.
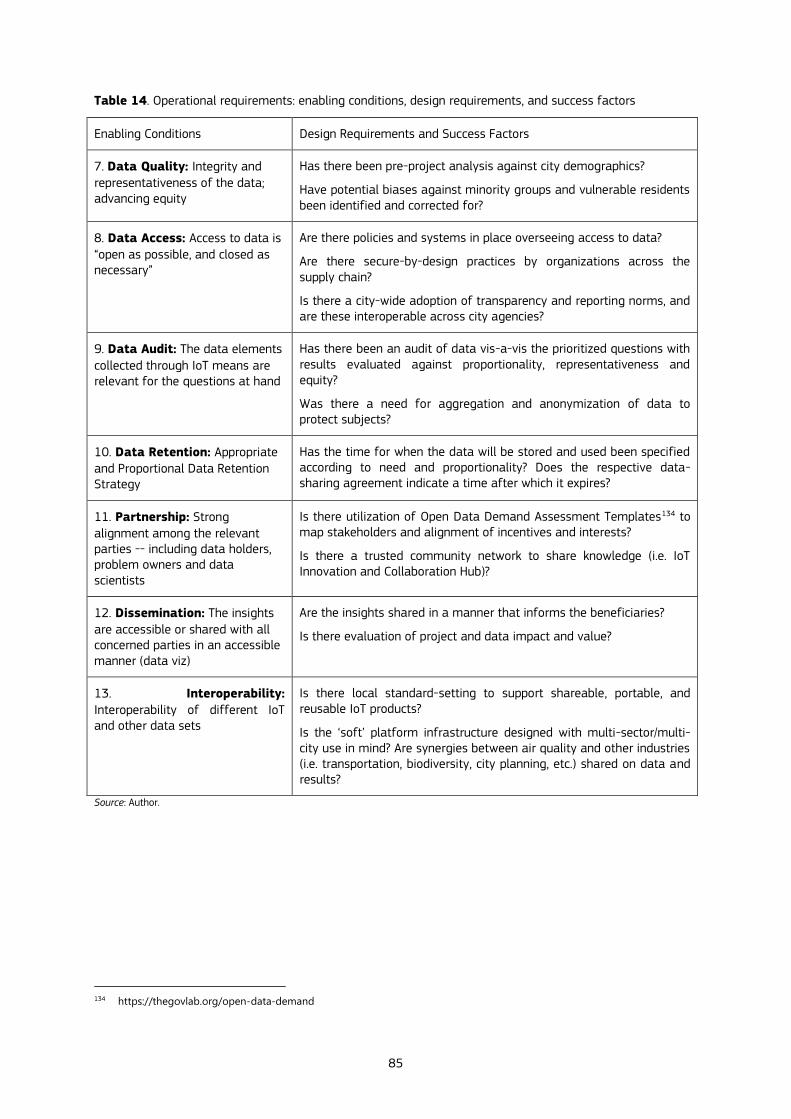
85
Table 14. Operational requirements: enabling conditions, design requirements, and success factors
Enabling Conditions Design Requirements and Success Factors
7. Data Quality: Integrity and representativeness of the data; advancing equity
Has there been pre-project analysis against city demographics?
Have potential biases against minority groups and vulnerable residents been identified and corrected for?
8. Data Access: Access to data is “open as possible, and closed as necessary”
Are there policies and systems in place overseeing access to data?
Are there secure-by-design practices by organizations across the supply chain?
Is there a city-wide adoption of transparency and reporting norms, and are these interoperable across city agencies?
9. Data Audit: The data elements
collected through IoT means are relevant for the questions at hand
Has there been an audit of data vis-a-vis the prioritized questions with results evaluated against proportionality, representativeness and equity?
Was there a need for aggregation and anonymization of data to protect subjects?
10. Data Retention: Appropriate and Proportional Data Retention Strategy
Has the time for when the data will be stored and used been specified according to need and proportionality? Does the respective data-sharing agreement indicate a time after which it expires?
11. Partnership: Strong alignment among the relevant parties -- including data holders, problem owners and data scientists
Is there utilization of Open Data Demand Assessment Templates134 to map stakeholders and alignment of incentives and interests?
Is there a trusted community network to share knowledge (i.e. IoT Innovation and Collaboration Hub)?
12. Dissemination: The insights are accessible or shared with all concerned parties in an accessible manner (data viz)
Are the insights shared in a manner that informs the beneficiaries?
Is there evaluation of project and data impact and value?
13. Interoperability: Interoperability of different IoT and other data sets
Is there local standard-setting to support shareable, portable, and reusable IoT products?
Is the ‘soft’ platform infrastructure designed with multi-sector/multi-city use in mind? Are synergies between air quality and other industries (i.e. transportation, biodiversity, city planning, etc.) shared on data and results?
Source: Author.
134 https://thegovlab.org/open-data-demand

86
Table 15. Scientific requirements: enabling conditions, design requirements, and success factors
Enabling Conditions Design Requirements and Success Factors
14. Questions that Matter: Taking a Question-Led Approach to the implementation and use of IoT sensors
Are there one or more clearly formulated questions that can be answered by IoT Data and that can inform decisions or actions (Situation Analysis; Cause and Effect; Impact Assessment; Prediction)?
15. From Insight to Action: Clear understanding on how to use the insight generated along with commitment to use
Has there been a plan on how insight will be used for decision making prior to and during implementation?
Is there public awareness and buy-in for using insight for decision making?
Are uses for diverse communities prioritized?
Source: Author.
Table 16. Human/technical requirements: enabling conditions, design requirements, and success factors
Enabling Conditions Design Requirements and Success Factors
16. Capacity: Human and technical capacity to analyse, act upon and protect IoT data
Are there sufficient organizational resources to procure, construct, implement and maintain data collaborations?
Is data sharing culture based around purpose-driven, user-centered, participation, and preventing harm?
Is there Decision Provenance Mapping135 for accountable and transparent data handling?
17. Technology: Fit for purpose technical and collaborative architecture
Is the data held in a secure system/cloud and data sharing audited?
Is there an access permissioning system?
Where applicable, is an immutable auditing system to provide trustworthiness for third-party auditors upheld?
18. Environmentally
Sustainable: IoT project creates minimal waste
Has there been an environmental impact assessment?
Are physical IoT products created and disposed of in an environmentally-friendly manner?
19. Financially Sustainable: There is a fair business model or resource availability for the longer term (with specific provisions to support SMEs if relevant)
Has there been exploration of innovative socially-good business models, such as social enterprise structures, for data collaborative set up that is strengthened by private/public/academic partnerships?
Are there new mechanisms to support IoT deployments in under-resourced areas and across SMEs, such as through a Public IoT Innovation Fund?
Are there standardized operational requirements to obtain a Trusted IoT Stamp of Approval for a product?
20. Timeliness: Timeliness of Data Collection and Sharing Strategy
Is there real-time access by authorized parties?
Are there local storage, data processing, and embedded data mining abilities?
Source: Author.
135 https://files.rd4c.org/RD4C_Decision_Provenance_Mapping.pdf
87
7.4 Results
To operationalize and test the canvas we first mapped and categorized existing efforts, and subsequently selected four use cases to which we sought to apply the canvas (see section 7.3). In particular, based upon a more extensive review of examples and categorizations (see Annex 1), we identified and compared three categories of IoT operational models for air quality data collaboratives:
— Private-Public Partnerships: These air quality projects are run at a local or multi-local government level, with most projects utilizing privately-run sensor technology to gather data.
— Academic Research Hubs: These initiatives are conducted by academic institutions, in partnership with other research groups and/or government actors.
— Community-Driven Project: These data collaboratives are primarily managed by community groups to monitor air quality at a local level.
To situate these operational models in real-world contexts, we profile below four IoT air quality data collaboratives from these categorizations against the enabling conditions. The four case studies were selected because of the available literature that could demonstrate air quality data collaboration by creating enhanced data collection tools, forming multi-city coalitions, designing transparency and ethics frameworks, and involving residents for informed participation, representation, and engagement. A brief description of each case study is given from Box 17 to Box 20.
The comparison was done leveraging desk research; and only uses available online material. As such, this approach represents several limitations that readers should keep in mind. First, the reliance on desk research means that certain details may not be well represented, and should in future iterations be complemented with interviews. Second, the selection of the examples was in part a result of the availability of online material and as such is not representative of the full universe. While the research was never meant to be comprehensive but rather exploratory, we recognize the inherent limitations of our scope and methodology.
Table 17 show a comparative review of the four case studies against the Canvas’s enabling conditions seen from Table 13 to Table 16.
Box 17. Vignette of Breeze Technologies136: Private-Public Partnerships, Local Level
Founded in 2015, Breeze Technologies is an air quality sensor firm that produces small monitoring devices that can be attached to commonplace structures. Sensors collect information on temperature, humidity, carbon monoxide, carbon dioxide, hydrogen nitride (ammonia), nitric oxide, nitrogen dioxide, ozone, particulate matter (PM10 and PM2.5), sulfur dioxide, and volatile organic compounds. Information gathered by these sensors is analysed by artificial intelligence in real time and stored in the Breeze Environmental Intelligence Cloud, which provides predictive analytics on the data. The data also informs prescriptive “smart actions” for cities to improve air quality. Sensors within and across cities allow for data-driven policies and informed citizen actions to fight air pollution. Breeze Technologies publishes the sensor data of clients who opt-in to information sharing in an open-access Citizen Portal.
Box 18. Vignette of AirThings137: Private-Public Partnerships, Multi-Government Partnership
AirThings hosts an “effective air monitoring” network that measures particulate matter and gaseous chemicals in the air. Funded by the European Union through the Balkan-Mediterranean Program, it is run by municipalities across five cities in Bulgaria, Greece, Cyprus, Albania, and North Macedonia. Sofia, Bulgaria, is the lead partner of the project. Thessaloniki, Greece, Nicosia, Cyprus, Tirana, Albania and Skopje, North Macedonia are also involved. AirThings has installed 91 IoT sensors to gather and monitor air quality data in real time to inform policies to mitigate and reduce air pollution and increase public awareness of cleaner air measures. The data gathered is housed in an Open Data System that holds and visualizes the information individuals and organizations to utilize.
136 https://www.eib.org/en/stories/air-pollution-monitor 137 https://airthings-project.com
88
Box 19. Vignette of Chicago Array of Things Project138: Academic Research Hub
The Array of Things project was developed by the University of Illinois, Northwestern-Argonne Institute for Science and Engineering, and the University of Chicago. They partnered with the Chicago Department of Transportation Division of Electrical Operations and the National Science Foundation to install 130 sensor nodes around street intersections in the city of Chicago. The nodes are connected to Waggle, an open source system developed by the Argonne National Laboratory. The sensors provide real-time and location-based information on air quality, temperature, light, vibration, and barometric pressure. Nodes have been installed since 2016, with the most recent iterations including camera technology that can capture information from images and then delete the picture to protect individuals. The project is governed by principles hinged on transparency and accountability and overseen by an executive oversight committee consisting of multiple stakeholders, who periodically review privacy policies. Sensors transmit findings every 30 seconds to a server housed at Argonne National Laboratory; information is uploaded to the API service every five minutes and the website is refreshed every 24 hours. Data gathered by the sensors is “open, free, and available to the public;” people are encouraged to use the data to design solutions for better urban living.
Box 20. Vignette of Stadslab Air Quality139: Community-Driven Project
Following an open call by the municipality of Rotterdam, in the Netherlands, on ways to improve local air quality, the Stadslab Air Quality Lab was created in 2014. While no longer financially supported, the Stadslab Air Quality Lab focused on multidisciplinary knowledge sharing and community engagement. In addition to collecting air quality data on particulate matter across towns, the Lab hosted talks, events, and workshops to involve locals in air quality awareness and best practices to reduce pollutants. Additionally, the Stadslab Air Quality Lab designed methods to improve air quality, such as a natural moss air filter.
138 https://arrayofthings.github.io/ 139 https://www.stadslabluchtkwaliteit.nl/waarom/
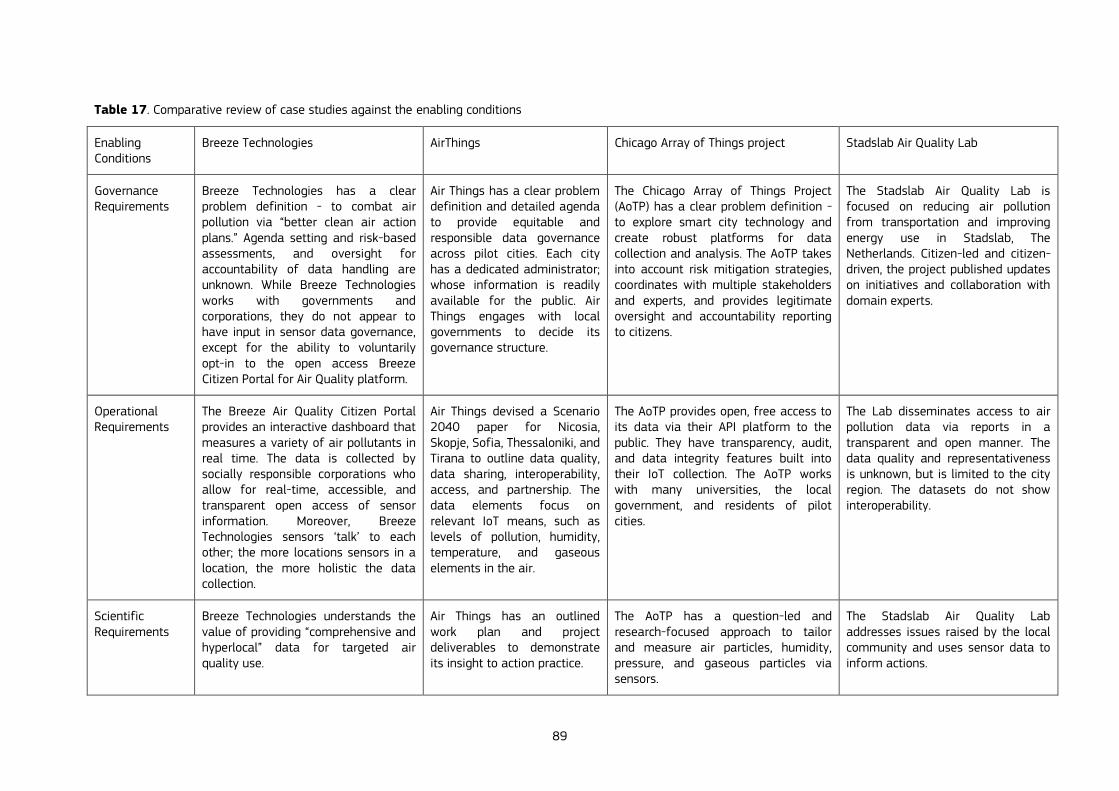
89
Table 17. Comparative review of case studies against the enabling conditions
Enabling Conditions
Breeze Technologies AirThings Chicago Array of Things project Stadslab Air Quality Lab
Governance Requirements
Breeze Technologies has a clear problem definition - to combat air pollution via “better clean air action plans.” Agenda setting and risk-based assessments, and oversight for accountability of data handling are unknown. While Breeze Technologies works with governments and corporations, they do not appear to have input in sensor data governance, except for the ability to voluntarily opt-in to the open access Breeze Citizen Portal for Air Quality platform.
Air Things has a clear problem definition and detailed agenda to provide equitable and responsible data governance across pilot cities. Each city has a dedicated administrator; whose information is readily available for the public. Air Things engages with local governments to decide its governance structure.
The Chicago Array of Things Project (AoTP) has a clear problem definition - to explore smart city technology and create robust platforms for data collection and analysis. The AoTP takes into account risk mitigation strategies, coordinates with multiple stakeholders and experts, and provides legitimate oversight and accountability reporting to citizens.
The Stadslab Air Quality Lab is focused on reducing air pollution from transportation and improving energy use in Stadslab, The Netherlands. Citizen-led and citizen-driven, the project published updates on initiatives and collaboration with domain experts.
Operational Requirements
The Breeze Air Quality Citizen Portal provides an interactive dashboard that measures a variety of air pollutants in real time. The data is collected by socially responsible corporations who allow for real-time, accessible, and transparent open access of sensor information. Moreover, Breeze Technologies sensors ‘talk’ to each other; the more locations sensors in a location, the more holistic the data collection.
Air Things devised a Scenario 2040 paper for Nicosia, Skopje, Sofia, Thessaloniki, and Tirana to outline data quality, data sharing, interoperability, access, and partnership. The data elements focus on relevant IoT means, such as levels of pollution, humidity, temperature, and gaseous elements in the air.
The AoTP provides open, free access to its data via their API platform to the public. They have transparency, audit, and data integrity features built into their IoT collection. The AoTP works with many universities, the local government, and residents of pilot cities.
The Lab disseminates access to air pollution data via reports in a transparent and open manner. The data quality and representativeness is unknown, but is limited to the city region. The datasets do not show interoperability.
Scientific Requirements
Breeze Technologies understands the value of providing “comprehensive and hyperlocal” data for targeted air quality use.
Air Things has an outlined work plan and project deliverables to demonstrate its insight to action practice.
The AoTP has a question-led and research-focused approach to tailor and measure air particles, humidity, pressure, and gaseous particles via sensors.
The Stadslab Air Quality Lab addresses issues raised by the local community and uses sensor data to inform actions.
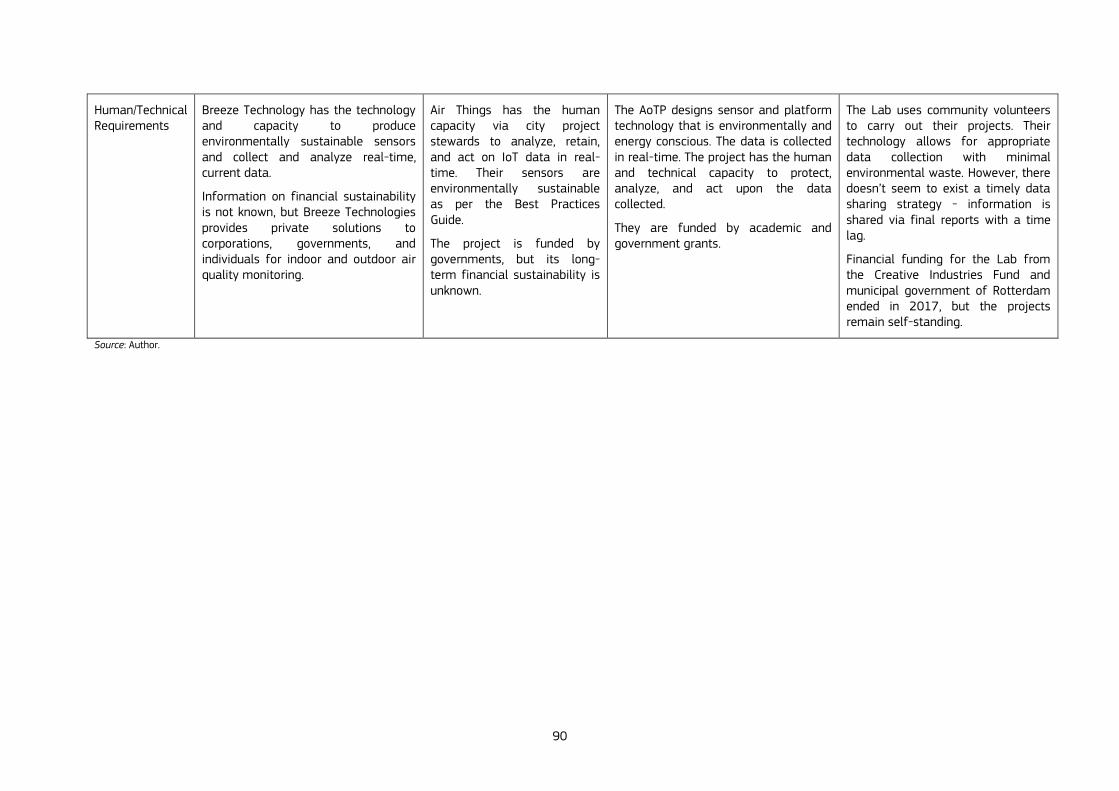
90
Human/Technical Requirements
Breeze Technology has the technology and capacity to produce environmentally sustainable sensors and collect and analyze real-time, current data.
Information on financial sustainability is not known, but Breeze Technologies provides private solutions to corporations, governments, and individuals for indoor and outdoor air quality monitoring.
Air Things has the human capacity via city project stewards to analyze, retain, and act on IoT data in real-time. Their sensors are environmentally sustainable as per the Best Practices Guide.
The project is funded by governments, but its long-term financial sustainability is unknown.
The AoTP designs sensor and platform technology that is environmentally and energy conscious. The data is collected in real-time. The project has the human and technical capacity to protect, analyze, and act upon the data collected.
They are funded by academic and government grants.
The Lab uses community volunteers to carry out their projects. Their technology allows for appropriate data collection with minimal environmental waste. However, there doesn’t seem to exist a timely data sharing strategy - information is shared via final reports with a time lag.
Financial funding for the Lab from the Creative Industries Fund and municipal government of Rotterdam ended in 2017, but the projects remain self-standing.
Source: Author.

91
7.5 Lessons learned and recommendations
7.5.1 Lessons learned
Governance Requirements. All four case studies seem to be well aware of the need for governance structures, and risk management frameworks, yet there seems to be confusion with regard to what a comprehensive governance framework should look like as well as how accountability gets established.
Operational Requirements. While data access and transparent data collection was prioritized and present across all models, data quality centered on equitable and representative data and information audit methods seem to be lacking. In addition, only one case study (AirThings, a multi-city public-private air quality IoT) outlined situations across its pilot cities for data quality; and only another case study (the Chicago Array of Things academic hub) implemented robust audit mechanisms of the data collected and how it was used. The two projects that build their own technology, such as Breeze Technologies and the Chicago Array of Things, include a focus on interoperability.
Scientific Requirements. Some of the projects had a set of prioritized questions and issues that were determined by local actors; yet how subsequently the insights will be translated into action was often unclear.
Technical and Human Capacity Requirements. All four case studies worked with a robust network of partners and shared results across stakeholders. They all also emphasized the presence of (and need for) a human and technical architecture. A commitment for environmentally sustainable IoT technology is outlined by all projects but unknown for the Chicago Array of Things initiative. However, there is a lack of economic sustainability for involvement of non-private actors in data collaboratives:
— private corporations retain financial sustainability by contracting their sensors to governments;
— multi-city data sharing structures, academic hubs, and citizen groups utilize local and national grants to sustain activities yet little is known how they will fund the operations over a longer period of time.
7.5.2 Recommendations
What follows are some recommendations moving forward that can enable more systematic, sustainable and responsible data collaboration as it relates to IoT air quality data. These recommendations are informed by the application of the canvas above but also lessons learned from other fields of data collaboration.
— Developing A Common IoT Governance Framework: Public actors, private actors, and civil society worldwide should work together to develop and clarify a governance framework for the trusted reuse of IoT generated air quality data. This framework should include: open data policies; transparency requirements and safeguards; and accountability mechanisms, including engagement with a wider public on expectations and priorities.
— Building Capacity: National and local governments should increase the readiness and the operational capacity and maturity of the public and private sectors to re-use and act on IoT air quality data, for example by investing in the training, education, and reskilling of policymakers and civil servants so as to better build and deploy data collaboratives. Building capacity also includes increasing the ability to ask and formulate questions140 that matter and that could be answered by IoT generated data. Such a list of priority questions and metrics could facilitate more rapid response by critical data holders.
— Establishing Data Stewards: To scale and streamline the operational and responsible use of IoT air quality data, Private, public, and civil society entities should create and promote the position of a Data Stewards within organisations (Verhulst et al., 2020). Data stewards would be mandated to coordinate and collaborate with counterparts toward unlocking the public interest value of IoT generated air quality data, to protect potentially sensitive information, and to act on insights derived through data analysis.
— Engaging Citizens: Citizens should be encouraged to co-create IoT data collaboratives for well-defined and documented air quality purposes of their choice. To enable this, efforts should be made to make more transparent to citizens what the benefits of IoT data collaboration around air quality could be for them personally and for society at large.
140 http://the100questions.org/

92
— Increase Research and Finetune Canvas: Though there is an increasing interest in IoT data collaboration and data reuse, the field is held back, ironically, by a lack of good evidence on the conditions under which these approaches work best. There are few empirical studies that could guide or accelerate new initiatives. Best practices largely remain limited. These gaps make it hard to finetune and test the canvas presented above. A dedicated or coordinated research initiative such as an observatory dedicated to documenting developments in the area of IoT data for air quality and assessing their impact, might be valuable moving forward.
93
8 Understanding demand for data-driven innovation in the public sector –
the case of algorithmic processes
8.1 Introduction
There is a widespread assumption that every industry and domain wants to make use of data and find new ways to make decisions, improve processes, and come up with methods and technologies that solve problems (Hemerly, 2013). This includes public bodies that are increasingly turning to data to optimise public administration and services. For the purposes of this report, data-driven innovation by public bodies refers to the practice of the collection and use of different data sources to inform or change processes of public administration. According to the OECD, ‘a data-driven public sector recognizes data as a strategic asset in policies and services design and delivery.’ (Ubaldi et al., 2020: 30) In this chapter, the focus is particularly on the delivery of public services.
In most European countries there is no formal register or overview over the extent of data-driven innovation in public bodies, and knowledge is predominantly based on ad-hoc research and reports. Some cities have sought to address this gap by introducing registers of public algorithms, as seen in Helsinki and Amsterdam, but these are currently in an experimental phase (Floridi, 2020). In the UK, there have been calls for a national register to be created that would list all algorithmic systems in use in government and the public sector, and a template for what such a register would look like is currently being developed by the civil society organization, the Ada Lovelace Institute (Science and Technology Committee, 2018; Ada Lovelace Institute, 2021).
Existing research has pointed to a general increase in take-up of data-driven innovation amongst public bodies. A study by the Data Justice Lab in 2018 based on 423 Freedom of Information requests to all councils and local authorities in the UK identified 53 instances that mentioned predictive analytics, as one component of data-driven innovation, being in use (Dencik et al., 2019). In a more recent survey from Vogl et al. (2020) of local authorities in the UK, they found that 27% of respondents mentioned that their local authority is experimenting with some kind of automatic text of content analysis. 17% of respondents mentioned that their local authority experimented with some kind of predictive analytics. In both studies, welfare and social care stood out as an application domain, whereas others have also identified policing as a prominent application domain for data-driven innovation (Couchman, 2019).
This resonates with studies from other countries in Europe. In the report Automating Society from the non-profit research and advocacy organization AlgorithmWatch, they outline a range of uses of automated decision tools in different European countries. Whilst the report is not exclusively concerned with applications by public bodies, the examples listed overwhelmingly concern the delivery of public services, particularly in areas of unemployment, benefits, welfare and social care, and policing. Another significant area is that of health (AlgorithmWatch, 2019). In their 2020 follow-up report they argue that what they saw as an emerging development in the first report has now become well-established across Europe (AlgorithmWatch, 2020).
8.2 Literature review
8.2.1 Drivers for data-driven innovation
Studies on the deployment of data-driven innovation in the public sector provide an indication of the nature of applications and the types of demands data-driven innovation are being sought to fulfil, but they also cut across many different types of data applications, data sources and data arrangements. According to Hemerly (2013) there are two broad categories of data-driven innovation that have already shown positive returns: making decisions and improving efficiency. Often these two categories are provided as key justifications for government strategies dedicated to advancing data-driven innovation. Data for decision-making means using both real-time data and historical data to inform decisions in the present (Hemerly, 2013). Often this is a key component of how data systems are understood to be of use. In the report from AlgorithmWatch, for example, they identified a range of data systems sought out to assist with decision-making, either through autonomous agents or decision assistance tools, including decisions on benefit fraud, traffic offences, and the allocation of health treatments (AlgorithmWatch 2019).
Linked to the demand for data-driven innovation to assist with decision-making is the demand to improve efficiency. Hemerly (2013) understands this in terms of analysing and matching up data from multiple sources in order to help planners distribute resources. According to Yeung (2018), the emphasis on efficiency in public administration continues a strand of developments that we are familiar with in terms of ‘new public
94
management’ in which public bodies are being run as businesses that streamline processes and cut back ‘dead wood’ in the face of modern complexity. With the advent of data-driven innovation, however, Yeung (2018) contends that we are seeing a paradigm shift towards ‘new data analytics’ in which public administration is increasingly organized around the use of data analytics. Where written rules and procedures are not fast enough and there are too many for people to remember, algorithms are seen as a way to provide support.
A third category that we might add to Hemerly’s two previous ones is that of prediction. Much of the perceived value of data-driven innovation, both in terms of assisting decision-making and increasing efficiency, lies in its promises of prediction. The assumption is that through the calculation of risks, data-driven prediction will shift governance from being ‘reactive’ to being ‘proactive’ and advance pre-emptive measures as the operative logic of government (Dencik et al., 2017; Andrejevic, 2019). Research has shown this logic to be particularly prominent in areas of child welfare and policing, where the demand is for earlier targeted interventions (Redden et al., 2020; Andrejevic et al., 2020).
A fourth category could be “public interest”, the premise under which data sharing among both external and internal actors in the public sector takes place is associated with using data ‘for good’ and improving public services. This may involve collecting data for the purposes of research as has been prominent in the area of healthcare (Adibuzzaman et al., 2017), or tracking levels of pollution to increase transparency for citizens (Janssen et al., 2017). It overlaps with efficiency, but is based on the assumption that “more” could be achieved with data-driven innovation, so it is not only about optimizing existing services, but also to add new opportunities.
Importantly, however, the drive for public sector datafication goes beyond the promise of improving processes and services. As outlined by Collington (2021) in her study of digitalization strategies in Danish public administration, such goals are accompanied by a new motive of private sector growth. As she argues, especially in the decade following the financial crisis, public sector assets and capabilities developed as resources for exploitation by the private sector in the pursuit of growth. This point has been echoed elsewhere, for example in relation to public health data (Sharon, 2018) and in recent analyses of EU data and AI policy (Paul and Carmel, 2021).
8.2.2 Demands for data sources
The demand for data-driven innovation also relates to particular demand for particular sources of data. Research illustrates four broad categories of the kind of data sources being sought out by public bodies for the purposes of data-driven innovation:
— publicly held data;
— open data;
— data collected by the private sector; and
— citizen-generated data.
Overwhelmingly, research shows a demand from public bodies to make better use of existing data collected or held by public bodies. In the UK, for example, councils and local authorities have sought to create ‘data warehouses’ and ‘data lakes’141 based on existing databases (Dencik et al., 2019).
So-called ‘open data’, meanwhile, became part of a widespread effort to generate data from a range of sources that can be freely used, re-used and redistributed by anyone. Predominantly, this would include data published by government, local authorities and public bodies, but may also include data from companies and civil society organisations that want to develop data infrastructures with public access (Open Data Institute, 2021).
Privately held personal data includes data collected by mobile phone operators, social media platforms, transport services, accommodation websites, energy providers etc. According to a study by Micheli (2020), accessing such data could benefit public bodies, but the actual practice of data sharing between businesses and governments is currently sporadic and lacks sustainability. There is also a lack of appropriate governance
141 A ‘data lake’ is different from a ‘data warehouse’, as it contains raw data with a purpose, which is not yet defined.
Conversely, a ‘data warehouse’ contains processed data, which is currently in use.
95
frameworks for how such data sharing can happen effectively (for a more extensive review of the issues at stake see European Commission, 2020d).
Finally, citizen-generated data refers to data individuals or communities produce to directly monitor, demand or drive change on issues that affect them (Ponti and Craglia, 2020). This can include the gathering of environmental data (like air quality and noise) as supported by NGOs like Mapping for Change (Couldry and Powell, 2014), or can also include activities in the so-called ‘quantified self’ movement (Lupton, 2016) such as data from fitness trackers or other forms of health data collected by citizens outside a health setting. In this sense there could be an overlap with privately held personal data as citizen-generated data does not necessarily mean that it is controlled or owned by the citizen.
8.2.3 Implementation of data-driven innovation
In terms of actual implementation of data-driven innovation, Vogl et al. (2020) argue that smart technologies are at an early, but foundational, stage of adoption in local authorities. Importantly, they argue that such technologies add a new element to the socio-technical organization of public administration in local authorities. It is difficult to measure the exact value of data-driven innovation and so far there has been little concrete research on the actual implications of its drive within public administration. In part, this is due to a lack of studies on the actual impact of data-driven innovation on decision-making processes or delivery of services within the public sector. The field of Human-Computer Interaction (HCI) has provided some useful insights into decision-making that suggest that reliance on data systems does alter decision-making, but does not necessarily improve it. In the first study of its kind, Green and Chen (2021) carried out an online experiment with 2,140 lay participants simulating high-stakes government contexts and found that algorithmic risk assessments can systematically alter decision-making processes by increasing the salience of risk as a factor in decisions and that these shifts could exacerbate inequalities, such as racial disparities. This speaks to a longer-standing issue of automation bias prevalent in HCI research that suggests the tendency to over-rely on automation (Alberdi et al., 2009).
Sociological studies of data-driven innovation in public administration, however, have also demonstrated areas of tension in the implementation of new technologies, often illustrating a clash between managerial visions of data-driven innovation, and experiences of such innovation amongst frontline workers. Christin (2017), for example, in her study of uses of algorithmic risk assessment tools in US criminal justice settings, found a gap between the ‘view from the top’ and what takes place on the ground. Drawing on institutionalist sociology, she refers to this as a ‘decoupling’ in which managers feel pressure to imitate other organisations through the purchasing of new technological tools, but the people working on the ground are much slower or reluctant to adapt. In many instances, this results in what Christin refers to as ‘buffering’ strategies amongst frontline workers, such as ignoring, gaming or actively resisting data-driven techniques.
In a study of counsellors working with a new algorithmic risk assessment system in the public employment service in Portugal, for example, Zejnilovic et al. (2020) found that counsellors sometimes felt that the kind of risk profiles generated by algorithmic systems sometimes contradict their obligations to engage with, assist and support clients and they therefore seek ways to game or ignore them. In Sweden, when Trelleborg municipality started to fully automate the decision-making process for social benefits and reduce the number of caseworkers, other municipalities planning to implement similar models were confronted with strikes and caseworkers leaving their jobs based on a reluctance towards automation and concerns about the implications of automated decision-making for the relationship with applicants for social benefits (Björklund, 2018).
Research has also found that sometimes tensions emerge between expectations of data-driven innovation and operational challenges in implementing data systems. For example, Janssen and Van der Voort (2016) argue that many municipalities want to set up a data warehouse, in which they can bring all data together in a structured manner. Yet, municipalities seem to underestimate how much monetary resources and time this requires. According to public administration experts “the data and the analytical techniques do not pose the greatest challenge, but rather the organization of it and the new coordination processes required for a soundly functioning data warehouse” (van Zoonen, 2020).
8.2.4 Value underpinning data-driven innovation
These findings point to not only a friction in demand at different levels of public bodies, but are also indicative of particular trade-offs between different public values that are perceived to take place with the advent of data-driven innovation in the public sector. In her study of health research, Sharon (2018) identifies
96
five different repertoires in what she refers to as the ‘googlisation of health research’ that express different values and visions of the common good. These include ‘civic’, which speaks to collective well-being and values of inclusivity, ‘solidarity’, and ‘equality’, but also include ‘market’ and ‘industrial’ which privilege economic growth and increased efficiency and express values of consumer choice and profit, and functionality and optimization. These competing moral repertoires enact trade-offs between different values.
On a more general level, the field of critical data studies has highlighted the presence of a set of values inherent in datafication that Van Dijck (2014) refers to as ‘dataism’ as the ideological component of datafication. For example, she argues, data-driven innovation is premised on contested assumptions about not only the neutral channels of technology, but also a particular relationship between individuals and data that suggests it is possible to predict behaviour based on data about group traits. In the context of public services, data-driven innovation has particularly been oriented towards risk capture in this regard, that has also meant an extension of risk management as the operative logic of delivery. Whilst this may allow for a greater diversity of risk, and potentially need, to be captured by public administrators, there have also been concerns raised that the definition of risk in data-driven innovation is overwhelmingly associated with risk factors attached to behaviours and characteristics, at the expense of social and structural issues (Dencik, 2021). The worry is that in areas such as welfare provision, data-driven innovation drives social policy towards a focus on individual rather than collective responsibility (Keddell, 2015).
At the same time, as pointed out in Zejnilovic et al.’s (2020) study, whilst professionals might find working with data-driven risk assessments a negative experience, they paradoxically show a preference for having the system in place to satisfy a perceived need to engage with large volumes of data. Such a disposition is echoed in studies of other settings where the collection of data is considered important without necessarily finding the use of data systems beneficial. In their analysis of predictive policing in Germany, for example, Egbert & Leese (2020) found that although police may be aware that tools do not necessarily work in the way they have been said to, there remains a positive feeling about data collection. That is, predictive policing is considered to make a valuable contribution in principle, despite the lack of proof that the tools aid crime prevention.
Moreover, Jansen (forthcoming) has found that in these contexts, often the collection of data and the introduction of new data systems are incentivized through national funding schemes or policy reforms. In the UK, for example, the Police Transformation Fund provided funding opportunities for local police forces to invest in digital transformation that incentivized police forces to embark on projects using data-driven capabilities, but without there being a clear strategy about the end goal. Police officers themselves have identified this as a form of ‘top-down pressure’ to adopt data-driven technology in policing (Jansen, forthcoming). In child welfare, meanwhile, the introduction of the Troubled Families programme in 2012, a substantial social policy reform, placed demands on local authorities to evidence service delivery through more extensive and integrated data collection that came to underpin further data-driven innovation measures (Redden et al., 2020).
8.3 Methods to research data-driven innovation
It is clear that there is still much to uncover in order to understand demand for data-driven innovation in the public sector. It also remains a difficult area to study.
This is in part due to the way data systems are often introduced into public bodies, the lack of any common taxonomy for what constitutes data-driven innovation, and issues around what can and cannot be revealed either due to different forms of sensitivity or lack of knowledge. In the study by the Data Justice Lab (Dencik et al., 2018), for example, the use of Freedom of Information Requests about uses of data analytics and algorithmic decision-making to councils and local authorities in the UK revealed that almost 40% of responses had some complications with the process, such as receiving ‘no response’, refusal on grounds that providing answers would take too much time, refusal on the basis that the information could interfere with the policing of unlawful activity (such as the use of data analytics in assessments of benefit fraud) or refusal on grounds of commercial sensitivity and that the release of information would jeopardise the commercial interests of a private company. Importantly, also, in several instances there was extra clarification needed for what constituted data analytics or algorithmic decision-making. In light of this, the experimentation with registers pointed out above may aid desk research, such as the use of Freedom of Information Requests to assess demand for data-driven innovation.
In the study from the Data Justice Lab, they complemented this with computational methods that consisted of scraping government websites using a list of keywords relating to data-driven innovation that they then aggregated into a searchable database categorized according to geographical area and public sector domain.
97
This method draws inspiration from Trielli, Stark and Diakopolous’ (2017) ‘Algorithm Tips’ resource which seeks to lower the cost of finding newsworthy leads about the use of algorithms in government by providing an easily searchable database. As such, whilst a significant limitation lies in the lack of verification in the collection of documents that mean many irrelevant documents form part of any interpretation of results, it can serve as a starting point for more in-depth research. For example, such a method captures documents such as job descriptions as well as public policy documents that may be useful to identify specific areas of demand and can assist researchers with identifying key strategic publications that can serve the basis for more in-depth analysis.
Document analysis can generate important insights about the articulation of demand at a strategic level. In the study by Collington (2021) on digitalization in public administration in Denmark, for example, document analysis of public policy and strategy papers formed a key part of analysing the drivers of demand. Similarly, in Broomfield & Reutter’s (2021) study of data-driven public administration in Norway, they include document analysis of the public sector digitalization strategy and concept phase analysis as ‘guiding documents’ for practitioners’ engagement with data-driven innovation and as a way to analyse policy priorities. Including this method provides a useful context for further research as any engagement with data-driven innovation in practice is partly shaped by institutional contexts and policy priorities (Dencik, 2019).
Broomfield and Reutter complement their document analysis with a survey and interviews with practitioners, mostly system-level designers rather than street-level bureaucrats as this is where data-driven efforts are most observable in the Norwegian context. Their survey focused particularly on challenges when working with data-driven public administration. In their study of public administration in the UK, Vogl et al. (2020) also include a survey with local authorities. The survey was originally designed to provide a broad overview of the spread of data science technologies, reasons for their uptake, barriers to their implementation, and the impact of these technologies. They received a response rate of 23%, and from this were able to outline broad application domains and informed areas for further in-depth research.
The most prominent method in research pertaining to demand is the use of interviews that is often the core or used for triangulation in the studies outlined in this chapter. Interviews allow researchers to gain a deeper understanding of demand, including the frictions present in demand, that are particularly illustrated in research that includes interviews with different types of actors in an organization. In this sense, interviews allow for the scrutinizing of how different social groups are differently situated and possess unequal degrees of power in relation to data-driven innovation. Data-driven initiatives, as planned by decision-makers, might encounter unpredicted obstacles when put in practice in specific context. This is shown in the studies mentioned in this chapter, which highlight how interviews and focus groups have been adopted to identify values underpinning data innovation, as well as uncertainties, experiences and cultural clashes associated with its implementation (e.g. Madsen, 2018; Klievink et al., 2016). Whilst interviews are often considered to lend themselves to more subjective analysis and require a significant sample to gain theoretical saturation, as a way to triangulate research they have so far provided the most useful insights for understanding demand for data-driven innovation in the public sector.
8.4 Conclusions and lessons learned
This chapter shows that there are many different ways the topic of demand for data-driven innovation in the public sector can be approached, and what the foci of such an analysis should be. Outlined below are a few key lessons about studying the demand side of data-driven innovation in the public sector:
— There is a need for more research on the demand side of data-driven innovation in the public sector.
— Demands for data-driven innovation are multi-faceted and range from different applications to different sources.
— There are significant tensions and clashes on the demand side of data-driven innovation in the public sector, particularly between management and professionals.
— Demand for data-driven innovation is not simply about technological advancement, but entails different value systems and priorities.
— Researching the demand side of data-driven innovation in the public sector needs a multi-method approach that combines attitudes and experiences amongst public sector workers with institutional settings and policy agendas.
98
— Document analysis and Freedom of Information Requests can provide useful context for research with public sector workers at different levels.
— Surveys provide a good overview of demand, but this method can be limited with low response rates.
— Interviews provide more in-depth understanding of demands, including conflicting demands and experiences.
— When conducting interviews, it is important to include different groups within an organization, and to address questions on a) the nature of data, sharing arrangements and application; b) the rationale for its implementation; c) experiences with its use; and d) perceptions and attitudes towards its contribution.
Data-driven innovation in the public sector is a rapidly growing development that can have significant implications for the delivery of public services. Much focus has been on the supply-side of data-driven innovation and the possibilities that emerging technologies are said to provide. However, it is important to understand where the demand for this development is coming from, what the demand actually is, and whether that demand is met. Research so far suggests that this is a complex picture that requires further investigation, particularly of the kind that considers demand across policy, institutions, and social actors. In carrying out such investigations, there are many different aspects to consider, including demands for data collection and data sharing, to demands for the application of algorithmic processes and predictive analytics as has been emphasized in this chapter. Studying these different aspects will also require different methods that can often be used in combination as a way to strengthen understanding. Such approaches are needed in order to capture not only the specifics of the demand, but also the conflicts and contradictions that may substantiate any such demand.
99
9 Aligning EU-level policies and local practices within the context of
European data spaces
9.1 Introduction
With the ecological and digital transitions high on the European agenda, the European Commission (EC) is pushing the twin green and digital strategies. One important aim is the creation of a single market for data, where data can safely and fairly be used for the common good (European Commission, 2020b). As part of this strategy for data, the EC is focusing on the creation of European data spaces in areas such as the environment, energy, health, mobility and agriculture, that would enable researchers, public administrators, companies and individuals to share and make better use of publicly held data.
To lead the way, the EU is aiming to ‘combine fit-for-purpose legislation and governance to ensure availability of data, with investments in standards, tools and infrastructures as well as competences for handling data ’ (European Commission, 2020b, p. 5). In this line, the Inception Impact Assessment for the European data spaces (European Commission, 2020c) proposes technical recommendations to Member States as a possible means to tackle the current low use of data held by public bodies, e.g. due to legal constraints, complicated and costly processes and lack of standards and mechanisms. Therefore, a continuous exploration of emerging technologies, possible future standards and replicable use cases with recognition of societal trends, is of utmost importance to support of the development of effective and desirable use and governance of data. The body of research brought together in this document presents the results as part of this exploration.
In this chapter, we approach the research results reported in previous chapters from the local perspective of cities and regions142. Firstly, because from a European perspective they are a crucial factor in the successful implementation and added value of the European data spaces. Secondly, because the advent of these data spaces also has implications for local and regional authorities. At the same time, municipalities struggle to bridge the gap that exists between EU-policy developments and local practices. Aligning these perspectives requires ways to anticipate, facilitate and participate in the development and implementation of regulations and strategies based on a mutual understanding and overview of the playing field.
This chapter is divided into two main parts clearly differentiated in purpose and scope. In the first part (section 9.2), we briefly explore significant aspects and trends related to the local playing field in the European context. In the second part (section 9.3), we highlight the research findings reported throughout this document that are relevant for the consideration of cities, regions and municipalities in their local digital strategies. Section 9.4 provides conclusions.
9.2 Exploring the local playing field in Europe
Before we look at the playing field of cities and regions in which the digital transition takes place, it is necessary to briefly create a frame of reference for the research outputs discussed in this document as well as a context for its applicability. This helps to understand the practical implications of these recommendations and to validate to some extent their relevance for cities and regions.
The exploratory body of research presented in previous chapters focuses on use cases stemming from, but not restricted to, the geospatial domain. In the context of European data spaces, the geospatial dimension of data is an important enabler for data integration, sophisticated analyses and powerful visualisations, e.g. for digital twins143 and governance dashboards. Furthermore, there is no dedicated geospatial data space, but geospatial data rather blends within the broader context and adds its dimension to each of the thematic data spaces, making it relevant in support of all themes with dedicated European data spaces of their own.
It is also helpful to understand that the establishment of the European data spaces takes place in a broader context of current macro-economic Cloud-related trends in Europe recognized by the EC144, which are illustrated in Figure 23.
142 In this context, ‘regions’ applies to regional municipalities and their conglomerates as well. Acknowledging that there are
significant differences, the terms ‘city’, ‘region’ and ‘municipality’ may loosely be used interchangeably, each implying local-
level, rather than national or EU-levels of government and context. 143 A summary of the different definitions of the term ‘Digital Twin’ is provided by El Saddik (2018). 144 Presentation for webinar ‘Common European data spaces for Smart Manufacturing’, source:
https://ec.europa.eu/newsroom/dae/document.cfm?doc_id=66648, slide 30.
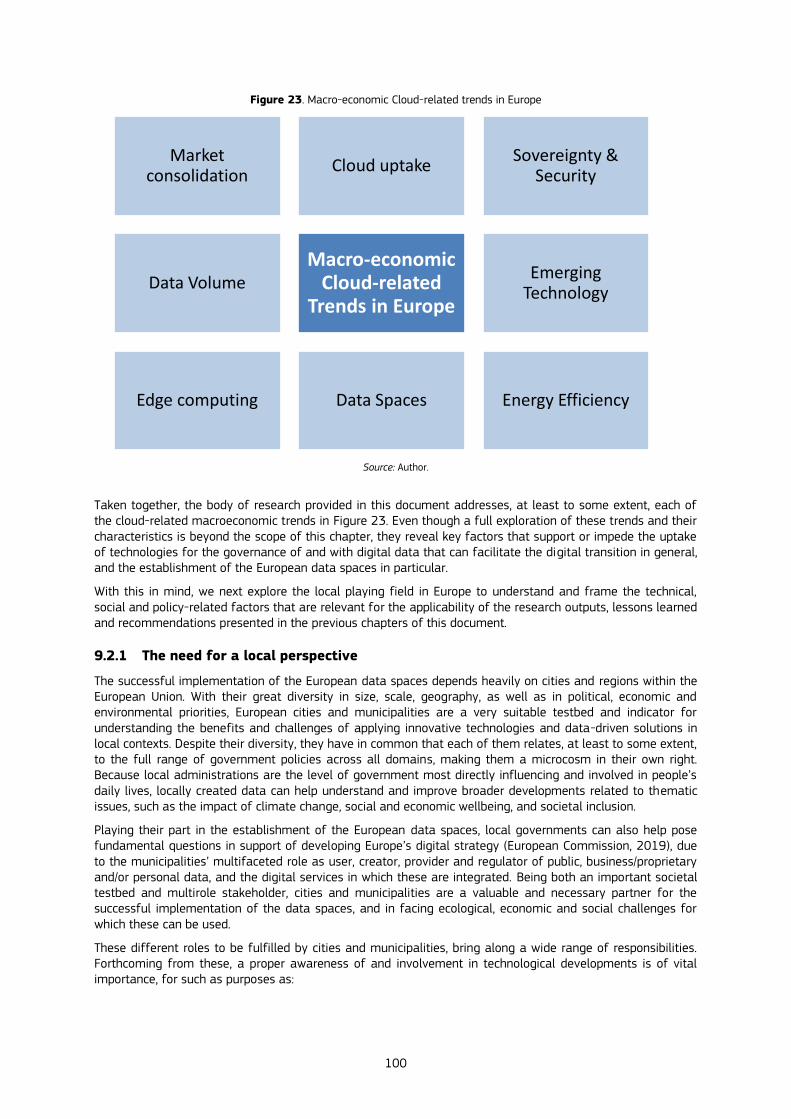
100
Figure 23. Macro-economic Cloud-related trends in Europe
Source: Author.
Taken together, the body of research provided in this document addresses, at least to some extent, each of the cloud-related macroeconomic trends in Figure 23. Even though a full exploration of these trends and their characteristics is beyond the scope of this chapter, they reveal key factors that support or impede the uptake of technologies for the governance of and with digital data that can facilitate the digital transition in general, and the establishment of the European data spaces in particular.
With this in mind, we next explore the local playing field in Europe to understand and frame the technical, social and policy-related factors that are relevant for the applicability of the research outputs, lessons learned and recommendations presented in the previous chapters of this document.
9.2.1 The need for a local perspective
The successful implementation of the European data spaces depends heavily on cities and regions within the European Union. With their great diversity in size, scale, geography, as well as in political, economic and environmental priorities, European cities and municipalities are a very suitable testbed and indicator for understanding the benefits and challenges of applying innovative technologies and data-driven solutions in local contexts. Despite their diversity, they have in common that each of them relates, at least to some extent, to the full range of government policies across all domains, making them a microcosm in their own right. Because local administrations are the level of government most directly influencing and involved in people’s daily lives, locally created data can help understand and improve broader developments related to thematic issues, such as the impact of climate change, social and economic wellbeing, and societal inclusion.
Playing their part in the establishment of the European data spaces, local governments can also help pose fundamental questions in support of developing Europe’s digital strategy (European Commission, 2019), due to the municipalities’ multifaceted role as user, creator, provider and regulator of public, business/proprietary and/or personal data, and the digital services in which these are integrated. Being both an important societal testbed and multirole stakeholder, cities and municipalities are a valuable and necessary partner for the successful implementation of the data spaces, and in facing ecological, economic and social challenges for which these can be used.
These different roles to be fulfilled by cities and municipalities, bring along a wide range of responsibilities. Forthcoming from these, a proper awareness of and involvement in technological developments is of vital importance, for such as purposes as:
Market consolidation
Cloud uptakeSovereignty &
Security
Data VolumeMacro-economic
Cloud-related Trends in Europe
Emerging Technology
Edge computing Data Spaces Energy Efficiency

101
— their aim to continuously improve and expand their digital-service delivery, by innovating and optimizing their processes and channels of interaction to meet changing demands,
— their capacity to explore, experiment with and (co-)create digital solutions, by relying on their own expertise,
— their ability to procure and commission well-fitting solutions from the market, by defining the desired criteria and specifications,
— their need to reduce operational costs, by exploring options for outsourcing their local infrastructure to cloud platforms or shared service centres,
— their means to anticipate societal impact of digital developments to safeguard citizens’ interests and upholding their rights, by understanding both possibilities and implications, and,
— their need for the availability of and access to reliable communication-infrastructures and reliable data, in case of crisis or calamity management,
— their contribution to research and development, by providing a relevant social, economic and geographical context for testing and validation.
Together, these governance-related purposes comprise several of the main aspects for municipalities to take into consideration for their own digital transition and strategy, each from a different perspective and role that they fulfil.
9.2.2 The importance of active participation
Taking the different roles of municipalities mentioned above into account, the technological developments within the context of the European data spaces explored in this document are relevant even for municipalities that themselves have no capacity or priority on actively developing digital services. Along the way of finding a balance between push and pull, these emerging technologies and developments will sooner or later arrive on the doorstep of cities.
Because cities and regions have a societal responsibility across all domains, they benefit from the availability of reliable data, such as is to be provided by these data spaces. A clear application can be found in evidence-based policy development to address societal challenges at the local or regional level, and beyond. To help harness the potential of their own data and those of private parties in relevant domains, in coming years the European Commission brings support to local authorities145, for example through extensive funding programs, expertise and technical recommendations.
At the same time, the Inception Impact Assessment for European data spaces states that ‘hard law options will be considered (with different degrees of intensity), […] more specifically: […] options to be examined will range from sharing of best practices among Member States to creation of obligations on Member States to offer certain support services to researchers and business innovators.’ This will ultimately affect local authorities, seeing that ‘most impact is expected from options that would focus on public sector bodies that hold relevant data’ (European Commission, 2020c).
Awareness of these developments will help anticipate upcoming directives or regulations. Additionally, the exploration of technical possibilities and best practices will help determine possible approaches when it comes to future implementation. It is therefore important to look at possible obstacles for municipalities to do so effectively.
9.2.3 Barriers to investments
With the importance of local involvement in the preparation and execution of the European strategy for data in mind, it is significant to note that the 2020 open consultation on European data spaces resulted in very limited input from cities and municipalities146. Apart from its significance from a quantitative perspective, the provided input by public authorities itself also addresses an important issue. Two of the few representatives
145 https://digital-strategy.ec.europa.eu/en/activities/funding-digital 146 See ‘Statistics’ at https://ec.europa.eu/info/law/better-regulation/have-your-say/initiatives/12491-Data-sharing-in-the-EU-
common-European-data-spaces-new-rules-/feedback_en?p_id=8166525&page=2
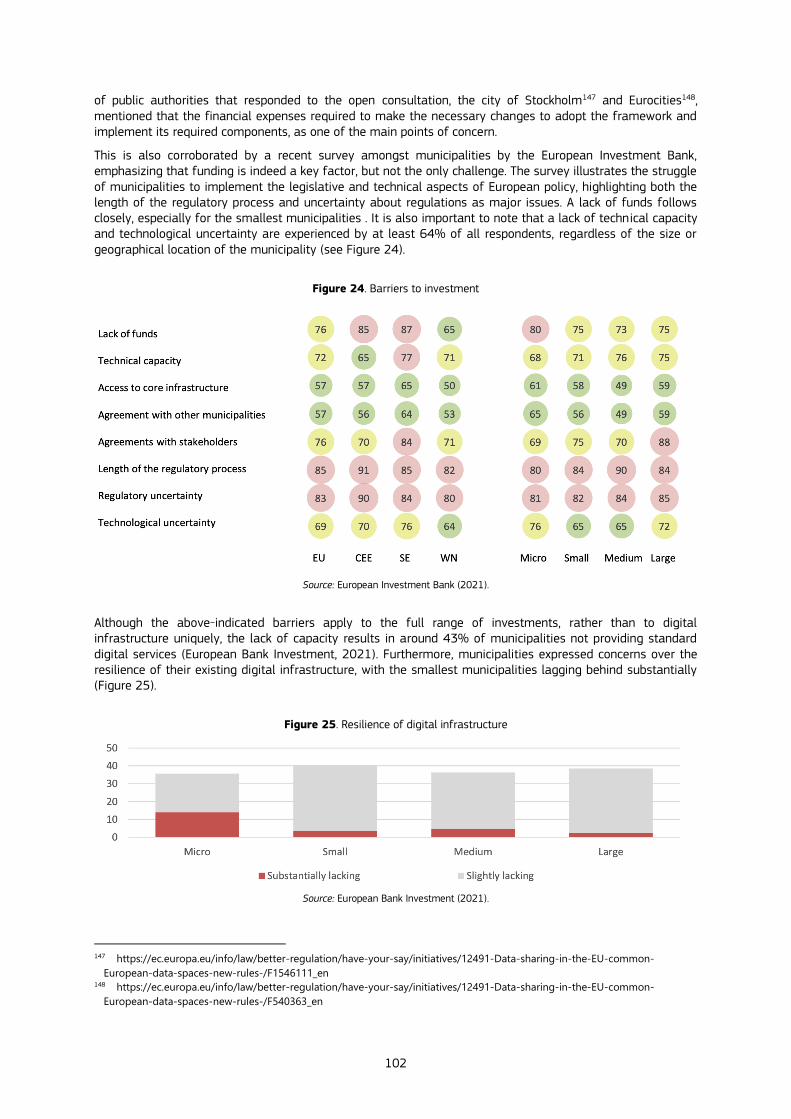
102
of public authorities that responded to the open consultation, the city of Stockholm147 and Eurocities148, mentioned that the financial expenses required to make the necessary changes to adopt the framework and implement its required components, as one of the main points of concern.
This is also corroborated by a recent survey amongst municipalities by the European Investment Bank, emphasizing that funding is indeed a key factor, but not the only challenge. The survey illustrates the struggle of municipalities to implement the legislative and technical aspects of European policy, highlighting both the length of the regulatory process and uncertainty about regulations as major issues. A lack of funds follows closely, especially for the smallest municipalities . It is also important to note that a lack of technical capacity and technological uncertainty are experienced by at least 64% of all respondents, regardless of the size or geographical location of the municipality (see Figure 24).
Figure 24. Barriers to investment
Source: European Investment Bank (2021).
Although the above-indicated barriers apply to the full range of investments, rather than to digital infrastructure uniquely, the lack of capacity results in around 43% of municipalities not providing standard digital services (European Bank Investment, 2021). Furthermore, municipalities expressed concerns over the resilience of their existing digital infrastructure, with the smallest municipalities lagging behind substantially (Figure 25).
Figure 25. Resilience of digital infrastructure
Source: European Bank Investment (2021).
147 https://ec.europa.eu/info/law/better-regulation/have-your-say/initiatives/12491-Data-sharing-in-the-EU-common-
European-data-spaces-new-rules-/F1546111_en 148 https://ec.europa.eu/info/law/better-regulation/have-your-say/initiatives/12491-Data-sharing-in-the-EU-common-
European-data-spaces-new-rules-/F540363_en
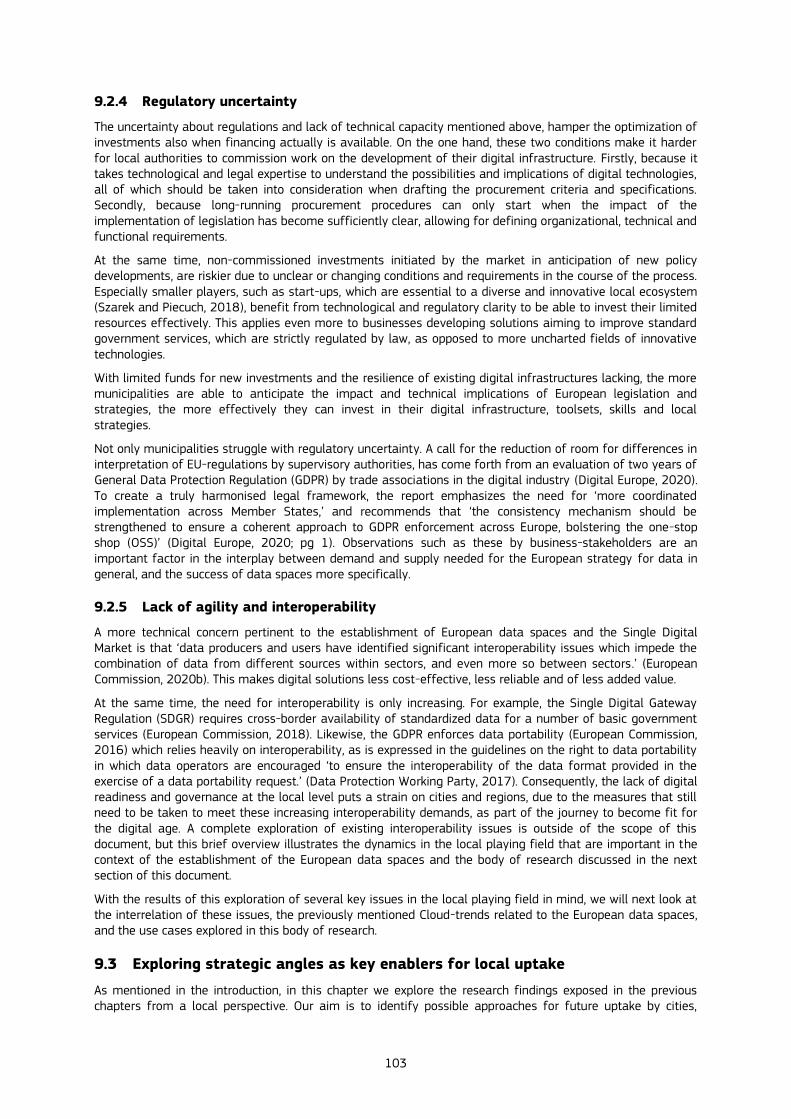
103
9.2.4 Regulatory uncertainty
The uncertainty about regulations and lack of technical capacity mentioned above, hamper the optimization of investments also when financing actually is available. On the one hand, these two conditions make it harder for local authorities to commission work on the development of their digital infrastructure. Firstly, because it takes technological and legal expertise to understand the possibilities and implications of digital technologies, all of which should be taken into consideration when drafting the procurement criteria and specifications. Secondly, because long-running procurement procedures can only start when the impact of the implementation of legislation has become sufficiently clear, allowing for defining organizational, technical and functional requirements.
At the same time, non-commissioned investments initiated by the market in anticipation of new policy developments, are riskier due to unclear or changing conditions and requirements in the course of the process. Especially smaller players, such as start-ups, which are essential to a diverse and innovative local ecosystem (Szarek and Piecuch, 2018), benefit from technological and regulatory clarity to be able to invest their limited resources effectively. This applies even more to businesses developing solutions aiming to improve standard government services, which are strictly regulated by law, as opposed to more uncharted fields of innovative technologies.
With limited funds for new investments and the resilience of existing digital infrastructures lacking, the more municipalities are able to anticipate the impact and technical implications of European legislation and strategies, the more effectively they can invest in their digital infrastructure, toolsets, skills and local strategies.
Not only municipalities struggle with regulatory uncertainty. A call for the reduction of room for differences in interpretation of EU-regulations by supervisory authorities, has come forth from an evaluation of two years of General Data Protection Regulation (GDPR) by trade associations in the digital industry (Digital Europe, 2020). To create a truly harmonised legal framework, the report emphasizes the need for ‘more coordinated implementation across Member States,’ and recommends that ‘the consistency mechanism should be strengthened to ensure a coherent approach to GDPR enforcement across Europe, bolstering the one-stop shop (OSS)’ (Digital Europe, 2020; pg 1). Observations such as these by business-stakeholders are an important factor in the interplay between demand and supply needed for the European strategy for data in general, and the success of data spaces more specifically.
9.2.5 Lack of agility and interoperability
A more technical concern pertinent to the establishment of European data spaces and the Single Digital Market is that ‘data producers and users have identified significant interoperability issues which impede the combination of data from different sources within sectors, and even more so between sectors.’ (European Commission, 2020b). This makes digital solutions less cost-effective, less reliable and of less added value.
At the same time, the need for interoperability is only increasing. For example, the Single Digital Gateway Regulation (SDGR) requires cross-border availability of standardized data for a number of basic government services (European Commission, 2018). Likewise, the GDPR enforces data portability (European Commission, 2016) which relies heavily on interoperability, as is expressed in the guidelines on the right to data portability in which data operators are encouraged ‘to ensure the interoperability of the data format provided in the exercise of a data portability request.’ (Data Protection Working Party, 2017). Consequently, the lack of digital readiness and governance at the local level puts a strain on cities and regions, due to the measures that still need to be taken to meet these increasing interoperability demands, as part of the journey to become fit for the digital age. A complete exploration of existing interoperability issues is outside of the scope of this document, but this brief overview illustrates the dynamics in the local playing field that are important in the context of the establishment of the European data spaces and the body of research discussed in the next section of this document.
With the results of this exploration of several key issues in the local playing field in mind, we will next look at the interrelation of these issues, the previously mentioned Cloud-trends related to the European data spaces, and the use cases explored in this body of research.
9.3 Exploring strategic angles as key enablers for local uptake
As mentioned in the introduction, in this chapter we explore the research findings exposed in the previous chapters from a local perspective. Our aim is to identify possible approaches for future uptake by cities,
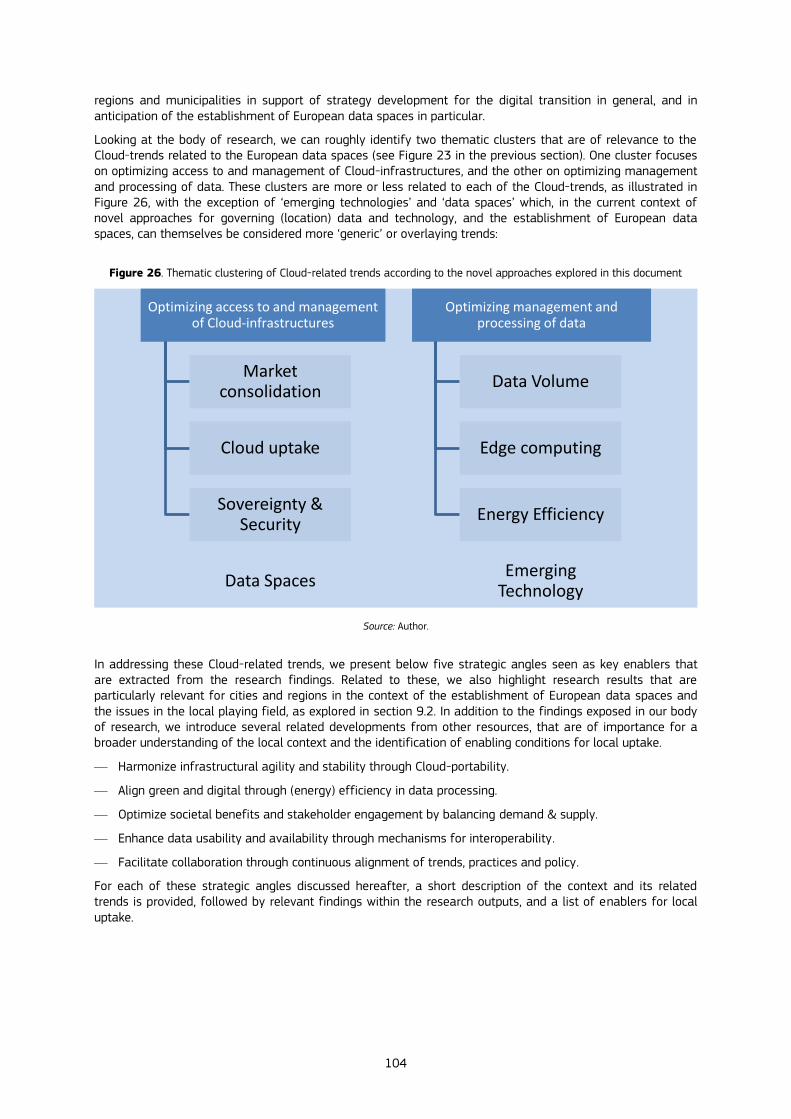
104
regions and municipalities in support of strategy development for the digital transition in general, and in anticipation of the establishment of European data spaces in particular.
Looking at the body of research, we can roughly identify two thematic clusters that are of relevance to the Cloud-trends related to the European data spaces (see Figure 23 in the previous section). One cluster focuses on optimizing access to and management of Cloud-infrastructures, and the other on optimizing management and processing of data. These clusters are more or less related to each of the Cloud-trends, as illustrated in Figure 26, with the exception of ‘emerging technologies’ and ‘data spaces’ which, in the current context of novel approaches for governing (location) data and technology, and the establishment of European data spaces, can themselves be considered more ‘generic’ or overlaying trends:
Figure 26. Thematic clustering of Cloud-related trends according to the novel approaches explored in this document
Source: Author.
In addressing these Cloud-related trends, we present below five strategic angles seen as key enablers that are extracted from the research findings. Related to these, we also highlight research results that are particularly relevant for cities and regions in the context of the establishment of European data spaces and the issues in the local playing field, as explored in section 9.2. In addition to the findings exposed in our body of research, we introduce several related developments from other resources, that are of importance for a broader understanding of the local context and the identification of enabling conditions for local uptake.
— Harmonize infrastructural agility and stability through Cloud-portability.
— Align green and digital through (energy) efficiency in data processing.
— Optimize societal benefits and stakeholder engagement by balancing demand & supply.
— Enhance data usability and availability through mechanisms for interoperability.
— Facilitate collaboration through continuous alignment of trends, practices and policy.
For each of these strategic angles discussed hereafter, a short description of the context and its related trends is provided, followed by relevant findings within the research outputs, and a list of enablers for local uptake.
Optimizing access to and management of Cloud-infrastructures
Market consolidation
Cloud uptake
Sovereignty & Security
Data Spaces
Optimizing management and processing of data
Data Volume
Edge computing
Energy Efficiency
Emerging Technology
105
9.3.1 Harmonize infrastructural agility and stability through Cloud-portability149
A context characterized by an increasing speed of technological developments combined with regulatory uncertainty, drives the need for infrastructural agility. A robust cloud-based infrastructure for virtualized solutions can offer great benefits in this respect. While the consolidation of the cloud market and vendor lock-ins may act as a constraint for moving towards or between these platforms, facilitating, or even automating, the process of switching cloud providers can be a step towards a greater uptake.
The approach to build, test and deploy digital data services described in Chapter 5 can be taken into consideration by cities and municipalities for their local digital strategies. The ability to easily change running data web services by a single Git(Hub) pull request, which can be applied to any Git or hosting provider, can remove hesitance to exchange local legacy infrastructure for the cloud, knowing that adaptations can be made again. A similar ease of migration is the goal of the ‘Haven’-project, initiated by the Association of Netherlands Municipalities (VNG), aiming ‘to painlessly migrate entire workloads from one Haven cluster [i.e. a configured Kubernetes cluster] to another, which don't even have to be deployed on the same environment/cloud.’150
Being able to easily migrate between trusted cloud-providers by making use of these or similar approaches, brings the best of both worlds in terms of stability and agility, closer to the digital practices of municipalities and can act as an enabler in the digital transition.
At the same time, although these are convenient technological (configuration) solutions, they have limited use without integrations on, for example, subscription level, SLAs, liability and contractual agreements, between different owners and providers of the physical infrastructure. Agreements or obligations for cloud-providers to use harmonised contract (level) agreements for public services based on EU governance rules, and compliant with existing EU legislation, makes changing cloud-providers more feasible and, with that, the technological approach more applicable in actual practice.
The technical approach presented in our current scope of research, can therefore best be applied in combination with collective procurement schemes for Infrastructure-as-a-Service, as is envisaged in the European Commission’s strategy for data, similar to what was undertaken by GÉANT, a European collaboration on e-infrastructure and services for research and education. They conducted a Pan-European tender ‘to allow Research and Education institutions to consume the cloud in a safe, easy and predictable way’.151 In the approach taken by GÉANT, multiple cloud-providers were included in the final framework agreement between which research institutions could choose for their service delivery based on their specific needs.
In summary, the following enablers are then suggested for local uptake:
— Include cloud-portability mechanisms in migration strategies to mitigate vendor lock-ins and increase agility in the digital infrastructure;
— Ensure the availability of necessary requirements, e.g. supporting infrastructure and contractual agreements, on both client and provider side, for actual implementation of these mechanisms;
— Facilitate cloud-portability by collective procurement of Infrastructure-as-a-Service-provisions, in regional/national and international collaborations;
— Invest in knowledge of / access to expertise regarding container virtualization to prepare the digital infrastructure for increased agility in deploying digital solutions to meet changing demands.
9.3.2 Align green and digital through (energy) efficiency in data processing152
With the digital and green transition both high on the European agenda, energy efficiency in relation to data usage has become a combined effort. Anticipating the global volume of data to increase rapidly in the coming years153, all areas of data processing, including the creation, storage, transport, analysis and display of data, will accordingly require continuous exploration of measures for increased sustainability. The green and digital
149 Addressing cloud-trends in market consolidation, cloud uptake and sovereignty (& security) 150 https://gitlab.com/commonground/haven/haven 151 https://digital-strategy.ec.europa.eu/en/news/results-geant-tender-infrastructure-service-solutions 152 Addressing cloud-trends in data volume, edge computing and energy efficiency 153 https://ec.europa.eu/info/strategy/priorities-2019-2024/europe-fit-digital-age/european-data-strategy_en
106
agendas are also related through an increase in available technologies that can help evaluate environmental issues, such as air quality and noise pollution, by analysis of sensory data.
The body of research presented in this document addresses energy efficiency and data volume in several areas within the data flow, targeting the green agenda154:
— Binary data serialization for increased efficiency in data volume during transport (Chapter 2);
— Event-driven architectures for reducing redundant data exchanges (Chapter 3); and
— Edge computing for reducing processing power through in-context sensor-data capture and analysis (Chapter 4).
Each of these approaches obviously has the highest impact in a context characterized by large data volumes and frequent data transactions, such as at a national or European level. Nevertheless, also at the local level it is important to take energy efficiency in consideration. Not only for efficient use of local and global resources155, but also for principally making the digital agenda contribute to the green goals in its execution strategy, rather than creating adverse side effects by consuming unnecessary amounts of energy or natural resources. With over 80,000 municipalities within the European Union, the collective effort will ultimately add up to have a positive impact.
Local application of the research findings presented in these three topics listed above, can theoretically be done by cities through their own development activities. However, with few cities engaged in the actual development of digital solutions in which to incorporate these technological approaches, the relevance in that respect is most likely limited. Furthermore, based on the findings presented so far, it is impossible to provide a definite conclusion on the energy efficiency of using binary data serialization protocols, for example, especially when it comes to large-scale data exchange and sharing. Whereas significant benefits are found in the reduction of data volume in transport (serialization), this often is counterbalanced by increased computational demands for deserialization data after transport (see Chapter 2).
Research indicates that when it comes to the architectural design of the digital infrastructure, benefits can alternatively be looked for by processing data only where and where it’s needed. Event-driven architectures using push-based data delivery mechanisms can in certain use cases contribute to energy efficiency by reducing the load of data transactions to those that convey real updates of data. Furthermore, they also result in the delivery of near-real time data to data consumers, fostering the infrastructure and service agility necessary to consolidate a data-driven market (see Chapter 3). This approach is especially advantageous in the case of large numbers of data streams with infrequent updates, or with an irregular, non-predictable update frequency. Apart from the benefits of reduced data transactions, push-based delivery also allows for new application scenarios, such crisis management where local authorities can actively be informed of new developments based on sensory data or triggered protocols.
Benefits of efficient and effective handling of data can be further increased when combined with the proper balancing of granular versus aggregated data capture and analysis, as can be achieved in cloud and edge architectures (see Chapter 4). In such setups, processing training models that involved large and complex datasets is done in the cloud, while model-based prediction capabilities of smaller data volumes representing new data instances can be done more locally on the edge and IoT devices in real time as pointed out in the schematic edge infrastructure in Figure 27.
154 Out of scope for this particular angle addressing energy efficiency and data volume, but targeting air quality as part of the
green agenda, is the research presented on Data Collaboratives (see Chapter 7). 155 Financial resources, available green energy, global availability of natural resources for hardware production and distribution
as examples.
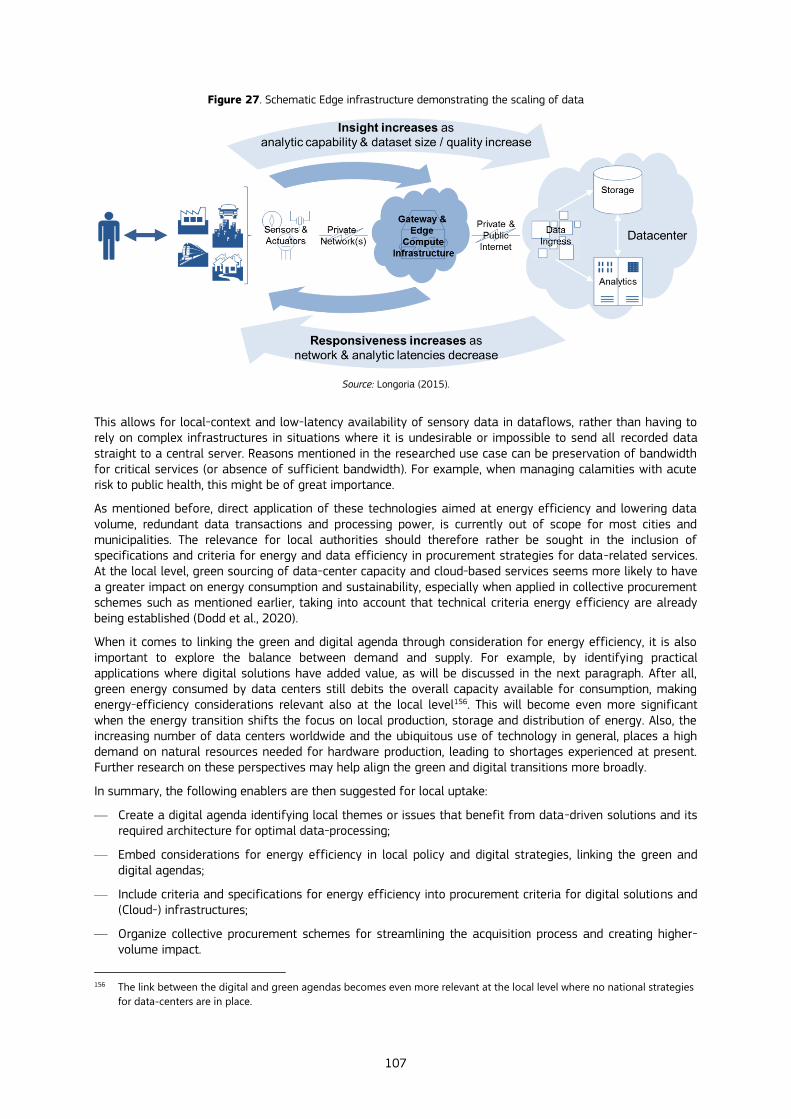
107
Figure 27. Schematic Edge infrastructure demonstrating the scaling of data
Source: Longoria (2015).
This allows for local-context and low-latency availability of sensory data in dataflows, rather than having to rely on complex infrastructures in situations where it is undesirable or impossible to send all recorded data straight to a central server. Reasons mentioned in the researched use case can be preservation of bandwidth for critical services (or absence of sufficient bandwidth). For example, when managing calamities with acute risk to public health, this might be of great importance.
As mentioned before, direct application of these technologies aimed at energy efficiency and lowering data volume, redundant data transactions and processing power, is currently out of scope for most cities and municipalities. The relevance for local authorities should therefore rather be sought in the inclusion of specifications and criteria for energy and data efficiency in procurement strategies for data-related services. At the local level, green sourcing of data-center capacity and cloud-based services seems more likely to have a greater impact on energy consumption and sustainability, especially when applied in collective procurement schemes such as mentioned earlier, taking into account that technical criteria energy efficiency are already being established (Dodd et al., 2020).
When it comes to linking the green and digital agenda through consideration for energy efficiency, it is also important to explore the balance between demand and supply. For example, by identifying practical applications where digital solutions have added value, as will be discussed in the next paragraph. After all, green energy consumed by data centers still debits the overall capacity available for consumption, making energy-efficiency considerations relevant also at the local level156. This will become even more significant when the energy transition shifts the focus on local production, storage and distribution of energy. Also, the increasing number of data centers worldwide and the ubiquitous use of technology in general, places a high demand on natural resources needed for hardware production, leading to shortages experienced at present. Further research on these perspectives may help align the green and digital transitions more broadly.
In summary, the following enablers are then suggested for local uptake:
— Create a digital agenda identifying local themes or issues that benefit from data-driven solutions and its required architecture for optimal data-processing;
— Embed considerations for energy efficiency in local policy and digital strategies, linking the green and digital agendas;
— Include criteria and specifications for energy efficiency into procurement criteria for digital solutions and (Cloud-) infrastructures;
— Organize collective procurement schemes for streamlining the acquisition process and creating higher-volume impact.
156 The link between the digital and green agendas becomes even more relevant at the local level where no national strategies
for data-centers are in place.
108
9.3.3 Optimize societal benefits and stakeholder engagement by balancing demand &
supply157
The main goal of the European data spaces is to enable researchers, public administrators, companies and individuals to share and make better use of publicly held data. They can play a pivotal role in cross-border, cross-sector and cross-domain collaborations on the challenges we are facing as a society. With the high expectations when it comes to solving societal challenges through digital solutions, it is important to continuously re-evaluate the balance of demand and supply. Validating the added value and actual benefits of a data-driven solution, and understanding where it derives from, can help decide the optimal approach and target investments accordingly.
The research presented on understanding the demand for data-driven innovation in the public stresses the importance of asking whether a certain digital solution is actually beneficial from a demand perspective, rather than, for example, being driven by a tech-push. Although more research is needed, it is clear that the benefits of data-driven solutions are not always obvious and undisputed, as occurred within the field of policing and social services (see Chapter 8). Implementing digital solutions only when they have added public value will result in greater acceptance when applied158. A strong agenda, both political and organizational, with a clear strategy and positioning can help explore and weigh different scenarios in line with societal values, strengths, and challenges at the local level. A concrete agenda will also help engage in alliances for addressing complex themes collaboratively, for example by sharing data, capacity and expertise.
Focusing on the supply side of data-driven innovations, an important stakeholder group are businesses. In often privatized markets, such as energy and mobility, businesses hold crucial data for policy development and service delivery by local authorities. In the concluding statement on a recent exploration of business-to-government (B2G) data sharing, Eurocities brings up a critical issue regarding the successful establishment of European Data Spaces, especially at the local level. They observed that ‘companies have a low level of interest to share data with city authorities, especially with small and medium sized cities. This lack of interest overlooks the proven potential of city authorities as enablers and facilitators of well-functioning local data-driven innovation ecosystems.’ (Eurocities, 2021). The focus of companies on the immediate return on investment and visibility, are cited as the reasons for them to choose with which city to collaborate and how159. This issue is further impacted by the fact that ‘cities differ in size, technical skills and spending capacities’ (Eurocities, 2021), making practical collaborations harder to bring towards execution.
The issue of availability of and access to privately held data is also recognized by the research on data collaboratives. Although the business-to-government data sharing is not its particular focus, the enabling conditions and success factors for governance, operational requirements, scientific requirements, and human/technical requirements, provide building blocks for uptake to facilitate future data collaborations. Research on data collaboratives shows that these can play an important role in aligning supply and demand of data-driven innovation, being used to provide functional access to previously siloed data assets so that they can be leveraged in the public interest (see Chapter 7). Especially towards smaller municipalities that don’t have the resources to organize their own technical expertise, data collaboratives can help ensure that the capacity required for data security and quality is available collectively. This allows smaller cities and municipalities to be more involved overall as well, which is of particular importance considering the hesitance of businesses to collaborate with small- and medium-sized cities directly. Even when local resources are scarce, at the minimum, capacity for participation in collaborative procurement procedures should be organized by local authorities to benefit from these enabling collaborations.
Apart from practical and technical approaches to stakeholder engagement and data collaboratives, exemplifying good practices and icon projects can create strong incentives to get involved. Platforms such as Living-in.eu160 can provide both cities and businesses with a podium to showcase their results, share knowledge and insights, and establish future collaborations. Acting as gatekeeper, applying criteria that emphasize involvement of local actors from smaller regions or municipalities into such platforms, can help bridge the gap that might occur when left solely to the market. Local participation in such innovative projects
157 Addressing cloud-trends in sovereignty & security, and market consolidation. 158 This will at the same time help align the green and digital agendas by limiting demand on digital infrastructures, including
the required energy consumption and resources for hardware, as discussed in the previous paragraph. 159 The difficulties arising from differing interpretations of regulations by supervisory authorities is of relevance here as well, as
observed in our earlier discussion on regulatory uncertainty at the municipal level when it comes to data exchanges under
the GDPR. 160 https://www.living-in.eu
109
can be at different levels of involvement, ranging from observing, to acting as a local testbed, and from validating design criteria for later upscaling, to taking the role of implementation partner.
In summary, the following enablers are then suggested for local uptake:
— Formulate public values and desired societal impact, to help balance the tech-push with social demand and to focus related efforts;
— Integrate the digital transition into the local political agenda and make topics related to this theme into boardroom decisions;
— Organize at least minimum capacity for local participation in data collaboratives; e.g. agenda setting, project- and contract management, community building;
— Prepare the local digital infrastructure and datasets for data collaborations using open standards and technologies, allowing for data exchange and analyses in support of solving societal challenges.
9.3.4 Enhance data usability and availability through mechanisms for interoperability161
The advent of the European data spaces brings along an increased necessity for the reliable exchange of and access to data. Exploration of the local context in the previous section, highlighted significant issues in this field. Especially at the local level, diversity in datasets and definitions across Europe is high. For example, different software suppliers providing digital solutions for public service delivery, use different data structures, ontologies and technologies, resulting in data-interoperability and usability issues even between neighbouring municipalities.
Recent initiatives targeting these issues in order to increase data interoperability and usability are already
established. Examples are the FAIR-principles for data162 and infrastructures for data-sharing, such as the INSPIRE-infrastructure for the spatial domain (European Parliament and Council, 2007). The recent proposal for a European Interoperability Framework for Smart Cities and Communities (Deloitte, European Commission, and KU Leuven, 2021) aims to further enhance data interoperability from different governance perspectives.
Research on the integration of authoritative and citizen-generated data provided in this document, using OpenStreetMaps as an example, demonstrates the importance of well governed datasets (see Chapter 6). Although the provided use cases focused on the national level, it offers lessons that can be extrapolated to the local level as well. When it comes to data enrichment, research shows the mutual benefits for all stakeholders. Local authorities can enrich their authoritative data with citizen-generated datasets, which at times includes more up-to-date or even more detailed data. Sets of citizen-generated data can benefit from the reliability of structurally maintained datasets that are governed under formal regulations. The experimental study explores a methodology and recommended tooling for such integrations.
Apart from semantic and technical considerations for interoperability, the research also emphasizes the importance of legal and organizational interoperability. In practice, differences in licensing can complicate the integration of datasets, which will be of relevance for data collaborations and, ultimately, data spaces. Because procedures for the integration of existing datasets are in practice hard to generalise, most advantages can be gained already in the preparation stage of datasets, taking interoperability into account at its inception. For cities and municipalities, it is important to work towards well-designed and well-maintained datasets to be able to benefit from data collaborations and fact-based policy development163.
The research findings on binary data serialization (Chapter 2) underline the importance of well-managed data as well, but also introduce potential risks when using this approach in search of the desired data-volume reduction. On top of existing issues with data interoperability, the exclusion of the data-structure specifications from the binary-data transaction itself, requires the sender and recipient to have the corresponding schema and protocol specific software code. Misaligning between updated versions can result in erroneous data, which is harder to trace due to binary data not being human-readable. Moreover, in the case of changes in data structure, the recompilation of software libraries for serialization and deserialization might be necessary, requiring technical expertise not widely available within the government. These findings should be taken into consideration from the perspective of interoperability versus data-volume optimizations (see also section 9.3.2).
161 Addressing cloud-trends in data spaces 162 https://www.go-fair.org/fair-principles/ 163 This has relevance for the ease of participation in data collaboratives discussed previously as well.

110
Taking a concrete approach to facilitate cross-sector interoperability, the establishment of the Minimum
Interoperability Mechanisms (MIMs)164 and, in this document’s context, in particular the new MIM7 in relation
to spatial data165, aims to support the design of systems in which the integration and exchange of data will be more reliable and command less effort. At a local level, its recommended standards for web-interfaces and data-encoding of spatial data can be integrated into technical specifications for software development or criteria for the procurement of solutions, in order to ensure interoperability, accessibility and enrichment of locally relevant policy-related data. At the same time, existing and future local practices and experiences with data management and usage, can in reverse be integrated into future updates for the MIM7-specifications,
allowing it to evolve over time, as intended in its proposed governance166. These dynamics will be further explored in the next section.
In summary, the following enablers are then suggested for local uptake:
— Invest in interoperability from the inception stage of future datasets, by integrating standards and mechanisms for interoperability into the design specifications (semantic, legal, technological and organizational);
— Develop a data-quality strategy to upgrade or migrate existing local datasets to match current open standards for interoperability, targeting those affected by European regulations first (i.e. Single Digital Gateway Regulation);
— Organize efforts for implementing interoperability collectively, by setting requirements at the EU-level (see discussion on interpretability of regulations in section 9.2.4), and taking actions for implementation at the regional or national level where possible rather than individually commissioning required customizations at the local level;
— Digitalize existing paper archives and manual processes prioritizing those that will free up capacity for personal service delivery to citizens and will help solve societal challenges benefitting from data analyses.
9.3.5 Facilitate collaboration through continuous alignment of trends, practices and
policy167
In coming years, data-driven innovations are strongly pushed by the European Digital Agenda, as well as by the global markets. Being part of this strategy, the European data spaces will fulfil their role of providing valuable data to face the challenges of our time in a dynamic context of emerging technologies and changing needs.
The body of research that we have explored in the chapters of this document, provides us with technologies and insights than can act as enablers in the establishment of these data spaces, and in the participation of cities, regions and municipalities, in collaboration with businesses and knowledge institutions. In general, the importance of further or continued research into these and similar technologies is emphasized in the preceding chapters. Rather than fixating these outcomes and similar results from future research, it is important to continuously exchange and discuss findings such as those presented in this body of research. To help align and anticipate policy developments, local practices and technological and societal trends, a continuous exploratory dialogue is essential to bring these aspects together (see Figure 28).
164 Embedded in the EIF4SCC Interoperability Governance under ‘Technological Interoperability’. 165 https://mims.oascities.org/interaction/oasc-mim7-places 166 https://mims.oascities.org/basics/oasc-mims-governance 167 Addressing Cloud-trends in emerging technology
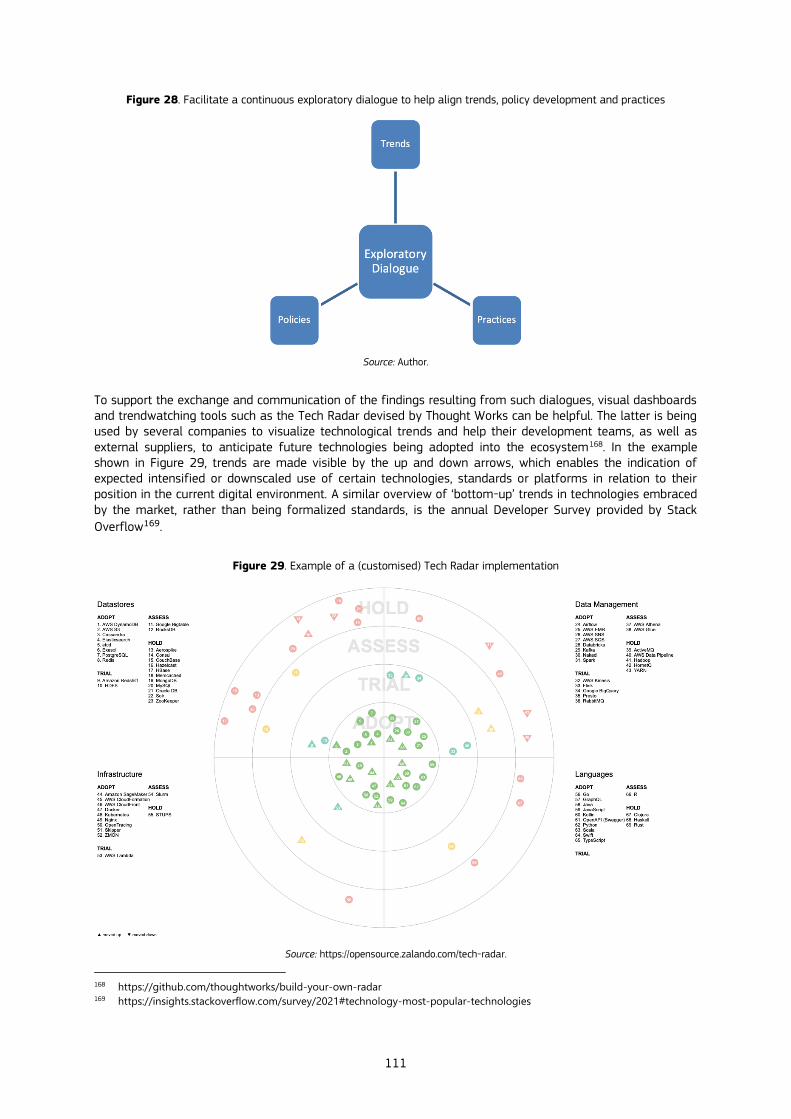
111
Figure 28. Facilitate a continuous exploratory dialogue to help align trends, policy development and practices
Source: Author.
To support the exchange and communication of the findings resulting from such dialogues, visual dashboards and trendwatching tools such as the Tech Radar devised by Thought Works can be helpful. The latter is being used by several companies to visualize technological trends and help their development teams, as well as external suppliers, to anticipate future technologies being adopted into the ecosystem168. In the example shown in Figure 29, trends are made visible by the up and down arrows, which enables the indication of expected intensified or downscaled use of certain technologies, standards or platforms in relation to their position in the current digital environment. A similar overview of ‘bottom-up’ trends in technologies embraced by the market, rather than being formalized standards, is the annual Developer Survey provided by Stack
Overflow169.
Figure 29. Example of a (customised) Tech Radar implementation
Source: https://opensource.zalando.com/tech-radar.
168 https://github.com/thoughtworks/build-your-own-radar 169 https://insights.stackoverflow.com/survey/2021#technology-most-popular-technologies

112
With clear playing rules and mutual agreement that no guarantees can be given regarding the actual adoption
of promising technologies and standards170, a more informal and fluid space for exploration between the formally accepted standards on one end of the spectrum, and the dynamic diversity of existing and upcoming technologies, on the other, can be created. The importance of such dialogues is recognized in the fact that the best standards are those that are actually being used. These dynamics require time for the actual implementation of standards that are being introduced top-down, for example through legislation. At the same time, formal authorities also require time to incorporate bottom-up changes in technologies actually in use by the community of developers into new or revised standards. In either case, standardisation is an important enabler for innovation, because investors in the development of digital solutions can rely on agreed technical specifications and related interoperability required for the data spaces and Single Digital Market.
This approach of taking mutual perspectives into consideration, could help bridge the gap between local practices and EU-level policy developments and soften the latter’s anticipated impact by exploring and identifying technologies that support the operational implementation at the local level. These can either be translated and included in collective procurement criteria or, if applicable, used in the development of digital solutions by cities themselves.
Regional collaborations between cities, municipalities, businesses, welfare organizations and knowledge- and educational institutions also play an important role in the exploration of changing societal demands and the local impact of government policies. Not only does it help to combine expertise from research, operation and experiential expertise, but it also allows for shared capacity-building. This supports continuity of such efforts, especially when integrated in the process of policy development and embedded in the educational curricula. These collaborations can also be approached thematically, targeting specific societal or ecological challenges within the region. The findings resulting from such regional collaborations, can be consolidated into key enablers from which others can benefit. Furthermore, data collaboratives can strengthen these efforts by support knowledge creation and transfer, decision making, policy monitoring and evaluation, and forecasting (see Chapter 8). Ultimately, well-governed data from such collaboratives can be made accessible through the European data spaces to address supra-regional developments and challenges.
In summary, the following enablers are then suggested for local uptake:
— Participate in platforms exploring trends and anticipated changes in standards and technologies, bringing legislators, developers and operational experts together from different levels of government and various stakeholders;
— Create local capacity for testing new technologies, by functioning as a testbed or by validating future scalability of novel approaches, including manpower and an agile digital infrastructure;
— Build alliances with regionally or thematically related stakeholders to gain understanding of changing demands and impact of policies, aimed at identifying enabling factors;
— Strengthen regional alliances with data collaboratives for knowledge creation and transfer, policy monitoring and evaluation, decision making and forecasting.
9.4 Conclusions
In this chapter we analysed the findings in our exploration of novel approaches for governing (location) data and technology from the perspective of cities and regions. In doing so, our aim was to work towards bridging the gap that exists between European-level policy developments and local practices. To facilitate the process, we have taken the European strategy for data, and especially the establishment of the European data spaces and its cloud-related trends, to provide a concrete context for application and validation of the research findings.
The successful establishment of data spaces depends on the active involvement of cities and regions, but this requires a conscious effort. An overview of the local playing field helps us understand the challenges cities and municipalities are facing. The overall length of European regulatory processes and uncertainty of regulations, combined with a local lack of capacity and technological uncertainty create a challenging playing field. Also citing the financial expenses that are required for making the necessary changes to adopt the framework as point of concern, the more local authorities are able to anticipate developments, whether those being societal trends or upcoming EU-policies, the better they are able to focus their efforts.
170 See for example: https://www.thoughtworks.com/insights/articles/radar-hits-misses

113
The establishment of the European data spaces will take place among macro-economic cloud-trends in Europe. The research presented in this document relates to these trends roughly through approaches for optimizing access to and management of cloud-infrastructures, and through optimizing management and processing of data. We have seen how the research findings in the preceding chapters allow us to identify several strategic angles that can act as key enablers for the active involvement of cities, regions and municipalities in the establishment of the data spaces.
Especially technologies and methodologies that improve overall infrastructural agility, digital sovereignty and effective management of data are crucial. Working towards well-structured and maintained local datasets, prioritizing these efforts based on societal demands, is the basis for successful participation in data collaboratives and benefiting from knowledge creation and transfer, decision making, policy monitoring and evaluation, and forecasting. The dynamic context in which this takes place, calls for a continuous exploration of emerging technologies and changing demands. For each of the key enablers, we have highlighted specific actions that can be recommended for adoption into local strategies of cities, regions and municipalities for future uptake.
One important outcome in our review of this body of research from the local perspective is that cities and municipalities can only indirectly apply the research findings, which in many cases are technological in nature. Regardless of whether software development should be considered a core task of the government, most government organisations procure and consume, rather than develop digital solutions themselves. Therefore, positive impact resulting from the outcomes of the technical experiments presented in the previous chapters should mainly be sought through the application of criteria and specifications for public procurement procedures or uptake in local digital strategies.
The second outcome is the reconfirmation of the importance of organizing efforts collectively. In the case of procurement, this can be done through collective procurement schemes for digital services and infrastructures, or through the application of standardized procurement criteria in the case of procurement procedures by individual cities and municipalities. The definition of such collective criteria for procurement and standardized contractual clauses, should ideally be done at the European, or at least the national, level. This helps ensure the quality of procured services, the level of interoperability, and lessens the demand for legal and technological expertise required at the local level, with capacity being scare.
Local investments should at minimum be focused on the ability to participate in collective efforts. Not only in the collective procurement schemes mentioned before, but also in for example thematic or regional data collaboratives. This includes capacity for agenda setting, project- and contract management and community building. Furthermore, for cities and municipalities, the availability of, or at least access to, technological and legal expertise is important for determining the optimal quality and relevance of the outcomes of such collective efforts. For such collaborations to be fruitful, it is also important to have a local agenda that balances demand and supply, supports political and societal aims, and integrates the developments in social, economic and physical policy domains with those in the digital domain.
This readiness of cities and municipalities to actively participate, also helps engage business and knowledge institutions in such collaborations. These partners hold important data, currently contained in silos within often privatized sectors, for example relating to mobility, energy and healthcare. Data collaboratives can be a means to arrange the proper exchange of such data between business and governments, integrating design principles for privacy and security and standards for interoperability. Such collaborations will require cities and municipalities to prepare and manage also their own data, but in doing so will help them to meet possible obligations of future regulations. More importantly, it helps them to benefit from high-quality data for local policy development addressing societal challenges.
It is only through many small steps and in close collaboration that the European data spaces can be established. This body of research explores some of these steps, and future opportunities that may arise. It also helps us understand the challenges in the complex and dynamic local playing field. A continuous exploratory dialogue to bridge the gap between trends, EU-policy developments and local practices, as presented in this chapter, is essential to make Europe, with its cities, regions and municipalities, fit for the digital age.
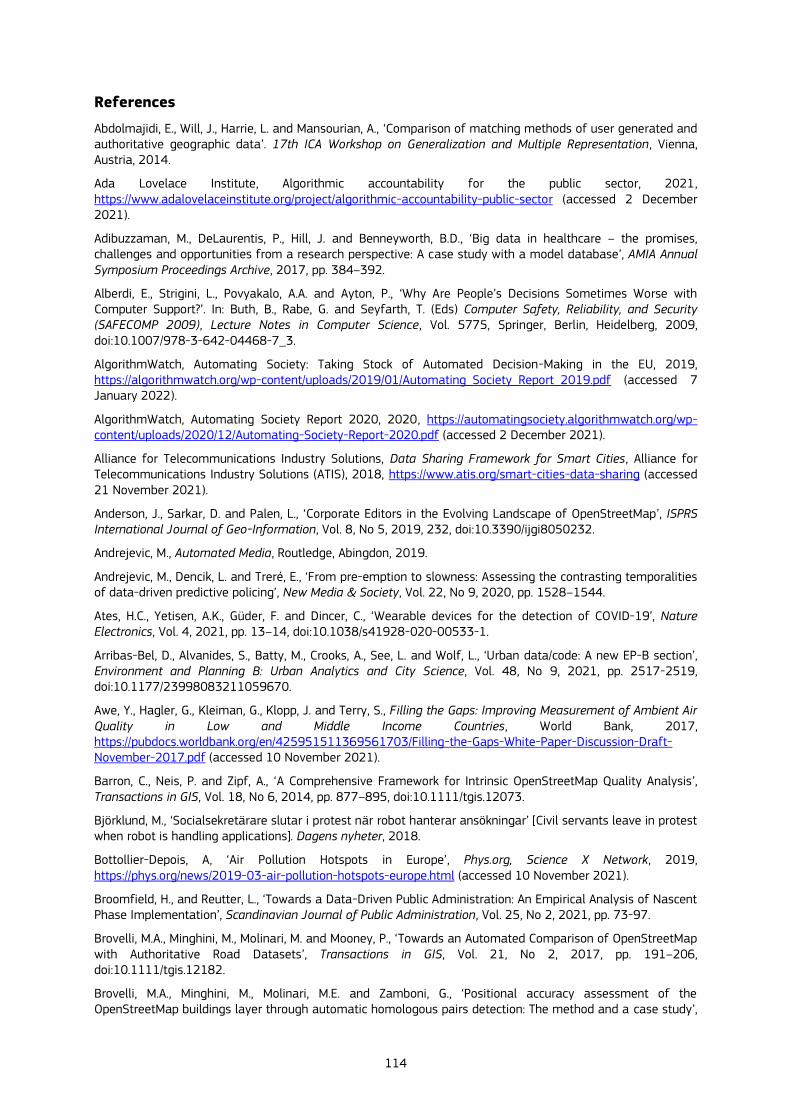
114
References
Abdolmajidi, E., Will, J., Harrie, L. and Mansourian, A., ‘Comparison of matching methods of user generated and authoritative geographic data’. 17th ICA Workshop on Generalization and Multiple Representation, Vienna, Austria, 2014.
Ada Lovelace Institute, Algorithmic accountability for the public sector, 2021, https://www.adalovelaceinstitute.org/project/algorithmic-accountability-public-sector (accessed 2 December 2021).
Adibuzzaman, M., DeLaurentis, P., Hill, J. and Benneyworth, B.D., ‘Big data in healthcare – the promises, challenges and opportunities from a research perspective: A case study with a model database’, AMIA Annual Symposium Proceedings Archive, 2017, pp. 384–392.
Alberdi, E., Strigini, L., Povyakalo, A.A. and Ayton, P., ‘Why Are People’s Decisions Sometimes Worse with Computer Support?’. In: Buth, B., Rabe, G. and Seyfarth, T. (Eds) Computer Safety, Reliability, and Security (SAFECOMP 2009), Lecture Notes in Computer Science, Vol. 5775, Springer, Berlin, Heidelberg, 2009, doi:10.1007/978-3-642-04468-7_3.
AlgorithmWatch, Automating Society: Taking Stock of Automated Decision-Making in the EU, 2019, https://algorithmwatch.org/wp-content/uploads/2019/01/Automating_Society_Report_2019.pdf (accessed 7 January 2022).
AlgorithmWatch, Automating Society Report 2020, 2020, https://automatingsociety.algorithmwatch.org/wp-content/uploads/2020/12/Automating-Society-Report-2020.pdf (accessed 2 December 2021).
Alliance for Telecommunications Industry Solutions, Data Sharing Framework for Smart Cities, Alliance for Telecommunications Industry Solutions (ATIS), 2018, https://www.atis.org/smart-cities-data-sharing (accessed 21 November 2021).
Anderson, J., Sarkar, D. and Palen, L., ‘Corporate Editors in the Evolving Landscape of OpenStreetMap’, ISPRS International Journal of Geo-Information, Vol. 8, No 5, 2019, 232, doi:10.3390/ijgi8050232.
Andrejevic, M., Automated Media, Routledge, Abingdon, 2019.
Andrejevic, M., Dencik, L. and Treré, E., ‘From pre-emption to slowness: Assessing the contrasting temporalities of data-driven predictive policing’, New Media & Society, Vol. 22, No 9, 2020, pp. 1528–1544.
Ates, H.C., Yetisen, A.K., Güder, F. and Dincer, C., ‘Wearable devices for the detection of COVID-19’, Nature Electronics, Vol. 4, 2021, pp. 13–14, doi:10.1038/s41928-020-00533-1.
Arribas-Bel, D., Alvanides, S., Batty, M., Crooks, A., See, L. and Wolf, L., ‘Urban data/code: A new EP-B section’, Environment and Planning B: Urban Analytics and City Science, Vol. 48, No 9, 2021, pp. 2517-2519, doi:10.1177/23998083211059670.
Awe, Y., Hagler, G., Kleiman, G., Klopp, J. and Terry, S., Filling the Gaps: Improving Measurement of Ambient Air Quality in Low and Middle Income Countries, World Bank, 2017, https://pubdocs.worldbank.org/en/425951511369561703/Filling-the-Gaps-White-Paper-Discussion-Draft-November-2017.pdf (accessed 10 November 2021).
Barron, C., Neis, P. and Zipf, A., ‘A Comprehensive Framework for Intrinsic OpenStreetMap Quality Analysis’, Transactions in GIS, Vol. 18, No 6, 2014, pp. 877–895, doi:10.1111/tgis.12073.
Björklund, M., ‘Socialsekretärare slutar i protest när robot hanterar ansökningar’ [Civil servants leave in protest when robot is handling applications]. Dagens nyheter, 2018.
Bottollier-Depois, A, ‘Air Pollution Hotspots in Europe’, Phys.org, Science X Network, 2019, https://phys.org/news/2019-03-air-pollution-hotspots-europe.html (accessed 10 November 2021).
Broomfield, H., and Reutter, L., ‘Towards a Data-Driven Public Administration: An Empirical Analysis of Nascent Phase Implementation’, Scandinavian Journal of Public Administration, Vol. 25, No 2, 2021, pp. 73-97.
Brovelli, M.A., Minghini, M., Molinari, M. and Mooney, P., ‘Towards an Automated Comparison of OpenStreetMap with Authoritative Road Datasets’, Transactions in GIS, Vol. 21, No 2, 2017, pp. 191–206, doi:10.1111/tgis.12182.
Brovelli, M.A., Minghini, M., Molinari, M.E. and Zamboni, G., ‘Positional accuracy assessment of the OpenStreetMap buildings layer through automatic homologous pairs detection: The method and a case study’,

115
ISPRS International Archives of the Photogrammetry, Remote Sensing and Spatial Information Sciences , Vol. XLI-B2, 2016, pp. 615–620, doi:10.5194/isprs-archives-XLI-B2-615-2016.
Center for Devices and Radiological Health, Thermal Imaging Systems (Infrared Thermographic Systems / Thermal Imaging Cameras), U.S. Food and Drug Administration, 2021, https://www.fda.gov/medical-devices/general-hospital-devices-and-supplies/thermal-imaging-systems-infrared-thermographic-systems-thermal-imaging-cameras (accessed 21 November 2021).
Chiu, K., Devadithya, T., Lu, W. and Slominski, A., ‘A binary XML for scientific applications’, Proceedings of the First International Conference on e-Science and Grid Computing (e-Science'05), 2005, pp. 1–8, doi:10.1109/E-SCIENCE.2005.1.
Christin, A., ‘Algorithms in practice: Comparing web journalism and criminal justice’, Big Data & Society, 2017, pp. 1–14, doi:10.1177/2053951717718855.
Cipeluch, B., Jacob, R., Winstanley, A. and Mooney, P., ‘Comparison of the accuracy of OpenStreetMap for Ireland with Google Maps and Bing Maps’, Proceedings of the Ninth International Symposium on Spatial Accuracy Assessment in Natural Resources and Environmental Sciences, Leicester, UK, 2010.
Collington, R., ‘Disrupting the Welfare State? Digitalisation and the Retrenchment of Public Sector Capacity’, New Political Economy, 2021, doi:10.1080/13563467.2021.1952559.
Couchman, H., Policing by Machine: Predictive Policing and the Threat to Our Rights, 2019, https://www.libertyhumanrights.org.uk/sites/default/files/LIB%2011%20Predictive%20Policing%20Report%20WEB.pdf (accessed 21 November 2021).
Couldry, N. and Powell, A., ‘Big data from the bottom up’, Big Data & Society, Vol. 1, No 2, 2014, pp. 1–12, doi:10.1177/2053951714539277.
Craglia M., Scholten H., Micheli M., Hradec J., Calzada I., Luitjens S., Ponti M. and Boter J., Digitranscope; The governance of digitally-transformed society, EUR 30590 EN, JRC123362, Publications Office of the European Union, Luxembourg, 2021, doi:10.2760/503546.
Creative Commons, Creative Commons Attribution 4.0 International (CC BY 4.0), 2021a, https://creativecommons.org/licenses/by/4.0 (accessed 23 June 2021).
Creative Commons, Creative Commons 0 1.0 Universal (CC0 1.0) Public Domain Dedication, 2021b, https://creativecommons.org/publicdomain/zero/1.0 (accessed 24 June 2021).
Data Protection Working Party, Guidelines on the right to data portability, 16/EN, WP 242 rev.01, 2017, http://ec.europa.eu/newsroom/document.cfm?doc_id=44099 (accessed 14 November 2021).
De Longueville, B., Annoni, A., Schade, S., Ostlaender, N. and Whitmore, C., ‘Digital Earth’s Nervous System for Crisis Events: Real-Time Sensor Web Enablement of Volunteered Geographic Information’, International Journal of Digital Earth, Vol. 3, No 3, 2010, pp. 242–259, doi:10.1080/17538947.2010.484869.
Deloitte, European Commission and KU Leuven, Final Study Report - Proposal for a European Interoperability Framework for Smart Cities and Communities (EIF4SCC), Publications Office of the European Union, Luxembourg, 2021, doi:10.2799/085469, https://op.europa.eu/s/uvXK (accessed 14 November 2021).
Dencik, L., ‘Situating practices in datafication - from above and below’. In: Stephansen, H. and Treré, E. (Eds.) Citizen Media and Practice, Routledge, London and New York, 2019.
Dencik, L., ‘The Datafied Welfare State: A Perspective from the UK’. In: Hepp, A., Jarke, J. and Kramp, L. (Eds.) The Ambivalences of Data Power: New perspectives in critical data studies, Palgrave Macmillan, 2021.
Dencik, L., Hintz, A. and Carey, Z., ‘Prediction, pre-emption and limits to dissent: Social media and big data uses for policing protests in the United Kingdom’, New Media & Society, Vol. 20, No 3, 2017, pp. 1433–1450.
Dencik, L., Hintz, A., Redden, J. and Warne, H., Data Scores as Governance: Investigating Uses of Citizen Scoring in Public Services, Cardiff University, 2018, https://datajustice.files.wordpress.com/2018/12/data-scores-as-governance-project-report2.pdf (accessed 2 December 2021).
Dencik, L., Redden, J., Hintz, A. and H. Warne, H., ‘The ‘Golden View’: Data-Driven Governance in the Scoring Society’, Internet Policy Review, Vol. 8, No 2, 2019, doi:10.14763/2019.2.1413.

116
Digital Europe, Two years of GDPR: A report from the digital industry, 2020, https://www.digitaleurope.org/wp/wp-content/uploads/2020/06/DIGITALEUROPE_Two-years-of-GDPR_A-report-from-the-digital-industry.pdf (accessed 21 November 2021).
Dodd, N., Alfieri, F., Maya-Drysdale, L., Viegand, J., Flucker, S., Tozer, R., Whitehead, B., Wu, A. and Brocklehurst F., Development of the EU Green Public Procurement (GPP) Criteria for Data Centres Server Rooms and Cloud Services, EUR 30251 EN, JRC118558, Publications Office of the European Union, Luxembourg, 2020, doi:10.2760/964841.
Dorn, H., Törnros, T. and Zipf, A., 2015. ‘Quality Evaluation of VGI Using Authoritative Data—A Comparison with Land Use Data in Southern Germany’, ISPRS International Journal of Geo-Information, Vol. 4, No 3, 2015, pp. 1657–1671, doi:10.3390/ijgi4031657.
Du, H., Anand, S., Alechina, N., Morley, J., Hart, G., Leibovici, D., Jackson, M. and Ware, M., ‘Geospatial Information Integration for Authoritative and Crowd Sourced Road Vector Data: Authoritative and Crowd Sourced Road Vector Data’, Transactions in GIS, Vol. 16, No 4, 2012, pp. 455–476, doi:10.1111/j.1467-9671.2012.01303.x.
Egbert, S. and Leese, M., Criminal Futures: Predictive Policing and Everyday Police Work, Routledge, Abingdon, 2020.
El Saddik, A., ‘Digital twins: The convergence of multimedia technologies’. IEEE multimedia, Vol. 25, No 2, 2018, pp. 87-92, doi:10.1109/MMUL.2018.023121167.
Eurocities, Better Business to Government (B2G) data sharing that works for cities and people. Eurocities.eu, 2021, https://eurocities.eu/wp-content/uploads/2021/08/EUROCITIES-statement-on-B2G-data-sharing.pdf (accessed 14 November 2021).
European Commission, Commission Regulation (EC) No 2016/679 of the European Parliament and of the Council of 27 April 2016 on the protection of natural persons with regard to the processing of personal data and on the free movement of such data, and repealing Directive 95/46/EC (General Data Protection Regulation), Official Journal of the European Union, L 119, 2016, pp. 1–78, https://eur-lex.europa.eu/eli/reg/2016/679/2016-05-04 (accessed 14 November 2021).
European Commission, Commission Regulation (EC) No 2018/1724 of 2 October 2008 establishing a single digital gateway to provide access to information, to procedures and to assistance and problem-solving services and amending Regulation (EU) No 1024/2012, Official Journal of the European Union, L 295, 2018, pp. 1–38, https://eur-lex.europa.eu/legal-content/EN/TXT/?uri=CELEX:32018R1724 (accessed 14 November 2021)
European Commission, The European Commission’s priorities for 2019-24, 2019, https://ec.europa.eu/info/strategy/priorities-2019-2024 (accessed 7 June 2021).
European Commission, Best Practices in Citizen Science for Environmental Monitoring, Commission Staff Working Document, SWD (2020) 149 final, 2020a, pp. 1–75, https://ec.europa.eu/environment/legal/reporting/pdf/best_practices_citizen_science_environmental_monitoring.pdf (accessed 7 June 2021).
European Commission, Communication from the Commission to the European Parliament, the Council, the European Economic and Social Committee and the Committee of the Regions, A European Strategy for Data, COM (2020) 66 final, 2020b, pp. 1–34, https://eur-lex.europa.eu/legal-content/EN/TXT/?qid=1593073685620&uri=CELEX%3A52020DC0066 (accessed 9 August 2021).
European Commission, Inception Impact Assessment - Legislative framework for the governance of common European data spaces, 2020c, Ref. Ares(2020)3480073 - 02/07/2020.
European Commission, Towards a European strategy on business-to- government data sharing for the public interest, Final report prepared by the High-Level Expert Group on Business-to-Government Data Sharing, Publications Office of the European Union, Luxembourg, 2020d, doi:10.2759/731415.
European Commission, Public Sector Modernisation for EU Recovery and Resilience, https://ec.europa.eu/jrc/en/science-update/public-sector-modernisation-eu-recovery-and-resilience, 2021a (accessed 7 June 2021).
European Commission, Workshop Summary and Report - Data-driven communities: fostering a local data ecosystem for sustainability, 2021b, https://digital-strategy.ec.europa.eu/en/library/workshop-summary-and-
117
report-data-driven-communities-fostering-local-data-ecosystem-sustainability (accessed 21 November 2021).
European Environment Agency, Air Pollution: How It Affects Our Health, European Environment Agency, 2020, https://www.eea.europa.eu/themes/air/health-impacts-of-air-pollution (accessed 10 November 2021).
European Investment Bank, ‘The state of local infrastructure investment in Europe’, EIB Municipalities Survey 2020, 2021, doi:10.2867/071226.
European Parliament and Council, Directive (EU) 2007/2/EC of the European Parliament and of the Council of 14 March 2017 establishing an Infrastructure for Spatial Information in the European Community (INSPIRE), Official Journal of the European Union, L 108, 2007, pp. 1–14, https://eur-lex.europa.eu/eli/dir/2007/2/2019-06-26 (accessed 9 August 2021).
European Parliament and Council, Regulation (EU) 2016/679 of the European Parliament and of the Council of 27 April 2016 on the protection of natural persons with regard to the processing of personal data and on the free movement of such data, and repealing Directive 95/46/EC (General Data Protection Regulation), Official Journal of the European Union, L 119, 2016, pp. 1–88, https://eur-lex.europa.eu/eli/reg/2016/679/oj (accessed 12 August 2021).
European Union, Directive (EU) 2019/1024 of the European Parliament and of the Council of 20 June 2019 on open data and the re-use of public sector information, Official Journal of the European Union, L 172, 2019, pp. 56–83, https://eur-lex.europa.eu/eli/dir/2019/1024/oj (accessed 9 August 2021).
Fan, H., Yang, B., Zipf, A. and Rousell, A., ‘A polygon-based approach for matching OpenStreetMap road networks with regional transit authority data’, International Journal of Geographical Information Science, Vol. 30, No 4, 2016, pp. 748–764, doi: 10.1080/13658816.2015.1100732.
Fan, H., Zipf, A., Fu, Q. and Neis, P., ‘Quality assessment for building footprints data on OpenStreetMap’, International Journal of Geographical Information Science, Vol. 28, No 4, 2014, pp. 700–719, doi:10.1080/13658816.2013.867495.
Fernandes, V.O., Elias, E.N. and Zipf, A., ‘Integration of authoritative and Volunteered Geographic Information for updating urban mapping: challenges and potentials’, The International Archives of the Photogrammetry, Remote Sensing and Spatial Information Sciences, Vol. XLIII-B4-2020, 2020, pp. 261–268, doi:10.5194/isprs-archives-XLIII-B4-2020-261-2020.
Fonte, C.C., Patriarca, J.A., Minghini, M., Antoniou, V., See, L. and Brovelli, M.A., ‘Using OpenStreetMap to create land use and land cover maps: Development of an application’. In: Campelo, C.E.C., Bertolotto, M. and Corcoran, P. (Eds) Volunteered Geographic Information and the Future of Geospatial Data, IGI Global, 2017a, pp. 113–137, doi:10.4018/978-1-5225-2446-5.ch007.
Fonte, C.C., Minghini, M., Patriarca, J.A., Antoniou, V., See, L. and Skopeliti, A., ‘Generating Up-to-Date and Detailed Land Use and Land Cover Maps Using OpenStreetMap and GlobeLand30’, ISPRS International Journal of Geo-Information, Vol. 6, No 4, 2017b, 125, doi:10.3390/ijgi6040125.
Galup, S., Dattero, R. and Quan, J., ‘What do agile, lean, and ITIL mean to DevOps?’, Communications of ACM, Vol. 63, No 10, 2020, pp. 48–53, doi:10.1145/3372114.
Ganzleben, C. and Marnane, I., Healthy Environment, Healthy Lives: How the Environment Influences Health and Well-Being in Europe, European Environment Agency, EEA Report No 21/2019, 2020, doi:10.2800/53670.
Garcia, M., Rodrigues, J., Silva, J., Marques, E.R.B. and Lopes, L.M.B., ‘Ramble: Opportunistic Crowdsourcing of User-Generated Data Using Mobile Edge Clouds’, 2020 Fifth International Conference on Fog and Mobile Edge Computing, Paris, France, 2020, pp. 172–179, doi:10.1109/FMEC49853.2020.9144881.
Gerboles, M., Spinelle, L. and Borowiak, A., Measuring Air Pollution with Low-Cost Sensors, JRC107461, 2017, https://publications.jrc.ec.europa.eu/repository/handle/JRC107461 (accessed 2 December 2021).
Girres, J.-F. and Touya, G., ‘Quality assessment of the French OpenStreetMap dataset’, Transactions in GIS, Vol. 14, No 4, 2010, pp. 435–459, doi:10.1111/j.1467-9671.2010.01203.x.
Granell, C., Kamilaris, A., Kotsev, A., Ostermann, F. and Trilles, S., ‘Internet of Things’. In: Guo, H., Goodchild, M.F. and Annoni A. (Eds.) Manual of Digital Earth, Springer, Singapore, 2020, pp. 387–423, doi:10.1007/978-981-32-9915-3_11.
118
Green, B. and Chen, Y., ‘Algorithmic Risk Assessments Can Alter Human Decision-Making Processes in High-Stakes Government Contexts’, Proceedings of the ACM on Human-Computer Interaction. Vol. 5, No CSCW, 2021, Article 418.
Guidehouse Insights, Air Quality Monitoring for Smart Cities, 2020, https://guidehouseinsights.com/reports/air-quality-monitoring-for-smart-cities (accessed 10 November 2021).
Haklay, M., ‘How good is volunteered geographical information? A comparative study of OpenStreetMap and Ordnance Survey datasets’, Environment and planning B: Planning and design, Vol. 37, No 4, 2010, pp. 682–703, doi:10.1068/b35097.
Helbich, M., Amelunxen, C., Neis, P. and Zipf, A., ‘Comparative Spatial Analysis of Positional Accuracy of OpenStreetMap and Proprietary Geodata’, GI Forum 2012: Geovizualisation, Society and Learning, pp. 24–33, 2012.
Hemerly, J., ‘Public Policy Considerations for Data-driven Innovation’, Computer, Vol. 46, No 6, 2013, pp. 25-31.
Hennigan, W.J. and Park, A., ‘The Novel Tracking And Monitoring Technology Getting The COVID-19 Vaccine Distributed Across the U.S.’, Time, 2020, https://time.com/5922352/covid-19-vaccine-distribution-technology (accessed 3 January 2022).
Hericko, M., Juric, M.B., Rozman, I., Beloglavec, S. and Ales Zivkovic, A., ‘Object serialization analysis and comparison in Java and .NET’, SIGPLAN, Vol. 38, No 8, 2003, pp. 44–54, doi:10.1145/944579.944589.
Herle, S. and Blankenbach, J., ‘Enhancing the OGC WPS Interface with GeoPipes Support for Real-Time Geoprocessing’, International Journal of Digital Earth, Vol. 11, No 1, 2018, pp. 48–63, doi:10.1080/17538947.2017.1319976.
Hoffman, W., Boral, A. and Olukoya, D., Data Collaboration for the Common Good: Enabling Trust and Innovation Through Public-Private Partnerships, World Economic Forum and McKinsey & Company, 2019, https://www.weforum.org/reports/data-collaboration-for-the-common-good-enabling-trust-and-innovation-through-public-private-partnerships (accessed 21 November 2021).
Hoffman, W., Bick, R., Boral, A., Henke, N., Olukoya, D., Rifai, K., Roth, M., and Youldon, T., Collaborating for the Common Good: Navigating Public-Private Data Partnerships, McKinsey & Company, 2019, https://www.mckinsey.com/business-functions/mckinsey-analytics/our-insights/collaborating-for-the-common-good (accessed 21 November 2021).
INSPIRE Thematic Working Group Addresses, D2.8.I.5 Data Specification on Addresses – Technical Guidelines, 2014, https://inspire.ec.europa.eu/id/document/tg/ad (accessed 22 June 2021).
Internet Engineering Task Force, The GeoJSON Format, 2016, https://datatracker.ietf.org/doc/html/rfc7946 (accessed 22 June 2021).
Jansen, F., Justice in the Age of Data-driven Policing, PhD Thesis, Cardiff University, in press.
Janssen, M., Konopnicki, D., Snowdon, J.L. and Ojo, A., ‘Driving public sector innovation using big and open linked data (BOLD)’, Information Systems Frontiers, Vol. 19, No 2, 2017, pp. 189–195, doi:10.1007/s10796-017-9746-2.
Kamilaris, A. and Ostermann, F.O., ‘Geospatial Analysis and the Internet of Things’, ISPRS International Journal of Geo-Information, Vol. 7, No 7, 2018, 269, doi:10.3390/ijgi7070269.
Keddell, E., ‘The ethics of predictive risk modelling in the Aotearoa/New Zealand child welfare context: Child abuse prevention or neo-liberal tool?’, Critical Social Policy, Vol. 35, No 1, 2015, pp. 69-88.
Khanna, P., Srivastava, T. and Jeetet, K., Air Cognizer: Predicting Air Quality with TensorFlow Lite, 2019, https://medium.com/tensorflow/air-cognizer-predicting-air-quality-with-tensorflow-lite-942466b3d02e (accessed 10 November 2021).
Klievink, B., Romijn, B.-J., Cunningham, S., and de Bruijn, H., ‘Big data in the public sector: Uncertainties and readiness’, Information Systems Frontiers, Vol. 19, 2017, pp. 267–283, doi:10.1007/s10796-016-9686-2.
Kotsev, A., Schade, S., Craglia, M., Gerboles, M., Spinelle, L. and Signorini, M., ‘Next Generation Air Quality Platform: Openness and Interoperability for the Internet of Things’, Sensors, Vol. 16, No 3, 2016, 403, doi:10.3390/s16030403.
119
Kotsev, A., Minghini, M., Tomas, R., Cetl, V. and Lutz, M., ‘From Spatial Data Infrastructures to Data Spaces—A technological perspective on the evolution of European SDIs’, ISPRS International Journal of Geo-Information, Vol. 9, No 3, 2020, 176, doi:10.3390/ijgi9030176.
INSPIRE Expert Group, Good Practice: INSPIRE download services based on OGC API - Features, 2021, https://github.com/INSPIRE-MIF/gp-ogc-api-features (accessed 23 November 2021).
Koukoletsos, T., Haklay, M. and Ellul, C., ‘Assessing Data Completeness of VGI through an Automated Matching Procedure for Linear Data’, Transactions in GIS, Vol. 16, No 4, 2012, pp. 477–498, doi:10.1111/j.1467-9671.2012.01304.x.
Kunze, C. and Hecht, R., ‘Semantic enrichment of building data with volunteered geographic information to improve mappings of dwelling units and population’, Computers, Environment and Urban Systems, Vol. 53, 2015, pp. 4–18, doi:10.1016/j.compenvurbsys.2015.04.002.
Liu, X., Heller, A. and Nielsen P.S., ‘CITIESData: a smart city data management framework’, Knowledge and Information Systems, Vol. 53, 2017, pp. 699–722, doi:10.1007/s10115-017-1051-3.
Longoria, G. ‘How the Internet of Things will shape the datacenter of the future’, The Forbes, 2015, https://www.forbes.com/sites/moorinsights/2015/08/04/how-the-internet-of-things-will-shape-the-datacenter-of-the-future (accessed 14 November 2021).
Lükewille, A., Assessing Air Quality through Citizen Science, European Environment Agency, EEA Report No 19/2019, 2019, doi:10.2800/6192.
Lupton, D., The Quantified Self, Polity Press, Cambridge and Malden, 2016.
Madsen, A.K., ‘Data in the smart city: How incongruent frames challenge the transition from ideal to practice’ , Big Data & Society, Vol. 5, No 2, 2018, pp. 1–13, doi:10.1177/2053951718802321.
Madubedube, A., Coetzee, S. and Rautenbach, V., ‘A Contributor-Focused Intrinsic Quality Assessment of OpenStreetMap in Mozambique Using Unsupervised Machine Learning’, ISPRS International Journal of Geo-Information, Vol. 10, No 3, 2021, 156, doi:10.3390/ijgi10030156.
Maeda, K., ‘Performance evaluation of object serialization libraries in XML, JSON and binary formats ’, 2012 Second International Conference on Digital Information and Communication Technology and its Applications (DICTAP), 2012, pp. 177–182, doi:10.1109/DICTAP.2012.6215346.
Marconcini, M., Esch, T., Bachofer, F. and Metz-Marconcini, A., ‘Digital Earth in Europe’. In: Guo, H., Goodchild, M.F. and Annoni A. (Eds.) Manual of Digital Earth, Springer, Singapore, 2020, pp. 647-681, doi:10.1007/978-981-32-9915-3_20.
McKinnon, M., ‘Advanced Satellite Tracks Air Pollution in Extraordinary Detail’, Eos Science News, 2017, https://eos.org/articles/advanced-satellite-tracks-air-pollution-in-extraordinary-detail (accessed 10 November 2021).
Merenda, M., Porcaro, C. and Iero, D., ‘Edge Machine Learning for AI-Enabled IoT Devices: A Review’, Sensors, Vol. 20, No 9, 2020, 2533, doi:10.3390/s20092533.
Micheli, M., ‘Accessing privately held data: Public/private sector relations in twelve European cities’, Data for Policy Conference Proceedings, 2020, doi:10.5281/zenodo.3967044.
Minghini, M. and Frassinelli, F., ‘OpenStreetMap history for intrinsic quality assessment: Is OSM up-to-date?’, Open Geospatial Data, Software and Standards, Vol. 4, No 1, 2019, pp. 1–17, doi:10.1186/s40965-019-0067-x.
Minghini, M., Kotsev, A. and Lutz, M., ‘Comparing INSPIRE and OpenStreetMap data: how to make the most out of the two worlds’, The International Archives of the Photogrammetry, Remote Sensing and Spatial Information Sciences, Vol. XLII-4, No W14, 2019, pp. 167–174, doi:10.5194/isprs-archives-XLII-4-W14-167-2019.
Mooney, P. and Minghini, M., ‘A review of OpenStreetMap data’. In: Foody, G., See, L., Fritz, S., Mooney, P., Olteanu-Raimond, A.-M., Fonte, C.C. and Antoniou, V. (Eds) Mapping and the Citizen Sensor, Ubiquity Press, London, 2017, pp. 37–59, doi:10.5334/bbf.c.
Mühlhäuser, M., Meurisch, C., Stein, M., Daubert, J., Von Willich, J., Riemann, J. and Wang, L., ‘Street Lamps as a Platform’, Communications of the ACM, Vol. 63, No 6, 2020, pp. 75–83, doi:10.1145/3376900.
120
Murshed, M.G.S., Murphy, C., Hou, D., Khan, N., Ananthanarayanan, G. and Hussain, F., ‘Machine Learning at the Network Edge: A Survey’, ACM Computing Surveys, Vol. 54, No 8, 2022, pp. 1–37, doi:10.1145/3469029.
Neis, P., Zielstra, D. and Zipf, A., ‘The street network evolution of crowdsourced maps: OpenStreetMap in Germany 2007-2011’, Future Internet, Vol. 4, No 1, 2012, pp. 1–21, doi:10.3390/fi4010001.
Organization for the Advancement of Structured Information Standards, MQTT Version 3.1.1, OASIS Standard, 2014, http://docs.oasis-open.org/mqtt/mqtt/v3.1.1/os/mqtt-v3.1.1-os.html (accessed 26 October 2021).
Open Data Institute, About the ODI, 2021, https://theodi.org/about-the-odi (accessed 21 November 2021).
Open Geospatial Consortium, OGC Abstract Specification, Geographic information — Observations and measurements, OGC 10-004r3, 2013, https://portal.ogc.org/files/?artifact_id=41579 (accessed 3 January 2022).
Open Geospatial Consortium, OGC SensorThings API Part 1: Sensing Version 1.1, 2021, https://docs.ogc.org/is/18-088/18-088.html (accessed 3 January 2022).
Paul, R. and Carmel, E., ‘From algorithmic to regulatory bias. The uneven regulation of AITs in European Migration Governance’, Council of European Studies Virtual 27th International Conference of Europeanists, 2021, https://ces-columbia.secure-platform.com/a/organizations/main/home (accessed 23 November 2021).
Popić, S., Pezer, D., Mrazovac, B., and Teslić, N., ‘Performance evaluation of using Protocol Buffers in the Internet of Things communication’, 2016 International Conference on Smart Systems and Technologies, 2016, pp. 261–265, doi:10.1109/SST.2016.7765670.
Ponti, M., and Craglia, M., Citizen-generated data for public policy, European Commission, Ispra, 2020, JRC120231.
Pourabdollah, A., Morley, J., Feldman, S. and Jackson, M., ‘Towards an Authoritative OpenStreetMap: Conflating OSM and OS OpenData National Maps’ Road Network’, ISPRS International Journal of Geo-Information, Vol. 2, No 3, 2013, pp. 704–728, doi:10.3390/ijgi2030704.
Proos, D.P. and Carlsson, N., ‘Performance Comparison of Messaging Protocols and Serialization Formats for Digital Twins in IoV’, 2020 IFIP Networking Conference (Networking), 2020, pp. 10–18.
Ramm, F. and Topf, J., OpenStreetMap: using and enhancing the free map of the world, UIT Cambridge, Cambridge, 2011.
Redden, J., Dencik, L. and Warne, H., ‘Datafied child welfare services: unpacking politics, economics and power’, Policy Studies, Vol. 41, No 5, 2020, pp. 507–526, doi:10.1080/01442872.2020.1724928.
Rieke, M., Bigagli, L., Herle, S., Jirka, S., Kotsev, A., Liebig, T., Malewski, C., Paschke, T. and Stasch, C., ‘Geospatial IoT—The Need for Event-Driven Architectures in Contemporary Spatial Data Infrastructures’, ISPRS International Journal of Geo-Information, Vol. 7, No 10, 2018, 385, doi:10.3390/ijgi7100385.
Rubí, J.N.S. and Gondim, P.R., ‘IoT-based platform for environment data sharing in smart cities’, Vol. 34, No 2, 2021, doi:10.1002/dac.4515.
Russo, M., and Feng, T., The Risks and Rewards of Data Sharing for Smart Cities, BCG Henderson Institute, 2020, https://www.bcg.com/publications/2020/smart-cities-need-to-understand-the-risks-and-rewards-of-data-sharing-part-3 (accessed 10 November 2021).
Sarretta, A. and Minghini, M., ‘Towards the integration of authoritative and OpenStreetMap geospatial datasets in support of the European Strategy for Data’, The International Archives of the Photogrammetry, Remote Sensing and Spatial Information Sciences, Vol. XLVI-4, No W2-2021, 2021, pp. 159–166, doi:10.5194/isprs-archives-XLVI-4-W2-2021-159-2021.
Science and Technology Committee, House of Commons, Algorithms in decision-making, 2018, https://publications.parliament.uk/pa/cm201719/cmselect/cmsctech/351/351.pdf (accessed 2 December 2021).
Senaratne, H., Mobasheri, A., Ali, A.L., Capineri, C. and Haklay, M., ‘A review of volunteered geographic information quality assessment methods’, International Journal of Geographical Information Science, Vol. 31, No 1, 2017, pp. 139–167, doi:10.1080/13658816.2016.1189556.
121
Shade, S., Granell, C., Vancauwenberghe, G., Keßler, C., Vandenbroucke, D., Masser, I. and Gould, M., ‘Geospatial Information Infrastructures’. In: Guo, H., Goodchild, M.F. and Annoni A. (Eds.) Manual of Digital Earth, Springer, Singapore, 2020, pp. 161–190, doi:10.1007/978-981-32-9915-3_5.
Sharon, T., ‘When digital health meets digital capitalism, how many common goods are at stake?’, Big Data & Society, Vol. 5, No 2, 2018, pp. 1–12, doi:10.1177/2053951718819032.
Shuiguang, D., Zhao, H., Fang, W., Yin, J., Dustdar, S. and Zomaya, A.Y., ‘Edge Intelligence: The Confluence of Edge Computing and Artificial Intelligence’, IEEE Internet of Things Journal, Vol. 7, No 8, 2020, pp. 7457–7469, doi:10.1109/JIOT.2020.2984887.
Silva, L.S.L. and Camboim, S.P., ‘Authoritative cartography in Brazil and collaborative mapping platforms: challenges and proposals for data integration’, Boletim de Ciências Geodésicas, Vol. 27, No 1, 2021, doi:10.1590/s1982-21702021000100003.
Sumaray, A., and Kami Makki, S., ‘A comparison of data serialization formats for optimal efficiency on a mobile platform’, Proceedings of the 6th International Conference on Ubiquitous Information Management and Communication (ICUIMC '12), Kuala Lumpur, Malaysia, 2012, pp. 1–6, doi:10.1145/2184751.2184810.
Susha, I., Janssen, M. and Verhulst, S., ‘Data Collaboratives as a New Frontier of Cross-Sector Partnerships in the Age of Open Data: Taxonomy Development’, Proceedings of the 50th Hawaii International Conference on System Sciences in Waikoloa, Hawaii, 2017, pp. 2691–2700.
Srivastava, D.J., Vosegaard, T., Massiot, D. and Grandinetti, P.J., ‘Core Scientific Dataset Model: A lightweight and portable model and file format for multi-dimensional scientific data’, PLOS ONE, Vol. 15, No 1, 2020, e0225953, doi:10.1371/journal.pone.0225953.
Szarek, J. and Piecuch, J., ‘The importance of startups for construction of innovative economies’, International Entrepreneurship, Vol. 4, No 2, 2018, doi:10.15678/PM.2018.0402.05.
The GovLab, Periodic Table of Open Data's Impact Factors, The GovLab, 2021, https://odimpact.org/periodic-table.html (accessed 21 November 2021).
Trielli, D., Stark, J. and Diakopolous, N., ‘Algorithm Tips: A Resource for Algorithmic Accountability in Government’, Proceedings of the Computation+Journalism 2017 Symposium, 2017.
Tsinaraki, C., Mitton, I., Minghini, M., Micheli, M., Kotsev, A., Hernandez Quiros, L., Spinelli, F.A., Dalla Benetta, A. and Schade, S., ‘Mobile Apps to Fight the COVID-19 Crisis’, Data, Vol. 6, No 10, 106, 2021, doi:10.3390/data6100106.
Ubaldi, B., Gonzalez-Zapata, F. and Barbieri, M.P., Digital Government Index 2019 Results, 2020, http://www.oecd.org/gov/digitalgovernment-index-4de9f5bb-en.htm (accessed 21 November 2021).
United Nations, Cities: a 'Cause of and Solution to' Climate Change, 2019, https://news.un.org/en/story/2019/09/1046662 (accessed 10 November 2021).
United Nations, Cities and Pollution, United Nations, 2021, https://www.un.org/en/climatechange/climate-solutions/cities-pollution (accessed 10 November 2021).
Vaccari, L., Posada Sanchez, M., Boyd, M., Gattwinkel, D., Mavridis, D., Smith, R., Santoro, M., Nativi, S., Medjaoui, M., Reusa, I., Switzer, S. and Friis-Christensen, A., Application Programming Interfaces in Governments: Why, what and how, EUR 30227 EN, JRC120429, Publications Office of the European Union, Luxembourg, 2020, doi:10.2760/58129.
van den Broecke, J.A., van Genuchten, P., Brentjens, T. and Penninga, F., Geonovum OGC API Testbed, 2021, https://apitestdocs.geonovum.nl (accessed 23 November 2021).
van den Broecke, J.A., Data Services for EC JRC, 2021, https://github.com/justb4/ogc-api-jrc (GitHub repository), https://jrc.map5.nl (documentation), https://jrc.map5.nl/pygeoapi (OGC API - Features endpoint) (accessed 23 November 2021).
Van Dijck, J., ‘Datafication, dataism and dataveillance: Big Data between scientific paradigm and ideology’, Surveillance & Society, Vol. 12, No 2, 2014, pp. 197–208.
Vandecasteele, A. and Devillers, R., ‘Improving volunteered geographic data quality using semantic similarity measurements’, The International Archives of the Photogrammetry, Remote Sensing and Spatial Information Sciences, Vol. XL-2, No W1, 2013, pp. 143–148, doi:10.5194/isprsarchives-XL-2-W1-143-20131750.
122
Vanura, J. and Kriz, P., ‘Perfomance Evaluation of Java, JavaScript and PHP Serialization Libraries for XML, JSON and Binary Formats’. In: Ferreira, J., Spanoudakis, G., Ma, Y. and Zhang, L.J. (Eds) Services Computing – SCC 2018, Lecture Notes in Computer Science, Vol 10969. Springer, Cham, 2018, doi:10.1007/978-3-319-94376-3_11.
Verhulst, S. and Sangokoya, D., Data Collaboratives: Exchanging Data to Improve People’s Lives, 2015, https://sverhulst.medium.com/data-collaboratives-exchanging-data-to-improve-people-s-lives-d0fcfc1bdd9a#.flib5frf (accessed 10 November 2021).
Verhulst, S., Young, A., Winowatan, M. and Zahuranec, A.J., Leveraging Private Data for Public Good: A Descriptive Analysis and Typology of Existing Practices, The GovLab, 2019, https://datacollaboratives.org/static/files/existing-practices-report.pdf (accessed 10 November 2021).
Verhulst, S., Zahuranec, A.J., Young, A. and Winowatan, M., Wanted: Data Stewards - (Re)Defining the Roles and Responsibilities of Data Stewards for an Age of Data Collaboration, The GovLab, 2020, https://thegovlab.org/static/files/publications/wanted-data-stewards.pdf (accessed 21 November 2021).
Verhulst, S., Young, A. and Srinivasan, P., An Introduction to Data Collaboratives, Data Collaboratives, The GovLab, 2021, https://datacollaboratives.org/static/files/data-collaboratives-intro.pdf (accessed 21 November 2021).
Vogl, T. M., Seidelin, C., Ganesh, B. and Bright, J., ‘Smart Technology and the Emergence of Algorithmic Bureaucracy: Artificial Intelligence in UK Local Authorities’, Public Administration Review, Vol. 80, No 6, 2020, pp. 946-961.
Vohra, D., Apache Avro. In: Practical Hadoop Ecosystem, Apress, Berkeley, CA, 2012, doi: 10.1007/978-1-4842-2199-0_7.
Wagemann, J., Clements, O., Marco Figuera, R., Pio Rossi, A. and Mantovani, S., ‘Geospatial Web Services Pave New Ways for Server-Based on-Demand Access and Processing of Big Earth Data’, International Journal of Digital Earth, Vol. 11, No 1, 2018, pp. 7–25, doi:10.1080/17538947.2017.1351583.
Warden, P. and Situnayake, D., TinyML, O’Reilly Media, Inc., 2019.
Wiemann, S. and Bernard, L., ‘Conflation Services within Spatial Data Infrastructures’, 13th AGILE Conference on Geographic Information Science, Guimarães, Portugal, 2010.
World Economic Forum, Future of the Connected World: A Roadmap for Mobilizing Global Action – Vision, Progress and Measures of Success, World Economic Forum, 2021, https://www3.weforum.org/docs/WEF_Future_of_the_Connected_World_global_action_2021.pdf (accessed 7 January 2022).
World Health Organization, 9 Out of 10 People Worldwide Breathe Polluted Air, but More Countries Are Taking Action, World Health Organization, 2018, https://www.who.int/news/item/02-05-2018-9-out-of-10-people-worldwide-breathe-polluted-air-but-more-countries-are-taking-action (accessed 10 November 2021).
Xu, Z., Shah, H.S. and Ramachandran, U., ‘Coral-Pie: A Geo-Distributed Edge-Compute Solution for Space-Time Vehicle Tracking’, Proceedings of the 21st International Middleware Conference, Delft, Netherlands, 2020, pp. 400–414, doi:10.1145/3423211.3425686.
Yang, Q., Liu, Y., Tianjian Chen, T. and Tong, Y., ‘Federated Machine Learning: Concept and Applications’, ACM Transactions on Intelligent Systems and Technology, Vol. 10, No 2, 2019, pp. 1–19, doi:10.1145/3298981.
Yeung, K., ‘Algorithmic Regulation: A Critical Interrogation’, Regulation & Governance, Vol. 12, No 4, 2018, pp. 505–523.
Young, A. and Verhulst S.G., ‘Data Collaboratives’. In: Harris, P., Bitonti, A., Fleisher, C. and Skorkjær Binderkrantz, A. (Eds) The Palgrave Encyclopedia of Interest Groups, Lobbying and Public Affairs, Palgrave Macmillan, Cham, 2020, doi:10.1007/978-3-030-13895-0_92-1.
Bertelsmann Foundation and The GovLab, People-Led Innovation: Toward a Methodology for Solving Urban Problems in the 21st Century, 2018, https://www.peopleledinnovation.org/static/files/bertelsmann-report-worksheets.pdf (accessed 7 January 2022).
Zejnilovic, L., Lavado, S., Martinez de Rituerto de Troya, I., Sim, S. and Bell, A., ‘Algorithmic Long-Term Unemployment Risk Assessment in Use: Counselors’ Perceptions and Use Practices’, Global Perspectives, Vol. 1, No 1, 2020, 12908.

123
Zhou, Z., Chen, X., Li, E., Zeng, L., Luo, K. and Zhang, J., ‘Edge Intelligence: Paving the Last Mile of Artificial Intelligence With Edge Computing’, Proceedings of the IEEE, Vol. 107, No 8, 2019, pp. 1738–1762, doi:10.1109/JPROC.2019.2918951.
Zhou, X., Zeng, L., Jiang, Y., Zhou, K. and Zhao, Y., ‘Dynamically Integrating OSM Data into a Borderland Database’, ISPRS International Journal of Geo-Information, Vol. 4, No 3, 2015, pp. 1707–1728, doi:10.3390/ijgi4031707.
Zielstra, D. and Zipf, A., ‘A comparative study of proprietary geodata and Volunteered Geographic Information for Germany’, 13th AGILE Conference on Geographic Information Science, Guimarães, Portugal, 2010.
van Zoonen, L., ‘Data governance and citizen participation in the digital welfare state’, Data & Policy, Vol. 2, 2020, e10, doi:10.1017/dap.2020.10.

124
List of abbreviations and definitions
ADS-B Automatic Dependent Surveillance – Broadcast
AI Artificial Intelligence
API Application Programming Interface
AMQP Advanced Message Queuing Protocol
ANN Artificial neural network
AWS Amazon Web Services
BAG Basisregistratie Adressen en Gebouwen [Dutch cadastre of addresses and buildings]
BLE Bluetooth Low Energy
CC Creative Commons
CI/CD Continuous Integration and Deployment
CORS Cross-Origin Resource Sharing
CPU Central Processing Unit
CRS Coordinate Reference System
CSV Comma-Separated Values
DG ENV Directorate-General for Environment
DG ESTAT Directorate-General for European Statistics
EC European Commission
EEA European Environment Agency
ELISE European Location Interoperability Solutions for e-Government
ETL Extract-Transform-Load
EU European Union
EUPL European Union Public License
FAIR Findable, Accessible, Interoperable and Reusable
FOSS4G Free and Open Source Software for Geospatial
GDPR General Data Protection Regulation
GeoJSON Geographic JSON
GPKG GeoPackage
GPU Graphical Processing Unit
HCI Human-Computer Interaction
HDMI High-Definition Multimedia Interface
HTML HyperText Markup Language
HTTP Hypertext Transfer Protocol
INSPIRE Infrastructure for Spatial Information in the European Community
IoT Internet of Things
ISA2 Interoperability solutions for public administrations, businesses and citizens
ISO International Organization for Standardization
JRC Joint Research Centre
JSON JavaScript Object Notation
125
K8s Kubernetes
LAU Local Administrative Units
MIMs Minimum Interoperability Mechanisms
MQTT Message Queuing Telemetry Transport
NGOs Non-Governmental Organizations
NL The Netherlands
NLS National Land Survey
NMAs National Mapping Agencies
O&M Observations and Measurements
OAFeat OGC API Features
ODbL Open Database License
OECD Organization for Economic Co-operation and Development
OGC Open Geospatial Consortium
OSM OpenStreetMap
OSMF OpenStreetMap Foundation
PBF Protocolbuffer Binary Format
PDF Portable Document Format
PM Particulate Matter
OASIS Organization for the Advancement of Structured Information Standards
QoS Quality of Service
RAM Random Access Memory
REST Representational State Transfer
SDGR Single Digital Gateway Regulation
SDI Spatial Data Infrastructure
SMEs Small and Medium-sized Enterprises
TCP Transmission Control Protocol
UK United Kingdom
UML Unified Modelling Language
USB Universal Serial Bus
VGI Volunteered Geographic Information
VM Virtual Machine
VNG Association of Netherlands Municipalities
XML Extensible Markup Language
XMPP Extensible Messaging and Presence Protocol
WFS Web Feature Service
WHO World Health Organization
WKT Well-Known-Text
YAML YAML Ain't Markup Language
126
List of boxes
Box 1. Main terminology as it is used in this chapter ............................................................................................................................. 10
Box 2. Main terminology as it is used in this chapter ............................................................................................................................. 24
Box 3. Example of a MQTT topic structure for weather station data ........................................................................................... 25
Box 4. Example of encoding a data stream in the SensorThings API ........................................................................................... 29
Box 5. Example of encoding an observation in the SensorThings API ......................................................................................... 30
Box 6. Main terminology as it is used in this chapter ............................................................................................................................. 37
Box 7. Main terminology as it is used in this chapter ............................................................................................................................. 53
Box 8. Preparation steps of the Ubuntu server VM .................................................................................................................................. 58
Box 9. Actions to create a GitHub repository from the Template repo ....................................................................................... 58
Box 10. Command to clone the Git repo locally ........................................................................................................................................ 58
Box 11. Command to install Ansible Modules ............................................................................................................................................. 59
Box 12. Actions to disable GitHub Workflows ............................................................................................................................................. 59
Box 13. Actions to disable GitHub Workflows ............................................................................................................................................. 60
Box 14. Command to bootstrapping a Ansible playbook ..................................................................................................................... 60
Box 15. Commands to enable GitHub Workflows by reaming the directory ........................................................................... 60
Box 16. Main terminology as it is used in this chapter ......................................................................................................................... 63
Box 17. Vignette of Breeze Technologies: Private-Public Partnerships, Local Level........................................................... 87
Box 18. Vignette of AirThings: Private-Public Partnerships, Multi-Government Partnership ......................................... 87
Box 19. Vignette of Chicago Array of Things Project: Academic Research Hub .................................................................... 88
Box 20. Vignette of Stadslab Air Quality: Community-Driven Project ......................................................................................... 88
127
List of figures
Figure 1. Overall workflow for experiment 1 – static data ................................................................................................................. 14
Figure 2. Overall workflow for experiment 2 – dynamic data .......................................................................................................... 15
Figure 3. Pull-based data access ........................................................................................................................................................................ 24
Figure 4. Push-based data delivery ................................................................................................................................................................... 26
Figure 5. Overview of the architecture ............................................................................................................................................................ 27
Figure 6. Photo of the Raspberry Pi with the USB receiver and the antenna ......................................................................... 28
Figure 7. Percentage of redundant requests with 256 clients requesting data. Each line in the graph represents a different number of tracked objects. Horizontal axis: request interval in milliseconds (ms) ............ 32
Figure 8. Percent of redundant data volume with 256 clients requesting data. Each line in the graph represents a different number of tracked objects. Horizontal axis: request interval in milliseconds (ms) ............ 33
Figure 9. Server load during pull-based delivery of observation data: 32 clients, 32 tracked aircrafts, and
1000 milliseconds (ms) request interval ......................................................................................................................................................... 34
Figure 10. Server load during push-based delivery of observation data: 32 subscribers and 32 tracked aircrafts ................................................................................................................................................................................................................................. 34
Figure 11. Workflow of the experiment .......................................................................................................................................................... 45
Figure 12. Main components of Arduino Nano 33 BLE Sense code .............................................................................................. 47
Figure 13. Operational stack of the Geonovum’s OGC API Testbed Platform using GitOps.......................................... 55
Figure 14. Platform’s software components and GitOps workflow .............................................................................................. 56
Figure 15. Monitoring tool to inspect GitHub Actions’ execution logs ......................................................................................... 57
Figure 16. Distribution of address data in an area of Helsinki, Finland. OSM addresses associated to nodes (white points) and ways (black polygons); NLS addressed (red points) ........................................................................................ 66
Figure 17. Simplified workflow to integrate the OSM and NLS address datasets in a single dataset................... 69
Figure 18. Simplified workflow to integrate the OSM and BAG address datasets in a single dataset .................. 70
Figure 19. Percentage ratio between the number of OSM and NLS addresses, computed on the 10x10 km EEA Reference Grid. ....................................................................................................................................................................................................... 72
Figure 20: Integrated address dataset in an area in Helsinki showing the origin of each address point: OSM dataset (red), NLS dataset (black) ........................................................................................................................................................................ 73
Figure 21. Percentage ratio between the number of OSM and BAG addresses, computed on the 10x10 km EEA Reference Grid......................................................................................................................................................................................................... 74
Figure 22. A camping area in the integrated dataset where OSM address data is present while BAG is not ... 75
Figure 23. Macro-economic Cloud-related trends in Europe .......................................................................................................... 100
Figure 24. Barriers to investment .................................................................................................................................................................... 102
Figure 25. Resilience of digital infrastructure.......................................................................................................................................... 102
Figure 26. Thematic clustering of Cloud-related trends according to the novel approaches explored in this document........................................................................................................................................................................................................................... 104
Figure 27. Schematic Edge infrastructure demonstrating the scaling of data................................................................... 107
Figure 28. Facilitate a continuous exploratory dialogue to help align trends, policy development and practices
................................................................................................................................................................................................................................................. 111
Figure 29. Example of a (customised) Tech Radar implementation .......................................................................................... 111
128
List of tables
Table 1. Comparison of Apache Avro and Protocols Buffers ............................................................................................................. 12
Table 2. Results of Experiment 1 using the complete GPKG dataset and the small GPKG dataset (sample) .... 17
Table 3. Results of Experiment 2 using the GeoJSON dataset ......................................................................................................... 18
Table 4. Application options for pilot case study (first row is the case study chosen for implementation) ........ 41
Table 5. Hardware options for noise detection on the edge (non-exhaustive list, details subject to rapid change) .................................................................................................................................................................................................................................. 43
Table 6. Hardware used in the pilot case study......................................................................................................................................... 43
Table 7. Performance of models (cell shades: green indicates good performance, red unacceptable)................. 49
Table 8: Address-related OSM keys used in this experiment ............................................................................................................ 64
Table 9: Address-related NLS attributes ........................................................................................................................................................ 66
Table 10: Address-related BAG attributes ..................................................................................................................................................... 67
Table 11: Mapping between INSPIRE/NLS attribute names and OSM data models related to addresses ........... 68
Table 12. Mapping between BAG attribute names and OSM data models related to addresses .............................. 70
Table 13. Governance requirements: enabling conditions, design requirements, and success factors .................. 83
Table 14. Operational requirements: enabling conditions, design requirements, and success factors .................. 85
Table 15. Scientific requirements: enabling conditions, design requirements, and success factors ........................ 86
Table 16. Human/technical requirements: enabling conditions, design requirements, and success factors ...... 86
Table 17. Comparative review of case studies against the enabling conditions .................................................................. 89
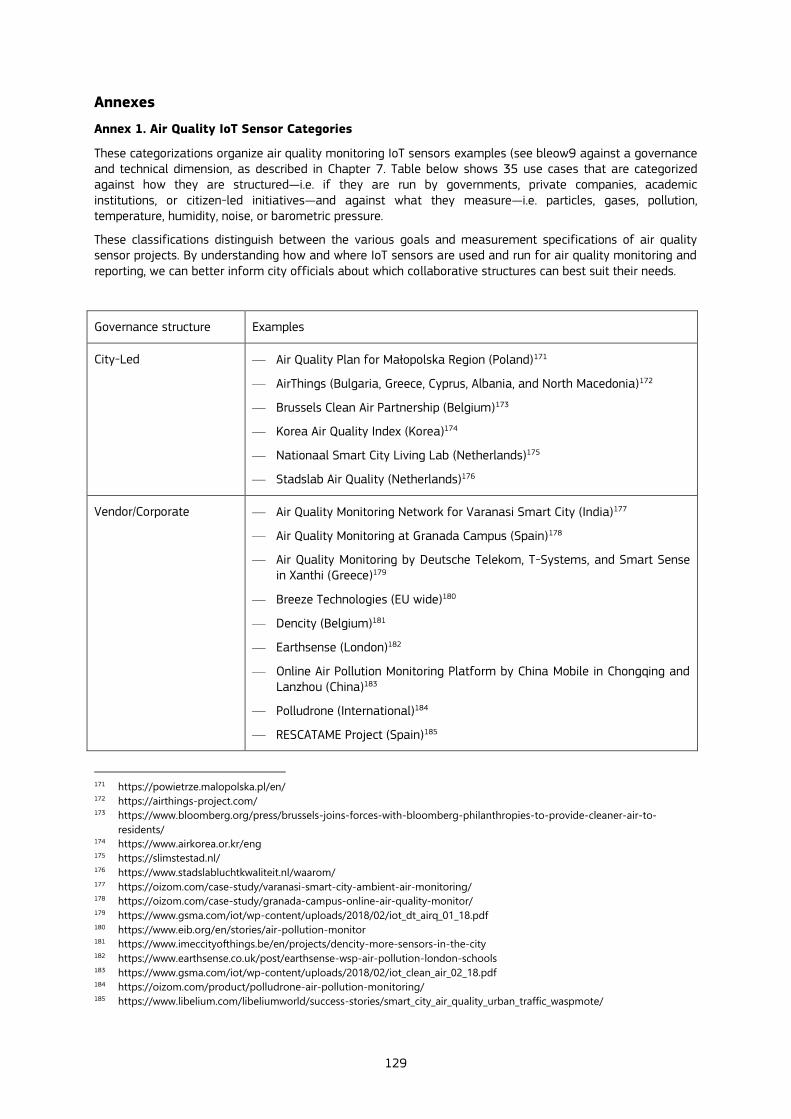
129
Annexes
Annex 1. Air Quality IoT Sensor Categories
These categorizations organize air quality monitoring IoT sensors examples (see bleow9 against a governance and technical dimension, as described in Chapter 7. Table below shows 35 use cases that are categorized against how they are structured—i.e. if they are run by governments, private companies, academic institutions, or citizen-led initiatives—and against what they measure—i.e. particles, gases, pollution, temperature, humidity, noise, or barometric pressure.
These classifications distinguish between the various goals and measurement specifications of air quality sensor projects. By understanding how and where IoT sensors are used and run for air quality monitoring and reporting, we can better inform city officials about which collaborative structures can best suit their needs.
Governance structure Examples
City-Led — Air Quality Plan for Małopolska Region (Poland)171
— AirThings (Bulgaria, Greece, Cyprus, Albania, and North Macedonia)172
— Brussels Clean Air Partnership (Belgium)173
— Korea Air Quality Index (Korea)174
— Nationaal Smart City Living Lab (Netherlands)175
— Stadslab Air Quality (Netherlands)176
Vendor/Corporate — Air Quality Monitoring Network for Varanasi Smart City (India)177
— Air Quality Monitoring at Granada Campus (Spain)178
— Air Quality Monitoring by Deutsche Telekom, T-Systems, and Smart Sense in Xanthi (Greece)179
— Breeze Technologies (EU wide)180
— Dencity (Belgium)181
— Earthsense (London)182
— Online Air Pollution Monitoring Platform by China Mobile in Chongqing and Lanzhou (China)183
— Polludrone (International)184
— RESCATAME Project (Spain)185
171 https://powietrze.malopolska.pl/en/ 172 https://airthings-project.com/ 173 https://www.bloomberg.org/press/brussels-joins-forces-with-bloomberg-philanthropies-to-provide-cleaner-air-to-
residents/ 174 https://www.airkorea.or.kr/eng 175 https://slimstestad.nl/ 176 https://www.stadslabluchtkwaliteit.nl/waarom/ 177 https://oizom.com/case-study/varanasi-smart-city-ambient-air-monitoring/ 178 https://oizom.com/case-study/granada-campus-online-air-quality-monitor/ 179 https://www.gsma.com/iot/wp-content/uploads/2018/02/iot_dt_airq_01_18.pdf 180 https://www.eib.org/en/stories/air-pollution-monitor 181 https://www.imeccityofthings.be/en/projects/dencity-more-sensors-in-the-city 182 https://www.earthsense.co.uk/post/earthsense-wsp-air-pollution-london-schools 183 https://www.gsma.com/iot/wp-content/uploads/2018/02/iot_clean_air_02_18.pdf 184 https://oizom.com/product/polludrone-air-pollution-monitoring/ 185 https://www.libelium.com/libeliumworld/success-stories/smart_city_air_quality_urban_traffic_waspmote/
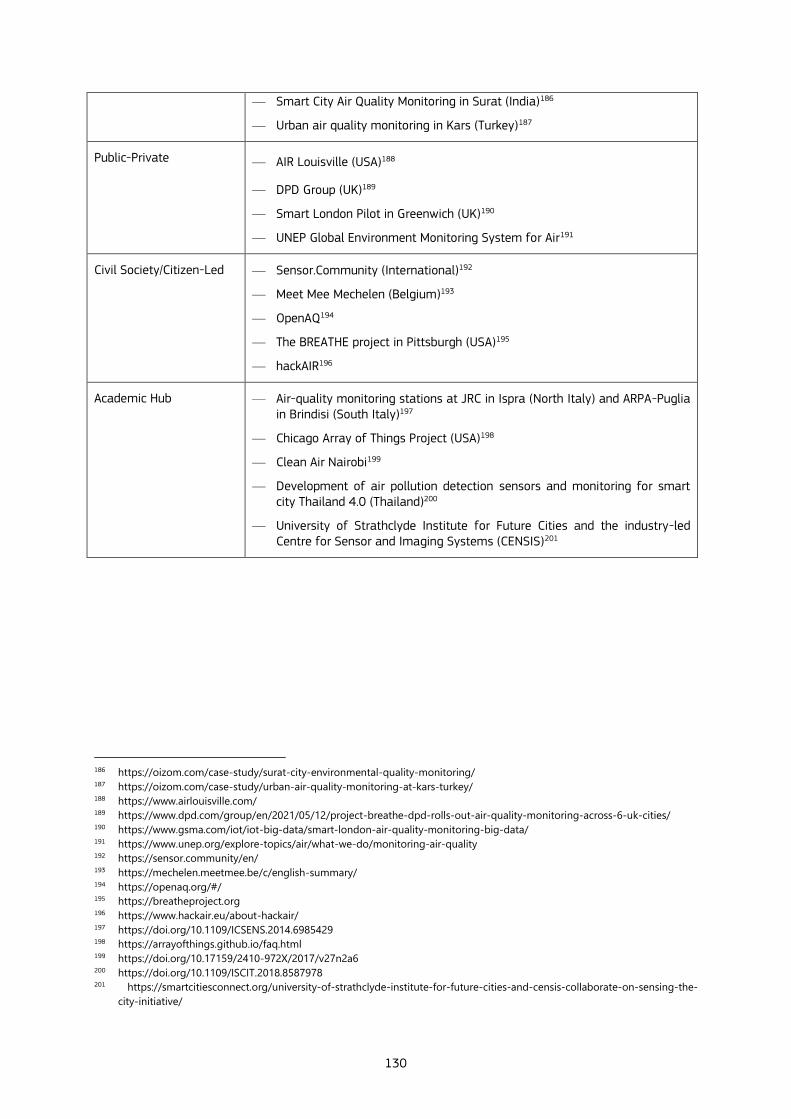
130
— Smart City Air Quality Monitoring in Surat (India)186
— Urban air quality monitoring in Kars (Turkey)187
Public-Private — AIR Louisville (USA)188
— DPD Group (UK)189
— Smart London Pilot in Greenwich (UK)190
— UNEP Global Environment Monitoring System for Air191
Civil Society/Citizen-Led — Sensor.Community (International)192
— Meet Mee Mechelen (Belgium)193
— OpenAQ194
— The BREATHE project in Pittsburgh (USA)195
— hackAIR196
Academic Hub — Air-quality monitoring stations at JRC in Ispra (North Italy) and ARPA-Puglia in Brindisi (South Italy)197
— Chicago Array of Things Project (USA)198
— Clean Air Nairobi199
— Development of air pollution detection sensors and monitoring for smart city Thailand 4.0 (Thailand)200
— University of Strathclyde Institute for Future Cities and the industry-led Centre for Sensor and Imaging Systems (CENSIS)201
186 https://oizom.com/case-study/surat-city-environmental-quality-monitoring/ 187 https://oizom.com/case-study/urban-air-quality-monitoring-at-kars-turkey/ 188 https://www.airlouisville.com/ 189 https://www.dpd.com/group/en/2021/05/12/project-breathe-dpd-rolls-out-air-quality-monitoring-across-6-uk-cities/ 190 https://www.gsma.com/iot/iot-big-data/smart-london-air-quality-monitoring-big-data/ 191 https://www.unep.org/explore-topics/air/what-we-do/monitoring-air-quality 192 https://sensor.community/en/ 193 https://mechelen.meetmee.be/c/english-summary/ 194 https://openaq.org/#/ 195 https://breatheproject.org 196 https://www.hackair.eu/about-hackair/ 197 https://doi.org/10.1109/ICSENS.2014.6985429 198 https://arrayofthings.github.io/faq.html 199 https://doi.org/10.17159/2410-972X/2017/v27n2a6 200 https://doi.org/10.1109/ISCIT.2018.8587978 201 https://smartcitiesconnect.org/university-of-strathclyde-institute-for-future-cities-and-censis-collaborate-on-sensing-the-
city-initiative/

GETTING IN TOUCH WITH THE EU
In person
All over the European Union there are hundreds of Europe Direct information centres. You can find the address of the centre nearest you at: https://europa.eu/european-union/contact_en
On the phone or by email
Europe Direct is a service that answers your questions about the European Union. You can contact this service:
- by freephone: 00 800 6 7 8 9 10 11 (certain operators may charge for these calls),
- at the following standard number: +32 22999696, or
- by electronic mail via: https://europa.eu/european-union/contact_en
FINDING INFORMATION ABOUT THE EU
Online
Information about the European Union in all the official languages of the EU is available on the Europa website at: https://europa.eu/european-union/index_en
EU publications
You can download or order free and priced EU publications from EU Bookshop at: https://publications.europa.eu/en/publications. Multiple copies of free publications may be obtained by contacting Europe Direct or your local information centre (see https://europa.eu/european-union/contact_en).

KJ-N
A-3
09
69
-EN-N
doi:10.2760/630723
ISBN 978-92-76-46937-7