Embed Size (px)
Citation preview
INIS-mf—13420
THE ENERGY OF OUR RESOURCES
THE POWER OF OUR IDEAS

ELECTRIC POWER IN CANADA 1990
Electricity BranchEnergy Sector
Energy, Mines and Resources Canada
Published under the Authority of theMinister of Energy, Mines and Resources,
Government of CanadaiHipriinv sunlitpup'wr rt'cycli'
Acknowledgments
The Department of Energy, Mines and Resources gratefully acknowledgesthe cooperation of the electric utilities and the Canadian Electrical Associationin the preparation of this publication.
Contacts
Any comments regarding this publication should be addressed to:David BurpeeDirector, Electric Utilities DivisionElectricity BranchEnergy, Mines and Resources Canada580 Booth StreetOttawa, Ontario, Canada K1A OE4Tel: (613) 995-7460
For general information regarding the preparation and content of this publication, contact:Po-Chih LeeSenior Economist & Manager of Information SystemsElectricity BranchEnergy, Mines and Resources Canada580 Booth StreetOttawa, Ontario, Canada K1A OE4Tel: (613) 996-4779
Copies of this publication are available upon request to:Distribution SectionCommunications BranchEnergy, Mines and Resources Canada580 Booth StreetOttawa, Ontario, Canada K1A 0E4Tel: (613) 992-0759Facsimile: (613) 996-9094
Pour obtenir la version frangaise, s'addresser a :Centre de diffusionDirection des CommunicationsMinistere de l'Energie, des Mines et des Ressources580, rue BoothOttawa (Ontario) Canada K1A 0E4Tel.: (613) 992-0759Fac-simil6 : (613) 996-9094
© Minister of Supply and Services Canada, 1991Cat. No: M23-7/90-EISBN: 0-662-19038-6ISSN: 0070-962X
CONTENTS
Page
1. The Electric Power Industry in Canada 1
2. Canadian Electricity in the International Context 8
3. Regulatory Structures 18
4. Electricity and the Environment 23
5. Electricity Consumption 29
6. Electricity Generation 38
7. Generating Capacity and Reserve 46
8. Electricity Trade 57
9. Transmission 67
10. Electric Utility Investment and Financing 73
11. Costing and Pricing 79
12. Electricity Outlook 86
13. Demand-Side Management 98
14. Non-Utility Generation 105
APPENDIX A
Table Al. Installed capacity and electrical energy consumption in Canada, 1920-1990 112
Table A2. Installed generating capacity, 1990 113
Table A3. Conventional thermal capacity by principal fuel type, 1990 114
Table A4. Electrical energy production by principal fuel type, 1990 114
Table A5. Provincial electricity imports and exports 115
Table A6. Canadian electricity exports by exporter and importer, 1990 117
Table A7. Generation capacity by type 119
Table A8. Installed generating capacity expansion in Canada by station.Major 1990 additions and 1991-2010 projections 124
CONTENTS (continued)
Page
APPENDIX B
Bl. Chronology of Canadian electrical energy developments and achievements 130
B2. Chronology of regional interconnections 134
APPENDIX C
Cl. Remaining hydroelectric potential in Canada 136
APPENDIX D
Federal environmental standards and guidelines 147
APPENDIX E
E1. Current and proposed electrical efficiency-improvement programs
offered by Canadian electrical utilities 152
E2. Load-shifting programs 153
E3. Prices paid by major electric utilities for non-utility generation in 1991 1S4
Definitions and Abbreviations 158
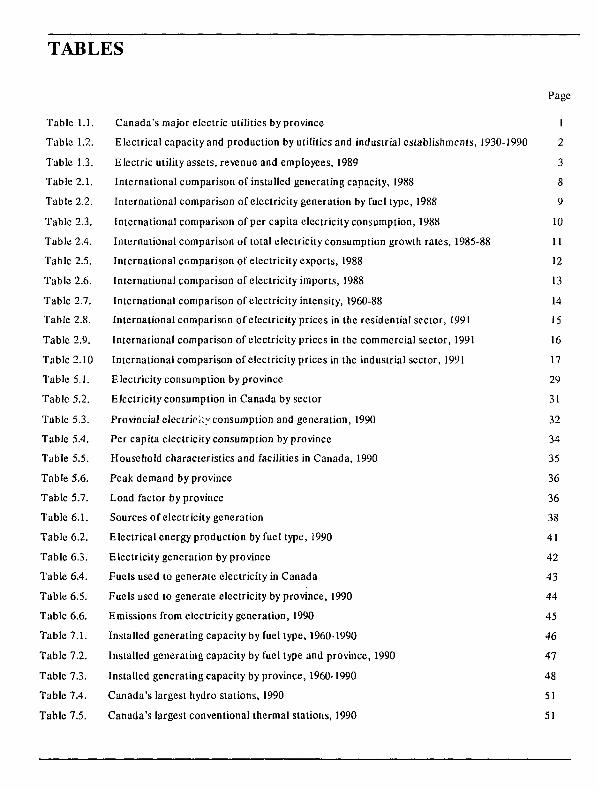
TABLES
Page
Table 1.1. Canada's major electric utilities by province 1
Table 1.2. Electrical capacity and production by utilities and industrial establishments, 1930-1990 2
Table 1.3. Electric utility assets, revenue and employees, 1989 3
Table 2.1. International comparison of installed generating capacity, 1988 8
Table 2.2. International comparison of electricity generation by fuel type, 1988 9
Table 2.3. International comparison of per capita electricity consumption, 1988 10
Table 2.4. International comparison of total electricity consumption growth rates, 1985-88 11
Table 2.5. International comparison of electricity exports, 1988 12
Table 2.6. International comparison of electricity imports, 1988 13
Table 2.7. International comparison of electricity intensity, 1960-88 14
Table 2.8. International comparison of electricity prices in the residential sector, 1991 15
Table 2.9. International comparison of electricity prices in the commercial sector, 1991 16
Table 2.10 International comparison of electricity prices in the industrial sector, 1991 17
Table 5.1. Electricity consumption by province 29
Table 5.2. Electricity consumption in Canada by sector 31
Table 5.3. Provincial electricity consumption and generation, 1990 32
Table 5.4. Per capita electricity consumption by province 34
Table 5.5. Household characteristics and facilities in Canada, 1990 35
Table 5.6. Peak demand by province 36
Table 5.7. Load factor by province 36
Table 6.1. Sources of electricity generation 38
Table 6.2. Electrical energy production by fuel type, 1990 41
Table 6.3. Electricity generation by province 42
Table 6.4. Fuels used to generate electricity in Canada 43
Table 6.5. Fuels used to generate electricity by province, 1990 44
Table 6.6. Emissions from electricity generation, 1990 45
Table 7.1. Installed generating capacity by fuel type, 19601990 46
Table 7.2. Installed generating capacity by fuel type and province, 1990 47
Table 7.3. Installed generating capacity by province, 1960-1990 48
Table 7.4. Canada's largest hydro stations, 1990 51
Table 7.5. Canada's largest conventional thermal stations, 1990 51
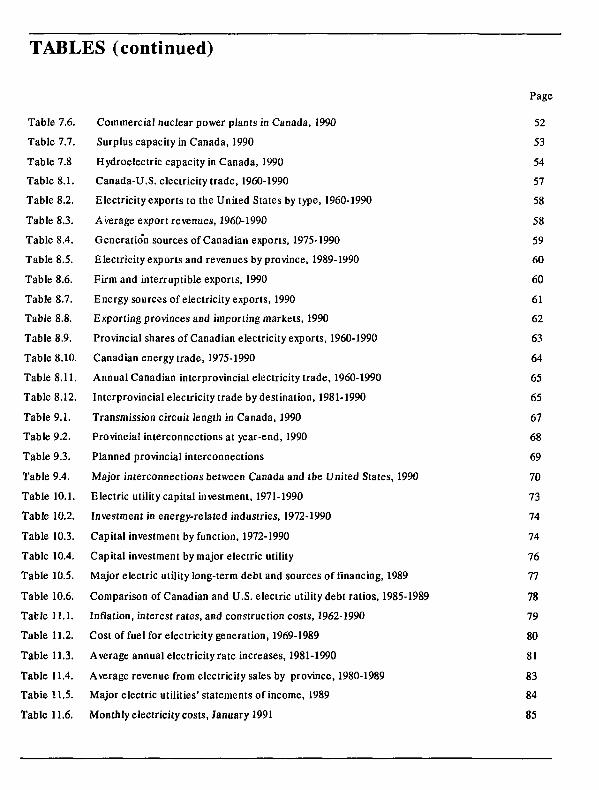
TABLES (continued)
Table 7.6. Commercial nuclear power plants in Canada, 1990
Table 7.7. Surplus capacity in Canada, 1990
Table 7.8 Hydroelectric capacity in Canada, 1990
Table 8.1. Canada-U.S. electricity trade, 1960-1990
Table 8.2. Electricity exports to the United States by type, 1960-1990
Table 8.3. Average export revenues, 1960-1990
Table 8.4. Generation sources of Canadian exports, 1975-1990
Table 8.5. Electricity exports and revenues by province, 1989-1990
Table 8.6. Firm and interruptible exports, 1990
Table 8.7. E nergy sources of electricity exports, 1990
Table 8.8. Exporting provinces and importing markets, 1990
Table 8.9. Provincial shares of Canadian electricity exports, 1960-1990
Table 8.10. Canadian energy trade, 1975-1990
Table 8.11. Annual Canadian interprovincial electricity trade, 1960-1990
Table 8.12. Interprovincial electricity trade by destination, 1981-1990
Table 9.1. Transmission circuit length in Canada, 1990
Table 9.2. Provincial interconnections at year-end, 1990
Table 9.3. Planned provincial interconnections
Table 9.4. Major interconnections between Canada and the United States, 1990
Table 10.1. Electric utility capital investment, 1971-1990
Table 10.2. Investment in energy-related industries, 1972-1990
Table 10.3. Capital investment by function, 1972-1990
Table 10.4. Capital investment by major electric utility
Table 10.5. Major electric utility long-term debt and sources of financing, 1989
Table 10.6. Comparison of Canadian and U.S. electric utility debt ratios, 1985-1989
Table 11.1. Inflation, interest rates, and construction costs, 1962-1990
Table 11.2. Cost of fuel for electricity generation, 1969-1989
Table 11.3. Average annual electricity rate increases, 1981-1990
Table 11.4. Average revenue from electricity sales by province, 1980-1989
Tabie H.5. Major electric utilities'statements of income, 1989
Table 11.6. Monthly electricity costs, January 1991
Page
52
53
54
57
58
58
59
60
60
61
62
63
64
65
65
67
68
69
70
73
74
74
76
77
78
79
80
81
83
84
85
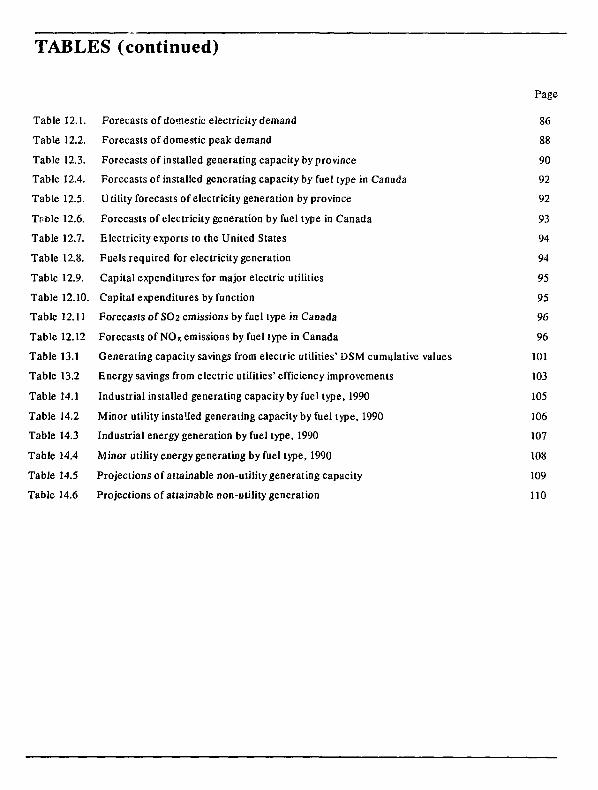
TABLES (continued)
Table 12.1. Forecasts of domestic electricity demand
Table 12.2. Forecasts of domestic peak demand
Table 12.3. Forecasts of installed generating capacity by province
Table 12.4. Forecasts of installed generating capacity by fuel type in Canada
Table 12.5. Utility forecasts of electricity generation byprovince
Tfiole 12.6. Forecasts of electricity generation by fuel type in Canada
Table 12.7. Electricity exports to the United States
Table 12.8. Fuels required for electricity generation
Table 12.9. Capital expenditures for major electric utilities
Table 12.10. Capital expenditures by function
Table 12.11 Forecasts of SO2 emissions by fuel type in Canada
Table 12.12 Forecasts of NOX emissions by fuel type in Canada
Table 13.1 Generating capacity savings from electric utilities' DSM cumulative values
Table 13.2 Energy savings from electric utilities' efficiency improvements
Table 14.1 Industrial installed generating capacity by fuel type, 1990
Table 14.2 Minor utility installed generating capacity by fuel type, 1990
Table 14.3 Industrial energy generation by fuel type, 1990
Table 14.4 Minor utility energy generating by fuel type, 1990
Table 14.5 Projections of attainable non-utility generating capacity
Table 14.6 Projections of attainable non-utility generation
Page
86
88
90
92
92
93
94
94
95
95
96
96
101
103
105
106
107
108
109
110
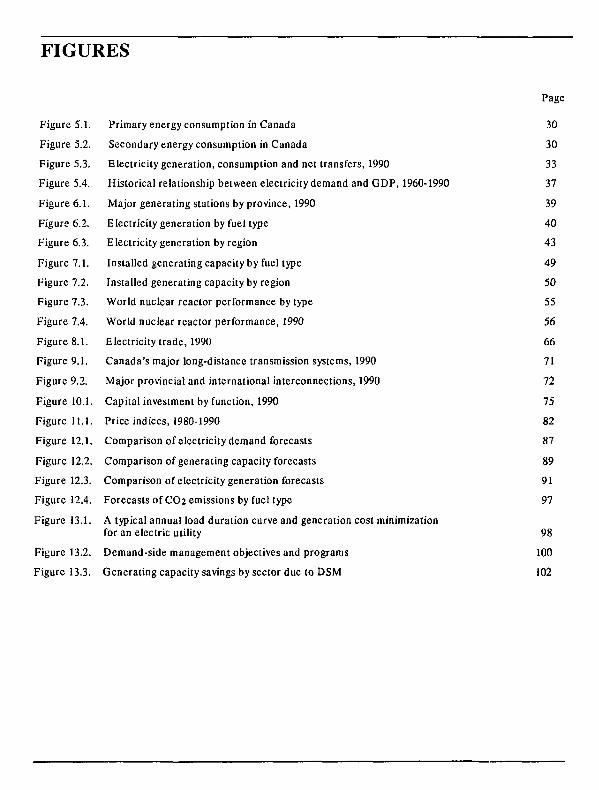
FIGURES
Figure 5.1. Primary energy consumption in Canada
Figure 5.2. Secondary energy consumption in Canada
Figure 5.3. Electricity generation, consumption and net transfers, 1990
Figure 5.4. Historical relationship between electricity demand and GDP, 1960-1990
Figure 6.1. Major generating stations by province, 1990
Figure 6.2. Electricity generation by fuel type
Figure 6.3. Electricity generation by region
Figure 7.1. Installed generating capacity by fuel type
Figure 7.2. Installed generating capacity by region
Figure 7.3. World nuclear reactor performance by type
Figure 7.4. World nuclear reactor performance, 1990
Figure 8.1. E lectricity trade, 1990
Figure 9.1. Canada's major long-distance transmission systems, 1990
Figure 9.2. Major provincial and international interconnections, 1990
Figure 10.1. Capital investment by function, 1990
Figure 11.1. Price indices, 1980-1990
Figure 12.1. Comparison of electricity demand forecasts
Figure 12.2. Comparison of generating capacity forecasts
Figure 12.3. Comparison of electricity generation forecasts
Figure 12.4. Forecasts of CO2 emissions by fuel type
Figure 13.1. A typical annual load duration curve and generation cost minimizationfor an electric utility
Figure 13.2. Demand-side management objectives and programs
Figure 13.3. Generating capacity savings by sector due to DSM
Page
30
30
33
37
39
40
43
49
50
55
56
66
71
72
75
82
87
89
91
97
98
100
102
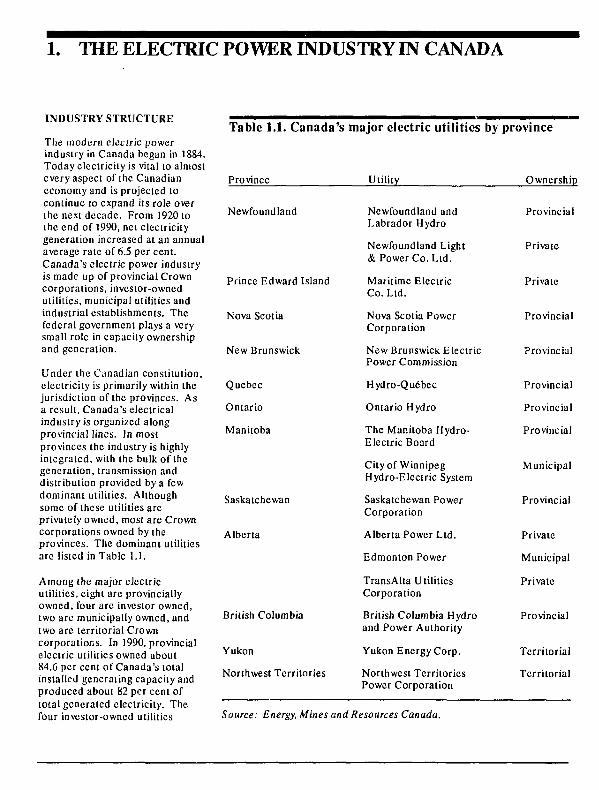
1. THE ELECTRIC POWER INDUSTRY IN CANADA
INDUSTRY STRUCTURE
The modern electric powerindustry in Canada began in 1884.Today electricity is vital to almostevery aspect of the Canadianeconomy and is projected tocontinue to expand its role overthe next decade. From 1920 loIhe end of 1990, net electricitygeneration increased at an annualaverage rate of 6.5 per cent.Canada's electric power industryis made up of provincial Crowncorporations, investor-ownedutilities, municipal utilities andindustrial establishments. Thefederal government plays a verysmall role in capacity ownershipand generation.
Under the Canadian constitution,electricity is primarily within thejurisdiction of the provinces. Asa result, Canada's electricalindustry is organized alongprovincial lines. In mostprovinces the industry is highlyintegrated, with the bulk of thegeneration, transmission anddistribution provided by a fewdominant utilities. Althoughsome of these utilities areprivately owned, most are Crowncorporations owned by theprovinces. The dominant utilitiesare listed in Table 1.1.
Among the major electricutilities, eight arc provinciallyowned, lour are investor owned,two are municipally owned, andtwo are territorial Crowncorporations. In 1990, provincialelectric utilities owned about84.6 per cent of Canada's totalinstalled generating capacity andproduced about 82 per cent oftotal generated electricity. Thefour investor-owned utilities
Table 1.1. Canada's major electric utilities by province
Province
Newfoundland
Prince Edward Island
Nova Scotia
New Brunswick
Quebec
Ontario
Manitoba
Saskatchewan
Alberta
British Columbia
Yukon
Northwest Territories
Utility
Newfoundland andLabrador Hydro
Newfoundland Light& Power Co. Ltd.
Maritime ElectricCo. Ltd.
Nova Scotia PowerCorporation
New Brunswick ElectricPower Commission
Hydro-Qu6bec
Ontario Hydro
The Manitoba Hydro-Electric Board
City of WinnipegHydro-Electric System
Saskatchewan PowerCorporation
Alberta Power Ltd.
Edmonton Power
TransAlta UtilitiesCorporation
British Columbia Hydroand Power Authority
Yukon Energy Corp.
Northwest TerritoriesPower Corporation
Ownership
Provincial
Private
Private
Provincial
Provincial
Provincial
Provincial
Provincial
Municipal
Provincial
Private
Municipal
Private
Provincial
Territorial
Territorial
Source: Energy, Mines and Resources Canada.
accounted for 5.8 per cent of allCanadian electric utility capacityand produced about 7.7 per centof total electricity. Municipallyowned utilities accounted for 1.5per cent of capacity ownership,and produced 1.1 per cent oftotal generated electricity. Thetwo territorial Crown corpora-tions accounted for 0.3 per centand 0.2 per cent of capacity andgeneration respectively.
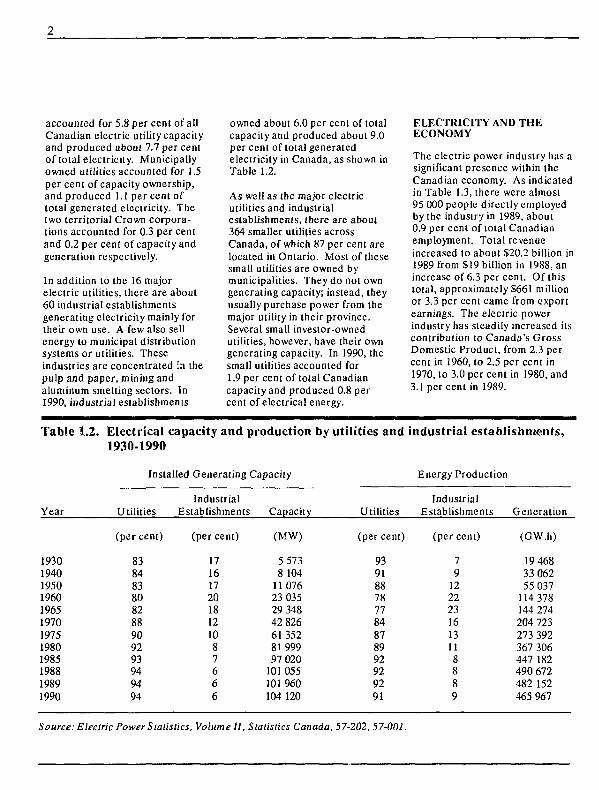
In addition to the 16 majorelectric utilities, there are about60 industrial establishmentsgenerating electricity mainly fortheir own use. A few also sellenergy lo municipal distributionsystems or utilities. Theseindustries are concentrated in thepulp and paper, mining andaluminum smelting sectors. In1990, industrial establishments
owned about 6.0 per cent of totalcapacity and produced about 9.0per cent of total generatedelectricity in Canada, as shown inTable 1.2.
As well as the major electricutilities and industrialestablishments, there are about364 smaller utilities acrossCanada, of which 87 per cent arelocated in Ontario. Most of thesesmall utilities are owned bymunicipalities. They do not owngenerating capacity; instead, theyusually purchase power from themajor utility in their province.Several small investor-ownedutilities, however, have their owngenerating capacity. In 1990, thesmall utilities accounted for1.9 per cent of total Canadiancapacity and produced 0.8 percent of electrical energy.
ELECTRICITY AND THEECONOMY
The electric power industry has asignificant presence within theCanadian economy. As indicatedin Table 1.3, there were almost95 000 people directly employedby the industry in 1989, about0.9 per cent of total Canadianemployment. Total revenueincreased to about S20.2 billion in1989 from $19 billion in 1988 anincrease of 6.3 per cent. Of thistotal, approximately S661 millionor 3.3 per cent came from exportearnings. The electric powerindustry has steadily increased itscontribution to Canada's GrossDomestic Product, from 2.3 percent in 1960, to 2.5 per cent in1970, to 3.0 per cent in 1980, and3.1 per cent in 1989.
Table 1.2. Electrical capacity and production by utilities and industrial establishments,1930-1990
Installed Generating Capacity Energy Production
Year
193019401950196019651970197519801985198819891990
Utilities
(per cent)
838483808288909293949494
IndustrialEstablishments
(percent)
1716172018121087666
Capacity
(MW)
5 5738 104
11 07623 03529 34842 8266135281 99997 020
101 055101 960104 120
Utilities
(per cent)
939188787784878992929291
IndustrialEstablishments
(per cent)
79
1222231613118889
Generation
(GW.h)
19 46833 06255 037
114 378144 274204 723273 392367 306447 182490 672482 152465 967
Source: Electric Power Statistics, Volume II. Statistics Canada, 57-202, 57-001.
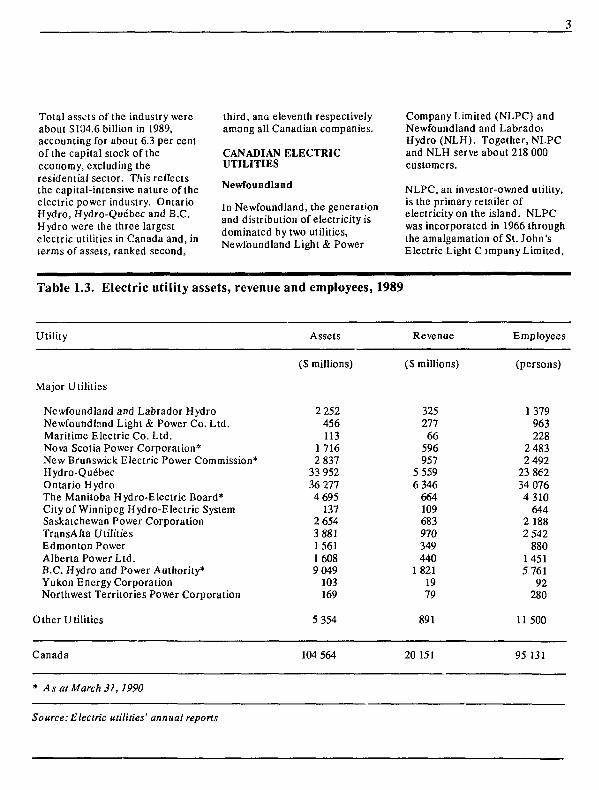
Total assets of the industry wereabout S104.6 billion in 1989,accounting for about 6.3 per centof the capital stock of theeconomy, excluding theresidential sector. This reflectsthe capital-intensive nature of theelectric power industry. OntarioHydro, Hydro-Quebec and B.C.Hydro were the three largestelectric utilities in Canada and, interms of assets, ranked second,
third, ana eleventh respectivelyamong all Canadian companies.
CANADIAN ELECTRICUTILITIES
Newfoundland
In Newfoundland, the generationand distribution of electricity isdominated by two utilities,Newfoundland Light & Power
Company Limited (NLPC) andNewfoundland and LabradorHydro (NLH). Together, NLPCand NLH serve about 218 000customers.
NLPC, an investor-owned utility,is the primary retailer ofelectricity on the island. NLPCwas incorporated in 1966 throughthe amalgamation of Si. John'sElectric Light C jmpany Limited,
Table 1.3. Electric utility assets, revenue and employees, 1989
Utility Assets Revenue Employees
Major Utilities
Newfoundland and Labrador HydroNewfoundland Light & Power Co. Ltd.Maritime Electric Co. Ltd.Nova Scotia Power Corporation*New Brunswick Electric Power Commission*Hydro-QuebecOntario HydroThe Manitoba Hydro-Electric Board*City of Winnipeg Hydro-Electric SystemSaskatchewan Power CorporationTransAIta UtilitiesEdmonton PowerAlberta Power Ltd.B.C. Hydro and Power Authority*Yukon Energy CorporationNorthwest Territories Power Corporation
Other Utilities
($ millions)
2 252456113
1 7162 83733 95236 2774 695137
2 6543 8811 56116089 049103169
($ millions)
32527766596957
5 5596 346664109683970349440
1 8211979
(persoi
1379963228
2 4832 49223 86234 0764 310644
2 1882 542880
14515 76192280
5 354 891 11500
Canada 104 564 20 151 95 131
* As at March 31,1990
Source: Electric utilities' annual reports

United Towns Electric CompanyLimited and Union Electric Lightand Power Company. Approxi-mately 92 per cent of thecompany's power supply ispurchased from NLH, with thebalance generated by its ownhydro stations. NLPC is asubsidiary of FORTIS Inc.,formed in 1987.
NLH is a provincial Crowncorporation, whose mandate is togenerate and transmit electricityin the province. It wasestablished by an act of theprovincial legislature in 1954 andwas incorporated in 1975. It isthi parent company of a groupthai includes Churchill Falls(Labrador) Corporation(CFLCo), the Lower ChurchillDevelopment Corporation(LCDC), Twin Falls PowerCorporation Limited, Gull IslandPower Co. Ltd., and the PowerDistribution District ofNewfoundland and Labrador.NLH has 51 per cent ownershipin LCDC; the Government ofCanada owns the remaining 49per cent. Through CFLCo, NLHowns and operates the ChurchillFalls plant, one of the largestpower facilities in the world.NLH's on-island capacity isgenerated from oil and hydrosources.
Prince Edward Island
Maritime Electric CompanyLimited (MECL) is aninvestor-owned utility that hasprovided electricity service toPrince Edward Island since 1918.The company owns and operatesa fully integrated Ciectric utilitysystem providing for thegeneration, transmission and
distribution of electricitythroughout the island. MECLoperates two oil-fired generatingplants on the island, and has a 10per cent equity interest in NewBrunswick Electric PowerCommission's coal/oil-fired No. 2unit located in Dalhousie, N.B.Two submarine cables linkMECL's system with NewBrunswick's power grid. MECLis the major distributor on theisland, serving about 49 800customers. A municipal utility inthe town of Summerside has itsown distribution system andpurchases power from MECL.
Nova Scotia
The Nova Scotia PowerCorporation (NSPC) wasincorporated in 1973. It is aprovincial Crown corporationthat produces and distributeselectricity throughout theprovince. NSPC generates mostof its electricity from thermalenergy, with more than 58 percent of the production comingfrom coal. The utility alsomaintains hydro-generation andoil-fired facilities, and purchasespower from New Brunswick. Thelargest portion of the province'stotal production is derived fromthe Lingan generating stationlocated on Cape Breton Island.In 1990, NSPC served about389 000 customers.
New Brunswick
The New Brunswick ElectricPower Commission (NB Power)was established by an act of theNew Brunswick Legislature in1920. The mandate of NB Poweris to generate and distributepower under public ownership to
all areas of the province. Theutility owns and operates 14generating stations, andelectricity is generated from abalance of nuclear, hydro andthermal sources. NB Power alsopurchases energy from Quebec.In 1990, NB Power directlyprovided electricity to 271 000customers and indirectly servedan additional 39 500 customersthrough sales to two municipalutilities.
Quebec
Hydro-Quebec is a Crowncorporation, established by theprovincial Legislative Assemblyin 1944. It is responsible for thegeneration, transmission anddistribution of most of theelectricity sold in Quebec.Almost all of the electricitygenerated by Hydro-Quebec at itsstations throughout the provinceis from hydraulic sources. Theutility currently serves more than3.1 million customers.
Hydro-Qu6bec has six whollyowned subsidiaries: -- the Societfid'energie de la Baie James, whichcarried out the construction ofPhase 1 of La Grande complexand which now manages largeconstruction projects forHydro-Quebec; -- Hydro-QuebecInternational, which providesengineering and consultingservices abroad for electric powerprojecis; — Cedars RapidsTransmission Company Limited,which owns and operates atransmission line betweenQuebec and New York State; --Somarex Inc., which was createdto finance, construct and operatea transmission line in the State ofMaine; — Nouveler Inc., which

promotes energy efficiency andalternative energy sources; and- Societe 2312-0843 QuebecInc., which is a partner in thelimited partnership societe encommandile HydrogenAL II andwhich, on January 1, 1990 becamea partner in the limited partner-ships sociele en commandileHydrogenAL and societe encommanifite ArgonAL, whoseother partner is Canadian LiquidAir Ltd.
Hydro-Quebec has a 34.2 percent interest in Churchill Falls(Labrador) Corporation Limited,which operates the ChurchillFalls power plant. It also has a50 per cent interest inHydrogenAL Inc., HydrogenALII Inc., and ArgonAL Inc.
Ontario
Ontario Hydro is a provinciallyowned corporation, established in1906 by a special statute of theProvince of Ontario. OntarioHydro is a financiallyself-sustaining corporationwithout share capital. Bonds andnotes issued to the public areguaranteed by the Province.Under the Power CorporationAct, the main responsibility ofOntario Hydro is to generate,supply and deliver electricitythroughout Ontario. It alsoproduces and sells steam and hotwater as primary products.Working with municipal utilitiesand with the Canadian StandardsAssociation, Ontario Hydro isresponsible for the inspectionand approval of electricalequipment and wiring throughoutthe province.
Ontario Hydro sells wholesaleelectric power to 315 municipalutilities, which in turn retail it tocustomers in their service areas.Ontario Hydro also servesdirectly about 112 large industrialcustomers and more than 891 000small business and residentialcustomers in rural and remoteareas. In 1990, more than 3.6million customers were served byOntario Hydro and the municipalutilities in the province. OntarioHydro operates 80 hydraulic,fossil and nuclear generatingstations and an extensivetransmission system across theprovince.
In Ontario, there are also anumber of small regional utilities.An example is Great Lakes PowerLimited, a private hydroelectricgeneration and distribution utilityoperating in Sault Ste. Marie andwest of the Algoma district ofOntario. In 1990, the utilityserved over 10 000 customers innorthern Ontario directly, andanother 30 000 indirectly.
Manitoba
The Manitoba Hydro-ElectricBoard (Manitoba Hydro) is aCrown corporation established in1949 by the provincial legislature.It has broad powers to provideelectric power throughout theprovince and operates under the1970 Manitoba Hydro Act.Almost all of the province'selectric power is produced byManitoba Hydro at its generatingstations on the Churchill/Nelsonriver system in northernManitoba. Manitoba Hydrodistributes electricity toconsumers throughout theprovince, except for the central
portion of Winnipeg, which isserved by the municipally ownedWinnipeg Hydro. ManitobaHydro and Winnipeg Hydrooperate as an integratedelectrical generation andtransmission system. In 1990,Manitoba Hydro served morethan 368 000 customers directly,and Winnipeg Hydro served overHI 000customers.
Saskatchewan
The Saskatchewan PowerCorporation (SaskPower) is aCrown corporation operatingunder the 1950 PowerCorporation Act. Under the Act,the mandate of SaskPowcrincludes the generation,transmission and distribution ofelectricity. At the end of 1990,the corporation served more than409 000 customers withelectricity. The bulk of theelectricity generated bySaskPowcr is from thermalsources.
In 1988, the gas operations of thecorporation became separatecompanies within SaskPower.The parent company of the gasoperations is the SaskatchewanEnergy Corporation(SaskEnergy). In 1989,SaskEnergy became a totallyseparate company.
Alberta
There arc three major electricutilities in Alberta: TransAllaUtilities Corporation, AlbertaPower Limited, and EdmontonPower. Together, they supplyabout 92 per cent of Alberta'selectrical energy requirements.A1J arc linked by a transmission
network largely owned byTransAlta. The remaining 8 percent of Alberta's electrical energyis supplied by industry. Over 89per cent of the electricitygenerated by Alberta utilities isproduced by large coal-firedgenerating stations.
TransAlta Utilities Corporation,formerly Calgary Power Limited,is the largest investor-ownedelectric utility in Canada. Thecompany was incorporated underthe laws of Canada and has beenengaged in the production anddistribution of electricity in theProvince of Alberta since 1911.About 67 per cent of the electricenergy requirements of Albertaare supplied by TransAlta, toover half of the population. In1990, more than 305 000customers were served directly byTransAlta, while another 315 000customers were served indirectlythrough wholesale contracts.TransAlta has a number ofsubsidiaries: TransAltaResources Corporation, itsprincipal subsidiary, holdsinvestment in non-regulatedactivities including TransAltaTechnologies Inc.; TransAltaEnergy Systems Corporationwhich provides buildingautomation and energymanagement services acrossCanada; TransAlta Fly Ash Ltd.;Kanelk Transmission CompanyLimited; and Farm ElectricServices Ltd.
Alberta Power Limited,incorporated in 1972, is anotherinvestor-owned electric utility inAlberta, and a subsidiary ofCanadian Utilities Ltd. Theactivity of the company isconcentrated in east-central and
northern Alberta. In 1990,Alberta Power supplied about 17per cent of total Albertaelectricity requirements andserved more than 157 000customers.
Edmonton Power has the largestgenerating capacity of anymunicipally owned utility inCanada. Since its creation in1902, Edmonton Power has keptpace with the growth anddevelopment of Edmonton.Although the utility producedonly 10 per cent of the electricityrequirements of Alberta, it had a14 per cent share of the totalprovincial market in 1990, servingmore than 245 000 customers.Edmonton Power purchases mostof its electricity from TransAltaUtilities and Alberta Power.
British Columbia
British Columbia Hydro & PowerAuthority (B.C. Hydro),incorporated in 1962, is a Crowncorporation operating in BritishColumbia. B.C. Hydro provideselectrical service throughout theprovince, with the exception ofthe southern interior, which isserved by West Kootenay Powerand Light Company, Limited.B.C. Hydro is the third largestelectric utility in Canada. Itgenerates, transmits anddistributes electricity to morethan 1.2 million customers in aservice area which contains morethan 92 per cent of thepopulation of the province.
In 1988, B.C. Hydro proceededwith a corporate restructuringthat resulted in the privatizationof its mainland gas operationsand its rail operations, and the
creation of a number ofsubsidiaries. B.C. HydroInternational Limited providesconsulting services in the areas ofengineering and utility operationsto Canadian and internationalcustomers. British ColumbiaPower Export Corporation(POWEREX) was established tomarket the province's firmelectricity exports. POWEREXnegotiates and administers firmexport sales agreements with U.S.utilities and purchase agreementswith electricity producers, andwill make arrangements withHydro for services such astransmission facilities. PowertechLabs Inc. was formed to provideresearch, testing and consultingwork for electrical technologicaldevelopment. WestechInformation Systems Inc. wascreated in 1989 to offer a widerange of professional services,including the design, develop-ment and maintenance ofintegrated computer systems.Western Integrated TechnologiesInc. was also created in 1989 toprovide technical support anddata processing operations.
West Kootenay Power is aninvestor-owned utility supplyingelectric service in the southerninterior of British Columbia. Thecompany generates anddistributes hydroelectricitydirectly to more than 63 000customers in its service area. Italso supplies power to sevenwholesale customers, who in turnserve almost 38 000 customers.West Kootenay Power is ownedby UtiliCorp United Inc. ofKansas City, Missouri.
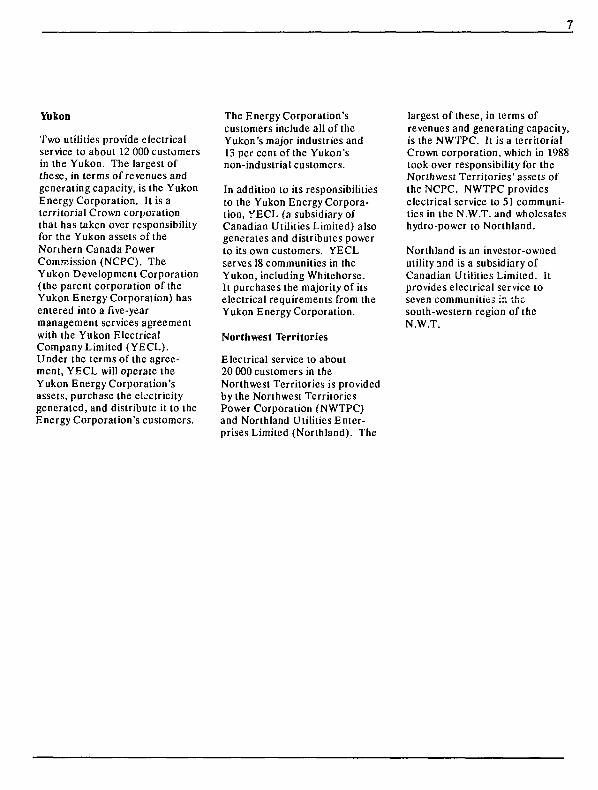
Yukon
Two utilities provide electricalservice to about 12 000 customersin the Yukon. The largest ofthese, in terms of revenues andgenerating capacity, is the YukonEnergy Corporation. It is aterritorial Crown corporationthat has taken over responsibilityfor the Yukon assets of theNorthern Canada PowerCommission (NCPC). TheYukon Development Corporation(the parent corporation of theYukon Energy Corporation) hasentered into a five-yearmanagement services agreementwith the Yukon ElectricalCompany Limited (YECL).Under the terms of the agree-ment, YECL will operate theYukon Energy Corporation'sassets, purchase the electricitygenerated, and distribute it to theEnergy Corporation's customers.
The Energy Corporation'scustomers include all of theYukon's major industries and13 per cent of the Yukon'snon-industrial customers.
In addition to its responsibilitiesto the Yukon Energy Corpora-tion, YECL (a subsidiary ofCanadian Utilities Limited) alsogenerates and distributes powerto its own customers. YECLserves 18 communities in theYukon, including Whitehorse.It purchases the majority of itselectrical requirements from theYukon Energy Corporation.
Northwest Territories
Electrical service to about20 000 customers in theNorthwest Territories is providedby the Northwest TerritoriesPower Corporation (NWTPC)and Northland Utilities Enter-prises Limited (Northland). The
largest of these, in terms ofrevenues and generating capacity,is the NWTPC. It is a territorialCrown corporation, which in 1988took over responsibility for theNorthwest Territories' assets ofthe NCPC. NWTPC provideselectrical service to 51 communi-ties in the N.W.T. and wholesaleshydro-power to Northland.
Northland is an investor-ownedutility and is a subsidiary ofCanadian Utilities Limited. Itprovides electrical service toseven communities :a thesouth-western region of theN.W.T.
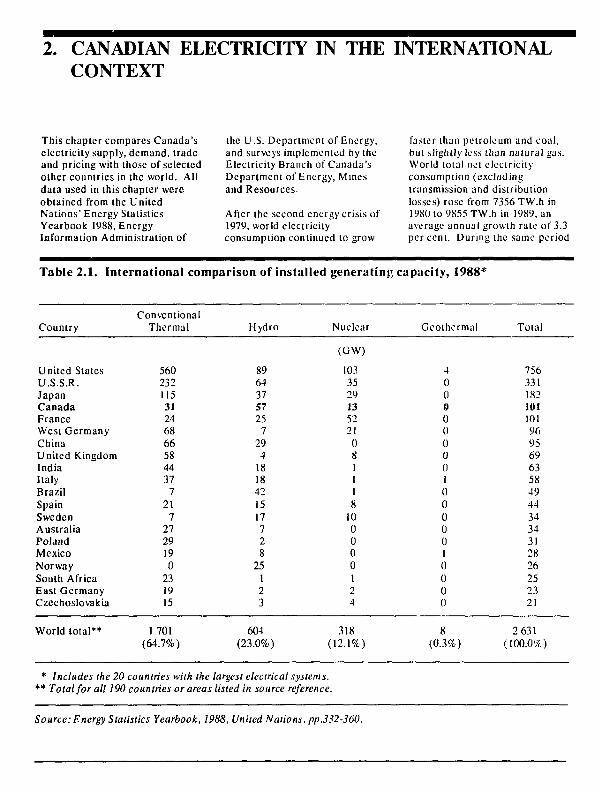
2. CANADIAN ELECTRICITY IN THE INTERNATIONALCONTEXT
This chapter compares Canada'selectricity supply, demand, tradeand pricing with those of selectedother countries in the world. Alldata used in this chapter wereobtained from the UnitedNations' Energy StatisticsYearbook 1988, EnergyInformation Administration of
the U.S. Department of Energy,and surveys implemented by theE lectrieity Branch of Canada'sDepartment of Energy, Minesand Resources.
After the second energy crisis of1979, world electricityconsumption continued to grow
faster than petroleum and coal,but slightly less than natural gas.World total net electricityconsumption (excludingtransmission and distributionlosses) rose from 7356 TW.h in1980 to 9S55 TW.h in 1989, anaverage annual growth rale of 3.3per cent. During the same period
Table 2.1. International comparison of installed
Country
United StatesU.S.S.R.JapanCanadaFranceWest GermanyChinaUnited KingdomIndiaItalyBrazilSpainSwedenAustraliaPolandMexicoNorwaySouth AfricaEast GermanyCzechoslovakia
World total**
* Includes the 20
ConventionalThermal
56023211531246866584437
721
72729190
231915
1 701(64.7%)
Hydro
8964375725
7294
1818421517728
25123
604(23.0%)
countries with the largest electrical systems.
generating
Nuclear
(GW)
1033529135221
081118
100000124
318(12.1%)
** Total for all 190 countries or areas listed in source reference.
capacity, 1988*
Geolhermal
40000000010000010000
8(0.3%)
Total
756331182101101969569635849443434312826252321
2 631(100.0%)
Source: Energy Statistics Yearbook, 1988, United Nations, pp.332-360.
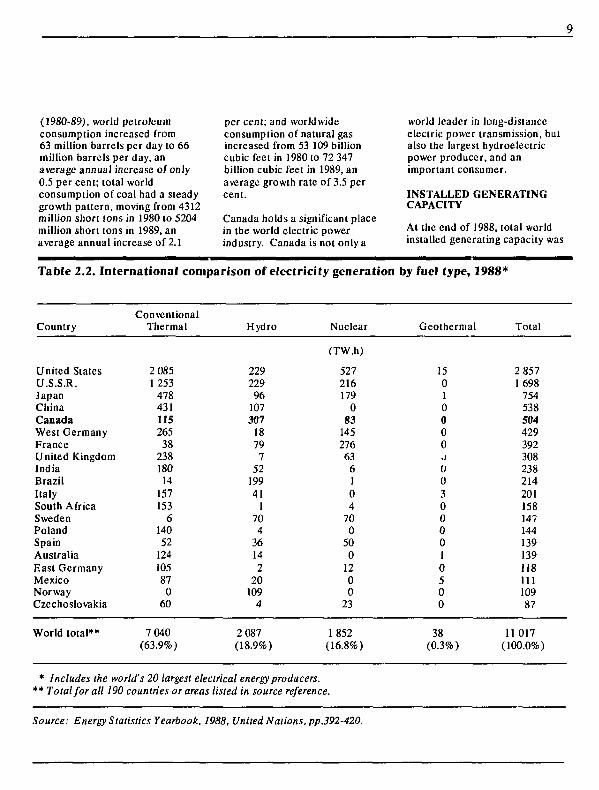
(1980-89), world petroleumconsumption increased from63 million barrels per day to 66million barrels per day, anaverage annual increase of only0.5 per cent; total worldconsumption of coal had a steadygrowth pattern, moving from 4312million short tons in 1980 to 5204million short tons in 1989, anaverage annual increase of 2.1
per cent; and worldwideconsumption of natural gasincreased from 53 109 billioncubic feet in 1980 to 72 347billion cubic feet in 1989, anaverage growth rate of 3.5 percent.
Canada holds a significant placein the world electric powerindustry. Canada is not only a
world leader in long-distanceelectric power transmission, butalso the largest hydroelectricpower producer, and animportant consumer.
INSTALLED GENERATINGCAPACITY
At the end of 1988, total worldinstalled generating capacity was
Table 2.2. International comparison of electricity generation
Country
United SlatesU.S.S.R.JapanChinaCanadaWest GermanyFranceUnited KingdomIndiaBrazilItalySouth AfricaSwedenPolandSpainAustraliaEast GermanyMexicoNorwayCzechoslovakia
World total**
ConventionalThermal
2 0851253
478431115265
3823818014
157153
614052
124105870
60
7 040(63.9%)
Hydro
22922996
107307
1879
752
19941
1704
36142
20109
4
2 087(18.9%)
Nuclear
(TW.h)
527216179
083
14527663
6104
700
500
1200
23
1852(16.8%)
* Includes the world's 20 largest electrical energy producers.** Total for all 190 countries or areas listed in source reference.
by fuel type, 1988*
Geothermal Total
15010000j
003000010500
38(0.3%)
2 8571698
75453850442939230823821420115814714413913911811110987
11017(100.0%)
Source: Energy Statistics Yearbook, 1988, United Nations, pp.392-420.
10
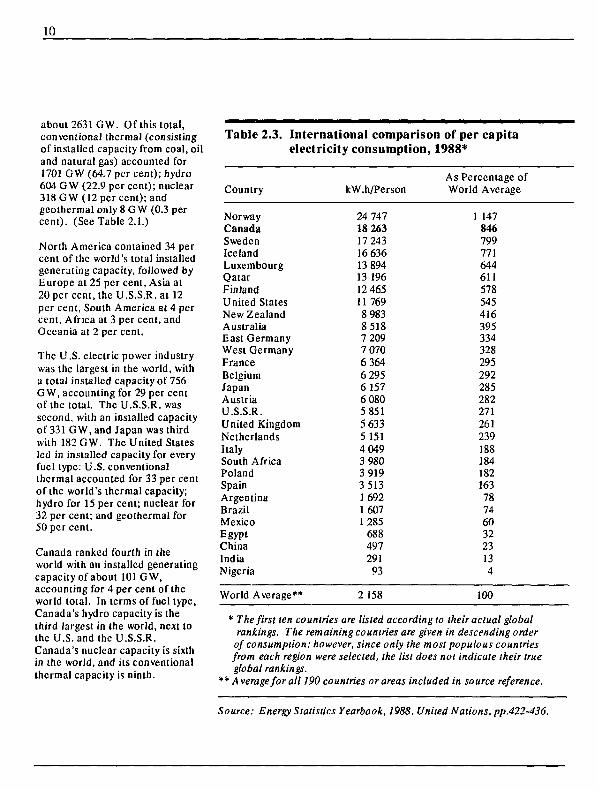
about 2631 GW. Of this total,conventional thermal (consistingof installed capacity from coal, oiland natural gas) accounted for1701 GW (64.7 per cent); hydro604 GW (22.9 per cent); nuclear318 GW (12 per cent); andgeothermal only 8 G W (0.3 percent). (See Table 2.1.)
North America contained 34 percent of the world's total installedgenerating capacity, followed byEurope at 25 per cent, Asia at20 per cent, the U.S.S.R. at 12per cent, South America at 4 percent, Africa at 3 per cent, andOceania at 2 per cent.
The U.S. electric power industrywas the largest in the world, witha total installed capacity of 756G W, accounting for 29 per centof the total. The U.S.S.R. wassecond, with an installed capacityof 331 GW, and Japan was thirdwith 182 GW. The United Statesled in installed capacity for everyfuel type: U.S. conventionalthermal accounted for 33 per centof the world's thermal capacity;hydro for 15 per cent; nuclear for32 per cent; and geothermal for50 per cent.
Canada ranked fourth in theworld with an installed generatingcapacity of about 101 GW,accounting for 4 per cent of theworld total. In terms of fuel type,Canada's hydro capacity is thethird largest in the world, next tothe U.S. and the U.S.S.R.Canada's nuclear capacity is sixthin the world, and its conventionalthermal capacity is ninth.
Table 2.3. International comparison of per capitaelectricity consumption, 1988*
Country
NorwayCanadaSwedenIcelandLuxembourgQatarFinlandUnited StatesNew ZealandAustraliaEast GermanyWest GermanyFranceBelgiumJapanAustriaU.S.S.R.United KingdomNetherlandsItalySouth AfricaPolandSpainArgentinaBrazilMexicoEgyptChinaIndiaNigeria
World Average**
kW.h/Person
24 74718 26317 2431663613 89413 19612 465117698 9838 5187 2097 0706 3646 2956 1576 0805 8515 6335 1514 0493 9803 9193 513169216071 285
68849729193
2 158
As Percentage ofWorld Average
1 1478467997716446115785454163953343282952922852822712612391881841821637874603223134
100
* The first ten countries are listed according to their actual globalrankings. The remaining countries are given in descending order
of consumption; however, since only the most populous countriesfrom each region were selected, the list does not indicate their trueglobal rankings.
** Average for all 190 countries or areas included in source reference.
Source: Energy Statistics Yearbook, 1988, United Nations, pp.422-436.
11
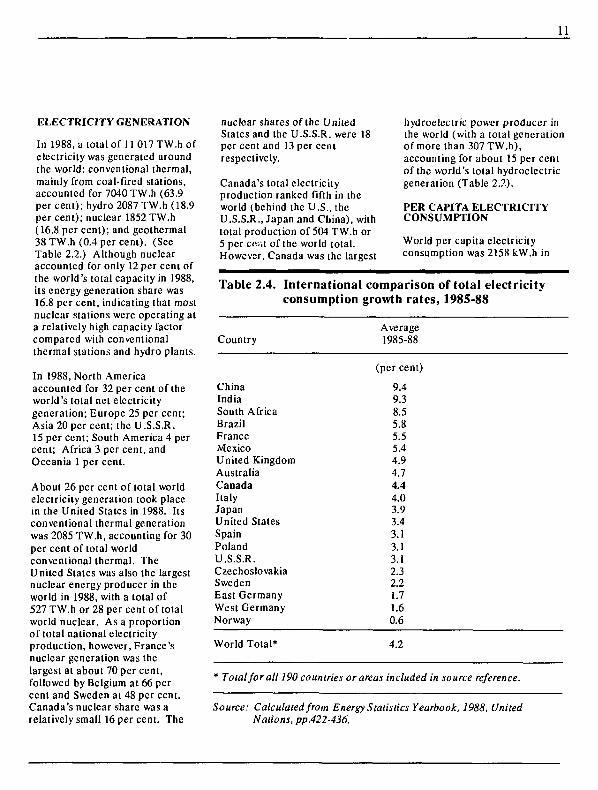
ELECTRICITY GENERATION
In 1988, a total ofl 1 017 TW.h ofelectricity was generated aroundthe world: conventional thermal,mainly from coal-fired stations,accounted for 7040 TW.h (63.9per cent); hydro 2087 TW.h (18.9per cent); nuclear 1852 TW.h(16.8 per cent); and geothermal38 TW.h (0.4 per cent). (SeeTable 2.2.) Although nuclearaccounted for only 12 per cent ofthe world's total capacity in 1988,its energy generation share was16.8 per cent, indicating that mostnuclear stations were operating ata relatively high capacity factorcompared with conventionalthermal stations and hydro plants.
In 1988, North Americaaccounted for 32 per cent of theworld's total net electricitygeneration; Europe 25 per cent;Asia 20 per cent; the U.S.S.R.15 per cent; South America 4 percent; Africa 3 per cent, andOceania 1 per cent.
Aboul 26 per cent of total worldelectricity generation took placein the United States in 1988. Itsconventional thermal generationwas 2085 TW.h, accounting for 30per cent of total worldconventional thermal. TheUnited States was also the largestnuclear energy producer in theworld in 1988, with a total of527 TW.h or 28 per cent of totalworld nuclear. As a proportionof total national electricityproduction, however, France'snuclear generation was thelargest at about 70 per cent,followed by Belgium ai 66 percent and Sweden at 48 per cent.Canada's nuclear share was arelatively small 16 per cent. The
nuclear shares of the UnitedStates and the U.S.S.R. were 18per cent and 13 per centrespectively.
Canada's total electricityproduction ranked fifth in theworld (behind the U.S., theU.S.S.R., Japan and China), withtotal production of 504 TW.h or5 per ce.it of the world total.However, Canada was the largest
hydroelectric power producer inthe world (with a total generationof more than 307 TW.h),accounting for about 15 per centof the world's total hydroelectricgeneration (Table 2.2).
PER CAPITA ELECTRICITYCONSUMPTION
World per capita electricityconsumption was 2158 kW.h in
Table 2.4. International comparison of total electricityconsumption growth rates, 1985-88
CountryAverage1985-88
ChinaIndiaSouth AfricaBrazilFranceMexicoUnited KingdomAustraliaCanadaItalyJapanUnited StatesSpainPolandU.S.S.R.CzechoslovakiaSwedenEast GermanyWest GermanyNorway
(per cent)
9.49.38.55.85.55.44.94.74.44.03.93.43.13.13.12.32.21.71.60.6
World Total* 4.2
* Total for all 190 countries or areas included in source reference.
Source: Calculated from Energy Statistics Yearbook, 1988, UnitedNations, pp.422-436.
12
1988. North America had thehighest average of 8474 kW.h;followed by Oceania at 6767kW.h; the U.S.S.R. at 5851 kW.h;Europe at 5538 kW.h; SouthAmerica at 1504 kW.h; Asia at730 kW.h; and Africa at 480 kW.h.
Canada's per capita electricityconsumption ranked second inthe world in 1988 at 18 263 kW.h,next only lo Norway's 24 747kW.h. As Table 2.3 shows, percapita consumption variessignificantly among countries.Norway consumed more than 11times the world average; Canadamore than eight times; and theUnited States five limes.Nigeria's and India's per capitaconsumption levels were less than14 per cent of the world average.Although China was the fourthlargest electricity producer in theworld, its per capita consumptionwas only 23 per cent of the worldaverage.
Two principal factors contributeto Canada's large per capitaconsumption of electricity.Abundant water resources havepermitted the development ofeconomical hydroelectric powerprojects in various regions,making electrical energyrelatively inexpensive andplentiful. This has led lorelatively high electricityconsumption among all energyusers, and it has led manyelectricity-intensive industries tolocale in Canada. As well,Canada's northerly locationmeans a long and cold winter,resulting in much electricity beingused for space-heating purposes.Currently, about 33 per cent oftotal households in Canada useelectricity for space healing.
Table 2.5. International comparison of electricity exports,1988*
Country
FranceU.S.S.R.CanadaSwitzerlandWest GermanyAustriaPolandCzechoslovakiaBelgiumSwedenNorwayUnited StatesSpainEast GermanyYugoslaviaSouth AfricaHungryUraguayMexicoDenmarkZambiaHong KongParaguayPortugalLaos
Total World Exports***
Exports**(GW.h)
44 42538 92034 02924 72722 3298 2837 9807 8537 8337 6717 3377 0674 8034 0882 5592 5002 3232 0911 99616481 5001 4401 1001027
755
251012
Production(GW.h)
391 9261 698 400
504 28557 953
428 85648 273
144 37287 37464 606
146 534109 350
2 856 624138511118 32883 654
157 90229 2166 998
110 87627 9928 485
25 5082 900
224151 100
11 017011
Percentageof Exports
to Production
11.32.36.7
42.75.2
17.25.59.0
12.15.26.70.23.53.53.11.68.0
29.91.85.9
17.75.6
37.94.6
68.6
2.3
* Includes the world's 25 largest electricity exporters.** Includes non-cash exchanges.
*** Total for all exporting countries or areas listed in source reference.
Source: Energy Statistics Yearbook, 1988, United Nations, pp.422-436.
13
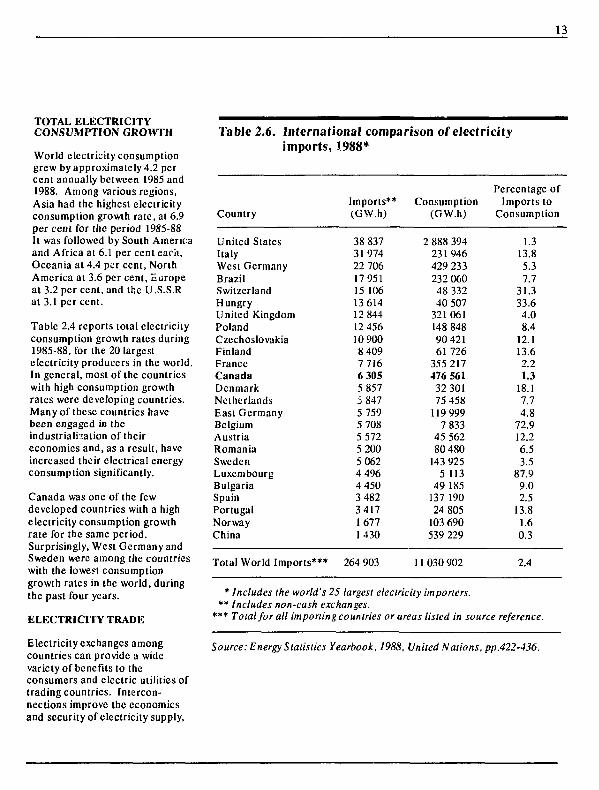
TOTAL ELECTRICITYCONSUMPTION GROWTH
World electricity consumptiongrew by approximately 4.2 percent annually between 1985 and1988. Among various regions,Asia had the highest electricityconsumption growth rate, at 6.9per cent for the period 1985-88It was followed by South Americaand Africa at 6.1 per cent each,Oceania at 4.4 per cent, NorthAmerica at 3.6 per cent, Europeat 3.2 per cent, and the U.S.S.Rat 3.1 per cent.
Table 2.4 reports total electricityconsumption growth rates during1985-88, for the 20 largestelectricity producers in the world.In general, most of the countrieswith high consumption growthrates were developing countries.Many of these countries havebeen engaged in theindustrialization of theireconomics and, as a result, haveincreased their electrical energyconsumption significantly.
Canada was one of the fewdeveloped countries with a highelectricity consumption growthrate for the same period.Surprisingly, West Germany andSweden were among the countrieswith the lower! consumptiongrowth rates in the world, duringthe past four years.
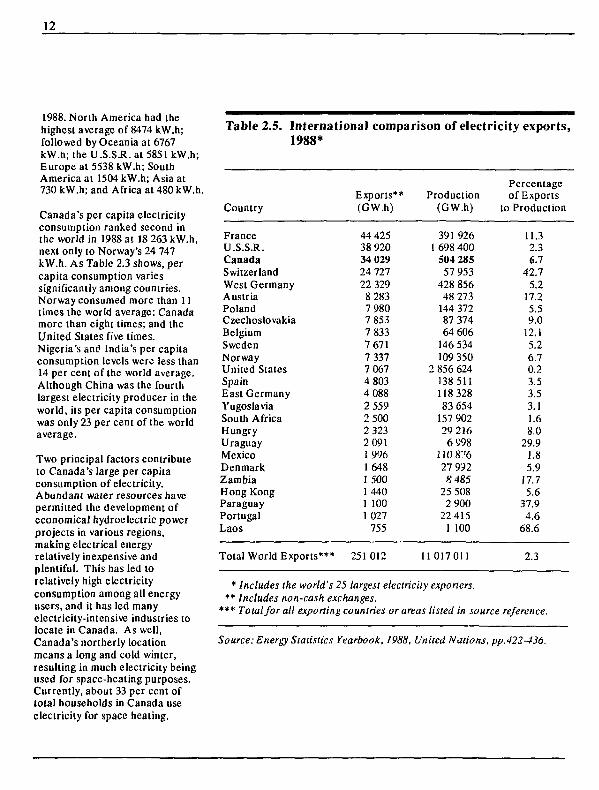
ELECTRICITY TRADE
Electricity exchanges amongcountries can provide a widevariety of benefits to theconsumers and electric utilities oftrading countries. Intercon-nections improve the economicsand security of electricity supply,
Table 2.6. International comparison of electricityimports, 1988*
Country
United SlatesItalyWest GermanyBrazilSwitzerlandHungryUnited KingdomPolandCzechoslovakiaFinlandFranceCanadaDenmarkNetherlandsEast GermanyBelgiumAustriaRomaniaSwedenLuxembourgBulgariaSpainPortugalNorwayChina
Total World Imports***
Imports**(GW.h)
38 83731 97422 70617 95115 10613 61412 84412 45610 9008 4097 7166 3055 8575 8475 7595 7085 5725 2005 0624 4964 4503 482341716771430
264 903
Consumption(GW.h)
2 888 394231 946429 233232 06048 33240 507
321 061148 84890 42161 726
355 217476 56132 30175 458
119 9997 833
45 56280 480
143 9255 113
49 185137 19024 805
103 690539 229
11 030 902
Percentage ofImports to
Consumption
1.313.85.37.7
31.333.64.08.4
12.113.62.21.3
18.17.74.8
72.912.26.53.5
87.99.02.5
13.81.60.3
2.4
* Includes the world's 25 largest electricity importers.** Includes non-cash exchanges.
*** Total for all importing countries or areas listed in source reference.
Source: Energy Statistics Yearbook, 1988, United Nations, pp.422-436.
14
and ihcy reduce the level ofcapacity needed lo meet peakloads. Interconnections alsoimprove the flexibility ofelectricity supply, making itpossible to minimize costs byreplacing the highest-costgeneration, such as oil-firedgeneration, with importedhydroelectric energy.
In 1988, a total of 251 TW.h ofelectricity was exportedinternationally, accounting forabout 2.3 per cent of worldproduction (Table 2.5). Theseexports look place mainly inNorth America and Europe,where there are extensiveinterconnections betweenelectrical generating stations.
Europe, the U.S.S.R and NorthAmerica accounted for 96 percent of total world electricityexports in 1988. As shown inTable 2.5, France was the largestelectricity exporter in the worldin 1988, with a total of more than44 TW.h, accounting for about 18per cent of total world exports.The U.S.S.R. was second,accounting for 16 per cent, andCanada was third with 14 per cent.
On the import side, the worldtotal was 265 TW.h, accountingfor 2.4 per cent of total worldconsumption in 1988 (Table 2.6).Again, Europe, the U.S.S.R. andNorth America were the majortrading areas, accounting for 91per cent of total world imports.
The United States was the largestelectricity importer in 1988, witha total of about 39 TW.h or 15per cent of total world imports.Italy was second with 32 TW.h,and West Germany was third with
Table 2.7. International comparison of electricityintensity*
Country**
NorwayNew ZealandSwedenLuxembourgIcelandCanadaPortugalFinlandGreeceAustraliaTurkeyBelgiumSpainIrelandUnited StatesAustriaWest GermanyFranceUnited KingdomNetherlandsDenmarkJapanItalySwitzerland
1960
1.520.590.710.930.620.940.490.440.240.390.190.440.340.330.470.520.430.350.530.300.200.430.360.37
1970
(kW.h/U
1.830.840.861.561.051.050.600.660.500.550.340.550.500.580.620.580.560.420.730.450.390.520.450.37
1980
.S. S1985)
1.701.141.061.301.201.130.860.850.740.700.590.660.710.660.690.620.630.540.690.540.510.530.480.44
1987
1.651.21.35.12.26.21.02.03
0.910.780.730.730.740.650.650.660.650.600.630.560.540.490.490.49
1988
1.681.331.331.301.251.221.051.020.950.790.760.720.720.650.650.650.640.630.620.570.530.500.500.48
• Electricity intensity is defined as total electricity consumption perdollar of gross domestic product.
** Due to limited availability of data, table includes only OECD-member countries.
Source: Real gross domestic product in U.S. dollars was obtained fromNational Accounts, 1960-1988. Department of Economics andStatistics, OECD, February 1990. Electrical energy data wereobtained from Energy Statistics Yearbook, United Nations,various issues.
15
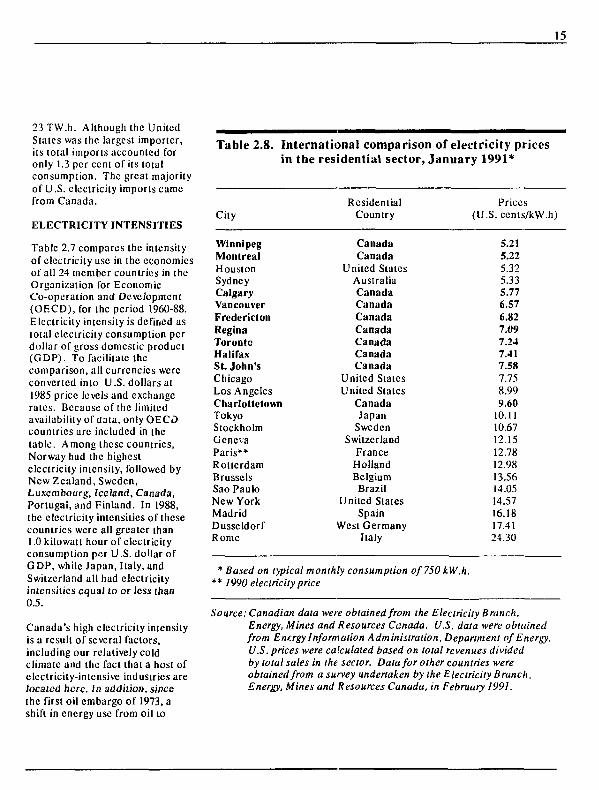
23 TW.h. Although the UnitedStales was the largest importer,its total imports accounted foronly 1.3 per cent of its totalconsumption. The great majorityof U .S. electricity imports camefrom Canada.
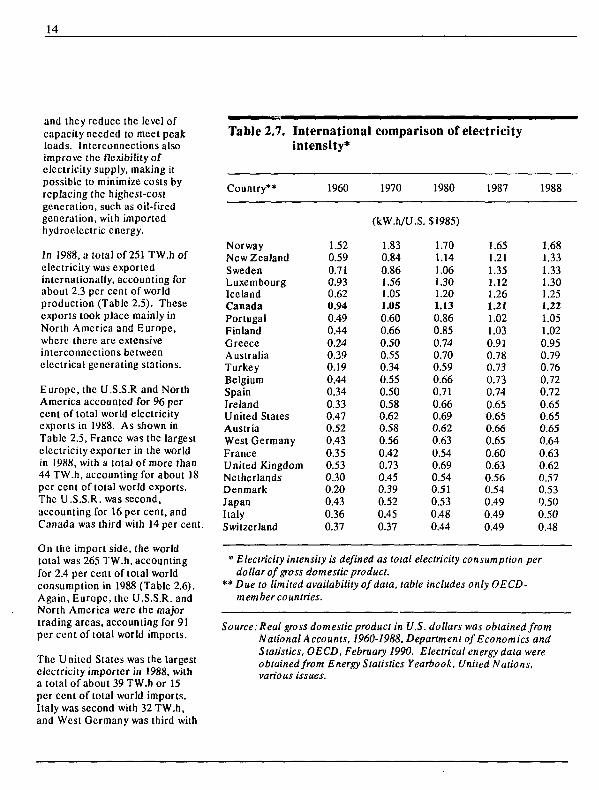
ELECTRICITY INTENSITIES
Table 2.7 compares the intensityof electricity use in the economiesof all 24 member countries in theOrganization for EconomicCo-operation and Development(OECD), for the period 1960-88.Electricity intensity is defined astotal electricity consumption perdollar of gross domestic product(GDP). To facilitate thecomparison, all currencies wereconverted into U.S. dollars at1985 price levels and exchangerates. Because of the limitedavailability of data, only OECDcountries arc included in thetable. Among these countries,Norway had the highestelectricity intensity, followed byNew Zealand, Sweden,Luxembourg, Iceland, Canada,Portugal, and Finland. In 1988,the electricity intensities of thesecountries were all greater than1.0 kilowatt hour of electricityconsumption per U.S. dollar ofGDP, while Japan, Italy, andSwitzerland all had electricityintensities equal lo or less than0.5.
Canada's high electricity intensityis a result of several factors,including our relatively coldclimate and the fact that a host ofelectricity-intensive industries arelocated here. In addition, sincethe first oil embargo of 1973, ashift in energy use from oil to
Table 2.8. International comparison of electricity pricesin the residential sector, January 1991*
City
WinnipegMontrealHoustonSydneyCalgaryVancouverFrederictonReginaTorontoHalifaxSt. John'sChicagoLos AngelesCharlotletownTokyoStockholmGenevaParis**RotterdamBrusselsSao PauloNew YorkMadridDusseldorfRome
ResidentialCountry
CanadaCanada
United SlatesAustraliaCanadaCanadaCanadaCanadaCanadaCanadaCanada
United StatesUnited States
CanadaJapan
SwedenSwitzerland
FranceHollandBelgiumBrazil
United StatesSpain
West GermanyItaly
* Based on typical monthly consumption of 750 kW.h.** 1990 electricity price
Prices(U.S. ccnls/kW.h)
5.215.225.325.335.776.576.827.097.247.417.587.758.999.60
10.1110.6712.1512.7812.9813.5614.0514.5716.1817.4124.30
Source: Canadian data were obtained from the Electricity Branch,Energy, Mines and Resources Canada. U.S. data were obtainedfrom Energy Information Administration, Department of Energy.U.S. prices were calculated based on total revenues dividedby total sales in the sector. Data for other countries wereobtained from a survey undertaken by the Electricity Branch,Energy, Mines and Resources Canada, in February 1991.
16
electricity has occurred in allsectors of the economy.
All 24 OECD-member countriesexperienced a time-trendincrease in electricity intensitybetween 1960 and 1988, althoughsome minor fluctuations occurredin the United States, the UnitedKingdom and Japan. In fact,electricity intensities have beensteadily declining since 1970 forthe U.K., suggesting thatelectricity use in producingoutput has been reduced.
ELECTRICITY PRICES
A comparison of internationalelectricity prices is difficultbecause of different rateschedules, consumption levelsand national currencies.Nevertheless, a reasonablecomparison has been establishedby using average revenue perkilowatt hou» in a given sector,under a certain level ofconsumption, and by convertingto U.S. dollars. For a moreaccurate comparison, purchasingpower parities should be usedwhen converted to U.S. dollars.However, such parities are notavailable for some countriescovered in this study and aretherefore not taken intoconsideration.
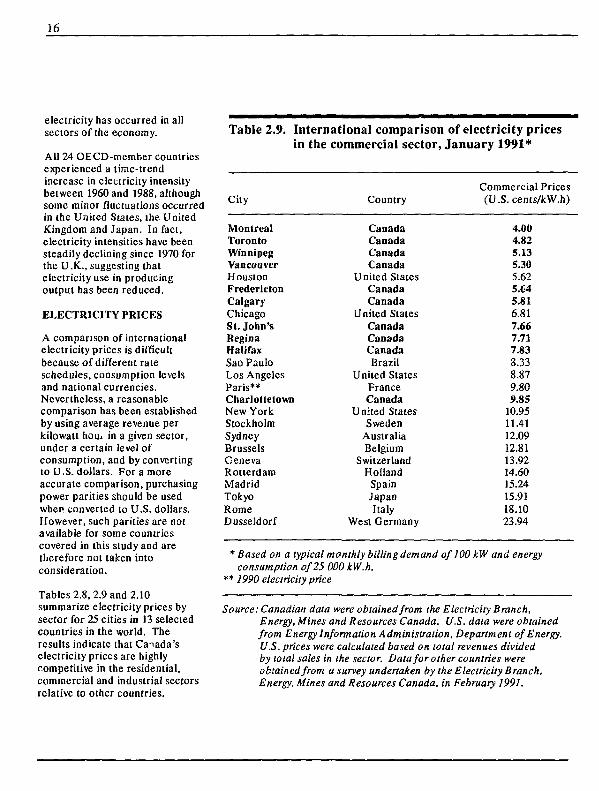
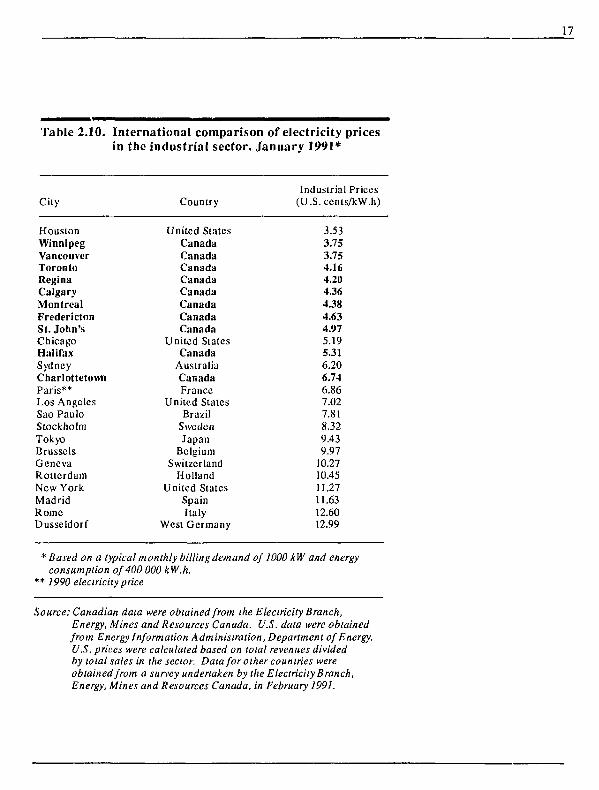
Tables 2.8, 2.9 and 2.10summarize electricity prices bysector for 25 cities in 13 selectedcountries in the world. Theresults indicate that Canada'selectricity prices are highlycompetitive in the residential,commercial and industrial sectorsrelative to other countries.
Table 2.9. International comparison of electricity pricesin the commercial sector, January 1991*
City
MontrealTorontoWinnipegVancouverHoustonFrederictonCalgaryChicagoSt. John'sReginaHalifaxSao PauloLos AngelesParis**CharlottetownNew YorkStockholmSydneyBrusselsGenevaRotterdamMadridTokyoRomeDusseldorf
Country
CanadaCanadaCanadaCanada
United StatesCanadaCanada
United StalesCanadaCanadaCanadaBrazil
United StatesFranceCanada
United StatesSweden
AustraliaBelgium
SwitzerlandHollandSpainJapanItaly
West Germany
Commercial Prices(U.S. cents/kW.h)
4.004.825.135.305.625.645.816.817.667.717.838.338.879.809.85
10.9511.4112.0912.8113.9214.6015.2415.9118.1023.94
* Based on a typical monthly billing demand of 100 kW and energyconsumption of 25 000 kW.h.
** 1990 electricity price
Source: Canadian data were obtained from the Electricity Branch,Energy, Mines and Resources Canada. U.S. data were obtainedfrom Energy Information Administration, Department of Energy.U.S. prices were calculated based on total revenues dividedby total sales in the sector. Data for other countries wereobtained from a survey undertaken by the Electricity Branch,Energy, Mines and Resources Canada, in February 1991.
17
Table 2.10. International comparison of electricity pricesin the industrial sector. January 1991*
City
HoustonWinnipegVancouverTorontoReginaCalgaryMontrealFrederictonSt. John'sChicagoHalifaxSydneyCharloltetownParis**Los AngelesSao PauloStockholmTokyoBrusselsGenevaRotterdamNew YorkMadridRomeDusseldorf
Country
United StatesCanadaCanadaCanadaCanadaCanadaCanadaCanadaCanada
United StatesCanada
AustraliaCanadaFrance
United StalesBrazil
SwedenJapan
BelgiumSwitzerland
HollandUnited States
SpainItaly
West Germany
Industrial Prices(U.S. cents/kW.h)
3.533.753.754.164.204.364.384.634.975.195.316.206.746.867.027.818.329.439.97
10.2710.4511.2711.6312.6012.99
* Based on a typical monthly billing demand of 1000 kW and energyconsumption of 400 000 kW.h.
** 1990 electricity price
Source: Canadian data were obtained from the Electricity Branch,Energy, Mines and Resources Canada. U.S. data were obtainedfrom Energy Information Administration, Department of Energy.U.S. prices were calculated based on total revenues dividedby total sales in the sector. Data for other countries wereobtained from a survey undertaken by the Electricity Branch,Energy, Mines and Resources Canada, in February 1991.
3. REGULATORY STRUCTURES
FEDERAL REGULATION
Constitutional Authority
Under the CanadianConstitution, legislative authorityfor electricity generation,transmission and distributionrests primarily with the provinces.Federal authority regardingelectricity is restricted to nuclearenergy and international andinterprovincial trade. Federalresponsibility for electricity tradestems primarily from Section 91.2of the Constitution Act, whichgives the federal governmentbroad authority over trade andcommerce. Federal control ofnuclear energy derives fromsections 91.29 and 92.10 of theAct, which permit federalregulation of matters that aredeclared by Parliament to be forthe general advantage of Canada.
Provincial ownership of mostenergy resources stems fromSection 109 of the ConstitutionAct, which in turn is supple-mented by Section 92A of theAct, giving provincial legislaturesauthority over the development,conservation and management ofsites and facilities in the provincefor the generation and productionof electrical energy. UnderSection 92A, which was enactedin 1982, the provinces also haveauthority to make laws regardinginterprovincial sales of electricity,as long as such laws do notconflict with federal laws and donot permit discrimination inprices or supplies exported todifferent parts of Canada.
National Energy Board
The National Energy Board(NEB) is a federal tribunal,
created in 1959 by an Act ofParliament. The Board's powersand duties are derived from theNational Energy Board Act.Under the Act, the Board advisesthe federal government on thedevelopment and use of energyresources, and regulates specificmatters concerning oil, gas andelectricity. The Board'sjurisdiction over electricalmatters is limited to thecertification of international anddesignated interprovincial powerlines and the licensing ofelectricity exports from Canada.The Board has no jurisdictionover imports of electricity.
On September 6, 1988, a newpolicy concerning the regulationof electricity exports andinternational power lines wasannounced. Legislationamending the NEB Act to giveeffect to this policy (Bill C-23)was proclaimed on June 1, 1990.
Under the new policy, theGovernment of Canada willcontinue to authorizeinternational power lines andexports of electricity. Suchauthorizations will be of twokinds: (i) permits, which will notrequire a public hearing orGovernor in Council approval; or(ii) licences (in the case ofelectricity exports) or certificates(in the case of power lines),which will require a publichearing and Governor in Councilapproval.
Authorizations will normally beby an NEB-issued permit unlessthe Governor in Council, on theadvice of the Board, designatesthe application for certificationor licensing. Designations are
not likely to occur, except incases where provincial regulationis deemed to be insufficient - forexample, in cases where thesponsoring province has notcomplied with relevant federalenvironmental processes.
Once an application isdesignated, the Board willconduct a public hearing, and itwill not issue a licence orcertificate unless it is fullysatisfied that the proposal is inthe Canadian public interest.Licences and certificates will notbe issued unless they are alsoapproved by the Governor inCouncil.
Under the amendments to theNEB Act, Part III.l provides forthe federal regulation ofinternational power lines. Indetermining whether torecommend to the Governor inCouncil designation of a powerline, the Board will have regardto all relevant considerations,including: (i) the effect of thepower line on other provinces;(ii) the impact of constructionand operation of the power lineon the environment; and (iii) anyother matters that may bespecified in the regulations.
In making its determination, theBoard will seek to avoid theduplication of measures taken bythe applicant and the relevantprovincial government(s). TheNEB will continue to authorizethe general corridor throughwhich an international power linewill pass. However, the preciselocation of the line within thiscorridor will normally bedetermined by provincialregulatory procedures, and any
19
expropriation that may benecessary will be done underprovincial laws. The onlyexception to this generalprocedure will be in cases wherethe applicant elects to havefederal law apply.
The Governor in Council may byorder designate a particularinterprovincial power line forregulation in the same manner asinternational power lines. Whenpower from one province simplyenters the grid of anotherprovince, there is no federalregulation.
Part VI of the amended NEB Actincludes a Division II, whichprovides tor the regulation ofelectric power exports. Themaximum duration of exportlicences and permits will be 30years. In determining whether torecommend to the Governor inCouncil designation of anapplication for export, the boardwill have regard to all relevantconsiderations, including: (i) theeffect of the export on provincesother than that from which theelectricity is to be exported; (ii)whether those wishing to buyelectricity for consumption inCanada have been granted fairmarket access to the electricityproposed for export; (iii) theimpact of the export on theenvironment; and (iv) any othermatters that may be specified inthe regulations. In making itsdeiermination the Board will alsoseek to avoid the duplication ofmeasures taken by the applicantand the sponsoring provincialgovernment.
Atomic Energy Control Board
Immediately after World War II,Canada began to study thequestion of how to encourage theuse of nuclear energy for peacefulpurposes while at the same timepreventing its use for weapons.In 1946, Parliament passed theAtomic Energy Control Act withthese objectives in mind.
The Act gave the federalgovernment control over thedevelopment, application and useof nuclear energy and establishedthe Atomic Energy ControlBoard (AECB). Thefive-member Board administersand enforces the Act, from whichit derives its authority to regulatethe health, safety, security andenvironmental aspects of nuclearenergy. The AECB reports toParliament through a designatedMinister, currently the Ministerof Energy, Mines and Resources.
The Board's primary function isto license Canadian nuclearfacilities and activities dealingwith prescribed substances andequipment. Nuclear facilitiesinclude power and researchreactors, uranium mines andrefineries, fuel fabrication plants,heavy water plants, wastemanagement facilities andparticle accelerators. Prescribedsubstances include uranium,thorium, heavy water andradioisotopes. Activities relatingto such substances, which may belicensed, include production,processing, sale, use, import andexport. Before issuing a licence,the AECB ensures that theappropriate health, safety andsecurity standards are met.
The AECB's control also extendsto international security ofnuclear materials and technology.Through the licensing process, itensures that nuclear equipmentand supplies are exported only inaccordance with Canada'sobligations under the Treaty onthe Non-Proliferation of NuclearWeapons.
PROVINCIAL REGULATION
As noted above, under theCanadian Constitution theprovinces have legislativeauthority over the generation,transmission and distribution ofelectricity. In most provincessome form of regulation exists,and most provinces haveestablished regulatory bodies tooversee the utilities, although thedegree of supervision varies. Themajor areas subject to review arerate-setting and the constructionof new facilities. The nature ofprovincial regulation with respectto these matters is describedbriefly below. The environmentalregulations of the provinces aredescribed in chapter 4.
Newfoundland
Newfoundland Light & PowerCompany (NLPC) andNewfoundland and LabradorHydro (NLH) arc regulated bythe Newfoundland Board ofCommissioners of PublicUtilities. The Board fullyregulates the rates and policies ofNLPC, including the constructionof new facilities. Since 1977, theBoard has also had authorityunder the Electric Power ControlAct to review NLH's rates forresidential customers. The Board

20
makes recommendations to theNewfoundland Cabinet, which isthe final authority for utility rates.
Cabinet is also the final authoritywith respect to NLH's capitalexpenditure program. Proposalsby NLH for new facilities mustreceive Cabinet approval beforeconstruction can begin. NLPCmust receive the approval of theprovince's Board of Commis-sioners of Public Utilities beforeproceeding with the constructionof new facilities.
Prince Edward Island
Maritime Electric CompanyLimited is regulated by the PublicUtilities Commission of PrinceEdward Island under theprovisions of the Electric Powerand Telephone Act. TheCommission has decision-makingauthority over electric utilityrates in the province and screensa'l proposals for the constructionof new generation and trans-mission facilities. If theCommission believes lhat a newfacility may adversely affect theenvironment, a formalenvironmental assessment reviewprocess is initiated. A descrip-tion of this process is provided inchapter 4.
Nova Scotia
Since 1976, the Nova ScotiaBoard of Commissioners ofPublic Utilities, in accordancewilh the provincial PublicUtilities Act, has had fulldecision-making power over theutility's rates and policies.
The Board's authority extends tothe construction of new facilities.
and utilities are required to applydirectly to the Board whenplanning new generation ortransmission facilities. As part ofthe review process, the Boardholds public hearings, duringwhich the utility presents itsproposed project, costs andalternative plans. Members ofthe public may intervene directlyduring a hearing. The Board ofCommissioners is the finalauthority on new facilities.
New Brunswick
As a Crown corporation. NewBrunswick Power reports to theprovincial government through itschairman, who is a member of theCabinet. Rates and operationsare regulated by a nine-memberBoard of Commissionersappointed by the LieutenantGovernor of New Brunswick.The utility's chairman and vicechairman sit on the Board. TheBoard's recommendations arereferred to the provincialCabinet, which is the finalregulatory authority. Abi-partisan Crown corporationcommittee also reviews utilityrales and operations annually.
NB Power must receive approvalfrom the Lieutenant Govcrnor-in-Council before proceedingwith the construction of newfacilities. Although theLieutenant Governor-in-Councilis the final authority in thisregard, ils decision is based upona recommendation from theMinister of Municipal Affairs andEnvironment, following anevaluation of the project'spossible environmental impacts.New Brunswick's environmental
impact assessment process isdescribed in chapter 4.
Quebec
In Quebec, the NationalAssembly's committee oneconomics and employmentreviews Hydro-Quebec'slong-term development plan,which includes any proposed ratechanges. The committee thenmakes a recommendation to theMinister of Energy andResources, who in turn makes arecommendation to Cabinet.Rate increases can therefore beimplemented by Hydro-Quebeconly after they have beenapproved by Cabinet.
The construction of new facilitiesby Hydro-Quebec can take placeonly after the utility has receivedan Order-in-Council from theprovincial government. Before anOrder is issued, the Departmentof the Environment and theDepartment of Energy andResources must approve plans forthe new facility. Otherdepartments and agencies arealso consulted.
Ontario
Ontario Hydro is a provinciallyowned corporation, which reportsto the government through theMinister of Energy. Themanagement of Ontario Hydro isunder the direction jnd controlof its Board of Directors.Proposed rate changes arereferred to the Ontario EnergyBoard (OEB), through theMinister of Energy, forexamination at public hearings.However, it is the Board ofOntario Hydro that is authorized
21
to set the utility's rates, and itmay accept or reject therecommendations of the OEB.
On matters concerning itsgeneration expansion programand transmission facilities,Ontario Hydro is regulated by theprovincial Joint Hearing Board.The Board is composed ofmembers from the EnvironmentalAssessment Board and theOntario Municipal Board. TheJoint Board makes a recom-mendation to the provincialgovernment, and final approvalmust be given through anOrder-in-Council.
Manitoba
Under the Manitoba CrownCorporations Public Review andAccountability Act of 1988,Manitoba Hydro's proposedchanges to domestic rates mustbe reviewed by the ManitobaPublic Utilities Board, whichholds a public review and makes afinal decision on the proposal.
Under the 1988 ManitobaEnvironment Act, the provincialgovernment must also approvemajor facility construction.Applications arc made to theMinister of the Environment anda full environmental assessment isrequired. A description ofManitoba's environmentalassessment review process isgiven in chapter 4.
Saskatchewan
Saskatchewan Power Corporation(SaskPower) is governed by agovernment-appointed Board ofDirectors that is responsible forthe management and operation of
the Crown utility. Proposals toincrease rates or construct newgeneration or transmissionfacilities must be approved by theBoard of Directors. The ministerresponsible for SaskPower is amember of the Board.
Alberta
TransAlta U tilities Corporationand Alberta Power Limited arcregulated by the Alberta EnergyResources Conservation Board(ERCB) with respect to thedevelopment of generation andtransmission facilities, coal minedevelopments and changes inservice areas. Thermalgenerating stations are issuedpermits, which are subject toLieutenant Governor-in-Councilapproval, while hydro damapprovals require finalauthorization through the passageof a bill in the legislature.TransAlta's and Alberta Power'srates are regulated by the AlbertaPublic Utilities Board, under theprovisions of the Public UtilitiesBoard Act of 1980.
As a municipally owned utility,Edmonton Power is subject to theauthority of Edmonton Council,as well as the various provincialregulatory bodies. Its rates andfinancing are regulated by citycouncil, while the ERCB isresponsible for the regulation ofnew generation and transmissionfacilities.
The three utilities participate inthe cost-pooling program of theElectric Energy MarketingAgency (EEMA). The EEMAwas established in 1982 by theprovincial government to helpequalize power costs throughout
Alberta. Under EEMAlegislation, the utilities'generation and transmission costsare regulated by the PublicUtilities Board. The Board alsoapproves the selling prices ofelectricity to EEMA, which thenpools the utilities' costs andresells the power at averageprices back to the utilities.
British Columbia
Electricity rate changes in theprovince of British Columbiarequire the approval of theBritish Columbia UtilitiesCommission (BCUC). Majorgeneration and transmissionprojects require the approval ofthe provincial Cabinet. Uponreceiving an application toconstruct a major facility, thegovernment may refer theapplication to the BCUC forreview and a recommendedcourse of action. Projects thatobtain Cabinet approval receivean Energy Project Certificatefrom the province.
Yukon
The Yukon Energy Corporationand the Yukon ElectricalCompany are regulated by theYukon Utility Board, under thePublic Utilities Act of 1986.Under this Act, the Corporationand Company must fileapplications for rale changes orfacility construction with theBoard, which reviews theapplications and makes a decision.
Northwest Territories
The Northwest Territories PowerCorporation and NorthlandUtilities Enterprises Limited are
22
regulated by the NorthwestUtilities Act of 1989. Under theAct, they must file an applicationwith the N.W.T. Public UtilitiesBoard in order to receiveauthority for rate changes orfacility development. Uponreceiving an application, theBoard holds a public hearing andthen reaches a decision, which isfinal.
4. ELECTRICITY AND THE ENVIRONMENT
Most, if not all, electricitygeneration and transmissionprojects have some impact on theenvironment. Fossil-fuelgenerating stations releasechemicals into the atmosphere,and dam and transmission lineconstruction projects have aneffect on local plant, animal andaquatic life. Governments,industry and other groups insociety have recognized the needto assess and reduce theseimpacts. For their part, federaland provincial governments haveestablished processes that aredesigned to measure and reducethe environmental consequencesof electrical generation andtransmission projects.
Despite differences from oneprovince to another in the natureof the environment and in thescale and type of projectproposed, there are similarities inthe processes developed by thevarious provincial governments toensure thai the development ofelectricity generation andtransmission projects does aslittle harm as possible to theenvironment.
In most provinces, the proponent(a person, company, provincialagency or Crown corporation) isresponsible for conducting anenvironmental assessment ofactivities. A lead agency (oftenin the department responsible forthe environment) is normallyappointed to review thisassessment on behalf of theprovincial government.
In all provinces, decision-makingoccurs in discrete steps. Small,routine projects with nosignificant impacts are first
screened out and allowed toproceed with a minimum loss oftime and expense. Projects thatmay adversely affect theenvironment are submitted for amore detailed (and sometimesmore visible and structured)review. Such projects could besubject to public review by anindependent board or panel.
The Environmental ImpactStatement (EIS) is used in mostprovinces and by the federalgovernment to assess projectsthat may have a major adverseenvironmental impact. The EISformat is similar in alljurisdictions and involves (i) aproject description, (ii) ananalysis of how the project willaffect the environment, and (iii) adescription of proposed measuresto reduce environmental impacts.It is normally prepared by theproject proponent and isreviewed by the lead and othergovernment agencies or by apublic review board or panel.
The EIS process usually involvessome form of public review, butthe degree of formality variesamong provinces, from formallegal procedures to informalcommunity meetings. At both thefederal and provincial levels, thefinal decision-maker is usually anelected official or officials - aCabinet minister or the entireCabinet.
The processes in place inCanadian jurisdictions areoutlined below. Some of thismaterial is reviewed in moredetail in a report prepared by theCanadian Council of Resourcesand Environment Ministers.'Since this 1985 report was
completed, Manitoba, NewBrunswick and Prince EdwardIsland have introduced majorchanges, and these arc reflectedin this chapter. In addition, anEnvironmental Assessment Actwas passed in Nova Scoiia in 1988and was proclaimed in July 1989.
FEDERAL PROCESS
The Federal Government'sEnvironmental AssessmentReview Process
In December 1973, Cabinetestablished the federalEnvironmental AssessmentReview Process (EARP) toensure that the environmentaleffects of all federal proposalsarc assessed early in the planningprocess. A federal proposal isone initiated by u federal agency,or one that involves federalfunding, federal property, oraffects an area of federalresponsibility. Federal Crowncorporations arc not bound bythe Cabinet decision, but they areinvited to participate in theprocess.
Under EARP, federaldepartments are responsible forassessing their own proposals.They conduct an initial screeningto determine whether a givenproposal will have significant
1 William J. Couch, Ph.D. (ed),Environmental Assessment inCanada: 1985 Summary of CurrentPractice in Canada. (Ottawa,Canadian Council of Resourceand Environment Minister?, 1985,catalogue numberEN 104-4/1985.)

24
environmental effects. If no sucheffects are perceived, the projectmay go ahead with appropriatemonitoring by the initiatingdepartment. The results of allsuch decisions are published insummary form.
If potentially significantenvironmental effects areperceived, a formal reviewprocess is undertaken by anEnvironmental Assessment Panelcreated by the Minister of theEnvironment. The Panel isassisted in its work by the FederalEnvironmental AssessmentReview Office. The Panelnormally requires that thesponsor of the proposal preparean EIS. If the Minister of theEnvironment and the initiatingminister concur, the scope of thePanel may be broadened toinclude general sociocconomiceffects and the need for theproject.
Public participation is an integralpart of the assessment process.Any person or organization withan interest in the proposal isprovided with an opportunity toappear before the Panel.
Once a Panel has completed itsdeliberations and evaluated allinformation on a proposal, itprepares a report containing itsfindings and recommendations.A Panel could recommend that aproposal not proceed, that itproceed as planned, or that itproceed subject to certain termsand conditions. The recommend-ations arc submitted to theMinister of the Environment andthe initiating minister, who mustdecide (i) to whom therecommendations are directed,
(ii) to what extent they should beincorporated into terms andconditions governing the project,and (iii) in what manner they areto be made public. In the eventof a disagreement between thetwo ministers, the question maybe submitted to Cabinet.
Following the publication of agreen paper in 1987 thatidentified a number of possiblechanges to the EARP process,2
the Federal EnvironmentalAssessment Review Office(FEARO) has carried outextensive consultations with thepublic, and federal departmentsand agencies. Bill C-78,introducing a new CanadianEnvironmental Assessment Act,was tabled in the House ofCommons on June 18, 1990, andwas discussed but not concludedin the last year's session. BillC-78 will be reintroduccd in theHouse of Commons and isexpected to be passed in thisfiscal year.
PROVINCIAL PROCESSES
British Columbia
The principal legal basis forBritish Columbia's energy projectreview process is the UtilitiesCommission Act, 1980. Majorenergy projects cannot proceeduntil the proponent has receivedapproval by means of an EnergyProject Certificate, a Ministers'Order, or a Certificate of PublicConvenience and Necessity, all ofwhich set out the terms andconditions under which thefacility may be constructed andoperated.
In order to obtain approval for aproject, a proponent mustprovide a prospectus and then anapplication to the Ministry ofEnergy, Mines and PetroleumResources, which in turn refersthem to an Energy ProjectCoordinating Committee(EPCC). This steering group ischaired by the Ministry ofEnergy, Mines and PetroleumResources, and includesrepresentatives from the Ministryof Environment, the BritishColumbia Utilities Commission(BCUC),and FEARO.
In the application, the proponentmust address, among other items,environmental impacts; impactmanagement strategies; benefitand costs; and proposals forcompensation, mitigation andmonitoring. The EPCC, throughthree inter-ministry workinggroups, reviews the material andsubmits its recommendations tothe ministers of Environment andEnergy, Mines and PetroleumResources. Generally, therecommendations arc cither for apublic hearing by the BCUC orexemption from provisions of theUtilities Commission Act. Theapplication may also be rejectedif it fails to satisfy public interestcriteria.
If an application is referred tothe BCUC, once the publichearing is completed, a report issent to the two ministers forconsideration by Cabinet. The
2 Environment Canada,Reforming En vironmenlaiAssessment: A Discussion Paper.(Oltawa, Minister of Supply andServices, Canada 1987, cataloguenumber EN 106-5/1987.)

25
Minister of Energy, Mines andPetroleum Resources, with theconcurrence of the Minister ofEnvironment, then announces theCabinet decision.
If a public utility applies for anEnergy Project Certificate, theministers may refer theapplication to the BCUC forreview and a decision. This mayinclude holding a public hearingand may result in the issuance,directly by the Commission, of aCertificate of Public Convenienceand Necessity.
Alberta
Alberta's Environmental ImpactAssessment (E!A) process wasestablished by the Land SurfaceConservation and ReclamationAct of 1973. Pursuant to Section8 of the Act, the Minister of theEnvironment may require theproponent of a proposeddevelopment to prepare an EIAreport if he or she believes it is inthe public interest to do so. Thepurpose of an EIA is to provideinformation to the public and thegovernment to enable earlyidentification and resolution ofsignificant adverse effects on theenvironment.
The Alberta EIA process isimplemented in accordance withthe Alberta EIA Guidelines andadministered by the AlbertaDepartment of Environment.Most major resourcedevelopments proposed inAlberta are subject to thisrequirement. Major thermal andhydro generation projects requirean EIA, and proponents ofsmaller projects must submit theenvironmental information
necessary for the requiredapprovals. In preparing an EIA,the proponent must consult withthe public and provideopportunities for the public toparticipate in the preparation andreview of the EIA.
Energy projects require theapproval of the Alberta EnergyResources Conservation Board(ERCB) and AlbertaEnvironment. Consequently,Alberta Environment and theERCB coordinate theirrespective informationrequirements and reviews ofenergy projects. EIAs on energyprojects are filed with AlbertaEnvironment and the ERCB aspart of the application to theERCB. The ERCB may require apublic hearing to be held for aproject. After the ERCB makesits decision, Alberta Environmentissues detailed environmentalpermits and licences.
New environmental assessmentlegislation resulting fromextensive public consultation in1990-91 was introduced in theAlberta legislature in the Springof 1991.
Saskatchewan
The Environment AssessmentAct of 1980 requiresenvironmental impactassessments to be completed formajor development projects.Exemptions may be granted byCabinet only in cases ofemergency.
The province's environmentalimpact assessment and reviewprocess is administered by theSaskatchewan Department of
Environment and Public Safely,and projects may proceed onlywith the approval of the Minister.Proposals are screened by thedepartment to determine whetherthe Act applies to a project and,if so, the nature and scope of theEIA. If it is determined that anEIA is not required, the projectmay proceed subject to all otherstatutory requirements.
Where an EIA is required,proponents are encouraged toundertake a public participationprogram as early as possible sothat public comments andrecommendations may beconsidered during thepreparation of the EnvironmentalImpact Statement (EIS). Furthersafeguards are built into theprocess, such as a minimum30-day public review of the EISand the power given to theMinister to require a publicinformation meeting to beconducted and/or appoint aboard of inquiry. The finaldecision to approve (with orwithout conditions) or to refusethe proposed development restswith the Minister.
Manitoba
The Manitoba Environment Actof 1988 replaces the former CleanEnvironment Act of 1968 and theEnvironmental Assessment andReview Process, adopted asprovincial Cabinet policy in 1975.
The Act ensures that any personor organization undertaking adevelopment specified in theregulations is required to file aProposal with the Department ofEnvironment at an early stage inthe planning schedule. Other

26
developments o( environmentalconsequence are governed byregulations setting standards lorenvironmental protection.
Developments are classifiedaccording to their potentialenvironmental impact. Class 1developments arc any activitiesdischarging pollutants. Class 2developments are any activitieswith significant environmentalimpact caused by factors inaddition to pollution, such astransportation and transmissionfacilities. Class 3 developmentsinvolve large-scale projects suchas major hydroelectricdevelopments.
Every submission for adevelopment must be filed at apublic registry. Once a proposalis filed, the Department ofEnvironment is required to invitepublicly written comments on theproposal. For more complexproposals, study guidelines aredeveloped to assist proponents inpreparing environmentalassessments. Both the guidelinesand the completed assessmentarc made available to the publicfor review.
Public meetings hosted by theproponent or public hearings bythe Manitoba Clean EnvironmentCommission, or both, may be heldas part of the asscssmenl andreview process. TheCommission's role is to provideadvice and recommendations tothe Minister and to develop andmaintain public participation inenvironmental matters.
The final product of the processis an environmental licence withterms and conditions specific lo
the proposal. Alternatively, alicence to proceed could berefused on the grounds ofunacceptable environmentaldamage.
Ontario
The Minister of the Environmentis responsible for theadministration of theEnvironmental Assessment Act,which promotes improvedplanning by involving governmentministries and agencies and thepublic in the environmentalassessment, planning andapproval process. (Theenvironmental process in Ontariois also subject to the terms of theConsolidated Hearings Act, 1981.Details of the ConsolidatedHearings Act may be obtainedfrom Environmental Assessmentin Canada , or from the October1987 issue of CanadianEn vironmenlal L aw Reports. )The environmental assessmentpro i in Ontario is currentlybeii.,_ i«;viewed by thegovernment. Amendments to theEnvironmental Assessment Actare expected to be proposed inthe very near future.
The Environment Minister may,with the approval of Cabinet,exempt proponents from theapplication of the EnvironmentalAssessment Act, which currentlyapplies to the activities ofprovincial ministries,municipalities and conservation
3 William J. Couch, Ph.D., op. cil.
Canadian Environmental LawReports, New Scries, Vol. 1,Part 6, October 1987.
authorities. Only those projectsof the private sector designatedby regulation are subject to theAct. Proponents planning aproject must determine if the Actapplies; where it does not apply,or where an exemption has beengranted, the activity may proceed.If the Act applies, the proponentmust prepare an EnvironmentalAssessment (EA), which isreviewed by the Ministry ofEnvironment and other interestedprovincial and federalgovernment organizations.
The Ministry subsequentlyprepares a Government Reviewwhich, together with the EA, isreleased for a minimum 30-daypublic review. A hearing of theEnvironmental Assessment Boardmay then be requested by thereviewers, the public or theproponent. The Minister - withthe concurrence of Cabinet — willmake a decision whether toaccept the EA, and whether toapprove the undertaking, with orwithout conditions. The Ministermay refer the decision to acceptthe EA, or the decision toapprove the undertaking, or both,lo a Board hearing. When theMinister decides to refer thematter lo a Board hearing, theBoard must give reasonablenotice of the hearing, which isopen to the public. The Ministeror Cabinet has 28 days to makeany amendments to the Board'sdecision; if no amendments aremade within this period, theBoard's decision becomesbinding.

27
Quebec
In Quebec, the process ofenvironmental assessment variesdepending on whether a project isin the south of the province or ina territory that is the subject ofagreements with native people.
The 1972 Environment QualityAct was amended significantly in1978 to include an environmentalimpact assessment and reviewprocedure. By regulation, thisprocedure applies essentially toprojects in the south of theprovince. When a project issubject to the procedure, theproponent must submit an EIA tothe Department of the Environ-ment for an admissibility analysisand an evaluation of theenvironmental acceptability ofthe project. All projects aresubject to a public consultationperiod, during which any citizenmay ask the Minister of theEnvironment to hoid a publichearing. Citizens can thus voicetheir views before the project isreferred to Cabinet foracceptance or refusal.
In the northern Quebecterritories, the provincialgovernment has implemented twoprocedures to assess and reviewthe environmental and socialimpacts of a given project. Thefirst procedure is applicable tothe James Bay region (betweenthe 49th and 55lh parallels). Afeature of this procedure is theuse of committees on whichnative people are alwaysrepresented. These committeesadvise the Minister of theEnvironment throughout thevarious stages of the authoriza-tion process. North of the 55th
parallel, the KalivikEnvironmental QualityCommission is in charge ofreviewing the impact assessmentstudy and has decision-makingauthority. These procedures,which were incorporated into theEnvironment Quality Act,stemmed from the James Bay andNorthern Quebec Agreement(1975) and the NortheasternQuebec Agreement (1978).
New Brunswick
New Brunswick's Regulation onEnvironmental ImpactAssessment came into effect inJuly 1987, to provide a legislativeframework for environmentalplanning, including opportunitiesibr public involvement. TheRegulation, which replaced theprovince's 1975 Policy onEnvironmental Assessment, isdesigned to identify theenvironmental impacts associatedwith development proposals,before their implementation.
Under the Regulation,individuals, companies or publicagencies proposing certain typesof projects (for example, allelectric power generatingfacilities with a production ratingof three MW or more, and allelectric power transmission linesexceeding sixty-nine kV incapacity or five km in length) arerequired to register informationabout the project with theMinister of Environment, at anearly stage in the planning cycle.The Minister then screens theproposal to determine whether itis likely to have significantenvironmental impacts, includingsocioeconomic and biophysicaleffects.
If it appears that the project'simpacts arc likely to besignificant, the Minister willinform the proponent that an EIAis required, and staff from theDepartment of Environment willwork with the proponent inpreparing initial draft guidelinesfor the EIA Study. A ReviewCommittee, consisting oftechnical specialists fromgovernment agencies potentiallyaffected by the proposal, isappointed by the Minister toformulate draft guidelines for theStudy. These draft guidelines,which identify the importantenvironmental issues to beaddressed, must then be issued bythe Minister for public comment,and any interested party mayprovide written comments to theMinister.
The principal objective of theEIA Study is to predict theproject's impacts, should itproceed. Information gatheredduring the study is compiled in adraft Environmental ImpactAssessment Report, which is thencarefully examined by the ReviewCommittee. If, on <hc advice ofthe Committee, the Minister issatisfied that the reportadequately addresses all aspectsof the guidelines, a second andmore comprehensive opportunityfor public involvement begins. Asummary of the report, commentsof the Review Committee, andfull copies of the final report arcreleased for public review andcomment.
A public meeting to discuss theEIA takes place. Thereafter, theMinister reviews the study andpublic comments, and thenrecommends to the Lieutenant-

28
Governor in Council whether ornot the project should proceed.
Nova Scotia
The current legal basis forenvironmental impact assessmentin Nova Scotia is the Environ-mental Assessment Act.
The Nova Scotia Department ofthe Environment (NSDOE), inconsultation with othergovernment agencies, isresponsible for screening allprojects submitted and advisingthe Minister on those that mayhave a significant and adverseenvironmental impact. Afterreviewing NSDOE's advice, aswell as any public concu nexpressed, the Ministe Jecideswhether a project requires anEnvironmental Assessment (EA)Report. Where it is decided oneis required, the proponentprepares a draft Report inresponse to guidelines andsubmits it to NSDOE. Thedepartment, other interestedprovincial and federal agencies,and the public review the EAReport. NSDOE thenrecommends to the Ministerwhether the project should beapproved, with or withoutconditions, or refused.
The public is invited loparticipate in the review processby providing comments when aproject is submitted to theNSDOE, when study guidelinesarc issued, and when the EAReport is released. The Minister,taking into considerationNSDOE's recommendations andthe views of the public, decideswhether the project should
proceed and, if so, under whatconditions.
Prince Edward Island
The Environmental ProtectionAct of 1988 provides the overalllegal authority for theenvironmental assessmentprocess. It requires that anyperson who wishes to initiate aproject must file a writtenproposal with the Department ofthe Environment and obtainwritten approval from theMinister to proceed.
With respect to utilities, theprocess is set out in the ElectricPower and Telephone Act, whichauthorizes the Public UtilitiesCommission to issueproject-specific guidelines to theproponent for the preparation ofan EIS, if it believes that theproject may adversely affect theenvironment. A copy of the EISis then sent by the Commission lothe Executive Council for itsconsideration. The Council maymake a decision on the evidenceavailable, or it may determinethat the public interest requirespublic hearings to be held in thelocality affected by the project.After the public hearings, theCommission examines theevidence and issues its findings tothe Executive Council.
Newfoundland
The province's environmentalassessment process operatesunder the authority of theEnvironmental Assessment Act of1980, which is administered bythe Department of Environmentand Lands.
Any project that may have asignificant adverse environmentalimpact must be registered withthe Minister of Environment andLands. After public andinterdepartmental reviews ol theregistration document, theMinister, on the advice of thedepartment, decides whether ornot an EIS is required. If an EISis not required, the project mayproceed subject to other relevantacts or regulations.
Where the Minister, on theadvice of the Department,decides that an EIS may berequired, an EnvironmentalPreview Report (EPR) can beordered. The EPR is preparedby the proponent and is availablefor pi'blic review and comment.Upon examination of the EPR,the Minister decides whether anEIS is required. If one is notrequired, the project mayproceed subject to other relevantacts or regulations.
Where an EIS is required, it isprepared by the proponent; theMinister then makes it availablefor public review and comment.Should strong public interest beexpressed, the Minister mayrecommend to Cabinet that anEnvironmental Assessment Boardbe appointed to conduct publichearings. The Minister makes theBoard's report public, deliverscopies to Cabinet, andsubsequently recommends toCabinet whether the projectshould be permitted to proceed,with or without conditions, orwhether permission should berefused.
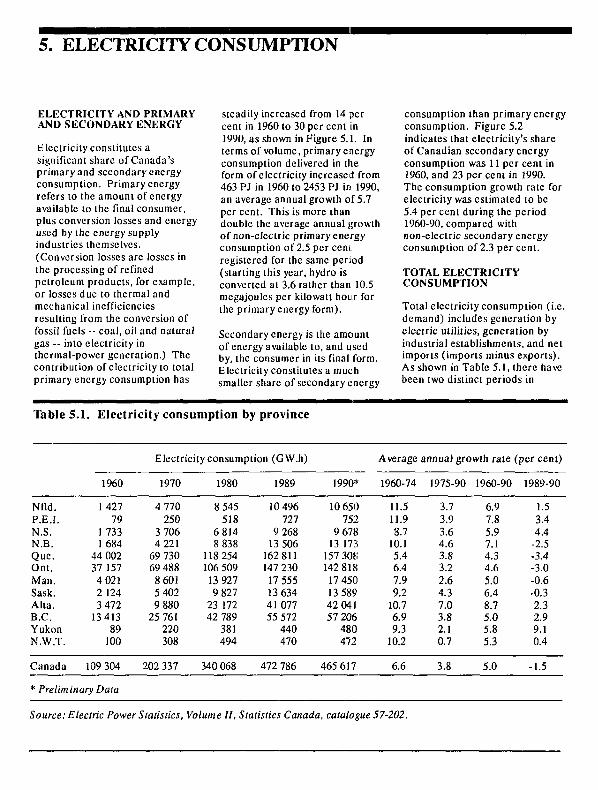
5. ELECTRICITY CONSUMPTION
ELECTRICITY AND PRIMARYAND SECONDARY ENERGY
Electricity constitutes asignificant share of Canada'sprimary and secondary energyconsumption. Primary energyrefers to the amount of energyavailable to the final consumer,plus conversion losses and energyused by ihc energy supplyindustries themselves.(Conversion losses are losses inthe processing of refinedpetroleum products, for example,or losses due to thermal andmechanical inefficienciesresulting from the conversion offossil fuels -- coal, oil and naturalgas -- into electricity inthermal-power generation.) Thecontribution of electricity to totalprimary energy consumption has
steadily increased from 14 percent in 1960 to 30 per cent in1990, as shown in Figure 5.1. Interms of volume, primary energyconsumption delivered in theform of electricity increaseJ from463 PJ in 1960 to 2453 PJ in 1990,an average annual growth of 5.7per cent. This is more thandouble the average annual growthof non-electric primary energyconsumption of 2.5 per centregistered for the same period(starting this year, hydro isconverted at 3.6 rather than 10.5megajoules per kilowatt hour forthe primary energy form).
Secondary energy is the amountof energy available to, and usedby, the consumer in its final form.Electricity constitutes a muchsmaller share of secondary energy
consumption than primary energyconsumption. Figure 5.2indicates that electricity's shareof Canadian secondary energyconsumption was 11 per cent in1960, and 23 per cent in 1990.The consumption growth rate forelectricity was estimated to be5.4 per cent during the period1960-90, compared withnon-electric secondary energyconsumption of 2.3 per cent.
TOTAL ELECTRICITYCONSUMPTION
Total electricity consumption (i.e.demand) includes generation byelectric utilities, generation byindustrial establishments, and netimports (imports minus exports).As shown in Table 5.1, there havebeen two distinct periods in
Table 5.
Nfld.P.E.I.N.S.N.B.Que.Ont.Man.Sask.Alia.B.C.YukonN.W.T.
Canada
1. Electricity consumption
I960
142779
1 7331 684
44 00237 1574 0212 1243 472
1341389
100
109 304
* Preliminary Data
by province
Electricity consumption (GW.li)
1970
4 770250
3 7064 221
69 73069 4888 6015 4029 880
25 761220308
202 337
1980
8 545518
6 8148 838
118 254106 50913 9279 827
23 17242 789
381494
340 068
1989
10 496727
9 26813 506
162 811147 23017 55513 6344! 07755 572
440470
472 786
1990*
10 650752
9 67813 173
157 30K142 81817 45013 58942 04157 206
480472
465 617
Average annual growth rate
1960-74
11.511.98.7
10.15.46.47.99.2
10.76.99.3
10.2
6.6
1975-90
3.73.93.64.63.83.22.64.37.03.82.10.7
3.8
1960-90
6.97.85.97.14.34.65.06.48.75.05.85.3
5.0
(per cent)
1989-90
1.53.44.4
-2.5-3.4-3.0-0.6-0.32.32.99.10.4
-1.5
Source: Electric Power Statistics, Volume II, Statistics Canada, catalogue 57-202.
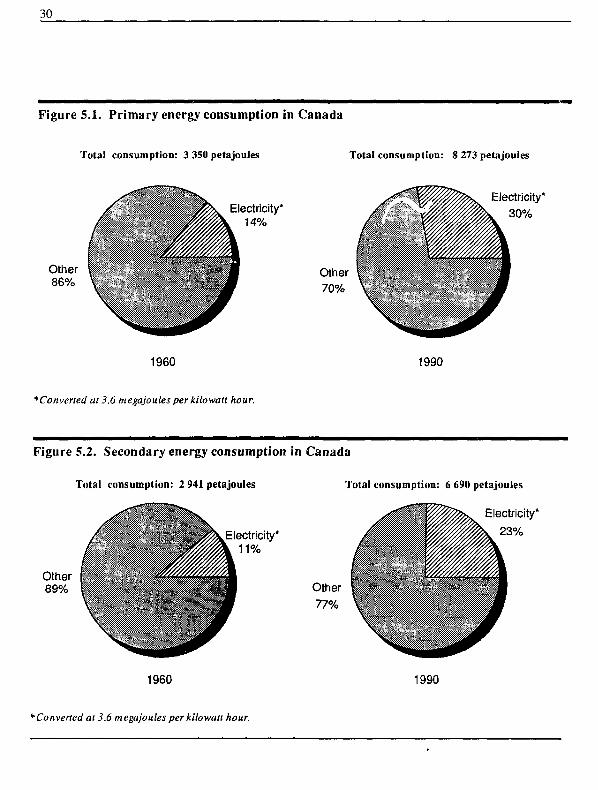
30
Figure 5.1. Primary energy consumption in Canada
Total consumption: 3 350 petajoules
Other86%
Electricity*14%
1960
* Converted at 3.6 megajoules per kilowatt hour.
Total consumption: 8 273 petajoules
Electricity*
30%
1990
Figure 5.2. Secondary energy consumption in Canada
Total consumption: 2 941 petajoules Total consumption: 6 690 petajoules
Other89%
Electricity*11%
Electricity*
23%
1960 1990
*Converted at 3.6 megajoules per kilowatt hour.
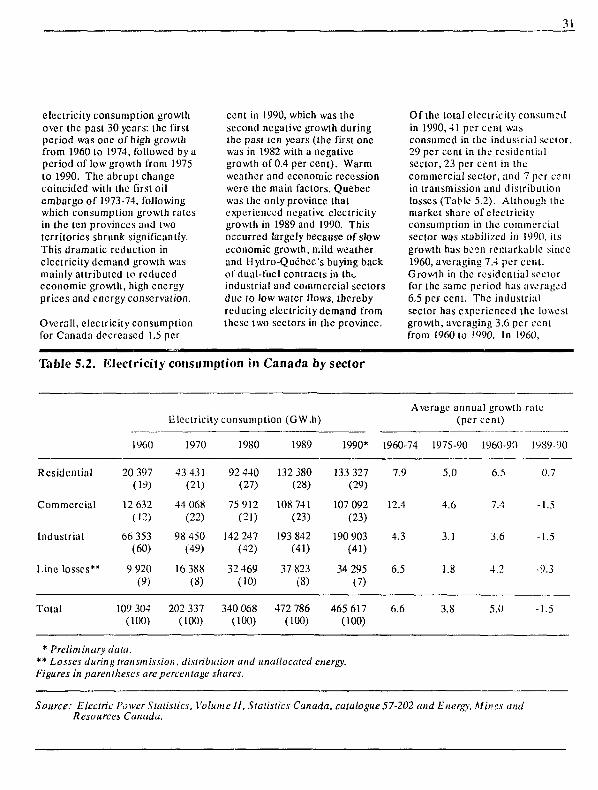
31
electricity consumption growthover the past 30 years: the firstperiod was one of high growthfrom 1960 to 1974, followed by aperiod of low growth from 1975to 1990. The abrupt changecoincided with the first oilembargo ol 1973-74, followingwhich consumption growth ralesin the ten provinces and twoterritories shrunk significantly.This dramatic reduction inelectricity demand growth wasmainly attributed to reducedeconomic growth, high energyprices and energy conservation.
Overall, electricity consumptionfor Canada decreased 1.5 per
cent in 1990, which was thesecond negative growth duringthe past ten years (the first onewas in 1982 with a negativegrowth of 0.4 per cent). Warmweather and economic recessionwere the main factors. Quebecwas the only province thatexperienced negative electricitygrowth in 1989 and 1990. Thisoccurred largely because of sloweconomic growth, mild weatherand Hydro-Quebec's buying backof dual-fuel contracts in tlKindustrial and commercial sectorsdue to low water flows, therebyreducing electricity demand fromthese two sectors in the province.
Of the total electricity consumedin 1990,41 per cent wasconsumed in the industrial sector,29 per cent in the residentialsector, 23 per cent in thecommercial sector, and 7 per centin transmission and distributionlosses (Table 5.2). Although themarket share of electricityconsumption in the commercialsector was stabilized in 1990, itsgrowth has been remarkable since1960, averaging 7.4 per cent.Growth in the residential sectorfor the same period has averaged6.5 per cent. The industrialsector has experienced the lowestgrowth, averaging 3.6 per centfrom I960 to .'"90. In 1960,
Table 5.2. Electricity consumption in Canada by sector
Residential
Commercial
Industrial
Line losses**
1960
20 397(19)
12 632(12)
66 353(60)
9 920
Electricity
1970
43 431(21)
44 068(22)
98 450(49)
16 388(»)
consumption (GW.li)
1980
92 440(27)
75 912(21)
142 247(42)
32 469(10)
1989
132 380(28)
108 741(23)
193 842(41)
37 823(8)
1990*
133 327(29)
107 092(23)
190 903(41)
34 295(7)
Average annual growth(per cent)
1960-74
7.9
12.4
4.3
6.5
1975-90
5.0
4.6
3.1
1.8
1960-90
6.5
7.4
3.6
4.2
rate
1989-90
0.7
-1.5
-1.5
-9.3
Total 109 304(100)
202 337(100)
340 068(100)
472 786(100)
465 617(100)
6.6 3.8 5.0 -1.5
* Preliminary data.** Losses during transmission, distribution and unallocated energy.Figures in parentheses are percentage shares.
Source: Eleciric Power Statistics, Volume 11, Statistics Canada, catalogue 57-202 and Energy, Mines andResources Canada.
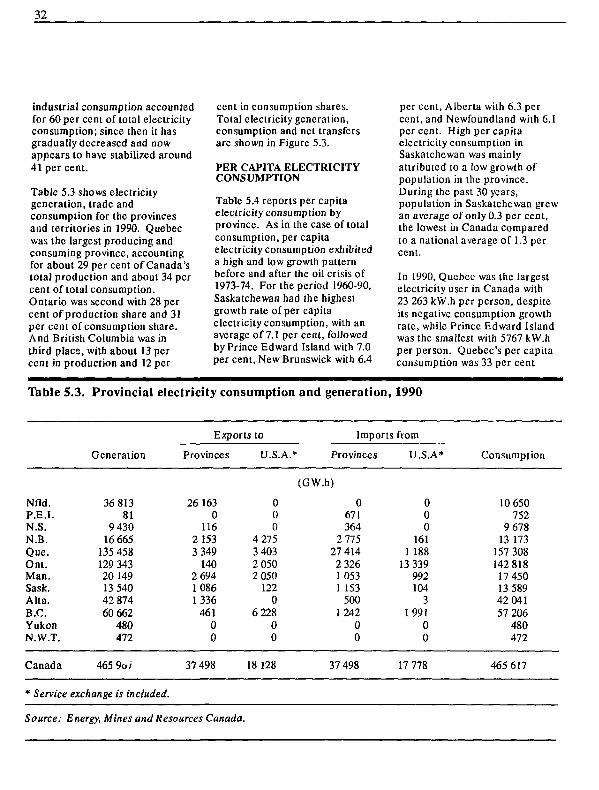
32
industrial consumption accountedfor 60 per cent of total electricityconsumption; since then it hasgradually decreased and nowappears to have stabilized around41 per cent.
Table 5.3 shows electricitygeneration, trade andconsumption for the provincesand territories in 1990. Quebecwas the largest producing andconsuming province, accountingfor about 29 per cent of Canada'stotal production and about 34 percent of total consumption.Ontario was second with 28 percent of production share and 31per cent of consumption share.And British Columbia was inthird place, with about 13 percent in production and 12 per
cent in consumption shares.Total electricity generation,consumption and net transfersare shown in Figure 5.3.
PER CAPITA ELECTRICITYCONSUMPTION
Table 5.4 reports per capitaelectricity consumption byprovince. As in the case of totalconsumption, per capitaelectricity consumption exhibiteda high and low growth patternbefore and after the oil crisis of1973-74. For the period 1960-90,Saskatchewan had the highestgrowth rate of per capitaelectricity consumption, with anaverage of 7.1 per cent, followedby Prince Edward Island with 7.0per cent, New Brunswick with 6.4
per cent, Alberta with 6.3 percent, and Newfoundland with 6.1percent. High per capitaelectricity consumption inSaskatchewan was mainlyattributed to a low growth ofpopulation in the province.During the past 30 years,population in Saskatchewan grewan average of only 0.3 per cent,the lowest in Canada comparedto a national average of 1.3 percent.
In 1990, Quebec was the largestelectricity user in Canada with23 263 kW.h per person, despiteits negative consumption growthrale, while Prince Edward Islandwas the smallest with 5767 kW.hper person. Quebec's per capitaconsumption was 33 per cent
Table
Nfld.P.E.I.N.S.N.B.Que.Ont.Man.Sask.Alta.B.C.YukonN.W.T.
Canada
5.3. Provincial
Generation
36 81381
9 43016 665
135 458129 34320 14913 54042 87460 662
480472
465 9o/
electricity consumption
Exports to
Provinces
261630
1162 1533 349
1402 69410861336
46100
37 498
* Service exchange is included.
Source: Energy, Mines and Resources Canada
U.S.A.*
000
4 2753 4032 0502 050
1220
6 22800
18 128
i.
and generation,
Imports
Provinces
(GW.h)
0671364
2 77527 4142 3261 0531 153
5001242
00
37 498
1990
from
U.S.A*
000
1611 188
13 339992104
31991
00
17 778
Consumption
10 650752
9 67813 173
157 308142 81817 45013 58942 04157 206
480472
465 617
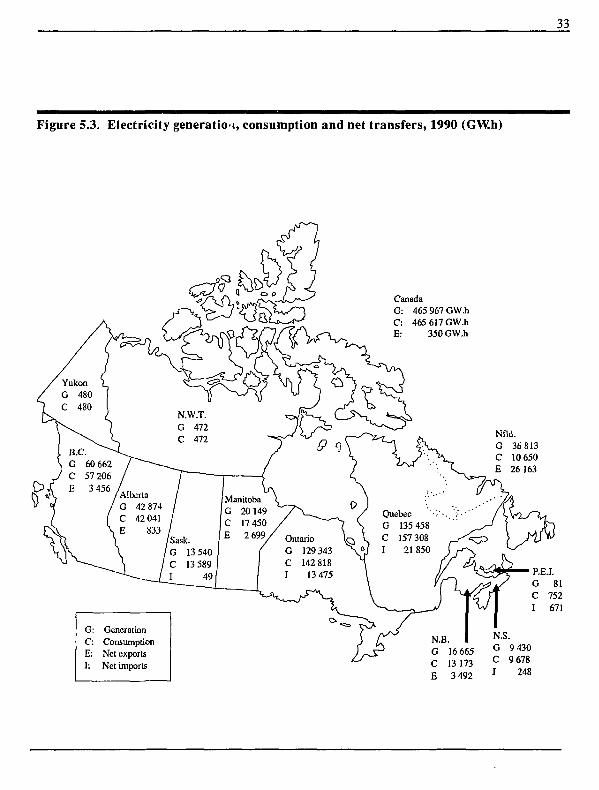
33
Figure 5.3. Electricity generation, consumption and net transfers, 1990 (GW.h)
CanadaG: 465 967 GW.hC: 465 617 GW.hE: 350 GW.h
QuebecG 135 458C 157 308I 21850
G: GenerationC: ConsumptionE: Net exportsI: Net imports
Nfld.G 36 813C 10 650E 26 163
/
H
JN.BGCE
I16 66513 1733 492
ST
ft\
<£— P.E.I.7 GCI
1N.S.GCI
9 4309 678248
81752671
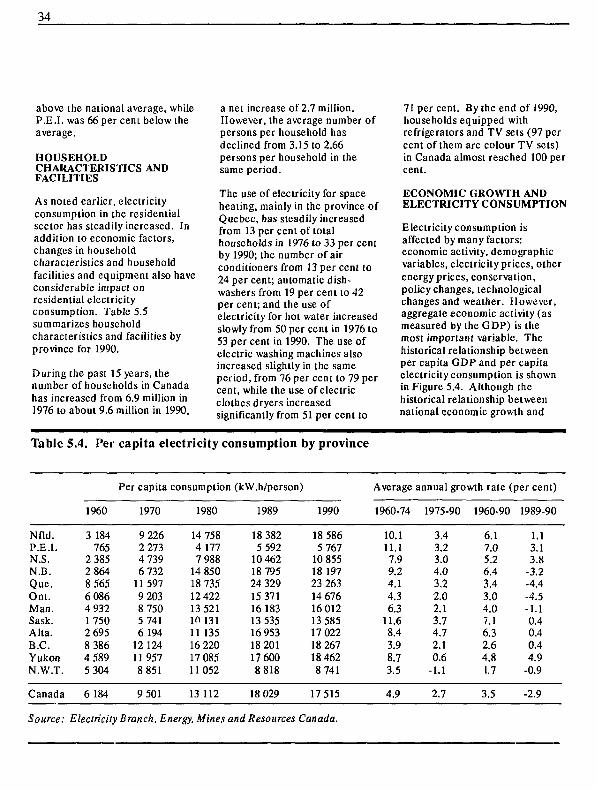
34
above the national average, whileP.E.I, was 66per cent below theaverage.
HOUSEHOLDCHARACTERISTICS ANDFACILITIES
As noted earlier, electricityconsumption in the residentialsector has steadily increased. Inaddition to economic factors,changes in householdcharacteristics and householdfacilities and equipment also haveconsiderable impact onresidential electricityconsumption. Table 5.5summarizes householdcharacteristics and facilities byprovince for 1990.
During the past 15 years, thenumber of households in Canadahas increased from 6.9 million in1976 to about 9.6 million in 1990,
a net increase of 2.7 million.However, the average number ofpersons per household hasdeclined from 3.15 to 2.66persons per household in thesame period.
The use of electricity for spaceheating, mainly in the province ofQuebec, has steadily increasedfrom 13 per cent of totalhouseholds in 1976 to 33 per centby 1990; the number of airconditioners from 13 per cent to24 per cent; automatic dish-washers from 19 per cent to 42per cent; and the use ofelectricity for hot water increasedslowly from 50 per cent in 1976 to53 per cent in 1990. The use ofelectric washing machines alsoincreased slightly in the sameperiod, from 76 per cent to 79 percent, while the use of electricclothes dryers increasedsignificantly from 51 per cent to
71 per cent. By the end of 1990,households equipped withrefrigerators and TV sets (97 percent of them are colour TV sets)in Canada almost reached 100 percent.
ECONOMIC GROWTH ANDELECTRICITY CONSUMPTION
Electricity consumption isaffected by many factors:economic activity, demographicvariables, electricity prices, otherenergy prices, conservation,policy changes, technologicalchanges and weather. However,aggregate economic activity (asmeasured by the GDP) is themost important variable. Thehistorical relationship betweenper capita GDP and per capitaelectricity consumption is shownin Figure 5.4. Although thehistorical relationship betweennational economic growth and
Table 5.4. Per capita electricity consumption by province
Per capita consumption (kW.h/person) Average annual growth rate (per cent)
Nfld.P.E.I.N.S.N.B.Quc.Ont.Man.Sask.Alta.B.C.YukonN.W.T.
1960
3 184765
2 3852 8648 5656 0864 93217502 6958 3864 5895 304
1970
9 2262 2734 7396 732115979 2038 7505 7416 19412 124119578 851
1980
14 7584 1777 98814 85018 73512 42213 521I" 13111 1351622017 08511052
1989
18 3825 59210 46218 79524 32915 37116 18313 53516 95318 20117 6008 818
1990
18 5865 76710 85518 19723 26314 67616 01213 58517 02218 26718 4628 741
1960-74
10.111.17.99.24.14.36.311.68.43.98.73.5
1975-90
3.43.23.04.03.22.02.13.74.72.10.6-1.1
1960-90
6.17.05.26.43.43.04.07.16.32.64.81.7
1989-90
1.13.13.8-3.2-4.4-4.5-1.10.40.40.44.9-0.9
Canada 6184 9 501 13 112 18 029 17 515 4.9 2.7 3.5 -2.9
Source: Electricity Branch, Energy, Mines and Resources Canada.
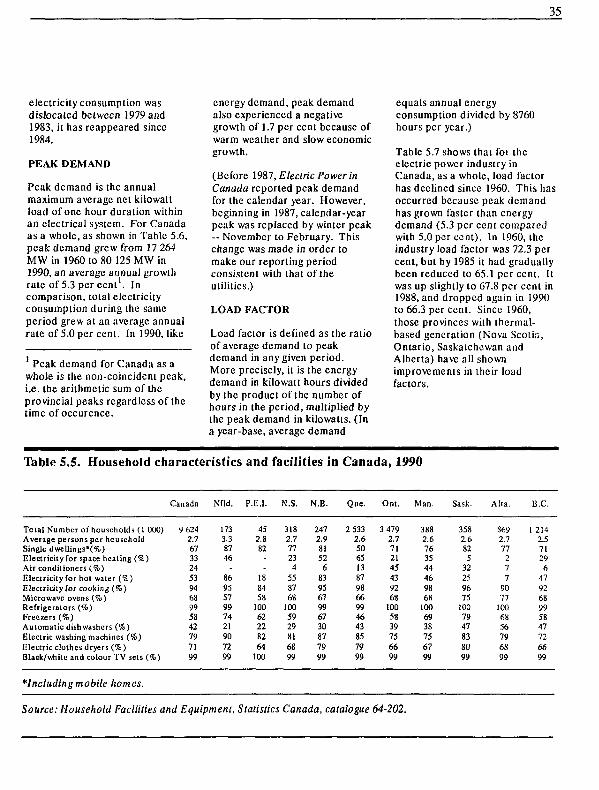
35
electricity consumption wasdislocated between 1979 and1983, it has reappeared since1984.
PEAK DEMAND
Peak demand is the annualmaximum average net kilowattload of one hour duration withinan electrical system. For Canadaas a whole, as shown in Table 5.6,peak demand grew from 17 264MW in 1960 to 80 125 MW in1990, an average annual growthrate of 5.3 per cent . Incomparison, total electricityconsumption during the sameperiod grew at an average annualrate of 5.0 per cent. In 1990, like
Peak demand for Canada as awhole is the non-coincident peak,i.e. the arithmetic sum of theprovincial peaks regardless of thetime of occurence.
energy demand, peak demandalso experienced a negativegrowth of 1.7 per cent because ofwarm weather and slow economicgrowth.
(Before 1987, Electric Power inCanada reported peak demandfor the calendar year. However,beginning in 1987, calendar-yearpeak was replaced by winter peak— November to February. Thischange was made in order tomake our reporting periodconsistent with that of theutilities.)
LOAD FACTOR
Load factor is defined as the ratioof average demand to peakdemand in any given period.More precisely, it is the energydemand in kilowatt hours dividedby the product of the number ofhours in the period, multiplied bythe peak demand in kilowatts. (Ina year-base, average demand
equals annual energyconsumption divided by 8760hours per year.)
Table 5.7 shows that for theelectric power industry inCanada, as a whole, load factorhas declined since 1960. This hasoccurred because peak demandhas grown faster than energydemand (5.3 per cent comparedwith 5.0 per cent). In 1960, theindustry load factor was 72.3 percent, but by 1985 it had graduallybeen reduced to 65.1 per cent. Itwas up slightly to 67.8 per cent in1988, and dropped again in 1990to 66.3 per cent. Since 1960,those provinces with thermal-based generation (Nova Scotia,Ontario, Saskatchewan andAlberta) have all shownimprovements in their loadfactors.
Table 5.5. Household characteristics
Ci
Toial Number of households (1 000)Average persons per householdSingle dwcllings*(%)Electricity for space healing (%)Air conditioners (%)Electricity for hot water (%)Electricity for cooking (%)Microwave ovens {%)Refrigerators {%)Freezers (%)Automatic dishwashers (%)Electric washing machines (%)Electric clothes dryers (%)Black/while and colour TV sets (%)
*lncluding mobile homes.
Source: Household Facilities and
inada
9 6242.7673324539468995842797199
N'fld.
1733.38746
869557997421907299
and
P.E.I.
452.882
IS8458
10062228264
100
facilities in
N.S.
3182.777234
558768
1005929816899
N.B.
2472.981526
839567996730877999
Canada,1990
Que.
2 5332.6506513879866994643857999
Ont.
3 4792.7712145439268
1005839756699
Equipment, Statistics Canada, catalogue 64-202.
Man.
3882.6763544469868
1006938756799
Sask.
3582.6825
32259675
1007947838099
Alta.
8692.777277
9077
1006856796899
B.C.
1 2142,571296
479268995847726699
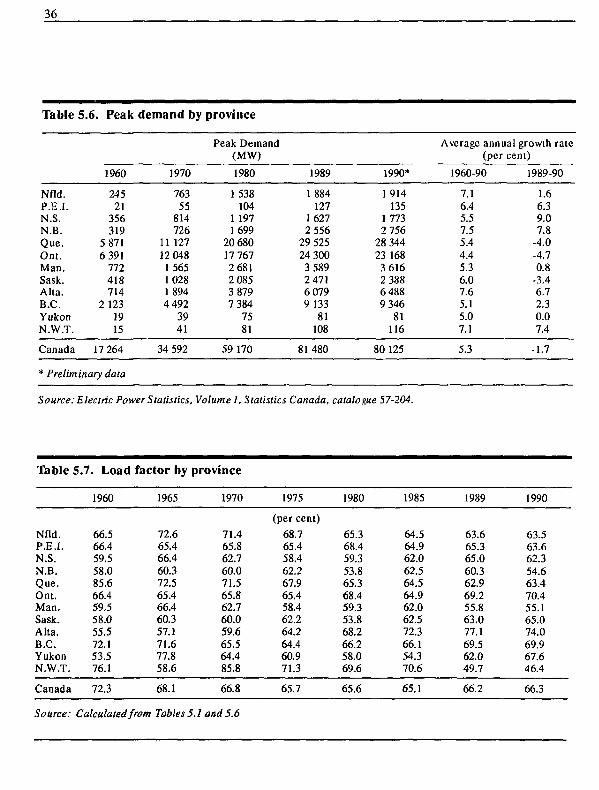
36
Table 5
Nfld.P.H.I.N.S.N.B.Que.Ont.Man.Sask.Alta.B.C.YukonN.W.T.
Canada
.6. Peak
I960
24521
356319
5 8716 391
772418714
2 1231915
17 264
* Preliminary data
demand by
1970
76355
814726
11 12712 0481565102818944 492
3941
34 592
province
Peak Demand(MW)
1980
1538104
1 1971699
20 68017 7672 6812 0853 8797 384
7581
59 170
1989
1884127
1 6272 556
29 52524 3003 5892 4716 0799 133
81108
81 480
1990*
1914135
1 7732 756
28 34423 1683 6162 3886 4889 346
81116
80 125
Average annual growth rate(per cent)
1960-90 1989-90
7.16.45.57.55.44.45.36.07.65.15.07.1
5.3
1.66.39.07.8
-4.0-4.70.8
-3.46.72.30.07.4
-1.7
Source: Electric Power Statistics. Volume I, Stalistics Canada, catalogue 57-204.
Table 5.7
Nfld.P.E.I.N.S.N.B.Que.Ont.Man.Sask.Alta.B.C.YukonN.W.T.
Canada
. Load
1960
66.566.459.558.085.666.459.558.055.572.153.576.1
72.3
factor by
1965
72.665.466.460.372.565.466.460.357.171.677.858.6
68.1
province
1970
71.465.862.760.071.565.862.760.059.665.564.485.8
66.8
Source: Calculated from Tables 5.1 and 5.6
1975
(per cent)68.765.458.462.267.965.458.462.264.264.460.971.3
65.7
1980
65.368.459.353.865.368.459.353.868.266.258.069.6
65.6
1985
64.564.962.062.564.564.962.062.572.366.154.370.6
65.1
1989
63.665.365.060.362.969.255.863.077.169.562.049.7
66.2
1990
63.563.662.354.663.470.455.165.074.069.967.646.4
66.3
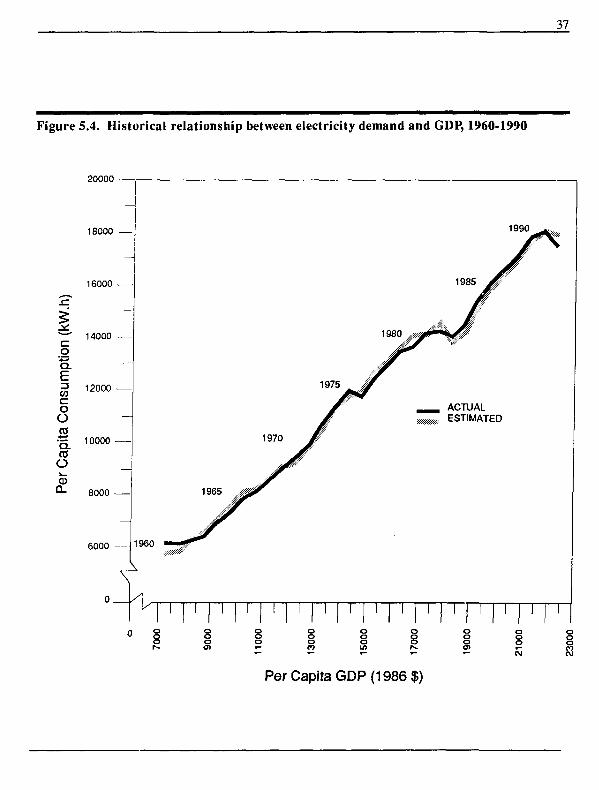
Figure 5.4. Historical relationship between electricity demand and GDP, 1960-1990
37
20000
18000
16000
Ig
*•#—*
Q.
CO
O
OB~_ 10000COO
14000
12000
CD8000
6000 —- 960
1970
1965
1990
1980
1975
ACTUALESTIMATED
I I
g
I I I I I I
s
i i n i
o
Per Capita GDP (1986$)
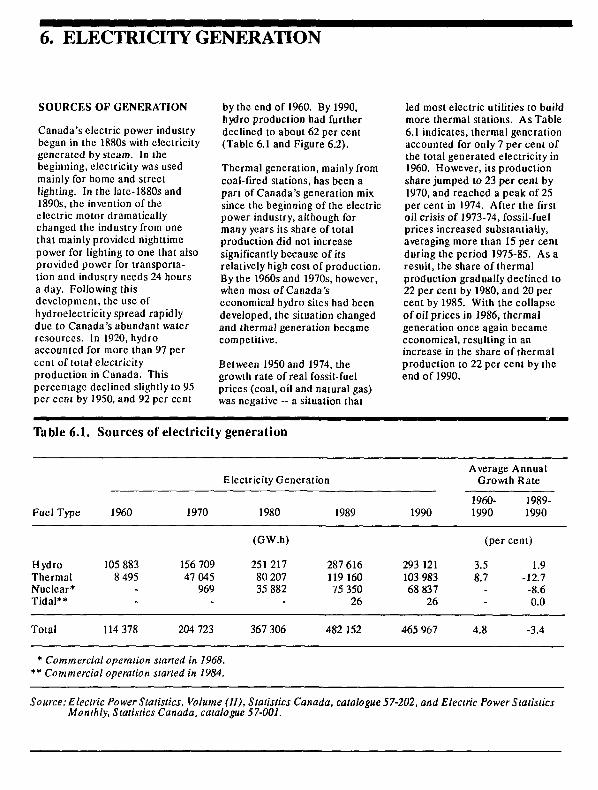
6. ELECTRICITY GENERATION
SOURCES OF GENERATION
Canada's electric power industrybegan in the 1880s with electricitygenerated by steam. In thebeginning, electricity was usedmainly for home and streetlighting. In the late-1880sand1890s, the invention of theelectric motor dramaticallychanged the industry from onethat mainly provided nighttimepower for lighting lo one that alsoprovided power for transporta-tion and industry needs 24 hoursa day. Following thisdevelopment, the use ofhydroelectricky spread rapidlydue to Canada's abundant waterresources. In 1920, hydroaccounted for more than 97 percent of total electricityproduction in Canada. Thispercentage declined slightly to 95per cent by 1950, and 92 per cent
by the end of 1960. By 1990,hydro production had furtherdeclined to about 62 per cent(Table 6.1 and Figure 6.2).
Thermal generation, mainly fromcoal-fired stations, has been apart of Canada's generation mixsince the beginning of the electricpower industry, although formany years its share of totalproduction did not increasesignificantly because of itsrelatively high cost of production.By the 1960s and 1970s, however,when mosi of Canada'seconomical hydro sites had beendeveloped, the situation changedand thermal generation becamecompetitive.
Between 1950 and 1974, thegrowth rate of real fossil-fuelprices (coal, oil and natural gas)was negative -- a situation that
led most electric utilities to buildmore thermal stations. As Table6.1 indicates, thermal generationaccounted for only 7 per cent ofthe total generated electricity in1960. However, its productionshare jumped to 23 per cent by1970, and reached a peak of 25per cent in 1974. After the firstoil crisis of 1973-74, fossil-fuelprices increased substantially,averaging more than 15 per centduring the period 1975-85. Asaresult, the share of thermalproduction gradually declined lo22 per cent by 1980, and 20 percent by 1985. With the collapseof oil prices in 1986, thermalgeneration once again becameeconomical, resulting in anincrease in the share of thermalproduction to 22 per cent by theend of 1990.
Table 6.1.
Fuel Type
HydroThermalNuclear*Tidal**
Total
Sources
I960
105 8838 495
114 378
of electricity
i
1970
156 70947 045
969
204 723
* Commercial operation started in 1968.** Commercial operation started in 1984.
generation
Electricity Generation
1980
(GW.h)
251 21780 20735 882
367 306
1989
287 616119 16075 350
26
482 152
1990
293 121103 98368 837
26
465 967
Average AnnualGrowth Rale
1960-1990
1989-1990
(per cent)
3.5 1.98.7 -12.7
-8.60.0
4.8 -3.4
Source: Electric Power Statistics, Volume (II), Statistics Canada, catalogue 57-202, and Electric Power StatisticsMonthly, Statistics Canada, catalogue 57-001.
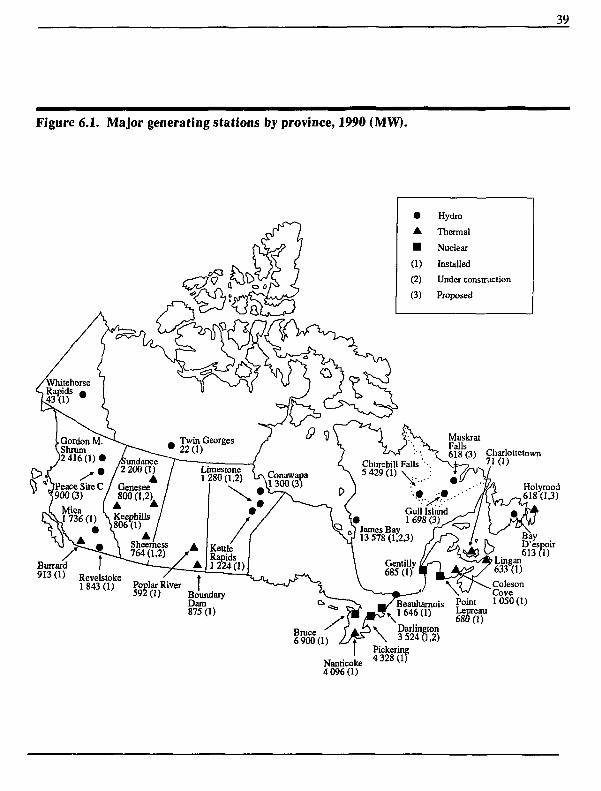
39
Figure 6.1. Major generating stations by province, 1990 (MW).
hitehorse, Rapids m
L Gordon M.\Shrum
2 416(1)1
vPeace Site C^900(3)
MicaJ 736(1)
/Sundance(2 200(1)
Genesee800(1,2)
• ±Keephills
[806 (1)
. Twin Georges1 22(1)
Limestone1280(1,2)
•
A
•(1)(2)
(3)
Hydro
Thermal
Nuclear
Installed
Under construction
Proposed
Burrard913(1) ReveUtoke
1 843 (1)
Sheemess764(1,2)
A
\ Conawap.\l3OO(35
Churchill Falls \5 429 (1) \ :
Muskrat
618 (3) Charlottetown- • 71 (1)
Holyrood,618(1,3)
Gull Island1 698 (3)
KettleRapids1224(1)
>oplar R
mm59 BoundaryDam875 (1)
/ j auiies nay1 13 578 (1.2,3)
Gentilly I685 (1)
Bruce6 900(1)
Nanticoke4096(1)
Beauharnois^1 646 (1)
\Darlington3 524(1,2)
Pickering4 328(1?
PointLepreau680(1)
tLingan633 (1)
ColesonCove1050(1)
BayD'espoir613 0 )
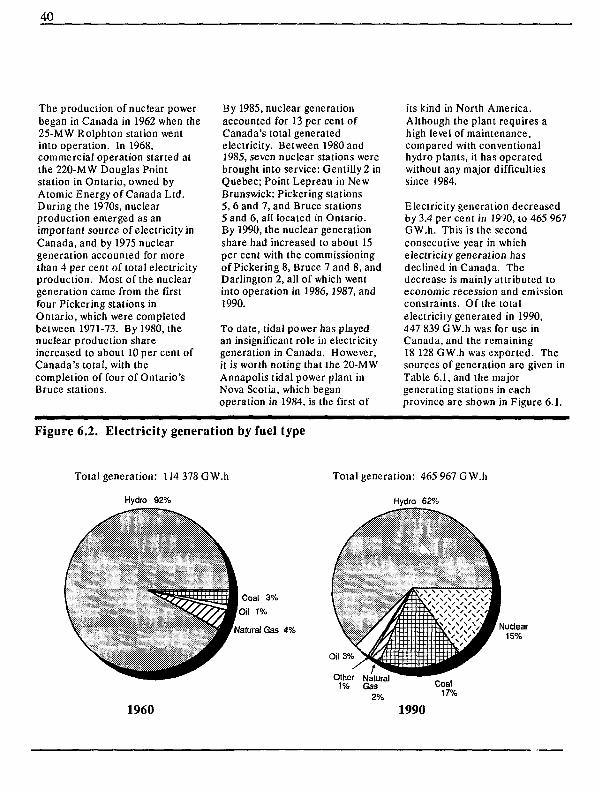
40
The production of nuclear powerbegan in Canada in 1962 when the25-MW Rolphton station wentinto operation. In 1968,commercial operation started atthe 220-MW Douglas Pointstation in Ontario, owned byAtomic Energy of Canada Ltd.During the 1970s, nuclearproduction emerged as animportant source of electricity inCanada, and by 1975 nucleargeneration accounted for morethan 4 per cent of total electricityproduction. Most of the nucleargeneration came from the firstfour Pickering stations inOntario, which were completedbetween 1971-73. By 1980, thenuclear production shareincreased to about 10 per cent ofCanada's total, with thecompletion of four of Ontario'sBruce stations.
By 1985, nuclear generationaccounted for 13 per cent ofCanada's total generatedelectricity. Between 1980 and1985, seven nuclear stations werebrought into service: Gentilly 2 inQuebec; Point Lepreau in NewBrunswick; Pickering stations5, 6 and 7, and Bruce stations5 and 6, all located in Ontario.By 1990, the nuclear generationshare had increased to about 15per cent with the commissioningof Pickering 8, Bruce 7 and 8, andDarlington 2, all of which wentinto operation in 1986, 1987, and1990.
To date, tidal power has playedan insignificant role in electricitygeneration in Canada. However,it is worth noting that the 20-MWAnnapolis tidal power plant inNova Scotia, which beganoperation in 1984, is the first of
its kind in North America.Although the plant requires ahigh level of maintenance,compared with conventionalhydro plants, it has operatedwithout any major difficultiessince 1984.
Electricity generation decreasedby 3.4 per cent in 1990, to 465 967GW.h. This is the secondconsecutive year in whichelectricity generation hasdeclined in Canada. Thedecrease is mainly attributed toeconomic recession and emissionconstraints. Of the totalelectricity generated in 1990,447 839 GW.h was for use inCanada, and the remaining18 128 GW.h was exported. Thesources of generation are given inTable 6.1, and the majorgenerating stations in eachprovince are shown in Figure 6.1.
Figure 6.2. Electricity generation by fuel type
Total generation: 114 378 GW.h
Hydro 92%
Total generation: 465 967 GW.h
Hydro 62%
Natural Gas 4%
Other Natural1% Gas
2%
1960 1990
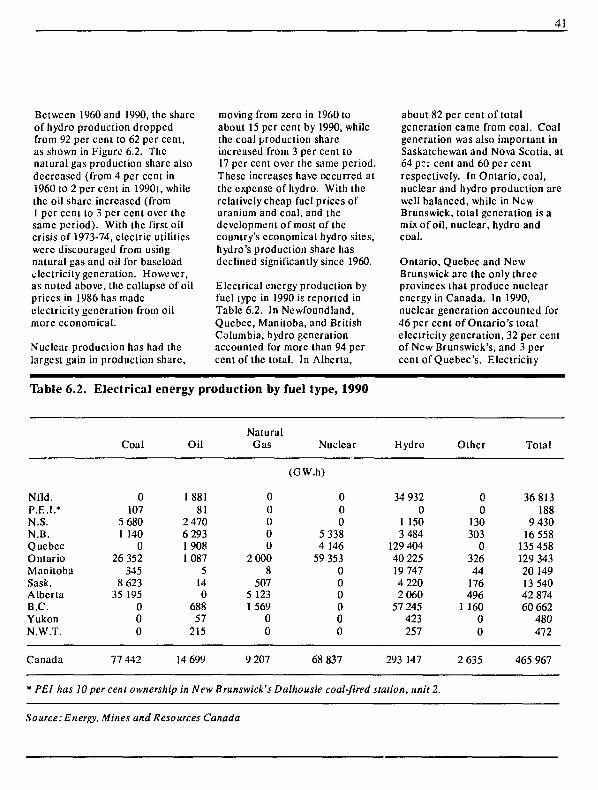
41
Between 1960 and 1990, the shareof hydro production droppedfrom 92 per cent to 62 per cent,as shown in Figure 6.2. Thenatural gas production share alsodecreased (from 4 per cent in1960 to 2 per cent in 1990j, whilethe oil share increased (from1 per cent to 3 per cent over thesame period). With the first oilcrisis of 1973-74, electric utilitieswere discouraged from usingnatural gas and oil for baseloadelectricity generation. However,as noted above, the collapse of oilprices in 1986 has madeelectricity generation from oilmore economical.
Nuclear production has had thelargest gain in production share,
moving from zero in 1960 toabout 15 per cent by 1990, whilethe coal production shareincreased from 3 per cent to17 per cent over the same period.These increases have occurred atthe expense of hydro. With therelatively cheap fuel prices ofuranium and coal, and thedevelopment of most of thecountry's economical hydro sites,hydro's production share hasdeclined significantly since 1960.
E lectrical energy production byfuel type in 1990 is reported inTable 6.2. In Newfoundland,Quebec, Manitoba, and BritishColumbia, hydro generationaccounted for more than 94 percent of the total. In Alberta,
about 82 per cent of totalgeneration came from coal. Coalgeneration was also important inSaskatchewan and Nova Scotia, at64 pc: cent and 60 per centrespectively. In Ontario, coal,nuclear and hydro production arcwell balanced, while in NewBrunswick, total generation is amix of oil, nuclear, hydro andcoal.
Ontario, Quebec and NewBrunswick are the only threeprovinces that produce nuclearenergy in Canada. In 1990,nuclear generation accounted for46 per cent of Ontario's totalelectricity generation, 32 per centof New Brunswick's, and 3 percent of Quebec's. Electricity
Table 6.
Nfld.P.E.I.*N.S.N.B.QuebecOntarioManitobaSask.AlbertaB.C.YukonN.W.T.
Canada
* PEl has
2. Electrical energy production by
Coal
0107
5 6801 140
026 352
3458 623
35 195000
77 442
Oil
188181
2 4706 2931 9081087
5140
68857
215
14 699
NaturalGas
00000
2 0008
5075 1231 569
00
9 207
fuel type, 1990
Nuclear
(GW.h)
000
5 3384 146
59 353000000
68 837
Hydro
34 9320
1 1503 484
129 40440 22519 7474 2202 060
57 245423257
293 147
10 per cent ownership in New Brunswick's Dalhousie coal-fired station, unit 2.
Other
00
130303
032644
176496
1 16000
2 635
Total
36813188
9 43016 558
135 458129 34320 14913 54042 87460 662
480472
465 967
Source: Energy, Mines and Resources Canada
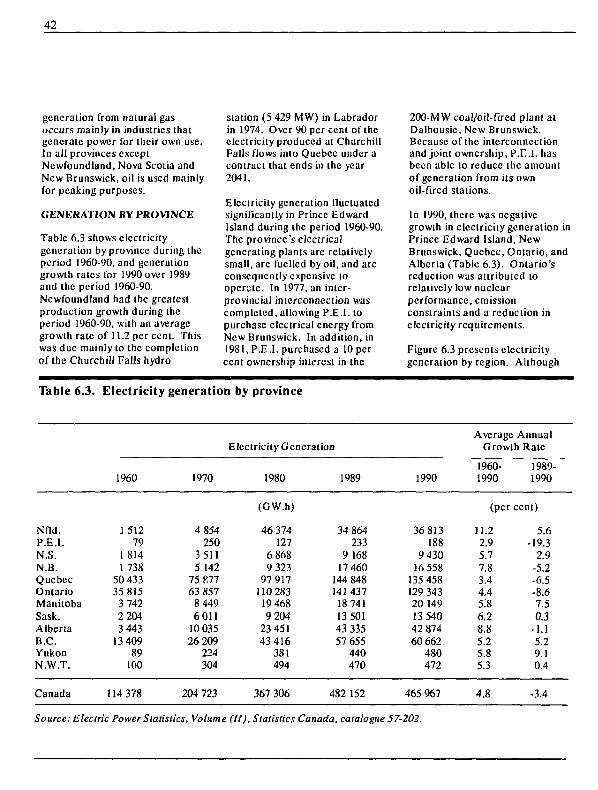
42
generation from natural gasoccurs mainly in industries thatgenerate power for their own use.In all provinces exceptNewfoundland, Nova Scotia andNew Brunswick, oil is used mainlyfor peaking purposes.
GENERATION BY PROVINCE
Table 6.3 shows electricitygeneration by province during theperiod 1960-90, and generationgrowth rates for 1990 over 1989and the period 1960-90.Newfoundland had the greatestproduction growth during theperiod 1960-90, with an averagegrowth rale of 11.2 per cent. Thiswas due mainly to the completionof the Churchill Falls hydro
station (5 429 MW) in Labradorin 1974. Over 90 per cent of theelectricity produced at ChurchillFalls flows into Quebec under acontract that ends in the year2041.
Electricity generation fluctuatedsignificantly in Prince EdwardIsland during the period 1960-90.The province's electricalgenerating plants are relativelysmall, arc fuelled by oil, and areconsequently expensive tooperate. In 1977, an inter-provincial interconnection wascompleted, allowing P.E.I, topurchase electrical energy fromNew Brunswick. In addition, in1981, P.E.I, purchased a 10 percent ownership interest in the
200-MW coal/oil-fired plant atDalhousic, New Brunswick.Because of the interconnectionand joint ownership, P.E.I, hasbeen able to reduce the amountof generation from its ownoil-fired stations.
In 1990, there was negativegrowth in electricity generation inPrince Edward Island, NewBrunswick, Quebec, Ontario, andAlberta (Table 6.3). Ontario'sreduction was attributed torelatively low nuclearperformance, emissionconstraints and a reduction inelectricity requirements.
Figure 6.3 presents electricitygeneration by region. Although
Table 6.3.
Nfld.P.E.I.N.S.N.B.QuebecOntarioManitobaSask.AlbertaB.C.YukonN.W.T.
Canada
Electricity
1960
1 51279
18141 738
50 43335 8153 7422 2043 443
13 40989
100
114 378
generation by province
Electricity Generation
1970
4 854250
35115 142
75 £7763 8578 4496011
10 03526 209
224304
204 723
1980
(CW.h)
46 374127
6 8689 323
97 917110 28319 4689 204
23 45143 416
381494
367 306
1989
34 864233
9 16817 460
144 848141 43718 74113 50143 33557 655
440470
482 152
1990
36 813188
9 43016 558
135 458129 34320 14913 54042 87460 662
480472
465 967
Average AnnualGrowth Rate
1960-1990
(per
11.22.95.77.83.44.45:86.28.85.25.85.3
4.8
1989-1990
cent)
5.6-19.3
2.9-5.2-6.5-8.67.50.3
-1.15.29.10.4
-3.4
Source: Electric Power Statistics, Volume (II), Statistics Canada, catalogue 57-202.
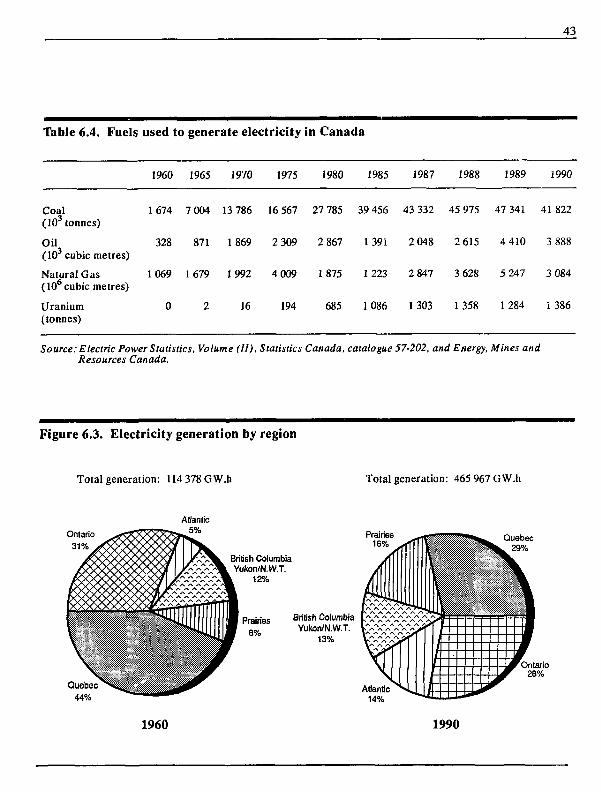
43
Table 6.4. Fuels used to generate electricity in Canada
1960 1965 1970 1975 1980 1985 1987 1988 1989 1990
1674 7 004 13 786 16 567 27 785 39 456 43 332 45 975 47 341 41822
328 871 1869 2 309 2 867 1391 2 048 2 615 4 410 3 888
Coal(103 tonnes)
Oil(10 cubic metres)
Natural Gas 1069 1679 1992 4 009 1875 1223 2 847 3 628 5 247 3 084(106 cubic metres)
Uranium(tonnes)
16 194 685 1086 1 303 1 358 1 284 1 386
Source: Electric Power Statistics, Volume (11), Statistics Canada, catalogue 57-202, and Energy, Mines andResources Canada.
Figure 6.3. Electricity generation by region
Total generation: 114 378GW.h Total generation: 465 967 GW.h
Ontario31% J£
Quebec^44%
Atlantic
KJC^w^yOCy U^ <** ̂ ^ "̂ ̂
. British Columbiak Yukon/N.W.T.m 12%
[ • PrairiesI V 8%
fBritish Columbia
13%
Quebec29%
1960 1990
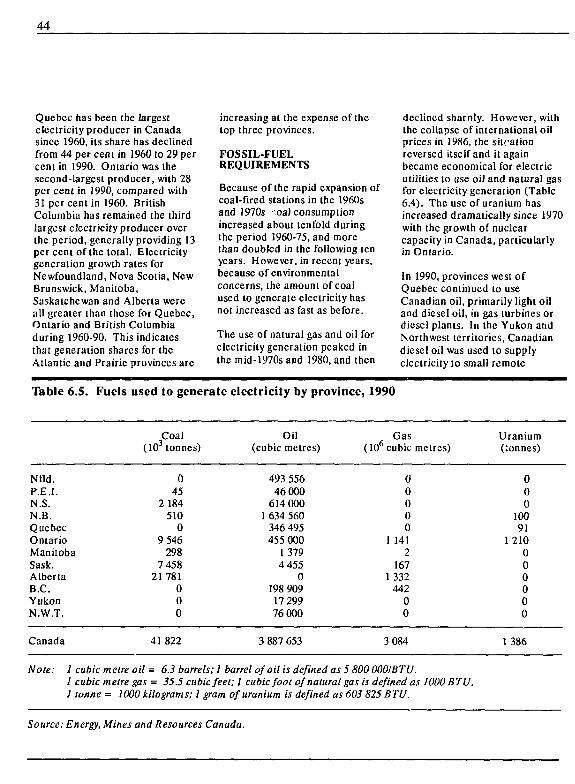
44
Quebec has been the largestelectricity producer in Canadasince 1960, its share has declinedfrom 44 per cent in 1960 to 29 percent in 1990. Ontario was thesecond-largest producer, with 28per cent in 1990, compared with31 per cent in 1960. BritishColumbia has remained the thirdlargest electricity producer overthe period, generally providing 13per cent of the total. Electricitygeneration growth rates forNewfoundland, Nova Scotia, NewBrunswick, Manitoba,Saskatchewan and Alberta wereall greater than those for Quebec,Ontario and British Columbiaduring 1960-90. This indicatesthat generation shares for theAtlantic and Prairie provinces are
increasing at the expense of thetop three provinces.
FOSSIL-FUELREQUIREMENTS
Because of the rapid expansion ofcoal-fired stations in the 1960sand 1970s oal consumptionincreased about tenfold duringthe period 1960-75, and morethan doubled in the following tenyears. However, in recent years,because of environmentalconcerns, the amount of coalused to generate electricity hasnot increased as fast as before.
The use of natural gas and oil forelectricity generation peaked inthe mid-1970s and 1980, and then
declined sharply. However, withthe collapse of international oilprices in 1986, the silcationreversed itself and it againbecame economical for electricutilities to use oil and natural gasfor electricity generation (Table6.4). The use of uranium hasincreased dramatically since 1970with the growth of nuclearcapacity in Canada, particularlyin Ontario.
In 1990, provinces west ofQuebec continued to useCanadian oil, primarily light oiland diesel oil, in gas turbines ordiesel plants. In the Yukon andNorthwest territories, Canadiandiesel oil was used to supplyelectricity to small remote
Table 6.5.
Nfld.P.E.I.N.S.N.B.QuebecOntarioManitobaSask.AlbertaB.C.YukonN.W.T.
Canada
Fuels used to generate
Coal(103 tonnes)
045
2 184510
09 546
2987 458
21 781000
41822
electricity by province
Oil(cubic metres)
493 55646 000
614 0001 634 560
346 495455 000
1 3794 455
0198 90917 29976 000
3 887 653
,1990
Gas(106 cubic metres)
00000
1 1412
1671332
44200
3 084
Uranium(:onnes)
000
10091
1 210000000
1386
Note: 1 cubic metre oil = 6.3 barrels; 1 barrel of oil is defined as 5 800 000/BTU.1 cubic metre gas = 35.5 cubic feet; 1 cubic foot of natural gas is defined as 1000 BTU.1 tonne = 1000 kilograms; 1 gram of uranium is defined as 603 825 BTU.
Source: Energy, Mines and Resources Canada.
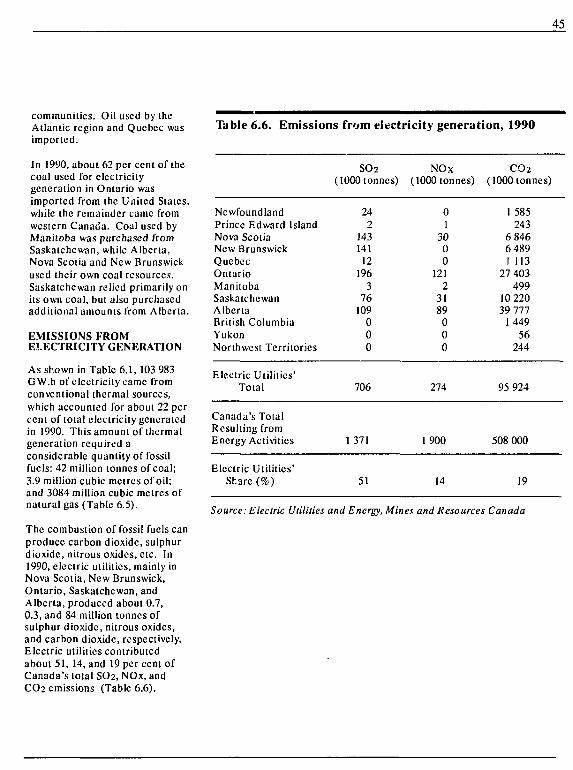
45
communities. Oil used by theAtlantic region and Quebec wasimported.
In 1990, about 62 per cent of thecoal used for electricitygeneration in Ontario wasimported from the United States,while the remainder came fromwestern Canada. Coal used byManitoba was purchased fromSaskatchewan, while Alberta,Nova Scotia and New Brunswickused their own coal resources.Saskatchewan relied primarily onits own coal, but also purchasedadditional amounts from Alberta.
EMISSIONS FROMELECTRICITY GENERATION
As shown in Table 6.1, 103 983GW.h of electricity came fromconventional thermal sources,which accounted for about 22 percent of total electricity generatedin 1990. This amount of thermalgeneration required aconsiderable quantity of fossilfuels: 42 million tonnes of coal;3.9 million cubic metres of oil;and 3084 million cubic metres ofnatural gas (Table 6.5).
The combustion of fossil fuels canproduce carbon dioxide, sulphurdioxide, nitrous oxides, etc. In1990, electric utilities, mainly inNova Scotia, New Brunswick,Ontario, Saskatchewan, andAlberta, produced about 0.7,0.3, and 84 million tonnes ofsulphur dioxide, nitrous oxides,and carbon dioxide, respectively.Electric ulilities contributedabout 51, 14, and 19 per cent ofCanada's total SO2, NOx, andCO2 emissions (Table 6.6).
Table 6.6. Emissions from eiectricity generation, 1990
NewfoundlandPrince Edward IslandNova ScotiaNew BrunswickQuebecOntarioManitobaSaskatchewanAlbertaBritish ColumbiaYukonNorthwest Territories
Electric Utilities'Total
Canada's TotalResulting fromEnergy Activities
Electric Utilities'Share (%)
SO2
(1000 tonnes)
242
14314112
1963
76109
000
706
1 371
51
NOx(1000 tonnes;
01
3000
1212
3189
000
274
1 900
14
CO 2) (1000 tonnes)
1 585243
6 8466 4891 113
27 403499
10 22039 777
1 44956
244
95 924
508 000
19
Source: Electric Ulilities and Energy, Mines and Resources Canada
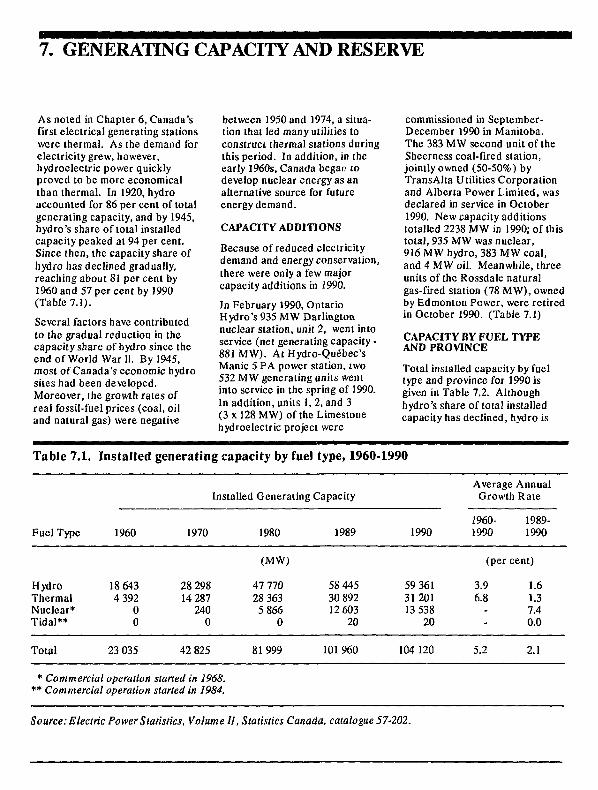
7. GENERATING CAPACITY AND RESERVE
As noted in Chapter 6, Canada'sfirst electrical generating stationswere thermal. As the demand forelectricity grew, however,hydroelectric power quicklyproved to be more economicalthan thermal. In 1920, hydroaccounted for 86 per cent of totalgenerating capacity, and by 1945,hydro's share of total installedcapacity peaked at 94 per cent.Since then, the capacity share ofhydro has declined gradually,reaching about 81 per cent by1960 and 57 per cent by 1990(Table 7.1).
Several factors have contributedto the gradual reduction in thecapacity share of hydro since theend of World War 11. By 1945,most of Canada's economic hydrosites had been developed.Moreover, the growth rates ofreal fossil-fuel prices (coal, oiland natural gas) were negative
between 1950 and 1974, a situa-tion that led many utilities toconstruct thermal stations duringthis period. In addition, in theearly 1960s, Canada began todevelop nuclear energy as analternative source for futureenergy demand.
CAPACITV ADDITIONS
Because of reduced electricitydemand and energy conservation,there were only a few majorcapacity additions in 1990.
In February 1990, OntarioHydro's 935 MW Darlingtonnuclear station, unit 2, went intoservice (net generating capacity -881 MW). At Hydro-Quebec'sManic 5 PA power station, two532 MW generating units wentinto service in the spring of 1990.In addition, units 1, 2, and 3(3 x 128 MW) of the Limestonehydroelectric project were
commissioned in September-December 1990 in Manitoba.The 383 MW second unit of theSheerness coal-fired station,jointly owned (50-50%) byTransAlta Utilities Corporationand Alberta Power Limited, wasdeclared in service in October1990. New capacity additionstotalled 2238 MW in 1990; of thistotal, 935 MW was nuclear,916 MW hydro, 383 MW coal,and 4 MW oil. Meanwhile, threeunits of the Rossdale naturalgas-fired station (78 MW), ownedby Edmonton Pcwer, were retiredin October 1990. (Table 7.1)
CAPACITY BY FUEL TYPEAND PROVINCE
Total installed capacity by fueltype and province for 1990 isgiven in Table 7.2. Althoughhydro's share of total installedcapacity has declined, hydro is
Table 7.1. Installed generating capacity by fuel type, 1960-1990
Fuel Type
HydroThermalNuclear*Tidal**
1960
18 6434 392
00
1970
28 29814 287
2400
Installed Generating Capacity
1980
(MW)
47 77028 3635 866
0
1989
58 44530 89212 603
20
1990
59 3613120113 538
20
AverageGrowth
1960-1990
AnnualRate
1989-1990
(per cent)
3.9 1.66.8 1.3
7.40.0
Total 23 035 42 825 81999 101 960 104 120 5.2 2.1
* Commercial operation started in 1968.** Commercial operation started in 1984.
Source: Electric Power Statistics, Volume II, Statistics Canada, catalogue 57-202.
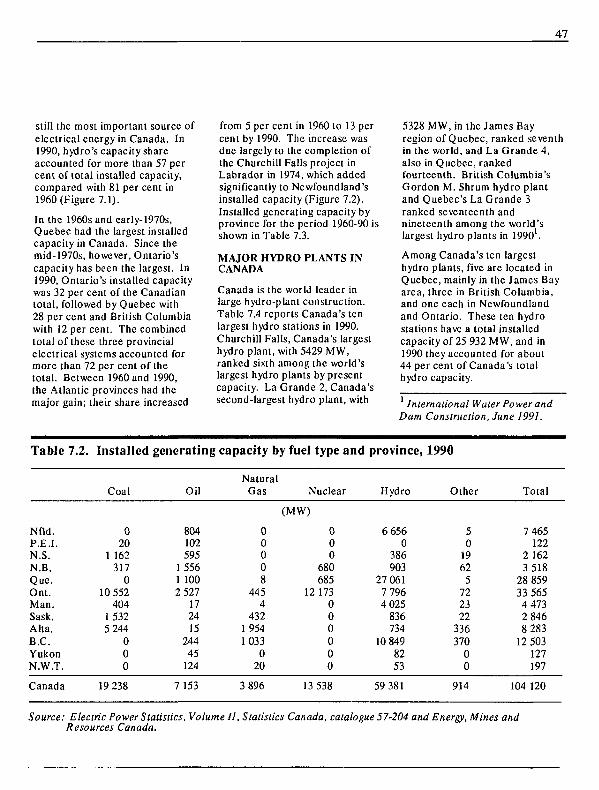
47
still the most important source ofelectrical energy in Canada. In1990, hydro's capacity shareaccounted for more than 57 percent of total installed capacity,compared with 81 per cent in1960 (Figure 7.1).
In the 1960s and early-1970s,Quebec had the largest installedcapacity in Canada. Since themid-1970s, however, Ontario'scapacity has been the largest. In1990, Ontario's installed capacitywas 32 per cent of the Canadiantotal, followed by Quebec with28 per cent and British Columbiawith 12 per cent. The combinedtotal of these three provincialelectrical systems accounted formore than 72 per cent of thetotal. Between 1960 and 1990,the Atlantic provinces had themajor gain; their share increased
from 5 per cent in 1960 to 13 percent by 1990. The increase wasdue largely to the completion ofthe Churchill Falls project inLabrador in 1974, which addedsignificantly to Newfoundland'sinstalled capacity (Figure 7.2).Installed generating capacity byprovince for the period 1960-90 isshown in Table 7.3.
MAJOR HYDRO PLANTS INCANADA
Canada is the world leader inlarge hydro-plant construction.Table 7.4 reports Canada's tenlargest hydro stations in 1990.Churchill Falls, Canada's largesthydro plant, with 5429 MW,ranked sixth among the world'slargest hydro plants by presentcapacity. La Grande 2, Canada'ssecond-largest hydro plant, with
5328 MW, in the James Bayregion of Quebec, ranked seventhin the world, and La Grande 4,also in Quebec, rankedfourteenth. British Columbia'sGordon M. Shrum hydro plantand Quebec's La Grande 3ranked seventeenth andnineteenth among the world'slargest hydro plants in 19901.
Among Canada's ten largesthydro plants, five are located inQuebec, mainly in the James Bayarea, three in British Columbia,and one each in Newfoundlandand Ontario. These ten hydrostations have a total installedcapacity of 25 932 MW, and in1990 they accounted for about44 per cent of Canada's totalhydro capacity.
International Water Power andDam Construction, June 1991.
Table 7.2. Installed generating capacity by fuel type and province, 1990
Coal OilNatural
Gas Nuclear Hydro Other Total
(MW)
Nfld.P.E.I.N.S.N.B.Que.Ont.Man.Sask.Alta.B.C.YukonN.W.T.
020
1 1623170
10 552404
15325 244
000
804102595
15561 1002 527
17241524445124
00008
4454
4321 9541033
020
000
680685
12 173000000
6 6560
386903
27 0617 7964 025836734
10 8498253
501962572232233637000
7 465122
2 1623 51828 85933 5654 4732 8468 28312 503127197
Canada 19 238 7 153 3 896 13 538 59 381 914 104 120
Source: Electric Power Statistics, Volume II, Statistics Canada, catalogue 57-204 and Energy, Mines andResources Canada.
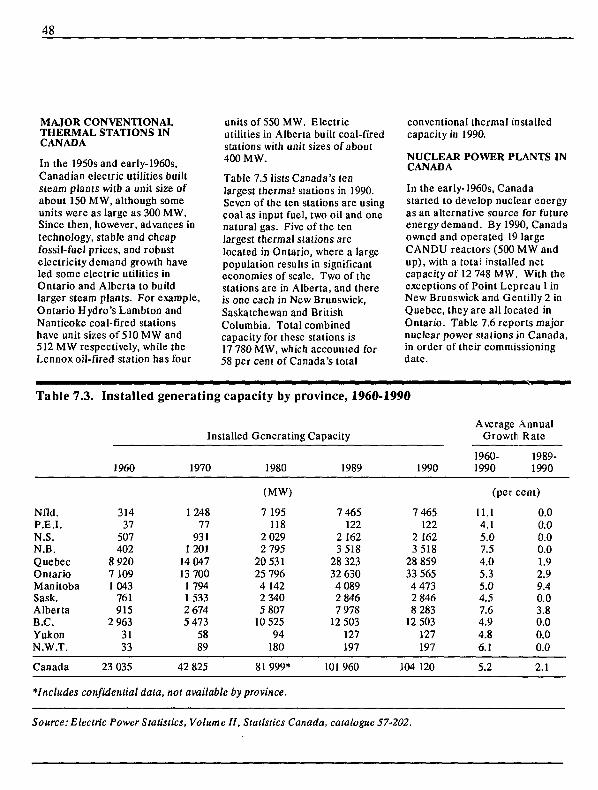
48
MAJOR CONVENTIONALTHERMAL STATIONS INCANADA
In the 1950s and early-1960s,Canadian electric utilities builtsteam plants with a unit size ofabout 150 MW, although someunits were as large as 300 MW,Since then, however, advances intechnology, stable and cheapfossil-fuel prices, and robustelectricity demand growth haveled some electric utilities inOntario and Alberta to buildlarger steam plants. For example,Ontario Hydro's Lambton andNanticoke coal-fired stationshave unit sizes of 510 MW and512 MW respectively, while theLennox oil-fired station has four
units of 550 MW. Electricutilities in Alberta built coal-firedstations with unit sizes of about400 MW.
Table 7.5 lists Canada's tenlargest therma! stations in 1990.Seven of the ten stations are usingcoal as input fuel, two oil and onenatural gas. Five of the tenlargest thermal stations arelocated in Ontario, where a largepopulation results in significanteconomies of scale. Two of thestations are in Alberta, and thereis one each in New Brunswick,Saskatchewan and BritishColumbia. Total combinedcapacity for these stations is17 780 MW, which accounted for58 per cent of Canada's total
conventional thermal installedcapacity in 1990.
NUCLEAR POWER PLANTS INCANADA
In the early-1960s, Canadastarted to develop nuclear energyas an alternative source for futureenergy demand. By 1990, Canadaowned and operated 19 largeCANDU reactors (500 MW andup), with a total installed netcapacity of 12 748 MW. With theexceptions of Point Lepreau I inNew Brunswick and Gentilly 2 inQuebec, they are all located inOntario. Table 7.6 reports majornuclear power stations in Canada,in order of their commissioningdate.
Table 7.3.
Nfld.P.E.I.N.S.N.B.QuebecOntarioManitobaSask.AlbertaB.C.YukonN.W.T.
Canada
Installed
I960
31437
507402
8 9207 1091 043
761915
2 9633133
23 035
generating capacity by
Installed
1970
124877
9311 201
14 04713 700179415332 6745 473
5889
42 825
province, 1960-
Generating Capacity
1980
(MW)
7 195118
2 0292 795
20 53125 7964 1422 3405 807
10 52594
180
81 999*
*Inctudes confidential data, not available by province.
1989
7 465122
2 1623 518
28 32332 6304 0892 8467 978
12 503127197
101 960
1990
1990
7 465122
2 1623 518
28 85933 5654 4732 8468 283
12 503127197
104 120
AverageGrowth
1960-1990
AnnualRale
1989-1990
(per cent)
11.14.15.07.54.05.35.04.57.64.94.86.1
5.2
0.00.00.00.01.92.99.40.03.80.00.00.0
2.1
Source: Electric Power Statistics, Volume If, Statistics Canada, catalogue 57-202.
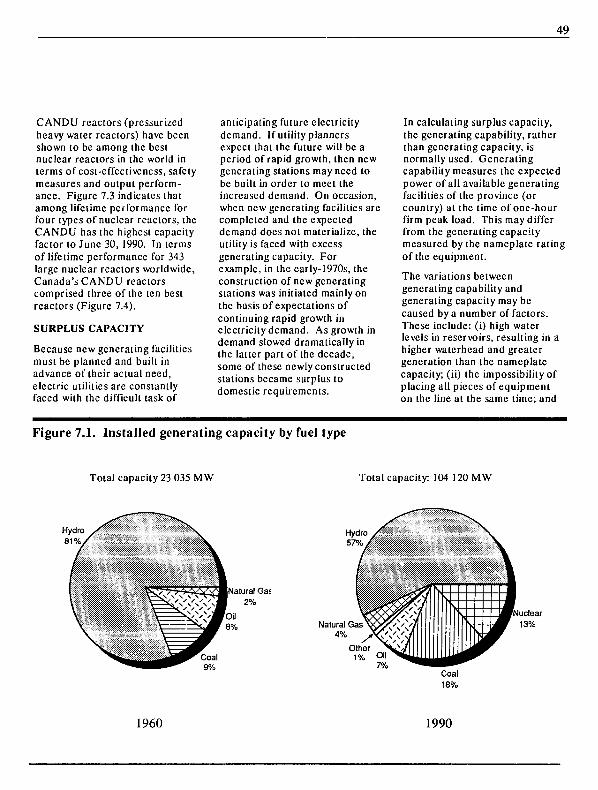
49
CANDU reactors (pressurizedheavy water reactors) have beenshown to be among the bestnuclear reactors in the world interms of cost-effectiveness, safetymeasures and output perform-ance. Figure 7.3 indicates thatamong lifetime performance forfour types of nuclear reactors, theCANDU has the highest capacityfactor to June 30, 1990. In termsof lifetime performance for 343large nuclear reactors worldwide,Canada's CANDU reactorscomprised three of the ten bestreactors (Figure 7.4).
SURPLUS CAPACITY
Because new generating facilitiesmust be planned and built inadvance of their actual need,electric utilities are constantlyfaced with the difficult task of
anticipating future electricitydemand. If utility plannersexpect that the future will be aperiod of rapid growth, then newgenerating stations may need tobe built in order to meet theincreased demand. On occasion,when new generating facilities arecompleted and the expecteddemand does not materialize, theutility is faced with excessgenerating capacity. Forexample, in the early-1970s, theconstruction of new generatingstations was initiated mainly onthe basis of expectations ofcontinuing rapid growth inelectricity demand. As growth indemand slowed dramatically inthe latter part of the decade,some of these newly constructedstations became surplus todomestic requirements.
In calculating surplus capacity,the generating capability, ratherthan generating capacity, isnormally used. Generatingcapability measures the expectedpower of all available generatingfacilities of the province (orcountry) at the time of one-hourfirm peak load. This may differfrom the generating capacitymeasured by the namcplate ralingof the equipment.
The variations betweengenerating capability andgenerating capacity may becaused by a number of factors.These include: (i) high waterlevels in reservoirs, resulting in ahigher waterhead and greatergeneration than the nameplatecapacity; (ii) the impossibility ofplacing all pieces of equipmenton the line at the same time; and
Figure 7.1. Installed generating capacity by fuel type
Total capacity 23 035 MW Total capacity: 104 120 MW
tural Gas2%
Hydro /57%/
Natural G a s ^ J V N ' N ' /
1% O i l ^* l i | | ,7% ^ ^ *
vlTkJp
Coal18%
••M JI^WNuclear
•^J 13%
1960 1990
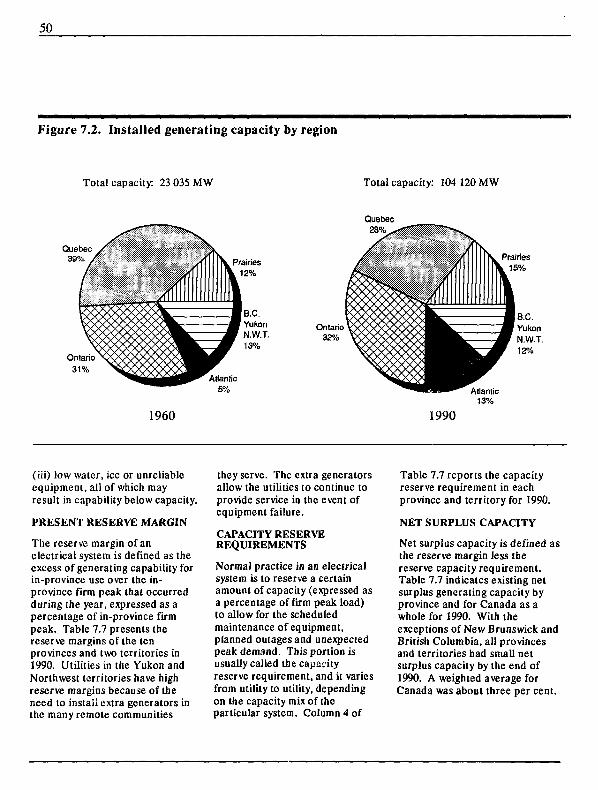
50
Figure 7.2. Installed generating capacity by region
Total capacity: 23 035 MW Total capacity: 104 120 MW
Ontario31%
1960 1990
(iii) low water, ice or unreliableequipment, all of which mayresult in capability below capacity.
PRESENT RESERVE MARGIN
The reserve margin of anelectrical system is defined as theexcess of generating capability forin-province use over the in-province firm peak that occurredduring the year, expressed as apercentage of in-province firmpeak. Table 7.7 presents thereserve margins of the tenprovinces and two territories in1990. Utilities in the Yukon andNorthwest territories have highreserve margins because of theneed to install extra generators inthe many remote communities
they serve. The extra generatorsallow the utilities to continue toprovide service in the event ofequipment failure.
CAPACITY RESERVEREQUIREMENTS
Normal practice in an electricalsystem is to reserve a certainamount of capacity (expressed asa percentage of firm peak load)to allow for the scheduledmaintenance of equipment,planned outages and unexpectedpeak demand. This portion isusually called the capacityreserve requirement, and it variesfrom utility to utility, dependingon the capacity mix of theparticular system. Column 4 of
Table 7.7 reports the capacityreserve requirement in eachprovince and territory for 1990.
NET SURPLUS CAPACITY
Net surplus capacity is defined asthe reserve margin less thereserve capacity requirement.Table 7.7 indicates existing netsurplus generating capacity byprovince and for Canada as awhole for 1990. With theexceptions of New Brunswick andBritish Columbia, all provincesand territories had small netsurplus capacity by the end of1990. A weighted average forCanada was about three per cent.
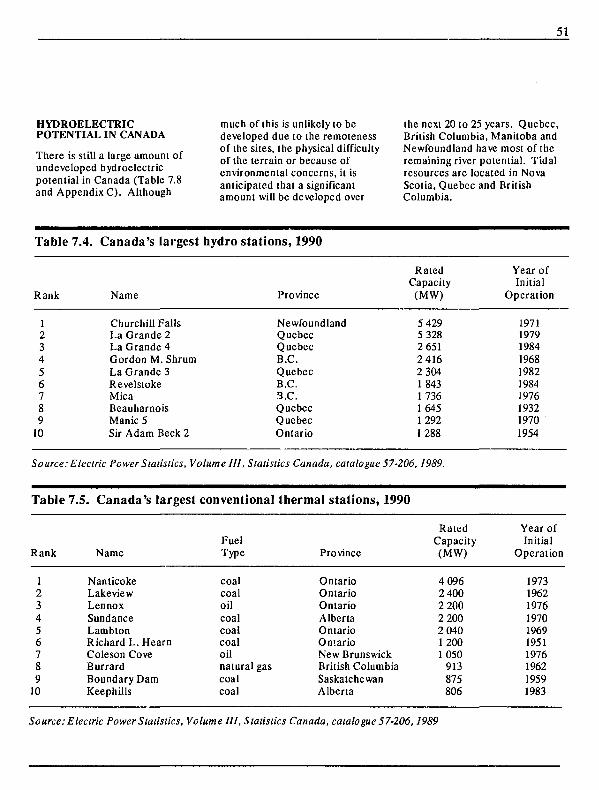
51
HYDROELECTRICPOTENTIAL IN CANADA
There is still a large amount ofundeveloped hydroelectricpotential in Canada (Table 7.8and Appendix C). Although
much of this is unlikely to bedeveloped due to the remotenessof the sites, the physical difficultyof the terrain or because ofenvironmental concerns, it isanticipated that a significantamount will be developed over
the next 20 to 25 years. Quebec,British Columbia, Manitoba andNewfoundland have most of theremaining river potential. Tidalresources are located in NovaScotia, Quebec and BritishColumbia.
Table
Rank
123456789
10
Source:
Table
Rank
123456789
10
7.4. Canada's largest
Name
Churchill FallsLa Grande 2La Grande 4Gordon M. ShrumLa Grande 3RevelstokeMicaBeauharnoisManic 5Sir Adam Beck 2
hydro stations, 1990
Province
NewfoundlandQuebecQuebecB.C.QuebecB.C.3.C.QuebecQuebecOntario
RatedCapacity(MW)
5 4295 3282 6512 4162 30418431 736164512921288
Electric Power Statistics, Volume III, Statistics Canada, catalogue 57-206,1989.
7.5. Canada's largest
Name
NanticokeLakeviewLennoxSundanceLambtonRichard L. HearnColeson CoveBurrardBoundary DamKeephills
conventional thermal stations, 1990
FuelType
coalcoaloilcoalcoalcoaloil
Province
OntarioOntarioOntarioAlbertaOntarioOntarioNew Brunswick
natural gas British Columbiacoalcoal
SaskatchewanAlberta
RatedCapacity(MW)
4 0962 4002 2002 2002 04012001 050
913875806
Year ofInitial
Operation
1971197919841968198219841976193219701954
Year ofInitial
Operation
1973196219761970196919511976196219591983
Source: Electric Power Statistics, Volume III, Statistics Canada, catalogue 57-206,1989
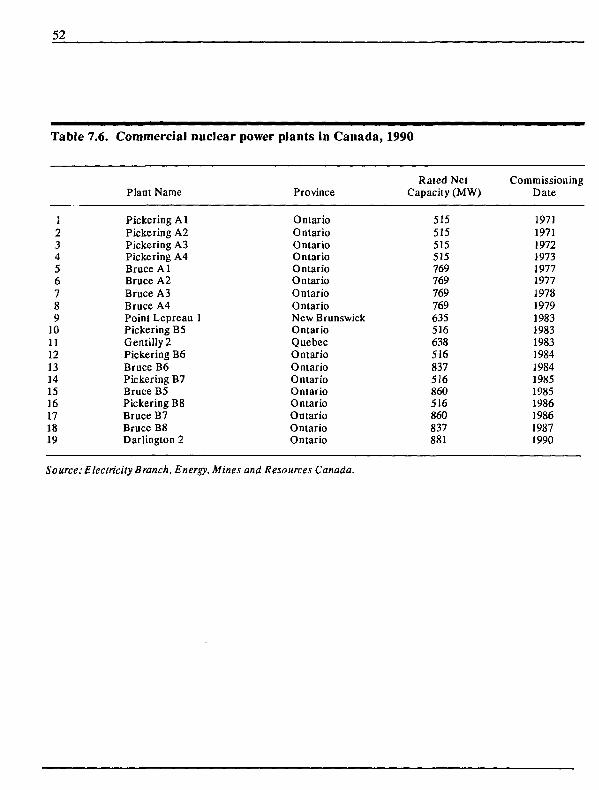
52
Table 7.6.
1234567g9
10111213141516171819
Commercial nuclear
Plant Name
Pickering A1Pickering A2Pickering A3Pickering A4Bruce AlBruce A2Bruce A3Bruce A4Point Lepreau 1Pickering B5Gentilly2Pickering B6Bruce B6Pickering B7Bruce B5Pickering B8Bruce B7Bruce B8Darlington 2
power plants in Canada,
Province
OntarioOntarioOntarioOntarioOntarioOntarioOntarioOntarioNew BrunswickOntarioQuebecOntarioOntarioOntarioOntarioOntarioOntarioOntarioOntario
1990
Rated NetCapacity (MW)
515515515515769769769769635516638516837516860516860837881
CommissioningDate
1971197119721973197719771978197919831983198319841984198519851986198619871990
Source: Electricity Branch, Energy, Mines and Resources Canada.
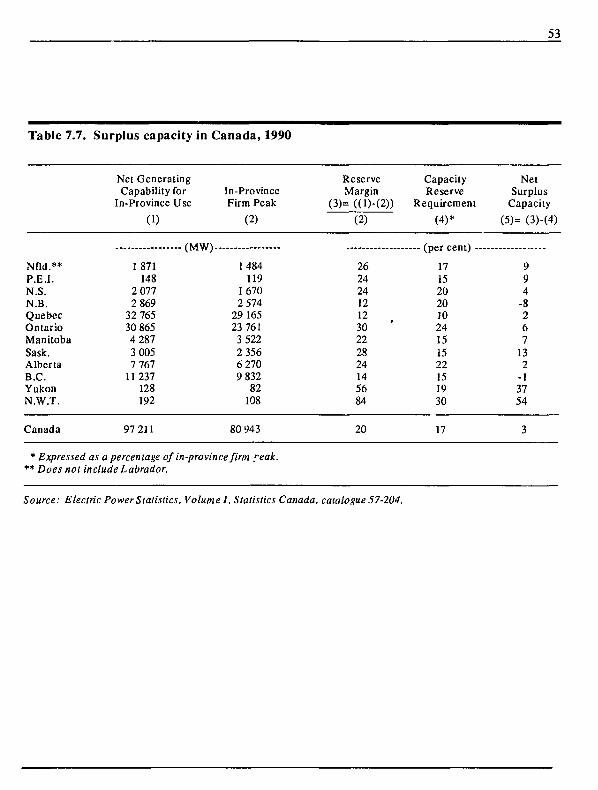
53
Table 7.7.
Nfld.**P.E.I.N.S.N.B.QuebecOntarioManitobaSask.AlbertaB.C.YukonN.W.T.
Canada
Surplus capacity in Canada, 1990
Net GeneratingCapability for
In-Province Use
(1)
(MW)~
1871148
2 0772 869
32 76530 8654 2873 0057 767
11 237128192
97 211
In-ProvinceFirm Peak
(2)
1484119
16702 574
29 16523 761
3 5222 3566 2709 832
82108
80 943
* Expressed as a percentage of in-province firm feak.** Does not include Labrador.
ReserveMargin
(3)= ((l)-(2))(2)
262424121230222824145684
20
CapacityReserve
Requirement
(4)*
(per cent) —
171520201024151522151930
17
NetSurplus
Capacity(5)= (3)-(4)
994
-8267
132
-13754
3
Source: Electric Power Statistics, Volume/, Statistics Canada, catalogue 57-204.
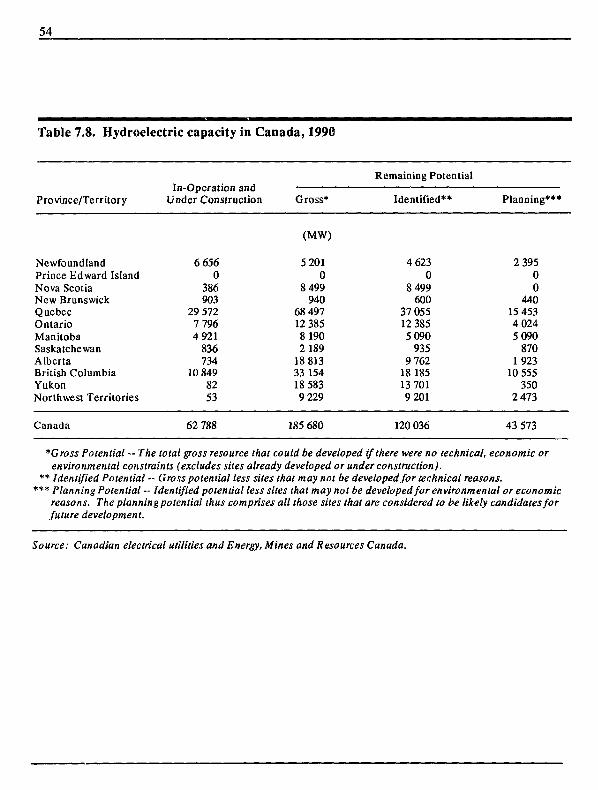
54
Table 7.8. Hydroelectric capacity in Canada, 1990
Province/TerritoryIn-Operation and
Under Construction Gross*
Remaining Potential
Identified** Planning***
(MW)
NewfoundlandPrince Edward IslandNova ScotiaNew BrunswickQuebecOntarioManitobaSaskatchewanAlbertaBritish ColumbiaYukonNorthwest Territories
6 6560
386903
29 5727 7964 921
836734
10 8498253
5 2010
8 499940
68 49712 3858 1902 189
18 81333 15418 5839 229
4 6230
8 499600
37 05512 3855 090
9359 762
18 18513 7019 201
2 39500
44015 4534 0245 090
8701923
10 555350
2 473
Canada 62 788 185 680 120 036 43 573
*Gross Potential — The total gross resource that could be developed if there were no technical, economic orenvironmental constraints (excludes sites already developed or under construction).
** Identified Potential -- Gross potential less sites that may not be developed for technical reasons.*** Planning Potential — Identified potential less sites that may not be developed for environmental or economic
reasons. The planning potential thus comprises all those sites that are considered to be likely candidates forfuture development.
Source: Canadian electrical utilities and Energy, Mines and Resources Canada.
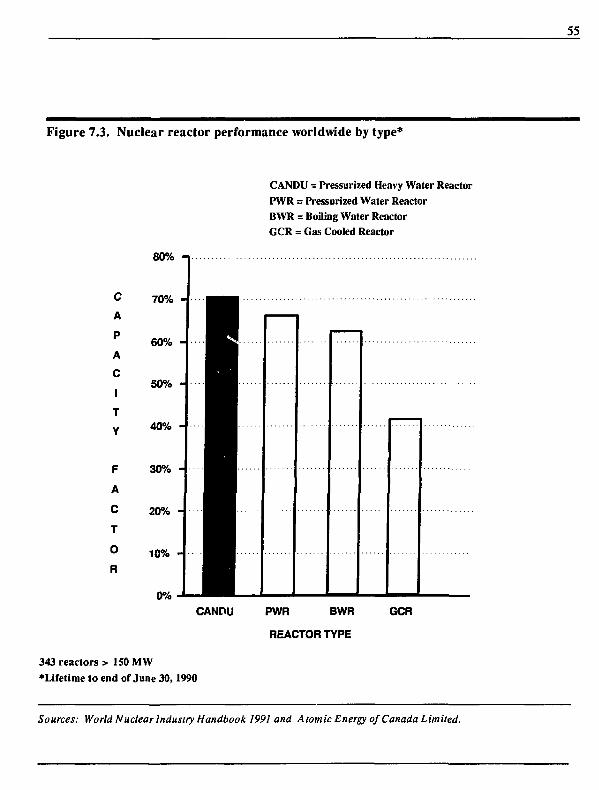
55
Figure 7.3. Nuclear reactor performance worldwide by type*
80%
CANDU = Pressurized Heavy Water ReactorPWR = Pressurized Water ReactorBWR = Boiling Water ReactorGCR = Gas Cooled Reactor
C
A
P
A
C
T
Y
F
A
C
T
O
R
70% -
60% -
50% -
40% -
30% •
20% -
10% -
CANDU PWR BWR
REACTOR TYPE
GCR
343 reactors > 150 MW
•Lifetime to end of June 30,1990
Sources: World Nuclear Industry Handbook 1991 and Atomic Energy of Canada Limited.
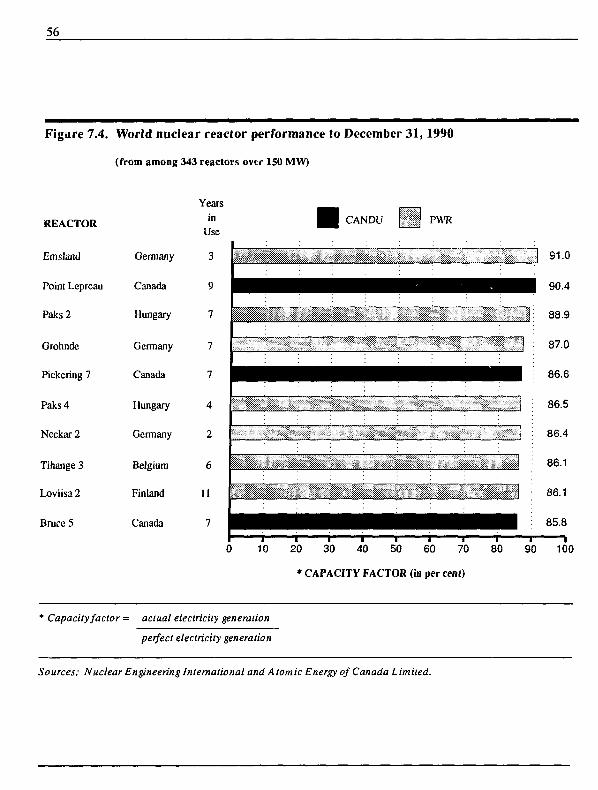
56
Figure 7.4. World nuclear reactor performance to December 31,1990
(from among 343 reactors over 150 MW)
REACTOR
Emsland
Point Leprcau
Paks2
Grohnde
Pickering 7
Paks4
Neckar 2
Tihange 3
Loviisa 2
Bruce 5
Germany
Canada
Hungary
Germany
Canada
Hungary
Germany
Belgium
Finland
Canada
Yearsin
Use
3
9
7
7
7
4
2
6
11
7
CANDU PWR
88.9
87.0
86.6
86.5
86.4
86.1
86.1
85.8
0 10 20 30 40 50 60 70 80 90 100
* CAPACITY FACTOR (in per cent)
: Capacity factor = actual electricity generation
perfect electricity generation
Sources: Nuclear Engineering International and A tomic Energy of Canada Limited.
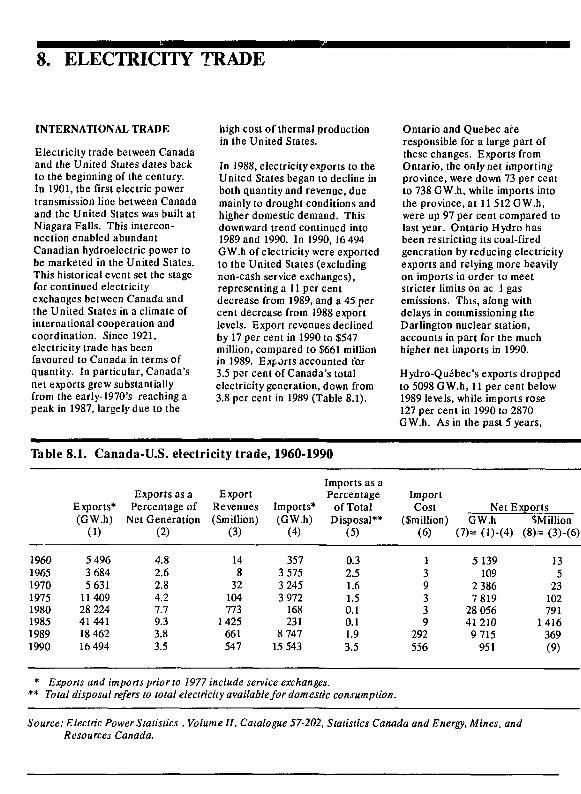
8. ELECTRICITY TRADE
INTERNATIONAL TRADE
Electricity trade between Canadaand the United States dates backto the beginning of the century.In 1901, the first electric powertransmission line between Canadaand the United States was built atNiagara Falls. This intercon-nection enabled abundantCanadian hydroelectric power tobe marketed in the United States.This historical event set the stagefor continued electricityexchanges between Canada andthe United States in a climate ofinternational cooperation andcoordination. Since 1921,electricity trade has beenfavoured to Canada in terms ofquantity. In particular, Canada'snet exports grew substantiallyfrom the early-1970's reaching apeak in 1987, largely due to the
high cost of thermal productionin the United States.
In 1988, electricity exports to theUnited States began to decline inboth quantity and revenue, duemainly to drought conditions andhigher domestic demand. Thisdownward trend continued into1989 and 1990. In 1990, 16 494GW.h of electricity were exportedto the United States (excludingnon-cash service exchanges),representing a 11 per centdecrease from 1989, and a 45 percent decrease from 1988 exportlevels. Export revenues declinedby 17 per cent in 1990 to $547million, compared to $661 millionin 1989. Exports accounted for3.5 per cent of Canada's totalelectricity generation, down from3.8 per cent in 1989 (Table 8.1).
Ontario and Quebec areresponsible for a large part ofthese changes. Exports fromOntario, the only net importingprovince, were down 73 per centto 738 GW.h, while imports intothe province, at 11 512 GW.h,were up 97 per cent compared tolast year. Ontario Hydro hasbeen restricting its coal-firedgeneration by reducing electricityexports and relying more heavilyon imports in order to meetstricter limits on ac 1 gasemissions. This, along withdelays in commissioning theDarlington nuclear station,accounts in part for the muchhigher net imports in 1990.
Hydro-Quebec's exports droppedto 5098 GW.h, 11 per cent below1989 levels, while imports rose127 per cent in 1990 to 2870GW.h. As in the past 5 years,
Table
19601965197019751980198519891990
8.1. Canada-U.S. electricity trade,
Exports*(GW.h)
(1)
5 4963 6845 631
1140928 2244144118 46216 494
Exports as aPercentage of
Net Generation(2)
4.82.62.84.27.79.33.83.5
ExportRevenues(Smillion)
(3)
148
32104773
1425661547
1960-1990
Imports*(GW.h)
(4)
3573 5753 2453 972
168231
8 74715 543
Imports as aPercentage
of TotalDisposal**
(5)
0.32.51.61.50.10.11.93.5
• Exports and imports prior to 1977 include service exchanges.
ImportCost
(Smillion)(6)
139339
292556
** Total disposul refers to total electricity available for domestic consumption.
NetGW.h
(7)= (l)-(4
5 139109
2 3867 819
28 05641 2109 715
951
ExportsSMillion
) (8)= (3)-(6)
135
23102791
1 416369(9)
Source: Electric Power Statistics , Volume II, Catalogue 57-202, Statistics Canada and Energy, Mines, andResources Canada.
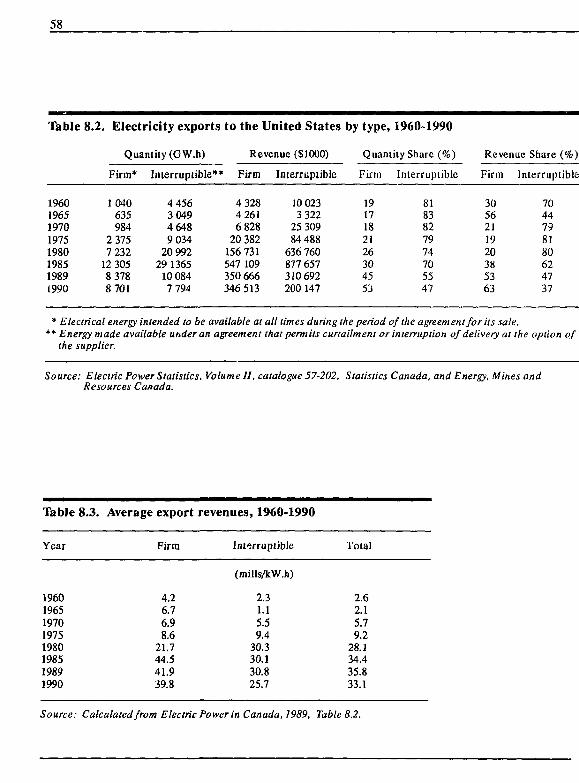
58
Table
I9601965197019751980198519891990
8.2. Electricity exports
Quantity (GW.h)
Firm*
1040635984
2 3757 232
12 3058 3788 701
Interruptible**
4 4563 0494 6489 034
20 99229 1365
10 0847 794
to the United States
Revenue ($1000)
Firm
4 3284 2616 828
20 382156 731547 109350 666346 513
Interruptible
10 0233 322
25 30984 488
636 760877 657310 692200 147
by type,, 1960-1990
Quantity Share (%)
Firm
1917182126304553
Interruptible
8183827974705547
Revenue Share {%)
Firm
3056211920385363
Interruptible
70AA798180624737
* Electrical energy intended to be available al all limes during the period of the agreement for its sale.** Energy made available under an agreement that permits curtailment or interruption of delivery at the option of
the supplier.
Source: Electric Power Statistics, Volume II, catalogue 57-202, Statistics Canada, and Energy, Mines andResources Canada.
Table 8.3.
Year
19601965197019751980198519891990
Average export
Firm
4.26.76.98.6
21.744.541.939.8
revenues, 1960-1990
Interruptible
(mills/kW.h)
2.31.15.59.4
30.330.130.825.7
Total
2.62.15.79.2
28.134.435.833.1
Source: Calculated from Electric Power in Canada, 1989, Table 8.2.
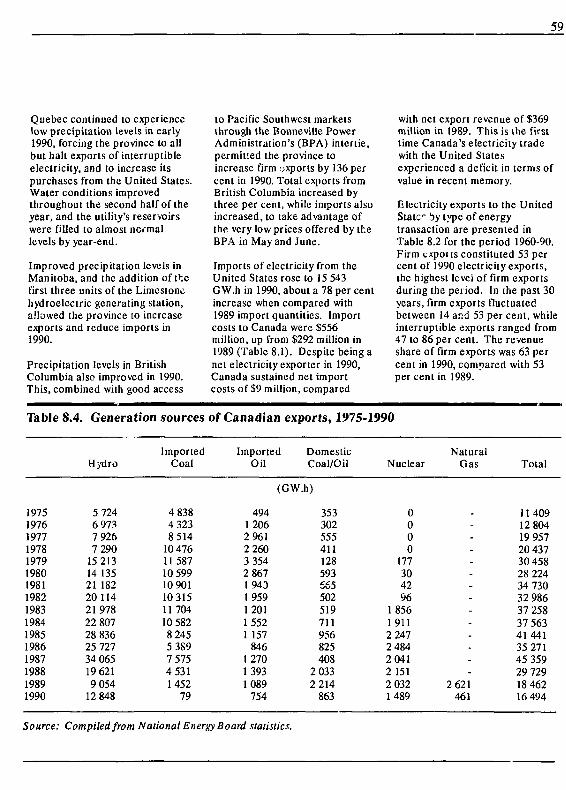
59
Quebec continued to experiencelow precipitation levels in early1990, forcing the province to allbut hall exports of interruptibleelectricity, and to increase itspurchases from the United States.Water conditions improvedthroughout the second half of theyear, and the utility's reservoirswere filled to almost normallevels by year-end.
Improved precipitation levels inManitoba, and the addition of thefirst three units of the Limestonehydroelectric generating station,allowed the province to increaseexports and reduce imports in1990.
Precipitation levels in BritishColumbia also improved in 1990.This, combined with good access
to Pacific Southwest marketsthrough the Bonneville PowerAdministration's (BPA) inlertie,permitted the province toincrease firm oxports by 136 percent in 1990. Total exports fromBritish Columbia increased bythree per cent, while imports alsoincreased, to take advantage ofthe very low prices offered by theBPA in May and June.
Imports of electricity from theUnited States rose to 15 543GW.h in 1990, about a 78 per centincrease when compared with1989 import quantities. Importcosts to Canada were S556million, up from $292 million in1989 (Table 8.1). Despite being anet electricity exporter in 1990,Canada sustained net importcosts of S9 million, compared
with net export revenue of $369million in 1989. This is the firsttime Canada's electricity tradewith the United Stalesexperienced a deficit in terms ofvalue in recent memory.
Electricity exports to the UnitedStater by lj<pe of energytransaction are presented inTable 8.2 for the period 1960-90.Firm txpous constituted 53 percent of 1990 electricity exports,the highest level of firm exportsduring the period. In the past 30years, firm exports fluctuatedbetween 14 and 53 per cent, whileinterruptible exports ranged from47 to 86 per cent. The revenueshare of firm exports was 63 percent in 1990, compared with 53per cent in 1989.
Table 8.4.
1975197619771978197919801981198219831984198519861987198819891990
Generation
Hydro
5 7246 9737 9267 290
15 21314 13521 18220 1142197822 80728 83625 72734 06519 6219 054
12 848
sources
ImportedCoal
4 8384 3238 514
10 4761158710 59910 90110 3151170410 5828 2455 3897 5754 5311452
79
of Canadian
ImportedOil
exports, 1975-1990
DomesticCoal/Oil
(GW.h)
4941 2062 9612 2603 3542 86719401959120115521 157
8461 27013931089
754
353302555411128593665502519711956825408
2 0332 214
863
Nuclear
0000
177304296
18561 9112 2472 48420412 1512 0321489
NaturalGas
_--
--
--
2 621461
Total
11 40912 80419 95720 43730 45828 22434 73032 98637 25837 5634144135 27145 35929 72918 46216 494
Source: Compiled from National Energy Board statistics.
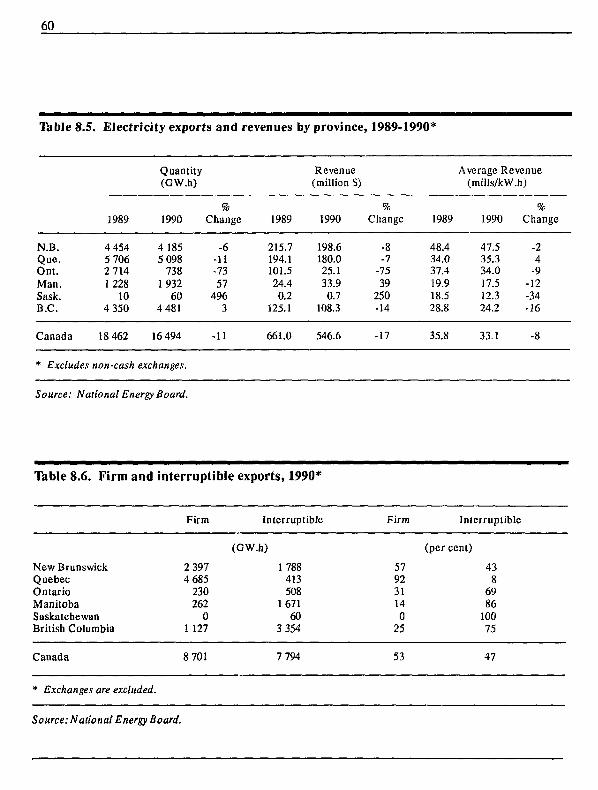
60
Table 8.5. Electricity exports and revenues by province, 1989-1990*
N.B.Que.Ont.Man.Sask.B.C.
1989
4 4545 7062 7141228
104 350
Quantity(GW.h)
1990
4 1855 098
7381932
604 481
%Change
-6-11-7357
4963
1989
215.7194.1101.524.4
0.2125.1
Revenue(million S)
1990
198.6180.025.133.90.7
108.3
%Change
-8-7
-7539
250-14
1989
48.434.037.419.918.528.8
Average Revenue(mills/kW
1990
47.535.334.017.512.324.2
•h)
%
Change
-24
-9-12-34-16
Canada 18 462 16 494 -11 661.0 546.6 -17 35.8 33.1 -8
* Excludes non-cash exchanges.
Source: National Energy Board.
Table 8.6. Firm and
New BrunswickQuebecOntarioManitobaSaskatchewanBritish Columbia
Canada
* Exchanges are excluded.
interruptible
Firm
exports, 1990*
Interruptible
(GW.h)
2 3974 685
230262
01 127
8 701
1 788413508
167160
3 354
7 794
Firm
579231140
25
53
Inierruptible
(per cent)
438
6986
10075
47
Source: National Energy Board.
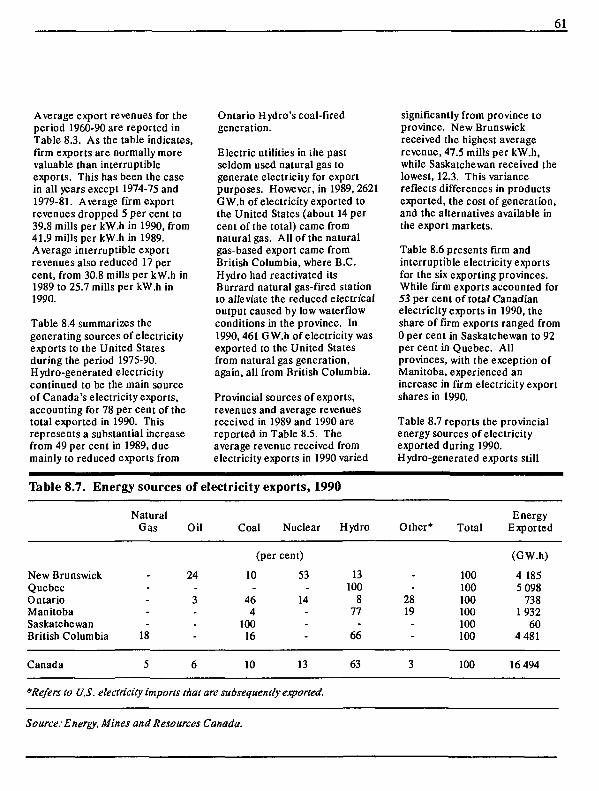
61
Average export revenues for theperiod 1960-90 are reported inTable 8.3. As the table indicates,firm exports are normally morevaluable than interruptibleexports. This has been the casein all years except 1974-75 and1979-81. Average firm exportrevenues dropped 5 per cent to39.8 mills per kW.h in 1990, from41.9 mills per kW.h in 1989.Average interruptible exportrevenues also reduced 17 percent, from 30.8 mills per kW.h in1989 to 25.7 mills per kW.h in1990.
Table 8.4 summarizes thegenerating sources of electricityexports to the United Statesduring the period 1975-90.Hydro-generated electricitycontinued to be the main sourceof Canada's electricity exports,accounting for 78 per cent of thetotal exported in 1990. Thisrepresents a substantial increasefrom 49 per cent in 1989, duemainly to reduced exports from
Ontario Hydro's coal-firedgeneration.
Electric utilities in the pastseldom used natural gas togenerate electricity for exportpurposes. However, in 1989, 2621GW.h of electricity exported tothe United States (about 14 percent of the total) came fromnatural gas. All of the naturalgas-based export came fromBritish Columbia, where B.C.Hydro had reactivated itsBurrard natural gas-fired stationto alleviate the reduced electricaloutput caused by low waterflowconditions in the province. In1990,461 GW.h of electricity wasexported to the United Statesfrom natural gas generation,again, all from British Columbia.
Provincial sources of exports,revenues and average revenuesreceived in 1989 and 1990 arereported in Table 8.5. Theaverage revenue received fromelectricity exports in 1990 varied
significantly from province toprovince. New Brunswickreceived the highest averagerevenue, 47.5 mills per kW.h,while Saskatchewan received thelowest, 12.3. This variancereflects differences in productsexported, the cost of generation,and the alternatives available inthe export markets.
Table 8.6 presents firm andinterruptible electricity exportsfor the six exporting provinces.While firm exports accounted for53 per cent of total Canadianelectricity exports in 1990, theshare of firm exports ranged from0 per cent in Saskatchewan to 92per cent in Quebec. Allprovinces, with the exception ofManitoba, experienced anincrease in firm electricity exportshares in 1990.
Table 8.7 reports the provincialenergy sources of electricityexported during 1990.Hydro-generated exports still
Table 8.7. Energy sources of electricity exports, 1990
NaturalGas
New BrunswickQuebecOntarioManitobaSaskatchewanBritish Columbia 18
Canada 5
Oil Coal Nuclear
(per cent)
24 10 53
3 46 144
10016
6 10 13
*Refers to U.S. electricity imports that are subsequently exported.
Source: Energy, Mines and Resources Canada.
Hydro
13100
877
-66
63
Other*
-2819
--
3
Total
100100100100100100
100
EnergyExported
(GW.h)
4 1855 098
7381932
604 481
16 494
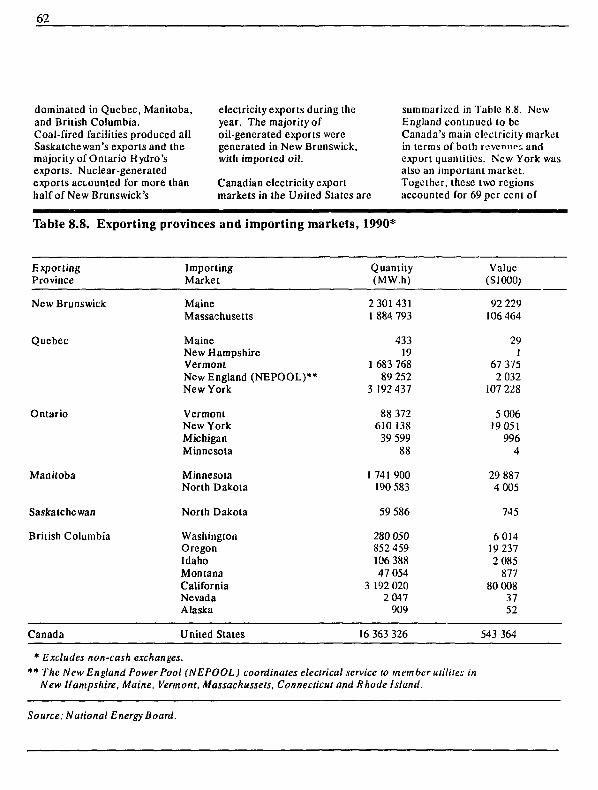
62
dominated in Quebec, Manitoba,and British Columbia.Coal-fired facilities produced allSaskatchewan's exports and themajority of Ontario Hydro'sexports. Nuclear-generatedexports accounted for more thanhalf of New Brunswick's
electricity exports during theyear. The majority ofoil-generated exports weregenerated in New Brunswick,with imported oil.
Canadian electricity exportmarkets in the United Slates are
summarized in Table 8.8. NewEngland continued to beCanada's main electricity marketin terms of both revenues andexport quantities. New York wasalso an important market.Together, these two regionsaccounted for 69 per cent of
Table 8.8. Exporting
ExportingProvince
New Brunswick
Quebec
Ontario
Manitoba
Saskatchewan
British Columbia
Canada
provinces and importing markets
ImportingMarket
MaineMassachusetts
MaineNew HampshireVermontNew England (NEPOOL)**New York
VermontNew YorkMichiganMinnesota
MinnesotaNorth Dakota
North Dakota
WashingtonOregonIdahoMontanaCaliforniaNevadaAlaska
United Stales
, 1990*
Quantity(MW.h)
2 3014311 884 793
43319
1 683 76889 252
3 192 437
88 372610 13839 599
88
1 741 900190 583
59 586
280050852 459106 38847 054
3 192 0202 047
909
16 363 326
Value(SI 000)
92 229106 464
291
67 3752 032
107 228
5 00619051
9964
29 8874 005
745
601419 2372 085
87780 008
3752
543 364
* Excludes non-cash exchanges.** The New England Power Pool (NEPOOL) coordinates electrical service to member ulililes in
New Hampshire, Maine, Vermont, Massackussets, Connecticut and Rhode Island.
Source: National Energy Board.
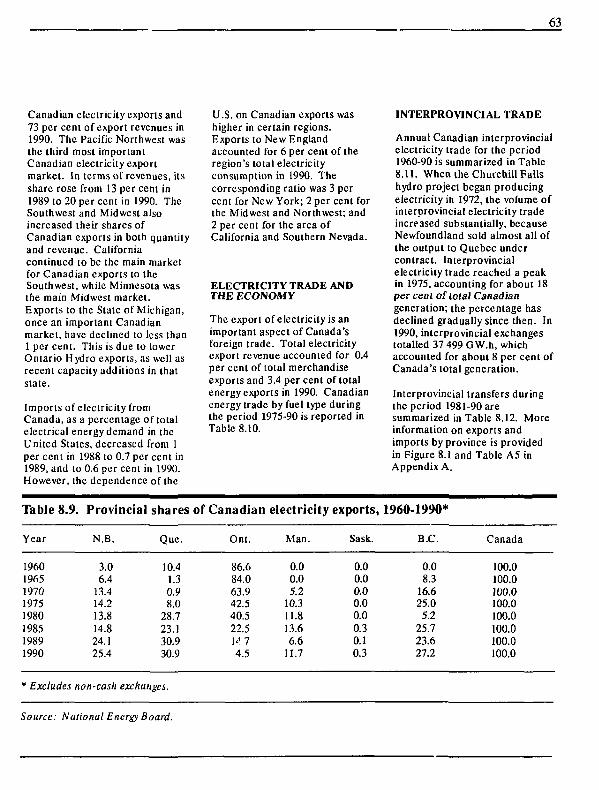
63
Canadian electricity exports and73 per cent of export revenues in1990. The Pacific Northwest wasthe third most importantCanadian electricity exportmarket. In terms of revenues, itsshare rose from 13 per cent in1989 to 20 per cent in 1990. TheSouthwest and Midwest alsoincreased their shares ofCanadian exports in both quantityand revenue. Californiacontinued to be the main marketfor Canadian exports to theSouthwest, while Minnesota wasthe main Midwest market.Exports to the Slate of Michigan,once an important Canadianmarket, have declined lo less than1 per cent. This is due to lowerOntario Hydro exports, as well asrecent capacity additions in thatstate.
Imports of electricity fromCanada, as a percentage of totalelectrical energy demand in theUnited States, decreased from 1per cent in 1988 to 0.7 per cent in1989, and to 0.6 per cent in 1990.However, the dependence of the
U.S. on Canadian exports washigher in certain regions.Exports to New Englandaccounted for 6 per cent of theregion's total electricityconsumption in 1990. Thecorresponding ratio was 3 percent for New York; 2 per cent forthe Midwest and Northwest; and2 per cent for the area ofCalifornia and Southern Nevada.
ELECTRICITY TRADE ANDTHE ECONOMY
The export of electricity is animportant aspect of Canada'sforeign trade. Total electricityexport revenue accounted for 0.4per cent of total merchandiseexports and 3.4 per cent of totalenergy exports in 1990. Canadianenergy trade by fuel type duringthe period 1975-90 is reported inTable 8.10.
INTERPROVINCIAL TRADE
Annual Canadian interprovincialelectricity trade for the period1960-90 is summarized in Table8.11. When the Churchill Fallshydro project began producingelectricity in 1972, the volume ofinterprovincial electricity tradeincreased substantially, becauseNewfoundland sold almost all ofthe output to Quebec undercontract. Interprovincialelectricity trade reached a peakin 1975, accounting for about 18per cent oftotal Canadiangeneration; the percentage hasdeclined gradually since then. In1990, inlerprovincial exchangestotalled 37 499 GW.h, whichaccounted for about 8 per cent ofCanada's total generation.
Interprovincial transfers duringthe period 1981-90 aresummarized in Table 8.12. Moreinformation on exports andimports by province is providedin Figure 8.1 and Table A5 inAppendix A.
Table 8.9.
Year
19601965197019751980198519891990
Provincial shares
N.B.
3.06.4
13.414.213.814.824.125.4
Quc.
10.41.30.98.0
28.723.130.930.9
* Excludes non-cash exchanges.
of Canadian
Ont.
86.684.063.942.540.522.51--! 74.5
electricity
Man.
0.00.05.2
10.311.813.66.6
11.7
exports,
Sask.
0.00.00.00.00.00.30.10.3
1960-1990*
B.C.
0.08.3
16.625.05.2
25.723.627.2
Canada
100.0100.0100.0100.0100.0100.0100.0100.0
Source: National Energy Board.
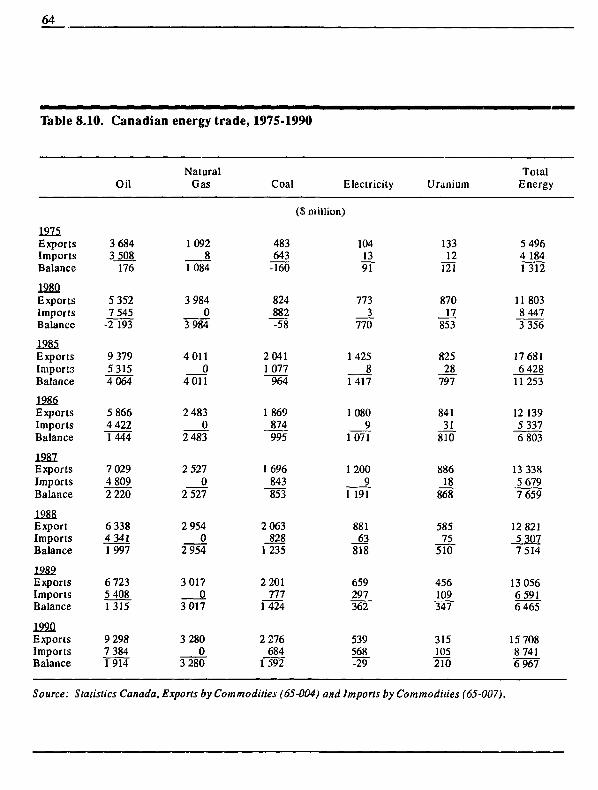
64
Table 8.10. Canadian
1975ExportsImportsBalance
1980ExportsImportsBalance
1985ExportsImportsBalance
1986ExportsImportsBalance
1987ExportsImportsBalance
1988ExportImportsBalance
12S2ExportsImportsBalance
1990ExportsImportsBalance
Oil
3 6843 508
176
5 3527 545
-2 193
9 3795 3154064
5 8664 4221444
7 0294 8092 220
6 3384 3411997
6 7235 4081315
9 2987 3841 914
energy trade,
NaturalGas
10928
1084
3 9840
3 984
40110
4011
2 4830
2 483
2 5270
2 527
2 9540
2 954
3 0170
3 017
3 2800
3 280
1975-1990
Coal Electricity
(S million)
483 104643 13
-160
824882-58
20411077
964
1869874995
1 696843853
2 063828
1235
2 201777
1424
2 276684
1592
91
7733
770
14258
1417
10809
1071
12009
1 191
88163
818
659297362
539568-29
Uranium
13312
121
87017
853
82528
797
84131
810
88618
868
58575
510
456109347
315105210
TotalEnergy
5 4964 1841312
118038 4473 356
17 6816 428
11 253
12 1395 3376 803
13 3385 6797 659
12 8215 3077 514
13 0566 5916 465
15 7088 7416 967
Source: Statistics Canada, Exports by Commodities (65-004) and Imports by Commodities (65-007).
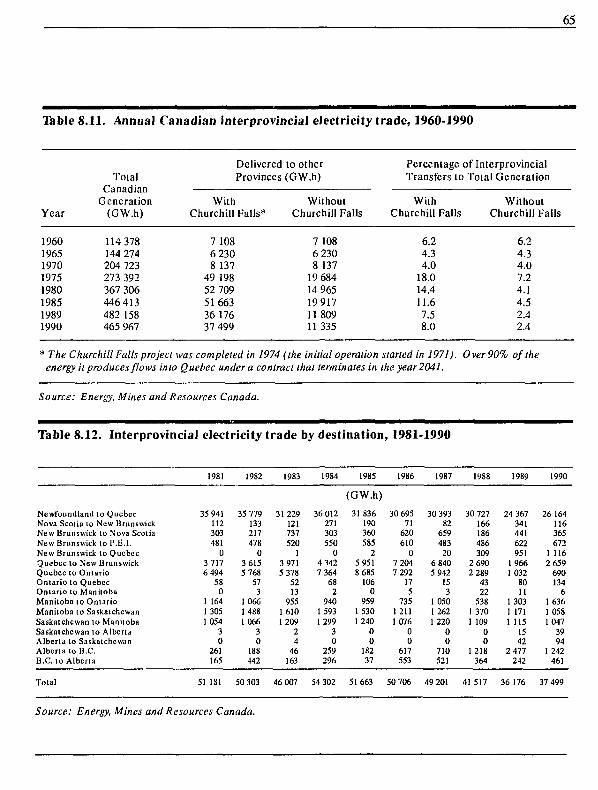
65
Table 8.11. Annual Canadian interprovincial electricity trade, 1960-1990
Year
19601965197019751980198519891990
Total
Generation(GW.h)
114 378144 274204 723273 392367 306446 413482 158465 967
With
Delivered to otherProvinces (GW.h)
WithoutChurchill Falls* Churchill Falls
7 1086 2308 137
49 19852 7095166336 17637 499
7 1086 2308 137
19 68414 96519 91711 80911 335
Percentage of InterprovincialTransfers to Total Generation
WithChurchill Falls
6.24.34.0
18.014.411.67.58.0
WithoutChurchill Falls
6.24.34.07.24.14.52.42.4
* The Churchill Falls project was completed in 1974 (the initial operation started in 1971). Over 90% of theenergy it produces flows into Quebec under a contract that terminates in the year 2041.
Source: Energy, Mines and Resources Canada.
Table 8.12. Interprovincial electricity trade by destination, 1981-1990
Newfoundland lo QuebecNova Scotia lo New BrunswickNew Brunswick to Nova ScoliaNew Brunswick to P.H.I.New Brunswick to QuebecQuebec lo New BrunswickQuebec to OntarioOntario lo QuebecOnlario to ManitobaManitoba to OnlarioManitoba to SaskatchewanSaskatchewan lo ManitobaSaskatchewan to AlbertaAlberta to SaskatchewanAlberta to B.C.B.C. to Alberta
Total
1981
35 941112303481
03 7176 494
580
1 1641 3051 054
30
261165
51 181
1982
35 779133217478
03 6155 768
573
106614881 066
30
188442
50 303
1983
31229121737520
13 9715 378
5213
9551 6101209
24
46163
46 007
1984
36 012271303550
041427 364
682
94015931 299
30
259296
54 302
1985
(GW.h)
31 836190360585
25 9518 685
1060
9591 5301240
00
18237
51663
1986
30 69571
620610
07 2047 292
175
7351 2111 076
00
617553
50 706
1987
30 39382
659483
206 8405 942
153
105012621 220
00
710521
49 201
1988
30 727166186486309
2 6902 289
4322
5381 3701 109
00
1 218364
41 517
1989
24 367341441622951
19661032
8011
1 3031 1711 115
IS42
2 477242
36 176
1990
26 164116365672
1 1162 659
690134
61 63610581047
3994
1 242461
37 499
Source: Energy, Mines and Resources Canada.
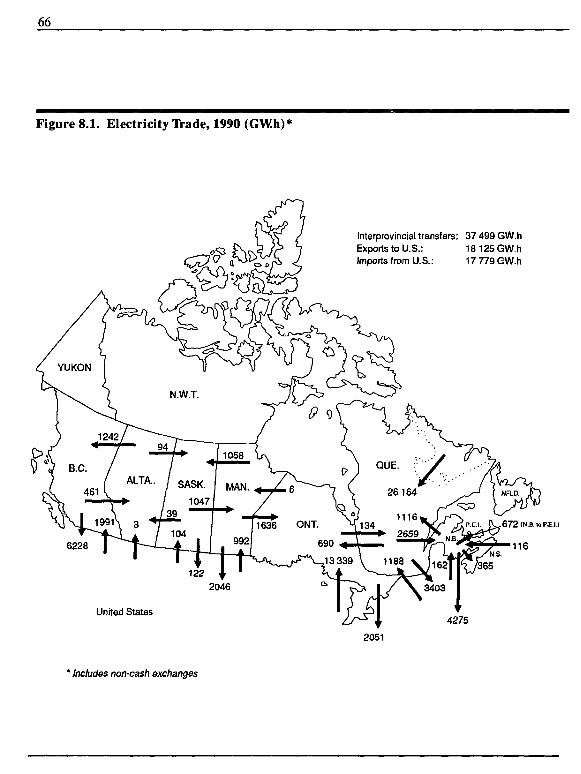
66
Figure 8.1. Electricity IVade, 1990 (GW.h)*
YUKON
1242/94
B.C.
461A L T A - / SASK.
1058
MAN.
Interprovincial transfers: 37 499 GW.hExports to U.S.: 18 125 GW.hImports from U.S.: 17 779 GW.h
0
QUE.
1047r 39
1041636 ONT.
26164
1116.
992 690
,13 339 \ 1188
NRD.
,672(N.B.toP.E.l.)
•116
United States
* Includes non-cash exchanges
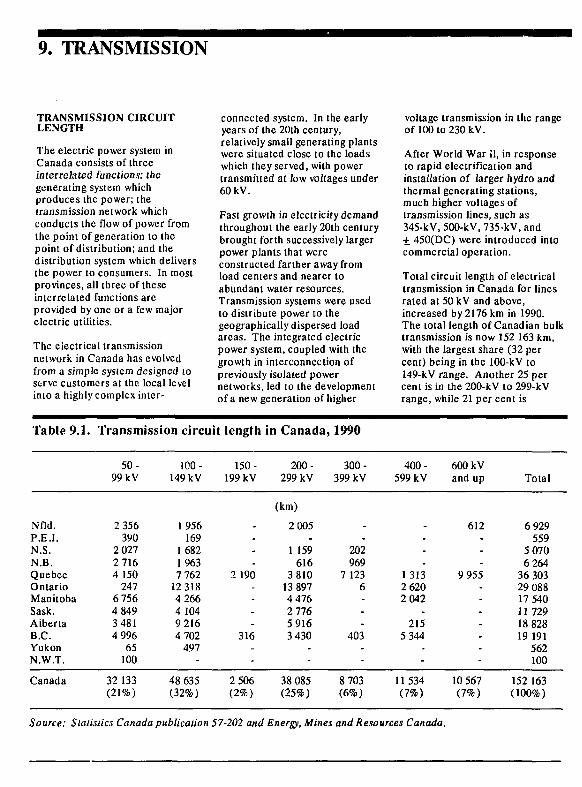
9. TRANSMISSION
TRANSMISSION CIRCUITLENGTH
The electric power system inCanada consists of threeinterrelated functions: thegenerating system whichproduces the power; thetransmission network whichconducts the flow of power fromthe point of generation to thepoint of distribution; and thedistribution system which deliversthe power to consumers. In mostprovinces, all three of theseinterrelated functions areprovided by one or a few majorelectric utilities.
The electrical transmissionnetwork in Canada has evolvedfrom a simple system designed toserve customers at the local levelinto a highly complex inter-
connected system. In the earlyyears of the 20th century,relatively small generating plantswere situated close to the loadswhich they served, with powertransmitted at low voltages under60 kV.
Fast growth in electricity demandthroughout the early 20th centurybrought forth successively largerpower plants that wereconstructed farther away fromload centers and nearer toabundant water resources.Transmission systems were usedto distribute power to thegeographically dispersed loadareas. The integrated electricpower system, coupled with thegrowth in interconnection ofpreviously isolated powernetworks, led to the developmentof a new generation of higher
voltage transmission in the rangeof 100 to 230 kV.
After World War il, in responseto rapid electrification andinstallation of larger hydro andthermal generating stations,much higher voltages oftransmission lines, such as345-kV, 500-kV, 735-kV, and+ 450(DC) were introduced intocommercial operation.
Total circuit length of electricaltransmission in Canada for linesrated at 50 kV and above,increased by 2176 km in 1990.The total length of Canadian bulktransmission is now 152 163 km,with the largest share (32 percent) being in the 100-kV to149-kV range. Another 25 percent is in the 200-kV to 299-kVrange, while 21 per cent is
Table 9.1.
Nfld.P.E.I.N.S.N.B.QuebecOntarioManitobaSask.AibertaB.C.YukonN.W.T.
Canada
Transmission circuit
50-99 kV
2 356390
2 0272 7164 150
2476 7564 8493 4814 996
65100
32 133(21%)
100 -149 kV
1 956169
16821 9637 762
12 3184 2664 1049 2164 702
497-
48 635(32%)
length
150-199 kV
-
2 190
-
-316
--
2 506(2%)
in Canada,
200-299 kV
(km)
2 005
1 159616
3 81013 8974 4762 7765 9163 430
-
38 085(25%)
1990
300-399 kV
.202969
7 1236--
403
-
8 703(6%)
400-599 kV
-
13132 6202 042
2155 344
-
11534(7%)
600 kVand up
612
--
9 955
--
--
10 567(7%)
Total
6 929559
5 0706 264
36 30329 08817 5401172918 82819 191
562100
152 163(100%)
Source: Statistics Canada publication 57-202 and Energy, Mines and Resources Canada.
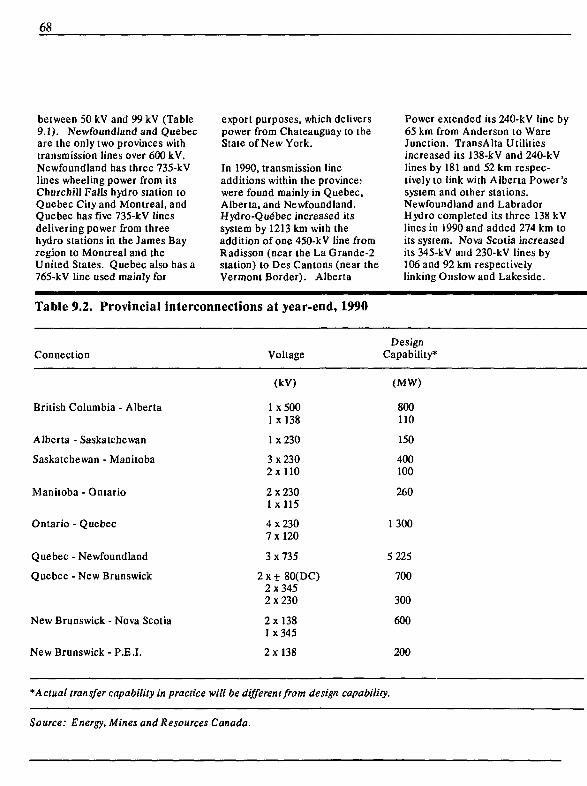
68
between 50 kV and 99 kV (Table9.1). Newfoundland and Quebecare the only two provinces withtransmission lines over 600 kV.Newfoundland has three 735-kVlines wheeling power from itsChurchill Falls hydro station toQuebec City and Montreal, andQuebec has five 735-kV linesdelivering power from threehydro stations in the James Bayregion to Montreal and theUnited States. Quebec also has a765-kV line used mainly for
export purposes, which deliverspower from Chateauguay to theState of New York.
In 1990, transmission lineadditions within the provinceswere found mainly in Quebec,Alberta, and Newfoundland.Hydro-Quebec increased itssystem by 1213 km with theaddition of one 450-kV line fromRadisson (near the La Grande-2station) to Des Cantons (near theVermont Border). Alberta
Power extended its 240-kV line by65 km from Anderson to WareJunction. TransAlta Utilitiesincreased its 138-kV and 240-kVlines by 181 and 52 km respec-tively to link with Alberta Power'ssystem and other stations.Newfoundland and LabradorHydro completed its three 138 kVlines in 1990 and added 274 km toits system. Nova Scotia increasedits 345-kV and 230-kV lines by106 and 92 km respectivelylinking Onslow and Lakeside.
Table 9.2. Provincial interconnections at year-end, 1990
Connection
British Columbia - Alberta
Alberta - Saskatchewan
Saskatchewan - Manitoba
Manitoba - Ontario
Ontario - Quebec
Quebec - Newfoundland
Quebec - New Brunswick
New Brunswick - Nova Scotia
New Brunswick - P.E.I.
Voltage
(kV)
1x5001x138
1x230
3x2302x110
2x2301x115
4x2307x120
3x735
2 x + 80(DC)2x3452x230
2x1381x345
2x138
DesignCapability
(MW)
800110
150
400100
260
1300
5 225
700
300
600
200
*Actual transfer capability in practice will be different from design capability.
Source: Energy, Mines and Resources Canada.
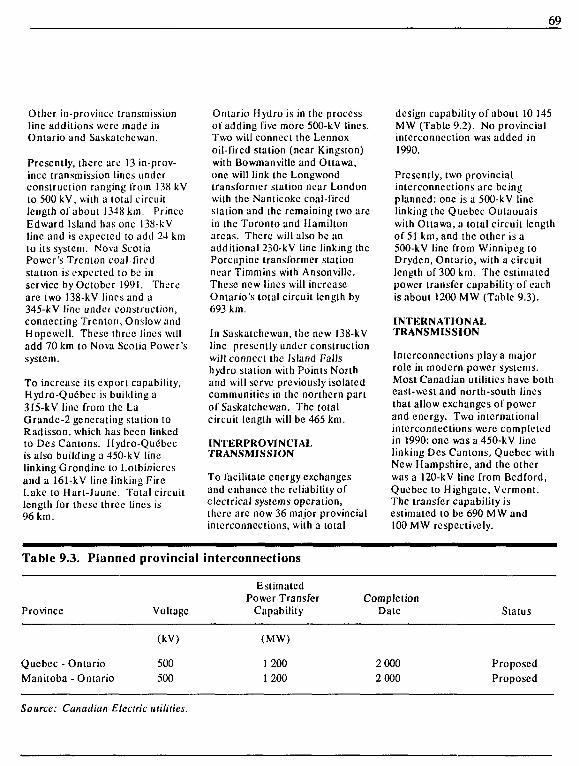
69
Other in-provincc transmissionline additions wore made inOntario and Saskatchewan.
Presently, there are 13 in-prov-ince transmission lines underconstruction ranging from 138 kVto 500 kV, with a total circuitlength of about 1348 km. PrinceEdward Island has one 138-kVline and is expected lo add 24 kmlo its system. Nova ScoiiaPower's Trenton coal-firedstation is expected lo be inservice by October 1991. Therearc two 138-kV lines and a345-kV line under construction,connecting Trenlon, Onslow andHopewcll. These three lines willadd 70 km to Nova Scotia Power'ssystem.
To increase its export capability,Hydro-Quebec is building a315-kVline from the LaGrande-2 generating station toRadisson, which has been linkedto Des Cantons. Hydro-Quebecis also building a 450-kV linelinking Grondine lo Lolbinicresand a 161-kV line linking FireLake to Hart-Jaune. Total circuitlength for these three lines is96 km.
Ontario Hydro is in ihe processof adding five more 500-kV lines.Two will connect the Lennoxoil-fired station (near Kingston)with Bowmanville and Ottawa,one will link the LongwoodIransformer station near Londonwith the Nanlicokc coal-firedstation and the remaining two arcin the Toronto and Hamiltonareas. There will also be anadditional 230-kV line linking thePorcupine transformer stationnear Timmins wilh Ansonville.These new lines will increaseOntario's total circuit length by693 km.
In Saskatchewan, the new 138-kVline presently under constructionwill connect the Island FalJshydro station wilh Points Northand will serve previously isolatedcommunities in the northern partof Saskatchewan. The totalcircuil length will be 465 km.
INTERPROVINCIALTRANSMISSION
To facilitate energy exchangesand enhance the reliability ofelecirical systems operation,there are now 36 major provincialinterconnections, wilh a total
design capability of about 10 145MW (Table 9.2). No provincialinterconnection was added in1990.
Presently, two provincialinterconnections are beingplanned: one is a 500-kV linelinking the Quebec Oulaouaiswith Ottawa, a total circuit lengthof 51 km, and the other is a500-kV line from Winnipeg loDryden, Ontario, wilh a circuitlength of 300 km. The estimatedpower transfer capability of eachis about 1200 MW (Table 9.3).
INTERNATIONALTRANSMISSION
Interconnections play a majorrole in modern power systems.Most Canadian utilities have botheast-west and norlh-south linesthat allow exchanges of powerand energy. Two internationalinterconnections were completedin 1990: one was a 450-kV linelinking Des Cantons, Quebec wilhNew Hampshire, and the otherwas a 120-kV line from Bedford,Quebec lo Highgate, Vermont.The transfer capability isestimated to be 690 MW and100 MW respectively.
Table 9.3. Planned provincial interconnections
Province Voltage
EstimatedPower Transfer
CapabilityCompletion
Date Status
(kV)
Quebec - Ontario 500Manitoba - Ontario 500
(MW)
12001200
2 0002 000
ProposedProposed
Source: Canadian Electric utilities.
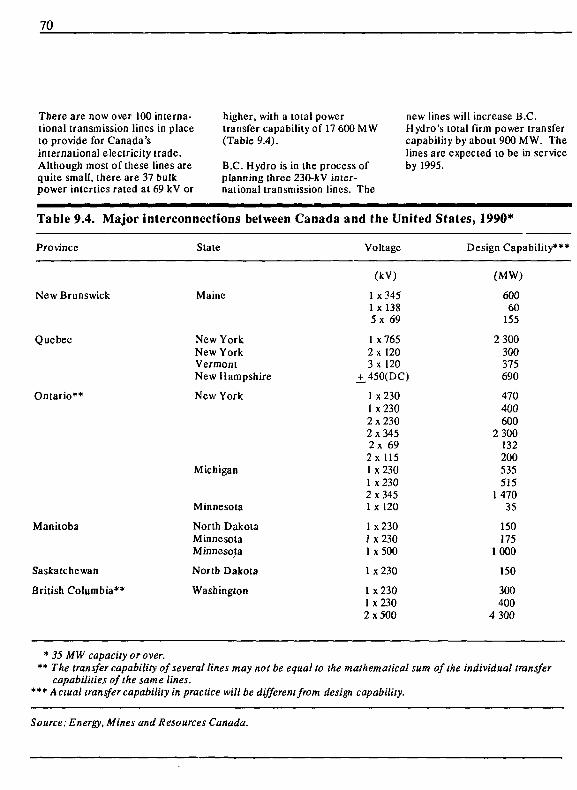
70
There are now over 100 interna-tional transmission lines in placeto provide for Canada'sinternational electricity trade.Although most of these lines arequite small, there are 37 bulkpower inlerties rated at 69 kV or
higher, with a total powertransfer capability of 17 600 MW(Table 9.4).
B.C. Hydro is in the process ofplanning three 230-kV inter-national transmission lines. The
new lines will increase B.C.Hydro's total firm power transfercapability by about 900 MW. Thelines are expected to be in serviceby 1995.
Table 9.4. Major
Province
New Brunswick
Quebec
Ontario**
Manitoba
Saskatchewan
British Columbia**
interconnections between
State
Maine
New YorkNew YorkVermontNew Hampshire
New York
Michigan
Minnesota
North DakotaMinnesotaMinnesota
North Dakota
Washington
Canada and the United
Voltage
(kV)
1 x?451 xl385x 69
1 x7652x 1203x120
^ 4 5 0 ( 0 0
1x2301x2302x2302x3452x 692x 1151x2301 x2302x3451 xl20
1x2301x2301x500
1x230
1x2301x2302x500
States, 1990*
Design Capability***
(MW)
60060
155
2 300300375690
470400600
2 300132200535515
147035
150175
1000
150
300400
4 300
* 35 MW capacity or over.** The transfer capability of several lines may not be equal to the mathematical sum of the individual transfer
capabilities of the same lines.*** Actual transfer capability in practice will be different from design capability.
Source: Energy, Mines and Resources Canada.
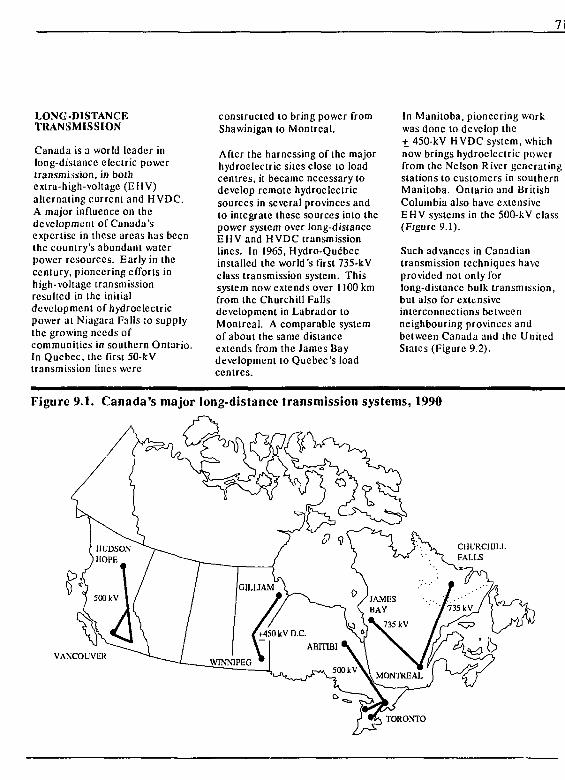
71
LONG-DISTANCETRANSMISSION
Canada is a world leader inlong-distance electric powertransmission, in bothextra-high-voltagc (EHV)alternating current and HVDC.A major influence on thedevelopment of Canada'sexpertise in these areas has beenthe country's abundant waterpower resources. Early in thecentury, pioneering efforts inhigh-voltage transmissionresulted in the initialdevelopment of hydroelectricpower at Niagara Falls ;o supplythe growing needs ofcommunities in southern Ontario.In Quebec, the first 50-kVtransmission lines were
constructed to bring power fromShawinigan to Montreal.
After the harnessing of the majorhydroelectric sites close to loadcentres, it became necessary todevelop remote hydroelectricsources in several provinces andto integrate these sources into thepower system over long-distanceEHV and HVDC transmissionlines. In 1965, Hydro-Quebecinstalled the world's first 735-kVclass transmission system. Thissystem now extends over 1100 kmfrom the Churchill Fallsdevelopment in Labrador toMontreal. A comparable systemof about the same distanceextends from the James Baydevelopment to Quebec's loadcentres.
In Manitoba, pioneering workwas done to develop thet 450-kV HVDC system, whichnow brings hydroelectric powerfrom the Nelson River generatingstations to customers in southernManitoba. Ontario and BritishColumbia also have extensiveEHV systems in the 500-kV class(Figure 9.1).
Such advances in Canadiantransmission techniques haveprovided not only forlong-distance bulk transmission,but also for extensiveinterconnections betweenneighbouring provinces andbetween Canada and the UnitedStates (Figure 9.2).
Figure 9.1. Canada's major long-distance transmission systems, 1990
VANCOUVER
TORONTO
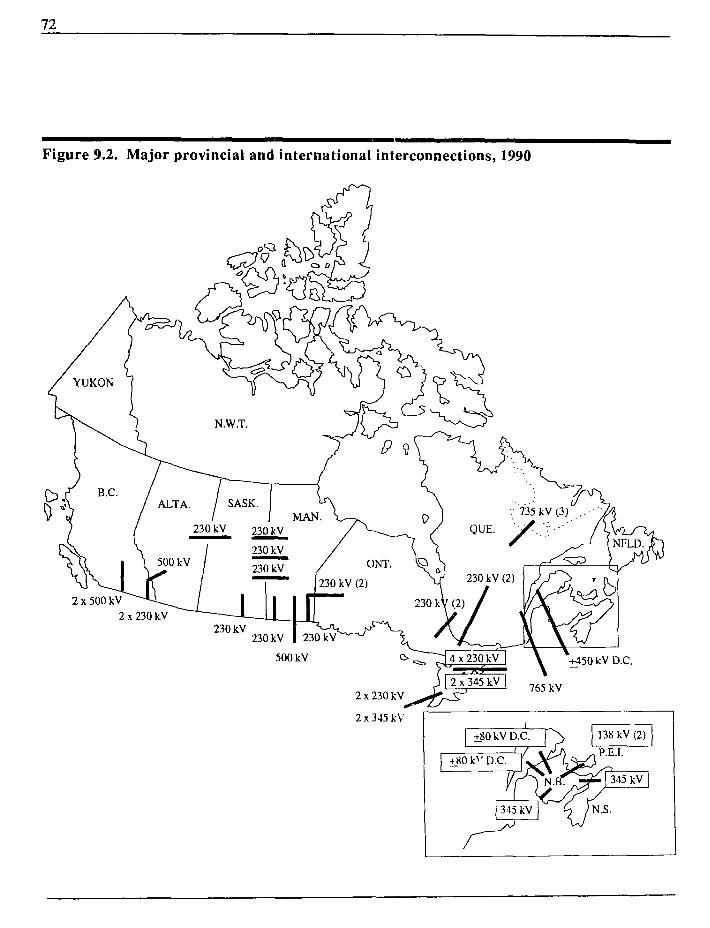
72
Figure 9.2. Major provincial and international interconnections, 1990
ALTA. / SASK.
230 kV 230 kV
230 kV
230 kV
2 x 500 kV
2 x 230 kV
+450 kV D.C.
2 x 230 kV
2 x 345 kV
765 kV
1 1 '+80 kV D.C. N
i /+80 k^'D.C. ' v .
138 kV (2)
KM c^yxPEL
|//YN'.ir^J345kV|
r~345 kV \J N.S.
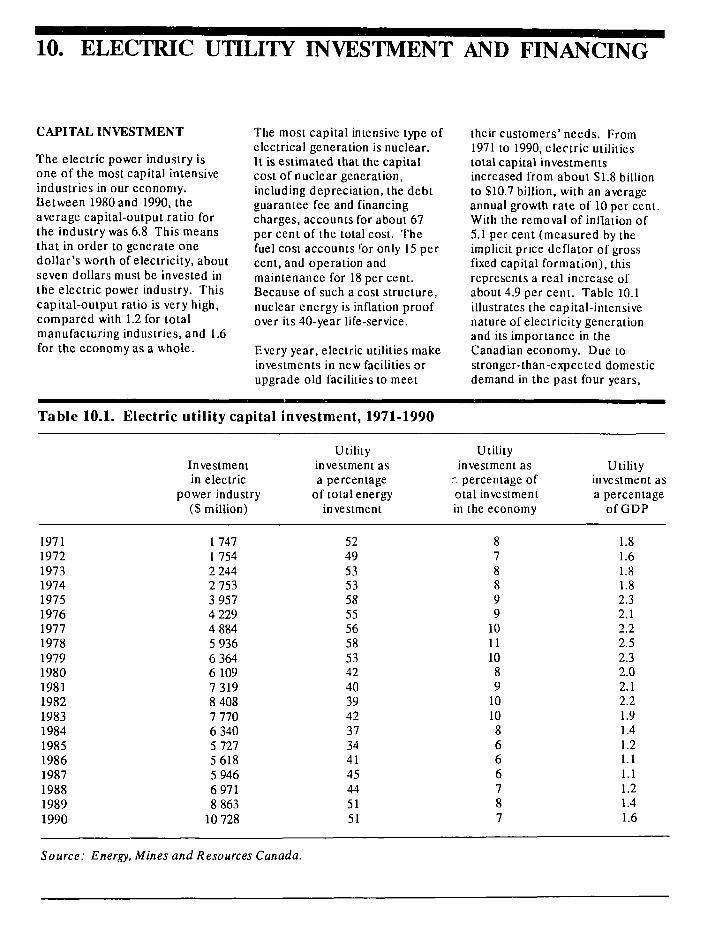
10. ELECTRIC UTILITY INVESTMENT AND FINANCING
CAPITAL INVESTMENT
The electric power industry isone of the most capital intensiveindustries in our economy.Between 1980 and 1990, theaverage capital-output ratio forthe industry was 6.8 This meansthat in order to generate onedollar's worth of electricity, aboutseven dollars must be invested inthe electric power industry. Thiscapital-output ratio is very high,compared with 1.2 for totalmanufacturing industries, and 1.6for the economy as a whole.
The most capital intensive type ofelectrical generation is nuclear.It is estimated that the capitalcost of nuclear generation,including depreciation, the debtguarantee fee and financingcharges, accounts for about 67per cent of the total cost. Thefuel cost accounts for only 15 percent, and operation andmaintenance for 18 per cent.Because of such a cost structure,nuclear energy is inflation proofover its 40-year life-service.
Every year, electric utilities makeinvestments in new facilities orupgrade old facilities to meet
their customers' needs. From1971 to 1990, electric utilitiestotal capital investmentsincreased from about SI.8 billionto S10.7 billion, with an averageannual growth rate of 10 per cent.With the removal of inflation of5.1 per cent (measured by theimplicit price deflator of grossfixed capital formation), thisrepresents a real increase ofabout 4.9 per cent. Table 10.1illustrates the capital-intensivenature of electricity generationand its importance in theCanadian economy. Due tostronger-than-expected domesticdemand in the past four years,
Table 10.1. Electric utility capital investment, 1971-1990
Investmentin electric
power industry(S million)
1 74717542 2442 7533 9574 2294 8845 9366 3646 1097 3198 4087 7706 3405 7275 6185 9466 9718 863
10 728
Utilityinvestment asa percentage
of total energyinvestment
5249535358555658534240394237344145445151
Utilityinvestment as
r. percentage ofotal investmentin the economy
878899
10111089
10108666787
Utilityinvestment asa percentage
ofGDP
1.81.61.81.82.32.12.22.52.32.02.12.21.91.41.21.11.11.21.41.6
19711972197319741975197619771978197919801981198219831984198519861987198819891990
Source: Energy, Mines and Resources Canada.
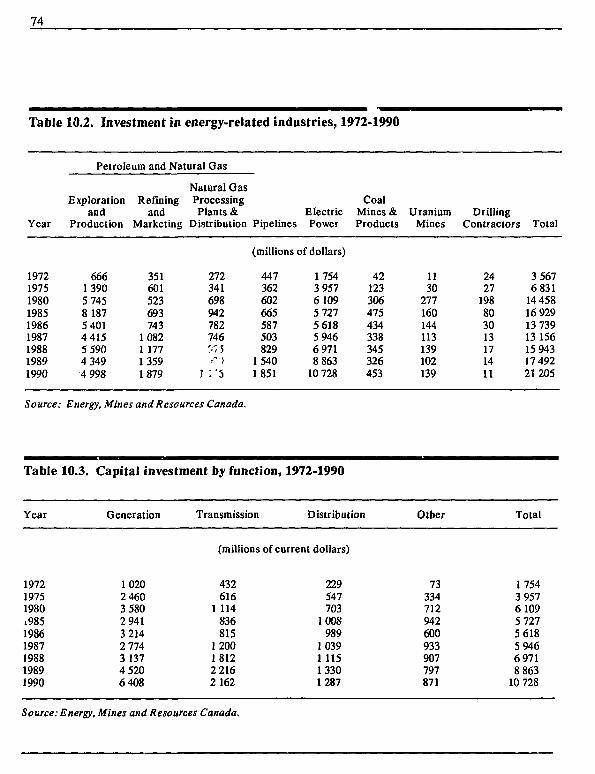
74
Table
Year
197219751980198519861987198819891990
10.2. Investment in energy-related industries, 1972-1990
Petroleum and Natural Gas
Explorationand
Production
6661 3905 7458 1875 40144155 5904 3494 998
Refiningand
Marketing
351601523693743
10821 17713591879
Natural GasProcessingPlants &
Distribution
272341698942782746• •',ri
•"•)
ElectricPipelines Power
(millions of dollars)
447362602665587503829
15401851
17543 95761095 7275 6185 9466 9718 863
10 728
CoalMines &Products
42123306475434338345326453
UraniumMines
1130
277160144113139102139
DrillingContractors
2427
198803013171411
Total
3 5676 831
14 45816 92913 73913 15615 94317 49221205
Source: Energy, Mines and Resources Canada.
Table 10.3. Capital investment by function, 1972-1990
Year Generation Transmission Distribution Other Total
(millions of current dollars)
197219751980i98519861987198819891990
10202 4603 5802 9413 2142 7743 1374 5206 408
432616
1 114836815
120018122 2162162
229547703
1008989
10391 11513301287
73334712942600933907797871
17543 95761095 7275 6185 9466 9718 863
10 728
Source: Energy, Mines and Resources Canada.
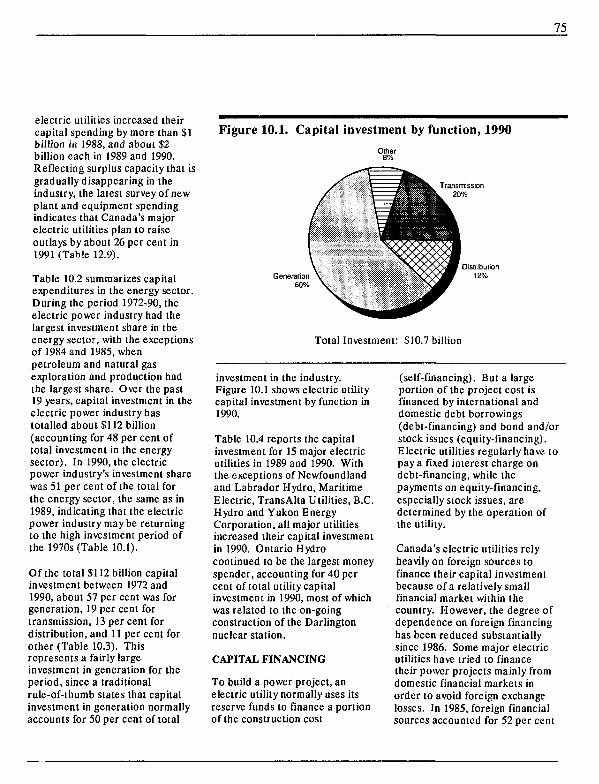
75
electric utilities increased theircapital spending by more than $1billion in 1988, and about $2billion each in 1989 and 1990.Reflecting surplus capacity that isgradually disappearing in theindustry, the latest survey of newplant and equipment spendingindicates that Canada's majorelectric utilities plan to raiseoutlays by about 26 per cent in1991 (Table 12.9).
Table 10.2 summarizes capitalexpenditures in the energy sector.During the period 1972-90, theelectric power industry had thelargest investment share in theenergy sector, with the exceptionsof 1984 and 1985, whenpetroleum and natural gasexploration and production hadthe largest share. Over the past19 years, capital investment in theelectric power industry hastotalled about $112 billion(accounting for 48 per cent oftotal investment in the energysector). In 1990, the electricpower industry's investment sharewas 51 per cent of the total forthe energy sector, the same as in1989, indicating that the electricpower industry may be returningto the high investment period ofthe 1970s (Table 10.1).
Of the total SI 12 billion capitalinvestment between 1972 and1990, about 57 per cent was forgeneration, 19 per cent fortransmission, 13 per cent fordistribution, and 11 per cent forother (Table 10.3). Thisrepresents a fairly largeinvestment in generation for theperiod, since a traditionalrule-of-thumb states that capitalinvestment in generation normallyaccounts for 50 per cent of total
Figure 10.1. Capital investment by function, 1990
Other
Total Investment: $10.7 billion
investment in the industry.Figure 10.1 shows electric utilitycapital investment by function in1990.
Table 10.4 reports the capitalinvestment for 15 major electricutilities in 1989 and 1990. Withthe exceptions of Newfoundlandand Labrador Hydro, MaritimeElectric, TransAlta Utilities, B.C.Hydro and Yukon EnergyCorporation, all major utilitiesincreased their capital investmentin 1990. Ontario Hydrocontinued to be the largest moneyspender, accounting for 40 percent of total utility capitalinvestment in 1990, most of whichwas related to the on-goingconstruction of the Darlingtonnuclear station.
CAPITAL FINANCING
To build a power project, anelectric utility normally uses itsreserve funds to finance a portionof the construction cost
(self-financing). But a largeportion of the project cost isfinanced by international anddomestic debt borrowings(debt-financing) and bond and/orstock issues (equity-financing).Electric utilities regularly have topay a fixed interest charge ondebt-financing, while thepayments on equity-financing,especially stock issues, aredetermined by the operation ofthe utility.
Canada's electric utilities relyheavily on foreign sources tofinance their capital investmentbecause of a relatively smallfinancial market within thecountry. However, the degree ofdependence on foreign financinghas been reduced substantiallysince 1986. Some major electricutilities have tried to financetheir power projects mainly fromdomestic financial markets inorder to avoid foreign exchangelosses. In 1985, foreign financialsources accounted for 52 per cent
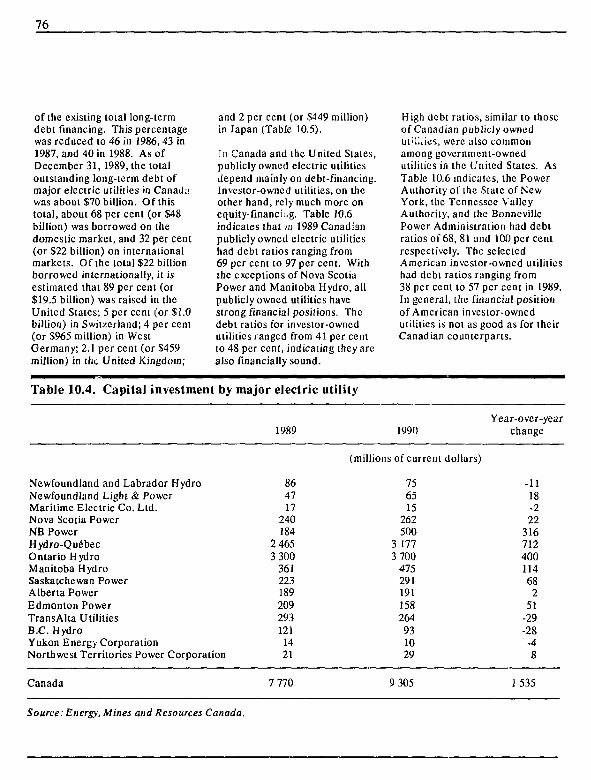
76
of the existing total long-termdebt financing. This percentagewas reduced to 46 in 1986,43 in1987, and 40 in 1988. As ofDecember 31, 1989, ihe totaloutstanding long-term debt ofmajor electric utilities in Canadawas about S70 billion. Of thistotal, about 68 per cent (or S48billion) was borrowed on thedomestic market, and 32 per cent(or S22 billion) on internationalmarkets. Of the total $22 billionborrowed internationally, it isestimated that 89 per cent (orS19.5 billion) was raised in theUnited States; 5 per cent (or $1.0billion) in Switzerland; 4 per cent(or $965 million) in WestGermany; 2.1 per cent (or S459million) in the United Kingdom;
and 2 per cent (or S449 million)in Japan (Table 10.5).
In Canada and the United States,publicly owned electric utilitiesdepend mainly on debt-financing.Investor-owned utilities, on theother hand, rely much more onequity-financing. Table 10.6indicates that in 1989 Canadianpublicly owned electric utilitieshad debt ratios ranging from69 per cent to 97 per cent. Withthe exceptions of Nova ScotiaPower and Manitoba Hydro, allpublicly owned utilities havestrong financial positions. Thedebt ratios for investor-ownedutilities ranged from 41 per centto 48 per cent, indicating they arealso financially sound.
High debt ratios, similar to thoseof Canadian publicly ownedutilities, were also commonamong government-ownedutilities in the United States. AsTable 10.6 indicates, the PowerAuthority of the Stale of NewYork, the Tennessee ValleyAuthority, and the BonneviilePower Administration had debtratios of 68, 81 and 100 per centrespectively. The selectedAmerican investor-owned utilitieshad debt ratios ranging from38 per cent to 57 per cent in 1989.In general, the financial positionof American investor-ownedutilities is not as good as for theirCanadian counterparts.
Table 10.4. Capital investment by major electric utility
1989 1990
ofcurre
756515
262500
3 1773 700
475291191158264
931029
Year-over-yearchange
nt dollars)
-1118-222
31671240011468
251
-29-28
-48
Newfoundland and Labrador Hydro 86Newfoundland Light & Power 47Maritime Electric Co. Ltd. 17Nova Scotia Power 240NB Power 184Hydro-Quebec 2 465Ontario Hydro 3 300Manitoba Hydro 361Saskatchewan Power 223Alberta Power 189Edmonton Power 209TransAlta Utilities 293B.C. Hydro 121Yukon Energy Corporation 14Northwest Territories Power Corporation 21
Canada 7 770 9 305 1535
Source: Energy, Mines and Resources Canada.
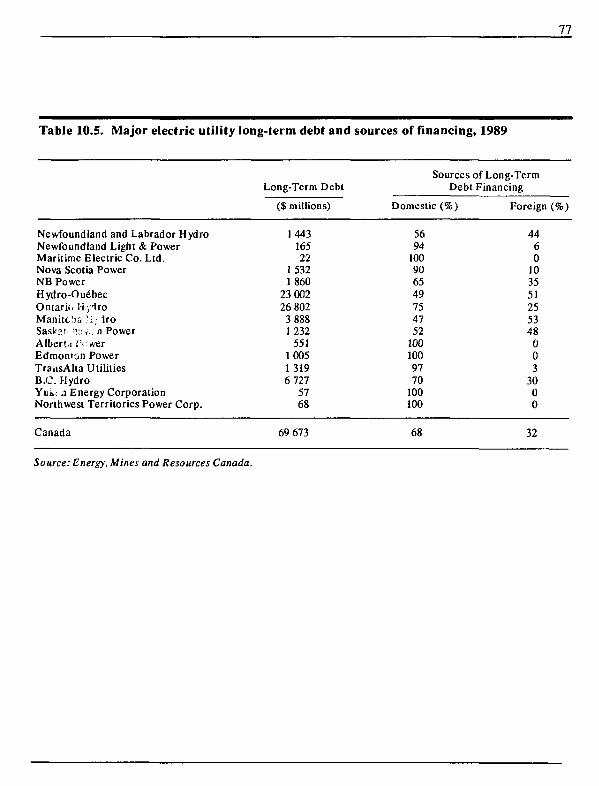
77
Table 10.5. Major electric utility long-term debt and
Newfoundland and Labrador HydroNewfoundland Light & PowerMaritime Electric Co. Ltd.Nova Scotia PowerNB PowerHydro-OuebecOntario HyiroManitoba ' i ; IroSasWa!.".:; .̂ a PowerAlberts pc vverEdmonron PowerTransAlla UtilitiesB.C. HydroYuk; .1 Energy CorporationNorthwest Territories Power Corp.
Canada
Long-Term Debt
($ millions)
144316522
15321860
23 00226 8023 8881 232
551100513196 727
5768
69 673
sources of financing, 1989
Sources of Long-Term
Domestic
5694
100906549754752
1001009770
100100
68
Debt Financing
(%) Foreign (%)
4460
103551255348
003
3000
32
Source: Energy, Mines and Resources Canada.
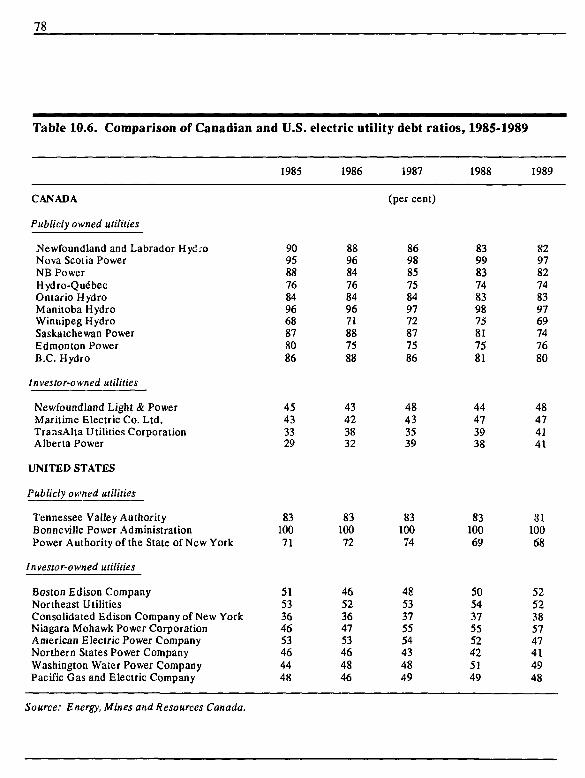
78
Table 10.6. Comparison of Canadian and U.S. electric utility debt ratios, 1985-1989
1985 1986 1987 1988 1989
CANADA
Publicly owned utilities
Newfoundland and Labrador HydroNova Scotia PowerNB PowerHydro-QuebecOntario HydroManitoba HydroWinnipeg HydroSaskatchewan PowerEdmonton PowerB.C. Hydro
Investor-owned utilities
Newfoundland Light & PowerMaritime Electric Co. Ltd.Trar.sAlta Utilities CorporationAlberta Power
UNITED STATES
Publicly owned utilities
Tennessee Valley AuthorityBonneville Power AdministrationPower Authority of the State of New York
Investor-owned utilities
Boston Edison CompanyNortheast UtilitiesConsolidated Edison Company of New YorkNiagara Mohawk Power CorporationAmerican Electric Power CompanyNorthern States Power CompanyWashington Water Power CompanyPacific Gas and Electric Company
90958876849668878086
45433329
88968476849671887588
43423832
(per cent)
86988575849772877586
48433539
83998374839875817581
44473938
82978274839769747680
48474141
8310071
5153364653464448
8310072
4652364753464846
8310074
4853375554434849
8310069
5054375552425149
8110068
5252385747414948
Source: Energy, Mines and Resources Canada.
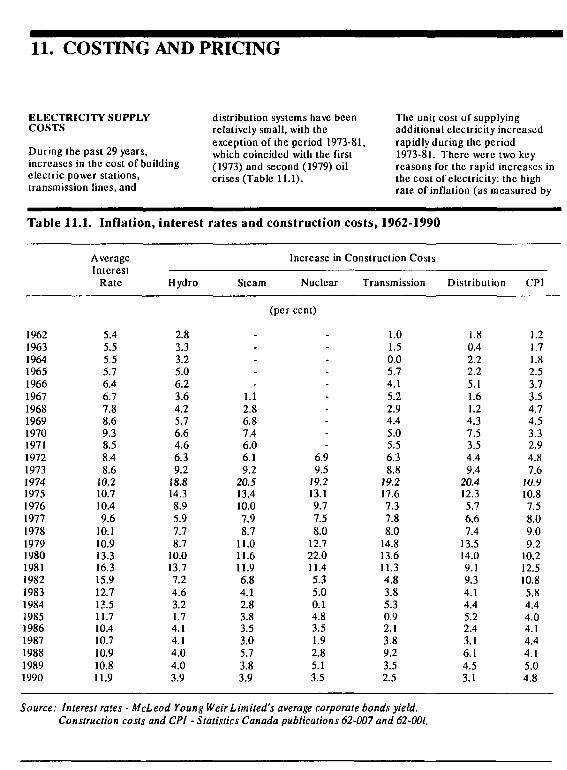
11. COSTING AND PRICING
ELECTRICITY SUPPLYCOSTS
During the past 29 years,increases in the cost of buildingelectric power stations,transmission lines, and
distribution systems have beenrelatively small, with theexception of the period 1973-81,which coincided with the first(1973) and second (1979) oilcrises (Table 11.1).
The unit cost of supplyingadditional electricity increasedrapidly during the period1973-81. There were two keyreasons for the rapid increases inthe cost of electricity: the highrale of inflation (as measured by
Table 11.
19621963196419651966196719681969197019711972197319741975197619771978197919801981198219831984198519861987198819891990
1. Inflation,
AverageInterest
Rate
5.45.55.55.76.46.77.88.69.38.58.48.6
10.210.710.49.6
10.110.913.316.315.912.713.511.710.410.710.910.811.9
interest
Hydro
2.83.33.25.06.23.64.25.76.64.66.39.2
18.814.38.95.97.78.7
10.013.77.24.63.21.74.14.14.04.03.9
rates and
Steam
-
-
1.12.86.87.46.06.19.2
20.513.410.07.98.7
11.011.611.96.84.12.83.83.53.05.73.83.9
construction
Increase in
Nuclear
(per cent)
---------
6.99.5
19.213.19.77.58.0
12.722.011.45.35.00.14.83.51.92.85.13.5
costs, 1962-1990
Construction Costs
Transmission
1.01.50.05.74.15.22.94.45.05.56.38.8
19.217.67.37.88.0
14.813.611.34.83.85.30.92.13.89.23.52.5
Distribution
1.80.42.22.25.11.61.24.37.53.54.49.4
20.412.35.76.67.4
13.514.09.19.34.14.45.22.43.16.14.53.1
CPI
1.21.71.82.53.73.54.74.53.32.94.87.6
10.910.87.58.09.09.2
10.212.510.85.84.44.04.14.44.15.04.8
Source: Interest rates - McLeod Young Weir Limited's average corporate bonds yield.Construction costs and CPI - Statistics Canada publications 62-007 and 62-001.
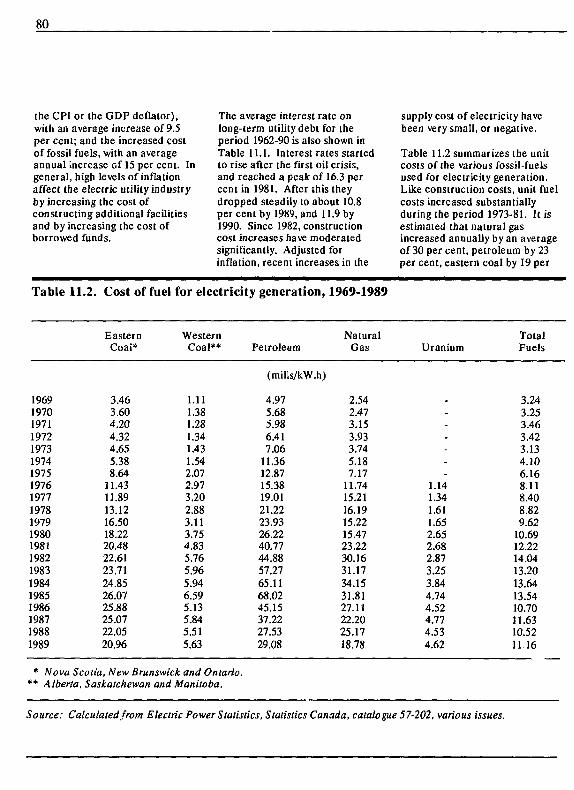
80
the CPI or the GDP deflator),with an average increase of 9.5per cent; and the increased costof fossil fuels, with an averageannual increase cf 15 per cent. Ingeneral, high levels of inflationaffect the electric utility industryby increasing the cost ofconstructing additional facilitiesand by increasing the cost ofborrowed funds.
The average interest rate onlong-term utility debt for theperiod 1962-90 is also shown inTable 11.1. Interest rates startedto rise after the first oil crisis,and reached a peak of 16.3 percent in 1981. After this theydropped steadily to about 10.8per cent by 1989, and 11.9 by1990. Since 1982, constructioncost increases have moderatedsignificantly. Adjusted forinflation, recent increases in the
supply cost of electricity havebeen very small, or negative.
Table 11.2 summarizes the unitcosts of the various fossil-fuelsused for electricity generation.Like construction costs, unit fuelcosts increased substantiallyduring the period 1973-81. It isestimated that natural gasincreased annually by an averageof 30 per cent, petroleum by 23per cent, eastern coal by 19 per
Table 11.2
196919701971197219731974197519761977197819791980198119821983198419851986198719881989
>. Cost of fuel
EasternCoai*
3.463.604.204.324.655.388.64
11.4311.8913.1216.5018.2220.4822.6123.7124.8526.0725.8825.0722.0520.96
for electricity generation,
WesternCoal**
1.111.381.281.341.431.542.072.973.202.883.113.754.835.765.965.946.595.135.845.515.63
Petroleum
(mills/kW.h)
4.975.685.986.417.06
11.3612.8715.3819.0121.2223.9326.2240.7744.8857.2765.1168.0245.1537.2227.5329.08
* Nova Scotia, New Brunswick and Ontario.** Alberta, Saskatchewan and Manitoba.
1969-1989
NaturalGas
2.542.473.153.933.745.187.17
11.7415.2116.1915.2215.4723.2230.1631.1734.1531.8127.1122.2025.1718.78
Uranium
-----
1.141.341.611.652.652.682.873.253.844.744.524.774.534.62
TotalFuels
3.243.253.463.423.134.106.168.118.408.829.62
10.6912.2214.0413.2013.6413.5410.7011.6310.5211.16
Source: Calculated from Electric Power Statistics, Statistics Canada, catalogue 57-202, various issues.
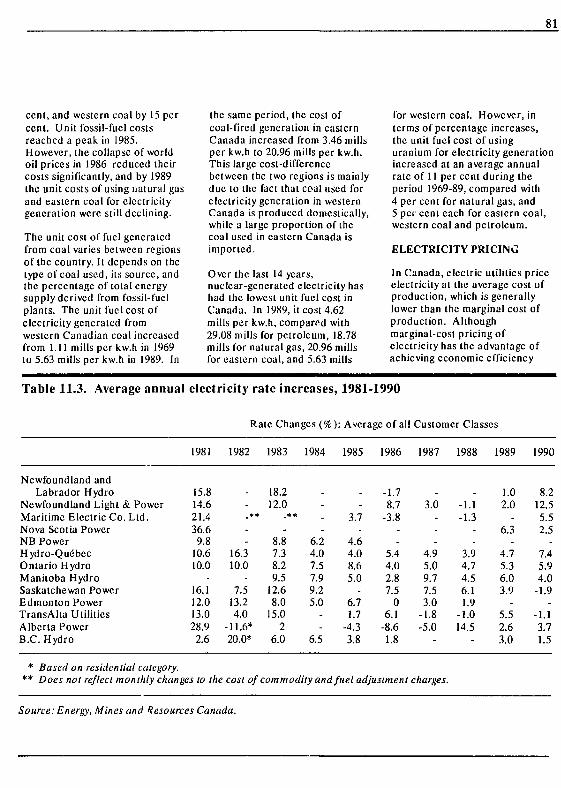
81
cent, and western coal by 15 percenl. Unit fossil-fuel costsreached a peak in 1985.However, the collapse of worldoil prices in 1986 reduced theircosts significantly, and by 1989the unit costs of using natural gasand eastern coal for electricitygeneration were still declining.
The unit cost of fuel generatedfrom coal varies between regionsof the country. It depends on thetype of coal used, its source, andthe percentage of total energysupply derived from fossil-fuelplants. The unit fuel cost ofelectricity generated fromwestern Canadian coal increasedfrom 1.11 mills per kw.h in 1969to 5.63 mills per kw.h in 1989. In
the same period, the cost ofcoal-fired generation in easternCanada increased from 3.46 millsper kw.h to 20.96 mills per kw.h.This large cost-differencebetween the two regions is mainlydue to the fact that coal used forelectricity generation in westernCanada is produced domestically,while a large proportion of thecoal used in eastern Canada isimported.
Over the last 14 years,nuclear-generated electricity hashad the lowest unit fuel cost inCanada. In 1989, it cost 4.62mills per kw.h, compared with29.08 mills for petroleum, 18.78mills for natural gas, 20.96 millsfor eastern coal, and 5.63 mills
for western coal. However, interms of percentage increases,the unit fuel cost of usinguranium for electricity generationincreased at an average annualrate of 11 per cent during theperiod 1969-89, compared with4 per cent for natural gas, and5 pci cenl each for eastern coal,western coal and petroleum.
ELECTRICITY PRICING
In Canada, electric utilities priceelectricity at the average cost ofproduction, which is generallylower than the marginal cost ofproduction. Althoughmarginal-cost pricing ofelectricity has the advantage ofachieving economic efficiency
Table 11.3. Average annual electricity rate increases, 1981-1990
Rate Changes (%): Average of all Customer Classes
Newfoundland andLabrador Hydro
Newfoundland Light & PowerMaritime Electric Co. Ltd.Nova Scotia PowerNB PowerHydro-QuiSbecOntario HydroManitoba HydroSaskatchewan PowerEdmonton PowerTransAlta UtilitiesAlberta PowerB.C. Hydro
* Based on residential category.
1981
15.814.621.436.6
9.810.610.0
-16.112.013.028.92.6
1982
--
-
16.310.0
-7.5
13.24.0
-11.6*20.0*
1983
18.212.0
.**-
8.87.38.29.5
12.68.0
15.02
6.0
1984
---
6.24.07.57.99.25.0
--
6.5
1985
--
3.7
4.64.08.65.0
-6.71.7
-4.33.8
1986
-1.78.7
-3.8
-5.44.02.87.5
06.1
-8.61.8
1987
-3.0
--
4.95.09.77.53.0
-1.8-5.0
-
** Does not reflect monlhly changes to the cost of commodity and fuel adjustment charges.
1988
-1.1-1.3
-3.94.74.56.11.9
-1.014.5
-
1989
1.02.0
.6.3
.4.75.36.03.9
_5.52.63.0
1990
8.212.55.52.5
-7.45.94.0
-1.9
-1.13.71.5
Source: Energy, Mines and Resources Canada.
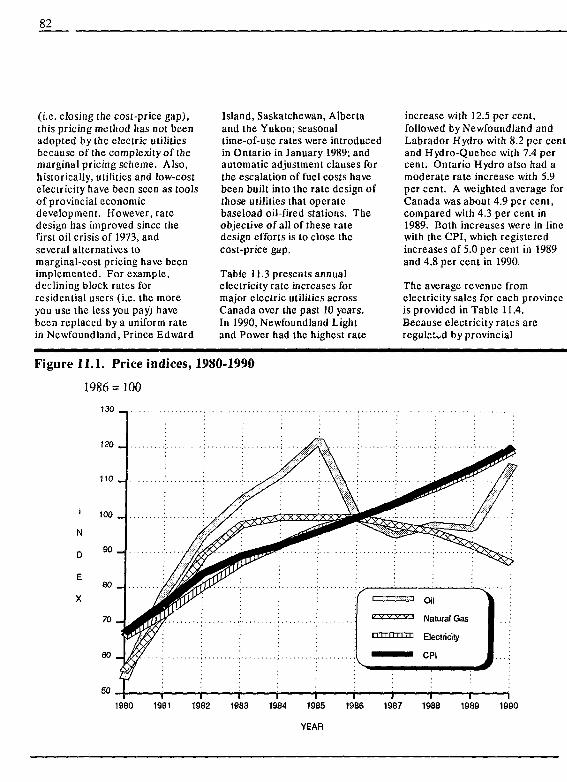
82
(i.e. closing the cost-price gap),this pricing method has not beenadopted by the electric utilitiesbecause of the complexity of themarginal pricing scheme. Also,historically, utilities and low-costelectricity have been seen as toolsof provincial economicdevelopment. However, ratedesign has improved since thefirst oil crisis of 1973, andseveral alternatives tomarginal-cost pricing have beenimplemented. For example,declining block rates forresidential users (i.e. the moreyou use the less you pay) havebeen replaced by a uniform ratein Newfoundland, Prince Edward
Island, Saskatchewan, Albertaand the Yukon; seasonaltime-of-use rates were introducedin Ontario in January 1989; andautomatic adjustment clauses forthe escalation of fuel costs havebeen built into the rate design ofthose utilities that operatebaseload oil-fired stations. Theobjective of all of these raledesign efforts is to close thecost-price gap.
Table 11.3 presents annualelectricity rate increases formajor electric utilities acrossCanada over the past 10 years.In 1990, Newfoundland Lightand Power had the highest rate
increase with 12.5 per cent,followed by Newfoundland andLabrador Hydro with 8.2 per centand Hydro-Quebec with 7.4 percent. Ontario Hydro also had amoderate rate increase with 5.9per cent. A weighted average forCanada was about 4.9 per cent,compared with 4.3 per cent in1989. Both increases were in linewith the CPI, which registeredincreases of 5.0 per cent in 1989and 4.8 per cent in 1990.
The average revenue fromelectricity sales for each provinceis provided in Table 11.4.Because electricity rates areregulated by provincial
Figure 11.1. Price indices, 1980-1990
1986 =100
130
j
N
D
E
X
120 _
110 _,
100 _
90 _
80 _
70 _
60 _
50 _
• • • ; • • • % •
: vs.
-i r
C T V
UTTTTI
mmmV
333 Oil
223 Natural Gas
m i Electricity
• • • CPI
i r
¥\f :
J1960 1961 1982 1983 1984 1985 1986 1987 1986 1989 1990
YEAR
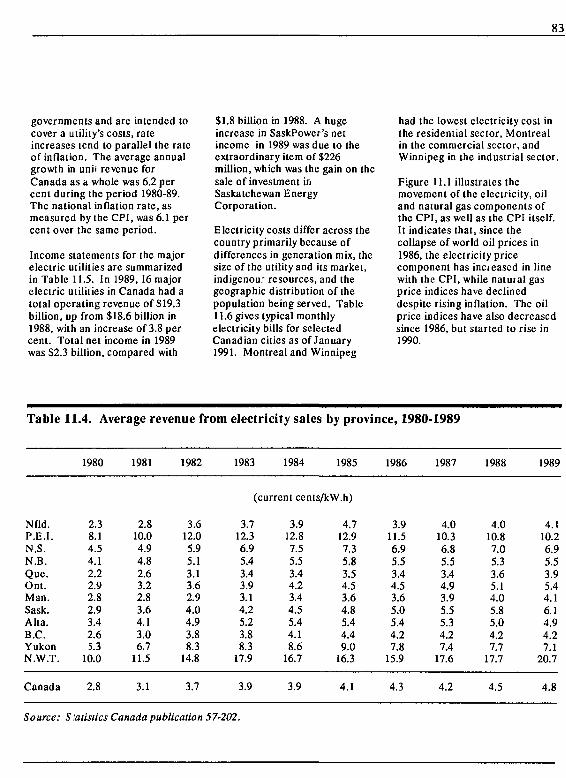
83
governments and are intended tocover a utility's costs, rateincreases tend to parallel the rateof inflation. The average annualgrowth in unit revenue forCanada as a whole was 6.2 percent during the period 1980-89.The national inflation rate, asmeasured by the CPI, was 6.1 percent over the same period.
Income statements for the majorelectric utilities are summarizedin Table 11.5. In 1989, 16 majorelectric utilities in Canada had atotal operating revenue of $19.3billion, up from $18.6 billion in1988, with an increase of 3.8 percent. Total net income in 1989was $2.3 billion, compared with
$1.8 billion in 1988. A hugeincrease in SaskPower's netincome in 1989 was due to theextraordinary item of $226million, which was the gain on thesale of investment inSaskatchewan EnergyCorporation.
Electricity costs differ across thecountry primarily because ofdifferences in generation mix, thesize of the utility and its market,indigenou. resources, and thegeographic distribution of thepopulation being served. Table11.6 gives typical monthlyelectricity bills for selectedCanadian cities as of January1991. Montreal and Winnipeg
had the lowest electricity cost inthe residential sector, Montrealin the commercial sector, andWinnipeg in the industrial sector.
Figure 11.1 illustrates themovement of the electricity, oiland natural gas components ofthe CPI, as well as the CPI itself.It indicates that, since thecollapse of world oil prices in1986, the electricity pricecomponent has increased in linewith the CPI, while natural gasprice indices have declineddespite rising inflation. The oilprice indices have also decreasedsince 1986, but started to rise in1990.
Table
Nfld.P.E.I.N.S.N.B.Que.Ont.Man.Sask.Alta.B.C.YukonN.W.T.
Canada
11.4. Average revenue from
1980
2.38.14.54.12.22.92.82.93.42.65.3
10.0
2.8
1981
2.810.04.94.82.63.22.83.64.13.06.7
11.5
3.1
1982
3.612.05.95.13.13.62.94.04.93.88.3
14.8
3.7
electricity sales
1983 1984
by province, 1980-1989
1985
(current cents/kW.h)
3.712.36.95.43.43.93.14.25.23.88.3
17.9
3.9
3.912.87.55.53.44.23.44.55.44.18.6
16.7
3.9
4.712.97.35.83.54.53.64.85.44.49.0
16.3
4.1
1986
3.911.56.95.53.44.53.65.05.44.27.8
15.9
4.3
1987
4.010.36.85.53.44.93.95.55.34.27.4
17.6
4.2
1988
4.010.87.05.33.65.14.05.85.04.27.7
17.7
4.5
1989
4.110.26.95.53.95.44.16.14.94.27.1
20.7
4.8
Source: S 'atislics Canada publication 57-202.
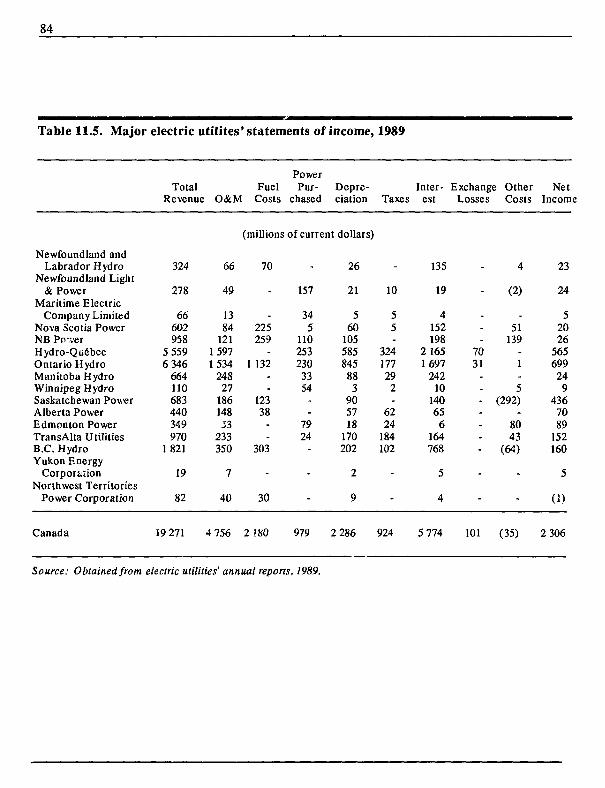
84
Table 11.5. Major
Newfoundland andLabrador Hydro
Newfoundland Light& Power
Maritime ElectricCompany Limited
Nova Scotia PowerNB PowerHydro-QuebecOntario HydroManitoba HydroWinnipeg HydroSaskatchewan PowerAlberta PowerEdmonton PowerTransAlta UtilitiesB.C. HydroYukon Energy
CorporationNorthwest Territories
Power Corporation
Canada
electric
Total
utilites
Revenue O&M
324
278
66602958
5 5596 346
664
no683440349970
1 821
19
82
19 271
66
49
1384
12115971534
24827
18614853
233350
7
40
4 756
'statements of income,
FuelCosts
PowerPur-
chasedDepre-ciation
(millions of current dollars)
70
-
-225259
-1 132
-12338
--
303
-
30
2 !80
-
157
345
110253230
3354
--
7924
-
-
97S
26
21
560
105585845883
905718
170202
2
9
2 286
1989
Taxes
-
10
55.
32417729
2-
6224
184102
-
-
924
Inter-est
135
19
4152198
2 1651697
24210
14065
6164768
5
4
5 774
Exchange OtherLosses Costs
4
(2)
-51
1397031 1
5- (292)-
8043
- (64)
-
-
101 (35)
NetIncom
23
24
52026
565699249
4367089
152160
5
O>
2 306
Source: Obtained from electric utilities' annual reports, 1989.
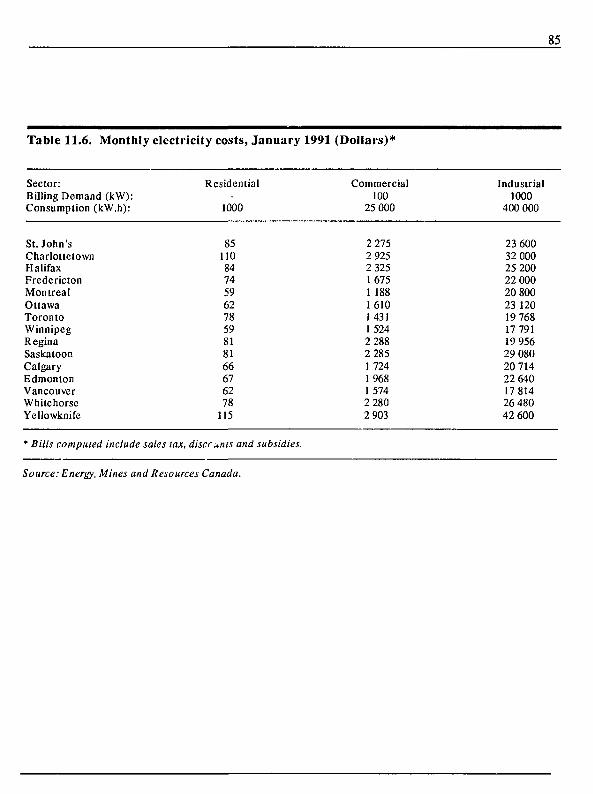
Table 11.6. Monthly electricity costs, January 1991 (Dollars)*
85
Sector:Billing Demand (kW):Consumption (kW.h):
St. John'sCharlottetownHalifaxFrederictonMontrealOttawaTorontoWinnipegReginaSaskatoonCalgaryEdmontonVancouverWhitehorseYellowknife
Residential-
1000
85110847459627859818166676278
115
Commercial100
25 000
Industrial1000
400 000
2 2752 9252 32516751 1881610143115242 2882 28517241 9681 5742 2802 903
23 60032 00025 20022 00020 80023 12019 76817 79119 95629 08020 71422 64017 81426 48042 600
' Bills computed include sales lax, discrunis and subsidies.
Source: Energy, Mines and Resources Canada.
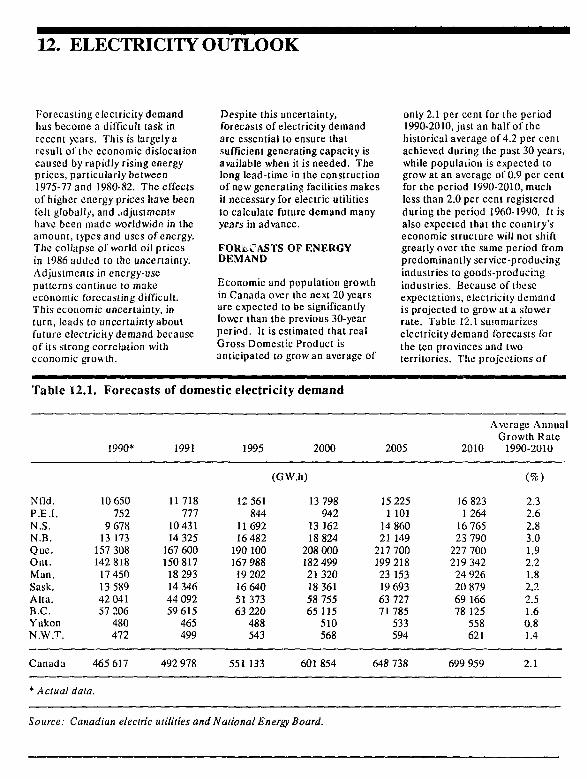
12. ELECTRICITY OUTLOOK
Forecasting electricity demandhas become a difficult task inrecent years. This is largely aresult of the economic dislocationcaused by rapidly rising energyprices, particularly between1975-77 and 1980-82. The effectsof higher energy prices have beenfelt globally, and adjustmentshave been made worldwide in iheamount, types and uses of energy.The collapse of world oil pricesin 1986 added to the uncertainty.Adjustments in energy-usepatterns continue to makeeconomic forecasting difficult.This economic uncertainty, inturn, leads to uncertainly aboutfuture electricity demand becauseof its strong correlation witheconomic growth.
Despite this uncertainty,forecasts of electricity demandare essential to ensure thatsufficient generating capacity isavailable when it is needed. Thelong lead-time in the constructionof new generating facilities makesit necessary for electric utilitiesto calculate future demand manyyears in advance.
FORECASTS OF ENERGYDEMAND
Economic and population growthin Canada over the next 20 yearsare expected to be significantlylower than the previous 30-yearperiod. It is estimated that realGross Domestic Product isanticipated to grow an average of
only 2.1 per cent for the period1990-2010, just an half of thehistorical average of 4.2 per centachieved during the past 30 years,while population is expected togrow at an average of 0.9 per centfor the period 1990-2010, muchless than 2.0 per cent registeredduring the period 1960-1990. It isalso expected that the country'seconomic structure will not shiftgreatly over the same period frompredominantly service-producingindustries to goods-producingindustries. Because of theseexpect£tions, electricity demandis projected to grow at a slowerrate. Table 12.1 summarizeselectricity demand forecasts forthe ten provinces and twoterritories. The projections of
Table 12.1
Nfld.P.E.I.N.S.N.B.Que.Ont.Man.Sask.Alta.B.C.YukonN.W.T.
Canada
* Actual data
. Forecasts
1990*
10 650752
9 67813 173157 308142 81817 45013 58942 04157 206480472
465 617
of domestic electricity demand
1991
11 718777
10 43114 325167 600150 81718 29314 34644 09259 615465499
492 978
1995 2000
(GW.h)
12 561844
1169216 482190 100167 98819 20216 64051 37363 220488543
551 133
13 798942
13 16218 824
208 000182 4992132018 36158 75565 115510568
601 854
2005
15 2251 10114 86021 149217 700199 21823 15319 69363 72771785533594
648 738
2010
16 8231 264
16 76523 790227 700219 34224 92620 87969 16678 125558621
699 959
Average AnnualGrowth Rate1990-2010
(%)
2.32.62.83.01.92.21.82.22.51.60.81.4
2.1
Source: Canadian electric utilities and National Energy Board.
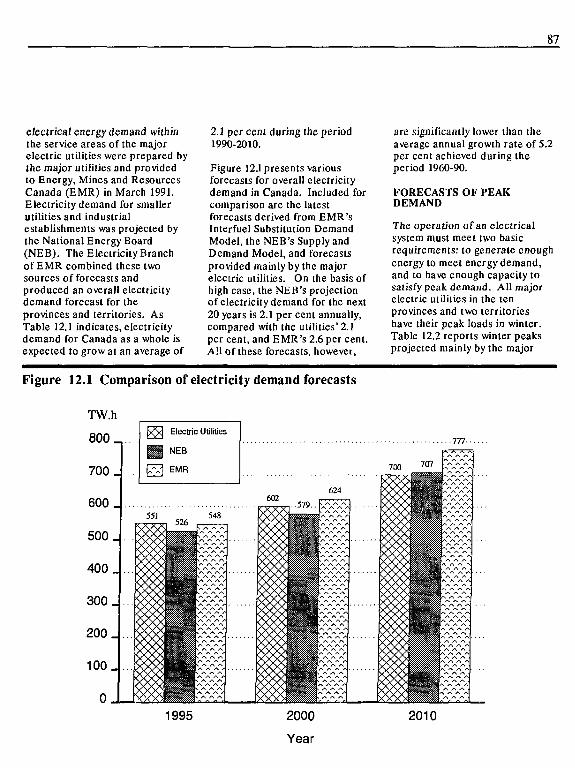
87
electrical energy demand withinthe service areas of the majorelectric utilities were prepared bythe major utilities and providedto Energy, Mines and ResourcesCanada (EMR) in March 1991.Electricity demand for smallerutilities and industrialestablishments was projected bythe National Energy Board(NEB). The Electricity Branchof EMR combined these twosources of forecasts andproduced an overall electricitydemand forecast for theprovinces and territories. AsTable 12.1 indicates, electricitydemand for Canada as a whole isexpected to grow at an average of
2.1 per cent during the period1990-2010.
Figure 12.1 presents variousforecasts for overall electricitydemand in Canada. Included forcomparison are the latestforecasts derived from EMR'sInterfuel Substitution DemandModel, the NEB's Supply andDemand Model, and forecastsprovided mainly by the majorelectric utilities. On the basis ofhigh case, the NEB's projectionof electricity demand for the next20 years is 2.1 per cent annually,compared with the utilities'2.1per cent, and EMR's 2.6 per cent.All of these forecasts, however,
are significantly lower than theaverage annual growth rate of 5.2per cent achieved during theperiod 1960-90.
FORECASTS OF PEAKDEMAND
The operation of an electricalsystem must meet two basicrequirements: to generate enoughenergy to meet energy demand,and to have enough capacity tosatisfy peak demand. All majorelectric utilities in the tenprovinces and two territorieshave their peak loads in winter.Table 12.2 reports winter peaksprojected mainly by the major
Figure 12.1 Comparison of electricity demand forecasts
777-
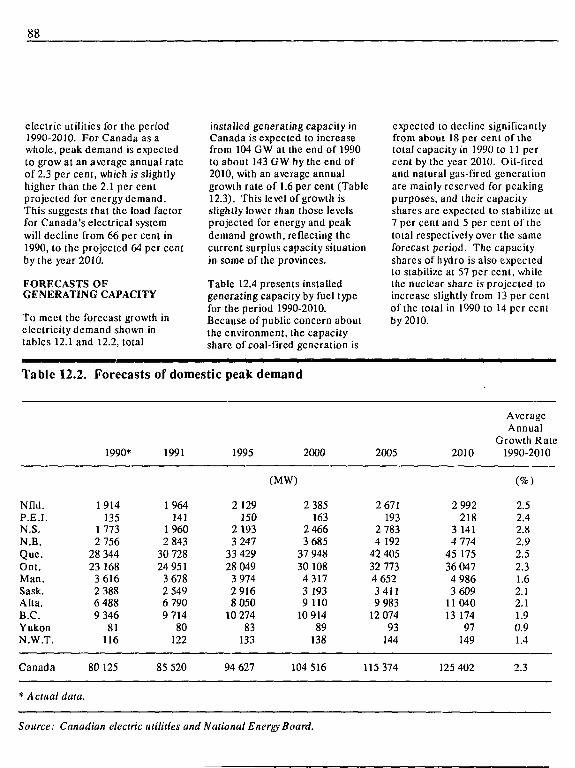
electric utilities for the period1990-2010. For Canada as awhole, peak demand is expectedto grow at an average annual rateof 2.3 per cent, which is slightlyhigher than the 2.1 per centprojected for energy demand.This suggests that the load factorfor Canada's electrical systemwill decline from 66 per cent in1990, to the projected 64 per centby the year 2010.
FORECASTS OFGENERATING CAPACITY
To meet the forecast growth inelectricity demand shown intables 12.1 and 12.2, total
installed generating capacity inCanada is expected to increasefrom 104 GW at the end of 1990to about 143 GW by the end of2010, with an average annualgrowth rate of 1.6 per cent (Table12.3). This level of growth isslightly lower than those levelsprojected for energy and peakdemand growth, reflecting thecurrent surplus capacity situationin some of the provinces.
Table 12.4 presents installedgenerating capacity by fuel typefor the period 1990-2010.Because of public concern aboutthe environment, the capacityshare of coal-fired generation is
expected to decline significantlyfrom about 18 per cent of thetotal capacity in 1990 to 11 percent by the year 2010. Oil-firedand natural gas-fired generationare mainly reserved for peakingpurposes, and their capacityshares are expected to stabilize at7 per cent and 5 per cent of thetotal respectively over the sameforecast period. The capacityshares of hydro is also expectedto stabilize at 57 per cent, whilethe nuclear share is projected toincrease slightly from 13 per centof the total in 1990 to 14 per centby 2010.
Table 12.2.
Nfld.P.E.I.N.S.N.B.Que.Ont.Man.Sask.Alta.B.C.YukonN.W.T.
Canada
* Actual data.
Forecasts
1990*
1914135
17732 756
28 34423 168
3 6162 3886 4889 346
81116
80 125
of domestic
1991
1 964141
19602 843
30 72824 951
3 6782 5496 7909 714
80122
85 520
peak
1995
2 129150
2 1933 247
33 42928 049
3 9742 9168 050
10 27483
133
94 627
demand
2000
(MW)
2 385163
2 4663 685
37 94830 1084 3173 1939 110
10 91489
138
104 516
2005
2 671193
2 7834 192
42 40532 7734 65234119 983
12 07493
144
115 374
2010
2 992218
3 1414 774
45 17536 0474 9863 609
11 04013 174
97149
125 402
AverageAnnual
Growth Rate1990-2010
(%)
2.52.42.82.92.52.31.62.12.11.90.91.4
2.3
Source: Canadian electric utilities and National Energy Board.
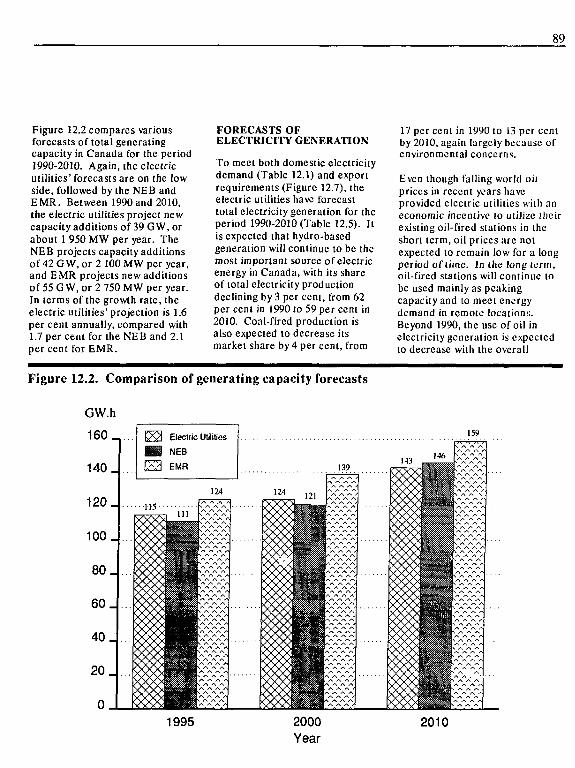
89
Figure 12.2 compares variousforecasts of total generatingcapacity in Canada for the period1990-2010. Again, the electricutilities' forecasts are on the lowside, followed by the NEB andEMR. Between 1990 and 2010,the electric utilities project newcapacity additions of 39 GW, orabout 1 950 MW per year. TheNEB projects capacity additionsof 42 GW, or 2 100 MW per year,and EMR projects new additionsof 55 GW, or 2 750 MW per year.In terms of the growth rate, theelectric utilities'projection is 1.6per cent annually, compared with1.7 per cent for the NEB and 2.1per cent for EMR.
FORECASTS OFELECTRICITY GENERATION
To meet both domestic electricitydemand (Table 12.1) and exportrequirements (Figure 12.7), theelectric utilities have forecasttotal electricity generation for theperiod 1990-2010 (Table 12.5). Itis expected that hydro-basedgeneration will continue to be themost important source of electricenergy in Canada, with its shareof total electricity productiondeclining by 3 per cent, from 62per cent in 1990 to 59 per cent in2010. Coal-fired production isalso expected to decrease itsmarket share by 4 per cent, from
17 per cent in 1990 to 13 per centby 2010, again largely because ofenvironmental concerns.
Even though falling world oilprices in recent years haveprovided electric utilities with aneconomic incentive to utilize theirexisting oil-fired stations in theshort term, oil prices arc notexpected to remain low for a longperiod of time. In the long term,oil-fired stations will continue tobe used mainly as peakingcapacity and to meet energydemand in remote locations.Beyond 1990, the use of oil inelectricity generation is expectedto decrease with the overall
Figure 12.2. Comparison of generating capacity forecasts
159
1995 2010
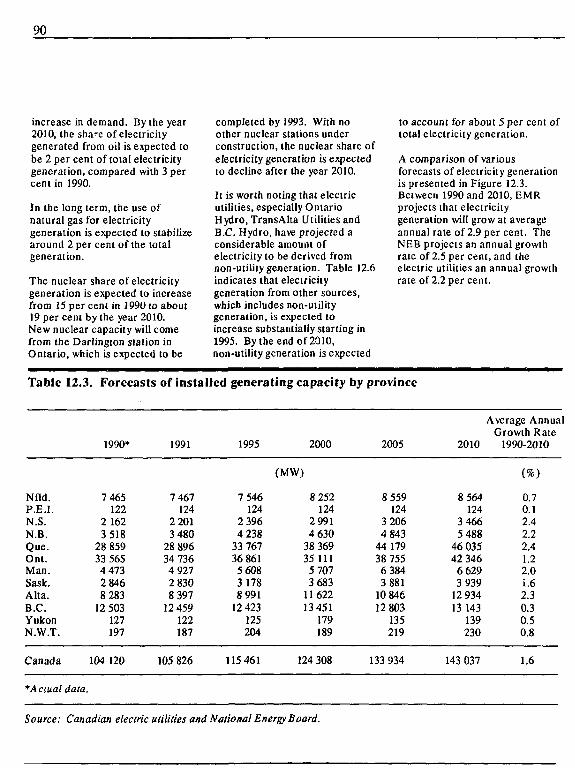
90
increase in demand. By the year2010, the share of electricitygenerated from oil is expected tobe 2 per cent of total electricitygeneration, compared with 3 percent in 1990.
In the long term, the use ofnatural gas for electricitygeneration is expected to stabilizearound 2 per cent of the totalgeneration.
The nuclear share of electricitygeneration is expected to increasefrom 15 per cent in 1990 to about19 per cent by the year 2010.New nuclear capacity will comefrom the Darlington station inOntario, which is expected to be
completed by 1993. With noother nuclear stations underconstruction, the nuclear share ofelectricity generation is expectedto decline after the year 2010.
It is worth noting that electricutilities, especially OntarioHydro, TransAlta Utilities andB.C. Hydro, have projected aconsiderable amount ofelectricity to be derived fromnon-utility generation. Table 12.6indicates that electricitygeneration from other sources,which includes non-utilitygeneration, is expected toincrease substantially starting in1995. By the end of 2010,non-utility generation is expected
to account for about 5 per cent oftotal electricity generation.
A comparison of variousforecasts of electricity generationis presented in Figure 12.3.Between 1990 and 2010, EMRprojects that electricitygeneration will grow at averageannual rate of 2.9 per cent. TheNEB projects an annual growthrate of 2.5 per cent, and theelectric utilities an annual growthrate of 2.2 per cent.
Table 12
Nfld.P.E.I.N.S.N.B.Que.Onl.Man.Sask.Aha.B.C.YukonN.W.T.
Canada
.3. Forecasts
1990*
7 465122
2 1623 518
28 85933 5654 4732 8468 283
12 503127197
104 120
* Actual data.
of installed generating capacity by province
1991
7 467124
2 2013 480
28 89634 7364 9272 8308 397
12 459122187
105 826
1995
7 546124
2 3964 238
33 76736 8615 6083 1788 991
12 423125204
115 461
2000
(MW)
8 252124
2 9914 630
38 36935 1115 7073 683
1162213 451
179189
124 308
2005
8 559124
3 2064 843
44 17938 7556 3843 881
10 84612 803
135219
133 934
2010
8 564124
3 4665 488
46 03542 346
6 6293 939
12 93413 143
139230
143 037
Average AnnualGrowth Rate
1990-2010
( * )
0.70.12.42.22.41.22.0i.62.30.30.50.8
1.6
Source: Canadian electric utilities and National Energy Board.
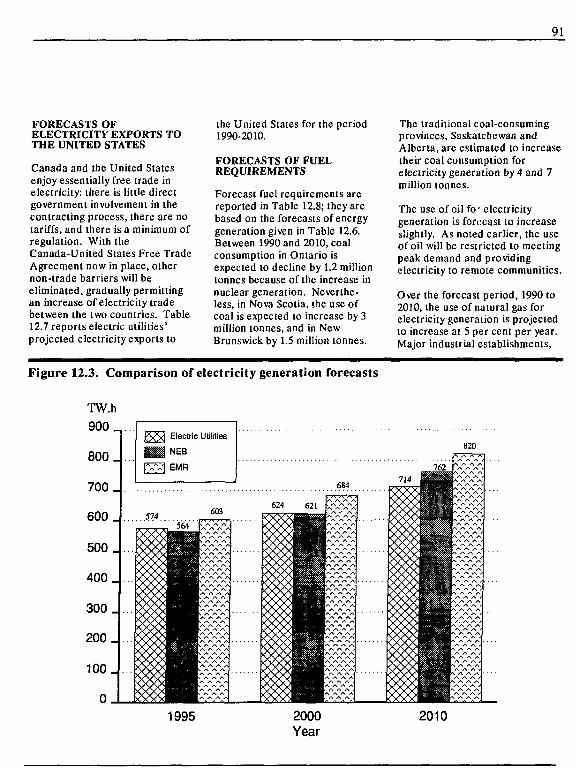
91
FORECASTS OFELECTRICITY EXPORTS TOTHE UNITED STATES
Canada and the United Statesenjoy essentially free trade inelectricity: there is little directgovernment involvement in thecontracting process, there are notariffs, and there is a minimum ofregulation. With theCanada-United States Free TradeAgreement now in place, othernon-trade barriers will beeliminated, gradually permittingan increase of electricity tradebetween the two countries. Table12.7 reports electric utilities'projected electricity exports to
the United States for the period1990-2010.
FORECASTS OF FUELREQUIREMENTS
Forecast fuel requirements arereported in Table 12.8; they arebased on the forecasts of energygeneration given in Table 12.6.Between 1990 and 2010, coalconsumption in Ontario isexpected to decline by 1.2 milliontonnes because of the increase innuclear generation. Neverthe-less, in Nova Scotia, ihe use ofcoal is expected to increase by 3million tonnes, and in NewBrunswick by 1.5 million tonnes.
The traditional coal-consumingprovinces, Saskatchewan andAlberta, are estimated to increasetheir coal consumption forelectricity generation by 4 and 7million tonnes.
The use of oil fo' electricitygeneration is forecast to increaseslightly. As noted earlier, the useof oil will be restricted to meetingpeak demand and providingelectricity to remote communities.
Over the forecast period, 1990 to2010, the use of natural gas forelectricity generation is projectedto increase at 5 per cent per year.Major industrial establishments,
Figure 12.3. Comparison of electricity generation forecasts
1995 2000Year
2010
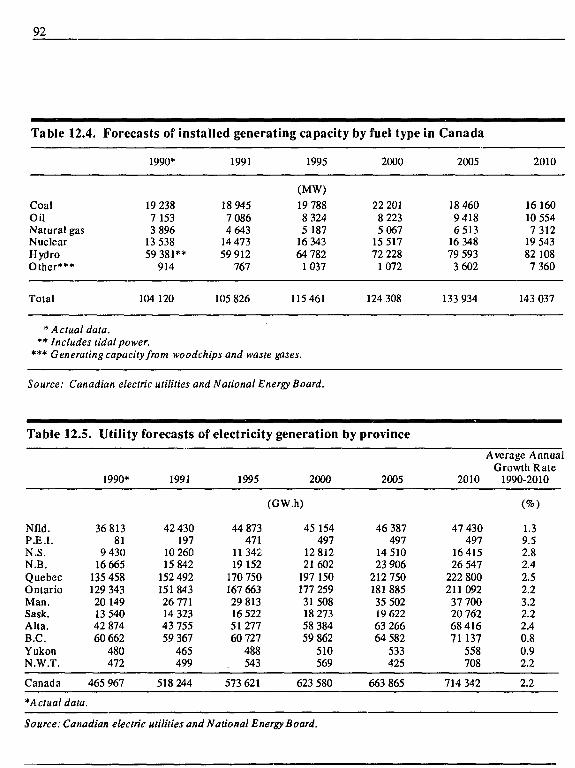
92
Table 12.4.
CoalOilNatural gasNuclearHydroOther***
Total
Forecasts of installed generating capacity
1990*
19 2387 1533 896
13 53859 381**
914
104 120
1991
18 9457 0864 643
14 47359 912
767
105 826
1995
(MW)19 7888 3245 187
16 34364 782
1037
115 461
by fuel type
2000
22 2018 2235 067
15 51772 228
1072
124 308
in Canada
2005
18 4609 4186 513
16 34879 5933 602
133 934
2010
16 16010 5547 312
19 54382 1087 360
143 037
* Actual data.** Includes tidal power.
*** Generating capacity from woodchips and waste gases.
Source: Canadian electric utilities and National Energy Board.
Table 12.5
Nfld.P.E.I.N.S.N.B.QuebecOntarioMan.Sask.Alta.B.C.YukonN.W.T.
Canada
* Actual data.
. Utility
1990*
36 81381
9 43016 665
135 458129 34320 14913 54042 87460662
480472
465 967
forecasts
1991
42 430197
10 26015 842
152 492151 84326 77114 32343 75559 367
465499
518 244
of electricity generation
1995 2000
(GW.h)
44 873471
11 34219 152
170 750167 66329 81316 52251 27760 727
488543
573 621
45 154497
12 81221602
197 150177 2593150818 27358 38459 862
510569
623 580
by province
2005
46 387497
14 51023 906
212 750181 88535 50219 62263 26664 582
533425
663 865
2010
47 430497
1641526 547
222 80021109237 70020 76268 41671 137
558708
714 342
Average AnnualGrowth Rale
1990-2010
(%)
1.39.52.82.42.52.23.22.22.40.80.92.2
2.2
Source: Canadian electric utilities and National Energy Board.
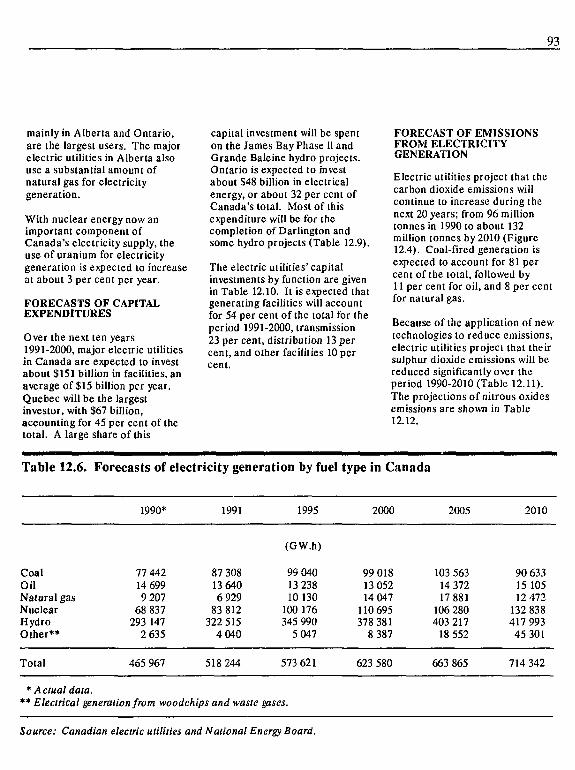
93
mainly in Alberta and Ontario,are the largest users. The majorelectric utilities in Alberta alsouse a substantial amount ofnatural gas for electricitygeneration.
With nuclear energy now animportant component ofCanada's electricity supply, theuse of uranium for electricitygeneration is expected to increaseat about 3 per cent per year.
FORECASTS OF CAPITALEXPENDITURES
Over the next ten years1991-2000, major electric utilitiesin Canada are expected to investabout $151 billion in facilities, anaverage of $15 billion per year.Quebec will be the largestinvestor, with $67 billion,accounting for 45 per cent of thetotal. A large share of this
capital investment will be spenton the James Bay Phase 11 andGrande Baleine hydro projects.Ontario is expected to investabout $48 billion in electricalenergy, or about 32 per cent ofCanada's total. Most of thisexpenditure will be for thecompletion of Darlington andsome hydro projects (Table 12.9).
The electric utilities' capitalinvestments by function are givenin Table 12.10. It is expected thatgenerating facilities will accountfor 54 per cent of the total for theperiod 1991-2000, transmission23 per cent, distribution 13 percent, and other facilities 10 percent.
FORECAST OF EMISSIONSFROM ELECTRICITYGENERATION
Electric utilities project that thecarbon dioxide emissions willcontinue to increase during thenext 20 years; from 96 milliontonnes in 1990 to about 132million tonnes by 2010 (Figure12.4). Coal-fired generation isexpected to account for 81 percent of the total, followed by11 per cent for oil, and 8 per centfor natural gas.
Because of the application of newtechnologies to reduce emissions,electric utilities project that theirsulphur dioxide emissions will bereduced significantly over theperiod 1990-2010 (Table 12.11).The projections of nitrous oxidesemissions are shown in Table12.12.
Table 12.6.
CoalOilNatural gasNuclearHydroOther**
Total
* Actual data
Forecasts of electricity generation by fuel
1990*
77 44214 6999 207
68 837293 147
2 635
465 967
1991
87 30813 6406 929
83 812322 515
4 040
518 244
•• Electrical generation from woodchips and waste
1995
(GW.h)
99 04013 23810130
100 176345 990
5 047
573 621
gases.
type in Canada
2000
99 01813 05214 047
110 695378 381
8 387
623 580
2005
103 56314 37217 881
106 280403 217
18 552
663 865
2010
90 63315 10512 472
132 838417 99345 301
714 342
Source: Canadian electric utilities and National Energy Board.
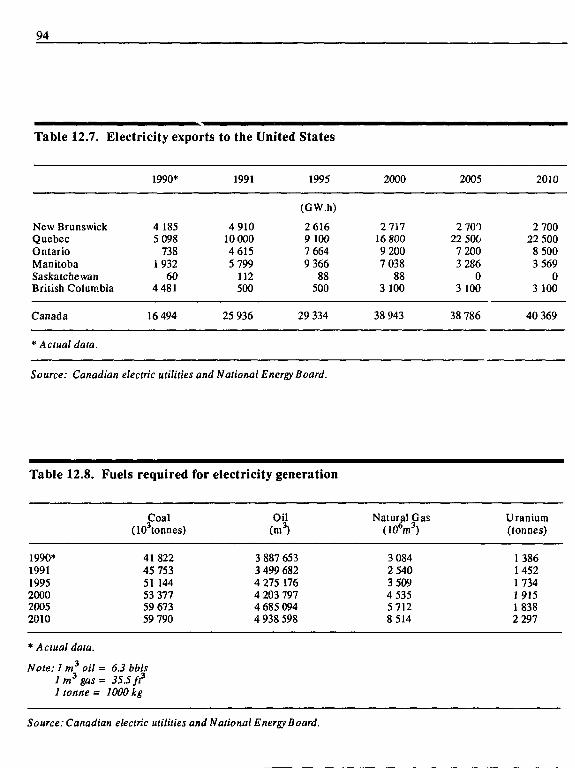
94
Table 12.7. Electricity exports
New BrunswickQuebecOntarioManitobaSaskatchewanBritish Columbia
Canada
* Actual data.
1990*
4 1855 098
7381932
604 481
16 494
to the United
1991
4 91010 0004 6155 799
112500
25 936
States
1995
(GW.h)
2 6169 1007 6649 366
88500
29 334
2000
271716 8009 2007 038
883 100
38 943
2005
2 70022 500
7 2003 286
03 100
38 786
2010
2 70022 500
8 5003 569
03 100
40 369
Source: Canadian electric utilities and National Energy Board.
Table 12.8.
1990*19911995200020052010
* Actual data.
Note: 1 m3 oil1 m3 gas1 tonne =
Fuels required
Coal(103 tonnes)
4182245 75351 14453 37759 67359 790
= 6.3 bbls= 35.5 ft3
•• 1000 kg
for electricity generation
Oil(m3)
3 887 6533 499 6824 275 1764 203 7974 685 0944 938 598
Natural Gas(10V)
3 0842 5403 5094 5355 7128 514
Uranium(tonnes)
1 386145217341 91518382 297
Source: Canadian electric utilities and National Energy Board.
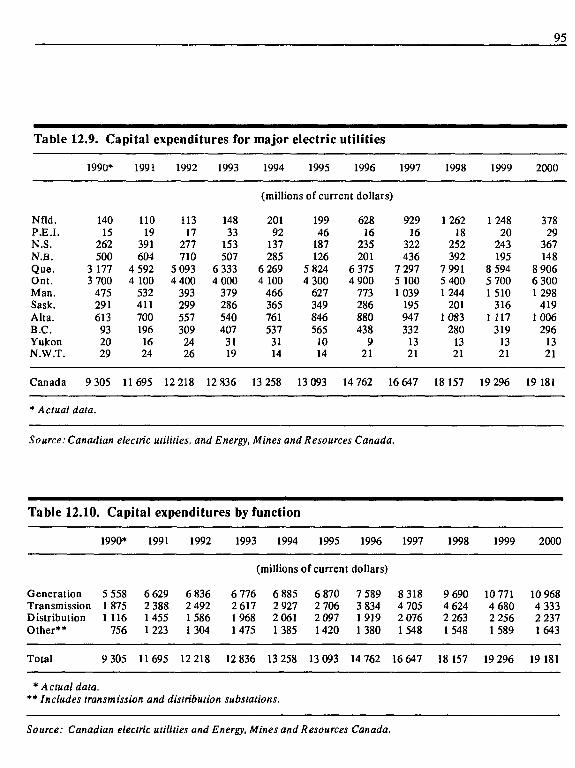
Table
Nfld.P.E.I.N.S.N.B.Que.Ont.Man.Sask.Alta.B.C.YukonN.W.T.
Canada
12.9. Capital expenditures for
1990*
14015262500
3 1773 700475291613932029
9 305
* Actual data.
1991
11019391604
4 5924 1005324117001961624
11695
1992
11317277710
5 0934 4003932995573092426
12218
1993
14833153507
6 3334 0003792865404073119
12 836
major
1994
electric
1995
utilities
1996 1997
(millions of current dollars)
20192137285
6 2694 1004663657615373114
13 258
19946187126
5 8244 3006273498465651014
13 093
62816235201
6 3754 900773286880438921
14 762
92916322436
7 2975 10010391959473321321
16 647
1998
126218252392
7 9915 4001244201
10832801321
18 157
1999
1 24820243195
8 5945 7001510316
1 1173191321
19 296
2000
37829367148
8 9066 3001298419
10062961321
19 181
Source: Canadian electric utilities, and Energy, Mines and Resources Canada.
Table 12.10. Capital expenditures by function
1990* 1991 1992 1993 1994 1995 1996 1997 1998 1999 2000
Generation 5 558 6 629 6 836Transmission 1 875 2 388 2 492Distribution 1116 1455 1586Other** 756 1223 1304
(millions of current dollars)
6 776 6 885 6 870 7 589 8 318 9 690 10 771 10 9682 617 2 927 2 706 3 834 4 705 4 624 4 680 4 3331968 2 061 2 097 1919 2 0761475 1385 1420 1380 1548
2 2631548
2 256 2 2371 589 1 643
Total 9 305 11695 12 218 12 836 13 258 13 093 14 762 16 647 18 157 19 296 19 181
* Actual data.** Includes transmission and distribution substations.
Source: Canadian electric utilities and Energy, Mines and Resources Canada.
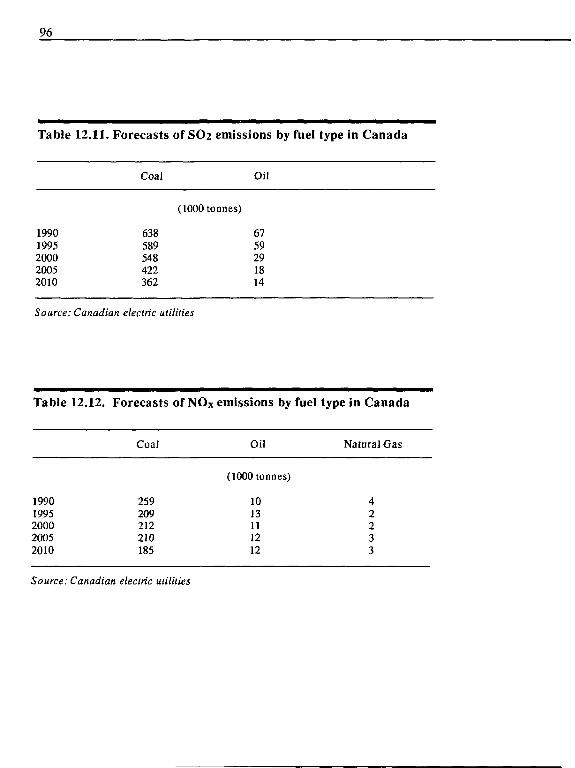
96
Table 12.11. Forecasts of SO2 emissions by fuel type in Canada
Coal Oil
19901995200020052010
638589548422362
(1000 tonnes)
6759291814
Source: Canadian electric utilities
Table 12.12.
19901995200020052010
Forecasts of NOX
Coal
259209212210185
emissions by fuel
Oil
(1000 tonnes)
1013111212
type in Canada
Natural Gas
42233
Source: Canadian electric utilities
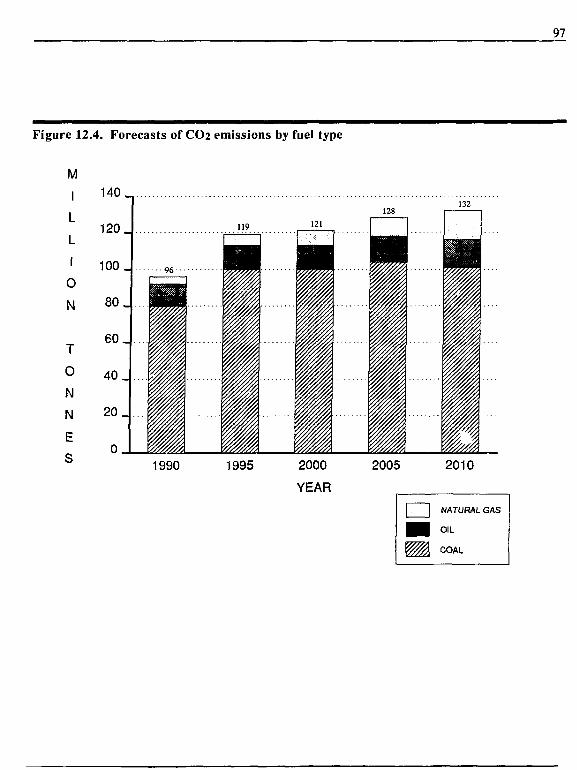
Figure 12.4. Forecasts of CO2 emissions by fuel type
97
M
1
L
L
1
0
N
T
0
N
N
E
S
140
120
100
80
60
40
20
0
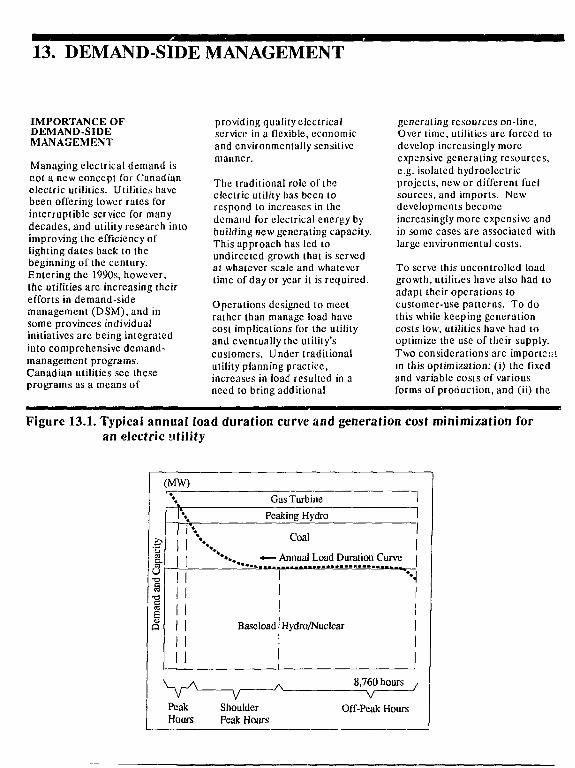
13. DEMAND-SIDE MANAGEMENT
IMPORTANCE OFDEMAND-SIDEMANAGEMENT
Managing electrical demand isnot a new concept for Canadianelectric utilities. Utilities havebeen offering lower rates forinlerruptible service for manydecades, and utility research intoimproving the efficiency oflighting dales back to thebeginning of the century.Entering the 1990s, however,the utilities are increasing theirefforts in demand-sidemanagement (DSM), and insome provinces individualinitiatives are being integratedinto comprehensive demand-management programs.Canadian utilities see theseprograms as a means of
providing quality electricalservice in a flexible, economicand environmentally sensitivemanner.
The traditional role of theelectric utility has been torespond to increases in thedemand for electrical energy bybuilding new generating capacity.This approach has led toundirected growth that is servedat whatever scale and whatevertime of day or year it is required.
Operations designed to meetrather than manage load havecost implications for the utilityand eventually the utility'scustomers. Under traditionalutility planning practice,increases in load resulted in aneed to bring additional
generating resources on-line.Over time, utilities are forced todevelop increasingly moreexpensive generating resources,e.g. isolated hydroelectricprojects, new or different fuelsources, and imports. Newdevelopments becomeincreasingly more expensive andin some cases are associated withlarge environmental costs.
To serve this uncontrolled loadgrowth, utilities have also had toadapt their operations tocustomer-use patterns. To dothis while keeping generationcosts low, utilities have had tooptimize the use of their supply.Two considerations are imports:!',in this optimization: (i) the fixedand variable costs of variousforms of production, and (ii) the
Figure 13.1. Typical annual load duration curve and generation cost minimization foran electric utility
(MW)
Gas Turbine
Peaking Hydro
Coal
, *— Annual Load Duration Curve
1 •'II
Baseload' Hydro/Nuclear
8,760 hours
PeakHours
ShoulderPeak Hours
Off-Peak Hours
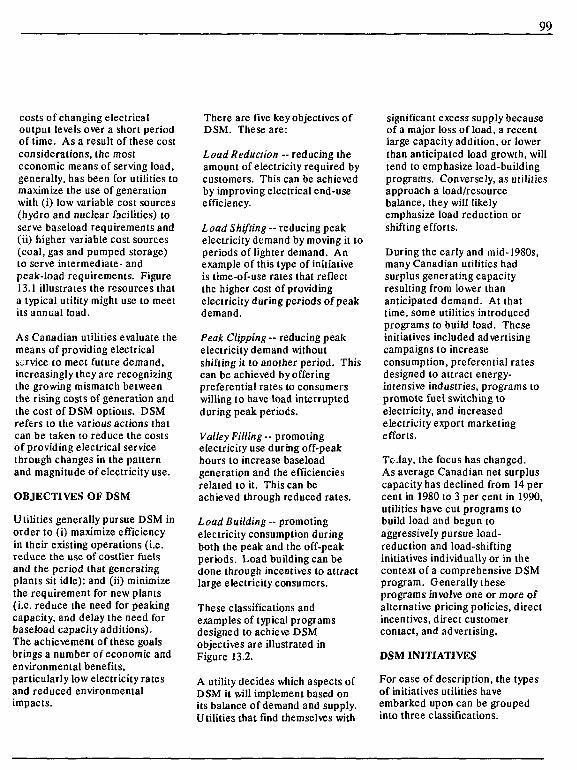
99
costs of changing electricaloutput levels over a short periodof time. As a result of these costconsiderations, the mosteconomic means of serving load,generally, has been for utilities tomaximize the use of generationwith (i) low variable cost sources(hydro and nuclear facilities) toserve baseload requirements and(ii) higher variable cost sources(coal, gas and pumped storage)to serve intermediate- andpeak-load requirements. Figure13.1 illustrates the resources thata typical utility might use to meetits annual load.
As Canadian utilities evaluate themeans of providing electricalservice to meet future demand,increasingly they are recognizingthe growing mismatch betweenthe rising costs of generation andthe cost of DSM options. DSMrefers to the various actions thatcan be taken to reduce the costsof providing electrical servicethrough changes in the patternand magnitude of electricity use.
OBJECTIVES OF DSM
Utilities generally pursue DSM inorder to (i) maximize efficiencyin their existing operations (i.e.reduce the use of costlier fuelsand the period that generatingplants sit idle); and (ii) minimizethe requirement for new plants(i.e. reduce the need for peakingcapacity, and delay the need forbaseload capacity additions).The achievement of these goalsbrings a number of economic andenvironmental benefits,particularly low electricity ratesand reduced environmentalimpacts.
There are five key objectives ofDSM. These are:
Load Reduction — reducing theamount of electricity required bycustomers. This can be achievedby improving electrical end-useefficiency.
Load Shifting - reducing peakelectricity demand by moving it toperiods of lighter demand. Anexample of this type of initiativeis time-of-use rates that reflectthe higher cost of providinge lectrici ty d uring period s of peakdemand.
Peak Clipping -- reducing peakelectricity demand withoutshifting it to another period. Thiscan be achieved by offeringpreferential rates to consumerswilling to have load interruptedduring peak periods.
Valley Filling — promotingelectricity use during off-peakhours to increase baseloadgeneration and the efficienciesrelated to it. This can beachieved through reduced rates.
Load Building - promotingelectricity consumption duringboth the peak and the off-peakperiods. Load building can bedone through incentives to attractlarge electricity consumers.
These classifications andexamples of typical programsdesigned to achieve DSMobjectives are illustrated inFigure 13.2.
A utility decides which aspects ofDSM it will implement based onits balance of demand and supply.Utilities that find themselves with
significant excess supply becauseof a major loss of load, a recentlarge capacity addition, or lowerthan anticipated load growth, willtend to emphasize load-buildingprograms. Conversely, as utilitiesapproach a load/resourcebalance, they will likelyemphasize load reduction orshifting efforts.
During the early and mid-1980s,many Canadian utilities hadsurplus generating capacityresulting from lower thananticipated demand. At thattime, some utilities introducedprograms to build load. Theseinitiatives included advertisingcampaigns to increaseconsumption, preferential ratesdesigned to attract energy-intensive industries, programs topromote fuel switching toelectricity, and increasedelectricity export marketingefforts.
Today, the focus has changed.As average Canadian net surpluscapacity has declined from 14 percent in 1980 to 3 per cent in 1990,utilities have cut programs tobuild load and begun toaggressively pursue load-reduction and load-shiftinginitiatives individually or in thecontext of a comprehensive DSMprogram. Generally theseprograms involve one or more ofalternative pricing policies, directincentives, direct customercontact, and advertising.
DSM INITIATIVES
For ease of description, the typesof initiatives utilities haveembarked upon can be groupedinto three classifications.
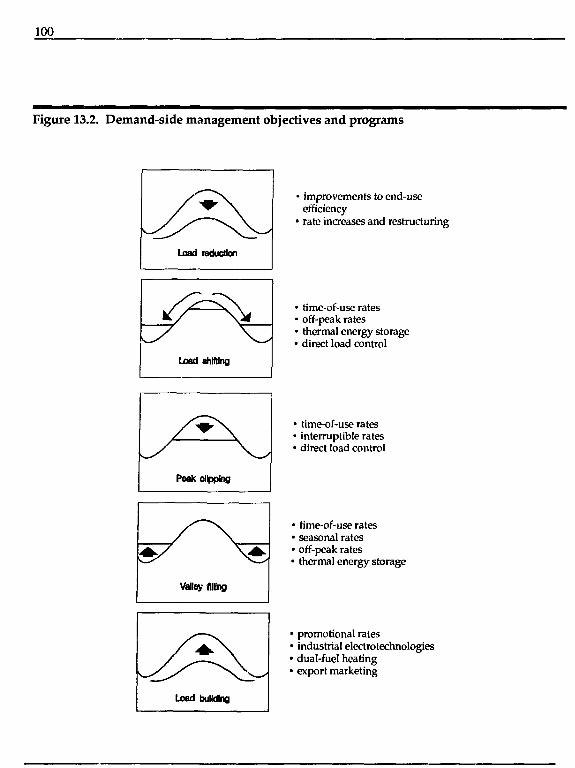
100
Figure 13.2. Demand-side management objectives and programs
Load reduction
Load shifting
Peak clipping
Valley Oiling
Load bulldtog
• improvements to end-useefficiency
• rate increases and restructuring
• time-of-use rates1 off-peak rates• thermal energy storage1 direct load control
• time-of-use rates1 interruptible rates1 direct load control
1 time-of-use rates• seasonal rates• off-peak rates1 thermal energy storage
• promotional rates• industrial electrotechnologies• dual-fuel heating• export marketing
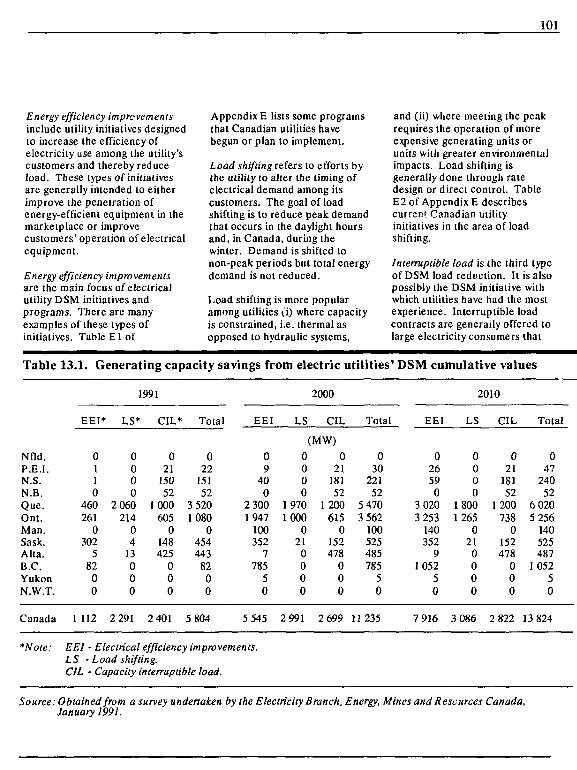
101
Energy efficiency improvementsinclude utility initiatives designedto increase the efficiency ofelectricity use among the utility'scustomers and thereby reduceload. These types of initiativesare generally intended to eitherimprove the penetration ofenergy-efficient equipment in themarketplace or improvecustomers'operation of electricalequipment.
Energy efficiency improvementsare the main focus of electricalutility DSM initiatives andprograms. There are manyexamples of these types ofinitiatives. Table El of
Appendix E lists some programsthat Canadian utilities havebegun or plan to implement.
Load shifting refers to efforts bythe utility to alter the timing ofelectrical demand among itscustomers. The goal of loadshifting is to reduce peak demandthat occurs in the daylight hoursand, in Canada, during thewinter. Demand is shifted tonon-peak periods but total energydemand is not reduced.
Load shifting is more popularamong utilities u) where capacityis constrained, i.e. thermal asopposed to hydraulic systems,
and (ii) where meeting the peakrequires the operation of moreexpensive generating units orunits with greater environmentalimpacts. Load shifting isgenerally done through ratedesign or direct control. TableE2 of Appendix E describescurrent Canadian utilityinitiatives in the area of loadshifting.
Interruptible load is the third typeof DSM load reduction. It is alsopossibly the DSM initiative withwhich utilities have had the mostexperience. Interruptible loadcontracts are generally offered tolarge electricity consumers that
Table
Nfld.P.E.I.N.S.N.B.Que.Ont.Man.Sask.Alia.B.C.YukonN.W.T.
Canada
13.1. Generating capacity savings from electric utilities'
EEI*
0110
460261
0302
58200
1 112
1991
• LS*
0000
2 060214
04
13000
2 291
CIL*
021
15052
1000605
0148425
000
2 401
Total
022
15152
3 5201080
0454443
8200
5 804
EEI
09
400
2 3001947
100352
7785
50
5 545
LS
(
0000
19701000
021
0000
2 991
2000
CIL
;MW)
021
18152
1200615
0152478
000
2 699
Total
030
22152
5 4703 562
100525485785
50
11235
DSM cumulative values
EEI
02659
03 0203 253
140352
91052
50
7 916
2010
LS
0000
18001265
021
0000
3 086
CIL
021
18152
1200738
0152478
000
2 822
Total
047
24052
6 0205 256
140525487
105250
13 824
*Note: EEI - Electrical efficiency improvements.LS - Load shifting.CIL - Capacity interruptible load.
Source: Obtained from a survey undertaken by the Electricity Branch, Energy, Mines and Resources Canada,January 1991.
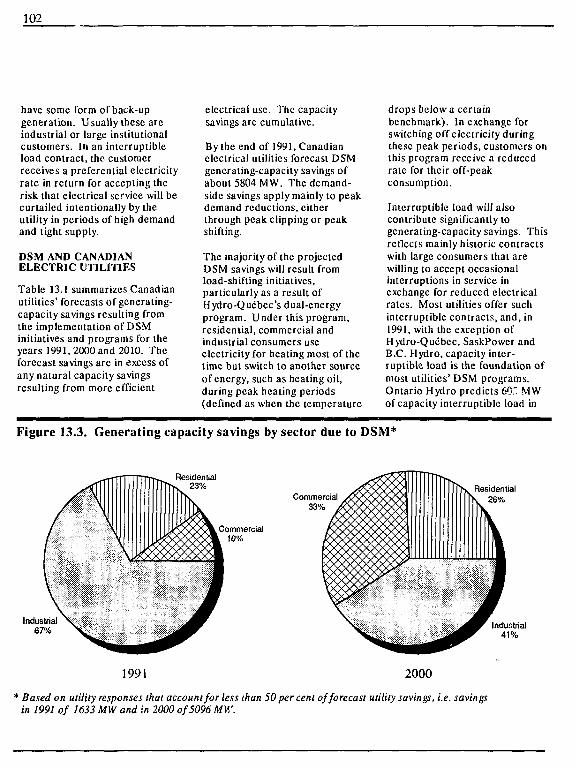
102
have some form of back-upgeneration. Usually ihesc areindustrial or large institutionalcustomers. In an intcrruplibleload contract, the customerreceives a preferential electricityrate in return for accepting therisk that electrical service will becurtailed intentionally by theutility in periods of high demandand tight supply.
DSM AND CANADIANELECTRIC UTILITIES
Table 13.1 summarizes Canadianutilities' forecasts of gcnerating-capacity savings resulting fromthe implementation of DSMinitiatives and programs for theyears 1991, 2000 and 2010. Theforecast savings are in excess ofany natural capacity savingsresulting from more efficient
electrical use. The capacitysavings are cumulative.
By the end of 1991, Canadianelectrical utilities forecast DSMgencrating-capacity savings ofabout 5804 MW. The demand-side savings apply mainly to peakdemand reductions, citherthrough peak clipping or peakshifting.
The majority of the projectedDSM savings will result fromload-shifting initiatives,particularly as a result ofHydro-Quebec's dual-energyprogram. Under this program,residential, commercial andindustrial consumers useelectricity for heating most of thetime but switch to another sourceof energy, such as heating oil,during peak heating periods(defined as when the temperature
drops below a certainbenchmark). In exchange forswitching off electricity duringthese peak periods, customers onthis program receive a reducedrate for their off-peakconsumption.
Interruptible load will alsocontribute significantly togencrating-capacily savings. Thisreflects mainly historic contractswith large consumers that arewilling to accept occasionalinterruptions in service inexchange for reduced electricalrales. Most utilities offer suchinterruptible contracts, and, in1991, with the exception ofHydro-Quebec, SaskPowcr andB.C. Hydro, capacity inter-ruptible load is the foundation ofmost utilities' DSM programs.Ontario Hydro predicts 6O.r MWof capacity interruptible load in
Figure 13.3. Generating capacity savings by sector due to DSM*
Residential26%
1991 2000
* Based on utility responses that account for less than 50 per cent of forecast utility savings, i.e. savingsin 1991 of 1633 MW and in 2000 of 5096 MV,'.
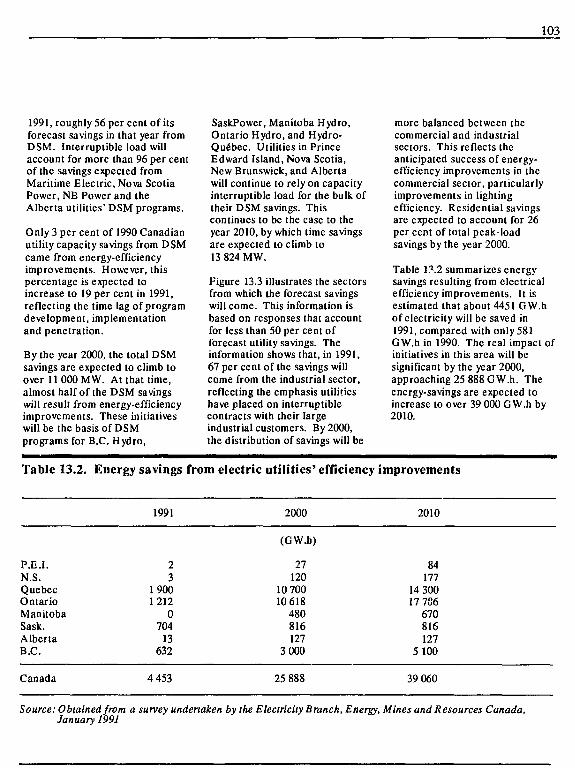
103
1991, roughly 56 per cent of itsforecast savings in that year fromDSM. Interruplible load willaccount for more than 96 per centof the savings expected fromMaritime Electric, Nova ScotiaPower, NB Power and theAlberta utilities' DSM programs.
Only 3 per cent of 1990 Canadianutility capacity savings from DSMcame from energy-efficiencyimprovements. However, thispercentage is expected toincrease to 19 per cent in 1991,reflecting the time lag of programdevelopment, implementationand penetration.
By the year 2000, the total DSMsavings are expected to climb toover 11 000 MW. At that time,almost half of the DSM savingswill result from energy-efficiencyimprovements. These initiativeswill be the basis of DSMprograms for B.C. Hydro,
SaskPower, Manitoba Hydro,Ontario Hydro, and Hydro-Quebec. Utilities in PrinceEdward Island, Nova Scotia,New Brunswick, and Albertawill continue to rely on capacityinterruptible load for the bulk oftheir DSM savings. Thiscontinues to be the case to theyear 2010, by which time savingsare expected to climb to13 824 MW.
Figure 13.3 illustrates the sectorsfrom which the forecast savingswill come. This information isbased on responses that accountfor less than 50 per cent offorecast utility savings. Theinformation shows that, in 1991,67 per cent of the savings willcome from the industrial sector,reflecting the emphasis utilitieshave placed on interruptiblecontracts with their largeindustrial customers. By 2000,the distribution of savings will be
more balanced between thecommercial and industrialsectors. This reflects theanticipated success of energy-efficiency improvements in thecommercial sector, particularlyimprovements in lightingefficiency. Residential savingsare expected to account for 26per cent of total peak-loadsavings by the year 2000.
Table 1!*.2 summarizes energysavings resulting from electricalefficiency improvements. It isestimated that about 4451 GW.hof electricity will be saved in1991, compared with only 581GW.h in 1990. The real impact ofinitiatives in this area will besignificant by the year 2000,approaching 25 888 GW.h. Theenergy-savings are expected toincrease to over 39 000 GW.h by2010.
Table 13.2. Energy savings from electric utilities' efficiency improvements
1991 2000 2010
P.E.I.N.S.QuebecOntarioManitobaSask.AlbertaB.C.
23
19001 212
0704
13632
(GW.h)
27120
10 70010 618
480816127
3 000
84177
14 30017 786
670816127
5 100
Canada 4 453 25 888 39 060
Source: Obtained from a survey undertaken by the Electricity Branch, Energy, Mines and Resources Canada,January 1991
104
PROJECTED CAPITALCOSTS OF DSM
Most utilities are unable toestimate the costs of the DSMprograms and initiatives that theyare planning to undertake. Partof the reason relates todifficulties in determining thepenetration rate of suchprograms. Another reason is thatinterruplible load programsaccount for much of the DSMeffort, and establishing the costsof these programs is complex andin many instances dependent onthe frequency of unanticipatedshortages. Some of the smallerutilities identified that their DSMplanning is not as detailed nor as
long-term as other resourceplanning.
The three largest Canadianelectrical utilities (Hydro-Quibec, Ontario Hydro andB.C. Hydro) have allimplemented aggressive DSMprograms and have been able toforecast the cost of theseprograms. Cumulatively, theirefforts in DSM are expected toaccount for between 81 and87 per cent of total Canadianutility savings over the period1991-2010. Their DSMexpenditures to the year 2000are forecast to be S7 billion($ current). Ontario Hydro'sexpenditures on DSM will
account for S4.3 billion ,Hydro-Quebec SI.8 billion, andB.C. Hydro will account for theremainder. In 1991, electricutilities across Canada areexpected to spend aboutS322 million for electricalefficiency improvements.
Ontario Hydro forecasts DSMexpenditures to 2000 of S3 billion(S199I). To conform with thereporting of the other utilitiesreporting costs, Ontario Hydro'sexpenditures have been escalatedat the forecast rate of increase inthe CPI for the periods inquestion.
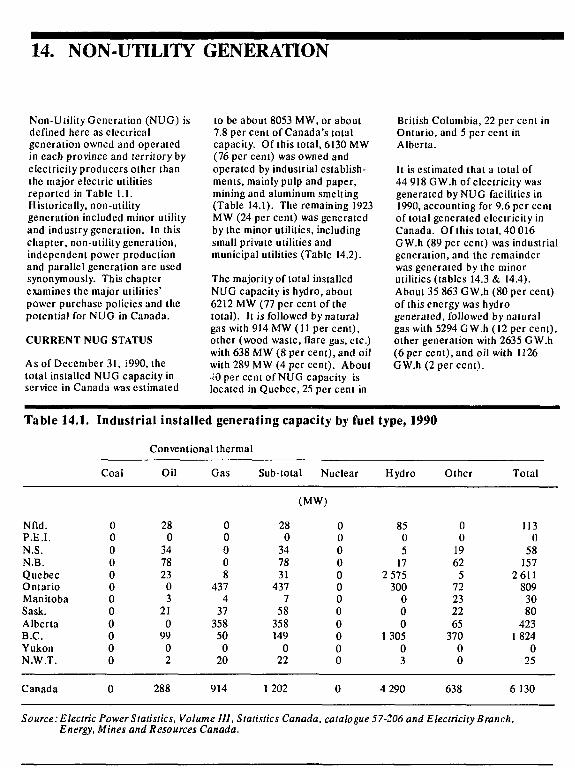
14. NON-UTILITY GENERATION
Non-Ulility Generation (NUG) isdefined here as electricalgeneration owned and operatedin each province and territory byelectricity producers other thanthe major electric utilitiesreported in Table I.I.Historically, non-ulilitygeneration included minor utilityand industry generation. In thischapter, non-utility generation,independent power productionand parallel generation are usedsynonymously. This chapterexamines the major utilities'power purchase policies and thepotential for NUG in Canada.
CURRENT NUG STATUS
As of December 31, i990, thetotal installed NUG capacity inservice in Canada was estimated
to be about 8053 MW, or about7.8 per cent of Canada's totalcapacity. Of this total, 6130 MW(76 per cent) was owned andoperated by industrial establish-ments, mainly pulp and paper,mining and aluminum smelting(Table 14.1). The remaining 1923MW (24 per cent) was generatedby the minor utilities, includingsmall private utilities andmunicipal utilities (Table 14.2).
The majority of total installedNUG capacity is hydro, about6212 MW (77 per cent of thetotal). It is followed by naturalgas with 914 MW (11 per cent),other (wood waste, flare gas, etc.)with 638 MW (8 per cent), and oilwith 289 MW (4 per cent). About•iO per cent of NUG capacity islocated in Quebec, 25 per cent in
British Columbia, 22 per cent inOntario, and 5 per cent inAlberta.
It is estimated that a total of44 918 GW.h of electricity wasgenerated by NUG facilities in1990, accounting for 9.6 per centof total generated electricity inCanada. Of this total, 40 016GW.h (89 per cent) was industrialgeneration, and the remainderwas generated by the minorutilities (tables 14.3 & 14.4).About 35 863 GW.h (80 per cent)of this energy was hydrogenerated, followed by naturalgas with 5294 GW.h (12 per cent),other generation with 2635 GW.h(6 per cent), and oil with 1126GW.h (2 per cent).
Table 14.1. Industrial installed generating capacity by fuel type, 1990
Conventional thermal
Nfld.P.E.I.N.S.N.B.QuebecOntarioManitobaSask.AlbertaB.C.YukonN.W.T.
Canada
Coai
000000000000
0
Oil
280
347823
03
210
9902
288
Gas
00008
4374
3735850
020
914
Sub-total Nuclear
(MW)
280
347831
4377
58358149
022
1202
000000000000
0
Hydro
8505
172 575
300000
130503
4 290
Other
00
1962
572232265
37000
638
Total
1130
58157
2611809
3080
4231 824
025
6 130
Source: Electric Power Statistics, Volume HI, Statistics Canada, catalogue 57-206 and Electricity Branch,Energy, Mines and Resources Canada,
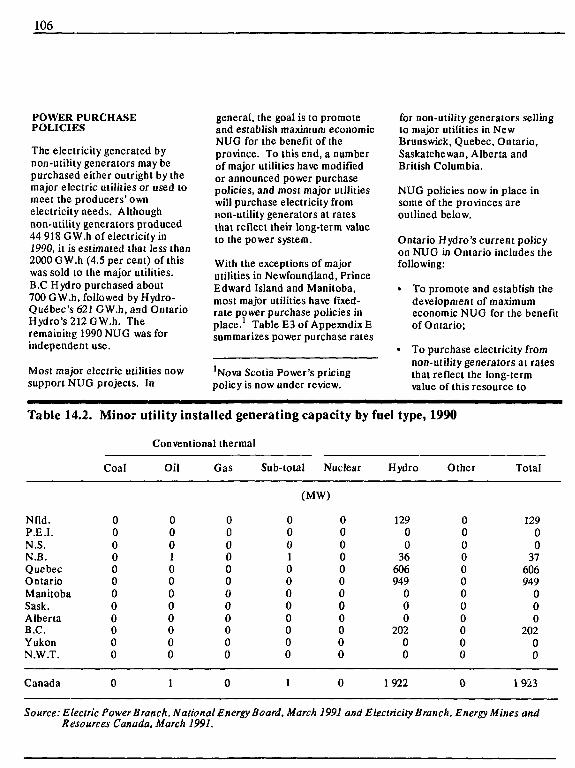
106
POWER PURCHASEPOLICIES
The electricity generated bynon-utility generators may bepurchased either outright by themajor electric utilities or used tomeet the producers' ownelectricity needs. Althoughnon-utility generators produced44 918 GW.h of electricity in1990, it is estimated that less than2000 GW.h (4.5 per cent) of thiswas sold to the major utilities.B.C Hydro purchased about700 GW.h, followed by Hydro-Quebec's 621 GW.h, and OntarioHydro's 212 GW.h. Theremaining 1990 NUG was forindependent use.
Most major electric utilities nowsupport NUG projects. In
general, the goal is to promoteand establish maximum economicNUG for the benefit of theprovince. To this end, a numberof major utilities have modifiedor announced power purchasepolicies, and most major utilitieswill purchase electricity fromnon-utility generators at ratesthat reflect their long-term valueto the power system.
With the exceptions of majorutilities in Newfoundland, PrinceEdward Island and Manitoba,most major utilities have fixed-rate power purchase policies inplace.1 Table E3 of AppexndixEsummarizes power purchase rates
'Nova Scotia Power's pricingpolicy is now under review.
for non-utility generators sellingto major utilities in NewBrunswick, Quebec, Ontario,Saskatchewan, Alberta andBritish Columbia.
NUG policies now in place insome of the provinces areoutlined below.
Ontario Hydro's current policyon NUG in Ontario includes thefollowing:
• To promote and establish thedevelopment of maximumeconomic NUG for the benefitof Ontario;
• To purchase electricity fromnon-utility generators at ratesthat reflect the long-termvalue of this resource to
Table 14.2. Minor utility installed generating capacity by fuel type, 1990
Conventional thermal
Nfld.P.E.I.N.S.N.B.QuebecOntarioManitobaSask.AlbertaB.C.YukonN.W.T.
Canada
Coal
000000000000
0
Oil
000100000000
1
Gas
000000000000
0
Sub-total Nuclear
(MW)
000100000000
1
000000000000
0
Hydro
12900
36606949
000
20200
1 922
Other
000000000000
0
Total
12900
37606949
000
20200
1923
Source: Electric Power Branch, National Energy Board, March 1991 and Electricity Branch, Energy Mines andResources Canada, March 1991.
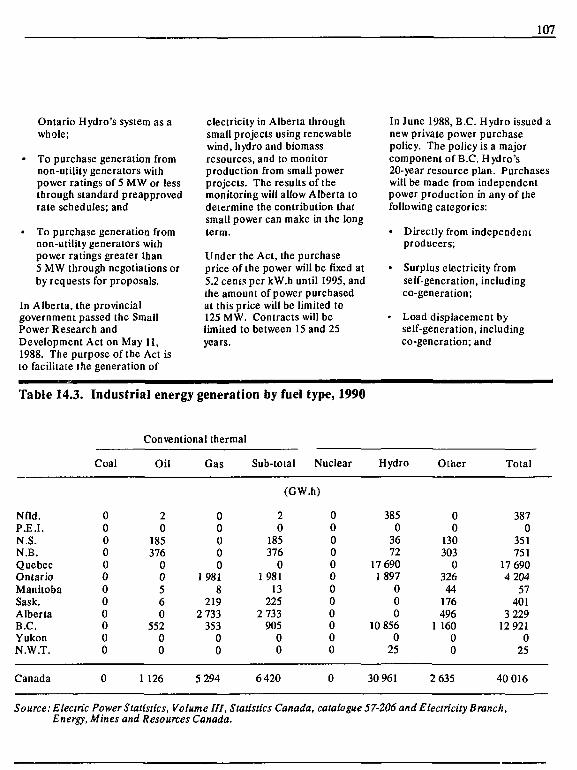
107
Ontario Hydro's system as awhole;
• To purchase generation fromnon-utility generators withpower ratings of 5 MW or lessthrough standard preapprovedrate schedules; and
• To purchase generation fromnon-utility generators withpower ratings greater than5 MW through negotiations orby requests for proposals.
In Alberta, the provincialgovernment passed the SmallPower Research andDevelopment Act on May 11,1988. The purpose of the Act isto facilitate the generation of
electricity in Alberta throughsmall projects using renewablewind, hydro and biomassresources, and to monitorproduction from small powerprojects. The results of themonitoring will allow Alberta todetermine the contribution thatsmall power can make in the longterm.
Under the Act, the purchaseprice of the power will be fixed at5.2 cents per kW.h until 1995, andthe amount of power purchasedat this price will be limited to125 MW. Contracts will belimited to between 15 and 25years.
In June 1988, B.C. Hydro issued anew private power purchasepolicy. The policy is a majorcomponent of B.C. Hydro's20-year resource plan. Purchaseswill be made from independentpower production in any of thefollowing categories:
• Directly from independenlproducers;
• Surplus electricity fromself-generation, includingco-generation;
• Load displacement byself-generation, includingco-generation; and
Table 14.3. Industrial energy generation by fuel type, 1990
Conventional thermal
Nfld.P.E.I.N.S.N.B.QuebecOntarioManitobaSask.AlbertaB.C.YukonN.W.T.
Canada
Coal
000000000000
0
Oil
20
185376
00560
55200
1 126
Gas
00000
19818
2192 733
35300
5 294
Sub-total
(GW
20
185376
01981
13225
2 733905
00
6 420
Nuclear
.h)
000000000000
0
Hydro
3850
3672
17 6901897
000
10 8560
25
30 961
Other
00
130303
032644
176496
1 16000
2 635
Total
3870
351751
17 6904 204
57401
3 22912 921
025
40 016
Source: Electric Power Statistics, Volume HI, Statistics Canada, catalogue 57-206 and Electricity Branch,Energy, Mines and Resources Canada.
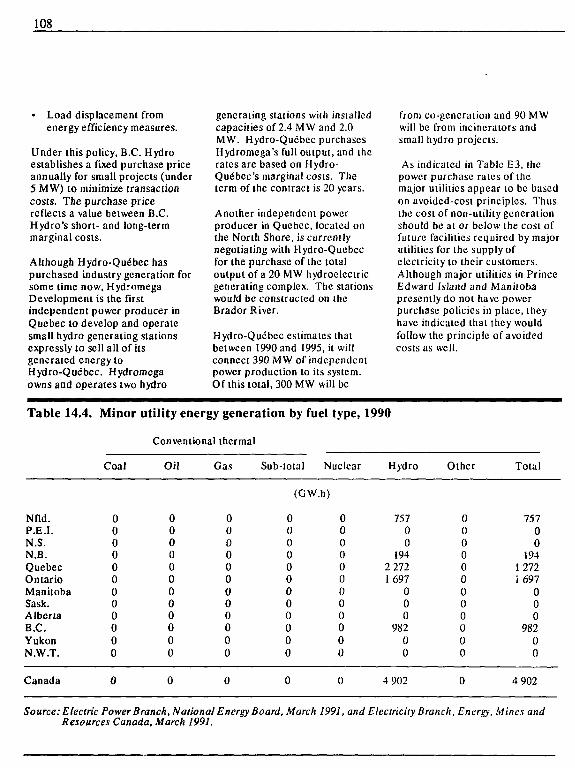
108
• Load displacement fromenergy efficiency measures.
Under this policy, B.C. Hydroestablishes a fixed purchase priceannually for small projects (under5 MW) to minimize transactioncosts. The purchase pricereflects a value between B.C.Hydro's short- and long-termmarginal costs.
Although Hydro-Quebec haspurchased industry generation forsome lime now, HydrcmegaDevelopment is the firstindependent power producer inQuebec to develop and operatesmall hydro generating stationsexpressly to sell all of itsgenerated energy toHydro-Quebec. Hydromcgaowns and operates two hydro
generating stations with installedcapacities of 2.4 MW and 2.0MW. Hydro-Quebec purchasesHydromega's full output, and therates are based on Hydro-Quebec's marginal costs. Theterm of the contract is 20 years.
Another independent powerproducer in Quebec, located onthe North Shore, is currentlynegotiating with Hydro-Quebecfor the purchase of the totaloutput of a 20 MW hydroelectricgenerating complex. The stationswould be constructed on theBrador River.
Hydro-Quebec estimates thatbetween 1990 and 1995, it willconnect 390 MW of independentpower production to its system.Of this total, 300 MW will be
from co-generation and 90 MWwill be from incinerators andsmall hydro projects.
As indicated in Table E3, ihepower purchase rates of themajor utilities appear to be basedon avoided-cost principles. Thusthe cost of non-utility generationshould be at or below the cost offuture facilities required by majorutilities for the supply ofelectricity to their customers.Although major utilities in PrinceEdward Island and Manitobapresently do not have powerpurchase policies in place, theyhave indicated that they wouldfollow the principle of avoidedcosts as well.
Table 14.4. Minor utility energy generation by fuel type, 1990
Conventional thermal
Nfld.P.E.I.N.S.N.B.QuebecOntarioManitobaSask.AlbertaB.C.YukonN.W.T.
Canada
Coal
000000000000
0
Oil
000000000000
0
Gas
000000000000
0
Sub-total
(GW
000000000000
0
Nuclear
'.h)
000000000000
0
Hydro
75700
1942 2721 697
000
98200
4 902
Other
000000000000
0
Total
75700
1941 272i 697
000
98200
4 902
Source: Electric Power Branch, National Energy Board, March 1991, and Electricity Branch, Energy, Mines andResources Canada, March 1991.
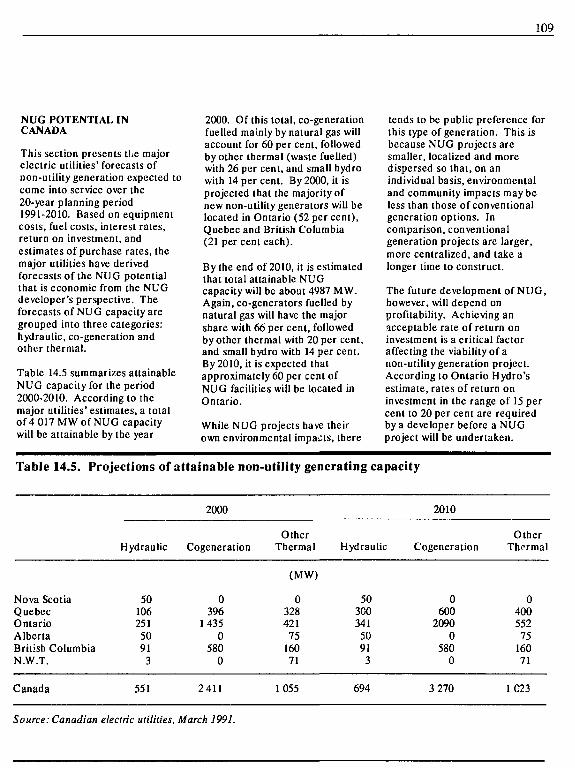
109
NUG POTENTIAL INCANADA
This section presents the majorelectric utilities' forecasts ofnon-utility generation expecied tocome into service over the20-year planning period1991-2010. Based on equipmentcosts, fuel costs, interest rates,return on investment, andestimates of purchase rates, themajor utilities have derivedforecasts of the NUG potentialthat is economic from the NUGdeveloper's perspective. Theforecasts of NUG capacity aregrouped into three categories:hydraulic, co-generation andother thermal.
Table 14.5 summarizes attainableNUG capacity for the period2000-2010. According to themajor utilities' estimates, a totalof 4 017 MW of NUG capacitywill be attainable by the year
2000. Of this total, co-generationfuelled mainly by natural gas willaccount for 60 per cent, followedby other thermal (waste fuelled)with 26 per cent, and small hydrowith 14 per cent. By 2000, it isprojected that the majority ofnew non-utility generators will belocated in Ontario (52 per cent),Quebec and British Columbia(21 per cent each).
By the end of 2010, it is estimatedthat total attainable NUGcapacity will be about 4987 MW.Again, co-generators fuelled bynatural gas will have the majorshare with 66 per cent, followedby other thermal with 20 per cent,and small hydro with 14 per cent.By 2010, it is expected thatapproximately 60 per cent ofNUG facilities will be located inOntario.
While NUG projects have theirown environmental impacts, there
tends to be public preference forthis type of generation. This isbecause NUG projects aresmaller, localized and moredispersed so that, on anindividual basis, environmentaland community impacts may beless than those of conventionalgeneration options. Incomparison, conventionalgeneration projects are larger,more centralized, and take alonger time to construct.
The future development of NUG,however, will depend onprofitability. Achieving anacceptable rate of return oninvestment is a critical factoraffecting the viability of anon-utility generation project.According to Ontario Hydro'sestimate, rates of return oninvestment in the range of 15 percent to 20 per cent are requiredby a developer before a NUGproject will be undertaken.
Table 14.5. Projections of attainable non-utility generating capacity
Nova ScotiaQuebecOntarioAlbertaBritish ColumbiaN.W.T.
Canada
Hydraulic
501062515091
3
551
2000
Cogeneration
0396
14350
5800
2411
OtherThermal
(MW)
0328421
7516071
1055
Hydraulic
50300341
5091
3
694
2010
Cogeneration
0600
20900
5800
3 270
OtherThermal
040055275
16071
1C23
Source: Canadian electric utilities, March 1991.
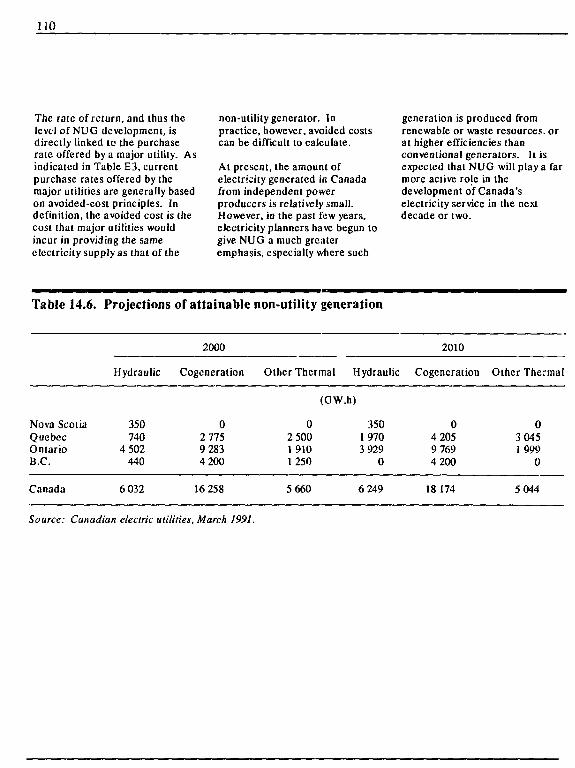
110
The rate of return, and thus thelevel of NUG development, isdirectly linked tc the purchaserate offered by a major utility. Asindicated in Table E3, currentpurchase rates offered by themajor utilities arc generally basedon avoided-cost principles. Indefinition, the avoided cost is thecost that major utilities wouldincur in providing the sameelectricity supply as that of the
non-utility generator. Inpractice, however, avoided costscan be difficult to calculate.
At present, the amount ofelectricity generated in Canadafrom independent powerproducers is relatively small.However, in the past few years,electricity planners have begun togive NUG a much greateremphasis, especially where such
generation is produced fromrenewable or waste resources, orat higher efficiencies thanconventional generators. It isexpected that NUG will play a farmore active role in thedevelopment of Canada'selectricity service in the nextdecade or two.
Table 14.6. Projections of attainable non-utility generation
2000 2010
Hydraulic Cogeneralion Other Thermal Hydraulic Cogeneration Other Thermal
(GW.li)
Nova ScotiaQuebecOntarioB.C.
350740
4 502440
02 7759 2834 200
02 50019101250
35019703 929
0
04 2059 7694 200
03 0451999
0
Canada 6 032 16 258 5 660 6 249 18 174 5 044
Source: Canadian electric utilities, March 1991.
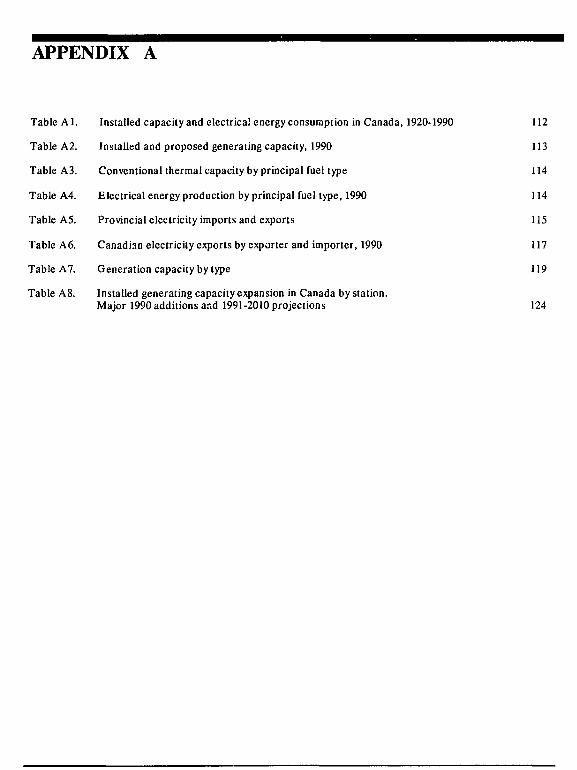
APPENDIX A
Table Al. Installed capacity and electrical energy consumption in Canada, 1920-1990
Table A2. Installed and proposed generating capacity, 1990
Table A3. Conventional thermal capacity by principal fuel type
Table A4. Electrical energy production by principal fuel type, 1990
Table A5. Provincial electricity imports and exports
Table A6. Canadian electricity exports by exporter and importer, 1990
Table A7. Generation capacity by type
Table A8. Installed generating capacity expansion in Canada by station.Major 1990 additions and 1991-2010 projections
112
113
114
114
115
117
119
124
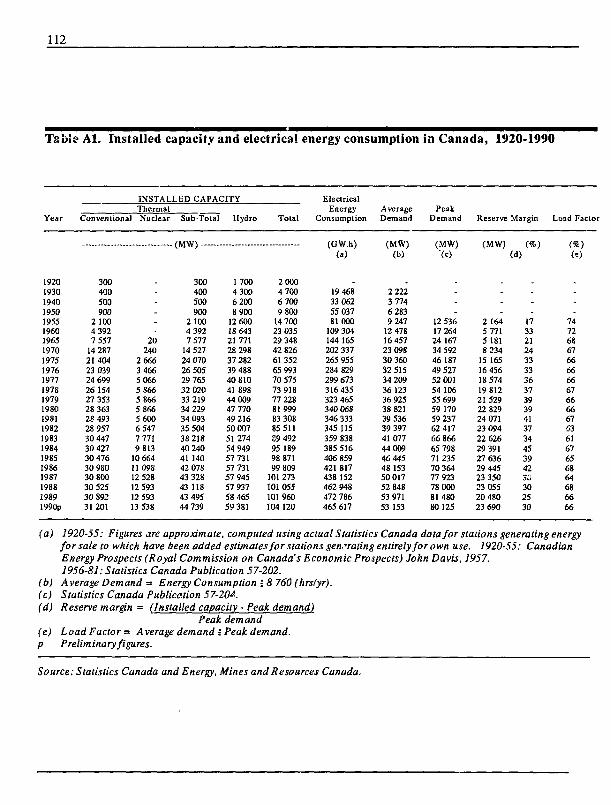
112
Tsb!e Al. Installed capacity and electrical energy consumption in Canada, 1920-1990
Year Conventional
INSTALLED CAPACITYThermalNuclear Sub-Total Hydro Tot;ll
ElectricalEnergy
ConsumptionAverageDemand
PeakDemand Reserve Margin Load Factor
19201930194019501955196019651970197519761977197819791980198119821983198419851986198719881989199Op
300400500900
2 1004 3927 55714 2872140423 03924 69926 15427 35328 3632S49328 95730 44730 42730 47630 98030 80030 52530 89231 201
--
20240
2 6663 4665 0665 8665 8665 8665 6006 5477 7719 81310 6641109812 52812 59312 59313 538
- (MW) -—
300400500900
2 1004 3927 57714 52724 07026 50529 76532 02033 21934 22934 09335 50438 21840 24041 14042 07843 32843 11843 49544 739
17004 3006 2008 90012 60018 6432177128 29837 28239 48840 81041 89844 00947 77049 21650 0075127454 94957 73157 73157 94557 93758 46559 381
20004 7006 7009 80014 70023 03529 34842 8266135265 99370 57573 91877 22881 99983 30885 51189 49295 18998 87199 809101 273101 055101960104 120
(GW.h)(a)
19 46833 06255 03781 000109 304144 165202 337265 955284 829299 673316 435323 465340 068346 333345 115359 838385 516406 859421 817438 152462 948472 786465 617
(MW)(b)
2 2223 7746 2839 24712 47816 45723 09830 36032 51534 20936 12336 92538 82139 53639 3974107744 00946 44548 15350 01752 84353 971S3 153
(MW)(c)
--
12 53617 26424 16734 59246 18749 52752 00154 10655 69959 17059 23762 41766 86665 7987123570 36477 92378 0008148080 125
(MW)
-
2 1645 7715 1818 23415 16516 45618 57419 81221 52922 82924 07123 09422 62629 39127 63629 44523 35023 05520 48023 690
{%)(d)
--
1733212433333637393941373445394232302530
(%)
to
-7472686766666667666667536167656864686666
(a) 1920-55: Figures are approximate, computed using actual Statistics Canada data for stations generating energyfor sale to which have been added estimates for stations generating entirely for own use. 1920-55: CanadianEnergy Prospects (Royal Commission on Canada's Economic Prospects) John Davis, 1957.1956-81: Statistics Canada Publication 57-202.
(b) A verage Demand = Energy Consumption ~ 8 760 (hrsfyr).(c) Statistics Canada Publication 57-204.(d) Reserve margin = (Installed capacity - Peak demand)
Peak demand(e) Load Factors Average demand 5 Peak demand,p Preliminary figures.
Source: Statistics Canada and Energy, Mines and Resources Canada.
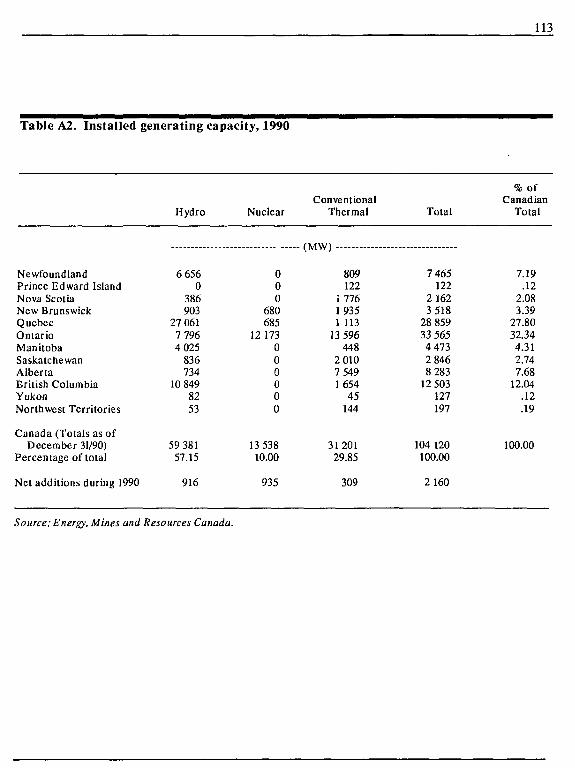
Table A2. Installed generating capacity, 1990
113
NewfoundlandPrince Edward IslandNova ScotiaNew BrunswickQuebecOntarioManitobaSaskatchewanAlbertaBritish ColumbiaYukonNorthwest Territories
Canada (Totals as ofDecember 31/90)
Percentage of total
Net additions during 1990
Hydro
6 6560
386903
27 0617 7964 025
836734
10 8498253
59 38157.15
916
Nuclear
000
680685
12 173000000
13 53810.00
935
ConventionalThermal
-- (MW)
809122
177619351 113
13 596448
2 0107 5491654
45144
3120129.85
309
Total
7 465122
2 1623 518
28 85933 5654 4732 8468 283
12 503127197
104 120100.00
2 160
% ofCanadian
Total
7.19.12
2.083.39
27.8032.344.312.747.68
12.04.12.19
100.00
Source:Energy, Mines and Resources Canada.
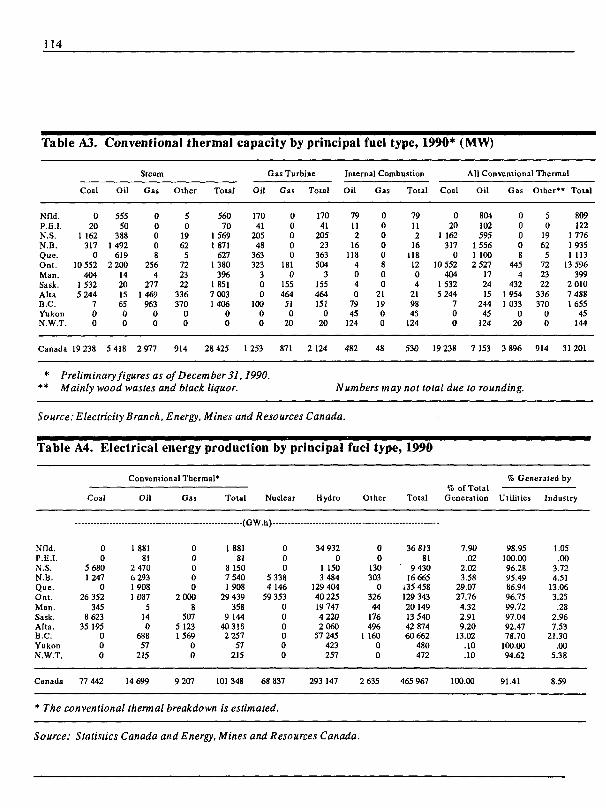
114
Table A3. Conventional thermal capacity by principal fuel type, 1990* (MW)
Steam Gas Turbine Internal Combustion AU Conventional Thermal
Nfld.P.E.I.N.S.N.B.Que.Ont.Man.Sask.AltaB.C.YukonN.W.T.
Coal
020
1 162317
010 552
4041 5325 244
700
ou
55550
3881492
6192 200
1420156500
Gas
00008
2564
2771 469
96300
Other
50
19625
722322
336370
00
Total
56070
15691871
6271 380
3961 BS17 0031406
00
Oil
17041
20548
363323
300
10000
Gas
00000
1810
15546451
020
Total
17041
20523
363504
3155464151
020
Oil
79112
16118
4040
7945
124
Gas
00000800
211900
Total
79112
16118
1204
219845
124
Coal
020
1 162317
010 552
40415325 244
700
Oil
804102595
15561 1002 527
172415
24445
124
Gas
00008
4454
4321 9541 033
020
Other** Total
50
19625
722322
336370
00
809122
17761 9351 113
13 596399
2 0107 4881 655
45144
Canada 19 238 5 418 2 977 914 28 425 1253 871 2 124 482 48 530 19 238 7 153 3 896 914 31201
* Preliminary figures as of December 31,1990.** Mainly wood wastes and black liquor. Numbers may not total due to rounding.
Source: Electricity Branch, Energy, Mines and Resources Canada.
Table A4. Electrical energy production by principal fuel type, 1990
Conventional Thermal* % Generated by
Nfld.P.E.I.N.S.N.B.Que.Ont.Man.Sask.Alta.B.C.YukonN.W.T.
Coal
00
5 6801247
026 352
3458 623
35 195000
Oil
1 88181
2 4706 2931 9081 087
5140
68857
215
Gas
00000
20008
5075 1231 569
00
Total
. tatu
1 88181
8 1507 5401908
29 439358
9 144403182 257
57215
Nuclear
\y h) . ...
000
5 3384 146
59 353000000
Hydro
34 9320
1 1503 484
129 40440 22519 7474 2202060
57 245423257
Other
00
130303
032644
176496
1 16000
Total
36 81381
9 43016 665
135 458129 34320 14913 54042 87460 662
480472
% ot lotalGeneration
7.90.02
2.023.58
29.0727.764.322.919.20
13.02.10.10
Utilities
98.95100.0096.2895.4986.9496.7599.7297.0492.4778.70
100.0094.62
Industry
1.05.00
3.724.51
13.063.25.28
2.967.53
21.30.00
5.38
Canada 77 442 14 699 9 207 101 348 68 837 293 147 2 635 465 967 100.00 91.41 8.59
* The conventional thermal breakdown is estimated.
Source: Statistics Canada and Energy, Mines and Resources Canada.
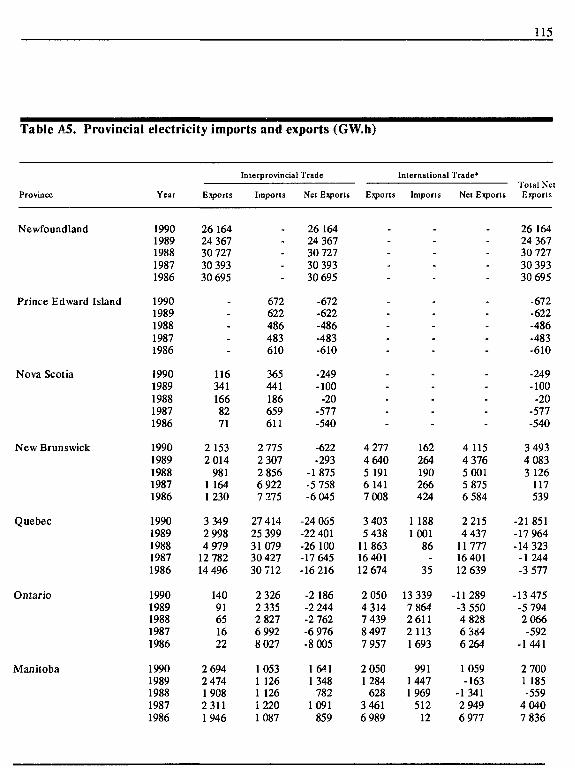
115
Table A5. Provincial
Province
Newfoundland
Prince Edward Island
Nova Scotia
New Brunswick
Quebec
Ontario
Manitoba
electricity imports and
Year
19901989198819871986
19901989198819871986
19901989198819871986
19901989198819871986
19901989198819871986
19901989198819871986
19901989198819871986
Exports
26 16424 36730 72730 39330 695
_-
_-
1163411668271
2 1532 014
9811 1641230
3 3492 9984 979
12 78214 496
14091651622
2 6942 474190823111946
exports (GW.h)
Interprovinciat Trade
Imports
.-
-
672622486483610
365441186659611
2 7752 3072 8566 9227 275
27 41425 3993107930 42730 712
2 3262 3352 8276 9928 027
10531 1261 12612201087
Net Export:
26 16424 36730 72730 39330 695
-672-622-486-483-610
-249-100
-20-577-540
-622-293
-1875-5 758-6 045
-24 065-22 401-26 100-17 645-16 216
-2 186-2 244-2 762-6 976-8 005
16411 348
7821091
859
> Exports
-
-
-
_
--
-
-
-
-
4 2774 6405 1916 1417 008
3 4035 438
1186316 40112 674
2 0504 3147 4398 4977 957
2 0501284
6283 4616 989
Internation:
Imports
---
-
-
-
_
---
-
162264190266424
1 1881001
86-
35
13 3397 8642 6112 1131693
99114471969
51212
il Trade*
Net Exports
---
-
--
-
_
---
-
4 1154 3765 0015 8756 584
22154 437
1177716 40112 639
-11289-3 5504 8286 3846 264
1059-163
-1 3412 9496 977
Total NetExports
26 16424 36730 72730 39330 695
-672-622-486-483-610
-249-100
-20-577-540
3 4934 0833 126
117539
-21 851-17 964-14 323-1 244-3 577
-13 475-5 7942 066-592
-1 441
2 7001 185-559
4 0407 836
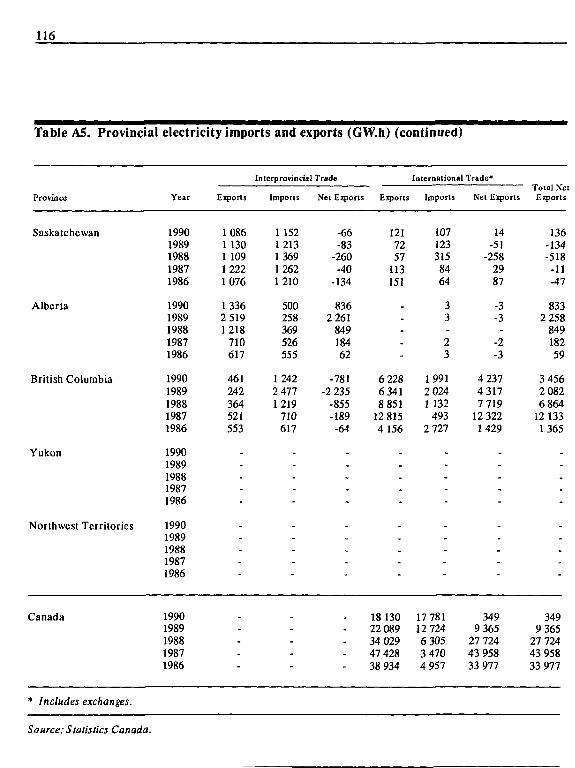
116
Table A5. Provincial
Province
Saskatchewan
Alberta
British Columbia
Yukon
Northwest Territories
Canada
* Includes exchanges.
electricity imports and
Year
19901989198819871986
19901989198819871986
19901989198819871986
19901989198819871986
19901989198819871986
19901989198819871986
exports (GW.h) (continued)
Interprovincial Trade
Exports
10861 1301 10912221076
13362 5191218
710617
461242364521553
_
-
_
_-
---
Imports
1 1521213136912621210
500258369526555
12422 4771219
710617
_
-
_
__-
---
Net Exports Exports
-66-83
-260-40
-134
8362 261
84918462
-781-2 235
-855-189-64
-
_-
--
1217257
113151
---
6 2286 3418 851
12 8154 156
__
--
_
-
18 13022 08934 02947 42838 934
International Trade*
Imports
1071233158464
33-23
19912 0241 132
4932 727
-
--
_
___-
17 78112 7246 3053 4704 957
Net Exports
14-51
-2582987
-3-3
--2-3
4 2374 3177 719
12 3221429
_-
-
_
___-
3499 365
27 72443 95833 977
Total Ne:Exports
136-134-518
-11-47
8332 258
84918259
3 4562 0826 864
12 1331365
_
-
_
-
3499 365
27 72443 95833 977
Source: Statistics Canada.
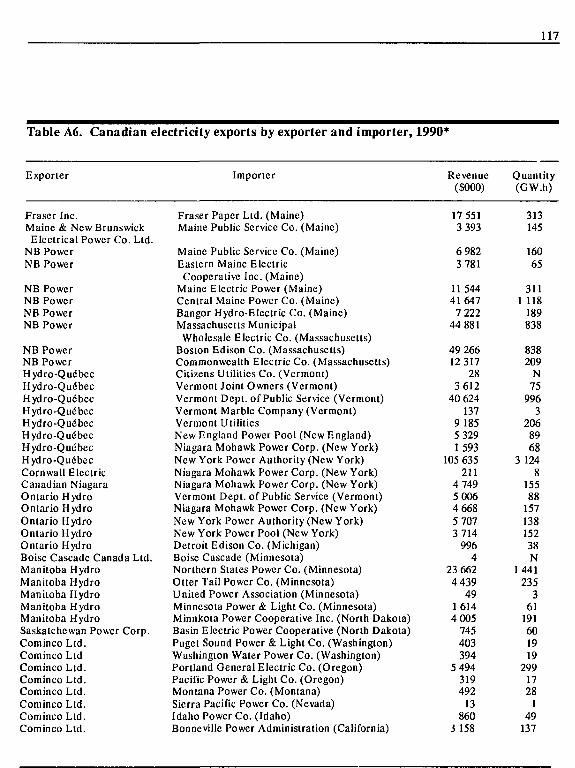
Table A6. Canadian electricity exports by exporter and importer, 1990*
117
Exporter Importer Revenue($000)
Quantity(GW.h)
Fraser Inc.Maine & New BrunswickElectrical Power Co. Ltd.
NB PowerNB Power
NB PowerNB PowerNB PowerNB Power
NB PowerNB PowerHydro-QuebecHydro-QuebecHydro-QuebecHydro-QuebecHydro-QuebecHydro-Que'bccHydro-QuebecHydro-QuebecCornwall ElectricCanadian NiagaraOntario HydroOntario HydroOntario HydroOntario HydroOntario HydroBoise Cascade Canada Ltd.Manitoba HydroManitoba HydroManitoba HydroManitoba HydroManitoba HydroSaskatchewan Power Corp.Cominco Ltd.Cominco LtdCominco Ltd.Cominco Ltd.Cominco Ltd.Cominco Ltd.Cominco Ltd.Cominco Ltd.
Fraser Paper Ltd. (Maine)Maine Public Service Co. (Maine)
Maine Public Service Co. (Maine)Eastern Maine ElectricCooperative Inc. (Maine)
Maine Electric Power (Maine)Central Maine Power Co. (Maine)Bangor Hydro-Electric Co. (Maine)Massachusetts MunicipalWholesale Electric Co. (Massachusetts)
Boston Edison Co. (Massachusetts)Commonwealth Electric Co. (Massachusetts)Citizens Utilities Co. (Vermont)Vermont Joint Owners (Vermont)Vermont Dcpt. of Public Service (Vermont)Vermont Marble Company (Vermont)Vermont UtilitiesNew England Power Pool (New England)Niagara Mohawk Power Corp. (New York)New York Power Authority (New York)Niagara Mohawk Power Corp. (New York)Niagara Mohawk Power Corp. (New York)Vermont Dept. of Public Service (Vermont)Niagara Mohawk Power Corp. (New York)New York Power Authority (New York)New York Power Pool (New York)Detroit Edison Co. (Michigan)Boise Cascade (Minnesota)Northern States Power Co. (Minnesota)Otter Tail Power Co. (Minnesota)United Power Association (Minnesota)Minnesota Power & Light Co. (Minnesota)Minnkota Power Cooperative Inc. (North Dakota)Basin Electric Power Cooperative (North Dakota)Puget Sound Power & Light Co. (Washington)Washington Water Power Co. (Washington)Portland General Electric Co. (Oregon)Pacific Power & Light Co. (Oregon)Montana Power Co. (Montana)Sierra Pacific Power Co. (Nevada)Idaho Power Co. (Idaho)Bonneville Power Administration (California)
17 5513 393
6 9823 781
11 54441 6477 222
44 881
49 26612 317
283 612
40 624137
9 1855 3291593
105 635211
4 7495 0064 6685 7073 7149964
23 6624 43949
16144 005745403394
5 49431949213860
3 158
313145
16065
3111 118189838
838209N759963
2068968
3 1248
1558815713815238N
1 4412353611916019192991728149137
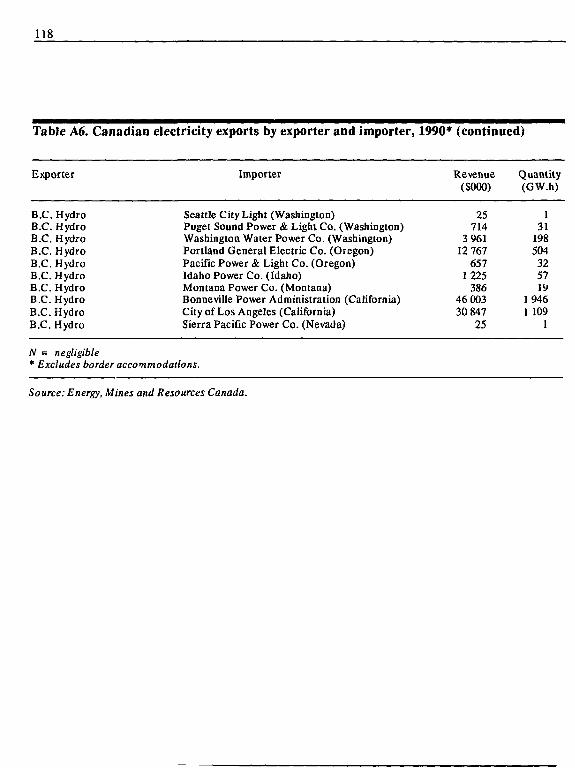
118
Table A6. Canadian electricity exports by exporter and importer, 1990* (continued)
Exporter Importer Revenue Quantity($000) (GW.h)
B.C. Hydro Seattle City Light (Washington)B.C. Hydro Puget Sound Power & Light Co. (Washington)B.C. Hydro Washington Water Power Co. (Washington)B.C. Hydro Portland General Electric Co. (Oregon)B.C. Hydro Pacific Power & Light Co. (Oregon)B.C. Hydro Idaho Power Co. (Idaho)B.C. Hydro Montana Power Co. (Montana)B.C. Hydro Bonneville Power Administration (California)B.C. Hydro City of Los Angeles (California)B.C. Hydro Sierra Pacific Power Co. (Nevada)
N = negligible* Excludes border accommodations.
Source: Energy, Mines and Resources Canada.
25714
3 96112 767657
1225386
46 00330 847
25
131198504325719
19461 109
1
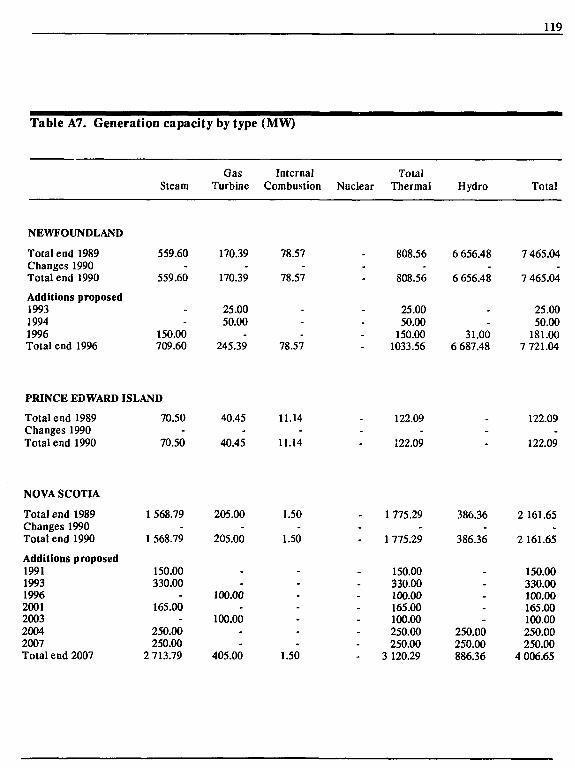
Table A7. Generation capacity by type (MW)
119
Gas Internal TotalSteam Turbine Combustion Nuclear Thermal Hydro Total
NEWFOUNDLAND
Total end 1989Changes 1990Total end 1990
Additions proposed199319941996Total end 1996
559.60-
559.60
--
150.00709.60
170.39
170.39
25.0050.00
245.39
78.57-
78.57
--
78.57
808.56
808.56
25.0050.00
150.001033.56
6 656.48-
6 656.48
-31.00
6 687.48
7 465.04
7 465.04
25.0050.00
181.007 721.04
PRINCE EDWARD ISLAND
Total end 1989Changes 1990Total end 1990
NOVA SCOTIA
Total end 1989Changes 1990Total end 1990
Additions proposed1991199319962001200320042007Total end 2007
70.50-
70.50
1 568.79
1 568.79
150.00330.00
-165.00
-250.00250.00
2 713.79
40.45-
40.45
205.00-
205.00
100.00
100.00
-405.00
11.14
11.14
1.50-
1.50
-1.50
122.09
122.09
122.09
122.09
1 775.29
1 775.29
150.00330.00100.00165.00100.00250.00250.00
3 120.29
386.36
386.36
250.00250.00886.36
2 161.65
2 161.65
150.00330.00100.00165.00100.00250.00250.00
4 006.65
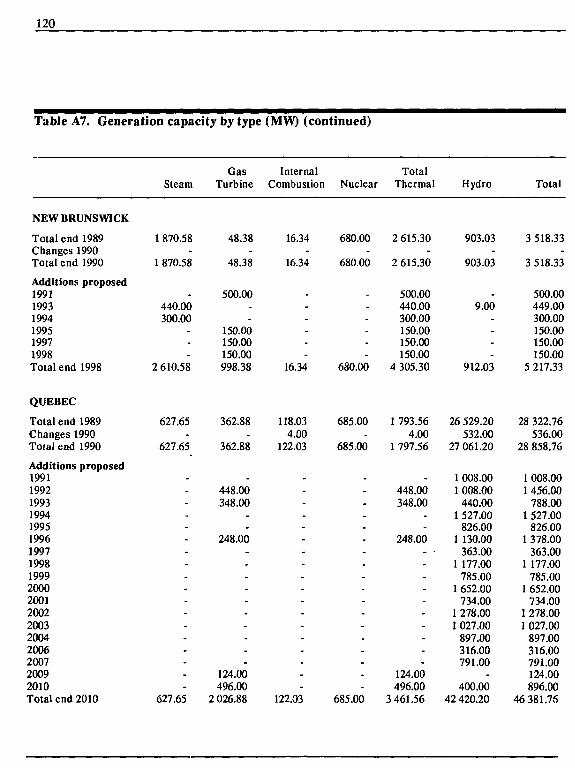
120
Table A7. Generation capacity by type
NEW BRUNSWICK
Total end 1989Changes 1990Total end 1990
Additions proposed199119931994199519971998Total end 1998
Steam
1 870.58-
1 870.58
440.00300.00
-2 610.58
GasTurbine
48.38-
48.38
500.00
150.00150.00150.00998.38
(MW) (continued)
InternalCombustion
16.34-
16.34
-
-16.34
Nuclear
680.00-
680.00
-
-680.00
TotalThermal
2 615.30-
2 615.30
500.00440.00300.00150.00150.00150.00
4 305.30
Hydro
903.03-
903.03
9.00
-912.03
Total
3 518.33-
3 518.33
500.00449.00300.00150.00150.00150.00
5 217.33
QUEBEC
Total end 1989Changes 1990Total end 1990
Additions proposed199119921993199419951996199719981999200020012002200320042006200720092010Total end 2010
627.65
627.65
------
-----•
-
-
-
-
627.65
362.88-
362.88
-448.00348.00
--
248.00-
------
-124.00496.00
2 026.88
118.034.00
122.03
-----------
-
---
122.03
685.00
685.00
-------
-
-
-
--
-685.00
1 793.564.00
1 797.56
-448.00348.00
--
248.00
--------
124.00496.00
3 461.56
26 529.20532.00
27 061.20
1 008.001 008.00
440.001 527.00
826.001 130.00
363.001 177.00
785.001 652.00
734.001 278.001 027.00
897.00316.00791.00
400.0042 420.20
28 322.76536.00
28 858.76
1 008.001 456.00
788.001 527.00
826.001 378.00
363.001 177.00
785.001 652.00
734.001 278.001 027.00
897.00316.00791.00124.00896.00
46 381.76
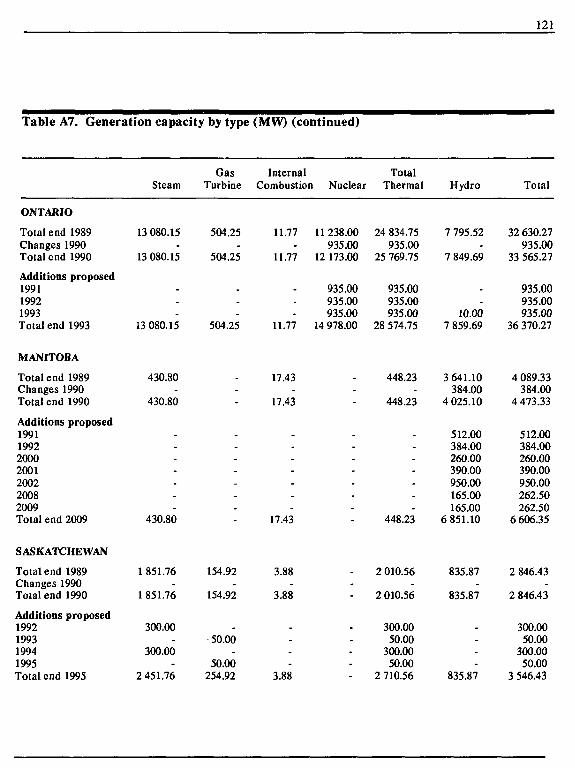
121
Table A7. Generation capacity by type
ONTARIO
Total end 1989Changes 1990Total end 1990
Additions proposed199119921993Total end 1993
MANITOBA
Total end 1989Changes 1990Total end 1990
Additions proposed1991199220002001200220082009Total end 2009
SASKATCHEWAN
Total end 1989Changes 1990Total end 1990
Additions proposed1992199319941995Total end 1995
Steam
13 080.15
13 080.15
-
13 080.15
430.80-
430.80
-
--
-430.80
1 851.76-
1 851.76
300.00
300.00-
2 451.76
GasTurbine
504.25
504.25
-
-504.25
_--
_
-
-
-
154.92
154.92
-50.00
50.00254.92
(MW) (continued)
InternalCombustioi
11.77
11.77
-
11.77
17.43-
17.43
----
17.43
3.88-
3.88
-
-3.88
l Nuclear
11238.00935.00
12 173.00
935.00935.00935.00
14 978.00
--
------
_--
-_
TotalThermal
24 834.75935.00
25 769.75
935.00935.00935.00
28 574.75
448.23-
448.23
_
-
-448.23
2 010.56-
2 010.56
300.0050.00
300.0050.00
2 710.56
Hydro
7 795.52
7 849.69
-
10.007 859.69
3 641.10384.00
4 025.10
512.00384.00260.00390.00950.00165.00165.00
6 851.10
835.87-
835.87
-
-835.87
Total
32 630.27935.00
33 565.27
935.00935.00935.00
36 370.27
4 089.33384.00
4 473.33
512.00384.00260.00390.00950.00262.50262.50
6 606.35
2 846.43-
2 846.43
300.0050.00
300.0050.00
3 546.43
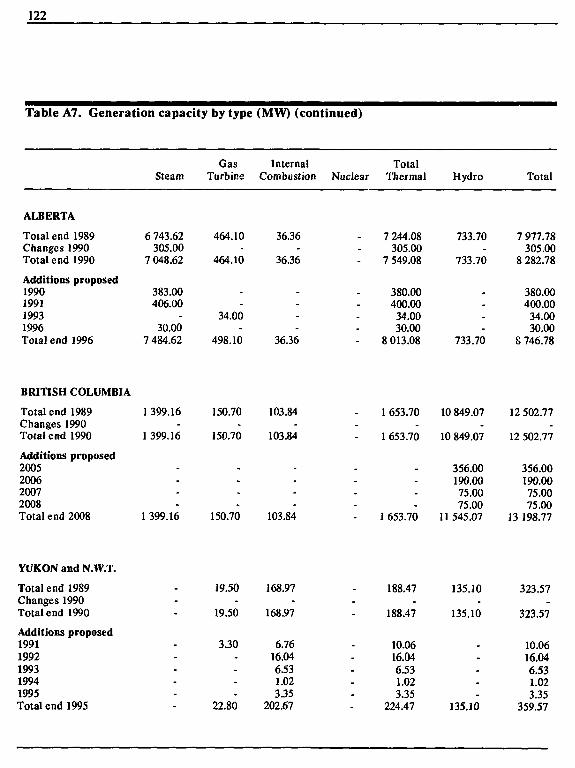
122
Table A7. Generation capacity by type (MW) (continued)
Gas Internal TotalSteam Turbine Combustion Nuclear Thermal Hydro Total
ALBERTA
Total end 1989Changes 1990Total end 1990
Additions proposed1990199119931996Total end 1996
6 743.62305.00
7 048.62
383.00406.00
30.007 484.62
464.10-
464.10
34.00
498.10
36.36
36.36
-36.36
7 244.08305.00
7 549.08
380.00400.00
34.0030.00
8 013.08
733.70
733.70
-733.70
7 977.78305.00
8 282.78
380.00400.0034.0030.00
8 746.78
BRITISH COLUMBIA
Total end 1989Changes 1990Total end 1990
Additions proposed2005200620072008Total end 2008
1 399.16-
1 399.16
-
-1 399.16
150.70
150.70
150.70
103.84-
103.84
--
103.84
1653.70 10 849.07 12 502.77
1653.70 10 849.07 12 502.77
356.00 356.00190.00 190.0075.00 75.0075.00 75.00
1653.70 11545.07 13 198.77
YUKON and N.W.T.
Total end 1989Changes 1990Total end 1990
Additions proposed19911992199319941995Total end 1995
19.50
19.50
3.30
22.80
168.97
168.97
6.7616.046.531.023.35
202.67
188.47
188.47
10.0616.046.531.023.35
224.47
135.10
135.10
135.10
323.57
323.57
10.0616.046.531.023.35
359.57
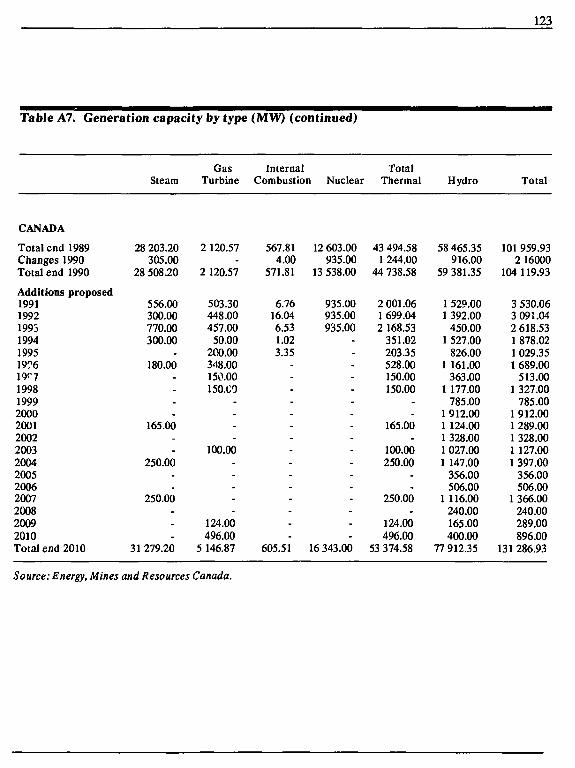
123
Table A7. Generation capacity by type
CANADA
Total end 1989Changes 1990Total end 1990
Steam
28 203.20305.00
28 508.20
Additions proposed1991199219931994199519?6
1998199920002001200220032004200520062007200820092010Total end 2010
556.00300.00770.00300.00
180.00--
165.00-
250.00
250.00
-31 279.20
GasTurbine
2 120.57
2 120.57
503.30448.00457.00
50.00200.00348.00150.00150.00
-
--
100.00--
-
124.00496.00
5 146.87
(MW) (continued)
InternalCombustion Nuclear
567.814.00
571.81
6.7616.046.531.023.35
----
-----
-
--
605.51
12 603.00935.00
13 538.00
935.00935.00935.00
--
---
----
-
--
16 343.00
TotalThermal
43 494.581 244.00
44 738.58
2 001.061 699.042 168.53
351.02203.35528.00150.00150.00
165.00-
100.00250.00
-
250.00
124.00496.00
53 374.58
Hydro
58 465.35916.00
59 381.35
1 529.001 392.00
450.001 527.00
826.001 161.00
363.001 177.00
785.001 912.001 124.001 328.001 027.001 147.00
356.00506.00
1 116.00240.00165.00400.00
77 912.35
Total
101 959.932 16000
104 119.93
3 530.063 091.042 618.531 878.021 029.351 689.00
513.001 327.00
785.001 912.001 289.001 328.001 127.001 397.00
356.00506.00
1 366.00240.00289.00896.00
131 286.93
Source: Energy, Mines and Resources Canada.
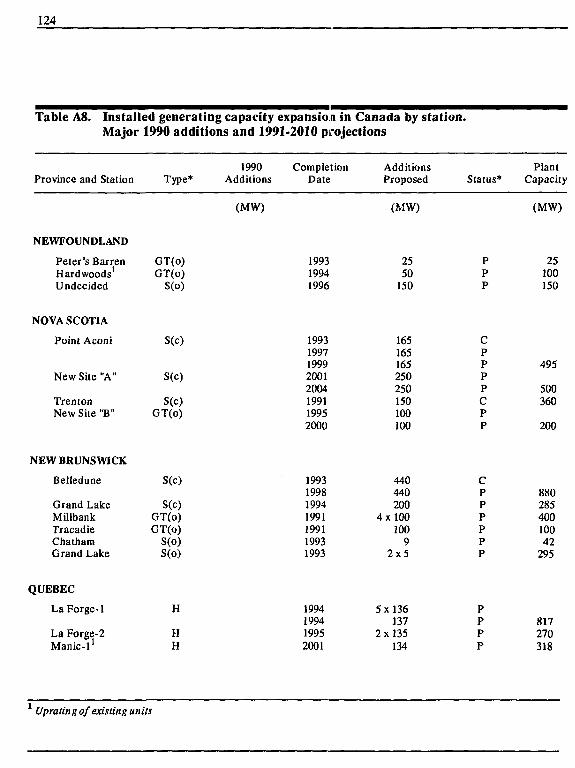
124
Table AS. Installed generating capacity expansion in Canada by station.Major 1990 additions and 1991-2010 projections
Province and Station Type*1990 Completion
Additions DateAdditionsProposed Status*
(MW) (MW) (MW)
NEWFOUNDLAND
Peter's BarrenHardwoodsUndecided
NOVA SCOTIA
Point Aconi
New Site "A"
TrentonNew Site "B"
NEW BRUNSWICK
Belledune
Grand LakeMillbankTracadieChathamGrand Lake
QUEBEC
La Forge-1
GT(o)GT(o)
S(o)
S(c)
S(c)
S(c)GT(o)
S(c)
S(c)GT(o)GT(o)
S(o)S(o)
H
199319941996
19931997199920012004199119952000
2550
150
165165165250250150100100
PPP
CPPPPCPP
25100150
495
500360
200
1993 440
La Forge-2Manic-1
HH
199819941991199119931993
1994199419952001
440200
4x100100
92 x 5
5x136137
2x135134
PPPPPP
PPPP
88028540010042
295
817270318
1 Uprating of existing units
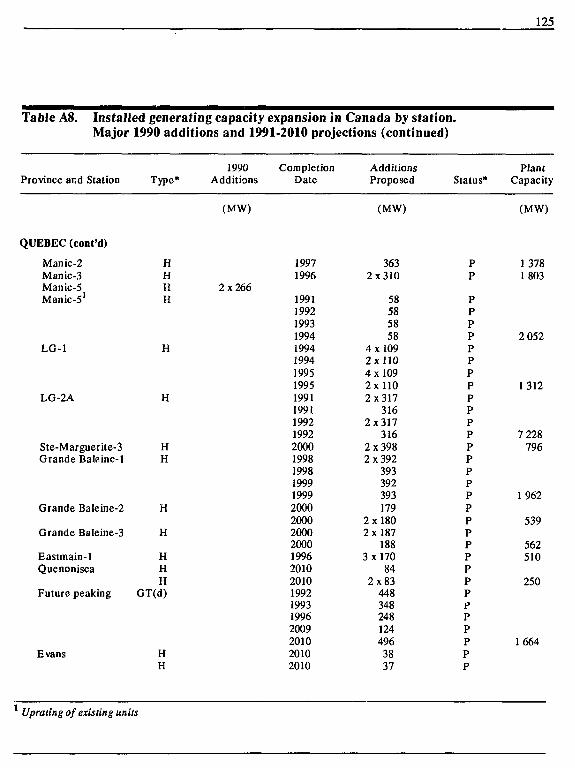
Table A8. Installed generating capacity expansion in Canada by station.Major 1990 additions and 1991-2010 projections (continued)
125
Province and Station Type*1990
AdditionsCompletion
DateAdditionsProposed Status*
PlantCapacity
(MW) (MW) (MW)
QUEBEC (cont'd)
Manic-2Manic-3Manic-5Manic-5
LG-1
LG-2A
HHHH
H
H
Ste-Marguerite-3Grande Baleine-1
Grande Baleine-2
Grande Baleine-3
Eastmain-1Quenonisca
Future peaking
HH
H
H
HHH
GT(d)
2x266
Evans HH
19971996
1991199219931994199419941995199519911991199219922000199819981999199920002000200020001996201020101992199319962009201020102010
3632x310
58585858
4x1092x1104x1092x1102x317
3162x317
3162x3982x392
393392393179
2x1802x187
1883x170
842x83
448348248124496
3837
PP
PPPPPPPPPPPPPPPPPPPPPPPPPPPPPPP
13781803
2 052
1312
7 228796
1962
539
562510
250
1664
Uprating of existing units
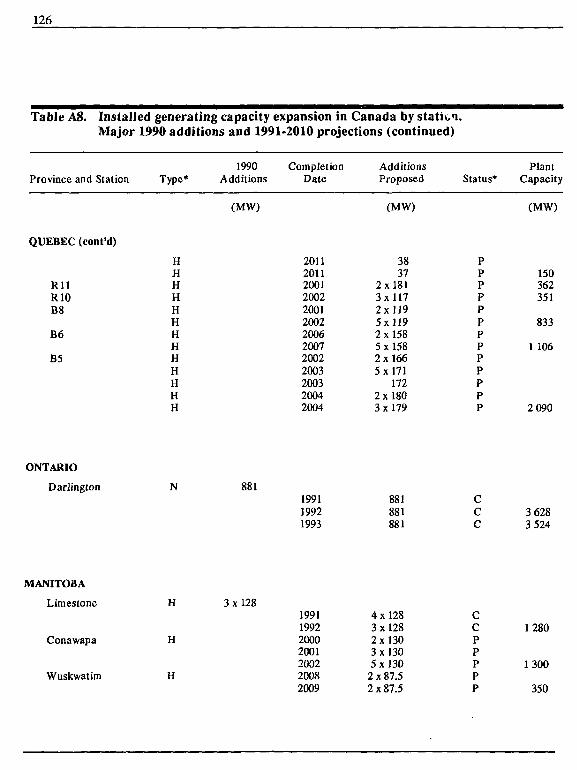
126
Table A8. Installed generating capacity expansion in Canada by station.Major 1990 additions and 1991-2010 projections (continued)
Province and Station1990 Completion Additions
Type* Additions Date ProposedPlant
Status* Capacity
(MW) (MW) (MW)
QUEBEC (cont'd)
R l lRIOB8
B6
B5
HHHHHHHHHHHHH
2011201120012002200120022006200720022003200320042004
3837
2x1813x1172x1195x1192x1585x1582x1665x171
1722x1803x179
PPPPPPPPPPPPP
150362351
833
1 106
2 090
ONTARIO
Darlington N 881
199119921993
881881881
CCC
3 6283 524
MANITOBA
Limestone
Conawapa
Wuskwatim
H
H
3x1281991199220002001200220082009
4x1283x1282x1303x1305x130
2 x 87.52 x 87.5
CCPPPPP
1280
1300
350
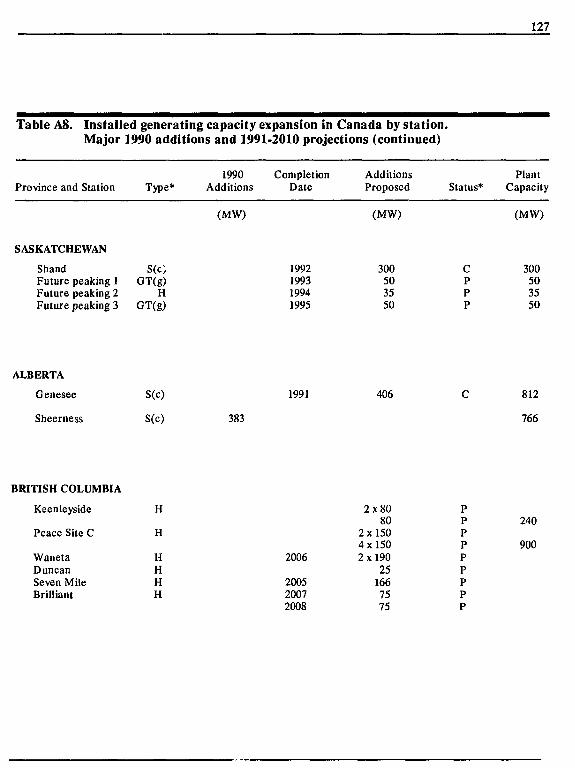
127
Table A8. Installed generating capacity expansion in Canada by station.Major 1990 additions and 1991-2010 projections (continued)
Province and Station Type*1990
AdditionsCompletion
DateAdditionsProposed Status*
PlantCapacity
(MW) (MW) (MW)
SASKATCHEWAN
Shand S(c)Future peaking 1 GT(g)Future peaking 2 HFuture peaking 3 GT(g)
1992199319941995
300503550
CPPP
300503550
ALBERTA
Genesee
Sheerness
S(c)
S(c)
1991 406
383
812
766
BRITISH COLUMBIA
Keenleyside
Peace Site C
WanctaDuncanSeven MileBrilliant
H
H
HHHH
2006
200520072008
2x8080
2x1504x1502x190
251667575
PPPPPPPPP
240
900
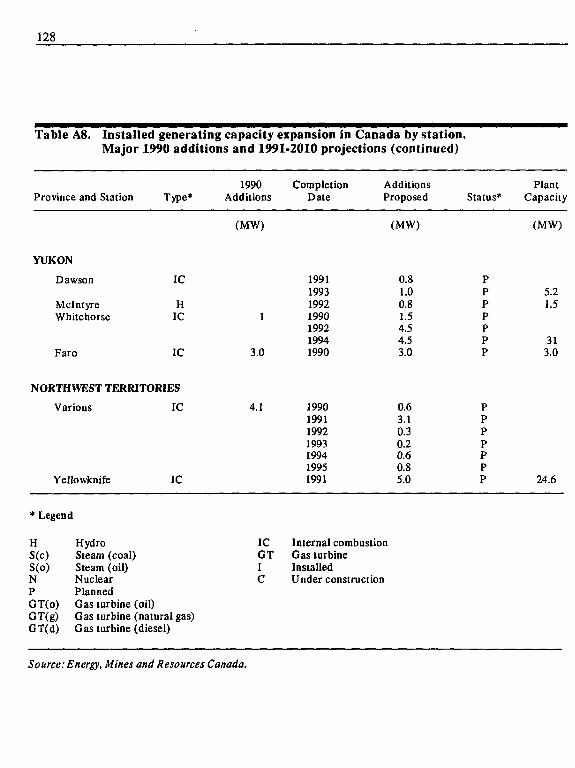
128
Table A8. Installed generating capacity expansion in Canada by station.Major 1990 additions and 1991-2010 projections (continued)
Province and Station Type*1990
AdditionsCompletion
DateAdditionsProposed Status*
PlantCapacity
(MW) (MW) (MW)
YUKON
Dawson
MclntyreWhitehorse
Faro
IC
HIC
IC
NORTHWEST TERRITORIES
Various IC
3.0
4.1
Yellowknife IC
1991199319921990199219941990
1990199119921993199419951991
0.81.00.81.54.54.53.0
0.63.10.30.20.60.85.0
PPPPPPP
PPPPPPP
5.21.5
313.0
24.6
' Legend
HS(c)S(o)NPOT(o)GT(g)GT(d)
HydroSteam (coal)Steam (oil)NuclearPlannedGas turbine (oil)Gas turbine (natural gas)Gas turbine (diesel)
ICGTIC
Internal combustionGas turbineInstalledUnder construction
Source: Energy, Mines and Resources Canada.

APPENDIX B
Bl. Chronology of Canadian electrical energy developments and achievements 130
B2. Chronology of regional interconnections 134
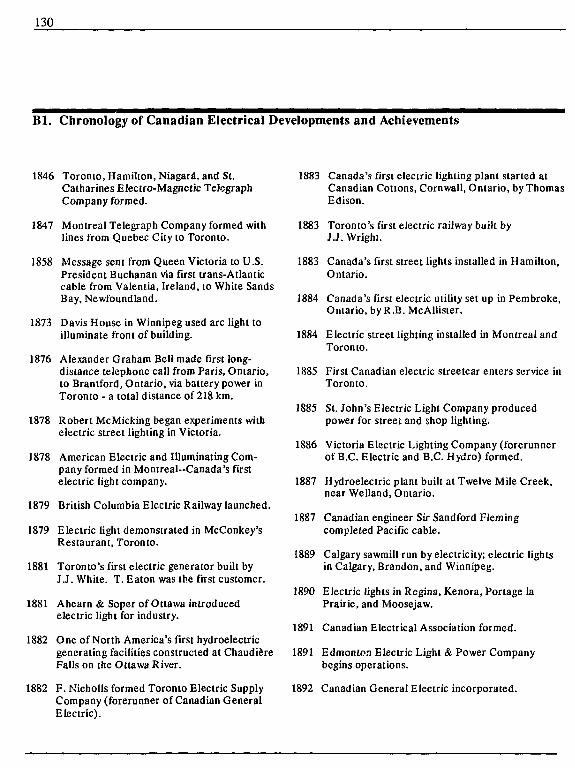
130
Bl. Chronology of Canadian Electrical Developments and Achievements
1846 Toronto, Hamilton, Niagara, and St.Catharines Electro-Magnetic TelegraphCompany formed.
1847 Montreal Telegraph Company formed withlines from Quebec City to Toronto.
1858 Message sent from Queen Victoria to U.S.President Buchanan via first trans-Atlanticcable from Valentia, Ireland, to White SandsBay, Newfoundland.
1873 Davis House in Winnipeg used arc light toilluminate front of building.
1876 Alexander Graham Bell made first long-distance telephone call from Paris, Ontario,to Brantford, Ontario, via battery power inToronto - a total distance of 218 km.
1878 Robert McMicking began experiments withelectric street lighting in Victoria.
1878 American Electric and Illuminating Com-pany formed in Montreal-Canada's firstelectric light company.
1879 British Columbia Electric Railway launched.
1879 Electric light demonstrated in McConkey'sRestaurant, Toronto.
1881 Toronto's first electric generator built byJ.J. White. T. Eaton was the first customer.
1881 Ahearn & Soper of Ottawa introducedelectric light for industry.
1882 One of North America's first hydroelectricgenerating facilities constructed at ChaudiereFalls on the Ottawa River.
1882 F. Nicholls formed Toronto Electric SupplyCompany (forerunner of Canadian GeneralElectric).
1883 Canada's first electric lighting plant started atCanadian Cottons, Cornwall, Ontario, by ThomasEdison.
1883 Toronto's first electric railway built byJ.J. Wright.
1883 Canada's first street lights installed in Hamilton,Ontario.
1884 Canada's first electric utility set up in Pembroke,Ontario, by R .B. McAllister.
1884 Electric street lighting installed in Montreal andToronto.
1885 First Canadian electric streetcar enters service inToronto.
1885 St. John's Electric Light Company producedpower for street and shop lighting.
1886 Victoria Electric Lighting Company (forerunnerof B.C. Electric and B.C. Hydro) formed.
1887 Hydroelectric plant built at Twelve Mile Creek,near Welland, Ontario.
1887 Canadian engineer Sir Sandford Flemingcompleted Pacific cable.
1889 Calgary sawmill run by electricity; electric lightsin Calgary, Brandon, and Winnipeg.
1890 Electric lights in Regina, Kenora, Portage laPrairie, and Moosejaw.
1891 Canadian Electrical Association formed.
1891 Edmonton Electric Light & Power Companybegins operations.
1892 Canadian General Electric incorporated.
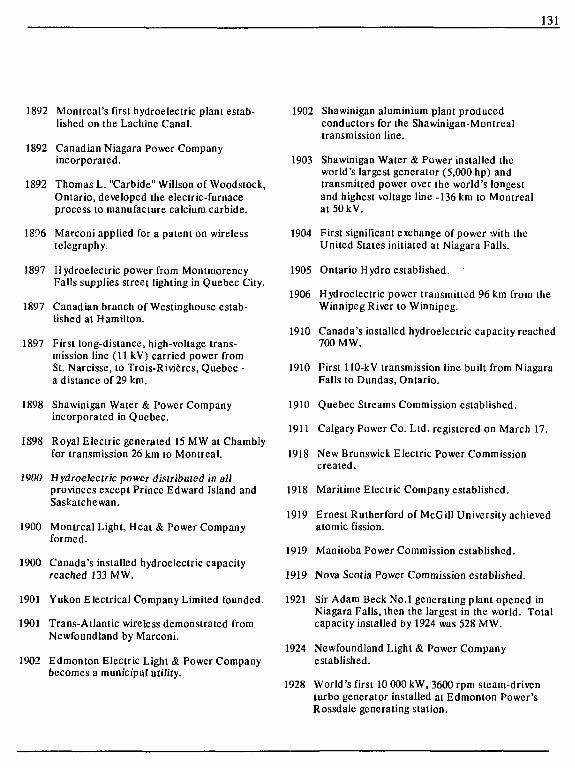
131
1892 Montreal's first hydroelectric plant estab-lished on the Lachine Canal.
1892 Canadian Niagara Power Companyincorporated.
1892 Thomas L. "Carbide" Willson of Woodstock,Ontario, developed the electric-furnaceprocess to manufacture calcium carbide.
1896 Marconi applied for a patent on wirelesstelegraphy.
1897 Hydroelectric power from MontmorencyFalls supplies street lighting in Quebec City.
1897 Canadian branch of Westinghouse estab-lished at Hamilton.
1897 First long-distance, high-voltage trans-mission line (II kV) carried power fromSt. Narcisse, to Trois-Rivieres, Quebec -a distance of 29 km.
1898 Shawinigan Water & Power Companyincorporated in Quebec.
1898 Royal Electric generated 15 MW at Chamblyfor transmission 26 km to Montreal.
1900 Hydroelectric power distributed in allprovinces except Prince Edward Island andSaskatchewan.
1900 Montreal Light, Heat & Power Companyformed.
1900 Canada's installed hydroelectric capacityreached 133 MW.
1901 Yukon Electrical Company Limited founded.
1901 Trans-Atlantic wireless demonstrated fromNewfoundland by Marconi.
1902 Edmonton Electric Light & Power Companybecomes a municipal utility.
1902 Shawinigan aluminium plant producedconductors for the Shawinigan-Montrealtransmission line.
1903 Shawinigan Water & Power installed theworld's largest generator (5,000 hp) andtransmitted power over the world's longestand highest voltage line -136 km to MontrealatSOkV.
1904 First significant exchange of power with theUnited States initiated at Niagara Falls.
1905 Ontario Hydro established.
1906 Hydroelectric power transmitted 96 km from theWinnipeg River to Winnipeg.
1910 Canada's installed hydroelectric capacity reached700 MW.
1910 First 110-kV transmission line built from NiagaraFalls to Dundas, Ontario.
1910 Quebec Streams Commission established.
1911 Calgary Power Co. Ltd. registered on March 17.
1918 New Brunswick Electric Power Commissioncreated.
1918 Maritime Electric Company established.
1919 Ernest Rutherford of McGill University achievedatomic fission.
1919 Manitoba Power Commission established.
1919 Nova Scotia Power Commission established.
1921 Sir Adam Beck No.l generating plant opened inNiagara Falls, then the largest in the world. Totalcapacity installed by 1924 was 528 MW.
1924 Newfoundland Light & Power Companyestablished.
1928 World's first 10 000 kW, 3600 rpm steam-driventurbo generator installed at Edmonton Power'sRossdale generating station.
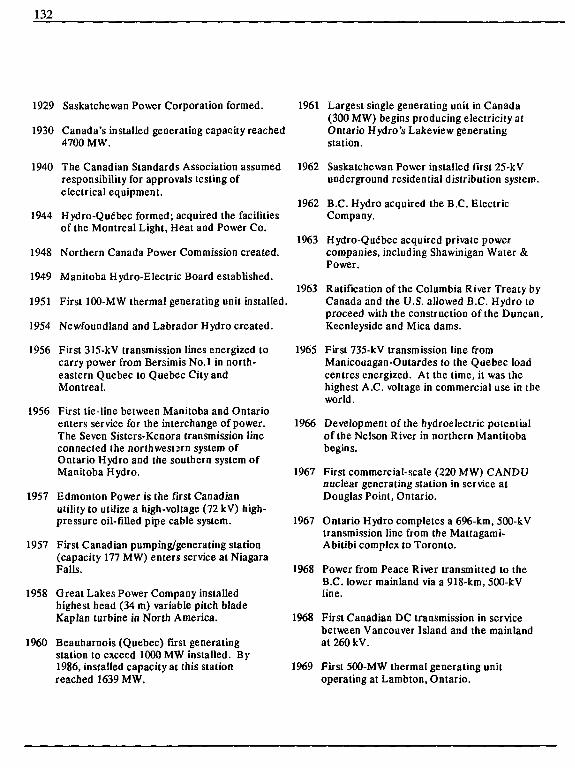
132
1929 Saskatchewan Power Corporation formed.
1930 Canada's installed generating capacity reached4700 MW.
1940 The Canadian Standards Association assumedresponsibility for approvals testing ofelectrical equipment.
J944 Hydro-Qu6bec formed; acquired the facilitiesof the Montreal Light, Heat and Power Co.
1961 Largest single generating unit in Canada(300 MW) begins producing electricity atOntario Hydro's Lakeview generatingstation.
1962 Saskatchewan Power installed first 25-kVunderground residential distribution system.
1962 B.C. Hydro acquired the B.C. ElectricCompany.
1948 Northern Canada Power Commission created.
1949 Manitoba Hydro-Electric Board established.
1951 First 100-MW thermal generating unit installed.
1954 Newfoundland and Labrador Hydro created.
1956 First 315-kV transmission lines energized tocarry power from Bersimis No.l in north-eastern Quebec to Quebec City andMontreal.
1956 First tie-line between Manitoba and Ontarioenters service for the interchange of power.The Seven Sislers-Kenora transmission lineconnected the northwestern system ofOntario Hydro and the southern system ofManitoba Hydro.
1957 Edmonton Power is the first Canadianutility to utilize a high-voltage (72 kV) high-pressure oil-filled pipe cable system.
1957 First Canadian pumping/generating station(capacity 177 MW) enters service at NiagaraFalls.
1958 Great Lakes Power Company installedhighest head (34 m) variable pitch bladeKaplan turbine in North America.
1960 Beauharnois (Quebec) first generatingstation to exceed 1000 MW installed. By1986, installed capacity at this stationreached 1639 MW.
1963 Hydro-Quebec acquired private powercompanies, including Shawinigan Water &Power.
1963 Ratification of the Columbia River Treaty byCanada and the U.S. allowed B.C. Hydro toproceed with the construction of the Duncan,Keenleyside and Mica dams.
1965 First 735-kV transmission line fromManicouagan-Outardes lo the Quebec loadcentres energized. At the lime, it was thehighest A.C. voltage in commercial use in theworld.
1966 Development of the hydroelectric potentialof the Nelson River in northern Mantitobabegins.
1967 First commercial-scale (220 MW) CANDUnuclear generating station in service atDouglas Point, Ontario.
1967 Ontario Hydro completes a 696-km, 500-kVtransmission line from the Mattagami-Abitibi complex to Toronto.
1968 Power from Peace River transmitted to theB.C. lower mainland via a 918-km, 500-kVline.
1968 First Canadian DC transmission in servicebetween Vancouver Island and the mainlandat260kV.
1969 First 500-MW thermal generating unitoperating at Lambton, Ontario.
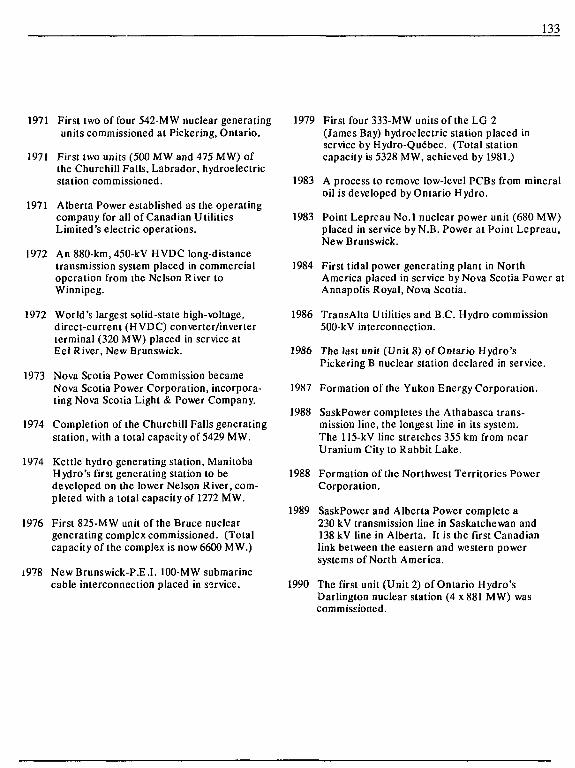
133
1971 First two of four 542-MW nuclear generatingunits commissioned at Pickering, Ontario.
1971 First two units (500 MW and 475 MW) orthe Churchill Falls, Labrador, hydroelectricstation commissioned.
1971 Alberta Power established as the operatingcompany for all of Canadian UtilitiesLimited's electric operations.
1972 An 880-km, 450-kV HVDC long-distancetransmission system placed in commercialoperation from the Nelson River toWinnipeg.
1972 World's largest solid-state high-voltage,direct-current (HVDC) converter/inverterterminal (320 MW) placed in service atEel River, New Brunswick.
1973 Nova Scotia Power Commission becameNova Scotia Power Corporation, incorpora-ting Nova Scotia Light & Power Company.
1974 Completion of the Churchill Falls generatingstation, with a total capacity of 5429 MW.
1974 Kettle hydro generating station, ManitobaHydro's first generating station to bedeveloped on the lower Nelson River, com-pleted with a total capacity of 1272 MW.
1976 First 825-MW unit of the Bruce nucleargenerating complex commissioned. (Totalcapacity of the complex is now 6600 MW.)
i978 New Brunswick-P.E.I. 100-MW submarinecable interconnection placed in service.
1979 First four 333-MW units of the LG 2(James Bay) hydroelectric station placed inservice by Hydro-Qu6bec. (Total stationcapacity is 5328 MW, achieved by 1981.)
1983 A process to remove low-level PCBs from mineraloil is developed by Ontario Hydro.
1983 Point Lepreau No.l nuclear power unit (680 MW)placed in service by N.B. Power at Point Lepreau,New Brunswick.
1984 First tidal power generating plant in NorthAmerica placed in service by Nova Scotia Power atAnnapolis Royal, Nova Scotia.
1986 TransAlta Utilities and B.C. Hydro commission500-kV interconnection.
1986 The last unit (Unit 8) of Ontario Hydro'sPickering B nuclear station declared in service.
1987 Formation of the Yukon Energy Corporation.
1988 SaskPower completes the Athabasca trans-mission line, the longest line in its system.The 115-kV line stretches 355 km from nearUranium City to Rabbit Lake.
1988 Formation of the Northwest Territories PowerCorporation.
1989 SaskPower and Alberta Power complete a230 kV transmission line in Saskatchewan and138 kV line in Alberta. It is the first Canadianlink between the eastern and western powersystems of North America.
1990 The first unit (Unit 2) of Ontario Hydro'sDarlington nuclear station (4 x 881 MW) wascommissioned.
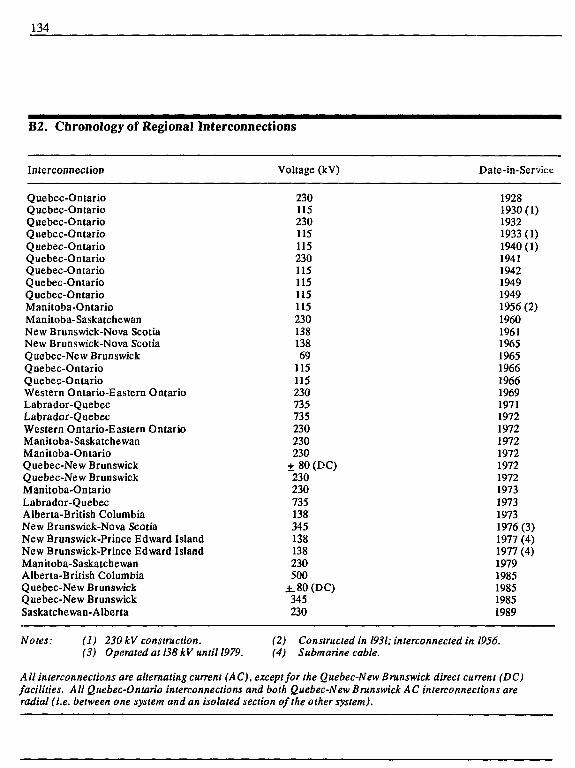
134
B2. Chronology of Regional Interconnections
Interconnection
Quebec-OntarioQuebec-OntarioQuebec-OntarioQuebec-OntarioQuebec-OntarioQuebec-OntarioQuebec-OntarioQuebec-OntarioQuebec-OntarioManitoba-OntarioManitoba-SaskatchewanNew Brunswick-Nova ScotiaNew Brunswick-Nova ScotiaQuebec-New BrunswickQuebec-OntarioQuebec-OntarioWestern Ontario-Eastern OntarioLabrador-QuebecLabrador-QuebecWestern Ontario-Eastern OntarioManitoba-SaskatchewanManitoba-OntarioQuebec-New BrunswickQuebec-New BrunswickManitoba-OntarioLabrador-QuebecAlberta-British ColumbiaNew Brunswick-Nova ScotiaNew Brunswick-Prince Edward IslandNew Brunswick-Prince Edward IslandManitoba-SaskatchewanAlberta-British ColumbiaQuebec-New BrunswickQuebec-New BrunswickSaskatchewan-Alberta
Voltage (kV)
23011523011511523011511511511523013813869
115115230735735230230230
+ 80 (DC)230230735138345138138230500
i 80 (DC)345230
Date-in-Service
19281930(1)19321933(1)1940 (1)19411942194919491956 (2)196019611965196519661966196919711972197219721972197219721973197319731976 (3)1977 (4)1977 (4)19791985198519851989
Notes; (I) 230 kV construction.(3) Operated atl38kV until 1979.
(2) Constructed in 1931; interconnected in 1956.(4) Submarine cable.
All interconnections are alternating current (AC), except for the Quebec-New Brunswick direct current (DC)facilities. All Quebec-Ontario interconnections and both Quebec-New Brunswick AC interconnections areradial (i.e. between one system and an isolated section of the other system).

APPENDIX C
Cl. Remaining hydroelectric potential in Canada 136
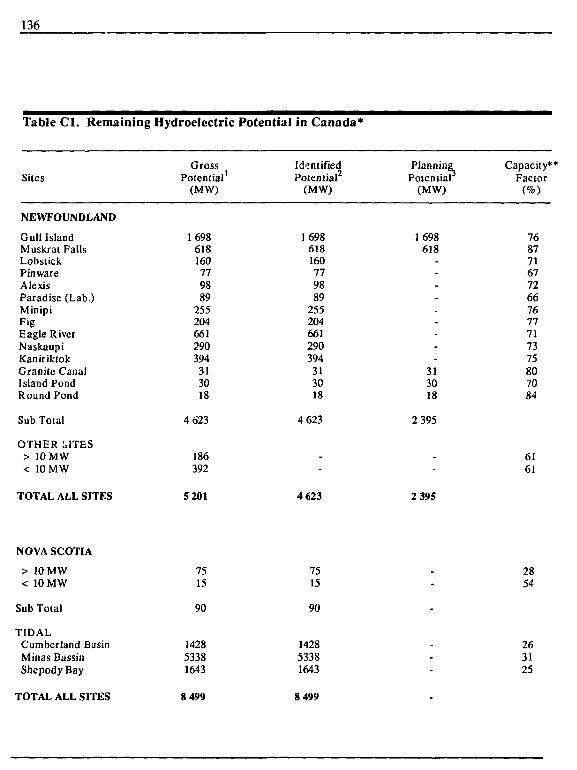
136
Table Cl. Remaining Hydroelectric Potential in Canada*
Sites
NEWFOUNDLAND
Gull IslandMuskral FallsLobstickPin wareAlexisParadise (Lab.)MinipiFigEagle RiverNaskaupiKaniriktokGranite CanalIsland PondRound Pond
Sub Total
OTHER UTES> 10 MW< 10 MW
GrossPotential1
(MW)
1698618160779889
255204661290394
313018
4 623
186392
IdentifiedPotential2
(MW)
1698618160779889
255204661290394
313018
4 623
-_
Planning.Potential3
(MW)
Capacity**Factor
1698618
_
-313018
7687716772667677717375807084
2 395
6161
TOTAL ALL SITES 5 201 4 623 2 395
NOVA SCOTIA
> 10 MW< 10 MW
Sub Total
TIDALCumberland BasinMinas BassinShcpody Bay
7515
90
142853381643
7515
90
142853381643
2854
263125
TOTAL ALL SITES 8 499 8 499
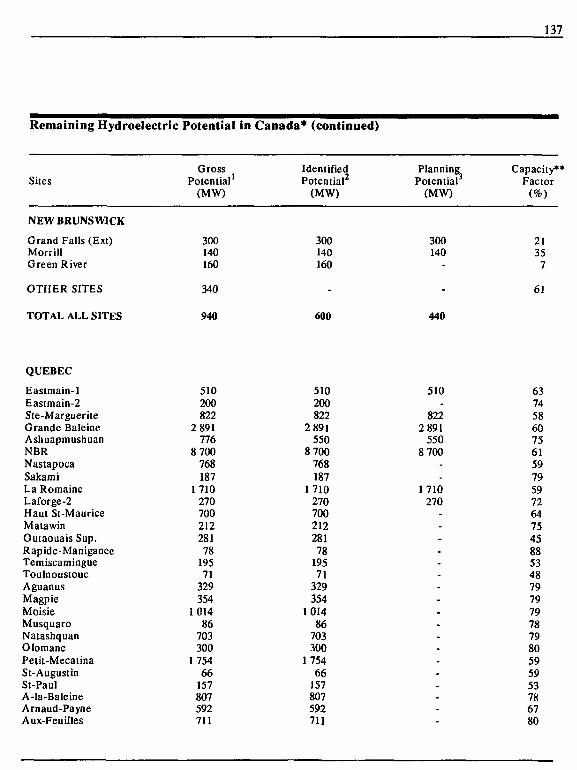
137
Remaining Hydroelectric
Sites
NEW BRUNSWICK
Grand Falls (Ext)MorrillGreen River
OTHER SITES
TOTAL ALL SITES
Potential
GrossPotential1
(MW)
300140160
340
940
in Canada* (continued)
IdentifiedPotential2
(MW)
300140160
-
600
PlanningPotentiar
(MW)
300140
-
440
Capacity**Factor
(%)
21357
61
QUEBEC
Eastmain-1Eastmain-2Ste-MargueriteGrande BaleineAshiiapmushuanNBRNastapocaSakamiLa RomaineLaforge-2Haut Si-MauriceMatawinOutaouais Sup.Rapide-ManiganceTemiscamingueToulnoustoucAguanusMagpieMoisieMusquaroNatashquanOlomanePetit-MecatinaSt-AugustinSt-PaulA-la-BaleineArnaud-PayneAux-Feuilles
510200822
2 891776
8 700768187
171027070021228178
19571
329354
101486
703300
175466
157807592711
510200822
2 891550
8 700768187
171027070021228178
19571
329354
101486
703300
175466
157807592711
510
8222 891
5508 700
--
1 710270
----
--
--
-
-
63745860756159795972647545885348797979787980595953786780
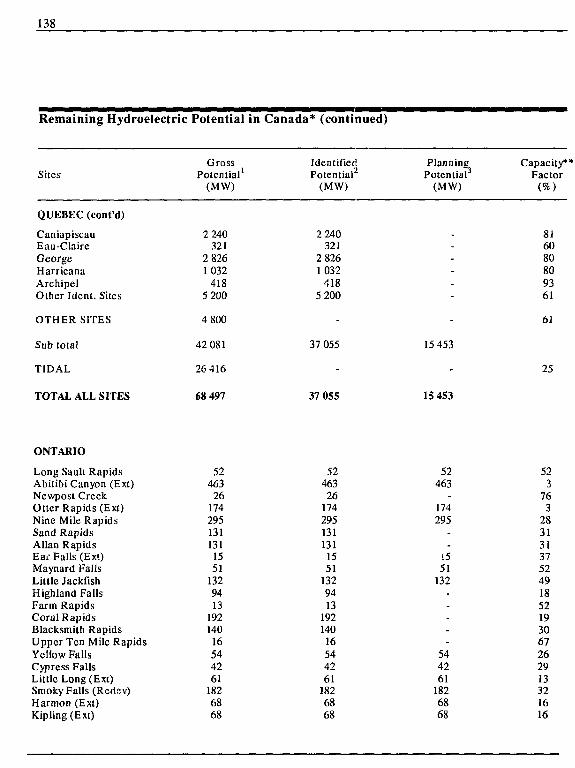
138
Remaining Hydroelectric
Sites
QUEBEC (cont'd)
CaniapiscauEau-ClaireGeorgeHarricanaArchipelOther Idem. Sites
OTHER SITES
Sub total
TIDAL
TOTAL ALL SITES
ONTARIO
Long Sault RapidsAbilibi Canyon (Ext)Newpost CreekOtter Rapids (Ext)Nine Mile RapidsSand RapidsAllan RapidsEai- Falls (Ex!)Maynard FallsLittle JackfishHighland FallsFarm RapidsCoral RapidsBlacksmith RapidsUpper Ten Mile RapidsYellow FallsCypress FallsLittle Long (Ext)Smoky Falls (Redov)Harmon (Ext)Kipling (Ext)
Potential
GrossPotential1
(MW)
2 240321
2 8261032
4185 200
4 800
42 081
26 416
68 497
52463
261742951311311551
1329413
19214016544261
1826868
in Canada* (continued)
IdentifiedPotential2
(MW)
2 240321
2 8261032
4185 200
-
37 055
-
37 OSS
5246326
174295131131
1551
1329413
192140
16544261
1826868
PlanningPotential3
(MW)
-----
-
15 453
-
IS 453
52463
-174295
--
(551
132-----
544261
1826868
Capacity*Factor
(%)
816080809361
61
25
523
763
2831313752491852193067262913321616
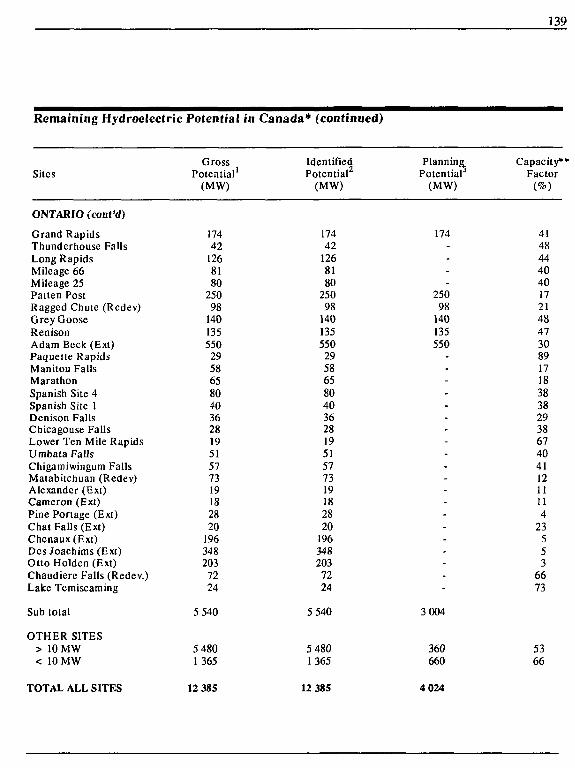
Remaining Hydroelectric Potential in Canada* (continued)
SitesGross
Potential1
(MW)
IdentifiedPotential2
(MW)
PlanningPotential
(MW)
ONTARIO (cont'd)
Grand RapidsThunderhouse FallsLong RapidsMileage 66Mileage 25Patten PostRagged Chute (Redev)Grey GooseRenisonAdam Beck (Ext)Paquette RapidsManitou FallsMarathonSpanish Site 4Spanish Site 1Denison FallsChicagouse FallsLower Ten Mile RapidsUmbata FallsChigamiwingum FallsMatabitchuan (Redev)Alexander (Ext)Cameron (Ext)Pine Portage (Ext)Chat Falls (Ext)Chenaux(Ext)Des Joachims (Ext)Otto Holdcn (Ext)Chaudierc Falls (Redev.)Lake Temiscaming
Sub total
OTHER SITES> 10 MW< 10 MW
17442
1268180
25098
140135550295865804036281951577319182820
1963482037224
5 540
5 4801365
17442
1268180
25098
140135550295865804036281951577319182820
1963482037224
5 540
5 4801365
174-
--
25098
140135550
-
---
-
------
--
41484440401721484730891718383829386740411211114
23553
6673
3004
360660
5366
TOTAL ALL SITES 12 385 12 385 4 024
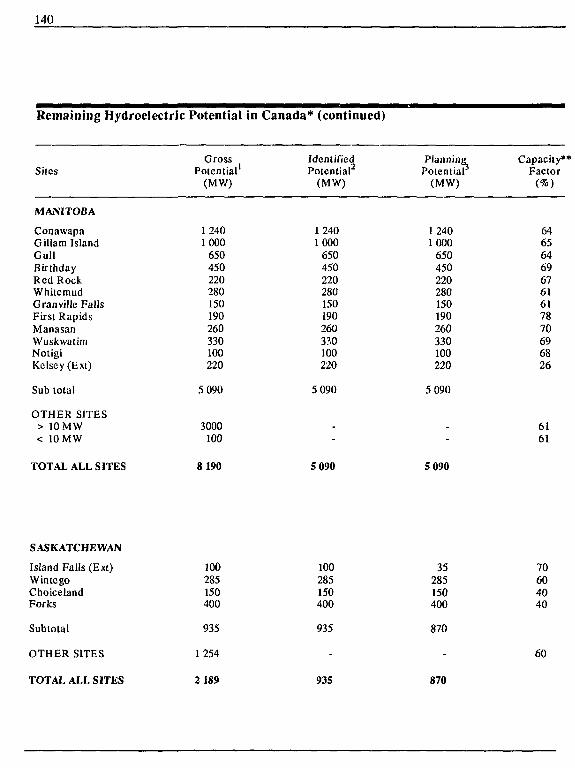
140
Remaining Hydroelectric Potential in Canada* (continued)
SitesGross
Potential1
(MW)
IdentifiedPotential2
(MW)
PlanningPotentiar
(MW)
Capacity**Factor
MANITOBA
ConawapaGillam IslandGullBirthdayRed RockWhitcmudGranville FallsFirst RapidsManasanWuskwatimNotigiKelsey(Ext)
Sub total
OTHER SITES> 10 MW< 10 MW
1 2401000
650450220280150190260330100220
5 090
3000100
124010006504502202801501902603?.O100220
5 090
12401000
650450220280150190260330100220
646564696761617870696826
5 090
6161
TOTAL ALL SITES 8 190 5 090 5 090
SASKATCHEWAN
Island Falls (E xi)WintcgoChoicelandForks
Subtotal
OTHER SITES
TOTAL ALL SITES
100285150400
935
1254
2189
100285150400
935
935
35285150400
70604040
870
870
60
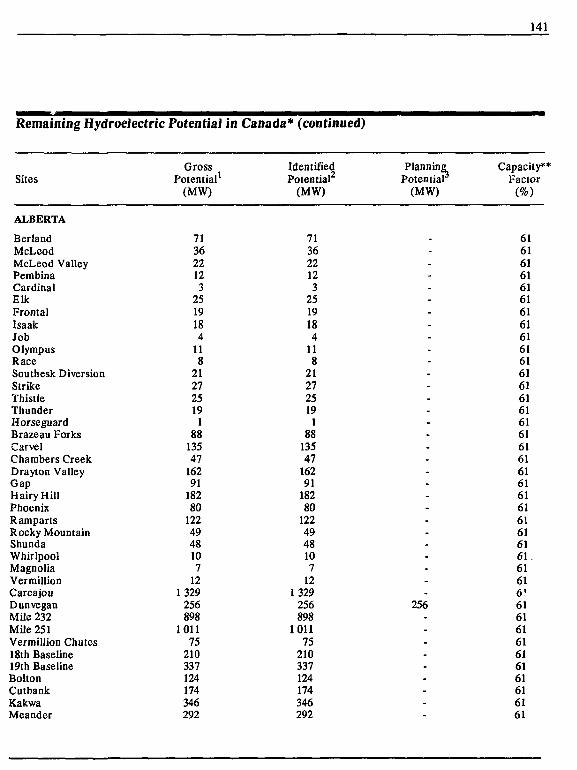
141
Remaining Hydroelectric Potential
Sites
ALBERTA
BerlandMcLeodMcLeod ValleyPembinaCardinalElkFrontalIsaakJobOlympusRaceSouthesk DiversionStrikeThistleThunderHorseguardBrazeau ForksCarvelChambers CreekDrayton ValleyGapHairy HillPhoenixRampartsRocky MountainShundaWhirlpoolMagnoliaVermillionCarcajouDun veganMile 232Mile 251Vermillion Chutes18th Baseline19th BaselineBoltonCutbankKakwaMeander
GrossPotential1
(MW)
713622123
2519184
118
21272519
188
13547
16291
18280
1224948107
121329
256898
101175
210337124174346292
in Canada* (continued)
IdentifiedPotential
(MW)
713622123
2519184
118
21272519
188
13547
16291
18280
1224948107
121329
256898
101175
210337124174346292
PlanningPotentiar
(MW)
---
--
-----
--
--
---
256
--
-
Capacity**Factor
(%)
61616161616161616161616161616161616161616161616161616 1 .61616!61616161616161616161
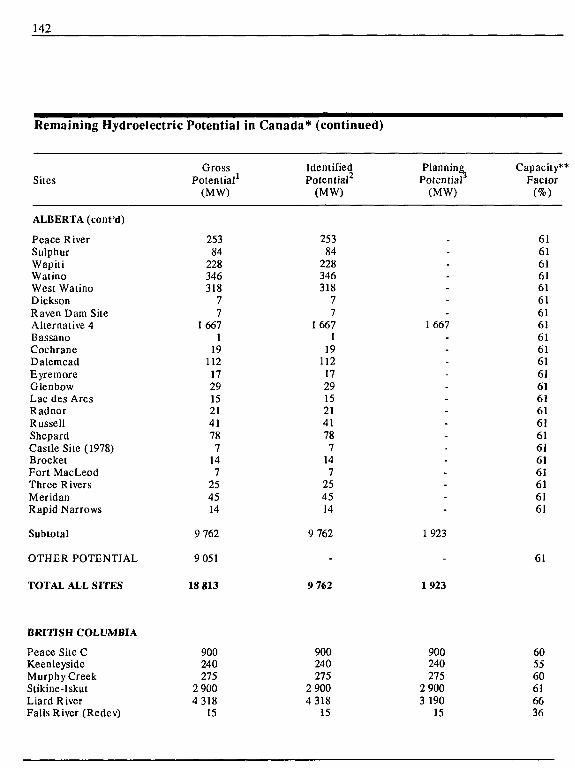
142
Remaining Hydroelectric
Sites
ALBERTA (cont'd)
Peace RiverSulphurWapitiWatinoWest WatinoDicksonRaven Dam SiteAlternative 4BassanoCochraneDalemeadEyremoreGlenbowLac des ArcsRadnorRussellShepardCastle Site (1978)BrocketFort MacLeodThree RiversMeridanRapid Narrows
Subtotal
OTHER POTENTIAL
Potential in
GrossPotential1
(MW)
25384
228346318
77
16671
191121729152141787
147
254514
9 762
9 051
Canada* (continued)
IdentifiedPotential2
(MW)
25384
228346318
77
1 6671
191121729152141787
147
254514
9 762
PlanningPotential
(MW)
_---
--
1667-
---
-
--
----
1923
Capacity*Factor
(%)
6161616161616161616161616161616161616161616161
61
TOTAL ALL SITES 18 813 9 762 1923
BRITISH COLUMBIA
Peace Site CKeenleysideMurphy CreekStikine-IskutLiard RiverFalls River (Redev)
900240275
2 9004 318
15
900240275
2 9004 318
15
900240275
2 9003 190
15
605560616636
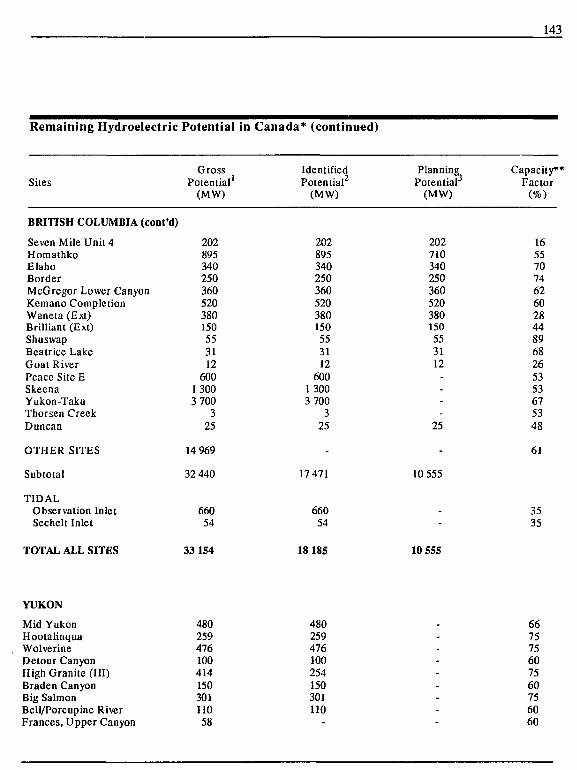
Remaining Hydroelectric Potential in Canada* (continued)
143
SitesGross
Potential1
(MW)
IdentifiedPotential2
(MW)
PlanningPotential3
(MW)
Capacity**Factor
BRITISH COLUMBIA (confd)
Seven Mile Unit 4HomathkoElahoBorderMcGregor Lower CanyonKemano CompletionWaneta (Ext)Brilliant (Ext)ShuswapBeatrice LakeGoat RiverPeace Site ESkeenaYukon-TakuThorsen CreekDuncan
OTHER SITES
Subtotal
TIDALObservation InletSechelt Inlet
202895340250360520380150553112
60013003 700
325
14 969
32 440
66054
202895340250360520380150553112
60013003 700
325
-
17471
66054
202710340250360520380150553112
-
--
25
16557074626028448968265353675348
10 555
61
3535
TOTAL ALL SITES 33154 18 185 10 555
YUKON
Mid YukonHootalinquaWolverineDetour CanyonHigh Granite (III)Braden CanyonBig SalmonBell/Porcupine RiverFrances, Upper Canyon
48025947610041415030111058
480259476100254150301110
667575607560756060
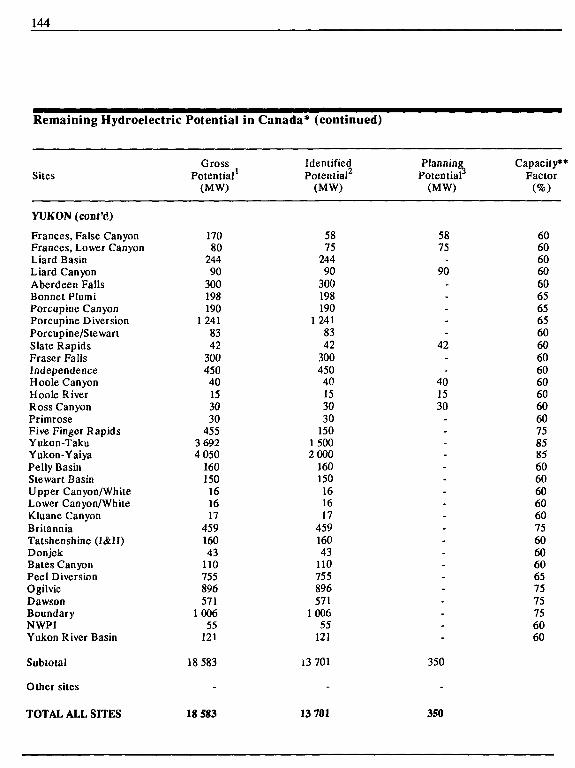
144
Remaining Hydroelectric
Sites
YUKON (cont'd)
Frances, False CanyonFrances, Lower CanyonLiard BasinLiard CanyonAberdeen FallsBonnet PlumiPorcupine CanyonPorcupine DiversionPorcupine/StewartSlate RapidsFraser FallsIndependenceHoole CanyonHoole RiverRoss CanyonPrimroseFive Finger RapidsYukon-TakuYukon-YaiyaPelly BasinStewart BasinUpper Canyon/WhiteLower Canyon/WhiteKluane CanyonBritanniaTatshenshine (I&II)DonjekBates CanyonPeel DiversionOgilvieDawsonBoundaryNWPIYukon River Basin
Subtotal
Other sites
TOTAL ALL SITES
Potential
GrossPotential1
(MW)
17080
24490
300198190
12418342
300450
40153030
4553 6924 050
160150161617
45916043
110755896571
100655
121
18 583
-
18 583
in Canada* (continued)
IdentifiedPotential2
(MW)
5875
24490
300198190
12418342
300450
40153030
15015002 000
160150161617
45916043
110755896571
100655
121
13 701
-
13 701
PlanningPotentia?
(MW)
5875
.90
-----
42--
401530
.-_--
-------
-----
350
-
350
Capacity*Factor
(%)
60606060606565656060606060606060758585606060606075606060657575756060
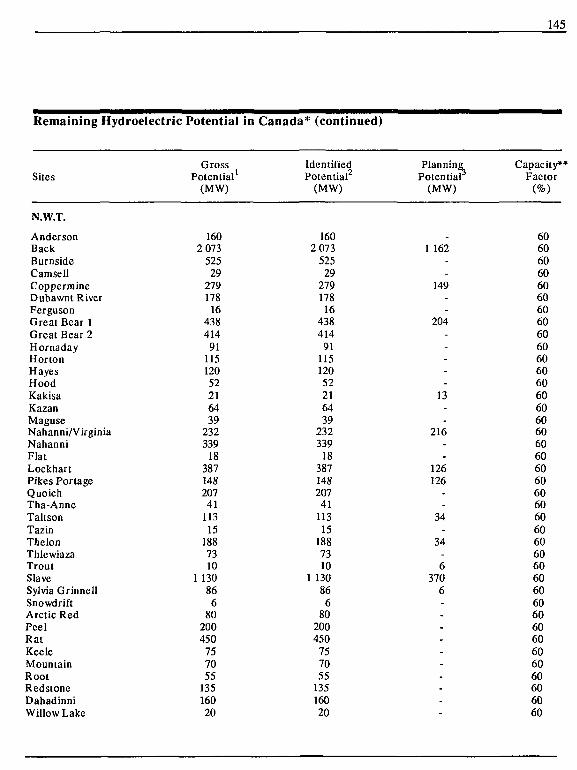
145
Remaining Hydroelectric Potential in Canada* (continued)
Sites
N.W.T.
AndersonBackBurnsideCam sellCoppermineDubawnt RiverFergusonGreat Bear 1Great Bear 2HornadayHortonHayesHoodKakisaKazanMaguseNahanni/VirginiaNahanniFlatLockhartPikes PortageQuoichTha-AnneTaltsonTazinThelonThlewiazaTroutSlaveSylvia GrinnellSnowdriftArctic RedPeelRatKeeleMountainRootRedstoneDahadinniWillow Lake
GrossPotential1
(MW)
1602 073
52529
279178
16438414
9111512052216439
232339
18387148207
4111315
1887310
1 13086
680
200450
757055
13516020
IdentifiedPotential2
(MW)
1602 073
52529
279178
16438414
9111512052216439
232339
1838714820741
11315
1887310
1 130866
80200450
757055
13516020
PlanningPotentiar
(MW)
_1 162
-149
--
204-----
13--
216-.
126126
--
34.
34-6
3706---
--
-
_
60606060606060606060606060606060606060606060606060606060606060606060606060606060
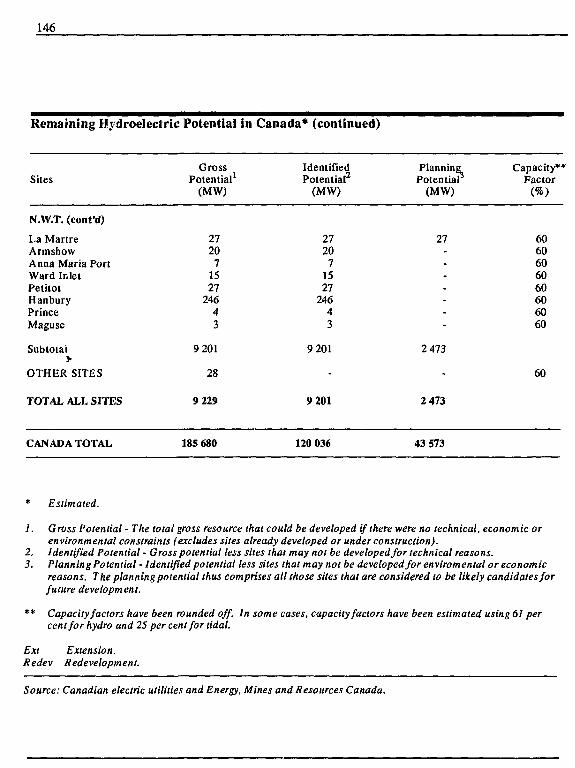
146
Remaining Hydroelectric Potential in Canada* (continued)
SitesGross
Potential1
(MW)
IdentifiedPotential2
(MW)
PlanninePotentiar
(MW)
Capacity**Factor
N.W.T. (cont'd)
La MartreArmshowAnna Maria PortWard InletPetitotHanburyPrinceMaguse
Subtotal
OTHER SITES
TOTAL ALL SITES
27207
1527
24643
9 201
28
9 229
2720
71527
24643
9 201
9 201
27
2 473
2 473
6060606060606060
60
CANADA TOTAL 185 680 120 036 43 573
* Estimated.
1. Gross Potential - The total gross resource that could be developed if there were no technical, economic orenvironmental constraints (excludes sites already developed or under construction).
2. Identified Potential • Gross potential less sites that may not be developed for technical reasons.3. Planning Potential - Identified potential less sites that may not be developed for enviromental or economic
reasons. The planning potential thus comprises all those sites that are considered to be likely candidates forfuture development.
** Capacity factors have been rounded off. In some cases, capacity factors have been estimated using 61 percent for hydro and 25 per cent for tidal.
Ext Extension.Redev Redevelopment.
Source: Canadian electric utilities and Energy, Mines and Resources Canada.

APPENDIX DFEDERAL ENVIRONMENTAL STANDARDS ANDGUIDELINES
Recent amendments to theNational Energy Board Actspecify that the Board, inassessing applications for exportsand international transmissionlines, consider the potentialimpacts of projects on theenvironment. (See Chapter 3 fora detailed discussion of theregulatory process.) Thisappend- provides a briefoverview of some federalenvironmental standards that,in addition to provincialenvironmental protectionmeasures, may be particularlyrelevant to the assessment ofsuch impacts.
Federal environmental standardsare those that have beenauthorized or endorsed by thefederal government and thatapply where a project affects anarea of explicit federal juris-diction, such as navigable watersor migratory birds. Following ageneral discussion of types ofenvironmental standards, therelevant federal standards aresummarized briefly.
1 Greater detail on federallegislation, initiatives andstandards may be obtained bycontacting the Electricity Branchof Energy, Mines and ResourcesCanada.
TYPES OF ENVIRONMENTALSTANDARDS
Environmental standards arenorms established with theoverall objective of protectingboth human and environmentalhealth. For the purposes of thisreport, the term "environmentalstandards" will be used as ageneral reference to allenvironmental guidelines,objectives, limits, criteria andcodes of practice. Federalenvironmental standards aregrouped into three generalcategories for the purposes ofdiscussion: ambient standards,emission standards and otherstandards.
Ambient Standards
Ambient standards arequantitative or qualitativestatements describing a level ofenvironmental quality that, ifmaintained in the "ambient" oropen environment, will normallyprotect environmental and humanhealth. Such standards generallyspecify concentrations ofsubstances, or physicalcharacteristics such as watertemperature. Federal ambientstandards normally have no legalforce in themselves. Theydescribe a level of environmentalquality that may apply to specificdesignated regions, or to allregions of Canada. They serve asthe goals or objectives towardswhich pollution-controlinitiatives, including legislationand regulations specifyingemission standards, are directed.
Emission Standards
Emission standards refer to alimit on the quantity or quality ofsubstances that may be releasedfrom industrial processes, basedon the use of the besteconomically achievabletechnology. They usually specifya release rate or maximumconcentration of a harmfulsubstance that may be present inthe emission as it emerges fromits source: a smokestack, pipelineor landfill drainage system.Federal emission standards,which may be given force of lawunder regulations, are consideredto be the minimum acceptablerequirements for any industrialundertaking. More stringentemission standards may berequired to meet appropriateambient standards at a particularsite.
Other Standards
Other standards includeprograms and legislation thatprovide for a wide variety ofenvironmental protectionmeasures, in addition to ambientor emission standards. Examplesinclude the Environmental Codesof Practice for Steam ElectricPower Generation and theCanadian EnvironmentalProtection Act.

148
OVERVIEW OF FEDERALSTANDARDS
1.1 Ambient Standards: Air
National Ambient Air QualityObjectives
The National Ambient Air QualityObjectives, published under theauthority of the CanadianEnvironmental Protection Act(CEPA), specifies criteria fortolerable, acceptable anddesirable levels of sulphurdioxide, nitrogen oxides,paniculate matter, ozone andcarbon monoxide in the open orambient atmosphere.
Intergovernmental Agreements
Ambient standards are onemethod of implementingintergovernmental agreements toreduce and control air pollution.(For a general discussion ofintergovernmental agreements onair pollution, see section 3.3 ofthis appendix.) The Governmentof Canada and the seven easterlyprovinces have signed federal-provincial agreements to reduceemissions of sulphur dioxide,based on a wet sulphatedeposition target (ambientstandard) of 20 kilograms perhectare per year.
1.2 Ambient Standards: Water
Water Quality Guidelines
The Canadian Water QualityGuidelines, published by theCanadian Council of Resourceand Environment Ministers(CCREM), is an inventory of"water quality objectives"(ambient standards) suitable fordifferent water uses in Canada,
such as aquatic life, industrialprocesses, human consumption,recreational use and agriculturalirrigation. These standards differdepending on the different wateruses and must therefore beadapted to meet regional waterquality needs. These standardsare developed from existingguidelines where appropriate,such as the Guidelines forCanadian Drinking Water Quality,established by the Federal-Provincial Subcommittee onDrinking Water.
Intergovernmental Agreements
Canada has entered into anagreement with the United States(The Great Lakes Water QualityAgreement) to restore andmaintain the water quality of theGreat Lakes basin. To assist inmeeting the goals of theAgreement, environmentalquality objectives (ambientstandards) were established forthese waters.
Other regional ambient standardsmay be developed underfederal-provincial agreementsand programs enacted pursuantto the Canada Water Act.
2.1 Emission Standards: Air
Thermal Power GenerationEmissions — National Guidelinesfor New Stationary Sources
These guidelines, publishedunder the authority of CEPA, aretechnology-based air emissionstandards for new fossil-fuelledelectric generating stations. Theyare generic emission limitationsrecommended as minimumnational standards that should be
adopted by utilities andprovincial governments. Criteriaspecified in the guidelinesinclude those for sulphur dioxide,nitrogen oxide and paniculatematter emissions, as well as foropacity (visibility standards).
2.2 Emission Standards: Water
The Environmental Codes ofPractice for Steam Electric PowerGeneration
See Other Federal Standards,section 3.1, for a genera!description of the Codes ofPractice.
The Design Phase Code ofPractice recommendstechnology-based minimum wastewater emission limitations. Thesestandards specify effluent criteriafor metals, oil and grease,chlorine, suspended solids an/iacidity, to minimize the totalamount of contaminantsdischarged to surface waters.These criteria are of concern toaquatic and human life.
FEDERAL LEGISLATION:THE FISHERIES ACT, THECANADA WATER ACT, ANDTHE MIGRATORY BIRDS ACT
The Fisheries Act prohibits thedeposit of deleterious substancesin any waters inhabited by fish.Regulations may limit the depositof certain types of waste orsubstances in specific quantitiesand concentrations. Provisionsare supported by EnvironmentCanada's Environmental Codes ofPractice for Steam Electric PowerGeneration. The Act alsoincludes a broad range ofenvironmental protectionmeasures that cannot be
149
adequately discussed in this shortsummary.
The Canada Water Act providesthe federal government with theauthority to regulate the emissionof substances in designated"water quality management"areas. No regulations for wateremissions have been implementedunder this Act. The Act alsoprovides the federal governmentwith the authority to enteragreements with the provinces forwater quality management.
Regulations pursuant to theMigratory Birds Act prohibit, incertain circumstances, thedumping of substances harmful tomigratory birds in any water orarea populated by these birds inCanada.
OTHER FEDERALSTANDARDS
3.1 Environmental Codes ofPractice for Steam ElectricPower Generation
The Environmental Codes ofPractice, developed by afederal-provincial governmentand industry task forceestablished by EnvironmentCanada, contain recommenda-tions judged to be reasonable andpractical measures that can betaken to preserve the quality ofthe environment affected byfossil- and nuclear-fuelledelectric power generation.Codes of practice now exist forthe design, siting andconstruction phases of steamelectric power generationprojects. Although the designand siting phase codes have nolegal status, the constructionphase code is published under the
authority of CEPA. Environ-ment Canada is now developingcodes for the operation anddecommissioning phases ofprojects.
The various phases of the codesof practice, although treated inseparate documents, areinterdependent. To ensureenvironmental protectionthroughout the life of a steamelectric power generating facility,the Codes should be consideredas a whole.
3.2 Federal Legislation forthe Control of HarmfulSubstances
The Canadian EnvironmentalProtection Act provides authorityfor the control of harmful or toxicsubstances at any stage of thelife-cycle of these substances,including development,manufacturing, storage,transportation, use and disposal.The Act specifies that theMinister of the Environment maydevelop environmental objectives(ambient standards), releaseguidelines (emission standards)and codes of pra nice, as well asenforceable regulations based onthese and other environmentalstandards. Regulations includestandards for the storage anddisposal of polychlorinatcdbiphenyls (PCBs).
The Transportation of DangerousGoods Act authorizes thecreation and enforcement ofsafety standards for transport,preparation for transport, and therelated handling of dangerousgoods (including PCBs andradioactive substances).
The Pest Control Products Actauthorizes the development andenforcement of safety standardsfor the storage, handling and useof pesticides.
3.3 Intergovernmental AirPollution Agreements
Canada is a signatory to twointernational protocols of theUnited Nations EconomicCommission for Europe (ECE),under the 1979 Convention onLong-Range Transboundary AirPollution. The protocols commitsignatories to the reduction ofsulphur dioxide emissions (1985)and nitrogen oxide emissions(1988). These protocols call foremission controls to reducesulphur dioxide emissions by30 per cent of 1980 levels by 1993,and to freeze emissions ofnitrogen oxides at 1987 levels by1994.
The protocol for the reduction ofsulphur dioxide emissions hasbeen implemented in Canada byindividual agreements betweenthe Government of Canada andthe seven easterly provinces, toreduce emissions of sulphurdioxide by approximately 50 percent of 1980 emissions by 1994.Consistent with thenitrogen-oxide protocolcommitment, Canadianenvironment ministers aredeveloping a comprehensive planof action for the furthermanagement of nitrogen oxidesand volatile organic compoundemissions in Canada.
On March 13, 1991 thegovernments of Canada and theUnited Slates signed anagreement on air quality (the Air
150
Quality Accord). Among otherthings, Canada agreed to:
• Cap SO2 emissions in the7 easternmost provinces at2.3 million tonnes per yearfrom 1995 to 1999.
• Achieve a permanent nationalcap of 3.2 million tonnes peryear by 2000.
• Reduce annual emissions ofNOx from stationary sourcesby 100 000 tonnes per yearbelow the year 2000 forecastlevel of 970 000 tonnes peryear.
• Develop, by January 1,1995,further annual nationalemission reductionrequirements from stationarysources to be achieved by 2000and/or 2005.
• By January 1, 1995, estimateSO2 and NOx emissions fromeach new existing electricutility unit greater than25 MW, using a method ofcomparable effectiveness tocontinuous emissionmonitoring.
3.4 General EnvironmentalStandards for Nuclear PowerGeneration: Atomic EnergyControl Board
See Chapter 3 for a generaldiscussion of tlie regulatoryfunction of the Atomic EnergyControl Board (AECB).
The AECB's standards forlicensing and monitoring nuclearfacilities include regulationspursuant to the Atomic EnergyControl Act for limiting radiationdosage to the public, and
transportation standards forpackaging and marking nuclearsubstances. The Board receivesadvice on environmentalstandards from EnvironmentCanada and frequently conductsits licensing activities under ajoint regulatory process involvingfederal and provincialenvironment authorities. TheAECB coordinates its regulatoryactivities with the federalEnvironmental Assessment andReview Process (EARP) and anyprovincial environmental reviewproces . that may be required fornuclear facilities.
3.5 General EnvironmentalStandards for ElectricityGeneration and Transmissionfor Export: National EnergyBoard
See Chapter 3 for details of theNational Energy Board'sregulatory process.
Applicants for a permit arerequired to submit information tothe National Energy Board on thepotential environmental impactsof the export or internationaltransmission line. The Board willapply the procedures specified inthe federal EARP GuidelinesOrder in determining whether torecommend designating anapplication for the licensing orcertification process. When alicence hearing is necessary,applicants may be required toundertake a detailed analysis ofthe project, including amongother things, environmentalconsiderations.
3.6 Federal EnvironmentalAssessment and Review ProcessGuidelines Order
See Chapter 4 for details of thefederal EARP.
The Guidelines Order sets outstandard procedures that shouldbe followed by federalgovernment departments inconducting an initial screening ofprojects under their authority forsignificant environmental effect:;.

APPENDIX E
E1. Current and proposed electrical efficiency-improvement programs offered
by Canadian electrical utilities 152
E2. Load-shifting programs 153
E3. Prices paid by major electric utilities for non-utility generation in 1991 154

152
El. Current and proposed electrical efficiency-improvement programs offeredby Canadian electrical utilities
RESIDENTIAL PROGRAMS
1. New home construction -- promotion of minimum efficiency standards for new residential buildings,labelling of energy-efficient homes, and sponsoring builder training programs.
2. Building upgrades — consumers provided with information, audits and financial assistance to carry outenergy efficiency activities in electrically heated homes.
3. Improving appliance efficiency-- promotion of minimum energy efficiency standards for appliances,labelling of energy-efficient appliances, consumer education, promotion, financial incentives for retailers,rebates for purchases of efficient equipment including timers for block heaters and the' nostats, buybacksof inefficient equipment, water-heater tune-ups and give-aways of water-heater insulawon and water savingdevices.
4. Fuel choices — promotion of alternative fuels to electricity as the fuel of choice for new and existing spaceand water heating, incentives offered to consumers who switch from electrical space or water heating toother forms of heating systems.
COMMERCIAL PROGRAMS
1. New building construction — promotion of minimum efficiency standards for new commercial buildings,labelling of efficient buildings, and financial incentives to owners, designers and builders to developenergy-efficient designs.
2. Building retrofit — technical, audit and financial assistance for upgrades to the building envelope(i.e. lighting, HVAC, water heating, heat recovery, refrigeration and other electrical equipment), as wellas purchases of energy-management equipment.
3. Fuel choices — promotion of alternative fuels to electricity as the fuel of choice for new commercialbuildings.
4. Energy-efficient lighting — education, promotion and incentives for purchases and conversions of energy-efficient lighting.
INDUSTRIAL PROGRAMS
1. New building construction ~ promotion of energy efficiency in new industrial plant design.
2. Plant retrofit -- education, promotion, field support, audits, and technical and financial assistance providedto industrial customers to evaluate and implement improvements in plant energy efficiency.
3. High-efficiency and adjustable speed drive motors - education, promotion and rebates lot installation ofhigh-efficiency motors in new and replacement situations.
4. Pressurized air-piping systems - leak test on compressed air systems.
5. Energy-efficient lighting — education, promotion and incentives for purchases and conversions of energy-efficient lighting, including conversions of existing roadway lighting to more efficient high-pressure sodiumlighting.

153
E2. Load-shifting programs
1. TIME-OF-USE RATES -- The cost of providing electricity varies throughout the year, the week, and thehours the day. This is because different load requirements necessitate the use of different mixes ofgenerating facilities. Those facilities with the highest variable costs are generally operated only to meetpeak-ioad requirements. Time-of-use rates are designed to reflect these increased costs of electricitysupply during the seasonal or daily peak. They are intended to encourage more efficient use of theelectrical system while offering customers financial rewards, in the form of reduced rates, for managingtheir loads between peak and off-peak periods. The utility benefits by reducing its seasonal and dailypeaks.
While time-of-use concepts are embedded in a number of Canadian utility rate structures, and particularlyin relation to iarge industrial and commercial users, Ontario Hydro is the only Canadian electrical utilitythat has implemented time-of-use rates. L has established four time-of-use periods: winter peak, winteroff-peak, summer peak, and summer off-peak. Summer consists of the months of April through Septemberinclusive, with winter being the months of October to March. The peak period in each season extendsfrom 7 a.m. to 11 p.m., Monday to Friday, except for public holidays. All other hours are off-peak.The rates apply to Ontario Hydro's large industrial customers, large customers of the municipal utilitiesserved by Ontario Hydro, and on a voluntary basis to municipal utilities themselves. Eighty per cent ofOntario Hydro's electrical load is now on time-of-use rates.
2. LOAD-CONTROL PROGRAMS -- Direct control of customer load is another means to shift load frompeak to off-peak periods. Equipment is installed to enable the utility to control electrical loads throughthe day. The most common application is to space and water heating, whereby electricity for thesepurposes is managed to reduce peak and smooth the overall load.
3. HEAT-STORAGE/COOL-STORAGE PROGRAMS - Utilities can shift daytime loads to nighttime byproviding incentives for customers to purchase thermal storage systems. Once the thermal storage systemis in operation, electricity is used during the night to either make ice or heat, a medium which is usedthrough the day for eitherspace or water healing.
4. DUAL-ENERGY PROGRAMS - These types of programs involve both peak shifting and valley filling.Dual-energy programs generally apply to consumers that can rely on a second energy form for space orwater heating. The utility offers a reduced price for off-peak consumption on the understanding thatduring peak periods the consumer is to rely on an alternative energy source, e.g. natural gas or oil-firedheating. Any peak period electrical consumption by consumers participating in the program is at a muchhigher rate.
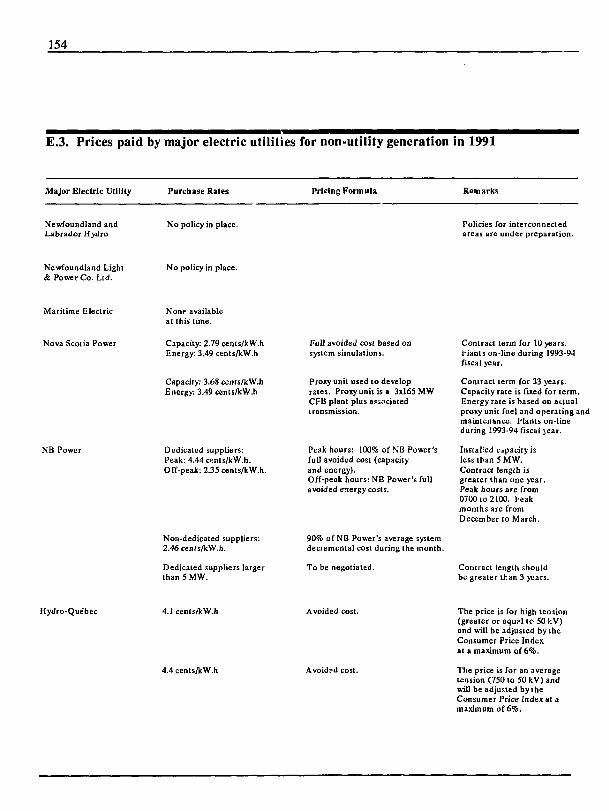
154
E.3. Prices paid by major electric utilities for non-utility generation in 1991
Major Electric Utility Purchase Rates Pricing Formula Remarks
Newfoundland andLabrador Hydro
No policy in place. Policies for interconnectedareas are under preparation.
Newfoundland Light& Power Co. Ltd.
No policy in place.
Maritime Electric
Nova Scotia Power
NB Power
None availableat this time.
Capacity: 2.79 cents/kW.hEnergy: 3.49 cents/kW.h
Capacity: 3.68 cenis/kW.bEnergy: 3.49 cents/kW.h
Dedicated suppliers:Peak: 4.44 cenls/kW.h.Off-peak: 2.35 cents/kW.h.
Non-dedicated suppliers:2.46cents/kW.h.
Dedicated suppliers largerthan 5 MW.
Full avoided cost based onsystem simulations.
Proxy unit used to developrates. Proxy unit is a 3x165 MWCFB plant plus associatedtransmission.
Peak hours: 100% of KB Power'sfull avoided cost (capacityand energy).Off-peak hours: NB Power's fullavoided energy costs.
90% of NB Power's average systemdecremental cost during the month.
To be negotiated.
Contract term for 10 years.Hants on-line during 1993-94fiscal year.
Contract term for 33 years.Capacity rate is fixed for term.Energy rate is based on auualproxy unit fuel and operating andmaintenance. Plants on-lineduring 1993-94 fiscal jear.
Instated capacity isless than 5 MW.Contract length isgreater than one year.Peak hours are from0700 lo 2100. Peakmonths are fromDecember to March.
Contract length shouldbe greater lhan 3 years.
Hydro-Quebec 4.1 cents/kW.h
4.4 cents/kW.h
Avoided cost.
Avoided cost.
The price is for high tension(greater or equ?l to 50 kV)and will be adjusted by theConsumer Price Indexat a maximum of 6%.
The price is for an averagetension (750 to SQkV) andwill be adjusted by theConsumer Price Index at amaximum of 6%.
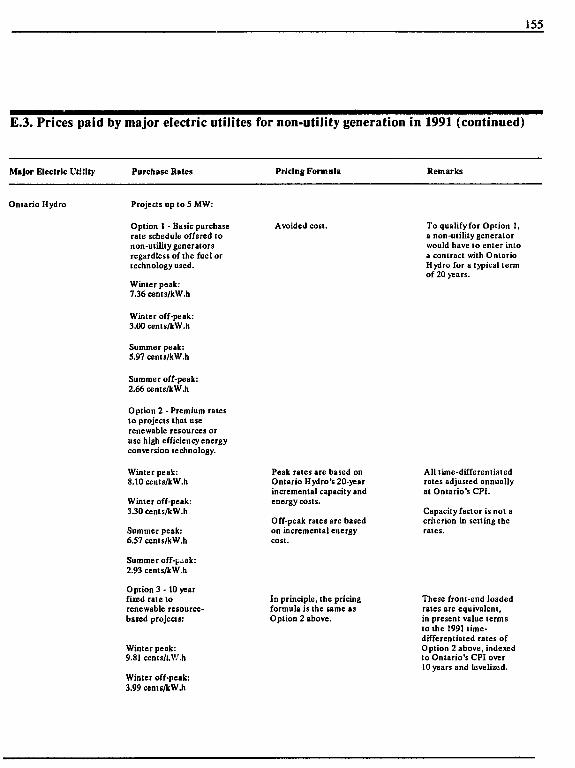
155
E.3. Prices paid by major electric utiiites for non-utility generation in 1991 (continued)
Major Electric Utility Purchase Kates Pricing Formula Remarks
Ontario Hydro Projects up to 5 MW:
Option 1 - Basic purchaserate schedule offered tonon-utility generatorsregardless of the fuel ortechnology used.
Winter peak:7.36cents/kW.h
Avoided cost. To qualify for Option 1,a non-utility generatorwould have to enter intoa contract with OntarioHydro for a typical termof 20 years.
Winter off-peak:3.00 cenls/kW.h
Summer peak:5.97 cents/kW.h
Summer off-peak:2.66 cents/kW.h
Option 2 - Premium ratesto projects that userenewable resources oruse high efficiency energyconversion technology.
Winter peak:8.10 cents/kW.h
Winter off-peak:3.3Ocents/kW.h
Summer peak:6.57 cents/kW.h
Summer off-[..ak:2.93 cents/kW.h
Option 3 - 10 yearfixed rate torenewable resource-based projects:
Winter peak:9.81 cents/UV.h
Winter off-peak:3.99 cems/kW.h
Peak rales are based onOntario Hydro's 20-yearincremental capacity andenergy costs.
Off-peak rales are basedon incremental energycost.
In principle, the pricingformula is the same asOption 2 above.
All time-differentiatedrates adjusted annuallyal Ontario's CPI.
Capacity factor is not acriterion in setting therates.
These front-end loadedrales are equivalent,in present value termslo the 1991 lime-differentiated rales ofOption 2 above, indexedlo Ontario's CPI over10 years and levelized.
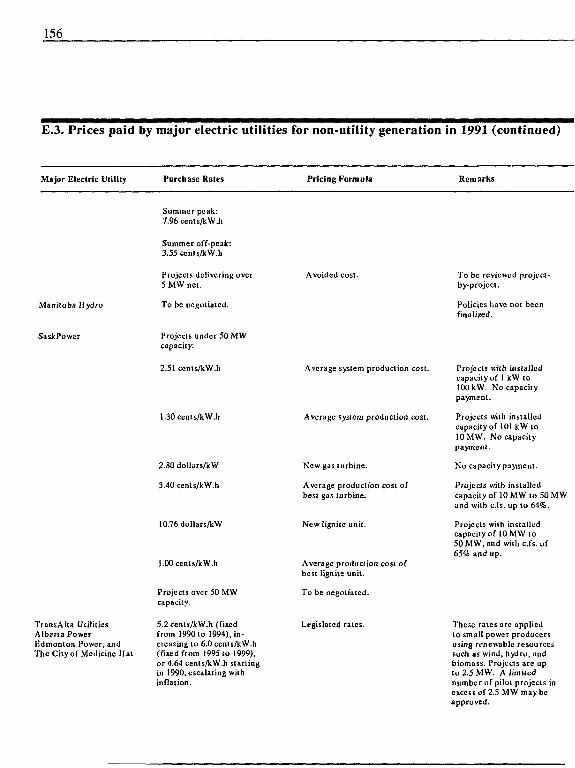
156
£.3. Prices paid by major electric utilities for non-utility generation in 1991 (continued)
Major Electric Utility Purchase Rates Pricing Formula Remarks
Manitoba Hydro
SaskPower
TransAlta UtilitiesAlberta PowerEdmonton Power, andThe City of Medicine Hat
Summer peak:7.96cents/kW.h
Summer off-peak:3.55 cents/kW.h
Projects delivering ovei5 MW net.
To be negotiated.
Projects under 50 MWcapacity:
2.51 cents/kW.h
1.30 cent s/kW.h
2.80 dollars/kW
3.4Ocents/kW.h
10.76 dollars/kW
l.OOccnts/kW.h
Projects over 50 MWcapacity.
5,2 cents/kW.h (fixedfrom 1990 to 1994). in-creasing to 6.0 cents/kW.h(fixed from 1995 to 1999),or 4,64 cents/kW.h startingin 1990, escalating withinflation.
Avoided cost.
Average syslem production cost.
Average system produclion cost.
New gas turbine.
Average production cost ofbest gas turbine.
New lignite unit.
Average production cost ofbest lignite unit.
To be negotiated.
Legislated rates.
To be reviewed projccl-by-project.
Policies have not beenfinalized.
Projects with installedcapacity of 1 kW to100 kW. No capacitypayment.
Projects with installedcapacity of 101 kW to10 MW. No capacitypayment.
No capacity payment.
Projecis with installedcapacity of 10 MW to 50 MWand with c.fs. up to 64%.
Projects with installedcapacity of 10 MW to50MW,and with c.fs. of65% and up.
These rates are appliedto small power producersusing renewable resourcessuch as wind, hydro, andbiomass. Projects are upto2.5MW. A limitednumber of pilot projects inexcess of 2.5 MW may beapproved.
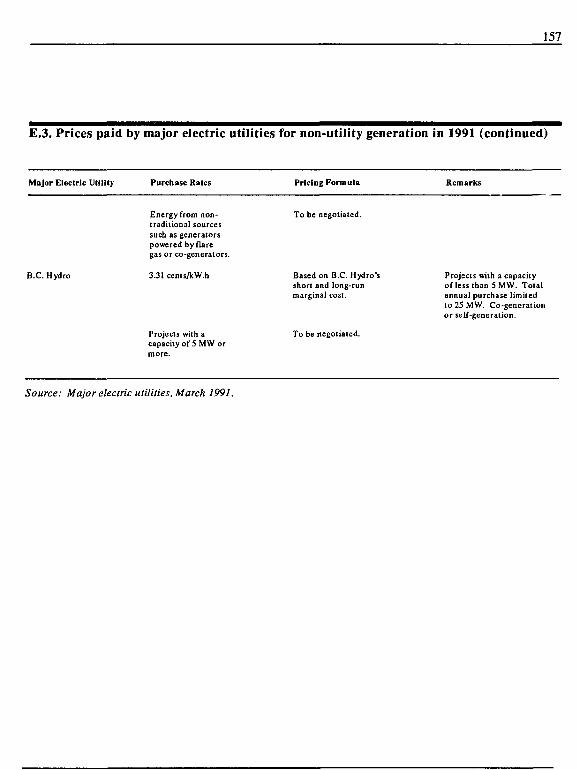
157
£.3. Prices paid by major electric utilities for non-utility generation in 1991 (continued)
Major Electric Utility Purchase Rales Pricing Formula Remarks
Energy from non- To be negotiated,traditional sourcessuch as generatorspowered by flaregas or co-generalors.
B.C. Hydro 3.31 cents/kW.h Based on B.C. Hydro's Projects wilh a capacityshort and long-run of less than 5 MW. Totalmarginal cost. annual purchase limited
to 25 MW. Co-generationor self-generation.
Projects with a To be negotiated.capacity of 5 MW ormore.
Source: Major electric utilities, March 1991.
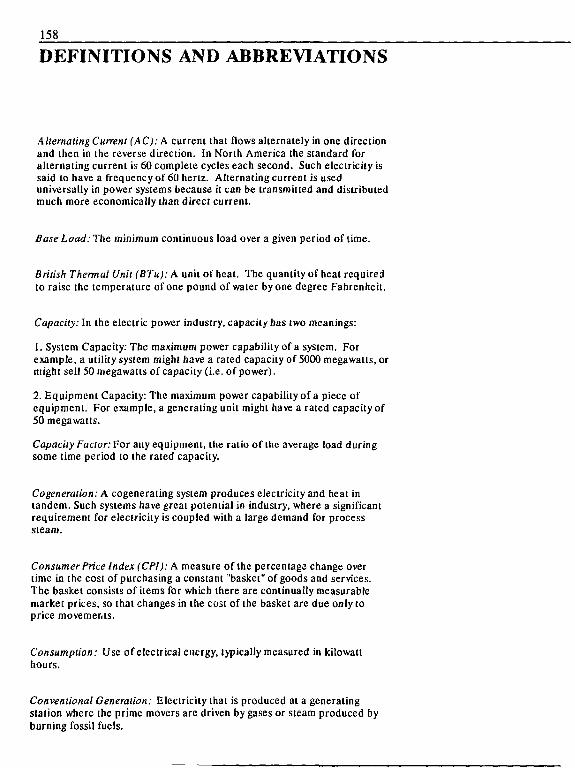
158
DEFINITIONS AND ABBREVIATIONS
Alternating Current (AC): A current that flows alternately in one directionand then in the reverse direction. In North America the standard foralternating current is 60 complete cycles each second. Such electricity issaid to have a frequency of 60 hertz. Alternating current is useduniversally in power systems because it can be transmitted and distributedmuch more economically than direct current.
BaseLoad.The minimum continuous load over a given period of time.
British Thermal Unit (BTu): A unit of heat. The quantity of heat requiredto raise the temperature of one pound of water by one degree Fahrenheit.
Capacity: In the electric power industry, capacity has two meanings:
1. System Capacity: The maximum power capability of a system. Forexample, a utility system might have a rated capacity of 5000 megawatts, ormight sell 50 megawatts of capacity (i.e. of power).
2. Equipment Capacity: The maximum power capability of a piece ofequipment. For example, a generating unit might have a rated capacity of50 megawatts.
Capacity Factor: For any equipment, the ratio of the average load duringsome time period to the rated capacity.
Cogeneralion: A cogenerating system produces electricity and heat intandem. Such systems have great potential in industry, where a significantrequirement for electricity is coupled with a large demand for processsteam.
Consumer Price Index (CPI): A measure of the percentage change overlime in the cost of purchasing a constant "basket" of goods and services.The basket consists of items for which there are continually measurablemarket prices, so that changes in the cost of the basket are due only toprice movements.
Consumption: Use of electrical energy, typically measured in kilowatthours.
Conventional Generation: Electricity that is produced at a generatingstation where the prime movers are driven by gases or steam produced byburning fossil fuels.
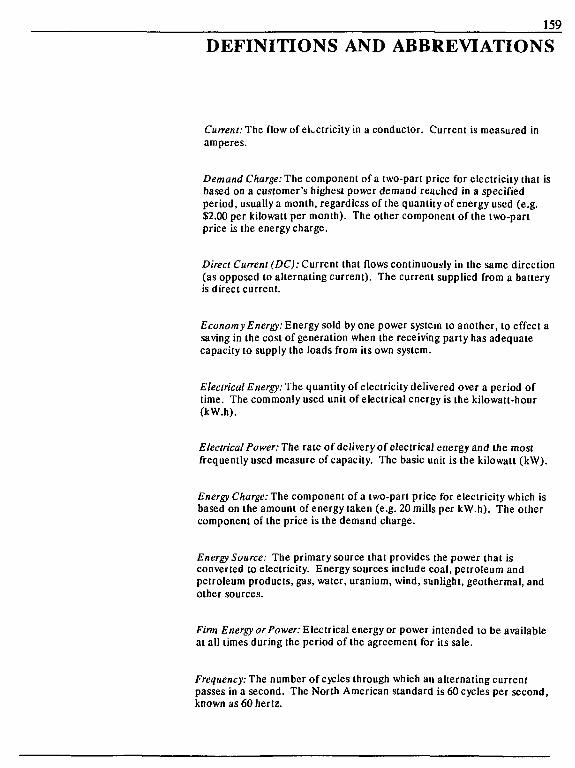
159
DEFINITIONS AND ABBREVIATIONS
Current: The flow of electricity in a conductor. Current is measured inamperes.
Demand Charge: The component of a two-part price for electricity that isbased on a customer's highest power demand reached in a specifiedperiod, usually a month, regardless of the quantity of energy used (e.g.$2.00 per kilowatt per month). The other component of the two-partprice is the energy charge.
Direct Current (DC): Current that flows continuously in the same direction(as opposed to alternating current). The current supplied from a batteryis direct current.
Economy Energy: Energy sold by one power system to another, to effect asaving in the cost of generation when the receiving party has adequatecapacity to supply the loads from its own system.
Electrical Energy: The quantity of electricity delivered over a period oftime. The commonly used unit of electrical energy is the kilowatt-hour(kW.h).
Electrical PowerThe rale of delivery of electricaj energy and the mostfrequently used measure of capacity. The basic unit is the kilowatt (kW).
Energy Charge: The component of a two-part price for electricity which isbased on the amount of energy taken (e.g. 20 mills per kW.h). The othercomponent of the price is the demand charge.
Energy Source: The primary source that provides the power that isconverted to electricity. Energy sources include coal, petroleum andpetroleum products, gas, water, uranium, wind, sunlight, geothermal, andother sources.
Firm Energy or Power: Electrical energy or power intended to be availableat all times during the period of the agreement for its sale.
Frequency: The number of cycles through which an alternating currentpasses in a second. The North American standard is 60 cycles per second,known as 60 hertz.
160
DEFINITIONS AND ABBREVIATIONS
Gigawatt(GW): One billion watts. (See Watt.)
Gigawatt hour(GW.h): A unit of bulk energy. A million kilowatt hours.A billion watt hours.
Grid: A network of electric power lines and connections.
Gross Domestic Product (GDP): The total value of goods and servicesproduced in Canada. GDP measured in constant dollars is defined asReal GDP.
Grow National Product (GNP): The total value of production of goodsand services measured at market prices.
Hertz (Hz): The unit of frequency for alternating current. Formerly calledcycles per second. The standard frequency for power supply in NorthAmerica is 60 Hz.
Installed Capacity: The capacity measured at the output terminals of allthe generating units in a station, without deducting station servicerequirements.
Interruptible Energy or Power: Energy or power made available under anagreement that permits curtailment or interruption of delivery at theoption of the supplier.
Joule: The international unit of energy. The energy produced by a powerof one watt flowing for one second. The joule is a very small unit: thereare 3.6 million joules in a kilowatt hour.
Kilovolt (kV): 1000 volts.
Kilowatt (kW): The commercial unit of electric power; 1000 watts. Akilowatt can best be visualized as the total amount of power needed tolight ten 100-watt light bulbs.
161
DEFINITIONS AND ABBREVIATIONS
Kilowatt hour (kW.h): The commercial unit of electric energy; 1000 watthours. A kilowatt hour can best be visualized as the amount of electricityconsumed by ten 100-watt light bulbs burning for an hour. One kilowatthour is equal to 3.6 million joules.
Load: The amount of electric power or energy consumed by a particularcustomer or group of customers.
Load Factor: The ratio of the average load during a designated period to thepeak or maximum load in that same period. (Usually expressed in per cent.)
Megawatt (MW): A unit of bulk power; 1000 kilowatts.
Megawatt hour(MW.h): A unit of bulk energy; 1000 kilowatt hours.
Mill: 1/1000 of a dollar.
Net Exports: Total exports minus total imports.
Nuclear Power: Power generated at a station where the steam to drive theturbines is produced by an atomic process, rather than by burning acombustible fuel such as coal, oil or gas.
Peak Demand: The maximum power demand registered by a customer or agroup of customers or a system in a stated period of time such as a month ora year. The value may be the maximum instantaneous load or more, usuallythe average load over a designated interval of lime, such as one hour, and isnormally stated in kilowatts or megawatts.
Power System: All the interconnected facilities of an electrical utility. Apower system includes all the generation, transmission, distribution,transformation, and protective components necessary to provide service tothe customers.
Primary Energy Source: The source ofprimary energy from which electricityis generated. This may be falling water, uranium (by nuclear fission), coal,oil, natural gas, wind, tidal energy, etc.

162
DEFINITIONS AND ABBREVIATIONS
Reserve Generating Capacity: The extra generating capacity required on anypower system over and above the expected peak load. Such a reserve isrequired mainly for two reasons: (i) in case of an unexpected breakdown ofgenerating equipment; (ii) in case the actual peak load is higher thanforecast.
Terawatt Hours (TW.h): One billion kilowatt hours.
Voltage: The electrical force or potential that causes a current to flow in acircuit (just as pressure causes water to flow in a pipe). Voltage is measuredin volts (V) or kilovolts (kV). 1 kV = 1000 V.
Watt: The scientific unit of electric power; a rate of doing work at the rate ofone joule per second. A typical light bulb is rated 25,40,60 or 100 watts,meaning that it consumes that amount of power when illuminated. A horsepower is 746 watts.