Embed Size (px)
Citation preview
HAL Id: tel-01166049https://tel.archives-ouvertes.fr/tel-01166049
Submitted on 22 Jun 2015
HAL is a multi-disciplinary open accessarchive for the deposit and dissemination of sci-entific research documents, whether they are pub-lished or not. The documents may come fromteaching and research institutions in France orabroad, or from public or private research centers.
L’archive ouverte pluridisciplinaire HAL, estdestinée au dépôt et à la diffusion de documentsscientifiques de niveau recherche, publiés ou non,émanant des établissements d’enseignement et derecherche français ou étrangers, des laboratoirespublics ou privés.
Elastomer based composites filled with layered fillersand ionic liquids
Anna Laskowska
To cite this version:Anna Laskowska. Elastomer based composites filled with layered fillers and ionic liquids. Polymers.Université Claude Bernard - Lyon I; Uniwersytet lódzki, 2014. English. �NNT : 2014LYO10281�.�tel-01166049�
Year 2014
PH.D. THESIS COMPLETED IN “COTUTELLE”
ELASTOMER BASED COMPOSITES FILLED WITH LAYERED FILLERS AND IONIC LIQUIDS
presented by
MSc ANNA LASKOWSKA
between
TECHNICAL UNIVERSITY OF LODZ – Lodz (POLAND)
and
UNIVERSITY CLAUDE BERNARD – LYON 1 Lyon (FRANCE)
For obtaining the degree of Doctor of Philosophy
Specialty: Polymers and Composites Materials
Defence of the thesis will be held in Lodz, 2 December 2014.
Thesis supervisors: Professor Marian ZABORSKI (Poland)
Doctor Gisele BOITEUX (France)
Thesis co-supervisors: Dr. Magdalena Lipińska, Dr. Anatoli Serghei
Jury
ZABORSKI Marian Professor Thesis supervisor BOITEUX Gisele Doctor Thesis supervisor ESPUCHE Eliane Professor Examiner JESIONOWSKI Teofil Professor Reviewer PIELICHOWSKI Krzysztof Professor Reviewer SERGHEI Anatoli Doctor Thesis co-supervisor
Année 2014
Thèse “COTUTELLE”
COMPOSITES ELASTOMÈRES CHARGÉS AVEC DES CHARGES LAMELLAIRES ET DES LIQUIDES
IONIQUES présentée par
ANNA LASKOWSKA
entre
UNIVERSITÉ POLYTECHNIQUE DE LODZ (POLOGNE)
et
UNIVERSITÉ CLAUDE BERNARD – LYON 1 LYON (FRANCE)
pour obtenir le grade de docteur
Spécialité: Matériaux Polymères et Composites
École doctorale: Matériaux Innovants
Soutenue le 2 décembre 2014 à l'Université Polytechnique de Lodz
Directeur de thèse: Professeur Marian ZABORSKI (Pologne)
Directeur de Recherche CRNS Gisele BOITEUX (France)
Co-directeur de thèse: Dr. Magdalena Lipińska, Dr. Anatoli Serghei
Jury
ZABORSKI Marian Professeur Directeur de thèse BOITEUX Gisele Directeur de Recherche CNRS Directeur de thèse ESPUCHE Eliane Professeur Examinatrice JESIONOWSKI Teofil Professeur Rapporteur PIELICHOWSKI Krzysztof Professeur Rapporteur SERGHEI Anatoli Chargé de Recherche CNRS Co-directeur de thèse
UNIVERSITE CLAUDE BERNARD - LYON 1
Président de l’Université Vice-président du Conseil d’Administration Vice-président du Conseil des Etudes et de la Vie Universitaire Vice-président du Conseil Scientifique Directeur Général des Services
M. François-Noël GILLY M. le Professeur Hamda BEN HADID M. le Professeur Philippe LALLE M. le Professeur Germain GILLET M. Alain HELLEU
COMPOSANTES SANTE
Faculté de Médecine Lyon Est – Claude Bernard Faculté de Médecine et de Maïeutique Lyon Sud – Charles Mérieux Faculté d’Odontologie Institut des Sciences Pharmaceutiques et Biologiques Institut des Sciences et Techniques de la Réadaptation Département de formation et Centre de Recherche en Biologie Humaine
Directeur : M. le Professeur J. ETIENNE Directeur : Mme la Professeure C. BURILLON Directeur : M. le Professeur D. BOURGEOIS Directeur : Mme la Professeure C. VINCIGUERRA Directeur : M. le Professeur Y. MATILLON Directeur : Mme. la Professeure A-M. SCHOTT
COMPOSANTES ET DEPARTEMENTS DE SCIENCES ET TECHNOLOGIE Faculté des Sciences et Technologies Département Biologie Département Chimie Biochimie Département GEP Département Informatique Département Mathématiques Département Mécanique Département Physique UFR Sciences et Techniques des Activités Physiques et Sportives Observatoire des Sciences de l’Univers de Lyon Polytech Lyon Ecole Supérieure de Chimie Physique Electronique Institut Universitaire de Technologie de Lyon 1 Ecole Supérieure du Professorat et de l’Education Institut de Science Financière et d'Assurances
Directeur : M. F. DE MARCHI Directeur : M. le Professeur F. FLEURY Directeur : Mme Caroline FELIX Directeur : M. Hassan HAMMOURI Directeur : M. le Professeur S. AKKOUCHE Directeur : M. le Professeur Georges TOMANOV Directeur : M. le Professeur H. BEN HADID Directeur : M. Jean-Claude PLENET Directeur : M. Y.VANPOULLE Directeur : M. B. GUIDERDONI Directeur : M. P. FOURNIER Directeur : M. G. PIGNAULT Directeur : M. le Professeur C. VITON Directeur : M. le Professeur A. MOUGNIOTTE Directeur : M. N. LEBOISNE
4
ACKNOWLEDGMENTS
This Ph.D. was completed as a co-shared thesis (French: “Cotutelle”) between the
laboratory Ingénierie des Matériaux Polymères, IMP@Lyon1, CNRS, University Claude
Bernard Lyon 1, France and the Institute of Polymer and Dye Technology, Technical
University of Lodz, Poland.
I would like to take an opportunity to express my sincerest appreciation and gratitude to
my two supervisors Prof. Marian Zaborski and Dr.Gisele Boiteux for their attentive guidance,
constructive suggestions, encouragement and continuous support through the course of this
work.
I would also wish to extend my gratitude to the members of the jury who have accepted to
evaluate this work, Prof. Eliane Espuche, to the two reviewers, Prof. Teofil Jesionowski and
Prof. Krzysztof Pielichowski, as well as all members of the jury.
I am also thankful to all employees of ITPiB and IMP@Lyon1 laboratories, especially
Dr. Magdalena Lipińska, Dr. Anatoli Serghei and Dr. Olivier Gain, for all their help during
my Ph.D. research.
Finally, I wish to express my grateful thanks to my parents, colleagues and to my dear
friend Lionel Dumont for their encouragement and motivation.
Table of contents
5
TABLE OF CONTENTS
ACKNOWLEDGMENTS ..................................................................................................................... 4 LIST OF ABBREVIATIONS AND SYMBOLS ................................................................................. 8 INTRODUCTION ................................................................................................................................ 11 1. LITERATURE REVIEW ................................................................................................................ 12
1.1. REINFORCING FILLERS FOR ELASTOMER COMPOSITES .......................................... 12 1.2. TYPES OF LAYERED FILLERS AND THEIR APPLICATIONS
IN RUBBER COMPOSITES ................................................................................................. 24 1.2.1. CATIONIC CLAYS - HECTORITE ........................................................................... 24 1.2.2. ANIONIC CLAYS - LAYERED DOUBLE HYDROXIDES (LDHs) ....................... 30 1.2.3. GRAPHENE ................................................................................................................ 41
1.3. IONIC LIQUIDS (ILs) AND THEIR APPLICATIONS IN RUBBER COMPOSITES ........ 46 1.3.1. IONIC LIQUIDS (ILs) – PROPERTIES AND APPLICATIONS ............................... 46 1.3.2. PROPERTIES AND APPLICATIONS OF ROOM TEMPERATURE
IMIDAZOLIUM IONIC LIQUIDS (RTILs) CONTAINING TETRACHLOROALUMINATE [ALCL4]−, THIOCYANATE [SCN]− AND BIS(TRIFLUOROMETHYLSULFONYL)IMIDE [TFSI]− ANIONS ......................... 49
1.3.3. IONIC LIQUIDS (ILs) IN ELASTOMER COMPOSITES ......................................... 52 2. AIM OF THE WORK ..................................................................................................................... 58 3. MATERIALS.................................................................................................................................... 59
3.1. ELASTOMERS AND CURING AGENTS ............................................................................ 59 3.2. LAYERED FILLERS .............................................................................................................. 60 3.3. IMIDAZOLIUM IONIC LIQUIDS (ILs)................................................................................ 62 3.4. OTHER MATERIALS ............................................................................................................ 63
4. CHARACTERIZATION TECHNIQUES ..................................................................................... 64 4.1. SCANNING ELECTRON MICROSCOPY (SEM) ................................................................ 64 4.2. BET N2 ADSORPTION MEASUREMENTS ........................................................................ 64 4.3. X-RAY DIFFRACTION (XRD) ............................................................................................. 64
4.4 OIL ABSORPTION PARAMETER DBPA ...................................................................... 65 4.5. THERMOGRAVIMETRIC ANALYSIS (TGA) .................................................................... 65 4.6. X-RAY PHOTOELECTRON SPECTROSCOPY ANALYSIS (XPS) .................................. 65 4.7. INVERSE GAS CHROMATOGRAPHY (IGC) .................................................................... 65 4.8. CURING CHARACTERISTICS ............................................................................................ 69 4.9. CROSSLINK DENSITY MEASUREMENTS ....................................................................... 70 4.10. FOURIER-TRANSFORM INFRARED SPECTROSCOPY (FTIR) .................................... 71 4.11. DYNAMIC MECHANICAL ANALYSIS (DMA) ............................................................... 71 4.12. DIFFERENTIAL SCANNING CALORIMETRY (DSC) .................................................... 71 4.13. BROADBAND DIELECTRIC SPECTROSCOPY (BDS) ................................................... 72 4.14. AIR PERMEABILITY .......................................................................................................... 72
Table of contents
6
4.15. TENSILE TESTING ............................................................................................................. 72 4.16. HARDNESS SHORE A ........................................................................................................ 72 4.17. TEAR STRENGTH ............................................................................................................... 72 4.18. THERMO-OXIDATIVE AGING AND RESISTANCE TO UV RADIATION .................. 73 4.19. COLORIMETRIC STUDIES ................................................................................................ 73
5. RESULTS AND DISCUSSION....................................................................................................... 74 5.1. RUBBER COMPOSITES CONTAINING MINERAL LAYERED FILLERS ...................... 74
5.1.1. CHARACTERIZATION OF THE MORPHOLOGICAL, STRUCTURAL, THERMAL AND SURFACE PROPERTIES OF LAYERED FILLERS ............................................... 74 5.1.1.1. SEM observations of filler particles morphology ................................................... 74 5.1.1.2. Specific surface area and interlayer distance of layered fillers ............................... 77 5.1.1.3. ATR-FTIR studies of layered fillers ....................................................................... 78 5.1.1.4. Thermal stability of layered fillers .......................................................................... 80 5.1.1.5. Examination of the surface chemical composition of layered fillers by XPS ......... 81 5.1.1.6. Examination of the surface energetic characteristics of layered fillers using IGC . 83 5.1.1.7. Conclusions ............................................................................................................. 86
5.1.2. COMARPISON OF THE INFLUENCE OF HECTORITE AND HYDROTALCITE ON MECHANICAL AND MORPHOLOGICAL PROPERTIES OF ACRYLONITRILE-BUTADIENE RUBBER (NBR) AND CARBOXYLATED ACRYLONITRILE-BUTADIENE RUBBER (XNBR) COMPOSITES ............................................................ 87 5.1.2.1. Preparation of NBR and XNBR composites containing layered fillers .................. 87 5.1.2.2. Curing studies and crosslink densities of NBR and XNBR composites ................. 87 5.1.2.3. Mechanical and morphological properties of NBR and XNBR composites ........... 90 5.1.2.4. Thermal stability of NBR and XNBR composites .................................................. 93 5.1.2.5. Accelerated UV aging of NBR and XNBR composites .......................................... 94 5.1.2.6. Conclusions ............................................................................................................. 96
5.1.3. APPLICATION OF MAGNESIUM-ALUMINUM LAYERED DOUBLE HYDROXIDES (MgAl-LDHs) AS REINFORCING FILLERS AND CURING AGENTS FOR CARBOXYLATED BUTADIENE-ACRYLONITRILE RUBBER (XNBR) .................... 97 5.1.3.1. Preparation of XNBR/MgAl-LDH composites ....................................................... 97 5.1.3.2. Curing studies and crosslink densities of XNBR/MgAl-LDH composites ............. 98 5.1.3.3. Optical and thermotropic properties of XNBR/MgAl-LDH composites .............. 102 5.1.3.4. ATR-FTIR studies of XNBR/MgAl-LDH composites ......................................... 106 5.1.3.5. XPS studies of XNBR/MgAl-LDH composites .................................................... 108 5.1.3.6. Dynamic mechanical analysis (DMA) of XNBR/MgAl-LDH composites ........... 109 5.1.3.7. Mechanical properties of XNBR/MgAl-LDH composites .................................... 112 5.1.3.8. Microstructure and morphological analysis of XNBR/MgAl-LDH composites ... 114 5.1.3.9. Gas barrier properties of XNBR/MgAl-LDH composites..................................... 117 5.1.3.10. Thermal stability of XNBR/MgAl-LDH composites .......................................... 118 5.1.3.11. UV-aging and thermo-oxidative aging of XNBR/MgAl-LDH composites ........ 119 5.1.3.12. Conclusions ......................................................................................................... 121
Table of contents
7
5.2. EFFECTS OF IONIC LIQUIDS (ILs) ON THE PROPERTIES OF ELASTOMER COMPOSITES BASED ON CARBOXYLATED ACRYLONITRILE-BUTADIENE RUBBER (XNBR) AND LAYERED DOUBLE HYDROXIDE (LDH) ................................ 122 5.2.1. Preparation of XNBR/IL-LDH composites ........................................................................ 122 5.2.2. Curing studies and crosslink densities of XNBR/IL-LDH composites .............................. 123 5.2.3. Dynamic mechanical analysis (DMA) of XNBR/IL-LDH composites .............................. 125 5.2.4. Mechanical properties of XNBR/IL-LDH composites ....................................................... 129 5.2.5. Ionic conductivity of XNBR/IL-LDH composites ............................................................. 131 5.2.6. Thermal stability of XNBR/IL-LDH composites ............................................................... 136 5.2.7. Microstructure and morphological analysis of XNBR/LDH/IL composites ...................... 138 5.2.8. Accelerated UV aging of XNBR/IL-LDH composites ....................................................... 143 5.2.9. Conclusions ........................................................................................................................ 144
5.3. NITRILE RUBBER COMPOSITES CONTAINING GRAPHENE FILLERS .................... 145 5.3.1. CHARACTERIZATION OF MORPHOLOGICAL, SURFACE AND THERMAL
PROPERTIES OF GRAPHENE FILLERS ....................................................................... 145 5.3.1.1. SEM observations of graphene particles morphology .......................................... 145 5.3.1.2. Specific surface area and structure of graphene fillers .......................................... 147 5.3.1.3. Examination of the surface chemical composition of graphenes by XPS ............. 148 5.3.1.4. Thermal stability of graphene fillers ..................................................................... 151 5.3.1.5. Conclusions ........................................................................................................... 152
5.3.2. REINFORCEMENT OF ACRYLONITRILE-BUTADIENE RUBBER (NBR) AND CARBOXYLATED ACRYLONITRILE-BUTADIENE RUBBER (XNBR) WITH GRAPHENE NANOPLATELETS WITH VARYING SURFACE AREAS AND MORPHOLOGIES ............................................................................................................ 153 5.3.2.1. Preparation of NBR and XNBR composites containing graphene fillers ............. 153 5.3.2.2. Curing studies and crosslink densities of NBR and XNBR compounds ............... 153 5.3.2.3. Mechanical properties of NBR and XNBR composites ........................................ 156 5.3.2.4. Dynamic mechanical analysis (DMA) of XNBR/xGnP-C-750 composites ......... 158 5.3.2.5. Thermal stability of XNBR/xGnP-C-750 composites ........................................... 160 5.3.2.6. Microstructure and morphological analysis of NBR and XNBR composites ....... 161 5.3.2.7. Thermo-oxidative aging of nitrile rubber composites ........................................... 165 5.3.2.8. Accelerated UV aging of nitrile rubber composites .............................................. 168 5.3.2.9. Conclusions ........................................................................................................... 169
6. CONCLUSIONS ........................................................................................................................... 170 7. LIST OF PUBLICATIONS ........................................................................................................... 173 8. REFERENCES ............................................................................................................................... 177
List of abbreviations and symbols
8
LIST OF ABBREVIATIONS AND SYMBOLS
AEC Anion exchange capacity [AMIM][TFSI] 1-Allyl-3-methylimidazolium bis(trifluoromethylsulfonyl)imide ATR-FTIR Attenuated Total Reflection Fourier Transform Infrared
Spectroscopy BDS Broadband Dielectric Spectroscopy BET Brunauer–Emmett–Teller [BMIM][AlCl4] 1-Butyl-3-methylimidazolium tetrachloroaluminate [BMIM][TFSI] 1-Butyl-3-methylimidazolium bis(trifluoromethylsulfonyl)imide CEC Cation exchange capacity CR Chloroprene rubber CRI Cure rate index d Interlayer distance DBPA Dibutyl phthalate absorption number DMA Dynamic Mechanical Analysis DSC Differential Scanning Calorimetry DTG Derivative Thermogravimetric Analysis DTA Differential Thermal Analysis E′ Storage modulus E′′ Loss modulus EB Elongation at break EDS Energy Dispersive X-ray Spectrometry [EMIM][SCN] 1-Ethyl-3-methylimidazolium thiocyanate [EMIM][TFSI] 1-Ethyl-3-methylimidazolium bis(trifluoromethylsulfonyl)imide EPDM Ethylene propylene diene rubber F Tear strength H Shore Hardness A [HMIM][TFSI] 1-Hexyl-3-methylimidazolium bis(trifluoromethylsulfonyl)imide HNBR Hydrogenated acrylonitrile-butadiene rubber HT Hydrotalcite HXNBR Hydrogenated carboxylated acrylonitrile-butadiene rubber IGC Inverse Gas Chromatography ILs Ionic liquids KT Thermo-oxidative aging coefficient KUV UV-aging coefficient LDHs Layered double hydroxides LDH30 Pural MG 30 HT LDH63 Pural MG 63 HT LDH70 Pural MG 70 HT LSs Layered silicates MBT Mercaptobenzothiazole MgAl-LDHs Magnesium-aluminum layered double hydroxides MH Maximum torque ML Minimal torque ML at 200 °C Mass loss at corresponding temperature NAT HEC Hectorite natural NBR Acrylonitrile-butadiene rubber
List of abbreviations and symbols
9
phr Parts per hundred rubber ppm Parts per million PUR Polyurethane rubber rpm Revolutions per minute SBR Styrene-butadiene rubber SA Specific surface area Sf Specific interaction parameter SE100, SE200, SE300 Stress at 100, 200 and 300% deformation SEM Scanning Electron Microscopy SR Silicone rubber SYN HEC Hectorite synthetic tΔ2 Scorch time t90 Optimal cure time T2, T5, T10, T50 Temperature corresponding to the 2, 5, 10 and 50 % weight loss Tg Glass transition temperature Ti Ionic transition temperature TGA Thermogravimetric Analysis TEM Transmission Electron Microscopy TS Tensile strength XNBR Carboxylated acrylonitrile-butadiene rubber XPS X-ray photoelectron spectroscopy XRD X-ray diffraction
αf Wolff coefficient of activity γS
D Dispersive component of surface free energy γS
SF Specific or polar component of surface free energy ΔGA
SF Molar specific free adsorption energy ΔHA
SF Molar enthalpy of specific interactions ΔM Torque increment Δν Ionic crosslinks content ε′ Permittivity tan δ Loss factor σ′ Alternating current (AC) conductivity νT Crosslink density χ Huggins parameter for elastomer-solvent interaction
Introduction
10
INTRODUCTION
The production of elastomer materials with improved mechanical and thermal properties,
and low gas permeability using environmentally friendly processes is highly desirable in
various branches of industry. In large-scale production, elastomers are routinely compounded
with fillers to improve performance properties (e.g., stiffness, toughness, tensile properties),
provide long life service and reduce the cost of the final product. The most widely used
reinforcing fillers in the rubber industry have been carbon blacks (CBs) and silicas. Although
both fillers effectively strengthen the performance properties and durability of elastomer
materials, other types of fillers have been sought as competitive alternatives for commercial
scale applications. Layered solids consisting of two-dimensional layers are good candidates
for use as reinforcing fillers in elastomer compounds due to their lamellar structure and
anisotropic particle shape. Furthermore, plate-like fillers can enhance the gas barrier
properties of polymeric matrices, a particularly important advantage of using these materials
to produce technical rubber goods with reduced gas permeability. A wide range of layered
materials, including phyllosilicates, layered oxides, layered double hydroxides, graphite, and
graphene have been studied extensively as promising candidates for the reinforcement of
various types of polymer matrices. Advantageously, these types of fillers may simultaneously
serve multiple functions in polymer compounds such as flame retardants, gas barrier
enhancers, crosslinking agents, UV screeners, etc. However, the disadvantage of layered
fillers is their high tendency to agglomerate resulting in undesirable heterogeneity of the
material. Thus, various methods have been developed to produce stable filler dispersions that
provide optimal performance. Ionic liquids have attracted increasing attention due to their
appealing physical and chemical properties and are considered useful processing aids in the
preparation of functional elastomer composites with controlled mechanical, morphological
and ionic conductivity parameters. This thesis has focused on the preparation and
characterization of elastomer composites with layered fillers exhibiting improved mechanical
properties, decreased swelling in solvents, reduced gas permeability and increased UV
stability. The practical applications of ionic liquids as dispersing agents and conductivity
enhancers for rubber systems has also been demonstrated.
This thesis is divided into eight chapters:
Chapter 1 Reviews the current literature relating to the use of layered fillers for rubber
reinforcement and the applications of ionic liquids in elastomer composites.
Introduction
11
Chapter 2 Outlines the motivation for this thesis and the research aims.
Chapter 3 and Chapter 4 Present the materials and experimental research methodology.
Chapter 5 Is divided into three subchapters with results and discussion:
Subchapter 5.1 (5.1.1) Presents the morphological, structural, thermal and surface properties
of layered fillers. (5.1.2) Discusses the effects of layered mineral fillers (natural
hectorite, synthetic hectorite and hydrotalcite) on the curing kinetic, crosslink
density, mechanical, thermal and morphological properties of nitrile rubber
composites. (5.1.3) Presents the impact of structurally differentiated MgAl-LDH
on the cure degree, optical, mechanical, thermal, barrier and morphological
properties of XNBR composites. Proposes the simultaneous application of
magnesium-aluminum layered double hydroxides (MgAl-LDHs) as curing agents
and reinforcing fillers for carboxylated acrylonitrile-butadiene rubber (XNBR).
The results have been partly published: Laskowska A., et al., Przemysł Chemiczny 89, 461
(2010); Laskowska A., et al., Przemysł Chemiczny 90, 878 (2011); Laskowska A., et al., Express
Polymer Letters 8, 374 (2014); Laskowska A., et al,. European Polymer Journal 60, 172 (2014). Subchapter 5.2 Considers the application of hydrophilic and hydrophobic imidazolium ionic
liquids, which are characterized by high ionic conductivities, as processing aids
for the improvement of filler distribution, facilitating and expediting rubber-filler
compounding, and ionic conductivity enhancement of the composites. The
concentration and type of ionic liquids were optimized to achieve a good
compromise between the mechanical and conductivity properties of the rubber
composite.
The results have been partly published: Laskowska A., et al., Polymer International 62,
1575 (2013); Laskowska A., et al., Macromolecular Symposia 341, 7 (2014); Laskowska A., et al.,
Macromolecular Symposia 342, 35 (2014). Subchapter 5.3 (5.3.1) Presents the morphological, surface and thermal properties of
graphene-based fillers. (5.3.2) Discusses the reinforcing effect of graphene-based
fillers on acrylonitrile-butadiene rubber (NBR) and carboxylated acrylonitrile-
butadiene rubber (XNBR).
The results have been partly published: Laskowska A. et al., Journal of Polymer
Engineering (2014). Chapter 6 Provides general conclusions.
Chapter 7 Contains a list of authored and coauthored publications and a conferences list.
Chapter 8 Includes the reference list.
Chapter 1. Literature review
12
1. LITERATURE REVIEW
1.1. REINFORCING FILLERS FOR ELASTOMER COMPOSITES
Fillers are relatively inexpensive, solid substances that are added in fairly large volumes to
polymers to adjust volume, weight, cost, surface, color, processing behavior, mechanical
strength and other properties. In most industrial applications, elastomers are compounded
with fillers to improve their performance properties (stiffness, toughness, tensile properties),
to enhance the durability of rubber compounds and to reduce the cost of the final product.
Fillers can typically be classified in the following categories:
diluent or degrading fillers (non-reinforcing): decrease the strength of the rubber
compounds to which they are added and are mainly added to reduce production costs by
increasing the volume and mass of the product (however, in reality, there is no filler that is
fully inactive and reduces costs only), e.g., pigments, calcium carbonate (dry ground), talc,
barium sulfate;
extending or semi-reinforcing fillers: have little impact on the strength of the rubber
compounds, e.g., hard clay, precipitated calcium carbonate;
reinforcing fillers: increase the strength of rubber compounds and substantially enhance
their mechanical properties, e.g., precipitated silica, fumed silica, carbon blacks (CBs).
Reinforcement can be defined as the improvement of the mechanical properties of
compounds, particularly their strength, hardness, stiffness, abrasion and tear resistance, which
consequently improves the service life of rubber products.1 Carbon black (CB) and
precipitated silica are the most important reinforcing fillers for rubber composites due to their
large specific area, nanosize and the presence of active functional groups on their surfaces.
Due to its strong interactions with hydrocarbon rubbers, CB exhibits strong reinforcement
effects and has been employed as a reinforcing filler since 1904. However, due to its polluting
nature, the ubiquitous black color of the compounded rubber material, decreased
processability at high CB loadings and the dependence of CB on petroleum feedstock (for
synthesis), researchers have investigated other “white”, environmentally friendly, reinforcing
fillers. Compared to CB, silica particles are less compatible with hydrocarbon rubbers and
tend to form a filler-filler network via hydrogen bonding of the silanol groups present on the
Chapter 1. Literature review
13
particle surfaces.2 The development of silica treads in passenger tires inspired extensive
research of non-black fillers other than silica. Commercial clay has long been used as an
inexpensive, non-reinforcing filler, but a breakthrough occurred when Toyota Co. invented a
layered silicate/polyamide nanocomposite.3 Substantial research has since focused on the use
of layered mineral fillers as reinforcing fillers in many other polymer matrices. Small particle
powders including not only CB and silica, but also layered silicates, layered double
hydroxides, graphene, carbon nantotubes, calcium carbonates, calcium silicates, zeolites
silica, alumina, starch and many others, have been studied extensively as potential
reinforcement additives. In addition to classifications based on their reinforcing effect in the
elastomer matrix, fillers can also be distinguished based on their structure and different
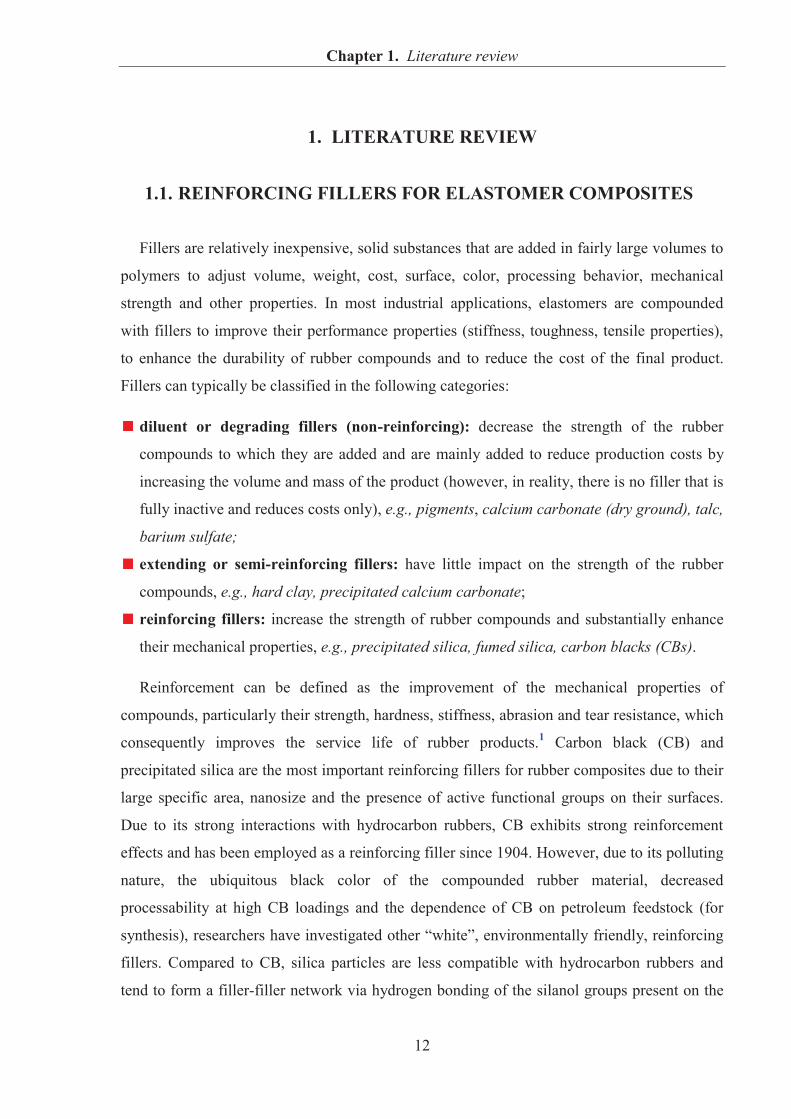
dimensionalities (Figure 1):
zero-dimensional (0D): low aspect ratio, isotropic spheres, cubes, polyhedrons, e.g., CB,
calcium carbonate, fullerene;
one-dimensional (1D): filler particles in which one dimension is considerably longer than
the others (rods, wires, tubes), e.g., multiwalled carbon nanotubes, carbon nanowires,
sepiolite;
two-dimensional (2D): filler particles in which two dimensions are of considerable length
(discs, prisms, plates), e.g., layered silicate, graphene, graphite;
three-dimensional (3D): filler particles in which three dimensions are of considerable
length, e.g., boehmite, diamond.
Figure 1 Various types of nanoscale materials.4
The mechanical properties of polymer composites can vary dramatically depending on the
dimensionality of the filler (1D, 2D, and 3D),5 and the reinforcing effect of fillers follows the
order: 1D filler > 2D filler > 3D filler. Other factors that determine the reinforcing effect of
fillers in a polymer matrix are discussed in detail in subsequent chapters.
Chapter 1. Literature review
14
The main criteria impacting reinforcement
The crucial parameters that determine the effect of fillers on the properties of composites
are the filler geometry (size, shape, aspect ratio) and the filler-matrix interactions.6
Particle size
The average particle size is typically the first characteristic of a filler to be considered. 7 A
new generation of nanosized fillers has emerged in response to the importance of small-sized
particles in the preparation of functional, high-performance composites with sophisticated
architectures. The extent of reinforcement increases as the particle size decreases, providing a
higher polymer-filler interface and thus a more efficient interfacial bond when a certain
degree of bonding exists between the two phases. Reinforcing fillers usually have particle
diameters in the range of 10 to 100 nm. Large agglomerates in the rubber limit the contact
between the rubber matrix and the filler surface and act as failure initiation sites that lead to
premature failure of the material.
Specific surface area (SA) and porosity
The term "specific surface area" (SA) refers to the area/unit mass and is usually expressed
as m2/g. The specific surface area is strictly related to the particle size. A decrease in the
average particle size of fillers and the consequent increase in the SA, increase the
polymer/filler interfacial volume and thus are desirable in designing mechanically strong
composites.8 The specific surface area determines the total surface of the filler that is in
contact with the polymer. The SA is characterized by measuring the adsorption of specific
molecules. The most widely used adsorption technique is based on the Brunauer–Emmett–
Teller (BET) method of N2 adsorption, which provides the ‘total’ surface area including
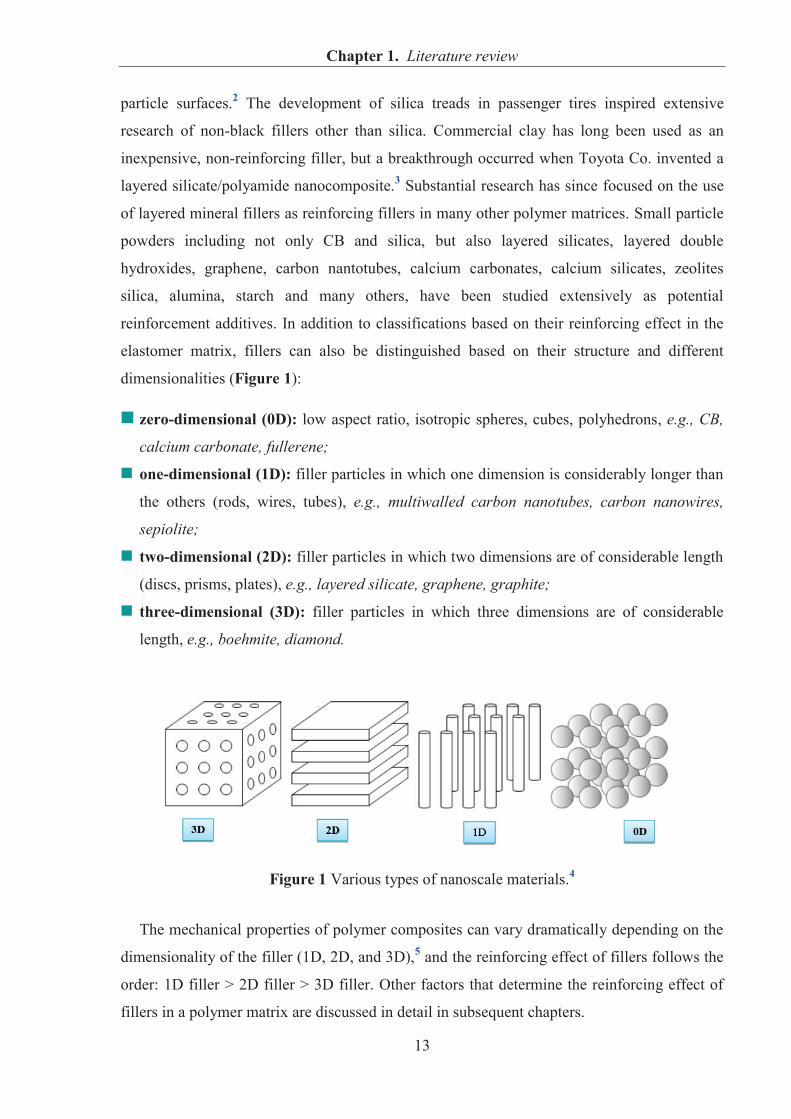
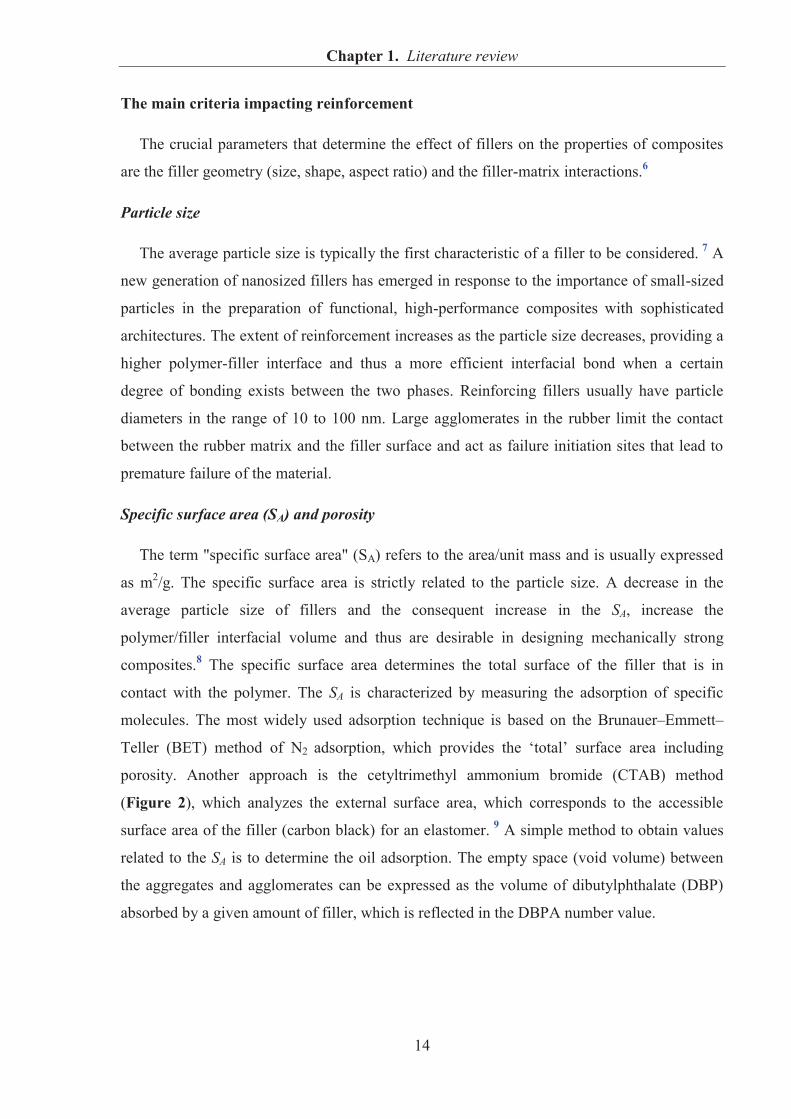
porosity. Another approach is the cetyltrimethyl ammonium bromide (CTAB) method
(Figure 2), which analyzes the external surface area, which corresponds to the accessible
surface area of the filler (carbon black) for an elastomer. 9 A simple method to obtain values
related to the SA is to determine the oil adsorption. The empty space (void volume) between
the aggregates and agglomerates can be expressed as the volume of dibutylphthalate (DBP)
absorbed by a given amount of filler, which is reflected in the DBPA number value.
Chapter 1. Literature review
15
Figure 2 Comparison of methods BET and CTAB.10
DBPA oil absorption is a technique used to quantify the amount and structural
characteristics of a grade of carbon black (CB) by providing information about the degree of
porosity and the structure of the filler particles. Higher DBPA oil absorption numbers
correspond to higher CB structures. In general, increasing the surface area (decreasing particle
size) provides lower resilience and higher Mooney viscosity, tensile strength, abrasion
resistance, tear resistance and hysteresis.
Particle shape and aspect ratio
Spherical particles have the closest packing structures, resulting in uniform stress
distribution and reduced melt viscosity of the blend. Branched, dendritic particles have a very
large surface area, enabling extensive interaction between the filler and polymer particles and
enhancing rubber reinforcement. Lamellar structures facilitate orientation, reduce
permeability to liquids, vapors and gases and enhance the mechanical properties of elastomer
compounds. Longitudinal particle shapes (needles or fibers) with high anisotropy increase the
extent of reinforcement, reduce shrinkage and thermal expansion, and exhibit thixotropic
properties. Fillers with irregularly shaped particles do not exhibit any specific advantages
beyond easy production and low cost.11 Particles with longitudinal shapes are more difficult to
disperse in polymers, which causes stress concentrations and a reduction of the reinforcing
effect. Inhalation of nanosized, thin or fibrous particles may be harmful to health even when
their concentration in the inhaled air is low. Silicosis, the most ancient recognized
occupational disease, is exclusively caused by exposure to crystalline silica. Similarly,
asbestos, a fibrous filler, was once widely used and is now prohibited because of its health
and safety risks.
Chapter 1. Literature review
16
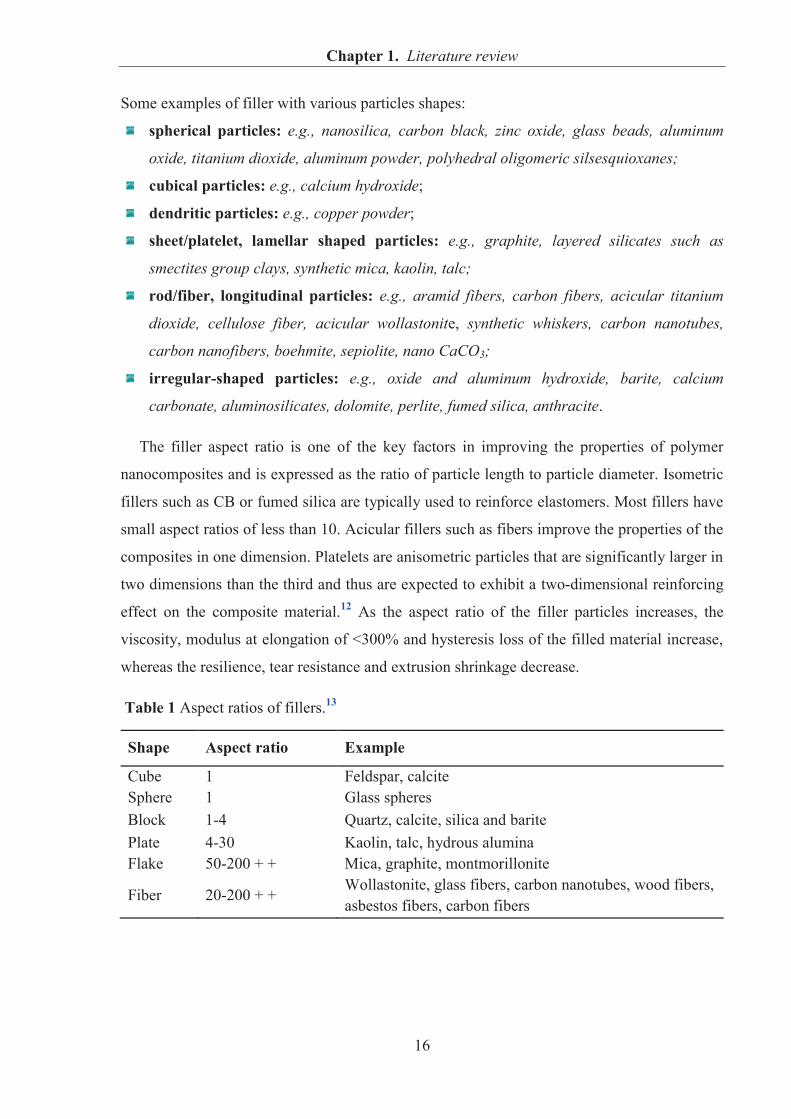
Some examples of filler with various particles shapes:
spherical particles: e.g., nanosilica, carbon black, zinc oxide, glass beads, aluminum
oxide, titanium dioxide, aluminum powder, polyhedral oligomeric silsesquioxanes;
cubical particles: e.g., calcium hydroxide;
dendritic particles: e.g., copper powder;
sheet/platelet, lamellar shaped particles: e.g., graphite, layered silicates such as
smectites group clays, synthetic mica, kaolin, talc;
rod/fiber, longitudinal particles: e.g., aramid fibers, carbon fibers, acicular titanium
dioxide, cellulose fiber, acicular wollastonite, synthetic whiskers, carbon nanotubes,
carbon nanofibers, boehmite, sepiolite, nano CaCO3;
irregular-shaped particles: e.g., oxide and aluminum hydroxide, barite, calcium
carbonate, aluminosilicates, dolomite, perlite, fumed silica, anthracite.
The filler aspect ratio is one of the key factors in improving the properties of polymer
nanocomposites and is expressed as the ratio of particle length to particle diameter. Isometric
fillers such as CB or fumed silica are typically used to reinforce elastomers. Most fillers have
small aspect ratios of less than 10. Acicular fillers such as fibers improve the properties of the
composites in one dimension. Platelets are anisometric particles that are significantly larger in
two dimensions than the third and thus are expected to exhibit a two-dimensional reinforcing
effect on the composite material.12 As the aspect ratio of the filler particles increases, the
viscosity, modulus at elongation of <300% and hysteresis loss of the filled material increase,
whereas the resilience, tear resistance and extrusion shrinkage decrease.
Table 1 Aspect ratios of fillers.13
Shape Aspect ratio Example
Cube 1 Feldspar, calcite Sphere 1 Glass spheres Block 1-4 Quartz, calcite, silica and barite Plate 4-30 Kaolin, talc, hydrous alumina Flake 50-200 + + Mica, graphite, montmorillonite
Fiber 20-200 + + Wollastonite, glass fibers, carbon nanotubes, wood fibers, asbestos fibers, carbon fibers
Chapter 1. Literature review
17
Surface activity and surface energy
The reinforcement of elastomers by particulate fillers is dependent on the physical
interactions between the filler and rubber matrix, which can determine the degree of adhesion
at the interfaces. The surface activity is related to the number and type of active functional
groups, the surface energy, and energetically different crystallite faces of the filler surfaces.
The surface activity is the predominant factor with regard to polymer-filler phase bonding and
filler-filler interactions. The surface activity determines the compatibility of the filler with a
specific elastomer and the ability of an elastomer to adhere to the inorganic phase. Generally,
it is attributed to the distribution of highly active sites for the adsorption of polymer segments
on the surface of reinforcing fillers.14 A filler can have a high surface area and a high aspect
ratio but still offer relatively poor reinforcement when its specific surface is characterized by
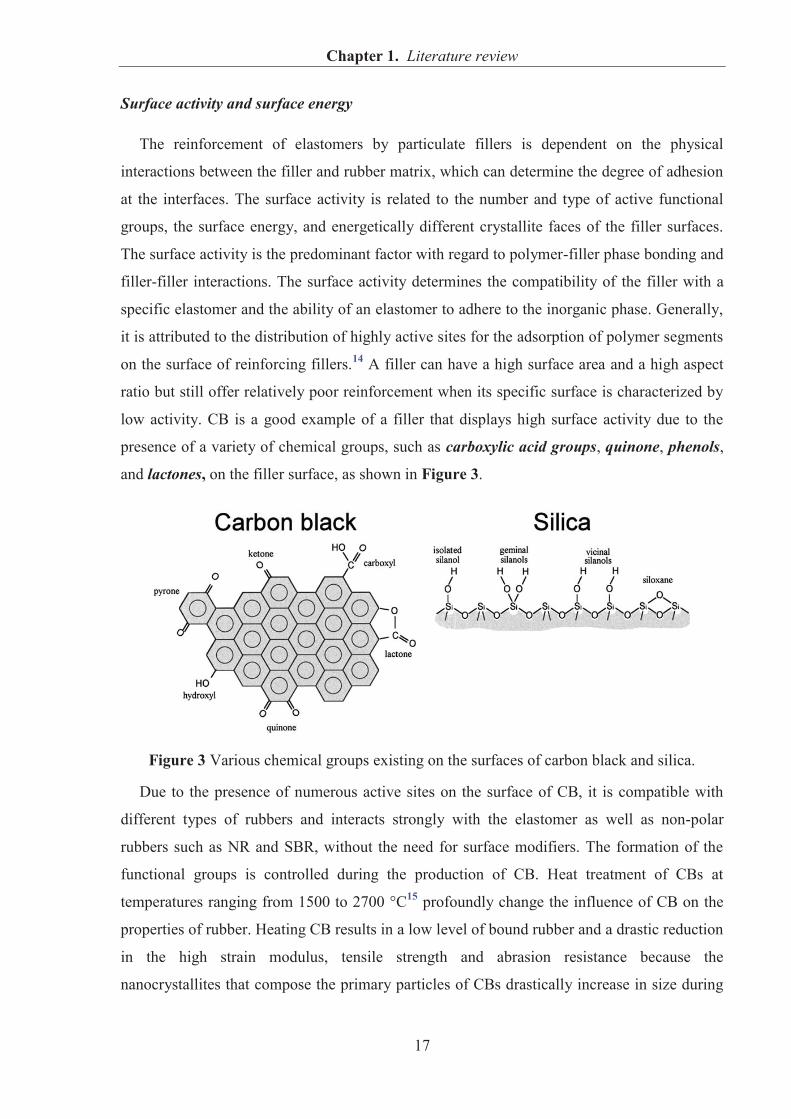
low activity. CB is a good example of a filler that displays high surface activity due to the
presence of a variety of chemical groups, such as carboxylic acid groups, quinone, phenols,
and lactones, on the filler surface, as shown in Figure 3.
Figure 3 Various chemical groups existing on the surfaces of carbon black and silica.
Due to the presence of numerous active sites on the surface of CB, it is compatible with
different types of rubbers and interacts strongly with the elastomer as well as non-polar
rubbers such as NR and SBR, without the need for surface modifiers. The formation of the
functional groups is controlled during the production of CB. Heat treatment of CBs at
temperatures ranging from 1500 to 2700 °C15 profoundly change the influence of CB on the
properties of rubber. Heating CB results in a low level of bound rubber and a drastic reduction
in the high strain modulus, tensile strength and abrasion resistance because the
nanocrystallites that compose the primary particles of CBs drastically increase in size during
Chapter 1. Literature review
18
heat treatment, whereas the number of high-energy sites located at the edges of the crystallites
drastically decreases. 16
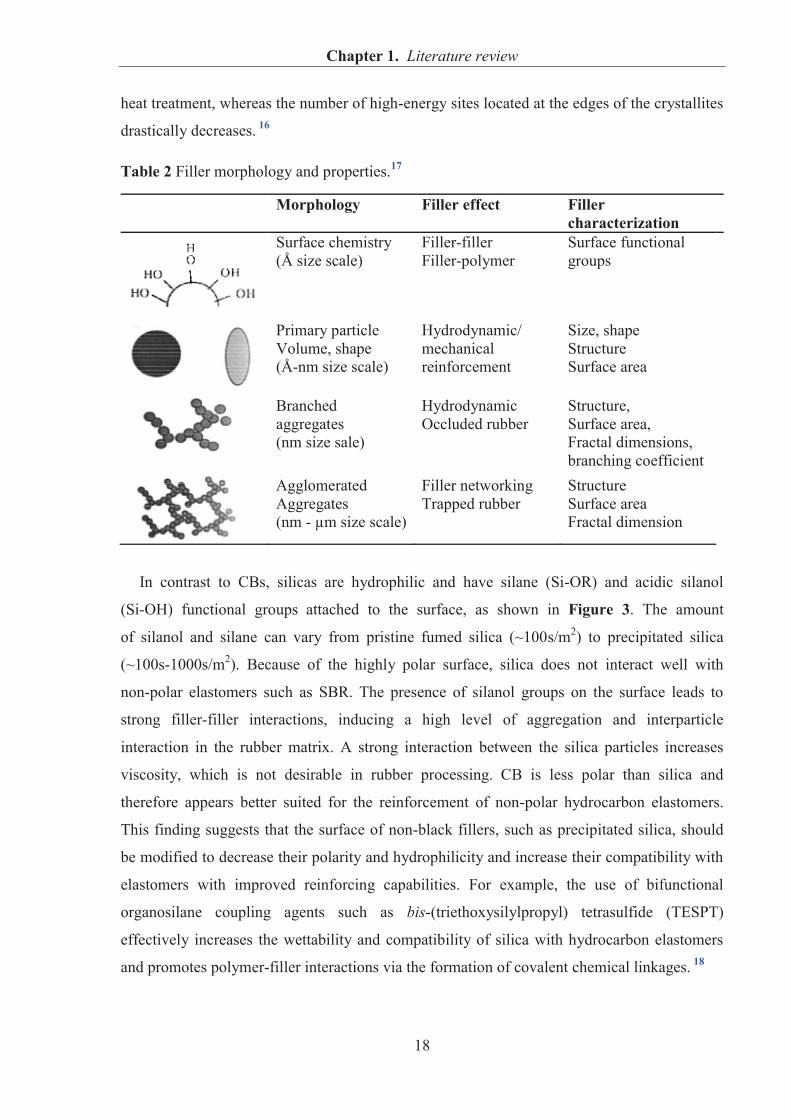
Table 2 Filler morphology and properties.17
Morphology Filler effect Filler characterization
Surface chemistry (Å size scale)
Filler-filler Filler-polymer
Surface functional groups
Primary particle Volume, shape (Å-nm size scale)
Hydrodynamic/ mechanical reinforcement
Size, shape Structure Surface area
Branched aggregates (nm size sale)
Hydrodynamic Occluded rubber
Structure, Surface area, Fractal dimensions, branching coefficient
Agglomerated Aggregates (nm - μm size scale)
Filler networking Trapped rubber
Structure Surface area Fractal dimension
In contrast to CBs, silicas are hydrophilic and have silane (Si-OR) and acidic silanol
(Si-OH) functional groups attached to the surface, as shown in Figure 3. The amount
of silanol and silane can vary from pristine fumed silica (~100s/m2) to precipitated silica
(~100s-1000s/m2). Because of the highly polar surface, silica does not interact well with
non-polar elastomers such as SBR. The presence of silanol groups on the surface leads to
strong filler-filler interactions, inducing a high level of aggregation and interparticle
interaction in the rubber matrix. A strong interaction between the silica particles increases
viscosity, which is not desirable in rubber processing. CB is less polar than silica and
therefore appears better suited for the reinforcement of non-polar hydrocarbon elastomers.
This finding suggests that the surface of non-black fillers, such as precipitated silica, should
be modified to decrease their polarity and hydrophilicity and increase their compatibility with
elastomers with improved reinforcing capabilities. For example, the use of bifunctional
organosilane coupling agents such as bis-(triethoxysilylpropyl) tetrasulfide (TESPT)
effectively increases the wettability and compatibility of silica with hydrocarbon elastomers
and promotes polymer-filler interactions via the formation of covalent chemical linkages. 18
Chapter 1. Literature review
19
One of the most sensitive and convenient techniques for the characterization of the surface
activity of fillers is inverse gas chromatography (IGC) at infinite dilution. IGC is based on the
adsorption and desorption kinetics of the gas molecules in the flow of an inert carrier gas and
is widely used to determine the surface energy of fillers and the highly active sites on their
surfaces. A good match of surface energies indicates filler-polymer interactions and greater
compatibility of the rubber and filler. For instance, a high degree of filler agglomeration in the
rubber matrix results from large differences in surface energy between the filler and polymer,
strong interparticle forces, and high filler loadings. The surface energy of the filler indicates
how compatible it is with the rubber. Generally, the surface energies of fillers are much higher
than those of organic polymers. Most inorganic fillers have surface energies greater than 100
mJ/m2, whereas polymers typically have surface energies of approximately 35 mJ/m2.
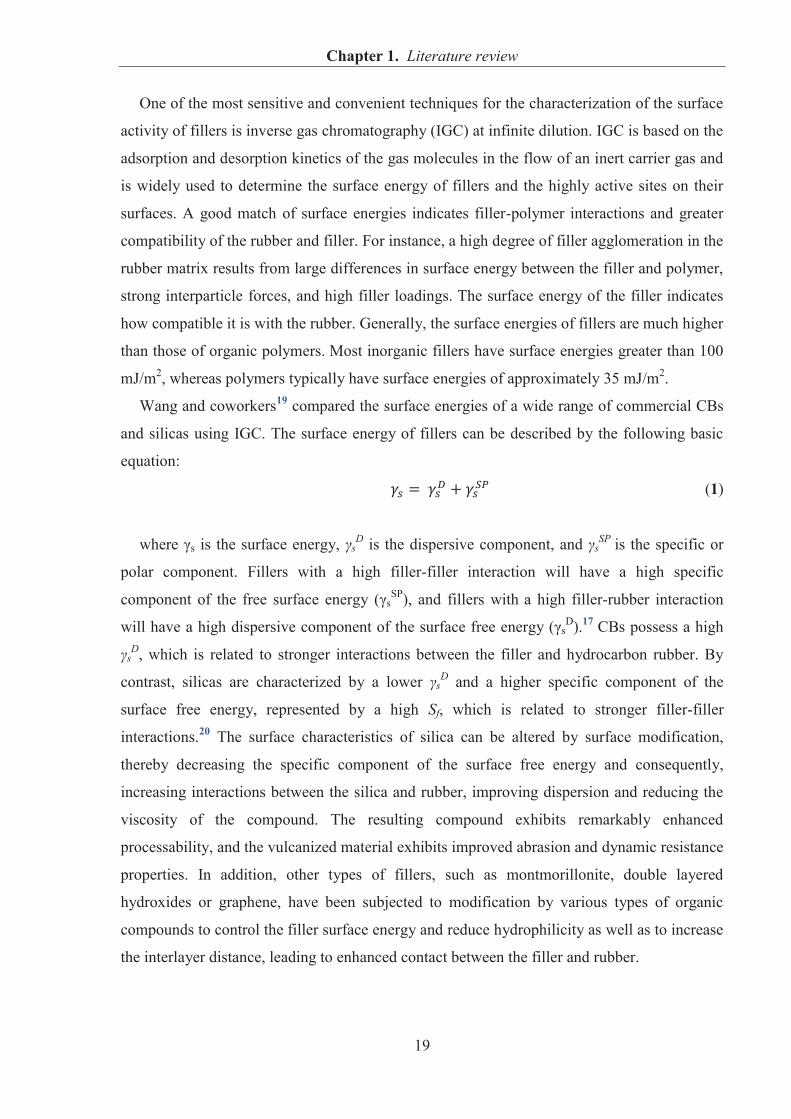
Wang and coworkers19 compared the surface energies of a wide range of commercial CBs
and silicas using IGC. The surface energy of fillers can be described by the following basic
equation:
(1)
where γs is the surface energy, γsD is the dispersive component, and γs
SP is the specific or
polar component. Fillers with a high filler-filler interaction will have a high specific
component of the free surface energy (γsSP), and fillers with a high filler-rubber interaction
will have a high dispersive component of the surface free energy (γsD).17 CBs possess a high
γsD, which is related to stronger interactions between the filler and hydrocarbon rubber. By
contrast, silicas are characterized by a lower γsD and a higher specific component of the
surface free energy, represented by a high Sf, which is related to stronger filler-filler
interactions.20 The surface characteristics of silica can be altered by surface modification,
thereby decreasing the specific component of the surface free energy and consequently,
increasing interactions between the silica and rubber, improving dispersion and reducing the
viscosity of the compound. The resulting compound exhibits remarkably enhanced
processability, and the vulcanized material exhibits improved abrasion and dynamic resistance
properties. In addition, other types of fillers, such as montmorillonite, double layered
hydroxides or graphene, have been subjected to modification by various types of organic
compounds to control the filler surface energy and reduce hydrophilicity as well as to increase
the interlayer distance, leading to enhanced contact between the filler and rubber.
Chapter 1. Literature review
20
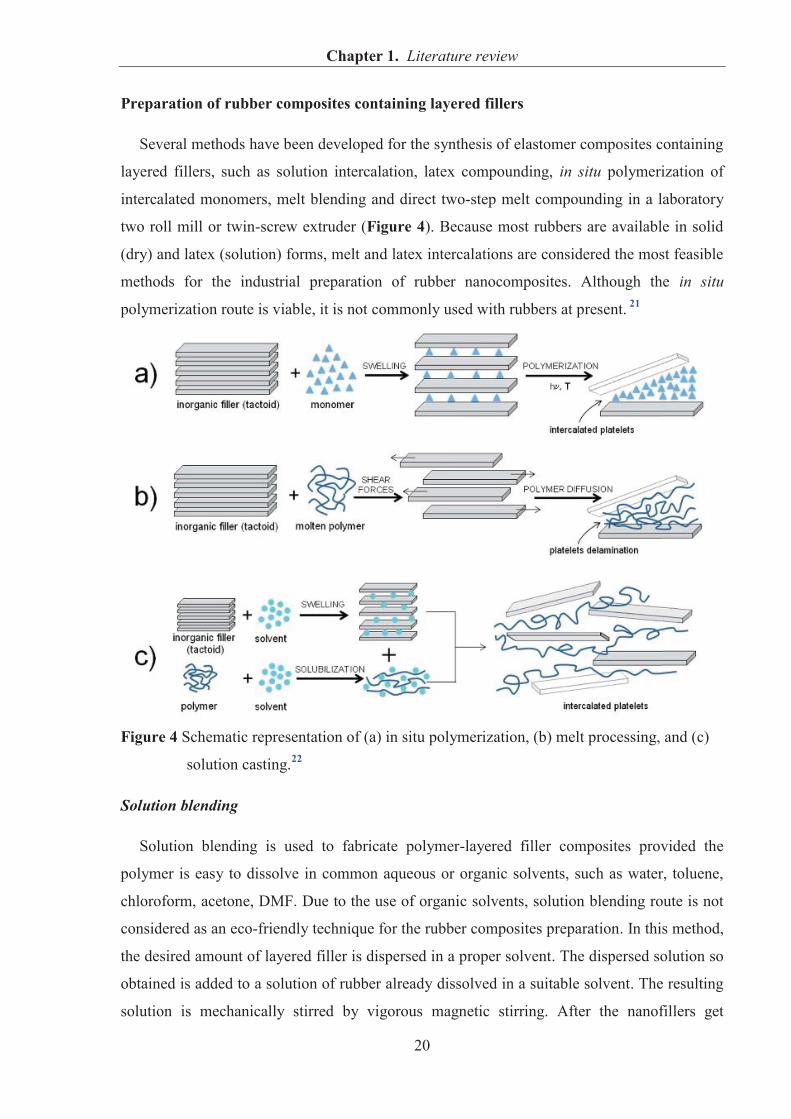
Preparation of rubber composites containing layered fillers
Several methods have been developed for the synthesis of elastomer composites containing
layered fillers, such as solution intercalation, latex compounding, in situ polymerization of
intercalated monomers, melt blending and direct two-step melt compounding in a laboratory
two roll mill or twin-screw extruder (Figure 4). Because most rubbers are available in solid
(dry) and latex (solution) forms, melt and latex intercalations are considered the most feasible
methods for the industrial preparation of rubber nanocomposites. Although the in situ
polymerization route is viable, it is not commonly used with rubbers at present. 21
Figure 4 Schematic representation of (a) in situ polymerization, (b) melt processing, and (c)
solution casting.22
Solution blending
Solution blending is used to fabricate polymer-layered filler composites provided the
polymer is easy to dissolve in common aqueous or organic solvents, such as water, toluene,
chloroform, acetone, DMF. Due to the use of organic solvents, solution blending route is not
considered as an eco-friendly technique for the rubber composites preparation. In this method,
the desired amount of layered filler is dispersed in a proper solvent. The dispersed solution so
obtained is added to a solution of rubber already dissolved in a suitable solvent. The resulting
solution is mechanically stirred by vigorous magnetic stirring. After the nanofillers get
Chapter 1. Literature review
21
dispersed, the solvent is removed. The curatives may be incorporated before solvent
evaporation, or may be added to the above solution and stirred altogether. The resultant
solution is vacuum dried. Finally, the composites obtained are roll-milled at room temperature
followed by compression moulding at specific conditions.23
Latex compounding
The latex is an aqueous dispersion of elastomer particles in the submicron-micron range.
There are some elastomers which are available in the form of latex, for instance, NR, SBR,
CR, XSBR, XNBR, PUR. Most of rubber/layered silicate nanocomposites are produced by
this method. To the rubber latex pristine clay can be added directly, or in its aqueous
dispersion (slurry). Note that clays are strongly hydrophilic and thus adsorb water molecules,
which is associated with an expansion of their intergallery spacing. So, hydration decreases
the attractive forces between the silicate layers, making easier their exfoliation under stirring.
After mixing/stirring of the clay-containing lattices, they are cast in a mold and dried. In this
case, the rubber/clay nanocomposite remains unvulcanized or suitable rubber curatives, which
can be dispersed in water, may also be mixed with the clay-containing rubber latex. After
casting and drying, the related articles can be cured accordingly.27
Melt mixing method
The most commonly applied processing method of direct mechanical mixing of the filler
particles and rubber is termed a melt blending technique. From an industrial standpoint, melt
blending is the most direct, eco-friendly and the most economically viable (as no organic
solvents are involved) method to synthesize rubber composites. On the other hand, a better
degree of dispersion is achieved by in situ polymerization, followed by solution mixing. The
advantage of melt mixing method lies in the absence of utilization of organic solvents, and its
applicability to both polar and non-polar elastomers. This involves equipment like internal
mixers and open two-roll mills. The mixing temperature and shear rate employed when using
mixers and open two roll mills strongly influence the filler dispersion in the rubber matrix;
however, the high viscosity of the material often causes non-uniform dispersion of the filler
platelets.
Chapter 1. Literature review
22
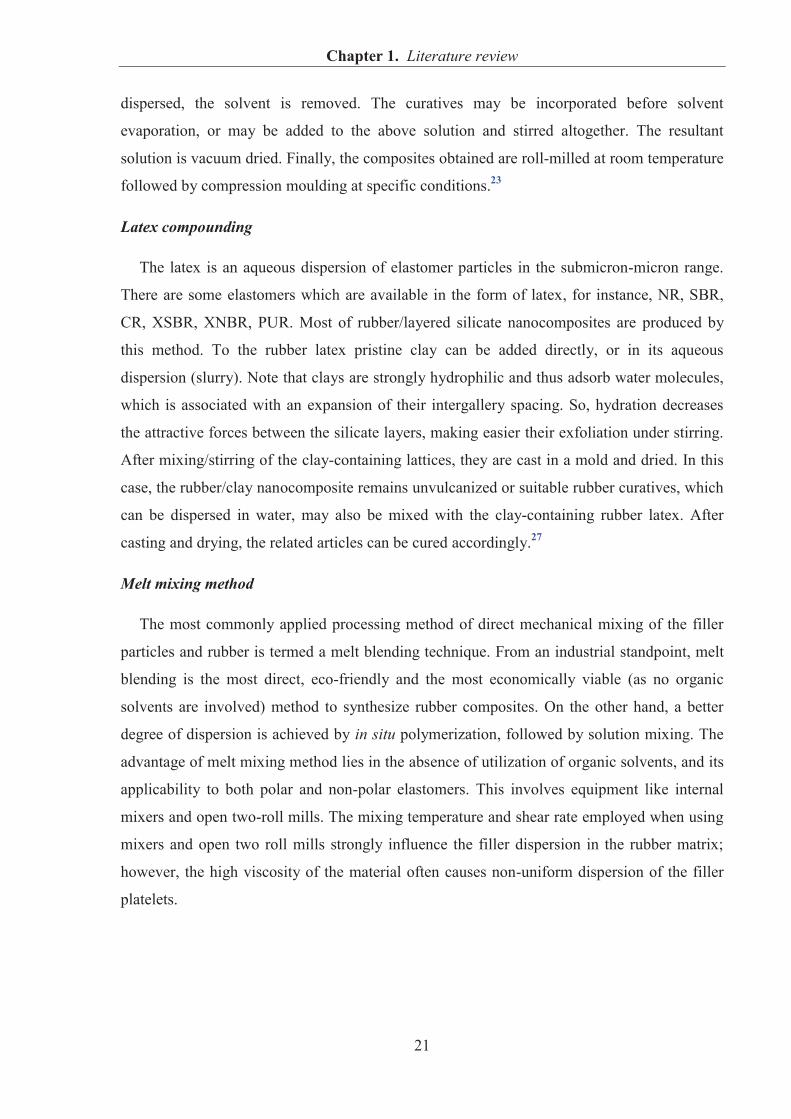
Morphology of rubber/layered filler composites
The physical properties of a rubber product depend on the morphology and distribution of
particles in the elastomer matrix. The state of dispersion of the layered fillers in rubber
compounds is typically characterized by scanning electron microscopy (SEM), transmission
electron microscopy (TEM) and X-ray diffraction (XRD). In general, two basic structures of
polymer composites containing layered fillers are recognized: intercalated and exfoliated. In
the first case, the polymer chains are incorporated between the galleries; however, total
separation of the layers does not occur. During exfoliation, these distances increase such that
the interaction between adjacent layers and the arrangement of the crystalline materials are
lost. Thus, for completely exfoliated clays, no wide-angle X-ray peak is expected for the
nanocomposite. If the polymer chains cannot intercalate between the filler sheets, then a
traditional microphase-separated structure (conventional or microcomposite) is formed, and
there is no shifting of the X-ray d-spacing. The possible dispersions of layered silicate in a
polymer are schematically depicted in Figure 5.
Figure 5 Different structures of polymer (rubber)/clay nanocomposites.24
Exfoliated, intercalated and mixed morphologies are obtained depending on the following
factors: (a) the polymer polarity, (b) the properties of the nanofiller (particularly the ion
exchange capacity), (c) the alkyl modifier chain length and (d) the method of composite
synthesis.
Chapter 1. Literature review
23
Properties of rubber/layered filler composites
Elastomer composites containing layered fillers are competitive with conventional
materials filled with commercial CBs and silicas, mainly due to the eco-friendliness resulting
from layered solids origins and their natural abundance, as well as due to the possibility of
fabrication of low cost materials with some multifunctional properties. The following
advantages of rubber/layered filler composites are anticipated:
enhanced mechanical properties of the rubber matrix at low filler loadings;25
improved fire resistance of vulcanizates due to a delay in thermal-oxidative degradation
and a decrease in the heat release rate;
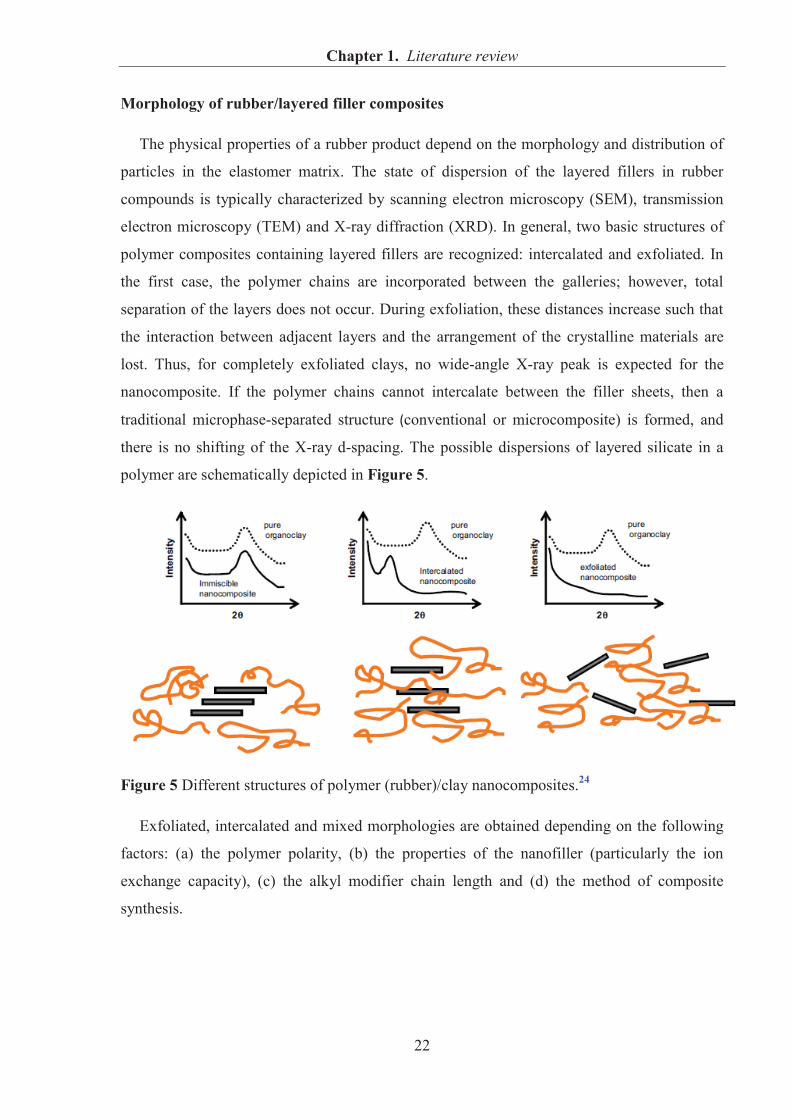
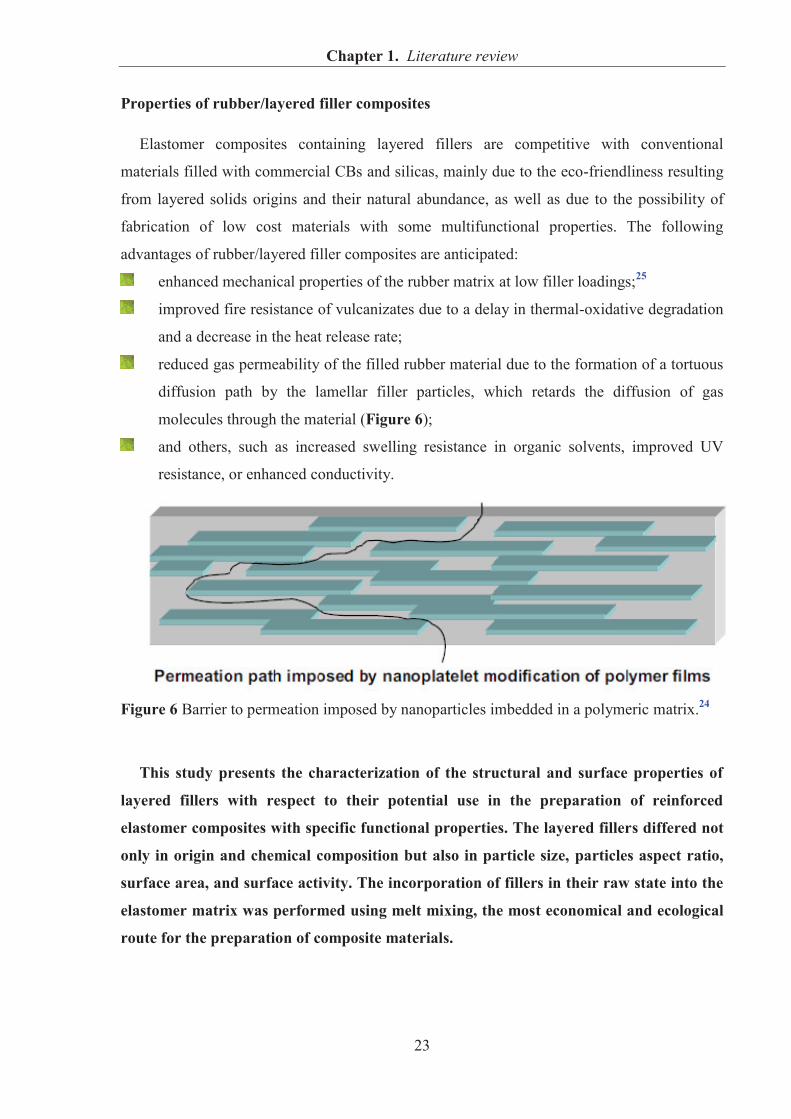
reduced gas permeability of the filled rubber material due to the formation of a tortuous
diffusion path by the lamellar filler particles, which retards the diffusion of gas
molecules through the material (Figure 6);
and others, such as increased swelling resistance in organic solvents, improved UV
resistance, or enhanced conductivity.
Figure 6 Barrier to permeation imposed by nanoparticles imbedded in a polymeric matrix.24
This study presents the characterization of the structural and surface properties of
layered fillers with respect to their potential use in the preparation of reinforced
elastomer composites with specific functional properties. The layered fillers differed not
only in origin and chemical composition but also in particle size, particles aspect ratio,
surface area, and surface activity. The incorporation of fillers in their raw state into the
elastomer matrix was performed using melt mixing, the most economical and ecological
route for the preparation of composite materials.
Chapter 1. Literature review
24
1.2. TYPES OF LAYERED FILLERS AND THEIR APPLICATIONS
IN RUBBER COMPOSITES
1.2.1. CATIONIC CLAYS - HECTORITES
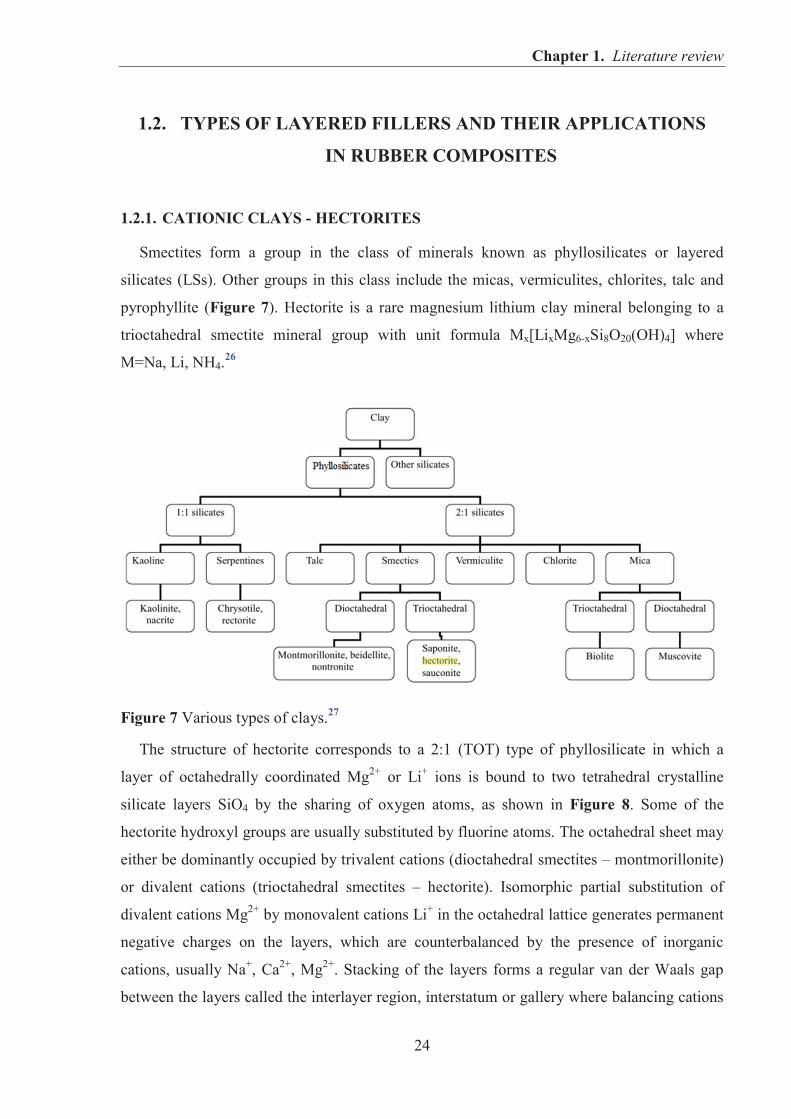
Smectites form a group in the class of minerals known as phyllosilicates or layered
silicates (LSs). Other groups in this class include the micas, vermiculites, chlorites, talc and
pyrophyllite (Figure 7). Hectorite is a rare magnesium lithium clay mineral belonging to a
trioctahedral smectite mineral group with unit formula Mx[LixMg6-xSi8O20(OH)4] where
M=Na, Li, NH4.26
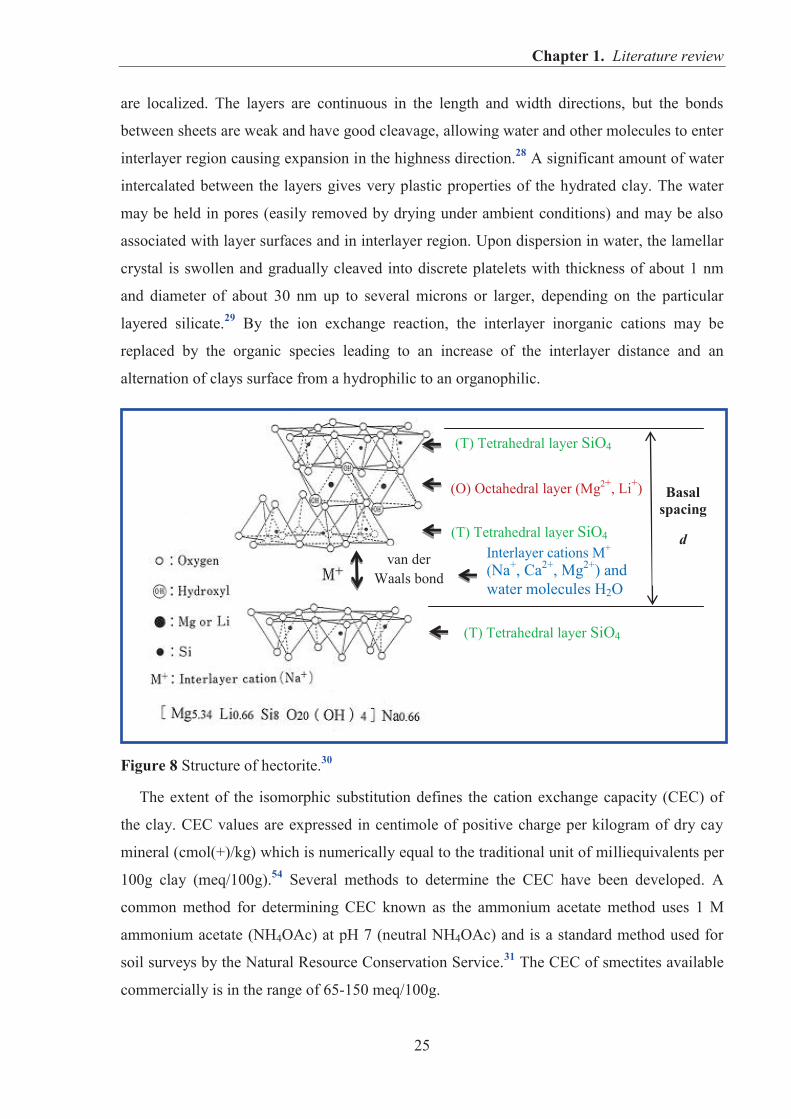
Figure 7 Various types of clays.27 The structure of hectorite corresponds to a 2:1 (TOT) type of phyllosilicate in which a
layer of octahedrally coordinated Mg2+ or Li+ ions is bound to two tetrahedral crystalline
silicate layers SiO4 by the sharing of oxygen atoms, as shown in Figure 8. Some of the
hectorite hydroxyl groups are usually substituted by fluorine atoms. The octahedral sheet may
either be dominantly occupied by trivalent cations (dioctahedral smectites – montmorillonite)
or divalent cations (trioctahedral smectites – hectorite). Isomorphic partial substitution of
divalent cations Mg2+ by monovalent cations Li+ in the octahedral lattice generates permanent
negative charges on the layers, which are counterbalanced by the presence of inorganic
cations, usually Na+, Ca2+, Mg2+. Stacking of the layers forms a regular van der Waals gap
between the layers called the interlayer region, interstatum or gallery where balancing cations
Chapter 1. Literature review
25
are localized. The layers are continuous in the length and width directions, but the bonds
between sheets are weak and have good cleavage, allowing water and other molecules to enter
interlayer region causing expansion in the highness direction.28 A significant amount of water
intercalated between the layers gives very plastic properties of the hydrated clay. The water
may be held in pores (easily removed by drying under ambient conditions) and may be also
associated with layer surfaces and in interlayer region. Upon dispersion in water, the lamellar
crystal is swollen and gradually cleaved into discrete platelets with thickness of about 1 nm
and diameter of about 30 nm up to several microns or larger, depending on the particular
layered silicate.29 By the ion exchange reaction, the interlayer inorganic cations may be
replaced by the organic species leading to an increase of the interlayer distance and an
alternation of clays surface from a hydrophilic to an organophilic.
Figure 8 Structure of hectorite.30
The extent of the isomorphic substitution defines the cation exchange capacity (CEC) of
the clay. CEC values are expressed in centimole of positive charge per kilogram of dry cay
mineral (cmol(+)/kg) which is numerically equal to the traditional unit of milliequivalents per
100g clay (meq/100g).54 Several methods to determine the CEC have been developed. A
common method for determining CEC known as the ammonium acetate method uses 1 M
ammonium acetate (NH4OAc) at pH 7 (neutral NH4OAc) and is a standard method used for
soil surveys by the Natural Resource Conservation Service.31 The CEC of smectites available
commercially is in the range of 65-150 meq/100g.
(T) Tetrahedral layer SiO4
(T) Tetrahedral layer SiO4
(T) Tetrahedral layer SiO4
(O) Octahedral layer (Mg2+, Li+)
Interlayer cations M+ (Na+, Ca2+, Mg2+) and water molecules H2O
van der Waals bond
Basal spacing
d
Chapter 1. Literature review
26
Hectorites are the most common authigenic clay minerals. They form at low temperatures
and pressures by the alteration of oceanic and continental basalts and other basic volcanic
rocks.32 The naturally occurring clay mineral hectorite is seldom found in soils and mined
only in limited localizations. Natural hectorite often contains significant amounts of
impurities (iron) and other minerals such as, for example, dolomite or calcite. Smectites can
be mined from natural resources, however their synthesis allows to obtain an impurity-free
reproducible solid. A classical method of hectorite synthesis involves long hydrothermal
treatments with the use of high temperatures or long aging times (from several days to several
weeks).33 Hydrothermal treatment frequently starts with the preparation of slurries consisting
of the necessary reagents such as Mg, Li, F, Si, etc., which are aged under reflux or in
autoclave at around 333-573 K producing the hectorite with designed composition. A method
for incorporating a variety of intercalats directly during hydrothermal synthesis of hectorite
was developed by Carrado in 1992.34 This approach was unique in that the organic intercalate
was present during synthesis rather than being added later by ion exchange. The microwave–
hydrothermal treatment is quite modern technique and it is definitely a faster method used for
clay synthesis.35 Most common synthetic clays are hectorite and fluorohectorite. A synthetic
hectorite has some obvious advantages over natural ones, for instance:
controllable pore size distribution;
higher specific surface area;
higher purity;
tunable composition;
excellent reproducibility.36
Hectorite suspensions display a high viscosity and transparency as well as other attractive
rheological properties, which render hectorite a very valuable clay mineral for industrial
applications. Due to their high cation exchange capacity (CEC), high specific surface area,
small particles size, chemical and mechanical stabilities, thixotropic properties, acid
properties together with their swelling ability in water up to thirty five times its weight and to
form organic and inorganic interlayer complexes, hectorites are interesting materials widely
used in many technological applications such as: 26
ceramics;
suspending agent in glazes;
rheology-modifiers;
plasticizing agent for non-plastic formulations;
Chapter 1. Literature review
27
oil drilling fluid;
supports of metal catalysts and occasionally as catalysts themselves;
substrate for colloidal systems;
adsorbents for heavy metal ions, adsorbents for the removal anionic dyes (basic dyes),
organic compounds, pesticides, and other environmental applications or waste isolation;
due to its white color and good gelling properties, hectorites find wide application in
paint, cosmetic and paper industries;
fillers used in polymer composites.
Most of technological uses of smectites are related to reactions that take place in the
gallery region where hydrated and exchangeable interlayer cations such as Na+, K+, Ca2+ and
Mg2+ are localized. Polymeric hydro(oxides) of Al, Fe, Cr, Zn, Ti can intercalate into
smectites by cation exchange. After heating, these so-called “pillared clays” exhibit a large
surface area, huge porosity, high acidity and catalyzing properties.54 In their pristine form
montmorillonite and hectorite are hydrophilic in nature, and this property makes them very
difficult to disperse into a hydrophobic media. The most common way to make hydrophilic
clay surface hydrophobic is to exchange interlayer cations with organic cations by ion
exchange reaction.
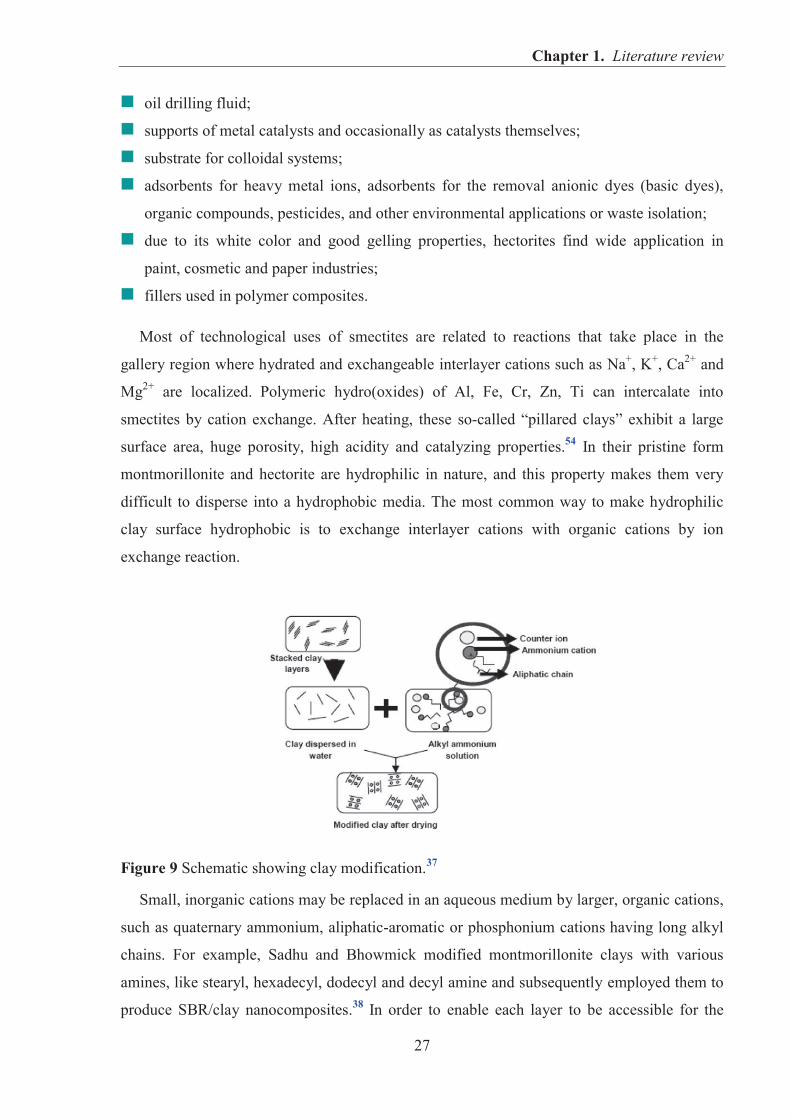
Figure 9 Schematic showing clay modification.37
Small, inorganic cations may be replaced in an aqueous medium by larger, organic cations,
such as quaternary ammonium, aliphatic-aromatic or phosphonium cations having long alkyl
chains. For example, Sadhu and Bhowmick modified montmorillonite clays with various
amines, like stearyl, hexadecyl, dodecyl and decyl amine and subsequently employed them to
produce SBR/clay nanocomposites.38 In order to enable each layer to be accessible for the
Chapter 1. Literature review
28
surfactant molecules from the solution, clay layers need to swell to exfoliate in the solvent
(usually water) (as shown in Figure 9). Incorporation of large, organic cations into the
interlayer not only causes that the silicates become organophilic, but also leads to an increase
in the interlayer distance which size depends on the functionality and length of the chains of
organic molecules. Organophilization reduces the surface energy of the mineral silicates,
facilitates the intercalation of polymer macromolecules and improves the compatibility
between the two phases. The quaternary alkylammonium salts are cationic surfactants and
the most used organic compounds to prepare organoclays. The advantage of using
phosphonium salts over the ammonium salts is higher degradation temperature of the
modified silicates up to 350 °C. Silicates modified with phosphonium cations can be used in
the preparation of nanocomposites by the melt mixing method. Also, aromatic compounds,
such as imidazole or quinolone moieties exhibit greater thermal stability than the commercial
cation-pyridine or alkyl ammonium salts.39 Most of the commercially available modified clay
minerals is produced by exchanging the metal cations in the interlayer space with the
ammonium cations. However, some types of surface modifier, particularly amines, may affect
the degree of crosslinking and vulcanization time of elastomer composites. For instance, it has
been found that octadecylamine acts as an accelerator for NR vulcanized with sulfur.40
Rubber/hectorite composites
In recent years, much attention has been paid to the composites based on layered fillers and
rubber matrices, however there are only a few reports concerning the use of hectorite as
a reinforcing filler in elastomer composites. For example, Maiti and Bohowmick41
investigated the influence of natural and synthetic hectorite (at loadings of 4 and 16 phr)
on the mechanical, dynamic mechanical, swelling, and thermal properties of fluoroelastomer
– a terpolymer of hexafluoropropylene, vinylidene fluoride and tetrafluoroethylene.
The composites were prepared by a solution mixing method. First, a mixture of dissolved
rubber and layered silicate dispersed in a common solvent methyl ethyl ketone was stirred to
make it homogeneous, after solvent evaporation, the sample was cured at optimum cure time
in a hydraulic press. The natural hectorite, even after extensive cleaning, still contained
CaCO3, quartz, and (Mg, Fe, Ca)SiO3 impurities. Moreover, the synthetic clays showed
smaller particle size and higher specific surface areas (around 159 m2/g) relative to the natural
one (71 m2/g). Compared with natural hectorite, all the synthetic materials impart better
properties of elastomer composites due to the lower particle size and higher surface area
of synthetic clays which enhance the polymer–filler interaction. Bhattacharya et al.42
Chapter 1. Literature review
29
examined the effects of varying morphological and chemical constitution of nanofillers
(montmorillonite, sepiolite, hectorite, carbon nanofiber and expanded graphite) and various
dispersion methods on natural rubber (NR) nanocomposites. Incorporation of 4 phr of natural
hectorite and Laponite (synthetic hectorite) to the NR matrix during compounding
in an internal mixer Brabender did not improve modulus, tensile strength and tear strength
and had no effect on the crosslink density of the final NR nanocomposites.
In order to achieve a better compatibility between hydrophobic polyurethane matrix (PUR)
and synthetic hectorite Laponite RD, the reactive organifier terminated by hydroxyl end group
to react with diisocyanate was synthesized and used for the preparation of organoclay.43
The polyurethane nanocomposites were synthesized by mixing of organoclay suspended in
DMF with polyurethane prepolymer PTMG, removing the dispersion medium DMF and
subsequent reaction between reagents. The authors reported that the d-spacing increased up to
2.08 nm with increasing the molecular weight of organifier. The enhancement of Young’s
modulus was directly attributed to the reinforcement provided by the dispersed silicate layers
and to the strong interactions between polyurethane matrix and silicate layers via the
formation of ionic bonding as well as hydrogen bonding. The maximum increase of tensile
strength was 45 %.
Many studies have reported the preparation and investigation of elastomer/layered
filler composites with improved mechanical, thermal and gas barrier properties. The
majority of these studies have used organo-modified montmorillonite as a reinforcing
filler in various elastomers, whereas the potential of hectorite in this field has not been
sufficiently explored. Hectorite possesses a lamellar structure, high aspect ratio and high
thermal stability similar to that of montmorillonite and is an interesting mineral that
could act as an active filler for rubbers and produce a reinforced rubber material with
improved barrier and thermal properties. The main difference between hectorite and
montmorillonite is the presence of magnesium ions in the octahedral layer, therefore,
hectorite belongs to the trioctahedral smectite mineral group. The presence of
magnesium ions and the polar mineral surface may contribute to possible interactions
with polar functionalities attached to the rubber hydrocarbon chains, such as –CN or
–COOH. This research focused in part on the evaluation and comparison of the
reinforcing effects of natural and synthetic hectorite in two elastomers of differing
polarity and curing system.
Chapter 1. Literature review
30
1.2.2. ANIONIC CLAYS - LAYERED DOUBLE HYDROXIDES (LDHs)
In recent years, there is a growing interest in using layered double hydroxides (LDHs)
(also known as hydrotalcite-like compounds) as novel fillers for elastomer composites and in
that sense they are competing materials to layered silicates (LSs).44 In contrast to the cationic
clay minerals with negatively charged layers (1:1, 2:1 type), the LDHs are a kind of anionic
clay minerals consisting of positively charged sheets (1:1 type, brucite type) with intercalated
water and interlayer exchangeable anions that maintain electroneutrality.
LDHs have been known since 1842. Hydrotalcite is one of the most representative
minerals of the LDH group which naturally occurs as a white hydrous mineral with chemical
formula given as Mg6Al2(OH)16(CO3) · 4H2O.45 Natural hydrotalcites are rare in the nature,
exist in small quantities and are highly contaminated. The sites of hydrotalcite occurrence are
Snarum, Norway, New South Wales and Tasmania, Australia. Table 3 shows some known
naturally occurring minerals with structural composition similar to that of hydrotalcite.
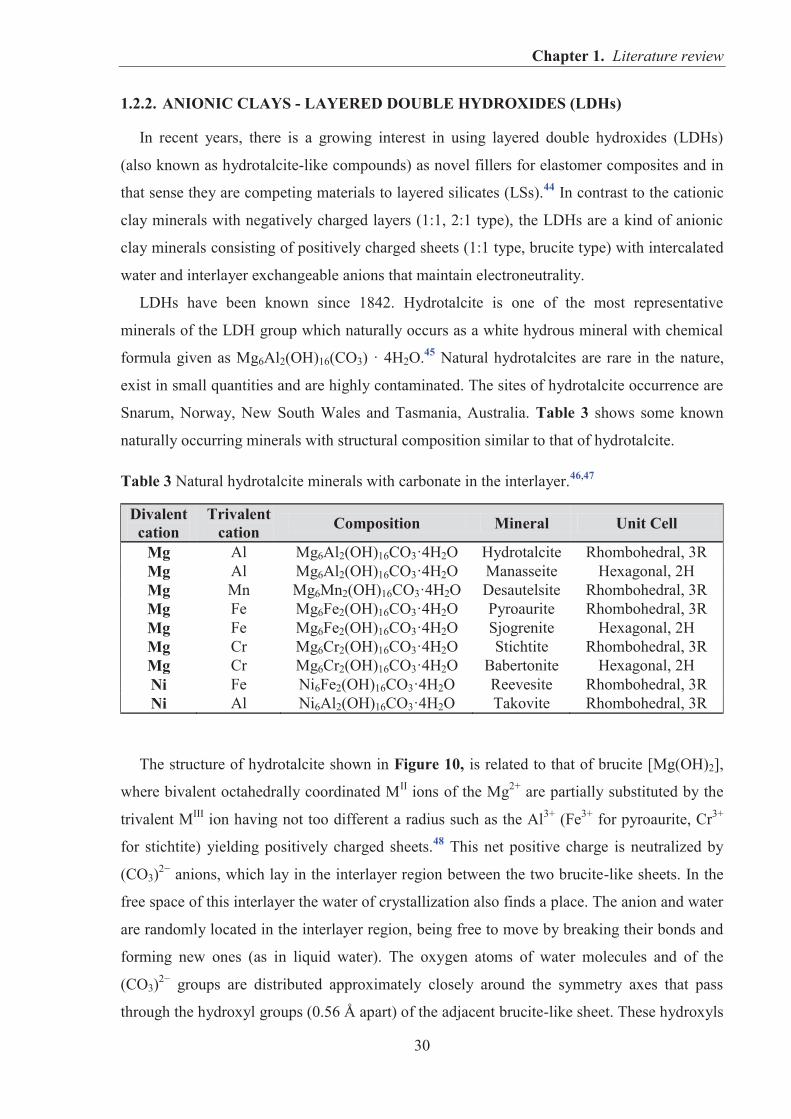
Table 3 Natural hydrotalcite minerals with carbonate in the interlayer.46,47
Divalent cation
Trivalent cation Composition Mineral Unit Cell
Mg Al Mg6Al2(OH)16CO3·4H2O Hydrotalcite Rhombohedral, 3R Mg Al Mg6Al2(OH)16CO3·4H2O Manasseite Hexagonal, 2H Mg Mn Mg6Mn2(OH)16CO3·4H2O Desautelsite Rhombohedral, 3R Mg Fe Mg6Fe2(OH)16CO3·4H2O Pyroaurite Rhombohedral, 3R Mg Fe Mg6Fe2(OH)16CO3·4H2O Sjogrenite Hexagonal, 2H Mg Cr Mg6Cr2(OH)16CO3·4H2O Stichtite Rhombohedral, 3R Mg Cr Mg6Cr2(OH)16CO3·4H2O Babertonite Hexagonal, 2H Ni Fe Ni6Fe2(OH)16CO3·4H2O Reevesite Rhombohedral, 3R Ni Al Ni6Al2(OH)16CO3·4H2O Takovite Rhombohedral, 3R
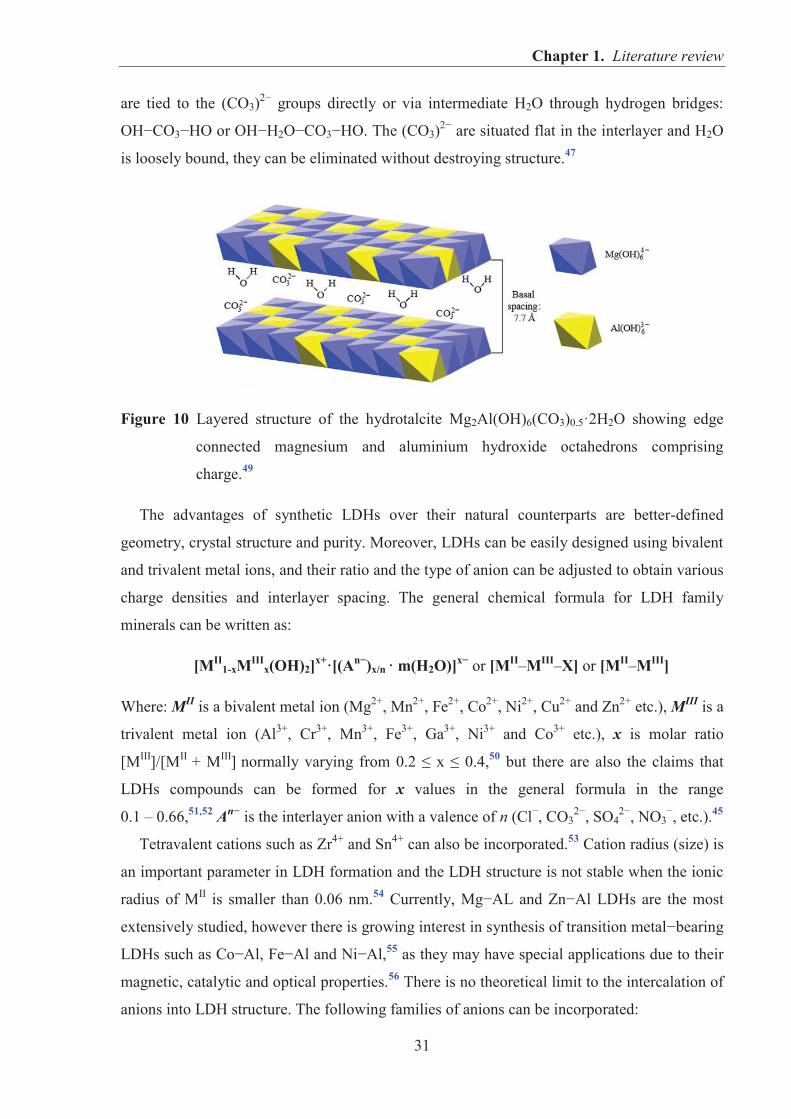
The structure of hydrotalcite shown in Figure 10, is related to that of brucite [Mg(OH)2],
where bivalent octahedrally coordinated MII ions of the Mg2+ are partially substituted by the
trivalent MIII ion having not too different a radius such as the Al3+ (Fe3+ for pyroaurite, Cr3+
for stichtite) yielding positively charged sheets.48 This net positive charge is neutralized by
(CO3)2− anions, which lay in the interlayer region between the two brucite-like sheets. In the
free space of this interlayer the water of crystallization also finds a place. The anion and water
are randomly located in the interlayer region, being free to move by breaking their bonds and
forming new ones (as in liquid water). The oxygen atoms of water molecules and of the
(CO3)2− groups are distributed approximately closely around the symmetry axes that pass
through the hydroxyl groups (0.56 Å apart) of the adjacent brucite-like sheet. These hydroxyls
Chapter 1. Literature review
31
are tied to the (CO3)2− groups directly or via intermediate H2O through hydrogen bridges:
OH−CO3−HO or OH−H2O−CO3−HO. The (CO3)2− are situated flat in the interlayer and H2O
is loosely bound, they can be eliminated without destroying structure.47
Figure 10 Layered structure of the hydrotalcite Mg2Al(OH)6(CO3)0.5·2H2O showing edge
connected magnesium and aluminium hydroxide octahedrons comprising
charge.49
The advantages of synthetic LDHs over their natural counterparts are better-defined
geometry, crystal structure and purity. Moreover, LDHs can be easily designed using bivalent
and trivalent metal ions, and their ratio and the type of anion can be adjusted to obtain various
charge densities and interlayer spacing. The general chemical formula for LDH family
minerals can be written as:
[MII1-xMIII
x(OH)2]x+·[(An−)x/n · m(H2O)]x− or [MII–MIII–X] or [MII–MIII]
Where: MII is a bivalent metal ion (Mg2+, Mn2+, Fe2+, Co2+, Ni2+, Cu2+ and Zn2+ etc.), MIII is a
trivalent metal ion (Al3+, Cr3+, Mn3+, Fe3+, Ga3+, Ni3+ and Co3+ etc.), x is molar ratio
[MIII]/[MII + MIII] normally varying from 0.2 ≤ x ≤ 0.4,50 but there are also the claims that
LDHs compounds can be formed for x values in the general formula in the range
0.1 – 0.66,51,52 An− is the interlayer anion with a valence of n (Cl−, CO32−, SO4
2−, NO3−, etc.).45
Tetravalent cations such as Zr4+ and Sn4+ can also be incorporated.53 Cation radius (size) is
an important parameter in LDH formation and the LDH structure is not stable when the ionic
radius of MII is smaller than 0.06 nm.54 Currently, Mg−AL and Zn−Al LDHs are the most
extensively studied, however there is growing interest in synthesis of transition metal−bearing
LDHs such as Co−Al, Fe−Al and Ni−Al,55 as they may have special applications due to their
magnetic, catalytic and optical properties.56 There is no theoretical limit to the intercalation of
anions into LDH structure. The following families of anions can be incorporated:
Chapter 1. Literature review
32
halides (F−, Cl−, Br−, I−);
non-metal oxoanions (BO33−, CO3
2−, NO3−, Si2O5
2−, HPO42−, SO4
2−, ClO4−, AsO4
3−,
SeO42−, BrO−, etc);
oxometallate anions (VO43−, CrO4
2−, MnO4−, V10O28
6−, Cr2O72−, Mo7O24
6−, PW12O403−,
etc.);
anionic complexes of transition metals (Fe(CN)62− etc.);
volatile organic anions (CH3COO−, C6H5COO−, C12H25COO−, C2O42−, C6H5SO3
−, etc.);
anionic polymers (PSS, PVS, etc.).54
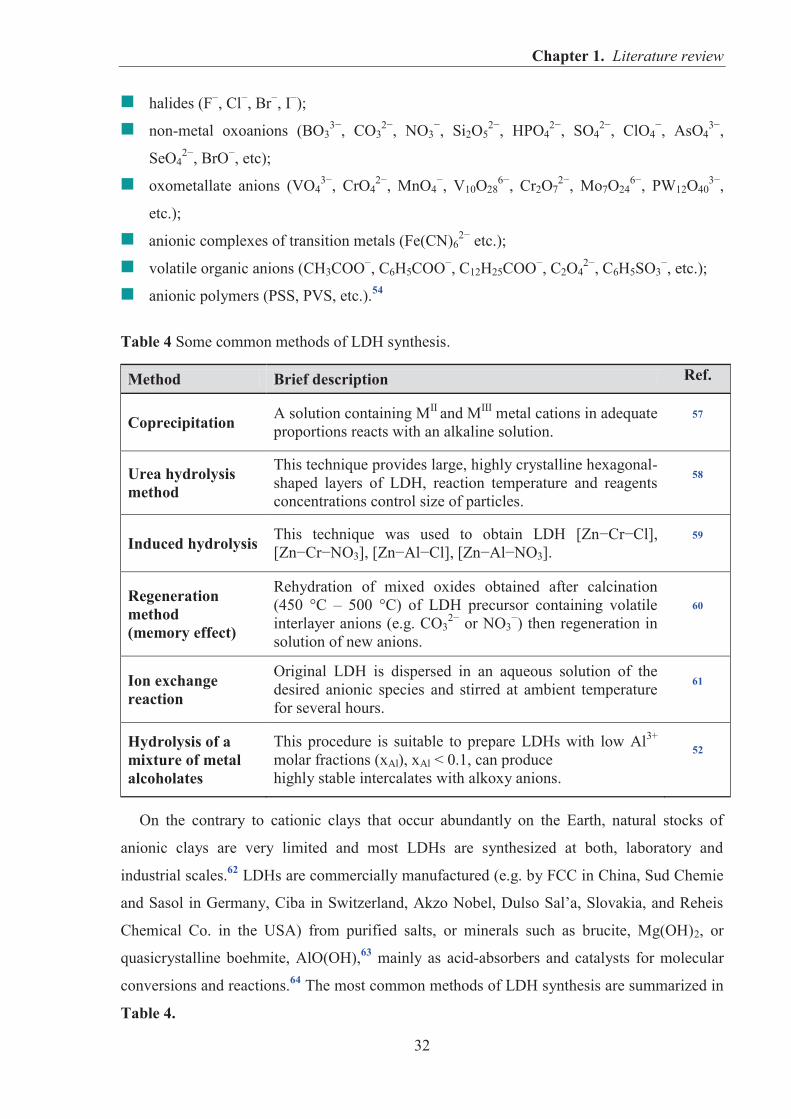
Table 4 Some common methods of LDH synthesis.
Method Brief description Ref.
Coprecipitation A solution containing MII and MIII metal cations in adequate proportions reacts with an alkaline solution.
57
Urea hydrolysis method
This technique provides large, highly crystalline hexagonal-shaped layers of LDH, reaction temperature and reagents concentrations control size of particles.
58
Induced hydrolysis This technique was used to obtain LDH [Zn−Cr−Cl], [Zn−Cr−NO3], [Zn−Al−Cl], [Zn−Al−NO3].
59
Regeneration method (memory effect)
Rehydration of mixed oxides obtained after calcination (450 °C – 500 °C) of LDH precursor containing volatile interlayer anions (e.g. CO3
2− or NO3−) then regeneration in
solution of new anions.
60
Ion exchange reaction
Original LDH is dispersed in an aqueous solution of the desired anionic species and stirred at ambient temperature for several hours.
61
Hydrolysis of a mixture of metal alcoholates
This procedure is suitable to prepare LDHs with low Al3+ molar fractions (xAl), xAl < 0.1, can produce highly stable intercalates with alkoxy anions.
52
On the contrary to cationic clays that occur abundantly on the Earth, natural stocks of
anionic clays are very limited and most LDHs are synthesized at both, laboratory and
industrial scales.62 LDHs are commercially manufactured (e.g. by FCC in China, Sud Chemie
and Sasol in Germany, Ciba in Switzerland, Akzo Nobel, Dulso Sal’a, Slovakia, and Reheis
Chemical Co. in the USA) from purified salts, or minerals such as brucite, Mg(OH)2, or
quasicrystalline boehmite, AlO(OH),63 mainly as acid-absorbers and catalysts for molecular
conversions and reactions.64 The most common methods of LDH synthesis are summarized in
Table 4.
Chapter 1. Literature review
33
LDHs have attracted researchers attention for their interesting properties such as:
high anion-exchange capacity AEC (from 200 to 450 meq/100g);
structural memory effect;
layered crystalline structure;
simplicity of synthesis;
possibility of controlling particle size and aspect ratio by changing the reaction
conditions;
their highly designable characteristics and rich host-guest chemistry.
LDHs have already been used as controlled release drug carriers in pharmaceutical field,65
host for organic UV ray absorbents66 or biosensors for human health,67 catalysts and catalyst
precursors,62 anion scavengers in wastewater treatments,68 host for flame retardants69 or dye
adsorbents,70,71 a hybrid LDH photoinitiators,72 HCl absorbing agents for poly(vinyl chloride)
(PVC) and other halogenated polymers.73
Recently, LDHs have been recognized as alternative to some conventional fillers for
polymer composites as they exhibit layered structure, high aspect ratio of particles and may
play role as flame retardant and thermal stabilizer for polymers.74 Research demonstrate that
incorporation of LDHs into a polymer matrix can remarkably enhance polymer properties
such as mechanical, thermal, and reduce gas permeability and other physicochemical
properties compared to neat polymers or composites containing conventional fillers.75,76,77
Most publications on polymer/LDH composites refer to thermoplastic matrices or epoxy
resins, and comparatively fewer studies have investigated the effects of LDH particles on
elastomer matrix properties.
Generally LDHs are similar to layered silicates (LSs) in some aspects, however the main
advantages of LDHs over LSs lay in controlling size of particles, purity and a wide range of
organic species that can be used to diminish their hydrophilic surface property. On the other
hand, the disadvantages of LDHs are strong interactions between positively charged sheets
and high charge density which make the exfoliation of LDHs much more difficult than LSs.78
Nevertheless, exfoliation may occur by using chemical exfoliation, pre-intercalation or
modification of the lamellar surface by mechanical process.79 The basal d-spacing of typical
magnesium-aluminum LDH is 0.76 − 0.77 nm and the small ions presented in interlayer
region can be replaced by larger organic species which weakens the electrostatic forces
between the hydroxide sheets. In general, the objective of organic modification is to enlarge
the basal d-spacing, make LDH more polymer-wettable and also reduce of surface energy of
Chapter 1. Literature review
34
LDHs. In order to obtain homogeneous dispersion in the polymer matrix, the inorganic LDH
is made hydrophobic by the replacement of interlayer anions such as Cl−, NO3− or CO3
2− with
organic anions. Various methods for LDHs organophilization, such as ion exchange,
regeneration and thermal reactions, are used in order to achieve the successful dispersion of
layered filler in hydrophobic elastomer matrix.80 Mostly, LDHs are organically modified by
the rehydration process of calcined LDH (also known as a regeneration technique), which is
based on LDHs “structure memory effect”. Pristine LDH is first calcined in a muffle furnace
at 500 °C for several hours to convert it into a mixed oxide form known as calcined LDH,
then is suspended in a aqueous solution of the surfactant and stirred for around 24h at elevated
temperature. The modified solid residue is then separated by filtration and dried to a constant
weight.81 The most common organic anions used for LDH modification are: dodecyl sulfate
(C12H25SO4−),82 1-decanesulfonate (C10H21SO3
−),81 1-hexadecanesulfonate (C16H33SO3−),81
dodecylbenzenesulfonate (C18H29SO3−),60 stearate (C18H35O2
−).83 Usually wide-angle X-ray
diffraction (XRD, WAXS) measurements are used to determine an interlayer distance before
and after organic modification of LDH.
Preparation of rubber/LDH composites
One of the most often used technique for the rubber/LDH composite preparation is a two-
step melt compounding (Table 5). There are two possible procedures: In the first step raw
rubber is milled in a two roll mill with curing agents. Subsequently, the compounded rubbers
are melted in an internal mixer at elevated temperature with a high speed of rotor, then
layered filler is added to the mixture.97 Alternatively, in the first step the raw rubber is melted
in an internal mixer at elevated temperature at high rotor speed, then the layered mineral is
added and further mixed, in the second step all the rest ingredients are added to rubber/filler
mix in an open two roll mill at room temperature.81 Solution blending is used to fabricate
polymer-layered filler composites provided the polymer is easily dissolved in common
aqueous or organic solvents, such as water, toluene, chloroform, acetone, DMF.
Majority of studies on polymer/LDH composites refer to thermoplastic matrixes, such as
polyethylene (PE),84 polypropylene (PP),85 poly(vinyl alcohol) (PVA),86 poly(vinyl chloride)
(PVC),87 polystyrene (PS),88 poly(methyl methacrylate) (PMMA),89 poly(ethylene-co-vinyl
acetate) (EVA),90 poly(ethylene oxide) (PEO),91 poly(ε-caprolactone) (PCL),92 poly(ethylene
terephthalate) (PET),93 etc., as well as epoxy resins,94 whereas not as much works have been
devoted to study the interactions between LDH particles and elastomer matrices. There have
been several reports published in recent years related to the elastomeric composites.
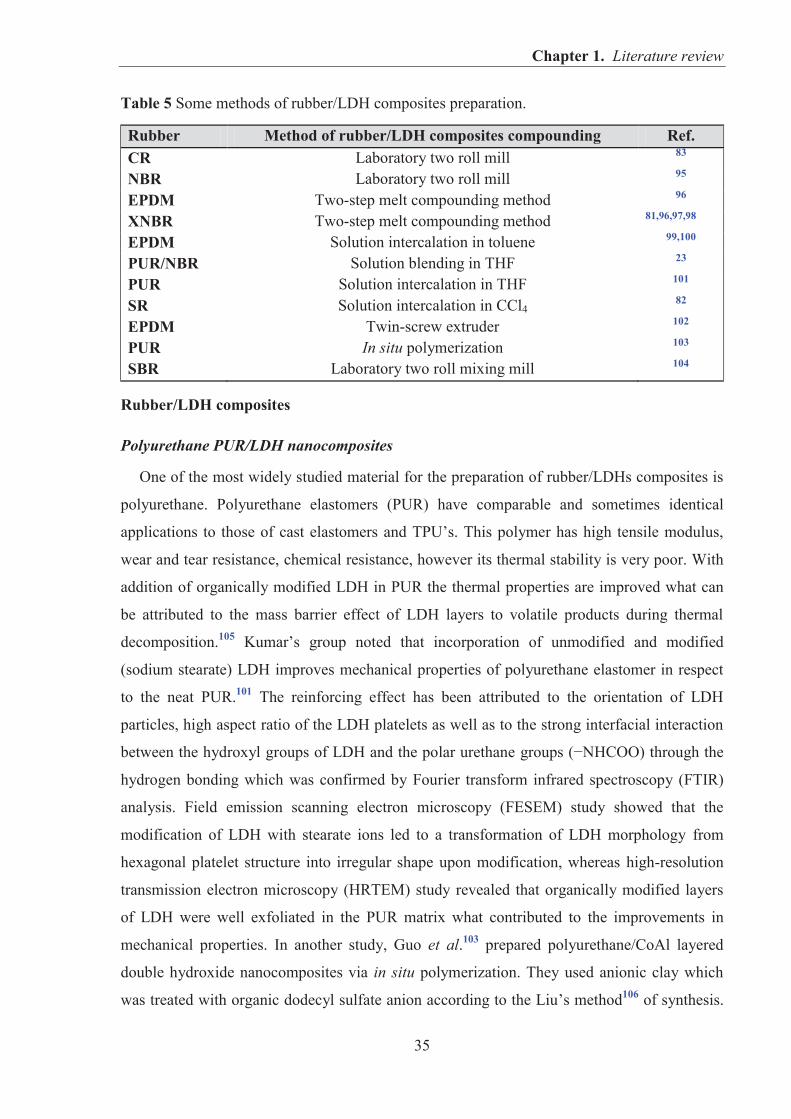
Chapter 1. Literature review
35
Table 5 Some methods of rubber/LDH composites preparation.
Rubber Method of rubber/LDH composites compounding Ref. CR Laboratory two roll mill 83
NBR Laboratory two roll mill 95 EPDM Two-step melt compounding method 96 XNBR Two-step melt compounding method 81,96,97,98 EPDM Solution intercalation in toluene 99,100 PUR/NBR Solution blending in THF 23
PUR Solution intercalation in THF 101 SR Solution intercalation in CCl4
82
EPDM Twin-screw extruder 102 PUR In situ polymerization 103 SBR Laboratory two roll mixing mill 104
Rubber/LDH composites
Polyurethane PUR/LDH nanocomposites
One of the most widely studied material for the preparation of rubber/LDHs composites is
polyurethane. Polyurethane elastomers (PUR) have comparable and sometimes identical
applications to those of cast elastomers and TPU’s. This polymer has high tensile modulus,
wear and tear resistance, chemical resistance, however its thermal stability is very poor. With
addition of organically modified LDH in PUR the thermal properties are improved what can
be attributed to the mass barrier effect of LDH layers to volatile products during thermal
decomposition.105 Kumar’s group noted that incorporation of unmodified and modified
(sodium stearate) LDH improves mechanical properties of polyurethane elastomer in respect
to the neat PUR.101 The reinforcing effect has been attributed to the orientation of LDH
particles, high aspect ratio of the LDH platelets as well as to the strong interfacial interaction
between the hydroxyl groups of LDH and the polar urethane groups (−NHCOO) through the
hydrogen bonding which was confirmed by Fourier transform infrared spectroscopy (FTIR)
analysis. Field emission scanning electron microscopy (FESEM) study showed that the
modification of LDH with stearate ions led to a transformation of LDH morphology from
hexagonal platelet structure into irregular shape upon modification, whereas high-resolution
transmission electron microscopy (HRTEM) study revealed that organically modified layers
of LDH were well exfoliated in the PUR matrix what contributed to the improvements in
mechanical properties. In another study, Guo et al.103 prepared polyurethane/CoAl layered
double hydroxide nanocomposites via in situ polymerization. They used anionic clay which
was treated with organic dodecyl sulfate anion according to the Liu’s method106 of synthesis.
Chapter 1. Literature review
36
The authors obtained the nanoscale dispersion of CoAl-LDH layers in PUR matrix what has
been verified by the XRD and TEM studies. The real-time FTIR revealed that such prepared
nanocomposites had a slower thermo-oxidative rate than the neat PUR in the temperature
region from 160 °C to 340 °C, the proposed explanation of this behavior is the barrier effect
of LDH layers.103
Chloroprene rubber CR/LDH composites
Chloroprene rubber (CR) is well known for its high ozone and weather resistance, low
flammability, good adhesion to other materials and high vulcanizate strength arising from
strain induced crystallization, therefore CR has many applications in the elastomer field.
Despite its excellent physical properties, the influence of small amount of nanofiller such as
LDH on CR crystallization behavior was investigated by Das’s group.83 It was found that
LDHs particles have capability to resist the crystallization of CR whereas organically
modified montmorillonite strongly enhances it.
Ethylene propylene diene rubber EPDM/LDH composites
Ethylene propylene diene rubber (EPDM) is an extremely versatile rubber because of high
resistance to heat, weather, ozone as well as resistance to polar substances and steam. It is
commonly used in general industrial manufacture of seals and other products requiring
excellent water, ozone, heat resistance, however it is not recommended for applications with
petroleum and mineral oils or fuel exposure.
Acharya et al.99,100 successfully prepared partially exfoliated EPDM/MgAl-LDH
nanocomposites by the solution intercalation method using dodecyl sulfate modified LDH
(DS-LDH). The nanocomposites containing 2 − 8 wt% of DS−LDH showed a significant
improvements in mechanical properties and thermal stability in comparison to neat EPDM.
Kumar et al. 102 investigated the influence of MgAl-LDH on photo-oxidation of EPDM
composites with stabilizers prepared by using a twin-screw extruder. According to their
results, the rate of photo-oxidative degradation of EPDM/LDH was faster than that of blank
EPDM. Such effect could occur because of the adsorption of the stabilizing additives onto the
LDH sheets, which partially inhibits their activity.
Another interesting study was carried out by Pradhan et al.96 who noted that EPDM
composites containing organically modified LDH (with decanesulfonate anions) exhibited a
decrease in storage modulus with an increasing filler content. The EPDM/LDH
nanocomposites displayed a softening effect below glass transition temperature (Tg) which
Chapter 1. Literature review
37
was attributed to the effect of surfactant that could eventually increase the mobility of the
polymer matrix.96
Silicone rubber SR/LDH composites
Silicone rubber (SR) is an elastomer material that possesses excellent weatherability, good
chemical stability, oxidation resistance, thermal stability, low-temperature toughness,
electrical-insulation properties, low surface energy, low toxicity and high optical
transparency. However unfilled SR is also well-known for its very poor mechanical
properties.
Pradhan’s group synthesized SR/dodecyl sulfate intercalated LDH (DS-LDH) composite
by a solution-intercalation method.82 Composites were filled with 1, 3, 5 and 8 wt% of
modified DS-LDH. The great improvements in mechanical properties, thermal stability and
solvent resistance were successfully achieved for nanocomposite containing 5 wt% of filler.
In their subsequent research, SR filled with 5 phr of stearate ion-modified-LDH exhibited a
significant improvement in gas barrier properties.107
For enhancing mechanical properties of SR, LDH/multiwalled carbon nanotubes
(MWCNT) hybrids were prepared by simple dry grinding of Li-Al-LDH, Mg-Al-LDH and
Co-Al-LDH with MWCNT. It has been reported that Mg-Al-LDH was most effective in
dispersing MWCNT in polar and non-polar solvent due to its cationic charge on the platelet
surface and large surface area. The improvement in mechanical properties was due to the
synergistic effect of MWCNT and LDH on the SR matrix. In addition, the excellent
synergistic effect of Mg-Al-LDH/MWCNT hybrid was related to the highest surface area
which contributed to nanolevel dispersion and strong interfacial interaction between Mg-Al-
LDH/MWCNT with SR matrix.108
Solution-based styrene-butadiene rubber S-SBR/LDH composites
Styrene-butadiene rubber (SBR) is one of the most versatile copolymer rubber compounds
exhibiting high abrasion resistance. It is used in a wide variety of products, such as
automobile tires, mechanical goods, automotive, adhesives. However, SBR shows poor
mechanical properties unless reinforcing fillers are incorporated.
Elastomer/LDH composites were prepared based on the solution styrene-butadiene rubber
(S-SBR) and zinc-aluminum layered double hydroxide ZnAl-LDH (with a composition of 3:1
(Zn/Al)), using a conventional sulfur cure system.104 The amounts of filler were 4, 60, 80 and
100 phr and were incorporated without any oil and plasticizers. All filled composites
Chapter 1. Literature review
38
exhibited an interesting phenomenon of thermoreversible transparency, i.e., the transparent
sample becomes opaque at elevated temperature and restores the transparency at room
temperature. Moreover, such materials have other advantages, like easy processing (shear
mixing), low cost and they are environmentally friendly. The authors proposed that such
materials may lead to the development of smart materials, such as temperature sensors for
automobile tires.104
Acrylonitrile-butadiene rubber NBR/LDH composites
Acrylonitrile-butadiene rubber (NBR) provides a material that has versatile applications
requiring good processability, elasticity at low temperature and oil resistance. The major
drawbacks of the NBR are its poor ozone and weather resistance and moderate heat
resistance. Normally sulfur, zinc oxide, stearate acid and accelerators form the cure system for
the NBR formulation. With sulfur alone, the vulcanization process would take long time but
with this curing system vulcanization time is reduced to a minimum.
Recently Das’s group designed and employed of LDH in rubber formulation to prepare
environmentally friendly rubber composites.95 Since both stearic acid and zinc are
indispensable activators in sulfur rubber vulcanization to promote cross-linking of the rubber
chains, authors designed and synthesized LDH that was a source of both zinc and stearate ions
which could deliver zinc ions in the vulcanization reaction as accelerators, stearate anions as
activators to promote vulcanization process as well as where LDH layers acted as highly
anisotropic nanofillers to reinforce the rubber matrix. In such system LDH played several
roles as a reinforcing filler, reservoir of other ingredients and also provided transparent sulfur
cross-linked rubber material. The important advantage of this novel approach is reduction the
number of steps of rubber mixing, as well as reduction in necessary Zn2+ content what has
potentially great importance for the rubber industry. The novel multifunctional LDH has been
applied not only to NBR but also to rubbers with different polarity and chemical structure
such as carboxylated acrylonitrile-butadiene rubber (XNBR), solution styrene-butadiene
rubber (SSBR), butadiene rubber (BR), polychloroprene rubber (CR), natural rubber (NR) and
ethylene propylene diene monomer rubber (EPDM).95
In another study dealing with the rubber/LDH nanocomposites Kotal’s group characterized
polyurethane blended with NBR (PUR/NBR; 1:1 w/w) containing 1, 3, 5 and 8 wt% LDH
with dodecyl sulfate (DS) anions intercalated.23 The highest concentration of LDH in
PU/NBR blend led to a substantial improvement in thermal stability and solvent resistance
property of the nanocomposites. The thermal stability of PUR, NBR, PUR/NBR and
Chapter 1. Literature review
39
PUR/NBR/DS-LDH followed the order NBR> PUR/NBR/DS-LDH > PUR/NBR > PUR.
TEM and XRD studies were performed to show the structure of PUR/NBR/DS–LDH
nanocomposite. The authors reported formation of partially distributed layers of DS–LDH in
PUR/NBR blends suggesting the formation of partially exfoliated nanocomposites.
Carboxylated acrylonitrile-butadiene rubber XNBR/LDH composites
Carboxylated acrylonitrile-butadiene rubber (XNBR) offers both excellent abrasion
resistance and superior chemical resistance (especially to aliphatic hydrocarbons) compared to
the straight acrylonitrile-butadiene rubber (NBR). XNBR a is terpolymer of acrylonitrile,
butadiene and monomers containing carboxyl groups, such as acrylic and methacrylic acids.
Lateral carboxyl groups –COOH provide additional curing sites and make possible to use
curing agents that can react with the carboxyl functionalities.109
In 2008 Pradhan et al.96 reported that the mechanical properties of XNBR filled with
5.0 – 10 phr of MgAl-LDH (modified with sodium 1-decanesulfonate) were enhanced due to
the acid/base and polar interactions that occur between carboxylated rubber and hydroxide
metal filler. A decreased amount of metal oxide curative in sulfur vulcanizing system was
used deliberately to keep the –COOH on XNBR free for possible interaction with LDH
particles. Based on mechanical tests and FTIR studies, it has been observed that LDH exhibits
a potential as a reinforcing nanofiller in elastomer and also could be used as a curing agent in
functionalized elastomers.96,110 The advantage of using LDH in such system (XNBR or its
hydrogenated counterpart HXNBR) give rise to possibility of replacing a part of conventional
curatives like ZnO, MgO by organo-LDH.
In 2009 Thakur’s et al.97 investigated the influence of organically modified and
unmodified MgAl-LDH (Mg/Al 63 : 37) on the curing process of XNBR crosslinked with
zinc oxide. The authors reported that both pristine and dodecylbenzenesulfonate intercalated
MgAl-LDH used in the amount of 5 phr quite significantly inhibit formation of ionic-
crosslinks between XNBR and ZnO, what was proven by dynamic mechanical analysis
(DMA), FTIR and mechanical studies, however the effect of suppression of ionic-links
formation was found to be more pronounced in the presence of unmodified LDH.97
The role of organic modifiers on nanofiller dispersion in XNBR/MgAl-LDH composites
was examined by Costa et al.81 Authors concluded that higher d-value of the organo-clay
results in higher degree of exfoliation and homogenous dispersion of filler particles in the
uncrosslinked compounds, however after crosslinking more complicated reorganization might
occur.
Chapter 1. Literature review
40
In 2014 Basu et al.111 studied the effects of unmodified ZnAl-LDH on the mechanical and
thermal properties of XNBR matrix. The composites were vulcanized by a standard sulfur
cure system containing 4 phr of ZnO and by unconventional sulfur cure system where ZnO
was replaced by ZnAl-LDH at concentrations of 4, 10, 40 and 100 phr. It was observed from
FTIR studies that Zn2+ ions present in the ZnAl-LDH structure react with the –COOH of the
rubber chains, however the ionic transition peak (Ti) which is characteristic for ionic
elastomers was not detected during DMA analysis. Their subsequent studies112 aimed at
exploration the nature of the ionic crosslinking of XNBR produced by ZnO, ZnCl2 and ZnAl-
LDH. The unmodified ZnAl-LDH was applied as a curing agent for XNBR and such
composites were compared to those containing ZnO or ZnCl2 as curatives. The authors stated
that all zinc-containing compounds can react with the carboxylic groups of XNBR under
vulcanization conditions, however only ZnO is able to produce microphase separation
demonstrated by high-temperature dynamic mechanical relaxation behavior. Such additional
ionic transition was not observed in the case of XNBR crosslinked with ZnAl-LDH.
The development of reinforced elastomer/LDH materials based on various types of
polymer matrices has been studied extensively, and the number of studies related to the
use of LDH in carboxylated acrylonitrile-butadiene rubber (XNBR) is steadily
increasing. Most research has focused on the impact of low concentrations (up to 10 phr)
of organically modified MgAl-LDH on the mechanical and morphological properties of
XNBR crosslinked by a conventional sulfur vulcanizing package. Very recent studies
have considered the possibility of the replacement of zinc oxide by ZnAl-LDH in the
sulfur cure system to crosslink diene rubbers. However, the simultaneous application of
pristine MgAl-LDH as a curing agent and as a reinforcing filler in XNBR for the
production of strong, ionic elastomer composites with improved mechanical properties,
reduced swelling and enhanced gas barrier properties has not been examined.
Therefore, a part of this thesis has been devoted to the employment of pristine
MgAl-LDHs with various Mg/Al ratios, surface properties and morphologies
as reinforcing fillers and curatives in XNBR and the evaluation of the main factors
impacting the reinforcement in such systems.
Chapter 1. Literature review
41
1.2.3. GRAPHENE
In 2004, isolation of single-layer graphene crystals stable in their free state led to a rapid
increase in interest in this material due to its unique thermal, electrical, mechanical and
optical properties. Graphene is a two-dimensional monolayer of sp2-hybridized carbon atoms
closely packed in a honeycomb-like lattice, which is the basic building block of all other
carbon nanostructures: fullerene, carbon nanotubes and graphite. Graphene nanosheets have
high mechanical strength (>1060 GPa), high thermal conductivity (~3000 W/mK) and a high
specific surface area (2600 m2/g).113 Graphene and its derivatives are frequently used in the
production of devices for electronics and optoelectronics 114,115 and in polymer composites as
reinforcing nanofillers.116 In the near future, graphene may replace silicon in electronic
devices117 and be employed in lithium ion batteries,118 as a hydrogen storage material,119 and
in drug delivery systems.120 The high aspect ratio of graphene in combination with its unique
physical properties support its use as a filler for manufacturing conductive polymer
composites.121,122 Moreover, polymer composites containing graphene are expected to exhibit
improved mechanical, gas barrier and thermal properties.
Graphene synthesis and properties
Graphene can be easily fabricated by employing different methods with inexpensive
graphite, even at large scales, and is already commercially offered by various companies.
However, commercial graphene produced by exfoliation of graphite at the industrial scale is
usually not completely exfoliated; thus, it is better described as ultra-thin graphite.123 Various
mechanical,124 physical,125 and chemical126 methods have been developed to obtain carbon
layers. In 2004, Geim and Novoselov isolated a homogeneous graphene layer through the
micro-exfoliation of a small amount of a highly oriented, pyrolytic graphite (micromechanical
exfoliation).119 They were awarded the Nobel Prize in Physics in 2010 by the Royal Swedish
Academy of Sciences for their discovery. Micro-exfoliation yields graphene with an ideal
crystal structure and preserved high electron mobility115 but is time-consuming for the
preparation of large quantities of material. An alternative method for the synthesis of high-
quality graphene is epitaxial growth of single-domain graphene on a silicon carbide (SiC)
substrate.127,128 Using controlled sublimation of silicon from the SiC crystal at a temperature
of approximately 1500 °C, surfaces of high-quality graphene can be produced that are ideal
for building transistors or diodes. The disadvantage of this method is the difficulty of
achieving large graphite domains with uniform thicknesses. 127
Chapter 1. Literature review
42
So far, the least complicated and most effective method is the production of chemically
synthesized graphene flakes. The starting raw material is graphite, which is first treated with
concentrated strong mineral acids (H2SO4, KMnO4, HNO3; Hummer’s method) 129 or other
oxidizing agents. The product of this reaction is graphite oxide (GO) containing numerous
oxygen-containing groups attached to the surface and the edges of layers. Epoxy and hydroxyl
groups are present in the highest concentrations on the surfaces of the GO layers and the sp3
hybridized carbon atoms, whereas the carboxyl and carbonyl are groups are located on the
edges of the layers. Thus, GO is easily dispersed in aqueous media.130,131 Due to the strong
tendency of water molecules to intercalate into GO sheets, the interlayer distance depends on
the ambient humidity and varies between 6 and 12 Å.132,133,134 The surface charge
(zeta potential) of the oxidized layers of graphene dispersed in an aqueous medium is negative
because electrostatic repulsion between the negatively charged layers forms a stable aqueous
suspension. GO can be exfoliated by either thermal shock135 or chemical reduction.134
Although the chemical oxidation of graphite and further exfoliation provides a large number
of individual layers of GO, such aggressive treatment inevitably leads to structural
defects.136,137 Defects in the graphene lattice structure interfere with electron mobility and
create a semiconductor. After chemical reduction or annealing (1000 °C), graphene structures
can be only partially recovered, as confirmed by X-ray photoelectron spectroscopy (XPS)
studies.138 In a thermal reduction process, GO is exfoliated by rapid heating to a temperature
of 1050 °C in an inert gas atmosphere (5 % H2 and 95 % Ar).139 The preparation time must be
sufficiently short (heating rate of 2000 °C/min) to avoid aggregation and graphitization at
high temperatures. During pyrolysis, CO2 mechanically separates layers held by weak van der
Waals forces.140,141 The resulting product forms a very loosely structured mass with low
density and 100- to 300-fold volume expansion.
Thermally reduced graphene oxide (TRG) is characterized by high surface development
(1700 m2/g) and electrical conductivity (10 – 20 S/cm).141 To completely remove the oxygen
functionalities located on the edges of the TRG plane, it can be subjected to the further
reduction in acetonitrile under ultrasonic irradiation, as shown in Figure 11.142
TRG forms a highly agglomerated structure that disperses readily in polar solvents such as
N-methylpyrrolidone, dimethylformamide, 1,2–dichlorobenzene, nitromethane or
tetrahydrofuran under ultrasonic irradiation. The GO layers are chemically reduced using
reducing agents such as hydrazine143 or sodium borohydride144. Despite its toxicity, hydrazine
is the most commonly used chemical in the preparation of graphene sheets. This method
delivers reduced GO that is less hydrophilic and precipitates from the aqueous medium due to
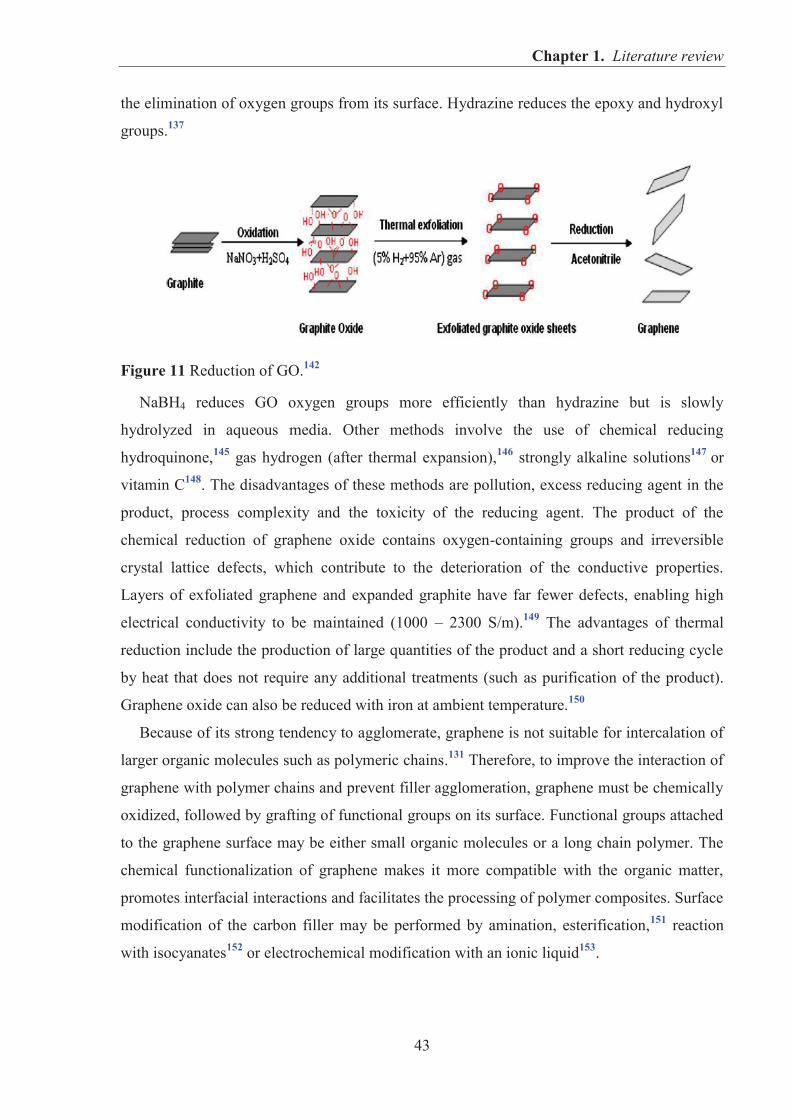
Chapter 1. Literature review
43
the elimination of oxygen groups from its surface. Hydrazine reduces the epoxy and hydroxyl
groups.137
Figure 11 Reduction of GO.142
NaBH4 reduces GO oxygen groups more efficiently than hydrazine but is slowly
hydrolyzed in aqueous media. Other methods involve the use of chemical reducing
hydroquinone,145 gas hydrogen (after thermal expansion),146 strongly alkaline solutions147 or
vitamin C148. The disadvantages of these methods are pollution, excess reducing agent in the
product, process complexity and the toxicity of the reducing agent. The product of the
chemical reduction of graphene oxide contains oxygen-containing groups and irreversible
crystal lattice defects, which contribute to the deterioration of the conductive properties.
Layers of exfoliated graphene and expanded graphite have far fewer defects, enabling high
electrical conductivity to be maintained (1000 – 2300 S/m).149 The advantages of thermal
reduction include the production of large quantities of the product and a short reducing cycle
by heat that does not require any additional treatments (such as purification of the product).
Graphene oxide can also be reduced with iron at ambient temperature.150
Because of its strong tendency to agglomerate, graphene is not suitable for intercalation of
larger organic molecules such as polymeric chains.131 Therefore, to improve the interaction of
graphene with polymer chains and prevent filler agglomeration, graphene must be chemically
oxidized, followed by grafting of functional groups on its surface. Functional groups attached
to the graphene surface may be either small organic molecules or a long chain polymer. The
chemical functionalization of graphene makes it more compatible with the organic matter,
promotes interfacial interactions and facilitates the processing of polymer composites. Surface
modification of the carbon filler may be performed by amination, esterification,151 reaction
with isocyanates152 or electrochemical modification with an ionic liquid153.
Chapter 1. Literature review
44
Graphene-based fillers in elastomer composites
Among the various nanocomposite systems, those of graphitic based fillers are important
due to their multi-functional behavior. They can improve mechanical and tribological
properties, thermal stability, microwave absorption, electrical and thermal conductivities,
dielectric performances and gas barrier properties of all elastomer matrices.154 Polymer
nanocomposites acquire new characteristic properties due to the presence of graphene layered
filler. Increase in strength and electrical conductivity of polymer composites is significantly
greater with an addition of graphene filler, when compared to a commonly nanofillers such as
silicate or other carbon fillers. Although the strength of carbon nanotubes is similar to that of
graphene, they are inferior in terms of thermal and conductive properties,155 as well as their
cost of production. Furthermore, it was observed that this type of filler can play also the role
of an anti-aging agent.156 Reinforcing effect GO has been already observed in various kinds of
elastomers as shown in Table 6. It was found that the presence of the graphene improves the
mechanical strength, enhances the impact resistance, resistance to cracking,157 gas barrier
properties or may influence the vulcanization kinetic of rubbers.
For example, unfunctionalized few layer graphene (FLG) nanoplatelets were mixed with
acrylonitrile-butadiene rubber (NBR) by melt mixing method and explored as a reinforcing
filler for the NBR matrix. The NBR/FLG composite properties were compared with those of
compositions having equal loadings of carbon black (CB), and 1 : 1 mixture of FLG and CB.
It was reported that FLG acts as a better reinforcing filler for NBR compared to CB. The
rheometer torque values showed the effect of FLG in improving the scorch safety of the
compositions. Additionally, the helium leak rate of the composites was decreased by 40 % in
the presence of FLG due to its platelet structure. These studies showed that by tuning the
rubber formulation, significant improvement in mechanical, dynamic mechanical and gas
barrier properties can be achieved with a very low loading of either FLG or a mixture of CB
and FLG without adopting challenging steps like functionalization of graphene.161
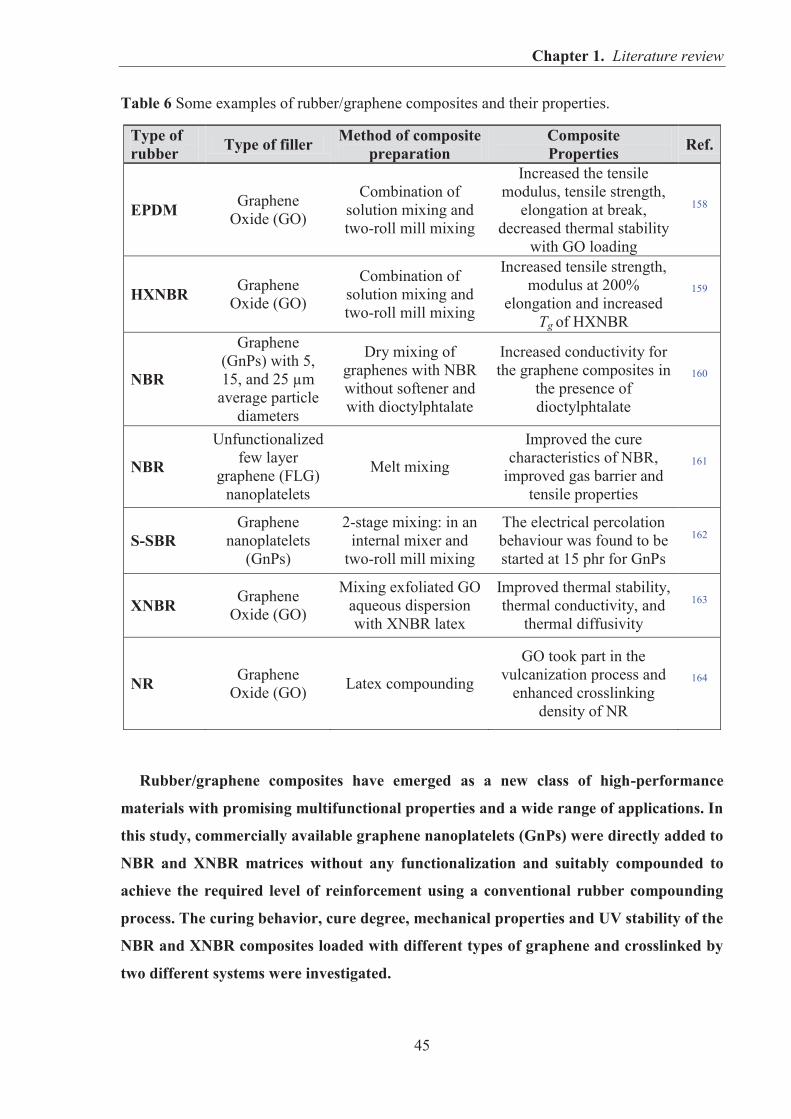
Chapter 1. Literature review
45
Table 6 Some examples of rubber/graphene composites and their properties.
Type of rubber Type of filler Method of composite
preparation Composite Properties Ref.
EPDM Graphene Oxide (GO)
Combination of solution mixing and two-roll mill mixing
Increased the tensile modulus, tensile strength,
elongation at break, decreased thermal stability
with GO loading
158
HXNBR Graphene Oxide (GO)
Combination of solution mixing and two-roll mill mixing
Increased tensile strength, modulus at 200%
elongation and increased Tg of HXNBR
159
NBR
Graphene (GnPs) with 5, 15, and 25 μm
average particle diameters
Dry mixing of graphenes with NBR without softener and with dioctylphtalate
Increased conductivity for the graphene composites in
the presence of dioctylphtalate
160
NBR
Unfunctionalized few layer
graphene (FLG) nanoplatelets
Melt mixing
Improved the cure characteristics of NBR,
improved gas barrier and tensile properties
161
S-SBR Graphene
nanoplatelets (GnPs)
2-stage mixing: in an internal mixer and
two-roll mill mixing
The electrical percolation behaviour was found to be started at 15 phr for GnPs
162
XNBR Graphene Oxide (GO)
Mixing exfoliated GO aqueous dispersion with XNBR latex
Improved thermal stability, thermal conductivity, and
thermal diffusivity 163
NR
Graphene Oxide (GO) Latex compounding
GO took part in the vulcanization process and
enhanced crosslinking density of NR
164
Rubber/graphene composites have emerged as a new class of high-performance
materials with promising multifunctional properties and a wide range of applications. In
this study, commercially available graphene nanoplatelets (GnPs) were directly added to
NBR and XNBR matrices without any functionalization and suitably compounded to
achieve the required level of reinforcement using a conventional rubber compounding
process. The curing behavior, cure degree, mechanical properties and UV stability of the
NBR and XNBR composites loaded with different types of graphene and crosslinked by
two different systems were investigated.

Chapter 1. Literature review
46
1.3. IONIC LIQUIDS (ILs) AND THEIR APPLICATIONS IN RUBBER
COMPOSITES
1.3.1. IONIC LIQUIDS (ILs) – PROPERTIES AND APPLICATIONS
According to a definition of ionic liquids (ILs), organic molten salts composed entirely of
ions that melt at or below 100 °C are categorized as ILs.165 The current interest in ILs is
mainly driven by their proven or potential applications as solvents for "green chemistry" due
to the their non-volatility which results in low impact on the environment and human
health.166 Ideally, such organic compounds are optically clear, have negligible volatility, low
combustibility, high chemical stability and are relatively undemanding and inexpensive to
manufacture. Nowadays, the most widely explored ILs consist of imidazolium, ammonium,
phosphonium, pyridinium, pyrrolidinium cation which is weakly coordinated to an organic or
inorganic anion, such as Cl−, I−, Br−, [SCN]−, [AlCl4]−, [N(CN)2]−, [BF4]−,[PF6]−, [NO3]−,
[CH3COO]−, [CF3SO3]−, [(CF3SO2)2N]− and their chemical structures are showed in Figure
12.167
Figure 12 Common cations and anions for ILs.168
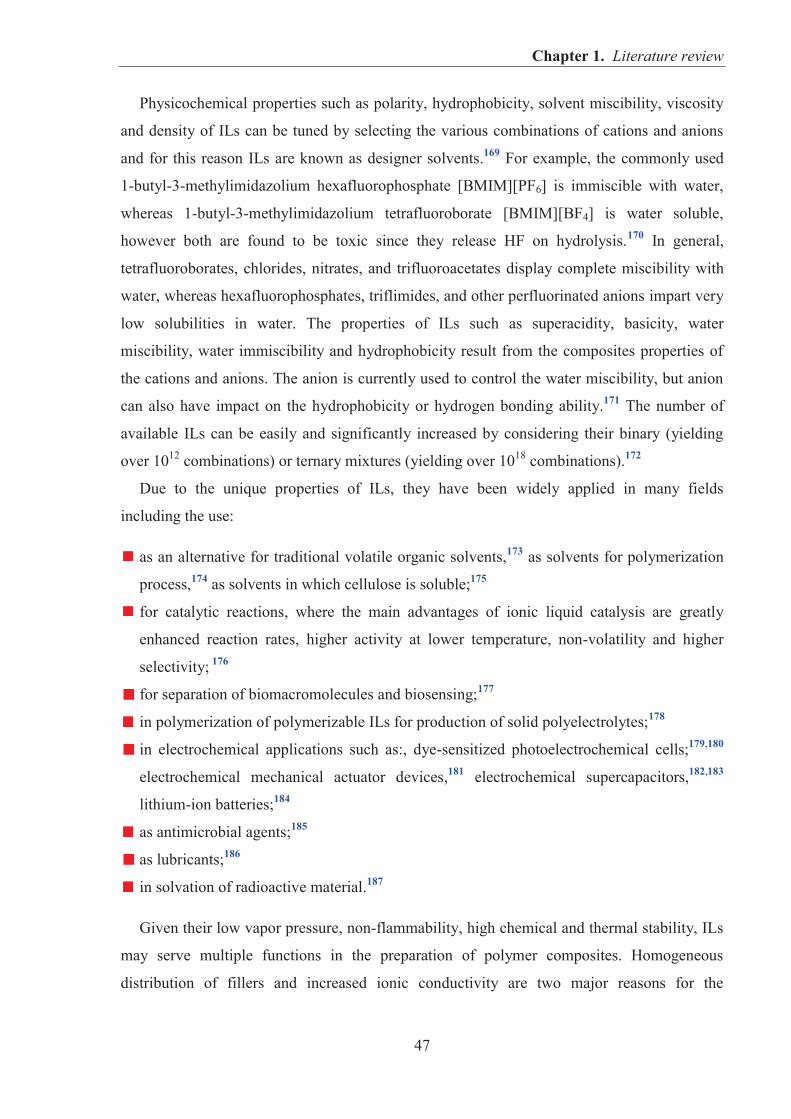
Chapter 1. Literature review
47
Physicochemical properties such as polarity, hydrophobicity, solvent miscibility, viscosity
and density of ILs can be tuned by selecting the various combinations of cations and anions
and for this reason ILs are known as designer solvents.169 For example, the commonly used
1-butyl-3-methylimidazolium hexafluorophosphate [BMIM][PF6] is immiscible with water,
whereas 1-butyl-3-methylimidazolium tetrafluoroborate [BMIM][BF4] is water soluble,
however both are found to be toxic since they release HF on hydrolysis.170 In general,
tetrafluoroborates, chlorides, nitrates, and trifluoroacetates display complete miscibility with
water, whereas hexafluorophosphates, triflimides, and other perfluorinated anions impart very
low solubilities in water. The properties of ILs such as superacidity, basicity, water
miscibility, water immiscibility and hydrophobicity result from the composites properties of
the cations and anions. The anion is currently used to control the water miscibility, but anion
can also have impact on the hydrophobicity or hydrogen bonding ability.171 The number of
available ILs can be easily and significantly increased by considering their binary (yielding
over 1012 combinations) or ternary mixtures (yielding over 1018 combinations).172
Due to the unique properties of ILs, they have been widely applied in many fields
including the use:
as an alternative for traditional volatile organic solvents,173 as solvents for polymerization
process,174 as solvents in which cellulose is soluble;175
for catalytic reactions, where the main advantages of ionic liquid catalysis are greatly
enhanced reaction rates, higher activity at lower temperature, non-volatility and higher
selectivity; 176
for separation of biomacromolecules and biosensing;177
in polymerization of polymerizable ILs for production of solid polyelectrolytes;178
in electrochemical applications such as:, dye-sensitized photoelectrochemical cells;179,180
electrochemical mechanical actuator devices,181 electrochemical supercapacitors,182,183
lithium-ion batteries;184
as antimicrobial agents;185
as lubricants;186
in solvation of radioactive material.187
Given their low vapor pressure, non-flammability, high chemical and thermal stability, ILs
may serve multiple functions in the preparation of polymer composites. Homogeneous
distribution of fillers and increased ionic conductivity are two major reasons for the
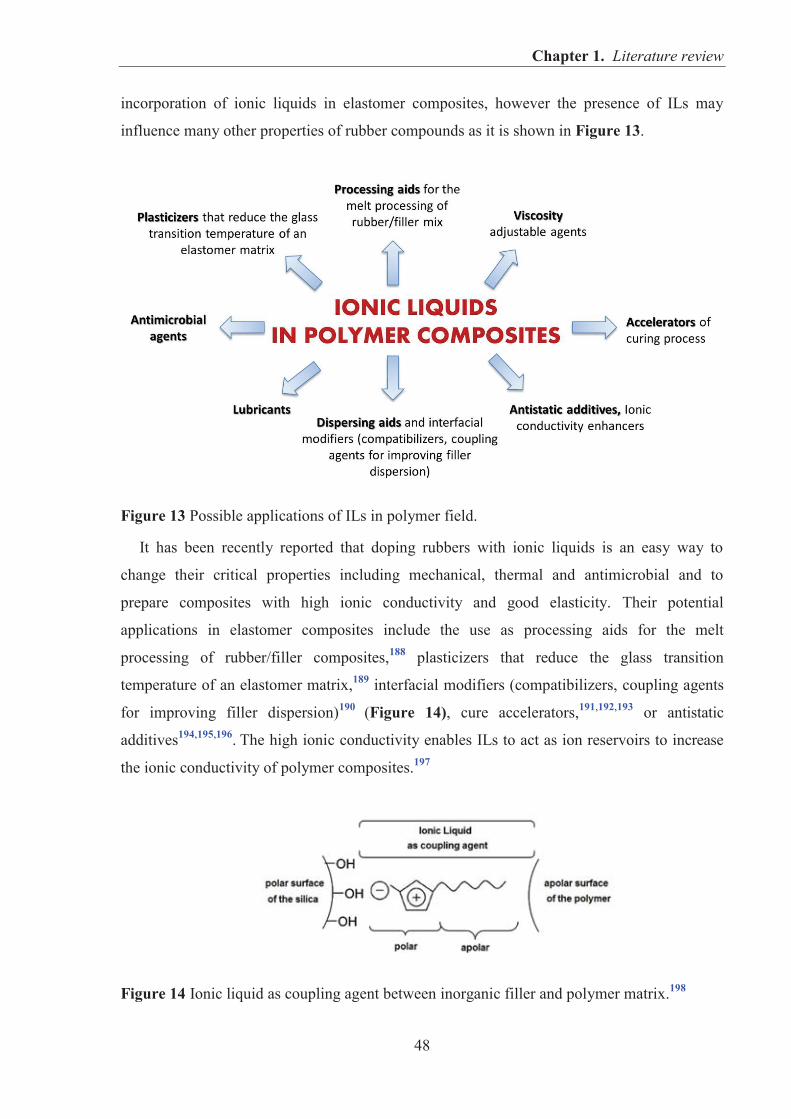
Chapter 1. Literature review
48
incorporation of ionic liquids in elastomer composites, however the presence of ILs may
influence many other properties of rubber compounds as it is shown in Figure 13.
Figure 13 Possible applications of ILs in polymer field.
It has been recently reported that doping rubbers with ionic liquids is an easy way to
change their critical properties including mechanical, thermal and antimicrobial and to
prepare composites with high ionic conductivity and good elasticity. Their potential
applications in elastomer composites include the use as processing aids for the melt
processing of rubber/filler composites,188 plasticizers that reduce the glass transition
temperature of an elastomer matrix,189 interfacial modifiers (compatibilizers, coupling agents
for improving filler dispersion)190 (Figure 14), cure accelerators,191,192,193 or antistatic
additives194,195,196. The high ionic conductivity enables ILs to act as ion reservoirs to increase
the ionic conductivity of polymer composites.197
Figure 14 Ionic liquid as coupling agent between inorganic filler and polymer matrix.198
Chapter 1. Literature review
49
1.3.2. PROPERTIES AND APPLICATIONS OF ROOM TEMPERATURE
IMIDAZOLIUM IONIC LIQUIDS (RTILs) CONTAINING
TETRACHLOROALUMINATE [ALCL4]−, THIOCYANATE [SCN]− AND
BIS(TRIFLUOROMETHYLSULFONYL)IMIDE [TFSI]− ANIONS
The properties and applications of imidazolium ionic liquids containing
tetrachloroaluminate anion [AlCl4]−
In 1981, Wilkes et al.199 announced dialkylimidazolium chloroaluminate melts as a new
class of RTILs for electrochemistry, spectroscopy and synthesis. A few years later, the
physicochemical properties of [BMIM]Cl/AlCl3 were studied by Fannin et al.200 Depending
on the ratio of cation/anion, the IL can be Lewis-acidic, neutral, or Lewis-basic.201 The acidity
of these ILs can be tuned by changing the molar ratio of organic chloride salt ([R]Cl) to
AlCl3. When the apparent mole fraction, x, of AlCl3 is higher than 0.5, the ILs are acidic due
to an excess of Lewis acidic AlCl3. The most widely studied apparent mole fraction range of
AlCl3 is 0.50 to 0.66, and the main species of Lewis acidic anions are confirmed as [Al2Cl7]−
in these ILs.202 Chloroaluminate ionic liquids display Lewis acidity what makes them
attractive alternative solvent-catalyst systems.202 For example, the synthesis of high molecular
weight poly(isobutylene) in acidic [EMIM][AlCl4] ionic liquid without an additional catalyst
has been reported.203 Another example involves the application of [BMIM][AlCl4] ionic
liquid in biphasic ethylene polymerization as a medium of Cp2TiCl2 titanocene catalyst.207,204
The relatively high conductivity (23.0 mS/cm for [EMIM]+ at 20 °C,200 9.5 mS/cm for
[BMIM]+ at 20 °C,202) low viscosity (18 cP at 20 °C for [EMIM]+ 200) wide electrochemical
window, and tunable acidity render these ILs as potential electrolytes and catalysts. Over the
past decades, Lewis acidic chloroaluminate ILs have been widely applied in the low-
temperature metal electrodeposition,205 in the desulfurization of model diesel fuels,201 in
biphasic ethylene polymerization.206,207 and as catalyst.208 De Castro et al.209 applied
[BMIM][AlCl4] ionic liquid immobilized on a range of alumina and silica supports as a Lewis
acid catalyst for Friedel–Crafts alkylation reactions. Another example involves application of
imidazolium tetrachloroaluminate as the electrolyte/separator in solid-state lithium batteries,
however exposure to atmospheric moisture of tetrachloroaluminate results in release of heat
and HCl due to an extremely high moisture sensitivity of anion [AlCl4]−. For a certain time,
chloroaluminate ILs were investigated as a potential RTIL electrolyte,210 but due to
elimination of the safety advantages of [AlCl4]− the interest in the use of non-chloroaluminate
ionic liquids has gradually increased.

Chapter 1. Literature review
50
The properties and applications of imidazolium ionic liquids containing thiocyanate anion
[SCN]−
1-Ethyl-3-methylimidazolium thiocyanate [EMIM][SCN] is hydrophilic, low-viscous
(22 cP at 20 °C)211 and highly-conductive (21.0 mS/cm at 20 °C)212,217 ionic liquid. As used
herein “hydrophilic ionic liquid” means an ionic liquid which is partially or wholly miscible
with water. The crystallization and the melting point occur at -94 and -6 °C, respectively.
[EMIM][SCN] shows quite good thermal stability with weight loss beginning above 237 °C.
The thiocyanate is a strongly coordinating ion and, as such, the ionic liquids produced with
this anion are expected to display similar physical properties to the ionic liquids containing
the dicyanamide anion [DCN]−, also a pseudo-halide.213,214 The species is electrochemically
stable down to -1.4 V and up to 0.8 V vs. Ag/Ag+. This is a small electrochemical window
compared to those of other ionic liquids such as [BMIM][PF6], largely due to the
electrochemical instability of the anion. This is thought to be related to the pseudo-halide
behavior of the anion, oxidation producing the neutral dimeric species [SCN]2. While the
thermal stability of the thiocyanate salts was confirmed as relatively good, the optical stability
of the species is less certain. The salts are often yellow or orange in color and darken on
extended exposure to sunlight. The thiocyanate ion is known to dimerise to thiocyanogen
[SCN]2 under chemically or electrochemically oxidative conditions in melts, or in solutions of
alkali metal thiocyanates.215 Thiocyanogen is itself unstable and polymerizes to
polythiocyanogen [SCN]x, a linear polymer whose structure has only recently been
established.214,216
The main advantages of [EMIM][SCN] are high conductivity and low viscosity at room
temperature which makes it an interesting electrolyte for the preparation of an electrochemical
double layer capacitors (EDLC) 217,218 or an alternative extraction solvent.219,220 Due to the
electrostatic nature of ionic liquids, [EMIM][SCN] interacts strongly with cellulose acetate
(CA) molecules through pronounced hydrogen bonding, Coulombic forces and van der Waals
interactions, which play an important role in dissolving CA.221
Chapter 1. Literature review
51
The properties and applications of imidazolium ionic liquids containing
bis(trifluoromethylsulfonyl)imide anion [TFSI]−
Dialkylimidazolium bis(trifluoromethylsulfonyl)imides [TFSI]− are hydrophobic ionic
liquids saturated by less than 2 % of water which were first time synthesized by
Bonhote et al.222 Dialkylimidazolium [TFSI]− salts are easy to prepare and they combine low
viscosity, high thermal and electrochemical stability. Their immiscibility with water and
solvents of low polarity (ethers, haloalkanes, alkanes) opens interesting perspectives for
synthetic and electrochemical applications (supercapacitors, sensors, biosensors).222
The cation structure influences the salt viscosity which is an important feature of
electrolytes. One of the most fluid ionic liquids is 1-ethyl-3-methylimidazolium
bis(trifluoromethanesulfonyl)imide [EMIM][TFSI] which has viscosity of 34 cP at 20 °C.223
The minimal viscosity value of [EMIM][TFSI] salt results from its sufficient side chain
mobility and low molecular weight. Alkyl chain lengthening or fluorination makes the salt
more viscous, due to increased van der Waals interactions. The effect of the viscosity on ionic
conductivity is equally as important as the influence of ion size and weight. For instance, the
conductivity of [EMIM][TFSI] and [BMIM][TFSI] was found to be 8.8 and 3.9 mS/cm at
20 °C, repectively.222 Generally, ionic liquids have excellent ionic conductivity up to their
decomposition temperature. Unlike other highly conductive but less electrochemically and
thermally stable ILs (e.g., those containing dicyanamide [DCN]− (28 mS/cm at 20 °C for
[EMIM]DCN])224 or thiocyanate [SCN]− ions), TFSI-based imidazolium salts are
characterized by high chemical and thermal stability up to 380 °C 222,225 whereas for
[EMIM][TFSI] it was found to be 439 °C.226 The thermal stability decreases with increasing
number of carbon atoms in the alkyl chain from methyl to butyl after which no noticeable
changes in the decomposition temperature are observed.226
The thermal stability of ILs is a critical factor in their suitability at the high temperatures
involved in the melt-blending process. Hydrophobicity (immiscibility with water) is another
advantage of TFSI-based imidazolium ILs making them more compatible with hydrophobic
rubber matrices, preventing leakage (migration within the polymer matrix), facilitating rubber
processing and improving filler dispersion throughout the elastomer matrix. Additionally, the
immiscibility with water increases with increasing length of the cation side chain due to the
increased surface activity of longer-chain cations.227
The use of TFSI-based imidazolium ILs as processing aids, filler-matrix compatibilizers
(interfacial modifiers) and conductivity enhancers in elastomers has been already reported for
Chapter 1. Literature review
52
hydrogenated nitrile rubber (HNBR),228 chloroprene rubber (CR),229,230,231,232,233,234 nitrile
rubber (NBR)197,235,236,237,238 and solution styrene butadiene rubber (SSBR).239 Most
publications present the ability of IL-modified carbon nanotubes (CNTs)228,231 or carbon black
(CB)245 to improve rubber conductivity and filler dispersion. Few studies have investigated
the ability of high levels of pure ionic liquids to improve the ionic conductivity of unfilled
rubber materials.197,236 Another example involves the use of TFSI-based ILs for enhanced
antistatic properties of polyurethane films. It was found that addition of [BMIM][TFSI] in the
amount of 10 ppm results in the reduction of surface resistivity (ρs) from 2.1×10¹² to 9.4×10¹⁰
ohm/sq. Because a such small concentration is not sufficient to generate a successive
conduction pathway, the antistatic effect cannot be explained by the percolation theory. The
authors suggested that the antistatic effect may be derived from the conduction of free ions
generated in polymer network.195
1.3.3. IONIC LIQUIDS (ILs) IN ELASTOMER COMPOSITES
Acrylonitrile-butadiene rubber (NBR)
For applications in electrochemical devices, where flexibility, thermal stability and high
ionic conductivity are required, polymer electrolytes are frequently based on acrylonitrile-
butadiene rubber (NBR) combined with an ionic liquid. For example, polymer electrolytes
with high ionic conductivity and good elasticity were prepared by Marwanta et al.236 by
mixing NBR with ionic liquid, N-ethylimidazolium bis(trifluoromethanesulfonyl)imide,
[EMIM][TFSI]. Sample with ionic liquid content of 50 wt% displayed the ionic conductivity
of 1.2×10⁵ S/cm at 30 °C. Incorporation of lithium salt to this composite further increased the
ionic conductivity to about 104 S/cm without deterioration of the mechanical properties.
Marwanta et al.236 reported the Raman study of NBR/[EMIM][TFSI] composites to confirm
the existence of interaction between the anion of imidazolium ionic liquid and –CN group of
NBR. A similar studies on the solid polymer electrolyte preparation were carried out by
Cho et al.235 The combination of 1-butyl-3-methylimidazolium bis(trifluoromethylsulfonyl)-
imide [BMIM][TFSI] and NBR with 40 mol% of acrylonitrile content (ACN) delivered
material exhibiting high conductivity of 2.54×10⁻⁴ S/cm at 20 °C as well as high electrical
stability. Moreover, the investigations showed that both the dielectric constant and the uptake
of the ionic liquid in the NBR films increased with increasing ACN level.
The imidazolium, benzalkonium and phosphonium ILs combined with the
2-mercaptobenzothiazolate anion were prepared for the application as vulcanization
Chapter 1. Literature review
53
accelerators in NBR compounds crosslinked with sulfur-based cure systems. The synthesized
ionic liquids allowed to reduce amount of 2-mercaptobenzothiazol which is a conventional
vulcanization accelerator that is widely used in the rubber industry.191 In the another work, a
series of alkylimidazolium and alkylammonium ILs added in the amount of 1 phr to the
unfilled NBR was studied for the effect of anions (chloride, bromide, hexafluorophosphate,
tetrafluoroborate) on zinc oxide nanoparticles activity in sulfur vulcanization of NBR.192 The
authors concluded that alkylimidazolium and alkylammonium salts catalyze the interface
crosslinking reactions, and consequently, the vulcanization time of the rubber compounds
remarkably decreases whereas the crosslink density of the vulcanizates increases. The cure
rate and crosslink density of NBR vulcanizates increased with the length of alkyl chains
present in the alkylimidazolium or alkylammonium salt. Higher cure rate of rubber
compounds was observed in the presence of alkylimidazolium Cl− and Br− anions, whereas
the longest vulcanization times were displayed by the rubber compounds with
alkylimidazolium hexafluorophosphate. Considering mechanical properties of vulcanizates,
the most effective ones were ILs with 1-butyl-3-methylimidazolium cation, especially
tetrafluoroborate and bromide.192
Hydrogenated acrylonitrile-butadiene rubber (HNBR)
Likozar et al.228,240 prepared solid electrolytes by following steps: (1st step) melt
compounding of the carbon nanotubes (MWCNT-OH) with hydrogenated acrylonitrile-
butadiene rubber (HNBR), (2nd step) mixing it with peroxide curing system, (3rd step) curing,
and (4th step) immersion of HNBR/MWCNT–OH films into the diluted ionic liquid
(dialkylimidazolium and pyrrolidinium-based ILs with tetrafluoroborate,
hexafluorophosphate, bis(trifluoromethylsulfonyl)imide anions). The elastomer based
electrolytes exhibited high tensile strength and elongation at break. A plasticizing effect of
TFSI-based ILs on HNBR matrix was observed as the glass transition temperature (Tg) of
HNBR/MWCNT-OH/IL compounds decreased as a function of increasing IL content,
whereas the presence of the ILs with [PF6]− and [BF4]− anions caused the opposite effect and
led to the elevation of Tg by 5 °C. The author suggested that ionic liquids bearing
bis(trifluoromethylsulfonyl)imide anions have good miscibility with HNBR/MWCNT-OH
compounds due to the interaction of the dipoles of HNBR-originating nitrile group with
[TFSI]−-originating sulfonyl groups and negatively charged nitrogen atom, causing van der
Waals forces. Moreover, ILs with [BMIM]+ had better miscibility with nitrile rubber than the
most commonly known ionic liquids with [EMIM]+.
Chapter 1. Literature review
54
Maciejewska et al.241 investigated the activity of several ionic liquids (alkylimidazolium
(allyl-, ethyl-, butyl-, hexyl-, and octyl-) salts containing bromide, chloride, tetrafluoroborate,
and hexafluorophosphate ions) that were used to improve the dispersion of coagent particles
in peroxide-crosslinked HNBR. It was found that alkylimidazolium salts displayed a positive
impact on the coagent dispersion in the elastomer matrix. The results obtained for a series of
tetrafluoroborates indicated that crosslink density and tensile strength of vulcanizates
decreased with increasing alkyl chain lengths.
Chloroprene rubber (CR)
In numerous studies, the conductivity of chloroprene rubber (CR)/carbon-nanotubes
(CNTs) composites has been enhanced by using imidazolium salts as dispersion
agents.229,231,232,234 Subramaniam et al.229 reported that combining commercial grade multi-
walled carbon nanotubes (MWCNTs) with 1-butyl-3-methylimidazolium
bis(trifluoromethylsulfonyl)imide [BMIM][TFSI] in CR produces composite with an
electrical conductivity of 0.1 S/cm with a stretchability >500 %.The increased conductivity of
the composite was ascribed to the synergistic effect of electrons and ions and to the formation
of percolating network with the IL modified tubes. The authors did not observe a proportional
increase in the conductivity by increasing the loading of pure IL. The ionic conductivity of the
CR/[BMIM][TFSI] mixture increased from 10-11 S/cm (neat CR) to 10-9 S/cm in the presence
of 5 phr of IL and remained unaltered upon amount till 20 phr of IL. DMA measurements
showed that the presence of IL had no effect on the glass transition temperature (Tg) of
composites.229 In later work on CR/IL-CNTs composites, Subramaniam et al.231 reported that
the physical (cation–π/π–π) interaction existing between [BMIM][TFSI] and MWCNTs result
in enhanced thermal stability of the rubber composite and promote to obtain homogenous
dispersion of nanotubes in elastomer matrix. This was confirmed by subsequent
investigation.230 In other studies, the electrical conductivity of IL- CR/CNTs composites
increased upon accelerated thermal aging, and therefore, the authors suggested that these
composites may be useful for applications where conductivity at elevated temperatures is
required.233
Steinhauser et al.232 investigated the influence of [BMIM][TFSI] on the dielectric
relaxation behavior of CR/CNTs nanocomposites. Composite contained: 0.5 phr of stearic
acid, 5 phr zinc of oxide (ZnO), 4 phr of magnesium oxide (MgO), 1 phr of ethylene thiourea
and 20 phr of [BMIM][TFSI] for unfilled sample, or 15 phr of [BMIM][TFSI] for composites
loaded with 3 phr of CNTs. The improvement of the conductivity over more than two orders
Chapter 1. Literature review
55
of magnitude, which was found in the presence of IL in the composite, was explained through
the role of [BMIM][TFSI] as a coupling agent which leads to the enhanced CR-CNTs
interaction.
Solution-styrene-butadiene rubber (SSBR)
Two types of thiol ILs, 1-methylimidazolium mercaptopropionate [MIM][MP] and
bis(1-methylimidazolium) mercaptosuccinate [BMIM][MS], were studied as interfacial
modifiers for SBR/halloysite nanotubes (SBR/HNTs) composites. Significant mechanical
improvements and lowered mechanical loss in the temperature range of 50 – 80 °C were
ascribed to the enhanced HNTs dispersion and strengthened interfacial interactions.190
In another study, the role of 1-methylimidazolium mercaptopropionate [MIM][MP] as a
modifier for SBR/silica composites was evaluated,242 also the effects of 1-methylimidazolium
methacrylate [MIM][MA] were investigated in SBR/silica composites.243
The IL-coated HNTs (1-butyl-3-methylimidazolium hexafluorophosphate [BMIM][PF6])
were used for reinforcement of SBR compounds. Compared with the rubber composites with
pristine HNTs, the uncured compounds with modified HNTs exhibited accelerated curing, and
the resulting vulcanizates showed substantially higher tensile properties and much lower
hardness. The unique changes in the compounds were ascribed to the interaction between IL
and HNTs and improvements in the state of filler dispersion.244
In order to ensure better compatibility between the blend of SSBR/polybutadiene rubber
(BR) and multi-walled carbon nanotubes (MWCNTs) and to enhance the state of filler
dispersion in the rubber matrix, a series of ionic liquids was tested ([AMIM][Cl],
[EMIM][SCN], [MOIM][Cl], 3-(triphenylphosphonic)-1-sulfonic acid tosylate,
trihexyl(tetradecyl)phosphonium decanoate). It was found that in the presence of especially
one ionic liquid, 1-allyl-3-methylimidazolium chloride [AMIM][Cl], for the blend of
SSBR/BR, a threefold increase of tensile strength was achieved with only at ~3 wt% of
MWCNTs loading. The enhancement in the mechanical properties was explained through the
chemical coupling between MWCNTs and rubber chains by 1-allyl-3-methylimidazolium
chloride [AMIM][Cl], as it was evidenced by Raman spectra, dynamic mechanical analysis
(DMA) and electrical properties.245
Kreyenschulte246 conducted investigations on the interaction between 1-allyl-3-
methylimidazolium chloride [AMIM][Cl] and carbon black (CB) and its influence on the
properties of the blend of SSBR/BR and EPDM. An improvement in composites conductivity
was achieved, however the addition of [AMIM][Cl] contributed to a significant increase in the
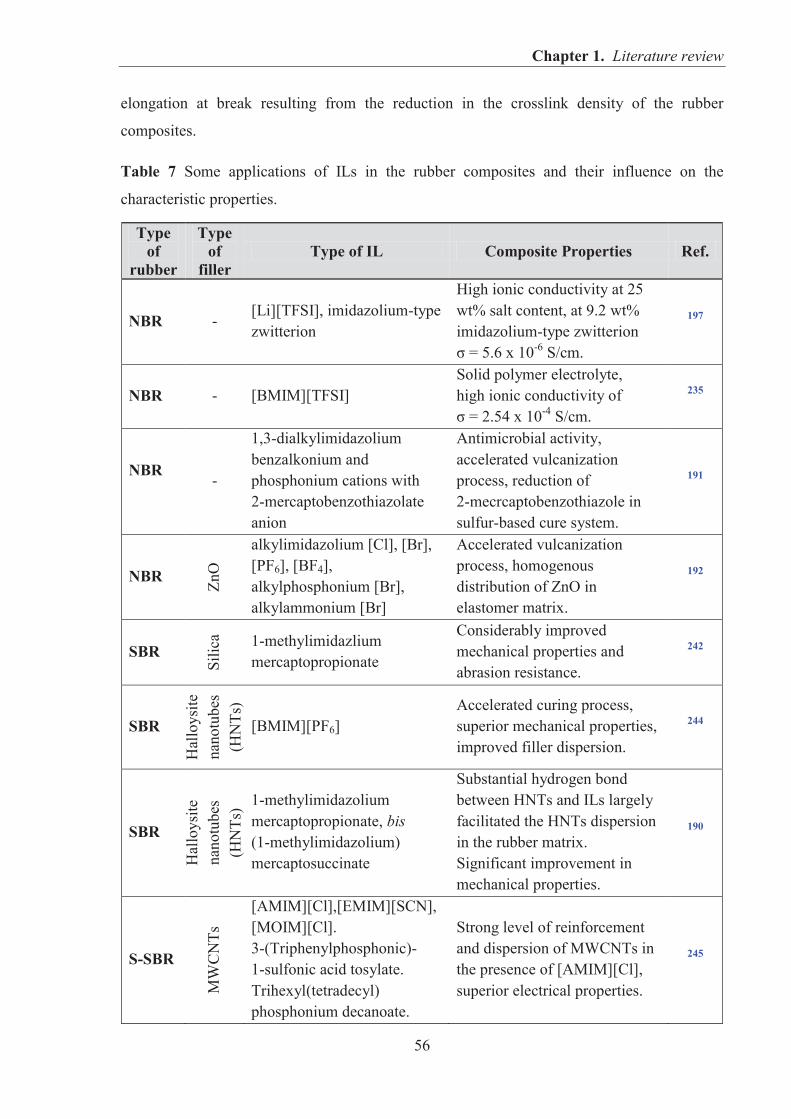
Chapter 1. Literature review
56
elongation at break resulting from the reduction in the crosslink density of the rubber
composites.
Table 7 Some applications of ILs in the rubber composites and their influence on the
characteristic properties.
Type of
rubber
Type of
filler Type of IL Composite Properties Ref.
NBR - [Li][TFSI], imidazolium-type zwitterion
High ionic conductivity at 25 wt% salt content, at 9.2 wt% imidazolium-type zwitterion σ = 5.6 x 10⁻⁶ S/cm.
197
NBR
- [BMIM][TFSI] Solid polymer electrolyte, high ionic conductivity of σ = 2.54 x 10⁻⁴ S/cm.
235
NBR
-
1,3-dialkylimidazolium benzalkonium and phosphonium cations with 2-mercaptobenzothiazolate anion
Antimicrobial activity, accelerated vulcanization process, reduction of 2-mecrcaptobenzothiazole in sulfur-based cure system.
191
NBR
ZnO
alkylimidazolium [Cl], [Br], [PF6], [BF4], alkylphosphonium [Br], alkylammonium [Br]
Accelerated vulcanization process, homogenous distribution of ZnO in elastomer matrix.
192
SBR
Silic
a 1-methylimidazlium mercaptopropionate
Considerably improved mechanical properties and abrasion resistance.
242
SBR H
allo
ysite
na
notu
bes
(HN
Ts)
[BMIM][PF6] Accelerated curing process, superior mechanical properties, improved filler dispersion.
244
SBR
Hal
loys
ite
nano
tube
s (H
NTs
) 1-methylimidazolium mercaptopropionate, bis (1-methylimidazolium) mercaptosuccinate
Substantial hydrogen bond between HNTs and ILs largely facilitated the HNTs dispersion in the rubber matrix. Significant improvement in mechanical properties.
190
S-SBR
MW
CN
Ts
[AMIM][Cl],[EMIM][SCN], [MOIM][Cl]. 3-(Triphenylphosphonic)- 1-sulfonic acid tosylate. Trihexyl(tetradecyl) phosphonium decanoate.
Strong level of reinforcement and dispersion of MWCNTs in the presence of [AMIM][Cl], superior electrical properties.
245
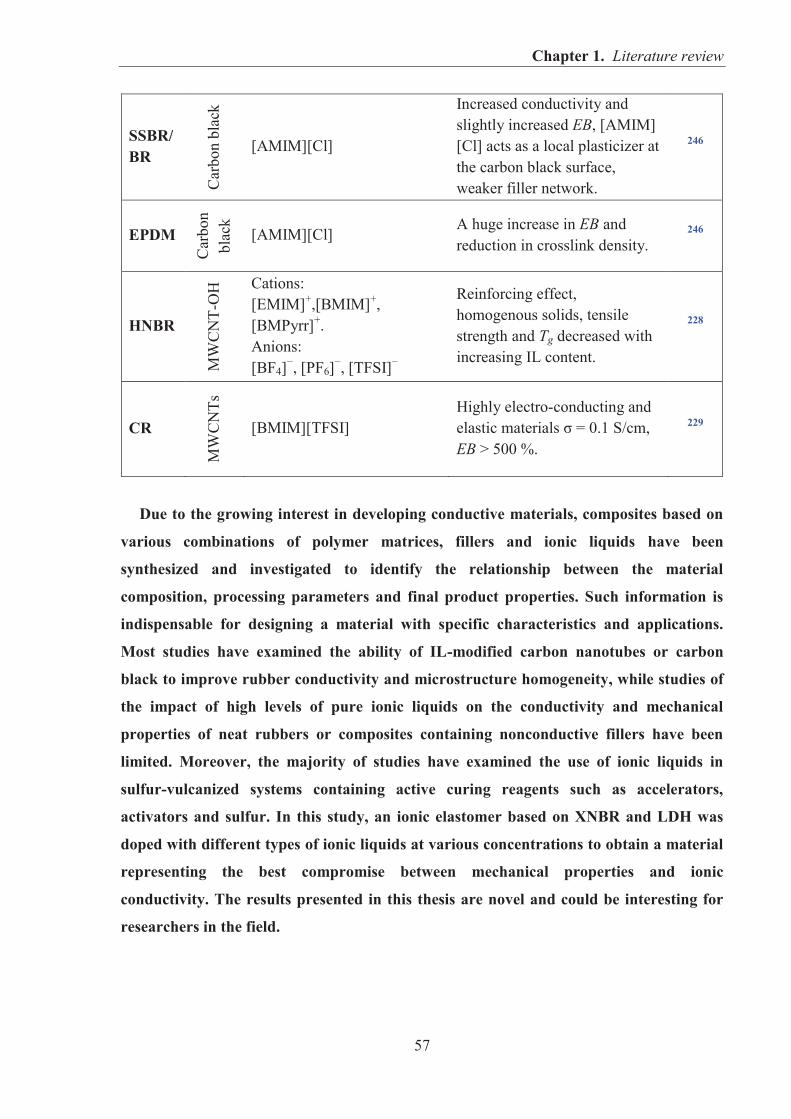
Chapter 1. Literature review
57
Due to the growing interest in developing conductive materials, composites based on
various combinations of polymer matrices, fillers and ionic liquids have been
synthesized and investigated to identify the relationship between the material
composition, processing parameters and final product properties. Such information is
indispensable for designing a material with specific characteristics and applications.
Most studies have examined the ability of IL-modified carbon nanotubes or carbon
black to improve rubber conductivity and microstructure homogeneity, while studies of
the impact of high levels of pure ionic liquids on the conductivity and mechanical
properties of neat rubbers or composites containing nonconductive fillers have been
limited. Moreover, the majority of studies have examined the use of ionic liquids in
sulfur-vulcanized systems containing active curing reagents such as accelerators,
activators and sulfur. In this study, an ionic elastomer based on XNBR and LDH was
doped with different types of ionic liquids at various concentrations to obtain a material
representing the best compromise between mechanical properties and ionic
conductivity. The results presented in this thesis are novel and could be interesting for
researchers in the field.
SSBR/ BR
Car
bon
blac
k
[AMIM][Cl]
Increased conductivity and slightly increased EB, [AMIM] [Cl] acts as a local plasticizer at the carbon black surface, weaker filler network.
246
EPDM
Car
bon
blac
k [AMIM][Cl]
A huge increase in EB and reduction in crosslink density.
246
HNBR
MW
CN
T-O
H Cations:
[EMIM]+,[BMIM]+, [BMPyrr]+. Anions: [BF4]−, [PF6]−, [TFSI]−
Reinforcing effect, homogenous solids, tensile strength and Tg decreased with increasing IL content.
228
CR
MW
CN
Ts
[BMIM][TFSI] Highly electro-conducting and elastic materials σ = 0.1 S/cm, EB > 500 %.
229
Chapter 2. Aim of the work
58
2. AIM OF THE WORK
Fillers are important for enhancing the properties of elastomers and can therefore be used
for the development of a new generation of composite materials with improved or new
functionalities. This work focused on the fabrication and characterization of elastomer
composites containing layered fillers and ionic liquids with improved mechanical and ionic
conductivity properties. The impact of layered fillers of different origins with various particle
aspect ratios, specific surface areas and elemental compositions on the reinforcement of nitrile
rubbers (acrylonitrile-butadiene rubber (NBR), and carboxylated acrylonitrile-butadiene
rubber, (XNBR)) composites was explored. Some of the layered minerals were investigated
not only in terms of their use as reinforcing fillers for rubbers but also as crosslinking agents,
gas barriers and UV stability enhancers. The multifunctionality of these fillers makes them
interesting materials with broad potential applicability for the manufacture of high-
performance elastomers. The layered fillers included cationic clays (natural and synthetic
hectorite), anionic clays (hydrotalcites or magnesium-aluminum layered double hydroxides
(MgAl-LDHs)) and graphene-based materials.
The use of layered minerals in rubber formulations has ecological and economic
importance and offers the potential for environmentally friendly rubber products. Moreover,
the melt mixing method used in this work for the preparation of rubber/layered filler
composites is one of the most eco-friendly routes that excludes the use of organic solvents
and is the most suitable for industrial-scale production.
Moreover, to enhance the ionic conductivity of the selected rubber/layered filler
composites characterized by significantly improved mechanical properties, room temperature
imidazolium ionic liquids (RTILs) exhibiting high ionic conductivity were employed. Such
organic compounds may play a role not only as ionic conductivity enhancers in the rubber
material but also as processing and dispersion aids in the preparation of elastomer composites.
This work sought a compromise between the type and concentration of imidazolium ionic
liquids and the enhancement in mechanical strength and ionic conductivity of elastomer
composites.
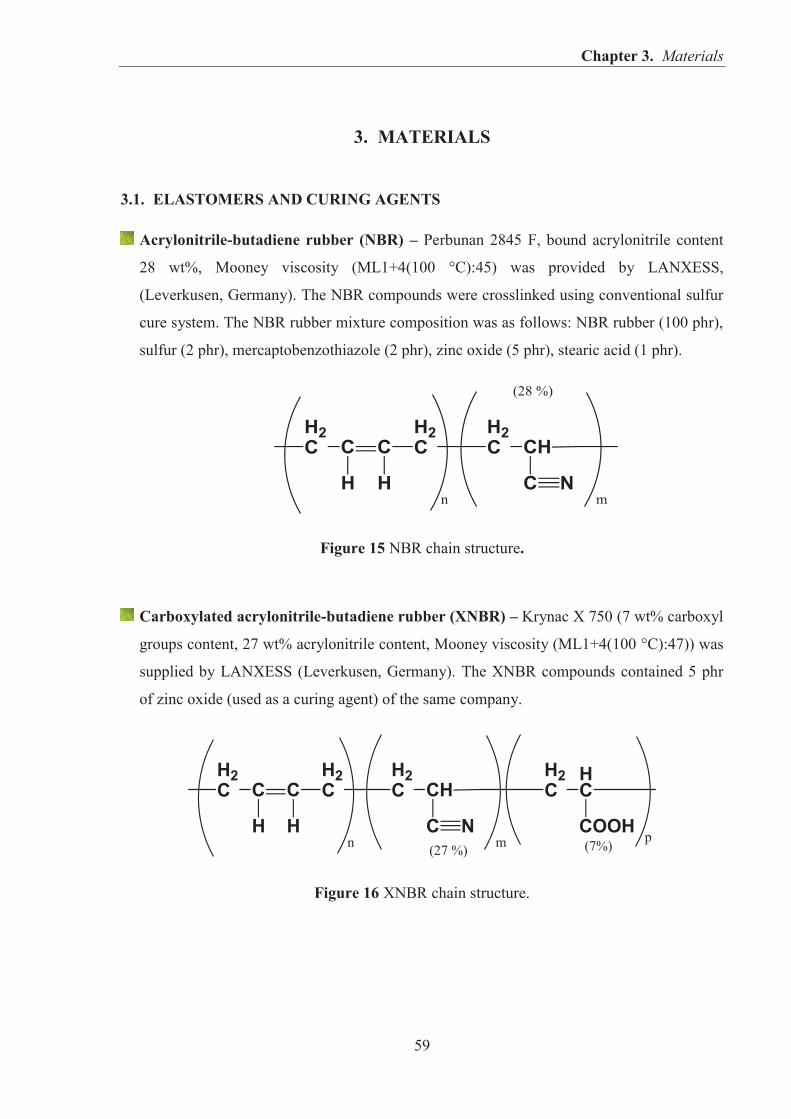
Chapter 3. Materials
59
3. MATERIALS
3.1. ELASTOMERS AND CURING AGENTS
Acrylonitrile-butadiene rubber (NBR) – Perbunan 2845 F, bound acrylonitrile content
28 wt%, Mooney viscosity (ML1+4(100 °C):45) was provided by LANXESS,
(Leverkusen, Germany). The NBR compounds were crosslinked using conventional sulfur
cure system. The NBR rubber mixture composition was as follows: NBR rubber (100 phr),
sulfur (2 phr), mercaptobenzothiazole (2 phr), zinc oxide (5 phr), stearic acid (1 phr).
Figure 15 NBR chain structure.
Carboxylated acrylonitrile-butadiene rubber (XNBR) – Krynac X 750 (7 wt% carboxyl
groups content, 27 wt% acrylonitrile content, Mooney viscosity (ML1+4(100 °C):47)) was
supplied by LANXESS (Leverkusen, Germany). The XNBR compounds contained 5 phr
of zinc oxide (used as a curing agent) of the same company.
Figure 16 XNBR chain structure.
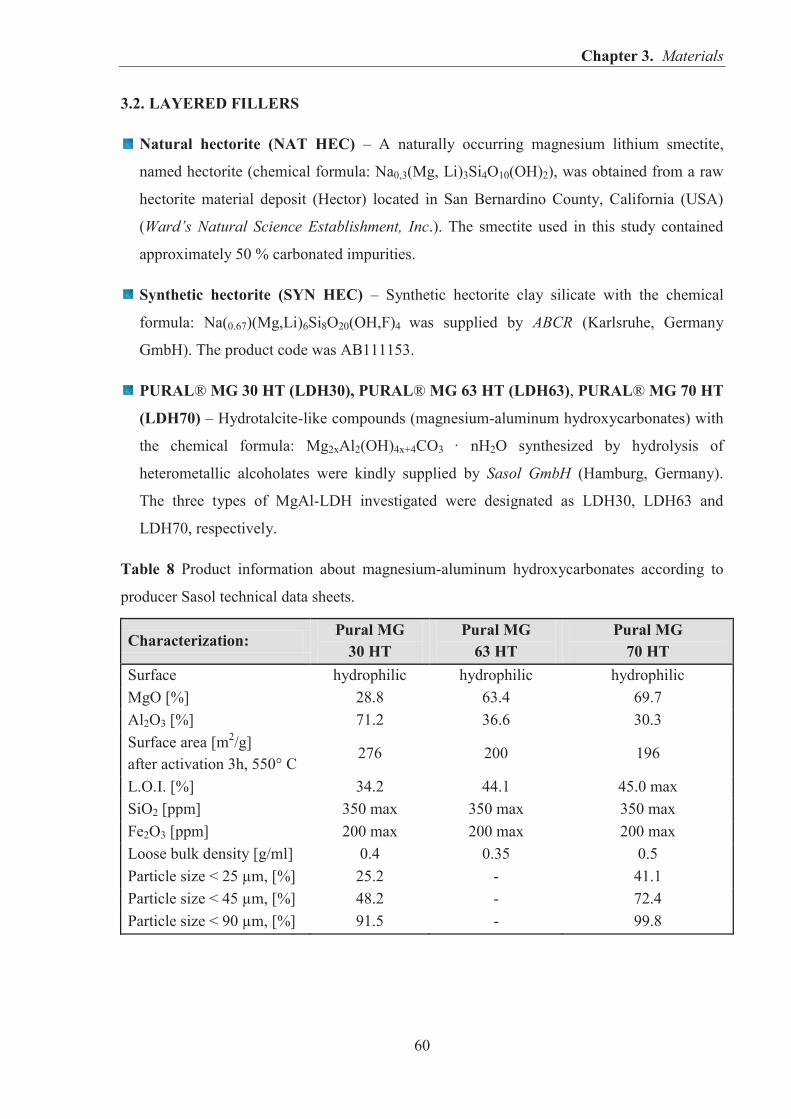
Chapter 3. Materials
60
3.2. LAYERED FILLERS
Natural hectorite (NAT HEC) – A naturally occurring magnesium lithium smectite,
named hectorite (chemical formula: Na0,3(Mg, Li)3Si4O10(OH)2), was obtained from a raw
hectorite material deposit (Hector) located in San Bernardino County, California (USA)
(Ward’s Natural Science Establishment, Inc.). The smectite used in this study contained
approximately 50 % carbonated impurities.
Synthetic hectorite (SYN HEC) – Synthetic hectorite clay silicate with the chemical
formula: Na(0.67)(Mg,Li)6Si8O20(OH,F)4 was supplied by ABCR (Karlsruhe, Germany
GmbH). The product code was AB111153.
PURAL® MG 30 HT (LDH30), PURAL® MG 63 HT (LDH63), PURAL® MG 70 HT
(LDH70) – Hydrotalcite-like compounds (magnesium-aluminum hydroxycarbonates) with
the chemical formula: Mg2xAl2(OH)4x+4CO3 · nH2O synthesized by hydrolysis of
heterometallic alcoholates were kindly supplied by Sasol GmbH (Hamburg, Germany).
The three types of MgAl-LDH investigated were designated as LDH30, LDH63 and
LDH70, respectively.
Table 8 Product information about magnesium-aluminum hydroxycarbonates according to
producer Sasol technical data sheets.
Characterization: Pural MG
30 HT Pural MG
63 HT Pural MG
70 HT Surface hydrophilic hydrophilic hydrophilic MgO [%] 28.8 63.4 69.7 Al2O3 [%] 71.2 36.6 30.3 Surface area [m2/g] after activation 3h, 550° C
276 200 196
L.O.I. [%] 34.2 44.1 45.0 max SiO2 [ppm] 350 max 350 max 350 max Fe2O3 [ppm] 200 max 200 max 200 max Loose bulk density [g/ml] 0.4 0.35 0.5 Particle size < 25 μm, [%] 25.2 - 41.1 Particle size < 45 μm, [%] 48.2 - 72.4 Particle size < 90 μm, [%] 91.5 - 99.8
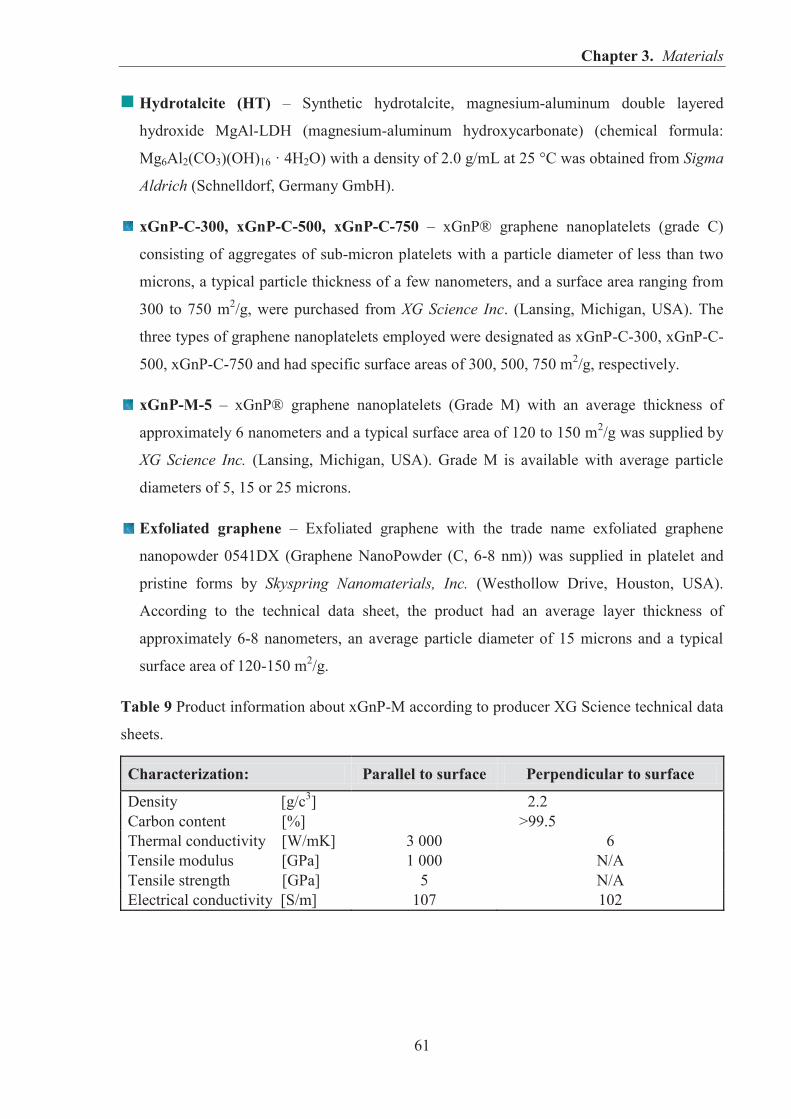
Chapter 3. Materials
61
Hydrotalcite (HT) – Synthetic hydrotalcite, magnesium-aluminum double layered
hydroxide MgAl-LDH (magnesium-aluminum hydroxycarbonate) (chemical formula:
Mg6Al2(CO3)(OH)16 · 4H2O) with a density of 2.0 g/mL at 25 °C was obtained from Sigma
Aldrich (Schnelldorf, Germany GmbH).
xGnP-C-300, xGnP-C-500, xGnP-C-750 – xGnP® graphene nanoplatelets (grade C)
consisting of aggregates of sub-micron platelets with a particle diameter of less than two
microns, a typical particle thickness of a few nanometers, and a surface area ranging from
300 to 750 m2/g, were purchased from XG Science Inc. (Lansing, Michigan, USA). The
three types of graphene nanoplatelets employed were designated as xGnP-C-300, xGnP-C-
500, xGnP-C-750 and had specific surface areas of 300, 500, 750 m2/g, respectively.
xGnP-M-5 – xGnP® graphene nanoplatelets (Grade M) with an average thickness of
approximately 6 nanometers and a typical surface area of 120 to 150 m2/g was supplied by
XG Science Inc. (Lansing, Michigan, USA). Grade M is available with average particle
diameters of 5, 15 or 25 microns.
Exfoliated graphene – Exfoliated graphene with the trade name exfoliated graphene
nanopowder 0541DX (Graphene NanoPowder (C, 6-8 nm)) was supplied in platelet and
pristine forms by Skyspring Nanomaterials, Inc. (Westhollow Drive, Houston, USA).
According to the technical data sheet, the product had an average layer thickness of
approximately 6-8 nanometers, an average particle diameter of 15 microns and a typical
surface area of 120-150 m2/g.
Table 9 Product information about xGnP-M according to producer XG Science technical data
sheets.
Characterization: Parallel to surface Perpendicular to surface
Density [g/c3] 2.2 Carbon content [%] >99.5 Thermal conductivity [W/mK] 3 000 6 Tensile modulus [GPa] 1 000 N/A Tensile strength [GPa] 5 N/A Electrical conductivity [S/m] 107 102
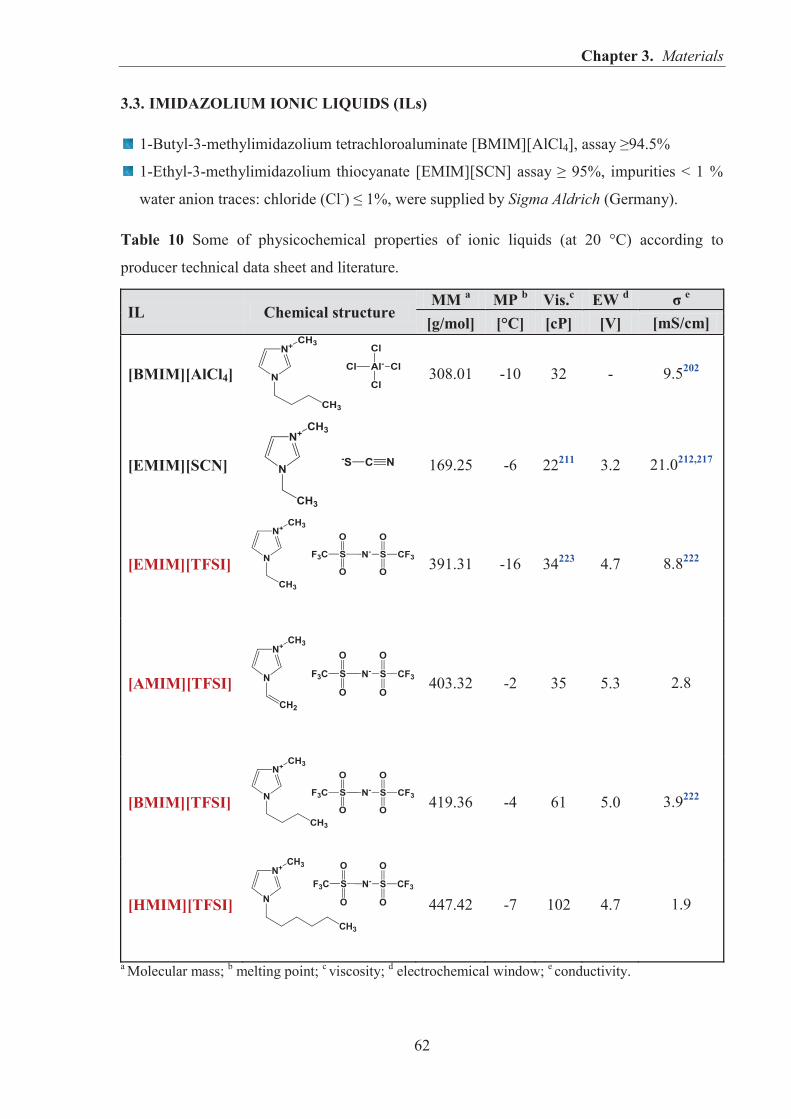
Chapter 3. Materials
62
3.3. IMIDAZOLIUM IONIC LIQUIDS (ILs)
1-Butyl-3-methylimidazolium tetrachloroaluminate [BMIM][AlCl4], assay ≥94.5%
1-Ethyl-3-methylimidazolium thiocyanate [EMIM][SCN] assay ≥ 95%, impurities < 1 %
water anion traces: chloride (Cl-) ≤ 1%, were supplied by Sigma Aldrich (Germany).
Table 10 Some of physicochemical properties of ionic liquids (at 20 °C) according to
producer technical data sheet and literature.
IL Chemical structure MM a MP b Vis.c EW d σ e
[g/mol] [°C] [cP] [V] [mS/cm]
[BMIM][AlCl4]
308.01 -10 32 - 9.5202
[EMIM][SCN]
169.25 -6 22211 3.2 21.0212,217
[EMIM][TFSI]
391.31 -16 34223 4.7 8.8222
[AMIM][TFSI]
403.32 -2 35 5.3 2.8
[BMIM][TFSI]
419.36 -4 61 5.0 3.9222
[HMIM][TFSI]
447.42 -7 102 4.7 1.9
a Molecular mass; b melting point; c viscosity; d electrochemical window; e conductivity.
Chapter 3. Materials
63
1-Ethyl-3-methylimidazolium bis(trifluoromethylsulfonyl)imide [EMIM][TFSI],
1-Allyl-3-methylimidazolium bis(trifluoromethylsulfonyl)imide [AMIM][TFSI],
1-Butyl-3-methylimidazolium bis(trifluoromethylsulfonyl)imide [BMIM][TFSI],
1-Hexyl-3-methylimidazolium bis(trifluoromethylsulfonyl)imide [HMIM][TFSI]
were supplied by IoLiTec Ionic Liquids Technologies GmbH (Heilbronn, Germany).
3.4. OTHER MATERIALS
Toluene pure – POCh (Gliwice, Poland);
Ammonia 25 % solution – POCh (Gliwice, Poland);
Sulfur S8 – curing substance, ZCh Siarkpol (Tarnobrzeg, Poland);
Mercaptobenzothiazole (MBT) – accelerator in the sulfur vulcanization, Chemical
Worldwide Business Sp. z o.o. (Słupca, Poland);
Zinc oxide (ZnO) – activator in the sulfur vulcanization or curative for XNBR, Lanxess
(Leverkusen, Germany);
Stearic acid – activator in the sulfur vulcanization, Sigma Aldrich (Germany).
Chapter 4. Characterization techniques
64
4. CHARACTERIZATION TECHNIQUES
4.1. SCANNING ELECTRON MICROSCOPY (SEM)
The morphology of the layered filler particles was evaluated by scanning electron
microscopy (SEM) with a LEO 1530 Gemini scanning electron microscope (Zeiss/LEO,
Oberkochen, Germany).
The fractured surfaces of rubber composites were inspected using a scanning electron
microscopy equipped with an energy dispersive spectrometer (EDS) with a microscope SEM
HITACHI S800 (Tokyo, Japan) at the accelerating voltage of 15 kV. Prior to SEM
observations, liquid nitrogen-fractured surfaces of the composites were Au/Pd sputtered (with
a thickness of approximately 10 nm).
4.2. BET N2 ADSORPTION MEASUREMENTS
Specific surface area was measured based on nitrogen adsorption at 77 K over the relative
pressure (P/P0) range of 10−6 – 1 using a Gemini 2360 V2.01 porosimeter (Micromeritics,
USA). Measurements were performed according to the Brunauer-Emmett-Teller (BET)
nitrogen adsorption method. The samples were degassed for 20 hours at 100 °C under
vacuum. The samples were then subjected to a 99–point BET surface area analysis and full
adsorption isotherms were collected.
4.3. X-RAY DIFFRACTION (XRD)
Powder X-ray diffraction patterns were collected at room temperature using
a PANalytical X’Pert Pro MPD diffractometer with a Bragg-Brentano reflecting geometry and
CuKα radiation from a sealed tube (Almelo, Netherlands). Data were collected in the 2θ range
of 2 – 70° with a 0.0167° step size and a 20-s exposure per step. The interlayer distance of
mineral layers d was calculated according to the Bragg’s equation, Equation (2).
(2)
Å (3)
where: λ – wavelength (Equation (3)), d – distance between layers, θ – Bragg’s angle.
Chapter 4. Characterization techniques
65
4.4. OIL ABSORPTION PARAMETER DBPA
The oil absorption parameter (DBPA) of fillers was measured according to ASTM D2414
using Absorptometer C equipment Brabender Measuring Mixer N50 (Duisburg, Germany).
The process parameters were: sample weight 20 g, titration rate 4.0 ml/min. The oil used in
this study was dibutyl phthalate DBP.
4.5. THERMOGRAVIMETRIC ANALYSIS (TGA)
Thermal decomposition of the rubber compounds was performed using
a TA Instruments Q500 Thermogravimetric Analyzer (TGA) (New Castle, USA). Samples
were analyzed in the presence of nitrogen or air atmosphere from 10 °C to 600 °C using a
heating rate of 10 °C/min.
4.6. X-RAY PHOTOELECTRON SPECTROSCOPY ANALYSIS (XPS)
The surface elemental composition of the fillers and XNBR composites was determined by
X-ray photoelectron spectroscopy (XPS) analysis. XPS spectra were recorded on
a Prevac X-ray photoelectron spectrometer (Rogow, Poland) equipped with a SES 2002, VG
Scienta hemispheric electron energy analyzer (Uppsala, Sweden) and an aluminum (mono) Kα
source (1486.6 eV). The aluminum Kα source was operated at 15 kV and 25 mA. The
spectrometer was calibrated using Ag 3D BE = 368.27 eV core-level photoemission spectra.
For rubber samples, a high-resolution survey (pass energy 50 eV) was performed in the
appropriate spectral regions. All core level spectra were referenced
to the C 1s neutral carbon peak at 284.6 eV.
4.7. INVERSE GAS CHROMATOGRAPHY (IGC)
Inverse gas chromatography (IGC) was used to determine the surface properties of the
mineral fillers: natural hectorite247 and synthetic hydrotalcite.98 IGC measurements at infinite
dilution conditions were performed with a Hewlett Packard 5890A gas chromatograph
equipped with a high-sensitivity flame ionization detector. Measurements were carried out
using steel columns measuring with the inner diameter of 3.17 mm and the length of 360 mm.
The measurements for each of the powders were performed at four temperatures.
The columns were conditioned at 100 °C for 24 h before all measurements.
Helium was used as the carrier gas with a flow rate of 20 cm3/min, measured with a soap
flow-meter. To ensure adsorption at infinite dilution conditions, the amount of the gas probe
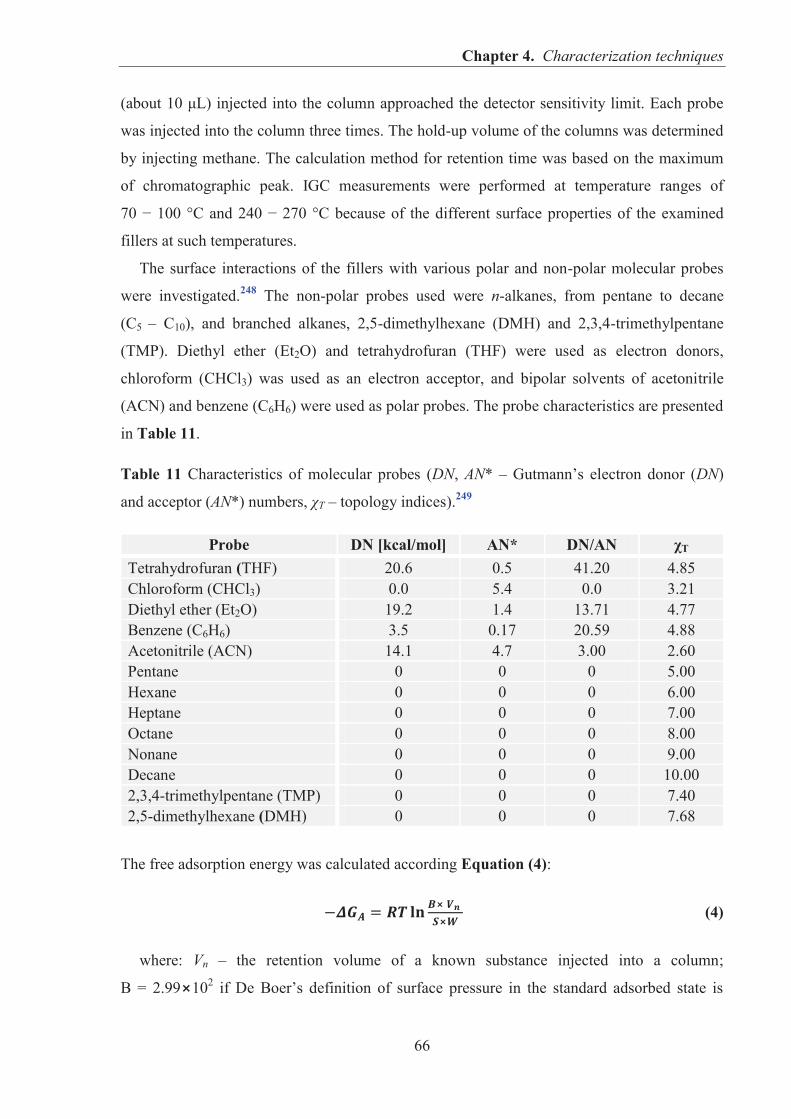
Chapter 4. Characterization techniques
66
(about 10 μL) injected into the column approached the detector sensitivity limit. Each probe
was injected into the column three times. The hold-up volume of the columns was determined
by injecting methane. The calculation method for retention time was based on the maximum
of chromatographic peak. IGC measurements were performed at temperature ranges of
70 − 100 °C and 240 − 270 °C because of the different surface properties of the examined
fillers at such temperatures.
The surface interactions of the fillers with various polar and non-polar molecular probes
were investigated.248 The non-polar probes used were n-alkanes, from pentane to decane
(C5 – C10), and branched alkanes, 2,5-dimethylhexane (DMH) and 2,3,4-trimethylpentane
(TMP). Diethyl ether (Et2O) and tetrahydrofuran (THF) were used as electron donors,
chloroform (CHCl3) was used as an electron acceptor, and bipolar solvents of acetonitrile
(ACN) and benzene (C6H6) were used as polar probes. The probe characteristics are presented
in Table 11.
Table 11 Characteristics of molecular probes (DN, AN* – Gutmann’s electron donor (DN)
and acceptor (AN*) numbers, χT – topology indices).249
Probe DN [kcal/mol] AN* DN/AN χT Tetrahydrofuran (THF) 20.6 0.5 41.20 4.85 Chloroform (CHCl3) 0.0 5.4 0.0 3.21 Diethyl ether (Et2O) 19.2 1.4 13.71 4.77 Benzene (C6H6) 3.5 0.17 20.59 4.88 Acetonitrile (ACN) 14.1 4.7 3.00 2.60 Pentane 0 0 0 5.00 Hexane 0 0 0 6.00 Heptane 0 0 0 7.00 Octane 0 0 0 8.00 Nonane 0 0 0 9.00 Decane 0 0 0 10.00 2,3,4-trimethylpentane (TMP) 0 0 0 7.40 2,5-dimethylhexane (DMH) 0 0 0 7.68
The free adsorption energy was calculated according Equation (4):
(4)
where: Vn – the retention volume of a known substance injected into a column;
B = 2.99 102 if De Boer’s definition of surface pressure in the standard adsorbed state is
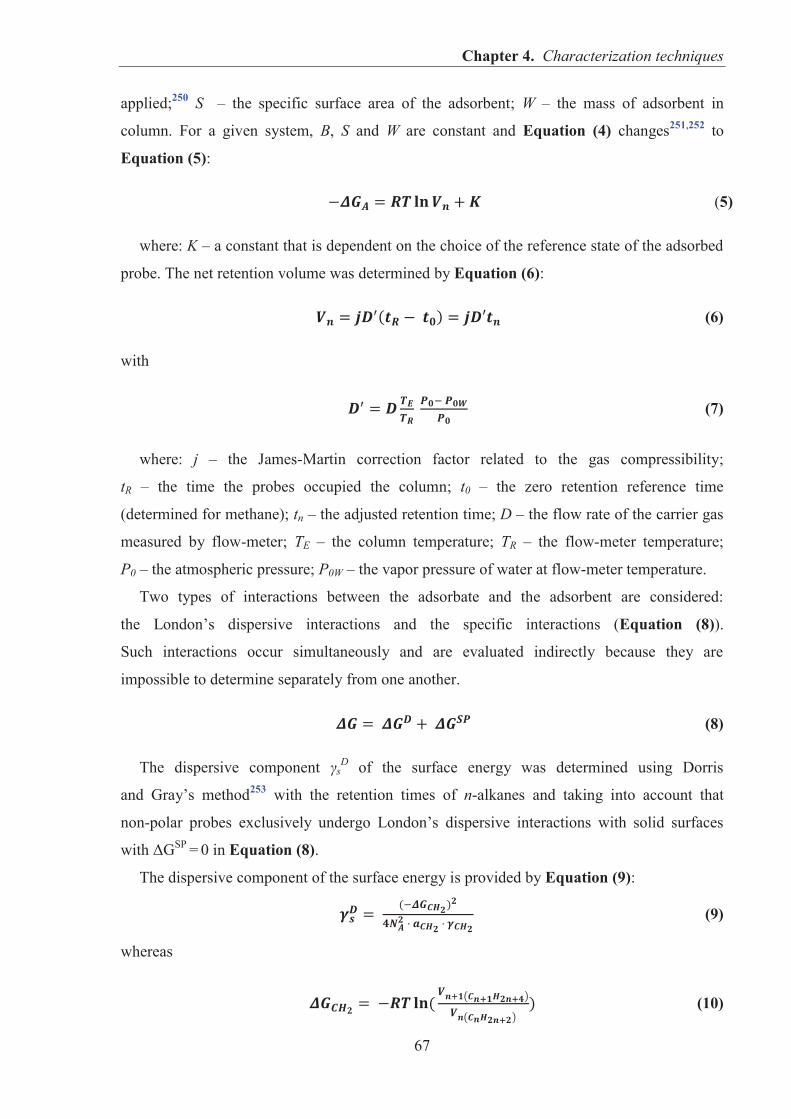
Chapter 4. Characterization techniques
67
applied;250 S – the specific surface area of the adsorbent; W – the mass of adsorbent in
column. For a given system, B, S and W are constant and Equation (4) changes251,252 to
Equation (5):
(5)
where: K – a constant that is dependent on the choice of the reference state of the adsorbed
probe. The net retention volume was determined by Equation (6):
(6)
with
(7)
where: j – the James-Martin correction factor related to the gas compressibility;
tR – the time the probes occupied the column; t0 – the zero retention reference time
(determined for methane); tn – the adjusted retention time; D – the flow rate of the carrier gas
measured by flow-meter; TE – the column temperature; TR – the flow-meter temperature;
P0 – the atmospheric pressure; P0W – the vapor pressure of water at flow-meter temperature.
Two types of interactions between the adsorbate and the adsorbent are considered:
the London’s dispersive interactions and the specific interactions (Equation (8)).
Such interactions occur simultaneously and are evaluated indirectly because they are
impossible to determine separately from one another.
(8)
The dispersive component γsD of the surface energy was determined using Dorris
and Gray’s method253 with the retention times of n-alkanes and taking into account that
non-polar probes exclusively undergo London’s dispersive interactions with solid surfaces
with ΔGSP = 0 in Equation (8).
The dispersive component of the surface energy is provided by Equation (9):
(9)
whereas
(10)
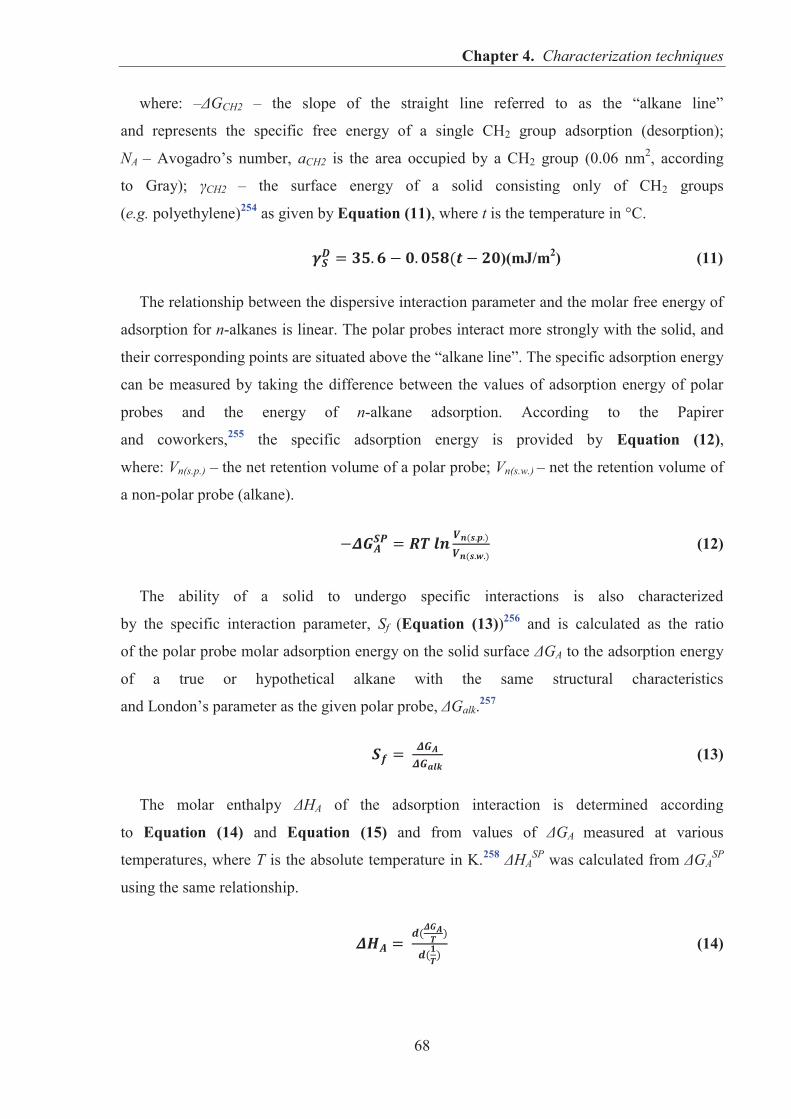
Chapter 4. Characterization techniques
68
where: –ΔGCH2 – the slope of the straight line referred to as the “alkane line”
and represents the specific free energy of a single CH2 group adsorption (desorption);
NA – Avogadro’s number, aCH2 is the area occupied by a CH2 group (0.06 nm2, according
to Gray); γCH2 – the surface energy of a solid consisting only of CH2 groups
(e.g. polyethylene)254 as given by Equation (11), where t is the temperature in °C.
)(mJ/m2) (11)
The relationship between the dispersive interaction parameter and the molar free energy of
adsorption for n-alkanes is linear. The polar probes interact more strongly with the solid, and
their corresponding points are situated above the “alkane line”. The specific adsorption energy
can be measured by taking the difference between the values of adsorption energy of polar
probes and the energy of n-alkane adsorption. According to the Papirer
and coworkers,255 the specific adsorption energy is provided by Equation (12),
where: Vn(s.p.) – the net retention volume of a polar probe; Vn(s.w.) – net the retention volume of
a non-polar probe (alkane).
(12)
The ability of a solid to undergo specific interactions is also characterized
by the specific interaction parameter, Sf (Equation (13))256 and is calculated as the ratio
of the polar probe molar adsorption energy on the solid surface ΔGA to the adsorption energy
of a true or hypothetical alkane with the same structural characteristics
and London’s parameter as the given polar probe, ΔGalk.257
(13)
The molar enthalpy ΔHA of the adsorption interaction is determined according
to Equation (14) and Equation (15) and from values of ΔGA measured at various
temperatures, where T is the absolute temperature in K.258 ΔHASP was calculated from ΔGA
SP
using the same relationship.
(14)
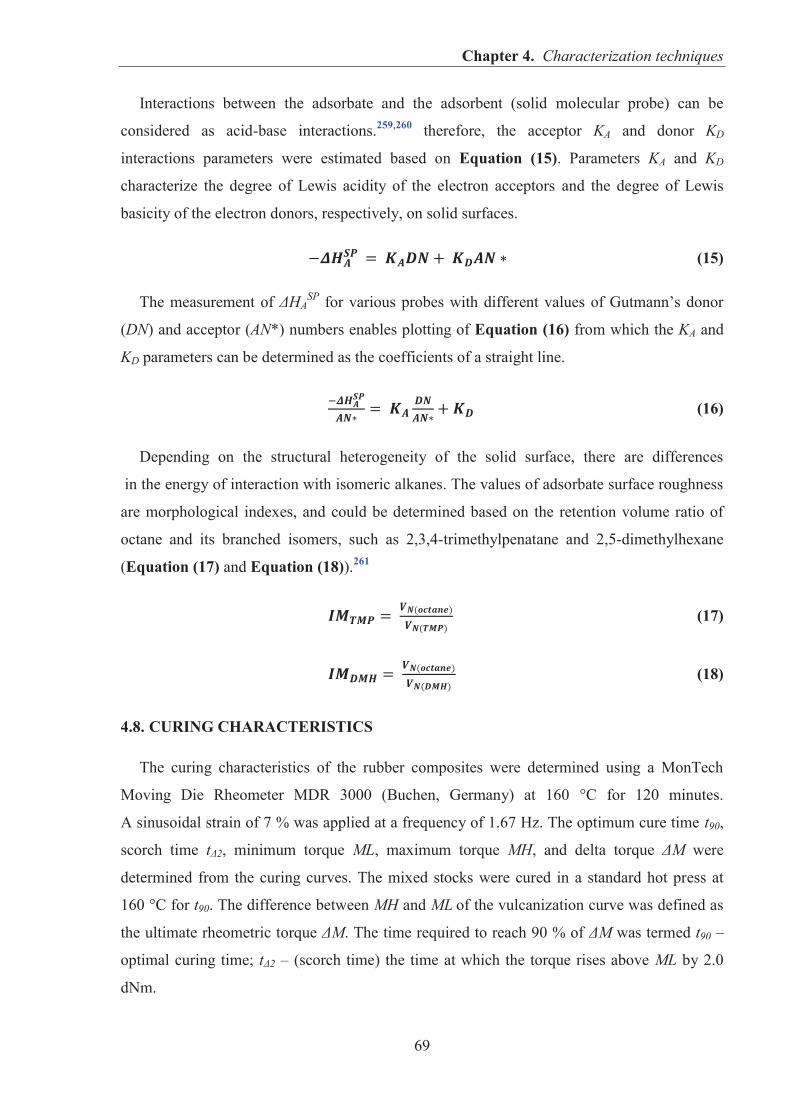
Chapter 4. Characterization techniques
69
Interactions between the adsorbate and the adsorbent (solid molecular probe) can be
considered as acid-base interactions.259,260 therefore, the acceptor KA and donor KD
interactions parameters were estimated based on Equation (15). Parameters KA and KD
characterize the degree of Lewis acidity of the electron acceptors and the degree of Lewis
basicity of the electron donors, respectively, on solid surfaces.
(15)
The measurement of ΔHASP for various probes with different values of Gutmann’s donor
(DN) and acceptor (AN*) numbers enables plotting of Equation (16) from which the KA and
KD parameters can be determined as the coefficients of a straight line.
(16)
Depending on the structural heterogeneity of the solid surface, there are differences
in the energy of interaction with isomeric alkanes. The values of adsorbate surface roughness
are morphological indexes, and could be determined based on the retention volume ratio of
octane and its branched isomers, such as 2,3,4-trimethylpenatane and 2,5-dimethylhexane
(Equation (17) and Equation (18)).261
(17)
(18)
4.8. CURING CHARACTERISTICS
The curing characteristics of the rubber composites were determined using a MonTech
Moving Die Rheometer MDR 3000 (Buchen, Germany) at 160 °C for 120 minutes.
A sinusoidal strain of 7 % was applied at a frequency of 1.67 Hz. The optimum cure time t90,
scorch time tΔ2, minimum torque ML, maximum torque MH, and delta torque ΔM were
determined from the curing curves. The mixed stocks were cured in a standard hot press at
160 °C for t90. The difference between MH and ML of the vulcanization curve was defined as
the ultimate rheometric torque ΔM. The time required to reach 90 % of ΔM was termed t90 –
optimal curing time; tΔ2 – (scorch time) the time at which the torque rises above ML by 2.0
dNm.
Chapter 4. Characterization techniques
70
Reinforcing activity of tested fillers was compared using Wolff coefficient
of activity αf. 262 Mspec and αf were calculated according to Equation (19) and Equation (20).
(19)
(20)
where: ΔMx – the torque increment of the rubber mix containing x phr of filler during
vulcanization; ΔM0 – the torque increment of non-filled rubber during vulcanization;
mx – weight of added filler; mp, – weight of polymer in the mix.
Cure rate index (CRI) was calculated according to Equation (21):
(21)
4.9. CROSSLINK DENSITY MEASUREMENTS
The crosslinking density in the cured network was determined by the method of
equilibrium swelling. The vulcanizates were swollen in toluene for 48 h at room temperature.
The swollen samples were then weighed on a torsion balance, dried in a dryer at a temperature
of 60 ºC to a constant weight, and reweighed after 48 h. The volume fraction of rubber in the
swollen gel (Vr) was calculated from the following equation which is based the simple
additive rule of volumes as follows:
(22)
where: H – initial weight of the test specimen; D – deswollen weight of the test specimen
(until constant weight); F – weight fraction of the insoluble components of the rubber mix,
such as fillers; A0 – weight of the absorbed solvent (A0 = immediate weight – H); ρr – density
of the rubber; ρs – density of the solvent, here density of toluene ρs = 0.867 [g/cm3] (20 °C).
The crosslink density (νT) was calculated using the Flory-Rehner equation,
Equation (23),263 and the Huggins parameter χ for elastomer-solvent interaction at a
temperature of 20 °C are given by Equation (24) and Equation (25).
(23)
Chapter 4. Characterization techniques
71
where: νT – crosslink density; Vr – the volume fraction of elastomer in the swollen gel;
and VS – the molar volume of solvent.
For NBR elastomer: (24)
For XNBR elastomer:264 (25)
To determine the content of ionic crosslinks in the elastomer network, samples were
swollen in toluene in a desiccator with saturated ammonia vapor (25% aqueous solution). The
percentage of ionic crosslinks (Δν) formed in XNBR was determined by their decomposition
under the influence of ammonia265 and was calculated from Equation (26).266
(26)
where: νA – the crosslink density determined for samples treated with ammonia vapour
using the Huggins elastomer-solvent interaction parameter χ described by Equation (27).266
(27)
4.10. FOURIER-TRANSFORM INFRARED SPECTROSCOPY (FTIR)
Attenuated total reflection Fourier transform infrared (ATR-FTIR) spectra were recorded
on a Thermo Scientific Nicolet 6700 FT-IR spectrometer (Waltham, MA, USA) at room
temperature with a resolution of 4 cm-1 and a 64-scan signal from 600 – 4000 cm-1 in
absorbance mode.
4.11. DYNAMIC MECHANICAL ANALYSIS (DMA)
Dynamic mechanical analysis (DMA) was performed on a TA Instruments Q 800 Dynamic
Mechanical Analyzer (New Castle, USA) operating in tension mode
at a frequency of 10 Hz. Storage modulus (E′), loss modulus (E′′) and loss tangent (tan δ)
were measured in tension mode in the temperature range of -80 to 100 °C, at frequency 1, 3,
5, 10, 20, 30, 70 and 100 Hz with a heating rate of 2 °C/min.
4.12. DIFFERENTIAL SCANNING CALORIMETRY (DSC)
DSC measurements (Q 200 DSC, TA Instrument, USA) of samples were performed
at a heating rate of 10 °C/min in the temperature range -80 to 180 °C under a nitrogen
atmosphere. The glass transition temperatures were determined at the midpoint of the step.
Chapter 4. Characterization techniques
72
4.13. BROADBAND DIELECTRIC SPECTROSCOPY (BDS)
Dielectric measurements were conducted with broadband dielectric spectroscopy
(Novocontrol alpha analyser, Hundsagen, Germany) in the frequency range from
10-1 to 107 Hz at room temperature. The samples were placed between two copper electrodes
with diameters of 20 mm.
4.14. AIR PERMEABILITY
The through-plane air permeability of composites was determined by manometric method
in accordance with the ASTM standard D1434, using circular samples 30 mm
in diameter and 1 mm in thickness. The tests were conducted by using atmospheric air
at room temperature. Gas permeability P was determined as volume of gas passing through a
membrane of unit thickness, per unit area and unit time, under unit partial - pressure
difference between the two sides of the material. P is expressed in mole meters per square
meter second Pascal [mol·m/m2·s·Pa].
4.15. TENSILE TESTING
Tensile properties were characterized on a ZWICK 1435 tensile testing machine from the
Zwick Roell Group (Ulm, Germany). The moduli at 100 %, 200 % and 300 % elongation
(SE100, SE200, SE300), tensile strength (TS) and elongation at break (EB) were measured
at room temperature with a crosshead speed of 500 mm/min. For testing, type 2 dumb-bell
specimens were prepared according to the ISO-37-2005 standard. Five different dumbbell-
shaped specimens were tested, and the average value for each formulation was reported.
4.16. HARDNESS SHORE A
Hardness testing of vulcanizates was performed with Shore type A durometer Zwick Roell
Group (Ulm, Germany) at room temperature according to the standard PN-80/C-04238. The
measuring error ± 1°Sh.
4.17. TEAR STRENGTH
Tear strength tests were performed with a universal material testing machine Zwick Roell
Group (Ulm, Germany) at room temperature according to the standard ISO
34-1:2010. The measuring error ± 10 %.
Chapter 4. Characterization techniques
73
4.18. THERMO-OXIDATIVE AGING AND RESISTANCE TO UV RADIATION
(A) The thermo-oxidative aging test. Samples were subjected to the action of air
at elevated temperature (100 °C) for 10 days in a dryer with thermo-circulation
(Binder Inc., New York, USA).
(B) The UV-aging test. Accelerated UV aging studies were carried out for rubber
composites using a UV2000 Atlas solar simulation chamber (Linsengericht, Germany)
(UV-A, λ = 342 nm). Sample aging lasted for 120 h during which alternating day (radiation
intensity 0.7 W/m2, temperature 60 °C, duration 8 h) and night (without UV radiation,
temperature 50 °C, duration 4 h) segments were repeated.
After aging, stress-strain tests were performed. The thermo-oxidative aging coefficients
(KT) and UV aging coefficients (KUV) were calculated according to the Equation (28).
(28)
where: TS – tensile strength [MPa], EB – elongation at break [%]. In addition,
the crosslink densities of the samples subjected to UV radiation were measured by the
swelling method using toluene as the solvent, as described above.
4.19. COLORIMETRIC STUDIES
The color of the obtained composites was measured using a CM-3600d spectrophotometer
from Konica Minolta Sensing, Inc. (Osaka, Japan). The instrument provided the color in
terms of the CIE L*a*b color space system, where L represents
the lightness (or brightness), a and b are color coordinates, where +a* is the red direction,
-a* is the green direction, +b* is the yellow direction, and –b* is the blue direction. Changes
in the individual components allowed estimation of the total change of color ΔE for
composites subjected to elevated temperature. The spectral range of the apparatus was
360 – 740 nm and ΔE was calculated by Equation (31).
(29)
where ΔL corresponds to the difference in the brightness intensity between light and dark,
Δa corresponds to the difference of intensity between green and red, Δb corresponds to the
difference of intensity between blue and yellow, and the ΔE implies the difference in the color
of the sample before and after heating.
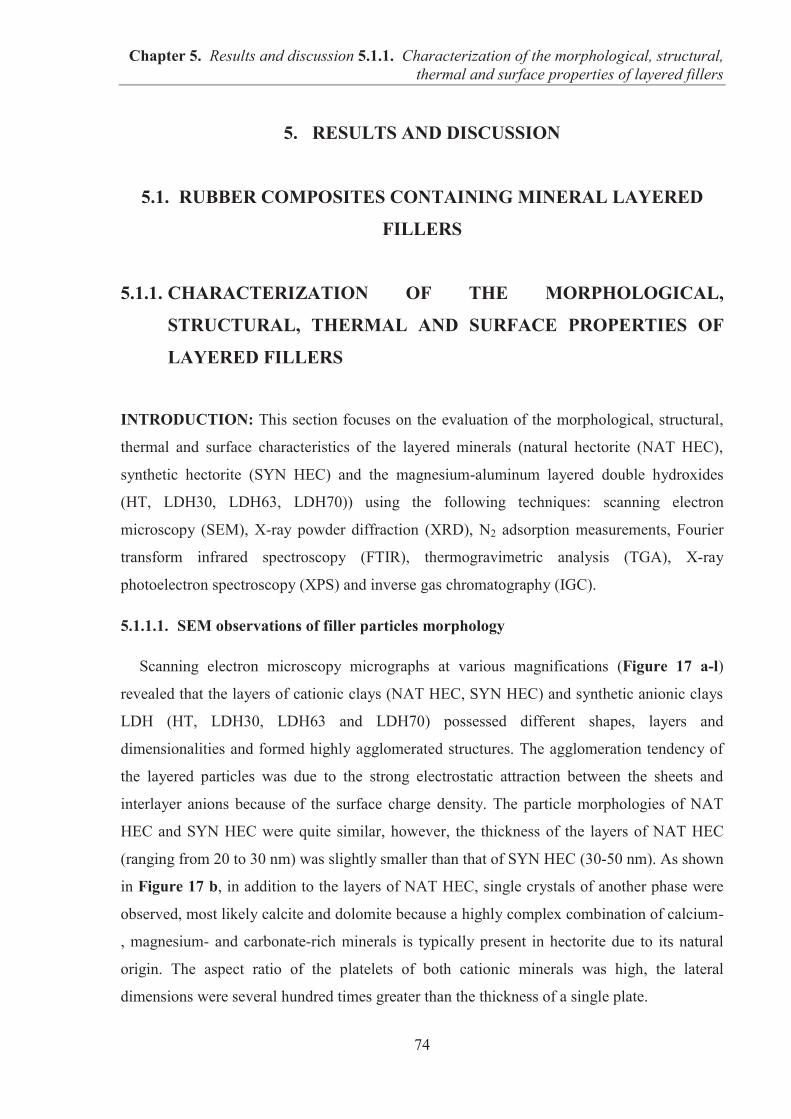
Chapter 5. Results and discussion 5.1.1. Characterization of the morphological, structural, thermal and surface properties of layered fillers
74
5. RESULTS AND DISCUSSION
5.1. RUBBER COMPOSITES CONTAINING MINERAL LAYERED
FILLERS
5.1.1. CHARACTERIZATION OF THE MORPHOLOGICAL,
STRUCTURAL, THERMAL AND SURFACE PROPERTIES OF
LAYERED FILLERS
INTRODUCTION: This section focuses on the evaluation of the morphological, structural,
thermal and surface characteristics of the layered minerals (natural hectorite (NAT HEC),
synthetic hectorite (SYN HEC) and the magnesium-aluminum layered double hydroxides
(HT, LDH30, LDH63, LDH70)) using the following techniques: scanning electron
microscopy (SEM), X-ray powder diffraction (XRD), N2 adsorption measurements, Fourier
transform infrared spectroscopy (FTIR), thermogravimetric analysis (TGA), X-ray
photoelectron spectroscopy (XPS) and inverse gas chromatography (IGC).
5.1.1.1. SEM observations of filler particles morphology
Scanning electron microscopy micrographs at various magnifications (Figure 17 a-l)
revealed that the layers of cationic clays (NAT HEC, SYN HEC) and synthetic anionic clays
LDH (HT, LDH30, LDH63 and LDH70) possessed different shapes, layers and
dimensionalities and formed highly agglomerated structures. The agglomeration tendency of
the layered particles was due to the strong electrostatic attraction between the sheets and
interlayer anions because of the surface charge density. The particle morphologies of NAT
HEC and SYN HEC were quite similar, however, the thickness of the layers of NAT HEC
(ranging from 20 to 30 nm) was slightly smaller than that of SYN HEC (30-50 nm). As shown
in Figure 17 b, in addition to the layers of NAT HEC, single crystals of another phase were
observed, most likely calcite and dolomite because a highly complex combination of calcium-
, magnesium- and carbonate-rich minerals is typically present in hectorite due to its natural
origin. The aspect ratio of the platelets of both cationic minerals was high, the lateral
dimensions were several hundred times greater than the thickness of a single plate.
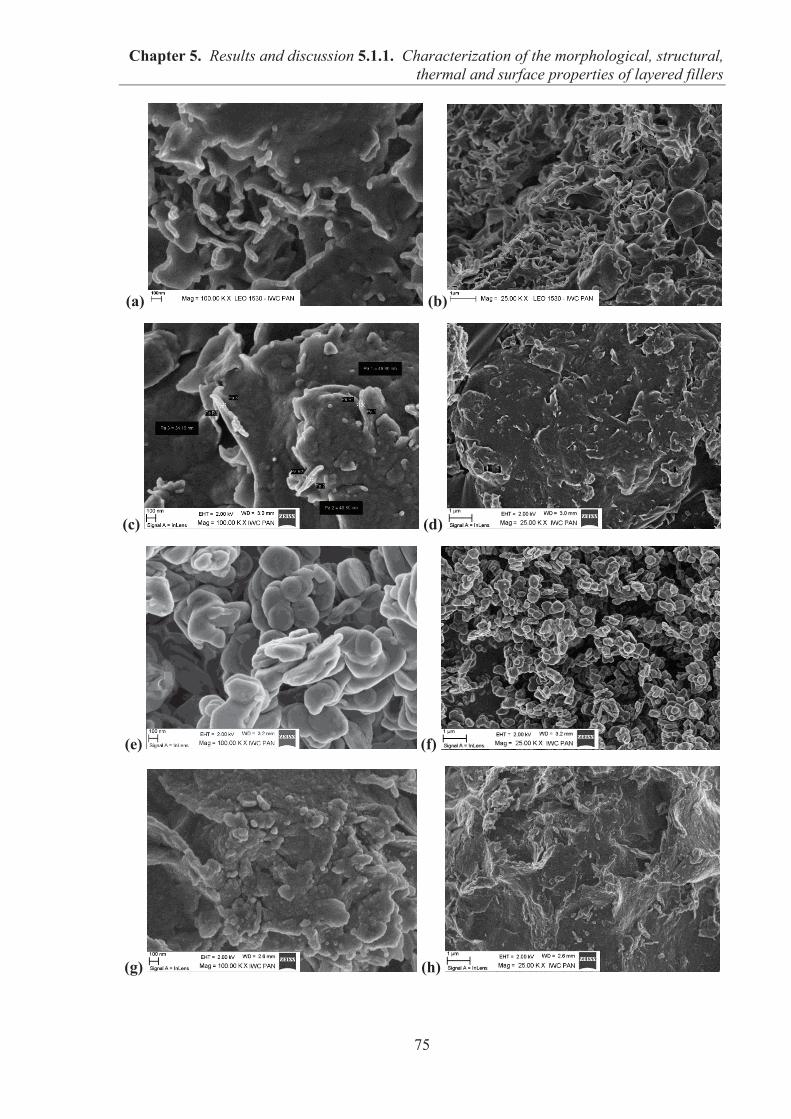
Chapter 5. Results and discussion 5.1.1. Characterization of the morphological, structural, thermal and surface properties of layered fillers
75
(a) (b)
(c) (d)
(e) (f)
(g) (h)
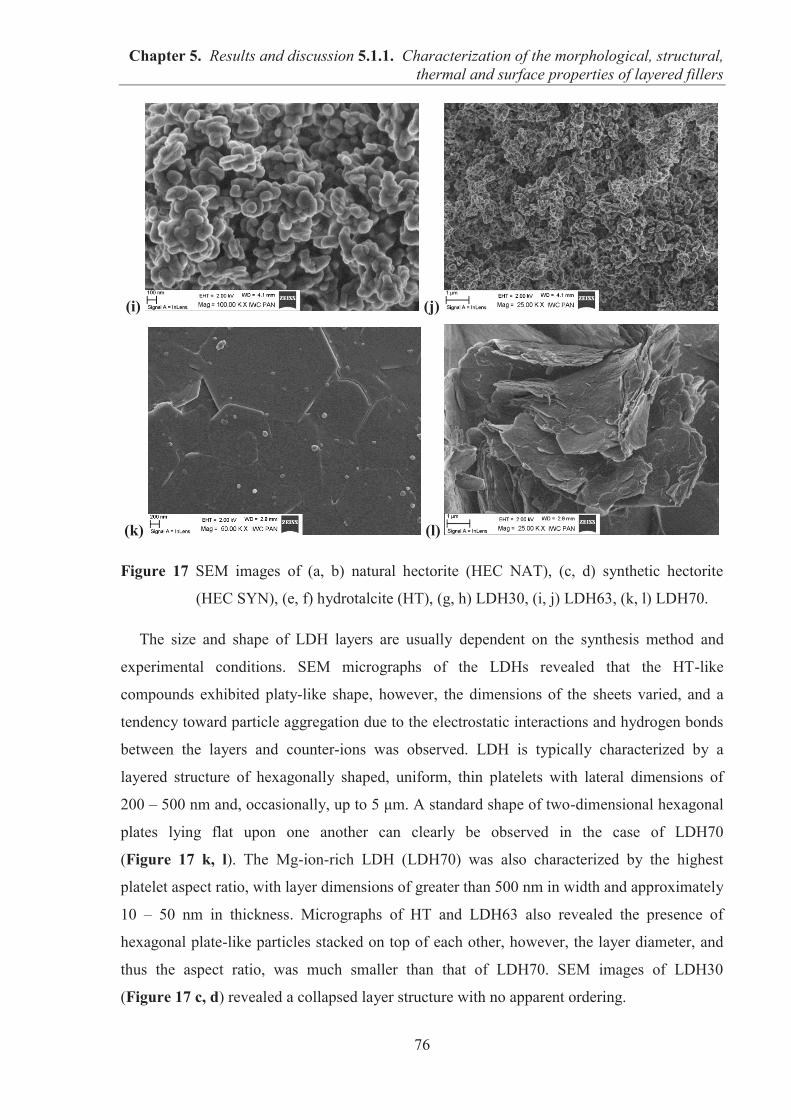
Chapter 5. Results and discussion 5.1.1. Characterization of the morphological, structural, thermal and surface properties of layered fillers
76
(i) (j)
(k) (l)
Figure 17 SEM images of (a, b) natural hectorite (HEC NAT), (c, d) synthetic hectorite
(HEC SYN), (e, f) hydrotalcite (HT), (g, h) LDH30, (i, j) LDH63, (k, l) LDH70.
The size and shape of LDH layers are usually dependent on the synthesis method and
experimental conditions. SEM micrographs of the LDHs revealed that the HT-like
compounds exhibited platy-like shape, however, the dimensions of the sheets varied, and a
tendency toward particle aggregation due to the electrostatic interactions and hydrogen bonds
between the layers and counter-ions was observed. LDH is typically characterized by a
layered structure of hexagonally shaped, uniform, thin platelets with lateral dimensions of
200 – 500 nm and, occasionally, up to 5 μm. A standard shape of two-dimensional hexagonal
plates lying flat upon one another can clearly be observed in the case of LDH70
(Figure 17 k, l). The Mg-ion-rich LDH (LDH70) was also characterized by the highest
platelet aspect ratio, with layer dimensions of greater than 500 nm in width and approximately
10 – 50 nm in thickness. Micrographs of HT and LDH63 also revealed the presence of
hexagonal plate-like particles stacked on top of each other, however, the layer diameter, and
thus the aspect ratio, was much smaller than that of LDH70. SEM images of LDH30
(Figure 17 c, d) revealed a collapsed layer structure with no apparent ordering.
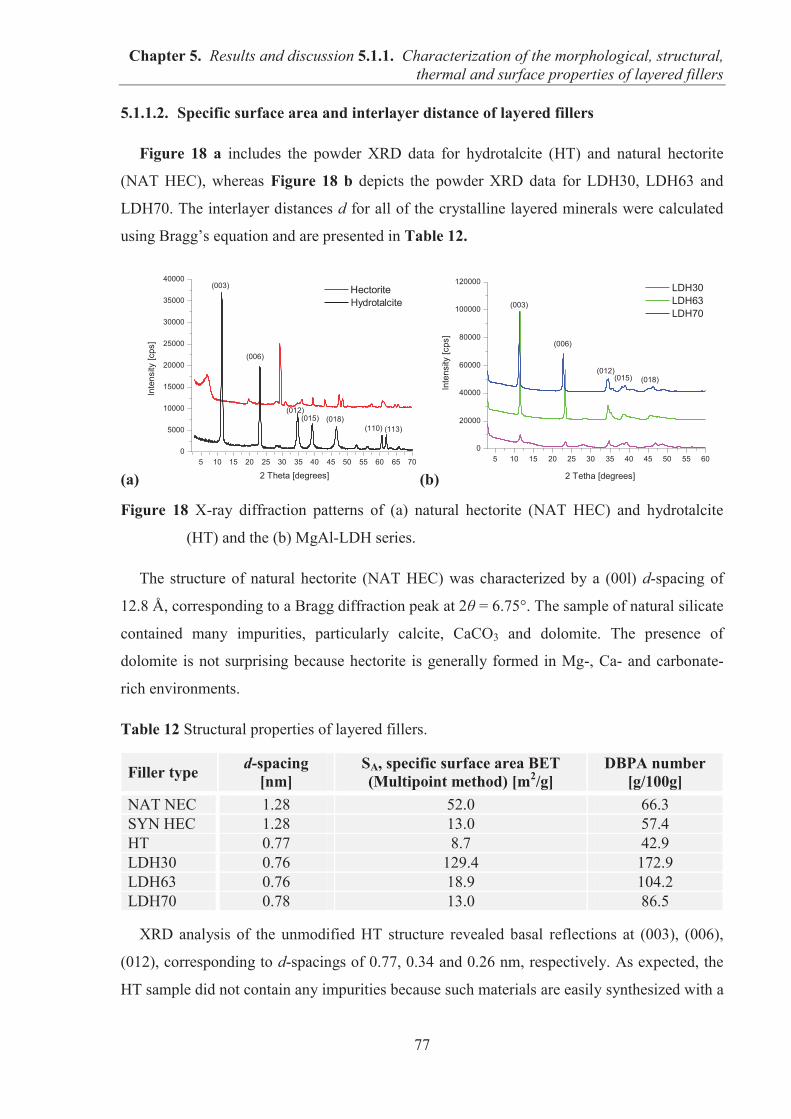
Chapter 5. Results and discussion 5.1.1. Characterization of the morphological, structural, thermal and surface properties of layered fillers
77
5.1.1.2. Specific surface area and interlayer distance of layered fillers
Figure 18 a includes the powder XRD data for hydrotalcite (HT) and natural hectorite
(NAT HEC), whereas Figure 18 b depicts the powder XRD data for LDH30, LDH63 and
LDH70. The interlayer distances d for all of the crystalline layered minerals were calculated
using Bragg’s equation and are presented in Table 12.
(a) (b)
Figure 18 X-ray diffraction patterns of (a) natural hectorite (NAT HEC) and hydrotalcite
(HT) and the (b) MgAl-LDH series.
The structure of natural hectorite (NAT HEC) was characterized by a (00l) d-spacing of
12.8 Å, corresponding to a Bragg diffraction peak at 2θ = 6.75°. The sample of natural silicate
contained many impurities, particularly calcite, CaCO3 and dolomite. The presence of
dolomite is not surprising because hectorite is generally formed in Mg-, Ca- and carbonate-
rich environments.
Table 12 Structural properties of layered fillers.
Filler type d-spacing [nm]
SA, specific surface area BET (Multipoint method) [m2/g]
DBPA number [g/100g]
NAT NEC 1.28 52.0 66.3 SYN HEC 1.28 13.0 57.4 HT 0.77 8.7 42.9 LDH30 0.76 129.4 172.9 LDH63 0.76 18.9 104.2 LDH70 0.78 13.0 86.5
XRD analysis of the unmodified HT structure revealed basal reflections at (003), (006),
(012), corresponding to d-spacings of 0.77, 0.34 and 0.26 nm, respectively. As expected, the
HT sample did not contain any impurities because such materials are easily synthesized with a
5 10 15 20 25 30 35 40 45 50 55 60 65 700
5000
10000
15000
20000
25000
30000
35000
40000
(015) (018)
Inte
nsity
[cps
]
2 Theta [degrees]
Hectorite Hydrotalcite
(003)
(006)
(012)
(110) (113)
5 10 15 20 25 30 35 40 45 50 55 600
20000
40000
60000
80000
100000
120000
(018)(015)(012)
(006)
(003)
Inte
nsity
[cps
]
2 Tetha [degrees]
LDH30 LDH63 LDH70
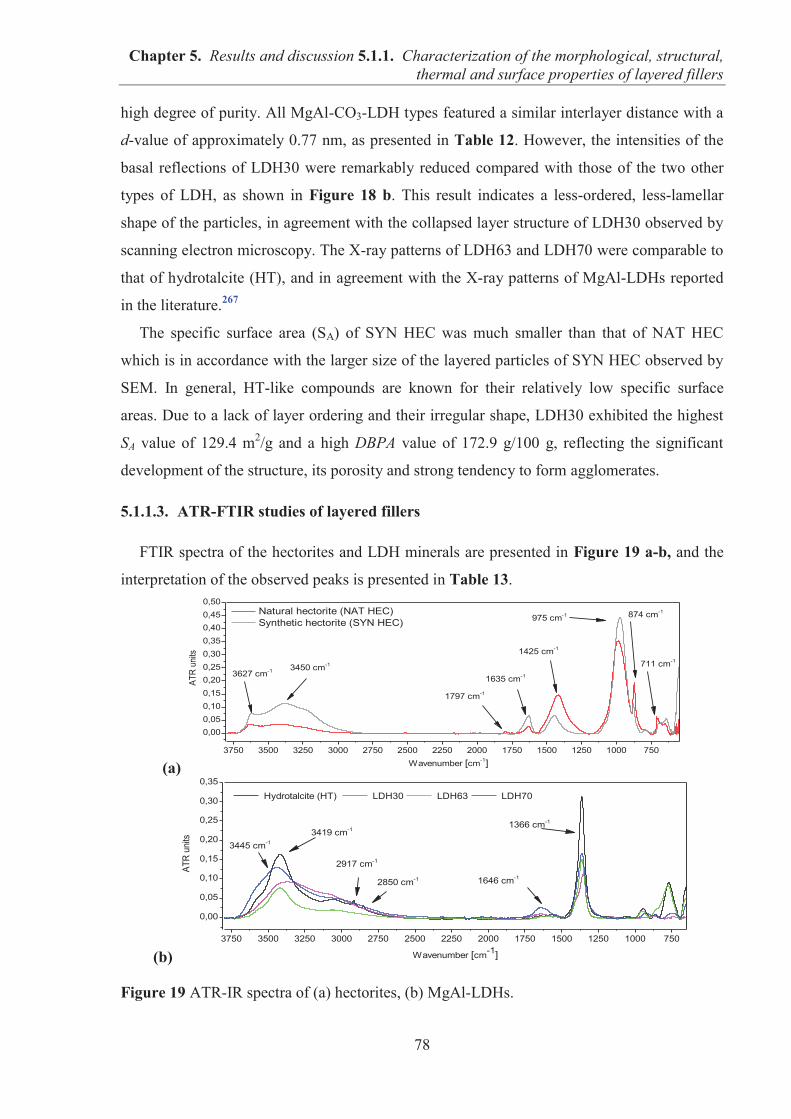
Chapter 5. Results and discussion 5.1.1. Characterization of the morphological, structural, thermal and surface properties of layered fillers
78
high degree of purity. All MgAl-CO3-LDH types featured a similar interlayer distance with a
d-value of approximately 0.77 nm, as presented in Table 12. However, the intensities of the
basal reflections of LDH30 were remarkably reduced compared with those of the two other
types of LDH, as shown in Figure 18 b. This result indicates a less-ordered, less-lamellar
shape of the particles, in agreement with the collapsed layer structure of LDH30 observed by
scanning electron microscopy. The X-ray patterns of LDH63 and LDH70 were comparable to
that of hydrotalcite (HT), and in agreement with the X-ray patterns of MgAl-LDHs reported
in the literature.267
The specific surface area (SA) of SYN HEC was much smaller than that of NAT HEC
which is in accordance with the larger size of the layered particles of SYN HEC observed by
SEM. In general, HT-like compounds are known for their relatively low specific surface
areas. Due to a lack of layer ordering and their irregular shape, LDH30 exhibited the highest
SA value of 129.4 m2/g and a high DBPA value of 172.9 g/100 g, reflecting the significant
development of the structure, its porosity and strong tendency to form agglomerates.
5.1.1.3. ATR-FTIR studies of layered fillers
FTIR spectra of the hectorites and LDH minerals are presented in Figure 19 a-b, and the
interpretation of the observed peaks is presented in Table 13.
(a)
(b)
Figure 19 ATR-IR spectra of (a) hectorites, (b) MgAl-LDHs.
3750 3500 3250 3000 2750 2500 2250 2000 1750 1500 1250 1000 750
0,000,050,100,150,200,250,300,350,400,450,50
711 cm-1
874 cm-1
3627 cm-1 3450 cm-1
1797 cm-1
975 cm-1
ATR
units
Wavenumber [cm-1]
Natural hectorite (NAT HEC) Synthetic hectorite (SYN HEC)
1635 cm-1
1425 cm-1
3750 3500 3250 3000 2750 2500 2250 2000 1750 1500 1250 1000 750
0,00
0,05
0,10
0,15
0,20
0,25
0,30
0,35
ATR
units
Wavenumber [cm-1]
Hydrotalcite (HT) LDH30 LDH63 LDH70
3419 cm-1
2917 cm-1
2850 cm-1
1366 cm-1
3445 cm-1
1646 cm-1
Chapter 5. Results and discussion 5.1.1. Characterization of the morphological, structural, thermal and surface properties of layered fillers
79
The FTIR spectra presented in Figure 19 a reveal that both types of hectorites exhibited
the same characteristic bands at corresponding wavelengths, although their intensities differ
slightly. For example, the intensity of the band corresponding to the stretching of the O–H
group derived from adsorbed water was higher for SYN HEC than NAT HEC, whereas the
higher intensity of the peak at 1425 cm-1, assigned to the impurities like quartz,41 was
characteristic of natural silicate (NAT HEC), but also for synthetic hectorite. Moreover, in the
spectrum of NAT HEC, a band at 1797 cm-1 due to the presence of calcite was observed. The
FTIR data for the hectorites were in good agreement with those reported in the literature.41
Table 13 Assignment of FT-IR spectra of hectorite and hydrotalcite.
Wavenumber [cm-1] Assignment
HE
CT
OR
ITE
3627 Stretching of O–H 3450 H2O OH stretching 1797 Calcite
1650 – 1620 H2O deformation (bending vibration), bending vibration of the interlayer
1640 –Mg–O41 975 Si–O stretch 874 Calcite CO3 bend 711 Calcite 655 Bending vibration of –OH attached to Mg41
HY
DR
OT
AL
CIT
E
3600 – 3200 Stretching of O–H H2O, O–H stretching vibration of the surface and interlayer water molecules
Shoulder at 3000
Hydrogen bonding between water and carbonate anions in the interlayer galleries
2917 Asymmetric stretching of methylene groups 2850 Symmetric stretching of methylene groups
1650 – 1620 H2O deformation (bending vibration), bending vibration of the interlayer water molecules (δ(HOH))
1366 Asymmetric stretching of carbonate counter-ions CO32–
943 Doublet “Al–OH” deformation or asymmetric stretching of carbonate counter-ions CO3
2– 782 Stretching of M–OH, Al–O, Mg–Al–O bond
vibrations in the brucite-like layer 670 – 620 Bending vibrations of carbonate bonds
As shown in Figure 19 b, all MgAl-LDHs exhibited a broad, strong band in the range of
3600 – 3200 cm-1, which is characteristic of the O–H stretching modes of the surface and
interlayer water molecules. The broad shoulder near 3000 cm-1 visible in Figure 19 b is due
Chapter 5. Results and discussion 5.1.1. Characterization of the morphological, structural, thermal and surface properties of layered fillers
80
to hydrogen bonding between water and CO32– counter-ions in the interlayer galleries. The
high peak located at approximately 1366 cm-1 was assigned to the asymmetric stretching
vibration of CO32– counter-ions in the interlayer galleries. HT exhibited the strongest
1366 cm-1 peak, whereas the intensity of this band was comparable among the remaining
LDHs. The peak located at approximately 782 cm-1 was assigned to the Al–O or Mg–Al–O
bond. The FTIR data for the LDH layered minerals were also in good agreement with those
reported in the literature.268
5.1.1.4. Thermal stability of layered fillers
The thermal stability of the layered minerals was determined by TGA in air, and the
recorded data are presented in Table 14. The TGA profiles and the differential curves (DTG)
of the layered minerals are shown in Figure 20 a-b. Due to the substantial amount of partially
intercalated water molecules in the interlayers of the clay materials, a characteristic weight
loss peak is typically observed at approximately 100 °C, however, this peak was observed
only for the cationic clays (hectorites). The first mass loss (ML) below 200 °C corresponding
to the loss of partially intercalated water molecules was reported to occur at levels of 7.0 and
3.9 % by weight for SYN HEC and NAT HEC, respectively. This result indicates that the
SYN HEC contained a higher percentage of interlayer water and water adsorbed on the
external surfaces of the cationic clay than NAT HEC. The shape of the TGA curves revealed
that NAT HEC had the highest thermal stability among the investigated types of mineral
layered fillers. The decomposition temperature of synthetic hectorite was slightly lower than
that of natural one at corresponding weight loss (ML) values.
Table 14 Thermal stability of layered fillers.
Filler type T2% [°C]
T5% [°C]
T10% [°C]
ML at 200° °C
[wt%]
ML at 400° °C
[wt%]
Char residue [wt%]
NAT HEC 84 592 720 3.9 4.5 78 SYN HEC 85 125 600 7.0 8.3 81 HT 165 216 240 3.8 29.8 54 LDH30 94 153 219 7.5 24.8 66 LDH63 150 202 232 4.8 29.4 54 LDH70 135 186 226 6.3 26.1 56
The thermal stability of LDHs typically depends on several factors, such as the nature of
the cation, the cationic composition in the brucite-like layers, the nature of the interlayer
anions, and crystallinity. Similar to the cationic clays, the first weight loss in the temperature
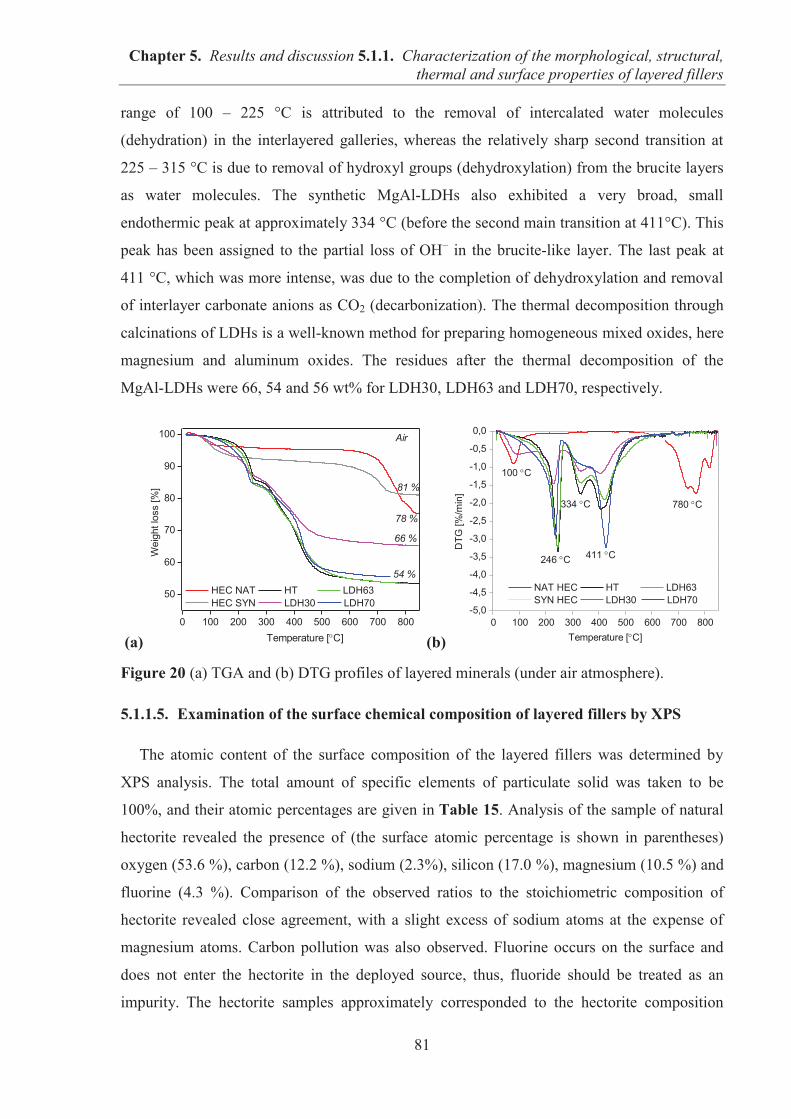
Chapter 5. Results and discussion 5.1.1. Characterization of the morphological, structural, thermal and surface properties of layered fillers
81
range of 100 – 225 °C is attributed to the removal of intercalated water molecules
(dehydration) in the interlayered galleries, whereas the relatively sharp second transition at
225 – 315 °C is due to removal of hydroxyl groups (dehydroxylation) from the brucite layers
as water molecules. The synthetic MgAl-LDHs also exhibited a very broad, small
endothermic peak at approximately 334 °C (before the second main transition at 411°C). This
peak has been assigned to the partial loss of OH– in the brucite-like layer. The last peak at
411 °C, which was more intense, was due to the completion of dehydroxylation and removal
of interlayer carbonate anions as CO2 (decarbonization). The thermal decomposition through
calcinations of LDHs is a well-known method for preparing homogeneous mixed oxides, here
magnesium and aluminum oxides. The residues after the thermal decomposition of the
MgAl-LDHs were 66, 54 and 56 wt% for LDH30, LDH63 and LDH70, respectively.
(a) (b)
Figure 20 (a) TGA and (b) DTG profiles of layered minerals (under air atmosphere).
5.1.1.5. Examination of the surface chemical composition of layered fillers by XPS
The atomic content of the surface composition of the layered fillers was determined by
XPS analysis. The total amount of specific elements of particulate solid was taken to be
100%, and their atomic percentages are given in Table 15. Analysis of the sample of natural
hectorite revealed the presence of (the surface atomic percentage is shown in parentheses)
oxygen (53.6 %), carbon (12.2 %), sodium (2.3%), silicon (17.0 %), magnesium (10.5 %) and
fluorine (4.3 %). Comparison of the observed ratios to the stoichiometric composition of
hectorite revealed close agreement, with a slight excess of sodium atoms at the expense of
magnesium atoms. Carbon pollution was also observed. Fluorine occurs on the surface and
does not enter the hectorite in the deployed source, thus, fluoride should be treated as an
impurity. The hectorite samples approximately corresponded to the hectorite composition
0 100 200 300 400 500 600 700 800
50
60
70
80
90
100
78 %
81 %
Air
54 %
Wei
ght l
oss
[%]
Temperature [ C]
HEC NAT HT LDH63 HEC SYN LDH30 LDH70
66 %
0 100 200 300 400 500 600 700 800-5,0
-4,5
-4,0
-3,5
-3,0
-2,5
-2,0
-1,5
-1,0
-0,5
0,0
780 C
411 C
334 C
246 C
100 CD
TG [%
/min
]
Temperature [ C]
NAT HEC HT LDH63 SYN HEC LDH30 LDH70
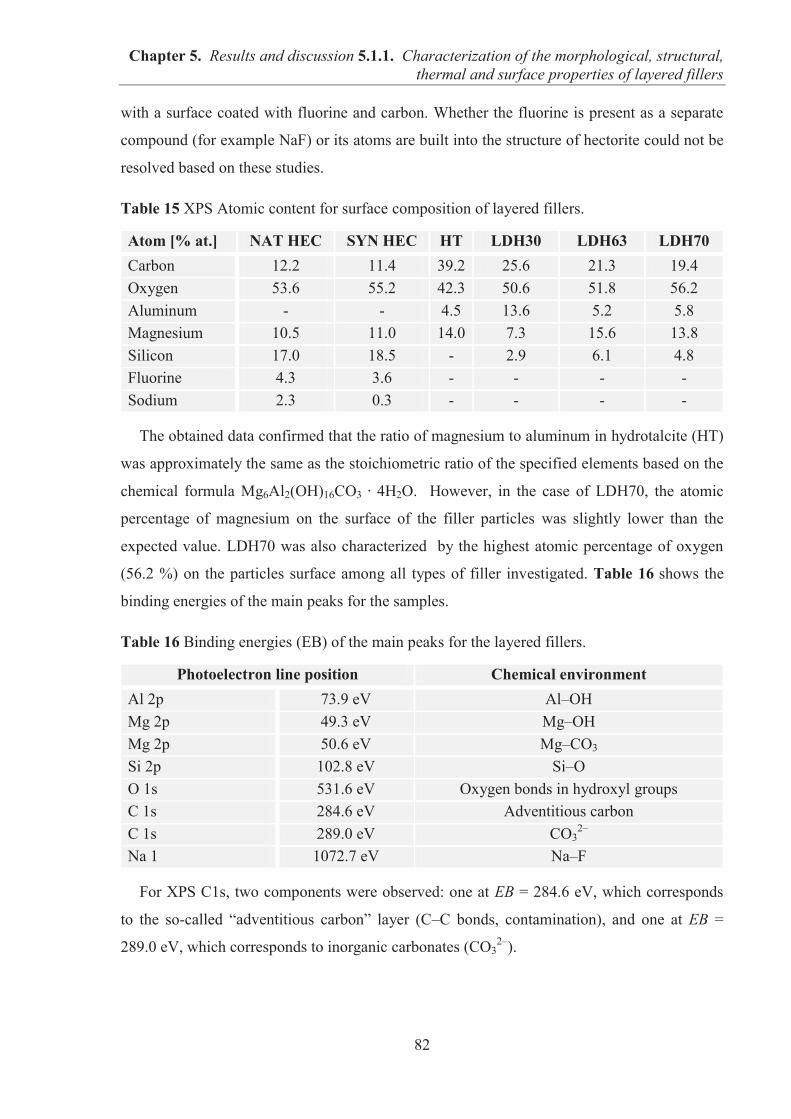
Chapter 5. Results and discussion 5.1.1. Characterization of the morphological, structural, thermal and surface properties of layered fillers
82
with a surface coated with fluorine and carbon. Whether the fluorine is present as a separate
compound (for example NaF) or its atoms are built into the structure of hectorite could not be
resolved based on these studies.
Table 15 XPS Atomic content for surface composition of layered fillers.
Atom [% at.] NAT HEC SYN HEC HT LDH30 LDH63 LDH70 Carbon 12.2 11.4 39.2 25.6 21.3 19.4 Oxygen 53.6 55.2 42.3 50.6 51.8 56.2 Aluminum - - 4.5 13.6 5.2 5.8 Magnesium 10.5 11.0 14.0 7.3 15.6 13.8 Silicon 17.0 18.5 - 2.9 6.1 4.8 Fluorine 4.3 3.6 - - - - Sodium 2.3 0.3 - - - -
The obtained data confirmed that the ratio of magnesium to aluminum in hydrotalcite (HT)
was approximately the same as the stoichiometric ratio of the specified elements based on the
chemical formula Mg6Al2(OH)16CO3 · 4H2O. However, in the case of LDH70, the atomic
percentage of magnesium on the surface of the filler particles was slightly lower than the
expected value. LDH70 was also characterized by the highest atomic percentage of oxygen
(56.2 %) on the particles surface among all types of filler investigated. Table 16 shows the
binding energies of the main peaks for the samples.
Table 16 Binding energies (EB) of the main peaks for the layered fillers.
Photoelectron line position Chemical environment Al 2p 73.9 eV Al–OH Mg 2p 49.3 eV Mg–OH Mg 2p 50.6 eV Mg–CO3
Si 2p 102.8 eV Si–O O 1s 531.6 eV Oxygen bonds in hydroxyl groups C 1s 284.6 eV Adventitious carbon C 1s 289.0 eV CO3
2– Na 1 1072.7 eV Na–F
For XPS C1s, two components were observed: one at EB = 284.6 eV, which corresponds
to the so-called “adventitious carbon” layer (C–C bonds, contamination), and one at EB =
289.0 eV, which corresponds to inorganic carbonates (CO32–).
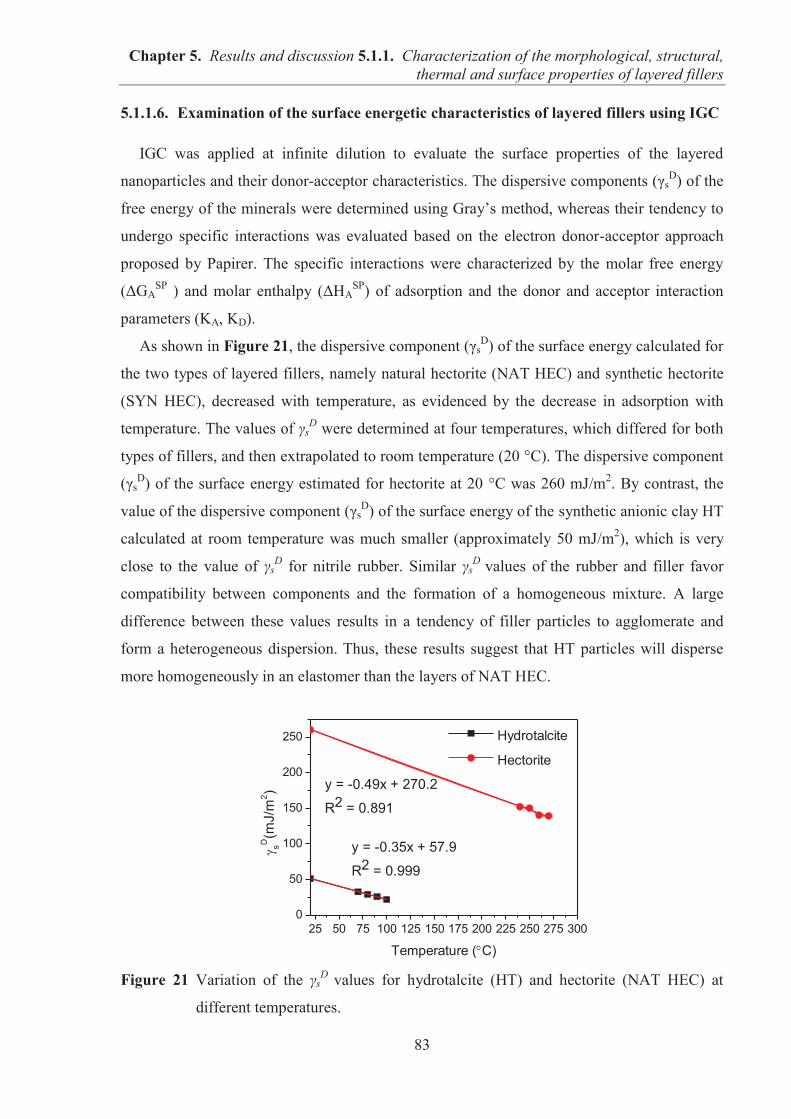
Chapter 5. Results and discussion 5.1.1. Characterization of the morphological, structural, thermal and surface properties of layered fillers
83
5.1.1.6. Examination of the surface energetic characteristics of layered fillers using IGC
IGC was applied at infinite dilution to evaluate the surface properties of the layered
nanoparticles and their donor-acceptor characteristics. The dispersive components (γsD) of the
free energy of the minerals were determined using Gray’s method, whereas their tendency to
undergo specific interactions was evaluated based on the electron donor-acceptor approach
proposed by Papirer. The specific interactions were characterized by the molar free energy
(ΔGASP ) and molar enthalpy (ΔHA
SP) of adsorption and the donor and acceptor interaction
parameters (KA, KD).
As shown in Figure 21, the dispersive component (γsD) of the surface energy calculated for
the two types of layered fillers, namely natural hectorite (NAT HEC) and synthetic hectorite
(SYN HEC), decreased with temperature, as evidenced by the decrease in adsorption with
temperature. The values of γsD were determined at four temperatures, which differed for both
types of fillers, and then extrapolated to room temperature (20 °C). The dispersive component
(γsD) of the surface energy estimated for hectorite at 20 °C was 260 mJ/m2. By contrast, the
value of the dispersive component (γsD) of the surface energy of the synthetic anionic clay HT
calculated at room temperature was much smaller (approximately 50 mJ/m2), which is very
close to the value of γsD for nitrile rubber. Similar γs
D values of the rubber and filler favor
compatibility between components and the formation of a homogeneous mixture. A large
difference between these values results in a tendency of filler particles to agglomerate and
form a heterogeneous dispersion. Thus, these results suggest that HT particles will disperse
more homogeneously in an elastomer than the layers of NAT HEC.
Figure 21 Variation of the γsD values for hydrotalcite (HT) and hectorite (NAT HEC) at
different temperatures.
25 50 75 100 125 150 175 200 225 250 275 3000
50
100
150
200
250
y = -0.49x + 270.2
R2 = 0.891
sD(m
J/m
2 )
Temperature ( C)
Hydrotalcite
Hectorite
y = -0.35x + 57.9
R2 = 0.999
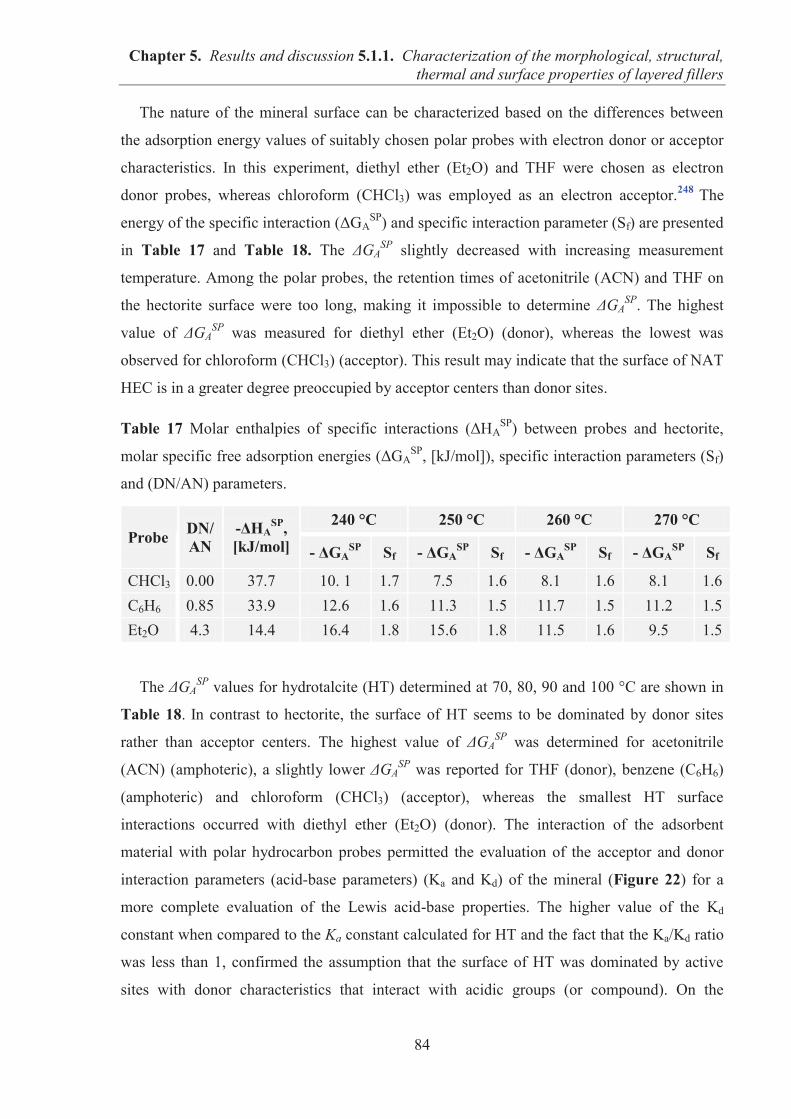
Chapter 5. Results and discussion 5.1.1. Characterization of the morphological, structural, thermal and surface properties of layered fillers
84
The nature of the mineral surface can be characterized based on the differences between
the adsorption energy values of suitably chosen polar probes with electron donor or acceptor
characteristics. In this experiment, diethyl ether (Et2O) and THF were chosen as electron
donor probes, whereas chloroform (CHCl3) was employed as an electron acceptor.248 The
energy of the specific interaction (ΔGASP) and specific interaction parameter (Sf) are presented
in Table 17 and Table 18. The ΔGASP slightly decreased with increasing measurement
temperature. Among the polar probes, the retention times of acetonitrile (ACN) and THF on
the hectorite surface were too long, making it impossible to determine ΔGASP. The highest
value of ΔGASP was measured for diethyl ether (Et2O) (donor), whereas the lowest was
observed for chloroform (CHCl3) (acceptor). This result may indicate that the surface of NAT
HEC is in a greater degree preoccupied by acceptor centers than donor sites.
Table 17 Molar enthalpies of specific interactions (ΔHASP) between probes and hectorite,
molar specific free adsorption energies (ΔGASP, [kJ/mol]), specific interaction parameters (Sf)
and (DN/AN) parameters.
Probe DN/ AN
-ΔHASP,
[kJ/mol]
240 °C 250 °C 260 °C 270 °C
- ΔGASP Sf - ΔGA
SP Sf - ΔGASP Sf - ΔGA
SP Sf
CHCl3 0.00 37.7 10. 1 1.7 7.5 1.6 8.1 1.6 8.1 1.6 C6H6 0.85 33.9 12.6 1.6 11.3 1.5 11.7 1.5 11.2 1.5 Et2O 4.3 14.4 16.4 1.8 15.6 1.8 11.5 1.6 9.5 1.5
The ΔGASP values for hydrotalcite (HT) determined at 70, 80, 90 and 100 °C are shown in
Table 18. In contrast to hectorite, the surface of HT seems to be dominated by donor sites
rather than acceptor centers. The highest value of ΔGASP was determined for acetonitrile
(ACN) (amphoteric), a slightly lower ΔGASP was reported for THF (donor), benzene (C6H6)
(amphoteric) and chloroform (CHCl3) (acceptor), whereas the smallest HT surface
interactions occurred with diethyl ether (Et2O) (donor). The interaction of the adsorbent
material with polar hydrocarbon probes permitted the evaluation of the acceptor and donor
interaction parameters (acid-base parameters) (Ka and Kd) of the mineral (Figure 22) for a
more complete evaluation of the Lewis acid-base properties. The higher value of the Kd
constant when compared to the Ka constant calculated for HT and the fact that the Ka/Kd ratio
was less than 1, confirmed the assumption that the surface of HT was dominated by active
sites with donor characteristics that interact with acidic groups (or compound). On the
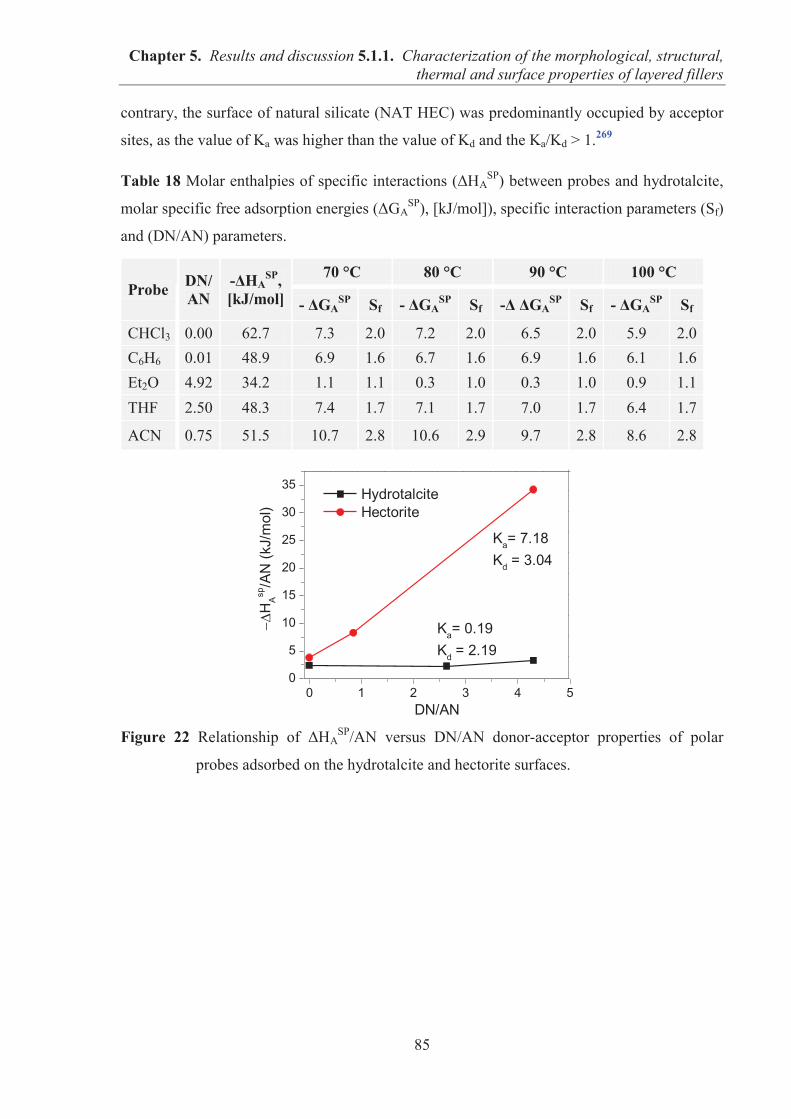
Chapter 5. Results and discussion 5.1.1. Characterization of the morphological, structural, thermal and surface properties of layered fillers
85
contrary, the surface of natural silicate (NAT HEC) was predominantly occupied by acceptor
sites, as the value of Ka was higher than the value of Kd and the Ka/Kd > 1.269
Table 18 Molar enthalpies of specific interactions (ΔHASP) between probes and hydrotalcite,
molar specific free adsorption energies (ΔGASP), [kJ/mol]), specific interaction parameters (Sf)
and (DN/AN) parameters.
Probe DN/ AN
-ΔHASP,
[kJ/mol]
70 °C 80 °C 90 °C 100 °C
- ΔGASP Sf - ΔGA
SP Sf -Δ ΔGASP Sf - ΔGA
SP Sf
CHCl3 0.00 62.7 7.3 2.0 7.2 2.0 6.5 2.0 5.9 2.0 C6H6 0.01 48.9 6.9 1.6 6.7 1.6 6.9 1.6 6.1 1.6 Et2O 4.92 34.2 1.1 1.1 0.3 1.0 0.3 1.0 0.9 1.1 THF 2.50 48.3 7.4 1.7 7.1 1.7 7.0 1.7 6.4 1.7
ACN 0.75 51.5 10.7 2.8 10.6 2.9 9.7 2.8 8.6 2.8
Figure 22 Relationship of ΔHASP/AN versus DN/AN donor-acceptor properties of polar
probes adsorbed on the hydrotalcite and hectorite surfaces.
0 1 2 3 4 50
5
10
15
20
25
30
35
HAsp
/AN
(kJ/
mol
)
DN/AN
Hydrotalcite Hectorite
Ka= 0.19Kd = 2.19
Ka= 7.18 Kd = 3.04
Chapter 5. Results and discussion 5.1.1. Characterization of the morphological, structural, thermal and surface properties of layered fillers
86
5.1.1.7. Conclusions
The investigated types of hectorites (natural hectorite and synthetic hectorite) were
hydrophilic with high sorption capacities and displayed high decomposition temperatures
(approximately 750 °C). The natural silicate was characterized by a high specific surface area
(SA) of 52 m2/g, whereas the synthetic hectorite possessed a much lower specific surface area
(SA) of 13 m2/g. Both types of cationic clays exhibited similar particle morphologies and layer
dimensionalities, as determined by SEM. XPS revealed that the surface chemical
compositions of the hectorites were comparable, as evidenced by the similar surface atomic
percentages of specific elements. Only the surface of synthetic silicate was characterized by a
higher atomic percentage of oxygen and magnesium and lack of sodium in its composition.
Moreover, FTIR analysis showed that when comparing both hectorites, the surface of
synthetic hectorite contained a higher level of adsorbed water and interlayer water molecules,
as evidenced by which provided a characteristic band in the range of 3600-3200 cm-1. The
natural silicate was most likely contaminated with mixtures of other minerals such as calcite
and dolomite. The surface of NAT HEC was acidic, and acceptor centers were predominant.
The dispersive component of the surface energy (γsD) was very high (approximately 260
mJ/m2) at 20 °C. In contrast to the cationic clay, the surface of hydrotalcite (HT) was
dominated by active sites with donor characteristics. Moreover, the dispersive component of
the surface energy (γsD) calculated for the synthetic anionic clay was approximately 50 mJ/m2
at 20 °C. The layered particles of HT were much smaller than those of the cationic clays,
however, the specific surface area of HT was also quite small (8.7 m2/g). The particle size,
morphology and the specific surface area (SA) varied depending on the type of MgAl-LDH.
The particles size and shape as well as the surface characteristics of HT were comparable to
those of LDH63. Among the MgAl-LDHs, LDH70 exhibited the highest aspect ratio, with
plate-shaped hexagonal layers. LDH30 exhibited a high specific surface area of 124 m2/g and
a high sorption capacity, however, SEM analysis of its particle morphology revealed a
collapsed layer structure that exhibited a small degree of order confirmed by XRD studies.
The MgAl-LDHs were much less thermally stable than the silicates, and LDHs underwent
thermal decomposition in several steps, leading to the formation of a mixture of metal oxides
known as “calcined LDH”.
Chapter 5. Results and discussion 5.1.2. The influence of hectorite and hydrotalcite on mechanical and morphological properties of NBR and XNBR
87
5.1.2. COMARPISON OF THE INFLUENCE OF HECTORITE AND
HYDROTALCITE ON MECHANICAL AND MORPHOLOGICAL
PROPERTIES OF ACRYLONITRILE-BUTADIENE RUBBER
(NBR) AND CARBOXYLATED ACRYLONITRILE-BUTADIENE
RUBBER (XNBR) COMPOSITES
INTRODUCTION: The effects of layered fillers and their loadings on the rheometric,
mechanical, morphological and thermal properties of nitrile butadiene rubber (NBR) and
carboxylated nitrile butadiene rubber (XNBR) were studied. Natural hectorite (NAT HEC),
synthetic hectorite (SYN HEC) and magnesium–aluminium layered double hydroxide
(hydrotalcite, HT) were incorporated at loadings of 5, 10, 20, 30 and 40 parts per hundred
rubber (phr).
5.1.2.1. Preparation of NBR and XNBR composites containing layered fillers
The filler and curing agents were mixed with NBR and XNBR in a laboratory two roll mill
at a temperature of approximately 40 °C. The total compounding cycle was less than 10 min.
The friction ratio of the rolling mill was 1:1.1 during the mixing period. The raw rubber was
masticated prior to the addition of filler and curative.
5.1.2.2. Curing studies and crosslink densities of NBR and XNBR composites
Table 19 and Table 20 present the influence of the layered fillers on the torque parameters
of the NBR and XNBR gum vulcanizates. The cure rate index (CRI) is a measurement of the
vulcanization rate based on the difference between the optimum cure time (t90) and the
incipient scorch time (tΔ2) at which vulcanization begins. The incorporation of minerals
increased the optimum cure time (t90) and lowered the CRI of the NBR composites compared
to the control NBR sample (without filler). At higher filler loadings, the rate of crosslinking
(CRI) remarkably decreased, particularly for the sample filled with HT. The increase in t90
may be attributable to the absorption of the curative substance on the filler surface. The
scorch time (tΔ2) of the NBR composites remained almost unchanged in the presence of
fillers. Increased loadings of HT and SYN HEC tended to slightly decrease the number of
crosslinks formed during the vulcanization of NBR.
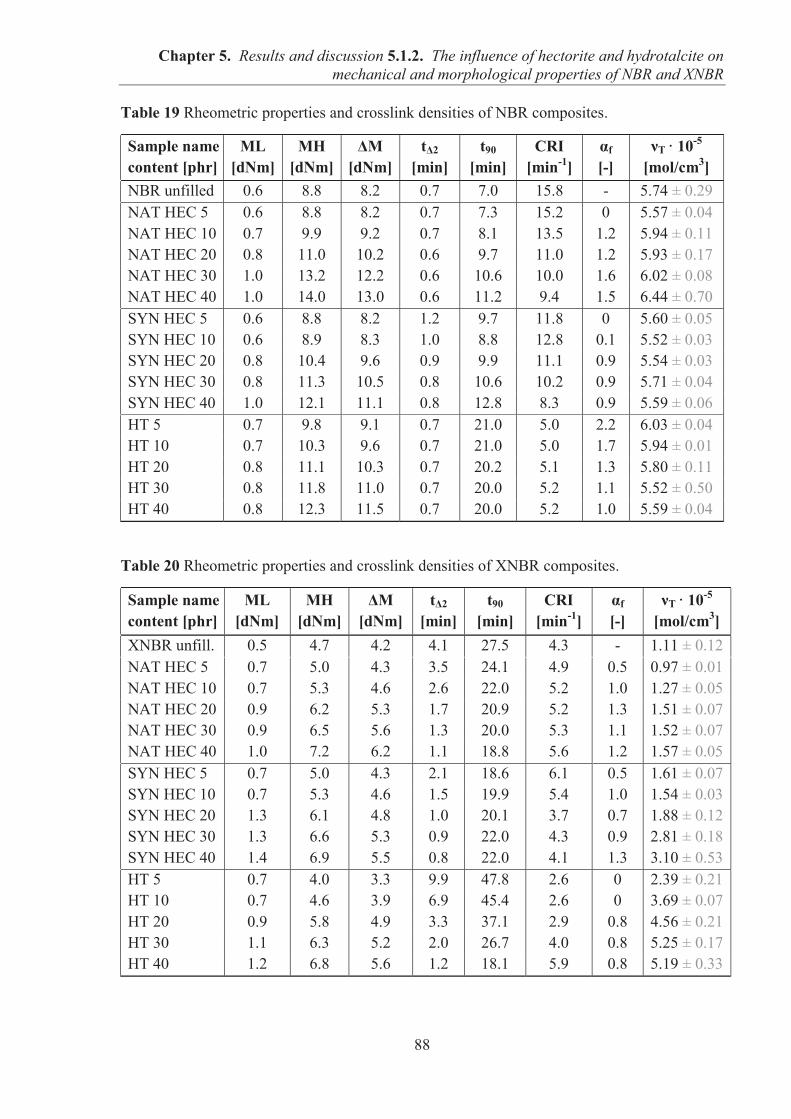
Chapter 5. Results and discussion 5.1.2. The influence of hectorite and hydrotalcite on mechanical and morphological properties of NBR and XNBR
88
Table 19 Rheometric properties and crosslink densities of NBR composites.
Sample name content [phr]
ML
[dNm] MH
[dNm] ΔM
[dNm] tΔ2
[min] t90
[min] CRI
[min-1] αf [-]
νT · 10-5 [mol/cm3]
NBR unfilled 0.6 8.8 8.2 0.7 7.0 15.8 - 5.74 ± 0.29 NAT HEC 5 0.6 8.8 8.2 0.7 7.3 15.2 0 5.57 ± 0.04 NAT HEC 10 0.7 9.9 9.2 0.7 8.1 13.5 1.2 5.94 ± 0.11 NAT HEC 20 0.8 11.0 10.2 0.6 9.7 11.0 1.2 5.93 ± 0.17 NAT HEC 30 1.0 13.2 12.2 0.6 10.6 10.0 1.6 6.02 ± 0.08 NAT HEC 40 1.0 14.0 13.0 0.6 11.2 9.4 1.5 6.44 ± 0.70 SYN HEC 5 0.6 8.8 8.2 1.2 9.7 11.8 0 5.60 ± 0.05 SYN HEC 10 0.6 8.9 8.3 1.0 8.8 12.8 0.1 5.52 ± 0.03 SYN HEC 20 0.8 10.4 9.6 0.9 9.9 11.1 0.9 5.54 ± 0.03 SYN HEC 30 0.8 11.3 10.5 0.8 10.6 10.2 0.9 5.71 ± 0.04 SYN HEC 40 1.0 12.1 11.1 0.8 12.8 8.3 0.9 5.59 ± 0.06 HT 5 0.7 9.8 9.1 0.7 21.0 5.0 2.2 6.03 ± 0.04 HT 10 0.7 10.3 9.6 0.7 21.0 5.0 1.7 5.94 ± 0.01 HT 20 0.8 11.1 10.3 0.7 20.2 5.1 1.3 5.80 ± 0.11 HT 30 0.8 11.8 11.0 0.7 20.0 5.2 1.1 5.52 ± 0.50 HT 40 0.8 12.3 11.5 0.7 20.0 5.2 1.0 5.59 ± 0.04
Table 20 Rheometric properties and crosslink densities of XNBR composites.
Sample name content [phr]
ML
[dNm] MH
[dNm] ΔM
[dNm] tΔ2
[min] t90
[min] CRI
[min-1] αf [-]
νT · 10-5 [mol/cm3]
XNBR unfill. 0.5 4.7 4.2 4.1 27.5 4.3 - 1.11 ± 0.12 NAT HEC 5 0.7 5.0 4.3 3.5 24.1 4.9 0.5 0.97 ± 0.01 NAT HEC 10 0.7 5.3 4.6 2.6 22.0 5.2 1.0 1.27 ± 0.05 NAT HEC 20 0.9 6.2 5.3 1.7 20.9 5.2 1.3 1.51 ± 0.07 NAT HEC 30 0.9 6.5 5.6 1.3 20.0 5.3 1.1 1.52 ± 0.07 NAT HEC 40 1.0 7.2 6.2 1.1 18.8 5.6 1.2 1.57 ± 0.05 SYN HEC 5 0.7 5.0 4.3 2.1 18.6 6.1 0.5 1.61 ± 0.07 SYN HEC 10 0.7 5.3 4.6 1.5 19.9 5.4 1.0 1.54 ± 0.03 SYN HEC 20 1.3 6.1 4.8 1.0 20.1 3.7 0.7 1.88 ± 0.12 SYN HEC 30 1.3 6.6 5.3 0.9 22.0 4.3 0.9 2.81 ± 0.18 SYN HEC 40 1.4 6.9 5.5 0.8 22.0 4.1 1.3 3.10 ± 0.53 HT 5 0.7 4.0 3.3 9.9 47.8 2.6 0 2.39 ± 0.21 HT 10 0.7 4.6 3.9 6.9 45.4 2.6 0 3.69 ± 0.07 HT 20 0.9 5.8 4.9 3.3 37.1 2.9 0.8 4.56 ± 0.21 HT 30 1.1 6.3 5.2 2.0 26.7 4.0 0.8 5.25 ± 0.17 HT 40 1.2 6.8 5.6 1.2 18.1 5.9 0.8 5.19 ± 0.33
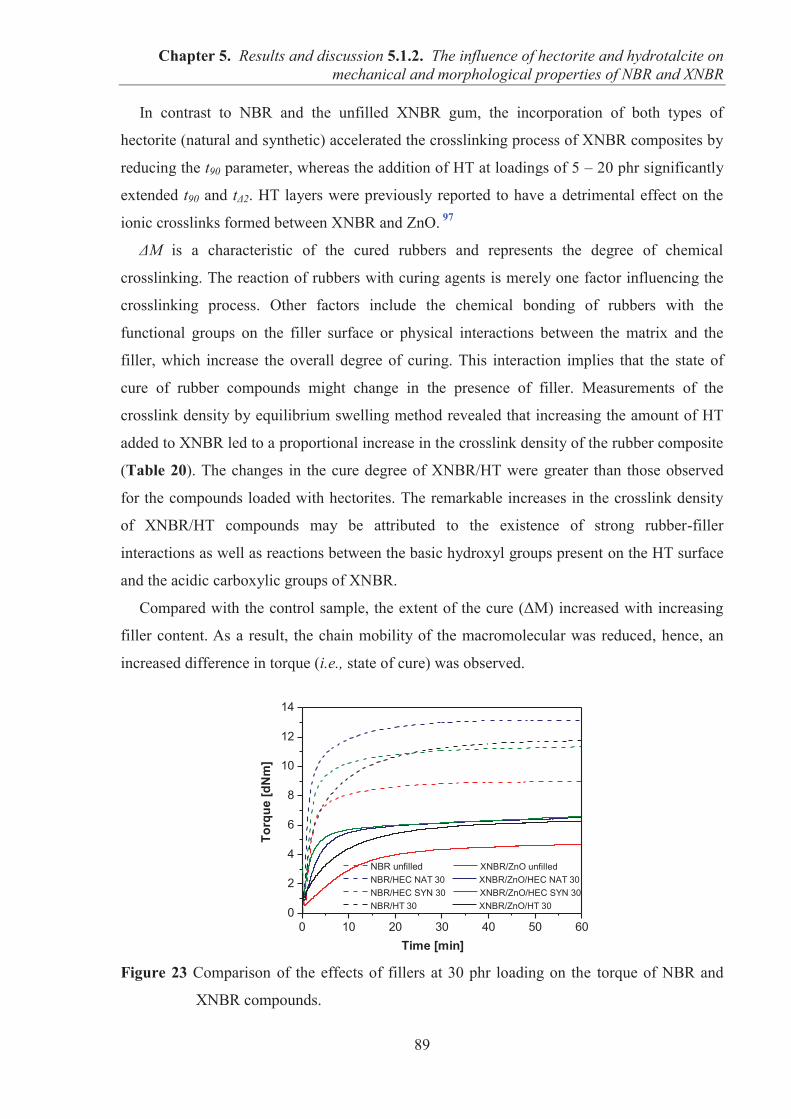
Chapter 5. Results and discussion 5.1.2. The influence of hectorite and hydrotalcite on mechanical and morphological properties of NBR and XNBR
89
In contrast to NBR and the unfilled XNBR gum, the incorporation of both types of
hectorite (natural and synthetic) accelerated the crosslinking process of XNBR composites by
reducing the t90 parameter, whereas the addition of HT at loadings of 5 – 20 phr significantly
extended t90 and tΔ2. HT layers were previously reported to have a detrimental effect on the
ionic crosslinks formed between XNBR and ZnO. 97
ΔM is a characteristic of the cured rubbers and represents the degree of chemical
crosslinking. The reaction of rubbers with curing agents is merely one factor influencing the
crosslinking process. Other factors include the chemical bonding of rubbers with the
functional groups on the filler surface or physical interactions between the matrix and the
filler, which increase the overall degree of curing. This interaction implies that the state of
cure of rubber compounds might change in the presence of filler. Measurements of the
crosslink density by equilibrium swelling method revealed that increasing the amount of HT
added to XNBR led to a proportional increase in the crosslink density of the rubber composite
(Table 20). The changes in the cure degree of XNBR/HT were greater than those observed
for the compounds loaded with hectorites. The remarkable increases in the crosslink density
of XNBR/HT compounds may be attributed to the existence of strong rubber-filler
interactions as well as reactions between the basic hydroxyl groups present on the HT surface
and the acidic carboxylic groups of XNBR.
Compared with the control sample, the extent of the cure (ΔM) increased with increasing
filler content. As a result, the chain mobility of the macromolecular was reduced, hence, an
increased difference in torque (i.e., state of cure) was observed.
Figure 23 Comparison of the effects of fillers at 30 phr loading on the torque of NBR and
XNBR compounds.
0 10 20 30 40 50 600
2
4
6
8
10
12
14
Torq
ue [d
Nm
]
Time [min]
NBR unfilled XNBR/ZnO unfilled NBR/HEC NAT 30 XNBR/ZnO/HEC NAT 30 NBR/HEC SYN 30 XNBR/ZnO/HEC SYN 30 NBR/HT 30 XNBR/ZnO/HT 30
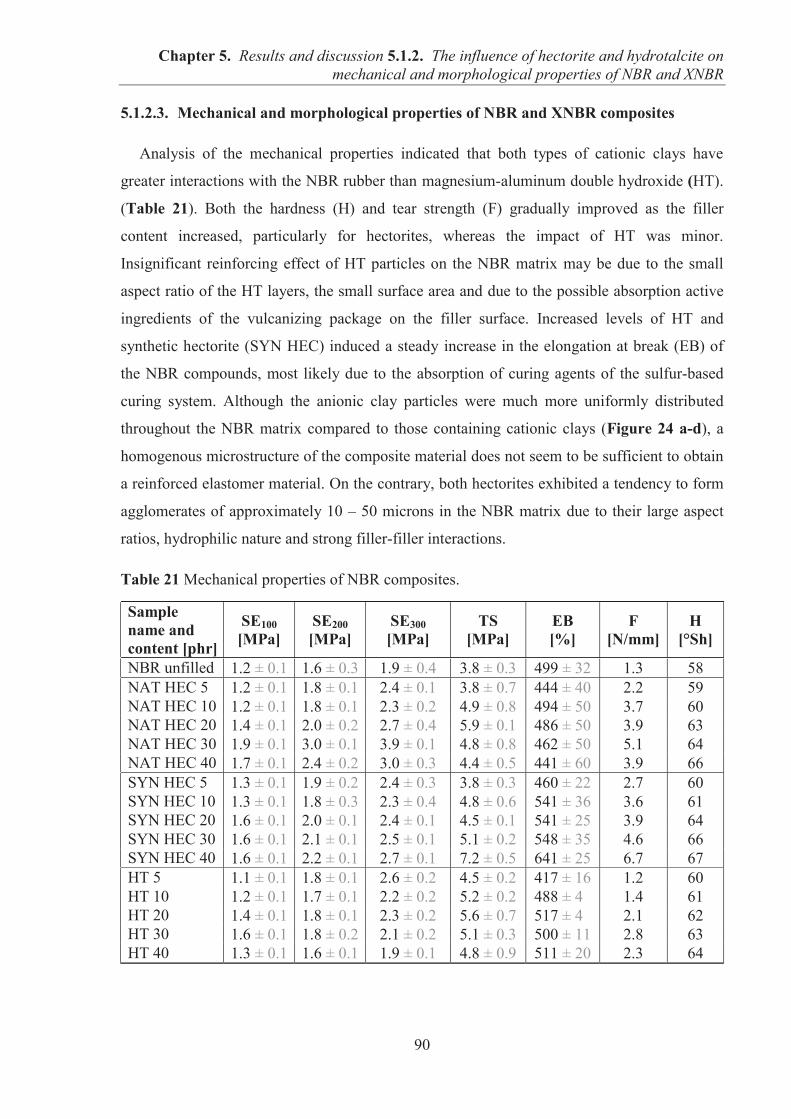
Chapter 5. Results and discussion 5.1.2. The influence of hectorite and hydrotalcite on mechanical and morphological properties of NBR and XNBR
90
5.1.2.3. Mechanical and morphological properties of NBR and XNBR composites
Analysis of the mechanical properties indicated that both types of cationic clays have
greater interactions with the NBR rubber than magnesium-aluminum double hydroxide (HT).
(Table 21). Both the hardness (H) and tear strength (F) gradually improved as the filler
content increased, particularly for hectorites, whereas the impact of HT was minor.
Insignificant reinforcing effect of HT particles on the NBR matrix may be due to the small
aspect ratio of the HT layers, the small surface area and due to the possible absorption active
ingredients of the vulcanizing package on the filler surface. Increased levels of HT and
synthetic hectorite (SYN HEC) induced a steady increase in the elongation at break (EB) of
the NBR compounds, most likely due to the absorption of curing agents of the sulfur-based
curing system. Although the anionic clay particles were much more uniformly distributed
throughout the NBR matrix compared to those containing cationic clays (Figure 24 a-d), a
homogenous microstructure of the composite material does not seem to be sufficient to obtain
a reinforced elastomer material. On the contrary, both hectorites exhibited a tendency to form
agglomerates of approximately 10 – 50 microns in the NBR matrix due to their large aspect
ratios, hydrophilic nature and strong filler-filler interactions.
Table 21 Mechanical properties of NBR composites.
Sample name and content [phr]
SE100 [MPa]
SE200 [MPa]
SE300 [MPa]
TS [MPa]
EB [%]
F [N/mm]
H [°Sh]
NBR unfilled 1.2 ± 0.1 1.6 ± 0.3 1.9 ± 0.4 3.8 ± 0.3 499 ± 32 1.3 58 NAT HEC 5 1.2 ± 0.1 1.8 ± 0.1 2.4 ± 0.1 3.8 ± 0.7 444 ± 40 2.2 59 NAT HEC 10 1.2 ± 0.1 1.8 ± 0.1 2.3 ± 0.2 4.9 ± 0.8 494 ± 50 3.7 60 NAT HEC 20 1.4 ± 0.1 2.0 ± 0.2 2.7 ± 0.4 5.9 ± 0.1 486 ± 50 3.9 63 NAT HEC 30 1.9 ± 0.1 3.0 ± 0.1 3.9 ± 0.1 4.8 ± 0.8 462 ± 50 5.1 64 NAT HEC 40 1.7 ± 0.1 2.4 ± 0.2 3.0 ± 0.3 4.4 ± 0.5 441 ± 60 3.9 66 SYN HEC 5 1.3 ± 0.1 1.9 ± 0.2 2.4 ± 0.3 3.8 ± 0.3 460 ± 22 2.7 60 SYN HEC 10 1.3 ± 0.1 1.8 ± 0.3 2.3 ± 0.4 4.8 ± 0.6 541 ± 36 3.6 61 SYN HEC 20 1.6 ± 0.1 2.0 ± 0.1 2.4 ± 0.1 4.5 ± 0.1 541 ± 25 3.9 64 SYN HEC 30 1.6 ± 0.1 2.1 ± 0.1 2.5 ± 0.1 5.1 ± 0.2 548 ± 35 4.6 66 SYN HEC 40 1.6 ± 0.1 2.2 ± 0.1 2.7 ± 0.1 7.2 ± 0.5 641 ± 25 6.7 67 HT 5 1.1 ± 0.1 1.8 ± 0.1 2.6 ± 0.2 4.5 ± 0.2 417 ± 16 1.2 60 HT 10 1.2 ± 0.1 1.7 ± 0.1 2.2 ± 0.2 5.2 ± 0.2 488 ± 40 1.4 61 HT 20 1.4 ± 0.1 1.8 ± 0.1 2.3 ± 0.2 5.6 ± 0.7 517 ± 40 2.1 62 HT 30 1.6 ± 0.1 1.8 ± 0.2 2.1 ± 0.2 5.1 ± 0.3 500 ± 11 2.8 63 HT 40 1.3 ± 0.1 1.6 ± 0.1 1.9 ± 0.1 4.8 ± 0.9 511 ± 20 2.3 64
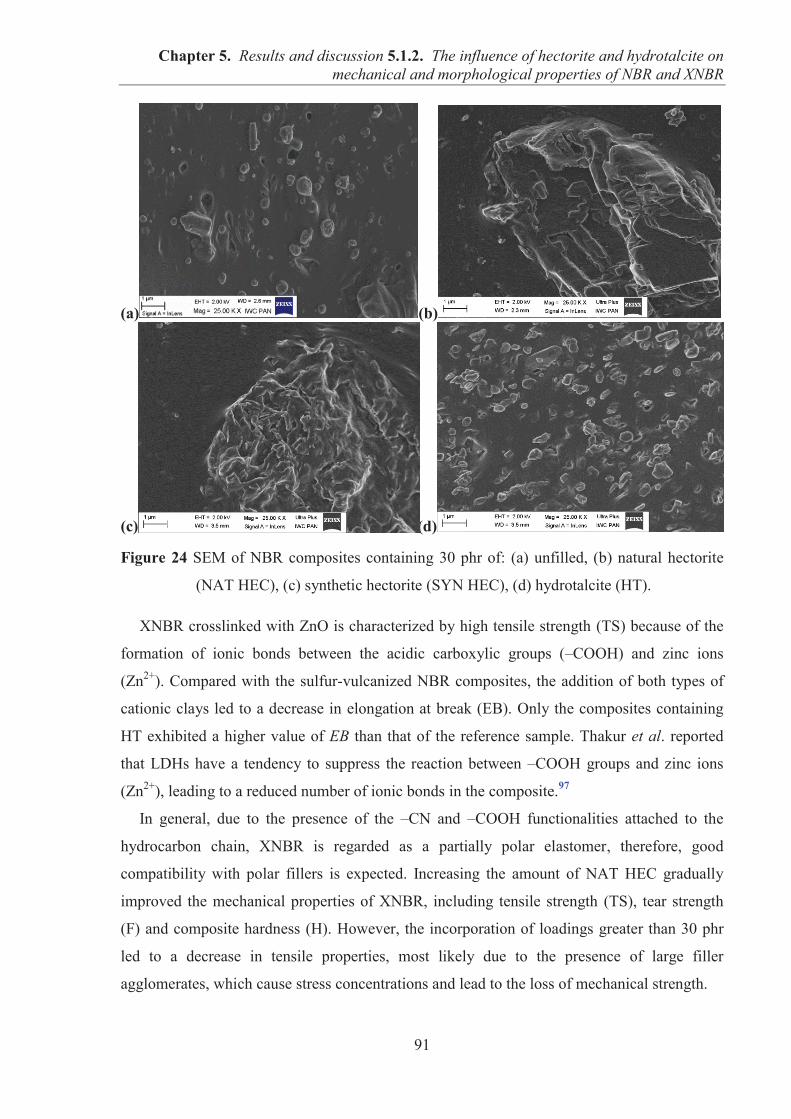
Chapter 5. Results and discussion 5.1.2. The influence of hectorite and hydrotalcite on mechanical and morphological properties of NBR and XNBR
91
(a) (b)
(c) (d)
Figure 24 SEM of NBR composites containing 30 phr of: (a) unfilled, (b) natural hectorite
(NAT HEC), (c) synthetic hectorite (SYN HEC), (d) hydrotalcite (HT).
XNBR crosslinked with ZnO is characterized by high tensile strength (TS) because of the
formation of ionic bonds between the acidic carboxylic groups (–COOH) and zinc ions
(Zn2+). Compared with the sulfur-vulcanized NBR composites, the addition of both types of
cationic clays led to a decrease in elongation at break (EB). Only the composites containing
HT exhibited a higher value of EB than that of the reference sample. Thakur et al. reported
that LDHs have a tendency to suppress the reaction between –COOH groups and zinc ions
(Zn2+), leading to a reduced number of ionic bonds in the composite.97
In general, due to the presence of the –CN and –COOH functionalities attached to the
hydrocarbon chain, XNBR is regarded as a partially polar elastomer, therefore, good
compatibility with polar fillers is expected. Increasing the amount of NAT HEC gradually
improved the mechanical properties of XNBR, including tensile strength (TS), tear strength
(F) and composite hardness (H). However, the incorporation of loadings greater than 30 phr
led to a decrease in tensile properties, most likely due to the presence of large filler
agglomerates, which cause stress concentrations and lead to the loss of mechanical strength.
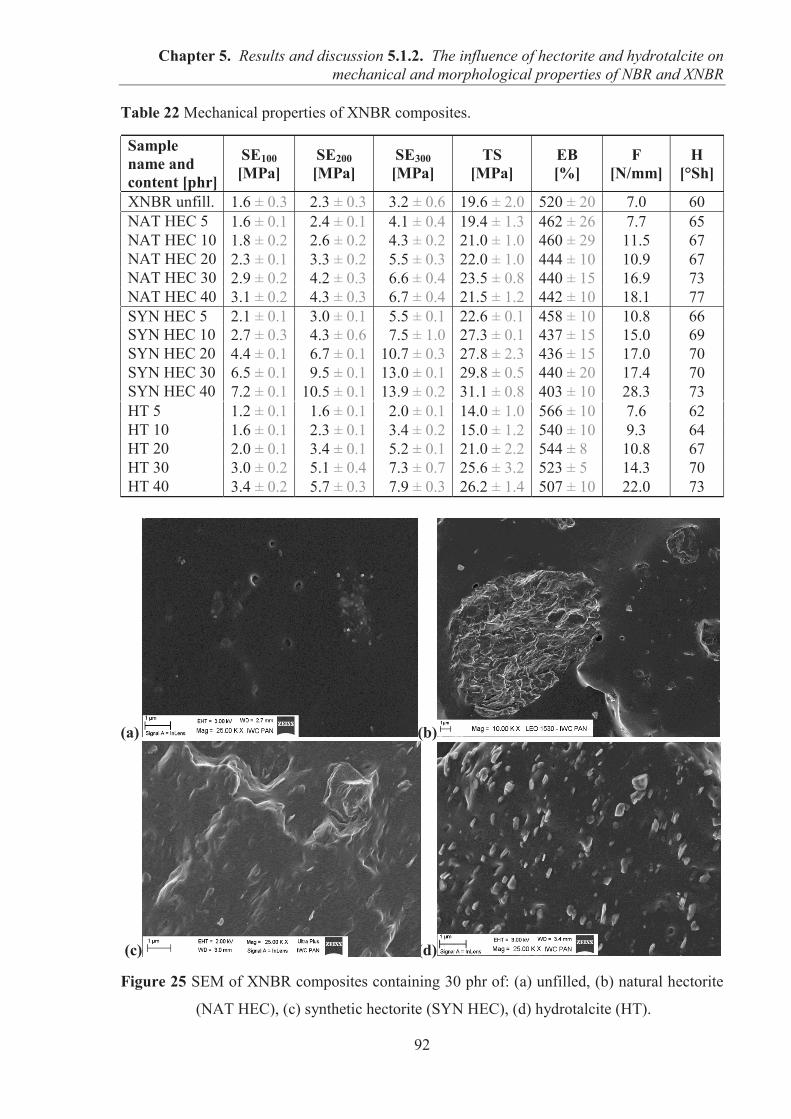
Chapter 5. Results and discussion 5.1.2. The influence of hectorite and hydrotalcite on mechanical and morphological properties of NBR and XNBR
92
Table 22 Mechanical properties of XNBR composites.
Sample name and content [phr]
SE100 [MPa]
SE200 [MPa]
SE300 [MPa]
TS [MPa]
EB [%]
F [N/mm]
H [°Sh]
XNBR unfill. 1.6 ± 0.3 02.3 ± 0.3 03.2 ± 0.6 19.6 ± 2.0 520 ± 20 7.0 60 NAT HEC 5 1.6 ± 0.1 02.4 ± 0.1 04.1 ± 0.4 19.4 ± 1.3 462 ± 26 7.7 65 NAT HEC 10 1.8 ± 0.2 02.6 ± 0.2 04.3 ± 0.2 21.0 ± 1.0 460 ± 29 11.5 67 NAT HEC 20 2.3 ± 0.1 03.3 ± 0.2 05.5 ± 0.3 22.0 ± 1.0 444 ± 10 10.9 67 NAT HEC 30 2.9 ± 0.2 04.2 ± 0.3 06.6 ± 0.4 23.5 ± 0.8 440 ± 15 16.9 73 NAT HEC 40 3.1 ± 0.2 04.3 ± 0.3 06.7 ± 0.4 21.5 ± 1.2 442 ± 10 18.1 77 SYN HEC 5 2.1 ± 0.1 03.0 ± 0.1 05.5 ± 0.1 22.6 ± 0.1 458 ± 10 10.8 66 SYN HEC 10 2.7 ± 0.3 04.3 ± 0.6 07.5 ± 1.0 27.3 ± 0.1 437 ± 15 15.0 69 SYN HEC 20 4.4 ± 0.1 06.7 ± 0.1 10.7 ± 0.3 27.8 ± 2.3 436 ± 15 17.0 70 SYN HEC 30 6.5 ± 0.1 09.5 ± 0.1 13.0 ± 0.1 29.8 ± 0.5 440 ± 20 17.4 70 SYN HEC 40 7.2 ± 0.1 10.5 ± 0.1 13.9 ± 0.2 31.1 ± 0.8 403 ± 10 28.3 73 HT 5 1.2 ± 0.1 01.6 ± 0.1 02.0 ± 0.1 14.0 ± 1.0 566 ± 10 7.6 62 HT 10 1.6 ± 0.1 02.3 ± 0.1 03.4 ± 0.2 15.0 ± 1.2 540 ± 10 9.3 64 HT 20 2.0 ± 0.1 03.4 ± 0.1 05.2 ± 0.1 21.0 ± 2.2 544 ± 80 10.8 67 HT 30 3.0 ± 0.2 05.1 ± 0.4 07.3 ± 0.7 25.6 ± 3.2 523 ± 50 14.3 70 HT 40 3.4 ± 0.2 05.7 ± 0.3 07.9 ± 0.3 26.2 ± 1.4 507 ± 10 22.0 73
(a) (b)
(c) (d)
Figure 25 SEM of XNBR composites containing 30 phr of: (a) unfilled, (b) natural hectorite
(NAT HEC), (c) synthetic hectorite (SYN HEC), (d) hydrotalcite (HT).
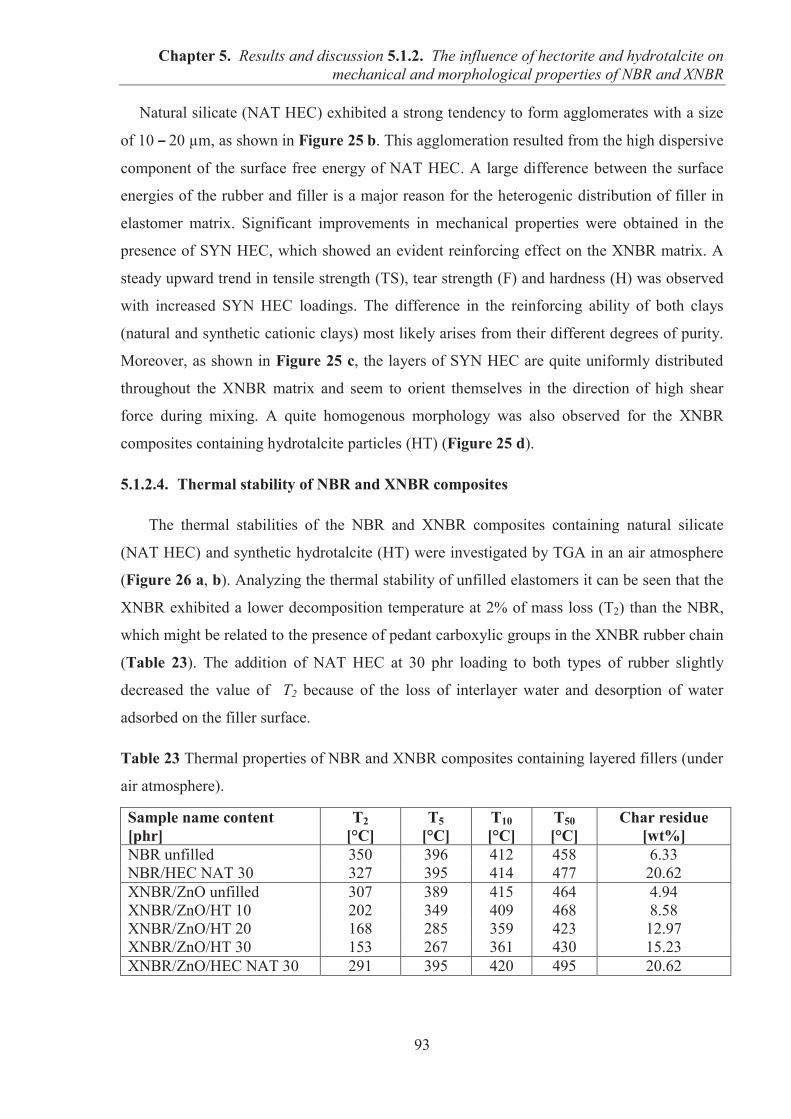
Chapter 5. Results and discussion 5.1.2. The influence of hectorite and hydrotalcite on mechanical and morphological properties of NBR and XNBR
93
Natural silicate (NAT HEC) exhibited a strong tendency to form agglomerates with a size
of 10 – 20 μm, as shown in Figure 25 b. This agglomeration resulted from the high dispersive
component of the surface free energy of NAT HEC. A large difference between the surface
energies of the rubber and filler is a major reason for the heterogenic distribution of filler in
elastomer matrix. Significant improvements in mechanical properties were obtained in the
presence of SYN HEC, which showed an evident reinforcing effect on the XNBR matrix. A
steady upward trend in tensile strength (TS), tear strength (F) and hardness (H) was observed
with increased SYN HEC loadings. The difference in the reinforcing ability of both clays
(natural and synthetic cationic clays) most likely arises from their different degrees of purity.
Moreover, as shown in Figure 25 c, the layers of SYN HEC are quite uniformly distributed
throughout the XNBR matrix and seem to orient themselves in the direction of high shear
force during mixing. A quite homogenous morphology was also observed for the XNBR
composites containing hydrotalcite particles (HT) (Figure 25 d).
5.1.2.4. Thermal stability of NBR and XNBR composites
The thermal stabilities of the NBR and XNBR composites containing natural silicate
(NAT HEC) and synthetic hydrotalcite (HT) were investigated by TGA in an air atmosphere
(Figure 26 a, b). Analyzing the thermal stability of unfilled elastomers it can be seen that the
XNBR exhibited a lower decomposition temperature at 2% of mass loss (T2) than the NBR,
which might be related to the presence of pedant carboxylic groups in the XNBR rubber chain
(Table 23). The addition of NAT HEC at 30 phr loading to both types of rubber slightly
decreased the value of T2 because of the loss of interlayer water and desorption of water
adsorbed on the filler surface.
Table 23 Thermal properties of NBR and XNBR composites containing layered fillers (under
air atmosphere).
Sample name content [phr]
T2 [°C]
T5 [°C]
T10 [°C]
T50 [°C]
Char residue [wt%]
NBR unfilled 350 396 412 458 6.33 NBR/HEC NAT 30 327 395 414 477 20.62 XNBR/ZnO unfilled 307 389 415 464 4.94 XNBR/ZnO/HT 10 202 349 409 468 8.58 XNBR/ZnO/HT 20 168 285 359 423 12.97 XNBR/ZnO/HT 30 153 267 361 430 15.23 XNBR/ZnO/HEC NAT 30 291 395 420 495 20.62
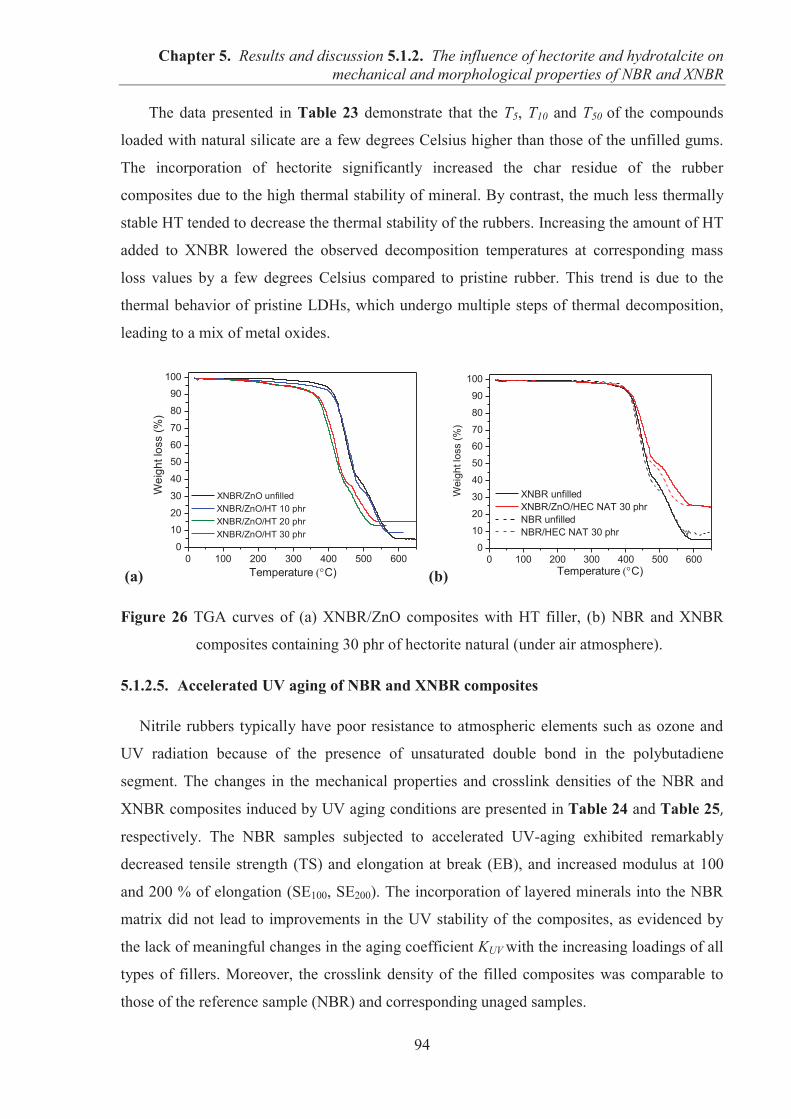
Chapter 5. Results and discussion 5.1.2. The influence of hectorite and hydrotalcite on mechanical and morphological properties of NBR and XNBR
94
The data presented in Table 23 demonstrate that the T5, T10 and T50 of the compounds
loaded with natural silicate are a few degrees Celsius higher than those of the unfilled gums.
The incorporation of hectorite significantly increased the char residue of the rubber
composites due to the high thermal stability of mineral. By contrast, the much less thermally
stable HT tended to decrease the thermal stability of the rubbers. Increasing the amount of HT
added to XNBR lowered the observed decomposition temperatures at corresponding mass
loss values by a few degrees Celsius compared to pristine rubber. This trend is due to the
thermal behavior of pristine LDHs, which undergo multiple steps of thermal decomposition,
leading to a mix of metal oxides.
(a) (b)
Figure 26 TGA curves of (a) XNBR/ZnO composites with HT filler, (b) NBR and XNBR
composites containing 30 phr of hectorite natural (under air atmosphere).
5.1.2.5. Accelerated UV aging of NBR and XNBR composites
Nitrile rubbers typically have poor resistance to atmospheric elements such as ozone and
UV radiation because of the presence of unsaturated double bond in the polybutadiene
segment. The changes in the mechanical properties and crosslink densities of the NBR and
XNBR composites induced by UV aging conditions are presented in Table 24 and Table 25,
respectively. The NBR samples subjected to accelerated UV-aging exhibited remarkably
decreased tensile strength (TS) and elongation at break (EB), and increased modulus at 100
and 200 % of elongation (SE100, SE200). The incorporation of layered minerals into the NBR
matrix did not lead to improvements in the UV stability of the composites, as evidenced by
the lack of meaningful changes in the aging coefficient KUV with the increasing loadings of all
types of fillers. Moreover, the crosslink density of the filled composites was comparable to
those of the reference sample (NBR) and corresponding unaged samples.
0 100 200 300 400 500 6000
10
20
30
40
50
60
70
80
90
100
Wei
ght l
oss
(%)
Temperature C)
XNBR/ZnO unfilled XNBR/ZnO/HT 10 phr XNBR/ZnO/HT 20 phr XNBR/ZnO/HT 30 phr
0 100 200 300 400 500 6000
10
20
30
40
50
60
70
80
90
100
Wei
ght l
oss
(%)
Temperature C)
XNBR unfilled XNBR/ZnO/HEC NAT 30 phr NBR unfilled NBR/HEC NAT 30 phr
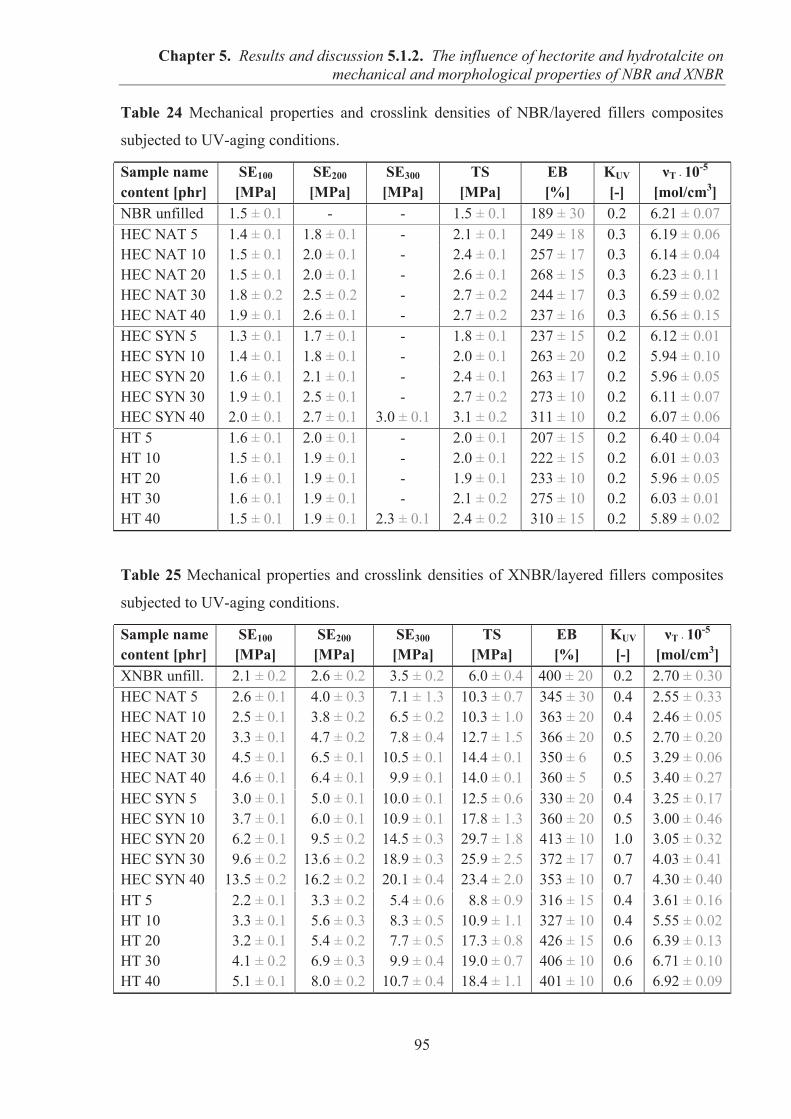
Chapter 5. Results and discussion 5.1.2. The influence of hectorite and hydrotalcite on mechanical and morphological properties of NBR and XNBR
95
Table 24 Mechanical properties and crosslink densities of NBR/layered fillers composites
subjected to UV-aging conditions.
Sample name content [phr]
SE100 [MPa]
SE200 [MPa]
SE300 [MPa]
TS [MPa]
EB [%]
KUV
[-] νT · 10-5
[mol/cm3] NBR unfilled 1.5 ± 0.1 - - 1.5 ± 0.1 189 ± 30 0.2 6.21 ± 0.07 HEC NAT 5 1.4 ± 0.1 1.8 ± 0.1 - 2.1 ± 0.1 249 ± 18 0.3 6.19 ± 0.06 HEC NAT 10 1.5 ± 0.1 2.0 ± 0.1 - 2.4 ± 0.1 257 ± 17 0.3 6.14 ± 0.04 HEC NAT 20 1.5 ± 0.1 2.0 ± 0.1 - 2.6 ± 0.1 268 ± 15 0.3 6.23 ± 0.11 HEC NAT 30 1.8 ± 0.2 2.5 ± 0.2 - 2.7 ± 0.2 244 ± 17 0.3 6.59 ± 0.02 HEC NAT 40 1.9 ± 0.1 2.6 ± 0.1 - 2.7 ± 0.2 237 ± 16 0.3 6.56 ± 0.15 HEC SYN 5 1.3 ± 0.1 1.7 ± 0.1 - 1.8 ± 0.1 237 ± 15 0.2 6.12 ± 0.01 HEC SYN 10 1.4 ± 0.1 1.8 ± 0.1 - 2.0 ± 0.1 263 ± 20 0.2 5.94 ± 0.10 HEC SYN 20 1.6 ± 0.1 2.1 ± 0.1 - 2.4 ± 0.1 263 ± 17 0.2 5.96 ± 0.05 HEC SYN 30 1.9 ± 0.1 2.5 ± 0.1 - 2.7 ± 0.2 273 ± 10 0.2 6.11 ± 0.07 HEC SYN 40 2.0 ± 0.1 2.7 ± 0.1 3.0 ± 0.1 3.1 ± 0.2 311 ± 10 0.2 6.07 ± 0.06 HT 5 1.6 ± 0.1 2.0 ± 0.1 - 2.0 ± 0.1 207 ± 15 0.2 6.40 ± 0.04 HT 10 1.5 ± 0.1 1.9 ± 0.1 - 2.0 ± 0.1 222 ± 15 0.2 6.01 ± 0.03 HT 20 1.6 ± 0.1 1.9 ± 0.1 - 1.9 ± 0.1 233 ± 10 0.2 5.96 ± 0.05 HT 30 1.6 ± 0.1 1.9 ± 0.1 - 2.1 ± 0.2 275 ± 10 0.2 6.03 ± 0.01 HT 40 1.5 ± 0.1 1.9 ± 0.1 2.3 ± 0.1 2.4 ± 0.2 310 ± 15 0.2 5.89 ± 0.02
Table 25 Mechanical properties and crosslink densities of XNBR/layered fillers composites
subjected to UV-aging conditions.
Sample name content [phr]
SE100 [MPa]
SE200 [MPa]
SE300 [MPa]
TS [MPa]
EB [%]
KUV
[-] νT · 10-5
[mol/cm3] XNBR unfill. 02.1 ± 0.2 02.6 ± 0.2 03.5 ± 0.2 06.0 ± 0.4 400 ± 20 0.2 2.70 ± 0.30 HEC NAT 5 02.6 ± 0.1 04.0 ± 0.3 07.1 ± 1.3 10.3 ± 0.7 345 ± 30 0.4 2.55 ± 0.33 HEC NAT 10 02.5 ± 0.1 03.8 ± 0.2 06.5 ± 0.2 10.3 ± 1.0 363 ± 20 0.4 2.46 ± 0.05 HEC NAT 20 03.3 ± 0.1 04.7 ± 0.2 07.8 ± 0.4 12.7 ± 1.5 366 ± 20 0.5 2.70 ± 0.20 HEC NAT 30 04.5 ± 0.1 06.5 ± 0.1 10.5 ± 0.1 14.4 ± 0.1 350 ± 60 0.5 3.29 ± 0.06 HEC NAT 40 04.6 ± 0.1 06.4 ± 0.1 09.9 ± 0.1 14.0 ± 0.1 360 ± 50 0.5 3.40 ± 0.27 HEC SYN 5 03.0 ± 0.1 05.0 ± 0.1 10.0 ± 0.1 12.5 ± 0.6 330 ± 20 0.4 3.25 ± 0.17 HEC SYN 10 03.7 ± 0.1 06.0 ± 0.1 10.9 ± 0.1 17.8 ± 1.3 360 ± 20 0.5 3.00 ± 0.46 HEC SYN 20 06.2 ± 0.1 09.5 ± 0.2 14.5 ± 0.3 29.7 ± 1.8 413 ± 10 1.0 3.05 ± 0.32 HEC SYN 30 09.6 ± 0.2 13.6 ± 0.2 18.9 ± 0.3 25.9 ± 2.5 372 ± 17 0.7 4.03 ± 0.41 HEC SYN 40 13.5 ± 0.2 16.2 ± 0.2 20.1 ± 0.4 23.4 ± 2.0 353 ± 10 0.7 4.30 ± 0.40 HT 5 02.2 ± 0.1 03.3 ± 0.2 05.4 ± 0.6 08.8 ± 0.9 316 ± 15 0.4 3.61 ± 0.16 HT 10 03.3 ± 0.1 05.6 ± 0.3 08.3 ± 0.5 10.9 ± 1.1 327 ± 10 0.4 5.55 ± 0.02 HT 20 03.2 ± 0.1 05.4 ± 0.2 07.7 ± 0.5 17.3 ± 0.8 426 ± 15 0.6 6.39 ± 0.13 HT 30 04.1 ± 0.2 06.9 ± 0.3 09.9 ± 0.4 19.0 ± 0.7 406 ± 10 0.6 6.71 ± 0.10 HT 40 05.1 ± 0.1 08.0 ± 0.2 10.7 ± 0.4 18.4 ± 1.1 401 ± 10 0.6 6.92 ± 0.09
Chapter 5. Results and discussion 5.1.2. The influence of hectorite and hydrotalcite on mechanical and morphological properties of NBR and XNBR
96
On the contrary to the NBR, the exposure of XNBR compounds to UV-aging conditions
led to considerably increased stiffness of the material, which is reflected in the higher
modulus (SE) and reduced elongation at break (EB). The enhanced stiffness of the composites
resulted from the further crosslinking process which was induced by elevated temperature
conditions. Thus, the UV-aged XNBR materials exhibited higher number of crosslinks (νT) of
XNBR when compared to the corresponding unaged samples. The XNBR containing
synthetic hectorite (SYN HEC) exhibited the highest mechanical parameters among all
investigated composites after UV-aging, whereas increasing concentrations of synthetic HT
resulted in a formation of greater number of crosslinks in the XNBR matrix when exposed to
UV aging conditions.
5.1.2.6. Conclusions
The slight effect of natural silicate on the improvements in tensile strength of NBR and
XNBR composites may result from the tendency of the hydrophilic filler particles to
agglomerate in the hydrophobic medium, the lack of compatibility between the components
and weak filler-rubber interaction. Rubber composites containing synthetic hectorite exhibited
superior mechanical parameters compared with those filled with natural hectorite. Increasing
concentrations of the synthetic silicate led to steady increases in the modulus, tensile strength,
tear strength and hardness of the composites. In general, greater reinforcement by layered
fillers was observed in the XNBR matrix compared to the NBR due to the presence of acidic
–COOH functionalities in the XNBR chain structure, which may contribute to enhanced
rubber-filler interactions and greater reinforcement. Moreover, the addition of increasing
amounts of synthetic hydrotalcite with a lamellar structure consisting of Mg2+ and Al3+ ions
contributed to a steady increment in the number of crosslinks of XNBR. This result may be
useful for the application of magnesium-aluminum layered double hydroxides to fulfill dual
roles: as a filler and as a curative in functionalized rubber free of other crosslinking agents.
Chapter 5. Results and discussion 5.1.3. Application of MgAl-LDHs and reinforcing fillers and curing agents for XNBR
97
5.1.3. APPLICATION OF MAGNESIUM-ALUMINUM LAYERED
DOUBLE HYDROXIDES (MgAl-LDHs) AS REINFORCING
FILLERS AND CURING AGENTS FOR CARBOXYLATED
BUTADIENE-ACRYLONITRILE RUBBER (XNBR)
INTRODUCTION: From the research presented in the previous section, it could be observed
that incorporation of hydrotalcite to carboxylated acrylonitrile-butadiene rubber (XNBR)
remarkably increased the cure degree of the composite. At present, the frequently used curing
agents for XNBR, leading to the formation of ionic bonds, are based on bivalent metal oxides,
such as ZnO, MgO, CaO. Possible application of magnesium-aluminum layered double
hydroxide MgAl-LDH as a crosslinking agent for XNBR (or its hydrogenated counterpart
XNBR) could be an interesting alternative to conventional ZnO which is believed to be
harmful for the environment. In this section, the effects of LDHs with various platelets
structures, specific surface areas and Mg/Al ratios for the potential use as curing agents and
possible replacements for ZnO were investigated. The influences of MgAl-LDHs on the
curing behavior, crosslink density, mechano-dynamical properties, thermo-optical properties
and morphology of XNBR composites were presented and the results of XNBR/LDH
composites were compared with XNBR compound crosslinked with zinc oxide (ZnO).
5.1.3.1. Preparation of XNBR/MgAl-LDH composites
The rubber compounds were processed in an internal mixer Brabender Measuring Mixer
N50 at a rotor speed of 50 rpm (revolutions per minute), and the initial temperature was set to
70 °C. After approximately 5 minutes of rubber mastication, the LDH filler (2.5, 5, 10, 20 and
30 phr) was added. The total time of compounding was 20 minutes. Subsequently, the
compounded rubbers were milled in a laboratory-scale open two-roll mixing mill. The
compounding ingredients and the amounts are presented in Table 26.
Table 26 Formulation of XNBR/LDH compounds, [phr].
Component XNBR XZnO 5 XLDH 2.5
XLDH 5
XLDH 10
XLDH 20
XLDH 30
XNBR 100 100 100 100 100 100 100 HT 0 0 2.5 5 10 20 30 ZnO 0 5 0 0 0 0 0
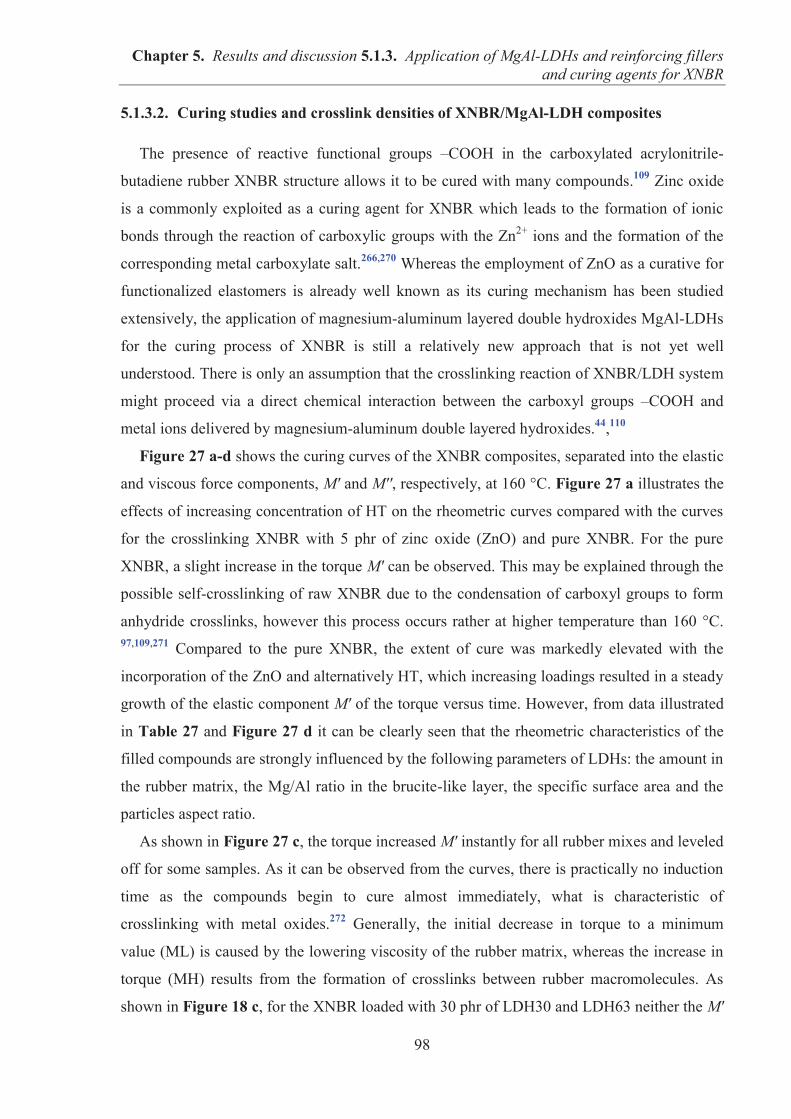
Chapter 5. Results and discussion 5.1.3. Application of MgAl-LDHs and reinforcing fillers and curing agents for XNBR
98
5.1.3.2. Curing studies and crosslink densities of XNBR/MgAl-LDH composites
The presence of reactive functional groups –COOH in the carboxylated acrylonitrile-
butadiene rubber XNBR structure allows it to be cured with many compounds.109 Zinc oxide
is a commonly exploited as a curing agent for XNBR which leads to the formation of ionic
bonds through the reaction of carboxylic groups with the Zn2+ ions and the formation of the
corresponding metal carboxylate salt.266,270 Whereas the employment of ZnO as a curative for
functionalized elastomers is already well known as its curing mechanism has been studied
extensively, the application of magnesium-aluminum layered double hydroxides MgAl-LDHs
for the curing process of XNBR is still a relatively new approach that is not yet well
understood. There is only an assumption that the crosslinking reaction of XNBR/LDH system
might proceed via a direct chemical interaction between the carboxyl groups –COOH and
metal ions delivered by magnesium-aluminum double layered hydroxides.44,110
Figure 27 a-d shows the curing curves of the XNBR composites, separated into the elastic
and viscous force components, M′ and M′′, respectively, at 160 °C. Figure 27 a illustrates the
effects of increasing concentration of HT on the rheometric curves compared with the curves
for the crosslinking XNBR with 5 phr of zinc oxide (ZnO) and pure XNBR. For the pure
XNBR, a slight increase in the torque M′ can be observed. This may be explained through the
possible self-crosslinking of raw XNBR due to the condensation of carboxyl groups to form
anhydride crosslinks, however this process occurs rather at higher temperature than 160 °C.
97,109,271 Compared to the pure XNBR, the extent of cure was markedly elevated with the
incorporation of the ZnO and alternatively HT, which increasing loadings resulted in a steady
growth of the elastic component M′ of the torque versus time. However, from data illustrated
in Table 27 and Figure 27 d it can be clearly seen that the rheometric characteristics of the
filled compounds are strongly influenced by the following parameters of LDHs: the amount in
the rubber matrix, the Mg/Al ratio in the brucite-like layer, the specific surface area and the
particles aspect ratio.
As shown in Figure 27 c, the torque increased M′ instantly for all rubber mixes and leveled
off for some samples. As it can be observed from the curves, there is practically no induction
time as the compounds begin to cure almost immediately, what is characteristic of
crosslinking with metal oxides.272 Generally, the initial decrease in torque to a minimum
value (ML) is caused by the lowering viscosity of the rubber matrix, whereas the increase in
torque (MH) results from the formation of crosslinks between rubber macromolecules. As
shown in Figure 18 c, for the XNBR loaded with 30 phr of LDH30 and LDH63 neither the M′
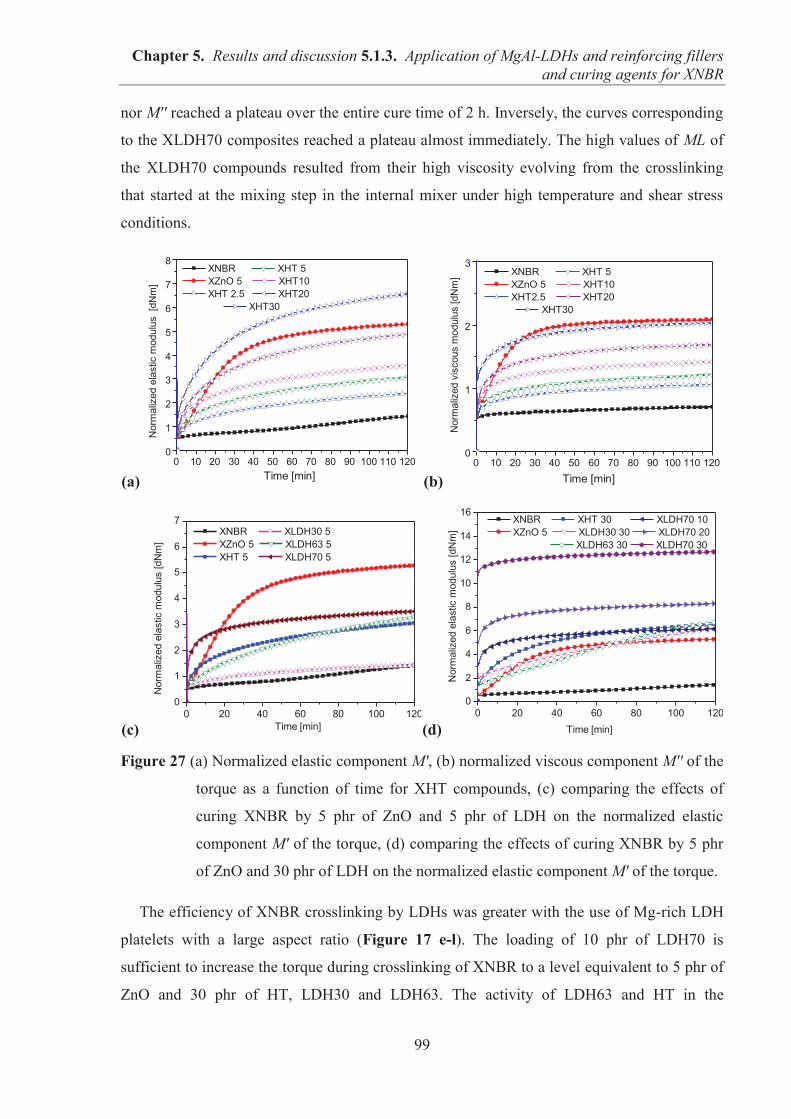
Chapter 5. Results and discussion 5.1.3. Application of MgAl-LDHs and reinforcing fillers and curing agents for XNBR
99
nor M′′ reached a plateau over the entire cure time of 2 h. Inversely, the curves corresponding
to the XLDH70 composites reached a plateau almost immediately. The high values of ML of
the XLDH70 compounds resulted from their high viscosity evolving from the crosslinking
that started at the mixing step in the internal mixer under high temperature and shear stress
conditions.
(a) (b)
(c) (d)
Figure 27 (a) Normalized elastic component M′, (b) normalized viscous component M′′ of the
torque as a function of time for XHT compounds, (c) comparing the effects of
curing XNBR by 5 phr of ZnO and 5 phr of LDH on the normalized elastic
component M′ of the torque, (d) comparing the effects of curing XNBR by 5 phr
of ZnO and 30 phr of LDH on the normalized elastic component M′ of the torque.
The efficiency of XNBR crosslinking by LDHs was greater with the use of Mg-rich LDH
platelets with a large aspect ratio (Figure 17 e-l). The loading of 10 phr of LDH70 is
sufficient to increase the torque during crosslinking of XNBR to a level equivalent to 5 phr of
ZnO and 30 phr of HT, LDH30 and LDH63. The activity of LDH63 and HT in the
0 10 20 30 40 50 60 70 80 90 100 110 1200
1
2
3
4
5
6
7
8
Nor
mal
ized
ela
stic
mod
ulus
[dN
m]
Time [min]
XNBR XHT 5 XZnO 5 XHT10 XHT 2.5 XHT20
XHT30
0 10 20 30 40 50 60 70 80 90 100 110 1200
1
2
3
Nor
mal
ized
vis
cous
mod
ulus
[dN
m]
Time [min]
XNBR XHT 5 XZnO 5 XHT10 XHT2.5 XHT20
XHT30
0 20 40 60 80 100 1200
1
2
3
4
5
6
7
Nor
mal
ized
ela
stic
mod
ulus
[dN
m]
Time [min]
XNBR XLDH30 5 XZnO 5 XLDH63 5 XHT 5 XLDH70 5
0 20 40 60 80 100 1200
2
4
6
8
10
12
14
16
Nor
mal
ized
ela
stic
mod
ulus
[dN
m]
Time [min]
XNBR XHT 30 XLDH70 10 XZnO 5 XLDH30 30 XLDH70 20
XLDH63 30 XLDH70 30
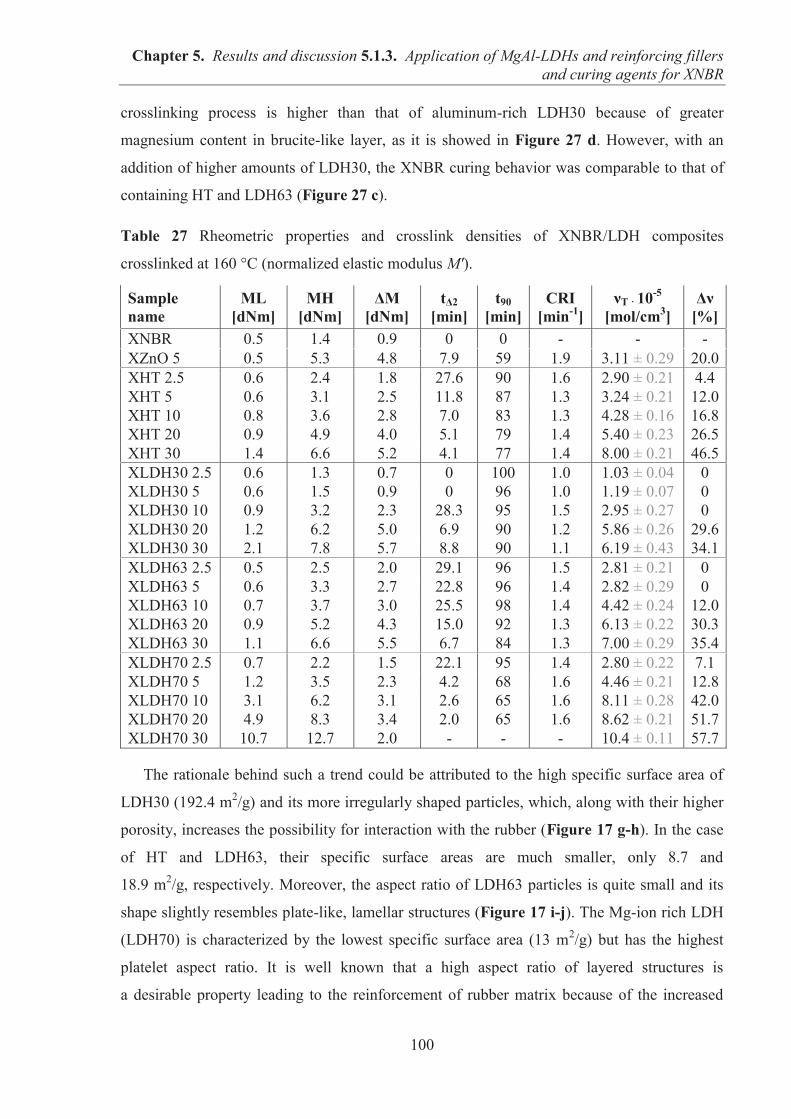
Chapter 5. Results and discussion 5.1.3. Application of MgAl-LDHs and reinforcing fillers and curing agents for XNBR
100
crosslinking process is higher than that of aluminum-rich LDH30 because of greater
magnesium content in brucite-like layer, as it is showed in Figure 27 d. However, with an
addition of higher amounts of LDH30, the XNBR curing behavior was comparable to that of
containing HT and LDH63 (Figure 27 c).
Table 27 Rheometric properties and crosslink densities of XNBR/LDH composites
crosslinked at 160 °C (normalized elastic modulus M′).
Sample name
ML
[dNm] MH
[dNm] ΔM
[dNm] tΔ2
[min] t90
[min] CRI
[min-1] νT · 10-5
[mol/cm3]
Δν [%]
XNBR 0.5 1.4 0.9 0 0 - - - XZnO 5 0.5 5.3 4.8 7.9 59 1.9 3.11 ± 0.29 20.0 XHT 2.5 0.6 2.4 1.8 27.6 90 1.6 2.90 ± 0.21 4.4 XHT 5 0.6 3.1 2.5 11.8 87 1.3 3.24 ± 0.21 12.0 XHT 10 0.8 3.6 2.8 7.0 83 1.3 4.28 ± 0.16 16.8 XHT 20 0.9 4.9 4.0 5.1 79 1.4 5.40 ± 0.23 26.5 XHT 30 1.4 6.6 5.2 4.1 77 1.4 8.00 ± 0.21 46.5 XLDH30 2.5 0.6 1.3 0.7 0 100 1.0 1.03 ± 0.04 0 XLDH30 5 0.6 1.5 0.9 0 96 1.0 1.19 ± 0.07 0 XLDH30 10 0.9 3.2 2.3 28.3 95 1.5 2.95 ± 0.27 0 XLDH30 20 1.2 6.2 5.0 6.9 90 1.2 5.86 ± 0.26 29.6 XLDH30 30 2.1 7.8 5.7 8.8 90 1.1 6.19 ± 0.43 34.1 XLDH63 2.5 0.5 2.5 2.0 29.1 96 1.5 2.81 ± 0.21 0 XLDH63 5 0.6 3.3 2.7 22.8 96 1.4 2.82 ± 0.29 0 XLDH63 10 0.7 3.7 3.0 25.5 98 1.4 4.42 ± 0.24 12.0 XLDH63 20 0.9 5.2 4.3 15.0 92 1.3 6.13 ± 0.22 30.3 XLDH63 30 1.1 6.6 5.5 6.7 84 1.3 7.00 ± 0.29 35.4 XLDH70 2.5 0.7 2.2 1.5 22.1 95 1.4 2.80 ± 0.22 7.1 XLDH70 5 1.2 3.5 2.3 4.2 68 1.6 4.46 ± 0.21 12.8 XLDH70 10 3.1 6.2 3.1 2.6 65 1.6 8.11 ± 0.28 42.0 XLDH70 20 4.9 8.3 3.4 2.0 65 1.6 8.62 ± 0.21 51.7 XLDH70 30 10.7 12.7 2.0 - - - 10.4 ± 0.11 57.7
The rationale behind such a trend could be attributed to the high specific surface area of
LDH30 (192.4 m2/g) and its more irregularly shaped particles, which, along with their higher
porosity, increases the possibility for interaction with the rubber (Figure 17 g-h). In the case
of HT and LDH63, their specific surface areas are much smaller, only 8.7 and
18.9 m2/g, respectively. Moreover, the aspect ratio of LDH63 particles is quite small and its
shape slightly resembles plate-like, lamellar structures (Figure 17 i-j). The Mg-ion rich LDH
(LDH70) is characterized by the lowest specific surface area (13 m2/g) but has the highest
platelet aspect ratio. It is well known that a high aspect ratio of layered structures is
a desirable property leading to the reinforcement of rubber matrix because of the increased
Chapter 5. Results and discussion 5.1.3. Application of MgAl-LDHs and reinforcing fillers and curing agents for XNBR
101
contact between the filler surface and rubber. In addition, this could be important for the
improvement in curing efficiency.
Although the cure rate index (CRI) indicates that a faster curing reaction was achieved
when ZnO was used compared to that of XNBR/LDH, both the optimal cure time t90 and the
scorch time tΔ2 are shortened with the incorporation of increasing amounts of LDH filler. The
global crosslinking reaction rate presented by the CRI parameter exhibited a steady upward
trend with increasing Mg/Al ratio in the LDH (Table 27). A faster reaction was achieved
when Mg-rich LDH was used, whereas a slower, progressive curing process was observed in
the presence of Al-rich LDH.
The crosslinking of XNBR with LDH takes place through polar interactions, which can
occur between the functional groups of XNBR (–CN, –COOH) and the basic hydroxyl groups
present –OH on the filler surface as well as through the formation of ionic crosslinks between
the –COOH groups and metal ions provided by MgAl-LDH. From the rheometry studies, we
can observe that the viscous component of the torque M′′ curve rises with the curing time
(Figure 27 b), which according to the literature, is characteristic for ionic vulcanization with
metal oxides.271,272,273,274 Experimental confirmation of the existence of ionic bonds in
XNBR/LDH composites was achieved by measuring the percent content of ionic crosslinks
via decomposition under the influence of ammonia (Δν) (Table 27). Mandal et al.265 have
shown that ammonia acts as a strong plasticizer of the ionic aggregates present in the
vulcanized rubber, therefore when cured compound is exposed to saturated ammonia vapor
the ionic aggregates are supposed to disappear. Table 27 shows the effect of the filler type
and loading amount on the crosslinking density (νT) of the rubber composites. Compared to
the unfilled sample XNBR, which did not contain any curing agent and was dissolved in
toluene, increasing levels of LDH filler in the rubber matrix contributed to an increase in the
network density (νT) and the formation of a higher number of ionic bonds (Δν). This trend
agrees with the extent of the cure, which was assessed based on the maximum torque (MH)
measured during the moving-die rheometer studies. It can be clearly observed that XNBR
became more crosslinked in the presence of LDH70, which provided the highest number of
ionic crosslinks (Δν) (57.7 %) compared to the other composites. However, crosslinking
XNBR with of ZnO yielded a higher number of Δν compared to that of XNBR/LDH at the
corresponding concentration of 5 phr. This may be explained through the existence of
stronger interaction between Zn2+ and –COOH groups due to the accessibility of Zn2+ derived
from ZnO for reaction with acid groups. The lower value of Δν found for XNBR cured with
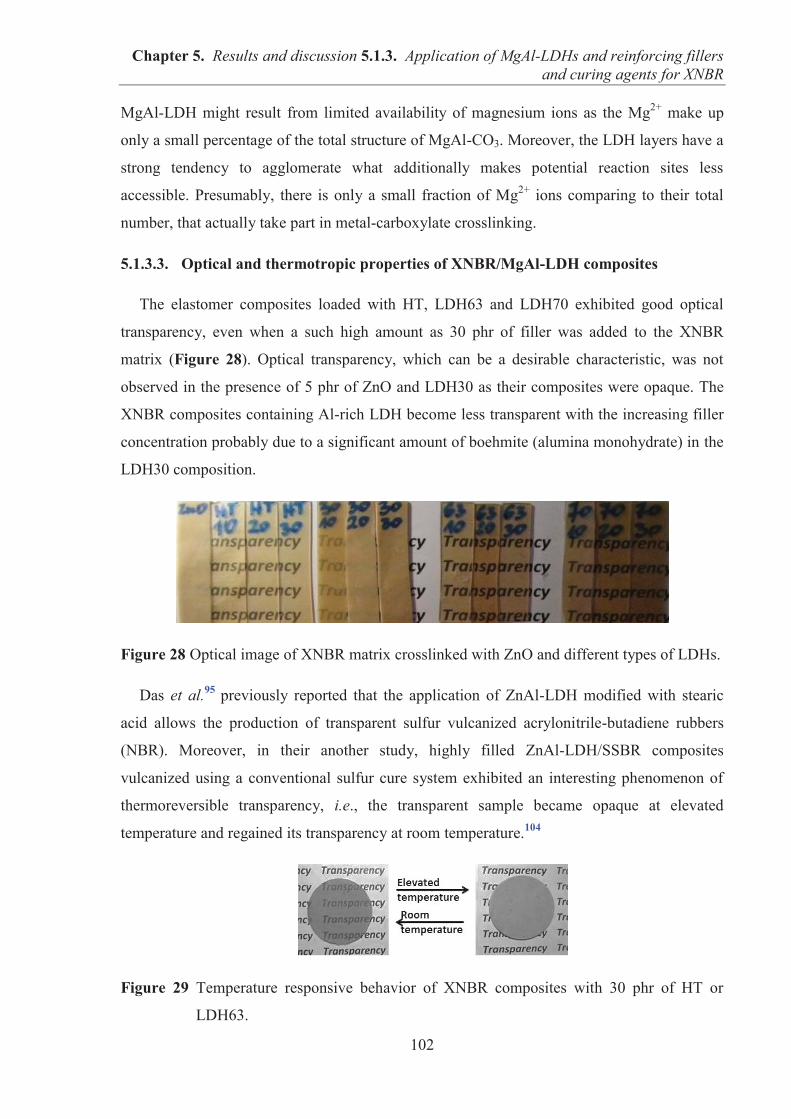
Chapter 5. Results and discussion 5.1.3. Application of MgAl-LDHs and reinforcing fillers and curing agents for XNBR
102
MgAl-LDH might result from limited availability of magnesium ions as the Mg2+ make up
only a small percentage of the total structure of MgAl-CO3. Moreover, the LDH layers have a
strong tendency to agglomerate what additionally makes potential reaction sites less
accessible. Presumably, there is only a small fraction of Mg2+ ions comparing to their total
number, that actually take part in metal-carboxylate crosslinking.
5.1.3.3. Optical and thermotropic properties of XNBR/MgAl-LDH composites
The elastomer composites loaded with HT, LDH63 and LDH70 exhibited good optical
transparency, even when a such high amount as 30 phr of filler was added to the XNBR
matrix (Figure 28). Optical transparency, which can be a desirable characteristic, was not
observed in the presence of 5 phr of ZnO and LDH30 as their composites were opaque. The
XNBR composites containing Al-rich LDH become less transparent with the increasing filler
concentration probably due to a significant amount of boehmite (alumina monohydrate) in the
LDH30 composition.
Figure 28 Optical image of XNBR matrix crosslinked with ZnO and different types of LDHs.
Das et al.95 previously reported that the application of ZnAl-LDH modified with stearic
acid allows the production of transparent sulfur vulcanized acrylonitrile-butadiene rubbers
(NBR). Moreover, in their another study, highly filled ZnAl-LDH/SSBR composites
vulcanized using a conventional sulfur cure system exhibited an interesting phenomenon of
thermoreversible transparency, i.e., the transparent sample became opaque at elevated
temperature and regained its transparency at room temperature.104
Figure 29 Temperature responsive behavior of XNBR composites with 30 phr of HT or
LDH63.
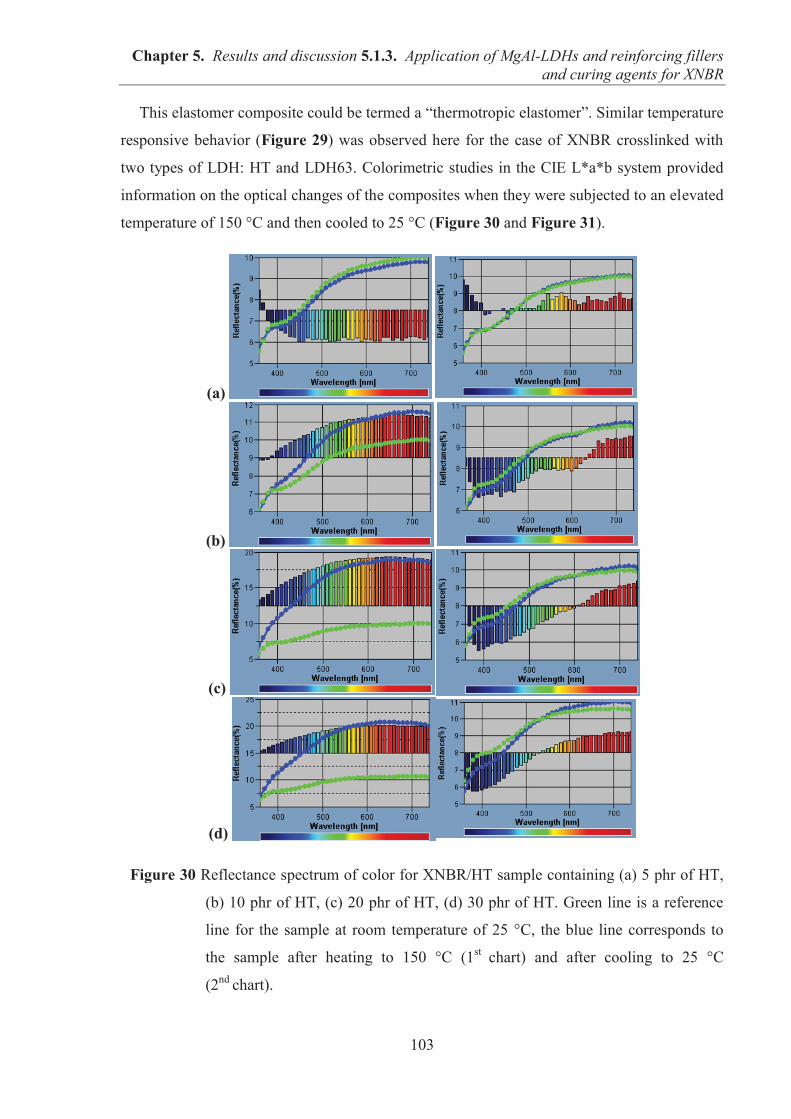
Chapter 5. Results and discussion 5.1.3. Application of MgAl-LDHs and reinforcing fillers and curing agents for XNBR
103
This elastomer composite could be termed a “thermotropic elastomer”. Similar temperature
responsive behavior (Figure 29) was observed here for the case of XNBR crosslinked with
two types of LDH: HT and LDH63. Colorimetric studies in the CIE L*a*b system provided
information on the optical changes of the composites when they were subjected to an elevated
temperature of 150 °C and then cooled to 25 °C (Figure 30 and Figure 31).
(a)
(b)
(c)
(d)
Figure 30 Reflectance spectrum of color for XNBR/HT sample containing (a) 5 phr of HT,
(b) 10 phr of HT, (c) 20 phr of HT, (d) 30 phr of HT. Green line is a reference
line for the sample at room temperature of 25 °C, the blue line corresponds to
the sample after heating to 150 °C (1st chart) and after cooling to 25 °C
(2nd chart).
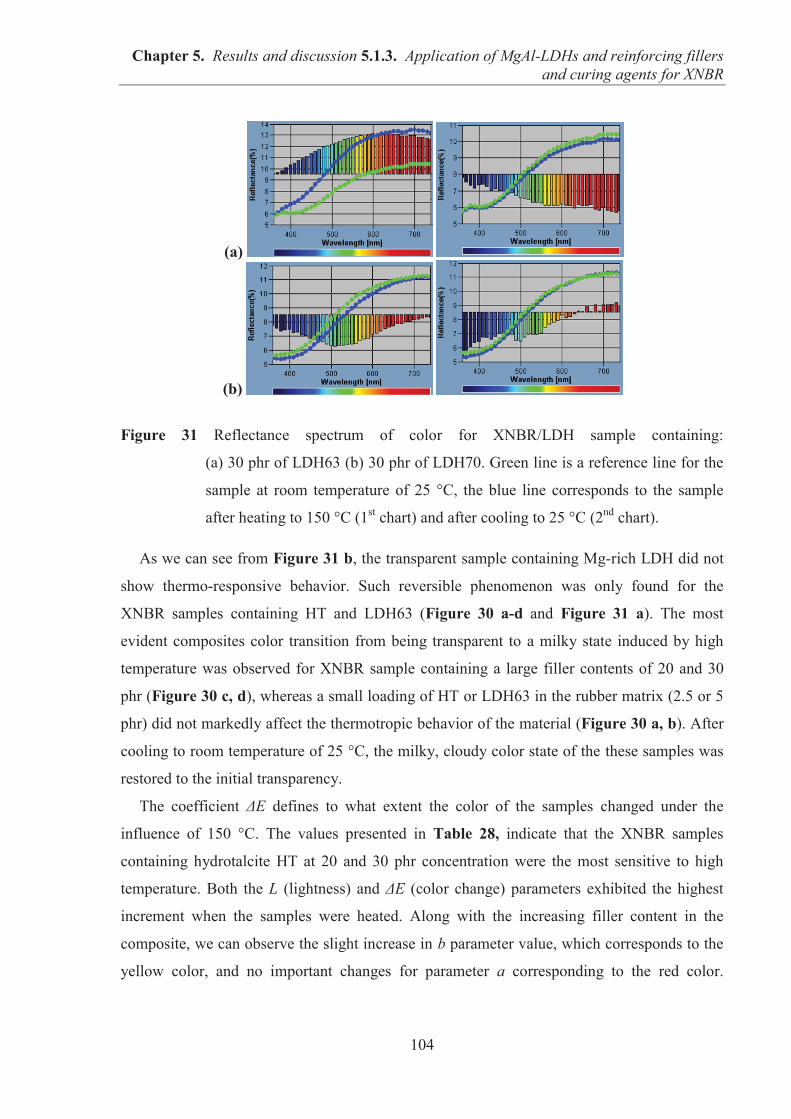
Chapter 5. Results and discussion 5.1.3. Application of MgAl-LDHs and reinforcing fillers and curing agents for XNBR
104
(a)
(b)
Figure 31 Reflectance spectrum of color for XNBR/LDH sample containing:
(a) 30 phr of LDH63 (b) 30 phr of LDH70. Green line is a reference line for the
sample at room temperature of 25 °C, the blue line corresponds to the sample
after heating to 150 °C (1st chart) and after cooling to 25 °C (2nd chart).
As we can see from Figure 31 b, the transparent sample containing Mg-rich LDH did not
show thermo-responsive behavior. Such reversible phenomenon was only found for the
XNBR samples containing HT and LDH63 (Figure 30 a-d and Figure 31 a). The most
evident composites color transition from being transparent to a milky state induced by high
temperature was observed for XNBR sample containing a large filler contents of 20 and 30
phr (Figure 30 c, d), whereas a small loading of HT or LDH63 in the rubber matrix (2.5 or 5
phr) did not markedly affect the thermotropic behavior of the material (Figure 30 a, b). After
cooling to room temperature of 25 °C, the milky, cloudy color state of the these samples was
restored to the initial transparency.
The coefficient ΔE defines to what extent the color of the samples changed under the
influence of 150 °C. The values presented in Table 28, indicate that the XNBR samples
containing hydrotalcite HT at 20 and 30 phr concentration were the most sensitive to high
temperature. Both the L (lightness) and ΔE (color change) parameters exhibited the highest
increment when the samples were heated. Along with the increasing filler content in the
composite, we can observe the slight increase in b parameter value, which corresponds to the
yellow color, and no important changes for parameter a corresponding to the red color.
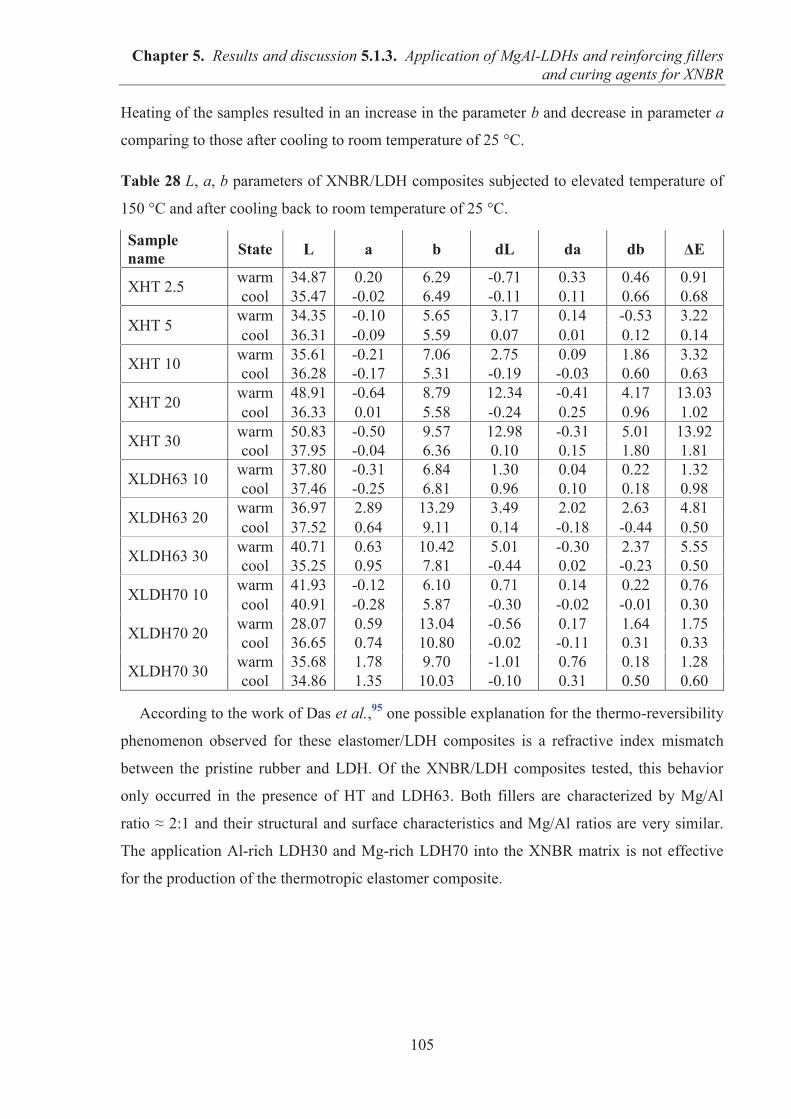
Chapter 5. Results and discussion 5.1.3. Application of MgAl-LDHs and reinforcing fillers and curing agents for XNBR
105
Heating of the samples resulted in an increase in the parameter b and decrease in parameter a
comparing to those after cooling to room temperature of 25 °C.
Table 28 L, a, b parameters of XNBR/LDH composites subjected to elevated temperature of
150 °C and after cooling back to room temperature of 25 °C.
Sample name State L a b dL da db ΔE
XHT 2.5 warm 34.87 0.20 6.29 -0.71 0.33 0.46 0.91 cool 35.47 -0.02 6.49 -0.11 0.11 0.66 0.68
XHT 5 warm 34.35 -0.10 5.65 3.17 0.14 -0.53 3.22 cool 36.31 -0.09 5.59 0.07 0.01 0.12 0.14
XHT 10 warm 35.61 -0.21 7.06 2.75 0.09 1.86 3.32 cool 36.28 -0.17 5.31 -0.19 -0.03 0.60 0.63
XHT 20 warm 48.91 -0.64 8.79 12.34 -0.41 4.17 13.03 cool 36.33 0.01 5.58 -0.24 0.25 0.96 1.02
XHT 30 warm 50.83 -0.50 9.57 12.98 -0.31 5.01 13.92 cool 37.95 -0.04 6.36 0.10 0.15 1.80 1.81
XLDH63 10 warm 37.80 -0.31 6.84 1.30 0.04 0.22 1.32 cool 37.46 -0.25 6.81 0.96 0.10 0.18 0.98
XLDH63 20 warm 36.97 2.89 13.29 3.49 2.02 2.63 4.81 cool 37.52 0.64 9.11 0.14 -0.18 -0.44 0.50
XLDH63 30 warm 40.71 0.63 10.42 5.01 -0.30 2.37 5.55 cool 35.25 0.95 7.81 -0.44 0.02 -0.23 0.50
XLDH70 10 warm 41.93 -0.12 6.10 0.71 0.14 0.22 0.76 cool 40.91 -0.28 5.87 -0.30 -0.02 -0.01 0.30
XLDH70 20 warm 28.07 0.59 13.04 -0.56 0.17 1.64 1.75 cool 36.65 0.74 10.80 -0.02 -0.11 0.31 0.33
XLDH70 30 warm 35.68 1.78 9.70 -1.01 0.76 0.18 1.28 cool 34.86 1.35 10.03 -0.10 0.31 0.50 0.60
According to the work of Das et al.,95 one possible explanation for the thermo-reversibility
phenomenon observed for these elastomer/LDH composites is a refractive index mismatch
between the pristine rubber and LDH. Of the XNBR/LDH composites tested, this behavior
only occurred in the presence of HT and LDH63. Both fillers are characterized by Mg/Al
ratio ≈ 2:1 and their structural and surface characteristics and Mg/Al ratios are very similar.
The application Al-rich LDH30 and Mg-rich LDH70 into the XNBR matrix is not effective
for the production of the thermotropic elastomer composite.
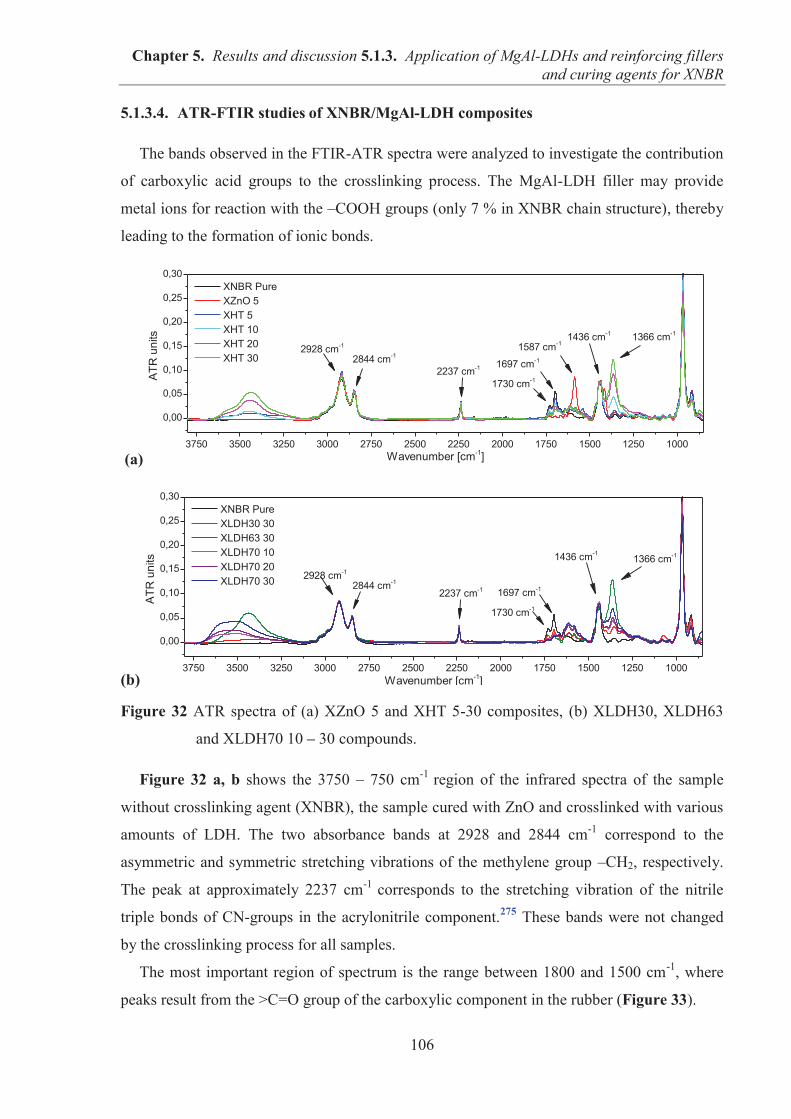
Chapter 5. Results and discussion 5.1.3. Application of MgAl-LDHs and reinforcing fillers and curing agents for XNBR
106
5.1.3.4. ATR-FTIR studies of XNBR/MgAl-LDH composites
The bands observed in the FTIR-ATR spectra were analyzed to investigate the contribution
of carboxylic acid groups to the crosslinking process. The MgAl-LDH filler may provide
metal ions for reaction with the –COOH groups (only 7 % in XNBR chain structure), thereby
leading to the formation of ionic bonds.
(a)
(b)
Figure 32 ATR spectra of (a) XZnO 5 and XHT 5-30 composites, (b) XLDH30, XLDH63
and XLDH70 10 – 30 compounds.
Figure 32 a, b shows the 3750 – 750 cm-1 region of the infrared spectra of the sample
without crosslinking agent (XNBR), the sample cured with ZnO and crosslinked with various
amounts of LDH. The two absorbance bands at 2928 and 2844 cm-1 correspond to the
asymmetric and symmetric stretching vibrations of the methylene group –CH2, respectively.
The peak at approximately 2237 cm-1 corresponds to the stretching vibration of the nitrile
triple bonds of CN-groups in the acrylonitrile component.275 These bands were not changed
by the crosslinking process for all samples.
The most important region of spectrum is the range between 1800 and 1500 cm-1, where
peaks result from the >C=O group of the carboxylic component in the rubber (Figure 33).
3750 3500 3250 3000 2750 2500 2250 2000 1750 1500 1250 1000
0,00
0,05
0,10
0,15
0,20
0,25
0,30
1366 cm-11436 cm-1
1587 cm-1
1697 cm-1
1730 cm-12237 cm-1
2844 cm-1
ATR
uni
ts
Wavenumber [cm-1]
XNBR Pure XZnO 5 XHT 5 XHT 10 XHT 20 XHT 30
2928 cm-1
3750 3500 3250 3000 2750 2500 2250 2000 1750 1500 1250 1000
0,00
0,05
0,10
0,15
0,20
0,25
0,30
1366 cm-11436 cm-1
1697 cm-1
1730 cm-1
2237 cm-12844 cm-1
ATR
uni
ts
Wavenumber [cm-1]
XNBR Pure XLDH30 30 XLDH63 30 XLDH70 10 XLDH70 20 XLDH70 30 2928 cm-1
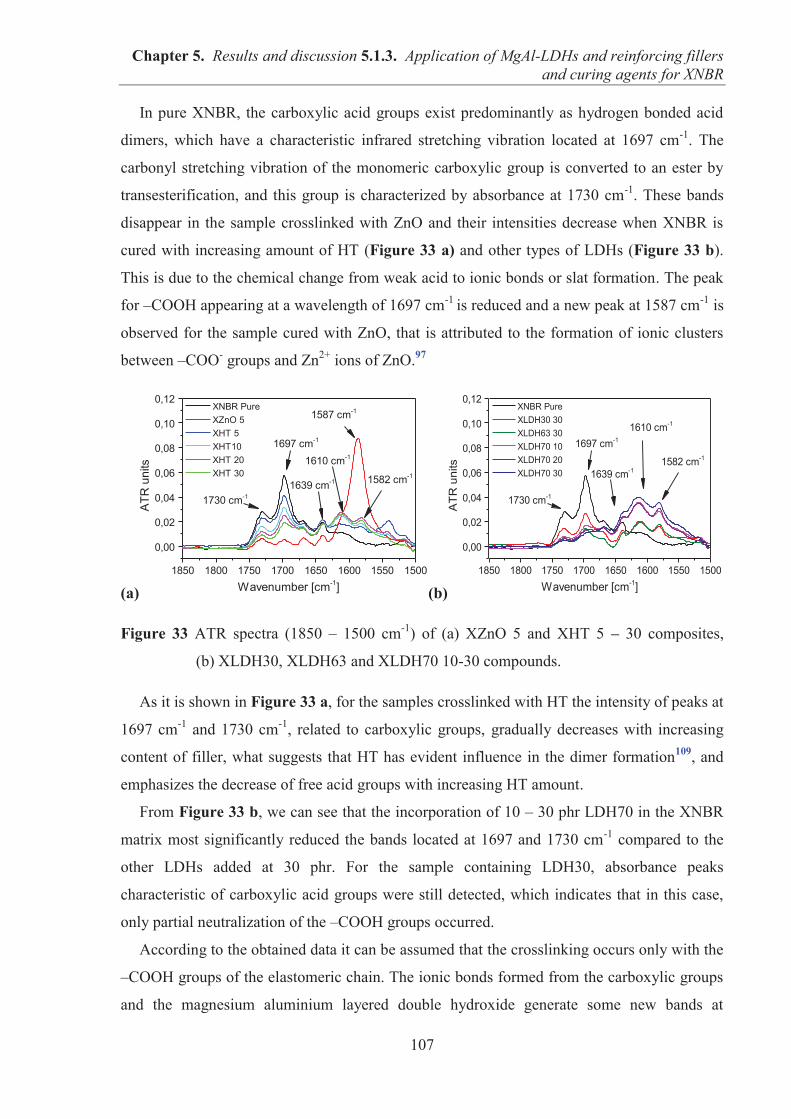
Chapter 5. Results and discussion 5.1.3. Application of MgAl-LDHs and reinforcing fillers and curing agents for XNBR
107
In pure XNBR, the carboxylic acid groups exist predominantly as hydrogen bonded acid
dimers, which have a characteristic infrared stretching vibration located at 1697 cm-1. The
carbonyl stretching vibration of the monomeric carboxylic group is converted to an ester by
transesterification, and this group is characterized by absorbance at 1730 cm-1. These bands
disappear in the sample crosslinked with ZnO and their intensities decrease when XNBR is
cured with increasing amount of HT (Figure 33 a) and other types of LDHs (Figure 33 b).
This is due to the chemical change from weak acid to ionic bonds or slat formation. The peak
for –COOH appearing at a wavelength of 1697 cm-1 is reduced and a new peak at 1587 cm-1 is
observed for the sample cured with ZnO, that is attributed to the formation of ionic clusters
between –COO- groups and Zn2+ ions of ZnO.97
(a) (b)
Figure 33 ATR spectra (1850 – 1500 cm-1) of (a) XZnO 5 and XHT 5 – 30 composites,
(b) XLDH30, XLDH63 and XLDH70 10-30 compounds.
As it is shown in Figure 33 a, for the samples crosslinked with HT the intensity of peaks at
1697 cm-1 and 1730 cm-1, related to carboxylic groups, gradually decreases with increasing
content of filler, what suggests that HT has evident influence in the dimer formation109, and
emphasizes the decrease of free acid groups with increasing HT amount.
From Figure 33 b, we can see that the incorporation of 10 – 30 phr LDH70 in the XNBR
matrix most significantly reduced the bands located at 1697 and 1730 cm-1 compared to the
other LDHs added at 30 phr. For the sample containing LDH30, absorbance peaks
characteristic of carboxylic acid groups were still detected, which indicates that in this case,
only partial neutralization of the –COOH groups occurred.
According to the obtained data it can be assumed that the crosslinking occurs only with the
–COOH groups of the elastomeric chain. The ionic bonds formed from the carboxylic groups
and the magnesium aluminium layered double hydroxide generate some new bands at
1850 1800 1750 1700 1650 1600 1550 1500
0,00
0,02
0,04
0,06
0,08
0,10
0,12
1639 cm-1
1610 cm-1
1582 cm-1
1587 cm-1
1697 cm-1
1730 cm-1
ATR
uni
ts
Wavenumber [cm-1]
XNBR Pure XZnO 5 XHT 5 XHT10 XHT 20 XHT 30
1850 1800 1750 1700 1650 1600 1550 1500
0,00
0,02
0,04
0,06
0,08
0,10
0,12
1639 cm-1
1610 cm-1
1582 cm-1
1697 cm-1
1730 cm-1
ATR
uni
ts
Wavenumber [cm-1]
XNBR Pure XLDH30 30 XLDH63 30 XLDH70 10 XLDH70 20 XLDH70 30
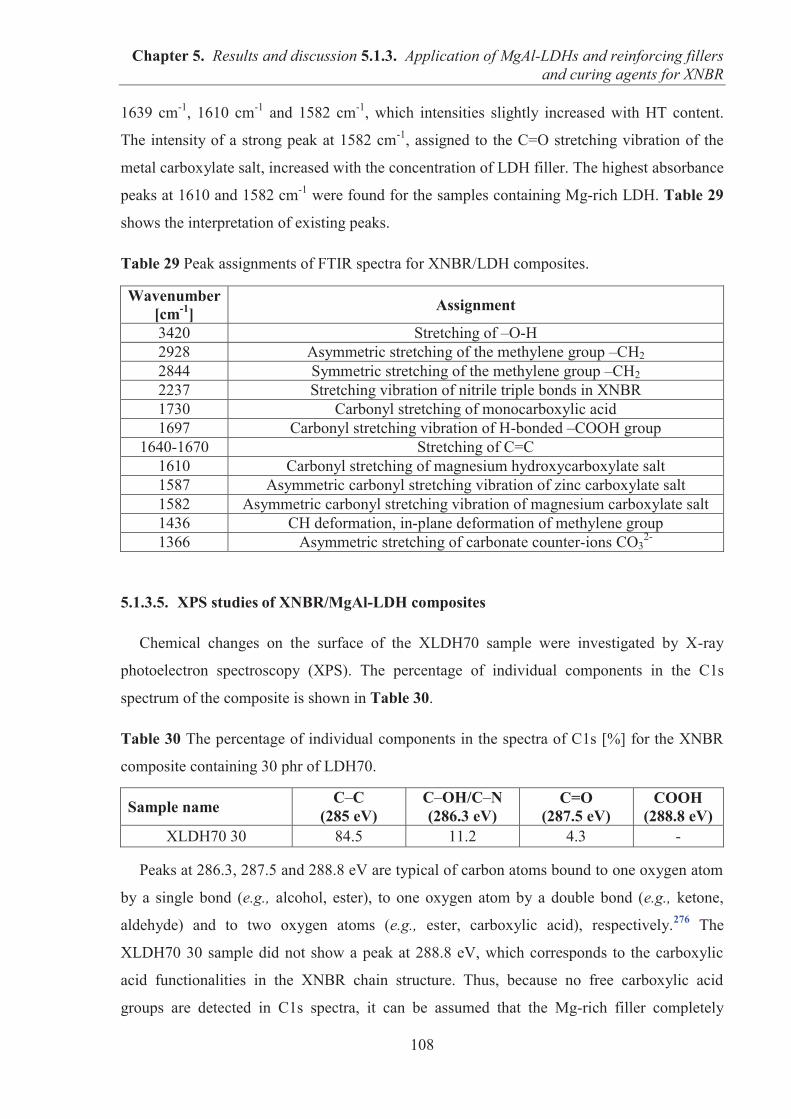
Chapter 5. Results and discussion 5.1.3. Application of MgAl-LDHs and reinforcing fillers and curing agents for XNBR
108
1639 cm-1, 1610 cm-1 and 1582 cm-1, which intensities slightly increased with HT content.
The intensity of a strong peak at 1582 cm-1, assigned to the C=O stretching vibration of the
metal carboxylate salt, increased with the concentration of LDH filler. The highest absorbance
peaks at 1610 and 1582 cm-1 were found for the samples containing Mg-rich LDH. Table 29
shows the interpretation of existing peaks.
Table 29 Peak assignments of FTIR spectra for XNBR/LDH composites.
Wavenumber [cm-1] Assignment
3420 Stretching of –O-H 2928 Asymmetric stretching of the methylene group –CH2 2844 Symmetric stretching of the methylene group –CH2 2237 Stretching vibration of nitrile triple bonds in XNBR 1730 Carbonyl stretching of monocarboxylic acid 1697 Carbonyl stretching vibration of H-bonded –COOH group
1640-1670 Stretching of C=C 1610 Carbonyl stretching of magnesium hydroxycarboxylate salt 1587 Asymmetric carbonyl stretching vibration of zinc carboxylate salt 1582 Asymmetric carbonyl stretching vibration of magnesium carboxylate salt 1436 CH deformation, in-plane deformation of methylene group 1366 Asymmetric stretching of carbonate counter-ions CO3
2-
5.1.3.5. XPS studies of XNBR/MgAl-LDH composites
Chemical changes on the surface of the XLDH70 sample were investigated by X-ray
photoelectron spectroscopy (XPS). The percentage of individual components in the C1s
spectrum of the composite is shown in Table 30.
Table 30 The percentage of individual components in the spectra of C1s [%] for the XNBR
composite containing 30 phr of LDH70.
Sample name C–C (285 eV)
C–OH/C–N (286.3 eV)
C=O (287.5 eV)
COOH (288.8 eV)
XLDH70 30 84.5 11.2 4.3 -
Peaks at 286.3, 287.5 and 288.8 eV are typical of carbon atoms bound to one oxygen atom
by a single bond (e.g., alcohol, ester), to one oxygen atom by a double bond (e.g., ketone,
aldehyde) and to two oxygen atoms (e.g., ester, carboxylic acid), respectively.276 The
XLDH70 30 sample did not show a peak at 288.8 eV, which corresponds to the carboxylic
acid functionalities in the XNBR chain structure. Thus, because no free carboxylic acid
groups are detected in C1s spectra, it can be assumed that the Mg-rich filler completely
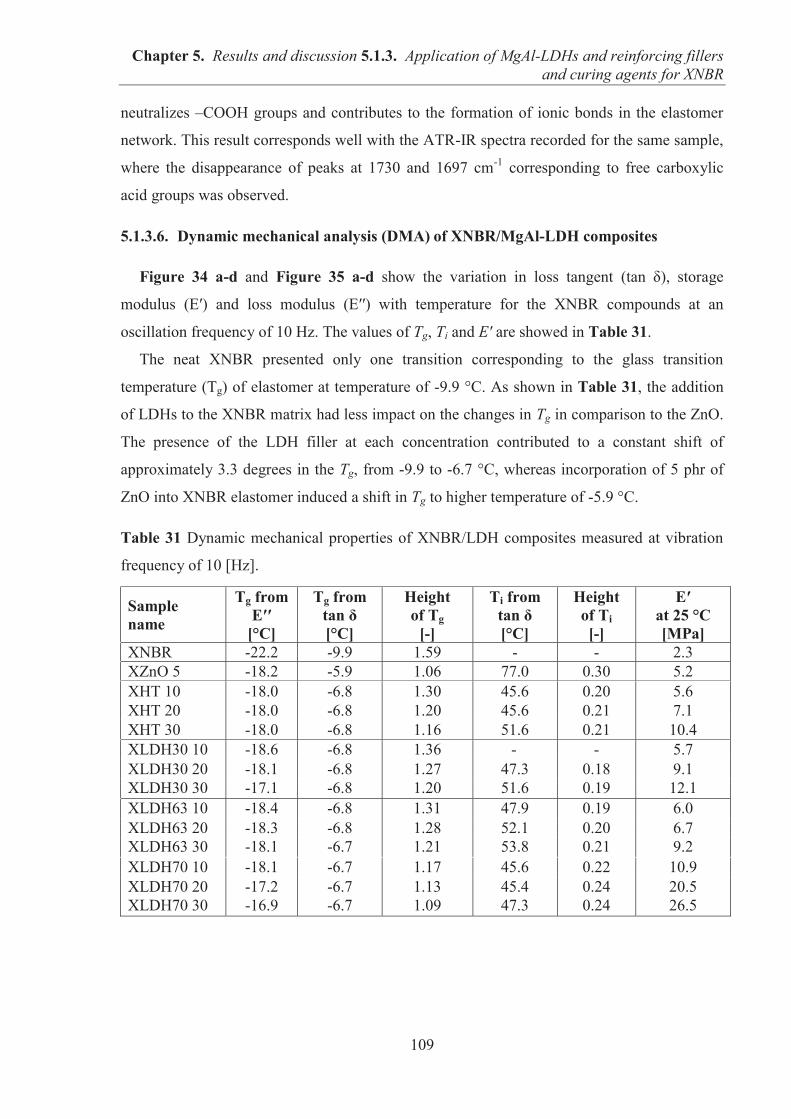
Chapter 5. Results and discussion 5.1.3. Application of MgAl-LDHs and reinforcing fillers and curing agents for XNBR
109
neutralizes –COOH groups and contributes to the formation of ionic bonds in the elastomer
network. This result corresponds well with the ATR-IR spectra recorded for the same sample,
where the disappearance of peaks at 1730 and 1697 cm-1 corresponding to free carboxylic
acid groups was observed.
5.1.3.6. Dynamic mechanical analysis (DMA) of XNBR/MgAl-LDH composites
Figure 34 a-d and Figure 35 a-d show the variation in loss tangent (tan δ), storage
modulus (E′) and loss modulus (E′′) with temperature for the XNBR compounds at an
oscillation frequency of 10 Hz. The values of Tg, Ti and E′ are showed in Table 31.
The neat XNBR presented only one transition corresponding to the glass transition
temperature (Tg) of elastomer at temperature of -9.9 °C. As shown in Table 31, the addition
of LDHs to the XNBR matrix had less impact on the changes in Tg in comparison to the ZnO.
The presence of the LDH filler at each concentration contributed to a constant shift of
approximately 3.3 degrees in the Tg, from -9.9 to -6.7 °C, whereas incorporation of 5 phr of
ZnO into XNBR elastomer induced a shift in Tg to higher temperature of -5.9 °C.
Table 31 Dynamic mechanical properties of XNBR/LDH composites measured at vibration
frequency of 10 [Hz].
Sample name
Tg from E′′
[°C]
Tg from tan δ [°C]
Height of Tg
[-]
Ti from tan δ [°C]
Height of Ti [-]
E′ at 25 °C [MPa]
XNBR -22.2 -9.9 1.59 - - 2.3 XZnO 5 -18.2 -5.9 1.06 77.0 0.30 5.2 XHT 10 -18.0 -6.8 1.30 45.6 0.20 5.6 XHT 20 -18.0 -6.8 1.20 45.6 0.21 7.1 XHT 30 -18.0 -6.8 1.16 51.6 0.21 10.4 XLDH30 10 -18.6 -6.8 1.36 - - 5.7 XLDH30 20 -18.1 -6.8 1.27 47.3 0.18 9.1 XLDH30 30 -17.1 -6.8 1.20 51.6 0.19 12.1 XLDH63 10 -18.4 -6.8 1.31 47.9 0.19 6.0 XLDH63 20 -18.3 -6.8 1.28 52.1 0.20 6.7 XLDH63 30 -18.1 -6.7 1.21 53.8 0.21 9.2 XLDH70 10 -18.1 -6.7 1.17 45.6 0.22 10.9 XLDH70 20 -17.2 -6.7 1.13 45.4 0.24 20.5 XLDH70 30 -16.9 -6.7 1.09 47.3 0.24 26.5
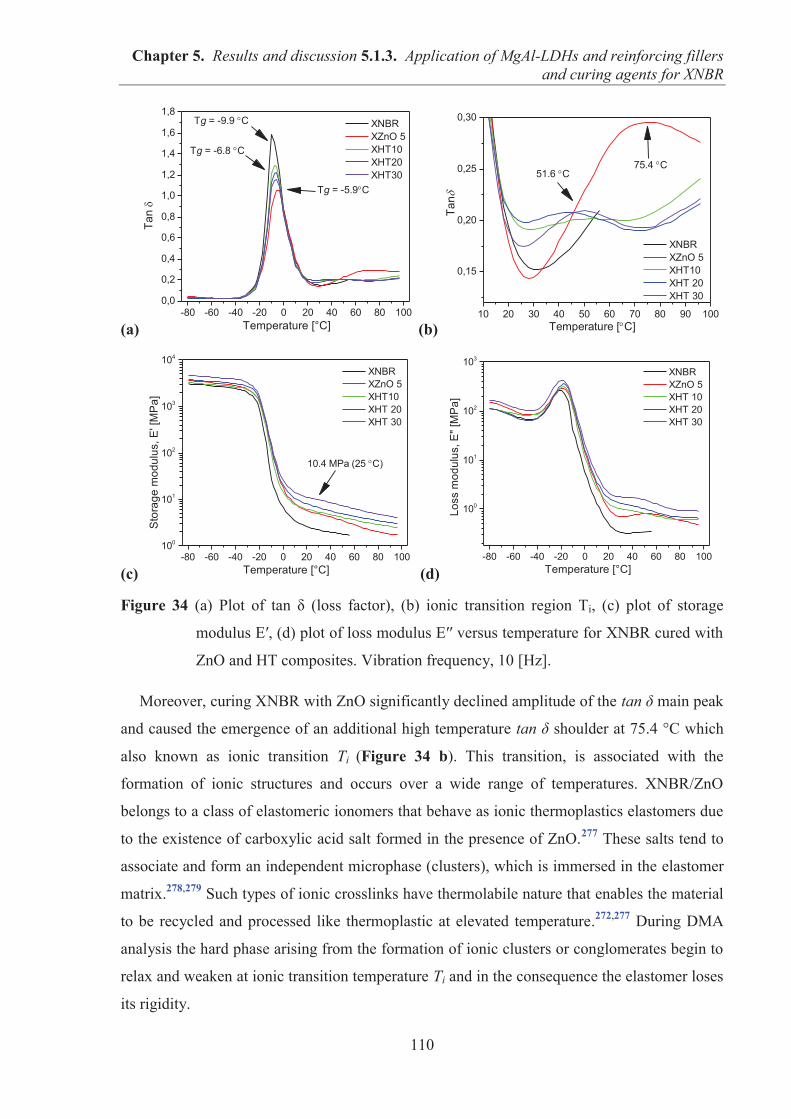
Chapter 5. Results and discussion 5.1.3. Application of MgAl-LDHs and reinforcing fillers and curing agents for XNBR
110
(a) (b)
(c) (d)
Figure 34 (a) Plot of tan δ (loss factor), (b) ionic transition region Ti, (c) plot of storage
modulus E′, (d) plot of loss modulus E′′ versus temperature for XNBR cured with
ZnO and HT composites. Vibration frequency, 10 [Hz].
Moreover, curing XNBR with ZnO significantly declined amplitude of the tan δ main peak
and caused the emergence of an additional high temperature tan δ shoulder at 75.4 °C which
also known as ionic transition Ti (Figure 34 b). This transition, is associated with the
formation of ionic structures and occurs over a wide range of temperatures. XNBR/ZnO
belongs to a class of elastomeric ionomers that behave as ionic thermoplastics elastomers due
to the existence of carboxylic acid salt formed in the presence of ZnO.277 These salts tend to
associate and form an independent microphase (clusters), which is immersed in the elastomer
matrix.278,279 Such types of ionic crosslinks have thermolabile nature that enables the material
to be recycled and processed like thermoplastic at elevated temperature.272,277 During DMA
analysis the hard phase arising from the formation of ionic clusters or conglomerates begin to
relax and weaken at ionic transition temperature Ti and in the consequence the elastomer loses
its rigidity.
-80 -60 -40 -20 0 20 40 60 80 1000,0
0,2
0,4
0,6
0,8
1,0
1,2
1,4
1,6
1,8
Tg = -5.9 C
Tg = -9.9 C
Tg = -6.8 C Ta
n
[ ]
XNBR XZnO 5 XHT10 XHT20 XHT30
10 20 30 40 50 60 70 80 90 100
0,15
0,20
0,25
0,30
Tan
Temperature [ C]
XNBR XZnO 5 XHT10 XHT 20 XHT 30
75.4 C51.6 C
-80 -60 -40 -20 0 20 40 60 80 100100
101
102
103
104
Sto
rage
mod
ulus
, E' [
MP
a]
[ ]
XNBR XZnO 5 XHT10 XHT 20 XHT 30
10.4 MPa (25 C)
-80 -60 -40 -20 0 20 40 60 80 100
100
101
102
103
Loss
mod
ulus
, E" [
MP
a]
[ ]
XNBR XZnO 5 XHT 10 XHT 20 XHT 30
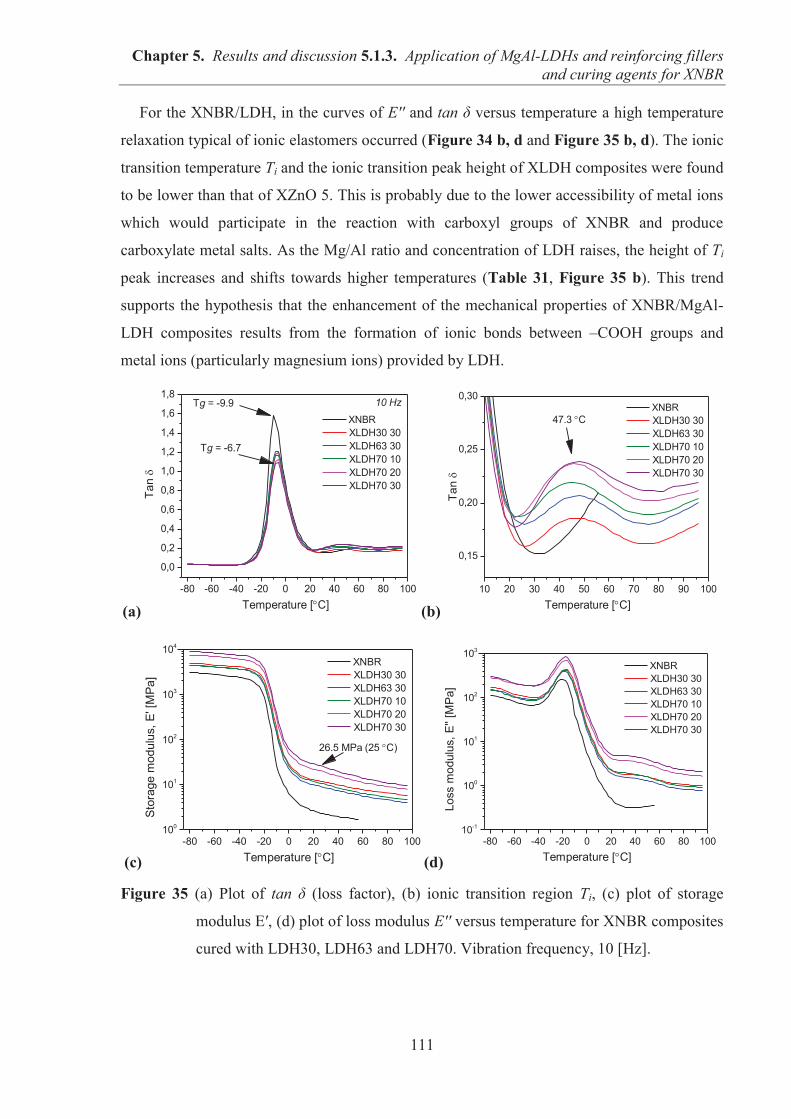
Chapter 5. Results and discussion 5.1.3. Application of MgAl-LDHs and reinforcing fillers and curing agents for XNBR
111
For the XNBR/LDH, in the curves of E′′ and tan δ versus temperature a high temperature
relaxation typical of ionic elastomers occurred (Figure 34 b, d and Figure 35 b, d). The ionic
transition temperature Ti and the ionic transition peak height of XLDH composites were found
to be lower than that of XZnO 5. This is probably due to the lower accessibility of metal ions
which would participate in the reaction with carboxyl groups of XNBR and produce
carboxylate metal salts. As the Mg/Al ratio and concentration of LDH raises, the height of Ti
peak increases and shifts towards higher temperatures (Table 31, Figure 35 b). This trend
supports the hypothesis that the enhancement of the mechanical properties of XNBR/MgAl-
LDH composites results from the formation of ionic bonds between –COOH groups and
metal ions (particularly magnesium ions) provided by LDH.
(a) (b)
(c) (d)
Figure 35 (a) Plot of tan δ (loss factor), (b) ionic transition region Ti, (c) plot of storage
modulus E′, (d) plot of loss modulus E′′ versus temperature for XNBR composites
cured with LDH30, LDH63 and LDH70. Vibration frequency, 10 [Hz].
-80 -60 -40 -20 0 20 40 60 80 100
0,0
0,2
0,4
0,6
0,8
1,0
1,2
1,4
1,6
1,8
Tg = -6.7
Tan
Temperature [ C]
XNBR XLDH30 30 XLDH63 30 XLDH70 10 XLDH70 20 XLDH70 30
Tg = -9.9 10 Hz
10 20 30 40 50 60 70 80 90 100
0,15
0,20
0,25
0,30
Tan
Temperature [ C]
XNBR XLDH30 30 XLDH63 30 XLDH70 10 XLDH70 20 XLDH70 30
47.3 C
-80 -60 -40 -20 0 20 40 60 80 100100
101
102
103
104
Stor
age
mod
ulus
, E' [
MPa
]
Temperature [ C]
XNBR XLDH30 30 XLDH63 30 XLDH70 10 XLDH70 20 XLDH70 30
26.5 MPa (25 C)
-80 -60 -40 -20 0 20 40 60 80 10010-1
100
101
102
103
Loss
mod
ulus
, E'' [
MPa
]
Temperature [ C]
XNBR XLDH30 30 XLDH63 30 XLDH70 10 XLDH70 20 XLDH70 30
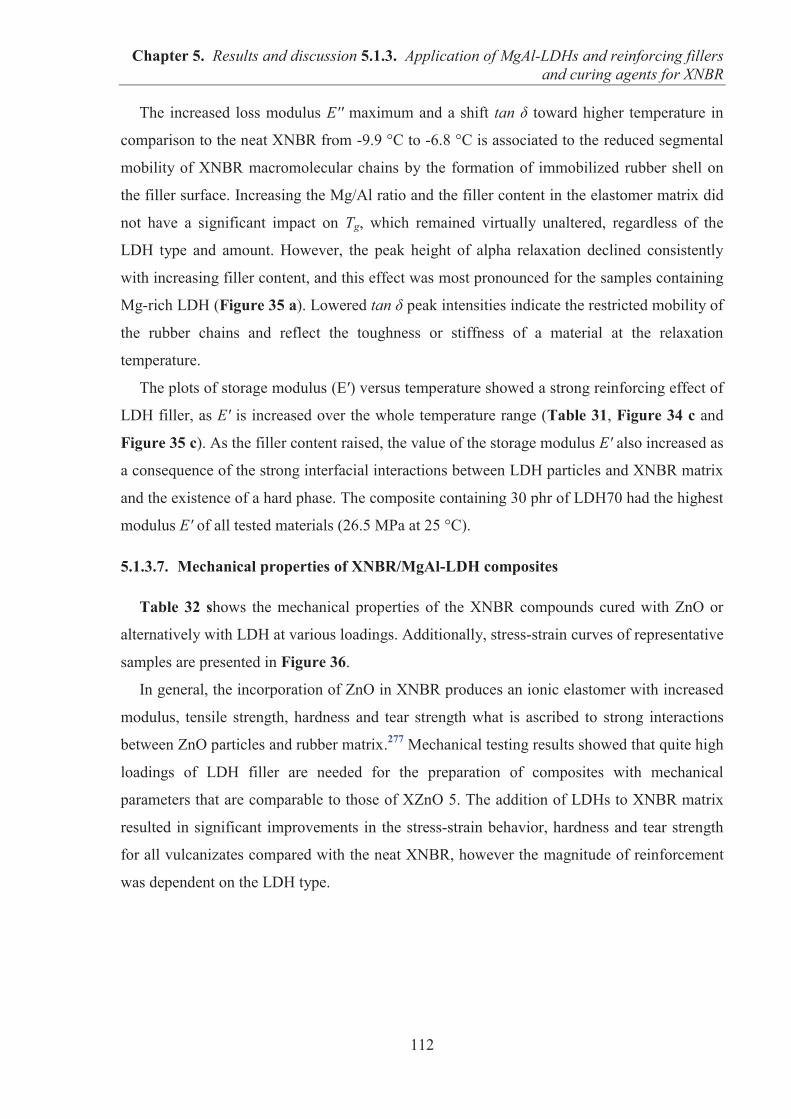
Chapter 5. Results and discussion 5.1.3. Application of MgAl-LDHs and reinforcing fillers and curing agents for XNBR
112
The increased loss modulus E′′ maximum and a shift tan δ toward higher temperature in
comparison to the neat XNBR from -9.9 °C to -6.8 °C is associated to the reduced segmental
mobility of XNBR macromolecular chains by the formation of immobilized rubber shell on
the filler surface. Increasing the Mg/Al ratio and the filler content in the elastomer matrix did
not have a significant impact on Tg, which remained virtually unaltered, regardless of the
LDH type and amount. However, the peak height of alpha relaxation declined consistently
with increasing filler content, and this effect was most pronounced for the samples containing
Mg-rich LDH (Figure 35 a). Lowered tan δ peak intensities indicate the restricted mobility of
the rubber chains and reflect the toughness or stiffness of a material at the relaxation
temperature.
The plots of storage modulus (E′) versus temperature showed a strong reinforcing effect of
LDH filler, as E′ is increased over the whole temperature range (Table 31, Figure 34 c and
Figure 35 c). As the filler content raised, the value of the storage modulus E′ also increased as
a consequence of the strong interfacial interactions between LDH particles and XNBR matrix
and the existence of a hard phase. The composite containing 30 phr of LDH70 had the highest
modulus E′ of all tested materials (26.5 MPa at 25 °C).
5.1.3.7. Mechanical properties of XNBR/MgAl-LDH composites
Table 32 shows the mechanical properties of the XNBR compounds cured with ZnO or
alternatively with LDH at various loadings. Additionally, stress-strain curves of representative
samples are presented in Figure 36.
In general, the incorporation of ZnO in XNBR produces an ionic elastomer with increased
modulus, tensile strength, hardness and tear strength what is ascribed to strong interactions
between ZnO particles and rubber matrix.277 Mechanical testing results showed that quite high
loadings of LDH filler are needed for the preparation of composites with mechanical
parameters that are comparable to those of XZnO 5. The addition of LDHs to XNBR matrix
resulted in significant improvements in the stress-strain behavior, hardness and tear strength
for all vulcanizates compared with the neat XNBR, however the magnitude of reinforcement
was dependent on the LDH type.
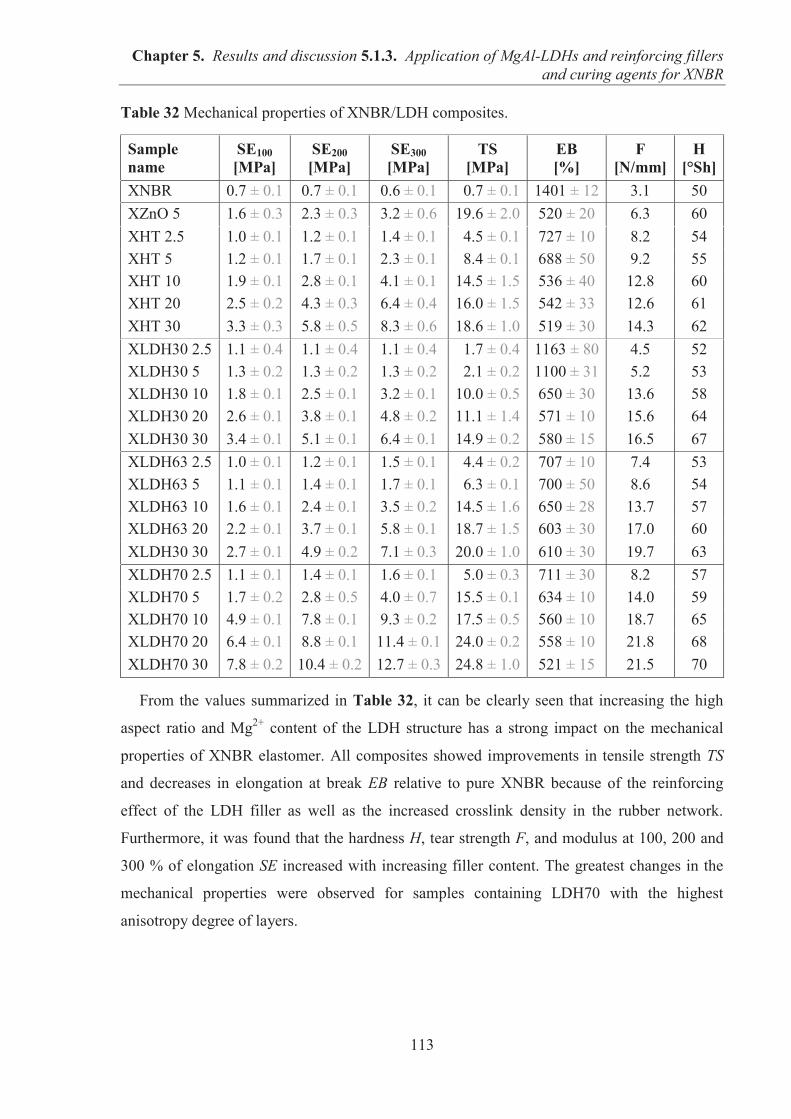
Chapter 5. Results and discussion 5.1.3. Application of MgAl-LDHs and reinforcing fillers and curing agents for XNBR
113
Table 32 Mechanical properties of XNBR/LDH composites.
Sample name
SE100 [MPa]
SE200 [MPa]
SE300 [MPa]
TS [MPa]
EB [%]
F [N/mm]
H [°Sh]
XNBR 0.7 ± 0.1 0.7 ± 0.1 0.6 ± 0.1 00.7 ± 0.1 1401 ± 12 3.1 50 XZnO 5 1.6 ± 0.3 2.3 ± 0.3 3.2 ± 0.6 19.6 ± 2.0 520 ± 20 6.3 60 XHT 2.5 1.0 ± 0.1 1.2 ± 0.1 1.4 ± 0.1 04.5 ± 0.1 727 ± 10 8.2 54 XHT 5 1.2 ± 0.1 1.7 ± 0.1 2.3 ± 0.1 08.4 ± 0.1 688 ± 50 9.2 55 XHT 10 1.9 ± 0.1 2.8 ± 0.1 4.1 ± 0.1 14.5 ± 1.5 536 ± 40 12.8 60 XHT 20 2.5 ± 0.2 4.3 ± 0.3 6.4 ± 0.4 16.0 ± 1.5 542 ± 33 12.6 61 XHT 30 3.3 ± 0.3 5.8 ± 0.5 8.3 ± 0.6 18.6 ± 1.0 519 ± 30 14.3 62 XLDH30 2.5 1.1 ± 0.4 1.1 ± 0.4 1.1 ± 0.4 01.7 ± 0.4 1163 ± 80 4.5 52 XLDH30 5 1.3 ± 0.2 1.3 ± 0.2 1.3 ± 0.2 02.1 ± 0.2 1100 ± 31 5.2 53 XLDH30 10 1.8 ± 0.1 2.5 ± 0.1 3.2 ± 0.1 10.0 ± 0.5 650 ± 30 13.6 58 XLDH30 20 2.6 ± 0.1 3.8 ± 0.1 4.8 ± 0.2 11.1 ± 1.4 571 ± 10 15.6 64 XLDH30 30 3.4 ± 0.1 5.1 ± 0.1 6.4 ± 0.1 14.9 ± 0.2 580 ± 15 16.5 67 XLDH63 2.5 1.0 ± 0.1 1.2 ± 0.1 1.5 ± 0.1 04.4 ± 0.2 707 ± 10 7.4 53 XLDH63 5 1.1 ± 0.1 1.4 ± 0.1 1.7 ± 0.1 06.3 ± 0.1 700 ± 50 8.6 54 XLDH63 10 1.6 ± 0.1 2.4 ± 0.1 3.5 ± 0.2 14.5 ± 1.6 650 ± 28 13.7 57 XLDH63 20 2.2 ± 0.1 3.7 ± 0.1 5.8 ± 0.1 18.7 ± 1.5 603 ± 30 17.0 60 XLDH30 30 2.7 ± 0.1 4.9 ± 0.2 7.1 ± 0.3 20.0 ± 1.0 610 ± 30 19.7 63 XLDH70 2.5 1.1 ± 0.1 1.4 ± 0.1 1.6 ± 0.1 05.0 ± 0.3 711 ± 30 8.2 57 XLDH70 5 1.7 ± 0.2 2.8 ± 0.5 4.0 ± 0.7 15.5 ± 0.1 634 ± 10 14.0 59 XLDH70 10 4.9 ± 0.1 7.8 ± 0.1 9.3 ± 0.2 17.5 ± 0.5 560 ± 10 18.7 65 XLDH70 20 6.4 ± 0.1 8.8 ± 0.1 11.4 ± 0.1 24.0 ± 0.2 558 ± 10 21.8 68 XLDH70 30 7.8 ± 0.2 10.4 ± 0.2 12.7 ± 0.3 24.8 ± 1.0 521 ± 15 21.5 70
From the values summarized in Table 32, it can be clearly seen that increasing the high
aspect ratio and Mg2+ content of the LDH structure has a strong impact on the mechanical
properties of XNBR elastomer. All composites showed improvements in tensile strength TS
and decreases in elongation at break EB relative to pure XNBR because of the reinforcing
effect of the LDH filler as well as the increased crosslink density in the rubber network.
Furthermore, it was found that the hardness H, tear strength F, and modulus at 100, 200 and
300 % of elongation SE increased with increasing filler content. The greatest changes in the
mechanical properties were observed for samples containing LDH70 with the highest
anisotropy degree of layers.
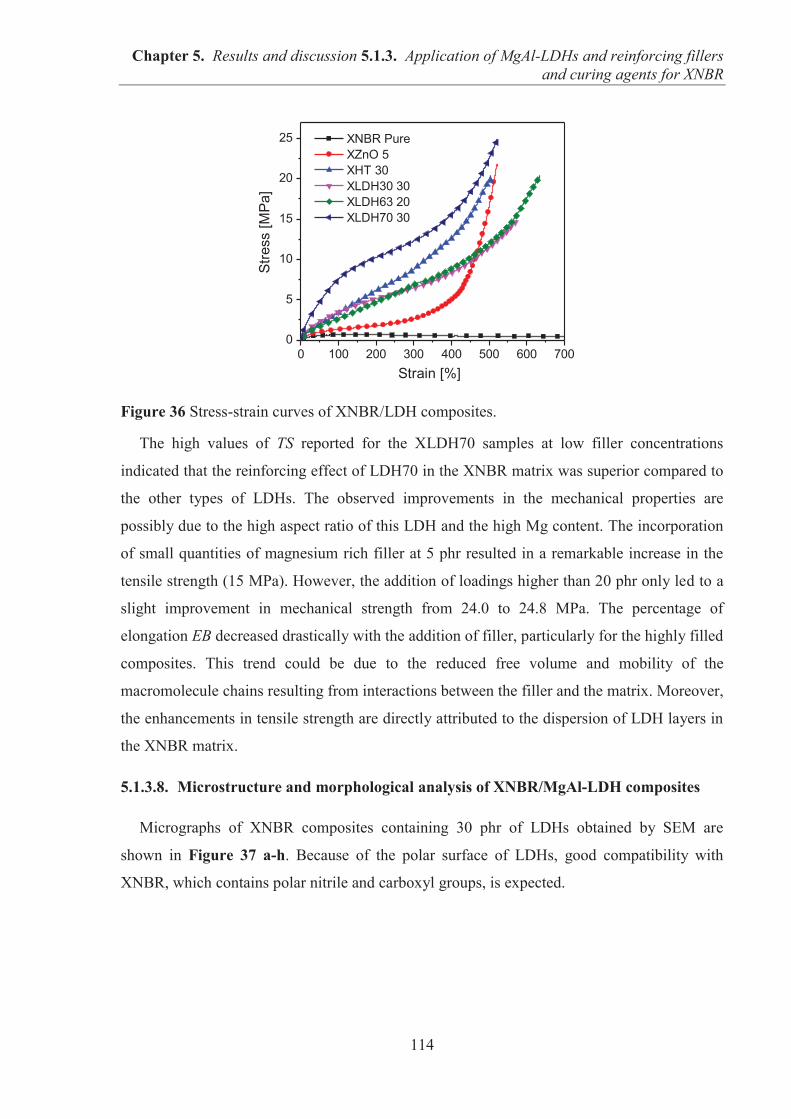
Chapter 5. Results and discussion 5.1.3. Application of MgAl-LDHs and reinforcing fillers and curing agents for XNBR
114
Figure 36 Stress-strain curves of XNBR/LDH composites.
The high values of TS reported for the XLDH70 samples at low filler concentrations
indicated that the reinforcing effect of LDH70 in the XNBR matrix was superior compared to
the other types of LDHs. The observed improvements in the mechanical properties are
possibly due to the high aspect ratio of this LDH and the high Mg content. The incorporation
of small quantities of magnesium rich filler at 5 phr resulted in a remarkable increase in the
tensile strength (15 MPa). However, the addition of loadings higher than 20 phr only led to a
slight improvement in mechanical strength from 24.0 to 24.8 MPa. The percentage of
elongation EB decreased drastically with the addition of filler, particularly for the highly filled
composites. This trend could be due to the reduced free volume and mobility of the
macromolecule chains resulting from interactions between the filler and the matrix. Moreover,
the enhancements in tensile strength are directly attributed to the dispersion of LDH layers in
the XNBR matrix.
5.1.3.8. Microstructure and morphological analysis of XNBR/MgAl-LDH composites
Micrographs of XNBR composites containing 30 phr of LDHs obtained by SEM are
shown in Figure 37 a-h. Because of the polar surface of LDHs, good compatibility with
XNBR, which contains polar nitrile and carboxyl groups, is expected.
0 100 200 300 400 500 600 7000
5
10
15
20
25
Stre
ss [M
Pa]
Strain [%]
XNBR Pure XZnO 5 XHT 30 XLDH30 30 XLDH63 20 XLDH70 30
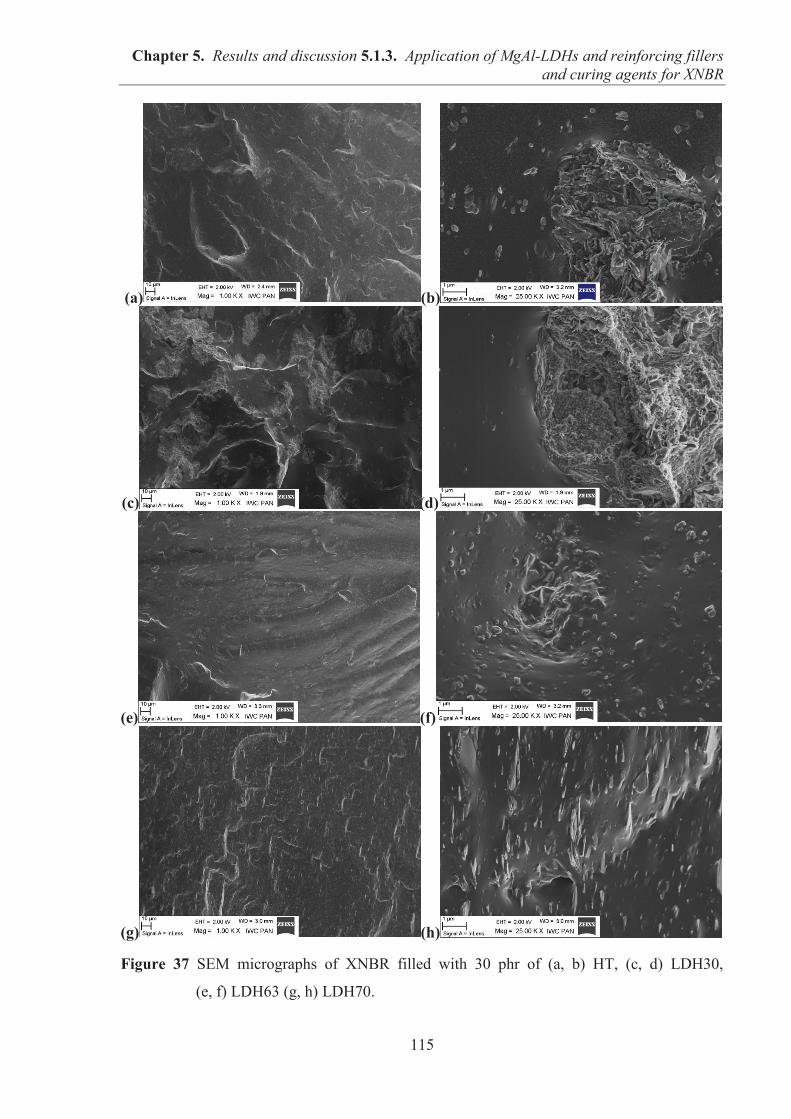
Chapter 5. Results and discussion 5.1.3. Application of MgAl-LDHs and reinforcing fillers and curing agents for XNBR
115
(a) (b)
(c) (d)
(e) (f)
(g) (h)
Figure 37 SEM micrographs of XNBR filled with 30 phr of (a, b) HT, (c, d) LDH30,
(e, f) LDH63 (g, h) LDH70.
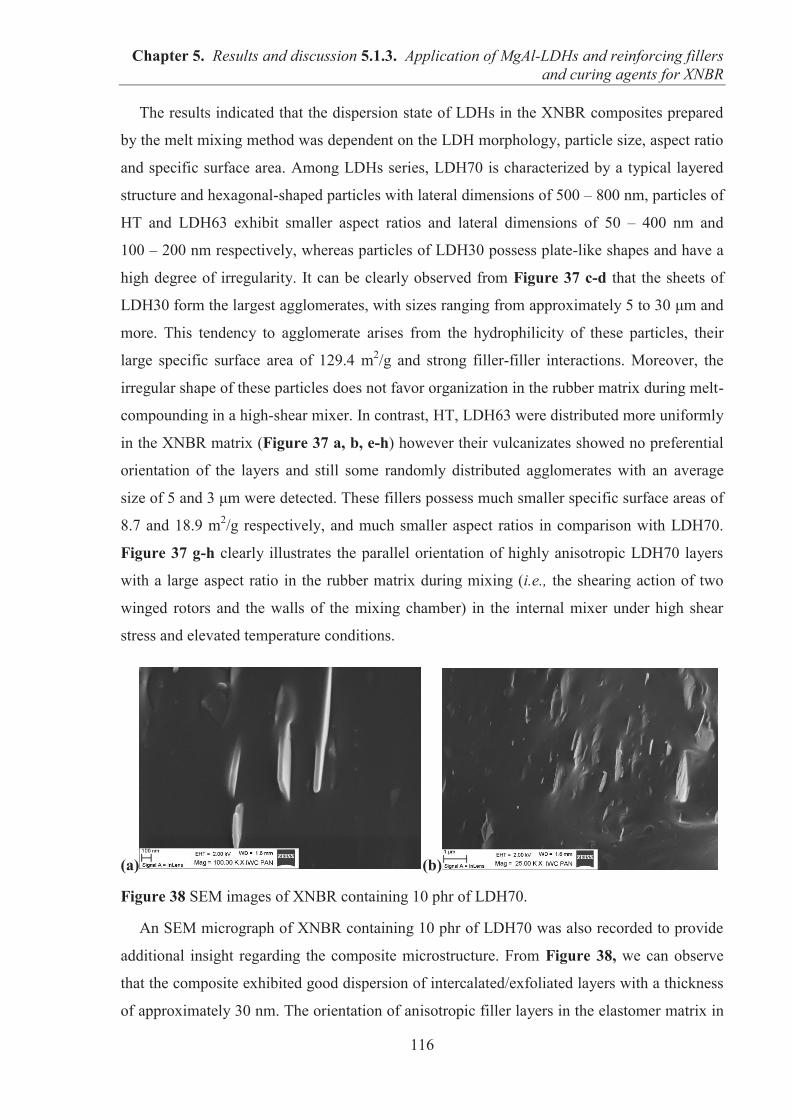
Chapter 5. Results and discussion 5.1.3. Application of MgAl-LDHs and reinforcing fillers and curing agents for XNBR
116
The results indicated that the dispersion state of LDHs in the XNBR composites prepared
by the melt mixing method was dependent on the LDH morphology, particle size, aspect ratio
and specific surface area. Among LDHs series, LDH70 is characterized by a typical layered
structure and hexagonal-shaped particles with lateral dimensions of 500 – 800 nm, particles of
HT and LDH63 exhibit smaller aspect ratios and lateral dimensions of 50 – 400 nm and
100 – 200 nm respectively, whereas particles of LDH30 possess plate-like shapes and have a
high degree of irregularity. It can be clearly observed from Figure 37 c-d that the sheets of
LDH30 form the largest agglomerates, with sizes ranging from approximately 5 to 30 μm and
more. This tendency to agglomerate arises from the hydrophilicity of these particles, their
large specific surface area of 129.4 m2/g and strong filler-filler interactions. Moreover, the
irregular shape of these particles does not favor organization in the rubber matrix during melt-
compounding in a high-shear mixer. In contrast, HT, LDH63 were distributed more uniformly
in the XNBR matrix (Figure 37 a, b, e-h) however their vulcanizates showed no preferential
orientation of the layers and still some randomly distributed agglomerates with an average
size of 5 and 3 μm were detected. These fillers possess much smaller specific surface areas of
8.7 and 18.9 m2/g respectively, and much smaller aspect ratios in comparison with LDH70.
Figure 37 g-h clearly illustrates the parallel orientation of highly anisotropic LDH70 layers
with a large aspect ratio in the rubber matrix during mixing (i.e., the shearing action of two
winged rotors and the walls of the mixing chamber) in the internal mixer under high shear
stress and elevated temperature conditions.
(a) (b)
Figure 38 SEM images of XNBR containing 10 phr of LDH70.
An SEM micrograph of XNBR containing 10 phr of LDH70 was also recorded to provide
additional insight regarding the composite microstructure. From Figure 38, we can observe
that the composite exhibited good dispersion of intercalated/exfoliated layers with a thickness
of approximately 30 nm. The orientation of anisotropic filler layers in the elastomer matrix in
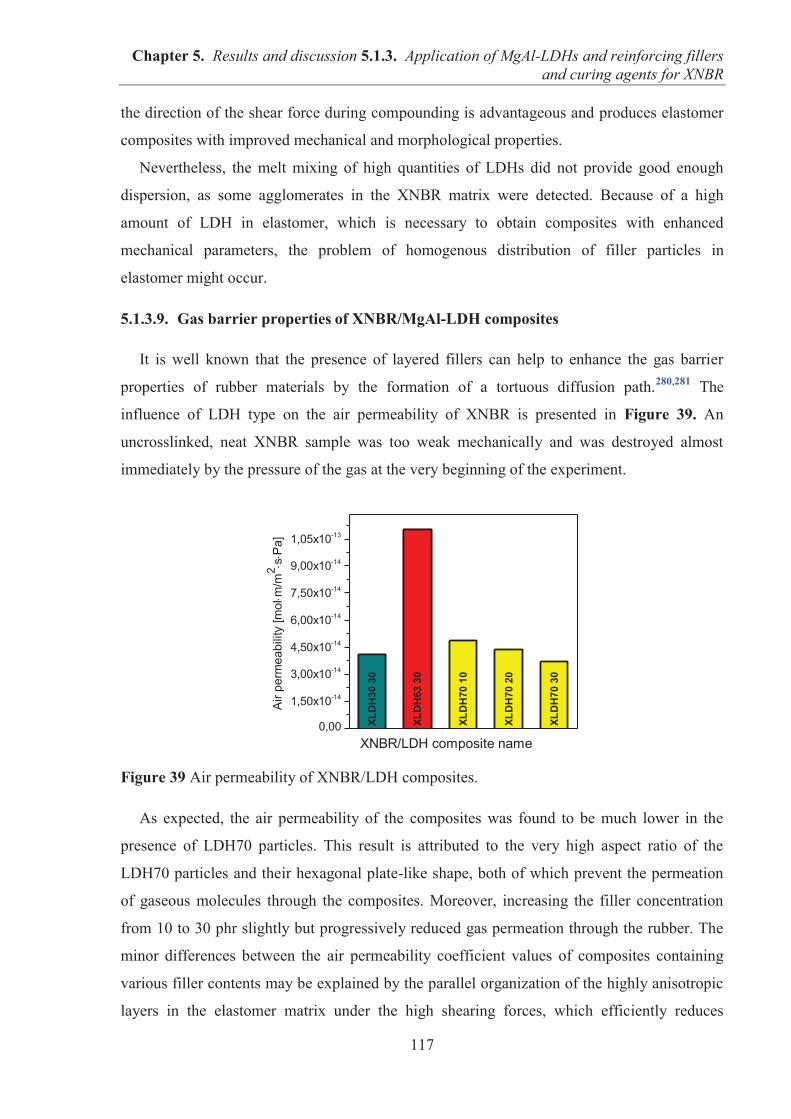
Chapter 5. Results and discussion 5.1.3. Application of MgAl-LDHs and reinforcing fillers and curing agents for XNBR
117
the direction of the shear force during compounding is advantageous and produces elastomer
composites with improved mechanical and morphological properties.
Nevertheless, the melt mixing of high quantities of LDHs did not provide good enough
dispersion, as some agglomerates in the XNBR matrix were detected. Because of a high
amount of LDH in elastomer, which is necessary to obtain composites with enhanced
mechanical parameters, the problem of homogenous distribution of filler particles in
elastomer might occur.
5.1.3.9. Gas barrier properties of XNBR/MgAl-LDH composites
It is well known that the presence of layered fillers can help to enhance the gas barrier
properties of rubber materials by the formation of a tortuous diffusion path.280,281 The
influence of LDH type on the air permeability of XNBR is presented in Figure 39. An
uncrosslinked, neat XNBR sample was too weak mechanically and was destroyed almost
immediately by the pressure of the gas at the very beginning of the experiment.
Figure 39 Air permeability of XNBR/LDH composites.
As expected, the air permeability of the composites was found to be much lower in the
presence of LDH70 particles. This result is attributed to the very high aspect ratio of the
LDH70 particles and their hexagonal plate-like shape, both of which prevent the permeation
of gaseous molecules through the composites. Moreover, increasing the filler concentration
from 10 to 30 phr slightly but progressively reduced gas permeation through the rubber. The
minor differences between the air permeability coefficient values of composites containing
various filler contents may be explained by the parallel organization of the highly anisotropic
layers in the elastomer matrix under the high shearing forces, which efficiently reduces
XLD
H30
30
XLD
H63
30
XLD
H70
10
XLD
H70
20
XLD
H70
30
0,00
1,50x10⁻¹⁴
3,00x10⁻¹⁴
4,50x10⁻¹⁴
6,00x10⁻¹⁴
7,50x10⁻¹⁴
9,00x10⁻¹⁴
1,05x10⁻¹³
Air
perm
eabi
lity
[mol
m/m
2s
Pa]
XNBR/LDH composite name
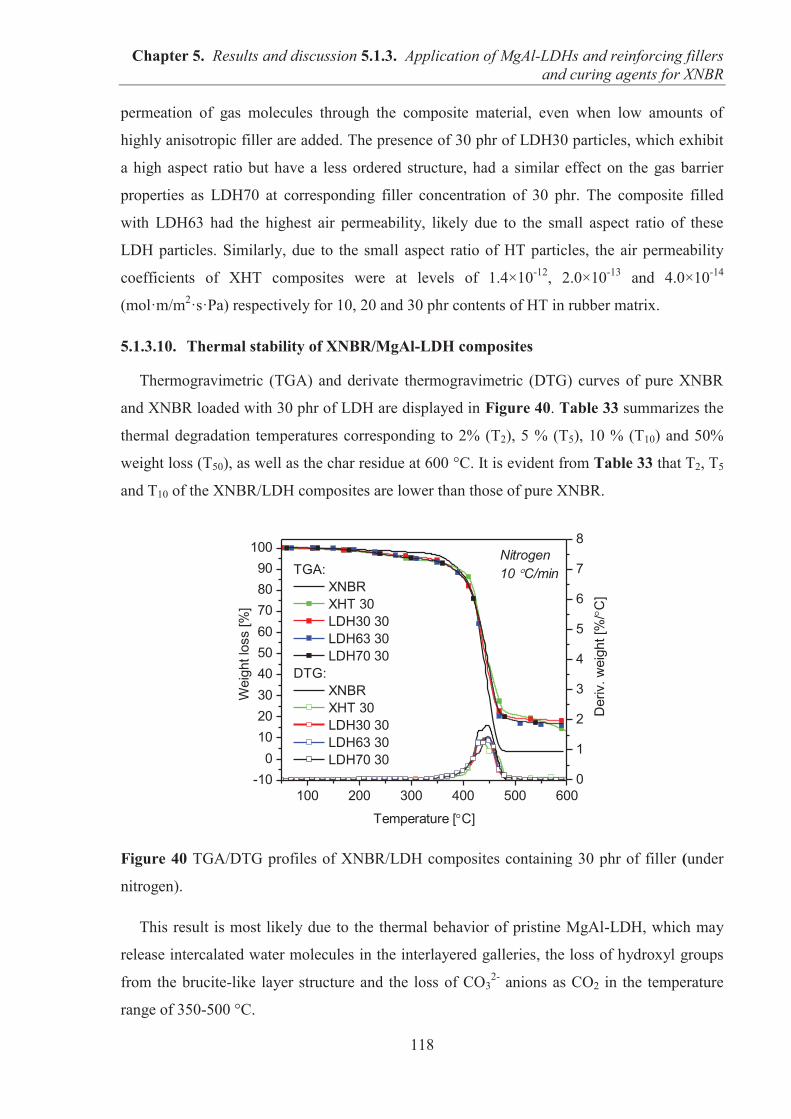
Chapter 5. Results and discussion 5.1.3. Application of MgAl-LDHs and reinforcing fillers and curing agents for XNBR
118
permeation of gas molecules through the composite material, even when low amounts of
highly anisotropic filler are added. The presence of 30 phr of LDH30 particles, which exhibit
a high aspect ratio but have a less ordered structure, had a similar effect on the gas barrier
properties as LDH70 at corresponding filler concentration of 30 phr. The composite filled
with LDH63 had the highest air permeability, likely due to the small aspect ratio of these
LDH particles. Similarly, due to the small aspect ratio of HT particles, the air permeability
coefficients of XHT composites were at levels of 1.4×10⁻¹², 2.0×10⁻¹³ and 4.0×10⁻¹⁴
(mol·m/m2·s·Pa) respectively for 10, 20 and 30 phr contents of HT in rubber matrix.
5.1.3.10. Thermal stability of XNBR/MgAl-LDH composites
Thermogravimetric (TGA) and derivate thermogravimetric (DTG) curves of pure XNBR
and XNBR loaded with 30 phr of LDH are displayed in Figure 40. Table 33 summarizes the
thermal degradation temperatures corresponding to 2% (T2), 5 % (T5), 10 % (T10) and 50%
weight loss (T50), as well as the char residue at 600 °C. It is evident from Table 33 that T2, T5
and T10 of the XNBR/LDH composites are lower than those of pure XNBR.
Figure 40 TGA/DTG profiles of XNBR/LDH composites containing 30 phr of filler (under
nitrogen).
This result is most likely due to the thermal behavior of pristine MgAl-LDH, which may
release intercalated water molecules in the interlayered galleries, the loss of hydroxyl groups
from the brucite-like layer structure and the loss of CO32- anions as CO2 in the temperature
range of 350-500 °C.
100 200 300 400 500 600-10
0102030405060708090
100 Nitrogen10 C/minTGA:
XNBR XHT 30 LDH30 30 LDH63 30 LDH70 30
DTG: XNBR XHT 30 LDH30 30 LDH63 30 LDH70 30
Temperature [ C]
Wei
ght l
oss
[%]
0
1
2
3
4
5
6
7
8
Der
iv. w
eigh
t [%
/C
]
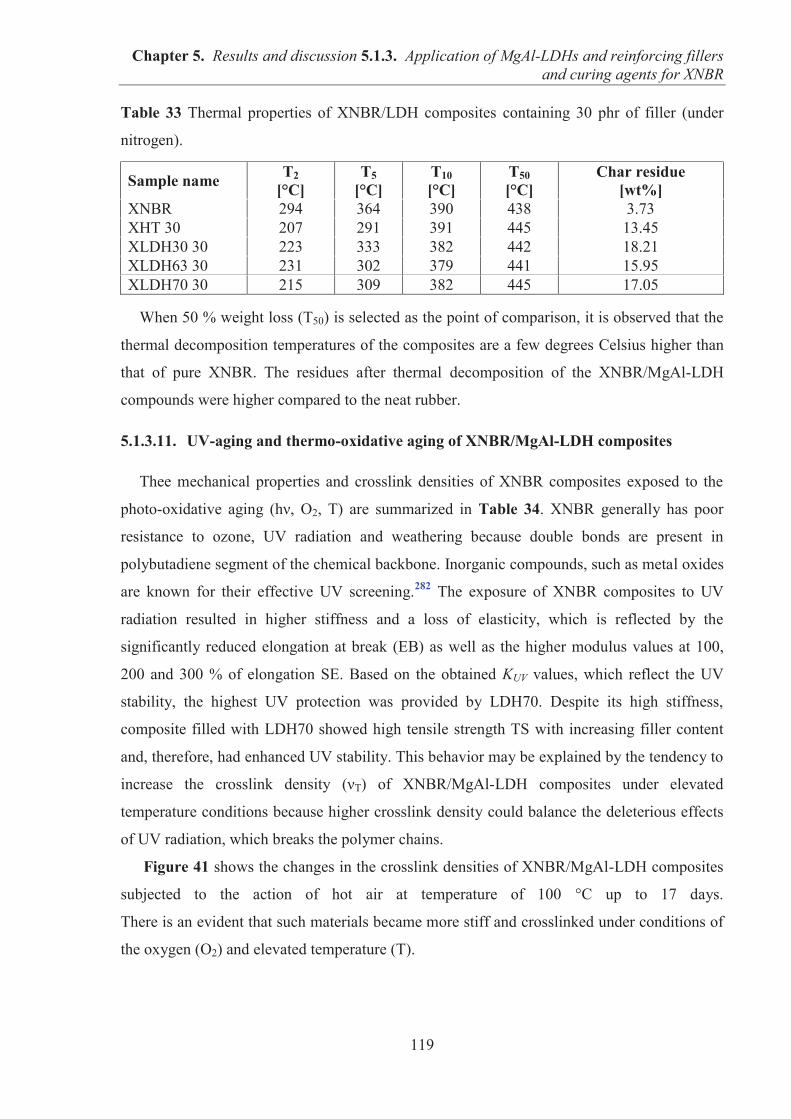
Chapter 5. Results and discussion 5.1.3. Application of MgAl-LDHs and reinforcing fillers and curing agents for XNBR
119
Table 33 Thermal properties of XNBR/LDH composites containing 30 phr of filler (under
nitrogen).
Sample name T2 [°C]
T5 [°C]
T10 [°C]
T50 [°C]
Char residue [wt%]
XNBR 294 364 390 438 3.73 XHT 30 207 291 391 445 13.45 XLDH30 30 223 333 382 442 18.21 XLDH63 30 231 302 379 441 15.95 XLDH70 30 215 309 382 445 17.05
When 50 % weight loss (T50) is selected as the point of comparison, it is observed that the
thermal decomposition temperatures of the composites are a few degrees Celsius higher than
that of pure XNBR. The residues after thermal decomposition of the XNBR/MgAl-LDH
compounds were higher compared to the neat rubber.
5.1.3.11. UV-aging and thermo-oxidative aging of XNBR/MgAl-LDH composites
Thee mechanical properties and crosslink densities of XNBR composites exposed to the
photo-oxidative aging (hν, O2, T) are summarized in Table 34. XNBR generally has poor
resistance to ozone, UV radiation and weathering because double bonds are present in
polybutadiene segment of the chemical backbone. Inorganic compounds, such as metal oxides
are known for their effective UV screening.282 The exposure of XNBR composites to UV
radiation resulted in higher stiffness and a loss of elasticity, which is reflected by the
significantly reduced elongation at break (EB) as well as the higher modulus values at 100,
200 and 300 % of elongation SE. Based on the obtained KUV values, which reflect the UV
stability, the highest UV protection was provided by LDH70. Despite its high stiffness,
composite filled with LDH70 showed high tensile strength TS with increasing filler content
and, therefore, had enhanced UV stability. This behavior may be explained by the tendency to
increase the crosslink density (νT) of XNBR/MgAl-LDH composites under elevated
temperature conditions because higher crosslink density could balance the deleterious effects
of UV radiation, which breaks the polymer chains.
Figure 41 shows the changes in the crosslink densities of XNBR/MgAl-LDH composites
subjected to the action of hot air at temperature of 100 °C up to 17 days.
There is an evident that such materials became more stiff and crosslinked under conditions of
the oxygen (O2) and elevated temperature (T).
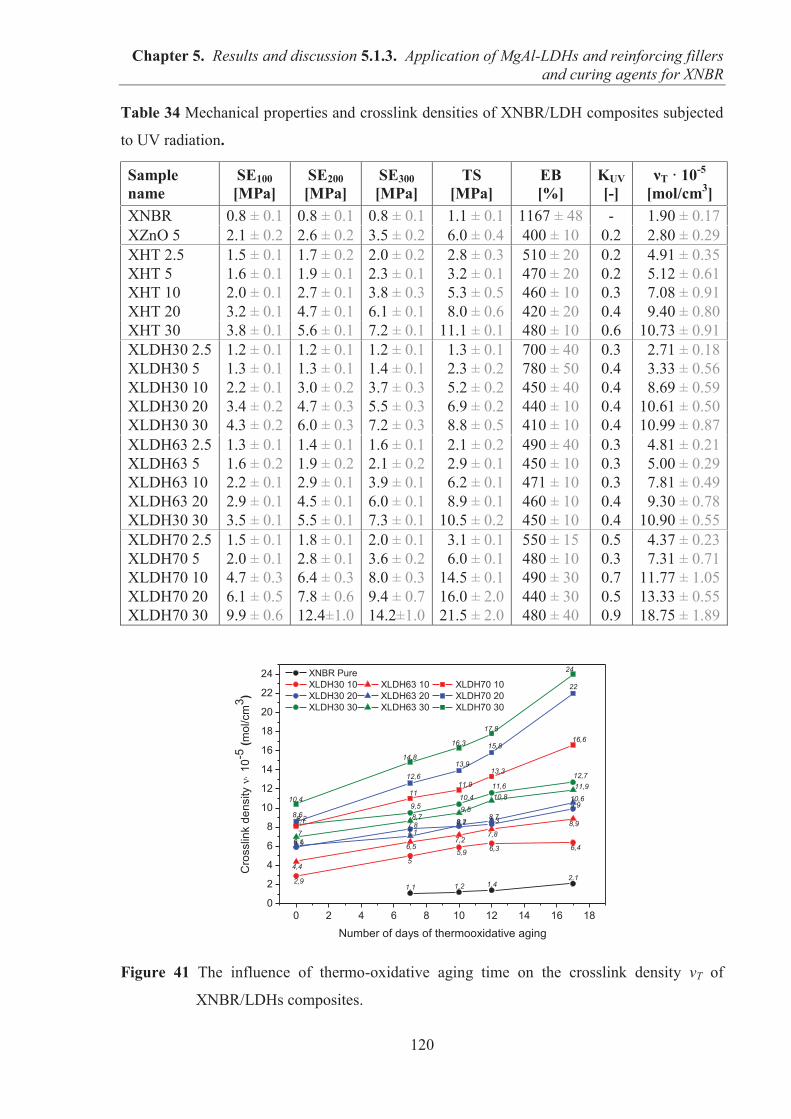
Chapter 5. Results and discussion 5.1.3. Application of MgAl-LDHs and reinforcing fillers and curing agents for XNBR
120
Table 34 Mechanical properties and crosslink densities of XNBR/LDH composites subjected
to UV radiation.
Sample name
SE100 [MPa]
SE200 [MPa]
SE300 [MPa]
TS [MPa]
EB [%]
KUV [-]
νT · 10-5 [mol/cm3]
XNBR 0.8 ± 0.1 0.8 ± 0.1 0.8 ± 0.1 01.1 ± 0.1 1167 ± 48 - 01.90 ± 0.17 XZnO 5 2.1 ± 0.2 2.6 ± 0.2 3.5 ± 0.2 06.0 ± 0.4 400 ± 10 0.2 02.80 ± 0.29 XHT 2.5 1.5 ± 0.1 1.7 ± 0.2 2.0 ± 0.2 02.8 ± 0.3 510 ± 20 0.2 04.91 ± 0.35 XHT 5 1.6 ± 0.1 1.9 ± 0.1 2.3 ± 0.1 03.2 ± 0.1 470 ± 20 0.2 05.12 ± 0.61 XHT 10 2.0 ± 0.1 2.7 ± 0.1 3.8 ± 0.3 05.3 ± 0.5 460 ± 10 0.3 07.08 ± 0.91 XHT 20 3.2 ± 0.1 4.7 ± 0.1 6.1 ± 0.1 08.0 ± 0.6 420 ± 20 0.4 09.40 ± 0.80 XHT 30 3.8 ± 0.1 5.6 ± 0.1 7.2 ± 0.1 11.1 ± 0.1 480 ± 10 0.6 10.73 ± 0.91 XLDH30 2.5 1.2 ± 0.1 1.2 ± 0.1 1.2 ± 0.1 01.3 ± 0.1 700 ± 40 0.3 02.71 ± 0.18 XLDH30 5 1.3 ± 0.1 1.3 ± 0.1 1.4 ± 0.1 02.3 ± 0.2 780 ± 50 0.4 03.33 ± 0.56 XLDH30 10 2.2 ± 0.1 3.0 ± 0.2 3.7 ± 0.3 05.2 ± 0.2 450 ± 40 0.4 08.69 ± 0.59 XLDH30 20 3.4 ± 0.2 4.7 ± 0.3 5.5 ± 0.3 06.9 ± 0.2 440 ± 10 0.4 10.61 ± 0.50 XLDH30 30 4.3 ± 0.2 6.0 ± 0.3 7.2 ± 0.3 08.8 ± 0.5 410 ± 10 0.4 10.99 ± 0.87 XLDH63 2.5 1.3 ± 0.1 1.4 ± 0.1 1.6 ± 0.1 02.1 ± 0.2 490 ± 40 0.3 04.81 ± 0.21 XLDH63 5 1.6 ± 0.2 1.9 ± 0.2 2.1 ± 0.2 02.9 ± 0.1 450 ± 10 0.3 05.00 ± 0.29 XLDH63 10 2.2 ± 0.1 2.9 ± 0.1 3.9 ± 0.1 06.2 ± 0.1 471 ± 10 0.3 07.81 ± 0.49 XLDH63 20 2.9 ± 0.1 4.5 ± 0.1 6.0 ± 0.1 08.9 ± 0.1 460 ± 10 0.4 09.30 ± 0.78 XLDH30 30 3.5 ± 0.1 5.5 ± 0.1 7.3 ± 0.1 10.5 ± 0.2 450 ± 10 0.4 10.90 ± 0.55 XLDH70 2.5 1.5 ± 0.1 1.8 ± 0.1 2.0 ± 0.1 03.1 ± 0.1 550 ± 15 0.5 04.37 ± 0.23 XLDH70 5 2.0 ± 0.1 2.8 ± 0.1 3.6 ± 0.2 06.0 ± 0.1 480 ± 10 0.3 07.31 ± 0.71 XLDH70 10 4.7 ± 0.3 6.4 ± 0.3 8.0 ± 0.3 14.5 ± 0.1 490 ± 30 0.7 11.77 ± 1.05 XLDH70 20 6.1 ± 0.5 7.8 ± 0.6 9.4 ± 0.7 16.0 ± 2.0 440 ± 30 0.5 13.33 ± 0.55 XLDH70 30 9.9 ± 0.6 12.4±1.0 14.2±1.0 21.5 ± 2.0 480 ± 40 0.9 18.75 ± 1.89
Figure 41 The influence of thermo-oxidative aging time on the crosslink density νT of
XNBR/LDHs composites.
0 2 4 6 8 10 12 14 16 180
2
4
6
8
10
12
14
16
18
20
22
24
1,1 1,2 1,42,12,9
55,9 6,3 6,45,9
7,8 8,1 8,3
9,9
8,2
9,510,4
11,612,7
4,4
6,57,2
7,88,9
6,17,1
8,2 8,7
10,6
7
8,79,5
10,811,9
8,1
1111,9
13,3
16,6
8,6
12,6
13,9
15,8
22
10,4
14,8
16,3
17,8
24
Cro
sslin
k de
nsity
1
0-5 (m
ol/c
m3 )
Number of days of thermooxidative aging
XNBR Pure XLDH30 10 XLDH63 10 XLDH70 10 XLDH30 20 XLDH63 20 XLDH70 20 XLDH30 30 XLDH63 30 XLDH70 30
Chapter 5. Results and discussion 5.1.3. Application of MgAl-LDHs and reinforcing fillers and curing agents for XNBR
121
5.1.3.12. Conclusions
The simultaneous application of magnesium-aluminum layered double hydroxide (MgAl-
LDH) as a filler and as a crosslinking agent in carboxylated nitrile butadiene rubber (XNBR)
produces mechanically strong and transparent elastomer composites without requiring the
addition of standard curatives, such as zinc oxide, or a sulfur cure system, which is an
important ecological and economical advantage. In addition, it was found that the optical
properties of XNBR/LDH composites are reversible, depending on temperature and the type
of MgAl-LDH. The addition of high levels of LDH with a Mg/Al ratio ≈ 2:1 to the XNBR
matrix produced composites that exhibited thermoreversible transparency. In contrast, the
application of aluminum rich LDH resulted in opaque materials, whereas XNBR filled with
Mg-rich LDH exhibited transparency but did not show thermotropic behavior. It was found
that the LDHs effectively participate in the crosslinking reaction of XNBR and contributes to
obtaining strong and stiff elastomeric composites. The high aspect ratio of the layers and the
high magnesium content in the LDH structure resulted in significant improvements in
mechanical and barrier properties and promoted the formation of a higher number of ionic
crosslinks between the XNBR and filler. The parallel orientation of highly anisotropic filler
layers in the rubber matrix under the conditions of high shearing force in the internal mixer is
advantageous and produces elastomer composites with improved physical properties. The
dynamic mechanical analysis revealed a remarkable enhancement in the storage moduli and
increase in glass transition temperature when LDH is present in the XNBR matrix. The
increase in crosslink density and the improvement in mechanical properties of XNBR/HT
composites may result from the following types of interactions between: (a) acidic
functionalities of XNBR and basic hydroxyl groups existing on the filler sheets, (b) polar
functional groups of XNBR and polar surface of filler, (c) –COOH and metal ions provided
by HT (ionic bonds). The incorporation of LDH delivers not only an environmentally
friendly, zinc oxide-free rubber product but also an ionic elastomer composite with excellent
mechanical, barrier and transparent properties. However, obtaining material with
aforementioned parameters requires quite high loadings of layered mineral. Application of
large amounts of an inexpensive and easily synthesized filler is economically beneficial due to
the reduction of the cost of the final product, however, in consequence, the problem of
uniform distribution might occur.
Chapter 5. Results and discussion 5.2. Effects of ILs on the properties of elastomer composites based on XNBR and MgAl-LDH
122
5.2. EFFECTS OF IONIC LIQUIDS (ILs) ON THE PROPERTIES OF
ELASTOMER COMPOSITES BASED ON CARBOXYLATED
ACRYLONITRILE-BUTADIENE RUBBER (XNBR) AND
LAYERED DOUBLE HYDROXIDE (LDH)
INTRODUCTION: Application of room temperature ionic liquids (RTILs) can help
accelerate the curing process of rubbers, enhance the ionic conductivity and improve the state
of filler dispersion of elastomer composites. Therefore, this chapter mainly focuses on
investigation the influence of IL structure, hydrophilicity-hydrophobicity and concentration
on the aforementioned properties of rubber composites. The effects of an increasing
concentration of 2.5 phr to 15 phr (parts per hundred rubber) of imidazolium ionic liquids on
carboxylated acrylonitrile-butadiene rubber (XNBR) composites filled with magnesium-
aluminum layered double hydroxide (LDH) were investigated. The effects of anion type
(tetrachloroaluminate [AlCl4]–, thiocyante [SCN]– and bis(trifluoromethylsulfonyl)imide
[TFSI]–) of imidazolium ionic liquid and the impacts of the length of alkyl chain of
1-n-alkyl-3-methylimidazolium salt consisting with bis(trifluoromethylsulfonyl)imide anion
[Cn-MIM][TFSI] on the properties of XNBR/LDH compounds were analyzed.
5.2.1. Preparation of XNBR/IL-LDH composites
The magnesium-aluminum layered double hydroxide (LDH) in an amount of 30 phr was
mixed with different contents (2.5, 5, 10 and 15 phr) of imidazolium ionic liquid (IL) by
grinding it till a homogeneous paste was obtained. The rubber compounds were processed in
an internal mixer Brabender Measuring Mixer N50 at 50 rpm rotors speed and the initial
temperature was set at 70 °C. After around 5 minutes of rubber mastication, the mix
composed of LDH and IL was added and homogenized for around 10 minutes. Subsequently
the compounded rubbers were milled in a laboratory two-roll mill. The compounding
ingredients and the amounts are presented in Table 35.
Table 35 Formulation of XNBR/IL-LDH compounds, [phr].
Component XNBR/LDH IL 2.5 IL 5 IL 10 IL 15 XNBR 100 100 100 100 100 LDH 30 30 30 30 30 Ionic Liquid IL 0 2.5 5 10 15
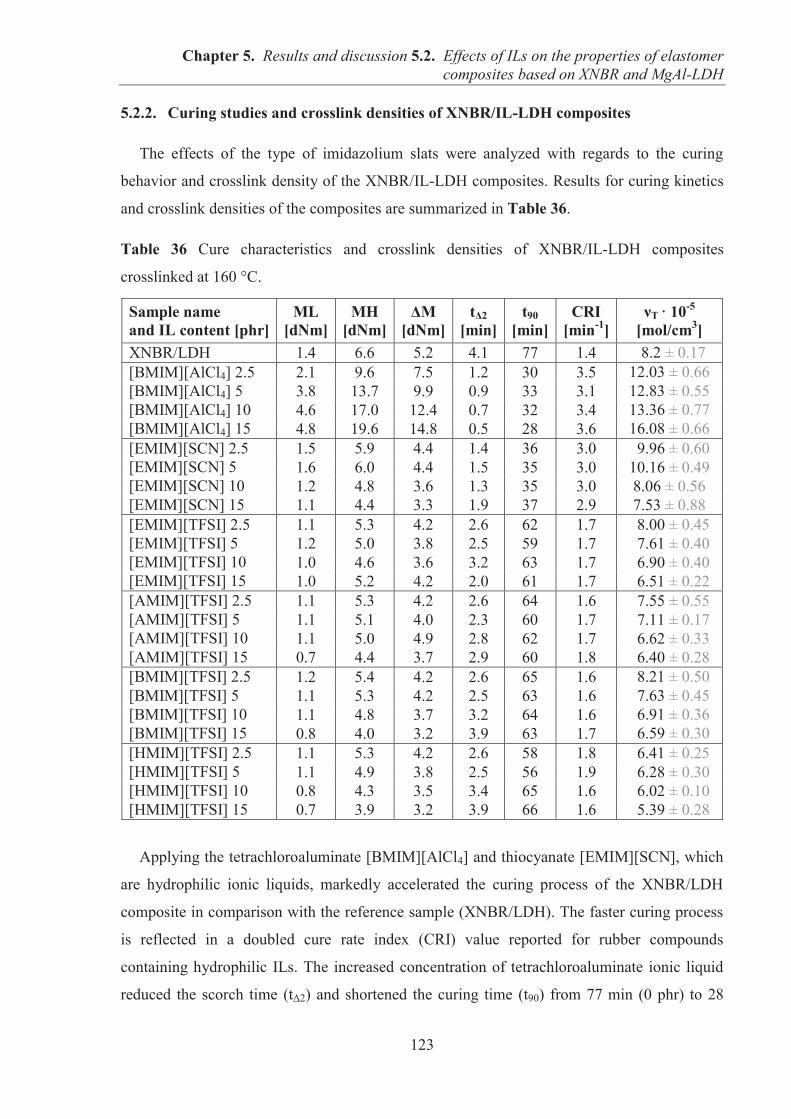
Chapter 5. Results and discussion 5.2. Effects of ILs on the properties of elastomer composites based on XNBR and MgAl-LDH
123
5.2.2. Curing studies and crosslink densities of XNBR/IL-LDH composites
The effects of the type of imidazolium slats were analyzed with regards to the curing
behavior and crosslink density of the XNBR/IL-LDH composites. Results for curing kinetics
and crosslink densities of the composites are summarized in Table 36.
Table 36 Cure characteristics and crosslink densities of XNBR/IL-LDH composites
crosslinked at 160 °C.
Sample name and IL content [phr]
ML [dNm]
MH [dNm]
ΔM [dNm]
tΔ2 [min]
t90 [min]
CRI [min-1]
νT · 10-5 [mol/cm3]
XNBR/LDH 1.4 6.6 5.2 4.1 77 1.4 08.2 ± 0.17 [BMIM][AlCl4] 2.5 2.1 9.6 7.5 1.2 30 3.5 12.03 ± 0.66 [BMIM][AlCl4] 5 3.8 13.7 9.9 0.9 33 3.1 12.83 ± 0.55 [BMIM][AlCl4] 10 4.6 17.0 12.4 0.7 32 3.4 13.36 ± 0.77 [BMIM][AlCl4] 15 4.8 19.6 14.8 0.5 28 3.6 16.08 ± 0.66 [EMIM][SCN] 2.5 1.5 5.9 4.4 1.4 36 3.0 09.96 ± 0.60 [EMIM][SCN] 5 1.6 6.0 4.4 1.5 35 3.0 10.16 ± 0.49 [EMIM][SCN] 10 1.2 4.8 3.6 1.3 35 3.0 8.06 ± 0.56 [EMIM][SCN] 15 1.1 4.4 3.3 1.9 37 2.9 7.53 ± 0.88 [EMIM][TFSI] 2.5 1.1 5.3 4.2 2.6 62 1.7 08.00 ± 0.45 [EMIM][TFSI] 5 1.2 5.0 3.8 2.5 59 1.7 07.61 ± 0.40 [EMIM][TFSI] 10 1.0 4.6 3.6 3.2 63 1.7 06.90 ± 0.40 [EMIM][TFSI] 15 1.0 5.2 4.2 2.0 61 1.7 06.51 ± 0.22 [AMIM][TFSI] 2.5 1.1 5.3 4.2 2.6 64 1.6 07.55 ± 0.55 [AMIM][TFSI] 5 1.1 5.1 4.0 2.3 60 1.7 07.11 ± 0.17 [AMIM][TFSI] 10 1.1 5.0 4.9 2.8 62 1.7 06.62 ± 0.33 [AMIM][TFSI] 15 0.7 4.4 3.7 2.9 60 1.8 06.40 ± 0.28 [BMIM][TFSI] 2.5 1.2 5.4 4.2 2.6 65 1.6 08.21 ± 0.50 [BMIM][TFSI] 5 1.1 5.3 4.2 2.5 63 1.6 07.63 ± 0.45 [BMIM][TFSI] 10 1.1 4.8 3.7 3.2 64 1.6 06.91 ± 0.36 [BMIM][TFSI] 15 0.8 4.0 3.2 3.9 63 1.7 06.59 ± 0.30 [HMIM][TFSI] 2.5 1.1 5.3 4.2 2.6 58 1.8 06.41 ± 0.25 [HMIM][TFSI] 5 1.1 4.9 3.8 2.5 56 1.9 06.28 ± 0.30 [HMIM][TFSI] 10 0.8 4.3 3.5 3.4 65 1.6 06.02 ± 0.10 [HMIM][TFSI] 15 0.7 3.9 3.2 3.9 66 1.6 05.39 ± 0.28
Applying the tetrachloroaluminate [BMIM][AlCl4] and thiocyanate [EMIM][SCN], which
are hydrophilic ionic liquids, markedly accelerated the curing process of the XNBR/LDH
composite in comparison with the reference sample (XNBR/LDH). The faster curing process
is reflected in a doubled cure rate index (CRI) value reported for rubber compounds
containing hydrophilic ILs. The increased concentration of tetrachloroaluminate ionic liquid
reduced the scorch time (tΔ2) and shortened the curing time (t90) from 77 min (0 phr) to 28
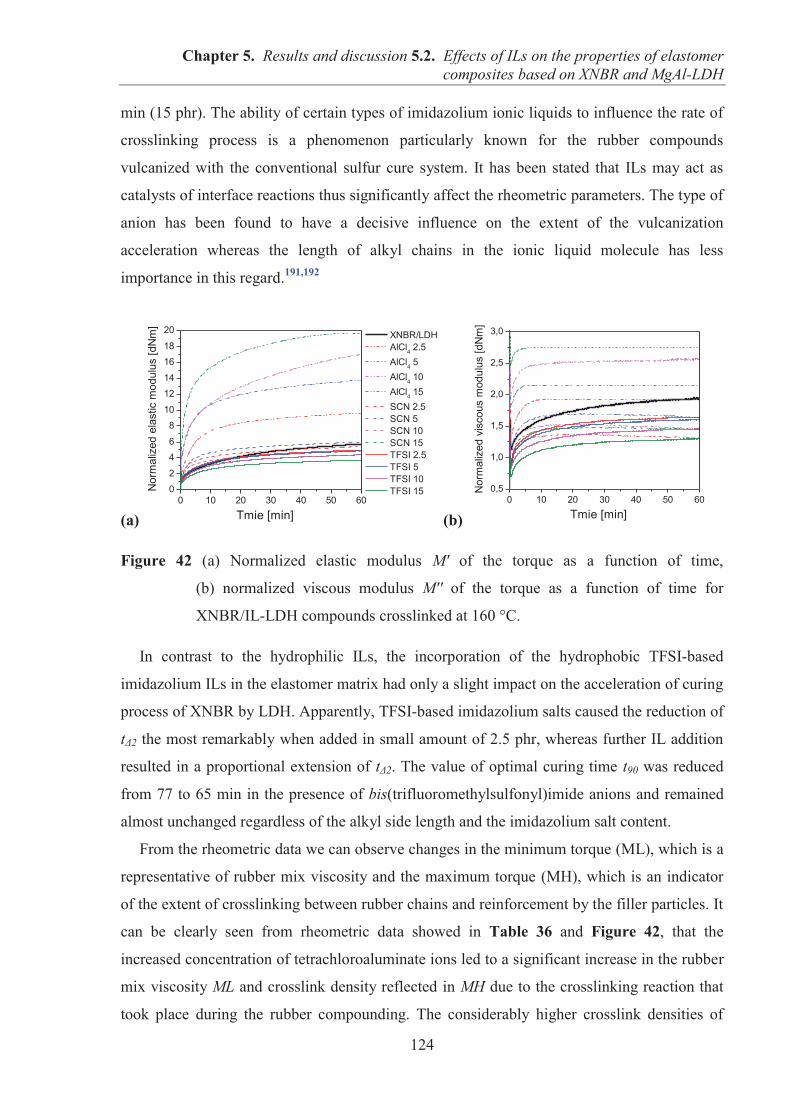
Chapter 5. Results and discussion 5.2. Effects of ILs on the properties of elastomer composites based on XNBR and MgAl-LDH
124
min (15 phr). The ability of certain types of imidazolium ionic liquids to influence the rate of
crosslinking process is a phenomenon particularly known for the rubber compounds
vulcanized with the conventional sulfur cure system. It has been stated that ILs may act as
catalysts of interface reactions thus significantly affect the rheometric parameters. The type of
anion has been found to have a decisive influence on the extent of the vulcanization
acceleration whereas the length of alkyl chains in the ionic liquid molecule has less
importance in this regard.191,192
(a) (b)
Figure 42 (a) Normalized elastic modulus M′ of the torque as a function of time,
(b) normalized viscous modulus M′′ of the torque as a function of time for
XNBR/IL-LDH compounds crosslinked at 160 °C.
In contrast to the hydrophilic ILs, the incorporation of the hydrophobic TFSI-based
imidazolium ILs in the elastomer matrix had only a slight impact on the acceleration of curing
process of XNBR by LDH. Apparently, TFSI-based imidazolium salts caused the reduction of
tΔ2 the most remarkably when added in small amount of 2.5 phr, whereas further IL addition
resulted in a proportional extension of tΔ2. The value of optimal curing time t90 was reduced
from 77 to 65 min in the presence of bis(trifluoromethylsulfonyl)imide anions and remained
almost unchanged regardless of the alkyl side length and the imidazolium salt content.
From the rheometric data we can observe changes in the minimum torque (ML), which is a
representative of rubber mix viscosity and the maximum torque (MH), which is an indicator
of the extent of crosslinking between rubber chains and reinforcement by the filler particles. It
can be clearly seen from rheometric data showed in Table 36 and Figure 42, that the
increased concentration of tetrachloroaluminate ions led to a significant increase in the rubber
mix viscosity ML and crosslink density reflected in MH due to the crosslinking reaction that
took place during the rubber compounding. The considerably higher crosslink densities of
0 10 20 30 40 50 600
2
4
6
8
10
12
14
16
18
20
Nor
mal
ized
ela
stic
mod
ulus
[dN
m]
Tmie [min]
XNBR/LDH AlCl4 2.5 AlCl4 5 AlCl4 10 AlCl4 15 SCN 2.5 SCN 5 SCN 10 SCN 15 TFSI 2.5 TFSI 5 TFSI 10 TFSI 15
0 10 20 30 40 50 600,5
1,0
1,5
2,0
2,5
3,0
Nor
mal
ized
vis
cous
mod
ulus
[dN
m]
Tmie [min]
Chapter 5. Results and discussion 5.2. Effects of ILs on the properties of elastomer composites based on XNBR and MgAl-LDH
125
composites containing tetrachloroaluminate anions were also confirmed by the study of
equilibrium swelling in toluene and is represented by the νT parameter. The value of νT
increased gradually with increasing amounts of [BMIM][AlCl4] from 8.2 · 10-5 (0 phr) up to
16.0 · 10-5 mol/cm3 at 15 phr content of IL. This results from the curing effect of anion of
alkylimidazolium salt in the XNBR compound. Similarly, application of hydrophilic
thiocyante ionic liquid [EMIM][SCN] at small concentrations 2.5 – 5 phr increased mix
viscosity and promoted obtaining higher crosslink densities of XNBR/LDH. When the
amounts of thiocyanate salt exceeded 10 phr, the torque parameters and the number of bonds
formed between macromolecules in the elastomer network were slightly reduced. This can be
explained through the fact that excess of IL acts as a plasticizer and may weaken filler-rubber
interactions thus reduces the formation of network nodes between the chains of elastomer.
The opposite effects of the imidazolium salt concentration on the torque parameters were
observed for the composites containing a series of hydrophobic TFSI-based ILs. Their
increased loadings resulted in the reduction of all the torque values compared to the control
sample thereby manifesting their plasticizing effect on XNBR matrix. It is noticeable that
increasing the alkyl chain length of imidazolium cation from ethyl to hexyl lowered the mix
viscosity and hindered network formation, which is reflected in reduced ΔM values in
comparison with the reference sample. For TFSI-based IL series, the plasticizing effect of
[HMIM]+ was found to be the highest likely due to its bulky structure. The results form a
moving die rheometer are in good agreement with the results of crosslink density obtained on
the base of equilibrium swelling method. The number of crosslinks (νT) formed in the
presence of [TFSI]– anions was inversely proportional to the IL amount. Most likely, the
hydrophobic IL present onto the filler surface acted like plasticizer.
5.2.3. Dynamic mechanical analysis (DMA) of XNBR/IL-LDH composites
The glass transition temperatures Tg of the XNBR/IL-LDH composites were measured by
differential scanning calorimetry DSC and dynamic mechanical analysis DMA
thermoanalytical techniques and are summarized in Table 37. The loss tangent (tan δ),
storage modulus (E') and loss modulus (E″) as functions of temperature are illustrated in
Figure 43 a-d and Figure 44 a-d. DMA experiments were performed at a vibration frequency
of 10 Hz.
According to the data showed in Table 37, both techniques showed a single Tg for all
composites suggesting no microscopic phase separation and compatibility of the polymer
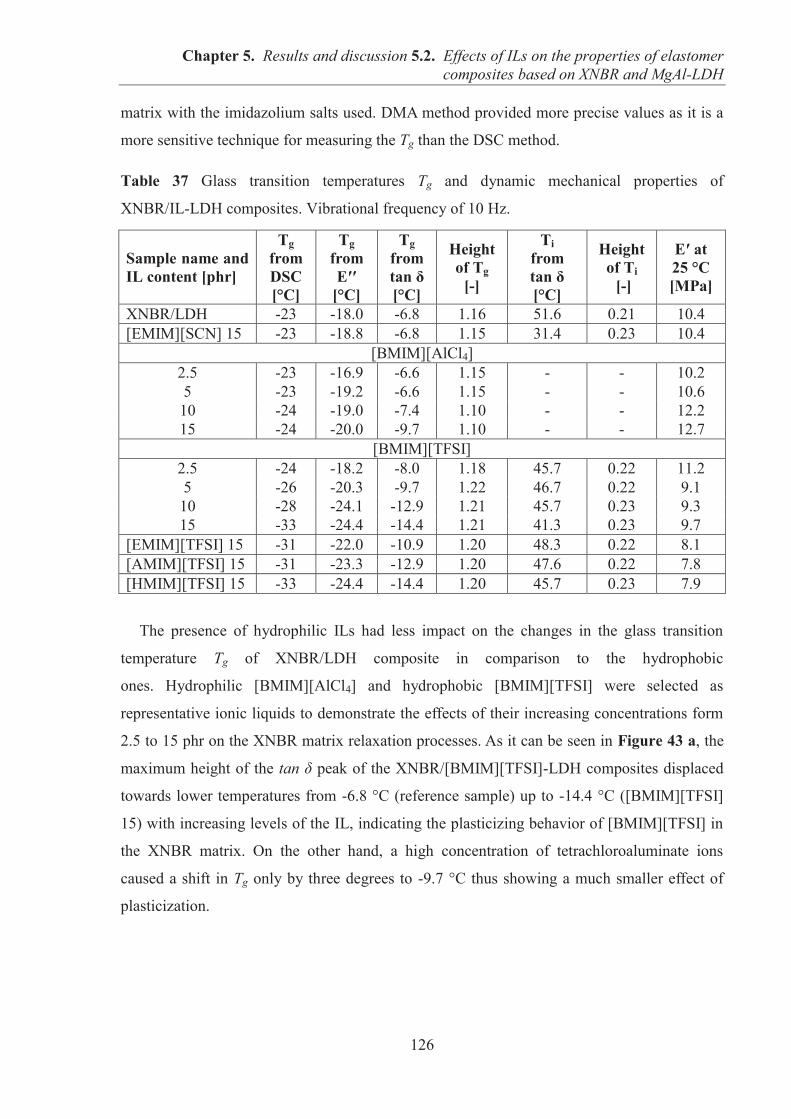
Chapter 5. Results and discussion 5.2. Effects of ILs on the properties of elastomer composites based on XNBR and MgAl-LDH
126
matrix with the imidazolium salts used. DMA method provided more precise values as it is a
more sensitive technique for measuring the Tg than the DSC method.
Table 37 Glass transition temperatures Tg and dynamic mechanical properties of
XNBR/IL-LDH composites. Vibrational frequency of 10 Hz.
Sample name and IL content [phr]
Tg from DSC [°C]
Tg from E′′
[°C]
Tg from tan δ [°C]
Height of Tg
[-]
Ti from tan δ [°C]
Height of Ti [-]
E′ at 25 °C [MPa]
XNBR/LDH -23 -18.0 -6.8 1.16 51.6 0.21 10.4 [EMIM][SCN] 15 -23 -18.8 -6.8 1.15 31.4 0.23 10.4
[BMIM][AlCl4] 2.5 -23 -16.9 -6.6 1.15 - - 10.2 5 -23 -19.2 -6.6 1.15 - - 10.6 10 -24 -19.0 -7.4 1.10 - - 12.2 15 -24 -20.0 -9.7 1.10 - - 12.7
[BMIM][TFSI] 2.5 -24 -18.2 -8.0 1.18 45.7 0.22 11.2 5 -26 -20.3 -9.7 1.22 46.7 0.22 9.1 10 -28 -24.1 -12.9 1.21 45.7 0.23 9.3 15 -33 -24.4 -14.4 1.21 41.3 0.23 9.7
[EMIM][TFSI] 15 -31 -22.0 -10.9 1.20 48.3 0.22 8.1 [AMIM][TFSI] 15 -31 -23.3 -12.9 1.20 47.6 0.22 7.8 [HMIM][TFSI] 15 -33 -24.4 -14.4 1.20 45.7 0.23 7.9
The presence of hydrophilic ILs had less impact on the changes in the glass transition
temperature Tg of XNBR/LDH composite in comparison to the hydrophobic
ones. Hydrophilic [BMIM][AlCl4] and hydrophobic [BMIM][TFSI] were selected as
representative ionic liquids to demonstrate the effects of their increasing concentrations form
2.5 to 15 phr on the XNBR matrix relaxation processes. As it can be seen in Figure 43 a, the
maximum height of the tan δ peak of the XNBR/[BMIM][TFSI]-LDH composites displaced
towards lower temperatures from -6.8 °C (reference sample) up to -14.4 °C ([BMIM][TFSI]
15) with increasing levels of the IL, indicating the plasticizing behavior of [BMIM][TFSI] in
the XNBR matrix. On the other hand, a high concentration of tetrachloroaluminate ions
caused a shift in Tg only by three degrees to -9.7 °C thus showing a much smaller effect of
plasticization.
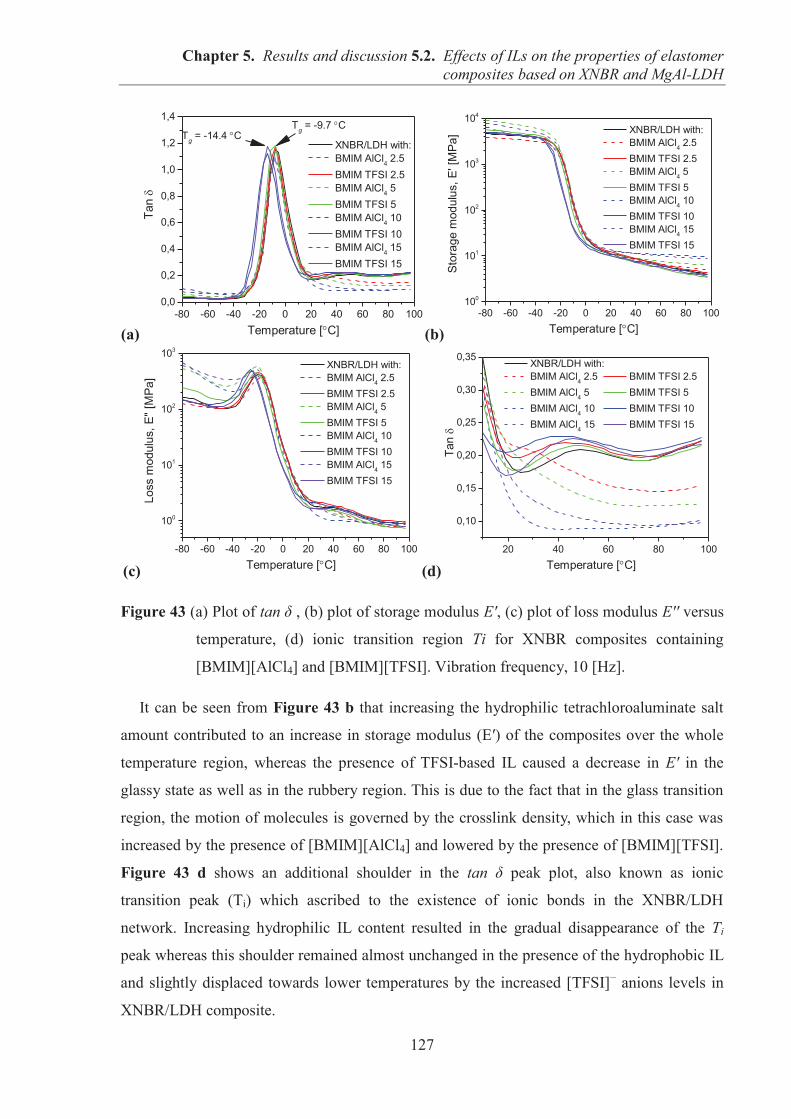
Chapter 5. Results and discussion 5.2. Effects of ILs on the properties of elastomer composites based on XNBR and MgAl-LDH
127
(a) (b)
(c) (d)
Figure 43 (a) Plot of tan δ , (b) plot of storage modulus E′, (c) plot of loss modulus E′′ versus
temperature, (d) ionic transition region Ti for XNBR composites containing
[BMIM][AlCl4] and [BMIM][TFSI]. Vibration frequency, 10 [Hz].
It can be seen from Figure 43 b that increasing the hydrophilic tetrachloroaluminate salt
amount contributed to an increase in storage modulus (E′) of the composites over the whole
temperature region, whereas the presence of TFSI-based IL caused a decrease in E′ in the
glassy state as well as in the rubbery region. This is due to the fact that in the glass transition
region, the motion of molecules is governed by the crosslink density, which in this case was
increased by the presence of [BMIM][AlCl4] and lowered by the presence of [BMIM][TFSI].
Figure 43 d shows an additional shoulder in the tan δ peak plot, also known as ionic
transition peak (Ti) which ascribed to the existence of ionic bonds in the XNBR/LDH
network. Increasing hydrophilic IL content resulted in the gradual disappearance of the Ti
peak whereas this shoulder remained almost unchanged in the presence of the hydrophobic IL
and slightly displaced towards lower temperatures by the increased [TFSI]– anions levels in
XNBR/LDH composite.
-80 -60 -40 -20 0 20 40 60 80 1000,0
0,2
0,4
0,6
0,8
1,0
1,2
1,4Tg = -9.7 C
Tan
Temperature [ C]
XNBR/LDH with: BMIM AlCl4 2.5 BMIM TFSI 2.5 BMIM AlCl4 5 BMIM TFSI 5 BMIM AlCl4 10 BMIM TFSI 10 BMIM AlCl4 15 BMIM TFSI 15
Tg = -14.4 C
-80 -60 -40 -20 0 20 40 60 80 100100
101
102
103
104
Stor
age
mod
ulus
, E' [
MPa
]
Temperature [ C]
XNBR/LDH with: BMIM AlCl4 2.5 BMIM TFSI 2.5 BMIM AlCl4 5 BMIM TFSI 5 BMIM AlCl4 10 BMIM TFSI 10 BMIM AlCl4 15 BMIM TFSI 15
-80 -60 -40 -20 0 20 40 60 80 100
100
101
102
103
Loss
mod
ulus
, E" [
MPa
]
Temperature [ C]
XNBR/LDH with: BMIM AlCl4 2.5 BMIM TFSI 2.5 BMIM AlCl4 5 BMIM TFSI 5 BMIM AlCl4 10 BMIM TFSI 10 BMIM AlCl4 15 BMIM TFSI 15
20 40 60 80 100
0,10
0,15
0,20
0,25
0,30
0,35
Tan
Temperature [ C]
XNBR/LDH with: BMIM AlCl4 2.5 BMIM TFSI 2.5 BMIM AlCl4 5 BMIM TFSI 5 BMIM AlCl4 10 BMIM TFSI 10 BMIM AlCl4 15 BMIM TFSI 15
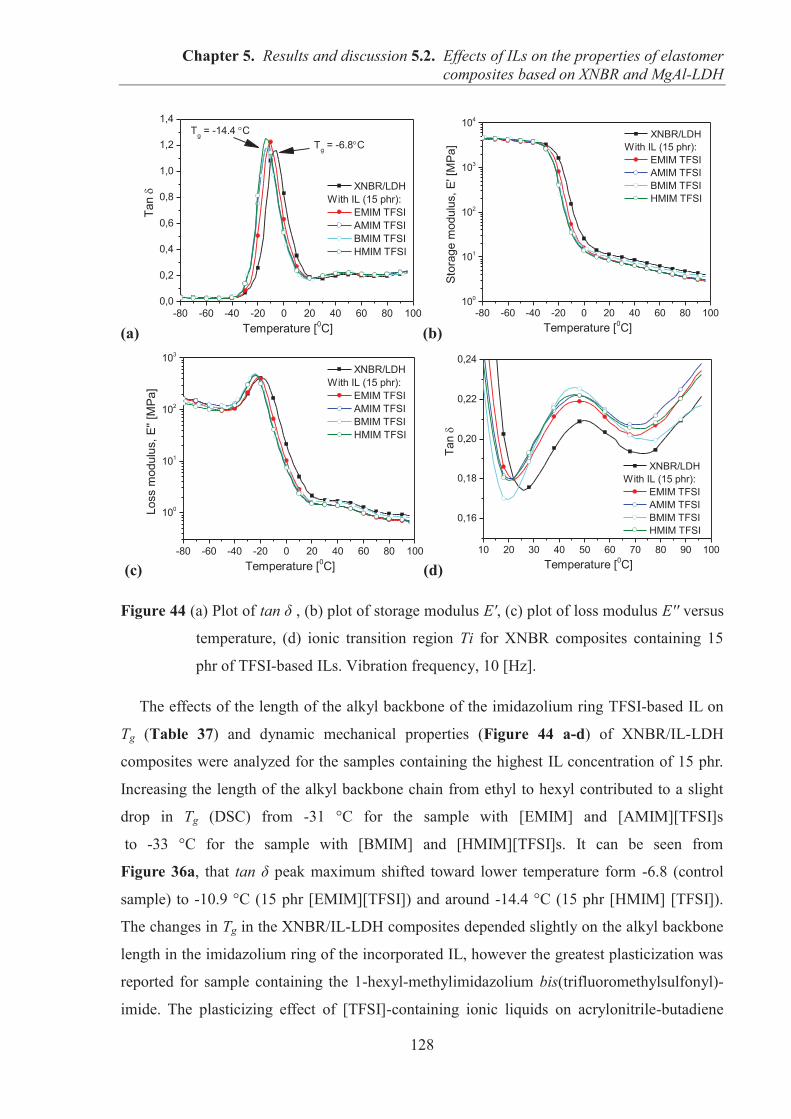
Chapter 5. Results and discussion 5.2. Effects of ILs on the properties of elastomer composites based on XNBR and MgAl-LDH
128
(a) (b)
(c) (d)
Figure 44 (a) Plot of tan δ , (b) plot of storage modulus E′, (c) plot of loss modulus E′′ versus
temperature, (d) ionic transition region Ti for XNBR composites containing 15
phr of TFSI-based ILs. Vibration frequency, 10 [Hz].
The effects of the length of the alkyl backbone of the imidazolium ring TFSI-based IL on
Tg (Table 37) and dynamic mechanical properties (Figure 44 a-d) of XNBR/IL-LDH
composites were analyzed for the samples containing the highest IL concentration of 15 phr.
Increasing the length of the alkyl backbone chain from ethyl to hexyl contributed to a slight
drop in Tg (DSC) from -31 °C for the sample with [EMIM] and [AMIM][TFSI]s
to -33 °C for the sample with [BMIM] and [HMIM][TFSI]s. It can be seen from
Figure 36a, that tan δ peak maximum shifted toward lower temperature form -6.8 (control
sample) to -10.9 °C (15 phr [EMIM][TFSI]) and around -14.4 °C (15 phr [HMIM] [TFSI]).
The changes in Tg in the XNBR/IL-LDH composites depended slightly on the alkyl backbone
length in the imidazolium ring of the incorporated IL, however the greatest plasticization was
reported for sample containing the 1-hexyl-methylimidazolium bis(trifluoromethylsulfonyl)-
imide. The plasticizing effect of [TFSI]-containing ionic liquids on acrylonitrile-butadiene
-80 -60 -40 -20 0 20 40 60 80 1000,0
0,2
0,4
0,6
0,8
1,0
1,2
1,4Tg = -14.4 C
Tan
Temperature [0C]
XNBR/LDHWith IL (15 phr):
EMIM TFSI AMIM TFSI BMIM TFSI HMIM TFSI
Tg = -6.8 C
-80 -60 -40 -20 0 20 40 60 80 100100
101
102
103
104
Stor
age
mod
ulus
, E' [
MPa
]
Temperature [0C]
XNBR/LDHWith IL (15 phr):
EMIM TFSI AMIM TFSI BMIM TFSI HMIM TFSI
-80 -60 -40 -20 0 20 40 60 80 100
100
101
102
103
Loss
mod
ulus
, E'' [
MPa
]
Temperature [0C]
XNBR/LDHWith IL (15 phr):
EMIM TFSI AMIM TFSI BMIM TFSI HMIM TFSI
10 20 30 40 50 60 70 80 90 100
0,16
0,18
0,20
0,22
0,24
Tan
Temperature [0C]
XNBR/LDHWith IL (15 phr):
EMIM TFSI AMIM TFSI BMIM TFSI HMIM TFSI
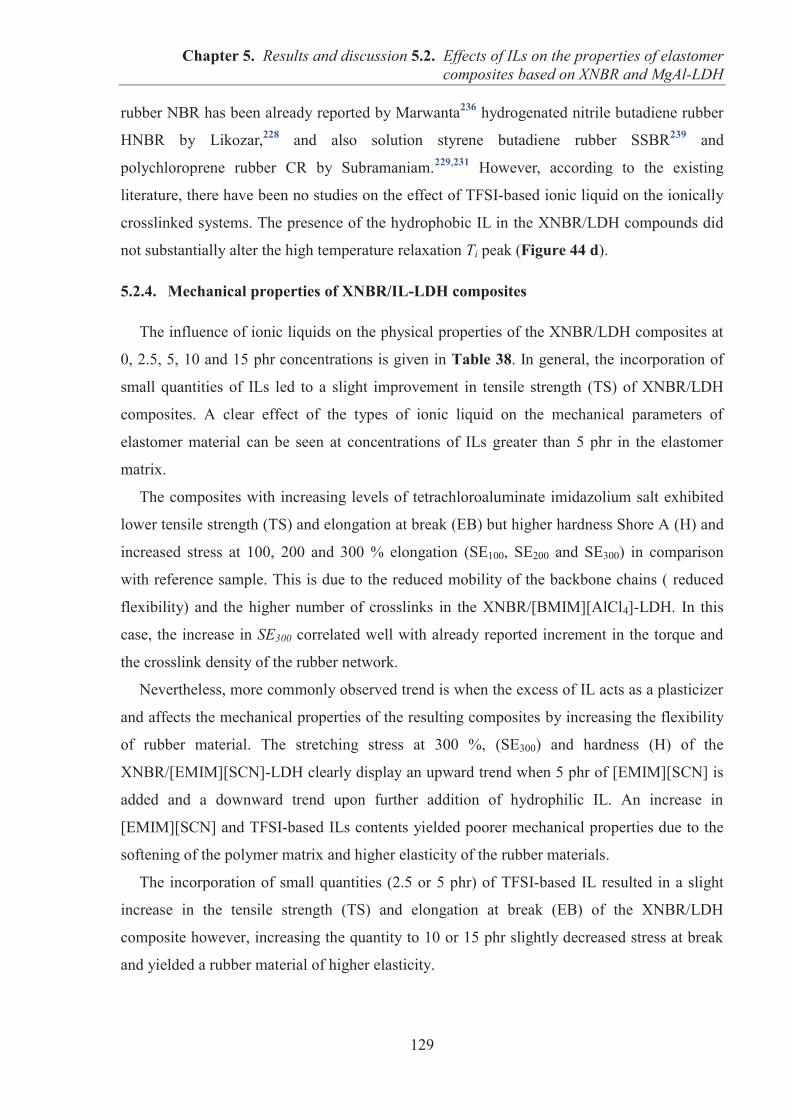
Chapter 5. Results and discussion 5.2. Effects of ILs on the properties of elastomer composites based on XNBR and MgAl-LDH
129
rubber NBR has been already reported by Marwanta236 hydrogenated nitrile butadiene rubber
HNBR by Likozar,228 and also solution styrene butadiene rubber SSBR239 and
polychloroprene rubber CR by Subramaniam.229,231 However, according to the existing
literature, there have been no studies on the effect of TFSI-based ionic liquid on the ionically
crosslinked systems. The presence of the hydrophobic IL in the XNBR/LDH compounds did
not substantially alter the high temperature relaxation Ti peak (Figure 44 d).
5.2.4. Mechanical properties of XNBR/IL-LDH composites
The influence of ionic liquids on the physical properties of the XNBR/LDH composites at
0, 2.5, 5, 10 and 15 phr concentrations is given in Table 38. In general, the incorporation of
small quantities of ILs led to a slight improvement in tensile strength (TS) of XNBR/LDH
composites. A clear effect of the types of ionic liquid on the mechanical parameters of
elastomer material can be seen at concentrations of ILs greater than 5 phr in the elastomer
matrix.
The composites with increasing levels of tetrachloroaluminate imidazolium salt exhibited
lower tensile strength (TS) and elongation at break (EB) but higher hardness Shore A (H) and
increased stress at 100, 200 and 300 % elongation (SE100, SE200 and SE300) in comparison
with reference sample. This is due to the reduced mobility of the backbone chains ( reduced
flexibility) and the higher number of crosslinks in the XNBR/[BMIM][AlCl4]-LDH. In this
case, the increase in SE300 correlated well with already reported increment in the torque and
the crosslink density of the rubber network.
Nevertheless, more commonly observed trend is when the excess of IL acts as a plasticizer
and affects the mechanical properties of the resulting composites by increasing the flexibility
of rubber material. The stretching stress at 300 %, (SE300) and hardness (H) of the
XNBR/[EMIM][SCN]-LDH clearly display an upward trend when 5 phr of [EMIM][SCN] is
added and a downward trend upon further addition of hydrophilic IL. An increase in
[EMIM][SCN] and TFSI-based ILs contents yielded poorer mechanical properties due to the
softening of the polymer matrix and higher elasticity of the rubber materials.
The incorporation of small quantities (2.5 or 5 phr) of TFSI-based IL resulted in a slight
increase in the tensile strength (TS) and elongation at break (EB) of the XNBR/LDH
composite however, increasing the quantity to 10 or 15 phr slightly decreased stress at break
and yielded a rubber material of higher elasticity.
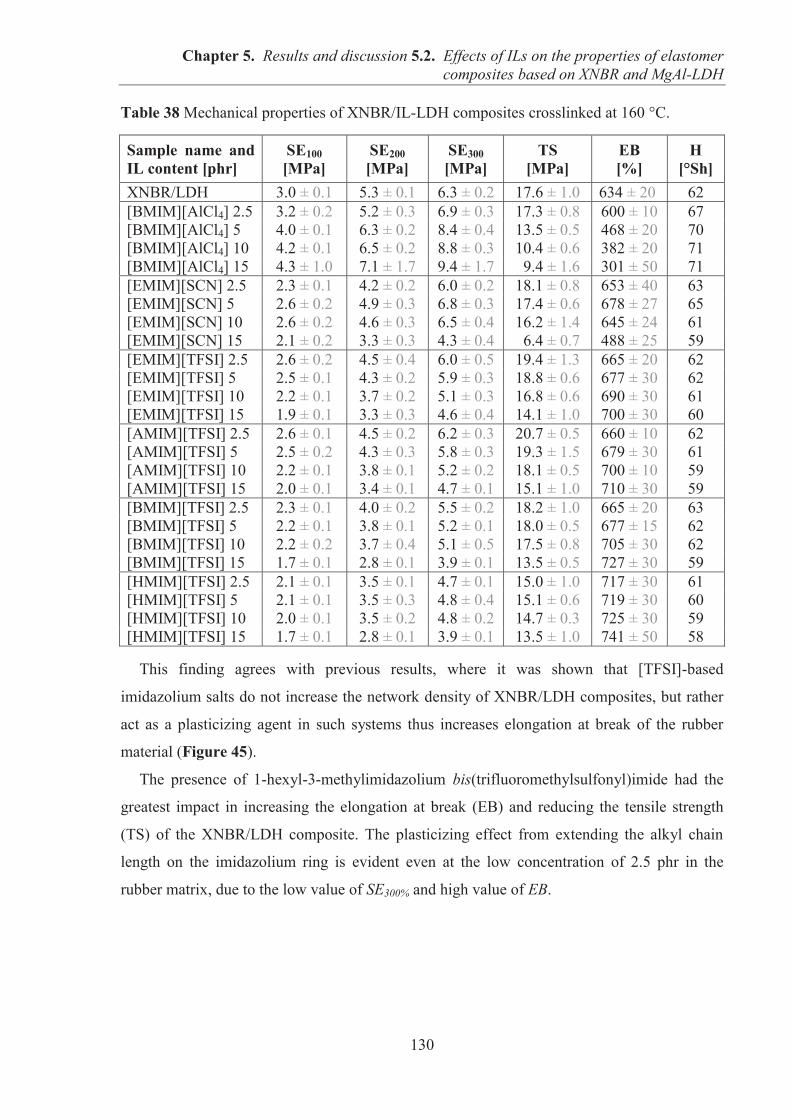
Chapter 5. Results and discussion 5.2. Effects of ILs on the properties of elastomer composites based on XNBR and MgAl-LDH
130
Table 38 Mechanical properties of XNBR/IL-LDH composites crosslinked at 160 °C.
Sample name and IL content [phr]
SE100 [MPa]
SE200 [MPa]
SE300 [MPa]
TS [MPa]
EB [%]
H [°Sh]
XNBR/LDH 3.0 ± 0.1 5.3 ± 0.1 6.3 ± 0.2 17.6 ± 1.0 634 ± 20 62 [BMIM][AlCl4] 2.5 3.2 ± 0.2 5.2 ± 0.3 6.9 ± 0.3 17.3 ± 0.8 600 ± 10 67 [BMIM][AlCl4] 5 4.0 ± 0.1 6.3 ± 0.2 8.4 ± 0.4 13.5 ± 0.5 468 ± 20 70 [BMIM][AlCl4] 10 4.2 ± 0.1 6.5 ± 0.2 8.8 ± 0.3 10.4 ± 0.6 382 ± 20 71 [BMIM][AlCl4] 15 4.3 ± 1.0 7.1 ± 1.7 9.4 ± 1.7 09.4 ± 1.6 301 ± 50 71 [EMIM][SCN] 2.5 2.3 ± 0.1 4.2 ± 0.2 6.0 ± 0.2 18.1 ± 0.8 653 ± 40 63 [EMIM][SCN] 5 2.6 ± 0.2 4.9 ± 0.3 6.8 ± 0.3 17.4 ± 0.6 678 ± 27 65 [EMIM][SCN] 10 2.6 ± 0.2 4.6 ± 0.3 6.5 ± 0.4 16.2 ± 1.4 645 ± 24 61 [EMIM][SCN] 15 2.1 ± 0.2 3.3 ± 0.3 4.3 ± 0.4 06.4 ± 0.7 488 ± 25 59 [EMIM][TFSI] 2.5 2.6 ± 0.2 4.5 ± 0.4 6.0 ± 0.5 19.4 ± 1.3 665 ± 20 62 [EMIM][TFSI] 5 2.5 ± 0.1 4.3 ± 0.2 5.9 ± 0.3 18.8 ± 0.6 677 ± 30 62 [EMIM][TFSI] 10 2.2 ± 0.1 3.7 ± 0.2 5.1 ± 0.3 16.8 ± 0.6 690 ± 30 61 [EMIM][TFSI] 15 1.9 ± 0.1 3.3 ± 0.3 4.6 ± 0.4 14.1 ± 1.0 700 ± 30 60 [AMIM][TFSI] 2.5 2.6 ± 0.1 4.5 ± 0.2 6.2 ± 0.3 20.7 ± 0.5 660 ± 10 62 [AMIM][TFSI] 5 2.5 ± 0.2 4.3 ± 0.3 5.8 ± 0.3 19.3 ± 1.5 679 ± 30 61 [AMIM][TFSI] 10 2.2 ± 0.1 3.8 ± 0.1 5.2 ± 0.2 18.1 ± 0.5 700 ± 10 59 [AMIM][TFSI] 15 2.0 ± 0.1 3.4 ± 0.1 4.7 ± 0.1 15.1 ± 1.0 710 ± 30 59 [BMIM][TFSI] 2.5 2.3 ± 0.1 4.0 ± 0.2 5.5 ± 0.2 18.2 ± 1.0 665 ± 20 63 [BMIM][TFSI] 5 2.2 ± 0.1 3.8 ± 0.1 5.2 ± 0.1 18.0 ± 0.5 677 ± 15 62 [BMIM][TFSI] 10 2.2 ± 0.2 3.7 ± 0.4 5.1 ± 0.5 17.5 ± 0.8 705 ± 30 62 [BMIM][TFSI] 15 1.7 ± 0.1 2.8 ± 0.1 3.9 ± 0.1 13.5 ± 0.5 727 ± 30 59 [HMIM][TFSI] 2.5 2.1 ± 0.1 3.5 ± 0.1 4.7 ± 0.1 15.0 ± 1.0 717 ± 30 61 [HMIM][TFSI] 5 2.1 ± 0.1 3.5 ± 0.3 4.8 ± 0.4 15.1 ± 0.6 719 ± 30 60 [HMIM][TFSI] 10 2.0 ± 0.1 3.5 ± 0.2 4.8 ± 0.2 14.7 ± 0.3 725 ± 30 59 [HMIM][TFSI] 15 1.7 ± 0.1 2.8 ± 0.1 3.9 ± 0.1 13.5 ± 1.0 741 ± 50 58
This finding agrees with previous results, where it was shown that [TFSI]-based
imidazolium salts do not increase the network density of XNBR/LDH composites, but rather
act as a plasticizing agent in such systems thus increases elongation at break of the rubber
material (Figure 45).
The presence of 1-hexyl-3-methylimidazolium bis(trifluoromethylsulfonyl)imide had the
greatest impact in increasing the elongation at break (EB) and reducing the tensile strength
(TS) of the XNBR/LDH composite. The plasticizing effect from extending the alkyl chain
length on the imidazolium ring is evident even at the low concentration of 2.5 phr in the
rubber matrix, due to the low value of SE300% and high value of EB.
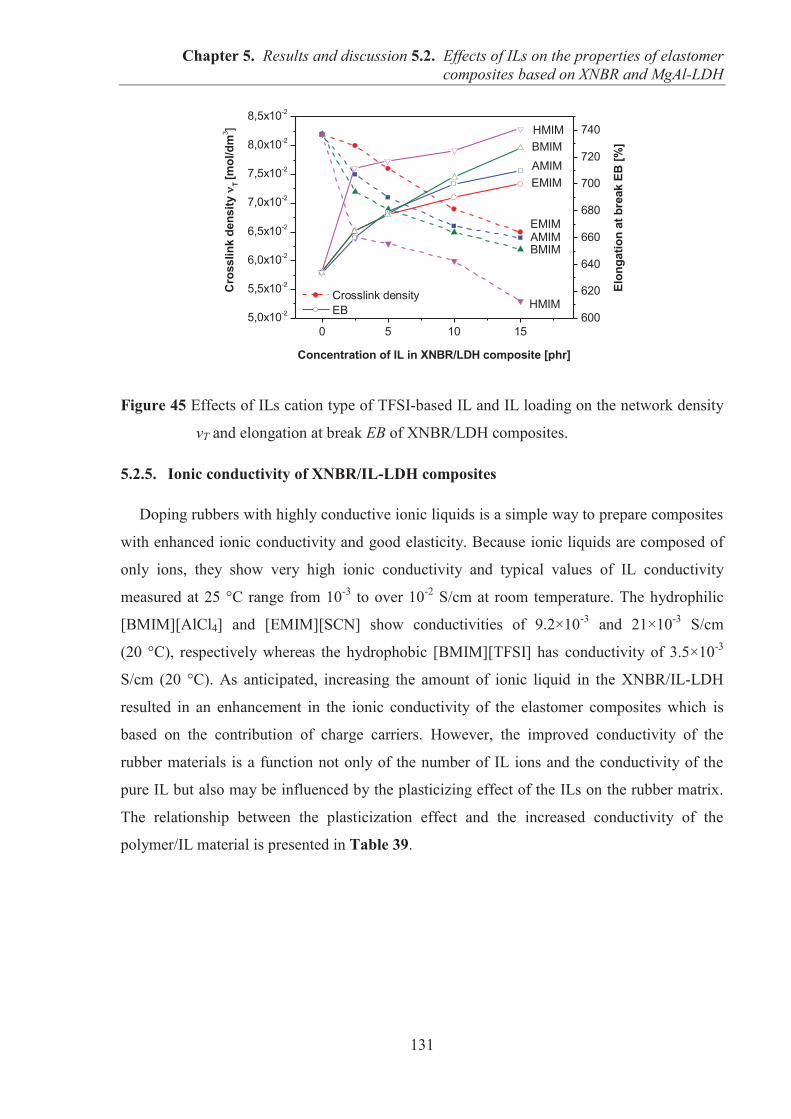
Chapter 5. Results and discussion 5.2. Effects of ILs on the properties of elastomer composites based on XNBR and MgAl-LDH
131
Figure 45 Effects of ILs cation type of TFSI-based IL and IL loading on the network density
νT and elongation at break EB of XNBR/LDH composites.
5.2.5. Ionic conductivity of XNBR/IL-LDH composites
Doping rubbers with highly conductive ionic liquids is a simple way to prepare composites
with enhanced ionic conductivity and good elasticity. Because ionic liquids are composed of
only ions, they show very high ionic conductivity and typical values of IL conductivity
measured at 25 °C range from 10-3 to over 10-2 S/cm at room temperature. The hydrophilic
[BMIM][AlCl4] and [EMIM][SCN] show conductivities of 9.2×10⁻³ and 21×10-3 S/cm
(20 °C), respectively whereas the hydrophobic [BMIM][TFSI] has conductivity of 3.5×10⁻³
S/cm (20 °C). As anticipated, increasing the amount of ionic liquid in the XNBR/IL-LDH
resulted in an enhancement in the ionic conductivity of the elastomer composites which is
based on the contribution of charge carriers. However, the improved conductivity of the
rubber materials is a function not only of the number of IL ions and the conductivity of the
pure IL but also may be influenced by the plasticizing effect of the ILs on the rubber matrix.
The relationship between the plasticization effect and the increased conductivity of the
polymer/IL material is presented in Table 39.
0 5 10 155,0x10⁻²
5,5x10⁻²
6,0x10⁻²
6,5x10⁻²
7,0x10⁻²
7,5x10⁻²
8,0x10⁻²
8,5x10⁻²
Crosslink density EB
EMIM
EMIM
BMIMAMIM
AMIM
HMIM
BMIM
Concentration of IL in XNBR/LDH composite [phr]
Cro
sslin
k de
nsity
T [m
ol/d
m3 ] HMIM
600
620
640
660
680
700
720
740
Elon
gatio
n at
bre
ak E
B [%
]
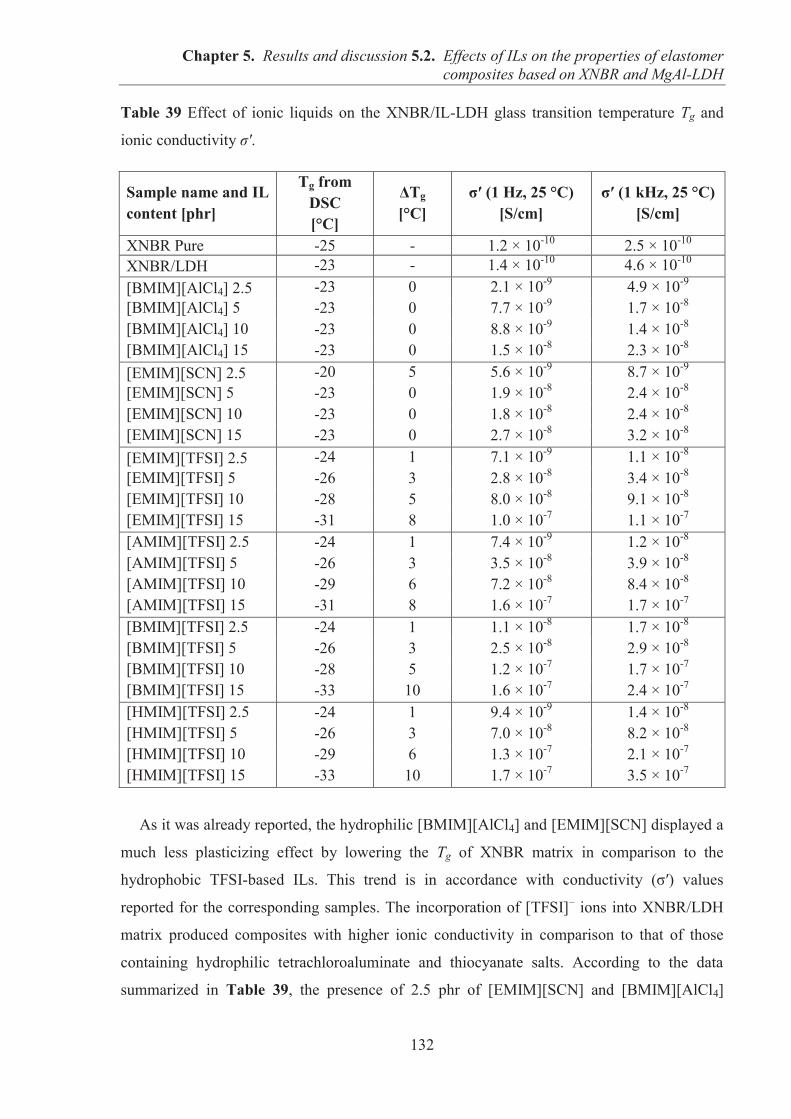
Chapter 5. Results and discussion 5.2. Effects of ILs on the properties of elastomer composites based on XNBR and MgAl-LDH
132
Table 39 Effect of ionic liquids on the XNBR/IL-LDH glass transition temperature Tg and
ionic conductivity σ′.
Sample name and IL content [phr]
Tg from DSC [°C]
ΔTg [°C]
σ′ (1 Hz, 25 °C) [S/cm]
σ′ (1 kHz, 25 °C) [S/cm]
XNBR Pure -25 - 1.2 × 10⁻¹⁰ 2.5 × 10⁻¹⁰ XNBR/LDH -23 - 1.4 × 10⁻¹⁰ 4.6 × 10⁻¹⁰ [BMIM][AlCl4] 2.5 -23 0 2.1 × 10⁻⁹ 4.9 × 10⁻⁹ [BMIM][AlCl4] 5 -23 0 7.7 × 10⁻⁹ 1.7 × 10⁻⁸ [BMIM][AlCl4] 10 -23 0 8.8 × 10⁻⁹ 1.4 × 10⁻⁸ [BMIM][AlCl4] 15 -23 0 1.5 × 10⁻⁸ 2.3 × 10⁻⁸ [EMIM][SCN] 2.5 -20 5 5.6 × 10⁻⁹ 8.7 × 10⁻⁹ [EMIM][SCN] 5 -23 0 1.9 × 10⁻⁸ 2.4 × 10⁻⁸ [EMIM][SCN] 10 -23 0 1.8 × 10⁻⁸ 2.4 × 10⁻⁸ [EMIM][SCN] 15 -23 0 2.7 × 10⁻⁸ 3.2 × 10⁻⁸ [EMIM][TFSI] 2.5 -24 1 7.1 × 10⁻⁹ 1.1 × 10⁻⁸ [EMIM][TFSI] 5 -26 3 2.8 × 10⁻⁸ 3.4 × 10⁻⁸ [EMIM][TFSI] 10 -28 5 8.0 × 10⁻⁸ 9.1 × 10⁻⁸ [EMIM][TFSI] 15 -31 8 1.0 × 10⁻⁷ 1.1 × 10⁻⁷ [AMIM][TFSI] 2.5 -24 1 7.4 × 10⁻⁹ 1.2 × 10⁻⁸ [AMIM][TFSI] 5 -26 3 3.5 × 10⁻⁸ 3.9 × 10⁻⁸ [AMIM][TFSI] 10 -29 6 7.2 × 10⁻⁸ 8.4 × 10⁻⁸ [AMIM][TFSI] 15 -31 8 1.6 × 10⁻⁷ 1.7 × 10⁻⁷ [BMIM][TFSI] 2.5 -24 1 1.1 × 10⁻⁸ 1.7 × 10⁻⁸ [BMIM][TFSI] 5 -26 3 2.5 × 10⁻⁸ 2.9 × 10⁻⁸ [BMIM][TFSI] 10 -28 5 1.2 × 10⁻⁷ 1.7 × 10⁻⁷ [BMIM][TFSI] 15 -33 10 1.6 × 10⁻⁷ 2.4 × 10⁻⁷ [HMIM][TFSI] 2.5 -24 1 9.4 × 10⁻⁹ 1.4 × 10⁻⁸ [HMIM][TFSI] 5 -26 3 7.0 × 10⁻⁸ 8.2 × 10⁻⁸ [HMIM][TFSI] 10 -29 6 1.3 × 10⁻⁷ 2.1 × 10⁻⁷ [HMIM][TFSI] 15 -33 10 1.7 × 10⁻⁷ 3.5 × 10⁻⁷
As it was already reported, the hydrophilic [BMIM][AlCl4] and [EMIM][SCN] displayed a
much less plasticizing effect by lowering the Tg of XNBR matrix in comparison to the
hydrophobic TFSI-based ILs. This trend is in accordance with conductivity (σ′) values
reported for the corresponding samples. The incorporation of [TFSI]– ions into XNBR/LDH
matrix produced composites with higher ionic conductivity in comparison to that of those
containing hydrophilic tetrachloroaluminate and thiocyanate salts. According to the data
summarized in Table 39, the presence of 2.5 phr of [EMIM][SCN] and [BMIM][AlCl4]
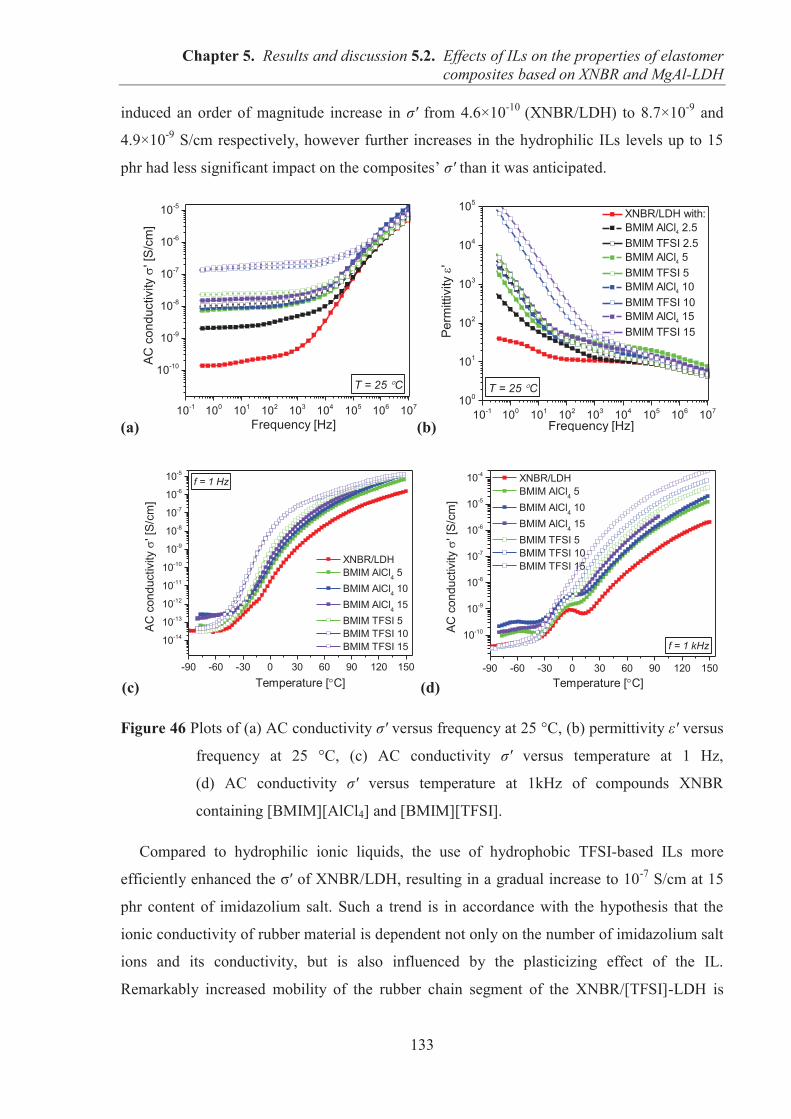
Chapter 5. Results and discussion 5.2. Effects of ILs on the properties of elastomer composites based on XNBR and MgAl-LDH
133
induced an order of magnitude increase in σ′ from 4.6×10⁻¹⁰ (XNBR/LDH) to 8.7×10⁻⁹ and
4.9×10⁻⁹ S/cm respectively, however further increases in the hydrophilic ILs levels up to 15
phr had less significant impact on the composites’ σ′ than it was anticipated.
(a) (b)
(c) (d)
Figure 46 Plots of (a) AC conductivity σ′ versus frequency at 25 °C, (b) permittivity ε′ versus
frequency at 25 °C, (c) AC conductivity σ′ versus temperature at 1 Hz,
(d) AC conductivity σ′ versus temperature at 1kHz of compounds XNBR
containing [BMIM][AlCl4] and [BMIM][TFSI].
Compared to hydrophilic ionic liquids, the use of hydrophobic TFSI-based ILs more
efficiently enhanced the σ′ of XNBR/LDH, resulting in a gradual increase to 10-7 S/cm at 15
phr content of imidazolium salt. Such a trend is in accordance with the hypothesis that the
ionic conductivity of rubber material is dependent not only on the number of imidazolium salt
ions and its conductivity, but is also influenced by the plasticizing effect of the IL.
Remarkably increased mobility of the rubber chain segment of the XNBR/[TFSI]-LDH is
10-1 100 101 102 103 104 105 106 107
10-10
10-9
10-8
10-7
10-6
10-5
AC c
ondu
ctiv
ity
' [S/
cm]
Frequency [Hz]
T = 25 C
10-1 100 101 102 103 104 105 106 107100
101
102
103
104
105
T = 25 C
Perm
ittiv
ity
'Frequency [Hz]
XNBR/LDH with: BMIM AlCl4 2.5 BMIM TFSI 2.5 BMIM AlCl4 5 BMIM TFSI 5 BMIM AlCl4 10 BMIM TFSI 10 BMIM AlCl4 15 BMIM TFSI 15
-90 -60 -30 0 30 60 90 120 150
10-14
10-13
10-12
10-11
10-10
10-9
10-8
10-7
10-6
10-5
AC c
ondu
ctiv
ity
' [S/
cm]
Temperature [ C]
XNBR/LDH BMIM AlCl4 5 BMIM AlCl4 10 BMIM AlCl4 15 BMIM TFSI 5 BMIM TFSI 10 BMIM TFSI 15
f = 1 Hz
-90 -60 -30 0 30 60 90 120 150
10-10
10-9
10-8
10-7
10-6
10-5
10-4
AC c
ondu
ctiv
ity
' [S/
cm]
Temperature [ C]
XNBR/LDH BMIM AlCl4 5 BMIM AlCl4 10 BMIM AlCl4 15 BMIM TFSI 5 BMIM TFSI 10 BMIM TFSI 15
f = 1 kHz
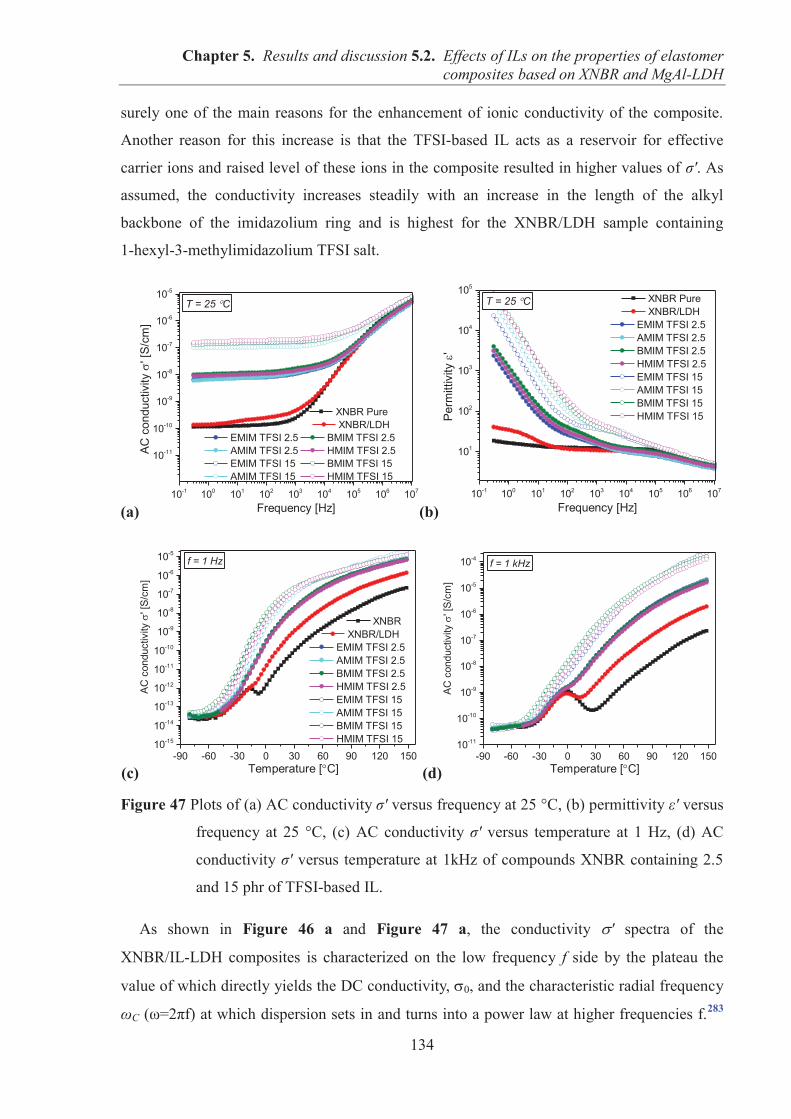
Chapter 5. Results and discussion 5.2. Effects of ILs on the properties of elastomer composites based on XNBR and MgAl-LDH
134
surely one of the main reasons for the enhancement of ionic conductivity of the composite.
Another reason for this increase is that the TFSI-based IL acts as a reservoir for effective
carrier ions and raised level of these ions in the composite resulted in higher values of σ′. As
assumed, the conductivity increases steadily with an increase in the length of the alkyl
backbone of the imidazolium ring and is highest for the XNBR/LDH sample containing
1-hexyl-3-methylimidazolium TFSI salt.
(a) (b)
(c) (d)
Figure 47 Plots of (a) AC conductivity σ′ versus frequency at 25 °C, (b) permittivity ε′ versus
frequency at 25 °C, (c) AC conductivity σ′ versus temperature at 1 Hz, (d) AC
conductivity σ′ versus temperature at 1kHz of compounds XNBR containing 2.5
and 15 phr of TFSI-based IL.
As shown in Figure 46 a and Figure 47 a, the conductivity ′ spectra of the
XNBR/IL-LDH composites is characterized on the low frequency f side by the plateau the
value of which directly yields the DC conductivity, 0, and the characteristic radial frequency
ωC (ω=2πf) at which dispersion sets in and turns into a power law at higher frequencies f.283
10-1 100 101 102 103 104 105 106 107
10-11
10-10
10-9
10-8
10-7
10-6
10-5
T = 25 C
AC c
ondu
ctiv
ity
' [S/
cm]
Frequency [Hz]
XNBR Pure XNBR/LDH
EMIM TFSI 2.5 BMIM TFSI 2.5 AMIM TFSI 2.5 HMIM TFSI 2.5 EMIM TFSI 15 BMIM TFSI 15 AMIM TFSI 15 HMIM TFSI 15
10-1 100 101 102 103 104 105 106 107
101
102
103
104
105
T = 25 C
Perm
ittiv
ity
'
Frequency [Hz]
XNBR Pure XNBR/LDH EMIM TFSI 2.5 AMIM TFSI 2.5 BMIM TFSI 2.5 HMIM TFSI 2.5 EMIM TFSI 15 AMIM TFSI 15 BMIM TFSI 15 HMIM TFSI 15
-90 -60 -30 0 30 60 90 120 15010-15
10-14
10-13
10-12
10-11
10-10
10-9
10-8
10-7
10-6
10-5f = 1 Hz
XNBR XNBR/LDH EMIM TFSI 2.5 AMIM TFSI 2.5 BMIM TFSI 2.5 HMIM TFSI 2.5 EMIM TFSI 15 AMIM TFSI 15 BMIM TFSI 15 HMIM TFSI 15
AC
con
duct
ivity
' [
S/c
m]
Temperature [ C]-90 -60 -30 0 30 60 90 120 150
10-11
10-10
10-9
10-8
10-7
10-6
10-5
10-4 f = 1 kHz
AC
con
duct
ivity
' [
S/c
m]
Temperature [ C]
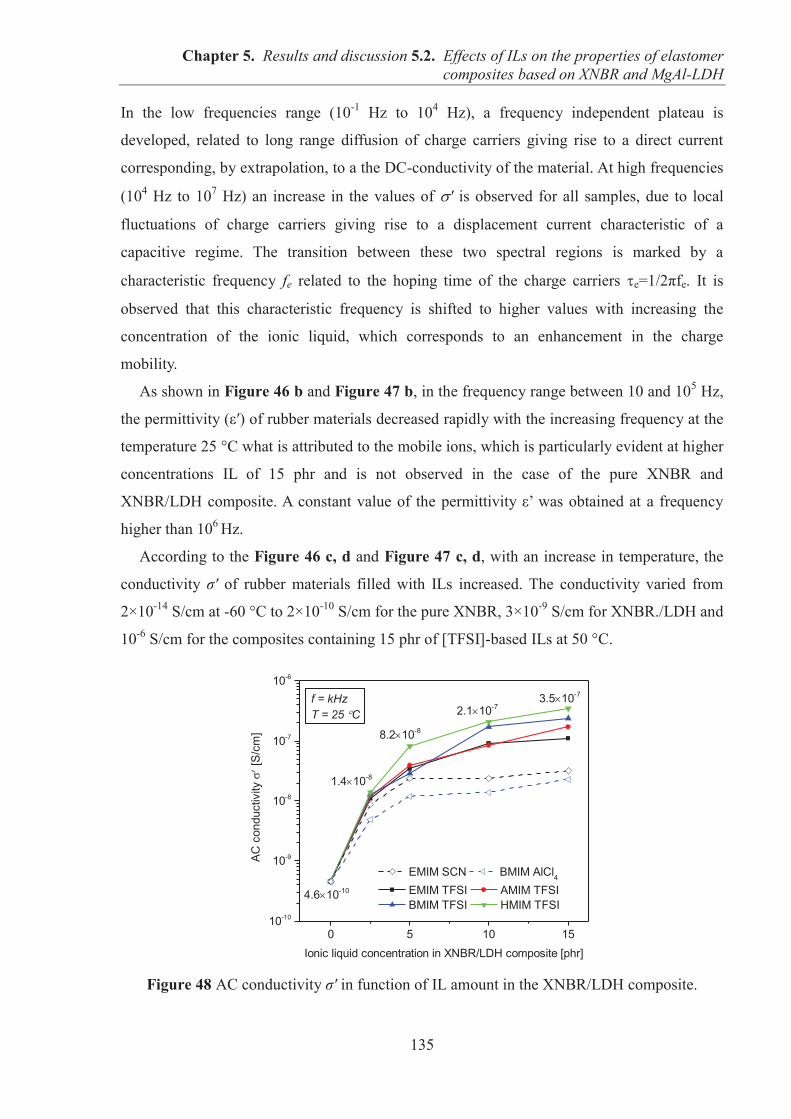
Chapter 5. Results and discussion 5.2. Effects of ILs on the properties of elastomer composites based on XNBR and MgAl-LDH
135
In the low frequencies range (10-1 Hz to 104 Hz), a frequency independent plateau is
developed, related to long range diffusion of charge carriers giving rise to a direct current
corresponding, by extrapolation, to a the DC-conductivity of the material. At high frequencies
(104 Hz to 107 Hz) an increase in the values of ′ is observed for all samples, due to local
fluctuations of charge carriers giving rise to a displacement current characteristic of a
capacitive regime. The transition between these two spectral regions is marked by a
characteristic frequency fe related to the hoping time of the charge carriers e=1/2πfe. It is
observed that this characteristic frequency is shifted to higher values with increasing the
concentration of the ionic liquid, which corresponds to an enhancement in the charge
mobility.
As shown in Figure 46 b and Figure 47 b, in the frequency range between 10 and 105 Hz,
the permittivity (ε′) of rubber materials decreased rapidly with the increasing frequency at the
temperature 25 °C what is attributed to the mobile ions, which is particularly evident at higher
concentrations IL of 15 phr and is not observed in the case of the pure XNBR and
XNBR/LDH composite. A constant value of the permittivity ε’ was obtained at a frequency
higher than 106 Hz.
According to the Figure 46 c, d and Figure 47 c, d, with an increase in temperature, the
conductivity σ′ of rubber materials filled with ILs increased. The conductivity varied from
2×10-14 S/cm at -60 °C to 2×10⁻¹⁰ S/cm for the pure XNBR, 3×10⁻⁹ S/cm for XNBR./LDH and
10-6 S/cm for the composites containing 15 phr of [TFSI]-based ILs at 50 °C.
Figure 48 AC conductivity σ′ in function of IL amount in the XNBR/LDH composite.
0 5 10 1510-10
10-9
10-8
10-7
10-6
1.4 10-8
4.6 10-10
3.5 10-7 2.1 10-7
AC
con
duct
ivity
[S
/cm
]
Ionic liquid concentration in XNBR/LDH composite [phr]
EMIM SCN BMIM AlCl4 EMIM TFSI AMIM TFSI BMIM TFSI HMIM TFSI
f = kHzT = 25 C
8.2 10-8
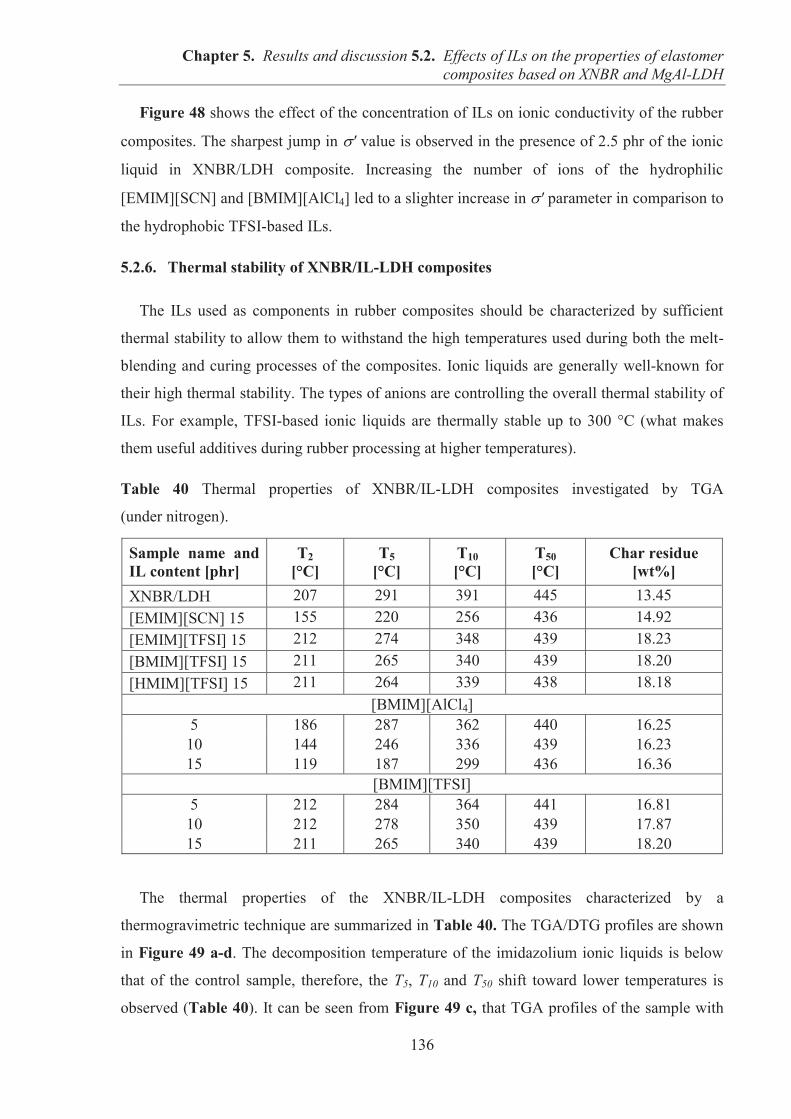
Chapter 5. Results and discussion 5.2. Effects of ILs on the properties of elastomer composites based on XNBR and MgAl-LDH
136
Figure 48 shows the effect of the concentration of ILs on ionic conductivity of the rubber
composites. The sharpest jump in ′ value is observed in the presence of 2.5 phr of the ionic
liquid in XNBR/LDH composite. Increasing the number of ions of the hydrophilic
[EMIM][SCN] and [BMIM][AlCl4] led to a slighter increase in ′ parameter in comparison to
the hydrophobic TFSI-based ILs.
5.2.6. Thermal stability of XNBR/IL-LDH composites
The ILs used as components in rubber composites should be characterized by sufficient
thermal stability to allow them to withstand the high temperatures used during both the melt-
blending and curing processes of the composites. Ionic liquids are generally well-known for
their high thermal stability. The types of anions are controlling the overall thermal stability of
ILs. For example, TFSI-based ionic liquids are thermally stable up to 300 °C (what makes
them useful additives during rubber processing at higher temperatures).
Table 40 Thermal properties of XNBR/IL-LDH composites investigated by TGA
(under nitrogen).
Sample name and IL content [phr]
T2 [°C]
T5 [°C]
T10 [°C]
T50 [°C]
Char residue [wt%]
XNBR/LDH 207 291 391 445 13.45 [EMIM][SCN] 15 155 220 256 436 14.92 [EMIM][TFSI] 15 212 274 348 439 18.23 [BMIM][TFSI] 15 211 265 340 439 18.20 [HMIM][TFSI] 15 211 264 339 438 18.18
[BMIM][AlCl4] 5 186 287 362 440 16.25
10 144 246 336 439 16.23 15 119 187 299 436 16.36
[BMIM][TFSI] 5 212 284 364 441 16.81
10 212 278 350 439 17.87 15 211 265 340 439 18.20
The thermal properties of the XNBR/IL-LDH composites characterized by a
thermogravimetric technique are summarized in Table 40. The TGA/DTG profiles are shown
in Figure 49 a-d. The decomposition temperature of the imidazolium ionic liquids is below
that of the control sample, therefore, the T5, T10 and T50 shift toward lower temperatures is
observed (Table 40). It can be seen from Figure 49 c, that TGA profiles of the sample with
Chapter 5. Results and discussion 5.2. Effects of ILs on the properties of elastomer composites based on XNBR and MgAl-LDH
137
tetrachloroaluminate and thiocyanate imidazolium salt showed no thermal changes before 100
°C, and over 100 °C, the mass loss is most likely due to evaporation of water or impurities
because both are highly hygroscopic compounds.
(a) (b)
(c) (d)
Figure 49 Thermal stability properties of XNBR/LDH composites (a) TGA profiles of
composites with 15 phr of IL, (b) DTG profiles of composites with 15 phr of IL,
(c) TGA/DTG profiles of composites with [BMIM][AlCl4], (d) TGA/DTG
profiles of composites with [BMIM][TFSI], (under nitrogen).
The addition of 15 phr IL with [TFSI]– anion increased the decomposition temperature at
2 % mass loss (T2) of XNBR/LDH and the TGA/DTG curves exhibited no thermal changes
below 266 °C (Figure 49 a-b), which confirmed that the hydrophobic TFSI-based ILs are
thermally stable in the temperature range of 25 – 250 °C. At higher temperatures, the
TGA/DTG showed a significant mass loss between 309 °C and 480 °C (Δm=72 %), and a
similar loss is observed in the control sample form 380 °C to 480 °C (Δm=69 %). The
bis(trifluoromethylsulfonyl)imide imidazolium salt exhibits superior thermal stability for
100 200 300 400 500 6000
20
40
60
80
100
Wei
ght l
oss
[%]
Temperature [0C]
XNBR/LDHwith IL (15 phr):
EMIM TFSI BMIM TFSI HMIM TFSI EMIM SCN BMIM AlCl4
100 200 300 400 500 600
0,0
0,5
1,0
1,5
242 C 266 C
DTG
[%/0 C
]
Temperature [0C]
XNBR/LDHwith IL (15 phr):
EMIM TFSI BMIM TFSI HMIM TFSI EMIM SCN BMIM AlCl4
438 C
100 200 300 400 500 6000
20
40
60
80
100
XNBR/LDHwith:
BMIM AlCl4 5 BMIM AlCl4 10 BMIM AlCl4 15
Temperature [C]
Wei
ght l
oss
[%]
0,0
0,5
1,0
1,5
Der
iv. w
eigh
t [%
/C
]
100 200 300 400 500 6000
20
40
60
80
100
XNBR/LDHwith:
BMIM TFSI 5 BMIM TFSI 10 BMIM TFSI 15
Temperature [C]
Wei
ght l
oss
[%]
0,0
0,5
1,0
1,5
Der
iv. w
eigh
t [%
/C
]
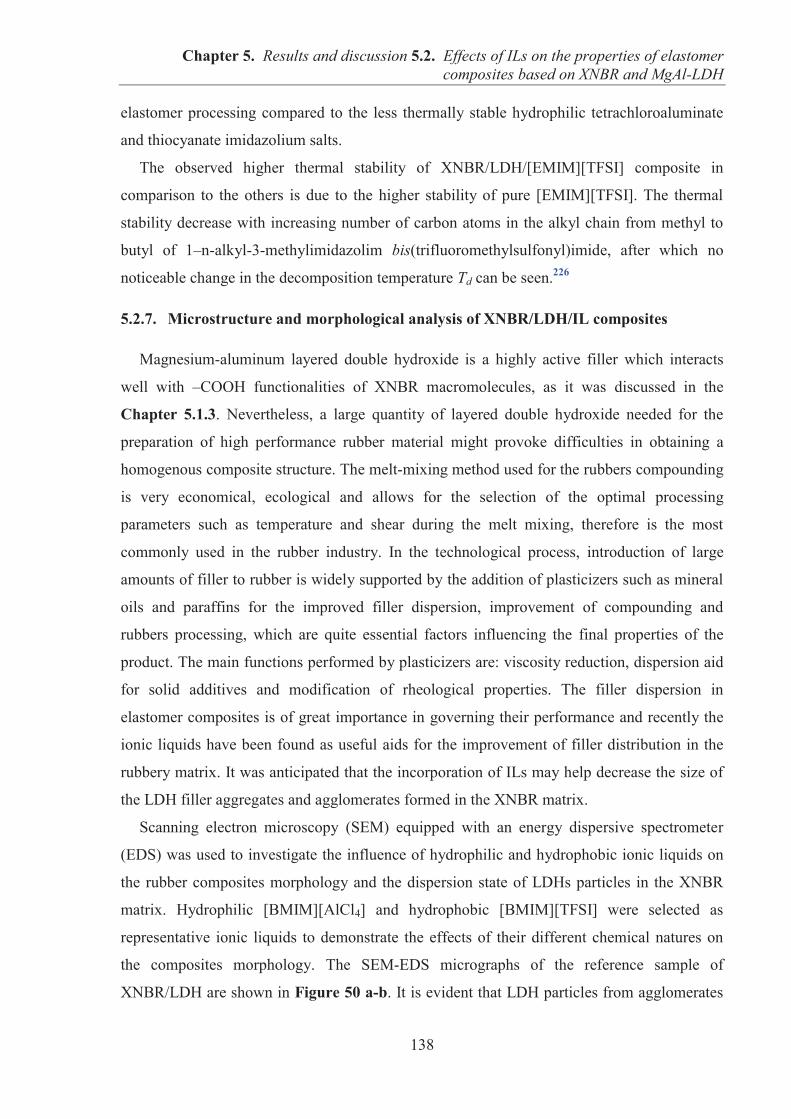
Chapter 5. Results and discussion 5.2. Effects of ILs on the properties of elastomer composites based on XNBR and MgAl-LDH
138
elastomer processing compared to the less thermally stable hydrophilic tetrachloroaluminate
and thiocyanate imidazolium salts.
The observed higher thermal stability of XNBR/LDH/[EMIM][TFSI] composite in
comparison to the others is due to the higher stability of pure [EMIM][TFSI]. The thermal
stability decrease with increasing number of carbon atoms in the alkyl chain from methyl to
butyl of 1–n-alkyl-3-methylimidazolim bis(trifluoromethylsulfonyl)imide, after which no
noticeable change in the decomposition temperature Td can be seen.226
5.2.7. Microstructure and morphological analysis of XNBR/LDH/IL composites
Magnesium-aluminum layered double hydroxide is a highly active filler which interacts
well with –COOH functionalities of XNBR macromolecules, as it was discussed in the
Chapter 5.1.3. Nevertheless, a large quantity of layered double hydroxide needed for the
preparation of high performance rubber material might provoke difficulties in obtaining a
homogenous composite structure. The melt-mixing method used for the rubbers compounding
is very economical, ecological and allows for the selection of the optimal processing
parameters such as temperature and shear during the melt mixing, therefore is the most
commonly used in the rubber industry. In the technological process, introduction of large
amounts of filler to rubber is widely supported by the addition of plasticizers such as mineral
oils and paraffins for the improved filler dispersion, improvement of compounding and
rubbers processing, which are quite essential factors influencing the final properties of the
product. The main functions performed by plasticizers are: viscosity reduction, dispersion aid
for solid additives and modification of rheological properties. The filler dispersion in
elastomer composites is of great importance in governing their performance and recently the
ionic liquids have been found as useful aids for the improvement of filler distribution in the
rubbery matrix. It was anticipated that the incorporation of ILs may help decrease the size of
the LDH filler aggregates and agglomerates formed in the XNBR matrix.
Scanning electron microscopy (SEM) equipped with an energy dispersive spectrometer
(EDS) was used to investigate the influence of hydrophilic and hydrophobic ionic liquids on
the rubber composites morphology and the dispersion state of LDHs particles in the XNBR
matrix. Hydrophilic [BMIM][AlCl4] and hydrophobic [BMIM][TFSI] were selected as
representative ionic liquids to demonstrate the effects of their different chemical natures on
the composites morphology. The SEM-EDS micrographs of the reference sample of
XNBR/LDH are shown in Figure 50 a-b. It is evident that LDH particles from agglomerates
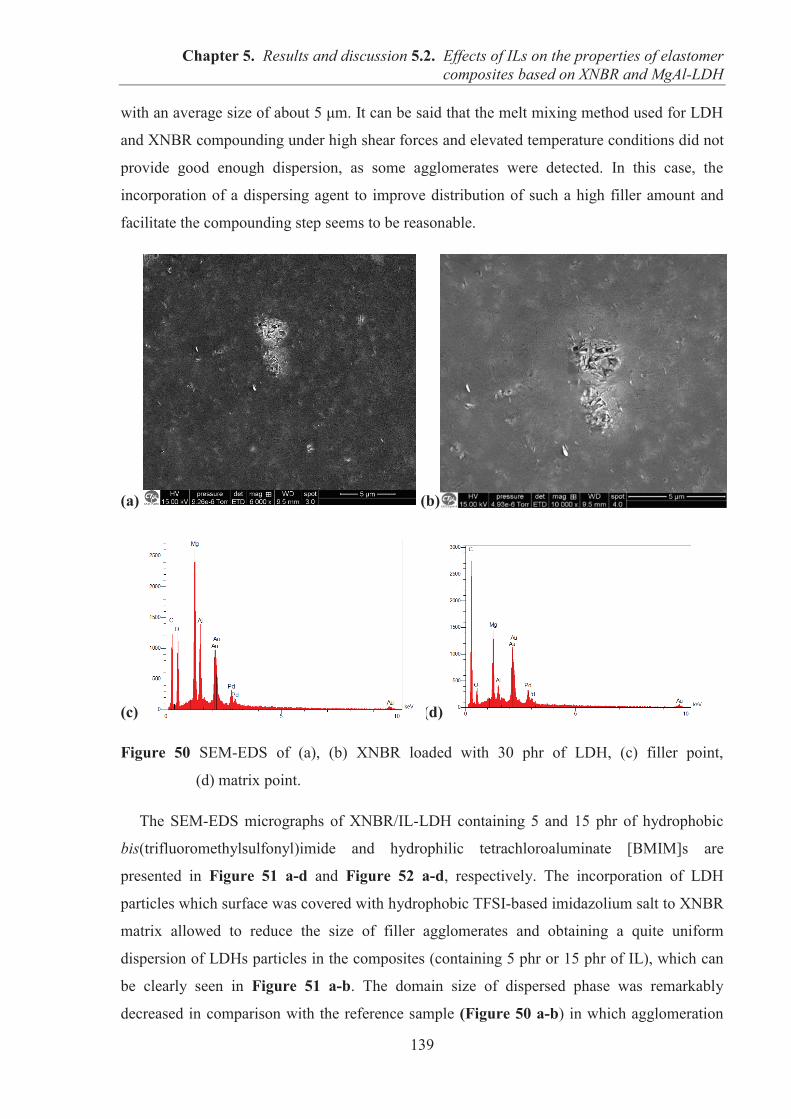
Chapter 5. Results and discussion 5.2. Effects of ILs on the properties of elastomer composites based on XNBR and MgAl-LDH
139
with an average size of about 5 μm. It can be said that the melt mixing method used for LDH
and XNBR compounding under high shear forces and elevated temperature conditions did not
provide good enough dispersion, as some agglomerates were detected. In this case, the
incorporation of a dispersing agent to improve distribution of such a high filler amount and
facilitate the compounding step seems to be reasonable.
(a) (b)
(c) (d)
Figure 50 SEM-EDS of (a), (b) XNBR loaded with 30 phr of LDH, (c) filler point,
(d) matrix point.
The SEM-EDS micrographs of XNBR/IL-LDH containing 5 and 15 phr of hydrophobic
bis(trifluoromethylsulfonyl)imide and hydrophilic tetrachloroaluminate [BMIM]s are
presented in Figure 51 a-d and Figure 52 a-d, respectively. The incorporation of LDH
particles which surface was covered with hydrophobic TFSI-based imidazolium salt to XNBR
matrix allowed to reduce the size of filler agglomerates and obtaining a quite uniform
dispersion of LDHs particles in the composites (containing 5 phr or 15 phr of IL), which can
be clearly seen in Figure 51 a-b. The domain size of dispersed phase was remarkably
decreased in comparison with the reference sample (Figure 50 a-b) in which agglomeration
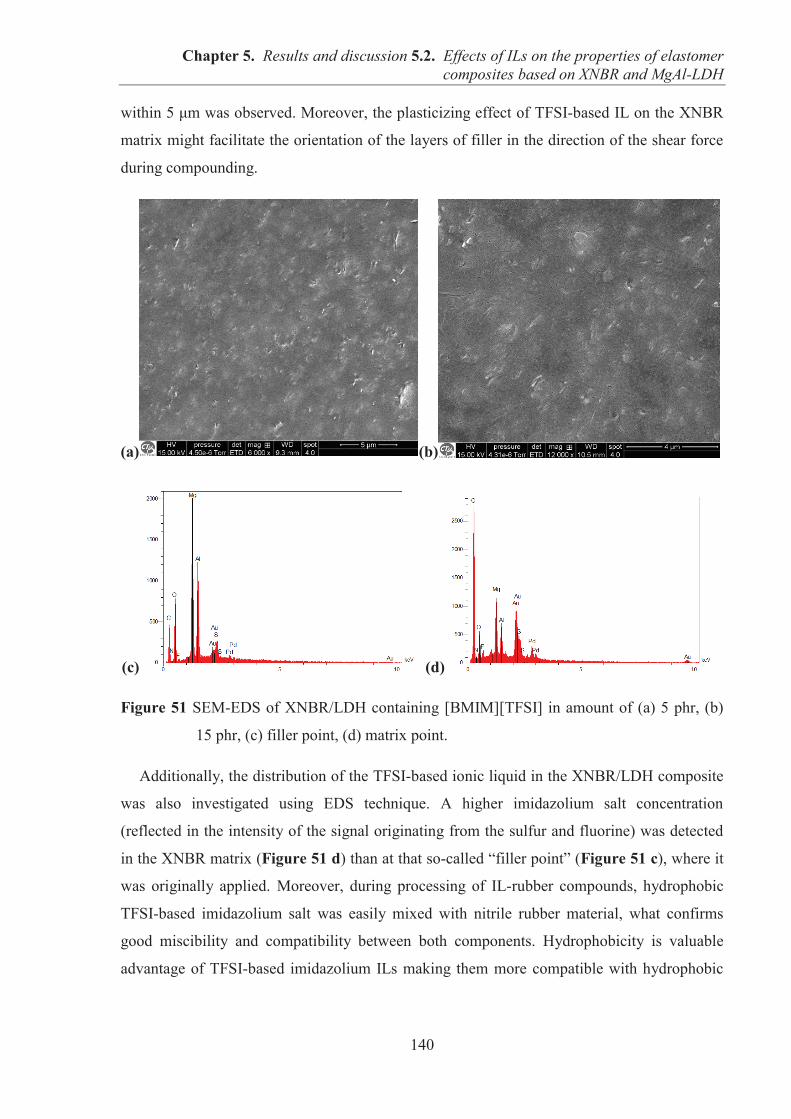
Chapter 5. Results and discussion 5.2. Effects of ILs on the properties of elastomer composites based on XNBR and MgAl-LDH
140
within 5 μm was observed. Moreover, the plasticizing effect of TFSI-based IL on the XNBR
matrix might facilitate the orientation of the layers of filler in the direction of the shear force
during compounding.
(a) (b)
(c) (d)
Figure 51 SEM-EDS of XNBR/LDH containing [BMIM][TFSI] in amount of (a) 5 phr, (b)
15 phr, (c) filler point, (d) matrix point.
Additionally, the distribution of the TFSI-based ionic liquid in the XNBR/LDH composite
was also investigated using EDS technique. A higher imidazolium salt concentration
(reflected in the intensity of the signal originating from the sulfur and fluorine) was detected
in the XNBR matrix (Figure 51 d) than at that so-called “filler point” (Figure 51 c), where it
was originally applied. Moreover, during processing of IL-rubber compounds, hydrophobic
TFSI-based imidazolium salt was easily mixed with nitrile rubber material, what confirms
good miscibility and compatibility between both components. Hydrophobicity is valuable
advantage of TFSI-based imidazolium ILs making them more compatible with hydrophobic
Chapter 5. Results and discussion 5.2. Effects of ILs on the properties of elastomer composites based on XNBR and MgAl-LDH
141
rubber matrices, preventing leakage (migration within the polymer matrix), facilitating rubber
processing and improving filler dispersion throughout the elastomer matrix.
(a) (b)
(c) (d)
Figure 52 SEM-EDS of XNBR/LDH containing [BMIM][AlCl4] in amount of (a) 5 phr, (b)
15 phr, (c) filler point, (d) matrix point.
Similarly, SEM studies showed that there is an improvement in the morphology of the
XNBR/LDH with the addition of hydrophilic [BMIM][AlCl4] which contributed to the
reduction of the filler agglomerates size and more uniform composite structure as it is shown
in Figure 52 a-b. However, the opposite effect of hydrophilic IL distribution in the
XNBR/LDH material was found. The IL concentration was detected to be the highest in the
“filler point” (Figure 52 c) and very low in the XNBR matrix (Figure 52 d). Moreover, the
miscibility between hydrophilic IL and nitrile rubber was limited and incorporation of filler
coated with higher loadings of IL during compounding was a time-consuming process in
comparison to the LDH with hydrophobic [BMIM][TFSI] which was easily introduced into
the elastomer matrix. Comparing both ionic liquids, the hydrophobic one containing a
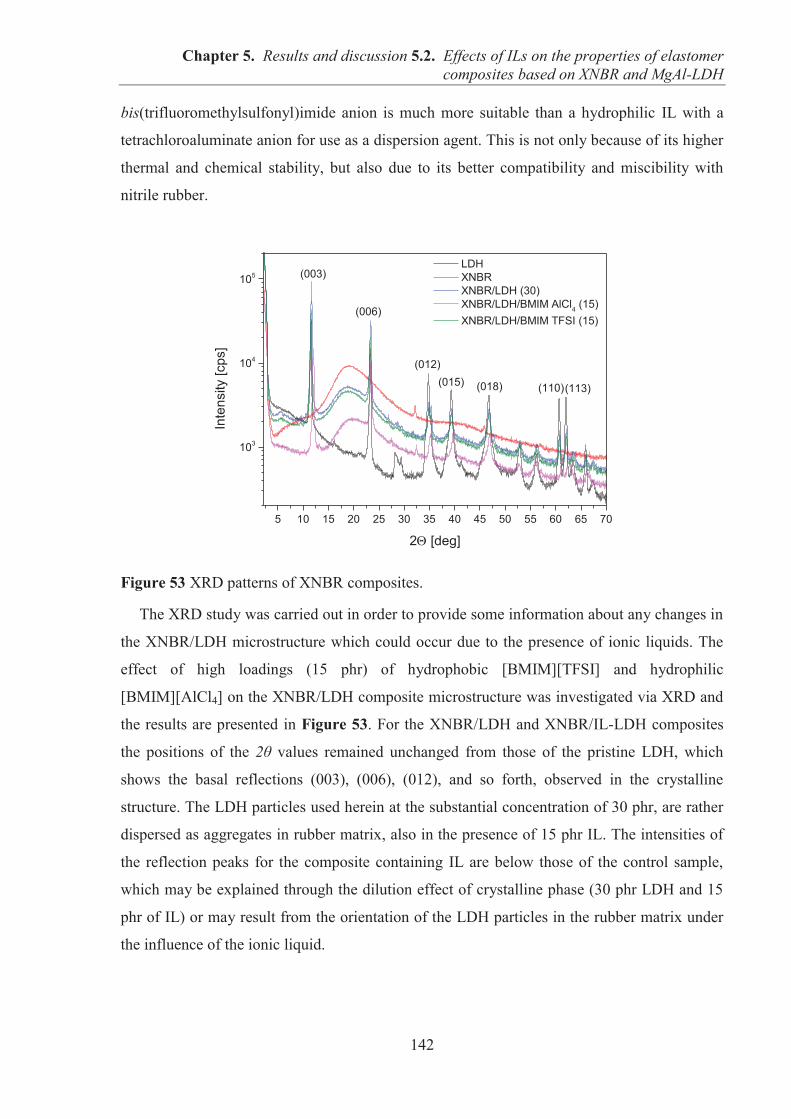
Chapter 5. Results and discussion 5.2. Effects of ILs on the properties of elastomer composites based on XNBR and MgAl-LDH
142
bis(trifluoromethylsulfonyl)imide anion is much more suitable than a hydrophilic IL with a
tetrachloroaluminate anion for use as a dispersion agent. This is not only because of its higher
thermal and chemical stability, but also due to its better compatibility and miscibility with
nitrile rubber.
Figure 53 XRD patterns of XNBR composites.
The XRD study was carried out in order to provide some information about any changes in
the XNBR/LDH microstructure which could occur due to the presence of ionic liquids. The
effect of high loadings (15 phr) of hydrophobic [BMIM][TFSI] and hydrophilic
[BMIM][AlCl4] on the XNBR/LDH composite microstructure was investigated via XRD and
the results are presented in Figure 53. For the XNBR/LDH and XNBR/IL-LDH composites
the positions of the 2θ values remained unchanged from those of the pristine LDH, which
shows the basal reflections (003), (006), (012), and so forth, observed in the crystalline
structure. The LDH particles used herein at the substantial concentration of 30 phr, are rather
dispersed as aggregates in rubber matrix, also in the presence of 15 phr IL. The intensities of
the reflection peaks for the composite containing IL are below those of the control sample,
which may be explained through the dilution effect of crystalline phase (30 phr LDH and 15
phr of IL) or may result from the orientation of the LDH particles in the rubber matrix under
the influence of the ionic liquid.
5 10 15 20 25 30 35 40 45 50 55 60 65 70
103
104
105
(113)(018)(015)(012)
(110)
(006)
Inte
nsity
[cps
]
2 [deg]
LDH XNBR XNBR/LDH (30) XNBR/LDH/BMIM AlCl4 (15) XNBR/LDH/BMIM TFSI (15)
(003)
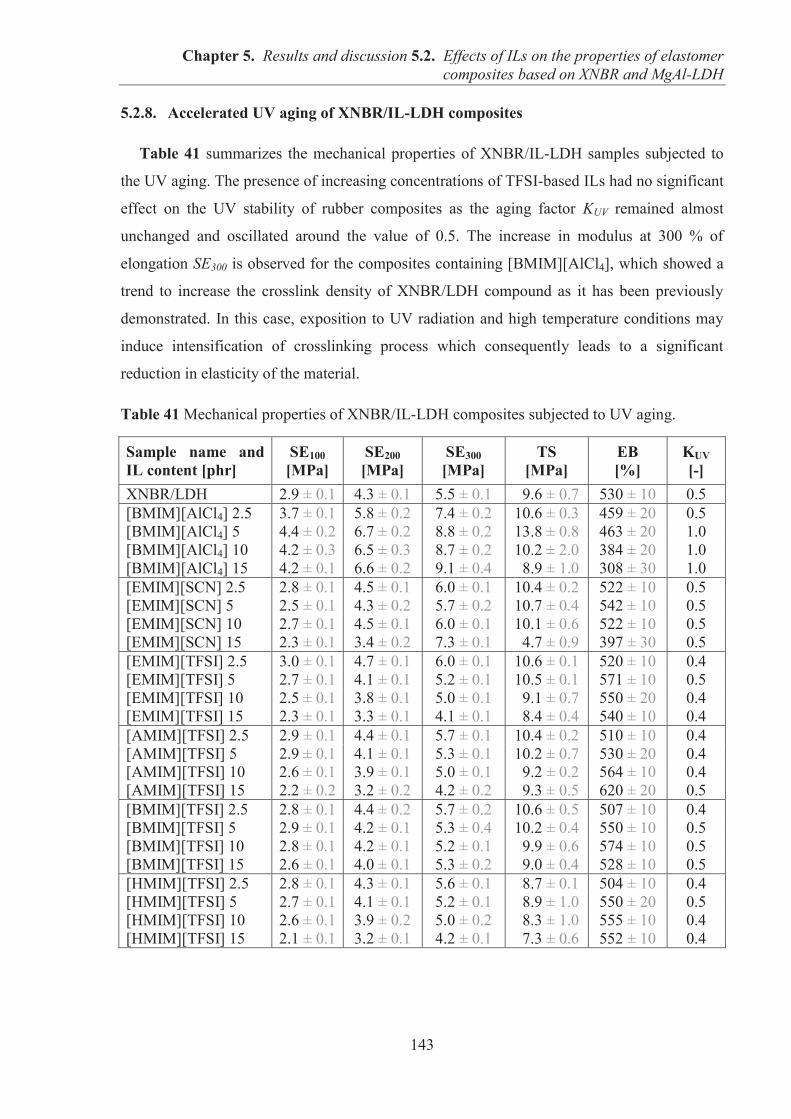
Chapter 5. Results and discussion 5.2. Effects of ILs on the properties of elastomer composites based on XNBR and MgAl-LDH
143
5.2.8. Accelerated UV aging of XNBR/IL-LDH composites
Table 41 summarizes the mechanical properties of XNBR/IL-LDH samples subjected to
the UV aging. The presence of increasing concentrations of TFSI-based ILs had no significant
effect on the UV stability of rubber composites as the aging factor KUV remained almost
unchanged and oscillated around the value of 0.5. The increase in modulus at 300 % of
elongation SE300 is observed for the composites containing [BMIM][AlCl4], which showed a
trend to increase the crosslink density of XNBR/LDH compound as it has been previously
demonstrated. In this case, exposition to UV radiation and high temperature conditions may
induce intensification of crosslinking process which consequently leads to a significant
reduction in elasticity of the material.
Table 41 Mechanical properties of XNBR/IL-LDH composites subjected to UV aging.
Sample name and IL content [phr]
SE100 [MPa]
SE200 [MPa]
SE300 [MPa]
TS [MPa]
EB [%]
KUV [-]
XNBR/LDH 2.9 ± 0.1 4.3 ± 0.1 5.5 ± 0.1 09.6 ± 0.7 530 ± 10 0.5 [BMIM][AlCl4] 2.5 3.7 ± 0.1 5.8 ± 0.2 7.4 ± 0.2 10.6 ± 0.3 459 ± 20 0.5 [BMIM][AlCl4] 5 4.4 ± 0.2 6.7 ± 0.2 8.8 ± 0.2 13.8 ± 0.8 463 ± 20 1.0 [BMIM][AlCl4] 10 4.2 ± 0.3 6.5 ± 0.3 8.7 ± 0.2 10.2 ± 2.0 384 ± 20 1.0 [BMIM][AlCl4] 15 4.2 ± 0.1 6.6 ± 0.2 9.1 ± 0.4 08.9 ± 1.0 308 ± 30 1.0 [EMIM][SCN] 2.5 2.8 ± 0.1 4.5 ± 0.1 6.0 ± 0.1 10.4 ± 0.2 522 ± 10 0.5 [EMIM][SCN] 5 2.5 ± 0.1 4.3 ± 0.2 5.7 ± 0.2 10.7 ± 0.4 542 ± 10 0.5 [EMIM][SCN] 10 2.7 ± 0.1 4.5 ± 0.1 6.0 ± 0.1 10.1 ± 0.6 522 ± 10 0.5 [EMIM][SCN] 15 2.3 ± 0.1 3.4 ± 0.2 7.3 ± 0.1 04.7 ± 0.9 397 ± 30 0.5 [EMIM][TFSI] 2.5 3.0 ± 0.1 4.7 ± 0.1 6.0 ± 0.1 10.6 ± 0.1 520 ± 10 0.4 [EMIM][TFSI] 5 2.7 ± 0.1 4.1 ± 0.1 5.2 ± 0.1 10.5 ± 0.1 571 ± 10 0.5 [EMIM][TFSI] 10 2.5 ± 0.1 3.8 ± 0.1 5.0 ± 0.1 09.1 ± 0.7 550 ± 20 0.4 [EMIM][TFSI] 15 2.3 ± 0.1 3.3 ± 0.1 4.1 ± 0.1 08.4 ± 0.4 540 ± 10 0.4 [AMIM][TFSI] 2.5 2.9 ± 0.1 4.4 ± 0.1 5.7 ± 0.1 10.4 ± 0.2 510 ± 10 0.4 [AMIM][TFSI] 5 2.9 ± 0.1 4.1 ± 0.1 5.3 ± 0.1 10.2 ± 0.7 530 ± 20 0.4 [AMIM][TFSI] 10 2.6 ± 0.1 3.9 ± 0.1 5.0 ± 0.1 09.2 ± 0.2 564 ± 10 0.4 [AMIM][TFSI] 15 2.2 ± 0.2 3.2 ± 0.2 4.2 ± 0.2 09.3 ± 0.5 620 ± 20 0.5 [BMIM][TFSI] 2.5 2.8 ± 0.1 4.4 ± 0.2 5.7 ± 0.2 10.6 ± 0.5 507 ± 10 0.4 [BMIM][TFSI] 5 2.9 ± 0.1 4.2 ± 0.1 5.3 ± 0.4 10.2 ± 0.4 550 ± 10 0.5 [BMIM][TFSI] 10 2.8 ± 0.1 4.2 ± 0.1 5.2 ± 0.1 09.9 ± 0.6 574 ± 10 0.5 [BMIM][TFSI] 15 2.6 ± 0.1 4.0 ± 0.1 5.3 ± 0.2 09.0 ± 0.4 528 ± 10 0.5 [HMIM][TFSI] 2.5 2.8 ± 0.1 4.3 ± 0.1 5.6 ± 0.1 08.7 ± 0.1 504 ± 10 0.4 [HMIM][TFSI] 5 2.7 ± 0.1 4.1 ± 0.1 5.2 ± 0.1 08.9 ± 1.0 550 ± 20 0.5 [HMIM][TFSI] 10 2.6 ± 0.1 3.9 ± 0.2 5.0 ± 0.2 08.3 ± 1.0 555 ± 10 0.4 [HMIM][TFSI] 15 2.1 ± 0.1 3.2 ± 0.1 4.2 ± 0.1 07.3 ± 0.6 552 ± 10 0.4
Chapter 5. Results and discussion 5.2. Effects of ILs on the properties of elastomer composites based on XNBR and MgAl-LDH
144
5.2.9. Conclusions
This study considered the effects of hydrophilic and hydrophobic imidazolium ionic
liquids on the curing behavior, cure degree, mechano-dynamical, morphological and ionic
conductivity properties of XNBR/LDH composites. The hydrophilic imidazolium salt
[BMIM][AlCl4] was found to be reactive toward XNBR by increasing the network density of
the rubber composites and significantly accelerating the curing process. Despite its own high
ionic conductivity of 10 mS/cm, tetrachloroaluminate slat did not induce a significant increase
in the ionic conductivity of rubber composites even when added at high concentration as the
conductivity increased only about two orders of magnitude. Similarly, the other hydrophilic
ionic liquid – thiocyanate imidazolium salt, which is also characterized by high ionic
conductivity of 27 mS/cm, displayed a moderated influence on the enhancement in the ionic
conductivity of the XNBR/LDH composite.
In contrast, the incorporation of a series of hydrophobic 1-n-alkyl-3-methylimidazolium
bis(trifluoromethylsulfonyl)imide ILs into the XNBR/LDH matrix produced elastomer
composites with a higher ionic conductivity than those containing hydrophilic
tetrachloroaluminate or thiocyanate salt. For XNBR/LDH composites, the conductivity
increased about three orders of magnitude (10-10 to 10-7 S/cm) at room temperature when 15
phr of TFSI-based IL was added. Advantageously, TFSI-based imidazolium salts exhibited
sufficient thermal stability for elastomer processing. With the addition of hydrophobic TFSI-
based imidazolium ILs, filler dispersion and ionic conductivity of the XNBR/LDH
composites were effectively improved. Such ILs showed a plasticizing effect on the XNBR
matrix, shifting the Tg towards lower temperatures with increasing concentrations. The
1-hexyl-3-methylimidazolium bis(trifluoromethylsulfonyl)imide displayed the highest
plasticizing effect in the XNBR/LDH material and the most efficiently increased the ionic
conductivity of the composite. However, the impact of the cation alkyl chain length on this
parameter was found to be less significant as it was anticipated. The optimal amount of TFSI-
based imidazolium IL for the preparation composites with enhanced conductivity and
improved morphological and mechanical properties was found to be 2.5 – 5 phr.
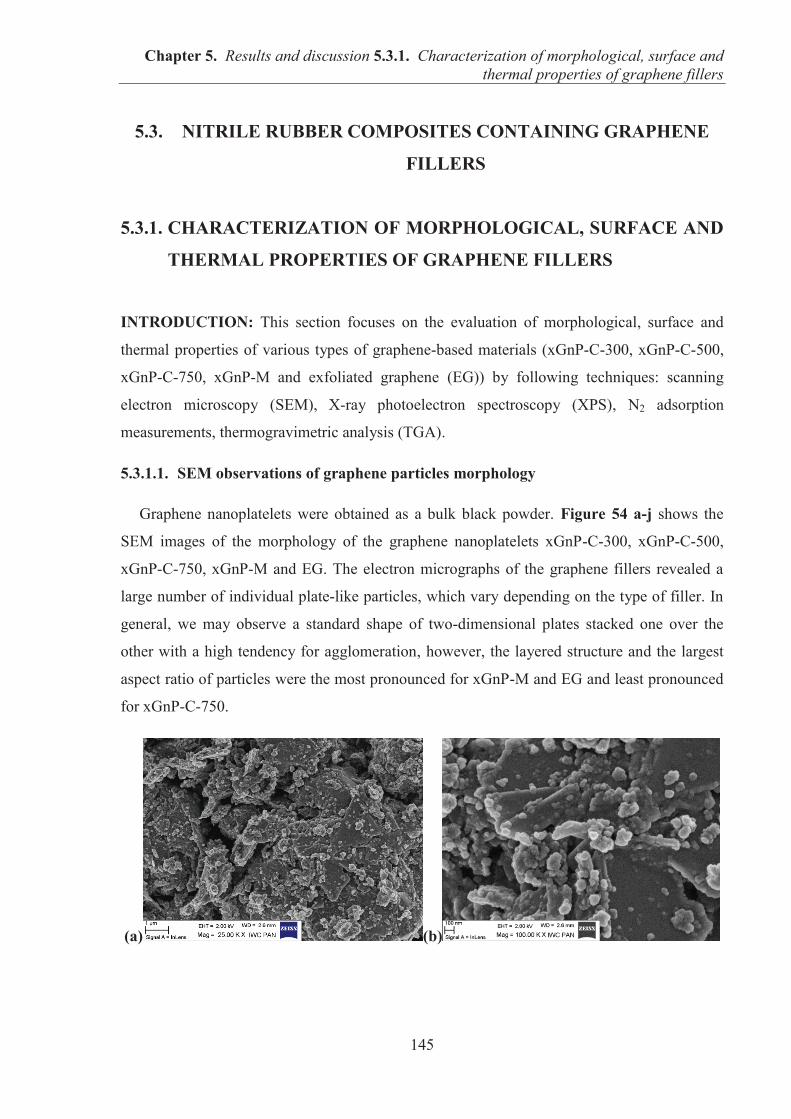
Chapter 5. Results and discussion 5.3.1. Characterization of morphological, surface and thermal properties of graphene fillers
145
5.3. NITRILE RUBBER COMPOSITES CONTAINING GRAPHENE
FILLERS
5.3.1. CHARACTERIZATION OF MORPHOLOGICAL, SURFACE AND
THERMAL PROPERTIES OF GRAPHENE FILLERS
INTRODUCTION: This section focuses on the evaluation of morphological, surface and
thermal properties of various types of graphene-based materials (xGnP-C-300, xGnP-C-500,
xGnP-C-750, xGnP-M and exfoliated graphene (EG)) by following techniques: scanning
electron microscopy (SEM), X-ray photoelectron spectroscopy (XPS), N2 adsorption
measurements, thermogravimetric analysis (TGA).
5.3.1.1. SEM observations of graphene particles morphology
Graphene nanoplatelets were obtained as a bulk black powder. Figure 54 a-j shows the
SEM images of the morphology of the graphene nanoplatelets xGnP-C-300, xGnP-C-500,
xGnP-C-750, xGnP-M and EG. The electron micrographs of the graphene fillers revealed a
large number of individual plate-like particles, which vary depending on the type of filler. In
general, we may observe a standard shape of two-dimensional plates stacked one over the
other with a high tendency for agglomeration, however, the layered structure and the largest
aspect ratio of particles were the most pronounced for xGnP-M and EG and least pronounced
for xGnP-C-750.
(a) (b)
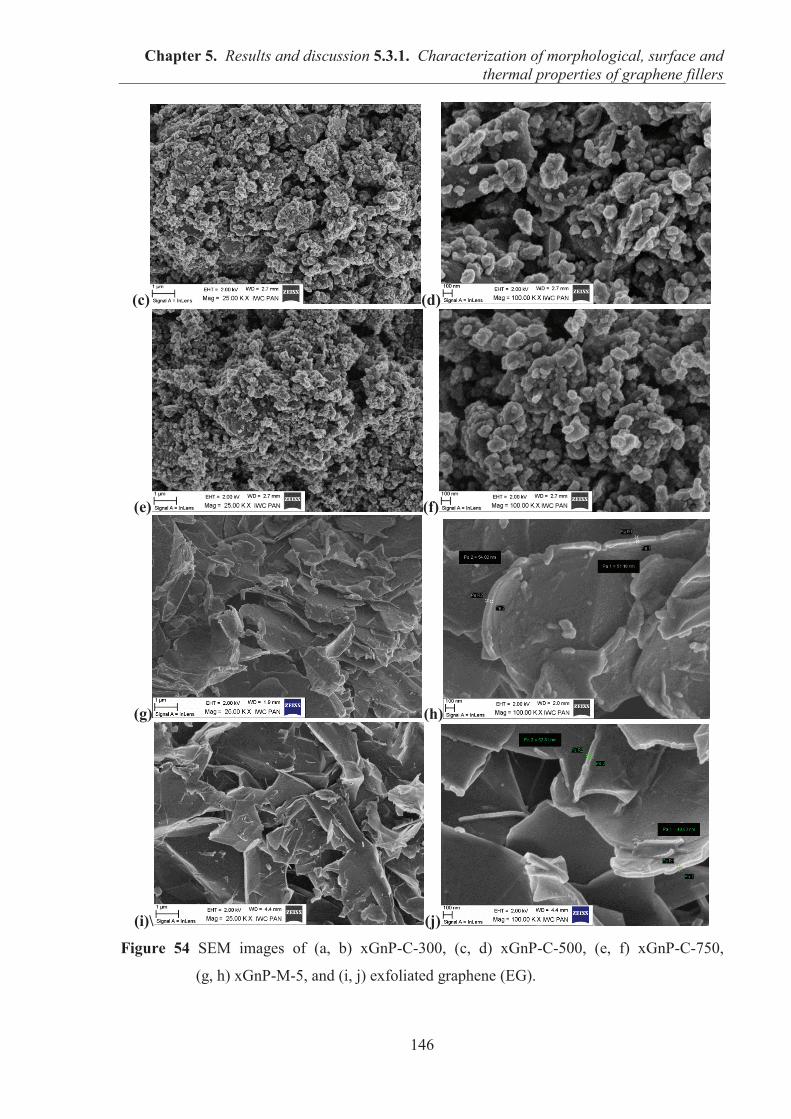
Chapter 5. Results and discussion 5.3.1. Characterization of morphological, surface and thermal properties of graphene fillers
146
(c) (d)
(e) (f)
(g) (h)
(i)\ (j)
Figure 54 SEM images of (a, b) xGnP-C-300, (c, d) xGnP-C-500, (e, f) xGnP-C-750,
(g, h) xGnP-M-5, and (i, j) exfoliated graphene (EG).
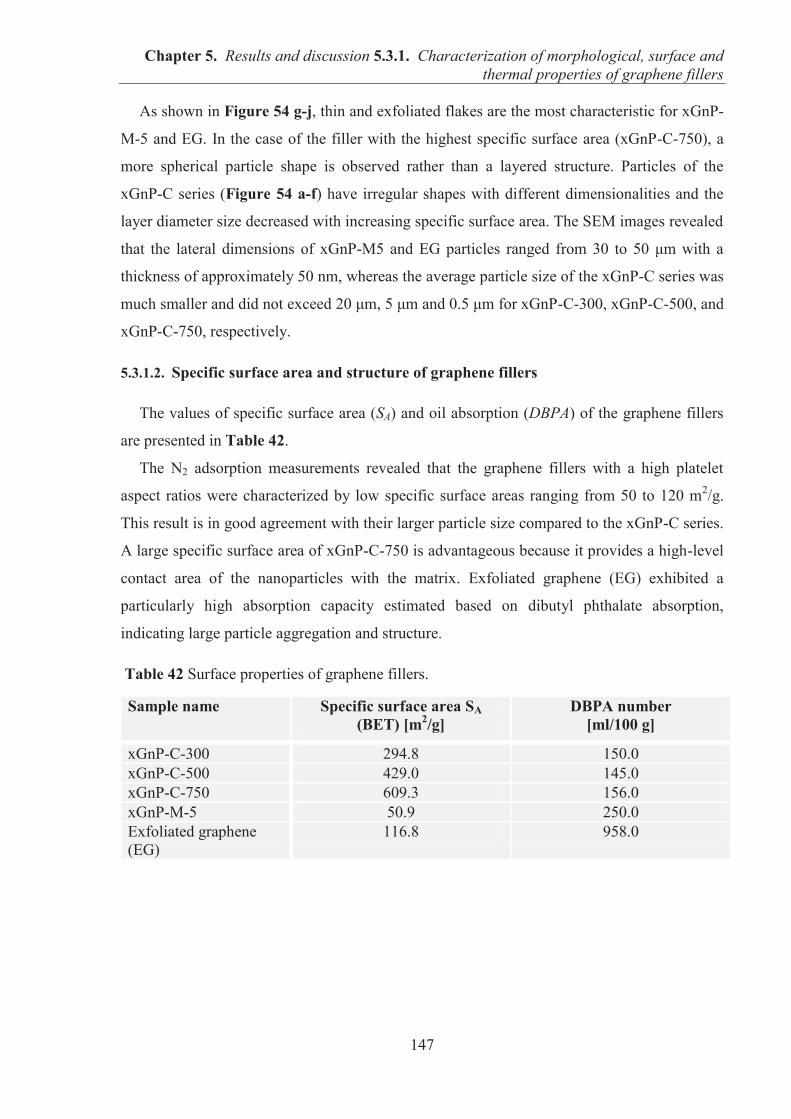
Chapter 5. Results and discussion 5.3.1. Characterization of morphological, surface and thermal properties of graphene fillers
147
As shown in Figure 54 g-j, thin and exfoliated flakes are the most characteristic for xGnP-
M-5 and EG. In the case of the filler with the highest specific surface area (xGnP-C-750), a
more spherical particle shape is observed rather than a layered structure. Particles of the
xGnP-C series (Figure 54 a-f) have irregular shapes with different dimensionalities and the
layer diameter size decreased with increasing specific surface area. The SEM images revealed
that the lateral dimensions of xGnP-M5 and EG particles ranged from 30 to 50 μm with a
thickness of approximately 50 nm, whereas the average particle size of the xGnP-C series was
much smaller and did not exceed 20 μm, 5 μm and 0.5 μm for xGnP-C-300, xGnP-C-500, and
xGnP-C-750, respectively.
5.3.1.2. Specific surface area and structure of graphene fillers
The values of specific surface area (SA) and oil absorption (DBPA) of the graphene fillers
are presented in Table 42.
The N2 adsorption measurements revealed that the graphene fillers with a high platelet
aspect ratios were characterized by low specific surface areas ranging from 50 to 120 m2/g.
This result is in good agreement with their larger particle size compared to the xGnP-C series.
A large specific surface area of xGnP-C-750 is advantageous because it provides a high-level
contact area of the nanoparticles with the matrix. Exfoliated graphene (EG) exhibited a
particularly high absorption capacity estimated based on dibutyl phthalate absorption,
indicating large particle aggregation and structure.
Table 42 Surface properties of graphene fillers.
Sample name Specific surface area SA (BET) [m2/g]
DBPA number [ml/100 g]
xGnP-C-300 294.8 150.0 xGnP-C-500 429.0 145.0 xGnP-C-750 609.3 156.0 xGnP-M-5 50.9 250.0 Exfoliated graphene (EG)
116.8 958.0
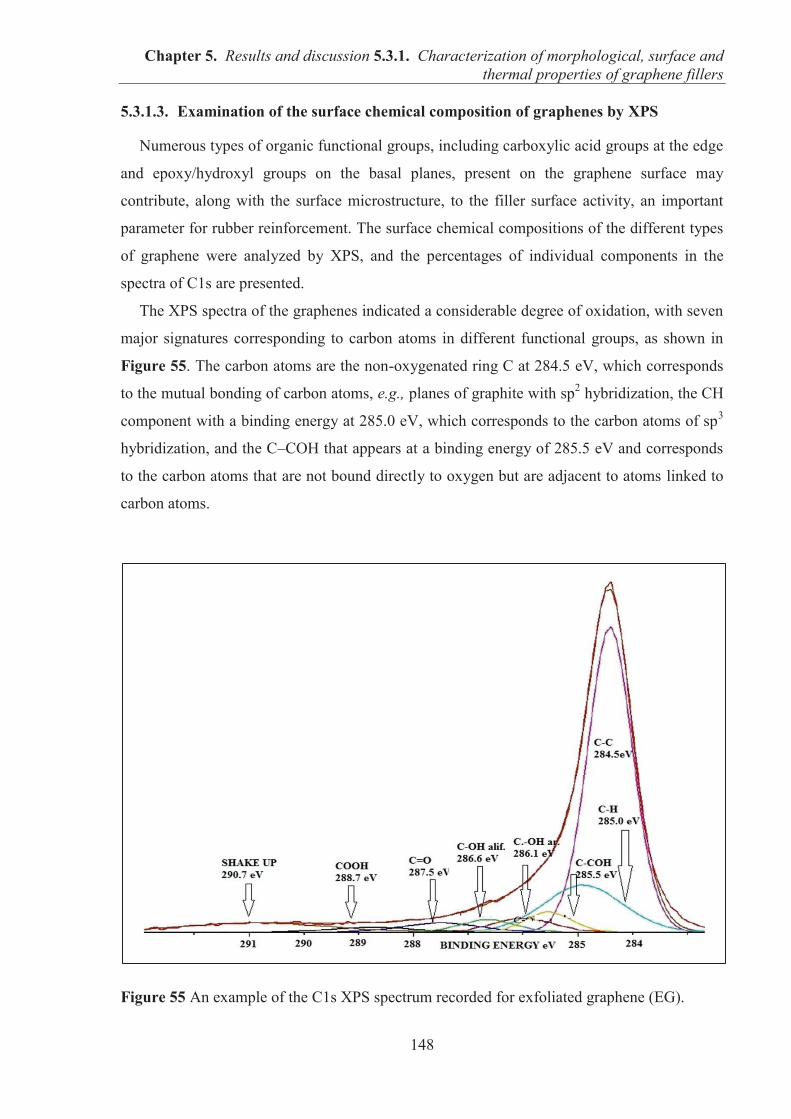
Chapter 5. Results and discussion 5.3.1. Characterization of morphological, surface and thermal properties of graphene fillers
148
5.3.1.3. Examination of the surface chemical composition of graphenes by XPS
Numerous types of organic functional groups, including carboxylic acid groups at the edge
and epoxy/hydroxyl groups on the basal planes, present on the graphene surface may
contribute, along with the surface microstructure, to the filler surface activity, an important
parameter for rubber reinforcement. The surface chemical compositions of the different types
of graphene were analyzed by XPS, and the percentages of individual components in the
spectra of C1s are presented.
The XPS spectra of the graphenes indicated a considerable degree of oxidation, with seven
major signatures corresponding to carbon atoms in different functional groups, as shown in
Figure 55. The carbon atoms are the non-oxygenated ring C at 284.5 eV, which corresponds
to the mutual bonding of carbon atoms, e.g., planes of graphite with sp2 hybridization, the CH
component with a binding energy at 285.0 eV, which corresponds to the carbon atoms of sp3
hybridization, and the C–COH that appears at a binding energy of 285.5 eV and corresponds
to the carbon atoms that are not bound directly to oxygen but are adjacent to atoms linked to
carbon atoms.
Figure 55 An example of the C1s XPS spectrum recorded for exfoliated graphene (EG).
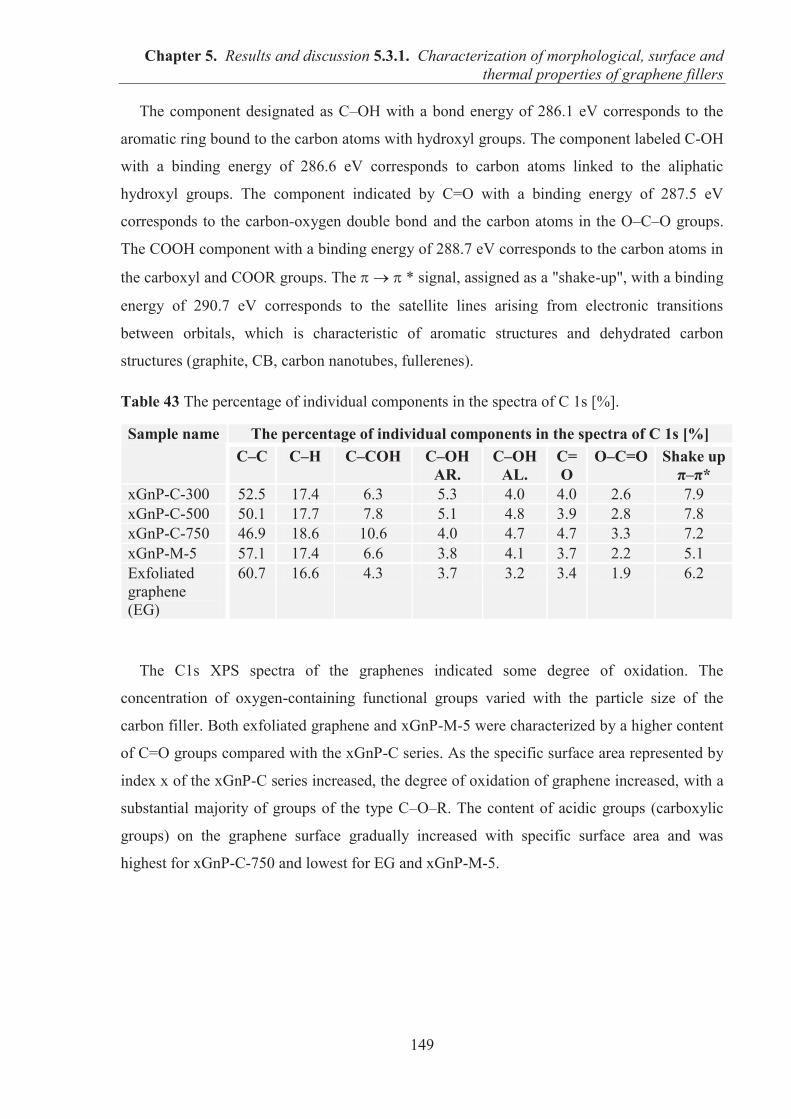
Chapter 5. Results and discussion 5.3.1. Characterization of morphological, surface and thermal properties of graphene fillers
149
The component designated as C–OH with a bond energy of 286.1 eV corresponds to the
aromatic ring bound to the carbon atoms with hydroxyl groups. The component labeled C-OH
with a binding energy of 286.6 eV corresponds to carbon atoms linked to the aliphatic
hydroxyl groups. The component indicated by C=O with a binding energy of 287.5 eV
corresponds to the carbon-oxygen double bond and the carbon atoms in the O–C–O groups.
The COOH component with a binding energy of 288.7 eV corresponds to the carbon atoms in
the carboxyl and COOR groups. The * signal, assigned as a "shake-up", with a binding
energy of 290.7 eV corresponds to the satellite lines arising from electronic transitions
between orbitals, which is characteristic of aromatic structures and dehydrated carbon
structures (graphite, CB, carbon nanotubes, fullerenes).
Table 43 The percentage of individual components in the spectra of C 1s [%].
Sample name The percentage of individual components in the spectra of C 1s [%] C–C C–H C–COH C–OH
AR. C–OH
AL. C=O
O–C=O Shake up π–π*
xGnP-C-300 52.5 17.4 6.3 5.3 4.0 4.0 2.6 7.9 xGnP-C-500 50.1 17.7 7.8 5.1 4.8 3.9 2.8 7.8 xGnP-C-750 46.9 18.6 10.6 4.0 4.7 4.7 3.3 7.2 xGnP-M-5 57.1 17.4 6.6 3.8 4.1 3.7 2.2 5.1 Exfoliated graphene (EG)
60.7 16.6 4.3 3.7 3.2 3.4 1.9 6.2
The C1s XPS spectra of the graphenes indicated some degree of oxidation. The
concentration of oxygen-containing functional groups varied with the particle size of the
carbon filler. Both exfoliated graphene and xGnP-M-5 were characterized by a higher content
of C=O groups compared with the xGnP-C series. As the specific surface area represented by
index x of the xGnP-C series increased, the degree of oxidation of graphene increased, with a
substantial majority of groups of the type C–O–R. The content of acidic groups (carboxylic
groups) on the graphene surface gradually increased with specific surface area and was
highest for xGnP-C-750 and lowest for EG and xGnP-M-5.
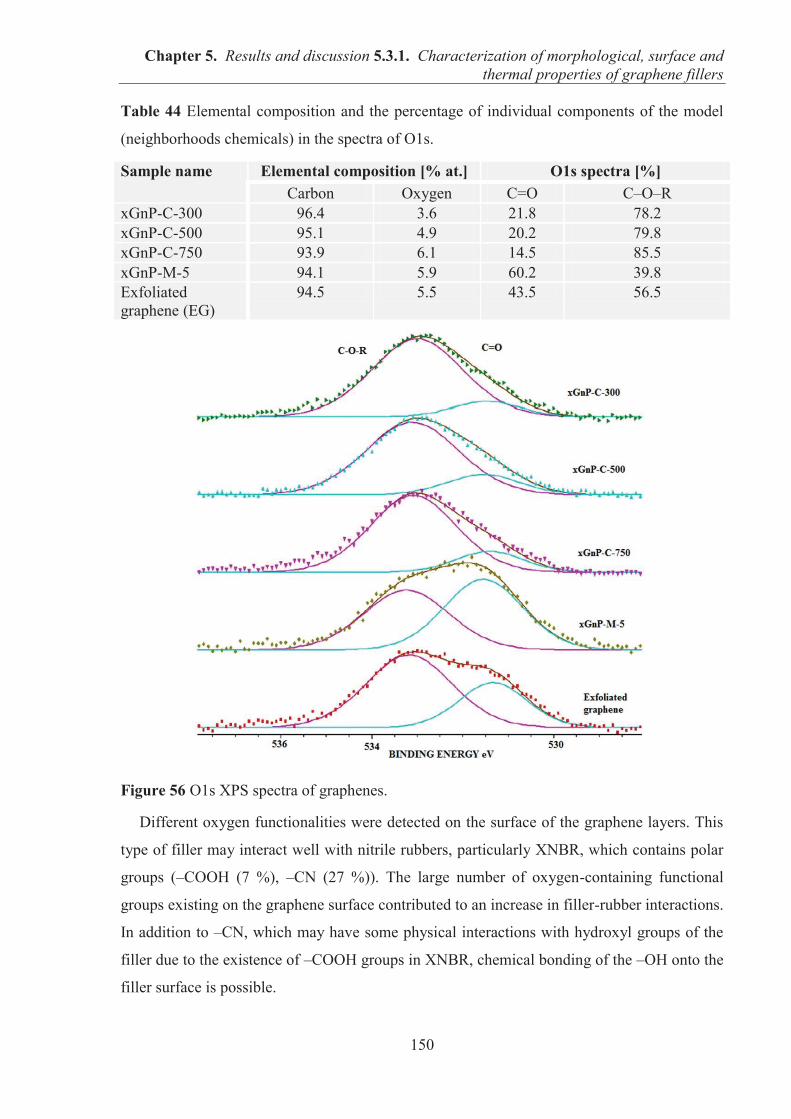
Chapter 5. Results and discussion 5.3.1. Characterization of morphological, surface and thermal properties of graphene fillers
150
Table 44 Elemental composition and the percentage of individual components of the model
(neighborhoods chemicals) in the spectra of O1s.
Sample name Elemental composition [% at.] O1s spectra [%] Carbon Oxygen C=O C–O–R
xGnP-C-300 96.4 3.6 21.8 78.2 xGnP-C-500 95.1 4.9 20.2 79.8 xGnP-C-750 93.9 6.1 14.5 85.5 xGnP-M-5 94.1 5.9 60.2 39.8 Exfoliated graphene (EG)
94.5 5.5 43.5 56.5
Figure 56 O1s XPS spectra of graphenes.
Different oxygen functionalities were detected on the surface of the graphene layers. This
type of filler may interact well with nitrile rubbers, particularly XNBR, which contains polar
groups (–COOH (7 %), –CN (27 %)). The large number of oxygen-containing functional
groups existing on the graphene surface contributed to an increase in filler-rubber interactions.
In addition to –CN, which may have some physical interactions with hydroxyl groups of the
filler due to the existence of –COOH groups in XNBR, chemical bonding of the –OH onto the
filler surface is possible.
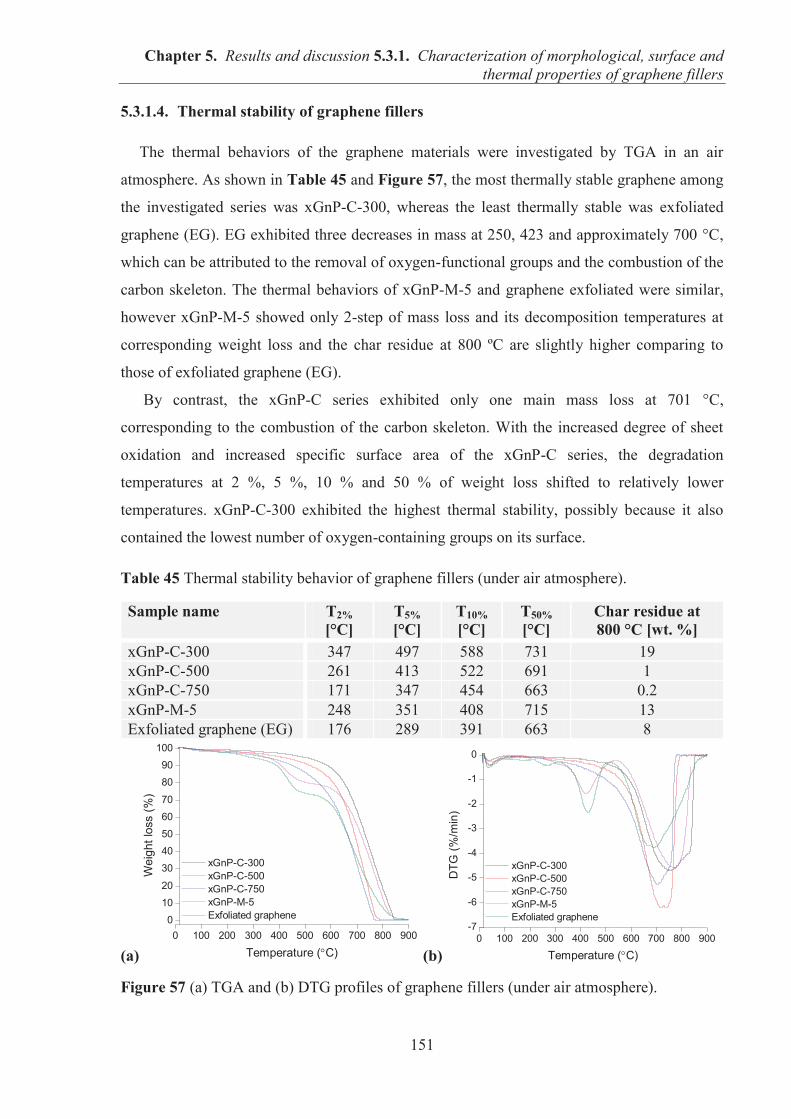
Chapter 5. Results and discussion 5.3.1. Characterization of morphological, surface and thermal properties of graphene fillers
151
5.3.1.4. Thermal stability of graphene fillers
The thermal behaviors of the graphene materials were investigated by TGA in an air
atmosphere. As shown in Table 45 and Figure 57, the most thermally stable graphene among
the investigated series was xGnP-C-300, whereas the least thermally stable was exfoliated
graphene (EG). EG exhibited three decreases in mass at 250, 423 and approximately 700 °C,
which can be attributed to the removal of oxygen-functional groups and the combustion of the
carbon skeleton. The thermal behaviors of xGnP-M-5 and graphene exfoliated were similar,
however xGnP-M-5 showed only 2-step of mass loss and its decomposition temperatures at
corresponding weight loss and the char residue at 800 ºC are slightly higher comparing to
those of exfoliated graphene (EG).
By contrast, the xGnP-C series exhibited only one main mass loss at 701 °C,
corresponding to the combustion of the carbon skeleton. With the increased degree of sheet
oxidation and increased specific surface area of the xGnP-C series, the degradation
temperatures at 2 %, 5 %, 10 % and 50 % of weight loss shifted to relatively lower
temperatures. xGnP-C-300 exhibited the highest thermal stability, possibly because it also
contained the lowest number of oxygen-containing groups on its surface.
Table 45 Thermal stability behavior of graphene fillers (under air atmosphere).
Sample name T2% [°C]
T5% [°C]
T10% [°C]
T50% [°C]
Char residue at 800 °C [wt. %]
xGnP-C-300 347 497 588 731 19 xGnP-C-500 261 413 522 691 1 xGnP-C-750 171 347 454 663 0.2 xGnP-M-5 248 351 408 715 13 Exfoliated graphene (EG) 176 289 391 663 8
(a) (b)
Figure 57 (a) TGA and (b) DTG profiles of graphene fillers (under air atmosphere).
0 100 200 300 400 500 600 700 800 9000
10
20
30
40
50
60
70
80
90
100
Wei
ght l
oss
(%)
Temperature ( C)
xGnP-C-300 xGnP-C-500 xGnP-C-750 xGnP-M-5 Exfoliated graphene
0 100 200 300 400 500 600 700 800 900-7
-6
-5
-4
-3
-2
-1
0
DTG
(%/m
in)
Temperature ( C)
xGnP-C-300 xGnP-C-500 xGnP-C-750 xGnP-M-5 Exfoliated graphene
Chapter 5. Results and discussion 5.3.1. Characterization of morphological, surface and thermal properties of graphene fillers
152
5.3.1.5. Conclusions
Among the investigated types of graphene-based materials, xGnP-M-5 and EG were
distinguished by the highest particle aspect ratio and the most typical graphene layered
structure consisting of thin and highly exfoliated nanoplatelets. Due to the large particle
dimensionalities of these fillers, they were characterized by lower specific surface areas (SA)
than the xGnP-C series, ranging from 50 to 120 m2/g. Exfoliated graphene (EG) exhibited
exceptional absorption capacities reflected in a high DBPA number of 958.2 ml/100 g, which
indicates large particle aggregation and a highly developed structure. The XPS analysis of the
surface chemical composition revealed a high degree of oxidation of xGnM-5 and exfoliated
graphene (EG) fillers in which a substantial majority were C=O groups. The thermal stability
of these types of graphenes was lower than that of the xGnP-C series, most likely due to the
higher percentages of oxygen-functional groups on their surfaces. By contrast, a series of
xGnP-C graphenes varied in the content of oxygen-containing functional groups on their
surfaces depending on the specific surface area. The highest oxidation degree was observed
when a substantial majority of the functional groups were C–O–R groups, as observed for
xGnP-C-750, which had the highest specific surface area (SA) of 609 m2/g, and gradually
decreased with decreasing SA value. The xGnP-C series showed only 1 main step of mass loss
at 701°C during thermal degradation in an air atmosphere, and the char residue decreased
with the degree of surface oxidation. Morphological analysis by SEM revealed that xGnP-C-
750 had the smallest particle size, the particles only slightly resembled plate-like structures.
The particle size increased and the shape became more lamellar as the specific surface area of
the xGnP-C graphenes decreased.
Chapter 5. Results and discussion 5.3.2. Reinforcement of NBR and XNBR with graphene nanoplatelets with varying surface areas and morphologies
153
5.3.2. REINFORCEMENT OF ACRYLONITRILE-BUTADIENE
RUBBER (NBR) AND CARBOXYLATED ACRYLONITRILE-
BUTADIENE RUBBER (XNBR) WITH GRAPHENE
NANOPLATELETS WITH VARYING SURFACE AREAS AND
MORPHOLOGIES
INTRODUCTION: Graphene fillers with various specific areas, surface chemistries and
particle morphologies were investigated as novel reinforcing fillers for NBR and XNBR. The
effects of different types of graphene nanoflakes on the rheometric characteristics, stress-
strain behavior, crosslink density, resistance to thermo-oxidative aging and UV radiation of
the NBR and XNBR composites were investigated.
5.3.2.1. Preparation of NBR and XNBR composites containing graphene fillers
The graphene nanoplatelets (5, 10 and 15 phr) were mixed with NBR and XNBR in a
laboratory two roll mill at a temperature of approximately 40 °C. The total compounding
cycle was less than 10 min. The friction ratio of the rolling mill was 1:1.1 during the mixing
period. The raw rubber was masticated prior to the addition of filler and curative. Graphene
was first mixed, and then the curing agents were incorporated.
5.3.2.2. Curing studies and crosslink densities of NBR and XNBR compounds
The rheometric characteristics of the NBR and XNBR compounds are shown in Table 46
and Table 47. The addition of fillers caused variations in the torque (MH, ML) and scorch
time values (tΔ2). Generally, the presence of graphene filler resulted in an increase in the
minimum torque (ML) and maximum torque (MH) compared with unfilled specimens of both
types of rubbers. The ML is representative of the rubber mix viscosity, whereas the MH
depends on the extent of crosslinking between rubber chains and the reinforcement by the
filler particles. Increasing the amount of graphene and its specific surface area in the
elastomer matrix contributed to an increase in the viscosity and the cure degree of
compounds, as indicated by the ML and MH parameters. In addition, the reinforcing potential
of graphene was reflected in the difference between the maximum and minimum torque
(ΔM).
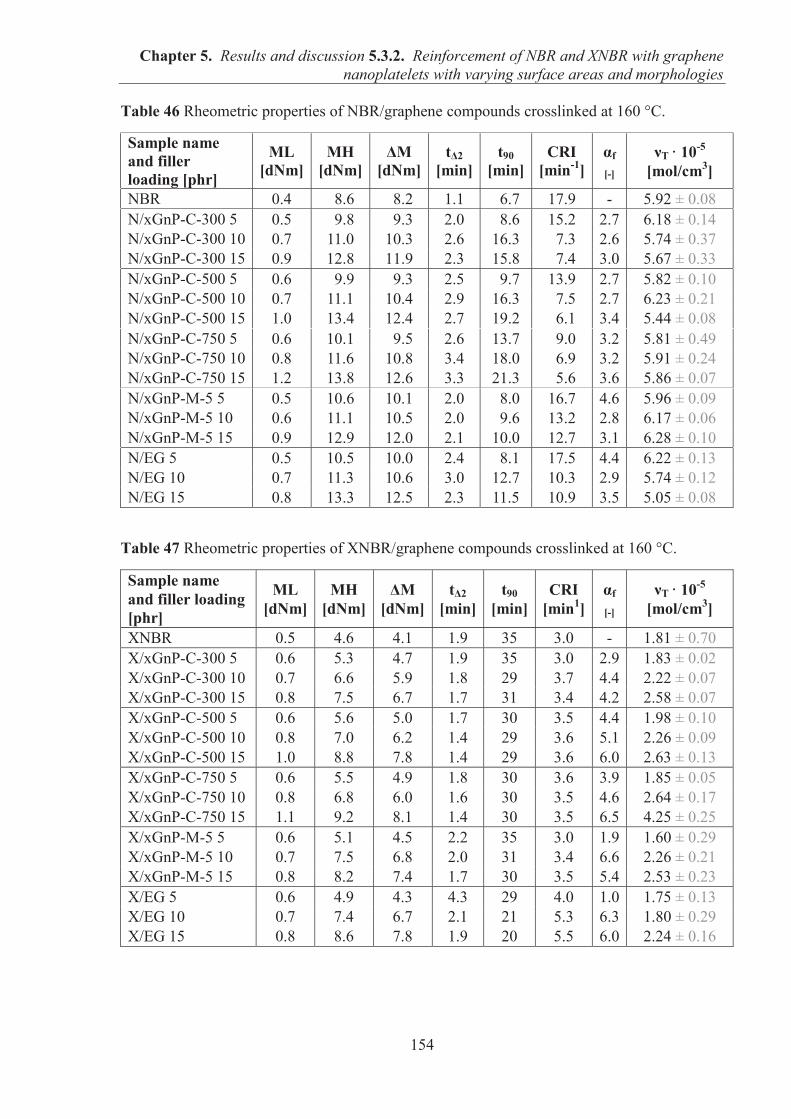
Chapter 5. Results and discussion 5.3.2. Reinforcement of NBR and XNBR with graphene nanoplatelets with varying surface areas and morphologies
154
Table 46 Rheometric properties of NBR/graphene compounds crosslinked at 160 °C.
Sample name and filler loading [phr]
ML
[dNm] MH
[dNm] ΔM
[dNm] tΔ2
[min] t90
[min] CRI
[min-1] αf
[-]
νT · 10-5
[mol/cm3]
NBR 0.4 08.6 08.2 1.1 06.7 17.9 - 5.92 ± 0.08 N/xGnP-C-300 5 0.5 09.8 09.3 2.0 08.6 15.2 2.7 6.18 ± 0.14 N/xGnP-C-300 10 0.7 11.0 10.3 2.6 16.3 07.3 2.6 5.74 ± 0.37 N/xGnP-C-300 15 0.9 12.8 11.9 2.3 15.8 07.4 3.0 5.67 ± 0.33 N/xGnP-C-500 5 0.6 09.9 09.3 2.5 09.7 13.9 2.7 5.82 ± 0.10 N/xGnP-C-500 10 0.7 11.1 10.4 2.9 16.3 07.5 2.7 6.23 ± 0.21 N/xGnP-C-500 15 1.0 13.4 12.4 2.7 19.2 06.1 3.4 5.44 ± 0.08 N/xGnP-C-750 5 0.6 10.1 09.5 2.6 13.7 09.0 3.2 5.81 ± 0.49 N/xGnP-C-750 10 0.8 11.6 10.8 3.4 18.0 06.9 3.2 5.91 ± 0.24 N/xGnP-C-750 15 1.2 13.8 12.6 3.3 21.3 05.6 3.6 5.86 ± 0.07 N/xGnP-M-5 5 0.5 10.6 10.1 2.0 08.0 16.7 4.6 5.96 ± 0.09 N/xGnP-M-5 10 0.6 11.1 10.5 2.0 09.6 13.2 2.8 6.17 ± 0.06 N/xGnP-M-5 15 0.9 12.9 12.0 2.1 10.0 12.7 3.1 6.28 ± 0.10 N/EG 5 0.5 10.5 10.0 2.4 08.1 17.5 4.4 6.22 ± 0.13 N/EG 10 0.7 11.3 10.6 3.0 12.7 10.3 2.9 5.74 ± 0.12 N/EG 15 0.8 13.3 12.5 2.3 11.5 10.9 3.5 5.05 ± 0.08
Table 47 Rheometric properties of XNBR/graphene compounds crosslinked at 160 °C.
Sample name and filler loading [phr]
ML
[dNm] MH
[dNm] ΔM
[dNm] tΔ2
[min] t90
[min] CRI
[min1] αf
[-]
νT · 10-5
[mol/cm3]
XNBR 0.5 4.6 4.1 1.9 35 3.0 - 1.81 ± 0.70 X/xGnP-C-300 5 0.6 5.3 4.7 1.9 35 3.0 2.9 1.83 ± 0.02 X/xGnP-C-300 10 0.7 6.6 5.9 1.8 29 3.7 4.4 2.22 ± 0.07 X/xGnP-C-300 15 0.8 7.5 6.7 1.7 31 3.4 4.2 2.58 ± 0.07 X/xGnP-C-500 5 0.6 5.6 5.0 1.7 30 3.5 4.4 1.98 ± 0.10 X/xGnP-C-500 10 0.8 7.0 6.2 1.4 29 3.6 5.1 2.26 ± 0.09 X/xGnP-C-500 15 1.0 8.8 7.8 1.4 29 3.6 6.0 2.63 ± 0.13 X/xGnP-C-750 5 0.6 5.5 4.9 1.8 30 3.6 3.9 1.85 ± 0.05 X/xGnP-C-750 10 0.8 6.8 6.0 1.6 30 3.5 4.6 2.64 ± 0.17 X/xGnP-C-750 15 1.1 9.2 8.1 1.4 30 3.5 6.5 4.25 ± 0.25 X/xGnP-M-5 5 0.6 5.1 4.5 2.2 35 3.0 1.9 1.60 ± 0.29 X/xGnP-M-5 10 0.7 7.5 6.8 2.0 31 3.4 6.6 2.26 ± 0.21 X/xGnP-M-5 15 0.8 8.2 7.4 1.7 30 3.5 5.4 2.53 ± 0.23 X/EG 5 0.6 4.9 4.3 4.3 29 4.0 1.0 1.75 ± 0.13 X/EG 10 0.7 7.4 6.7 2.1 21 5.3 6.3 1.80 ± 0.29 X/EG 15 0.8 8.6 7.8 1.9 20 5.5 6.0 2.24 ± 0.16
Chapter 5. Results and discussion 5.3.2. Reinforcement of NBR and XNBR with graphene nanoplatelets with varying surface areas and morphologies
155
The torque difference (ΔM) increased with increased filler loading and its specific surface
area. Generally, in all of the filled compounds, the torque or ΔM increased with filler loading
because of the hydrodynamic forces and the formation of a stable filler network. ΔM is
indirectly related to the crosslink density of the blends and can therefore be an approximation
of the extent of cure degree in the rubber phase.
The rate of the vulcanization of NBR and the curing of XNBR is represented by the CRI
parameter. A higher CRI value indicates a faster crosslinking process. By increasing the
graphene loading in the rubber matrix, the NBR vulcanization process is gradually rerated,
and the optimal cure time (t90) is steadily extended in comparison with the reference sample.
This result is the most likely due to the absorption of active ingredients of the sulfur
vulcanizing system onto the graphene sheet surfaces. In contrast to NBR, the XNBR
crosslinking reaction was slightly accelerated by the presence of graphene. The value of t90
was reduced to 30 min by the addition of 5 phr xGnP-C-500 and xGnP-C-750, whereas the
scorch time (tΔ2) was significantly decreased from 1.9 to 1.4 min in the presence of higher
graphene loadings.
The presence of carbon filler in the NBR matrix did not have a significantly impact on the
changes in the crosslink density (νT) of the compounds, which remained almost unaltered at a
value of approximately 6.0 · 10-5 mol/cm3. Only the sample containing exfoliated graphene
(EG) exhibited a downward trend in the extent of network density with increasing filler
content, possibly due to the absorption of vulcanizing agents by a larger amount of graphene
layers.
The equilibrium swelling results indicated that the presence of graphene particles may
affect the cure degree in XNBR. In contrast to the NBR compounds, the crosslink number (νT)
in the XNBR network was slightly impacted by increasing graphene filler content and its
specific surface area. The highest crosslink density of 4.25· 10-5 mol/cm3 was achieved for the
XNBR composite filled with xGnP-C-750 at the highest filler loading of 15 phr. This
observation is also supported by the highest torque value (MH) of 8.1 MPa obtained for the
same sample, as measured using a moving die rheometer. Because many oxygen-containing
functionalities are present on the graphene surface, as detected by XPS, some physical and
chemical interactions between the graphene and XNBR macromolecular chains may occur
during the curing process. Both high filler loadings and large specific surface areas provide
more functional groups on the filler surface, which are potential sites for interaction with the –
COOH functionalities of XNBR. The extent of equilibrium swelling may also be reduced due
Chapter 5. Results and discussion 5.3.2. Reinforcement of NBR and XNBR with graphene nanoplatelets with varying surface areas and morphologies
156
to the adsorption of polymer chains onto the filler particle surfaces. In general, the increase in
the crosslink density of XNBR in the presence of graphene filler may result from (a) the
adsorption of rubber chains on the filler sheet surfaces and (b) the interactions between
oxygen-containing groups of the filler and the –COOH functionalities of XNBR.
The changes in the rheometric studies with filler loading might be a measure of the filler-
rubber interaction or reinforcement represented by the reinforcing factor (αf). An increase in
the αf values with increasing graphene content was observed for both types of elastomers,
however, this effect was more pronounced for the functionalized XNBR. The values of αf
were also higher when the composite contained fillers with large specific surface areas, in this
case, xGnP-C-750 with SA = 750 m2/g.
5.3.2.3. Mechanical properties of NBR and XNBR composites
The influence of graphene fillers with different specific surface areas and various particle
aspect ratios on the physical properties of the NBR and XNBR compounds at 5, 10 and 15 phr
is presented in Table 48 and Table 49. Significant improvements in the tensile properties of
the nitrile composites were achieved. The results of the tensile strength measurements clearly
indicate that graphene reinforces both types of matrix, however, a higher level of
reinforcement was observed in XNBR. The tensile strength (TS) of XNBR composites was
superior even at small filler concentrations, such as 5 phr (xGnP-C-750), whereas the
improvement in tensile strength of NBR/graphene composites exhibited a steady upward
trend with increasing filler concentration from 5 to 15 phr. As expected, the stress at 100, 200
and 300 % elongation (SE100, SE200, and SE300), the tensile strength (TS) and the hardness (H)
of all loaded samples increased in all cases compared with unfilled rubbers. The stretching
stress at 300 % (SE300) is commonly related to the maximum torque (MH) and crosslink
density (νT). The results of the mechanical testing were in good agreement with the results of
previous rheometric studies. The increased loading of graphene with high platelet aspect
ratios, such as EG, xGnP-M-5 and xGnP-C-300, led to an essential increase in the EB of the
NBR composites, most likely due to the absorption of vulcanizing agents on the filler surface.
As the specific surface area of the fillers increased, the EB tended to decrease, particularly for
those NBR samples loaded with xGnP-C-500 and xGnP-C-750. Some studies have reported a
severe decrease in EB with the addition of graphene-based materials to polymers.284
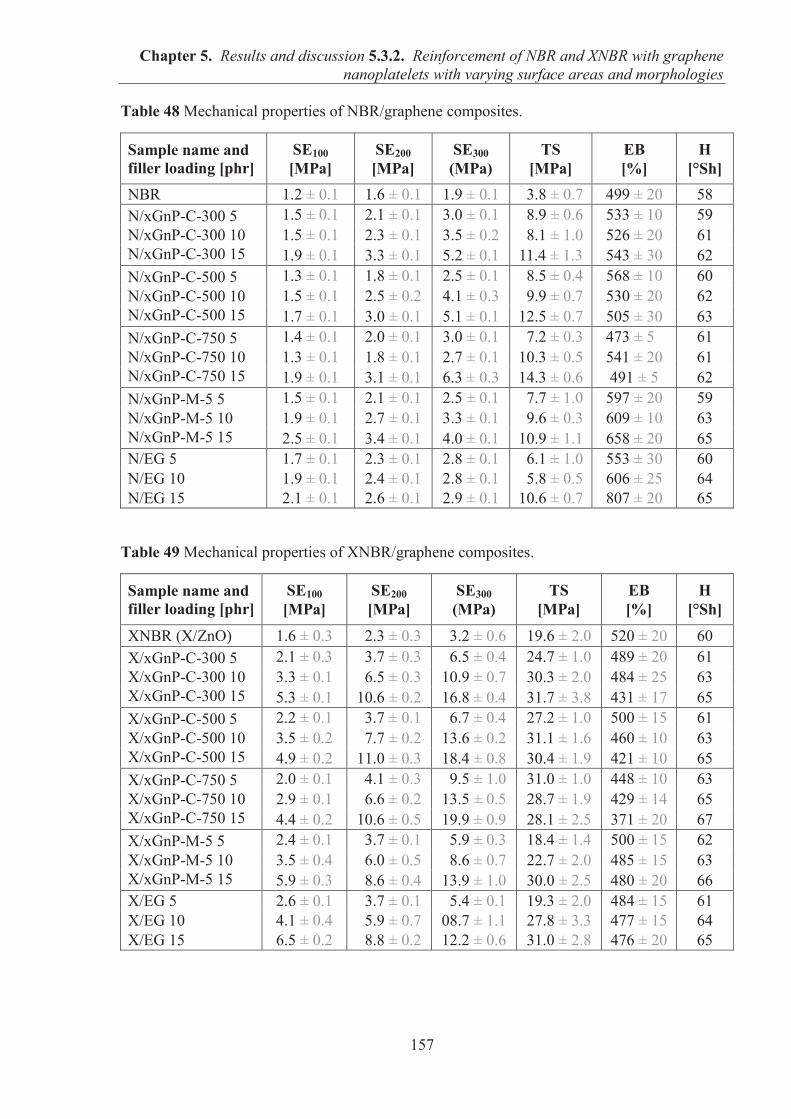
Chapter 5. Results and discussion 5.3.2. Reinforcement of NBR and XNBR with graphene nanoplatelets with varying surface areas and morphologies
157
Table 48 Mechanical properties of NBR/graphene composites.
Sample name and filler loading [phr]
SE100
[MPa] SE200
[MPa] SE300
(MPa) TS
[MPa] EB
[%] H
[°Sh] NBR 1.2 ± 0.1 1.6 ± 0.1 1.9 ± 0.1 03.8 ± 0.7 499 ± 20 58 N/xGnP-C-300 5 N/xGnP-C-300 10 N/xGnP-C-300 15
1.5 ± 0.1 2.1 ± 0.1 3.0 ± 0.1 08.9 ± 0.6 533 ± 10 59 1.5 ± 0.1 2.3 ± 0.1 3.5 ± 0.2 08.1 ± 1.0 526 ± 20 61 1.9 ± 0.1 3.3 ± 0.1 5.2 ± 0.1 11.4 ± 1.3 543 ± 30 62
N/xGnP-C-500 5 N/xGnP-C-500 10 N/xGnP-C-500 15
1.3 ± 0.1 1.8 ± 0.1 2.5 ± 0.1 08.5 ± 0.4 568 ± 10 60 1.5 ± 0.1 2.5 ± 0.2 4.1 ± 0.3 09.9 ± 0.7 530 ± 20 62 1.7 ± 0.1 3.0 ± 0.1 5.1 ± 0.1 12.5 ± 0.7 505 ± 30 63
N/xGnP-C-750 5 N/xGnP-C-750 10 N/xGnP-C-750 15
1.4 ± 0.1 2.0 ± 0.1 3.0 ± 0.1 07.2 ± 0.3 473 ± 50 61 1.3 ± 0.1 1.8 ± 0.1 2.7 ± 0.1 10.3 ± 0.5 541 ± 20 61 1.9 ± 0.1 3.1 ± 0.1 6.3 ± 0.3 14.3 ± 0.6 491 ± 5 62
N/xGnP-M-5 5 N/xGnP-M-5 10 N/xGnP-M-5 15
1.5 ± 0.1 2.1 ± 0.1 2.5 ± 0.1 07.7 ± 1.0 597 ± 20 59 1.9 ± 0.1 2.7 ± 0.1 3.3 ± 0.1 09.6 ± 0.3 609 ± 10 63 2.5 ± 0.1 3.4 ± 0.1 4.0 ± 0.1 10.9 ± 1.1 658 ± 20 65
N/EG 5 1.7 ± 0.1 2.3 ± 0.1 2.8 ± 0.1 06.1 ± 1.0 553 ± 30 60 N/EG 10 1.9 ± 0.1 2.4 ± 0.1 2.8 ± 0.1 05.8 ± 0.5 606 ± 25 64 N/EG 15 2.1 ± 0.1 2.6 ± 0.1 2.9 ± 0.1 10.6 ± 0.7 807 ± 20 65
Table 49 Mechanical properties of XNBR/graphene composites.
Sample name and filler loading [phr]
SE100
[MPa] SE200
[MPa] SE300
(MPa) TS
[MPa] EB
[%] H
[°Sh]
XNBR (X/ZnO) 1.6 ± 0.3 02.3 ± 0.3 03.2 ± 0.6 19.6 ± 2.0 520 ± 20 60 X/xGnP-C-300 5 X/xGnP-C-300 10 X/xGnP-C-300 15
2.1 ± 0.3 03.7 ± 0.3 06.5 ± 0.4 24.7 ± 1.0 489 ± 20 61 3.3 ± 0.1 06.5 ± 0.3 10.9 ± 0.7 30.3 ± 2.0 484 ± 25 63 5.3 ± 0.1 10.6 ± 0.2 16.8 ± 0.4 31.7 ± 3.8 431 ± 17 65
X/xGnP-C-500 5 X/xGnP-C-500 10 X/xGnP-C-500 15
2.2 ± 0.1 03.7 ± 0.1 06.7 ± 0.4 27.2 ± 1.0 500 ± 15 61 3.5 ± 0.2 07.7 ± 0.2 13.6 ± 0.2 31.1 ± 1.6 460 ± 10 63 4.9 ± 0.2 11.0 ± 0.3 18.4 ± 0.8 30.4 ± 1.9 421 ± 10 65
X/xGnP-C-750 5 X/xGnP-C-750 10 X/xGnP-C-750 15
2.0 ± 0.1 04.1 ± 0.3 09.5 ± 1.0 31.0 ± 1.0 448 ± 10 63 2.9 ± 0.1 06.6 ± 0.2 13.5 ± 0.5 28.7 ± 1.9 429 ± 14 65 4.4 ± 0.2 10.6 ± 0.5 19.9 ± 0.9 28.1 ± 2.5 371 ± 20 67
X/xGnP-M-5 5 X/xGnP-M-5 10 X/xGnP-M-5 15
2.4 ± 0.1 03.7 ± 0.1 05.9 ± 0.3 18.4 ± 1.4 500 ± 15 62 3.5 ± 0.4 06.0 ± 0.5 08.6 ± 0.7 22.7 ± 2.0 485 ± 15 63 5.9 ± 0.3 08.6 ± 0.4 13.9 ± 1.0 30.0 ± 2.5 480 ± 20 66
X/EG 5 2.6 ± 0.1 03.7 ± 0.1 05.4 ± 0.1 19.3 ± 2.0 484 ± 15 61 X/EG 10 4.1 ± 0.4 05.9 ± 0.7 08.7 ± 1.1 27.8 ± 3.3 477 ± 15 64 X/EG 15 6.5 ± 0.2 08.8 ± 0.2 12.2 ± 0.6 31.0 ± 2.8 476 ± 20 65
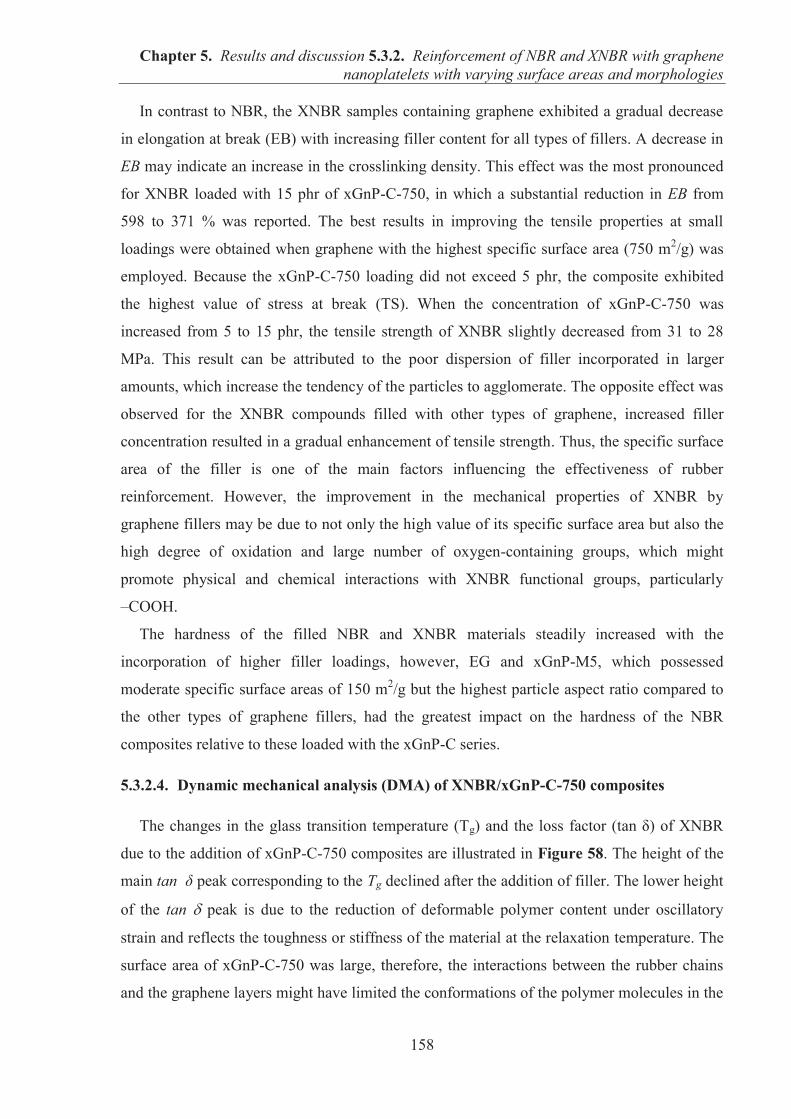
Chapter 5. Results and discussion 5.3.2. Reinforcement of NBR and XNBR with graphene nanoplatelets with varying surface areas and morphologies
158
In contrast to NBR, the XNBR samples containing graphene exhibited a gradual decrease
in elongation at break (EB) with increasing filler content for all types of fillers. A decrease in
EB may indicate an increase in the crosslinking density. This effect was the most pronounced
for XNBR loaded with 15 phr of xGnP-C-750, in which a substantial reduction in EB from
598 to 371 % was reported. The best results in improving the tensile properties at small
loadings were obtained when graphene with the highest specific surface area (750 m2/g) was
employed. Because the xGnP-C-750 loading did not exceed 5 phr, the composite exhibited
the highest value of stress at break (TS). When the concentration of xGnP-C-750 was
increased from 5 to 15 phr, the tensile strength of XNBR slightly decreased from 31 to 28
MPa. This result can be attributed to the poor dispersion of filler incorporated in larger
amounts, which increase the tendency of the particles to agglomerate. The opposite effect was
observed for the XNBR compounds filled with other types of graphene, increased filler
concentration resulted in a gradual enhancement of tensile strength. Thus, the specific surface
area of the filler is one of the main factors influencing the effectiveness of rubber
reinforcement. However, the improvement in the mechanical properties of XNBR by
graphene fillers may be due to not only the high value of its specific surface area but also the
high degree of oxidation and large number of oxygen-containing groups, which might
promote physical and chemical interactions with XNBR functional groups, particularly
–COOH.
The hardness of the filled NBR and XNBR materials steadily increased with the
incorporation of higher filler loadings, however, EG and xGnP-M5, which possessed
moderate specific surface areas of 150 m2/g but the highest particle aspect ratio compared to
the other types of graphene fillers, had the greatest impact on the hardness of the NBR
composites relative to these loaded with the xGnP-C series.
5.3.2.4. Dynamic mechanical analysis (DMA) of XNBR/xGnP-C-750 composites
The changes in the glass transition temperature (Tg) and the loss factor (tan δ) of XNBR
due to the addition of xGnP-C-750 composites are illustrated in Figure 58. The height of the
main tan δ peak corresponding to the Tg declined after the addition of filler. The lower height
of the tan peak is due to the reduction of deformable polymer content under oscillatory
strain and reflects the toughness or stiffness of the material at the relaxation temperature. The
surface area of xGnP-C-750 was large, therefore, the interactions between the rubber chains
and the graphene layers might have limited the conformations of the polymer molecules in the
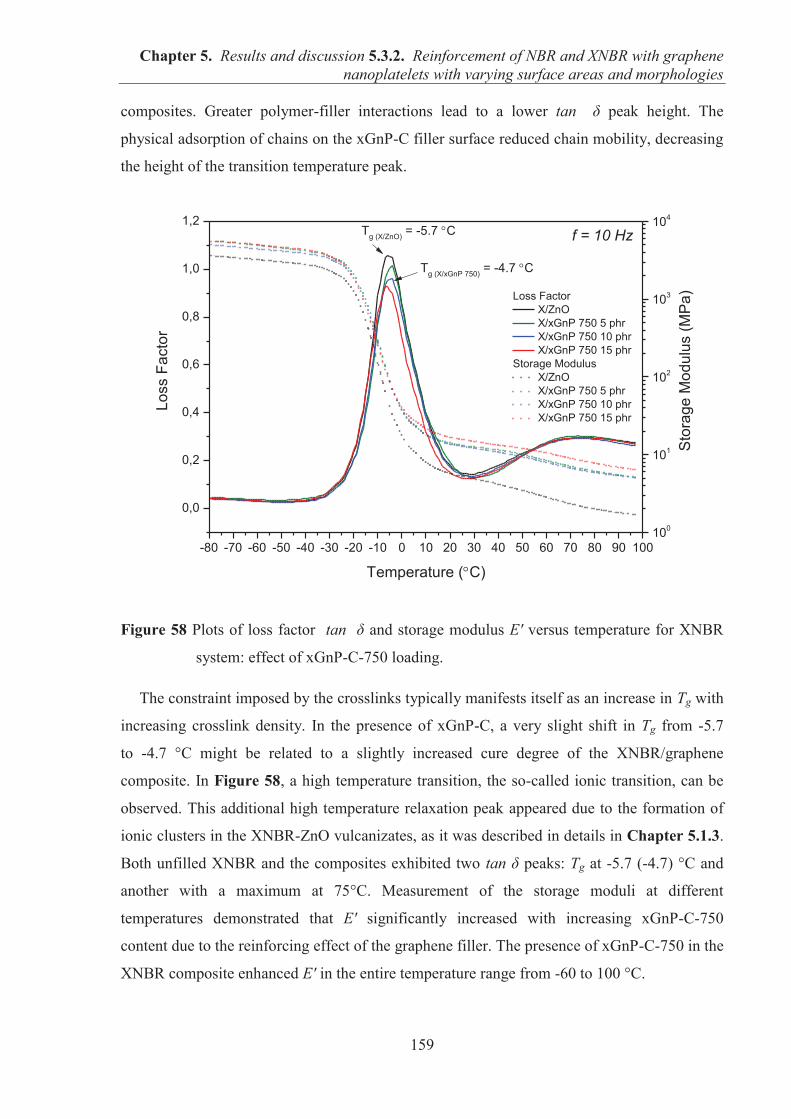
Chapter 5. Results and discussion 5.3.2. Reinforcement of NBR and XNBR with graphene nanoplatelets with varying surface areas and morphologies
159
composites. Greater polymer-filler interactions lead to a lower tan δ peak height. The
physical adsorption of chains on the xGnP-C filler surface reduced chain mobility, decreasing
the height of the transition temperature peak.
Figure 58 Plots of loss factor tan δ and storage modulus E′ versus temperature for XNBR
system: effect of xGnP-C-750 loading.
The constraint imposed by the crosslinks typically manifests itself as an increase in Tg with
increasing crosslink density. In the presence of xGnP-C, a very slight shift in Tg from -5.7
to -4.7 °C might be related to a slightly increased cure degree of the XNBR/graphene
composite. In Figure 58, a high temperature transition, the so-called ionic transition, can be
observed. This additional high temperature relaxation peak appeared due to the formation of
ionic clusters in the XNBR-ZnO vulcanizates, as it was described in details in Chapter 5.1.3.
Both unfilled XNBR and the composites exhibited two tan δ peaks: Tg at -5.7 (-4.7) °C and
another with a maximum at 75°C. Measurement of the storage moduli at different
temperatures demonstrated that E′ significantly increased with increasing xGnP-C-750
content due to the reinforcing effect of the graphene filler. The presence of xGnP-C-750 in the
XNBR composite enhanced E′ in the entire temperature range from -60 to 100 °C.
-80 -70 -60 -50 -40 -30 -20 -10 0 10 20 30 40 50 60 70 80 90 100
0,0
0,2
0,4
0,6
0,8
1,0
1,2
Loss Factor X/ZnO X/xGnP 750 5 phr X/xGnP 750 10 phr X/xGnP 750 15 phr
Storage Modulus X/ZnO X/xGnP 750 5 phr X/xGnP 750 10 phr X/xGnP 750 15 phr
Temperature ( C)
Loss
Fac
tor
100
101
102
103
104
Tg (X/xGnP 750) = -4.7 C
Sto
rage
Mod
ulus
(MP
a)
f = 10 HzTg (X/ZnO) = -5.7 C
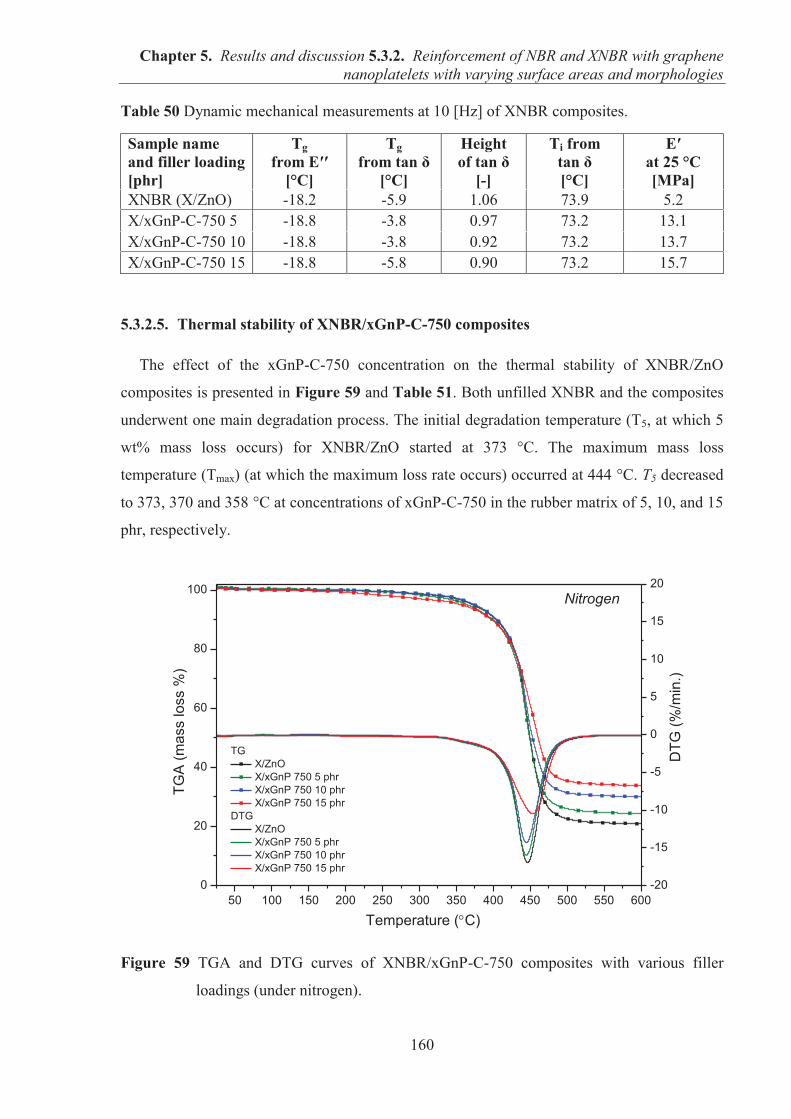
Chapter 5. Results and discussion 5.3.2. Reinforcement of NBR and XNBR with graphene nanoplatelets with varying surface areas and morphologies
160
Table 50 Dynamic mechanical measurements at 10 [Hz] of XNBR composites.
Sample name and filler loading [phr]
Tg from E′′
[°C]
Tg from tan δ
[°C]
Height of tan δ
[-]
Ti from tan δ [°C]
E′ at 25 °C [MPa]
XNBR (X/ZnO) -18.2 -5.9 1.06 73.9 5.2 X/xGnP-C-750 5 -18.8 -3.8 0.97 73.2 13.1 X/xGnP-C-750 10 -18.8 -3.8 0.92 73.2 13.7 X/xGnP-C-750 15 -18.8 -5.8 0.90 73.2 15.7
5.3.2.5. Thermal stability of XNBR/xGnP-C-750 composites
The effect of the xGnP-C-750 concentration on the thermal stability of XNBR/ZnO
composites is presented in Figure 59 and Table 51. Both unfilled XNBR and the composites
underwent one main degradation process. The initial degradation temperature (T5, at which 5
wt% mass loss occurs) for XNBR/ZnO started at 373 °C. The maximum mass loss
temperature (Tmax) (at which the maximum loss rate occurs) occurred at 444 °C. T5 decreased
to 373, 370 and 358 °C at concentrations of xGnP-C-750 in the rubber matrix of 5, 10, and 15
phr, respectively.
Figure 59 TGA and DTG curves of XNBR/xGnP-C-750 composites with various filler
loadings (under nitrogen).
50 100 150 200 250 300 350 400 450 500 550 6000
20
40
60
80
100
TG X/ZnO X/xGnP 750 5 phr X/xGnP 750 10 phr X/xGnP 750 15 phr
DTG X/ZnO X/xGnP 750 5 phr X/xGnP 750 10 phr X/xGnP 750 15 phr
Temperature ( C)
TGA
(mas
s lo
ss %
)
Nitrogen
-20
-15
-10
-5
0
5
10
15
20
DTG
(%/m
in.)
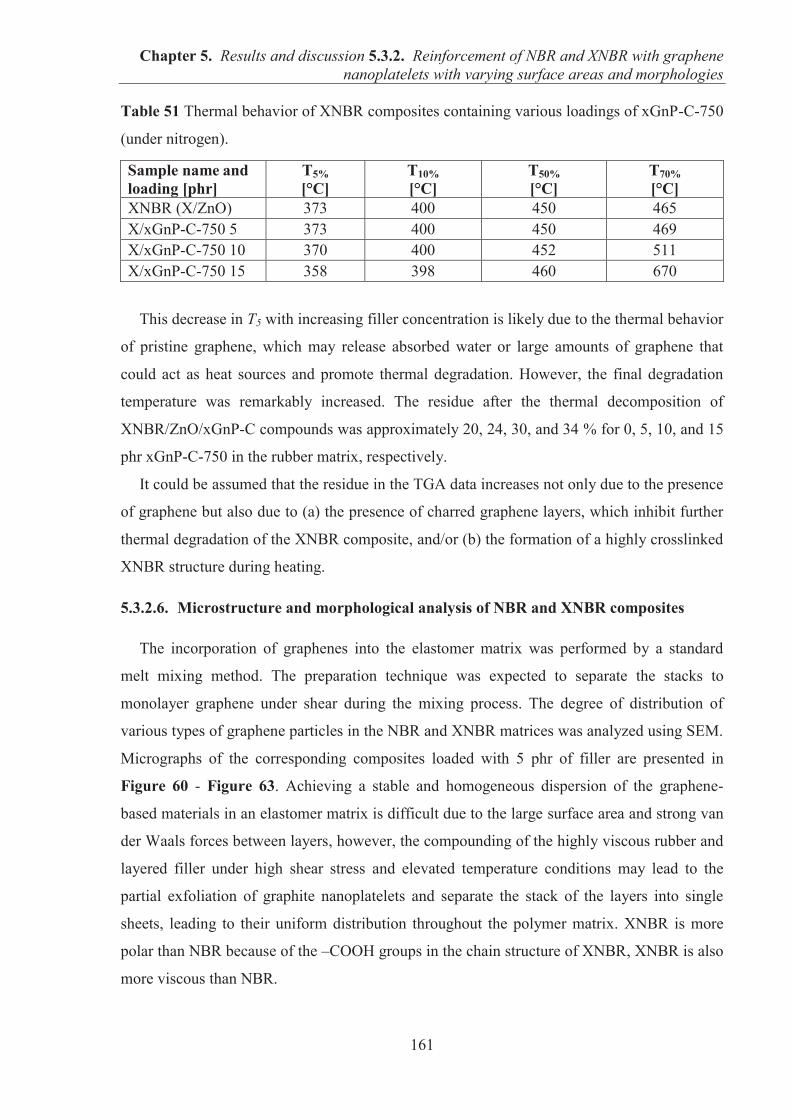
Chapter 5. Results and discussion 5.3.2. Reinforcement of NBR and XNBR with graphene nanoplatelets with varying surface areas and morphologies
161
Table 51 Thermal behavior of XNBR composites containing various loadings of xGnP-C-750
(under nitrogen).
Sample name and loading [phr]
T5% [°C]
T10% [°C]
T50% [°C]
T70% [°C]
XNBR (X/ZnO) 373 400 450 465 X/xGnP-C-750 5 373 400 450 469 X/xGnP-C-750 10 370 400 452 511 X/xGnP-C-750 15 358 398 460 670
This decrease in T5 with increasing filler concentration is likely due to the thermal behavior
of pristine graphene, which may release absorbed water or large amounts of graphene that
could act as heat sources and promote thermal degradation. However, the final degradation
temperature was remarkably increased. The residue after the thermal decomposition of
XNBR/ZnO/xGnP-C compounds was approximately 20, 24, 30, and 34 % for 0, 5, 10, and 15
phr xGnP-C-750 in the rubber matrix, respectively.
It could be assumed that the residue in the TGA data increases not only due to the presence
of graphene but also due to (a) the presence of charred graphene layers, which inhibit further
thermal degradation of the XNBR composite, and/or (b) the formation of a highly crosslinked
XNBR structure during heating.
5.3.2.6. Microstructure and morphological analysis of NBR and XNBR composites
The incorporation of graphenes into the elastomer matrix was performed by a standard
melt mixing method. The preparation technique was expected to separate the stacks to
monolayer graphene under shear during the mixing process. The degree of distribution of
various types of graphene particles in the NBR and XNBR matrices was analyzed using SEM.
Micrographs of the corresponding composites loaded with 5 phr of filler are presented in
Figure 60 - Figure 63. Achieving a stable and homogeneous dispersion of the graphene-
based materials in an elastomer matrix is difficult due to the large surface area and strong van
der Waals forces between layers, however, the compounding of the highly viscous rubber and
layered filler under high shear stress and elevated temperature conditions may lead to the
partial exfoliation of graphite nanoplatelets and separate the stack of the layers into single
sheets, leading to their uniform distribution throughout the polymer matrix. XNBR is more
polar than NBR because of the –COOH groups in the chain structure of XNBR, XNBR is also
more viscous than NBR.
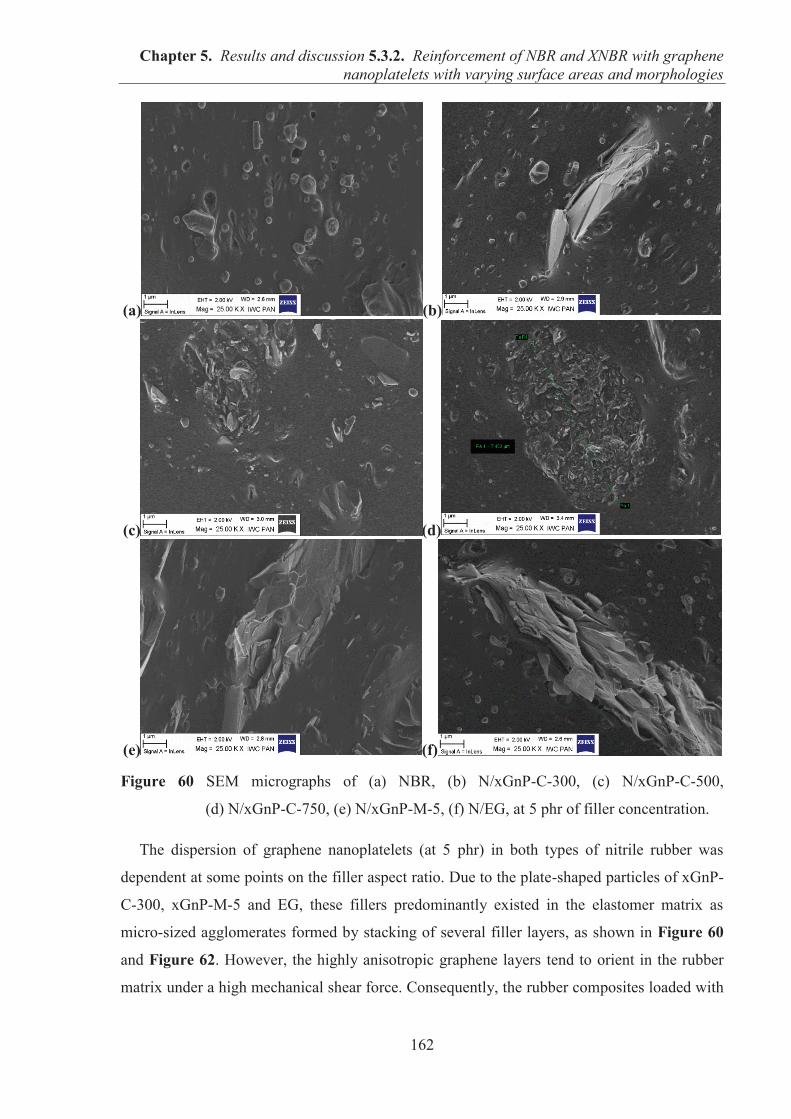
Chapter 5. Results and discussion 5.3.2. Reinforcement of NBR and XNBR with graphene nanoplatelets with varying surface areas and morphologies
162
(a) (b)
(c) (d)
(e) (f)
Figure 60 SEM micrographs of (a) NBR, (b) N/xGnP-C-300, (c) N/xGnP-C-500,
(d) N/xGnP-C-750, (e) N/xGnP-M-5, (f) N/EG, at 5 phr of filler concentration.
The dispersion of graphene nanoplatelets (at 5 phr) in both types of nitrile rubber was
dependent at some points on the filler aspect ratio. Due to the plate-shaped particles of xGnP-
C-300, xGnP-M-5 and EG, these fillers predominantly existed in the elastomer matrix as
micro-sized agglomerates formed by stacking of several filler layers, as shown in Figure 60
and Figure 62. However, the highly anisotropic graphene layers tend to orient in the rubber
matrix under a high mechanical shear force. Consequently, the rubber composites loaded with
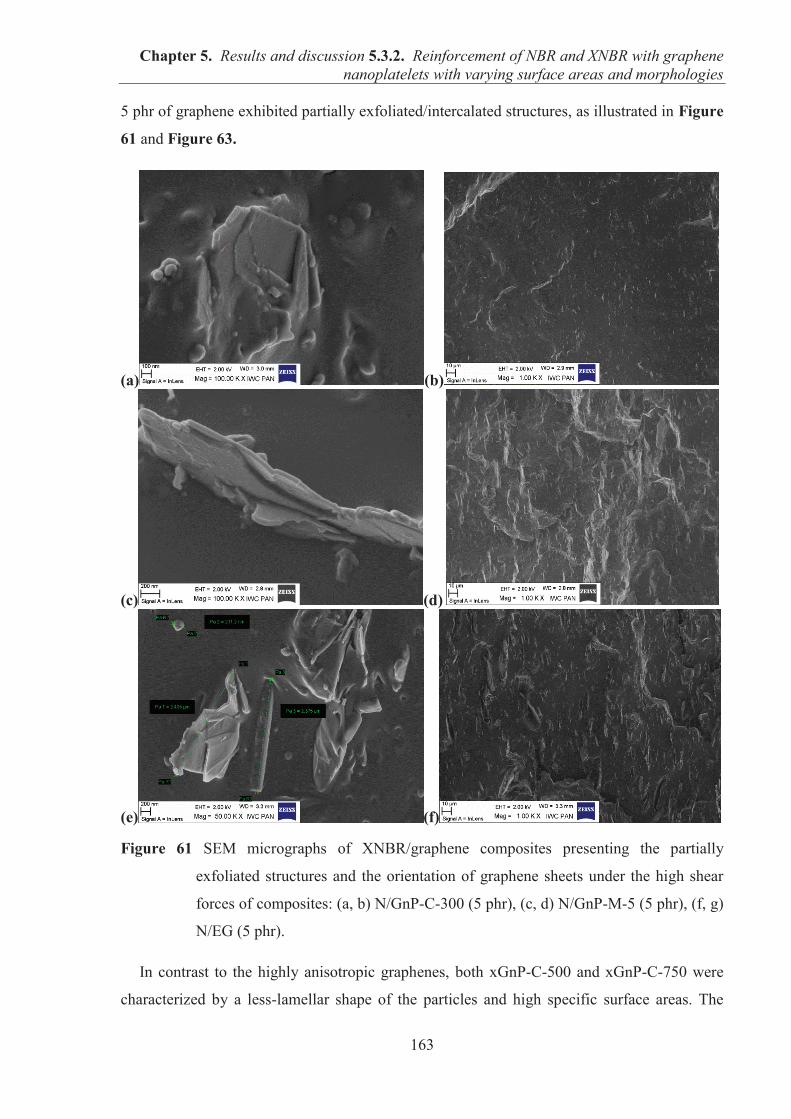
Chapter 5. Results and discussion 5.3.2. Reinforcement of NBR and XNBR with graphene nanoplatelets with varying surface areas and morphologies
163
5 phr of graphene exhibited partially exfoliated/intercalated structures, as illustrated in Figure
61 and Figure 63.
(a) (b)
(c) (d)
(e) (f)
Figure 61 SEM micrographs of XNBR/graphene composites presenting the partially
exfoliated structures and the orientation of graphene sheets under the high shear
forces of composites: (a, b) N/GnP-C-300 (5 phr), (c, d) N/GnP-M-5 (5 phr), (f, g)
N/EG (5 phr).
In contrast to the highly anisotropic graphenes, both xGnP-C-500 and xGnP-C-750 were
characterized by a less-lamellar shape of the particles and high specific surface areas. The
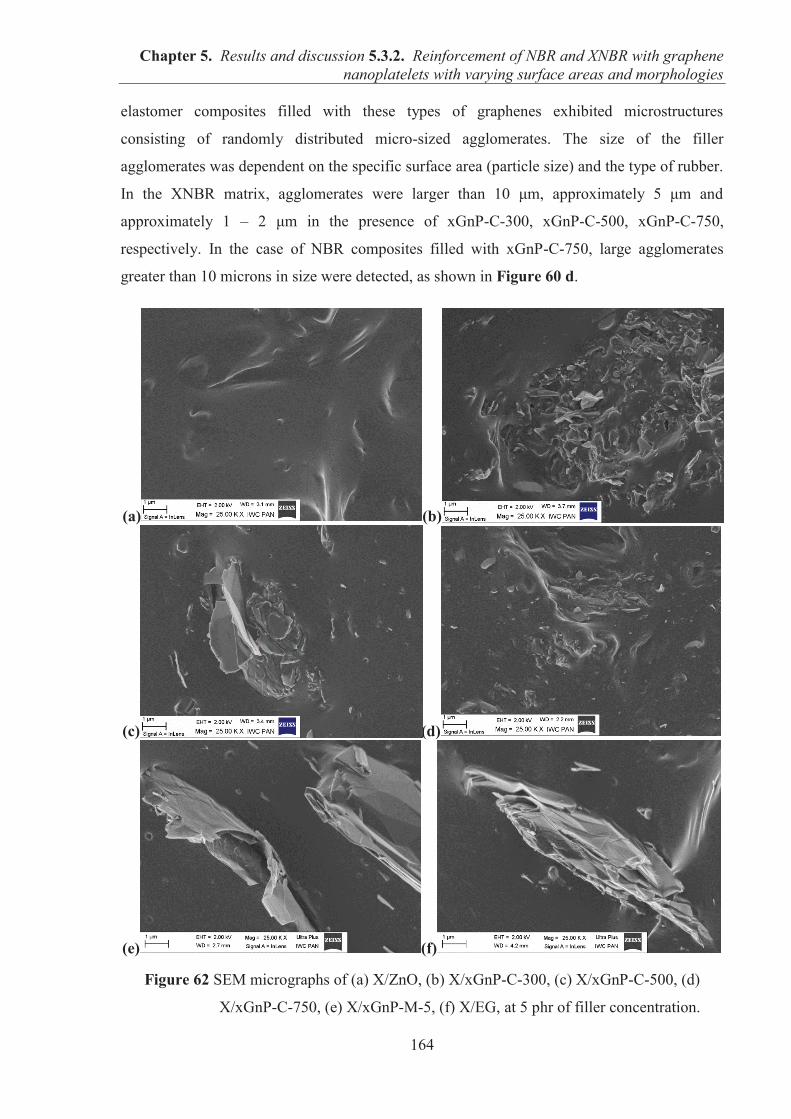
Chapter 5. Results and discussion 5.3.2. Reinforcement of NBR and XNBR with graphene nanoplatelets with varying surface areas and morphologies
164
elastomer composites filled with these types of graphenes exhibited microstructures
consisting of randomly distributed micro-sized agglomerates. The size of the filler
agglomerates was dependent on the specific surface area (particle size) and the type of rubber.
In the XNBR matrix, agglomerates were larger than 10 μm, approximately 5 μm and
approximately 1 – 2 μm in the presence of xGnP-C-300, xGnP-C-500, xGnP-C-750,
respectively. In the case of NBR composites filled with xGnP-C-750, large agglomerates
greater than 10 microns in size were detected, as shown in Figure 60 d.
(a) (b)
(c) (d)
(e) (f)
Figure 62 SEM micrographs of (a) X/ZnO, (b) X/xGnP-C-300, (c) X/xGnP-C-500, (d)
X/xGnP-C-750, (e) X/xGnP-M-5, (f) X/EG, at 5 phr of filler concentration.
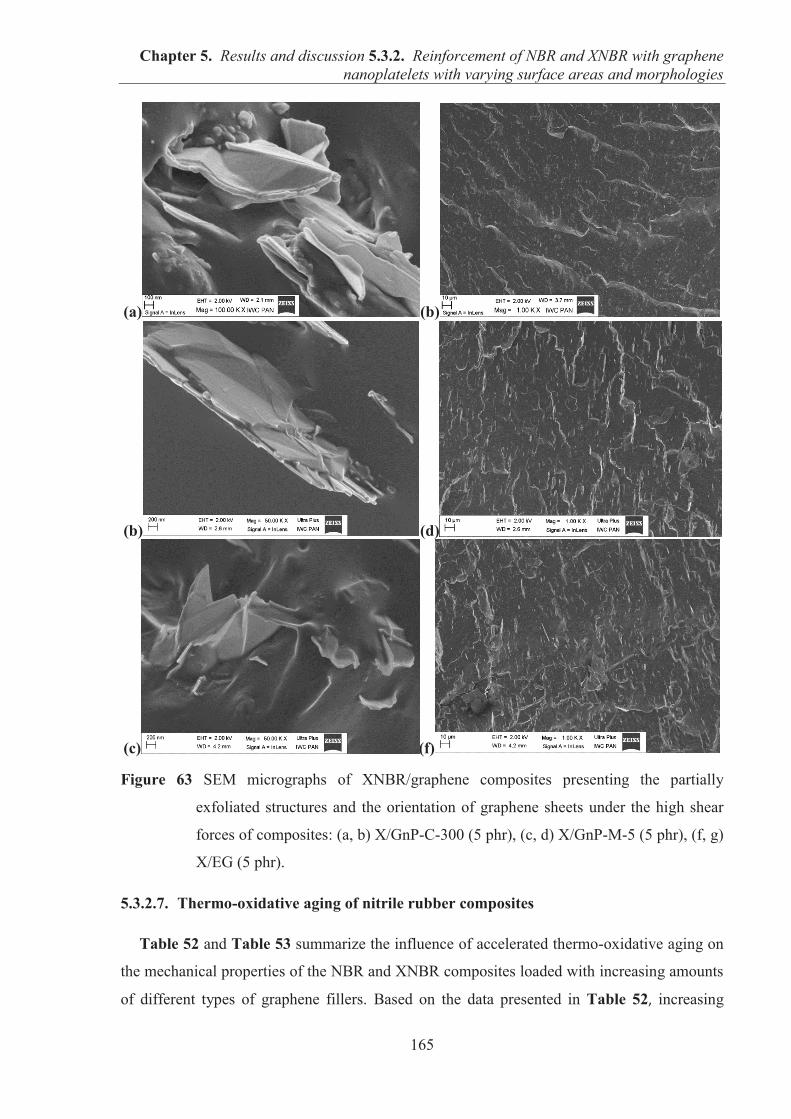
Chapter 5. Results and discussion 5.3.2. Reinforcement of NBR and XNBR with graphene nanoplatelets with varying surface areas and morphologies
165
(a) (b)
(b) (d)
(c) (f)
Figure 63 SEM micrographs of XNBR/graphene composites presenting the partially
exfoliated structures and the orientation of graphene sheets under the high shear
forces of composites: (a, b) X/GnP-C-300 (5 phr), (c, d) X/GnP-M-5 (5 phr), (f, g)
X/EG (5 phr).
5.3.2.7. Thermo-oxidative aging of nitrile rubber composites
Table 52 and Table 53 summarize the influence of accelerated thermo-oxidative aging on
the mechanical properties of the NBR and XNBR composites loaded with increasing amounts
of different types of graphene fillers. Based on the data presented in Table 52, increasing

Chapter 5. Results and discussion 5.3.2. Reinforcement of NBR and XNBR with graphene nanoplatelets with varying surface areas and morphologies
166
levels of graphene did not markedly protect NBR against the effects of thermo-oxidative
aging conditions, the aging coefficient (KT) of the NBR/graphene composites remained nearly
unchanged, with low values ranging from 0.2 to 0.4. The thermally aged NBR materials
became more brittle and exhibited significantly reduced percentages of EB, particularly at
higher graphene concentrations. All of the graphenes investigated exhibited a similar effect on
the mechanical properties of NBR exposed to thermo-oxidative aging conditions, however, a
clear impact of increasing specific surface area of the fillers and their concentration on the
gradual reduction in EB was observed.
Table 52 Mechanical properties and crosslink densities of NBR composites subjected to
thermo-oxidative aging.
Sample name and filler loading [phr]
SE100
[MPa] SE200
[MPa] SE300
[MPa] TS
[MPa] EB
[%] KT [-]
NBR 1.1 ± 0.1 1.5 ± 0.1 - 2.7 ± 0.7 282 ± 30 0.4 N/xGnP-C-300 5 N/xGnP-C-300 10 N/xGnP-C-300 15
2.1 ± 0.1 4.3 ± 0.1 - 05.2 ± 0.1 227 ± 50 0.3 2.9 ± 0.1 6.4 ± 0.1 - 07.6 ± 0.1 224 ± 20 0.3 4.6 ± 0.1 9.8 ± 0.1 - 10.7 ± 2.0 187 ± 20 0.4
N/xGnP-C-500 5 N/xGnP-C-500 10 N/xGnP-C-500 15
2.1 ± 0.1 4.4 ± 0.1 - 05.5 ± 0.1 228 ± 50 0.3 4.5 ± 0.9 - - 08.7 ± 0.1 193 ± 50 0.3 5.8 ± 0.1 - - 12.2 ± 0.1 174 ± 50 0.3
N/xGnP-C-750 5 N/xGnP-C-750 10 N/xGnP-C-750 15
2.7 ± 0.1 7.1 ± 0.1 - 07.4 ± 0.1 209 ± 70 0.4 3.5 ± 0.1 9.8 ± 0.2 - 10.6 ± 0.1 197 ± 50 0.4 9.2 ± 0.5 - - 12.9 ± 1.5 125 ± 15 0.2
N/xGnP-M-5 N/xGnP-M-10 N/xGnP-M-15
2.1 ± 0.1 3.3 ± 0.1 - 04.3 ± 0.4 253 ± 17 0.2 3.4 ± 0.1 5.4 ± 0.1 - 06.0 ± 0.5 218 ± 14 0.2 3.6 ± 0.1 5.6 ± 0.1 - 06.7 ± 0.6 205 ± 10 0.2
N/EG 5 2.1 ± 0.1 3.0 ± 0.1 - 03.9 ± 0.1 270 ± 50 0.3 N/EG 10 2.7 ± 0.1 3.6 ± 0.1 - 04.4 ± 0.1 274 ± 10 0.3 N/EG 15 3.0 ± 0.1 4.0 ± 0.1 - 05.2 ± 0.2 253 ± 50 0.2
In contrast to the NBR composites, the XNBR compounds exposed to oxygen and high
temperature (100 °C) exhibited significantly increased stiffness, as reflected in higher
modulus values at 100, 200 and 300 % elongation and higher crosslink densities ( T)
compared with the corresponding unaged samples (Figure 64). The coefficient KT reported
for the XNBR/graphene composites was very high and corresponds to a value of
approximately 1 or more. This result indicates that the thermo-oxidative aging conditions
promoted further crosslinking, as confirmed by the nearly twofold increase in crosslink
density values for the thermally aged samples compared with the unaged samples. The
crosslink density in the XNBR/graphene compounds tended to increase with increasing filler
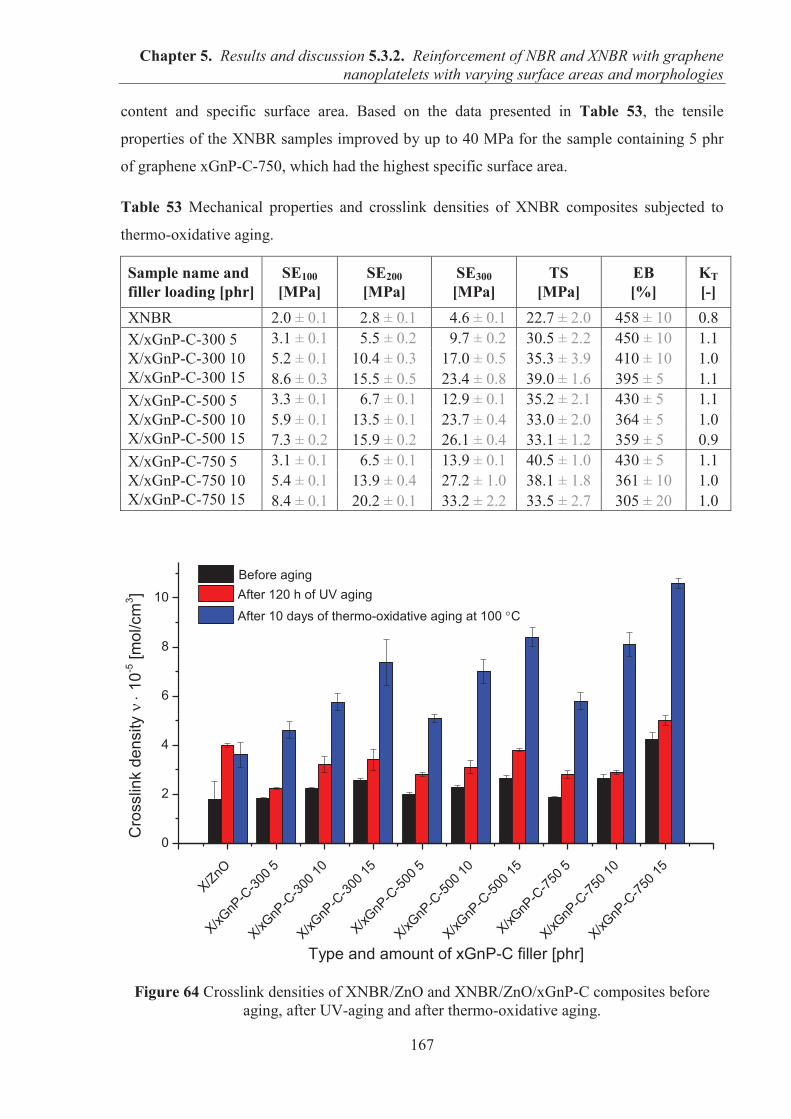
Chapter 5. Results and discussion 5.3.2. Reinforcement of NBR and XNBR with graphene nanoplatelets with varying surface areas and morphologies
167
content and specific surface area. Based on the data presented in Table 53, the tensile
properties of the XNBR samples improved by up to 40 MPa for the sample containing 5 phr
of graphene xGnP-C-750, which had the highest specific surface area.
Table 53 Mechanical properties and crosslink densities of XNBR composites subjected to
thermo-oxidative aging.
Sample name and filler loading [phr]
SE100
[MPa] SE200
[MPa] SE300
[MPa] TS
[MPa] EB
[%] KT [-]
XNBR 2.0 ± 0.1 02.8 ± 0.1 04.6 ± 0.1 22.7 ± 2.0 458 ± 10 0.8 X/xGnP-C-300 5 X/xGnP-C-300 10 X/xGnP-C-300 15
3.1 ± 0.1 05.5 ± 0.2 09.7 ± 0.2 30.5 ± 2.2 450 ± 10 1.1 5.2 ± 0.1 10.4 ± 0.3 17.0 ± 0.5 35.3 ± 3.9 410 ± 10 1.0 8.6 ± 0.3 15.5 ± 0.5 23.4 ± 0.8 39.0 ± 1.6 395 ± 50 1.1
X/xGnP-C-500 5 X/xGnP-C-500 10 X/xGnP-C-500 15
3.3 ± 0.1 06.7 ± 0.1 12.9 ± 0.1 35.2 ± 2.1 430 ± 50 1.1 5.9 ± 0.1 13.5 ± 0.1 23.7 ± 0.4 33.0 ± 2.0 364 ± 50 1.0 7.3 ± 0.2 15.9 ± 0.2 26.1 ± 0.4 33.1 ± 1.2 359 ± 50 0.9
X/xGnP-C-750 5 X/xGnP-C-750 10 X/xGnP-C-750 15
3.1 ± 0.1 06.5 ± 0.1 13.9 ± 0.1 40.5 ± 1.0 430 ± 50 1.1 5.4 ± 0.1 13.9 ± 0.4 27.2 ± 1.0 38.1 ± 1.8 361 ± 10 1.0 8.4 ± 0.1 20.2 ± 0.1 33.2 ± 2.2 33.5 ± 2.7 305 ± 20 1.0
Figure 64 Crosslink densities of XNBR/ZnO and XNBR/ZnO/xGnP-C composites before aging, after UV-aging and after thermo-oxidative aging.
X/ZnO
X/xGnP
-C-30
0 5
X/xGnP
-C-30
0 10
X/xGnP
-C-30
0 15
X/xGnP
-C-50
0 5
X/xGnP
-C-50
0 10
X/xGnP
-C-50
0 15
X/xGnP
-C-75
0 5
X/xGnP
-C-75
0 10
X/xGnP
-C-75
0 15
0
2
4
6
8
10
Cro
sslin
k de
nsity
1
0-5 [m
ol/c
m3 ]
Type and amount of xGnP-C filler [phr]
Before aging After 120 h of UV aging
After 10 days of thermo-oxidative aging at 100 C
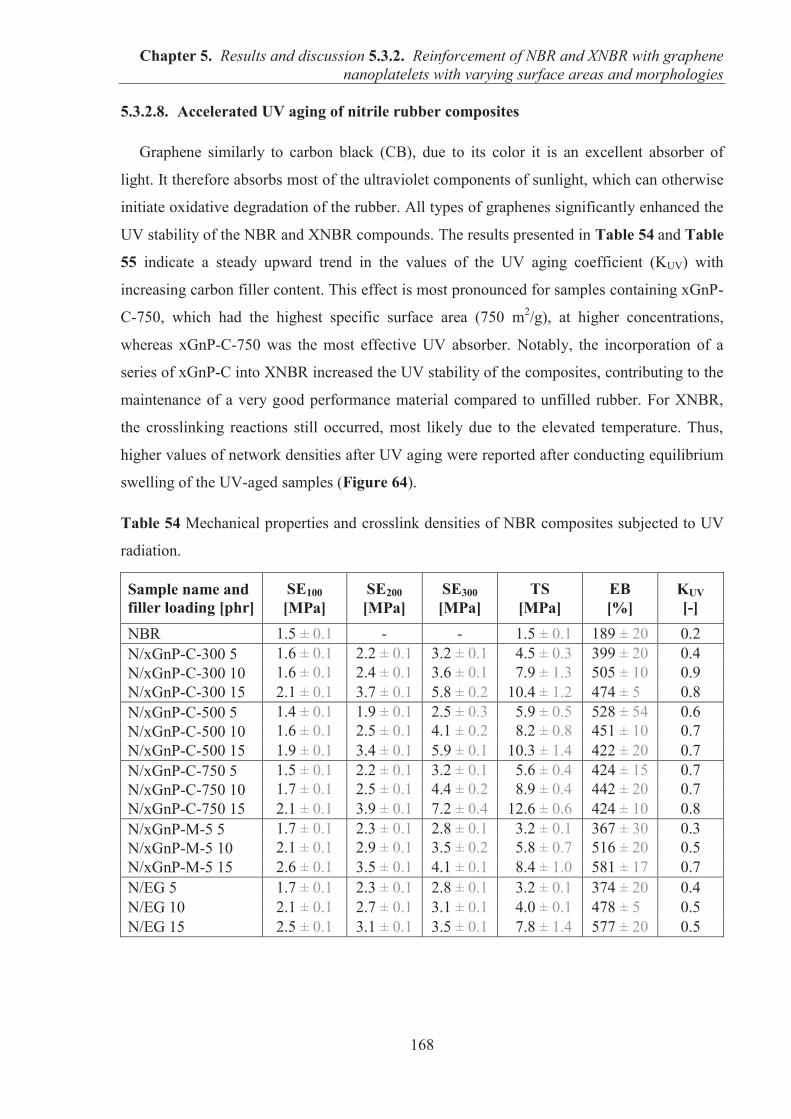
Chapter 5. Results and discussion 5.3.2. Reinforcement of NBR and XNBR with graphene nanoplatelets with varying surface areas and morphologies
168
5.3.2.8. Accelerated UV aging of nitrile rubber composites
Graphene similarly to carbon black (CB), due to its color it is an excellent absorber of
light. It therefore absorbs most of the ultraviolet components of sunlight, which can otherwise
initiate oxidative degradation of the rubber. All types of graphenes significantly enhanced the
UV stability of the NBR and XNBR compounds. The results presented in Table 54 and Table
55 indicate a steady upward trend in the values of the UV aging coefficient (KUV) with
increasing carbon filler content. This effect is most pronounced for samples containing xGnP-
C-750, which had the highest specific surface area (750 m2/g), at higher concentrations,
whereas xGnP-C-750 was the most effective UV absorber. Notably, the incorporation of a
series of xGnP-C into XNBR increased the UV stability of the composites, contributing to the
maintenance of a very good performance material compared to unfilled rubber. For XNBR,
the crosslinking reactions still occurred, most likely due to the elevated temperature. Thus,
higher values of network densities after UV aging were reported after conducting equilibrium
swelling of the UV-aged samples (Figure 64).
Table 54 Mechanical properties and crosslink densities of NBR composites subjected to UV
radiation.
Sample name and filler loading [phr]
SE100
[MPa] SE200
[MPa] SE300
[MPa] TS
[MPa] EB
[%] KUV [-]
NBR 1.5 ± 0.1 - - 01.5 ± 0.1 189 ± 20 0.2 N/xGnP-C-300 5 N/xGnP-C-300 10 N/xGnP-C-300 15
1.6 ± 0.1 2.2 ± 0.1 3.2 ± 0.1 04.5 ± 0.3 399 ± 20 0.4 1.6 ± 0.1 2.4 ± 0.1 3.6 ± 0.1 07.9 ± 1.3 505 ± 10 0.9 2.1 ± 0.1 3.7 ± 0.1 5.8 ± 0.2 10.4 ± 1.2 474 ± 50 0.8
N/xGnP-C-500 5 N/xGnP-C-500 10 N/xGnP-C-500 15
1.4 ± 0.1 1.9 ± 0.1 2.5 ± 0.3 05.9 ± 0.5 528 ± 54 0.6 1.6 ± 0.1 2.5 ± 0.1 4.1 ± 0.2 08.2 ± 0.8 451 ± 10 0.7 1.9 ± 0.1 3.4 ± 0.1 5.9 ± 0.1 10.3 ± 1.4 422 ± 20 0.7
N/xGnP-C-750 5 N/xGnP-C-750 10 N/xGnP-C-750 15
1.5 ± 0.1 2.2 ± 0.1 3.2 ± 0.1 05.6 ± 0.4 424 ± 15 0.7 1.7 ± 0.1 2.5 ± 0.1 4.4 ± 0.2 08.9 ± 0.4 442 ± 20 0.7 2.1 ± 0.1 3.9 ± 0.1 7.2 ± 0.4 12.6 ± 0.6 424 ± 10 0.8
N/xGnP-M-5 5 N/xGnP-M-5 10 N/xGnP-M-5 15
1.7 ± 0.1 2.3 ± 0.1 2.8 ± 0.1 03.2 ± 0.1 367 ± 30 0.3 2.1 ± 0.1 2.9 ± 0.1 3.5 ± 0.2 05.8 ± 0.7 516 ± 20 0.5 2.6 ± 0.1 3.5 ± 0.1 4.1 ± 0.1 08.4 ± 1.0 581 ± 17 0.7
N/EG 5 1.7 ± 0.1 2.3 ± 0.1 2.8 ± 0.1 03.2 ± 0.1 374 ± 20 0.4 N/EG 10 2.1 ± 0.1 2.7 ± 0.1 3.1 ± 0.1 04.0 ± 0.1 478 ± 50 0.5 N/EG 15 2.5 ± 0.1 3.1 ± 0.1 3.5 ± 0.1 07.8 ± 1.4 577 ± 20 0.5
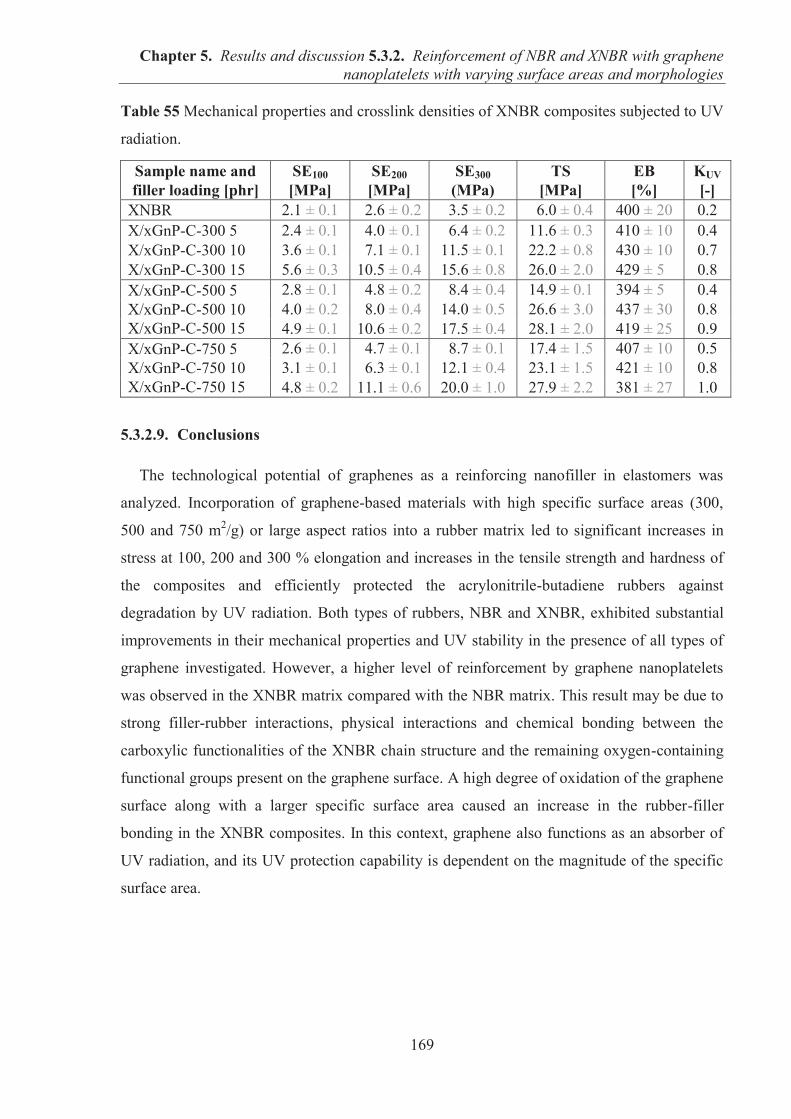
Chapter 5. Results and discussion 5.3.2. Reinforcement of NBR and XNBR with graphene nanoplatelets with varying surface areas and morphologies
169
Table 55 Mechanical properties and crosslink densities of XNBR composites subjected to UV
radiation.
Sample name and filler loading [phr]
SE100
[MPa] SE200
[MPa] SE300
(MPa) TS
[MPa] EB
[%] KUV [-]
XNBR 2.1 ± 0.1 02.6 ± 0.2 03.5 ± 0.2 06.0 ± 0.4 400 ± 20 0.2 X/xGnP-C-300 5 2.4 ± 0.1 04.0 ± 0.1 06.4 ± 0.2 11.6 ± 0.3 410 ± 10 0.4 X/xGnP-C-300 10 3.6 ± 0.1 07.1 ± 0.1 11.5 ± 0.1 22.2 ± 0.8 430 ± 10 0.7 X/xGnP-C-300 15 5.6 ± 0.3 10.5 ± 0.4 15.6 ± 0.8 26.0 ± 2.0 429 ± 50 0.8 X/xGnP-C-500 5 X/xGnP-C-500 10 X/xGnP-C-500 15
2.8 ± 0.1 04.8 ± 0.2 08.4 ± 0.4 14.9 ± 0.1 394 ± 50 0.4 4.0 ± 0.2 08.0 ± 0.4 14.0 ± 0.5 26.6 ± 3.0 437 ± 30 0.8 4.9 ± 0.1 10.6 ± 0.2 17.5 ± 0.4 28.1 ± 2.0 419 ± 25 0.9
X/xGnP-C-750 5 X/xGnP-C-750 10 X/xGnP-C-750 15
2.6 ± 0.1 04.7 ± 0.1 08.7 ± 0.1 17.4 ± 1.5 407 ± 10 0.5 3.1 ± 0.1 06.3 ± 0.1 12.1 ± 0.4 23.1 ± 1.5 421 ± 10 0.8 4.8 ± 0.2 11.1 ± 0.6 20.0 ± 1.0 27.9 ± 2.2 381 ± 27 1.0
5.3.2.9. Conclusions
The technological potential of graphenes as a reinforcing nanofiller in elastomers was
analyzed. Incorporation of graphene-based materials with high specific surface areas (300,
500 and 750 m2/g) or large aspect ratios into a rubber matrix led to significant increases in
stress at 100, 200 and 300 % elongation and increases in the tensile strength and hardness of
the composites and efficiently protected the acrylonitrile-butadiene rubbers against
degradation by UV radiation. Both types of rubbers, NBR and XNBR, exhibited substantial
improvements in their mechanical properties and UV stability in the presence of all types of
graphene investigated. However, a higher level of reinforcement by graphene nanoplatelets
was observed in the XNBR matrix compared with the NBR matrix. This result may be due to
strong filler-rubber interactions, physical interactions and chemical bonding between the
carboxylic functionalities of the XNBR chain structure and the remaining oxygen-containing
functional groups present on the graphene surface. A high degree of oxidation of the graphene
surface along with a larger specific surface area caused an increase in the rubber-filler
bonding in the XNBR composites. In this context, graphene also functions as an absorber of
UV radiation, and its UV protection capability is dependent on the magnitude of the specific
surface area.
Chapter 6. Conclusions
170
6. CONCLUSIONS
The aim of this thesis was the fabrication and study of elastomer composites produced by a
simple melt-mixing method and containing layered fillers and ionic liquids. These elastomer
materials were expected to exhibit improved mechanical properties, decreased swelling in
solvents, enhanced gas barrier properties and increased ionic conductivity. The layered fillers
were investigated with respect to their morphological, structural, thermal and surface
properties using the following techniques: SEM, XRD, N2 adsorption measurements, FTIR,
TGA, XPS and IGC. A detailed determination of the characteristic features of the layered
fillers, such as particle morphology and dimensionality, specific surface area, thermal
stability, surface chemical composition and surface acid-base characteristics, facilitated the
elucidation of the effects of fillers in the rubber matrices and their impact on the extent of
reinforcement. Natural hectorite, which was characterized by a large aspect ratio of lamellar
particles, may be useful for the production of eco-friendly rubber composites with reduced
gas permeability. However, due to the presence of mixtures of other mineral phases, a high
dispersive component of the surface free energy and acidic surface properties, the hectorite
particle distribution in the rubber matrix is heterogeneous. Rubbers filled with natural
hectorite did not exhibit any substantial improvements in mechanical properties, thus, this
type of filler could be regarded as non-reinforcing. By contrast, synthetic silicate, which
exhibited particle morphologies and surface chemical compositions similar to those of natural
hectorite, was much more suitable for the preparation of reinforced rubber composites. Its
reinforcing effect was the most pronounced in the XNBR matrix, in which the additional –
COOH functional groups in the rubber chain may contribute to rubber reinforcement due to
enhanced rubber-filler interactions. The anisotropic layers of synthetic hectorite were well-
oriented in the direction of the high shear stress applied during rubber and filler melt
compounding, resulting in further improvement of the mechanical properties of the composite
material. SYN HEC influenced the cure degree of XNBR, indicating the existence of some
interaction between its surface and the carboxylic rubber macromolecules. Similarly, the
incorporation of increased loadings of the synthetic anionic clay HT resulted in remarkable
increases in the network density of XNBR, which gave rise to the expectation that this layered
filler might be applied not only as a filler but also as a curative for the functionalized
carboxylic elastomer. Therefore, subsequent research aimed to simultaneously apply
Chapter 6. Conclusions
171
MgAl-LDH as a filler and crosslinking agent in XNBR, for these experiments, the composite
components were mixed in an internal mixer under high shear forces and elevated
temperature. Mechanically strong and transparent elastomer composites were fabricated in the
absence of standard curatives, such as zinc oxide, or a sulfur cure system, enabling the
production of eco-friendly materials due to the decrease in toxic ZnO, the reduction of
ingredients in the rubber formulation, the use of non-toxic and easily synthesized fillers and
the reduction of proportion of rubber by incorporating significant amounts of filler, an
important an economic advantage. The optical properties of the XNBR/LDH composites were
reversible depending on the temperature and type of MgAl-LDH. The use of high levels of
LDH with a Mg/Al ratio ≈ 2:1 in the XNBR matrix produced composites with
thermoreversible transparency. Moreover, LDHs effectively participated in the crosslinking
reaction of XNBR and contributed to the production of strong, stiff elastomeric composites.
The high aspect ratio of the layers and the high magnesium content in the LDH structure led
to significant improvements in the mechanical and barrier properties and promoted the
formation of a higher number of ionic crosslinks between the XNBR and the filler. The
parallel orientation of highly anisotropic filler layers in the rubber matrix under the high shear
force in the internal mixer is advantageous and produces elastomer composites with improved
physical properties. The dynamic mechanical analysis revealed a remarkable enhancement in
the storage moduli and an increase in the glass transition temperature when LDH was present
in the XNBR matrix. The increase in crosslink density and the improvement in the mechanical
properties of the XNBR/HT composites may be due to the interactions between (a) the acidic
functionalities of XNBR and the basic hydroxyl groups on the filler sheets, (b) the polar
functional groups of XNBR and the polar surface of the filler, and (c) –COOH and the metal
ions provided by HT (ionic bonds). The incorporation of LDH delivers not only an
environmentally friendly, zinc oxide-free rubber product but also an ionic elastomer
composite with excellent mechanical, barrier and transparent properties. However, obtaining a
material with the aforementioned parameters requires quite high loadings of the layered
mineral. The application of large amounts of an inexpensive and easily synthesized filler is
economically beneficial due to the reduction of the cost of the final product.
The effects of anion type (tetrachloroaluminate [AlCl4]–, thiocyante [SCN]– and
bis(trifluoromethylsulfonyl)imide [TFSI]–) of imidazolium ionic liquid and the impacts of the
length of alkyl chain of 1-n-alkyl-3-methylimidazolium salt consisting with
bis(trifluoromethylsulfonyl)imide anion [Cn-MIM][TFSI] on the properties of XNBR/LDH
compounds were analyzed. The hydrophilic imidazolium salt [BMIM][AlCl4] was found to
Chapter 6. Conclusions
172
be reactive toward XNBR by increasing the network density of the rubber composites and
significantly accelerating the curing process. The incorporation of a series of hydrophobic
1-n-alkyl-3-methylimidazolium bis(trifluoromethylsulfonyl)imide ILs into the XNBR/LDH
matrix produced elastomer composites with higher ionic conductivity than those containing
hydrophilic tetrachloroaluminate or thiocyanate salt. For XNBR/LDH composites, the
conductivity increased by approximately three orders of magnitude (10-10 to 10-7 S/cm) when
15 phr of TFSI-based IL was added. In addition, [TFSI] imidazolium salts exhibited sufficient
thermal stability for elastomer processing. With the addition of hydrophobic TFSI-based
imidazolium ILs, the filler dispersion and ionic conductivity of the XNBR/LDH composites
were effectively improved. These ILs exerted a plasticizing effect on the XNBR matrix,
shifting the Tg toward lower temperatures at increasing concentrations. 1-Hexyl-3-
methylimidazolium bis(trifluoromethylsulfonyl)imide displayed the highest plasticizing effect
in the XNBR/LDH material and most efficiently increased the ionic conductivity of the
composite. However, the impact of the cation alkyl chain length on this parameter was less
significant than anticipated. The optimal amount of TFSI-based imidazolium IL for the
preparation of composites with enhanced conductivity and improved morphological and
mechanical properties was 2.5 – 5 phr. The most important advantages of 1-n-alkyl-3-
methylimidazolium bis(trifluoromethylsulfonyl)imide ionic liquids making them useful as
melt processing aids in the XNBR/filler composites are following,
1. Good compatibility and miscibility with carboxylated acrylonitrile-butadiene
rubber XNBR prevents against leaking form elastomer matrix,
2. Sufficient thermal stability which allows to withstand high temperatures during
rubber processing and vulcanization,
3. Colorless and chemical stability,
4. Enhanced ionic conductivity of the rubber composites in the order of 10-8 S/cm at
low ionic liquid concentration,
5. Improvement of filler dispersion and mechanical properties of XNBR/filler
composites.
The NBR and XNBR exhibited a substantial improvement in mechanical properties even
when a small amount (approximately 5 phr) of graphene nanoplatelets was incorporated.
Graphene fillers with high specific surface areas (300, 500 and 750 m2/g) increased the tensile
strength and stress at 100, 200 and 300% elongation of the rubber composites and efficiently
protected XNBR against degradation by UV radiation. In this case, graphene acted as a
perfect absorber of UV radiation.
Chapter 7. List of publications
173
7. LIST OF PUBLICATIONS
PUBLICATIONS
1. Laskowska A., Zaborski M. Zastosowanie mineralnego krzemianu w kompozytach elastomerowych, 0033-2496, Przemysł Chemiczny 89(4), 461-458 (2010). (IF=0.29)
2. Laskowska A., Lipińska M., Zaborski M., Sokołowska J. Wpływ cieczy jonowych na właściwości kompozytów elastomerowych zawierających napełniacz warstwowy, Przemysł Chemiczny 89(11), 1189 (2010). (IF=0.29)
3. Laskowska A., Lipińska M., Zaborski M. Hydrotalkit jako napełniacz karboksylowanego kauczuku butadienowo-akrylonitrylowego, Przemysł Chemiczny 90(5), 878 (2011). (IF=0.414)
4. Laskowska A., Lipińska M., Zaborski M. Zastosowanie grafenu w kompozytach polimerowych, Przemysł Chemiczny 91(5), 841 (2012). (IF=0.344)
5. Laskowska A., Lipinska M., Zaborski M. Properties of carboxylated butadiene nitrile elastomer contained hydrotalcites with varying Mg/Al ratio, Journal of Engineering and Technology vol.2, No.1, 24 (2012).
6. Lipinska M., Laskowska A., Zaborski M. Elastomer composites containing layered fillers modified with ionic liquids, Materials Science Forum 714, 73 (2012).
7. Laskowska A., Marzec A., Boiteux G., Zaborski M., Gain O., Serghei A. Effect of imidazolium ionic liquid type of nitrile rubber composites, Polymer International 62, 1575 (2013). (IF=2.247)
8. Laskowska A., Zaborski M., Boiteux G., Gain O., Marzec A., Maniukiewicz W. Ionic Elastomers Based on Carboxylated Nitrile Rubber (XNBR) and Magnesium-aluminum Layered Double Hydroxide (Hydrotalcite), Express Polymer Letters 8, 374 (2014). (IF=2.953)
9. Laskowska A., Zaborski M., Boiteux G., Gain O., Marzec A., Maniukiewicz W. Effects of unmodified layered double hydroxides MgAl−LDHs with various structures on the properties of filled carboxylated acrylonitrile−butadiene rubber XNBR, European Polymer Journal 60, 172 (2014). (IF=3.242)
10. Laskowska A., Marzec A., Zaborski M., Boiteux G. Reinforcement of carboxylated acrylonitrile−butadiene rubber (XNBR) with graphene nanoplatelets with varying surface area, Journal of Polymer Engineering, DOI: 10.1515/polyeng−2013−0149 (2014). (IF=0.5)
11. Laskowska A., Marzec A., Boiteux G., Zaborski M., Gain O., Serghei A. Properties of carboxylated nitrile rubber/hydrotalcite composites containing imidazolium ionic liquids, Macromolecular Symposia 341, 7 (2014).
12. Laskowska A., Marzec A., Boiteux G., Zaborski M., Gain O., Serghei A., Maniukiewicz W. Improved Ionic conductivity of carboxylated nitrile rubber/LDH composites by adding imidazolium bis(trifluoromethylsulfonyl)imide ionic liquids, Macromolecular Symposia 342, 35 (2014).
Chapter 7. List of publications
174
13. Marzec A., Laskowska A. Boiteux G., Zaborski M., O. Gain, Serghei A. The impact of imidazolium ionic liquids on the properties of nitrile rubber composites, European Polymer Journal 53, 139 (2014). (IF=3.242)
14. Marzec A., Laskowska A., Boiteux G., Zaborski M., Gain O., Serghei A. Investigations of nitrile rubber composites containing imidazolium ionic liquids, Macromolecular Symposia 341, 18 (2014).
15. Marzec A., Laskowska A., Boiteux G., Zaborski M., Gain O., Serghei A. Study on weathering aging of nitrile rubber composites containing imidazolium ionic liquids, Macromolecular Symposia 342, 25 (2014).
BOOK’S CHAPTERS
1. Laskowska A., Zaborski M., Naturalne krzemiany warstwowe jako napełniacze nanokompozytów elastomerowych. Na Pograniczu Chemii i Biologii, Wydawnictwo Naukowe UAM 2009, ISBN 978-83-232-2114-2.
2. Laskowska A., Zaborski M., Syntetyczne związki hydrotalkitowe jako napełniacze w kompozytach polimerowych. Na Pograniczu Chemii i Biologii, Wydawnictwo Naukowe UAM 2010, ISBN 978-83-232-2254-5.
PATENT
1. Zaborski M., Lipińska M., Laskowska A., „Kompozycja elastomerowa przeznaczona na wyroby gumowe o podwyższonych właściwościach wytrzymałościowych i odporności na działanie cieczy organicznych” – eng. „Elastomeric composition intended for rubber products with improved robustness and resistance to organic liquids” P-392914, 10.11.2010.
PATENT APPLICATION
1. Laskowska A., Zaborski M., Marzec A., „Kompozycja elastomerowa przeznaczona na wyroby gumowe wykazujące właściwości termochromowe”, eng. “Elastomer composition intended for rubber products exhibiting thermochromic properties”. Date of notification: 12.06.2014 P.408535.
2. Marzec A., Zaborski M., Boruszczak Z., Laskowska A., „Kompozycja elastomerowa przeznaczona do produkcji materiałów o podwyższonej odporności na starzenie klimatyczne i UV”, eng. „Elastomeric composition intended for rubber products with increased resistance to climatic aging and UV aging”. Date of notification: 12.05.2014 P. 408194.
ORAL PRESENTATIONS (CONFERENCES)
1. VII Ogólnopolskie Seminarium Doktorantów „Na pograniczu biologii i chemii”, June 7th – 10th 2009, Szklarska Poręba, Poland. Laskowska A., Zaborski M. Naturalne minerały warstwowe jako napełniacze elastomerów.
Chapter 7. List of publications
175
2. VIII Ogólnopolskie Seminarium Doktorantów „Na pograniczu biologii i chemii” April 24th – 27th 2010, Jamorozowa Polana, Poland. Laskowska A., Zaborski M. Minerały warstwowe jako napełniacze elastomerów.
3. 4th International Seminar on Modern Polymeric Materials for Environmental Applications, December 1st – 3rd 2010, Cracow, Poland. Laskowska A., Lipińska M., Zaborski M. Effect of the type of layered mineral on the mechanical and thermal properties of carboxylated butadiene-acrylonitrile rubber.
4. 4th International Scientific and Technical Conference on Carbon Materials and Polymer Composites, November 7th – 10th 2011, Ustroń, Poland. Laskowska A., Lipińska M., Zaborski M. Application of graphene in polymer composites.
5. Rouen Symposium on Advanced Materials – 2013, ROSAM June 5th − 7th 2013, University of Rouen, France. Boiteux G., Laskowska A., Marzec A., Gain O., Serghei A., Melis F., Zaborski M., Effects of imidazolium ionic liquids additives on different properties of nitrile rubber composites.
6. EUPOC 2013, Polymers and Ionic Liquids September 1st – 5th 2013, Gargnano, Italy. Boiteux G., Laskowska A., Marzec A., Zaborski M., Gain O., Serghei A. Investigations of nitrile rubber composites containing imidazolium ionic liquids.
7. MACRO 2014, July 6th − 11th 2014, Chiang Mai, Thailand. Laskowska A., Marzec A., Zaborski M., Boiteux G., Gain O., Serghei A. Applications of room temperature ionic liquids in carboxylated nitrile rubber/layered double hydroxides XNBR/MgAl-LDH composites.
POSTER PRESENTATIONS (CONFERNCES)
1. XXXIV Chemistry for Agriculture, November 29th – December 12th 2009, Karpacz, Poland. Laskowska A., Zaborski M., Hektoryt - naturalny minerał warstwowy jako napełniacz elastomerów.
2. Czwartorzędowe Sole Amoniowe I Obszary Ich Zastosowania w Gospodarce, July 1st – 2nd 2010, Poznań, Poland. Laskowska A., Lipinska M., Zaborski M., Wpływ napełniaczy warstwowych zmodyfikowanych cieczami jonowymi na właściwości elastomerów.
3. XXXVI Chemistry for Agriculture, November 27th – 30th 2011, Karpacz. Poland. Laskowska A., Lipinska M., Zaborski M., Wpływ mineralnych napełniaczy warstwowych na właściwości elastomerów.
4. 6th International Conference on Modification. Degradation and Stabilization of Polymers (MoDeSt 2010), September 5th – 9th 2010, Athens, Greece. Laskowska A., Zaborski M., Ageing characteristic of elastomer composites filled with layered mineral.
5. Multiphase Polymers and Polymer Composites: from Nanoscale to Macro Compsites, June 7th – 10th 2011, Paris-Est. Creteil University, France. Laskowska A., Lipinska M., Zaborski M., The properties of nitrile-carboxylated elastomer filled with hydrotalcites varying in Mg/Al ratio.
6. 14th International Science & Technology Conference ELASTOMERS 2011 "Elastomers - innovation and sustainable development", November 23rd – 25th 2011, Warsaw, Poland. Marzec A., Laskowska A., Salaeh S., Zaborski M., Nakason C., Cassagnau P., Gain O.,
Chapter 7. List of publications
176
Serghei A., Boiteux G., Relationship between chemical structure and dielectric properties of polar elastomers.
7. 3rd International Multicomponent Polymer Conference, March 23rd – 25th 2012, Kottayam Kerala, India. Marzec A., Laskowska A., Zaborski M., Effect of different types of graphene and graphene loadings on the properties of nitrile rubber NBR and XNBR compounds.
8. 7th Conference Of The International Dielectric Society (BDS), September 3rd – 7th 2012, Leipzig, Germany. Boiteux G., Laskowska A., Marzec A., Serghei A., Gain O., Melis F., Zaborski M., Effect of imidazolium ionic liquid type on the properties of nitrile rubber composites.
9. 5th International Conference on Polymer Behavior, October 15th – 18th 2012, Averio, Portugal. Boiteux G., Laskowska A., Marzec A., Serghei A., Gain O., Melis F., Zaborski M., Effect of imidazolium ionic liquid type on the properties of nitrile rubber composites.
10. 7th International Conference on Modification, September 2nd – 6th 2012, Prague, Czech Republic. Laskowska A., G. Boiteux, Zaborski M., Effect of imidazolium ionic liquid type on the properties of carboxylated nitrile rubber/layered double hydroxide composite.
11. 7th International Discussion Meeting on Relaxation in Complex Systems, July 21st – 26th 2013, Barcelona, Spain. Boiteux G., Laskowska A., Marzec A., Zaborski M., Gain O., Serghei A., Cation effects in imidazolium ionic liquids on the performance of nitrile rubber composites.
12. Eurofillers 2013, August 25th – 29th 2013, Bratislava, Slovakia. Laskowska A., Marzec A., Boiteux G., Zaborski M., Gain O., Serghei A., Reinforcement of Carboxylated Acrylonitrile-Butadiene Rubber XNBR with Graphene Nanoplatelets with Varying Surface Area.
13. EUPOC 2013, Polymers and Ionic Liquids, September 1st – 5th 2013, Gargnano, Italy. Laskowska A., Marzec A., Boiteux G., Zaborski M., Gain O., Serghei A., Improved Ionic Conductivity of Carboxylated Nitrile Rubber XNBR/LDH Composites by Adding Imidazolium Ionic Liquids.
14. POLYCHAR 22 World Forum on Advanced Materials, April 7th – 11th 2014 Stellenbosch, South Africa. Laskowska A., Marzec A., Boiteux G., Zaborski M., Serghei A., Gain O., Enhanced ionic conductivity of carboxylated nitrile rubber/MgAl-LDH composites by adding imidazolium ionic liquids.
15. 8th Conference Of The International Dielectric Society (BDS) September 14th – 19th, 2014 Wisla, Poland. Boiteux G., Marzec A., Laskowska A., Zaborski M., Gain O., Serghei A., Application of imidazolium ionic liquids as conductivity and processing enhancers in the nitrile rubber composites.
ACHIEVMENTS
1. Lodz Marshall Scholarship for PhD students 2013. Financed project: "Elastomeric nanocomposites with enhanced functional properties containing layered fillers".
References
177
8. REFERENCES
[1] Donnet J.B., Comp. Sci. Technol. 63, 1085 (2003).
[2] Bokobza L., Leroy E.T., Lalanne V., Eur. Polym. J. 45, 996 (2009).
[3] Usuki A., Kawasumi M., Okada A., J. Mater. Res. 8, 1174 (1993).
[4] Yaya A., Agyei-Tuffour B., Dodoo-Arhin D., Nyankson E., Annan E., Konadu D.S., Sinayobye
E., Baryeh E.A., Ewels C.P., G.J.E.D.T. 1(2) 32, (2012).
[5] Flores A., Ania F., BaltaCalleja F.J., Polymer 50, 729 (2009).
[6] Hohenberger W., Fillers and Reinforcements/Coupling Agents, in Plastics Additives Handbook,
Ed. Zweifel H., Hanser, München (2001).
[7] Móczó J., Pukánszky B., J. Ind. Eng. Chem. 14, 535 (2008).
[8] Redhwi H.H., Siddiqui M.N., Andrady A.L., Hussain S., J. Nanomater.,
dx.doi.org/10.1155/2013/654716
[9] Frohlich J., Niedermeier W., Luginsland H.D., Composites: Part A 36, 449 (2005).
[10] Daudey S., Guy L. (Rhodia): Silica systems to modulate the compromise
reinforcement/hysteresis for the silica filled elastomers.
[11] Wypych G., Handbook of Fillers, Chem. Tech. Publischnig, New York (1999).
[12] Osman M.A., Atallah A., Kahr G., Suter U.W., J. Appl. Polym. Sci. 83, 2175 (2002).
[13] Functional Fillers for Plastics, Ed. Marino Xanthos, WILEY-VCH, Weinheim (2010).
[14] Schroder A., Kluppel M., Schuster R.H., Macromol. Mater. Eng. 292, 885 (2007).
[15] Wang M.J., Wolff S., Donnet J.B., Rubber Chem. Technol. 64, 714 (1991).
[16] Frohlich J., Niedermeier W., Luginsland H.D., Composites: Part A 36, 449 (2005).
[17] Kohls D.J., Beaucage G., Curr. Opin. Solid State Mater. Sci. 6, 183 (2002).
[18] Dierkes W.K., Tiwari M., Datta R.N., Talma A.G., Noordermeer J.W.M., Rubber Chem.
Technol. 83, 404 (2009).
[19] Wang M., Rubber Chem. Technol. 71, 521 (1998).
[20] Wolff S., Wang M.J., Rubber Chem. Technol. 65, 329 (1991).
[21] Sengupta R., Chakraborty S., Bandyopadhyay S., Dasgupta S., Mukhopadhyay R., Auddy K.,
Deur A.S., Polym. Eng. Sci. 47, 1956 (2007).
[22] Unalan I.U., Cerri G., Marcuzzo E., Cozzolino C.A., Farris S., RSC Adv. 4, 29393 (2014).
References
178
[23] Kotal M., Srivastava S.K., Bhowmick A.K., Polym. Int. 59, 2 (2010).
[24] Paul R.D., Roberson L.M., Polymer 49, 3187 (2008).
[25] Arroyo M., Lopez-Manchado M.A., Herrero B., Polymer 44, 2447 (2003).
[26] Sanchez T., Salagre P., Cesteros Y., Micro. Meso. Mat. 171, 24 (2013).
[27] Sabu T., Ranimol S., Rubber Nanocomposites: Preparation, Properties and Applications John
Wiley & Sons (Asia), Singapore (2010).
[28] Grim R.E., Applied Clay Mineralogy, McGraw-Hill, New York (1962).
[29] Nicolai T., Cocard S., Langmuir 16, 8189 (2000).
[30] Haraguchi K., JSRM 8, 2 (2012).
[31] Cason R., Lester L.W., Proc. Okla Acad. Sci. 57, 116 (1977).
[32] Kloprogge J.T., Komarneni S., Amonette J.E., Clays Clay Miner. 47, 529 (1999).
[33] Granquist W.T., Pollack S.S., Clays Clay Miner. 8, 150 (1959).
[34] Carrado K.A., Ind. Eng. Chem. Res. 31, 1654 (1992).
[35] Vicente I., Salagre P., Cesteros Y., Guirado F., Medina F., Sueiras J.E., Appl. Caly Sci. 43, 103
(2009).
[36] Pawar R.R., Patel H.A., Sethia G., Bajaj H.C., Appl. Clay Sci. 46, 109 (2009).
[37] Maiti M., Bhattacharya M., Bhowmick A.K., Rubber Chem. Technol. 81, 384 (2008).
[38] Sadhu S., Bhowmick A. K., Rubber Chem. Technol. 76, 860 (2003).
[39] Paiva B.L., Morales A.R., Diaz F., Appl. Clay Sci. 42, 8 (2008).
[40] Lopez-Manchado M.A., Arroyo M., Herrero B., Biagiotti J., J. Appl. Polym. Sci. 89, 1 (2003).
[41] Maiti M., Bhowmick A.K., J. Appl. Polym. Sci. 111, 1094 (2009).
[42] Bhattacharya M., Maiti M., Bhowmick A.K., Rubber Chem. Technol. 81, 782 (2008).
[43] Yu D.M., Jin H., Kim S.C., Macromol. Res. 18, 73 (2010).
[44] Basu D., Das A., Stockelhuber K.W., Wagenknecht U., Heinrich G., Prog. Polym. Sci. 39, 594
(2014).
[45] Reichle W.T., Solid State Ionics 22, 135 (1986).
[46] Frost R.L., Weier M.L., Kloprogge J.T., J. Raman Spectrosc. 34, 760 (2003).
[47] Cavani F., Trifiro F., Vaccari A., Catalysis Today 11, 173 (1991).
[48] Rives V., Layered double hydroxides: present and future, Nova Science Publishers, New York
(2001).
[49] Hintze-Bruening H., Troutier-Thuilliez A.L., Leroux F., Progr. Org. Coat. 64, 193 (2009).
[50] Wang Q., O’Hare D., Chem. Rev. 112(7), 4124 (2012).
[51] Noweck K., Diblitz K., Sohiefler J., Brasch A., Process for producing hydrotalcites and metal
oxides thereof. Patent No. US 6517795 B1 (2003).
[52] Giannini L., Lostritto A., Cipolletti V., Mauro M., Longo P., Guerra G., Appl. Clay Sci. 71, 27
(2013).
References
179
[53] Velu S., Suzuki K., Okazaki M., Osaki T., Tomura S., Ohashi F., Chem. Mater. 11, 2161
(1999).
[54] Bergaya F., Theng B.K.G., Lagaly G., Handbook of clay science. Developments of clay science,
vol 1. Elsevier, Amsterdam (2006).
[55] Wang L., Li B., Zhongqin H., Cao J., Appl. Clay Sci. 72, 138 (2013).
[56] Zhang Y., Evan J.R.G., Coll. Surf. A: Physicochem. Eng. Aspects 408, 71 (2012).
[57] Kovanda F., Jindova E., Lang K., Kubat P., Sedlakova Z., Appl. Clay Sci. 48, 260 (2010).
[58] Costantino U., Marmottini F., Nocchetti M., Vivani R., Eur. J. Inorg. Chem. 10, 1439 (1998).
[59] Beres A., Palinko I., Kiricsi I., Nagy J.B., Kiyozumi J., Mizukami F., Appl. Catal. A: General
182, 237 (1999).
[60] Costa F.R., Leuteritz A., Wagenknecht U., Jehnichen D., Häußler L., Heinrich G., Appl. Clay
Sci. 38, 153 (2008).
[61] Zhou C.H., Appl. Clay Sci. 48, 1 (2010).
[62] Xu Z.P., Zhang J., Adebajo M.O., Zhang Z.H.C., Appl. Clay Sci. 53, 139 (2011).
[63] Stamires D., O’Connor P., Jones W., Brady M., Process for producing anionic clay using
boehmite which has been peptized with an acid. US Patent 6,800,578 B2, 2004.
[64] Utracki L.A., Sepehr M., Boccaleri E., Polym. Adv. Technol. 18, 1 (2007).
[65] Carretero M.I., Pozo M., Appl. Clay Sci. 46, 73 (2009).
[66] Khan S.B., Liu C., Jang E.S., Akhtar K., Han, H., Mat. Let. 65, 2923 (2011).
[67] Hoyo C.D., Appl. Clay Sci. 36, 103 (2007).
[68] Orthman J., Zhu H.Y., Lu G.Q., Sep. Purif. Technol. 31, 53 (2003).
[69] Zhang L., Lin Y., Xu S., Li R., Zheng Z., Zhang F., Appl. Clay Sci. 48, 641 (2010).
[70] Bascialla G., Regazzoni A.E., Coll. Surf. A: Physicochem. Eng. Aspects 328, 34 (2008).
[71] Tang P., Feng Y., Li D., Dyes Pigments 90, 253 (2011).
[72] Yuan Y., Zhang Y., Shi W., Appl. Clay Sci. 53, 608 (2011).
[73] Ven L., Gemert M.L.M., Batenburg L.F., Keern J.J., Gielgens L.H., Koster T.P.M., Fischer.
H.R., Appl. Clay Sci. 17, 25 (2000).
[74] Feng Y., Tang P., Xi J., Jiang Y., Li D., Recent Pat Nanotechnol. 6(3), 231 (2012).
[75] Costa F.R., Wagenknecht U., Heinrich G., Polym. Deg. Stab. 92, 1813 (2007).
[76] Nyambo C., Chen D., Su S., Wilkie C.A., Polym. Deg. Stab. 94, 496 (2009).
[77] Cui W., Jiao Q., Zhao Y., Li H., Liu H., Zhou M., Express Polym. Lett. 6, 485 (2012).
[78] Costa F.R., Leuteritz A., Wagenknecht U., Landwehr M.A., Jehnichen D., Haeussler L.,
Heinirich G., Appl. Clay Sci. 44, 7 (2009).
[79] Filho J.F.N., Leroux F., Verney V., Valim J.B., Appl. Clay Sci. 55, 88 (2012).
[80] Poli A.L., Batista T., Schmitt C.C., Gessner F., Neumann M.G., J. Coll. Int. Sci. 325, 386
(2008).
References
180
[81] Costa F.R., Pradhan S., Wagenknecht U., Bhowmick A.K., Heinrich G., J. Polym. Sci. Part B:
Polym. Phys. 48, 2302 (2010).
[82] Pradhan B., Srivastava S.K., Ananthakrishnan R., Saxena A., Appl. Clay Sci. 119, 343 (2011).
[83] Das A., Costa F.R., Wagenknecht U., Heinrich G., Eur. Polym. J. 44, 3456 (2008).
[84] Costantino U., Gallipoli A., M. Nocchetti, G. Camino, F. Bellucci, A. Frache, Polym. Deg. Stab.
90, 586 (2005).
[85] Bocchini S., Morlat-Therias S., Gardette J.L., Camino G., Eur. Polym. J. 44, 3473 (2008).
[86] Huang S., Cen X., Zhu H., Yang Z., Yang Y. , Tjiu W.W., Liu T., Mater. Chem. Phys. 130, 890
(2011).
[87] Ven L., Gemert M.L.M., Batenburg L.F., Keern J.J., Gielgens L.H., Koster T.P.M., Fischer
H.R., Appl. Clay Sci. 17, 25 (2000).
[88] Nyambo C., Kandare E., Wang D., Wilkie C.A., Polym. Deg. Stab. 93, 1656 (2008).
[89] Guo X., Zhao L., Zhang L., Li J., Appl. Clay Sci. 258, 2404 (2012)
[90] Nyambo C., Kandare E., Wilkie C.A., Polym. Deg. Stab. 94, 513 (2009).
[91] Liao C.S., Ye W.B., J. Polym. Res. 10, 241 (2003).
[92] Sorrentino A., Gorrasi G., Tortora M., Vittoria V., Costantino U,, Fabio Marmottini F., Padella
F., Polymer 46, 1601 (2005).
[93] Martínez-Gallegos S., Herrero M., Barriga C., Labajos F.M., Rives V., Appl. Clay Sci. 45, 44
(2009).
[94] Becker C.M., Gabbardo A.D., Wypych F., Amico S.C., Composites: Part A 42, 196 (2011).
[95] Das A., Wang D.Y., Leuteritz A., Subramaniam K. H., Greenwell C., Wagenknecht U.,
Heinrich G., J. Mater. Chem. 21, 7194 (2011).
[96] Pradhan S., Costa F.R., Wagenknecht U., Jehnichen D., Bhowmick A.K., Heinrich G., Eur.
Polym. J. 44, 3122 (2008).
[97] Thakur V., Das A., Mahaling R.N., Rooj S., Gohs U., Wagenknecht U., Heinrich G., Macromol.
Mater. Eng. 294, 561 (2009).
[98] Laskowska A., Lipinska M., Zaborski M., Przem. Chem. 90, 878 (2011).
[99] Acharya H., Srivastava S.K., Bhowmick A.K., Comp. Sci. Tech. 67, 2807 (2007).
[100] Acharya H., Srivastava S.K, Bhowmick A.K., Nanoscale Res. Lett. 2, 1 (2007).
[101] Kumar S., Das C.K., Elastomery 4, 15 (2010).
[102] Kumar B., Rana S., Singh R.P., Express Polym. Lett. 1, 748 (2007).
[103] Guo S., Zhang C., Peng H., Wang, W., Liu, T., Comp. Sci. Technol. 71, 791 (2011).
[104] Das A., George J.J., Kutlu B., Leuteritz A., Wang D.Y., Rooj S., Jurk R., Rajeshbabu R.,
Stöckelhuber K.W., Galiatsatos V., Heinrich G., Macromol. Rapid Commun. 33, 337 (2012).
[105] Kotal M., Srivastava S.K., Int. J. Plast. Technol. 15, 61 (2011).
References
181
[106] Liu Z.P., Ma R.Z., Osada M., Iyi N., Ebina Y., Takada K., Sasaki T., J. Am. Chem. Soc. 128,
4872 (2006).
[107] Pradhan B., Srivastava S.K., Bhowmick A.K., Saxena A., Polym. Int. 61, 458 (2011).
[108] Pradhan B., Srivastava S.K., Composites Part A: Appl. Sci. Manufacturer. 56, 290 (2014).
[109] Brown H.P., Carboxylic elastomers. Rubber Chem. Technol. 30, 1347 (1957).
[110] Laskowska A., Zaborski M., Boiteux G., Gain O., Marzec A., Maniukiewicz W., Express
Polym. Lett. 8, 374 (2014).
[111] Basu D., Das A., George J.J., Wang D.Y., Stockelhuber W., Wagenknecht U., Leuteritz A.,
Kutlu B., Reuter U., Heinrich G., Rubber Chem. Technol. (2014). DOI: 10.5254/rct.14.86920
[112] Basu D., Das A., Stockelhuber K., Jehnichen D., Formanek P., Sarlin E., Vuorinen J., Heinrich
G., Macromolecules 47, 3436 (2014).
[113] Wang G., Shen X., Wang B., Yao J., Park J., Carbon 47, 1359 (2009).
[114] Bunch J.S., Zande A.M., Verbridge S.S., Frank I.W., Tanenbaum D.M., Parpia J.M., Science
315, 490 (2007).
[115] Vadukumpully S., Paul J., Valiyaveettil S., Carbon 47, 3288 (2009).
[116] Kovtyukhova N.I., Ollivier P.J., Martin B.R., Mallouk T.E., Chizhik S.A., Buzaneva E.V.,
Chem. Mater. 11, 771 (1999).
[117] Viculis L.M., Mack J.J., Mayer O.M., Hahn H.T., Kaner R.B., Nat. Nanotechnol. 12, 45
(2006).
[118] Takamura T., Endo K., Fu L., Wu Y., Lee K., Matsumoto T., Eletrochim. Acta 53, 1055
(2007).
[119] Novoselov K.S., Jiang D., Booth T., Khotkevich V.V., Morozov S.M., Geim A.K., Proc. Natl.
Acad. Sci. USA 102, 10451 (2005).
[120] Liu Z., Robinson J.T., Sun X.M., Dai H.J., J. Am. Chem. Soc. 1, 10876 (2008).
[121]Watcharotone S., Dikin D.A., Stankovich S., Piner R., Jung I., Dommett G.H.B., Evmenenko
G., Wu S.E., Chen S.F., Liu C.P., Nguyen S.T., Ruoff R.S., Nano Lett. 7, 1888 (2007).
[122] Hong W., Xu Y., Lu G., Li C., Shi G., Electrochem. Commun. 10, 1555 (2008).
[123] Menes O., Cano M., Benedito A., Gimenez E., Castell P., Maser W.K., Benito A.M., Comp.
Sci. Technol. 72, 1595 (2012).
[124] Di C.A., Wei D.C., Yu G., Liu Y.Q., Guo Y.L., Zhu D.B., Adv. Mater. 20, 3289 (2008).
[125] Liu Z.F., Liu Q., Huang Y., Ma Y.F., Yin S.G., Zhang X.Y., Adv. Mater. 20, 3924 (2008).
[126] Ang P.K., Chen W., Wee A.T.S., Loh K.P., J. Am. Chem. Soc. 130, 14392 (2008).
[127] Hu H., Liu Y., Wang Q., Zhao J., Liang Y., Mater. Lett. 65, 2582 (2011).
[128] Heer W.A., Berger C., Wu X.S., First P.N., Conrad E.H., Li X.B., Solid State Commun. 143,
92 (2007).
[129] Hummers W.S., Offeman R.E., J. Am. Chem. Soc. 80, 1339 (1958).
References
182
[130] Nethravathi C., Rajamathi J.T., Ravishankar N., Shivakumara C., Rajamathi M., Langmuir 24,
8240 (2008).
[131] Kuilla T., Bhadrab S., Yaoa D., Kimc N.H., Bosed S., Leea J.H., Progr. Polym. Sci. 35, 1350
(2010).
[132] Buchsteiner A., Lerf A., Pieper Jr A., J. Phys. Chem. 110, 22328 (2006).
[133] Potts J.R., Dreyer D.R., Belawski C.W., Ruoff R.S., Polymer 52, 5 (2011).
[134] Park S., An J.H., Jung I.W., Piner R.D., An S.J., Li X.S., Nano. Lett. 9, 1593 (2009).
[135] Ruess V.G., Vogt F., Monatsh. Chem. 78, 222 (1948).
[136] Singh V., Joung D., Zhai L., Das S., Khondaker S.I., Seal S., Science 56, 1178 (2011).
[137] Stankovich S., Dikin D.A., Piner R.D., Kohlhaas K.A., Kleinhammes A., Jia Y., Carbon 45,
1558 (2007).
[138] Becerril H.A., Man J., Liu Z., Stoltenberg R.M., Bao Z., Chen Y., ACS Nano 2, 463 (2008).
[139] Schniepp H.C., Li J.L., McAllister M.J., Sai H., Herrera-Alonso M., Adamson D.H., J. Phys.
Chem. 110, 8535 (2006).
[140] McAllister M.J., Li J.L., Adamson D.H., Schniepp H.C., Abdala A.A., Liu J., Chem. Mater.
19, 4396 (2007).
[141] Kim H., Kobayashi S., AbdurRahim M.A., Zhang M.J., Khusainova A., Hillmyer M.A.,
Abdala A.A., Macosko C.W., Polymer 52, 1837 (2011).
[142] Mahmoud W.E., Eur. Polym. J. 47, 1534 (2011).
[143] Eda G., Fanchini G., Chhowalla M., Nature Nanotechnol. 3, 270 (2008).
[144] Shin H.J., Sim K.K., Benayad A., Yoon S.M., Park H.K., Jung I.S., Adv. Funct. Mater. 19,
1987 (2009).
[145] Wang S., Chia P.J., Chua L.L., Zhao L.H., Png R.Q., Sivaramakrishnan S., Adv. Mater. 20,
3440 (2008).
[146] Wu Z.S., Ren W., Gao L., Liu B., Jiang C., Cheng H.M., Carbon 47, 493 (2009).
[147] Fan X., Peng W., Li Y., Li X., Wang S., Zhang G., Adv. Mater. 20, 4490 (2008).
[148] Wissert R., Steurer P., Schopp S., Thomann R., Mulhaupt R., Macromol. Mater. Eng. 295,
1107 (2010).
[149] Si Y., Samulski E.T., Nano Lett. 8, 1679 (2008).
[150] Fan Z.J., Kai W., Yan J., Wei, T., Zhi L.J., Feng J., Ren Y.M., Song L.P., Wei F., ACS Nano 5,
191 (2011).
[151] Niyogi S., Bekyarova E., Itkis M.E., McWilliams J.L., Hamon M.A., Haddon R.C.,
J. Am. Chem. Soc. 128, 7720 (2006).
[152] Stankovich S., Piner R.D., Nguyen S.T., Ruoff R.S., Carbon 44, 3342 (2006).
[153] Liu N., Luo F., Wu H., Liu Y., Zhang C., J. Chem. Adv. Funct. Mater. 18, 1518 (2008).
[154] Sadasivunia K.K., Ponnammab D., Thomas S., Grohensa Y. Prog. Polym. Sci. 39, 749 (2014).
References
183
[155] Tung V.C., Allen M.J., Yang Y., Kaner R.B., Nat. Nanotechnol. 4, 25 (2009).
[156] Soldano C., Mahmood A., Dujardin E., Carbon 48, 2127 (2010).
[157] Yavari F., Rafiee M.A., Rafiee J., Yu Z.Z., Koratkar N., ACS, Appl. Mater. Interfaces 2, 2738
(2010).
[158] Chen B., Ma N., Bai X., Zhang H., Zhang Y., RSC Adv. 2, 4683 (2012).
[159] Bai X., Wan C., Zhang Y., Zhai Y., Carbon 49, 1608 (2011).
[160] Mowes M.M., Fleck F., Kluppel M., Rubber Chem. Technol. 87, 70 (2014).
[161]Varghese T.V., Kumar H.A., Anitha S., Ratheesh S., Rajeev R.S., Rao V.L., Carbon 61, 476
(2013).
[162] Das A., Kasaliwal G.R., Jurk R., Boldt R., Fischer D., Stöckelhuber K.W., Heinrich G., Comp.
Sci. Technol. 72, 1961 (2012).
[163] Wang J., Jia H., Tang Y., Ji D., Sun Y., Gong X., Ding L., J. Mater. Sci. 48, 1571 (2013).
[164] Wu J., Xing W., Huang G., , Li H., Tang M., Wu S., Liu Y., Polymer 54 , 3314 (2013).
[165] Ogihara W., Kosukegawa H., Ohno H., Chem. Commun. 3637 (2006).
[166] Anjan S.T., Chem. Eng. Prog. 102 , 30 (2006).
[167] Moosavi F., The Structure of Supported Ionic Liquids at the Interface, Ionic Liquids - New
Aspects for the Future, Ed. Jun-ichi Kadokawa, InTech (2013).
[168] Plechkova N.V., Seddona K.R., Chem. Soc. Rev. 37, 123 (2008).
[169] Giernoth R., Angew. Chem. Int. Ed. 49, 2834 (2010).
[170] Fraser K.J., MacFarlane D.R., Aust. J. Chem. 62, 309 (2009).
[171] Huddleston J.G., Visser A.E., Reichert W.M., Willauer H.D., Broker G.A., Rogers R.D.,
Green Chem. 3, 156 (2001).
[172] Pensado A.S., Malberg F., Costa M.F, Agılio G., Padu A.H., Fernandez J., Kirchner B., RSC
Adv. 4, 18017 (2014).
[173] Rodgers R.D., Seddon K.R., Science 302, 792 (2003).
[174] Kubisa P., Prog. Polym. Sci. 29, 3 (2004).
[175] Zhu S., Wu Y., Chen Q., Yu Z., Wang C., Jin S., Ding Y., Wu G., Green Chem. 8, 325 (2006).
[176] Gordon C.M., Appl. Catal. 222, 101 (2001).
[177] Lu X., Hu J., Yao X., Wang Z., Li J., Biomacromolecules 7, 975 (2006).
[178] Lua J., Yana F., Texter J., Prog. Polym. Sci. 34, 431 (2009).
[179] Lu W., Fadeev A.G., Qi B., Smela E., Mattes B.R., Ding J., Spinks G.M., Mazurkiewicz J.,
Zhou D., Science 297, 983 (2002).
[180] Gorlov M., Kloo L., Dalton Trans 2655 (2008).
[181] Lu W., Norris I.D., Mattes B.R., Aust. J. Chem. 58, 263 (2005).
[182] Balducci A., Henderson W.A., Mastragostino M., Passerini S., Simon P., Soavi F.,
Electrochim. Acta 50, 2233 (2005).
References
184
[183] Lewandowski A., Swiderska A., Solid State Ionics 161, 243 (2003).
[184] Howlett P.C., Brack N., Hollenkamp A.F., Forsyth M., MacFarlane D.R.,
J. Electrochem. Soc. 153, A595 (2006).
[185] Gilmore B.F., Andrews G.P., Borberly G., Earle M.J., Gilea M.A., Gorman S.P., Lowry A.F.,
McLaughlina M., Seddon K.R., New J. Chem. 37, 873 (2013).
[186] Somers A.E., Howlett P.C., MacFarlane D.R., Forsyth M., Lubricants 1, 3 (2013).
[187] Allan D., Baston G., Bradley A.E., Gorman T., Haile A., Hamblett I., Hatter J.E., Heasley
M.J.F., Hodgson B., Lewin R., Lovell K.V., Newton B., Pitner W.R., Rooney D.W., D.
Sanders, Seddon K.R., Sims H.E., Thied R.C., Green Chem. 2, 152 (2002).
[188] Weyershausen B., Lehmann K., Green. Chem. 7, 15 (2005).
[189] Bermudez M.D., Jimenez A.E., Sanes J., Carrion F.J., Macromolecules 14, 2888 (2009).
[190] Lei Y., Tang Z., Zhu L., Guo B., Jia D., Polymer 52, 1337 (2011).
[191] Pernak J., Walkiewicz F., Maciejewska M., Zaborski M., Ind. Eng. Chem. Res. 49, 5012
(2010).
[192] Przybyszewska M., Zaborski M., Appl. Clay Sci. 116, 155 (2010).
[193] Maciejewska M., Walkiewicz F., Zaborski M., Ind. Eng. Chem. Res. 52 (25), 8410 (2013).
[194] Antistatic coating composition, antistatic film coated with the same and method for
manufacturing the antistatic film thereof, Patent US 2013/0178551 A1.
[195] Iwata T., Tsurumaki A., Tajima S., Ohno H., Macromol. Mater. Eng. (2013), DOI:
10.1002/mame.201300333.
[196] Roessler A., Schottenberger H., Prog. Org. Coat. 77, 579 (2014).
[197] Marwanta E., Mizumo T., Ohno H., Solid State Ionics 178, 227 (2007).
[198] Donato K.Z., Donato R.K., Matejka L., Schrekker H.S., Mauler R.S., Poster entitled:
Thermoplastic nanocomposites with silica/ionic liquid hybrid fillers, Frontiers in Polymer
Science 2013, 21st – 23rd May 2013, Spain.
[199] Wilkes J.S., Levisky J.A., Wilson R.A., Hussey C.L., Inorg. Chem. 21, 1263 (1982).
[200] Fannin A.A., Floreani D.A., King L.A., Landers J.S., Piersma B.J., Stech D.J., Vaughn R.L.,
Wilkes J.S., Williams J.L., J. Phys. Chem. 88, 2614 (1984).
[201] Schmidt R., Energy Fuels 22, 1774 (2008).
[202] Zheng Y., Dong K., Wang Q., Zhang J., Lu X., J. Chem. Eng. Data 58, 32 (2013).
[203] Murphy, V., World Patent 00/32658, 2000.
[204] Ochędzan-Siodłak W., Pawelska P., Polimery 53(5), 371 (2008).
[205] Jiang, T.; Chollier Brym, M. J.; Dubé, G.; Lasia, A., Brisard, G. M. Surf. Coat. Technol. 201, 1
(2006).
[206] Ochedzan-Siodlak W., Sacher-Majewska B., Eur. Polym. J. 43, 3688 (2007).
References
185
[207] Ochedzan-Siodlak W., Dziubek K., Siodlak D., Eur. Polym. J. 44, 3608 (2008).
[208] Qiao C.Z., Zhang Y.F., Zhang J.C., Li C.Y., Appl. Catal. A: General 276, 61 (2004).
[209] De Castro C., Sauvage E., Valkenburg, M.H., Holderich W.F., J. Catal. 196, 86 (2000).
[210] Tsuda T., Hussey C.L., The Electrochemical Society Interface 16(1), 42 (2007).
[211] Xing D.Y., Peng N., Chung T.S., J. Membr. Sci. 380, 87 (2011).
[212] Gyenge E.L., Oloman C.W., J. Appl. Electrochem. 33, 665 (2003).
[213] MacFarlane D.R., Golding J., Forsyth S., Forsyth M., Deacon G.B., Chem. Commun. 280,
1430 (2001), MacFarlane D.R., Forsyth S.A, Golding J., Deacon G.B., Green Chem. 4, 444
(2002).
[214] Pringle J.M., Golding J., Forsyth C.M., Deacon G.B., Forsyth M., MacFarlane D.R., Mater.
Chem. 12, 3475 (2002).
[215] Panzer R.E., Schaer M.J., J. Electrochem. Soc. 11(112), 1136 (1965).
[216] Cataldo F., Polyhedron, 11(1), 79 (1992).
[217] Sun G., Li K., Sun C., J. Power Sources 162, 1444 (2006).
[218] Morita M., Aoki S., Matsuda Y., J. Appl. Electrochem. 37, 119 (1992).
[219] Larriba M., Navarro P., García J., Rodríguez F., Chemical Engineering Transactions 32, 1957
(2013).
[220] Jongmans M.T.G., Schuur B., Haan A.B., J. Chem. Thermodyn. 47, 234 (2012).
[221] Xing D.Y., Peng N., Chung T.S., J. Membrane Sci. 380, 87 (2011).
[222] Bonhote P., Dias A.P., Papageorgiou N., Kalyanasundaram K., Gratzel M., Inorg. Chem. 35,
1168 (1996).
[223] MacFarlane D.R., Forsyth S.A., Golding J., Deacon G.B., Green Chem. 4, 444 (2002).
[224] Yoshida Y, Baba O., Saito G., J. Phys. Chem. B 111, 4742 (2007).
[225] Beigi A.A.M., Abdouss M., Yousefi M., Pourmortazavi S.M., Vahid A., J. Mol. Liq. 177, 361
(2013).
[226] Tokuda H., Hayamizu K., Ishii K.K., Susan A.B.H., Watanabe M., J. Phys. Chem. B 109, 6103
(2005).
[227] Fitchett B.D., Rollins J.B., Conboy J.C., J. Electrochem. Soc. 152, 251 (2005).
[228] Likozar B., Soft. Matter. 7, 970 (2011).
[229] Subramaniam K., Das A., Heinrich G., Comp. Sci. Technol. 71, 1441 (2011).
[230] Subramaniam K., Das A., Haussler L., Harnish C., Stockelhuber K.W., Heinrich G., Polym.
Degrad. Stab. 97, 776 (2012).
[231] Subramaniam K., Das A., Steinhauser D., Kluppel M., Heinrich G., Eur. Polym. J. 47, 2234
(2011).
[232] Steinhauser D., Subramaniam K., Das A., Heinrich G., Kluppel M., Express Polym. Lett. 11,
927 (2012).
References
186
[233] Subramaniam K., Das A., Heinrich G., Compos. Sci. Technol. 74, 14 (2013).
[234] Le H.H., Hoang X. T., Das A., Gohs U., Stoeckelhuber K.W., Boldt R., Heinrich G., Adhikari
R., Radush H.J., Carbon 50, 4543 (2012).
[235] Cho M., Seo H., Nam J., Choi H., Koo J., Lee Y., Sens. Actuators B 128, 70 (2007).
[236] Marwanta E., Mizumo T., Nakamura N., Ohno H., Polymer 46, 3795 (2005).
[237] Laskowska A., Marzec A., Boiteux G., Zaborski M., Gain O., Serghei A., Polym. Int. 62, 1575
(2013).
[238] Marzec A., Laskowska A., Boiteux G., Zaborski M., Gain O., Serghei A., Eur. Polym. J. 53,
139 (2014).
[239] Subramaniam K., Das A., Simon F., Heinrich G., Eur. Polym. J. 49, 345 (2013).
[240] Likozar B., Nanotechnology 17, 35 (2010).
[241] Maciejewska M., Zaborski M., J. Compos. 4, 2013. doi.org/10.1155/2013/286534
[242] Lei Y., Tang Z., Zhu L., Guo B., Jia D., J. Appl. Polym. Sci. 123, 1252 (2012).
[243] Lei Y.D., Tang Z.H., Guo B.C., Zhu L.X., Jia D.M., Express Polym. Lett. 11, 692 (2010).
[244] Guo B., Liu X., Zhou W.Y., Lei Y., Jia D., J. Macromol. Sci. Part B: Physics 49, 1029 (2010).
[245] Das. A., Stoclekhuber K.W., Jurk R., Fritzsche J., Kluppel M., Heinrich G., Carbon 47, 3313
(2009).
[246] Kreyenschulte H., Richter S., Gotze T., Fischer D., Steinhauser D., Kluppel M., Heinrich G.,
Carbon 50, 3649 (2012).
[247] Laskowska A., Zaborski M., Przem. Chem. 89(4), 458 (2010).
[248] Maciejewska M., Krzywania-Kaliszewska A., Zaborski M., J. Chromatogr. A, 1257, 141
(2012).
[249] Keller D.S., Luner P., Colloid Surf. A 161 401 (2000).
[250] De Boer L.H., The Dynamic Character of Adsorption, Clerendon Press, Oxford (1953).
[251] Saada A., Papirer E., Balard H., Siffert B., J. Colloid Interface Sci. 175, 212 (1995).
[252] Voelkel A., Krysztafkiewicz A., Powder Technol. 95 103 (1998).
[253] Martin R.L., Anal. Chem. 33, 347 (1961).
[254] Dorris G.M., Gray D.G., J. Colloid Interface Sci. 77, 353 (1980).
[255] Brendlé E., Papirer E., Powders and Fibres–Interfacial Science and Applications (Surfactant
Science Series, vol. 137), Ed. Nardin M., Papirer E., CRC Press, Boca Raton, FL (2007).
[256] Donnet J.B., Balard H., Nedjari N., Hamdi B., Barthel H., Gottschalk-Gaudig T., J. Colloid
Interface Sci. 328 15 (2008).
[257] Donnet J.B., Park S.J., Carbon 29, 955 (1991).
[258] Voelkel A., Strzemiecka B., Adamska K., Milczewska K., J. Chromatogr. A 1216, 1551
(2009).
[259] Drago R.J., Vogel G.C., Needham T.E., J. Am. Chem. Soc. 93, 6014 (1971).
References
187
[260] Gutmann V., The Donor–Acceptor Approach to Molecular Interactions, Plenum Press, New
York, 1978.
[261] Brendlé E., Papirer E, Powders and Fibres –Interfacial Science and Applications, (Surfactant
Science Series, vol. 137), Ed. Nardin M., Papirer E., CRC Press, Boca Raton, FL (2007).
[262] Wolf S., Kautschuk Gummi. Kunststoffe 23, 7 (1970).
[263] Flory P.J., Rehner J., J. Chem. Phys. 11, 521 (1943).
[264] Lenko D., Schlogl S., Temel A., Schaller R., Holzner A., Kern W., Appl. Clay Sci. 129, 2735
(2013).
[265] Mandal U.K., Tripathy D.K., De S.K., Polymer 37, 5739 (1996).
[266] Przybyszewska M., Zaborski M., Express Polym. Lett. 3, 542 (2009).
[267] Rahul R., Satyarthi J.K., Srinivas D., Ind. J. Chem. 50 A, 1017 (2011).
[268] Kloprogge J.T., Hickey L., Ray L., J. Raman Spectrosc. 35, 967 (2004)
[269] Kuczynski J., Papirer E., Eur. Polym. J. 27 (1991) 653.
[270] Sahoo S., Bhowmick A.K., J. Appl. Polym. Sci. 106, 3077 (2007).
[271] Eisenberg A., Hird B., Moore R.B., Macromolecules 23, 4098 (1990).
[272] Ibarra L., Rodriguez A., Mora-Barrantes I., Polym. Int. 58, 218 (2009).
[273] Ibarra L., Alzorriz M., J. Appl. Polym. Sci. 87, 805 (2003).
[274] Ibarra L., Alzorriz M., J. Appl. Polym. Sci. 84, 605 (2002).
[275] Mandal U.K., Polym. Int. 49, 1653 (2000).
[276] Pirlot C., Willems I., Fonseca A., Nagy J.B., Delhalle J., Adv. Eng. Mater. 4, 109 (2002).
[277] Anthony P., De S.K., J. Macromol. Sci., Polym. Rev. C41, 41 (2001).
[278] Ibarra L., Alzorriz., J. Appl. Polym. Sci. 103, 1894 (2007).
[279] Eisenberg A., Macromolecules 3, 147 (1970).
[280] Pradhan B., Srivastava S.K., Bhowmick A.K., Saxena A., Polym. Int. 61, 458 (2012).
[281] Zhang Y., Liu Q., Zhang Q., Lu Y., J. Appl. Clay Sci. 50, 255 (2010).
[282] Ammala A., Hill A.J., Meakin P., Pas S.J., Turney T.W., J. Nanopart. Res. 4, 167 (2002).
[283] Haddad B., Villemin D., Belarbi E., J. Mater. Environ. Sci. 3 (2) 312 (2012).
[284] Kim H., Abdala A.A., Mocosko C.W., Macromolecules 43, 6515 (2010).


