Embed Size (px)
Citation preview

International Journal of Heat and Fluid Flow 30 (2009) 778–788
Contents lists available at ScienceDirect
International Journal of Heat and Fluid Flow
journal homepage: www.elsevier .com/locate / i jhf f
Effects of bubble size on heat transfer enhancement by sub-millimeter bubblesfor laminar natural convection along a vertical plate
Atsuhide Kitagawa *, Kenji Uchida, Yoshimichi HagiwaraDepartment of Mechanical and System Engineering, Kyoto Institute of Technology, Goshokaido-cho, Matsugasaki, Sakyo-ku, Kyoto 606-8585, Japan
a r t i c l e i n f o a b s t r a c t
Article history:Received 30 June 2008Received in revised form 19 December 2008Accepted 9 February 2009Available online 26 March 2009
Keywords:Heat transfer enhancementBubbleNatural convectionParticle tracking velocimetry
0142-727X/$ - see front matter � 2009 Elsevier Inc. Adoi:10.1016/j.ijheatfluidflow.2009.02.008
* Corresponding author. Tel.: +81 75 724 7324; faxE-mail address: [email protected] (A. Kitagawa).
Injection of sub-millimeter bubbles is considered a promising technique for enhancing natural convec-tion heat transfer for liquids. So far, we have experimentally investigated heat transfer characteristicsof laminar natural convection flows with sub-millimeter bubbles. However, the effects of the bubble sizeon the heat transfer have not yet been understood. The purpose of this study is to clarify the effects of thebubble size on the heat transfer enhancement for the laminar natural convection of water along a verticalheated plate with uniform heat flux. Temperature and velocity measurements, in which thermocouplesand a particle tracking velocimetry technique are, respectively used, are conducted to investigate heattransfer and flow characteristics for different bubble sizes. Moreover, two-dimensional numerical simu-lations are performed to comprehensively understand the effects of bubble injection on the flow near theheated plate. The result shows that the ratio of the heat transfer coefficient with sub-millimeter-bubbleinjection to that without injection ranges from 1.3 to 2.2. The result also shows that for a constant bubbleflow rate, the heat transfer coefficient ratio increases with a decrease in the mean bubble diameter. It isexpected from our estimation based on both experimental data and simulation results that this increaseresults from an increase in the advection effect due to bubbles.
� 2009 Elsevier Inc. All rights reserved.
1. Introduction
Natural convection along a heated plate requires no driven de-vices such as pumps and fans, and thus the use of natural convec-tion heat transfer provides cost savings and allows a high level ofsafety in heat exchanger systems. In the case of liquids, the naturalconvection heat transfer is seen in a wide variety of heat exchang-ers (e.g., electrical water heaters and solar water heaters) and cool-ing systems of small reactors. Details of the heat transfercharacteristics for natural convections of liquids, particularlywater, can be found in Vliet (1969), Lloyd et al. (1972), Shaukatul-lah and Gebhart (1978) and Inagaki and Komori (1995).
The use of dispersions (e.g., bubbles and particles) has beenconsidered a promising technique for enhancing natural convec-tion heat transfer. Tamari and Nishikawa (1976) and Tokuhiroand Lykoudis (1994a,b) investigated experimentally the effects ofgas-bubble injection on natural convection heat transfer along aheated vertical plate in a liquid. Each research group showed theheat transfer coefficient is significantly increased by mixing dueto gas-bubbles. However, the gas-bubble injection technique, inwhich a few-millimeter bubbles were used, required largeamounts of gas to increase the bubble number density in the vicin-ity of the heated vertical plate (e.g., a gas flow rate of
ll rights reserved.
: +81 75 724 7300.
900�9200 mm3/s was used in the study of Tokuhiro and Lykoudis(1994a)). The increase in the energy for injecting gas-bubbles intoa flow results in a decrease in the heat transfer gain. In contrast, wefocused on the relationship between the bubble size and the ther-mal boundary layer thickness and used sub-millimeter bubbles toenhance the heat transfer for laminar natural convection along aheated vertical plate. Consequently, it was found that at bubbleflow rates lower than 60 mm3/s, the heat transfer coefficient withsub-millimeter-bubble injection is up to 2.0 times that withoutinjection (Kitagawa et al. 2008). It was also found that the ratioof the heat transfer rate obtained with the sub-millimeter-bubbleinjection to the power consumption of the sub-millimeter-bubblegeneration was 3.5�5.5. These results clearly demonstrate thatsub-millimeter-bubble injection is a highly efficient technique forenhancing natural convection heat transfer. Moreover, the simulta-neous measurement of temperature and velocity showed that theheat transfer enhancement is deeply related to flow and tempera-ture modifications induced by bubble motions near the heatedplate (Kitagawa et al. 2008). From this result, we expect the heattransfer gain depends strongly on bubble size. Therefore, we needinformation on temperature and velocity measurements for differ-ent bubble sizes to obtain optimum conditions for natural convec-tion heat transfer enhancement.
The purpose of this study is to clarify the effects of the bubblesize on the heat transfer enhancement for laminar naturalconvection of water along a vertical heated plate. Temperature

Nomenclature
AH surface area of heated plateAst overall surface area of stainless-steel foild bubble equivalent diameterdm mean bubble diameterF Faraday constantFA ideal driving forceFCA, FCM, FCH advection, mixing and heat insulation effects due
to bubblesFC0 net increase in heat transfer coefficient due to bubble
injectiong gravitational accelerationhx heat transfer coefficient with bubble injectionhx0 heat transfer coefficient without bubble injectionhxA heat transfer coefficient obtained from numerical simu-
lations of natural convection with FA
I electrical currentix unit vector in x directionk thermal conductivityLx, Ly lengths of computational domain in x and y directionsl total length of stainless-steel foiln number of bubblesN sum of all nNux local Nusselt numberP power consumption of bubble generationp pressureQ bubble flow rate_Qe heat transfer rate obtained with bubble injectionqw wall heat flux
R0 universal gas constantRa�x modified Rayleigh numberRed bubble Reynolds numberS cross-section area of stainless-steel foilT temperatureu velocity vectoru mean velocity in x directionuL,max maximum liquid rise velocityv mean velocity in y directionx, y, z streamwise, wall-normal and spanwise directionsyp y location of peak in liquid rise velocity profile
Greek symbolsa thermal diffusivityb coefficient of volume expansionDx, Dy grid intervals in x and y directionsg heat transfer gainm kinematic viscosityh angle between stainless-steel plate and top plate of
bubble generatorq densityq0 specific electrical resistance of stainless-steel foil
SubscriptsG gasL liquidw wall condition1 ambient condition
Bubble generator
Tank
yz
x
Heated plate
Cooling plate
Temperature controller
DC power supply
Peltier cooling unit
Fig. 1. Schematic diagram of the experimental apparatus.
A. Kitagawa et al. / International Journal of Heat and Fluid Flow 30 (2009) 778–788 779
measurements using thermocouples and velocity measurementsusing a particle tracking velocimetry (PTV) technique are con-ducted to investigate heat transfer and flow characteristics for dif-ferent bubble sizes. Two-dimensional numerical simulations arealso conducted to examine the validity of experimental data andto comprehensively understand the effects of bubble injection onthe flow near the heated plate. Tap water is used for working fluidand hydrogen bubbles generated by electrolysis are used as thesub-millimeter bubbles.
2. Experimental setup
2.1. Experimental apparatus
A schematic diagram of the experimental apparatus is shown inFig. 1. This apparatus consists of a container made of 10 mm thicktransparent acrylic resin plates (1200 mm height, 140 mm width,150 mm depth), a bubble generator, a vertical plate with uniformheat flux, a DC power supply (Takasago, EX-375H), a cooling plate(Sensor Controls, CHP-77HI) and a temperature controller (Yama-take, FC-2410). The bubble generator is set at the bottom of thecontainer. The vertical plate with uniform heat flux, which is calledthe ‘‘heated plate” in the following, is attached to the inner side-wall of the container. The temperature of the ambient liquid is con-trolled using the cooling plate and temperature controller.
The container is filled with water of 20 �C to 50 mm from thetop and the water is thoroughly mixed. It is then left for at least10 min to reduce liquid disturbance. As an electrolyte for bubblegeneration, a small amount of salt is injected into the water. Thesalt concentration is approximately 0.3%, and it is therefore consid-ered that the physical properties of the liquid are the same as thoseof water. The x, y and z axes are, respectively, set along the stream-wise, wall-normal and spanwise directions. x = 0, y = 0 and z = 0 areset at the starting point of the heating section, at the surface of the
heated plate and at the center of the container in the spanwisedirection, respectively.
2.2. Bubble generator
Sub-millimeter bubbles used in this study are generated byelectrolysis. This generation method is the same as that in our pre-vious study and the advantages of this method can be seen inKitagawa et al. (2008). The bubble flow rate Q is defined as
Acrylic resin plate 1 Acrylic resin plate 2
Acrylic resin plate 3
Kapton tape
Stainless steel foil
Air
z
x
149 mm
914 mm 1200 mm
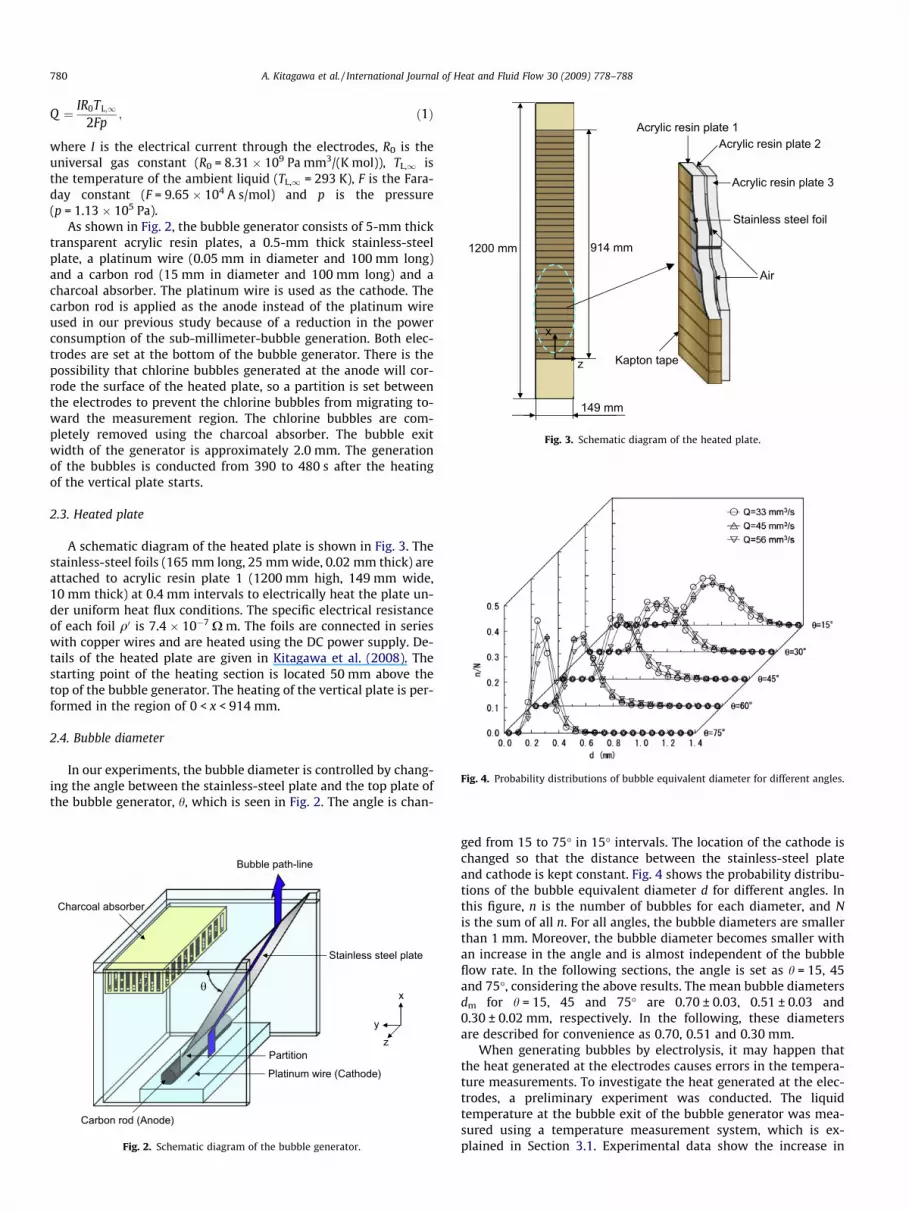
Fig. 3. Schematic diagram of the heated plate.
Fig. 4. Probability distributions of bubble equivalent diameter for different angles.
780 A. Kitagawa et al. / International Journal of Heat and Fluid Flow 30 (2009) 778–788
Q ¼ IR0TL;1
2Fp; ð1Þ
where I is the electrical current through the electrodes, R0 is theuniversal gas constant (R0 = 8.31 � 109 Pa mm3/(K mol)), TL,1 isthe temperature of the ambient liquid (TL,1 = 293 K), F is the Fara-day constant (F = 9.65 � 104 A s/mol) and p is the pressure(p = 1.13 � 105 Pa).
As shown in Fig. 2, the bubble generator consists of 5-mm thicktransparent acrylic resin plates, a 0.5-mm thick stainless-steelplate, a platinum wire (0.05 mm in diameter and 100 mm long)and a carbon rod (15 mm in diameter and 100 mm long) and acharcoal absorber. The platinum wire is used as the cathode. Thecarbon rod is applied as the anode instead of the platinum wireused in our previous study because of a reduction in the powerconsumption of the sub-millimeter-bubble generation. Both elec-trodes are set at the bottom of the bubble generator. There is thepossibility that chlorine bubbles generated at the anode will cor-rode the surface of the heated plate, so a partition is set betweenthe electrodes to prevent the chlorine bubbles from migrating to-ward the measurement region. The chlorine bubbles are com-pletely removed using the charcoal absorber. The bubble exitwidth of the generator is approximately 2.0 mm. The generationof the bubbles is conducted from 390 to 480 s after the heatingof the vertical plate starts.
2.3. Heated plate
A schematic diagram of the heated plate is shown in Fig. 3. Thestainless-steel foils (165 mm long, 25 mm wide, 0.02 mm thick) areattached to acrylic resin plate 1 (1200 mm high, 149 mm wide,10 mm thick) at 0.4 mm intervals to electrically heat the plate un-der uniform heat flux conditions. The specific electrical resistanceof each foil q0 is 7.4 � 10�7 X m. The foils are connected in serieswith copper wires and are heated using the DC power supply. De-tails of the heated plate are given in Kitagawa et al. (2008). Thestarting point of the heating section is located 50 mm above thetop of the bubble generator. The heating of the vertical plate is per-formed in the region of 0 < x < 914 mm.
2.4. Bubble diameter
In our experiments, the bubble diameter is controlled by chang-ing the angle between the stainless-steel plate and the top plate ofthe bubble generator, h, which is seen in Fig. 2. The angle is chan-
Carbon rod (Anode)
θ
Stainless steel plate
Partition
Platinum wire (Cathode)
yz
x
Bubble path-line
Charcoal absorber
Fig. 2. Schematic diagram of the bubble generator.
ged from 15 to 75� in 15� intervals. The location of the cathode ischanged so that the distance between the stainless-steel plateand cathode is kept constant. Fig. 4 shows the probability distribu-tions of the bubble equivalent diameter d for different angles. Inthis figure, n is the number of bubbles for each diameter, and Nis the sum of all n. For all angles, the bubble diameters are smallerthan 1 mm. Moreover, the bubble diameter becomes smaller withan increase in the angle and is almost independent of the bubbleflow rate. In the following sections, the angle is set as h = 15, 45and 75�, considering the above results. The mean bubble diametersdm for h = 15, 45 and 75� are 0.70 ± 0.03, 0.51 ± 0.03 and0.30 ± 0.02 mm, respectively. In the following, these diametersare described for convenience as 0.70, 0.51 and 0.30 mm.
When generating bubbles by electrolysis, it may happen thatthe heat generated at the electrodes causes errors in the tempera-ture measurements. To investigate the heat generated at the elec-trodes, a preliminary experiment was conducted. The liquidtemperature at the bubble exit of the bubble generator was mea-sured using a temperature measurement system, which is ex-plained in Section 3.1. Experimental data show the increase in

Table 1Experimental conditions.
Temperature measurementTemperature of ambient liquid TL,1 = 20.0 ± 0.1 �CBubble flow rate Q = 33, 45, 56 mm3/sWall heat flux qw = 533, 947, 1480 W/m2
Mean bubble diameter dm = 0.30, 0.51, 0.70 mmMeasurement position x = 70, 170, 270 mm, z = ±20 mm
Velocity measurementTemperature of ambient liquid TL,1 = 20.0 ± 0.1 �CBubble flow rate Q = 33, 56 mm3/sWall heat flux qw = 947 W/m2
Mean bubble diameter dm = 0.30, 0.51, 0.70 mmMeasurement position x = 170 mm, z = 20 mm
yz
x
Slit
Color CCD camera
Blue pass filter Line light guide
PCHalogen lights
Red pass filter
Cylindrical lens
Fig. 5. Schematic diagram of the two-phase velocity measurement system.
A. Kitagawa et al. / International Journal of Heat and Fluid Flow 30 (2009) 778–788 781
liquid temperature is less than 0.1 �C, and therefore the effect ofthe heat generated at the electrodes on the temperature field isconsidered negligible.
2.5. Experimental conditions
Table 1 shows the experimental conditions for each of the tem-perature and velocity measurements. In the velocity measure-ments, the wall heat flux qw and measurement position x arerespectively set as 947 W/m2 and 170 mm to allow detailed discus-sion of flow modifications by bubbles of different diameters andflow rates. qw is estimated from Eq. (2).
qw ¼q0lI2
SAst; ð2Þ
where l, S and Ast are the total length, cross-sectional area and over-all surface area of the stainless-steel foil, respectively. The depen-dency of the specific electrical resistance on temperature isignored because in our experiments the wall temperature rangesfrom 20 to 25 �C.
3. Temperature measurement technique
3.1. Temperature measurement system
The temperature measurement system consists of K-type100 lm thermocouples, a reference junction and a high-speed dataacquisition unit (Yokogawa, MX100). The thermocouples, which areaccurate within ±0.12 �C, are used to simultaneously measurethe surface temperature of the heated plate Tw and the watertemperature distant from the heated plate. The thermocouples formeasuring Tw are set at x = 70, 170, 270 mm and z = ±20 mm. Thehigh-speed data acquisition unit is directly connected to a personalcomputer monitor the thermoelectric force of the thermocouples inreal time. A thermostatic bath is used for calibrating the thermocou-ple temperature readings. The sampling frequency for the tempera-ture measurement is 5 Hz and the measurement period is 480 s.
3.2. Estimation of the local heat transfer coefficient
As described in Section 2.3, the vertical plate is heated under uni-form heat flux conditions, so that the local heat transfer coefficienthx at each of the measurement positions is obtained from Eq. (3).
hx ¼qw
Tw � TL;1; ð3Þ
where the subscript L stands for the liquid. In our experiments, thetotal uncertainly in the heat transfer coefficient associated withboth the thermocouple accuracy and the heat loss through the backof the heated plate is estimated to be approximately 6%.
4. Velocity measurement technique
4.1. Simultaneous velocity measurement technique
In this study, the PTV technique is applied to simultaneous two-phase velocity measurement and a shadow image technique isused for clearly obtaining the bubble interface. Details of thesetechniques are given in Kitagawa et al. (2005).
4.2. Velocity measurement system
A schematic diagram of the two-phase velocity measurementsystem is shown in Fig. 5. A digital color CCD camera (Imperx,VGA210-LC), which is set in front of the container, is used to cap-ture the tracer particle and bubble images. Particles of 60 lm inmean diameter and 1.02 in specific gravity are used as the tracerparticles and the particle concentration is approximately100 ppm. Two halogen-light sources (Moritex, MHAB-150 W) areused for illuminating the tracer particle and bubble. One halo-gen-light source for the tracer particle is set at the side of the con-tainer. A light sheet with a thickness of 5 mm is produced with aline light guide, a cylindrical lens, a blue-pass filter and a slit.The other halogen-light source for the bubble is set behind the con-tainer. The light emitted from the halogen-light source passesthrough a red-pass filter and illuminates bubbles in the vicinityof the heated plate. Consequently, the bubble images are capturedas shadow images. The measurement area is 163 < x < 177 mm,0 < y < 11 mm and 17.5 < z < 22.5 mm. Images of 600 � 480 pixels,which are taken with the color CCD camera, are directly recordedby a personal computer. The spatial resolution is 0.023 mm/pixel.The exposure time of the color CCD camera is 0.001 s and the framerate is 110–130 fps depending on the different experimentalconditions.
4.3. Measurement uncertainty
In the two-phase velocity measurement described above, liquidtracer particles are captured in the blue images and bubbles arecaptured in the red images. Separation of the two-phases is per-formed based on both blue and red images. The bubble diameteris calculated from the equivalent area of each bubble image. Detailsof the image processing technique for obtaining the two-phasevelocities are given in Kitagawa et al. (2007). The uncertainty inthe bubble velocity associated with the bubble centroid detectionis estimated to be 0.49 mm/s, and therefore the error in this valuerelative to the maximum bubble rise velocity (126.5 mm/s) is 0.4%.
782 A. Kitagawa et al. / International Journal of Heat and Fluid Flow 30 (2009) 778–788
On the other hand, the uncertainty in the liquid velocity associatedwith the particle centroid detection is estimated to be 0.55 mm/s.Hence, the error in this value relative to the maximum liquid risevelocity (33.4 mm/s) is 1.6%. To obtain highly accurate statisticaldata for both phases, which are presented in Section 6, we usedmore than 5500 images for each of the experimental conditions.
5. Numerical simulation method
5.1. Assumptions
The main assumptions in the numerical simulation are asfollows:
(1) The flow is two-dimensional laminar flow.(2) The density is constant in the governing equations men-
tioned in Section 5.3 except for that in the buoyancy term(Boussinesq approximation).
5.2. Computational domain
The configuration of the axes is the same as that described inSection 2.1. The lengths of the computational domain in the xand y directions are, respectively set as Lx = 1037 mm andLy = 120 mm, considering both the sizes of the container and thebubble generator used in the experiments. Non-slip conditionsare imposed for the bottom and both sidewalls of the computa-tional domain. The heating region under uniform heat flux condi-tions is set as x = 0�914 mm and is the same as the regiondescribed in Section 2.3. On the other hand, a free-slip conditionwith a constant temperature (T = 20 �C) is imposed for the top ofthe computational domain to express the gas�liquid interface.The grid intervals in the x and y directions are Dx = 1 mm andDy = 0.5 mm, respectively.
5.3. Governing equations
The governing equations are as follows:
(1) Conservation equation for the liquid mass:
r � uL ¼ 0; ð4Þ
where u is the velocity vector.
�
(2) Conservation equation for the liquid momentum:Fig. 6. Relationship between Rax and Nux without bubble injection.
@uL
@tþ ðuL � rÞuL ¼ �
1qLrpL þ mLr2uL
þ ðbLðTL � TL;1Þg � gÞix; ð5Þ
where q is the density, b is the coefficient of volume expan-sion, g is the gravitational acceleration, m is the kinematic vis-cosity and ix is the unit vector in the x direction. The firstterm in the parentheses on the right-hand side is the buoy-ancy force induced by the density difference in the liquid.
(3) Conservation equation for the liquid energy:
@TL
@tþ ðuL � rÞTL ¼ aLr2TL; ð6Þ
where a is the thermal diffusivity.
Fig. 7. Profiles of liquid rise velocity without bubble injection.
The governing equations are discretized by the finite differen-tial method and all the spatial derivative terms in Eqs. (4)–(6)
are discretized with a staggered grid system. A simplified mar-ker-and-cell (SMAC) method is used for pressure�velocity cou-pling. A two-dimensional cubic-interpolated propagation (CIP)scheme, which was proposed by Takewaki and Yabe (1987), is ap-plied to the advection terms in Eqs. (5) and (6). The viscous term inEq. (5) and the thermal conductivity term in Eq. (6) are discretizedin space by the second-order central difference scheme.
6. Results and discussion
6.1. Validity of experimental data and simulation results withoutbubble injection
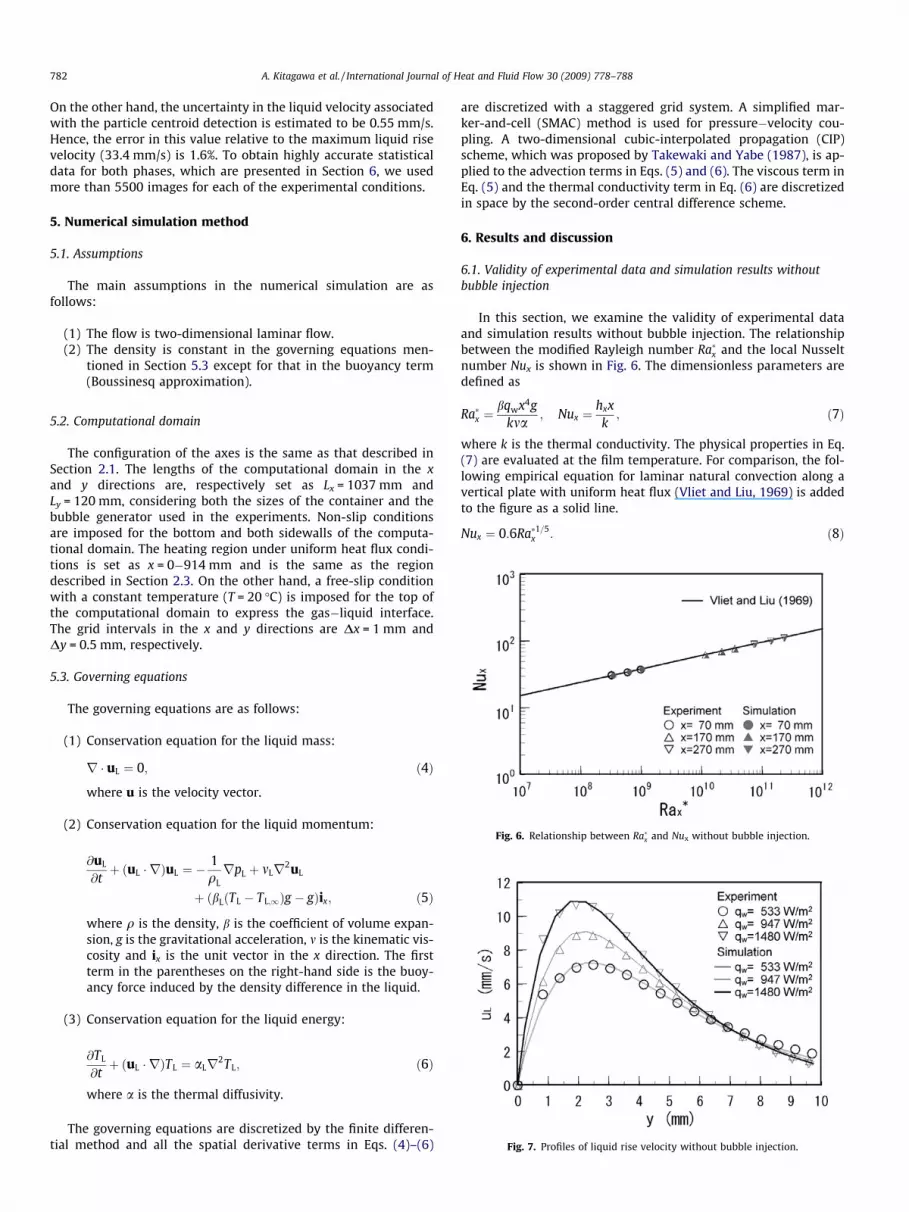
In this section, we examine the validity of experimental dataand simulation results without bubble injection. The relationshipbetween the modified Rayleigh number Ra�x and the local Nusseltnumber Nux is shown in Fig. 6. The dimensionless parameters aredefined as
Ra�x ¼bqwx4g
kma; Nux ¼
hxxk; ð7Þ
where k is the thermal conductivity. The physical properties in Eq.(7) are evaluated at the film temperature. For comparison, the fol-lowing empirical equation for laminar natural convection along avertical plate with uniform heat flux (Vliet and Liu, 1969) is addedto the figure as a solid line.
Nux ¼ 0:6Ra�1=5x : ð8Þ
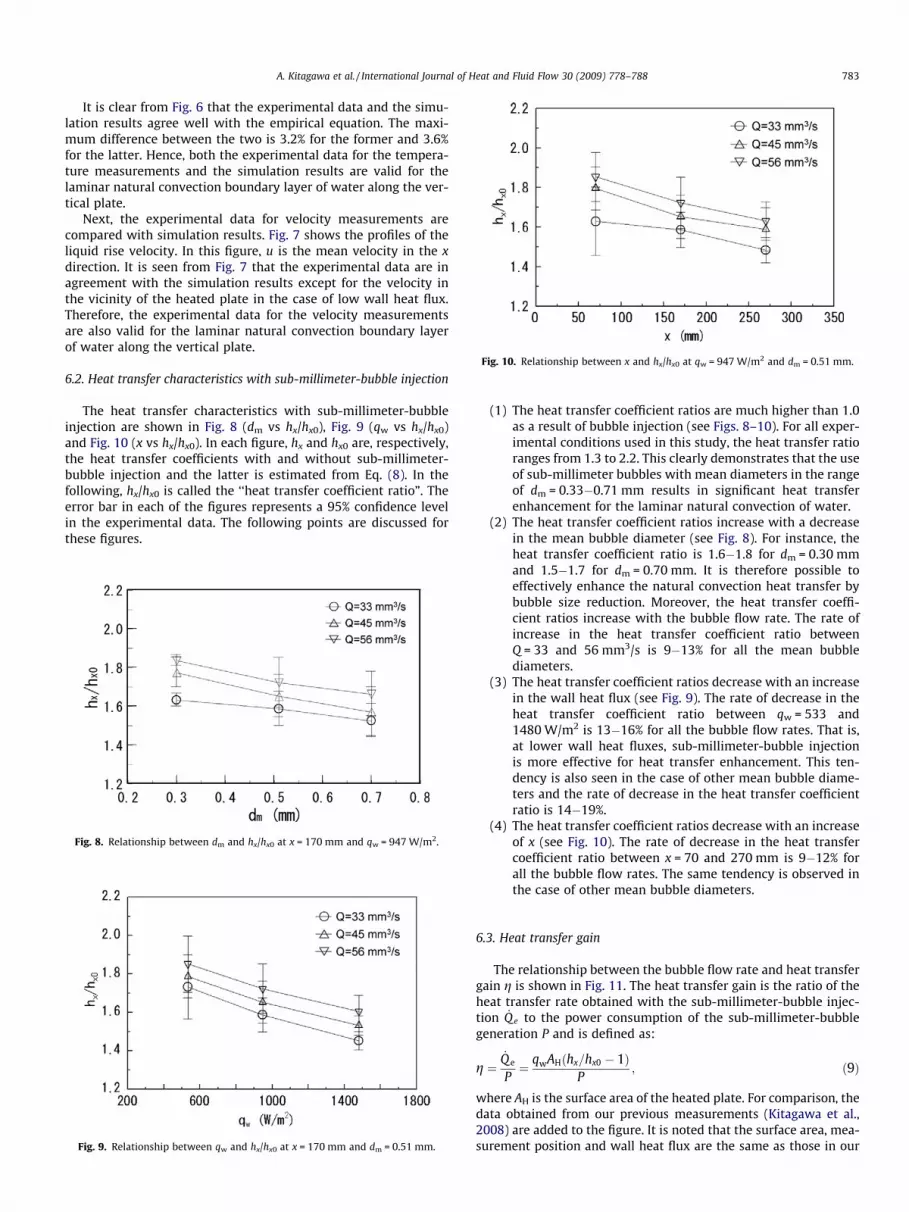
Fig. 10. Relationship between x and hx/hx0 at qw = 947 W/m2 and dm = 0.51 mm.
A. Kitagawa et al. / International Journal of Heat and Fluid Flow 30 (2009) 778–788 783
It is clear from Fig. 6 that the experimental data and the simu-lation results agree well with the empirical equation. The maxi-mum difference between the two is 3.2% for the former and 3.6%for the latter. Hence, both the experimental data for the tempera-ture measurements and the simulation results are valid for thelaminar natural convection boundary layer of water along the ver-tical plate.
Next, the experimental data for velocity measurements arecompared with simulation results. Fig. 7 shows the profiles of theliquid rise velocity. In this figure, u is the mean velocity in the xdirection. It is seen from Fig. 7 that the experimental data are inagreement with the simulation results except for the velocity inthe vicinity of the heated plate in the case of low wall heat flux.Therefore, the experimental data for the velocity measurementsare also valid for the laminar natural convection boundary layerof water along the vertical plate.
6.2. Heat transfer characteristics with sub-millimeter-bubble injection
The heat transfer characteristics with sub-millimeter-bubbleinjection are shown in Fig. 8 (dm vs hx/hx0), Fig. 9 (qw vs hx/hx0)and Fig. 10 (x vs hx/hx0). In each figure, hx and hx0 are, respectively,the heat transfer coefficients with and without sub-millimeter-bubble injection and the latter is estimated from Eq. (8). In thefollowing, hx/hx0 is called the ‘‘heat transfer coefficient ratio”. Theerror bar in each of the figures represents a 95% confidence levelin the experimental data. The following points are discussed forthese figures.
Fig. 8. Relationship between dm and hx/hx0 at x = 170 mm and qw = 947 W/m2.
Fig. 9. Relationship between qw and hx/hx0 at x = 170 mm and dm = 0.51 mm.
(1) The heat transfer coefficient ratios are much higher than 1.0as a result of bubble injection (see Figs. 8–10). For all exper-imental conditions used in this study, the heat transfer ratioranges from 1.3 to 2.2. This clearly demonstrates that the useof sub-millimeter bubbles with mean diameters in the rangeof dm = 0.33�0.71 mm results in significant heat transferenhancement for the laminar natural convection of water.
(2) The heat transfer coefficient ratios increase with a decreasein the mean bubble diameter (see Fig. 8). For instance, theheat transfer coefficient ratio is 1.6�1.8 for dm = 0.30 mmand 1.5�1.7 for dm = 0.70 mm. It is therefore possible toeffectively enhance the natural convection heat transfer bybubble size reduction. Moreover, the heat transfer coeffi-cient ratios increase with the bubble flow rate. The rate ofincrease in the heat transfer coefficient ratio betweenQ = 33 and 56 mm3/s is 9�13% for all the mean bubblediameters.
(3) The heat transfer coefficient ratios decrease with an increasein the wall heat flux (see Fig. 9). The rate of decrease in theheat transfer coefficient ratio between qw = 533 and1480 W/m2 is 13�16% for all the bubble flow rates. That is,at lower wall heat fluxes, sub-millimeter-bubble injectionis more effective for heat transfer enhancement. This ten-dency is also seen in the case of other mean bubble diame-ters and the rate of decrease in the heat transfer coefficientratio is 14�19%.
(4) The heat transfer coefficient ratios decrease with an increaseof x (see Fig. 10). The rate of decrease in the heat transfercoefficient ratio between x = 70 and 270 mm is 9�12% forall the bubble flow rates. The same tendency is observed inthe case of other mean bubble diameters.
6.3. Heat transfer gain
The relationship between the bubble flow rate and heat transfergain g is shown in Fig. 11. The heat transfer gain is the ratio of theheat transfer rate obtained with the sub-millimeter-bubble injec-tion _Q e to the power consumption of the sub-millimeter-bubblegeneration P and is defined as:
g ¼_Q e
P¼ qwAHðhx=hx0 � 1Þ
P; ð9Þ
where AH is the surface area of the heated plate. For comparison, thedata obtained from our previous measurements (Kitagawa et al.,2008) are added to the figure. It is noted that the surface area, mea-surement position and wall heat flux are the same as those in our

Fig. 11. Relationship between bubble flow rate and heat transfer gain.
784 A. Kitagawa et al. / International Journal of Heat and Fluid Flow 30 (2009) 778–788
previous study; i.e., AH = 600 mm � 149 mm, x = 170 mm andqw = 533 W/m2. The heat transfer gains for the present measure-ments are higher than those for our previous measurements. Thisis due to the anode being changed from platinum wire of 0.1 mmdiameter to a carbon rod of 15 mm diameter. In the present mea-surements, the heat transfer gain increases with a decrease in themean bubble diameter, and it is therefore possible to effectively in-crease the heat transfer gain as well as the heat transfer coefficientratio by bubble size reduction. Furthermore, the heat transfer gainreaches approximately 9.7. This clearly demonstrates that sub-mil-limeter-bubble injection is a highly efficient technique for enhanc-ing the natural convection heat transfer of water along a vertical flatplate.
6.4. Instantaneous two-phase velocity field
Fig. 12 illustrates a typical instantaneous two-phase velocityfield for the case of dm = 0.51 mm and Q = 56 mm3/s. The right-hand side of the image corresponds to the surface of the heatedplate. In this figure, the arrow represents the velocity vector, theblack solid circle is a bubble located in the measurement plane,and the gray solid circle is a bubble located out of the measure-ment plane. The magnitude of the bubble velocity vectors is setas 1/10 of the actual magnitude. It is found from this figure thatthe liquid velocity vectors and the bubble velocity vectors are ob-tained completely independently.
Fig. 12. Typical instantaneous two-phase velocity field for the case of dm = 0.51 mmand Q = 56 mm3/s.
6.5. Bubble location
The probability distributions of the bubble location atQ = 33 mm3/s are shown in Fig. 13. In this figure, n is the numberof bubbles at each y location. For all the mean bubble diameters,bubbles are located in the region of y = 0�2.0 mm. Moreover, thelocations of the peaks in the distributions for dm = 0.30, 0.51 and0.70 mm are, respectively, y = 0.22, 0.65 and 1.02 mm; i.e., smallerbubbles tend to concentrate near the heated plate. In particular, inthe case of dm = 0.30 mm, the distance between the peak locationand the heated plate is short compared with the mean bubblediameter. It is therefore expected that the probability of the directcontact between bubbles and the heated plate is relatively high. Inour experiments, the gas inside the bubble is hydrogen while theworking fluid is water, and the thermal conductivity of the formeris much lower than that of the latter. For this reason, it may happenthat in the case of dm = 0.30 mm, the bubble concentration near theheated plate leads to the ‘‘heat insulation effect”, which causesheat transfer deterioration. On the other hand, in the cases ofdm = 0.51 and 0.70 mm, the distance is long compared with themean bubble diameter. This means that the probability of the di-rect contact between bubbles and the heated plate is sufficientlylow. Hence, the heat insulation effect is considered negligible forboth cases.
6.6. Bubble mean velocity
Fig. 14 shows the profiles of the bubble mean velocities atQ = 33 mm3/s. The subscript G stands for the bubble and v is themean velocity in the y direction. In this figure, it is noted thatthe results for more than 100 samples are presented. Over a widerange of y, the bubble rise velocity increases with an increase in thebubble diameter. This is because the buoyancy force acting on thebubbles increases with the bubble diameter, as expected. In con-trast, according to our estimation using terminal velocity of eachbubble, the ratio of the bubble rise velocity shown in Fig. 14 tothe bubble terminal velocity for dm = 0.30 mm is higher than thatfor dm = 0.70 mm. This is related to the liquid rise velocity inducedby bubbles and it is discussed in Section 6.7.
Next, we focus on the bubble Reynolds number Red, which is de-fined as
Red ¼juG � uLj � d
mL: ð10Þ
It is estimated from our calculations that the bubble Reynoldsnumber is 15�25 for dm = 0.30 mm, 20�50 for dm = 0.51 mm and40�100 for dm = 0.70 mm. For all the mean bubble diameters, the
Fig. 13. Probability distributions of bubble location at Q = 33 mm3/s.
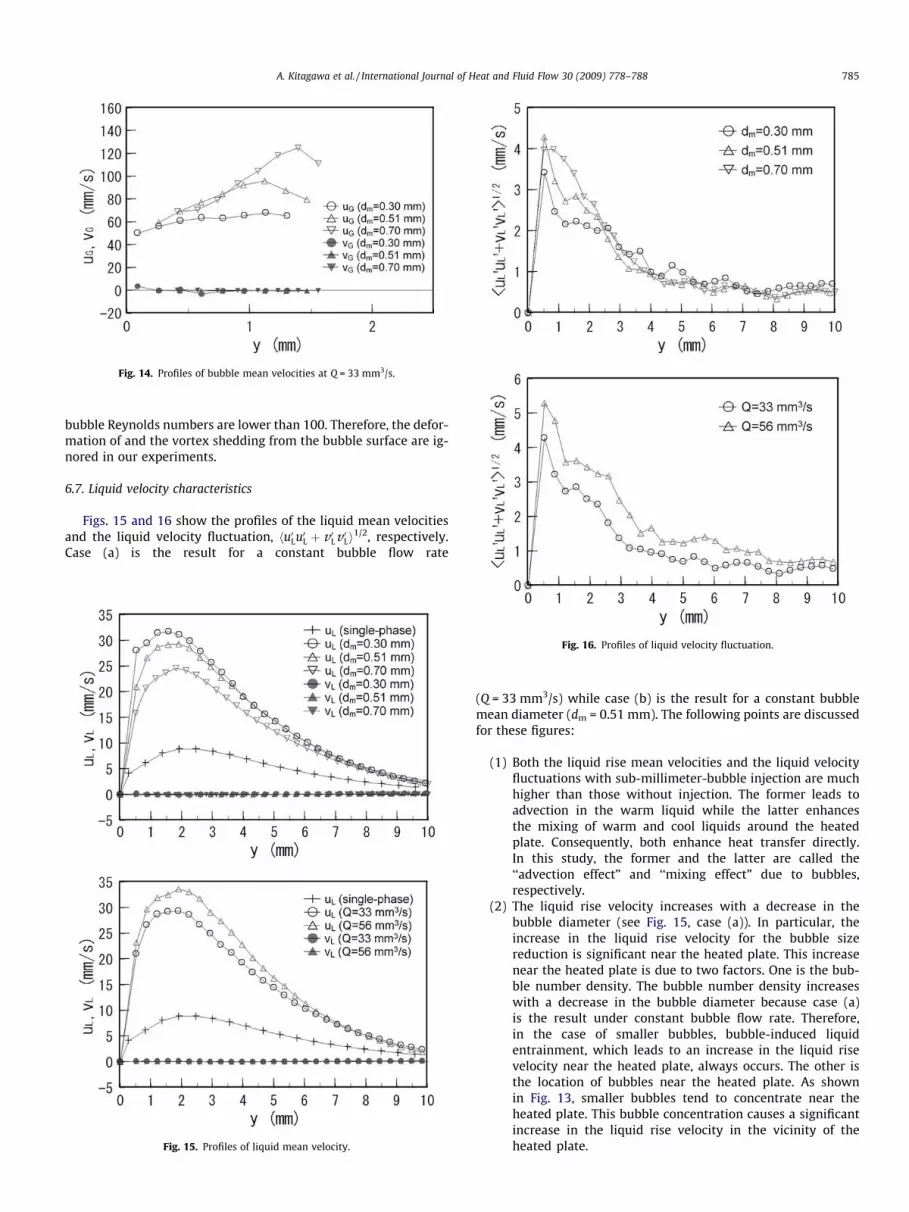
Fig. 14. Profiles of bubble mean velocities at Q = 33 mm3/s.
A. Kitagawa et al. / International Journal of Heat and Fluid Flow 30 (2009) 778–788 785
bubble Reynolds numbers are lower than 100. Therefore, the defor-mation of and the vortex shedding from the bubble surface are ig-nored in our experiments.
6.7. Liquid velocity characteristics
Figs. 15 and 16 show the profiles of the liquid mean velocitiesand the liquid velocity fluctuation, hu0Lu0L þ v 0Lv 0Li
1/2, respectively.Case (a) is the result for a constant bubble flow rate
Fig. 15. Profiles of liquid mean velocity.
Fig. 16. Profiles of liquid velocity fluctuation.
(Q = 33 mm3/s) while case (b) is the result for a constant bubblemean diameter (dm = 0.51 mm). The following points are discussedfor these figures:
(1) Both the liquid rise mean velocities and the liquid velocityfluctuations with sub-millimeter-bubble injection are muchhigher than those without injection. The former leads toadvection in the warm liquid while the latter enhancesthe mixing of warm and cool liquids around the heatedplate. Consequently, both enhance heat transfer directly.In this study, the former and the latter are called the‘‘advection effect” and ‘‘mixing effect” due to bubbles,respectively.
(2) The liquid rise velocity increases with a decrease in thebubble diameter (see Fig. 15, case (a)). In particular, theincrease in the liquid rise velocity for the bubble sizereduction is significant near the heated plate. This increasenear the heated plate is due to two factors. One is the bub-ble number density. The bubble number density increaseswith a decrease in the bubble diameter because case (a)is the result under constant bubble flow rate. Therefore,in the case of smaller bubbles, bubble-induced liquidentrainment, which leads to an increase in the liquid risevelocity near the heated plate, always occurs. The other isthe location of bubbles near the heated plate. As shownin Fig. 13, smaller bubbles tend to concentrate near theheated plate. This bubble concentration causes a significantincrease in the liquid rise velocity in the vicinity of theheated plate.

Fig. 17. Outline of each effect due to bubbles.
Fig. 18. Profiles of liquid rise velocity obtained from numerical simulations.
786 A. Kitagawa et al. / International Journal of Heat and Fluid Flow 30 (2009) 778–788
(3) The liquid velocity fluctuation increases with the mean bub-ble diameter (see Fig. 16, case (a)). As is mentioned in Sec-tion 6.6, the bubble Reynolds number for dm = 0.70 mm is2.5�4 times higher than that for dm = 0.30 mm. Bubble-induced velocity fluctuations (e.g., velocity fluctuationsinduced by displacement of the surrounding liquid arounda rising bubble and the wake around a rising bubble)increase with the bubble Reynolds number (Kitagawaet al., 2001), and therefore the liquid velocity fluctuationfor dm = 0.70 mm becomes higher.
(4) The liquid rise velocity increases with an increase in thebubble flow rate (see Fig. 15, case (b)). This is mainly dueto an increase in the bubble number density. This is becausethe probability distribution of the bubble diameter is almostindependent of the bubble flow rate, which is shown inFig. 4, and the dependency of the bubble location on thebubble flow rate is weak, according to our analysis. Similarly,the liquid velocity fluctuation increases with the bubble flowrate (see Fig. 16, case (b)). It is concluded from these resultsthat the increase in the bubble flow rate leads to increases inboth the advection and mixing effects due to bubbles. Thesame tendencies were reported in our previous paper (Kitag-awa et al., 2008).
6.8. Fractional contribution of each effect due to bubbles to heattransfer enhancement or deterioration
In this section, we estimate the fractional contributions of theeffects due to bubbles (i.e., advection, mixing and heat insulationeffects) to the heat transfer enhancement or deterioration, basedon numerical simulations of natural convection in which the bub-ble-induced upward flow near the heated plate is considered. Here,the bubble-induced upward flow is essentially different from theflow induced by a wall jet. This is because the former is hardly re-duced by the strong viscous effect near the heated wall and contin-ues from the bottom to the top of the container because of bubblebuoyancy. Therefore, in our simulations, an ideal driving force FA isadded to the conservation equation of the liquid momentum toaccurately express the bubble-induced upward flow near theheated plate.
@uL
@tþ ðuL � rÞuL ¼ �
1qLrpL þ mLr2uL þ ðbLðTL � TL;1Þg þ FA � gÞix:
ð11Þ
From the probability distribution of bubble location shown inFig. 13, FA is considered to change in the y direction. In addition,bubbles are located in the region of y = 0�2.0 mm, so that FA inthe y direction is given in this region. For these reasons, FA is de-fined as
FA ¼ FA0 sinpy
4Dy
� �ð0 � y � 4DyÞ; ð12Þ
where FA0 is the amplitude of the function and ranges from 0.018 to0.036 N/kg. FA in the x direction is given from the bottom to the topof the container; i.e., x = �50�980 mm. FA is discretely given at acenter of each computation cell.
Each effect due to bubbles is defined by Eq. (13) and illustratedin Fig. 17.
FCA ¼ hxA � hx0; FCM � FCH ¼ hx � hxA; ð13Þ
where, FCA, FCM and FCH are the advection, mixing and heat insula-tion effects due to bubbles, respectively. hxA is the heat transfercoefficient obtained from numerical simulations of natural convec-tion with FA. In Fig. 17, when FCM�FCH is positive, the mixing effect
is higher than the heat insulation effect. On the other hand, whenFCM�FCH is negative, the latter is higher than the former. As de-scribed in Section 6.5, in all the cases except for the case ofdm = 0.30 mm and Q = 33 mm3/s, the heat insulation effect is con-sidered negligible, so that FCH is set as zero.
Fig. 18 shows the profiles of the liquid rise velocity obtainedfrom the numerical simulations. The curves in this figure are ob-tained by applying the least-square method to the simulation re-sults. The ‘‘NC flow” stands for the natural convection flowwithout FA. In the region of y = 0�10 mm, the liquid rise velocityis increased by the addition of the ideal driving force and increaseswith FA0. Furthermore, the locations of the peaks in the profiles arearound y = 1.5 mm. These tendencies are almost same as thoseshown in Fig. 15 though there are small shifts in the locations ofthe peaks. Therefore, the addition of the driving force to the con-servation equation of the liquid momentum enables us to expressthe bubble-induced upward flow near the heated plate.
Fig. 19 shows the relationship between uL,max/yp and hxA. Here,uL,max and yp are the maximum liquid rise velocity and the y loca-tion of a peak in the profile of the liquid rise velocity, respectively.In the present computational conditions, the heat transfer coeffi-cient increases linearly with uL,max/yp. Therefore, using both uL,max
and yp obtained from Fig. 15, hxA is estimated by interpolating thesimulated data in Fig. 19 (as indicated by the arrows).
Table 2 gives the heat transfer coefficients and each effect dueto bubbles obtained from experimental data and simulation re-sults. In the table, FC0 (=hx � hx0) is the net increase in the heattransfer coefficient due to the sub-millimeter-bubble injection.Note that FCM for the case of Q = 33 mm3/s and dm = 0.30 mm isestimated using the relation, which is obtained from liquid velocityfluctuations averaged over the range of y = 0�2 mm and FCM forthe other cases. Fig. 20 shows the fractional contribution of theadvection and mixing effects due to bubbles to heat transferenhancement. The following points are discussed for Table 2 andFig. 20.

Table 2Heat transfer coefficients and each effect due to bubbles.
Q (mm3/s) 33 56
dm (mm) 0.30 0.51 0.70 0.51uL,max/yp (1/s) 19.9 16.1 13.8 17.6hxA (W/m2 K) 401 371 349 384hx (W/m2 K) 392 382 367 414hx0 (W/m2 K) 242 242 242 242FCM�FCH (W/m2 K) �9 11 18 30FC0 (W/m2 K) 150 140 125 172FCA (W/m2 K) 159 129 107 142FCM (W/m2 K) 6 11 18 30FCH (W/m2 K) 15 0 0 0
Fig. 20. Fractional contribution of advection and mixing effects due to bubbles toheat transfer enhancement.
Fig. 19. Relationship between uL,max/yp and hxA..
A. Kitagawa et al. / International Journal of Heat and Fluid Flow 30 (2009) 778–788 787
(1) For all cases, the contribution of the advection effect to theheat transfer enhancement is large compared with that ofthe mixing effect and its contribution is higher than 80%. Itis therefore considered that the heat transfer enhancementis dominated by the advection effect due to bubbles.
(2) For a constant bubble flow rate (Q = 33 mm3/s), the frac-tional contribution of the advection effect increases with adecrease in the mean bubble diameter. In the case of
dm = 0.30 mm, the fractional contribution of the advectioneffect is higher than 1. However, in this case, the heat insu-lation effect, which causes heat transfer deterioration,occurs and it corresponds to approximately 10% of the netincrease in the heat transfer coefficient. This is due to adecrease in the superficial thermal conductivity associatedwith the bubble concentration near the heated plate, whichis mentioned in Section 6.5. From the above results, we con-clude the increase in the heat transfer coefficient ratio forthe bubble size reduction, which is shown in Fig. 8, resultsfrom an increase in the advection effect due to bubbles. Inparticular, high heat transfer enhancement for dm = 0.30 mmis due to a significant advection effect due to bubbles risingclose to the heated plate, though there is a heat insulationeffect.
(3) For a constant bubble mean diameter (dm = 0.51 mm), thefractional contribution of the mixing effect increases withthe bubble flow rate. This corresponds to the liquid velocityfluctuation increasing with the bubble flow rate (see Fig. 16,case (b)). It is therefore expected that the increase in theheat transfer coefficient ratio for the bubble flow rate, whichis shown in Fig. 8, originates from an increase in the mixingeffect.
7. Conclusions
The effects of the bubble size on the heat transfer enhance-ment for the laminar natural convection of water along a verticalheated plate with uniform heat flux were experimentally andnumerically investigated. In the temperature and velocity mea-surements, thermocouples and the PTV technique were used.Moreover, two-dimensional numerical simulations were per-formed to comprehensively understand the effects of bubbleinjection on the flow near the heated plate. For mean bubblediameters in the range of 0.30 < dm < 0.70 mm, the conclusions ob-tained from measurements and numerical simulations are asfollows.
(1) The ratio of the heat transfer coefficient with sub-millime-ter-bubble injection to that without injection (i.e., the heattransfer coefficient ratio) ranges from 1.3 to 2.2 and the heattransfer gain reaches approximately 9.7 due to the sub-mil-limeter-bubble injection. These results clearly demonstratethat sub-millimeter-bubble injection is a highly efficienttechnique for enhancing the heat transfer for the laminarnatural convection of water.
(2) Under the experimental conditions for velocity measure-ments, the contribution of the advection effect to theheat transfer enhancement is large compared with that ofthe mixing effect and its contribution is higher than 80%.It is therefore considered that the heat transfer enhance-ment is mainly dominated by the advection effect due tobubbles.
(3) For a constant bubble flow rate, the heat transfer coefficientratio increases with a decrease in the mean bubble diameter.It is therefore possible to enhance effectively the naturalconvection heat transfer by bubble size reduction. Such anincrease in the heat transfer coefficient ratio results froman increase in the advection effect due to bubbles. In partic-ular, high heat transfer enhancement for dm = 0.30 mm isdue to a significant advection effect due to bubbles risingclose to the heated plate, though the heat insulation effect,which causes heat transfer deterioration, occurs.
(4) For a constant bubble mean diameter, the heat transfer coef-ficient ratio increases with the bubble flow rate. Thisincrease originates from an increase in the mixing effect.

788 A. Kitagawa et al. / International Journal of Heat and Fluid Flow 30 (2009) 778–788
References
Inagaki, T., Komori, K., 1995. Heat transfer and fluid flow of natural convection alonga vertical flat plate in the transition region: experimental analysis of the walltemperature field. Int. J. Heat Mass Transfer 38, 3485–3495.
Kitagawa, A., Murai, Y., Yamamoto, F., 2001. Two-way coupling of Eulerian–Lagrangian model for dispersed multiphase flows using filtering functions. Int. J.Multiphase Flow 27, 2129–2153.
Kitagawa, A., Hishida, K., Kodama, Y., 2005. Flow structure of microbubble-ladenturbulent channel flow measured by PIV combined with the shadow imagetechnique. Exp. Fluid 38, 466–475.
Kitagawa, A., Hagiwara, Y., Kouda, T., 2007. PTV investigation of phase interaction indispersed liquid–liquid two-phase turbulent swirling flow. Exp. Fluid 42, 871–880.
Kitagawa, A., Kosuge, K., Uchida, K., Hagiwara, Y., 2008. Heat transfer enhancementfor laminar natural convection along a vertical plate due to sub-millimeter-bubble injection. Exp. Fluid 45, 473–484.
Lloyd, J.R., Sparrow, E.M., Eckert, E.R.G., 1972. Laminar, transition and turbulentnatural convection adjacent to inclined and vertical surfaces. Int. J. Heat MassTransfer 15, 457–473.
Shaukatullah, H., Gebhart, B., 1978. An experimental investigation of naturalconvection flow on an inclined surface. Int. J. Heat Mass Transfer 21, 1481–1490.
Takewaki, H., Yabe, T., 1987. The cubic-interpolated pseudo particle (CIP) method:application to nonlinear and multi-dimensional hyperbolic equations. J. Comp.Phys. 70, 355–362.
Tamari, M., Nishikawa, K., 1976. The stirring effect of bubbles upon the heat transferto liquids. Jpn. Res. Heat Transfer 5, 31–44.
Tokuhiro, A.T., Lykoudis, P.S., 1994a. Natural convection heat transfer from avertical plate-I. Enhancement with gas injection. Int. J. Heat Mass Transfer 37,997–1003.
Tokuhiro, A.T., Lykoudis, P.S., 1994b. Natural convection heat transfer from avertical plate-II. With gas injection and transverse magnetic field. Int. J. HeatMass Transfer 37, 1005–1012.
Vliet, G.C., 1969. Natural convection local heat transfer on constant-heat-fluxinclined surfaces. ASME. J. Heat Transfer 91, 511–516.
Vliet, G.C., Liu, C.K., 1969. An experimental study of turbulent natural convectionboundary layers. Trans. ASME J. Heat Transfer 91, 517–531.


