Embed Size (px)
Citation preview

ACTA ECOLOGICA SINICA Volume 26, Issue 4, April 2006 Online English edition of the Chinese language journal
Cite this article as: Acta Ecologica Sinica, 2006, 26(4), 1012−1020.
*Correspondence author. E-mail:[email protected] Copyright © 2006, Ecological Society of China. Published by Elsevier BV. All rights reserved.
RESEARCH PAPER
Effect of the Yellow Sea Cold Water Mass (YSCWM) on Distribution of Bacterioplankton Li Hongbo1, 2, XiaoTian1, Ding Tao3, Lü Ruihua4
1 Key laboratory of Marine Ecology and Environmental Science, Qingdao Institute of Oceanology, Chinese Academy of Sciences, Qingdao
266071, China
2 Graduate School, Chinese Academy of Sciences, Beijing 100039, China 3 Laboratory of Ocean Dynamic Processes and Satellite Oceanography, Second Institute of Oceanography, SOA, Hangzhou 310012, China 4 First Institute of Oceanography, SOA, Qingdao 266061, China
Abstract: Four surveys were carried out in August 2001, and in August, September and October 2002, in the southern Yellow Sea, China. Bacterioplankton abundance and biomass were quantified along the transect from Qingdao in China to the Korean island of Jeju. In this paper, the author describes the distribution of bacterioplankton and predatory pressures, and has also discussed the im-pact of Yellow Sea Cold Water Mass (YSCWM) on the distribution of bacterioplankton. The range of Synechococcus biomass was 0.78–33.49 mg C/m3 (on average 6.26 mg C/m3), and heterotrophic bacteria biomass was 1.58–21.25 mg C/m3 (on average 5.79 mg C/m3, n=197). In the vertical direction, the distribution of Synechococcus biomass was shown as the mid-layer>surface>bottom, and heterotrophic bacteria biomass was surface>mid-layer>bottom. The contribution of Synechococcus to the total phytoplankton bio-mass (SB/PB) ranged from 2% to 99% (on average 42.5%), but the ratio of heterotrophic bacterial biomass to phytoplankton bio-mass (HBB/PB) was from 5% to 637% (on average 85%). Daily variations of bacterioplankton biomass at anchor stations showed the Synechococcus maximal biomass was 8.8 times that of the minimum, and 2.8 times in heterotrophic bacterial biomass. To be specific, the distribution of bacterioplankton was accorded with temperature and salinity, and the minimum of bacterioplankton bio-mass occurred in the YSCWM waters. At same time, the microzooplankton (20–200 μm) preyed on Synechococcus in these waters, with the rate of ingestion being about 0.20–0.42/d. Key words: Yellow Sea Cold Water Mass; Synechococcus; heterotrophic bacteria; distribution; microzooplankton
The Yellow Sea Cold Water Mass (YSCWM) is a very im-portant phenomenon in the southern Yellow Sea, and is par-ticularly prominent in the summer and the fall. It is renewed every winter, with the boundary and temperature-salinity structure remaining almost unchanged each year. The primary characteristics of YSCWM are low temperature with a re-markable variation (5–12 ) and a rather constant salinity ℃
(31.5–32.5)[ 1-3]. It has an impact not only on the vertical dis-tribution of hydrochemical elements, nutrients (nitrate) and Chl-a[4, 5], but also on the summer strategy of zooplankton, Calanus Sinicus, in the Yellow Sea[6].
Marine bacterioplankton are widely distributed in the pe-lagic ecosystem and have a large biomass and high-energy conversion efficiency. They are increasingly being studied by marine scientists, with these studies of bacterioplankton ecol-
ogy tending to focus on the situation outside China. Ning[11] studied the distribution character of heterotrophic bacteria and cyanobacterium Synechocossus in the Changjiang (Yangtze River) estuary and the adjacent East China Sea. Liu[12] studied heterotrophic bacteria abundance and production at the same location. In recent years, our team described the temporal and spatial distribution of bacterioplankton biomass and produc-tion in the Bohai Sea, Yellow Sea and East China Sea[13-16]. However, the impact of physical progress on the distribution of bacterioplankton was rarely studied. In this paper, we stud-ied the effect of YSCWM on bacterioplankton distribution, as well as the distribution characteristics of the bacterioplankton along the transect from Qingdao in China to the Korean island of Jeju.
1 Material and methods
LI Hongbo et al. / Acta Ecologica Sinica, 2006, 26(4): 1012–1020
1.1 Surveying time and sampling stations Four surveys were carried out aboard R/V Beidou from
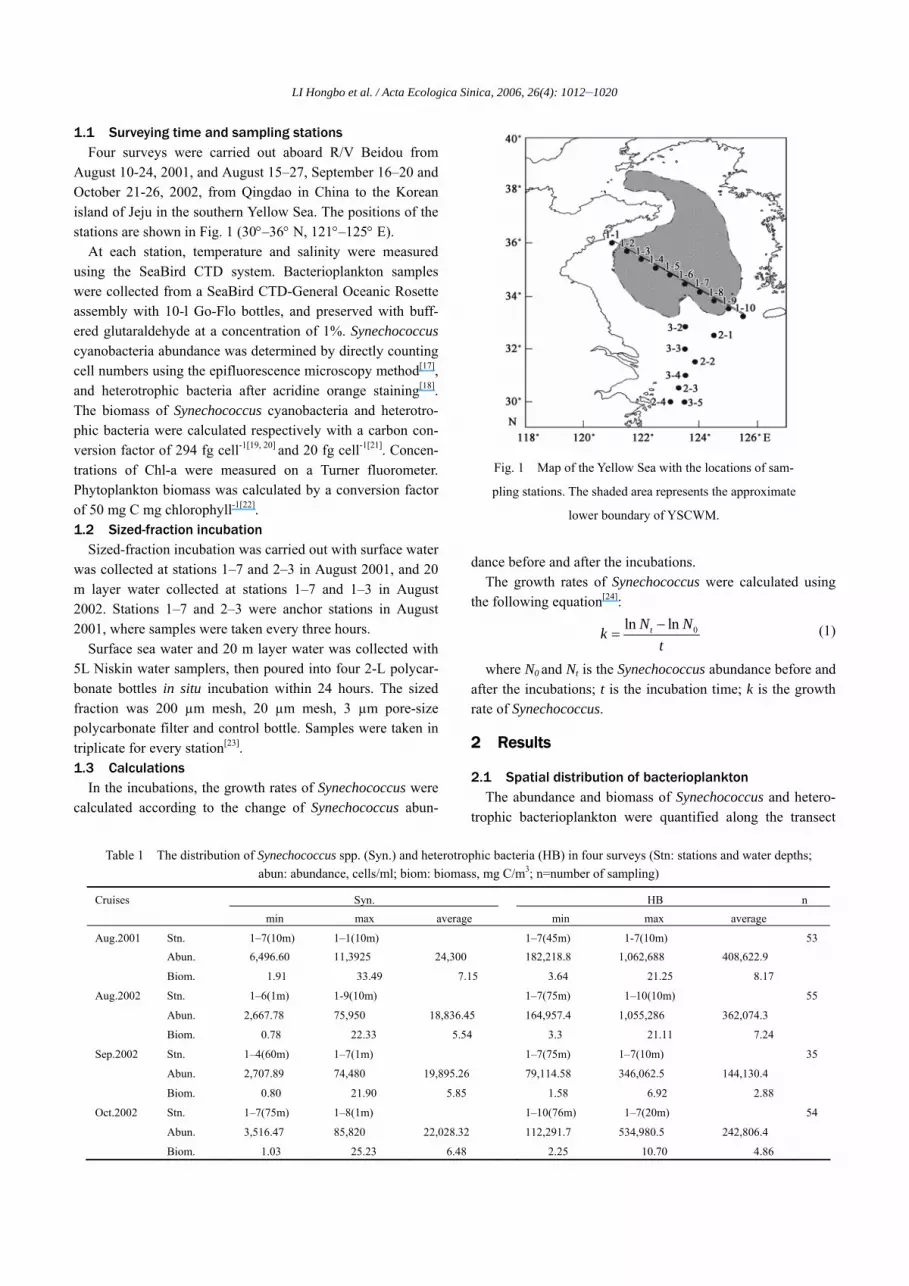
August 10-24, 2001, and August 15–27, September 16–20 and October 21-26, 2002, from Qingdao in China to the Korean island of Jeju in the southern Yellow Sea. The positions of the stations are shown in Fig. 1 (30°–36° N, 121°–125° E).
At each station, temperature and salinity were measured using the SeaBird CTD system. Bacterioplankton samples were collected from a SeaBird CTD-General Oceanic Rosette assembly with 10-l Go-Flo bottles, and preserved with buff-ered glutaraldehyde at a concentration of 1%. Synechococcus cyanobacteria abundance was determined by directly counting cell numbers using the epifluorescence microscopy method[17], and heterotrophic bacteria after acridine orange staining[18]. The biomass of Synechococcus cyanobacteria and heterotro-phic bacteria were calculated respectively with a carbon con-version factor of 294 fg cell-1[19, 20] and 20 fg cell-1[21]. Concen-trations of Chl-a were measured on a Turner fluorometer. Phytoplankton biomass was calculated by a conversion factor of 50 mg C mg chlorophyll-1[22]. 1.2 Sized-fraction incubation
Sized-fraction incubation was carried out with surface water was collected at stations 1–7 and 2–3 in August 2001, and 20 m layer water collected at stations 1–7 and 1–3 in August 2002. Stations 1–7 and 2–3 were anchor stations in August 2001, where samples were taken every three hours.
Surface sea water and 20 m layer water was collected with 5L Niskin water samplers, then poured into four 2-L polycar-bonate bottles in situ incubation within 24 hours. The sized fraction was 200 µm mesh, 20 µm mesh, 3 µm pore-size polycarbonate filter and control bottle. Samples were taken in triplicate for every station[23]. 1.3 Calculations
In the incubations, the growth rates of Synechococcus were calculated according to the change of Synechococcus abun-
dance before and after the incubations. The growth rates of Synechococcus were calculated using
the following equation[24]:
0ln lntN Nkt−
= (1)
where N0 and Nt is the Synechococcus abundance before and after the incubations; t is the incubation time; k is the growth rate of Synechococcus.
2 Results
2.1 Spatial distribution of bacterioplankton The abundance and biomass of Synechococcus and hetero-
trophic bacterioplankton were quantified along the transect
Fig. 1 Map of the Yellow Sea with the locations of sam-
pling stations. The shaded area represents the approximate
lower boundary of YSCWM.
Table 1 The distribution of Synechococcus spp. (Syn.) and heterotrophic bacteria (HB) in four surveys (Stn: stations and water depths; abun: abundance, cells/ml; biom: biomass, mg C/m3; n=number of sampling)
Cruises Syn. HB n min max average min max average
Aug.2001 Stn. 1–7(10m) 1–1(10m) 1–7(45m) 1-7(10m) 53 Abun. 6,496.60 11,3925 24,300 182,218.8 1,062,688 408,622.9
Biom. 1.91 33.49 7.15 3.64 21.25 8.17
Aug.2002 Stn. 1–6(1m) 1-9(10m) 1–7(75m) 1–10(10m) 55
Abun. 2,667.78 75,950 18,836.45 164,957.4 1,055,286 362,074.3
Biom. 0.78 22.33 5.54 3.3 21.11 7.24
Sep.2002 Stn. 1–4(60m) 1–7(1m) 1–7(75m) 1–7(10m) 35
Abun. 2,707.89 74,480 19,895.26 79,114.58 346,062.5 144,130.4
Biom. 0.80 21.90 5.85 1.58 6.92 2.88
Oct.2002 Stn. 1–7(75m) 1–8(1m) 1–10(76m) 1–7(20m) 54
Abun. 3,516.47 85,820 22,028.32 112,291.7 534,980.5 242,806.4
Biom. 1.03 25.23 6.48 2.25 10.70 4.86

LI Hongbo et al. / Acta Ecologica Sinica, 2006, 26(4): 1012–1020
from Qingdao in China to the Korean island of Jeju in Table 1. The Synechococcus biomass (SB) range was 0.78–33.49 mg C/m3 (on average 6.26 mg C/m3, n=197), and the maximum value was more 40 times the minimum. The heterotrophic bacterioplankton biomass (HBB) was 1.58–21.25 mg C/m3 (average was 5.79 mg C/m3, n=197), with the maximum being 13 times the minimum. The maximum SB mostly occurred in upper 10 m water and the maximum HBB was distributed at a depth of 10–20 m. However, the minimum SB may have oc-curred not only in the bottom water but also on the surface, and the minimum HBB occurred in the bottom water. 2.2 Vertical distribution of bacterioplankton
From Fig. 2, we could get the distribution characteristics of Synechococcus in a vertical direction. In the upper 30 m layer of water, Synechococcus abundance (SD) was high and the maximum was more than 60×103 cells/ml. However, it was low at below 30 m, with the abundance being less than 20×103 cells/ml in the four cruises. The peak value of SD mostly oc-curred in the middle layer (10 m–30 m), and the distribution of SB was shown as the mid-layer>surface>bottom in August, but the distribution was surface>mid-layer>bottom in Sep-tember and October (Table 2).
Heterotrophic bacterioplankton abundance (HBD) was higher on the surface and bottom than in the mid-layer at se-lected stations (Fig.2). At station 1–3, HBD changed to a far greater extent in a vertical direction during the cruise in Au-gust 2002 than during other cruises, with a maximum abun-dance of 66.83 ×10⁴ cells/ml occurring in the bottom layer. In August 2001, the maximum HBD was distributed in the 10 m layer (5.21×10⁵, 10.63×10⁵ cells/ml, respectively) at stations 1–5 and 1–7, and the minimum occurred in the bottom layer
(45 m) (3.07×10⁵ cells/ml, 1.82×10⁵ cells/ml, respectively). During other cruises, the minimum abundance occurred in the bottom layer. In Table 2, the average HBB distribution was at the surface, the 20 m layer and the bottom, while the maxi-mum occurred at the surface and the minimum was at the bot-tom. In a vertical direction, the distribution character is sur-face> mid-layer> bottom, apart from in August 2001. 2.3 Daily variations
Daily variations of bacterioplankton biomass at anchor sta-tions are shown in Fig.3. The SB varied in mid-layer>surface>bottom, and the HBB varied in sur-face>mid-layer>bottom in station 1–7. The SB varied in mid-layer>surface>bottom, and the HBB varied in
Fig. 2 Vertical distribution of Synechococcus and heterotrophic bacterial abundance in stations 1-3, 1-5, 1-7
a, a′: 1-3; b, b′: 1-5; c, c′: 1-7
Table 2 Temperature ( ℃), the biomasses (µg C/L)of Synecho-coccus (Syn) and heterotrophic bacteria (HB) in Yellow Sea Cold
Water Mass in four surveys
Time depth(m) T Syn HB1 26.40 6.12 11.10
20 20.21 8.76 6.08 Aug-01
bottom 9.13 4.27 7.67
1 25.29 4.14 8.16
20 23.36 7.14 6.85
Aug-02
bottom 9.86 2.28 5.91
1 23.26 9.28 3.54
20 23.08 5.51 3.24
Sep-02
bottom 11.60 2.00 2.09
1 19.39 10.38 5.28
20 19.57 7.12 5.52
Oct-02
bottom 12.18 1.80 3.32

LI Hongbo et al. / Acta Ecologica Sinica, 2006, 26(4): 1012–1020
mid-layer>bottom> surface at station 2–3. It indicated that the bacterioplankton abundance changed visibly on a daily basis,
but this in itself was insignificant. The maximum SB was 8.8 times that of the minimum, and it was 2.8 times that of the HBB. 2.4 Ratio of bacterioplankton biomass to total phyto-plankton biomass
Along transect 1 in August 2001, the ratio of Synechococ-cus biomass (SB) to the total phytoplankton biomass (PB) was 15%–99%, thus the minimum occurred at the surface of sta-tion 1–8 and the maximum occurred at the 10 m layer of sta-tion 1–1, while the average was 63%. The ratio of heterotro-phic bacteria biomass (HBB) to phytoplankton biomass (PB) was from 0.20 to 6.37 (the average was 1.52), thus the maxi-mum occurred at the bottom of station 1-10 and the minimum occurred at the bottom of station 1–1.
In August 2002, the SB/PB ratio was from 2% to 83% (an average of 28%), thus the maximum occurred at the sub-surface 10m layer of station 1–5 and the minimum at the surface of station 1–10. The ratio of HBB/PB was from 5.3%–536% (an average of 86%), thus the maximum was at the bottom of station 1-9 and the minimum ratio was at the surface of station 1–2.
During the cruise in September 2002, the ratio of SB/PB was from 11% to 96% (an average of 39%), thus the maxi-mum showed at the 10 m layer of station 1–6 and the mini-mum occurred at the 30 m layer of station 1–7. The ratio of HBB/PB was less than 100%, namely from 5.7% to 82% (an average of 33%), thus the maximum was at the 20 m layer of station 1–7 and the minimum at the 20 m layer of station 1–2.
During the cruise in October 2002, the ratio of SB/PB was from 9% to 99% (an average of 40%), thus the maximum
showed at the surface of station 1–7 and the minimum oc-curred at the 10 m layer of station 1–1. The ratio of HBB/PB
was from 12% to 319% (an average of 69%), thus the maxi-mum was at the bottom layer of station 1-10 and the minimum at the 10 m layer of station 1–1.
The contribution of Synechococcus to the total phytoplank-ton biomass (SB/PB) was from 2% to 99% (an average of 42.5%), but the ratio of HBB/PB was from 5% to 637% (an average of 85%) during the four cruises. 2.5 Synechococcus sized-fraction incubation
The Synechococcus growth rate was shown in Table 3 in the four incubations. The growth rate was highest ( -
0.024–1.681/d) in the second group with 20-µm mesh re-moved microzooplankton (20–200 µm) and it indicated that the microzooplankton was preying on the Synechococcus. The growth rate was less in the third and fourth group than in the first and second group at the surface of station 2–3 in August 2001 and at the 20 m layer of station 1–7 in 2002. Otherwise, the Synechococcus growth rate was the lowest in the first group incubation, pre-filtration with 3-µm pore-size polycar-bonate filter than other groups among the surface of station 1–7 in August 2001 and the 20 m layer of station 1–3 in Au-gust 2002. A virus and nano-zooplankton with less than 3 µm could have played a role in the Synechococcus growth proc-ess.
3 Discussion and Conclusion
3.1 Impact of YSCWM on bacterioplankton distribution The Yellow Sea Cold Water Mass (YSCWM) is formed in
the winter, owing to strong vertical mixing. When water is warmed in the spring, the central water in the bottom zone is
Fig. 3 Daily variations of bacterioplankton biomass at anchor stations in the Yellow Sea (Aug. 2001)
a. Station 1–7, Synechococcus; a′. Station 1–7, Heterotrophic bacteria, 13–14, Aug. 1–5 represent 0、10、25、45、75m
b. Station 2–3, Synechococcus; b′. Station 2–3, Heterotrophic bacteria, 16–17, Aug. 1–5 represent 0、10、15、25、55m
LI Hongbo et al. / Acta Ecologica Sinica, 2006, 26(4): 1012–1020
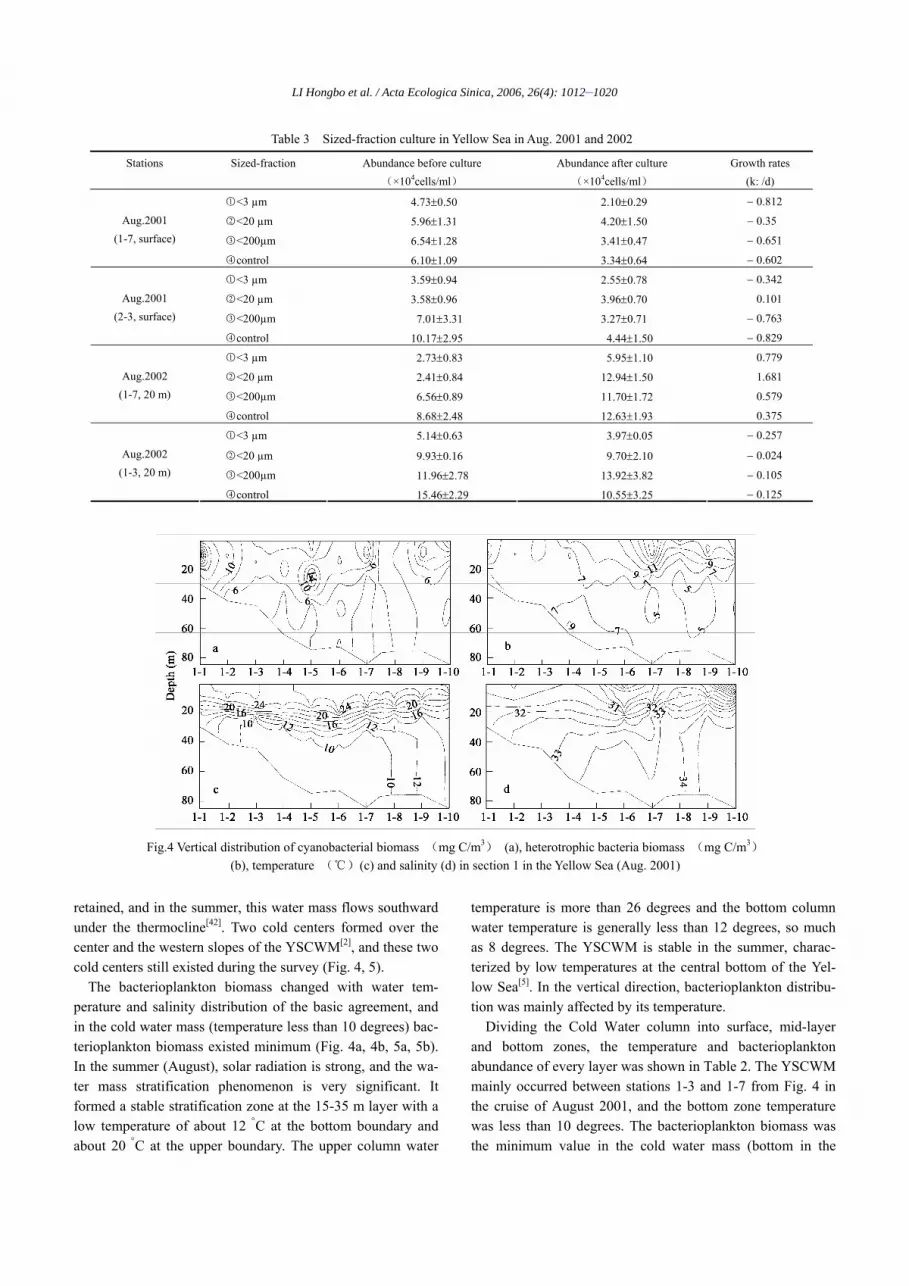
retained, and in the summer, this water mass flows southward under the thermocline[42]. Two cold centers formed over the center and the western slopes of the YSCWM[2], and these two cold centers still existed during the survey (Fig. 4, 5).
The bacterioplankton biomass changed with water tem-perature and salinity distribution of the basic agreement, and in the cold water mass (temperature less than 10 degrees) bac-terioplankton biomass existed minimum (Fig. 4a, 4b, 5a, 5b). In the summer (August), solar radiation is strong, and the wa-ter mass stratification phenomenon is very significant. It formed a stable stratification zone at the 15-35 m layer with a low temperature of about 12 °C at the bottom boundary and about 20 °C at the upper boundary. The upper column water
temperature is more than 26 degrees and the bottom column water temperature is generally less than 12 degrees, so much as 8 degrees. The YSCWM is stable in the summer, charac-terized by low temperatures at the central bottom of the Yel-low Sea[5]. In the vertical direction, bacterioplankton distribu-tion was mainly affected by its temperature.
Dividing the Cold Water column into surface, mid-layer and bottom zones, the temperature and bacterioplankton abundance of every layer was shown in Table 2. The YSCWM mainly occurred between stations 1-3 and 1-7 from Fig. 4 in the cruise of August 2001, and the bottom zone temperature was less than 10 degrees. The bacterioplankton biomass was the minimum value in the cold water mass (bottom in the
Table 3 Sized-fraction culture in Yellow Sea in Aug. 2001 and 2002
Stations Sized-fraction Abundance before culture (×104cells/ml)
Abundance after culture(×104cells/ml)
Growth rates (k: /d)
○1 <3 µm 4.73±0.50 2.10±0.29 − 0.812
○2 <20 µm 5.96±1.31 4.20±1.50 − 0.35
○3 <200µm 6.54±1.28 3.41±0.47 − 0.651
Aug.2001 (1-7, surface)
○4 control 6.10±1.09 3.34±0.64 − 0.602
○1 <3 µm 3.59±0.94 2.55±0.78 − 0.342
○2 <20 µm 3.58±0.96 3.96±0.70 0.101
○3 <200µm 7.01±3.31 3.27±0.71 − 0.763
Aug.2001 (2-3, surface)
○4 control 10.17±2.95 4.44±1.50 − 0.829
○1 <3 µm 2.73±0.83 5.95±1.10 0.779
○2 <20 µm 2.41±0.84 12.94±1.50 1.681
○3 <200µm 6.56±0.89 11.70±1.72 0.579
Aug.2002 (1-7, 20 m)
○4 control 8.68±2.48 12.63±1.93 0.375
○1 <3 µm 5.14±0.63 3.97±0.05 − 0.257
○2 <20 µm 9.93±0.16 9.70±2.10 − 0.024
○3 <200µm 11.96±2.78 13.92±3.82 − 0.105
Aug.2002 (1-3, 20 m)
○4 control 15.46±2.29 10.55±3.25 − 0.125
Fig.4 Vertical distribution of cyanobacterial biomass (mg C/m3) (a), heterotrophic bacteria biomass (mg C/m3)
(b), temperature (℃)(c) and salinity (d) in section 1 in the Yellow Sea (Aug. 2001)
LI Hongbo et al. / Acta Ecologica Sinica, 2006, 26(4): 1012–1020
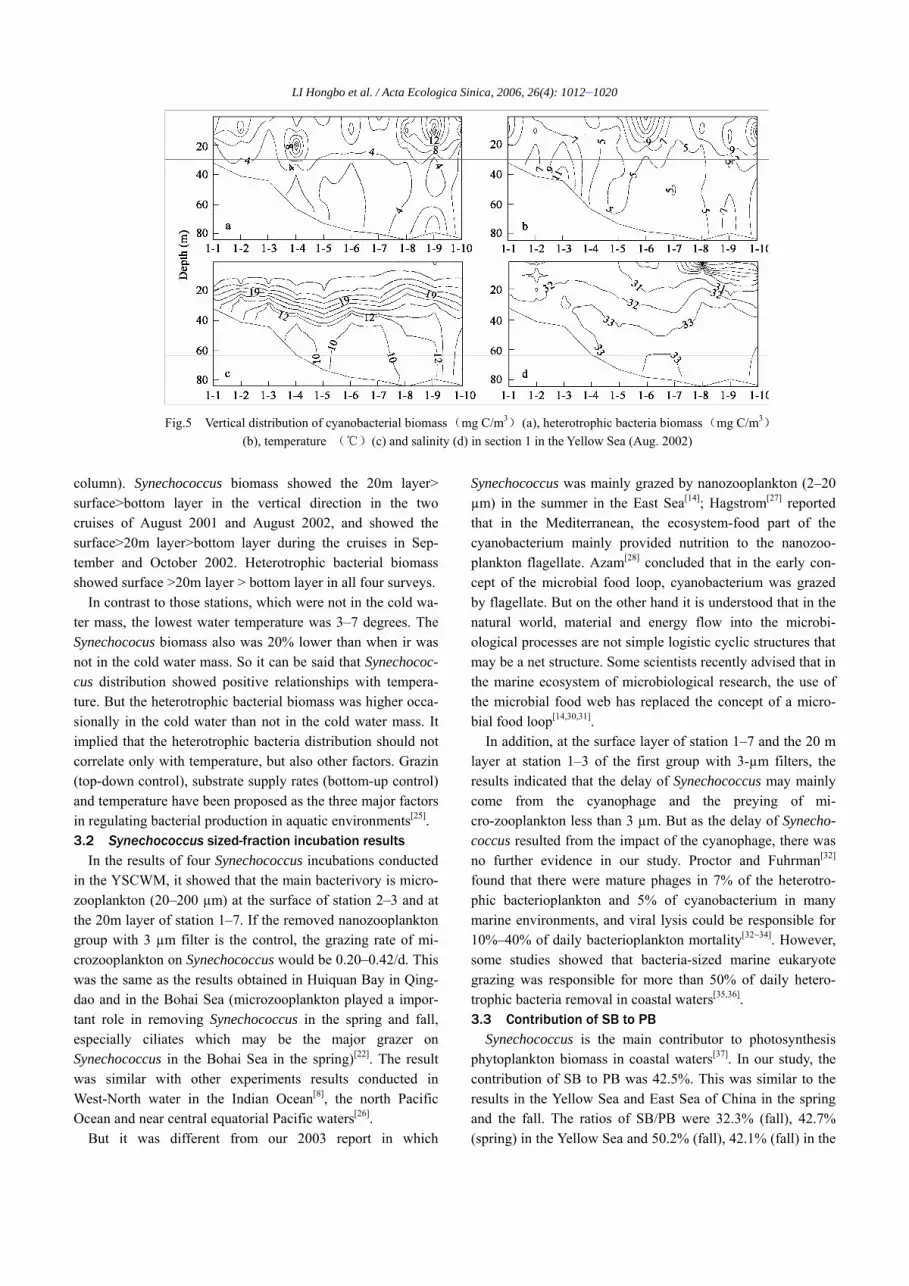
column). Synechococcus biomass showed the 20m layer> surface>bottom layer in the vertical direction in the two cruises of August 2001 and August 2002, and showed the surface>20m layer>bottom layer during the cruises in Sep-tember and October 2002. Heterotrophic bacterial biomass showed surface >20m layer > bottom layer in all four surveys.
In contrast to those stations, which were not in the cold wa-ter mass, the lowest water temperature was 3–7 degrees. The Synechococus biomass also was 20% lower than when ir was not in the cold water mass. So it can be said that Synechococ-cus distribution showed positive relationships with tempera-ture. But the heterotrophic bacterial biomass was higher occa-sionally in the cold water than not in the cold water mass. It implied that the heterotrophic bacteria distribution should not correlate only with temperature, but also other factors. Grazin (top-down control), substrate supply rates (bottom-up control) and temperature have been proposed as the three major factors in regulating bacterial production in aquatic environments[25]. 3.2 Synechococcus sized-fraction incubation results
In the results of four Synechococcus incubations conducted in the YSCWM, it showed that the main bacterivory is micro-zooplankton (20–200 µm) at the surface of station 2–3 and at the 20m layer of station 1–7. If the removed nanozooplankton group with 3 µm filter is the control, the grazing rate of mi-crozooplankton on Synechococcus would be 0.20–0.42/d. This was the same as the results obtained in Huiquan Bay in Qing-dao and in the Bohai Sea (microzooplankton played a impor-tant role in removing Synechococcus in the spring and fall, especially ciliates which may be the major grazer on Synechococcus in the Bohai Sea in the spring)[22]. The result was similar with other experiments results conducted in West-North water in the Indian Ocean[8], the north Pacific Ocean and near central equatorial Pacific waters[26].
But it was different from our 2003 report in which
Synechococcus was mainly grazed by nanozooplankton (2–20 µm) in the summer in the East Sea[14]; Hagstrom[27] reported that in the Mediterranean, the ecosystem-food part of the cyanobacterium mainly provided nutrition to the nanozoo-plankton flagellate. Azam[28] concluded that in the early con-cept of the microbial food loop, cyanobacterium was grazed by flagellate. But on the other hand it is understood that in the natural world, material and energy flow into the microbi-ological processes are not simple logistic cyclic structures that may be a net structure. Some scientists recently advised that in the marine ecosystem of microbiological research, the use of the microbial food web has replaced the concept of a micro-bial food loop[14,30,31].
In addition, at the surface layer of station 1–7 and the 20 m layer at station 1–3 of the first group with 3-µm filters, the results indicated that the delay of Synechococcus may mainly come from the cyanophage and the preying of mi-cro-zooplankton less than 3 µm. But as the delay of Synecho-coccus resulted from the impact of the cyanophage, there was no further evidence in our study. Proctor and Fuhrman[32] found that there were mature phages in 7% of the heterotro-phic bacterioplankton and 5% of cyanobacterium in many marine environments, and viral lysis could be responsible for 10%–40% of daily bacterioplankton mortality[32~34]. However, some studies showed that bacteria-sized marine eukaryote grazing was responsible for more than 50% of daily hetero-trophic bacteria removal in coastal waters[35,36]. 3.3 Contribution of SB to PB
Synechococcus is the main contributor to photosynthesis phytoplankton biomass in coastal waters[37]. In our study, the contribution of SB to PB was 42.5%. This was similar to the results in the Yellow Sea and East Sea of China in the spring and the fall. The ratios of SB/PB were 32.3% (fall), 42.7% (spring) in the Yellow Sea and 50.2% (fall), 42.1% (fall) in the
Fig.5 Vertical distribution of cyanobacterial biomass (mg C/m3) (a), heterotrophic bacteria biomass (mg C/m3)
(b), temperature (℃)(c) and salinity (d) in section 1 in the Yellow Sea (Aug. 2002)

LI Hongbo et al. / Acta Ecologica Sinica, 2006, 26(4): 1012–1020
East China Sea[15]. In 2002, Chiang[38] reported the contribu-tion was 44–59% in warm seasons and 6–25% in cold seasons. It was much higher than reported in 2003 that the SB/PB was 10% (0.5%~91.8%) in the winter and 3% (0.6%–10.6%) in the summer in the East China Sea[14]. In many studies, picophyto-plankton was studied as a whole in terms of its contribution to total phytoplankton biomass and not only to Synechococcus, something which was different about our work. Huang[39] re-ported that the contribution of picoplankton to phytoplankton biomass is 17%–60% in the winter and 20%–54% in the summer in the Taiwan Strait. Tata[40] said that the contribution of picophytoplankton to total phytoplankton biomass was about 50% of inshore water. It was revealed that Synechococ-cus was main component in picophytoplankton in the studied waters, so the result represented the contribution of picophy-toplankton to total phytoplankton biomass to a certain extent.
Burkill’s research showed that the waters were a eutrophic zone if NO3 concentration exceeded 5 µM, a mesotrophic zone if 0.5 µM <NO3<5 µM and an oligotrophic zone if NO3< 0.5 µM[8]. The NO3 concentration was analyzed by separating the vertical column into a eutrophic zone (deeper than 50 m), a mesotrophic zone (about 20–50m) and an oligotrophic zone (upper 20 m) [41]. The Synechococcus abundance was 0.27–5.58×10⁴ cells/ml (average was 2.88×10⁴ cells/ml, n=98) in the oligotrophic water, 0.56–5.89×10⁴ cells/ml (average was 1.44×10⁴ cells/ml, n=60) in the mesotrophic water and 0.27–3.46×10⁴ cells/ml (average was 1.04×10⁴ cells/ml, n=57) in the eutrophic water. Burkill[8] reported that the Synecho-coccus abundance was more than 105cells/ml in the oligotro-phic water in the Indian Ocean, which was one magnitude higher than in other waters. The Synechococcus distribution in water column was oligotrophic>mesotrophic> eutrophic, which was similar to the distribution in the vertical direction.
Acknowledgements
This study was financially supported by special funds from the National Key Basic Research Program of the People’s Republic of China G19990437, Natural Science Foundation of China (NSFC) grant no. 40376048 and the Natural Science Foundation of Qingdao. We thank the crew of R/V Beidou for their help and co-operation. Two anonymous referees offered valuable advice on an earlier draft of this manuscript.
References
[1] Su J L, Huang D J. On the current field associated with the Yellow Sea Cold Water Mass. Oceanologr. Limnol. Sin. supplement, 1995, 26(5): 1–7.
[2] Weng X C, Zhang Y K, Wang C M, et al. The Variational charac-teristic of the Huanghai Sea (Yellow Sea) Cold Water Mass. Journal of Ocean University of Qingdao, 1989, 19(1): 119–131.
[3] Zhao B. The fronts of the Huanghai Sea cold water mass induced
by tidal mixing. Oceanologr. Limnol. Sin., 1985, 16(6): 451–459. [4] Diao H X, Shen Z L. The vertical distribution of the chemical
factors in the Yellow Sea Cold Water. Studia Marina Sinica, 1985, 25: 41–51.
[5] Zhang S W, Xia C S, Yuan Y L. The physical-ecological coupling numerical models in the Yellow Sea Cold Water. Progress in Natural Science, 2002, 12(3): 315–319.
[6] Sun S, Wang R, Zhang G T, et al. A preliminary study on the over-summer strategy of Calanus Sinicus in the Yellow Sea. Oceanologr. Limnol. Sin., Special Issue: zooplankton, 2002, 92–99.
[7] Marchant H J, Wright A T, Wright S W. The distribution and abundance of chroococcoid cyanobacteria in the Southern Ocean. Polar Biol., 1987, 1:1–9.
[8] Burkill P H, Leakey R J G, Owens N J P, et al. Synechococcus and its importance to the microbial food web of the northwestern In-dian Ocean. Deep Sea Res., Ⅱ, 1993, 40(3): 773–782.
[9] Ducklow H W, Kirchman D L, Quinby H L, et al. Bacterioplank-ton carbon cycling during the spring bloom in the western North Atlantic Ocean. Deep Sea Res., Ⅱ, 1993, 40: 245–263.
[10] Kirchman D L, James H R, Barber R T. Biomass and biomass production of heterotrophic bacteria along 140°W in the equato-rial Pacific: Effect of temperature on the microbial loop. Deep Sea Res., Ⅱ, 1995, 42(2/3): 603–619.
[11] Ning X, Vaulot D. Distribution, cell characters and environ-mental regulation of cyanobacterium Synechococcus in the Changjiang (Yangtze River) estuary and the adjacent East China Sea. Acta Oceanologica Sinica, 1991, 13: 552–559.
[12] Liu Z L, Hiroshi K, Ning X, et al. Bacterioplankton production in dilution zone of the Changjiang. Acta Oceanologica Sinica, 2001, 23(4): 93–99.
[13] Xiao T, Wang R. Distribution of Synechococcus in the Bohai Sea in autumn and spring. Acta Ecologica Sinica, 2002, 22(12): 2 071–2 078.
[14] Xiao T, Yue H D, Zhang W C, et al. Distribution of Synecho-coccus and its role in the microbial food loop in the East China Sea. Oceanologr. Limnol. Sin., 2003, 34(1): 33–43.
[15] Sun S, Xiao T, Yue H D. Distribution character of Synechococ-cus spp. in the East China Sea and the Yellow Sea in autumn and spring. Oceanologr. Limnol. Sin., 2003, 34(2): 161–168.
[16] Zhao S J, Xiao T, Yue H D. The distribution of heterotrophic bacteria and some related factors in the East China and Yellow Seas during fall. Oceanologr. Limnol. Sin., 2003, 34(3): 295–305.
[17] Waterbury J B, Watson S W, Guillard R, et al. Widespread oc-currence of a unicellular, marine planktonic cyanobacterium. Nature, 1979, 277: 293–294.
[18] Hobbie J E, Daley R J, Jasper S. Use of nuclepore filters for counting bacteria by fluorescence microscopy. App. Environ. Microbiol., 1977, 33(5): 1 225–1 228.
[19] Cuhel R, Waterbury J B. Biochemical composition and short term nutrient incorporation patterns in unicellular marine
LI Hongbo et al. / Acta Ecologica Sinica, 2006, 26(4): 1012–1020
cyanobacterium, Synechococcus (WH7803). Limnol. Oceanogr., 1984, 29: 370–374.
[20] Gallagar S M, Waterbury J B, Stoecker D K. Efficient grazing and utilization of the marine cyanobacterium Synechococcus sp. by larvae of the bivalve Mercencaria. Mar. Biol., 1994, 119: 251–259.
[21] Lee S, Fuhrman J A. Relationships between biovolume and bio-mass of naturally derived marine bacterioplankton. Appl. Envi-ron. Microbiol., 1987, 53(6): 1 298–1 303.
[22] Krempin D W, Sullivan C W. The seasonal abundance, vertical distribution, and relative microbial biomass of chrococcoid cyanobacteria at a station in southern California coastal waters. Can. J. Microbiol., 1981, 27: 1 341–1 344.
[23] Xiao T, Zhang W C, Wang R. Elementary studies on the roles of cyanobacteria in marine microbial food pool. Marine Sciences, 1999, 23(5): 48–50.
[24] Frost B W. Effect of size and concentration of food particles on the feeding behavior of the marine planktonic copepod Calannus pacificus. Limonol. Oceanogr., 1972, 17: 805–815.
[25] Shiah F K, Ducklow H W. Temperature regulation of heterotro-phic bacterioplankton abundance, production, and specific growth rate in Chesapeake Bay. Limnol. Oceanogr., 1994, 39(6): 1 243–1 258.
[26] Iturriage R, Mitchell B G. Chrococcoid cyanobacteria: a signifi-cant component in the food web dynamics of the open ocean. Mar. Ecol. Prog. Ser., 1986, 28: 271–297.
[27] Landry M R. Microzooplankton grazing in the equatorial Pacific. Deep Sea Res.,Ⅱ, 1995, 42(2/3): 657–671.
[28] Hagstrom A, Azam F, Anderson A. Microbial loop in an oligrophic pelagic marine ecosystem. Mar. Ecol. Prog. Ser., 1988, 49: 171–178.
[29] Azam F, Fenchel T, Gray J G, et al. The ecological role of water column microbes in the sea. Mar. Ecol. Prog. Ser., 1983, 10: 257–263.
[30] Sherr E, Sherr B. Role of microbes in pelagic food webs: a re-
vised concept. Limnol. Oceanogr., 1988, 33(5): 1 225–1 227. [31] Christaki U, Jacquet S, Dolan J R, et al. Growth and grzing on
Prochlorococcus and Synechococcus by two marine ciliates. Limnol. Oceanogr., 1999, 44(1): 52–61.
[32] Proctor L M, Fuhrman J A. Viral mortality of marine bacteria and cyanobacteria. Nature, 1990, 343: 60–62.
[33] Fuhrman J A. Marine viruses and their biogeochemical and eco-logical effects. Nature, 1999, 399: 541–548.
[34] Suttle C A, Chan A M. Dyanmics and distribution of cyanophage and their effect on marine Synechococcus spp. Appl. Envi-ron. Microbiol., 1994, 60(9): 3 167–3 174.
[35] Fuhrman J A, Mcmanus G B. Do bacteria-sized marine eukaryo-tes consume significant bacterial production? Science, 1984, 224: 1 257–1 260.
[36] Wright R T, Coffin R B. Measuring microzooplankton grazing on planktonic marine bacteria by its impact on bacterial produc-tion. Micro Ecol, 1984, 10: 137–149.
[37] Jochem F. On the distribution and importance of picocyanobac-teria in a boreal inshore area (Kiel Bight, Western Baltic). J. Plankton Res., 1988, 10: 1 022–1 099.
[38] Chiang K P, Kuo M C, Chang J, et al. Spatial and temporal variation of Synechococcus popution in the East China Sea and its contribution to phytoplankton biomass. Continental Shelf Research, 2002, 22: 3–13.
[39] Huang B Q, Hong H S, Wang H L. Size fractioned primary pro-ductivity and the phytoplankton bacteria relationship in the Tai-wan Strait. Mar. Ecol. Prog. Ser., 1999, 183: 29–38.
[40] Tata K, Matsumoto K, Tata M, et al. Size distribution of phyto-plankton community in Hiroshima Bay. Kagawa Daigaku Nogakuibu Gakujutsu Hokoku, 1994, 46: 27–35.
[41] Wang B D. Characteristics of variations and interrelations of biogenic elements in the Huanghai Sea Cold Water Mass. Acta Oceanologica Sinica, 2000, 22(6): 47–54.


