Embed Size (px)
Citation preview
�����������������
Citation: Li, W.; Shang, H.; Zhou, H.;
Song, Y.; Zheng, S.; Yang, X. Effect of
Stabilizer on Gold Leaching with
Thiourea in Alkaline Solutions.
Minerals 2022, 12, 89. https://
doi.org/10.3390/min12010089
Academic Editor: Kenneth N. Han
Received: 15 October 2021
Accepted: 11 January 2022
Published: 13 January 2022
Publisher’s Note: MDPI stays neutral
with regard to jurisdictional claims in
published maps and institutional affil-
iations.
Copyright: © 2022 by the authors.
Licensee MDPI, Basel, Switzerland.
This article is an open access article
distributed under the terms and
conditions of the Creative Commons
Attribution (CC BY) license (https://
creativecommons.org/licenses/by/
4.0/).
minerals
Article
Effect of Stabilizer on Gold Leaching with Thiourea inAlkaline SolutionsWenjuan Li 1,2,3, He Shang 2,3, He Zhou 2, Yongsheng Song 2, Shuilin Zheng 1 and Xinlong Yang 2,3,*
1 School of Chemical & Environmental Engineering, China University of Mining & Technology,Beijing 100083, China; [email protected] (W.L.); [email protected] (S.Z.)
2 National Engineering Research Center for Environment-Friendly Metallurgy in Producing PremiumNon-Ferrous Metals, GRINM Resources and Environment Tech. Co., Ltd., Beijing 101407, China;[email protected] (H.S.); [email protected] (H.Z.); [email protected] (Y.S.)
3 GRIMAT Engineering Institute Co., Ltd., Beijing 101407, China* Correspondence: [email protected]
Abstract: The present work investigated the comparison of the effects of Na2SO3 and Na2SiO3
on thiourea stabilization, and a systematic study was undertaken to establish the effects of thesestabilizers on the stability of alkaline thiourea, both qualitatively and quantitatively. The effects ofthese stabilizers on the activation energy of alkaline thiourea gold leaching was also studied. Theresults showed that sodium silicate was more suitable as a stabilizer in this system than sodiumsulfite because the peak current of gold dissolution with sodium sulfite was higher than that withsodium silicate, but the inhibition of thiourea decomposition by the former was less obvious than thatof sodium silicate in the cyclic voltammetry curve. The quartz crystal microbalance results showedthat the quality decreased to about 100 ng cm2 in the presence of a stabilizer, while it increased to300 ng cm2 in the absence of the stabilizer. It is inferred that gold can be dissolved by alkaline thioureain the presence of a stabilizer, while it cannot without a stabilizer because of the decomposition ofthiourea. This assumption was confirmed by atomic force microscopy measurements. The surfaceactivation energy of Au dissolution decreased from 183.76 to 98.07 kJ/moL with the addition ofsodium silicate, indicating that Au dissolution was promoted with the chemical.
Keywords: alkaline thiourea; gold; stabilizer; electrochemical measurement; quartz crystal microbalance
1. Introduction
Thiourea leaching of gold has attracted much attention because of its environmentallyfriendliness. Gold recovery from high-grade e-waste, uranium tailing material, maturedumps, etc., using thiourea leaching has been widely studied [1–5]. In recent years, toovercome the disadvantages of acidic thiourea gold leaching, research has been undertakenon alkaline thiourea gold leaching to obtain a milder co-dissolution of base metals, lessthiourea destruction/consumption, less corrosion of equipment and greater environmen-tally friendliness [6–9]. Research on thiourea decomposition in alkaline media has shownthat stabilizers such as Na2SO3 and Na2SiO3 could prohibit thiourea decomposition to someextent and improve thiourea stabilization [10]. Based on a molecular-field analysis, andwith the application of HYCHEM technology software, Chai et al. studied the mechanismof molecular thiourea stability in terms of the molecular field, by comparing the highestoccupation molecule orbit (HOMO) of a thiourea molecule in related media [11–14], theresult of which helped to establish the structure–activity correlation between the stabilizerand the construction/stabilization of thiourea. This provides a theoretical basis for findingeconomic alkaline thiourea stabilizers. The HOMO energy of the thiourea molecule in acidicmedia is much lower than that in alkaline media, suggesting that thiourea is relativelyunstable in alkaline media. The addition of sulfite ions in alkaline media can form a stableloop structure with thiourea via lone pair electrons, which reduces the HOMO energy of
Minerals 2022, 12, 89. https://doi.org/10.3390/min12010089 https://www.mdpi.com/journal/minerals
Minerals 2022, 12, 89 2 of 13
the thiourea molecule in alkaline media from −3.403572 to −4.534400 eV and improvesthe stability of alkaline thiourea [15,16]. Mohammed R. Ahmed et al. showed that thepresence of sodium sulfite can significantly reduce thiourea decomposition, accelerate thegold dissolution process, decrease the leaching time, and lower the activation energy ofgold dissolution [2]. The activation energy with sodium sulfite is 7.62 kJ moL−1, which ismuch lower than 9.32 kJ moL−1 in the absence of sodium sulfite. The low activation energyconfirms the surface reaction dissolution mechanism.
It has been shown that the polarization current density of gold in an alkaline thioureasolution is slightly less than that in an acidic solution from the anodic polarization curve, butgold dissolves more easily than its usual companions and common associated elements, such assilver, copper, nickel, iron and so on, and has the tendency toward preferential dissolution [17].
A quartz crystal microbalance (QCM) is an instrument used to measure the change inthe surface quality of the electrode based on the piezoelectric effect of a quartz crystal. Therelationship between the quality of the metal film deposited on the surface of the quartzcrystal electrode and the change in the frequency of the quartz crystal is represented bythe Sauerbrey equation ∆F = −KF2∆M/A [18]. QCM-D has been reported in the fieldof metal corrosion, and in recent years, more and more attention has been paid to theinteraction between minerals and reagents. In the research on electrochemical workstationsand QCM (EQCM), the anodic dissolution of zinc was studied by cyclic voltammetry andthe concentration of Zn (I) on the surface of zinc was calculated by using the results of QCM,while the kinetic constants of secondary electron transfer of zinc were also estimated [19].A study was also performed on the oxidation-reduction mechanism of silver electrode byEQCM [20]. The corrosion of Au in dodecanethiol was studied by means of QCM and AFM,and the kinetic equation of the initial corrosion of Au in dodecanethiol was determined [21].The leaching of gold in a cyanide-copper-ammonia oxygenated solution was studied bymeans of QCM. The dissolution of gold was monitored by changing the concentration ofcopper ions and ammonia [22]. Using the quartz crystal microbalance with dissipation(QCM-D) technique, the leaching kinetics of gold using sodium dicyanamide as a leachingagent with and without potassium ferrocyanide were studied [23]. The mechanism ofamine collectors in reverse flotation of quartz from phosphorite veins was studied by usingQCM, and the adsorption process of GP193G75 on the surface of hydroxylapatite was alsostudied by using QCM with energy dissipation function [24]. There are no reports on thekinetic study of alkaline thiourea gold leaching systems by quartz crystal microbalanceelectrochemical workstations. The application of QCM-D in the above fields can be usedfor reference in the study of the kinetics of alkaline thiourea leaching gold systems.
According to the structure-activity correlation between the stabilizer and thiourea,sodium sulfite and sodium silicate are qualified as stabilizers. A comparison of the effectsof Na2SO3 and Na2SiO3 on thiourea stabilization needs to be established based on theexisting research results. The present work was novel because it made a systematic studyto determine the effects of these stabilizers on the stability of alkaline thiourea and theactivation energy of alkaline thiourea gold leaching. In addition, in this study, along withthe presentation of electrochemical measurements (including cyclic voltammetry curves,and the steady state polarization method) that can be used to select the Na2SO3 or Na2SiO3stabilizer, quartz-crystal microbalance (QCM-D), which is a new method for gold leaching,and atomic force microscopy were used to study the effects of the stabilizers on thioureastabilization. The Tafel curve method and activation energy calculations were used toestablish the effects of the stabilizers on the system.
2. Experimental2.1. Reagents
Reagent grade thiourea was purchased from Shanghai Lingfeng Chemical Reagent Co.,Ltd. (Shanghai, China). Reagent grade sodium silicate and sodium sulfite were purchasedfrom Tianjin Guangfu Technology Development Co., Ltd. (Tianjin, China). All solutionswere made from analytical reagents with deionized water.
Minerals 2022, 12, 89 3 of 13
2.2. Instrumentation
The Au electrode was a customized thin gold chip (1.5 cm diameter, 99.99% Au),and quartz crystals were purchased from Biolin Scientific AB (Västra Frölunda, Sweden).A Q-sense E4 Quartz crystal microbalance (QCM-D, Biolin Scientific AB) was used tomeasure the quality, frequency, and conformation changes on the surface of the goldchips. A PAR 273 A electrochemical station (USA EG&G Princeton Applied ResearchCompany, Oak Ridge, TN, USA) was used to measure the electrochemical behaviors.The electrode configuration was a triple-electrode system [25]. The Au electrode was theworking electrode, the Ag/AgCl electrode (the potential reference value is SSE) was thereference electrode, and the graphite electrode was the auxiliary electrode.
An Agilent AFM 5500 (Santa Clara, CA, USA) with a tapping mode cantilever (V-shaped cantilever configuration) was used to take the AFM images at a scan rate between2.9 and 3.52 Hz.
2.3. Electrochemical Measurements
Electrochemical behaviors were measured by the cyclic voltammetry and the steadystate polarization methods. Prior to the experiment, the Au working surface was polishedto a mirror surface with 2000-mesh metallographic sandpaper, washed three times withalcohol, and cleaned with distilled water. The counter and reference electrodes were placedin a fixture. A 1 × 10⁻⁴ m2 surface area was contacted with the solutions. The pH wasadjusted by using NaOH solution. The potentials in this study were converted to potentialsof standard hydrogen electrode (vs. SHE).
2.4. Measurements on Quartz Crystal Microbalance with Dissipation
All measurements on the quartz crystal microbalance with dissipation were performedat 25 degrees Celsius (±0.02 ◦C). A thiourea solution of 0.15 M concentration was preparedusing deionized water. Two groups of experiments were conducted, with zero and 0.09 Msodium silicate in the solution, respectively. The pH of the solution was adjusted to 11.0(±0.1) using NaOH. The flow rate of the solution was controlled at 100 µL/min. When thecurve was stable, a solvent was added using the pump to achieve the baseline value [26–29].
2.5. The Measurements on Atomic Force Microscope
The gold chip measured by the quartz crystal microbalance was dried for 2 h, and thesurfaces were tested using an atomic force microscope [30]. The corrosion and adsorptionof the gold chip surface were evaluated using nanoscope analysis software.
3. Results and Discussion3.1. Effect of Stabilizer on Gold Cyclic Voltammetry Curve in Alkaline Thiourea Solution
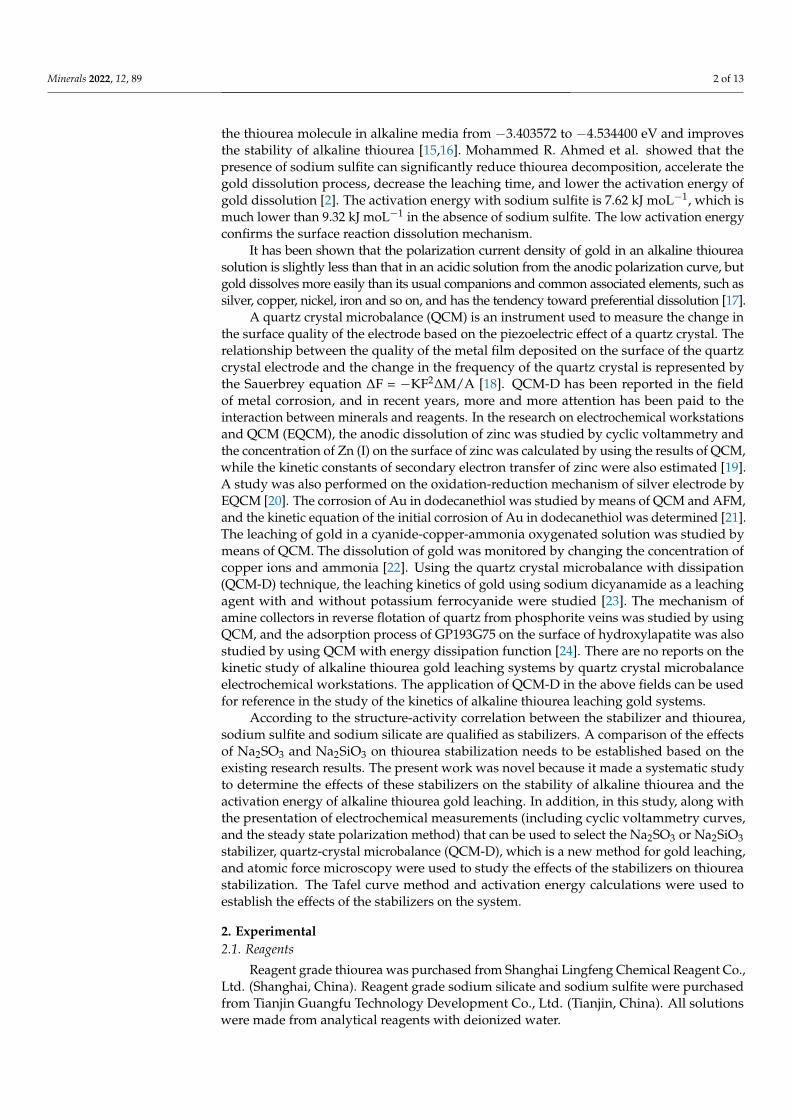
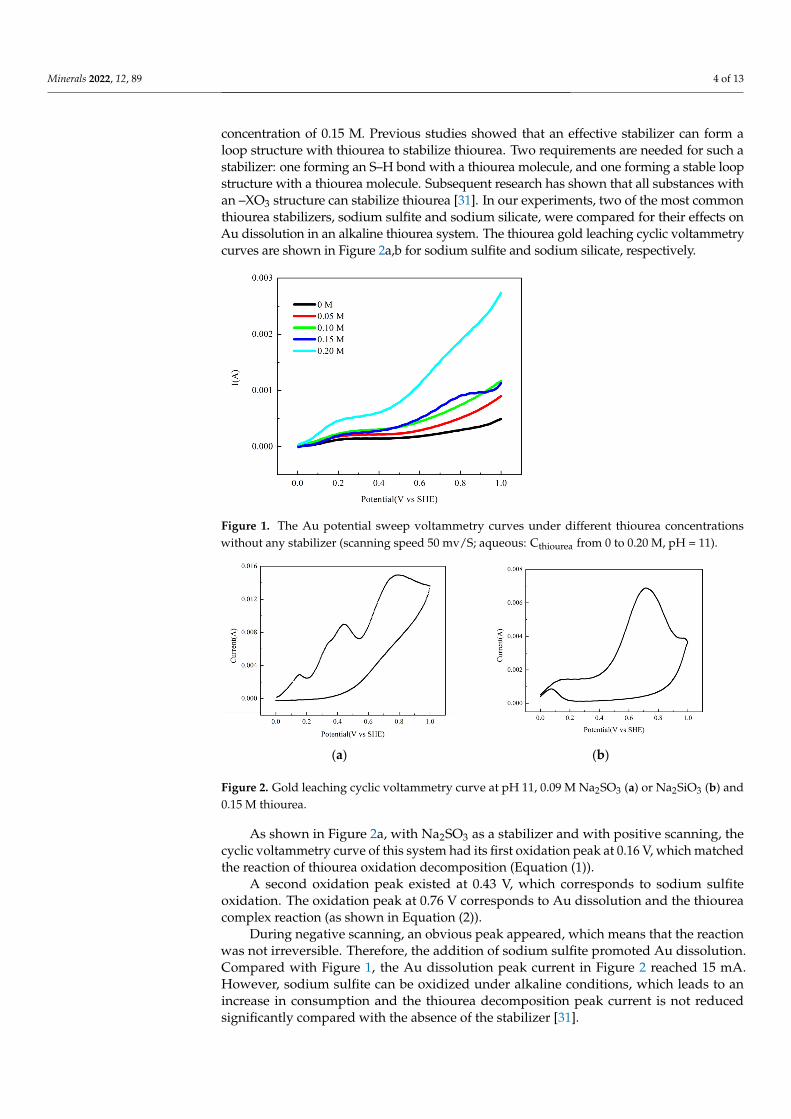
The Au cyclic voltammetry curves under different thiourea concentrations, withoutany stabilizer in alkaline solution, are shown in Figure 1.
The Au cyclic voltammetry curves indicated that an oxidation peak occurred at ~0.2 Vand shifted left when the thiourea concentration was increased. The thiourea decompositionreactions are shown in Equation (1).
2SC(NH2)2 + 2OH− = (SCN2H3)2 + 2H2O + 2e (1)
With the potential increased, another oxidation peak at ~0.8 V was observed at 0.15 Mthiourea. This peak corresponds to the Au dissolution, and the alkaline complex reaction isshown in Equation (2).
Au + SC(NH2)2 = Au[CS(NH2)2]2+ + e (2)
Without the stabilizer, thiourea decomposed significantly. Even if an oxidation peakappeared at 0.8 V, the dissolution current was low. There was a clear peak representing Audissolution at 0.15 M thiourea. The remaining experiments were performed at a thiourea
Minerals 2022, 12, 89 4 of 13
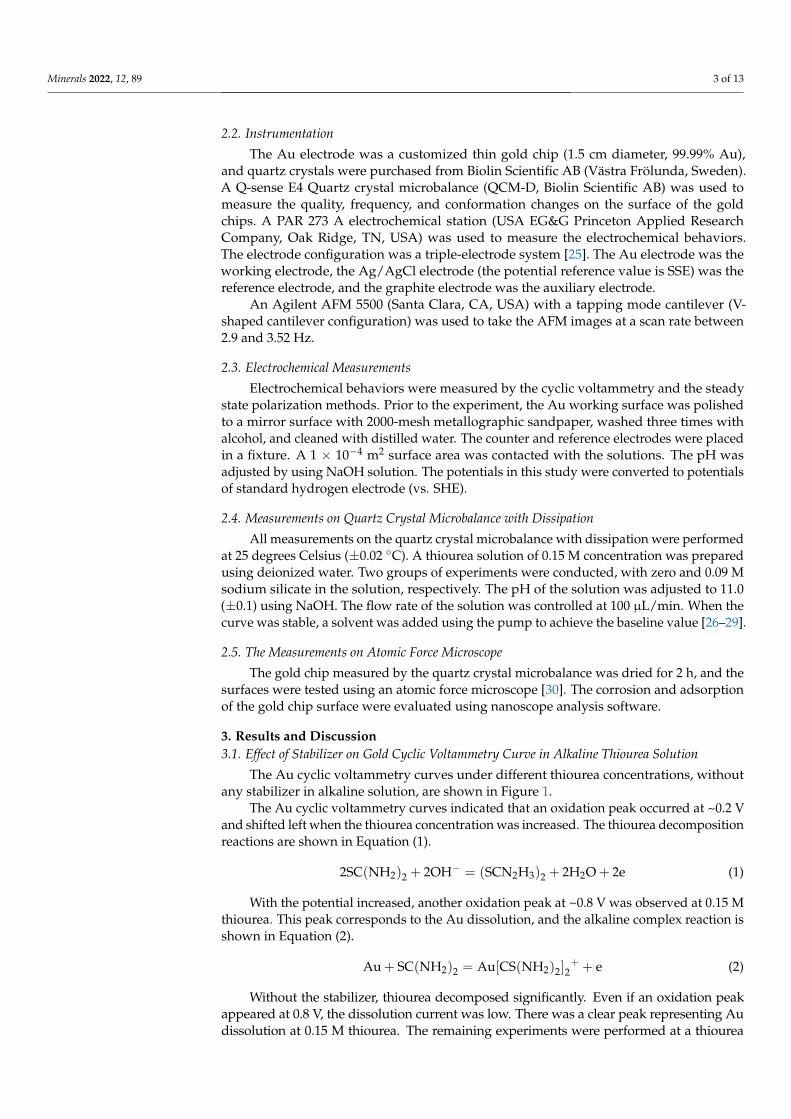
concentration of 0.15 M. Previous studies showed that an effective stabilizer can form aloop structure with thiourea to stabilize thiourea. Two requirements are needed for such astabilizer: one forming an S–H bond with a thiourea molecule, and one forming a stable loopstructure with a thiourea molecule. Subsequent research has shown that all substances withan –XO3 structure can stabilize thiourea [31]. In our experiments, two of the most commonthiourea stabilizers, sodium sulfite and sodium silicate, were compared for their effects onAu dissolution in an alkaline thiourea system. The thiourea gold leaching cyclic voltammetrycurves are shown in Figure 2a,b for sodium sulfite and sodium silicate, respectively.
Minerals 2022, 12, x FOR PEER REVIEW 4 of 13
Figure 1. The Au potential sweep voltammetry curves under different thiourea concentrations with-out any stabilizer (scanning speed 50 mv/S; aqueous: Cthiourea from 0 to 0.20 M, pH = 11).
The Au cyclic voltammetry curves indicated that an oxidation peak occurred at ~0.2 V and shifted left when the thiourea concentration was increased. The thiourea decompo-sition reactions are shown in Equation (1). 2SC(NH ) + 2OH = (SCN H ) + 2H O + 2e (1)
With the potential increased, another oxidation peak at ~0.8 V was observed at 0.15 M thiourea. This peak corresponds to the Au dissolution, and the alkaline complex reac-tion is shown in Equation (2). Au + SC(NH ) = Au CS(NH ) + e (2)
Without the stabilizer, thiourea decomposed significantly. Even if an oxidation peak appeared at 0.8 V, the dissolution current was low. There was a clear peak representing Au dissolution at 0.15 M thiourea. The remaining experiments were performed at a thio-urea concentration of 0.15 M. Previous studies showed that an effective stabilizer can form a loop structure with thiourea to stabilize thiourea. Two requirements are needed for such a stabilizer: one forming an S–H bond with a thiourea molecule, and one forming a stable loop structure with a thiourea molecule. Subsequent research has shown that all sub-stances with an –XO3 structure can stabilize thiourea [31]. In our experiments, two of the most common thiourea stabilizers, sodium sulfite and sodium silicate, were compared for their effects on Au dissolution in an alkaline thiourea system. The thiourea gold leaching cyclic voltammetry curves are shown in Figure 2a,b for sodium sulfite and sodium silicate, respectively.
(a) (b)
Figure 1. The Au potential sweep voltammetry curves under different thiourea concentrationswithout any stabilizer (scanning speed 50 mv/S; aqueous: Cthiourea from 0 to 0.20 M, pH = 11).
Minerals 2022, 12, x FOR PEER REVIEW 4 of 13
Figure 1. The Au potential sweep voltammetry curves under different thiourea concentrations with-out any stabilizer (scanning speed 50 mv/S; aqueous: Cthiourea from 0 to 0.20 M, pH = 11).
The Au cyclic voltammetry curves indicated that an oxidation peak occurred at ~0.2 V and shifted left when the thiourea concentration was increased. The thiourea decompo-sition reactions are shown in Equation (1). 2SC(NH ) + 2OH = (SCN H ) + 2H O + 2e (1)
With the potential increased, another oxidation peak at ~0.8 V was observed at 0.15 M thiourea. This peak corresponds to the Au dissolution, and the alkaline complex reac-tion is shown in Equation (2). Au + SC(NH ) = Au CS(NH ) + e (2)
Without the stabilizer, thiourea decomposed significantly. Even if an oxidation peak appeared at 0.8 V, the dissolution current was low. There was a clear peak representing Au dissolution at 0.15 M thiourea. The remaining experiments were performed at a thio-urea concentration of 0.15 M. Previous studies showed that an effective stabilizer can form a loop structure with thiourea to stabilize thiourea. Two requirements are needed for such a stabilizer: one forming an S–H bond with a thiourea molecule, and one forming a stable loop structure with a thiourea molecule. Subsequent research has shown that all sub-stances with an –XO3 structure can stabilize thiourea [31]. In our experiments, two of the most common thiourea stabilizers, sodium sulfite and sodium silicate, were compared for their effects on Au dissolution in an alkaline thiourea system. The thiourea gold leaching cyclic voltammetry curves are shown in Figure 2a,b for sodium sulfite and sodium silicate, respectively.
(a) (b)
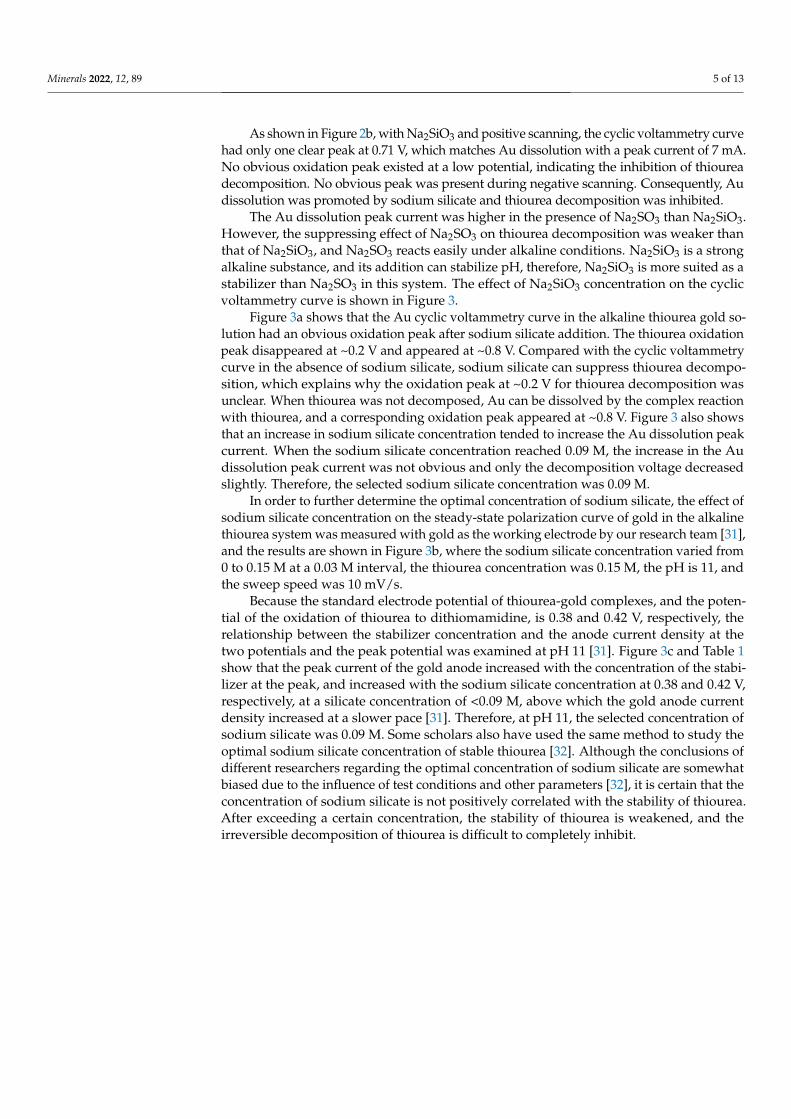
Figure 2. Gold leaching cyclic voltammetry curve at pH 11, 0.09 M Na2SO3 (a) or Na2SiO3 (b) and0.15 M thiourea.
As shown in Figure 2a, with Na2SO3 as a stabilizer and with positive scanning, thecyclic voltammetry curve of this system had its first oxidation peak at 0.16 V, which matchedthe reaction of thiourea oxidation decomposition (Equation (1)).
A second oxidation peak existed at 0.43 V, which corresponds to sodium sulfiteoxidation. The oxidation peak at 0.76 V corresponds to Au dissolution and the thioureacomplex reaction (as shown in Equation (2)).
During negative scanning, an obvious peak appeared, which means that the reactionwas not irreversible. Therefore, the addition of sodium sulfite promoted Au dissolution.Compared with Figure 1, the Au dissolution peak current in Figure 2 reached 15 mA.However, sodium sulfite can be oxidized under alkaline conditions, which leads to anincrease in consumption and the thiourea decomposition peak current is not reducedsignificantly compared with the absence of the stabilizer [31].
Minerals 2022, 12, 89 5 of 13
As shown in Figure 2b, with Na2SiO3 and positive scanning, the cyclic voltammetry curvehad only one clear peak at 0.71 V, which matches Au dissolution with a peak current of 7 mA.No obvious oxidation peak existed at a low potential, indicating the inhibition of thioureadecomposition. No obvious peak was present during negative scanning. Consequently, Audissolution was promoted by sodium silicate and thiourea decomposition was inhibited.
The Au dissolution peak current was higher in the presence of Na2SO3 than Na2SiO3.However, the suppressing effect of Na2SO3 on thiourea decomposition was weaker thanthat of Na2SiO3, and Na2SO3 reacts easily under alkaline conditions. Na2SiO3 is a strongalkaline substance, and its addition can stabilize pH, therefore, Na2SiO3 is more suited as astabilizer than Na2SO3 in this system. The effect of Na2SiO3 concentration on the cyclicvoltammetry curve is shown in Figure 3.
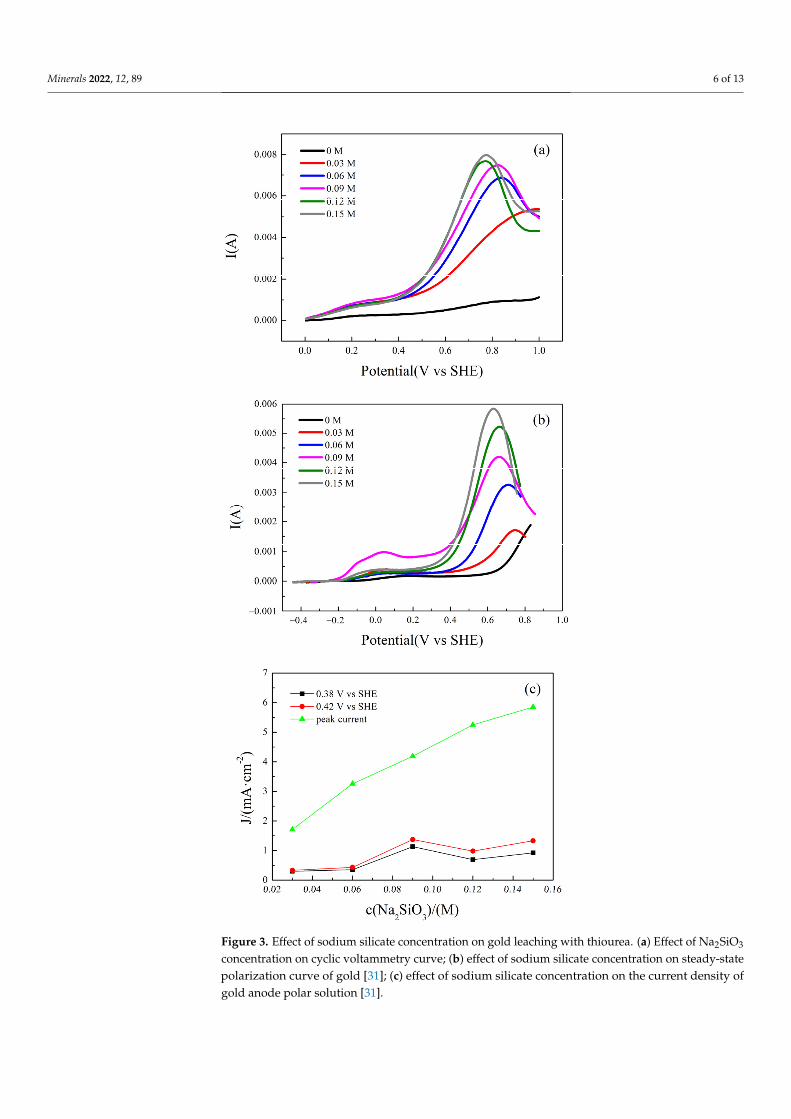
Figure 3a shows that the Au cyclic voltammetry curve in the alkaline thiourea gold so-lution had an obvious oxidation peak after sodium silicate addition. The thiourea oxidationpeak disappeared at ~0.2 V and appeared at ~0.8 V. Compared with the cyclic voltammetrycurve in the absence of sodium silicate, sodium silicate can suppress thiourea decompo-sition, which explains why the oxidation peak at ~0.2 V for thiourea decomposition wasunclear. When thiourea was not decomposed, Au can be dissolved by the complex reactionwith thiourea, and a corresponding oxidation peak appeared at ~0.8 V. Figure 3 also showsthat an increase in sodium silicate concentration tended to increase the Au dissolution peakcurrent. When the sodium silicate concentration reached 0.09 M, the increase in the Audissolution peak current was not obvious and only the decomposition voltage decreasedslightly. Therefore, the selected sodium silicate concentration was 0.09 M.
In order to further determine the optimal concentration of sodium silicate, the effect ofsodium silicate concentration on the steady-state polarization curve of gold in the alkalinethiourea system was measured with gold as the working electrode by our research team [31],and the results are shown in Figure 3b, where the sodium silicate concentration varied from0 to 0.15 M at a 0.03 M interval, the thiourea concentration was 0.15 M, the pH is 11, andthe sweep speed was 10 mV/s.
Because the standard electrode potential of thiourea-gold complexes, and the poten-tial of the oxidation of thiourea to dithiomamidine, is 0.38 and 0.42 V, respectively, therelationship between the stabilizer concentration and the anode current density at thetwo potentials and the peak potential was examined at pH 11 [31]. Figure 3c and Table 1show that the peak current of the gold anode increased with the concentration of the stabi-lizer at the peak, and increased with the sodium silicate concentration at 0.38 and 0.42 V,respectively, at a silicate concentration of <0.09 M, above which the gold anode currentdensity increased at a slower pace [31]. Therefore, at pH 11, the selected concentration ofsodium silicate was 0.09 M. Some scholars also have used the same method to study theoptimal sodium silicate concentration of stable thiourea [32]. Although the conclusions ofdifferent researchers regarding the optimal concentration of sodium silicate are somewhatbiased due to the influence of test conditions and other parameters [32], it is certain that theconcentration of sodium silicate is not positively correlated with the stability of thiourea.After exceeding a certain concentration, the stability of thiourea is weakened, and theirreversible decomposition of thiourea is difficult to completely inhibit.
Minerals 2022, 12, 89 6 of 13
Minerals 2022, 12, x FOR PEER REVIEW 5 of 13
Figure 2. Gold leaching cyclic voltammetry curve at pH 11, 0.09 M Na2SO3 (a) or Na2SiO3 (b) and 0.15 M thiourea.
As shown in Figure 2a, with Na2SO3 as a stabilizer and with positive scanning, the cyclic voltammetry curve of this system had its first oxidation peak at 0.16 V, which matched the reaction of thiourea oxidation decomposition (Equation (1)).
A second oxidation peak existed at 0.43 V, which corresponds to sodium sulfite oxi-dation. The oxidation peak at 0.76 V corresponds to Au dissolution and the thiourea com-plex reaction (as shown in Equation (2)).
During negative scanning, an obvious peak appeared, which means that the reaction was not irreversible. Therefore, the addition of sodium sulfite promoted Au dissolution. Compared with Figure 1, the Au dissolution peak current in Figure 2 reached 15 mA. However, sodium sulfite can be oxidized under alkaline conditions, which leads to an increase in consumption and the thiourea decomposition peak current is not reduced sig-nificantly compared with the absence of the stabilizer [31].
As shown in Figure 2b, with Na2SiO3 and positive scanning, the cyclic voltammetry curve had only one clear peak at 0.71 V, which matches Au dissolution with a peak current of 7 mA. No obvious oxidation peak existed at a low potential, indicating the inhibition of thiourea decomposition. No obvious peak was present during negative scanning. Conse-quently, Au dissolution was promoted by sodium silicate and thiourea decomposition was inhibited.
The Au dissolution peak current was higher in the presence of Na2SO3 than Na2SiO3. However, the suppressing effect of Na2SO3 on thiourea decomposition was weaker than that of Na2SiO3, and Na2SO3 reacts easily under alkaline conditions. Na2SiO3 is a strong alkaline substance, and its addition can stabilize pH, therefore, Na2SiO3 is more suited as a stabilizer than Na2SO3 in this system. The effect of Na2SiO3 concentration on the cyclic voltammetry curve is shown in Figure 3.
Minerals 2022, 12, x FOR PEER REVIEW 6 of 13
Figure 3. Effect of sodium silicate concentration on gold leaching with thiourea. (a) Effect of Na2SiO3 concentration on cyclic voltammetry curve; (b) effect of sodium silicate concentration on steady-state polarization curve of gold [31]; (c) effect of sodium silicate concentration on the current density of gold anode polar solution [31].
Figure 3a shows that the Au cyclic voltammetry curve in the alkaline thiourea gold solution had an obvious oxidation peak after sodium silicate addition. The thiourea oxi-dation peak disappeared at ~0.2 V and appeared at ~0.8 V. Compared with the cyclic volt-ammetry curve in the absence of sodium silicate, sodium silicate can suppress thiourea decomposition, which explains why the oxidation peak at ~0.2 V for thiourea decomposi-tion was unclear. When thiourea was not decomposed, Au can be dissolved by the com-plex reaction with thiourea, and a corresponding oxidation peak appeared at ~0.8 V. Fig-ure 3 also shows that an increase in sodium silicate concentration tended to increase the Au dissolution peak current. When the sodium silicate concentration reached 0.09 M, the increase in the Au dissolution peak current was not obvious and only the decomposition voltage decreased slightly. Therefore, the selected sodium silicate concentration was 0.09 M.
In order to further determine the optimal concentration of sodium silicate, the effect of sodium silicate concentration on the steady-state polarization curve of gold in the alka-line thiourea system was measured with gold as the working electrode by our research team [31], and the results are shown in Figure 3b, where the sodium silicate concentration varied from 0 to 0.15 M at a 0.03 M interval, the thiourea concentration was 0.15 M, the pH is 11, and the sweep speed was 10 mV/s.
Because the standard electrode potential of thiourea-gold complexes, and the poten-tial of the oxidation of thiourea to dithiomamidine, is 0.38 and 0.42 V, respectively, the relationship between the stabilizer concentration and the anode current density at the two
Figure 3. Effect of sodium silicate concentration on gold leaching with thiourea. (a) Effect of Na2SiO3
concentration on cyclic voltammetry curve; (b) effect of sodium silicate concentration on steady-statepolarization curve of gold [31]; (c) effect of sodium silicate concentration on the current density ofgold anode polar solution [31].
Minerals 2022, 12, 89 7 of 13
Table 1. Peak current and voltage of steady-state polarization curve of gold electrode at differentconcentrations of sodium silicate solution [31].
Na2SiO3 Concentration (M) Peak Voltage (V) Peak Current (10−3 A)
0 0 00.03 0.74 1.700.06 0.70 3.270.09 0.65 4.190.12 0.64 5.170.15 0.63 5.84
3.2. Dissolution of the Au Chip Surface in Alkaline Thiourea Solution with/without SodiumSilicate by QCM-D
QCM-D was used to study the surface dissolution of the Au chip at pH 11 and 0.15 Mthiourea with, or without, sodium silicate. The experimental results are shown in Figure 4.
Minerals 2022, 12, x FOR PEER REVIEW 7 of 13
potentials and the peak potential was examined at pH 11 [31]. Figure 3c and Table 1 show that the peak current of the gold anode increased with the concentration of the stabilizer at the peak, and increased with the sodium silicate concentration at 0.38 and 0.42 V, re-spectively, at a silicate concentration of <0.09 M, above which the gold anode current den-sity increased at a slower pace [31]. Therefore, at pH 11, the selected concentration of so-dium silicate was 0.09 M. Some scholars also have used the same method to study the optimal sodium silicate concentration of stable thiourea [32]. Although the conclusions of different researchers regarding the optimal concentration of sodium silicate are somewhat biased due to the influence of test conditions and other parameters [32], it is certain that the concentration of sodium silicate is not positively correlated with the stability of thio-urea. After exceeding a certain concentration, the stability of thiourea is weakened, and the irreversible decomposition of thiourea is difficult to completely inhibit.
Table 1. Peak current and voltage of steady-state polarization curve of gold electrode at different concentrations of sodium silicate solution [31].
Na2SiO3 Concentration (M) Peak Voltage (V) Peak Current (10−3 A) 0 0 0
0.03 0.74 1.70 0.06 0.70 3.27 0.09 0.65 4.19 0.12 0.64 5.17 0.15 0.63 5.84
3.2. Dissolution of the Au Chip Surface in Alkaline Thiourea Solution with/without Sodium Sili-cate by QCM-D.
QCM-D was used to study the surface dissolution of the Au chip at pH 11 and 0.15 M thiourea with, or without, sodium silicate. The experimental results are shown in Fig-ure 4.
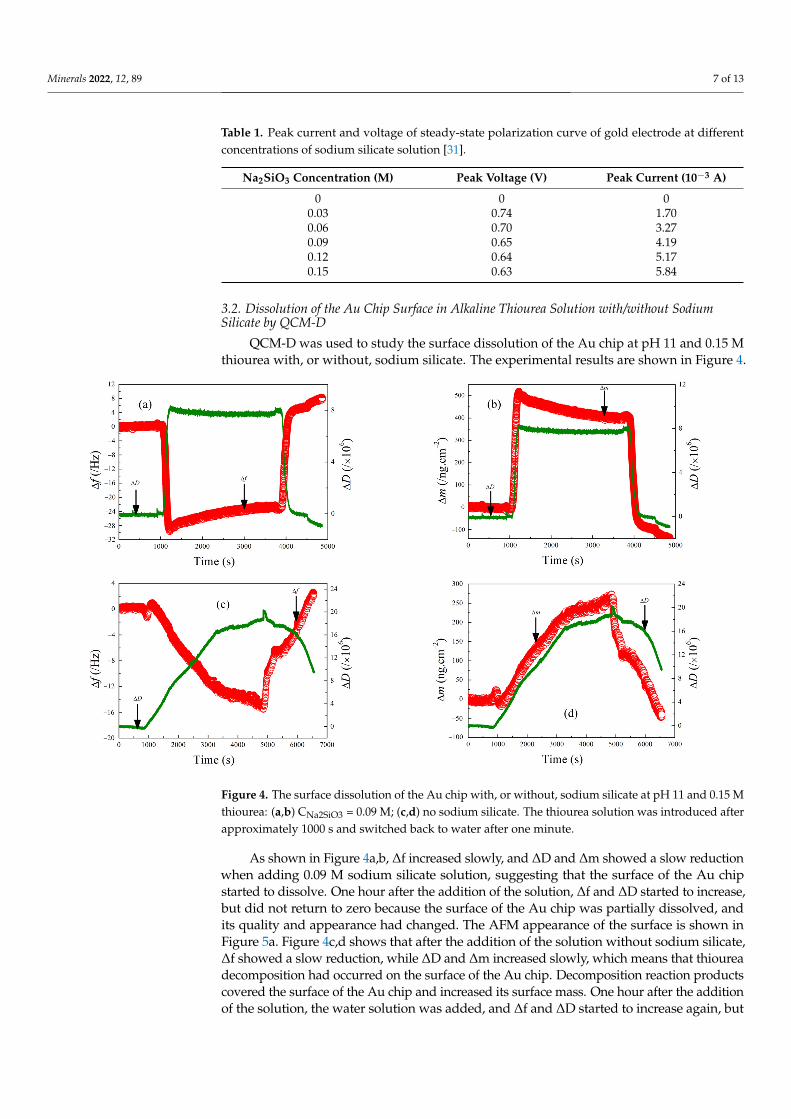
Figure 4. The surface dissolution of the Au chip with, or without, sodium silicate at pH 11 and 0.15 Mthiourea: (a,b) CNa2SiO3 = 0.09 M; (c,d) no sodium silicate. The thiourea solution was introduced afterapproximately 1000 s and switched back to water after one minute.
As shown in Figure 4a,b, ∆f increased slowly, and ∆D and ∆m showed a slow reductionwhen adding 0.09 M sodium silicate solution, suggesting that the surface of the Au chipstarted to dissolve. One hour after the addition of the solution, ∆f and ∆D started to increase,but did not return to zero because the surface of the Au chip was partially dissolved, andits quality and appearance had changed. The AFM appearance of the surface is shown inFigure 5a. Figure 4c,d shows that after the addition of the solution without sodium silicate,∆f showed a slow reduction, while ∆D and ∆m increased slowly, which means that thioureadecomposition had occurred on the surface of the Au chip. Decomposition reaction productscovered the surface of the Au chip and increased its surface mass. One hour after the additionof the solution, the water solution was added, and ∆f and ∆D started to increase again, but
Minerals 2022, 12, 89 8 of 13
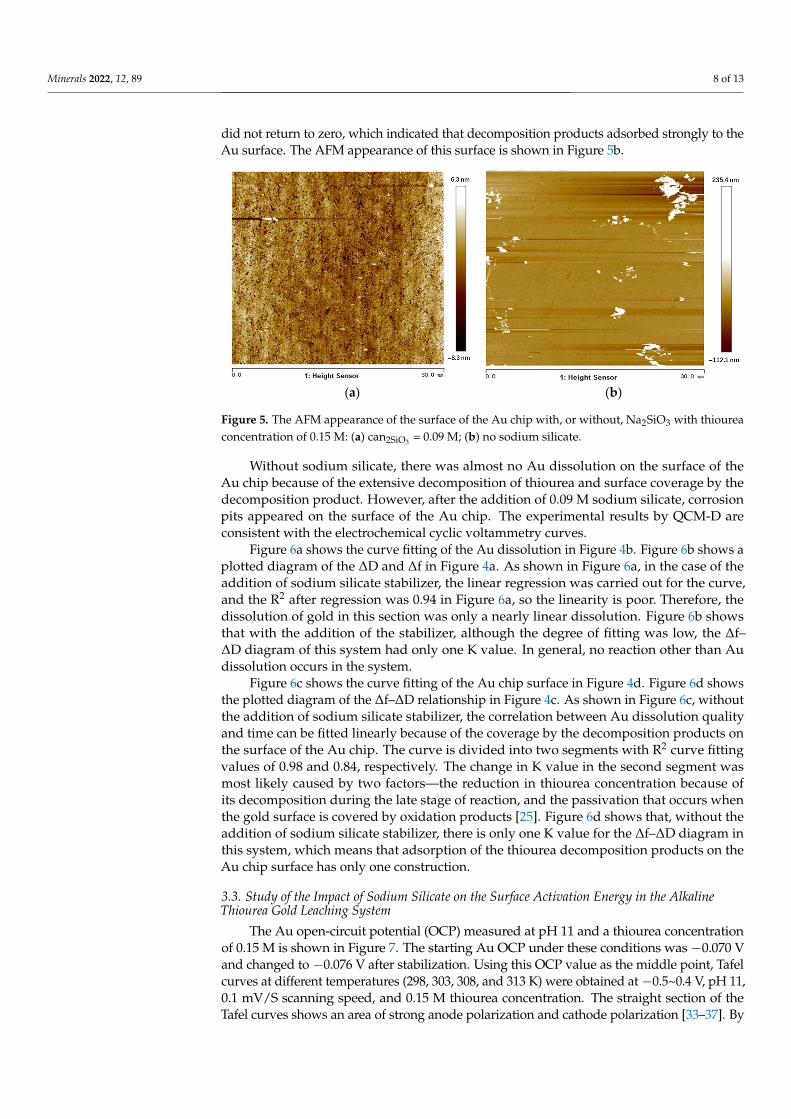
did not return to zero, which indicated that decomposition products adsorbed strongly to theAu surface. The AFM appearance of this surface is shown in Figure 5b.
Minerals 2022, 12, x FOR PEER REVIEW 8 of 13
Figure 4. The surface dissolution of the Au chip with, or without, sodium silicate at pH 11 and 0.15 M thiourea: (a,b) CNa2SiO3 = 0.09 M; (c,d) no sodium silicate. The thiourea solution was introduced after approximately 1000 s and switched back to water after one minute.
As shown in Figure 4a,b, Δf increased slowly, and ΔD and Δm showed a slow reduc-tion when adding 0.09 M sodium silicate solution, suggesting that the surface of the Au chip started to dissolve. One hour after the addition of the solution, Δf and ΔD started to increase, but did not return to zero because the surface of the Au chip was partially dis-solved, and its quality and appearance had changed. The AFM appearance of the surface is shown in Figure 5a. Figure 4c,d shows that after the addition of the solution without sodium silicate, Δf showed a slow reduction, while ΔD and Δm increased slowly, which means that thiourea decomposition had occurred on the surface of the Au chip. Decom-position reaction products covered the surface of the Au chip and increased its surface mass. One hour after the addition of the solution, the water solution was added, and Δf and ΔD started to increase again, but did not return to zero, which indicated that decom-position products adsorbed strongly to the Au surface. The AFM appearance of this sur-face is shown in Figure 5b.
(a) (b)
Figure 5. The AFM appearance of the surface of the Au chip with, or without, Na2SiO3 with thiourea concentration of 0.15 M: (a) can2SiO3 = 0.09 M; (b) no sodium silicate.
Without sodium silicate, there was almost no Au dissolution on the surface of the Au chip because of the extensive decomposition of thiourea and surface coverage by the de-composition product. However, after the addition of 0.09 M sodium silicate, corrosion pits appeared on the surface of the Au chip. The experimental results by QCM-D are consistent with the electrochemical cyclic voltammetry curves.
Figure 6a shows the curve fitting of the Au dissolution in Figure 4b. Figure 6b shows a plotted diagram of the ΔD and Δf in Figure 4a. As shown in Figure 6a, in the case of the addition of sodium silicate stabilizer, the linear regression was carried out for the curve, and the R2 after regression was 0.94 in Figure 6a, so the linearity is poor. Therefore, the dissolution of gold in this section was only a nearly linear dissolution. Figure 6b shows that with the addition of the stabilizer, although the degree of fitting was low, the Δf–ΔD diagram of this system had only one K value. In general, no reaction other than Au disso-lution occurs in the system.
Figure 5. The AFM appearance of the surface of the Au chip with, or without, Na2SiO3 with thioureaconcentration of 0.15 M: (a) can2SiO3 = 0.09 M; (b) no sodium silicate.
Without sodium silicate, there was almost no Au dissolution on the surface of theAu chip because of the extensive decomposition of thiourea and surface coverage by thedecomposition product. However, after the addition of 0.09 M sodium silicate, corrosionpits appeared on the surface of the Au chip. The experimental results by QCM-D areconsistent with the electrochemical cyclic voltammetry curves.
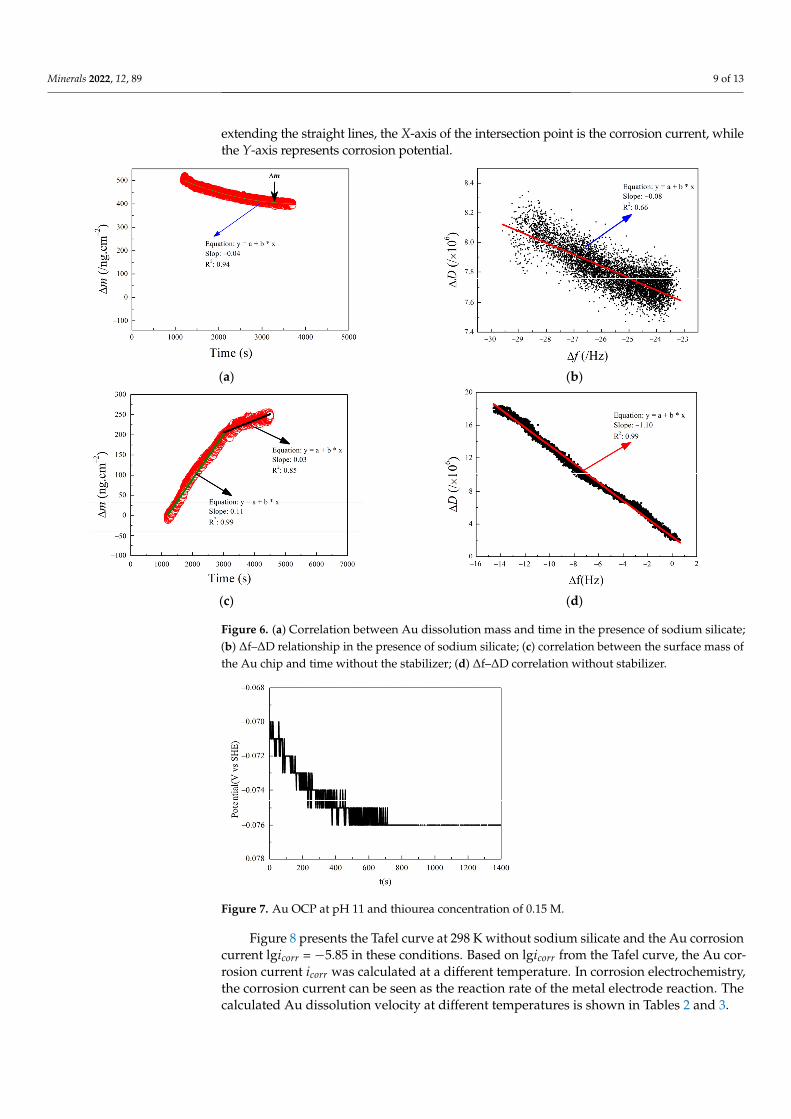
Figure 6a shows the curve fitting of the Au dissolution in Figure 4b. Figure 6b shows aplotted diagram of the ∆D and ∆f in Figure 4a. As shown in Figure 6a, in the case of theaddition of sodium silicate stabilizer, the linear regression was carried out for the curve,and the R2 after regression was 0.94 in Figure 6a, so the linearity is poor. Therefore, thedissolution of gold in this section was only a nearly linear dissolution. Figure 6b showsthat with the addition of the stabilizer, although the degree of fitting was low, the ∆f–∆D diagram of this system had only one K value. In general, no reaction other than Audissolution occurs in the system.
Figure 6c shows the curve fitting of the Au chip surface in Figure 4d. Figure 6d showsthe plotted diagram of the ∆f–∆D relationship in Figure 4c. As shown in Figure 6c, withoutthe addition of sodium silicate stabilizer, the correlation between Au dissolution qualityand time can be fitted linearly because of the coverage by the decomposition products onthe surface of the Au chip. The curve is divided into two segments with R2 curve fittingvalues of 0.98 and 0.84, respectively. The change in K value in the second segment wasmost likely caused by two factors—the reduction in thiourea concentration because ofits decomposition during the late stage of reaction, and the passivation that occurs whenthe gold surface is covered by oxidation products [25]. Figure 6d shows that, without theaddition of sodium silicate stabilizer, there is only one K value for the ∆f–∆D diagram inthis system, which means that adsorption of the thiourea decomposition products on theAu chip surface has only one construction.
3.3. Study of the Impact of Sodium Silicate on the Surface Activation Energy in the AlkalineThiourea Gold Leaching System
The Au open-circuit potential (OCP) measured at pH 11 and a thiourea concentrationof 0.15 M is shown in Figure 7. The starting Au OCP under these conditions was −0.070 Vand changed to −0.076 V after stabilization. Using this OCP value as the middle point, Tafelcurves at different temperatures (298, 303, 308, and 313 K) were obtained at −0.5~0.4 V, pH 11,0.1 mV/S scanning speed, and 0.15 M thiourea concentration. The straight section of theTafel curves shows an area of strong anode polarization and cathode polarization [33–37]. By
Minerals 2022, 12, 89 9 of 13
extending the straight lines, the X-axis of the intersection point is the corrosion current, whilethe Y-axis represents corrosion potential.
Minerals 2022, 12, x FOR PEER REVIEW 9 of 13
(a) (b)
(c) (d)
Figure 6. (a) Correlation between Au dissolution mass and time in the presence of sodium silicate; (b) Δf–ΔD relationship in the presence of sodium silicate; (c) correlation between the surface mass of the Au chip and time without the stabilizer; (d) Δf–ΔD correlation without stabilizer.
Figure 6c shows the curve fitting of the Au chip surface in Figure 4d. Figure 6d shows the plotted diagram of the Δf–ΔD relationship in Figure 4c. As shown in Figure 6c, without the addition of sodium silicate stabilizer, the correlation between Au dissolution quality and time can be fitted linearly because of the coverage by the decomposition products on the surface of the Au chip. The curve is divided into two segments with R2 curve fitting values of 0.98 and 0.84, respectively. The change in K value in the second segment was most likely caused by two factors—the reduction in thiourea concentration because of its decomposition during the late stage of reaction, and the passivation that occurs when the gold surface is covered by oxidation products [25]. Figure 6d shows that, without the ad-dition of sodium silicate stabilizer, there is only one K value for the Δf–ΔD diagram in this system, which means that adsorption of the thiourea decomposition products on the Au chip surface has only one construction.
3.3. Study of the Impact of Sodium Silicate on the Surface Activation Energy in the Alkaline Thi-ourea Gold Leaching System
The Au open-circuit potential (OCP) measured at pH 11 and a thiourea concentration of 0.15 M is shown in Figure 7. The starting Au OCP under these conditions was −0.070 V and changed to −0.076 V after stabilization. Using this OCP value as the middle point, Tafel curves at different temperatures (298, 303, 308, and 313 K) were obtained at −0.5~0.4 V, pH 11, 0.1 mV/S scanning speed, and 0.15 M thiourea concentration. The straight sec-tion of the Tafel curves shows an area of strong anode polarization and cathode polariza-tion [33–37]. By extending the straight lines, the X-axis of the intersection point is the cor-rosion current, while the Y-axis represents corrosion potential.
Figure 6. (a) Correlation between Au dissolution mass and time in the presence of sodium silicate;(b) ∆f–∆D relationship in the presence of sodium silicate; (c) correlation between the surface mass ofthe Au chip and time without the stabilizer; (d) ∆f–∆D correlation without stabilizer.
Minerals 2022, 12, x FOR PEER REVIEW 10 of 13
Figure 8 presents the Tafel curve at 298 K without sodium silicate and the Au corro-sion current lg 𝑖 = −5.85 in these conditions. Based on lg 𝑖 from the Tafel curve, the Au corrosion current 𝑖 was calculated at a different temperature. In corrosion electro-chemistry, the corrosion current can be seen as the reaction rate of the metal electrode reaction. The calculated Au dissolution velocity at different temperatures is shown in Ta-bles 2 and 3.
Figure 7. Au OCP at pH 11 and thiourea concentration of 0.15 M.
Figure 8. Au Tafel curve at 298 K, a thiourea concentration of 0.15 M and pH 11.
Table 2. Effect of temperature on Au dissolution velocity.
Temperature (K) 𝒊𝒄𝒐𝒓𝒓 (𝛍𝐀/𝐜𝐦𝟐) 298 1.45 303 12.90 308 23.63 313 72.06
Table 3. Effect of temperature on Au dissolution velocity with sodium silicate.
Temperature (K) 𝒊𝒄𝒐𝒓𝒓 (𝛍𝐀/𝐜𝐦𝟐) 298 11.90 303 35.76 308 60.32 313 90.15
Figure 7. Au OCP at pH 11 and thiourea concentration of 0.15 M.
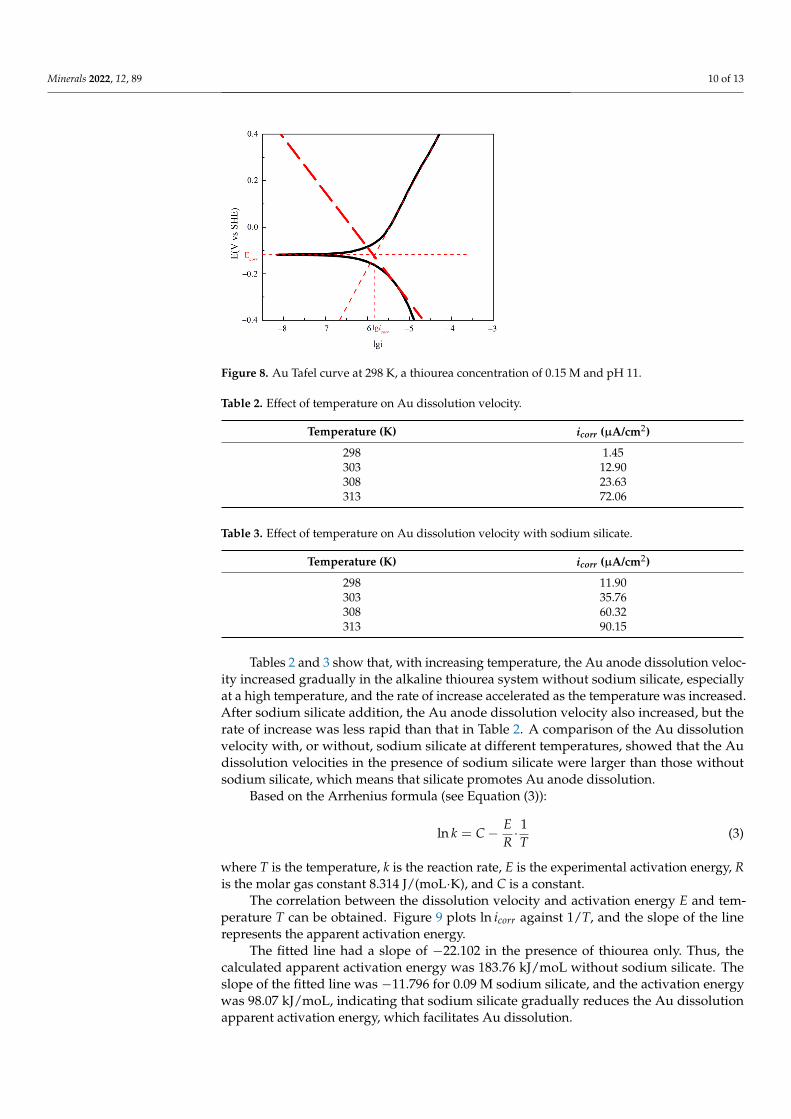
Figure 8 presents the Tafel curve at 298 K without sodium silicate and the Au corrosioncurrent lgicorr = −5.85 in these conditions. Based on lgicorr from the Tafel curve, the Au cor-rosion current icorr was calculated at a different temperature. In corrosion electrochemistry,the corrosion current can be seen as the reaction rate of the metal electrode reaction. Thecalculated Au dissolution velocity at different temperatures is shown in Tables 2 and 3.
Minerals 2022, 12, 89 10 of 13
Minerals 2022, 12, x FOR PEER REVIEW 10 of 13
Figure 8 presents the Tafel curve at 298 K without sodium silicate and the Au corro-sion current lg 𝑖 = −5.85 in these conditions. Based on lg 𝑖 from the Tafel curve, the Au corrosion current 𝑖 was calculated at a different temperature. In corrosion electro-chemistry, the corrosion current can be seen as the reaction rate of the metal electrode reaction. The calculated Au dissolution velocity at different temperatures is shown in Ta-bles 2 and 3.
Figure 7. Au OCP at pH 11 and thiourea concentration of 0.15 M.
Figure 8. Au Tafel curve at 298 K, a thiourea concentration of 0.15 M and pH 11.
Table 2. Effect of temperature on Au dissolution velocity.
Temperature (K) 𝒊𝒄𝒐𝒓𝒓 (𝛍𝐀/𝐜𝐦𝟐) 298 1.45 303 12.90 308 23.63 313 72.06
Table 3. Effect of temperature on Au dissolution velocity with sodium silicate.
Temperature (K) 𝒊𝒄𝒐𝒓𝒓 (𝛍𝐀/𝐜𝐦𝟐) 298 11.90 303 35.76 308 60.32 313 90.15
Figure 8. Au Tafel curve at 298 K, a thiourea concentration of 0.15 M and pH 11.
Table 2. Effect of temperature on Au dissolution velocity.
Temperature (K) icorr (µA/cm2)
298 1.45303 12.90308 23.63313 72.06
Table 3. Effect of temperature on Au dissolution velocity with sodium silicate.
Temperature (K) icorr (µA/cm2)
298 11.90303 35.76308 60.32313 90.15
Tables 2 and 3 show that, with increasing temperature, the Au anode dissolution veloc-ity increased gradually in the alkaline thiourea system without sodium silicate, especiallyat a high temperature, and the rate of increase accelerated as the temperature was increased.After sodium silicate addition, the Au anode dissolution velocity also increased, but therate of increase was less rapid than that in Table 2. A comparison of the Au dissolutionvelocity with, or without, sodium silicate at different temperatures, showed that the Audissolution velocities in the presence of sodium silicate were larger than those withoutsodium silicate, which means that silicate promotes Au anode dissolution.
Based on the Arrhenius formula (see Equation (3)):
ln k = C − ER· 1T
(3)
where T is the temperature, k is the reaction rate, E is the experimental activation energy, Ris the molar gas constant 8.314 J/(moL·K), and C is a constant.
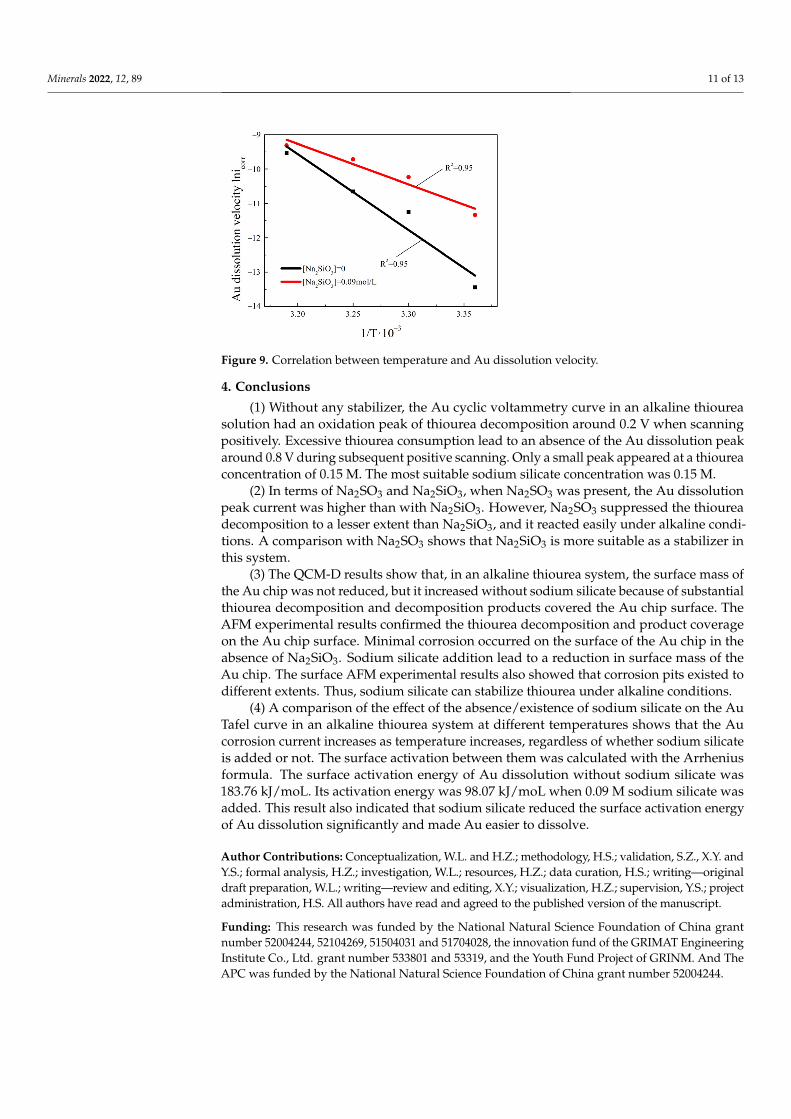
The correlation between the dissolution velocity and activation energy E and tem-perature T can be obtained. Figure 9 plots ln icorr against 1/T, and the slope of the linerepresents the apparent activation energy.
The fitted line had a slope of −22.102 in the presence of thiourea only. Thus, thecalculated apparent activation energy was 183.76 kJ/moL without sodium silicate. Theslope of the fitted line was −11.796 for 0.09 M sodium silicate, and the activation energywas 98.07 kJ/moL, indicating that sodium silicate gradually reduces the Au dissolutionapparent activation energy, which facilitates Au dissolution.
Minerals 2022, 12, 89 11 of 13
Minerals 2022, 12, x FOR PEER REVIEW 11 of 13
Tables 2 and 3 show that, with increasing temperature, the Au anode dissolution ve-locity increased gradually in the alkaline thiourea system without sodium silicate, espe-cially at a high temperature, and the rate of increase accelerated as the temperature was increased. After sodium silicate addition, the Au anode dissolution velocity also in-creased, but the rate of increase was less rapid than that in Table 2. A comparison of the Au dissolution velocity with, or without, sodium silicate at different temperatures, showed that the Au dissolution velocities in the presence of sodium silicate were larger than those without sodium silicate, which means that silicate promotes Au anode disso-lution.
Based on the Arrhenius formula (see Equation (3)): ln𝑘 = 𝐶 − 𝐸𝑅 ∙ 1𝑇 (3)
where T is the temperature, k is the reaction rate, E is the experimental activation energy, R is the molar gas constant 8.314 J/(mol·K), and C is a constant.
The correlation between the dissolution velocity and activation energy E and tem-perature T can be obtained. Figure 9 plots ln 𝑖 against 1/T, and the slope of the line represents the apparent activation energy.
Figure 9. Correlation between temperature and Au dissolution velocity.
The fitted line had a slope of −22.102 in the presence of thiourea only. Thus, the cal-culated apparent activation energy was 183.76 kJ/mol without sodium silicate. The slope of the fitted line was −11.796 for 0.09 M sodium silicate, and the activation energy was 98.07 kJ/mol, indicating that sodium silicate gradually reduces the Au dissolution appar-ent activation energy, which facilitates Au dissolution.
4. Conclusions (1) Without any stabilizer, the Au cyclic voltammetry curve in an alkaline thiourea
solution had an oxidation peak of thiourea decomposition around 0.2 V when scanning positively. Excessive thiourea consumption lead to an absence of the Au dissolution peak around 0.8 V during subsequent positive scanning. Only a small peak appeared at a thio-urea concentration of 0.15 M. The most suitable sodium silicate concentration was 0.15 M.
(2) In terms of Na2SO3 and Na2SiO3, when Na2SO3 was present, the Au dissolution peak current was higher than with Na2SiO3. However, Na2SO3 suppressed the thiourea decomposition to a lesser extent than Na2SiO3, and it reacted easily under alkaline condi-tions. A comparison with Na2SO3 shows that Na2SiO3 is more suitable as a stabilizer in this system.
(3) The QCM-D results show that, in an alkaline thiourea system, the surface mass of the Au chip was not reduced, but it increased without sodium silicate because of substan-tial thiourea decomposition and decomposition products covered the Au chip surface. The
Figure 9. Correlation between temperature and Au dissolution velocity.
4. Conclusions
(1) Without any stabilizer, the Au cyclic voltammetry curve in an alkaline thioureasolution had an oxidation peak of thiourea decomposition around 0.2 V when scanningpositively. Excessive thiourea consumption lead to an absence of the Au dissolution peakaround 0.8 V during subsequent positive scanning. Only a small peak appeared at a thioureaconcentration of 0.15 M. The most suitable sodium silicate concentration was 0.15 M.
(2) In terms of Na2SO3 and Na2SiO3, when Na2SO3 was present, the Au dissolutionpeak current was higher than with Na2SiO3. However, Na2SO3 suppressed the thioureadecomposition to a lesser extent than Na2SiO3, and it reacted easily under alkaline condi-tions. A comparison with Na2SO3 shows that Na2SiO3 is more suitable as a stabilizer inthis system.
(3) The QCM-D results show that, in an alkaline thiourea system, the surface mass ofthe Au chip was not reduced, but it increased without sodium silicate because of substantialthiourea decomposition and decomposition products covered the Au chip surface. TheAFM experimental results confirmed the thiourea decomposition and product coverageon the Au chip surface. Minimal corrosion occurred on the surface of the Au chip in theabsence of Na2SiO3. Sodium silicate addition lead to a reduction in surface mass of theAu chip. The surface AFM experimental results also showed that corrosion pits existed todifferent extents. Thus, sodium silicate can stabilize thiourea under alkaline conditions.
(4) A comparison of the effect of the absence/existence of sodium silicate on the AuTafel curve in an alkaline thiourea system at different temperatures shows that the Aucorrosion current increases as temperature increases, regardless of whether sodium silicateis added or not. The surface activation between them was calculated with the Arrheniusformula. The surface activation energy of Au dissolution without sodium silicate was183.76 kJ/moL. Its activation energy was 98.07 kJ/moL when 0.09 M sodium silicate wasadded. This result also indicated that sodium silicate reduced the surface activation energyof Au dissolution significantly and made Au easier to dissolve.
Author Contributions: Conceptualization, W.L. and H.Z.; methodology, H.S.; validation, S.Z., X.Y. andY.S.; formal analysis, H.Z.; investigation, W.L.; resources, H.Z.; data curation, H.S.; writing—originaldraft preparation, W.L.; writing—review and editing, X.Y.; visualization, H.Z.; supervision, Y.S.; projectadministration, H.S. All authors have read and agreed to the published version of the manuscript.
Funding: This research was funded by the National Natural Science Foundation of China grantnumber 52004244, 52104269, 51504031 and 51704028, the innovation fund of the GRIMAT EngineeringInstitute Co., Ltd. grant number 533801 and 53319, and the Youth Fund Project of GRINM. And TheAPC was funded by the National Natural Science Foundation of China grant number 52004244.
Minerals 2022, 12, 89 12 of 13
Acknowledgments: The authors are grateful for the financial support from the National NaturalScience Foundation of China (Grant No. 52004244, 52104269, 51504031, 51704028), the innovationfund of the GRIMAT Engineering Institute Co., Ltd. (Grant No. 533801, 53319) and the Youth FundProject of GRINM.
Conflicts of Interest: The authors declare no conflict of interest.
References1. Maria, I.N.; Ionela, B.; Francesco, F.; Marcello, C.; Francesco, V. Preliminary study on gold recovery from high grade e-waste by
thiourea leaching and electrowinning. Minerals 2021, 11, 235.2. Mohammed, R.A.; Mohammed, H.S.; Mohamed, G.E.; Yasser, K.A. Gold Leaching Using Thiourea from Uranium Tailing Material,
Gabal El-Missikat, Central Eastern Desert Egypt. J. Sustain. Metall. 2020, 6, 599.3. Boboev, I.R.; Selnitsin, R.S.; Kholikov, T.A.; Sharipov, B.K. Technology of gold extraction from mature dumps by thiourea Leaching.
Russ. J. Non-Ferr. Met. 2020, 61, 257. [CrossRef]4. Calla-Choque, D.; Lapidus, G.T. Acid decomposition and silver leaching with thiourea and oxalate from an industrial jarosite
sample. Hydrometallurgy 2020, 192, 105289. [CrossRef]5. Boboev, I.R.; Kurbonov, S.K.; Sel’nitsyn, R.S. Use of thiourea leaching during gold-containing dump treatment. Metallurgist 2019,
63, 633. [CrossRef]6. Chai, L.Y.; Min, X.B. Structure-property relationship between the stability of alkaline thiourea and the structure of thiourea and
sulfite ion. J. Cent. South Univ. Technol. 2002, 33, 473.7. Zhou, H. Electrochemical Studies of Gold Leaching in Alkaline Thiourea Solutions; General Research Institute for Nonferrous Metals:
Beijing, China, 2018; p. 29.8. Bai, A.P. Research on Influencing Factors and Mechanism of Gold Leaching with Alkaline Thiourea Solution. Master’s Dissertation,
General Research Institute for Nonferrous Metals, Beijing, China, 2017.9. Chen, L.; Tang, D.W.; Tang, Q.; Wang, F.; Xing, W.P.; Wang, X.W. Electrochemical behavior of sodium sulfite in alkaline thiourea
system for gold dissolution. Precious Met. 2020, 41, 43.10. Wei, D.W.; Chai, L.Y.; Ichino, R.; Okido, M. Gold leaching in an alkaline thiourea solution. J. Electrochem. Soc. 2019, 146, 559.
[CrossRef]11. Wang, Y.Y.; Chai, L.Y.; Min, X.B.; Peng, B.; He, D.W. Effect of Na2SiO3 on gold dissolution selectively in alkaline thiourea solutions.
J. Cent. South Univ. Technol. 2003, 34, 611.12. Sun, Z.F. Molecular Simulation technology on Windows 9X platform. Chem. Bull. 2000, 3, 59.13. Ren, Y.; Yang, J.; Wu, D.Y.; Li, Z.R.; Tian, A.M. Progress in molecular force field. J. Chem. Res. Appl. 1998, 1, 1.14. Zheng, S.; Wang, Y.Y.; Chai, L.Y. Mechanism of gold dissolution selectively in alkaline thiourea solutions based on complex theory.
Chin. J. nonferrous. Met. 2005, 15, 1629.15. Chu, J.H. Thermodynamic analysis of gold dissolution with thiourea. Gold 1982, 2, 46.16. Yu, D.Q. Investigation of Chemical Bond and Structure-Property Relationship of Crystal Materials. Ph.D. Dissertation, Dalian
University of Technology, Dalian, China, 2008. (In Chinese).17. Chai, L.Y.; Min, X.B.; Zhong, H.Y. Anodic behavior of gold in alkaline thiourea solution. Min. Metall. Eng. 1999, 19, 53.18. Chen, C.J.; Jiang, H.F. Review on research progress of QCM. Transducer Microsyst. Technol. 2014, 33, 5.19. Gimenez, R.D. Calculation of the surface concentration of Zn (I) from the anodic voltammetric peak of zinc combined with the
QCM results. Electrochem. Commun. 2004, 6, 903. [CrossRef]20. Chen, S.L.; Wu, B.L.; Yang, H.X. Studies on the redox process of silver using electrochemical quartz crystal microbalance. Chem. J.
Chin. Univ. 1994, 15, 103.21. Cao, Z.; Xiao, Z.L. Corrosion behaviors on polycrystalline gold substrates in self assembled processes of alkanethiol monolayers.
Anal. Lett. 2005, 38, 1289. [CrossRef]22. Zheng, J.; Ritchie, I.M.; La Brooy, S.R.; Singh, P. Study of gold leaching in oxygenated solutions containing cyanide-copper-
ammonia using a rotating quartz crystal microbalance. Hydrometallurgy 1995, 39, 277. [CrossRef]23. Li, G.Z.; Kou, J.; Xing, Y.; Hu, Y.; Han, W.; Liu, Z.Y.; Sun, C.B. Gold-leaching performance and mechanism of sodium dicyanamide.
Int. J. Miner. Metall. Mater. 2021, 28, 1759. [CrossRef]24. Kou, J.; Tao, D.; Xu, G. Fatty acid collectors for phosphate flotation and their adsorption behavior using QCM-D. Int. J. Miner.
Processing 2010, 95, 1–9. [CrossRef]25. Li, W.J.; Zhou, H.; Bai, A.P.; Song, Y.S.; Cai, L.L.; Zheng, S.L.; Zhang, Q.D.; Cao, S. Electrochemical adsorption and passivation on
gold surface in alkaline thiourea solutions. Rare Met. 2020, 39, 951–958. [CrossRef]26. Kou, J.; Yang, B.H.; Xu, S.H.; Sun, T.C. Adsorption kinetics of sodium dodecyl sulfonate onto hematite. Chin. J. Eng. 2016, 38, 1359.27. Kou, J.; Xu, S.H.; Sun, T.C. A study of sodium oleate adsorption on Ca2+ activated quartz surface using quartz crystal microbalance
with dissipation. Int. J. Miner. Process. 2016, 154, 24. [CrossRef]28. Xu, S.H.; Kou, J.; Sun, T.C.; Kwang, S.J. A study of adsorption mechanism of dodecylamine on sphalerite. Colloid Surface A 2015,
486, 145. [CrossRef]
Minerals 2022, 12, 89 13 of 13
29. Kou, J.; Xu, S.H. In situ kinetics and conformation studies of dodecylamine adsorption onto zinc sulfide using a quartz crystalmicrobalance with dissipation (QCM-D). Colloid Surface A 2016, 490, 110. [CrossRef]
30. Wu, L. Study on Hydration Film on Coal Surface and Interaction Force between Particles Based on AFM. Master’s Dissertation,China University of Mining & Technology, Xuzhou, China, 2015. (In Chinese).
31. Zhou, H.; Song, Y.S.; Li, W.J.; Song, K. Electrochemical behavior of gold and its associated minerals in alkaline thiourea solutions.Int. J. Miner. Metall. Mater. 2018, 25, 737. [CrossRef]
32. Zheng, S. Fundamentals of Green Process of Gold Leaching in Alkaline Thiourea Solution with High Stability. Ph.D. Dissertation,Central South University, Changsha, China, 2006. (In Chinese).
33. Wang, S.L.; Long, F.Y.; Yang, Y.; Wang, M.H. Application and progress of Electrochemical measurement technique in study ofpitting corrosion of stainless steel. Corros. Prot. 2016, 37, 586.
34. Hao, L.; Tang, D.Y.; Yao, H.; Lei, X.; Song, J.Z.; Wang, W.; Cheng, B.W. The effect of chlorine/argentum atomic ratios onelectrochemical behaviors and signal acquisition abilities of embroidered electrodes for bio-potential signal measurement. Appl.Phys. A 2019, 125, 501.
35. Le, G.; Li, W.J.; Song, K.; Song, Y.S.; Chen, Y.; Bai, A.P.; Cheng, Y. Electrochemical dissolution behavior of gold and its maincoexistent sulfide minerals in acid thiocyanate solutions. Rare Met. 2021, 41, 254–261. [CrossRef]
36. Le, G. Dissolution Behavior of Gold and Its Main Coexistent Sulfide Minerals in Acid Thiocyanate Solutions. Master’s Dissertation,General Research Institute for Nonferrous Metals, Beijing, China, 2020. (In Chinese).
37. Ren, C.Y.; Wu, B.; Shang, H.; Wen, J.K.; Zhang, Q.D. Combined process of biological pre-oxidation and gold leaching with acidthiourea. Min. Metall. 2020, 29, 63.