Embed Size (px)
Citation preview
BioMed CentralBMC Bioinformatics
ss
Open AcceMethodology articleEffect of false positive and false negative rates on inference of binding target conservation across different conditions and species from ChIP-chip dataDebayan Datta1 and Hongyu Zhao*2,3Address: 1Department of Biomedical Engineering, Yale University, New Haven, CT 06520, USA, 2Department of Epidemiology and Public Health, Yale University, New Haven, CT 06520, USA and 3Department of Genetics, Yale University, New Haven, CT 06520, USA
Email: Debayan Datta - [email protected]; Hongyu Zhao* - [email protected]
* Corresponding author
AbstractBackground: ChIP-chip data are routinely used to identify transcription factor binding targets.However, the presence of false positives and false negatives in ChIP-chip data complicates andhinders analyses, especially when the binding targets for a specific transcription factor arecompared across conditions or species.
Results: We propose an Expectation Maximization based approach to infer the underlying truecounts of "positives" and "negatives" from the observed counts. Based on this approach, we studythe effect of false positives and false negatives on inferences related to transcription regulation.
Conclusion: Our results indicate that if there is a significant degree of association among thebinding targets across conditions/species (log odds ratio > 4), moderate values of false positive andfalse negative rates (0.005 and 0.4 respectively) would not change our inference qualitatively (i.e.the presence or absence of conservation) based on the observed experimental data despite asignificant change in the observed counts. However, if the underlying association is marginal, withodds ratios close to 1, moderate to large values of false positive and false negative rates (0.01 and0.2 respectively) could mask the underlying association.
BackgroundTranscription factors play an important role in gene regu-lation by binding to specific DNA sequences in the regu-latory regions of their targets. Accurate identification ofthe binding targets of the transcription factors is para-mount to the understanding of the regulatory mechanism.Chromatin immunoprecipitation (ChIP) experiments arecommonly used to identify the regulatory targets inprokaryotes and eukaryotes. ChIP-chip experiments pro-vide us with information about the binding targets of aparticular regulator at the genome level [1-4].
The output of ChIP-chip experiments are often summa-rized in binary forms. Using replicate data, the statisticalevidence for a gene being the binding target of a transcrip-tion factor is typically summarized as a p-value. A thresh-old for the p-value, e.g. 0.001 is then chosen, and geneswith p-values less than the threshold are considered thebinding targets for the transcription factor. Thus, for atranscription factor, we can enumerate a list of geneswhich are "positives", i.e. binding targets and a list ofgenes which are "negatives", i.e. non-binding targets. Ifthe threshold is set at a very stringent level to control the
Published: 19 January 2009
BMC Bioinformatics 2009, 10:23 doi:10.1186/1471-2105-10-23
Received: 30 May 2008Accepted: 19 January 2009
This article is available from: http://www.biomedcentral.com/1471-2105/10/23
© 2009 Datta and Zhao; licensee BioMed Central Ltd. This is an Open Access article distributed under the terms of the Creative Commons Attribution License (http://creativecommons.org/licenses/by/2.0), which permits unrestricted use, distribution, and reproduction in any medium, provided the original work is properly cited.
Page 1 of 13(page number not for citation purposes)
BMC Bioinformatics 2009, 10:23 http://www.biomedcentral.com/1471-2105/10/23
number of false positives, this will be achieved at theexpense of high false negatives. A more relaxed thresholdwill reduce the number of false negatives, but will end upwith more false positive results. Over the past few years,ChIP-chip data has formed the basis of many transcrip-tion regulatory mechanism studies. Several groups havecompared the binding of a regulator across multipleexperimental conditions to determine condition depend-ence of binding [5-7]. Similarly, binding data of specifictranscription factors across species has been used to inves-tigate the presence of conserved binding targets [8].Unfortunately, the presence of noise, in the form of falsepositives and false negatives as discussed above, may leadto inaccurate inference of the binding targets, and thusbiased results and potentially incorrect conclusions onkey aspects of transcription regulation, e.g. preservation ofregulation targets across conditions and species. In thisarticle, we develop a statistical approach to analyzingChIP-chip data, appropriately incorporating false posi-tives and false negatives. Based on our approach, we inves-tigate the effect of false positives and false negatives on theinference of conservations of binding targets based onChIP-chip data.
MethodsSummarizing Contingency TablesAs discussed above, the output of ChIP-chip experimentsis typically summarized into binary forms and resultsacross different experiments for the same transcriptionfactor can be crosstabulated into a contingency table. Acommon question asked is whether a transcription factorhas similar binding targets across conditions, and this isreflected as the dependency of outcome among the condi-tions. In the following, we give a brief discussion on twostatistical measures that we will use to summarize thedegree of dependency in a contingency table.
For the sake of clarity, we will focus on ChIP-chip experi-ments involving two different conditions or two species.The number of target genes in the two conditions/speciescan be cross tabulated into a 2 by 2 contingency table. Weuse two metrics to summarize such contingency tables –Odds Ratio and Positive specific agreement [9,10].
Table 1 gives an illustration of a 2 by 2 contingency table.The goal is to identify whether a relationship, or associa-tion exists between the two categorical variables. In ourscenario, it would correspond to whether the transcrip-tion factor exhibits condition dependent binding or con-dition independent binding. For such a contingency table,the odds ratio is a commonly used measure to quantifyassociation among the categorical variables. An odds isdefined as the ratio of the frequency of being in one cate-gory and the frequency of not being in that category. For
example, from Table 1, the odds that a particular gene is abinding target in experimental condition 1 is equal to (c +d)/(a + b). This odds is called marginal odds, obtainedfrom the total frequencies in one margin of the table, dis-regarding the effects of the other variable. Conditionalodds are the chances of the transcription factor bindingrelative to not binding in one experimental condition,given a particular level (binding state) in the other exper-imental condition. The variables are deemed to be unas-sociated if the conditional odds are equal or close to eachother, and hence equal to the marginal odds. To comparedirectly the two conditional odds, a single summary statis-tic, obtained by dividing the first conditional odds by thesecond is called odds ratio. Thus, for the data in Table 1,the odds ratio is defined as: Odds Ratio = (a/c)/(b/d) = ad/bc. Odds ratio takes only positive values and has no upperlimit. An odds ratio of 1 indicates no relationship amongthe variables. In addition to the odds ratio, its logarithmis also commonly used. Logarithmic transformation ofdata has a number of advantages – the variation of logtransformed data tends to be less dependent on the mag-nitude of values, while taking logs also reduces the skew-ness of the distributions. After log transformation, datatends to be spread out more evenly, also making it easierto examine visually.
Other measures of dependency are also often used in psy-chological and medical research. For example, the prob-lem can be formulated as follows: Suppose two ratersclassify each subject in a sample from some target popula-tion according to the presence or absence of some charac-teristic of interest. The resulting data can then besummarized into a 2 by 2 table. The agreement betweenraters can be quantified by the metric simple agreement,which is defined as the proportion of cases for which bothraters agree, or (a + d)/(a + b + c + d). However, if a is large,this would approach 1 regardless of the performance onpositive cases. Positive specific agreement provides insightwhen the positive cases are rare. It estimates the condi-tional probability that one rater will agree that a case ispositive given the other one rated it positive, where the
Table 1: Simple 2 by 2 contingency table.
Condition 2
0 1
Condition 1 0 a b
1 c d
The categorical variables Condition 1 and Condition 2 each has two levels. The cell values are counts at each combination of two condition variables.
Page 2 of 13(page number not for citation purposes)
BMC Bioinformatics 2009, 10:23 http://www.biomedcentral.com/1471-2105/10/23
role of the two raters is selected randomly. Positive spe-cific agreement, ppos is defined as: ppos = 2d/(2d + b + c).Both (log) odds ratio and positive specific agreement willbe considered in our following discussion.
Model Setup
Consider an experiment with a binary outcome. Let p0
denote the proportion of true negatives, while p1 be the
proportion of true positives. We denote p = (p0, p1)t as the
vector of true proportions. Due to false positives and falsenegatives, the observed proportions likely differ from the
true proportions. Let denote the vector of the
observed proportions. The relationship between p and
E( ) can be written as:
where s is the false positive rate and t is the false negativerate. Denoting the transformation matrix as M, Equation(1) can be written as:
Thus, for different values of false positive and false nega-tive rates, different observed proportions will be obtainedbased on Equation (2). If the false positive and false neg-ative rates are known, the true proportions may beinferred based on the observed experimental proportions.Multiplying both sides of Equation (2) by M-1 gives us:
However, due to chance variations, p obtained through
this approach based on the observed may have nega-
tive components, leading to uninterpretable results.Instead, we propose to estimate the true proportions usingan Expectation Maximization (EM) based approachexplained in detail in the following subsection.
Often, we are interested in the analysis of the binding of aparticular transcription factor in multiple experimentalconditions or across different species. In either case, weare interested in counts of similarity of binding acrossconditions or organisms. This would correspond to anextension of Equation (2) into a higher dimension. Forsimplicity, we present our analysis for a 2-dimensionalcase. For example, if we consider the binding targets of atranscription factor across two experimental conditions,
the vector of true proportions can be represented as p =(p00, p01, p10, p11)t. Here p00 denotes the proportion of
genes which are not targets of the regulator in either con-dition, p01 denotes the proportion of genes which are tar-
gets of the regulator in the second condition but not in thefirst, p10 denotes the proportion of genes which are targets
of the regulator in the first condition but not in the sec-ond, while p11 denotes the proportion of genes which are
targets of the regulator in both conditions. Similarly, thevector for the observed proportions can be denoted as
. The relationship between the
observed and true proportions can be then written as:
If we consider Equation (2) to correspond to a 1-dimen-sional case, for the n-dimensional case, the new transfor-mation matrix would simply be obtained by taking thetensor product of M with itself n times. Here we assumethat the false positive and false negative rates to be thesame across two conditions. In general that may not bethe case. In such a scenario, for a 2-dimensional case,Equation 4 takes the general form:
where M1 and M2 are the transformation matrices for thefirst and second conditions respectively.
EM AlgorithmGiven a vector of observed proportions which we obtainfrom experimental output, for different values of falsepositive rates and false negative rates, we aim to infer thetrue proportions. This would give us an idea about howthe observed and true proportions differ for different lev-els of noise in the form of false positives and false nega-tives. We infer the true proportions from the observedproportions using an EM based approach which we nowdiscuss in detail.
Let us consider the binding patterns for a transcriptionfactor in experimental conditions c1 and c2. We define thevector for the true binary binding pattern of a particulargene G as b = (b1, b2), where b1 and b2 take binary value 1or 0 depending on whether the gene is a true binding tar-get for the transcription factor in c1 and c2 respectively.Thus, for the experimental conditions c1 and c2, thisbinary binding pattern vector can take four possible val-ues, {(0, 0), (0, 1), (1, 0), (1, 1)}. For example, a binarybinding pattern vector equal to (1, 1) indicates that thegene is a binding target for the transcription factor in both
ˆ ( ˆ , ˆ )p = p p t0 1
p̂
E p
E p
s t
s t
p
p
( )
( ),0
1
0
1
1
1
⎛
⎝⎜
⎞
⎠⎟ =
−−
⎛
⎝⎜
⎞
⎠⎟
⎛
⎝⎜
⎞
⎠⎟ (1)
E M( ) .p p= (2)
M E− =1 ( ) .p p (3)
p̂
ˆ ( ˆ , ˆ , ˆ , ˆ )p = p p p p t00 01 10 11
E M M( ) ( ) .p p= ⊗ (4)
E M M( ) ( ) ,p p= ⊗1 2 (5)
Page 3 of 13(page number not for citation purposes)
BMC Bioinformatics 2009, 10:23 http://www.biomedcentral.com/1471-2105/10/23
c1 and c2. We aim to infer this true binary binding patternfor all the genes and thus obtain the true binary counts.Due to experimental errors, we have the observed countsas the experimental output.
We denote the observed binding pattern for a particulargene as g = (g1, g2), where each component is either 0 or 1denoting whether the gene is observed to be the bindingtarget of the particular transcription factor in c1 and c2respectively, based on the experimental output. Thus, thevector g represents the observed data. The probability ofthe observed binding data is then given by
Thus, for N genes, the probability of the observed data is
In this article, we propose to estimate the P(b) to maxi-mize P(g1, g2, ..., gN) using the EM algorithm, by treatingb as the missing data as follows.
E-Step: In the Expectation step, the conditional distribu-tion of the missing data given the observed data is evalu-ated. We evaluate the posterior probabilities of each truebinding state given the observed binding pattern. Thus,for every gene G with observed binding pattern g, we esti-mate:
where b(m) is the estimate of the true binding state b prob-ability at the m-th step. Since b(m) can have four possiblevalues, at each step, we estimate four probabilities. Theprobability P(g|b(m)) can be expanded as:
where and are the first and second components
of the estimate b(m) and take binary value 0 or 1.
The second equation in (9) results from the independenceassumption for the data from two separate ChIP-chipexperiments. Thus, the probability of observing g1 would
be independent of the estimate of binding state ,
while the probability of observing g2 would be independ-
ent of the estimate of binding state . There are four
possible cases for the expression in Equation
(4). From Equation (1), they can be enumerated as:
Thus, for each gene, we start with a set of estimates P(b(m))and obtain estimates of the posterior probabilitiesP(b(m)|g) for each gene at the E-step.
M-Step: In the Maximization step, the parameters P(b) arere-estimated to maximize the likelihood of the completedata. After obtaining P(b(m)|g) for each gene, we cross-tab-ulate a two-way contingency table, with the "count" foreach of the four values {(0, 0), (0, 1), (1, 0), (1, 1)} beingthe sum of the probabilities for that particular value acrossall the genes. These counts are then used to obtainupdated P estimates for P(b). For example,
.
We iterate between the E-Step and the M-Step until con-vergence. The convergence criterion was set as: |P(b(m)) -P(b(m-1))| < 10-12.
Results and discussionIn this section, we study the effect of false positives andfalse negatives on inferring regulatory target conservationacross conditions/species through both simulations andreal data analyses.
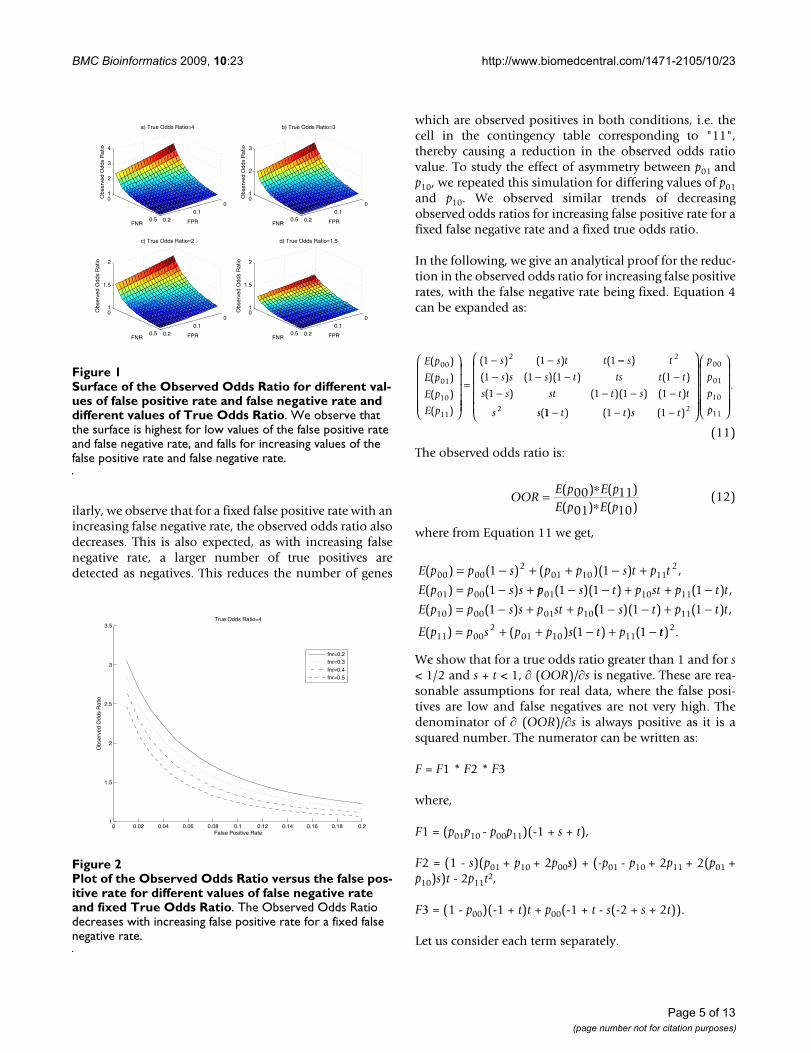
We consider an experiment involving the binding of atranscription factor in two different conditions with atotal of 1000 genes. We consider the odds ratio as ourmetric of interest. For fixed true odds ratios, and differentvalues of false positive and false negative rates, we plot thesurface of the observed odds ratio in Figure 1. Theobserved odds ratio is obtained from Equation 4. It can beseen that the observed odds ratio is the largest for low val-ues of false positive and false negative rates and its valuedecreases with increasing false positive and false negativerates. To visualize this phenomenon in two-dimensions,we fix the false negative rate, and plot the observed oddsratio as the false positive rate varies (Figure 2). We observethat with increasing false positive rates, the observed oddsratio decreases. This is expected, as with an increasing falsepositive rate, a larger number of true negatives aredetected as positives. This reduces the count of geneswhich are observed negatives in both conditions, i.e. thecell in the contingency table corresponding to "00". Thus,there is a reduction in the observed odds ratio value. Sim-
P P P P P
P
( ) ( ( , )) ( | ( , )) ( ( , )) ( | ( , ))
( ( ,
g b g b b g b
b
= = = + = = +=
0 0 0 0 0 1 0 1
1 00 1 0 1 1 1 1)) ( | ( , )) ( ( , )) ( | ( , )).P P Pg b b g b= + = =
(6)
P PN i
i
N
( , ,..., ) ( ).g g g g1 2
1
==
∏ (7)
PP m P m
P m P mm( | )
( | ( )) ( ( ))
( | ( )) ( ( ))
( )b gg b b
g b b= ∗
∗∑(8)
P P g g b b
P g b P g b
m m m
m m
( | ) (( , ) |( , ))
( | ) ( | ),
( ) ( ) ( )
( ) ( )
g b =
=1 2 1 2
1 1 2 2
(9)
b m1( ) b m
2( )
b m2( )
b m1( )
P g bi im( | )( )
P g b s P g b t
P g b s P
i im
i im
i im
( | ) , ( | ) ,
( | ) , (
( ) ( )
( )
= = = − = = =
= = =
0 0 1 0 1
1 0 gg b ti im= = = −1 1 1| ) .( )
(10)
P P gN i( ( , )) ( , ) | )b b= = =∑0 0 0 01
Page 4 of 13(page number not for citation purposes)
BMC Bioinformatics 2009, 10:23 http://www.biomedcentral.com/1471-2105/10/23
ilarly, we observe that for a fixed false positive rate with anincreasing false negative rate, the observed odds ratio alsodecreases. This is also expected, as with increasing falsenegative rate, a larger number of true positives aredetected as negatives. This reduces the number of genes
which are observed positives in both conditions, i.e. thecell in the contingency table corresponding to "11",thereby causing a reduction in the observed odds ratiovalue. To study the effect of asymmetry between p01 andp10, we repeated this simulation for differing values of p01and p10. We observed similar trends of decreasingobserved odds ratios for increasing false positive rate for afixed false negative rate and a fixed true odds ratio.
In the following, we give an analytical proof for the reduc-tion in the observed odds ratio for increasing false positiverates, with the false negative rate being fixed. Equation 4can be expanded as:
The observed odds ratio is:
where from Equation 11 we get,
We show that for a true odds ratio greater than 1 and for s< 1/2 and s + t < 1, ∂ (OOR)/∂s is negative. These are rea-sonable assumptions for real data, where the false posi-tives are low and false negatives are not very high. Thedenominator of ∂ (OOR)/∂s is always positive as it is asquared number. The numerator can be written as:
F = F1 * F2 * F3
where,
F1 = (p01p10 - p00p11)(-1 + s + t),
F2 = (1 - s)(p01 + p10 + 2p00s) + (-p01 - p10 + 2p11 + 2(p01 +p10)s)t - 2p11t2,
F3 = (1 - p00)(-1 + t)t + p00(-1 + t - s(-2 + s + 2t)).
Let us consider each term separately.
E p
E p
E p
E p
s s t t( )
( )
( )
( )
( ) ( ) (00
01
10
11
21 1 1⎛
⎝
⎜⎜⎜⎜⎜
⎞
⎠
⎟⎟⎟⎟⎟
=
− − −−− − − −− − − −
s t
s s s t ts t t
s s st t s t t
s s
)
( ) ( )( ) ( )
( ) ( )( ) ( )
(
2
2
1 1 1 1
1 1 1 1
11 1 1 2
00
01
10
11− − −
⎛
⎝
⎜⎜⎜⎜⎜
⎞
⎠
⎟⎟⎟⎟⎟
⎛
⎝
⎜⎜⎜⎜⎜
⎞
⎠
⎟⎟⎟⎟⎟
t t s t
p
p
p
p) ( ) ( )
.
(11)
OORE p E pE p E p
= ∗∗
( ) ( )( ) ( )
00 1101 10
(12)
E p p s p p s t p t
E p p s s
( ) ( ) ( )( ) ,
( ) ( )00 00
201 10 11
2
01 00
1 1
1
= − + + − += − + pp s t p st p t t
E p p s s p st p01 10 11
10 00 01 10
1 1 1
1
( )( ) ( ) ,
( ) ( )
− − + + −= − + + (( )( ) ( ) ,
( ) ( ) ( ) (
1 1 1
1 1
11
11 002
01 10 11
− − + −
= + + − + −
s t p t t
E p p s p p s t p tt) .2
Surface of the Observed Odds Ratio for different values of false positive rate and false negative rate and different values of True Odds RatioFigure 1Surface of the Observed Odds Ratio for different val-ues of false positive rate and false negative rate and different values of True Odds Ratio. We observe that the surface is highest for low values of the false positive rate and false negative rate, and falls for increasing values of the false positive rate and false negative rate.
00.1
0.2
0
0.5
1
2
3
4
FPR
a) True Odds Ratio=4
FNR
Obs
erve
d O
dds
Rat
io
00.1
0.2
0
0.5
1
2
3
FPR
b) True Odds Ratio=3
FNR
Obs
erve
d O
dds
Rat
io
00.1
0.2
0
0.5
1
1.5
2
FPR
c) True Odds Ratio=2
FNR
Obs
erve
d O
dds
Rat
io
00.1
0.2
0
0.5
1
1.5
2
FPR
d) True Odds Ratio=1.5
FNR
Obs
erve
d O
dds
Rat
io
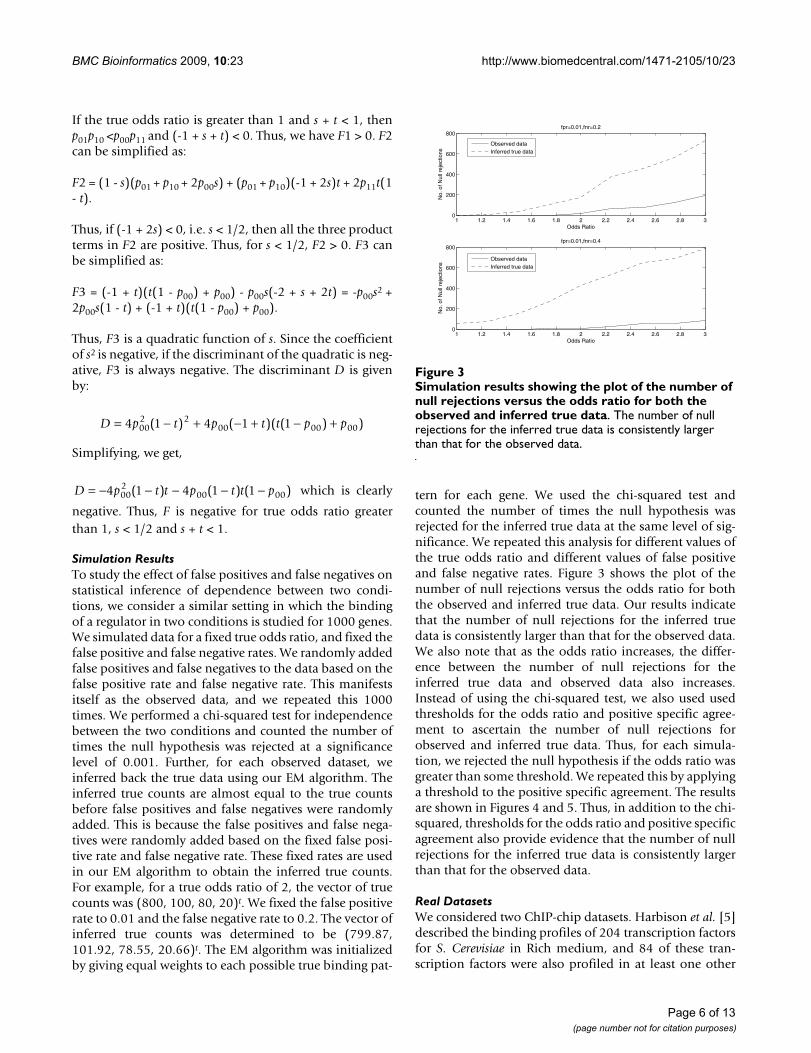
Plot of the Observed Odds Ratio versus the false positive rate for different values of false negative rate and fixed True Odds RatioFigure 2Plot of the Observed Odds Ratio versus the false pos-itive rate for different values of false negative rate and fixed True Odds Ratio. The Observed Odds Ratio decreases with increasing false positive rate for a fixed false negative rate.
0 0.02 0.04 0.06 0.08 0.1 0.12 0.14 0.16 0.18 0.21
1.5
2
2.5
3
3.5
False Positive Rate
Obs
erve
d O
dds
Rat
io
True Odds Ratio=4
fnr=0.2fnr=0.3fnr=0.4fnr=0.5
Page 5 of 13(page number not for citation purposes)
BMC Bioinformatics 2009, 10:23 http://www.biomedcentral.com/1471-2105/10/23
If the true odds ratio is greater than 1 and s + t < 1, thenp01p10 <p00p11 and (-1 + s + t) < 0. Thus, we have F1 > 0. F2can be simplified as:
F2 = (1 - s)(p01 + p10 + 2p00s) + (p01 + p10)(-1 + 2s)t + 2p11t(1- t).
Thus, if (-1 + 2s) < 0, i.e. s < 1/2, then all the three productterms in F2 are positive. Thus, for s < 1/2, F2 > 0. F3 canbe simplified as:
F3 = (-1 + t)(t(1 - p00) + p00) - p00s(-2 + s + 2t) = -p00s2 +2p00s(1 - t) + (-1 + t)(t(1 - p00) + p00).
Thus, F3 is a quadratic function of s. Since the coefficientof s2 is negative, if the discriminant of the quadratic is neg-ative, F3 is always negative. The discriminant D is givenby:
Simplifying, we get,
which is clearly
negative. Thus, F is negative for true odds ratio greaterthan 1, s < 1/2 and s + t < 1.
Simulation ResultsTo study the effect of false positives and false negatives onstatistical inference of dependence between two condi-tions, we consider a similar setting in which the bindingof a regulator in two conditions is studied for 1000 genes.We simulated data for a fixed true odds ratio, and fixed thefalse positive and false negative rates. We randomly addedfalse positives and false negatives to the data based on thefalse positive rate and false negative rate. This manifestsitself as the observed data, and we repeated this 1000times. We performed a chi-squared test for independencebetween the two conditions and counted the number oftimes the null hypothesis was rejected at a significancelevel of 0.001. Further, for each observed dataset, weinferred back the true data using our EM algorithm. Theinferred true counts are almost equal to the true countsbefore false positives and false negatives were randomlyadded. This is because the false positives and false nega-tives were randomly added based on the fixed false posi-tive rate and false negative rate. These fixed rates are usedin our EM algorithm to obtain the inferred true counts.For example, for a true odds ratio of 2, the vector of truecounts was (800, 100, 80, 20)t. We fixed the false positiverate to 0.01 and the false negative rate to 0.2. The vector ofinferred true counts was determined to be (799.87,101.92, 78.55, 20.66)t. The EM algorithm was initializedby giving equal weights to each possible true binding pat-
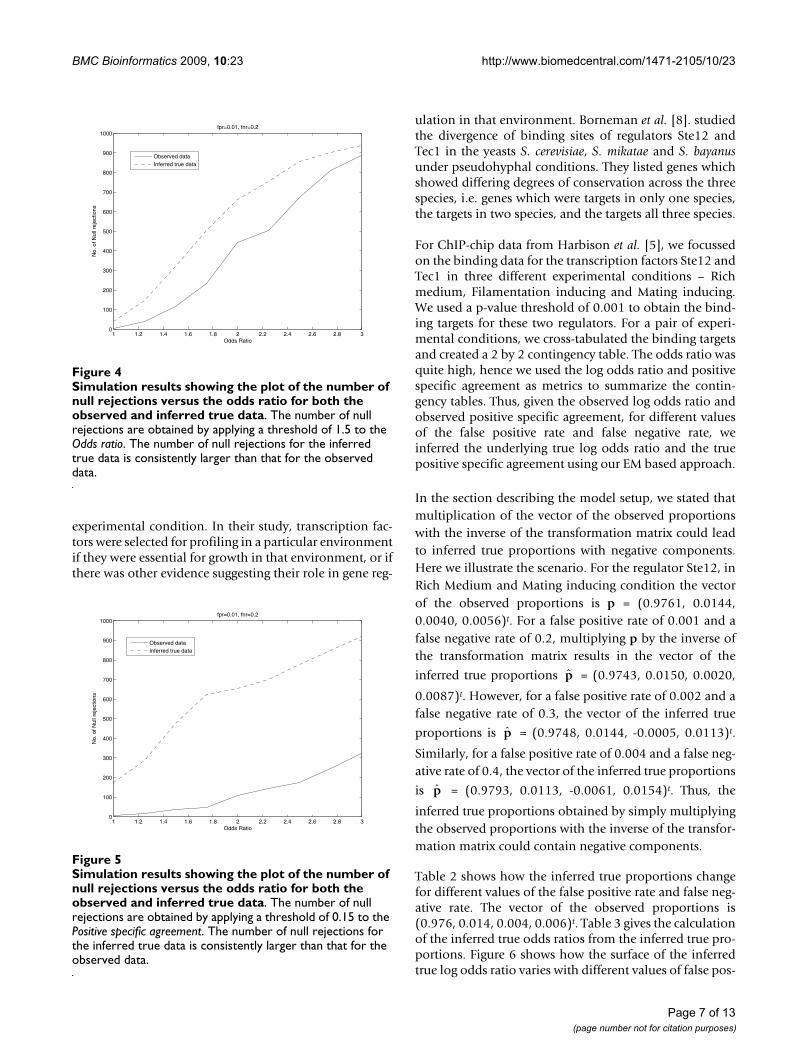
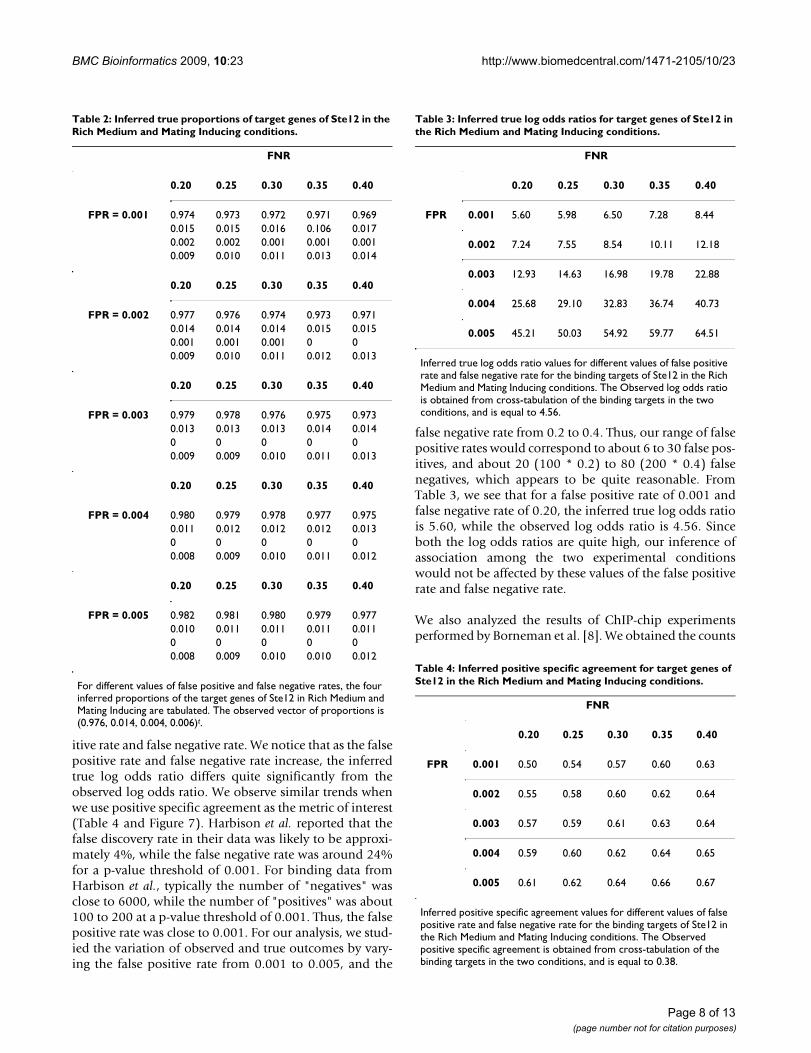
tern for each gene. We used the chi-squared test andcounted the number of times the null hypothesis wasrejected for the inferred true data at the same level of sig-nificance. We repeated this analysis for different values ofthe true odds ratio and different values of false positiveand false negative rates. Figure 3 shows the plot of thenumber of null rejections versus the odds ratio for boththe observed and inferred true data. Our results indicatethat the number of null rejections for the inferred truedata is consistently larger than that for the observed data.We also note that as the odds ratio increases, the differ-ence between the number of null rejections for theinferred true data and observed data also increases.Instead of using the chi-squared test, we also used usedthresholds for the odds ratio and positive specific agree-ment to ascertain the number of null rejections forobserved and inferred true data. Thus, for each simula-tion, we rejected the null hypothesis if the odds ratio wasgreater than some threshold. We repeated this by applyinga threshold to the positive specific agreement. The resultsare shown in Figures 4 and 5. Thus, in addition to the chi-squared, thresholds for the odds ratio and positive specificagreement also provide evidence that the number of nullrejections for the inferred true data is consistently largerthan that for the observed data.
Real DatasetsWe considered two ChIP-chip datasets. Harbison et al. [5]described the binding profiles of 204 transcription factorsfor S. Cerevisiae in Rich medium, and 84 of these tran-scription factors were also profiled in at least one other
D p t p t t p p= − + − + − +4 1 4 1 1002 2
00 00 00( ) ( )( ( ) )
D p t t p t t p= − − − − −4 1 4 1 1002
00 00( ) ( ) ( )
Simulation results showing the plot of the number of null rejections versus the odds ratio for both the observed and inferred true dataFigure 3Simulation results showing the plot of the number of null rejections versus the odds ratio for both the observed and inferred true data. The number of null rejections for the inferred true data is consistently larger than that for the observed data.
1 1.2 1.4 1.6 1.8 2 2.2 2.4 2.6 2.8 30
200
400
600
800
Odds Ratio
No.
of N
ull r
ejec
tions
fpr=0.01,fnr=0.2
Observed dataInferred true data
1 1.2 1.4 1.6 1.8 2 2.2 2.4 2.6 2.8 30
200
400
600
800
Odds Ratio
No.
of N
ull r
ejec
tions
fpr=0.01,fnr=0.4
Observed dataInferred true data
Page 6 of 13(page number not for citation purposes)
BMC Bioinformatics 2009, 10:23 http://www.biomedcentral.com/1471-2105/10/23
experimental condition. In their study, transcription fac-tors were selected for profiling in a particular environmentif they were essential for growth in that environment, or ifthere was other evidence suggesting their role in gene reg-
ulation in that environment. Borneman et al. [8]. studiedthe divergence of binding sites of regulators Ste12 andTec1 in the yeasts S. cerevisiae, S. mikatae and S. bayanusunder pseudohyphal conditions. They listed genes whichshowed differing degrees of conservation across the threespecies, i.e. genes which were targets in only one species,the targets in two species, and the targets all three species.
For ChIP-chip data from Harbison et al. [5], we focussedon the binding data for the transcription factors Ste12 andTec1 in three different experimental conditions – Richmedium, Filamentation inducing and Mating inducing.We used a p-value threshold of 0.001 to obtain the bind-ing targets for these two regulators. For a pair of experi-mental conditions, we cross-tabulated the binding targetsand created a 2 by 2 contingency table. The odds ratio wasquite high, hence we used the log odds ratio and positivespecific agreement as metrics to summarize the contin-gency tables. Thus, given the observed log odds ratio andobserved positive specific agreement, for different valuesof the false positive rate and false negative rate, weinferred the underlying true log odds ratio and the truepositive specific agreement using our EM based approach.
In the section describing the model setup, we stated thatmultiplication of the vector of the observed proportionswith the inverse of the transformation matrix could leadto inferred true proportions with negative components.Here we illustrate the scenario. For the regulator Ste12, inRich Medium and Mating inducing condition the vectorof the observed proportions is p = (0.9761, 0.0144,0.0040, 0.0056)t. For a false positive rate of 0.001 and afalse negative rate of 0.2, multiplying p by the inverse ofthe transformation matrix results in the vector of the
inferred true proportions = (0.9743, 0.0150, 0.0020,
0.0087)t. However, for a false positive rate of 0.002 and afalse negative rate of 0.3, the vector of the inferred true
proportions is = (0.9748, 0.0144, -0.0005, 0.0113)t.
Similarly, for a false positive rate of 0.004 and a false neg-ative rate of 0.4, the vector of the inferred true proportions
is = (0.9793, 0.0113, -0.0061, 0.0154)t. Thus, the
inferred true proportions obtained by simply multiplyingthe observed proportions with the inverse of the transfor-mation matrix could contain negative components.
Table 2 shows how the inferred true proportions changefor different values of the false positive rate and false neg-ative rate. The vector of the observed proportions is(0.976, 0.014, 0.004, 0.006)t. Table 3 gives the calculationof the inferred true odds ratios from the inferred true pro-portions. Figure 6 shows how the surface of the inferredtrue log odds ratio varies with different values of false pos-
p̂
p̂
p̂
Simulation results showing the plot of the number of null rejections versus the odds ratio for both the observed and inferred true dataFigure 4Simulation results showing the plot of the number of null rejections versus the odds ratio for both the observed and inferred true data. The number of null rejections are obtained by applying a threshold of 1.5 to the Odds ratio. The number of null rejections for the inferred true data is consistently larger than that for the observed data.
1 1.2 1.4 1.6 1.8 2 2.2 2.4 2.6 2.8 30
100
200
300
400
500
600
700
800
900
1000
Odds Ratio
No.
of N
ull r
ejec
tions
fpr=0.01, fnr=0.2
Observed dataInferred true data
Simulation results showing the plot of the number of null rejections versus the odds ratio for both the observed and inferred true dataFigure 5Simulation results showing the plot of the number of null rejections versus the odds ratio for both the observed and inferred true data. The number of null rejections are obtained by applying a threshold of 0.15 to the Positive specific agreement. The number of null rejections for the inferred true data is consistently larger than that for the observed data.
1 1.2 1.4 1.6 1.8 2 2.2 2.4 2.6 2.8 30
100
200
300
400
500
600
700
800
900
1000
Odds Ratio
No.
of N
ull r
ejec
tions
fpr=0.01, fnr=0.2
Observed dataInferred true data
Page 7 of 13(page number not for citation purposes)
BMC Bioinformatics 2009, 10:23 http://www.biomedcentral.com/1471-2105/10/23
itive rate and false negative rate. We notice that as the falsepositive rate and false negative rate increase, the inferredtrue log odds ratio differs quite significantly from theobserved log odds ratio. We observe similar trends whenwe use positive specific agreement as the metric of interest(Table 4 and Figure 7). Harbison et al. reported that thefalse discovery rate in their data was likely to be approxi-mately 4%, while the false negative rate was around 24%for a p-value threshold of 0.001. For binding data fromHarbison et al., typically the number of "negatives" wasclose to 6000, while the number of "positives" was about100 to 200 at a p-value threshold of 0.001. Thus, the falsepositive rate was close to 0.001. For our analysis, we stud-ied the variation of observed and true outcomes by vary-ing the false positive rate from 0.001 to 0.005, and the
false negative rate from 0.2 to 0.4. Thus, our range of falsepositive rates would correspond to about 6 to 30 false pos-itives, and about 20 (100 * 0.2) to 80 (200 * 0.4) falsenegatives, which appears to be quite reasonable. FromTable 3, we see that for a false positive rate of 0.001 andfalse negative rate of 0.20, the inferred true log odds ratiois 5.60, while the observed log odds ratio is 4.56. Sinceboth the log odds ratios are quite high, our inference ofassociation among the two experimental conditionswould not be affected by these values of the false positiverate and false negative rate.
We also analyzed the results of ChIP-chip experimentsperformed by Borneman et al. [8]. We obtained the counts
Table 2: Inferred true proportions of target genes of Ste12 in the Rich Medium and Mating Inducing conditions.
FNR
0.20 0.25 0.30 0.35 0.40
FPR = 0.001 0.974 0.973 0.972 0.971 0.9690.015 0.015 0.016 0.106 0.0170.002 0.002 0.001 0.001 0.0010.009 0.010 0.011 0.013 0.014
0.20 0.25 0.30 0.35 0.40
FPR = 0.002 0.977 0.976 0.974 0.973 0.9710.014 0.014 0.014 0.015 0.0150.001 0.001 0.001 0 00.009 0.010 0.011 0.012 0.013
0.20 0.25 0.30 0.35 0.40
FPR = 0.003 0.979 0.978 0.976 0.975 0.9730.013 0.013 0.013 0.014 0.0140 0 0 0 00.009 0.009 0.010 0.011 0.013
0.20 0.25 0.30 0.35 0.40
FPR = 0.004 0.980 0.979 0.978 0.977 0.9750.011 0.012 0.012 0.012 0.0130 0 0 0 00.008 0.009 0.010 0.011 0.012
0.20 0.25 0.30 0.35 0.40
FPR = 0.005 0.982 0.981 0.980 0.979 0.9770.010 0.011 0.011 0.011 0.0110 0 0 0 00.008 0.009 0.010 0.010 0.012
For different values of false positive and false negative rates, the four inferred proportions of the target genes of Ste12 in Rich Medium and Mating Inducing are tabulated. The observed vector of proportions is (0.976, 0.014, 0.004, 0.006)t.
Table 3: Inferred true log odds ratios for target genes of Ste12 in the Rich Medium and Mating Inducing conditions.
FNR
0.20 0.25 0.30 0.35 0.40
FPR 0.001 5.60 5.98 6.50 7.28 8.44
0.002 7.24 7.55 8.54 10.11 12.18
0.003 12.93 14.63 16.98 19.78 22.88
0.004 25.68 29.10 32.83 36.74 40.73
0.005 45.21 50.03 54.92 59.77 64.51
Inferred true log odds ratio values for different values of false positive rate and false negative rate for the binding targets of Ste12 in the Rich Medium and Mating Inducing conditions. The Observed log odds ratio is obtained from cross-tabulation of the binding targets in the two conditions, and is equal to 4.56.
Table 4: Inferred positive specific agreement for target genes of Ste12 in the Rich Medium and Mating Inducing conditions.
FNR
0.20 0.25 0.30 0.35 0.40
FPR 0.001 0.50 0.54 0.57 0.60 0.63
0.002 0.55 0.58 0.60 0.62 0.64
0.003 0.57 0.59 0.61 0.63 0.64
0.004 0.59 0.60 0.62 0.64 0.65
0.005 0.61 0.62 0.64 0.66 0.67
Inferred positive specific agreement values for different values of false positive rate and false negative rate for the binding targets of Ste12 in the Rich Medium and Mating Inducing conditions. The Observed positive specific agreement is obtained from cross-tabulation of the binding targets in the two conditions, and is equal to 0.38.
Page 8 of 13(page number not for citation purposes)
BMC Bioinformatics 2009, 10:23 http://www.biomedcentral.com/1471-2105/10/23
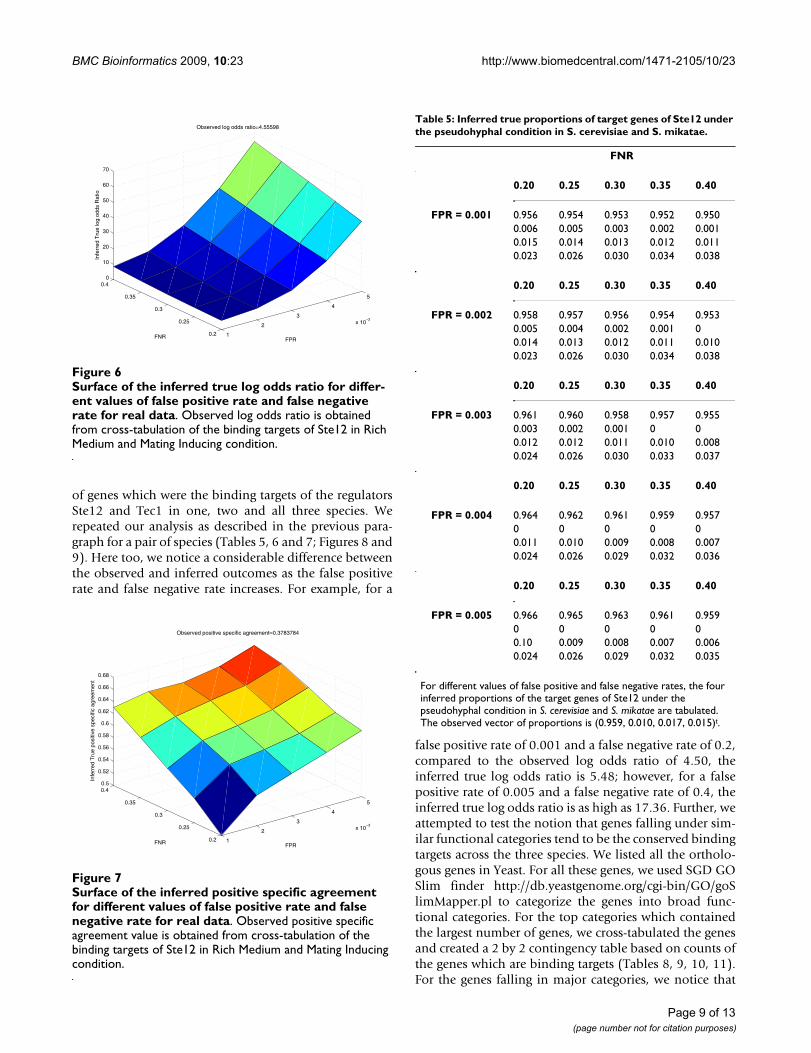
of genes which were the binding targets of the regulatorsSte12 and Tec1 in one, two and all three species. Werepeated our analysis as described in the previous para-graph for a pair of species (Tables 5, 6 and 7; Figures 8 and9). Here too, we notice a considerable difference betweenthe observed and inferred outcomes as the false positiverate and false negative rate increases. For example, for a
false positive rate of 0.001 and a false negative rate of 0.2,compared to the observed log odds ratio of 4.50, theinferred true log odds ratio is 5.48; however, for a falsepositive rate of 0.005 and a false negative rate of 0.4, theinferred true log odds ratio is as high as 17.36. Further, weattempted to test the notion that genes falling under sim-ilar functional categories tend to be the conserved bindingtargets across the three species. We listed all the ortholo-gous genes in Yeast. For all these genes, we used SGD GOSlim finder http://db.yeastgenome.org/cgi-bin/GO/goSlimMapper.pl to categorize the genes into broad func-tional categories. For the top categories which containedthe largest number of genes, we cross-tabulated the genesand created a 2 by 2 contingency table based on counts ofthe genes which are binding targets (Tables 8, 9, 10, 11).For the genes falling in major categories, we notice that
Surface of the inferred true log odds ratio for different values of false positive rate and false negative rate for real dataFigure 6Surface of the inferred true log odds ratio for differ-ent values of false positive rate and false negative rate for real data. Observed log odds ratio is obtained from cross-tabulation of the binding targets of Ste12 in Rich Medium and Mating Inducing condition.
1
2
3
4
5
x 10−3
0.2
0.25
0.3
0.35
0.40
10
20
30
40
50
60
70
FPR
Observed log odds ratio=4.55598
FNR
Infe
rred
Tru
e lo
g od
ds R
atio
Surface of the inferred positive specific agreement for differ-ent values of false positive rate and false negative rate for real dataFigure 7Surface of the inferred positive specific agreement for different values of false positive rate and false negative rate for real data. Observed positive specific agreement value is obtained from cross-tabulation of the binding targets of Ste12 in Rich Medium and Mating Inducing condition.
1
2
3
4
5
x 10−3
0.2
0.25
0.3
0.35
0.40.5
0.52
0.54
0.56
0.58
0.6
0.62
0.64
0.66
0.68
FPR
Observed positive specific agreement=0.3783784
FNR
Infe
rred
Tru
e po
sitiv
e sp
ecifi
c ag
reem
ent
Table 5: Inferred true proportions of target genes of Ste12 under the pseudohyphal condition in S. cerevisiae and S. mikatae.
FNR
0.20 0.25 0.30 0.35 0.40
FPR = 0.001 0.956 0.954 0.953 0.952 0.9500.006 0.005 0.003 0.002 0.0010.015 0.014 0.013 0.012 0.0110.023 0.026 0.030 0.034 0.038
0.20 0.25 0.30 0.35 0.40
FPR = 0.002 0.958 0.957 0.956 0.954 0.9530.005 0.004 0.002 0.001 00.014 0.013 0.012 0.011 0.0100.023 0.026 0.030 0.034 0.038
0.20 0.25 0.30 0.35 0.40
FPR = 0.003 0.961 0.960 0.958 0.957 0.9550.003 0.002 0.001 0 00.012 0.012 0.011 0.010 0.0080.024 0.026 0.030 0.033 0.037
0.20 0.25 0.30 0.35 0.40
FPR = 0.004 0.964 0.962 0.961 0.959 0.9570 0 0 0 00.011 0.010 0.009 0.008 0.0070.024 0.026 0.029 0.032 0.036
0.20 0.25 0.30 0.35 0.40
FPR = 0.005 0.966 0.965 0.963 0.961 0.9590 0 0 0 00.10 0.009 0.008 0.007 0.0060.024 0.026 0.029 0.032 0.035
For different values of false positive and false negative rates, the four inferred proportions of the target genes of Ste12 under the pseudohyphal condition in S. cerevisiae and S. mikatae are tabulated. The observed vector of proportions is (0.959, 0.010, 0.017, 0.015)t.
Page 9 of 13(page number not for citation purposes)
BMC Bioinformatics 2009, 10:23 http://www.biomedcentral.com/1471-2105/10/23
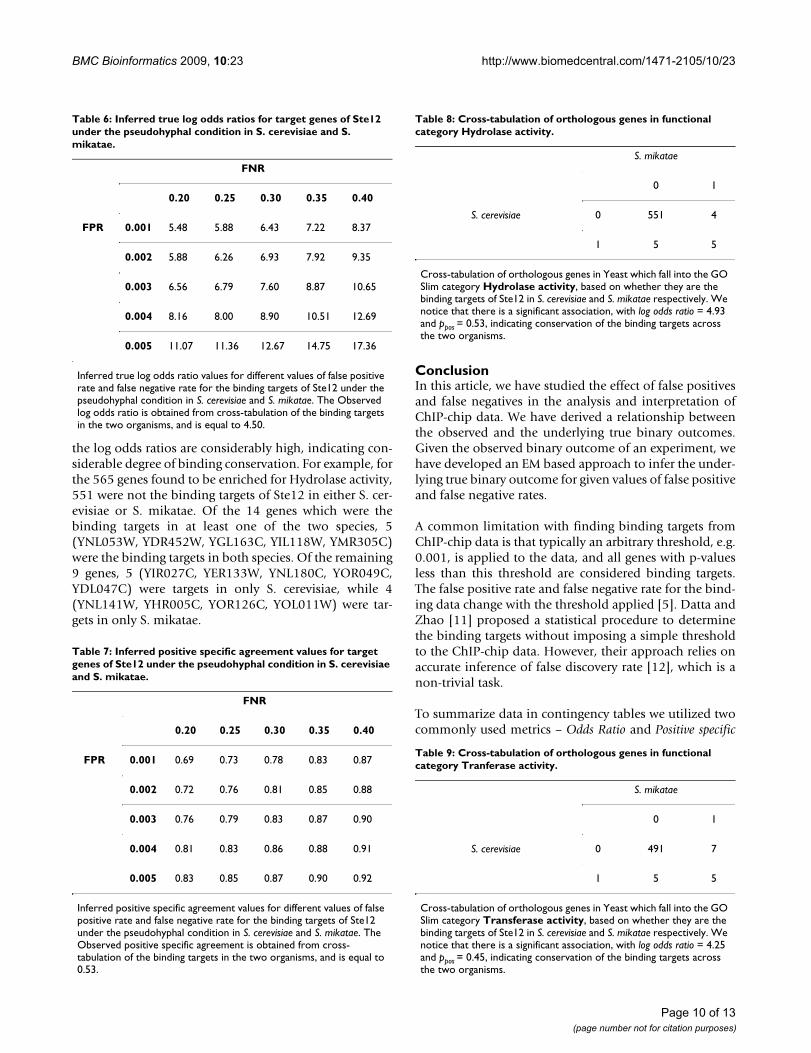
the log odds ratios are considerably high, indicating con-siderable degree of binding conservation. For example, forthe 565 genes found to be enriched for Hydrolase activity,551 were not the binding targets of Ste12 in either S. cer-evisiae or S. mikatae. Of the 14 genes which were thebinding targets in at least one of the two species, 5(YNL053W, YDR452W, YGL163C, YIL118W, YMR305C)were the binding targets in both species. Of the remaining9 genes, 5 (YIR027C, YER133W, YNL180C, YOR049C,YDL047C) were targets in only S. cerevisiae, while 4(YNL141W, YHR005C, YOR126C, YOL011W) were tar-gets in only S. mikatae.
ConclusionIn this article, we have studied the effect of false positivesand false negatives in the analysis and interpretation ofChIP-chip data. We have derived a relationship betweenthe observed and the underlying true binary outcomes.Given the observed binary outcome of an experiment, wehave developed an EM based approach to infer the under-lying true binary outcome for given values of false positiveand false negative rates.
A common limitation with finding binding targets fromChIP-chip data is that typically an arbitrary threshold, e.g.0.001, is applied to the data, and all genes with p-valuesless than this threshold are considered binding targets.The false positive rate and false negative rate for the bind-ing data change with the threshold applied [5]. Datta andZhao [11] proposed a statistical procedure to determinethe binding targets without imposing a simple thresholdto the ChIP-chip data. However, their approach relies onaccurate inference of false discovery rate [12], which is anon-trivial task.
To summarize data in contingency tables we utilized twocommonly used metrics – Odds Ratio and Positive specific
Table 6: Inferred true log odds ratios for target genes of Ste12 under the pseudohyphal condition in S. cerevisiae and S. mikatae.
FNR
0.20 0.25 0.30 0.35 0.40
FPR 0.001 5.48 5.88 6.43 7.22 8.37
0.002 5.88 6.26 6.93 7.92 9.35
0.003 6.56 6.79 7.60 8.87 10.65
0.004 8.16 8.00 8.90 10.51 12.69
0.005 11.07 11.36 12.67 14.75 17.36
Inferred true log odds ratio values for different values of false positive rate and false negative rate for the binding targets of Ste12 under the pseudohyphal condition in S. cerevisiae and S. mikatae. The Observed log odds ratio is obtained from cross-tabulation of the binding targets in the two organisms, and is equal to 4.50.
Table 7: Inferred positive specific agreement values for target genes of Ste12 under the pseudohyphal condition in S. cerevisiae and S. mikatae.
FNR
0.20 0.25 0.30 0.35 0.40
FPR 0.001 0.69 0.73 0.78 0.83 0.87
0.002 0.72 0.76 0.81 0.85 0.88
0.003 0.76 0.79 0.83 0.87 0.90
0.004 0.81 0.83 0.86 0.88 0.91
0.005 0.83 0.85 0.87 0.90 0.92
Inferred positive specific agreement values for different values of false positive rate and false negative rate for the binding targets of Ste12 under the pseudohyphal condition in S. cerevisiae and S. mikatae. The Observed positive specific agreement is obtained from cross-tabulation of the binding targets in the two organisms, and is equal to 0.53.
Table 8: Cross-tabulation of orthologous genes in functional category Hydrolase activity.
S. mikatae
0 1
S. cerevisiae 0 551 4
1 5 5
Cross-tabulation of orthologous genes in Yeast which fall into the GO Slim category Hydrolase activity, based on whether they are the binding targets of Ste12 in S. cerevisiae and S. mikatae respectively. We notice that there is a significant association, with log odds ratio = 4.93 and ppos = 0.53, indicating conservation of the binding targets across the two organisms.
Table 9: Cross-tabulation of orthologous genes in functional category Tranferase activity.
S. mikatae
0 1
S. cerevisiae 0 491 7
1 5 5
Cross-tabulation of orthologous genes in Yeast which fall into the GO Slim category Transferase activity, based on whether they are the binding targets of Ste12 in S. cerevisiae and S. mikatae respectively. We notice that there is a significant association, with log odds ratio = 4.25 and ppos = 0.45, indicating conservation of the binding targets across the two organisms.
Page 10 of 13(page number not for citation purposes)
BMC Bioinformatics 2009, 10:23 http://www.biomedcentral.com/1471-2105/10/23
agreement. Both these metrics are widely used to studydependency among categorical variables. Since we areinterested in quantifying association among two catego-rial variables, i.e. whether there is association across twodifferent conditions/species, the Odds Ratio and Positivespecific agreement are appropriate metrics of interest. In oursimulation, we used the chi-squared test of independenceto test the null hypothesis that the binding targets areindependent. Instead of using the chi-squared test, wecould also use the Fisher's exact test to test the independ-ence assumption on the two-way contingency table. Theresulting p-values from both tests indicate the statisticalevidence against the independence assumption. However,they do not provide a meaningful summary of the degreeof dependence as they are also dependent on the samplesize.
In general, for independently performed real world exper-iments, such as two separate ChIP-chip experiments, theindependence assumption of equation (9) should hold.This is because we can assume that data points in a partic-ular experiment are independent identically distributedrandom variables. However, for experiments with closelyassociated results, it is possible that the false positive and
false negative data points for the experiments are notentirely independent. This could result in an under-esti-mation of the underlying association after the EM proce-dure.
Table 10: Cross-tabulation of orthologous genes in functional category Protein binding.
S. mikatae
0 1
S. cerevisiae 0 338 3
1 5 3
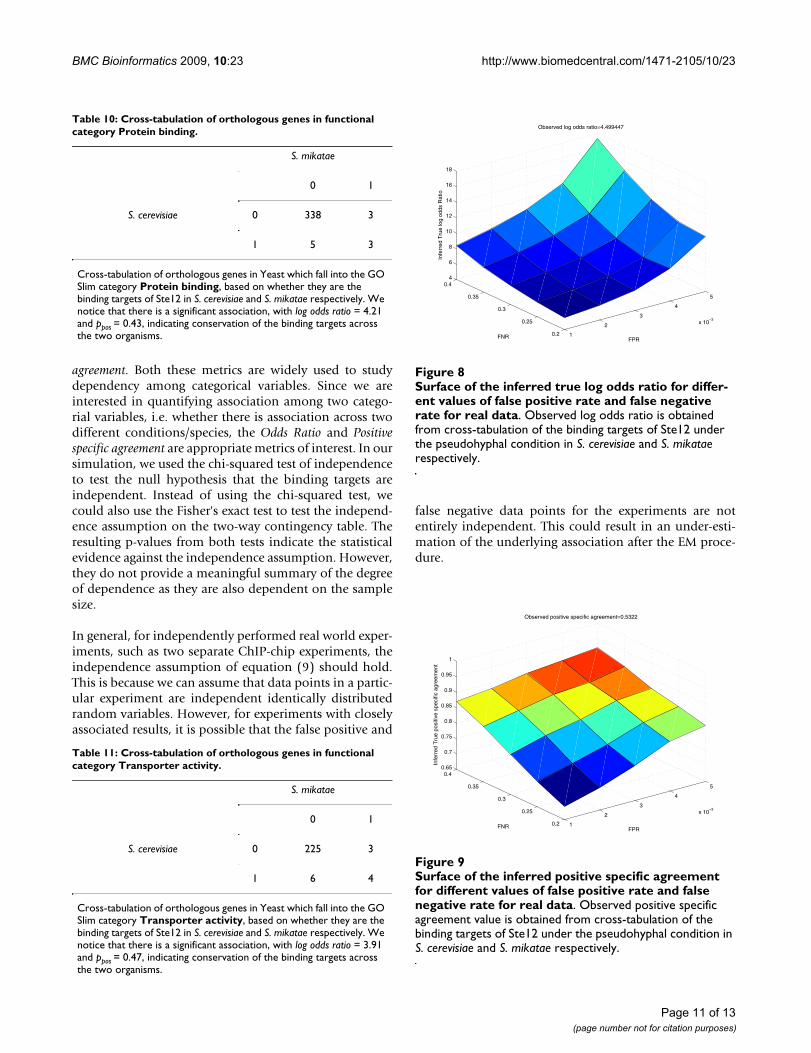
Cross-tabulation of orthologous genes in Yeast which fall into the GO Slim category Protein binding, based on whether they are the binding targets of Ste12 in S. cerevisiae and S. mikatae respectively. We notice that there is a significant association, with log odds ratio = 4.21 and ppos = 0.43, indicating conservation of the binding targets across the two organisms.
Table 11: Cross-tabulation of orthologous genes in functional category Transporter activity.
S. mikatae
0 1
S. cerevisiae 0 225 3
1 6 4
Cross-tabulation of orthologous genes in Yeast which fall into the GO Slim category Transporter activity, based on whether they are the binding targets of Ste12 in S. cerevisiae and S. mikatae respectively. We notice that there is a significant association, with log odds ratio = 3.91 and ppos = 0.47, indicating conservation of the binding targets across the two organisms.
Surface of the inferred true log odds ratio for different values of false positive rate and false negative rate for real dataFigure 8Surface of the inferred true log odds ratio for differ-ent values of false positive rate and false negative rate for real data. Observed log odds ratio is obtained from cross-tabulation of the binding targets of Ste12 under the pseudohyphal condition in S. cerevisiae and S. mikatae respectively.
1
2
3
4
5
x 10−3
0.2
0.25
0.3
0.35
0.44
6
8
10
12
14
16
18
FPR
Observed log odds ratio=4.499447
FNR
Infe
rred
Tru
e lo
g od
ds R
atio
Surface of the inferred positive specific agreement for differ-ent values of false positive rate and false negative rate for real dataFigure 9Surface of the inferred positive specific agreement for different values of false positive rate and false negative rate for real data. Observed positive specific agreement value is obtained from cross-tabulation of the binding targets of Ste12 under the pseudohyphal condition in S. cerevisiae and S. mikatae respectively.
1
2
3
4
5
x 10−3
0.2
0.25
0.3
0.35
0.40.65
0.7
0.75
0.8
0.85
0.9
0.95
1
FPR
Observed positive specific agreement=0.5322
FNR
Infe
rred
Tru
e po
sitiv
e sp
ecifi
c ag
reem
ent
Page 11 of 13(page number not for citation purposes)
BMC Bioinformatics 2009, 10:23 http://www.biomedcentral.com/1471-2105/10/23
Due to the limited degrees of freedom of the data, our EMalgorithm cannot be used to estimate the false positiverate and false negative rate in experimental data. At eachstep in the EM algorithm, we estimate three parameters,and we have three equations to solve for them. If we alsowish to estimate the false positive and false negative rates,we would have two additional parameters, but thenumber of equations would still be three. This would leadto an identifiability problem.
We initialized the EM algorithm by different initial esti-mates of the parameters. For each initial estimate of theparameters, the algorithm converged. The convergencecriteria for the EM algorithm require that the log likeli-hood of the parameters l(b|g) be continuous and differen-tiable in the parameter space. Unfortunately, the M-stepof our algorithm does not have a closed form. Hence, it isdifficult to evaluate the gradient of the log likelihoodfunction.
Harbison et al. performed their ChIP-chip experimentsusing microarrays consisting of spotted polymerase chainreaction (PCR) products representing all the intergenicregions of Saccharomyces cerevisiae. To obtain the bindingtargets a p-value threshold was applied to the bindingintensities associated with the probes. One of the draw-backs of PCR based arrays is the low resolution of theDNA elements in the microarray chip. For PCR arraysdesigned for Yeast, the typical resolution achieved is lessthan 1 kb. In recent years, high density oligonucleotidearrays, comprising of large numbers (40, 000 to morethan 6, 000, 000) of short oligonucleotides have been uti-lized for ChIP-chip studies [13-16]. A number of statisticalalgorithms have also been developed to determine thebinding targets from such large scale tiling arrays [17-20].Borneman et al. used high density oligonucleotide arraysto perform their experiment. The binding targets wereobtained using Tilescope [21]. Since they report the targetgenes in each organism, we simply used their results toobtain the counts of target genes in each of the threeorganisms.
Our analysis can be applied to any experimental settingwith binary outcomes. However, for the sake of simplicity,we have illustrated its application for ChIP-chip experi-ments. By applying our algorithm to ChIP-chip data fromHarbison et al. and Borneman et al., we observe that fordifferent values of the false positive and false negative rate,the observed and true metrics for the binary data can differquite dramatically. However, we notice that when the truelog odds ratio is greater than 4, i.e. there is a significantdegree of association among the binding targets acrossconditions/species, such differences in the observed andtrue metrics would not change our inference. On the otherhand, our simulation results indicate that when the true
odds ratio is close to 1, i.e. for cases when the underlyingassociation is marginal, moderate values of false positiveand false negative rates (0.01 and 0.2 respectively) maynot be able to provide conclusive evidence of any under-lying association or independence.
Authors' contributionsDD performed data analysis and drafted the manuscript.HZ conceived and guided the study. Both authors readand approved the final manuscript.
AcknowledgementsThis work was supported in part by NSF grant DMS-0714817 and NIH grant GM59507.
References1. Buck MJ, Lieb JD: ChIP-chip: considerations for the design,
analysis and application of genome-wide chromatin immu-noprecipitation experiments. Genomics 2004, 83:349-360.
2. Iyer VR, Horak CE, Scafe CS, Botstein D, Snyder M, Brown PO:Genomic binding sites of the yeast cell-cycle transcriptionfactors SBF and MBF. Nature 2001, 409:533-538.
3. Lieb JD, Liu X, Botstein D, Brown PO: Promoter-specific bindingof Rap1 revealed by genome-wide maps of protein-DNAassociation. Nature Genetics 2001, 28:327-334.
4. Ren B, Robert F, Wyrick JJ, Aparicio O, Jennings EG, Simon I, Zeitlin-ger J, Schreiber J, Hannett N, Kanin E, Volkert TL, Wilson CJ, Bell SP,Young RA: Genome-wide location and function of DNA-bind-ing proteins. Science 2000, 290:2306-2309.
5. Harbison CT, Gordon DB, Lee TI, Rinaldi NJ, Macisaac KD, DanfordTW, Hannett NM, Tagne JB, Reynolds DB, Yoo J, Jennings EG, Zei-tlinger J, Pokholok DK, Kellis M, Rolfe PA, Takusagawa KT, Lander ES,Gifford DK, Fraenkel E, Young RA: Transcriptional regulatorycode of an eukaryotic genome. Nature 2004, 431:99-104.
6. Beyer A, Workman C, Hollunder J, Radke D, Moller U, Wilhelm T,Ideker T: Integrated assessment and prediction of transcrip-tion factor binding. PLOS Computational Biology 2006, 2(6):e70.
7. Zeitlinger J, Simon I, Harbison CT, Hannett NM, Volkert TL, Fink GR,Young RA: Program-specific distribution of a transcriptionfactor dependent on partner transcription factor and MAPKsignaling. Cell 2003, 113:395-404.
8. Borneman AR, Gianoulis TA, Zhang ZD, Yu H, Rozowsky J, Sering-haus MR, Wang LY, Gerstein M, Snyder M: Divergence of tran-scription factor binding sites across related yeast species.Science 2007, 317:815-819.
9. Agresti A: An introduction to categorical data analysis New York: Wiley;1996.
10. Fleiss JL: Statistical methods for rates and proportions 2nd edition. NewYork: John Wiley; 1981.
11. Datta D, Zhao H: Statistical methods to infer cooperativebinding among transcription factors in Saccharomyces cerevi-siae. Bioinformatics 2008, 24(4):545-552.
12. Efron B: Large-scale simultaneous hypothesis testing: Thechoice of a null hypothesis. Journal of the American Statistical Asso-ciation 2004, 99:96-104.
13. Boyer LA, Lee TI, Cole MF, Johnstone SE, Levine SS, Zucker JP, Guen-ther MG, Kumar RM, Murray HL, Jenner RG, Gifford DK, Melton DA,Jaenisch R, Young RA: Core transcriptional regulatory circuitryin human embryonic stem cells. Cell 2005, 122:947-956.
14. Pokholok DK, Harbison CT, Levine S, Cole M, Hannett NM, Lee TI,Bell GW, Walker K, Rolfe PA, Hannett NM, Herbolsheimer E, Zei-tlinger J, Lewitter F, Gifford DK, Young RA: Genome-wide map ofnucleosome acetylation and methylation in yeast. Cell 2005,122:517-527.
15. Zeitlinger J, Zinzen RP, Stark A, Kellis M, Zhang H, Young RA, LevineM: Whole-genome ChIP-chip analysis of Dorsal, Twist andSnail suggests integration of diverse patterning processes inthe Drosophila embryo. Genes Development 2007, 21:385-390.
16. Zheng Y, Yosefowicz SZ, Kas A, Chu TT, Gavin MA, Rudensky AY:Genome-wide analysis of Foxp3 target genes in developingand mature regulatory T cells. Nature 2007, 445:936-940.
Page 12 of 13(page number not for citation purposes)
BMC Bioinformatics 2009, 10:23 http://www.biomedcentral.com/1471-2105/10/23
Publish with BioMed Central and every scientist can read your work free of charge
"BioMed Central will be the most significant development for disseminating the results of biomedical research in our lifetime."
Sir Paul Nurse, Cancer Research UK
Your research papers will be:
available free of charge to the entire biomedical community
peer reviewed and published immediately upon acceptance
cited in PubMed and archived on PubMed Central
yours — you keep the copyright
Submit your manuscript here:http://www.biomedcentral.com/info/publishing_adv.asp
BioMedcentral
17. Bertone P, Stolc V, Royce TE, Rozowsky JS, Urban AE, Zhu X, RinnJL, Tongprasit W, Samanta M, Weissman S, Gerstein M, Snyder M:Global identification of human transcribed sequences withgenome tiling arrays. Science 2004, 306:2242-2246.
18. Ji H, Wong WH: TileMap: create chromosomal map of tilingarray hybridizations. Bioinformatics 2005, 21:3629-3636.
19. Li W, Meyer CA, Liu XS: A hidden Markov model for analyzingChIP-chip experiments on genome tiling arrays and its appli-cation to p53 binding sequences. Bioinformatics 2005,21:i274-i282.
20. Du J, Rozowsky JS, Korbel JO, Zhang ZD, Royce TE, Schultz MH, Sny-der M, Gerstein M: A supervised hidden markov model frame-work for efficiently segmenting tiling array data intranscriptional and ChIP-chip experiments: systematicallyincorporating validated biological knowledge. Bioinformatics2006, 22(24):3016-3024.
21. Zhang ZD, Rozowsky J, Lam HY, Du J, Snyder M, Gerstein M: Tile-scope: online analysis pipeline for high-density tiling microar-ray data. Genome Biology 2007, 8:R81.
Page 13 of 13(page number not for citation purposes)


