Embed Size (px)
Citation preview
100058097
Education reforms in Latin America, 1990-2010
Introduction
In this essay I will analyse the development of the educational system in Latin America during the 1990s
and the first decade of the 2000s. I will start by focusing on what Latin American governments have done in
the field of education after the crisis of the 1980s; then I will stress their achievements as well as
shortcomings. A widespread opinion is that fostering human capital’s growth leads to a better economic
performance. However, this does not seem to have been the case in Latin America: despite some progress
in education, the results have been below expectation. Accordingly, I will offer a tentative answer to this
puzzle. In the conclusions I will sum up the findings and give some policy recommendations.
Reforms after the “lost decade”
In many Latin American countries, the burden of the austerity which the debt crisis of the 1980s entailed
affected the education sector: “regionally, between 1980 and 1985, public expenditures on education
declined by 18 per cent”1.Thus, when the crisis came to an end, many governments in region engaged in
reforming and restructuring the sector. Despite national differences, similar trends can be observed across
the entire area. In this section I will give a summary of what some governments did. I will start with the
countries that were still under an authoritarian or semi-democratic regime (Mexico, which suffered badly
from the debt crisis, and Venezuela, which did not); then I will analyse the democratic countries: first, those
on which the crisis had had a significant impact (Argentina and Brazil),; then the “low crisis” countries
(Uruguay, Costa Rica, Colombia and Chile).
In Mexico, inflation was lower than in Argentina, Peru and Brazil. Yet, in the late 1980s it sharply increased,
and threatened to transform itself into hyperinflation. Together with the fiscal deficit, it constrained
reforms. Only in 1992, the Salinas administration took some significant measures in education. Those were
aimed first of all at decentralizing the educational system. Salinas thought that this policy would improve
1 Merilee S. Grindle, 2004, Despite the Odds: the Contentious Politics of Education Reforms, Princeton University Press,
Princeton, page 3.
2
the quality of the services and weaken the teachers’ union2. Although the latter remained one of the
strongest in the country and kept on exerting its influence, decentralisation did force it to negotiate with
the administration about wages, resources allocation and assignments. The net result, in any case, was not
impressive: by and large, change in Mexico was rather modest, compared to countries such as Argentina
and Brazil3.
Venezuela suffered from the oil market’s collapse in the mid-1980.By 1988, the fiscal deficit had reached
9% and expenditure in social services had sharply dropped. Thus, the Pérez administration adopted liberal
policies in its effort to shake up the economy, and social reforms – including education – were relegated in
the back. Priority was assigned to restore monetary stability, control inflation, prices and the exchange
rates. In 1992, the new administration led by Caldera (1994-1999) recognised the importance of social
issues; yet, it adopted only a few measures, and spending for the education system kept declining. Change
came only with Chávez, starting from 2000, when social policies assumed more and more relevance on the
government’s agenda thanks to the oil boom that supplied the necessary revenues. The most important
educational project was the “Misión Ribas” which provided students with small wages in order to
incentivise them to finish high school4.
In Argentina, the Menem administration (1989-1998) came to power in the mid of the crisis, having
inherited both recession and hyperinflation. The government did launch some ambitious projects for the
educational system; yet, social reforms turned out to be a lower priority, since maintaining
macroeconomic stability was seen as the most important goal. Moreover, these projects entailed high costs
for the unions; as such, they were not only difficult in economic terms, but also delicate in political terms.
Despite all this, some things were done. In 1991, the minister of Economy, Domingo Cavallo, fostered the
decentralisation of the education system: responsibilities for financing secondary schools were transferred
to the provinces while the central government reserved to itself the right to allocate funds at its own
discretion5. Teachers’ union protests led to a compromise according to which the government committed
itself to raise federal transfers, to be addressed especially to finance the years of compulsory school, and
left the teachers the right to decide about assignments and promotions. The education system, however,
was deeply disrupted by the huge fiscal crisis of the 1990s6.
2 Merilee S. Grindle, 2004, “Interests Institutions and Reformers: The Politics of Education Decentralisation in Mexico”
in Robert R. Kaufman and Joan M. Nelson, Crucial Needs, Weak Incentives: Social Sector Reform, Democratisation and Globalisation in Latin America, John Hopkins University Press, Washington DC,pages 311-312. 3Stephan Haggard and Robert R. Kaufman, 2008, Development, Democracy and Welfare states: Latin America, East
Asia and Eastern Europe, Princeton University Press, Princeton, page 271. 4Ibidem pages 272-276.
5Ibidem pages 277, 279-280.
6 Javier Corrales, 2002, Presidents Without Parties: the Politics of Economic Reform in Argentina and Venezuela in the
1990s, University Park: Pennsylvania State University Press, pages 326-333.
3
In Brazil, like Argentina, high fiscal deficit and inflation had deep consequences during the 1980s and the
early 1990s. Unlike the Argentinean case, though, the economic bureaucracy (the central bank and the
finance ministry) were unable to exert any substantial pressure upon the social ministries. Between 1990
and 1992, the administration imposed a hard austerity plan which involved sharp cuts over social spending.
After stabilisation – achieved in 1994 through both fiscal and monetary policies combined with the
introduction of a new currency the de-indexation of wage contracts and price –reforms in the education
sector were undertook, but they were affected by stakeholder pressure and fiscal constraints. The policy
implemented by Paulo Renato Souza – the minister of education –focused on the reallocation of resources
within primary schools. Moreover, a constitutional amendment (FUNDEF) strengthened the funding for the
poorer schools in the rural north-east area. This measure devoted at least 15% of federal transfers to
primary schools; within these funds, 60% was reserved to teachers’ wages. Moreover, a minimum level of
fund per-pupil was to be provided by individual states: those who were too poor to afford it would receive
an additional federal aid.7
Uruguay preferred to expand services rather than undertaking administrative reforms directed to maximise
efficiency; in other words, it tried to defend the old welfare state. Unlike Brazil and Argentina, Uruguay had
not experienced the crisis of the 1980s;8 moreover, its success in containing inflation discouraged both a
redefinition of welfare arrangements and broader market reforms. The country undertook a series of
measures in order to expand the access to the public education system; moreover, thanks to the loans from
the World Bank and the Inter-American Development Bank, pre-school programs were made universal.
What is more, spending in education rose from 2.5% of GDP in 1995 to 3.5 during the following 3 years.
In Costa Rica, the government did not try to avoid drastic cuts during the crisis. However, since stabilisation
came soon, social policies received much attention as the country did not suffer from high inflation and
high deficit as much as Argentina, Brazil and Mexico did. Moreover, the US played an important role in
providing Costa Rica with economic aid during the 1980s9. In fact, in the early 1990s the Central American
wars came to a close and US capitals outflew; as such, demands for more substantial social and economic
reforms emerged. In this context, educational reforms were largely overridden by other important issues
such as health and pensions10.
Colombia started to deal with social problems only in the 1990s: previously, guerrilla warfare and drug
trafficking represented the most urgent issues. For the educational system, decentralisation was pursued,
especially under the pressure of the stakeholders, and the central government agreed to transfer a 7Stephan Haggard and Robert R. Kaufman, 2008, pages 281-282, 285-286.
8Ibidem pages 288-290.
9 Mary A. Clark, 2001, Gradual Economic Reform in Latin America: the Costa Rica Experience. Albany State Univerity Of
New York Press, page 47. 10
Stephan Haggard and Robert R. Kaufman, 2008, page 292.
4
substantial amount of responsibility and funding to provincial and municipal authorities. The expected
results were an increase of both efficiency and accountability. However, the incentives for the government
to push reforms were weak. Moreover, decentralisation was strongly opposed by the powerful teachers’
union and the ministry of education. The results were somewhat confusing: in the vacuum of executive
leadership, in 1998 Congress approved two acts in contrast with each other11; in addition, transfers from
the central government to the provinces and municipalities ended up with funding the teachers’ wages
rather than improving the quality of the services. Even the attempt of the Samper administration to provide
more funds to cover educational financial deficits proved useless, since they just gave the opportunity to
politicians to extend their patronage by hiring still more teachers12.
Finally, in Chile, the centre-left government of the 1990s had to face both the limits imposed by the market
reforms inherited from the Pinochet regime and the veto power of the right-wing party in the Senate.
However, the administration was able to expand and improve the public-social welfare system for at least
three reasons. The new government could rely on a healthy economy: growth was high and the fiscal
position stable. Therefore, a series of targeted reforms and across-the-board rationalisation were fostered
to revise the education system. Moreover, earmarked taxes originated new revenues, which enabled the
administration to expand pre-school enrolment and lengthen the primary-school day. Finally, the labour
market of the teachers was redesigned by increasing wages, improving the working conditions, creating
incentives through merit pay and job flexibility. However, these reforms did not alter at least two features
of the system adopted under Pinochet: the decentralisation of education responsibility and the
government's subsiding of private schools13.
To sum up, in authoritarian and semi-democratic states (Mexico and Venezuela) reforms in the educational
system were limited to decentralise responsibilities, if not completely absent. In democracies seriously
affected by the crisis (Argentina and Brazil), reforms were extensive; in democratic countries upon which
the crisis had had only a limited impact (Uruguay, Costa Rica Colombia and Chile), reforms were not
undertaken altogether, or were quite modest, with the exception of Chile.
11
Pamela S. Lowden, 2004 “Educatin Reform in Colombia: the Elusive Quest for Effectiveness” in Robert R. Kaufman and Joan M. Nelson, Crucial Needs, Weak Incentives: Social Sector Reform, Democratisation and Globalisation in Latin America, John Hopkins University Press, Washington DC, pages 358-59. 12
Stephan Haggard and Robert R. Kaufman, 2008, pages 292-295. 13
Ibidem pages 295, 297.
5
Achievements and limits
In this section I will assess the impact of the educational reforms implemented by the countries mentioned
above. My indicators will be spending in education, the rates of enrolment in schoolsof the all three levels
and the ratio of pupils-teachers in primary school. In my effort, I will avail myself of data from the World
Bank.
Broadly speaking, the reforms undertaken can be defined as neoliberal: the term derives from the
neoclassical economic theory – based on the models of Adam Smith and David Ricardo – which claims that
free trade, driven by perfect competition, is the strategy bringing the best outcomes. In such context, the
role of the government is to establish the rules and make sure that each player will respect them.
Therefore, the reforms under review led to decentralisation and privatisation of the school system14.
Decentralising educational structures can bring some benefits: ”schools are more likely to be responsive to
the communities in which they exist; and parents and students are more likely to involve themselves in the
school system if they can have a greater impact”15. During the 1990s, in all the levels of instruction a rise in
enrolment rates occurred, and educational services were extended to younger children in almost all the
region.
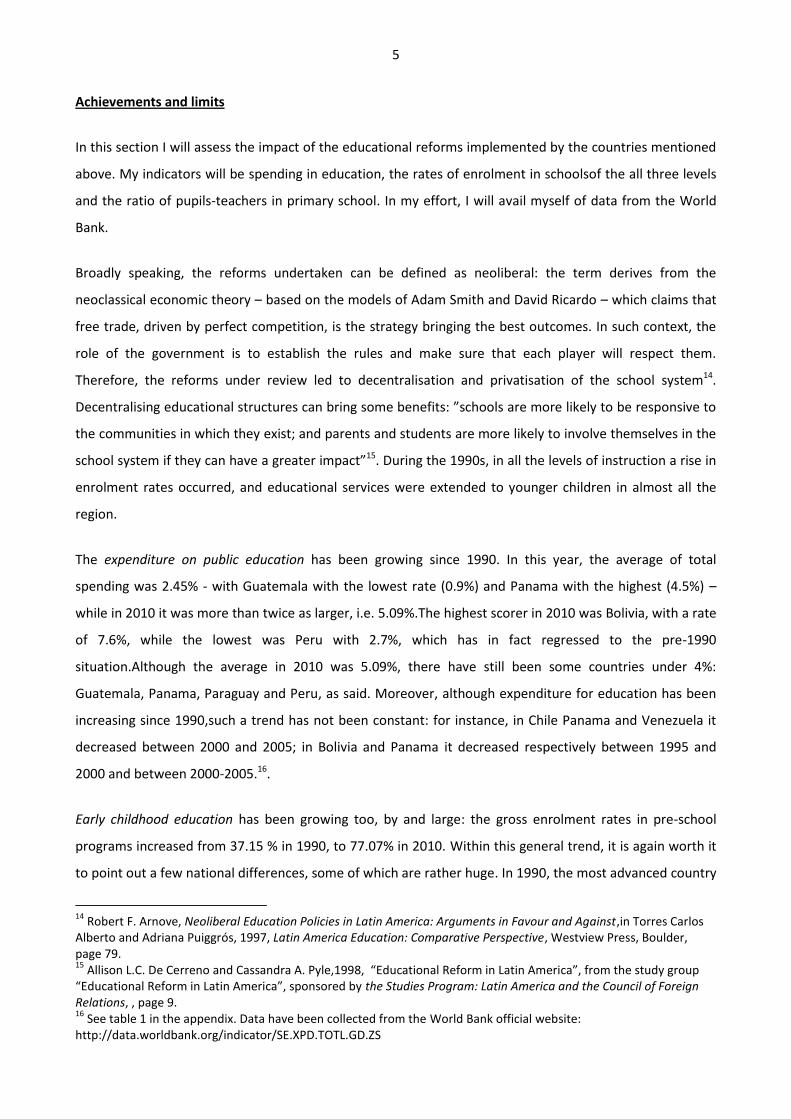
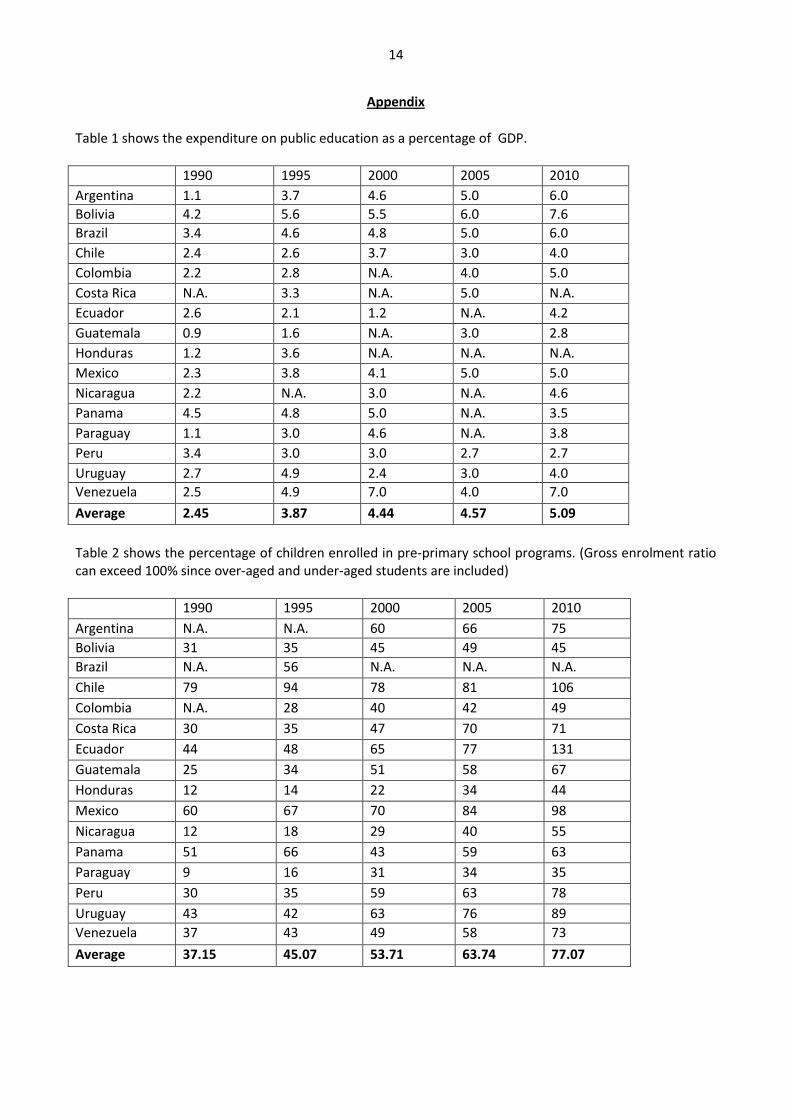
The expenditure on public education has been growing since 1990. In this year, the average of total
spending was 2.45% - with Guatemala with the lowest rate (0.9%) and Panama with the highest (4.5%) –
while in 2010 it was more than twice as larger, i.e. 5.09%.The highest scorer in 2010 was Bolivia, with a rate
of 7.6%, while the lowest was Peru with 2.7%, which has in fact regressed to the pre-1990
situation.Although the average in 2010 was 5.09%, there have still been some countries under 4%:
Guatemala, Panama, Paraguay and Peru, as said. Moreover, although expenditure for education has been
increasing since 1990,such a trend has not been constant: for instance, in Chile Panama and Venezuela it
decreased between 2000 and 2005; in Bolivia and Panama it decreased respectively between 1995 and
2000 and between 2000-2005.16.
Early childhood education has been growing too, by and large: the gross enrolment rates in pre-school
programs increased from 37.15 % in 1990, to 77.07% in 2010. Within this general trend, it is again worth it
to point out a few national differences, some of which are rather huge. In 1990, the most advanced country
14
Robert F. Arnove, Neoliberal Education Policies in Latin America: Arguments in Favour and Against,in Torres Carlos Alberto and Adriana Puiggrós, 1997, Latin America Education: Comparative Perspective, Westview Press, Boulder, page 79. 15
Allison L.C. De Cerreno and Cassandra A. Pyle,1998, “Educational Reform in Latin America”, from the study group “Educational Reform in Latin America”, sponsored by the Studies Program: Latin America and the Council of Foreign Relations, , page 9. 16
See table 1 in the appendix. Data have been collected from the World Bank official website: http://data.worldbank.org/indicator/SE.XPD.TOTL.GD.ZS
6
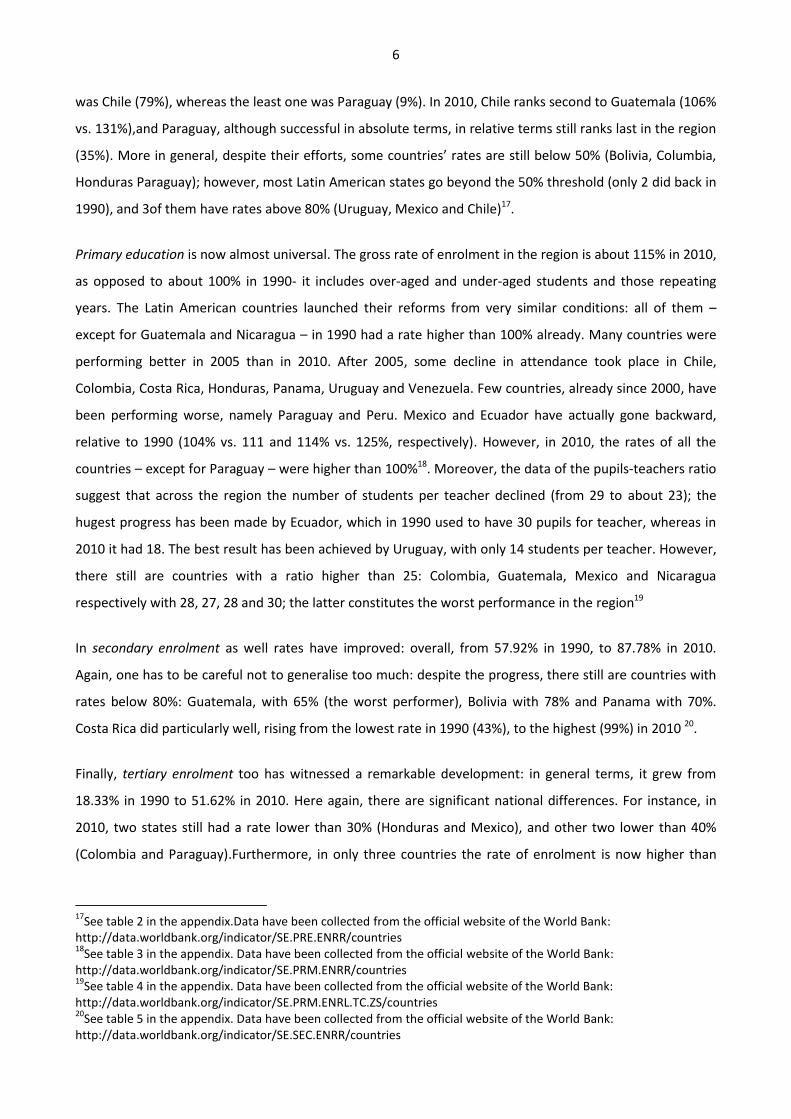
was Chile (79%), whereas the least one was Paraguay (9%). In 2010, Chile ranks second to Guatemala (106%
vs. 131%),and Paraguay, although successful in absolute terms, in relative terms still ranks last in the region
(35%). More in general, despite their efforts, some countries’ rates are still below 50% (Bolivia, Columbia,
Honduras Paraguay); however, most Latin American states go beyond the 50% threshold (only 2 did back in
1990), and 3of them have rates above 80% (Uruguay, Mexico and Chile)17.
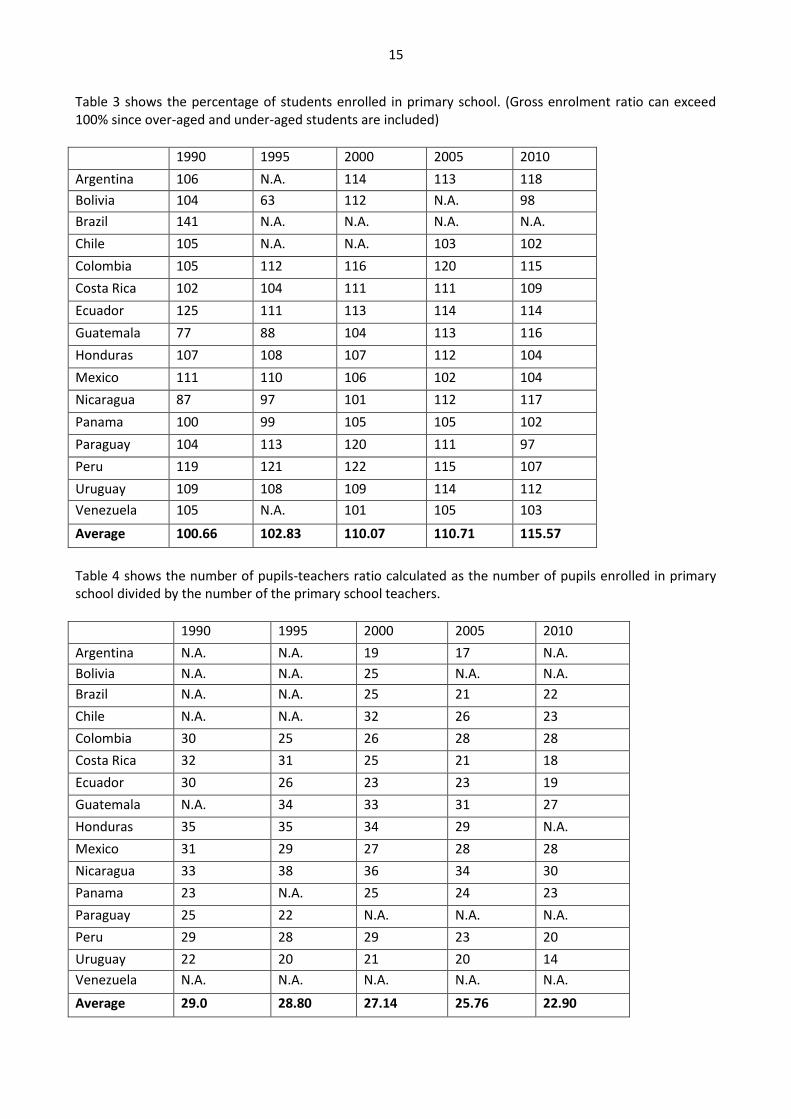
Primary education is now almost universal. The gross rate of enrolment in the region is about 115% in 2010,
as opposed to about 100% in 1990- it includes over-aged and under-aged students and those repeating
years. The Latin American countries launched their reforms from very similar conditions: all of them –
except for Guatemala and Nicaragua – in 1990 had a rate higher than 100% already. Many countries were
performing better in 2005 than in 2010. After 2005, some decline in attendance took place in Chile,
Colombia, Costa Rica, Honduras, Panama, Uruguay and Venezuela. Few countries, already since 2000, have
been performing worse, namely Paraguay and Peru. Mexico and Ecuador have actually gone backward,
relative to 1990 (104% vs. 111 and 114% vs. 125%, respectively). However, in 2010, the rates of all the
countries – except for Paraguay – were higher than 100%18. Moreover, the data of the pupils-teachers ratio
suggest that across the region the number of students per teacher declined (from 29 to about 23); the
hugest progress has been made by Ecuador, which in 1990 used to have 30 pupils for teacher, whereas in
2010 it had 18. The best result has been achieved by Uruguay, with only 14 students per teacher. However,
there still are countries with a ratio higher than 25: Colombia, Guatemala, Mexico and Nicaragua
respectively with 28, 27, 28 and 30; the latter constitutes the worst performance in the region19
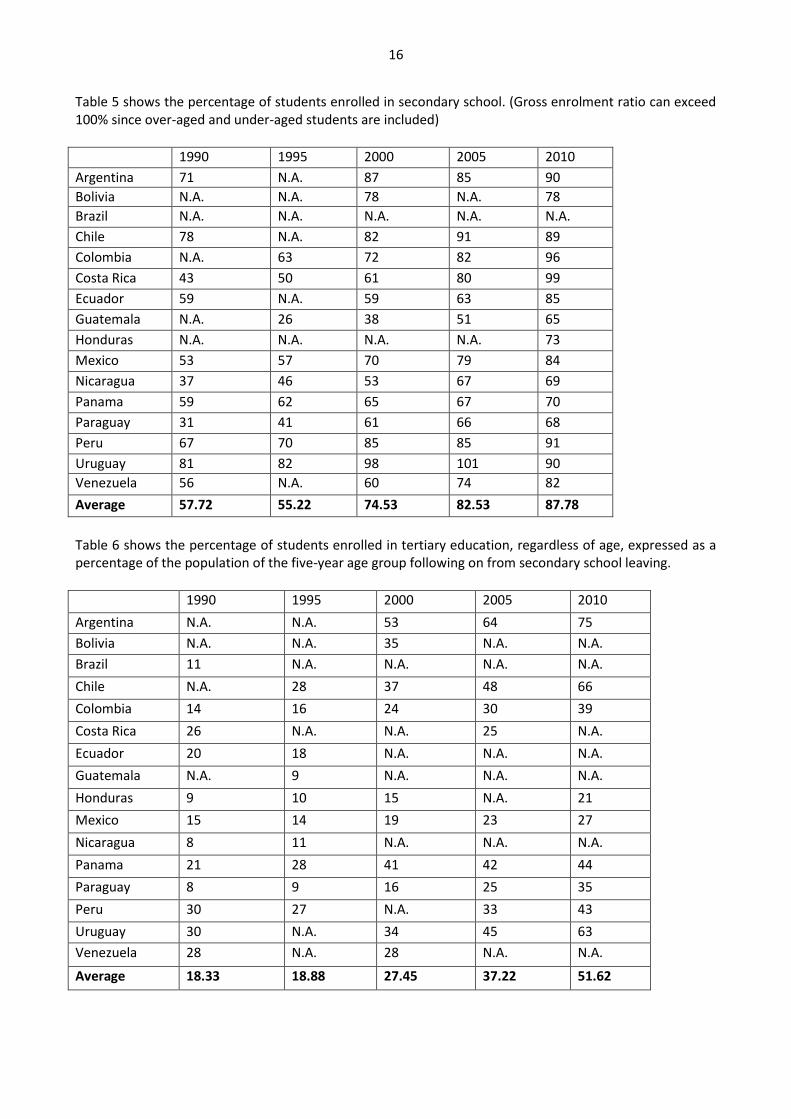
In secondary enrolment as well rates have improved: overall, from 57.92% in 1990, to 87.78% in 2010.
Again, one has to be careful not to generalise too much: despite the progress, there still are countries with
rates below 80%: Guatemala, with 65% (the worst performer), Bolivia with 78% and Panama with 70%.
Costa Rica did particularly well, rising from the lowest rate in 1990 (43%), to the highest (99%) in 2010 20.
Finally, tertiary enrolment too has witnessed a remarkable development: in general terms, it grew from
18.33% in 1990 to 51.62% in 2010. Here again, there are significant national differences. For instance, in
2010, two states still had a rate lower than 30% (Honduras and Mexico), and other two lower than 40%
(Colombia and Paraguay).Furthermore, in only three countries the rate of enrolment is now higher than
17
See table 2 in the appendix.Data have been collected from the official website of the World Bank: http://data.worldbank.org/indicator/SE.PRE.ENRR/countries 18
See table 3 in the appendix. Data have been collected from the official website of the World Bank: http://data.worldbank.org/indicator/SE.PRM.ENRR/countries 19
See table 4 in the appendix. Data have been collected from the official website of the World Bank: http://data.worldbank.org/indicator/SE.PRM.ENRL.TC.ZS/countries 20
See table 5 in the appendix. Data have been collected from the official website of the World Bank: http://data.worldbank.org/indicator/SE.SEC.ENRR/countries
7
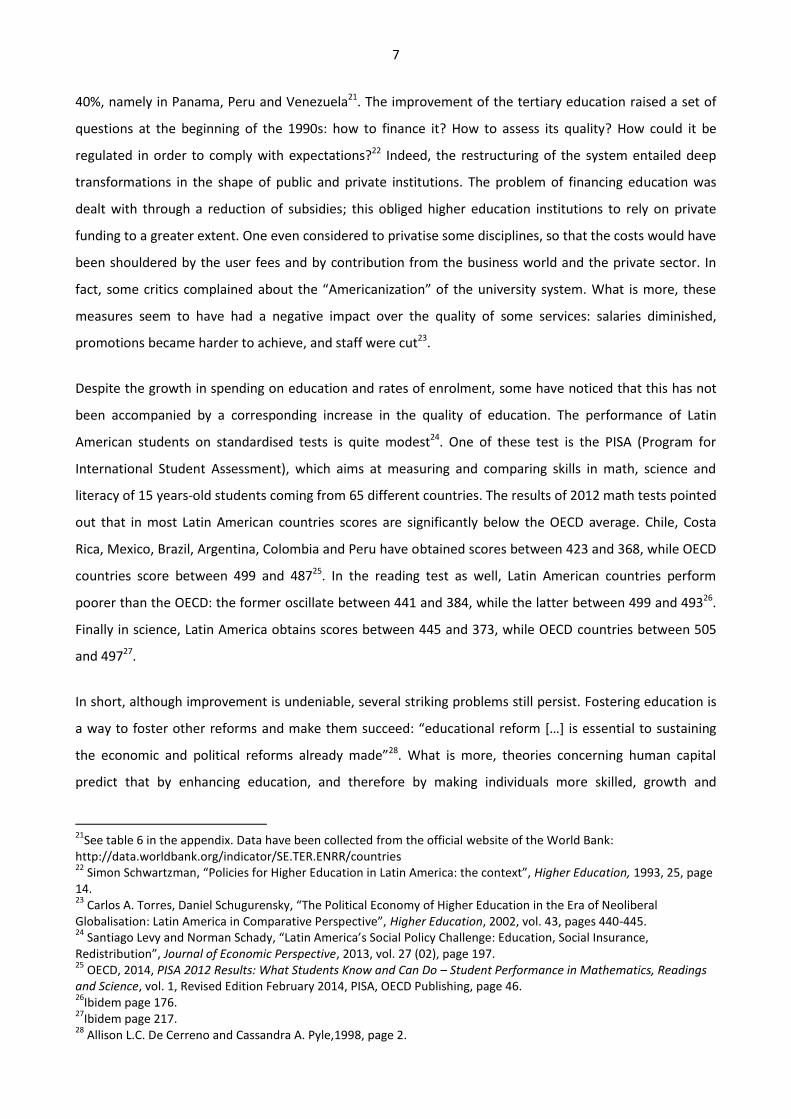
40%, namely in Panama, Peru and Venezuela21. The improvement of the tertiary education raised a set of
questions at the beginning of the 1990s: how to finance it? How to assess its quality? How could it be
regulated in order to comply with expectations?22 Indeed, the restructuring of the system entailed deep
transformations in the shape of public and private institutions. The problem of financing education was
dealt with through a reduction of subsidies; this obliged higher education institutions to rely on private
funding to a greater extent. One even considered to privatise some disciplines, so that the costs would have
been shouldered by the user fees and by contribution from the business world and the private sector. In
fact, some critics complained about the “Americanization” of the university system. What is more, these
measures seem to have had a negative impact over the quality of some services: salaries diminished,
promotions became harder to achieve, and staff were cut23.
Despite the growth in spending on education and rates of enrolment, some have noticed that this has not
been accompanied by a corresponding increase in the quality of education. The performance of Latin
American students on standardised tests is quite modest24. One of these test is the PISA (Program for
International Student Assessment), which aims at measuring and comparing skills in math, science and
literacy of 15 years-old students coming from 65 different countries. The results of 2012 math tests pointed
out that in most Latin American countries scores are significantly below the OECD average. Chile, Costa
Rica, Mexico, Brazil, Argentina, Colombia and Peru have obtained scores between 423 and 368, while OECD
countries score between 499 and 48725. In the reading test as well, Latin American countries perform
poorer than the OECD: the former oscillate between 441 and 384, while the latter between 499 and 49326.
Finally in science, Latin America obtains scores between 445 and 373, while OECD countries between 505
and 49727.
In short, although improvement is undeniable, several striking problems still persist. Fostering education is
a way to foster other reforms and make them succeed: “educational reform […] is essential to sustaining
the economic and political reforms already made”28. What is more, theories concerning human capital
predict that by enhancing education, and therefore by making individuals more skilled, growth and
21
See table 6 in the appendix. Data have been collected from the official website of the World Bank: http://data.worldbank.org/indicator/SE.TER.ENRR/countries 22
Simon Schwartzman, “Policies for Higher Education in Latin America: the context”, Higher Education, 1993, 25, page 14. 23
Carlos A. Torres, Daniel Schugurensky, “The Political Economy of Higher Education in the Era of Neoliberal Globalisation: Latin America in Comparative Perspective”, Higher Education, 2002, vol. 43, pages 440-445. 24
Santiago Levy and Norman Schady, “Latin America’s Social Policy Challenge: Education, Social Insurance, Redistribution”, Journal of Economic Perspective, 2013, vol. 27 (02), page 197. 25
OECD, 2014, PISA 2012 Results: What Students Know and Can Do – Student Performance in Mathematics, Readings and Science, vol. 1, Revised Edition February 2014, PISA, OECD Publishing, page 46. 26
Ibidem page 176. 27
Ibidem page 217. 28
Allison L.C. De Cerreno and Cassandra A. Pyle,1998, page 2.
8
productivity should follow: “The most distinctive feature of our economic system is the growth in human
capital. Without it there would be only hard manual work and poverty, except for those who have income
from poverty.”29 And, according to Romer’s model, “long-run growth is driven primarily by the
accumulation of knowledge by forward-looking, profit-maximising agents”30. Yet, those expectations have
not fully materialized in Latin America: the overall growth was from 2.45% in 1990 and 5.86% in 2010.
Although taking China as a benchmark might be questionable for a number of reasons, a rough comparison
can be instructive nonetheless: throughout the same period, China grew from 4.1% to 10.4%31. It goes
without saying that investment in education is only one of the several factors at play in producing national
economic growth – thus, all this should be taken with a grain of salt. But the fact remains that, if compared
to the Chinese experience, Latin America has not witnessed anything of the same sort when it comes to
growth. In addition – and incidentally --some paradoxical findings deserve mentioning. Latin American
seems to challenge the above-mentioned connection between educational spending and GDP. The country
that ranks first in 2010 spending (as percentage of GDP), Bolivia, ranks only ninth when it comes to GDP
growth, in 2010; Venezuela ranks second in spending, yet this has not prevented its GDP from dropping
from 10.3 in 2005 to -1.5 in 2010 (although recession has obviously nothing to do with education); in the
case of Argentina and Guatemala, there seems to be some significant covariance: the former ranks third in
spending and second in GDP growth, the latter ranks last in spending and last but one in GDP growth;
Brazil, likewise: third in spending, fifth in growth. Yet, Peru is at the bottom of educational spending (one
but last), and at in the top positions of GDP growth (third place), and Paraguay ranks eighth in spending but
first in GDP growth32.
All this suggests that the relationship between education and growth is anything but straightforward.
Having said that, however, the fact remains that reforms have not led, by and large, to the expected
outcomes.
29
Theodore W. Schultz, “Investment in Human Capital”, The American Economic Review, 1961, vol. 51 (01), page 16. 30
Paul M. Romer, “Increasing Returns and Long-Run Growth”, The Journal of Political Economy, 1986, vol. 94 (5) page 1003. 31
See table 7 in the appendix. Data have been collected from the official website of the World Bank: http://data.worldbank.org/indicator/NY.GDP.MKTP.KD.ZG/countries 32
See table 8 in the appendix.
9
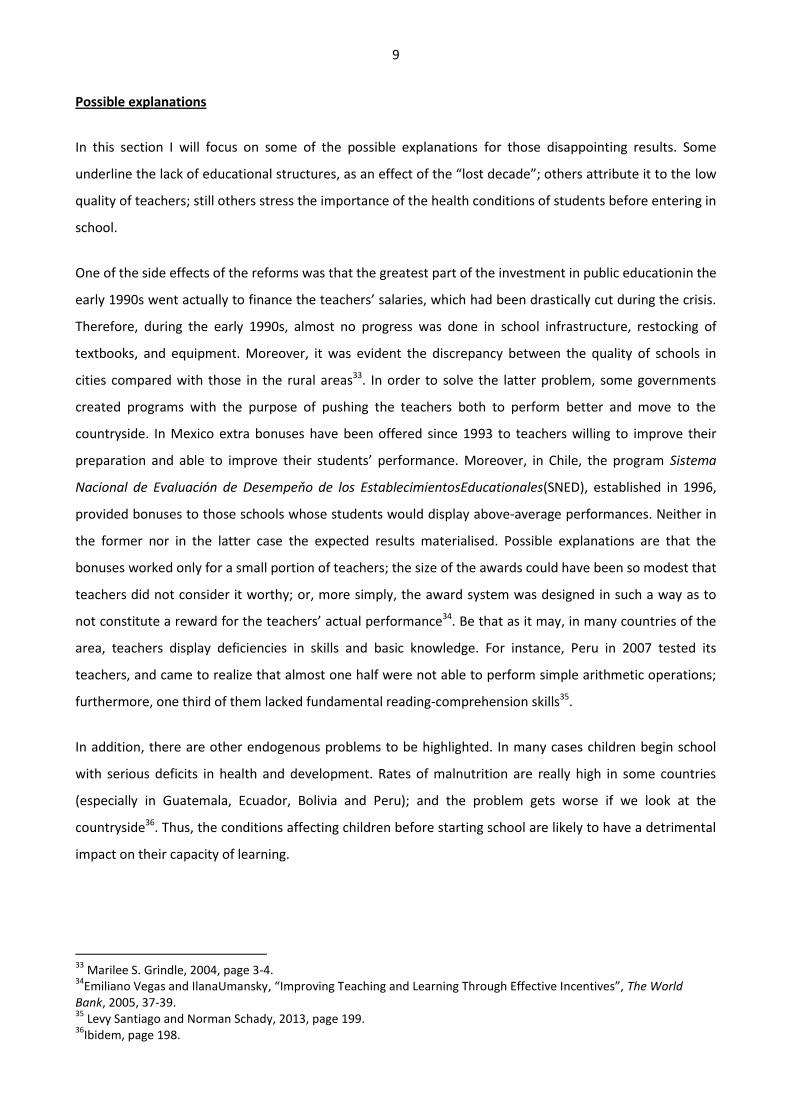
Possible explanations
In this section I will focus on some of the possible explanations for those disappointing results. Some
underline the lack of educational structures, as an effect of the “lost decade”; others attribute it to the low
quality of teachers; still others stress the importance of the health conditions of students before entering in
school.
One of the side effects of the reforms was that the greatest part of the investment in public educationin the
early 1990s went actually to finance the teachers’ salaries, which had been drastically cut during the crisis.
Therefore, during the early 1990s, almost no progress was done in school infrastructure, restocking of
textbooks, and equipment. Moreover, it was evident the discrepancy between the quality of schools in
cities compared with those in the rural areas33. In order to solve the latter problem, some governments
created programs with the purpose of pushing the teachers both to perform better and move to the
countryside. In Mexico extra bonuses have been offered since 1993 to teachers willing to improve their
preparation and able to improve their students’ performance. Moreover, in Chile, the program Sistema
Nacional de Evaluación de Desempeňo de los EstablecimientosEducationales(SNED), established in 1996,
provided bonuses to those schools whose students would display above-average performances. Neither in
the former nor in the latter case the expected results materialised. Possible explanations are that the
bonuses worked only for a small portion of teachers; the size of the awards could have been so modest that
teachers did not consider it worthy; or, more simply, the award system was designed in such a way as to
not constitute a reward for the teachers’ actual performance34. Be that as it may, in many countries of the
area, teachers display deficiencies in skills and basic knowledge. For instance, Peru in 2007 tested its
teachers, and came to realize that almost one half were not able to perform simple arithmetic operations;
furthermore, one third of them lacked fundamental reading-comprehension skills35.
In addition, there are other endogenous problems to be highlighted. In many cases children begin school
with serious deficits in health and development. Rates of malnutrition are really high in some countries
(especially in Guatemala, Ecuador, Bolivia and Peru); and the problem gets worse if we look at the
countryside36. Thus, the conditions affecting children before starting school are likely to have a detrimental
impact on their capacity of learning.
33
Marilee S. Grindle, 2004, page 3-4. 34
Emiliano Vegas and IlanaUmansky, “Improving Teaching and Learning Through Effective Incentives”, The World Bank, 2005, 37-39. 35
Levy Santiago and Norman Schady, 2013, page 199. 36
Ibidem, page 198.
10
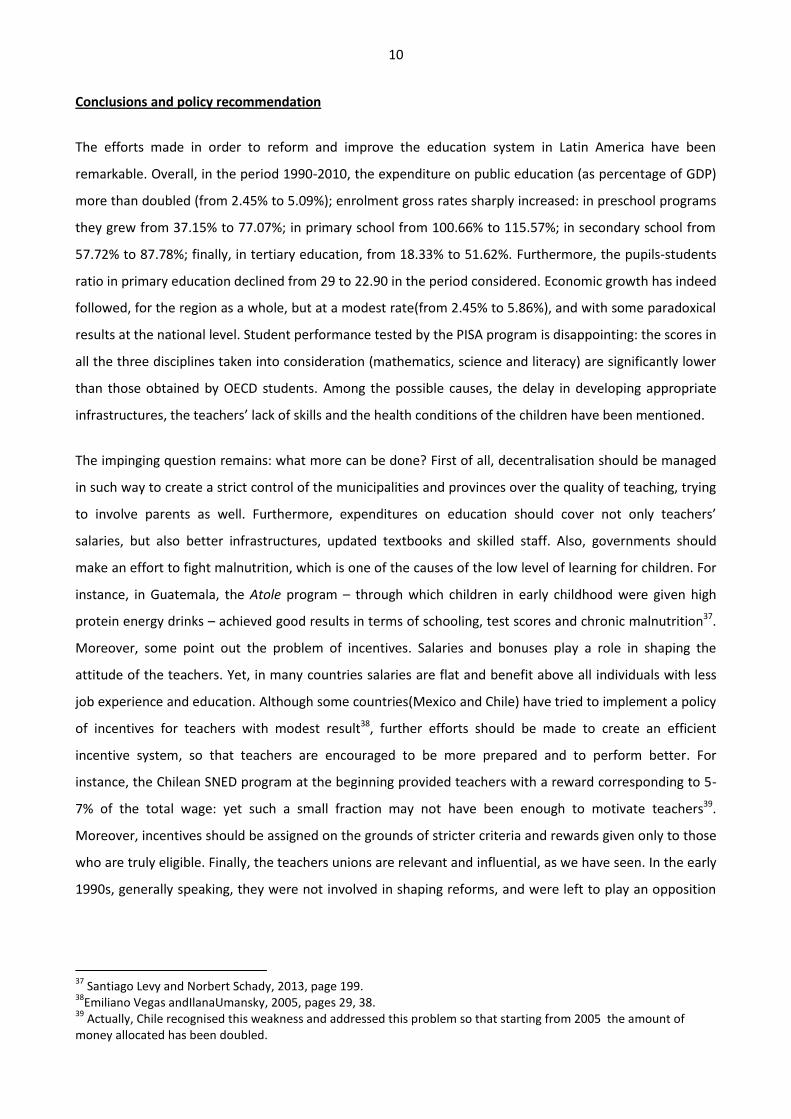
Conclusions and policy recommendation
The efforts made in order to reform and improve the education system in Latin America have been
remarkable. Overall, in the period 1990-2010, the expenditure on public education (as percentage of GDP)
more than doubled (from 2.45% to 5.09%); enrolment gross rates sharply increased: in preschool programs
they grew from 37.15% to 77.07%; in primary school from 100.66% to 115.57%; in secondary school from
57.72% to 87.78%; finally, in tertiary education, from 18.33% to 51.62%. Furthermore, the pupils-students
ratio in primary education declined from 29 to 22.90 in the period considered. Economic growth has indeed
followed, for the region as a whole, but at a modest rate(from 2.45% to 5.86%), and with some paradoxical
results at the national level. Student performance tested by the PISA program is disappointing: the scores in
all the three disciplines taken into consideration (mathematics, science and literacy) are significantly lower
than those obtained by OECD students. Among the possible causes, the delay in developing appropriate
infrastructures, the teachers’ lack of skills and the health conditions of the children have been mentioned.
The impinging question remains: what more can be done? First of all, decentralisation should be managed
in such way to create a strict control of the municipalities and provinces over the quality of teaching, trying
to involve parents as well. Furthermore, expenditures on education should cover not only teachers’
salaries, but also better infrastructures, updated textbooks and skilled staff. Also, governments should
make an effort to fight malnutrition, which is one of the causes of the low level of learning for children. For
instance, in Guatemala, the Atole program – through which children in early childhood were given high
protein energy drinks – achieved good results in terms of schooling, test scores and chronic malnutrition37.
Moreover, some point out the problem of incentives. Salaries and bonuses play a role in shaping the
attitude of the teachers. Yet, in many countries salaries are flat and benefit above all individuals with less
job experience and education. Although some countries(Mexico and Chile) have tried to implement a policy
of incentives for teachers with modest result38, further efforts should be made to create an efficient
incentive system, so that teachers are encouraged to be more prepared and to perform better. For
instance, the Chilean SNED program at the beginning provided teachers with a reward corresponding to 5-
7% of the total wage: yet such a small fraction may not have been enough to motivate teachers39.
Moreover, incentives should be assigned on the grounds of stricter criteria and rewards given only to those
who are truly eligible. Finally, the teachers unions are relevant and influential, as we have seen. In the early
1990s, generally speaking, they were not involved in shaping reforms, and were left to play an opposition
37
Santiago Levy and Norbert Schady, 2013, page 199. 38
Emiliano Vegas andIlanaUmansky, 2005, pages 29, 38. 39
Actually, Chile recognised this weakness and addressed this problem so that starting from 2005 the amount of money allocated has been doubled.
11
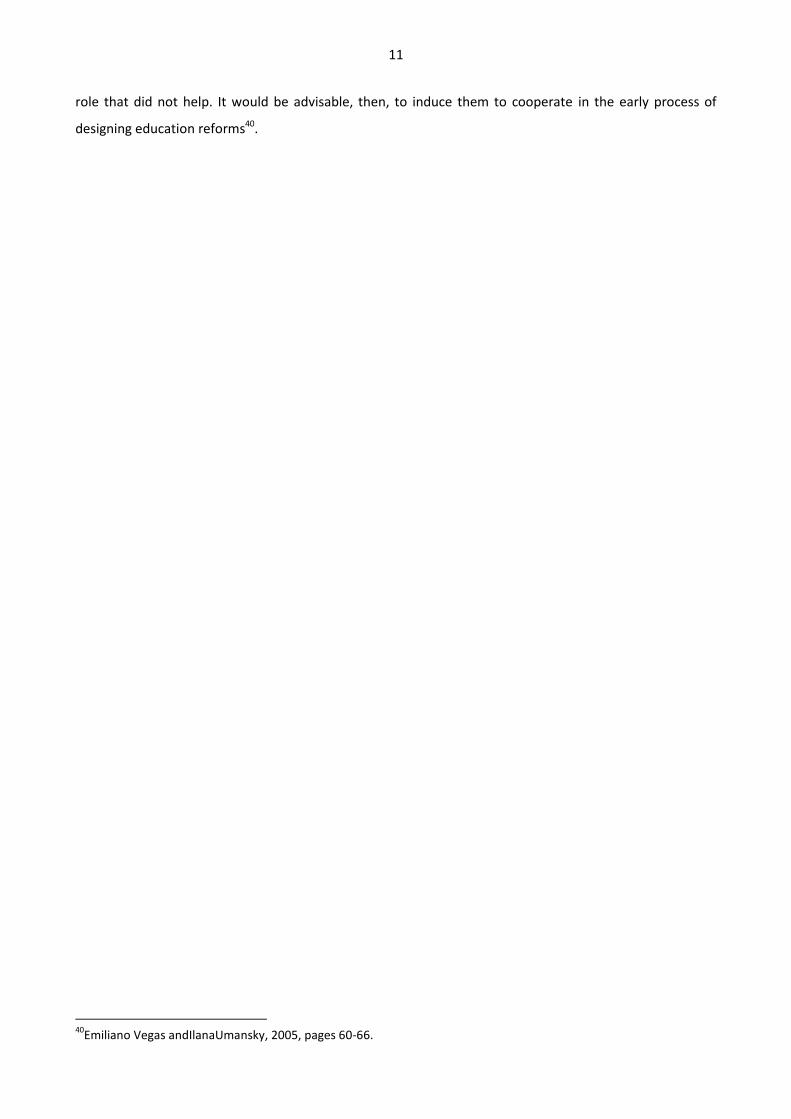
role that did not help. It would be advisable, then, to induce them to cooperate in the early process of
designing education reforms40.
40
Emiliano Vegas andIlanaUmansky, 2005, pages 60-66.
12
References
Arnove Robert F., Neoliberal Education Policies in Latin America: Arguments in Favour and Against,
in Torres Carlos Alberto and Adriana Puiggrós, 1997, Latin America Education: Comparative
Perspective, Westview Press, Boulder, Chapter 3.
Clark Mary A., 2001, Gradual Economic Reform in Latin America: the Costa Rica Experience.Albany
State Univerity Of New York Press.
Corrales Javier, 2002, Presidents Without Parties: the Politics of Economic Reform in Argentina and
Venezuela in the 1990s, University Park: Pennsylvania State University Press.
De Cerreno Allison L.C. and Pyle A. Cassandra, 1998, “Educational Reform in Latin America”, from
the study group “Educational Reform in Latin America”, sponsored by the Studies Program: Latin
America and the Council of Foreign Relations.
Grindle Merilee S., 2004, Despite the Odds: the Contentious Politics of Education Reforms, Princeton
University Press, Princeton.
Grindle Merilee S., 2004, “Interests Institutions and Reformers: The Politics of Education
Decentralisation in Mexico” in Robert R. Kaufman and Joan M. Nelson, Crucial Needs, Weak
Incentives: Social Sector Reform, Democratisation and Globalisation in Latin America, John Hopkins
University Press, Washington DC, pages 283-314.
Haggard Stephan and Kaufman Robert R., 2008, Development, Democracy and Welfare States: Latin
America, East Asia and Eastern Europe, Princeton University Press, Princeton.
Levy Santiago and Schady Norman, “Latin America’s Social Policy Challenge: Education, Social
Insurance, Redistribution”, Journal of Economic Perspective, 2013, vol. 27 (02), pages 193-218.
Lowden Pamela S., 2004 “Educatin Reform in Colombia: the Elusive Quest for Effectiveness” in
Robert R. Kaufman and Joan M. Nelson, Crucial Needs, Weak Incentives: Social Sector Reform,
Democratisation and Globalisation in Latin America, John Hopkins University Press, Washington DC
pages 350-375.
OECD, 2014, PISA 2012 Results: What Students Know and Can Do – Student Performance in
Mathematics, Readings and Science, vol. 1, Revised Edition February 2014, PISA, OECD Publishing.
Romer Paul M., “Increasing Returns and Long-Run Growth”, The Journal of Political Economy, 1986,
vol. 94 (5), pages 1002-1037.
Schultz Theodore W., “Investment in Human Capital”, the American Economic Review, 1961, vol. 51
(01), pages 1-17.
Schwartzman Simon, “Policies for Higher Education in Latin America: the context”, Higher
Education, 1993, vol. 25, pages 9-20.
13
Torres Carlos A., Schugurensky Daniel, “The Political Economy of Higher Education in the Era of
Neoliberal Globalisation: Latin America in Comparative Perspective”, Higher Education,2002,vol. 43
pages 429-455.
Vegas Emiliano and UmanskyIlana, “Improving Teaching and Learning Through Effective
Incentives”, The World Bank, 2005, Chapter 2.
14
Appendix
Table 1 shows the expenditure on public education as a percentage of GDP.
1990 1995 2000 2005 2010
Argentina 1.1 3.7 4.6 5.0 6.0
Bolivia 4.2 5.6 5.5 6.0 7.6
Brazil 3.4 4.6 4.8 5.0 6.0
Chile 2.4 2.6 3.7 3.0 4.0
Colombia 2.2 2.8 N.A. 4.0 5.0
Costa Rica N.A. 3.3 N.A. 5.0 N.A.
Ecuador 2.6 2.1 1.2 N.A. 4.2
Guatemala 0.9 1.6 N.A. 3.0 2.8
Honduras 1.2 3.6 N.A. N.A. N.A.
Mexico 2.3 3.8 4.1 5.0 5.0
Nicaragua 2.2 N.A. 3.0 N.A. 4.6
Panama 4.5 4.8 5.0 N.A. 3.5
Paraguay 1.1 3.0 4.6 N.A. 3.8
Peru 3.4 3.0 3.0 2.7 2.7
Uruguay 2.7 4.9 2.4 3.0 4.0
Venezuela 2.5 4.9 7.0 4.0 7.0
Average 2.45 3.87 4.44 4.57 5.09
Table 2 shows the percentage of children enrolled in pre-primary school programs. (Gross enrolment ratio can exceed 100% since over-aged and under-aged students are included)
1990 1995 2000 2005 2010
Argentina N.A. N.A. 60 66 75
Bolivia 31 35 45 49 45
Brazil N.A. 56 N.A. N.A. N.A.
Chile 79 94 78 81 106
Colombia N.A. 28 40 42 49
Costa Rica 30 35 47 70 71
Ecuador 44 48 65 77 131
Guatemala 25 34 51 58 67
Honduras 12 14 22 34 44
Mexico 60 67 70 84 98
Nicaragua 12 18 29 40 55
Panama 51 66 43 59 63
Paraguay 9 16 31 34 35
Peru 30 35 59 63 78
Uruguay 43 42 63 76 89
Venezuela 37 43 49 58 73
Average 37.15 45.07 53.71 63.74 77.07
15
Table 3 shows the percentage of students enrolled in primary school. (Gross enrolment ratio can exceed 100% since over-aged and under-aged students are included)
1990 1995 2000 2005 2010
Argentina 106 N.A. 114 113 118
Bolivia 104 63 112 N.A. 98
Brazil 141 N.A. N.A. N.A. N.A.
Chile 105 N.A. N.A. 103 102
Colombia 105 112 116 120 115
Costa Rica 102 104 111 111 109
Ecuador 125 111 113 114 114
Guatemala 77 88 104 113 116
Honduras 107 108 107 112 104
Mexico 111 110 106 102 104
Nicaragua 87 97 101 112 117
Panama 100 99 105 105 102
Paraguay 104 113 120 111 97
Peru 119 121 122 115 107
Uruguay 109 108 109 114 112
Venezuela 105 N.A. 101 105 103
Average 100.66 102.83 110.07 110.71 115.57
Table 4 shows the number of pupils-teachers ratio calculated as the number of pupils enrolled in primary school divided by the number of the primary school teachers.
1990 1995 2000 2005 2010
Argentina N.A. N.A. 19 17 N.A.
Bolivia N.A. N.A. 25 N.A. N.A.
Brazil N.A. N.A. 25 21 22
Chile N.A. N.A. 32 26 23
Colombia 30 25 26 28 28
Costa Rica 32 31 25 21 18
Ecuador 30 26 23 23 19
Guatemala N.A. 34 33 31 27
Honduras 35 35 34 29 N.A.
Mexico 31 29 27 28 28
Nicaragua 33 38 36 34 30
Panama 23 N.A. 25 24 23
Paraguay 25 22 N.A. N.A. N.A.
Peru 29 28 29 23 20
Uruguay 22 20 21 20 14
Venezuela N.A. N.A. N.A. N.A. N.A.
Average 29.0 28.80 27.14 25.76 22.90
16
Table 5 shows the percentage of students enrolled in secondary school. (Gross enrolment ratio can exceed 100% since over-aged and under-aged students are included)
1990 1995 2000 2005 2010
Argentina 71 N.A. 87 85 90
Bolivia N.A. N.A. 78 N.A. 78
Brazil N.A. N.A. N.A. N.A. N.A.
Chile 78 N.A. 82 91 89
Colombia N.A. 63 72 82 96
Costa Rica 43 50 61 80 99
Ecuador 59 N.A. 59 63 85
Guatemala N.A. 26 38 51 65
Honduras N.A. N.A. N.A. N.A. 73
Mexico 53 57 70 79 84
Nicaragua 37 46 53 67 69
Panama 59 62 65 67 70
Paraguay 31 41 61 66 68
Peru 67 70 85 85 91
Uruguay 81 82 98 101 90
Venezuela 56 N.A. 60 74 82
Average 57.72 55.22 74.53 82.53 87.78
Table 6 shows the percentage of students enrolled in tertiary education, regardless of age, expressed as a percentage of the population of the five-year age group following on from secondary school leaving.
1990 1995 2000 2005 2010
Argentina N.A. N.A. 53 64 75
Bolivia N.A. N.A. 35 N.A. N.A.
Brazil 11 N.A. N.A. N.A. N.A.
Chile N.A. 28 37 48 66
Colombia 14 16 24 30 39
Costa Rica 26 N.A. N.A. 25 N.A.
Ecuador 20 18 N.A. N.A. N.A.
Guatemala N.A. 9 N.A. N.A. N.A.
Honduras 9 10 15 N.A. 21
Mexico 15 14 19 23 27
Nicaragua 8 11 N.A. N.A. N.A.
Panama 21 28 41 42 44
Paraguay 8 9 16 25 35
Peru 30 27 N.A. 33 43
Uruguay 30 N.A. 34 45 63
Venezuela 28 N.A. 28 N.A. N.A.
Average 18.33 18.88 27.45 37.22 51.62
17
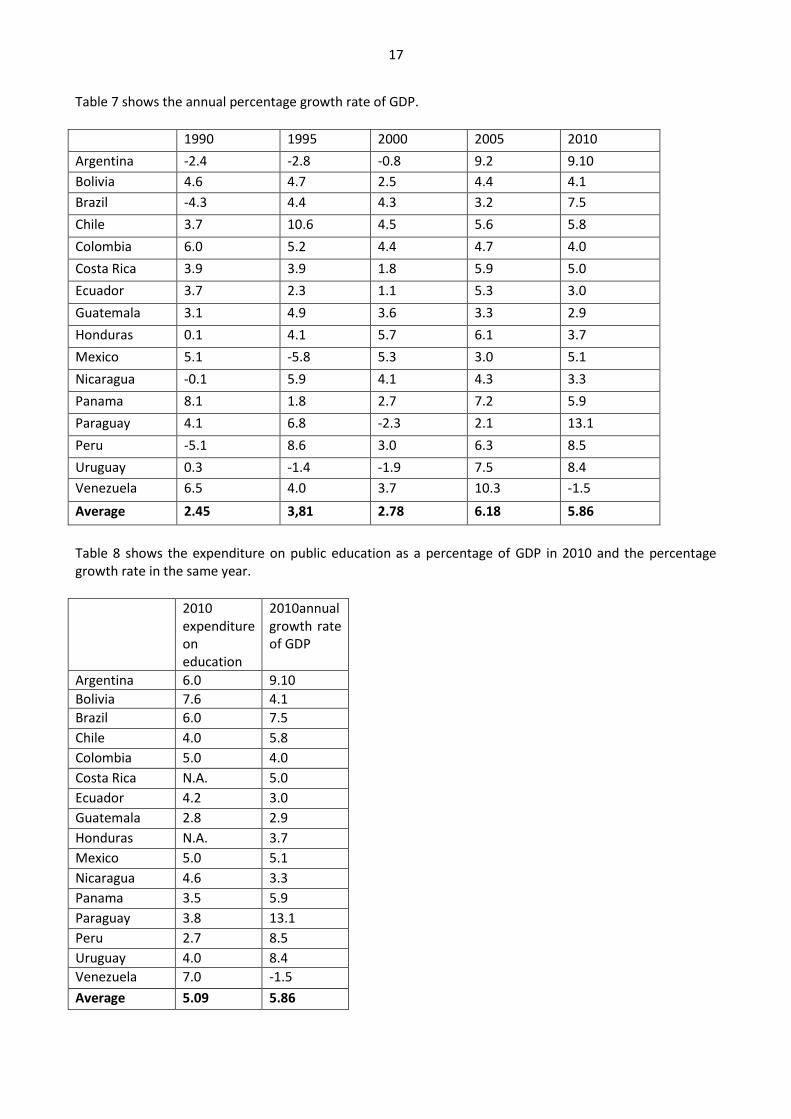
Table 7 shows the annual percentage growth rate of GDP.
1990 1995 2000 2005 2010
Argentina -2.4 -2.8 -0.8 9.2 9.10
Bolivia 4.6 4.7 2.5 4.4 4.1
Brazil -4.3 4.4 4.3 3.2 7.5
Chile 3.7 10.6 4.5 5.6 5.8
Colombia 6.0 5.2 4.4 4.7 4.0
Costa Rica 3.9 3.9 1.8 5.9 5.0
Ecuador 3.7 2.3 1.1 5.3 3.0
Guatemala 3.1 4.9 3.6 3.3 2.9
Honduras 0.1 4.1 5.7 6.1 3.7
Mexico 5.1 -5.8 5.3 3.0 5.1
Nicaragua -0.1 5.9 4.1 4.3 3.3
Panama 8.1 1.8 2.7 7.2 5.9
Paraguay 4.1 6.8 -2.3 2.1 13.1
Peru -5.1 8.6 3.0 6.3 8.5
Uruguay 0.3 -1.4 -1.9 7.5 8.4
Venezuela 6.5 4.0 3.7 10.3 -1.5
Average 2.45 3,81 2.78 6.18 5.86
Table 8 shows the expenditure on public education as a percentage of GDP in 2010 and the percentage growth rate in the same year.
2010 expenditure on education
2010annual growth rate of GDP
Argentina 6.0 9.10
Bolivia 7.6 4.1
Brazil 6.0 7.5
Chile 4.0 5.8
Colombia 5.0 4.0
Costa Rica N.A. 5.0
Ecuador 4.2 3.0
Guatemala 2.8 2.9
Honduras N.A. 3.7
Mexico 5.0 5.1
Nicaragua 4.6 3.3
Panama 3.5 5.9
Paraguay 3.8 13.1
Peru 2.7 8.5
Uruguay 4.0 8.4
Venezuela 7.0 -1.5
Average 5.09 5.86


![Latin-American [mythology]](https://img.dokumen.tips/doc/110x75/632837dfe491bcb36c0ba99e/latin-american-mythology.jpg)


