Embed Size (px)
Citation preview


^SEEY, C-iiillCi-iJIA 8Se43-86n-.


DEPARTMENT OF OCEAN ENGINEERING
MASSACHUSETTS INSTITUTE OF TECHNOLOGY
CAMBRIDGE. MASSACHUSETTS 02139
EARTHQUAKE RESISTANT SUBMARINE DRYDOCK BLOCKSYSTEM DESIGN
by
LIEUTENANT JAMES KENNETH LUCHS , Jr. USN
COURSE XI 11 -A MAY 1988
EARTHQUAKE RESISTANT SUBMARINE DRYDOCK BLOCK SYSTEM DESIGN
by
LIEUTENANT JAMES KENNETH LUCHS , Jr. U.S. NAVY
B.S. Mechanical EngineeringCornell University (1979)
SUBMITTED TO THE DEPARTMENT OF OCEAN ENGINEERINGIN PARTIAL FULFILLMENT OF THE REQUIREMENTS
FOR THE DEGREES OF
NAVAL ENGINEERand
MASTER OF SCIENCE IN MECHANICAL ENGINEERINGat the
MASSACHUSETTS INSTITUTE OF TECHNOLOGY
May 1988
(c^ James Kenneth Luchs, Jr., 1988
The author hereby grants to M.I.T. and the United StatesGovernment and its agencies permission to reproduce and todistribute copies of this thesis document in whole or in part.

C!7TTnr!T|
EARTHQUAKE RESISTANT SUBMARINE DRYDOCK BLOCK SYSTEM DESIGN
by
LIEUTENANT JAMES KENNETH LUCHS , Jr. U.S. NAVY
Submitted to the Department of Ocean Engineering In partialfulfillment of the requirements for the degrees of NavalEngineer and Master of Science in Mechanical Engineering
ABSTRACT
A three degree of freedom submarine drydock blockingsystem computer aided design package is developed.Differential equations of motion are developed to take intoaccount high blocking systems, wale shores, and side block capangles. The computer program is verified by a case studyinvolving the earthquake sliding failure of the C/SS Lea/3X (CG-16) . A parametric study is conducted to determine the effectsof wale shores, isolators, and block stiffness and geometryvariations on system survivability. The effects of usingearthquake acceleration time histories with differingfrequency spectrums on system survivability is studied.
None of eleven submarine drydock blocking systems studiedsurvive to dry dock failure (0.26 g 's) or even meet the Navy'scurrent 0.2 g survival requirement. This shows that currentU.S. Navy submarine drydock blocking systems are inadequate tosurvive expected earthquakes. Two design solutions are foundthat meet the dry dock failure requirements. The lowstiffness solution uses dynamic isolators and rubber caps, andthe high stiffness solution uses wale shores and rubber caps.The wale shore solution virtually prevents the submarine frommoving horizontally relative to the dock floor. The isolatorsolution allows relatively large horizontal displacements tooccur. Using the wale shore solution, the submarineexperiences forces which are an order of magnitude higher thanthose seen by the isolator solution.
Both of the design solutions can be constructed; however,there are cost and production interference concerns.Considering the almost certain occurrence of a majorearthquake in the proximity of a U.S. Naval shipyard wheresubmarines can be drydocked within the next 20 years, theexpeditious incorporation of one of these design solutionsinto U.S. Navy drydocking standards is strongly recommended.
THESIS SUPERVISOR: Dale G. Karr , Ph.D.
TITLE: Associate Professor of Ocean Engineering
ACKNOWLEDGEMENTS
First I thank God, for without His ample provision oftalents and blessing and providential guidance this projectcould not have been accomplished. I especially thank my dearwife* Jeannette, whose love, steadfast support and patiencewith me both while working on this thesis and during my otherwork at MIT was inspirational. My children, James and Laurawere also a joy to me during this trying time. My good friendand partner in this effort. Rick Hepburn, deserves a specialnote of thanks. His enthusiasm for docking got me interestedin the topic initially. And his perseverance and ourprofitable discussions on technical and other topics kept memotivated throughout years of effort.
I would also like to thank Professor Dale Karr for histremendous help on this thesis. His research laid thefoundation and he provided expert guidance and encouragementthroughout. I thank my reader. Professor Richard Lyon for hisinterest in the topic and for reading and providingcorrections and comments on such a lengthy document. I thankMr. Bob Dixson, for his collection of invaluable data. FinallyI thank Mr. Ross Haith and his assistant Jack Waldman who werethe driving forces behind this research.
BIOGRAPHICAL NOTE
The author graduated from Cornell University in 1979 witha Bachelor of Science degree in Mechanical Engineering. Hereceived his commission in the United States Navy through theNROTC program at Cornell. After a few Navy schools he joinedthe precommissioning crew of the USS Stephen W. Groves (FFG-29) in 1981. He served aboard for three years as DamageControl Assistant, Main Propulsion Assistant and OrdnanceOfficer. In 1984 he transferred to Engineering Duty andserved as a Ship Repair Officer at SUPSHIP Jacksonville. Heentered the XIII A program at MIT in June 1985.
TABLE OF CONTENTS
PAGE
LIST OF FIGURES 6
LIST OF TABLES 12
CHAPTER 1 INTRODUCTION 131.0 Description of Earthquake Threat to Submarine
Drydock Blocking Systems 131.1 Summary of Bilinear Material Results 141.2 Thesis Outline 15
CHAPTER 2 DEVELOPMENT OF THE THREE DEGREE OF FREEDOMEARTHQUAKE RESISTANT DRYDOCK BLOCKING DESIGNPACKAGE 17
2.0 Three Degree of Freedom Computer ProgramBackground 17
2.1 Horizontal and Vertical Acceleration Input . . 192.2 Force and Displacement Output 202.3 Development of Miscellaneous Support Programs. 21
CHAPTER 3 GEOMETRICAL IMPROVEMENTS TO THE THREE DEGREEOF FREEDOM MODEL AND COMPUTER PROGRAM 24
3.0 Geometrical Improvements; to the Three Degreeof Freedom Equations of Motion 24
3.1 Effect of Side Block Cap Angle on SystemSliding Failure Mode 36
3.2 Determination of Blocking System VerticalStatic Deflection 39
C/SS LEANy (CG-16) CASE STUDY 41Background 41
Modeling of the C/SS Lea/}y "Dry <^oQy.
Blocking System 54Results of the C/SS Leahy hr\Q.\ysis 55
WALE SHORE, ISOLATOR, AND BLOCK STIFFNESS/GEOMETRY VARIATION PARAMETRIC STUDIES 64Parametric Study Description 64Pai umcU ic Study RcLJulti; 65
DRYDOCK BLOCKING SYSTEM SURVIVAL COMPARISONSAND SITE SPECIFIC EFFECTS 74
6.0 Drydock Blocking System Survival Comparisons . 746.1 Earthquake Site Specificity 786.2 System Survivability Frequency Dependence. . . 89
CHAPTER 44.04.1
4.2
CHAPTER 5
5.05.1
CHAPTER 6
TABLE OF CONTENTS (Cont.)
PAGE
CHAPTER 7 ISOLATOR AND RUBBER LOW STIFFNESS DESIGN ... 947.0 Design Process 947.1 Description of the Low Stiffness Solution. . . 1057.2 Response of the Low Stiffness Solution .... 107
CHAPTER 8 WALE SHORE HIGH STIFFNESS DESIGN 1268.0 Design Process 1268.1 Description of the High Stiffness Solution . . 1328.2 Response of the High Stiffness Solution. . . . 135
CHAPTER 9 SUMMARY, CONCLUSIONS, AND RECOMMENDATIONS. . . 1539.0 Summary of Results 1539.1 Conclusions 1579.2 Recommendations for Further Study 163
REFERENCES 166
APPENDIX 1 168"3D0FRUB" Computer Program Listing. . . . 169"ACCLINPT" ,"BILINALL" , "RUBBER" , and"RESPALL" Subroutine Listings 190Sample Input Data File and Output File. . 198
APPENDIX 2 206"V2READ$" and"ACCELMOD" FORTRANProgram Listings 207"DATINNEW" and "MAKERUB" BASICProgram Listings 209
APPENDIX 3 215Typical Accelerogram Header 216Layout Sheet for (/SS Lea/jyLong Beach Dry Dock #3 217Z(?<?/'^ Horizontal and verticalStiffn«=!ss Spreadsheets 219System 1-11 and C/SS L^^^yStiffness Table 237Lea/)xl/iEh, QD, KU , and KD Valuesfor Bilinear Douglas Fir Caps 237Rotational Moment of InertiaCalculation for C/SS Lea/jy 236"3D0FRUB" l/SS Lea/iy \T\^\i\ Data File . . . 239Lea/}y Qb'p Angle Regression Analysis . . . 240"3D0FRUB" C/SS Lea/}y OmX'^mX File 241
TABLE OF CONTEN'I'S (Cont.)
PAGE
APPENDIX 4 245California Division of Mines andGeology Report on 1 October 1987Whittler Earthquake 246Survivability ComparisonSpreadsheets 250
APPENDIX 5 252"3D0FRUB" Isolator (EL Centro)Input Data File 25:^
"3D0FRUB" Isolator (EL Centro)Output File 254•'3D0FRUB" Isolator (NORM DD2)Input Data File 258"3D0FRUB" Isolator (NORM DD2)Output File 259Isolator Equivalent ModulusStiffness Spreadsheets « . . . 263Required Isolator CharacteristicsSpreadsheet 27b
APPENDIX 6 276"3D0FRUB" Wale Shore (EL Centro)Input Data File 277"3D0FRUB" Wale Shore (EL Centro)Outpdt File 278"3D0FRUB" Wale Shore (NORM DD2)Output File 282Wale Shore Design Spreadsheet 285
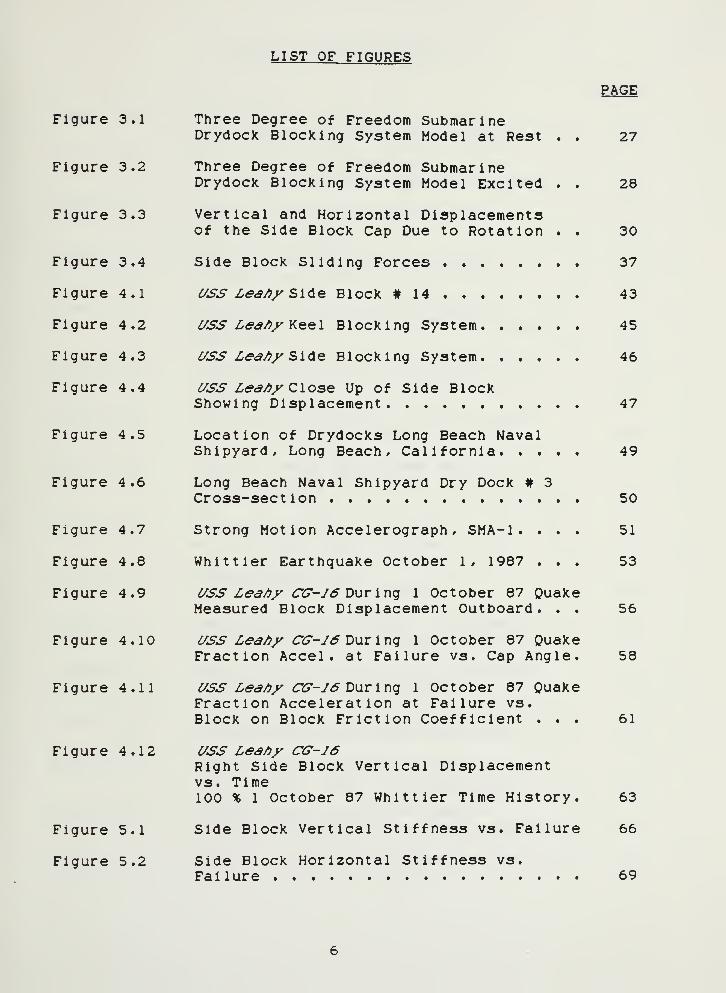
LIST OF FIGURES
PAGE
Figure 3.1 Three Degree of Freedom SubmarineDrydock Blocking System Model at Rest . . 27
Figure 3.2 Three Degree of Freedom SubmarineDrydock Blocking System Model Excited . . 28
Figure 3.3 Vertical and Horizontal Displacementsof the Side Block Cap Due to Rotation . . 30
Figure 3.4 Side Block Sliding Forces 37
Figure 4.1 USS Lea/^y S\<\^ Block #14 43
Figure 4.2 USS Lea/)y Y.q^\ Blocking System 45
Figure 4.3 C/SS Lea/iy S\^^ Blocking System 46
Figure 4.4 i/SS Lea/)x Close Up of Side BlockShowing Displacement 47
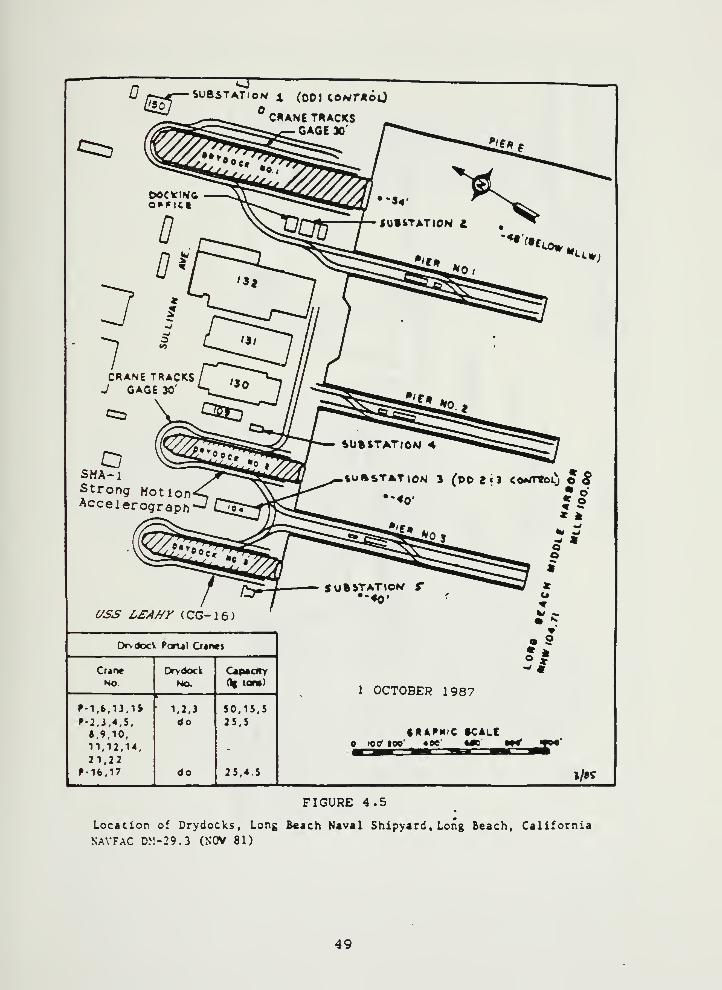
Figure 4.5 Location of Drydocks Long Beach NavalShipyard, Long Beach, California 49
Figure 4.6 Long Beach Naval Shipyard Dry Dock # 3Cross-section 50
Figure 4.7 Strong Motion Accelerograph , SMA-1 . ... 51
Figure 4.8 Whittier Earthquake October 1, 1987 ... 53
Figure 4.9 C/SS Leahy CG-J6 Ti\ir\T\q 1 October 87 QuakeMeasured Block Displacement Outboard. . . 56
Figure 4.10 USS Lea/iy CG-J6 D\it\r\q 1 October 87 QuakeFraction Accel, at Failure vs. Cap Angle. 58
Figure 4.11 i/SS Lea/)y CG-J6 V>\ir\r\q 1 October 87 QuakeFraction Acceleration at Failure vs.Block on Block Friction Coefficient ... 61
Figure 4.12 C/SS Lea/iy CG-J6Right Side Block Vertical Displacementvs. Time100 % 1 October 87 Whittier Time History. 63
Figure 5.1 Side Block Vertical Stiffness vs. Failure 66
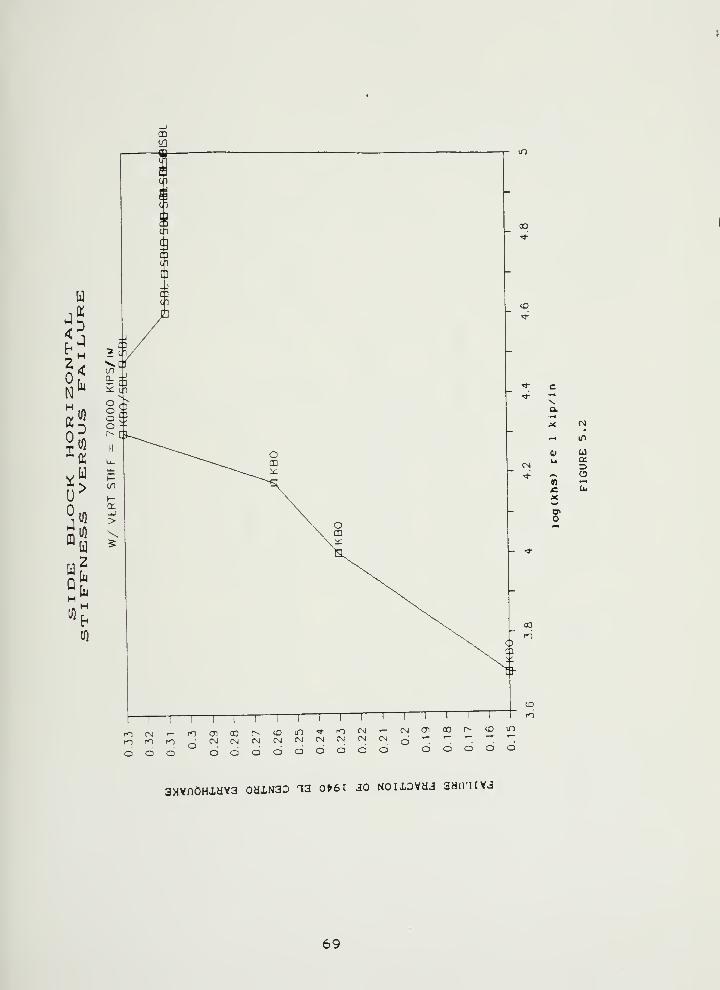
Figure 5.2 Side Block Horizontal Stiffness vs.Failure 69
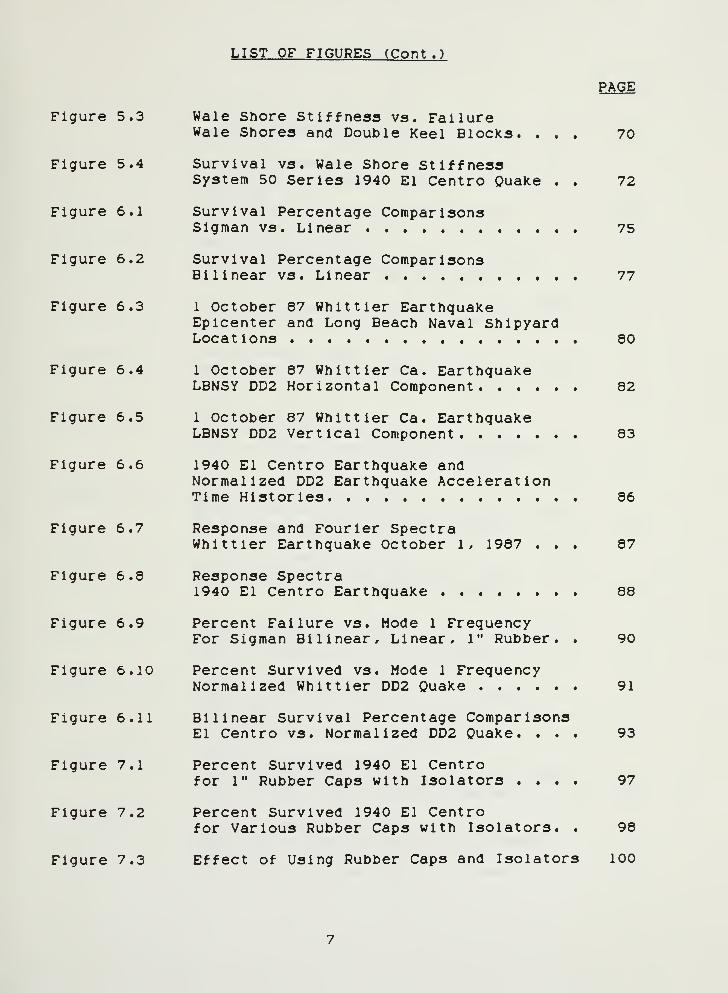
LIST OF FIGURES (Cont.)
PAGE
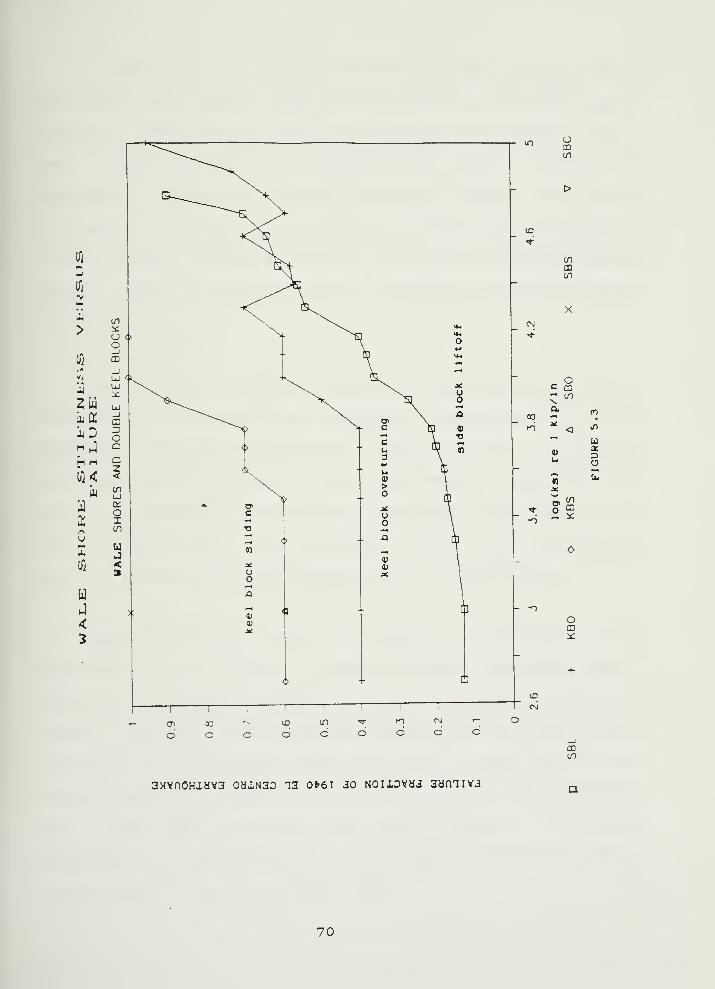
Figure 5.3 Wale Shore Stiffness vs. FailureWale Shores and Double Keel Blocks. ... 70
Figure 5.4 Survival vs. Wale Shore StiffnessSystem 50 Series 1940 El Centro Quake . . 72
Figure 6.1 Survival Percentage ComparisonsSigman vs. Linear 75
Figure 6.2 Survival Percentage ComparisonsBilinear vs. Linear 77
Figure 6.3 1 October 87 Whlttier EarthquakeEpicenter and Long Beach Naval ShipyardLocations 80
Figure 6.4 1 October 87 Whlttier Ca . EarthquakeLBNSY DD2 Horizontal Component 82
Figure 6.5 1 October 87 Whlttier Ca. EarthquakeLBNSY DD2 Vertical Component 83
Figure 6.6 1940 El Centro Earthquake andNormalized DD2 Earthquake AccelerationTime Histories 86
Figure 6.7 Response and Fourier SpectraWhlttier Earthquake October 1/ 1987 ... 87
Figure 6.8 Response Spectra1940 El Centro Earthquake 88
Figure 6.9 Percent Failure vs. Mode 1 FrequencyFor Sigman Bilinear, Linear, 1" Rubber. . 90
Figure 6.10 Percent Survived vs. Mode 1 FrequencyNormalized Whlttier DD2 Quake 91
Figure 6.11 Bilinear Survival Percentage ComparisonsEl Centro vs. Normalized DD2 Quake. ... 93
Figure 7.1 Percent Survived 1940 El Centrofor 1" Rubber Caps with Isolators .... 97
Figure 7.2 Percent Survived 1940 El Centrofor Various Rubber Caps with Isolators. . 98
Figure 7.3 Effect of Using Rubber Caps and Isolators 100
LIST OF FIGURES (Cont,)
PAGE
Figure 7.4 Isolator and RubberLow Stiffness Solution 106
Figure 7.5 Low Stiffness SolutionKeel Block Horizontal Displacementvs. Time63 % of Normalized DD2 Earthquake .... 109
Figure 7.6 Low Stiffness SolutionKeel Block Horizontal Force vs. Time63 % of Normalized DD2 Earthquake .... 110
Figure 7.7 Low Stiffness Solution Rotation vs. Time63 % of Normalized DD2 Earthquake .... Ill
Figure 7.8 Low Stiffness SolutionKeel Block Vertical Displacement vs. Time63 % of Normalized DD2 Earthquake .... 112
Figure 7.9 Low Stiffness SolutionKeel Block Horizontal Forcevs. Keel Block Horizontal Displacement63 % of Normalized DD2 Earthquake .... 114
Figure 7.10 Low Stiffness SolutionRight Side Block Vertical Force vs. Time63 % of Normalized DD2 Earthquake .... 115
Figure 7.11 Low Stiffness SolutionKeel Block Vertical Force vs. Time63 * of Normalized DD2 Earthquake .... 116
Figure 7.12 Low Stiffness SolutionLeft Side Block Vertical Force vs. Time63 * of Normalized DD2 Earthquake .... 117
Figure 7.13 Low Stiffness SolutionLeft Side Block Vertical Displacementvs. Time63 % of Normalized DD2 Earthquake .... 119
Figure 7.14 Low Stiffness SolutionKeel Block Vertical Displacement vs. Time63 * of Normalized DD2 Earthquake .... 120
Figure 7.15 Low Stiffness SolutionRight Side Block Vertical Displacementvs. Time63 % of Normalized DD2 Earthquake .... 121
8
LIST OF FIGURES (Cont.)
PAGE
Figure 7.16 Low Stiffness SolutionRight Side Block Vertical Forcevs. Left Side Block Vertical Displacement63 % of Normalized DD2 Earthquake .... 123
Figure 7.17 Low Stiffness SolutionKeel Block Vertical Forcevs. Keel Block Vertical Displacement63 % of Normalized DD2 Earthquake .... 124
Figure 7.18 Low Stiffness SolutionLeft Side Block Vertical Forcevs. Right Side Block Vertical Displacement63 * of Normalized DD2 Earthquake .... 125
Figure 8.1 Wale Shore High Stiffness Solution. . . . 133
Figure 8.2 Dockside Hinge-Pin-Jack Assembly 134
Figure 8.3 High Stiffness SolutionKeel Block Horizontal Displacementvs. Time72 % of 1940 El Centre Earthquake .... 137
Figure 8.4 High Stiffness SolutionKeel Block Horizontal Forcevs. Time72 % of 1940 El Centre Earthquake .... 138
Figure 8.5 High Stiffness Solution Rotation vs. Time72 * of 1940 El Centre Earthquake .... 139
Figure 8.6 High Stiffness SolutionKeel Block Vertical Displacement vs. Time72 % of 1940 El Centre Earthquake .... 140
Figure 8.7 High Stiffness SolutionWale Shore Horiz. Displacement vs. Time72 % of 1940 El Centre Earthquake .... 141
Figure 8.8 High Stiffness SolutionRight Side Block Vertical Force vs. Time72 % of 1940 El Centre Earthquake .... 143
Figure 8.9 High Stiffness SolutionKeel Block Vertical Force vs. Time72 % of 1940 El Centre Earthquake .... 144
LIST OF FIGURES (Cont.)
PAGE
Figure 8.10 High Stiffness SolutionLeft Side Block Vertical Force vs. Time72 % of 1940 El Centro Earthquake .... 145
Figure 8.11 High Stiffness SolutionLeft Side Block Vertical Displacementvs. Time72 % of 1940 El Centro Earthquake .... 147
Figure 8.12 High Stiffness SolutionKeel Block Vertical Displacement vs. Time72 % of 1940 El Centro Earthquake .... 148
Figure 8.13 High Stiffness SolutionRight Side Block Vertical Displacementvs. Time72 % of 1940 El Centro Earthquake .... 149
Figure 8.14 High Stiffness SolutionRight Side Block Vertical Forcevs. Left Side Block Vertical Displacement72 % of 1940 El Centro Earthquake .... 150
Figure 8.15 High Stiffness SolutionKeel Block Vertical Forcevs. J^eel Block Vertical Displacement72 % of 1940 El Centro Earthquake .... 151
Figure 8.16 High Stiffness SolutionLeft Side Block Vertical Forcevs. Right Side Block Vertical Displacement72 % of 1940 El Centro Earthquake .... 152
Figure 9.1 Survival Percentage ComparisonsSigman, Bilinear, Linear, Rubber, DD2 . . 155
Figure 9.2 Submarine Drydock Blocking System # 1
Survivability Comparison 156
Figure 9.3 Keel Block Horizontal Displacementvs. Time ComparisonHigh Stiffness Solutionand Low Stiffness Solution 158
Figure 9.4 Rotation vs. Time ComparisonHigh Stiffness Solutionand Low Stiffness Solution 159
10

LIST OF FIGURES (Cont. )
PAGE
Figure 9.5 Side Block Horizontal Force vs.Time ComparisonHigh Stiffness Solutionand Low Stiffness Solution 160
11

LIST OF TABLES
PAGE
Table 7.1 Original D.I.S. Isolator Parameters . , . 103
Table 7.2 Final Low Stiffness DesignIsolator Parameters 103
Table 8.1 Final High Stiffness DesignWale Shore Parameters 131
12

CHAPTER 1
INTRODUCTION
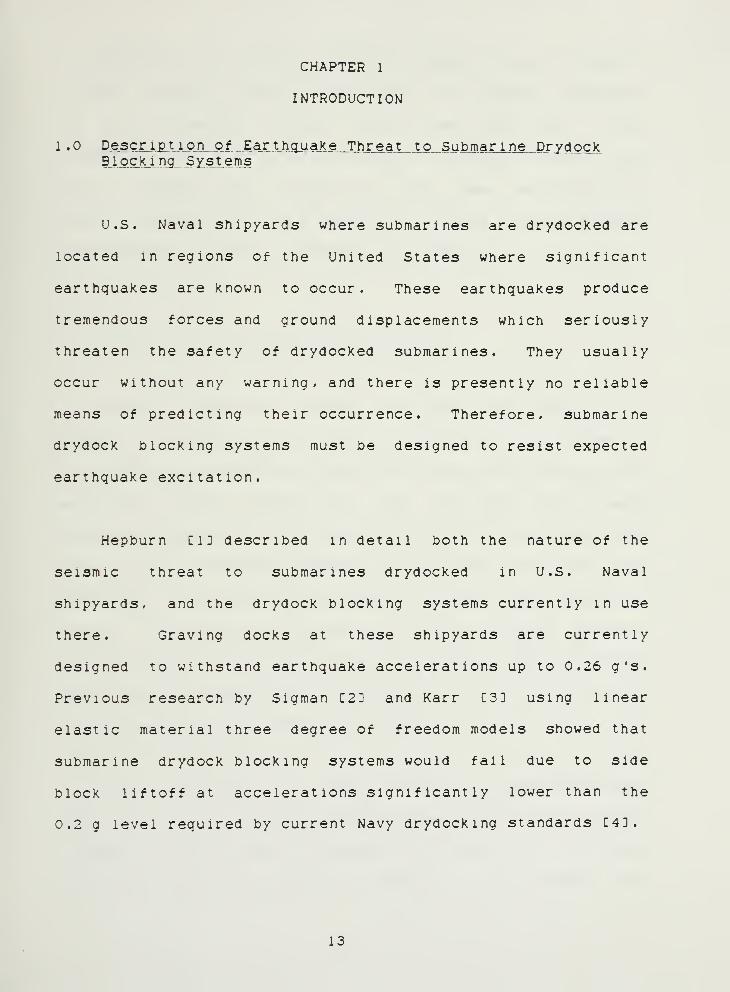
1 . Descr.ip_t _],p_n_ Of .Ea.rtLhgiiaKe„ Threat to Submarine DrydockBlocKlng Systems
U.S. Naval shipyards where submarines are drydocked are
located in regions of the United States where significant
earthquakes are known to occur. These earthquakes produce
tremendous forces and ground displacements which seriously
threaten the safety of drydocked submarines. They usually
occur without any warning, and there is presently no reliable
means of predicting their occurrence. Therefore, submarine
drydock blocking systems must be designed to resist expected
earthquake excitation.
Hepburn CID described in detail both the nature of the
seismic threat to submarines drydocked in U.S. Naval
shipyards, and the drydock blocking systems currently in use
there. Graving docks at these shipyards are currently
designed to withstand earthquake accelerations up to 0.26 g's.
Previous research by Sigman C2] and Karr C3] using linear
elastic material three degree of freedom models showed that
submarine drydock blocking systems would fail due to side
block liftoff at accelerations significantly lower than the
0.2 g level required by current Navy drydocking standards C4]
.
13

Hepburn's CID thesis confirmed these results using a
bilinear material model for wood wh'ich more closely represents
its actual behavior. Using this bilinear wood model, it was
determined that the submarine drydocK blocking systems would
fail by side block liftoff at even lower accelerations.
Clearly current U.S. Navy submarine drydock blocking systems
are inadequate to meet the earthquake threat.
1 . 1 Summary of. Bi linear _.Mater La.L-Res
Natural rubber and dynamic isolators were analyzed by
Hepburn Cl] using bilinear models to determine their potential
for increasing system survivability. The rubber was used as a
substitute for the Douglas fir soft cap, and the dynamic
isolators were used as a substitute for the oak (hard wood)
layer of the blocking systems. It was determined that
significant increases in survivability occur when rubber and
dynamic isolators are incorporated in the blocking systems.
Rubber caps and isolators either singly or in combination are
very attractive potential solutions to the submarine drydock
blocking systems' survivability problem.
This thesis uses the three degree of freedom analysis
model previously developed by Sigman L23 and Karr C3D with the
bilinear material models developed by Hepburn 111 to design
earthquake resistant submarine drydock blocking systems. The
14

use of natural rubber, dynamic isolators, wale shores,
blocking system stiffness, and geometry variations is studied.
1 .2 Thesis Outline
Chapter 2 describes improvements made to the three degree
of freedom computer program (3D0FRUB) developed jointly by
Luchs and Hepburn. The development of a computer aided design
package using this program as the core is described.
Significant modifications include the use of horizontal and
vertical accelerations input and force and displacement output
files, and development of miscellaneous support programs.
Chapter 3 describes the changes made in the equations of
motion to include the effects of cap angle and side block
height. This chapter also describes the effect of adding wale
shores to the blocking system. In addition, the side block
wedge effect on the sliding failure mode is developed.
The earthquake effects on the USS Leahy (CG-16) drydock
blocking system at Long Beach Naval Shipyard is described in a
case study in chapter 4. The results of this study are used
as a verification of the three degree of freedom drydock
blocking system model and computer program. In chapter 5, a
parametric study on the effect of wale shores, dynamic
isolators, and stiffness and block geometry variations is
conducted
.
15

The site specific earthquake effects on drydock blocking
system designs is analyzed in chapter 6. A low stiffness
dynamic isolator based drydock blocking design is developed in
chapter 7. Similarly, in chapter 8 a high stiffness wale
shore based drydock blocking design is developed. Finally, a
comparison of results, conclusions, and recommendations for
further study is included in chapter 9.
16

CHAPTER 2
DEVELOPMENT OF THE THREE DEGREE OF FREEDOM EARTHOUAKERESISTANT DRYDOCK BLOCKING DESIGN PACKAGE
2 . Three Degree of Freedom Computer Program Background
The computer program used to analyze the submarine
drydock blocking systems in this thesis was developed jointly
with Hepburn CID and is based on the program developed by
Sigman C23. Many significant modifications are made to
Sigman's program and several support programs are written to
improve the usefulness of this program as a design tool. The
two subroutines developed to model bilinear material
properties, "BILINALL" and "RUBBER", are described in detail
by Hepburn C 1 ]
.
The significant modifications made in this thesis include
the addition of horizontal and vertical acceleration inputs,
force and displacement outputs, and changes to the equations
of motion to include more complex geometry. The geometry
changes took into account the effects of side block height,
cap angle, and the inclusion of wale shores. In addition, the
side block wedge effect on the sliding failure mode is
included in the program.
17
The main program, "3D0FRUB" , inputs submarine (Jrydock
blocking system parameters then calculates the system's modal
masses, stiffnesses, damping coefficients, and natural
frequencies. The horizontal acceleration time history (and
vertical if applicable) are input using the "ACCLINPT"
subroutine. The main loop of the program solves the equations
of motion using the Fourth Order Runga-Kutta numerical method.
The blocking material stiffnesses are recalculated each time
step using the appropriate subroutines. At each time step,
keel and side block forces are calculated, and the system is
tested for failure.
The program begins by using 100 percent of the amplitude
of the input acceleration time history. It carries out
repeated loops through the whole history each time decreasing
the input acceleration. This continues until the system
survives a complete loop through the time history. Force and
displacement data files as chosen by the user are created
using subroutine "RESPALL" for use in plotting system
response. The main program, "3D0FRUB" , and all four
subroutine listings are included in Appendix 1. A sample
input data file and output file are also included in this
appendix
.
18
2.1 Horizontal and Vertical Acceleration Input
Sigrnan's program only allowed the Input of horizontal
earthquake acceleration time histories. Vertical
accelerations are input to the program by multiplying the
horizontal accelerations by a selected constant. The
resulting vertical acceleration is, therefore. Identical in
wave form with the horizontal acceleration which is not always
the case for actual earthquakes. A better way of handling
vertical accelerations is to use actual vertical acceleration
time histories. The "ACCLINPT" subroutine allows both
horizontal and vertical acceleration time histories to be read
independently.
The "ACCLINPT" subroutine asks the user for the
horizontal acceleration file name and then reads the data into
an array. The user is then asked if a vertical acceleration
file will be used. If the user chooses to use one, its data
is read into a different array. If the user declines to use a
vertical acceleration file, the user is asked to provide the
vertical to horizontal acceleration ratio. Each horizontal
acceleration data point is then multiplied by this ratio to
create a vertical acceleration data array.
The subroutine then checks to make sure that if
horizontal and vertical acceleration inputs are used, both the
inputs are from the same earthquake with the same time step.
19

Finally, "ACCLINPT" provides the main program, "3D0FRUB" , with
the earthquake name, the horizontal and vertical earthquake
component names, and the acceleration time step used.
2 . 2 Force and Displacement Output
In order to display the response of the three degree of
freedom system, it is essential to create force and
displacement output data files. Sigraan's C23 computer program
included a computer operating system dependent plotting
routine. In order to develop a useful and easily portable
software package, force and displacement response data is
output in ASCII files. This allows the user the option of
using a wide variety of plotting programs to display the
response data. The main program can then be run on any
system, including personal computers, that has a FORTRAN
compl ler
.
The main program, "3D0FRUB" , asks the user if response
and displacement output files are desired. If these files are
desired, the user can chose which of five force components
should be output. These force components are (1) keel
horizontal force, (2) side block horizontal force, ' (3) left
side block vertical force, (4) right side block vertical
force, and (5) keel block vertical force.
20

The main program calculates the appropriate force and
displacements. The program selects the correct displacements
corresponding to the chosen force then captures them in
arrays. For example, if left side block vertical force is
selected, the displacement, YPRIME, is captured. YPRIME
includes the vertical displacement of the Keel, rotation about
the keel times the lever arm to the left side block, and the
static deflection of the side block due to submarine weight.
"RESPALL" is the subroutine which creates force and
displacement output files. This subroutine asks the user for
X displacement, y displacement, rotation, and force output
file names. It then writes the force and displacement arrays
captured by the main program to these files. The program only
creates output data files for an earthquake magnitude that the
system survives (where no failures occur). These output files
are formatted such that they are directly usable by LOTUS 123
and other graphics programs.
2 . 3 De ve.l opme n t_._of.„.M LsceJJAneous _ Supp.orJ..._Pro^? am^^
Several support programs are developed to produce
acceleration time history data files usable by "3D0FRUB". The
first program, "V2READS" , based on a program provided by Lew
1988 CSD, creates three separate single column format
acceleration data files. The input for this FORTRAN program
is the standard format magnetic media data file containing
21

three complete earthquake records each provided by the
National Geophysical Data Center, Boulder, Colorado C6D.
The second program, "ACCELMOD" , modifies an acceleration
data file in single column format by adding a new data point
found by linear interpolation between each original data
point. This is necessary in some cases (e.g. the 1 October
1987 Whittier, California earthquake) to improve the accuracy
of the numerical computational scheme. The Whittier
earthquake was recorded with a 0.02 second time step. The
"3D0FRUB" program produces the best results if the time step
is 0.01 seconds or less.
The third computer program, "DATINNEW" , written in BASIC
inputs acceleration data from ASCII data files in either
single or multiple column format and modifies it in several
ways. First, if desired the program adds character string
labels to the first three lines of the output data file.
These labels are the name of the earthquake, the acceleration
component name, and the acceleration time step. These labels
are required in order for the output file to be used directly
by "SDOFRUB".
"DATINNEW" allows the user to produce an output data file
of any length up to the maximum number of entries in the input
data file. The program also allows the user to multiply each
data point by a desired constant to produce earthquake time
22

histories of varying magnitudes. The program gives the user
the option of having the output data file be in units of
inches per second squared or centimeters per second squared.
"3D0FRUB" requires centimeters per second squared data input.
"DATINNEW" removes gaps in data files produced by programs
such as LOTUS 123. The output of the program is an ASCII data
file in single column format.
Another BASIC program, "MAKERUB" , is developed to create
submarine and blocking system data input files for "3D0FRUB" .
This program is written based on a BASIC program written by
Paz (1986) C7D. This computer program allows the user to
prepare new data files or modify existing data files. The
program is labeled in detail and identifies all submarine and
blocking system data input file entries including their units
as used hy "3D0FRUB" . The program is versatile in that data
files can be moved, recalled, and modified quickly and easily.
"MAKERUB" prompts the user for each data entry by
description, units, and variable name. The program then
creates data files in the exact format required by "3D0FRUB"
without the user having to adjust anything. One important
feature of this program is that it labels the data files with
identifying information so when the data files are displayed
the user can see all pertinent information as text. The four
programs described in this section are included in Appendix
(2) .
23

CHAPTER 3
GEOMETRICAL IMPROVEMENTS TO THE THREE DEGREE OF FREEDOM MODELAND COMPUTER PROGRAM
3 .0 Geometrical Improvements t o the Three Degree of FreedomEquations of Motion
The three degree of freedom model of the submarine
drydock blocking system at rest as developed by Sigman (1986)
C2D and used by Hepburn' ClD is the system used as a baseline
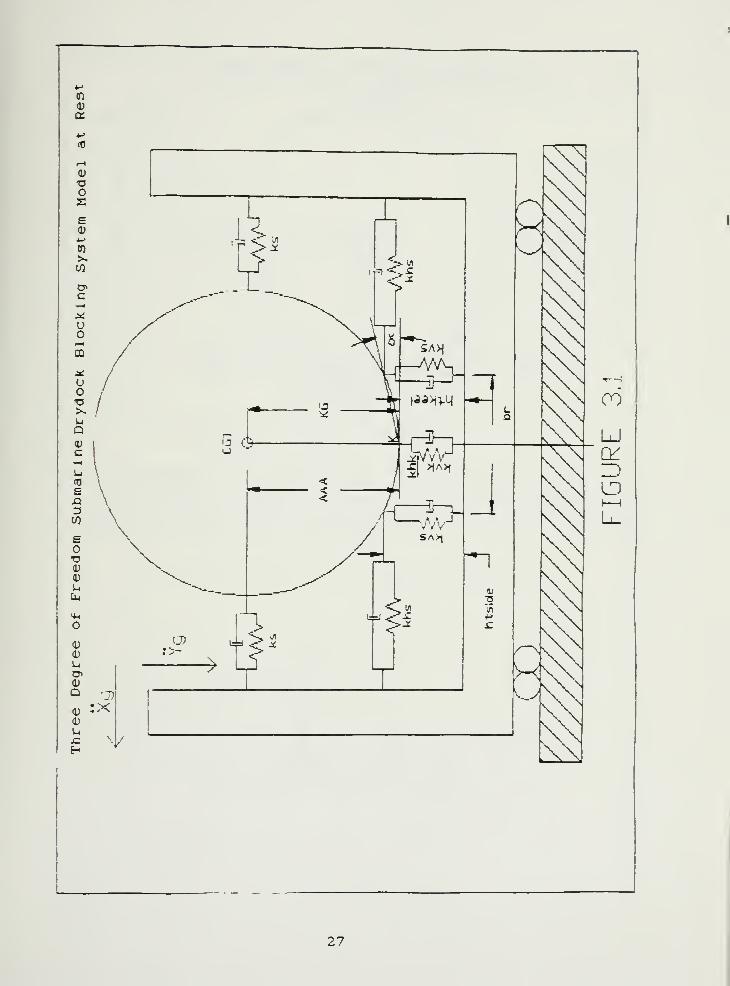
for this thesis. Figure (3.1) is a two dimensional
representation of the submarine and dry dock with the keel and
side block piers modeled as horizontal and vertical springs
and dashpots.
This figure differs from Sigman 's model in several
respects. First, wale shores, modeled as horizontal springs
and dashpots, at a distance AAA from the keel are added.
Second, the height of the side blocks above the keel baseline
and the resulting angle alpha between the baseline and a line
through the keel and side block point of contact is shown and
taken into account in the equations of motion.
The point CGI is the initial location of the center of
gravity of the submarine. The point K is the initial location
of the keel of the submarine. The point K', insert figure
(3.2), is the location of the keel after horizontal and
vertical translation has occurred. Rotation occurs about this
point. KG is the distance from the keel to the center of
24

gravity. The distance br is the transverse distance between
the center of the caps of the port and starboard side blocks.
The horizontal, vertical, and wale shore spring constants are
as designated in the figure.
The system is excited by horizontal and vertical dry dock
accelerations x^ and y„ respectively. The entire dry dock and
submarine system moves relative to a fixed reference frame.
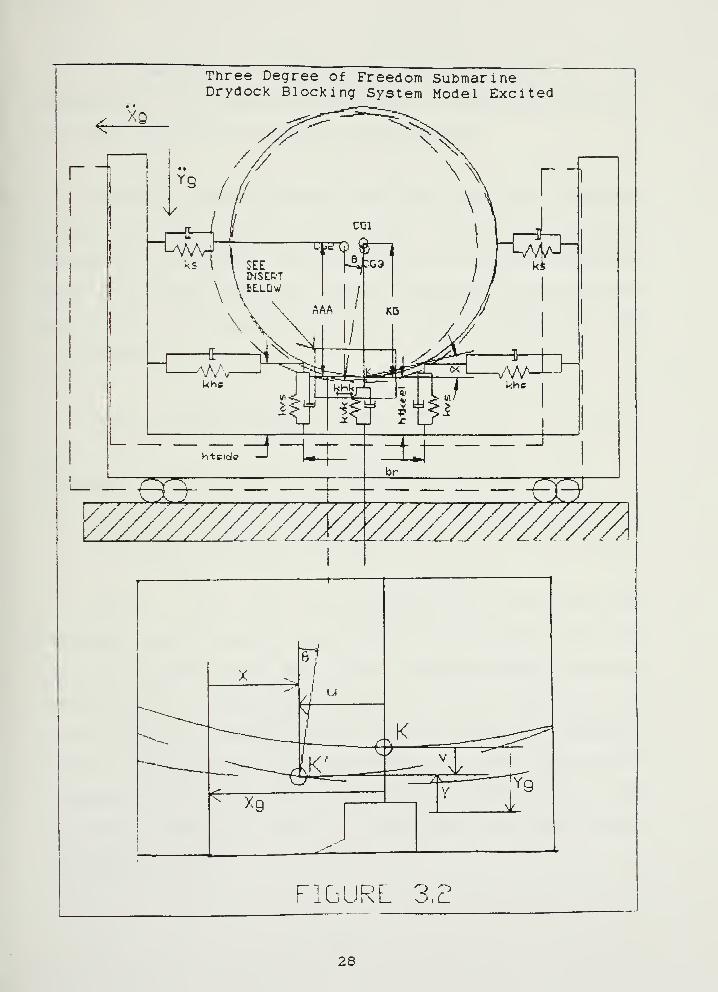
The excited system is shown in figure (3.2). The system of
equations are expressed in terms of motion of the submarine
relative to the dry dock.
The point CG2 in figure (3.2) is the location of the
center of gravity of the submarine relative to the fixed
reference frame after horizontal displacement u and vertical
displacement v. The point CG3 is the location of the
submarine's center of gravity after the additional absolute
rotation theta. The insert at the bottom of figure (3.2) is a
close up of the keel area of the submarine during this motion.
The displacements illustrated are described as follows:
The relative horizontal displacement coordinate x is the
displacement of the submarine keel with respect to the dry
dock. The displacement u is the position of the keel relative
to the fixed reference frame. With ground motion x^ the
following equations hold:
25

U = X + Xg
U = X + Xo (3.1)
similarly for vertical translation the following
equations hold:
y = V - y,
V = y + y«
V = y + y^ (3.2)
The coupled non-linear three degree of freedom equations
describing the system motion as developed by Sigman are as
f ol lows
:
MX + MKG9 + C^x + C„:e,© + (2KhS+khk)x = -Mx^ (3.3)
My + C^y + (2kvs+kvk)y = -My« (3.4)
U9 + MKGx - MK^y© + C„© + C.:^x + C(br^/2)kvs
-WKGDO = -MKGx^ (3.5)
26

4->
OS
27

Three Degree of Freedom SubmarineDrydock Blocking System Model Excited
4-XQ
r ^9i/7̂
\kcci
' ks 1 \ SEE -^:G31 \ D-JSEIRT '
\ \ BELLOW
^ \ V\ AAA
iyi
FIGURL
28
In equations 3.3 through 3.5, m is the mass of the
submarine, Ik is the rotational moment of the submarine about
the keel, and W is the weight of the submarine.
Sigman's analysis assumed that the height of the keel
blocks was the same as the height of the side blocks.
Therefore, the lever arm from the keel to the side block hull
point of contact is br/2. Taking the actual height of the
side block into account gives the following expression for
this lever arm:
LLL = ( (htside-htkeel )=^- + (br/2)^') ^'''^ (3.6)
The angle alpha is then:
**< = SIN-M (htside-htkeel ) /LLL) (3.7)
Figure (3.3) is an illustration of the additional
vertical and horizontal displacements of the side block cap
due to rotation theta (©) of the submarine about the keel.
The insert at the bottom of figure (3.3) is a close-up of the
side block cap geometry during submarine rotation. Assuming
small angle rotation, the displacement of the cap due to
rotation is L9, The vertical component of L0 is R. The
horizontal component is Z. L in the figure is the same as LLL
in equat ion (3.6).
29
Vertical and Horizontal Displacementsot the Side Block Cap Due to Rotation
figure: 3,3
30

The expression for R is developed as follows:
R = Le*SIN( 7 ) (3.8)
SIN( ^ ) = (BU + R)/L (3.9a)
For small angles of rotation:
SIN( (p ) = (BU)/L (3.9b)
BU = htside-htKeel (3.10)
From figure (3 .3)
:
7 + go' + ^ = 180 (3.11)
7 = 90** -(f)
Combining with equation (3.9b) gives:
(3,12)
= 90 - SIN-MBU/L) (3.13)]
Using a trigonometric identity gives:
SIN( 7 ) = COS(SIN--MBU/L) ) (3.14)
Substituting in equation (3.7) gives:
SIN( 7 ) = COS( ^ ) (3.15)
Therefore
:
R = Le*COS(cX ) (3.16)
In the case where BU = (side block height = keel block
height) as was the case in Sigman's analysis equation (3.16)
reduces to:
R = Le (3.17)
In this case L = br/2 and therefore:
R = (br/2)*G (3.18)
31

Similarly:
Z = Le*COS( 7 ) (3.19)
Z = L©*SIN(0. ) (3.20)
In the case where BU = O and L = br/2:
Z = L9*SIN(D) = (3.21)
R and Z are used in calculating the horizontal and
vertical forces on the side blocks. Without these geometric
relationships, the horizontal force exerted on the side blocks
of submarines due to rotation is not taken into account. Not
including this force is a significant underestimate of the
true horizontal forces seen by the side blocks. Including
this effect represents an important improvement to Sigman's
model .
With these equations incorporated into the "3D0FRUB"
computer program* the model is now general enough to take into
account the high buildups of surface ships. Even though for
submarines, including the geometric side block effects only
changes the survivability of the systems by approximately one
percent, for ships with higher buildups these effects will be
larger .
32

The total blocking system forces are calculated as
fol lows:
Keel block horizontal force:
RRl = khkb*x (3.22)
Right and left side block horizontal force:
RR2 = khSb*XPRIME (3.23)
XPRIME = X + Z (3.24)
Left side block vertical force:
RR3 = kvsbl * YPRIMEl (3.25)
YPRIMEl = -y - R + DELTA (3.26)
Right side block vertical force:
RR4 = kvsb2 * YPRIME2 (3.27)
YPRIME2 = -y + R + DELTA (3.28)
Keel block vertical force:
RR5 = kvkb*YPRIME3 (3.29)
YPRIME3 = -y + DELTA (3.30)
Right and left wale shore horizontal force:
RR6 = ks* (X + AAA*e) (3.31)
33

The total blocking system moments about the keel are
calculated as follows:
Right and left side block horizontal moment:
MMl = RR2*LLL*SIN(«<. ) (3.32)
Left side block vertical moment:
MM2 = RR3*LLL*C0S{ C5C ) (3.33)
Right side block vertical moment:
MM3 = RR4*LLL*C0S(-<^ ) (3.34)
Right and left wale shore horizontal moment:
MM4 = RR6*AAA (3.35)
DELTA is the static deflection of the side and keel
blocks due to the submarine's weight. The value of DELTA is
calculated in each loop of "3D0FRUB" and depends on the values
of the current side block and keel block vertical stiffnesses.
All blocking stiffness (e.g. khkb) are those found from
appropriate "BILINALL" or "RUBBER" subroutines. If a linear
material analysis is selected by the program user, linear
material stiffness values are used.
To derive the modified submarine drydock blocking system
equations of motion the following procedure is used. First
the forces in horizontal direction are summed and equated with
the mass times acceleration in that direction. Next, the
forces in the vertical direction are summed and equated with
34
the mass times acceleration in that direction. Finally, the
moments are summed about the Keel and equated with the
rotational inertia times rotational acceleration. After
combining terms and simplifying, the modified equations of
motion which include wale shore and side block geometric
effects are as follows:
Mx + MKGe + C^k + C^„e + (2ks+2khs4khk)x
+ (2kS*AAA + 2khs*LLL*SIN( «*<. ))e = -Mx« (3.36)
My + C^y + (2kvs+kvk)y = -My^ (3.37)
U^ + MKGx - MKGye + C«e + C«.^x
+ (2ks*AAA + 2khS*LLL*SIN( '^^ ))X
+ C2ks*AAA'- t 2khs* (LLL*SIN( <^ ) )='
+ (2*kVS)* (LLL*COS( '^^ ))*= - WKGDe = -MKGx' (3.38)
The three degree of freedom equations (3.36 - 3.38) are
now Stiffness as well as inertlally coupled. In matrix form,
there are now two new elements in the stiffness matrix (K^g =
Ksx), where K^a = (2ks*AAA + 2khs*LLL*SIN ( x )). The first
term, 2ks*AAA, is due to wale shores; and the second term,
2khs*LLL*SIN( «< ) , is due to the effect of system rotation on
the side blocks. The stiffness matrix elements Kti and Kaa
are also modified to include these effects.
35
3 , 1 Eflec t_j?X. S.id.e_J.LQck .Xap_.An3-ie_gji.._^^ in3_ FailureMode
All failure modes incorporated in the "3D0FRUB" computer
program are the same as those used by Sigman C2D except the
slide block sliding failure mode. A more general approach is
used to model the side block sliding forces. This allows this
program to be used for surface ship block geometries as well
as submarines. One additional data input required by the
program is the side block cap angle. An average value of side
block cap angles, obtained from the submarine docking
drawings, is used in this thesis. It is possible to model the
failure of the different side blocks along the length of the
submarine or ship by running the program separately for each
side block right and left set.
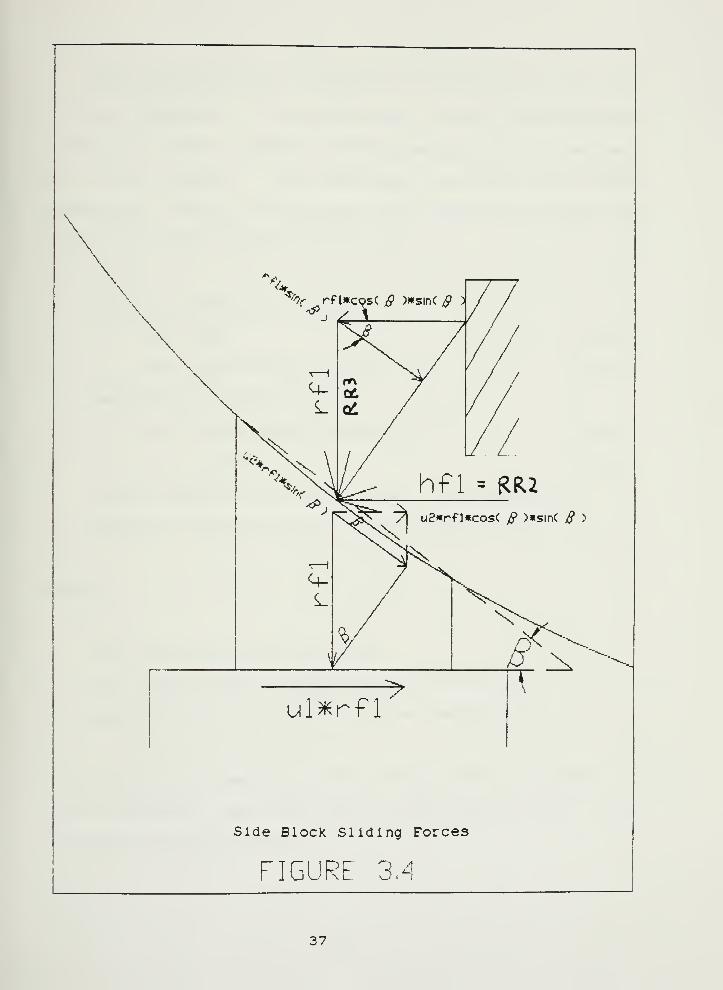
Figure (3.4) shows the geometry used in the modeling of
the side block cap. The side block cap is modeled as a wedge
using a system illustrated in Marks. Handbook C8:. Sigman in
his analysis did not include the outward force on the side
block caused by the vertical forces.
36

\
%.%r rf iKcosC ^ »«sin( /ff )
-' 4
ul^rfl
Side Block Sliding Forces
37

This outward force is caused by the relative rigidity of
the ship compared to the side blocks. When a vertical force
occurs/ it tends to push the block outboard rather than move
the ship inboard. The equations describing the forces
associated with the side blocks due to this wedge effect and
other frlctional forces are as follows:
Outboard horizontal forces:
hfl = RR2 (3.39)
hf2 = RR3*C0S(/3 )*SIN(/S ) (3.40)
Resisting horizontal forces:
hf3 = U2*RR3*C0S( /S )*SIN( /J ) (3.41)
hf4 = ul*RR3 (3.42)
In the figure rfl is equal to RR3 . RR2 and RR3 are
defined in equations 3.23 and 3.25 respectively.
Where
:
ft= the side block cap angle.
ul = is the block on block friction coefficient.
u2 = is the hull on block friction coefficient.
If rfl and hfl are acting in the direction shown in figure
(3.4), "3D0FRUB'* flags side block sliding failure if hfl + hf2
is greater than hf3 + hf4.
38

3 .2 Determination of Blocking System Vertical StaticDeflection
Due to the changing stiffness of the side and Keel blocks
during the earthquake because of their non-linear material
properties, the static deflection* DELTA, caused by the
submarine weight changes throughout the duration of the
earthquake. The accurate calculation of DELTA is essential so
that "3D0FRUB" correctly handles permanent set and bilinear
material properties. For some cases It is possible for the
keel or side blocks to start In the second (plastic) stiffness
of the bilinear stiffness model if the submarine weight is
great enough .
One assumption is made to simplify the calculation of
DELTA. It is assumed that the side block caps would never be
elastic when the keel block caps are plastic. The equations
for calculating DELTA are as follows:
Elastic case:
DELTA = weight/ (2kvs+kvk) (3.43)
Plastic case:
DELTA = YEL3 + (weight
-(YEL3* (2kvs+kvk) ) ) / (2kvsp+kvkp) (3.44)
Where:
YEL3 = 0D4/ (kvk-kvkp) (3.45)
39
0D4 is the keel restoring force, RR5 , intercept of the
second bilinear stiffness slope. The entire bilinear material
model is described by Hepburn ClD in detail.
"3D0FRUB" includes DELTA initialization and recalculation
sections. In the initialization section the program first
determines whether or not the static deflection has caused the
cap material to go plastic or remain elastic. If the material
is elastic, then equation (3.43) is utilized to compute DELTA.
If the material is plastic, the program uses equation (3.44)
to calculate DELTA. If kvk equals kvkp then YEL3 is equal to
zero. Then the DELTA equation reduces to the following:
DELTA = weight/ (2kvsp + kvk) (3.46)
This case occurs when the keel blocks are linear elastic
and the side blocks are bilinear rubber. In addition, if
either the keel or side blocks are bilinear wood then the
elastic case holds initially. For recalculation the same
equations are used with the updated stiffness values from the
appropriate stiffness subroutines.
40

CHAPTER 4
USS LEAffy (CG-16) CASE STUDY
4 . Background
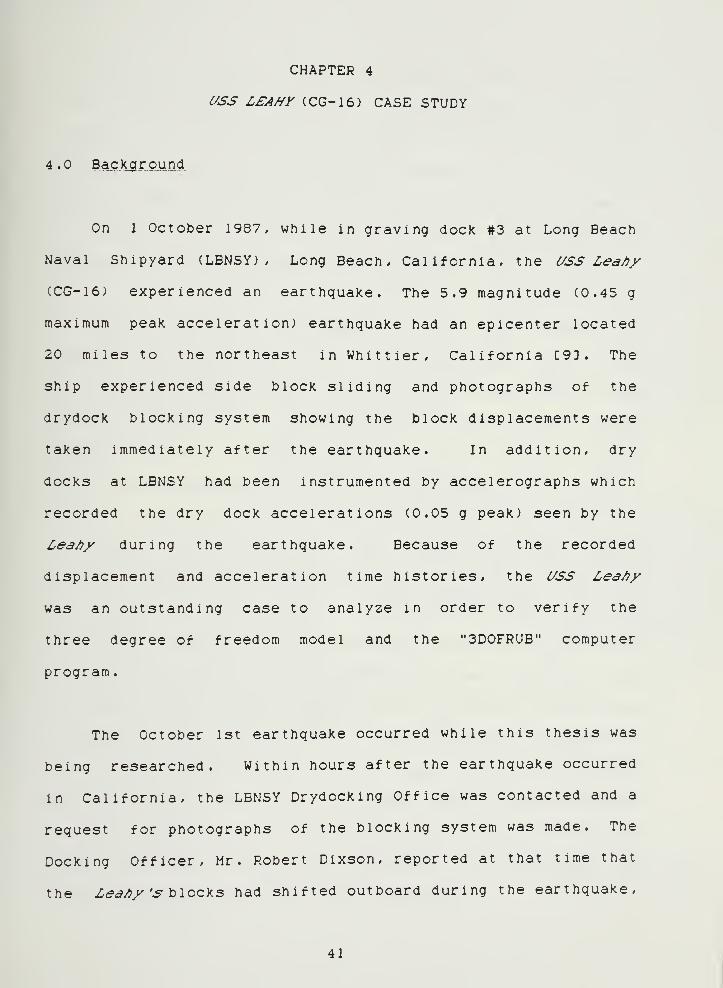
On 1 October 1987, while in graving dock #3 at Long Beach
Naval Shipyard (LBNSY) , Long Beach, California, the C/SS Lea/)/
(CG-16) experienced an earthquake. The 5.9 magnitude (0.45 g
maximum peak acceleration) earthquake had an epicenter located
20 miles to the northeast in Whittier, California C9D. The
ship experienced side block sliding and photographs of the
drydock blocking system showing the block displacements were
taken immediately after the earthquake. In addition, dry
docks at LBNSY had been instrumented by accelerographs which
recorded the dry dock accelerations (0.05 g peak) seen by the
LeaJ)x during the earthquake. Because of the recorded
displacement and acceleration time histories, the C/SS Lea/)y
was an outstanding case to analyze in order to verify the
three degree of freedom model and the "3D0FRUB" computer
program
.
The October 1st earthquake occurred while this thesis was
being researched. Within hours after the earthquake occurred
in California, the LBNSY Drydocking Office was contacted and a
request for photographs of the blocking system was made. The
Docking Officer, Mr. Robert Dixson, reported at that time that
the Lea/)x 's \i\ocY.3 had shifted outboard during the earthquake.
41

and four of the side blocks had remained away from the ship
after the earthquake was over. Providentially, the ship had
recently been sandblasted and painted, and when the earthquake
occurred the portions of the hull exposed due to slide block
sliding were very evident. Therefore, the exact displacements
of several of the side blocks following the earthquake was
recorded in the photographs taken on October 1st.
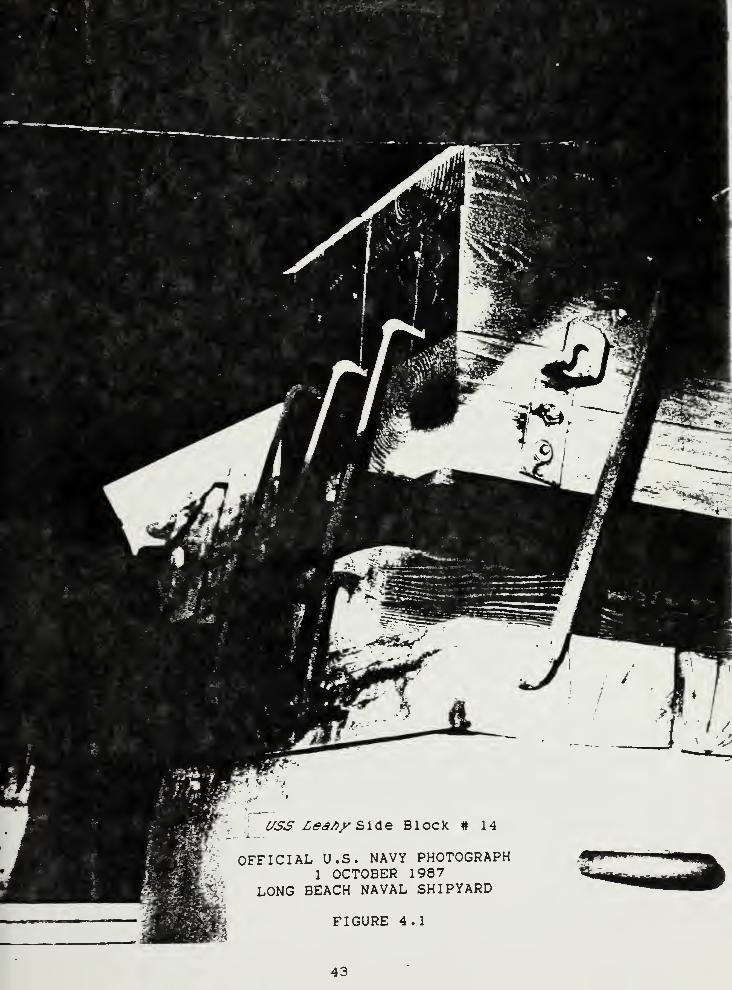
Figure (4.1) is a photograph of the # 14 (second most
forward) starboard side block. This photograph clearly shows
the outboard displacement of the block. It was reported that
several of the steel brackets (dogs) holding the block layers
together popped out during the earthquake. These brackets
were reattached before the photograph was taken.
LBNSY was visited in late October and the Lea/jy 's
blocking system was examined. The ship was still in dry dock
and the area around the displaced blocks had not been
repainted. Therefore, the displacements during the earthquake
were still evident. These displacements were measured and
recorded. There was no evidence of side block or keel block
crushing or keel block sliding. There was slight evidence of
side block liftoff. This liftoff apparently slightly skewed
some of the side blocks so the inboard face of the side blocks
was no longer parallel to the keel line. In addition, the new
paint that had been applied just before the earthquake was
broken between the hull and block interface.
42

'S VSt*
««;:->i
•<*"
FIGURE 4.1
i-'-M.*i»:'.-.
•>''^-
•. ..4^^^''
-^/
; i^. i-6/SS Z^s/!^ Side Block # 14
OFFICIAL U.S. NAVY PHOTOGRAPH1 OCTOBER 1987
;?x' LONG BEACH NAVAL SHIPYARD
43

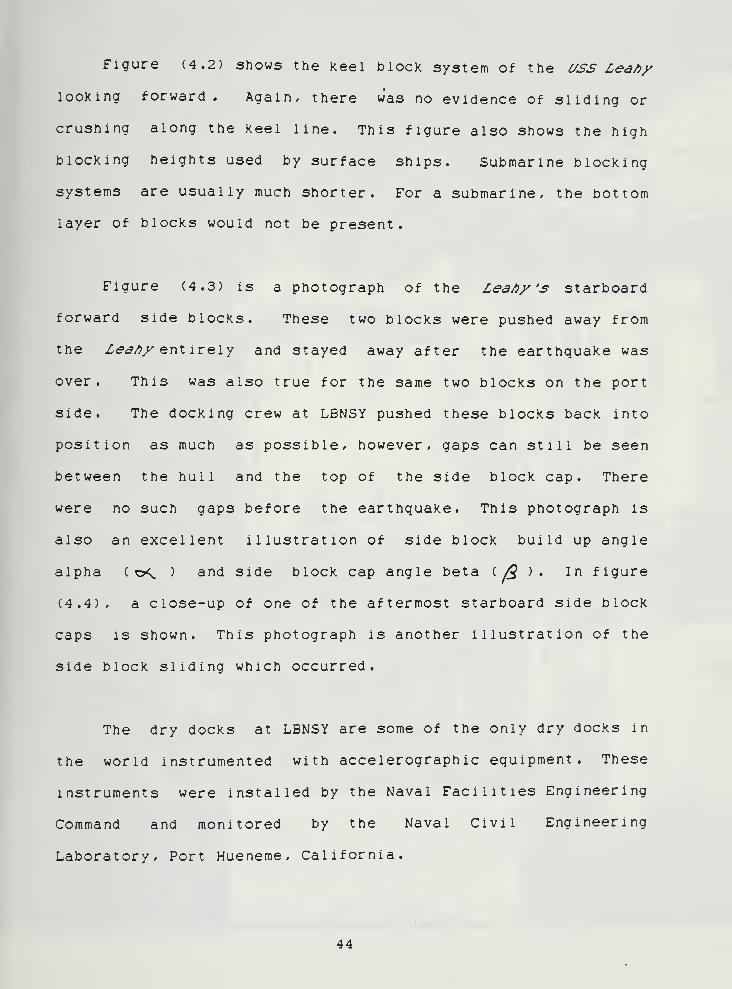
Figure (4.2) shows the keel block system of the ass Lea/)y
looking forward. Again, there was no evidence of sliding or
crushing along the keel line. This figure also shows the high
blocking heights used by surface ships. Submarine blocking
systems are usually much shorter. For a submarine, the bottom
layer of blocks would not be present.
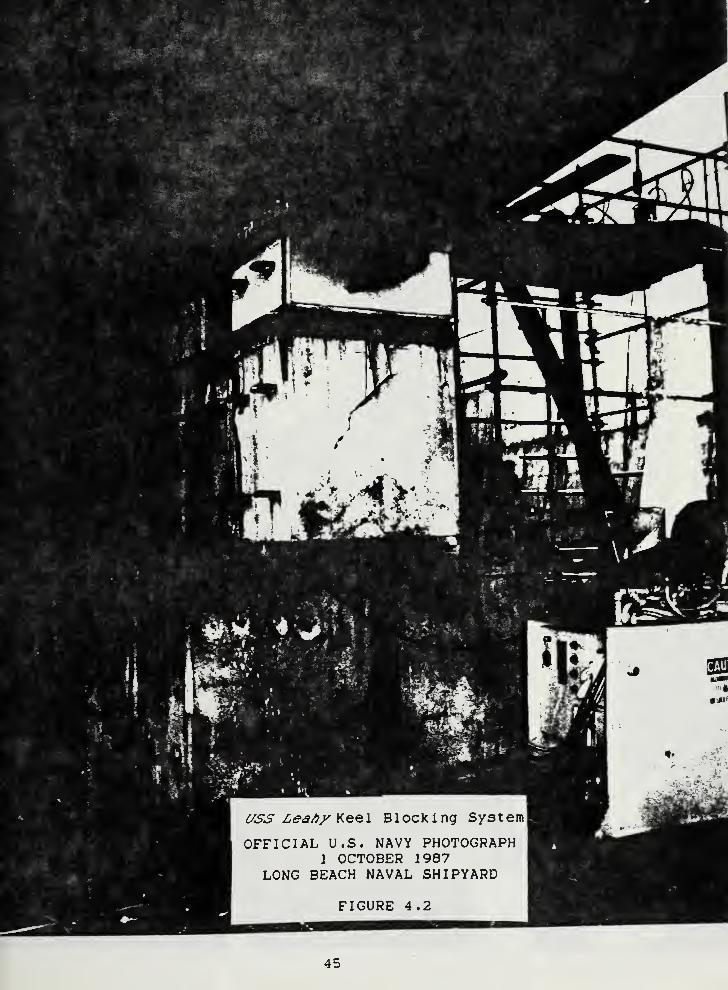
Figure (4.3) is a photograph of the Lea/)y 's starboard
forward side blocks. These two blocks were pushed away from
the Lea/^x ex\X\TQ\y and stayed away after the earthquake was
over. This was also true for the same two blocks on the port
side. The docking crew at LBNSY pushed these blocks back into
position as much as possible, however, gaps can still be seen
between the hull and the top of the side block cap. There
were no such gaps before the earthquake. This photograph is
also an excellent illustration of side block build up angle
alpha ( o<^ ) and side block cap angle beta ( /? ) . In figure
(4.4), a close-up of one of the aftermost starboard side block
caps is shown. This photograph is another illustration of the
side block sliding which occurred.
The dry docks at LBNSY are some of the only dry docks in
the world instrumented with accelerographic equipment. These
instruments were installed by the Naval Facilities Engineering
Command and monitored by the Naval Civil Engineering
Laboratory, Port Hueneme, California.
44

^^ k
/
rV* ./
Stf^
r
Wk-V^
6/SS L(^d/?^ Keel Blocking System|
OFFICIAL U.S. NAVY PHOTOGRAPH1 OCTOBER 1987
LONG BEACH NAVAL SHIPYARD
FIGURE 4.2

I - ~
*^^
46

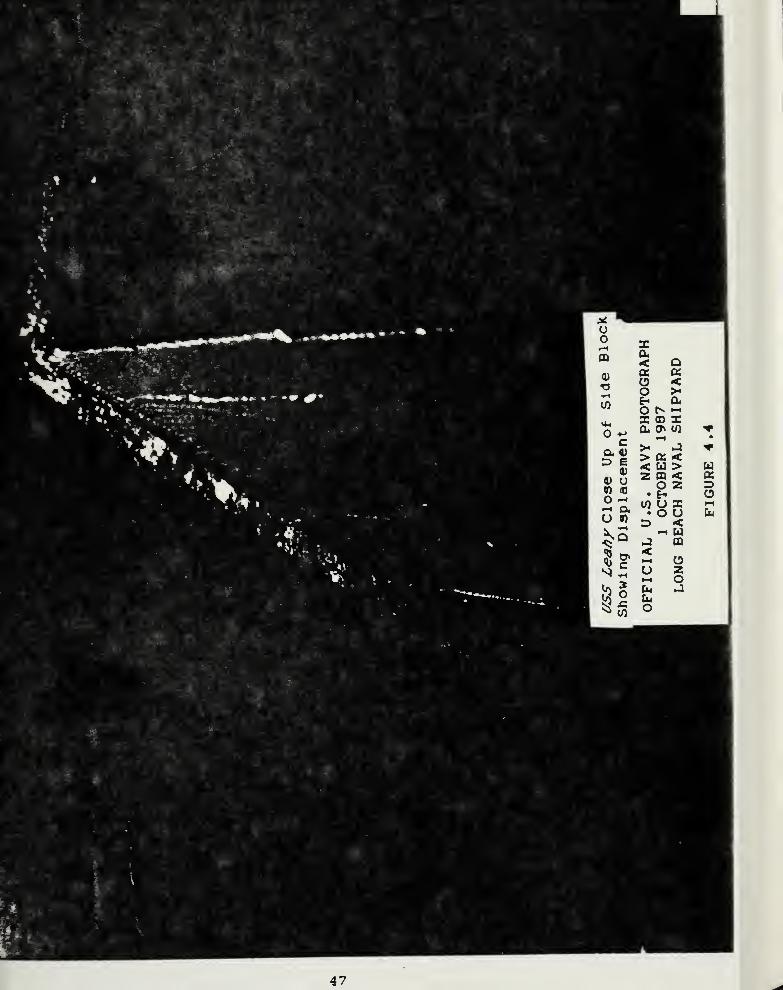
47

When the 1 October 1987 earthquake occurred, all of the
acceleration recorders (accelerographs) were triggered in the
dry docks at LBNSY . The acceleration time histories were
recorded on film in these instruments.
The clo<iest accelerograph to the C/SS Lea/jy during this
earthquake was located in dry dock #2 which is approximately
500 feet to the east of where the ship was drydocked . Dry
dock #2 is virtually identical in size and construction to
dry dock # 3 where the Lea/)y \t^s located. Figure (4.5) is a
layout of LBNSY ClOD waterfront and the location of the
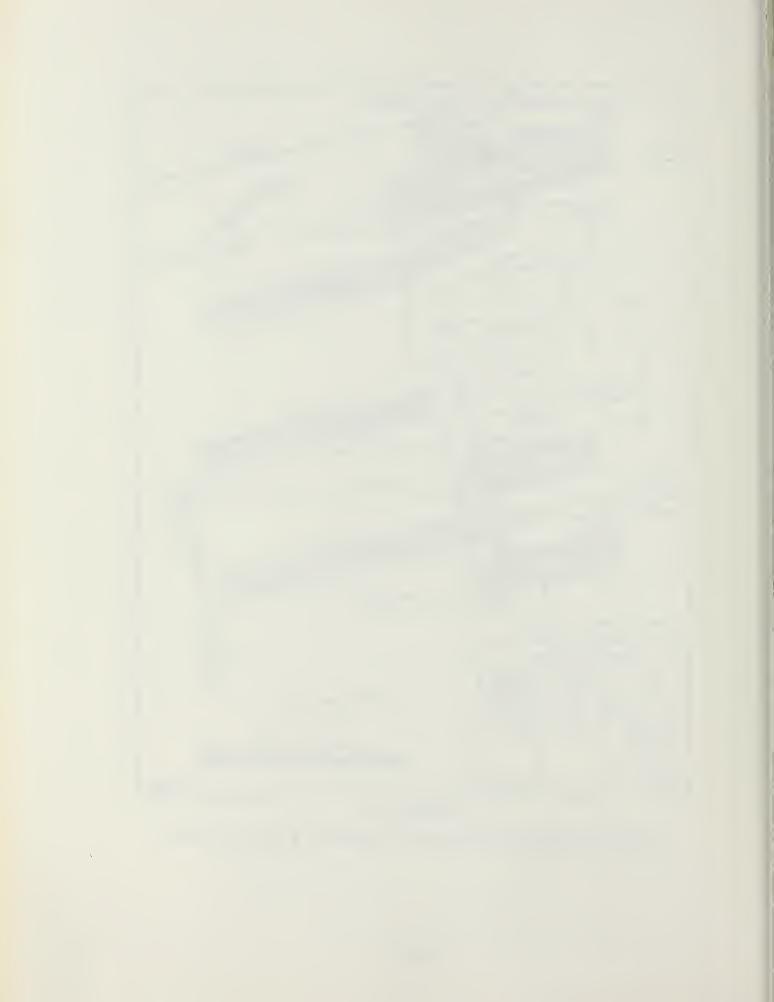
accelerograph and the Leahy ^t^ indicated. Figure (4.6) is a
cross-section of dry dock # 3.
The accelerograph in dry dock # 2 was a SMA-1 Strong
Motion Accelerograph. This instrument is a battery operated
earthquake recorder designed to measure ground acceleration
and structural response from strong local earthquakes. It
provides tri-axially (orthogonally arranged longitudinal,
vertical, and transverse) measured photographic records of the
local acceleration time history CUD. Figure (4.7) is a
photograph of this instrument.
48
p
U r-^^ SUBSTATION 1 (001 ce/vrAoO
———^—
-
RANE TRACKS
::^f^^^
Y^r j<^P-«<
J*^.^̂ t fU»»TATIC7N £
""'•'-.u.
^ /W II
/ ^§7 ^ ^CRANE TRACKS/ ,-^ »^J GAGE M' ^^.^..^^^^ik^^^555$4_
SMA-l ^^^^^Strong Motlon<S ^SAccel erograph --^ CZaJ^tT^
SUBSTATlOig 4 ^
_to»STATlOW 3 (do Z <3 COMTCOLj O ^
r^ f^
£/SS LSAJ/r (CG-16)
L -SUftiTATtOW r ^
1 OCTOBER 1987
1/Orvdock Porul Cranes
CuneNo.
Drvdock
No.
CapAcirY
Og tar»)
f-1>,13,1i^2,3.4,5,•,9,10.'','2,14,
21,22r-16,17
1,2,3
do
do
50.15.525.5
25,4.5
CRA^HiC tCALCe ictf too' . •ffc' xe m* if»t'
»/»^
FIGURE 4.5
Location of Drydocks, Long Beach Naval Shipyard, Long Beach, California
NAVFAC DM- 2 9. 3 (NOV 81)
49
5
I
« t
2 *
. 4 >-
-7
- Or5
IS5,«
a<a.
zU5
cn 2o
> u< oZ QX >"
O a:< Qjiffi
Ozo
uD
50
SMA-1Strong Motion Accelerograph
FIGURE 4,7
51
I
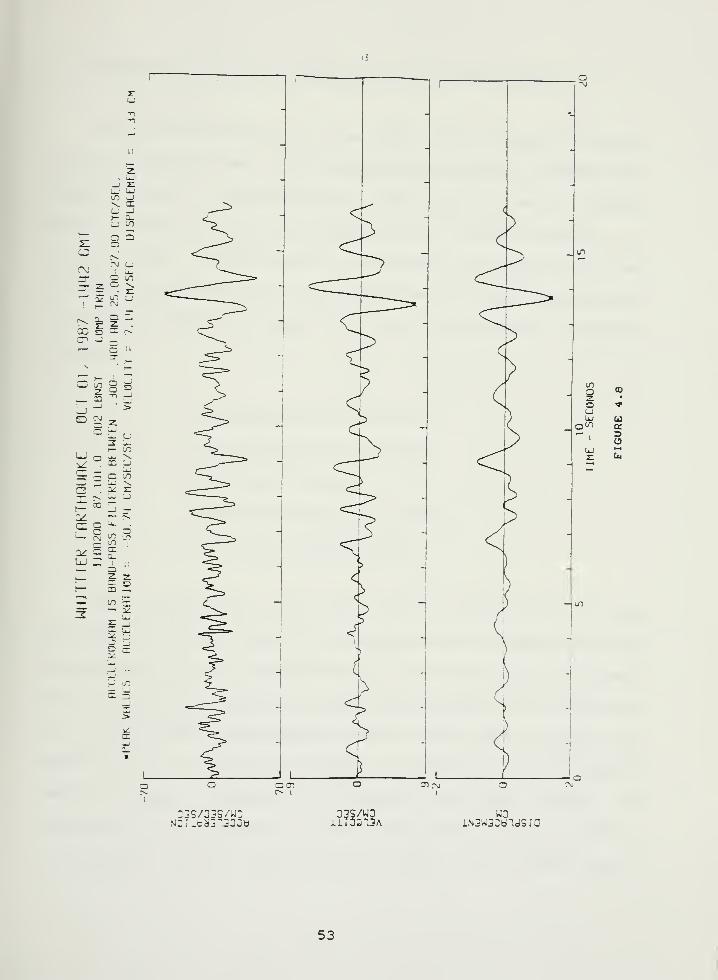
After the earthquake, the record from the SMA-1 in dry
dock # 2 was taken to the Naval Civil Engineering Laboratory
where the rough data was analyzed. This data was then
corrected and processed by Structural and Earthquake
Engineering Consultants, Arcadia, California. The corrections
were necessary due to instrument bias and recording errors.
The Naval Civil Engineering Laboratory forwarded these
results, and they were used in this thesis to analyze the
Lea/}x 's blocking system response. The results C53 of data
processing are called "corrected accelerograms" and are
provided in the standard format magnetic media data file as
used by the National Geophysical Data Center, Boulder,
Colorado. The data provided was further processed for use in
"3D0FR'JB" using the support programs described in section 2.3.
Figure (4.8) shows the corrected data plots provided by the
Naval Civil Engineering Laboratory for dry dock # 2's
transverse acceleration component. A typical header for one
of the data files is included in Appendix 3.
The data from the SMA-1 took months to process due to its
analog nature. Digital accelerograph instruments now exist
which can provide immediate processed information to users via
computer modems in the standard format. But these instruments
are not yet installed in dry docks.
52

I
U.' UJOl _)\ a:U _1J- a_C_; LO
!
—
CT Q^ O< '
Cs.' 1 lUrr o on
231O \
*~^Q^ bl _
I ^a_ Q Z
r^ Z; 200 O ^ .^
cr* 3^~^ O 1'
•\[
«—
•
—
^
c o °.
-n —1
'^ —' 5o CMo 2
a 'w.J
3 LlJ1— in
LU o uJ -v.
^ Tl -_)
3 5a a.1 z:
"^ UJ :j
p: ao [~ _'qz.
—' >-
(X 3 •*~
uJ OCNJ U1 ^
Q^ Q (XQ_
LU—
*
!— tE^~~ m -^
31/1 CL— Qt
d UJ
ex
CE
Q_
(D
U
:3S/3jS/W3NQ:_cS!3".j3ab
33S/W3JLirO013A
W3iN3W3CbldSrO
53
4 . 1 Mode ling_of._j;he_j;^*5:_Ze#^^ m
The characteristics of the C/SS Lea/^ys drydock blocking
system were obtained from the Docking Officer at LBNSY , Mr.
Robert Dixson. The information used came from a "layout
sheet" which was used to construct the blocking system. A
copy of this "layout sheet" is included in Appendix 3. The
following information is obtained from this sheet and is used
in producing an input data file for the "3D0FRUB" computer
program :
Side block height (htside)
Keel block height (htkeel)
Numbers of blocks
Side block cap angles (beta)
Side block breadths (br)
The photographs taken and visual inspection of the
blocking system are used to determine material quantities and
dimensions of each blocking layer. These dimensions are used
in the blocking system stiffness spreadsheets. The features
of the stiffness spreadsheets used are described in detail by
Hepburn CI J. They are included in Appendix 3. The bilinear
model is used to describe the Douglas fir caps. Also, in
Appendix 3 is a summary of the C/SS Lea/)y 's blocking system
stiffnesses and the resulting QD values. This summary sheet
54

displays the other submarine system stiffnesses as a
comparison
,
The moment of inertia about the keel for the Leahy is
calculated using a formula given by Gillmer & Johnson C12]
based on the ship's beam for a destroyer type ship. A
spreadsheet is used for this calculation and is included in
Appendix 3. The ship is modeled as a "rigid body". This is
considered reasonable for a cruiser type ship subject to a
small earthquake. Since / each set of Leahy's side blocks has
different heights, the Leahy sysXQx^ is modeled several times
using each set's heights. A typical data file for the Leahy
used by the "3D0FRUB" program is included in Appendix 3.
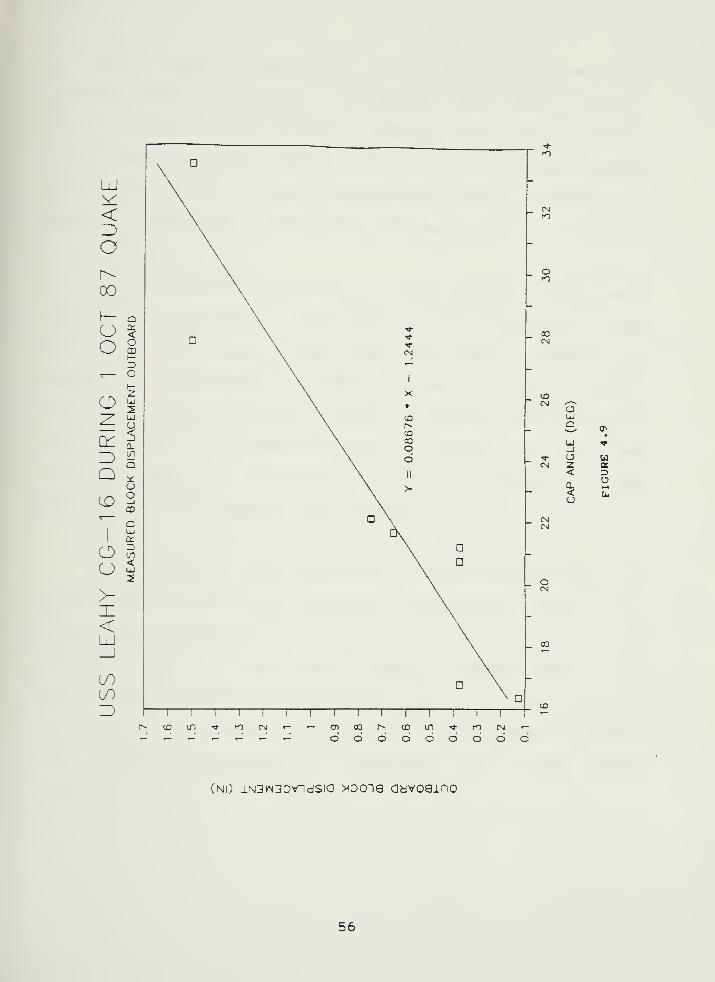
4 . 2 Resu It s_..of.__ t he_ iLSS_Leahx^,hJ\,^113i3.
One of the most interesting things found in examination
of the Leahy's blocking system is that the outboard
displacement varied significantly from block to block. Figure
(4.9) is a plot of measured outboard block displacement versus
cap angle. This figure shows that as cap angle increases
outboard side block displacement increases in a linear
fashion. A best fit linear regression line is shown along
with the data points.
55
•*n
CM
o
00
(£1
CM ao
cr
lU *—1
'^ o uCN z q:
< 3CL< Cuo
CMCSJ
oCN
(Ni) iN3kN3DvndSia xooia aavoaino
56

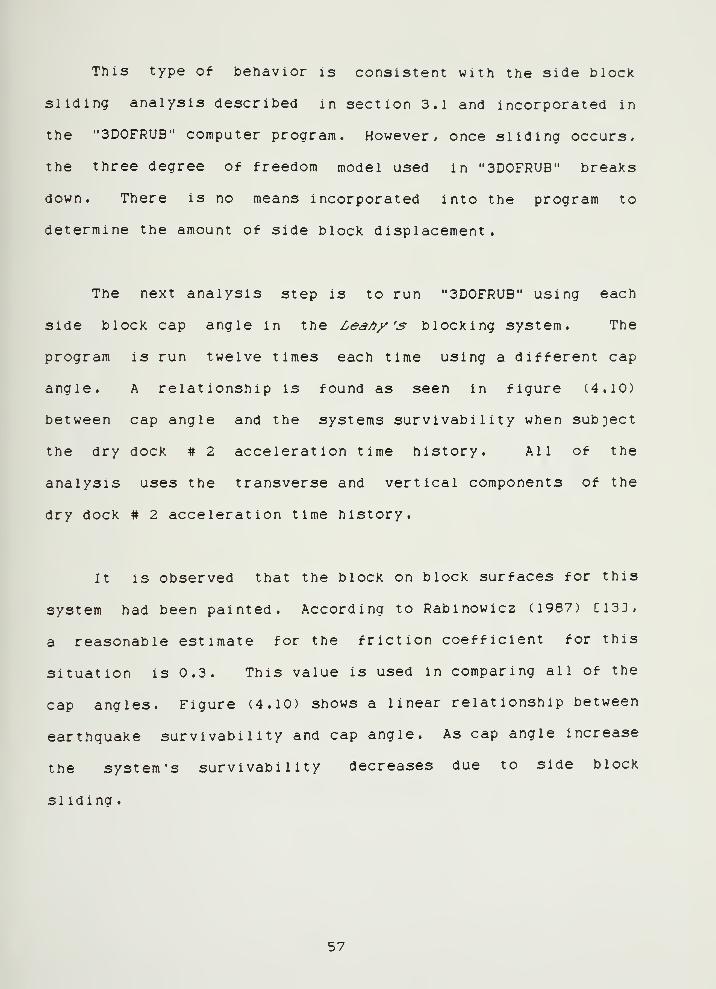
This type of behavior is consistent with the side block
sliding analysis described in section 3.1 and incorporated in
the "3D0FRUB" computer program. However, once sliding occurs,
the three degree of freedom model used in "3D0FRUB" breaks
down. There is no means incorporated into the program to
determine the amount of side block displacement.
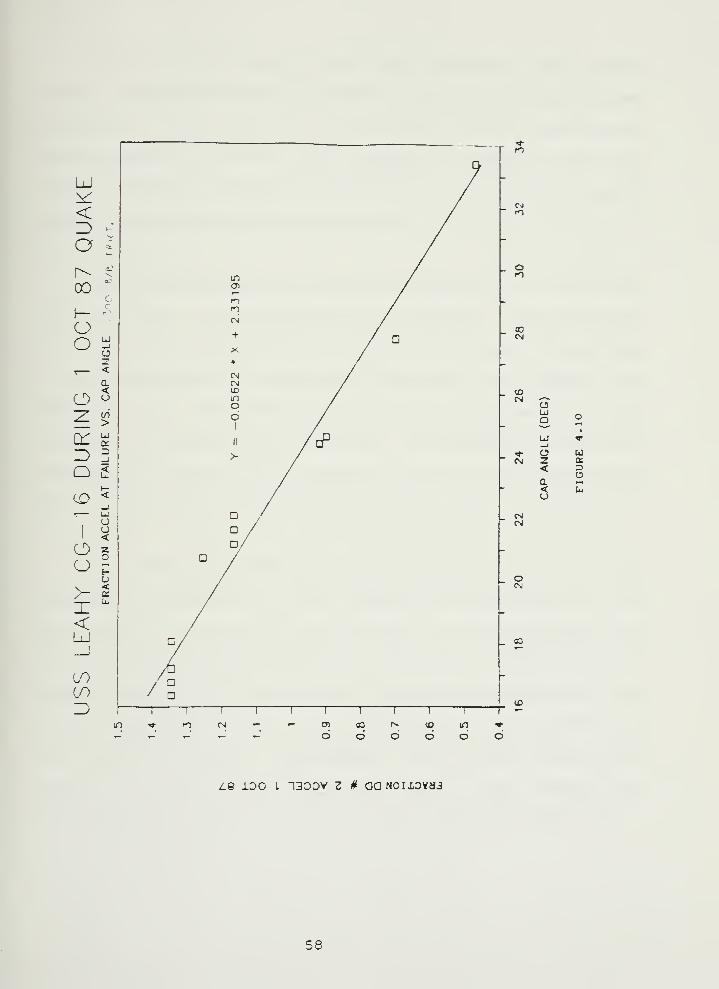
The next analysis step is to run "3D0FRUB" using each
side block cap angle in the Lea/iy 's blocking system. The
program is run twelve times each time using a different cap
angle. A relationship is found as seen in figure (4.10)
between cap angle and the systems survivability when subject
the dry dock # 2 acceleration time history. All of the
analysis uses the transverse and vertical components of the
dry dock # 2 acceleration time history.
It is observed that the block on block surfaces for this
system had been painted. According to Rabinowicz (1987) C13:,
a reasonable estimate for the friction coefficient for this
situation is 0.3. This value is used in comparing all of the
cap angles. Figure (4.10) shows a linear relationship between
earthquake survivability and cap angle. As cap angle increase
the system's survivability decreases due to side block
si idina .
57

K)
00CM
«3r>J O
o o
u ^_)
»*- o ufSI z ce
<a< (uo
CNCM
oCM
_ 03
(D
zie iDo L 130DV z # aaNoiiovaj
58

Figure (4.10) predicts that the following side blocks
would slide when subject to the dry dock # 2 acceleration time
history: (15, 14, 13, 7, 12, 6, 1, 4). All of these blocks
were observed to slide. Side blocks are numbered from the
stern forward. Blocks 14 and 15 are the farthest blocks
forward on the port and starboard side.
The program predicts failure ranging from 47 to 117 % of
the dry dock # 2 acceleration time history. The side block
systems which are predicted to fail at the lowest acceleration
time histories were those side blocks with the highest cap
angles. This correlates very well with observed side block
sliding failures on the i/SS Lea/}y, A spreadsheet including a
regression analysis of the observed side block displacements
for the (/SS Lea/iys blocking system is included in Appendix 3.
The model predicts side block sliding failure as the
primary failure mode for the C/SS Lea/iy sysXev\ subiect to the
dry dock # 2 acceleration time history. This is precisely the
actual system failure observed. The model also predicts that
side block liftoff is the primary failure for side blocks with
small cap angles. Again, this is consistent with observations
of the side blocks. The observed variations in the data as
seen in figure (4.9) could be due to such factors a.3
frictional and material variations among the side block piers.
59
I
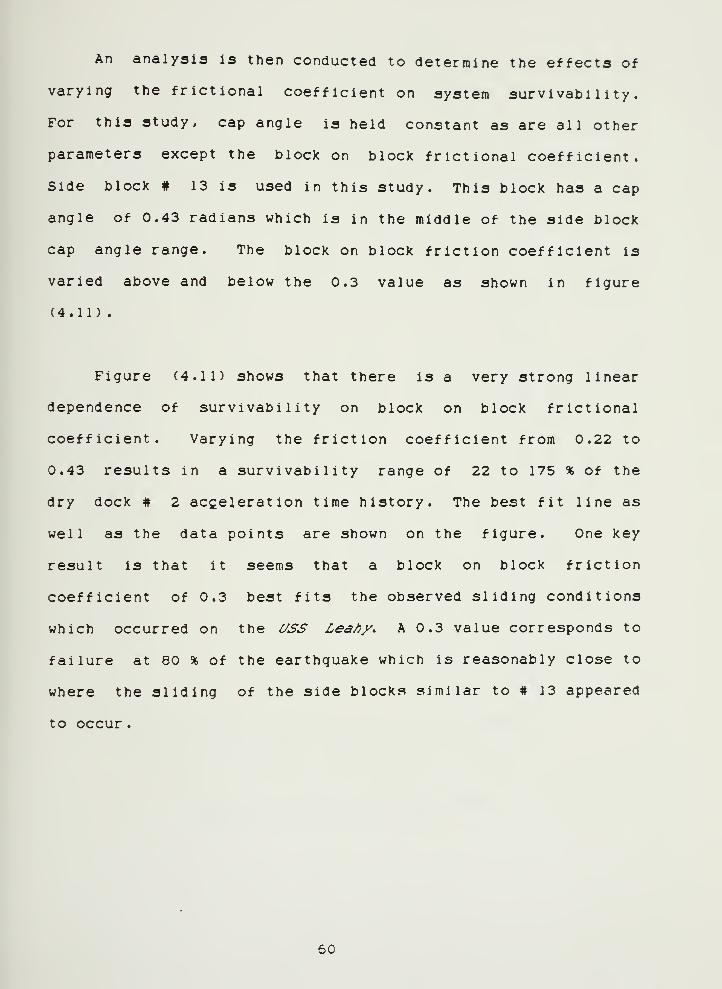
An analysis is then conducted to determine the effects of
varying the frictional coefficient on system survivability.
For this study, cap angle is held constant as are all other
parameters except the block on block frictional coefficient.
Side block # 13 is used in this study. This block has a cap
angle of 0.43 radians which is in the middle of the side block
cap angle range. The block on block friction coefficient is
varied above and below the 0.3 value as shown in figure
(4.11) .
Figure (4.11) shows that there is a very strong linear
dependence of survivability on block on block frictional
coefficient. Varying the friction coefficient from 0.22 to
0.43 results in a survivability range of 22 to 175 % of the
dry dock t 2 acceleration time history. The best fit line as
well as the data points are shown on the figure. One key
result is that it seems that a block on block friction
coefficient of 0.3 best fits the observed sliding conditions
which occurred on the 6/SS Lea/}x> A 0.3 value corresponds to
failure at 80 % of the earthquake which is reasonably close to
where the sliding of the side blocks similar to # 13 appeared
to occur.
60

Oo
n u rnO tt_i 3m o
m o [u
daom
3amivj IV isiH 3>Nii ^aa jo iDovNoixovaj
61

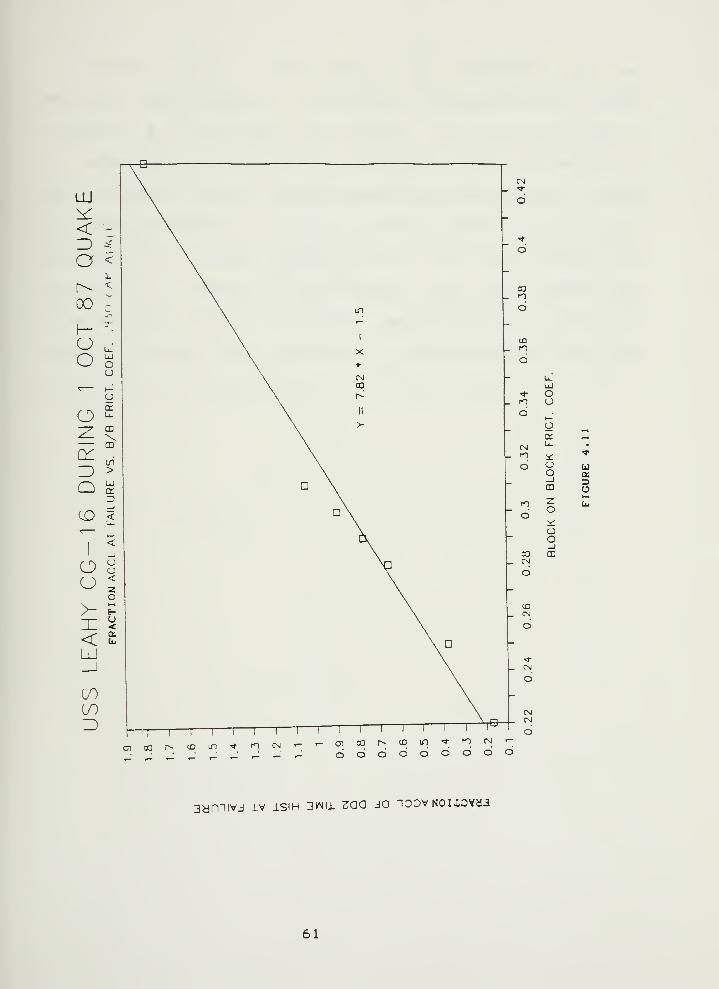
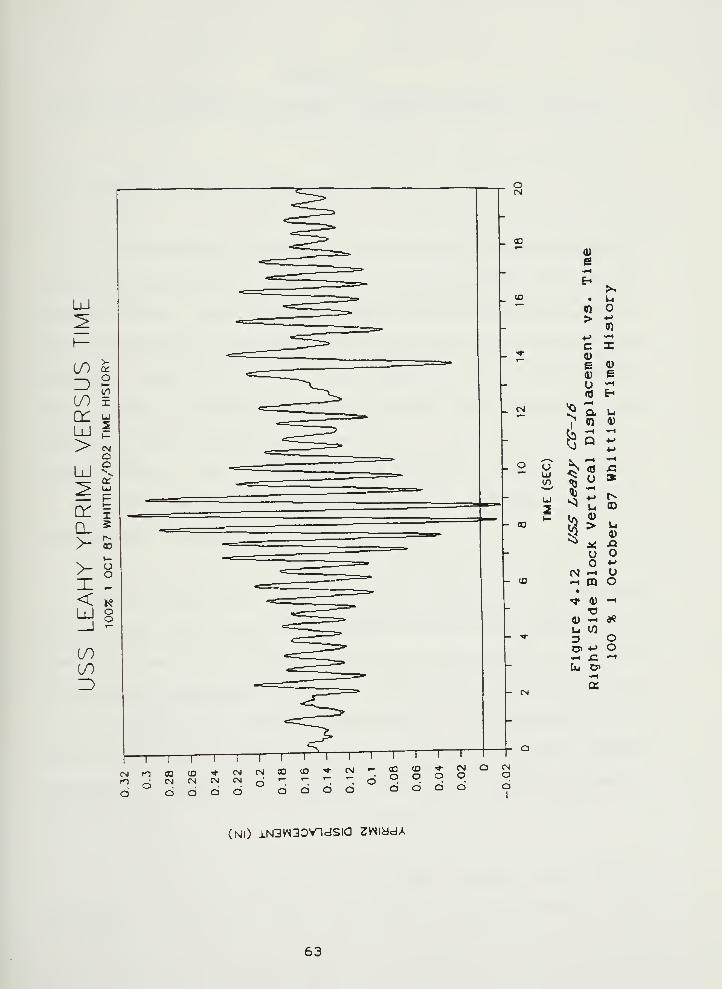
Figure (4.12) is the output from "3D0FRUB" for the
vertical displacement of the Lea/^y 's starboard side blocks
(assuming # 13 cap angle and height) during the earthquake.
It shows that slight liftoff does occur about 8 seconds into
the earthquake where the displacements become negative. This
also correlates well with the observed slight liftoff which
occurred. A typical "3D0FRUB" output run is included in
Appendix 3. Based on these results, the three degree of
freedom model and the "3D0FRUB" computer program appear to
correctly reflect the behavior of an actual drydock blocking
system including the effects of side block geometry.
62

4)e»H
t^>s
• Un>•!-» •^
c I0)
£ 0)
0) £u ••-•
<0 H
14)
^ Q »->
c? KF^
CUJ
^ U 3•fH
UJ
24->
^-
1
0)
>
u Oo 4J
(M fH U•—
1
OQ o^ 0) •—
I
0) •^ a>e
u t/1
a ocy 4-> o•^ x: <-l
Cm o>
(Ni) iN3W30>ndSia zwiydA
63

CHAPTER 5
WALE SHORE, ISOLATOR, AND BLOCK STIFFNESS/GEOMETRY VARIATIONPARAMETRIC STUDIES
5 . Parametric Study Descripti on
It has already been seen that present U.S. Navy drydock
blocking systems are inadequate to resist expected earthquake
accelerations. Some potential new materials such as rubber
caps and dynamic isolators look promising in correcting this
problem. Many other design improvements including the use of
wale shores, stiffening the side blocks, and widening the
blocking system base show potential. In order to explore
these possibilities and establish a feel for the design space,
a series of parametric studies using the "3D0FRUB" computer
program are conducted.
Due to the high number of runs expected to accomplish
this study, the Naval Sea Systems Command main frame (VAX)
computer was used. This reduced the run time of "3D0FRUB"
from several minutes to seconds. The system portability built
into the "3D0FRUB" source code allows it to be recompiled for
use on the VAX computer with very few minor changes. These
parametric studies took several days and involved several
hundred runs.
In order to determine the design space, wale shore
stiffness and side block and keel block horizontal and
64
vertical stiffnesses inputs to "3D0FRUB" are varied. These
values are not related to any particular existing or potential
blocking system. These values are input directly into the
program without first being produced by the stiffness
spreadsheets. Submarine drydock blocking system # 1 is used
as a baseline for these studies. In all cases except for the
study of systems with wale shores and 1 inch rubber block caps
(system 50 series), a linear material analysis is used. The
1940 El Centro earthquake acceleration time history used by
Hepburn CID is used throughout this parametric study. For
several of these studies, the effect of doubling the keel
block widths is Investigated.
5 . 1 Paramet ric Stu d y Result s
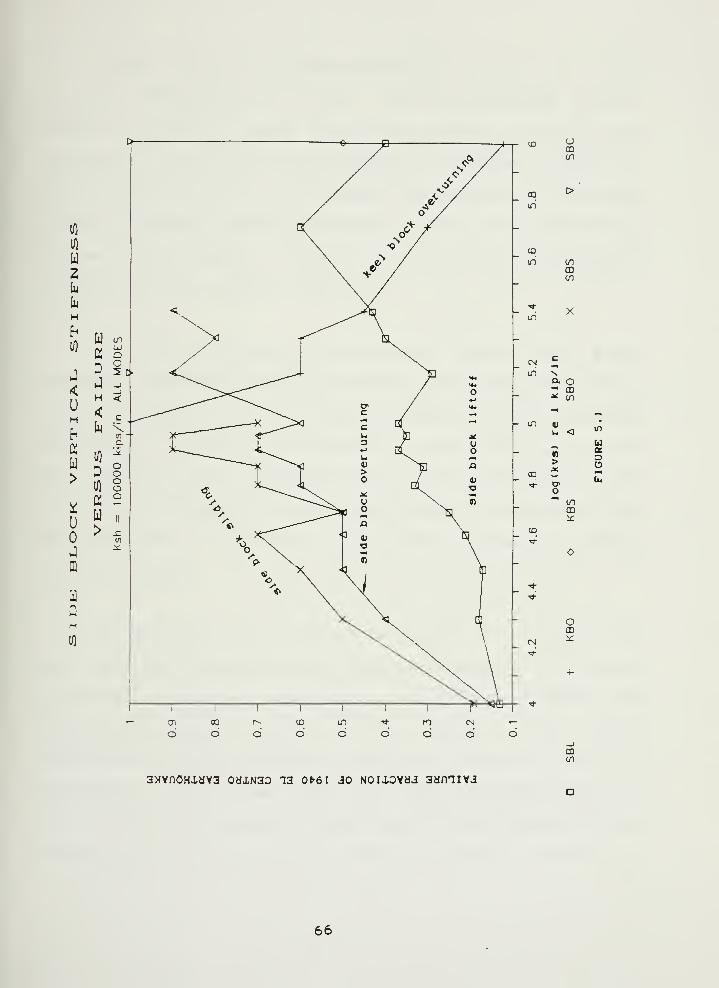
The results of system # 1 vertical side block stiffness
variations on failure due to the 1940 El Centro earthquake is
shown in figure (5.1). Log(kvs) with respect to 1 kip/in is
plotted against failure fraction of the earthquake. For each
stiffness, failure fractions due to all failure modes present
are plotted. The primary failure modes for this system are
side block liftoff, keel block overturning, side block
overturning, and side block sliding. For this particular
study, side block horizontal stiffness is held constant at
100,000 kips/in.
65
u2\^
M
b
<
b
>
u
Jm
uH
10
aCDcn
00
in
CO
in
ih
CSJ
CD
CNJ~
in \Q. O- CD^ en
u <
oenCD
OCD
u=»o
3MYnOHiaY3 oaxN3o 13 0fr6i 30 Noixovaj samiYJ
in
66

Since all failure modes are shown in figure (5.1), their
relative dominance can be seen. The curve showing overall
system failure for each stiffness consists of the lines
connecting the bottom failure modes in the figure. Therefore,
the modes of failure which dominate this system are side block
liftoff and keel block overturning. Side block liftoff is
dominant from log(kvs) = 4 to 5.4, and keel block overturning
is dominant from log(kvs) = 5.4 to 6.
The best survivability attained by varying side block
vertical stiffness is 40 % of the El Centre earthquake. While
there is some promise in increasing side block vertical
stiffness, it is still not possible to meet the 0.2 g criteria
by increasing this stiffness alone. Also, the horizontal and
vertical stiffnesses required are extremely high and may not
be practically obtainable in an actual submarine drydock
blocking system.
Another key factor evident in figure (5.1) is that side
and keel block overturning are important issues. As stiffness
increases, side block overturning and sliding become less
important; however, above 100,000 kips/in keel block
overturning quickly becomes increasingly important until it
dominates. It is clear that any design strategy must take
into account both preventing side block liftoff and keel block
overturning. As one failure mode is eliminated, another will
67

come to dominate; therefore, a design strategy that overcomes
the various failure modes at the same time is required.
Figure (5.2) shows the results of varying side block
horizontal stiffness. In this case, kvs is held constant at
70,000 Kips/in while khs is varied. As shown in the figure,
keel block overturning is the dominant failure mode up to
log(khs) = 4.3 after which slide block liftoff became
dominant
.
Since the failure fraction reaches a plateau at log (khs)
= 4.6 up to 5, this appears to be an upper design limit for
horizontal stiffness above which little increase in
survivability occurs. From these and other parametric studies
it is found that for optimal survivability, both horizontal
and vertical side block stiffness have to be increased
together. Again, this shows that a parallel design effort is
required. Varying one parameter alone does not result in a
successful design.
Results of using wale shores of various stiffnesses on
system # 1 survivability are shown in figure (5.3). Rapid
improvements in system survivability occur as wale shore
stiffness is increased. To prevent the occurrence of keel
block overturning, double width keel blocks are used in this
study
.
68
«
NH
k
2
0)
nn
in
Uq:
CM r- m"^ f^ X
ai enCM CM CM
UD iT) •*
CM C^J CM
O d O d
n CM •- CMCM CM CM _;
(71 00 r^ CD in
d d d d d
axvnOHiava oaiNao la 0^6 r jo Noixovaa aairiiva
69
<71 00 r- CD in * m CNi
O o O O o o o o
(D
Um01
CD(n
oc OD•»^ (nv.
a (nOJ *^
m X< »n
'^ u4)
q:
o
nX
'^ O CD:£.
oCD
CD
axYnOHiava oaxN30 i3 o^et io NOiiovai admivj
70
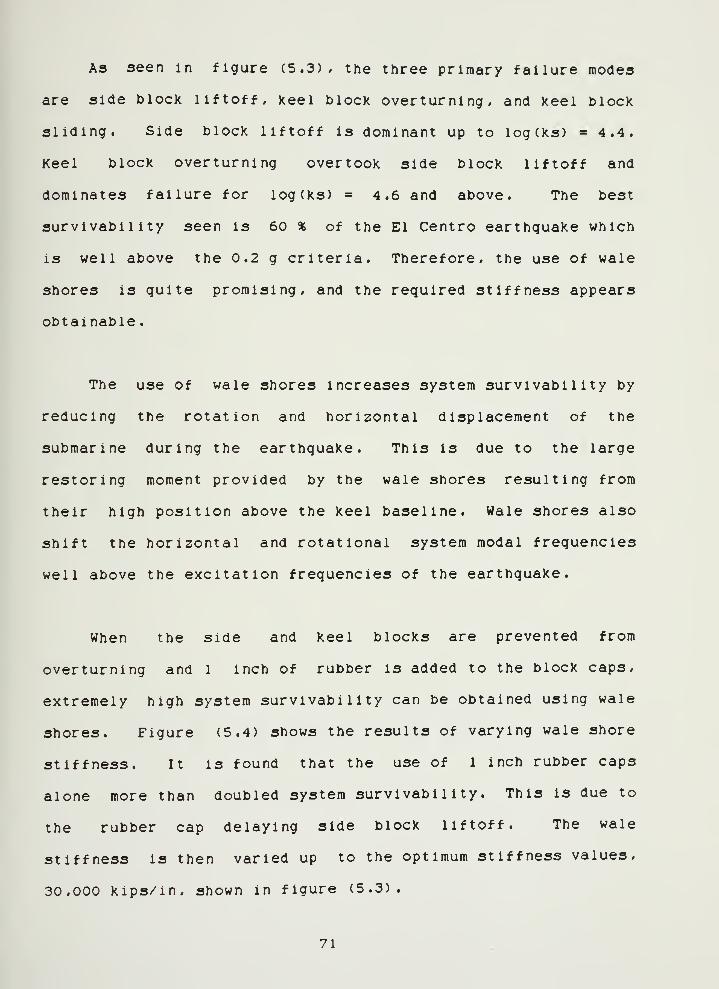
As seen in figure (5.3)/ the three primary failure modes
are side block liftoff, keel block overturning, and keel block
sliding. Side block liftoff is dominant up to log(ks) = 4.4.
Keel block overturning overtook side block liftoff and
dominates failure for log(ks) = 4.6 and above. The best
survivability seen is 60 * of the El Centre earthquake which
is well above the 0.2 g criteria. Therefore, the use of wale
shores is quite promising, and the required stiffness appears
obtainable.
The use of wale shores increases system survivability by
reducing the rotation and horizontal displacement of the
submarine during the earthquake. This is due to the large
restoring moment provided by the wale shores resulting from
their high position above the keel baseline. Wale shores also
shift the horizontal and rotational system modal frequencies
well above the excitation frequencies of the earthquake.
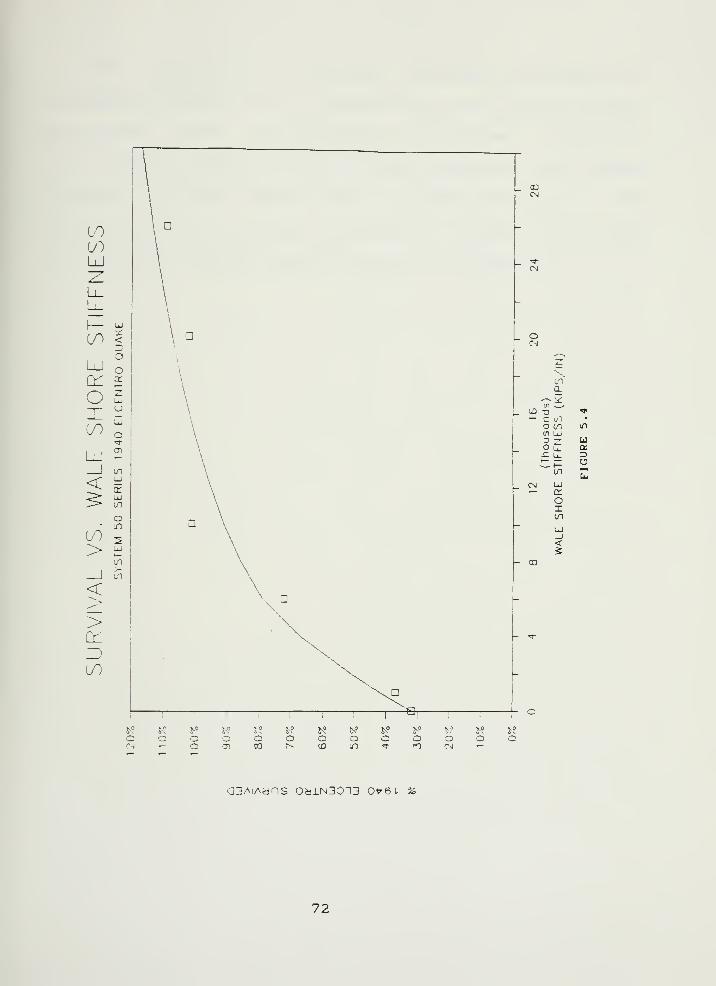
When the side and keel blocks are prevented from
overturning and 1 inch of rubber is added to the block caps,
extremely high system survivability can be obtained using wale
shores. Figure (5.4) shows the results of varying wale shore
stiffness. It is found that the use of 1 inch rubber caps
alone more than doubled system survivability. This is due to
the rubber cap delaying side block liftoff. The wale
stiffness is then varied up to the optimum stiffness values,
30,000 kips/in, shown in figure (5.3).
71

CO
UJ
(yO <
<
oo
<
{/)
o1^
—!— "-J
00 ;
on
o
\n
CM
_ O
-Bt
tnQ.
,~, Ven
oD "a'- c u1
c 0-;
OT UJDo Li.n Ii
t—t—(/I
CM LiJ
Ct
oX(n
UJ_)<5
ao
^? y? 5-° 5-? ^? V? !N^ )Ns« JN°KO r} JN°
o ^^ -^ O o c o O o o ar-1 — o Ti 00 r-~ U3 in •f m Csl •—
J-?
aSAiAidOS oaiN30~i3 ovet %
72

By increasing the wale shore stiffnesses, survivability
increased quickly up to about 80 % of the El Centre
earthquake. After this magnitude of earthquake, increasing
wale shore stiffness gave diminishing returns. This study
indicates that wale shores are a viable solution to the
submarine drydock blocking survivability problem. Details of
the wale shore design solution are given in chapter 8.
73

CHAPTER 6
DRYDOCK BLOCKING SYSTEM SURVIVAL COMPARISONS AND SITE SPECIFICEFFECTS
6 . Drydock Blocking System Sur viva l Comparisons
The eleven submarine drydock blocking systems analyzed by
Hepburn C13, Sigman C23 , and Karr C33 are again analyzed in
this thesis to determine the effect of including the geometric
modifications described in chapter 3. The "3D0FRUB" computer
program is run using the 1940 El Centre earthquake
acceleration time history and data files describing each of
the eleven systems. For purposes of comparison, the eleven
systems are modeled as linear-elastic. The bilinear system
data files used by Hepburn ClD are modified by setting CD's
equal to zero and setting the plastic stiffness values equal
to the elastic values.
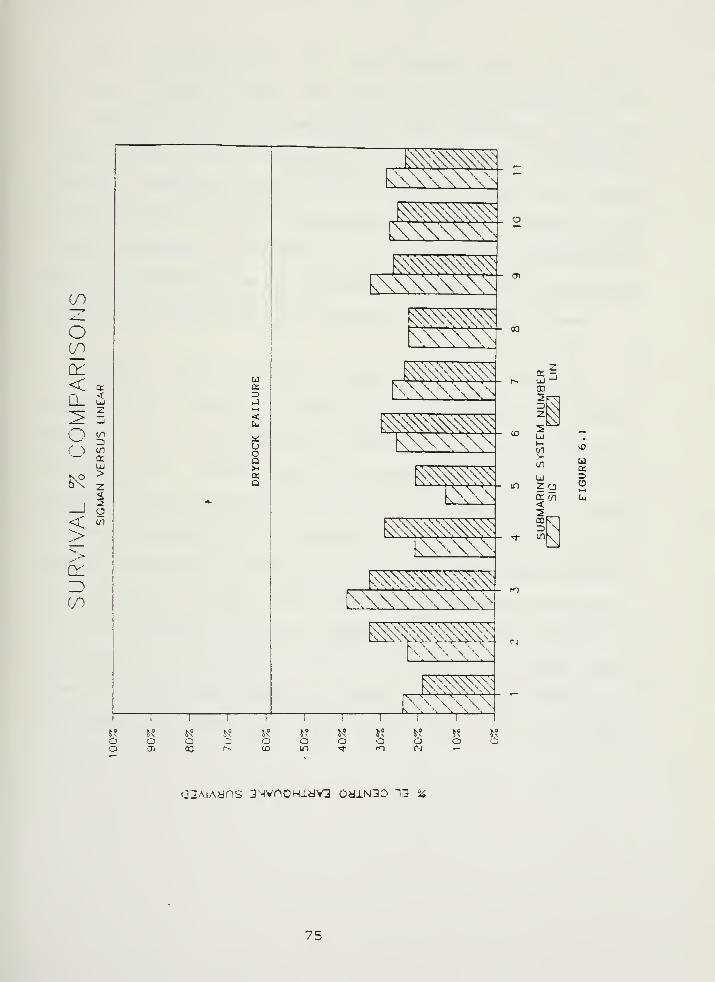
Figure (6.1) is a plot comparing the survivability of
Sigman 's C2D eleven submarine systems to the linear systems.
The purpose of this comparison is to determine what effect the
side block buildup angle (alpha), side block cap angle (beta),
and side block wedge effect has on system survivability. The
figure shows that the geometric effects has little impact on
overall system survivability. In some cases survivability is
improved, and in other cases it is decreased.
74

kW'WWW- 00
^^^^t^ ^ \ ^ \ \ ^
b;^^
b^x.
\\\ \ \
v
R^^^"^:=^3^^7^l::
\ '\ \\
s? 5? ^? .K° 5? 5-? ^» il J-? ^t ^?o o o ._) o O O o O o Jo '7i oa r-- iD ul t n C) T-
in
K)
iin
uzocr 1/1
<
uZ)o
03.AIA>dnS 3.MVnOHldV3 OdlN3D 13 %
75

The average value for survivability for all eleven
systems is 26 % for both the linear and Sigman analyses. This
is not surprising since submarines have relatively low side
block heights above baseline and low cap angles. Therefore,
Sigman 's assumption that submarines have zero side block
height above baseline is reasonable. However, as seen by the
Lea/}x case study in chapter 4, the geometric modifications
made to "3D0FRUB" become important in the case of surface
ships due to high side block heights and large cap angles.
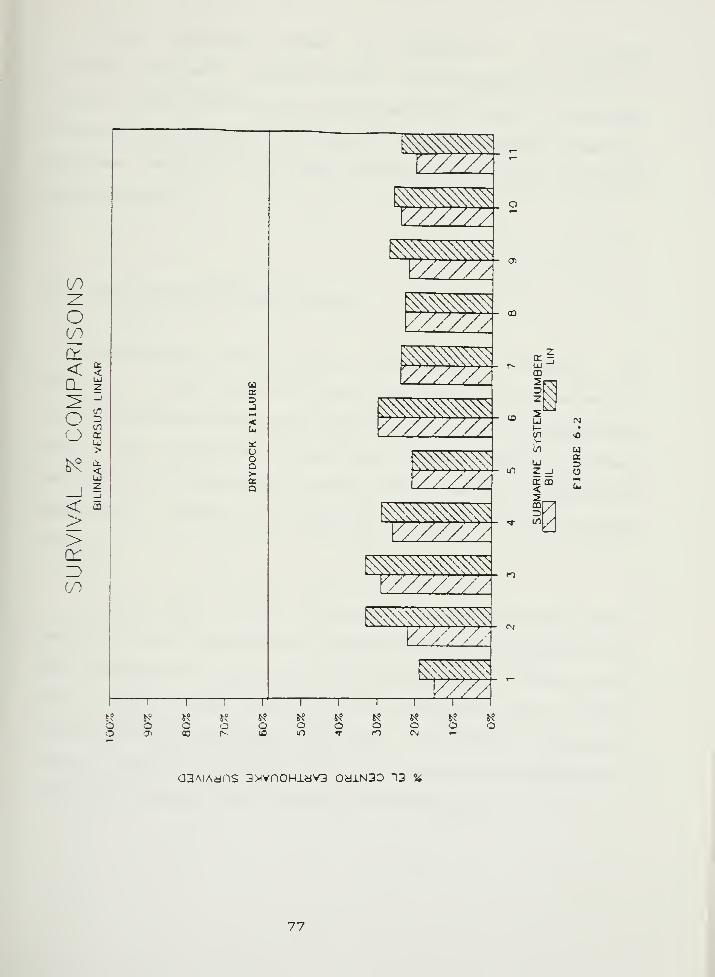
Figure (6.2) is a plot comparing the survivability of
Hepburn's [ID eleven bilinear submarine systems to the linear
systems. In this comparison there is a clear difference in
survivability between the two studies. Overall, linear
systems survive a higher earthquake percentage (26 %) than
bilinear systems (23 %) . There is no case where the bilinear
systems survive a larger earthquake than the linear systems.
Systems 5, 6, 7, and 8 survive the same earthquake magnitude.
For these systems, large cap areas are present and the Douglas
fir caps do not undergo plastic deformation. In every other
case, the cap does plastically deform causing the Douglas fir
to incur permanent set thus causing earlier side block
liftoff .
76

I
vO
Uex.
oo
^» ^° 5? s? ^? K» K° ^? S^ ^^ ^?Q o O o o o O o O O oo <7> 00 ^• (O UT f r^ CSJ 1—
o^AiAdns 3><vnoHiav2 oyiN3D i3 %
77
This comparison shows that Hepburn's ClD bilinear
analysis was more conservative by approximately 10 percent.
The bilinear analysis is a more cumbersome method. The linear
method can be used to approach an adequate design, then the
bilinear method can be used to fine tune the design to assure
survivabi lity
.
6 . 1 Earthquake Site Specificity
Earthquakes differ widely in magnitude, frequency, and
duration. Their effect on local structures is also dependent
on the immediate geological characteristics of the surrounding
area. For this reason, using the 1940 El Centro earthquake
acceleration time history alone is not considered adequate to
develop a satisfactory submarine drydock blocking system
design
.
In the case of the 1 October 1987 Whittier earthquake,
measured ground acceleration varied tremendously depending on
the distance and direction from the epicenter. In addition,
some areas further away from the epicenter felt larger
accelerations than closer locations. Appendix 4 contains a
report from the California Division of Mines and Geology C9D
regarding the data from the Whittier earthquake .
78
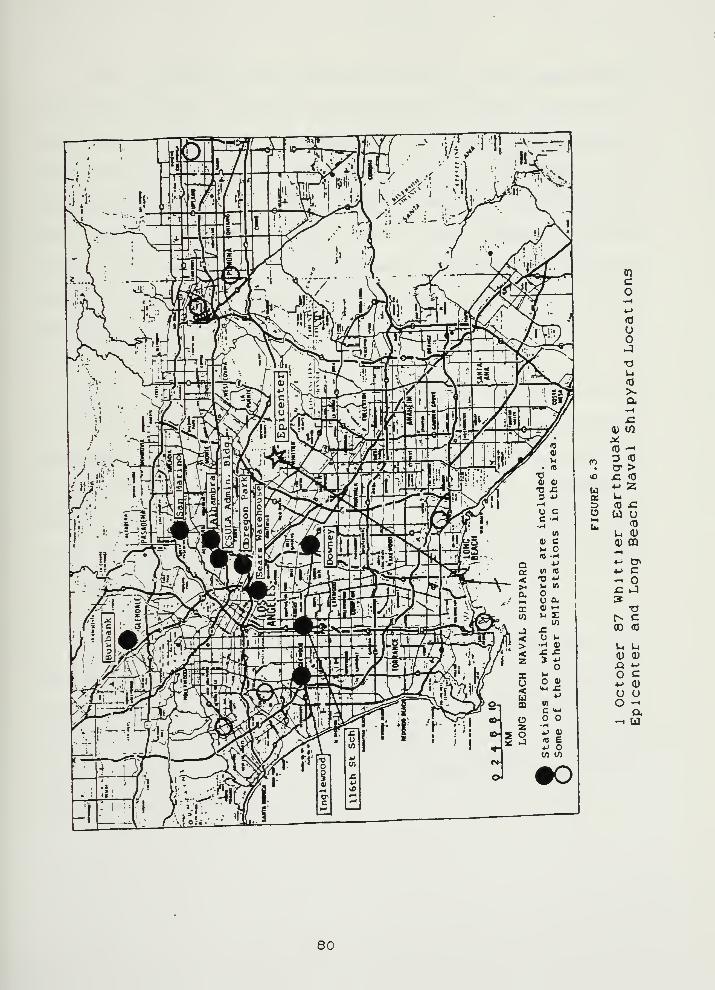
The frequency spectrum of the recorded ground
accelerations also depend on local geological conditions [93
C14:. Dry dock # 2 at Long Beach Naval Shipyard, where
accelerations were measured, is located approximately 20 miles
from the epicenter of the Whittier earthquake C15D. Figure
(6.3) is a map produced by the California Division of Mines
and Geology C9: which shows the locations of the epicenter and
Long Beach Naval Shipyard. The ground acceleration was
reduced from 0.45 g 's peak acceleration near the epicenter to
0.052 g's peak in dry dock # 2.
In addition the dominant frequency of the earthquake was
reduced from approximately 2 HZ near the epicenter to near 1
HZ in dry dock #2. Mr. Lew from the Naval Civil Engineering
Laboratory C14D stated that this reduction in frequency was
not unique to the dry dock. This frequency was experienced
throughout the Los Angeles harbor area.
Mr. Lew C14] stated that dry dock # 2 is sitting on an
aquifer which exhibits dynamic characteristics similar to a
solid. Along the sides of the dry dock is a layer of solid
material rising approximately 10 feet above the aquifer. A 30
foot deep hydraulic layer exists above this solid material.
Above this is a compacted land fill layer. This combination
of geological properties around the dry dock contributes to
the relatively low ground acceleration frequencies
experienced
.
79

I
1^
uKD
in
co••H
4->
<a
uo
•ou<o
>.a
0) w(D -^
cr >
4-> 2U
Cd U
L. (1)
0) m*^ ty<
^ c-i O
t^ c
0) 0)
£1 -M
O C
u uo -^
a-1 u
80

I
The geological conditions which exist at Long Beach Naval
Shipyard are very similar to conditions at other graving dock
locations. Lew C14: also stated that Mare Island Naval
Shipyard's can withstand a maximum of 0.26 g's before the
construction joints of the dry dock give-way. This value is
used as the "dry dock failure" level in this thesis. Mr. Lew
stated that the dry docks at Long Beach probably have the same
design limitation. The dry docks at both these locations are
very similar in construction.
The Nuclear Regulatory Commission requires that
earthquake acceleration time histories used in structural
analysis incorporate the actual vertical and horizontal
acceleration components when available. Otherwise,
statistically independent vertical and horizontal acceleration
time histories must be used with the vertical being two-thirds
the magnitude of the horizontal component C16D.
For dry dock # 2 acceleration time histories, both the
vertical and horizontal components were available. Figures
(6.4) and (6.5) are the acceleration time histories in the
horizontal and vertical directions respectively. These two
plots show that the two components do substantially differ in
magnitude and frequency content.
81

^
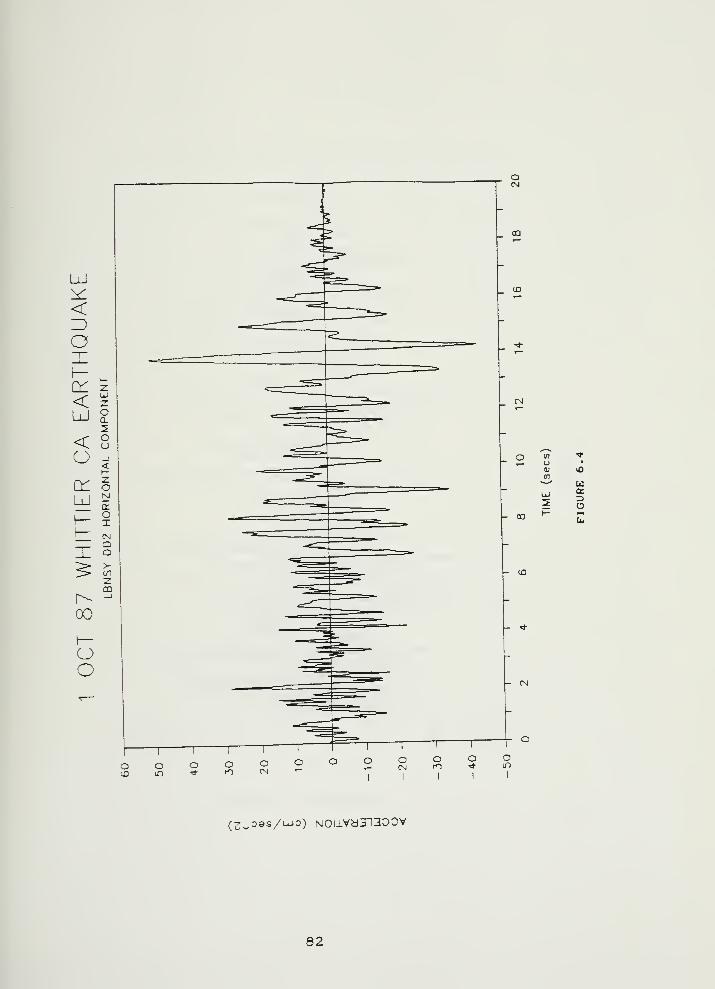
03
n in •<r
u •
01 «otn
~—
'
uUJ a5 3
- 03
n o o Q
1 1 11
(3^oss/Luo) N0llVy3n300V
82

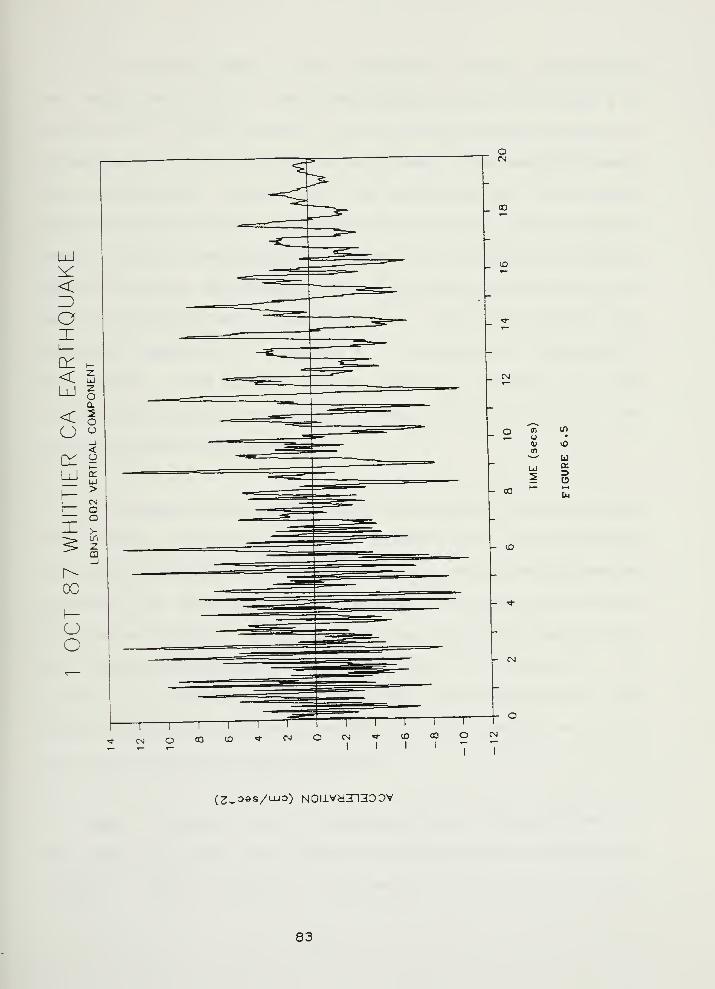
ua.z>o
(3^Dss/LU=>) N0llVy3n300V
83
In order to make a valid comparison between the effects
of using the 1940 El Centro earthquake and the dry dock # 2
acceleration time histories, the dry dock's accelerations are
normalized to the El Centro 's magnitudes. The energy content
of an earthquake depends on the magnitude of Its ground
displacements and the earthquake duration C17D. The amount of
energy that an earthquake imparts to a structural system
depends on the earthquake's frequency content relative to the
natural frequencies of the structure. It also depends on
relative impedance or mobility of the structure relative to
the ground. The Richter scale, which is measure of the
earthquake's energy, is based primarily on the log of the
earthquake peak displacement.
To normalize the dry dock # 2 earthquake, the first step
is to make the two earthquakes' acceleration time histories
the same duration, 20 seconds. The El Centro earthquake is
truncated by using the first 20 seconds, the most violent part
of the earthquake. The dry dock # 2 acceleration time history
was originally approvi mately 16 seconds in duration. To
create a 20 second duration, the last four seconds of the
record is multiplied by an exponential decay factor and added
on to the end of the existing record.
Next, the dry dock # 2 accelerations are normalized to
the same magnitude of El Centro by multiplying by a factor of
10.97. This factor is obtained by dividing the peak
84
displacement of the El Centre earthquake (14.61 cm) by the
peak displacement of the dry dock # 2 earthquake (1.33 cm).
Figure (6.6) shows the 1940 El Centre earthquake
acceleration time history and the normalized dry dock # 2
acceleration time history. it is clear from these plots that
the excitation frequency of the normalized earthquake is much
lower than that of the El Centre. These two earthquake
acceleration time histories are used in this thesis for system
design development .
It is clear from previous analysis that both a low
stiffness design approach using isolators and a high stiffness
design approach using wale shores are both viable. Using a
higher frequency -^earthquake like the El Centre is a more
conservative approach for a high stiffness design. Similarly
a lower frequency earthquake like the normalized dry dock # 2
accelerations is a more conservative approach for a low
stiffness design.
Figures (6.7) and (6.8) are the response (or shock)
spectra for the dry dock # 2 and the 1940 El Centre C7D
acceleration time history respectively. These figures shew
the dominant frequencies of these earthquakes. El Centre's
dominant frequency is approximately 2 HZ for the 5 % damping
case used in this thesis. For dry dock M 2 this dominant
frequency is approximately 1 HZ again using 5 % damping.
85
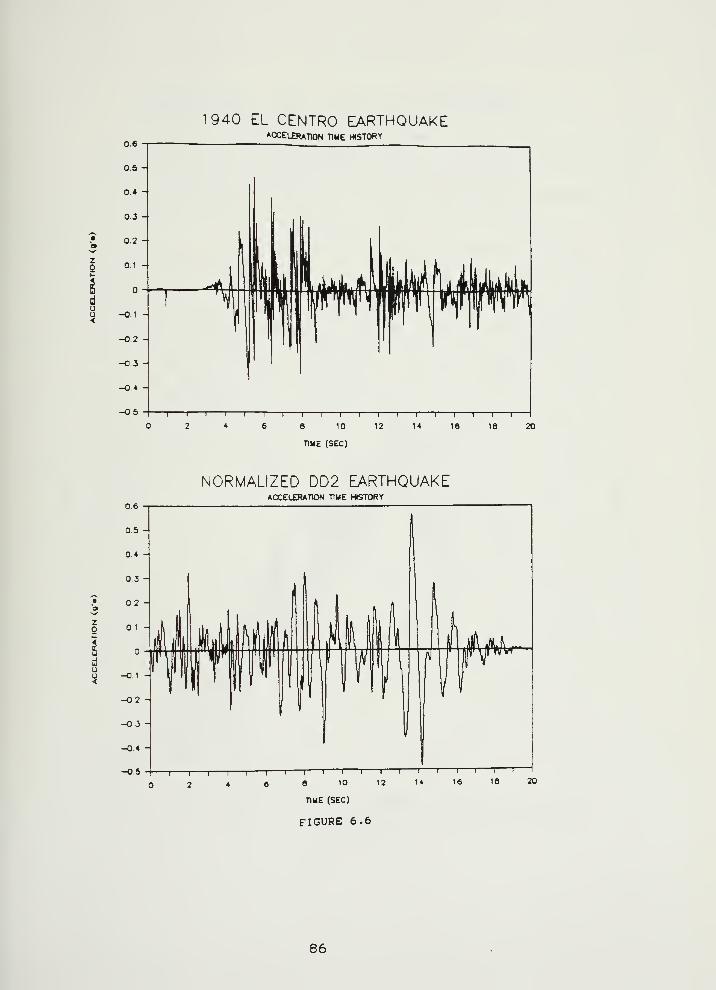
0.6
1940 EL CENTRO EARTHQUAKEACCELERATION TIME HISTOWY
0.5 -
0.4 -
0.3 -
0.2 -
0.1 -
-0.1 -
-0.2 -
-0.3 -
-0.4 -
-05I I I I I I p
2 4 6 8
1 1 1 1 1 1 1 1 1 1 T10 12 14 16 18 20
TIME (SEC)
NORMALIZED DD2 EARTHQUAKE
0.6ACCELERATION TIME HISTORY
86
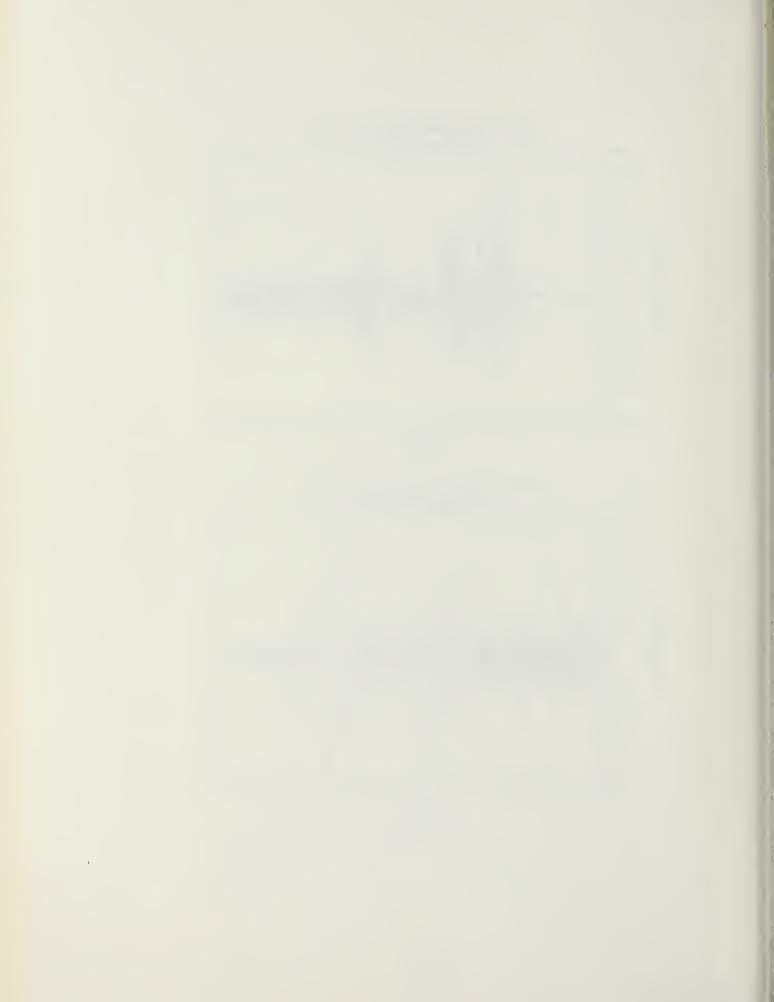
RESPONSE AND FOURIER SPECTRAUHITTIER EARTHQUAKE OCT (Z)l. 1981 -1MM2 GMT
lllDD2ae 87.iei.B COMP TRf^N
0D2 LBNSY
'ACCELEROGRAM IS BAND-PflSS rFLTERED BETWEEN .300- . saa AND 2S. 00-27. 00 CYC/SEC.
DAMPING VALUES ARE 0, 2. S. tO i 20 » or CRITICAL
RESPONSE SPECTRA: PSV.PSA i SD roUfifER AMPLITUDE SPECTRUM: fS
FREQUENCY - HZ
10 -
u
>COCL
FIGURE 6.7
87
^
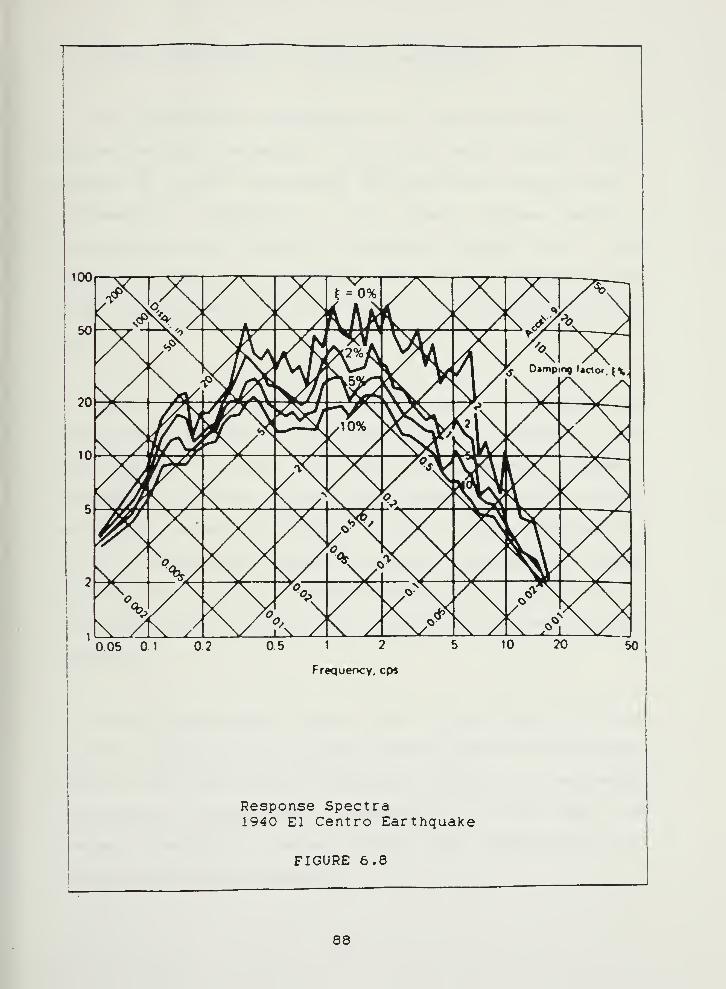
100
50-
20
10
p<?<AA
^A<J
v"«> Damp
^M^\//10%^Kc>(y<
^fs() <?<?^. /^^ <f\,
? AAV x/\A\ A\ /
X. ^ok<>^ 5\ ,''\>05 0.1 02 0.5 1 2 5
Frequency, cps
10 20 50
Response Spectra1940 El Centre Earthquake
FIGURE 6.8
88
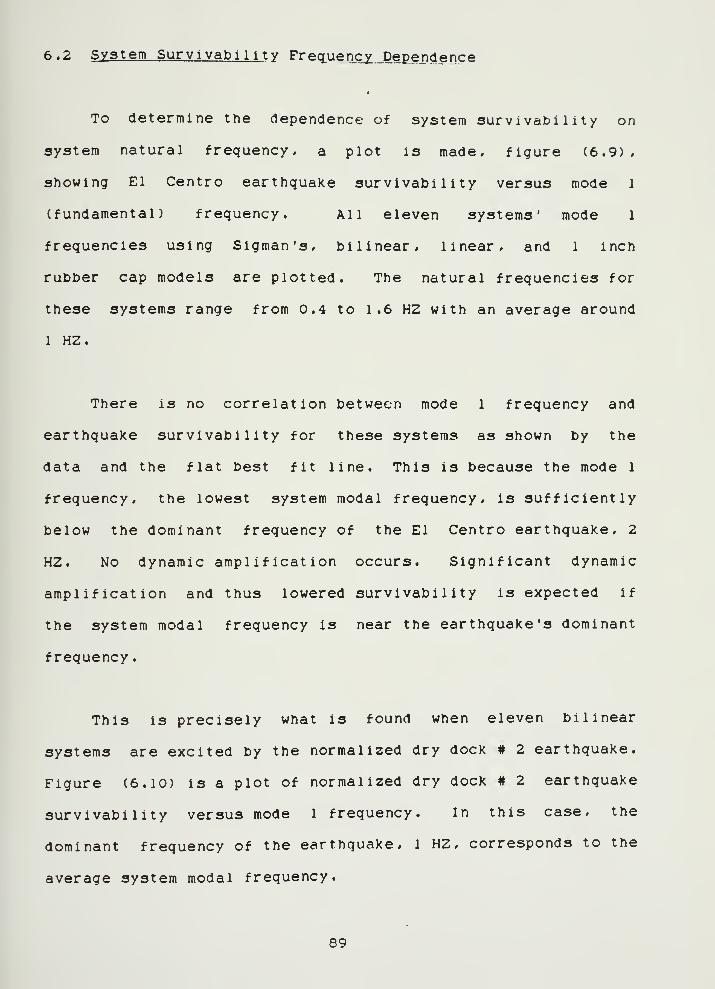
6.2 System Survivabilit y Freq_uencx _DeELen<lence
To determine the dependence of system survivability on
system natural frequency, a plot is made, figure (6.9),
showing El Centre earthquake survivability versus mode 1
(fundamental) frequency. All eleven systems' mode 1
frequencies using Sigman's, bilinear, linear, and 1 inch
rubber cap models are plotted. The natural frequencies for
these systems range from 0.4 to 1.6 HZ with an average around
1 HZ.
There is no correlation between mode 1 frequency and
earthquake survivability for these systems as shown by the
data and the flat best fit line. This is because the mode 1
frequency, the lowest system modal frequency, is sufficiently
below the dominant frequency of the El Centro earthquake, 2
HZ. No dynamic amplification occurs. Significant dynamic
amplification and thus lowered survivability is expected if
the system modal frequency is near the earthquake's dominant
frequency
.
This is precisely what is found when eleven bilinear
systems are excited by the normalized dry dock # 2 earthquake.
Figure (6.10) is a plot of normalized dry dock # 2 earthquake
survivability versus mode 1 frequency. In this case, the
dominant frequency of the earthquake, 1 HZ, corresponds to the
average system modal frequency.
89

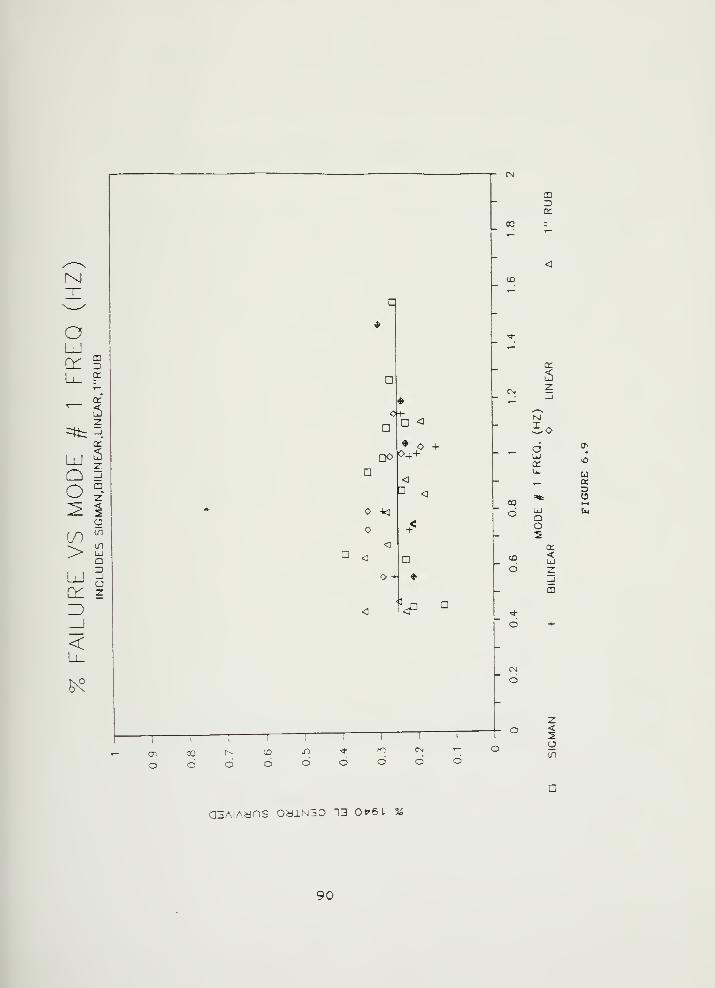
CD3
00
tr
6z_J
d (j>
<o
L>. u>-
=*; OOJ
o Qo
Cu
CD <UJ
O 2
•<^
o -1-
CM
d
o(/I
a^AiAans oaiN30 13 ov6l %
90

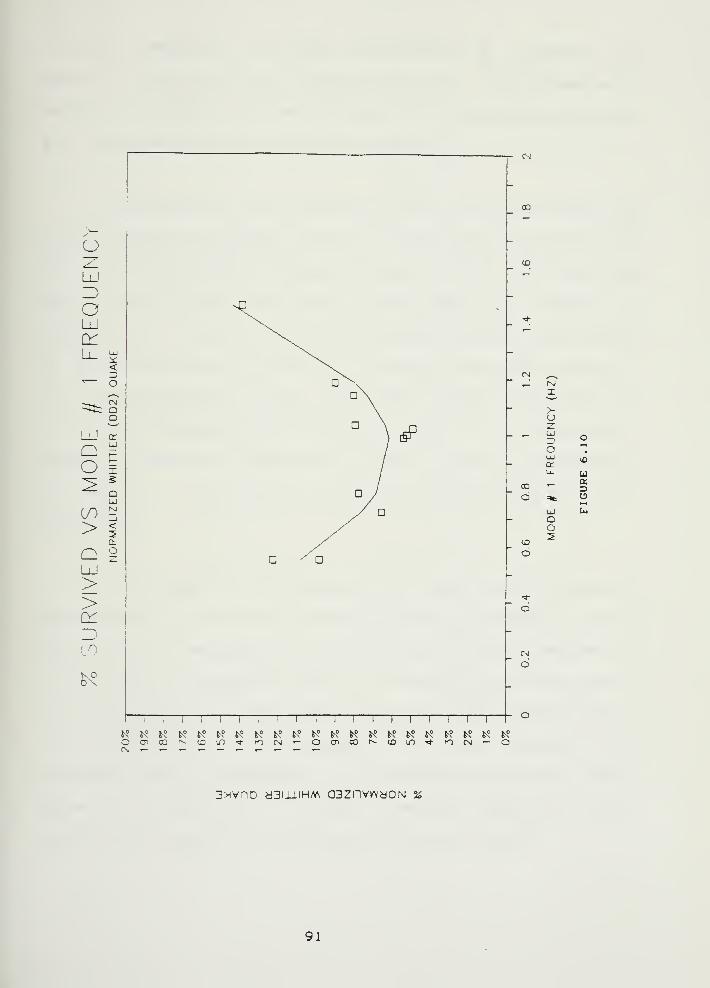
00
CNI ^^
I
>•
oz.
'"-J
oO
LlJ>o
cru. Cd
aj ' 3o =«fc o
bJ U4
Qo2
<u
O
CM
d
oCNJ
^ ^^ ^ J^ t? ^oi 00 r-- CD in <*
K° K° fr? ^? ^? N» K« ^° ^? K° K» t? K« K°rO CNJ >— o ai 03 r- 03 in * Kl CSJ •^ o
3>ivno a3iiiiHM a^znvkNdON %
91

A clear dependence of system survivability on frequency is
shown in the figure by the best fit curve. The systems with
natural frequencies closest to that of the normalized dry dock
# 2 earthquake has the lowest survivability.
A comparison of the survivability of the eleven submarine
drydock blocking systems due to El Centro and normalized dry
dock # 2 earthquakes is shown in figure (6.11). The data for
this figure as well as other comparisons is included in
Appendix 4. This figure clearly illustrates the degradation
of system survivability due to resonant frequency effects.
All eleven systems fail at much lower levels when excited by
the lower frequency normalized dry dock # 2 earthquake.
Overall, system survivability is about 8 % for the normalized
dry dock # 2 earthquake compared with 23 % for the El Centro
earthquake.
It is important to emphasis that these low survivability
percentages for submarine drydock blocking systems are based
on an actual earthquake acceleration time history measured in
a U.S. Naval shipyard dry dock. The validity of this problem
is confirmed by the C/SS Lea/iy ca.3^ study where a current U.S.
Navy ship drydock blocking system failed when subject to a
relatively small earthquake (0.05 g peak acceleration). This
shows the importance of taking frequency dependence into
account when designing an earthquake resistant system.
92
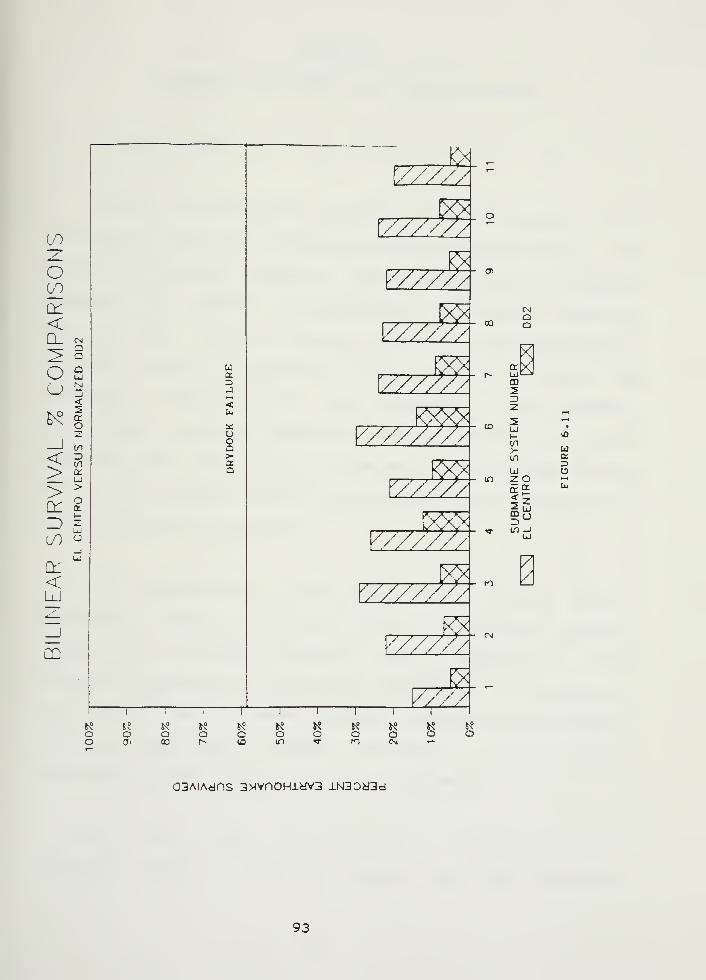
^? 5-? S^ t? ^; ^? ^? ^? ^« J? ^°
o o o o o o o o o O oo <Ti 00 1^ (O in ^ n CM "-
a>
00
in
CSJ
QO
Rtr XUJ L_i
CD
23Z
^^
5 »^
Ld•
t- oVI uUl a.
z>Ld oZf^ H-t
1?Ui
-i III^O(T) -J
a3AiAdns 3MvnoHiav3 iN3Dy3d
93
I
CHAPTER 7
ISOLATOR AND RUBBER LOW -STIFFNESS DESIGN
7.0 Design Process
Dynamic isolators and rubber caps either singly or in
combination are very attractive potential solutions to the
submarine drydock blocking system survivability problem.
Hepburn Ci: studied the properties of Dynamic Isolation
Systems Inc. (D.I.S.) dynamic isolators and developed a
bilinear model to describe their behavior. Using the
"3D0FRUB" program with the "BILINALL" and "RUBBER"
subroutines, a design study of a blocking system with D.I.S.
isolators and rubber caps is undertaken. The purpose of this
study is to find a low stiffness system which survives up to
dry dock failure (0.26 g 's) .
The first step in the study is to install D.I.S.
isolators in place of the oak layer in submarine blocking
system # 1, the SSBN 616 system used by Hepburn Ci:. The
isolator parameters are the same as Hepburn's. In addition,
one inch of natural rubber is added to the top of the Douglas
fir cap. The 1940 El Centre earthquake is the exciting
earthquake for the initial portion of this study.
The first result is unexpected. Using the D.I.S.
isolators without a rubber cap, Hepburn found that the system
94
survives 35 % of the earthquake. With one inch rubber cap
without isolators, system # 1 survives 32 %, it was expected
that the combination would increase survivability. Actually
it is found that this combination resulted in lower (20%)
survivabi 1 ity
.
In general, this decrease is due to the effect of
multiple modes of vibration. By using either 1 inch rubber
caps or D.I.S. isolators singly, the system's mode 1 frequency
is driven well below the fundamental frequency of the El
Centre Earthquake. At the same time, the system's mode 2
frequency is driven lower but still remains well above the
earthquakes fundamental frequency.
By combining the rubber and isolators, the mode 1
frequency is driven very low, but the mode 2 frequency is
driven into resonance. From this it became clear that to
develop a successful design, both the mode 1 and 2 system
frequencies must be driven well below resonance without
driving mode 3 into resonance. While mode 1 and 2 are
coupled, mode 1 is primarily the system's rotation, and mode 2
is primarily horizontal displacement. Mode 3 is the system's
vertical displacement.
Using "3D0FRUB" , several runs are made with progressively
less horizontally stiff isolators. To reduce horizontal
stiffness the values of khs, khk , khsp, kkhp , and the
95

associated QD values are decreased. Figure (7.1) is plot of
the 1 inch rubber cap/isolator system survivability versus
mode 2 frequency. The figure shows that as the systems
frequency and horizontal stiffness is decreased, system
survivability increases dramatically. The mode 2 frequency is
being driven below the earthquakes fundamental frequency.
Figure (7.1) shows that the system survives a 0.26 g
earthquake, however, the horizontal stiffness required is
reduced by 60 % from the original rubber/isolator horizontal
stiffness. To actually construct a system with this
horizontal stiffness would require isolators with extremely
low horizontal stiffness. These isolators may be impractical
to fabricate.
To allow the isolators to have higher horizontal
stiffness the effects of using thicker rubber caps is
explored. Figure (7.2) is a comparison of system
survivability using various rubber cap thicknesses. The use
of 3 inches of rubber does not significantly shift the
survivability curve toward higher stiffnesses. Therefore, the
use of 6 inch rubber caps is investigated. Six inches is
considered the practical thickness limit. Rubber caps thicker
than this would tend to be vulnerable to wind loads, but the
wind load problem is not investigated in this thesis.
96

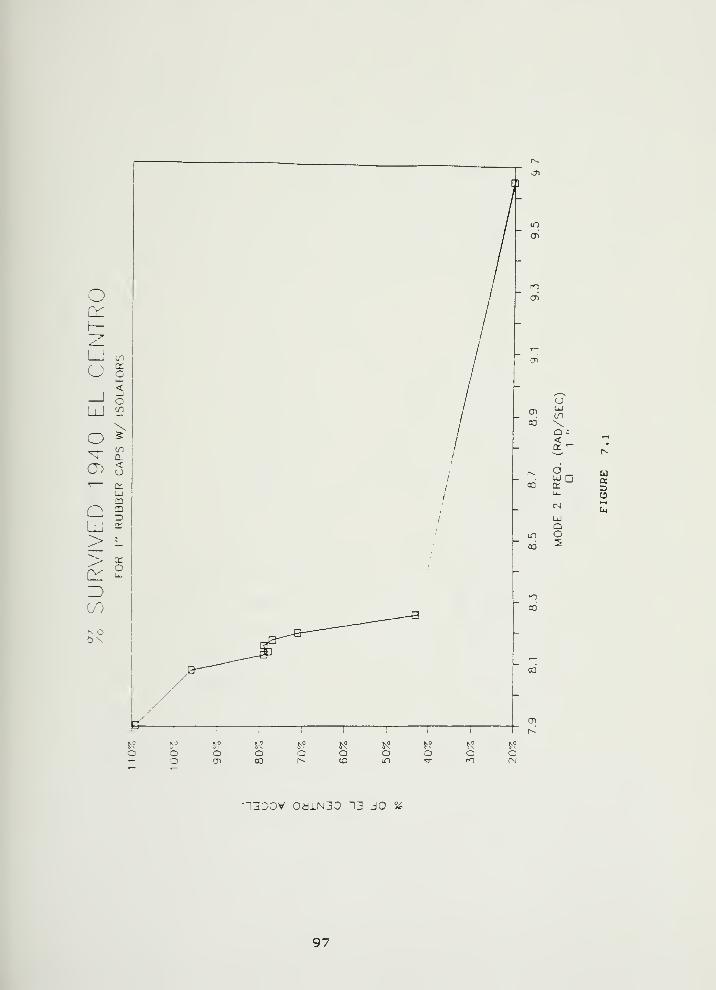
a00\Q :
<
OCL
QO
uq:=)o
•1300V 0dlN30 13 JO %
97

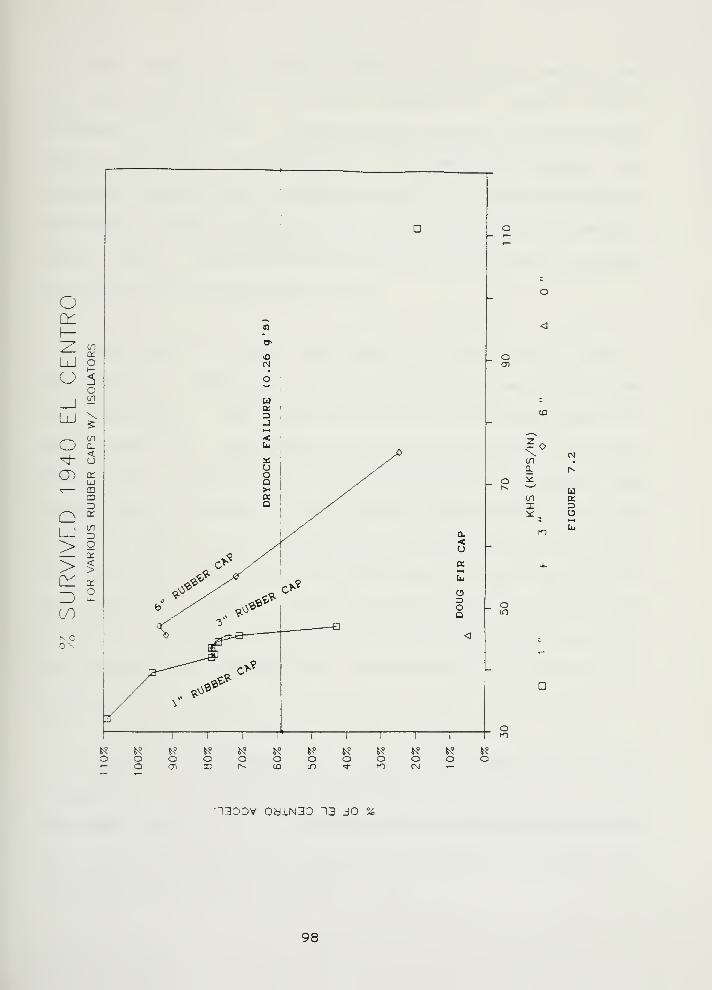
o
CO
.-o\ rgenQ. (^
n ^1^ '
'
Uen q:X 3it o
•n30DV 0a.LN30 13 JO %
98

The use of six inches of rubber significantly shifts the
survivability curve to the right as seen in figure (7.2).
Therefore, six inches is selected for the final low stiffness
design solution. Figure (7.3) is a comparison between the
various rubber cap thicknesses for a given horizontal
stiffness. This shows the additional benefits of the use of
rubber caps. Increasing the thickness of the rubber improves
survivability by preventing liftoff.
The use of at least one inch of rubber cap is vital.
Survivability ^umps from 5% to 70% with the use of just one
inch of rubber. The side block horizontal stiffness used for
the figure (7.3) comparison is the final design stiffness
used. The figure shows that if the rubber cap is removed the
system would survive a much smaller earthquake than the
original system # 1. However, the rubber caps alone cannot
provide a low enough horizontal stiffness to survive up to dry
dock failure. The final low stiffness solution using the 1940
El Centro earthquake survives 72 % (0.32 g's). The data file
and output from "3D0FRUB" for this solution is included in
Appendix 5.
Since the normalized dry dock # 2 earthquake has a lower
fundamental frequency, this earthquake is used to test the low
stiffness solution. It is found that the horizontal stiffness
has to be decreased even further for the system to survive the
0.26 g dry dock survival level.
99

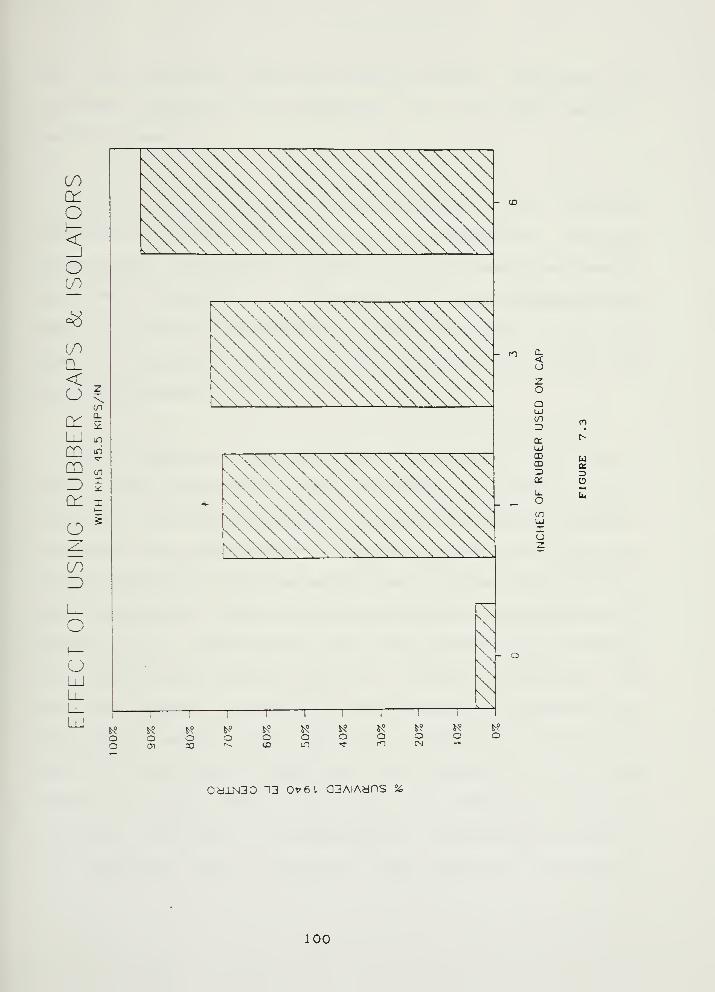
O<oif)
CL<O
(jn
C^CL
it:
1 1
1
in
m in
n) on
Z) Xc^ I
o
CO
O
o
oo
o5^ooo
o
Q.<a
oQUlcn3
CDmncr
Ll.
OenLUXo
\
o otn
o o o O o
uCE
C3
OaiN30 13 OVSL QBAIAanS %
:oo

The final survival level is 0.28 g's (63%). This new low
stiffness solution is recommended if the rubber/isolator
method is used.
From this solution, the parameters of the required
individual dynamic isolators has to be determined. This is
accomplished by using the blocking pier stiffness spreadsheets
included in Appendix 5. These are the same spreadsheets as
used to calculate the blocking pier stiffnesses. They are
used to calculate the individual isolator properties by
working backwards.
The isolators' parameters are determined as follows.
First, the spreadsheet for determining blocking pier
horizontal stiffness is used. Knowing the pier's overall
stiffness and dimensions and knowing the properties of all the
other layers, the only parameter that could be varied to give
the proper total pier stiffness is the isolator's modulus of
elasticity, £, By varying i^until the correct pier stiffness
is obtained, the correct value of £ for the isolator is
obtained. Next, to determine the horizontal stiffness of an
individual isolator, all the other blocking pier layers are
made infinitely stiff except for the isolator. With the
isolator i'value known, the value of individual isolator
stiffness is given by the spreadsheet. This procedure is used
to determine first stiffness line (elastic) and second
101

stiffness line (plastic) isolator parameters for both the keel
and side block systems.
The QD values for the isolators are determined using the
following equation:
OD = XEL* (KU-KD) (7,1)
where
:
XEL is the elastic limit for the original isolator, used by
Hepburn Cl3,in inches.
QD is the restoring force intercept of the second stiffness
slope for the isolator.
KU is equal to the elastic stiffness of the isolator.
KD is equal to the plastic stiffness of the isolator.
Table 7,1 are the original isolator parameters used by
Hepburn C13. Using the same XEL values as the original
isolators the value of QD is determined by applying equation
(7.1) .
102

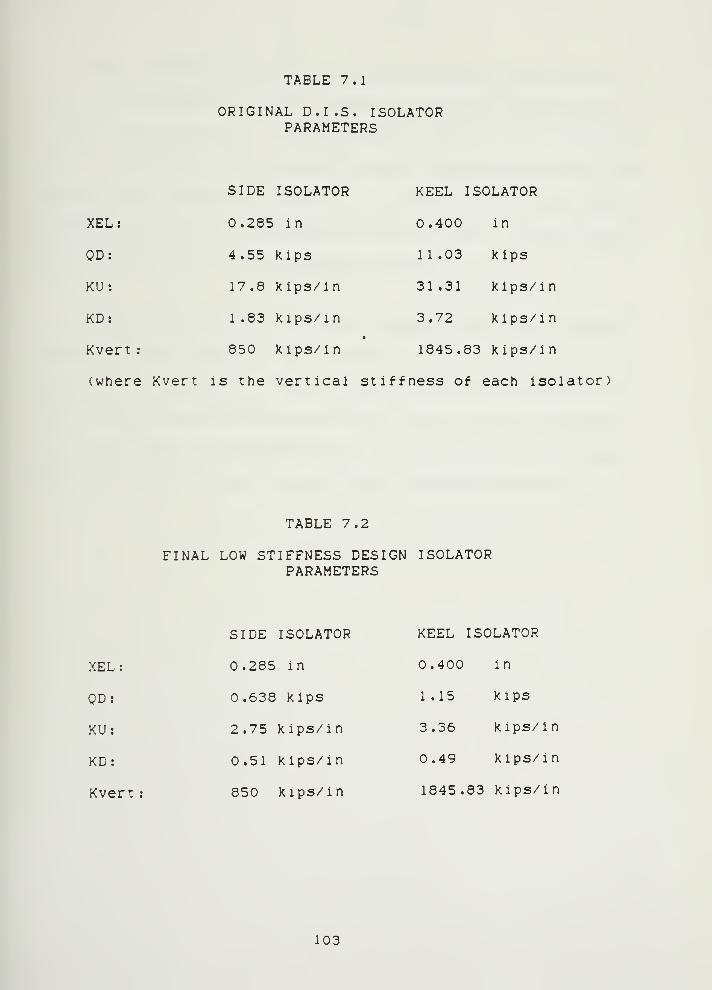
TABLE 7.1
ORIGINAL D.I.S. ISOLATORPARAMETERS
SIDE ISOLATOR KEEL ISOLATOR
XEL: 0.285 in 0.400 in
OD: 4.55 kips 11 .03 kips
KU: 17.8 kips/in 31.31 kips/in
KD: 1.83 kips/in 3.72 kips/in
Kvert : 850 kips/in 1845.83 kips/in
(where Kvert is the vertical stiffness of each isolator)
TABLE 7.2
FINAL LOW STIFFNESS DESIGN ISOLATORPARAMETERS
SIDE ISOLATOR KEEL ISOLATOR
XEL: 0.285 in 0.400 in
QD: 0.638 kips 1 .15 kips
KU: 2.75 kips/in 3.36 kips/in
KD: 0.51 kips/in 0.49 kips/in
Kvert: 850 kips/in 1845.83 kips/in
103
The manufacturer (D.I.S.) of the isolators was contacted
once the parameters of the required isolators were known.
D.I.S. Vice President for Engineering, Buckle [183, stated
that an isolator with these required parameters would be
impractical to build. However, he stated that an isolation
system of equivalent properties could be built using higher
stiffness isolators on every fourth block.
The blocks without isolators would have low friction
sliders which carry the vertical load and provide no
horizontal stiffness. These sliders would be coated with a
low friction material such as teflon. Such sliders, according
to Buckle, are used extensively in bridge isolation systems.
The final low stiffness solution does incorporate sliders.
104
7 . 1 Descr iption of the Low SLLf.f nessjSoiytJ.on
Figure (7.4) is a 2D drawing of the recommended low
stiffness submarine drydock blocking system solution. This
solution survives 63 % (0.28 g 's) of the normalized dry dock #
2 earthquake. The design includes the following features:
1. Isolators will be placed in every fourth keel and
side blocking pier. All other blocking piers will
contain sliders.
2. All keel and side block piers are rigidly attached
to the dry dock floor to prevent overturning.
3. A steel carriage is used to rigidly tie the caps
together transversely to prevent sliding. It also
ties the system together longitudinally so the
isolators provide a restoring force to entire
system
.
4. The steel carriage is only rigidly attached to the
blocking piers containing isolators. It is free to
slide on all other piers.
5. A 6" rubber cap is used on top of the steel carriage
to help prevent liftoff and to aid the isolators in
decoupling the submarine from ground acceleration.
105

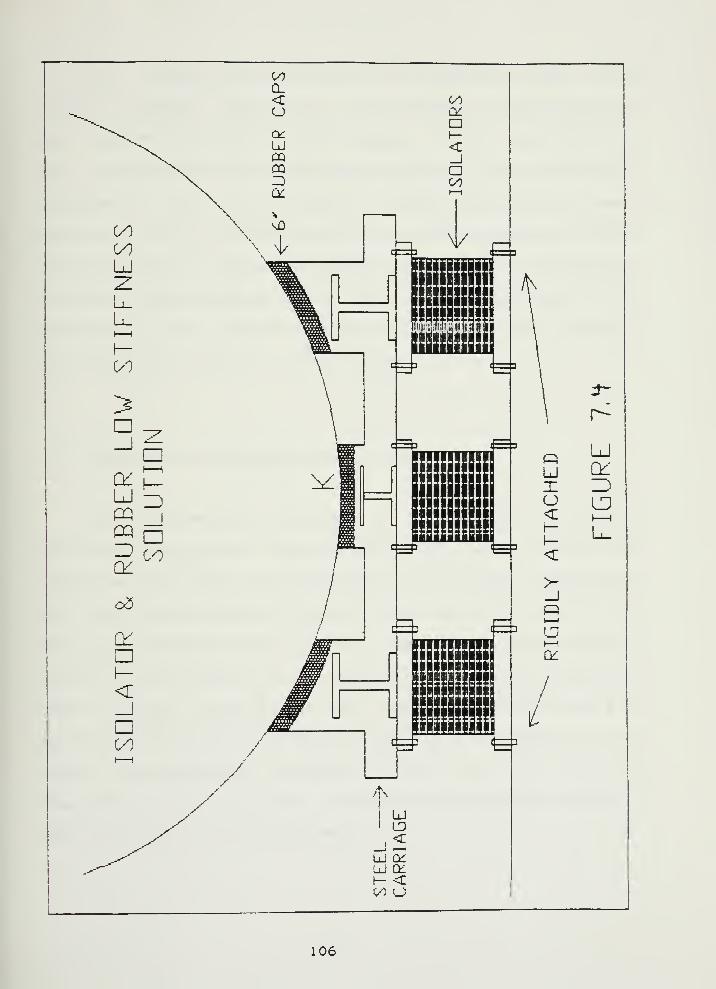
I—
I
106
The "3D0FRUB" program could not completely model this
system directly. Therefore, a few changes to the data file
are required to simulate this system. First, the keel and
side block widths are made extremely wide to simulate rigid
attachment. The block on block friction coefficient is made
extremely high to simulate the caps' rigid attachment to the
steel carriage. The model used has the isolators attached to
concrete blocks instead of to the dock floor; however, the
stiffness of the isolators is so low compared to the concrete
that this has no effect on the results.
7 . 2 Response of the Low Stiffness Sol utio n
The response plots analyzed in this section for the low
stiffness solution are due to excitation by 63 % of the
normalized dry dock # 2 earthquake. The natural frequencies
of the low stiffness solution are such that the lower
frequency normalized dry dock # 2 earthquake produced lower
levels of survivability, 63%, compared to the higher frequency
1940 El Centre earthquake, 72*. The normalized dry dock # 2
earthquake was used to produce the output plots because it had
lower frequencies and produced a lower level survivability;
therefore, it was the more conservative earthquake to use in
analyzing the low stiffness design.
107

Figure (7.5) is a plot of the Keel horizontal
displacement relative to the dry dock floor as a function of
time. This plot shows that the low stiffness solution has
very large horizontal relative displacements associated with
it. The maximum keel displacement seen in this figure, about
6 inches, is typical for base isolated structures according to
Buckle C18D. The displacements are large; however, they have
a low frequency and are smooth which means the submarine is
experiencing low velocities and accelerations. This
horizontal displacement response is extremely different from
that of the exciting acceleration shown in figure (6.6). This
illustrates the horizontal decoupling effect of the
rubber/isolator systems.
These low accelerations can be seen in the keel block
horizontal force versus time plot in figure (7.6). The high
stiffness solution discussed in chapter 8 has keel block
horizontal forces which are larger by an order of magnitude.
Figure (7.7) shows the rotational response of this system.
This figure is a plot of the systems rotation about the keel
versus time. This plot shows that the rotations are
relatively large, but smooth and low in frequency. This
response is also extremely different from that of the exciting
acceleration and shows the rotational decoupling of the
rubber/isolator system. However, figure (7.8) shows that the
vertical displacement is more closely coupled with the
earthquake's vertical acceleration (figure (6.5)).
108

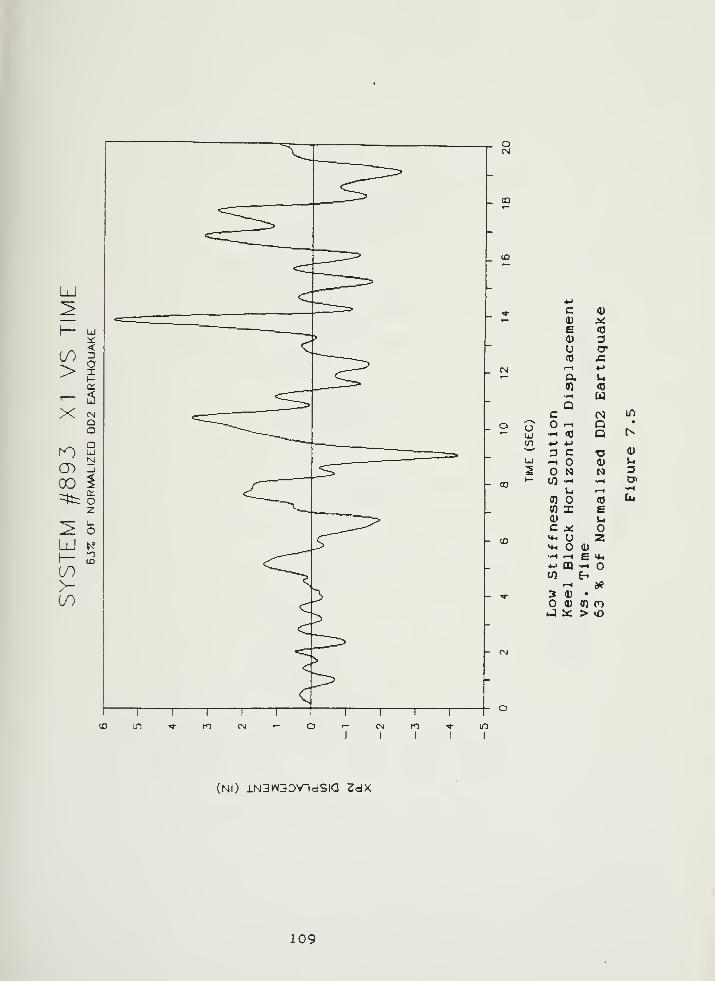
ou
c 0)
0) Xe <0
0) 3u CT<D x:^H *->
a u0) (0•^^ laQ
c N in
- Q •
•^ flU Q t^
••-> *->
3 C r3 (U
-1 0) uN N a
Ul - •^ o>
U f^ •^
CO <0 U4
CO X £0) uC MM- U z«*. 0)•fH ^H E »*<
'*-' QQ —I«/) E-
1—
1
ifi
3 0) •
0) (0 ooJ :»; > o
(NO lN3W3DV-ldSia ZdX
109
I
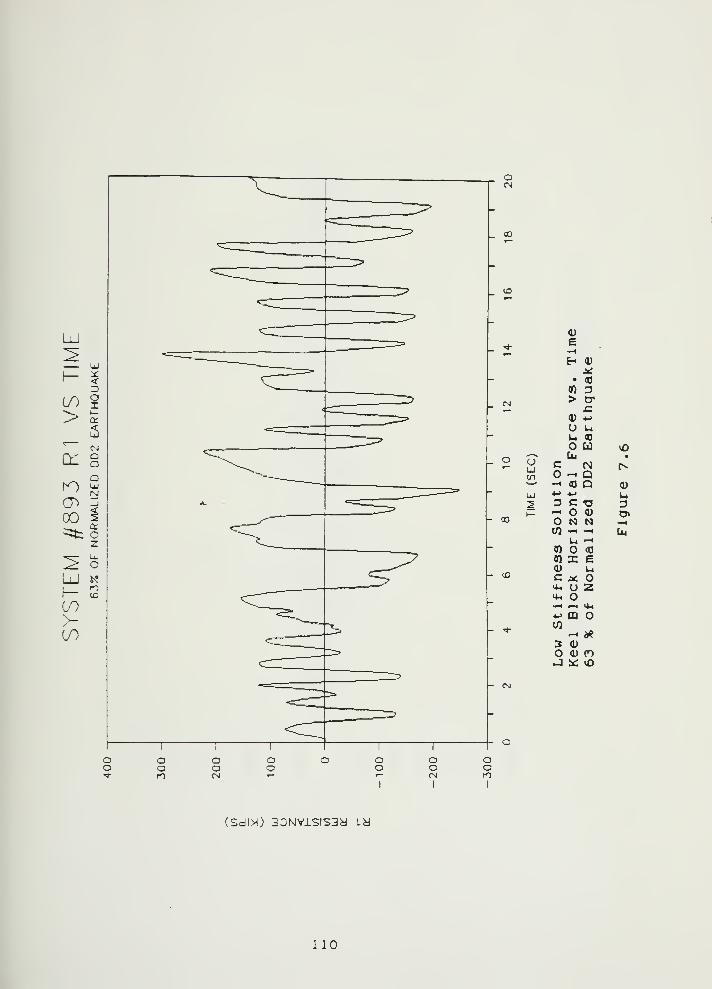
u
0)
s^E- 0)
X• <0
0) 3> cr
£:4) 4->
u uu to
o u "OCl4 •
c rg NO -H Q^ CO Q 4)4-> 4^ UiD C ^ 3-• (U rT>
O N N —
H
W « -H tuU -H
(0 o <0
n X £4) Ui
C X O«*^ O 2«^ o^ ^ *u4-> mCO^ «?
3 0)
O 4) COJ ii: o
(SdIM) 30NVlSIS3y Ld
no
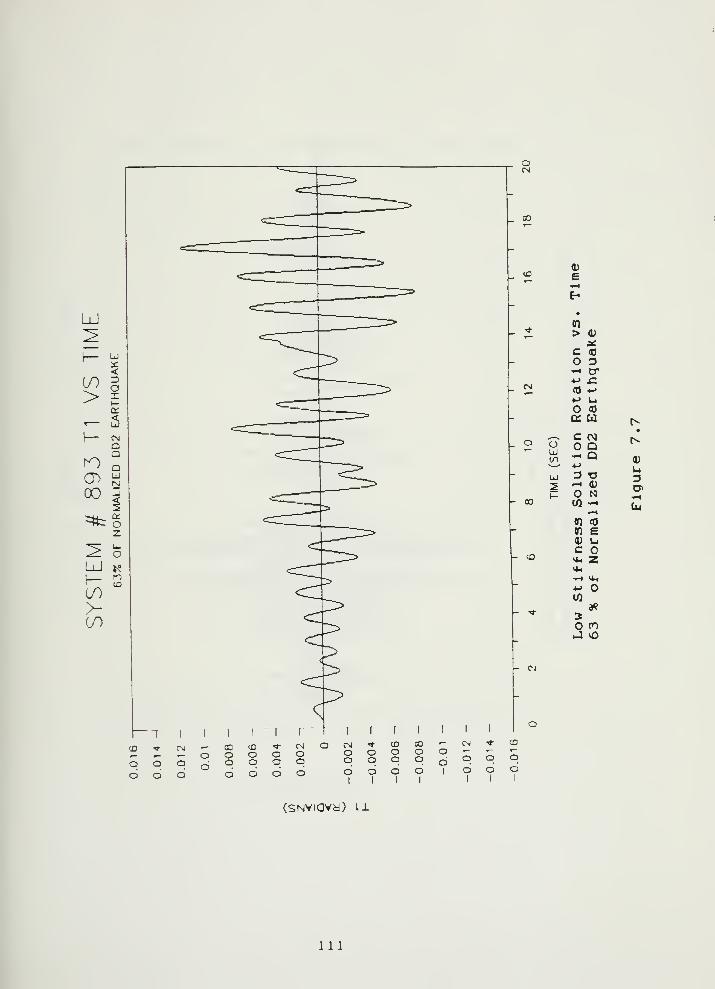
o
0)
0)
> <u
Xc <o
o o^ XT*-> x:(0 *->
^ Ui
<0
a: u t>
C M•
O D fc
-< Q0)
4->
3 rj 3O N0) -H
h*•—
t
n <o
cfj e0) Ui
C^ z>4-i
•^ Mh<- ow
ifi
5n
J yO
(SNViavy) Li
111

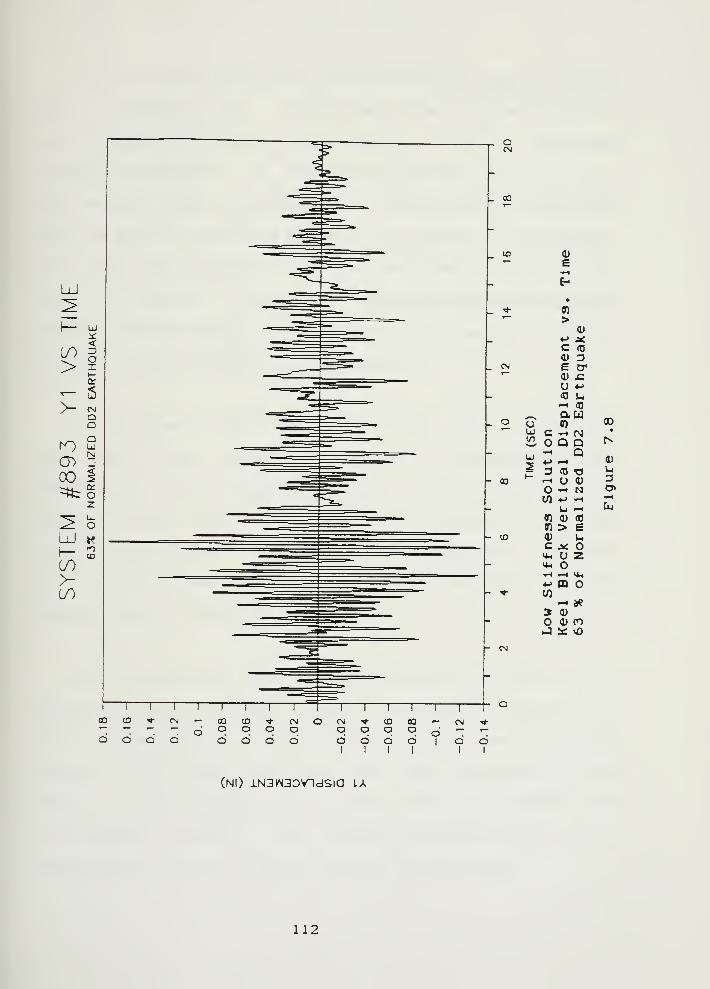
o
m
_ c^i
_ o
- 00
- 03
O
0)
e•r^
Eh
•
>0)
*-> XC (D
0) 3e cr0) £U -M
09 Ui
^ <oauff)
(JL)
C -. MQ Q N
— Q4J •—
1
0)
3 03 -O u-H U 4) 'J
O -H N o>C/5 4-> -H •^
Li --^ lu
n 0) <Q
m > e0) uc X^ o z<u—> >-> \U'•-> OQ OW
-< d?3 (1)
O d) niJ it: vo
(Nl) lN3W3DV1dSia LA
112
The bilinear behavior of the dynamic isolators is clearly
shown in figure (7.9). This figure shows the keel restoring
force versus horizontal displacement. The two stiffness
slopes are evident. If during an earthquake excitation loop
the isolator does not go plastic, the force oscillates up and
down the elastic stiffness slope as can be seen in the figure.
The total area inside all of the hysteresis loops is the
amount of energy the isolator dissipates from the system
during the earthquake. This hysteretical damping is one of
the key benefits of using D.I.S. isolators.
The forces on the left side blocks, keel blocks, and
right side blocks are shown in figures (7.10 through 7.12)
respectively. The first key thing to note about these three
figures is that at time zero the total force on all three
blocking systems is the weight of the submarine. The keel
block system's load is 12000 kips (70 %) , and each side block
system's load is 2300 kips (15 %) »
The side block force is mostly due to rotation of the
submarine as can be seen by its similarity to figure (7.7)
which is the plot of system rotation. The other significant
feature of the right and left side block plots is that the
forces are 180 degrees out of phase which is consistent with
the physical situation. The forces on the keel are due to a
combination of static load and vertical displacement.
113

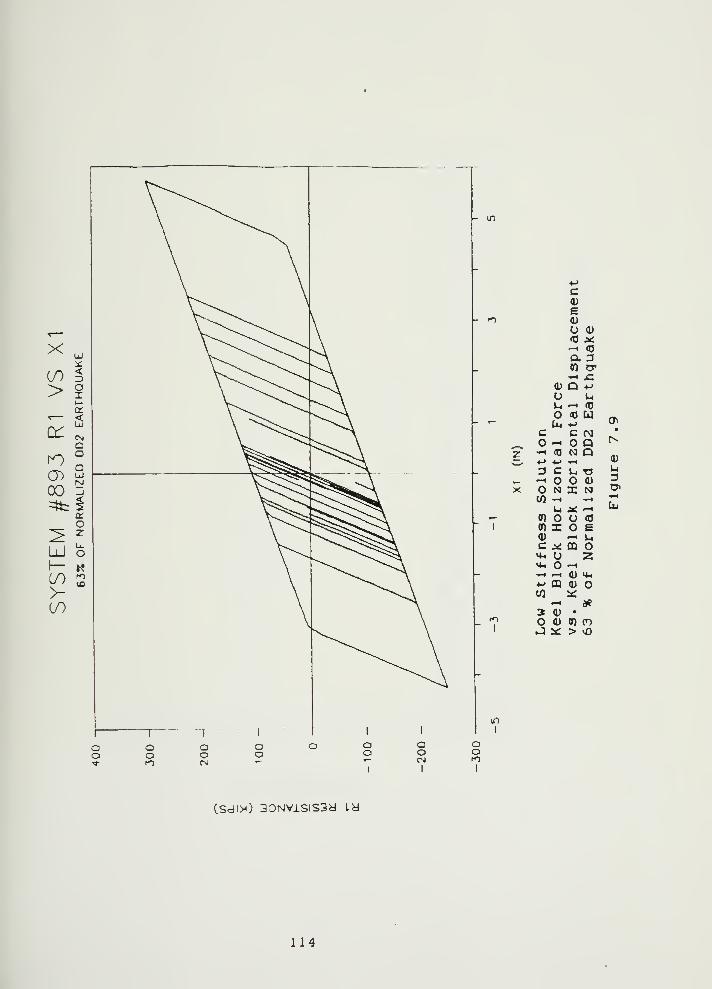
- in
in
I
c0)
ed)
O 0)
<a X<—1 <o
O. 3« CT-< £:
0) D ^O Li
U -H (0
O <0 Ulu *-> (^
C C N •
— Q t^
-• <0 N Q0)•4-> J -rt
D C Li T3 Li
-• (UD
N I N o>
0) -. -H
U X -<
CQ U <0
on X o e0) -• L.
C X CQ oMh u 2^0—1^ '^ 0) Ml4-> CQ 4)
CO it:
-< a«3 0) .
o (I) (0 (nJ is: > vo
oo
(Sdl>^) 3DNVlSlS3y Ly
114

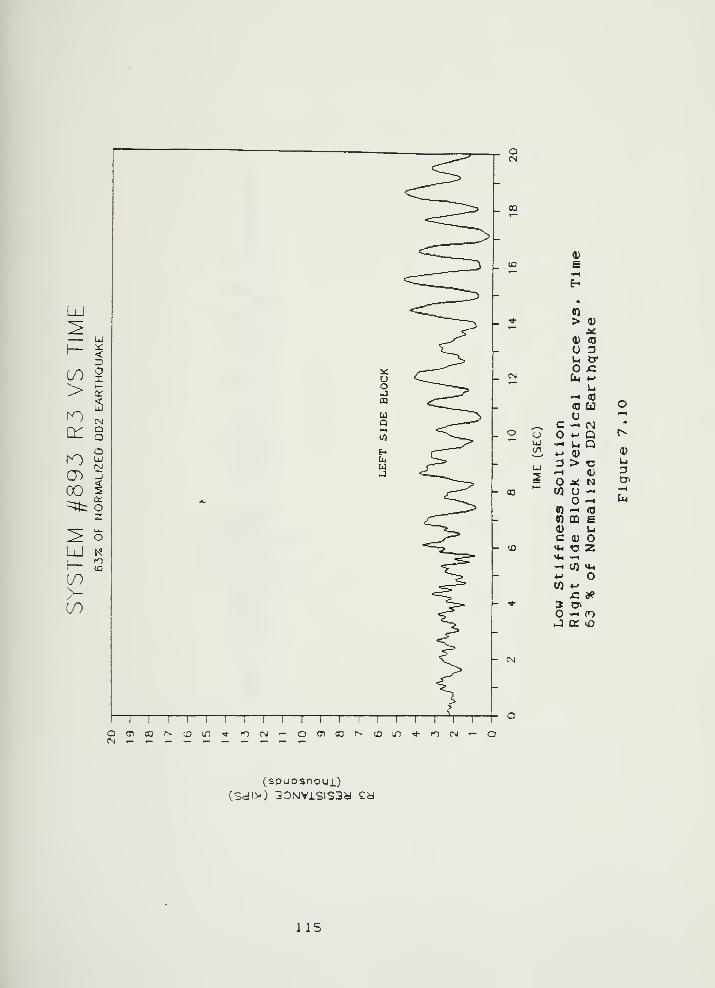
au
0)
(Q
> <U
X0) <0
u au crO fZCu *->
U^ <o
« u oo fl
C -< fvj
O 4^ Q t^
•^ U Q4^ 0) 01
O > rz Li
^ (b JJ^ N CJi
tn u 'H •^
-• Im
(Q ^ (0
n ffi £0) uC 0) o«^ T3 2«*< '-^
-H 01 «*,
- o0) ^
x: d?3 CT.
'-< (O^ CC yO
(apuosnoMi)(Sdl>^) 3DNVlSIS3d £d
115

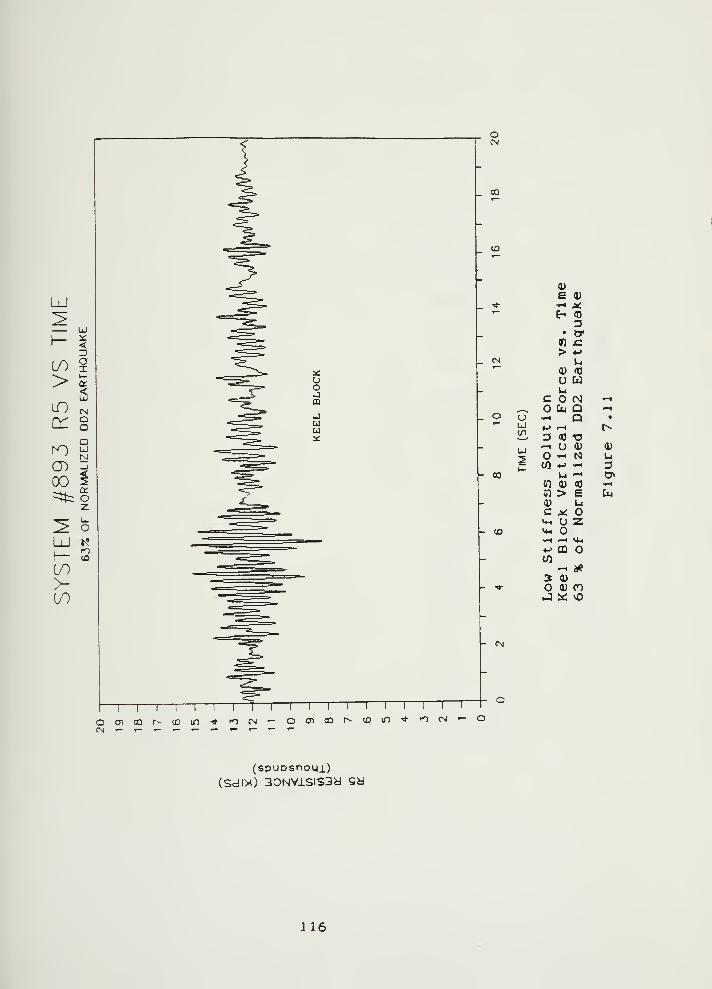
4)
€ 0)•^^ ji^
t- <0
• crOf) c> *->
u0) <D
u Uu
C C^J •—
t
^_^ Cu Q f—
1
o •.^ Q •
LU 4-> •-< r-VI 3 <0 rs
-H O 0) 0)
- N uW 4-» .-( D
Wi •—
t
D«(0 0) <0 •^
51 > £ Cu0) Ul
c J*:
«4-l O z«*H
^H -H >i4
'•^ QQ05
^H ifi
3 0)
OJ (OJ u: vo
(spuDsnoMi)
CSdIX) 3DNVlSIS3y "Sy
116
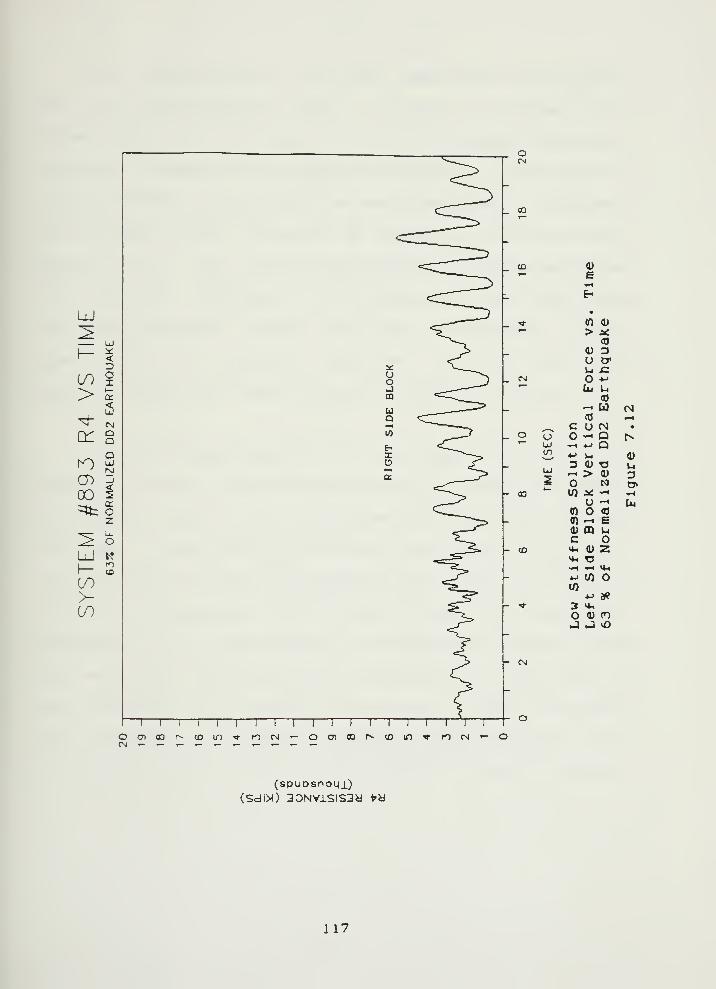
ouen
0)
0) 0)
> a:
u cr
O *->
U N-H Q^ Q
u. ^ 0) T3'- > (U
O Nt/i a -^
U '-<
0) o <0
n -« e(D QQ uC OM^ 0) Z«*< T3•^ -H <4h
J W O
*> a*
O <D COJ J vO
fM
0)
U
n CM >- o
(spuDsnoLji)
(Sdl>^) 3DNVlSIS3y -by
117
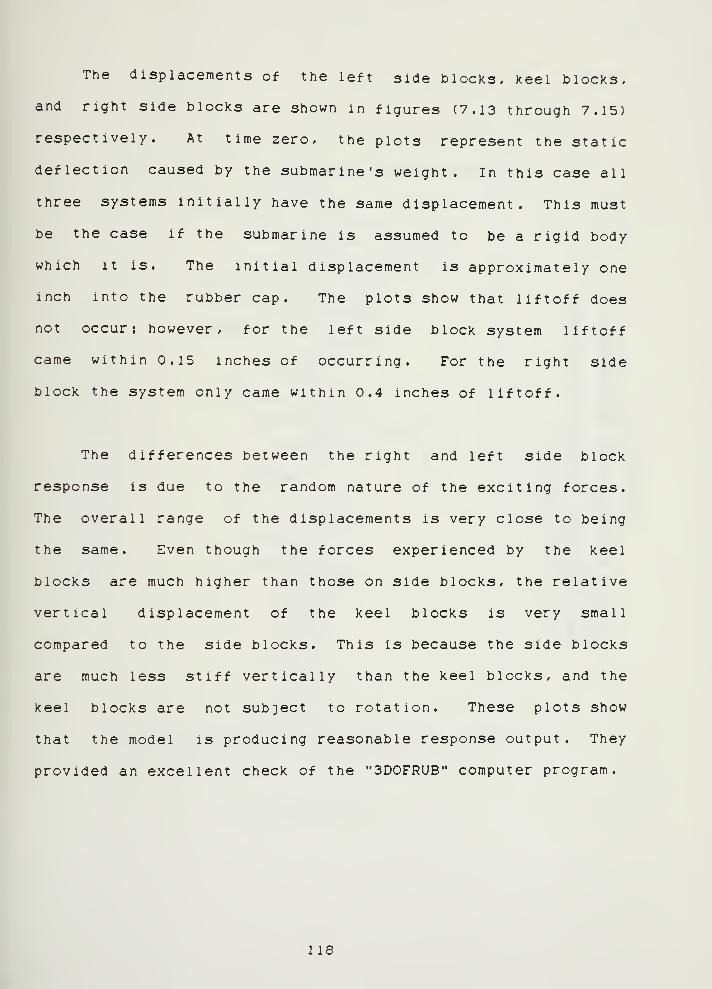
The displacements of the left side blocks. Keel blocks,
and right side blocks are shown in figures (7, 13 through 7.15)
respectively. At time zero, the plots represent the static
deflection caused by the submarine's weight. In this case all
three systems initially have the same displacement. This must
be the case if the submarine is assumed to be a rigid body
which it is. The initial displacement is approximately one
inch into the rubber cap. The plots show that liftoff does
not occur; however, for the left side block system liftoff
came within 0.15 inches of occurring. For the right side
block the system only came within 0.4 inches of liftoff.
The differences between the right and left side block
response is due to the random nature of the exciting forces.
The overall range of the displacements is very close to being
the same. Even though the forces experienced by the keel
blocks are much higher than those on side blocks, the relative
vertical displacement of the keel blocks is very small
compared to the side blocks. This is because the side blocks
are much less stiff vertically than the keel blocks, and the
keel blocks are not subject to rotation. These plots show
that the model is producing reasonable response output. They
provided an excellent check of the "3D0FRUB" computer program.
118

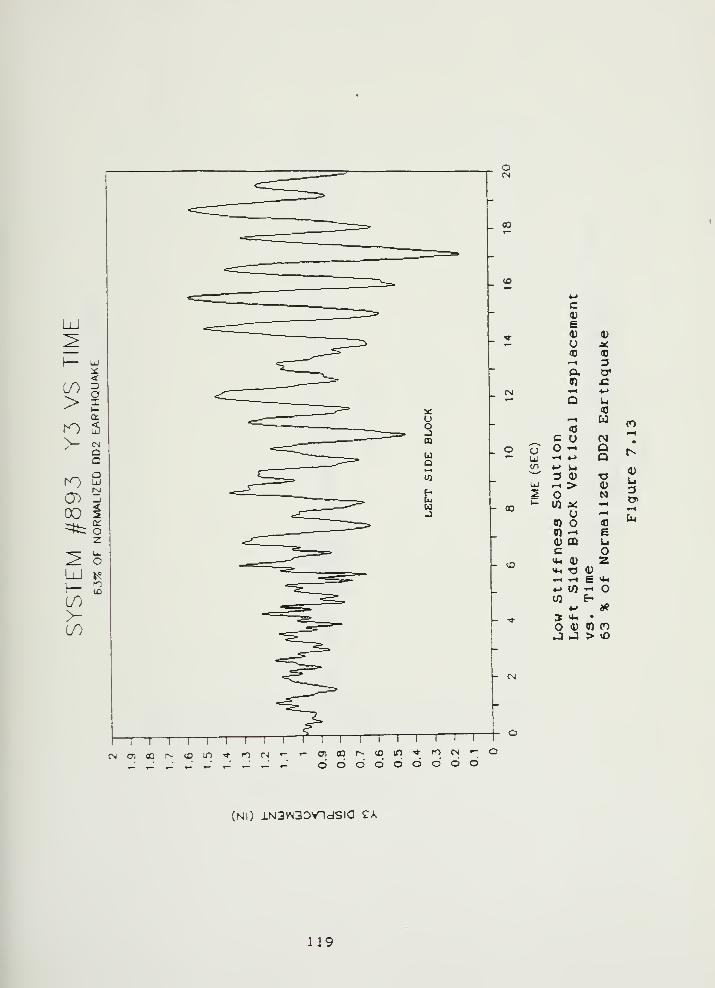
LlI
c0)
£4) 4)
U AC<0 03^H 3O. cr«r) x:•H 4>>
Q(0
c u- Q
O r^
J Ui
D 0) •o-• > <U
un
i-H
<0(u
CD - e0) OQ uc oV4h 0) z«i, T3 0)^ •-H s Vt-l
^ to •-» ow E^
»-> ifi
3 «*H •
O 0) (n CO
J J > «0
(Nl) lN3W3DV1dSia CA
119

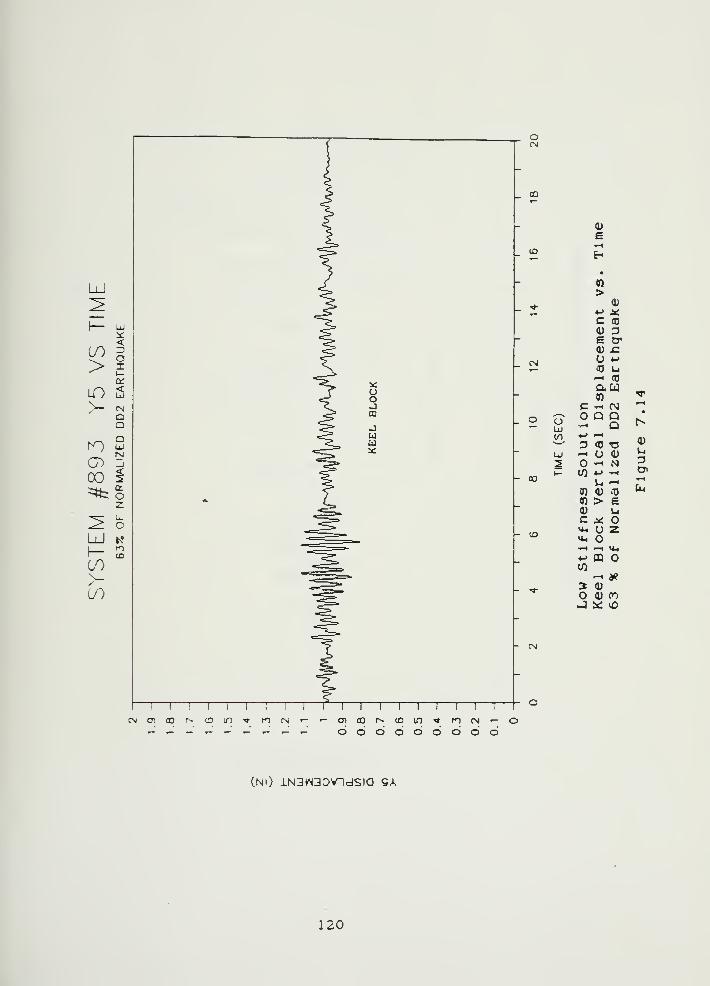
o
_ 00
_ o
- 00
- <D
- CN
0)
n>
(1)
•«-> Xc <0
0) 3E c0) JCu •M
03 Li^H <0auff)
^c -H CM
.—
^
o o QIII
-rH O l^
<n •t-" 1—4
0)D <0 T3LJ •-H u (U
L4
37 o •<-l N— (/) •»-' •^ u»
u ^H •»H
(Q 0) .TJUi
JO > E0) uc x«*-! u zMl o»H •-^ t^*-> OQw
—1 d«3 0)
O 0) (0J :*: o
T—
r
oiaQr^aDiD'^rocN'— oddddddddd
(Nl) lN3W30vndSia QA
120
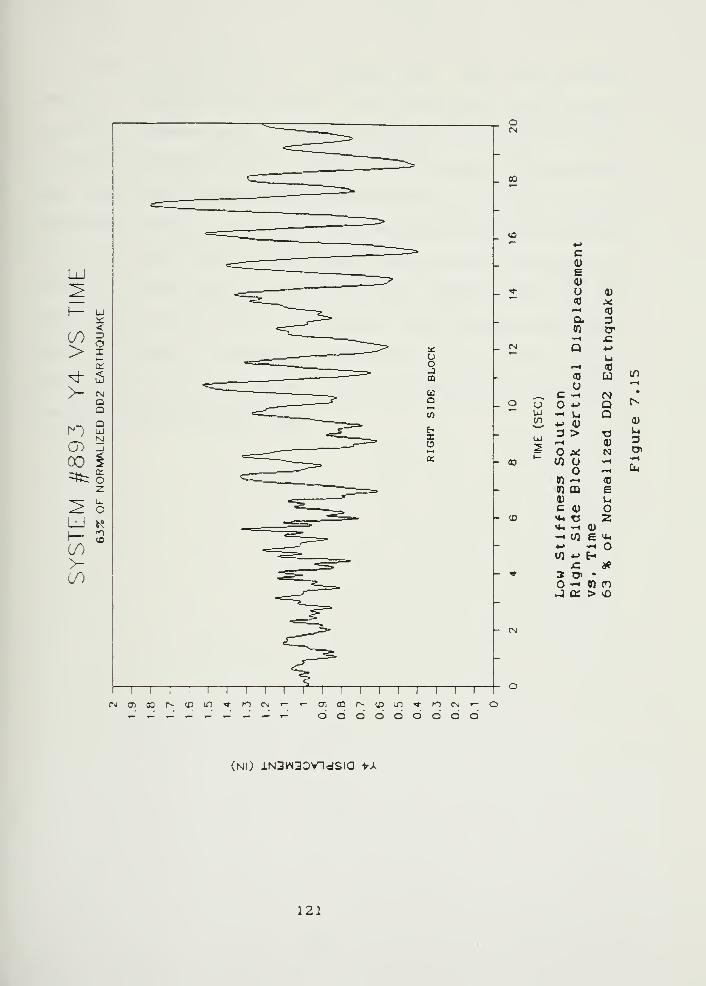
oCN
_ OQ
_ *
a:uoJQQ
UQ _ O
- OD
UJin
c0)
e0)
u 0)
<D X<—
1
(0
Q. 301 cr•-H x:Q•—
I
ffl
03 U I/)
U •—1
C -^ C")
^^ Q t^
-< u Q•!-> 0) •I'
D > T3 u<-H 0) JO M N o>
t/) U <fH -H
o t—
•
Cl4
«Q - <0
n QQ e<u uC 0)
*< T3 z<4-. -^ 0)
-1 w E 444-> •»^ oC/1 -M E-
x: *5 0> •
- Of) n-3 o: > vO
<- oi 03 r^oddn
—
\—
r
<D in •* Kl CNJ »- odt <6 d d d di
(Nl) lN3W30vndSia VA
121
Finally, figures (7.16 through 7.18) show the bilinear
behavior of the rubber caps. The plots show that the keel
blocking system starts out and remains on the second rubber
bilinear stiffness slope. For the side blocks, the plots show
that both sets of side blocks experienced both rubber bilinear
stiffness slopes. One very interesting issue seen in figure
(7.16) is that as the left side block system unloaded, the
rubber bilinear behavior significantly delays and prevents
side block liftoff from occurring. The smaller slope near
zero load helps to keep the submarine in the side blocks.
This is the primary reason rubber is a superior material for
use as a blocking system cap.
122

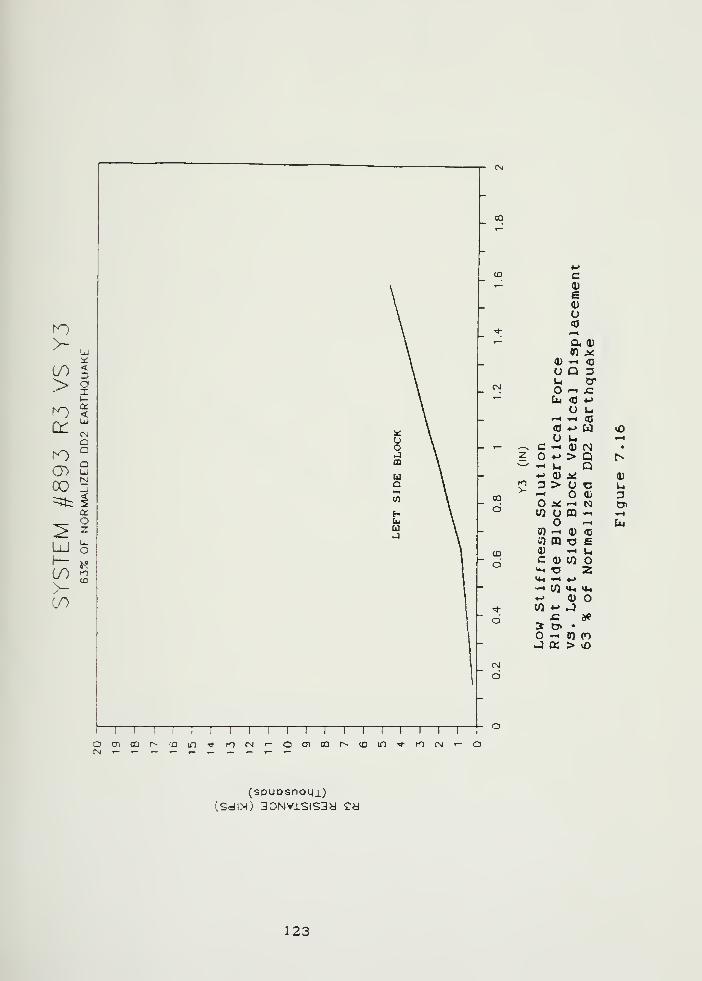
ro
;
>-,
\UJ \
:i: \
if) ^ \
> S \1— \
) , ]
\
'~^— CM "^ \Q u \
ro ° o \
O) SOO ^
14 \
(3 \•-4 \
^=tfc i w \ -ce t* \
_ o b4 \^ ^ U \ _
h1 o \
^ ^^1 -
^ 2 1
'if)
:
1 1 1 i 1 1 1 1 1 1 1 1 1 1 1 1 1 1 1
CM
00
->(O c
0)
0)
u<0
<<- t-^
0)
uDlsp
quake
CM o '^ x:(0 4->
<0 ^ w ou Ui ^^
.— .-, c fH 0) CNJ •
z O *-> > Q N^—
' -^ u Q•»-> 0) >: 0)
5 = > O T3 Ui
OQ O di aX -^ N D»O w u PQ ^ •^
r-i U*« ^H (D (C
CQ •o e(C 4) ^ uC3
C <U 05Mh r3 z»+^ 'S *->
•^ 03 ^ yuJ 0) O•^ W 4-> Jo xz d?
a D> •
o •*-i ff) (O-J a > »o
CM
di
OcTioQr^-jDcn'ii-ncM'-ocTioar^^oin'^rocMCM — ^'-'-r-^,-.-.-T- <- o
(3pUOSnOL|_|_)
(Sdl><) 3DNVlSlS3d Cy
123

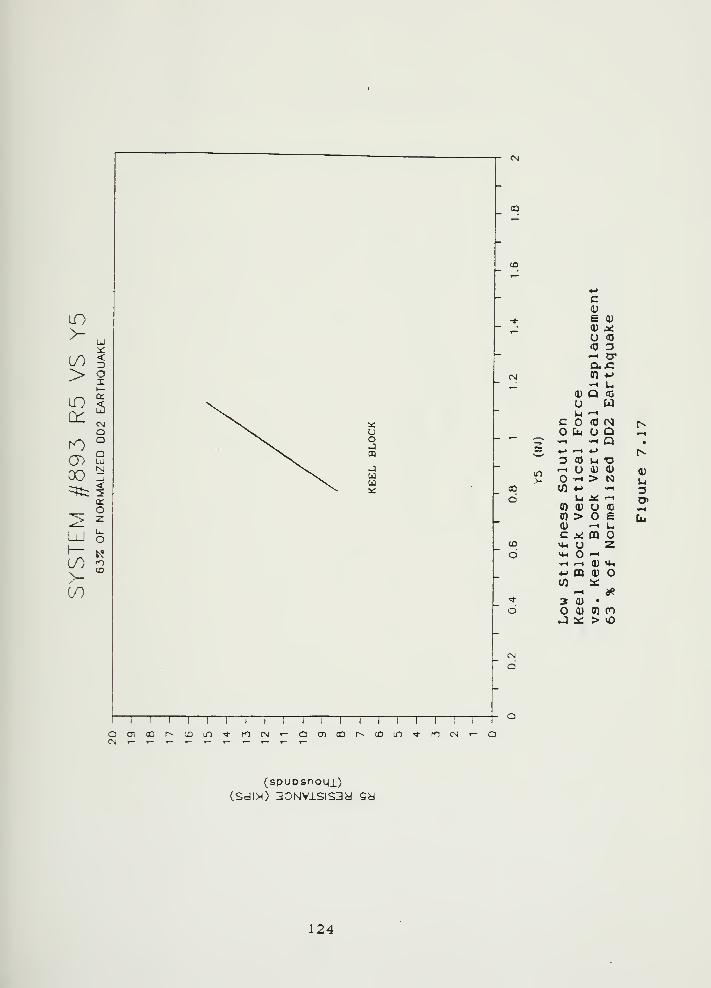
(Q
c0)
* E 0)
placehquak
CM Cf) •!-
,_ ^ u.
0) Q cc
O uu (-H
C <TJ NCu U Q*"
z" "^ - Q- -> —
«
*->
a OJ U T3
5u 0) <D•^^ > N
00 w 4-> •*-i
d Li j«: -^
« 0) O <D
(0 > e0) -^ uc X m o
(D H4 u zd »*< o <—
1
»H 1-^ 0) ««i
4-> OQ 0) ow it:
)—
(
a«'t 5 0) •
o 0) CO (0J :«: > «o
CN
d
0)
Ui
(spuDsnoqi)(SdN) 3DNVlSIS3y -38
124

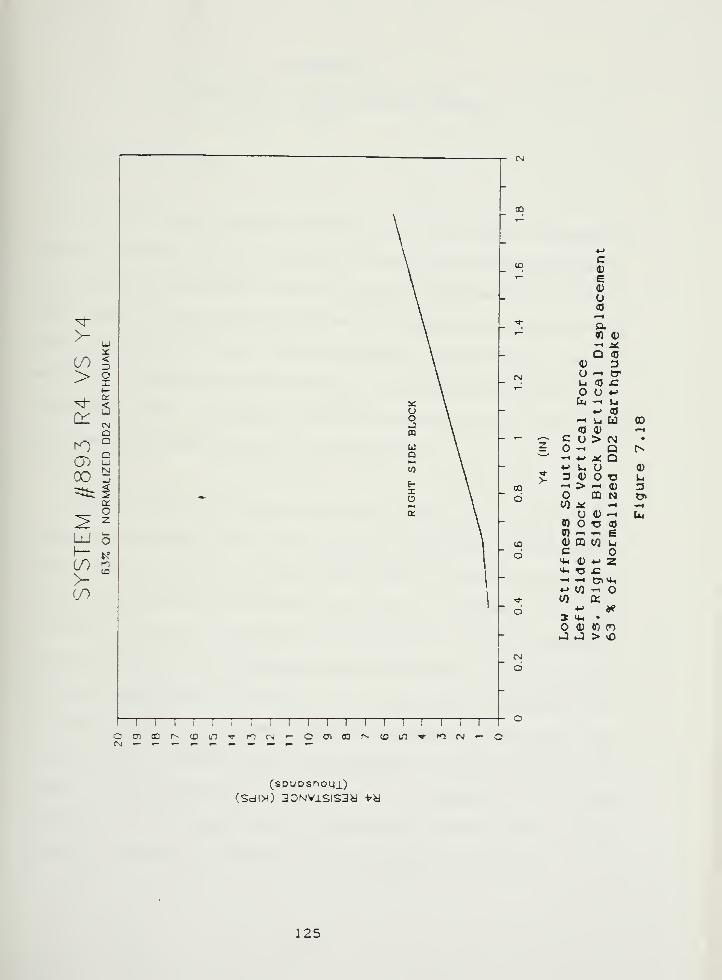
00
C(O
0)
E0)
u03
<*; a0) 0)
Q «4) 3
CN
al
Fo
ertlc
Eart
•— ^ ^ U > N? - Q^— -* •M X Q
4-> u ut 3 0) T3
CO^ ^ > -. 4)
ci CQ N10
O 0) -H0) r? <oCO »^ »^ g
(D 0) CD CO Ui
d c>i4
o4) -M 2
>44 T3 i=*H -H c?»*.••-> CO -
'*; CO q:
o 4^ ifi
3 *i •
4) CO COJ J > vD
CM
d
CO
4)
3i:7>
(SPUDSnOLIl)
(Sdl>^) 3DNvisiS3y vy
125

CHAPTER 8
WALE SHORE HIGH STIFFNESS DESIGN
8.0 Desig_ri._Process
As was shown in the section 5.1 wale shore parametric
study, the use of wale shores is also a promising solution to
the submarine drydock blocking system survivability problem.
The use of wale shores increases system survivability by
reducing the rotation and horizontal displacement of the
submarine during the earthquake. Wale shores also shift the
horizontal and rotational modal frequencies well above the
fundamental frequencies of the earthquake.
From the wale shore parametric study, it is found that
using wale shores with stiffnesses greater than or equal to
6000 kips/in along with one inch rubber keel and side block
caps produce system survivability well in excess of dry dock
failure. This is illustrated in figure (5.4). In order to
compare the high stiffness solution with the low stiffness
solution described in chapter 7, a system which survives 72 %
of the 1940 El Centro earthquake is designed. The input data
file and the output file from "3D0FRUB" , which realize this
level of survivability, is included in Appendix 6. Also
included in this appendix is the output file for this system
using the normalized dry dock # 2 earthquake excitation.
126
The 72 % (0.32 g's) survivability level is desirable to
give the system a reasonable factor of safety above the 0.26 g
dry dock failure level. For the low stiffness design only 63
* (0.28 g's) survivability could be attained due to excitation
by the normalized dry dock # 2 earthquake before practical
manufacturing limits of the isolator system are reached. This
level of survivability is still considered acceptable.
The next step in this study is to determine how to
practically realize this design. Once the required total
stiffness of the wale shores is determined, the actual number
and dimensions of the individual wale shores has to be found.
The first assumption made is to design the wale shores for
Long Beach Naval Shipyard dry dock # 2, which is a typical
U.S. Naval shipyard graving dock. This requires the lengths
of the wale shores to be approximately 32 feet when supporting
a system 1 submarine.
Since the wale shores are compression elements vulnerable
to buckling, based on Hughes C193 wide flange steel sections
are chosen for the wale shores. In order to minimize dry dock
production interference and to avoid overstressing the
submarine, wale shores are only placed over existing side
block pier locations. Therefore, the wale shores would bear
on the submarine ring stiffeners. To determine the required
individual wale stiffness, the number of wale shores is first
assumed to be seven. Then a spreadsheet similar to that used
127

to calculate blocking pier vertical stiffness is used to
determine what steel section is required to give the necessary
overall wale shore stiffness. This spreadsheet is included in
Appendix 6.
It is assumed that each wale shore would consist of a
layer of rubber, a half Inch steel backing plate, and a wide
flange steel beam. To prevent separation of the wale shore
from the submarine during the earthquake the wale shore Is
initially compressed against the submarine using an hydraulic
Jack. A satisfactory steel section is found using a steel
wide flange beam design table in Popov C20D.
Once a section is selected, it is tested for buckling
survivability using the following procedure:
1. Using Hughes' column design curves C19D, a value of
ultimate stress for a single wale shore is obtained.
The appropriate curve for a wide flange (universal
column) is selected. This curve takes into account
eccentricities in the beam.
2. To enter the curve a yield stress is required.
33000 psi mild steel is used.
3. Next, a slenderness ratio, Le/ r , is needed. This
is obtained from Popov C20:. For simply supported
conditions Le is equal to the length of the beam.
128

The value of r, the radius of gyration, is found
from Popov's beam design .table.
4. The actual stress in the beam then has to be
determined. This is accomplished by determining the
force in the wale shore and dividing it by the
sectional area of the beam, A^« . The equations for
the wale shore stress, (7~*^« ' ^'^^ as follows:
(y~~w = R/A^. (8.1)
R = ksp *x'^.^ + Fj (8.2)
Fj = (Dj - XEL)*ksp' + A^^e.* C~'--'= ^8'3)
XEL = (A^^t.* V"'-"t'^/J^S' (8.4)
Dj = X'„.:« (8.5)
where
:
R = maximum total force seen by an individual wale shore.
It includes the maximum earthquake forces and the
initial compressive forces applied by the hydraulic
3ack .
ksp' is the total stiffness of an individual wale shore
when its rubber cap is operating on its second
bilinear stiffness slope.
x'„,«x is the maximum horizontal deflection seen by the
wale shore as determined from the output of
"3D0FRUB" using the height of the wale shore above
the keel, AAA, the rotation angle theta, and the
keel horizontal displacement x.
129
F,i , the jacking force, is the initial force applied to
wale shore by the hydraulic jack to prevent
separat ion
.
Dj is the initial deflection of wale shore caused by the
jacking force.
XEL is the elastic limit deflection where the wale shore
stiffness changes slope.
Av ...h is the cross sectional area of the rubber cap of the
wale shore,
rr". .,f., is the stress at which the rubber cap changes
St if f ness
.
ks ' is the total stiffness of an individual wale shore
when its rubber cap is operating on its first
bilinear stiffness slope.
5. The final check for buckling requires that ^sj~'^^ is
less than \7^.,it. In order to meet this requirement
and maintain a reasonable wale shore si2e the number
of wale shores has to be increased to 14. Table 8.1
lists the parameters obtained for the final high
stiffness wale shore design which satisfies the
buckling criteria.
130

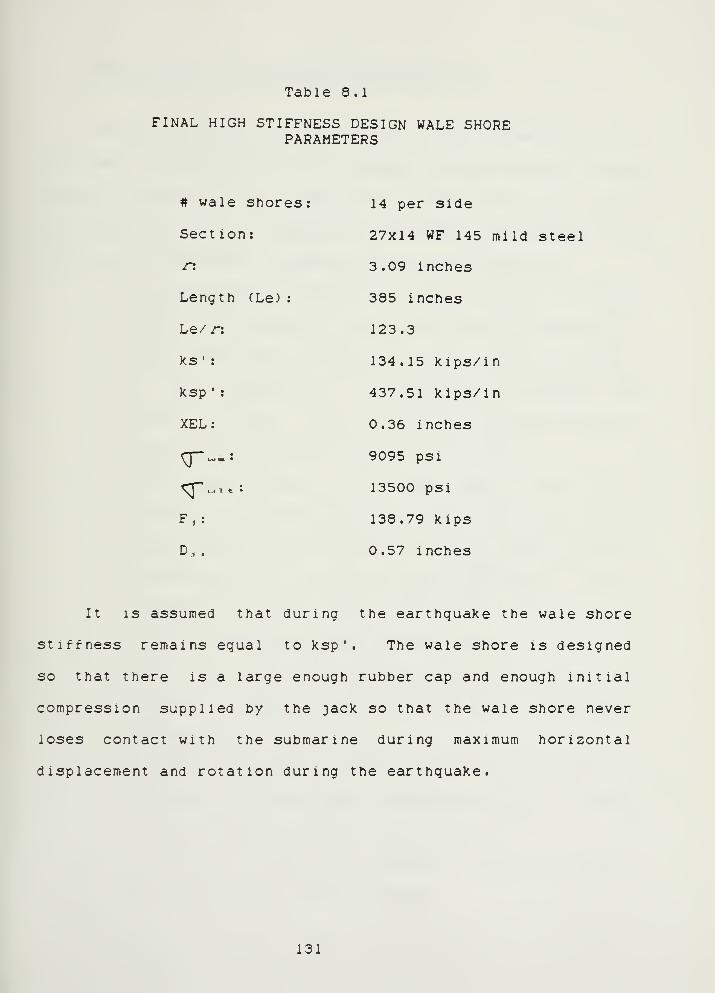
Table 8.1
FINAL HIGH STIFFNESS DESIGN WALE SHOREPARAMETERS
# wale s]lores: 14 per side
Section: 27x14 WF 145 mild steel
r: 3.09 inches
Length (Le)
:
385 inches
Le/ r: 123.3
ks ': 134.15 kips/in
ksp ': 437.51 kips/ln
XEL: 0.36 inches
g-..: 9095 psi
^ .. , . : 13500 psi
F,: 138.79 kips
D.. 0.57 inches
It is assumed that during the earthquake the wale shore
stiffness remains equal to ksp'. The wale shore is designed
so that there is a large enough rubber cap and enough initial
compression supplied by the jack so that the wale shore never
loses contact with the submarine during maximum horizontal
displacement and rotation during the earthquake.
131

I
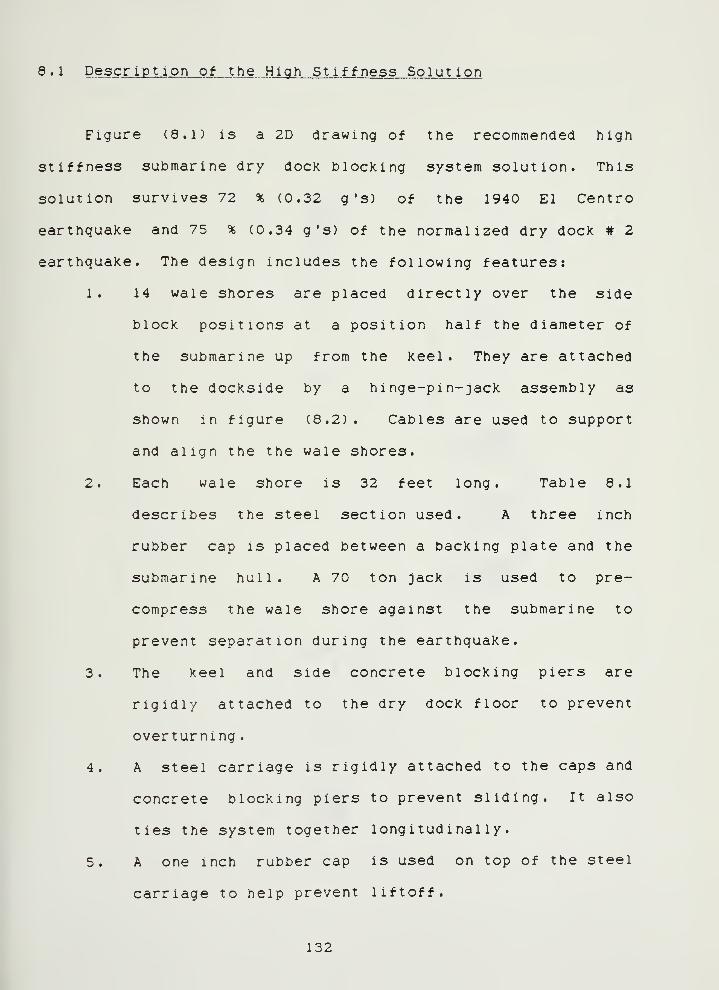
8 . i Descriptio n of the High Sti f fness Solution
Figure (8.1) is a 2D drawing of the recommended high
stiffness submarine dry dock blocking system solution. This
solution survives 72 % (0.32 g's) of the 1940 El Centro
earthquake and 75 % (0.34 g's) of the normalized dry dock # 2
earthquake. The design includes the following features:
1. 14 wale shores are placed directly over the side
block positions at a position half the diameter of
the submarine up from the keel. They are attached
to the dockside by a hinge-pin-jack assembly as
shown in figure (8.2). Cables are used to support
and align the the wale shores.
2. Each wale shore is 32 feet long. Table 8.1
describes the steel section used. A three inch
rubber cap is placed between a backing plate and the
submarine hull. A 70 ton jack is used to pre-
compress the wale shore against the submarine to
prevent separation during the earthquake.
3. The keel and side concrete blocking piers are
rigidly attached to the dry dock floor to prevent
overturn! ng
.
4. A steel carriage is rigidly attached to the caps and
concrete blocking piers to prevent sliding. It also
ties the system together longitudinally.
5. A one inch rubber cap is used on top of the steel
carriage to help prevent liftoff.
132

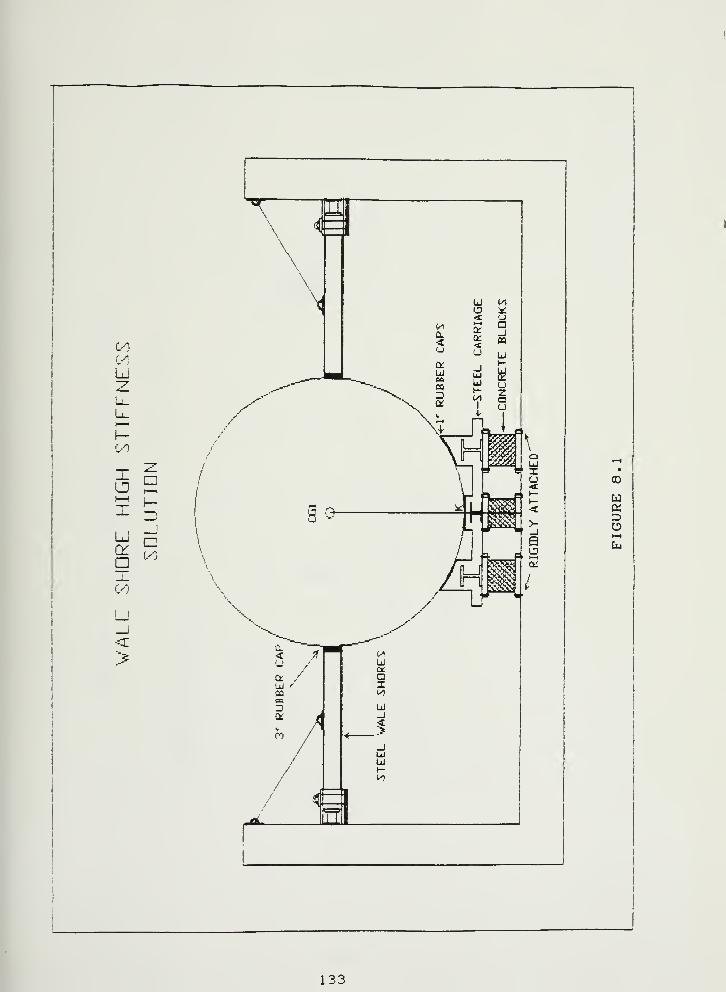
(A
u
u
p /
00
ua:DO1—4
133

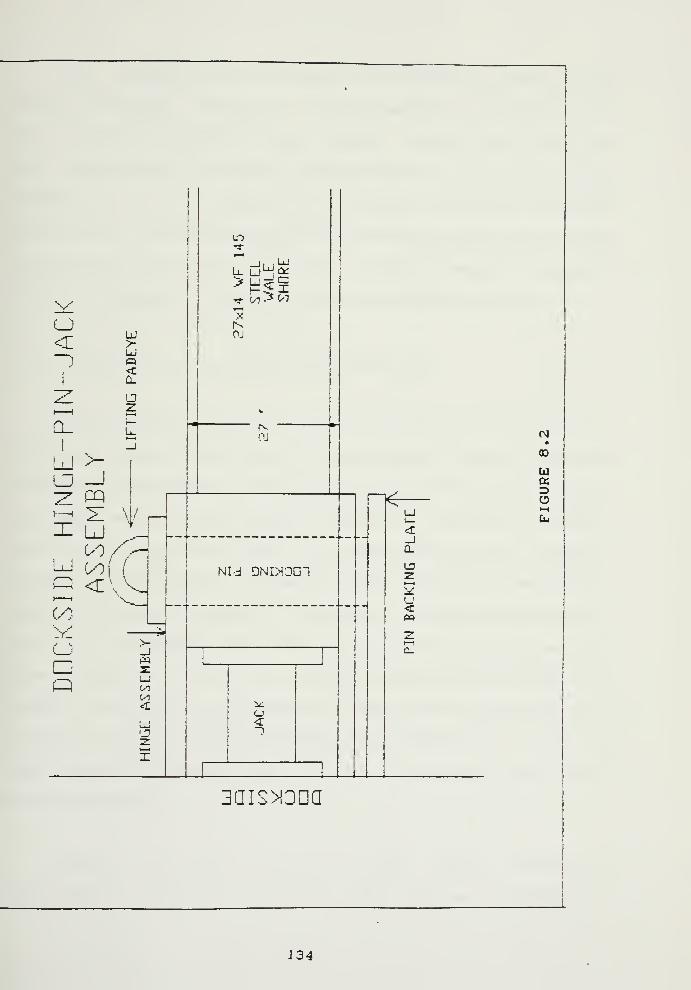
«
(D
U
Ob4
BaiSMGDQ
134

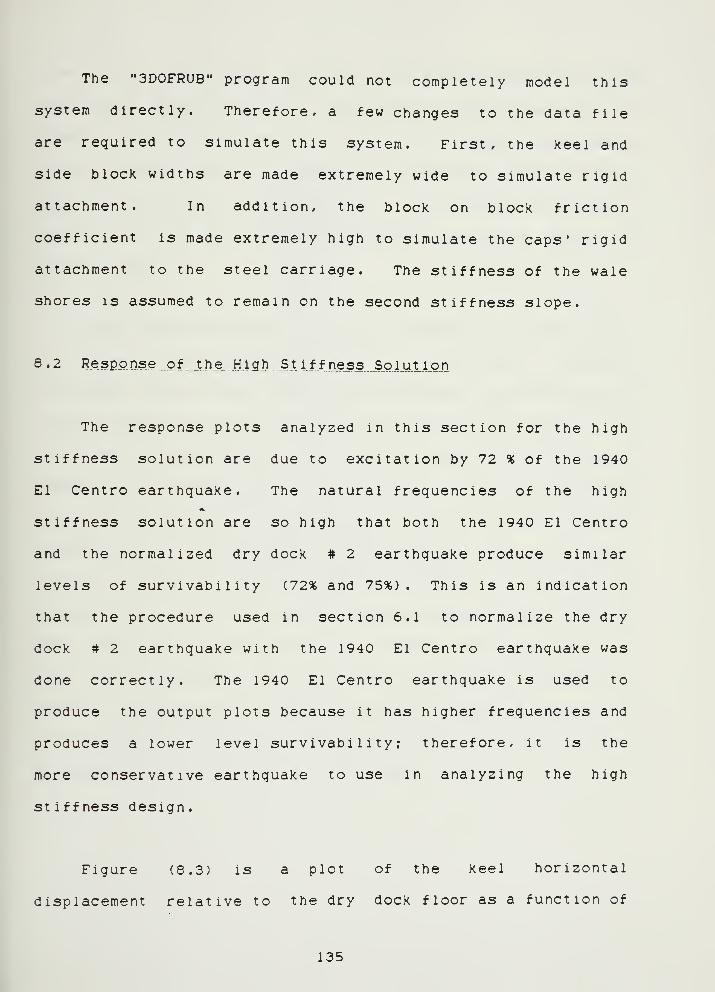
The "3D0FRUB" program could not completely model this
system directly. Therefore, a few changes to the data file
are required to simulate this system. First, the keel and
side block widths are made extremely wide to simulate rigid
attachment. In addition, the block on block friction
coefficient is made extremely high to simulate the caps' rigid
attachment to the steel carriage. The stiffness of the wale
shores is assumed to remain on the second stiffness slope.
8 . 2 Resp_qnse _ of^ _t he_ High Slif f ness...So.lu.t ion
The response plots analyzed in this section for the high
stiffness solution are due to excitation by 72 % of the 1940
El Centro earthquake. The natural frequencies of the high
stiffness solution are so high that both the 1940 El Centro
and the normalized dry dock # 2 earthquake produce similar
levels of survivability (725is and 75%). This is an indication
that the procedure used in section 6.1 to normalize the dry
dock # 2 earthquake with the 1940 El Centro earthquake was
done correctly. The 1940 El Centro earthquake is used to
produce the output plots because it has higher frequencies and
produces a lower level survivability; therefore, it is the
more conservative earthquake to use in analyzing the high
stiffness design.
Figure (8,3) is a plot of the keel horizontal
displacement relative to the dry dock floor as a function of
135

time. This plot shows that the high stiffness solution has
relatively small horizontal displacements associated with it.
However, the displacements are high in frequency and have
abrupt transitions which means the submarine is experiencing
high velocities and accelerations. This output is closely
coupled to the horizontal earthquake excitation shown in
figure (6.6) .
These high accelerations can be seen in the keel block
horizontal force versus time plot in figure (8.4). The high
stiffness solution has keel block horizontal forces which are
larger than the low stiffness forces described in chapter 7 by
an order of magnitude. Figure (8.5) shows the rotational
response of this system. This figure is a plot of the systems
rotation about the keel versus time. This plot shows that the
rotations are relatively small as is expected with use of wale
shores. Figure (8.6) shows that the vertical displacement is
coupled with the earthquake's vertical acceleration as is the
case for low stiffness solution. Figure (8.7) is a plot of
the left wale shore deflection versus time. In this figure, a
positive deflection is compression and a negative deflection
is expansion. The maximum amount of expansion the wale shores
are designed to withstand is 0.57 inches.
136

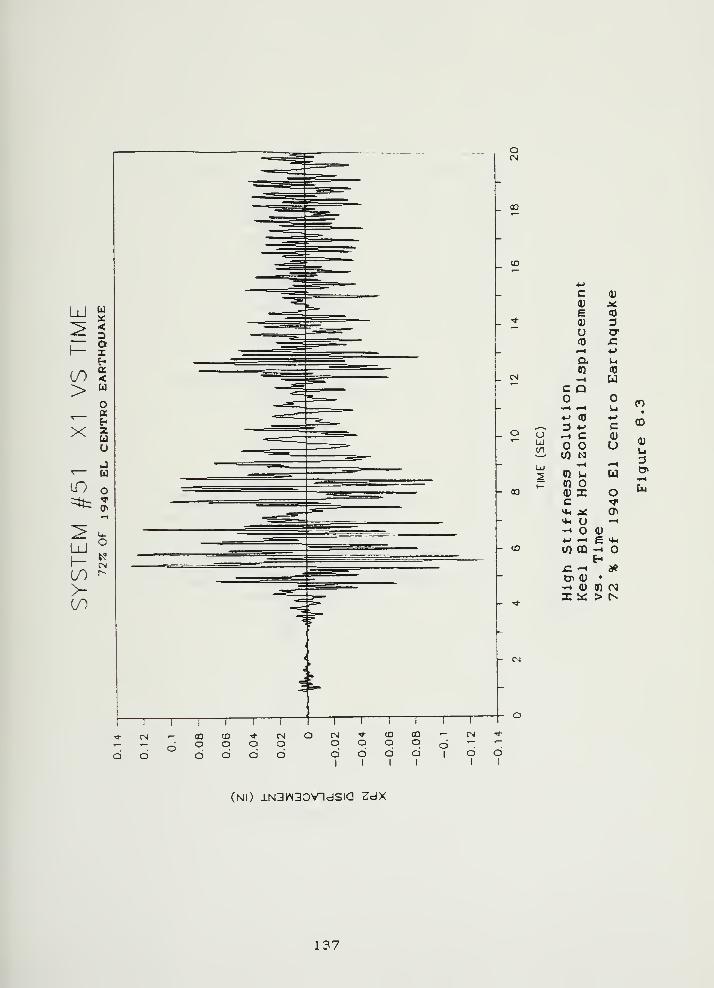
c 0)
0) X£ •0
0) Du cr<a xz^H *>
o. un <0
1-t uC Q••H <—
1
u4-> (Q ••-»
3 *-» c-. C <D
O U(/I N
•»^ i-H
0) U un o0) I oc 'T«*« a: 0»«*, o t-^
- 0)J -^ e o^
tn m ••-1
E-£ -H ae0» 0) •
•^ 0) «n NI sc > r-
-- 03
O <^
o
CDO
CNO
CNO o
(DO
CQ
O o O o
CO
0)
u3
U4
OI
(Nl) lN3W30VndSia ZdX
137

I
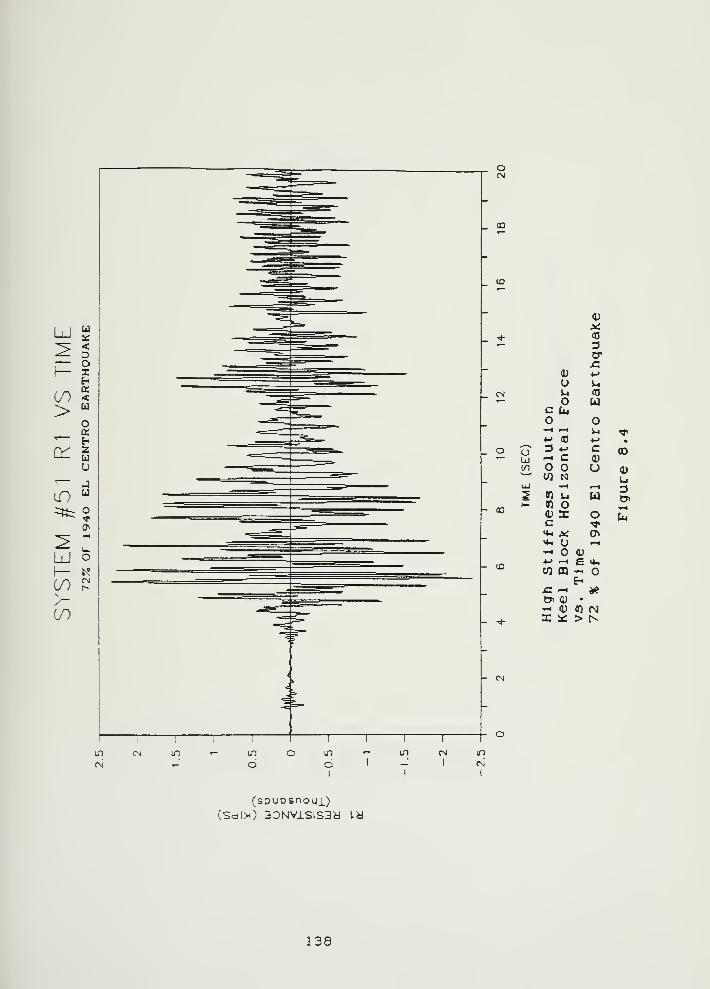
o
_ 00
_ to
_ C\l
_ o
- CO
u
0)
X<0
3crx:
4) JU uu <o
uC tuO.H ^H u ^4^ 03 4-> •
3 -M C (T)--< C 0)
O u 1103 N U
•^ <-H 3V) Ui u o»n o r-t
(U X o Tilc rr<*< a: ON4-. o •-I
^ 0)•M -H £ »*i
U} QQ
£ ^ Hi0> 0) •
•-1 <u on rMI !«: > N
- CN
(spuDsnoui)(Sdi><) 3DNvisis3y i.y
138

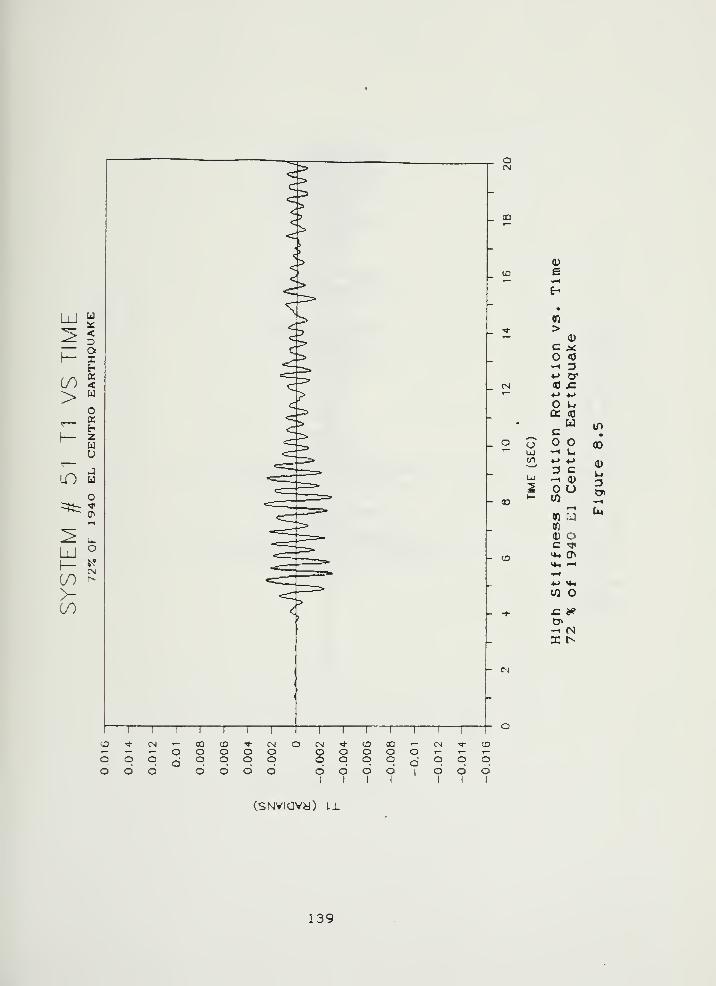
4)
oen 4-> 4_>
w>
0)
c ^<0
•-• 3«-> cr<o x:•M J
UO: (0
u inc •
O 0)-H U.*-> 4->
(1)3 CUi
-. 0) -3
u0)
« :
J
Cu
n4) OC ^Mh 0^
10 o
1 1^
(SNviavd) 11
139
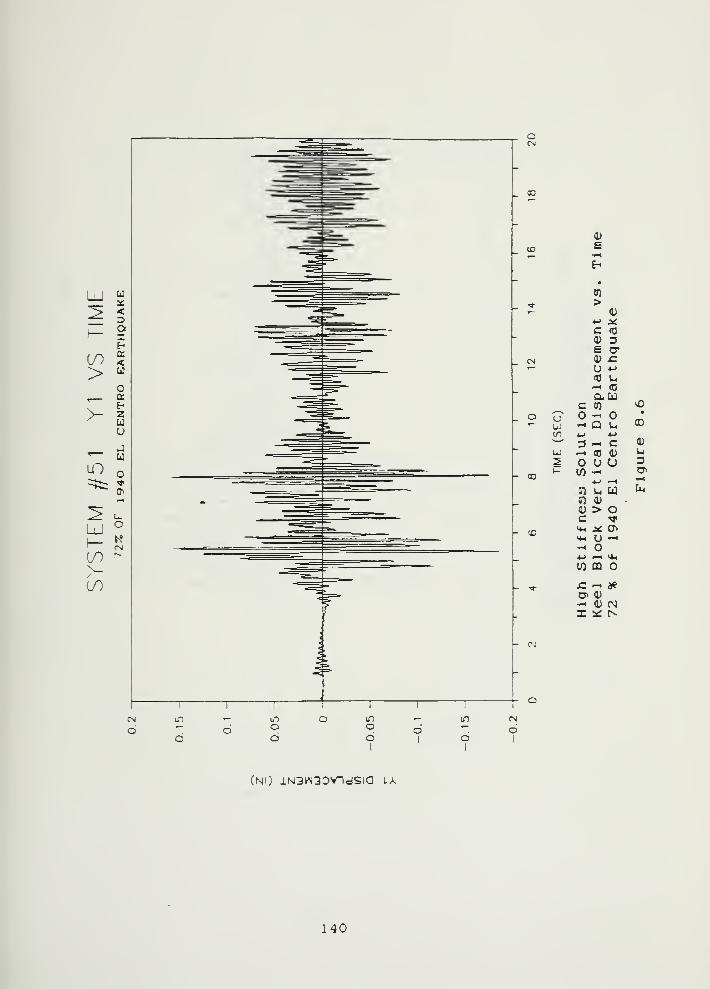
o
_ to
_ O
- 00
u
CO
>0)
C (0
e cr
u *^
c (0
0-^0'H Q ut-r -M
3 -" C-•(DO)O U U10 -^
u] m o
jC -. i?
I :s: r^
CD
0)
U tl4
O
(Nl) lN3>N3D>ndSia LA
140
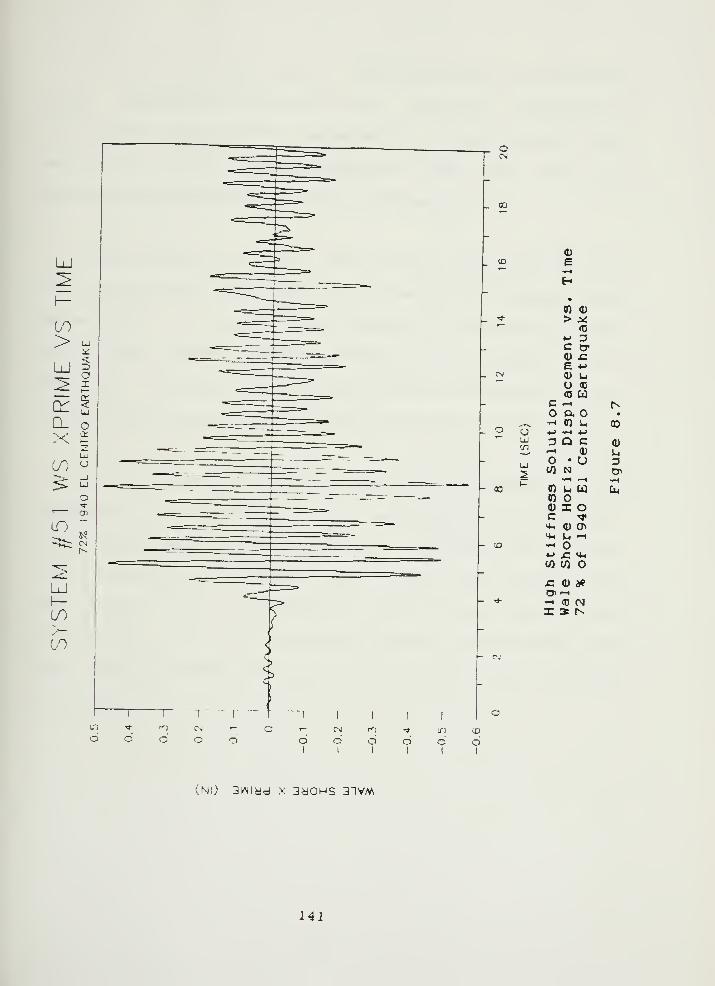
o
_ 00
o
- CO
- CD
0)
s»H
H•
n (1)
> X<D
^^ 3C CP4) £:E .M
<D UO <D
(0 Uc -. Na •
- CQ L, CO-> -^ •«->
3 Q C 0)»-4 Q) uo • u DCO N D>
1-t ^^ •^H
n u u Du(0
4) X oC -"Ji
«** D C^<^ Ui -1-+-> x: v4h
CO CO
x: 0) a?^ ^^-« (D OJX :» t^
(Nl) 3kNiad X 3dOHS 3nVM
141
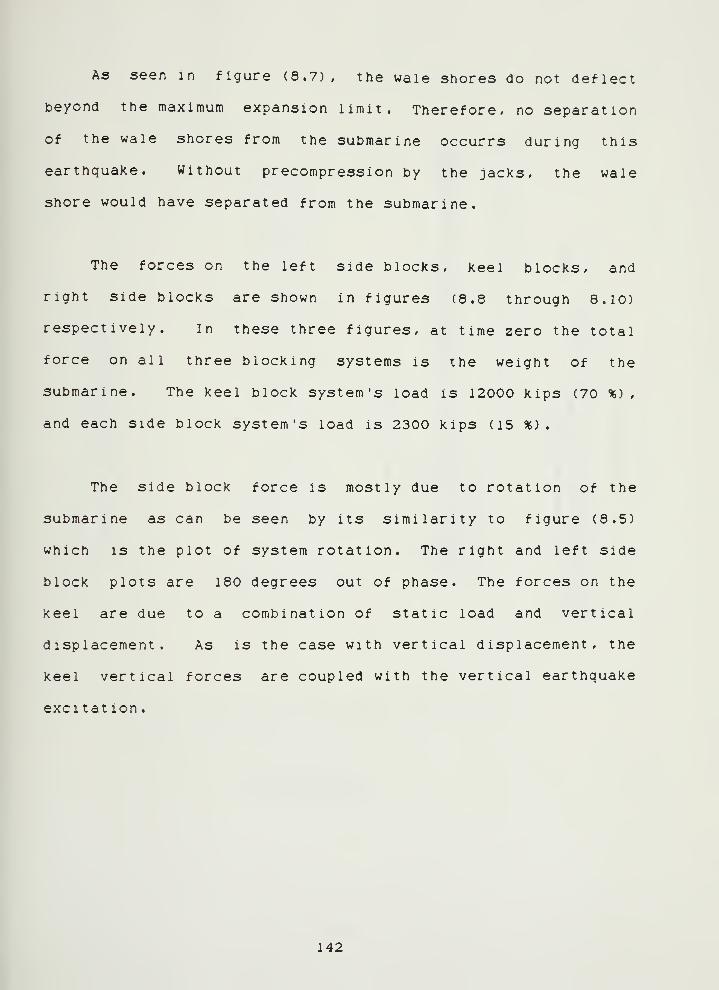
As seen in figure (8,7), the wale shores do not deflect
beyond the maximum expansion limit. Therefore, no separation
of the wale shores from the submarine occurrs during this
earthquake. Without precompression by the jacks, the wale
shore would have separated from the submarine.
The forces on the left side blocks, keel blocks, and
right side blocks are shown in figures (8.8 through 8.10)
respectively. In these three figures, at time zero the total
force on all three blocking systems is the weight of the
submarine. The keel block system's load is 12000 kips (70 %) ,
and each side block system's load is 2300 kips (15 %)
.
The side block force is mostly due to rotation of the
submarine as can be seen by its similarity to figure (8.5)
which is the plot of system rotation. The right and left side
block plots are 180 degrees out of phase. The forces on the
keel are due to a combination of static load and vertical
displacement. As is the case with vertical displacement, the
keel vertical forces are coupled with the vertical earthquake
exci tat ion .
142

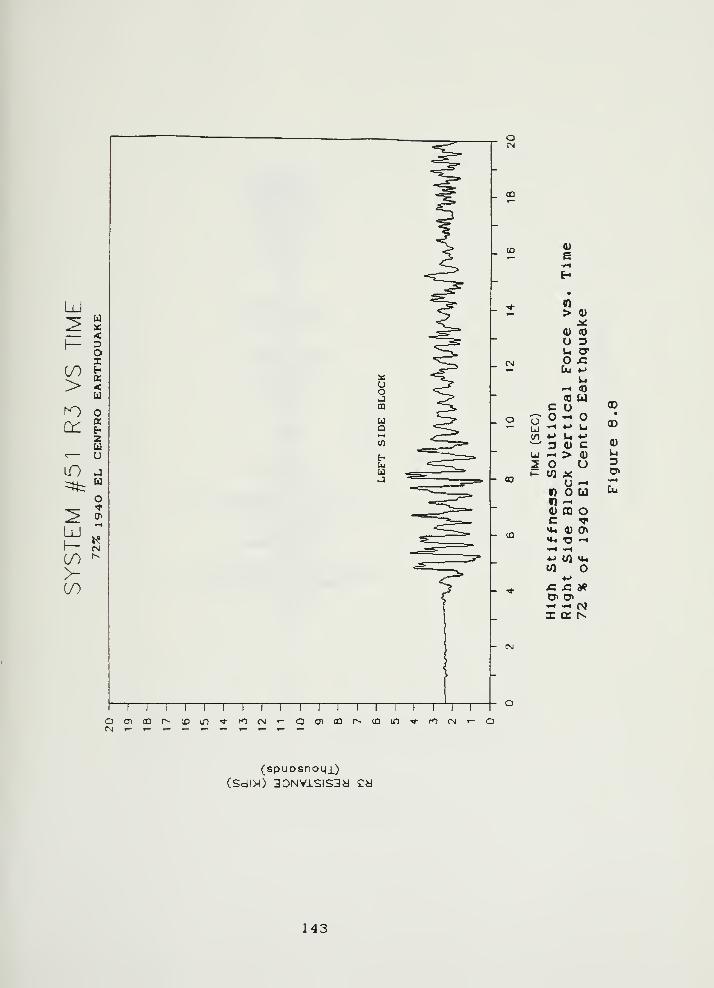
4)
a^t*
•
n> 4)
X0) <0
U 3U XT
;CDu ^
U^ 03
<0 Uc u
hi
-«•^ ^ u
v^ ••-> u -»
D 4) CUJ -• > 4)
2 O Ut— 01 X
O -^
V) o un -1
4) CQ Oc ^>4h 4) 0^**< -o —
•
^ •-<
4-> U) «44
w o4J
x: x: i?o. o>-^ -< rgI a r^
00
GO
4)
u3
(spuosnoLJi)
(SdIX) 3DNVlSlS3d Cd
143

4
0)
E 0)•^ ASE- <0
a• tT
0) £> -M
iH
0) <0
u uc uO
^-^ -» Cm uu *> J3 - C^ (0 (U
LkJ U U2 01 -1- •»-> ^1
0) u u9) (U
(I) > OC "q*
y-i X c^*4h U '^-14>> —1 «i4
0) mx: '-< je
o> OJ
-H (I) CM
I it: t^
0^
CO
0)
uD
(spuosnoMi)
144
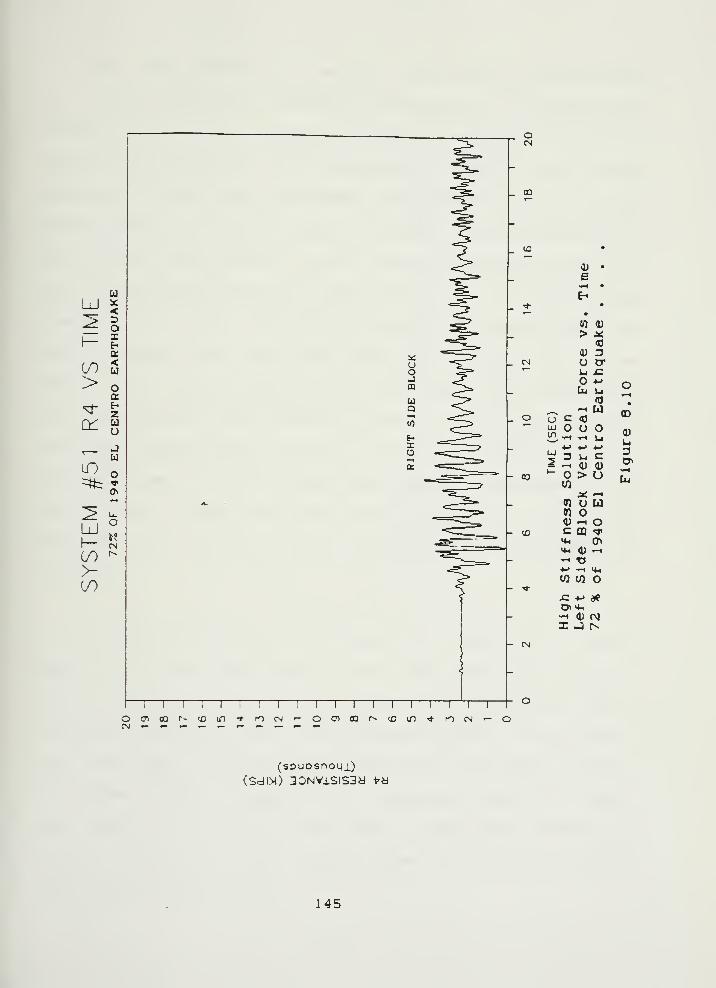
0) •
£•.H •
E-i
•
•
01 0)
>
H) Do CT1-1 £
4->
[u<0
^1—
1
UtJ c <0u o OW) •-• •*^ u
*-> (-> JUl D Ul c^ ^H 0) 0)t—
01> uM >—
1
« o w01
OJ ^H oc 03 ^<^ 0^^ <D -^*^ •o•M ••^ U401 01 o
x: 4-> aeD>*4-.»H (D rgX J N
GO
U3
03 in
(spuDsnoMi)(Sdm) 3DNVlSIS3y t'd
145

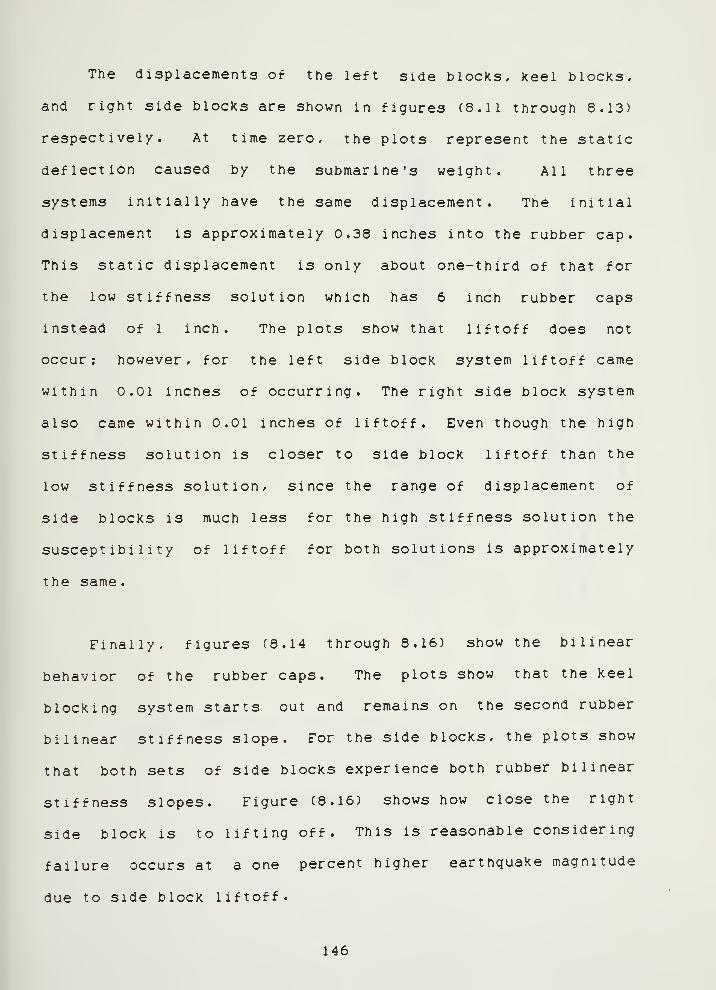
The displacements of the left side blocks, keel blocks,
and right side blocks are shown in figures (8.11 through 8.13)
respectively. At time zero, the plots represent the static
deflection caused by the submarine's weight. All three
systems initially have the same displacement. The initial
displacement is approximately 0.38 inches into the rubber cap.
This static displacement is only about one-third of that for
the low stiffness solution which has 6 inch rubber caps
instead of 1 inch. The plots show that liftoff does not
occur; however, for the left side block system liftoff came
within 0.01 inches of occurring. The right side block system
also came within 0.01 inches of liftoff. Even though the high
stiffness solution is closer to side block liftoff than the
low stiffness solution, since the range of displacement of
side blocks is much less for the high stiffness solution the
susceptibility of liftoff for both solutions is approximately
the same.
Finally, figures (8.14 through 8.16) show the bilinear
behavior of the rubber caps. The plots show that the keel
blocking system starts out and remains on the second rubber
bilinear stiffness slope. For the side blocks, the plots show
that both sets of side blocks experience both rubber bilinear
stiffness slopes. Figure (8.16) shows how close the right
side block is to lifting off. This is reasonable considering
failure occurs at a one percent higher earthquake magnitude
due to side block liftoff.
146

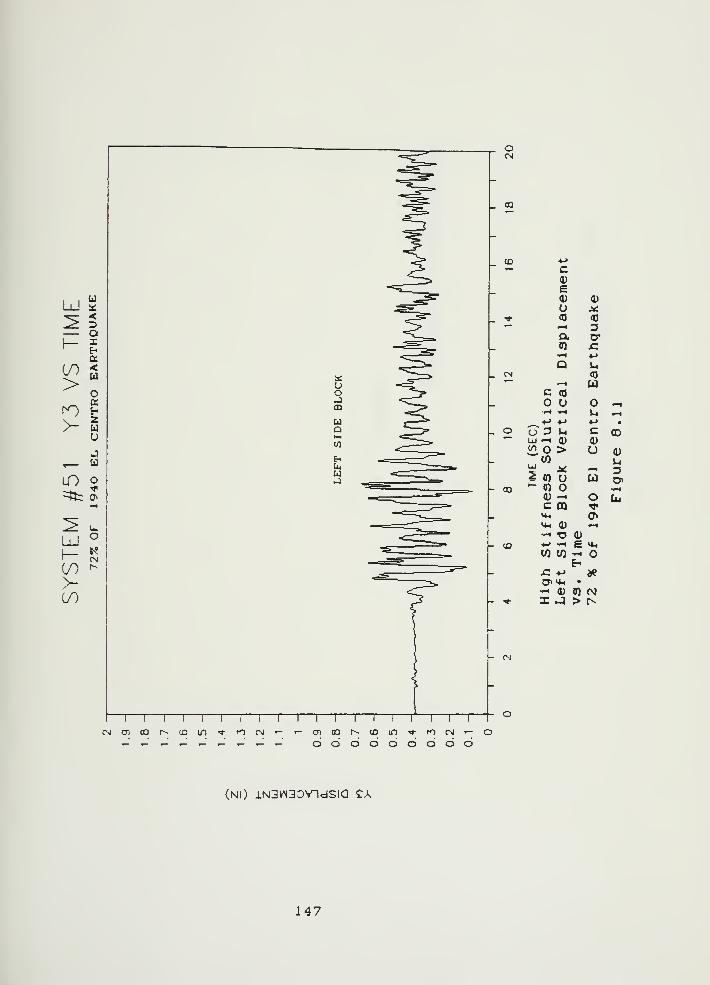
4->
c0)
e<u 0)
u X<0 (01—
<
3o. cr01 x:••H 4->
Q^H U
C (0
o »^•»^ -rt Ui t-iJ 4-> 4->
(J 3 Ui c COLd »-< d) 0)
iG. > u 0)Ul Ui
i^ X <—
1
-1
J « u u rr»^00 •*-i
<u ^ o (uC DQ •*>44 (^Mh 0) •-•
-• r? 0)4-' -^ E 0410 CO
Ehx: *-> if!
a»«4^ •
^ 0) Of) CJX J > t^
•-0)00d d
I r
d d d d d d d
(Nl) lN3kN3DVndSia CA
147
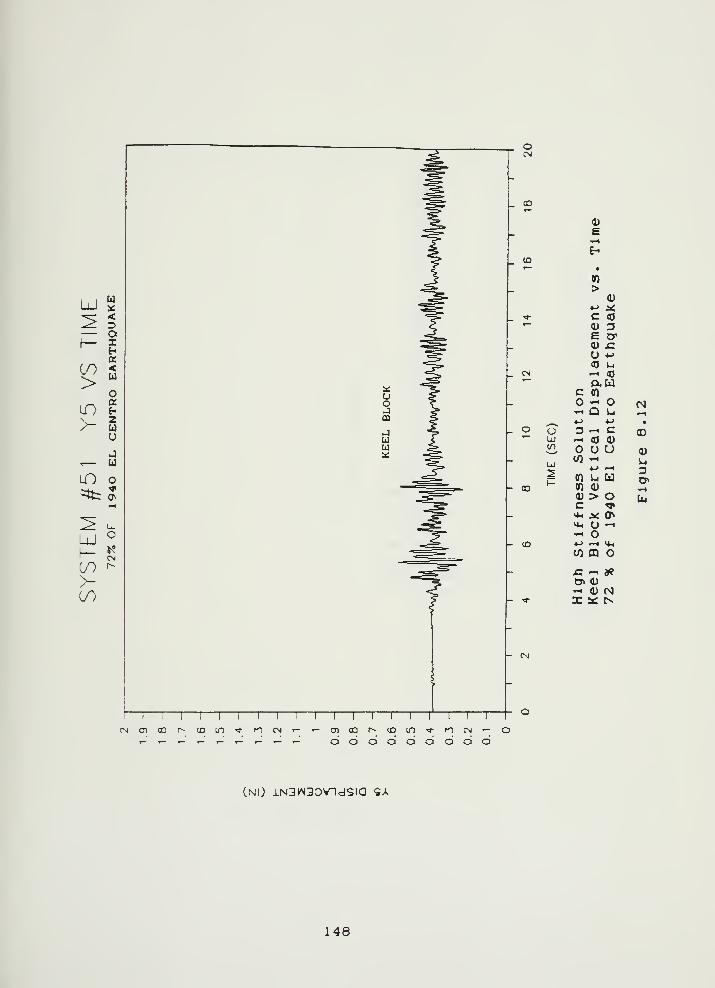
o
_ 03
_ O
- 00
OuCD
- tN
csicTieor-yain-^ncN'-I 1 I r
n>
4)<-> >cC <D
<D O6 cr0) jc:
U ^^
<0 u<—
I
<o
O.U
o -• o•-< Q U••-> ->
3 '-• Cn (0 d)
O U Uc/5 -^
OON
(/} m o
xz ^ d?
^ 0) (MI it: N
CJ
00
(Nl) lN3^N3D>ndSia QA
148
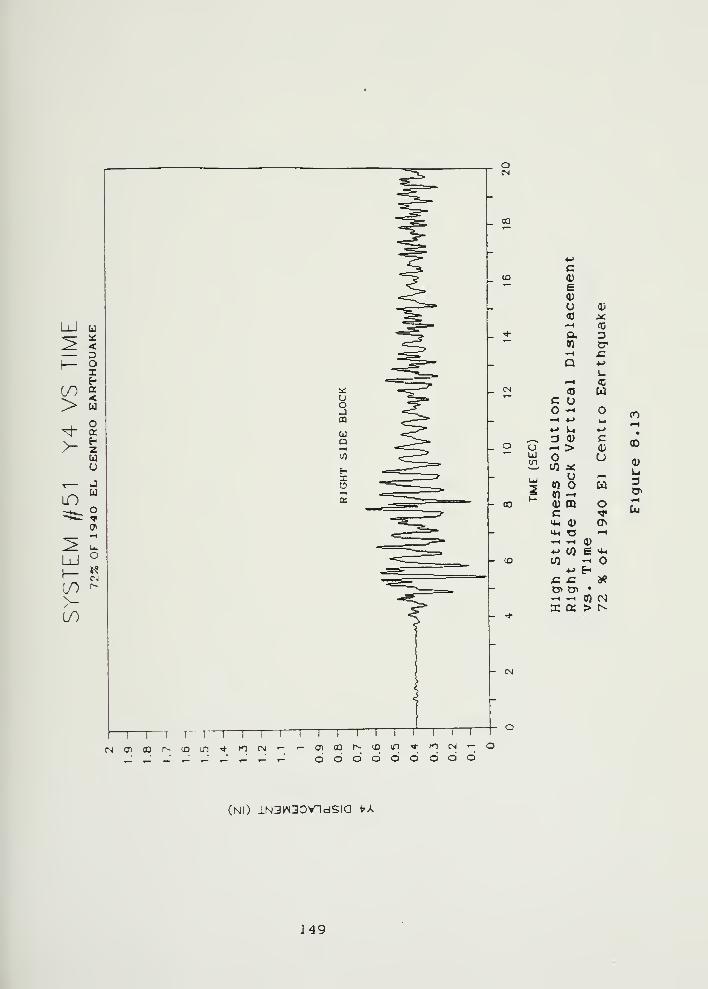
LU
0)
£0)
u 0)
<0 X^H 00
D, 3OQ C•»H x:Q *->
u«—
I
<o
« uc u-
(n-H 4-> l-l
.-H*> u *->
3 0) cCD
'-• > di
u4)
3lO >i
o —CD O ueo - D>
0) mc
oUj
Mh 0) (^«tH T3 •—
I
••-» .-( (U
•M CO £ Mh
05 •.-1 o4-> E-
£ x: jc
D> a> •
.H —
^
Vi csj
I a > t^
I
—
\—r—r T" "1 r
C'j oi oQ r- <D in *"I
—
\—i
—
I—
r
rocM>- t-aioor^!i3m'*-nr>i'-;0
(Nl) lN2kN3DVldSia VA
149

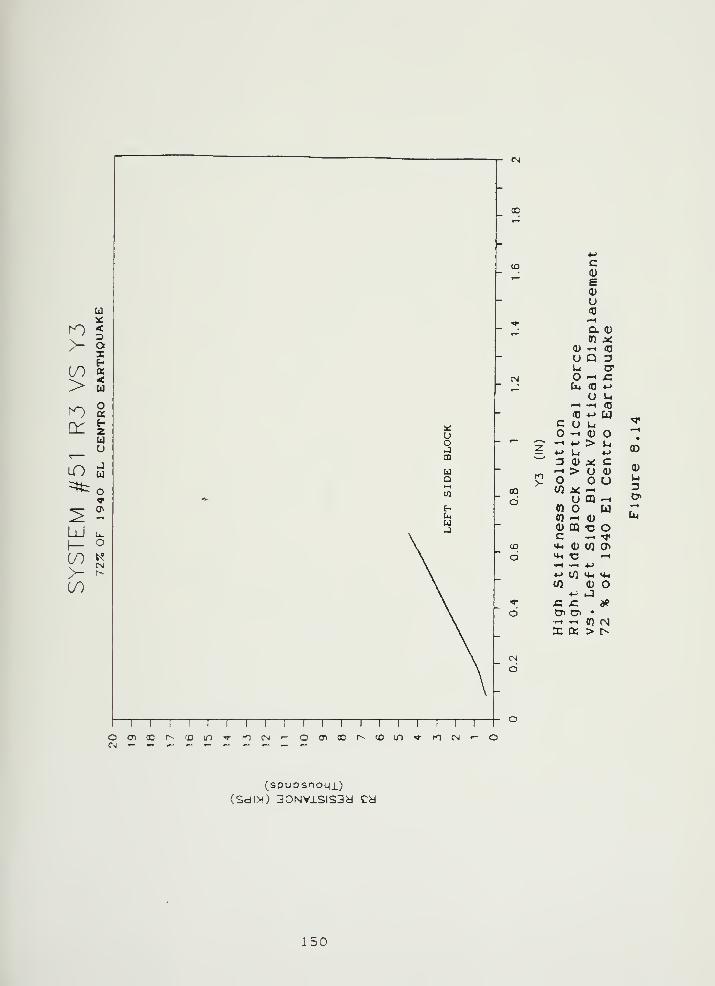
T ^
00
(O c0)
E0)
u
•<t-^H
a (D
CO >c0) ^ <c
U Q 3U cr
CM '-^ i3Cl4 <0 4->
u ur-i •^^ (0
03 •M Uc U uo •-1 0)
•"
f r4-> > Ui
u. ->^ 3 (D X cK1 ^ > U 0)
V O u00 01 X •-^
o u m -Hen u05 <-^ 0)
(D CQ •D Oc ^ «»«
(C Hh 0) (/) c^
o Mh T3 '-^
•^ •*-^ *->
^ m ^ U-,
W 0)
^ J•5(- .c XZ d?o D< Ci •
•<-t w-^ en (NI OS > t^
CM
O
oo
0)
u3
(spuosnoMi)(Sdl>^) 3DNvisis3y cy
150

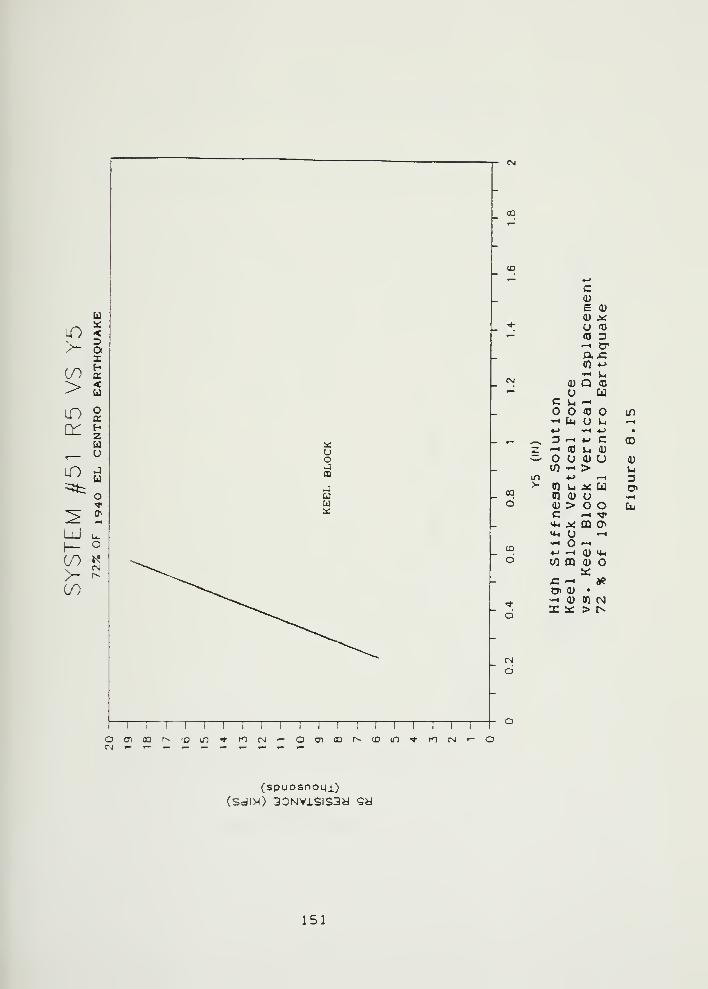
00
00
d
d
d
d
d)
E 0)
0) Ji:
U 'D
<0 D-• Crai:05 «->
•^ u0) Q (C
u Uc Ui •-H
<0 m•<-t In o u <—
I
•M •^ 4^ •
^ 3 -H 4-> C 00^ '-* (0 Li (1)^ u 0) U (U
01 •.-H > Uiin 4-> <—i a>- fn u Ai u o>
ff) 0) o •M0) > o o Cuc r^ 5J.
VU X OQ c^^< u <—
1
t-i o *—
<
4-> —1 Q) «4^
CO ffl OJ
St:
x: t—t ifi
D> <u •
.H 0) CO cqX i£: > t^
uD in
(spuDsnogx)(Sdl>l) 30NVlSIS3y Qy
151
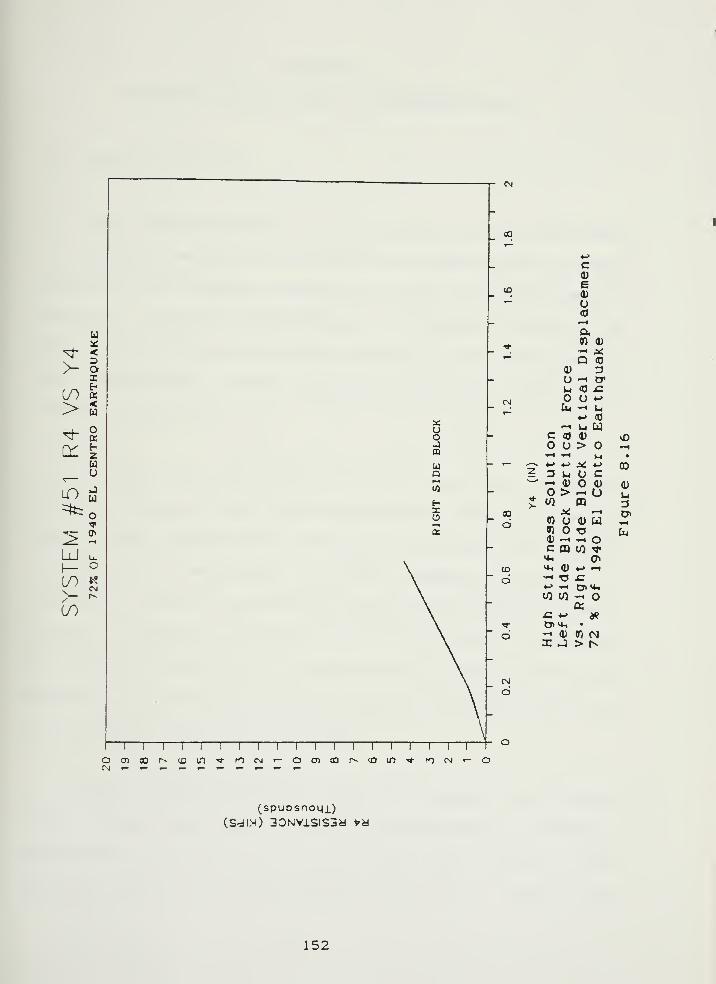
CN
SO
4->
c0)
<DE0)
'" o<0^Ha
*•" D <0
0) 3o -H crui <o ii:
CNJO u *-»
b4 -^ Ui*"-> (0
'-• u Uc ao 4)
u > o•»-< •^ M
I— ^ •«-»*- X -MS 3 U U C— ^ a; o 0)
_ > --< uJ to m
00 X ^Q to u 4) U
05 r3OJ ^ -< oc m (fi ^>*, 0\
(D ^ <i) *-> '^
o ^ T3 XZ*-> -^ o>«*<to {/I -i
aJC -M Jf?
•5*- 0> M-i •
ci -. 0) CO OJI J > r-
CN
CJ
«o
CD
0)
3
(apuosnom)(SdDH) 3DNVlSIS3y Vd
152

CHAPTER 9
SUMMARY, CONCLUSIONS, AND RECOMMENDATIONS
9 . SajM^r_y„P_t„Ejesul.t
s
This thesis described the development of the three degree
of freedom submarine drydocK blocking system design package
based on the "3D0FRUB" computer program. The differential
equations of motion are developed to include the effect of
high blocking systems and wale shores. The sliding failure
mode is modified to more accurately take into account the
effects of cap angle.
A case study is undertaken involving the earthquake
sliding failure of the C/SS Lea/iy (CG-16) while in a graving
dock at Long Beach Naval Shipyard. This study verifies the
accuracy and usefulness of the "3D0FRUB" program. A
parametric study is conducted to determine the effects of wale
shores, isolators, and block stiffness and geometry variations
on system survivability. The effects of using earthquake
acceleration time histories with differing frequency spectrums
on system survivability is studied.
Eleven submarine drydock blocking systems are studied
using linear wood caps, bilinear wood caps for two different
earthquakes, and one inch bilinear rubber caps. None of these
systems survive to dry dock failure (0.26 g's) or even met the
153

U.S. Navy earthquake acceleration survivability criteria (0.20
g's). This shows that current U.S. Navy submarine drydock
blocking systems are inadequate to survive expected
earthquakes. Figure (9.1) illustrates the survivability
levels of the various systems studied.
Two design solutions are found that met the dry dock
failure requirements. The low stiffness solution uses dynamic
isolators and rubber caps, and the high stiffness solution
uses wale shores and rubber caps. The survivability of these
two solutions when excited by the 1940 El Centre Earthquake is
plotted in figure (9.2). This figure also includes the
survivability of submarine system 1 using linear and bilinear
wood, one inch rubber caps, and dynamic isolators. Both of
the solutions have the same survivability level, and provide a
reasonable margin of safety over the dry dock failure level.
154

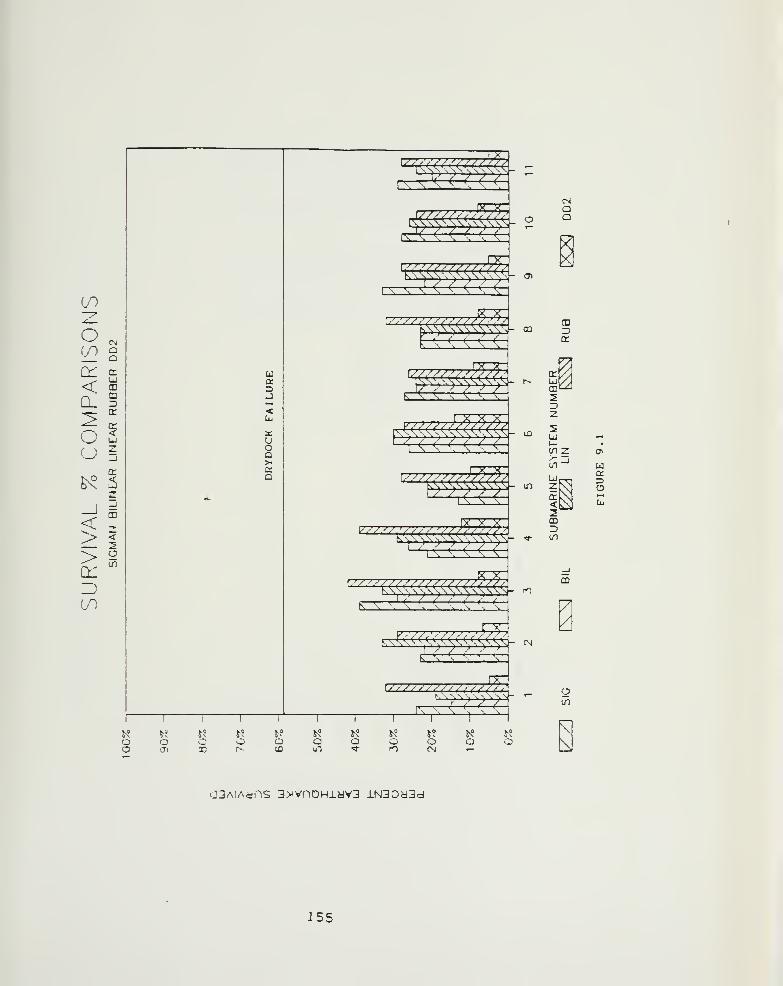
oo
o CN
U)
\Y tr
<rUJm
n 3'^ q:
o 5UJ
o Z
rr
&<^ ^
1
<ZJ
m
> <5
> O1/1
Z)(tO
ua
<
uoQ>KQ
^^->-->-^ a>
I V ^ <. ^. ^x-^-^
r-^—^
—
V ^' <
h^-^)wI ( (. r (^ r <
czzzz
^ v ^ ^v < <
K V V ' C "^ < < < < C-K—^
—
^ ' < "^ < «'
k' <- < V "', 'eN \ \
EZZZZZ27ZZ2ZzizZ
rr— i << <
CMQa
00 3
m32
UJ
(/I Z CT>
(;i
CO3
r- ^ un
1N» w u» S-; 5-? ^? ^° N° J? S\° J?o o o o o O O o o o oo 71 00 r-- (D UT 'J- n r-i •-
CO
U1
\
ua.
OjAiAdns 3>^vnoHiay3 iN3Dy3d
155

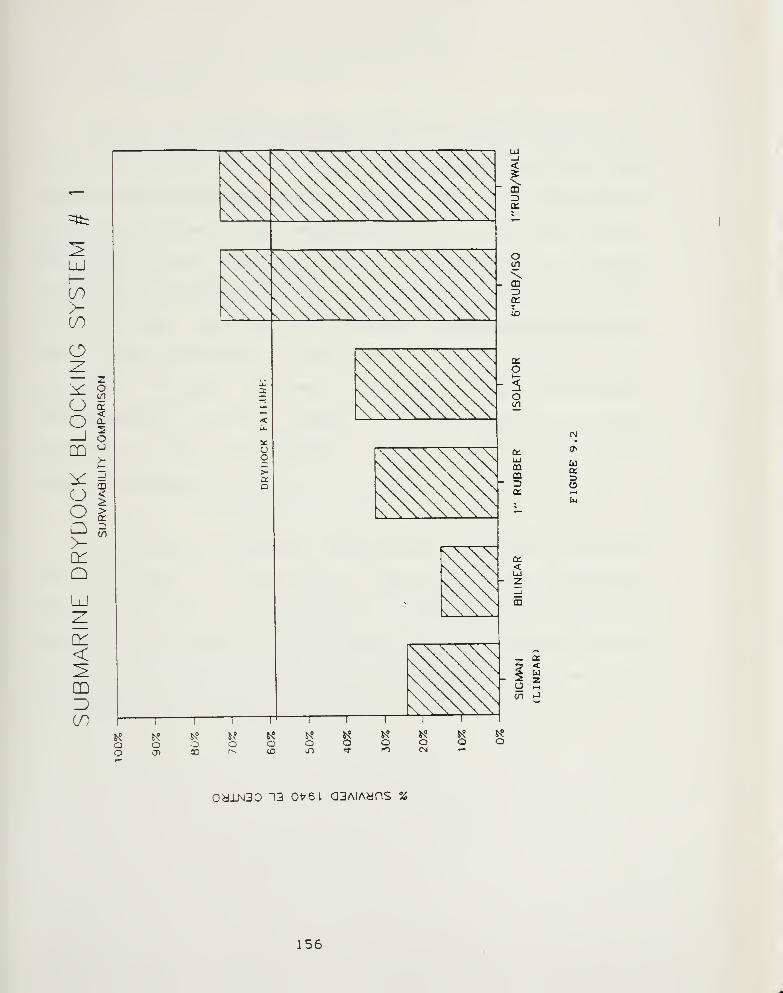
=fc
LU\—00
o2
o I-J oCD ^
(JoQ>-
cr
UJ
<CD
00
<>cr
Ui
<
0^
o(/I
\q:
(b
oQ
o•71 00
Q
u
oaiN3D 13 ovet a3AiAyns %
156

9 . 1 Conclusions
Both of the design solutions survive beyond the dry dock
failure level; however, each of the designs have their own
advantages and disadvantages. Figure (9.3) is a comparison
between the keel block displacements for the wale shore
solution and the isolator solution when excited by their
respective design earthquakes. It is evident from this figure
that the wale shore solution virtually prevents the submarine
from moving horizontally relative to the dock floor. The
isolator solution allows relatively large horizontal
displacements to occur. Figure (9.4) is a comparison of the
rotation of these two systems. Again, the wale shores are
reducing movement.
The primary difference between the two design solutions
is illustrated in figure (9.5). This figure is a comparison
between the side block horizontal forces experienced by each
solution. As seen in this figure, the wale shore system
experiences forces which are an order of magnitude higher than
those seen hy the isolator solution.
157

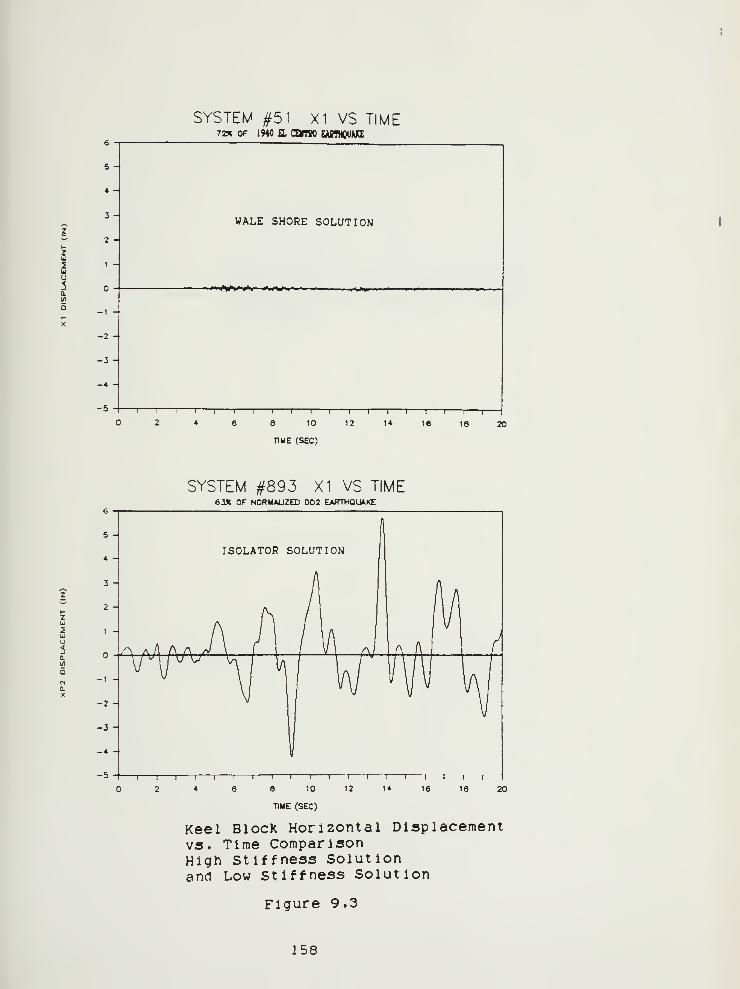
5 -
4 -
3 -
2 -
1
-1 -
-2 -
-3-
-4 -
-5-i r-
2
SYSTEM #51 X1 VS TIME72X OF 1940 EI CamO EABTHQUAJO;
WALE SHORE SOLUTION
^'Ai^o** »«»^^»
T) 10
TIME (SEC)
—1
—
12 14
—r—16 16 20
SYSTEM #893 XI VS TIME63X OF NORMALIZED 002 EARTHQUAKE
12 14 16 18 20
TIME (SEC)
Keel Block Horizontal Displacementvs. Time ComparisonHigh Stiffness Solutionand Low Stiffness Solution
Figure 9.3
158

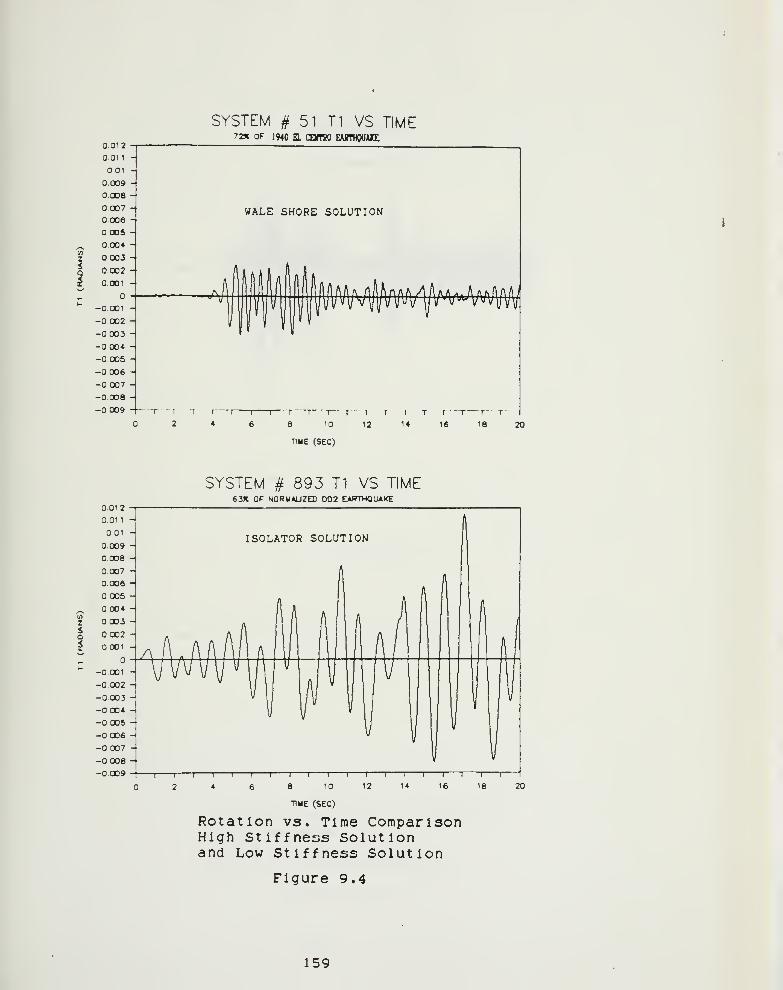
0.012
SYSTEM # 51 T1 VS TIME7W OF 1940 a CDITBO EMmWME
SYSTEM # 893 T1 VS TIME633t OF NORMALIZED 002 E^WTWOUAKE
TIME (SEC)
Rotation vs. Time ComparisonHigh Stiffness Solutionand Low Stiffness Solution
Figure 9.4
159
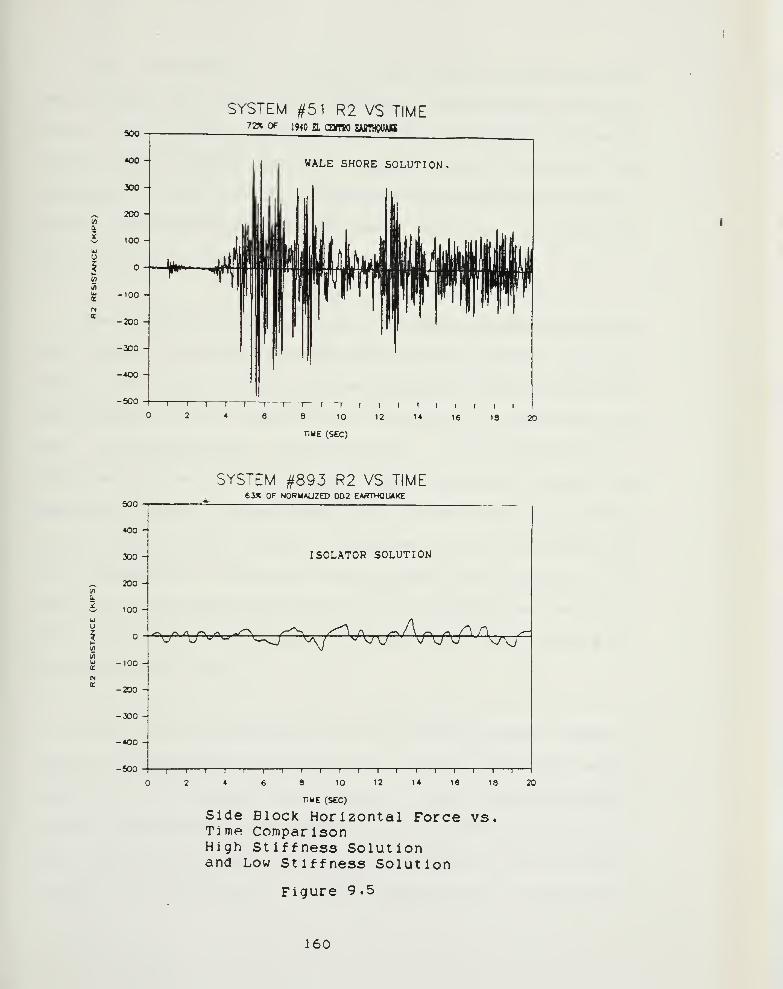
SYSTEM #51 R2 VS TIME72X OF 1940 a CafTBO GABTWUAB
WALE SHORE SOLUTION
20
500
400
300
200
100
-100
-200
-300
-*O0
-SOO
SYSTEM #893 R2 VS TIME63X OF NORMAUZED 002 EARTHQUAKE
ISOLATOR SOLUTION
'yj^ -'Xf^^^ M,"^7^
-\ 1 1 r
2 4
-| T"
8
—
I
r10 12
-| 1 1\
1 1 r
14 16 18 20
TIME (SEC)
Side Block Horizontal Force vs.Time ComparisonHigh Stiffness Solutionand Low Stiffness Solution
Figure 9.5
160
The forces seen by the wale shore solution are also much
more abrupt and higher in frequency. As expected, the wale
shore solution very closely follows the earthquake. The wale
shore high stiffness solution almost rigidly attaches the
submarine to the dry dock. Therefore, personnel and equipment
inside the submarine will experience the full acceleration
magnitudes of the earthquake.
The isolator solution nearly uncouples the submarine from
the dry dock so that the submarine remains almost fixed in
space while the dry dock vibrates beneath. The accelerations
experienced by the submarine are an order of magnitude less
than the earthquake accelerations. This substantially
improves the safety of personnel and equipment Inside the
submarine. Even though submarines are designed to withstand
large shock factors, when a submarine is in dry dock much of
its equipment and machinery may be open for repairs. In
addition, the shocks accompanying an earthquake may last well
over one minute as opposed to the very short duration of a an
explosion shock wave.
Both of the design solutions can be constructed; however,
there are some cost and interference concerns. The wale shore
solution will interfere with access to the dry dock to some
degree, although the wale shores could be used as utility runs
and staging platforms. This solution's impact on the dry dock
itself is non-trivial. The installation of 28 hinge
161

assemblies along the docKside will be a major dry dock
modification. In addition, the steel carriage and dry dock
floor attachment fixtures are major changes to current
drydocking practices and will require significant design and
construction efforts.
Most of the modifications required to the blocking system
and dry dock are within the capability of shipyards to
accomplish. After a drydocking evolution has been completed/
many additional manhours will be required to install the wale
shores. One wale shore per side can be removed for production
reasons while still meeting the survivability criteria. The
use of the steel carriage and rubber caps might reduce the
hours required to layout a blocking system. The measurements
of the system would be locked into the construction, and it
would be easier and faster to assemble this blocking system
with cranes. The use of rubber and steel in the blocking
system is much more reliable than the present oak and Douglas
fir.
The isolator solution may be the more expensive solution
due to the large number and high cost of the dynamic
isolators. However, this solution offers less production
interference and a substantial increase in submarine personnel
and equipment safety. The actual blocking system size
increase will be limited to the cross-connections of the steel
carriage, but significant changes will still be required to
162

the dock floor to allow rigid attachment. Again, the use of
the steel carriage and rubber caps should reduce the layout
time of the drydocK blocking system. Even though the
submarine may move up to six inches horizontally during an
earthquake using isolators, this motion is acceptable if
appropriate precautions are taken in rigging services and
platforms
.
Considering the almost certain occurrence of a major
earthquake in the proximity of a U.S. Naval shipyard where
submarines can be drydocked within the next 20 years, the
expeditious incorporation of one of these design solutions
into U.S. Navy drydocking standards is strongly recommended.
9 . 2 Recommendali ons for Furj;.h.er .._.Sl.udx
It is highly recommended that the following areas be
investigated to further verify the feasibility of the proposed
designs :
1. Study the effect of the wide range of existing wood
blocking material properties on pier stiffness using
statistical analysis.
2. Conduct additional tests on wood blocking materials
to determine their properties when loaded at angles
to the grain normally seen in a blocking system.
163

3. Conduct tests on rubber cap material in order
determine its stiffness and rigidity behavior under
biaxial loading.
4. The specific dynamic isolator and the associated
sliders required for the low stiffness solution need
to be designed in detail,
5. The steel carriage assembly for both solutions needs
to be designed .
6. The required dry dock structural modifications need
to be determined .
7. The design solutions need to be verified using model
tests employing shaker tables and scale models.
8. A detailed earthquake site specific study needs to
be accomplished. This would include the
instrumentation of all graving docks susceptible to
earthquakes in order to increase the data base. The
proposed designs should be checked against a full
range of different earthquake acceleration time
histor ies
.
9. Surface ship blocking systems need further
examination. This should include modeling the
flexibility inherent in surface ships. The problem
of surface ship's significant longitudinal block
loading distribution should also be taken into
account .
164

10. The final design solution for use in Navy dry docks
should also take into account the longitudinal
excitation and response of the blocking system.
16S

References
1. Hepburn, Richard D., "Non-linear Material Three Degree ofFreedom Analysis of Submarine Drydock Blocking Systems"/M.I.T. Thesis, May 1988.
2. Sigman, Dale, E., "The Coupled Three Degree of FreedomMotion Response of a Drydocked Submarine to SeismicLoad", MIT Thesis, May 1986.
3. Karr , Dale G., "Docking Under Seismic Loads", FinalReport to CASDE Corporation for the Naval Sea SystemsCommand Structural Integrity Division, June 1987.
4. U.S. Navy, ,NAVSEA Technical Manual S9086-7G-STM-000
,
Chapter 997, Revision 1 "Docking Instructions and RoutineWork in Drydock" ,
.
5. Information in enclosure to letter to author from TingleyK. Lew, Structures Division Code LSI, Naval CivilEngineering Laboratory, Port Hueneme, California, 19January 1988.
6. U.S. Department of Commerce, National Oceanic andAtmospheric Administration, National Geophysical DataCenter Code E/GC, "Digital Strong Motion Data", Boulder,Colorado, October 1987.
7. Paz, Mario, Mi cro Computer-Aided Engineering StructuralDynamics , Von Nostrand Reinhold Company, New York, 1986.
8. Baumeister, Theodore, Editor-in-chief, et al , MarksStandard Handbook f or Mechanical Engineers , EighthEdition, McGraw Hill Book Company, New York, 1978, pp 3-29.
9. Shakal , Tony. "CSMIP Records from Whittier Earthquake ofOctober 1, 1987". California Strong MotionInstrumentation Program (CSMIP), Division of Mines andGeology, Department of Conservation, State of California,October 3, 1987
10. U.S. Department of the Navy, Naval Sea Systems Command,Long Beach Naval Shipyard, "Drydocking FacilitiesCharacteristics", Long Beach Naval Shipyard, March 1985.
11. Kinemetrics Systems brochure, "SMA-1 Strong MotionAccelerograph" , Kinemetrics Systems, Pasadena,California, 1986.
12. Gillmer, Thomas C, and Bruce Johnson, IjitxodJLiCt_ioil_Jti>
N.a V a_l_ JUT c h i t_ec t _ur e , United States Naval Institute,Annapolis, Maryland, 1982, p. 272.
166
1
I
4
13. Rabinowicz, Ernest, Lecture, "Tribology", M.I.T., Course2.800, Fall 1987.
14. Telephone conversation between Tlngley K. Lew, StructuresDivision Code LSI, Naval Civil Engineering Laboratory,Port Hueneme, California, and LCDR Richard D. Hepburn,M.I.T. Graduate Student, 1 February 1986.
15. Information in enclosure to letter from Tingley K. Lew,Structures Division Code LSI, Naval Civil EngineeringLaboratory, Port Hueneme, California, to LCDR Richard D.Hepburn, M.I.T. Graduate Student, 19 January 1988.
16. Telephone conversation between Ian G. Buckle, VicePresident for Engineering Dynamic Isolation SystemsIncorporated, Berkeley, California, and LCDR Richard D.Hepburn, M.I.T. Graduate Student, January 1988.
17 Meirovitch, Leonard, Elements of Vibration Analysis ,
McGraw Hill Inc., New York, 197S, p. 56-57.
18. Telephone conversation between Ian G. Buckle, VicePresident for Engineering Dynamic Isolation SystemsIncorporated, Berkeley, California, and LCDR Richard D.Hepburn, M.I.T. Graduate Student, February 1988.
19. Hughes, Owen, Ship Structural Design; A Rationally-Based,Comput er-Aided, Op timization Approach , John Wiley & Sons,New York, 1983, pp. 396-399.
20. Popov, Egor P., Introducti o n to Mechanics of Solids ,
Prentice-Hall, Inc., Englewood Cliffs, New Jersey, 1968,pp . 531 ,557.
167

APPENDIX 1
1. "3D0FRUB" Computer Program Listing2. "ACCLINPT" ,"BILINALL" /"RUBBER" , and
"RESPALL" Subroutine Listings3. Sample Input Data File and Output File
168

I
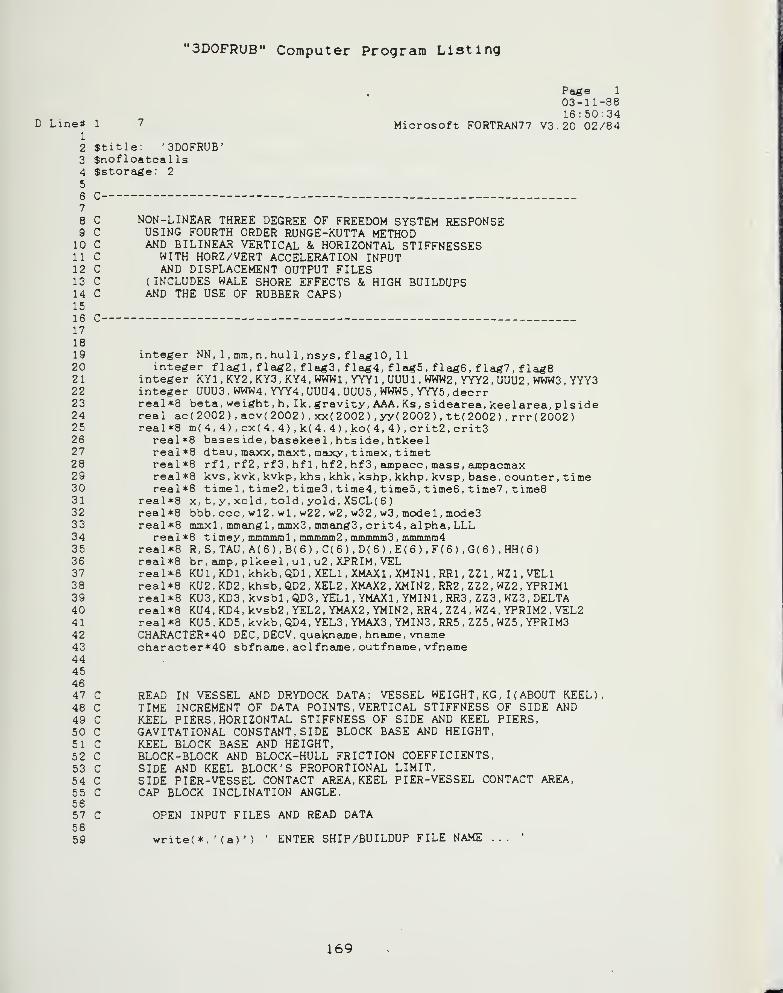
"3D0FRUB" Computer Program Listing
D Linetf 1
1
2
3
4
5
6 C-
Pa^e 1
03-11-8816:50:34
Microsoft FORTRAN?? V3.20 02/84
?
8
9
10111213141516171819202122232425262728293031323334353637383940414243444546474849505152535455565?5859
$title: '3D0FRUB'$nof loatcal Is$storage: 2
C NON-LINEAR THREE DEGREE OF FREEDOM SYSTEM RESPONSEC USING FOURTH ORDER RUNGE-KUTTA METHODC AND BILINEAR VERTICAL & HORIZONTAL STIFFNESSESC WITH HORZ/VERT ACCELERATION INPUTC AND DISPLACEMENT OUTPUT FILESC ( INCLUDES WALE SHORE EFFECTS & HIGH BUILDUPSC AND THE USE OF RUBBER CAPS)
integer NN, 1 , mm, n, hul 1 , nsys, flag 10, 11integer f lagl, f lag2, flag3, flag4, f lag5, flag6, flag?, flag8
integer KYI , KY2 , KY3 , KY4 , WWWl , YYYl , UUUl , WWW2 , YYY2 , UUU2 , WWW3 , YYY3integer UUU3, WWW4, YYY4, UUU4, UUU5, WWW5, YYY5, decrrreal*8 beta, weight, h, Ik, gravity, AAA, Ks, sidearea, keelarea, plsidereal ao(2002) , acv(2002) , xx(2002) , yy( 2002 ), tt( 2002 ) , rrr(2002)real*8 m( 4, 4) ,
cx( 4, 4) , k( 4, 4) , ko( 4, 4) , crit2, crit3real*8 bases ide, basekeel, htside, htkeelreal*8 dtau, maxx, maxt, maxy, tiraex, timetreal*8 rf 1, rf2, rf3, hf 1, hf2, hf3, ampacc, mass, ampacmaxreal*8 kvs , kvk, kvkp, khs, khk, kshp, kkhp, kvsp, base, counter, timereal*8 timel, time 2, time 3. time4, time5, time6, time?, timeS
real*8 x, t, y, xold, told, yold, XSCL(6)real*8 bbb, ccc, wl2 , wl , w22, w2, w32, w3 , model, mode3real*8 mmxl , mmangl , mmx3, mmangS, crit4, alpha, LLL
real*8 timey, mmmmml , mmmmm2 , mmmmm3 , mmmmm4real*8 R, S, TAU, A( 6 ) , B( 6 ) , C(6),D(6),E(6),F(6),G(6),HH(6)real*8 br. amp, plkeel , ul , u2 , XPRIM, VELreal *8 KU 1 , ECD 1 , khkb , QDl , XELl , XMAXl , XMINl , RRl , ZZ 1 , WZ 1 , VELlreal*8 KU2 , KD2, khsb, QD2 , XEL2, XMAX2, XMIN2, RR2, ZZ2, WZ2, YPRIMlreal *8 KU3 , KD3 , kvsbl , QD3 , YELl , YMAXl , YMINl , RR3 , ZZ3 , WZ3 , DELTAreal*8 KU4,KD4, kvsb2, YEL2, YMAX2 , YMIN2 , RR4, ZZ4. WZ4, YPRIM2 , VEL2real*8 KU5 , KD5 , kvkb, QD4, YEL3, YMAX3, YMIN3 . RR5 . ZZ5, WZ5, YPRIM3CHARACTER*40 DEC, DECV, quakname, hname, vnamecharacter*40 sbfname, aclfname, outfname, vfname
C READ IN VESSEL AND DRYDOCK DATA; VESSEL WEIGHT, KG , I( ABOUT KEEL)C TIME INCREMENT OF DATA POINTS, VERTICAL STIFFNESS OF SIDE ANDC KEEL PIERS, HORIZONTAL STIFFNESS OF SIDE AND KEEL PIERS,C GAVITATIONAL CONSTANT, SIDE BLOCK BASE AND HEIGHT,C KEEL BLOCK BASE AND HEIGHT,C BLOCK-BLOCK AND BLOCK-HULL FRICTION COEFFICIENTS,C SIDE AND KEEL BLOCK'S PROPORTIONAL LIMIT,C SIDE PIER-VESSEL CONTACT AREA, KEEL PIER-VESSEL CONTACT AREA,C CAP BLOCK INCLINATION ANGLE.
C OPEN INPUT FILES AND READ DATA
write( *,' (a) '
)
ENTER SHIP/BUILDUP FILE NAME
169
3D0FRUB
D Lineit
60616263646566676869707172737475767778798081828384858687888990919293949596979899100101102103104105106107108109110111112113114115116117118
read(*, ' (a) ') sbfname
PagB 2
03-11-8816:50:34
Microsoft FORTRAN77 V3. 20 02/84
open(4, file- sbfname. status='Qld' , form=' formatted'
read(4, *) weight, h, Ik, kvs, kvsp, kvk, AAA, Ksread (4, *) khs.khk, kshp, kkhp, QDl , QD2, QD3, gravity
read(4,*) baseside, basekeel, htside, htkeel , ul , u2read( 4,*) br.plside, pi keel , sidearea, keel area, zeta
read(4,*) hull , nsys , beta, QD4, kvkpCLOSE (4)
'DO YOU WANT RESPONSE OUTPUT FILES? (Y OR N)) decY' . or . dec. eq. 'y' ) thenINPUT DESIRED RESISTANCE OUTPUT: (1,2,3,4,5)'KEEL HORIZONTAL FORCE = rSIDE BLOCK HORIZONTAL FORCE = 2'
LEFT SIDE BLOCK VERT FORCE = 3^
RIGHT SIDE BLOCK VERT FORCE = 4'
KEEL BLOCK VERTICAL FORCE = 5^
write (*, *)read(*, ' (a)if (dec. eq.write(*, *)write( *, *)write( *, *)write(*, *)write(*, *)write( *, *)read( *, *) decrrend if
do 12, i=l,3do 13, j=l,
3
m( i, j)=0.k(i, j)=0.0cx( i, j)=0.0ko(i, j)=0.0
13 continue12 continue .
CALCULATE SYSTEM PARAMETERS
mas s=weight /gravityLLL=sqrt( (htside-htkeel)**2D0+(br/2D0)**2D0)alpha=asin( (htside-htkeel ) /LLL)
ra( 1 , 1 ) =massm( 1 , 3) =h*massm( 2 , 2 ) =massm( 3 . 1 ) =mass*hm(3, 3)=Ik
k(l, l)=(2DO*Ks+2DO*khs+khk)k( 1, 3)=(2DO*Ks*AAA+2DO*khs*LLL*sin(alpha)
)
k(3. l)=k( 1,3)k(2, 2)=(2D0*kvs-t-kvk)k(3. 3)=(2DO*Ks*AAA**2DO+2DO*khs*( (LLL*sin( alpha) )**2D0)+
•- (2D0*kvs*( (LLL*cos(alpha) ) **2D0) -( weight*h) ) )
ko(l, l)=k(l, 1)
ko( 1, 3)=k( 1, 3)ko(3, l)=k(3, 1)
ko(2,2)=k(2, 2)ko(3, 3)=k(3,3)
DETERMINE NATURAL FREQUENCIES OF SYSTEMbbb=-(m(l, l)*k(3.3)+m(3,3)*k(l, l)-m(l,3)*k(3, l)-m(3, l)*k(l,3))
170
3D0FRUB p^g 3
03-11-88
n T -, 16:50:34D Linett 1 7 Microsoft FORTRAN?? V3.20 02/84
119 + /{m(l, l)*m(3, 3)-m(l, 3)*m(3, 1)
)
120 ccc = (k(l, l)*k(3,3)-k(l,3)*k(3,l))/(m(l, l)*m(3,3)-m(l,3)*m(3, D)121 C122123 C NATURAL FREQ. MODE «1124125 wl2=(-bbb-sqrt(bbb**2-4D0*ccc) )/2D0126 wl=sqrt(wl2)127128 C NATURAL FREQ. MODE «2129130 w22=k(2, 2)/m(2,2)131 w2=sqrt(w22)132 C NATURAL FREQ. MODE «3133134 w32=(-bbb+sqrt(bbb**2-4D0*ccc) )/2D0135 w3=sqrt(w32)136137 C MODE SHAPE «1 & »3138139 model =(m( 1 , 3 ) *wl2-k( 1, 3 ) )/( -m( 1, 1 ) *wl2+k( 1, 1 )
)
140 modes =(m( 1, 3)*w32-k( 1, 3) )/(-m(l, l)*w32+k( 1,1))141 C DETERMINE Cll , C13 , C31 , C33142 mmxl=m( 1, l)+m( 1, 3)/model143 mmangl=model*m(3, l)+m(3, 3)144 mmx3=m( 1, l)+m( 1, 3)/mode3145 mmang3=mode3*m(3, l)+m(3, 3)146 mmmmml=2D0*2eta*mmxl*wl147 mmmmm2=2D0*zeta*mmx3*w3148 mmmmm3 =2D0*zeta*mmang 1 *wl149 mmmmm4=2D0*zeta*mmang3*w3150151152153154155 cx( 1 , 3 ) =(mmmmml-mmmmm2 ) /( 1 /model -l/mode3
)
156 cx( 1 , 1 ) =mmmmml-( cx( 1 , 3 ) /model
)
157 cx{2, 2)=2D0*2eta*m(2, 2)*w2158 CX(3, 1 ;i =f mnimmm.?-mmmmm4^ /( mndf>\ -mndt^:^ "}
159 cx( 3 , 3 ) =mmmmm3-( cx( 3, 1 ) *model
)
160161162 C READ IN ACCELERATION DATA163164 CALL ACCLINPT( amp, ac, acv, dtau, quaknfiune, hname, vname)165166 C ESTABLISH FAILURE CRITERIA AND FLAGS167168 crit2=min (ul,u2)169 crit3= ( 6 . 6D-l*baseside-l . 2D1) /htside170 crit4=basekeel/(6D0*htkeel)171 ampacc=lDO172 counter=0.0173 ainpacmax=0.0 »
174 10000 continue175 write(*,*) ampacc176 flagl=0177 fla^2=0
171

JDOFRUB p^^ 4
03-11-88n T • .* 1 7 16:50:34
?^= 1-. o ^ Microsoft FORTRAN?? V3.20 02/841 fa iiago=0179 fla«4=0180 fla«5=0181 flag6=0182 fla^?=0183 flag8=0184 fla^lO=0185 maxx=0.0186 maxt=0.0187 maxy=0.0188 mm=0189 x=0.0190 y=0.0191 t=0.0192 xold=0.0193 yold=0.0194 told=0.0195 R=0.0196 S=0.0197 TAU=0.0198199 C INITIALIZING BILINEAR VARIABLES200201 C INITIALIZING DELTA202203 if (kvs . eq. kvsp) then204 YEL1=0.0205 elseif (kvs . ne. kvsp) then206 YELl=(iD3/(kvs-kvsp)207 endif208 if (kvk. eq.kvkp) then209 YEL3=0.0210 elseif ( kvk. ne. kvkp) then211 YEL3=QD4/(kvk-kvkp)212 endif213 DELTA=weight/(2D0*kvs+kvk)214 if (QD3.ge. 0. 0. or.QD4.ge. 0. 0) then215 kvsbl=kvs216 kvkb=kvk217 goto 100218 endif219 if (DELTA. It. YEL3. and. DELTA. It. YELl) then220 kvsbl=kvs221 kvkb=kvk222 elseif (DELTA. ge. YEL3. or. DELTA. ge. YELl ) then223 kvsbl=kvsp224 kvkb=kvkp225 DELTA=YEL3+(weight-(YEL3*(2DO*kvs+kvk) ) ) /( 2D0*kvsp+kvkp)226 endif227228 100 continue229230 C INITIALIZING KEEL HORIZONTAL STIFFNESS231232 KUl=khk233 KDl=kkhp234 khkb=KUl235 if (QDl .eq. 0.0) goto 101236 KY1=0
172

i
03-11-88_ , . ^ ,
_ 16:50:34D Linetf 1 7 Microsoft FORTRAN?? V3.20 02/84
237 XEL1=QD1/(KU1-KD1)238 XMAX1=0.0239 XMIN1=0.0240 RR1=0.0241 ZZ1=0.0242 WZ1=0.0243 WWW1=0.0244 YYY1=0.0245 UUU1=0.0246247 101 continue248249 C INITIALIZING SIDE BLOCK HORIZONTAL STIFFNESS250251 KU2=khs252 KD2=kshp253 khsb=KU2254 if (QD2 . eq. 0.0) goto 102255 KY2=0256 XEL2=QD2/(KU2-KD2)257 XMAX2=0.0258 XMIN2=0.0259 RR2=0.0260 ZZ2=0.0261 WZ2=0.0262 WWW2=0.0263 YYY2=0.0264 UUU2=0.0265266 102 continue267268 C INITIALIZING LEFT SIDE BLOCK VERTICAL STIFFNESS2 69270 KU3=kvs271 KD3=kvsp272 if (QD3 .eq. 0.0) goto 103273 KY3=0274 YMAX1=0.0275 YMIN1=0.0276 RR3=kvsbl*DELTA27? ZZ3=0.0278 WZ3=0.0279 WWW3=0.0280 YYY3=0.0281 UUU3=0.0282283 103 continue284285 C INITIALIZING RIGHT SIDE BLOCK VERTICAL STIFFNESS286 KU4=kvs287 KD4=kvsp288 kvsb2=kvsbl289 if (QD3 . eq. 0.0) goto 104290 KY4=0291 YEL2=YEL1292 YMAX2=0.0293 YMIN2=0.0294 RR4=kvsb2*DELTA295 ZZ4=0.0
173

I
M
03-11-88rin«»«1 7 < 16:50:34
296 WZ4=0Microsoft FORTRAN?? V3.20 02/84
297 WWW4=0.0298 YYY4=0.0299 UUU4=0.0300301 104 continue302303 C INITIALIZING KEEL VERTICAL STIFFNESS304305 KU5=kvk306 KD5=kvkp307 if (QD4.eq.0.0) goto 105308 KY5=0309 YMAX3=0.0310 YMIN3=0.0311 RR5=kvkb*DELTA312 ZZ5=0.0313 WZ5=0.0314 WWW5=0,0315 YYY5=0.0316 UUU5=0.0317318 105 continue319320 C IMPLEMENTATION OF EQUATIONS OF MOTION INTO THE321 C RUNGE-KUTTA FORMULUS322323 do 301, 1=1, 2000324325 C CALCULATE BILINEAR STIFFNESS AND RESISTANCE326327 C CALCULATE KEEL HORIZONTAL BILINEAR STIFFNESS328329 if (QDl .eq. 0.0) goto 106330331 CALL BILINALL(x, S,khkb,RRl,KDl,QDl,KUl,XELl,XMAXl,XMINl,332 + KYl.ZZl, WZl, WWWl, YYYl.UUUl)333334 106 continue335336 C CALCULATE SIDE BLOCK HORIZONTAL BILINEAR STIFFNESS337338 XFRIM=+x+LLL*t*sin( alpha)339340 if (QD2 .eq. 0.0) goto 107341342 VEL=+S+LLL*TAU*sin( alpha)343344 CALL BILINALL(XFRIM, VEL,khsb,RR2,KD2,QD2.KU2,XEL2.XMAX2.XMIN2,345 + KY2,ZZ2, WZ2, WWW2, YYY2,UUU2)346347 107 continue348349 C CALCULATE LEFT SIDE BLOCK VERTICAL BILINEAR STIFFNESS350351 YPRIMl=-y-t*LLL*cos( alpha) +DELTA352353 if (QD3 .eq. 0.0) goto 108354 if (QD3 .gt. 0.0) then
174
i
03-11-8816:50: 34
D Line« 1 7 Microsoft FORTRAN?? V3.20 02/84355356 VELl=-R-TAU*LLL*cos( alpha)357358 CALL BILINALL(yPRIMl,VELl,kvsbl,RR3,KD3,QD3,KU3,YELl, YMAXl,359 + YMIN1,KY3,ZZ3,WZ3.WWW3, YYY3,UUU3)360361 elseif (QD3 .It. 0.0) then362363 CALL RUBBER(YPRIMl,kvsbl,RR3,KD3,QD3,KU3,YELl)364365 endif366367 108 continue368369 C CALCULATE RIGHT SIDE BLOCK VERTICAL BILINEAR STIFFNESS370371 YPRIM2=-y+t*LLL*cos( alpha )+DELTA372373 if (QD3 . eq. 0.0) goto 109374 if (QD3 .gt. 0.0) then375376 VEL2=-R+TAU*LLL*cos( alpha)377378 CALL BILINALL(YPRIM2, VEL2,kvsb2,RR4,KD4,(iD3,KU4, YEL2, YMAX2,379 + YMIN2.KY4,ZZ4,WZ4, WWW4, YYY4,UUU4)380381 elseif (QD3 .It. 0.0) then382383 CALL RUBBER (YPRIM2,kvsb2,RR4,KD4,QD3,KU4,YEL2)384385 endif386387 109 continue368 ^389 C CALCULATE KEEL VERTICAL STIFFNESS390391 YPRIM3=-y+DELTA392393 if (QD4 . eq. 0.0) goto 110394 if (QD4 .gt. 0.0) then395396 CALL BILINALL(YPRIM3, -R,kvkb,RR5,KD5,QD4,KU5, YEL3,YMAX3,397 • YMIN3,KY5,ZZ5,WZ5, WWW5, YYY5,UUU5)398399 elseif (QD4 .It. 0.0) then400401 CALL RUBBER(YPRIM3,kvkb,RR5,KD5,QD4,KU5. YEL3)402403 endif404405 110 continue406407408 C RECALCULATION OF DELTA409410 if (QD3. ge. 0. 0. or.QD4. ge. 0. 0) then411 DELTA=weight/(2D0*kvs+kvk)412 goto 120413 endif
3D0FRUBP«srf
175
<Jd-ii-oo
Linptf 1 7 ... 16:50:34aII •* /I, i,k , , V . Microsoft FORTRAN?? V3.20 C2/84414 if (kvkb. eq. kvk) then415 DELTA=weight/(2D0*kvs+kvk)416 elseif (kvkb. gt. kvk) then417 DELTA=YEL3 + {weight-(YEL3*(2DO*kvs+kvk)))/(2DO*kvsp-t-kvkp)418 end if419420 120 continue421422 if (QDl.eq.O.O.and.QD2.eq.O.O.and.QD3 eq423 + and.QD4. eq. 0. 0) goto 111424425 C RECALCULATION OF STIFFNESS MATRIX VALUES42642? k(l, l)={2D0*Ks+2D0*khsb+khkb)428 k(l,3)=(2D0*Ks*AAA+2D0*khsb*LLL*sin(aIpha))429 k{3, l)=k(l, 3)430 k(2, 2)=(kvsbl+kvsb2+kvkb)431 k(3, 3) = (2D0*Ks*AAA**2D0+2D0*khsb*( (LLL*sin( alpha) )**2D0)
+
432 + ( (kvsbl+kvsb2)*( (LLL*cos(alpha) )**2D0)-(weight*h) )
)
433434 111 DO 3000, 11=0,5
2 435 A(11)=0.02 436 B(11)=0.02 43? C{11)=0.02 438 D(11)=0.02 439 E(11)=0.02 440 F(11)=0.02 441 G(11)=0.02 442 HH(11)=0.02 443 3000 CONTINUE1 444 rmn=mm+l1 445 DO 302, NN=1,
4
2 446 IF(NN.EQ. 1) THEN2 44? FF=0.02 448 ELSE IF (NN.EQ.2 .OR. NN.EQ.3) THEN2 449 FF=5D-12 450 ELSE IF (NN.EQ.4) THEN2 451 FF=1D02 452 ENDIF2 453 A(NN)=dtau*(R+FF*D(NN-l))2 454 B(NN)=dtau*(S+FF*E(NN-l)
)
2 455 C(NN)=dtau*(TAU+FF*F(NN-l)
)
2 456 D(NN)=dtau*( ( -cx{ 2, 2 ) /m( 2, 2 )) *(R+FF*D(NN-1 ) )-(k(2,2)/m(2,2))
2 457 +*(y+FF*A(NN-l) )-aiLp*ainpacc*acv( l)/2. 54D0)2 458 G(NN)=dtau*( (-cx(l, l)/m(l, 1) ) *( S+FF*E(NN-1 )
) -( cx( 1 , 3 ) /ra( 1, 1 )
)
2 459 +*(TAU+FF*F(NN-l))-(k(l, l)/m(l, 1) )*(x+FF*B(NN-l)
)
2 460 +-(k( 1, 3)/m( 1, 1) )*(t+FF*C(NN-l) )-ampacc*ac( l)/2. 54D0)2 461 HH(NN)=dtau*( ( -cx( 3 , 3 ) /m( 3, 3 )
) *( TAU+FF*F(NN-1 )) -( cx( 3 , 1 ) /m{ 3 , 3 )
)
2 462 +*(S+FF*E(NN-1) ) -( k( 3, 3 )/m( 3, 3 )) *( t+FF*C(NN-l ) )+(ra(3,l)/m(3,3))
2 463 +*( (-cx(2, 2)/m(2,2) ) *( R4-FF*D(NN-1 ) ) -( k( 2 , 2 ) /m( 2, 2 ) ) *(y+FF*A( NN-2 464 +1) ) )*(t+FF*C(NN-l))2 465 +-(k(3, l)/m(3,3) )*(x+FF*B(NN-l))2 466 +-(m(3, l)/m(3, 3) )*ampacc*ac(l)/2. 54D0)2 4672 468 E(NN)=(m(l, l)*m(3,3)*G(NN)-ra(l,3)*m(3,3)*HH(NN))/2 469 +(m(3, 3)*m( 1, l)-ra( 1, 3)*m(3, 1)
)
2 470 F{NN)=(HH(NN)-(m(3, l)/m(3,3))*E(NN))2 4?1 302 continue1 4?2
3D0FRUB Page
176

16: 50:34Linett 1 7 Microsoft FORTRAN?? V3.20 02/84
4?3 C DETERMINING SYSTEM RESPONSE4?44?5 yold=y4?6 y=yold+(A(l)+2D0*A(2)+2D0*A(3)+A(4) )/6D0477478 xald=x479 x=xold+(B( 1)+2D0*B(2)+2D0*B(3)+B(4) )/6D0480481 told=t482 t=told+( C ( 1 ) +2D0*C( 2 ) +2D0*C( 3 ) +C( 4) ) /6D0483484 R=R+(D(1)+2D0*D(2)+2D0*D(3)+D(4) )/6D0485486 S=S+ ( E ( 1 ) +2D0*E ( 2 ) +2D0*E( 3 ) +E( 4 ) ) /6D048?488 TAU=TAU+(F( l)+2DO*F(2)+2DO*F(3)+F(4) )/6D0489490 C MAXIMUM VALUES FOR TRANSLATIONS AND ROTATION491492 if (abs(xold) .gt. abs(maxx) ) then493 timex=dtau*( 1-1)494 maxx=xold49 5 end if496 if (abs(told) .gt. abs(maxt) ) then49? timet=dtau*( 1-1)498 max-t=told499 endif500 if ( abs (yold)
.gt . abs(maxy) ) then
501 timey=dtau*( 1-1)502 maxy^yold503 endif504505 C CALCULATE VERTICAL AND HORIZONTAL FORCES CAUSED BY VESSEL,506 C TEST FOR FAILURE507508 C CALCULATE FORCES ON SIDE/KEEL BLOCKS509 if (QD3.eq.0.0) then510 rf l=kvs*( (weight/k(2, 2) ) -yGld-(LLL*cos( alpha) )*told)511 rf2=kvs*( (weight/k(2, 2) ) -yold+( LLL*cos( alpha) )*told)512 elseif (QD3.ne.0.0) then513 rfl=RR3514 rf2=RR4515 endif516517 if (QD4.eq.0.0) then518 rf3=kvk*( ( weight/k( 2, 2 ) )-yold)519 elseif (QD4.ne.0.0) then520 rf3=RR5521 endif522523 if (QD2.eq.0.0) then524 hf l=khs*(xold+LLL*told*sin(alpha)
)
525 hf2=khs*(xold+LLL*told*sin(alpha)
)
526 elseif (QD2.gt.0.0) then52? hfl=RR2528 hf2=RR2529 endif530531 if (QDl.eq.0.0) then
177
3D0FRUB Pa^e 1003-11-8816:50:34
D Line« 1 7 Microsoft FORTRAN?? V3.20 02/84532 hf3=khk*(xold)533 elseif (QDl.gt.0.0) then534 hf3=RRl535 endif536537 C TEST FOR SIDE BLOCK SLIDING538539 if (fla^l.eq. 1) then540 go to 400541 else if (hf 1 . It . 0. 0. and. rf 1
.gt . 0.
542 + .and. ul*rf 1+hf l+u2*rf l*cos( beta) *sin(beta)543 + -rf l*cos(beta)*sin(beta) .It. 0.0) then544 timel= dtau*( 1-1)545 flagl=l546 else if ( hf 2
.gt . 0. 0. and. rf 2
.gt . 0.
547 + .and. -ul*rf2+hf2-u2*rf2*( cos(beta) *sin(beta)
)
548 + t-rf2*cos(beta)*sin(beta) .gt. 0.0) then549 timel=dtau*(l-l)550 flagl=l551 endif552 xl=xold553 yl=yold554 tl=told555 400 continue556557 C TEST FOR KEEL BLOCK SLIDING558559 if (flag2.eq.l) then560 go to 410561 else if ( rf 3
.gt . 0. 0. and. abs(hf3/rf 3 )
.gt . crit2 ) then
562 time2=dtau*( 1-1)563 flag2=l564 endif565 x2=xold566 y2=yold567 t2=told568 410 continue569 C TEST FOR SIDE BLOCK OVERTURNING570571 if (flags. eq. 1) then572 go to 420573 else if (hf 1 . It . 0. 0. and. rf 1
.gt . 0. 0. and. abs(hf 1/rf 1 )
.gt . crit3 ) then
574 time3= dtau*(l-l)575 flag3=l576 else if (hf 2
.gt . 0. 0. and. rf 2. gt . 0. 0. and. abs (hf2/rf 2 )
.gt. crit3 ) then
577 time3=dtau*( 1-1)578 flagS^l579 endif580 x3=xold581 y3=yold582 t3=told583 420 continue584585 C TEST FOR KEEL BLOCK OVERTURNING586587 if (flag4.eq.l) then588 go to 430589 else if ( rf 3. gt. 0. 0. and. abs(hf3/rf 3 )
.gt. crit4) then
590 time4=dtau*( 1-1)
178

3D0FRUB]
(
D Line» 1 7 Microsoft FORTRAN77 V3
.
1 591 fla^4=l1 592 end if1 593 x4=xold1 594 y4=yoId1 595 t4=told1 596 430 continue1 5971 598 C TEST FOR SIDE BLOCK LIFTOFF1 5991 600 if (flagb. eq. 1 ) then1 601 go to 4401 602 else if (rfl.lt. 0.0 .or. rf2.lt. 0.0) then1 603 time5=dtau*( 1-1)1 604 flag5=l1 605 end if1 606 x5=xold1 607 y5=yold1 608 t5=told1 609 440 continue1 6101 611 C TEST FOR KEEL BLOCK LIFTOFF1 6121 613 if (flag6. eq. 1) then1 614 go to 4501 615 else if (rf3.lt. 0.0) then1 616 time6=dtau*( 1-1)1 617 fla^6=l1 618 end if1 619 x6=xold1 620 y6=yold1 621 t6=told1 622 450 continue1 6231 624 C TEST FOR SIDE BLOCK CRUSHING1 6251 626 if (f lag7, eq. 1) then1 627 go to 4601 628 else if (rfl.gt.O.O .and. ( rf l/sidearea) . gt . plside) then1 629 flag7=l1 630 time7=dtau*( 1-1
)
1 6311 632 else if (rf2.gt.0.0 .and. ( rf2/sidearea)
.gt. plside) then
1 633 flag7=l1 634 tim.e7=dtau*( 1-1)1 635 end if1 636 x7=xold1 637 y7=yold1 638 t7=told1 639 460 continue1 6401 641 C TEST FOR KEEL BLOCK CRUSHING1 6421 643 if (flags. eq. 1) then1 644 go to 4701 645 else if (rf3.gt.0.0 .and. ( rf3/keelarea)
.gt
.plkeel ) then
1 646 flag8=l1 647 time8=dtau*( 1-1)1 648 end if1 649 x8=xold
Page 1103-11-8816:50:34
179

i3D0FRUB
Page 1203-11-88
I i„«« 1 7 16:50:342c^ o ,, Microsoft FORTRAN?? V3.20 02/84650 y8=yold651 t8=told652 4?0 continue653654 C CAPTURE OF DISPLACEMENT, ROTATION & RESISTANCE OUTPUT"655656 if (dec. ne. '
Y'. and. dec. ne. 'y' ) goto 301
65? xx(mm)=xold658 tt(mni)=told659 goto (501, 502, 503, 504, 505), decrr660 501 if (QDl.eq.0.0) then661 rrr(mm)=hf3662 elseif (QDl.gt.0.0) then663 rrr(imn)=RRl664 end if665 yy(nim)=yold666 goto 506667 502 if (QD2 eq.0.0) then668 rrr(mm)=hfl669 elseif (QD2.gt.0,0) then6?0 rrr(min)=RR26?1 xx(imn)=XPRIM6?2 endif6?3 yy(mm)=yold6?4 goto 5066?5 503 if (QD3.eq.0.0) then6?6 rrr(mm)=rfl6?? elseif (QD3.ne.0.0) then6?8 rrr(mm)=RR3679 endif680 yy(mm)=YPRIMl681 goto 506682 504 if (QD3.eq^0.0) then683 rrr(mm)=rf2684 elseif (QD3.ne.0.0) then685 rrr(mm)=RR4686 endif68? yy(mm)=YPRIM2688 goto 506689 505 if (QD4.eq.0.0) then690 rrr(mm)=rf3691 elseif (QD4.ne.0.0) then692 rrr(mm)=RR5693 endif694 yy( mm) =YPR I M3695696 506 continue697698 301 continue699700 go to 999701702 60000 continue703 if (dec. ne. '
Y'. and. dec. ne. '
y' ) then
704 write(*. ' (A) ' )' I AM FINISHING. '
705 goto 20000706 endif707708 C CREATION OF DISPLACEMENT, ROTATION, & RESISTANCE OUTPUT FILES:
180

3D0FRUB Page 1303-11-8816:50:34
D Line» 1 7 Microsoft FORTRAN?? V3.20 02/84709710 CALL RESPALL(xx,yy, tt, rrr.dtau)711712 998 go to 20000713714 999 CONTINUE715716 if (ampacc. eq. IDO) then717718 write(*, '(a)' )
' ENTER OUTPUT FILENAME ...'719 read( *,
' (a)
' ) outfname720 open (46, f ile=outfname, status='new' , form=' formatted'
)
721722723 write(46, 4000) nsys724 4000 format( Ix, /, 28x, '**** System ', 12, Ix, '****'
)
725 write(46, 4050) hull726 4050 format( Ix, /, 30x, '** Hull ' , 13, Ix, ' **'
)
727 write(46, 4100)728 4100 format( Ix, //, 28x, ' * Ship Parameters *')729 write(46, 4150)730 4150 format( Ix. /, 5x, 'Weight' ,8x, 'Moment of Inertia' , 9x, ' K. G.
'
)
731 write(46, 4200) weight, Ik,
h
732 4200 format( Ix, f9. 1, Ix, 'kips' , Ix, fll. 1, Ix, 'kips-in-sec2'
,
733 +3x, f6. 1, IX, ' ins'
)
734 write(46, 4250)735 4250 format( Ix, //, 26x, ' * Drydock Parameters *')736 write(46, 4300)737 4300 format( Ix. /, Ix, 'Side Block Height ', 3x, ' Side Block Width',738 +3x. 'Keel Block Height ', 3x, ' Keel Block Width')739 write( 46, 4350) htside, baseside, htkeel , basekeel740 4350 format (2x, f 6 . 1 , Ix, ' ins ' , llx, f 6 . 1, Ix, ' ins ' , 1 Ix, f6 . 1 , Ix, ' ins'
,
741 -t-9x, f6. 1, Ix, ' ins' )
742 write(46, 4400)743 4400 formatdx. /, Ix, 'Side-to-Side Pier Distance' , 3x, 'Wale Shore Ht. '
744 + ,3x,'Wale Shore Stif fness ' , 2x, ' Cap Angle')745 write(46, 4450) br, AAA, Ks, beta746 4450 format ( Ix, t7, f 6 . 1, Ix, ' ins' , 17x, f6. 1, Ix, ' ins' , 8x, f8. 1, Ix,747 + 'kips/in' , Ix, f5. 3, Ix, ' rad'
)
748 write(46, 4470)749 4470 format( Ix, /,
' ISide Side Pier Contact Area'750 +,3x. 'Total Keel Pier Contact Area' , 6X. ' kkhp'
)
751 write( 46, 4475 ) sidearea, keelarea. kkhp752 447 5 format ( Ix, 8x, f 1 1 . 1, Ix, ' in2 ' , 14x, f 1 1 . 1 , Ix, ' in2 ' , lOx, f? . 1 , Ix,753 + 'kips/in'
)
754 write(46, 4500)755 4500 format( Ix, /. Ix. 'B/B Friction Coeff',3x,756 +'H/B Friction Coef f
' , 5x, ' kshp' , lOx, ' kvsp'
)
75? write(46, 4550) ul , u2, kshp, kvsp758 4550 format (6x, f 7 . 3, 13x, f 7 . 3, 7x, f 7 . 1 , Ix, ' kips/in' , Ix, f 7 . 1 , Ix,
759 + 'kips/in'
)
760 write{46, 4600)761 4600 format( Ix, /. Ix. 'Side Pier Fail Stress Limit ', 4x, 'Keel Pier'762 +, ' Fail Stress Limit' , 6x, ' kvkp'
)
763 write(46, 4650) plside, plkeel , kvkp764 4650 format ( Ix, lOx, f? . 3 , Ix, 'kips/in2' 15x, f?. 3, Ix, 'kips/in2'
,
765 + 6x, f7. 1, Ix, 'kips/in'
)
766 write(46, 4700)767 4700 format( Ix, /. Ix. 'Side Pier Vertical Stiffness ', 3x, ' Side Pier',
181

jDuFRUB
D Linett 1
768769770 4750771772 4775773774775 4780776777 4782778779 4785780781782 4800783784 4850785786 4852787788 4854789790 4875791792793 4995794795796 4990797798 4900799800 4950801802 5000803
1 8041 805 50501 806
8075100
808 5200809
1 8101 811 52501 812
8135300
814 5400815
1 8161 817 54501 818
8195500
820 5700821822 6000823824825 6001826
Page 1403-11-8816:50:34
7 Microsoft F0RTRAN77 V3.20 02/84+' Horizontal Stiffness')write(46, 4750) kvs.khs
format(lx,3x.fll. 1, Ix, 'kips/in', llx, fll. 1. Ix, 'kips/in'
)
write(46,4775)format( Ix, /, Ix, 'Keel Pier Vertical Stiffness ' , 3x,
+'Keel Pier Horizontal Stiffness')write(46, 4780) kvk,khk
format ( Ix, 3x, f 1 1 . 1, Ix, 'kips/in' , 1 Ix, f 11 . 1, Ix, 'kips/ in'
)
write(46, 4782)format (Ix, /, 6x, 'QDl' , 17x, 'QD2' , 18x, 'QD3' , 17x, 'QD4'
)
write(46, 4785) QDl , QD2, QD3, QD4format(2x, f8. 1, Ix, 'kips' ,7x, f8. 1, Ix, 'kips' ,8x, f8. 1, Ix, 'kips'
,
+7x, f8. 1, Ix, 'kips'
)
write(46, 4800)formate Ix, //, 20x, ' * System Parameters and Inputs *')wr ite( 46, 4850) quaknaime
format ( Ix, /, Ix, ' Earthquake Used is ',A40)write( 46 , 4852 ) hnameformat ( Ix, /, Ix, ' Horizontal acceleration input is ',A40)write( 46 , 4854) vnaineformate Ix, /, Ix, ' Vertical acceleration input is ',A40)write(46. 4875)formate Ix, 20x, ' Earthquake Acceleration Time History.')
write(46, 4995)formate Ix, /, Ix, 'Vertical/Horizontal Ground Acceleration Ratio'
+,3x, 'Data Time Increment')writee46, 4990) amp.dtauformate Ix, lOx, f 6 . 3, t55, f6. 3, IX, 'sec' )
writee46, 4900)formate Ix, /, Ix, 'Gravitational Constant ', 3x, '% System Damping')writee46, 4950) gravity, zeta*100.formate Ix, 7x, f6 . 2, Ix, ' in/sec2' , lOx, f6. 2, Ix, '%'
)
writee46, 5000)formate Ix, /, 25x, 'Mass Matrix' , /)
do 5100 i=l,
3
write e 46, 5050) me i , 1 ) , me i . 2 ) , me i , 3
)
formate Ix, f 15 . 4, 5x, f 15 . 4, 5x, f 15 . 4)continuewritee46, 5200)formate Ix, /, 25x, ' Damping Matrix' , /)
do 5300 i=l, 3
writee46, 5250) cx( i , 1 ) , cxe i , 2 ) , cxe i, 3
)
formate Ix, fl5.4,5x,fl5.4,5x,fl5.4)continuewritee46, 5400)formate Ix, /, 25x, ' Stiffness Matrix' , /)
do 5500 i=l,3write e 46, 5450) koe i , 1 ) , koe i . 2 ) , koe i, 3
)
formate Ix,fl5.4,5x,fl5.4,5x,fl5.4)continuewritee46, 5700)
formate Ix, //)WRITEe46,6000)
FORMAT e IX, 'Undamped Natural Frequencies ', t35, ' Mode »l',t50,
+'Mode »2' , t65, 'Mode »3')writee46,6001) wl,w3,w2formate Ix, t31 , f 7 . 3 , Ix, 'rad/sec' , t46, f7. 3, Ix, 'rad/sec' , t62, f7. 3,
+' rad/sec '
)
182

JiJ^jfrtuD Page lo03-11-8816:50:34
D Line» 1 7 Microsoft FORTRAN?? V3.20 02/8482? WRITE(46, 6002)828 6002 FORMAT ( IX, 'Damped Natural Frequencies ', t35, ' Mode «l',t50,829 +'Mode »2
' , t65 ,
' Mode »3')830 WRITE(46, 6500) wl*sqrt(l-zeta**2 ) , w3*sqrt(l-zeta**2 )
,
831 +w2*sqrt( l-zeta**2)832 6500 formate Ix, t31, f7. 3, Ix, ' rad/sec' , t46, f7. 3, Ix, ' rad/sec' , t62, f? . 3,833 +' rad/sec'
)
834 endif835836 write(46, 10500) ampacc*100, quakname837 10500 formatdx, ///, Ix, 'For Earthquake Acceleration of ',f6.2,' % '
838 +, 'of the ', A40, /)
839840 write(46, 25000)841 25000 formatdx, 'Maximums/Failures' ,t26, 'X ( ins )
', t36 ,
' Y (ins)',t51,842 +'Theta ( rads )
' , t65 ,
' Time (sec)')843 write(46, 25001)844 25001 format ( Ix. ' '
, t25, ''
, t35, ''
, t50,845 +' '
, t64, ''
)
846 write (46,310) maxx,timex847 310 format ( Ix, ' Maximum X' , t25, f 9 . 6, t65, f 5 . 2
)
848 write (46,311) maxy.timey849 311 format ( Ix, ' Maximum Y' , t35, f9 . 6, t65, f5 . 2
)
850 write (46,312) maxt, timet851 312 format ( Ix, ' Maximum Rotation ' , t50, f9 . 6, t65, f 5 . 2
)
852853 if (flagl. eq. 1) then854 flaglO=flaglO+l855 write (46,313) xl
, yl , tl , timel856 313 format (Ix, 'Side block sliding' , t25, f9 . 6, t35, f9 . 6, t50, f 9 . 6,857 +t65,f5.2)858859 endif860861 if (flag2. eq. 1) then862 f laglO=f laglO+1863 write (46,314) x2
, y2 , t2 , time2864 314 format (Ix, 'Keel block sliding' , t25, f9 . 6, t35 , f9 . 6, t50, f9 . 6,865 +t65,f5.2)866 endif867868 if (flags. eq. 1) then869 flaglO=flaglO+l870 write (46,315) x3
,y3 . t3 , time3
871 315 format (Ix, 'Side block overturning' , t25 , f 9 . 6 , t35 , f 9. 6 , t50, f9 . 6,
872 +t65,f5.2)873 endif874875 if (flag4. eq. 1) then876 flaglO=f laglO+1877 write (46,316) x4, y4, t4, time4878 316 format (Ix, 'Keel block overturning' , t25, f 9. 6, t35, f9. 6, t50, f 9 . 6,
879 +t65,f5.2)880 endif881882 if (flag5. eq. 1) then883 flaglO=flaglO+l884 write (46,317) x5
, y5 , t5 , time5885 317 format (Ix.'Side block liftoff , t25 , f 9 . 6 , t35, f9 . 6, t50, f 9 . 6
,
183
D Lineit886887888889890891892893894895896897898899900901902903904905906907908909910911912913914915916917918919920921922923924925926927928929930931932
Name
+t65. f5. 2)end if
03-11-8816-. 50.34
Microsoft FORTRAN77 V3.20 02/84
if (fla^6. eq. 1) thenfla«10=fla«10+lwrite (46,318) x6
, y6, t6 , time6318 format (Ix, 'Keel block liftoff , t25. f 9 . 6 , t35, f 9 . 6, t50, f9. 6,
+t65. f5.2)end if
if (flag7.eq. 1) thenflagl0=flagl0+lwrite (46,319) x7
.y7 , t7, time?
319 format (Ix, 'Side block crushing' , t25, f9 . 6, t35, f9. 6 , t50, f9. 6,+t65, f5. 2)end if
if (flags. eq. 1) thenf Iagl0=flagl0+1write (46,320) x8 , y8 , t8 , time8
320 format (Ix, 'Keel block crushing' , t25, f 9 . 6, t35, f9 . 6, t50, f9. 6,
+t65, f5. 2)end if
No failures occurred.').and. flaglO.eq.O) then
then
if ( f laglO. eq. 0) thenwrite(46, 11000)
11000 format( Ix. /, Ix,if(counter. eq. 1.
go to 60000end ifif ( counter. eq. 0. 0)ampacmax=ampaccampacc=ampacc+lD-l
counter=l .
write( *,' (
A)' )
' In secondary looping stage.end ifend ifif ( ampacc. le. ampacmax) go to 20000if ( counter . eq. 1 . 0) thenampacc = £iJiipacc-lD-2
else if ( counter. eq. 0. 0) thenampacc=ampacc-lD-lend ifgo to 10000
20000 continuestopend
Type Offset P Class
A REAL*8AAA REAL*
8
ABSAC REALACLFNA CHAR*40ACV REALALPHA REAL*
8
AMP REAL*
8
AMPACC REAL*8
4894649082
32882*****40890493444949649656
INTRINSIC
184

D Line» 1 7
AMPACM REAL*8 49672ASIN INTRINSICB REAL*8 48898BASE REAL*8 *****BASEKE REAL«8 49170BASESI REAL*
8
49162BBB REAL*8 49352BETA REAL*8 49258BR REAL*8 49210C REAL*8 32834CCC REAL*8 49360COS INTRINSICCOUNTS REAL*8 49664CRIT2 REAL*
8
49632CRIT3 REAL*8 49640CRIT4 REAL*
8
49648cx REAL*8 32658D REAL*8 32786DEC CHAR*40 49282DECRR INTEGER*2 49322DECV CHAR*40 *****DELTA REAL*
8
49812DTAU REAL*8 49504E REAL*8 32562F REAL*8 32610FF REAL 50266FLAGl INTEGER*2 49680FLAG 10 INTEGER*2 49696FLAG 2 INTEGER*2 49682FLAG 3 INTEGER*2 49684FLAG 4 INTEGER*2 49686FLAGS INTEGER*2 -- 49688FLAGS INTEGER*2 49690FLAG? INTEGER*2 49692FLAGS INTEGER*2 49694G REAL*8 32514GRAVIT REAL*
8
49154H REAL*
8
49042HFl REAL*8 50318HF2 REAL*8 50326HF3 REAL*
8
50334HH REAL*
8
32466HNAME CHAR*40 49552HTKEEL REAL*
8
49186HTSIDE REAL*
8
49178HULL INTEGER*2 49254I INTEGER*2 49324IK REAL*8 49050J INTEGER*2 49326K REAL*
8
32338KDl REAL*8 49844KD2 REAL*
8
49924KD3 REAL*8 50004KD4 REAL*8 50068KD5 REAL*
8
50148KEELAR REAL*8 49242KHK REAL*
8
49106KHKB REAL*8 49852KHS REAL*8 49098
TnnTTpnn
03-11-8816: 50:34
Microsoft FORTRAN?? V3.20 02/84
185

D Li-ne» 1 7
KHSB REAL*8 49932KKHP REAL«8 49122KO REAL*8 32210KS REAL*8 49090KSHP REAL*8 49114KUl REAL*8 49836KU2 REAL*8 49916KU3 REAL*8 49996KU4 REAL«8 50060KU5 REAL*8 50140KVK REAL*8 49074KVKB REAL*8 49828KVKP REAL*8 49274KVS REAL*8 49058KVSBl REAL*8 49820KVSB2 REAL*
8
50076KVSP REAL*8 49066KYI INTEGER*2 49860KY2 INTEGER*2 49940KY3 INTEGER*2 50012KY4 INTEGER*2 50084KY5 INTEGER*2 50156L INTEGER*2 50204LL INTEGER*2 50262LLL REAL*
8
49336M REAL*
8
32082MASS REAL*8 49328MAXT REAL*
8
49706MAXX REAL*8 49698MAXY REAL*
8
49714MIN INTRINSICMM INTEGER*2 49722MMANGl REAL*8 49440MMANG3 REAL*8 49456MMMMMl REAL*8 49464MMMMM2 REAL*8 49472MMMMM-j REAL*
8
49480MMMMM4 REAL*8 49488MMXl REAL*8 49432MMX3 REAL*8 49448MODEl REAL*8 49416M0DE3 REAL*8 49424N INTEGER*2 *****NN INTEGER*2 50264NSYS INTEGER*2 49256OUTFNA CHAR*40 50502PLKEEL REAL*8 49226PLSIDE REAL*
8
49218QDl REAL*8 49130QD2 REAL*8 49138QD3 REAL*
8
49146QD4 REAL*
8
49266QUAKNA CHAR*40 49512R REAL*8 49772RFl REAL*
8
50294RF2 REAL*8 50302RF3 REAL*8 50310RRl REAL*8 49886RR2 REAL*
8
49966
3D0FRUB
Microsoft FORTRAN77 V3
03-11-8816;50;3420 02/84
Patfe 19
186

D Li-ne» 1 7
RR3 REAL*8 50030RR4 REAL*8 50110RR5 REAL*8 50174RRR REAL 24074S REAL*8 49780SBFNAM CHAR*40 48994SIDEAR REAL*8 49234SIN INTRINSICSORT INTRINSICT REAL*
8
49740Tl REAL 50358T2 REAL 50378T3 REAL 50398T4 REAL 50418T5 REAL 50438T6 REAL 50458T7 REAL 50478T8 REAL 50498TAU REAL*8 49788TIME REAL*8 *****TIMEl REAL*
8
50342TIME2 REAL*
8
50362TIME3 REAL*
8
50382TIME4 REAL«8 50402TIME5 REAL*8 50422TIMES REAL*
8
50442TIME? REAL*
8
50462TIMES REAL*
8
50482TIMET REAL*8 50278TIMEX REAL*8 50270TIMEY REAL*8 50286TOLD REAL*8 49764TT REAL 16066Ul REAL*8 49194U2 REAL*8 49202UUUl INTEGER*2 49914UUU2 INTEGER*2 49994UUU3 INTEGER*2 50058UUU4 INTEGER*2 50138UUU5 INTEGER*2 50202VEL REAL*
8
50214VELl REAL*
8
50230VEL 2 REAL*
8
50246VFNAME CHAR*40 *****VNAME CHAR*40 49592Wl REAL*8 49376W12 REAL*8 49368W2 REAL*
8
49392W22 REAL*8 49384W3 REAL*
8
49408W32 REAL*8 49400WEIGHT REAL*
8
49034WWWl INTEGER*2 49910WWW2 INTEGER*2 49990WWW3 INTEGER*2 50054WWW4 INTEGER*2 50134WWW5 INTEGER*2 50198wzi REAL*
8
49902WZ2 REAL*8 49982
UO-i i-OO16:50:34
Microsoft F0RTRAN77 V3.20 02/84
3D0FRUB Page 20
187

D Line» 1 7WZ3 REAL*8 50046WZ4 REAL*8 50126WZ5 REAL*
8
50190X REAL*8 49724XI REAL 50350X2 REAL 50370X3 REAL 50390X4 REAL 50410X5 REAL 50430X6 REAL 50450X7 REAL 50470X8 REAL 50490XELl REAL*
8
49862XEL2 REAL*8 49942XMAXl REAL*8 49870XMAX2 REAL*
8
49950XMINl REAL*8 49878XMIN2 REAL*8 49958XOLD REAL*8 49748XPRIM REAL*8 50206XSCL REAL*
8
16018XX REAL 2
Y REAL*8 49732Yl REAL 50354Y2 REAL 50374Y3 REAL 50394Y4 REAL 50414Y5 REAL 50434Y6 REAL 50454Y7 REAL 50474Y8 REAL 50494YZLl REAL*8 49796YEL2 REAL*8 50086YEL3 REAL*8 49804YMAXl REAL*8 50014YMAX2 REAL*8 50094YMAX3 REAL*8 50158YMINl REAL*
8
50022YMIN2 REAL*8 50102YMIN3 REAL*8 50166YOLD REAL*8 49756YPRIMl REAL*8 50222YPRIM2 REAL*8 50238YPRIM3 REAL*8 50254YY REAL 8010YYYl INTEGER*2 49912YYY2 INTEGER*2
' 49992YYY3 INTEGER*2 50056YYY4 INTEGER*2 50136YYY5 INTEGER*2 50200ZETA REAL 49250ZZl REAL*8 49894ZZ2 REAL*8 49974ZZ3 REAL*
8
50038ZZ4 REAL*
8
50118ZZ5 REAL*8 50182
16:50;34Microsoft FORTRAN77 V3.20 02/84
3D0FRUB Page 21
188

D Lui«« I 7
Name Type
ACCLINBILINAMAINRESPALRUBBER
16 : 50: 34Microsoft FORTRAN?? V3.20 02/84
Size Class
SUBROUTINESUBROUTINEPROGRAMSUBROUTINESUBROUTINE
Pass One No Errors Detected932 Source Lines
189

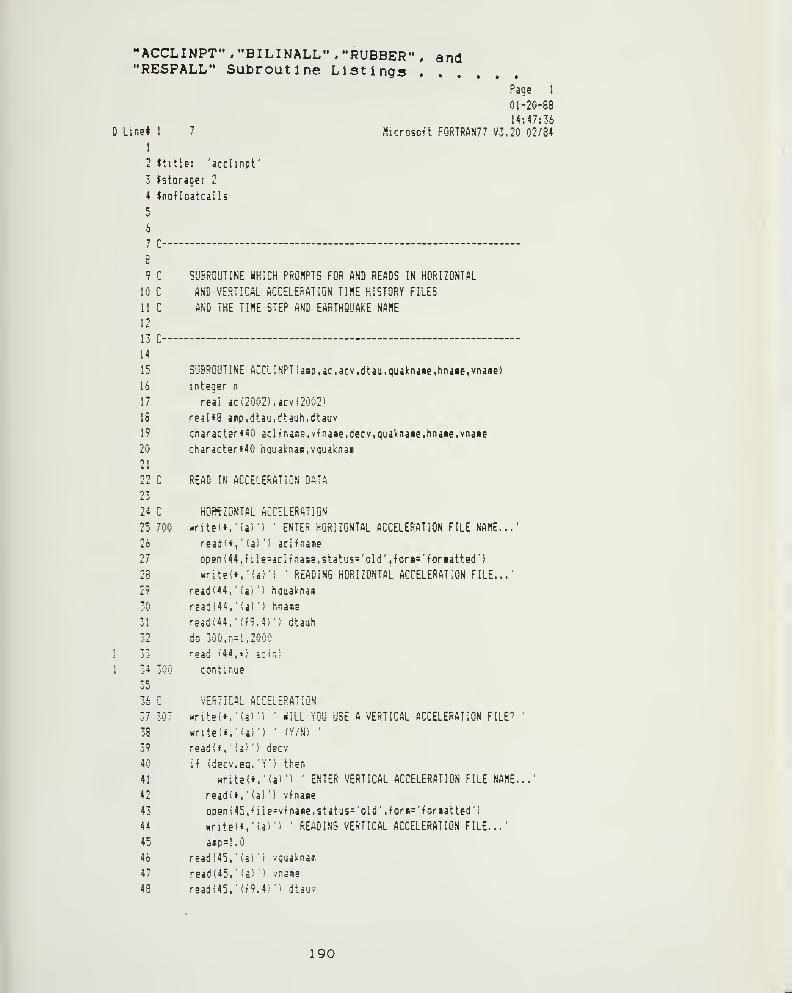
"ACCL I NPT "," B I L I NALL "
," RUBBER " , and
"RESPALL" Subroutine ListingsPage I
01-20-88
14:47:36
D Linel 1 7 Hicrosoft F0RTRAN77 V3.20 02/84
1
2 Ititle: 'acclinpt'
3 Jstorage: 2
4 tno-floatcalls
6
7 C- -
8
9 C SUBROUTINE WHICH PROflPTS FOR AND READS IN HORIZONTAL
10 C AND VERTICAL ACCELERATION TIHE HISTORY FILES
11 C AND THE TIME STEP AND EARTHQUAKE NAME
12
13 C—
-
-
14
15 SUBROUTINE ACCLINPT(aip,ac,acv,dtaij,guaknase,hnaae,vnaiiB)
16 integer n
17 real ac(2002) ,acv(2002>
18 rsi\*S asp.dtau.dtauh.dtauv
19 character*40 aclfna3ie,vfnaae,decv,quaknaie,hnaie.vnaiie
20 character»40 hauaknaa.vquaknaB
21
22 C READ IN ACCELERATION DATA
i. V
24 C HORIZONTAL ACCELERATION
25 700 «rite(t.'(ai') ' ENTER HORIZONTAL ACCELERATION FILE NAME...'
26 read(», '
(a) ') acHnase
27 open(44,fils=3clfnas9,status='old' ,forB='foriatted')
28 writB(*.'!a)') ' READING HORIZONTAL ACCELERATION FILE. ..
'
29 read(44, ' iai ') hguaknas
30 read (44,' (a) ') hnase
31 re5di44.'if9.4;'; dtauh
32 do 300, n=l ,2000
i 33 read i44,*; aci-)
1 34 300 continue
35
36 C VERTICAL ACCELERATION
37 307 write(*,'i3i'i ' WILL YnlJ USE A VERTICAL ACCELERATION FILE?'
3S wntei*, I'a) ')' (Y/Ni
39 read(t,'i3) ') decv
40 if idecv.eq. 'Y'i then
41 writsi*,'ia)') ' ENTER VERTICAL ACCELERATION FILE NAME..."
42 read't, '
(a) ') vfnaae
43 oDen(45.file=vfnaBe,5tatu5='old',for«=''foriatted')
44 write(*,'(a) I' READING VERTICAL ACCELERATION FILE...'
45 a«p=1.0
46 rpad(4j, ' (ai ") vquaknasi
47 read (45,' !a) ) vna«e
48 r9adi45,'if9.4,i 'i dtauv
190

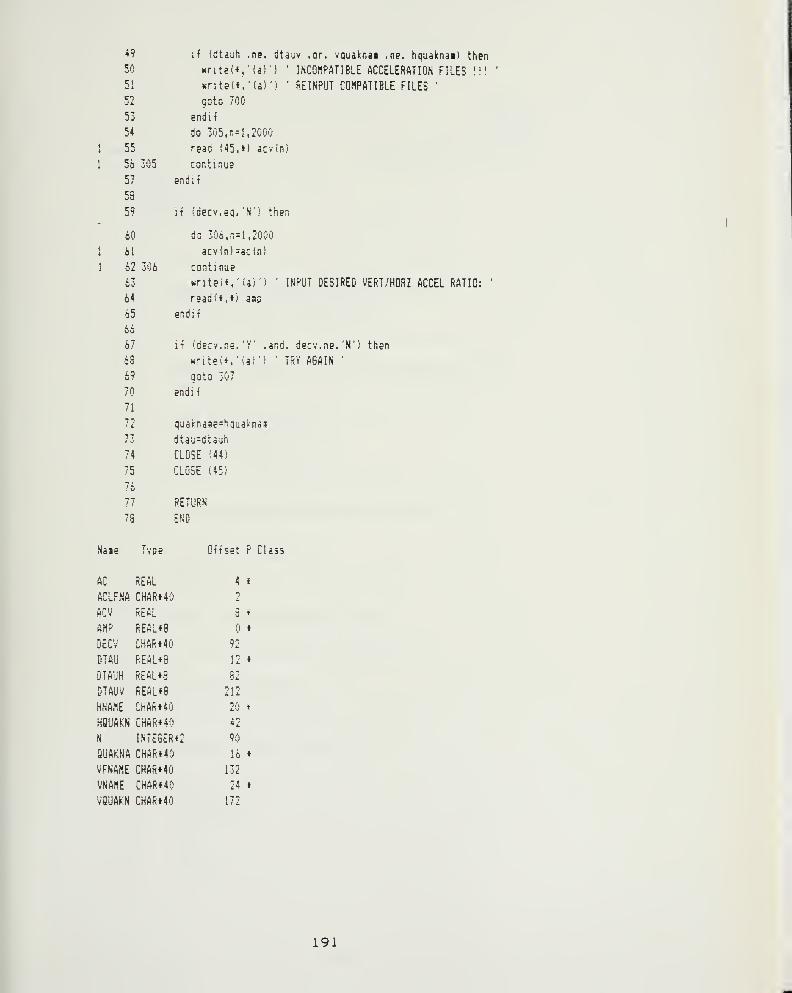
49
50
51
52
53
54
55
56 305
57
58
59
60
61
62 306
63
64
65
66
67
68
69
70
71
Ti1 1.
ItI -J
74
75
76
77
if (dtauh .ne. dtauv .or. vquaknaa .ne. hquaknai) then
«(rit8(*/!a;') ' INCOMPATIBLE ACCELERATION FILES 111
writeH,'(d)') • REINPUT COMPATIBLE FILES'
goto 700
endif
do 305, n= 1,2000
read (45,*) acvin)
continue
endit
if (decv.eq. 'N') then
do 306, n= 1, 2000
acv(n)=acini
continue
writei*, '
(a) ')
read'*.*; aso
endif
INPUT DESIRED VERT/HORZ ACCEL RATIO:
if I'decv.ne.'Y' .and. decv.ne.'N'! then
Knteit.'ia)') ' TRY AGAIN'
goto 307
endif
quaknase^hquaknas
dtau=dtauh
CLOSE ;44)
CLOSE (45)
RETURN
END
Nase
AC
ACLFNA
ACV
AHP
DECV
DTAU
DTAUH
DTAUV
HNAME
KQUAKN
N
9UAKNA
VFNAME
VNAHE
VQUAKN
lYPe
REAL
CHAR«40
REAL
REAL*8
CHAR»40
REALtS
REALtS
REhL«8
CHARMO
CHARt40
INTEGER»2
CHAR»40
CHAR»40
CHAR*40
CHAR»40
Offset P Class
4 *
1L
3 *
92
12
82
212
20 *
42
90
16 i
132
24 i
172
191

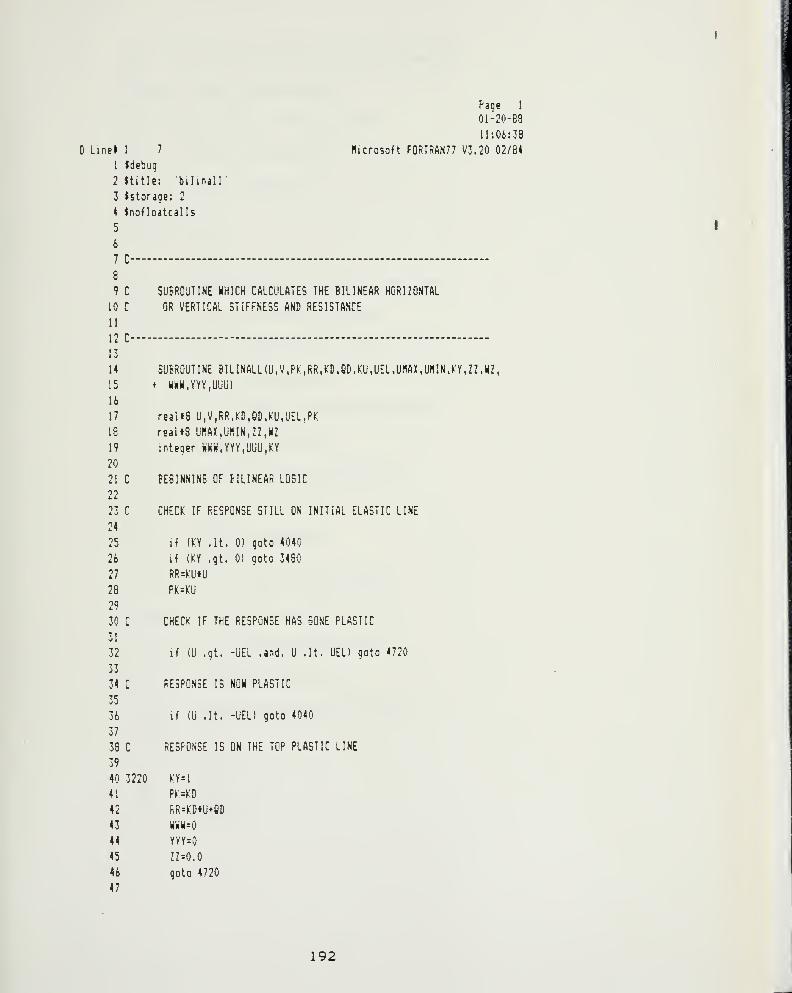
D Linel 1 7
1 $debug
2 Ititle: 'bilinall
3 tsloraoe: 2
4 InoHoatcalls
5
6
7 C
Page 1
01-20-83
11:06:38
Microsoft FORTRAN?? V3.20 02/84
9 C
10 C
11
12 C-—13
14
IS
16
17
18
19
20
21 C
22
23 C
24
25
26
27
28
29
30 C
31
32
33
34 C
35
36
37
38 C
39
40 3220
41
42
43
44
45
46
47
SUBROUTINE WHICH CALCULATES THE BILINEAR HORIZONTAL
OR VERTICAL STIFFNESS AND RESISTANCE
SUBROUTINE BILINALL(U,y,PK,RR.KD.QD.KU,UEL.UflAX,UHIN.KY.ZZ.HZ,
+ HWW.YYY.UUU)
real«8 U,V,RR.KD.QD.KU.LIEL.PK
realtS UMAK,U«IN,ZZ,HZ
integer iit!H.YYY,UUU,KY
BESINNINB OF BILINEAR LOGIC
CHECK IF RESPONSE STILL ON INITIAL ELASTIC LINE
if (KY .It. 0) goto 4040
if (KY .gt. 0) goto 3480
RR4'U«U
PK=k;U
CHECK IF THE RESPONSE HAS 60NE PLASTIC
if (U .gt. -UEL .and. U .It. UEL) goto *720
RESPONSE IS NOW PLASTIC
if (U .It. -UEL) goto 4040
RESPONSE IS ON THE TOP PLASTIC LINE
KY=1
RR=KD*U+QD
UWH=0
YYY=0
ZZ=0.0
goto 4720
192
t
4
I
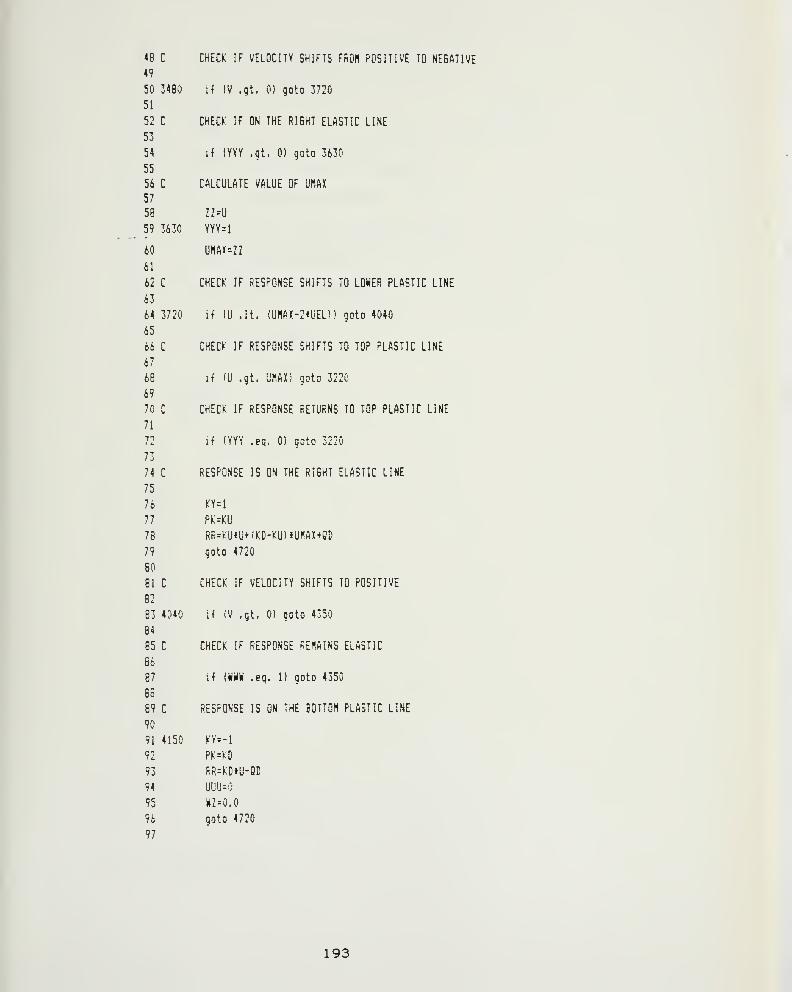
48 C CHECK IF VELOCITY SHIFTS FftOH POSITIVE TO NEGATIVE
49
50 34B0 if (V .Qt. 0) Qoto 3720
51
52 C CHECK IF ON THE RIGHT ELASTIC LINE
53
54 if (YYY .Qt. 0) goto 3630
55
56 C CALCULATE VALUE OF UHAX
57
58 22=U
59 3630 YYY=1
60 UNA)(=ZZ
61
62 C CHECK IF RESPONSE SHIFTS TO LOWER PLASTIC LINE
63
64 3720 if (U .It. (UHAX-2*LiEL)) goto 4040
65
66 C CHECK IF RESPONSE SHIFTS TO TOP PLASTIC LINE
67
68 if (U .gt. UMAX) goto 3220
69
70 C CHECK IF RESPONSE RETURNS TO TOP PLASTIC LINE
71
72 if (YYY .eq. 0) goto 3220
73
74 C RESPONSE IS ON THE RIGHT ELASTIC LINE
75
76 KY=1
77 PK=KU
78 RR=KUtU+iKD-KU)tUHA)(+eD
79 goto 4720
80
81 C CHECK IF VELOCITY SHIFTS TO POSITIVE
82
83 4040 if (V .gt. 0) goto 4350
84
85 C CHECK IF RESPONSE REGAINS ELASTIC
86
87 if (HWH .eg. 1) goto 4350
88
89 C RESPONSE IS ON THE BOTTOM PLASTIC LINE
90
91 4150 Ki=-1
92 PK=KD
93 RR=KD«U-QD
94 UUIJ=0
95 WZ=0.0
96 goto 4720
97
193

98 C CHECK IF RESPONSE IS ON THE LEFT ELASTIC LINE
99
100 4350 li (UL-U .gt. 0) goto 4370
101 WZ=IJ
102 4370 UUU=1
103 UHIN=W:
104
105 C CHECK IF RESPONSE RETURNS TO TOP PLftSTIC LINE
106
107 i^ (U .gt. (UHIN+2»UEL)! aoto 3220
108
109 C CHECK IF RESPONSE RETURNS TO BOTTOM PLASTIC LINE
110
HI if (U .It. UfllN) Qoto 4150
112
113 C RESPONSE IS ON THE LEFT ELASTIC LINE
114
115 WaW^l
116 RR=KLltU+iK!;-kU)»UMIN-GD
117 PK=Kli
118
119 4720 continue
120 RETURN
121 END
Nace Tyoe Offset P Class
KD REhL*6 16 «
KU REAL*8 24 «
KY INTESER*2 40
PK REAL»8 8 *
QD REAL«8 20
RR REALte i: »
U REAL48 i
UEL REAL»8 28
UNA! REAL48 32
UfllN REALtS 36
UUU INTEGER*2 60 «
V REAL»8 4 »
WWU INTEGER»2 52 «
«Z REAL«e 48
YYY INT£5ER»2 56
ZZ REAL»8 44
Naae Type Size Class
BILINA SUBROUTINE
Pass One No Errors Detected
121 Source Lines
194

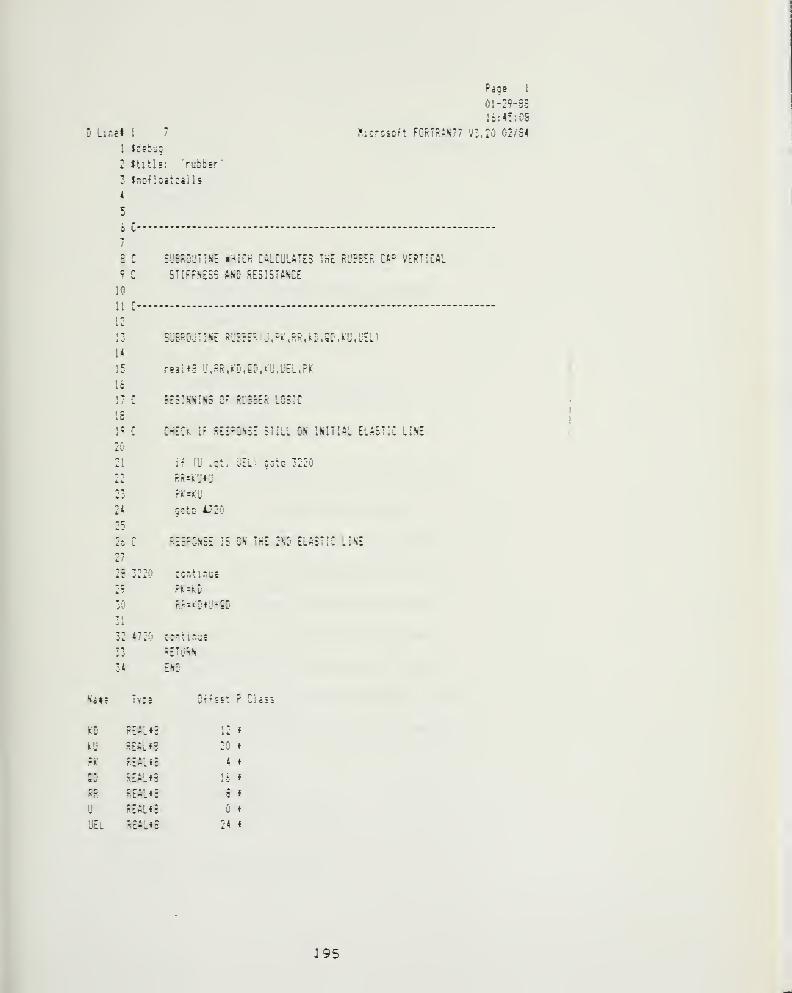
Page 1
01-29-98
1S:45:08
D Linet 1 7 Hicrosoft F0fiTRAH77 V3.20
1 tdeb-jq
2 Jtjtl e: rubber'
3 fnofl catcalls
4
5
L rI
7
8 C SUBROUTINE WHICH CALCULATES THE RUBBER CA" VERTICAL
9 C STIFFNESS AND RESISTANCE
10
11 r11 L-
12
t T SUBROUTINE RUBBER ai.PK.RR.KD.QD.J-'U.UED
14
15 reai»S U.RR.KD.QD.KU.UEL.PK
16
BE5INNINS OF RUBBER LOGIC
16
19 C CHECK IF RESPONSE STILL ON INITIAL ELASTIC LINE
20
21 if (U .gt. UELi goto 3220IT
RR=»:u«u
57PK=KU
24 Qotc 4720-
25
i.u L RESFONSE IS ON THE 2Nr' ELASTIC LINE
27
28 3220 continue
- IT PMKD
30 RR=KD*U+QD
32 4720 continue
33 RETURN
34 ENI.
N'aie Tvcs Offset P ClosS
12 *
20 «
4
16 «
6 «
»
24
KD REAL»S
ku REALt8
PK REAL*?
nr. R£AL*8
RR REAL*8
U REALiS
UEL REAL*8
J95

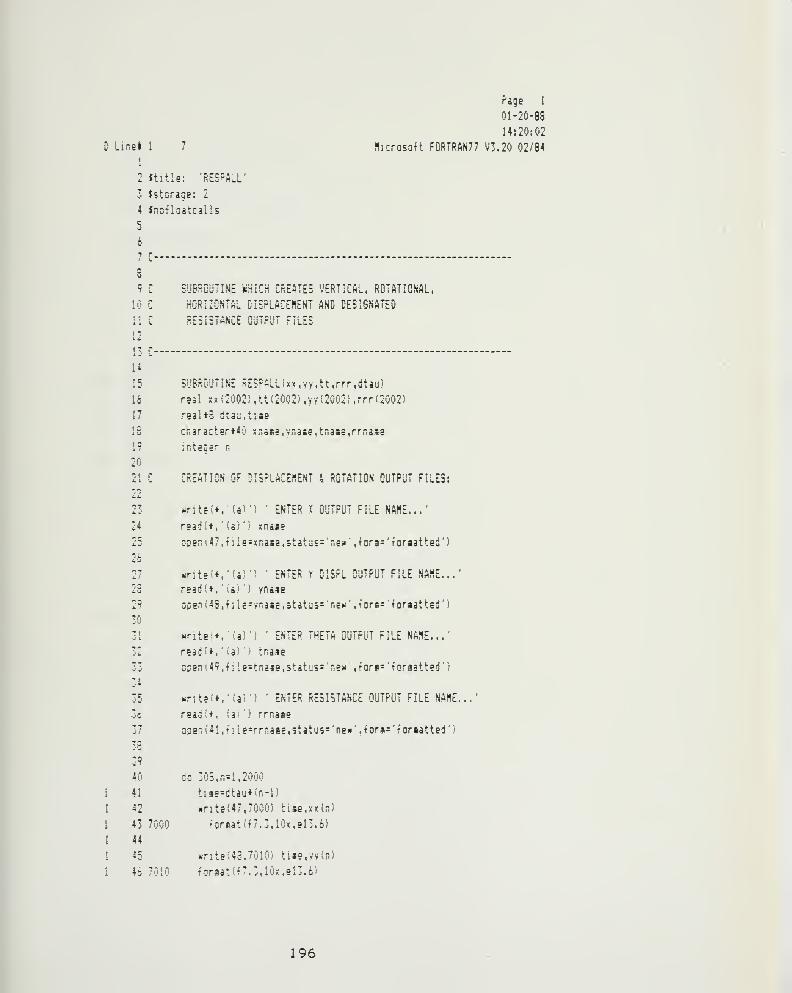
D Linel I 7
Page 1
01-20-88
14:20:02
flicrosoU F0RTRAN77 V3.20 02/84
2 ftitle: 'RESPALL'
3 fstorage: 2
4 fncfloatcalls
5
6
1 r
9 C SUBRCUTINE SHICH CREATES VERTICAL, ROTATIONAL.
10 C HORIZONTAL DISPLACEMENT AND DESIGNATED
11 C RESISTANCE G'JTPyT FILES
12
(7 r
14
SUBROUTINE RESPALLixx .yy.tt.rrr.dtau)
real xs (2002) ,tt{2002i ,Yy(2002> ,rrr(2002)
reai*3 dteu.tise
character**!) .xr,aiie,VMas8,tnaae,rrnase
integer n
CREATION OF DISPLACEMENT t ROTATION OUTPUT FILES:
24
26
27
23
29
30
write>«/!a>') ENTER X OUTPUT FIlE NAME...'
readi*, ' (a) ') xnaie
open (47 ,n I e=xna»e . 5tatiJ5= ' new'
, f ora= ' foraatted '
)
writeft.'la)') ' ENTER Y DISPL OUTPUT FILE NAME...
read'*, ' (a) ') ynaae
cpBn(4S,file=vna8e,5tatu5='new' ,tore=' foraatted')
Hrite;*, va; ENTER THETA OUTPUT FILE NAME...'
read?*, ' (a) ' ) tnaae
open (49,f!le=tnaae.5tatu5=' new ,fora=' •foraatted ')77
34
35
36
37
38
39
40
1 41
1 i2
1 43 7000
1 44
1 35 «rite(48,7010; tiae.yy(n)
i 46 7010 tor8at{f7.3,l0x.ei3.6)
t«rite(», ' (a) ')' ENTER RESISTANCE OUTPUT FILE NAME,
read;*, (a) ') rrnaae
openi41,f!ie=rrnaae,statu5='ne«' ,fora='Toraatted'i
do 303, n= 1,2000
tiae=dtau*(n-l)
«rite(47,7000; tiae,xx(n)
toraat(f7.3,l0x,el3.6)
196

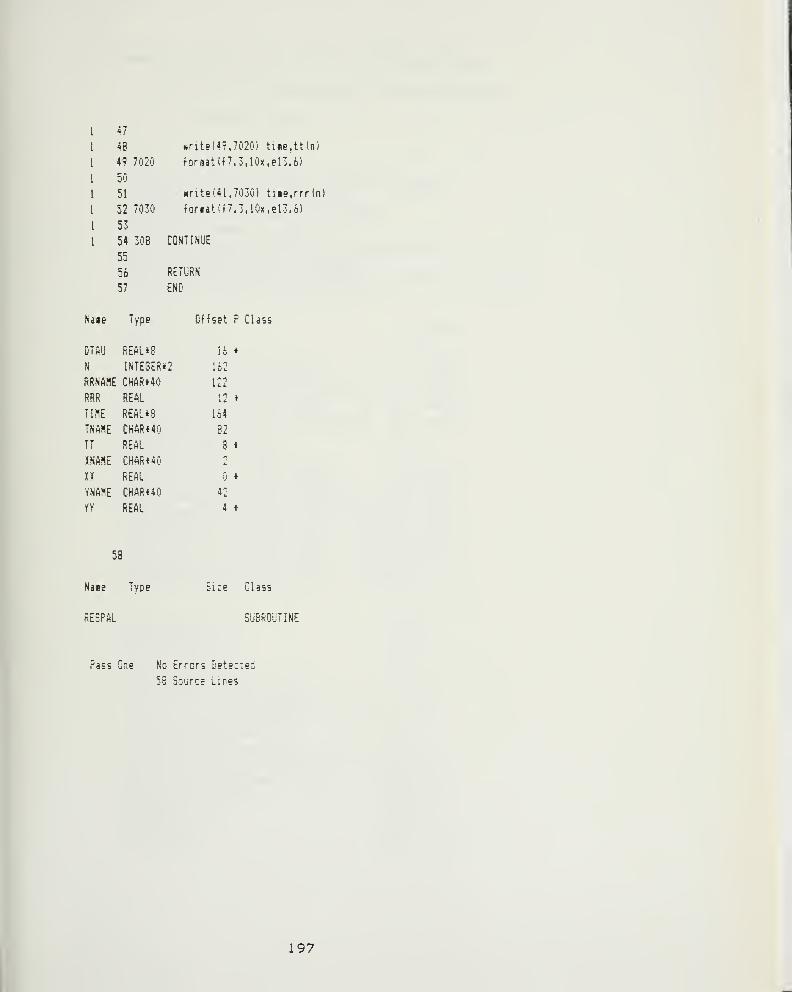
47
48
49 7020
50
51
52 7030
53
54 308 CONTINUE
55
56 RETURN
57 END
«rite<:49.7020i tme.tKn)
forisat{f7.3,10x,el3.6)
«rite(41 ,7030) tiae.rrrin)
foriiat>f7.3,10x,el3.6)
Naie Type
DTAU REAL»8
N INTEGER«2
RRNfiHE CHARt40
RRR REAL
TIME REAL»8
TNAHE CKhR*40
TT REAL
KNAHE CHhR*40
U REAL
YNAHE CHARt40
YY REAL
Offset P Class
16
122
12
164
82
8 «
42
4
58
Naee Type
RE3PAL
Size Class
SUBROUTINE
Pass One No Errors Detected
53 Soiirce Lines
197

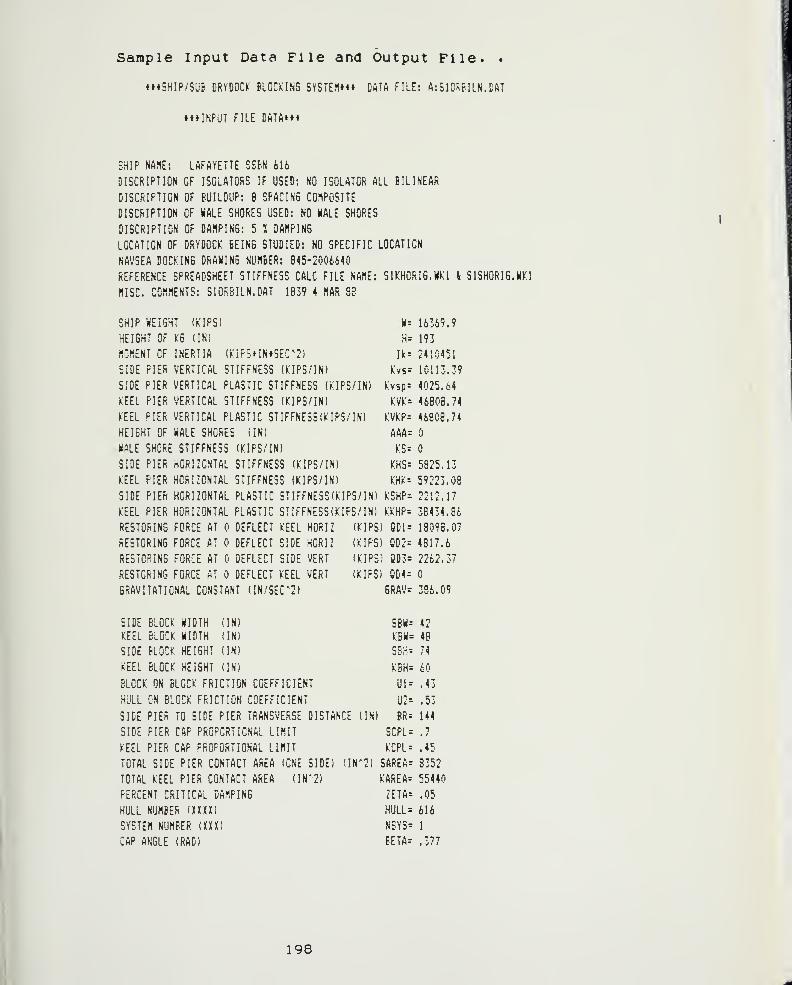
Sample Input Data File and Output File. .
»i»SHlP/SLiB DRYDOCK BLOCKING SYSTEHtt* DATA FILE: A:510RBILN.DAT
otINPUT FILE DATft*"
SHIP NAdE: LAFAYETTE SSBN 616
DISCRIPTION OF ISOLATORS IF USED: NO ISOLATOR ALL BILINEAR
DISCRIPTION OF BUILDUP: 8 SPACING COMPOSITE
DISCRIPTION OF HALE SHORES USED: NO HALE SHORES
DISCRIPTION OF DAMPING: 5 I DAMPING
LOCATION OF DRYDOCK BEING STUDIED: NO SPECIFIC LOCATION
NA'.'SEA DOCKING DRAHINS NUMBER: 845-2006640
REFERENCE SPREADSHEET STIFFNESS CALC FILE NAME: S1KH0RI6.HK1 \. SlSHORIG.HKl
MISC. COMMENTS: SIORBILN.DAT 1839 4 MAR 83
SHIP HEIGHT (KIPS) H= 16369.9
HEIGHT OF KG (IN) H= 193
MOMENT OF INERTIA {KIFSiINtSEC"2) Ik= 2410451
SIDE PIER VERTICAL STIFFNESS (KIPS/IN) Kv5= 10113.39
SIDE PIER VERTICAL PLASTIC STIFFNESS (KIPS/IN) Kv5p= 4025.64
KEEL PIER VERTICAL STIFFNESS (KIPS/IN) KVK= 46803.74
KEEL PIER VERTICAL PLASTIC STIFFNESSiKIPS/IN) KVKP= 46808.74
HEIGHT OF HALE SHORES ilN) AAA=
HALE SHORE STIFFNESS (KIPS/IN) KS=
SIDE PIER HORIZONTAL STIFFNESS (KIPS/IN) KHS= 5825.13
KEEL PIER HORIZONTAL STIFFNESS (KIPS/IN) KHK= 59223.08
SIDE PIER HORIZONTAL PLASTIC STIFFNESS(KIPS/IN) KSHP= 2212.17
KEEL PIER HORIZONTAL PLASTIC STIFFNESS(KIPS/IN) KKHP= 38434.86
RESTORING FORCE AT DEFLECT KEEL HORIZ (KIPS) QD1= 18098.07
RESTORING FORCE AT DEFLECT SIDE HORIZ (KIPS) QD2= 4817.6
RESTORING FORCE AT DEFLECT SIDE VERT (KIPS) gD3= 2262.37
RESTORING FORCE AT DEFLECT KEEL VERT (KIPS) QD4=
GRAVITATIONAL CONSTANT (IN/S£C^2) GRAV= 386.09
SIDE BLOCK HIDTH (IN) SBH= 42
KEEL BLOCK HIDTH (IN) KBH= 48
SIDE BLOCK HEIGHT (IN) SBH= 74
KEEL BLOCK HEIGHT (IN) KBH= 60
BLOCK ON BLOCK FRICTION COEFFICIENT Ul= .43
HULL ON BLOCK FRICTION COEFFICIENT U2= .53
SIDE PIER TO SIDE PIER TRANSVERSE DISTANCE (IN) BR= 144
SIDE PIER CAP PROPORTIONAL LIMIT SCPL= .7
KEEL PIER CAP PROPORTIONAL LIMIT KCPL= .45
TOTAL SIDE PIER CONTACT AREA (ONE SIDE) ;IN*2) SAREA= 8352
TOTAL KEEL PIER CONTACT AREA (IN*2) KAREA= 55440
PERCENT CRITICAL DAMPING ZETA= .05
HULL NUMBER iXUl) HULL= 616
SYSTEM NUMBER (XH) NSYS= 1
CAP ANGLE (RAD) BETA= .377
198

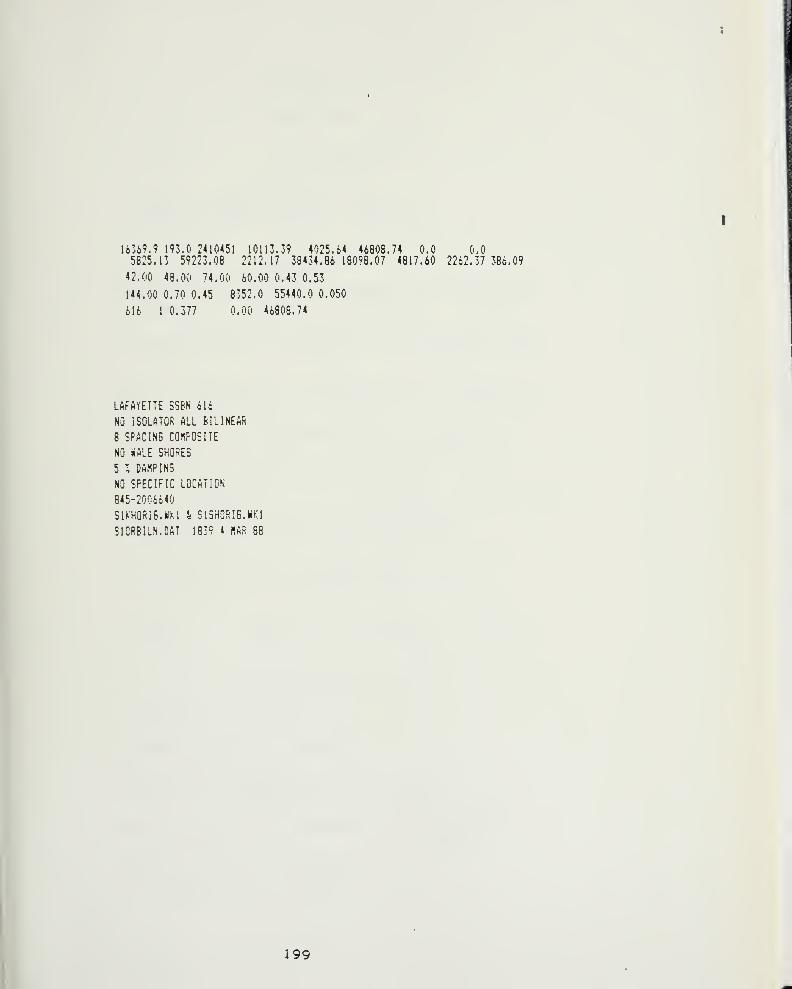
16369.9 193.0 2410451 10113.39 4025.64 46808.74 0.0 0.05825.13 59223.08 2212.17 38434.86 18098.07 4817.60 2262.37 386.09
42.00 48,00 74.00 60.00 0.43 0.53
144.00 0.70 0.45 8352.0 55440.0 0.050
616 1 0.377 0.00 46808.74
LAFAYETTE SS&N 616
NO ISOLATOR ALL BILINEAR
8 SPACING COMPOSITE
NO WALE SHORES
5 X DAMPING
NO SPECIFIC LOCATION
845-2006640
SU'HORiS.WKl i SlSHQRIG.k
SICRBILN.CAT 1839 4 MAR
199

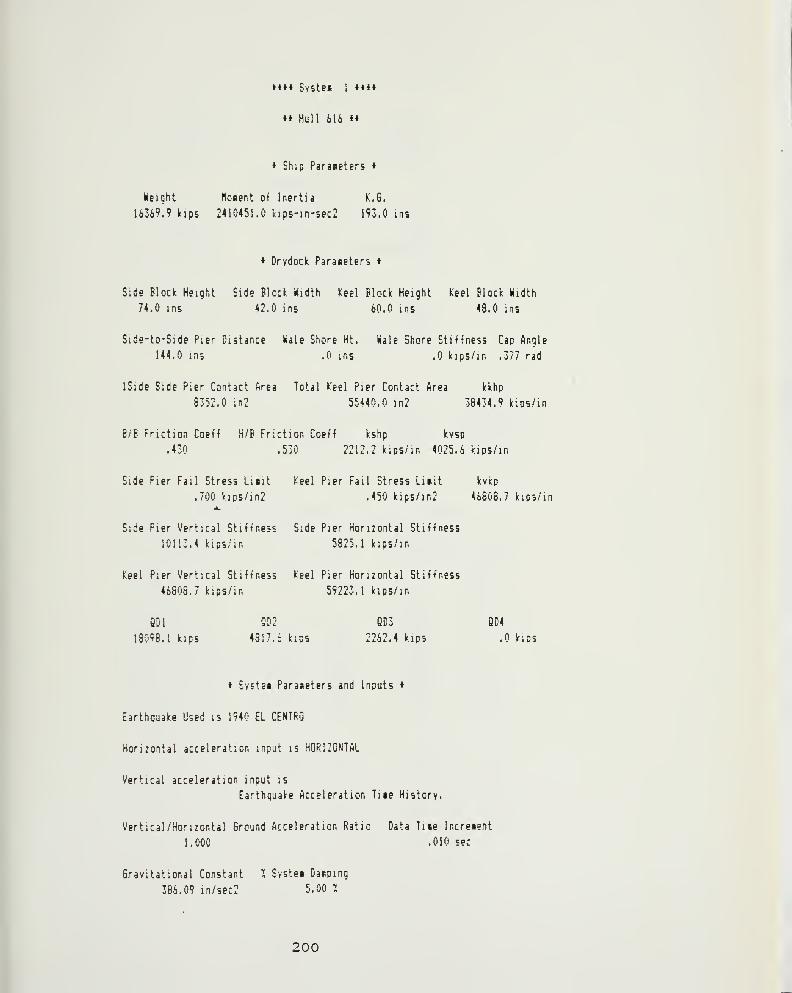
»» SvsteB 1 »«»t
» Hull 616
Ship Paraneters
Weight Hoiient of Inertia K.6.
16369.9 kips 2410451.0 kip5-in-sec2 193.0 ins
Drydock Paraneters *
Side Block Height Side Block Width Keel Block Height Keel Block Width
74.0 ins 42.0 ins 60.0 ins 48.0 ins
Side-to-Side Pier Distance Wale Shore Ht. Wale Shore Stiffness Cao Angle
144.0 ins .0 ins .0 kips/in .377 rad
ISlde Side Pier Contact Area Total Keel Pier Contact Area kkhp
8352.0 in2 55440.0 in2 38434.9 kips/in
B/B Friction Coeff H/B Friction Coeff kshp kvsp
.430 .530 2212.2 kips/in 4025.6 kips/in
Side Pier Fail Stress Liiit l^eel Pier Fail Stress Liiit kvkp
.700 kips/in2 .450 kips/in2 46808.7 kips/in
Side Pier Vertical Stiffness Side Pier Horirontal Stiffness
10113.4 kips/in 5825.1 kips/in
Keel Pier Vertical Stiffness Keel Pier Horizontal Stiffness
46808.7 kips/in 59223.1 kips/in
QDi 8D2 QD3 QD4
13098.1 kips 4817.0 kips 2262.4 kips .0 kips
Svstei Parameters and Inputs
Earthquake Used is 1940 EL CENTRO
Horizontal acceleration input is HORIZONTAL
Vertical acceleration input is
Earthquake Acceleration Tue History.
Vertical/Horizontal Ground Acceleration Ratio Data Tine Increment
1.000 .010 sec
Gravitational Constant X Systei Dasping
386.09 in/sec2 5.00 I
200

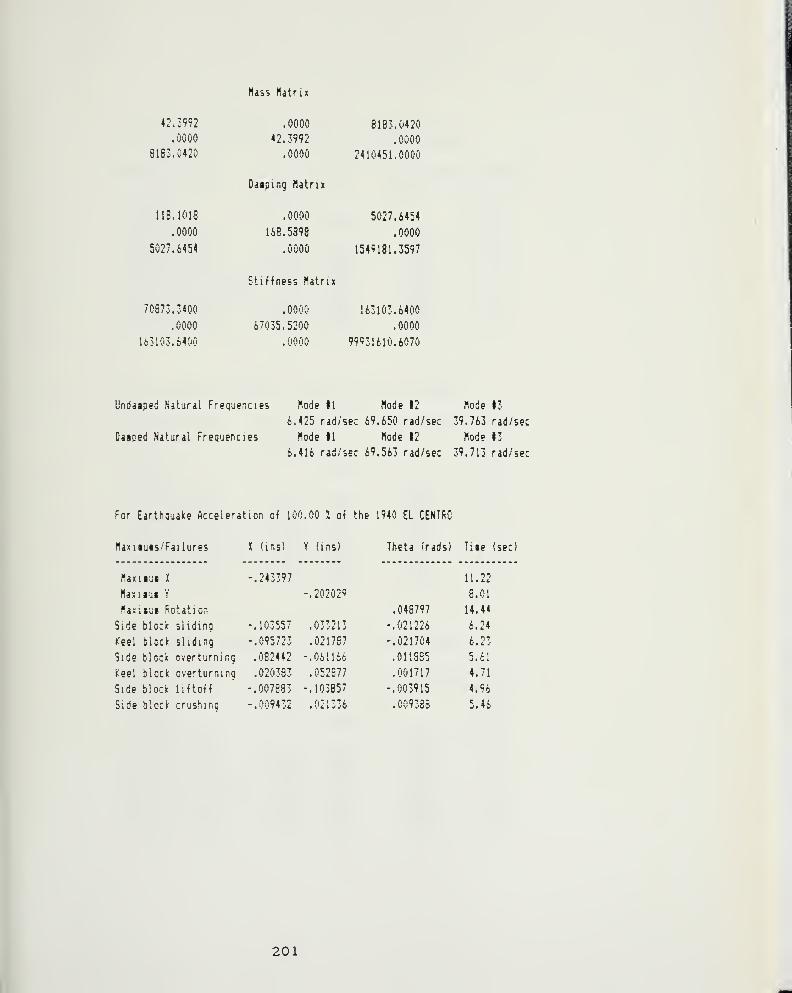
Has5 Matrix
42.3992 .0000 8183.0420
. 0000 42.3992 .0000
8163.0420 .0000
Daiping Hatrix
2410451.0000
118.1018 .0000 5027.6454
.0000 168.5898 .0000
5027.6454 .0000 1549131.3597
Stiffness Hatrix
70873.3400 .0000 163103.6400
.0000 67035.5200 .0000
63103.6400 .0000 99931610.6070
Undaaped Natural Frequencies Hode II Mode 12 Mode 13
6.425 rad/sec 69.650 rad/sec 39.763 rad/sec
Daaped Natural Frequencies Hode II Hode 12 Hode 13
6.416 rad/sec 69.563 rad/sec 39.713 rad/sec
For Earthauake Acceleration of 100.00 a of the 1940 EL CENTRC
Haxiiuis/Failures I (ins) Y (ms) Theta irads) Tue (sec)
Haxiiui K -.243397
Hauiui Y -.202029
Haxisut Rotation
Side block sliding -.103557 .033213
Keel block sliding -.095723 .021787
Side block overturning .082442 -.061166
f:.eel block overturning .020383 .052S77
Side block liftoff -.007883 -.103857
Side block crushinq -.009432 .021336
11.22
8.01
.048797 14.44
-.021226 6.24
-.021704 6.23
.011885 5.6i
.001717 4.71
-.003915 4.96
.009333 5.46
201
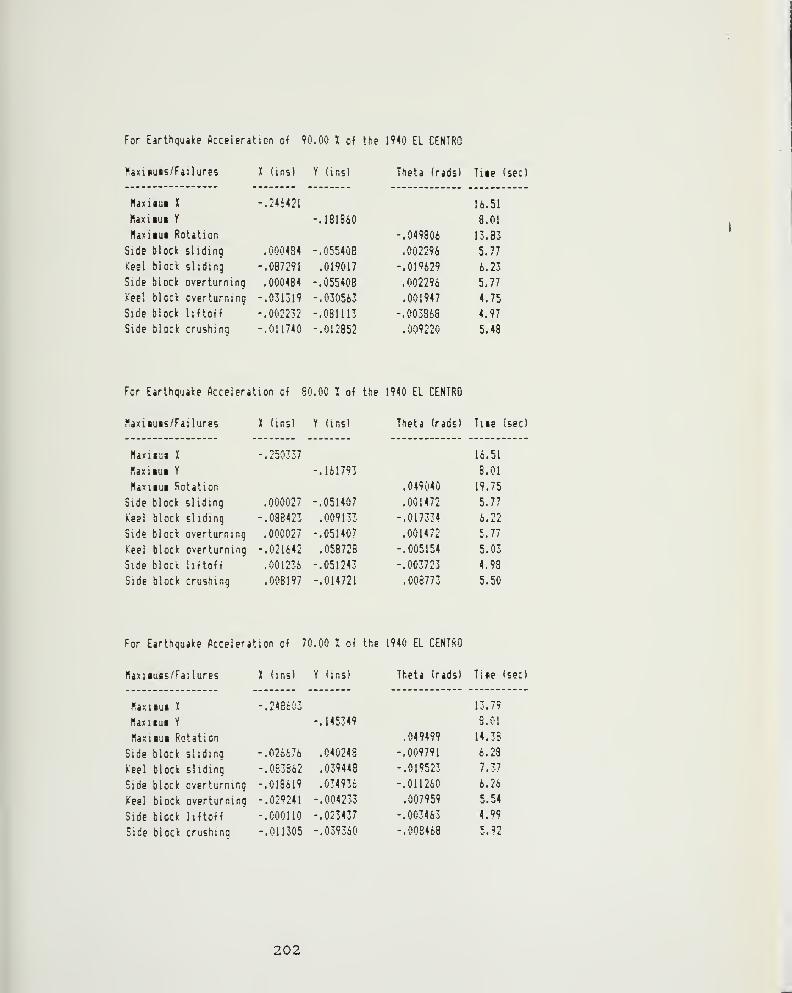
For Earthquake Acceleration of 90.00 X of the 1940 EL CENTRO
Haxiituis/Failures X (ins) Y (ins) Theta (rads) Tiie (sec)
Haxitui I
hax iiui Y
llaxiaui Rotation
Side block sliding
Keel block sliding
Side block overturning
Keel block overturning
Side block liftoff
Side block crushing
-.246421 16.51
-.181860 8.01
-.049806 13.83
.000484 -.055408 .002296 5.77
-.087291 .019017 -.01''629 6.23
.000484 -.055408 .002296 5.77
-.031319 -.030563 .001947 4.75
-.002232 -.081113 -.003868 4.97
-.011740 -.012852 . 009220 5.48
For Earthquake Acceleration of 80.00 I of the 1940 EL CENTRO
Haxisuis/Failures I (ins) Y (ins) Theta (rads) Ti«e (sec)
Hax i BUI I 16.51
llaxitui Y -.161793 8.01
Haxiiui Rotation .049040 19.75
Side block sliding .000027 -.051407 .001472 5.77
Keel block sliding -.088423 .009133 -.017334 6.22
Side block overturninq .000027 -.051407 .001472 5.77
Keel block overturning -.021642 .058728 -.005154 5,03
Side block liftoff .001236 -.051243 -.003723 4.98
Side block crushing .008197 -.014721 .008773 5.50
For Earthquake Acceleration of 70.00 I of the 1940 EL CENTRO
Maxiiuis/Failures X (ins) Y (ins) Theta (rads) Tise (sec)
Kaxisut X
naxifiui Y
Haxitui Rotation
Side block sliding
Keel block sliding
Side block overturning
Keel block overturning
Side block liftoff
Side block crushing
-.248603 13.79
-.145349 8.01
.049499 14.39
-.026676 .040248 -.009791 6.23
-.0S3862 .039448 -.019523 7.37
-.018619 .034936 -.011260 6.26
-. 029241 -.004233 .007959 5.54
-.000110 -.023437 -.003463 4.99
-.011305 -.039360 -.008468 5.92
202

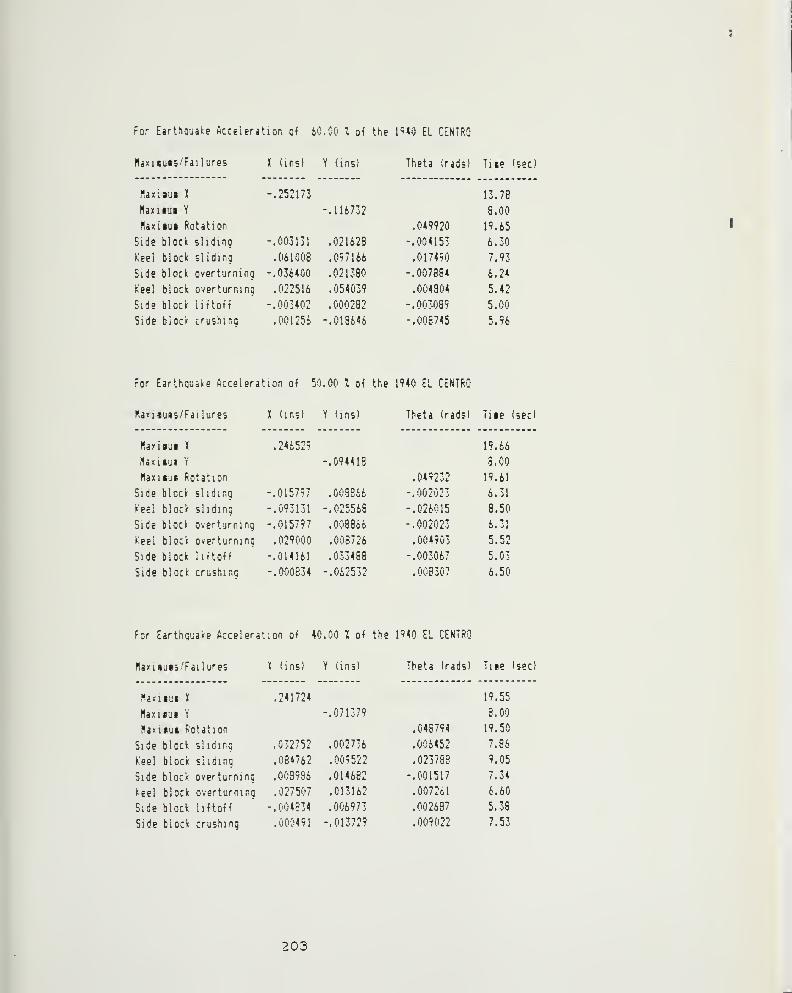
For Earthquake Acceleration of 60.00 I of the 1940 EL CENTRQ
Haxiiuis'Failures
flaxiiua J
Haxiiui Y
Haxiiui Rotation
Side block sliding
Keel block sliding
Side block overturning
Keel block overturning
Side block liftoff
Side block crushing
K (ins) Y (ins) Theta (rads) Tiie (sec)
-.252173 13.78
-.116732 8.00
.049920 19.65
-.003131 .021628 -.004153 6.30
.061008 .097166 .017490 7.93
-.036400 .021380 -.007884 6.24
.022516 .054039 .004804 5.42
-.003402 .000232 -.003089 5.00
.001256 -.013646 -.006745 5.96
For Earthquake Acceleration of 50.00 I of the 1940 EL CENTRO
Ha«i9U9s/Failures K (ins) Y (ins) Theta (rads) Tiie (sec)
Kanaua I .246529 19.66
llaxiaui Y -.094418 3.00
Maxiiu* Rotation .049232 19.61
Side block slidinq -.015797 .008866 -.002023 6.31
Keel block sliding -.093131 -.025568 -.026015 8.50
Side block overturning -.015797 .008866 -.002023 6.31
Keel block overturning .029000 .008726 ,004903 5.52
Side block liftoff -.014161 .033488 -.003067 5.03
Side block crushing -.000834 -.062532 .008307 6.50
For Earthquake Acceleration of 40.00 :: of the 1940 EL CENTRO
Haxisuis/Failures I (ins) Y ims) Theta (rads) Tiie (sec)
f*axiiuc K .241724 19.55
I1axi«ui Y -.071379 3.00
naxicu* Rotation .046794 19.50
Side block sliding .032752 .002736 .006452 7.86
Keel block sliding .084762 .009522 .023788 9.05
Side block overturning .008986 .014682 -.001517 7.34
Keel block overturning .027507 .013162 .007261 6.60
Side block liftoff -.004834 .006973 .002687 5.38
Side block crushing .000491 -.013729 .009022 7.53
203
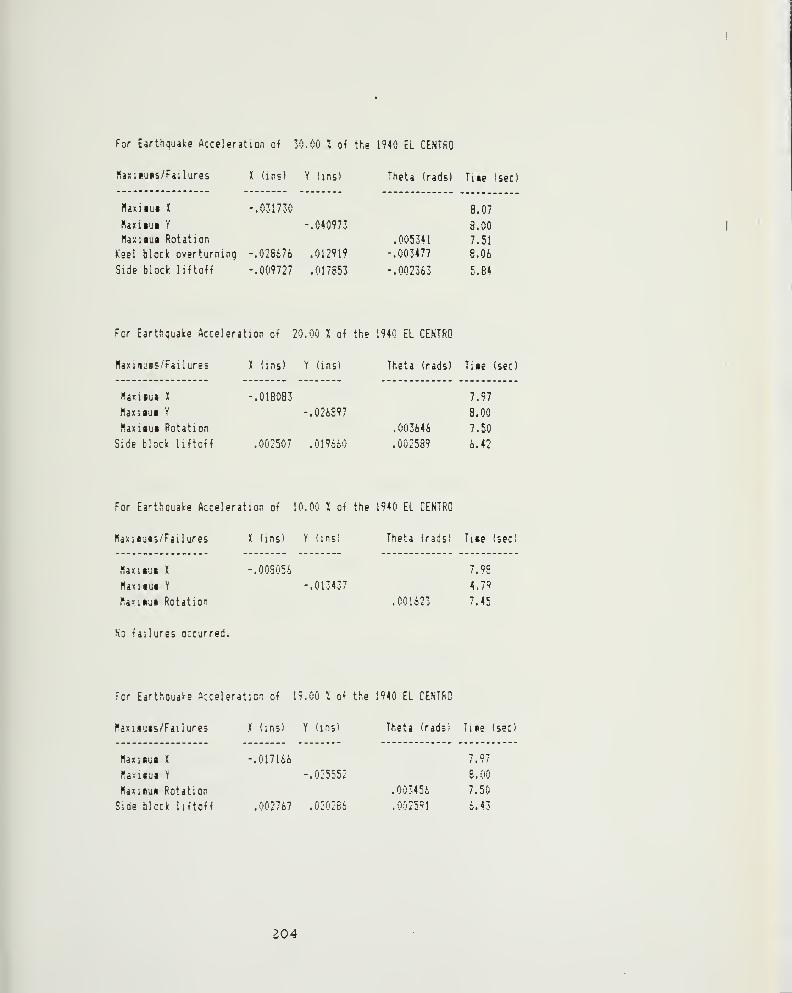
For Earthquake Acceleration of 30.00 I of the 1940 EL CENTRO
Maxiiuis/Failures X (ins) Y (ins) Theta (rads) Tiae (sec)
Haxiiui K -.031730 8.07
Haxnui Y -.040973 8.00
Naxiiuj Rotation .005341 7.51
Keel block overturning -.028676 .012919 -.003477 8.06
Side block liUoH -.009727 .017853 -.002363 5.84
For Earthquake Acceleration of 20.00 X of the 1940 EL CENTRO
Haxnuis/Failures X (ins) Y (ins) Theta (rads) Tite (sec)
HaxiiuB t -.018083 7.97
flaxnui Y -.026897 8.00
Haxiaui Rotation ,003646 7.50
Side block liftoff .002507 .019660 .002589 6.42
For Earthquake Acceleration of 10.00 X of the 1940 EL CENTRO
Haxnuis/Fai lures K (ins) Y (ins; Theta (rads) Ti«e (sec)
Haxiiui I -.008056 7.9=
Mauiui Y -.013437 4.79
llaniui Rotation .001623 7.45
No failures occurred.
For Earthquake Acceleration of 19.00 X of the I<540 EL CENTRO
flaxi«u«s/Faiiures )( (ins) Y (ins' Theta (radsi Tite (sec)
naxmua X -.017166 7.97
Ffaxicui Y -.025552 8.00
HasiBUd Rotation .003456 7.50
Side block liftoff .002767 ,020286 .002591 6.43
204
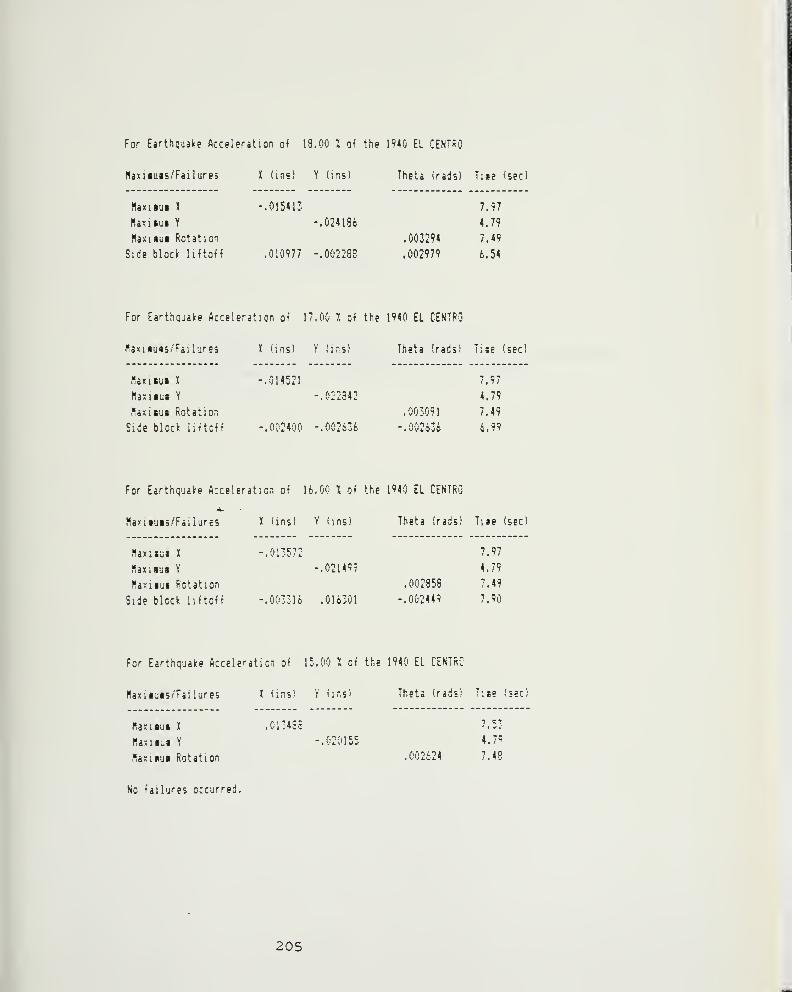
For Earthquake Acceleration of 18.00 I oi the 1940 EL CENTRO
Haxnuis/Failures K (ins) Y (ins) Theta irads) Tiie (sec)
Haxitui K -.015413 7.97
llansui Y -.024186 4.79
flaxiiui Rotation .003294 7.49
Side block liftoff .010977 -.002288 .002979 6.54
For Earthauake Acceleration of 17.00 I of the 1940 EL CENTRO
Haxnuas/Fai lures K (ins) Y (ins) Theta (rads) Tise (sec)
Kaxicut I -.014521 7.97
Haxiiut Y -.022342 4.79
Haxiius Rotation .003091 7.49
Side block liftoff -.002400 -.002636 -.002636 6.99
For Earthquake Acceleration of 16.00 X of the 1<»40 EL CENTRG
Maxnuis/Failures )( iins) Y (ins) Theta irads) Ti*e (sec)
ilaxitui K -.013572 7.97
naxiiua Y -.021499 4.79
Naxnu* Rotation .002858 7.49
Side block liftoff -.003316 .016301 -.002449 7.90
For Earthquake Acceleration of 15.00 X of the 1940 EL CENTRO
Haxiiuis/Failures I <ins; Y (insi Theta (rad;: Tise (sec)
1 C7flaxnui I .C134S5
Haxiius Y -.020155 4.79
Haxiiuj Rotation .002624 7.48
No failures occurred.
205

APPENDIX 2
"V2READ$" and"ACCELMOD" FORTRANProgram List ingsSample Vertical and Horizontal"DATINNEW" and "MAKERUB" BASIC ProgramList ingss
206

I
i
I
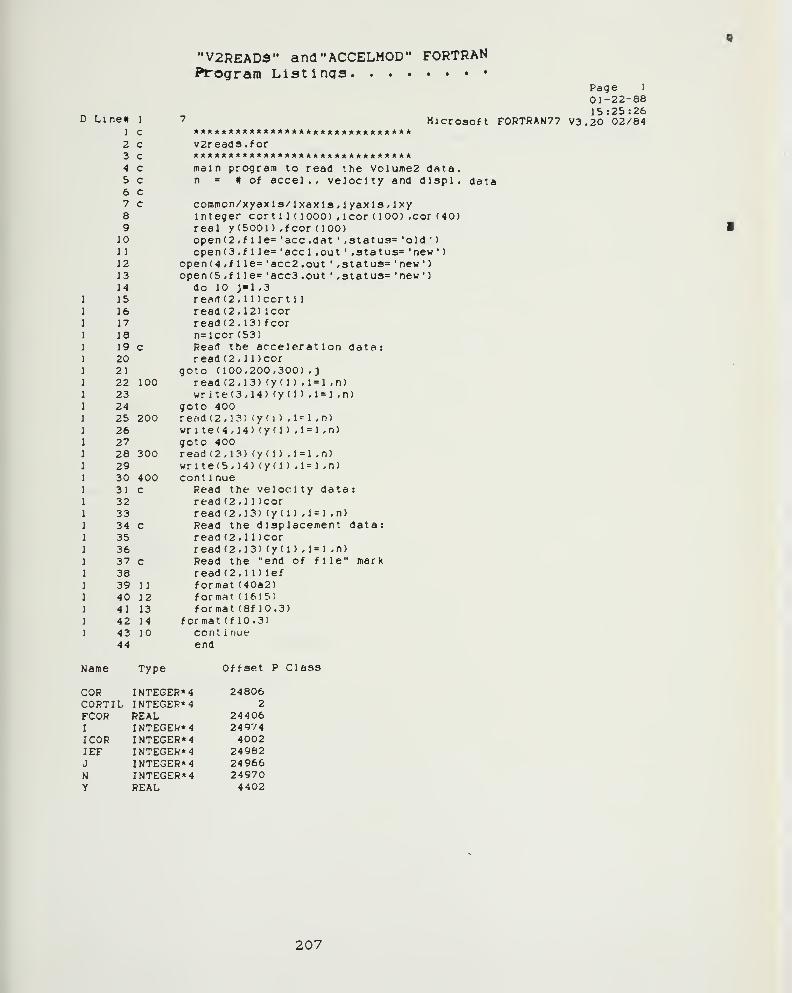
"V2READ$" and"ACCELMOD" FORTRANProgram Listings
D Line# 1
1 c
2 c3 c4 c5 c6 c7 c89
1011
121314
1 151 16J 171 161 19 c1 201 211 22 1001 231 241 25 2001 261 271 28 3001 291 30 4001 31 c1 321 331 34 c1 351 361 37 c1 381 39 11
1 40 121 41 131 42 14
1 43 1044
Name Type Offset
COR INTEGER*
4
24806CORTIL INTEGER*
4
2
FCOR REAL 24406I INTEGER*
4
24 974I COR INTEGER*
4
4002lEF INTEGER*
4
24962J INTEGER*
4
24966N INTEGER*
4
24970y REAL 4402
*******************************v2read9.for*******************************main program to read the VolumeZ data.n = « of accel . , velocity and dlspl. data
common/xyaxls/lxaxl3 , lyaxla , Ixyinteger cort 1 1 (lOOO) ,lcor (100) ,cor (40)real y (5001 ) .fcor (100)open (2 ,f 1 le= 'ace .dat ' ,status= 'old ')
open (3 .f 1 le= 'accl .out ' ,statLis= 'new '
)
open (4 .f 1 le= 'acc2 .out ' ,status= ' new '
)
open (5 .f 1 le= 'acc3 .out ' ,status= 'new •)
do 10 J»l .3
read (2,1) )cor t 1
1
read (2.12) Icorread (2,13) f corn=lcor (53)Read the acceleration data:read (2,11 )cor
goto (100,200,300) .Jread (2,13) (y (1 ) ,1=1 ,n)
write(3,14) (yd) ,1 = 1 ,n)
goto 400re£id (2,13) (y (i ) .1 = ] ,n)
wr ite(4 ,14) (y (1 ) .1 = 1 ,n)
goto 400read (2,13) (y (1 ) ,1=1 ,n)
wrlte(5,14) (yd) ,1 = 1 .n)
cont 1 nueRead the velocity data:read (2,11 )corread (2,13) (y d ) ,1=1 ,n)
Read the displacement data:read (2,11 )corread (2,13) (y d ) ,1 = 1 .n)
Read the "end of file" markread (2,1 1) lefformat (40a2)format (16i5)format (8f 10.3)
format (f 10.3)cont i nueend
P Class
Page 1
01-22-8815:25:26
Microsoft F0RTRAN77 V3.20 02/84
207
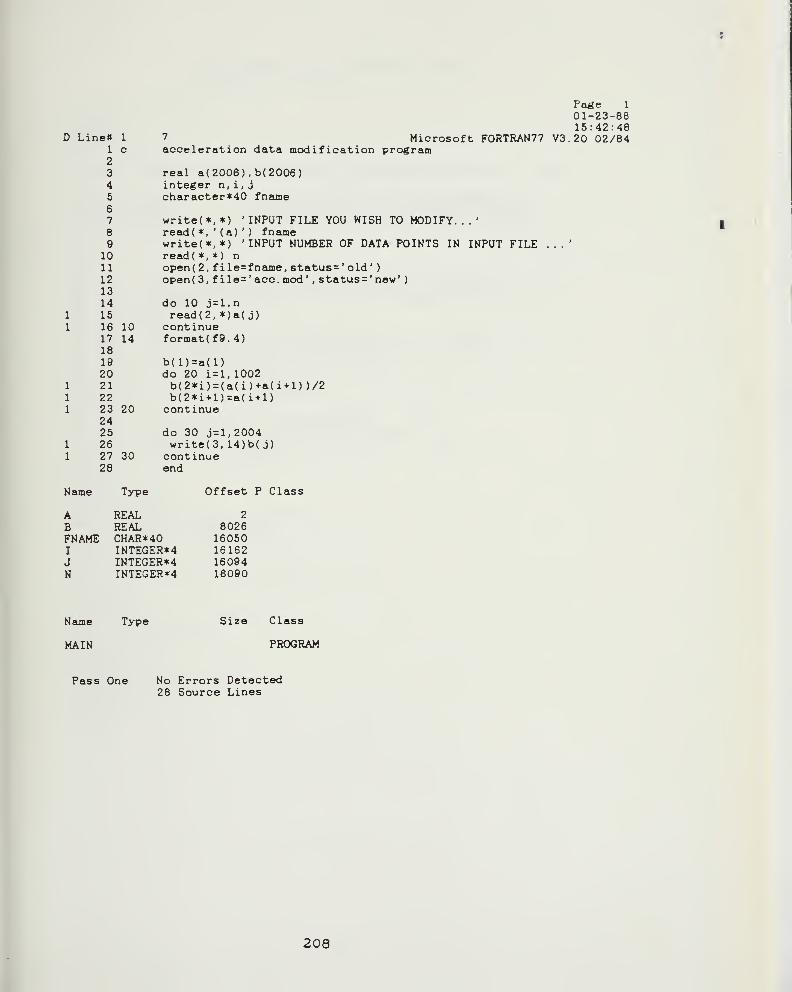
D Line» 1
1 c
2
34567
e9
1011121314
1 151 16 10
17 14181920
1 211 221 23 20
2425
1 261 27 30
28
Pa^e 1
01-23-8815:42:48
7 Microsoft F0RTRAN77 V3.20 02/84acceleration data modification program
real a( 2006) , b(2006)integer n, i,
j
character*40 fname
write(*,*) 'INPUT FILE YOU WISH TO MODIFY...'read( *,
' (a)
' ) fnamewrite(*,*) 'INPUT NUMBER OF DATA POINTS IN INPUT FILE ...'read( *, *) nopen( 2, file=fname, status =' old'
)
open( 3, f ile=' ace. mod' , status =' new'
)
do 10 j=l,nread(2, *)a( j)
continueformat(f9. 4)
b(l)=a(l)do 20 i=l, 1002b(2*i)=(a(i)+a(i+l) )/2b(2«i+l)=a(i+l)continue
do 30 j=l,2004write(3, 14)b( j)continueend
Name Type Offset P Class
ABFNAMEI
JN
REALREALCHAR*40INTEGER*4INTEGER*4INTEGER*4
2
802616050161621609416090
Name
MAIN
Type Size Class
PROGRAM
Pass One No Errors Detected28 Source Lines
208

4
I
4
1
i
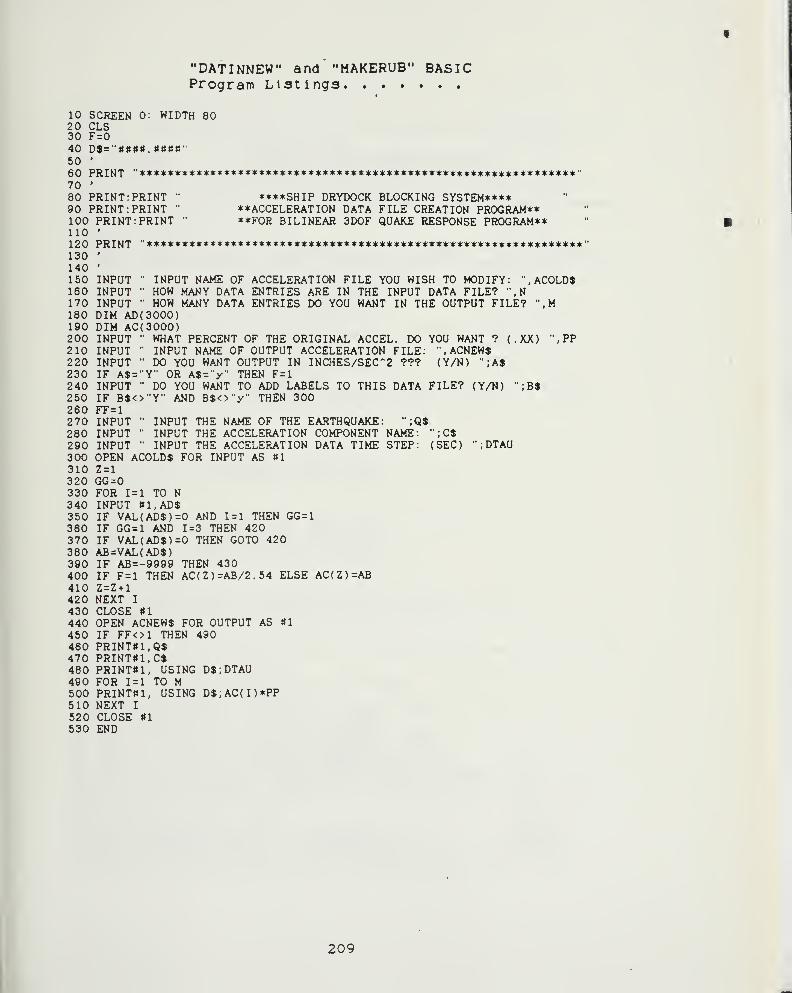
"DATINNEW" and "MAKERUB" BASICProgram Listings
10 SCREEN 0: WIDTH 8020 CLS30 F=040 D$="J<«««. «««»"50 '
60 PRINT "***************************************«*****************«*"70 '
80 PRINT: PRINT " ****SHIP DRYDOCK BLOCKING SYSTEM****90 PRINT: PRINT " **ACCELERATION DATA FILE CREATION PROGRAM**100 PRINT: PRINT " **F0R BILINEAR 3D0F QUAKE RESPONSE PROGRAM**110 '
120 PRINT "**************************************************************130 '
140 '
150 INPUT •• INPUT NAME OF ACCELERATION FILE YOU WISH TO MODIFY: ".ACOLDt160 INPUT " HOW MANY DATA ENTRIES ARE IN THE INPUT DATA FILE? ".N170 INPUT " HOW MANY DATA ENTRIES DO YOU WANT IN THE OUTPUT FILE? ".M180 DIM AD(3000)190 DIM AC(3000)200 INPUT •• WHAT PERCENT OF THE ORIGINAL ACCEL. DO YOU WANT ? (.XX) "^PP210 INPUT " INPUT NAME OF OUTPUT ACCELERATION FILE: "
, ACNEW$220 INPUT • DO YOU WANT OUTPUT IN INCHES/SEC"2 ??? (Y/N) ";A$230 IF A$="Y" OR A$=-y" THEN F=l240 INPUT • DO YOU WANT TO ADD LABELS TO THIS DATA FILE? (Y/N) ••;B$
250 IF B$<>"Y" AND B$<>"y" THEN 300260 FF=1270 INPUT INPUT THE NAME OF THE EARTHQUAKE: •;Q$280 INPUT " INPUT THE ACCELERATION COMPONENT NAME: ";Ct290 INPUT • INPUT THE ACCELERATION DATA TIME STEP: (SEC) ";DTAU300 OPEN ACOLD$ FOR INPUT AS »1
310 Z=l320 GG=0330 FOR 1=1 TO N340 INPUT »1,AD$350 IF VAL(AD$)=0 AND 1=1 THEN GG=1360 IF GG=1 AND 1=3 THEN 420370 IF VAL(AD$)=0 THEN GOTO 420380 AB=VAL(AD$)390 IF AB=-9999 THEN 430400 IF F=l THEN AC( Z ) =AB/2. 54 ELSE AC(Z)=AB410 Z=Z+1420 NEXT I
430 CLOSE #1440 OPEN ACNEW$ FOR OUTPUT AS «1
450 IF FFOI THEN 490460 PRINT»1,Q$470 PRINT»1,C$480 PRINT«1, USING D$;DTAU490 FOR 1=1 TO M500 PRINT»1, USING D$;AC(I)*PP510 NEXT I
520 CLOSE »1530 END
209
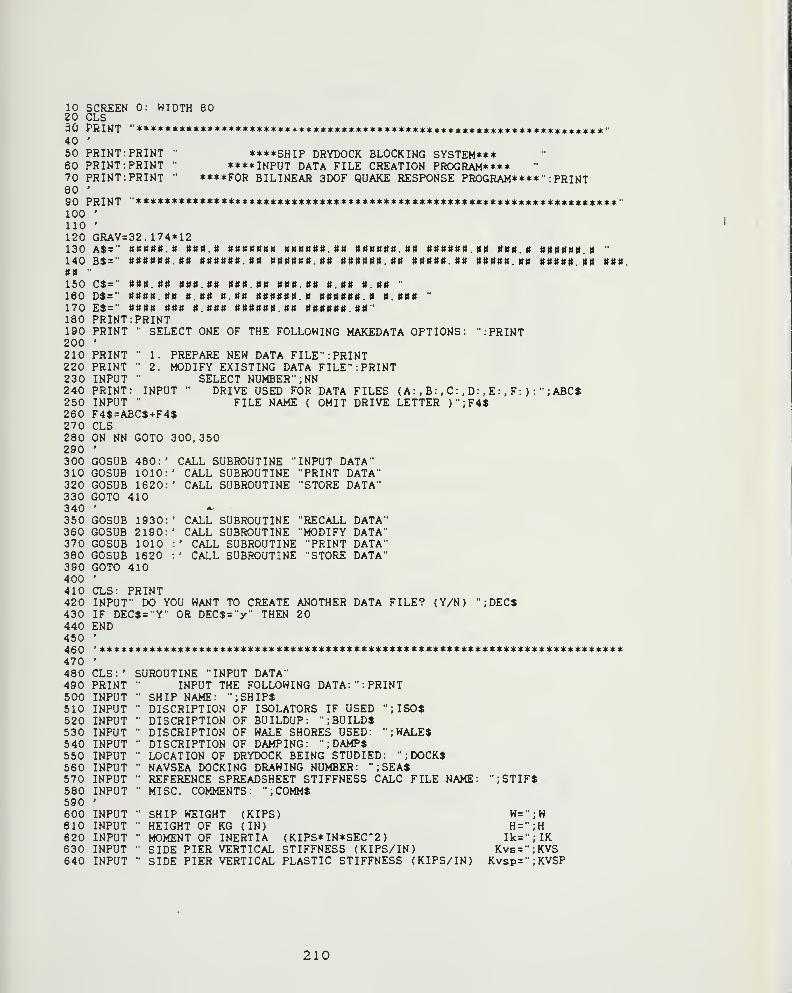
10 SCREEN 0: WIDTH 8020 CLS30 PRINT "*****************«******«***»*******«**«***#**«««««*«**««««»««««**"40 '
50 PRINT: PRINT "****SHIP DRYDOCK BLOCKING SYSTEM***
60 PRINT: PRINT " **«*inpuT DATA FILE CREATION PROGRAM****70 PRINT:PRINT " **«*FOR BILINEAR 3D0F QUAKE RESPONSE PROGRAM****" : PRINT80 '
90 PRINT '*****************************************************«****«**«*****•100 '
110 '
120 GRAV=32. 174*12130 A$=" n»»«».tt »«».» »»nt>»tt» nntmniit . »n tutttnnn.tttt »»»(>»».«« »»».» »»ttntt».»
"
140 B$=" »»»»»».»» »»tntn».ntt tttf»»ttiit.n» »»»»»».»» »»»«».»» »»»»».»» »»»»».»« »»».ttn
150 c$=" ««».«« »»«.»« #»#.«» »»«.«» ».«« n.ttit
ISO D$=" tt9itn.»n «.n» n.nn 9»»nmt.» «»»»*».» ».««9 "
170 E$=" «»n» n«» ».««» nttntmit.tui ««»«»».»»"180 PRINT: PRINT190 PRINT " SELECT ONE OF THE FOLLOWING MAKEDATA OPTIONS:200 '
210 PRINT220 PRINT230 INPUT240 PRINT: INPUT " DRIVE USED FOR DATA FILES (A: , B: , C: , D: , E: , F: )
:
" ; ABC$250 INPUT "
260 F4$=ABC$+F4$270 CLS280 ON NN GOTO 300, 350290 '
300 GOSUB 480:' CALL SUBROUTINECALL SUBROUTINE "PRINT DATA"CALL SUBROUTINE "STORE DATA"
1. PREPARE NEW DATA FILE": PRINT2. MODIFY EXISTING DATA FILE": PRINT
SELECT NUMBER" ;NNINPUT " DRIVE USED FOR DATA FILES (A: , B: , C: , D: , E: , F: )
:
FILE NAME ( OMIT DRIVE LETTER )";F4$
CALL SUBROUTINE "RECALL DATA"CALL SUBROUTINE "MODIFY DATA"
' CALL SUBROUTINE "PRINT DATA"CALL SUBROUTINE "STORE DATA"
INPUT DATA'310 GOSUB 1010:320 GOSUB 1620:330 GOTO 410340 '
350 GOSUB 1930:360 GOSUB 2190:370 GOSUB 1010380 GOSUB 1620390 GOTO 410400 '
410 CLS: PRINT420 INPUT" DO YOU WANT TO CREATE ANOTHER DATA FILE? (Y/N) ";DEC$430 IF DEC$= "Y" OR DEC$="y" THEN 20440 END450 '
450 '«**«**««*«*«***««*«*******************************************************470 '
SUROUTINE "INPUT DATA"INPUT THE FOLLOWING DATA:": PRINT
SHIP NAME: "; SHIPSDISCRIPTION OF ISOLATORS IF USED ";ISO$DISCRIPTION OF BUILDUP: "; BUILDSDISCRIPTION OF WALE SHORES USED: "; WALESDISCRIPTION OF DAMPING: "; DAMPSLOCATION OF DRYDOCK BEING STUDIED: "; DOCKSNAVSEA DOCKING DRAWING NUMBER: "
; SEASREFERENCE SPREADSHEET STIFFNESS CALC FILE NAME: ";STIFSMISC. COMMENTS: "
; COMMS
480 CLS:
'
490 PRINT500 INPUT510 INPUT520 INPUT530 INPUT540 INPUT550 INPUT560 INPUT570 INPUT580 INPUT590 '
600 INPUT610 INPUT620 INPUT630 INPUT640 INPUT
SHIP WEIGHT (KIPS)HEIGHT OF KG (IN)MOMENT OF INERTIA (KIPS*IN*SEC"2)SIDE PIER VERTICAL STIFFNESS (KIPS/IN)SIDE PIER VERTICAL PLASTIC STIFFNESS (KIPS/IN)
W=" WH=" HIk=" IK
Kvs = " KVS.vsp=" KVSP
210

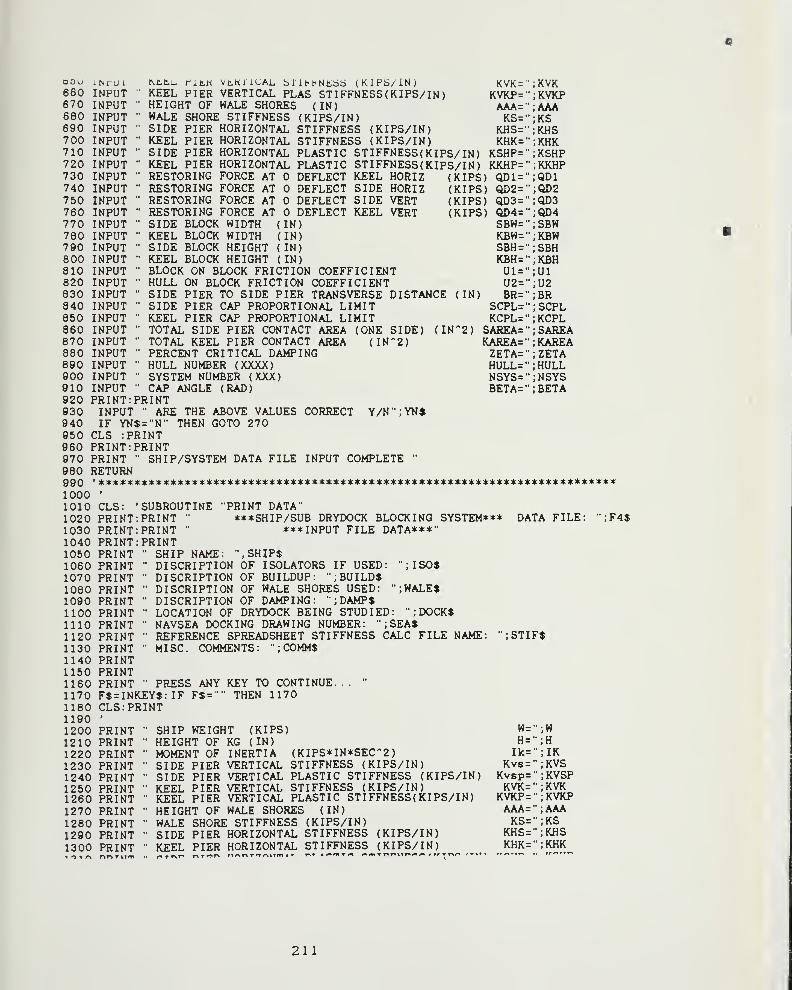
DOU6606706806907007107207307407507607707807908008108208308408508608708808909009109209309409509609709809901000101010201030
iNru i
INPUTINPUTINPUTINPUTINPUTINPUTINPUTINPUTINPUTINPUTINPUTINPUTINPUTINPUTINPUTINPUTINPUTINPUTINPUTINPUTINPUTINPUTINPUTINPUTINPUTINPUT
^cc,l^ t^itLti vtKiiCAi. b'lihbNtSb (KIPS/IN) KVK-"KEEL PIER VERTICAL PLAS STIFFNESS( KIPS/IN) KVKP="HEIGHT OF WALE SHORES (IN) AAA="WALE SHORE STIFFNESS (KIPS/IN) KS="SIDE PIER HORIZONTAL STIFFNESS (KIPS/IN) KHS="KEEL PIER HORIZONTAL STIFFNESS (KIPS/IN) KHK="SIDE PIER HORIZONTAL PLASTIC STIFFNESS(KIPS/IN) KSHP="KEEL PIER HORIZONTAL PLASTIC STIFFNESS(KIPS/IN) KKHP="RESTORING FORCE AT DEFLECT KEEL HORIZ (KIPS) QD1="RESTORING FORCE AT DEFLECT SIDE HORIZ (KIPS) QD2="RESTORING FORCE AT DEFLECT SIDE VERT (KIPS) QD3="RESTORING FORCE AT DEFLECT KEEL VERT (KIPS) QD4="SIDE BLOCK WIDTH (IN) SBW="KEEL BLOCK WIDTH (IN) KBW="SIDE BLOCK HEIGHT (IN) SBH="KEEL BLOCK HEIGHT (IN) KBH="BLOCK ON BLOCK FRICTION COEFFICIENT Ul="HULL ON BLOCK FRICTION COEFFICIENT U2="SIDE PIER TO SIDE PIER TRANSVERSE DISTANCE (IN) BR="SIDE PIER CAP PROPORTIONAL LIMIT SCPL="KEEL PIER CAP PROPORTIONAL LIMIT KCPL="TOTAL SIDE PIER CONTACT AREA (ONE SIDE) (IN''2) SAREA="TOTAL KEEL PIER CONTACT AREA (IN'2) KAREA="PERCENT CRITICAL DAMPING ZETA="HULL NUMBER (XXXX) HULL="SYSTEM NUMBER (XXX) NSYS="CAP ANGLE (RAD) BETA="
PRINT: PRINTINPUT • ARE THE ABOVE VALUES CORRECT Y/N";YN$IF YN$ = "N'- THEN GOTO 270
CLS : PRINTPRINT:PRINTPRINT • SHIP/SYSTEM DATA FILE INPUT COMPLETE "
RETURN' *************************************************************************
KVKKVKPAAAKSKHSKHKKSHPKKHPQDlQD2QD3QD4SBWKBWSBHKBHUlU2BRSCPLKCPLSAREAKAREAZETAHULLNSYSBETA
CLS: 'SUBROUTINEPRINT: PRINT "
PRINT: PRINT "
1040 PRINT: PRINT1050 PRINT
•PRINT DATA"***SH IP/SUB DRYDOCK BLOCKING SYSTEM***
*»*INPUT FILE DATA***"DATA FILE: ";F4$
106010701080109011001110
PRINTPRINTPRINTPRINTPRINTPRINT
1120 PRINT1130 PRINT
PRINTPRINTPRINT
";ISO$
; WALES
SHIP NAME: ", SHIPSDISCRIPTION OF ISOLATORS IF USED:DISCRIPTION OF BUILDUP: "; BUILDSDISCRIPTION OF WALE SHORES USED:DISCRIPTION OF DAMPING: "; DAMPSLOCATION OF DRYDOCK BEING STUDIED: "; DOCKSNAVSEA DOCKING DRAWING NUMBER: "
; SEASREFERENCE SPREADSHEET STIFFNESS CALC FILE NAME:MISC. COMMENTS: "
; COMMS";STIF$
1140115011601170118011901200121012201230124012501260127012801290
PRESS ANYF$=INKEYS: IF F$="CLS: PRINT
KEY TO CONTINUE.• THEN 1170
PRINT " SHIP WEIGHT (KIPS)PRINT " HEIGHT OF KG (IN)
PRINT " MOMENT OF INERTIA (KIPS*IN*SEC'2)PRINT " SIDE PIER VERTICAL STIFFNESS (KIPS/IN)PRINT " SIDE PIER VERTICAL PLASTIC STIFFNESS (KIPS/IN)PRINT " KEEL PIER VERTICAL STIFFNESS (KIPS/IN)PRINT " KEEL PIER VERTICAL PLASTIC STIFFNESS(KIPS/IN)PRINT " HEIGHT OF WALE SHORES (IN)
PRINT " WALE SHORE STIFFNESS (KIPS/IN)PRINT " SIDE PIER HORIZONTAL STIFFNESS (KIPS/IN)
1300 PRINT " KEEL PIER HORIZONTAL STIFFNESS (KIPS/IN) KHK=
W=" WH =
"H
Ik=" IKKvs =
" KVSKvsp=" KVSPKVK=" KVK
KVKP=" KVKPAAA=" AAAKS=" KS
KHS =" KHS
KHK=" KHK
211
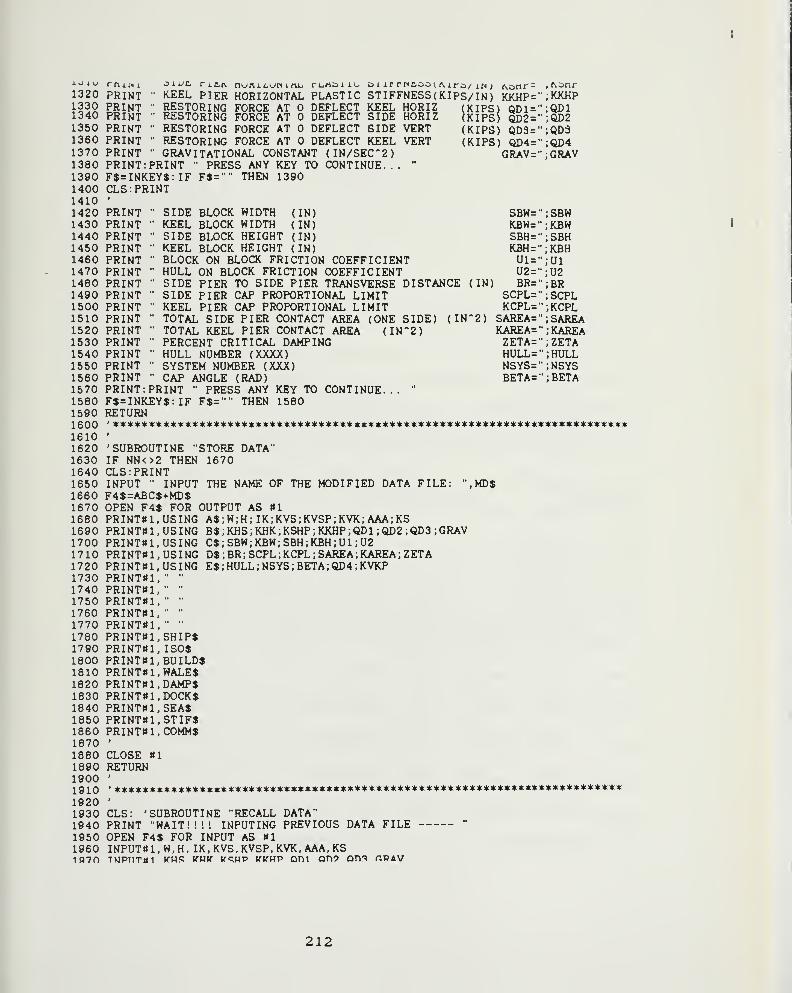
13201330134013501360137013801390140014101420143014401450146014701480149015001510152015301540155015601570158015901600161016201630164016501660167016801690170017101720173017401750176017701780179018001810182018301840185018601870188018901900191019201930194019501960ifl7n
PRINT KEEL PIER HORIZONTAL PLASTIC STIFFNESS(KIPS/IN) KKHP="PRINT RESTORING FORCE AT DEFLECT KEEL HORIZ (KIPS) QD1 =
"
PRINT •• RESTORING FORCE AT DEFLECT SIDE HORIZ (KIPS) QD2="PRINT " RESTORING FORCE AT DEFLECT SIDE VERT (KIPS) QD3="PRINT • RESTORING FORCE AT DEFLECT KEEL VERT (KIPS) QD4="PRINT ' GRAVITATIONAL CONSTANT (IN/SEC-2) GRAV="PRINT:PRINT •' PRESS ANY KEY TO CONTINUE... "
F$=INKEY$:IF F$="" THEN 1390CLS: PRINT
PRINT •• SIDE BLOCK WIDTH (IN)PRINT " KEEL BLOCK WIDTH (IN)PRINT SIDE BLOCK HEIGHT (IN)PRINT •• KEEL BLOCK HEIGHT (IN)PRINT •• BLOCK ON BLOCK FRICTION COEFFICIENTPRINT HULL ON BLOCK FRICTION COEFFICIENTPRINT • SIDE PIER TO SIDE PIER TRANSVERSE DISTANCEPRINT " SIDE PIER CAP PROPORTIONAL LIMITPRINT •• KEEL PIER CAP PROPORTIONAL LIMITPRINT • TOTAL SIDE PIER CONTACT AREA (ONE SIDE) (INPRINT " TOTAL KEEL PIER CONTACT AREA (IN '2)PRINT " PERCENT CRITICAL DAMPINGPRINT • HULL NUMBER (XXXX)PRINT •• SYSTEM NUMBER (XXX)PRINT • CAP ANGLE (RAD)PRINT:PRINT " PRESS ANY KEY TO CONTINUE... "
F$=INKEY$:IF F$="" THEN 1580RETURN
KKHPQDlQD2QD3QD4GRAV
SBW=" SBWKBW=", KBWSBH=" SBHKBH=", KBHUl = "
UlU2 =
"U2
IN) BR=' BRSCPL=" SCPLKCPL=" KCPL
2) SAREA=" SAREAKAREA=" KAREAZETA=" ZETAHULL=" ;HULLNSYS=" NSYSBETA=' ;BETA
t
'SUBROUTINE "STORE DATA"IF NN<>2 THEN 1670CLS: PRINTINPUT " INPUT THE NAME OF THE MODIFIED DATA FILE: ",MD$F4$=ABC$+MD$OPEN F4$ FOR OUTPUT AS «1PRINTS 1, USING A$;W;H;IK;KVS;KVSP;KVK;AAA;KSPRINTS 1 , USING B$ ; KHS ; KHK ; KSHP ; KKHP ; QDl ; QD2 ; QD3 ; GRAVPRINTOl. USING C$;SBW;KBW;SBH;KBH;U1;U2PRINT«1, USING D$; BR; SCPL; KCPL; SAREA; KAREA; ZETAPRINTt»l, USING E$ ; HULL; NSYS; BETA ;QD4;KVKPPRINT«1,PRINT»1,PRINT«1,PRINTOl.PRINT«1,PRINT«1, SHIP$PRINT«1. ISO$PRINT»1, BUILDSPRINT«1, WALESPRINT»1, DAMPSPRINT»1, DOCKSPRINT«1,SEASPRINT«1,STIFSPRINTS l.COMMSt
CLOSE »1RETURN
'****«*******«***«********«****************************#****«**********
CLS: 'SUBROUTINE "RECALL DATA"PRINT "WAIT!!!! INPUTING PREVIOUS DATA FILE "
OPEN F4$ FOR INPUT AS «1INPUTttl, W,H, IK,KVS,KVSP,KVK, AAA,KSTMPriTui tfWR K»v Kqwp KK»p oni on? onr^ rzRAV
212
)
I
I
19801990200020102020203020402050206020702080209021002110212021302140215021602170218021902200221022202230224022502260227022802290$)2300231023202330$)2340235023602370238023902400241024202430$)24402450$)24602470)
24802490)
25002510)
25202530)
25402550
INPUTS 1, SBW.KBW, SBH, KBH , U 1 , U2INPUTIH , BR, SCPL, KCPL, SAREA, KAREA, ZETAINPUTWl , HULL, NSYS, BETA, QD4, KVKPINPUT«1,NULL$INPUT«1, NULLSINPUT»1, NULLSINPUT J»l, NULLSINPUTS 1, NULLSINPUT»1, SHIPSINPUTSl, ISOSINPUT»1, BUILDSINPUTS 1, WALESINPUTS 1, DAMPSINPUTS 1, DOCKSINPUTSl.SEASINPUTSl.STIFSINPUTS l.COMMSCLOSE SIRETURNt
CLS: 'SUBROUTINE "MODIFY DATA"PRINT " SHIP WEIGHT (KIPS) M=";WINPUT "NEW VALUE: *N0 CHANGE: PRESS ENTER* W=";IS:IF I$<>""THEN W=VAL(IS)PRINT " HEIGHT OF KG (IN) H=";HINPUT "NEW VALUE: *N0 CHANGE PRESS ENTER* H=";Q$:IF QS<>""THEN H=VAL(QS)PRINT " MOMENT OF INERTIA (KIPS*IN*SEC~2) Ik=" ; IKINPUT "NEW VALUE *N0 CHANGE PRESS ENTER* Ik=";QS:IF QS<>""THEN IK=VAL(QS)PRINT " SIDE PIER VERTICAL STIFFNESS (KIPS/IN) Kvs=";KVSINPUT "NEW VALUE *N0 CHANGE PRESS ENTER* Kvs=";QS:IF QS<>""THEN KVS=VAL(Q$)PRINT " SIDE PIER VERTICAL PLASTIC STIFFNESS (KIPS/IN) Kvsp=";KVSPINPUT "NEW VALUE *N0 CHANGE PRESS ENTER* Kvsp=";Q$:IF QS<>""THEN KVSP=VAL(Q
PRINT " KEEL PIER VERTICAL STIFFNESS (KIPS/IN) KVK=";KVKINPUT "NEW VALUE *N0 CHANGE PRESS ENTER* Kvk=";QS:IF QS<>""THEN KVK=VAL(QS)PRINT " KEEL PIER VERTICAL PLASTIC STIFFNESS(KIPS/IN) KVKP=";KVKPINPUT "NEW VALUE *N0 CHANGE PRESS ENTER* Kvkp=";QS:IF QS<>""THEN KVKP=VAL(Q
PRINTINPUTPRINTINPUTPRINTINPUTPRINTINPUTPRINTINPUT
PRINTINPUT
PRINTINPUT
PRINTINPUT
PRINTINPUT
PRINTINPUT
PRINTINPUT
HEIGHT OF WALE SHORES (IN) AAA:NEW VALUE *N0 CHANGE PRESS ENTER* AAA=";QS:IF QS<>""THEN AAA=VAL(QS)WALE SHORE STIFFNESS (KIPS/IN) KS='
NEW VALUE *N0 CHANGE: PRESS ENTER* KS=";QS:IF QS<>""THEN KS=VAL(QS)SIDE PIER HORIZONTAL STIFFNESS (KIPS/IN) KHS="
NEW VALUE *N0 CHANGE PRESS ENTER* Khs=";QS:IF QS<>""THEN KHS=VAL(QS)KEEL PIER HORIZONTAL STIFFNESS (KIPS/IN) KHK='
•NEW VALUE *N0 CHANGE PRESS ENTER* KHK=";QS:IF QS<>""THEN KHK=VAL(Q$)SIDE PIER HORIZONTAL PLASTIC STIFFNESS(KIPS/IN) KSHP="
AAA
KS
KHS
KHK
KSHP"NEW VALUE *N0 CHANGE PRESS ENTER* KSHP=";QS:IF QS<>""THEN KSHP=VAL(Q
" KEEL PIER HORIZONTAL PLATIC STIFFNESS(KIPS/IN) KKHP=";KKHP"NEW VALUE *N0 CHANGE PRESS ENTER* KKHP=";Q$:IF QS<>""THEN KKHP=VAL(Q
" RESTORING FORCE AT DEFLECT KEEL HORIZ (KIPS) QD1=";QD1"NEW VALUE *N0 CHANGE PRESS ENTER* QD1=";QS:IF QS<>""THEN QD1=VAL{QS
• RESTORING FORCE AT DEFLECT SIDE HORIZ (KIPS) QD2=";QD2"NEW VALUE *N0 CHANGE PRESS ENTER* QD2=";QS:IF QS<>""THEN QD2=VAL(Q$
" RESTORING FORCE AT DEFLECT SIDE VERT (KIPS) QD3=";QD3"NEW VALUE *N0 CHANGE PRESS ENTER* QD3=";QS:IF QS<>""THEN QD3=VAL(Q$
" RESTORING FORCE AT DEFLECT KEEL VERT (KIPS) QD4=";QD4"NEW VALUE *N0 CHANGE PRESS ENTER* QD4=";QS:IF Q$<>""THEN QD4=VAL(Q$
" GRAVITATIONAL CONSTANT (IN/SEC*2) GRAV=";GRAV"NEW VALUE *N0 CHANGE PRESS ENTER* GRAV=";Q$:IF Q$<>""THEN GRAV=VAL(Q
213

2560257025802590260026102620263026402650266026702680269027002710$)27202730$)27402750(Q$)27602770(Q$)27802790$)28002810Q$)28202830$)28402850$)286028702880289029002910Q$292029302940295029602970298029903000301030203030304030503060
PHINTINPUTPRINTINPUTPRINTINPUTPRINTINPUTPRINTINPUTPRINTINPUTPRINTINPUTPRINTINPUT
PRINTINPUT
PRINTINPUT
PRINTINPUT
PRINTINPUT
PRINTINPUT
PRINTINPUT
PRINTINPUT
SIDE BLOCK WIDTH (IN)NEW VALUE *N0 CHANGE PRESS ENTER* SBW=";Q$:
• KEEL BLOCK WIDTH (IN)•NEW VALUE *N0 CHANGE PRESS ENTER* KBW=";Q$:• SIDE BLOCK HEIGHT (IN)•NEW VALUE *N0 CHANGE PRESS ENTER* SBH=";Q$:• KEEL BLOCK HEIGHT (IN)•NEW VALUE *N0 CHANGE PRESS ENTER* KBH = ^^;Q$:
BLOCK ON BLOCK FRICTION COEFFICIENT•NEW VALUE *N0 CHANGE PRESS ENTER* U1 = ^';Q$:• HULL ON BLOCK FRICTION COEFFICIENT•NEW VALUE *N0 CHANGE PRESS ENTER* U2 = '^;Q$:• SIDE PIER TO SIDE PIER TRANSVERSE DISTANCE•NEW VALUE *N0 CHANGE PRESS ENTER* BR=";Q$:• SIDE PIER CAP PROPORTIONAL LIMIT•NEW VALUE *N0 CHANGE PRESS ENTER* SCPL=^^;Q$
SBW=^';SBWIF Q$<>'"THEN SBW=VAL(Q$)
KBW=^;KBWIF Q$<>'^"THEN KBW=VAL(Q$)
SBH=';SBHIF QSO^'THEN SBH=VAL(Q$)
KBH= ••;KBH
IF QSO^'THEN KBH=VAL(Q$)U1=-;U1
IF QSO^^'^THEN U1=VAL(Q$)U2=^;U2
IF QSO^'^'THEN U2=VAL(Q$)(IN) BR='^;BR
IF Q$<> •••THEN BR=VAL(Q$)SCPL=^^;SCPL
:IF Q$<>^'^^THEN SCPL=VAL(Q
• KEEL PIER CAP PROPORTIONAL LIMIT KCPL=^^;KCPL•NEW VALUE *N0 CHANGE PRESS ENTER* KCPL=" ;Q$: IF Q$<>""THEN KCPL=VAL(Q
• TOTAL SIDE PIER CONTACT AREA (ONE SIDE) (IN-2) SAREA= ••; SAREA
•NEW VALUE *N0 CHANGE PRESS ENTER* SAREA=^' ;Q$: IF Q$<>^^^^THEN SAREA=VAL
• TOTAL KEEL PIER CONTACT AREA (IN*2) KAREA= ••; KAREA
•NEW VALUE *N0 CHANGE PRESS ENTER* KAREA=" ;Q$: IF Q$<>^-"THEN KAREA=VAL
• PERCENT CRITICAL DAMPING ZETA='^;ZETANEW VALUE *N0 CHANGE PRESS ENTER* ZETA=^' ;Q$: IF QJO^^^THEN ZETA=VAL(Q
• HULL NUMBER (XXXX) HULL=^;HULL•NEW VALUE *N0 CHANGE PRESS ENTER* HULL=" ;Q$: IF Q$<>^"THEN HULL=VAL(
• SYSTEM NUMBER (XXX) NSYS="^;NSYS•NEW VALUE *N0 CHANGE PRESS ENTER* NSYS=" ;Q$: IF Q$<>"^^THEN NSYS=VAL(Q
• CAP ANGLE (RAD) BETA=";BETANEW VALUE *N0 CHANGE PRESS ENTER* BETA=^' ;Q$: IF Q$<>^^"THEN BETA=VAL(Q
PRINT • SHIP NAME: ••.SHIPSINPUT ••NEW VALUE *N0 CHANGE PRESS ENTER*PRINT •• DISCRIPTION OF ISOLATORS IF USED:INPUT ••NEW VALUE *N0 CHANGE PRESS ENTER*PRINT •• DISCRIPTION OF BUILDUP: ••; BUILDSINPUT ••NEW VALUE *N0 CHANGE PRESS ENTER*
SHIP$=^^;QS:IF QSO^^^THEN SHIPS=QS••; ISOSISO$=^;Q$:IF QS<>'"THEN ISO$=Q$
BUILDS=^^;Q$:IF QS<>'"THEN BUILDS=
•; WALESWALES=^;QS:IF QSO^'^THEN WALES=Q$
DAMPS=^";QS: IF Q$<>^; DOCKS
DOCKS=";QS:IF QS<>"
THEN DAMPS =Q$
••THEN DOCKS=Q$
PRINT DISCRIPTION OF WALE SHORES USED:INPUT NEW VALUE *N0 CHANGE PRESS ENTER*PRINT •• DISCRIPTION OF DAMPING: '•; DAMPSINPUT ••NEW VALUE *N0 CHANGE PRESS ENTER*PRINT •• LOCATION OF DRYDOCK BEING STUDIED:INPUT •NEW VALUE *N0 CHANGE PRESS ENTER*PRINT NAVSEA DOCKING DRAWING NUMBER: ; SEASINPUT •NEW VALUE *N0 CHANGE PRESS ENTER* SEA$ = ^^ ;QS: IF QS<>""THEN SEAS=Q$PRINT •• REFERENCE SPREADSHEET STIFFNESS CALC FILE NAME: •^iSTIFS
INPUT •NEW VALUE *N0 CHANGE PRESS ENTER* STIF$='^ ;Q$ : IF QSo'^^THEN STIFS=Q$PRINT •• MISC. COMMENTS: •;COMMSINPUT ••NEW VALUE *N0 CHANGE PRESS ENTER* COMMS=^^ ;QS: IF QSO^^^^THEN COMMS=Q$RETURN
, «4c4.^««^^«4;4.^4,^^«:^^:,c«:^«4:^4c**«»««»«****«*«*««««*«****************«*****«**
214
APPENDIX 3
1
.
Typical Accelerogram Header2. Layout Sheet for l/SS Lea/jy
Long Beach Dry Dock # 33. Z(?<5y^/' Horizontal and Vertical
Stiffness Spreadsheets4. System 1-11 and l/SS Lea/}y
Stiffness Table5. Z<e<5/'^XEL, OD/ KU , and KD Values
for Bilinear Douglas Fir Caps6. Rotational Moment of Inertia
Calculation for l/SS Lea/iy7. "SDOFRUB" USS LeaAy IxvpxiX Data File8. Lea/jy Zo.'p Angle Regression Analysis9. "3D0FRUB" USS Lea/)^ OmX^mX File
215

I
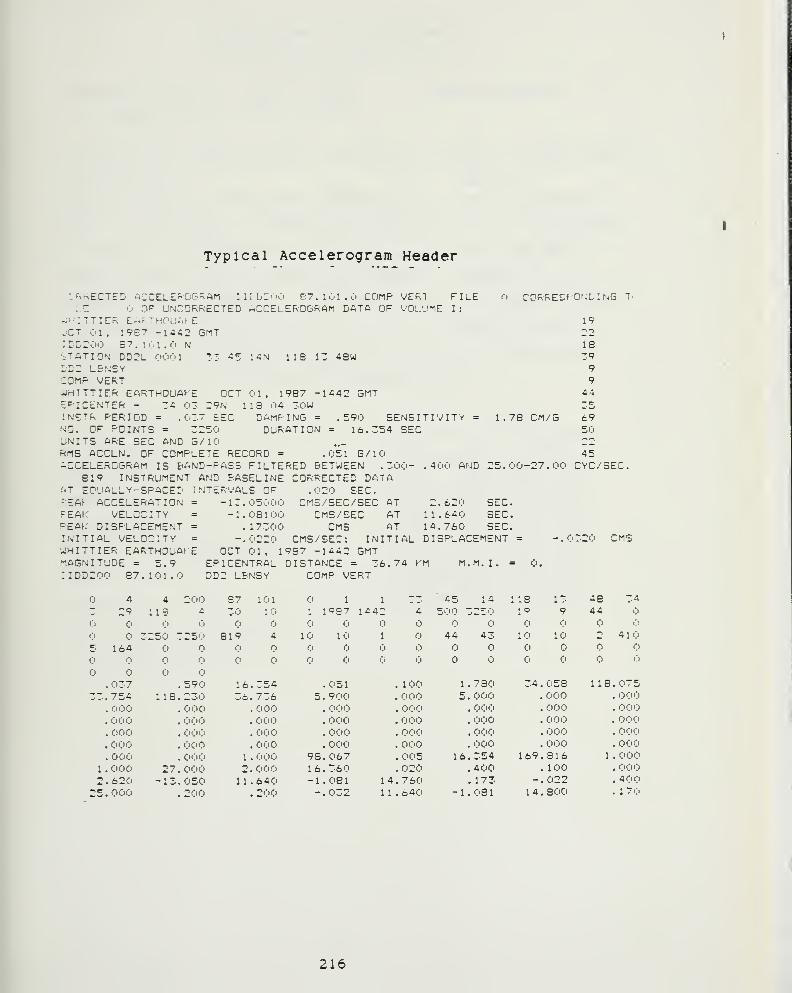
Typical Accelerogram Header
ACCELEf=>OPP;«^M lULCOO £7.101.0 COMP VERT FILEOF UNCORRECTED ACCELEROGRAM DATA OF VOL.'JME I :
14N 11 B 13 48W
. JRRECTED''..1
--ilTTIER EMF.THPL!Hr EjCT 01. 1987 -1442 GMT:DD200 87. 101.0 NI "NATION DD2L 0001 33 45
COMP VERT^HITTIER EARTHQUAKE OCTFF-ICEWTER - 34 03 29N1N?;TR PERIOD = .037 £ECHd. OF POINTS = 3250UNITS ARE SEC AND G/10 .^RMS ACCLN. OF COMPLETE RECORD = .051 G/10ACCELEROGRAM IS BAND-PASS FILTERED BETWEEN .300-
819 INSTRUMENT AND BASELINE CORRECTED DATAAT EOUALLY-SPACED INTERVALS OF
il. 19B7118 '|4 30WDAMPING =
DURATION =
1442 GMT
. 59016.3:
CORREEPONLING T.
19
183999.
44
SENSITIVITY4 SEC
1 .78 CM/G
400 AND 25.00-27.00
-EM ACCELERATION =
PEAK VELOCITYPEAK DISPLACEMENT =
INITIAL VELOCITY =
UJHITTIER EARTHOUAt EMAGNITUDE = 5.9: IDD200 87. 101.0
. i;i20 EEC.-13.05000 CMS /SEC /SEC AT-1.08100 CMS/ EEC AT
.17300 CMS AT-.0220 CMS/SEC: INITIAL
OCT 01, 1937 -1442 GMTEP I CENTRAL DISTANCE = 36.74 KMDD2 LBNSY COMP VERT
2.620 SEC.11.640 SEC.14.760 SEC.DISPLACEMENT =
M.M.I. =
69502245
CYC/SEC.
-.0320 CMS
4 4 200 S7 101 1 1 73 "
^,5 14 113 I— 48 ~a
— 29 119 a. 30 10 1 1987 1442 4 5'JO 325ij 19 9 44C) C) (j i;) (j
3250 :250 819 4 10 10 1 44 43 10 10 o 4 1
cr 164 f)
C) n
037 590 16 354 .051 . 100 1 . 780 34 058 lis .07533 754 118 230 36 736 5 . 900 . 'j'!>'li 5 . 0C)0 000 . 0':)0
O'JO OOC) 000 . O'i'O . 000 . OC'O 000 . o<:)0
O'ji') C>00 000 . C'lJO . 000 . 000 000 . 000000 ''>00 000 . 000 . 000 . 000 000 . 000000 000 000 . 000 . 000 . 000 000 . 000000 . 000 1 OO'J 93 .067 . 005 16.354 169 ,816 1 . 000
1 000 27 000 2 000 16 . 360 . 020 .400 100 . 0002 620 -13 . 050 11 640 -1 .081 14 .760 . 173 - .022 . 400
25 000 200 200 - .032 11 . 640 - 1 . 08
1
14 . 800 . 170
216
I
I
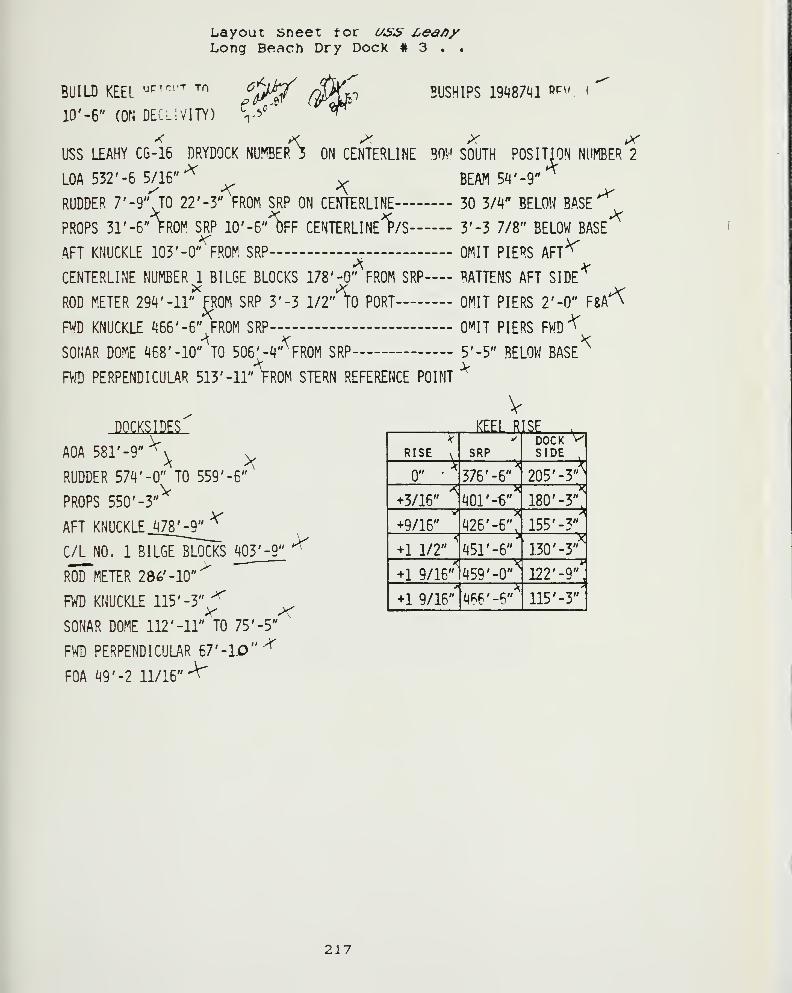
Layout sneet for uss Lea/iyLong Beach Dry Dock # 3 . .
BUILD KEEL'^''^""^ "^^
10'-6" (ON DEClIVITY)'^/^^ BUSHIPS 19^87^^! R^^' '
USS LEAHY C6-16 DRYDOCK NU^ER3 ON CENTERLINE BOV SOUTH POSITION NUMBER 2
LOA 532'-6 5/16"*^^ BEAM 5^' -9"
RUDDER 7'-9"J0 22'-3" FROM SRP ON CENTERLINE 30 3/^" BELOW BASE"^
PROPS 31'-6" FROM SRP 10'-6"^FF CENTERLINeI'/S 3'-3 7/8" BELOW BASE
AFT KNUCKLE 103'-0" FROM SRP - — - OMIT PIERS AFT^
CENTERLINE NUMBER 1 BILGE BLOCKS 178'-0" FROM SRP—- BATTENS AFT SIDE*^
ROD METER 29^'-ll'^FR0M SRP 3'-3 I/2A0 PORT OMIT PIERS 2'-0" F&A"^
FWD KNUCKLE i|65'-5" FROM SRP O^IT PIERS FWD '^
SONAR DOME 468'-10" TO 506'-4"'^FR0M SRP - 5'-5" BELOW BASE^
FV/D PERPENDICULAR 513'-11" FROM STERN REFERENCE POINT^
DOCKS IDES
AOA 581' -9" ^\ .
RUDDER 574 '-0" TO 559 '-6"
PROPS 550 '-3"^
AFT KNUCKLE 478 ' -9"^
C/L NO. 1 BILGE BLOCKS 403
ROD METER 286'-10"^
F^ KNUCKLE 115 ' -3" '^ ^SONAR DOME 112'-11" TO 75'-5"
'
FWD PERPENDICULAR 67'-1.0"^
FOA 49 '-2 11/16'"^
'_Q" *^
RISE
0"\
+3/16"^
+9/16"
+1 1/2"
+1 9/16"
+1 9/16"
VKFFl RISE
SRP
376 '-6"'^
401' -6"
426 '-6",
451'-6"
459 '-0"^
4P6'-6"
dock"^SIDE
205'-31^
180' -3",
155 '-3"
130 '-3"
122 '-9"
115 '-3"
217
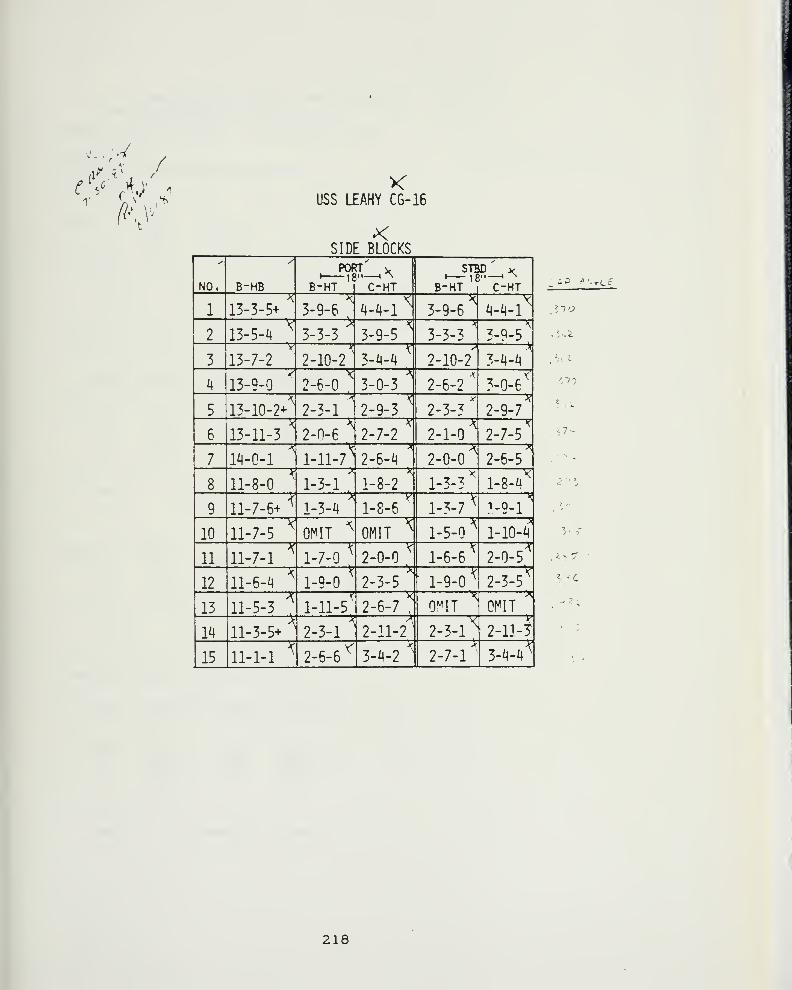
•Y/
10
11
12
13
ii15
USS LEAHY C6-16
KSIDE BLOCKS
NO. B-HB B-HT
PORT18'
13-3-5+
13-5-i]
^ 3-9-6^
13-7-2-V-
3-3-3-y
2-10-2
13-9-0 2-6-0"<
13-10-2+\
13-11-3
^ 2-3-1
-^
2-n-67
W-0-1^
1-11-7:^
11-8-0
11-7-6+r1-3-1
1-3-^^
"^'
11-7-5^"
Or^IT\
11-7-1
'^"
1-7-0
ll-6-i< 1-9-0
11-5-3^
11-3-5+
11-1-1
^ 1-11-5T
2-3-1
2-6-6Y
\C-HT
4-^-1X
3-9-5
3-4-4
3-0-3^
2-9-3
2-7-2
2-6-4
1-8-2
1-8-6
OMIT^
2-0-0T
2-3-5
2-6-7:^
2-11-2
3-4-2^
B-HT
STBD18'
3-9-6^
3-3-3
2-10-2
2-6-2
2-3-3
2-1-0-K
2-0-0^
|_7_7
1-3-7
1-5-0
1-6-6
1-9-0
O^IT-X'
2-3-1
2-7-1
X-
C-HT
4-4-1^
3-9-5
3-4-4
3-0-6?
2-9-7T?
2-7-5
2-6-5
1-8-iJ"K
1-9-1
1-10-4
2-0-5"^'
2-3-5^
2-11-^
3-4-4^
5- r
218

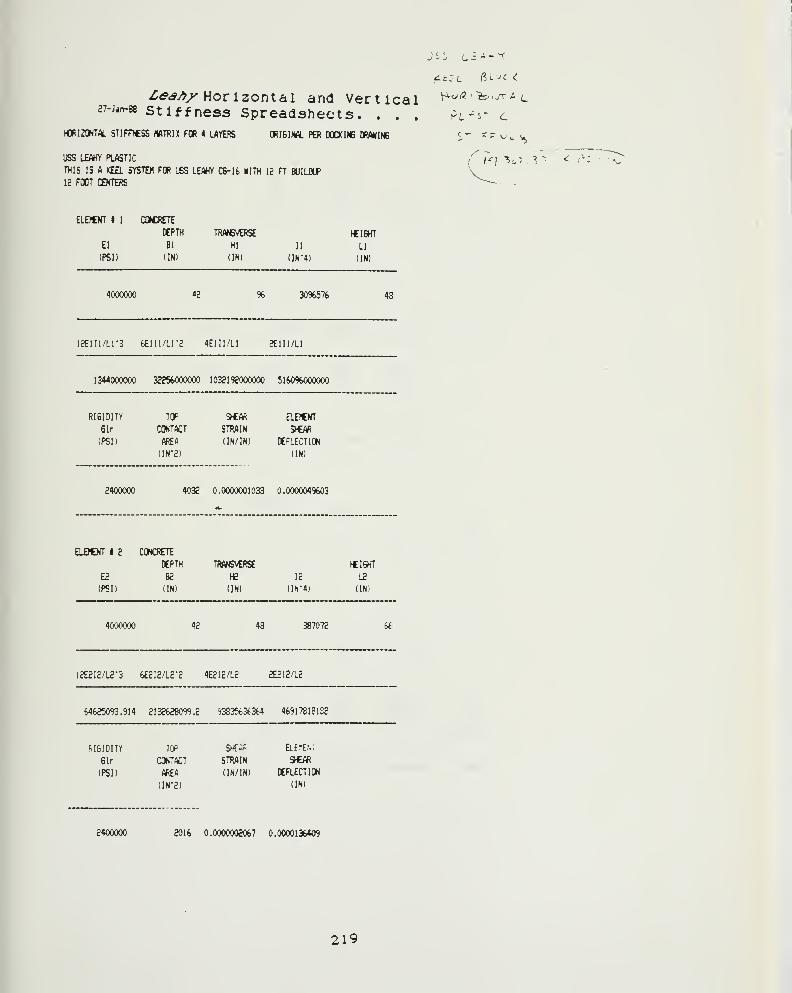
Zd»«*y»/' Horizontal and Vertical27-jif»-88 stiffness Spreadsheets. . . .
HORIZONTAL STIFftCSS HflTRIX FOR 4 WYERS ORIGIfW. PER DOCKINB DRAHINE
USS LEAHY PLASTIC
THIS IS A KEEL SYSTEM FOR USS LEWY C6-I6 WITH 12 FT BUILDUP
12 FOOT CENTERS
Jil Li--^
K^ (5 ' "it, , yr A ^
NT 1 1 COttfiETE
[€PTH TRW6VERSE tCISHT
El Bl HI 11 LI
(PSD (IN) (IN) (IN"4) (IN)
4000000 42 % 30%576 48
12E1I1/Lr3 6£1II/Lr2 4E1II/L1 2E1I1/L1
1344000000 32256000000 1032192000000 5160%000000
RI6IDITY TOP SfCAR' ELP€NT
6lr (3)NTflCT STRAIN S>€/«
(PSD AREA (IN/IN) DEFLECTION
(IN-2) (IN)
2400000 4032 0.0000001033 0.000004%03
ELEItNT t 2 CONCHtlt
DEPTH TRM6VERSE tCISHT
E2 B2 H2 12 L2
(PSD (IN) (IN) (IN-4) (INI
4000000 42 48 387072
12E2I2/L2-3 6E2I2/L2-2 4E2I2/L2 2E2I2/L2
64625093.914 213K^8099.2 93835t.3t.364 469178181S2
RIGIDITY TOP SKE-f ELEriE'..
Bir CONTACT STRAIN S>€Afi
(PSD MtEA (IN/IN) DEFLECTION
(IN'2) (IN)
2400000 2016 0.0000002067 0.0000136409
219

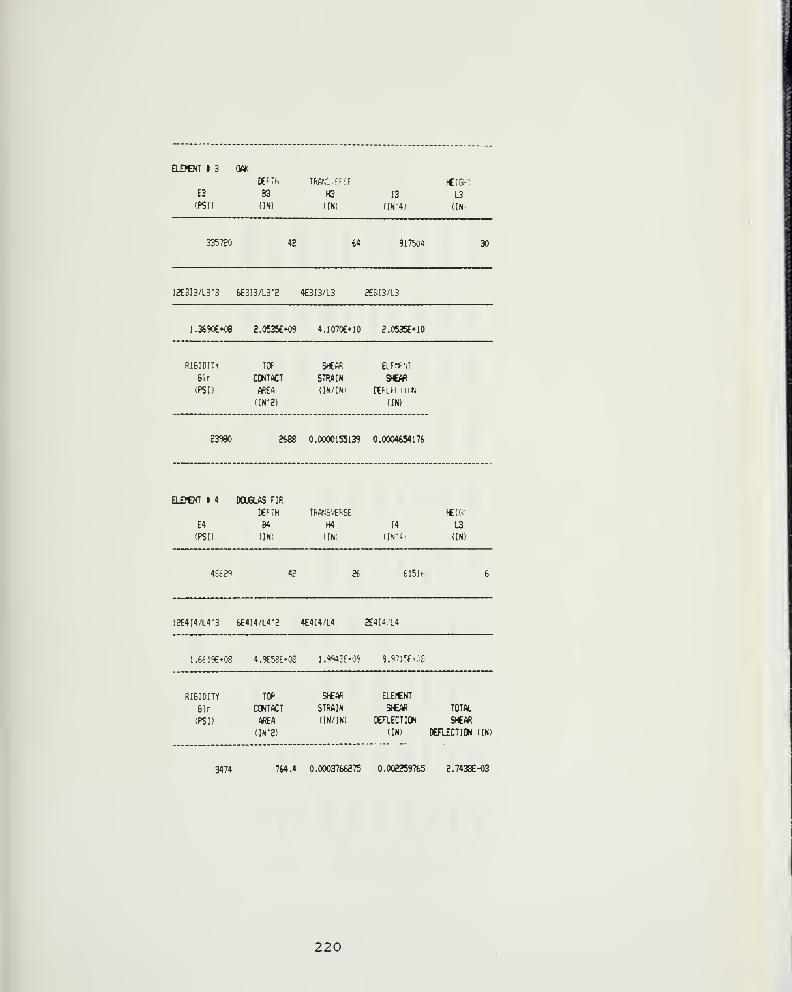
ELDWT t 3 mDEfTh T(<Af.~:-ff':f ICIGl-'-
£3 B3 H3 13 L3
(PSD (IN) (INI (INI) (IN'
3357?0 42 64 917W4 30
12E313/L3-3 6£3I3/L3'2 4E3I3/L3 2ESI3/L3
1.3690e*O8 2.0535E+<« 4.107OE+10 5.0535E+10
RISIDITr
61r
(PSD
TOf SHEAR ELF-5M
CONTACT STTWIN 9C/W
(Kd (IN/IN) DEFiHiii'iN
(IN-2) (IN)
23980 2688 0.0000155139 0.0004654176
ELE)€NT I 4 OOJGLAS FIR
KfTH TRAf;S'^F>-SE
E4 B4 H4
(PSD (IN) (INI
HE!f^
14 L3
(IN-J (IN
Hii-?< 42 26 615lr.
12E4I4/L4-3 6£4I4/La"2 4E4I4/L4 2E4IH.L4
l.«19Et08 4,9858E 'OS l.*=t4iE -09 9.171'f' .'£
RIGIDITY TIDP SHEAR ELErCNT
Glr CONTACT STRAIN 9£M^ TOTAL
(PSD AREA (IN/IN) XRECTION S*(«
(IN-2) (IN) DEFLECTION (IN)
3474 764.4 0.0003766275 0.002259765 2.7438E-03
220

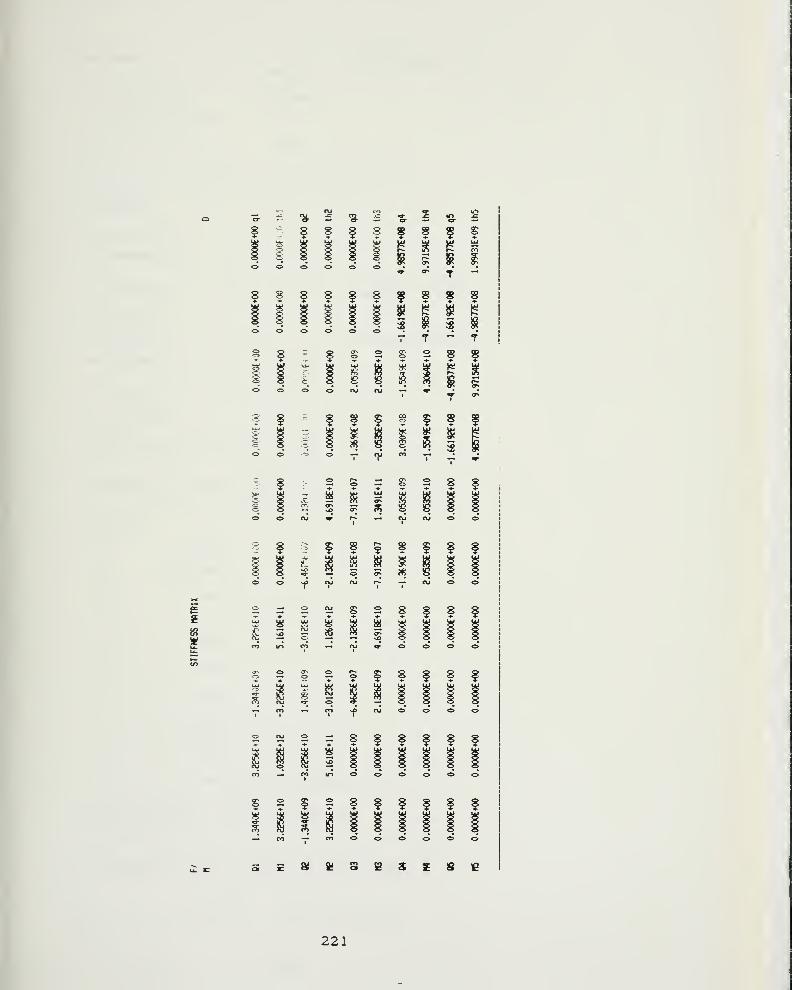
&*- ex*- o--^ o"'— w*^f'fffffffff' '^ • • • .gRa^Sa^
tf. <JN «- ^^
fffffffSfSoooooo-—• « — w
I I I
§8 = 8S2S288ooo<ocuoj — ^ • •
o^—^ — cum.—
2 8 r 2 S = S 2 8 8
II It2 = £:2S2S^8f
£2S2S§8f8fS!CSbiaS8888— m — mN^oj^^oo2S!2z:8fffff
I
S2f28ff|f|
221

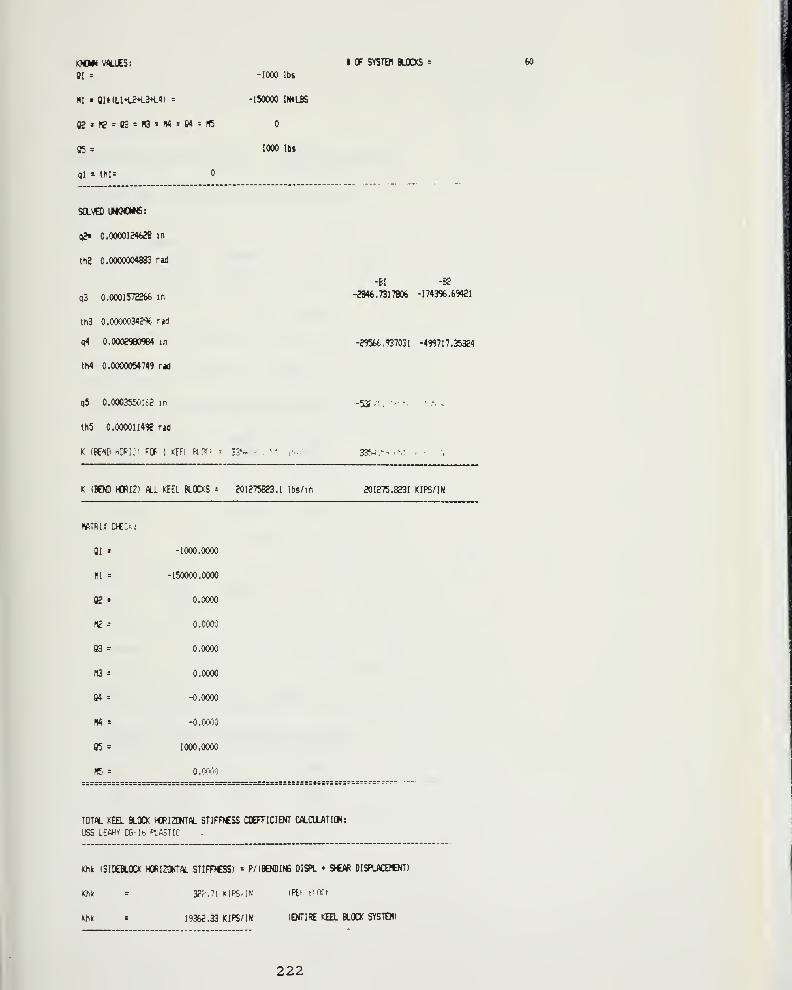
KMMN VM.UE5:
Ql s -1000 lbs
HI = Qli(Ll*t2*C3*l4) = -150000 IWLBS
K = rC = e3 = «3 = M = M = «5
05 s 1000 lbs
ql = thl=
I OF SYSTD1 BLOCKS = 60
SOLVED UNOOMS:
q2= 0.0000124628 in
th2 0.0000004883 rad
q3 0.0001572266 in
th3 0.00000342S(. rad
q4 0.0002960984 m
th4 0.0000054749 rad
-Bl -B2
-2846.7317806 -1743%.69421
-29566.937031 -499717.35324
q5 0.0003550]c.2 in
th5 0.000011492 nO
K (BEND mi:-' FOfv 1 KEFl ftf?'
-53f,;. -
33S .'-'•v'.''
K (BEND HDR12) W.L <EEL BLOCKS = 201275823.1 Ibs/in 201275.8231 KIPS/IN
PWTRIK CHECK:
Ql - -1000.0000
HI = -150000.0000
02 = 0.0000
H2 = 0.0000
03 = 0.0000
H3 = 0.0000
04 z -0.0000
m = -0.0000
05 = 1000.0000
H5 = 0.i>v,i)
TOTAL KEH. BLOCK HORIZONTW. STIFFJCSS COEFFICIENT CflLOJLATION:
USS LEW^v CG It. frASTIC
Khk (SIDEBLOCK HORIZOKT*. STIFFfCSS) = P/ (BENDING DISPL SJCAfi DISPLflC£?€NT)
Khk = 32f .71 KIPE..1N (Pti- r riff
Khk - 19362.33 KIPS/IN (ENTIRE KEEL BLOCK SYSTEM)
222

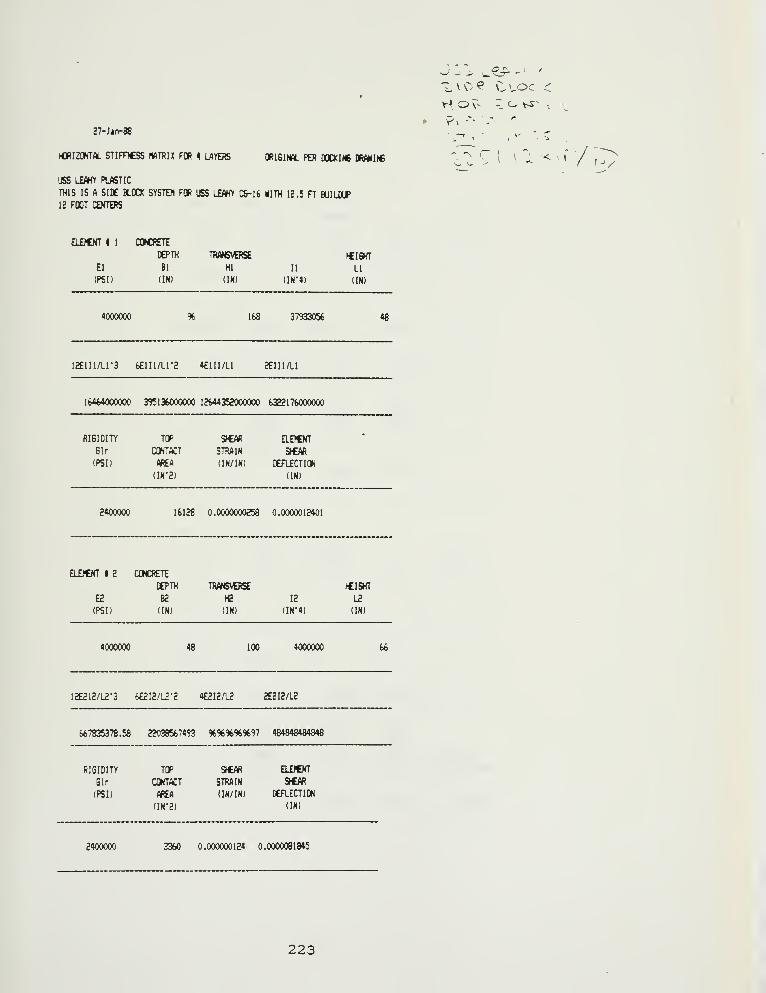
27-J*ft-88
HORIZONTAL STIFRCSS flATRU FOR 4 LAYERS ORIGINAL PER DOCKINE ORAHI«
USS LEAHY PLASTIC
THIS IS A SIDE BLOOC SYSTEM POR USS LE^WY C6-16 KITH 12.5 FT BUILDUP
IE FOOT CENTERS
ELDtNT 1 1
El
(PSD
CONCRETE
DEPTH
Bl
(IN)
TRANSVtRSt
HI
(IN)
It
(IN*4)
SIGHT
LI
(IN)
4000000 % 168 37933056 48
12£lIl/Lr3 6£1I1/Lr2 4E1I1/L1 2E1I1/L1
lb464000000 395136000000 12644352000000 63??1 76000000
RI6IDITY
Gir
(PSD
TOP
CONTACT
MSA(IN-2)
STRAIN
(IN/IN)
ELEJCNT
DEFLECTION
(IN)
•
• Vi
\ 1 '< n /;:
2400000 16128 0.0000000258 0.0000012401
ELflCNT I 2 CONCRETE
DEPTX TRM6VOSE
E2 B2 H2
(PSD (IN) (IN)
tCIGHT
12 L2
(IN-4> (IN)
4000000 48 100 4000000 66
12E2I2/L2-3 6E2I2/L2-2 4E2I2/L2 2E2I2/L2
667835378.58 22038567493 %%%%%97 484848484848
RIGIDITY TOP SfCAR ELEFCNT
Sir CONTACT STRAIN S«Afi
(PSD («£A (IN/IN) DEFLECTION
(IN-2) (IN)
2400000 3360 0.000000124 0.0000061845
223
i
1
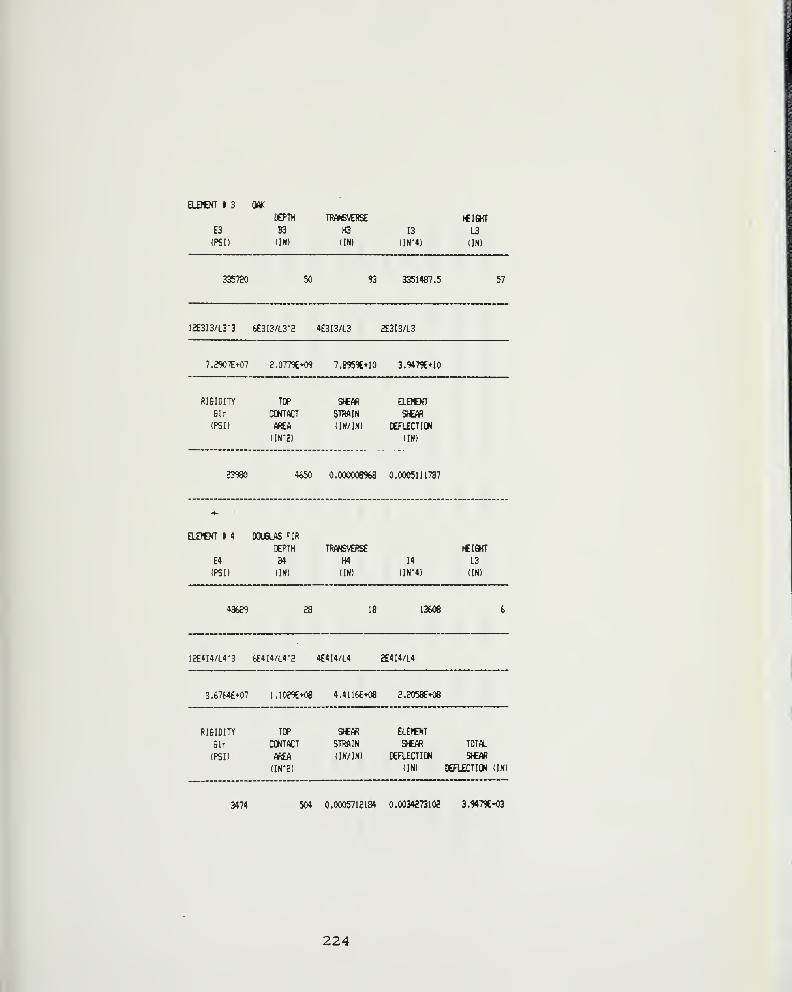
ELDBfT I 3 mE3
(PSI)
DEPTH TRflNSVERSE
B3 K3
(IN) (IN)
«IGHT
13 L3
(IN-4) (IN)
335750 50 93 3351487.5 57
iaE3I3/L3-3 6£3I3/L3*2 4E3I3/L3 2E3I3/L3
7.2907E+07 2.077SE+09 7.8959E+10 3.947%+10
RIGIDITY TOP S>€Wi ELEICfT
Sir OXTflCT STRAIN S»C/«
(PSI) WO (IN/IN) DEFLECTION
(IN-2) (IN)
23980 4650 0.000008968 0.0005111787
ELDtNT I 4 DOUGLAS TIR
ttPTH TWWSVERSE
E4 B4 H4
(PSI) (IN) (IN)
«IGHT
14 L3
(IN*4) (IN)
48629 28 13608
12E4I4/L4-3 6E4I4/L4-2 4E4I4/L4 2E4I4/1.4
3.6764E+07 1.1029e+O8 4.4116E+08 2.2058E+08
RIGIDITY TOP
Glr COiTfCl
(PSI) CKA
(IN'2)
Stew? aotNTSTRAIN S»€Afi TOTW.
(IN/ IN) DEFLECTION Si€ff(
(IN) DEFLECTION (IN)
3474 504 0.0005712184 0.0034273102 3.9479E-03
224
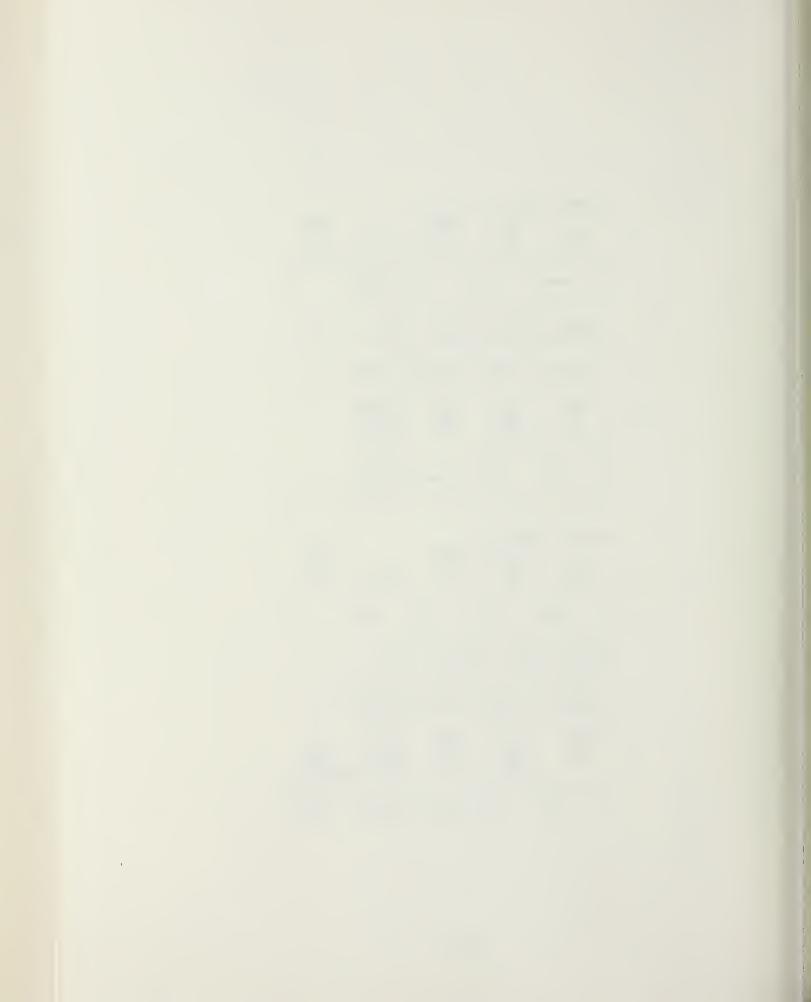
i
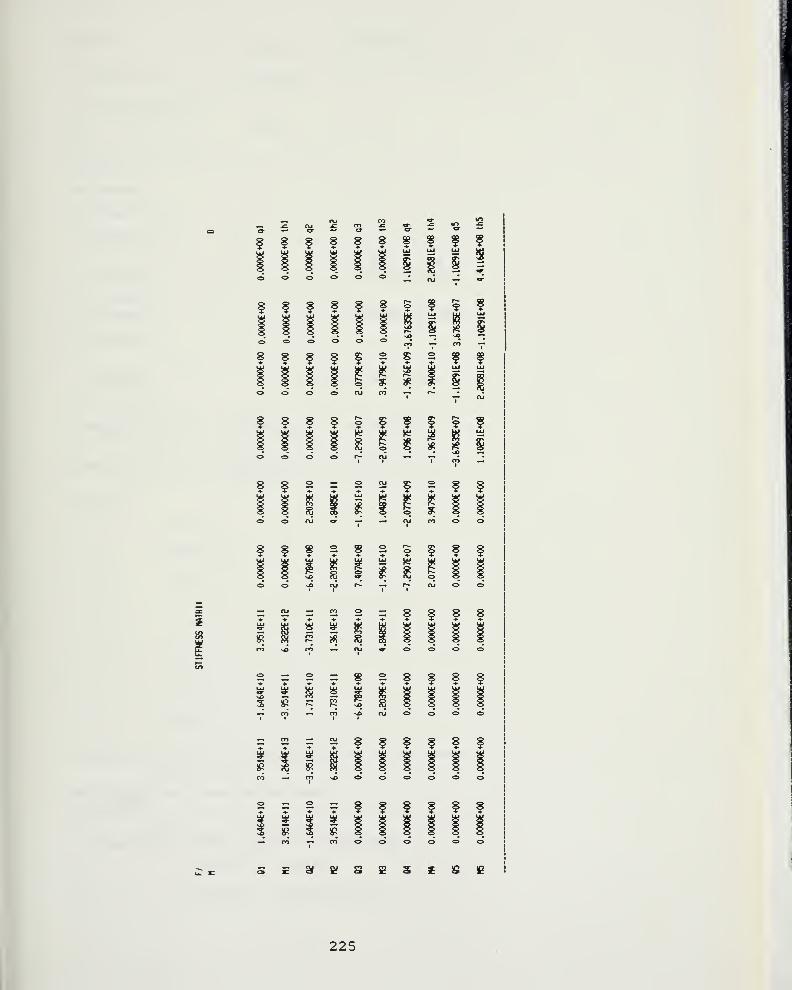
§ 8 f 8cr —8 8
- O- —S 8
•a M
o -o ^ o o o -^ cu -^
? f f f f f
o o
8 8
o o
f f S 2
? 8
fT> —
•
S 2
^ <^ <^ ^ cu m
I ICO —
•
— nj I
fff^Sfff^f<z> ^ o o OJ -" —
O ^ O — ^ CVI
f f V T V V
^ 1
^ 2
o <h
f f
—. — fxj m ^ o
f f
? I
8 2
^ 2?
iff^<0'^ojr— — r*-nj^o
2
£S
<-• ru -^ m O -^
en ,^
8 yi ^S
f f 8 8
cn — cu«»-oc^^^o — o —
3 !P
2 8 f 8 f^
-* m -^ nj ^ ^ ^ ^
= a!|8f88f^ i ^
TTTTlfffff<z> <2> <:><=> <=>
S£aiSjSeS2!S!£
225

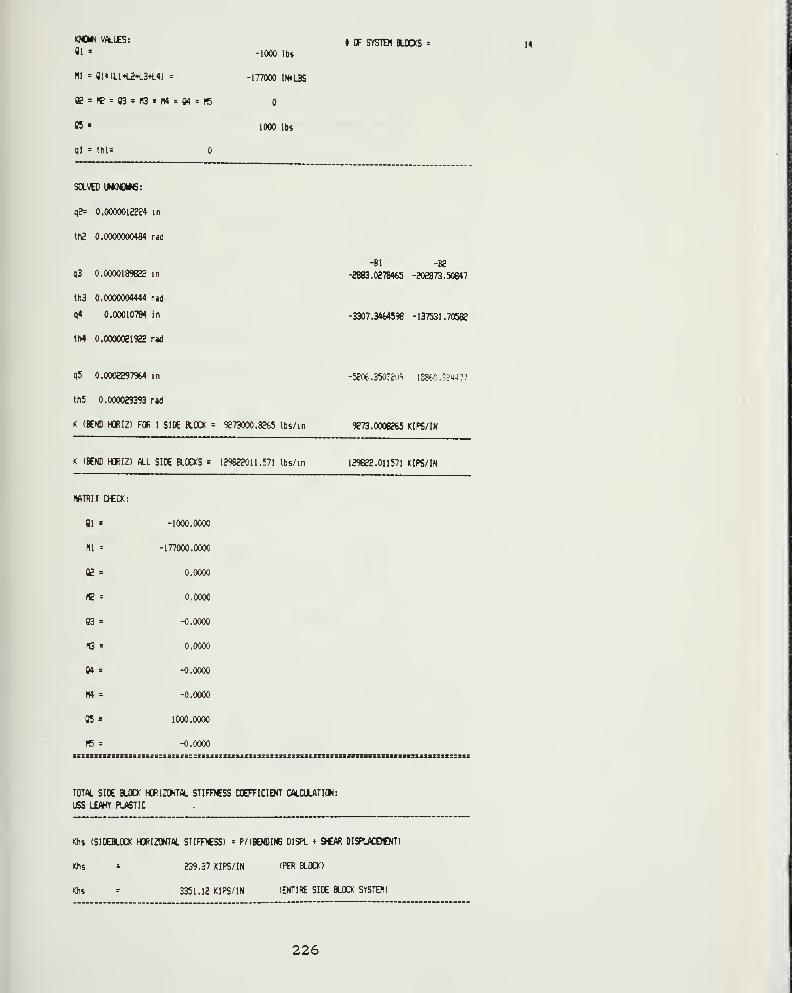
KMMN VM.UE5:
81 = -1000 lbs
ni = 0U(L1+L2-H.3*t4) = -177000 IMiLBS
aS = W = 03 = H3 = n4 = M = fC
05 = 1000 lbs
ql = thl=
I OF SYSTEM BLXKS = 14
SOLVED UMQOMS:
q?= 0.0000012224 in
th2 0.0000000484 rad
q3 0.0000189622 in
(h3 0.0000004444 rad
q4 0.00010784 in
th4 0.0O0OOE1922 rad
-Bi -re
-2883.0278465 -202873.50847
-3307.3464598 -137531.70582
q5 0.0OOS297%4 in
th5 0.000029393 rad
K (BEW) HORIZ) FOR 1 SIDE ROOt = 9273000.8265 Ibs/in
-52«..350?20«i lS«.(i. ;£*!??
9273.0008265 KIPS/IN
K (BEND HORIZ) ALL SIDE BLOCKS = 129822011.571 Ibs/in 129822.011571 KIPS/IN
HftTRIX OCCK:
Ql = -1000.0000
HI = -177000.0000
QE = 0.0000
« = 0.0000
03 = -0.0000
K3 = 0.0000
04 = -0.0000
n4 = -0.0000
05 = 1000.0000
«5 = -0.0000
Wa. SIDE BLOCK HORIZONTW. STIFFJCSS COEFFICIENT C«.aiATION:
USS LEAHY PLASTIC
Khs (SIDEBLOCK HORIZONTtt. STIFPCSS) = P/(BEM)INB DISa + XfiK DISPLACOtNT)
Khs = 239.37 KIPS/IN (PER BLOCK)
Khs = 3351.12 KIPS/ IN (ENTIRE SIDE BLOCK SYSTEM)
226
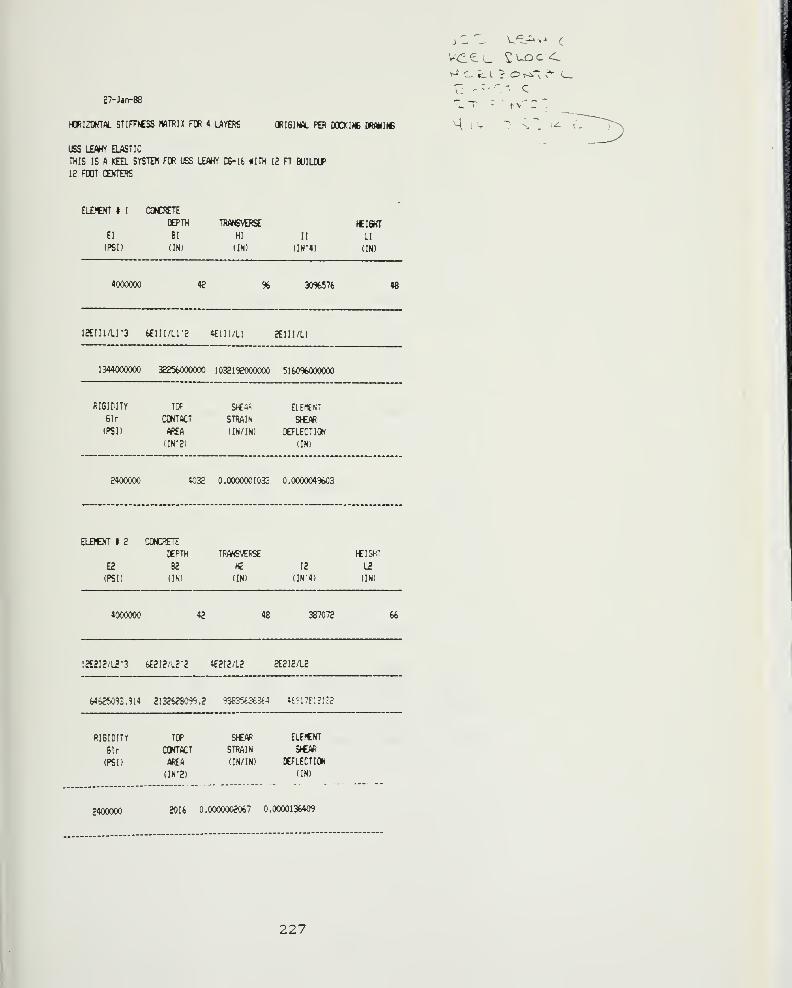
27-Jatv-88
HDRIZOMTW. STIFffCSS NATRIX FOR « LAYERS ORISIIW. m DOtXINB DRAHIN6
USS LEAHY ELASTIC
THIS IS fl KEE SYSTEM FOR USS LEAHY C&-16 KITK 1£ n ftJlLIiP
12 FOOT CENTERS
ELE>CNT I 1 CONCRETE
DEPTH TRANSVERSE
El Bl HI
(PSD (IN) (IN)
fCIGHT
II LI
(IN*4) (IN)
4(X)0000 42 % 30%576 48
12£lIl/Lr3 6E1I1/L1-2 4E1I1/L1 2E1II/L1
1344000000 32256000000 1032192000000 51W%000000
RIGIDITY TOf
Sir CONTACT
(PSD MSA(IN-2)
SHE« ElEflENT
STRAIN SHEAR
(IN/IN) DEFLECTION
(IN)
2400000 4032 0.OOOOO01033 O.000004%03
ELBtNT t 2 CONCRETE
DEPTH TR«6VERS£ «I(3HT
ES B2 H2 12 L£
(PSD (IN) (IN) (IN-4) (IN)
4000000 42 48 387072 66
12E2I2/L2*3 6E2I2/L2-2 4E2I2/L2 2E2I2/L2
646^5093.914 2132628099.2 13SrA3t3iA 4t^I7fl?i::?
RIGIDITY TOP SJC/V< ELEfCNT
Sir CONTACT STRAIN SJCAR
(PSD (W£A (IN/IN) DEFLECTION
(IN-2) (IN)
2400000 2016 0.0000002067 0. 0000136409
227

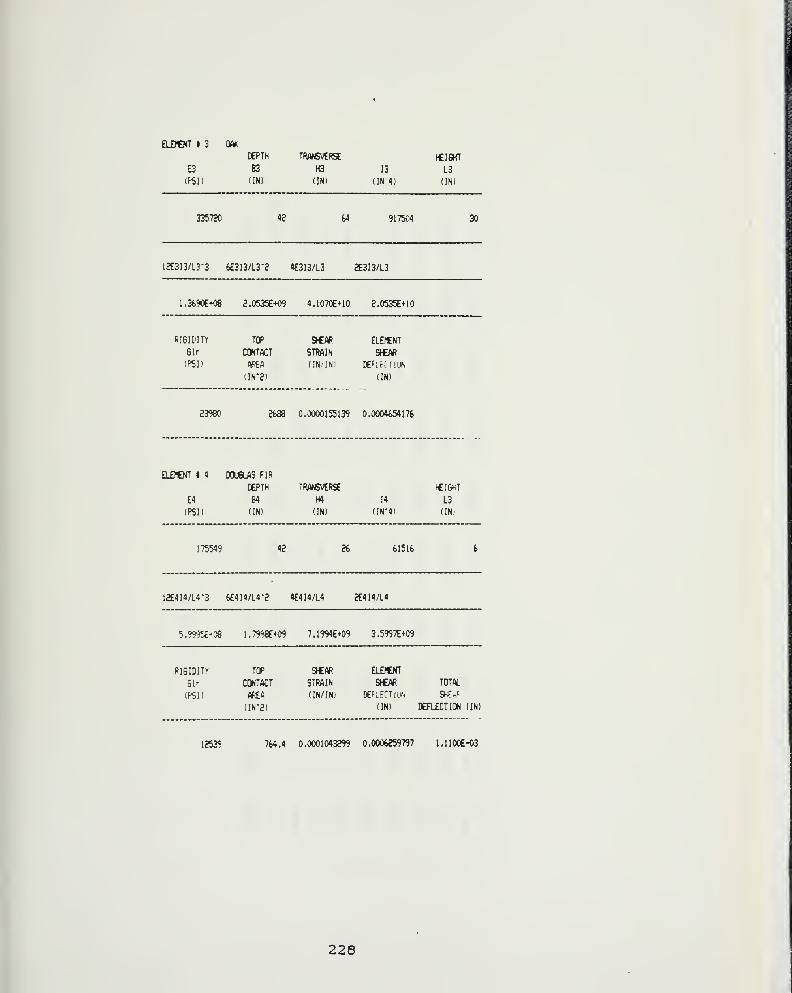
EL£?tNT t 3 mOEPTH TRANSVERSE tCIGHT
E3 B3 H3 13 L3
(PSD (IN) (IN) (IN H) (IN)
335720 12 (A 917501 30
12E3I3/LP-3 6E3I3/L3-2 4E3I3/L3 2E3I3/L3
1.3690E+08 2.0535E+O9 4.1070e*10 2.0535E+10
RIGIDITY TOP Sf€/« ELEMENT
6lr (HDNTACT STRAIN St€M(PSD («fl (IN/INI DEFiKdLIN
(IN"2) (IN)
23980 2688 0.0000155139 0.0004654176
ELDOT » 4 IXXieLAS PIR
OEPTH TR/*6VERS£
E4 B4 H4
(PSD (IN) (IN)
^C16^.T
14 L3
(IN-4) (IN)
175549 42 26 61516 6
12E4I4/L4-3 6E4I4/L4-2 4E4I4/L4 2E4I4/L4
5.99^*08 1.7998E+09 7.1994E+09 3.5997E*09
RIGIDITY TOP SfCM? ELEJtKT
Sir OINTACT STRAIN S€m TOT*.
(PSD («£A (IN/IN) DEF.FCTllif. SHf-t
(IN-2) (IN) DEFLfCTIQN (IN)
12539 764.4 0.0001043299 0.0006259797 l.llOOE-03
228
I
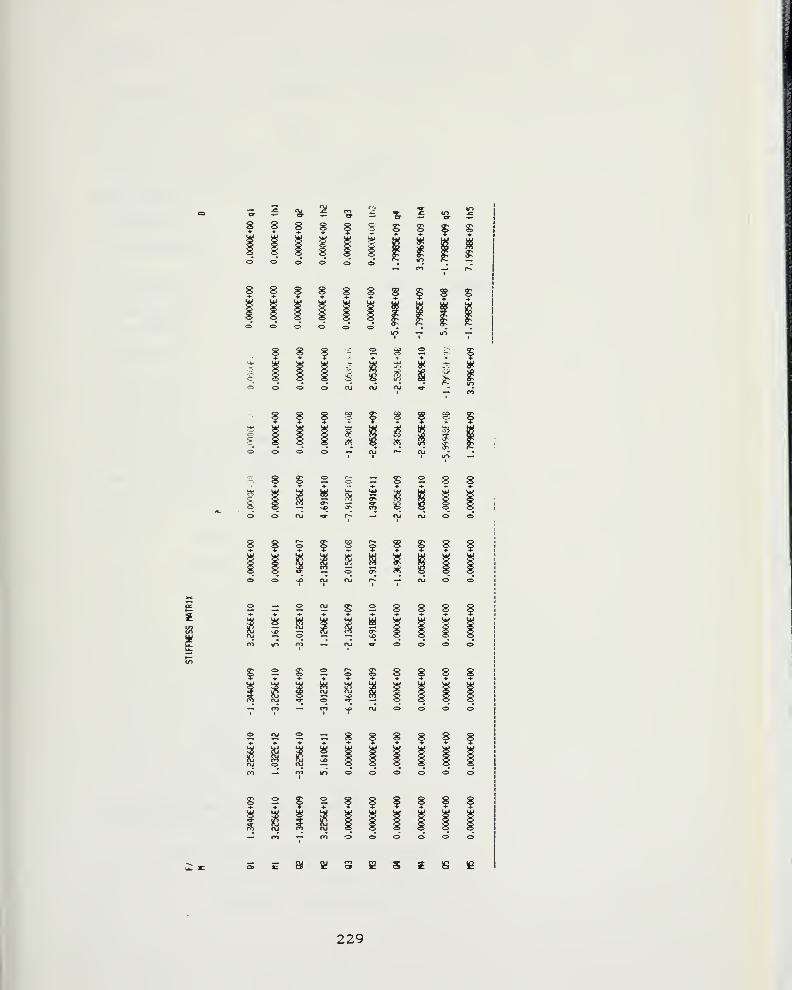
s
fffff§i|?f— m -^ r^
t
fffffffffslO — lO -«
I I I
8 8 8 -" 2 8 2 ^ Sr J? 5 5 -" C '^' ^ -•" ^s 8 g 8 6 s u^ a y ^O'^<^<::>ajojoj«'
- 8 8 f g ^ S ^ g f
<i>^<3o-^c\jr*-ojII t \r> -^^
:=. 8 S 2 £ = S 2 8 8
oofu^r-—ojnj<3>offSfg^Sflf
S2S2S|;8S88— m — m-xtnjocjooII II
2i!2=;8888ffI
S2|28ff8f8
229
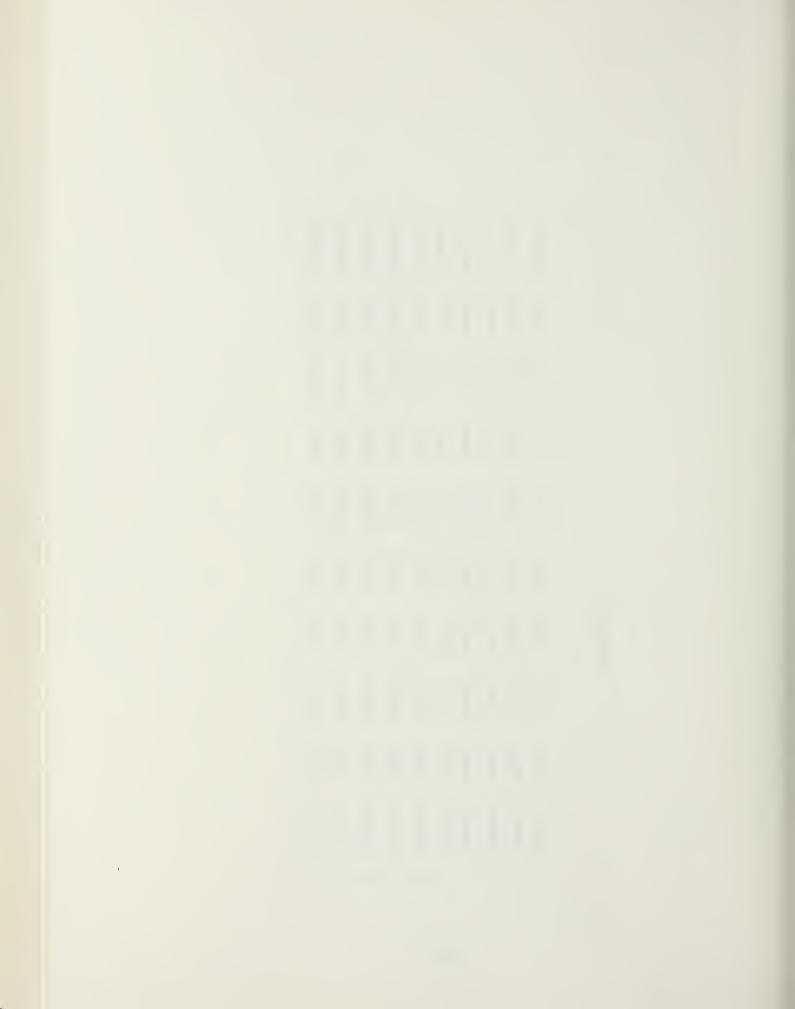
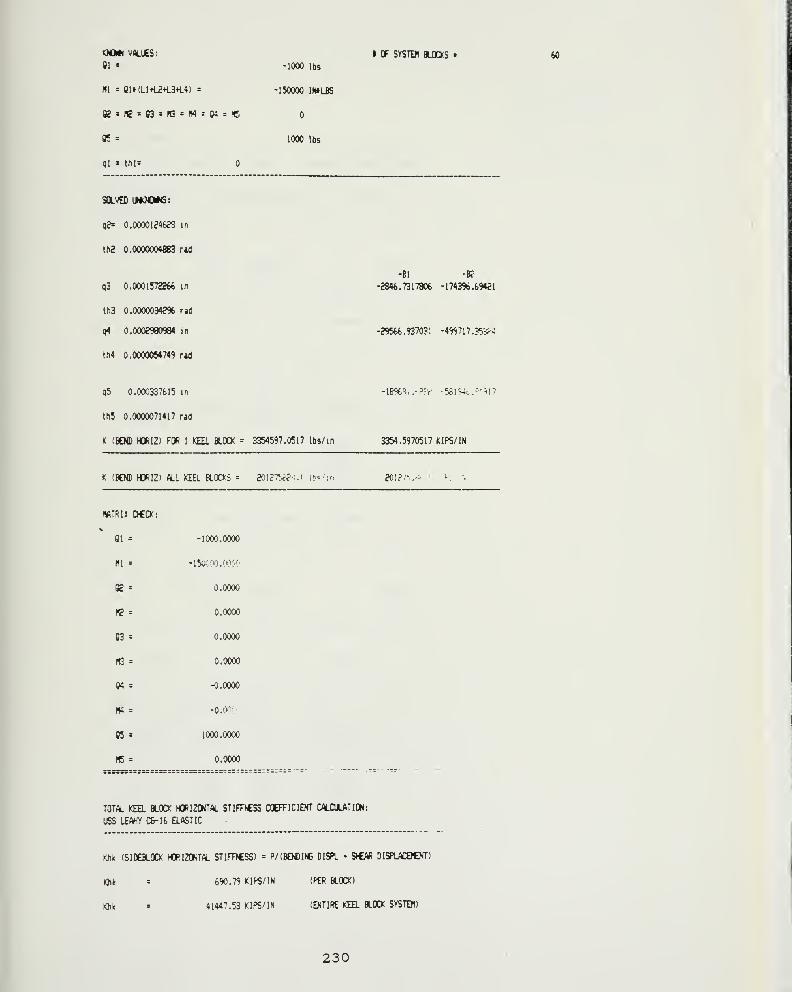
KNOMN VALUES:
Ql =
HI = 81t(Ll+L2+l3*i4) =
Q£ = K = 03 = R3 = M = MrH5
05 =
ql - thl=
SOLVED IMOONNS:
qe= 0.0000124b?8 in
th2 0.0000004883 rad
q3 0.0001572266 in
th3 0.00000342% rid
q4 0.000?5e0984 in
th4 0.0000054749 raJ
I OF SYSTD1 BLOXS * 60
-1000 lbs
-150000 INtLBS
1000 lbs
-Bl -K-2846.7317806 -174396.69421
-29566.937031 -49971 7. S^S--!
q5 0.000337615 in
th5 0.0000071417 rad
K (BEND HORIZ) FOR 1 KEEL BLOCX = 3354597.0517 Ibs/in
-189t.^o.-?':f- ^.V^4^ .-"<\1
3354.5970517 KIPS/IN
K <BEND HORIZi «^L KEEL H.0O5 = e()1^7^^^•M it"';'. 201?'A.--
IWTRU OCCK:
Ql = -1000.0000
HI = -i5o.':ioo,on(";i
ffi - 0.0000
Fe = 0.0000
03 = 0.0000
H3 = 0.0000
04 = H).0000
H4 = -0.000-
05 = 1000.0000
«5 = 0.0000
T0T<1 KEEL BLOCK HQRI20KT(^ STIFItSS CCEFICIEVT CflLDJLATIQN:
USS L£«Y 1:8-16 ELASTIC
Khk (SIOEBLOCK HORIZONT^l STIFRCSS) = P/(KM)IN6 DISPL SfCAfi DISPLAStNT)
Khk - 690.79 KIPS/IN (PER BLOCK)
Khk = 41447.53 KIPS/IN (ENTIRE KEEL BLOCK SYSTEM)
230

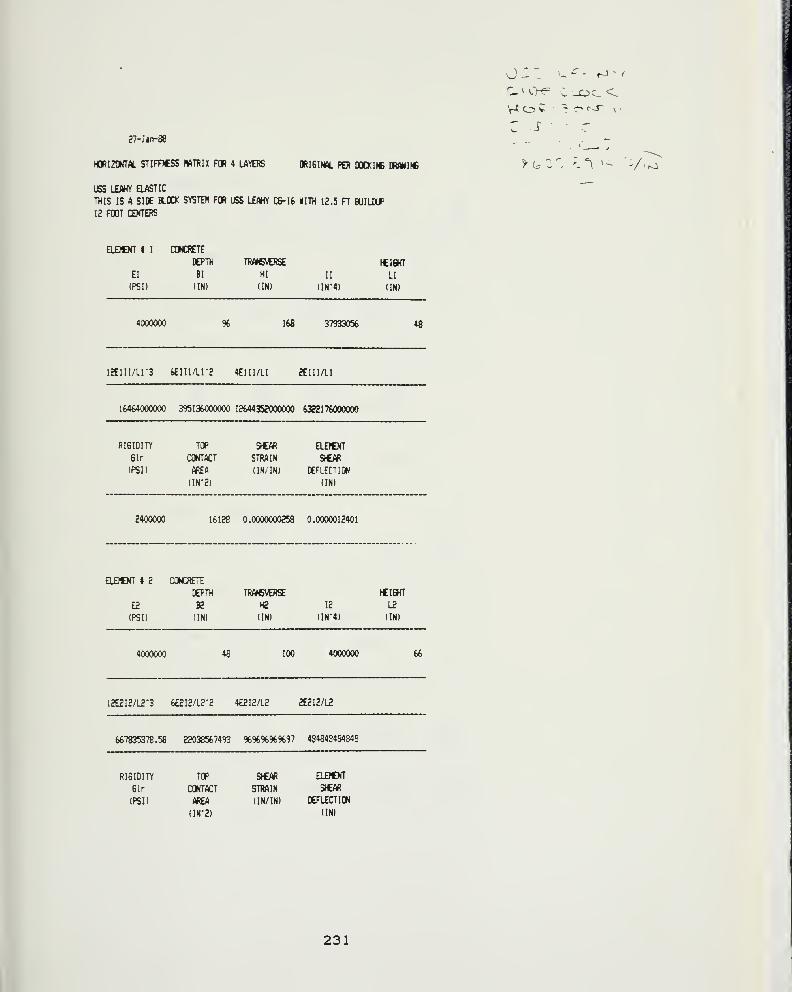
E7-Jif»-88
HORIZONTAL STIFPCSS MATRIX FOR 4 LAYERS 0RI6INM. PER DOCKINB DRMINE
USS LEAHY ELASTIC
THIS IS A SIDE BLOCK SYSTEM FOR USS LEAHY C6-16 KITH 12.5 H BUILKJP
12 FOOT CENTERS
o - _ \^ - - fJ- (
r» V.>^ ^ _OC_<^
w O V 'Z. -rJ- X-
u .1 ^
^t -'. '. °\ ^- ''/-,
ELDtNT 1 1 CONCRETE
DEPTW TRANSVERSE »CI6HT
El Bl HI 11 LI
(PSD (IN) (IN) (IN*4) (IN)
4(XXX)00 % 168 3«33056 48
12E1I1/Lr3 fe£lIl/Ll-? 4E1I1/L1 2E1I1/L1
16464000000 395136000000 12644352000000 6322176000000
RI6IDITY TOP
Sir CONTACT
(PSD /«£ft
(IN"2)
StCAR ELOtNT
STRAIN 9CAR
(IN/IN) DEFLECTION
(IN)
2400000 16128 0.0000000258 0.0000012401
ELEJCNT I 2 CONCRETE
DEPTH TWWVERSE
E2 B2 H2
(PSD (IN) (IN)
tCIBHT
12 12
(IN-4) (IN)
4000000 48 100 4000000 66
12E2I2/L2-3 6E2I2/L2-2 4E2I2/L2 SE2I2/L2
667R?S?78.58 22038567493 %%%%%97 4S48494S4848
RIGIDITY TOP StCAR ELDCMT
Sir CONTACT STRAIN S»C/«
(PSD MCA (IN/IN) DEFLECTION
(IN'2) (IN)
231

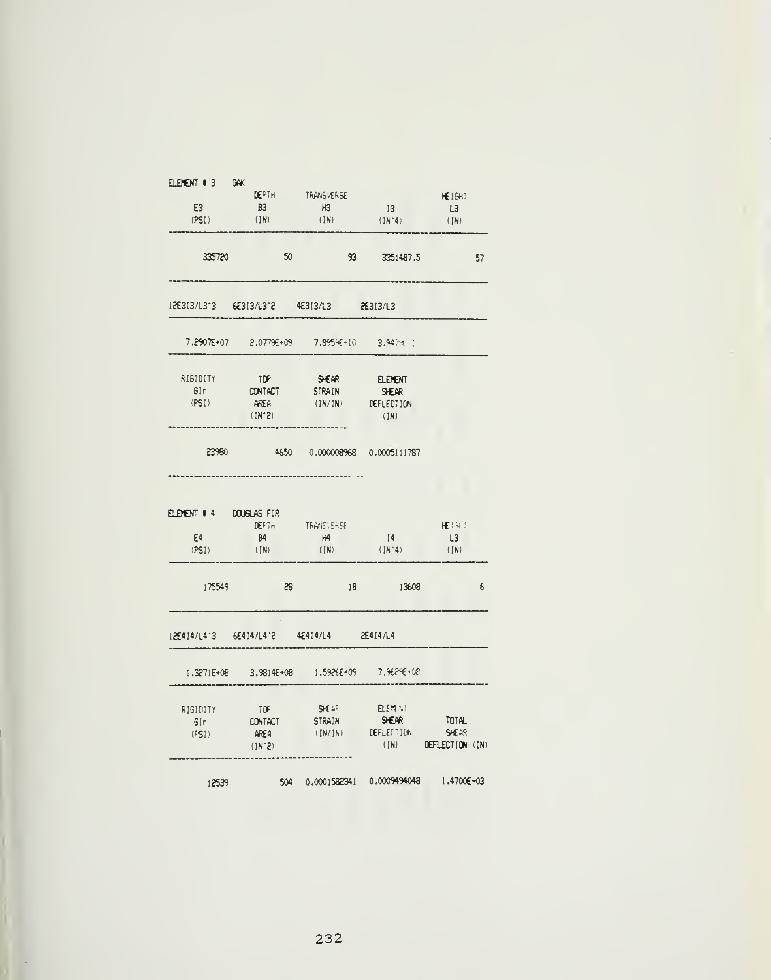
EL£?€KT t 3 OAK
DEPTH TIW6VEf>S£ tCIGHT
E3 B3 H3 13 L3
(PSD (IN) (IN) {lN-41 (IN)
335720 50 93 3351487.5 57
12E3I3/L3-3 6£3I3/L3*2 4E3I3/L3 2E3I3/L3
7.2907E+07 2.0779t«0S l.S^j<-\0 3.«;-i
RIGIDITY TOP SHE<« ELDBdSir CONTACT STRAIN 3i€tR
(PS!) «EA (IN/IN) [EFLECTION
(IN"2) (IN)
23980 4650 0.000008%8 0.0005111787
ELDtNT t 4 DOUGLAS FIR
DEFIn Tf<Af6.E'^?F fCi."^::
E4 B4 H4 14 L3
(PSD (IN) (IN) (IN-4) (IN)
175549 28 18 13W8
12E4I4/L4-3 fe£4I4/L4-2 4E4I4/L4 2£4I4/L4
1.327lEt08 3.9814£*08 1.592t€*09 7.%?^-0f
RIGIDITY TOf Srti=^ ElE^'.:
Sir CONTACT STRAIN StCAfi TOTAL
(PSD (fiA (IN/IN) DEfLffTlO. SHEW
(IN-2) (IN) DERfCTIQH (IN)
12539 504 0.0001582341 0.0009494048 1.4700E-03
232
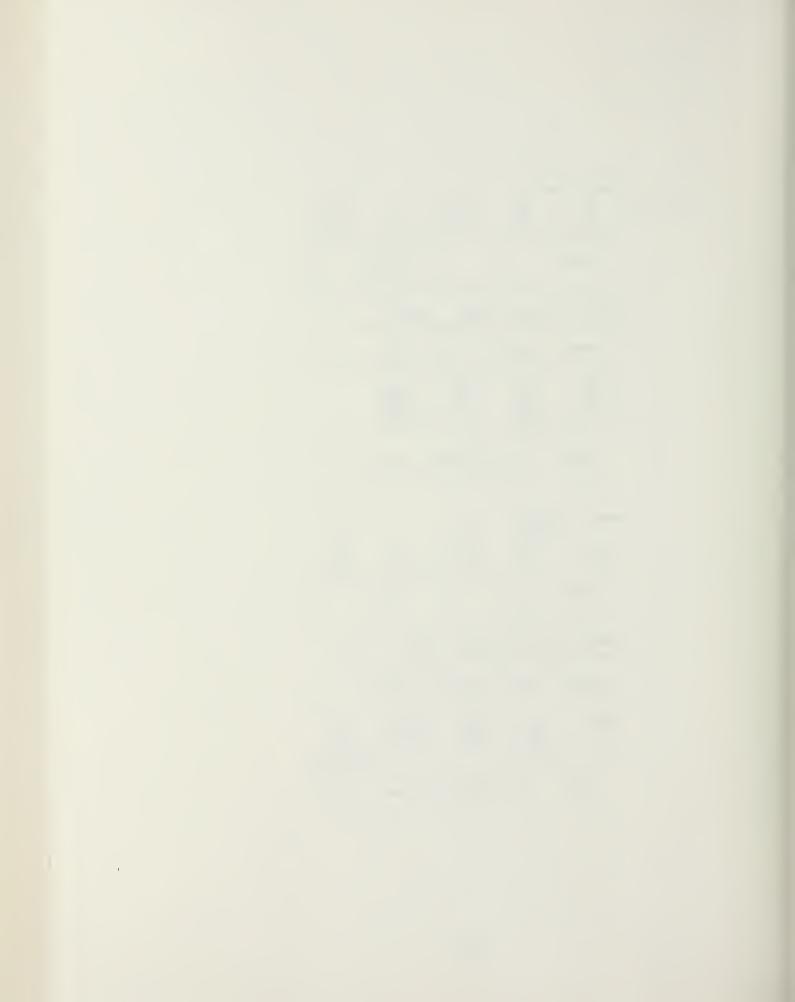
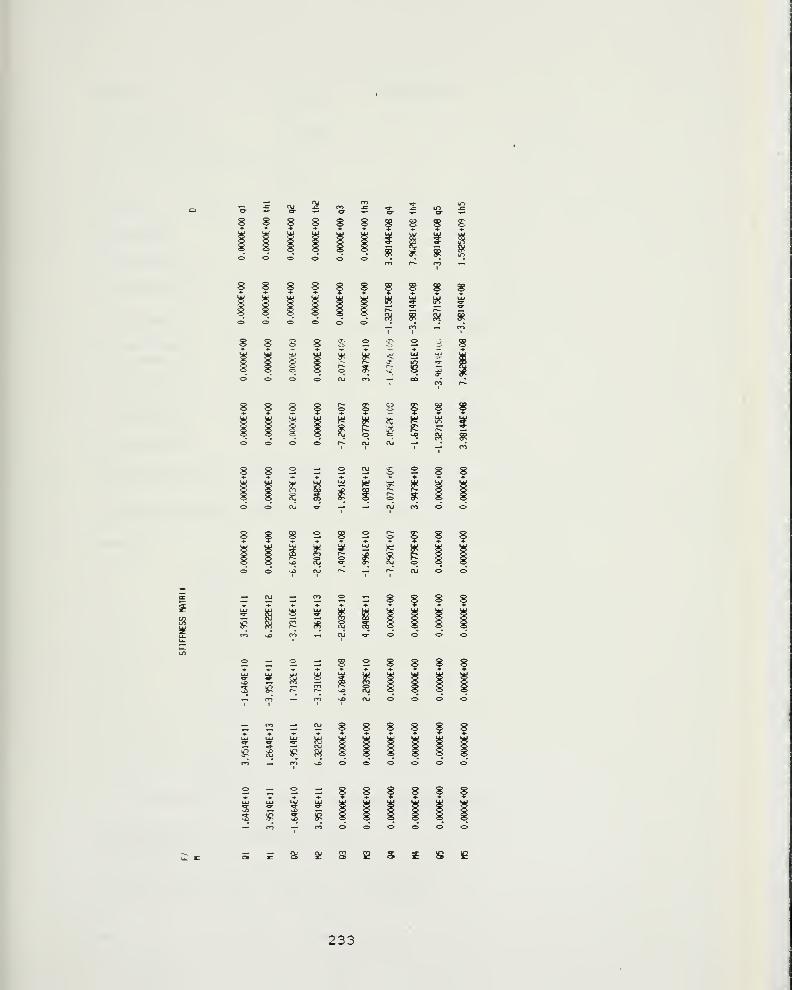
2Si
oooooo..."^m r- m —
— m —* ont I I
8 8 S 8 £ 2 S 2 a 8
88080^ crSSw
8ff|S|g§8SgIt I — m
t j^J I J i 1j^^^
1 il I^ f L^ i^j ^^ 1 tJ ^1
8fS282S§8f^^ ^U UJ ^U L^ UJ UJ ^U ^U t^o & CD m r*- ^ o F* O O
-~n:r22r88S8
2n|;=:§28S8f
+ + ••••*-*
2z:2 = 88f8f8
233

\
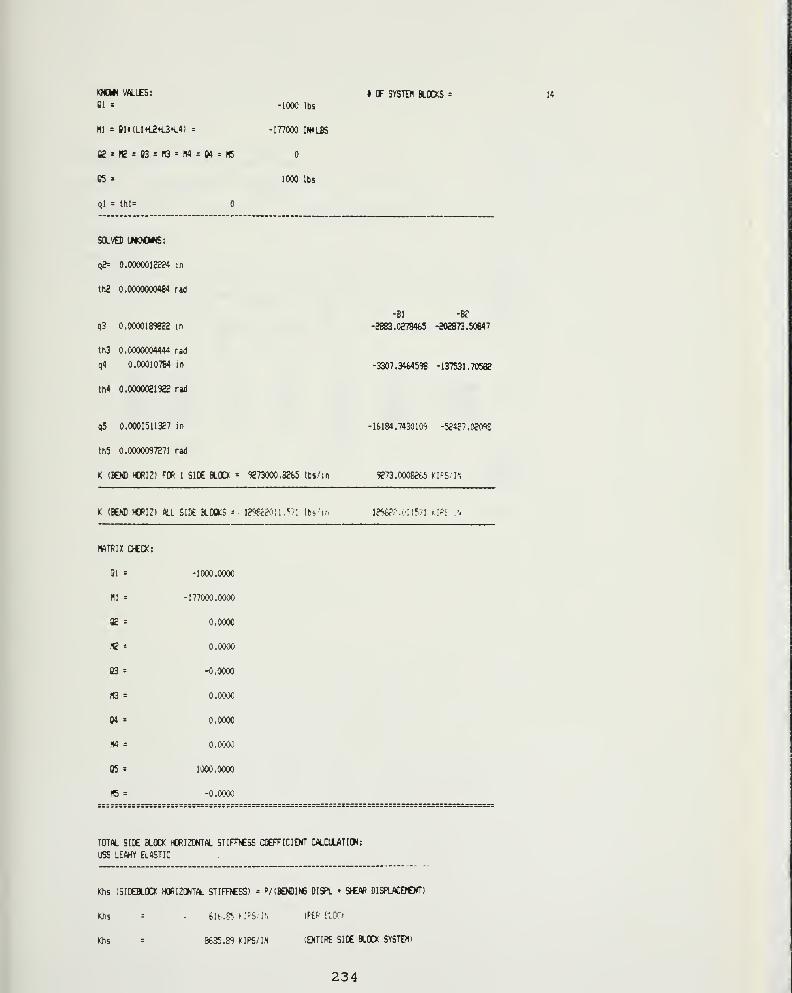
KNOMN VM.UE5:
Ql =
Q£ = fC = 03 = fQ = fM = (M = H5
05 =
ql - this
SOLVED UKNOHNS:
q2= 0.0000012??4 in
th2 0.0000000484 rad
q3 0.0000189822 in
th3 0.0000004444 rad
q4 0.00010784 in
IM 0.0000021922 rad
I OF SYSTEM BLOCKS =
-1000 lbs
-177000 INtLBS
1000 lbs
-Bl -Be"
-2883.02784^ -202873.50647
-3307.3464598 -137531.70562
q5 0.0001511327 in
th5 0.0000097271 rad
K (BEND H0RI2) FOR 1 SIDE BLOCK = 92730O0.82S5 Ibs/in
- 16184. 743010';( -52427.02098
9273.00082(5 'IPS/IN
K (BEND H0RI2) «.L SIDE BLOCKS = 1298cf0:i .571 Ibs'in l?%?r.nil5?l i^lF-S
HATRU oca:
Ql = -1000.0000
m = -177000.0000
02 = 0.0000
«2 = 0.0000
03 = -0.0000
PG = 0.0000
04 = 0.0000
M = 0.0000
85 = lOOO.OOOO
H5 = -0.0000
TOTW. SIDE BLOCK HORIZONTAL STIFFNESS COEFFICIENT CALCULATION:
USS LEAHY ELASTIC
Khs (SIDEBLOCK HORIZONT*^ STIFFJCSS) = P/(BENDIN6 DISPL S>€Afi DISPLACOCNT)
Khs = 61t..E*' KPS. ;r. (Ft^ flOfc
Khs = 8635.89 KIPS/IN (ENTIRE SIDE BLOCK SYSTEM)
234
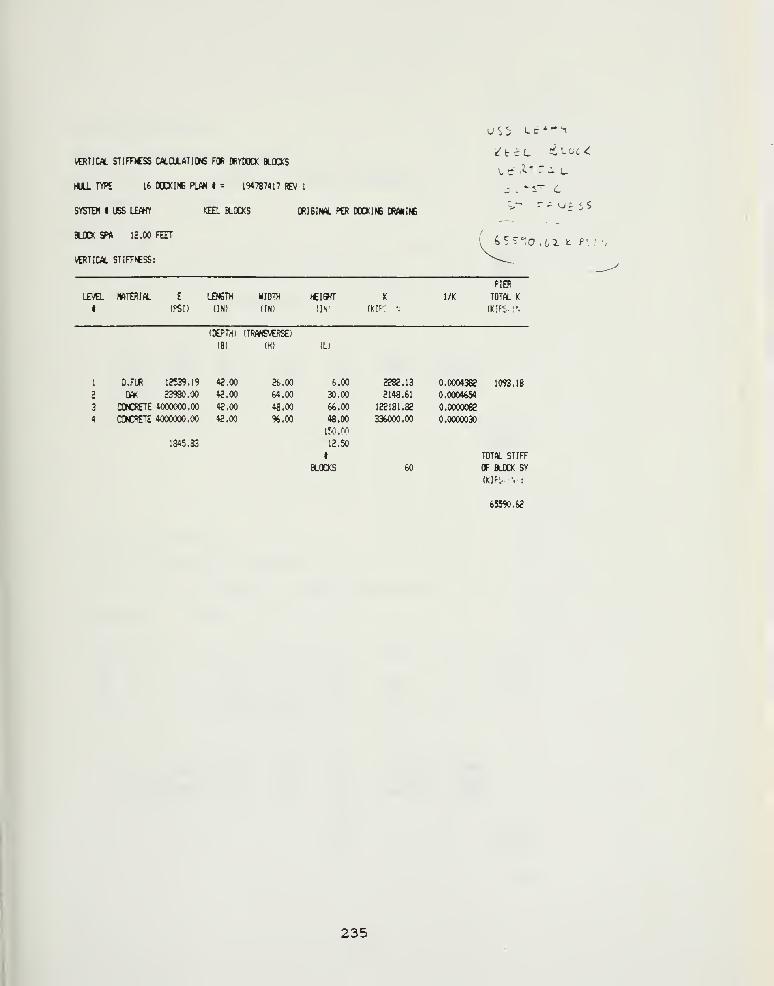
VERTICAL STimCSS CALOIATIONS FOR DRYCOCK BLOOCS
«JLL TYPE 16 DOaiNB PUW • = 194787417 REV 1
SYSTDt I US5 LEAHY KEEL BLOCKS QRI6INM. PER OOCKINE DRMIie
BLOCK SPA 12,00 FEET
\€RTICAL STIFtCSS:
u S 3 L t * '* ^
PIER
LEVEL NATERIAL £ LENGTW WDTH «I6HT K 1/K TOTtt. K
1 (PSD (IN) (IN) (IN vay. • (K!fS ;•.
(DEPTH) (TWWSVERSE)
(B) (H) (L)
1 D.FUR 12539.19 42.00 2(,.00 6.00 2282.13 0.0004382 1093.18
2 OAK 23980.00 42.00 64.00 30.00 2148.61 0.0004654
3 CONCRETE 4000000.00 42.00 48.00 66.00 122181.82 0.0O0OO82
4 CONCRETE 4000000.00 42.00 %.00 48.00 336000.00 0.0000030
IM.OO
1845.33 12.50
t
BLIXXS 60
TOTW. STIFF
OF BLOCK SY
(Klfi.. .;
65590.62
235
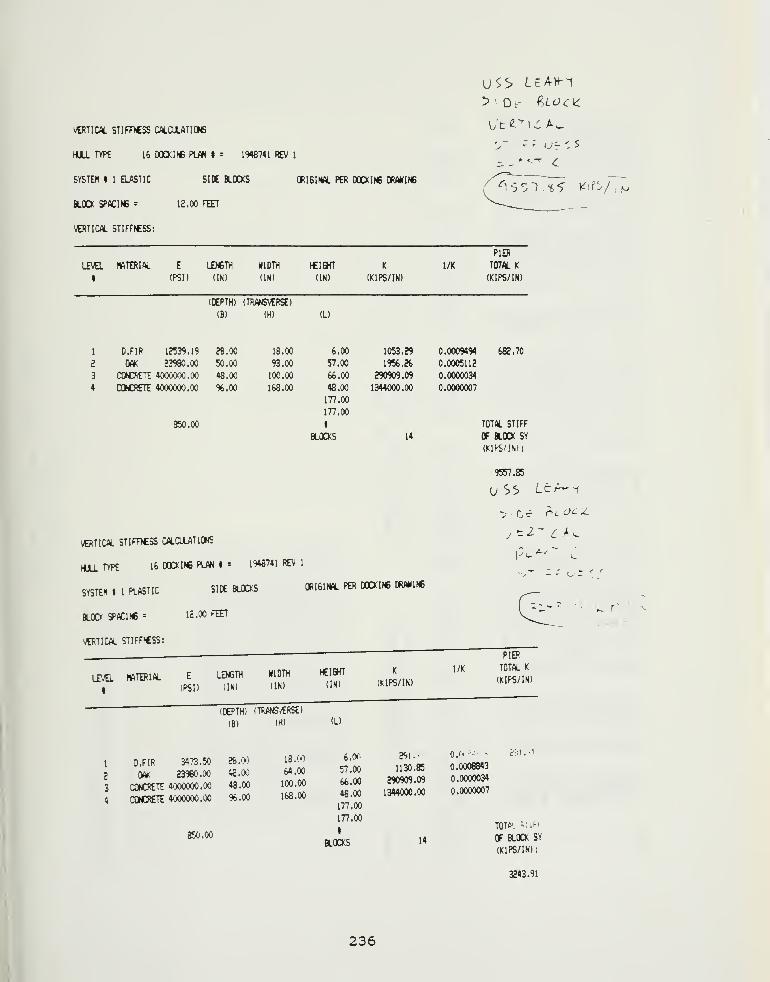
VERTICAL STIFTTCSS CflLCULflTIONS
HULL TYPE 16 D0CKIM6 PLAN I = 1948741 REV 1
SYSTEH t 1 ELASTIC SIDE BLOCKS ORISIFM. PER DOCKING DRAWINB
BLOCK SPACING - 12.00 FEET
VERTICW. STIFFfCSS:
LEVEL
1
mminL E
(PSD
LENGTH
(IN)
NIDTH
(IN)
tCIGHT
(IN)
K
(KIPS/IN)
l/K
PIER
TOTAL K
(KIPS/IN)
(DEPTH)
(B)
(TR/V6VERSE)
(H) (L)
1
2
3
4
D.FIR 12539.19
m 23980.00
CONCRETE 4000000.00
CONCRETE 4000000.00
850.00
28.00
50.00
48.00
96.00
18.00
93.00
100.00
168.00
6.00
57,00
66.00
48.00
177.00
177.00
1
BLOCKS
1053.29
1956.26
290909.09
1344000.00
14
0.0009494
0.0005112
0.0000034
0.0000007
682.70
TOTAL STIFF
OF HOCK SY
(KIPS/ IN):
9557.85
VERTICAL STIFRCSS CALCULATIONSy^ 2 ~ £ ;* w
Hua TYPE 16 DOCKING PLAN » = 1948741 REV 1
SYSTEH I 1 FLASTIC SIK a.OCKS ORIBINW. PER MCKI»C WANING
BLOCK SPACING = 12.00 FEH
VERTICAL STIFFICSS:
- ^ '^iF.
LEVEL
1
rWTERIW. E
(PSD
LENGTH
(IN)
WIDTH
(IN)
HEIGHT
(IN)
K
(KIPS/IN)
l/K
PIEP
TOTAL K
(KIPS/IN)
(DEPTH) (TRANS-^RSE)
(B) (H) (L)
1
2
3
4
D.Flft 3473.50
m 23980.00
CONCRETE 4000000.00
CONCRETE 4000000.00
26. '»
42.00
48.00
%.00
18.'>?
64.00
100.00
168.00
6. Of'
57.00
66.00
48.00
177.00
177.00
1
BLOCKS
2^1.
1130.85
290909.09
1344000.00
0.'" '
0.0008843
0. 0000034
0.0000007
TOTC. ^i.*-'
850.0014 OF BLOCK SY
(KIPS/IN):
3243.91
236
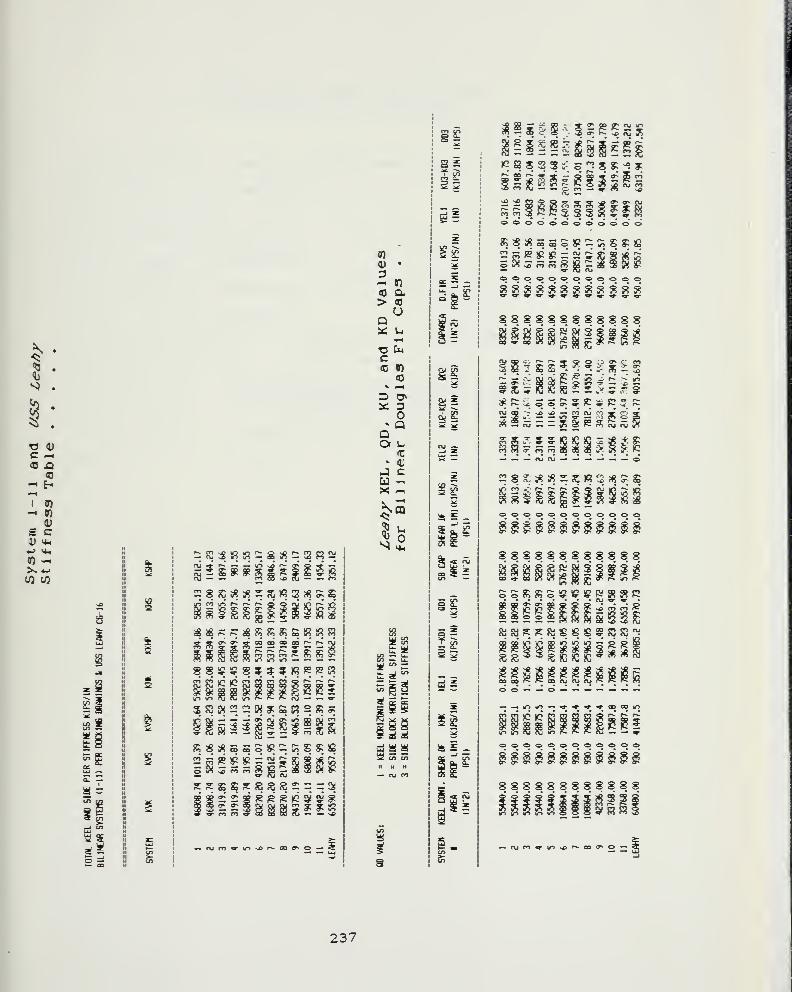
\ .
<5<<1 .
<b
S .
^ .
^ .
rj (Uc -.
<0 A03
- fr-^^
1 fn-. CQ
0)
£ C0) >i^
«-> **<
Cf) -.>s*>u) to
— It
Kg
^S 2iS3 :S
Ri = 2
R R ::
— — u->
S S S £S ^ X — is§
if? R
Sllg8
^ S 2
ID CO ^
OO GO 00 r^
r^ ~ 5 jr
S lO — —
IP m? 5 5 R e e s
eg win ?6 i= :: 5:
I
jf;
— .— 9^
:S :« je g g 2 S» — S m
« 5
ooS^fP — 1005^00
^ ^ =c - a 9
^* ^ gp o
V en m
^ ^ jp Oj
CO
0)•
a- en
03 Q.> 03
UQit: u
T3 tuC
03» ^^
oQ
QOt u
It
» o;
J c
N «4h
fS
S4»• en "-
a*"'
ui ISaf a: as
S *l
i^^MM
i\HH« to
s
i^
S5
^S
I en *^
1 a s1 =»sI —
1 ^hI ^ ^
5 S I
^ E - 1
S^2 i
tn —
5S
ii
ds
5 e 1
ii
!fe E -I
000 000f?5 iSiS s s 82 c: IT) S^ IG
— w fO r\j
s s s S S8 8 SS 8 8 S^ o SS 2 10— i « r~ oJ^* r~ K ^
•= e ^ s ?. s ^ r- en
m — ^o
c ffi ?y f^ X o ^O ^ ^^ w
B ^ :: i 2= > ? - sK s P ? K
ffi — fu
I
— — iO w= = 5 s
£ 1 S iSm fn S 36
rS ^ nj f\.
' 2 <\j in -r JDp»»- r»- p»-
S Sjg
£.
oooooooo<ooo^c^ ^» o^ ^ ff^ ^ ff" ^ ^» ^ fl^ tr*
888888888888fy
r^ r* gr ffN r* i^ K->o o m m <^ ^ ^
Rj S S 8J S €
?u nj Oj
§ § § ? SJT' ^ r^ M^ r*
IS P:! S 3? P• fXi 9- V •
»j a 2 § ^S ? S3 ffi "i
^ i J^" ^"
fi!<; id
— in
S3 ic ^'B3 SS S
V «r 00 OS mr- r- r*
^* lys ^^ ^s Cr* ff* v^ ^^ ^^ ^^ w^ ^*
8 888888 8 8 8 8 8
I ^ 3 S Ii S ^ ^ 3
— njm^-iDv^r^-oo^^o —
237

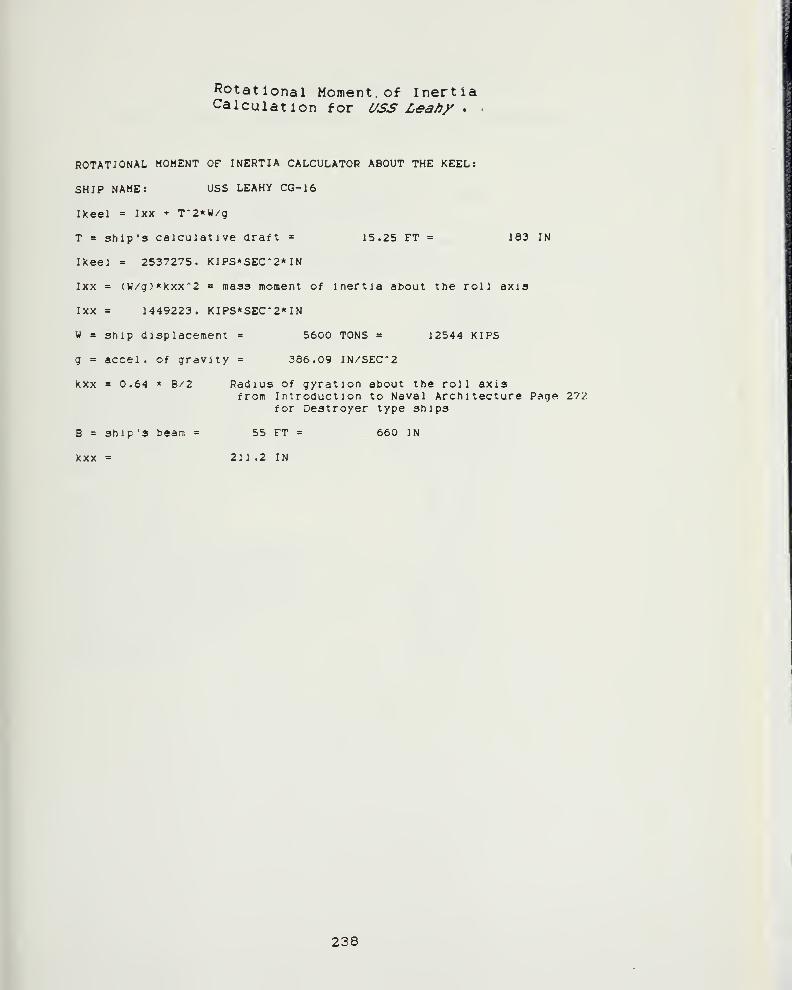
Rotational Moment. of InertiaCalculation for l/SS Lea/jy ,
ROTATIONAL MOMENT OF INERTIA CALCULATOR ABOUT THE KEEL:
SHIP NAME: USS LEAHY CG-16
Ikeel = Ixx T*2»W/g
T = ship's calculatlve draft = 15.25 FT = 183 IN
IKeel = 2537275. KIPS*SEC-2* IN
Ixx = (W/g)*Kxx*2 = mass moment of Inertia about the roll axis
Ixx = 1449223. KIPS*SEC-2*IN
W = Ship displacement = 5600 TONS = 12544 KIPS
g = accel . of gravity = 386.09 IN/SEC*2
kxx = 0.64 * B/2 Radius of gyration about the roll axisfrom Introduction to Naval Architecture Page 272
for Destroyer type ships
B = ship's beam = 55 FT = 660 IN
kxx = 211 .2 IN
238

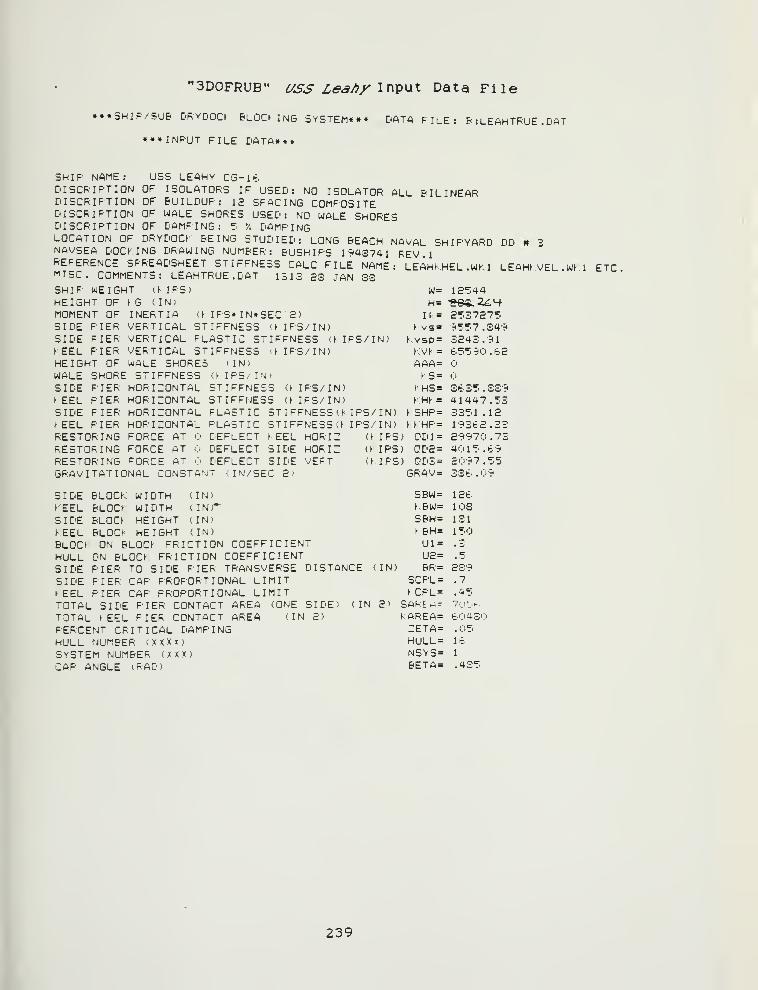
"3D0FRUB" c/ss Leahy lr\^^x Data File
..•SHIP/SUB DRYDOCK BLGCt ING SYSTEM.** DATA FILE: B :LEAHTRUE .DAT
»•» INPUT FILE DATA»»»
SHIP NAME: USS LEAHY CG-lt-D I SCRIPT ION OF ISOLATORS IF USED: NO ISOLATOR ALL BILINEARDISCRIPTION OF BUILDUP: 12 SPACING COMPOSITED I SCRIPT I ON OF WALE SHORES USED: NO WALE SHORESDISCRIPTION OF DAMPING: 5 7. DAMPINGLOCATION OF DRYDOCK BEING STUDIED: LONG BEACH NAVAL SHIPYARD DD # 3NAVSEA DOCKING DRAWING NUMBER: BUSH I PS l'?4S7ai REV . 1
REFERENCE SPREADSHEET STIFFNESS CALC FILE NAME: LEAHKHEL.WKl LEAH^VEL WH ETCMTSC. COMMENTS: LEAHTRUE.DAT 131S £S JAN S3SHIP WEIGHT a- IPS) W= 12^44HEIGHT OF KG ^IN) H=-eeS.^4MOMENT OF INERTIA (f IPS* I N« SEC ' 2) Ik= £'537275SIDE PIER VERTICAL STIFFNESS (KIPS/ IN) Kvs= 9557. 34wSIDE PIER VERTICAL PLASTIC STIFFNESS (t- IPS/IN) Kvso= 3243.91KEEL PIER VERTICAL STIFFNESS '\ IPS/ IN) KVK= 65590.62HEIGHT OF wALE SHORES iJN) AAA=WALE SHORE STIFFNESS (^IPS/INt KS=SIDE PIER HORIZONTAL STIFFNESS (KIPS/ IN) K HS= S635.SS9KEEL PIER HORIZONTAL STIFFNESS (K IPS/IN) KHK= 41447.53SIDE FIER HORIZONTAL FLASTJC ST I FFNESS ( K I PS/ I N) K SHP= 3351.12^ EEL PIER HORIZONTAL PLASTIC ST I FFNESS ( K I PS/ IN) M HP= 19362.33RESTORING FORCE AT DEFLECT KEEL HORIZ (KIPS) QD1= 29970.73RESTORING FORCE AT DEFLECT SIDE HOPIZ (k:IPS) 0D£= 4015.69RESTORING FORCE AT DEFLECT SIDE VERT (KIPS) QD3= £097.55GRAVITATIONAL C0NSTA^4T i IN/SEC R) GRAV= 336.09
SIDE BLOCK WIDTH (IN) SBW= 126KEEL BLOCK WIDTH (IN)*" KBW= lOSSIDE BLOCK HEIGHT (IN) SBH= 131
KEEL BLOCK HEIGHT (IN) ^^BH= 150block: on BLOCK FRICTION COEFFICIENT Ul= .3
HULL ON BLOCK. FRICTION COEFFICIENT U2= .5
SIDE PIER TO SIDE PIER TRANSVERSE DISTANCE (IN) BR= 239SIDE PIEP CAP PROPORTIONAL LIMIT SCPL= .7
> EEL PIER CAP PROPORTIONAL LIMIT > CPL= .45
TOTAL SIDE PIER CONTACT AREA (ONE SIDE) (IN £) SAPE -^ 7f. I-TOTAL > EEL PIER CONTACT AREA (IN 2) K AREA= 60430PERCENT CRITICAL DAMPING ZETA= .05
HULL NUMBER (XXXx; HULL= 16
SYSTEM NUMBER (XXX) NSYS= 1
CAP ANGLE vRAD) BETA= .435
239
I
J
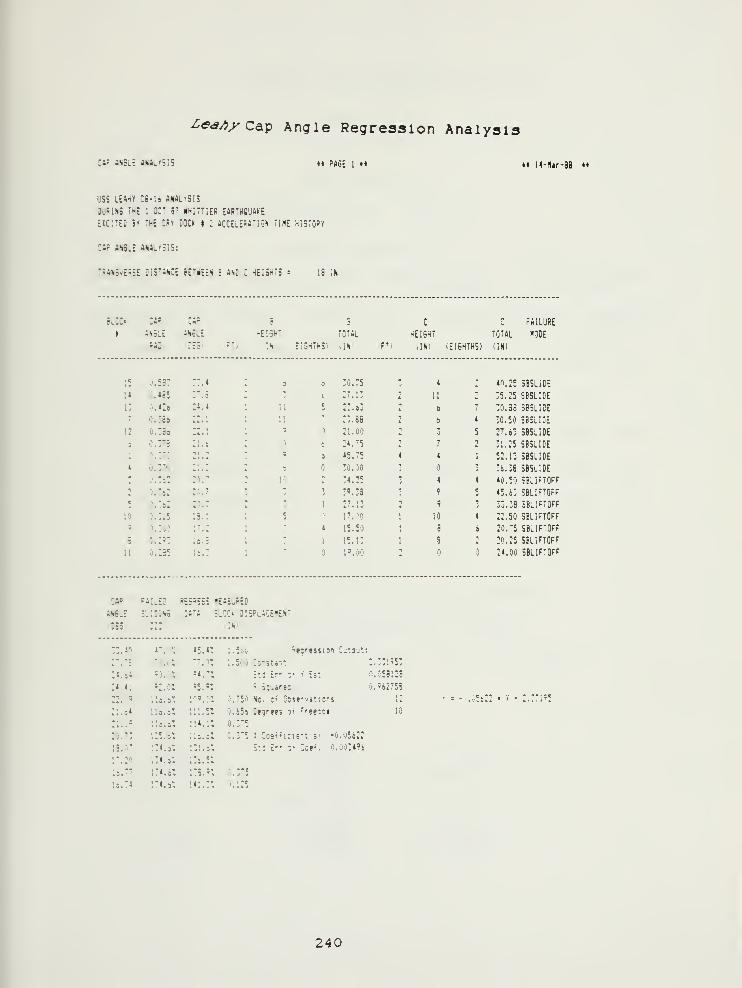
Lea/)xc^^ Angle Regression Analysis
CAP ANGLE ANAL VS 1
5
t« PA6E 1 >• * l4-«jr-88
USS LEAHY CS-I6 AMALfSIS
DUfilNS THE 1 OCT a: KHITTIER EARTHQUAt;E
EICITED BY THE DRV DOCK I I ACCELERATION TIHE HISTORY
CAR ANSLE ANALYSIS:
TRANSVERSE DISTANCE BETNEEN B AND i HEISHT3 = 18 IN
BLJC* CAR AF B 8 c C FAILURE
1 itiSLE .JN5L-: HEIGHT TOTAL HEIGHT TOTAL NODE
IRAD) DES'",
.:s; EIGHTHS) (IN) iF^; aNi EIGHTHS) (IN)
15 0.533 33.4-
3 3 30.75.
4 40.25 SBSLIDE
1« .;.4S5 :-.3k.
*I 27.13 i. 11 35.25 SBSLIDE
13 0.426 24.4 1 11 23.63 L 6 30.33 SBSLIDE
7 0.384 1 11 7 23.88 16 4 30.50 SBSliJE
12 0.386 22.1 1 9 21.00 1 T5 27.63 SBSlIDE
e 0.378 21.6 k 6 24.75 1 7 131.25 SBSLIDE
: 0.370 11 13 9 6 45.75 4 4 1 52.13 SBSLIDE
4 0.370 jii . fc C 6 30.00 3T
36.38 SBSlIOE
J 0.362 20.7 n^ 10 fc 34.25 3 4 4 40.50 3BLIFT0FF
Tfc 0.3o2
-i.% ?3
T 7 39.39 3 5 5 45.63 SBLIFTOFF
5 0.3s2 20.7 L 3 111 n 1 9 3 33.39 SBLI'TOFF
10 0.315 13.1 1 17.00 1 10 4 22.50 SBLIFTOFF
9 0.300 • ' *1 7 4 15.50 1 3 6 20. "5 SBLIFTOFF
8 0.293 le.S I
?I 15.13 1 9
1& 20.25 SBLIFTOFF
U 0.235 It.! t I'.OO - n ,•) 24.00 SBLIFTOFF
CAP fAkED re;"!:: IEASjRED
AN6LE 5i;CiS6 CATh BLCCK DISPLACEMENT
:0E5' ::: :;ni
.egression Cu:3ut:"3.10 4'..:; 45.4^ 1.500
2'.": ".' j*.^ '7.0' 1.500 [on5ta-t 2 331953
:i.:l 'o.''-.;'4.-' 3ta E:-' : I Est 053123
:'.4; 52. ox 95.?: R Sj-jareii 962753
22.::9 116.61 'OP ';'
. 0.750 Nc. OT 063 e'vations 14^ f = -0.056 22'« » 2.33195
:i.o4 lU.oJ 111 c 0.656 Ceqrees or froeil5i 10
21. 1' llo.o* 114.1 . 0.3-5
20.73 125.6: Uc.ol C.375 I CosfMcient.si - J. 05622
19. -t? 134. o: 131.6 i'.a E" :• :=e<. 003496
17.20 134.61 136.5'
16.77 134.61 135.? . 0.375
U.34 134. a'. 141.3" .-, 1 -c
240

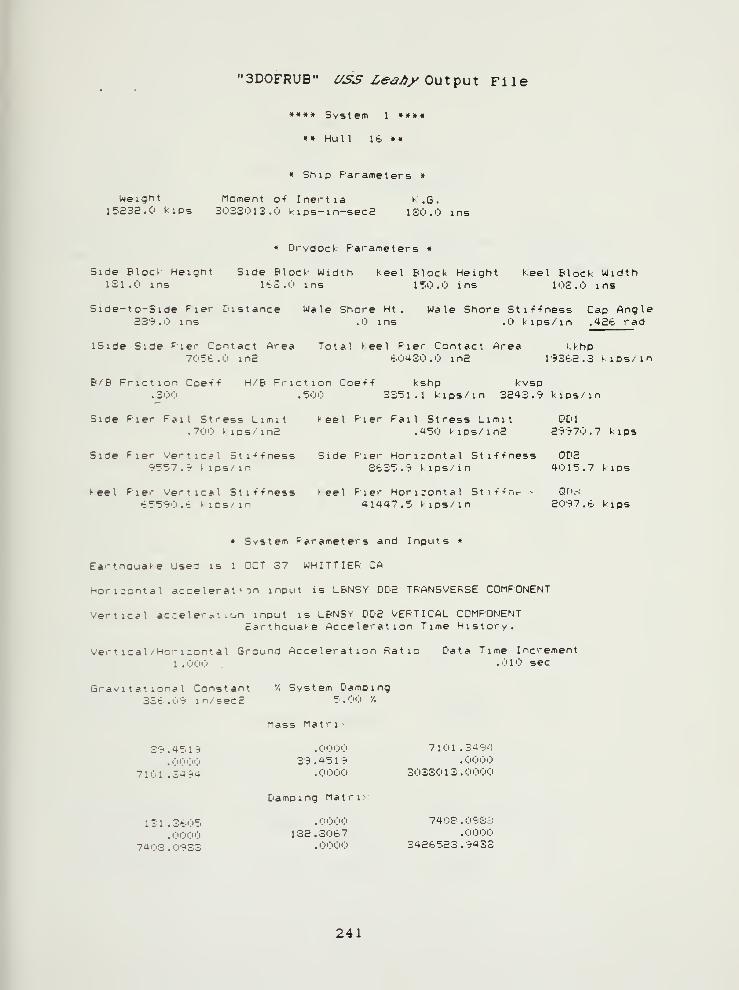
"3D0FRUB" C/SS Lea/iy OxyX^MX File
««•« System 1 »««#
»» Hull 16 »•
» Ship Parameters «
Weight Moment o-f Inertia K. G.15S32.0 kips 3033013.0 kips-in-sec2 130.0 ins
• Drydock Parameters *
Side Block Height Side Block Width Keel Block Height Keel Block Width131.0 ins lt3.0 ins 150.0 ins 103.0 ins
Side-to-Side Pier Distance Wale Shore Ht . Wale Shore Sti'f-fness Cap AngleSS'Tt.O ins .0 ins .0 kips/ in .4Eb rad
ISide Side Pier Contact Area Total Keel Pier Contact Area kkhp705b. inE 60430.0 i n2 19362.3 ^:lps/ln
B/B Friction Coet-f H/B Friction Coe-f-f kshp kvsp.300 .500 3351.1 kips/in 3243. 5 kips/in
Side Pier Pail Stress Limit Heel Fier Fail Stress Limit QEil
.700 ^los/ln2 .450 kips/in2 2?r'70.7 kips
Side Fier Vertical Sti-f-fness Side Fier Horizontal Sti-f-fness QEi2
t'557 . H ^lps/ln 3635.9 kips/in 4015.7 kips
keel Fier Vertical Sti-f-fness feel Fier Horizontal Sti-f-frit-^ Zi\K<
65590.6 i-iDS/in 41447.5 kips/ in 2097.6 kips
* System Farameters and Inputs «
Earthquake Used is 1 OCT 37 WHITTIER CA
Horizontal accelerat'^n input is LBNSY DD2 TRANSVERSE COMPONENT
Vertical ac-eler^-. i'_,n input is LBNSV DD2 VERTICAL COMPONENTEarthquake Acceleration Time History.
Ver t ical /Hor izonta I Ground Acceleration Ratio Data Time Increment1 .000 .'.'10 sec
Gravitational Constant '/. System Damping336.09 in/sec2 5.00 "/.
Mass Matrix
39 .4519.'JO'.'O
7101 .3494
131 .3605.'j'l'OO
7403 .0933
. I.H.ll.ll.*
39.4519. iJiJt'O
Damping Matrix
. O'l'O'J
13S.3067
7101 .349-'
3033013 .0<;>ii
7403.093
J
.00003426523.9433
241

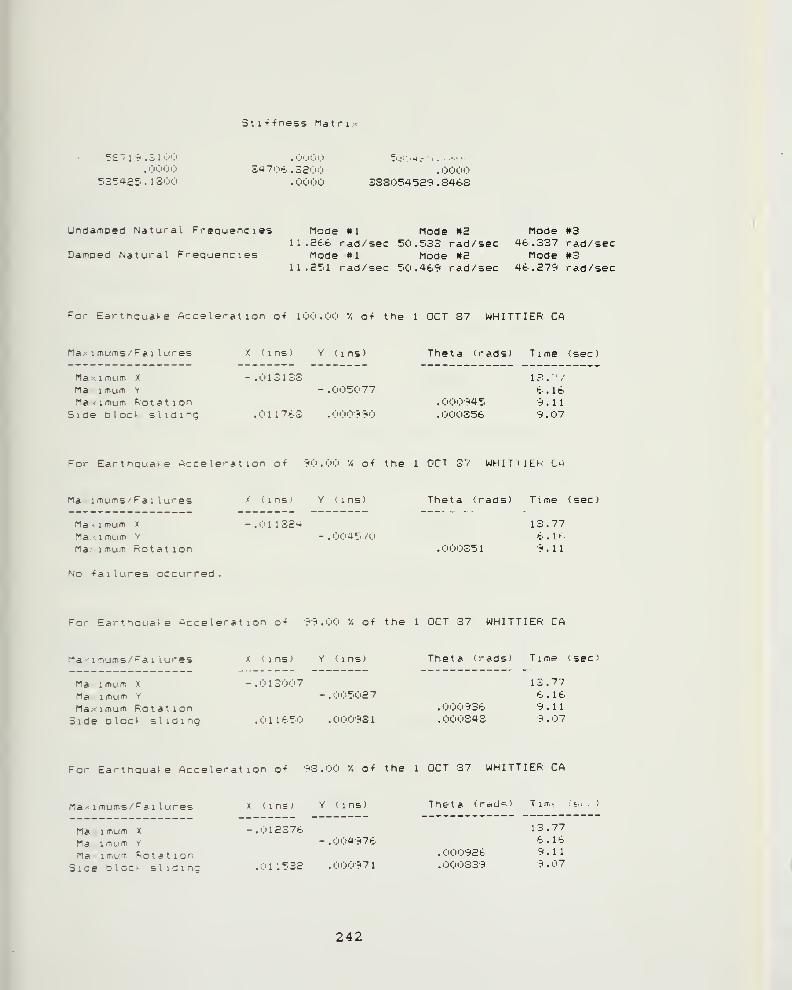
St I + -f ness Matr i
5£ "/ 1 T< . 3 1 >;'0
.0000535435 . 1 300
34706.321. OOi: »o
. '""J'JO
3SS0545e9,S4t.S
Undamped Natural Frequencies Mode #1 Mode #2 Mode #311.2t.t. rad/sec 50.533 rad/sec 4t..337 rad/sec
Damped Natural Frequencies Mode #1 Mode »2 Mode #311.251 rad/sec 50.469 rad/sec 46.279 rad/sec
For Earthquake Acceleration o-f 100.00 '/. o-f the 1 OCT 37 WHITTIER CA
Ma-- imums/Fc»i lures
Ma:--iiT>um X
Ma imum Y
Maximum RotationSide Dloct- sliding
X (ins) Y (ins)
- . ij 1 3 1 33-.005077
.011763 .'JOOt''t<0
Theta (rads) Time (sec)
6.16. 000945 9.11.000356 9.07
For Ea^thoua^e Acceleration o-f 90.00 */. o-f the 1 OCT 37 WHIT'llEK Lhi
Ma imums ' Fa 1 I ui-es
Maximum x
Ma - imum y
Ma- imum Rotation
No -failures occurred
X (ins) Y (ins)
-.011324- .004570
Theta (rads) Time (sec)
13.776 . 1 ^
.000351 9.11
For Earthquake Acceleration o-f 99.00 '/. o-f the 1 OCT 37 WHITTIER CA
Maximums/Fai lures
Ma: -imum X
Ma -imum Y
Ma;<imum RotationSide D lock si id 1 ng
X (ins) Y (ins)
- .01 3007- .0<;i5027
.01 1650 .000931
Theta (rads) Time (see)
13.77t. . 1 6.
.000936 9.11
.000343 9 .07
For Eartnquate Acceleration o-f 93.00 '/. o-f the 1 OCT 37 WHITTIER CA
Ma' 1 mums/Fa i lures
Ma imum X
Ma imum Y
Ma -imum RotationSide bloc^ sliding
X (ins) Y (ins)
-.012376- .004976
.01 1532 .000971
Theta (raiJ<=) Tirr.^ :«:.i
13.77t. . 1
6
.i;)(;>092t' 9.11
.000339 9.07
242

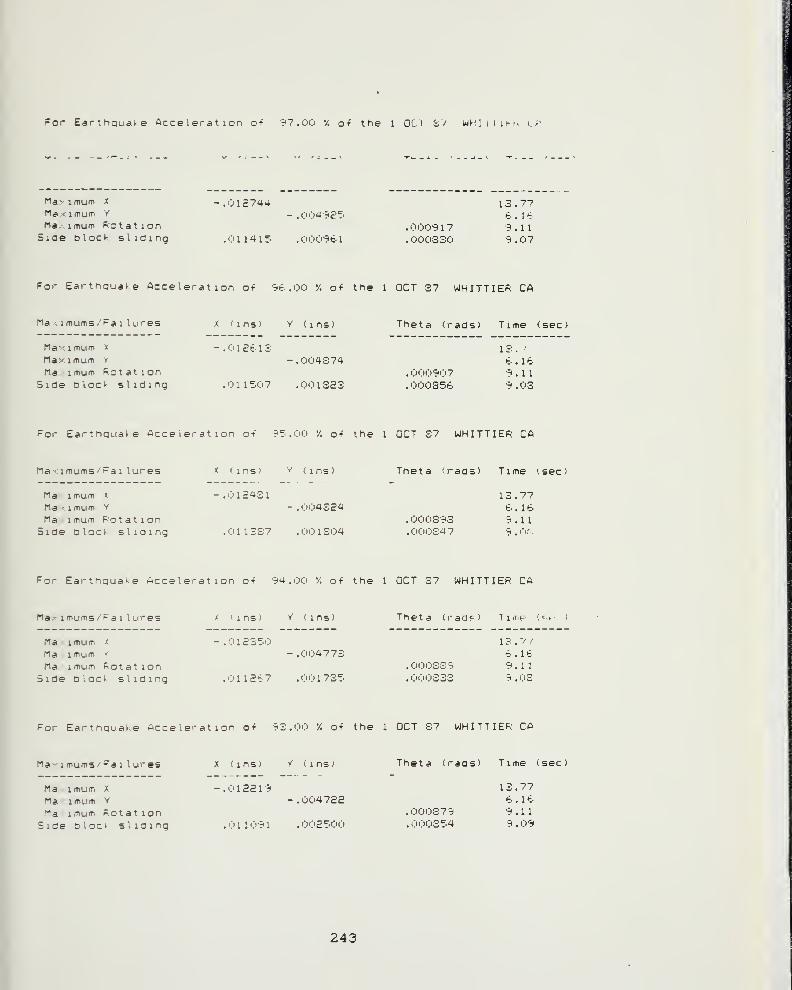
For EarthQucite Acceleration oi ii7 .00 '/, o-f the 1 OCT £7 WHIilJhK LP
Ma- 1 mu"! X
Ma < I muw Y
Ma xmum RotationSide bloc^ sliding
- .012744 13.77- .004 7i£^. e-.\t'
.000917 9.11. <:> 1 1 4 1 5 .OOO'T'tl .000S30 9 .07
For Eai-thquate Acceleration o-f 9b .00 •/. o-f the 1 OCT 37 WHITTIER CA
Maximums/Fai lures
Ma -1 mum X
Maximum V
Ma imum RotationSide Dloct< sliding
X ( 1 ns) Y (ins)
-.OlEfc.13- .004374
.01 l'o07 .001323
Theta (rads) Time (sec)
13.t. . 1 b
. 0<;i09ili7 9.11
.000356 9.03
For Earthqua>e Acceleration ot 9":.. 00 */. o-f the 1 OCT 37 WHITTIER CA
Ma^ 1 mums/ Fa 1 lures
Ma^ imum x
Ma ' I mum Y
Ma imum RotationSide bloc* sliding
X (ins) Y (ins)
-.012431- .004324
.011337 .001304
Theta (rads) Time (sec)
13.77t. . 1 t.
. 000S9S 9.11
.00034 7 9.0o
For Earthquake Acceleration o-f 94.00 */. o-f the 1 OCT 37 WHITTIER CA
Ma> 1 mums/ Fa i I ures
Ma imum j
Ma imum »
Ma imum Rotationbide b'loct sliding
X (ins) Y (ins)
- .0123^.0- .004772
.0112ir7 .001731
Theta (rad?) Timp <<^f )
1 ': . 7 /
b.l6.0<!ii!)3S9 9.11. i!'0'!i333 9 ,03
For Earthquake Acceleration o-f 93.00 */. o-f the 1 OCT 37 WHITTIER CA
Ma 'imums/Fai lures
Ma: imum X
Ma imum Y
Ma imum RotationSide b locf s 1 id 1 ng
X (ins) y (ins>
-.012219-.004722
.01 1091 .002500
Theta (rads) Time (sec)
13.77
.00IJ379 9.11. 000354 9 . 09
243

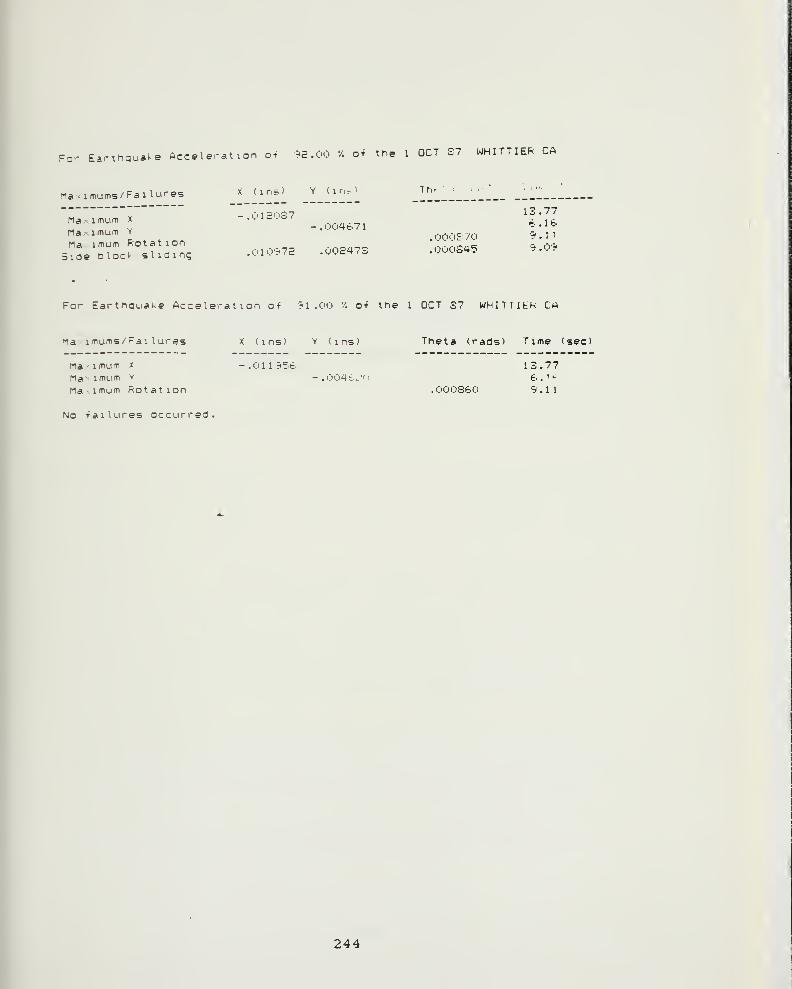
For EarthquaKe Acceleration of 9S.00 '/. ci the 1 OCT S7 WHITTIER CA
X (ins) Y (ir.^l Tr.tMa < imums/Fai lures
-.012037- .004t.71
Ma- 1 mum X -.012037 13.77•:• . lii-
. 00OS /o 9.11
.000345 S.09
Ma , I mum Y
Ma imum Rotation. ^^„_^
5ide Dloc^ sliding .010-72 .u0S47o
For Earthquake Acceleration oi ?! .00 '/. oi the 1 OCT 27 WHITTItK CA
Ma imums/Fai lures X (ins) Y (ins) Theta (rads) Time (sec)
Ma 1 mum X - . <!) 1 r7»56 13.77Ma imum Y -.OO^t^': €.'^>
Ma -1 mum Rotation .000360 "5.11
No failures occurred.
244

APPENDIX 4
1. California Division of Mines andGeology Report on 1 October 1987Whittier
2. Survivability ComparisonSpreadsheets
245


California Division of Mines andGeology Report on 1 October 1987Whlttler Earthquake
-Jt- :r- iKi
KmE>ian G«-<
CxrAiTM^Ni ex CO(S(t«»iK>i
DIVISION OF MINES AND GEOLOGYOfFiCC Of STRONG MOTION STUDIES
6X1 M«CU' 0«tvt
SACiAMlNiO CA «S«14
IfHONC 914- )?2 JIOS)
r 3. 1987To : Strong Motion Data Users
FrocD : Tony ShaXal and Staff "^'^ ^id:<\California Strong Motion iHstrumentation Prcgrao (CSMIP)Division of Mines and Geology/DeparUnent of Conservation
Subject: CSMIP Recorda from Whittier Earthquake of October 1, 1987
Accelerograjne of particular interest recorded at CSMIP stations during the October 1 earth-quaXe near Whittier, 15 km east of downtown Los Angeles, are attached. Over 35 records havebeen recovered at this time; record recovery from outlying stations is still underway. Weestimate that over 100 CSMIP stations have recorded the earthquake.
The map in Figure 1 shows the locations of the stations for which records are included hereand described below. The map also shows the locations of some of the other CSMIP stationsfixm which records are being recovered. Table 1 lists preliminary station eplcentraldistances and, when available, peak acceleration values.
Ground-Response Stations:o Alhambra - Closest CSMIP station to the epicenter (7 km); instrument in a l-story schoolo Obregon Park - Largest CSMIP ground acceleration, 45X g horizontal, was recorded at this
station approxijnately 10 kni frcm the epicenter. The ijxstrument is in a small building,o San Marino - Closest station to northwest, relatively low amplitude (20X g)
.
o Downey, Inglewood, 116th St. School - These recorda from close-in freefield stations to th.
west of the epicenter are also included for refereix».
Structures
:
o Admin. Bldg. - Cal State Univ LA. Nine-story reinforced concrete building about 10 km frcthe epicenter with a "soft first-story" design very similar to the Imperial County Service-
Building in El Centre. Maximum acceleration of about 40X g at the base, and 50X g at theroof. For ooroparison, the 1979 Imperial County Services Building record had a peak valueof about 35X g at the base, and 60X g at the roof. The CSULA record is shorter Induration, and has less long period energy than the 1979 record. This CSULA building is
near the parking structure where the news reported a fatality from a falling concrete slat
o Loe Angeles - Sears Warehouse. Large 5-8tory reinforoed-concrete frame building about 14
km from the epicenter. Peak acceleration was 18X g at the base and 24X g at the xx»f
.
o Burbank - Records from two buildings in the Burbank au:-ea, 25 km northwest of the epicenter
aire included. A 6-6tory steel frame building had a base acceleration of about 25X g, and
roof acceleration of 30% g. A nearby 10-story reinforced concrete building had a roofacceleration of 55X.
Although definitive patterns await further data, it appears that San Marino, south ofPasadena, had relatively low shaking (20X g) though only 10 km from the epicenter. Many mo:
distant stations have greater amplitudes. Poeiona, 30 km east of the epicenter, had only 5X
ground acceleration (record not shown here), nuch lower than stations at a similar distance
to the West. A low acceleration record (5X g) was recorded at the base- isolated Countybuilding in Rancho Cucaroonga. Some of the buildings fixm which records were recovered
Buffered damage during the earthquake; damage information is incomplete at this time.
A standard data report on all CSMIP records will be completed In several weeks. To allow
ra^id distribution of these records, copies ar^ being sent to only a subset of our normal
mailing list. You may wish to make more copies to distribute to your colleagues.
246

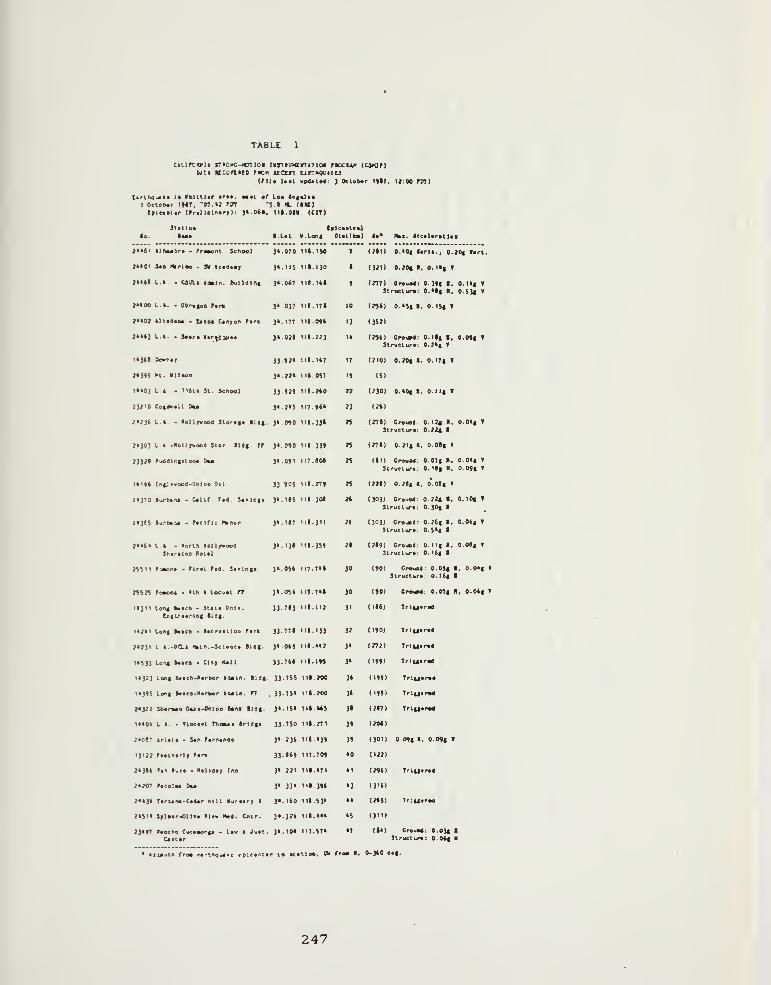
TABLE
ctLiPcmi STtovc-wnioi usTtuwiniTioi tuxtw (cjiar)MTt KunarD rnn uorr urrHOouu
(rilt lot gp«»t»4: 3 0«l«tar Itit, 12:00 niT)
C«rthqu«kt !• VUltUr ar**. «a»t of Let in|&l*eI OcUbar IMT, '07. •; rPT -}.l N. (IK)tplnilar (fral Islnarr) : 3<-0«l, IllOtV (CfT)
(a.
Sitiioa KpleaairaiI.Lat V.loi>( Dut(a) ti* >toi. Icealaratto*
2««tl llht«tra . rrasoDt School 3*. 070 III.IM
»<0l Saa MrlM • SH lca«aar St.nj III. 130
2K6I 1.1. - UULl t«li<. »ull4ln( 3<.0«1 ni.ltl
2««oa l.l. • Obrafoa rani 3< 037 iK.iTI
f*01 llta4«aa • tatoa Cannon fark 31.177 nt.Oti
2>ii3 l.l. - Saara VarfCIu**
U3it »o«ar
;(39S Kt. »ilaoa
1O0] L t. - nttn St School
;j?iO Coifvall Daa
3<.02l n«.223
33.»J« ii».i«7
3«.JJ« lis. 047
33.9J? nS.»0
3«.J«5 117. »»•
2>?36 L.l. - ollr>oo4 Storata Sldf. 31.090 I1S.33S
;<}0] I I . -xoi 1 jrvoo« Star iidi. rr 31.090 nt.339
?332S ru«dlii|Slooa Oaa 3>.091 117. SOS
Mi9i Iiitl««ao<-UaUa Oil 33 90S lit. 779
;<370 Su/'»an< • Calir. Tad. Sa<10(i 3«.lSS tit. 304
3«.H7 lit. 3"
3«.13t lit. 359
3«.05i 117. 7«t
3«.(»» 1IT.7«I
33.7t3 iit.iij
2»)ti B^rteU - riciric tkoor
2><6« LI. - •orlJl loUroooOSharatoa total
?SSii FsMina - ririt ra«. Sa<ln(a
ran romont • nt t locxat rr
14311 ton4 Baacb - Stata Onl*.
tA4Lr«arlB( lldg.
lt;il Loai taack - lacraalloo Part 33. 771 lit. 133
?>23i L t.-oai flatn -S<ltaca 1104. 3> 0(9 lll.>*2
II53) Lan4 SatO - Clt| Mall 33-7it llt.lM
1I32] La«( Soch-Darkor tdaln. Sldf. 33.7Si lit. 200
1I195 lon| Saace-Kirbor Idala. IT . 3).7S> lit. 200
2>32? SAaraaa Oata-Onloa tank I14|. 3*. IS* III.WS
ItlOt I 1. Tiacaat Tlioaai Irldfa 33 750 lit. 271
2>0t7 Irlata - San Parnando 3' 23t llt.«39
13122 riatAarlf Part 33.t«9 117.709
2>3>i 'an tura • Kolidar lu 3> 221 lit. •71
2>207 Paealaa Du 3* 33> llt.39t
2>l3t Tartana-Ca«ar Mil auraarr 1 3>.liO llt.S3>
2«SI> Srlaar-Ollaa Hav Mad. Cntr. 3>.32S llt.<«
23*97 Uaeke Cvcaaenfa - La> t Juat. 3k.lO< 117. S7k
Caatar
T (2(1) 0. 'Of tarlt., 0.20c Tart.
t (321) 0.20« •, O.I9| T
9 (277) 0r«us4: 0.39t 1. 0.lt| T
Structura: Olf R, O.S3( f
10 (25t) O.kSf i. O.IJt f
11 (W)
l« (25tl Cr«i«d: O.llf I, 0.09( T
Strvctura: 0.2kg T
n (210) o.20t a. o.i7( i
19 (S)
n (2301 o.kOf I, o.ii( T
23 (2«)
25 (271) Crouad; O.I2« 1. 0.0«( f
Structura. 0.22t
2S (27t) 0.21| 1. O.Otf I
n (ID Crouad: 0.07| R, 0.0«t «
Structura: 0. It* N, 0.09t '
25 (22t) 0.291 I. o'.Otf I
1* (303) Crouod 22* 1. O.lOf f
Structura: 0.30* I
26 (3031 Croxid: 0.2(| I, O.Oif «
Structura. 0.5k| I
21 (2t9) Crovsd O.llf I, O.Otf 1
Structura: 0. I(f I
30 (90) Crouad: O.Off i, O.Okf f
Structura. 0. Itf i
JO (90) Cnxad: 0.01* R.
31 (IIS) Trlffarat
32 (190) Trlffaraf
3« (272) Trlffa raf
J» (199) Trlffara*
3» (199) Trtutrad
3» (199) 7rlutr*4
3> (2t7) TrluarM
39 (201)
39 (301) 09| I. 0.09g »
• (122)
• 1 (29S) 7rl|fira«
«3 1 31t)
• • (2t5) 7r:fiira«
•J (311)
•7 (to Cn>ua«: e.03t 1Structura: O.Otf II
* Atlvuth fro* *art.hqutRc tplctr.fr to itAtl ee, Ctf fro* . 0-360 6tg.
247

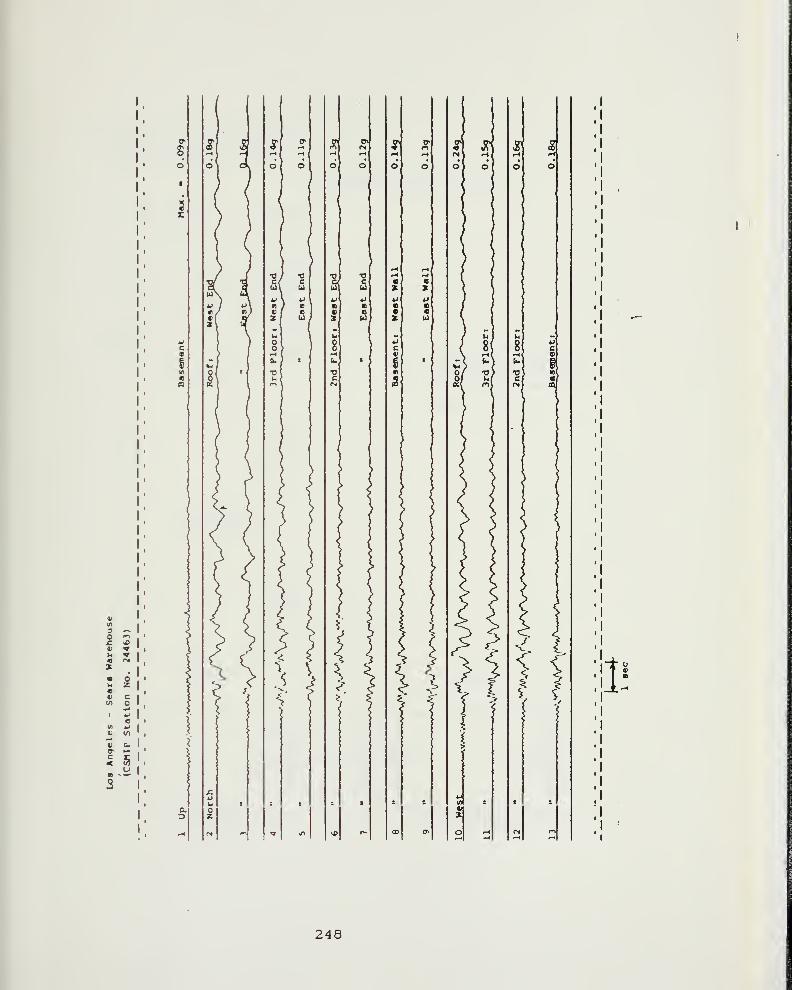
0>
so
I
3z
o
3 ^o <-»
01 V)
41 C
o
3
a
^
V
X
V
.
^ 5
1:
248

\
I
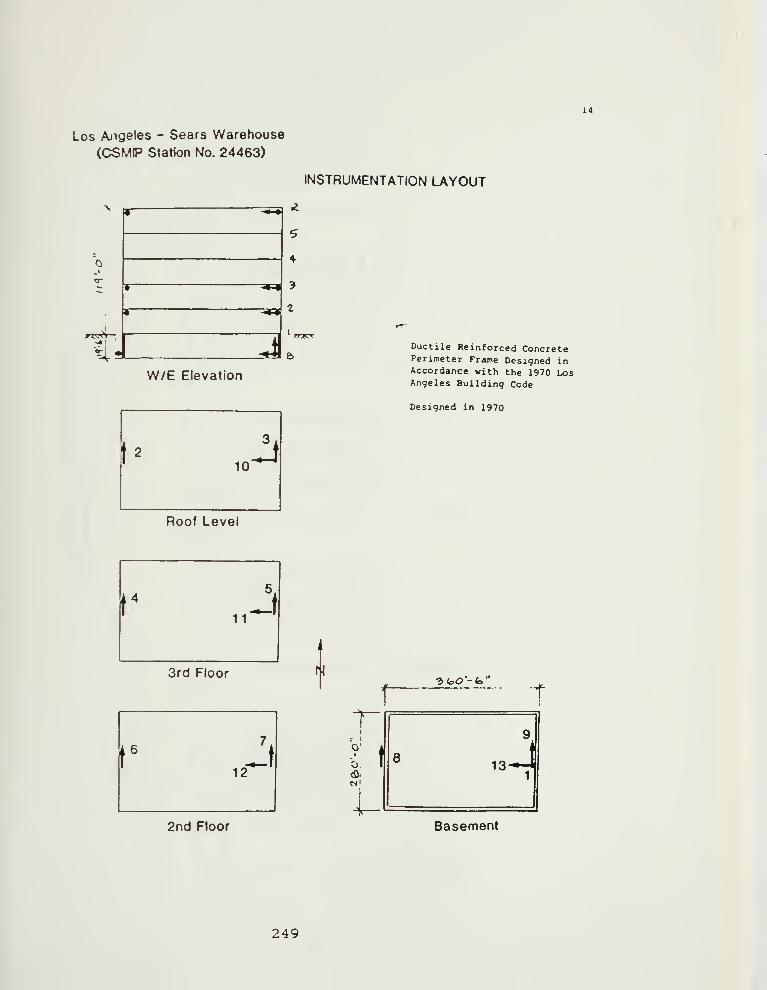
X4
Los Ajigeles - Sears Warehouse
(CSMIP Station No. 24463)
vr
%W/E Elevation
INSTRUMENTATION LAYOUT
2
Roof Level
Ductile Reinforced ConcretePerimeter Frame Designed inAccordance with the 1970 LosAngeles Building Code
Designed in 1970
3rd Floor r^JfaO'-fo'
2nd Floor Basement
249
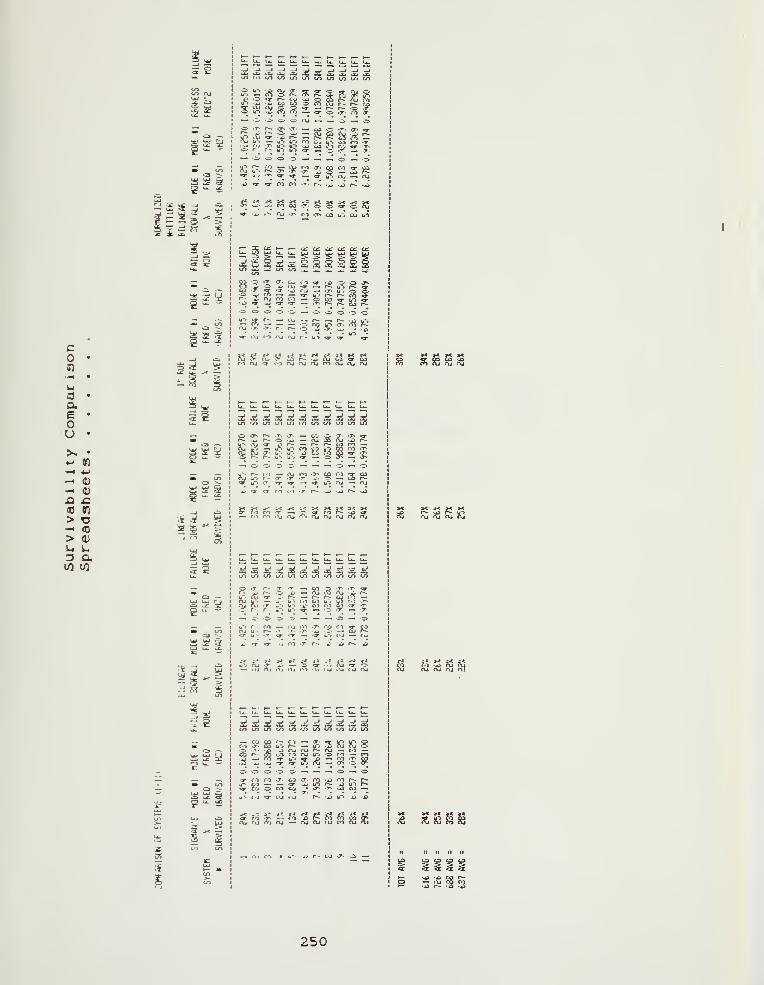
^ K_ ,_ ^ , ^ ^ ^__ ^_ ^ ^ ^U- U- u li
<r ^ :^ •Xi .-^ si s; 2! ffl .tI"" '" tn m U'l in
enen ru j^
U-.nS 94 ?: 3; ?:
=.
%i^
CJ >; •J 03 S S r-r.->
^ ^ 5 ;y i« rt z £ •X' ;=o
— -• o o C' t-u — — C* — o—. ^ .r. r- •T- .T- ,^ ro .— .-r. .T- ,^"
C3I _!C
.V l;w ;« ^ v^J
iS f-M A r^
y U-* ro"'^ r.T O't
•^ ^ ';
«r •T- _ T-— c- ::- O o — — _ O « =>
i
C9tn S
r^•7«9-* r.-j
*7--•T-
?<
CO s-L, •^ •^ 01 o-j •T' r- *. w r- >*>
rj ^ Ji _* w-^ »-fc* ^ ^ i*J
^ = ^ 5 ..- ^5 - r; 1 S^ X - " ^Z X JCi u-,
CO
Q.eou
*-> (0
^-4 0)•-^ 0)
A x:<0 a:
> •o-H <0
> 0)
u u3 o.01 c/2
•a- /? V^._ ^
tnOl
tv s^
^ •^
1_
:ri 3l %^
§-"*
,^15
^ a«x t
^ )^ i'CD L^
s*; i^ a2- •£
4 a! yi^ ^ " r
CJ —^ 1^ c^CD I* —
^ in
a ^ 3z:
_^ ,^
^ ^* ?>
:^s^ S-4 **'
^ ^
^ t^ y
'^ :£ a
g « 5.
•^ 5 ot fi S >= § S Sr S Sj^" -•-• I"*- <"«j 'T- ro 'T* CO u"/ CO *•">
Ix- ^^ L^ Lk L^. LdJ LlJ ^J ^J ^j 1.
1
m fcj^ 1-^ en en ^ ,_ ;fc_^- ^ '^
in —.*.--.-*.
Oi Z' -T' .T- CO t'O «» •*> -3- .^ «T*CO ^ S 4> I'U T — I— Ul (^ «-CO .y «. ^ ^ ru —
.
x- U-' o 5-—' -V
'^'* "^ — "S" u ' f^ r- oS «r- 2 Oi CO i o —. o 00 .^T 10 5
tj tr -^ ^- ^:r —
•
•^- n- r-- OD r^^ o <!> :^ « .c> ^ o => ou'l g- r- -^ ixj -.« r^ — I
—
.i> U-*n *T' tr r* r* "^ '^ »*"> "• •"•» •**r\4 iT- "T- r • r^ z> •^ -T- -x^ * £>tr- ixj (O t\j iXi r • u ^ *3^ *» **
«x
cn fJ^ tn tn in «n CO tn m tn in
<^ iT* r^ -T. cr- —. &-J w T- -T* -^r^ ^ r- -c- ^ — »xj 00 cu -45 r-
cu u ' — I?' b- m CO ij-* 55 PI -TVru ru T uj ir- .0 CO ro 03 »• -r-
— o> -c- o- c- — — -^ o —
•
o«-• r* 1-* — iXl 01 -7^ CO CO -T COoj g-* r- T -T .7- 4;. T « CO r-«>- u-> -T «3- o- —
•
«* u"* <\j — ru
*:« -^ cr ro lO -r- r- -.o ^ r- -^
»< >i rf-e i-= *< i< >« a* X s; »«^ CO fo -T- -* —• ^ CO r* ^D w
-^ fo r.i ixi nj ro rtj nj fXj fXi nj
LnLninlrjtnLricncncntnm
Z> <J- r- -x- •» — 03 P J^ •» crr- x»r^ o -i* -^ruLOCVj ui
—
li" aj «• * r^ -" r- r- CO ro —
.
nj u-' — J*. u-< 1*0 05 u-< 55 'O cr-nj ru 'T- M-. ij-. -x- o3 to od •t <t-— r-- r- y~. u*. «a- -* ;• 'T- — -t-
_; r" 3^-'
-I -I _; -I =>
sr - CO
•y ;vi-or-
li
roCO
CO
ro T- r- *:, ^ r- ^*i
tn tn en (Ji en rn en uT (n LTi en
— CO CO r-~ ro — 0-- «» u"* w"' C'n* O"- CO U-* r- —. ir* i Oj (Vj -t^o '? 'X- fcj ru oj c^ nj -^ ro ^-OD r- uo «.o ro ru ir» r- ro —
•
ro^ —. fo rr U-- ^ i3 — ro 'T. M
^ ro ro T- 03 -J" oi x* fo r— r-J*- &3 — — «a- ^ u^ r- 4i L"< P-«» CO O CO Co • .T^ -r uO C3 -*
u'- ti -a- i\j '^j r— ji tj"« *j ^
O" ro 'T -— ro ^ r- CO fo CO g^oj fu n"j cu — ru ru ru CO ru ni
-^ ri I ro
X X >< Xtf 00 CO .Dm cu OJ OJ
>« >e X Xr- sii r- u"iru nj ru nj
X »« »< X >«
i\j f\j c^j en fG
II II II M
^ ^ ^ ^<x ^ <r <x
^^> ^ CO r--^ t"u c6 ro^J^ r- -o -45
250

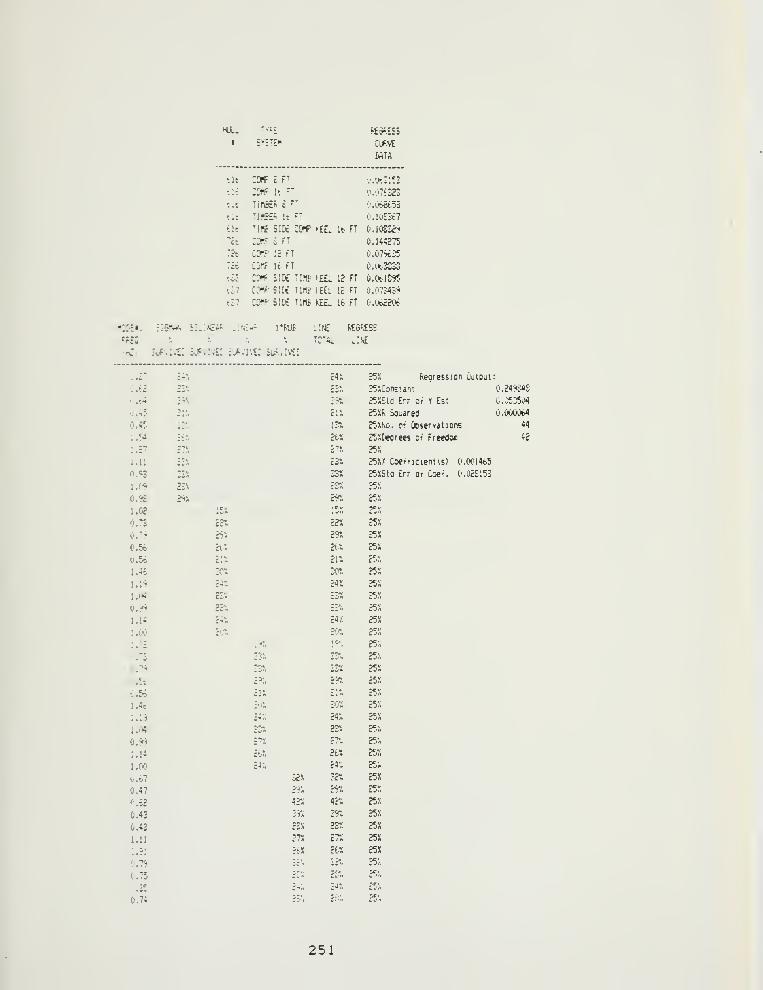
HULL TVIE. f(£6(<£S5
1 eye'E" CURVE
'.It cw EFT
WTfl
v.ot::=3; ; ::ofif \i
~0.076323
^it TIHBen £"
O.Ciwtoi
tit Ti-pEF If n 0.10£ic7
tit TINf SIEt COff >Etl lb FT 0.103329
7£:. :orJ^ £ FT 0.144275
TSt COrff' 12 FT 0.079635
7«. CoriF- It FT 0.0t.3S3S
'.He COf sue TI* »ill 12 FT 0.0t.lS95
in COnF- SUt TIM? -EEl Ic FT 0.0754E9
ill con'' 5IK TINt HEl 16 FT 0.062206
"t'KI. :";5?M. il. INEW -;'.IH* I'ffJi .!NE RE6RESE
fFii ),-.. r. x 'CTAl w.' t£
•nZ jc.v.i: SLiF .'.'^: ij'. i\z: iU'.IVE:
24i 2jX degression ujiDut,,.:- ^'"l
:.ii ^Jm E3« 3T.;CDrtstar,t. 0.249848
'j.iA ;?•/. riii Jf.XStd Err ot Y Est C.C'5j5rtJ4
o..;? £;•„ clX 25'aF Souarefl .00(1064
0.45 ;3" :3a 2f'XNo. c» Ccservalions 44
;.f4 it:. dtx 25XIieqrees o^ Freedoe 42
;.:7 E7X :"« 35S
1.11 i3i E3X 25r.X Coe^ nc lent ts) 0. ("01465
0.93 ^^A 33X 25XStQ Err ot Coet. 0.02£i53
l.(W 2£X-.rwi
25.x
ii.% ?9X 29y, 257,
1.0? '.11• ev
25?.
0.7S c2X £2X 25X
(..7h iSl 2r, 25X
O.K. H'J. 2(.S 25X
0.5t 2;i 2n 25.;'.
1.16 3ex 3or. 25S
i.:9 2« 3« 25X
!.';«) 23X £3X 25X
O.f^ 22!. ££'. i^''i
1.14 c« Siy. 25X
1.00 £or. 20X 25X
; ,r-2 ;?" 19'. 25X
>>.?3 rsx 33-/. 25>.
0.79 335! 33X 25X
0.5t. :?'/. Ell" 25X
0.56 £1X Er- 25"
I. It l.-ji 3«JX 25X
Mil £4*,; 24;, 25X
1..VI 2S-X 23i; 25x
0.9^ 'z-^ip-».
25.;
:.i4 ii' 26X 25;
1.00 Er,; 24'„ 25.;
0.67 32X •2X 25.x
0.«7 29- 29'/. 25X
0.62 42S 42; 257.
0.43 3% 39; 25X
0.43 2EX 23X 25X
1.11 27X £T; 25X
0.9! 26X 2tX 25X
0.79
0.75' -*;
0.74
2*1'/. E5.X
251

APPENDIX 5
1. "3D0FRUB" Isolator (EL Centro)Input Data File
2. "3D0FRUB" Isolator (EL Centro)Output File
3. "3D0FRUB" Isolator (NORM DD2)Input Data File
4. "3D0FRUB" Isolator (NORM DD2)Output File
5. Isolator Equivalent ModulusStiffness Spreadsheets
6. Required Isolator CharacteristicsSpreadsheet
252

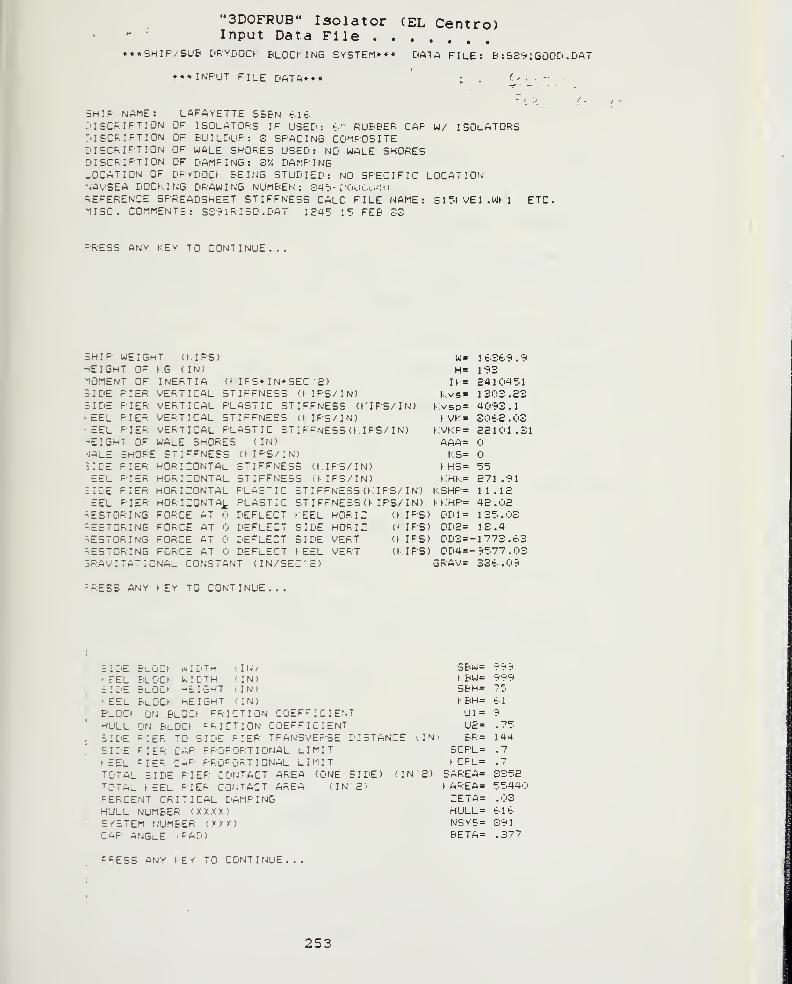
"3D0FRUB" Isolator (EL Centro)' * Input Data File• ••SHIF/SUB DRYDOCK BLOC» ING SYSTEM*** DATA FILE: E< :SS'?1 GOOD .DAT
• •INPUT FILE DATA***'
r .. Cr. - .
SHIP NAME: LAFAYETTE S5&N k 1 ^.
JISCPIFTION OF ISOLATORS IF USED: t" RUBBER CAP W/ ISOLATORS7'! SCRIPT ION OF BUILDUP: 3 SPACING COMPOSITEJ I SCRIPT I ON OF WALE SHORES USED: NO WALE SHORESD I SCRIPT I ON OF DAMPING: 3'/. DAMPING_OCmTION of dp t dock being STUDIED: NO SPECIFIC LOCATIONNAVSEA DOCKING DRAWING NUMBER: Sat- i:-0>.)i ...-:
)
REFERENCE SPREADSHEET STIFFNESS CALC FILE NAME;"1ISC. COMMENTS: S3?1R 1 50 . DAT 1245 15 FEB S3
Slf.KVEl ,Wt 1 ETC,
='RESS ANY KEY TO CONTINUE.
5HIP WEIGHTHEIGHT OF KGMOMENT OF5 IDE PIER5 IDE PIERr.EEL PIER• EEL PIERHEIGHT OF•JALE SHORE
(KIPS)(IN)
INERTIA (KIPS*
I
VERTICAL 3TIFFNEVERTICAL PLASTICVERTICAL STIFFNEVERTICAL PLASTICWALE SHORES (INSTIF-NEES (KIPS
:IDEEEL
3 IDEEEL
PIERPIERPIERPIER
HORIZONTALHORIZONTALHORIZONTALHORIZONTALFORCE ATFORCE ATFORCE AT <:>
FORCE AT
[C
RESTORING FORCE AT DEFLECT=E5T0RING FORCE AT DEFLECTRESTORING FORCE AT DEFLECTRESTORING FORCE AT DEFlECT3RAVITATI0NAL CONSTANT (IN/SE
STIFFSTIFFPLA5TPLASTDEFLEDEFLEDEFLEDEFlE
N*SEC E)SS O IPS/ IN)
STIFFNESS (KIPS/ IN)SS (KIPS/IN)STIFFNESS (KIPS/IN)
/IN)NESS (KIPS/ IN)NESS (K IPS/IN)IC STIFFNE55(KIPS/IN)
STIFFNESS(KIPS/IN)\ EELSIDESIDE^ EEL
HOPIZHORIZVERTVERT
(KIPS)(KIPS)(KIPS)(KIPS)
W=
H=
IK =
Kvs =
t vsp =
KVK =
KVKP=AAA=KS=
KHS=t:HK=
KSHP=K.KHP=
GD1 =
QDE=DD3=QD4=
GRAV=
I tSb'ri .'?
19324104511303. S34093 .
1
S0t2 .03ESlOl .31
cc
£71 .91
II .1242 . 021 35 . 0313.4
-1 773.63-9577.0333k .09
:RESS ANY KEY TO CONTINUE.
= i ZiE BwC'C> wIl'TH , IN^' EEL BlDO WIE'TH 'IN)ilDE BL-OCf nEIGHT aN)» EEL Block height 'in)
BLOCK ON BLOCK FRICTION COEFFICIENTHULL ON BLOCK f^RICTION COEFFICIENTSIDE PIER TO SIDE PIER TPAN3VEP5E DISTANCE iIN;
SIDE PIER CAP PROPORTIONAL LIMITf EEL =IER CAP PROPORTIONAL LIMITTOTAL SIDE PIER CONTACT AREA (ONE SIDE) (IN 2)
TOTAL > EEL PIER COIJTf,rT AREA 'IN 2/
PERCENT CRITICAL DAMPINGHULL NUMBER (XXXX)SYSTEM NUMBER (XXX)CAP ANGlE I FAD)
3Bw= 999K&W= 999S&H= 75KBH= blUl = 9
U2= -?=;
BP = 1445CPL = .7
KCPL = .7
SAREA= 3352\ AREA= 5544(ZETA= .03HULL = bibNSy5= S91BETA= .377
pi^ESS ANY KEY TO CONTINUE.. i
253

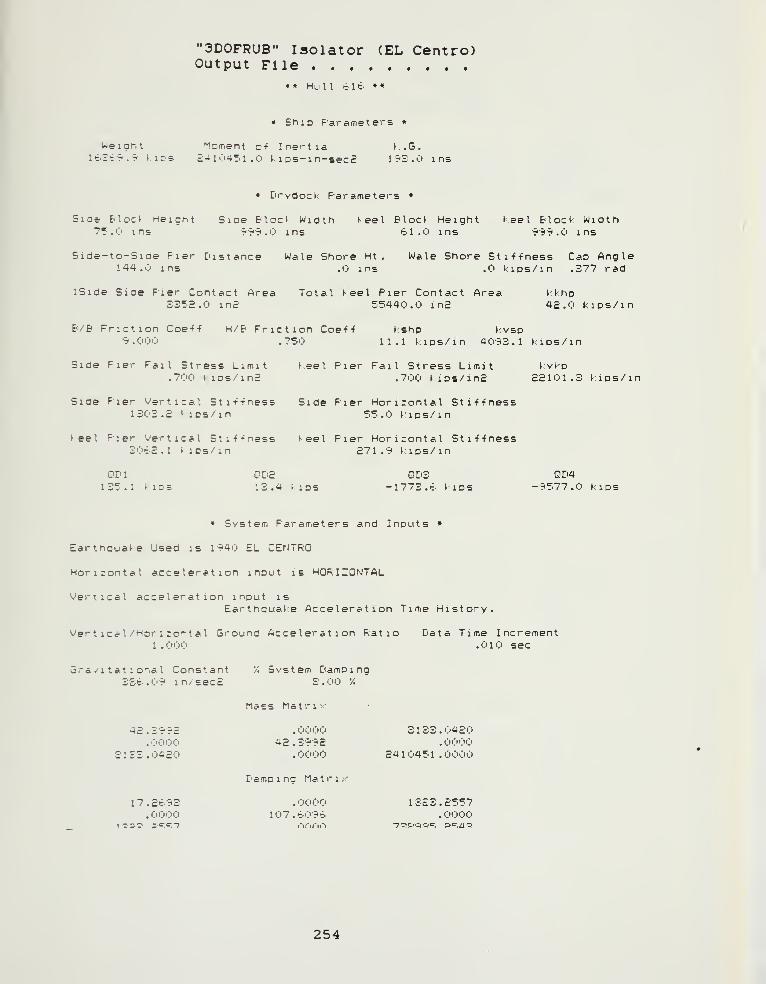
"3D0FRUB" Isolator (EL Centro)Output File
* • Hu I T €16 •
*
• ShiD Farameters *
Weight Moment o-f Inertia t .G.ItE-:?.-? kiDs £410451.0 kips-in-secP If-S-O ins
• Drydock Parameters •
Side Block Height Sioe Block Width feel Block Height keel Block Width75.0 ins T<:'9.0 I ns 61.0 ins 999.0 ins
5ide-to-5ide Pier Distance Wale Shore Ht . Wale Shore Sti-f-fness Cap Angle144.0 ins ,0 ins .0 kips/ in .377 rad
ISide Siae Pier Contact Area Total feel Pier Contact Area kkhp3352.0 in2 55440.0 i nE 4E.0 kips/ in
B/B Pnction Coe-f-f H/B Friction Coe-f-f kshp kvsp9.000 .750 11.1 kips/in 4093.1 kips/in
Side Pier Fail Stress Limit keel Pier Fail Stress Limit kvkp.700 k IDS/ma .700 kips/mS SSI 01. 3 kips/ in
Side Pier Vertical Stittness Side Pier Horizontal Sti-f-fness1303.S k IDS/ in 55.0 kips/ in
keel Pier Vertical Sti-f-fness keel Pier Horirontal Sti-f-fness3065.1 kiDs/in S71 .9 kips/in
DDl QDS QD3 QD4135.1 kiDS 13.4 y IDS -1773.6 kips -9577.0 kips
• System Parameters and Inputs •
Earthouafe Used is 194i:. EL CENTRO
Horizontal acceleration input is HORIZONTAL
Vertical acceleration input isEarthauake Acceleration Time History.
Ver t 1 ca I /Hor i ront al Ground Acceleration Ratio Data Time Increment1 ."jOO .01'!) sec
Gravitational Constant "'. System Damping3S6. . C'9 1 n / = ec £ £ . 'I'O '/.
Mass Matrix
4£ . S99S . 0000 S 1 S3 . 0420.0000 4S.399S .0000
3 1 33 . 04S0 . 0000 S4 1 045 1 . 00>J0
E'amping Matrix
17.5693 .0000 1323.5557.0000 107.6096 .0000
254

C'l
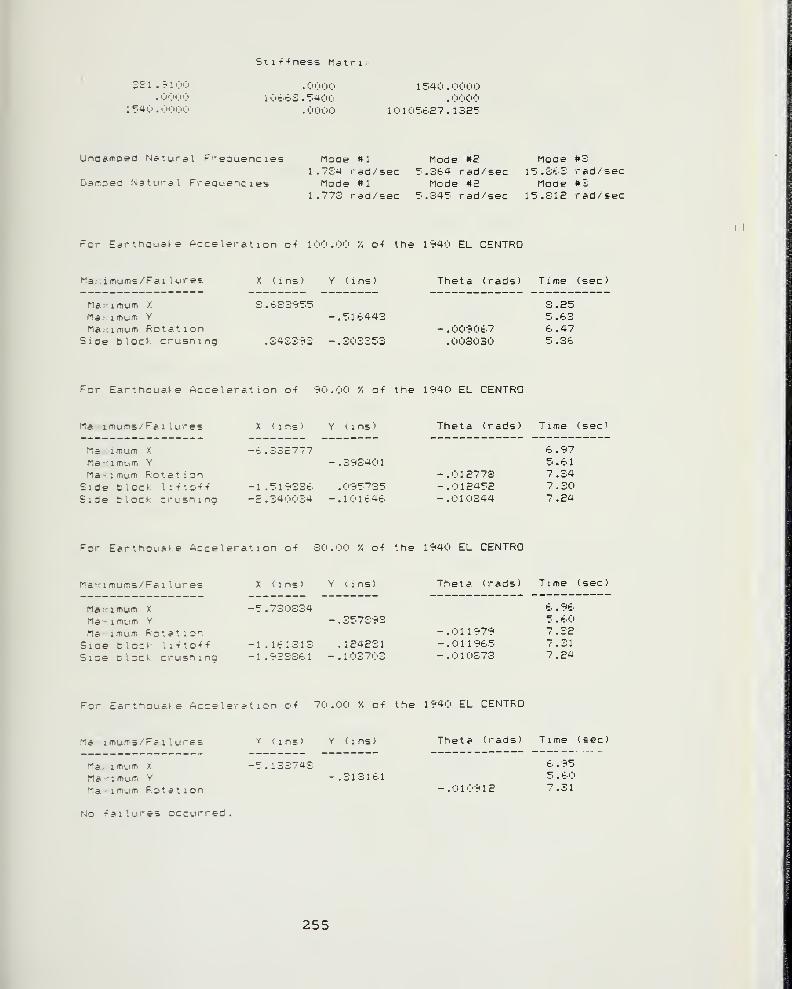
St 1 1-f ness Mat r 1
2E1 . 7*100
. 0<J0(
1 540 . 'JOO'!
. '-"i'OO
1 Oit-3 . 5400. OOC'O
1 540 .0000. O'JOO
101 05t.£7. 1325
Undsmoea Natural Frequencies Mooe #1 Mode #5 Mode #31.7E4 rad/sec 5.St-4 rad/sec l5.St-3 rad/sec
Damoea Natui^al Freauencies Mode #1 Mode #£ Moae #31.773 rad/sec 5.345 rad/sec 15.312 rad/sec
For Ea^thaua^e Acceleration o+ 100.00 */. o-f the r-^40 EL CENTRO
Ma;, i mums/Fa 1 lures
Maximum /
Maximum YMax.imum Rotation
Siae block crusning
X (ins) Y (ins) Theta (rads) Time sec)
S.6S3955 S.E5-.51t.443
- .00r<0t.7
5.b36.47
.34S39S -.303353 .003030 5.Sb
For Earthauate Acceleration o-f 90.00 '/. o-f the 1940 EL CENTRO
Ma: imums/Fai lures
Maximum X
Maximum Y
Maximum RotationSide block 1
1 -ft o-f -f
Side block crusning
X (ms)
-t. .335777
Y (ins)
.393401
-1 .519336 .095735-£. 340034 -.101i:-4b
Theta (rads) Time (sec)
b .975.61
-.012773 7.34-.012452 7.30-.010344 7.24
For Earthquake Acceleration o-f 30.00 '/. o-f the 1940 EL CENTRO
Maximums/Fai lures
Maximum X
Maximum YMa- imum RotationSiae block li-fto-f-f
Sice block crusnina
X (ins) Y (ins)
-5.730334-.357S9S
-1 . IblSlS .124231-1 .933361 - . 103703
Theta (rads) Time (sec)
6 . 965 . 60
-.011 979 7 . 32-.011 965 7.31-.010373 7.24
Far Earthauat e Acceleration o-f 70.00 '/. o-f the 1940 EL CENTRO
Ma. 1 muiT' 5 / Fr : l u res
Ma.: imun-i ;
Maximum Y
Maximum Rotation
No -failures occurred
,v (ins) Y (ins)
-5.133743-.313161
Theta (rads) Time (sec:
-.010912
6 . 955 . 607.31
255

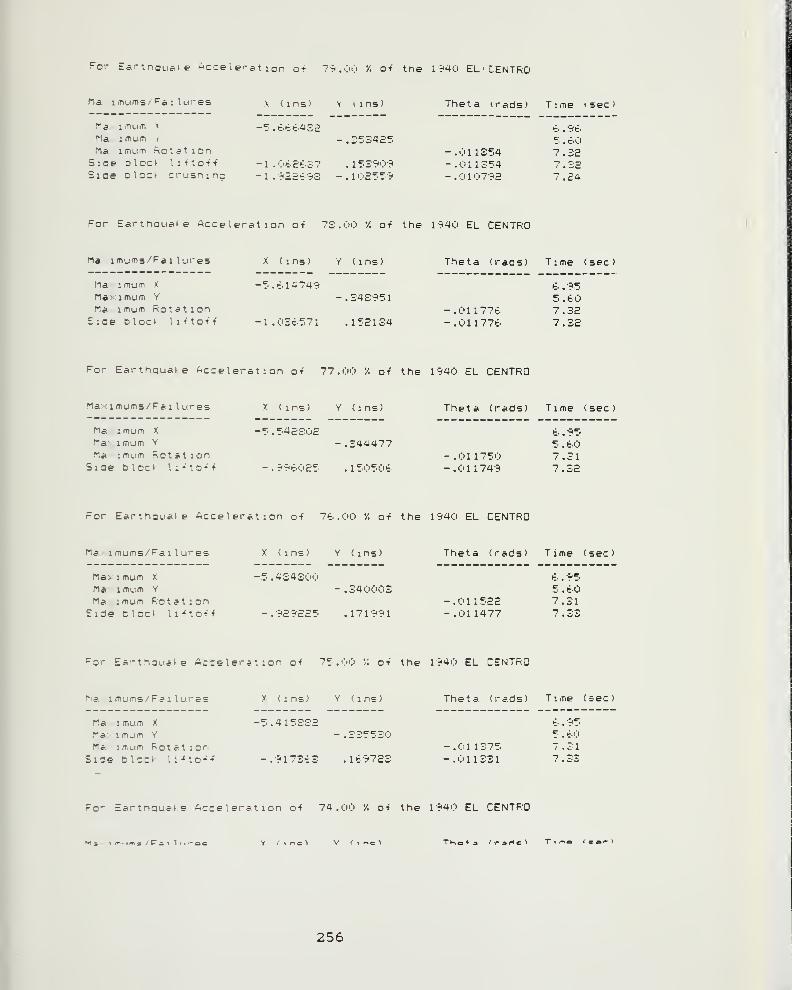
For Eartnauote ncceie'-at ion of 7:*. 00 '/> oi the 1^40 EL'CENTRO
Ma i.TiLims. Fsi lures x (ins) V (ins) Theta trads) Time (see)
>Z- . 'T*t'
5 .t.O
-.011354 7.32-.011354 7.32-.0107'5<2 7.34
Ma -KnuiTi X -5 . t-iit-iss
Ma. iffium I- -.353425Ma 1 mum RotationSide block li + to-f-f -1 .';'b2tE7 .153909Side Dloct crushing - 1 .r^=.S'z^r'^3 -.102559
For Ea^thaua^e Acceleration o-f 73.00 '/. o-f the 1940 EL CENTRO
Ma imums^Fai lures X (ins) Y (ins) Theta (rads) Time (sec)
Maximum X -5.614749Maximum Y -.343951Ma imum RotationSiae bloct littot-f -1 .03t571 .152134
6 . 955 . 60
-.011776 7.32-.011776 7.32
For Earthqua>e (acceleration o-f 77.00 '/. o-f the 1940 EL CENTRO
Maximums/Fai lures X (ins) Y (ins) Theta (rads) Time (sec)
t' . 955.60
-.011750 7.31-.011749 7.32
Maximum X -5.542302Ma-:imum Y -.344477Ma imum Rotation
Siae Dloc>- li-'to-f-f -.996025 .150506
For EarthQuale Hcceleration o-f 76.00 '/. o-f the 1940 EL CENTRO
Max 1 mums /P'a 1 lu-es X (ins) Y (ins) Theta (rads) Time (sec)
Maximum X -5.4343i;i0 6. 95Ma imum Y -.340003 5.60Ma imum Rotation -.011522 7.31Bide blocl li-fto-f-f -.929225 .171991 -.011477 7.33
For Ea^thgua^e Acceleration o-f 75.00 '/. o+ the 1940 EL CENTRO
ha imums/ Fa : lu'-es X (ins) Y 'ins) Theta (rads) Time (sec)
6 . 955 . t'O
-.011375 7.31-.011331 7.33
Maximum X -5.415332Maximum Y -.325530Ma imum Rotation
Side block li-fto-f-f -.917363 .169723
For Eartnauake Acceleration o-f 74.00 */. o-f the 1940 EL CENTRO
256

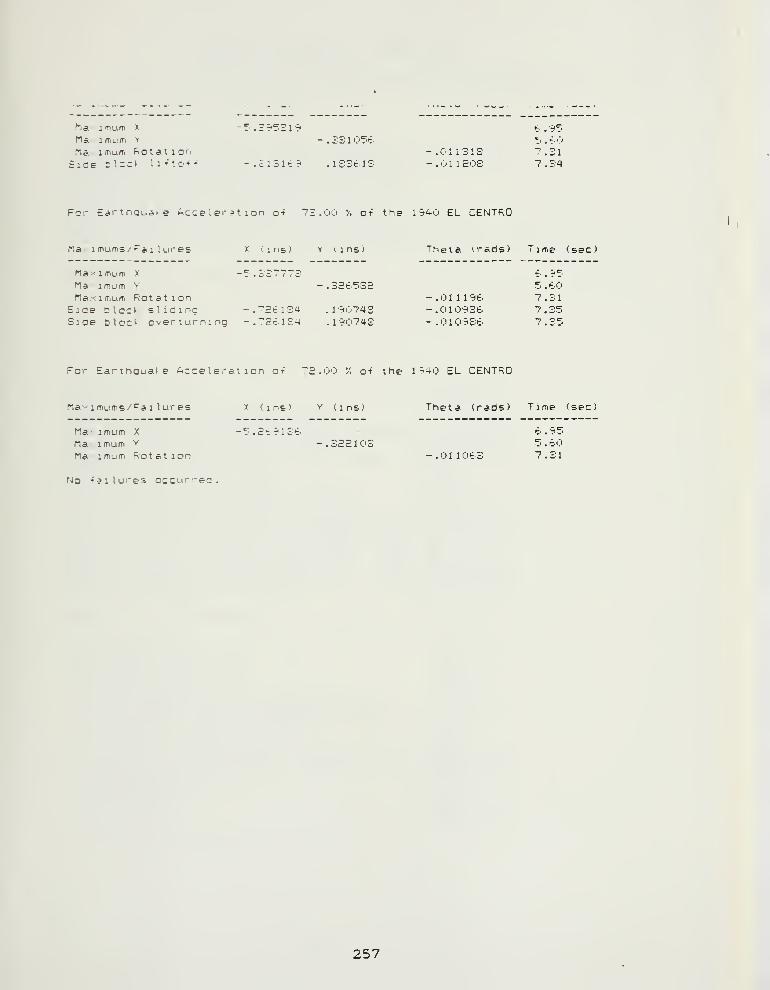
ha loiLifD X
M» irTiLim Y
Mc..icDum Rotation:ide sleek li-fto-f-
;3105t.
SlSlt?' .ISStlS- . C'l 1 3 1
3
-.011 SOS
b . 'r*'
7.34
For Eai- tnguat- e Acceleration o+ 73.00 % ot the 1 ^^0 EL CENTRO
na imums/Fai lures
Ma>- imuoi X
Ma iffium YMa 1 mum Rot a t i on
Side block slidingSide blocJ overturnina
X ( 1 ns ) Y I 1 ns J
- .33b5S£
'SblSa .1907as'c^ilSa .190743
Theta n-ads) Time (sec)
i- . 955.K0
- . <:> 11
1
9<i. 7.31- .01093b 7.35— . ('1 1 r)9£;t' 7.35
For Earthquake Acceleration o+ ~S.OO '/. o-f the 1940 EL CENTRO
Ma.-- imums/ ^a 1 lures
Maximum X
Ma- 1 mum Y
Ma: imum Rotation
X ( : ns) Y (ins)
5.ct?13'^--.322103
Theta (rads) Time (sec)
- .01 1063
b .955.t.0
7.31
No -fail ur e; :cu'''-ec .
257

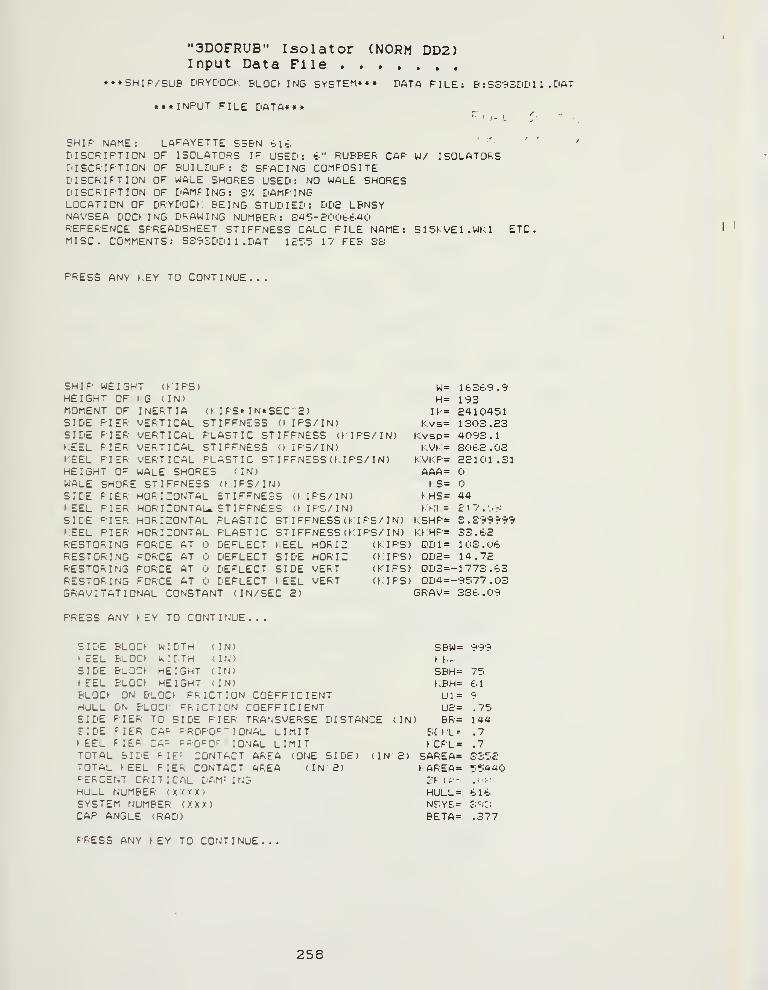
"3D0FRUB" Isolator (NORM DD2)Input Data File
• ••SHIP/SUP DRYDOCK BLOCtING SySTEM««« DATA FILE: B :SS'?3DD1 1 . DAT
«««IMPUT FILE DATA«»«^'1- L
SHIP NAME: LAFAYETTE SSBN bit. ' '
D I SCRIPT I ON OF ISOLATORS IF USED: b" RUBBER CAP W/ ISOLATORSDISCRIFTION OF BUILDUP: S SPACING COMPOSITED I SCR I FT I ON OF WALE SHORES USED: NO WALE SHORESDISCRIFTION OF DAMPING: SV. DAMPINGLOCATION OF DRYDOCf BEING STUDIED: DD2 LBNSYNAVSEA DOCKING DRAWING NUMBER: S4T.-E00t.K40REFERENCE SPREADSHEET STIFFNESS CALC FILE NAME: S15KVE1.WK1 ETC.MISC. COMMENTS: S3?£DDl 1 . DAT lEZZ 17 FEB S&
PRESS ANY t,EY TO CONTINUE.
SHIP WEIGHTHEIGHT OFMOMENT OFSIDE PIERSIDE PIERKEEL PIERKEEL PIERHEIGHT OFWALE SHORE
( K I F'S )
y.G (IN)INERTIAVERTICALVERTICALVERTICALVERTICALWALE SHORESTIFFNESS
(KIPS* IN* SEC 2)STIFt^NESS (t IPS/IN)PLASTIC STIFFNESS (KIPS/IN)STIFFNESS (KIPS/IN)PLASTIC STIFFNE5S(KIPS/IN)
< IN)(t IPS/ IN)
SIDEKEELSIDEKEEL
PIERPIERPIERPIER
HORIZONTAL STIFFNESSHORIZONTAL*. STIFFNESS
(t IPS/ IN)(\ I PS/ IN)
RESTORINGRESTORINGRESTORINGRESTORING
HORIZONTALHORIZONTALFORCE ATFORCE ATFORCE ATFORCE AT
PLASTICPLASTICDE'LECTDEFLECTDEFLECTDEFLECT
STIFFNESS (KIPS/ IN)
STIFFNESS (KIPS/ IN)
t.:EEL
SIDESIDEt EEL
HORIZHOP I
Z
VERTVERT
(KIPS)(KIPS)( K I PS
)
(KIPS)GRAVITATIONAL CONSTANT (IN/SEC 2)
W=
H=Ik =
Kvs=Kvsp=KW =
KVKP=AAA=KS=
KHS=KKl::=
KSHP=KKHP=QD1 =
QD2=QD3=QD4=
GRAV=
l-=(3
24104511303.234093 .
1
SOt.2 . OS22101 .31
44ci7.s.-;
S .Sri'9'?'5'5
103 .0614.72
-1773.83-9577.03336 .09
PRESS ANY KEY TO CONTINUE.
SIDEk EELSIDEf EELBLOCKHULLSIDESIDEKEEL
BLOC>BLOCIBLOCKPLOCt
WIDTHWiEiTHHEIGHTHEIGHT
( IN)(IN)(IN)( IN)
ON &LOC^ FRICTION COEFFICIENTON BLOCl FRICTION COEFFICIENTPIER TO SIDE PIER TRAr.SVERSE DISTANCEPIER CAP PROPOF-IONAL LIMITFIER CAF FPOPO^" lONAL LIMIT
( IN)
TOTAL SIDE PIE- CONTACT AREATOTAL KEEL PIER CONTACT AREAPERCENT CRITICAL DAMPINGHULL NUMBER ( X '^ X X )
SYSTEM NUMBER (XXX)CAP ANGLE (RAD)
(ONE SIDE)(IN 2)
(IN 2)
SBW= 999Kl..
SBH= 75KBH= tlUl = •z*
U&= .75BR = 144
SCKL- .7
KCPL = .7
SAREA= 3352KAREA= 554402^ 1 A'
-. '
'•"'
HULL= bibNr.YE.= ?'-':
BETA= .377
PRESS ANY t EY TO CONTINUE,
258

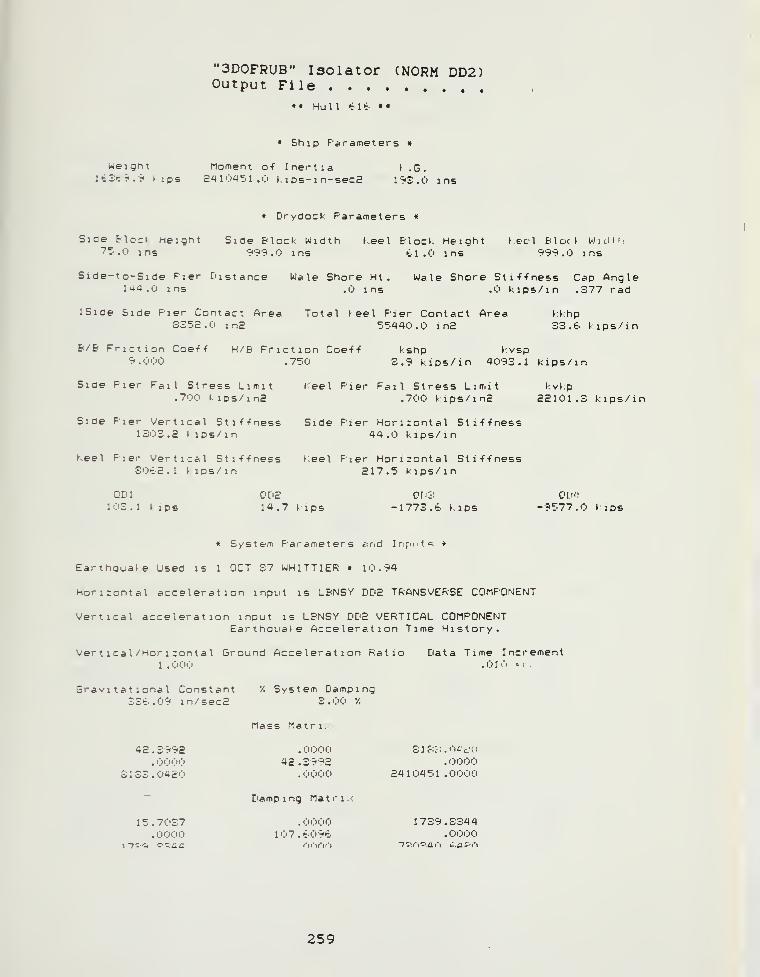
"3D0FRUB" Isolator (NORM DD2)Output File
• • Hu 1 I t- 1 6 » •
* 5h 1 p Farameters «
Weight Moment o-f Inertia t .G.leSt^.'zi tips SaiOaT'l ,0 kips-in-sec2 192.0 ins
« Drydock Parameters •
Siae Block Height Side Block Width tee I Block Height tecl Block WjtlHi"^^.0 ins 9r''?.0 ins tl .0 ins ^SS .0 ins
Side-to-Side Pier Distance Wale Shore Ht . Wale Shore Sti-f-fness Cap Anglewa.O ins .0 ins .0 kips/in .377 rad
iSide Side Pier Contact Area Total Keel Pier Contact Area kkhp2252.0 in2 55440.0 i n2 33. & kips/ in
B/B Friction Coe-f-f H/B Friction Coe-f'f kshp kvsp9.000 .750 S.S kips/in 4093.1 kips/in
Side Fier Fail Stress Limit keel Pier Fail Stress Limit kvkp.700 t ips/in2 .700 kips/inS 2E101 .3 kips/in
Side Pier Vertical Sti-f-fness Side Pier Horizontal Sti-f-fness1303.2 kips/in 44.0 kips/in
Keel Pier Vertical Sti-f-fness Keel Fier Horizontal Sti-f-fnessSOt-2 . 1 t ips/in 217.5 kips/in
QDl 0D2 Ql'3 QUO103. 1 kips 14.7 kips -1773.6 kips -9577.0 kips
• S/stem F'arameters ^rid Irifuit'i *
Earthquake Used is 1 OCT 37 WHITTIER • 10.94
Horizontal acceleration input is LBNSY DD2 TRANSVERSE COMPONENT
Vertical acceleration input is LBNSY DD2 VERTICAL COMPONENTEarthpLiate Acceleration Time History.
Vert ical /Horizontal Ground Acceleration Ratio Data Time Increment1 .000 .01 1'l ' •
Gravitational Constant '/. System DampingSSt. .09 in/5ec2 3.00 7.
Mass Matrix
42 . 3 992 . 0000 S 1 f :':. 0^' cO
. C"J ij 42.3992 .0000S 1 E3 . 0420 . 0000 24 1 045 1 . 0000
~Eiamp 1 ng Matrix
15.7037 .0000 1739.S344.0000 107.6096 .0000
259

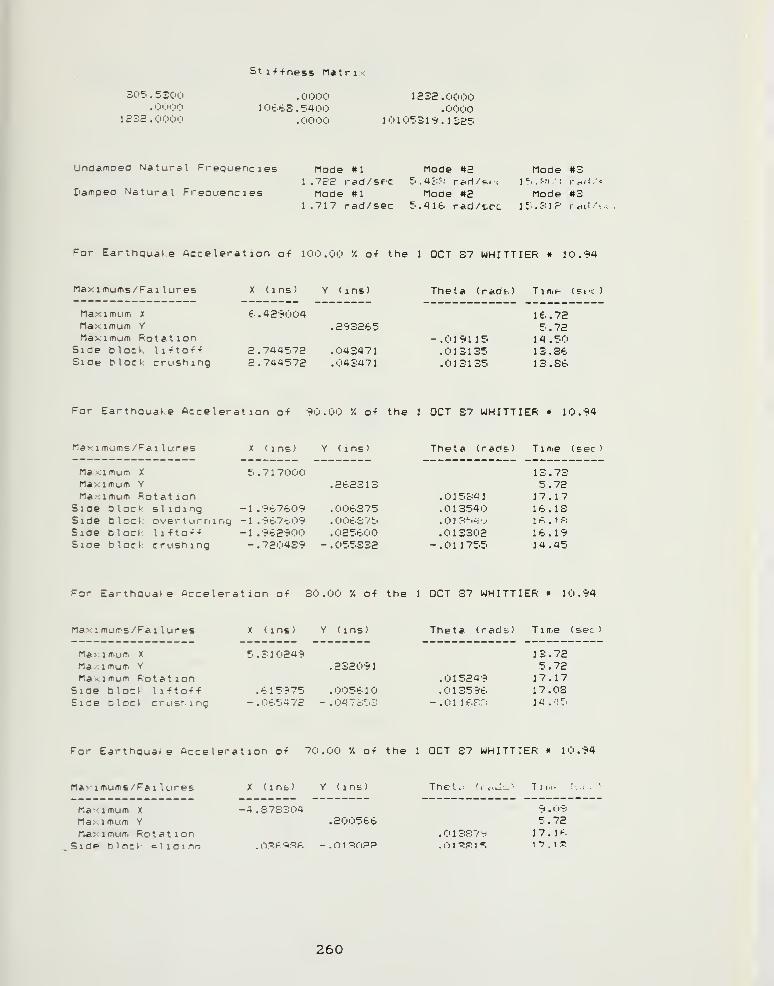
St 1 -f f ness Matrix
30T. .5300. '-"'•;> <;>o
1S32 .0000
. C'CxJO
1 OKbS . 54001232.0000
.00001 01 0531 •^. 1325
UnflcXTiped Nature"! Frequencies
Damped Natural Frequencies
Mode #1 Mode #2 Mode #31 .7?E rad/src 5.4:-:': r^ri/^-.c j^.r-if.: r-'l.' =
Mode «1 Mode »2 Mode «31.717 rad/sec 5. 416 rad/scc 15.i:-:ir' rctlS-
For Ea^thqua^e Acceleration o-f 100.00 '/. o-f the 1 OCT 37 WHITTIER • 10.94
Maximums/Fai lures
Maximum X
Maximum Y
Maximum RotationSide block I i^to-f-f
Side block crushing
Theta (radt.) Time- (?~i-: )
d- .429004 1 e. . 72.293265 5.72
-.019115 1 4 . 50E. 744572 .043471 .013135 13.362.744572 ,043471 .013135 13.36
For Earthquake Acceleration o-f 90.00 */. o-f the 1 OCT S7 WHITTIER » 10.94
Mavimums/Fa 1 lures X (ins) Y (ins) Theta (rads) Tinie (sec)
5 .717000Maximum X
Maximum Y
Maximum RotationSide block sliding -1.967609Side block over t ur rii nt) - 1 .9'£7t'."'9
Siae block li-fto-f-f -1.962900Side block crushing -.720439
.262313
. 006S75
. 006&Vt>
. 025600
. 055332
. 1 584
1
.013540
.Oi:-!'-) .'
.013302-.011755
13.735.7217.1716.131 6 . 1 f
:
16.1914.45
For Earthquake Acceleration o-f 30.00 '/. o-f the 1 OCT 37 WHITTIER « 10.94
Maximums/Fai lures
Maximum X
Maximum YMaximum Rotation
Side block 11 -ft o-f -f
Side block crLisr.ir.q
X (ins) Y (ins) Theta (ra db) Time (sec
)
5.310249 13.72.232091
.0152495.7217.17
.615975 .005610 .013596 17.03- .0t-5-^7E -
. 04 7o-'3 -.01 it.rr: 14.'! T.
For Earthquake Acceleration o-f 70.00 */. o-f the 1 OCT 37 WHITTIER * 10.94
Ma>:imums/Fai Kires
Maximum X
Maximum YMaximum Rotation
SidP block <s 1 1 d 1 no
X (inb) Y (int)
-4.S7S304.200566
. 09A'=iP!k - . n 1 '=!OPP
The I, 7 ir.i-
9 . '!i9
5.72.013P7H 1 7 . 1 H.
. o 1 -^P^ 1 =; 1 7 . 1 p:
260

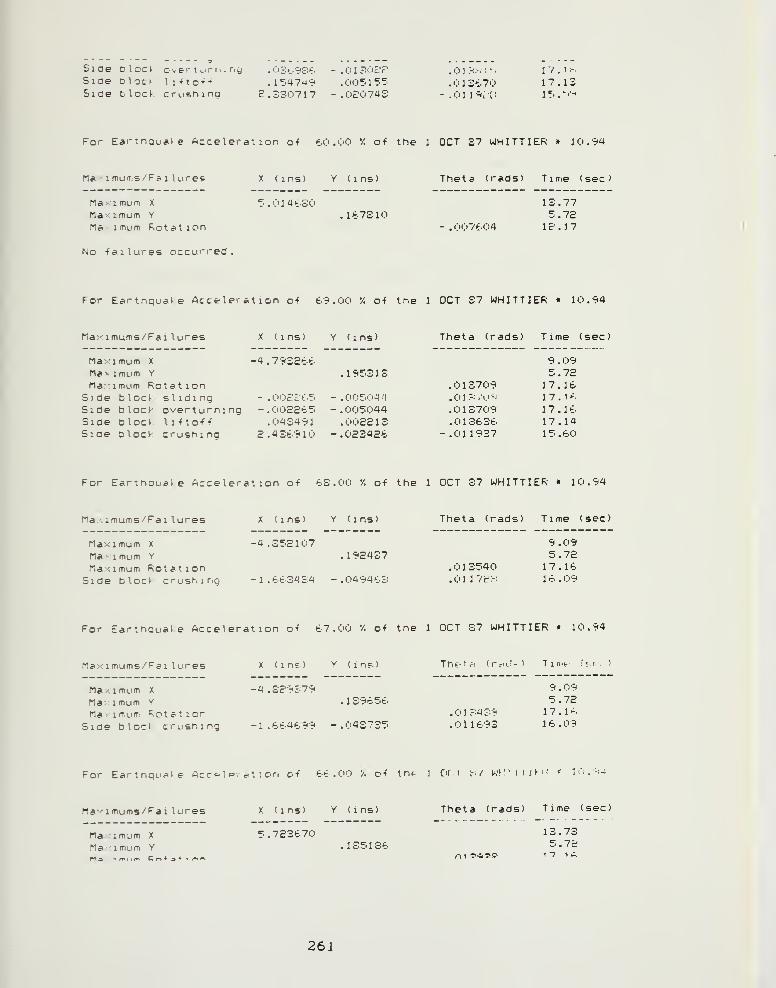
Siae b I oc t ever tLirni rig .'J3t.98t:. - .Ol^OL'F'Siae dloc^ Ij-fto+t .154749 .00515-'Sioe block crushing £.330717 -.0c074S
.0 ],-:::
.013870- .01 ]9:[;
17.1 ;-.
17.1315.'--«
For Earthqua^e Acceleration o-f bO.OO */. o-f the 1 OCT 37 WHITTIER • 10.94
Maximums /Fa i Kires
Maximum X
Maximum Y
Ma imum Rot^<tion
No -failures occurred
X (ins) Y (ins)
5 .014bS0. 167310
Theta (rads) Time (sec)
- .007t.04
13.775.72
1 c' . ] 7
For Earthquale Acceleration o-f fc-9.00 '/. o-f the 1 OCT S7 WHITTIER « 10.94
Ma;- 1 mums /Fa i I ures X (ins) Y (ins)
-4.7932'£.t.
,195313Ma; 1 mum X
Maximum Y
Ma;'imum RotationSide blocl: sliding - .00?c.'t-5 -.00504-1Side block' overturning -.002Sb5 -.005044Side block: U-fto-f-f .043491 .002213Side block crushing 2.43t910 -.023426
Theta (rads) Time (sec)
9 . 095.72
.013709 17.16
.01 -: <'u-J 17.1<=.
.013709 17.16
.013636 17.14-.011937 15.60
For Earthquake Acceleration o-f 63.00 */. o-f the 1 OCT 37 WHITTIER « 10.94
Maximums/Fa i lures
Maximum X
Maximum Y
Maximum RotationSide block crushing
X (ins) Y (ins)
-4.352107.192437
-1.663434 -.049463
Theta (rads) Time (sec)
9 .095.72
.013540 17.16
.On7ir':-: 16.09
For Earthquake Acceleration o-f 67.00 */. o-f the 1 OCT 37 WHITTIER » 10.94
Maximums/Fai Kires
Maximum X
Ma; 1 mum Y
Ma> 1 mum Rot c t ionSiqe block crushing
X (ins) Y (inp.)
-4 .329379.139656
-1.664699 -.043735
Th6-'rf (rc<i.'- ) T 1 rtPt 'Ff- '
9 .095.72
.01 34?: 9 17.16
.011693 1 6 . 09
For Earthqu.=<ke. Acc^l p.- ^.t i on o-f 66.00 '/. o-f the J Cir. I L-: / W^;'iiJM' < ]'; . -;4
Maximums/Fai lures
Ma : imum X
Maximum YM a -.• 1 *m I w» C /-I a + 1 /-I r-.
X (ins) Y (ins)
5.723670.135136
Theta (rads) Time (sec)
13.735.72
261

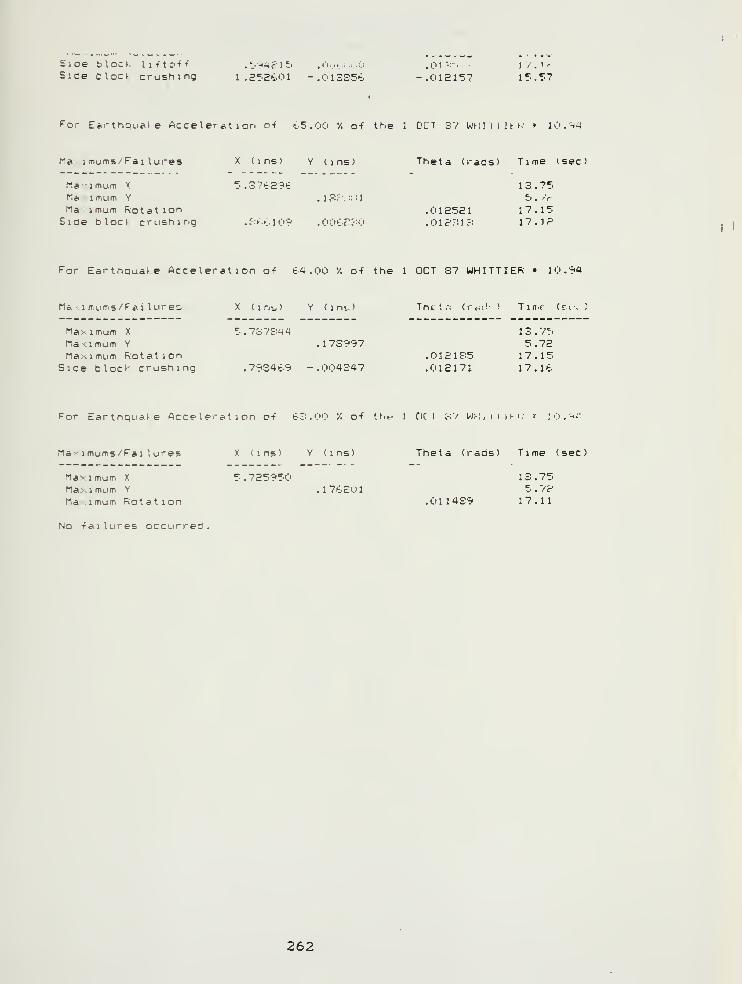
£ioe block li-ftD-f-f .'.H-4c)^ .("K.iir.i .i,.i;i
Siae Clock crushing 1 .252b01 -.013S5<:..01 '-' - 1 V . 1 '
.0121^7 15.57
^or Ecirthquate Acceleration o-f t.5.00 */. o-f the 1 DC! E'V WHIfllM- 10. w^
Max I mums/ Fa 1 lures
Ma-: I mum X
Maximum YMa imum RotationSide block crLishing
X (ins) Y (ins)
5 .SliS9iz-
.IP.-.;;: J
.?:•:•: 1 <J9 .00t.pi;0
Theta (rads) Time (sec)
13.75
.012521 17.15
.01?'!]?; 17. IPI
I
For EarthQuate Acceleration o-f ta.OO */. o-f the 1 OCT 37 WHITTIER » 10.94
MaximLims/Fai Kires
Maximum X
Ma-<imum Y
Maximum RotationSide block crushing
X ( 1 nt,
)
Y ( 1 n«:
)
Thcl.-. (ri^i<- > TiniE (r. . ;
5 . 7&7&44 1 3 . 7^.173997 5.72
. 1 £• 1 f:5 17.15.793469 -.004347 .012171 17.lt.
For Earthquake Acceleration o-f t.r:.00 */. o-f tf.t- 5 DC: I C-;V WriiMji-i;
Maximums/Fai lures
Maximum X
Ma>;imum Y
Maximum Rotation
No -failures occtirred
X (ins) Y (ins)
5 . 725950.176201
Theta (ra(ds) Time (sec)
.011439
13.75
17.11
262

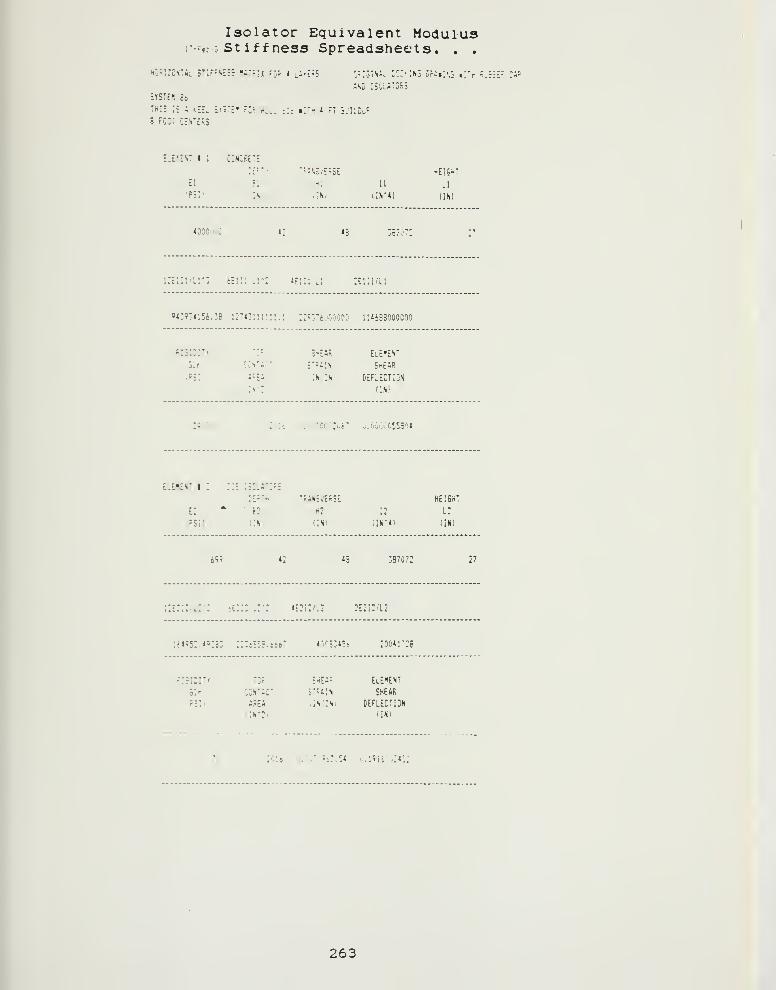
Isolator Equivalent Modulusr--KE Stiff ness Spreadsheets. . .
HQn;:OSThl ST:FfNi:r "(hTvI fjS 4 l;':=5 C:;S;Ni-- lIl-'.H'i Df:«:M. «:> :..:;-[r CAP
hSu ISCLfllORS
SYSTEH 86
THIS :E i iEEv iTsTt' r^F, H^jll sic ""r 4 FT BJlLDdP
8 FO-i CENTERS
ELE'^E'i' I ; C;NCi<ETE
:"•"'-i><E.ES5E KEI6HT
£1 5: ^'. II Li
'F:I" :s -iNi Ch'O (IN!
4000(iji' *2 «B
[;ii/Lr3 6E!i:.Lr: *e::: li :Ei:i/Li
'43934154.38 12743:ii::i.: 2:«"t.V.O0O0 11*698000000
RIGIDITv ',:S-EfiR Element
Sir uY'ir STRAIN SKEfiR
iF5I: H^li <IN/Itii DEFLECTION
'S'3 (!N)
Zi'.'^-^.
:.'.'. './vCOiZOiT 0.00C0055301
ELEMENT » 3 Ti? ISGlflTCRS
DE?TH TRANSVERSE HEIGHT
e:*'
b: h2 :: i:
:Fsi! ;:n) (INI iiN'4i UN)
b<i9 42 48 38707
:e:i:'\.:-: -i::: .v: 4e:;:/l2 2E2I2/l2
:64?52.493S3 ::2tS:5.6667 40C3345!) 20041728
RIdISITv TC? iHEAR ElEXENT
sir CONTACT STRAIN SHEAR
,?3i) AREA .IN.'IN) DEFLECTION
CN'I) (IN)
2016 o..y0'";.?43i54 u.i'ii:::*:;
263

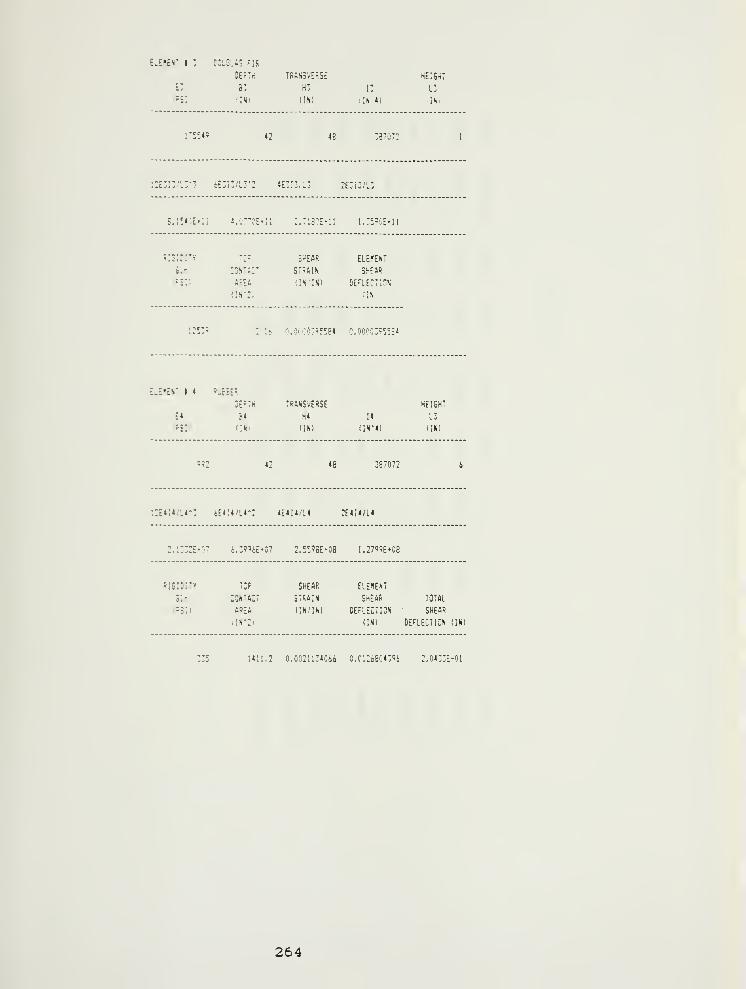
iJ.nr t 3 CCLGLhS FIR
DEPTH TRftNS.'EfvS-: HEIGHT
E3 83 H3 13 L"
1'55« 42 4B 39707:
2E3I3'L3-3 tE3I3/1.3-: «E3i3;L3 2E3I3/L3
i54':E'ii i.o""OE';; :.':3:-t:i i.:5?oemi
RISiDITV TCP S^'EflR ELEKENT
air CONTA" STfifilN SHEIR
•;fS:) AREA (IN/IN) DE'LECTISN
CN':, ;IV)
1253' M4 0.00C0355584 0.0000395561
"EN' I « RJcBER
DEPTH TRANSVERSE
E4 H K4
(PSD ntl) (INI
992 42 4B 3B7072
HEIGHT
14 L3
(IN^4) ilN)
;2E4I4/L4-3 6E4I4/ 1.4*: *E4 14;'L4 2E4I4/L4
2.:332E*07 6. 3996E«C7 n,559BE'OB 1.2799E+0B
RIBI3ITV TCP SHEAR ELEMENT
Sir CONTACT STRAIN SHEAR TOTAL
{PSil AREA ilN/IN) DEFLECTION SHEAR
aN"2- (INI DEFLECTION (IN)
Mil. 2 0.0021i:4Ci4 O.C'.:66043't6 2.0433E-01
264

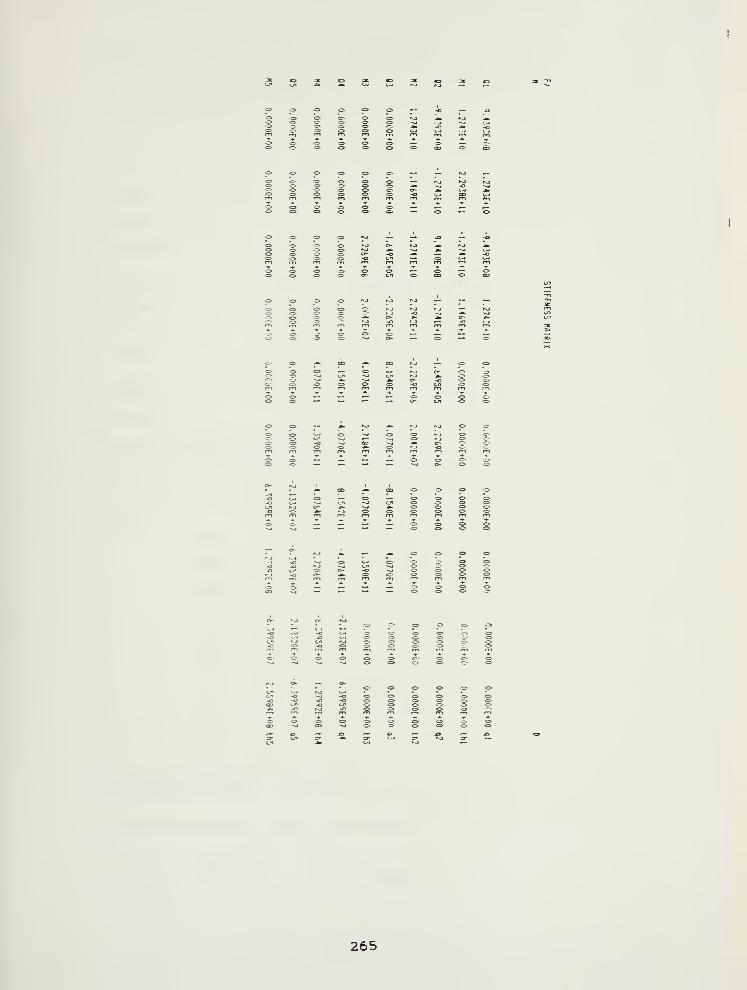
c o<Z> --J
<r> — —'=>'=• .^ ^j
en *-
c> — — o
O -I^
«- .» a- -»
^ CD
O —
O — Jfc
-o •=?
.*-, ^ '^ ^ ^ '<=> •=> KJ ^ V-,
t/»•oo
r^ m o m T r»i
.» CD -^
Cr- .«» --*-J (.1
— o-.» — » c>
<^ o>
^ c»
z> — —
tn rj
<_1 -O
-^ O
c -o o-
=r tn-^ XJ
265

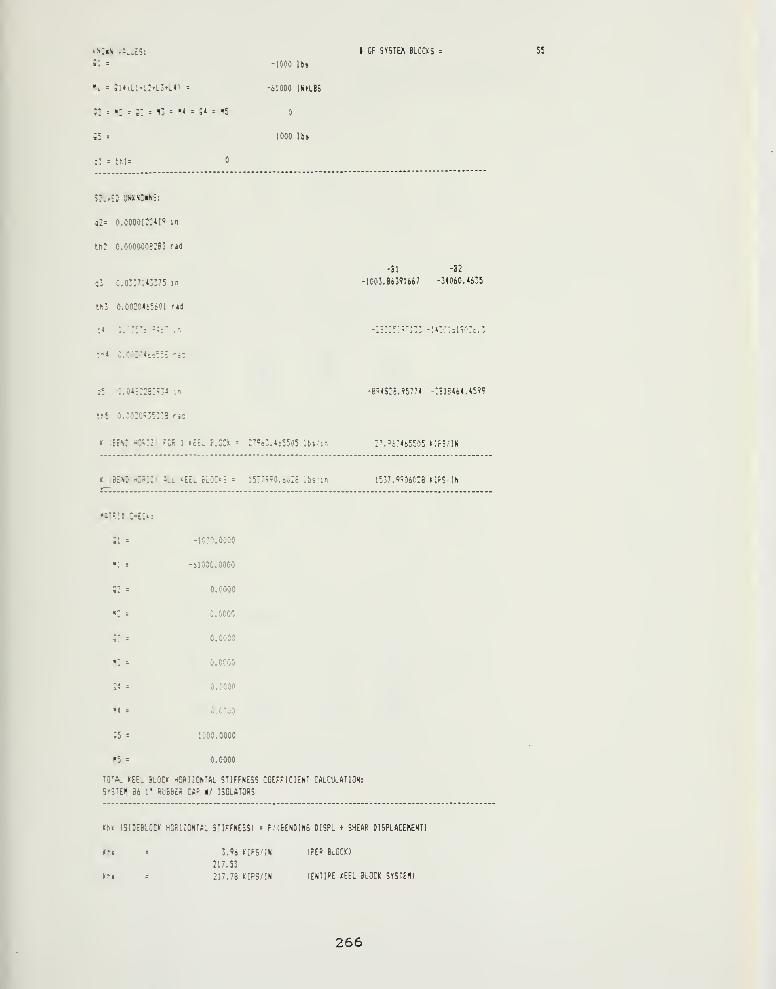
KNCW vALiitS:
01 = -1000 lbs
HI = 81«lLl«L2»L3tL4) = -61000 INUBS
;; = h: = ;; = N3 = M = 5« = « o
S5 = 1000 lbs
Ql = thl=
I OF S¥STE« BLOCKS 55
SClvES UNKNOHNS:
q2= 0.0000122419 in
lh2 0.0000008283 r»d
a3 0.0337143375 in
th3 0.00204&5601 ni
:i o.o:!-i:=;:- -.r.
th4 0.00:04!,/,555 rad
-Bl -B2
-1003.86391667 -34040.4635
:;:3 -:r::ii9o:c.:
05 0.0482283934 :n
tk5 0.00209:53'8 rad
r (BEND HORiZ) FOR 1 Utt. BL3Cli = 27963.465505 Ibi.'m
-894828.95774 -:3ie464.4599
27.9-3465505 KIrS/IN
« ;BESiu HC.S;2) ALL kEE;. ROC': = 1537990. e0:3 ib5':n 1537. 9906028 HFS'IN
WTRH :HECK:
SI = -1000. 0000
•; : -61000.0000
02 = 0.0000
K - 0.0000
i: -- o.cooo
!13 = o.cooo
3» : 0.0000
-I : o.cooo
05 = lOOO.OOOO
K -- 0.0000
TGTftL IfEEL BLOCK HORIZONTAL STIFFNESS COEFFICIENT CALCULflTION:
SVSTEN 86 r RUBBER CftP *l ISOLATORS
Khk (5IDEBL0CK HORIZONTAL STIFFNESS) = P; (BENDING DISPL SHEAR DISPLACEMENT)
rhk = 3.96 KIPS/IN IPER BlOCK)
217,53
m s 217.78 KIPS/;n (entire keel block SYSTEH)
266

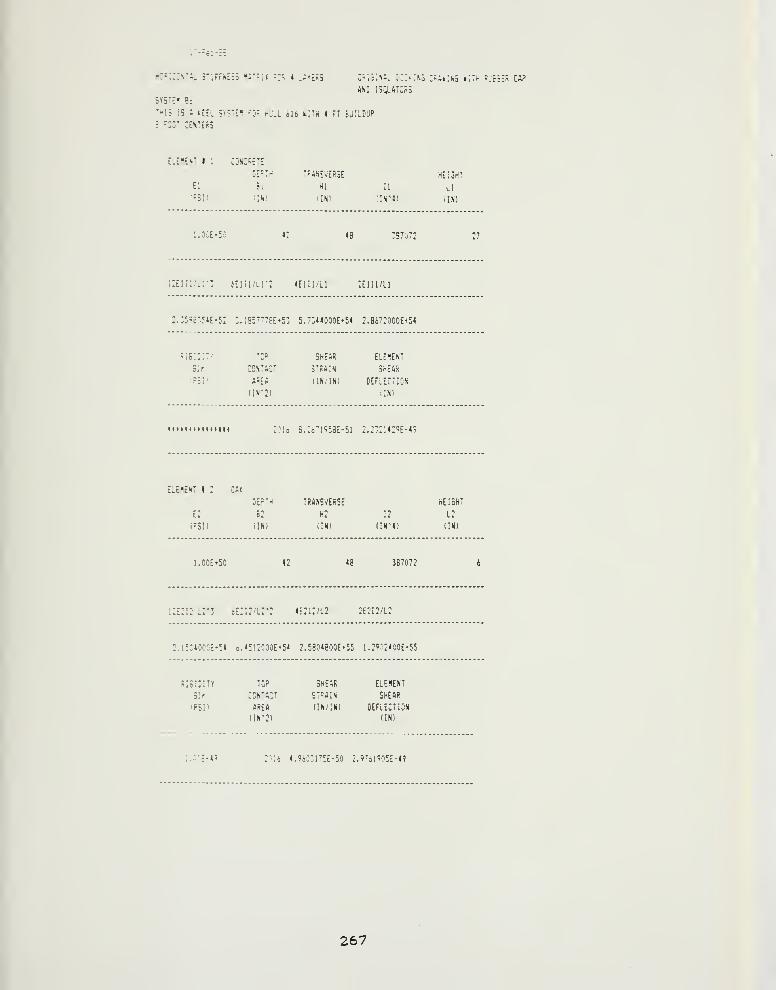
HC^wJ^'iL 5':Fr»<t55 tiTMi r;-, i :;yE«9 CnlilNiL [k'.-'MZ :;i»:i,'5 i,\:u nJrf-ES CAP
AND l-,~ji.H]M
THi; iS A kEcL 5V5iEK -0^ HULL 616 tiilH 4 FT BuILDUP
3 "Cj' CENTEkS
ElEHENT I 1 CONCRETE
DEPTH TPAN^vERjE HEiSHT
El Bi HI 11 LI
'PSn ilN) (IN! ilN-l) ,iN)
I.OCEtSO 42 48 :S7072 27
12Ei:i/Ll;•- iEl ;i/Li•1
4E1I11/11 2£lil/Ll
2.3593;.54E+52 :. IB577 78E+53 5,7;;44000E*54 2.8672000E+S4
R!6iO;TY TCP SHEAR ELEMENT
Sir CONTACT STRAIN SHEAR
(PSD AREA I IN/IN) DEFLECTION
(IN'2) ilN!
•MtiiuMiuM 2016 S.:(i"l''58E-51 2.2":427E-49
ElENENT 1 2 CAr
DEPTH TRANSVERSE KEISHT
E2 B2 H2 12 L2
iPSI) (IN) (IN) (IN*41 (IN)
1.00E*50 42 48 387072
12E2I2''L2'3 6E2!2/L2*2 4E2I2/L2 2E2I2/L2
2.15040f!0E«54 6.4512000E*54 2.5e0480CE*55 1.2")"24C0E*
RIdIDITY TOP SHEAR ELEHENT
Sir CONTACT STRAIN SHEAR
(P5P AREA (IN/IN) DEFLECTION
(IN-2) (IN)
1.:':E'4? 2014 4.960:i7!E-50 2.9Til905£-49
267

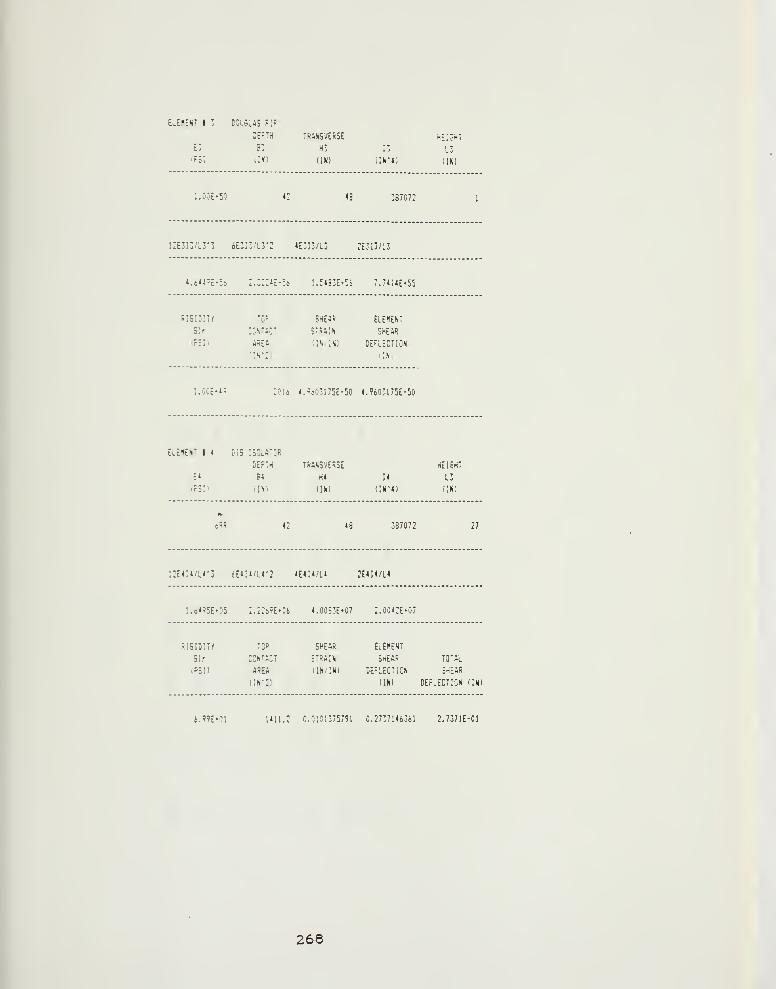
ELEHENT I 3 OCUSLAS FIR
DEPTH TRANSVERSE hE;3HT
t3 83 H3 ;: L3
'•?;: iiN) (INI iiti-4; iw
l.OOE+50 42 48 387072
12E3I3/L3'3 iE3I3/L3-: 4t3I3/L3 2E3;3/L3
.Zrjl-li :.548:E'5S 7.74;4E«55
RiBIDITy TO? SHEAR ELEWENT
Sir CONTACT STRAIN SHEAR
(rSI) AREA (IN/INl DEFLECTION
;iN'2l (IS)
1.0Ct'-4? 2016 4.960'175t-50 4.9o03175E-50
ELENENT I 4 PiS ISClATCR
DEPTH TRANSVERSE HEIGHT
E* B4 H4 14 L3
(PSIl iIN) (INI (IN'4) ;:n)
6?9 42 48 387072 27
12E4U/L4-3 tE4i4/L4*2 4E4I4/L4 2E4I4/L4
l.o4'J5E*05 :.226';E»06 4,O0S3EtO7 2.0042E*07
RIGIDITY TOP SHEAR ELEHENT
Glr CONTACT STRAIN SHEAR TOTAL
iPSI) AREA (IN/INl DEFLECTION S-itAR
IIN-21 ilNl DEFLECTION (INi
4.?9E^01 1411.2 0.0101375791 0.2737146361 2.7371E-01
268

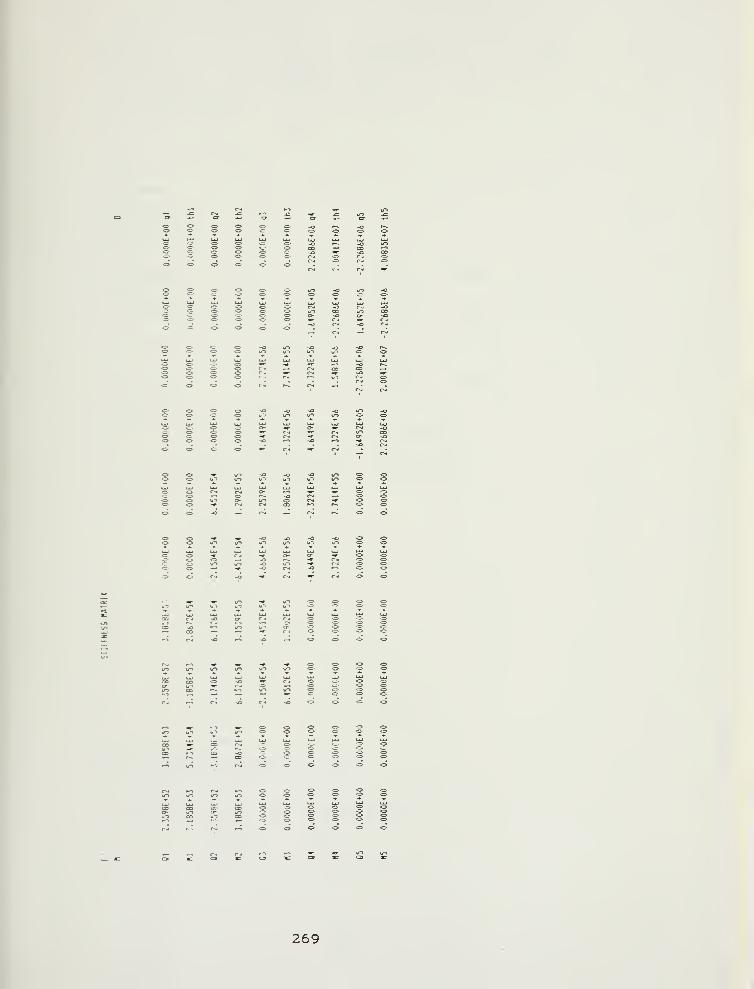
•^ o- cr- =-
<:^ o- o- ^
o- oc> <=-
GO ^-
w- O
U-) o-
— CSi
— <z> — <z>
-o — r-- <z>
^ ^ U-) lO 1/1•c *' w-i Y <3>
je o * r- » o^ o- ;^ ^ ^r^
lO ir»
*=^" "*^ f-N* ''^ *-; *^
n-i o-^ u-> u-> " u-> "^ -^ •^ O'
al r^ ^ UJr-. J^ ii^ ^ (Jj ^
r-*lO uT <=" oo ~ *"
^*^
— o
k«J ^ »t-c-
:l LU!^
~; " ^. '^ ^ *-:
^- o-
—
.
CDO- O- •3'
<^ c =• <=•
269

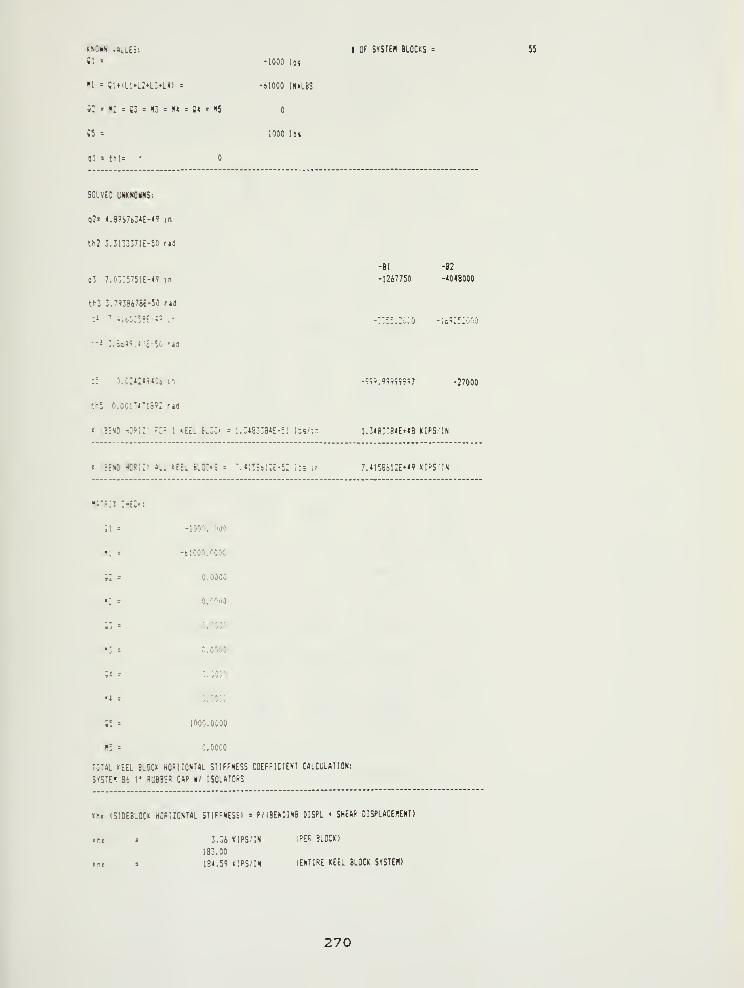
KXOKN -.flLiJES:
111 = -1000 lbs
"1 = Bl»ai»L2*L3»L«) = -61000 INHBS
S: = f<: : B3 = H3 = S4 = S» = H5
85 = 1000 lbs
Ql : thl= -
I OF SYSTEH BLOCKS 55
SOLVED UNKNOWS:
q2= 4.8947634E-49 in
th2 3.3133371E-5C rid
q3 7.0::5751E-49 in
th3 3.79J867K-50 r»d
:• ".i;'.-!-r55f--' .-
•' 3.5o4';;i.'E-50 'id
-Bl
-12i7750
-B2
-4048000
::!:::o;.o -lo'z^iooo
55 O.C242494Ca in
th5 0.001T471692 fit
t BEND m\V. E3R I KEEL L::< = i.34E3:a4E'5! \til\-
-^i;9. 99999997
l.J4e".B4E«48 KIPS/iN
-27000
r BEND H0RI2I «L. KEEL BLOCKE = '.4:53ii:£'5: iDs-in 7.4158612E+49 KI^SiN
''i"s:i >e:»:
31 = -1000.0000
III = -61000.0000
62 = 0.0000
fi = o.ocoo
Sj = 0.000?
S3 = 0.0000
54 -. * ^p''fl
n - o.ccco
S5 = 1000.0000
H5 C.OCCO
TOTAL KEEL BLOCK HORUONTftL STIFFNESS COEFFICIENT CALCULATION:
SVSTEH 86 1" RUBBER CAP »/ ISOLATORS
Khk (SIDEBLOCK HORIZONTAL STIFFNESS) = P/(BEN01N8 DISPL SHEAR DISPLACERENT)
itt -. 3.34 KIPS/IN iPEf BLOCK)
183.00
m = 184.59 KIPS/IM (ENTIRE KEEL BLOCK SYSTEM)
270

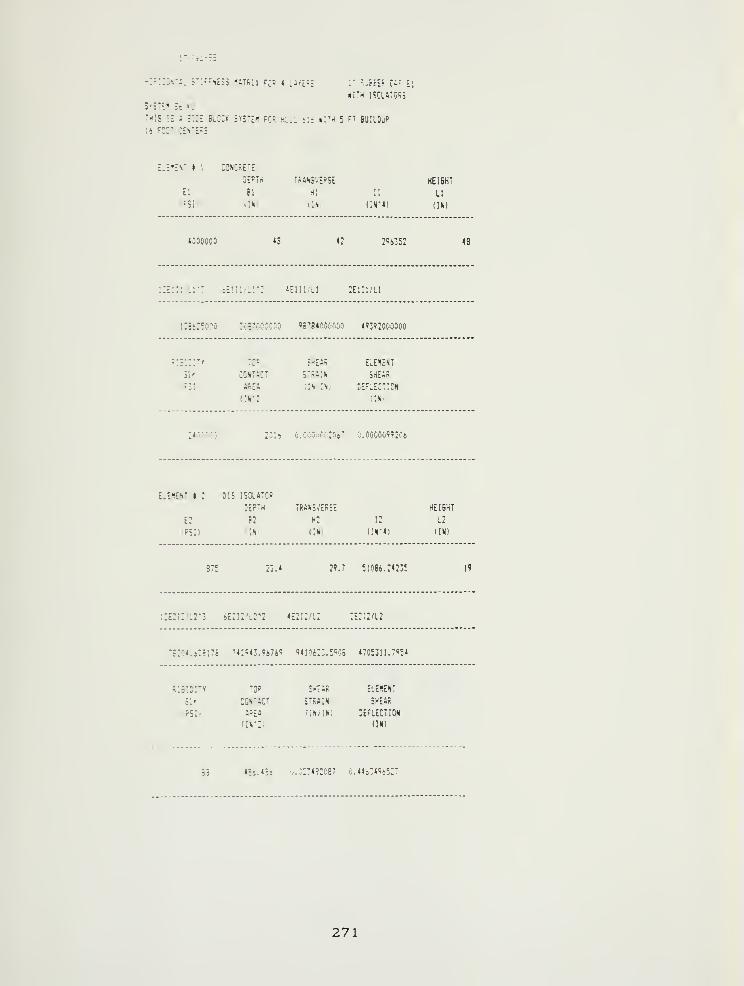
KITH ISOLATORS
SViTEH 36 »'0
THIS !S i SIDE BL3CK SY3TEN FOR HLIIL tit KITH 5 FT BUILDUP
14 FOOT :es-es=
£.£:<.• « 1 C3NCSETE
DEPTH TRANSVERSE HEI6HT
El Bl HI 11 LI
iPSi) >IN) uSi (INM) (IN)
4000000 294352 48
HE 1 :: ir: 4£i:i/l:-: 4E!!i/li :£iii/li
1:8625000 3087000000 "8784000000 49392000000
r:;;c:t» tof
Sir CONTACT
:?3r, AREA
(!»i-2i
SHEAR ELEMENT
STRAIN SHEAR
(IN.'.'Nl PEFLECTICN
ilN.
2014 O.OCOOOOrOo- 0.0000099204
ELENENT 12 31 S ISOLATOR
DEPTH TRANSVERSE HEIGHT
E2 B2 H2 12 L2
FS;) ilNi (INI lIN-ll (INI
875 23.4 29.7 51084.24235 19
!:e:i:/l2-3 4e:i2/l2*2 4E2i:/l: :e2:2/l2
78204.428178 742?43. 94749 941062:. 5908 4705311.7954
%:5IDITY TOP SHEAR ElEHENT
Sir CONTACT STRAIN SHEAR
iPSli AREA ilN/IN; DEFLECTION
(IH-21 IINI
33 4Si.4?o ';..:.::4?2C87 0.444:4965:?
271

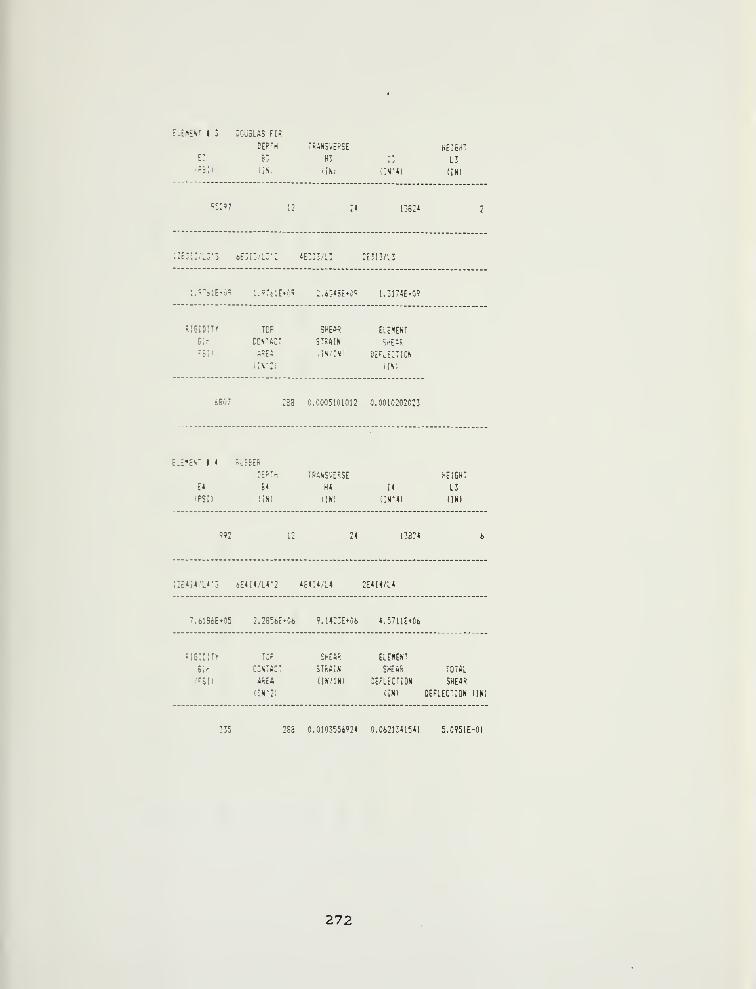
c.EHEST I 3 DOUSLflS FIR
DEPTH TRANSVERSE HEIGHT
E3 5: H! ;; l3
''^S:' (i.s: iiSi CN-*) (IN)
'-•I-'? 12 24 13824
i2E3i:./L3"3 6E3i3/l.r: 4E-I3/L3 2E3I3/L3
:."olE^v? :."61Et05 2.o34SEt0i? 1.3174E'0''
BiSlOITY TOP SHEAR ElE«ENT
Glr CONTACT STRAIN SHEAR
.'fSn AREA .iN/INl DEFECTION
!iN-2; (INi
6807 283 0.0005101012 0.0010202023
Element t 4 rubber
CEPTH TRANSVERSE HEIGHT
E4 B4 H4 14 L3
(PSD !IN) CNl iIN"4) (IN)
992 12 24 13824
12E4i4/L4'3 6E4I4/L4-2 4E4I4/L4 2E4I4a4
.6I84E«05 2.2854E*06 9.U23E»06 4.5711E+C4
RIBICITY TOP SHEAR ELEMENT
Sir CONTACT STRAIN SHEAR TOTAL
!PS1) AREA (IN/INI DEFLECTION SHEAR
([N^2) ilN) DEFLECTION (IN)
335 288 0.0103556924 0.0621341541 5.0951E-01
272

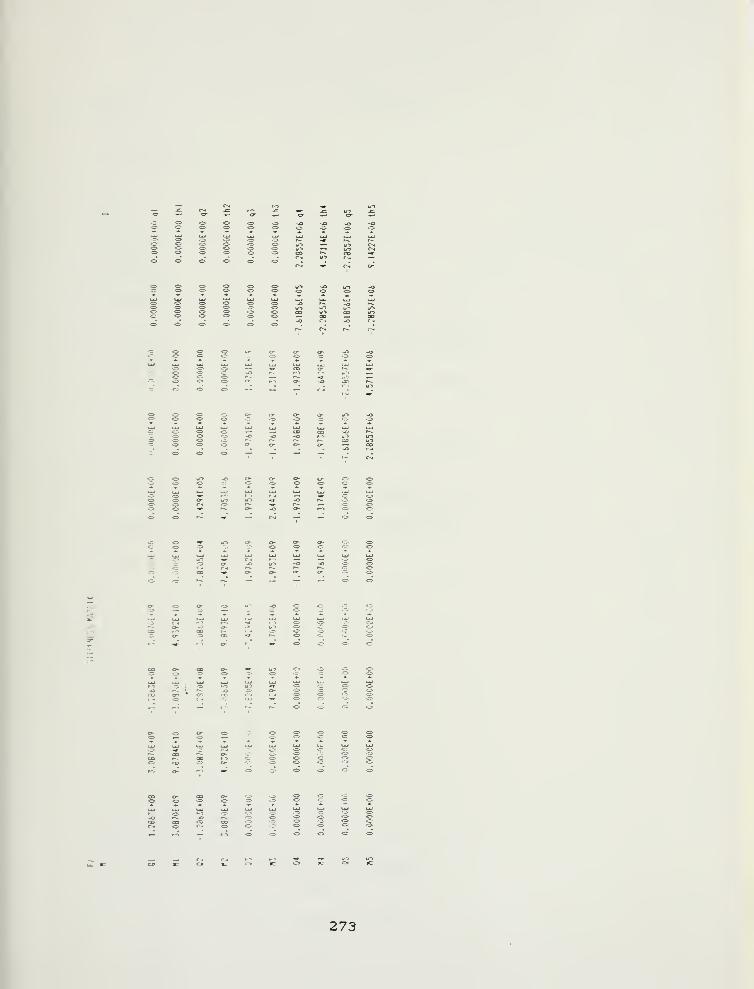
U-) —•= O
o .« CO —c> c?
c- o
C;, — —
^^ r— O- O- r--. <=-
-^ — O
c^ "O
<^ —
<^ o-
J^ CXI (^ ^ c^ ^. sT-^ o.•^ '^ ^ "- c=- ; ; ^
to 1 ^ »-o u-) i^ <=.i.^
<=> sV
c^ '-*^ *; ^ '-' '-; '-^
o <;-
<=• <z- o
O '^
v^. O T
'T- <^ o <= o-
273

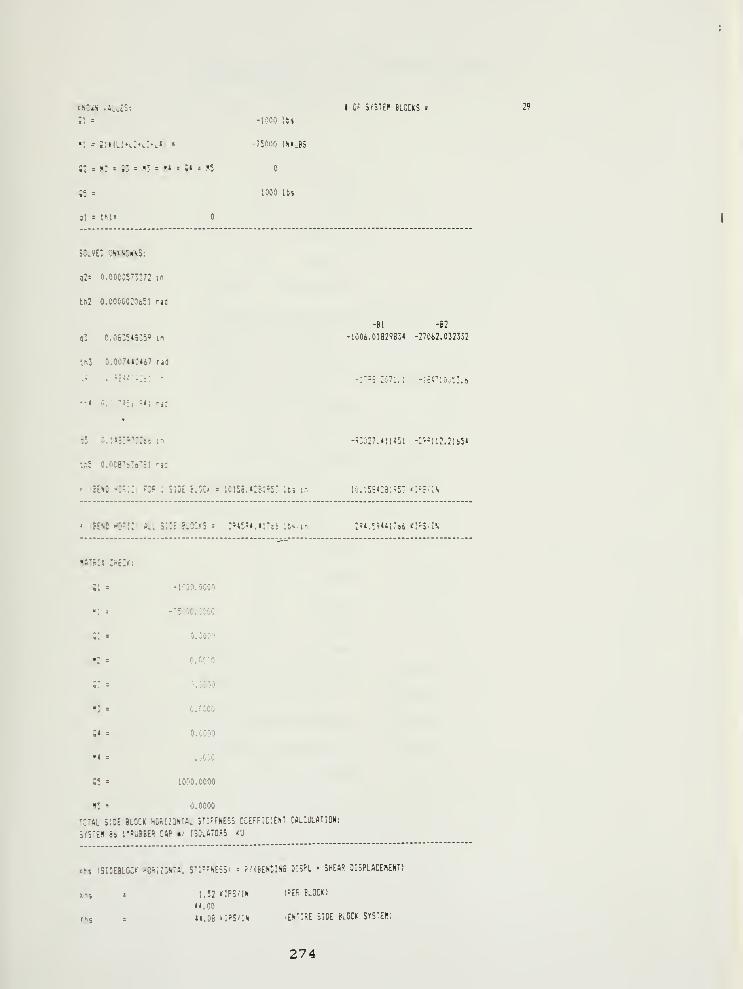
KliOafi UL'J£S:
CI = -1000 lbs
K = S"»(l.iH:'L>Hi : -75000 INti.BS
Q2 : h: = 83 = R3 = «» = 5* = N5
05 : 1000 lbs
31 = thl:
» 0' 5»';TlH elccks =
SOIVEC UNK>I3NNS:
q2= 0.00005733.72 in
th2 0.00CCC20651 r»d
a3 C. 083548359 in
th3 0.007440467 rid
th4 ',.'\-'i:\-)<H\ r»c
-Bl -B2
-1006.01829834 -27062.032332
-:7=5;.:o7i.: -;c47ioo53.6
q5 0.:45:9''3:6fc m
th5 0.0C87436781 Md
< SEND riC^::; FOR 1 SIDE RSCK = 10153. 4:5:?5:. :ts/in
-93027. 41H5I -:'-?n2. 21651
ly.:5S428:953 K^l^W
« .SEND -^0'::' ALL ?:DE blocks = :94594.ir:: ib^.m :=l.!914;7s6 IflfS/IS
WTRU CHECr:
Ql = -ICOO.OCOO
•: = -7500C.C500
;: = o.ooeo
"2 = o.ocoo
0.0000
K3 = o.ocoo
!4 = 0.0000
tf4 : v.:coc
65 = 1000.0000
N5 = 0.0000
TCTftL SIDE BLOCK HCnI20NT«L STIFFNESS COEFriCIEST CALCULATIOM:
jySTEH 86 I'RUBBER CAP iti ISOLATORS KU
Khs I3IDEBL0CK HORIZONTAL S'l'-NESSi = F.MBENEINS 0I3PL * SHEAF DISPLACEMENT)
Khs
rhs
1.52 KIPS/IN
44.00
44.08 kIPS/IN
(^Efi BLOCt!)
iENTIRE SIDE BLOCK SYS^EH)
274

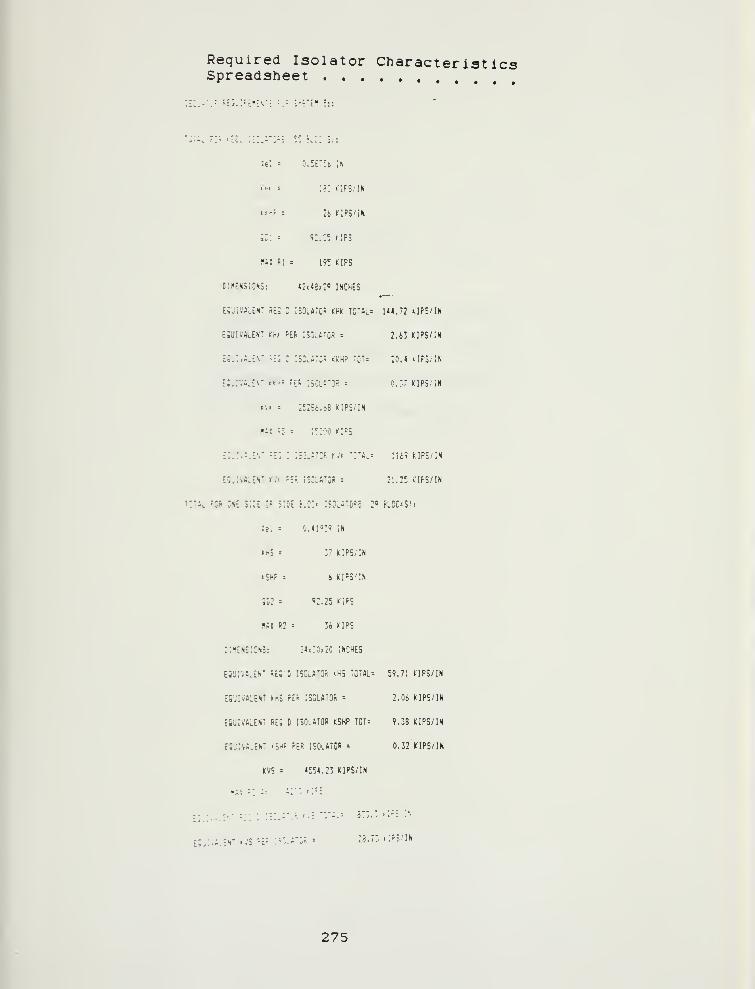
Required Isolator CharacteristicsSpreadsheet
T:.> »t:....-c":
.-,1 'ic.
U\ = 0.5t":-6 ;n
t«r-? : 2i HPS/Iti
;:; = 9:.:^ HP3
MI M : 19! triPS
CINENSICNS; 42>«8<:'' INCHES
ESJiW;.ENT SES'D ISOLATOR KHK TS'6L= U«.72 UPS/IN
EflUIVflLENT KKK PER ISOLATOR = 2.i3 KIPS/IN
E^uI.•i.E^' '-;; : nz^y.Zn an? "'= :o.4 hps/in
ESuivft.EK: >(-= ?ER isolator = 0." KIPS/ in
KW = 25286.68 KIPS/IN
r.i! r; = ;!200 riPS
£SU:v:.E\' =;E:D ISS.ATCR Kvr. TD'Al: 1U9 KIPS/IN
equivalen; rvt; per isolator = 21.25 kifs/in
TC'TSL FOR one SuE u' SIDE 5.0:> :SO;.flTO=;=. .29 tiLDC»:S!:
le: = 0.41939 IN
KHS = 37 KIPS/IN
KSHP = 6 KIPS/IN
aD2 = 92.25 KIPS
KhI R2 : J6 KIPS
OI«ENSIONS: 24i:0«20 INCHES
EQUIVALENT RESD ISOLATOR KK3 TOTAL= 59.71 KIPS/IN
EQUIVALENT KHS PER ISOLATOR = 2.04 KIPS/IN
EQUIVALENT REO D ISOLATOR KSHP TOT= 9.38 KIPS/IN
EQl'IVALENT fSHP PER ISOLATOR = 0.32 KIPS/IN
KVS = 4554.23 KIPS/IN
EQ;jI.iLEN' <V5 =Eh ::23.7: t'.PS/IN
275

I
i
J
APPENDIX 6
1. "3D0FRUB" Wale Shore (EL Centre)Input Data File
2. "3D0FRUB" Wale Shore (EL Centro)Output File
3. "3D0FRUB=' Wale Shore (NORM DD2)Output File
4. Wale Shore Design Spreadsheet
276
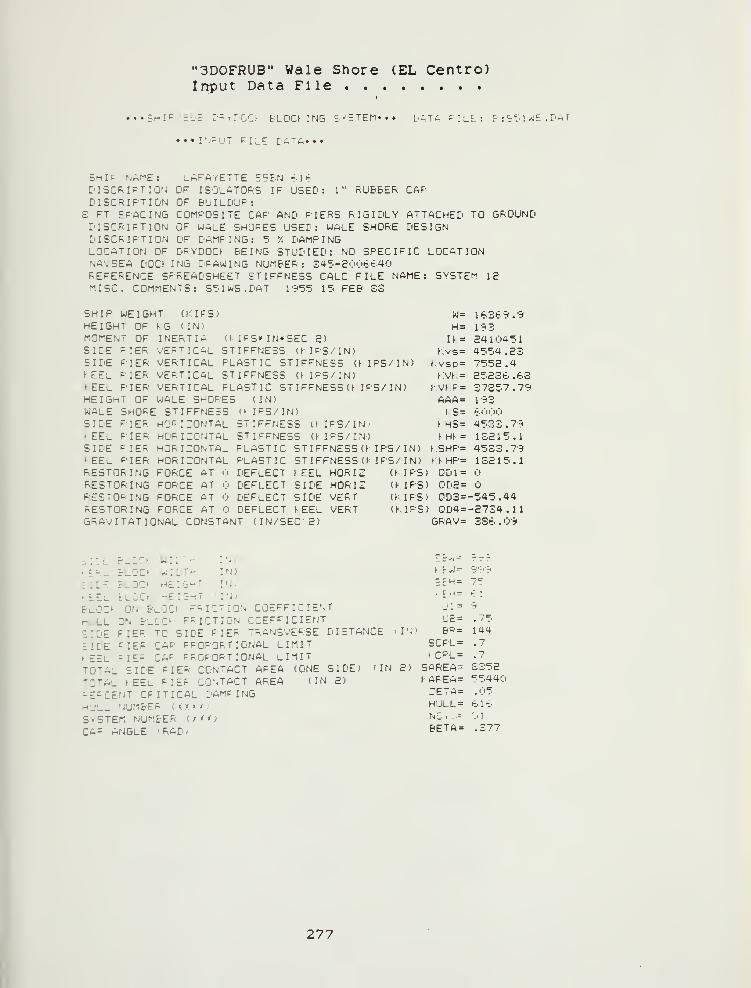
"3D0FRUB" Wale Shore (EL Centre)Input Data File
•• Ship -PUE" T^TDOCf BLDCIING 5rETF.n»»» L'ATh -ILE.': P : S':". 1 W£ . I'AT
•••Itj^^UT FILE C'A'A***
5HIF NAME:DI5CRIFTI0ND I SCR I FT I ON
3 FT SPACINGDISCRIFT I OND I SCR I FT I ONLOCATION OFNA«, SEA DOCK ;
1" RUBBER CAFLAFAYETTE 55BN Klb
OF ISOLATORS IF USEDOF BUILDUP':COMPOSITE CAP AND PIERS RIGIDLY ATTACHED TO GROUNDOF WALE SHORES USED: WALE SHORE DESIGNOF DAMPING: 5 '/. DAMPINGDRYDOCK BEING STUDIED: NO SPECIFIC LOCATION:n6 DRAWING NUMBER: 345-2006^40
REFERENCE SPREADSHEET STIFFNESS CALC FILE NAME: SYSTEM IBMISC. COMMENTS: STaW5.DAT iMfT' 15 FEB SS
SHIP WEIGHTHEIGHT OF KGMOMENT OFSIDE PIERSIDE PIERKEEL PIERKEEL PIERHEIGHT OFWALE SHORE
(KIPS)(IN)
INERTIAVERTICALVERTICALVERTICALVERTICALWALE SHORESSTIFFNESS
SIDErEELSIDEKEEL
PIERPIERPIERP I ER
RESTORINGRESTORINGRESTORINGRESTORING
HuRIZOrjTALHORIZONTALHORIZONTALHORIZONTALFORCE ATFORCE ATFORCE ATFORCE AT
IFS«IN»SEC 2)IFFNE3S (KIPS/ IN)ASTIC STIFFNESS (KIPS/IN)IFFNES5 O IPS/IN)ASTIC STIFFNESS(KIPS/IN)
(IN)(> I PS/ IN)STIFFNESS O IPS/ IN)
STIFFNESS (MPS/ IN)PLASTIC STIFFNESS (K IPS/ IN)
PLASTIC 5TIFFNESS(K, IPS/IN)DEFLECT > EEL HORIZ (KIPS)DEFLECT SIDE HORIZ (KIPS)DEFLECT SIDE VERT (KIPS)DEFLECT KEEL VERT (KIPS)
GRAVITATIONAL CONSTANT (IN/SEC 2)
W=H=
Ik =
Kvs=Kvsp =
KVK =
K Vt P =
AAA=KS=
KHS =
K Ht =
KSHP =
Kf HP =
QD1 =
QD2=003=QD4 =
GRAV=
li&3t9 .3
19324104':.1
4554.237552 .
4
2523b. bS37357.79193b<!>00
4533.79132 15.14533.791 32 1 5 .
1
-545.44-2734.113Sb . 09
> E5--i_
S 1 DE» EELBLGC^HULLSIDE:IDEKEELTOTAL
B:_jCt
BLOCKBLJCtBLuCt
w::"-WIDT-HEIG-^T-IEI5HT
IN)• IN)Ifii
' lUl
ON BLUCt FRICTION COEFFICIENTON BLCCt FRICTION COEFFICIENTFIER TO SIDE PIER TRANSVERSE DISTANCE vIN)
PIER CAP FROPORTIONAL LIMITPIER CAP PROPORTIONAL LIMITSIDE PIER CONTACT AREA (ONE SIDE) (IN 2)
TOTAL ^ EEL PIER CONTACT AREAPERCENT CRITICAL DAMPINGHULL riUMBEF (XX XX;
SYSTEM NUMBER (XXX)CAP ANGLE (RAD;
( IN 2)
EPH =
h PH =
U2 =
BR=SCPL =
t CPL =
SAREA=i AREA=ZETA =
HULL =
NS .:=
BETA =
75bl
144.7
.7
£35255440
, ri5
bib..1
.377
277

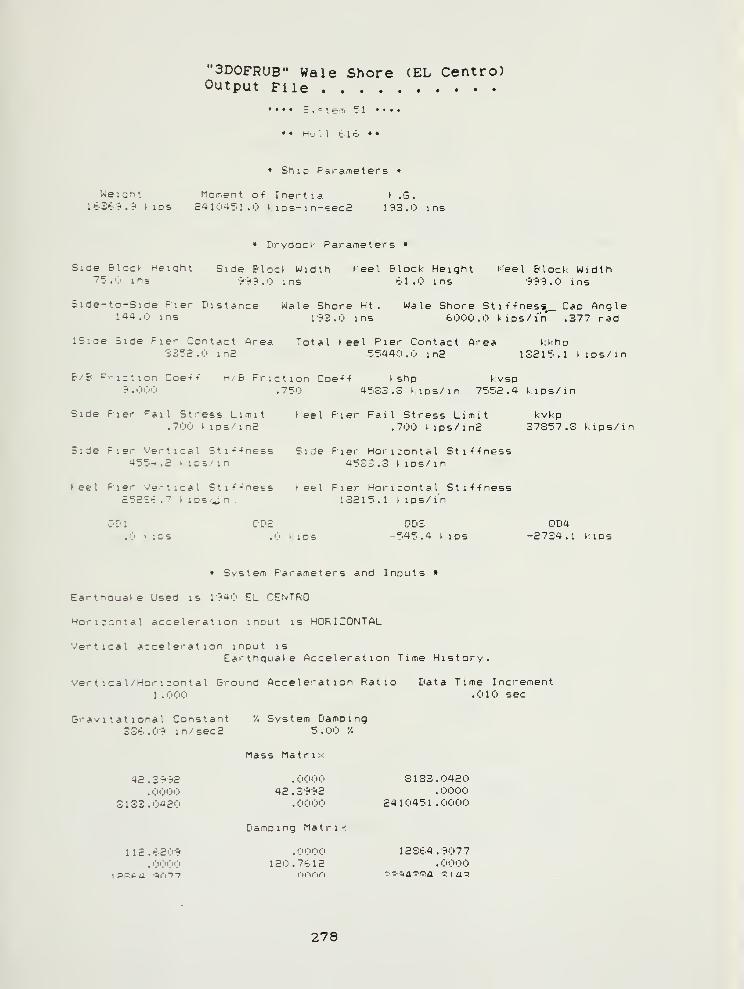
"3D0FRUB" Wale Shore (EL Centro)Output File
• »• E.^teTi f i •* • Hu 11 If' 1 >: * *
• ShiD F'arameters «
Weight Moment of Inertia ^ .G.IbSt^.^ tips £4104':'l .0 kips-in-sec2 193.0 ins
• Drydock F'arameters »
Side Block Height Side Block Width Keel Block Height keel Block Width7Z .'.' ins f'r'T'.O ins lil.ij ins 'f*'?':!.!;) ins
Side-to-5ide Fier Distance Wale Shore Ht . Wale Shore St i -f-fness^ Can Angle144,0 ins IhS.O ms bOOO.O kips/in*" .377 rad
ISide Side Fie'- Contact Area Total feel F'ler Contact Area kkhp3352.0 inS 55440.0 i n2 13E15.1 kips/ in
B/B Friction Coet't H/B Friction Coe-f-f t shp kvsp51.000 .750 4533.3 kips/ in 755S.4 kips/ in
Side Fier Fail Stress Limit feel Fier Fail Stress Limit kvkp.700 tips/inS .700 kips/inS 37357.3 kips/in
Side Fie'- Vertical Stit-fness Side Fier Horizontal Sti-f-fness4554.2 tiD5'in 45S3.3 kips/in
keel Pier Vertical Sti-f-'ness feel Fier Horizontal Sti-f-fnessc523t-.7 kips/^n. 13215.1 fips/in
C'Dl ODE 0D3 DD4.0 kios .0 k IPS -545.4 kips -2734.1 fiDs
» System Farameters and Inputs »
Earthquafe Used is r?40 EL CENTRO
Horizontal acceleration input is HORIZONTAL
Vertical acceleration input isEarthquafe Acceleration Time Histor-/.
Ver t ica 1 /Hor 1 zont a 1 Ground Acceleration Ratio Data Time Increment1 .000 .010 sec
Gravitational Constant V, System Damping33t.0'T< in/ sec 2 5.00 '/.
Mass Matrix
42
.
3332 . 0000 S 1 S3 . 0420.0000 42.3992 .0000
S 1 S3 . 0420 . 0000 24 1 045 1 . 0000
Eiamp 1 ng Mat r ix
112. t209 . OiJOO 1 2Sf:.4 . 9077,0000 120. 7b 12 .0000
278

I
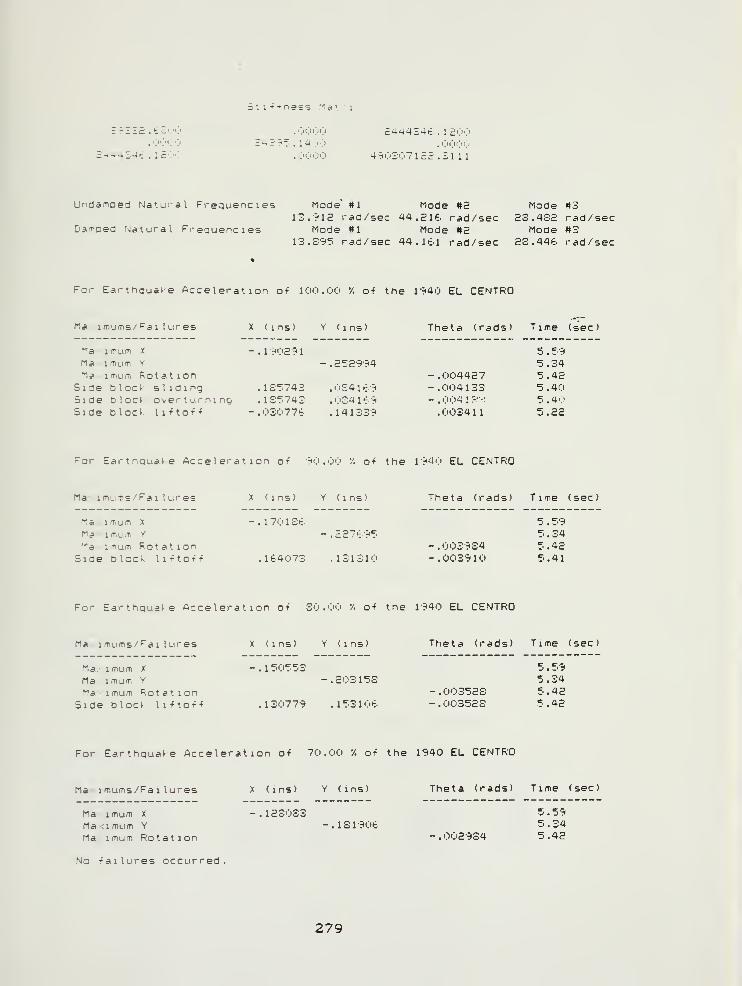
31 1 + t ne£5 [la '.-
i
!IE .tS".'".'' .0000 c444Z4(: . 1 Sijij
. 0e"!"j 1-4 E' 7-5 . 1 4';i'I) . i!";)':'"!'
14^ . : EOO . 0000 4hi;'307 1 EE; . S 1 1 1
Undamped Natural Frequencies Mode"#l Mode #2 Mode #313.?12 rad/sec 44.216. rad/sec 2S.4SE rad/sec
Damoed Natural Freauencies Mode #1 Mode #2 Mode #313.SH5 rad/sec 44.161 rad/sec 23.448 rad/sec
For Ea^thaua^e Acceleration o-f 100.00 '/. o-f the 1940 EL CENTRO
Ma imums/ Fa 1 lures X (ins) Y (ms) Theta (rads) Time (sec)
5.595.34
- .004427 5.42- .004133 5 . 40- .0041.-.•: 5.4';i
.003411 5.22
"".a imum K -.190291Ma 1 mum Y -.252994Ma .1 mum Rotation
Siae block sliding .135743 .034169Side Dlock overtumino .1S5743 .(!'S41t9
Side blocK li^fto-f-f -.03077b .141339
For Earthauate Acceleration o-f 90.00 /. o-f the 1940 EL CENTRO
Ma- imums/Fa 1 lures X (ins) Y (ins) Theta (rads) Time (sec)
Maximum X -.170136. 5.59Ma imum Y -.£276.h5 5.34Ma : mum Rotation -.003934 5.42Side block li^to^-f .16.4073 .131310 -.003910 5.41
For Earthqual-e Acceleration o-f 30.00 '/. o-f the 1940 EL CENTRO
Ma imums/Fai lures X (ins) Y (ins) Theta (rads) Time (sec)
Ma- imum X -.150553Maximum Y -.203153Ma- imum Rotation
Side bloc^ li-fto-f-f .130779 .153106.
5.595.34
-.003523 5.42-.003523 5.42
For Earthquake Acceleration o-f 70.00 V. o-f the 1940 EL CENTRO
Ma imums/Failures X (ins) Y (ins) Theta (rads) Time (sec)
Maximum X -.123033 5.59Maximum Y -.181906. 5.34Ma imum Rotation -.002934 5.42
No -failures occurred.
279

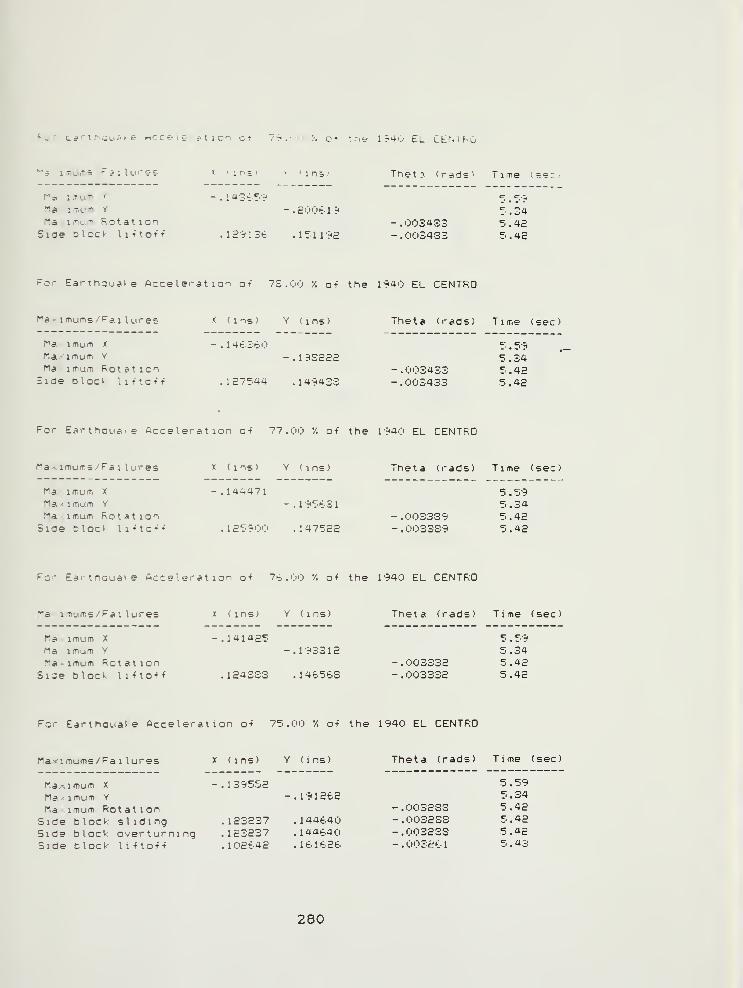
fcr tartnauofe mccc i e: £. t i on or /'b .'..' '/, ot trie 1 ?4i.i EL CEr-liFG
'^~ imu'^s P?;iL"- = = » 'ir.-' « 'ins' Theta (rads' Time ('
r^a KT-um <
Ma "1 mum y
Ma imu.''^ RotationSide block li^to-f-f
-.14S-:.5":< '=;.59
- . 200t' 1
9
5.34-.003433 5.42
.12^136 .151192 -.003433 5.42
»-or Ea^^hqua^e Acceleration ot 73.00 */. o-f the 1940 EL CENTRO
ria - 1 mums/rai lures
Ma imum X
Ma,' 1 mum Y
Ma imum RotationSide bloct. litto'f-f
X <ins) Y (ins) Theta (rads) T 1 me (Isec )
- . 14t.5t0 5 .59-.193222
- .0034335.345.42
.127544 .149433 -.003433 5.42
For Earthaua-e Acceleration o-f 77,00 '/. o-f the 1940 EL CENTRO
Maximums/Fai lures X (ins) Y (ins) Theta (rads) Time (sec)
5.595.34
- .003339 5.42- .003339 5.42
Maximum X -.144471Maximum Y -.195tSlMa:imum RotationSide block li-ftct-f .125900 .147522
Far Eartnaua^e Acce'ierat ion o-f 76.00 V. o-f the 1940 EL CENTRO
Maximums/Fai lures X (ins) Y (ins) Theta (rads) Time (sec)
"^ iTi.:-? r -.141425Ma im'jm v -.193312Maximum Rotation
Side block li-fto-f^ .124333 .14b563
5.595.34
-.003332 5.42-.003332 5.42
For Earthquake Acceleration o-f 75.00 */. o-f the 1940 EL CENTRO
Maximums/Fai lures X (ins) Y (ins) Theta (rads) Time (sec)
Ma,', imum X -.139552 5.59Ma -^ imum Y -.191262 5.34Ma imum Rotation -.003283 5.42Side block sliding .123237 .144640 -.003233 5.42Side block overturning .123237 .144640 -.003233 5.42Side block lifto-f-f .102642 .161626 -.003261 5.43
280

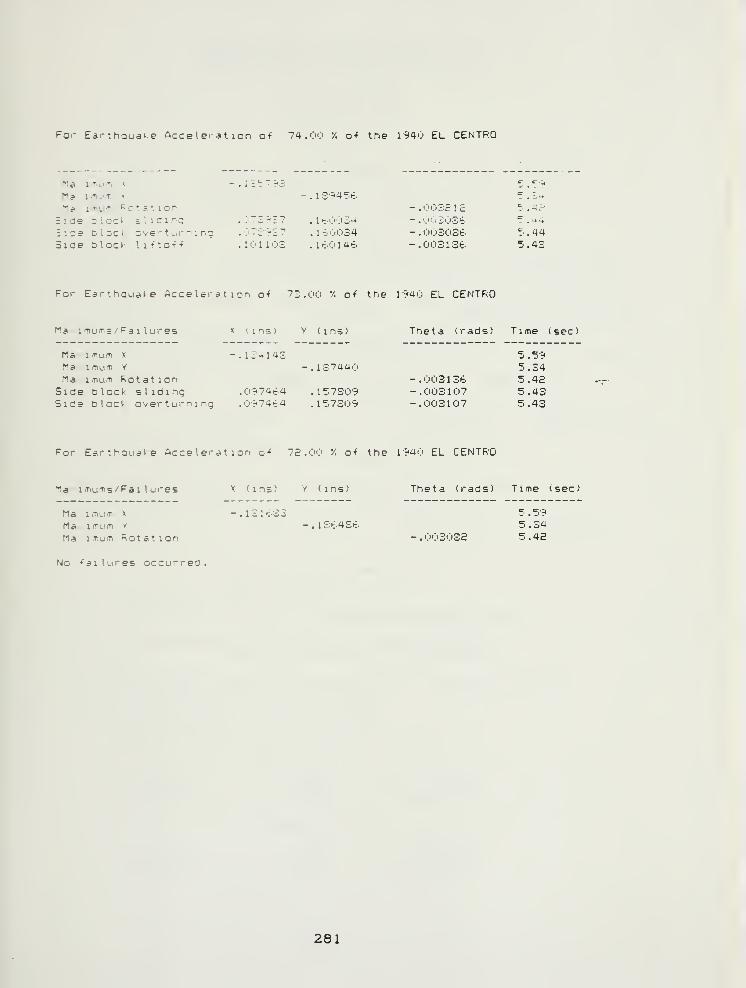
^or EarthquaKe Acceleration o-f 74.00 '/. o-f the 1940 EL CENTRO
Mcl liTium A
Ma 1 mum Pc'a*. ionSide Dloct slidingE:de bloc^. over t lit n: ngSide block li-fto-f-f
11'
1394?K
073 ^i? .lb<;'034
07S-?S7 . 1 b00341 ij 1 1 OS . 1 60 1 4e
•-"JSE 1 E ^. .4c-
C'OiOSb 5 . 44<!i03'!)Sb 5 .44
003136 5 .43
For Earthquake Acceleration o-f 73.00 */. o-f the l'7i40 EL CENTRO
Ma ii-nuiTis / p'a 1 lures X I ins) Y (ins)
- . 124143
Theta (rads) Time (sec)
Ma-imum X
Ma;-. 1 mum V -.137440Ma imum RotationSide block sliding .0-?74t.4 .157309Side Dlock o-^er turning .097464 .157309
- .003136- .003107-.003107
.34
.42i.43
.43
For Earthquake Acceleration o-f 72.00 '/. o-f the 1940 EL CENTRO
Ma 1 mums ^Fai I ures
Ma I mum X
Ma. 1 mtim Y
Ma imum Rot at ion
X (ins) Y (ins)
- .131633-.136436
Theta (rads) Time (seel
.00311)32 .42
No -failures occurred
261

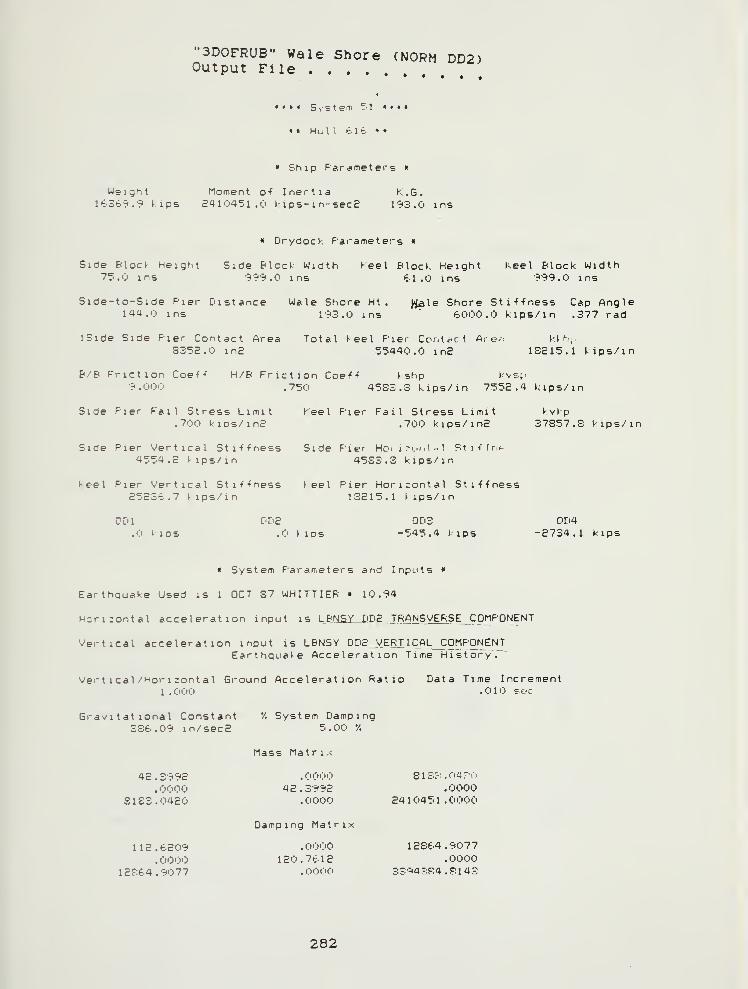
"3D0FRUB" Wale Shore (Norm dd2)Output File
«•« System ^'1 «»»
• • HuU tlb ••
» Ship Parameters »
Weight Moment o-f Inertia K.G.It.StS.'ri lips £410451.0 I- ips-i n-secE 193.0 ins
• Drydock Parameters »
Side Block Height Side Block Width Keel Block Height Keel Block Width75.0 ins '^^ri.O ins tl .0 ins 393.0 ins
Side-to-Side Pier Distance Wale Shore Ht . W^le Shore Sti-f-fness Cap Angle144.0 ins 193.0 ins ' 6000.0 kips/in .377 rad
ISide Side Pier Contact Area Total Keel Pier Cor,tc<ct Ar e/: kt hpS35S.0 inS 55440.0 i n2 1SS15.1 kips/ in
B/B Priction Coe-f-f H/B Friction Coe-f-f J shp kvsp9.000 .750 4533.3 kips/in 7552.4 kips/in
Side Fier Fail Stress Limit Keel Pier Fail Stress Limit kvkp.700 kips/inS .700 kips/inS 37S57.S kips/in
Side Pier Vertical Bti-f-fness Side Pier Hor i n..!. t -- 1 Pti-ffri-
4554.5 ^lps/^n 4533.3 kips/in
Keel Pier Vertical Sti-f-fness keel Pier Horizontal Sti-f-fness2523t .7 kips/in 13215.1 kips/in
QDl QD2 QD3 QD4.0 kips .0 kips -545.4 kips -2734.1 kips
• System Faran.eters and Inpi'ts »
Earthquake Used is 1 OCT 37 WHITTIER » 10.94
Horizontal acceleration input is LBri£r_IiD2_TRANSyERS^C0MP0NENT
Vertical acceleration input is LBNSY DD2 _ VERT I CAL_ COMPONENTEarthquake Acceleration Time History'.
Ver t ical /Hor I zont al Ground Acceleration Ratio Data Time Increment1 .000 .Oil!) sc-c
Gravi tat lonal Constant '/. System Damping336. 09 in/ sec
2
5.00 */.
Mass Matrix
42.3992 .0000 81 3?^ ."''^'v i
.0000 42.3992 .0000S1S3.0420 .0000 2410451.0000
Damping Matrix
112. 6209 . 0000 1 £864 . 9077.0000 120.7612 .0000
12f;64.9077 .0000 S3w4':F:4 .81 43
282
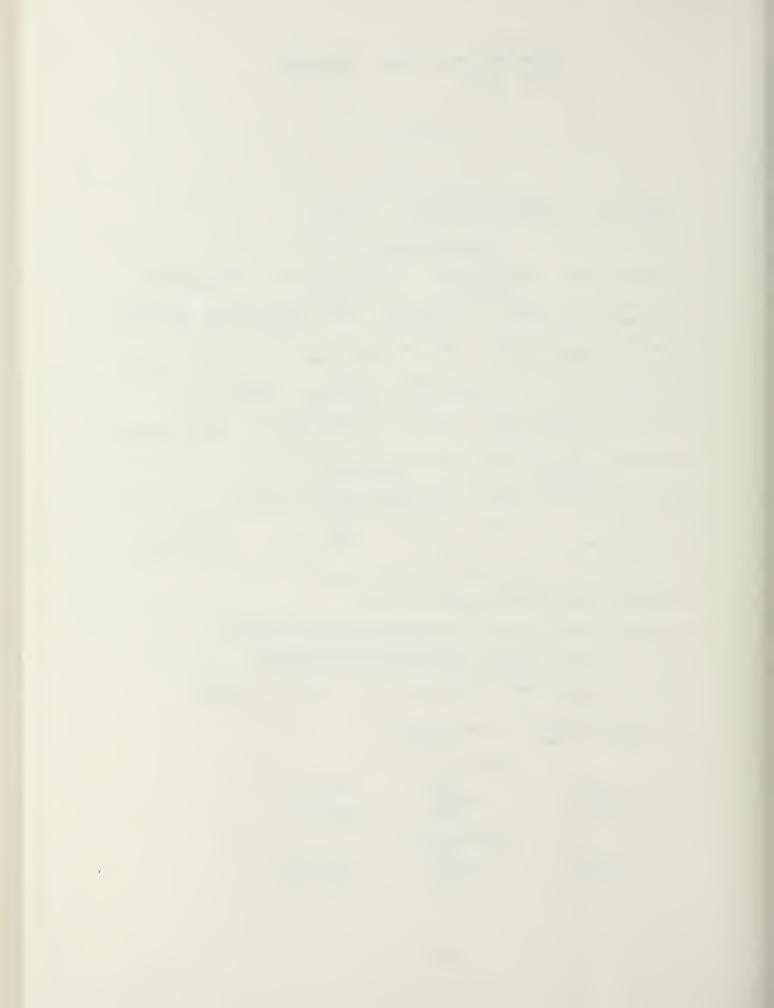
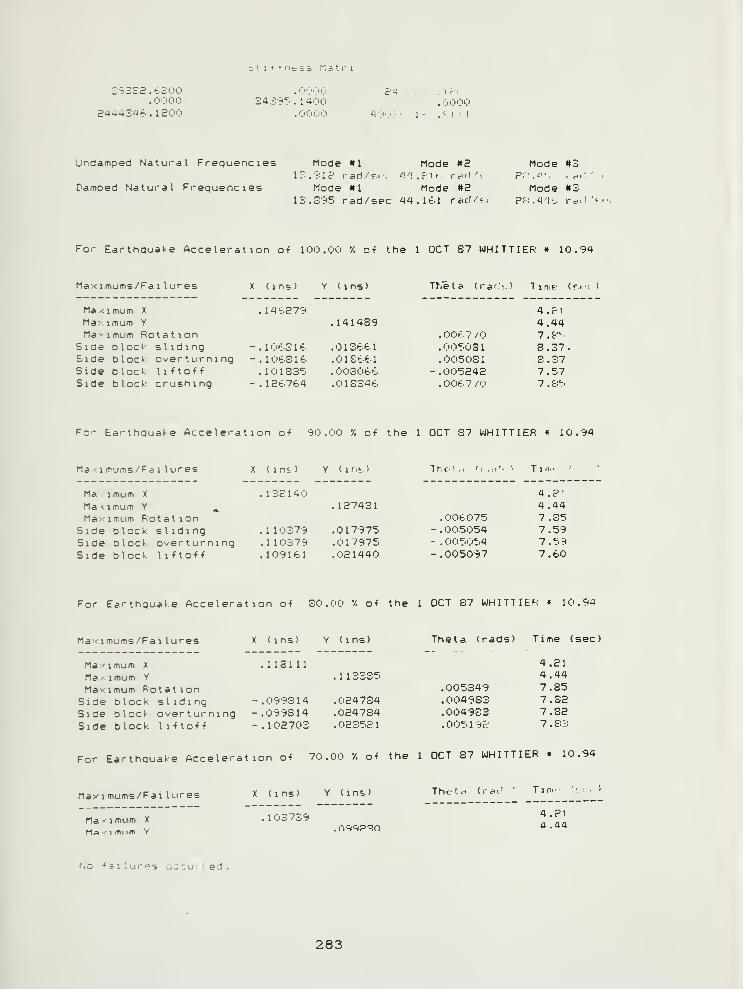
r. 5 f. 1-
1
3'f*3S2 . t'SOO.0000
244434t..lS003439^ .14'
4S'j.-; 'I'r-. ..'-.1I 1
Undampecj Natural Frequencies
Damped Natural Frequencies
Mode #1 Mode «E13. 91? rari/r. . 'i'J.fif. re"'-'-
Mode *! Mode #213.S95 rad/sFc 44.1tl ri<cJ/
Mode OS?:;.i' ., , ^,: '
.
Mode #3
For Earthquate Acceleration o-f 100.00 */. o-f the 1 OCT S7 WHITTIER • 10.34
Maximums/Fai lures
Maximum X
Maximum Y
Maximum RotationSide block slidingSide block overturningSide block 1 1 •f to-f -f
Side block crushing
X (ins) Y (ins) Tf.eta (rarls) TiiTif (rti )
.mt.E73 4.?i.141489 4.44
.OOt 7 /O 7 . C-:^'
- . 1 OtS 1 '^ .OlSbbl .005031 3.37.- . 1 Ot.S 1 6- . 1 ste. 1 . 0050S
1
3.37. 10 133? .003066 -.005242 7.57
- .12t.7t.4 .013346 .006-7 /(.) 7.frS
For Earthquake Acceleration o-f '90.00 */. o-f the 1 OCT 37 WHITTIER • 10. 54
Maximums/Fai lures
Ma imum X
Maximum Y ^Maximum Rotation
Side block slidingSide block overturningSide block li^to^f
X (ins) Y ( 1 nt
)
The-i < '. .:t'- • Tin.' '
.132140 4 .?'
.127431.006075
4.447.35
.110375 .017975 -.005054 7.59
.1 10379 .017975 - . 005054 7.59
. 1 09 1 6
1
.021440 -.005097 7.60
For Earthquake Acceleration o-f SO. 00 */. of the 1 OCT 87 WHITIIEK • 10.94
Ma-< imums/Fa 1 lures
Maximum X
Ma-< imum Y
Maximum RotationSide block sliding -.099314Side bloc I- overturning -.099814Side block I 1 -ft o-f f -.102703
X (ins) Y (ins)
.1181 1 1
Theta (rads) Time (sec)
4.211 1 3385 4 .44
.005349 7.85024784 .004983 7. 82024784 .004933 7.82023521 .0051 91-^ 7.8:-J
For Earthquake Acceleration o-f 70.00 */. o-f the 1 OCT 87 WHITTIER » 10.94
Maximums/Fai lures
Maximum X
M;»-rimiim Y
X (ins) Y (ins)
. 103739
Thelc< (i-ii('- Tin..
4.P1a .44
No -failures oc:ui-red.
283

For Ee»rthquake Acceleration o-f 79.00 '/. o-f the 1 OCT S7 WHITTIEFv » 1 . 94
Maximums/Fai lures X (ins) Y (ins) Theta (rads) Time (sec)
Ma'-imum X
Ma -1 mum Y
Maximum RotationSide bloct- slidingSide block overt urn
1
Side block li-fto-f-f
For Earthquake Acceleration of 73.00 */. o-f the I OCT S7 WHITTIER » 10.94
Maximums/Fai lures
- - -
. 1 1 63 1 4.21.11) 97t. 4.0'!
.005233 7.S5- .0999S3 .007420 .00f.p:;4 7.SK-.099933 .007420 .005234 7.86.- .ioiap5 .0?:-:r'. / .OOt.lrV 7.C-:-
Maximum X
Maximum Y
Maximum RotationSide block I i-f to-f -f
X (ins) Y ( 1 ns
)
Thet ., (r c^r^ :) Tim. <:-f< )
. 1 1 5422 4.21.110565 4.44
.005216 7.S5-.100145 .022933 .005062 7.33
For Earthquake Acceleration o-f 77.00 */. o-f the 1 OfT 87 WHllilLK « 10.94
Ma imums/Fai lures X (ins) Y (ins) Theta (rads) Time (sec)
Maximum X .114073 4.21Maximum Y .109152 4.44Ma><imum Rotation .005150 7.85Side block sliding -.093869 .022639 .0049:i7 7.8c:Side block overturning -.093369 .022639 .004997 7.83Side block li-fto-f-f - .0990S6 .019?7i .00511b 7.S4
For Earthquake Acceleration oi 76.00 */. of the 1 OCT 87 WHITTIER » 10.94
Ma«imums/Fai lures X (ins) Y (ins) Theta (radr) Time (ser)
Maximum X .112592 4.21MaN-imum Y .107735 4.44Maximum Rotation .005r':-:r' 7 .&":•
Side block sliding -.097927 .019054 .005051 7.84Side block overturning -.097927 .019054 .005'.'';.1 7.S4
For Earthquake Acceleration oi 75.00 '/. of the 1 OCT 87 WHITTIER » 10.94
Maximums/Fai lures X (ins) Y (ins) Theta (rads) Time (sec)
Maximum X .111111 4.21Ma VI mum Y .10»^.:^17 4.44
rjo failures occurred.
284

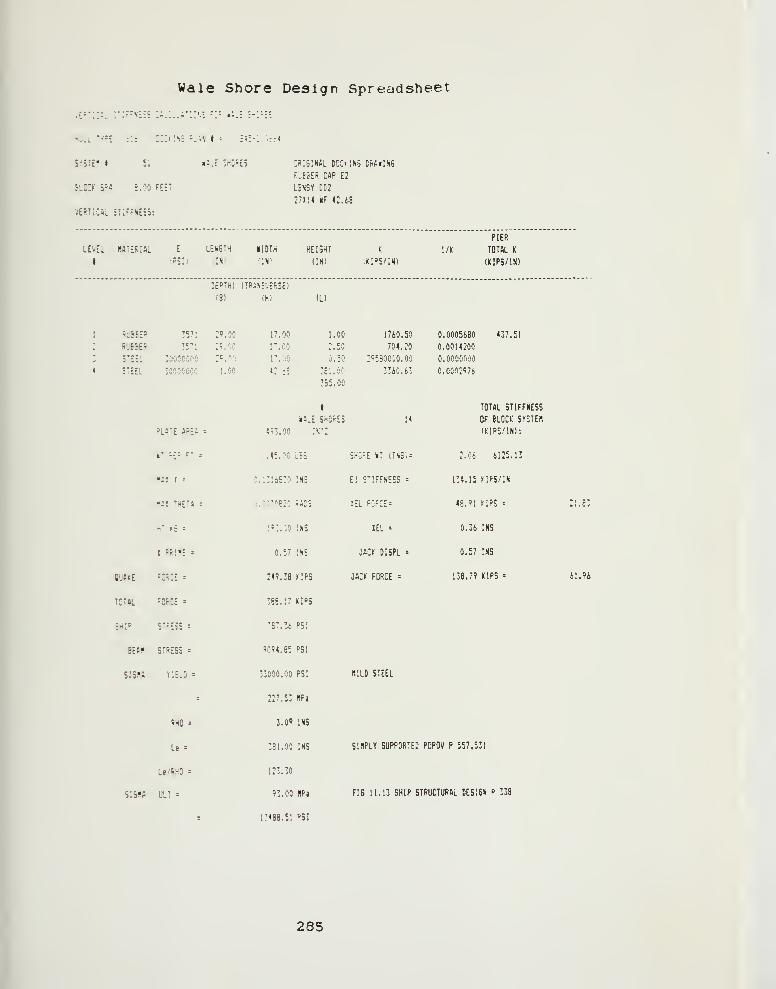
Wale Shore Design Spreadsheet
"(ESS
SfSTE" t 51 »i?u SHOStS CRiSINAL DOCklNS DRANISS
f.BpES CAP E2
BLCCr SP« 8.00 FEET LBNSV DD2
27IM KF 42.68
VERTICAL STIFFXESs:
PIER
LEVEL MTERiftL E LEN6TH KIDTK KEIBHT K 1/K TOTAL K
I (FSI! CN; (IN) (IN! !KIPS/IX) tKIPS/IS)
:3EPTH) (TRANSVERSE)
(B) (H) (L)
H'Mi^ 357! 29.00 17.00 1.00 1760.50 0.0005680 437.51
fil'fSER 3571 29,00 17.00 2.50 704.20 0.001420C
3'EEL ;C!OOCOCC 2'. 00 P. 00 0.50 29530000.00 0.0000000
STEEL 30CC0C0C 1.00 42. js 381.00 3340.63 0.0002976
355.00
t TOTAL STIFFNESS
MALE S-'WES 14 OF BLOCK SYSTEB
493.00 ;k'2 (KlPS/IN):
145.00 LBS 3HG?E KT iTNS;= 2.06 6125.13
0.1316830 INS El STIFFNESS = 134.15 KIPS/IN
0.00:0820 RADS lEL FC-5CE= 48.91 UPS = 21.83
193.00 INS lEL = 0.36 INS
0.57 INS JACK DISPL = 0.57 INS
249.38 CIPS JACK FORCE = 138.79 KIPS = 61.96
388.17 KIPS
-87.36 P3I
9094.85 PSI
33000.00 PSI HILD STEEL
227.53 HP*
RHO = 3.09 INS
Le = 381.00 INS SI«PLV SUPPORTED POPOV P 557,531
Le/RHQ = 123.30
Si6«A ULT = 93.00 HPj FIB U. 13 SHIP STRUCTURAL DESISN P 338
= 13486.51 PSI
PLiTE A9E' =
r PE? f: =
MI I =
I'M THETA :
HT ,-5 =
I PRI1E =
OUAKE FOV.E =
TOTAL FORCE =
SHIP cT:r;: z
BEAU STRESS =
SISHA VIE.D =
285


ThesisL89135c.l
LuchsEarthquake resistant
submarine drydock blocksystem design.
Thesis
L89135c.l
LuchbEarthquake resistant
submarine drydock block
system design.
//>
^^H^^-