Embed Size (px)
Citation preview
United States
Agriculture
Forest Service
Southern Forest Experiment Station New Orleans, Louisiana
Proceedings of a Workshop on the
Durability of ructural Panels
( General Technical Report 1 *w--=w -- *#&- A# A'
oecernber 1984 Pensacok. Florida October 5:7, 1982
Edited by Eddie W. Price
Proceedings s f a Workshop on the
DURABILITY OF STRUCTURAL PANELS
Pensacol a , Florida October 5-7, 1982
Edited by Eddie W. Price
Presented by the
Southern Forest Experiment Station
and
Auburn University
FOREWORD
Wood i s a b i o l o g i c a l m a t e r i a l t h a t i s sub jec t t o d e t e r i o r a t i o n f rom na tu ra l elements and organisms. To counterac t t he de te r i o ra t i on , wood may be t r e a t e d o r u t - i l i z e d i n a protective manner, But wood i s o f t e n used w i t h t he knowledge t h a t a c e r t a i n amount o f d e t e r i o r a t i o n w i 11 occur and t he s t r u c t u r e w i l l r m a i n f unc t i ona l , Also, when one type o f wood product i s being rep laced w i t h another wood product, f o r instance, plywood r e p l a c i n g s o l i d lumber, con- cern i s expressed about t h e d u r a b i l i t y o f t h e product and appropr ia te eva lua t i on techniques.
Dur ing t h e 1960ts, t he development o f the southern p i ne plywood occurred and t h e product d u r a b i l i t y , p a r t i c u l a r l y t he bond d u r a b i l i t y , was o f t e n debated. Today, a group o f s t r u c t u r a l panels i s being proposed t o be u t i l i z e d i n r oo f , wa l l s , and f l o o r sheath ing app l i ca t ions , Pane1 types i n t h i s group are r e f e r r e d t o as waferboards, f 1 akeboards, strandboards, OSB ( o r i e n t e d s t r u c t u r a l boards), s t r u c t u r a l par t i c leboards , etc, I n d i v i d u a l companies wi 11 a l so se lec t t rade- names f o r market ing purposes f o r t h e i r product. I n general, a11 t h e products are manufactured w i t h a phenol-fomaldehyde r e s i n and wood p a r t i c l e s o f s u f f i - c i e n t s i z e t o ob ta i n t h e requ i red s t r u c t u r a l p roper t ies . A l a r g e percentage o f t he wood p a r t i c l e s u s u a l l y has a l eng th t o th ickness r a t i o g rea te r than 50 and o f t e n g rea te r than 100, Also being proposed are m a t e r i a l s w i t h a combination o f veneer and wood p a r t i c l e s ,
The development o f these s t r u c t u r a l panels has taken several years and many i nd i v i dua l s , But, d u r a b i l i t y and eva lua t ion techniques are s t i l l a major concern of t he indus t ry , s c i e n t i s t s , and users. For c e r t a i n panel types, p a r t i e u l a r l y those u t i 1 i z i n g a m ix tu re o f southern hardwoods, t h e d u r a b i l i t y o f t h e proposed panel has delayed t he i n d u s t r i a l expansion,
Therefore, t h e Southern Fo res t Experiment S t a t i o n proposed a Workshop on t h e d u r a b i l i t y o f s t r u c t u r a l panels. Auburn U n i v e r s i t y s c i e n t i s t s had worked w i t h t he Fores t Serv ice s c i e n t i s t s i n developing an understanding o f dimensional s t a b i l i t y and were i n v i t e d t o a s s i s t i n sponsoring t he Workshop. The economic s i t u a t i o n a t t he planned meeting dates, October 5-7, 1982, l i m i t e d t h e t r a v e l o f several i nd i v i dua l s . However, t he meeting was attended by 26 i nd i v i dua l s , 22 papers were presented, and 20 papers inc luded i n t he Proceedings. The Workshop concluded w i t h a ha l f -day d iscuss ion on t h e research needs, A summary o f t h i s d iscuss ion i s g iven as t h e f i n a l p resen ta t i on o f t he Proceedings.
TPSLE OF CONTENTS
D U R A B I L I T Y . Otto Suchslaod ........................................................................ ....... D U R A B I L I T Y PROBLEMS A S S O C I A T E D W I T H WOOD COFISTRUCTION. Don Percival ..................,....
. ...... PiCCEtERATED AGING GF HOOD-BASED PPNEL PRODUCTS: A 2EV TEN AbJD CGOl"4ENTA2Y. R o b e r t i-i G i 1 1 espie
D U R A B I L I T Y : I T S CONCEDTCALIZATTOM. CONSEQYENCES. AND G3PQAGIE91LATION. Jay 4 . Johnsoq.. ......... A N A L Y S I S OF T H E D I F 4 E N S I O N P L S T A B I L I T Y OF WOOD BASED COMPOSIrES. R . 6. Tang. E . W . P r i c e . a n d C. C . ....................................................................................... C h e n l l l l
E F F E C T OF F L A K E - C U T T I N G P A T T E R N S AND R E S I N CONIEWTS ON D I M E N S I O N A L CHANGES OF FLAKEROPRD UNDER . . . . . C Y C L I C HYGROSCOPIC TREATPENT. R 6. T a n g . 6 Y Hse. and Z 3 Z h o u .......................... ....... . D U R A B I L I T Y AS A F F E C T E D BY R E S I N TYPE. James R W i l s o n ......................*........+......
............ . . E F F E C T OF R E S I N A L K A L I N I T Y ON D I M E N S I O N A L S T A B I L I T Y OF HARDWOOD FLAKEBOARDS. C Y H s e
HOW C Y C L I C H U M I D I F Y A F F E C T S S T A T I C B E N D I N G AND D I H E M S I O N A L P R O P E R T I E S OF SOME WOOD-BASE PANEL ...................................................................... PRODUCTS. J . D o b b i n M c N a t t
P R E D I C T I N G A S T M D l 0 3 7 & - C Y C L E ACCELERATED A G I N G OF WAFERBOARD I N 27 HOURS. R . M . K n u d s o n a n d 6 . N . R o s e n b e r g .................................................................................
D U R A B I L I T Y OF STRUCTURAL FLAKEBOARD FROM SOUTAERN HARDWOODS S P E C I E S . M . W . K e l l y a n d E . W. P r i c e . . . . .*..... STRUCTURAL D U R A B I L I T Y OF 3 - L A Y E R O R I E N T E D FLAKEBOARD FROM SOUTHERN HARDMOODS. E J R i b l i s . 97
COMPACTION R A T I O AND R E S I N COVERAGE E F F E C T S ON P R O P E R T I E S OF THICK. "HENOL IC-BONDED FLAKEBOARD. .................................................................................. J a m e s T . R i c e 1 0 3
. . .*.... D U R A B I L I T Y E V A L U A T I O N OF HARDWOOD VENEERED FLAKEROAPD CONPOSITES. P . C h o w a n d J J J a n o w i a k 119
D U R A B I L I T Y OF F I B R O U S - F E L T E D BOARDS. G e o r g e E . W o o d s o n ..................................... 127
PERFORMANCE OF WAFERBOARD: LOAD DURATION. D I M E N S I O N A L S T A B I L I T Y AND B I O D E T E R I O R A T I O N . ..................................................................... J . A l e x o p o u l o s a n d T . S z a b o 133
P R E S E R V A T I V E TREATMENT E F F E C T S ON M E C H A N I C A L AND T H I C K N E S S S W E L L I N G P R O P E R T I E S OF ASPEN WAFER- BOARD. H e n r y J . H a l 1. R o l a n d 0. G e r t j e j a n s e n . E l m e r L . S c h m i d t . C h a r l e s G . C a r l 1. a n d R o d n e y 6 .
E V A L U A T I O N OF P R E S E R V A T I V E E F F E C T S ON M E C H A N I C A L P R O P E R T I E S AND B I O D U R A B I L I T Y OF ASPEN WAFERBOARD. .. . . . E . L . S c h m i d t . H . J Wall. a n d R O G e r t j e j a n s e n .................................... 153
D U R A B I L I T Y OF COMPOSITE WOOD PRODUCTS. R o y D . A d a m s . . . . . . . . . . . . . . . . . . . . . . . . . . . . . . . . . . . . . 161
P R E S E R V A T I V E T R E A T E D SOUTHERM HARDWOOD FLAKEBOARD. P a u l H . S h o r t a n d D u a n e E . L y o n ................ 169
RESEARCH NEEDS ON D U R A B I L I T Y OF STRUCTURAL PANELS. E . W . P r i c e and R . C . T a n g ...................... 783
2 / Otto Suchsland-
Abstract,--After an examination of the popular concept o f durabi l i ty , the relationship between product cost and product durabili ty i s explored. Most wood product standards are not expl ic i t on durabili ty or service 1 i f e . The dura- bi 1 i ty of particleboard i s believed to be limited by swel- l ing stresses that may lead to permanent strength reduction.
DEFINITION A N D POPULAR CONCEPTS O F DURABILITY
Many a speech has been launched in the proper direction with a quotation from Webster's Dictionary. Webster's definition of durabi l i ty , however, i s so genera1 tha t i t becomes ambiguous, par t icular ly when appl ied to man-made materi a1 s and s t ructures :
"Durability i s the ab i l i t y to exis t fo r a long time with retention of original qua1 i t i es, abi 1 i t i e s , or capabi l i t i es. "
Taken l i t e r a l l y , i t doesn't seem to apply to anything, because almost nothing retains i t s original quality for a long period of time.
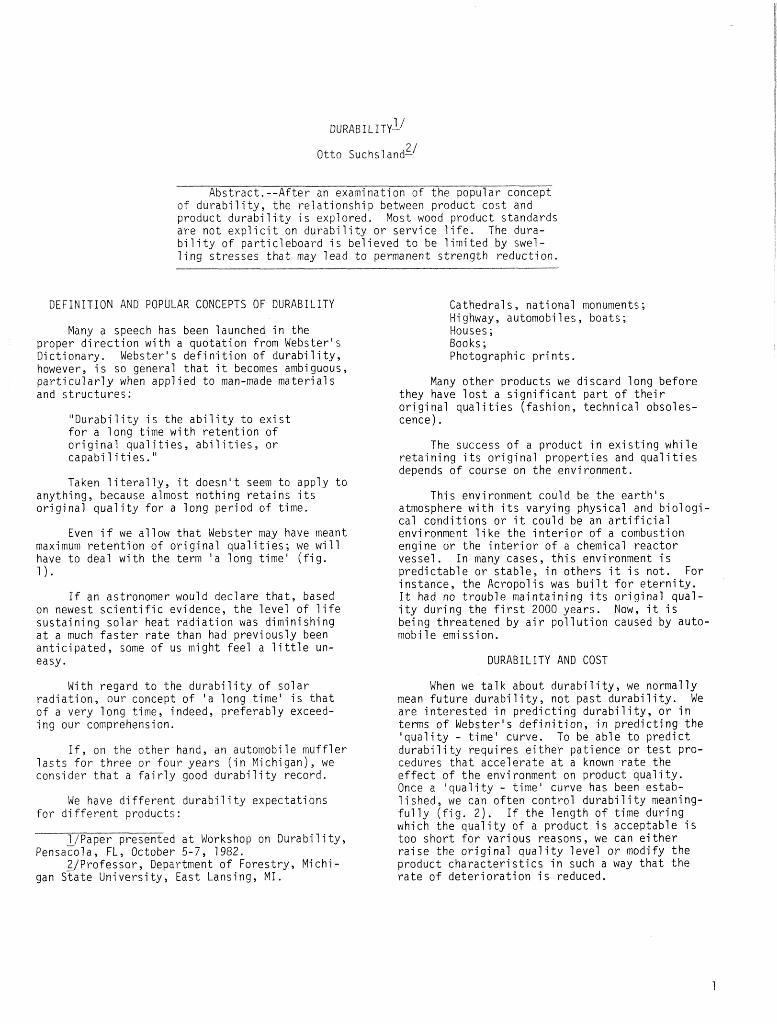
Even i f we allow that Webster may have meant maximum retent i on of ori gi na1 qual i t i es; we wi 11 have to deal with the term ' a long time' ( f ig . 1 ) .
If an astronomer would declare tha t , based on newest sc ien t i f i c evidence, the level of l i f e sustaining solar heat radiation was dimini shing a t a much f a s t e r ra te t h a n had previously been anticipated, some of us might feel a l i t t l e un- easy.
With regard to the durabili ty of solar radiation, our concept of ' a long time' i s that of a very long time, indeed, preferably exceed- ing our comprehension.
I f , on the other hand, an automobile muffler l a s t s fo r three o r four years ( in Michigan), we consider tha t a f a i r l y good durabi 1 i ty record.
We have different durabi 1 i ty expectations for different products:
1JPaper presented a t Workshop on Durability, ~ensaco la , FL, October 5-7, 7982.
Z/Professor, Department of Forestry, Michi- gan ~ T a t e University, East Lansing, M I .
Cathedrals, nati ona1 monuments; Hi ghway, automobi 1 es , boats ; Houses ; Books ; Photographic prints.
Many other products we discard long before they have l o s t a significant part of the i r original qual i t i e s (fashion, technical obsoles- cence).
The success of a product in existing while retaining i t s original properties and qual i t i e s depends of course on the environment.
This environment could be the ea r t h ' s atmosphere with i t s varying physical and biologi- cal conditions or i t could be an a r t i f i c i a l environment l ike the in te r io r of a combustion engine or the in te r io r of a chemical reactor vessel. In many cases, t h i s environment i s predictable or s table , in others i t i s not. For instance, the Acropolis was bu i l t fo r e terni ty . I t had no trouble maintaining i t s original qual- i ty during the f i r s t 2000 years. Now, i t i s being threatened by a i r pollution caused by auto- mobile emission.
DURABILITY AND COST
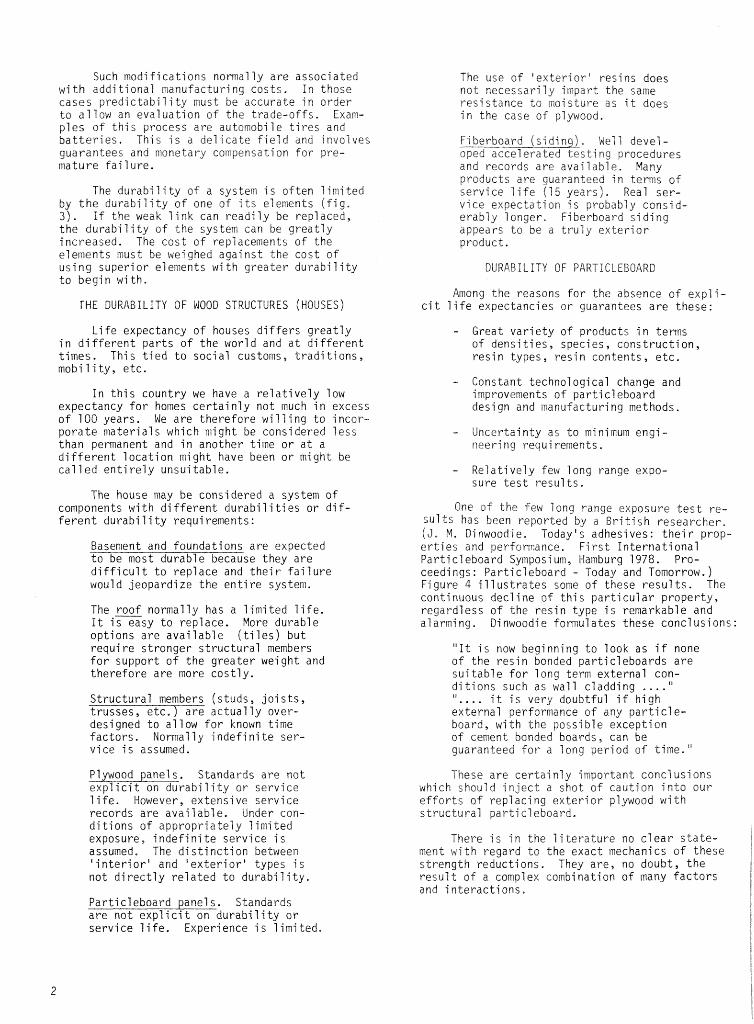
When we ta lk about durabi l i ty , we normally mean future durabi l i ty , not past durabili ty. We are interested in predicting durabi 1 i ty , or in terms of Webster's def ini t ion, in predicting the 'qual i ty - time' curve. To be able to predict durabi 1 i ty requires e i ther patience or t e s t pro- cedures that accelerate a t a known ra te the effect of the environment on product quality. Once a 'qual i ty - time' curve has been estab- 1 i shed, we can often control durabi 1 i ty meaning- fu l ly ( f i g . 2 ) . If the length of time during which the quality of a product i s acceptable i s too short for various reasons, we can e i ther ra ise the original quality level or modify the product character is t ics in such a way that the ra te of deterioration i s reduced.
Such modi f i cat i ons normal 1 y are associated with additional manufacturing costs. In those cases predictabi 1 i ty must be accurate in order t o allow an evaluation of the trade-offs. Exam- ples of th i s process are automobile t i r e s and ba t te r ies . This i s a delicate f i e l d and involves guarantees and monetary compensation for pre- mature fa i 1 ure.
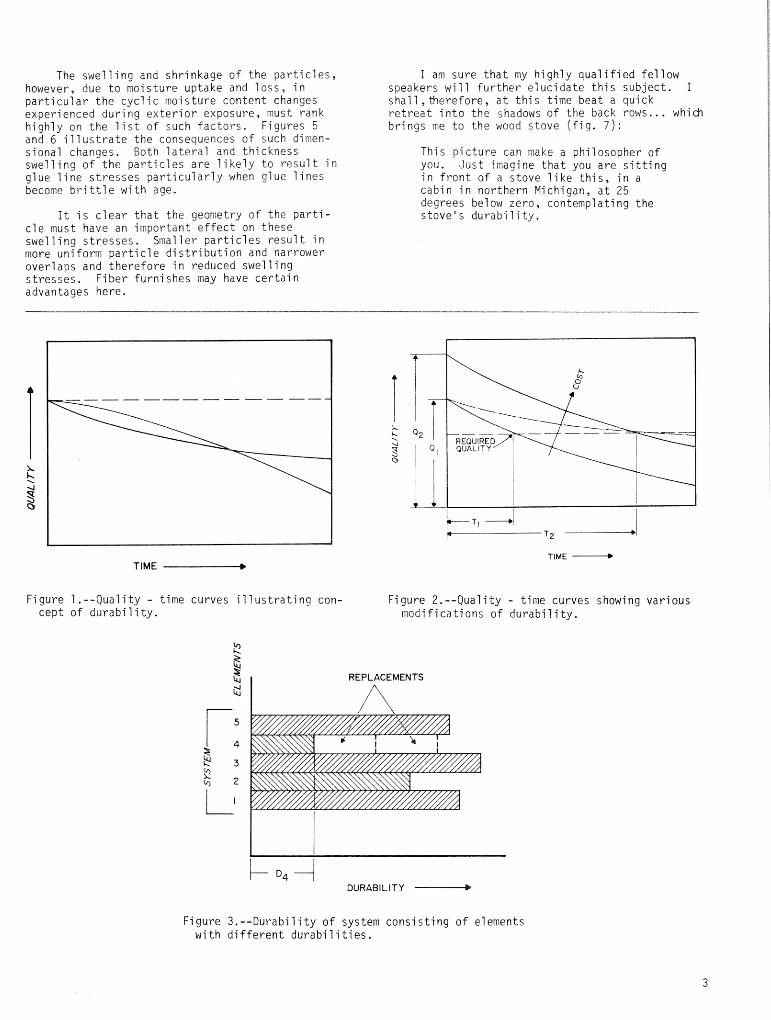
The durabi 1 i ty s f a system i s often 1 imi ted by the durabili ty of one of i t s elements ( f i g , 3). If the weak 1 ink can read'lly be replaced, the durabi l i ty of the system can be greatly increased. The cost of replacements of the elements must be weighed against the cost of using superior elements wi t h greater durabi 1 i ty to begin wi t h .
T H E DURABILITY O F WOOD STRUCTURES (HOUSES)
Life expectancy of houses differs greatly in different parts of the world and a t different times. This t ied t o social customs, t radi t ions, mobi 1 i ty , e tc .
In t h i s country we have a re la t ively low expectancy for homes certainly not much in excess of 100 years. We are therefore willing to incor- porate materials which might be considered less than permanent and in another time or a t a different location might have been or might be cal l e d enti rely unsuitable.
The house may be considered a system of components with different durabi 1 i t i es or di f - ferent durabi 1 i ty requi rements:
Basement and foundations are expected to be most durable because they are d i f f i cu l t to replace and the i r fa i lu re would jeopardize the en t i re system.
The roof normally has a limited l i f e . I t i s easy to replace. More durable options are available ( t i l e s ) b u t requi re stronger structural members fo r support of the greater weight and therefore are more costly.
Structural members (studs, jo i s t s , trusses, e t c . ) are actually over- designed to a1 low for known time factors, Normal 1 y indefinite ser- vice i s assumed.
Plywood panels. Standards are not expl ic i t on durabi l i ty or service l i f e . However, extensive service records are available. Under con- di tions of appropriately 1 imi ted exposure, indefini te service i s assumed. The dis t inct ion between ' i n t e r i o r ' and ' e x t e r i o r ~ y p e s i s not direct ly re1 ated t o durabi 1 i ty .
The use of ' ex te r io r ' resins does not necessarily impart the same resistance to moisture as i t does in the case of plywood.
. Well devel- oped accelerated tes t ina procedures and records are availabie. Many products are guaranteed in terms of service l i f e (15 years). Real ser- v i c e expectation i s probably consid- erabl y 7 onger. Fi berboard s i di ng appears to be a t ruly exterior product.
DURABILITY OF PARTICLEBOARD
Among the reasons for the absence of exp7i- c i t l i f e expectancies or guarantees are these:
- Great variety of products in terms of densi t ies , species, construction, resin types, resin contents, e t c .
- Constant techno1 ogi cal change and improvements of particleboard design and manufacturing methods.
- Uncertainty as to minimum engi - neering requirements.
- Relatively few long range expo- sure t e s t resul ts .
One o f the f ew long range exposure t e s t re- su l t s has been reported by a British researcher. ( J . M. Dinwoodie. Today's adhesives: t he i r prop- e r t i e s and perfor~ance. Firs t International Parti cl eboard Symposi um, Hamburg 1978. Pro- ceedi ngs : Particleboard - Today and Tomorrow. ) Figure 4 i l l u s t r a t e s some of these resu l t s . The continuous decl i ne of thi s parti cul a r property, regardless of the resin type i s remarkable and alarming. Dinwoodie formulates these conclusions:
" I t i s now beginning to look as i f none of the resi n bonded parti c1 eboards are suitable fo r long term external con- ditions such as wall cladding . . . ." "..., i t i s very doubtful i f high external performance of any par t ic le- board, with the possi b1e exception of cement bonded boards, can be guaranteed fo r a fang period of time.'"
These are certainly important conclusions which should inject a shot of caution into our e f for t s of replacing exterior plywood with structural particleboard.
There i s i n the l i t e ra ture no c lear s ta te - ment with regard to the exact mechanics of these strength reductions. They are , no doubt, the resul t o f a complex combination of many factors and i nteracti ons,
Particleboard panels. Standards are not expf i c i t on durabili ty or service l i f e . Experience i s l imited,
The swelling and shrinkage of the par t ic les , however, due to moisture uptake and loss , in particular the cyclic moisture content changes experienced during exterior exposure, must rank highly on the l i s t of such fac to r s . Figures 5 and 6 i l l u s t r a t e the consequences of such dimen- sional changes. Both la teral and thickness swef f i ng of the parti c1 es are 1 i kely to resul t i n glue l ine s t resses particularly when glue l ines become b r i t t l e with age.
I t i s c lear that the geometry of the par t i - c le must have an important e f fec t on these swell i ng s t resses . Small e r parti c1 es resul t in more uniform part ic le dis t r ibut ion and narrower over1 aps and therefore i n reduced swell i ng s t resses . Fi ber furni shes may have certai n advantages here.
I am sure that my highly qualified fellow speakers will further elucidate th i s subject. I sha l l , eherefore, a t t h i s time beat a quick re t rea t in to t h e shadows of the back rows... which brings me t o the wood stove ( f ig . 7 ) :
T h i s picture can make a phi losopher of you. Just imagine tha t you are s i t t i ng in front of a stove l ike th i s , in a cabin in northern Michigan, a t 25 degrees below zero, contemplating the stove's durabili ty.
TlME ------+ TIME -
Figure 1.--Quality - time curves i l lus t ra t ing con- Figure 2.--Quality - time curves showing various cept of durabi 1 i ty. modifications of durabili ty.
REPLACEMENTS
A
i-- ~4 4 DURABILITY -
Figure 3. --Durabi 1 i ty of system consi sting of elements with different durabi l i t ies .
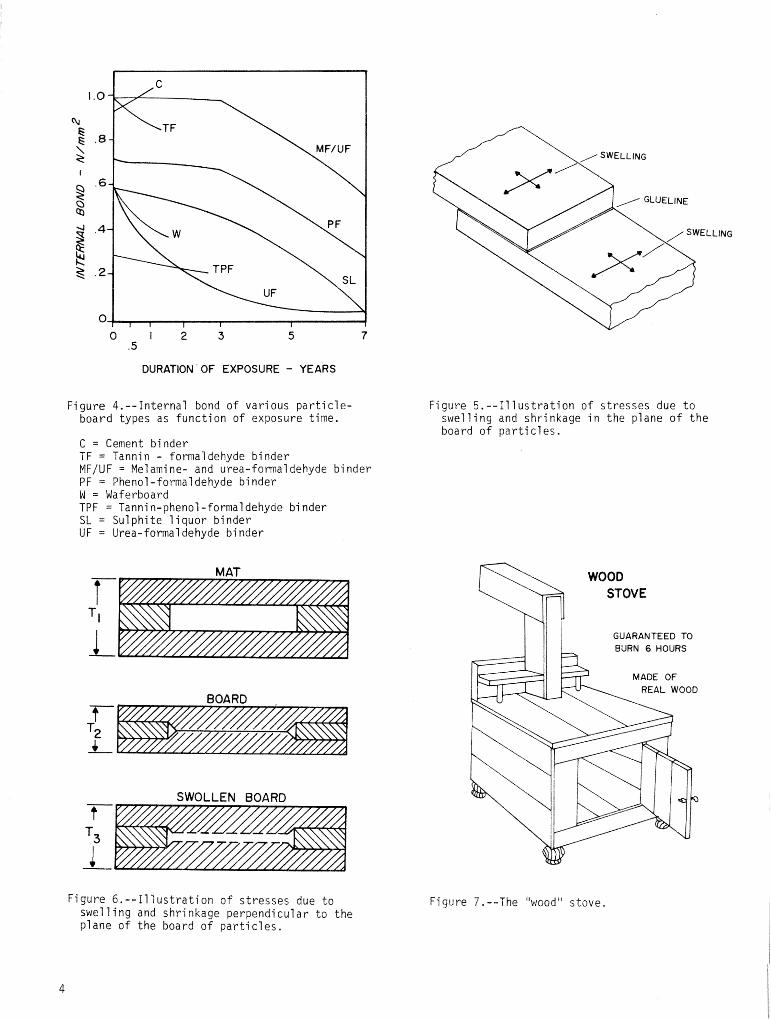
DURATION ' OF EXPOSURE - YEARS
Figure 4.--Internal bond of various pa r t i c l e - board types as function of exposure time.
C = Cement binder TF = Tannin - formaldehyde binder MF/UF = Melamine- and urea-formaldehyde binder P F = Phenol-formal dehyde binder W = Waferboard TPF = Tanni n-phenol -formal dehyde bi nder SL = Sulphite 1 iquor binder UF = Urea-formaldehyde binder
MAT
Figure 5 . - - I l lu s t r a t ion of s t r e s ses due t o swelling and shrinkage in the plane of t h e board of par t i el es .
GUARANTEED TO BURN 6 HOURS
MADE OF REAL WOOD
Figure 6.--11 lus t r a t ion of s t r e s ses due t o swelling and shrinkage perpendicular to the plane of the board of p a r t i c l e s ,
Figure 7 . --The '"wcod" stove.
2URABI L I TY PR38tEK ASSOCIATED WI TY M O D C O ~ " ~ S T R ~ I C T I O ~ ~ ~
Don ~ e r c i v a l g
.------------------ -------------- Abstract.--A few exafltples of dura6fl-iiff-a<<o"G"~Cfe"d-GFt4C-
wood construction are presented. Most of the prsbletns dis- cussed are related to the inattention t o recommended fnstruc- tions a n d the appf ication of the various elements o f the structure.
Durabil i ty problems associated with wood construction can best be di scussed usi ng sampl es of deterioration. Unfortunately, many of the pic torial i 1 lustrations presented a t the Workshop are not in this written proceedings, However, anyone connected with wood construction will have simi 1 ar experiences, and need only refer to their f i l e s for illustrations.
Even though this Morkshop i s primarily con- cerned with panel or reconstituted wood bui l di ng products durabil i ty, general problems associ ateb with light-frame construction will be discussed, This includes panel products and the framing elements.
The definition of durabil i ty i s rather elusive and can mean many things to inany peopl e. From personal experiences over the years, dura- bil i ty, or the 1 ack thereof, usually mans a deterioration of an element of the structure requiring repair or rep1 acement, reattachment, refinishing, etc. , a t some given period earl ier i dentification stamp. than expected, Other than repainting or re- finishing, etc. , a consensus might be i nterpreted as expecting the structure to out1 ast the mort- gage. Some expect the house to l a s t forever wh~le others may prefer the structure to l a s t ten years before rep1 acement.
Most problems I have experience with are directly related to (1 ) the physics sf moisture and humidity (Anderson and Sherdood l 974; Small Homes Council 1975; Shewood and Hans 19791, and ( 2 ) inattention to recommended instructions and appl ication of the various elements of the s true ture. General ly , the importance of control - l ing free water and rnoisture vapor i s known. Hsw- ever with the increasing emphasis on energy con- servation towards tighter construction and exten- sive use of insulation, the importance of conlrol- 1 ing the moisture becomes paramount.
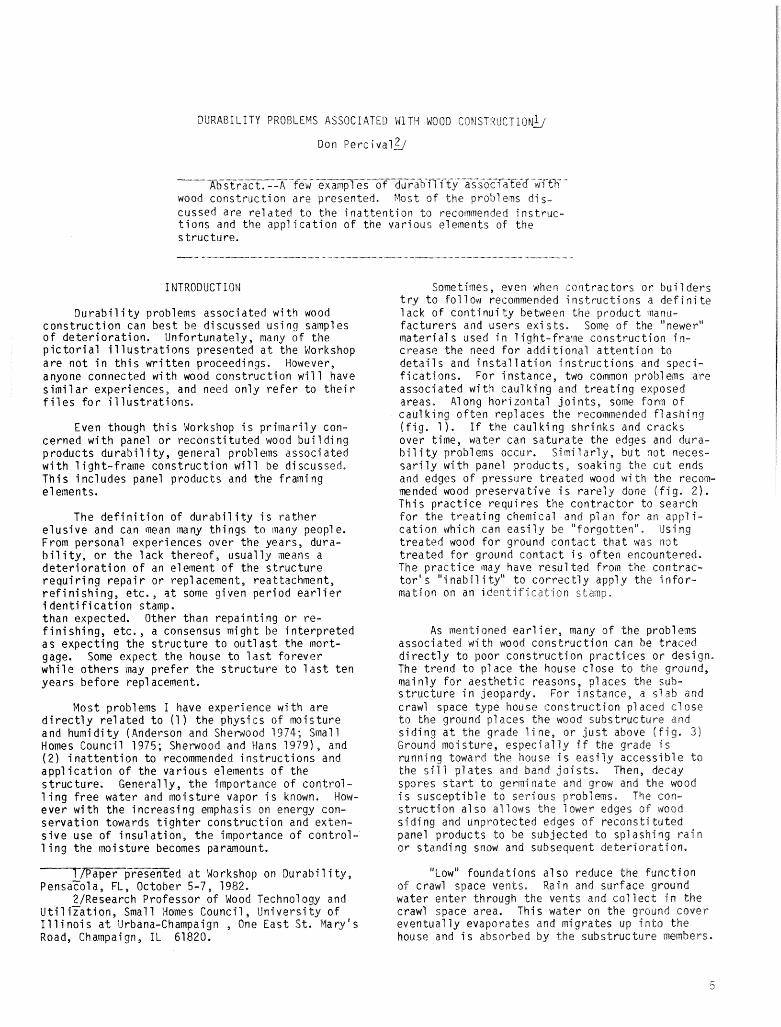
Sometimes, even #!het~ zcntrac tors or b u i 1 ders t ry to fof 1 ow recommended instructions a def i n i te 9 ack of corrtinui ty between the product manil- facturers and users exists. Some of the "newer" material s used in 1 ight-fra:ne construction i n - crease the need for addi t i o ~ a l attention t o details and installation instructions and speci- fications. For instance, two common problem are associated wi t 9 caul king and treating exposed areas, Along horizontal joints, some form of caul king often rep1 aces the recommended fl asning (f ig. 9 1. If the caul king shrinks and cracks over time, water can saturate the edges and bura- bil i ty problems occur. Similarly, b u t not neces- sarily with panel products, soaking the cut ends and edges of pressure treated wood with the recom- mended wood preservative i s rarefy done (f ig. 2 ) . This practice requires the contractor to search for the treating chemical a n d plan for an agp1 i - cation ~ h i c h can easily be "'Forgotten'" .Using treated wood for ground contact that was n 3 t treated for ground contact i s often encountered. The practice may have resu"lte froin the contrac- tor" ""iabi l i t y ' y t correctly apply the i nfor- mation on a n identification stamp.
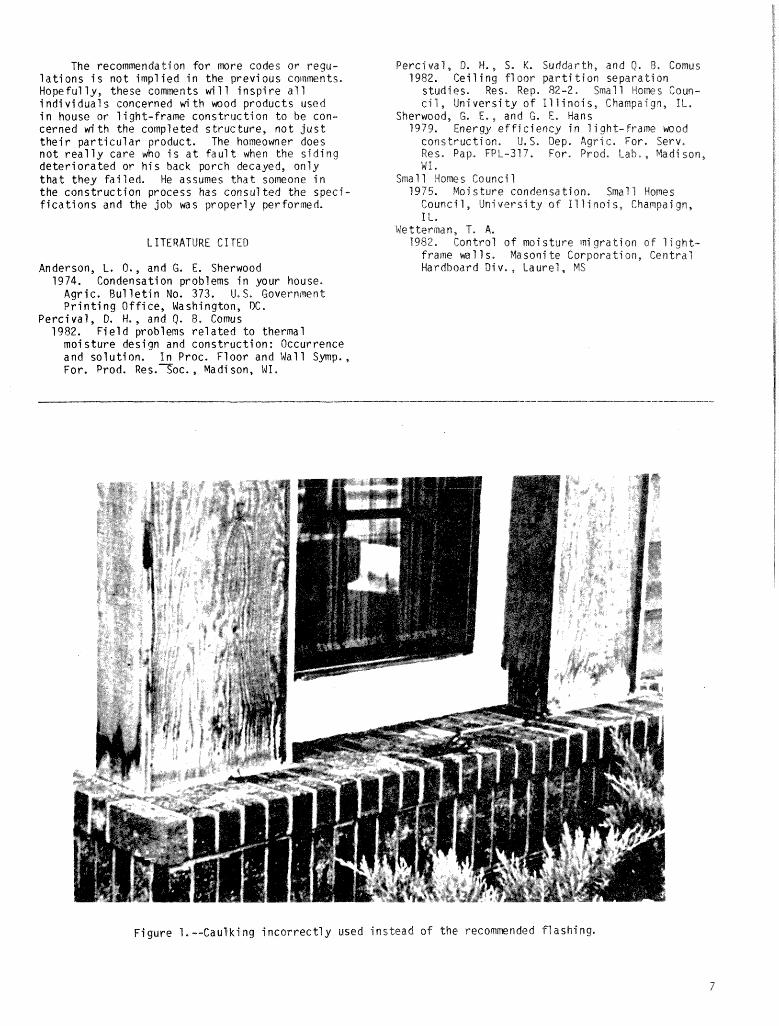
As mentioned earl i er , many of the probl ens associated w i t h wood construction can be traced directly to poor construction practices or design. The trend to place the house close to the ground, ~ a i n l y for aesthetic reasons, places the sub- structure in jeopardy, For instance, a s7 3b and crawl space type house construction pl aced cS ose do the ground pl aces the wood substructure and siding a t the grade ii ne, or just above ( f i g . 31 Ground moisture, especially i f the grade i s running toward the house i s easily accessible t o the s i l 1 gl ates and band joists, Then, decay' spores s t a r t to germinate and grow and the wood i s susceptible do serious probleqs. The con- struction also a1 lows the l ower edges o f wood siding and unprotected edges of reconsti tuted panel products to be subjected to splashing ra in or standing snow and subsequent deterioration.
Y F a F F r x e X e d a t Workshop on Durabil i ty, "Low" foundations a1 so reduce the Function PensaFola, FL, October 5-7, 1982. o f crawl space vents, Rain and surface ground
2/Research Professor of Wood Technology and water enter through the ven ts and collect i n the Uti 1 iration, Small 14omes Council, Universi Gy of crawl space area. This water on the ground cover I1 l i nois a t Urbana-Champaign , One East S t . Maryi s eventually evaporates and migrates u p i n t o the Road, Champaign, IL 61820. house and i s absorbed by the substructure members.
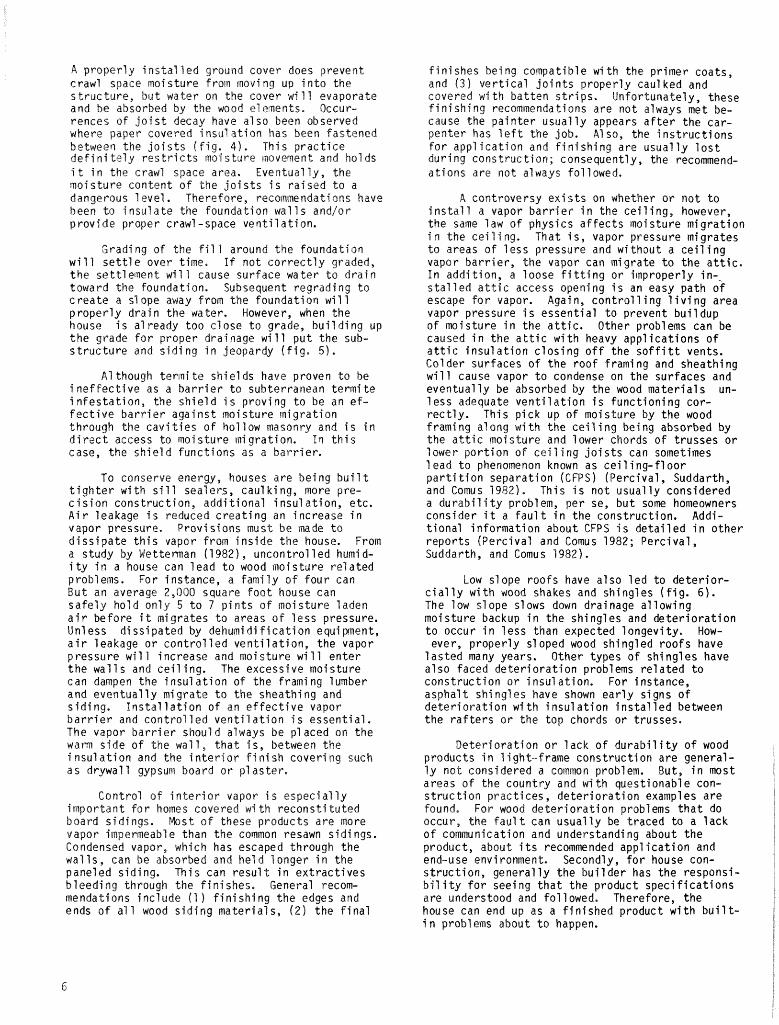
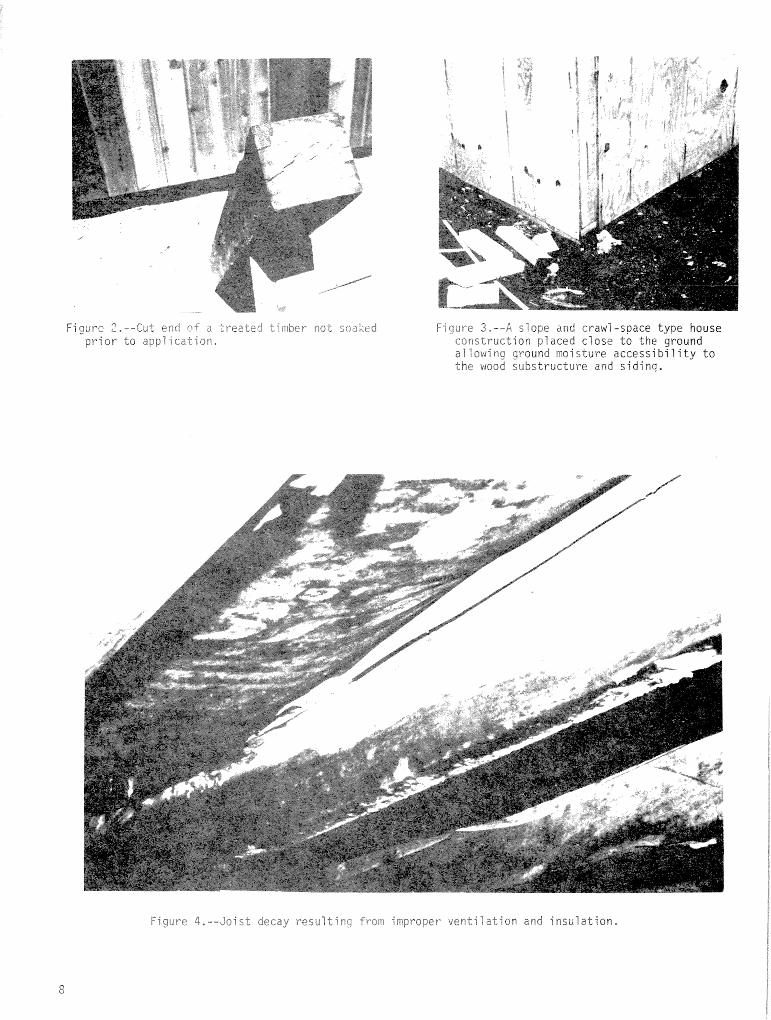
A p r o p e r l y i n s t a l l e d ground cover does prevent crawl space mois tu re frotn tnovi ng up i n t o t he s t r u c t u r e , b u t water on the cover wi 11 evaporate and be absorbed by the wood elements. Occur- rences of j o i s t decay have at so been observed where paper covered i nsul a t i o n has been fastened between the j o i s t s ( F i g . 4) . Th is p r a c t i c e d e f i n i t e l y r e s t r i c t s mol'sture movement and holds i t i n the crawl space area. Eventual l y , t he mo i s tu re content o f the j o i s t s i s r a i s e d t o a dangerous 1 eve1 , Therefore, reeomwndations have been t o i n s u l a t e the foundat ion w a l l s and/or p r o v i d e proper crawl-space v e n t i l a t i o n .
Grading o f the f i l l around t he foundat ion w i l l s e t t l e over time. I f n o t c o r r e c t l y graded, t h e s e t t l e t ~ e n t w i l l cause sur face water t o d r a i n toward t he foundation. Subsequent regrad ing t o c r e a t e a st ope away from the foundat ion w i l 1 p r o p e r l y d r a i n t he water. However, when t he house i s a1 ready t oo c l ose t o grade, b u i l d ing up t h e grade f o r proper d ra i r~age wi 11 p u t t h e sub- s t r u c t u r e and s i d i n g i n jeopardy ( f i g . 51,
A1 though ter in i t e sh ie lds have proven t o be i n e f f e c t i v e as a b a r r i e r t o subterranean t e r m i t e i n f e s t a t i on, t he s h i e l d i s p rov i ng t o be an e f - f e c t i v e b a r r i e r aga ins t mo is tu re migration through the c a v i t i e s of hol low masonry and i s i n d i r e c t access t o mo is tu re migrat ion, I n t h i s case, t he s h i e l d f unc t i ons as a b a r r i e r ,
To conserve energy, houses a re be ing b u i 1 t t i g h t e r w i t h s i l l sealers, caul k ing, more pre- c i s i o n cons t ruc t ion , a d d i t i o n a l i nsul a t ion , etc. A i r leakage i s reduced c r e a t i n g an increase i n vapor pressure, Prov is ions must be made t o d i s s i p a t e t h i s vapor from i n s i d e t h e house. From a study by Wetterman (1982), uncon t ro l l ed humid- i t y i n a house can l e a d t o wood mois tu re r e l a t e d problems. For instance, a f am i l y o f f o u r can B u t an average 2,000 square f o o t house can s a f e l y ho ld on ly 5 t o 7 p i n t s o f mo is tu re laden a i r be fo re i t migrates t o areas o f l e s s pressure. Unl ess d i s s i pated by dehumi d i f i c a t i o n equi ptnent, a i r leakage o r c o n t r o l l e d v e n t i l a t i o n , t he vapor p ressure w i l l increase and mois tu re wi 11 en te r t h e w a l l s and c e i l ing. The excessive mo is tu re can dampen t he i n s u l a t i o n o f t he f raming lumber and even tua l l y m igra te t o t he sheath ing and s id ing . I n s t a l l a t i o n o f an e f f e c t i v e vapor b a r r i e r and c o n t r o l 1 ed v e n t i l a t i o n I s essent ia l . The vapor b a r r i e r should always be p laced on t he wam s ide o f t he wa l l , t h a t i s , between t he i nsul a t i o n and t he i n t e r i o r f i n i s h cover ing such as d rywa l l gypsum board o r p l a s t e r *
Cont ro l o f i n t e r i o r vapor i s e s p e c i a l l y impo r tan t f o r homes covered wi t k r econs t i t u t e d board sid ings. Most o f these products a re more vapor impermeable than t he common resawn s id ings, Condensed vapor, which has escaped through t he wa l l s , can be absorbed and he1 d 9 onger i n t h e paneled s id ing. Th is can r e s u l t i n e x t r a c t i v e s b1 eedi ng through t he f i n i shes , General recom- mendations i nc l ude (1) f i n i s h i n g t h e edges and ends o f a1 I wood s i d i n g mater ia ls , ( 2 ) t h e f i n a l
f i n i s h e s being compat ib le w i t h t he p r imer coats, and (3 ) v e r t i c a l j o i n t s p rope r l y caulked and covered w i t h ba t t en s t r i p s * Unfor tuna te ly , these f i n i s h i n g recommendations a re no t always met be- cause t he p a i n t e r u s u a l l y appears a f t e r the car - pen ter has l e f t t he job. Also, the i n s t r u c t i o n s f o r a p p l i c a t i o n and f i n i s h i n g a re u s u a l l y l o s t du r i ng construe t i o n ; consequently, t he recomend- a t i ons are no t always fol lowed.
A controversy e x i s t s on whether o r n o t t o i n s t a l l a vapor b a r r i e r i n t he c e i l i n g , however, t he same law of phys ics a f f ec t s mo is tu re m i g r a t i o n i ri t he c e i l i n g . That i s , vapor pressure migra tes t o areas o f l e s s pressure and w i t hau t a c e i l i n g vapor b a r r i e r , t he vapor can migra te t o t h e a t t i c . I n add i t ion , a loose f i t t i n g o r improperly in-. s t a l l e d a t t i c access opening i s an easy pa th o f escape f o r vapor. Agai n, c o n t r o l 1 i n g 1 i v i ng area vapor pressure i s essen t i a l t o prevent bu i l dup o f mo is tu re i n t he a t t i c . Other problems can be caused i n t he a t t i c w i t h heavy app l i ca t i ons o f a t t i c i n s u l a t i o n c l o s i n g o f f t he s o f f i t t vents, Colder sur faces o f t h e r o o f f raming and sheath ing w i l l cause vapor t o condense on t he sur faces and even tua l l y be absorbed by t he wood m a t e r i a l s un- 1 ess adequate v e n t i l a t i o n i s f unc t i on ing cor- r e c t l y . Th is p i c k up of moisture by t he wood f raming a long w i t h t he c e i l i n g being absorbed by t he a t t i c mo is tu re and lower chords o f t russes o r lower p o r t i o n o f c e i l i n g j o i s t s can sometimes l ead t o phenomenon known as c e i 1 i ng- f l oor p a r t i t i o n separa t ion (CFPS) (Perc iva l , Suddarth, and Comus 1982). Th is i s n o t usua l l y considered a d u r a b i l i t y problem, per se, b u t some homeowners consider i t a f a u l t i n t he construct ion. Addi- t i o n a l i n f o rma t i on about CFPS i s d e t a i l e d i n o the r r epo r t s (Perc iva l and Comus 1982; Perc iva l , Suddarth, and Comus 1982).
tow s lope roo f s have a l so l e d t o d e t e r i o r - c i a l l y w i t h wood shakes and sh ing les ( f i g . 6) . The low s lope slows down drainage a l l ow ing mo is tu re backup i n t he sh ing les and d e t e r i o r a t i o n t o occur i n l e s s than expected longev i ty . How- ever, p rope r l y s1 oped wood sh ing led r o o f s have
l a s t e d many years. Other types o f sh ing les have a l so faced d e t e r i o r a t i o n problems re1 a ted t o cons t ruc t i on o r i n s u l at ion. For instance, aspha l t sh ing les have shown e a r l y s igns o f d e t e r i o r a t i o n w i t h i n s u l a t i o n i n s t a l l e d between t h e r a f t e r s o r t he top chords o r t russes.
D e t e r i o r a t i o n o r l a c k o f d u r a b i l i t y o f wood products i n 1 i g h l - f rame cons t ruc t i on a re general- l y n o t considered a common problem. But, i n most areas o f t he count ry and w i t h quest ionable con- s t r u c t i o n p rac t i ces , d e t e r i o r a t i o n examples a re found, For wood d e t e r i o r a t i o n problems t h a t do occur, t he Faul t can usual ly be t r aced t o a lack o f communication and understanding about t he product, about i t s recommended a p p l i c a t i o n and end-use environmenL Secondly, f o r house con- s t r u c t i o n , general l y t he b u i l d e r has t he responsi - b i l i t y f o r seeing t h a t t he product speci f i c a t i o n s a re understood and fol lowed, Therefore, t he hsu se can end up as a f i n i s h e d product w i t h b u i 1 t- i n problems about t o happen.
The recommendation for more codes or regu- l a t i o n s i s not implied in the previous colnnrents, Hopefully, these c o m n t s wi 11 insp i re a l l i ndi vi dual s concerned wi t h mod products used i n house or 1 ight-frame construction t o be con- cerned with the completed s t ruc tu re , not j u s t t h e i r pa r t i cu la r product. The homeomer does not r e a l l y care rJho i s a t f a u l t when the s i d i n g deter iora ted or h i s Sack porch decayed, only t h a t they fai led. We assumes t h a t someone in the construction process has consulted the speci- f i c a t i o n s and the job was properly ~ e r f o r w d .
LITERATURE CITED
Anderson, L. 0., and G, E. Sherwood 1974. Condensation problems in your house.
Agric. Bullet in No. 373. U.S. Government P r in t ing Office, Washington, DC,
Perciva'l, D. H. , and ff. R. Comus 1982. Field problems re l a t ed t o thermal
moi s t u r e design and construction: Occurrence and solution. In Proc. Floor and Wall Symp. , For. Prod. Res.Toc., Madison, MI.
Perclvaf , D. kf, , S, K. Surlddsrth, and Q. 9. Csmus 1982. Cei 1 ing f l oar par t i t i on separation
studjes. Res. Rep. 82-2. Small Homes Coun- c i l , University o f I 1 l i n o i s , Ghanpaigo, I t .
Sherwood, G. E . , and 6. E. Hans 1979, Enerlly e f f i c i e n c y i n light-frame wad
construction. iJ, 5. Dep. Wgric. For. Serv, Res. Pap. FFL-317, For. Prod, Lab, , Kadi son, WI *
Smal l Wows Counci 1 '1975, M o ~ s t u r e condensation. Sma'l Homer
Councf I , Univessi Gy of I 1 1 i n o i s, Chanpai gn, I ' i L.
ttjetterman, f, A. '1982, Control of misture migration o f l i g h t -
frarne m l 1 s - Masoni t e Co~poradion, Central Hardboard Di v. , Laurel, MS
Figure 1. --Caul king incorrect1 y used i n s tead of the recommnded flashing..
Fict~rc: 2,--Cut end r;" 2 ~re(sl;?d t~i.;ber not sszked prior to appIicatSoc,
F i q u r e 3 , - - A slope and crawl-s~ace tyae house construction p l a c e d close t o t h e ground allowing g r o u n d noisture accessibility t o t he wood substructure and s i d i n g .
Figure hh,--dois"ecay result5"riz froin improper venti~atiar; and i ns l i l a t i on ,
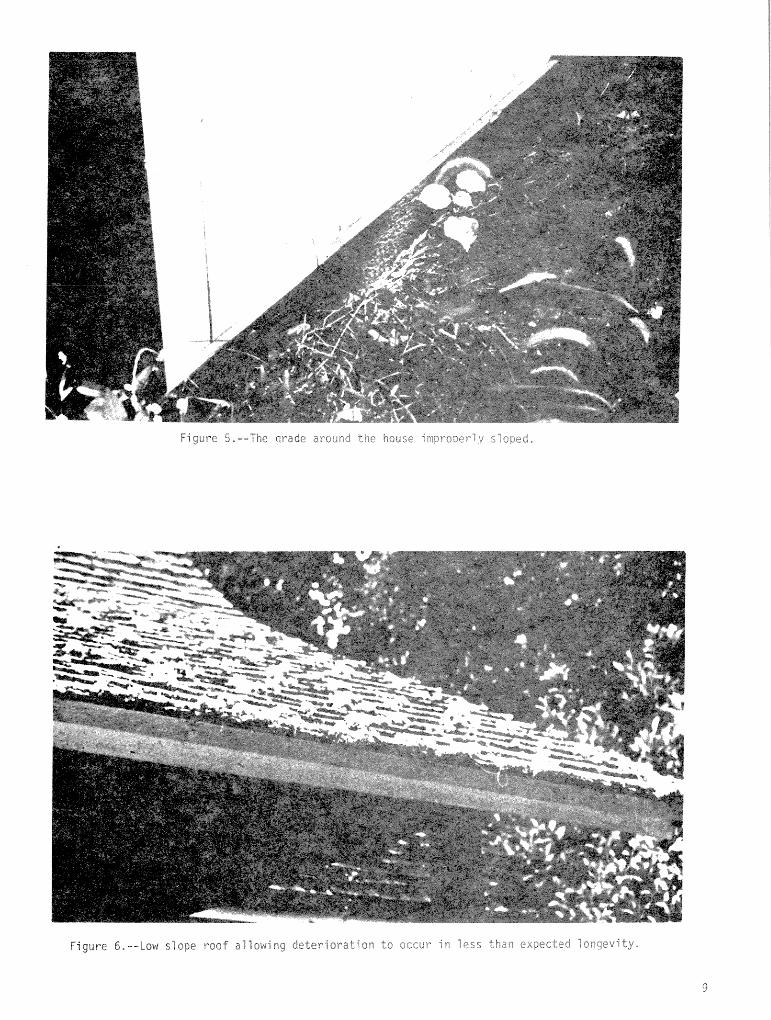
F igure 5. --The qi-ade a round t.ie house ii-incrox.l $4 ~ S c p e d .
Figure 6,--tow slope roof allawing deteriuratda? do occw- in less a h d o egpected I l rqev i ty ,
ACCELERATED A G I N G OF #OOD-BASED PANEL PRODUCTS:
7 / A REVIEW AND COMMENTARY-
2 1 Robert H, Gil lespie-
Abstract.--The purpose s f th i s report i s to review how accelerated-aging procedures were developed to evaluate the durabil i ty potential of wood-based materials. I t traces the development of accelerated-aging back to concerns about paper fo r l ibrary or archival storage and includes the pro- cedures subsequently developed for wood, adhesives, plywood, particleboard, flakeboard, and other wood-based panel products. Viewing these procedures in the perspective intended by the original investigators should lead to a bet ter understanding about the i r use and the information they provide and, thereby, guide and stimulate further developments in t h i s area of research.
INTRODUCTION
Our more durable materials will survive years of natural weathering of the most severe variety, B u t the length of t ine required to bring about substantial change in physical proper- t i e s in these materials i s often longer than many investigators can devote to such evaluations. A t the present time i t must be recognized that there i s no al ternat ive to using accelerated-aging treatments to evaluate a wood product's potential durabili ty. What i s most needed i s a better understanding of the procedures we now use and a willingness to continue the development of new and improved methods based as much as possible on sound s c i en t i f i c principles.
This report i s an e f for t to correct some of the mi sunderstandings that prevai 1 about durabi 1 i ty evaluations, by tracing the historical development of some pertinent procedures, by defining purposes for the i r development and the i r relationship to performance classes , and by discussing different phi losophies of approach. Durabi 1 i ty evaluations pertinent to wood-based panels involve different adhesives, different forms of wood elements combined in many different ways, and different wood spec i es .
The accelerated-aging procedures f ~ r th i s wide variety of wood-based composites will be presented in the chronological order of their development. While the emphasis may be on
11 Paper presented a t Workshop on Durability, ~ensayola , FI. October 5-7, 1982.
21 Author i s a Supervisory Research Chemist a t the Forest Products Laboratory, Forest Service, U.S. DeparGment of Agricuf ture, Madison, WI,
historical significance of these developments, different philosophies of approach, the purpose for their development, or the i r interrelationship to other procedures are interwoven throughout the report.
The purpose of accelerated aging i s to evaluate a material or portion o f a structure for i t s durabil i ty , serviceabil i ty, or long-term performance. These three terms a77 imply a design requirement being met or exceeded for a specified period in a particular service environ- ment. Accelerated aging, therefore, becomes the means for generating information about durabili ty-- the capabili ty o f maintaining the serviceabili ty of a product, component, assembly, or construction over a specified time (ASTM E 632).
The mere mention of accelerated aging raises images of doubt and cynicism in the minds o f some investigators, and a t l eas t cause for concern in others. This i s understandable, for acceierated aging most often means treatments that are more rugged than found in service environments. These treatments are considered by some investigators to be dnreal is t ic and, consequently, inappropriate. Accelerated aging a1 so often means short- term data col iection with mathematical manipulation for long-term prediction--a process some investi- gators feel i s no more just i f ied than gazing into a c rys ta l b a l l ,
However, the investigators who ini t ia ted and refined the early accelerated-aginq procedures were concerned about these same problems. They considered the appropriateness s f different procedures and different a l ternat ives and recog- ni zed the 1 imi tations and appf icabif i t y of various treatments. Consequently, a review of develop- ments in accelerated aging should be beneficial
toward e s t a b l i s h i n g an improved perspective and understanding. T h i s shouid then form a firm foundation f o r fur ther developnent a n d stimulate p r o d u c t i v e research i n thSs f i e l d .
ACCELERATED AGING VS . WhTURAL HEATHER1 NG
I d e a l l y , an accelerated-asing procedure s h o u l d eva lua te a nater iz l d u r i n g 1 to 2 months tes t ing and provide resul t s tha t would trans? a t e i n t o accurate predictions of i t s behavior in natural weathering, as in some service environ- ments, This ideal s i tuzt ion i s seldom, i f ever, achieved f o r a variety of reasons.
F i r s t among the many problems associated with correlations of t h i s type i s the lack of any def ini t ion or standard for weathering. Xnvesti- gators spend math time and e f for t developing accelerated-aging procedures, carefully controlling exposure conditions, attempting to reduce variabil i ty in material response and, final l y , establ i sh a standard procedure. The investigators then ask questions such as, "If a material loses 25 percent strength during 10 cycl es of th i s standard accel era ted-agi ng procedure, how long would i c l a s t during natural weathering?" This would seem to be a logical and reasonable question, except for the fac t that ~ a t u r a l weathering cannot represent a sing1 e , we7 1 control l ed , and r e ~ e a t a b l e s e t of exposure conditions,
Seldom, i f ever, i s a weathering exposure defined in terms of cl imate variables which would include the extremes, the means, and the frequency of departure frorn the means of tei~perature, wind velocity, precipitation, moisture condensation, solar radiation, e tc . C f inates are highly variable, total l y uncontrol lab1 e, and seldom predi ctab? e. Efforts do correlate the effects of accelerated a g i n g wi t h those caused by exposure to one s e t of climate conditions hardly seem worthwhile in v i e w of the elusive character of the weathering experience.
There are problems not only with variable cl irnates b u t also with the manner in which materials are exposed to weathering. For example, small panels or specimens are exposed without f inish or protection to maximize the amount of solar radiation impacting the surface. Most experiments with weather exposure are designed to accelerate the e f fec t s of weathering, not t c approximate those effects . Thus, the conditions selected do not represent any expected service environment. There i s no standard way of exposing materials t e tne elements o f weathering. Conse- quently, the results of weathering studies cannot be translated into performance a t any particular service environment. T h e var iabi l i ty among sp:cimens often increases during weathering, which precludes any s t a t i s t i c a l evaluation of the s i gni Ficance of differences noted. Usual l y a b o u t the best that can be expected i s that any patterns, trends, or rankings t h a t develop during acceler- ated ag ing also take place when the same materials are exposed t o natural weathering.
Another problem associated with correlations between accelerated aging and natural aging i s the fac t that strength lgsses for many materials during natural aging are not always cont in~ous 2nd l inear w i t h t iqe of exposure. More strength i s l o s t during summer than winter in northern climates and losses may slow up a f t e r 1 or 2 years exposure. For exampl e, the natural weathering of phenol ic-bonded flakeboards has shown a general pattern of rapid loss of strength and s t i f fness during the f i r s t year or two of exposure wi t h a much slower rate of loss in subsequent years (biCMA 1965, 1970; Hann, Black, and Blomquist 7962, 1953; Jokerst 1968; and Clad and Schmidt-He1 1 erau 7 9 6 5 ) .
Performance Classes
There are those who feel that different performance classes of wood composites should be produced and the products differentiated by sensi t i ve accei erated-agi ng tes t s . Most often the suggested performance classes are based upon the intended service environment for the product. While only problems associated with evaluating exterior-grade products will be considered in this report, i t i s important that the jus t i f i ca - tion for th i s res t r ic t ion be made clear.
I t i s claimed that performance classes allow different materials to be considered and permits them to be combined in the most economical way to meet certain end-use requirements. The argument i s that expensive waterproof adhesives should not be used for products destined for mild service environments, since this not only increases costs b u t inhibi ts the development and use of a l terna- t ive sat isfactory adhesives. In a recent confer- ence attended by investigators recogni zed as eminent in the f ie ld of wood composites (Oliver 1921) , four different durabili ty classes were suggested : ( 1 f Open exterior, ( 2 ) protected exter ior , ( 3 ) humid in te r io r , and (4) dry in te r io r .
While th i s approach to new product develop- ment i s logical and laudable, there are obstacles to i t s fu l l implementation, a n d arguments against i t . Practical s i tuations must be considered. Cost savings resulting from the use of a less expensive adhesive, reduction in adhesive spread, or inclusion of additional f i l l e r s and extenders could be rapidly eaten u p by additional inventory costs, qua1 f ty control costs, product identi f i ca - tion a n d grade stamp costs, shipping and marketing costs, e tc , Misuse during shipping, storage, and instal lation would increase with four d i s t i nc t l y different end-use grades to be readily recognized even a f t e r cutting so that a71 material becomes installed where intended. No provision can be made for accidental, but inappropriate, exposure to water from roof or plumbing leaks, or moisture condensation that often takes place even under the best attention to construction de ta i l s . Because of these probf ems, i t i s almost impossi ble to define the micro-climates that would charac- ter ize each of the proposed exposure c lass i f i ca - tions. Furthermore, the development of t e s t procedures that could be used to distinguish between product classes, including the development
of sat isfactory qua1 i ty control t e s t s for the i r manufacture, appears to be an almost insurmount- able probleln in l igh t of our present capabi l i t ies fo r durabi 7 i ty assessment.
Performance classes , based only upon the service environment for which a product i s intended, represent many problems to the user of the product. In contrast, performance classes, based upon the end-use function in an assembly, are more readily understood by the user of the products. A performance concept that combines functional character is t ics with service environments has been developed by the American Plpood Association for structural panel products t o be used as wall, f loor , and roof sheathing (Countryman 7 980). The essenti a1 performance a t t r ibu tes of sheathing panels were identified as structural capacity, dimensional stabi 1 i ty , and bond durabi l i ty . A ser ies of t es t s i s recommended for measuring the mechanical properties important t o structural capacity, and also for determining dimensional s t ab i l i t y . Bond durabi l i ty , which i s planned for three levels--exterior, intermediate, and interior--wi 11 be measured by specific accelerated-aging tes t s . I n a1 1 1 i kel i hood future developments in wood-based composites will emphasize mu1 t i ple-cri t e r ia fo r end-use perform- ance. They will probably be engineered or " t a i l o r made" to perform a specific function in a par- t i cu la r service s i tuat ion,
While i t i s important that accelerated-aging procedures are developed to distinguish between different durabi l i ty levels, th i s report will concentrate on the most durable situation--full exter ior weatherability without protection.
HISTORICAL BACKGROUND
The accelerated-aging procedures to evaluate the durabi l i ty of paper and f iber building boards represent some of the ea r l i e s t developments of such treatments. A review of the historical background surrounding these developments and how they evolved into present-day methods provides insight into the purpose for each development, the appl icabi l i ty and limitations each presents, and the need for further developments.
The most widely used accelerated-aging procedures for evaluating wood-based panel products in the United States i s that described
in ASTM O 1037 (1981); A-1 .g/ This standard method of evaluation i s under the jurisdiction of ASTM Committee D-7 on wood and was published original l y in 1949. The accel erated-aging proce- dure was incorporated in the original standard. Lewis ( 1 956) summarized the procedures used a t tha t time t o t e s t various building boards, and noted the f ac t that the accelerated-aging t e s t had been developed by the National Bureau of Standards (NBS). The procedure was f i r s t men- tioned in a se r ies of reports on Building Materials
and Structures, and was described by Jessup, Weissberg, and Weber (1938) in a report on accelerated aging of f iber building boards, It must be remembered that the NBS always had an active program of t e s t method development and conducted research on building material s and other materials since i t s establishment a t the turn of the century.
In I337 Congress appropriated funds for NBS for a research program dealing with materials and methods of construction suitable for use in low-cost housing. This program involved many housing agencies in the Government, and particu- l a r ly the Forest Products Laboratory, for studies of wood constructions. The plans for th i s program were described in the f i r s t report of the se r ies by Dryden (1938) who he1 ps describe the approach to accelerated aging with such statements as:
"Research i s controlled, directed, and accelerated experience."
"Accelerated weathering tes t s made in a laboratory do not give resul ts for many constructions which can be used to estimate the service l i f e with reasonable accuracy. Such tes t s are , however, helpful because they indicate which constructions may be expected to give the longer service."
The accel erated-agi n g procedure devel oped by Jessup, Wei ssberg , and Weber ( 1 938) was based on ear l i e r work by Rasch (1931, 1933) evaluating the permanence of paper. Rascn had evaluated several accelerated-aging procedures and concluded that oven heating for 72 hours a t 100°C (212°F) pro- duced the same kind of changes in mechanical properties that took place during the natural aging of paper. Also, heating a variety of papers under these condi t i ons reduced fol ding endurance and produced the same ranking as resulted from natural aging. This oven heating treatment of paper and folding endurance measure- ment remains as a standard method today (ASTM D 776-71 ; Tappi 1962).
Jessup e t a l . (1938) found that f iber building boards underwent l i t t l e change in mechanical properties upon heating a t 100°C (21 2 " F ) , even for twice the time found useful fo r paper. They reasoned that a high humidity phase was needed to impose the effects of alternate wetting and drying, and chose a spray of conden- sing steam to help supply the moisture. They reasoned further that low temperatures encountered in certain loca l i t i es sometimes caused moisture to condense and freeze within walls. Consequently, a freezing phase was added to the aging procedure. This resulted in a cycle that required 2 days to complete. These cycles were repeated for a total
3f The conditions used for treatment in a laboratory procedure are shown in the Appendix with the procedures numbered sequentially.
of 300 treatment hours -2' This accel era ted-agi ng treatment produced changes in the strength, permeability, and chemical composition of the boards being tested, and the changes were suf f i - c ien t ly large to permit classifying the boards into d i s t i n c t groups. This met the objectives of the approach to accelerated aging which had been developed a t NBS. The approach was:
'The material s are subjected to conditions which produce in a short time i n the labora- tory effects similar to those arising from long periods of natural aging. These condi- t ions must be, of necessity, much more d r a s t i c than the deteriorating conditions encountered in use, in order to achieve r e su l t s in a comparatively short time. However, . . . experience with paper and some other materials has shown that a high order of s t ab i l i t y to accelerated aging means sat isfactory permanence, while low s t a bi 1 i ty to accelerated aging means unsatisfactory permanence." (Jessup, Wei ssberg , and Weber 1938) .
This accelerated-aging procedure was used to evaluate a number of commercial f iber building boards, comparing the resul t s with those obtained upon 15 months exposure to outdoor weathering in the Washington, D . C . area (Jessup, Weber, and Weissberg 1940). The results showed a s imilar i ty in the changes of the physical properties resul t ing from the two aging treatments. I t was concluded that the types of boards studied were not sui table for the exterior covering of buildings. The imp1 ication was tha t the accel erated-aging t e s t was suff ic ient ly severe to d i f fe ren t ia te among boards tha t possessed exterior performance capabi l i t ies from those tha t did not.
This question of exterior versus inter ior serviceabi l i ty of f iber boards apparently was of concern, because another less severe accelerated- aging t e s t was developed during the same time period for use with sheathing papers (Weissberg, Jessup, and Weber 1939) and f iber sheathing boards ( Jessup, Weber, and Wei ssberg 1941 } (A-2).
These accelerated-aging procedures had a rather humble beginning. Those developing the procedures expected to learn how various materi a1 s compared with regard to the i r resistance to the e f fec t s of aging. Consequently, these methods were designed to provide an estimate of a mater ia l ' s potential for sat isfactory performance in service. From one viewpoint they might be considered procedures to qualify a fiberboard material for building purposes, Over the years these procedures were used to evaluate new products during the i r development stages. The
41 The 300 treatment hours were probably an approximation. The l a t e r version in ASTM 0 1037 called for 6 cycles, each lasting 48 hours, for a total of 288 hours, or 12 days. The specimens were then removed a f t e r a drying cycle so they could be readily conditioned for mechanical property measurement.
procedures were widely accepted for such use, and confidence in the resul ts continued t o r i se .
Several wood- based panel products achieved commercial success in the early 1940" sand volun- tary commercial standards were developed to guide the manufacture of these products. These standards included : CS-42-43 (revised 1949)5/ for Structural Fiber Insulating Board and R-7 79-63, a simp1 i f ied practice recommendation for Struc- tural Insulating Board (wood or core f i be r ) ; CS-7 12-43 for Homogeneous Fiber Waf 1 board; CS-176-57 (revised 1958) in Prefinished Wall Panels; CS-251-63 for Hardboard; and 65-236-61 (revised 1966) for Mat-Formed Wood Particleboard. Only one of these commercial standards has been converted into a new product standard--CS-42-49 became PS-57-73 For Cellulosic Fiber Insulating Board .
Most of these products were intended for inter ior applications, so the standards did not include an accelerated-aging t e s t requirement. One exception was the 1966 revision of CS-236-61 for Mat- Formed Wood Parti cl eboard provided for both a type l ( i n t e r i o r ) and type 2 (ex te r io r ) c lass i f i ca t ion , while the original standard described only the inter ior product. The accelerated-aging procedure chosen to evaluate the exterior-type board was the 6-cycle exposure originated by Jessup e t a l . a t the National Bureau of Standards .
Prior to the development of these commercial standards for the manufacture of panel products, the ASTM D 1037 t e s t methods had been standardized for evaluating such products. These t e s t methods had been in continuous use for product development purposes since their acceptance as standards. Because of th i s and because there had been no other e f for t s to develop meaningful procedures, i t can be readily understood why the 6-cycle accelerated-aging t e s t was adopted for the comrner- cia1 standard. I t was the only procedure tha t
5/ There have been changes over the years in the voluntary standards that may be used by indus- t r i e s for the manufacture of specific products. Commercial standards were under the jur isdict ion of the Commodity Standards Division of the U.S. Department of Commerce until 1965. For example, CS-45-38, was a commercial standard, No. 45, assigned to Douglas-fir plywood, issued in 1938. The Department of Commerce l a t e r transferred the responsi bi 1 i ty for the promul ga- tion of standards to the Products Standard Section of the National Bureau of Standards. I n 1974 any new standard or revision of old standards was converted to a product standard such as PS-7-74. The f i r s t of th i s ser ies was for s t ructural sof t - wood plywood which combined commercial standards dealing with different softwood species, Cur- rently, a l l standards are being revised and rei ssued by the American National Standards I nsti tute . For example, 65-236, Mat-Formed Wood Particleboard, was never reissued as a product standard (PS No.) b u t has now been reissued as ANSI A208.1 (1979) (National Particleboard Association 1379).
had been used extensively, and earned a high level of confidence among investigators dealing with wood-based panel products. A1 though the 6-cycle procedure was too lengthy to serve as a quality control procedure for a manufacturing process, there was no suitable a l ternat ive that could be used with confidence, Research designed to develop such a suitable qua1 i ty control procedure has been undertaken only during recent years.
PREDICTING D U R A B I L I T Y
While there was essent ia l ly no change in the 6-cycf e procedure to evaluate the durabili ty sf wood-based panel products during many years of use, further developments took place in the evaluation of paper in e f for t s to predict length of service. This i s a simpler case than that of wood- based panel products because panel products are used in a wide variety of service environments, while paper i s used primarily in the temperatures and humidities found in living spaces, Many of the same basic principles apply to e i ther product.
Much of the concern about the durabili ty of paper centered around book papers and archival storage. The problem was of national interest to l ib ra r ies , and much of the early work was spon- sored by the Virginia State Library with extensive investigations carried out by the W . J . Barrow Research Laboratory of Richmond, Va. By 1960, investigators were claiming as a f i r s t approxi- mation that 3 days of heating paper a t 100°C (212°F) gave resul ts equal to about 25 years of natural aging (Hobbs 1960). A completely inde- pendent similar study in the Netherlands yielded an equivalent of 28 years of natural aging. From a l l these investigations on paper durabi l i ty , i t became very clear that most modern papers had a reasonable l i f e expectancy of only about 50 years. On the other hand, papers from old books had been observed to survive natural aging for longer periods of time, more than 500 years in some cases ( W . J . Barrow Research Laboratory 1 9 6 4 ) . W. J . Barrow concluded from his research that the reason for the poor durabili ty of modern papers was the acidic nature of the paper resulting from the use of alum-rosin sizing in i t s manufacture. This led to the development of processes to deacidify existing papers so they might r e s i s t future degradation. I t a lso led to the develop- ment of specifications for the manufacture of book papers that had a theoretical useful l i f e of a t l eas t 300 years (Church 1960).
The prediction of th i s useful l i f e resulted from extensive testing which involved heat t reat- ment for as long as 48 days, with testing a t different time intervals for fold endurance and tear resistance. I t was found that the rate of deterioration of paper was not constant but decreased with time of heating, This led to the f i t t i n g of standard curves to the data so the comparison of one paper with another could be made with some s t a t i s t i c a l inferences. Also, estimates of strength beyond the point where the l a s t t e s t was actually measured could be made by cautious extension or extrapolation. This view
of de"crioration as a ra te phenon-ienon material 1 y improved the procedures for paper evaluation, and permitted s isnif icant proqress to be made in the manufacture of durable materials. However, many important questions could not be answered until th is rate-process approach was extended to measure~zents a t several temperatures and appl ica- tion o f the Arrh~nius temperature-dependence relationship.
A hypothetical exarnp!e of the determination of the Arrhenius temperature-dependence relation- ship i s shown in figure 7 . A ~hys i ca l property such as a strength property i s measured period- i ca l ly as a material that i s exposed to three o r more elevated temperatures, as depicted in figure I A as T I , T2, or T3. The rate of property loss a t each temperature may be expressed as a ra te ( k ) or as the time to lose a specified amount of the original property, such as 25 or 50 percent.
The Arrhenius equation i s usually written as :
where k = the ra te constant, E = the activation energy, R = the molar gas constant, and T = the absolute temperature.
A plot of the rates of property loss versus the reciprocal of the absolute temperature pro- duces a s t ra ight l ine relationship such as i s shown in figure 1B.
Mu1 t i temperature studies (Gray 1977) detected differences in the way temperature affected the deterioration rates of different papers. Papers often responded different ly to changes in the temperature of aging. These differences were reflected in the activation energy as determined by the Arrhenius temperature-dependence relation- ship, where the logarithm of the rate of change in some selected property i s plotted against the reciprocal of the absolute temperature to give a s t ra ight l ine . The slope of th i s l ine i s a measure of the activation energy. The permanence of a paper in service could be predicted by extrapolation of the Arrhenius temperature- dependence relationship to the expected service temperature.
The Arrhenius equation evolved from kinetic studies of chemical reactions. There i s a theo- re t ical basis for applying the Arrhenius equation to the study of the deterioration of materials such as paper. Physical properties in paper change as a resu l t of chemical changes. There- fore, the e f fec t s of hydrolysis, oxidation, or thermal degradation can be measured indirectly by measuring changes in physical properties.
However, in the degradation process, i t must be recogni zed that ( 1 ) several chemical reactions
may occur sirnu1 taneously, j 2 ) individual reactions can proceed a t d i f fe ren t ra tes , ( 3 ) reactions may not proceed independently of each other, ( 4 ) additional reactions may occur as the resul ts of intermediates formed, and ( 5 ) rate constants can vary with temperature. Because of the complexity of the deterioration process from a chemical point of view, i t i s understandable why the activation energy might vary From one material to another. I t i s not surprising, therefore, tha t the slopes of the Arrhenius plots may d i f fe r considerably from one paper to another and tha t the regression lines may even cross over one another.
The attempts to correlate the resul t s of single temperature-accelerated aging with natural aging were based on a fa l se assumption--that changes in temperature affected the degradation of a l l materials equally. The ear ly claims tha t 3 days of heating a t 100°C (212°F) was equivalent to 25 years natural aging in one case and 28 years in another was simply coincidental. Values as low as 18.5 to as high as 63 years, depending on the activation energy, have since been reported (Roberson 1981).
The determination of a complete Arrhenius re la t ion for any material i s a long and sofiewhat tedious procedure. An obvious disadvantage to such multi-temperature rate studies i s the increased time and cost of experimentation as compared wi t h sing1 e-temperature, single dwel l - time t e s t s . However, the kinetic or rate-process approach to durabi l i ty evaluation has become a valuable research tool to probe into the reactions and reaction mechani sms that characterize the aging of individual materials. The procedure can provide an understanding of the basic cause of deterioration in each case and yield r e a l i s t i c estimates of room-temperature degradation rates. Such rate-process studies are too time consuming and expensive to serve as quality control t e s t s for a manufactured product, b u t the i r application to the evaluation of a product's response to degrading influences should suggest t e s t condi- tions sui tab1 e for short-term qua1 i ty control needs.
The durabi 1 i ty of composi tes depends upon the durabi l i ty of a l l components--the substrates, the adhesives, and the interfaces formed between adhesives and substrates during the manufacture of the composite. Over the years there have been many evaluations designed to emphasize adhesive durabi l i ty , others specif ical ly for substrate durabi l i ty , and s t i l l others concentrating on the performance of a parti cul a r bonded-wood product. Each of these approaches to durabi l i ty evaluation can supply vaf uable information, b u t no one s e t of t e s t s can provide the answers to a11 the durabi l i ty questions that ar ise .
WOOD DURABILITY
Some of the ea r l i e s t work on the durabili ty of wood was concerned with the e f fec t of steaming or heating on the mechanical properties of d i f - ferent species. I t was common practice to steam
wood for various purposes, so i t was desirable to know i f different steam temperatures and treatment periods were detrimental to wood properties. Some of the most extensive research on th i s problem was carried out by J. D. MacLean (1951, 1953, 7954) . This work was dis t inct ive because i t yielded information about how each mechanical property changed during the time of exposure. Rates of change were measured. This l ed to the use o f mu1 t i p l e temperature, mu7 t i p l e dwell-time data from which activation energies could be calculated by way of the Arrhenius temperature- dependence relationship, Stamn (1956) co l t ected and analyzed rate data on reaction kinet ics , i ncl udi ng data o f YacLean "1951 , 1953, 1954) and Rasch (1931, 1933 ) . He compared how wood a n d various lignoceilulosic components resisted thermal degradation, and he provided estimates of strength loss during kiln drying and during natural aging a t room temperature.
ADHESIVE DURABILITY
The early work on evaluating the durabil i t y of different wood adhesives took a different tack. Prior to the introduction of adhesives based on synthetic resins in the 30's and 40's, practical wood adhesives were obtained from natural sources and were used mainly for in te r io r appl ications. The procedures t h a t had evol ved to evaluate their durabi 1 i ty were, consequently, based on the in te r io r conditions that might be met in service.
These exposures included extremes of tempera- ture and moisture to which bonded wood products might be subjected, as we11 as conditions con- sidered normal inter ior exposures--continuous and cyclic. A summary of the resul ts of adhesive durabil i ty evaluations made over many years a t the Forest Products Laboratory was published in 7944, with the l a s t reprinting in 1963, following two revisions with additions (FPL 1963 ) . There were six different continuous exposure conditions invol ving different temperature-humidi ty s i tua- tions (A-3) and four combinations of cyclic conditions (A-4). The data were coll ected a f t e r different time intervals of exposure so changes in shear strength and wood fa i lure were obtained, In most cases data were obtained every 6 months, u p to a total of 3 years of exposure, with more frequent testing under the more severe conditions. When the more durable adhesives from synthetic resins became available, time periods between t e s t s were extended to as long as a fu l l year, and in some cases requiring a total exposure time of 10 years to complete a t e s t . These t e s t s were discontinued in the early 7960's because the total exposure time requi red to evaluate durabl e adhesives was excessive.
Early in the 1960ks, a meeting was held to assess future prospects for the wood industry with representatives of West Coast lumber asso- c ia t ions, and sc ien t i s t s from industry, government, and universities in attendance, The attendees concluded that the outlook for the future was discouraging mainly because the long-term per- formance of any new bonded wood product, and
particularly any new adhesive potentially useful for wood bonding, could not be predicted with any reasonable degree of confidence. While i t was recognized tha t the research task to resolve th i s problem was nearly inpossible to accomplish, a small grodp of sc ien t i s t s agreed to tackle i t in an unprecedented e f for t . Thus, the Steering Conirni t t e e for the Accel erated Testi ng of Adhesi ves (SCATA) was formed. Over a period of about 9 years, t h i s group met regularly to discuss the s ta tus of each element of the problem, to plan separate b g t coordinated zttacks on the problem, and to assess progress of research as various studies reached completion. k brief sun~mary of the e f for t s of SCATA was recently prepared by Marra (1981). This group made numerous contribu- t ions to a bet ter understanding of durabili ty assessment by accelerated aging, a n d influencing and stimulating the direction of productive research on t h i s subject for well over a decade.
Durabi 1 i ty evaluation of adhesives has not been carried out on cured samples of adhesive alone with any consistent success. Efforts to do th i s so f a r have not been very productive. Most durabi 1 i ty testing has involved bonded assembl ies where the adhesive i s confined in a thin bondline between wood substrates. Any durabili ty evalua- tion consequently involves an adhesive-wood interface in addition to the adhesive i t s e l f . The question that always ar ises when evaluating adhesive durabili ty i s which wood species and joint configuration should be used. Attempts to develop standard procedures for adhesive evalua- tion resulted in ASTM D 905, Strength Properties of Adhesive Bonds in Shear by Compression Loading, and ASTM D 906, Strength Properties of Adhesives in Plywood-Type Construction in Shear by Tension Loading. ASTM D 905 specifies hard maple for the preparation of shear blocks, while ASTM D 906 specifies ye1 low birch veneer fo r preparation of plywood specimens. These species were selected because of the i r high strength and f ine, uniform texture. While these two ASTM procedures are normally fo1 lowed for adhesive evaluations, some modifications have been incorporated in kinetic studies invol ving accel erated-aging and rate- process analysis.
The f i r s t kinetic studies with wood adhesives were carried out using yellow birch 3-ply plywood specimens prepared according to ASTM D 906 (Gi 11 espie f 965, 1968; Gi 11 espie and River 1975, 1976) . The one exception to ASTM D 906 was to increase the thickness of veneers used for bonding i nto p1 ywood panel s . These kinetic studies demon- s t ra ted again that reasonable predictions of strength retention a t room temperature could be made only by determining how changes in ternpera- ture affected the rates of thermal degradation or hydrolysis. This could be done only by multiple temperature, multiple dwell-time experimentation, a n d application of the Arrhenius temperature; dependence relationship. Additional kinetic studies designed to determine the precision of the method for predicting durabili ty of adhesive bonds used hard maple shear blocks based upon ASTM D 905, except the bonded area per specimen was reduced to 645 mm2 (1 i n e 2 ) from the specified
2 2 1,935 mm ( 3 in. ) (Mil le t t and Gillespie 1978; Mil le t t , Gillespie, and Baker 19801, and the adherent thickness was a1 so reduced. Thi s change was made so that the required large number of specimens could be easi ly prepared, could be readily exposed without crowding in ovens and water baths with precisely controlled temperature, and would reach equilibrium conditions rapidly prior to strength t e s t s . Small specimen testing was particularly required for kinetic studies to predict durabili ty of adhesives because of the large number of specimens required for precise estimates. The resul ts of the kinetic studies with shear block testing compared adhesive dura- bi 1 i ty of bonded specimens with that of wood, using the time required for each to lose 25 per- cent of i t s original shear strength (Gillespie 1981). This behavior was shown to be equivalent to centuries of natural aging when wood was unaffected by f i r e , insects, or microorganisms.
These basic studies provided fundamental information about an adhesive's resistance to hydrolysis and thermal degradation. They supplied background data for use in comparing the behavior of any new adhesive with that of conventional adhesives of known durabili ty a n d a1 so with tha t of wood i t s e l f . New adhesives and wood species combinations could a1 so be evaluated by these established procedures. From studies such as these, highly durable adhesives can be selected for use in new bonded wood products with assurance tha t both the adhesive a n d substrate would r e s i s t the chemical effects of aging, The remaining problem, which i s associated with resistance to physical forces imposed upon the joints , then needs to be evaluated with the particular adhesive-species combination and specific joint geome t ry required for the product being devel oped.
SOFTWOOD PLYWOOD DURABILITY
The accel era ted-agi n g procedure to eval ua t e the durabi 1 i ty of exterior-type softwood plywood was developed empirically in the early 1930's and i s s t i l l in use today. However, an additional procedure has since been developed which i s less time consuming and more responsive to differences that may ex is t in adhesive cure.
One of the f i r s t exterior-type bonded-wood products to be developed was cons t ruct i on-grade softwood plywood. Specifications for i t s manu- facture were described in U.S. Commercial Standard GS-45-38, issued in November 1938. The exterior- type product was expected to survive many years exposure to open weather in a l l areas of the Uni ted States. The qua1 i ty control t e s t procedure for t h i s product was w h a t i s now known as the boil-cycle t e s t (BDB) (A-5). After the broken specimens were dried, the percentage of wood fa i lu re over the fractured surface was estimated. High wood fa i lu re in th i s t e s t was found to correlate with years of outdoor exposure without delamination, while shear strength values did not. Since i t was l a t e r proved that phenolic adhesives were more resis tant to hydrolysis and thermal degradati on than wood, i t became apparent
that t he niain function of the boil-cycle t e s t as a qua l i ty control procedure was to apply a large amount of swelling and shrinking i n a short t ine. I t answered the question a b o u t whether or not a high qua l i ty bond had been manufactured--one that wobld r e s i s t the internal stresses that could be generated within the particular plywood configb- ration in question.
The boil-dry-boil t e s t served the softwood plywood industry well during i t s early develop- ment. The t e s t excluded the use of urea- formaldehyde adhesives which would not have been su i tab le for service environments where construction-grade materials were to be used. The t e s t , as a quality control tool, effectively led t o the production and use of a quality product which enjoyed increasing consumer acceptance and use. The boil-cycle t e s t proved not to be the most ideal system, however, for i t cobld not detect undercured bond1 ines of hot-pressed phenol ic adhesives. The boil-cycle t e s t a1 so proved less than ideal for evaluating mismanufacture because of the lengthy time required to carry i t out-- over 24 hours. These problems provided support to those who advocated performance simulation t e s t s and who reject boiling as unrealistic.
Later the boi 1 -cycle t e s t was supplemented with a vacuum-pressure-soak (VPS) (A-6) t e s t which served the same function b u t used a lower temperature. This procedure could evaluate undercured bonds which in the past had been advanced in cure by the higher temperatures of the boil-cycle and be undetected. The VPS proce- dure a l so used wood fa i lu re as a measure of bond qual i ty . The history of these developments was reviewed by Raymond ( 1975) .
The fac t that plywood shear strength lacked correlation with performance during outdoor exposure was due to the fac t that the t e s t for strength measured the rolling shear strength of the inner plies. These were low values compared with strengths of pl ies bonded parallel to the grain, and they reflected the qual i t y of veneers rather than that of the bonds. While bonding may have reinforced the surfaces of the inner pl ies , th i s apparently was not detectable with relation to performance or within the normal variations of strength due to differences in grain, lathe checks, and other elements of wood structure contributing to shear strength.
The function of the adhesive bond in plywood was to t ransfer s t ress between adjacent pl ies whose grain directions were a t right angles to one another, and to r e s i s t the internal s t ress development that takes place with moisture content changes, The qual i ty control t e s t s of BDB and VPS simply developed the maximum internal s t ress the product was able to generate, and the amount of wood fa i lu re was a measure of the area of bond capable of res is t ing tha t s t ress .
This discussion about plywood has demon- s t ra ted that t es t s developed for one panel product such as plywood cannot be direct ly applied to the durabi f i ty evaluation and qua1 i ty control of another, such as a composite panel. The
cieveiopment of composite panels with veneer Faces on cores consisting of par t ic les , f l akes , or strands posed new problems i n evaluating bond qua1 i ty in tern~s o f expected performance.
COMPOSITE PANEL DURAEI L I T Y
Wi t h the devel cpri~ent of composi t e panel s t h a t combined veneers w i t n partic7e-type cores, the need arose f o r qua? i t y control t e s t s f o r the ~anufacttir-r'ng process, The corfi rnateri a1 d j d not lend i t s e l f t o any estimate of wood f a i l u r e as a measure of bond q u a l i t y . Some other approach was needed. The American Plywood Association (PPA) conducted a n extensive study eka:dating a varietJj of composite panels by several laboratory t e s t procedures a n d cor~~pared " c h e resul ts w t ' t h those following outdoor exposure of the same niater-ia'ls (Raymond 1975) / A - 7 ) . The results a f t e r 1 year suggested t h a t a suitable t e s t might consis t of exposing small specimens to daily cycles of soaking under vacuum and drying a t nod era t e temperatures. The specimens would then be examined for delamination. One hundred percent of a1 1 specimens should survive 4 cycles or 2 days exposure to assure outdoor durabif i t y we11 in excess of 1 year. Here again, the condi- tions of exposure create high internal s t resses and the extent of delmaination measures those areas where bonds were incapable of res is t ing the s t ress . The delamination measurements can readily be made i f there i s a d i s t inc t l ine of demarcation to probe, but i t cannot be applied to fiberboards, f lakeboards, strandboards, or waferboards where such a d i s t inc t bondline does not ex i s t .
P A R T I C L E - FLAKE-, WAFER-, OR S T R A N D ~ O A R D DURAB I L ITY
The development of new wood-based panel products from wafers, flakes, or strands for exterior appl i cat i ons resul ted in renewed e f fo r t s to develop inlproved accelerated-aqing procedures, These attempts took place in a number of d i f fe ren t laboratories using a variety of approaches to the problems under investigation. A review of these e f for t s i s particularly pertinent to the s i tuat ion as i t exis ts today in the waferboard and flake- board industries.
Waferboard originated in the United States in 1954 through developnlents by J . D ' A . Clark. The f i r s t plant was bui l t in Idaho in 1956, and commercial interest in waferboard increased as a resul t of further developments in Canada ( 3 . D'A. Clark 1980; P. Vajda 1980). The product resuf ti'ng from these developments used a powdered phenolic resin a t a level of approximately 3 per- cent ovendry weight of wafers.
Later a flakeboard development was carried out by the U.S. Forest Service to stimulate the use of forest residues. Performance c r i t e r i a were set u p using the best engineering judgment available to produce a product that could possibly serve the same end uses currently sa t i s f ied by construction-grade p7 ywood. T a r g e t properties for the Forest Service structural flakeboard aopraached those of construction-grade softwood
plywood. The resul t s of the structural Pla keboard devel op~ient program were sumrnari zed in a genera 1 technical report ( U S B A 7978). The product was characterized by the use of liquid phenolic adhesive a t a ?eve1 of approxin~ately 5 to 6 percent.
The major ef for t s i n the development of structural f l akeboard used phenol i c resin binders, because a highly d u r a b l e , waterproof bond was desired. Even with the selection of a heat and hydrolytically res is tant adhesive, there was s t i l l a need t o demonstrate tha t the resulting product would perform as intended. There was also the need for developing a qua7 i ty control t e s t , b u t the performance-oriented question was addressed f i r s t ,
Accelerated-Aging Tests
Based on the premise tha t the major degrading influence affecting phenol i c-bonded f l akeboard would be internal s t ress development, the proce- dures selected for evaluating th i s factor con- s is ted of mu1 t i p l e cycles of boiling and drying, and also vacuum-pressure soaking with intermediate temperature drying. A variety of f lakeboards was subjected to these procedures along with samples of plywood and solid wood. The resulting changes in bending strength and s t i f fness under soaking and drying conditions so severe that even highly res i s tan t sol id 1 umber and marine-grade plywood, whose performance i s well regarded, suffered appreciable losses (Baker and Gil lespie I 978; River, Gi 1 lespie , and Baker 1981).
Other investigators a1 so found cycl i c expo- sures useful for evaluating exterior-type panel products. Beech ( 1 973) ; Beech, Hudson, Laid1 aw, and Pinion (1 974) advocated the V313 three-cycle procedure (AFN 7972) (A-9). The change in bending strength, bending s t i f fness , internal bond, and thickness swelling correlated well with the property changes a f t e r 2 years weathering.
Lehmann (1 963) evaluated a number of exterior-type particleboards by the ASTM D 1037 aging t e s t , by the West Coast Adhesive Manufacturer' s Association (MCAMA) 6-cycl e expo- sure (A-101, and by a vacuum-pressure soak and dry (VPSD) 5-cycle procedure ( A - 1 1 ) . In a l l cases t e s t s were carried out a f t e r specimens were conditioned to 65 percent re la t ive humidity (RH) . I t was found that VPSD exposure t e s t resul ts provided the best correlation with 2 years of natural weathering.
In a l a t e r study, Lehmann (1377) evaluated a number of commercial and labora tory-prepared partic1 eboards, f lakeboards, waferboards, and fiberboards using the ASTM D 1037 aging procedure, the VPSD exposure, a spray-dry exposure from ASTM D 2898 ( A - 12), a n d a 2-hour boi 1 i ng with testing both wet and dry. The D 1037, VPSD, and D 2898 procedures were repeated with specimens removed for t e s t a f t e r 1 , 2 , 3, 6, 12, and 24 cycles. However, no consistent correlation was found between resu l t s of accelerated aging a n d those from 1 year of natural weathering. The resul t s
led Lehmann to recommend two types of t es t s : ( 7 ) a rapid t e s t of a vacuum-pressure soak, boiling, and drying, a n d (2) a cyclic wetting and drying using moderate temperatures rather than boil i ng fol lowed by high-temperature drying.
Tests in Simulated Service Environments
There are certain important end-use proper- t i e s of wood-based panel products that can be measured only through simulation o f service environments rather than with the use of condi- tions that might be unreal is t ic . Even though the temperature and moi s ture conditions sel ected are within the range found in service environments, the procedures can be considered as accelerated aging because the cycles selected usually take . place more frequently than normal, and the condi- tions range between extremes rather than changing moderately. The objective i s usually the deter- mination of how much change would occur in a product with regard to bending strength and s t i f fness , creep, or dimensional s t ab i l i t y when subjected to simulated service environments.
McNatt (1982) investigated the effects of cyclic humidity exposure on the bending strength a n d s t i f fness of wood-based panel products as reported by different investigators. The nine studies evaluated provided indications that : ( 1 ) UF- bonded particleboards were affected more by cyclic exposures to changes in humidity than were those bonded by phenol -formal dehyde adhesi ves, ( 2 ) cyclic humidity exposures are more severe a t elevated temperatures, and ( 3 ) for a given temperature, cycling between two humidity condi- tions wi 11 produce comparable resul ts that depend on total exposure time rather than the number of cycles when essent ia l ly equilibrium moisture content i s achieved a f t e r each humidity change.
McNatt and others (Amstrong and Grossman 1972; McNatt and H u n t 1982; Lehmann, Ramaker, and Hefty 1975; McNatt and Superfesky 1982; Schniewind and Lyon 1973; and Tyne 1978) evaluated creep deflections when particleboard and hardboard were subjected to cycl i c humidity while under load a t ambient temperature. I t was found that creep deflections were as much as f ive times greater under cycl i c humidity conditions than when humidity was held constant. I t was recognized that cycl i c humidity a t a constant temperature i s not a " rea l - l i fe" exterior exposure condition where a decrease in humidity i s usually accom- panied by an increase in temperature and vice versa. I t was also found that cyclic humidity- constant temperature exposure was considerably more severe fo r creep under load than when exposed to an exter ior exposure where protection was provided against direct exposure to sun1 ight and preci pita t i on.
DURABILITY TESTS VERSUS QUALITY CONTROL TESTS
Test procedures designed to evaluate dura- bil i t y are different from those used to control quality of manufacture. The same t e s t procedures do not serve both purposes.
A1 1 of the mu1 tiple-cycle exposures have as t he i r main objective the demonstration whether or not a board product will perform as desired for many years in d i rec t weathering. They are time consuming, labor intensive, complicated, and require numerous large specimens and comensurate equipment capacities. There i s a basic d i f f icu l ty involved in the development and use of such t e s t procedures. F i r s t of a l l , there i s a desire for t e s t procedures that simulate actual long-term service conditions. B u t when new products are to be evaluated, there i s l i t t l e choice but to use accelerating procedures. In contrast, there i s a need for quick and inexpensive t e s t procedures to detect the adverse effects of product mismanufac- ture. The lengthy cyclic t es t s are needed to qualify new products for certain end uses, while the quick and nonsimulative type are required for qual i ty control purposes during product manufac- ture. In addition, t e s t procedures have been developed for purposes other than those mentioned above. These include t e s t s to evaluate adhesive durabi l i ty properties; t es t s to exclude the use of adhesives a1 ready known to be unsuitable for cer ta in uses; t e s t s designed to include specific materials known to be sat isfactory; t e s t s to simulate service condition effects on dimensional s t ab i l i t y ; t e s t s fo r creep behavior in changing environments, e tc . Many of these t e s t s are misused, the resul ts of others are misinterpreted, or the resul t s may be viewed with overexpectations.
These confl ic ts or philosophical d i f f i cu l t i e s have been discussed by Carroll (1978, 1980)- The major heading for these a r t i c l e s which s ta tes , "We s t i l l don ' t boil houses," suggests, therefore, tha t i t i s improper to boil primary building materials when evaluating the i r durabil i ty. This, of course, refers to the boil-dry-boil cycle t e s t used to evaluate construction grades of softwood plywood (PS- 1-1 974). Carroll traces the history of t e s t development for wood-based panel products and discusses the different philosophies of approach and the inconsistencies tha t a r i se .
Carroll ' s second a r t i c l e ( 1980) extended the discussion to consider the more profound differ- ences that ex i s t in the testing of s t ructural- type particleboards. He compared the par t ic le- board standards and specifications developed in Europe with those used in North America. Differ- ences ex is t in the expected performance. The Europeans favor a board with 8 to 10 percent resin and springback below 8 percent a f t e r cyclic aging, while the Canadian waferboard contains only 2 to 3 percent P F resin binder and shows 30 to 35 percent springback a f t e r boiling and recon- ditioning. All of the specifications contain t e s t procedures to measure a moisture resistance or simulated weathering resistance. They a1 1 contained t e s t c r i t e r i a tha t define the limita- t ions that are permitted to take place in spring- back, internal bond, or bending properties a f t e r specimens have been subjected to certain laboratory-controlled exposure conditions.
The U . S. standard for particleboards (NPA 1979) uses the 6-cycl e accel erated-agi ng t e s t described in ASTM D 1037 (1951). Bending
specimens are reconditioned prior t o t e s t , so 3 to 4 weeks are required to complete the data col l ec t i on, The French CTB-H standard ( 19751, and the Bri t ish standard (BS 5669, 7979) use the V313 procedure wi t h recondi t i oni ng prior to t e s t . The time required to complete i s 4 to 5 weeks. In contrast , the German and Canadian standards use a 2-hour boil t e s t . The German standard, DIN 68763 VlO0 (7973) ( A - 1 3 ) re l ies on testing for internal bond in the wet condition. This requires bonding of gripping blocks t o the fares of the specimens before soaking and boiling, therefore, the t e s t requires approximately 6 hours. The Canadian standards (CSA 7 978) (A-14) descri be the use of bending specimens For a 2-hour boil and 1-hour soak in cool water before tes t ing wet for bending strength. Elapsed time o f t e s t i s only 3 hours. Of these procedures o n l y the 2-hour boil t e s t of the German and Canadian standards approaches the short time conditions required for an acceptable t e s t for controlling mismanufacture of a product. These two standards also require the use of a P F resin adhesive which automatically establishes a high level of hydroly- s i s resistance for the system. The accelerated- aging procedures in the U.S. , French, and Bri t ish standards, which do not specify the adhesive type, are to ta l ly unsuitable for control of product mi smanufacture because of the sl ow nature of the cyclic procedures, a n d the time spent reconditioning specimens to EMC conditions. There are def ini te needs to develop rapid wet t es t s that are better suited for control of mismanufacture,
Efforts have been made to develop such rapid qual i ty control t e s t s , particularly in Canada. Shen (1977) summarizes the work on developing a proposed rapid accelerated-agi ng t e s t for exter ior waferboard which involved the measurement of torsion shear strength. The specimen s ize was 25 mm x 25 mm ( 1 in. x 1 i n . ) . The specimens were boiled for 20 minutes before cooling in water and measured wet for shear strength by a tors i on technique. These torsion shear val ues were shown to be related to other strength proper- t i e s of particleboards (Shen 1971). This system eliminated the bonding of gripping blocks to specimens as required for standard internal bond t e s t s , reduced the size of specimens and the time of exposure, and made i t possible to t e s t many more specimens rapidly and accurately. This t e s t procedure has not been incorporated in any standards or specifications so fa r but continued use and evaluation should demonstrate i t s f u l l potential fo r the purpose of controlling mismanu- Facture, The technique has been appl ied to the evaluation of compasi t e panel s (veneer-over1 aid core boards) with encouraging resul ts (Countryman 1979)- Continued eval uation o f wet torsion shear t es t s on small specimens should probably be carried out on boiled specimens and also those subjected to vacuum-pressure soaking, a s suggested by Clad (1979).
The need for a number of different t e s t s designed for specif ic purposes has a ? so been advocated by Gressel (1980, parts 1, 2, 3) (A-75). Gressel carried out an extensive review of the problems associated with evaluating the durabil i t y
of particleboard, a n d carried out lengthy a n d extensive experiflientation. He was searching for t e s t procedures that would account for the inost important degrading i-riechanisrns acting on a wood- adhesive system a n d that were also independent of the type of adhesive involved. Resdlts fror:~ the 1 abora tory tes t ing procedures were compared with those froin wea"eherj ng exposures where sampl es were exposed for as long as 9 years to direcr outdoor exposure, a n d a l s o to protected outdoor exposure in both a stressed and unstressed condi- t ion. He concluded that neither the outdoor weathering t e s t s nor a si::rple accelerated t e s t i n the laboratory were suf f ic ien t , a! one, to provide a comprehensive assessment of the durabil i ty o f a particleboard adhesive. Gressei suggested that proof of fu ture serviceabil i ty could be estab- lished by use of four laboratory t e s t methods, dispeosing w i t h outdoor weathering expcsares. We categorizes these t e s t procedures as being of two types: perforizance tes t s which perrni t the del i b- erate use of conditions that considerably exceed those found i n the expected na tura 1 env f ronmen t , and s u i t a b i l i t y t es t s that use climatic conditions that approximate those tha t might occur in service.
Each t e s t i s designed to provide a certain type of information relating to a specific degra- dation mechanism. None of these tes t s can be expected to be useful for control of mismanufac- ture, however.
DESIGNING FOR D U R A B L E BONDED-WOOD ASSEMBLIES
Another approach to durabi 1 i ty eval uation i s to use a specified ser ies of t es t s that supply information t o architects or design engineers fo r designing s a f e structures.
Adhesives have been used in t ruly structural applications for many years, A design strategy for using adhesives in such applications was not needed since joints always fai led with high wood fa i lu re . The properties of the adherends governed the design, and the adhesive being stronger and more durable than wood provided a s t ress- transfer function.
I n recent years, adhesives less strong, less durable, and more susceptible to creep than wood have been used in assembly bonding for structural applications. Examples are the use of elastomeric mastic adhesives for bonding plywood t o floor jo i s t s during onsite construction, and the anpli- cation of polyvinyl acetate adhesives for bonding panels -in mobile homes to iinprove racking res i s t - ance during over- the-road transportation. These developmenh raised new concerns about the use of adhesives i n structural a p p l ications, and a b o u t how new assesibl ies could be designed with adhe- sives whose properties might control the u t t ina te performance o f the assembly.
A technique for dcttern~ining design s t resses for bonded joints 5ased on the already accepted method for developing design s t resses for wood was proposed by Lewis (Gi l lespie and tewi s 7972) . For wood, the values for the mechanical properties of smal 1, clear wood specimens are converted to
design values by a ser ies of redbcticn factors , These adjss t the clear wood situation to the real-1 i f e situation with wood having grain direc- t i o n s , knots, e tc , The proposed e q u a t i o n fo r design s t ress of adhesives was:
Desi~n = Eea n VariabiS i t y Exposure s t ress x x condition s t ress fac-cor fac tor
Qua7 i ty x contrcl x Dcrationof Safety
X
factor l o a d Factor fac tor
A s i c i l a r equation car be appiied to shear modulus d a t a t c provide desisn values for the anticjpated deqornation of a n assei:b? y .
This concept was a d o p t e d a n d expanded by Krueger (7987 3 during a n investiqaticn o f adhe- sives having potential for bonding structural elements in mobile homes or industrialized house manufacture. Mechanical properties of t h e adhe- sives were determined in shear a n d i n tension before a n d a f t e r exposure to cheinicdls, moisture, heat, rodents, a n d microorqanisms. Data were obtained for the e f fec t s of loads so that physical forces were evaluated along with the cheaical effects o f aging, This work also emphasized that a number of t e s t procedures was necessary t o characterize a n adhesive" potential for ionq- term performance in s t r d c t ~ r a i appl i c a t i ~ n s . I t a 1 so demonstrated one acceptable method for applying these d a t a in situations which face design engineers. T h i s design strateqy was applicable to adhesives varying widely in mechani- ca l properties, and cou ld also be bsed f o r primary builaing materials ccintafning adhesives, bonded joints , and bonded asseujbl ies .
DEVELOPIPiG S!iO2?-TERM ACCELERATED TESTS
Fucure needs f o r accelerated-aoi~g t e s t s night be met by y e t another approach t o procedure development which was suqgested by investigators a t the National Bureau of Standards.
The steps normally fol lowed t o develop t e s t s t h a t predict the durab-il i ty o f building fi~aterii i ls have been ou t l i nea i n a new FETK Recommended Practice (ASTM E 532, 7978). She practice l i s t s the degradation facters affecticq the service l i f e of building materials and obtlines 0 i6-step procedure for d e \ ~ e l o ~ i n s short-tern- t e s t s that evaluate these inf9 uences. The objective of t h i s practice i s to lead t o greater unifornf t;~ i n the approaches to service l i f e a n d dhrabi7 5 ty predic- tions so that increased ccnfidence in the predic- tions w i l l grow through i t s use,
T h e rapid developments t h a t have t aken p lace i n space technology have emphasized the engi- neering concept of r e l i ab i l i t y of materials, These concepts are based upon the probabi? i ty t h a t a material or device will perforrq as intended under the planned service conditions a n d for the expected period o f time. Future stud-ies d e a l i n g with the development of methods to predict durabiliey should involve the qgestions about
s t a t i s t i c a l s i g n i f i c a n c e s of observed d i f f e r e n c e s i n m a t e r i a l behav io r , and a l s o they should be approached from t h e s t a t i s t i c a l v i e w p o i n t o f r e 1 i a b i 1 i t y t h e o r y ( Frohnsdor f f and ! k s t e r s 1980) .
CONCLUSIONS
The p a s t s r u d i e s o f t h e d u r a b i l i t y o f b u i l d i n g components and nrater ia ' is d iscussed i n t h i s paper have resdl ted i n t he development o f a wide v a r i e t y o f t e s t procedures and p r a c t i c e s . Many o f these procedures a r e misunderstood and some of them rnisused, There a r e severa l reasons why such a s i t u a t i o n e x i s t s . We a77 have d i f f i - c u l t y unders tand ing each o t h e r when words l i k e d u r a b i 1 i t y , weatherabi l i t y , s e r v i c e a b i l i t y , perfornlance, and s e r v i c e env i ronments mean soi.iie- what d i f f e r e n t t h i n g s t o d i f f e r e n t i n v e s t i g a t o r s . T h i s c o n d i t i o n i s aggravated f u r t h e r upon t r a n s - l a t i n g t h e meanings o f words f rom one language t o ano ther . A1 so, i n v e s t i g a t o r s have d i f f e r e n t p h i l o s o p h i e s o f approach t o d u r a b i l i t y assessment, r a n g i n g from those who i n s i s t on s i m u l a t i n g s e r v i c e c o n d i t i o n s w i t h o u t exceeding t h e i r i n t e n - s i t y t o those who a r e w i l l i n g t o exaggerate t h e l e v e l s found i n end-use env i ronments w e l l beyond n a t u r a l c o n d i t i o n s . I n a d d i t i o n , i n v e s t i g a t o r s o f t e n over1 ook t h e h i s t o r i c a l background i nforma- t i o n p e r t i n e n t t o t h e development of a s p e c i f i c procedure. T h i s i n f o r m a t i o n may n o t be r e a d i l y a v a i l a b l e , o r t h e o r i g i n a l purpose f o r t h e development may be obscure. A t e s t procedure i s o f t e n borrowed f o r use w i t h a new m a t e r i a l o r f o r a new purpose. I t i s more exped ien t t o a t t e m p t such a t r a n s f e r of techno logy r a t h e r than develop new methods.
I n cases where new standards and s p e c i f i c a - t i o n s have been w r i t t e n f o r p roduc ts e n t e r i n g commercial r e a l i ty, s u i t a b l e t e s t procedures f o r c o n t r o l o f mismanufacture had n o t been developed as y e t . The a u t h o r s o f such documents had no a l t e r n a t i v e b u t t o fa11 back on t h e t e s t proce- dures used d u r i n g p r o d u c t development as t h e o n l y methods i n which a reasonable l e v e l o f con f idence c o u l d be generated and agreed upon by producers, users , and t h e genera l i n t e r e s t people invo lved . The devel opment o f s u i t a b l e qual i t y assurance t e s t s was o f t e n neg lec ted . Common misunder- s t a n d i n g about s h o r t - t e r m t e s t s f o r p r o d u c t d u r a b i l i t y became f u r t h e r compounded by misuse o f a procedure and t h e i n e v i t a b l e m i s i n t e r p r e t a t i o n o f r e s u l t s ,
There i s a need f o r severa l d i f f e r e n t t e s t s t o c l a r i f y a11 t h e q u e s t i o n s r e l a t i n g the new m a t e r i a l s ' response t o a s p e c i f i e d end-use s i t u a - t i o n . There i s a c o n t i n u a l need f o r new t e s t procedures developed f o r new m a t e r i a l s and f o r new purposes so t h a t p e r t i n e n t d u r a b i l i t y ques- t i o n s can be answered more r a p i d l y and a c c u r a t e l y . There i s a p a r t i c u l a r need f o r t h e development o f new qual i t y assurance t e s t s t o reduce t h e p o s s i - b i 1 i t y of mi smanufactur i ng new bonded wood p roduc ts . There i s a need t o a p p l y new approaches such as those based upon r e l i a b i l i t y t h e o r y so t h a t improved p r e d i c t i o n s can be made.
An improved understanding of e x i s t i n g t e s t procedures, a r e d u c t i o n i n c o n f l i c t s of o u t l o o k , and t h e development of new procedures w i t h we1 1 - designed pbrposes based upon w e l l - e s t a b l i s h e d Fundamentai p r i n c i p l e s w i l l ~ r o v i d e the c c n f i d e n c e needed for t h e successful development and use o f cur f u t u r e b u i l d i n g components and i m t e r i a l s .
LITERATURE C I T E D
Ameri car: S o c i e t y f o r T e s t i fig and U a t e r i a l s . 1970. S t r e n g t h p r o p e r t i e s gf adhesives i n
plywood-type c o n s t r u c t i o n i n shear by t e n s i o n l o a d i n g . ASTM D 906, P a r t 22, American S o c i e t y f o r T e s t i n g and N a t e r i a l s, Phi I a d e l p h i a , Pa.
American S o c i e t y f o r T e s t i n g and M a t e r i a l s . 1978. Recon~mended p i -ac t i ce f o r deve lop ing
s h o r t - te rm a c c e l e r a t e d t e s t s f o r p r e d i c t i o n of t h e s e r v i c e l i f e o f b u i l d i n g components and m a t e r i a l s ; Des igna t ion ASTM E 632, P a r t 18, American S o c i e t y f o r T e s t i n g and M a t e r i a l s, P h i l a d e l p h i a , Pa.
American S o c i e t y f o r T e s t i n g and M a t e r i a l s . 1980. Standard t e s t method f o r r e l a t i v e s t a -
b i l i t y of paper ( e f f e c t o f hea t on f o l d i n g endurance) , ASTM D 776-71, P a r t 20. American S o c i e t y f o r T e s t i n g and M a t e r i a l s , P h i l a d e l p h i a , Pa.
American S o c i e t y f o r T e s t i n g and M a t e r i a l s . 1981. S t r e n g t h p r o p e r t i e s o f adhesive bonds i n
shear by compression load ing . ASTM D 905, P a r t 22. American S o c i e t y f o r T e s t i n g and M a t e r i a l s , P h i l a d e l p h i a , Pa.
American S o c i e t y f o r T e s t i n g and M a t e r i a l s . 1981. Standard methods o f e v a l u a t i n g t h e
p r o p e r t i e s o f wood- based f i b e r and p a r t i c l e panel m a t e r i a l s . ASTM D 1037-78, P a r t 22. American S o c i e t y f o r T e s t i n g and M a t e r i a l s , P h i l a d e l p h i a , Pa.
American S o c i e t y f o r T e s t i n g and M a t e r i a l s. 1981. Acce le ra ted weather ing o f f i r e -
r e t a r d a n t - t r e a t e d wood f o r f i r e t e s t i n g . ASTM D 2898, P a r t 22. American S o c i e t y f o r T e s t i n g and M a t e r i a l s , P h i l a d e l p h i a , Pa.
Armstrong, L. D. , and P. V . A . Grossman. 1972. The behav io r of p a r t i c l e b o a r d and hard-
board beams d u r i n g mois l u r e c y c l i n g . Wood S c i . and Techno1 . 6(2 ) : 128-737.
A s s o c i a t i o n Francoise de N o r m a l i z a t i o n . 1972. NF51263 Epreuve de v i e i l l i s s e m e n t
a c c e l e r e p a r l a method d i t V313 AFNOR, P a r i s . Baker, A. J . , and R, ti, G i l l e s p i e .
1978, Acce le ra ted ag ing of phenol i c - bonded f lakeboards. Sen, Tech. Rep, NO-5, USDA, For, Serv, , Washington, D.C., p. 93-100,
Beech, 3. C, 7973. An a c c e l e r a t e d t e s t f o r p r e d i c t i n g t h e
performance o f ch ipboard f o r e x t e r i o r use. BRE I n f o r m a t i o n - I S 22/73, B u i l d i n g Research Es tab l i shment , P r inces Risborough Labora to ry , England.
Beech, J , C,, R. W. Hudson, R , A, La id law, and t , C. P i n i o n . 1974, Stud ies of t h e performance o f p a r t i c l e -
board i n e x t e r i o r s i t u a t i o n s and t h e develop- ment of l a b o r a t o r y p r e d i c t i v e t e s t s . C u r r e n t Pap, CP 77/74. B u i l d i n g Research E s t a b l i s h - ment, P r i n c e s Risborough Laboratory , England.
B r i t i s h S tandard BS5669. 1979. S p e c i f i c a t i o n f o r wood chipboard and
methods of t e s t f o r p a r t i c l e b o a r d . BSZ, London.
Canadian S t a n d a r d s Assoc ia t ion , 7968. Hat-formed wood p a r t i c f eboard, Standard 0188, 77 Spencer S t , , Ot tawa , Canada.
Canadian S t a n d a r d s Assoc ia t ion . 1978. T e s t nethods f o r mat-formed p a r t i c l e b o a r d
and waferboard. CAN3 0188. OM. Canadian S tandards A s s o c i a t i o n , Rexbale, Onta r io .
C a r r o l l , M . N. 1978, We s t i 11 don 3 tboi l houses: exani na t ion
of t h e bo i l -d ry-bo i l t e s t i n plywood s t a n d a r d s . For. Prod. J . 28(5):23-27.
C a r r o l l , M. N . 7980. We s t i l l d o n ' t bo i l houses: t e s t proce-
dures Per p a r t i c l e b o a r d used i n genera l b u i l d i n g c o n s t r u c t i o n . Proc. Washington S t a t e Univ. P a r t i c l e b o a r d Syrnp. No. 1 4 , Pullman, Wash., p. 39.
Centre Technique du Bois . 1975. Marque de q u a l i t e des panneaux de p a r t i -
c l e l e s CTD-H, Aglas 454, C.T.B., P a r i s . Church, R . W . ( E d . )
1960. The manufacture and t e s t i n g of d u r a b l e book p a p e r s - - i n v e s t i g a t i o n s of W . J. Barrow, V i r g i n i a S t a t e L ibra ry Pub1 i c a t i o n s , No. 13. The V i r g i n i a S t a t e L i b r a r y , Richmond, Va.
Clad, W . 1979. T e s t i n g of p a r t i c l e b o a r d a f t e r s h o r t
evacua t ion i n wate r . Holz Roh- und Werkstoff 37: 383-388;419-425.
Clad, W . , and C . Schmidt-Hel lerau, 1965. Behavior of amino p l a s t i c and phenol ic
r e s i n s i n p a r t i c l e b o a r d dur ing outdoor expo- s u r e . t l o l z - Z e n t r a l b l a t t 44/45:349-352.
Cla rk , J . D'A. 1980. How i t a l l s t a r t e d : t h e h i s t o r y of
waferboard. Proc. Canadian Waferboard Syrnp., p. 5-14. For in tek Canada Corp.
Countryman, D. R . 1979. I n v e s t i g a t i o n of cornposi t e pane l s under
exposure c o n d i t i o n s . Proc, Washington S t a t e Univ. P a r t i c l e b o a r d Syrnp, No. 13, Pullman, \dash., p, 3.
Countryman, D, R . 1980. The performance concept f o r e v a l u a t i o n
o f s t r u c t u r a l panel p roduc t s . Proc. Can, Maferboard Symp. p. 443-448. For in tek Canada Corp.
D f N68763 V100. 1973. Spanpl a t t e n : f 1 a c h p r e s s p l a t t e n f u e r das
Bonwesen; Beuth- V e r t r i e b Gmblf, B e r l i n . Dryden, H e L.
1938. Research on bu i ld ing m a t e r i a l s and s t r u c t u r e s f o r use i n low-cost housing. B a i l d i n g M a t e r i a l s and S t r u c t u r e s Rep. B M S ~ , June 16. National Bureau of S tandards , U,S. Dep. Commerce, Washington, D.C.
F o r e s t P roduc t s Laboratory. 1953, D u r a b i l i t y of w a t e r - r e s i s t a n t woodworking
g l u e s , No. 7530. USDA, For. S e r v . , For, Prod. Lab. , Madison, v i s .
F rohnsdor f f , G . , and L . W. Masters. 1980. The meaning of d u r a b i l i t y and d u r a b i l i t y
p r e d i c t i o n . D u r a b i l i t y o f b u i l d i n g m a t e r i a l s and components. ASTM SIP 691, P. J . Sereda and 6. G . Li tvan (Ed . ) Amer. Soc, f o r T e s t i n g and M a t e r i a l s , P h i l a d e l p h i a , Pa., p. 17-30.
G i l l e s p i e , R. H, 1965. Accel p ra ted-ag i ng of adhesives i n
plywood-type j o i n t s . For. Prod, J. 75(9) : 369-378.
G i l l e s p i e , R. H . 1968, Heat and moisture resistance o f a urea-
r e s i n i n plywood j o i n t s , For. Prod. J , 78j8) :35-41,
G i l l e s p i e , R, H a 1987, Eva lua t ing durzSil i t y of adhesive-bonded
wood j o i n t s . Froc. 1%8 symposium '%Wo@d Adhesives--Research, Apgi ica t ion , and Needs," Sponsored by For. Prod, Lab, and Wash, S t a t e Un iv . , Madison, # i s , , Sep t . 23-25, p. 768-77e,
G i l l e s p i e , R. M,, and B. H . River . 1975. Durabi 'I i t y of adhes ives in plywood:
d ry-hea t e f f e c t s by r a t e - p r o c e s s a n a l y s i s . For. Prod. J . 25(7):26-32,
G i l l e s p i e , R. H., a n d B. H, River , 1976. D u r a b i l i t y of adhes ives i n plywood,
For. Prod. J , 226(10) :21-26. G i l l e s p i e , R . H. , and W . 6. Lewis.
7972. Evaluat ing adhes ives f o r bu i ld ing con- s t r u c t i o n , USDA For. Serv. Res. Pap, F P L - 1 7 2 , For, Prod, tab. , Madison, Wis.
Gray, 6. 6, 1977, Determinat ion and s i g n i f i c a n c e of a c t i v a t i o n
energy in permanence t e s t s p rese rva t ion of paper and t e x t i l e s of h i s t o r i c and a r t i s t i c va lue , John C. Wil l iams, Ed. Advances i n Chem. S e r . 164, Arner. Ghem. S o c , , Washington, D , C , , p, 286-313.
G r e s s e l , P . 1980, Chipboard adhes ive durab i l i t y
assessment--a c o n t r i b u t i o n t o t h e fo rmula t ion of glue- independent t e s t g u i d e l i n e s , P a r t 1, Statement of t h e probl em--test planning and execu t ion- - resu l t s , Hol z a1 s Roh- und Werkstoff 3861) :17-35,
Gressel , P . 1980. Tes t ing and judging t h e d u r a b i l i t y of
p a r t i c l eboard adhesives--a proposal f o r t h e e s t a b l i s h m e n t of g e n e r a l l y v a l i d t e s t i n g guide1 i n e s . P a r t 2 : Discussion of resu l t s , Holz a l s Roh- und Werkstoff 38(2):61-77.
Gressel , P. 1980. Chipboard adhes ive durab i l i t y t e s t i n g
and assessment--a c o n t r i b u t i o n t o t h e formu- l a t i o n of g l u e independent t e s t g u i d e l i n e s , P a r t 3: Conclusions and proposed t e s t guide- l i n e s , Holz a l s Roh- und Werkstoff 38(3):109-113.
Hann, R. A,,J , M. Black, and R. F. Blomquist, 1962, How d u r a b l e i s p a r t i c l e b o a r d ? For,
Prod, J . 12(12):517-584. Wann, R . A * , J. M . BSack, and R . F, Blomquist,
7963. How d u r a b l e i s p a r t i c l e b o a r d : P a r t I T , The e f f e c t of temperature and humidity. For, Prod, J, 13(5) :169-174.
Hobbs, R, B, 1960. Es t imat ing t h e 1 i fe -expec tancy of book
papers , PermanentlDurabl e Book Paper. Vi rg in ia S t a t e L ibra ry PubS, No. 16, The Vi rg in ia S t a t e L ibra ry , Richmond, Va,
Jessup , D. A * , G , G . Weber, and 5. G . Meissberg. 1940. S t a b i l i t y of f i b e r bu i ld ing boards a s
determined by a c c e l e r a t e d ag ing , Bui lding Mater. and S t r u c t , Rep. BMSSO, Nat, Bur. S tand . , U.S. Dep, Commerce, Washington, D . C .
J e s s u p , D, A , , 6. G , Weber, and S , 6 . Weissberg, 1947. S t a b i 4 i t y o f f i b e r s h e a t h i n g boards a s
de te rmined by a c c e l e r a t e d ag ing . Bui Id . Mat, and S t r u c t , Rep. BMS69. Nat, Bur, S t a n d . , U.S. Dep, Comrrrerce, Washington, D. C.
J e s s u p , D. A,, S. G . Weissberg, and C . G. Weber. 1938. Acce le ra ted ag ing of f i b e r Bb i ld ing
b o a r d s . Bu i ld . Mat. and S t r u c t , Rep, BMS4, O c t . 17, Mat. Bur. S t a n d . , U.S. Dep. Commerce, Washington, 0.6.
J o k e r s t , R. N. 1968. Long- term durab i l i t y o f 7abora tory-made
D o u g l a s - f i r f l a k e b o a r d . USDA For. Se rv . Res. Note FPL-0199. For. Prod. t a b . , Madison, Wis.
Krueger , 6 . P. 1981. Design methodology f o r a d h e s i v e s based
on s a f e t y and durab i 1 i t y . Module i n t h e H e r i t a g e Workshop on Adhesive Bonding o f Wood and Othe r S t r u c t u r a l Ma t e r i a1 s , Madi s o n , Wi s. To be pub l i shed i n J o u r n a l o f Educa t iona l Modules f o r M a t e r i a l s S c i e n c e and Eng inee r ing (JEMMSEJ
Krueger , G . P. 1981. De te rmina t ion o f working s t r e s s e s f o r
s t r u c t u r a l a d h e s i v e s . Proc. 1980 Symp. "Wood Adhesives--Research, A p p l i c a t i o n , and Needs," sponsored by For . Prod. Lab. and Wash. S t a t e Univ. , S e p t . 23-25, Madison, Mis.
Lehmann, W . F. 1968. Durabi i i t y o f e x t e r i o r p a r t i c l e b o a r d .
P roc . Wash. S t a t e Univ. P a r t i c l e b o a r d Symp. No. 2, Pullman, Wash., p. 275.
Lehmann, W . F. 1977. Durabil i t y o f composi t i o n board p r o d u c t s ,
P roc . Washington S t a t e Univ. P a r t i c l e b o a r d Symp. No. 1 1 , Pullman, Wash., p. 351.
Lehmann, k. F . , T. J . Ramaker, and F. V . Hef ty . 1975. Creep c h a r a c t e r i s t i c s o f s t r u c t u r a l
p a n e l s . Proc. Ninth Mash. S t a t e Univ. P a r t i c l e b o a r d Symp., Pullman, Wash., p. 151-772.
Lewis, W . C. 1956. T e s t i n g and e v a l u a t i n g p rocedures f o r
b u i l d i n g boards . For. Prod. J . 6 ( 7 ) : 241 -246. MacLean, J . D.
1951. Rate o f d i s i n t e g r a t i o n o f wood under d i f f e r e n t h e a t i n g c o n d i t i o n s , Proc. Amer. Wood Prese rv . Assoc. 47:755-168,
MacLean, J . D. 1953. E f f e c t o f s t eaming on t h e s t r e n g t h of
wood. Proc. Amer. Wood Prese rv . Assoc. 49:88-112.
MacLean, J . D. 1954. E f f e c t o f h e a t i n g i n w a t e r on t h e
s t r e n g t h p r o p e r t i e s o f wood. Amer. Wood P r e s e r v . Assoc. 50:253-281.
Marra, G , 6. 1981. The r o l e of adhes ion and a d h e s i v e s i n
t h e wood p r o d u c t s i n d u s t r y , Proc, 1980 Symp. '"Wood Adhesives--Research, A p p l i c a t i o n , and N e e d s . ' Y p o n s o r e d by For . Prod. Lab. and Wash, S t a t e Univ., Madison, Mis. , S e p t . 23-25, p. 1-8.
McNatt, J . D. 7982. How c y c l i c humidi ty a f f e c t s s t a t i c
bending and dimensional s t a b i l i t y o f some wood-based panel p r o d u c t s . Proc. o f Workshop on D u r a b i l i t y , Pensaco la , F l a . , Oc t , 5-7,
McNatt, J , D. , and M. 0. Hunt. 7982, Creep p r o p e r t i e s o f t h i c k s t r u c t u r a l
f l akeboard under c o n s t a n t and cycl i c humidi ty condi t i o n s . For. Prod. ?. 3 2 ( 5 ) :49-54.
McNatt, J , D., and M. J . Super fesky , 7 982, Performance o f hardboard-webbed I-beams
d u r i n g long- term load ing i n i n t e r i o r , e x t e r i o r , and cyc l i c humidi ty environments . USDA For. S e r v . Res. Pap. i n p r o c e s s .
M i l l e t t , M. D., and R . H. G i l l e s p i e , 1978. P r e c i s i o n o f t h e r a t e - p r o c e s s method f o r
p r e d i c t i n g bond1 i n e durab i l i t y . P repa red f o r Dep. Housing and Urban 3ev. (HUD) , Nat . Tech. Inform. Se rv . (NTIS) PB80-f 21866.
M i l l e t t , M. D., R . H . G i l l e s p i e , and A, J . Baker. 1950. P r e c i s i o n o f t h e r a t e - p r o c e s s method f o r
p r e d i c t i n g d u r a b i l i t y o f adhes ive bonds. D u r a b i l i t y o f b u i l d i n g m a t e r i a l s and compo- n e n t s , ASTM STP 691. P. 3. Sereda and 6. G , L i tvan ( E d . ) . Amer, Soc. f o r T e s t i n g and Mater . , p. 913-923.
Na t iona l P a r t i c l e b o a r d A s s o c i a t i o n . 1979. Mat-formed wood p a r t i c l e b o a r d . ANSI
A208.1-1979. O l i v e r , I . F, (Ed . )
7981. Adhesives i n c e l l u l o s i c and wood-based compos i t e s , NATO Conf. S e r . VI, Mater . S c i . ; V . 3 , May 72-15, 1980. Q u e e n ' s U n i v e r s i t y , Kingston, O n t a r i o . Plenum P r e s s , N . Y . , p. 235.
Rasch, R. H, 1931. A c c e l e r a t e d ag ing t e s t f o r p a p e r , Na t .
Bur , S t a n d . , J . Res. 7:465-475, Res. Pap. No, 352.
Rasch, R. H, , and B, W . S c r i b n e r . 1933. Comparison o f n a t u r a l ag ing o f paper
w i t h a c c e l e r a t e d ag ing by h e a t i n g , Na t . Bur. S t a n d . , 3 . Res . , 11:727-732; Dec.
Raymond, R , C , 7975. Outdoor wea the r ing of plywood and corn-
p o s i t e s . Proc. 1975 Symp, "Adhesives f o r P roduc t s from Wood." Sponsored by For . Prod. Lab., Madison, Wis , , S e p t . 24-26, p. 164-169.
R ive r , B . H . , R . H . G i l l e s p i e , and A . J . Baker. 1981. Acce le ra ted aging of phenol ic-bonded
ha rdboards and f l akeboards , USDA For , S e r v . Res. Pap. FPt-393. For. Prod. l a b . , Madison, Wis,
Roberson, D . D. 1981. Permanenceldurabi l i t y and p r e s e r v a t i o n
r e s e a r c h a t t h e Barrow Labora to ry . P r e s e r v a - t i o n o f paper and t e x t i l e s o f h i s t o r i c and a r t i s t i c value-11. John C , Will iams (Ed. ) . Advances i n Chem, S e r , No. 193, p. 45-55, Amer, Chem. S o c , , Washington, D . C .
Schniewind, G , P. , and D, E, t yon . 7 973, F u r t h e r exper imen t s on c r e e p r u p t u r e
l i f e under c y c l i c environmental c o n d i t i o n s . Wood and F i b e r 4/ 4) : 334-341 ,
Sken, K, 6, 1971. The r e l a t i o n s h i p s between t e n s i o n , s h e a r ,
and o t h e r s t r e n g t h p r o p e r t i e s of p a r t i c l e b o a r d , For. Prod. J. 21 (6 ) :40-43.
Shen, K . C . 7977. A proposed r a p i d a c c e l e r a t e d - a g i n g t e s t
f o r e x t e r i o r waferboard, Rep. OPXlGOE, E a s t e r n For . Prod. Lab , , O n t a r i o .
Stamm, A. J. 1956. Thermal d e g r a d a t i o n o f wood and c e l l uf o s e ,
Ind. Eng. Chem, 48:413-417.
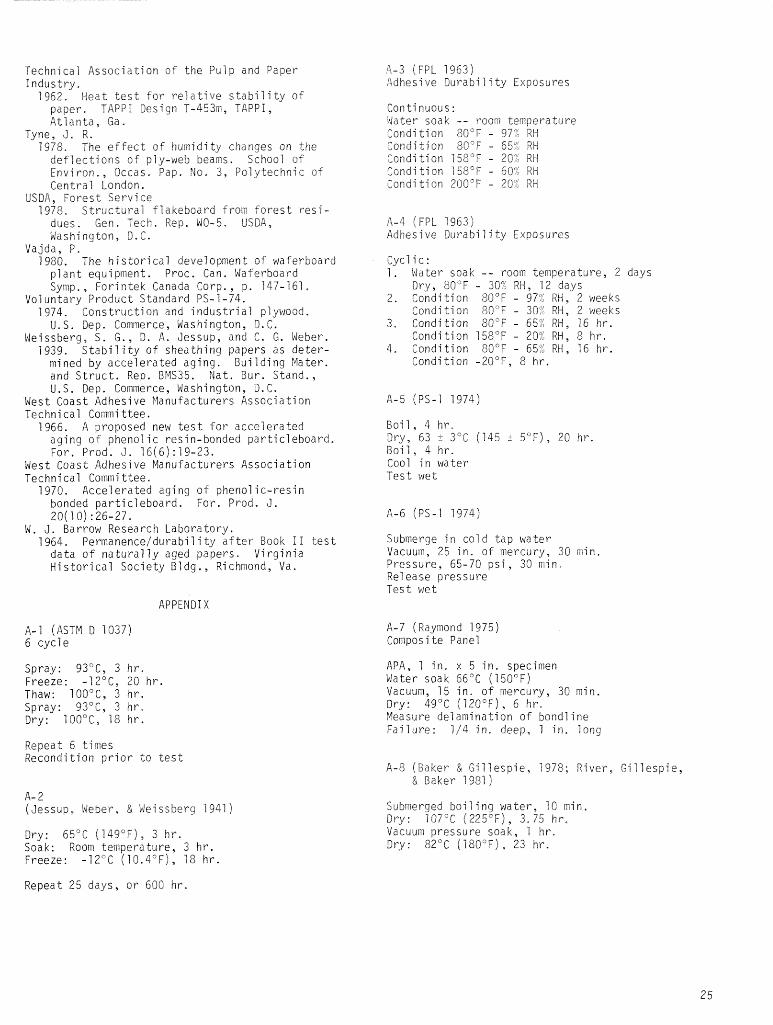
Technical Assoc ia t ion of t he Pulp and Paper Indus t ry .
1962. Heat t e s t f o r r e l a t i v e s t a b i l i t y of paper. T A P P I Design T-453111, TAPPI, A t l an t a , Ga.
Tyne, 3. R . 1975. The e f f e c t of humidity changes on the
d e f l e c t i o n s of ply-web beams. School of Environ. , Dccas. P a p , No. 3, Polytechnic of Central London.
USDA, Fores t Serv ice 1975, S t r u c t u r a l f lakeboard f rorn f o r e s t r e s i -
dues. Gen. Tech, Rep, WO-5. USDA, Washington, D . C .
Vajda, P . 1980. The h i s t o r i c a l development of waferboard
p l a n t equipment. Proc. Can. Waferboard Symp. , Fcr in tek Canada Corp. , p, 147-161,
Voluntary Product Standard PS-1-74. 1974. Construct ion and i n d u s t r i a l plywood.
U . S . Dep. Commerce, Washington, D. C. Weissberg, S . G . , D . A , Jessup , and C . G. Weber.
1939. S t a b i l i t y of shea th ing papers a s d e t e r - mined by acce l e r a t ed ag ing . Bui 1 ding Ma t e r . and S t r u c t . Rep. B!4S35, Nat. Bur. S tand . , U.S. Dep. Commerce, Washington, D . C .
West Coast Adhesive Manufacturers Associat ion Technical Committee.
1966. A proposed new t e s t f o r a cce l e r a t ed aging of phenol i c r e s i n - bonded pa r t i c l eboa rd . For. Prod. 3. 16(6):19-23.
West Coast Adhesive Manufacturers Associat ion Technical Gommi t t e e .
1970. Accelerated aging of phenol ic - res in bonded pa r t i c l eboa rd . For. Prod. J . 20(10) : 26-27.
W . J . Barrow Research Laboratory. 1964, Permanence/durabi l i ty a f t e r Book I1 t e s t
da ta o f n a t u r a l l y aged papers . Virginia H i s to r i c a l Soc ie ty Bldg., Richmond, Va.
A-1 (ASTM D 1037) 6 cyc le
Spray: 93"C, 3 h r . Freeze: -7Z°C, 20 hr . Thaw: 100°C, 3 hr . Spray: 93'C, 3 h r , Dry: 700"C, 18 hr .
4-3 (FPL 1963) Adhesive Durabi l i t y Exposures
Con t i nuou s : dater soak -- r-oom t e ~ p e r a t u r e Condi t i o n 80°F - 97' RW Condition 80°F - 65' RH Condition 758°F - 20: RH Sondi t i on 158°F - 60"W Condftion 200°F - 20" RH
A-4 (FPL 1963) Adhesive Durabi l i t y Exposures
Cycl i c : 1 . Vater soak - - room temperature, 2 days
Dry, 80°F - 30': RW, 12 days 2. Condition 80°F - 97" RH, 2 weeks
Condition 80°F - 30,' R H , 2 weeks 3. Condition 80°F - 657; R H , 76 hr.
Condition 758°F - 202 R H , 8 hr . 4. Condition 80°F - 65:L RW, 16 hr .
Condition -2O0F, 8 hr .
Boi l , 4 hr. Dry, 63 + 3°C (145 i 5"F) , 20 hr . Boi l , 4 hr. Coo1 in water Tes t wet
Submerge in cold t ap water Vacuum, 25 in . of mercury, 30 n in . Pressure , 65-70 p s i , 30 min. Re1 ease pressure Tes t wet
A-7 (Raymond 1975) Compos i t e Panel
A P A , 1 i n . x 5 i n . specimen Water soak 66°C (150°F) Vacuum, 15 i n . of mercury, 30 min. Dry: 49°C (72O0F), 6 h r , Measure de7 amination of bond1 ine Fa i l u r e : 114 i n . deep, I i n , long
Repeat 6 t imes Recondition p r i o r t o t e s t
A-8 (Baker & G i l l e s p i e , 1978; River, G i l l e s p i e , & Baker 1981 )
A- 2 ( Jessup , Weber, & Weissberg 1941)
Dry: 65°C (149"F) , 3 hr. Soak: Room temperature, 3 h r . Freeze: -12°C (70 ,4"F) , 18 h r ,
Submerged bo i l i ng water , 10 mine Dry: 707°C (22S0F), 3 ,75 hr , Vacuum pressure soak, 1 hr . Dry: 82°C (780"F), 23 hr.
Repeat 25 days, o r 600 hr .
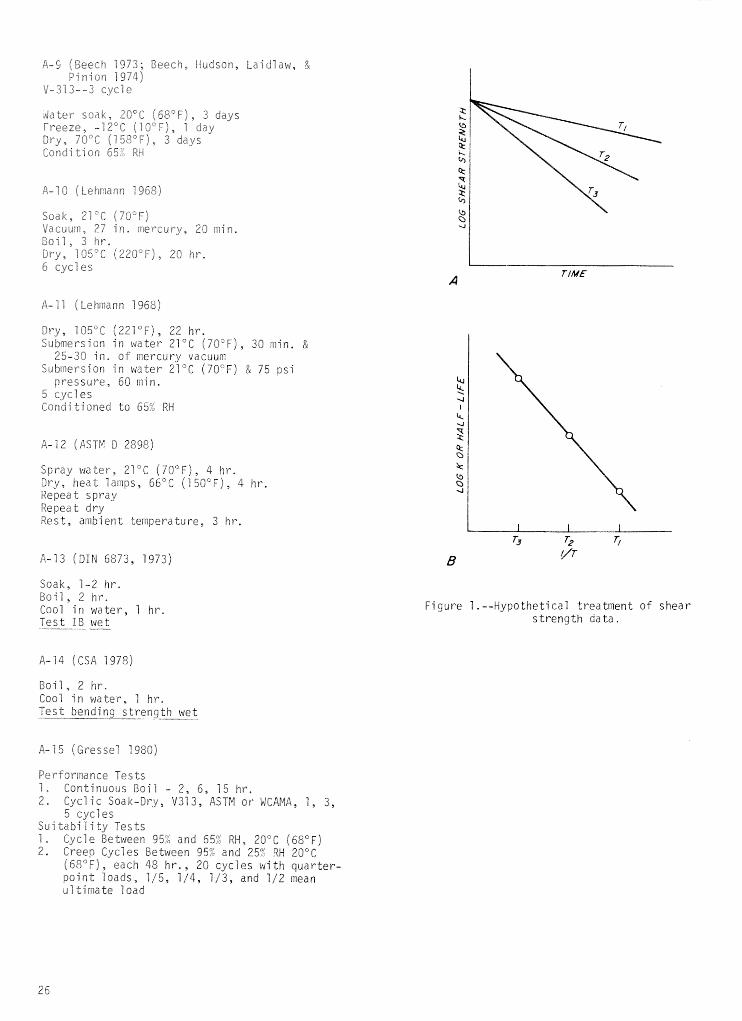
4-"(eeech 1973; Beech, Hudson , La id l aw , & Pinion 1974)
V-313--3 cycle
tiater soak , 26°C (68"F), 3 days Freeze, -12°C ( 1GCF j , I day Dry, 70°C ( 7 55"F), 3 days Gcndi tSon 65, RH
S o a k , 21°C i70"F) Vacuum, 27 i n , mercary, 20 mine Boil, 3 hr, Dry, 505°C [22O0F), 20 hr, 6 cycles
Dry, 105°C (22I0Fj, 22 hr. Submersion i n water 21°C (70°F) , 30 min, &
25-30 i n . of mercury vacuum Submersion i n water 27°C (70°F) 13; 75 p s i
pressure, 60 min. 5 cycles Condi t i c n e d to 65'4 RH
A-1 2 (ASTM D 2898)
Spray water, 21°C (TO":), 4 hr, Dry, h e a t lamps, 66°C (T50°F), 4 hr. Repeat spray Repeat dry Rest, ambient temperature, 3 hr.
A - 1 3 ( D I M 6873 , 1973)
Soak, 7-2 h r . B o i l , 2 hr. Cool i n water, 7 hr, Test IB wet
Boil, 2 hr. 6061 i n water, 7 hr. Test bending strength wet
Performance Tests 1 , Continuous Boi l - 2 , 6 , 15 hr. 2 . Cyclic Soak-Dry, V313, ASTM or WCAMA, 1, 3 ,
5 cycles Suitab~lidy T e s t s 1 . Cycle Between 957 and 65: RH, 20°C (68°F) 2, Creep Cycles Between 95% and 25'i RW 20°C
(68"F), each 48 h r . , 20 cycles with quarter- p o i n t l o a d s , 115 , 1 / 4 , 7 i 3 , and 1 / 2 mean ultimate Toad
Figure 1 . --Hypothetical treatment of shear strength d a t a .
2 / Jay A. Johnson-
Abstract .-- ln t h i s presentation the issue of composite panel du rab i l i ty i s viewed fron an overall framework: end- use requirements should be r e l a t ed t o qua1 i t y control t e s t s which in turn should be r e l a t ed t o process and raw material var iables . A de f in i t ion of du rab i l i t y i s given which in- c1 udes identifying f a i 1 ure events , agents, and t h e i r i n t e r - ac t ions responsible fo r material breakdown and the use of time as a measure of the degree of degradation. Examples are given t o i l l u s t r a t e a few points and a plea i s made t o develop a quant i ta t ive information linkage system,
INTRODUCTION
Since t h i s paper i s par t of a workshop, I don ' t fee l compelled t o follow a r ig id format of a formal s c i e n t i f i c paper. I do fee l compelled, however, t o l e t the reader know how I am going t o s t r i n g my thoughts together fo r t h i s presen- t a t ion . The menu of topics wi l l be as follows: (1 ) message of the paper; ( 2 ) de f in i t ion and general discussion of durabi 1 i t y ; ( 3 ) some thoughts on an overall perspbctive; ( 4 ) some examples of how t o character ize durab i l i ty con- cepts and f i n a l l y ; ( 5 ) I wi 11 summarize and make a plea fo r an integrated approach t o the subject of durabi 1 i t y .
Consider a simplified view of the manufac- tur ing process of a wood based product fo r a part i- cular end-use ( f i g . 1 ) . The material flow con- s i s t s of assembling the raw material a t the p lant , sending t h i s raw material through a s e r i e s of unit operations which produces a f ina l product and t h i s i s sent out t o s a t i s f y a need. The ult imate owner pays, up f r o n t , fo r the product and his expectation i s t h a t the product wi l l continue t o perform i t s function the rea f t e r . The customer is apparently s a t i s f i e d ; the manufacturer makes a p ro f i t and a l l i s r igh t with the world. Right? Wrong !
To make sure the product continues t o perform i t s function and t h a t the manufacturer continues t o make a p r o f i t , there i s a need fo r an infor- mation flow in t h i s system. The information flow can be segmented in to four par ts ( f i g . I ) : the
l/Paper presented a t Workshop on Durabil i ty, ~ e n s a c o l a , FL, October 5-7, 1982.
Z/Associate Professor, University of ~ a s h i n g t o n , S e a t t l e , HA.
character iza t ion of product performance, q u a l i t y control , process control , and raw material character iza t ion. I t i s important t o recognize t h a t the information flow i s counter-current t o the material flow. One needs t o know what per- formance level the product needs t o s a t i s f y and fo r how long, then quali ty procedures are required which wi 11 provide indicators fo r fu ture prform- ance; they will d is t inguish between good and bad product. I f bad product i s detected, the uni t operations must be adjusted and control led within acceptable tolerances t o r e c t i f y the problem. Changes in raw material cha rac te r i s t i c s need t o be monitored and t h e i r contribution t o product qua l i ty understood in order t o i n t e l l i g e n t l y deal with adjustments t o stop making poorer qua l i ty product.
The durab i l i ty question of s t ructura l panels i s but one of the many performance re- quirements which must s a t i s f y end-user needs and, consequently: ( t h i s i s the message).
There i s a need fo r an information linkage system f o r product dura- b i l i t y which will connect and in t e r - r e l a t e raw material cha rac te r i s t i c s , processing var iables and qua l i ty con- t r o l t e s t s t o actual end-use service condit ions .
and furthermore: ( t h i s i s a mini-message) . The i nformati on 1 i nkage system shoul d be as auan t i t a t ive as ~ o s s i b l e with : point of the system.
DEFIPiITION OF DURABILITY
A number of def i n i t ions of durabi 1 i t y have been given a t t h i s workshop and I will probably dupl ica te the e f f o r t s of o the r s , but nevertheless I do not want t o be l e f t out of t h i s exerc ise .
She reason why one spends time defining a concept i s not because of the glory and acclaim one wi 11 receive from the pa r t i cu la r pear ls of wisdom which will be wri t ten down, but because i t i s b a s i c a l f y a good way t o t~nderstand the oature of t he problem.
X s t a n d a r d gimmick used t o define a concept i s to l o o k the word u p in the dictionary. So l e t " do t h a t , ( A s though dic t ionary ed i to r s are experts an technical concepts such as durabi l i ty . ) %hat you f i n d i s sowething l i k e : du rab i l i t y has something t o do w i t h the q u a l i t y o f being durable I s n ' t t h a t helpful? Reading on you f ind: i t i s the abi Si ty t o l a s t i n s p i t e o f frequent use. That ' s b e t t e r , but r e a l l y no d i f f e ren t than a common sense de f in i t ion t h a t my brother gave me: a durable product wi l l l a s t a long time. So much fo r d ic t iona r i e s ,
A number of good de f in i t ions are found in an ASTM publication dealing with durab i l i ty of building materials (Sereba and Litran 1980). De- f i n i t i o n s emerge Prom the papers in t h i s document l ike: (1 the durab i l i ty of a material i s i t s a b i l i t y t o r e s i s t changes of i t s s t a t e ; (2) d u r a b i l i t y has t o do with the safe performance o f a s t ruc tu re (o r a portion of i t ) fo r i t s des i red 1 i f e expectancy; or ( 3 ) durabi l i t y i s a complimentary concept of r e l i a b i l i t y which i s r e l a t e d t o the probabi l i ty of the successful operation o f a device (or product in a manner i t was intended. This l a s t idea i s neat as i t opens up the use of probabi l i ty mathematics t o help character ize durab i l i ty .
I have concluded, a f t e r dabbling in the l i t e r a t u r e a b i t , t h a t t o define a general C O M -
cept l i k e durab i l i ty i s not easy. Having sa id t h a t I am going t o t r y anyway. F i r s t , however, I wi l l s t a r t with a TRUTH which I claim i s s e l f - evident , t h a t i s :
A PRODUCT, in use, wi l l be subjected t o AGENTS which wi l l INTERACT with the MATERIALS of which i t i s com~osed and change the STATE of the product from one form t o another.
A general de f in i t ion of du rab i l i ty follows from t h i s t r u t h :
The DURABILITY of a product i s an ATTRIBUTE r e l a t ed t o the TIME tzken f o r i t t o D E G R A D E t o the point &ere i t f a i l s t o PERFORM i t s intended PURPOSE or FUNCTION.
Specific de f in i t ions of durabi l i t y can be formulated once the agents have been iden t i f i ed , types of in terac t ions known and failure events c l e a r l y defined,
A l i s t s f degradaticn f ac to r s (agents) has been put together by Frohnsdorff and Masters (1980) which include: WEATHERING ( r ad ia t ion , temperature, water, normal a i r const i tuents , a i r conlaiminants , freeze-thaw cycles , and wi nd) , BIOLOGICAL (mi cro-organi sms , fung i and b a c t e r i a ) ,
STRESS (sustained and periodic loads ) , INCOMPATI- BILITY (corrosion, chemi ca1 and physical degra- dat ion) and USE (normal wear and t e a r , abuse, f au l ty des ign) . Obviously, the performance of s t ruc tu ra l ~ o o d panel s would be influenced keavi 1 y by the f i r s t three categories.
For a given s i tua t ion , such as panel products a t the j o b s"e b e i n g subjected t o dr iv ing r a i n and subsequently being dried by intense r ad ia t ion from the sun, a nuvber af the f ac to r s nay be in- volved in the deter iora t ion of the product. These f ac to r s need t o be iden t i f i ed f o r a s p e c i f i c defi n i t ion of durabi 1 i t y .
The in terac t ions of the agents with the material i s usually very complex and d i f f i c u l t t o understand theore t i ca l ly , consequently, simulation (weathering t e s t s ) o r '"wow case" procedures (boi l-dry-boi l cycles , fo r example) a r e used t o assess the r a t e of deter iora t ion as ind ica to r s of du rab i l i t y . Methodologies fo r assessing durabi l - i t y generally consis t of performing t e s t s on products subjected t o periodic "loads" of a degradation f ac to r . The response of a measured " indicator" ((strength, appearance, movement, e t c . ) i s p lo t ted over time.
Characterizing the responses i s not as straightforward as one might think. Farhi (1980) discusses four types of behavior which conceiv- ably could be encountered in durab i l i ty s tud ies ( f i g . 2 ) . Very durable products are ones which degrade slowly so they v i r t u a l l y never s l i p below the th res ho1 d of acceptable performance ( f i g . 2a 1. The degradation may be rapid t o begin with but level out above the threshold l eve l ; hence, t he product would be durable but would show s igns of decay ( f i g . 2b). The product may decay past the threshold l e v e l , but a t l e a s t have a l imi ted l i f e expectancy ( f i g . 2c) . Rep1 acement s t r a t e g i e s would be important here and providing the degra- dation was not rapid a safe ty fac tor concept would be employed. The behavior which would be the most d i f f i c u l t t o design fo r would be one in which the degradation rapidly decelcra tes a t a pa r t i cu la r point in time ( f i g . 2d f .
More work i s needed in t h i s area t o under- stand the "physicst ' of the degradation processes. By doing fundamental s tud ies , ins ight wi l l be gained and be t t e r judgment of end-use performance should folfow. The ingredients fo r dealing with the in terac t ions then, must be: INSIGHT, U N D E R - STANDING, AND JUDGMENT.
F inal ly , t o f i n i s h up t h i s sec t ion on de f i - n i t ion , there i s a need t o be more s p e c i f i c about f a i l u r e events. How long will a product l i k e a s t ruc tu ra l panel "see" u a r t a i n "load" o r level of a degradation f ac to r?
If more information were avai lable f o r t h e frequency of the "loads" (degradation f a c t o r s ( i . e , , r a i n f a l l , wet/dry cycles , e t c , f then per- haps durabi 1 i t y could be handled in a l oadf res is tance format, This i s shown schematically in f igure 3. A s a fe ty index i s defined once the durabi l i t y res is tance and the "load" d i s t r i b u t i o n
are characterized. The manufacturer who can keep his product durabi l i ty resfstarce dis t r ibut ion " t ightgi wwill be in a bet ter position to provide product performance a t reduced cost or qreater prof i t .
Another question related to defining fa i lu re events tha t might be worth asking i s : Are there specific sequences of events which must be sa t i s - fied before a fa i lu re wi 11 occur? This type of analysis can be done with a faul t - t ree approach, see, for example, Hen1 ey and Kumamoto (1 981 1. Chances are tha t i f t h i s tool were used to ident- i fy problems in durabili ty of structural panels, many of the sequences of events leading t o fa i lure would be related to ins ta l la t ion problems or sim- ple misuse of products for certain applications. The use of a faul t - t ree diagram has been used to assess problems related to f i r e in buildings.
e The t e s t fence served as a simulation of end-use conditions; subjective judgment of durabi 1 i l y .
e Simple t e s t methods were developed (gener- a l l y of the boil-dry-boil cycle type); t e s t s easy t o perform, resul ts used as indicators of durabi l i ty; useful for comparisons.
e Basically no incentive existed to develop more of a theoretical understanding.
Present
o Uncertain times: Will buildinq practices change or remain the same?
0 New generation of wood products emergino: waferboard, OSB, other ( ? ) .
PERSPECTIVES
Some time ago Stan Suddarth discussed some aspects of research needs in light-frame construc- t ion (Suddarth 1973). He mentioned a few things in par t icular about durabi l i ty; i . e . , moisture i s one of the agents of importance in wood product durabi l i ty , but he also brought u p a few points of a general nature that I think are worth mentioning. Let me paraphrase a few pertinent points:
e Consumers lack an adequate understanding of the behavior of wood and wood products (widespread misconceptions exis t about wood).
s The lack of adequate performance standards are an impediment t o progress in l ight- frame construction.
0 There i s a need for a comprehensive design methodology (more emphasi s on "how to" rather than "what to").
0 Expected potentials might be gained by introducing probability concepts into design procedures since inherent varia- b i l i t y of wood and wood products has penalized the i r u t i l i za t ion potential .
Although there has been some progress toward resolving some of the deficiencies pointed out by Stan, I think they s t i l l ex i s t today. The area of durabi l i ty of various wood products i s par t i - cularly 1 acki ng in consumer understanding per- formance standards tha t adequately re f lec t end-use requirements, and design methodology which addres- ses durabi 1 i ty.
What can be done about changinp t h i s s ta te of a f f a i r s ? Is there any need t o making these changes? To answer these questions, consider the problem from a historical perspective:
Past
s Experience served as a guide.
e Uncertainty about : long-term performance; mismatch in end-use; proper application.
Future
r If no drast ic chanse in product usage, then no major change in evaluation of durabili ty.
0 I f , however, changes do occur (fewer housing s t a r t s , more discriminating con- sumer, more competition from non-wood mater ia ls) , then there may be an incentive for better evaluation procedures.
s Quali ty may become an issue i f demand decreases; less emphasis on supply.
0 Costs can be lowered by being more e f f i - cient in the end-use application.
0 Insight gained by understanding phenomena leading to increased durabi 1 i t y may be beneficial in terms of spinninq off new products.
I feel things will change; hence, I would say there i s a need to do things different . As f a r as "what can be done?" I don't have any specific answers. The approach will have to vary from one application area to another but i t i s important that a central group, an ASTM committee perhaps, serve as a focusing body to deal with the problem from an overall perspective.
To be more specific about quantifying dura- b i l i t y concepts, l e t me present a few examples. In my opinion, there are two broad categories of performance requirements for bui 1 ding materi a1 s : APPEARANCE and BEHAVIORAL. The f i r s t example, buck1 i ng of medium density siding (MDS), involves an appearance requirement for acceptable perform- ance, whereas the other two examples tha t I have
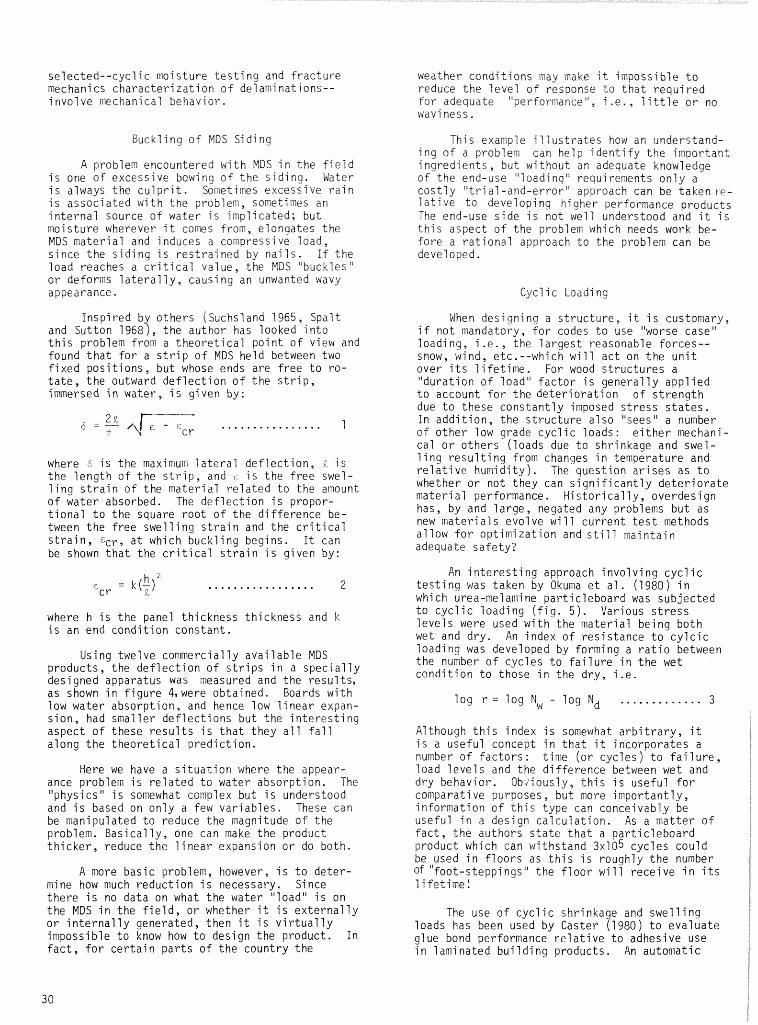
selected--cyclic moisture tes t ing and fracture mechanics characterization of delaminations-- involve mechanical behavior.
Buck1 ing of NDS Siding
A problem encountered with MDS in the f ie ld i s one of excessive bowing of the siding. Water i s always the cu lpr i t . Sometimes excessive rain i s associated with the prob7em, sometimes an internal source of water i s implicated; but moisture wherever i t comes from, elongates the MDS material and induces a compressive load, since the siding i s restrained by nai ls . If the load reaches a c r i t i c a l value, the MDS "buckles" or deforms la te ra l ly , causing an unwanted wavy appearance.
inspired by others [~uchsland 1965, Spa1 t and Sutton 1968), the author has looked into t h i s problem from a theoretical point of view and found tha t for a s t r i p of MDS held between two fixed positions, b u t whose ends are free t o ro- t a t e , the outward deflection of the s t r i p , immersed in water, i s given by:
where 6 i s the maximum lateral deflection, 2 i s the length of the s t r i p , and i s the free swel- l ing s t r a i ~ of the material related to the amount of water absorbed. The deflection i s propor- t ional t o the square root of the difference be- tween the free swelling s t ra in and the c r i t i c a l s t r a i n , Ecr, a t which buckling begins. I t can be shown that the c r i t i c a l s t ra in i s given by:
where h i s the panel thickness thickness and k i s an end condition constant.
Using twelve commercial 1y available MDS products, the deflection of s t r i p s in a specially designed apparatus was measured and the results, as shown in figure 4,were obtained. Boards with low water absorption, and hence low linear expan- sion, had smaller deflections b u t the interesting aspect of these resul ts i s that they a l l f a l l along the theoretical prediction.
Here we have a s i tuat ion where the appear- ance problem i s related to water absorption, The "physics" i s somewhat complex b u t i s understood and i s based on only a few variables. These can be manipulated to reduce the magnitude of the problem. Basically, one can make the product thicker, reduce the l inear expansion or do both.
A more basic problem, however, i s t o deter- mine how much reduction i s necessary. Since there i s no data on what the water "load" i s on the MDS in the f i e l d , or whether i t i s externally or internal ly generated, then i t i s v i r tua l ly impossible to know how to design the product. In f a c t , for certain parts of the country the
weather conditions may make i t impossible t o reduce the level of resoonse t o that required for adequate '"erformance'\ i .e . , 1 i t t l e or no waviness ,
This example i l l u s t r a t e s how an understand- ing o f a problem can help identify the important ingredients, b u t without an adequate knowledge o f the end-use "?o&inq" requirements only a costly ""trial-and-error'" approach can be taken up- latiwe to developing higher performance products The end-use side i s not well understood and i t i s t h i s aspect of the problem which needs work be- fore a rational approach to the problem can be developed.
Cycl i c Loadi n g
'idhen desiqninq a s t ructure , i t i s customary, i f not mandatory, for codes to use "worse case" loading, i . e . , the largest reasonable forces-- snow, wind, etc.--which will act on the unit over i t s l ifetime. For wood structures a "duration of load" factor i s generally applied t o account for the deterioration of strength due t o these constantly imposed s t ress s t a t e s . In addition, the structure also "sees" a number of other low grade cyclic loads: e i ther mechani- cal or others (loads due to shrinkage and swel- ling resulting from changes in temperature and relat ive humidity). The question ar ises as t o whether or not they can s ignif icant ly deter iorate material performance. Historically, overdesign has, by and large, negated any problems but as new materials evolve will current t e s t methods allow for optimization and s t i l l n~aintain adequate safety?
An interest ing approach involving cycl i c tes t ing was taken by Okuma e t a l . (1980) in which urea-melamine particleboard was subjected to cyclic loading ( f i g . 5 ) . Various s t r e s s levels were used with the material being both wet and dry. An index of resistance t o cylcic loading was developed by forming a r a t i o between the number of cycles to fa i lure in the wet condition to those in the dry, i . e .
log r = log Nw - log Nd ............. 3
Although t h i s index i s somewhat a rb i t ra ry , i t i s a useful concept in that i t incorporates a number of factors : time (or cycles) to f a i l u r e , load levels and the difference between wet and dry behavior. Obdiously, t h i s i s useful for comparative purposes, but more importantly, information of t h i s type can conceivably be useful in a design calculation. As a matter of fac t , the authors s ta te that a particleboard product which can withstand 3x10⁵ cycles could be used in floors as t h i s i s roughly the number of "foot-steppings" the floor will receive in i t s lifetime!
The use of cyclic shrinkage and swelling loads has been used by Caster (1980) t o evaluate glue bond performance relat ive to adhesive use in laminated building products. An automatic
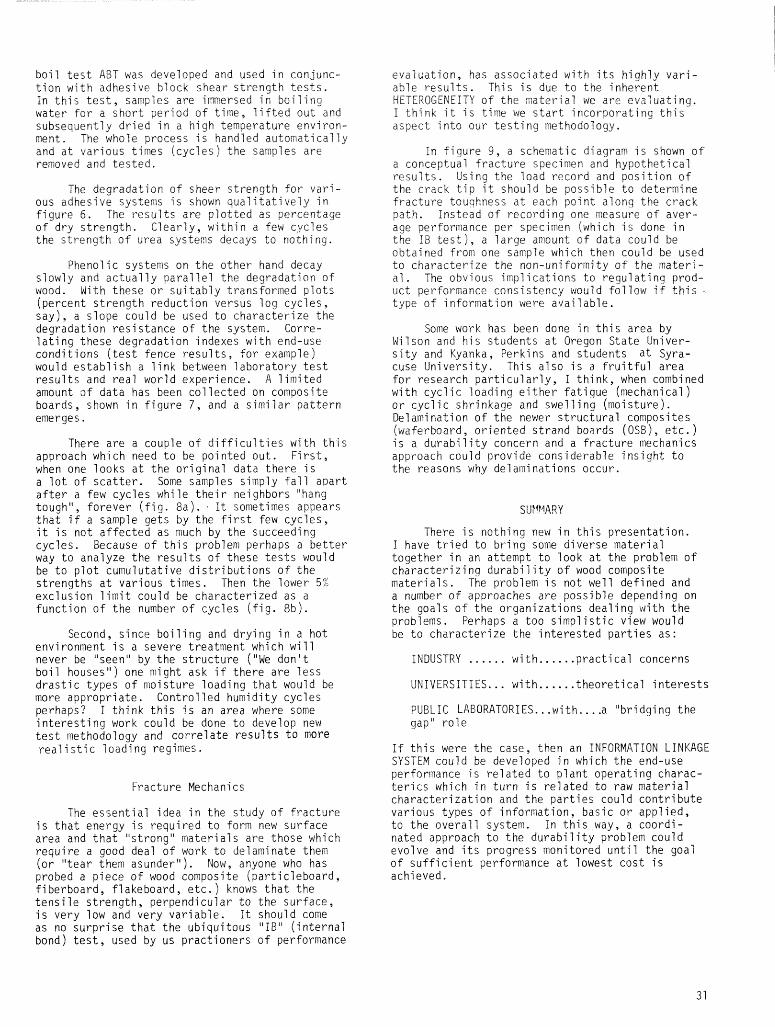
boil t e s t ABT was developed and used in conjunc- t ion with adhesive block shear strength t e s t s . In t h i s t e s t , samples are immersed in boiling water for a short period of time, l i f t ed out and subsequently dried in a high temperature environ- ment. The whole process i s handled automatically and a t various times (cycles) the samples are removed and tes ted.
The degradation of sheer strength for vari- ous adhesive systems i s shown qual i ta t ively i n figure 6 . The resul ts are plotted as percentage of dry strength. Clearly, within a few cycles the strength of urea systems decays to nothing.
Phenolic systems on the other hand decay slowly and actually parallel the degradation of wood. With these or suitably transformed plots (percent strength reduction versus log cycles, say) , a slope could be used to characterize the degradation resistance of the system. Corre- la t ing these degradation indexes with end-use conditions ( t e s t fence resul ts , for example) would establ ish a link between laboratory t e s t resul ts and real world experience. A limited amount ~f data has been collected on composite boards, shown in figure 7 , and a similar pattern emerges.
There are a couple of d i f f icu l t i es with t h i s approach which need to be pointed out. F i r s t , when one looks a t the original data there i s a l o t of sca t te r . Some samples simply f a l l apart a f te r a few cycles while the i r neighbors "'hang tough", forever ( f i g . 8a) . I t sometimes appears that i f a sample gets by the f i r s t few cycles, i t i s not affected as much by the succeeding cycles. Because of th i s problem perhaps a better way to analyze the resul ts of these t e s t s would be to plot cu~nulutative distributions of the strengths a t various times. Then the lower 5% exclusion l imit could be characterized as a function of the number of cycles ( f ig . 8b).
Second, since boiling and drying in a hot environment i s a severe treatment which will never be "seen" by the structure ("We don't boil houses") one might ask i f there are less drast ic types of moisture loading tha t would be more appropriate. Controlled humidity cycles perhaps? I think th i s i s an area where some interesting work could be done t o develop new t e s t methodology and correlate resul ts to more r ea l i s t i c loading regimes.
Fracture Mechanics
The essential idea in the study of fracture i s tha t energy i s required t o form new surface area and tha t '"strong" materials are those which require a good deal of work to delaminate them (or "tear them asunder"). Now, anyone who has probed a piece of wood composite (par t i cleboard, fiberboard, flakeboard, e tc . ) knows tha t the tensi le strength, perpendicular to the surface, i s very low and very variable. I t should come as no surprise that the ubiquitous "IB" "nternal bond) t e s t , used by us practioners of performance
evaluation, has associated with i t s highly vari- able resu l t s , This i s due t o the inherent HETEROGEMEITY of the material we are evaluating. I think i t i s time we s t a r t incorporating t h i s aspect into our tes t ing methodology.
In figure 9 , a schematic diagram i s shown of a conceptual fracture specimen and hypothetical resu l t s . Using the load record and position of the crack t i p i t should be possible t o determine fracture touqhness a t each point alonq the crack path. Instead of recording one measure of aver- age performance per specimen (which i s done in the IB t e s t j, a large amount of data could be obtained from one sample which then could be used to characterize the non-uniformity of the materi- a l . The obvious implications to regulating prod- uct performance consistency would follow i f t h i s - type of information were available.
Some work has been done in t h i s area by Wilson and his students a t Oregon State Univer- s i t y and Kyanka, Perkins and students a t Syra- cuse University. This also i s a f ru i t fu l area for research par t icular ly , I think, when combined with cyclic loading e i ther fatique (mechanical ) or cyclic shrinkage and swelling (moisture). Del ami nati on of the newer structural composi t e s (waferboard, oriented strand bo2rds (0%) , e tc . ) i s a durabili ty concern and a fracture mechanics approach could provide considerable insight t o the reasons why delaminations occur.
There i s nothing new in t h i s presentation. I have t r i ed to bring some diverse material together in an attempt to look a t the problem of characterizing durabi l i ty of wood composite materials. The problem i s not well defined and a number of approaches are possible depending on the goals of the organizations dealing with the problems. Perhaps a too simplistic view would be to characterize the interested parties as:
INDUSTRY ...... with . . . . . . p ractical concerns
UNIVERSITIES ... with ...... theoretical in te res t s
PUBLIC LABORATORIES ... with .... a "bridging the gap" role
If t h i s were the case, then an INFORMATION LINKAGE SYSTEM could be developed in which the end-use performance i s related to plant operating charac- t e r ics which in turn i s related t o raw material characterization and the parties could contribute various types of inforn-iation, basic or appl ied, to the overall system. In t h i s way, a coordi- nated approach t o the durabi l i ty problem could evolve and i t s progress monitored until the goal of suff ic ient performance a t lowest cost i s achieved.
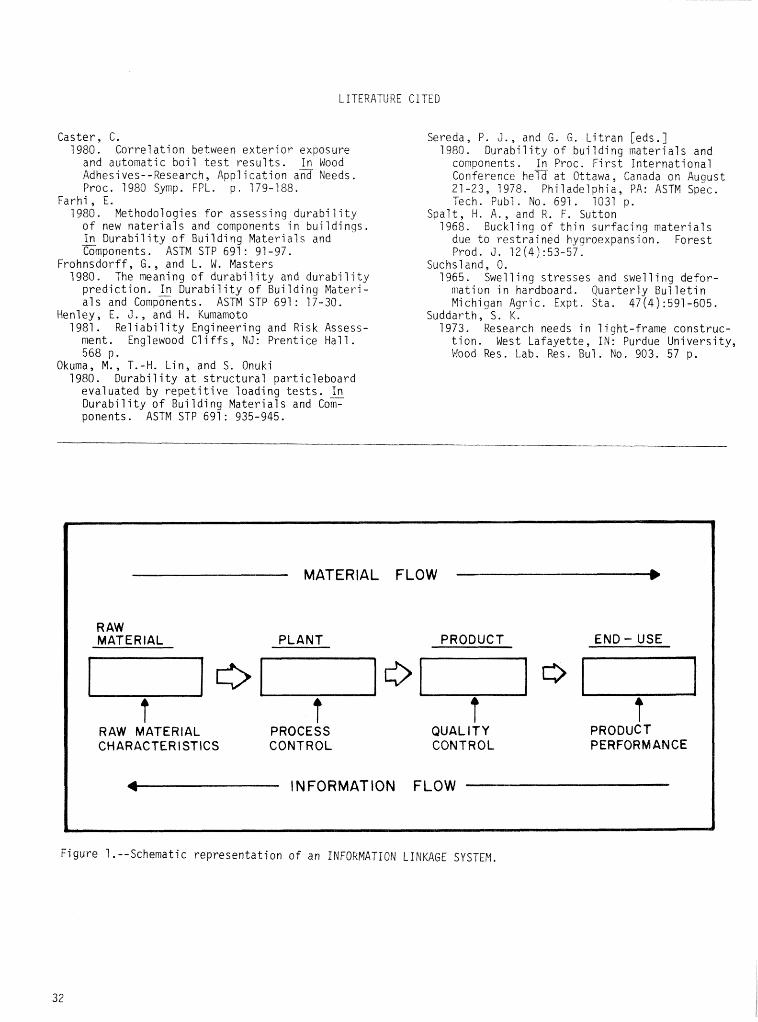
LITERATURE CITED
Caster, C. 1980. Correlation between e x t e r i o r exposure
and automatic boil t e s t r e s u l t s . In Wood Adhesives--Research, Application and Needs. Proc. 1980 Syrnp. FPL. p. 179-188.
Farhi , E. 1980. &thodologies f o r assessing durabi 1 i t y
of new n a t e r i a l s and components in buildings. In Durabil i ty of Building Materials and v
Components. ASTM STP 691: 91-97. Frohnsdorff, G . , and L . W. Masters
1980. The meaning of du rab i l i ty and durabil i t y prediction. 3 Durabi 1 i t y of Bui lding Materi - a1 s and Components. ASTM STP 691 : 17-30.
Henley , E. J . , and H. Kumamoto 1981. Re l i ab i l i t y Engineering and Risk Assess-
ment. Englewood C l i f f s , NJ: Prentice Hall. 568 p .
Okuma, M . , T.-H. Lin, and S. Onuki 1980. Durabil i ty a t s t ruc tu ra l part icleboard
evaluated by r e p e t i t i v e loading t e s t s . Durabi 1 i t y of Bui 1 ding Materi a1 s and Com- ponents. ASTM STP 691: 935-945.
Sereda, P. J . , and 6 . G . Li t r an [eds. 1980. Durabi 1 i t y of bui 1 ding materi a1 s and
components. In Proc. F i r s t International Conference held a t Ottawa, Canada on August 21-23, 1978. Philadelphia, PA: ASTM Spec. Tech. Pub1 . No. 697. 1031 p.
Spal t , H. A., and R. F. Sutton 7 958. Buck1 i ng of th in surfacing mater ia ls
due t o res t ra ined hyqroexpansion. Forest Prod. J , 12(4):53-57.
Suchsland, 0. 1965. Swell i ng s t r e s ses and swell i ng defor-
mation in hardboard. Quar ter ly Bul le t in Michigan Agric. Expt. Sta. 47(4) :591-605.
Suddarth, S. K. 1973. Research needs in light-frame construc-
t i on . West Lafayette, IN: Purdue University, b!ood Res. Lab. Res. Bul. No. 903. 57 p.
MATERIAL FLOW
PRODUCT END - USE
CHARACTERISTICS
S INFORMATION FLOW
Figure 1.--Schematic representation of an INFORMATION LINKAGE SYSTEM.
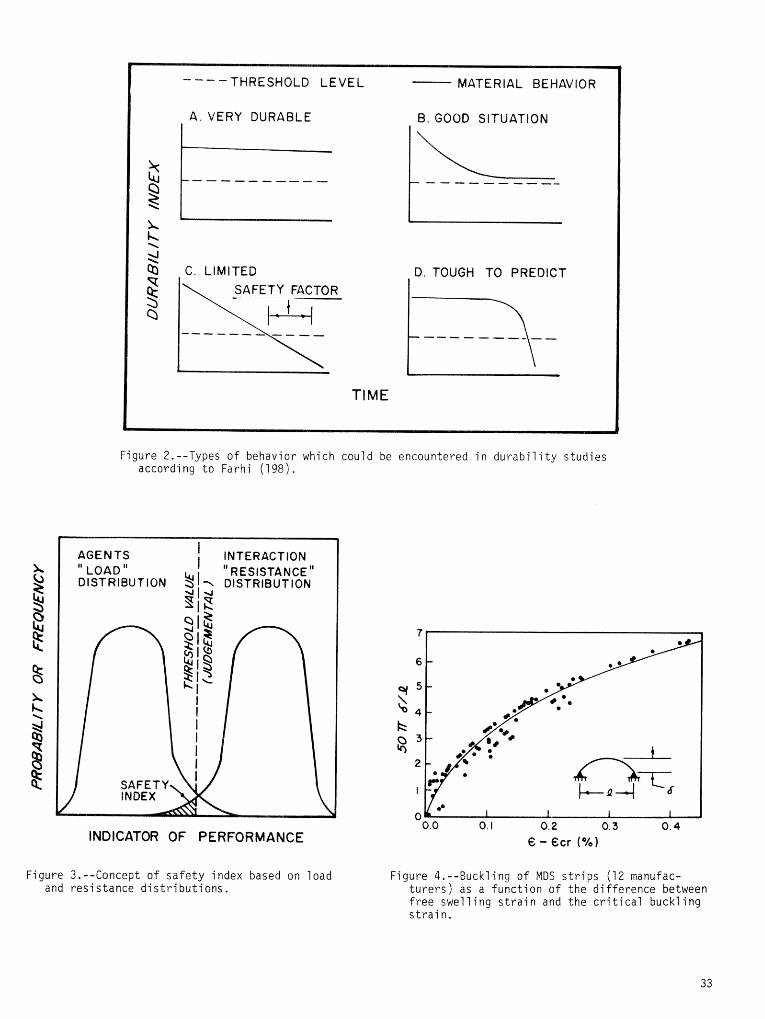
. VERY DURABLE . GO00 SITUATION
0. TOUGH TO PREDICT
TIME
Figure 2.--Types of behavior which could be encountered in durab i l i ty s tudies according t o Farhi (198).
AGENTS
INDICATOR OF PERFORMANCE
Figure 3.--Concept of sa fe ty index based on load and res is tance d i s t r ibu t ions .
Figure 4.--Buckling o f MDS s t r i p s (12 manufac- t u r e r s ) as a function of the difference between f r e e swelling s t r a i n and the c r i t i c a l buckling s t r a i n .
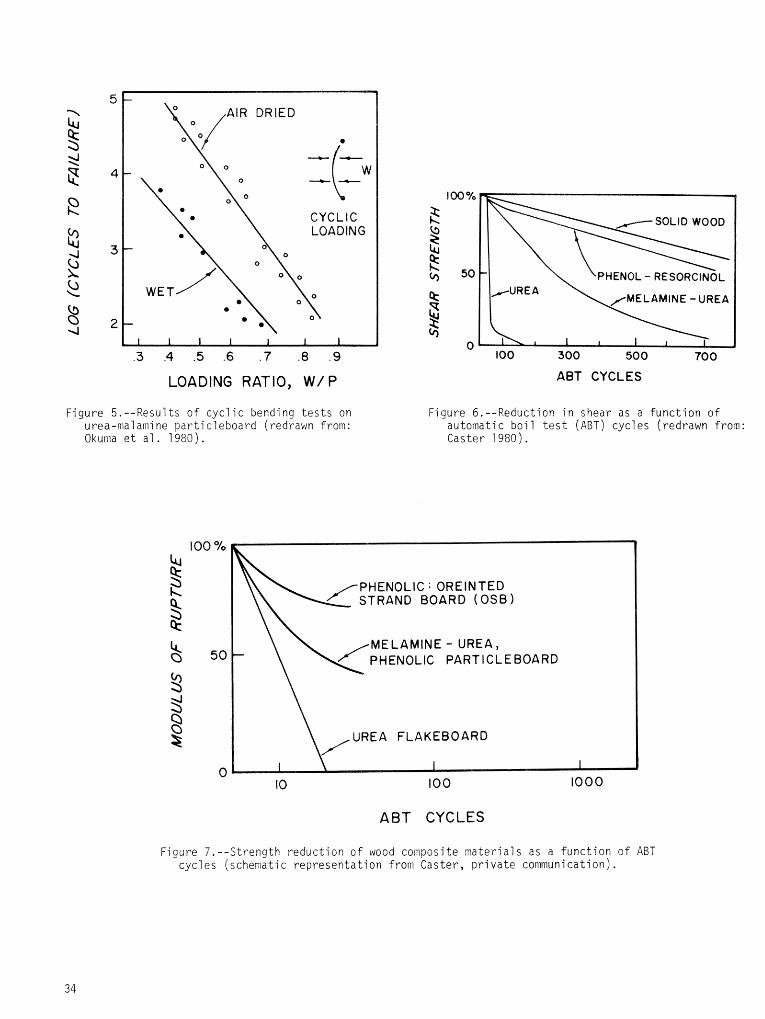
LOADING RATIO, W/P
Figure 5.--Results of c y c l i c bending t e s t s on urea-ma1 ami ne par t ic leboard (redrawn from: Okuma e t a1 . 1980).
ABT CYCLES
Figure 6.--Reduction i n shear as a f unc t i on of automatic boi l t e s t ( A B T ) cyc les (redrawn from: Cas te r 1980).
PHENOLIC : OREINTED STRAND BOARD ( O S B )
MELAMINE - UREA, PHENOLIC PARTICLEBOARD
UREA FLAKEBOARD
ABT CYCLES
Figure ? .--Strength reduc t ion of wood composite m a t e r i a l s a s a func t ion of ABT cyc l e s (schematic r ep r e sen t a t i on from Cas t e r , p r i v a t e communication).
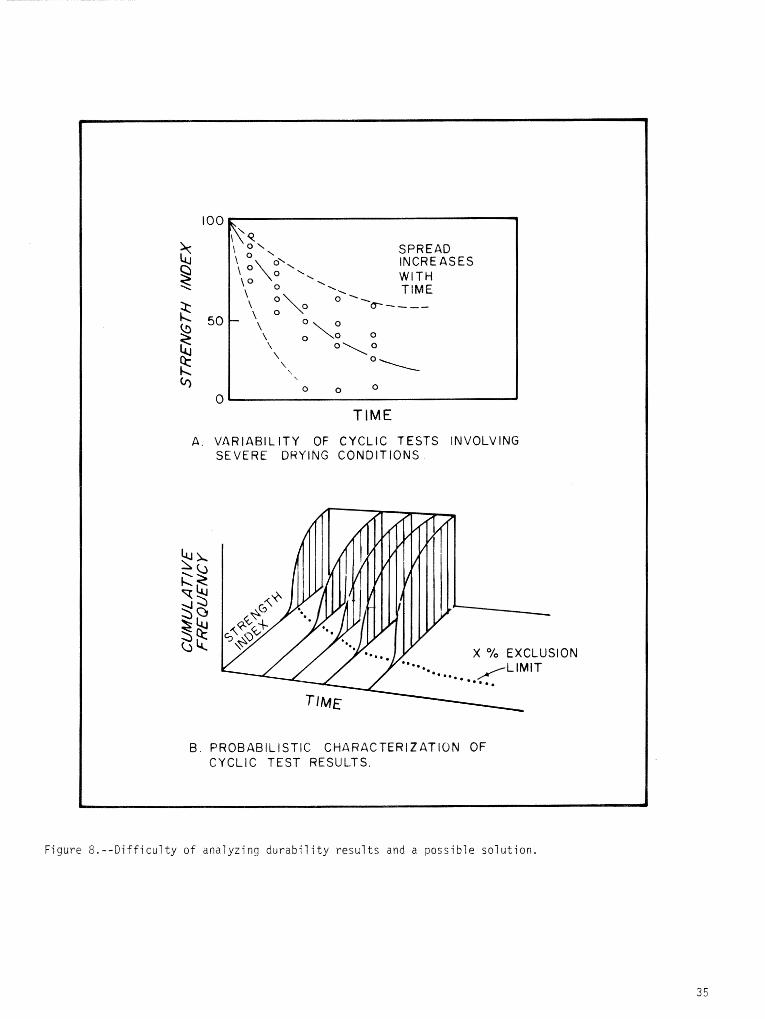
TIME
A. V A R I A B I L I T Y OF C Y C L I C TESTS INVOLVING SEVERE DRYING CONDITIONS.
B. P R O B A B I L I S T I C C H A R A C T E R I Z A T I O N OF CYCL IC T E S T RESULTS.
Figure 8.--Difficulty o f analyzing durability results and a possible solution.
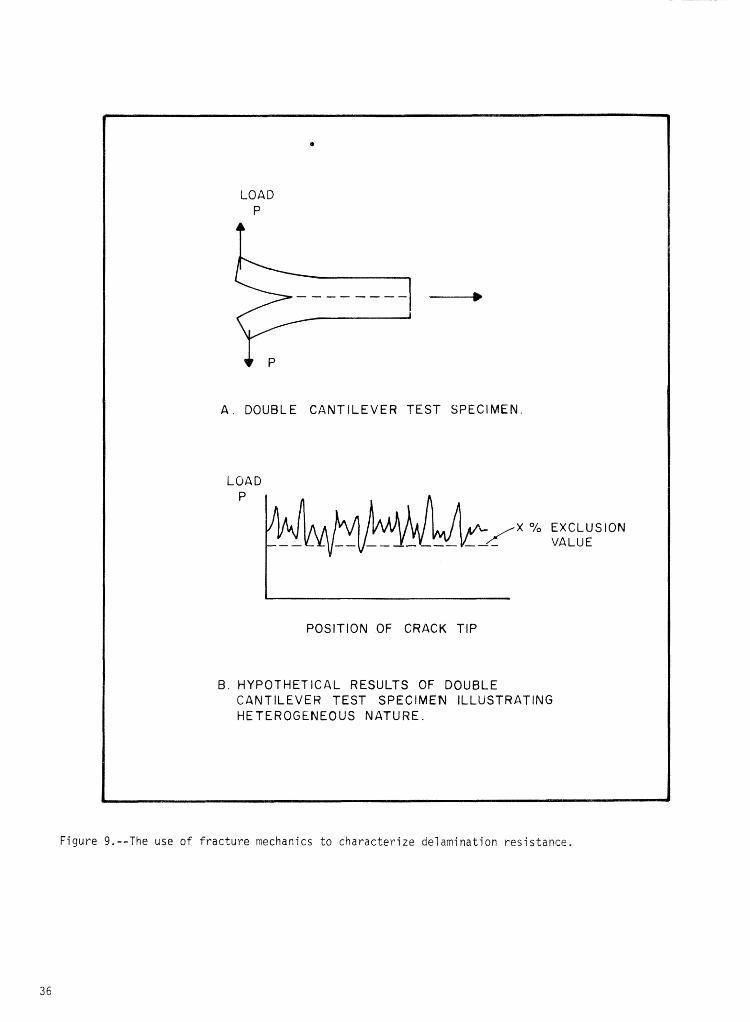
LOAD P
A . DOUBLE CANTILEVER TEST SPECIMEN.
LOAD
POSITION OF CRACK TIP
B. HYPOTHETICAL RESULTS OF DOUBLE CANTILEVER TEST SPECIMEN ILLUSTRATING HETEROGENEOUS NATURE.
figure 9.--The use of fracture mechanics t o characterize delamination resistance.
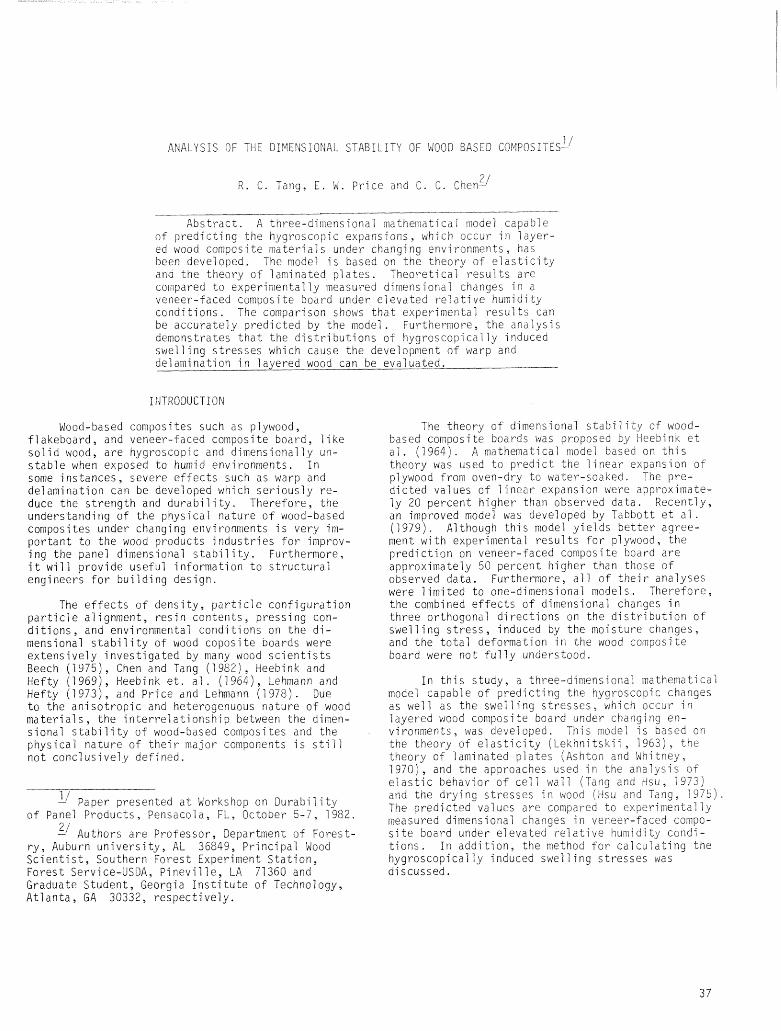
1 ' ANALYSIS OF THE Di$4ENSiOl lAI STABILITY OF WOOD BASED CGMPOSIIES-'
2 / R. C. Tang, E. W . Price a n d 6. C . Chen-
Abstract . A three-dimensional mathemalicai n;odel capable of predicting the hygroscopic expansions, which occur i n layer- ed wood composite materials under changing environments, has been developed. The model i s based on the theory of e l a s t i c i t y ana tne theory of laminated p la t e s . Theoretical r e s u l t s are corfipared to experimentally measured dimensional changes in a veneer-faced composite board under elevated r e l a t i v e kumidity condit ions. The comparison shows tha t experimental r e su l t s can be accurately predicted by the model. Furthermore, the analysis demonstrates t h a t the d i s t r ibu t ions of hyqroscopically induced swelling s t r e s ses which cause the development of warp and delamination in layered wood can be evaluated,
Wood-based composites such as plywood, flakeboard, and veneer-faced composite board, l ike so l id wood, a re hygroscopjc and dimensionally u n - s t a b l e when exposed to humid environments. In some ins tances , severe e f fec t s such as warp and delamination can be developed which serious1 y re- duce the s t rength and durab i i i ty . Therefore, the understanding of the physical nature of wood-based composites under changing environments i s very im- portant to the wood products indust r ies f o r improv- i ng the panel dimensional s t ab i 1 i t y . Furthermore, i t wil l provide useful information t o s t ruc tu ra l engineers f o r building design.
The e f f e c t s of densi ty , p a r t i c l e configuration p a r t i c l e alignment, resin contents, pressing con- d i t i o n s , and environmental conditions on the d i - mensional s t a b i l i t y of wood coposite ~ o a r d s were extensively investigated by many wood s c i e n t i s t s Beech ( 1 9 7 5 ) , Chen and Tang (59821, Heebink and Hefty ( 1 9691, Heebink e t . a ] . (19641, Lehmann and Hefty (1973), and Price and Lehmann ( 1 918). Due t o the anisot ropic and heterogenuous nature of wood materials , the in ter re la t ionship between the dimen- sional s t a b i l i t y of wood-based composites and the physical nature of t h e i r major components i s s t i l l not conclusively defdned.
/ Paper presented a t Workshop on Durabi i i t y o f Panel Products, Pensacola, F L , October 5-9, 1982.
2 " - Authors a r e Professor, Department of Forest- ry , Auburn univers i ty , AL 36849, Principal Wood S c i e n t i s t , Southern Forest Experiment S ta t ion , Forest Service-USDA, Pinevi l le , LA 71360 and Graduate Student, Georgia I n s t i t u t e of Technology, Atlanta, G A 30332, respectively.
The theory of dimensional s t a b i l i t y of wood- based composite boards was proposed by Heebink e t a l . (1964). A mathematical model based on t h i s theory was used to predic t the l inea r expansion of plywood from oven-dry to water-soaked. The pre- dicted values of l i nea r expansion were approxirnate- 7y 20 percent higher than observed data . Recently, an improved model was developed by Tabbott e t a1 . ( 1979). A1 though th i s model yi el ds be t t e r agree- ment with experimental r e s u l t s fo r plywood, the prediction on veneer-faced composite board are approximately 50 percent higher than those of observed data . Furthermore, a11 of t h e i r analyses were l imited to one-dimensional models. Therefore, the combined e f fec t s of dimensional changes in three orthogonal d i rec t ions on the d i s t r i bution of swelling s t r e s s , induced by the moisture changes, and the to t a l deformation in the wood composite board were not f u l l y understood.
In t h i s study, a three-dimensional mathematical model capable of predicting the hygroscopic changes as well as the swelling s t r e s s e s , which occur i n layered wood composite board under changing en- vironments, was developed. This model i s based on the theory of e l a s t i c i t y ( l ekhn i t sk i i , 1963j, t he theory of laminated pla tes (Ashton and Whi toey, i970j , and the approaches used i n the analysis o f e l a s t i c behavior of ce l l wail (Tang and Hsu, 1975) and the drying s t r e s ses i o wood [gsu a n d T a n g , 1975). The predicted values are compared t o experimentally measured dimensional changes in veneer-faced cornpo- s f t e board under elevated re7 a t i v e humidity condl - t i ons . in addi t ion , the method f o r ca lcula t ing the hygroscopically induced swelling s t r e s ses was discussed.
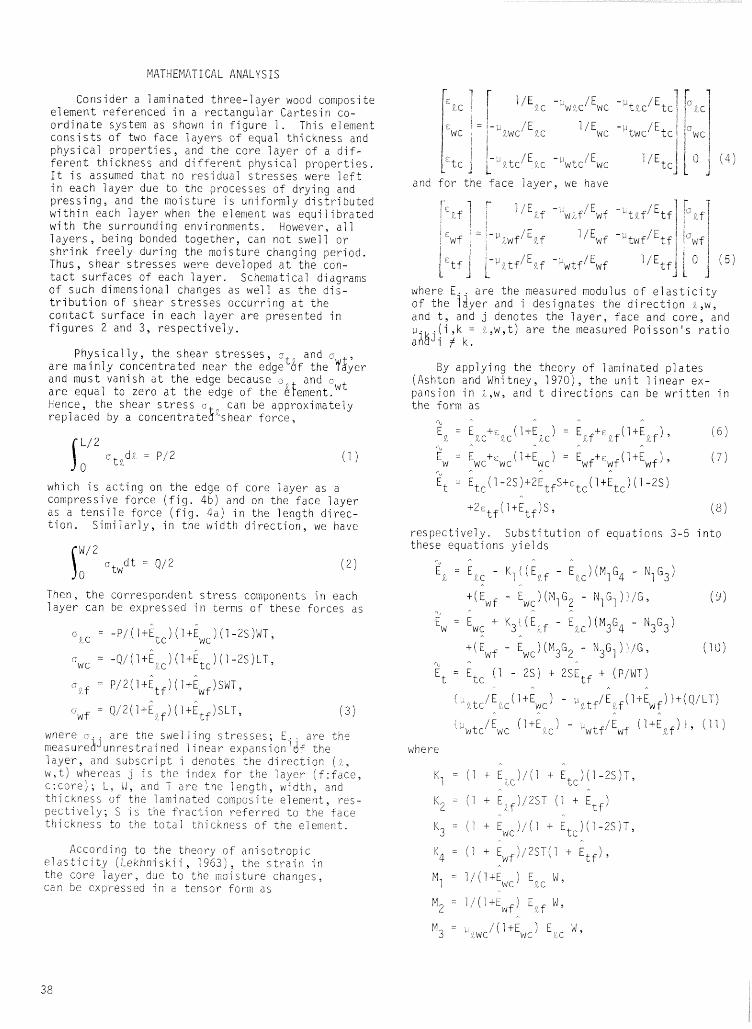
MATHEMATICAL ANALYSIS
Consider a laminated three-layer wood composite element referenced i n a rectangular Cartesin co- o rd ina te system as shown in f igure 1 . This element cons i s t s of two face 1 ayers of equal thickness and physical proper t ies , and tne core layer of a d i f - f e r e n t thickness and d i f f e r e n t physical properties . I t i s assumed tha t no residual s t r e s ses were l e f t in each layer due t o the processes of drying and pressing, and the moisture i s uniformly dis t r ibuted within each layer when the element was equi l ibra ted with the surrounding environments. However, a77 l a y e r s , being bonded together, can not swell o r shrink f r ee ly during the moisture cnanging period. Thus, shear s t r e s ses were developed a t the con- t a c t surfaces of each l aye r . Schematical diagrams of such dimensional changes as we1 I as the d is - t r i b u t i o n of shear s t r e s s e s occurring a t the contact surface in each layer a re presented in f i g u r e s 2 and 3, respectively.
Physically, the shear s t r e s s e s , a t ? and a , a r e mainly concentrated near the edge 6f the Ygyer and must vanish a t the edge because a and cwt a r e equal to zero a t the edge of the &tement. Hence, the shear s t r e s s CT can be approximately rep] aced by a concentrateb'vshear force ,
which i s acting on the edge of core layer as a compressive force ( f i g . 4b) and on the face layer as a t e n s i l e force ( f i g . 4 a j in the length d i rec- t i on . Simi lar ly , in the width d i r ec t ion , we have
Then, the correspondent s t r e s s components in each layer can be expressed in terms of these forces as
wnere 3.; are the swelling s t r e s ses ; E . . a re the nieasuredJunres t r a i ned I i near expansion3df the l aye r , and subscr ip t i denotes the d i rec t ion j ; , w , t ) whereas j i s the index f o r the layer ( f : face , c : c c r e ) ; L, \!, a n d T are tne l e n g t h , width, and thickness of tile laminated composite element, res- pect ively; S i s the f r ac t ion referred to the face thickness to the to t a l thickness o f tne element.
According to tne theory of anisotropic e l a s t i c i t y (Lekhniskii , 1963j, the s t r a i n in the core l aye r , due to the moisture changes, can be expressed in a tensor form as
and f o r the face l aye r , we have
where E. . a re the measured modulus of e l a s t i c i t y o f the layer and i designates the d i r ec t ion L , W , and t , and j denotes the l aye r , face and core , and
( i ,k = r,,w,t) a r e the measured Poisson's r a t i o aLiikji + k .
By applying the theory of laminated p la t e s (Ashton and Whi tney, 1970), the unit l i n e a r ex- pansion in i ,w, and t d i rec t ions can be wri t ten in the form as
i = E + ( i + E ) = Ewf+cwf(i+Ewf), w wc 'wc wc (7)
respect ively . Subst i tu t ion of equations 3-5 in to these equations y ie lds
where
K 7 = ( 1 t E. , c )/(I -L Etc)(l-ZS)T,
Ki = ( 1 + Ep , j / iST n I ( 1 + E ti1
S 3 = ii t Ew,)/(? t E t c ) ( l - i ~ j T ,
K4 = ( 1 + Ewf)/2ST(! i E t f ) ,
M 7 = l / j l+Ew,j E c c W ,
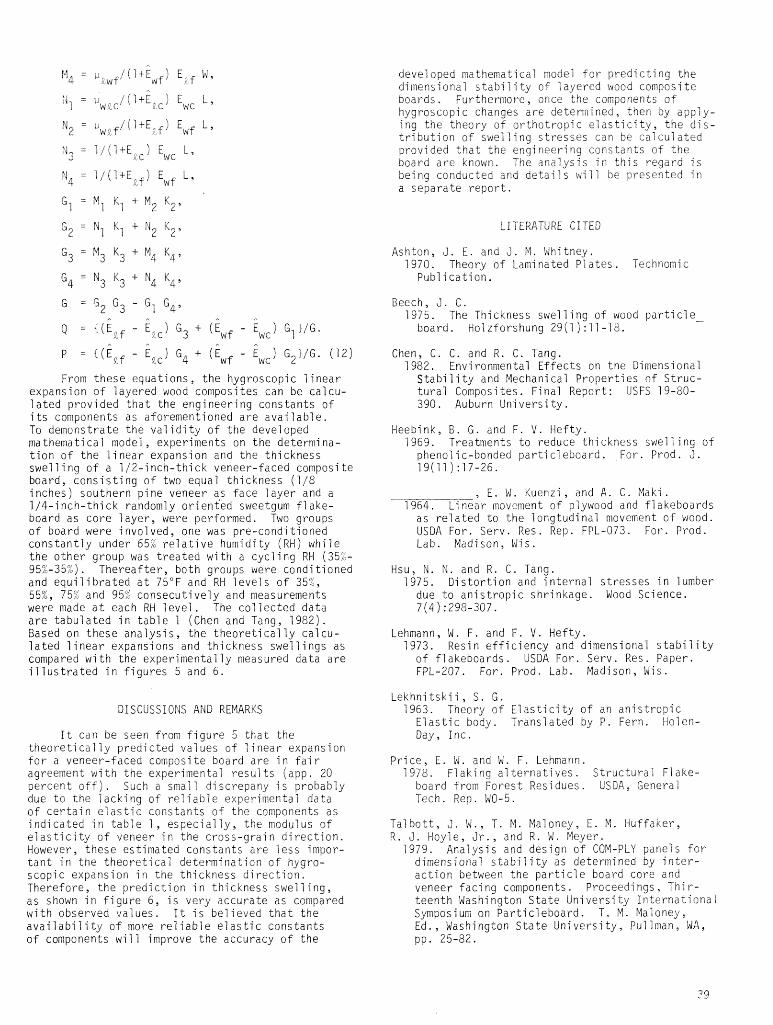
From these equations, the hygroscopic l inear expansion of layered wood composites can be calcu- la ted provided tha t the engineering constants of i t s components as aforementioned a re avai lable . To demonstrate the va l id i ty of the developed ma themati cal model , experiments on the determi na- t ion of the l i n e a r expansion and the thickness swelling of a 1/2-inch-thick veneer-faced composite board, consis t ing of two equal thickness ( l / E inches) southern pine veneer as face layer and a 1/4-inch-thick randomly oriented sweetgum f lake- board as core layer , were performed. Two groups of board were involved, one was pre-conditioned constantly under 65% r e l a t i v e humidity ( R H ) while the other group was t rea ted with a cycling RH (35% 95%-35%). Thereafter , both groups were conditioned and equi l ibra ted a t 75°F and RH levels of 35%, 55%, 75% and 95% consecutively and measurements were made a t each RH level . The collected data a r e tabulated in table 1 (Chen and Tang, 1982). Based on these analys is , the theore t i ca l ly calcu- la ted l i n e a r expansions and thickness swellings as compared with the experimentally measured data a re i l l u s t r a t e d in f igures 5 and 6 .
DISCUSSIONS A N D REMARKS
I t can be seen from f igure 5 tha t the theore t i cal I y predi cted va1 ues of 1 i near expansion f o r a veneer-faced composite board are in f a i r agreement with the experimental r e su l t s (app. 20 percent o f f ) . Such a sma7 7 di screpany i s probably due t o the lacking of r e l i a b l e experimental data of ce r t a in e l a s t i c constants of the components as indicated in t ab le 1 , especial i y , the modul us of e l a s t i c i t y of veneer in the cross-grai n d i r ec t ion . However, these estimated constants are l e s s impor- t a n t in the theore t ica l determination of hygro- scopic expansion in the thickness d i r ec t ion . Therefore, the prediction in thickness swell ing, as shown in f igu re 6 , i s very accurate as compared with observed values. I t i s believed t h a t the a v a i l a b i l i t y of more r e l i a b l e e l a s t i c constants of components will improve the accuracy of the
developed mathematical model fo r predicting the dimensional s tabi 1 i ty of 1 ayered wood compos i t e boards. Furthermore, once the components of hygroscopic changes a r e determined , then by app ly- ing the theory of orthotropic e l a s t i c i t y , the d i s - t r ibut ion of swelling s t r e s ses can be calculated provided t h a t the engineering constants of the board a re k n o w n . The analysis i n t h i s regard i s being conducted and d e t a i l s wil? be presented i n a separate repor t .
LITERATURE CITED
Ashton, J . E . and 3 . M . Whitney. 1970. Theory of Laminated Pla tes . Technomic
Publication.
Beech, 3. C. 1975. The Thickness swelling of wood par t ic le-
board. Holzforshung 29(1):11-18.
Chen, C . C. and R . C . Tang. 1982. Environmental Effects on the Dimensional
Stabi 1 i ty and Mechani cal Properties of Struc- tura l Composites. Final Report: USFS 19-80- 390. Auburn Universi ty .
Heebink, B . G . and F . V . Hefty, 1 969. Treatments to reduce thi ckness swell i ng of
phenol i c-bonded par t i cl eboard . For. Prod. J . 19(11):17-26.
, E . W . Kuenzi , and A . C. Maki . 1964. Linear ~novcment of plywood and f1 akeboards
as re la ted to the longtudinal movement of wood. USDA For. Serv. Res. Rep. FPL-073. For. Prod. Lab. Madison, Wis.
Hsu, N . N . and R . C. Tang. 1975. Distort ion and in ternal s t r e s ses in lumber
due to anis t ropic shrinkage. Wood Science. 7(4) : 295-307.
Lehmann, W . F. and F . V . Hefty. 1973. Resin ef f ic iency and dimensional s t ab i 1 i t y
of flakeboards. USDA For. Serv. Res. Paper. FPL-207. For. Prod. Lab. Madison, Wis.
Lekhnitskii , S. G . 1963. Theory of E las t i c i ty of an anis t ropic
E las t i c body. Translated by P. Fern. Holen- Day, Inc.
Pr ice , E . W . and W . F . Lehmann. 1978. Flaking a1 t e rna t ives . Structural Flake-
board from Forest Residues. USDA, General Tech. Rep. WO-5.
Talbot t , J . M . , T . M . Maloney, E . M . Huffaker, R . J . Moyle, J r . , and R. W . Meyer.
7979. Analysis and design of COM-PLY panels f o r dimensional s tabi l i tg , as determined by i n t e r - action between the p a r t i c l e board core and veneer facing components. Proceedings, Thir- teenth Washington S ta t e University International Symposiu~ on Part icleboard. T . M. Maloney, Ed., Washington S t a t e Universi ty, Pullman, MA, pp. 25-82.
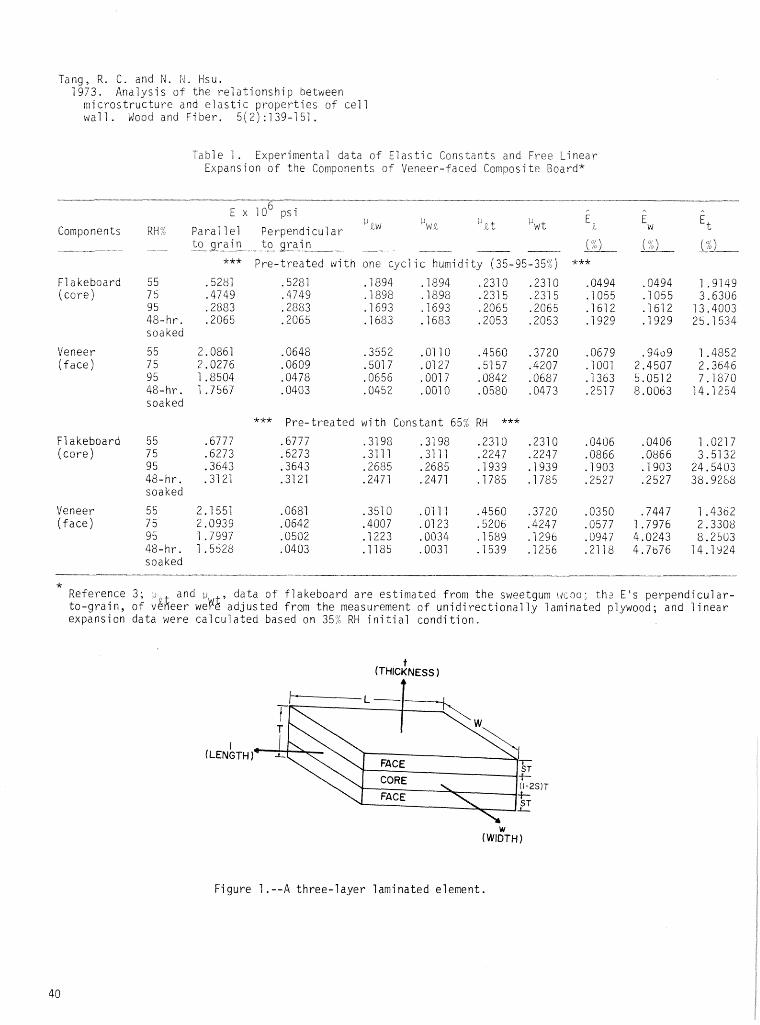
Tang, R . 6. andN. i 4 . Hsu. 7973. Analysis of the relationship between
microstructure and e las t ic properties of c e l l wal l . Wood and Fiber. 5 ( 2 ) :I 39-1 51.
Table 1 . Experimental data o f Eiastic Constants and Free Linear Expansion o f the Components of Veneer-faced Composite Board*
Components
F l akeboard (core)
Veneer ( face)
F'l akeboard (core)
Veneer ( face)
S E x 10 psi
LJ~ I
p%f, iJ
RH? Para1 1 el Perpendicular : t + w t
t o grain t o grain - - - -- *** Pre-treated with one cyc l i c humidity (35-95-35:<)
5 5 .5281 .5281 .I894 .I894 .2310 .2310 75 -47 49 .4749 . I898 . I898 .2315 .2315 95 ,2883 .2583 . I693 -1693 .2065 .2065 48-hr. .2065 .2065 . I683 -1683 .2053 .2053 soaked
55 2.0861 .0648 ,3552 .0110 .4560 -3720 7 5 2.0276 .&I609 .5017 .0127 ,5157 .4207 9 5 1.8504 .0478 .0656 -0017 .0842 .0687 48-hr. 7 ,7567 .0403 ,0452 .&I010 .0580 .0473 soaked
*** Pre-treated with Constant 65% RH *** 55 .6777 ,6777 .3198 ,3198 .23lO .2310 7 5 .6273 .6273 .3111 -31 7 1 .2247 .2247 95 -3643 .3643 ,2685 .2685 .I939 -1939 48-hr. .3121 .3121 .2471 .2471 '1785 . I785 soaked
55 2.1 557 ,0681 .3570 .Oi 11 .4560 .3720 75 2.0939 .0642 ,4007 .0123 .5206 .4247 9 5 1.7997 .OW2 .I223 .0034 .I589 .129d 48-hr. i .5528 .0403 .I185 .0031 .I539 .I256 soaked
* Reference 3; r-l and ii , data of flakeboard are estimated from the stveetgum i ic-7a; thz E ' s perpendicular- to-grain, of v&heer weP& adjusted from the measurement of unidirectional l y laminated plywood; and 1 inear expansion data were calculated based on 357 RH i n i t i a l condition.
I (LENGTH
t (THICKNESS 1
SIT
W f WIDTH f
Figure 7 . - - A three-layer laminated element.
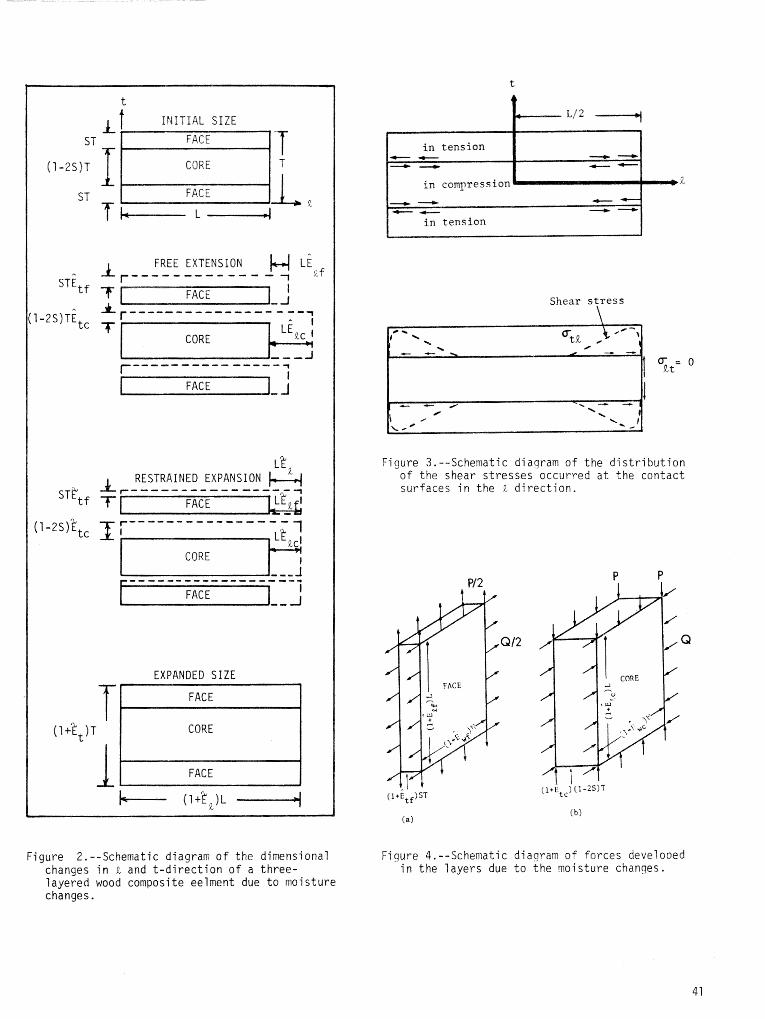
f INITIAL SIZE
FREE EXTENSION r'""-"""-"--- -
Lt e 1 RESTRAINED EXPANSION
ST% f
I EXPANDED SIZE 1
Figure 2.--Schematic diagram of the dimensional changes in .t and t-direction of a three- layered wood composite eelment due to moisture changes.
I i n compression R
Shear stress \
Figure 3.--Schematic diaqram of the distribution of the shear stresses occurred at the contact surfaces in the a direction.
Figure 4.--Schematic diaqram of forces develooed in the layers due to the moisture changes.
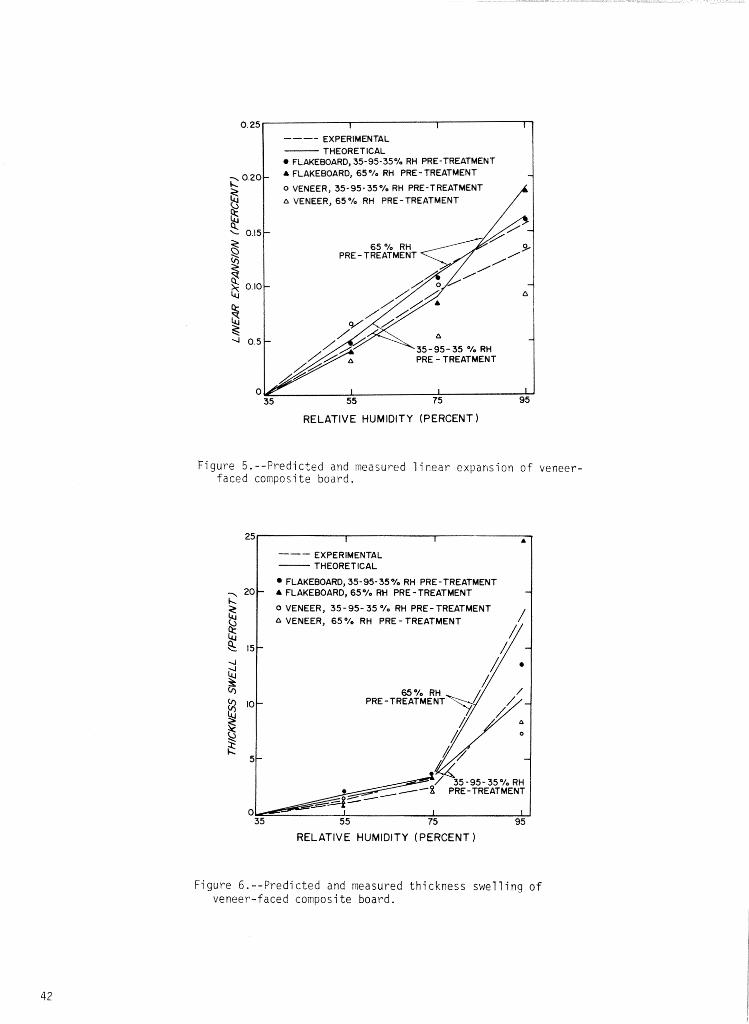
---- EXPERIMENTAL THEORETICAL
FLAKEBOARD, 35-95-35 % RH PRE -TREATMENT - A FLAKEBOARD, 65 O/O RH PRE - TREATMENT
0 VENEER, 35-95- 35 % RH PRE-TREATMENT
8 B VENEER, 65OA RH PRE-TREATMENT
5 '- 015 2 8 PRE - TREATMENT
!$ 010
$ h 4 0 5
35 - 95 - 35 % RH PRE - TREATMENT
0 35 55 75 95
RELATIVE HUMIDITY (PERCENT
Figure 5.--Predicted and measured licear expansion of veneer- faced composite board.
I I A
--- EXPERIMENTAL THEORETICAL
FLAKEBOARD, 35-95- 35 % RH PRE - TREATMENT - FLAKEBOARD, 65 '10 RH PRE -TREATMENT
0 VENEER, 35- 95- 35 % RH PRE - TREATMENT A VENEER, 65 % RH PRE - TREATMENT
PRE - TREATMENT
-95-35'/0 RH -TREATMENT
RELATIVE HUMIDITY (PERCENT
Figure 6.--Predicted and measured thickness swelling o f veneer-faced composite board.
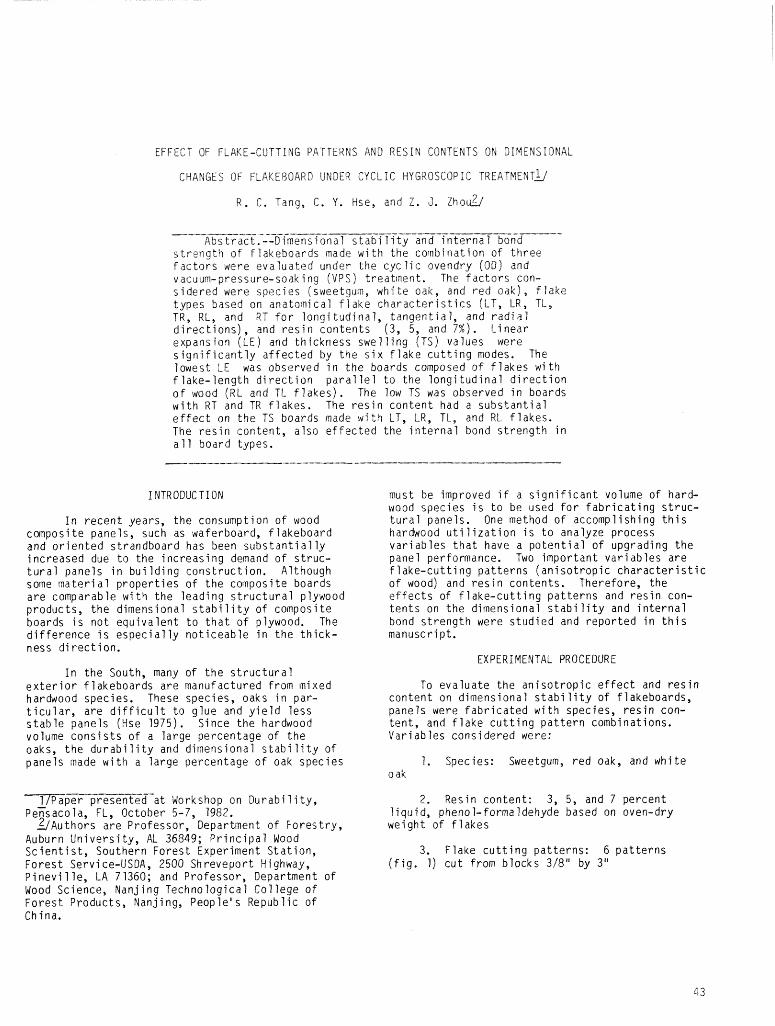
EFFECT OF FLAKE-CUTTING PATTERNS AND R E S I N CONTENTS ON D I M E N S I O N A L
CHANGES OF FLAKEBOARD UNDER CYCLIC HYGROSCOPIC TREATMENT^
R . C. Tang, C. Y. Hse, and Z. J. ~ h o &
--- - _ _ _ - - --- - --- -___- - --_ - -_ - Abst ract . - -Dimensional s t a b i l i t y and i n t e r n a l bond
s t r e n g t h of f l akeboards made w i t h t h e c o ~ b i n a t i o n o f t h r e e f a c t o r s Here e v a l u a t e d under t h e c y c l i c ovendry (00) and vacuum-pressure-soak i n g (VPS) t reat inent . The f a c t o r s con- s i d e r e d were spec ies (sweetgum, w h i t e oak, and r e d oak), f l a k e t y p e s based on anatorr l ical f l a k e c h a r a c t e r i s t i c s (LT, LR, TL, TR, RL, and RT f o r l o n g i t u d i n a l , t a n g e n t i a l , and r a d i a l d i r e c t i o n s ) , and r e s i n c o n t e n t s (3, 5, and 7%). L i n e a r expans i o l (LE) and t h i c k n e s s swel l i n g (TS) va lues were s i g n i f i c a n t l y a f f e c t e d by t h e s i x f l a k e c u t t i n g modes. The lowes t tE was observed i n t h e boards composed o f f l a k e s w i t h f l a k e - l e n g t h d i r e c t i o n pa ra1 l e l t o t h e l o n g i t u d i n a l d i r e c t i o n o f wood (RL and TL f l a k e s ) . The low TS was observed i n boards w i t h RT and TR f l a k e s . The r e s i n c o n t e n t had a s u b s t a n t i a l e f f e c t on t h e TS boards made w i t 9 LT, LR, TL, and RL f l a k e s . The r e s i n con ten t , a l s o e f f e c t e d t h e i n t e r n a l bond s t r e n g t h i n a l l board types.
INTRODUCTION
I n r e c e n t years, t h e consumption o f wood composi te panels , such as waferboard, f l a k e b o a r d and o r i e n t e d s t randboard has been s u b s t a n t i a l l y i n c r e a s e d due t o t h e i n c r e a s i n g demand o f s t r u c - t u r a l pane ls i n b u i l d i n g c o n s t r u c t i o n . A l though some m a t e r i a1 p r o p e r t i e s o f t h e coinposi t e boards a r e comparable w i t h t h e l e a d i n g s t r u c t u r a l plywood p roduc ts , t h e d imensional s t a b i l i t y o f composi te boards i s n o t e q u i v a l e n t t o t h a t o f plywood. The d i f f e r e n c e i s e s p e c i a l l y n o t i c e a b l e i n t h e t h i c k - ness d i r e c t ion.
I n t h e South, many o f t h e s t r u c t u r a l e x t e r i o r f l akeboards a r e manufactured f rom mixed hardwood spec ies. These spec ies, oaks i n par- t i c u l a r , a r e d i f f i c u l t t o g l u e and y i e l d l e s s s t a b l e panels (Hse 1975). S ince t h e hardwood volume c o n s i s t s o f a l a r g e percentage o f t h e oaks, t h e d u r a b i l i t y and d i rnens ional s t a b i l i t y o f pane ls made w i t h a l a r g e percentage o f oak spec ies
must be improved i f a s i g n i f i c a n t volume of hard- wood spec ies i s t o be used f o r f a b r i c a t i n g s t r u c - t u r a l panels . One method of accompl ish ing t h i s hardwood u t i l i z a t i o n i s t o analyze process v a r i a b l e s t h a t have a p o t e n t i a l o f upgrading t h e panel performance. Two i m p o r t a n t v a r i a b l e s a r e f l a k e - c u t t i n g p a t t e r n s ( a n i s o t r o p i c c h a r a c t e r i s t i c o f viood) and r e s i n con ten ts . Therefore, t h e e f f e c t s o f f l a k e - c u t t i n g p a t t e r n s and r e s i n con- t e n t s on t h e d imensional s t a b i l i t y and i n t e r n a l bond s t r e n g t h were s t u d i e d and r e p o r t e d i n t h i s manuscr ip t .
EXPERIMENTAL PROCEDURE
To e v a l u a t e t h e a n i s o t r o p i c e f f e c t and r e s i n c o n t e n t on d imensional s t a b i l i t y o f f lakeboards, panels were f a b r i c a t e d w i t h species, r e s i n con- t e n t , and f l a k e c u t t i n g p a t t e r n combinat ions. V a r i a b l e s cons ide red were:
1 . Species: Sweetgum, r e d oak, and w h i t e oak
1fPaper p resen ted a t Workshop on D u r a b i l i t y , 2, Res in con ten t : 3, 5, and 7 pe rcen t ~ e ~ s a c o l a , FL, October 5-7, 1982. l i q u i d , phenol-formaldehyde based on oven-dry
a ~ u t h o r s a r e Professor , Department o f F o r e s t r y , we igh t of f l a k e s Auburn U n i v e r s i t y , At 36849; P r i n c i p a l Mood S c i e n t i s t , Southern F o r e s t Experiment S t a t i o n , 3. F lake c u t t i n g p a t t e r n s : 6 p a t t e r n s F o r e s t Service-USDA, 2500 Shrevepor t Highway, ( f i g . 1) c u t from b l o c k s 3 1 8 ' 3 ~ 3" P i n e v i l l e , LA 71360; and Pro fessor , Department o f Wood Science, N a n j i n g Techno log ica l C o l l e g e of F o r e s t Products , N a n j i ng, Peop le ' s Repub 1 i c o f China.
02 Flake Pat te f i ~i dt-F6T~h i ckness )
Tangent i a 1 ( T ) L f ( R ) R a d i a l (R) LR i f )
L o n g i t i d i n a l ( L ) R a d i a l 7% o-) T a n g e n t i a l RT fi) Longi t u d i n a l Rk ( T )
Each cornbinat ion of these v a r i a b l e s were r e p l i c a t e d 8 t imes r e q u i r i n g a t o t a l o f 324 p a n e l s t o be F a b r i c a t e d ( i . e . , 3 spec ies x 3 r e s i n con ten ts x 6 f l a k e c u t t i n g p a t t e r n s x 6 p a n e l r e p l i c a t i o n s ) . The f l a k e s , c u t on a 1 a b o r a t o r y d i s k f f aker, were approx imate ly 3 i n c h e s long, 0 -02- inch t h i c k , and 3 /8 - inch wide and d r i e d t o 3 p e r c e n t m o i s t u r e c o n t e n t b e f o r e adhes ive was a p p l i e d .
Pane l f a b r i c a t i o n c o n d i t i o n s were:
Pane l s i z e : 112" x 18" x 22" Pane l d e n s i t y : Sweetgum panels - 40 p c f , and oak p a n e l s - 45 pcf H o t p r e s s temperature: 3400F P r e s s t ime: 6 minutes ( 1-1/2 min. t o s t o p p l u s 4-112 min, c losed.
A l though t h e panels were r e p l i c a t e d 8 t imes , o n l y s i x boards were used t o o b t a i n t h e r e s u l t s r e p o r t e d i n t h e manuscr ip t . The s i x boards, randomly se lected, were tr immed t o a p p r o x i m a t e l y 16 x 20 inches, then i n t o 2 p ieces 2 by 16 inches, and 1 p i e c e 16 x 16 inches, Each 2- by 16-inch specimen was then f u r t h e r c u t t o y i e l d two 2- by 2 - inch samples f o r t e s t i n g o f t e n s i l e s t r e n g t h p e r p e n d i c u l a r t o t h e f a c e ( i n t e r n a l bond (IB)) and one 2- by 12-inch sample f o r t h e ineasurement o f d imensional s t a b i l i t y . T h i s procedure r e s u l t e d i n 24 I B and 12 dimen- s i o n a l s t a b i l i t y samples p e r v a r i a b l e com- b i n a t i o n ,
The I8 values were o b t a i n e d f rom specimens a t approx imate ly 6% m o i s t u r e c o n t e n t whi l e dimen- s i o n a l s t a b i l i t y va lues were o b t a i n e d a f t e r one cyc l e o f an ovendry-vacuum-pressure-soaki ng t r e a t m e n t (OD-VPS), The OD-VPS t rea t fnen t i n v o l v e d ( 1 ) d r y i n g a t 2120F f o r 72 hours, ( 2 ) soak ing i n water f o r 16 hours, (3 ) vacuum i n 25- inches of mercury f o r one hour and t h e n p laced under 75 p s i p ressure (submerged under wa te r a t room temperature) f o r 2 hours, and ( 4 ) con t inuous wa te rsoak i ng f o r 12 hours wi t h o u t pressure. L i n e a r expansion (LE) and t h i c k n e s s swe 1 l i n g (TSf , measured w i t h a spec i a1 l y des igned dev ice ( f i g . 2), were c a l c u l a t e d based on t h e change o f d imensions f rom OD c o n d i t i o n t o t h e end o f t h e OD-VPS cyc 1e.
RESULTS AND DISCUSSIONS
Average o f LE, TS, and IB o f t h e t e s t e d specimens a r e summarized i n t a b l e 1,
L i n e a r ex pans^ (LE): The average LE ranges ------ p e r t h r e e spec ies are:
Sweetgum: 0.08 t o 7.53 p e r c e n t Red oak: 3.18 t o 4.5 1 percen t White oak: 3.32 t o 5.83 p e r c e n t
The e f f e c t of f l a k e c u t t i n g p a t t e r n s on t h e LE i s p l o t t e d i n f i g u r e 3. As expected, t h e boards composed o f RT f l a k e s c o n s i s t e n t l y r e s u l t e d i n t h e h i g h e s t t E and f o l l o w e d i n a dec reas ing o r d e r o f TR, IT-LR, and T t - R t F l a k e s & i t 4 t h e e x c e p t i o n o f TR f l a k e s of sweetgum. The LT-LR and TL-RL f l a k e s @ere grouped t o g e t h e r because t h e r e was no s i g n f i c a n t d i f f e r e n c e i n t E between these two f l a k e c u t t i n g p a t t e r n s , respec- t i v e l y . The L E changes f o r these f l akeboards c l o s e l y p a r a l l e l t h e uneven d imensional changes f o r wood a long t h e t h r e e o r thogona l s t r u c t u r a l d i r e c t i o n s ( F P L 1960, 1972). As e v i d e n t i n F i g u r e 3, t h e low LE i s assoc ia ted w i t h f l a k e s h a v i n g f l a k e l e n g t h d i r e c t i o n p a r a l l e l t o t h e i o n g i t u d i n a l d i r e c t i o n of wood, t h e medium LE i s a s s o c i a t e d w i t h f l a k e s hav ing t h e i r f l a k e w i d t h d i r e c t i o n p a r a l l e l t o t h e l o n g i t u d i n a l d i r e c t i o n .
I n general, as t h e r e s i n c o n t e n t i n c r e a s e d t h e LE decreased ( f i g . 4 ) . T h i s r e l a t i o n s h i p was t r u e f o r panels f a b r i c a t e d w i t h RT, TR, LT, and LR f l a k e s f o r a l l spec ies. The excep t ions were a t the h i g h e r r e s i n con ten t , 5 t o 7 p e r c e n t , f o r RT f l a k e s o f r e d oak and LT f l a k e s o f sweetgum. For TL and R L f l a k e s , LE was n o t a f f e c t e d by t h e r e s i n con ten t .
Th ickness s w e E (TS): The average TS ranged f rom 6% t o 76%. For i n d i v i d u a l species, t h e TS averages are:
Sweetgum: 9.1 t o 47.8 pe rcen t Red oak: 6.0 t o 49.1 p e r c e n t Whi te oak: 9.7 t o 75.5 pe rcen t
I n f i g u r e 5, t h e e f f e c t s o f f l a k e t y p e on TS a re presented. The s u b s t a n t i a l l y lower TS shown i n panels made o f RT and TR f l a k e s were due t o t h e f a c t t h a t t h e f l a k e t h i c k n e s s i s p a r a l l e l t o the l o n g i t u d i n a l d i r e c t i o n o f wood. However, when t h e f l a k e t h i c k n e s s d i r e c t i o n was i n t h e r a d i a l wood d i r e c t i o n (LT and TL), a l a r g e TS d i f f e r e n c e was o b t a i n e d between the two f l a k e types. The p o s s i b l e e x p l a n a t i o n f o r t h e r e s u l t may be t h a t t h e LT f l a k e s have a tendency t o warp more than TL f l a k e s due t o t h e ana tomica l s t r u c t u r e .
As was exper ienced w i t h LEY as t h e r e s i n con- t e n t i nc reased t h e TS decreased ( f i g . 61, How- ever a much l a r g e r TS decrease o c c u r r e d as r e s i n c o n t e n t i nc reased from 3 t o 5 p e r c e n t as compared t o r e s i n c o n t e n t i nc reased f rom 5 t o 7 pe rcen t .
Comparing species, w h i t e oak f l a k e s con- s i s t e n t l y r e s u l t e d i n t h e g r e a t e s t TS f o l l o w e d by sweetgum and then r e d oak a t t h e 3 and 5% r e s i n c o n t e n t ( f i g , 7 ) . For t h e 7% r e s i n con ten t , sweetgum o f t e n had t h e h i g h e s t TS and r e d oak t h e leas t , Therefore, f o r t h i s s t u d y a r e d oak pane l always y i e l d e d the s m a l l e s t amount o f TS.
I n t e r n a l bond s t r e n g t c (18 ) : Ranges o f average I B f o r t h e T h r e e spec ies are:
Sweetgum: 46 t o 288 p s i Red oak: 37 t o 217 p s i Wh i te oak: 13 t o 68 p s i
The e f f e c t s o f r e s i n c o n t e n t on I 9 a r e shown i n f i g d r e 8. As expected, t h e 13 inc reased as t h e r e s i n c o n t e n t increased. However, t h e I R f o r w h i t e oak a t 7 p e r c e n t r e s i n c o n t e n t was l e s s than t h e IB o f r e d oak o r sweetgum a t 3 p e r c e n t r e s i n con ten t , The ex t rz ine ly low IB f o r most w h i t e oak f lakeboards was p a r t l y due t o t h e i r low pane l den- s i t y . As g i v e n i n t a b l e 1, t h e panel d e n s i t y o f ~ h i t e oak f l a k e b o a r d s ranged f rom 38.7 t o 49.6 p c f . The average panel dens i t y , 44.9 p c f , i s much l e s s than 48.1 p c f minirncln w h i t e oak pane l d e n s i t y f o r 70 p s i i n I B as d e t e r ~ i n e d i n a p r e v i o u s s tudy (Hse 1915).
I n f i g u r e 9, t h e e f f e c t s o f f l a k e t y p e on I B a r e presented. S u r p r i s i n g l y , t h e boards made o f RT and TR f l a k e s o f sweetgum and r e d oak showed v e r y h i g h I B i n comparison w i t h o t h e r t ype f l a k e s . The r e s u l t s i n d i c a t e t h a t t h e boards w i t h a h i g h LE o r low TS may have a h i g h I B and f u r t h e r exaqi - n a t i o n s u s i n g Scanning E l e c t r o n Microscopy t o i d e n t i f y t h i s phenomenon a r e underway.
SUMMARY
1. The low LE occur red i n t h e f lakeboards h a v i n g f l a k e l e n g t h p a r a l l e l t o t h e l o n g i t u d i n a l d i r e c -
t i o n o f wood, t h e medium LE developed i n these w i t h F lakes hav ing f l a k e w i d t h a l i g n e d w i t h t h e l o n g i t i 4 d i n a l d i r e c t i o n o f wood and t i l e h i g h LE recorded i n t i e s e w i t h f l a k e s hav ing f l a k e t h i c k - ness c o i n c i d e d w i t h t h e l o n g i t ~ d i n a l d i r e c t i o n o f wood.
2. LE decredsed as r e s i n c o n t e n t i nc reased b u t the e f f e c t i v e n e s s o f h i g h r e s i n c o n t e n t was n o t pronounced i n t h e boards w i t 4 TL and R t f l a k e s .
3. High TS was observed f o r boards w i t 9 f l a k e s h a v i n g t h e i r t h i c k n e s s d i r e c t i o n i n e i t h e r r a d i a l o r t a n g e n t i a l d i r e c t i o n o f wood w h i l e t h e low TS o c c r ~ r r e d o n l y on these w i t h f l a k e s hav ing t h i c k n e s s d i r e c t i o n p a r a l l e l t o t h e l o n g i t ~ d i- n a l d i r e c t i o n o f wood.
4. I n c r e a s i n g t h e r e s i n c o n t e n t s u b s t a n t i a l l y decreased t h e TS i n a l l t ypes o f specimens.
LITERATURE CITED
F o r e s t P roduc ts L a b o r a t o r y 1960. L o n g i t u d i n a l sh r inkage of wood. U.S.
Dep. Agr i c . For, Serv. Rep. No. 1093. 10 p. F o r e s t Products L a b o r a t o r y
1974. Wood handbook: Wood as an e n g i n e e r i n g m a t e r i a l . LI.S, Dep. Agr i c , For, Serv. Agr i c . Handbook 72, rev .
Hse, [ . - Y e 1975. P r o p e r t i e s o f f lakeboards f rom hardwoods
growing on sou thern p i n e s i t e s . For. Prod. J. 25(3) :48-53.
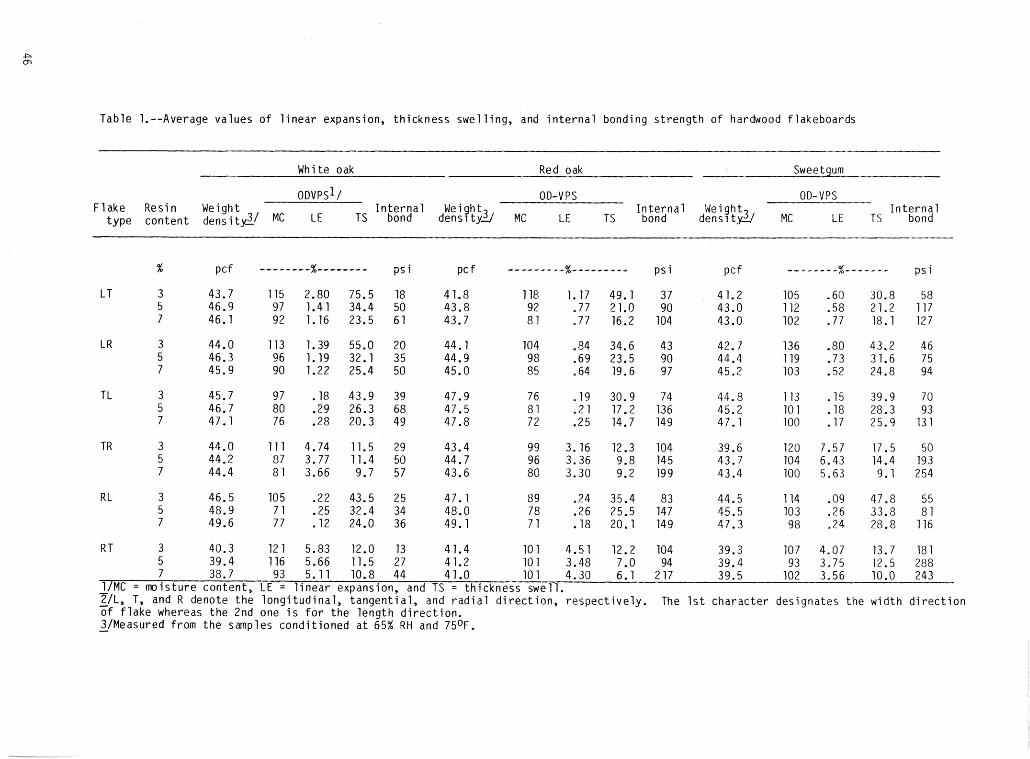
Table 1.--Average values o f l i n e a r expansion, th ickness swe l l ing , and i n t e r n a l bonding s t reng th o f hardwood f lakeboards
White oak Red oak P --- Sweet gum ------
O D V P S ~ / OD-VPS OD- v PS 7 --
Flake Resin Weight I n t e r n a l Weight3 I n t e r n a l Weight3 I n t e r n a l t ype content density?/ MC LE TS bond dens1 t d MC L E TS bond dens1 t d MC LE I S bond
% pcf - - - - - - - -%- - - - - - - - p s i pcf --------- % .--...------ p s i pcf -------..x------- p s i
7 38.7 93 5.11 10.8 44 4 1 .O 101 4.30 6.1 217 39.5 102 3,56 10.0 243 1/MC = mo is tu re content , LE = l i n e a r expansion, and TS = th ickness swel l . T/L, T, and R denote t h e l ong i t ud ina l , tangent ia l , and r a d i a l d i r e c t ion, r espec t i ve l y . The 1s t charac te r desi ynates the wid th d i r e c t i o n - of f l a k e whereas t he 2nd one i s f o r t he leng th d i r ec t i on . 3/Measured from the samples cond i t ioned a t 65% RH and 75OF. -
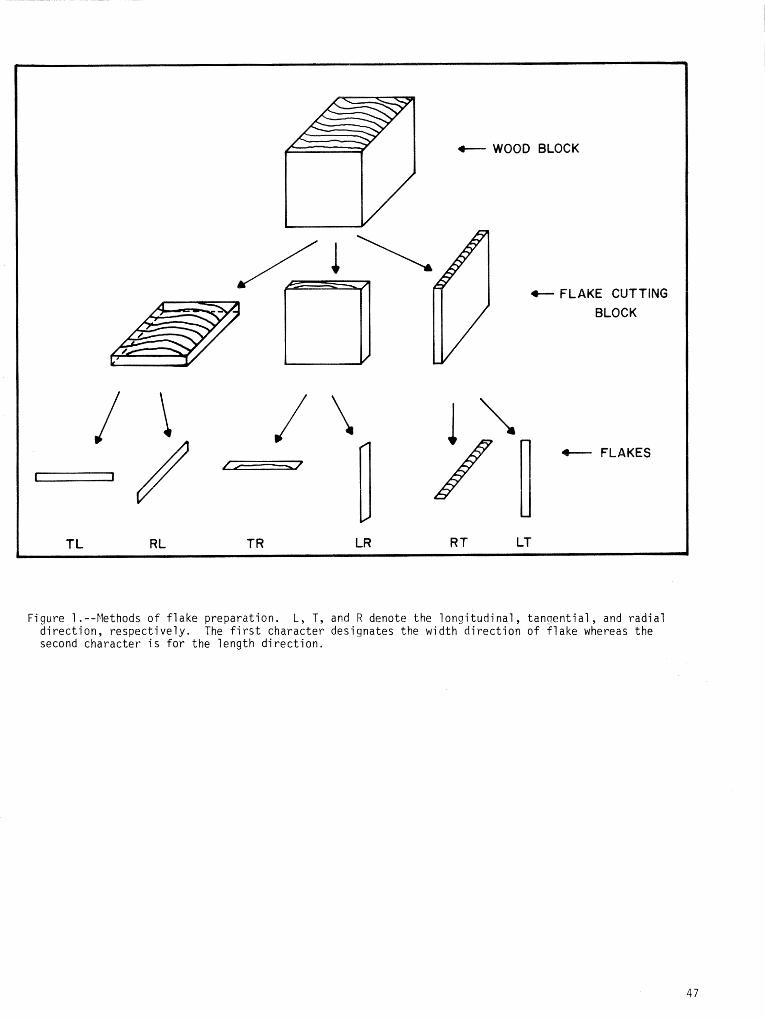
Figure 1 o f f l a k e p repara t ion . L, T, and R denote the l o n g i t u d i n a l , t anoen t i a l , and r a d i a l d i r e c t i o n , r espec t i ve l y . The f i r s t character designates the w id th d i r e c t i o n o f f l a k e whereas the second character i s f o r the l eng th d i r e c t i o n .
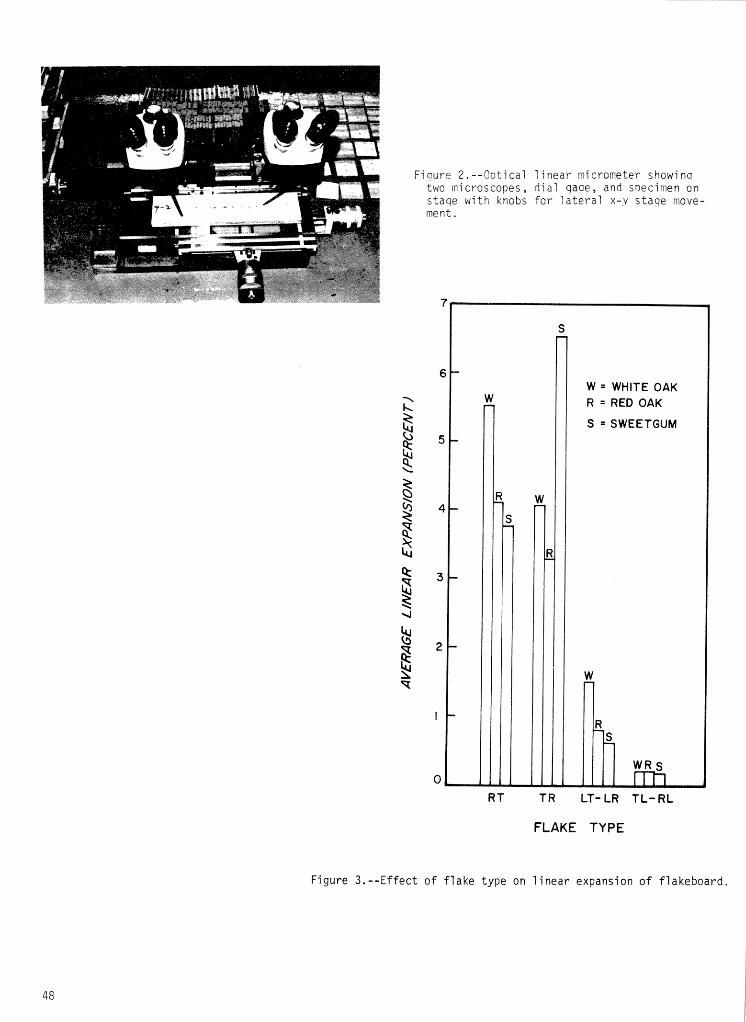
Fisure 2 . - - 0 ~ t i c a l l i n e a r micrometer showina two microscopes, d i a l qaae, and snecimen on s t aqe with knobs For lateral x-y staqe move- ment.
RT TR LT- LR TL-RL
FLAKE TYPE
Figure 3.--Effect o f flake type on linear expansion of flakeboard,
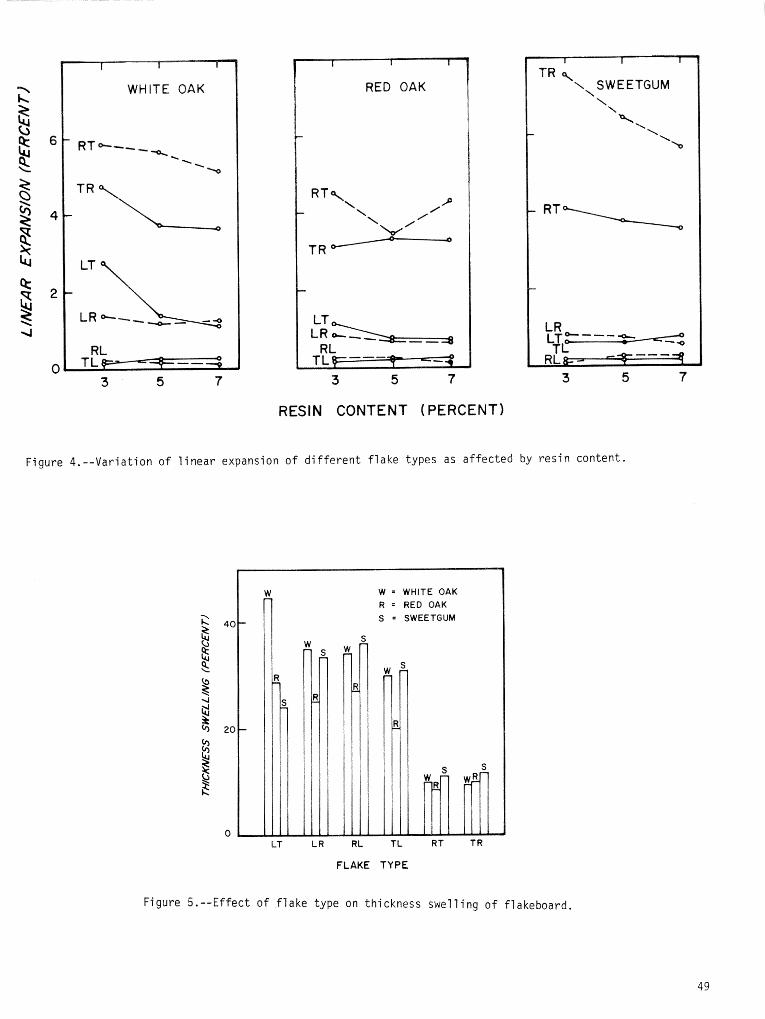
RESIN CONTENT (PERCENT)
Figure 4 . - -Var ia t ion o f l i n e a r expansion o f d i f f e r e n t f l a k e types as a f f ec ted by r e s i n content .
W = WHITE OAK R = RED OAK I
LT LR RL TL RT TR
FLAKE TYPE
Figure !?. - -Ef fect o f f l a k e type on th ickness swe l l i ng o f f lakeboard.
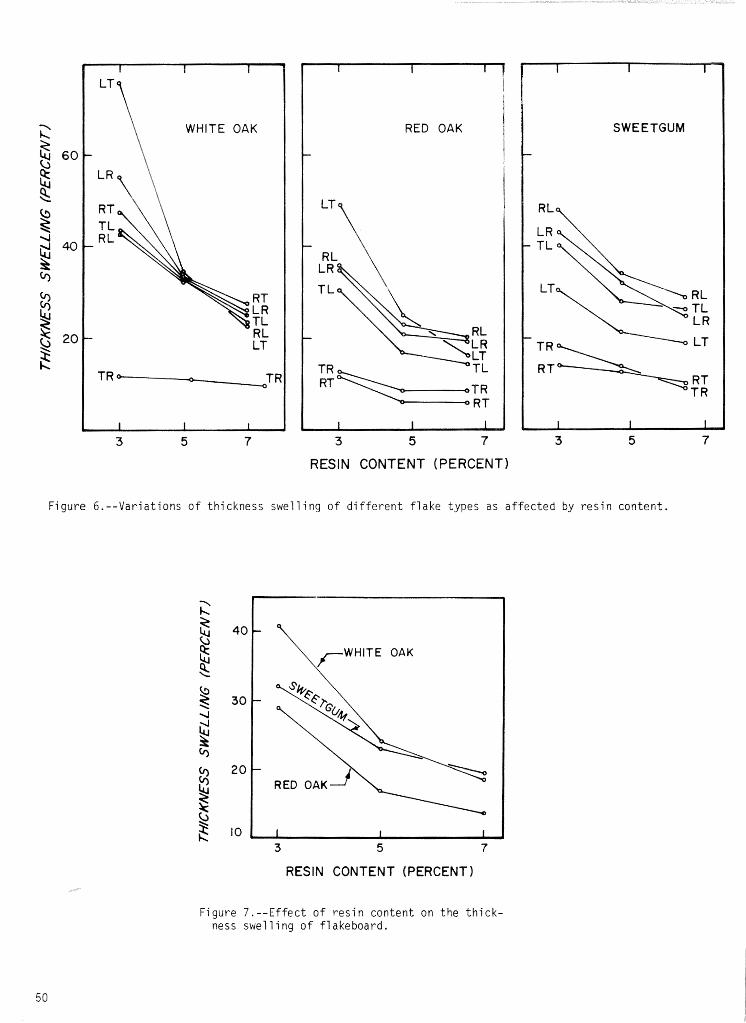
3 5 7 3 5
RESIN CONTENT (PERCENT)
SWEETGUM
Figure 6.--Variations of thickness swelling of different flake types as affected by resin content.
3 5 7
RESIN CONTENT (PERCENT 1
Figure 7.--Effect of resin content on the thick- ness swelling of flakeboard.
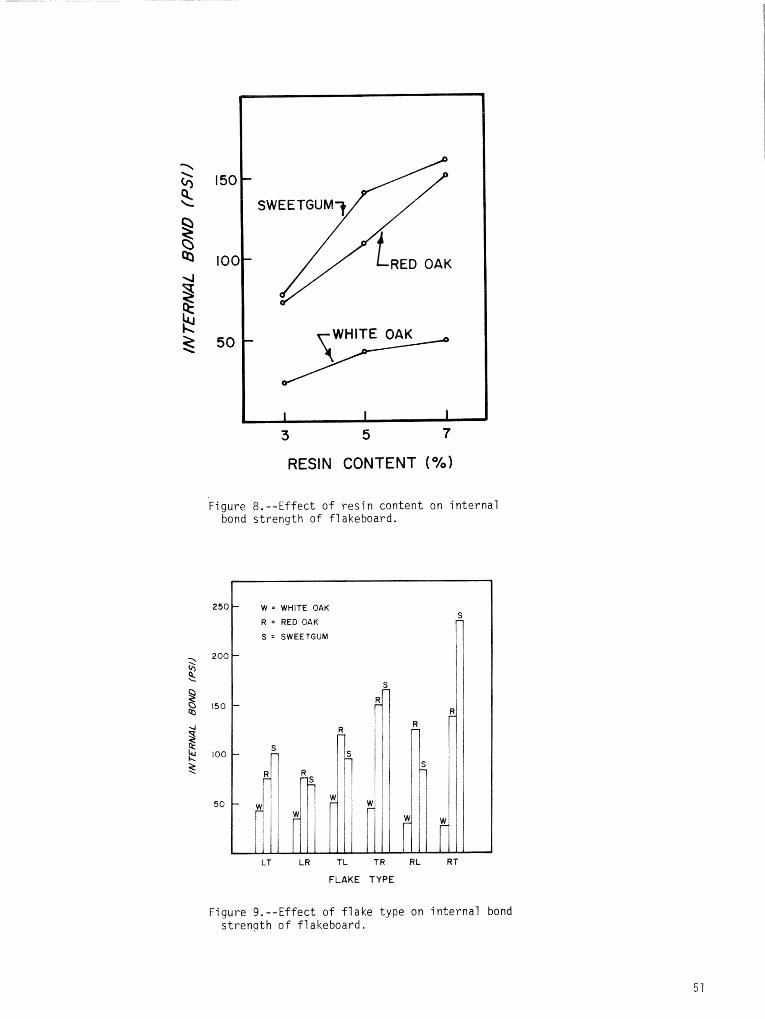
3 5 7
RESIN CONTENT (O/O)
Figure 8 . - -E f fec t o f r e s i n content on i n t e r n a l bond s t r eng th o f f lakeboard.
LT LR TL TR R L RT
FLAKE TYPE
F igure 9 . - -E f fec t o f f l a k e type on i n t e r n a l bond s t r eng th o f f lakeboard.
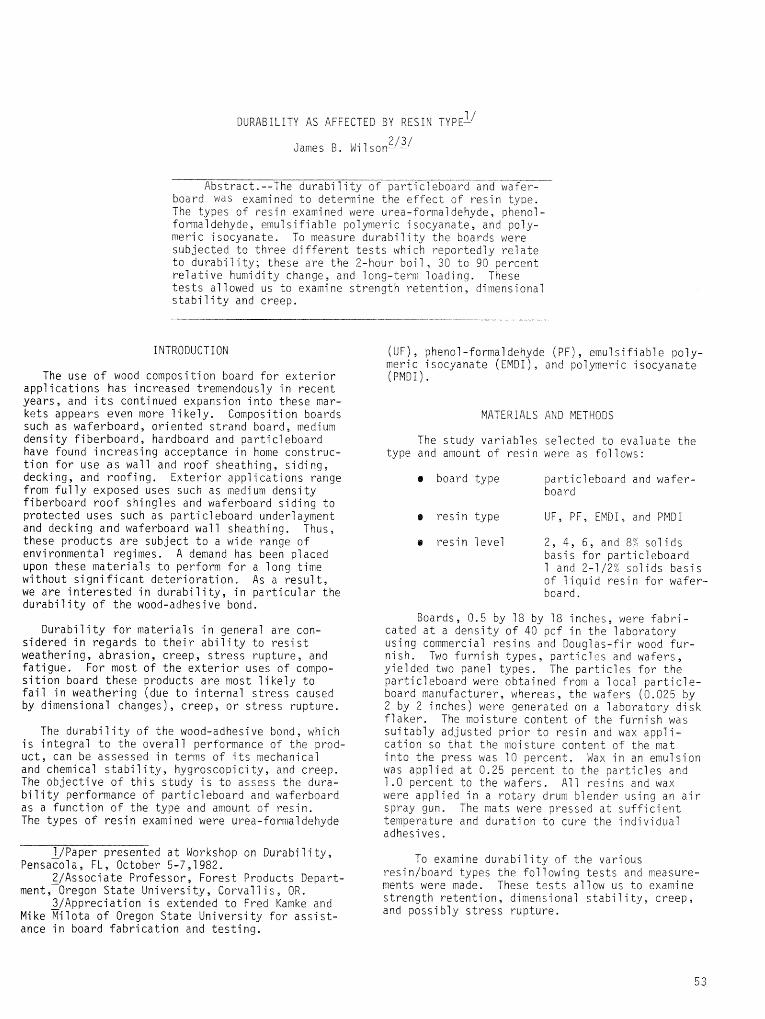
1 i DURABILITY AS AFFECTED BY RESIN TYPE-
2 / 3 / James B. W i 1 son- --
Abstract.--The durab i l i ty of part icleboard and wafer- board was examined t o determine the e f f e c t o f res in type. The types of res in examined were urea-formaldehyde, phenof- formaldehyde, emu1 s i f i a b l e polymeric isocyanate, and poly- ~ e r i c isocyanate. To measure durab i l i ty the boards were subjected t o three d i f f e ren t t e s t s which reportedly r e l a t e t o durabi l i t y ; these are the 2-hour boi l , 30 t o 90 percent re1 a t i ve humi di t y change, and l ong-term 1 oadi ng. These t e s t s allowed us to examine strength re tent ion, dimensional s t ab i 1 i t y and creep.
INTRODUCTION
The use of wood composition board f o r ex te r io r appl i c a t i ons has increased tremendously i n recent years , and i t s continued expansion i n t o these mar- kets appears even more l i kely. Composi t i on boards such as waferboard, oriented strand board, medium density f iberboard , hardboard and part icleboard have found increasing acceptance in home construc- t ion f o r use a s wall and roof sheathing, s id ing, decking, and roofing. Exterior appl ica t ions range from f u l l y exposed uses such as medium density fiberboard roof shingles and waferboard siding t o protected uses such as part icleboard under1 ayment and decking and waferboard wall sheathing. Thus, these products are subject t o a wide range of environmental regimes. A demand has been placed upon these mater ia ls t o perform f o r a long time without s i g n i f i c a n t deter iora t ion. As a r e s u l t , we are in t e res t ed in durab i l i ty , in pa r t i cu la r the durab i l i ty of the wood-adhesive bond.
Durabil i ty f o r materials in genera1 are con- sidered in regards to t h e i r a b i l i t y t o r e s i s t weathering, abrasion, creep, s t r e s s rupture, and fa t igue . For most of the ex te r io r uses of compo- s i t i o n board these products a r e most l i ke ly t o f a i l in weathering (due t o in ternal s t r e s s caused by dimensional changes), creep, o r s t r e s s rupture.
The d u r a b i l i t y of the wood-adhesive bond, which i s in tegra l t o the overall performance of the prod- uc t , can be assessed in terms of i t s mechanical and chemical s tabi 1 i t y , hygroscopic1 t y , and creep. The object ive of t h i s study i s t o assess the dura- b i l i t y performance of part icleboard and waferboard as a function of the type and amount of res in . The types of res in examined were urea-formaldehyde
1 /Paper presented a t Workshop on Durabi 1 i t y , ~ e n s a c o l a , FL, October 5-7,1982,
2fAssociate Professor, Forest Products Depart- ment ,-0regon S ta t e University, Corval i i s , OR.
3/Appreciation i s extended t o Fred Kamke and Mike Ei lo t a of Oregon S ta t e University fo r a s s i s t -
(UF) , phenol -formaldehyde ( P F ) , emu1 s i f iabl e poly- meric isocyanate (EMDI) , and polymeric isocyanate (PMDI).
MATERIALS A N D METHODS
The study var iables selected to evaluate the type and amount of resin were as foilows:
r board type particleboard and wafer- board
r res in type UF, P F , EMDI, and PMDI
e res in level 2 , 4 , 6 , and 8% so l ids basis f o r part icleboard 1 and 2-1/22 sol ids bas is s f l iquid resin f o r wafer- board.
Boards, 0 .5 by 18 by 18 inches, were f a b r i - cated a t a density of 40 pcf in the laboratory using commercial res ins snd Douglas-fi r wood fu r - nish. Two furnish types, pa r t i c l e s and wafers, yielded two panel types. The pa r t i c l e s fo r the particf eboard were obtained from a local pa r t i c l e - board manufacturer, whereas, the wafers (0.025 by 2 by 2 inches) were generated on a laboratory disk f l ake r . The moisture content o f the furnish Mas sui tably adjusted p r io r t o resin and wax appl i - cation so t h a t the moisture content of the mat in to the press was 10 percent. Wax in an emulsion was applied a t 0.25 percent t o the pa r t i c l e s and 1.0 percent to the wafers. A11 res ins and wax were applied in a ro tary drum blender u s i n g an a i r spray gun. The mats were pressed a t su f f i c i en t temperature and duration t o cure the individual adhesives.
To examine durab i l i ty of the various resin/board types the following t e s t s and measure- ments were made. These t e s t s a1 low us t o examine strength re tent ion, dimensional s t a b i l i t y , creep, and possi bl y s t r e s s rupture.
ance in board fabr ica t ion and tes t ing ,
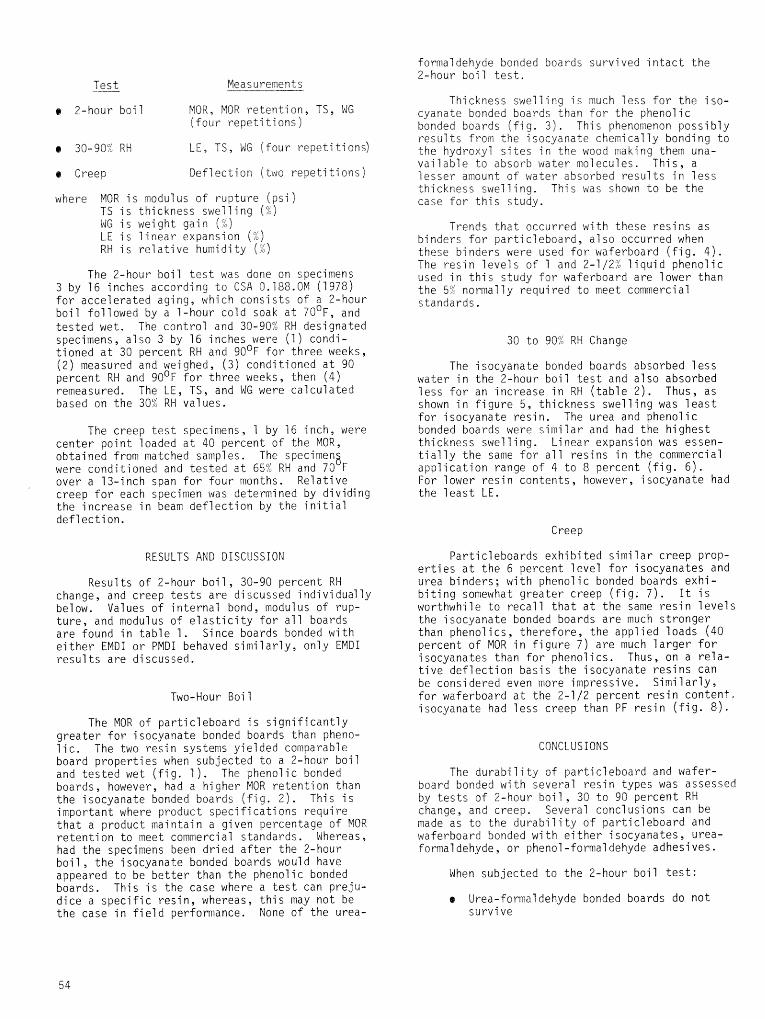
formaldehyde bonded boards survived intact the 2-hour boil t e s t .
Test --- Measurements
a 2-hour bci 1 MOR, MOR retention, TS, WG (four repet i t ions)
9 30-90"; R H LE, TS, WG (four repetitions)
9 Creep Deflection (two repet i t ions)
where MOR i s modulus of rupture ( p s i ) TS i s thickness swelling ( X ) WG i s weight gain C o g ) L E i s 1 inear expansion ('L) RH i s re la t ive humidity (9)
The 2-hour boil t e s t was done on specimens 3 by 16 inches according to CSA 0.188.OM (1978) for accelerated aging, which consists of a 2-hour boil followed by a 1-hour cold soak a t 70O~, and tested wet. The control and 30-907; R H designated specimens, also 3 by 16 inches were (1) condi- tioned a t 30 percent R H and 90 '~ for three weeks, (2) measured and weighed, (3) conditioned a t 90 percent R H and 90 '~ for three weeks, then ( 4 ) remeasured. The L E Y TS, and WG were calculated based on the 302 RH values.
The creep t e s t specimens, 1 by 16 inch, were center point loaded a t 40 percent of the MOR, obtained from matched samples. The specimen3 were conditioned and tested a t 65% R H and 70 F over a 13-inch span for four months. Relative creep for each specimen was determined by dividing the increase in beam deflection by the i n i t i a l deflection.
RESULTS AND DISCUSSION
Results of 2-hour boi l , 30-90 percent R H change, and creep t e s t s are discussed individually below. Values of internal bond, modulus of rup- ture , and modulus of e l a s t i c i t y for a1 1 boards are found in table 1. Since boards bonded with e i ther EMDI or PMDI behaved similarly, only EMDI resul ts are discussed.
Two-Hour Boil
The MOR of particleboard i s significantly greater fo r isocyanate bonded boards than pheno- l i c . The two resin systems yielded comparable board properties when subjected to a 2-hour boil and tested wet ( f ig . 1 ) . The phenolic bonded boards, however, had a higher MOR retention than the isocyanate bonded boards ( f i g . 2). This i s important where product specifications require that a product maintain a given percentage of MOR retention to meet commercial standards. Whereas, had the specimens been dried a f t e r the 2-hour boi l , the isocyanate bonded boards would have appeared to be bet ter than the phenolic bonded boards. This i s the case where a t e s t can preju- dice a specific resin, whereas, t h i s may not be the case in f i e ld performance. None of the urea-
Thickness swelling i s much less fo r the iso- cyanate bonded boards than f c r the phenolic bonded boards ( f i g. 3 ) . This phenomenon possibly resul ts from the isocyanate chemically bonding to the hydroxyl s i t e s i n the wood making them una- vai lable t o absorb water no1 ecules. This, a lesser amount o f water absorbed resul ts in l ess thickness swelling. This was shown to be the case for t h i s study.
Trends that occurred with these resins as binders fo r particleboard, also occurred when these binders were used for waferboard ( f i g . 4 ) . The resin levels of 1 and 2-1/2X liquid phenolic used in t h i s study for waferboard are lower than the 5% normally required to meet commercial standards.
30 to 90% R H Change
The isocyanate bonded boards absorbed less water in the 2-hour boil t e s t and also absorbed less for an increase in R H ( table 2 ) . Thus, as shown in figure 5 , thickness swelling was l e a s t for isocyanate resin. The urea and phenolic bonded boards were similar and had the highest thickness swelling. Linear expansion was essen- t i a l l y the same for a l l resins in the commercial application range of 4 to 8 percent ( f ig . 6 ) . For lower resin contents, however, isocyanate had the leas t L E .
Creep
Particleboards exhi hi ted simi 1 a r creep prop- e r t i e s a t the 6 percent level fo r isocyanates and urea binders; with phenolic bonded boards exhi- biting somewhat greater creep ( f i g . 7 ) . I t i s worthwhile to recall tha t a t the same resin levels the isocyanate bonded boards are much stronger than phenol i cs , therefore, the appl i ed 1 oads (40 percent of MOR in figure 7 ) are much larger f o r isocyanates than for phenolics. Thus, on a re la- t ive deflection basis the isocyanate res ins can be considered even more impressive. Simi 1 ar ly , for waferboard a t the 2-112 percent resin content. isocyanate had less creep than PF resin ( f i g . 8 ) .
CONCLUSIONS
The durabi 1 i ty o f particleboard and wafer- board bonded with several resin types was assessed by t e s t s of 2-hour boi l , 30 t o 90 percent RW change, and creep. Several conclusions can be made as to the durabili ty of particleboard and waferboard bonded with e i ther isocyanates, urea- formaldehyde, or phenol-formaldehyde adhesives.
When subjected to the 2-hour boil t e s t :
e Urea-formaldehyde bonded boards do not survive
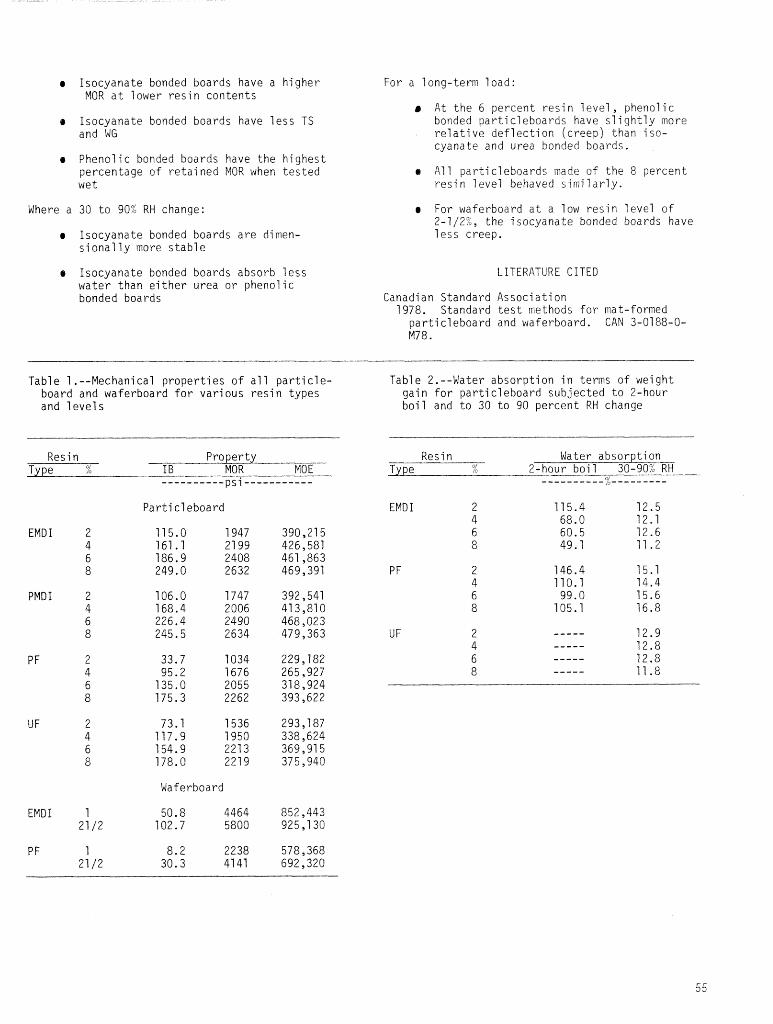
o Isocyanate bonded boards have a higher MOR a t lower r e s i n conten ts
Isocyanate bonded boards have l e s s TS and ahiG
a Phenolic bonded boards have t h e h ighes t percentage of r e t a i ned MOR when t e s t e d wet
Where a 30 t o 90% RH change:
e Isocyanate bonded boards a r e dimen- s i o n a l l y more s t a b l e
e Isocyanate bonded boards absorb l e s s water than e i t h e r urea o r phenolic bonded boards
For a 1 ong-term load:
A t t h e 6 percent r e s i n 1 eve1 , phenol i c bonded pa r t i c l eboa rds have s1 i gh t l y more r e l a t i v e de f l e c t i on ( c r eep ) than i so- cyanate and urea bonded boards.
e A17 par t ic leboards made o f t h e 8 percent r e s i n leve l behaved s i m i l a r l y .
o For waferboard a t a low r e s i n leve l of 2-1/2%, t he i socyana te bonded boards have l e s s creep.
LITERATURE CITED
Canadian Standard Associat ion 1978. Standard t e s t methods f o r mat-formed
p a r t i c l eboard and waferboard. CAN 3-01 88-0- M78.
Tab1 e 1. --Mechanical p rope r t i e s of a1 1 p a r t i c l e - board and waferboard f o r var ious r e s i n types and l e v e l s
Table 2.--Water absorp t ion i n terms of weight gain f o r par t ic leboard subjec ted t o 2-hour bo i l and t o 30 t o 90 percent R H change
Resi n Property Type % I B MOR MO E
----------psi-----------
Par t ic leboard
EMD I 2 115.0 1947 390,215 4 161.1 21 99 426,581 6 186.9 2408 461,863 8 249.0 2632 469,391
PMD I 2 106.0 1747 392,541 4 168.4 2006 413,810 6 226.4 2490 468,023 8 245.5 2634 479,363
Waferboard
EMD I 1 50.8 4464 852,443 21 /2 102.7 5800 925,130
Resin Water absorpt ion Type % 2-hour boi 1 30-907; R H
EMD I 2 115.4 12.5 4 68.0 12.1 6 60.5 12.6 8 49.1 11.2
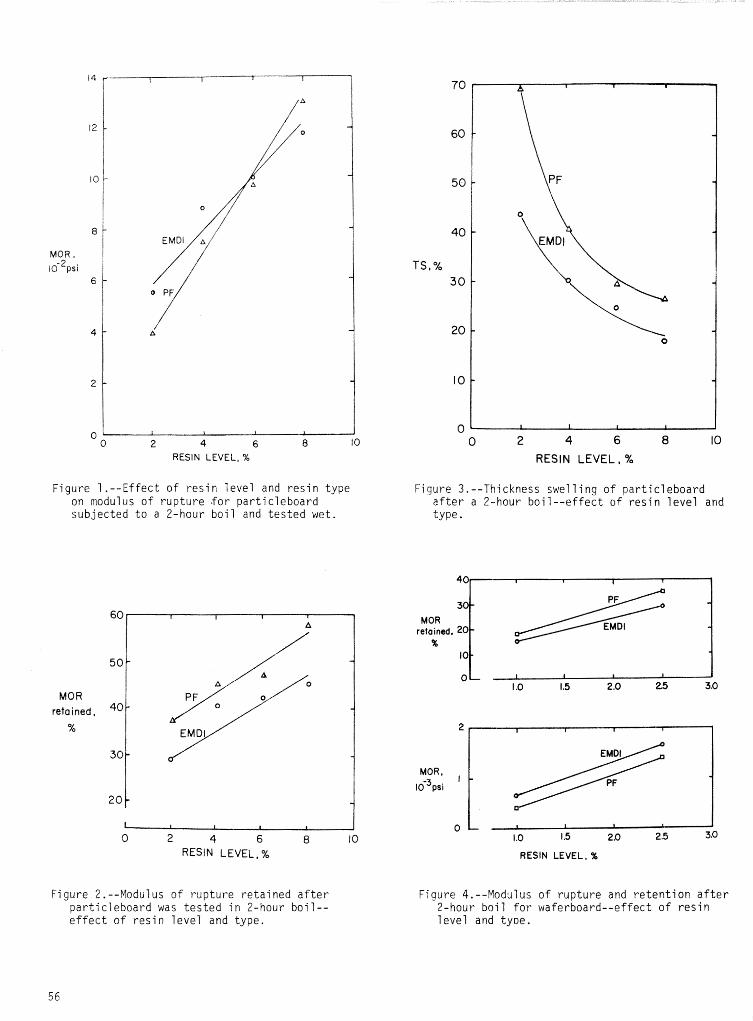
RESIN LEVEL, %
Figure 1.--Effect of res in level and res in type on modulus of rupture .for part icleboard subjected t o a 2-hour boil and t e s t ed wet.
MOR refaineci,
%
1 0 2 4 6 8 10
RESIN LEVEL, %
Figure 2 . --Modul us o f rupture retained a f t e r part icleboard was t e s t ed i n 2-hour boil-- e f f e c t of res in level and type.
0 2 4 6 8 10 RESIN LEVEL, %
Fiqure 3.--Thickness swelling of part icleboard a f t e r a 2-hour boi l - -ef fec t of res in level and type
retained, 20 %
RESIN LEVEL, %
f igure 4.--Modulus of rupture and re tent ion a f t e r 2-hour boil fo r waferboard--effect of r e s in level and t y ~ e .
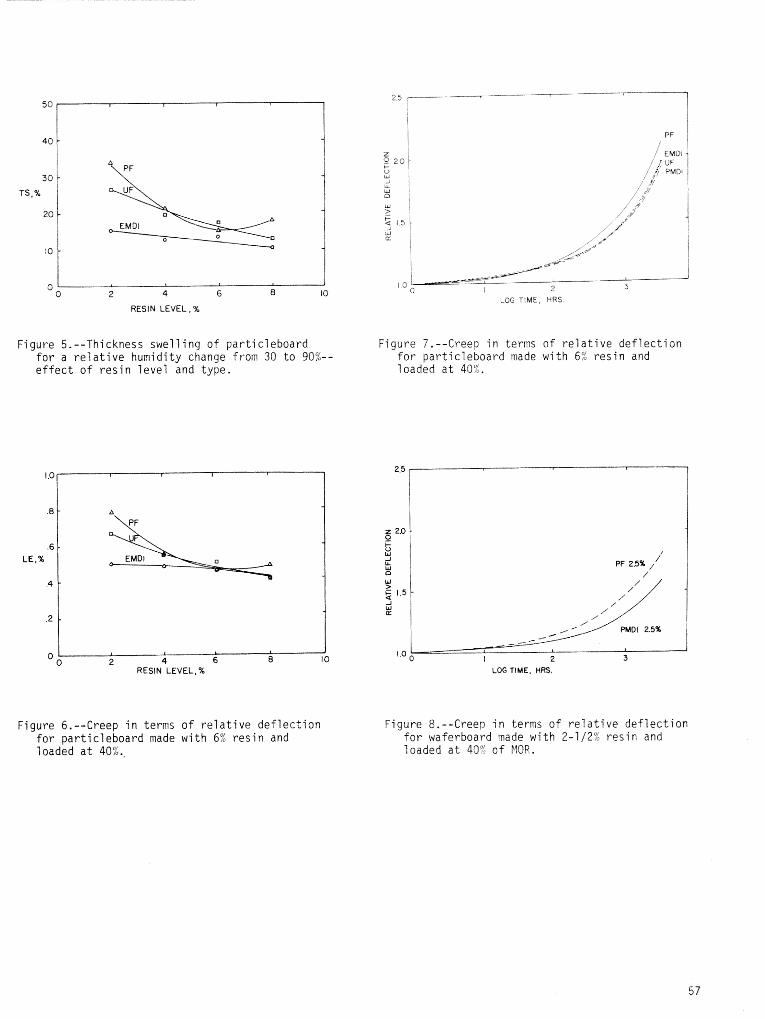
0 I
0 2 4 6 8 10
RESIN LEVEL, %
Figure 5.--Thickness swelling of particleboard for a relative humidity change from 30 to 90%- effect of resin level and type.
1 I I
2 4 6 8 10 RESIN LEVEL. %
Figure 6.--Creep in terms of relative deflection for particleboard made with 6% resin and 1 oaded at 4074..
Figure 7.--Creep in terms o f relative deflection for particleboard made with 6% resin and loaded at 40%.
LOG TIME, H a .
Figure 8.--Creep in terms of relative deflection for waferboard made with 2-1/2% resin and loaded at 40% of PIOR.
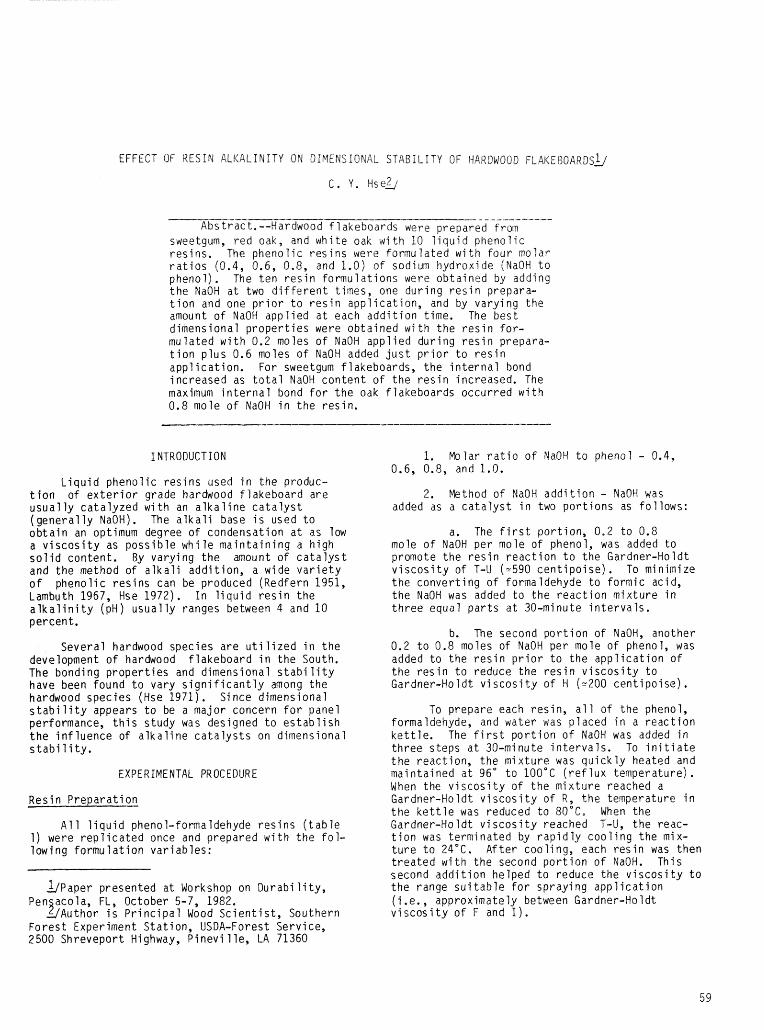
EFFECT OF RESIW ALKALINITY ON CIMEMSIONAL STABILITY OF HARDWOOD F L A K E B O A R D S ~
------- --- - - - ---- -- ---- A b s t r a c t . --Hardwood f 1 akeboards were prepared from
sweetgum, r e d oak, and w h i t e oak w i t h 10 l i q u i d p h e n o l i c r e s i n s . The p h e n o l i c r e s i n s were fo rmu la ted w i t h f o u r molar r a t i o s (0.4, 0.6, 0.8, and 1.0) o f sodium hydrox ide (NaOH t o phenol ) , The t e n r e s i n f o r n u f a t i o n s were ob ta ined by adding t h e NaOH a t two d i f f e r e n t t imes, one d u r i n g r e s i n prepara- t i o n and one p r i o r t o r e s i n a p p l i c a t i o n , and by v a r y i n g t h e amount o f NaOH a p p l i e d a t each a d d i t i o n time. The b e s t d imensional p r o p e r t i e s were ob ta ined w i t h t h e r e s i n f o r - mu la ted w i t h 0.2 moles o f NaOH a p p l i e d d u r i n g r e s i n prepara- t i o n p l u s 0.6 moles of NaOH added j u s t p r i o r t o r e s i n a p p l i c a t i o n . For sweetgum f lakeboards, t h e i n t e r n a l bond inc reased as t o t a l NaOH c o n t e n t o f t h e r e s i n increased. The maximum i n t e r n a l bond f o r t h e oak f lakeboards occur red w i t h 0.8 mole o f NaOH i n t h e r e s i n .
I NTRODUCT ION
L i q u i d p h e n o l i c r e s i n s used i n t h e produc- t i o n o f e x t e r i o r grade hardwood f l a k e b o a r d a re u s u a l l y c a t a l y z e d w i t h an a l k a l i n e c a t a l y s t ( g e n e r a l l y NaOH). The a l k a l i base i s used t o o b t a i n an optimum degree o f condensat ion a t as low a v i s c o s i t y as p o s s i b l e w h i l e m a i n t a i n i n g a h igh s o l i d con ten t . By va ry ing t h e amount o f c a t a l y s t and t h e method o f a l k a l i add i t i on , a wide v a r i e t y o f p h e n o l i c r e s i n s can be produced (Redfern 1951, Lambuth 1967, Hse 1972)" I n l i q u i d r e s i n t h e a l k a l i n i t y (pH) u s u a l l y ranges between 4 and 10 percent .
Severa l hardwood species a re u t i l i z e d i n t h e development o f hardwood f l a k e b o a r d i n t h e South. The bonding p r o p e r t i e s and d imensional s t a b i li t y have been found t o vary s i g n i f i c a n t l y among t h e hardwood spec ies (Wse 1971). Si nce d imensional s t a b i 1 i t y appears t o be a major concern f o r panel performance, t h i s s tudy was designed t o e s t a b l i s h t h e i n f l u e n c e o f a l k a l i n e c a t a l y s t s on d imensional s t a b i 1 i t y .
EXPERIMENTAL PROCEDURE
Res in P r e p a r a t i o n
A1 1 l i q u i d phenol - fomaldehyde r e s i n s ( t a b l e 1) were r e p l i c a t e d once and prepared w i t h t h e f o l - l ow ing f o r m u l a t i o n va r iab les :
a ~ a p e r presented a t Workshop on D u r a b i l i t y , Pen acola, FL, October 5-7, 1982. 1 J A u t h o r i s P r i n c i p a l Wood S c i e n t i s t , Southern F o r e s t Experiment S ta t ion , USDA-Forest Service, 2500 Shrevepor t Highway, P i n e v i l l e , LA 71360
1. Molar r a t i o o f NaOH t o phenol - 0.4, 0.6, 0.8, and 1.0.
2. Pllethod o f NaOH a d d i t i o n - NaOH was added as a c a t a l y s t i n two p o r t i o n s as fo l lows:
a. The f i r s t p o r t i o n , 0.2 t o 0.8 mole o f NaOH p e r mole o f phenol, was added t o promote t h e r e s i n r e a c t i o n t o t h e Gardner-Holdt v i s c o s i t y o f T-U (1.590 c e n t i p o i s e ) . To mi nirnize t h e c o n v e r t i n g o f formaldehyde t o f o r m i c acid, t h e NaOH was added t o t h e r e a c t i o n m i x t u r e i n t h r e e equal p a r t s a t 30-minute i n t e r v a l s .
b. The second p o r t i o n o f NaOH, another 0.2 t o 0.8 moles o f NaOH p e r mole o f phenol, was added t o t h e r e s i n p r i o r t o t h e a p p l i c a t i o n o f t h e r e s i n t o reduce t h e r e s i n v i s c o s i t y t o Gardner-Ho l d t v i scos i t y o f H (-200 c e n t i p o i s e ) .
To prepare each r e s i n , a l l o f t h e phenol, formaldehyde, and water was p l a c e d i n a r e a c t i o n k e t t l e . The f i r s t p o r t i o n o f NaOH was added i n t h r e e s teps a t 30-minute i n t e r v a l s . To i n i t i a t e t h e reac t ion , t h e m i x t u r e was q u i c k l y heated and ma in ta ined a t 96" t o 190°C ( r e f tux temperature) . When the v i s c o s i t y o f t h e m i x t u r e reached a Gardner-Holdt v i s c o s i t y o f R, t h e temperature i n t h e k e t t l e was reduced t o 80°C- When t h e Gardner-Holdt v i s c o s i t y reached T-0, t h e reac- t i o n was te rmina ted by r a p i d l y c o o l i n g t h e mix- t u r e t o 24°C. A f t e r coo l ing , each r e s i n was then t r e a t e d w i t h t h e second p o r t i o n o f NaOH. Th is second a d d i t i o n he lped t o reduce the v i s c o s i t y t o t h e range s u i t a b l e f o r sp ray ing a p p l i c a t i o n ( i ,e. , approx imate ly between Gardner-Ho 1dt v i s c o s i t y o f F and I ) .
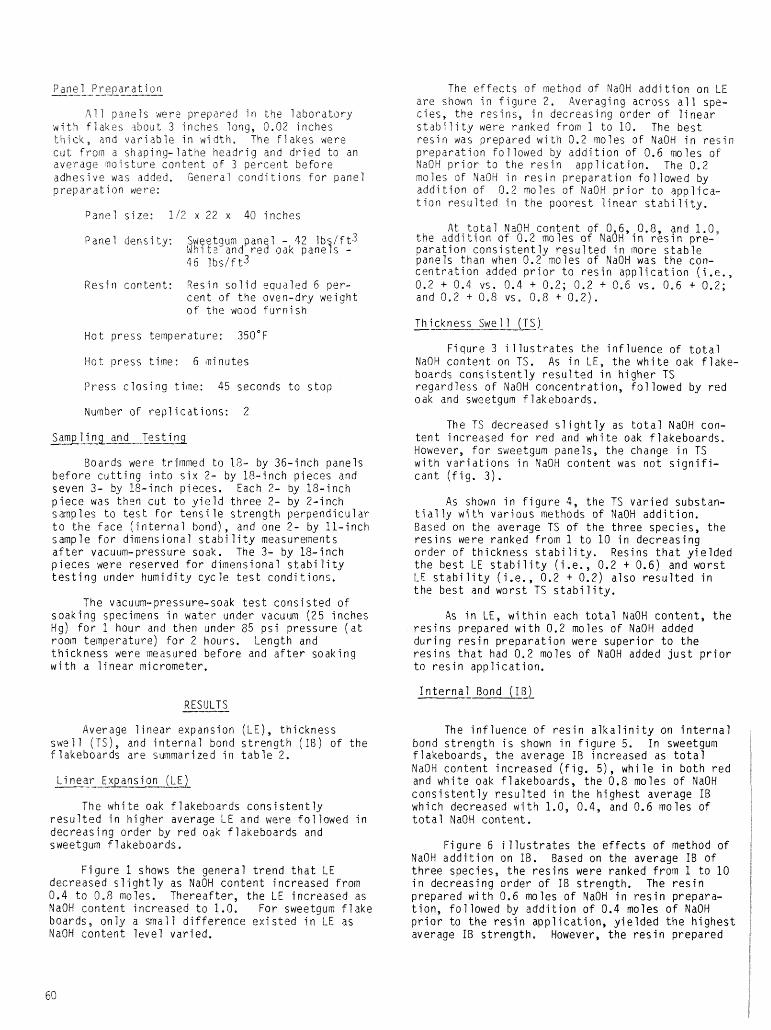
Panel P r e ~ a r a t i ~ ~ n
A l l aanels were prepared i~ t b e l a b o r a t o r y w i t ? f l a k e s 3 b o u t 3 inches loog, 0.02 i nches t h i ck , and v a r i a b l e i n w id th . The F lakes wers c u t f r o w a shaping- fa t f ie h e a d s i g and d r i e d t o an average irtcristure c o n t e n t o f 3 p e r c e n t b e f o r e adhes ive was added . General c o n d i t i o n s For pane l p r e p a r a t i o n were:
Pane l s i ze : 1/2 x 22 x 40 inches
Panel densi ty : Sweetgum pane l - 42 l b / f t 3 Yhi L ? and- red oak panets -
R e s i n con ten t : Res in s o l i d equaled 6 per- c e n t o f t h e oven-dry we igh t o f t h e wood f u r n i s h
H o t press temperature: 350°F
Hot press t ime: 6 ~ n i n u t e s
Press c l o s i n g t ime: 45 seconds t o s t o p
Number o f r e p l i c a t i o n s : 2
Sampl ing and T
Boards were trimmed t o 18- by 36 - inch panels b e f o r e c u t t i n g i n t o s i x 2- by 18 - inch p ieces and seven 3- by 18- inch p ieces. Each 2- by 18 - inch p i e c e was then c u t t o y i e l d t h r e e 2- by 2- inch s a ~ p l e s t o t e s t f o r t e n s i l e s t r e n g t h p e r p e n d i c u l a r t o t h e face ( i n t e r n a l bond), and one 2 - by 11 - inch samp l e f o r d imensional s t a b i l i t y measureinent s a f t e r vacuum-pressure soak. The 3- by & i n c h p i e c e s were reserved f o r d imensional s t a b i li t y t e s t i n g under h u m i d i t y c y c l e t e s t c o n d i t i o n s .
The vacuum-pressure-soak t e s t c o n s i s t e d o f soak ing specimens i n water under vacuum (25 inches Wg) f o r ? hour and then under 85 p s i p ressure ( a t rooin temperature) f o r 2 hours. Length and t h i c k n e s s were lneasured b e f o r e and a f t e r soak ing w i t h a l i n e a r micrometer.
The e f f e c t s o f ve thod of NaOW a d d i t i o n on t E a r e shown i n f i g u r e 2. Averaging across a l l spe- c ies , t h e r e s i n s , i n decreas ing o r d e r o f l i n e a r s t a b i l i t y were ranked from I t o 10. The b e s t resin was prepared w i t h 0.2 ~ o l e s of NaOH i n r e s i n p r e p a r a t i o n f o l l o w e d by a d d i t i o n of 0.6 w t e s o f NaOH p r i o r t o t h e r e s i n a p p l i c a t i o n . The 0.2 moles o f NaBH i n r e s i n p r e p a r a t i o n f o l l o w e d by a d d i t i o n of 0.2 moles of NaOH p r i o r t o a p p l i c a - t i o n r e s u l t e d i n t h e p o o r e s t l i n e a r s t a b i l i t y .
At * t p t a l NaOH c o n t e n t of 0.6, -0.8, and 1.0, t h e a d d ~ t ~ o n o f 0.2 moles o f NaOH I n r e s l n p re - p a r a t i o n c o n s i s t e n t l y r e s u l t e d i n more s t a b l e panels than when 0.2 moles of NaOH was t h e con- c e n t r a t i o n added p r i o r t o r e s i n a p p l i c a t i o n ( i .e . , 0.2 + 0.4 vs. 0.4 + 0.2; 0.2 + 0.6 vs. C.6 + 0.2; and 0.2 + 0.8 vs, 0.8 + 0.2).
Th ickness Swe 11 (TS) - ---- F i q u r e 3 i l l u s t r a t e s the i n f l u e n c e o f t o t a l
NaOH c o n t e n t on TS. As i n LE, t h e w h i t e oak f l a k e - boards c o n s i s t e n t l y r e s u l t e d i n h i g h e r TS r e g a r d l e s s o f NaOH concen t ra t ion , f o l l o w e d by r e d oak and sweetgum f lakeboards.
The TS decreased s l i g h t l y as t o t a l NaOH con- t e n t i nc reased f o r r e d and w h i t e oak f l akeboards . However, f o r sweetgum panels, t h e change i n TS w i t h v a r i a t i o n s i n NaOH c o n t e n t was n o t s i g n i f i - c a n t ( f i g , 3 ) .
As shown i n f i g u r e 4, t h e TS v a r i e d substan- t i a l l y w i t h v a r i o u s methods o f NaOH a d d i t i o n . Based on t h e average TS o f t h e t h r e e spec ies, t h e r e s i n s were ranked from 1 t o 10 i n dec reas ing o r d e r o f th i ckness s t a b i l i t y . Resins t h a t y i e l d e d t h e b e s t LE s t a b i l i t y ( i .e., 0.2 + 0.6) and w o r s t LE s t a b i l i t y ( i .e . , 0.2 + 0.2) a l s o r e s u l t e d i n t h e b e s t and wors t TS s t a b i l i t y .
As i n LE, w i t h i n each t o t a l MaOH con ten t , t h e r e s i n s prepared w i t h 0.2 moles o f NaOH added d u r i n g r e s i n p r e p a r a t i o n were s u p e r i o r t o t h e r e s i n s t h a t had 0.2 moles o f NaOH added j u s t p r i o r t o r e s i n a p p l i c a t i o n .
I n t e r n a l Bond ( I B 3 RESULTS
Average l i n e a r expansion (LE) , t h i c k n e s s s w e l l (TS), and i n t e r n a l bond s t r e n g t h (18 ) o f t h e F lakeboards a r e summarized i n t a b l e 2.
The w h i t e oak f l akeboards c o n s i s t e n t l y r e s u l t e d i n h i g h e r average f E and were f o l l o w e d i n dec reas ing o rder by r e d oak f l akeboards and sweetgum f 1 akeboards.
F i g u r e 1 shows t h e genera l t r e n d t h a t LE decreased s l i g h t l y as NaOH c o n t e n t i nc reased f rom 0.4 t o 0.8 moles. Therea f te r , t h e LE inc reased as MaOH c o n t e n t i nc reased t o 1.0, For sweetgum f l a k e boards, o n l y a sma l l d i f f e r e n c e e x i s t e d i n LE as NaOH c o n t e n t l e v e l va r ied .
The i n f l u e n c e o f r e s i n a l k a l i n i t y on i n t e r n a l bond s t r e n g t h i s shown i n f i g u r e 5. I n sweetgum f lakeboards , t h e average I B inc reased as t o t a l NaOH c o n t e n t i n c r e a s e d ( f i g . 51, whi l e i n b o t h r e d and w h i t e oak f lakeboards, t h e 0.8 moles o f NaOH c o n s i s t e n t l y r e s u l t e d i n t h e h i g h e s t average IB which decreased w i t h 1.0, 0.4, and 0.6 moles of t o t a l NaOH con ten t .
f i g u r e 6 i l l u s t r a t e s t h e e f f e c t s o f method o f NaOH a d d i t i o n on IB. Based on t h e average I B of t h r e e species, t h e r e s i n s were ranked f r o m 1 t o 1 0 i n dec reas ing o r d e r o f I B s t reng th . The r e s i n p repared w i t h 0.6 moles o f NaOH i n r e s i n prepara- t i o n , f o l l o w e d by a d d i t i o n o f 0.4 moles of NaOH p r i o r t o t h e r e s i n a p p l i c a t i o n , y i e l d e d t h e h i g h e s t average I B s t r e n g t h . However, t h e r e s i n p repared
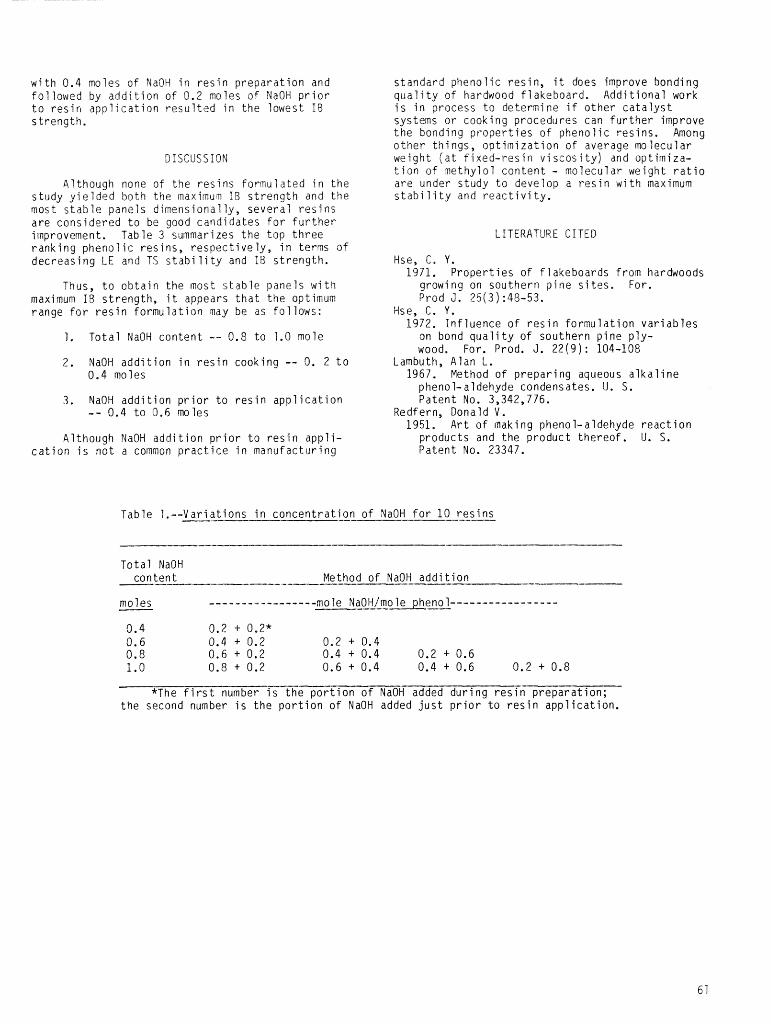
w i t h 0.4 motes o f NaOH i n r e s i n p r e p a r a t i o n and f o l l o w e d by a d d i t i o n o f 0.2 moles o f NaOH p r i o r t o r e s i n a p p l i c a t i o n r e s u l t e d i n t h e lowest IR s t reng th .
DISCUSSION
A l though none o f t h e r e s i n s f o r m u l a t e d i n t h e s tudy y i e l d e d b o t h t h e maxinun 13 s t r e n g t h and t h e most s t a b l e panels d imens iona l l y , s e v e r a l r e s i n s a r e cons ide red t o be good cand ida tes f o r f u r t h e r improvement. Table 3 summarizes t h e t o p t h r e e r a n k i n g p h e n o l i c r e s i n s , r e s p e c t i v e l y , i n t e r w o f dec reas ing L E and TS s t a b i l i t y and If3 s t r e n g t h .
Thus, t o o b t a i n t h e most s t a b l e panels w i t 4 maximum IR s t r e n g t h , i t appears t h a t t h e optimum range f o r r e s i n f o r m u l a t i o n may be as f o l l o w s :
1 T o t a l NaOH c o n t e n t -- 0.8 t o 1.0 mole
2. NaOH a d d i t i o n i n r e s i n cook ing -- 0. 2 t o 0.4 moles
3. 4aOH a d d i t i o n p r i o r t o r e s i n a p p l i c a t i o n -- 0.4 t o 0.6 moles
A l though NaOH a d d i t i o n p r i o r t o r e s i n a p p l i - c a t i o n i s n o t a common p r a c t i c e i n manu fac tu r ing
s tandard pheno l i e r e s i n , i t does improve bonding q u a l i t y o f hardwood f l akeboard . A d d i t i o n a l work i s i n process t o determine i f o t h e r c a t a l y s t systems o r cook ing procedures can f u r t h e r improve t h e bonding p r o p e r t i e s o f p h e n o l i c r e s i n s . M o n g o t h e r t h i n g s , o p t i m i z a t i o n o f average i m f e c u l a r we igh t ( a t f i x e d - r e s i n v i s c o s i t y ) and op t im iza - t i o n o f m e t h y l o l c o n t e n t - mo lecu la r weight r a t i o a r e under s tudy t o develop a r e s i n w i t 4 maximum s t a b i l i t y and r e a c t i v i t y .
LITERATURE CITED
Hse, 6. Y. 1971. P r o p e r t i e s o f f 1 akeboards f ro in hardwoods
growing on sou thern p i n e s i t e s . For. Prod J. 25(3) :48-53,
Hse, G. Y. 1972. I n f l u e n c e o f r e s i n f o r m u l a t i o n v a r i a b l e s
on bond q u a l i t y o f sou thern p i n e p l y - wood. For. Prod. J. 2 2 ( 9 ) : 104-108
Lambuth, A lan L. 1967. Method o f p r e p a r i n g aqueous a l k a l i n e
phenol-aldehyde condensates. U, S. P a t e n t No. 3,342,776.
Redfern, Donald V. 1951. A r t o f making phenol-aldehyde r e a c t i o n
p roduc ts and t h e p r o d u c t t h e r e o f . U. S. Pa ten t No. 23347.
Tab le 1.--Vari a t i o n s i n concentrat Io_t -o f NaOH f o r 10-res ins
T o t a l NaOH con ten t -- Method o f NaOH a d d j t i o n
mo 1 es ---..-------------, % o l e NaOHImo 1e pheno 1-----------------
--- *The f i r s t number i s t h e p o r t i o n o f NaOH added d u r i n g r e s i n p r e p a r a t i o n ;
t h e second number i s t h e p o r t i o n o f NaOH added j u s t p r i o r t o r e s i n a p p l i c a t i o n .
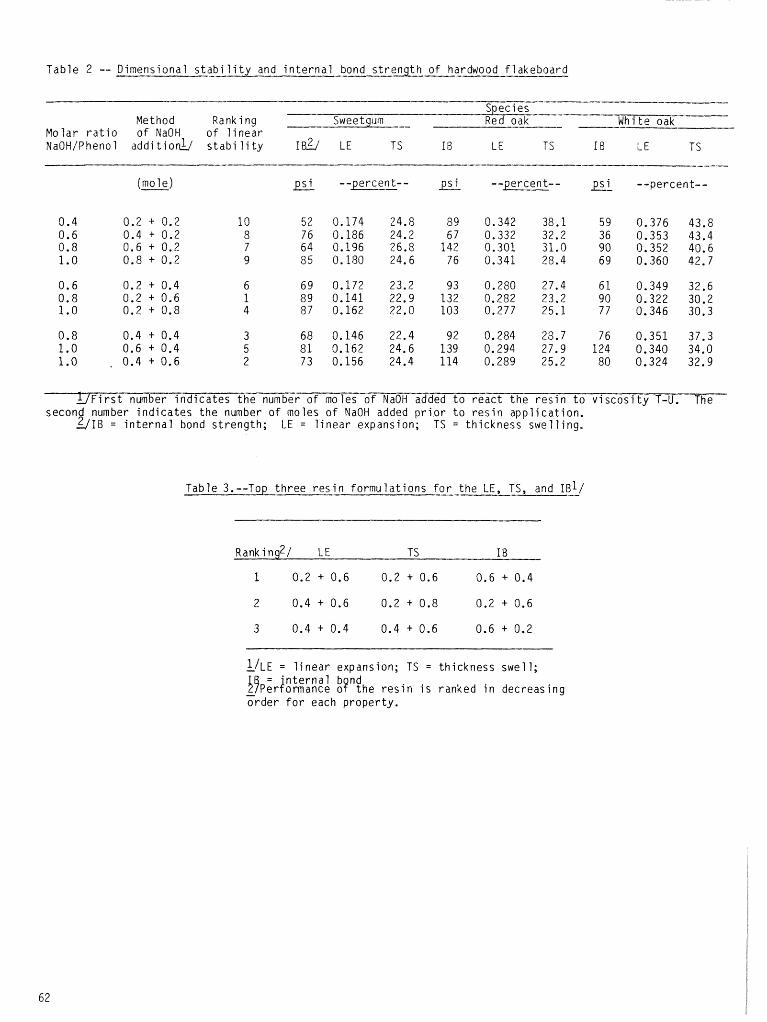
T a b l e 2 -- Dimensional s t a b i l i t y and i n t e r n a l bond s t r e n g t h o f hardwood f l a k e b o a r d
- --- - - Species ------
Met hod Rank i ng Sweetgum - Red v.kp- --- &fh i t e oak-- M o l a r r a t i o o f NaOW o f l i n e a r NaOHlPhenol add1 t i o & s t a b i 'ii t y I& LE T S I B LE TS f B LE T f
(mole) psi - -percent - - Psi - -percent - - psi --percent - -
Y F i r s t number i n d i c a t e s t h e number o f moles o f NaOH added t o r e a c t t h e r e s i n t o v i s c o s i t y T-U. The second number i n d i c a t e s t h e number o f moles o f NaOH added p r i o r t o r e s i n a p p l i c a t i o n .
Q I B = i n t e r n a l bond s t reng th ; LE = l i n e a r expansion; TS = t h i c k n e s s s w e l l i n g .
Tab le 3.--Top t h r e e r e s i n f o r m u i a t i o n s fo_r_-the LE, TS, and 181/
L/LE = l i n e a r expansion; TS = th i ckness s w e l l ; ' n t e r n a l b nd
$$~;r!ormance o? t h e r e s i n i s ranked i n dec reas ing - o r d e r f o r each p r o p e r t y .
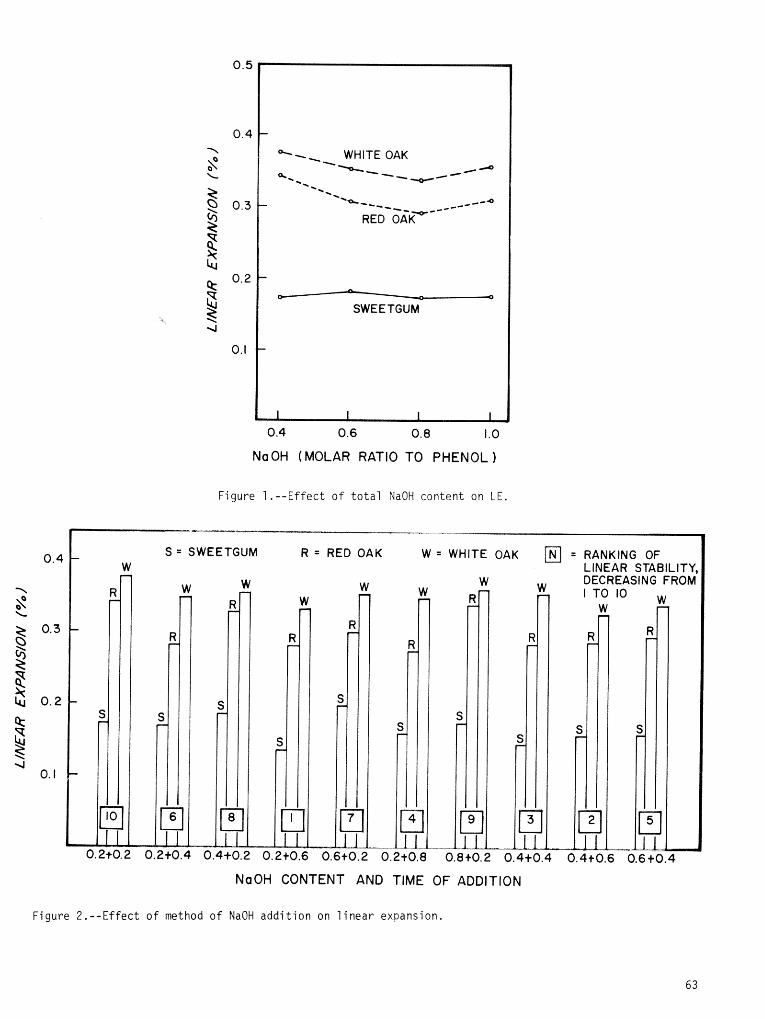
SWEETGUM
0 . 4 0 . 6 0.8 1.0
NaOH (MOLAR RATIO TO PHENOL
Figure ] . - -E f f ec t o f t o t a l NaOH content on L E .
S = SWEETGUM R = RED OAK W WHITE OAK = RANKING OF LINEAR STABILITY, DECREASING FROM
NaOH CONTENT AND TIME OF ADDITION
Figure 2 . - -E f fec t o f method o f NaOH a d d i t i o n on l i n e a r expansion.
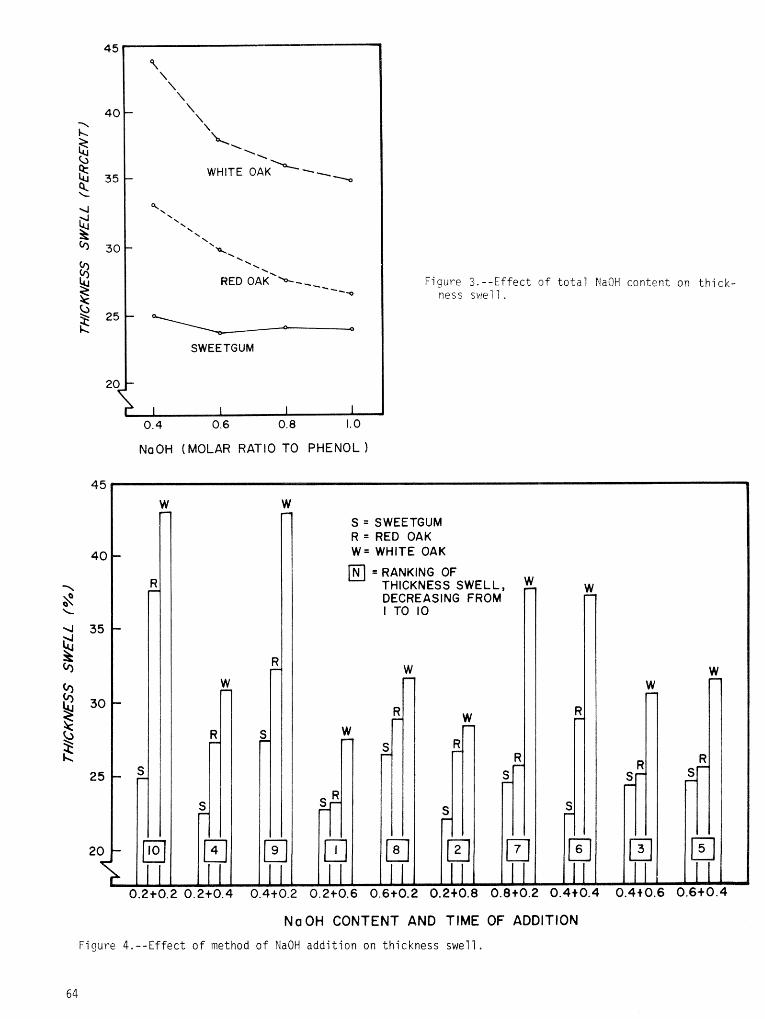
Figure 3 . - -E f fec t o f t o t a l NaOH content on t k i c k - ness s~!e11.
NaOH (MOLAR RATIO TO PHENOL 1
NoOW CONTENT AND TIME OF ADDITION
Figure 4.--Effect o f method o f NaOH a d d i t i o n on th ickness swe l l ,
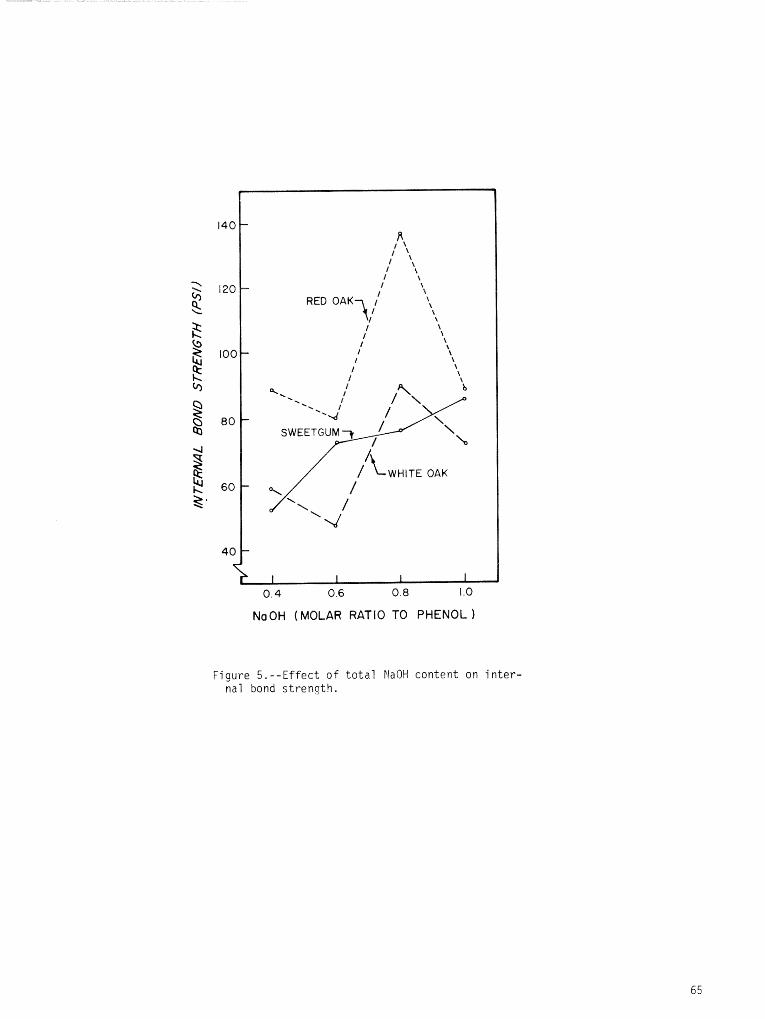
NaOH (MOLAR RATIO TO PHENOL )
Figure 5.--Effect of total NaOH content on inter- nal bond strength.
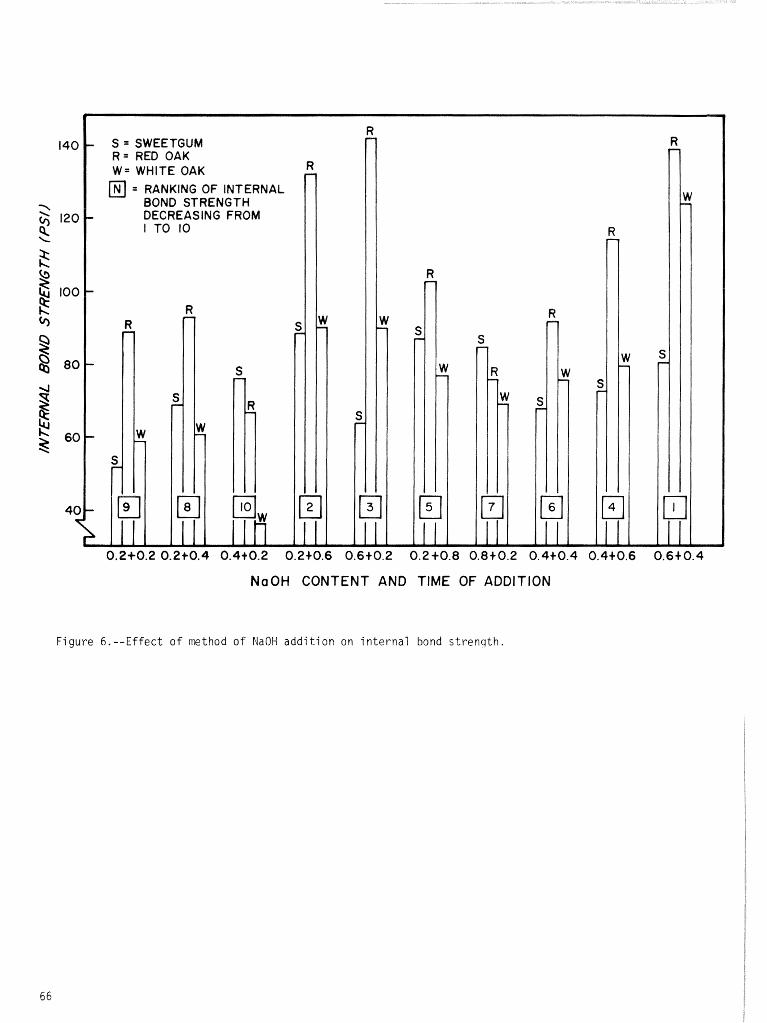
NoOH CONTENT AND TIME OF ADDITION
Figure 6.--Effect of method of NaOH addition on internal bond strenqth.
HOM CYCLIC HUMIDITY AFFECTS STATIC BENDING AND
DIMENSIONAL PROPERTIES OF SOME WOOD-BASE PANEL P R O D U C T S ~ ~
Z i J . Dobbin McNatt-
Abstract . - -Selected wood-base panel products were subjected t o a l t e r n a t i n g 30 and 90 percent r e l a t i v e humid i ty f o r up t o 2 years. The aim was t o eva lua te t he e f f e c t s o f c y c l i c humid i ty and l eng th o f exposure t ime du r i ng c y c l i n g on t he dimensional and s t a t i c bending p rope r t i es o f these products. Ma te r i a l s evaluated were f i be rboa rd sheathing, urea-formal dehyde (UF) and phenol -formaldehyde (PF) p a r t i c l e - board, waferboard, and hardboard. The l eng th o f each cyc le was e i t h e r 2 weeks o r 2 months. Some specimens were cyc led f o r a t o t a l of 2 years. A f t e r 12 consecut ive 2-week cycles, a1 1 panel types r e t a i n e d more than 80 percent o f t h e i r o r i g i n a l 1 oad-car ry i ng capac i ty and s t i f f ness i n bending . A f t e r 12 consecut ive 2-month cycles, t he f i be rboa rd sheathing, hard- board, waferboard, and PF pa r t i c l eboa rd s t i l l r e t a i ned 80 percent . However, t he UF p a r t i c l e b o a r d on l y r e ta i ned 50 t o 60 percent . D e t e r i o r a t i o n o f t he u rea- res in bond was a l s o r e f l e c t e d i n i r r e v e r s i b l e th ickness swe l l i ng t h a t was grea ter than t h a t o f o the r pane1 types.
INTRODUCTION exposure t ime dur ing c y c l i n g on the dimensional
Wood-base f i b e r and p a r t i c l e panel ma te r i a l s used i n s i d e f o r f u r n i t u r e and cab ine t pa r t s , f 1 oor under1 ayment , and w a l l and c e i 1 i ng cover ing a re seldom subjected t o extreme changes i n humid- i t y . However, panel products used as mobi le home f l o o r decking, e x t e r i o r s i d i ng , and roo f , w a l l , and f l o o r sheathing may be exposed t o cyc les o f h i gh and low humid i ty owing t o d a i l y and sea- sonal c1 imate v a r i a t i o n s (Lundgren 1969) o r t o moisture m ig ra t i on w i t h i n t he s t r u c t u r e (Duff 1968, Sherwood and Peters 1977). Such c y c l i c exposures can r e s u l t i n permanent dimensional changes, p a r t i c u l a r l y i n th ickness, and i n s t r eng th and s t i f f n e s s reduct ions. For adhesive- bonded wood p a r t i c l e panel s, t he magnitude o f t he changes i n p rope r t i es i s d i c t a t e d ma in ly by t he type and q u a n t i t y o f adhesive used. Proper ty changes, i n tu rn , a f f e c t t h e se rv i ce l i f e o f t he product. Palmer and Stashevski (1 979), f o r example, g i v e est imates made by Knight (1968) o f t he se rv i ce l i f e o f formaldehyde-based adhesives. The es t imate f o r urea-formal dehyde (UF) adhesives i n semiex te r io r and damp i n t e r i o r exposures i s 5 t o 10 years. Under t he same cond i t ions , a phenot- formaldehyde (PF) adhesive should per form indef- i n i t e l y .
The purpose o f t h i s s tudy was t o eva lua te t he e f f e c t s o f c y c l i c humid i ty and l eng th o f
1/Paper presented a t Workshop on Du rab i l i t y , ~ e n s a c o l a, FL, October 5-7-, 1982.
Z/Technologist, Fores t Products Laboratory, ~ ~ D ~ - F o r e s t Service, Madison, M I .
and s t a t i c bending p rope r t i es o f var ious wood- base panel products. F ive d i f f e r e n t wood-base panel types were evaluated f o r bending s t r eng th and s t i f f n e s s and dimensional changes a f t e r expo- posure t o d i f f e r e n t numbers o f cyc les (1, 3, 6, o r 12) of 30 t o 90 percent re1 a t i ve humidi ty (RH) . The l eng th o f each cyc le was e i t h e r 2 weeks o r 2 months so t h a t some specimens were cyc led f o r o n l y 2 weeks (1 wk, 30% RH + 1 wk, 90% RH) and some f o r 2 years (12 x (1 mo, 30% RH + 1 mo, 90% RH)). Panel types were se lec ted f rom those most l i k e l y t o undergo repeated h igh- low humid i ty cond i t i ons du r i ng serv ice : f i be rboa rd sheathing, hardboard s i d i ng , pa r t i c l eboa rd mobi le home f l o o r decking , pa r t i c l eboa rd f ac to r y -bu i 1 t house f 1 oor decking , and waferboard.
REVIEW OF LITERATURE
The l i t e r a t u r e i s extensive on t he e f f e c t s of moisture and weathering on phys ica l and mechanical p rope r t i es o f wood-base panel prod- uc ts . T h i r t y such references were l i s t e d by tehmann (1978). Many pub1 i c a t i o n s g i ve phys ica l and mechanical p rope r t i es o f wood-base panel products cond id t ioned a t d i f f e r e n t RW's f rom what has been r e f e r r e d t o as "mint cond i t i on . " That i s they were n o t subjected t o any p r i o r h igh- low humid i ty f l u c t u a t i o n s . Some o f these pub l i ca t i ons are l i s t e d i n l i t e r a t u r e c i t e d a t t he end o f t h i s paper (Ma l l igan and Schniewind 1974, Lundgren 1969, McNatt 1974a and b, and
1975, S t i l l inger and Goggan 1956, Terentiev 1965). Information from such s tudies i s useful as back- ground fo r fu r the r research; but in " r e a l - l i f e " exposures, some products are constantly subjected t o va r i a t ions in temperature and humidity.
Cycl i c Exposure Vs. Moisture Content and Dimensional Changes
f n most repor ts dealing with cyc l i c expo- sures of panel products, only changes in specimen moi s t u r e content (KC) and dimensions were determined (Beech 1975, Currier 1957, Halligan 1970, Heebink 1967, 1972, Johnson 1964, Ogland 1948, Ranta 1978, Steinmetz and Fahey 1968, Suchsland 1972, 1973). Usually r e s u l t s indica te an increase in e q u i l i - brium moisture content (EMC) due t o sorption hys te res i s and permanent thickness swelling. As reported by Hal 1 igan f 1970), a number of research- e r s have pointed out t h a t thickness swelling in part icleboard (and other wood-base panels) con- s i s t s of two par ts : swelling of the wood i t se l f - - recoverable, and re lease of compression s t r e s ses introduced by compression of the wood p a r t i c l e or f i b e r mat in the press--not recoverable. Most nonrecoverable dimensional changes occur a t h u - midi t i e s above 80 percent (Suchsland 1973). How- ever , Beech (1 975) reported an i r r eve r s ib le thickness increase of 1.2 t o 1 .5 percent fo r P F part icleboards (12% r e s i n ) conditioned t o equil i - brium a t 65 percent R H and then held a t t h a t condit ion f o r more than 20 weeks. This swelling was due t o spontaneous r e l i e f of compression s t r e s s e s in the wood and was in many cases es- s e n t i a l l y the same magnitude as t h a t of specimens cycled between 30 percent and 87 percent RH f o r 10 cycles (1 week a t each condit ion) and then reconditioned a t 65 percent R H . Suchsl and (1 973) and Lundgren (1969) point out t h a t par t of the "permanent" change measured when specimens are reconditioned a t the or ig inal RH i s due t o sorp- t i on hysteres is and would disappear i f the sam- ples were conditioned t o t h e i r or ig inal MC. Fra ipont ' s (1974) data support t h i s . He sub- jec ted numerous fiberboards and hardboards t o a s ing le cycle of 42 days each a t 65-95-40-65 per- cent RH. The i n i t i a l EMC averaged 6 percent. Final EMC averaged 7.2 percent.
Results from cyc l i c s tudies are af fec ted by the material evaluated, length of exposure f o r each s t ep in the cycle , number of cycles, and ranges of temperatures and humidities used. For exampl e , Gressel (1 980) reported MC increases of 2 t o 3 percent and thickness welling of about 0.4 percent during cycl ing of part icleboards between 45 and 80 percent RH every 24 hours a t 20°C. For specimens of the same material cycled between 25 and 95 percent RH every 24 hours a t 20°C, MC increase was 3-1/2 t o 5 percent, and thickness swelling was 1-1/2 t o 2 percent. When specimens were cycled between 35OC, 25 percent R H , and 200C, 95 percent R H , every 48 hours, MC increase averaged 6-1/2 t o 12 percent, and thick- ness swell averaged 2-1/2 t o 5 percent.
Different panel products pick up and lose moisture a t d i f f e ren t r a t e s depending upon raw material and manufacturing variables. I t i s doubtful t h a t hardboards o r pa r t i c f eboards reach EMC in l e s s than 6 or 7 weeks when exposed t o high humidity a t room temperatures f Fraipont 1974, Weebink 1972, Johnson 1956, Li i r i 1961 , tundgren 1969, McNatt 1974b. Shorter exposures would r e s u l t in intermediate levels of P4C and dimensional changes, Lundgren (1 969) found t h a t hardboards and part icleboards, i n i t i a l l y condi- tioned t o EMC a t 65 percent RH and then placed a t 90 percent R H , took 40 t o 50 days t o reach EMC but only 3 t o 6 days t o reach the halfway mark toward EMC. For cyc l i c humidity s tud ies , he suggested a cycle of 7 days a t 30 percent plus 7 days a t 90 percent R H .
3 1 Cyclic Exposure Vs. Strength Properties-
L i i r i (1961) determined loss in modulus of rupture (MOR) and in ternal bond s t rength f o r part icleboards subjected t o up t o 10 cycles of 3 weeks each a t 30 and 95 percent R H . The r a t e of strength loss decreased as the number of cycles increased, suggesting an asymptote some- where beyond 10 cycles. The MOR and in ternal bond strength decreased 25 percent f o r 10 cycles of exposure. Bryan and Schniewind (1965) r e - ported a 16 percent decrease in MOR and modulus of e l a s t i c i t y (MOE) f o r part icleboards subjected t o three cycles of 7 days a t 20 percent EFfC con- d i t i o n s , plus 7 days a t 6 percent EMC condit ions. In a study by Lehmann (1978), f ive cycles of 30 days each a t 90 and 30 percent R H had very l i t t l e e f f e c t on the 1 ad-carrying capacity and s t i f f - ness in bending/ of several experimental and commercial part icleboards. Morze and Synowiec (1979) reported an 88 t o 96 percent re tent ion of bending strength and 76 t o 93 percent re tent ion of bending MOE f o r various hardboards a f t e r s i x cycles of the following "stepwise" humidity cycle a t 20%: 48 hours a t 80 percent RH plus 120 hours a t 95 percent RH followed by 48 hours a t 70 percent R H . Dinwoodie (1978), repor t ing on work done a t the Princes Risborough Labor- a tory , B R E , in England, s t a t ed t h a t samples of UF commercial part icleboard subjected t o 50 cycles of 7 days a t 30 percent plus 7 days a t 90 percent RH (250C) retained 58 percent of or ig inal MOR and 45 percent of MOE. Panels bonded with phenol i c , ma1 ami ne-urea , o r sul f i t e l iquor adhesives retained more than 80 percent of MOR and more than 70 percent of MOE. Lee and Bib1 i s (1976) put UF and PF part icleboards through a s ingle cycle of 65-30-65-90-65 RH's a t
3lReported e f f e c t s of cycl ic humidity expo- sures-on bending properties mentioned here a r e sumarized in Table 4 and discussed l a t e r in t h i s paper.
4/The terms "load-carrying capacity" and "s t i f7ness" as used here r e f e r t o modulus of rupture and modulus of e l a s t i c i t y , respect ively , ca lcula ted using o r i g i n a l , unswelled specimen dimensions.
72OF (conditioned to EMC a t each s tep) . The MOE and MOR were reduced 20 and 16 percent, respect- ively,
The most severe temperature-humidity cyclic exposure for particleboard was reported by Hann e t a l . (1963). I t consisted of 1 week a t 8O0F and 90 percent RM, plus 1 week ad lSO°F and 20 percent R H . This exposure cycle was continued for 2 years on experimental particleboards. Per- cents of original bending strengths retained ranged from about 70 percent for PF boards to less than 20 percent for UF boards.
HATER IALS The f ive different commerical wood-base panel
products in t h i s study represented those products that were l ikely to undergo fluctuating MC in use. The materials were:
1. 112-inch-thick regular-density fiberboard sheathing
2. 318-inch-thick medium-density hardboard siding
3 . 518-inch-thick UF mobile home decking particleboard (Note: This material was manufactured under Class D-1 of the 1970 Standard for Particleboard for Mobile Home Decking, NPA 1-70. Class D-1 was deleted in revision of the standard so tha t now th i s material would not meet the current minimum property requirements for* particleboard mobile home decking in NPA 1-82.)
4. 5/8-inch-thick P F factory-built house decking particleboard.
5. 1/2-inch-thick PF aspen waferboard
The material used for specimens consisted of f ive 2- by &foot sections cut from f ive different panels of each of the panel types. Properties of these materials were determined from control specimens (Table 1 ) .
METHODS
Two separate ser ies of specimens were evalu- ated in t h i s study. The f i r s t ser ies was sub- jected to repeated cycling of 1 week a t 30 per- cent plus 1 week a t 90 percent RH a t 800F for a 2-week cycle. For the second ser ies a cycle of 30 days a t 30 percent plus 30 days a t 90 percent RH was used for a 2-month cycle.
Each of the 2- by 4-foot sections of material described in the previous section was cut into two se t s of twelve 3-inch-wide bending specimens ( f i g 1 Specimen length was 24 times the speci- men thickness plus 2 inches as specified in Ameri- can Society for Testing and Materials (ASTM) Standard D 1037 (1 972). A1 1 specimens were ini -
5 1 t i a l l y conditioned to EMC- a t 80°F and 65 per- cent RH. Those marked ""C' were then tested as controls without any cyclic exposure. One of each of the other specimens in each se t was ran- domly selected and subjected to e i ther 1 , 3, 6 , or 12 of the appropriate cycle ( 2 wk or 2 mo). Afterwards these specimens were reconditioned do EMC a t 65 percent RW and tested in s t a t i c bendins Three of the 5 replications subjected t o 12 repe- t i t i ons of the 2-week or 2-month cycle were weighed and measured a f t e r each half cycle to determine progressive changes in N C , thickness, and length during the 24 weeks or 24 months of total exposure time.
DISCUSSION AND RESULTS
Moisture Content and Dimensional Stabi l i ty
Figure 2 shows the progressive changes in moisture content, thickness, and length during the 24 weeks or 24 months of cyclic humidity exposure for the waferboard specimens. Average changes in MC, thickness, and length for the 23 times the waferboard specimens were transferred from 30 to 90 percent RH (or from 90 to 30) over the total exposure time were:
MC change Thickness change Length change
These values and figure 2 are presented simply as an example and do not represent the other materials. The corresponding values fo r a l l f ive panel types are shown in figure 3. As supposed, changes in moisture content as we1 1 as thickness and length were greater for the 2-month cycle than for the 2-week cycle because of the longer exposure time a t each humidity. The ex- ception to t h i s was the fiberboard sheathing which was able t o pick up, or lose, moisture fas te r because of i t s lower density and greater porosity (Fraipont 1974). The percent moisture change did not vary greatly among the panel types for e i ther the 2-week cycle (5.2% to 7%) or the 2-month cycle (7.1% to 9.4%) ; however, the weight of moisture gained, or l o s t , varied considerably. For example, the MC changes for the fiberboard sheathing and the hardboard siding were both about 7 percent, but the hardboard gained (and l o s t ) double the weight ot moisture since i t weighed twice as much as the fiberboard. Relative thickness change, and to a lesser degree I inear change of the fiberboard and hardboard, were affected by the density difference. The higher- density hardboard changed more in both thickness and length than did the fiberboard sheathing.
51"PracticaI equilibrium" as defined in ASTM D 1037 was used to determine when specimens were ready for tes t ing (specimens were neither losing nor gaining weight by more than 0.05% in a 24-hr period) .
For both cyclic exposures, thickness change was greater for the waferboard than for either of the two particleboards which were made pri- marily from planer shavings. On the other hand, linear expansion was much greater for the particleboards than for the waferboard. This is typical of comparative behavior of panels made from 1 arge flat flakes (wafers) and those made from finer particles (McNatt 1974a and 1974b, Suchsf and 19733, In panels made from wafers, the grain direction of the wood lies essentially in the plane of the panel ; whereas in panels made from planer-shaving- or sawdust- type particles, the grain direction can deviate substantially from the plane of the panel. Bonding of the randomly distributed overlapping wafers restricts linear movement in much the same way as cross alinement of veneers in ply- wood. At the same time, thickness swelling in flake-type panels is maximized because the grain of the flakes lies in the plane of the panel and wood swell s much more across the grain than along the grain.
Residual changes in MC and dimensions of the specimens reconditioned to 65 percent RH following the 12 humidity cycles are given in Table 2. Except for irreversible thickness swell ing (spri ngback) of the UF parti c1 eboard, little difference exists betbeen results from the 2-week and 2-month cycle exposures. Spring- back of the UF particleboard specimens after the twelve 2-month cycles (5.6%) was more than twice the springback after the twelve 2-week cycles (2.1%) ).
The longer exposure time at high humidity appears to have a greater effect on the point- to-point bonds in the UF particleboard than in the PF particleboard. Little difference in the PF particleboard springback exists between the 2-week cycle (1.2%) and the 2-month cycle (1 ' 7 % ) . Scharfetter (1 977) stated that chemical degrada- tion was not the cause of deterioration of ex- terior particleboard; rather the causes are of a mechanical nature. The greater deterioration of the UF panel is likely the result of hydro- lytic decomposition of the adhesive bond as dis- cussed by Gil lespie (1968) in addition to the repeated internal (mechanical ) stressing at the glue bonds as a result of the cycling (Dinwoodie 1977, Gillespie 1965).
As suggested by 0. Suchsland (personal correspondence, Michigan State University, 1982), a change in properties of a1 1 densified wood-base products associated with permanent thickness swelling exists aside from any deteri- oration of the g1 ue bonds. GI ue bonds wi 1 l break during swelling, but not because of the effect of moisture on the bonds. This change in properties whould be independent of glueline quality and should be subtracted from the original (control ) property before glue bond deterioration is determined.
For long exposure to high humidity in a nonsterile environment, deterioration due to
fungus attack is a possibility. Phenolics are more resistant to fungus attack than ureas (Schmidt et a1 . 1978).
Specimens in this study were reconditioned at 65 percent RH from the 90 percent RH exposure. Due to sorption hysteresis, final EMC values at 65 percent RH were 1.2 to 2.8 percent higher than those after initial conditioning. Residual changes in length were inconsistent and ranged from -0.04 percent to e0.07 percent.
Static Bending Properties
The effects of humidity cycling on static bending properties were determined from values of "load-carrying capacity" and 'ktiffness," defined here as being MOR and MOE calculated using initial specimen thickness at 65 percent RH. Calculations based on initial thickness remove the influence of irreversible thickness swelling on load- carrying capacity and stiffness. Changes in a wood-base panel's ability to carry the required load or resist deflection due to cyclic exposure after being placed in a structure should be deter- mined independent of changes in dimension.
The average values for the five panel types, expressed as a percent of control values, are given in table 3 and plotted in figures 4 and 5. The effects of cycling were essentially the same for both load-carrying capacity and stiffness. The effects of the 2-month cycling were much more severe for the UF particleboard than for any of the other panel types.
After 12 of the 2-month cycles, the UF particleboard retained only 50 percent of the original strength and 61 percent of the original stiffness; the other four panel types retained 82 to 97 percent of their original strength and stiffness. After 12 of the 2-week cycles, all panel types, including the UF particleboard, retained 83 to 97 percent of their original strength and stiffness (fig. 6).
Except for the UF particleboard, differences between strength and stiffness retained after 12 cycles of the 2-month and 2-week exposures were not significant,
Using information from various literature sources (and this study), I have summarized the effects of cyclic humidity exposures on MOR and MOE in bending of wood-base panel products (table 41, With one exception (Lehmann 1978), previous1 y pub1 i shed data were cal cuf ated using specimen dimensions at test. Therefore, tehmann's 1978 data and the data in this study were converted to the same base so that some comparisons could be made. Because of the diverse exposure conditions used, direct comparisons among studies are diffi - cult; however, certain statements can be made based on table 4:
1. Properties of UF particleboards are affected more by cyclic exposure than those
than those bonded with more durable adhesives such as phenol -formaldehyde (Dinwoodie 1977, Hann, Black, and Blomquist 1963, Morze and Struk 1980, Palmer and Stashevski 1979 and this study).
2. Cyclic exposures affect board properties more severely at higher temperatures (Dinwoodie 1977 compared with Hann, Black, and Blomquist 1963 and Morze and Struk 1980).
3. At given temperaturelhumidity conditions, and the same total cyclic exposure time, effects on properties of UF particleboard will be compa- rable regardless of duration of individual cycle. For example, for 50 cycles of 7 days each at 30 and 90 percent RH, an exposure time of about 2 years (Dinwoodie 1977) gave essentially the same property retention (507;) as 12 cycles of 30 days each at 30 and 90 percent RH (current FPL study). This does not appear to be true for PF particle- boards. Comparisons among val ues reported by Dinwoodie (1977), by Lehmann (1978), and in this study show little differences in property re- tention for 5, 12, or 50 cycles or 2-week or 2- month exposures per cycle.
CONCLUSIONS
The results of cycling selected wood-base panel products between 30 and 90 percent RH--2 weeks or 2 months per cycle--for up to 12 cycles show that:
1. For particleboard, the long cycle expo- sure affected the UF product properties much more than it affected the PF product. After 12 of the 2-month cycles, the UF panel retained 50 to 60 percent of original load-carrying capacity and stiffness in bending whereas the PF particleboard, as well as the waferboard, hardboard siding, and fiberboard sheathing, retained more than 80 per- cent. However, after 12 of the 2-week cycles, all panel types, including the UF particleboard, retained more than 80 percent of their original load-carrying capacity and stiffness.
2. Deterioration of the urea-resin bond was a1 so reflected in greater irreversible thickness swell ing (springback) as compared to the other panel types.
3. The data in this study indicate that, with the exception of UF particleboard, the 2-week cycle is as effective as the 2-month cycle for evaluating the behavior of wood-base panel prod- ucts in fluctuating humidity environments.
LITERATURE CITED
American Society for Testing and Material s 1972. Standard methods of evaluating the prop- erties of wood-base fiber and particle pane1 materials. ASTM Design. D 1037-72a, Note 38.
Beech, J. C. 1975. The thickness swelling of wood particle- board. Holzforschung 29(1) : 1 1 -18.
Bryan, E. L., and A. P. Schniewind 1965. Strength and rheological properties of particleboards as affected by moisture
content and sorption. For. Prod. J . 15(4): 143-148.
Currier, R. A. 1957. Effect of cyclic humidification on dimen- sional stability of commercial hardboard. For. Prod. J . 7 (3 ) :95-100.
Dinwoodie, 3. J , 1977. Causes of deterioration of U.S. chipboard under cyclic humidity conditions. I. Per- formance of U.F. adhesive films. Holzfcrs- chung 31 (2) : 50-55.
Dinwoodie, J . M. 1978. The properties and performance of parti- cleboard adhesives. J. Inst. Wood Sci. 8(2) : 59-68.
Duff, J. E. 1968. Moisture distribution in wood-frame walls in winter. For. Prod. J. 18(1) :60-64.
Fraipont, L. 1974. Modification of the physical and mechani- cal properties of fiberboards caused by a long term immersion in water at 20°C and by natural and artificial aging tests. Rapport d'activate, Station de Technologie Forestiere, Gembl oux, Be1 gi um. p. 155-207.
Gillespie, R. H. 1965. Accelerated aging of adhesives in plywood-type joints. For. Prod. J. 15(9) :369- 378.
Gillespie, R. H. 1968. Parameters for determining heat and moisture resistance of a urea-resin in plywood-type joints. For. Prod. J. 18(8) :35- 41 .
Gressel , P. 1980. Particleboard adhesive durability testing and assessment. A contribution to the formu- lation of adhesive-independent test guide- lines. Part 1: Statement of the problem- test planning and execution-resul ts. Hol z a1 s Roh-und Werkstoff 38(1) : 17-35. Part 2: Discussion of results 38(2) :61-71. Part 3: Conclusions and proposed test guidelines 38(3) : 109-1 13.
Halligan, A. F. 1970. A review of thickness swellinq in parti- cleboard. Wood Sci . and Techno1 . 4(4) :301- 312.
Halligan, A. F., and A. P. Schniewind 1974. Prediction of particleboard mechanical properties at various moisture contents. Wood Sci. and Techno. 8(1):68-78.
Hann, R . A., J . M. Black, and R. F. Blomquist 1963. How durable is particleboard? Part 11: The effect of temperature and humidity. f o r . Prod. J . 13(5):169-174,
Heebink, B. G . 1967, A look at degradation in particleboard for exterior use. For. Prod. 3. 77(1):53-66.
Heebink, B. G. 1972. Irreversible dimensional changes in panel materials. For. Prod. 5. 22(5) :44-48.
Johnson, J . W. 1956. Dimension change in hardboard from soak- ing and high humidity. Report No. T-16, Oregon Forest Products Laboratory, Oregon State University, Corvallis, OR.
Johnson, J. W. 1964. Effect of exposure cycles on stability of
commercial particleboard. For. Prod. J . 1467) :277-282.
Knight, R. A. G . 1968. The efficiency of adhesives for wood. Ministry of Technology. For. Prod. Res. Bull . No. 38. MMSO, London.
Lee, W.-C., and E. J . Biblis 1976. Effects of a high and low relative humidity cycle on properties o f southern yellow pine particleboards. For. Prod. J , 26 (6) : 32-35.
Lehmann, W. F. 1978. Cyclic moisture conditions and their effects on strength and stability of structural flakeboard. For. Prod. J . 28(6) : 23-31 .
Liiri, 0. 1961. Investigations into long-term moisten-
ing of wood particleboard and the effect of changes in moisture on its qualities. Paperi ja Puu 43(12) : 737-748.
Lundgren, S. A. 1969. Wood-base panel products as structural material. Part I. Swedish Wallboard Manu- facturers Assoc., Stockholm, Sweden.
McNatt, J. D. 1974a. Effects of equilibrium moisture con- tent changes on hardboard properties. For. Prod. J . 24(2) : 29-35.
McNatt, J. D. 1974b. Properties of particleboards at var-
ious humidity conditions. USDA For. Serv. Res. Pap. FPL 225. For. Prod. Lab., Madison, WI.
McNatt, J. D. 1975. Humidity effects on properties of structural particleboards from forest resi - dues. USDA For. Serv. Res. Pap. FPL 267. For. Prod. Lab., Madison, WI.
Morze, Z., and K. Struk. 1980. Variations of viscoelastic properties of particleboard as a result of moistening and drying. Wolzf. and Holzver. 32(5):113- 116.
Morze, Z., and J. Synowiec 1979. About the elastic properties of hard- board as a result of the effects of cyclic moistening and drying. Holzf. and Holzver. 31 (1 ) :9-14.
Ogland, N. J. 1948. Swelling and shrinking of hardboard. Svens k Papper. 51 (1 6) : 357-360.
Palmer, R. E., and A. M. Stashevski 1979. The effect of humidity cycling on commercial particleboards. Division of Building Research, CSIRO, Highett, Victoria, Australia.
Ranga, L. 1978. Investigations of dimensional changes
in the plane of particleboard. Part 4: Pilot tests to reduce linear surface variations by optimizing operational techni- ques. ti01 z a1 s Roh-und Werkstoff 36(1) : 37-44 *
Scharfetter, ti. 1977. How exterior particleboard deteriorates
IUFRO Paper S4.04-05 for presentation at meeting of IUFRO Wood Processing Subject Group, Oct. 3, 1977, Merida, Venezuela. 5 p.
Schmidt, E. L . , D. W . French, R . 0. Gertjejansen, J. Mermann, and H. Hall. 1978. Strength reductions in particleboard caused by fungi. For. Prod. 3. 28(2) : 26-31.
Sherwood, G. E., and C. C. Peters 1977. Moisture conditions in walls and ceil- ings of a simulated older home during winter. USDA For. Serv. Res. Pap. FPL 290. For. Prod. Lab., Madison, MI. 19 p.
Steinmetz, P. E., and D. G . Fahey 1968. Resin treatments for improving dimen- sional stability of structural fiberboard. For. Prod. J. 18(9) :71-75.
Stillinger, J. R., and W . G. Coggan 1956. Relationship of moisture content and flexural properties in 25 commerci a1 hard- boards. For. Prod. J. 6(5) : 179-1 86.
Suchsland, 0. 1972. Linear hygroscopic expansion of selected commercial particleboards. For. Prod. J. 22(11):28-32.
Suehsland, 0. 1973. Hygroscopic thickness swelling and related properties of selected commercial particleboards. For. Prod. J. 23(7) :26-30.
Terentiev, V. Ya. 1965. Influence of moisture content on the properties of particleboard. Derev. Prom. 14(1):5-7.
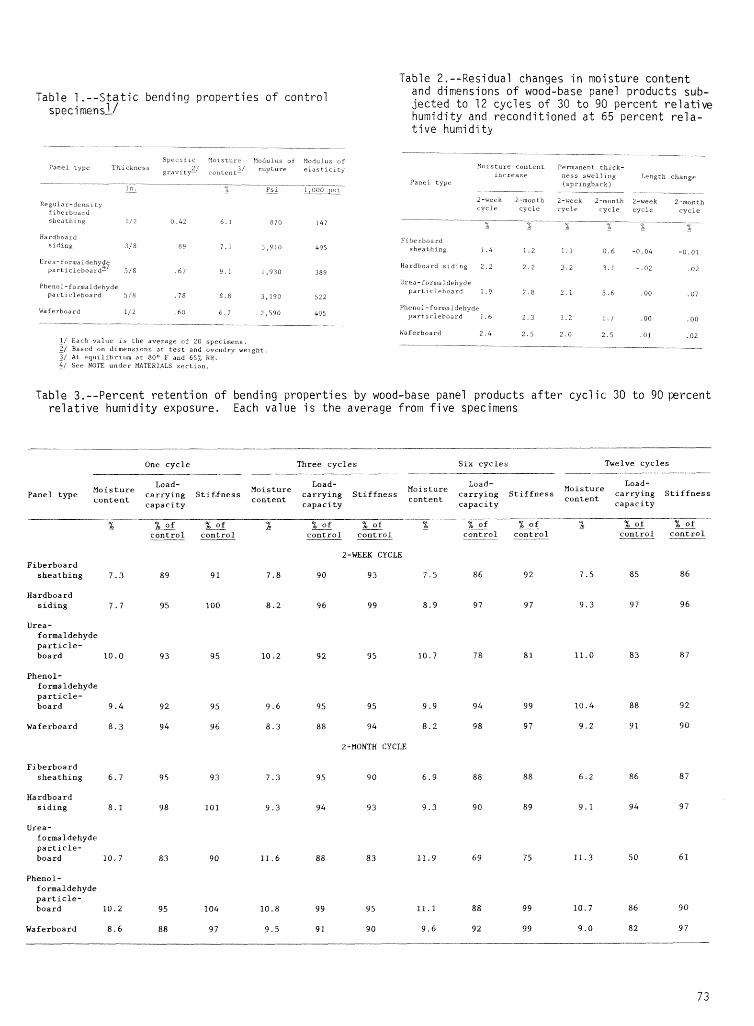
Table 2.--Residual chanses in moisture content
Table 1 . - -Stat ic bending properties of control specimensY
and dimensions of wood-base panel products sub- jected to 12 cycles of 30 t o 90 percent relative humidity and reconditioned a t 65 percent re la- t i ve humi di ty
--- S p r c ~ f i c Y o i s t b r e Modulus o f Modulus of
Parlei t y p e ThicXr.ess grav,tv2/ contert?i r u p t u r e e i a s t l c l r ~ Y o ~ s t u r r c o n t e n t Permanent t h r c k - ~ n c r e a s e n e s s s * e l l r n g Length change
- -- Panel t j p c IF
(spr ingback , - - b P S ~ -- ~ , ~ ~ ~ p l / --
i 'ardbaard s i drng 3 / 8 89 7 1 3 ,910 495
i / Each v a l u e x s t h e average of 20 cpeclmens 2 / Based on d i m e n s ~ o n s a t t e s t and ovendry b e ~ g h t 31 A t equxi rbrxum a t 8O0 F and 65% RH 4/ See NOTE u n d e r MTERIALS s e c t i o n
?-week 2-month c y c l e c y c l e
Hardboard s l d i n g 2 . 2 2 . 2
h e n o l - f o r n i a i d e h y d e y a r t ~ c l e b o a r d 1 . 6 2 . 3
Waferboard 2.4 2 . 5
2-beek Z-month Z-week 2-month c y c l e c y c l e c y c l e c y c l e --
X -- f x -
Table 3.--Percent retention of bending properties by wood-base panel products a f t e r cyclic 30 to 90 percent re la t ive humidity exposure. Each value i s the average from five specimens
One c y c l e Three c y c l e s S i x c y c l e s Twelve c y c l e s
Load- Load- Load- Load- panel type carrying S t i f , f n e s s content
carrying S t i f f n e s s content content carrying S t i f f n e s s carrying S t i f f n e s s Moisture
c o n t e n t capaci ty capaci ty capaci ty capaci ty
I!? %Of %* 2 % - o f X % o f % o f 3 %rt_f_ %A control control - - control control - - control control - - control c o n t r o l - -
2-WEEK CYCLE Fiberboard
sheathing 7.3 8 9 9 1 7 .8 9 0 9 3 7 . 5 86 9 2 7.5 85 86
Hardboard s i d i n g 7.7 9 5 100 8 . 2 9 6 99 8 .9 9 7 97 9 . 3 97 9 6
Urea- formaldehyde p a r t i c l e - board 10.0 93 95 10.2 92 95 10.7 7 8
Phenol- formaldehyde p a r t i c l e - board 9.4 92 95 9 .6 95 9 5 9 . 9 9 4
Waferboard 8 . 3 9 4 9 6 8 . 3 88 94 8 .2 9 8
2-MONTH CYCLE
Fiberboard sheathing 6 . 7 95 9 3 7 .3 95 9 0 6 . 9 88 88 6.2 86 87
Hardboard s i d i n g 8 . I 98 101 9 .3 9 4 93 9 . 3 90 89 9 . 1 9 4 9 7
Urea- fomaldehyde p a r t i c l e - board 1 0 . 7 83 9 0 11.6 88 8 3 11.9 69 75 11.3 5 0 6 1
Phenol- f omaldehyde p a r t i c l e - board 10.2 95 104 10.8 99 95 11.1 88 9 9 10.7 86 9 0
Waferboard 8 . 6 8 8 9 7 9 .5 9 1 9 0 9 .6 92 9 9 9 . 0 82 9 7
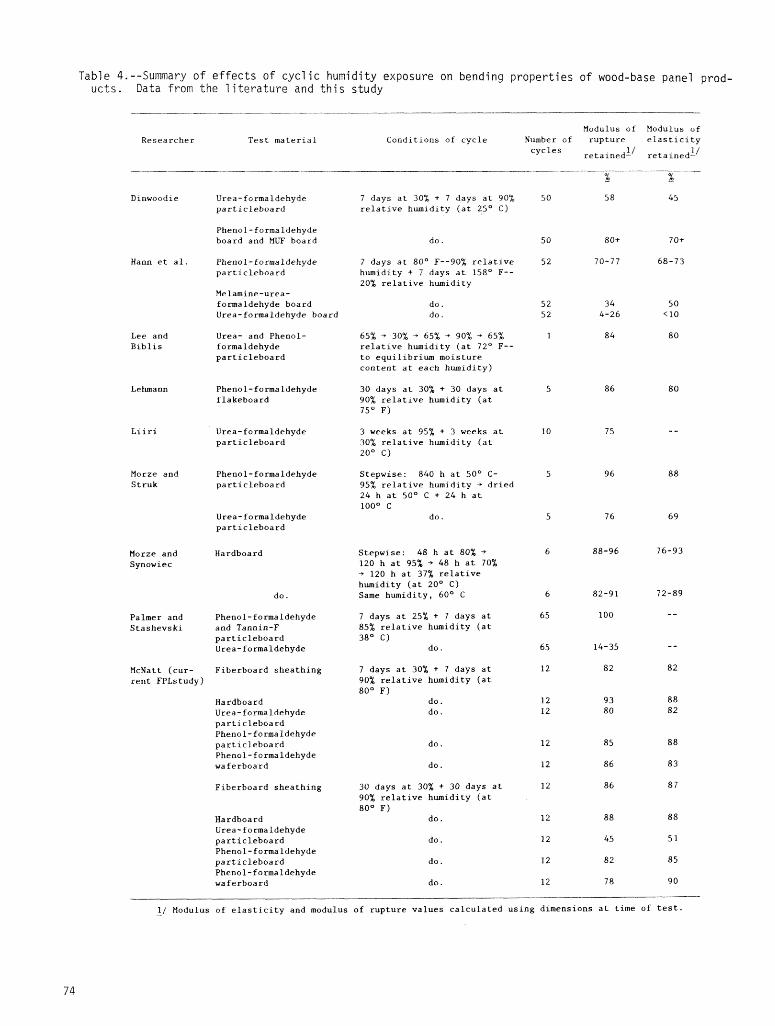
Table 4.--Summary of effects of cyclic humidity exposure on bending properties of wood-base panel prod- ucts. Data from the literature and this study
Modulus of Modulus of Researcher Test material Conditions of cycle Nunber of rupture elasticity
cycles retaxnedL/ retainedL'
Dinwoodie Urea-formaldehyde particleboard
7 days at 30% + 7 days at 90% relative humidity (at 25O 6)
Phenol-formaldehyde board and rPUF board do.
Phenol-formaldehyde particleboard
7 days at 80° F--90% relative humidity + 7 days at 158O F-- 20% relative humidity
Melamine-urea- formaldehyde board Urea-formaldehyde board
do. do.
Lee and Biblis
Urea- and Phenol- formaldehyde particleboard
65% + 30% + 65% + 90% + 65% relative humidity (at 72O F-- to equilibrium moisture content at each humidity)
Le hmann Phenol-formaldehyde f lakeboard
30 days at 30% + 30 days at 90% relative humidity (at 75O Fl
Urea-formaldehyde particleboard
3 weeks at 95% + 3 weeks at 30% relative humidity (at zoo C)
Liiri
Morze and Struk
Phenol-formaldehyde particleboard
Stepwise: 840 h at 50° C- 95% relative humidity * dried 24 h at 50° C + 24 h at loo0 C
do. Urea-formaldehyde particleboard
Stepwise: 48 h at 80% +
120 h at 95% -+ 48 h at 70% -+ 120 h at 37% relative humidity (at 20° C ) Same humidity, 60° C
Hardboard Morze and Synowiec
do.
7 days at 25% + 7 days at 85% relative humidity (at 38O C)
do.
Palmer and Phenol- formaldehyde Stashevski and Tannin-F
particleboard Urea-formaldehyde
McNatt (cur- Fiberboard sheathing rent FPLstudy)
7 days at 30% + 7 days at 90% relative humidity (at 80° F)
do. do.
Hardboard Urea-formaldehyde particleboard Phenol-formaldehyde particleboard Phenol-formaldehyde waferboard
do.
30 days at 30% + 30 days at 90% relative humidity (at 80° F)
do.
Fiberboard sheathing
Hardboard Urea-formaldehyde particleboard Phenol-formaldehyde particleboard Phenol-formaldehyde waf erboard
I / Modulus of elasticity and modulus of rupture values calculated using dimensions at time of test.
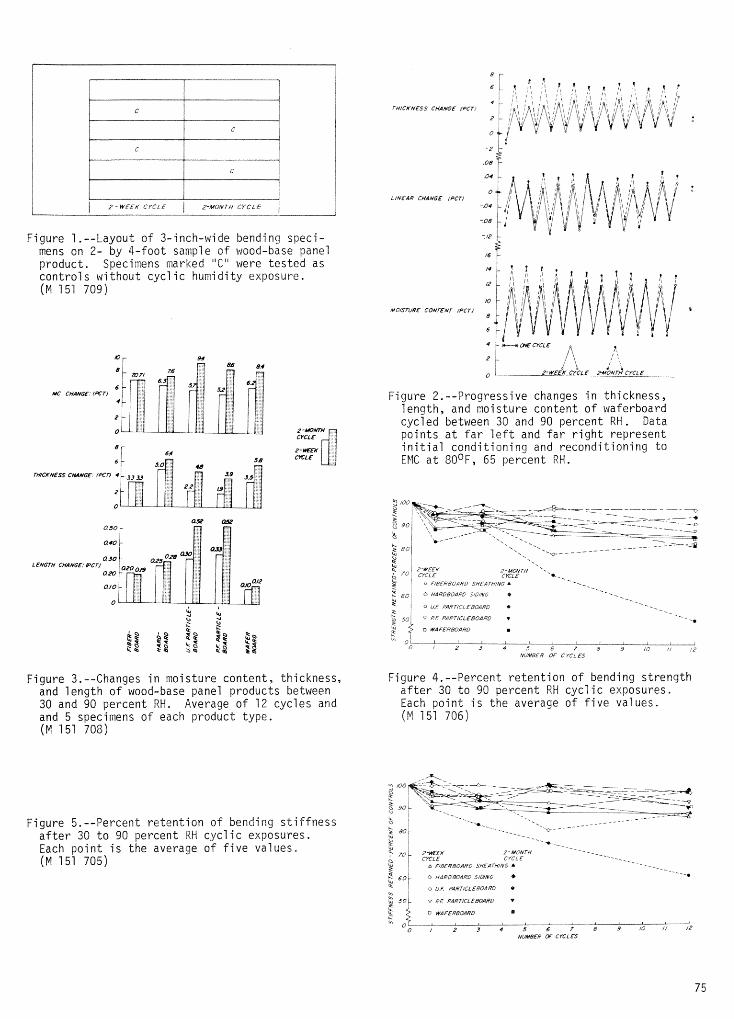
Figure 1.--Layout of 3-inch-wide bending speci- mens on 2- by &foot sample of wood-base panel product. Specimens marked "C'here tested as control s without cycl ic humidity exposure. (PI 151 703)
Figure 3.--Changes in moisture content, thickness, and length of wood-base panel products between 30 and 90 percent RH. Average of 12 cycles and and 5 specimens of each product type. (PI 151 708)
Figure 5.--Percent retention of bending stiffness after 30 to 90 percent RH cyclic exposures. Each point is the average o f five values, ( M 151 705)
I 0 ' 2'WEC-X CYCLE &WONT$ CYCLE'
Figure 2.--Progressive changes in thickness, length, and moisture content of waferboard cycled between 30 and 90 percent RH. Data points at far left and far right represent initial conditioning and reconditioning to EPIC at BO°F, 65 percent RH.
" 0 L 1 I t h ~ * j 8 . ~ , O f P . ? 4 5 6 7 8 9 ~ O / i ~ z
NdMBER OF CYCLES
Figure 4.--Percent retention of bending strength after 30 to 90 percent RH cyclic exposures. Each point is the average of five values. ( M 151 706)
1- MONTH -. 5 70 1 *-WEEK -. - -
CYCLE --
8 C " M -- --- .-
5 F / M R B O d R D SHEdTHIYG A - - -. -s - - .- - _ _
60 /- 0 HdRDBG.1R.O SiBNG * ----a
~ffMffE# (Y CYCLES
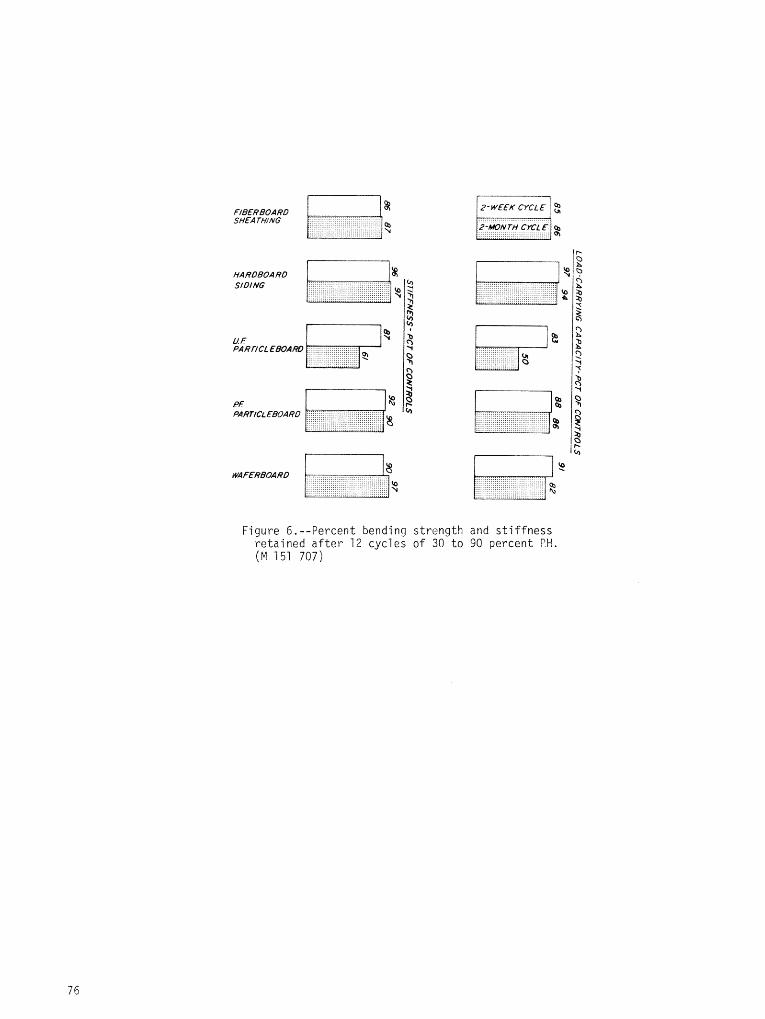
FIBERBOARD %
SHE4 THlNG 9
I WAF ERBOA RD ITro
L - A "
Figure 6.--Percent bending strength and stiffness retained after 1 2 cycles of 30 to 90 percent pH. (M 151 707)
PREDICTING ASTM Dl037 6-CYCLE
ACCELERATED AGING OF WAFERBOARD IN 27 HOUR^' 2 / R . M. Knudson and 6 . N. Rosenberg-
Abstract.--An excellent correlation, which allows pre- diction of aged MOE in 27 hours compared t o three weeks for the ASTM t e s t , was established in the laboratory between CSA 0188.0 two-hour boil t e s t followed by a 24-hour drying cycle and six-cycle ASTM Dl037 t e s t . ASTM MOE predicted by t h i s method, a f t e r adjustment for specific gravity showed that the majority of panels f e l l within "5% of the actual MOE va1 ue ( r2 = 0.67). For an in-pl ant evaluation, MacMi 11 an Bloedel Research personnel established and monitored the rapid aged MOE t e s t a t MacMillan Bloedel's Thunder Bay Divi- sion for about one year. Findings confirmed the su i tab i l i ty of the t e s t method as a quality control procedure, which would enable immediate corrective action i f there i s evidence that the process i s out of control. The rapid aged MOE t e s t has been adopted as part of the regular mi11 t e s t procedure to evaluate significant process changes a t MacFlillan Bloedel mills.
INTRODUCTION
Considerable research has been carried out t o develop accelerated weathering t e s t s and to corre- l a t e these t e s t s with long term natural weathering of wood based panel products (Deppe 1981 ; Deppe , St01 zenburg , and Schmidt 1976 ; Deppe and Schmidt 1979; Endicott and Frost 1967; Lehmann 1977; Shen 1977), Purpose of thi s work, however, was to develop a rapid method of simulating ASTtI Dl037 accelerated aging (American Society for Testing and Materials 1982) as a quality control procedure for waferboard manufacture.
Six-cycle ASTM Dl037 accelerated aging t e s t i s required by U.S. regulatory agencies fo r mar- keting waferboard in the United States. Minimum time to complete six-cycle ASTM accelerated aging i s 14 days. However, as most laboratories do not have automated aging f a c i l i t i e s , the normal time to complete s ix cycle ASTM accelerated aging i s three weeks. Because of the long time t o complete the aging cycle, the t e s t method i s not a suitable quality control procedure to enable corrective action in a production s i tuat ion.
1 /Paper presented a t Workshop on Durabi 1 i ty , ~ensaco la , F L , October 5-7, 1982.
2 / ~ h e authors are Section Head, Panel board ~ r o c e s s i ng , and Senior Research Chemist, MacMi 11 an Bloedel Research, 3350 East Broadway, Vancouver, B.C,, V5M 4E6, Canada.
PROCEDURE
Work to develop a rapid method for predic- t ing six-cycle ASTM 01037 accelerated aging as a qua1 i ty control procedure for waferboard man- facture was carried out in three successive stages.
Preliminary Screening Tests
A mill-produced 7116-inch (11.1 mm) thick 4 x 8 foot (1220 x 2440 mm) panel with known areas of good and poor bonding was cut into ASTM Dl037 s t a t i c bending t e s t specimens (American Society for Testing and Materials 1982). Speci- mens were assigned for tes t ing a f t e r accelerated aging by the following methods:
A. ASTM Dl037 six-cycle accelerated aging (29 samples; designated ASTM in remainder of t ex t ) . Each cycle consists of the following:
1. Immerse in water a t 120 + 3 ' ~ (49 i 2 ' ~ for 1 hour.
2. Spray with steam and water vapor a t 200 i 5OF (93 i 3OC) for 3 hours.
3. Store a t 10 c 5" (-12 t 3 '~) for 20 hours.
4. Heat a t 210 i 3 ' ~ (99 k 2 '~) in dry a i r fo r 3 hours.
5 . Spray again with steam and water vapor a t 200 + 5OF (93 k 3OC) for 3 hours.
6. Heat in dry a i r a t 210 ? 3 ' ~ (99 k 2OC) for 18 hours.
After completion of the six cycles of exposure, samples are conditioned a t a temperature of 68 4 60F (20 5 30C) and a re la t ive humidity of 65% 5 1:; for a t l eas t 48 hours before tes t ing.
B. CSA 0188 accelerated aging consisting of 2 hours boil followed by 1 hour cold water soak (Canadian Standards Association 1978) ; test wet a t room temperature (21 samples; designated CSAW) .
C . CSA 0188 accelerated aging with drying cycle (20 samples; designated CSAD). One cycle consisting of the following:
1. Boil for 2 hours.
2. Soak in cold water for 1 hour.
3. Dry a t 2 2 1 ~ ~ ( 1 0 5 ~ ~ ) for 24 hours.
Test a f t e r specimens are a t room temperature.
D. Vacuum-pressure-soak cycle where speci- mens are submerged in cold water and subjected t o 30 minutes under a vacuum of 25 inches of mercury (85 kPa) followed immediately by 30 minutes under pressure of 65 t o 70 psi (450- 480 kPA) and 2 hours water soak a t 150 '~ (66 '~) ; t e s t wet a t roonl temperature (21 samples; desig- nated VPSW) .
E . Vacuum-pressure-soak cycle followed by 18 hours drying a t 2100F (9g°C); t e s t a f t e r conditioning a t 68 ? 60F (20 + 3%) and relat ive humidity of 65% t 1% for 48 hours (20 samples; designated VPSD) .
Prior to accelerated aging, a l l specimens were proof loaded to determine modulus of elas- t i c i ty (MOE) . After accelerated aging a1 1 spec- imens were tested by ASTM Dl037 procedures to determine modulus of rupture (MOR), MOE and retention of pre-aged MOE a f t e r accelerated aging.
Laboratory Development of Test
Preliminary screening t e s t s had shown a relationship between CSAD and ASTM accelerated aging t e s t resul ts . Preliminary t e s t s also indicated a strong relationship between prop- e r t i e s and density. Thus, specific gravity had t o be taken into account in order to make a valid comparison between CSAD and ASTM resul ts .
Further development was carried out in the laboratory to improve the relationship between CSAD and ASTM by including the contribution of specific gravity. This work was carried out in two parts.
The f i r s t portion of the work was carried out t o determine the relationships between CSAD
HOE and ASTM MOE including the co~ t r i bu t i on of specific gravity. Six 11.7 mm panels from each of two different mills were cu t , par- a l l e l and perpendicular to machine direct ion, and tested by CSAD and ASTFl methods, These samples were selected to cover a wide range of specif ic gravity. T h e following samples were tes ted by each of the two methods (CSAD and ASTP1).
Hill 1 14 paral le1 29 perpendicular
Nil 1 2 18 paral l e l 47 perpendicular
After tes t ing by the CSAD method, sample MOE values were plotted against specific gravity, and regression parameters were calculated. Mean &SAD MOE for each panel was adjusted t o the same speci- f i c gravity a t which ASTM MOE was measured for that panel. A p lot , CSAD HOE vs ASTM HOE, was then made based on the t-esufts for each of the 12 panel s tested.
The second portion of the work was carried out to confirm the val idi ty of the relationship determined between CSAD MOE and ASTM MOE. Twenty 11.1 mm panels from a single mill manufactured over a two-month period were tested. A portion of each pane1 was tested by the CSAD method,while the remainder of the panel was tested according to ASTM D1037. Three samples parallel and three sam- ples perpendicular to machine direction from each panel were tested by each method. The e f fec t of specific gravity on &SAD was deter- mined for these panels. Predicted ASTM MOE was determined from an equation developed in the f i r s t section of the work a f t e r adjustment fo r specific gravity and compared to measured ASTM MOE values for these 20 panels.
Nil1 Verification Tests
After laboratory development of the CSAD rapid accelerated aging procedure, the t e s t was monitored a t MacMillan B1oedelts Thunder Bay Division for a 10-month period. Seventy-six 11.1 mm panels were sanpl ed and a portion of each panel was tested in the mil 1 by the CSAD method. The remainder of the panel was tested according to ASTM Dl037 by the tes t ing agency which ce r t i - f i e s our product quality in the United States . Four s t a t i c bending samples parallel and four samples pergendicul a r to machine direction from each pane1 were tested by each method.
MOE resu l t s a f t e r ASTM aging were analyzed using the method of multiple regression on predic- to rs of sample specific gravity in each t e s t and CSAD MOE, Regression equations were cal cu1 ated for parallel and perpendicular directions as well as for the combined data.
RESULTS AND DISCUSSION
Freliminary Screening Tests
Results of prel iminary screening t e s t s by the different accelerated aging t e s t methods are
given in table 1. CSAD aging values for MOR, MOE, and percent retention of HOE a11 closely followed the corresponding values obtained after ASTM accelerated aging. Values obtained after CSAD aging generally ranged between 04 and 10, higher than corresponding values obtained after ASTN aging. The CSAD test was also able to differen- tiate between good and bad areas of the pane l . CSAD aging showed an MOE difference of 174 Mpsi and ASTN aging showed m NOE difference of 192 Mpsi between good and bad areas of the panel. CSAD aging test gave the combined characteristics of correlation with ASTM test results and ability to differentiate between good and bad areas of the panel. Thus, the CSAD accelerated aging test meth- od was chosen for further evaluation as a rapid test procedure to predict ASTM accelerated aging.
CSAW and VPSW tests gave MOR, MOE, and per- cent retention of MOE values which were generally between 50% and 704 of those obtained by ASTM aging. CSAW and VPSW tests did not adequately d~fferentiate between good and bad areas of the panels. Comparing MOE values, CSAW aging showed a difference of 85 Mpsi, VPSW aging showed a differ- ence of 58 Mpsi , and ASTM aging showed a difference of 192 Mpsi between good and bad areas of the panel. CSAW aging gave 54% and 49:: MOE retention, VPSW againg gave 45% and 44% MOE reten- tion, and ASTM aging gave 86% and 714 retention for good and bad areas of the panel. Because of their inability to adequately differentiate be- tween good and bad panel areas, CSAW and VPSW test methods were not chosen for further evaluation.
VPSD aging showed very little effect on panel properties. Aged MOR and MOE values were con- siderably higher than those obtained by ASTM aging. There was virtually no loss in MOE from VPSD aging as shown by the 99% retention of pre- aged MOE. This test was judged to be unsatis- factory for predicting ASTM accelerated aging.
Initial screening tests also indicated that sample specific gravity had a large influence on results regardless of the test method. Thus specific gravity was included as a variable in a11 subsequent test method development.
Laboratory Development of Test
The first portion of laboratory development work was carried out to determine the relation- ships between CSAD and ASTM aged MOE including the effect of specific gravity, Table 2 shows regression equations describing the relationship between CSAD HOE and specific gravity. CSAD HOE for each pane1 was then adjusted to the same specific gravity at which ASTM MOE was wasured for that panel. Figure 1 shows the plot of ASTM MOE against specific gravity corrected CSAD MOE. The relationship derived between ASTM MOE and CSAD MOE was as follows:
HOE ASTM (Mps i ) = 0.698 MOE CSAD + 86.1 . . - 1 2 r = 0.40
Results of the second portion of laboratory development work testing 20 panels are given in Table 3. CSAD MOE values corrected to the speci- fic gravity of ASTM NOE samples for the corre- sponding panel are a7so shown, Corrected CSAD MOE values were determined from regression equations relating CSAD MOE and specific gravity for the 20 panels.
Predicted ASTM MOE was determined from equation 7 after adjustment for specific gravity, and compared to measured ASTM MOE values for these panels (Table 4). ASTM MOE values pre- dicted from CSAD MOE for the 20 panels are in very good agreement with the actual ASTM FIOE results. Flaximum difference between predicted and measured MOE values for an individual panel was 30%, with the majority of panels falling within the range of +5% to +15?: of the actual value. Mhen MOE values were averaged for the 20 panels in either the parallel or perpendicular directions the percentage difference between pre- dicted and measured ASTM MOE was reduced to approximate1 y 5%.
GSAD MOE and measured ASTM MOE from tbc 20 panel sample (Table 3) can be combined with data from figure 1 to give an inrproved prediction equation (see fig. 2).
MOE ASTM (Mps i ) = 0.681 MOE CSAD + 92.4 . . .2
Laboratory development work established a relationship between CSAD and ASTM accelerated aging tests. Based on the laboratory development work CSAD accelerated aging test was implemented as a mill quality control procedure to predict ASTM accelerated aging MOE.
Mill Verification Tests
Results of correlating CSAD MOE measured in the mill with ASTFI MOE measured by an outside testing agency are shown in table 5. The pre- dictive equations in table 5 are very similar, regardless of the direction of sample orientation. This was confirmed by substituting a range of CSAD values into the equations at a common speci- fic gravity. At low values of CSAD MOE, i.e, 450 Mpsi, there was a 5% maximum difference in predicted ASTM MOf between the three predictive equations. This difference increased to about 11% at a CSAD MOE of 700 Mpsi and to about 15% when @SAD MOE was 900 Mpsi (table 6).
Since the purpose of the predictive equations is to inform production staff when the mill pro- cess is out of control (i.e., ASTM MOE is falling below 400 Npsi which is the minimum allowable value for 11.1 mm thick panels), all three equations in table 5 ~iould appear equally valid in this range of ASTM MOE. Since the equation calculated from parallel and perpen- dicular values has the largest sample size = in 143) and the best index of determination (r =
0.67) i t would be bes t su i ted as a predic t ive 0i88.0-M78, Standard Test Methods f o r Mat- equation. This equation from tab le 5 can be Formed Wood Par t i c1 eboards and Waferboard. s impl i f ied f o r use a s a qua l i ty control tool by Deppe, H. 3. reducing t o a common spec i f i c gravity. 1981. Long term comparative t es t s between
natural and accelerated weatherins exposures MOE ASTM = 0.351 MOE CSAD + 396 SG - 106 ... 3
r 2 = 0.67
Based on 10 months of in-mill monitoring, the CSAD rapid accelera ted aging t e s t was adop&d a s p a r t of the regular mill t e s t procedure f o r measuring panel qua l i ty when s ign i f i can t process changes had occurred. Equation 3 would be recom- rsiended f o r use as a qua l i ty control tool t o pre- d i c t ASTM MOE. As addit ional r e s u l t s from in- mi11 CSAD MOE and ASTM MOE from the outs ide agency become ava i l ab le , t h a t data can be com- bined with previous data t o improve the r e l a t ion - ship between CSAD MOE and ASTM MOE.
SUMMARY AND CONCLUSIONS
Four d i f f e r e n t accelerated aging procedures were evaluated as potential methods of rapidly simulating six-cycle ASTM Dl037 accelerated aging f o r waferboard. One accelerated aging procedure (CSAD) , consist ing of CSA 01 88 accelerated aging ( 2 hours boil and 1 hour cold water soak) f o l - lowed by 24 hours drying showed a close re la t ion- ship with ASTM accelerated aging. Three other accelerated aging methods, CSA 0188 accelerated aging with no drying cycle and two vacuum- pressure-soak methods, did not show s u f f i c i e n t l y c lose re la t ionship with ASTM accelerated aging.
Subsequent 1 aboratory development work es- tabl ished an excel lent corre la t ion between CSAD and ASTM accelerated aging t e s t s . ASTM MOE pre- d ic ted by CSAD method, a f t e r adjustment f o r s p e c i f i c gravi ty , showed t h a t the majority of panels f e l l within '1 5% of the actual ASTM MOE value. CSAD accelerated aging t e s t a1 1 ows prediction of aged proper t ies in 27 hours com- pared t o 3 weeks f o r six-cycle ASTM accelerated aging t e s t .
MacMi 11 an Bl oedel Research establ i shed and monitored the CSAD rapid aged MOE t e s t a t MacMi 11 an Bloedel ' s Thunder Bay Division f o r approximately one year . Findings confirmed the s u i t a b i l i t y of the CSAD t e s t method as a qua1 i t y control procedure which would enable immediate correc t ive action i f there i s evidence t h a t the process i s out of control . CSAD rapid aged MOE t e s t has been adopted a s pa r t of the regular mi 1 1 t e s t procedure t o eval uate s ign i f i can t pro- cess changes a t MacMillan Bloedel mi l l s .
LITERATURE CITED
of coated and uncoated wood base i a t e r i a l . Proc. 15th International Part icleboard Synp., T. M. Maloney, Ed., Washington S ta t e Univ., Pullman, WA, p. 79-100.
Deppe, ti. J . , R. Stolzenburg, and K . Schmidt. 1976. Testing and assessing the d u r a b i l i t y of
part icleboard by accelerated weathering t e s t s . Holz a l s Roh-und Werkstoff 34:379- 384.
Deppe, H . J . , and K. Schmidt. 1979. Comparison of long-term and accelera ted
weathering t e s t s of wood based mater ia ls . Wolz a l s Roh-und Werkstoff 37:287-297.
Endicott, L . E . , and T. R . Frost. 1967. Correlat ion of accelerated and long
term s t a b i l i t y t e s t s f o r wood-based composite products. For. Prod. J . 17(10) : 35-40.
Lehmann, N. 1977. Durabil i ty of composition products.
Proc. 71th International Part icleboard Symp., T . M . Maloney, Ed., Washington S ta t e Univ., Pullman, &A, p. 351-368.
Shen, K. C . 1977. A proposed rapid accelerated aging t e s t
f o r ex te r io r waferboard. Canadian For. Serv. Rep. OP-X-l6OE. Forintek Canada Corporation (formerly Eastern Forest Products Laboratory), Ottawa, Ontario.
American Society f o r Testing and Materials. 1982, Annual Book of ASTM Standards, Part 22:
Wood; Adhesives, p. 298-340. Canadian Standards Association
1978. National Standards of Canada CAN-3-
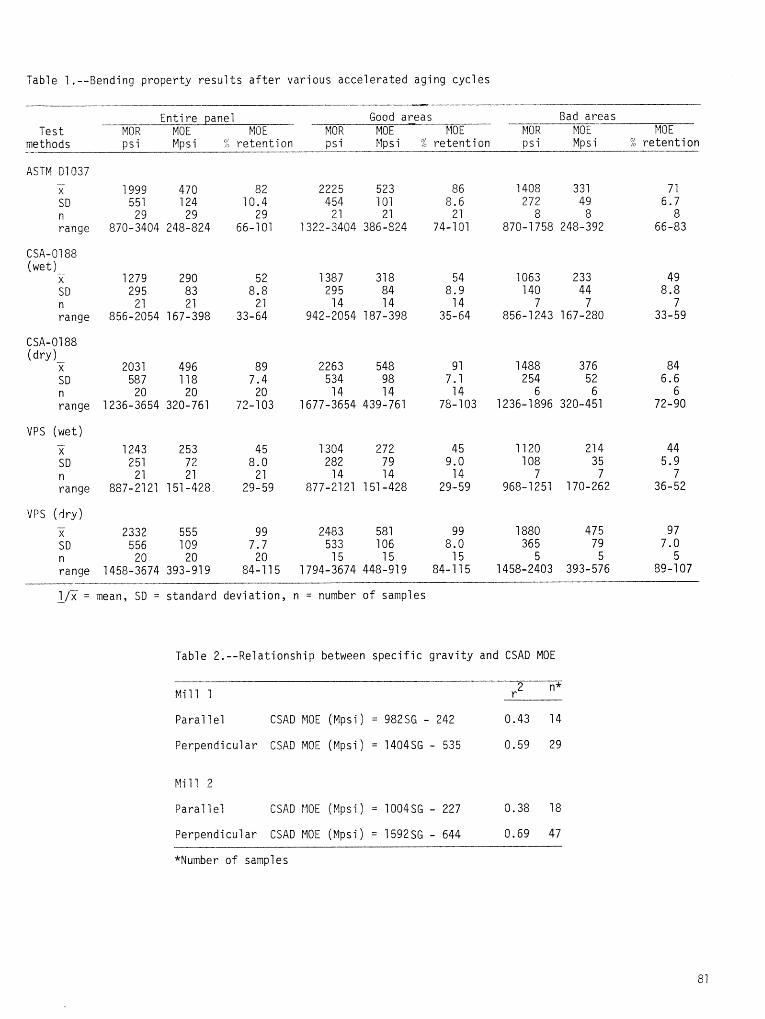
Table 1.--Bending property r e s u l t s a f t e r various accelerated aging cycles
Test methods
ASTN 01037 - X
S D n range
S D n range
S D n range
VPS (wet) - X SD n range
VPS (dry) - X S D n range
Entire panel Good areas Bad areas MOR MOE MOE MOR MOE WOE MOR MOE - MOE DS i M ~ s i 5; r e tent ion DS 1' Mpsi ?4 re tent ion p s i Mps i % re tent ion
1/x = mean, SD = standard deviation, n = number of samples -
Table 2.--Relationship between spec i f i c gravi ty and CSAD MOE
Mill 1 r 2 n*
Para1 1 el CSAD MOE (Mpsi ) = 982% - 242 0.43 14
Perpendicular CSAD MOE (Mpsi) = 1404% - 535 0.59 29
Mi11 2
Para1 1 e l &SAD f lOE (Mpsi ) = 1004SG - 227 0.38 18
Perpendicular CSAD MOE (Mpsi) = 1592SG - 644 0.69 47
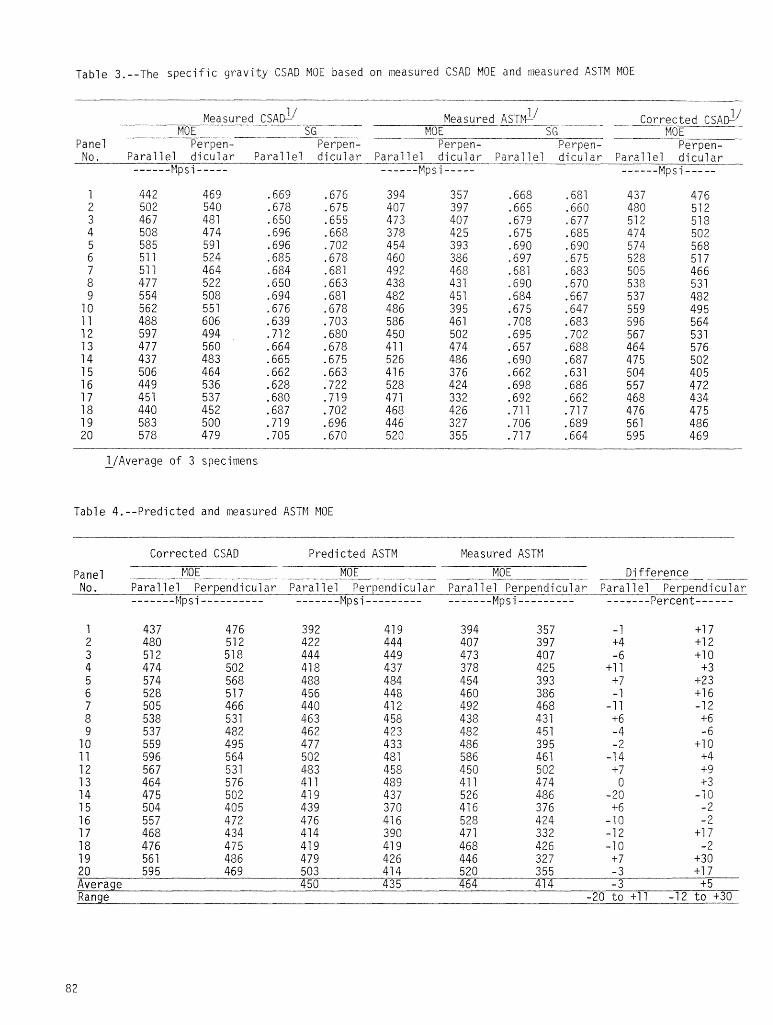
Table 3.--The specific gravity CSAD MOE based on measured CSAD MOE and measured ASTM MOE
-
Measured CSA~' Measured ASTM- / Corrected CSA&' FlOE S G MOE S G MOE
Panel Perpen- Perpen- Perpen- Perpen- Perpen- No. Para1 1e1 dicu1 ar Para1 lel dicul ar Para1 lel dicul a r Para1 7e1 dicular Par-l le'i dicuf ar
------ Mpsi ----- ------ Mpsj----- ------ Mpsj --- --
l/Average of 3 specimens -
Table 4.--Predicted and measured ASTM MOE
Corrected CSAD Predicted ASTM Measured ASTM
Panel MO E MOE MOE Difference No. Parallel Perpendicular Parallel Perpendicular Parallel Perpendicular Parallel Perpendicular
------- ~ Y ~ P S i - - - - - - - - - - ------- Mpsi--------- ------- Mps j ------ --- ---*--- Percent------
2 0 595 469 503 41 4 520 355 - 3 +17 Average 4 50 435 464 41 4 -3 + 5 Ranae -20 to +I1 -12 to +30
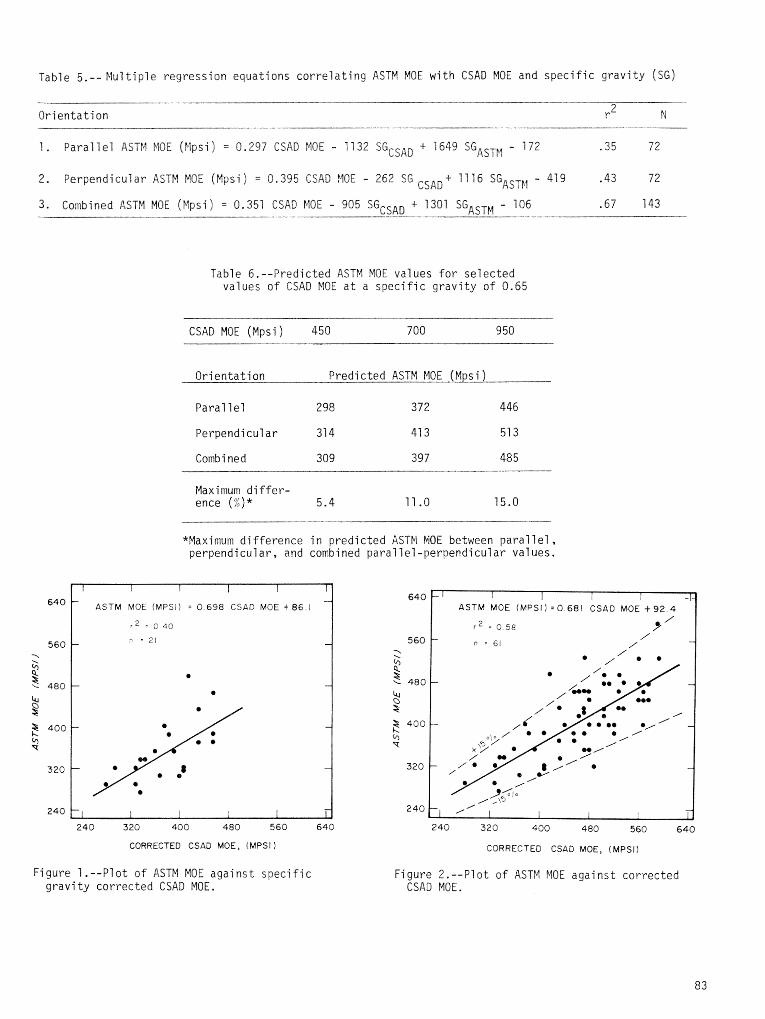
Table 5.-- Mu1 tiple regression equations correlating ASTM MOE with CSAD MOE and specific gravity (SG)
Orientation r 2 N
1 . Para1 1 el ASTF4 MOE (Elpsi ) = 0.297 CSAD MOE - 11 32 SGCSAD + 1649 SGASTFl - 172 -35 72
2. Perpendicular ASTM MOE (Mpsi ) = 0.395 CSAD MOE - 262 SG CSAD + 1 1 16 SGASTII - 41 9 -43 72
3. Combined ASTM MOE (Mpsi ) = 0.351 CSAD MOE - 905 SGCSAD + 1301 SGASTM - 106 .67 143
Table 6.--Predicted ASTM MOE values for selected values of GSAD MOE at a specific gravity of 0.65
CSAD MOE (Mpsi ) 450 700 950
Orientation 0
Para1 lel 298 372 446
Perpendicular 31 4 41 3 51 3
Combi ned 309 397 485
Maximum differ- ence (%)* 5.4 1 1 .O 15.0
*Maximum difference in predicted ASTM MOE between parallel, perpendicular, and combined parallel-perpendicular values.
ASTM MOE (MPSI) = 0 6 9 8 CSAD MOE + 8 6 1
CORRECTED CSAD MOE, (MPSI 1
Figure 1 .--Plot o f ASTM MOE against specific gravi ty corrected CSAD MOE.
CORRECTED CSAD MOE, [MPSI)
Figure 2.--Plot of ASTM MOE against corrected CSAD MOE.
DURABILITY OF STRUCTURAL FLAKEBOARD
FROM SOUTHERN HARDWOOOS S P E C I E S ~ ~
2 1 M . W. Kelly and E. W. Price-'
Abstract.--Flakeboard panel s made with individual species (sweetgum, hickory, red oak, white oak, and pine) and with a 20 percent mixture of each species were sub- jected t o a s e r i e s of exposure conditions. Mechanical and physical properties were determined and compared t o commercial waferboard. A t 50 percert R H condit ion, sweet- gum, red oak, and hickory panels had properties s imi lar t o the commercial waferboard a t a s imi lar density (42 pcf) . However, a f t e r the APA 6-cycle exposure and the ovendry- vacuum-pressure soak exposure, only sweetgum retained physical properties equal t o waferboard.
INTRODUCTION
The quant i ty of low-grade hardwoods growing in the South continues t o increase. These hard- woods a r e on s i t e s more su i t ab le t o pines and on hardwood s i t e s t h a t a re not properly managed. Until the f o r e s t s i t e s a re stocked with qual i ty t r ees and properly managed, the quanti ty of low- grade hardwoods will continue. However, the f i b e r presently occupying these s i t e s must f i r s t be economical l y removed. St ructura l pa r t i c l e - board o r flakeboard may provide a solution o r in- centive t o remove t h i s undesired f i b e r materi a1 .
Our object ive was t o determine i f a s t ruc- tu ra l panel could be produced from t h i s material with proper t ies comparable t o t h a t of commerci a1 1y- avai 1 abl e waferboard. We were par t i cul a r ly in t e r - ested in property re tent ions a f t e r several expo- sure evaluation conditions.
Many 1 aboratory exposure condit ions are used t o evaluate the property re tent ion o r du rab i l i ty of s t ruc tu ra l panels. Some widely used conditions a re the ASTM D 1037 (ASTM 1977), var ia t ions of the vacuum-pressure soak t e s t (Heebi n k 1967) including ovendryi ng p r io r t o soak, mu1 t i pl e vacuum-pressure and soaki ng times and temperatures (Gertjejansen e t a1 . 1973; Ha1 1 and Gertjejansen 1974; Hal 1 and Gertjejansen 1979; Hse 1976; Lehmann 1974; and River e t a l . 1981) and the APA t e s t methods S-6 a f t e r D-5 exposure (Ameri can PI ywood Association 1981 ). With the possible exception of the vacuum-pressure soak and i t s va r i a t ions , these
1 /Paper presented a t Workshop on Durabi l i t y , ~ e n s a c o l a , FL. October 5-7, 1982.
2/Professor, Department of Wood and Paper science, N . G . S t a t e University, Raleigh, NC and Pri nci pa1 Wood S c i e n t i s t , Southern Forest Experi - ment S ta t ion , Pinevi l le , LA.
This i s paper No. 8868 of the Journal Series of the N.C. Agric. Res. Serv., Raleigh, MC.
condit ions are a l l too long fo r ass is tance i n process control . Also, a l l of these t e s t s do not accurately simulate the type of exposure en- countered by most s t ruc tu ra l panels in service .
MATERIALS A N D METHODS
Five species , sweetgum, hickory, red oak, white oak, and pine, were used t o make flakeboard pane1 s a t three di f f e ren t densi t i es per speci es . A s ix th panel type, consist ing of equal port ions of the previous f i v e species, a l so was made a t three d i f f e ren t panel dens i t i e s . Table 1 contains the species , species density , nominal pane1 t a r g e t dens i t i e s , and the calculated compaction r a t i o s f o r each panel density. Four rep1 i c a t e panels were produced from each species-panel density combination f o r a to t a l of 72 panels. Also, f o r comparative purposes, commercial waferboard (assumed to be fabr ica ted with aspen) was pur- chased and evaluated.
The laboratory panels ( t a b l e 1 ) were produced with the following manufacturing parameters.
1. Panel s i z e (trimmed) - 36 by 32 inches
2. Nominal thickness - 0.5 inch
3. Press temperature - 350 '~
4. Press time - 8 minutes
5. Liquid phenolic res in - 5.5 percent r e s in so l ids based on O D wood b~eight
6. Flakes - Produced on shapin l a the ; approximate 3-i nch 1 ong, random width, th icknessesof 0.025 inch- fo r core and 0.01 5 tnch f o r face
7 . Panel construction - random flake orientation with 50% of panel weight in core and 25" of panel weight in each face
8. Time to stops - 5 seconds to 1 minute dependent on species and panel density
9. Maximum press pressure - 340 to 600 psi dependent on species and panel density
The properties and exposure conditions evaluated for each panel type were:
1. Stat ic bending and internal bond (ASTM D 1037 t e s t procedures).
a ) Control conditioned a t 502 R H , 70 '~ ( 2 specimens per panel ) . Internal bond determined from non-failed portion of sample.
5) Tested wet a f t e r ovendry-vacuum- pressure soak ( 2 specimens Per panel ) . Unabl e to determi ne i nter- nal bond because of rough surfaces.
c ) Tested a f t e r AFA 6-cycle 0-5 exposure ( 2 specimens per panel). Unable to determine internal bond because of rough surfaces.
2. Linear expansion and thickness swelling
a ) Equilibrium a t 50% R H to equil i - brium a t 90% R H (ASTM D 1037) (2 specimens per panel ) .
b ) From ovendry to vacuum-pressure soak ( 2 specimens per panel).
3 . Stat ic bending of 1 - by 5-inch specimen on edge, APA S-6 t e s t procedure (Ameri - can Plywood Association 1981 ) . a ) Control conditioned a t 50% RH and
7 0 ' ~ (4 specimens per panel).
b) Tested a f t e r APA 6-cycle 0-5 exposure ( 4 specimens per panel)
c ) Tested a f t e r equal ization a t 50% RH and 70oF following D-5 exposure ( 4 specimens per panel).
I n addition, two specimens per panel were exposed in a weatherometer to continuous irrad- ia t ion with a Xenon arc lamp a t a wavelen t h of 9 340 nm to a to ta l i r radiat ion of 500 k j / m . For 18 minutes of each two-hour cycle specimens were subjected to a water spray on the i r rad i - ated surface. Qua1 i t a t i ve evaluation of appear-
ance and percent thickness swelling were deter- mined a f t e r exposure.
RESULTS A N D DISCUSSION
Stati c Bending (ASTM)
The average density, compaction r a t i o , and modulus of rupture ( M O R ) of specimens from a1 1 densi ty-species combinations a f t e r condi t ioni ng, a f t e r the ovendry-vacuum-pressure soak (OD-VPS) , and a f t e r the APA D-5 exposures were obtained ( table 2 ) . MOR vaf ues are based on dimensions of t e s t specimen a t time of testing.
Comparing the resul ts for the conditioned specimens, most species-density combinations have MOW values higher than the commercial waferboard. The lowest density pine, 37.5 lbs. per cu. f t . (pcf), and white oak (42.5 pcf) panels are the only exceptions. Pine, a t 42.5 pcf, red oak a t 42.4 pcf, hickory a t 42 pcf, and the sweetgum a t 42.9 and 35.9 pcf are the species-density combi- nations with average MOR values higher than waferboard values a t similar or lower panel densities. A1 1 other species-densi ty combina- tions have both MOR values and panel densi t ies greater than the waferboard. These resul t s i l l u s t r a t e the increase in MOR with increasing panel density or compaction rat io .
The two exposure conditions had a cata- strophic effect on the MOR fo r a l l panels. The OD-VPS exposure resulted in only a 25% retention of the conditioned MOR values fo r the waferboard. The sweetgum, red oak, and pine panels a t densi- t i e s similar to waferboard also retained only 25% of the conditioned MOR. Other species- density combinations, with densities and MOR values similar to waferboard values, did not retain 25% of the conditioned MOR a f t e r the OD- VPS exposure.
The waferboard samples retained 44% of the unexposed MOR a f t e r the 0-5 exposure. None of the experimental panels with densities simi 1 a r to the waferboard before exposure retained t h i s level of MOR a f t e r D-5 exposure; the lowest den- s i t y sweetgum had the highest retention of 39%. Even though none of the experimental panels equaled the waferboard in percent MOR retention a f t e r the 0-5 exposure, the two lower density sweetgum classes had higher MOR values than the waferboard a f t e r exposure.
The extremely poor resul ts fo r a l l densi t ies of white oak panels a f t e r exposure indicates a lack of durable bonding with t h i s species. The original MOR values fo r the unexposed samples were lower than would be expected for the panel density b u t a f t e r both the OD-VPS and 0-5 expo- sures the samples practically f e l l apart; the MOR retention for a l l density-exposure white oak combinations was less than 10%.
Table 3 contains the apparent modulus of e l a s t i c i t y (MOE) determined on the same specimens reported in table 2 . MOE values are based on
dimensions of t e s t specimen a t time of t e s t . Internal bond strength of specimens obtained from a non-failed portion of the conditioned s t a t i c bending samples are a lso reported in table 3.
The MOE resul ts for the conditioned specimens closely follow MOR trends, Only the lowest den- s i ty panels of hickory, pine, and white oak had average HOE values below and the waferboard average in the unexposed s t a t e and these were only marginal 1y 1 ower. The experimental panels with density comparable to the waferboard a l l had ROE values which compared favorably with the wafer- board.
The waferboard samples a f t e r OD-VPS exposure retained 27% of the MOE of the unexposed samples. Only the lowest density of the sweetgum panels retained a higher percentage a f t e r exposure (30';) b u t the lowest density of red oak as well as the middle density of sweetgum and pine a1 1 retained above 20%. For experimental panels of i n i t i a l density similar to that of the t~aterbord only the red oak, sweetgum, and pine had MOE values similar to the waferboard a f t e r OD-VPS exposure.
The MOE retention for the waferboard a f te r the APA D-5 exposure was also 27% b u t the two lower density classes of the sweetgum panels retained more than 30%. All other experimental panels retained less than 20% of the MOE value a f t e r t h i s exposure condition. Also, only the sweetgum and pine had MOE values comparable to the waferboard a t similar density levels.
The internal bond averages for a1 1 experi - mental panels with densities similar to that of the commercial waferboard were a11 substantially below the 82 psi average of waferboard. Only experimental panel s wi t h densi t i es hi gher than the waferboard produced internal bonds equal to waferboard. The increase in internal bonds within the three density classes of each species ref lects the increase in the compaction ra t io and the sub- sequent improvement i n bondi ng. The 1 ower i nter- nal bonds for the sweetgum and pine panels as compared t o the hickory and red oak, even when the compaction rat ios are higher for the pine and sweetgum, probably is a reflection of the higher adhesive level per unit of par t ic le surface with the higher density species--hickory and red oak. The low internal bonds for the white oak panels as compared to the hickory panels a t similar com- paction ra t ios i s a further indication of the poor bonding normally obtained with white oak and phenol-formaldehyde adhesive,
The combined resul ts of tables 2 and 3, NOR and HOE a f t e r exposure versus the control, indi- cate only the sweetgum species i s capable of pro- ducing a phenol i G bonded pane1 with bending prop- e r t i e s comparable to comercia1 waferboard on equivalent panel density basis. Even though panel s from other species were produced wi t h con- di t i oned densi ty and bendi ng strength properti es simi 1 a r to waferboard, the simi 1 ar i ty of properties i s not retained, except fo r sweetgum, a f t e r both exposures.
Linear Expansion and Thickness Swelling
f i f t y to Ninety Percent Relative Humidity
The l inear expansion and thickness swelling of one specimen per panel were determined between equilibrium a t 50" and equilibrium a t 90"; refa- t ive humidity, both a t 70°F ( table 4 ) . The equi 1 i brium moisture content (EMC) and density a t 50 and 90Vrel a t i ve humi di t y were a1 so determined.
The waferboard attained a substantially lower EMG a t 50 and 90"' RH than any of the experimental panels. The reduced hygroscopicity of the wafer- board material i s probably due to differences in the drying or pressing conditions between the commerci a7 1 y produced waferboard a n d the experi - mental panels. The wax in the waferboard i s not believed to be effective in reducing the hygro- scopi ci ty of the waferboard.
The higher E M C k in the experimental panels did not resul t in higher l inear expansion; the white oak was the only species with l inear expan- sion values comparable to the waferboard. Most of the experimental panels, except white oak, had only ten percent of the l inear expansion of the waferboard. However, the percent thickness swelling trend in the same relat ive humidity increment was reversed; i . e . , thickness swell ing of experimental panels was a t least equal or 10% higher than that of the waferboard. The white oak panel thickness swelling was approximately TO% higher than the waferboard.
The higher compaction ra t io of the aspen in the waferboard should produce a higher resin u t i l - i zati on efficiency as compared to the experimental panel s . However, improved resi n eff i ci ency woul d be expected to produce lower l inear expansion and thickness swelling. If the aspen in the wafer- board had tension wood, a higher longitudinal change woul d occur. Another possi bl e expl anati on for the difference in l inear expansion could be par t ic le orientation. A severe incl ination angle of the wafers during the forming process resulting in the wafers not being in the plane of the panel could contribute to a higher l inear expansion. A1 so, i f the flakes were accidental 1 y oriented with the long axis parallel t o the length o f the l inear expansion specimen, the l inear expansion would be less . Unfortunately, no l inear expansion measurements were made i n the across-the-panel di recti on. Other possi b1 e differences cou1 d be related to the resin. The resin content of t he expermental boards was higher and was a l iquid. Thi s may have resuf ted in a heavier and poss ib ly a more uniform resin application i q the experi- mental boards.
Ovendry to Vacuum-Pressure Soak
Table 5 contains the average moisture content, thickness swelling, and l inear expansion values fo r each species-density combination of samples subjected to vacuum-pressure soaking a f t e r oven drying. Also included in table 5 are the averages
fo r waferboard specimens subjected to the same exposure.
The average moisture content a t the end of the soaking cycle decreased with increasing panel density, consi s tent with the decrease in the panel void volume, With thi s exposure the thickness swelling for the waferboard was again less than that of most of the experimental panels and only the white oak panels had higher l inear expansion t h a n the waferboard. The trend o f these resul ts duplicates those for the 50 to 905 re1 a t i ve humi di ty exposure. A1 so, no consi s tent relationship within species was evident between e i t he r thickness swell i ng or 1 i near expansion and panel density. The higher compaction ra t io of the commercial waferboard probably resulted in bet ter resin efficiency which also produced lower thickness swelling for t h i s exposure. How- ever, the anomalous resul ts for the l inear expan- sion of the waferboard do not indicate bet ter res in efficiency.
The l inear expansion and the thickness swelling for a l l panels were both higher fo r the ovendry to vacuum-pressure soak exposure than for the 50 to 90% re la t ive humidity exposure. The resul ts for both exposures indicate t ha t , except for white oak, panels produced from the species used in t h i s study will behave similarly t o the commercial waferboard. Red oak and sweet- gum resulted in panels with dimensional proper- t i e s most comparable to the waferboard.
Stat ic Bending ( A P A 5-6)
Control
The average breaking l oads for ebge-l oaded specimens, 1 by 5 inches, for a1 1 density classes of a11 species, and for the waferboard, are presented in table 6. The t e s t specimens were conditioned to moi sutre equi 1 i bri um a t 50:; re la t ive humidity and 70oF prior to tes t ing.
The average breaking load increased with increasing panel density (compacti on r a t i o ) fo r every species studied. Wi t h the exception of the lowest density classes of hickory, pine, and white oak, a l l experimental panels had average breaking loads higher than the comrnerci a1 wafer- board. However, except for the low density mixture and the middle density pine panel classes, the experimental panel s al so had densities higher than the waferboard. The higher density panels and the higher resin content both con- tributed to the higher breaking load for the experimental panel s ,
After APA B-5 Exposure
Table 7 contains the average breaking load for edge-loaded samples, 1 by 5 inches, a f t e r exposure to the APA 6-cycle D-5 accelerated aging t e s t . The average breaking load of t h e lowest density panel s wi thin each species was always s ignif icant ly lower than the two higher densities and only the highest density panels
of hickory, pine, and the mixture were s ign i f i - cantly bet ter than the middle density. The wki t e oak panels did n o t have much bond in tegr i ty a f t e r exposure; the thickness swelling was extremely large reducing the specimen density t o l ess than 20 p c f . A11 of the sweetgun density c lasses , the two higher red oak density classes, and the highest density o f hickory, pine, and the mixture a71 had breaking loads a t least as high as the waferboard a f t e r the D-5 accelerated aging expo- sure.
Re-conditioned a f t e r D-5 Exposure
Table 8 contains the average breaking 1 cad, density, and moisture content for samples exposed to the 6-cycle D-5 aging and then re-conditioned to moisture equi 1 i bri urn a t 7 0 ' ~ and 50% re la t ive humidity. The final step in the 0-5 exposure i s a 15-hour drying period in an oven s e t a t 1800F. Consequently, the moisture content of the t e s t specimens tested a f t e r the D-5 exposure ( tab le 7) i s lower than for the re-conditioned specimens in table 8. All density classes of the sweetqum panel s had breaking 1 cads s ignif icant ly above those of the waferboard, as did the two higher densities of the red oak and the highest density of the hickory, pine, and mixture.
The comparison between the experimental panels and the waferboard a f t e r exposure to the D-5 t e s t s should not only consider panel density and the breaking load b u t percent retention. The percent retention can be calculated from the information in tables 6 , 7 , and 8.
Most of the species used in the study retained only 30% of the original breaking load but the sweetgum and waferboard both retained approximately 60%. The white oak continued as the w r s t performer, retaining less than 10% of the original breaking load.
Weatherometer
Table 9 contains the average moisture con- tent and thickness swelling for a l l panel types a f t e r weatherometer exposure. This exposure consisted of 500 k j / m 2 irradiation with a Xenon arc lamp a t 340 nm wavelength, and an l8-minute water spray on one surface of the sample every two hours. Thus, the samples were subjected to a cyclic wetting and drying exposure. Four separate weatherometer runs with one specimen per panel type per run were performed and the aver- age given in table 9. The target i r radiat ion level , 500 k j l r n i , occurred shortly a f t e r the com- pletion of the water spray cycle in one run re- sul t ing in a 66% M.C. average. The others aver- aged 49, 43, and 444. Since the thickness swell o f the samples was similar in the four runs, moisture content and thickness swelling are averaged over a l l four runs (Table 9 ) .
None of the experimental panels came close to equaling the commercial waferboard in e i ther thickness swelling or moisture content, The average moisture content of the waferboard sam- ples was only 9% with only a 4% increase in
thickness . The 1 owest density sweetgum panel had the next lowest moisture content and thickness swelling, 45.9:: and 32.8?:, respectively. There was very l i t t l e difference in e i ther the moisture content or thickness swelling between species or between densities within species except for the white oak panels. With similar density values the white oak panels had substantially higher moisture content and aore thickness swelling than panels of other species. In f a c t , white oak panels essential ly doubled in thickness (1005- thickness swell ) and had moi s ture contents above 65% a t the end of the exposure cycle.
The appearance of the irradiated surfaces of a l l experimental samples compared to the commer- cial waferboard was a more bleached look. The experimental samples a1 so had surface f1 akes l i f t i n g from the panel which were not evident with the waferboard. In addition, the white oak panels had a dark, viscous material which exuded from the back face of the sample. This occurred while the sample was in the weatherometer and i s believed to be a water soluble extractive unique to the white oak. I t did not appear on other sampl es.
The exceptionally low water absorption and thickness swelling of the commercial waferboard i s somewhat surprising, Much of th i s excellent water resistance can undoubtedly be attributed to the wax content in the waferboard preventing the water spray from penetrating the surface.
The weatherometer resul ts with the waferboard are substantially different from the resul ts obtained in the ovendry to vacuum-pressure soak t e s t . In the soaking t e s t the wax did not prevent water from penetrating and swelling the panel. Usually wax i s thought to be ineffective in limiting water vapor adsorption and quite effective in reducing small amounts of liquid water pene- t ra t ion. The resul ts of t h i s study indicate that the wax may have been very effective against liquid water sprayed on the surface b u t much less effective when the material was submerged in water and the included a i r evacuated. The experimental panels contained no wax and did not offer any resistance to the penetration of the water spray into the surface of the weatherometer specimens.
CONCLUSIONS
The resul ts of th i s study are not overly encouraging with regard t c using the southern hard- woods as a furni sh for exterior-qua1 i ty flakeboard a t a density comparable t o commercial waferboard- Many of the experime~tal panels had properties as good as waferboard on unexposed samples b u d , upon subjecting the panels t o the various expo- sures, the majority of the experimental panels did not have percent retentions equal to wafer- board. Sweetgum was the only species examined which produced panel s wi t h properties comparable to commercial waferboard a t a comparable density. B u t sweetgum, the lowest density species used in the study, had a higher compaction ra t io compared Lo the other species. This higher compaction
ra t io enhances a1 1 of the physical properties re la t ive t o other species with the same panel density but lower compaction rat io . To obtain panel properties a f t e r exposure equal to or greater t h a n waferboard with a l l the other species studies, t he panel densities must be increased above that of the waferboard.
The waferboard used in th i s study as a control for the experimental panels was not exceptS onal 1 y durable or res is tant to a7 1 expo- sures. The MOE and MOR values determined by the ASTM s t a t i c bending t e s t , a f t e r ovendry to vacuum-pressure soak exposure, and A P A D-5 expo- sure, were only about 25% of the unexposed values. The other measured properties were also similarly reduced by the various exposures which leads one to question the producck su i tab i l i ty in contin- uous exterior exposures.
LITERATURE CITED
Ameri can Plywood Associ a t i on 1981. Manual of APA t e s t methods for structural
use panels. American Plywood Association, Tacoma, WA.
American Society for Testing and Materials 1977. Standard methods of evaluating the prop-
e r t i e s of wood-base f iber and par t ic le panel materials. ASTM D 1037-72, Philadelphia, PA.
Gertjejansen, R . , M . Hyvarinen, J . Haygreen, and D. French
1973. Physical properties of phenolic bonded wafer-type particleboard from mf xtures of aspen, paper birch, and tamarack. Forest Prod, J . 2 3 ( 6 ) : 24-28.
Hall, H., and R . Gertjejansen 7974. Improving the properties of commercial-
bonded, structural -type parti el eboard by oi 1 tempering. Forest Prod. 3 . 24(3): 40-42.
Hall, H., and R . Gertjejansen 1979. Weatherability of phenolic-bonded Ghanian
hardwood flakeboard made from ACA-treated flakes. Forest Prod. J . 29(72): 34-38.
Heebiqk, 6. G . 1967. A procedure for quickly evaluating
dimensional stabi 1 i ty of particleboard. Forest Prod. J. 1 7 ( 8 ) : 77-80.
Hse, C. Y. 1976. Exterior structural composite panels
with southern pine veneer faces and cores of southern hardwood flakes. Forest Prod. 2. 26(7): 21-27 .
Lehmann, \4. F . 1914. Properties of structural particleboard.
Forest Prod, 9. 2 4 ( 1 ) : 19-26, River, B. W . , R. H, Gillespie, and A . J. Baker
9 981 , Accei erated aging o* phenol ic-bonded hardboards and flakeboard. USDA-Forest Serv. Res. Pap. FPL 393, For. Prod. Lab . , Madison, W1.
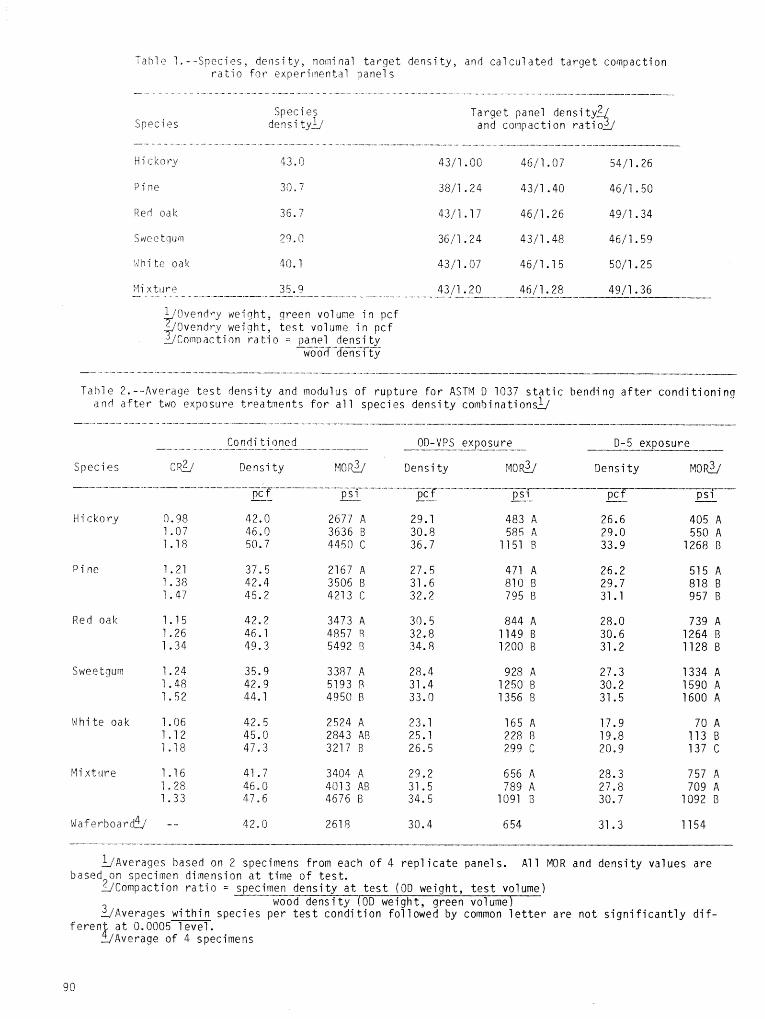
T 3 k l l2 I , --Snecit?s, de i l s i t y , norni na l t a r g e t d e n s i t y , and c a l c u l a t e d t a r g e t compact ion r a t i o f o r exper i i i lenta l panel s
Speci es densi tY-b
Targe t panel d e n s i t y ? and compact ion ra t io - . / - - - - - - - - - - - - - - - - - -- - _ - ----- - - - - . - _ -___________-I__ _----__-___---_---I-_ --
H i c k o r y 43.6 4311 . 00 46/1.01 5431.26
Red oak 36.7 43/7-17 46/7-26 4911.34
iaibi te oak 40.1 4311.07 46/1.15 50/1.25
P 0 v e n d r y weiaht , qreen volume i n pcf ;itQvendry weight , t e s t volume i n p c f 3 C o n p a c t i o n r a t i o = panel d e n s i t y - - - - - - - - -- ---
wood densi t y
Tahli. 2. --Average t e s t derlsi t y and modulus o f r u p t u r e f o r ASTM D 1037 s t a t i c bending a f t e r c o n d i t i o n i n g a n d a f t e r tdo exposure t reabnen ts f o r a1 1 spec ies d e n s i t y coirlbi n a t i o n s 9
Condi t i o n e d -- --- - - - - - - OD-VPS exposure - -- -- -- ------- D-5 exposure
Species C& D e n s i t y MO & Densi t y blO R2/ D e n s i t y MO Ft?/
----- -- -- ---------- PC -'-- -7- --- - - - - - - - -- - - --- - -- P C ~
r----- ---'---
-- - -- PSI --- -- PSI - PC ~ ? S T - - -
H i c k o r y 9.98 42.0 2677 A 29.1 483 A 26.6 405 A 1.07 46.0 3636 B 30.5 585 A 29.0 559 A 1 . l 8 50.7 4450 C 36.7 1151 R 33.9 1268 B
P i n e 1.21 37.5 2167 A 27.5 471 A 26.2 515 A 1.38 42.4 3506 B 31.6 810 B 29.7 818 B 1 - 4 7 45.2 4213 C 32.2 795 B 31.1 957 B
Swer tgum 1.24 35.9 3387 A 28.4 928 A 27.3 1334 A 1.48 42.9 5193 R 31.4 1250 B 30.2 1590 A 1.52 44.1 4950 R 33. r) 1356 B 31.5 1600 A
i d h i t e oak 1.06 42.5 2524 A 23.1 165 A 17.9 70 A 1.12 45.0 2843 AR 25.1 228 R 19.8 113 B 7.78 47.3 3217 R 26.5 299 C 20.9 137 C
Q ~ v e r a ~ e s based on 2 specimens f rom each o f 4 r e p l i c a t e panels. A l l MOR and d e n s i t y va lues a r e based-on specimen d imension a t t ime o f t e s t .
9 C o m p a c t i n n r a t i o = specimen d e n s i t y a t t e s t (OD weight , t e s t volume) wood d e n s i t y OD weight , green volume
a ~ v e r a ~ e s w i t h i n spec ies p e r t e s t c o n d i i i o n f o l l o w e d by common j e t t e r a r e n o t s i g n i f i c a n t l y d i f - f eren a t 0.OQ05 1 eve1 . i JAverage o f 4 specimens
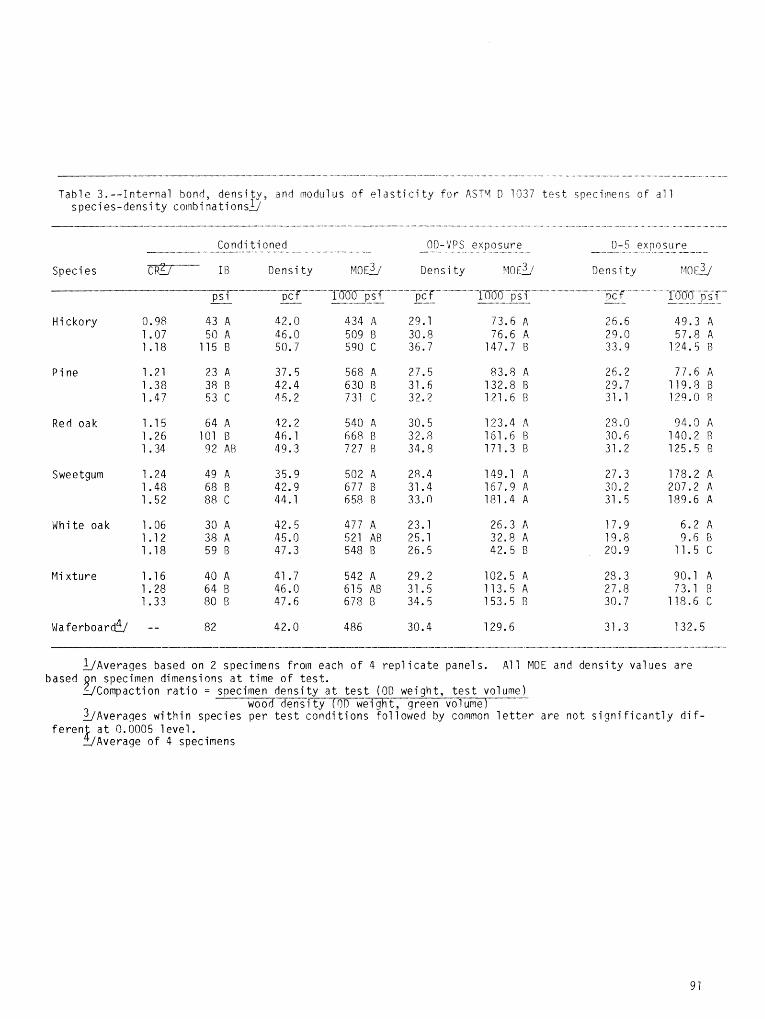
T a b l e 3 , - - I n t e r n a l bond, d e n s i t y , a n d modi l lus of e l a s t i c i t y f o r A S P I D 7037 t e s t speci~r lens o f a17 spec ies -dens i t y combi l a t i o n s b
C o n d i t i o n e d --- - -- --- --- OD-YPS - ---- exposure --- - - --- -- -- D-5 - - - exposi tre - - - - - - -- - - -.
Spec ies I R Densi t y M O E ~ Lfensi t y MO E% D e n s i t y ~ 1 0 ~ 2 ~
H i c k o r y 0.98 43 A 42.0 4 3 4 A 29.1 73.6 A 26.6 49.3 A 1.07 50 A 46.0 509 B 30.5 76.6 A 29.0 57.5 A 1.18 115 B 51). 7 590 C 36.7 147.7 B 33.9 124.5 B
P i n e 1.21 23 A 37.5 5 6 8 A 27.5 53.5 A 26.2 77.6 A 1.38 38 B 42.4 630 B 31.6 132.8 B 23.7 119.8 B 1.47 53 C 45.2 731 C 32.2 121.6 B 31.1 129.0 R
Red oak 1.15 64 A 42.2 540 A 30.5 123.4 A 23. 0 94.0 A 1.26 101 B 46.1 668 B 32. R 161.6 B 30.6 140.2 8 I .34 92 AB 49.3 727 f3 34.5 171.3 B 31.2 125.5 R
Sweetgum 1.24 49 A 35.9 5 0 2 A 28.4 149.1 A 27.3 178.2 A 1.48 68 B 42.9 677 B 31.4 167.9 A 30.2 207.2 A 1.52 88 C 44.1 658 R 33.0 181.4 A 31.5 189.6 A
W h i t e oak 1.06 30 A 42.5 477 A 23.1 26.3 A 17.9 6.2 A 1.12 38 A 45.0 521 AB 25.1 32.5 A 19.8 9.6 R 1.18 59 B 47.3 548 B 26.5 42.5 B 20.9 11.5 C
F l i x t u r e 1.16 40 A 41.7 5 4 2 A 29.2 102.5 A 25.3 90.1 A 1.28 64 B 46.0 6 1 5 A B 31.5 113.5 A 27.8 73.1 B 1.33 80 B 47.6 678 B 34.5 153.5 B 30.7 118.6 C
_ 1 / ~ v e r a ~ e s based on 2 specimens f rom each o f 4 r e p l i c a t e panels . 411 MOE and d e n s i t y v a l u e s a r e based Qn specimen d imens ions a t t i m e o f t e s t .
g ~ o m p a c t i o n r a t i o = specimen d e n s i t y a t t e s t (OD we igh t , t e s t volume) -- wood d e n s i t y OD w e i g h t , g reen volume
a ~ v e r a g e s w i t h i n spec ies p e r t e s t c o n d / t i o n s f o l l o w e d by cornno: l e t t e r a r e n o t s i g n i f i c a n t l y d i f - f e r e n a t 0.0005 1 eve1 . i JAverage o f 4 specimens
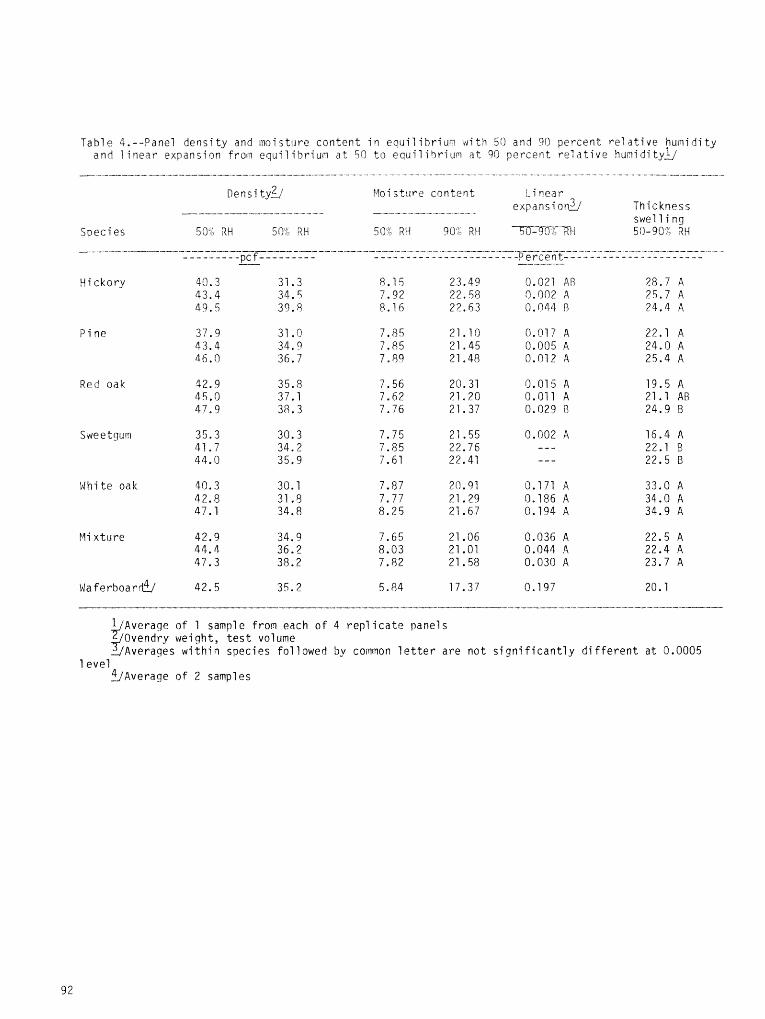
T a b l e 4.--Pane1 d e n s i t y and m o i s t u r e c o n t e n t i n e o r l i l i b r i t l r l x i t h 550 at73 30 p e r c e n t re la t ive hurrlidi t y a n d 1 inear exgansion f rom eqiii1ibriuil a t 50 t o e q u i l i 4 r i u m a t 90 p e r c e n t r e 7 a t i v e h u i ? i d i t Y 9
Species ------ -----
H i cksry
P i n e
Red oak
Sdeetgum
W h i t e oak
Mi x t u r e
~ a f e r b o a r d
~ e r i s i ty?J Moi st:tre c o n t e n t i-i near exclans i o n 3 Thickness - - - - - - - -- - - - - - - - - - - - -- - - - -- - -- - - -- -
swe l l i ng 535 RH 50-2 9M 50": 214 9 0 - 2t-f 50-773; -XH 513-9074 2.H
y ~ v e r a g e o f 1 sample f rom each o f 4 rep1 i c a t e panels Ovendry wei gh t, t e s t vo1 ume
$Averages w i t h 4 0 spec ies f o l l o w e d by common l e t t e r a r e n o t s i g n i f i c a n t l y d i f f e r e n t a t 0.0005 1 eve1
v ~ v e r a g e o f 2 samples
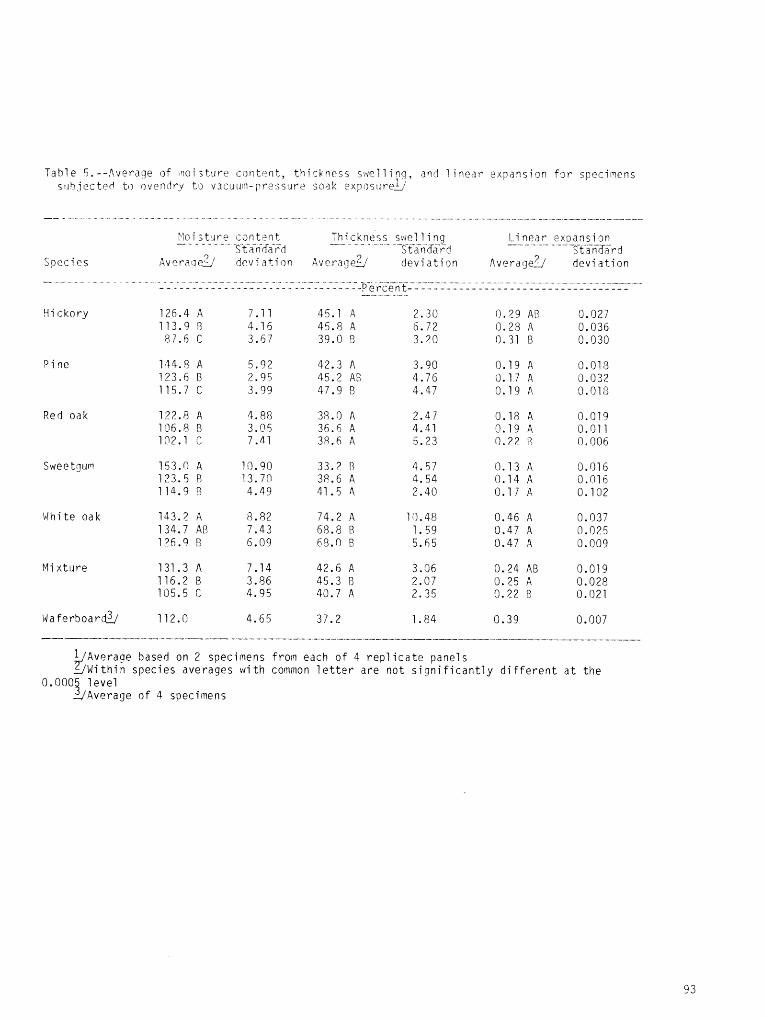
T a b l e 5. --Average of mi ;tilre cor:t?nt, thickness s w l I i ? q , a n d 1 i l ea r e x p a n s i ~ n f3r s p e ~ j m e n ~ s ! t b j e c t e r t t o ~ ~ e i l d r - ~ t3 ~ 3 c ~ t f l r - p r t ~ s ? l r l s soak i .x; i t~sr:re~/
f4o i stlire c a n t a n t - - - - - - - - - Th ickness s ~ e f l i n g - - - - - - - - - - L i near e x ~ a n s i ~ n - - - - - - - - - -- S %-iid<?d Sfa-n-'fZ?d St 3nXZr-d
j p e c i e s ~ v e r n q r ? d e v i a t i o n ~ v e r a ~ e q d e v i a t i o n A v e r a g e g d e v i a t i o n
t t i ckory 125.4 A 7.1 1 45.1 A 2,30 0.29 AR 3.027 113.9 B 4.16 45.8 A 6.72 0.28 A 0.036 87.6 C 3.57 39.0 B 3.20 0.31 B 0.030
P i n e
Red oak 122.5 A 4-88 38.0 A 2.47 0.18 A 0.019 1136.8 R 3.05 36.6 A 4.41 0.151 A 0.01 I 102.1 C 7.41 38.6 A 5. '23 0.22 P 0.006
W h i t e oak 153.3 A 8.82 74.2 A 10.48 0.46 A 0.037 134.7 AB 7.43 68.5 R 1.59 0.47 A 0.025 12fi.9 R 6.09 68.0 R 5.65 0.47 A 0.009
Y ~ v e r a ~ e based on 2 specimens from edch o f 4 r e p l i c a t e panels - / W i t h i n spec ies averages w i t h common l e t t e r a r e n o t s i g n i f i c a n t l y d i f f e r e n t a t t h e
0.000 l e v e l 9 - /Ave rage o f 4 specimens
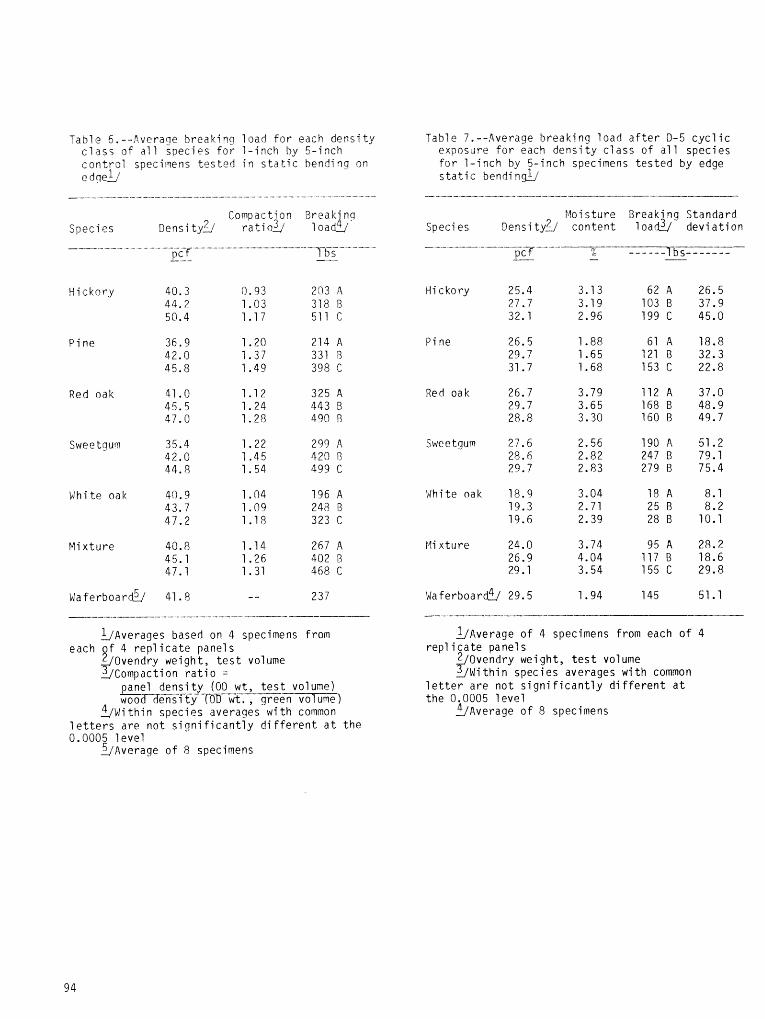
Tab le 5. --,fiverage b r e a k i n g l oad For each dens i t y c l a s s o f a1 1 spec ies f o r 1 - inch hy 5- inch c o n t r o l specirqens t e s t e d itl s t a t i c hendiqq on e d g e 9
Tab1 e 7.--Bverage b r e a k i n g l o a d a f t e r 9-5 c y c l i c exposure f o r eacb d e n s i t y c l a s s of a1 1 spec ies f o r 1 - i n c h by 5 - i n c h specimens t e s t e d b y edge s t a t i c bendi n&
Compaction B r c a k i nq Species ~ e n s i t ~ g r a t i o 3 load!!/.
H i c k o r y 40.3 9.93 203 A 44.2 1.03 318 R 50.4 1.17 511 C
P i n e 36.9 1.20 214 A 42.0 1.37 331 B 45.8 1.49 398 C
Red oak 41 .0 1.12 325 A 45.5 1.24 443 B 47.0 1.213 490 £3
Wh i te oak 41). 9 1.114 196 A 43.7 1.09 248 0 47.2 1.18 323 C
M i x t u r e 40.8 1.14 267 A 45.1 1.26 402 0 47.1 1.31 468 C
'lei s t u r e Break i ng Standard Speci es ~ e n s i t y g c o n t e n t 1 oa& d e v i a t i o n
H i c k o r y 25.4 3.13 6 2 A 26.5 27.7 3.19 103 B 37.9 32.1 2.96 199 C 45.0
Red oak 26.7 3.79 112 A 37.0 29.7 3.65 168 €3 48.9 28.8 3.30 1 6 0 B 49.7
White oak 18.9 3.04 1 8 A 8.1 19.3 2.71 25 I3 8.2 19.6 2.39 28 B 10.1
t l i x t u r e 24.0 3.74 9 5 A 28.2 26.9 4.04 117 B 18.6 29.1 3.54 1 5 5 C 29.5
Q ~ v e r a ~ e s based on 4 specimens f rom each f 4 r e p l i c a t e panels
#Ovendry weight , t e s t volume JCompaction r a t i o =
panel d e n s i t y (00 wt , t e s t volun$ - i i E 7 T T e n s i t y (OD wt., g r e e n v o l u m e ) ? /~ i t h i n spec ies averages wi t h common
1 e t t e r s a r e n o t s i g n i f i c a n t l y d i f f e r e n t a t t h e 0.0005 l e v e l
3 ~ v e r a ~ e o f 8 specimens
9 ~ v e r a g e o f 4 specimens from each o f 4 rep1 i ca t e panel s
?ovendry weight , t e s t volume _ / M i t h i n spec ies averages w i t h common
l e t t e r a r e n o t s i g n i f i c a n t l y d i f f e r e n t a t t h e 0.0005 l e v e l
! . /Average o f 8 specimens
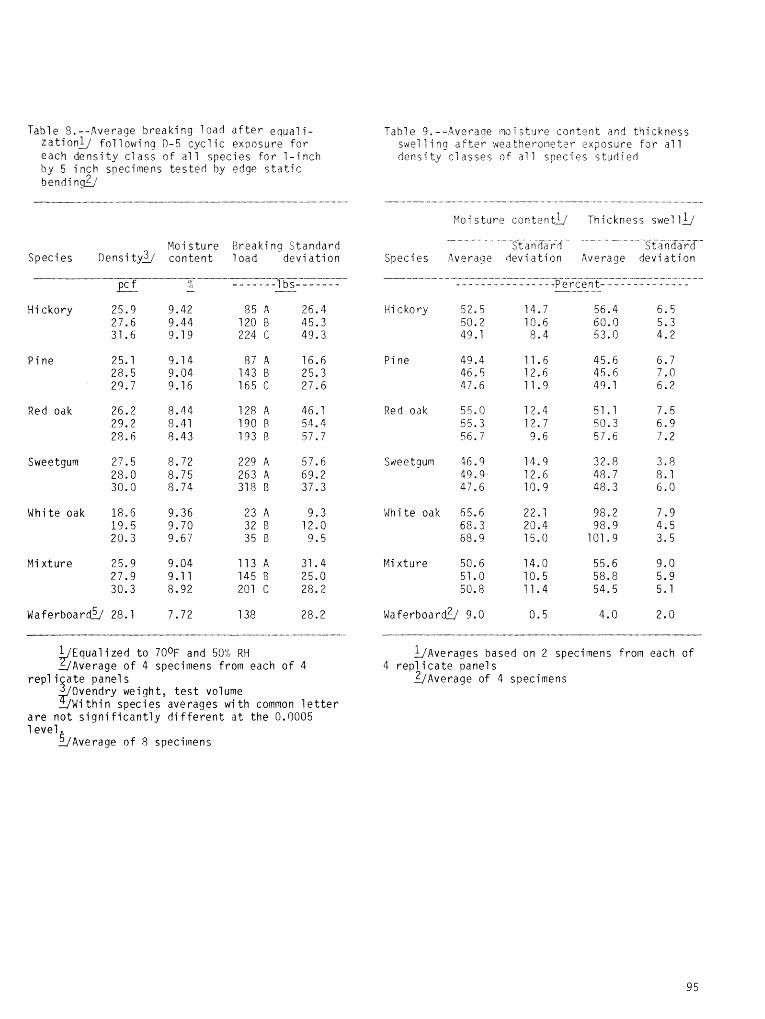
f a b l e 3.--,&verage b r e a k i n g t o a d a f t e r e a u a l i - z a t i o n g fa1 1 owing D-5 c y c l i c exposure f o r each d e n s i t y c l a s s o f a l l species f o r 1 - i n c h by 5 i n c h specimens t e s t e d by edge s t a t i c bend i n&
Tab1 e 9. - -Averaqe no i s t ! ~ r e c o n t e n t and th i ckness srie11 i rig a f t e r wea tberor7et;3r 2xnosure f a r a1 1 dens i t y c l a s s e s o f a1 1 spec ies s t u d i e d
Moi s t u r e Break ing S tandard Species ~ e n s i tya c o n t e n t 1 oad dev i a t i o n
t - t i c k o r y 25.9 9.42 185 A 26.4 21.6 9.44 120 B 45.3 31.6 9.1 9 224 C 49.3
P i n e 25.1 9.14 87 A 16.6 28.5 9.04 143 B 25.3 29.7 9.16 165 C 27.6
Red oak 26.2 8.44 128 A 46.1 29.2 8.41 190 R 54.4 28.6 8.43 193 D 57.7
Sweetgum 27.5 8.72 229 A 57.6 28.0 8.75 263 A 69.2 30.0 8.74 318 B 37.3
Wh i te oak 18,6 9.36 23 A 9.3 19.5 9.70 32 B 12.0 20.3 9.67 35 B 9.5
Mi x t u r e 25.9 9.04 113 A 31.4 27.9 9.1 1 145 B 25.0 30.3 8.92 201 C 28.2
Moi s t i ~ r e con ten tL i Th ickness swel lf, -- - -- - - - - --- - - -- - - - --- - -- - -
Standard S t atGhT-&- Species Average d e v i a t i o n Average d e v i a t i o n
H i c k o r y 52.5 14.7 56.4 6.5 50.2 10.6 60.0 5.3 49.1 8 . 4 53.0 4.2
Red oak 55.0 12.4 51.1 7.5 55.3 12.7 50.3 6.9 56.7 9.6 57.6 7.2
Whi te oak 65.6 22.1 98.2 7 ' 9 68.3 20.4 98.9 4.5 68.9 15.0 101.9 3.5
P l l i x t u r e 50.6 14.0 55.6 9.0 51.0 10.5 58.8 5.9 50.8 11.4 54.5 5.1
y ~ ~ u a l i z e d t o 700F and 50% RH -/Average o f 4 specimens f rom each o f 4
repl i c a t e panel s Ovendry wei gh t, t e s t volume
$Mi t h i n spec ies averages wi t h common 1 e t t e r a r e n o t s i g n i f i c a n t l y d i f f e r e n t a t t h e 0.0005 1 eve1
$Average o f 8 specimens
Q ~ v e r a g e s based on 2 specimens from each o f 4 r e p l i c a t e panel s
?/Average o f 4 specimens
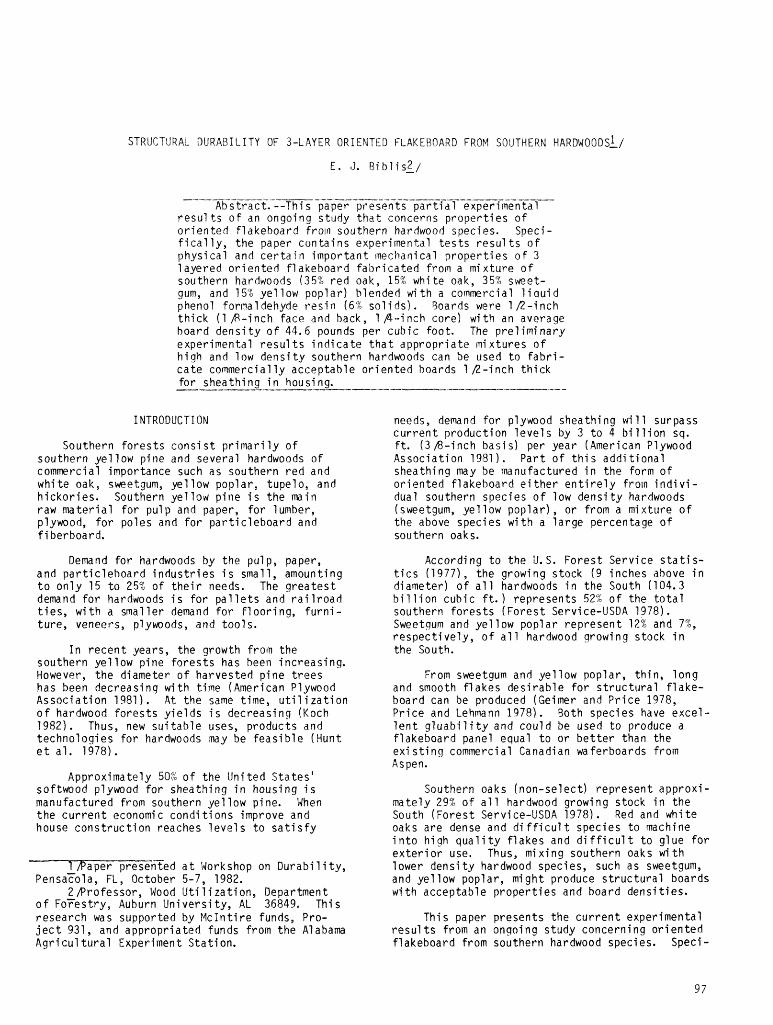
STRUCTURAL DURABILITY OF 3-LAYER OR1 ENTED FLAKEBOARD FROM SOUTHERN H A R D W O O O S ~ /
-- - -- ----- -- - ---- --------------- Abstract . --Thi s paper presents p a r t i a l experimental
r e s u l t s o f an ongoing study t h a t concerns p rope r t i es o f o r i e n t e d f lakeboard froin southern hardwood species. Speci- f i c a l l y , t he paper con ta ins experimental t e s t s r e s u l t s o f physi ca1 and c e r t a i n impor tan t mechdnical p rope r t i es o F 3 1 ayered o r i enterl f1 akeboard f ab r i ca ted from a mi x t u re o f southern ha rd~oods (35% r e d oak, 155 whi te oak, 35% sweet- gum, and 158 ye l l ow pop la r ) blended w i t h a commercial l i a u i d phenol formaldehyde r e s i n (6% so l i dsj . 9oards were 1 ,GI-inch t h i c k (1 P - i n c h face and back, 114-inch core) w i t h an average hoard d e n s i t y o f 44.6 pounds per cubic foot. The p r e l i m i n a r y exper imental r e s u l t s i n d i c a t e t h a t appropr ia te mix tu res o f h i gh and low dens i t y southern hardwoods can be used t o f a b r i - ca te commercial ly acceptable o r i en ted hoards 1 /L - inch t h i c k f o r sheath ing i n housing, ---------------------------
INTRODUCTION
Southern f o res t s consi s t p r ima r i l y o f southern ye1 low pine and several hardwoods of commercial importance such as southern r e d and wh i te oak, sweetgum, ye1 low poplar, tupelo, and h i cko r i es . Southern ye l l ow p ine i s the main raw m a t e r i a l f o r pu lp and paper, f o r lumber, plywood, f o r poles and f o r pa r t i c l eboa rd and f i berboard.
Demand f o r hardwoods by the pulp, paper, and p a r t i c l e b o a r d i n d u s t r i e s i s small, amounting t o o n l y 15 t o 25% o f t h e i r needs, The g rea tes t demand f o r hardwoods i s f o r p a l l e t s and r a i l r o a d t i e s , w i t h a smal ler demand f o r f l oo r i ng , f u r n i - tu re , veneers, plywoods, and too ls .
I n r ecen t years, the growth from the southern ye l l ow p ine f o r e s t s has been increasing. However, t he diameter o f harvested p i ne t r ees has been decreasing w i t h t ime (American Plywood Assoc ia t ion 1981). A t the same time, u t i l i z a t i o n o f hardwood f o res t s y i e l d s i s decreasing (Koch 1982). Thus, new s u i t a b l e uses, products and techno log ies f o r hardwoods may be f e a s i b l e (Hunt e t a1. 1978).
Approximately 505 o f the Uni Led Sta tes ' s o f t w o d plywood f o r sheath ing i n housing i s manufactured from southern ye1 low pine. When t he c u r r e n t economic cond i t i ons improve and house cons t ruc t i on reaches l e v e l s t o s a t i s f y
1 Pape r presenied a t Workshop on Durabi 1 i ty , Pensacola, F t , October 5-7, 1982.
2 P ro fesso r , Wood U t i l i z a t i o n , Department o f Fo%stry, Auburn Un i ve rs i t y , AL 36849, Th is research was supported by M c I n t i r e funds, Pro- j e c t 931, and appropr ia ted funds from the Alabama Ag r i cu l t u r a l Experiment Stat ion.
needs, demand f o r plywood sheathing wi 11 surpass c u r r e n t p roduc t ion l e v e l s by 3 t o 4 b i l l i o n sq. ft. (3 /8 - i nch basis) per year (American Plywood Assoc ia t i on 1981 1. P a r t o f t h i s a d d i t i o n a l sheathing may be manufactured i n the form o f o r i en ted f lakeboard e i t h e r e n t i r e l y frorn i n d i v i - dual southern species o f low d e n s i t y hardwoods (sweetgum, ye l l ow pop la r ) , o r from a mix tu re o f the above species w i t h a l a rge percentage o f southern oaks.
According t o the U. S. Fores t Serv ice s t a t i s- t i c s f1977), the growing stock (9 inches above i n diameter) o f a l l hardwoods i n t he South (104.3 b i l l i o n cubic ft. ) represents 52% o f the t o t a l southern f o r e s t s f Fo res t Service-USDA 1978). Sweetgum and ye l l ow pop la r represent 12% and 7%, respec t i ve l y , o f a l l hardwood growing stock i n the South.
From sweetgum and ye l low poplar, th in , l o n g and smooth f l akes des i r ab le f o r s t r u c t u r a l f 1 ake- board can be produced (Geimer and P r i c e 1978, P r i c e and Lehmann 1978). Both species have exce l - l e n t g l u a b i l i t y and cou ld be used t o produce a f lakeboard panel equal t o o r b e t t e r than the ex i s t i n g commercial Canadian waferboards from Aspen.
Southern oaks (non-select) represent approx i - m t e l y 29% o f a11 hardwood growing stock i n t he South f Fo res t Serv i ce-USDA 1978). Red and whi t e oaks are dense and d i f f i c u l t species t o machine i n t o h igh q u a l i t y f l akes and d i f f i c u l t t o g lue fo r e x t e r i o r use. Thus, m i x i ng southern oaks w i t h lower dens i t y hardwood species, such as sweetgum, and ye1 low poplar, m igh t produce s t r u c t u r a l boards w i t h acceptable p rope r t i es and board dens i t ies .
Thi s paper presents t he c u r r e n t experimental r esu l t s from an ongoing study concerning o r i e n t e d f lakeboard from southern hardwood species. Speci-
t wcc- V) 0 c w 0 OI c U r m
0 ? a 13 0 0
c, c f3 at w c 3 C W D
L C - .z % * U a w t O a.c
V, V, W m w c 3 3 0
U cn * e L *r 0 V V .r a c +CUO *r U v m c C G O w - W U c a,
'34' aJ ..- w mc,, L "c a 43
b % t - L .r a, s % LJ
cn .? c*?U
3 1 i!! U c ,
C- S=: L nJ Lo .t- -r- *r-
U 0 c .r
3 a, . n c r a, U L ~ Q P - E
5 01: E e-P-
I-- u w + L - a , 4 u a,.- @a, r a m o m t ' T - W O O L C V c r m O I L f d L U
V ) Q O Q * rcJ E w o C r W U m Q) 6, a , * - 0 -cC- C U t e C .FP-
w OF- Z L C L L t n 3 X c , . V) a, .r *, w w *i-
ECVWJ-) mU-- O 0 - c 3 o t'v-zI: a, a , U .--t' m a , w r 3 W -F.% V) a 0+- ' lnOV+1-- t n W 0 , K L L . i - C V ) L O D
0- c n c - i n + ' cc, r P - c c m c o ~ ~ L o o ~ L + ~ ~ u ~ , GJ OI t n j *I- W . r V ) O * r nr- L .r
I C l J 0 4 L c r fd U U * - Q O * m 1 v K'I- L h E X V P- JZCln+'cU 0 t f d - a u
V ) W = i w d , L U t O C , Q ) t ' W * - + ' O I O V . r c C I P - - Q W + ' & C U W W f+-'LC - C O . i - . I - - E
. r - v * v 4 O W V, 0 s . - m w a , * 3 a . t - o t ' r a t - 3 E O - t V m a +r- m C , % c - r L o m I-- O V U ~ $ J C t f , O U O P-- k * r V ) O t t ; . ~ - a J a L E O ~ ' L V ) O J - -c E a w d,f--2-.- U b r - cJ I-- c - ma7 a t c u c , v a t a m o - c , L P I - = % a L :
U . i - r b . r L ' 5 h L a m O O N
a, a, 2 L: C, C,
3 * 0 e V)
CO N a,
3,s n w e Q I W
, v . 3 W U P - 6)
0%- a' L W nj U W O W ' r - E m w a - c CT *I--
OI C C V) E d L
L m J 0 L . C C C a, V) l W M O c ,
m a t ' A 0 w r 7 3 rev7
m E t ' m e T 5 . 1 - L F-
X U a J S : V ) Z f + ' C:
I n 0 e) U Q) d,
. F W mnc( 'r- 4-J C U T 5 C W 3 W W 8.c.F c
aJ acL3 4-J IC) U *.- .P-
a t c a J m 3 w r n I,
I - - * t ~ g r " - ' V ) O c n I-- a, V) w W ' P of--I-- U C 0- =IL a, E (3s." W U * ~
I C - d W WQ- t a+' - % L . - . C L 3 o m * CV V) . mV)
OI- .ee. Q-0 w I--- a)+
sr: * c e - L e) m c o .L-,
P- UI rd C L .r 3 cn 0 .r If: I- I OCO
6% d-
-c L c, a, t'
+-'% nj m w T: w w t 'o V) V) a, a t' w
L C a , 0 0 0 - V ) . r V) a c, m .r Q, w L L c* w 0 +-'US m w 3 - L
m I U- C 0 .c c
to*- W a r
= L O , a, 0 W U L w t l a , = t at' a
c e - w 0 L 3
m c, a, cfi
0, c -r- t' a, c W L O a, a, .l- o s o
m V) V) ..- .F f L T w m t ' c *
m r a ? o c,
cc- .i- . ln uV)c a,? a t ' w v v t m a w
I-- a r a, c, m v
w C, a r t ' r s L m a,
9.2 z L L
CAB 0. - m a , a,* L C m o 0 Q N W
X w u .r 3= a' O.rJ-4-J
U E a, 0 P- L aJ U- vr
I -9-
S C U o o a ,
m ' c CL w c J m
v E 3 N 0 I-- %- C, cc- LOU-
a, 0 c u m - a o m m t ' C ,
0 O W + - , c, a,
t'4 I-- V) a, a, -t'. C r a w o
.I- L a - m @ + " a 3 .r
13 m w t a,- 0
- m u U C
'I- m U 4' QE L rd x r O..r u
V) rtc a, a, U a, m z L
c c - C , a , 13
U-'4- Lf 0 0 3
Ln w a,--
F-
0 ln ?@
LO
a, 0 ? sr: a, TI F
ii? L- o m +* I PI- ? #
0 N C &' a, I: e
a 0 ZZ
-c .r V 3-
0-0 .r I: --l -c'
U -i-
* * a, C CIC .r "--r
V)
a, CY
0 3 c 0
C-
E E 0 PI-
-bC
0 .P-
-C t'
S: 0 c 'i-
I U7 N 0
.A=
Cc, t n C
0 . aJ aJ- N
'F a, VIr-
a a, rtc P- .1-
U 3- iu
t' > L a n
C, 3 0
a* 0s
5 w *Q U) I * . . - 0 2E V
a, L 3 t' 'A -r 0 E L
a, cc-w O C
a, a, P-
-n U *r U- t ' o L m a
0 24 c, U W c c a,
F- TP- c m rtc L
m w Q w m C
c c - w c, SlI C W a r c fd -i- C, @ L O .
c! c I: a, v *- c V) *r L P-
I m a , q22 -7 a
. . c c! .II
c,
i! 0 cc- * m z
C c.r- 0 * O V ) C . r - -U C: ta t 'k w a, Q .-0 L E V , -@ N .r ePI-uv.C O t U U n c t l C C
ILZ a, *P- t ' f X U E 1 Vf c U S r . d - a,U324 U W t ' w nr a,--,
- O n - a, c n v , V f
ccr) C O W cno E 111 C'i- nL1 O a r t'
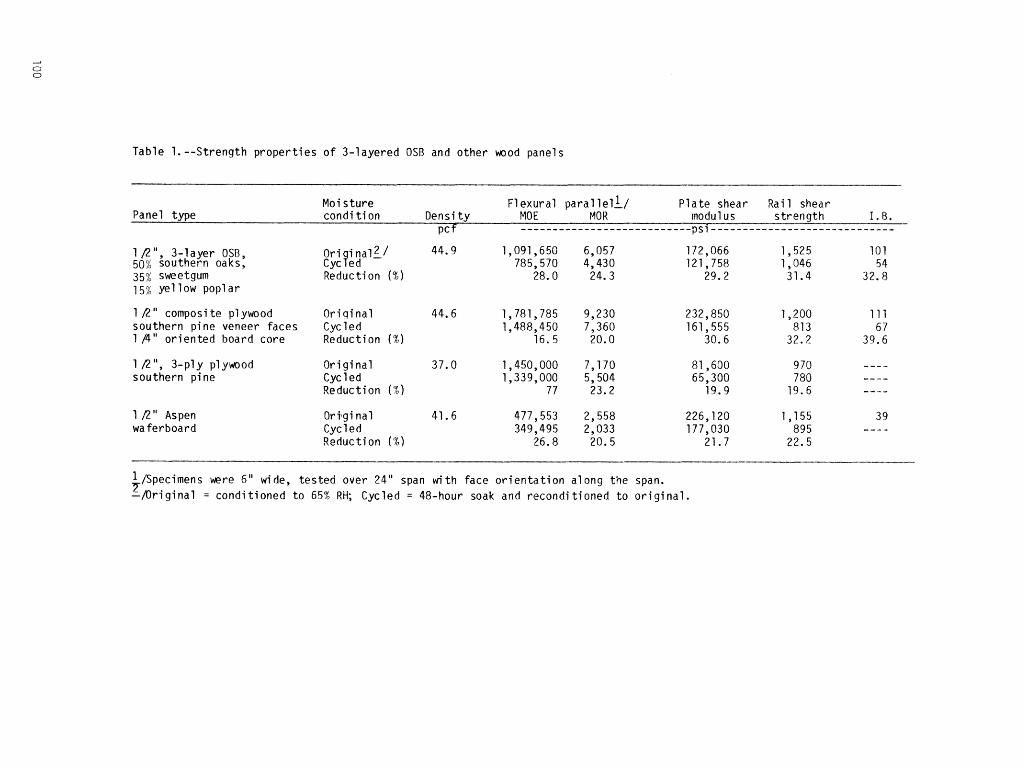
Table 1.--Strength p rope r t i e s of 3-layered OSR and o ther wood panels
Moi sture Flexural p a r a l l e l l / P l a t e shear Rai 1 shear Panel type condi t i on Density MO E MOR modul us s t r eng th 1.8.
- - - - - - - - - - - - - - - - - - - - - - - - - - -PSf-- - - - - - - - - - - - - - * - - - - - - - - - - - - - f
1 /2 " 3-layer OSB, 50% iouthern oaks, 35% swetgum 15% ye1 low pop1 a r
Ori i n a l L / 44.9 1,091,650 6,057 172,066 1,525 101 Cyc ?e d 785,570 4,430 121,758 1,046 54 Reduction (24) 28.0 24.3 29.2 31.4 32.8
1 R composi t e plywood Oriqinal 44.6 1,781,785 9,230 232,850 1,200 111 southern pine veneer faces Cycled 1,488,450 7,360 161,555 81 3 6 7 1 14"oriented board core Reduction ( % I 16.5 20.0 30.6 32.2 39.6
1 12 ", 3-pl y pl ywood Or i g i na1 37.0 1,450,000 7,170 81,600 970 southern pine Cyc 1 ed 1,339,000 5,504 65,300 7 80 .....--
Reduction (%I 77 23.2 19.9 19.6 ---- 11'2" Aspen wa ferboard
Oritgi nal 41.6 477,553 2,558 226,120 1,155 Cycled 349,495 2,033 177,030 895 - Reduction ( % I 26.8 20.5 21.7 22.5
/Specimens were 6" wide, t e s t ed over 24" span with face o r i e n t a t i o n along the span. Z ~ r i ~ i n a l = condit ioned t o 65% RH; Cycled = 48-hour soak and recondit ioned t o o r i g i n a l .
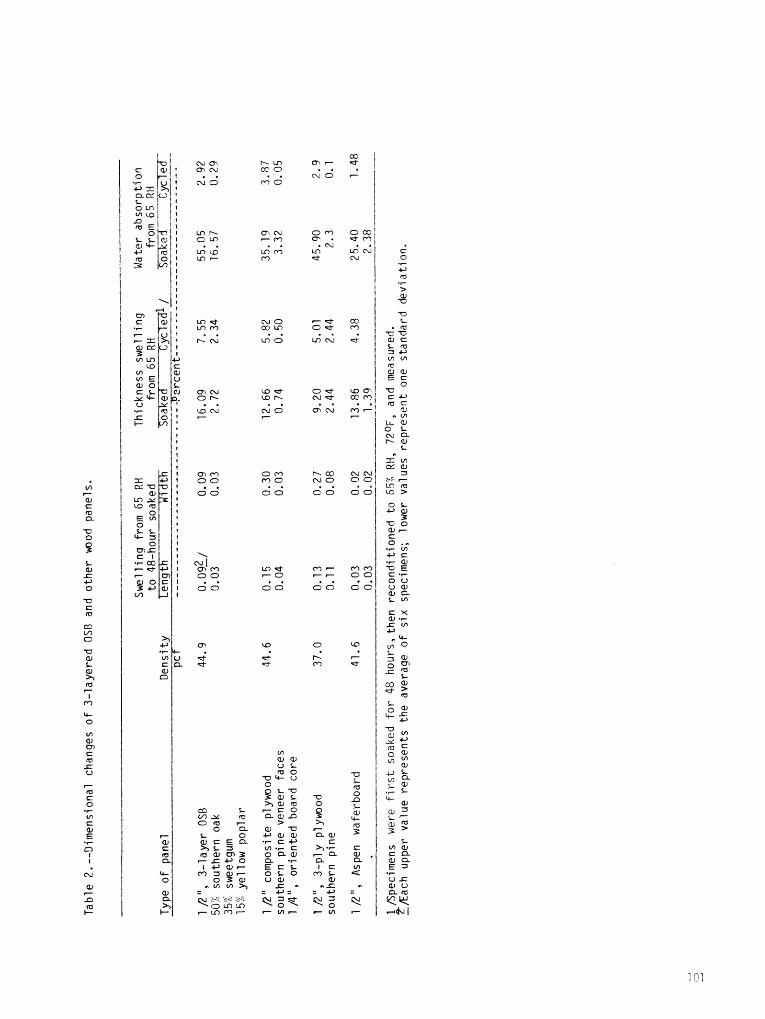
LC) r. o m tc; cd m -
Q * lola . . (No r-
CnN or-- . . L 3 N r-'
(NN i z ;
991 g7i 001 V: >
a L c n y l a Orb r- 0 a @J -3
+-'at a, .r s +-' V) .r C
g. E C L O L O
TQe p l a t e shear nodufus o f the o r i e o t c d board a f t e r cyc l ing , was 75% and 5 9 ' h f shear values f o r composi t n plywood and Canadian waferhoard, r espec t i ve l y . The valire o f o r i e n t e d board was 855 l a r g e r t h a n t h a t of southern p ine pfywoori. The r a i l shear s t r eng th ~f the o r i e n t e d hoard a f t e r c y c l j n g was 2 9 X , 34?, and 17% h iaher than vaioes o f composi t o plyr(go(3, COX southern p ine p l y w n d and Canadian waferhoard, resoec t i vely. The i n t e r q a f bond s t r e n g t h o f tae o r i e n t e d hoard a f t e r c y c f i n o was s l i q h t l y hipaes than the value o f the con- pos i t e plywood and h igher than the Aspen wa ferhoard.
Resu l ts i n t ab le 1 i n d i c a t e t h a t p rope r t i es o f 3 - l aye r o r i en ted board froin d mix tu re o f southern hardwoods are lower than commercial CDX southern p ine p l y w o d and experimental com- pos i t e plywood; however, they a re consi derahly h i ghe r than p rope r t i es o f t9e Canadian wafer- board. It should be po in ted o u t t h a t v ~ h i l e the 3 - l aye r o r i en ted bodrd i s approximately 9% h igher it1 dens i t y than the Canadian waferboard, t he f l e x u r a l p rope r t i es o f the o r i e n t e d board a re more than double those o f the Aspen waferboard.
Oimensional changes o f the o r i e n t e d hoard and o f o ther wood panels are presented i n t a b l e 2 . L inea r swe l l i ng of the o r i en ted board a long t he pane l ' s l eng tq and w id th ( p a r a l l e l and per- pend icu la r t o face p a r t i c l e o r i en ta t i on , r e s p e c t i v e l y ) i s equal t o t h a t o f the Aspen waferboard and cons iderab ly ' lower tblan t h a t 04: composite plywood and c o m w r i c a l soutbern p ine plywood. Water absorp t ion from 65% RH t o 48- hour soaking i s h igher f o r the o r i en ted board than fo r any o f the o ther boards,
SUMMARY
Th i s paper presents p a r t i a l experimental r e s u l t s o f an ongoing l a r g e study t h a t concerns p r o p e r t i e s o f o r i en ted f l akeboard from southern hardwood species. Speci f i c a l l y , the paper con- t a i ns experimental t e s t s r esu l t s o f physi ca1 and c e r t a i n impor tan t mechanical p rope r t i es o f 3 layered o r i en ted f l akeboard f ab r i ca ted f rom a mi x t u re o f southern hardwoods (35% r e d oak, 15% wh i te oak, 35% sweetgum, and 15% ye l l ow pop la r ) blended w i t h a commercial phenol formaldehyde r e s i n (6% s o l i d s ) , Soards * re 1 R - i n c h t h i c k (1 B - i n c h face and back, 114-inch core) w i t 6 an average board dens i t y o f 44.6 pounds per cubic foot .
Experimental r e s u l t s i n d i c a t e t h a t proper- t i e s o f t he o r i en ted boards a re lower than com- mer icaf CDX southern p ine p l y w o d and o f expe r i - mental composi t e southern p ine p lywod, however, they a re cons iderab ly h igher than p rope r t i es o f commercial Aspen waferboard, It should be po in ted o u t t h a t a1 though the 3 - layer o r i e n t e d board i s approximately 8% denser than t he Aspen waferboard, t he f l e x u r a l p rope r t i es i n t he d i r e c t i o n o f face p a r t i c l e o r i e n t a t i o n o f t he o r i e n t e d board a re more than tw ice t h a t o f
the randomly o r i e n t e d Aspenite wferboard, L i nea r ditnensional changes o f t he o r i en ted board w i t h changes o f rnoisture frotn 65% RH t o 48-hour soaked cond i t i on a re equal t o those of the Canadian waferhoard and much Se t t e r than those o f the southern p ine p l y w o d and composite plywood. Thickness s w e l l i n g o f the o r i en ted hoard i s approximately 2% h igher than t h a t o f the Aspen wa ferhoard.
i n summry, t he p re f imi nary experimental resuf t s i n d i c a t e t h a t appropr ia te mix tu res o f h igh and low dens i t y southern hardwoods can be used t o f ab r i ca te c o m w r c i a l l y acceptable o r i e n t e d hoards 112-inch t h i c k f o r sheath ing i n housins. Such boards, a l though 5-10% denser than Aspen naferboards, would a l so be s u b s t a n t i a l l y s t ronger and s t i f f e r .
LITERATURE CITED
American Plywood Associat ion. 1981. Personal communication w i t h Department o f !qarketing, Tacoma, MA.
American Soc ie ty f o r Tes t i ng and f l a t e r i a l s . 1974. Standard D1037; D3043; 02718; i n ASTM.
Annual Rook o f Standards, P a r t 22, Ph i lade lph ia , PA.
B i b l i s , E. J. , and W. 6. Lee. 1984. Proper t ies o f sheath ing grade plywood
made from sweetgum and southern pine. Wood and F ibe r 16(1) :86-92.
R i b l i s , E. J., and F. Mangalousis. 1983. Proper t ies o f 1 /2" composite plywood
w i t h southern ye l l ow p ine veneer faces and u n i d i r e c t i o n a l l y op r i en ted southern oaks s t rand core. For. Prod. J. 33(2) :43-49.
Fo res t Serv i ce-USDA. 1978. Fores t s t a t i s t i c s o f the U.S. i n 1977.
Washinqton, DC. Geimer, R. L. , and E. Lf. Price.
1978. Construct ion va r i ab les considered i n f a b r i c a t i o n of s t r u c u r a l f lakeboard. I n S t r u c t u r a l f lakeboard from f o r e s t r e s 3 u e s : symp: proc., Kansas C i t y , MO. June 6-8. U. S. Dep. Agric. For. Serv., Gen. Tech. Rep. WO-5, p, 69-80.
Hunt, M. O., W. L. Hoover, D. A. Fergus, W. F. Lehmann,and J. 5. McNatt. 1978. Red oak s t r u c t u r a l pa r t i c l eboa rd f o r
f o r i n d u s t r i a l commercial r o o f decking. RB-954, 61 p., i l l u s . Wood Res. Lab., Dep. For. and Nat. Resour., Agric. Exp. Stn., Purdue Oniv., Mest t a faye t t e , IN .
Koch, P. 1982. Non-pu1 p u t i 1 i za t i on o f above-ground
hiomass o f mixed-species f o r e s t s o f smal l t rees. Wood and F ibe r 14(2) : 118-143.
Pr ice, E. W., and W. F, Lehmann. 1978, F l ak i ng a1 t e rna t i ves . I n S t r u c t u r a l
f lakeboard from f o r e s t r e s i d E s : symp: proc., Kansas C i ty , MO, June 6-8. U.S. Dep. Agric. For. Serv., Gen. Tech. Rep. WO-5, p. 47-68.
COKPACTION RATIO AND RESIN COVERAGE EFFECTS OM PROPERTIES
Abstract.--Flakeboards 1.5-inch thick were made with various wood densities (species) , board densi t ies , flake thicknesses, and weight percent resin contents, Property data were analyzed for dependence on covpaction ra t io (C/R) and resin coverage ( R J C ) . Linear regression anal - yses showed that some 72" of the variation in MOR, HOE, and IB data was explainable through dependence upon CJR and R / C , thus suggesting tha t these parameters may be useful in preliminary analysis of untested board compositions. For a 24-hour watersoak thickness swelling, a dependence on R/C was significant b u t accounted for only 35% of the variation in the swelling data. However, C/R did not s ignif icant ly affect the swelling.
INTRODUCTION
The concept of COM-PLY panel and lumber products has been ful ly described by Koenigshof and others (1977-1982) in the U.S. Forest Ser- v ice ' s COM-PLY report ser ies . COM-PLY basically u t i l i zes a particleboard (most often a flake- board) center or core with adhesively bonded solid wood (usually veneer) faces or edge-bands to add strength and s t i f fness . The thrust of the COM-PLY idea i s to u t i l i z e small, and per- haps low grade, t rees to generate the construc- t ion lumber and panels which currently have to be produced from larger, higher quality and increasingly scarcer timber. The practical and economic feasi bi 1 i ty of the GOM-PLY concept wi 11 thus hinge on being able to use a wide range of wood species, and the economic success will cer- ta inly depend on keeping binder content aud costs as low as possible.
The present study was undertaken to evalu- a te the usefulness of the compaction ra t io (C/R) and resin coverage rate (RIG) parameters as pre- di ctors of particleboard properties (and re1 ated COM-PLY performance) when using a range of species. From the ea r l i e s t days of particle- board research the topic of species effects and related interactions with other material and process variables has been of interest . Early work tended more toward empirical studies of common species and related variabf es (Klauditz 1952, Rice 1960). However, recent studies have
l/Paper presented a t Workshop on Durability, ~ensa&la , FL, October 5-7, 1982.
2/Associate Professor, University of ~eorgTa, Athens, GA.
been pore analytical as to which characteri sties have contributed most to the differences between species, and considerable attention has been given to the interaction between wood density and board density, variously called compression r a t i o or compaction ra t io (Geimer and Price 1978, Hse 1975, Rice and Carey 1978, Vital, Lehmann, and Boone 1974). These l a t t e r studies have a17 indi- cated a def ini te effect of the compaction r a t i o , especially on the strength properties of particle- board. I t i s generally assumed tha t the compac- t ion ra t io i s indicative of the degree o f con- solidation and inter-par t ic le contact established within a board as i t i s pressed. I t could also be thought of as a measure of the bonding pres- sure available to form the inter-par t ic le adhe- sive joints needed to hold the board together.
One of the most widely recognized and re- searched factors in particleboard composition has been the adhesive binder amount and i t s d i s t r i - bution. Numerous studies have examined variation of the weight percentage of resin binder solids included in parti c1 eboard (Klaudi t z 1952, 1954, Rice and Carey 1978, Turner 7954). I t has Pur- ther been recognized that the normal wood gluing concept of zdhesive spread rate (1 bsjMSGi, ajm2 ~ i g h t be a better parameter to measure and re- port than weight percentage, i f id could be accu- ra te ly determined (Meinecke and Kl audi tz 1962). The problem of detervi ni ng resin coverage ra te with precision i s evident when one considers the d i f f icu l ty of accurately determining the to ta l surface area for a given quantity o f part ic les . The problem i s somewhat solvable in the case of flake-like par t ic les with a known average thick- ness. Fairly simple formulas have been p u t for th to compute the surface area of flakes and the resultant resin coverage rates when given weight percentages of resin are added (Meinecke and Klauditz 1962).
in the present study, t h i s computational approach t o the determination of f l a k e surface area kas taken and a modified formula i s g i v e n l a t e r . I t wil l be seen tha t the key fac tors a f f e c t i n g res in coverage r a t e are ( a ) weight per- cent resin added, (b : wood dens i ty , and ( c ) pa r t i - c l e geometry (especia l ly f l ake th ickness) .
I t can thus be seen t h a t the key species c h a r a c t e r i s t i c cf wood density a f fec t s b a t h compaction r z t i o a n d resip coverage ra te . Spe- c i e s e f f e c t s on board properties migh t then be best expressed tbrcugh cons idera t ion of these two f a c t o r s .
EXPERIMENTAL DESIGN
As indicated, the objective of t h i s study was t o determine the ef fec t iveness of compaction r a t i o and res in coverage r a t e as predictors of par t ic leboard proper t ies , especia l ly in coreboard f o r CON-FLY lumber, i . e , in 1%-inch th ick flake- boards. The ult imate purpose was t o devise an anproach for assessing new species and species blends without exhaustive laboratory t e s t s each time.
I t was recognized ( a ) t h a t the key fac to r s a f f ec t ing compaction r a t i o are wood density and board density, and ( b ) t h a t the key fac to r s a f - f e c t i n g res in coverage r a t e are weight percent r e s in addi t ion , wood densi ty , and f lake thickness. Four southeastern hardwood species, covering a f a i r l y broad range of recorded wood dens i t i e s ( F P L 1374) were chosen fo r study. They are l i s t e d in t ab le 1 , along with t h e i r t a rge t (book va1 ue) spec i f i c g r a v i t i e s , t h e i r actual average green volume basis spec i f i c g rav i t i e s and t h e i r estimated spec i f i c g rav i t i e s based on volume a t 5% moisture content. Lobfolly pine was a lso in- cluded i n the study as a c ~ n t r o l reference species , and i s a lso cataloged in t ab le 1 .
In addit ion t o the species var iable , three l eve l s of board density were chosen, namely 32, 38, and 44 pounds per cubic foot (based on wo~d and r e s i n dry weight per unit volume of board conditioned t o EMC a t 7 0 ' ~ and 65% R H ) . Further- more, two weight percent levels of phenol- formaldehyde res in so l ids addi t ion , namely 4?! and 7% and two levels of t a rge t average dry f lake thickness, rrarnely .1375" and .036 , were chosen. T h u s a range of compaction r a t i o s was generated, based on the d i f f e ren t wood and board dens i t i e s chosen. To fu r the r enhance t h i s aspect of the study, two soecies blends were also i n - cluded, n a ~ e l y ( a ) yellow-poplar and white oak blended t c the spec i f i c gravity average of sweet- gum, and (0) sweetgum and mockernut hickory blended t o t he spec i f i c g r av i t y average af white oak. Table 2 summarizes the vita7 information on the experimental combinations studied showing the ca lcula ted compaction r a t i o s and re s in cover- age r a t e s and measured average f lake thicknesses obtained. Since experimenta' var ia t ion in the actual vs. t a rge t board dens i t i e s and f lake thicknesses were encountered, the actual values were measured and reported and used in computing
the compaction r a t i o s and res in coverage r a t e s recorded. The formul as used in computi ng compac- t ion r a t i o s and res in coverage r a t e s a r e given as footnotes t o t ab le 2 . The l i t e r a t u r e has not been spec i f i c as t o what exact measure of wood and board density should go in to the computation of compaction r a t i o . However, i t i s c l e a r t h a t the in t en t i s t o est imate the degree of compaction o r densi f ica t ion of the wood in the pressing of a board. Thus, in t h i s study an attempt was made t o approxipate t h a t wood densification and t h e formu- i a shown as footnote 2 t o t ab le 2 was used. In reviewing t ab le 2 , i t i s seen t h a t compaction r a t i o s , in t h i s study, ranged from as low a s around 0.6 up t o a high of around 1 .4 . Based on other wood and board density measurements (e.g. , green volume wood density and as - i s t o t a l weight per uni t volume of board) the equivalent values would have ranged from approximately 0.8 up t o 1 . 7 5 ,
The formula used fo r computing r e s in cover- age r a t e i s given as footnote 3 t o t a b l e 2 and the computed values a re recorded in t h e body of t a b l e 2 . As wi l l be noted, the actual average f lake thicknesses varied from the two t a r g e t levels chosen. This ref lec ted the d i f f e r i n g responses the species had t o cut t ing on the labo- ra tory f l ake r , These differences were not noted un t i l the study had been es sen t i a l ly completed. The r e s in coverage r a t e s reported rang d from a !? low of around 3.5 grams of PF solids/rn of f lake surface up t o around 14.5 g/ rn2 . As a matter of comparison with more t r ad i t iona l glue spreads, a 40 lbs/MSGL spread (20 lbs/M of divided spread) of a 28% P F so l ids glue mix in pine plywood would correspond t o 27.34 grams of P F so l ids per square meter of surface.
EXPERIMENTAL PROCEDURE
Raw Materi a1
The wood u t i l i zed in t h i s study a l l came from t r e e s from a s ing le , mature, mixed pine- hardwood stand located near the campus of the University of Georgi a (Oconee-Denmark f o r e s t ) . An i n i t i a l survey of t h a t stand showed t h a t a l l f i v e species t o be studied ( i . e . , yellow-poplar, sweetgum, white oak, mockernut hickory and lob- lob1 l y pine) were present in good amount. Incre- ment cores were sampled a t breast height from several t r e e s of each species. The s p e c i f i c g rav i t i e s (Sg ' s ) of these cores were determined by the maximum moisture content method and whole t r e e averages est imated, Trees of estimated proper whole f r e e average Sg values were taken i n s u f f i c i e n t number [generally 2-3 t r e e s of each species) t o y i e ld an adequate amount of wood fo r f laking.
When f e l l e d , disks were cut from the base, mid-section and top of the t r e e , and Sg values f o r the wood in those disks used t o determine the tree-average Sg values reported in t a b l e 1 .
Logs from the se lec ted t r e e s were sawn in to nominal 2 " x 4" and 2 " x 6" lumber on a small
sawmi 11. Care was taken t o cut as much f 1a t grained lumber as possible. The ~ i e c e s were then cross-cut t o y i e ld blocks 3 -3 /4 'b long the grain and were then reduced t o approximately 1 - l jd" long f lake ribbons on a disk f laker described in e a r l i e r publications (Rice and Carey 1978). A1- though the f l a k e r was i n i t i a l l y s e t with care , t o cut the prescribed t a rge t f lake thicknesses of . 0 1 5 ' h d ..030'\ l a t e r ~easurements on samples of the dried and milled f lakes showed t h a t the .G3Ot ' f l akes , in f a c t , averaged between .077" and .023" f o r the various species. This was not discovered un t i l well a f t e r a1 7 boards had been made and t e s t ed , and thus became a f ac to r confounded with species in these data. However, since the actual average dry f lake thicknesses were known a t the time of data analys is , those values were used in cal cul a t i ng R / C r a t e s . Therefore, the K/C val ses used in the multiple regression analysis should be reasonably accurate.
The green f lakes were immediately k i ln dried t o a moisture content of 3-4% (subsequently averaging around 5%) and then hammermil led t o reduce the width t o l e s s than 1/4". A range of p a r t i c l e s i zes was generated during the mill ing and f ines (material passing through a 16 mesh wi ndow screen) were subsequent1 y removed by screening. Samples o f the dried and milled pa r t i c l e s fo r each species and thickness category were screen analyzed, and the data are reported in t ab le 3. Both weight percentage and average f lake dimensions are included fo r each p a r t i c l e type and screen s i ze c l a s s i f i ca t ion . The screen- ing was done on two, approximately 100 gram samples fo r each species x thickness c l a s s of f lakes . A Ro-tap shaker was used, with the screens a s noted in table 3, and running time of 20 minutes.
The screen f rac t ions were weighed, and the weight percentages caught on each screen s i ze (and pan) have been reported. In addit ion a random sample of 50 f lakes from each f rac t ion (or fewer, where 50 were not avai lable) were measured fo r length, width, and thickness, and average values fo r these measurements are a lso reported,
Since the COM-PLY concept generally c a l l s f o r as durable an adhesive bond as possible, a phenol-formaldehyde re s in , designed fo r use i n part icleboard manufacture was chosen. A 55 gallon drum of the Borden Chemical Company's Gascophen PB-65 was obtained and used as the res in binder. Thds res in i s a 45': sol i d s , 300 cps (Brookfield a t 25 C f viscos i ty product, t a i lo red f o r use in part icleboard. Periodic checks on viscos i ty and gel time showed the res in t o be on speci f ica t ion throughout the f i f e of t h i s study.
Material Calculations
In t h i s study, board density i s defined as oven dry f l ake and res in sol ids weight per uni t of t a rge t board volume. Since the nominal board s i z e was t o be 1-1/2" th ick x the f u l l press platen s i z e (25" x 25'7, the amount o f f lakes and l iquid r e s in were calculated t o give the
t a rge t board dens i t i e s (32, 38, and 44 pcf) fo r a 1-1/2" x 26'" 26" panel. Table 2 includes average dens i t i e s fo r each experiwental cornbi- nation (based on n;easuren;ents made on the MOR/MOE s t r i p s ) , and i t can be seen t h a t measbred values were generally a b i t on the l igh t s ide . This was probably due t o a snail material loss resul t ing f r o m "squeeze-out" at ahthe edges of the panel when pressed,
Gnce the Flake amounts had Seen determi ned , the r e s in so l ids weight percentages prescribed in the study plan ( 4 4 and 7 ,) were used t o ca l - cula te the weight (and, based on res in spec i f i c gravi ty , the volume) o f r e s ip needed fo r each board. Ps wil l be described l a t e r , t h i s pre- scribed amount o f res in was sprayed, as uniformly as was poss ib le , onto the f l akes ,
Panel Fabri cation
The study plan required 168 panels. Since the laboratory procedures placed no oa r t i cu la r const ra in ts on production sequence, the panels were made in a random order (based on blind drawing of numbers). The r a t e of panel produc- t ion was such t h a t a t o t a l time span of s ix weeks was involved.
The f a b r k c t i o n sequence consisted of using a round, cascade-type blender, 4 f e e t in diameter and 2 f e e t deep, as a blending chamber. The res in spray was accomplished using a serni- externally-atomizing nozzle, spraying from the center toward the blender periphery and in to the r ec i r cu la t ing cascade of f lakes . The a i r pres- sure on the nozzle were adjusted t o give a f i n e res in atomization and a moderate r a t e of spray.
Due t o the large quant i ty of pa r t i c l e s needed t o make these r e l a t i v e l y large t e s t panels, i t was necessary t o make two blender runs (using half of the f lakes each t ime) and then combine a11 res in coated f lakes jus t before mat formation. The half-batch f lake amounts varied from a low of around 9 pounds to a high sf around 13 pounds, depending on board density and res in content. Corresponding spray t ines ranged from a !ow of around 5 minutes t o a high of around 17 minutes.
Flake samples were taken both before and a f t e r blending and moisture contents checked. Moisture content of the f lakes g o i q i ~ t a the blender average around 5" ( a s previously noted) and corning out of the blender they ranged from a low of 8% t o a high of 13?, de~ending p r ina r i ly on the res in content and concurrect moisture addit ion. Since no fu r the r adjustment was made i n f lake r o i s t u r e content a f t e r unloading the blender, any e f f e c t s o f mat nois ture content, within the range of 8-73?0 are confounded, primaril 4 with res" coverage.
The mats were hand formed i n a 26" x 26 '" removable frame which rested on a 7!4" thick aluminum caul sheet . Care was taken t o form t h e mats as uniformly as possible, and, an analysis o+ the within-board density var ia t ion ( a s meas- ured on the two bending-test s t r i p s fo r each

C ? m t7 o m 3 o V t t oa,
W r o L I-72 a, O L r j S
- Q ) & ' o m 5 1 3 L V L L @ m w m .+-3% ( U W L . u 3 KJ W d F - SF-
Q) -r- m m u 5 sLc -v a 3 s at--. E m 5- a, 5- a, 0 m S W %r t
4-J t n r v, c-r" c- .r- 3 0 r r u EQ mt3.r-E 0 a, u- - L a '
3 =a, 4 - J V ) W L e m s .t-. a,'--+-) O E m a Q 3 3 L L W L
% -C, .t-' .F .r I
v) I W W C "r:.r- L arm crr E
g g ' E gj L T-3 : a , O V ) & C + - a a, a 0 1 0 E CLlnv+a 1acu L c 3 wl+
*r- LA m x-(J+ m $3 n 5 . r Q r:
7CI V1 .,-- 3 E c c-L
+ 3 0 _ " i 5 - 0 C n 3 0 a'+- r a w L a .$ @ 5 2 ")- W . J C ~ - c - , .r- 9: a, I T a u? l;r c
X 0 a m c *r-
E 0 cc-.
U, I?: + 13 c rci
-TJ (U
E L.
0 cc--
V) c6 3
4"J
2 .c U cj a,
Q) U S= a
~noaru I I; L + O mQ) "CV) .P-Era,rn ZI.I--0 5
-e, *r L a -C"a , r r - C , v l O > C
u?ctla)rrc V) m C4-J- TJLErcl I;: C I 0 Z m 0 0 3 < 2 c > -
U?-(-I CU *771 I;: CU L
Species averages fo r NOR ranged from a :ow of 3 , 3 3 0 psi fo r pine t o a high of 4,238 psi fo r sweetgum ( t a b l e 4:. Sweetgum also had the hf gh- e s t MOE a t 515,000 psi but white oak had the low- e s t MOE, 404,003 psi . The AOV fo r MOR indicated t h a t the only s t a t i s t i c a l l y s ign i f f can t species in terac t ions are species x r e s in content ( f i g . 1 ) and species x chip thickness ( f i g . 2). However, only the species x res in content ( f i g . 6) i n t e r - action i s s ign i f i can t fo r HOE. Regarding the s igni f icance f o r M09 of the species x chip ( f l a k e ) thickness in terac t ion ( f i g . 21, St shohld be remembered t h a t there are some noticeable devi- a t ions from t a r g e t f lake thicknesses ( t ab les 2 and 3 ) . Since some of the species accidenta l ly had flake thickness discrepancies, the species x f lake thickness may be biased.
Since the board density i s a highly s i g n i f i - cant f ac to r and the e f f e c t of density i s about the same fo r a l l species , the species x board density in terac t ion i s nonsignificant fo r both MOR and HOE. An increase in board densi ty , as expected, yielded an increase in both MOR and WOE ( t a b l e 4 ) .
There are some i nteract ions i nvol vi ng board density t h a t are s ign i f i can t . For instance, the in terac t ion of board density with res in content i s s ign i f i can t f o r both MOR and MOE ( f i g s . 3 and 7 ) . As i l l u s t r a t e d in the f igu res , an increase in res in content had a greater e f f e c t on the MOR 01'
MOE of the 3 8 pcf boards than fo r e i t h e r the 32 or 44 pcf boards. Another in t e rac t ion , board den- s i t y with f lake thickness, i s only s ign i f i can t fo r MOR. Figure 4 shows a s l i g h t l y greater in- crease in MOR with board density fo r the thinner (.015" t a r g e t th ickness) f lakes than fo r the th icker ones (.030" t a rge t th ickness) .
Resin content and f lake thickness, both s ign i f i can t f ac to r s fo r MOR and MOE, had a d i r e c t l y proportional e f f e c t on these mechanical proper t ies . . That i s an increase in res in content or an increase in f lake thickness resulted i n i n -
creased MOR and MOE properties ( t ab le 4 ) . The in terac t ion of res in content with f lake thickness i s a l so s ign i f i can t fo r both MOR and MOE. Sur- pri s i ngly, the increase in NOR or HOE with "creas- ing f lake thickness i s more pronounced a t the res in content level than a t 4': ( f i g s . 5 and 8 ) .
Linear model regression analys is r e s u l t s , fo r both MOR and MOE, on compaction r a t i o ( C / R ) and res in coverage r a t e (R/C) VJere calculated and plot ted ( t a b l e s 5 and 6 and f i g s . 1 2 and 13, r e spec t ive ly ) . Both MOR and MOE showed a s t a - t i s t i c a l l y s ign i f i can t regression on C / R and R / C with some 7 3 % of the overall var ia t ion in e i t h e r MOR tir MOE explainable by dependency on C / R and R / C . This, along with the analys is of variance r e s u l t s , indica tes t h a t , fo r both NOR and WOE examination of the re la ted C / R and R / C values fo r various species , species blends, f 1 ake thicknesses and res in addit ion l eve l s , should be a good place t o begin in predicting the properties of untested combinations.
INTERNAL BOND
The analys is of variance for in ternal bond data indicates t h a t , as w i t h MOR a n d MOE, a l l xain e f f e c t s (species , board density, res in con- t e n t , and f lake th ickness) and several i n t e r - actions have a s t a t i s t i c a l l y s fqc f i i can t e f f e c t O K in ternal bond ( IBj . Internal bond increases w i t h increasing board dens i ty , res in content, and f lake thickness ( t a b l e 4 ) . However, the s t a t i s t i - cal s igni f icance of 56 osi fo r the thinner f lakes vs. 68 psi fo r the th icker f lakes may be of doubtful pract ica l s igni f icance . The species e f f e c t on IB, with a low o f 39 psi fo r white oak and a high of 84 psi fo r yellovi-poplar, i s of pract ica l i ~ p o r t a n c e .
The s ign i f i can t in terac t ions are species x board density ( f i g . 9), species x res in content ( f i g . 101, board density x res in content ( f i g . 11) and species x res in content x chi^. The pattern of these in terac t ions i s much the same as with MOR and HOE,
Tabie 7 and f igure 14 summarize the l inea r model regression analysis r e s u l t s fo r IB on C / R and R / C . Again the impact of C / R and P I C on IB are c l e a r l y s i g n i f i c a n t , and soine 72J of the overall var ia t ion in IB i s explainable by depend- ence on C / R and P I C . For I 6 as with MOR and R O E , indications are t h a t C/R and R / C assessment i s a good place t o begin in evaluatinq the e f fec t of nelv species or species blends, res in contents, p a r t i c le geometrf es , e t c . o n internal bond.
T H I C K N E S S SWELLING
Based on the analysis of variance r e s u l t s , thickness swelling of the panels, as measured by 24-hour water soaking i s , s t a t i s t i c a l l y speaking, s ign i f i can t ly af fec ted by the main fac tors (species , board densi ty , res in content, and f lake thickness) and several i n t e rac t ions . However, the pract ica l s igni f icance i s ra ther doubtful. For example, the species aveifiages range from a low of 17.5;; fo r pine t o a high of only 22.9:; for sweet- gum. Likewise, the in terac t ions of s ~ e c i e s with board densi ty , res in content, f lake thickness, e t c . often yielded only a 2 o r 3" swelling range among values which average around 20Y3. The most noteworthy main e f f e c t i s fo r res in content. Boards with 4" resfn content averaged 27.7;( swe77ing and those with 77 res in averaged only 72.7" swelling.
Table 8 summarizes the l inear regression analysis fo r 24-hour thickness swelling on C / R and R / C . In contras t t o MOR, MOE, and IB, the e f f e c t of C / R on swelling was not s ign i f i can t , and only some 36% of the var ia t ion in the thick- ness swelling data was explainable by differences in C J R and R / C . The e f f e c t of R / C was c l ea r ly s ign i f i can t and accounts fo r the vast majority of the 36';. This Findinq indicates t h a t some fac- t o r ( ~ ) other than C / R and R/C are involved in con- t r o l l i n g the amount o f thickness swellinq produced by the boards.
The basic nature of the thickness swelling of par t ic leboard seems t o follow the mechanism which has been put fo r th t o explain thickness swell ing and shrinking in paper (Stamm and Cohen 1956). This involves components from ( a ) the normal revers ib le swelling of wood due t o c e l l walls expanding and contracting as adsorbed water i s taken in to or given off from them, ( b ) the i r r e v e r s i b l e recovery of any crushing of f i b e r s (crushed f i b e r s tend t o bal loon back when wetted 1, and ( G ) a revers ib le relaxation with f i b e r s which have taken on a " se t " or "bendIf and which then ""fever 'hr ' ' p r y open the board s t ruc tu re when wetted and then c lose back when redr ied , In par t ic leboard (including flakeboard, especial 1y) the component ( a ) f o r normal wood swelling should increase with wood density in most cases. The component ( b ) f a r i r r eve r s i ble crushing recovery should be primarily controlled by C / R and logi - c a l l y increase with i t , unless conditions fo r a permanent "se t" occur. The component ( c ) fo r r eve r s ib le r e f axation could be influenced by severa l f ac to r s , i ncl udi ng C / R and p a r t i c l e geom- e t r y , especia l ly length t o thickness r a t i o . Fur- t h e r study of thickness swelling as af fec ted by C / R and R/C and possibly by wood permeability, should be undertaken and measurements made t o r e l a t e these r e s u l t s , as much as possible, t o normal wood swell i ng , i r r eve r s ib le recovery and reve r s ib le re laxat ion.
CONCLUSIONS
For these data , compaction r a t i o ( C / R ) and res in coverage r a t e (RIC) can be seen as s i g n i f i - cant basic f ac to r s a f f ec t ing the mechanical proper t ies of th ick flakeboards. The l inea r model regression equations obtained for modulus of rupture J M O R ) , modulus of e l a s t i c i t y ( M O E ) , and in ternal bond f IB) approximations are :
NOR ( i n p s i ) = (3258)(C/Rj+(363)(~/~)-2083
MOE ( i n psi ) = (339246) (C/Rf+(37025) (R/C)-726721
I & ( i n p s i ) = (154.O)(C/R)+(9.2)(R/C)-152.5
The analyses of variance fo r the various main e f f e c t s and in t e rac t ions fo r these three mechanical properties can generally be seen t o ve r i fy the regression analysis f indings when one takes in to account ( a ) the e f f e c t s of wood den- s i t y (of the species and blends) and board den- s i t y on compaction r a t i o , and ( b ) the e f f e c t s of wood densi ty , res in content, and f lake thickness on r e s in coverage r a t e .
With regard t o the property of 24-hour watersoak thickness swelling percent, fu r the r study o r analys is i s needed. The analys is fo r l i nea r regression on C / R and R/C indicated tha t ( a ) the dependence on C / R i s not s t a t i s t i c a l l y s i g n i f i c a n t , and ( b ) t h a t the overall coe f f i c i en t of determination was only 0.36.
LITERATURE CITED
American Society fo r Testing and Materials (ASYM) 1978. Standard D1037, "Standard Method f o r
Eva1 uating the Properties of Wood Base Fiber and Pa r t i c l e Panels." Book of Standards. Part 2 2 , ASTM, Philadelphia, PA.
Forest Products Laboratory 1974. Wood Handbook. Agriculture Handbook No.
72, U.S. Forest Service, Dept. Agric. , Goverw ment Printing Office, Washington, DC.
Geimer, R. L . , and E . M. Price 1978. Construction variables considered i n
fabr ica t ion of a s t ruc tu ra l flakeboard. General Technical Rep. WO-5, U.S. Forest Service, Dept. Agric., Washington, DC.
Hse, C . - Y . 1975. Properties of f1 akeboards from hardwoods
growing on southern pine s i t e s . Forest Prod. 3. 25(3):48-53.
Klauditz, W . 1952. Untersuchungen iiber d ie Eignung von
verschiedenen Holzarten, insbesondere von Rotbuchenholz zur Herstellung von Holz- spanplatten. Berichte 25. I n s t i t u t f u r Wolzforschung, Braunschweig.
Klauditz, W. 1954. Entwicklung, Stand und Holzwirtschaft-
l i che Bedeutung der Holzspanplattenherstel- lung. Holz a l s Roh-und Werkstoff 13.
Koenigshof, G . , e t a l . 1977-1 982. COM-PLY Report Ser ies , Research
Report Ser ies , U.S. Forest Service, Southeast. For. Expt. S ta . , U.S. Dept. Agric., Ashevil le, NC.
Meinecke,.,E., and W. Klauditz. 1962. Uber d ie physikalischen und technishen
Vorgange bei der Beleimung und Verleimung von Holzspanen bei der Herstellung von Holzspanplatten. Berichte No. 1053, Fors- chungsberichte des Landes Nordhein-Westfalen. Westdeutscher Verlag, Koln und Opladen.
Rice, J . T., and R . H . Carey. 1978. Wood density and board composition e f -
f e c t s on phenolic resin-bonded f l akeboard. Forest Prod. J. 28(4) 321-28.
Rice, J . T. 1960. The e f f e c t s of selected var iables on the
proper t ies of f l a t pressed flakeboard. P1.S. Thesis, ?!orth Carolina Sta te Universi ty, Raleigh, NC.
Stamm, A . J . , and W. E. Cohen 1956. Swell i ng and dimensional control of
paper. Australian Pulp and Paper Industry Technical Association Proc. No, 10.
Turner, H . D. 1954. Effect of p a r t i c l e s i ze and shape on
s t rength and dimensional s t a b i l i t y of res in- bonded wood-parti cl e panel s . Forest Prod. J . 4(5):210-217.
Vi ta l , B. R . , W. F. Lehmann, and R . S. Boone. 1974. How species and board dens i t i e s a f f e c t
proper t ies of exot ic hardwood par t ic leboards . Forest Prod. J . 24(12) :37-45.
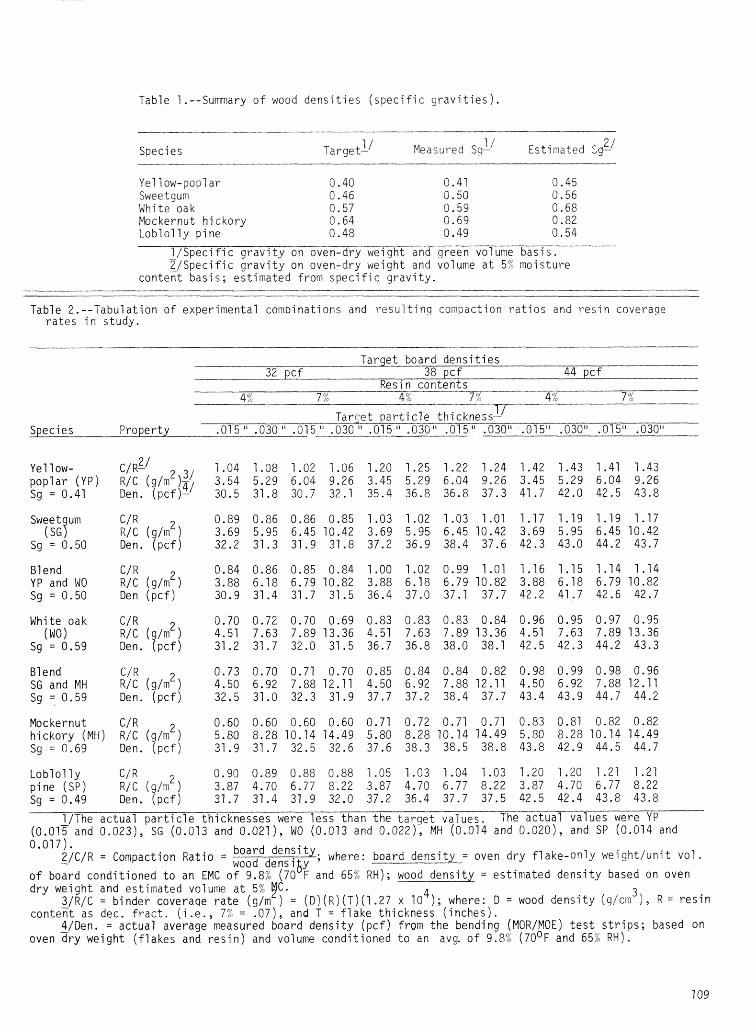
Table 1.--Summary o f wood d e n s i t i e s ( s p e c i f i c g r a v i t i e s ) .
Species Target- 1 1 Measured Sq- Est imated z g q
Ye1 low-pop1 a r Sweet gum White oak Mockernut h i c k o r y L o b l o l l y p i n e
l / S p e c i f i c g r a v i t y on oven-dry we igh t and green volume bas is . - 2 I S p e c i f i c g r a v i t y on oven-dry we igh t and volume a t 5:; m o i s t u r e
c o n t e c t bas is ; es t imated f rom s p e c i f i c g r a v i t y .
Table 2 . - -Tabu la t ion o f exper imenta l c o m ~ i n a t i o n s and r e s u l t i n g compaction r a t i o s and r e s i n coverage r a t e s i n s tudy.
Target board d e n s i t i e s 32 p c f 38 p c f 44 p c f
Resin con ten ts 4% 7% 0 7% 4% 7% 4"
? /
Ta rse t p a r t i c l e thicknessL/ Species Proper ty .015 " .030 " .015" .030 " .015 u .030° .015" .O3ON .015" .030H .015".030"
Ye1 low- 2 / C/R- 1.04 1.08 1.02 1.06 1.20 1.25 1.22 1.24 1.42 1.43 1.41 1.43 p o p l a r ( Y P ) R /C (g/m2)$; 3.54 5.29 6.04 9.26 3.45 5.29 6.04 9.26 3.45 5.29 6.04 9.26 S g = 0 . 4 1 Den. (pc f ) - 48.5 31.8 30.7 32.1 35.4 36.8 36.8 37.3 41.7 42.0 42.5 43.8
Sweetgum C/R 0.89 0.86 0.86 0.85 1.03 1.02 1.03 1.01 1.17 1.19 1.19 1.17 (SG) R/C (g/m2) 3.69 5.95 6.45 10.42 3.69 5.95 6.45 10.42 3.69 5.95 6.45 10.42
S g = 0 . 5 0 D e n , ( p c f ) 32.2 31.3 31.9 31.8 37.2 36.9 38.4 37.6 42.3 43.0 44.2 43.7
Blend C/ R 0.84 0.86 0.85 0.84 1.00 1.02 0.99 1.01 1.16 1.15 1.14 1.14 YP and WO R/C (g/m2) 3.88 6.18 6.79 10.82 3.88 6.18 6.79 10.82 3.88 6.18 6.79 10.82 Sg = 0.50 Den ( p c f ) 30.9 31.4 31.7 31.5 36.4 37.0 37.1 37.7 42.2 41.7 42.6 42.7
White oak C/R 0.70 0.72 0.70 0.69 0.83 0.83 0.83 0.84 0.96 0.95 0.97 0.95 (No R/C (g/m2) 4.51 7.63 7.89 13.36 4.51 7.63 7.89 13.36 4.51 7.63 7.89 13.36
Sg = 0 . 5 9 Den. ( p c f ) 31.2 31.7 32.0 31.5 36.7 36.8 38.0 38.1 42.5 42.3 44.2 43.3
Blend 0.73 0.70 0.71 0.70 0.85 0.84 0.84 0.82 0.98 0.99 0.98 0.96 SGandMH / m 2 4.50 6.92 7 .8812 .11 4.50 6.92 7 .8812 .11 4.50 6.92 7.8812.11 S g = 0 . 5 9 Den. ( p c f ) 32.5 31.0 32.3 31.9 37.7 37.2 38.4 37.7 43.4 43.9 44.7 44.2
Mockernut C/R 0.60 0.60 0.60 0.60 0.71 0.72 0.71 0.71 0.83 0.81 0.82 0.82 h i c k o r y (MH) R/C (g/m2) 5.80 8.28 10.14 14.49 5.80 8.28 10.14 14.49 5.80 8.28 10.14 14.49 Sg = 0 . 6 9 Den. ( p c f ) 31.9 31.7 32.5 32.6 37.6 38.3 38.5 38.8 43.8 42.9 44.5 44.7
L o b l o l 1y c/ 2 0.90 0.89 0.88 0.88 1.05 1.03 1.04 1.03 1.20 1.20 1.21 1.21 p i n e (SP) R/C (g/m2) 3.87 4.70 6.77 8.22 3.87 4.70 6.77 8.22 3.87 4.70 6.77 8.22 Sg = 0 . 4 9 Den. (pc f ) 31.7 31.4 31.9 32.0 37.2 36.4 37.7 37.5 42.5 42.4 43.8 43.8
1/The a c t u a l p a r t i c l e th i cknesses were l e s s t h a n t h e t a r g e t va lues, The a c t u a l va lues were YP (0.0!5 and 0.0231, SG (0.013 and 0.027), k10 (0.013 and 0.022), MH (0.014 and 0.020), and SP (0.014 and 0.017).
2/C/R = Compaction R a t i o = ~ ~ ~ ~ d d ~ ~ : ~ ~ ~ ; where: board d e n s i t y = oven d r y f l a k e - o n l y w e i g h t / u n i t v o l . - o f board c o n d i t i o n e d t o an EMC o f 9.8% (70 F and 65% RH); wood d e n s i t y = es t imated d e n s i t y based on oven d r y we igh t and es t imated volume a t 5% k)C. 4 3
3/R/C = b i n d e r coverase r a t e (g/m ) = (D)(R)(T)(1.27 x 10 ); where: D = wood d e n s i t y (q/cin 1, R = r e s i n con ten t as dec. f r a c t . ( i .e., 7% = .07), and T = f l a k e th ickness ( inches) .
4/Den. = a c t u a l average measured board d e n s i t y ( p c f ) f rom t h e bending (MOR/MOE) t e s t s t r i p s ; based on oven a r y we igh t ( f l a k e s and r e s i n ) and volume c o n d i t i o n e d t o an avg. o f 9.8% ( 7 0 ' ~ and 65:; RH).
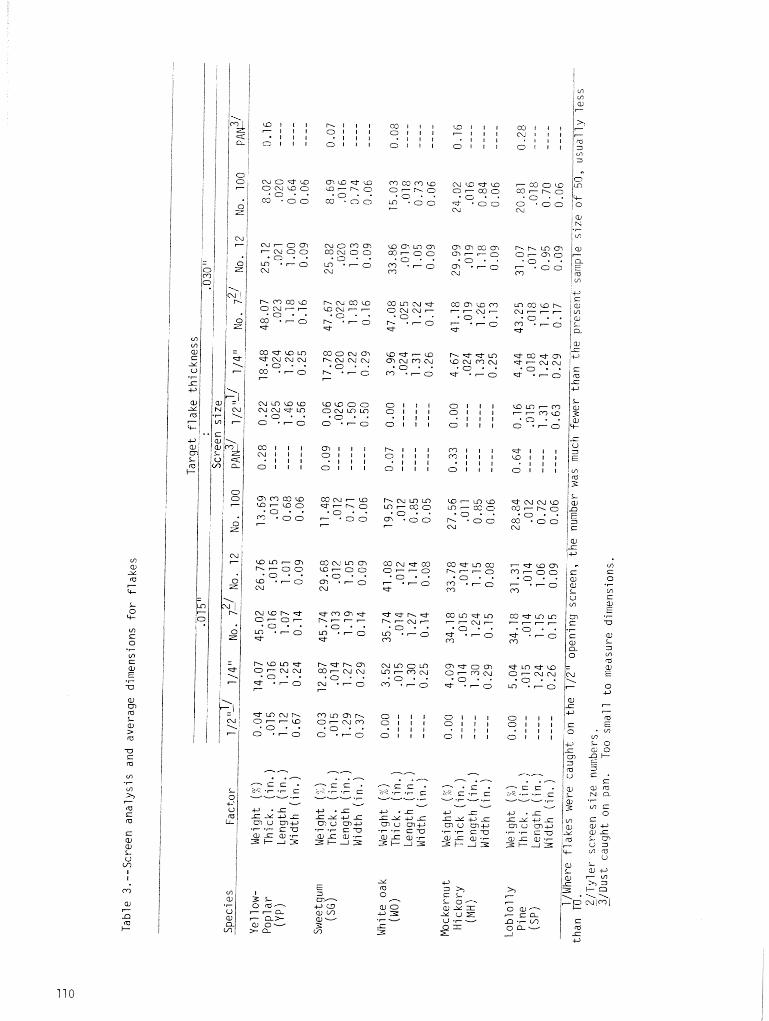
Nab" 0-?- .O .
LC) '-0 "
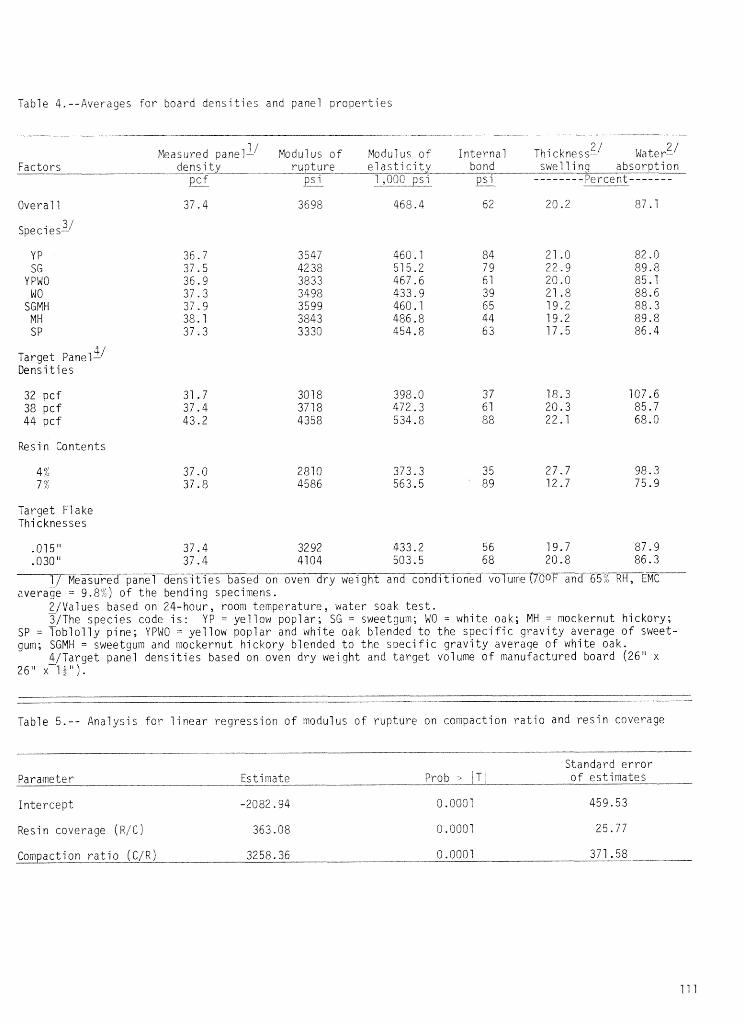
Table 4.--Averages f o r board d e n s i t i e s and panel p rove r t i e s
7 " Measured pane!-"odu7 us of Modulus o f i n t e rna l i h i ckness- 2/ Water- Factors dens i t y rupture el a s t i c i t y bond swell ing absorption
EL p s i 1,000 psi p s i -------- Percent------- - -
3 / Spec i es-
Y P SG
Y PWO WO
SGMH M H SP
Target panell ' Dens i t ies
32 pcf 38 pcf 44 pcf
Resin Contents
Target Flake Thicknesses
0 1 5 " 37.4 32 92 433.2 5 6 19.7 87.9 0 3 0 " 37.4 41 04 503.5 68 20.8 86.3
1 / Measured panel d e n s i t i e s based on oven dry weight and condit ioned volume (70oF and 65% RH, E r - average = 9.8%) of t h e bending specimens.
?/Values based on 24-hour, room temperature, water soak t e s t . - 3/The spec i e s code i s : YP = yellow poplar; SG = sweetgum; MO = white oak; M H = mockernut hickory;
SP = Toblo l ly pine; YPWO = yellow poplar and white oak blended t o t he s p e c i f i c g r av i t y average of sweet- gum; SGMH = sweetgum and mockernut hickory blended t o the s p e c i f i c g r av i t y average of white oak.
4/Target panel d e n s i t i e s based on oven dry weight and t a r g e t volume of manufactured board (26" x 26" x-14'".
Table 5.-- Analysis f o r l i n e a r regress ion of modulus of rupture on compaction r a t i o and r e s i n coverage
Standard e r r o r Parameter Estimate Prob r I T ! of es t imates
i n t e r cep t -2082.94 0.0001 459.53
Resin coverage ( R / C ) 363.08 0 .OQOI 25.77
Compaction r a t i o ( C / R ; 3258.36 0 .I3001 371.58
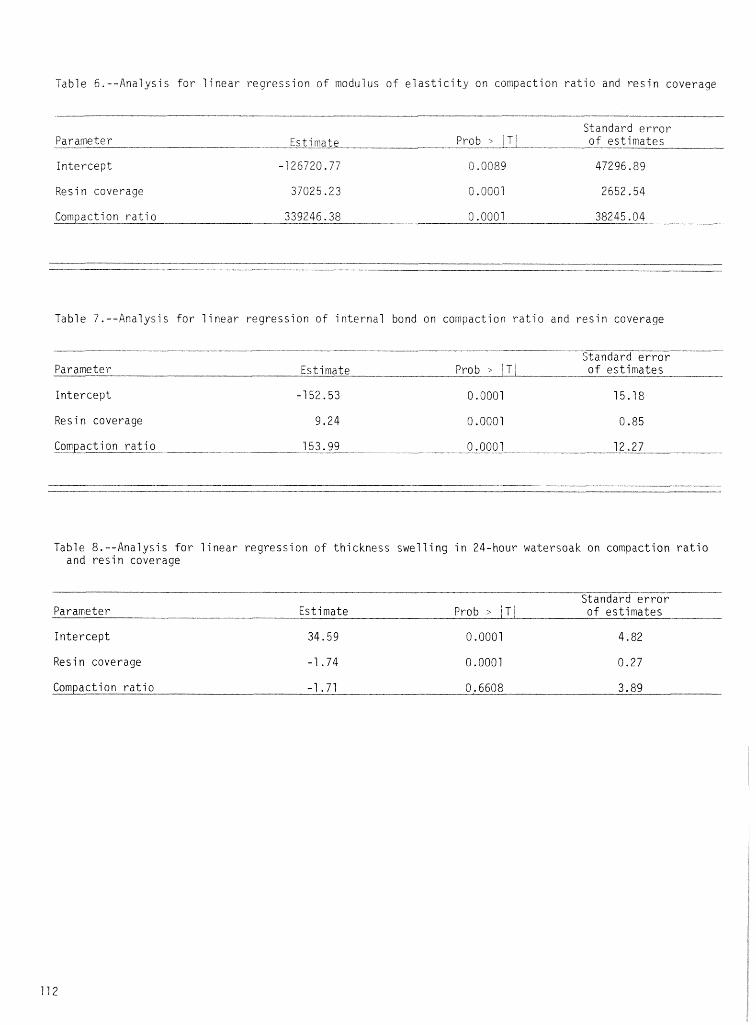
Table 6.--Analysis f o r l i n e a r r eg r e s s ion o f modulus o f e l a s t i c i t y on compaction r a t i o and r e s i n coverage
Standard e r r o r Parameter Est ima te Prob > Ti o f e s t ima t e s
I n t e r cep t -126720.77 3.11089 47296.89
Res i n coverage 37025.23 0 .0001 2652.54
Com~act ion r a t i o 339246.38 0.0001 38245.04
Table 7,--Analysis f o r l i n e a r regress ion of i n t e r n a l bond on compaction r a t i o and r e s i n coverage
Standard e r r o r Parameter Estimate Prob /TI of e s t ima t e s
I n t e r cep t -152.53 0.0001 15.18
Resi n coverage 9.24 0 .0001 0.85
Compaction r a t i o 153.99 -- 0 .OOOI 12.27
Table 8.--Analysis f o r l i n e a r r eg r e s s ion o f th ickness swel l ing i n 24-hour watersoak on compaction r a t i o and r e s i n coverage
Standard e r r o r Parameter Estimate Prob > !TI of e s t ima t e s
I n t e r cep t
Resi n coverage -1 ' 7 4 0.0001 0.27
Compaction r a t i o -1.71 0,6608 3.89
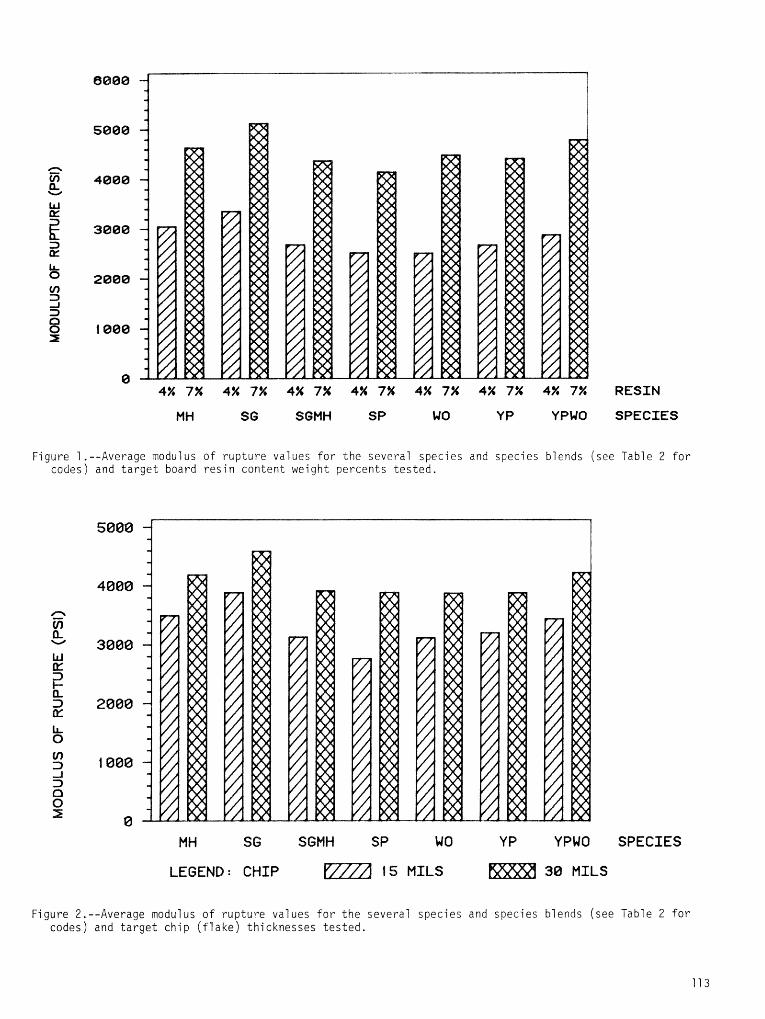
4% 7% 4% 7% 4% 7% 4% 7% 4% 7% 4% 7% 4% 7% RESIN
MH SG SGMH SP WO YP YPWO SPECIES
Figure 1 .--Average modulus of rupture values for the several species and species blends (see Table 2 for codes) and target board resin content weight percents tested.
MH se seMti SP wo YP YPWO SPECIES
LEGEND: CHIP f 5 MILS 30 MILS
Figure 2.--Average modulus of rupture values for the several species and species blends (see Table 2 for codes) and target chip (f lake) thicknesses tested.
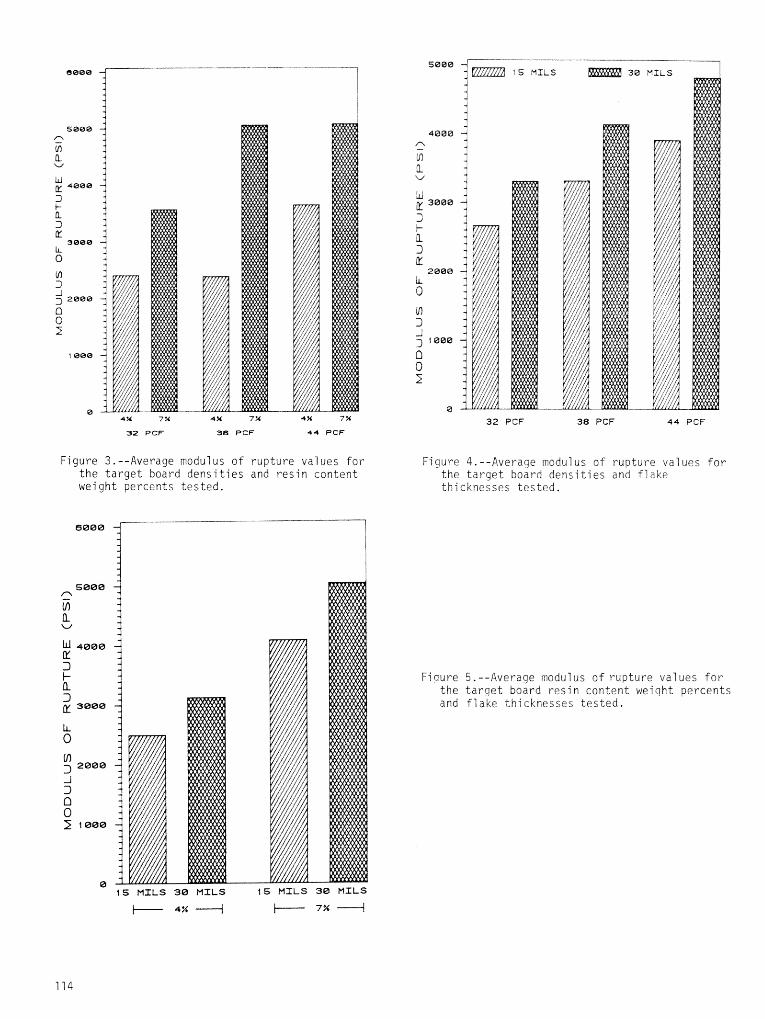
434 734 4% 7% 4% 734
32 PCF 38 PCF 44 PCF
Figure 3.--Average modulus o f rupture values for the target board densities and resin content weight percents tested.
32 PCF 38 PCF 44 PCF
Figure 4.--Averaqe modulus of rupture values for the target board d e n s i t i e s and f l ake thicknesses tested.
Fiqure 5.--Average modulus of rupture values f o r the tarqet board resin content weiqht percents and flake thicknesses tested.
15 MI L S 30 M I L S 15 M I L S 30 MILS
+ 4 % + /- 7%
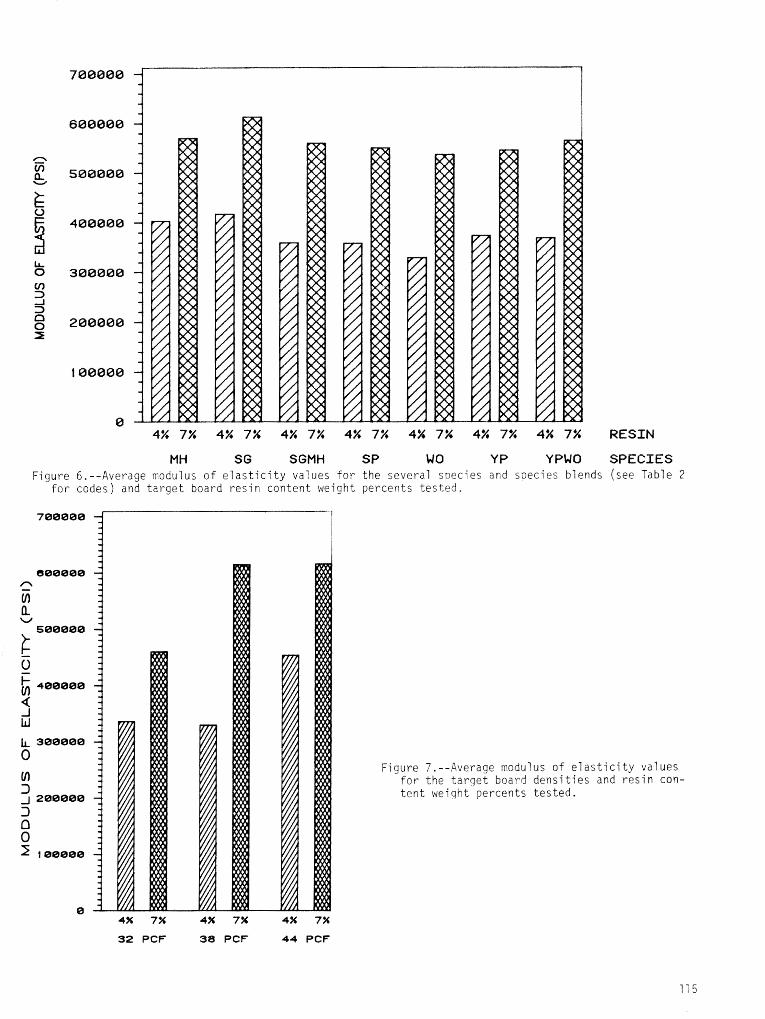
RESIN
MH SG SGMH SP WO YP YPWB SPECIES Figure 6.--Average modulus of e l a s t i c i t y values fo r the several soecies and soecies blends (see Table 2
fo r codes) and t a rge t board res in content weight percents t e s t ed .
4% 7%
32 PCF
4% 7%
3% PCF
4% 7%
44 PCF
Figure 7.--Average modulus of e l a s t i c i t y values f o r the t a rge t board dens i t i e s and res in con- tent weiqht percents tes ted.
16 M I L S 38 MI L S 38 MI L S
Figure 8.--Average modulus o f elasticity values for the target board resin content weight per- cents and flake thicknesses tested.
LEGEND: DENSITY 38 PCF
Figure 9.--Average internal bond values for the several species and species blends [see Table 2 for codes) and target board densities tested.
MH SG SGMW SP WO Y P YPWO
Figure 10.--Average internal bond values for the several species and species blends codes) and target board resin content weight oercents tested.
RESIN
SPECIES
(see Tab le 2 f o r
Figure 11.--Average internal bond values for the target board densities and resin content weight percents tested.
52 PCF 38 PCF 44 PCF
WACTION RAT1 O
Figure 12.--Plots of linear regression equation predicted val ues for modul us of ru~ture as a function of compaction ratio (see explanation in footnote 1 of Table 2) for three selected levels of resin coverage (in g1sq.M).
fur X -- s? *la.* M ,,/-/I
W A C T I O N RATIO
Figure 13.--Plots of linear regression equation predicted values for modulus of elasticity as a function of compaction ratio (see explanation in footnote 1 of Table 2) for three selected levels of resin coverage (in g/ss.M).
Figure 14.--Plots of linear regression equation predicted values for internal bond as a function of compaction ratio (see explana- t < o n in footnote 1 of Table 2) for three selected levels of resin coverage (in g/sa.M).
8.5 8.6 8.7 8.8 8.9 1.8 1.1 1.2 1.3 1.4 1.5
W A C T I O N RATIO
7 " . T r Q r n < v', ai
$g$? 3 . $ g 3 > s g F) n --.r.wU3 n, 3 m o m F u O 3 - 5 n u-ss ;r;: I cr- LR - U m w m o m ai - - r . U r - t - 5 * c u IR
,%Ct cr**, n 7 s -hd. m -. Cn (3.0 .-.J--*o,xT -- i .na--hc rt c 1 C V1 --himi--'--* x ( 3 . m sic, m m m .--7 c t o I **. r t m 1I) C L U - 3 a, r)
C D - - - l T 0 V 7 - - ' T ? 3 c l - O Q w - 5 - O R ) c t Q d . O f D O a -+I P, nv, - - i c ~ + - - - r m a , a , o i w o n n in T I 3 - 7 - i . ( R - r , r - T
3 m
rt. -.*, u +r ---J*J--".~ in 3 vr -> (7 LJ i D u I a, a i m < n C o c r 5 m r - t C u i = m C l r ? - r t L 3 - - - . r i - 7 rti*; -&7 fD -J1 ---'a 7
- - ~ . Z S C L - P . C D ~ ~ ~ - ~ C ' C I C L . m r m o m -.-7-.i.-'.cS" 3 < fA
i(II-3 3 f S , C > m O 3 0 X l W Z TU -.* + I C W &-%A V? K - - - ~ Q J m -n---~ri--r il) a 3--"-.y;l v.3-Q 3 --(.?-a 3 - 3 - - J . W m
( n r v , r a , r o w ; u r . i n a c s - - - - m a, 1 m c r - 5 7 % - m w m r R W ocrrc. m , . * 3 W, Cu---J -h 3
TCi /-.3* v , > a - - .-.Cia R, CU vs n a i m N k - 1 -1
* O W c-, -...* iu 0 -5 'icl r 0 *-I 3
I
p l a n t e n s i ze o f the h o t press, t h e veneers, p d r t i c leboarb r , and f 1 akeboards w2re c b t i n t o 20- by 24- inch p i e c e s f o r l a q i n a t i o n ,
Thc 7 a m i n a t b n process c o n s i s t e d o f g l u i n g f a c e veneers t o p a r t i c ' l e ~ o a r i and f l akeboard cores a j t h o l e of the t d o d i f f e r e n t types a f adhesives seiected For e v a l u a t i o n , Tho &we adkesjves Nere a melanine formaldehyde resin
forin) and a t h i o d r y f i l m o f p h e n o l i c r e s In. The adhesive ssippi i e r s c i a i m d t h a t b o t h of these r e s j n s meet tne requi remer i ts o f 2.S. Products Standard P 5 1 - 7 4 f o r e ~ r e r i o r g l u e bond ( K 2 t i o n a l Bureau 2 f Standards 1474).
Q r i o r t 7 l lamfnat ion, a l l c o r e panels were sanded s l ic jh t ly WI ti7 60 g r f t sandpaper t o e l irni n a t e uneven su r faces and t o improve t h e g l u e - bond p r o p e r t y . Panels laminated w i t h t h e d r y - film glue were h o t pressed a t a p ressure o f 225 p s i 3nd 300°F temperature, the p ress t imes were 6 rninirtes and 7-1/2 minutes f o r 1 /2 - inch and 3 /4 - inch t h i c k pane ls , r e s p e c t i v e l y . Core pane ls lamina ted w i t h t h e melamine l i q u i d r e s i n had a g l u e spread r a t e o f about 80 pounds p e r square f o o t (doub le g l u e l i n e ) , pressed w i t h a p l a t en temperature o f 270°F and 200 p s i p ressurs . Press t imes were 5-1/2 minutes and 7-112 minutes f o r 1 /2 - and 314- inch t h i c k com- p o s i t e panels , r e s p e c t i v e l y . For a l l o f t h e pane ls , t h e g r a i n d i r e c t k n o f t h e veneer over- l a y s was p a r a l l e l t o the l e n g t h of t h e co re m a t e r i a l .
A f t e r be ing pressed', a l l pane ls were t r i m - med t o specimen dimensions as s p e c i f i e d i n ASTM D 1037-72a (American S o c i e t y f o r T e s t i n g and M a t e r i a ? s 1981) . A1 l specimens were coded, and c o n d i t i o n e d a t a r e l a t i v e h u m i d i t y o f 65 1 p e r c e n t and a temperature o f 68 6°F. For cornparison purposes, matched specimens were a l s o c u t f rom commercial 1 / 2 - i n c h sheath ing grade D o u g l a s - f i r plywood, 1 / 2 - i n c h e x t e r i o r p a r t i c l e b o a r d , and 1 / 2 - i n c h e x t e r i o r wa fe r t ype aspen f 1 akeboard. The c o n t r o l sanp l e s were a l s o c u t f rom t h e t e s t m a t e r i a l s .
Acce le ra ted Aging Tests
S i x a c c e l e r a t e d ag ing regi ines were s e l e c t - ed f o r eva;uat ion. The t e s t procedures were:
1, ASTM D1037-72a, 6 cyc l e s , 12 days t o com- p l e t e (American S o c i e t y f o r T e s t i n g and M a t e r i a l s 1981, N a t i o n a l P a r t i c l e b o a r d A s s o c i a t i o n 2880)
a. Soaked i n wa te r a t 120°F f o r I hour
b. Steamed a t 200°F f o r 3 hours
c. Frozen a t iOof f o r 20 hours
b . D r i e d a t 210°F f o r 3 hours
F, Dried a t SIOQF f o r 18 hours
2. WCAA-6 cyc les , 6 days t o complete (West Coast Adhesive Manufacturers A s s ~ c i a t i o n 1966)
a. Submerged i n water a t 70°F w i t h 27- i n c h vacuum f o r 36 minutes
b . Bo i l ed i n water a t 210-212OF f o r 3 hours
c. D r i e d a t 22OoF f o r 20 hours
3. 24-hsur soak t e s t (American S o c i e t y f o r T e s t i n g and M a t e r i a l s 1981)
a. Specimens were submerged i n wa te r a t room temperature, approx imate ly 75°F
b . Specimens were removed a f t e r 24 hours
4. I - h o u r b o i l t e s t
a. Specimens were submerged i n b o i l i n g wa te r 210-212°F
b. Specimens were removed a f t e r 1 hour
5. 2-hour b o i l t e s t (Shen and Wrangham 1971)
a. Specimens were submerged i n b o i l i n g 1 water 210-212OF ,
b. Specimens were removed a f t e r 2 hours I
For t h e ASTM t e s t , a s e t of specimens was removed a t t h e end o f each cyc le . Sim- i l a r l y , specimens were removed from t h e WCAA t e s t a t t h e end o f c y c l e s 2, 4, and 6. Th is p e r m i t t e d comparisons o f s t r e n g t h r e d u c t i o n s due t o t h e number o f exposure c y c l e s f o r t h e two t e s t procedures.
S t r e n g t h P r o p e r t i e s Tests
A f t e r comp le t ing t h e a c c e l e r a t e d ag ing regimes, specimens were condi t i o n e d wi t h t h e c o n t r o l group specimens i n a c l i m a t e chamber ma in ta ined a t a r e l a t i v e h u m i d i t y o f 65 1 p e r c e n t and a temperature o f 68 6°F.
The IB and shear t e s t s were p e r f o r w d on condi t i o n e d c o r e m a t e r i a l , composi te pane l t y p e exposed t o t h e ag ing t e s t s , and t h e c o n d i t i o n e d c o n t r o l specimens u s i n g a T inus Olson t e s t i n g machine and a plywood shear t e s t e r . The i B t e s t s were p e r f o r w d accord- i n g t o method desc r ibed i n ASTM D 1037-72a (Ainerican S o c i e t y f o r T e s t i n g and M a t e r i a l s 19811, w h i l e t h e shear t e s t specimens were t e s t e d accord ing t o methods d e s c r i b e d i n ASTM 0805-63 (American S o c i e t y f o r T e s t i n g and M a t e r i a i s 1970).
e , Steamed a t 200°F f o r 18 hours
EXP ERIMEfdTAL DESIGN
In t h i s experiwent, analysis of variances ( A O V ) was conducted through the use of a co:n- p l e t e ly randomi zed des i g u . Components of the composite panels were considered as seperat2 f ac to r s : f a c t o r A--veneer species , 2 levels , red oak and hard maple; f a c t o r B--core mate- r i a l , 2 levels , part icleboard and flakeboard; f a c t o r C--glueline, 2 levels , d ry and wet; fac tor D--composite panel thickness, 2 levels, 112-inch and 314-inch; and f a c t o r E--acceferat- ed aging method, 5 ievels , 24-hodr soak, 1-hodr bo i l , 2-hour bo i l , ASTM-6 cycles, and HCAA-6 cycles. Thus the experi~nent was a 2 x 2 ~ 2 ~ 2 ~ 5 f a c t o r i a l design (Steel and Torrie 1980). The number of r ep l i ca t ions per variable was four f o r both IB and shear t e s t s . However, doe to the occurrence of the delanination of some wafer type flakeboard cores , the number of r ep l i ca te s tes ted f o r sorne ASTM and WCAA type specimens was less .
RESULTS A N D DISCUSSiON
Control Condition
Tables i and 2 give the average IB and shear strength values fo r the control speci- mens. No gluel ine f a i l u r e s were found between the face veneer and core board in these con- t ro l l ed veneered composite specimens. The average part icleboard IB value was higher than t h a t of the flakeboard. This I8 property d i f - ference a1 so occurred fo r the cornposi t e panels. Most l i ke ly the difference i s due to variat ion in the gluing properties of smaller p a r t i c l e s r e l a t i v e t o large f lakes or wafers.
Plywood specimens were found t o have high- er I6 and shear s t rengths than specimens made from part icleboard or f lakeboard core.
Accelerated Aging Test
The percent of IB and shear reductions based on values obtained a t control conditions were tabulated fo r repl ica t ion t h a t had no delaminated specimens (Tables 1 and 23.
Except f o r the ASTM-6 cycle compared with the WCAA-6 cycle t e s t , the IB means obtained by any two t e s t methods were s ign i f i can t ly d i f f e r - ent a t the 1 percent level {Table 3 ) . For the shear values, the two 6-cycle t e s t methods were s t a t i s t i c a l l y equivalent as well as the 24-hour versus the control .
Factorial Analysis
Both IB and shear values were s t a t i s t i c a l - l y analyzed using an analysis of variance ( A O V ) , The r e s u l t s of the AOV (Table 4) show tha t [ I ) f ac to r A (veneer species) s ign i f i can t - l y affected the IB values; (2) f ac to r B (core material ) s ign i f i can t ly influenced the IB
v a l f ~ e s ; (3; fac tor C igiueli~e) dra not haxde any e f f e c t on e i t h e r strength v a l u e '4) f a c - t 3 r D ! th i , : kqess j , and 15) f a c t o r E i a c c e l - e r a t ~ d a g i n g t e s t s ! had a s ~ g q i f i c a n t e f fec t 30 a1 l s t rength v a l i e s , Aver-age s t rength v a T ~ e s and r a t i o s o-strength r5tentiar1 f o r a l l exposed cotnp~si tes are 11stod ? n T 3 b I e 5.
Zased on t h i s a n a l y s i s , s2ver-a; c o t - 1 ~ 7 ~ ~ - sions can be s t a t ed . F i r s t , cornoosice panels made with tne partic:eSoard cores had a s ~ p e r i a r IB property, and r e s i s t ed the dc- grading e f f e c t s of the exposure c o f i d ~ t i ons be t t e r than p a n e l s i ~ a d e w i t n f l akeboard cores. Secondly, 1/2-inch t h i c k panels would be recoinrnended over 3/4-inch thickness. T h i s recommendation czn be given because a : arge portion of the Jl4-inch speciinens had de1a :n i - nated flakeboard core, a n d grea ter thickness swel lng. TRirdly, the 2-hodr boi i t e s t created Ehe g rea te s t average thickness swei l - ing of a1 1 hard&ood veneered composite panel speci~nens ( T a b l e 6 ) . Final iy, the exposure condition g rea t ly affected the amount of s t rength reduction based on the unexposed specimens:
Specimen condition Percent strength reduction 1 B - Shear
24-hour soak 9 1 l-hour boil 4 2 14 2-hour boil 46 34 ASTM 6-cycle 69 4 4 WCAA 6-cycle 7 4 5 4
ASTM-6 Cycles Versus WCAA-6 Cycles Test
Two of the most widely used accelerated aging t e s t s are &STM and WCAA cycl ic t e s t s . Both of these t e s t methods resulted in a large percentage of s t rength reduction fo r a l l materials evaluated ( T a b l e 7 ) . For t h i s reason, specia l a t t en t ion was given t o a coinparison between these two t e s t s and e f f e c t on the number of cycles.
To determine the e f f e c t s of the nurnber of cycles of both ASTM and MCAA accelerated aging procedures on the s t rength properties of composi t e panel, specimens were evaluated f o r 2 , 4 , and 6 cycles and compared s t a t i s t i c a l l y using the Duncan's Mu1 t i p l e Range Test. For both accelerated t e s t methods IS and shear proper t ies both sh~wed no s ign i f i can t d i f ference between 2 and 4 exposure cycles or 4 and 6 cycles except the shear valdes f o r ASTK cycl ic t e s t (Table 8). The r e s u l t of t h i s analysis suggests t h a t hardwood composite p a w l specimens subjected t o four cycles of e i t h e r ASTM or WCAA aging t e s t could achieve the same degree of s t rength reduction as specimens subjected t o s ix cycles ,
I t was found tha t the most d r a s t i c reduction of I& and shear was observed from the f i r s t t o second cycle of exposure f o r the
L i t e ra td re Cited &Sf14 procedui-2. 1'4 gradiial decline c f 13 and shear was a l s o shown for b 9 t h ASTM and dCAA t2st nethods,
GOP4CL.JS I O N S
Based an t h i s t ?~~e* imeq t37 design and r e ~ i i 1 ts, sever-a! ~o i i c igs ions can be s t a t ed .
1, Internal Son3 and shear f o r plywood Mere superior to any 3f the hardwood c o f ~ p a s i t e s o r core materials t e s t ed , Because of core delaa inat ioo, adhesive bond of red oak f ace veneer t o core matecial i s stronger than the coherence of c h i p s or f l akes in t4e core m t e - r i a l . S ignif icant shezr property differences are observed between core s a t 2 r i a l and hardw~od composites whi l e the IS of t h e two pane? types are s imi lar .
2. The 24-hour soaking t e s t had the l eas t amount of strength reduction and caused the l e a s t amount of thickness swelling. The NCAA acce:erated aging method resulted in the great - e s t observed average reduction f o r tho two s t rength properties exa:nined. However, s t a t i s t i c a l analysis showed there i s no real d i f ference between WCAA and ASTM, in reducing both val ues. S ignif icant differences are noted between 1-hour boil and 2-hour bo i l ; between 2- hour b o i l and ASTM 6-cycles; a ~ d between 2-hour 5 0 i 1 and WCAA 6-cycies t e s t in reducing both in ternal bond and shear by tension loading proper t ies .
3. S ignif icant differences were observed between control condi tion and 24-hour soak f o r I8 property while both IB and shear values were s ign i f i can t ly d i f f e r e n t f o r 1-hour boi 1 and 2- hour boil .
4. A gradual reduction occurred in both IB and shear strength with an increase in the number of exposure cycles f o r e i t h e r the ASTM or WCAA t e s t method. However, no s ign i f i can t d i f ferences i n most of the s t rength values were f o u n d between 4-cycle and 6-cycle t e s t s .
5. Internal bond was s ign i f i can t ly in- f luenced by the core materi a1 and ove ra l l panel thickness. The inaximum IB value f o r a compos- i t e panel was obtained u s i n g a part icleboard core and 1/2-inch cornposi t e thickness.
6, Shear s t rength i s s ign i f i can t ly in- fluenced by the overa l l thickness OF the c=lrnposi t e ,
7 . Red oak veneered composite panels demonstrated be t t e r gluabi 1 i t y cha rac te r i s t i c s than hard maple veneered panels.
8, Par t of the decreased s t rength proper- dkes due t o accelerated aging t e s t in hardwood composite panels may be a t t r ibu ted t o a lower density as a r e s u l t of thickness swelling and the deter iora t ion of the glue bond.
American Soci2ty f g r T e s t i ~ g and Materials . 1961. Standard methods af evaluating t he properties of m o d - b a s e f ibe r and p a r t i c l e pane: ::~atet-iair, A5T;""i 9 e s i g n a t i o n R 1i337- 72 , Part 22. ASTM, P h i l a d e l p + i a , P A ,
Aqerican Society f o r Testing and Va te r i a t s , 1470. Standard :nethods of evaluating the proper t ies 9f veneer, plydood and o t h e r g l u e d veneer constructions, ASTM Designa- t ion D 805-63, Part 2 6 , ASTM, Phi 1 adelphia, PA.
C ~ I O W , 53 , 2372. Modulus of e l a s t i c i t y and shear de- f l e c t i on of waln~t-veneered par t i cleboard composite beam i n f l exu re . Forest Prod. J ' 22 ( 11) : 33-38.
Chow, P, and J. J. Janowiak. 1983. Effects o f Accelerated Aging Tests on Some Bending Properties of Hardwood Composite Panels. Forest Prod. J . 33 ( 2) : 14-20.
Chow, P . and M. R . Redmond. 1931. huinidi t y and te;nperature e f f e c t s on
MOR and MOE of hard maple-veneered medium densi ty fiberboard. Forest Prod. J . 31 ( 6 ) : 54-58.
Jokers t , R. &., J . F . Lutz, and W. C. Kruel. 1976, Red oak -cottonwood plywood a f t e r one year ex te r io r exposure. Plywood and Panel 1 7 (2) : 14-17.
Lutz, 3. F. and R . W . Jokerst . 1974. " I f we need i t - construction ply-
wood from hardwood i s f e a s i b l e . ' Y I y w o o d and Panel 14(91: 15-20.
Hahoney, L. 1975. Economic considerations f o r the man-
uf acture of s t ruc tu ra l cornposi t e panels. Forest Prod, 3. 25 ( 9 ) : 51-63.
National Bureau of Standard. 1974. U.S. Products Standard P 51-74 f o r construction and Indust r ia l Plywood. Washington, D . C .
National Part icleboard Associ a t i on. 1980. Revi sed Standard f o r Mat-foming Part icleboard. Ply~ood and Panel. Apri 1 i980. p p . 30-32.
Shen, K. 6. and B. Wrangham. 1971. A rapid accelerated-aging t e s t pro- cedure f o r phenolic part icleboards. Forest Prod, ;. 21 ( 5 ) : 30-32.
S tee l , R . 6 . 0. and J, H , Torrie. 1980. Principles and Procedures o f S t a t i s t i c s - a Biometrical Approach. p4cGraw-Hi 1 1 , Inc. New York, N.Y.
U. S, Forest Service. 1973. The outlook f o r Timber - the United Sta tes Forest Resources Report. U.S.D.A. No. 20. U,S. Government P r in t ins Office. *
Washington, 17, C, West Coast Adhesive Manufacturers Associ a t ion .
1966, k proposed new t e s t f o r accelerated aging of phenolic resin bonded p a r t i c l e - board. Forest Prod. 3. 16 ( 6 ) : 19-23,
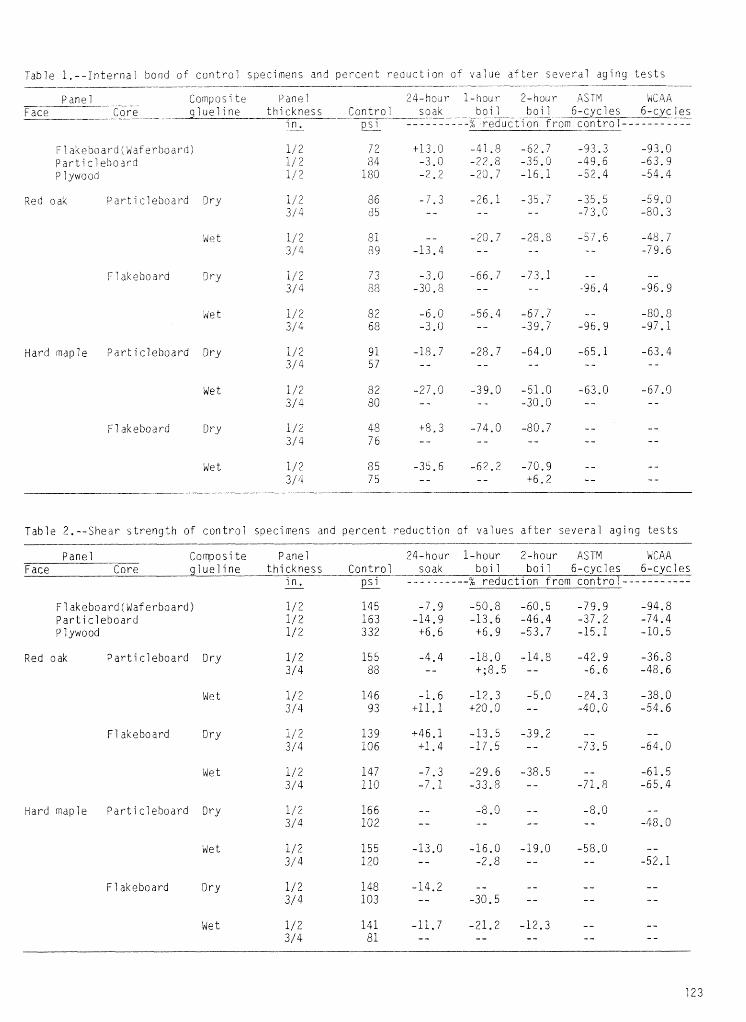
Table I . - - i n t e r n a l bond o f c o n t r o l specimens and percent r e d u c t i o n o f value a f t e r s e v e r a l a g i q g t e s t s
Panel Compos l' t e Panel 24-i?ol;r I -hour 2-hour ASTM H;3 4A Face - Core - g l u e i ine t h i c k n e s s Control soak b o i l boi 1 6 -cyc les 6 -cyc les
i n . ps j - - - - - - - - - -% r e d u c t i o n from c o n t r o l - - - - - - - - - - - - -
9ed oak P a r t i c l e b o a r d 3ry i / 2 8 6 -7 .3 -26.1 -35.7 -35.5 - 2
-59.3 314 t i5 - - - - - - -15.0 -8Q. 3
Hard maple P a r t i c l e b o a r d Dry 1 / 2 9 I -18.7 -28.7 -64.0 -65.1 -63.4 3/ 4 5 7 - - - - - - - - - -
Wet 1 /2 82 -27.0 -39.0 -51.0 -63.0 -67 .0 3/4 80 - - - - -30.0 - - - -
F l akeboard Dry 1/2 4 8 +8.3 -74.0 -80.7 - - - - 3/4 76 - - - - - - - - - -
Table 2 . --Shear s t r e n g t h of c o n t r o l specimens and p e r c e n t r e d u c t i o n of va lues a f t e r s e v e r a l aging t e s t s
Panel Cornposi t e Panel 24-hour 1-hour 2-hour ASTM WCAA Face Core g l u e l i n e t h i c k n e s s Control soak boi 1 boi 1 6 -cyc les 6 -cyc les
i n . PS j --- - - - - --- % r e d u c t i o n from con t ro l - - - - - - - - - - - - -
F l akeboard ( Waferboard) P a r t i c l e b o a r d P 1 ywood
Red oak P a r t i c l e b o a r d Dry 1/2 15 5 -4.4 -18.0 -14.8 -42.9 -36.8 314 8%: - - +;8.5 - - -6 .6 -48.6
F i akeboard Dry l/2 139 i 4 6 . 1 -13.5 -39.2 - - - - 314 I06 4-1.4 -17.5 - - -73.5 -64.0
Hard maple P a r t i c l e b o a r d Dry 1/ 2 166 - - -8.0 - - -8.0 - - 314 102 - - - - - - - - -48.0
Flakeboard Dry 1/2 148 -14.2 - - - - - - - - 31 4 103 - - -30.5 -- - - - -
Wet 112 141 -11.7 -21 .2 -12.3 - - - - 3/ 4 81 - - - - - - - - - -
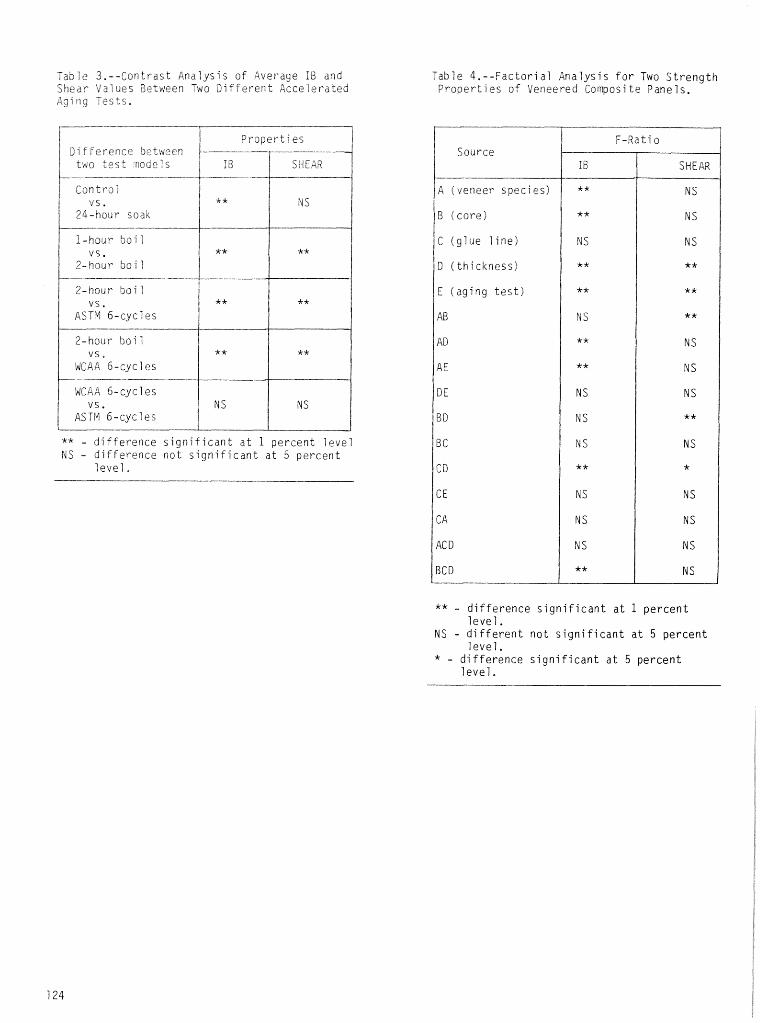
Table 3 . - -Con t ras t Ana lys i s o f Average IB and S h e a r Values aetween Two D i f f e r e n t Acce le ra ted Ag ing T e s t s .
---
3i f ference between two t e s t ncdels
** - d i f f e r e n c e s i g n i f i c a n t a t 1 p e r c e n t l e v e l NS - d i f f e r e n c e n o t s i g n i f i c a n t a t 5 p e r c e n t
l e v e l ,
Table 4 . - - F a c t o r i a l A n a l y s i s f o r Two S t r e n g t h P r o p e r t i e s of Veneered Conposite Panels.
A (veneer spe
B ( c o r e )
C ( g l u e l i n e )
D ( t h i c k n e s s )
I E ( a g i n g t e s t
** - d i f f e r e n c e s i g n i f i c a n t a t 1 p e r c e n t l e v e l .
NS - d i f f e r e n t n o t s i g n i f i c a n t a t 5 p e r c e n t l e v e l .
* - d i f f e r e n c e s i g n i f i c a n t a t 5 p e r c e n t l e v e l .
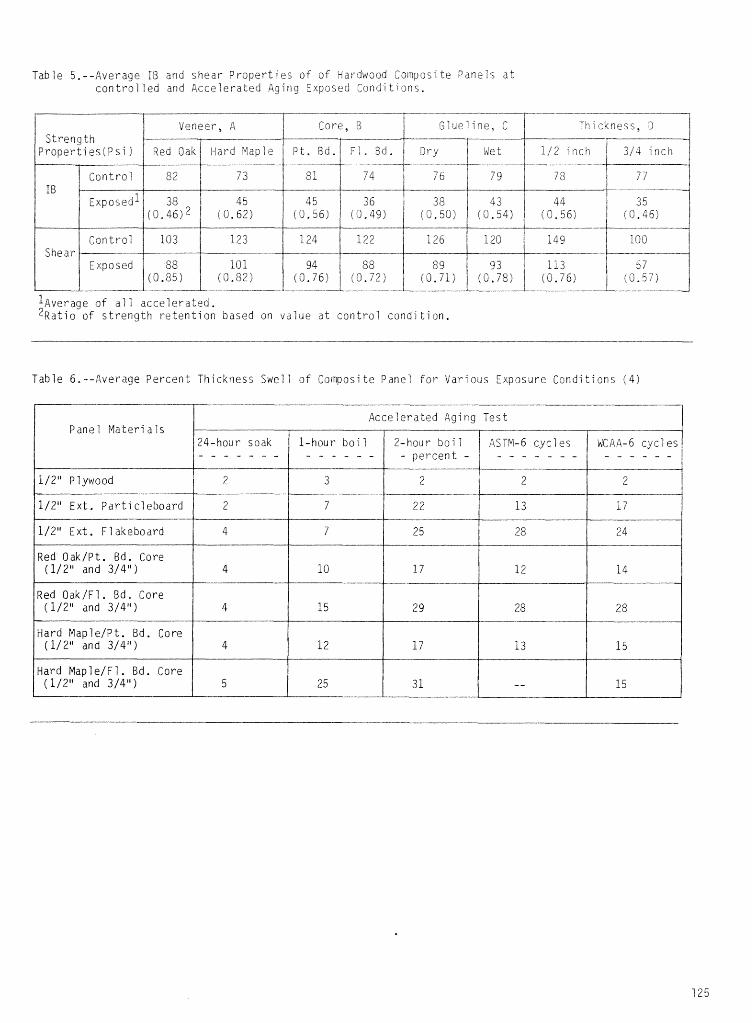
Table 5.--Average I9 and shear Properties of of Hardwood Goifipos-~ te Panels a t controlled and Accelerated Aging Exposed C o n d i t i o n s ,
Veneer, A Sore, B Thickness, Cl
l ~ v e r a ~ e of a1 1 accelerated. 2 ~ a t i o o f strength retention based on value at control condi tion.
Table 6. --Average Percent Thickness Swell o f Composi t e Panel f o r Various Exposure Conditions ( 4 )
Panel Materials
- - - - - - - - - - - - . .
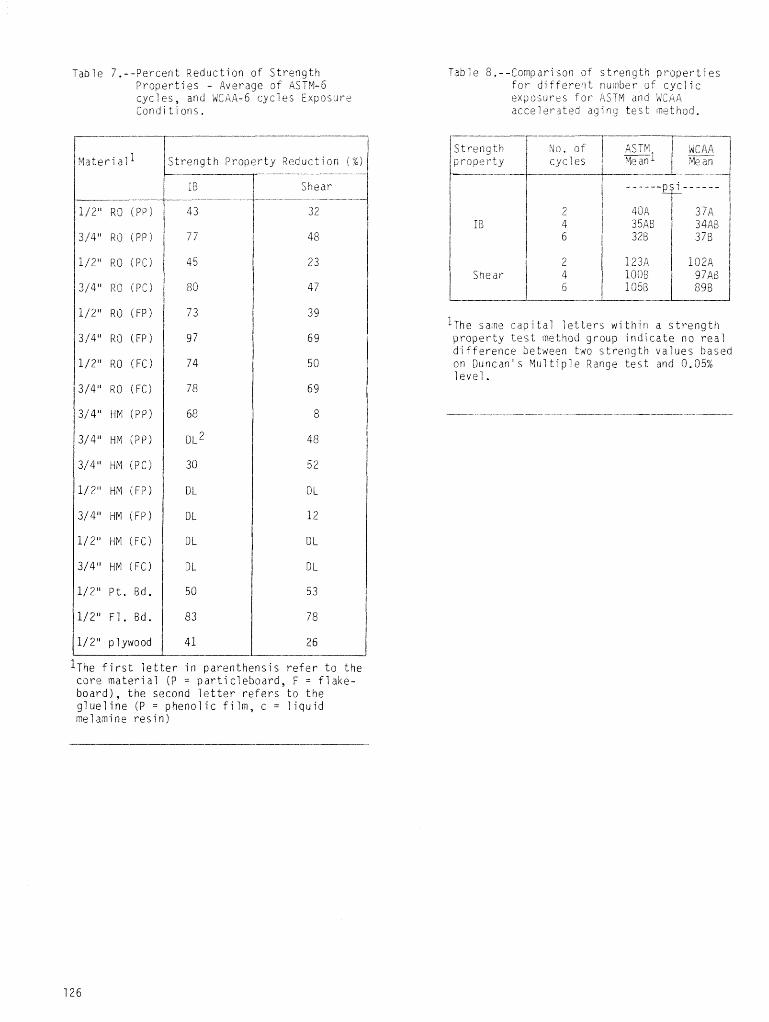
Tab le 7.--Percent qeduction of Strength Properties - Average of ASTY-6 cycles, and AG,AA-S cycjes Exposure Condi t i ons .
T a b l e 5.--Compari son of strength proper t ies For d i f f e ren t nli$nber of cycl ic exposure5 "or dSTp4 a n d WCAP accelerated a g i n g t e s t [nethod.
3/4" HM (PC)
1/2" HH HMFP)
3/4" HM ( F P )
112" HM ( F C )
3/4" HM JFC)
112" P t . Rd.
112" F l , Bd. 83 78
112" plywood 41 26
IT~E f i r s t l e t t e r in parenthensis r e f e r t o the core material ( P = par t ic leboard , F = f l a k e - board), the second l e t t e r r e fe r s to the g luel ine ( P = phenolic f i l m , c = liquid melanine r e s in )
l ~ h e s a w capi ta l l e t t e r s within a s t rength property t e s t rnethod group indicate no rea l d i fference between two strength values based on Duncan's Yult iple Range t e s t and 0.05% level .
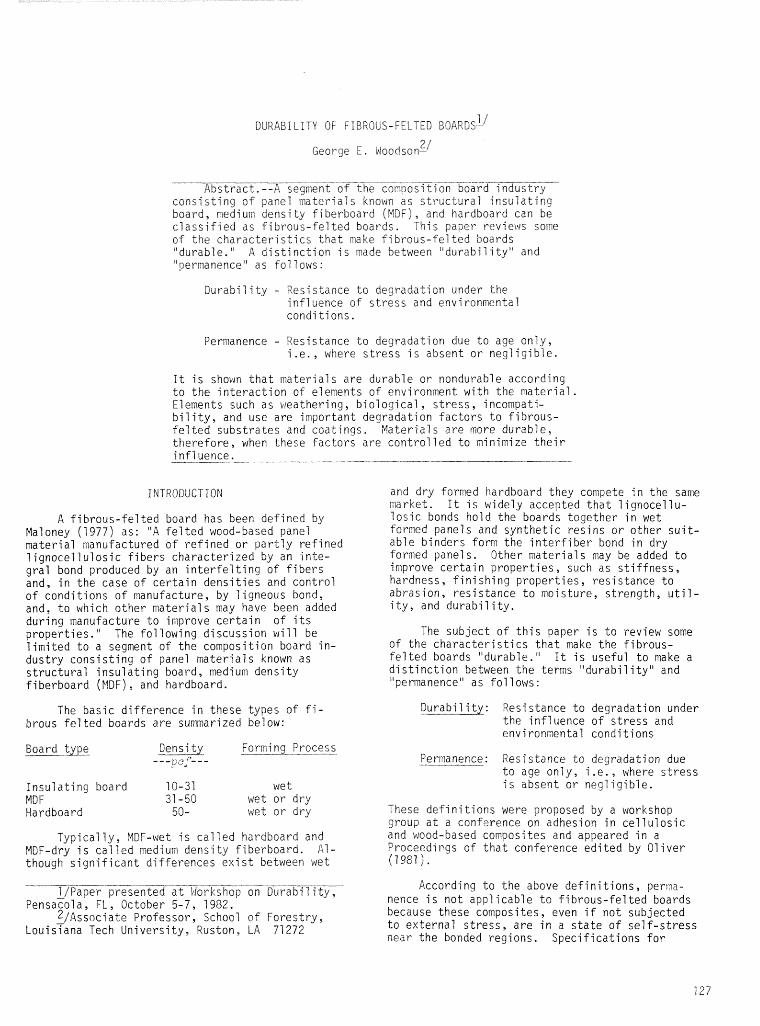
1 1 DURABILITY OF FIBROUS-FELTED BOARDS-
2 / George E. Woodson-
Abstract.--A segment of the c o n ~ i T n ~ $ ~ d - T n ~ s ~ consisting of panet materials known as structural insulating hoard, medium density fiberboard (MDF) , and hardboard can be classified as fibrous-felted boards, This paper reviews some of the characteristics that make fibrous-felted boards "durable.'" distinction is made between "durabil i ty" and "permanence" as foiiows:
Durability - Resistance to degradation under the influence of stress and environmental condi ti ons.
Permanence - Resistance to degradation due to age only, i.e., where stress is absent or negligible.
It is shown that materials are durable or nondurable according to the interaction of elements of environment with the material. Elements such as weathering, biological, stress, incompati- bility, and use are important degradation factors to fibrous- felted substrates and coatings. gaterial s are more durable, therefore, when these factors are controlled to minimize their i nf 1 uence.
INTRODUCTION
A fibrous-felted board has been defined by Maloney (1977) as: "A felted wood-based panel material manufactured of refined or partly refined lignocellulosic fibers characterized by an inte- gral bond produced by an interfelting of fibers and, in the case of certain densities and control of conditions of manufacture, by ligneous bond, and, to which other materials may have Seen added during manufacture to improve certain of its properties.'Yhe following discussion will be limited to a segment of the composition board in- dustry consisting of panel materials known as structural insulating board, medium density fiberboard (MDF) , and hardboard.
The basic difference in these types of fi- brous felted boards are summarized below:
Densi t y Forming Process ---p"f---
Insulating board 10-31 wet MDF 31 -50 wet or dry Hardboard 50- wet or dry
Typically, MDF-wet is called hardboard and MDF-dry is called medium density fiberboard. Al- though significant differences exist between wet
and dry formed hardboard they compete 'n the same market. It is widely accepted that lignocellu- losic bonds hold the boards together in wet formed panels and synthetic resins or other suit- able binders form the interfiber bond in dry formed panels. Other materials may be added to improve certain properties, such as stiffness, hardness, finishing properties, resistance to abrasion, resistance to moisture, strength, util- ity, and durability.
The subject of this paper is to review some of the characteristics that make the fibrous- felted boards "durable." It is useful to make a distinction between the terms "durability" and "'permanence" as follows:
Durability: Resistance to degradation under the influence of stress and environmental conditions
Permanence: Resistance to degradation due to age only, i.e., where stress is absent or negligible.
These definitions were proposed by a workshop group at a conference on adhesion in cellulosic and wood-based composites and appeared in a Proceedirgs of that conference edited by Oliver ( 1 9 8 1 ) .
1/Paper presented at klorkshop on Durahi 1 i ty, According to the above definitions, per:n3-
~ensacola, FL, October 5-7, 1982. nence is not applicable to fibrous-felted boards 2j~ssoci ate Professor, School of Forestry, because these composites, even if not subjected
Loui sTana Tech University, Ruston, LA 71 272 to external stress, are in a state of self-stress near the bonded regions. Specifications for
durability o f these products must recognize the wide range of density and q u a l i t y that exists and evaluations must be made in relation to end- use requirements,
The durability classes of '"exterior" and "'l'nterior'bre in many cases loo restrictive f o r the intended use. It i s highly desirable to have additional classes o f durability for more eco- nomical use o f materials. The commercial stand- ard specifications for hardboard were apparently developed with the idea that each piece of hard- board was a Jack-of-all trades and could be used for any and all end uses. Maximum econow and efficiency of operation can be achieved when the hardboard can be made to specific end uses and when specifications are made to adequately do the end use job required. For example, almost a71 the interior uses of hardboard in building and furniture are used as companion pieces to, or in competition with interior plywood and gypsumboard, both of which have very poor water resistance, kJhy spend a lot of money to make a water resistant product to compete with a product which has no water resistance in the glue line or with a prod- uct such as gypsumboard which will simply fall to pieces under any amount of liquid water? Accord- ing Eustis (1979), hardboard siding is one of the few hardboard products where liquid water absorp- tion is an important specification, Liquid water absorption is also important in hardboard to be used in manufacturing tileboard, for use in bath- room shower stalls, kitchens, and laundries. A great many uses of hardboard, however, do not encounter liquid water and'the money spent on additives for these end uses is an unnecesary expense in the manufacturing process. Other specifications may require expensive waterproof adhesives for materials that may be subjected to moderately hazardous conditions for short periods of time, e.g., rain at a building site, These specifications are designed to protect against extreme conditions and not only increase costs but inhibit the development and use of a1 ter- native adhesives.
In an effort to remove restrictions on the wider use of cellu1osic or wood-based composites, four durabil i ty classes have been suggested (01 i ver 1981 ) . These durabi 1 i ty classes were suggested with good durability against the hazards outlined for the respective classes. They are as follows:
Suggested Durability Classes
Class 1 - Exterior: wetting and drying cycles, exposure to UV radiation, large temperature variations, attack by micro-organisms.
Class 2 - Protected exterior: cycles of wide range of relative humidity and temper- ature changes.
Glass 3 - Interior, humid conditions: cycles of high and low humidity.
Class 4 - Interior, dry conditions: cycles of moderate changes in relative humidity.
Additional requirements were suggested to provide adequate mechanical properties and limited creep under the r espec t i ve environmental conditions,
In order to get a clear understanding of the various types and physical properties of fibrous- felted boards, the reader is encouraged to consult the appropriate product standard. A review o f the qua1 ity requirement for each product is beyond the scope of this paper but the reader may find the fol lowing tabulation useful in seeking infcrmation about different products:
Product Product -- Standard Citation
insulating PS-57-73 U.3, Dep. Commerce board (1 973a)
Basic PS-58-73 U.S. Dep. Commerce hardboard (1 973b)
Prefinished PS-59-73 U.S. Dep. Commerce hardboard (1 973c) panel l'ng
Hardboard PS-50-73 U.S. Bep. Commerce siding (1 9734)
Medium den- NPA-4-73 National Particle- sity fiber- board Association board (1 973)
MOISTURE-RELATIONS
Fibrous-felted boards like any other wood- based material, exhibit an expansion in a11 directions when its moisture content increases. This hygroscopic expansion is particularly important when boards are used as structural elements and the results can be disastrous if the materials are installed without regard for changes due to environment. Numerous studies have been made to investigate dimensional changes in com- position boards as a result of moisture absorption. Lehmann (1 972) used four types of particleboard, five types of hardboard, and five types of insu- lation board in a study of the relationships of physical properties to dimensional stabil i ty characteristics of the panels. He concluded that ~chanisms which reduced the rate of moisture movement had only slight value as stabilizing agents and t he best possibilities for panel sta- bility appeared to be the use o f coatings and bulking agents which prevent the passage and/or subseque~t absorption of liquid or vapor forms of \.rater.
Insulation Board Additives
Materials commonly used in the insulation board industry to retard moisture absorption are:
1, Molten wax 2. Wax emu7 sion
3, Paraffin wax 4. Rosin 5. Asphalt
Each additive has its advantages and disadvan- tages. For example, asphalt strengthens the insu- lation board while the waxes and rcsin reduce the strength of the board, Occasionally, starch is added to strengthen the board, but as the amount of starch increases the boards became more and more attractive to rodents and insects. Thus, an additive that is beneficial for one property can be detrimental for another.
Hardboard Additives
Common additives to improve water resistance in hardboard are:
1. Wax emulsion 2. Petrolatum 3. Linseed oil) 4. Tung oil 1 drying oils 5. Tall oil 6. Soybean oil)
The drying oils are used in conjunction with heat treatment to produce tempered boards. Oil tempering provides improved paint hold-out, high abrasive resistance, scratch and scar resistance, surface water resistance and generally improves wear quality of the board. All these features are of great importance in the manufacture of premi um qua1 i ty factory finished wall panel s.
Important markets for hardboard products have developed because hardboard is a good sub- strate for industrial application sf finishes. It presents a smooth hard surface. It can be manu- factured to close dimensional tolerances, and its properties can be controlled and modified to suit special applications. The commercial success of hardboard siding is due to a reputation of durability based on the quality of industrially applied finishing systems.
Basic Finishing Materials
All finishes have three basic components:
Resin or binder - component which develops the necessary adhesive and cohesive forces to form the film and to bond it to the substrate. It also controls many of the important proper- ties of the finish such as water resistance, weatherabi 1 i ty , and strength.
2. Pigments - component to provide color in coatings,
3 , Solvents - component Ghat maintains the coating in the liquid state and conrols the working properties
There is a common belief in the industry that development of water base coatings of high molecular weight has been the key to durability. In the d e v e l o p i n g years o f hardboard siding, molecular weights of 70,000 were common for coatings. Current system can have melecular weights as high as 500,000. One thing must al- ways be kept in ~ i n d regarding durabii ity. Even w i t h the advanced technology of finishing systems today, good coatings on poor substrates will re- sult i n undesirable finished products. Thus, it i s imperative for the industry to meet the stand- ards for each particular product and produce an acceptable substrate in combination with a com- patible coating,
Probably one-third of all hardboard siding is completely prefinished and the remaining two- thirds coated with a prime coat. Primed siding provides greater f lexi bil i ty for color selection of the Final coat or coats and removes the burden of providing a performance guarantee for the finished product. Coatings applied in the field, however, cannot be expected to give the per- formance of coatings applied at the plant and cured at high temperatures.
Performance Guarantees
Typical performance guarantees for hardboard sidings will place a cash 1 imited 5-year warranty on factory applied primer, a 5-year warranty on factory finish and a 25-year warranty on the sub- strate. A11 performance guarantees require that the manufacturer's published application instruc- tions must be followed to make the warranty mean- ingful. Other special coatings are warranted for 15 years not to require refinishing due to peeling, blistering, cracking, or erosion of the factory applied finish except for reasonable color fade from normal weathering. One manufacturer will provide a 25-year warranty on the performance of the finished surface against blistering, peeling, or checking if their innovative installation method is used,but only a 5-year warranty with standard face nailing applications. Another manu- facturer provides a 30-year warranty for a siding product that contains a polyvinyl fluoride film.
The important thing to remember about pre- dictable performance is that it is dependent on successful control of nature's forces. Materials are durable or nondurable according to the inter- action of elements of environment with the mate- rial . for any mechanism or process to promote deterioration one or more elements of environment must be acting upon the material (Garden 1980). If any one of t he essential factors can be elim- inated or controlled, the process will be con- trol 1 ed, For example , fungal decay sf an srgani c material occurs M ~ E M spores, oxygen, suitable temperature, and suitable moisture conditions are present. If any one of these conditions is controlled, rot will not occur. Intentionally altering the balance of heat, air, and moisture inside a building creates environmental differ- ences across wal l s, w i ndows , floors , and roof s. One of the mjor hardboard manufacturers has
noted (persona1 communication with the author) that claims for decay or other biological activity in hardboard siding has shown a significant in- crease since the new government standards were issued for energy savings in homes. Prior to 1975,reports of decay in siding were nonexistent. The obvious solution to biological activity would be to incorporate a preservative into the harb- board siding. Adding a preservative to a product made primarily by the wet process, hnw- ever, presents a major proble~ in control of water pollution and the costs appear to be pro- hibitive.
DEGRADATION FACTORS AFFECTING DURABILITY
As an aid to understanding the degradation factors that may affect the performance of build- ing materials and components, Frohnsdorff and Plasters (1 380) proposed a 1 ist of degradation factors one should consider. With modifications, a list appropriate for consideration for fibrous substrates and coatings can be proposed as:
I. Weathering
Radiation
Solar Nuclear Thermal
Temperature
Elevated Depressed Cycles
Water
Solid (snow, ice) Liquid (rain, condensation, standing
water 1 Vapor (high relative humidity)
Norma1 Ai r Constituents
Oxygen and ozone Carbon dioxide
Air Contdminants
Gases (oxides of nitrogen and sulfur) Mists (salt, acids, alkalies in water) Particul ates (sand, dust, dirt j
Wind
I I. Biological
Mi croorgani sms Fungi Bacteria
111. Stress
Sustained
Periodic Physical action of water Physical action of wind Combination of water ancf ~ i n d Vovement due to other factors (settle-
ment > i V . Incompatibility
Chemical
Physical
V. Use
Design o f system
Installation procedures
Maintenance procedures
Normal wear and tear
Abuse by user
Many of the factors have minimal effect on fibrous substrates but thermal shock is a serious matter in coatings and it can be disastrous in vinyl overlays. Temperature changes from day- light to dark can be substantial. Another item of current interest is the effect of air con- taminants such as acid rain, Sulfide staining in exterior coatings is a discoloration phenomena which has the potential for widespread occurrence. A factor contributing to this problem is the recognition of acid rain as an atmospheric pollu- tant. Metallic compounds susceptible to sulfide staining are commonly present in most exterior paints and the problem is common in industrial- ized areas.
The list of factors is included as a means of identifying some of the key factors that affect durability. No attempt has been made to identify the factors that influence durability most. A1- though some are more important than others, each has an influence and under the right conditions can become significant.
LITERATURE CITED
Eustis, 0. B. 1979. State of the art, fiberboard industry. unpubl i shed report suppl ied to the Southern For, Exp. S t n . , Pineville, LA.
Frahnsdorff, G., and L. W. Masters 1980. The meaning of durability and durability prediction. Durability of Building Mate- rial s and Components. Proceedings of the Fi rst International Conference. ASTM STP 691. ASTM, Philadelphia, PA.
Garden, G . K, 1950. Design determines durability, I n Dur- ability of Building Materials and ~oKonents. Proceedings of the First International Con- ference. ASTM STP 691. ASTM, Philadelphia, PA,
tehmann, W. F. 1872. Moisture-stability relationships in wood- base composition boards. For. Prod. J . 2 2 ( 7 ) : 53-59.
Maloney, T. M. 1977. Modern particleboard and dry-process fiberboard manufacturing. Mi 1 1 er Freeman Pub1 ications, Inc. San Franci sco, CA.
National Particf eboard Association. 1973. Standard for medium density fiberboard. NPA 4-73. Silver Spring, MD.
Oliver, J . F . (ed.) 1981. Adhesion in cellulose and wood-based composites. NATO Conference Series VI: Materials Science, Vol. 3. Proceedings of a Conference sponsored by the NATO Science Committee, May 1980, at Queen's University, Kingston, Ontario. Plenum Press, NY.
U.S. Department of Commerce. 1973a. Ce1 lulosic fiber insulating board. Voluntary Product Standard PS-57-73. U.S. Dep. Commerce, National Bureau of Standards, Washington, DG.
U.S. Department of Commerce. 1973b. Basic hardboard. Voluntary Product Standard PS-58-73. U.S. Dep. Comwrce, National Bureau of Standards, Washington, DC.
U.S. Department of Commerce. 1973~. Prefinished hardboard paneling. Volun- tary Product Standard PS-58-73. U.S. Dep. Commerce, National Bureau of Standards, Washington, DC.
U.S. Department of Commerce. 1973d. Hardboard siding. Voluntary Product Standard PS-60-73. U.S. Dep. Commerce, National Bureau of Standards, Washington, DC.
PERFORMANCE OF WAFERBOARD: LOAD DURATIQ!d, ? I
DTMENSZCNkL SThBl LITY AND G I O D E T E R ~ Q R A T ; ~ P ~ ~ '
2 1 3 , Alexopoulss and T, Szabo-
Abstract.--The behavior of two com;riercial types of waferhoard bonded hi t h phenol -formaldehyde (PF) and one type of experimental waferboard bonded with gethjlolated kraf t 1 ignin phenol -formaldehyde (MKL/PF) was studied in terms of load duration, dimensional s t a b i l i t y and bio- deterioration. In the case of load duration, a 4-element model was used to describe the creep behavior of the wafer- board specimens. The highest creep resistance a t a l l three l oad l eve1 s was exhibited by the 1 ong-wafer PF specimens tested parallel to panel length followed closely by the MKLjPF specimens a t the 1 ow load 1 eve1 , then by the 1 ong- wafer Pf specimens tested perpendicular t o panel length, A t the high load levels , however, the MKL/FF specimens showed much higher creep deflection and approached the creep resistance of t he long-wafer PF perpendicular speci- mens. In l inear expansion ( L E ) , thickness swel l ing (TS) and water absorption (MA) comparisons, the MKLiQF specimens per- formed as well or bet ter than both commercial P F board types. Differences in dimensional stabi l i ty means (signi - f i can t a t the 0.05 level of confidence) among the three board types occurred in l inear expansion tested perpendi- cular to panel length, thickness swelling, and water absorption. All hoard types displayed more or l ess equal resistance to fungal decay. However, re la t ive to the aspec poplar control specimens, s ignif icant ly higher decay resistance (0.01 1 eve1 1 was shown by a l l board types with the decay fungus i e ~ z - i t e s tra3ea. With Por:~ pZacensa, t he short-wafer PF and MKL/PF specimens were more decay res i s t - ant than the control, Mold was found not to have a signi- f i can t e f fec t on the bending strength of specimens tested on edge.
INTRODUCTION
Wood and wood-based products, in the i r var- ious applications, are expected to safely with- stand the conditions imposed by the particular service environments. Structural wooden members and panels are designed to carry loads contin- uously for long periods of time in adverse environmental conditions and under the influence of possible biodegradation, Information i s available on the mechanical behavior o f t radi- tional wood products with respect t o load duration, moisture and micro-organisms. However, the same cannot be said f a r commercial o r experi- mental waferboards. Thus, a study was j n j t - i a t e d
1/ Paper presented a t Workshop on Durability, penfacola, FL, October 4-7, i982,
g ~ h e authors are respectively, Research Sci- en t i s t and Department Manager, Forintek Canada Corporation, Eastern Laboratory, 800 Montreal Rd,, Ottawa, Canada, K 1 G 325.
to assess the effects o f 1 ) load on the time- dependent behavior of waferboard i o bend ing , 2 ) moisture OM the dimensional stabi l i t y of waferboard, and 3) mold and Fungi on the dura- b i l i t y of waferboard.
MATERIALS
For t h i s study, two types of commonly used ~~aferboard for roof s h e a t h i n g i n residential wood construction and one experiments? waferboard were selected ( f i g , I ) . The commercial boards , produced to meet the requirements of CAN3-0188,2- W78 and 4l.ISL A208-I-78 standards, had randon1 y oriented wafers bonded w i t h a phenolic powder resin (PF) . The two panels, designated P F l and FF2 differed by wafer length, The PFI had l u n g wafers (89 rm) while t h e PF2 panels had shorter wafers ( 3 8 mn). The commercial panels were ran- domly selected from shipments of two manufac- turers ,
The experimental waferboard was bonded with methylolated kraft ligninlphenol formaldehyde (MKLIPF) resin. These hoards were made with randomly oriented wafers (38 mm in length) in the laboratory. The fabrication technique in- volved spraying the wafers with 2 percent slack wax, then blending 2.5 percent powdered phenol- formaldehyde resin in a drum-type blender for 2 minutes. The mats with 5 t 0.5 percent moisture content were pressed for 5 minutes at 210oC press temperature. Press closing time was approximately 60 seconds. For more detailed information on this resin system and its appli- cation in waferboard production see Dolenko and Clarke (1 978).
EFFECT OF LOAD ON THE TIME-DEPENDENT BEHAVIOR OF WAFERBOARD IN BENDING
When a structural panel like waferboard is used in roof sheathing applications, its mechani- cal behavior exhibits time dependency. Depending on the circumstances, the panels may deviate from their plane exhibiting what is commonly referred to as sagging, buckling or creep, The amount of creep depends upon a number of factors including the magnitude of the load, the dura- tion of the load, the environmental temperature, and moisture content fluctuations.
Using the deformation curve in figure 2, the time-dependent behavior can be discussed as illustrated. On the application of a load at time (to), there is an instantaneous elastic deformation (OA). On maintaining the load to t1, the deformation increases at a decreasing rate; thus increment (AB) is known as "creep". On removal of the load at tl, an instantaneous creep recovery (BC) occurs which is approxi- mately equal in magnitude to the initial elastic deformation (OA). With time, there is a partial recovery ( C D ) of the creep deformation at a de- creasing rate until time t2. The amount of creep that has occurred during loading can be divided into a "recoverable" component, which displays delayed elastic behavior, and an "irrecoverable" component which is due to plastic or viscous flow (Pierce and Dinwoodie, 1977).
In this study, only the creep portion (AB) of the time-dependent behavior of waferboard is addressed. The creep evaluation consisted of subjecting one commercial waferboard (PF1 ) and the MKL/PF experimental waferboard to three load levels (table 1). After equilibration to room conditions (21oC and 65 percent relative humid- ity), the specimens, 11.1 x 153 x 660 mm, were center-point loaded over a span of 610 mm. For the commercial waferboard, approximately 15 specimens were evaluated from both panel direc- tions. Since the MKL/PF specimens do not show directional properties, only one test direction with respect to panel length was considered.
A creep loading frame and deflection measurement apparatus was constructed (fig. 3). The measurement apparatus contained a dial %gauge
with an accuracy of 0.01 mm and mounted as shown in figure 4. The apparatus was a tripod design of aluminum for stability and handling ease. The dial gauge arm rested on the actual specimens by means of holes drilled in the loading frame and 22-mm diameter steel pipes. This method of measuring deflections enabled the load to be removed or applied with the reference point maintained; thus the ei3stic response of the specimens, the deflection of the specimens imediately following load application and load removal , could be recorded.
Deflection measurements were taken at appro- priate times for two months with the load applied and two months with the load removed. Deflection at 1/2 minute following load application and load removal was defined as the elastic response of the specimens. At the end of the creep tests, all specimens including adjacent controls were tested in static bending over a 610-mm span. The test procedures followed the recommendations of CAN3-0188.0-M78 (1 978).
The results of the creep experiments are summarized graphically in figures 5 and 6. To better apprehend the creep resistance, relative deflection values obtained at two selected times were compared (table 2). The two times chosen were the instantaneous response (1 /2 minute after loading) and at 900 hours. For analysis, the data can be compared by 1) effect of board type-- within load levels, 2) effect of load level -- among load levels, and 3) combination of load level and board type--within and among load levels. For a11 these cases, the instantaneous deflection of specimens with the highest creep resistance were chosen as the control and the other measurements were rated based on the con- trol measurement.
In the "within load level " comparisons, the highest creep resistance was displayed by the PF1 parallel specimens followed by YKL/PF, then FF1 perpendicular specimens. However, the gap be- tween the MKL/PF specimens and the controls widened and approached the creep resistance exhibited by the PF1 perpendicular specimens for the high load level.
In "among load level" comparisons, when going from the low to the medium load level, a11 specimens showed an approximate increase of three times the control deflection at both time instances. However, at the high load level, the commercial specimens in the two test directions had close values (i .e., approximately 400 and 600 percent for t=l/2 minute and t=900 hours, respectively) whereas those for MKL/PF were some- what greater (i .e. , 600 and 800 percent for the two times).
When load levels and materials are compared, it can be seen that at the high load level the MKL/PF and PFl perpendicular specimens exhibited 1
approximately 800 and 900 percent increase in I
creep deflection at the instanteous time and 1200 1 and 1300 percent at 900 hours, respectively, rel- ative to the PF1 parallel control specimens. I
The creep response was analyzed in terms of a 4-parameter viscoeiastic model (fig. 7). The viscoelastic behavior has been represented by various spring and dasbot anologues in which the spring simulates the elastic component and the dashpot the plastic or viscous component. The four governing parameters are the spring constants Eo and El, and the dashpot constants and pL.
The governing differential equation for a 4- parameter or Burger's model according to S z a b and Ifju (1970) is:
Where: G and 8 = first and second derivatives of stress with respect to time
t: and G = first and second derivatives of strain with respect to time 2 (1 + E 1 / E o ) + ui - 0
PI - E 1
Ec = modulus of elasticity of the free spring
v,: = viscosity of the liquid in the free dashpot
El = modulus of elasticity of the spring in the retarded element
p1 = viscosity of the liquid in the dashpot of the retarded element
The solution of the differential equation for creep is:
Here: o,/E, = elastic deformation 't/T
1 . 1 - e ) = delayed elastic defor- mation
oot/uc = viscous flow
The constants in Equation ' 23 could be obtained from the experimental data :
a, (L ,M,H) = experimental stress level s (1.88, 4.79, and 7.69 GPa)
E, (PF1 , MKL/PF) = initial modul i of elasticity of the two waferboards (PF, parallel - 5.5 GPa, PF1 perpendicular-2.7 GPa, MKL/PF - 4.4 GPa)
The approximately constant slope attained by the creep curves in figures 5 and 6 allowed calcu- lation of , from the relationship:
C slope = 7
For the end of the creep curves in figures 5 and 6 where constant slope is reached ( f i g . 83, the solution of the differential equation may be re- written as follows:
Since the first two terms 1/E, and ]/El, are con- stants, it is easy to see that the slope of the curve is o o l c a for large values of t . The inter- cept of the tangent from the 3bove solution is therefore :
From this, E, can be calculated.
There remains only pl to be calculated to describe strain behavior in terms of the equation. This may be found from Equation C31.
In this study, T , a material constant, was not determined experimentally. Arbitrary values could be assigned to T and the one that satisfied Equation i21 was considered to be the true value. This procedure was followed in the analysis of the experimental data using digi ta1 computer techniques to find T , the retardation time. Then, from Equation C31, p, was obtained.
The results concerning the model parameters and coefficients of the governing differential equation are given in table 3 for PF1 board in parallel direction at the low load level. For the other cases (1 oad 1 eve1 and board type), relative values are given as the percentage of PF1 parallel specimen data at the low load level. These results (table 3) substantiate the dis- cussion presented earlier with the creep curves. Thus, the highest creep resistance was demon- strated by PF1 parallel specimens at all three load levels. The high elasticity in the system was confirmed by the high magnitude of elastic constants. At the same time, the magnitude of p, suggests that the viscous flow resistance of the system was also high.
The PF1 perpendicular specimens demonstrated substantially lower elasticity and less resist- ance to viscous flow relative to the control s. The MKL/PF specimens indicated slightly less elasticity as compared to the PF parallel speci- mens and their resistance to viscous flow was only slightly better than that o f the PF perpen- dicul ar specimns .
The MKL/PF specimens were tested three weeks following manufacture and some post-curing may still have been in progress. This may ex- plain the high viscous behavior of the board, especially at high load levels.
Bending t es t s following t he creep tests showed t h a t creep had no significant e f f e c t on the b e n d i n g properties of the test specinens relative to the ccntrol specimens a t the 70w load level , Testing 5s not compSeted a t t he other load levels.
EFFECT 0" lllSISIURE ON THE L)PYEhjSIONAI STASILIfv OF b4AFERE3PRD
k!aFerboard, a hygrcscepic material , w i i 1 snrink and swell wken exposed to conditions causing d e s o ~ p t i o n or adsorption o f water. The phenomenon can be attributed to the basic woad nature. The dimensional response of waferboard to moisture change is very importaut in its mjor applications. Two examples are joint quality due to edge swelling and buckling as a r e s u l t of expansion,
i n this work, the dimensional stability of 7l.i-mrn waferboard was studied in terms of l inear expansion (LE) , thickness swell ing (TS) , and water absorption ( M A ) . Ten specimens per panel direction were used for both PF commercial waferboards, The MKL/PF specimens totaled 20 with no consideration given to direction of testing- A14 specimens were cut to the same dimensions as the creep specimens,
LSnear expansion tests ~tere carried o u t according to APA Test Method P-I: Linear Expan- sion Measured from Oven Dry do Vacuum-Pressure Soak (American Plywood Association, 1980)- As the title suggests l inea r expansion was deter- mined from length measurements taken following oven-drying and after the specimens were exposed to water, vacuum a d pressure. Thickness swelling and water absorption were determined using the same LE specimens going from oven-dry t o t he saturated condition.
Linear expansion was weasured to the near- est G,01 mm using a bar-type trammel equipped with a dial gauge ( f i g , 9). A 610-mrn gauge length was defined on the longitudinal axis of each specimen by driving a common aluminum nail through the thickness ad 25.4 rnm from each end. A 1.1-mm hole was drilled in the geometric center o f each nail to accommodate the needles o f ehe trammel. A brass bar having identical hales drilled 610 ifin apart served as t he reference measurement. For accuracy, each specimen was placed in a flattening jig which removed any out-cf-plane distortions.
The results of the dimensional stability t es t s are shown i n t ab le 4. The linear expansion f o r specimens i n t h e per~endicular test direction was higher than t he corresponding l inear ex2an- s ion i n t h e parallel direction for bath commer- cia1 board types, The d i f f e r e n c e s , however, were not si nifi~ a n t ~ a t the 0,05 level of conffdence. The MY,?/PF specimens had a LE o f 0.26Y which equaled the average of b o t h commercial boards tested para:fe? to panel Se~gth,
From the p o i n t o f view of thickness sweilin~ PF2 specimens performed t he best , followed by PF1 then by the MKL/PF specimens, but t he differ-
ence between PFl and MKL/PF is non-significant, Water absorption tests showed that the MKt/PF specimens displayed the best performance by having approximately 7 5 percent less water ab- sorption than the average of the commercial specimens.
Analysis of variance for a one-way cfassifi- ca t i on showed that the difference in means amwg the three board types w i t h i n each category were found to be significant a t the 0.05 level of conf idence in all cases except in linear expan- s j o n comparisons with specimens tested parallel to panel l e n g t h ,
EFFECT OF MOLD AND FUNGI ON THE DURA- BILITY OF WAFERBOARD
Waferboard, i n its various applications, could be exposed to ambient conditions that make it prone to mold andlor fungal attack. It has been shown that wood species, particle geometry, board structr~re density, and adhesive factors are all involved in susceptib;lity of particle- board to fungi (Smith, 1974; Willeitner, 1965).
Waferboard is normally made from poplars which are susceptibk do mold and decay. The PF resin has been known to provide some protection against micro-organi sms (Bosshard and Futo, 1963) , but the combination effects with poplar and PF resin or MKL/PF resin in waferboard are not known.
Since the biodeterioration process usually coKnences w i t h mold foliowed by decay, the effects of both on the behav-ior of waferbcard were exarni ned,
EXPOSURE TO MOLD
Resistance to mold was evaluated using a mod-r"f i e d APA T e s t Method 0-2: Mold Test. The modification was not subjecting t h e control specinlens to WPA Test Method 0-4: Moisture Cycle for Quality Assurance. it was believed that variables beyond our control would be intro- duced and allowing the controls tooattain equilibrium moisture content at 21 G and 65 per- cent relative hurndity was better.
The test specimens were placed in a cabinet under mold-producing conditions (fig. 10). Each specimen measured 1 4 - 1 x 25-4 x 127 mrn and was tested on edge across a 102-mm span with the load applfed at midspan. The effect of mold was based on bending strength (MBR) differences between test and adjacent eoatr3f specimens. One series of specsmens was tested every two weeks starting at the four-week exposure time.
Table 5 presents the b e ~ d i n g strength re- tention resul ts of the mold specimens. Whether mold had a definite effect on MOR cannot be clearly stated, In some cases, the bending strength increased with increased exposure time as kndieaded by higher retention values. From a
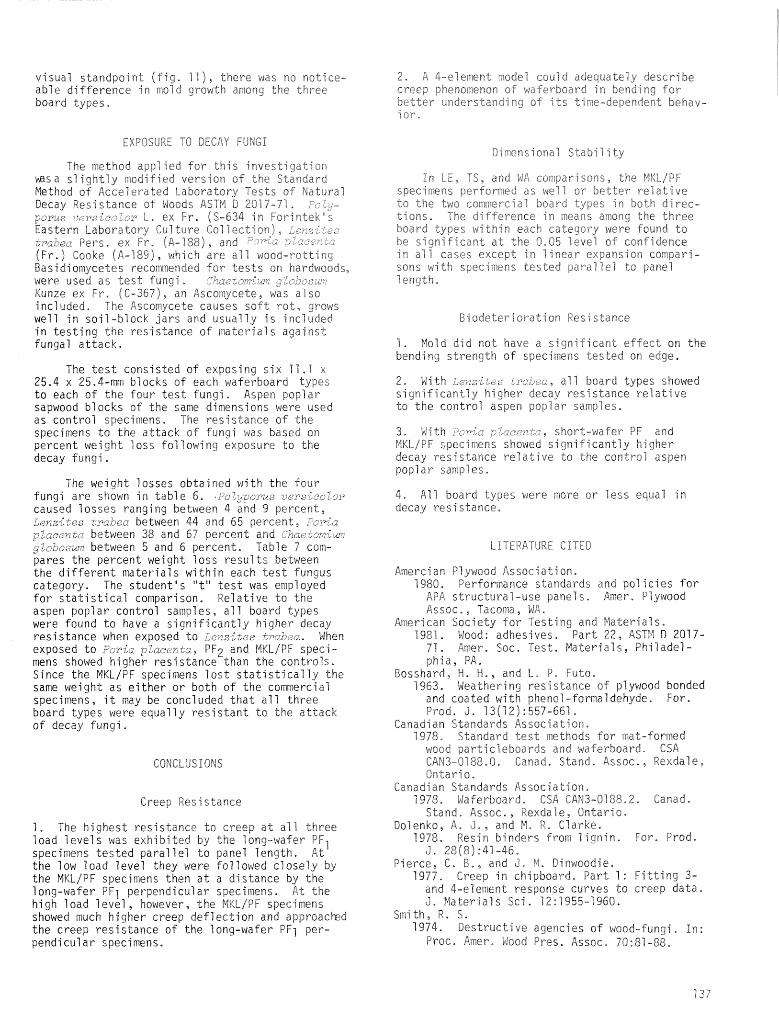
v i sual standpoint ( f i g 1 1 ) , there was no notice- able difference in mcld growth among the three board types.
2. A &element nodel could adequately describe creep phenofienon o f waferboard Sn bend ing f o r better understanding o f i r s time-dependent behav- j3r,
EXPOSURE TO DECAY FUNGI Dinensionat Stabil i f j
The method applied for this investigation ~Jas a sl ightly ~iodified version of the Standara Method o f Accelerated Laboratory Pests of Natural Decay Resistance of Ncods A S I M B 2017-71. rsU;- pcms usrc~co:or L, ex Fr, (5-634 in corintek's Eastern Laboratory Cu7 ture Col 1 e c t i on), F ~ T ~ Z ~ kc- tpalec Perr, ex F r , (A-J88), and "-')I"": p?2c~-:i: (Fr.) Cooke ( A - 7 8 9 ) , which a r e a11 wood-rotting Basidiomycetes recommended for tests on hardwoods, were used as test fungi, 2icecornS:~r ~ 2 n t ~ ~ s h ~ r ~ Kunze ex Fr, (5-367), an Ascoiriycete, was a1 se included. The Ascomycete causes soft rot, grows well in soil-block jars and usually is included in testing the resistance of materials against fungal attack.
The test consisted of exposing six 11.5 x 25.4 x 25.4-mm blocks o f each waferboard types to each of the four test fungi. Aspen poplar sapwood blocks o f the same dimensions were dsed as control specimens. The resistance of the specimens to the attack sf fungi was based on percent weight ioss following exposure to the decay fungi.
The weight losses obtained with the four fungi are shown in table 6. c?eZgparus ;ers;color caused losses ranging between 4 and 9 percent, ,5anzites trabaa between 44 and 65 percent, Fnria pZaeentLz between 38 and 67 percent and Chaezcmi^v~v gkbosan between 5 and 5 percent. Table 7 com- pares the percent weight loss results between the different materials within each test Fungus category. The student's "t'9est was employed for statistical comparison. Relative to the aspen poplar control samples, a7 7 board types were found to have a significantly higher decay resistance when exposed to Senz5re.s t raben. When exposed to Poria ~ Z a c s n t a , PFZ and MKLJPF speci- mens showed higher resistance than the controls. Since the MKLfPF specimens lost statistically the same weight. as either or bsth of the commercial specimens, it may be concluded that all three board types were equally resistant to the attack of decay fungi.
CONCLUSIONS
Creep Resistance
1. She highest resistance to creep at a71 three load level s was exhibited by the long-wafer PFI specimens tested parallel to panel length. At the low load level they were follov~ed closely by the MKLfPF specimens then at a distance by t h e long-wafer PF1 perpendicular specimens, Ad the high load level, however, the K K I / P F specimens showed much higher creep deflection and approackd the creep resistance of the long-wafer PF1 per- pendicular specimens.
In t E , TS, and WA ccmpariso~s, the MKL/PF specifiens performed as we17 o r better relative to the two commercial board types i n bsth direc- tions. The difference in means anlong the three b s a r d t ypes w i t h i n each c a t e g ~ r y were found to be significant a t the 0-05 level of confidence in a97 cases except in l i nea r e x ~ a n s i o n csvpari- sons w i t h soecinens tested parallel to panel 1 e n g t h .
Biodeterieration Resfstance
1 , Mold did not have a significant effect on t he bending strength o f specimens tested on edge.
2, With Lenzites t m k e a , a1 I board types showed si gnif i cant1 y hi qher decay res%tance re1 a t i ve to the control aspen poplar samples.
3. W i t h i ' ~ 5 ~ < ; 1 : pZace~&ir, short-wafer PF and MKL/PF specimens showed signiFicantly higher decay resistance re la t ive to the control aspen poplar sarnpl es,
4, All board types were more or less equal in decay resistance.
LITERATURE CITED
Amercian Plywood Association, 1980. Performance standards and policies for
APA structural-use panels. Amer, Plywood Assoc., Tacoma, MA.
American Society for Testing and Materials. 1987. Mod: adhesives. Part 22, NSTB? 1! 2017-
77. Arner. Sac. Test, Materials, Philadel- phia, PA.
Bosshard, H. H., and L, P, F b t o . 1963. Weathering resistance o f plywood bonded and coated with phenol-formaldehyde. For. Prod. J * 3 3j 12) : 557-667-
Canadian Standards Assaclation, 7978, Standard test methods for mat-formed wood particleboards and waferboard. CSA CAN3-69 88,O. Canad, Stand. Assoc. , Rexdal e , Ontario,
Canadian Standards Association, i 978, $jaFerboard, CSX CAN3-0188,2, Canad. Stand, ASSOG. , Rexdale, Ontario.
Dolenko, A, J, , and M, R, Clarke. 1978, Resin binders from lignin, Fcr, Prod.
3 , 28(8):41-46, Pierce, 6 . B,, and J. M, Dinwoodie,
1977. Creep in chipboard, Part 1: Fitting 3- and 4-element response curves to creep data. d . Materials Sc i , 12:1855-1960.
Smith, R, S. 1974, Destructive agencies of wood-Fungi. In:
Proe, Prner, bdood Pres, Wssoc, 70:81-88,
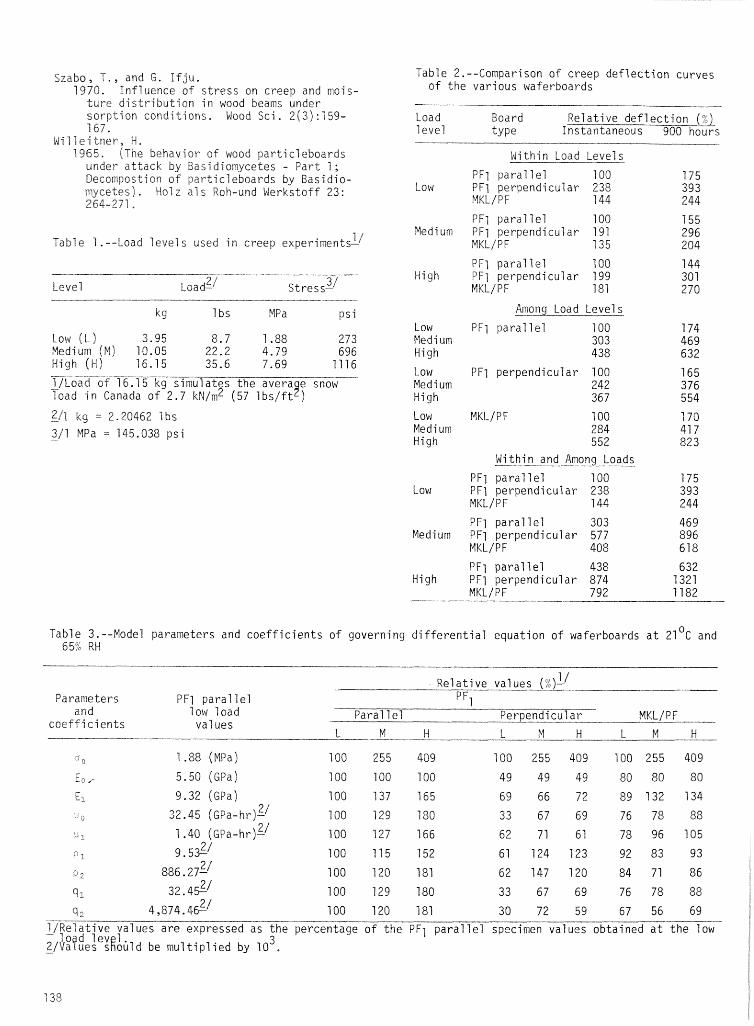
Szabo, f., and6. I f j u . 1870. Influence of stress on creep and mois- ture distribution in wood beams under sorption conditions. Wood Sci . 2(3) : 159- 7 6 7 ,
Willeidner, H. 1965. (The behavior of wood particleboards under attack by Basidiomycetes - Part 1; Decompostion sf particleboards by Basidio- mycetes j , HoI z a1 s sooh-und kjerkstof f 23 : 264-271.
Table 2. --Comparison of creep deflection curves of the various waferboards
Load Board Relative deflection (%) 1 eve1 type Instantaneous 900 hours
Within Load Levels
PF1 para1 le1 100 175 Low PF1 perpendi cu1 ar 238 39 3
MI(L/FF 144 244
PF1 parallel 100 155
7 / Medi urn PF1 perpendicular 191 296 Table 1.--Load levels used in creep experiments- MI<L/PF 135 204
PF] parallel 100 144
J/ High PF1 perpendicular 199 30 1
Level ~oadll Stress- MKL/PF 181 270
kg 1 bs MPa psi Among Load Levels
Low PF1 para1 lel 100 174 Low (L) 3.95 8.7 1.88 273 Medi urn 303 469 Medium (M! 10.05 22.2 4.79 696 High 438 632 High ( H ) 16.15 35.6 7.69 1116 Low PF1 perpendicular 100 165 1/Load of 16.75 kg simulat~s the avera e snow - 9 Med i urn 242 376 load in Canada of 2.7 k ~ / r n ~ (57 1 bs/ft ) High 367 554
217 kg = 2.20462 7 bs -
3/1 MPa = 145.038 psi -
Low MKL/PF Medi urn High
Within and Among Loads
PFj para1 lel 100 Low PFl perpendicular 238
MKL/PF 144
PF1 para1 lel 303 Medium PF1 perpendicular 577
MKL/PF 408
PF1 parallel 438 High PF1 perpendicular 874
MKL/PF 792
Tab1 e 3. --Model parameters and coefficients of governing differential equation of waferboards at 21 OC and 65% RM
1 / Re1 ati ve val ues (76)- Parameters PF1 ~arallel PF,
t
and ioi load Para1 1 el Perpendicular coefficients
MKL / PF val ues
L M H t M H L M H
I/Relative values are expressed as the percentage of the PF1 paral lel specimen values obtained at t h e low - load lev 1 3 2lVa [ues sgofild be multiplied by 10 . -
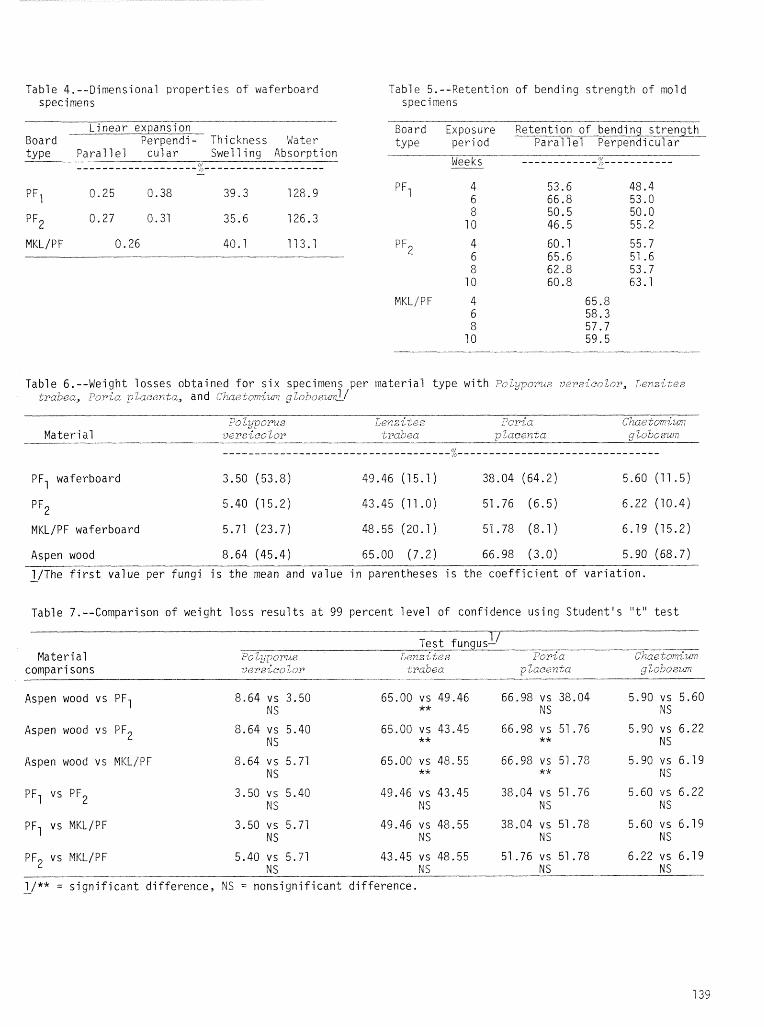
Table 4.--Dimensional properties of waferboard specimens
Table 5.--Retention of bending strength of mold specimens
Linear expansion Board Perpendi- Thickness Water type Paral le1 cuiar Swell ing Absorption
Board Exposure Retention of bending strength type period Paral 1 el Perpendicul ar
Weeks
MKL / P F 4 6 a
7 0
Table 6.--Weight losses obtained for six specimens per material type with i?oZ~porus versieclor, Senzitss -trrabca, P m i a pZiicar;ta, and Chae?omZ-m glabosmL/
20 lypo~zis ;er,zi-tes TOP~G Ckae -tomi?m Materi a1 ;)ersicoZar -t;~abea p Zcrcenta ~ZO~OSUI;;
- - - - - - - - - - - - - - - - - - - - - - - - - - - - - - - - - - - - ; & - - - - - - - - - - - - - - - - - - - - - - - - - - - - - - - -
PF1 waferboard 3.50 (53.8) 49.46 (15.1) 38.04 (64.2) 5.60 (11.5)
PF2 5.40 (15.2) 43.45 (11.0) 51.76 (6.5) 6.22 (10.4)
MKL/PF waferboard 5.71 (23.7) 48.55 (20.1) 51.78 (8.1) 6.19 (15.2)
Aspen wood 8.64 (45.4) 65.00 (7.2) 66.98 (3.0) 5.90 (68.7)
l/The first value per fungi is the mean and value in parentheses is the coefficient of variation. -
Table 7.--Comparison of weight loss results at 99 percent level of confidence using Student's "t" test
1 / Test fungus- Material i3C Zyporus L e ~ z z i -tes Poria Chae -i;om-Cuv
compari sons versico Lor trabea placenta g2oboszi.n
Aspen wood vs PF1
Aspen wood vs PF2
Aspen wood vs MKL/PF 8.64 vs 5.71 65.00 vs 48.55 66.98 vs 51.78 5.90 vs 6.19 N S ** ** N S
PF2 vs MKL/PF 5.40 vs 5.71 43.45vs48.55 51.76vs51.78 6.22 vs 6.19 NS RS NS NS
I/** = significant difference, NS = nonsignificant difference. -
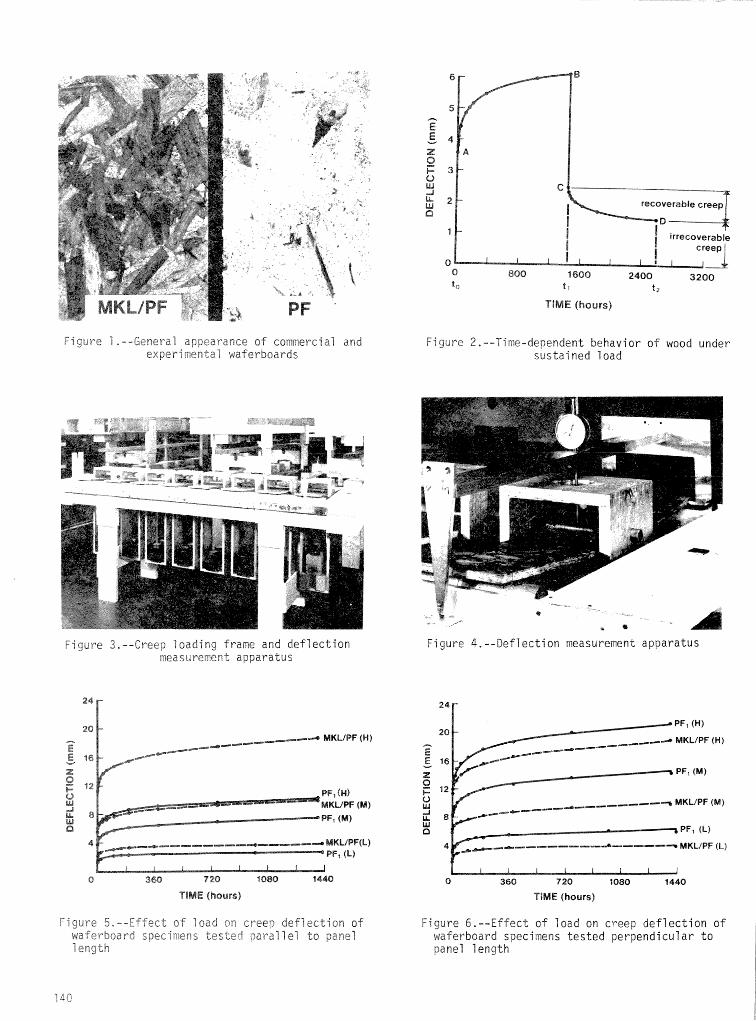
f lME (hours)
Figure 2.--Time-dependent behavior of wood under sustained 1 oad
Figure 1,--General appearance of commercial and experimental waferboards
Figure 3,--Creep loading frame and deflection ~easurement appara tus
PFI (X) MKVPF (M)
Pf=, (MI
Figure 5,--Effect o f load on creep deflection s f waferboard specimens tested parallel t o panel 1 ength
Figure 4,--Deflection measurement apparatus
0 360 720 'I 080 1440
TlME (hours)
Figure 6,--Effect of load on creep deflection o f waferboard specimens tested perpendicular to panel length
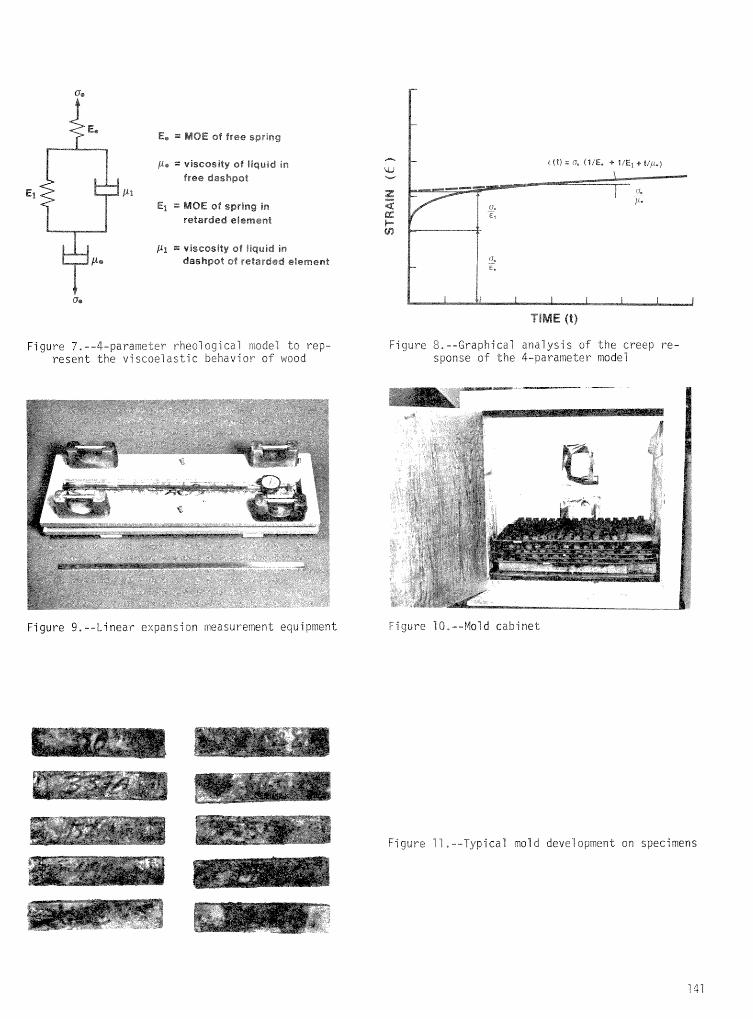
E, =r M0E of free spring
I 7 po t viscosity of liquid in free dashgot
El -. MOE sf spring in retarded element
" visc~8sift'lg of liquid in dashpot of retarded element
Figure 7 . --4-parameter rheol o g i cal model t o rep- resent the viscoelastic behav io r of wood
Figure 9.--Linear expansion measurement equipment
Figure 8,--Graphical a n a l y s i s of the creep re- sponse of the 4-parameter model
f igure 30, --Mold cab ine t
Figure 11,--Typical mold develop~ent on specimens
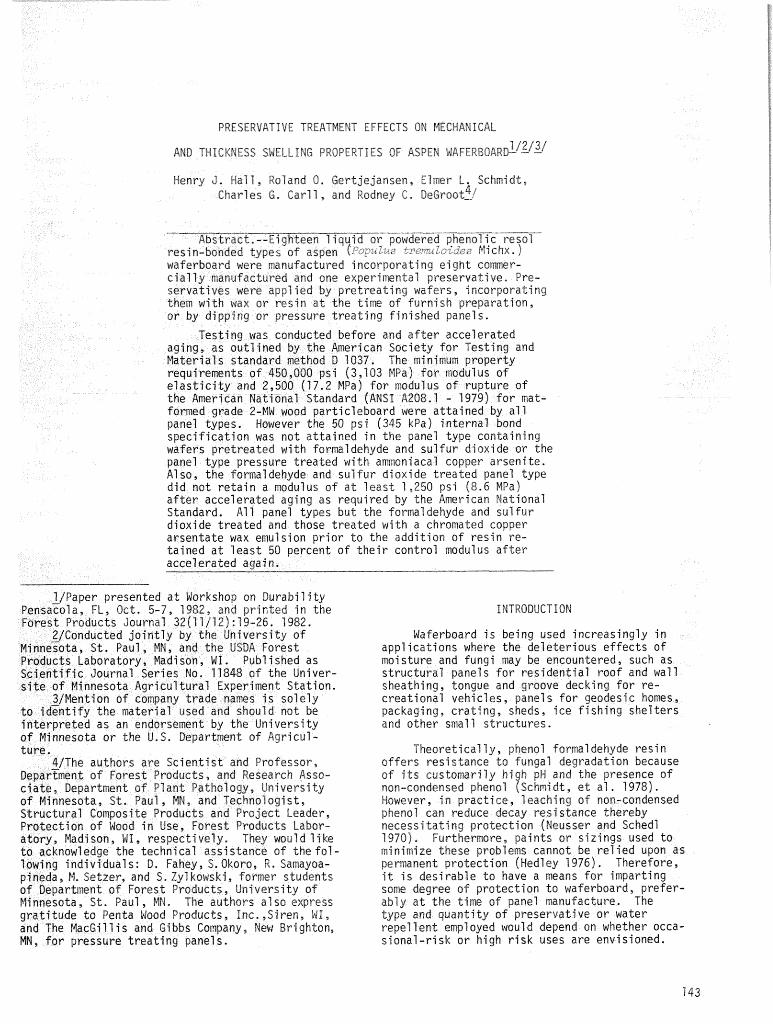
PRESERVATIVE TREATMENT EFFECTS ON MECHANICAL
1 /2/3/ AND THICKNESS SWELLING PROPERTIES OF ASPEN biAFERBOARfg---
Henry 3, Hall, Roland 6, Gertjejansen, Elmer t , Schmidt, Charles G. Carl 1, and Rodney C. ~ e ~ r o o e !
Abstract.--Eighteen l iqujd or powdered phenol ic resol resin-bonded types of aspen (~oruSur trem.!oidcs Michx.) waferboard were mnufactured incorporating eight comer- cially manufactured and one experimental preservative, Pre- servatives were applied by pretreating wafers, incorporating them with wax or resin at the time of furnish preparation, or by dipping or pressure treating Finished panels.
Testing was conducted before and after accelerated aging, as outlined by the American Society for Testing and Materials standard method D 1037, The minimum property requirements of 450,000 psi (3,103 MPaf for modulus of elasticity and 2,500 (17.2 MPa) for modulus of rupture of the American Pjational Standard (ANSI A208.1 - 1979) for mat- formed grade 2-MW wood particleboard were attained by a1 1 panel types. However the 50 psi (345 kPa) internal bond specification was not attained in the panel type containing wafers pretreated with formaldehyde and sulfur dioxide or the panel type pressure treated with ammoniacal copper arsenite. Also, the formaldehyde and sulfur dioxide treated panel type did not retain a modulus of at least 1,250 psi (8.6 MPa) after accelerated aging as required by the American National Standard. All panel types but the formaldehyde and sulfur dioxide treated and those treated with a chromated copper arsentate wax emulsion prior to the addition of resin re- tained at least 50 percent of their control modulus after accelerated again,
1 {Paper presented at Workshop on Durabi l i ty ~ensacola, FL, Oct, 5-7, 1882, and printed in the INTRODUCTION Forest Products Journal 32 (1 1 / I 2) : 7 9-26, 1982,
2JConducted jointly by the University of Waferboard is being used increasingly in Minnesota, St. Paul, MM, and the USDA Forest app1 ications where the deleterious effects of Products Laboratory, Madison, MI. Publ i shed as moisture and fungi may be encountered, such as Scientific Journal Series No, 11848 o f the Univer- structural panels for residential roof and wall site of Minnesota Agricultural Experiment Station. sheathing, tongue and groove decking for re-
3/Meintion of company trade names is solely creational vehicles, panel s for geodesic homes, to idsntify the material used and should not be packaging, crating, sheds, ice fishing shelters interpreted as an endorsement by the University and other smal l structures. o f Minnesota or the U.S, Department of Agricul- ture. Theoretically, phenol formaldehyde resin
&/The authors are Scientist and Professor, offers resistance to fungal degradation because ~eparTment of Forest Products, and Research Asso- o f its customarily high pH and the presence of ciate, Department o f Plant Pathology, University non-condensed phenol (Schmidt, e t a1 . 1978). o f Minnesota, St. Paul , MN, and Techno1 ogist , However, i n practice , 1 eachi ng of non-condensed Structural Composite Products and Project Leader, phenol can reduce decay resistance thereby Protection o f Wood in Use, Forest Products tabor- necess i tati ng protecli on (Neusser and Schedl atory, Madison, HI, respectively. They would like 1970). Furthermore, paints or sizings used to to acknowledge the technical assistance o f the fol - minimize these problems cannot be relied upon as lowing individuals: D, Fahey, S,Okors, R, Samayoa- permanent protection (Wed? ey 1976). Therefore, pineda, Me Setzer, and S, Zyl kowski, former students it is desirable to have a means for imparting of Department of Forest Products, University of some degree o f protection to waferboard, prefer- Hinnesota, St, Paul , MN. The authors al so express ably at the tim of panel manufacture. The gratitude to Penta Mood Products, Inc, ,Siren, H i , type and quantiQ of preservative or water and The MacGi1 l is and Gibbs Company, New Brighton, repel f ent empl oyed waul d depend on whether occa- MM, for pressure treating panels. sional-risk or high risk uses are envisioned.
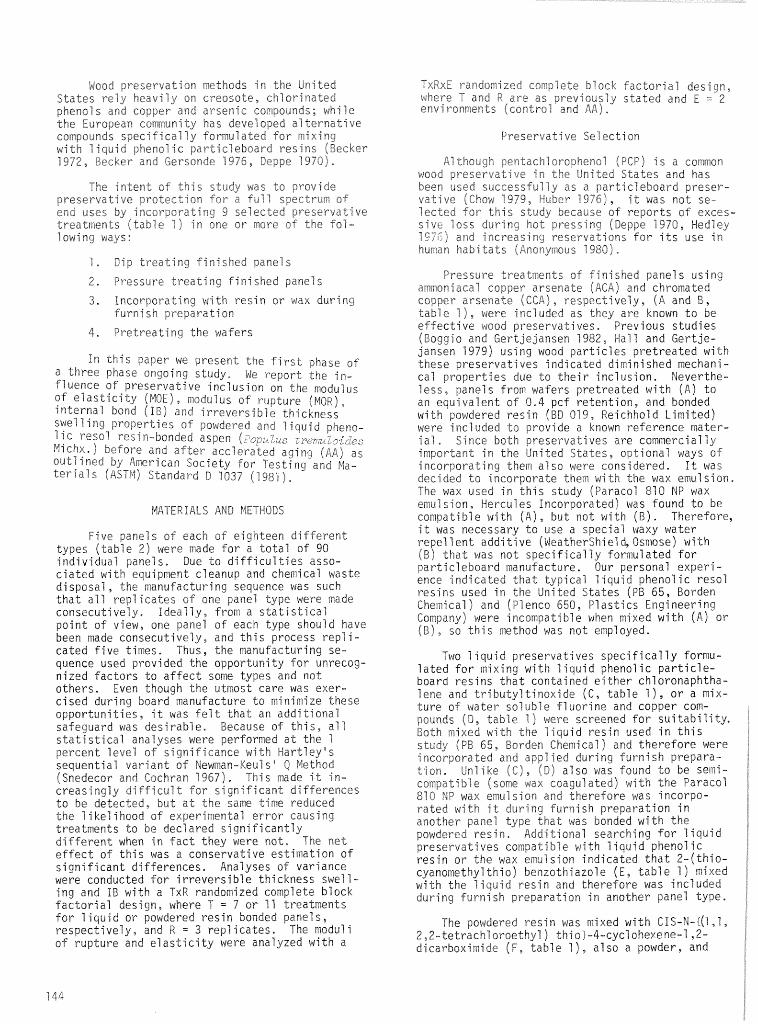
Wood preservation methods in the United States re1 y heav i l y on creosote, chl crinaded phenols and copper and arsenic compounds; while the European community has developed al ternat ive compounds specifically formulated POT mixing with 1 i q u i d phenolic particleboard resins {Becker 1972, Becker and Gersonde 1976, Deppe 19701,
The intent of this study was to provide preservative protection for a full spectruv of end uses by incorporating 9 selected preservative treatments (table 1 ) in one or more of the f o l - 7 owi ng ways :
7 , Dip treating finished panels 2. Pressure treating finished panels
3. Incorporating w i t h resin ar wax during furnish preparation
4. Pretreating the wafers
in t h i s paper we present the first phase o f a three phase oqoing study. We report the in- fluence of preservative inclusion on the modulus of elasticity (MOE), modulus of rupture (MOR), internal bond (IB) and irreversible thickness swelling properties of powdered and liquid pheno- 1 ic resol resin-bonded aspen ( ~ c p l u s rrerm2oide:: Michx.) before and after acclerated aging ( A A ) as outlined by American Society for Testing and Ma- terials ( A S I M ) Standard D 1037 (198i) .
MATERIALS AND METHODS
five panels of each o f eighteen different types (table 2) were made for a total of 90 individual panels. Due to difficulties asso- ciated with equipment cleanup and chemical waste disposal, the manufacturing sequence was such that all rep1 icates o f one panel type were made consecutively. Ideally, from a statistical point of view, one panel s f each type should have been made consecutively, and this process repli- cated five times. Thus, the manufacturing se- quence used provided the opportunity for unrecog- nized factors to affect some types and not others. Even though the utmost care was exer- cised during board manufacture to minimize these opportunities, it was felt that an additional safeguard was desirable, Because of this, all statistical analyses were performed at t h e I percent level of significance with Hartley's sequential variant of Newman-Keuls" Qethod (Snedecor and Cochran 1967). This made it i n - creasingly difficult for significant differences to be detected, but at the same time reduced the likelihood sf experimental error causing treatments to he declared significantly d i f f e r e n t when i n fact they were not, The net effect of this was a conservative estimation of significant differences. Analyses o f variance were conducted for irreversible thickness swell- ing and I B with a TxR randomized complete block factorial design, where T = 7 or 1 l treatments for liquid or powdered resin bonded pawls, respectively, and R = 3 replicates. The moduli of rupture and elasticity were analyzed with a
TxPxE randomized complete block factorial design , where T and R are as ~reviousfy s ta ted and E = 2 environments (control ' and AA) .
Preservative Se7ection
Al though pentack? oropkenol (PCP) is a common wood preservative in the United States a ~ d has been used successfully as a particleboard preser- v a t i v e (Chow 7979, Huber 7 976), it was not se- lected for this study because of reports o f exces- s i v e - loss d u r i v g ho t pressing (Deppe 1970, Hedlfy 7 S 7 F j and increasing reservations for its use in human habitats (Anonymous 7 980),
Pressure treataents o f finished panels using ammoni acal copper arsenate ( A C A ) and chromated copper arsenate (CCA) , respective1 y , (A and E, Gable I), were incl uded as they are known to be effective wood preservatives. Previous studies (Boggio and Gertjejansen 1982, Hal 1 and Gertje- jansen 1973) using wood particles pretreated with these preservatives indicated diminished mechani- cal properties due to their inclusion. Neverthe- 1 ess, panels from wafers pretreated with (A) to an equivalent of 0.4 pcf retention, and bonded with powdered resin (BD 019, Reichhold Limited) were included to provide a known reference rnater- i a l . Since both preservatives are commercially important in the United States, optional ways of incorporating them also were considered. I t was decided to incorporate them with the wax emulsion. The wax used in this study (Paracol 810 NP wax emu1 sion, Hercules Incorporated) was found to be compati ble with (A), but not with ( B ) . Therefore, it was necessary to use a special waxy water repel f ent addi l.i ve (Meathershi el d, Osmose) wi Lh ( B ) that was not specifically formulated for particleboard manufacture. Our personal experi - ence indicated that typical liquid phenolic resol resins used in the United States (PB 65, Borden Chemical ) and (Pienco 650, PI astics Engineering Company) were incompatible when mixed with (A) or ( B ) , so this method was not employed.
Two liquid preservatives specifically formu- lated for mixing with liquid phenolic particle- board resins that contained either chloronaphtha- lene and tributyl tinoxide (C, table l ) , or a mix- ture of water soluble fluorine and copper com- pounds (D, t a b l e 1 ) were screened for suitability, 80th mixed with the liquid resin used in this study ( F B 65, Borden Chemical ) and therefore were incorporated and applied during furnish prepara- tion. Unlike (C), (B) also was found t o be semi- cornpati bl e (some wax coagul ated) with the Paraeol 810 F4P wax emulsion and therefore was incorpo- rated with it during furnish preparation in another panel type that was bonded with the powdered resin, Additional searching for liquid preservatives compatible with liquid phenolic resin or t he wax emulsion indicated that 2 - f t h i o - cyanomethyl thio) benzothiazole ( E , table 1 ) mixed with the l iquid resin and therefore was incf uded during furnish preparation in another panel type.
The powdered resin was mixed with CIS-N-{(I , I , 2,2-tetrachloroethyl ) thioj-4-cyclohexene-132- dicarboximide (F, table 1 ) , a1 so a powder, and
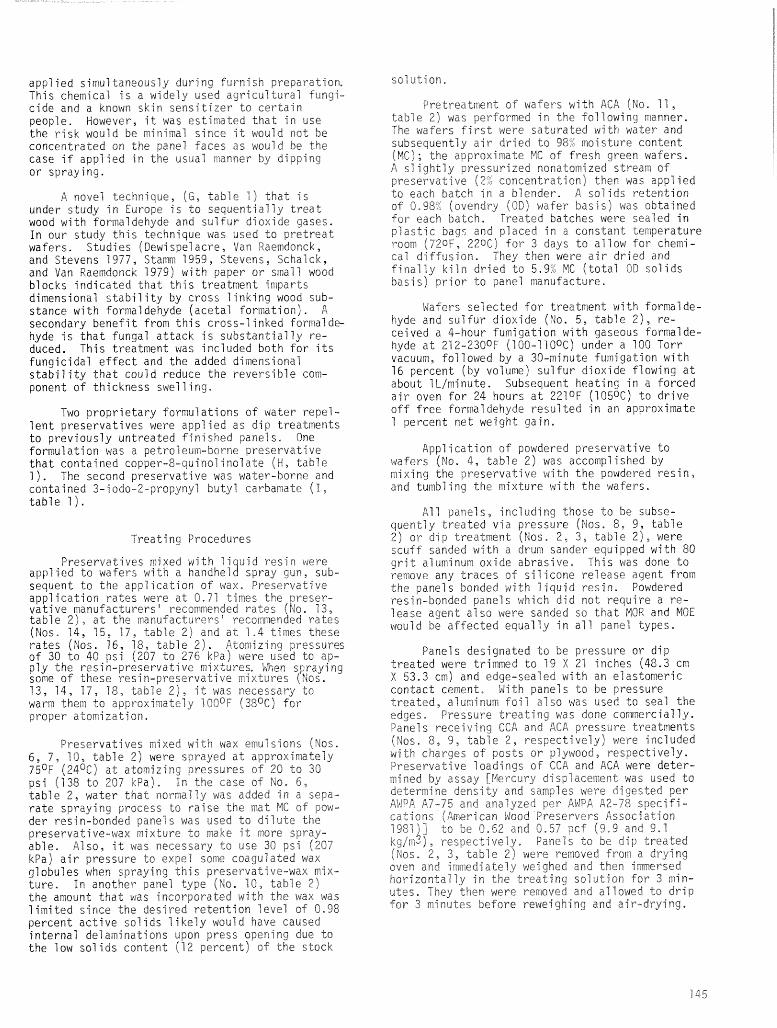
applied simultaneously during furnish preparat ion, This chemical is a widely used agricultcral fungi- cide and a known skin sensitizer to certain people. However, it was estimated that in use the risk would be minimal since it would not be concentrated on the panel Faces as would be the case if applied in the usual manner by dipping or spraying.
A novel technique, (G, table 1 ) that is under study in Europe is to sequentially treat wood with formaldehyde and sulfur d iox ide gases. In our study this technique was used to pretreat wafers. Studies (Dewi spei acre, Van Raemdonck, and Stevens 1977, Stamm 1959, Stevens, Schalck, and Van Raemdonck 1979) with paper or small wood blocks iodicated that this treatment imparts dimensional stabil ity by cross 1 inking wood sub- stance with formal dehyde (acetal formation). A secondary benefit from this cross-linked formalde hyde is that fungal attack is substantially re- duced. This treatment was included both for its fungicidal effect and the added dimensional stabi 1 ity that could reduce the reversi ble com- ponent of thickness swelling.
Two proprietary formulations of water repel- lent preservatives were applied as dip treatments to previously untreated finished panels, One formulation was a petroleum-borne preservative that contained copper-8-quino! inolate ( W , table 1 . The second preservative was water-borne and contained 3-i odo-2-propynyl butyl carhawate ( 1 , table 1).
Treating Procedures
Preservatives mixed with l i uid resin were applied to wafers with a handhell spray gun, sub- sequent to the application of wax, Preservative application rates were at 0.71 times the preser- vative manufacturers recommended rates (No. 13, table 21, at the manufacturers hecommended rates (Nos. 74, 15, 7 7 , table 2) and at 7-4 times these rates (Nos. 16, 18, table 2). Atomizing pressures of 30 to 40 psi (2C3 to-276 \Pa) were used to ap- ply the resi n-preservat~ ve m3xture5, When srrayi ng some of these resin-preservat~ve m~xtures (NOS. 13, 14, 17, 18, t a b l e 21, it was necessapy to warm them to approximately 700°F (38OC) fcr proper atomization.
Preservatives mixed w i tk wax emu7 sicns (Nos. 6, 7, 70, table 2) were sprayed at approximately 7S°F (24OC) at atomizing pressures of 20 to 30 psi (138 to 207 kPa). In the case of No, 6, table 2, water that normally was added in a sepa- rate spraying process to raise t he mat MC sf pow- der resin-bonded panels was used tc dilute the preservative-wax mixture to ~ a k e it more spray- able. A7 so, i t was necessary t o use 30 psi (207 kPa) air pressure to expel some coagulated wax globules when spraying this preservative-wax mix - Lure. In another panel type (No. 70, table 2) t he amount that was incorporated ~ i t h the wax was limited since the desired retention level o f 0,98 percent active solids likely would have caused internal delaminations upon press open ing due to the low sol ids content (12 percent) of the stock
s o l u t i o n .
Fretreatrnent of wafers with ACA (No. 11 , table 2) was performed in the following manner, The wafers first were saturated with water and subsequently air dried to 98% moisture content / K C ) ; the approxiqate MC of fresh green wafers. A slightly pressurized nonatomized stream of preservatjve (2"; concendratjon) then was app l ied to each batch f n a blender, A solids retention of 8-98:! (ovendry (OD) wafe r Oasis) was obtained for each batch. Treated batches were sealed in plastic bagc and placed in a constant temperature room (72oF, 2206) for 3 days to a1 low for cherni - ca7 diffusion. They t4en were air dried and finally kiln dried to 5.94 MC (total OD solids b a s i s ) prior to panel manufacture,
gafers selected for treatment with formalde- hyde and sulfur dioxide (No. 5, table 2 1 , re- ceived a 4-hour fumigation with gaseous formalde- hyde at 212-2300F (100-1lOoC) under a 700 Torr vacuum, followed by a 30-minute fumigation with 16 percent (by volume) sulfur dioxide flowing at about 1LJminute. Subsequent heating in a forced air oven for 24 hours at 22loF (10506) to drive off free formaldehyde resulted in an approximate l percent net weight gain,
Application of powdered preservative to wafers (No, 4, t a b l e 2 ) was accomplished by mixing the preservative w i t h the powdered resin, and tumbling the mixture with the wafers.
A11 panels, including those t o he subse- quently treated via pressure ( f l oss 8, 9, table 2) or d i p treatment (Nos. 2 3, table 2), were scuff sanded with a drum sander equipped with 80 grit aluminum oxide abrasive. This was done to remove any traces of silicone release agent from the panels bonded with liquid resin. Powdered resin-bonded panels which did not require a re- lease agent also were sanded so that MOR and MOE would be affected equally i n all panel types,
Panels designated to be pressure or dip treated were trimmed to 79 X 27 inches (48.3 cm X 53.3 cm) and edge-sealed with an elastomeric contact cement, With panels to be pressure treated, aluminum foil also was used do seal the edges. Pressure treating was done commercially. Panels receiving CCA and ACF pressure treatnents (NOS. 8, 9, table 2, respectively) were included with charges o f posts or plywood, respectively. Preservative l o a d i n g s sf CGA and ACA were deter- mined by assay [!4";ercury dl"sp7aceri:ent was used to determine density and samples were digested per AWPA A7-75 and analyzed per AWFA A2-78 speciff- c a t i o n s (American Yood Preservers Association 7987)] t o be 0,52 and 0.57 pcf (9-9 and 9 - 1 k g j d ) , respectively. Fanels to be d i p treated (Nos. 2, 3, table 2) were removed from a drying oven and immediately weighed and then immersed horizontally in the treating solution for 3 min- utes. They then were removed and allowed Lo drip for 3 rrinutes before reweighing and air-drying.
Panel Manufacturing Parameters
Untrimmed panels were 23 X 24 X 5/8 inches (58.4 crn X 70 cm X 1.6 cm) thick and had a nominal density of 42 pcf (673 kg/m3), This den- sity was based on ovendry mass of wood, resin solids, and wax solids, and volume at mcisture equilibrium in a control environment of 50% relative humidity at 7Z0F (22"~). All panels contained the same OD weight of comrcially produced, dried, and screened aspen (?cpkZxs -.,,- ,I ~ r ~ c z o i d e s Michx. ) wafers and wax sol ids (I percent wax solids, based on the OD weight of wafers). A11 boards, aside from those which received pressure-treating, contained 3 percent resin sol ids (based on OD weight of wafers) ; panels which received subsequent pressure-treat- ing contained 4 percent resin solids. A wax emulsion (Paracol 810 NP wax emulsion, Hercules Incorporated) was sprayed onto the wafer prior to resin application. One panel type (No. 7, table 2) contained a different wax emulsion (Weathershiel d, Osmose) . The two resol type phenol formaldehyde resins already mentioned were used. Initially a series of trial waferboards were manufactured to determine the manufacturing parameters needed to give a similar MOR, IB, and thickness swelling properties for panels bonded with powdered or liquid phenolic resins. Re- sults indicated that comparable properties were obtained when 32 solids of either powdered or liquid resin were employed, provided the wafer mats had equivalent moisture contents just prior to pressing, and that panels containing powdered resin were exposed to a slightly higher closing pressure, 515 psi (3.6 MPa) instead of 494 psi (3.4 MPa) and were pressed for a slightly longer time, 8-112 minutes instead of 7-112 minutes. Panels to be pressure treated contained 4 percent resin to minimize the effects of irreversible thickness swelling during treatment. The press temperature and mat MCs for a1 1 panel types were 41 OOF (210°~) and approximately 8.0 percent (total OD solids basis). After manufacture, a11 panel types received a simulated hot stacking by sandwiching panel s between 1 ayers of f i berg1 ass insulation.
Specimen Testing
Approximately 3 inches (7.6 cm) an all edges were trimmed from the original dimnsions of a11 panels to remove potential low density areas. Then six, 3-inch by 17-inch (7.6 cm by 43.2 cnj strips were cut from each panel rep1 i- cate and were labeled as outer, middle, or inner strips to indicate their former position witbin the panel. Thus, there were 2 outer, middle, and inner strips from each panel, Static bending test specimens then were allocated as fol 1 ows. Three of the 5 rep1 icates of each panel type were selected to provide 1 static bending specimens per panel so that an outer, middle, and inner strip was allocated for testing in an unaged (control ) condition. This process was
repeated again for allocating specimens to an aged, AA (l), condition, Thus, 3 specimens, each from different panel replicates and from different locations within a panel replicate were allocated to each condition. However, the control and AA specimens did not necessarily come from the same 3-panel replicates. This allocation scheme was used to insure that the estimate of experimental error was based on independent samples.
Static bending and IB properties were deter- mined at the control condition of 50 percent RH at 7 2 O ~ ( 2 2 0 ~ ) in accordance with ASIM standard C 7037-78 (American Society for Testing and Materials 1981). Three TB specimens were cut From intact portiovs of each failed control bendiqg strip. Ir- revers~ble thickness swelling, wh:ch I S the dif- ference between re-equilibrated thickness and.. initial thickness at the control condition expressed as a percentage of initial thickness at the control condition, was determined after AA.
RESULTS AND DISCUSSION
Table 3 and figures 1 through 8 give the basic properties of the 18 panel types. Odd numbered figures pertain to powdered resin-bonded panels and even numbered figures to liquid resin- bonded panel s.
MODULUS OF ELASTICITY
The requirement of 450,000 psi (3,103 MPa) , MOE for grade 2-MW particleboard specified by ANSI A208.1 - 1979 (National Particleoard Asso- ciation) was met by all panel types (control, HOE, tab1 e 3). These rnodul i were computed with post-preservative treatment thicknesses. Signi- ficantly different MOEs exist for the different powdered resin-bonded panels (fig. 1 ) , but not for the 1 iquid-bonded panels (fig. 2). The co- efficient of variation (COV) for untreated panel s with powdered resin and liquid resin are 7.1 percent and 11.6 percent, respectively, for the unaged condition, and 3.6 percent and 8.2 percent, respectively, after exposure to AA.
The MOE behavior of some of the treated powdered resi n-bonded panel types wi 11 be di s- cussed next. Exposure to AA significantly re- duced MOE of panels made of formaldehyde and sulfur dioxide treated wafers (No. 5, fig. I), while panels which received one of the dip treat- mnts (No. 3, fig. 1 ) showed no MOE loss as a result of AA exposure. This lack of MOE loss is not readily explained. Panels from formaldehyde and sulfur dioxide treated wafers (No. 5, fig. 1 f showed ROE values after AA that were significantly lower than MOE values for any other panel type. Also, the control HOE for panel type (No. 6, fig. 1) was found to be statistically higher than the MOE after AA of pressure treated panel types (Nos. 8, 9, fig. I). Due to thickness swelling during pressure treating and the fact that post preservat i ve-treatment re-equi 1 i brated thickness were used to compute MOE, the pressure treated panels (Nos. 8, 9, fig. 1) had the lowest MOE val ues .
Modulus of Rupture
Figures 3 and 4 i l lus t ra te the NOR proper- t ies of the powdered and liquid resin-bonded panels, respectively. The COVs for untreated panels bonded with powdered resin and 1 iquid resin are 15.9 percent and 18.7 percent, respect- ively, for the unaged condition, and 5.5 percent and 21.7 percent, respectively, af ter exposure to AA, Moduli of rupture, computed on the basis of thickness after preservative t rea tmnt , are presented in table 3. A11 panel types in i t ia l ly met the ANSI (National Particleboard Association 1979) minimum requirement of 2,500 psi (17.2 MPa) MOR (control MOR, tab1 e 3) . However, panel s made of formaldehyde and sulfur dioxide treated wafers and bonded with powdered resin (No. 5, AA M O R y
table 3) did not meet the minimum MOR requirement of 1,250 psi (8.6 MPa) after AA as required by the standard. Loss of MOR resulting from AA exposure was s ta t i s t ica l ly significant in some panel types (Nos. 5, 7 , 17, MOR loss, table 3) while the loss for panel no. 18 (MOR loss, table 3) was nearly significant.
The poor performance after AA of panels made from formaldehyde and sulfur dioxide treated wafers (No. 5, f ig . 3) may be due to cross-linked formaldehyde occupying a large number of pre- viously available hydroxyl s i tes for resin bonding, thus reducing the bonding abil i ty of resin to cellulose. The loss of MOR shown by panels made of wafers sprayed with CCA mixed in a wax emulsion (No. 7, MOR loss, table 3) i s possibly pH related. The extremely low treating solution pH for this panel type could cause either a retarding or accelerating effect on resin cure (Wake 1976). I n either case, 1 imited bonding or pre-curing could occur. To i l lus t ra te this point, notice the values for another panel type (No. 6, MOR loss, table 3 and f ig. 3) . This preservative treatment i s the same one used for a similar panel type (No. 18, MOR loss, table 3 and f ig. 4), a difference being that the preservative was mixed with wax, and powdered rein was used in- stead of liquid resin. The fact that different resins were used may be the primary reason for the different MORs. One of the dip treated panel types (No. 3 , MOR loss, table 3) showed the least percent loss of MOR from AA.
When unaged MORs of liquid resin-bonded panels are compared, there are no significant diferences among treatments. Likewise, when aged liquid resin-bonded panels are compared in a similar manner, no significant differences in MOR are found.
Internal Bond
Determining the 1B of aged material was not feasible because of visible shear failure in the core of some panel types (Nos. 5, 7, 11 , 14-1 8, table 2 ) during the s t a t i c bending testing. The results of unaged IB tes ts are given for the powdered and liquid resin-bonded panels in
figures 5 and 6 , respectively, and table 3. The CBVs for unaged untreated panels bonded with powdered and liquid resins are 16.6 percent and 10.4 percent, respectively. Panels made from formal dehyde and su1 fur dioxide treated wafers and ACA pressure-treated panels (Nos. 5, 9, control 18, table 3 ) did not meet the minimum IB requirement of 50 psi (345 kPa) IB specified by the ANSI standard (National Particleboard Asso- ciation 1979). The only s ta t i s t ica l ly signifi- cant difference for powdered res i n-bonded panel s (Nos. 1-11, f ig . 5) i s between the highest and lowest IBs, i .e , panel types Nos. 4 and 9 ( f ig . 5 ) . However, i t i s obvious that the panel type made from formaldehyde and sulfur dioxide treated wafers (No. 5, f ig. 5) also i s suspect. When making these comparisons,it should be remembered that the pressure treated panels (Nos. 8, 9, f ig . 5) contained an additional 1 percent resin sol ids to minimize irreversible thickness swelling and subsequent loss of IB.
Also, i t was determined s ta t i s t ica l ly that two of the liquid resin-bonded panels types, each one containing a different preservative, one applied a t 0.71 times the manufacturer's recom- mended rate and the other a t 1 .4 times the manufacturer ' s recommended rate, (Nos. 13 and 16, fig. 6, respectively), had significantly higher IBs than another liquid resin-bonded panel type containing a third preservative applied a t 1.4 times i t s manufacturer ' s recommended rate (No. 18, f ig. 6) . The preservative appl ied a t 0.71 times i t s manufacturer ' s recommended rate (No. 13, f ig. 6 ) also was applied a t 1.4 times i t s recommended rate, b u t th is level caused core delaminations upon hot press opening and there- fore was not included in table 2 .
Irreversible Thickness Swelling
Because much irreversible thickness swelling occurred during pressure treating, panels which were pressure-treated (Nos. 8 and 9, fig. 7 ) swelled the least from AA exposure. These panel types were equal s ta t i s t ica l ly , and had signif i- cantly less swelling than some other powdered resin-bonded panel types (Nos. 1,2,5,7, f ig. 7 ) . I t also can be stated that panels made from formaldehyde and sulfur dioxide treated wafers (No. 5 , f ig. 7 ) were s ta t i s t ica l ly equivalent to panels from wafers sprayed with CCA mixed in a wax emulsion (No. 7, f ig. 7 ) and those which received no preservative treatment or those which received one of the dip treatments (Nos. 1 , 2 , f ig. 7 ) . The COVs of irreversible thickness swelling after AA for untreated powdered and liquid resin-bonding panels were 10.5 percent and 16.7 percent, respectively. No s ta t i s t ica l 1y significant differences in irreversible thickness swell ing were found between any of the different board types bonded with liquid resin (Nos. 12-18, f ig . 8) .
SUMMARY
A11 panel types met the American National Standard (ANSI A208.1-1979) s ta t ic bending
requirements of 450,000 psi (3,103 MPa) modulus o f elasticity ( H O E ) and 2,500 p s i (77.2 MFa) modulus o f ru~ture (MOR) for mat-formed, grade 2-!4W wood particleboard (National Particleboard Association 7 979). However, the panel type manu- factured from wafe rs pretreated with formaldehyde and sulfur d iox ide (f4o. 5, t a b l e 2) d i d n o t meet this s t a n d a r d " s m i ~ i m u m r e q u i r e m e n t o f 1,250 psi (8-6 MFa) modulus of rupture a f t e r ASTM D 7C37- 78 a c c e l e r a t e d a g i n g (American Society f o r lest- i n g and Materials 9981), The panel type from wafers p r e t r e a t e d with formaldehyde and sulfur d iox ide (No. 5 , table 2) and the panel type t h a t was pressure treated after panel manufacture w i t h ammoniacal copper arsenate (No. 9 , table 2) failed to mcet t h e minimum requirement of 50 psi (345 k P a ) internal bond specified by the stand- ard (National Particleboard Association 1979). Panel types pressure treated with chromated cop- per arsenate (No. 8, table 2) and ammoniacal copper arsenate (No. 9, t a b l e 2) swel led i n thickness during treating such that subsequent accelerated aging (American Society for Testing and Materials 1981 j caused less than 1 percent irreversible thickness swelling. The panel type from wafers pretreated with formaldehyde and sulfur dioxide (No, 5, table 2 ) was statistically equivalent to the panel type containing chromated copper arsenate that was applied as a mixture with a wax emulsion during furnish preparation (No. 7, table 21, the untreated pane? type (No. 1, table 2) and the panel type whose finished panels were dip treated w i t h a copper-8-quinolinofate solution (No, 2, table 2). There were no statis- tically significant differences in irreversible thickness swelling between any of the panel types bonded with liquid resin (Nos. 12-18, t a b l e 21 ,
LITERATURE CITED
American Society f o r Testing and Materials 1981. S t a n d a r d methods of evaluating the properties o f wood-base fiber and particle panel materials, ASTM D 1037-78. Phila- delphia, PA,
American Woad Preservers Association, Book o f Standards 1881. Standard wet asking procedure for pre- paring wood for chemical analys is , A7-75, Bethesda, M3,
American Wood Preservers Association, Book sf Standards 1987, Standard methods For analysis of water- borne preservatives a ~ d fire-retardant formulations, A2-78, Bethesda, MD,
Anonymous 1980, PentaehiorophensS in tog homes - Ken- ducky- Morb id i t y and Mortality Weekly R e p o r t , HE)i pub1 icalion No, [CDC) 78-803 7.29 (933437-432, 437.
Becker, G , 1972. Protection of wood particleboard against termites, Wood S c i . and Iechnol, 6(1972): 239-248,
Becker, @,, and R, Gersonde 1976, Preservation of wood-based panels against fungi and insects and i t s efficiency.
Holzfcrsch, usd Holzverwert, 26( 1 ) : 7 2-1 5, Boggio, K, , arid R, Gertjejansen 1982, Influence o f ACA and CCA waterborne preservatives on the properties o f aspen waferboard, Forest Prod, 2, 3213) :22-26,
Chcw, P, 1979, Phenol iadhes-ive bonded medium-density
f iberboard Prom 2 - ~ a r l ~ f s ~ w i - a t. bark and sawdust, Mood and Fiber 7 9 ( 2 ) :92-98.
Deppe, H-J. 7978. The protection of sheet materials against water and decay. 3, Inst, o f Wood Sci , 5(3) :41-45,
Dewispelacre, W - , G , Van Saerndonck, and i"r, Stevens 7977. Decay resistance of wood treated For
d i ~ ~ e n s i o n a l stabilization with monomers and formaldehyde, Material und Organismen. 12(3):211-222,
Hall, H, J., and R. 0, Gertjejansen 1378 - Weatherabi ? i ty of phenol i c- bonded
Ghanaian hardwood f lakeboard Kade from ACA- treated flakes, Forest Prod. J . 29(3 2 ) :34-38,
Hedley, M. E, 1976, Preservative requi rementz for exterior
particleboard predicted From accelerated l abora tory tests. New Zealand J . Forestry Sci . 6(3) :457-462,
Huber, H. A, 1958. Preservation o f p a r t ' c l eboard and kard- board w i t h pentacklorophenoi, Forest Prod. 3 , 8(12) ~357-360,
Natmonal Particleboard A s s o c i a t i o n 1979, Americac National S t a n d a r d ( A N S I A209.7 - 1979), Mat-formed wood particleboard. Si 1 - ver S p r i n g , MD,
Neusser, H., and &, Schedl 1970, Verhalten von einigen span- und faser- plattentypen gegenuber pilzen (Resistance of some types sf partfcleboard and fiberboard La fungi), Hol zforsch. und Hsl zverwert. 22 (2) : 24-40,
Schmidt , E, L,, D. \I. French, P. 0. Gertjejansen, J, Hermann, and H, H a l ?
1978, Stre~gth reduction in particleboard caused by f ung i . Forest Prod, J . 28(2) : 26-31.
Snedecor, G., and W. Cochran 1967. Statistical Methods, 6 t h Edition, The Iowa State Univ, Press, Ames, IA, p, 273-274,
Stamx, A. J , 1959, Dimensional stabilization of wood by thermal reactions and formaldehyde cross- l i n k i n g , TAPPI 42(7):39-44,
Stevens, M., J , SchaSck, and 3, Van Raendonck 1979, Chemical modification o f wood by vapsur -
phase treatment w i t h formaldehyde and sulphur dioxide, The in ternat ional 3, Wood Preser- vation 1(2) : 57-68,
Make, $J, C, 1976, Adhesisc and the formulation of' adhe-
sives, App!ied Sci , P u b t , L t d , , London, Eng land , p. 794-798,
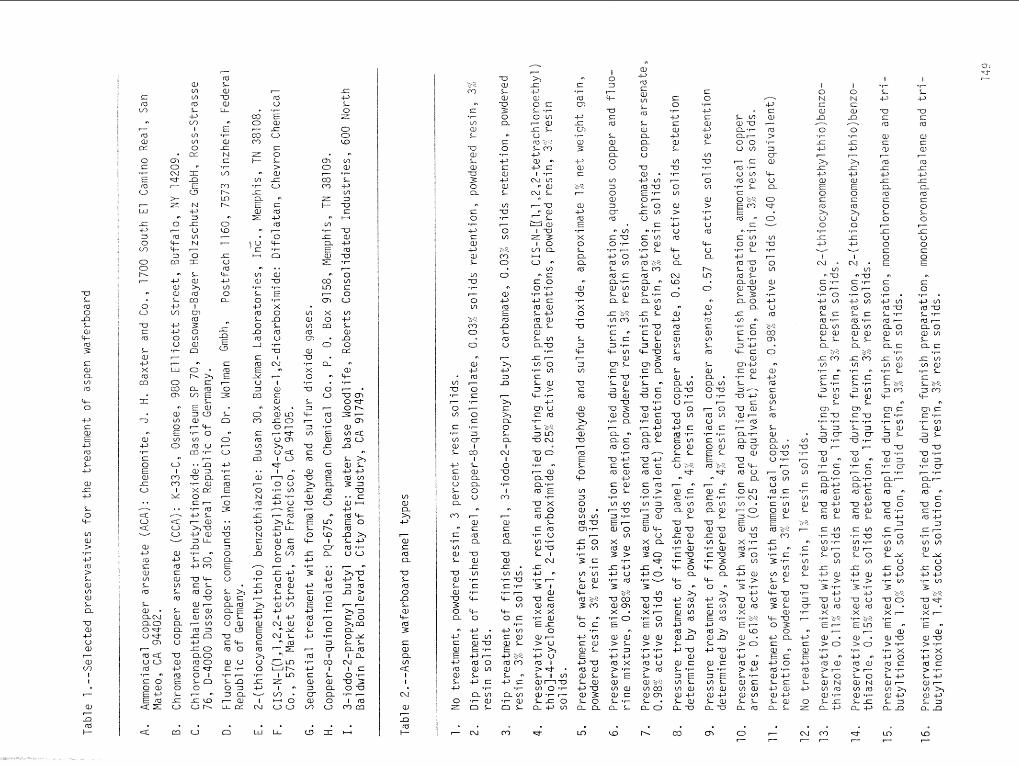
w L rsJ 0 a L a, 't- a 3 c a a V)
a 4-- 0
& (1: a, E &
m a L 4-J
a ..c 4-J
L 0 '4-
m a, > .P
@ rU 3 L Q1 V)
QJ 4 CL
TJ a, & U a, r"
(i, W)
I I
I---
at t-
LI m I--
la W )
r-"
m a,
C4:
0 2= ' II
E rb 0
I--- W
c 4-J 3 6 v,
0 ct, r- r̂
0 C )
u t nJ
L Q) & X 0 M
It:
TZ)
&, w ' I"- g: 8
5 11: l_S
. . .--. a C3 a u
a, -)-1 n;S 1= a, W )
L ra L a,. QDJ a C S , O* w e m I"-
a 4 UC1 n5 'r- fi
r;: 0 0 a E &" E m
. C z E
&+. m
c .I(
m a L
-TS a, L a, 75
i5 a ch
Cf 8 '1'1
4-J c a, -I-' a, L
V)
u -,-' 7
0 LQ
- 0 0'.
C3 O
0
Q) 4 m F-
0 Cf -I--
r- 0 s . C1 =I Cr I
33 I L a, a. CL 0 C)
I---
a, C nj 12.
v a, -c W 'r- s .I--
%-
ti- 0
@ . t W a) TJ E -t-
&I---
fa 0 a, m L C.) s
.I--
0. m 'r Q, n L
N
-w a' I- Q, TJ 3 0 12.
CT:
0 .r-
& s ClJ & w L
V)
T3 ' C
F-
0 V)
o+ n 0. 0
a, & m E cd
-C1 L m 0
7
=% C,
3 111
t-
2 2 0 L n. I N I 0 w 0
I C")
7
a, s cb 0.
T4 a, 111 V) 'I-
s .r 't-
rc 0
4 I= aJ £5
4.J nj a, L 4-J
Cr *F
n
m
rrr7
I--
=1 x 4.2 01 0 5I L .r 0 v,
r-- u fL: L U m z LCT) +-, QJ *
-@ c I .r
CV m " a,
fif L II
7- -w a,
Lk 1 - 0 sr 3 t o
m 11. n 0 "
V) * c s 0 0 .I"- *r & & CI cd aJ L 4-J m Ol as- a, L m a.w . r 2 7
W 0 .F m t, L a, 3 > 't- .r +-' tn 0 C m *r-
L ii.? 3 L n W N
T J O QJ r - ". r-- a, C L W 0-"r
a .? T3 X c 0 a 1 3 L
LZ: m .r- U V) 'I--
a,v L I
CV c - 9 " "r- I--- 3 1
a, u r: a, m X X .r- a, E X 0 at- > U
>., 4-J U a 1 >e . L 1 v) afnu v, OV- a) -r- r-- LJ= 0 CL+-'m
cl-
aJ 43 a IZ. Q) ln
S- 03
L al fL CZ 0 v
T7 a , . & V, mu E .r- o t - L O II V) 0
IT -.I--
C (R 0 (U
.I-- L & m &? 3.' M a a QI r L .r- n V)
aJ c L m .r U s a, L L =I a, rcu
3 m 0 s 12. .r-
L - 2.3 c 7J 0 . P-
U& CJ s
a, r--C, ILZ aJ Q L a
)"Z
w w t= LZ: m a t-
s s f l 0 2- .r .r- m 5 7 0- zr aJ
:%- U
X CL rg 3 0
Fsf I;:
4 3 0 +r W
m u u a, X t - +r- 0 E W
Q) a, > > .C .C
-@C, rrJ 0 > (0 L. '3 a? V)m a m L r r c l
h
lr 0 .II
4-J I;ll e, -w a, L
V)
1J .,+- r-- 8 V)
QJ > - r- & U m 't- U a. CV Ct,
0
a @ cb g: w Vi
L rg
L a) a- m nu 0 *i--
U - 0
u W a, w c cb .r- E m 0 a, L 1 s 0 0.2
-3-
r - - " a, 6: c .I"- cd cn a. a, L
TJ a,u sr a, v) L .r- a, eu .r- 3 cc- 0
tl %- 0
=% 4-J rrrc s V)
a, v, E fa -IJ
a 1, a111 L
+ u a
0 s 5 'E m L V) EU a, 4-J L u a73
03
t 0 ' r-
"4-J c cu C ' a L
m w .I"-
r--
0 V)
a, =*
st--
@ U rU
rc- U Cz
r-. m 0
a, + PC5 r;: a, V? L a L (U a. tl V) 0 9 3 U *i-
I--- - 0 cd Vt v a t .r- .,-' e v, 0 CJ E L- E cC! 60
I;rf
I--- - aJ r Z= 'r- m v) e
L -0 QJ 73 x CL) m L 'r- CIJ ST2 .f-- 5 cc- 0 a
't- o
2, & a s V)
2 -I"-'
fir 37 at LI L
-P13 CU
aJ s L .$- zr E V) L V) at a 4-J L a, &-a
m
I 0 N SZ a,
A 3 -*
0 * r- 2 4-J I--"
>, s J-3 Q)
5 c crJ h U
8 .r-
s G w
I tw *
V) "T)
C -r- a F- ',-" 0 -I-s v, m L T= rcj *I-- 0.. V) a QI L L
-c Cr) m - c s L .r- 3 V)
rc a, S-
CT,
t 73 'C-
L 3 3 w" u -1-
PII
TJ Q1 *I-- if I-- 0 av- a - E J f'3 T.
UI u -C;r rTT (ZS a L I= cn -II
W7 -e- cut-- S- 0
V1 AZ -w a, .I-- > 3 S F -
+ w v a, rer X .r- o0 Ef--
r-- a, > C5 *r- -CJ nri aJ >F"
L 0 a Z1N rn rrl Qf -#--
L X L 4 - J
M r--
I 0 n] It a, J3 ,-I*.
0 'f--
Sf -IJ P--
=-, 5= w E! 0 Tr: a3
=-, U
8 "#--
"c & .qx"
I CV *
V) mu c *I- 0- .r- 0 -&-s v) m 1- C: a *I-- a. W a, a, L 5- n
3.: x m V)
P " n
IT s Z- .I-- L_f W ti- a,
L tr,
I=m ST- .I--
L 3 3 0-
-w .. I---
TJ a - 'r- IT r-- 0 C2L.r- a& nj 'z
a, V & s a, a L
GZ m .i-- KY vl 'I--
ar- L. 0
II) -TtT -LJ a) *$- 3 3 .r
4-J -"a U a a -5 3.q E m
I--
a @
> a ' r-
@ " rcS a >r- L 0 CU nf V) m Q) .,-- L C a 4 - J
%J- C-
I =IY^
L -13
-a I=: r"J
a, C: rU I--
a "c w x a a c 0 L 0 7
s 0 0 tf: 0 E
I=I 0 'r- . -C-, V) m m L .I"- rj r- n o a, L.0 L a bF.
*r- c v, 07 EJ) .F L Lf: k w?. 3 Cr)
+ - * I;n l=: c .I--
.I-- LQ lu. a! 3 L u
T.3 w *t- aJ 3
*,"- 0- t- -C^
Qr-"
2- * Cf
u Q s .I-- rcl 4-J
2) GI-" .r- 8 LQ V) at 5-32 0
LI 0 +-'a '8- V)
3 * u 2
tla w a
XI"- '$-
E a, ww
> .I- *r- X G O a C: 5. .I-- I .r-" O J r V) -a a -v 5- 3 a&
m I--
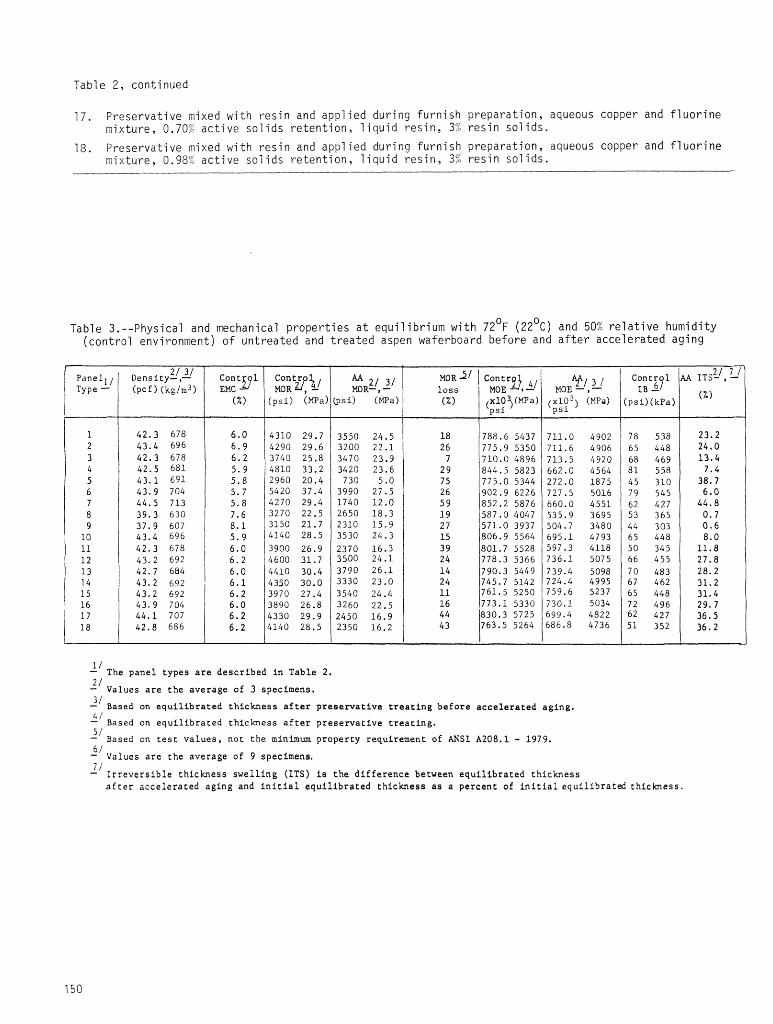
Table 2 , continued
77. Preservative mixed with resin and applied during furnish preparation, aqueous copper and fluorine mixture, 0.70% active solids retention, liquid resin, 32 resin solids.
18. Preservative mixed with resin and applied during furnish preparation, aqueous copper and fluorine mixture, 0.98% active sol ids retention, 1 iquid resin, 3% resin sol ids,
Table 3. --Physical and mechanical properties a t equil i brium with 72 '~ (22O~) and 50% relative humidity (control environment) of untreated and treated aspen waferboard before and after accelerated aging
EMC l o s s
p s i
APl ?_/ MOE -,
(x lo3 ) (MPa) p s i
1' The panel types a r e described i n Table 2.
2' Values a r e t%e average of 3 specimens. -!' Based on equ i l i b r a t ed thickness a f t e r preserva t ive t r e a t i n g before acce lera ted aging.
Based an equ i l i b r a t ed rhiekrtese a f t e r preserva t ive t r e a t i ng .
?/ Based on t e s t va lues , not t h e minimum property requirement of ANSI A208.1 - 1979.
'/ Values a r e rhe average of 9 specimens. * ; i l - I r r e v e r s i b l e thickness swel l ing (ITS) i s the d i f f e r ence between equ i l i b r a t ed thickness
a f t e r acce lera ted aging and i n i t i a l equ i l i b r a t ed thickness a s a percent of i n i t i a l equi l ibra ted thickness.
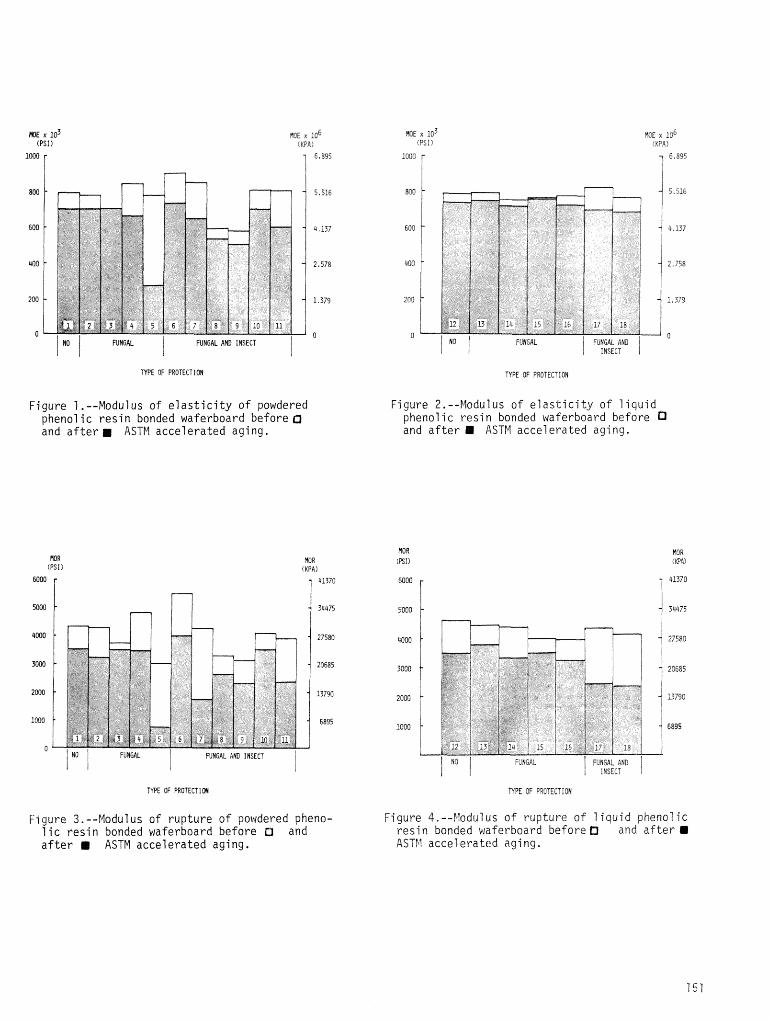
/ KI I FUNwL I FUNGAL At@ INSECT i I " i N O l
u FUNGAL
TYPE OF PROTECTION
Figure 1. --Modulus of e l a s t i c i t y of powdered phenol i c resin bonded waferboard before a and a f t e r a ASTM accelerated aging.
NOR (PSI )
6000 r NOR
(KPAI
1 "370
% 1 FUNGAL 1 FURGAL Wh?l INSECT 1 I I !
F~gure 3.--Modulus of rupture of powdered pheno- l i c resin bonded waferboard before 0 and a f t e r a ASTM accelerated aging.
TYPE OF PROTECTION
Figure 2.--Modulus of e l a s t i c i t y of liquid phenolic resin bonded waferboard before CI and a f t e r H ASTM accelerated aging.
NOR (PSI)
FUNGAL 1 FUNGAL ANC i INSECT 1
TYPE OF PROTECTION
Figure 4. --Flodul us o f rupture of l iquid phenol i c resin bonded waferboard before0 and a f t e r II ASTM accelerated aging.
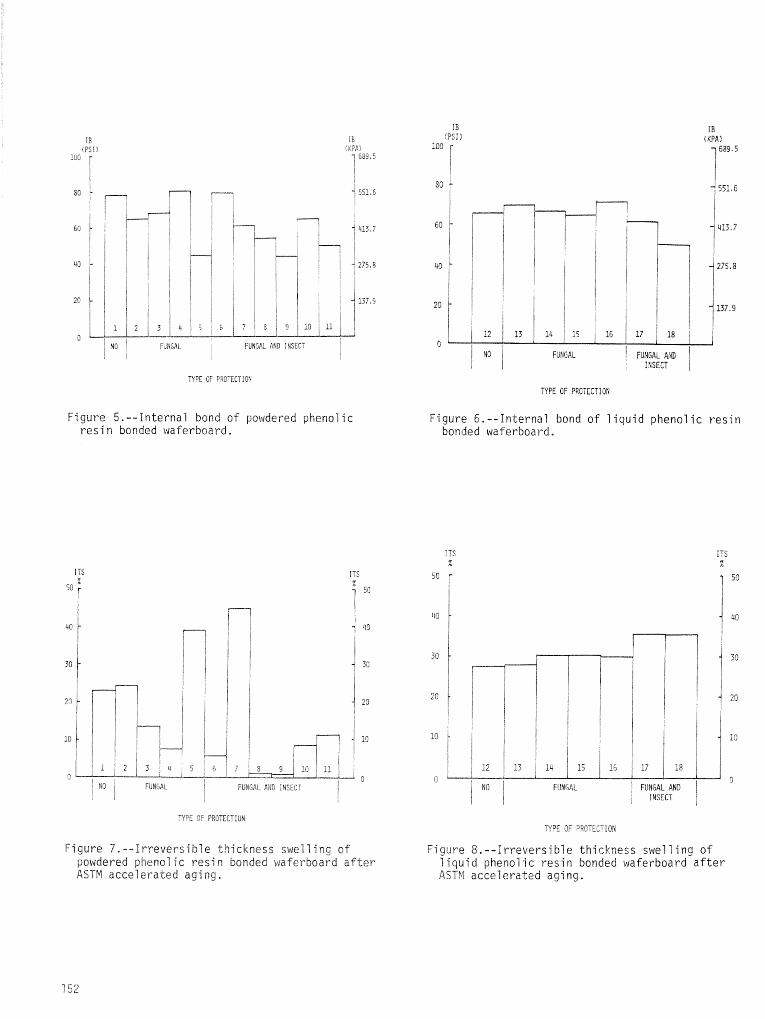
j NO ' FUNEAL AND IIISECT I
0 I I FUIiGAL AND 1 1 INSECT 1
TYPE OF PROTECTID!$
Figure 5.--Internal bond of powdered phenolic resin bonded waferboard.
Figure 6.--Internal bond of liquid phenolic resin bonded waferboard.
I T S z
ITS z
I
30
NO i I FUNGAL AN3 ,NSECT I I 1
T'r'FE OF FSOTECTIOS
Figure 7.--irreversible th i ckness swelling of powdered phenolic resin bonded waferboard after ASTM accelerated aging,
TYPE CF PXTECIION
Figure 8.--irreversible thickness swelling of liquid phenolic resin bonded waferboard after ASTM accelerated aging.
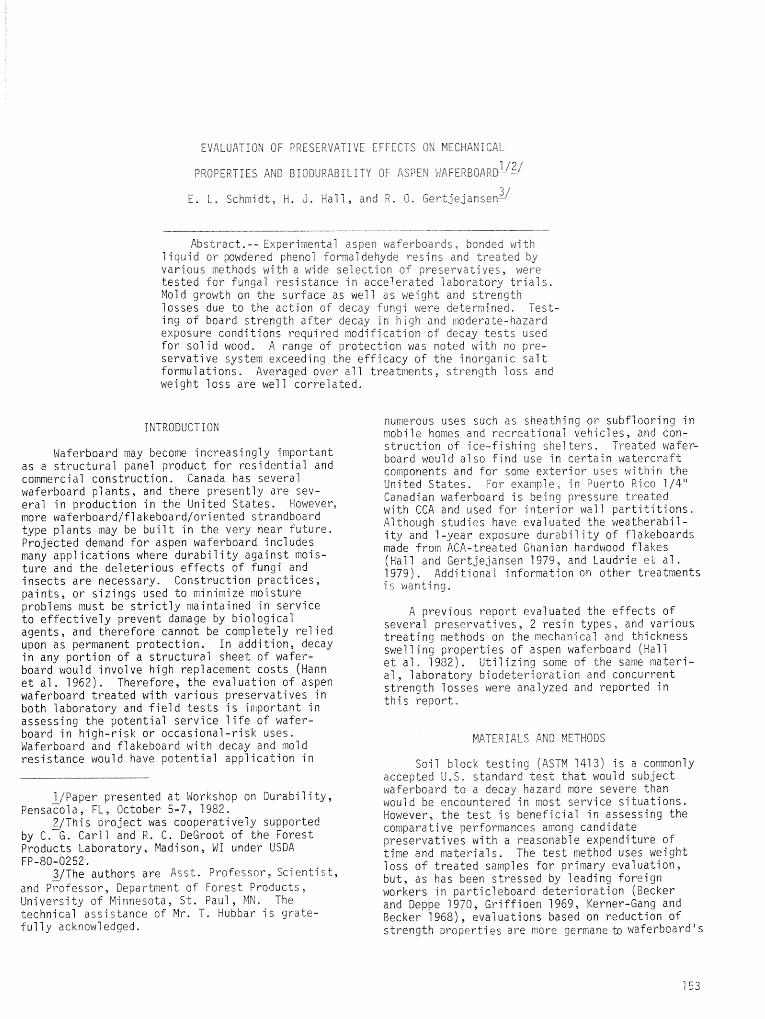
EVALUATION CF PRESERVATIVE EFFECTS ON MECHANICAL 1/31
PriCFERTiES AP-IC? B I O D I I R A B I h S T f l O " ASPEN iIAFERBOARD-
3 5 E , t , Schmidt, H. d , Hali , and R. 2, Gertjejansen-
Abstract.-- Experimental aspen waferboards, bonded w j t h l iquid or powdered phenol formaldehyde res ins 2nd t rea ted by various nethods with a wide selection o f preservatives, were t e s t ed f o r f u n g a l res is tance in acce7erated iaboratory t r i a l s . Mold growth on the surface as well as weight and strength losses due t o the action s f decay Fungi were determined. Test- ing of board strength a f t e r decay i n h i g h and moderate-hazard exposure condit ions required modification c f decay t e s t s used f o r so l id wood. A range of protection was noted with no pre- servat ive system exceeding the ef f icacy of the inorganic s a l t formulations, Averaged over a l l t reatments, strength loss and weight loss are well corre la ted .
INTRODUCTION
Waferboard may become increasingly important a s a s t ruc tu ra l panel product f o r res ident ia l and commercial construction. Canada has several waferboard p lan t s , and there presently a re sev- era l in production in the United S ta t e s . However, more waferboard/flakeboard/oriented strandboard type plants may be b u i l t in the very near fu ture . Projected demand f o r aspen waferboard includes many appl ica t ions where durab i l i ty agains t mois- tu re and the dele ter ious e f f e c t s of fungi and insects a r e necessary, Construction p rac t i ces , ~ a i n t s , o r s i z i n s s used t o minimize moisture brobiems must b e - s t r i c t l y maintained in service t o e f fec t ive ly prevent damage by biological agents, and therefore cannot be completely r e l i ed upon as permanent protection. In addi t ion , decay in any portion of a s t ruc tu ra l sheet of wafer- board wou1 d involve high rep1 acement cos ts (Hann e t a1 . 1962). Therefore, the evaluation of aspen waferboard t r ea ted with various preservatives in both laboratory and f i e l d t e s t s i s inlportant in
numerous uses such a s sheathing o r subflooring in nobile homes and recreational vehicles, and con- s t ruct ion of ice-fishing s h e l t e r s , Treated wafer- board would a l so f ind use in ce r t a in watercraf t components and fo r some ex te r io r uses within the United S ta t e s . For exavple, i n Puerto Rico 1/4" Canadian waferboard i s being pressure t rea ted with CCA and used fo r i n t e r i o r wall p a r t i t j t i o n s . Although s tudies have evaluated the weatherabil- i t y and 1-year exposure durab i l i ty of flakeboards made from ACA-treated Ghani~n hardwood f lakes (Hal 1 and Gertjejansen 1979, and taudr ie e t a1 . 1979). Additional information on other treatments i s wanti ng .
A previous repor t evaluated the e f fec t s of several preservat ives , 2 res in types, and various t r ea t ing methods on the mechanical and thickness swell 4 ng proper t ies of aspen waferboard (Hal 1 e t a1, 1982). Ut i l iz ing some of the same rnateri- al , laboratory b iodeter iora t i on and concurrent strength losses were analyzed and reported i n t h i s repor t ,
assessing the potent ia l service 1 i f e of wafer- board in high-risk or occasional-risk uses. Waferboard and flakeboard with decay and mold MATERIALS AND METHODS
res is tance would have potent ia l application in Soil block t e s t ing ( A S f M 1413) i s a commonly accepted U.5, standard t e s t t h a t would subject
]/Paper presented a t Workshop on Durabil i ty, ~ e n s a z o l a , FL, October 5-7, 1382.
&"This projec t was cooperatively supported by 6.-G. Carl l and R. C . DeGroot of the Forest Products Laboratory, Madison, WI under USDA FP-80-0252.
3/The authors a re bss t . Professor, Sci en t i s t , and ~ S f e s s a r , Eepartment o f Forest Products, University of Minnesota, S t . Paul, MN, The technical ass is tance of Mr. T, Wubbar i s grate- f u l l y acknowledged.
waferboard t o a decay hazard more severe than would be encountered in most service s i tua t ions . However, the t e s t i s beneficial in assessing the comparative performances among candidate preservatives w i t h a reasonable expenditure of time and mater ia ls , The t e s t method uses weight lo s s of t r ea t ed samples f o r primary evaluation, but, as has been s t ressed by leading foreign workers in part icf eboard deter iora t ion (Becker and Oeppe 1970, Griffioen 1969, Kerner-Gang and Becker 1968) , eval uations based on reduction of s t rength properties a re more germane to waferboard ' S
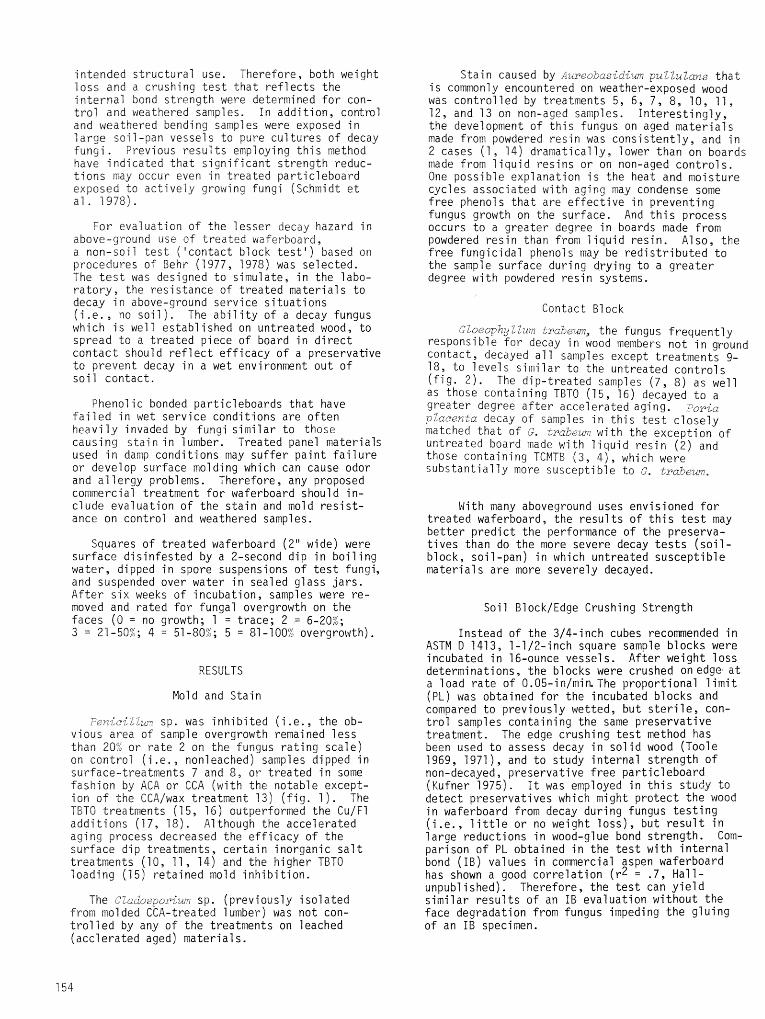
intended structural use. Therefore, both weight loss and a crushing t e s t that re f lec t s the internal bond strength were determined for con- t ro l and weathered samples. In addition, control and weathered bending samples were exposed in large soil-pan vessels to pure cultures of decay fungi, Previous resul ts employing t h i s method have indicated that significant strength reduc- t ions may occur even in treated particleboard exposed to actively growing fungi (Schmidt e t a l . 1978).
For evaluation of the lesser decay hazard in above-ground use of treated waferboard, a non-soil t e s t ( 'contact block t e s t ' ) based on procedures of Behr (1977, 1978) was selected. The t e s t was designed to simulate, in the labo- ra tory, the resistance of treated materials to decay in above-ground service situations ( i . e . , no s o i l ) . The ab i l i t y of a decay fungus which i s we11 established on untreated wood, to spread to a treated piece of board in d i rec t contact should re f lec t efficacy of a preservative t o prevent decay in a wet environment out of soil contact.
Phenolic bonded particleboards that have fa i led in wet service conditions are often heavily invaded by fungi similar to those causing s ta in in 1 umber. Treated panel materials used in damp conditions may suffer paint fa i lu re or develop surface molding which can cause odor and allergy problems. Therefore, any proposed commercial treatment for waferboard should in- clude evaluation of the s ta in and mold res i s t - ance on control and weathered samples.
Squares of treated waferboard (2" wide) were surface disinfested by a 2-second dip in boiling water, dipped in spore suspensions of t e s t fungi, and suspended over water in sealed glass jars . After six weeks of incubation, samples were re- moved and rated for fungal overgrowth on the faces (0 = no growth; 1 = trace; 2 = 6-20?;; 3 = 21 -50%; 4 = 51 -80%; 5 = 81-100% overgrowth).
RESULTS
Mold and Stain
iDexIeilitc;- sp. was inhibited ( i . e . , the ob- vious area of sample overgrowth remained 1 ess than 20% or ra te 2 on the fungus rating scale) on control ( i . e . , nonleached) samples dipped in surface-treatments 7 and 8, or treated in some fashion by ACA or CCA (with the notable except- ion of the CCAfwax t r e a t w n t 13) ( f i g . 1 ) . The TBTO treatments (15, 16) outperformed the Cu/Fl additions (17, 18). Although the accelerated aging process decreased the efficacy of the surface dip treatments, certain inorganic s a l t treatments (10, 11, 14) and the higher TBTO loading (1 5) retained mold inhibition.
The Cladosporiurli sp. (previously isolated from ma1 ded CCA-treated 1 umber) was not con- t ro l led by any of the treatments on leached (accl erated aged] material s .
Stain caused by Aureobasidim pullklans tha t i s commonly encountered on weather-exposed wood was controlled by treatments 5, 6, 7, 8, 10, 11, 12, and 13 on non-aged samples. Interest ingly, the development of t h i s fungus on aged materials made from powdered resin was consistently, and in 2 cases f 1, 14) dramatically, lower than on boards made from liquid resins or on non-aged controls. One possible explanation i s the heat and moisture cycles associated with aging may condense some free phenols that are effective in preventing fungus growth on the surface. And t h i s process occurs to a greater degree in boards made from powdered resin than from liquid resin. Also, the f ree fungicidal phenols may be redistributed to the sample surface during drying to a greater degree with powdered resin systems.
Contact Block
~Zosop iy Z7,xn: t ~ a b e m , the fungus frequently rcsponsi ble for decay in wood members not in ground contact, decayed a l l samples except treatments 9- 18, to levels similar to the untreated controls ( f i g . 2 ) . The dip-treated samples ( 7 , 8) as well as those containing TBTO (15, 16) decayed t o a greater degree a f t e r accelerated aging. Fo~icr: placenta decay of samples in th i s t e s t closely matched that of G. srabeux with the exception of untreated board made with liquid resin ( 2 ) and those containing TCMTB (3 , 41, which were substantially more susceptible to G, trabeil.r?l.
With many aboveground uses envisioned for treated waferboard, the resul ts of t h i s t e s t may better predict the performance of the preserva- t ives than do the more severe decay t e s t s (soi l - block, soil-pan) in which untreated susceptible materials are more severely decayed.
Soil BlockfEdge Crushing Strength
Instead of the 3/4-inch cubes recommended in ASTM D 1413, 1-1 f2-inch square sample blocks were incubated in 16-ounce vessels. After weight loss determinations, the blocks were crushed on edge a t a load rate of 0.05-in/min.The proportional l imit (PL) was obtained for the incubated blocks and compared to previously wetted, but s t e r i l e , con- t rol samples containing the same preservative treatment. The edge crushing t e s t method has been used to assess decay in sol id wood (Tool e 1969, 1971 ) , and to study internal strength of non-decayed, preservative free particleboard (Kufner 1975). I t was employed in t h i s study to detect preservatives which might protect the wood in waferboard from decay during fungus tes t ing ( i . e . , l i t t l e or no weight l o s s ) , b u t r esu l t in large reductions in wood-glue bond strength. Com- parison of PL obtained in the t e s t with internal bond (IB) values in commercial aspen waferboard has shown a good correlation ( r2 = .7, Hall- unpubl i shed), Therefore, the t e s t can yield similar resu l t s of an IB evaluation without the face degradation from fungus impeding the gluing of an IB specimen.
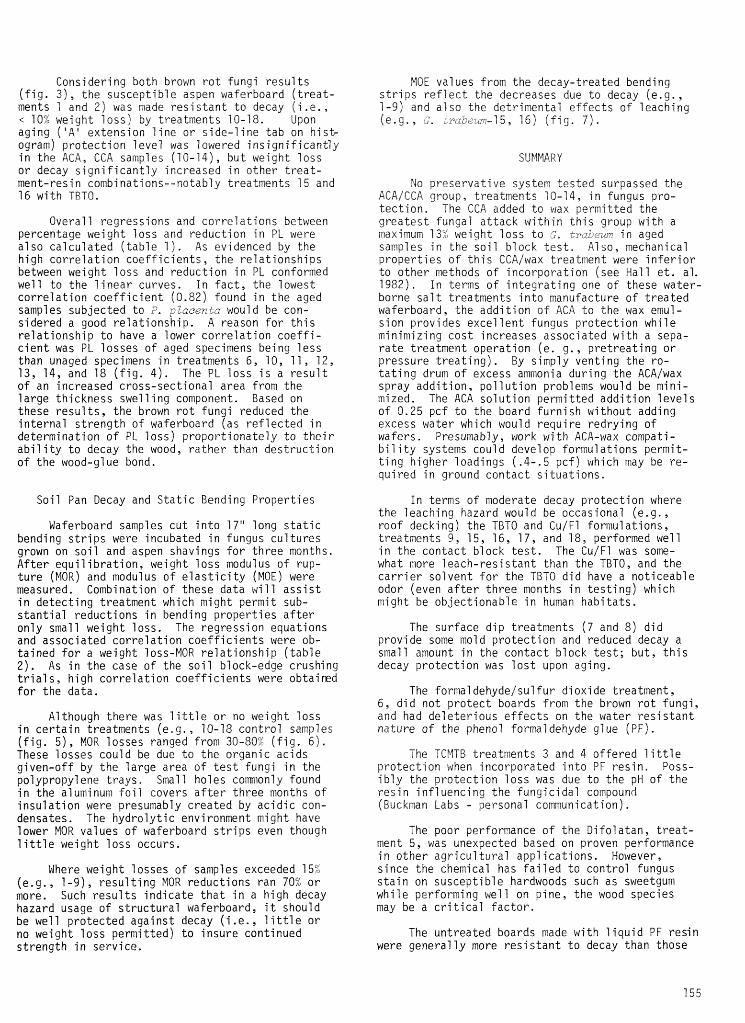
Considering both brown rot fungi results (fig. 31, the susceptible aspen waferboard (treat- ments 1 and 2) was made resistant to decay (i .e., < 10% weight loss) by treatments 10-18. Upon aging ('Abetension line or side-line tab on hist- ogram) protection level was lowered insignificantly in the ACA, CCA samples (10-741, but weight loss or decay significantly increased in other treat- ment-resin combinations--notably treatments 15 and 16 with TRTO,
Overall regressions and correlations between percentage weight loss and reduction in PL were a1 so calculated (table 1). As evidenced by the high correlation coefficients, the relationships between weight loss and reduction in PL conformed well to the linear curves, In fact, the lowest correlation coefficient (0.82) found in the aged samples subjected to I?. pZacenta would be con- sidered a good relationship. A reason for this relationship to have a lower correlation coeffi- cient was PL losses of aged specimens being less than unaged specimens in treatments 6, 10, 11, 12, 13, 14, and 18 (fig. 4). The PL loss is a result of an increased cross-sectional area from the large thickness swelling component. Based on these results, the brown rot fungi reduced the internal strength of waferboard (as reflected in determination of PL loss) proportionately to their abil i ty to decay the wood, rather than destruction of the wood-glue bond.
Soil Pan Decay and Static Bending Properties
Waferboard samples cut into 17" long static bending strips were incubated in fungus cultures grown on soil and aspen shavings for three months. After equilibration, weight loss modulus of rup- ture (MOR) and modulus of elasticity (MOE) were measured. Combination of these data will assist in detecting treatment which might permit sub- stantial reductions in bending properties after only small weight loss. The regression equations and associated correlation coefficients were ob- tained for a weight loss-MOR relationship (table 2). As in the case of the soil block-edge crushing trials, high correlation coefficients were obtaiwd for the data.
Although there was little or no weight loss in certain treatments (e.g., 10-18 control samples (fig. 5), MOR losses ranged from 30-80% (fig. 6 ) . These losses could be due to the organic acids given-off by the large area of test fungi in the polypropylene trays. Small holes comonly found in the aluminum foil covers after three months of insulation were presumably created by acidic con- densates. The hydrolytic environwnt might have lower MOR values of waferboard strips even though little weight loss occurs.
Where weight 1 osses of samples exceeded 15% (e.g,, 1-9), resulting MOR reductions ran 70% or more. Such results indicate that in a high decay hazard usage of structural waferboard, it should be well protected against decay (i .e., little or no weight loss permitted) to insure continued strength in service.
MOE values from the decay-treated bending strips reflect the decreases due to decay (e.g. , 7-91 and also the detrimental effects of leaching ( e - g , , G. s r a h ~ ~ ~ - 1 5 , 16) (fig. 7).
No preservative system tested surpassed the ACA/CCA group, treatments 10-14, in fungus pro- tection. The CCA added to wax permitted the greatest fungal attack within this group with a maximum 134 weight loss to S, t robem in aged samples in the soil block test, Also, mechanical properties of this GCAjwax treatment were inferior to other methods of incorporation (see Hall et. al. 1982). In terms of integrating one of these water- borne salt treatments into manufacture of treated waferboard, the addition of ACA to the wax emul- sion provides excel lent fungus protection while minimizing cost increases associated with a sepa- rate treatment operation (e, g., pretreating or pressure treating). By simply venting the ro- tating drum of excess ammonia during the ACA/wax spray addition, pollution problems would be mini- mi zed. The ACA solution permitted addition 1 eve1 s of 0.25 pcf to the board furnish without adding excess water which would require redrying of wafers. Presumably, work with ACA-wax compati- bi 1 i ty systems could develop formulations permi t- ting higher loadings (.a-.5 pcf) which may be re- quired in ground contact situations,
In terms of moderate decay protection where the leaching hazard would be occasional (e.g., roof decking) the TBTO and Cu/Fl formulations, treatments 9, 15, 16, 17, and 18, performed we1 1 in the contact block test. The Cu/Fl was some- what more leach-resistant than the TBTO, and the carrier solvent for the TBTO did have a noticeable odor (even after three months in testing) which might be objectionabf e in human habitats.
The surface dip treatments (7 and 8) did provide some mold protection and reduced decay a small amount in the contact block test; but, this decay protection was lost upon aging.
The formaldehydejsulfur dioxide treatment, 6, did not protect boards from the brown rot fungi, and had deleterious effects on the water resistant nature of the phenol formaldehyde glue (PF).
The TCMTB treatments 3 and 4 offered 1 ittle protection when incorporated into PF resin. Poss- ibly the protection loss was due to the pH of the resin influencing the fungicidal compound (Buckman Labs - personal communication).
The poor performance of the Difolatan, treat- ment 5, was unexpected based on proven performance in other agricultural applications. However, since the chemical has failed to control fungus stain on susceptible hardwoods such as sweetgum while performing well on pine, the wood species may be a critical factor.
The untreated boards made with liquid PF resin were generally more resistant to decay than those
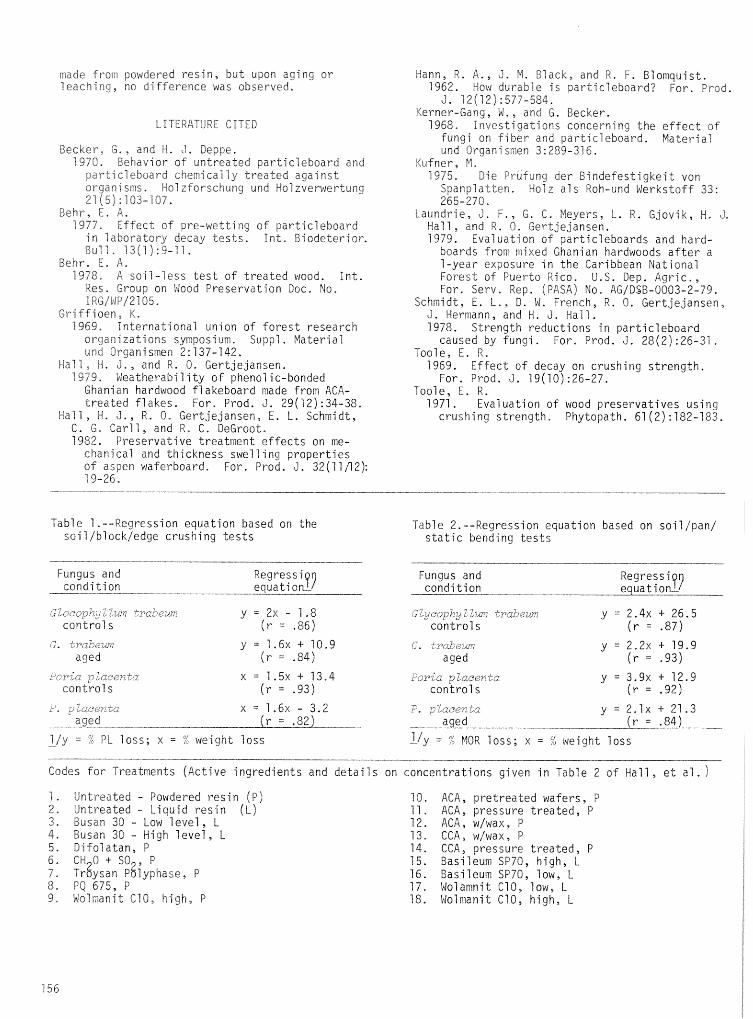
made from powdered resin, but upon aging or leaching, no difference was observed.
LITERATURE CITED
Becker, S , , and W . J . Deppe. 1970, 3ehavior of untreated particleboard and particleboard chemically treated aga in s t organisas. Holzforschung und Molzverwertung 27 (5) : 103-107.
Behr, E, A. 7977, Effect cf pre-wetting sf particleboard
in laboratory decay tests . I n t . Biodeterior. BUII. 13(1):9-13.
Behr. E. A, 1978, A soil-less test of treated wood. Int. Res. Group on Wood Preservation Doc. No, I RG/biP/2105,
Griffioen, K. 7969, International union of forest research organizations symposium. Suppl. Nateriai uvd Organismen 2:137-142.
Ha7 1 , 4, J . , and R. 0. Gertjejansen. 1979. Weatherability of phenolic-bonded Ghanian hardwood flakeboard made from ACA- treated flakes. For. Prod. J . 29(12):34-38.
Hall, W e J . , R. 0. Gertjejansen, E. L. Schmidt, C. G, Carll, and R. C. DeGroot. 1982, Preservative treatment effects on me- chanical and thickness swelling properties of aspen waferboard. For. Prod. 3 . 32(11/12): 7 9-26.
Hann, R. A * , 3 , M. Black, and R. F. Blomquist. 1962, Mow duraSle is article board? For. Prod,
J. 12(12):577-584. Kerner-Gang, W., and 6 . Becker. 1968. Investigations concerning the effect o f fungi on F i b e r and particleboard. Material und Organismen 3:289-376.
Yufner, F l . 7375, Die Prufuny der Bindefestigkeit von
Spanplatten. Holz a7s Roh-und Werkstoff 33: 265-27C,
Laundrie, J. F., G . C. Meyers, i. R. Gjovik, H. d, Hall, and R. 0. Gertjejansen. 1979. Evaluation of particleboards and hard- boards from mixed Ghanian hardwoods after a 1-year exposure in the Caribbean National Forest of Puerto Rico. U.S. Dep. Agric., For. Serv . Rep. (PASA) No. AG/DSB-0004-2-79.
Schmidt, E. L a , D. W . French, R, 0. Gertjejansen, J. Wermann, and W . J . Hall. 1978. Strength reductions in particleboard caused by fungi. For, Prod. J. 28(2) : 26-31 .
Toole, E. R. 1969. Effect of decay on crushing strength. For. Prod. J. 19(10):26-27.
Toole, E. R. 1971. Eva1 uation of wood preservatives using crushi~g strength, Phytopath. 61 (2) : 182-183.
Table 1.--Regression equation based on the soi 1 /blockledge crushing tests
Table 2. --Regression equation based on soi 1 /pan/ static bending tests
Fungus and condition equati Regressi77 on_
CZoa~phy Z Z-m t r a b e m y = ZX - 1.8 con-trcl s (r = .86)
U'. trabeu~7 y = 1 . 6 ~ + 10.9 aged (r = .84)
Pcria p Zaeentc x = 1 . 5 ~ + 13.4 con"io1 s (r = -93)
-7, p lacen-ca x = 1 . 6 ~ - 3.2 aged (r = .82)
11y = % PL loss; x = ?o weight loss -
Fungus and condition
Regressi 7 1 e a u a t i o ~
GZycophy l lit?? trabeuril y = 2 . 4 ~ + 26.5 control s (r = .87)
C, 5joabe-fi aged
Poria p Zacenca control s
-7, p Zacexta y = 2 , f x + 21-3 aged (r = .84)
- = Ti MOR loss; x = hqeight loss
Codes for Treatments (Active ingredients and details on concentrations given in Table 2 of Wall, e t al. 1
Untreated - Powdered resin (P) Untreated - Liquid resin (L) Busan 30 - Low level , L Busan 30 - High level, i Difoiatan, P CF20 + SO , P Troysan ~ g l ~ ~ h a s e , P PQ 675, P Wolnanit Cl0, high, P
AGA, pretreated wafers, P ACA, pressure treated, P ACA, w/wax, P CCA, w/wax, P CGA, pressure treated, P Basileum SP70, high, i Basileum SP70, low, L Wolamnit ClO, low, L Wolmanit C10, high, L
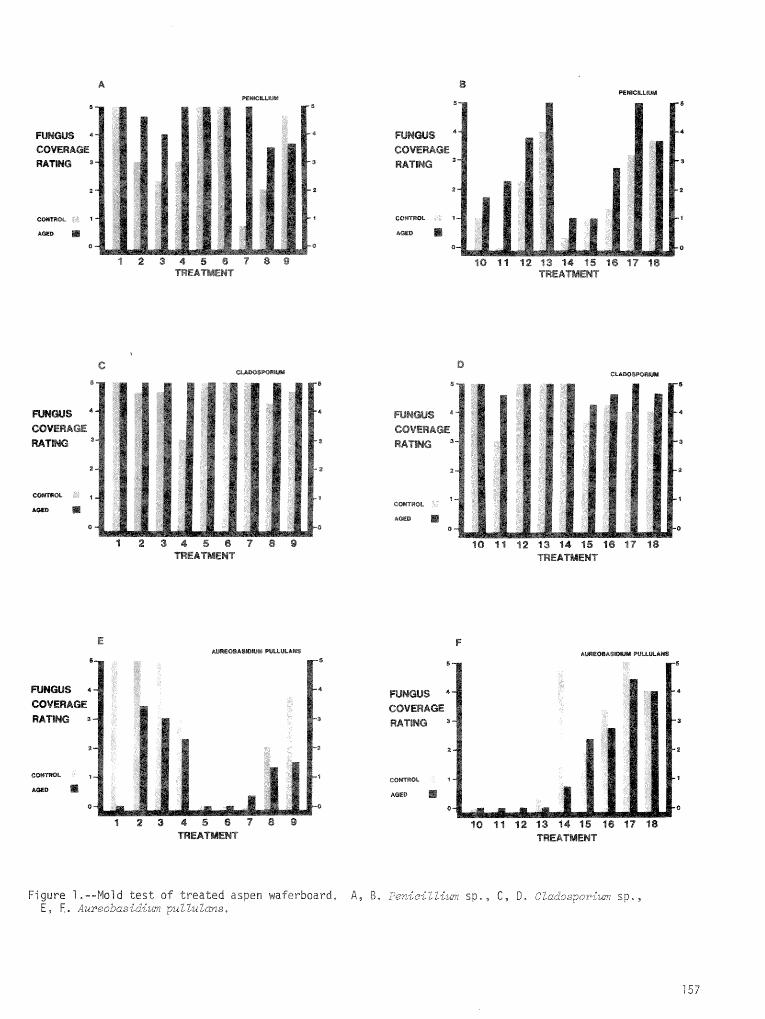
4 4
CiE RATING
2 4
r e a I
0
1 2 3 4 5 8 7 8 0 ) TREATMENT
10 11 1% 13 14 15 16 17 18 TREATMENT
6
COVERAGE
a
1 COMTRO1
End 0
10 d l 12 83 14 35 18 87 18 TREATMENT
FUNGUS * COVERAGE RATING
CWThia I
*wo
10 I3 12 13 14 15 16 17 98 TREATMENT
Figure 1,--Mold tes t of t r e a t e d aspen waferboard, A, B. ?eniziZZim sp,, 6 , D, Cladosporiiim sp,, E , E. kureob~s-l&iv~ p,-u"cu"Lns.
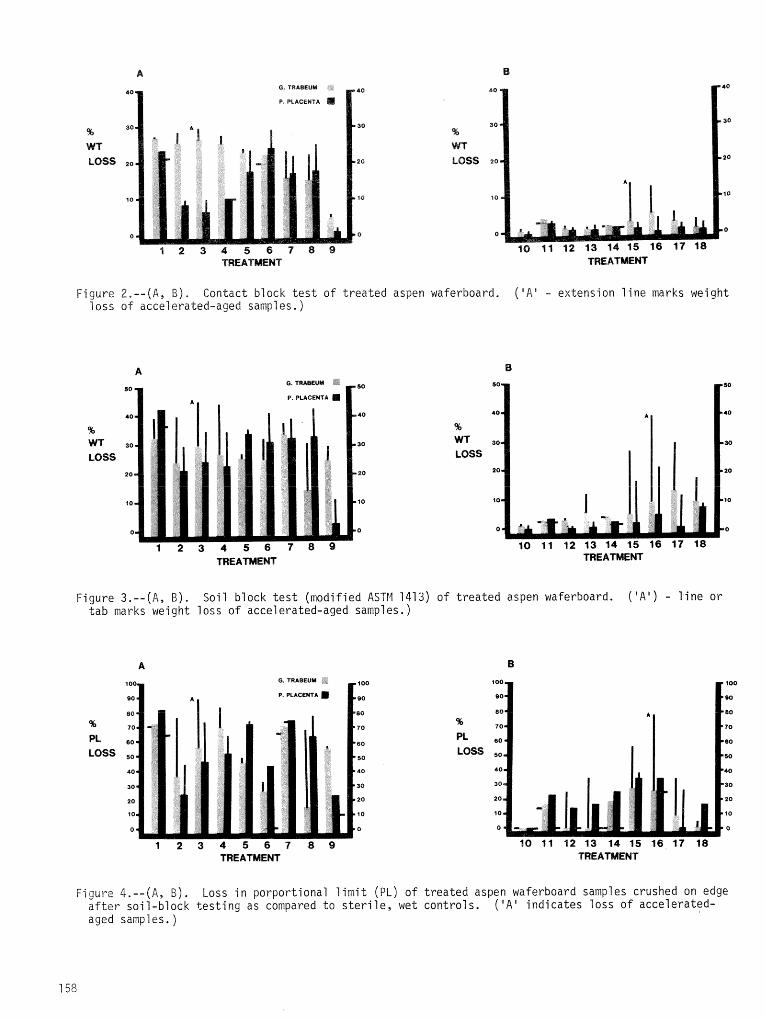
40 40 40
30 30 5% %
WT WT LOSS *o 20 LOSS 20
10 10
0 ti 0
1 2 3 4 5 6 7 8 9 TREATMENT TREAWENT
Figure 2.--(A, B ) , Contact block t e s t of treated aspen waferboard. ( ' A A " - extension 1 ine marks weight loss of accelerated-aged samples.)
40 40
%
WT 30 30
LOSS
20 20
10 10
0 0
TREATMENT
% WT LOSS
TREATMENT
Figure 3.--(A, B ) . Soil block t e s t (modified ASTM 1413) of treated aspen waferboard. ( 'A ' ) - line or tab marks weight 1 oss of accel erated-aged sarnpl es . )
80 80
% 70 70
P1 60 a0
LOSS 50
40 40
30 30
20 20
10 10
0 0
%
Pt LOSS
- .
TREATMENT TREATMENT
Figure 4,--(A, B ) . Loss in porportional limit (PL) of treated aspen waferboard samples crushed on edge after soi 1-block testing as compared to s t e r i l e , wet controls. ( ' A A ' indicates loss of accelerated- aged samples. )
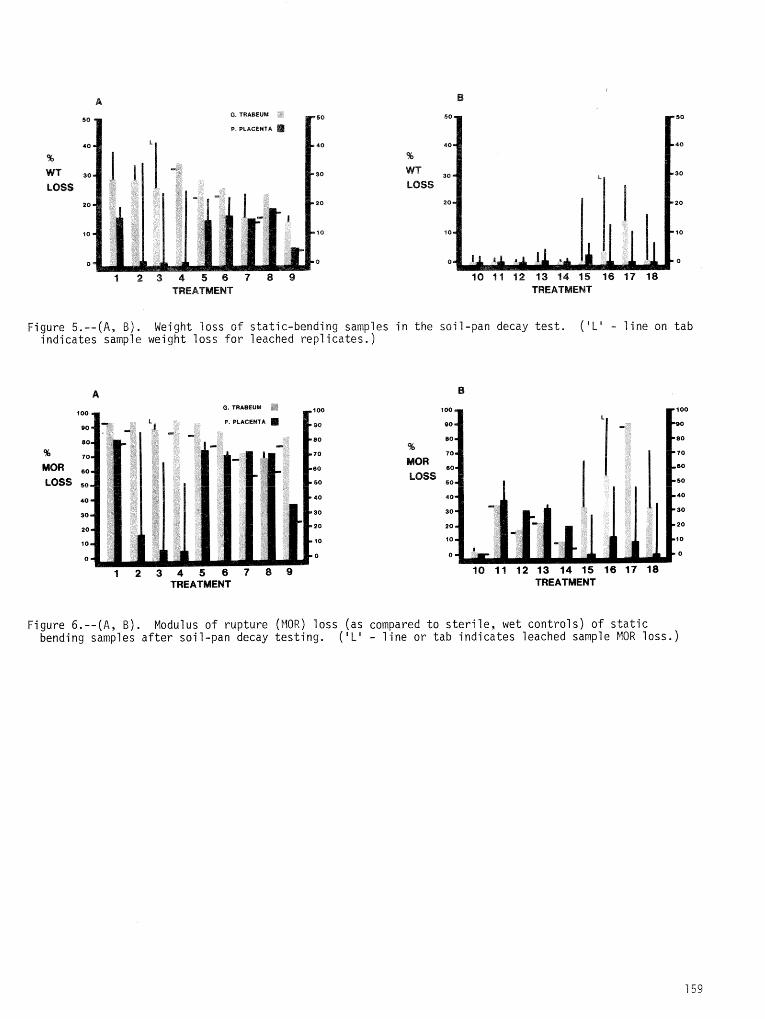
40
"kb
30
LOSS
O. TRABEUU
P. PLACENTA
TREATMENT TREATMENT
Figure 5,--(A, B) . Weight loss of static-bending samples in the soil-pan decay test. ( Y ' - line on tab indicates sample weight loss for leached rep1 icates. )
90 so
80 80 ' 70 70
MoR ,0 60
LOSS 60 50
40 40
30 30
20 20
10 10
0 0
1 2 3 4 5 6 7 8 9 TREATMENT TREATMENT
Figure 6.--(A, B). Modulus of rupture (MOR) loss (as compared to sterile, wet controls) of static bending samples after soil-pan decay testing. ('L' - line or tab indicates leached sample MOR loss.)
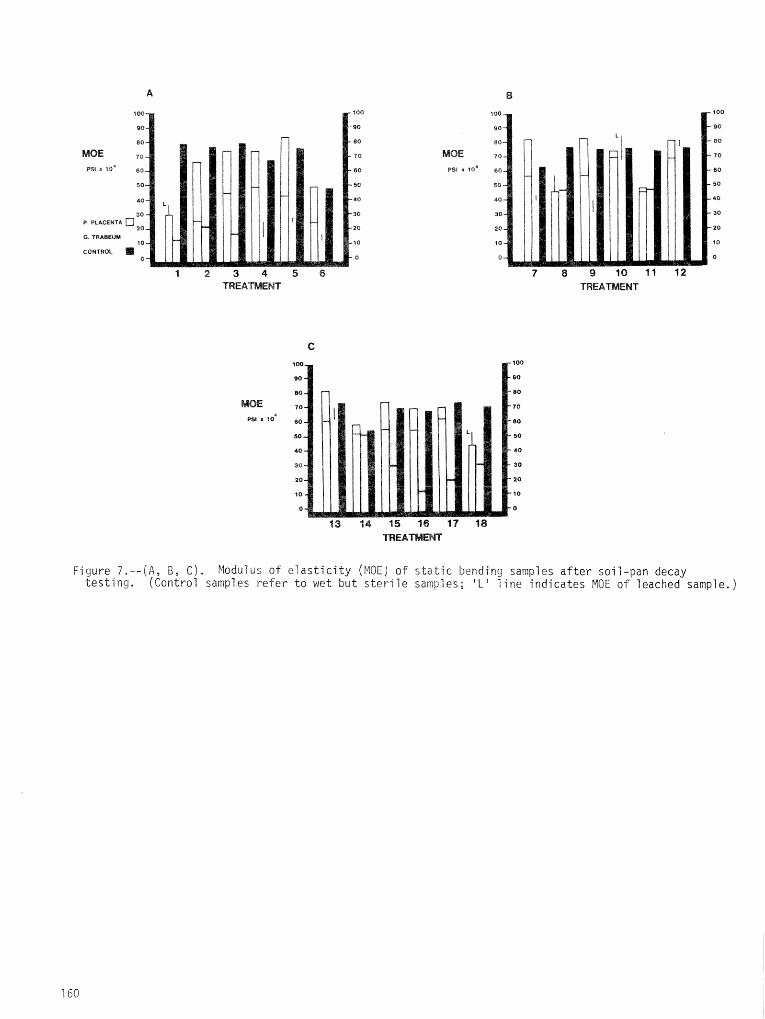
MOE PS) lo4
IMf
90 Bo
80 60
76 90
B5
SO 50
40 48
30 30
25 20
10 10
0 0
1 2 3 4 5 6 TREATMENT
1 8 0 2 00
SO 80
85 BO
MOE 70 7 0
P S ~ x 10' 60 60
50 65
40
30 30
20 20
10 10
5 0
7 8 9 10 1 1 12 TREATMENT
Figure 7 . - - (A , B , C). Modulus of elasticity (MOE) of static bending samples after so i l -pan decay testing. (Control samples refer to wet but sterile samples; ' L V ? i n e indicates MOE o f leached sample. j
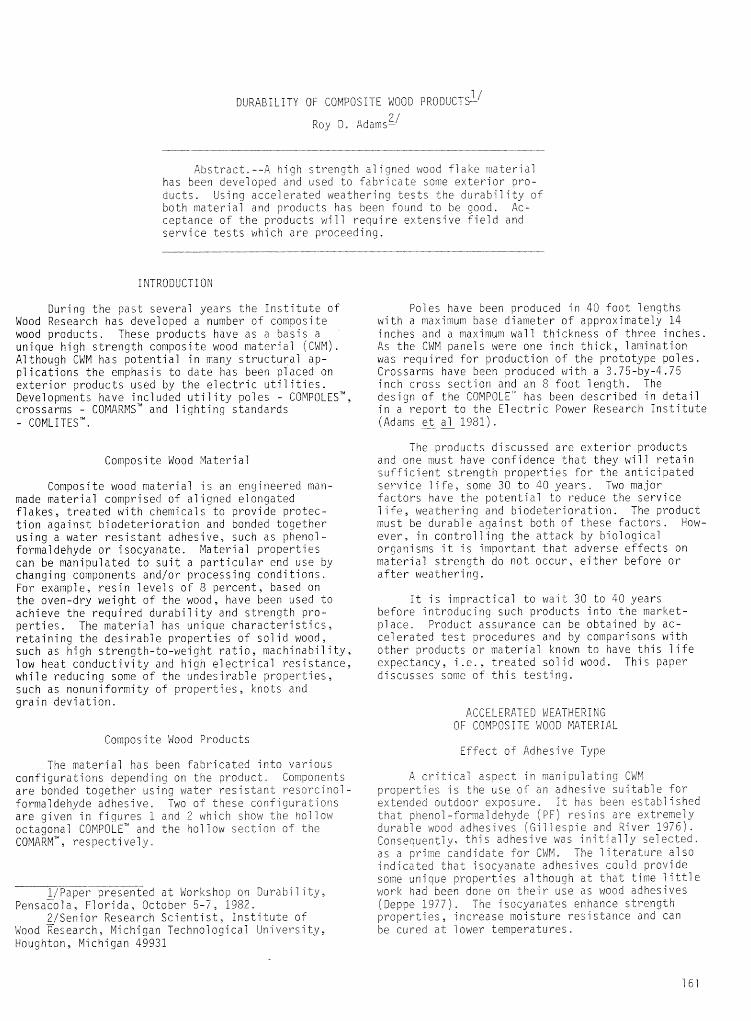
DURABILITY OF COMPOSITE WOOD PRODUCTS-~-/ 0 1
Roy O . ~darnsg'
Abstract.--A high strength a l i g n e d woad f l a k e material has been developed and used to fabricate some exterior pro- ducts. Using accelerated weathering tests the durability o f both material and products has been found to be good. Ac- ceptance of the products will require extensive field and service tests which are proceeding.
INTRODUCTION
During the past several years the Institute of Wood Research has developed a number of composite wood products. These products have as a basis a unique high strength composite wood material (CUM). Although CWM has potential in many structural ap- plications the emphasis to date has been placed on exterior products used by the electric utilities. Developments have incl uded uti 1 i ty pol es - COI"IPOLESTM, crossarms - COMARMS" and lighting standards - COMLITESTM.
Composite Wood Material
Composite wood material is an engioeered man- made material comprised of aligned elongated flakes, treated with chemicals to provide protec- tion against biodeterioration and bonded together using a water resistant adhesive, such as phenol- formaldehyde or isocyanate. Material properties can be manipulated to suit a particular end use by changing components andfor processing conditions. For example, resin levels of 8 percent, based on the oven-dry weight of the wood, have been used to achieve the required durability and strength pro- perties. The material has unique characteristics, retaining the desirable properties of solid wood, such as high strength-to-weight ratio, machinability, low heat conductivity and high electrical resistance, while reducing some of the undesirable properties, such as nonuniformity of properties, knots and grain deviation,
Poles have been produced in 40 foot lengths with a maximum base diameter of approximately 14 inches and a maximum wall thickness of three inches. As the CWM panels were one inch thick, lamination was required for production of the prototype poles. Crossarms have been produced with a 3.75-by-4.75 inch cross section and an 8 foot length. The design of the COMPOLETM has been described in detail in a report to the Electric Power Research Institute (Adarns et a1- 1981).
The products discussed are exterior products and one must have confidence that they will retain sufficient strength properties for the anticipated service 1 ife, some 39 to 30 years, Two major factors have the potential to reduce the service l i f e , weathering and biodeterioration. The product must be durable against both of these factors. How- ever, in control f i ng the attack by biol oaical organisms it is important that adverse effects on material strength do not occur, either before or after weathering.
It is impractical to wait 30 to 49 years before introducing such products into the market- place. Product assurance can be obtained by ac- celerated test procedures and by comparisons with other products or material known to have this life expectancy, i.e., treated solid wood. This paper discusses some of this testing.
ACCELERATED WEATHERING OF COMPOSITE WOOD MATERIAL
Composite Wood Products Effect of Adhesive Type
The material has been fabricated into various configurations depending on the product* Components are bonded together using water resistant resorcinol- formaldehyde adhesive, Two of these configurations are given in figures 1 and 2 which show the hollow octagonal COMPOLE" and the hollow section o f the COMARM'", respectively.
I/Paper presented at Workshop on Durability, ~ensa&fa, Florida, October 5-7, 1382.
2/Senior Research Scientist, Institute of Wood Research, Michigan Technological University, Houghton, Michigan 49931
A critic21 aspect in naniculating CWM properties i s the use of an adhes ive suitable for extended outdoor exposure. It has been established that phenol -formaldehyde (PF) resins are extreme! y durable w ~ o d adhesives (Gi7 7esp ie and River 19761. Consequent1 y, this adhesive was initial ly selected. as a prime candidate for CWM. The literature also indicated that isocyanate adhesives could provide some uoique properties although at that time little work had been done on their use as wood adhesives (Deppe 1977), The isocyanates enhance strength properties, increase moisture resistance and can be cured at lower temperatures.
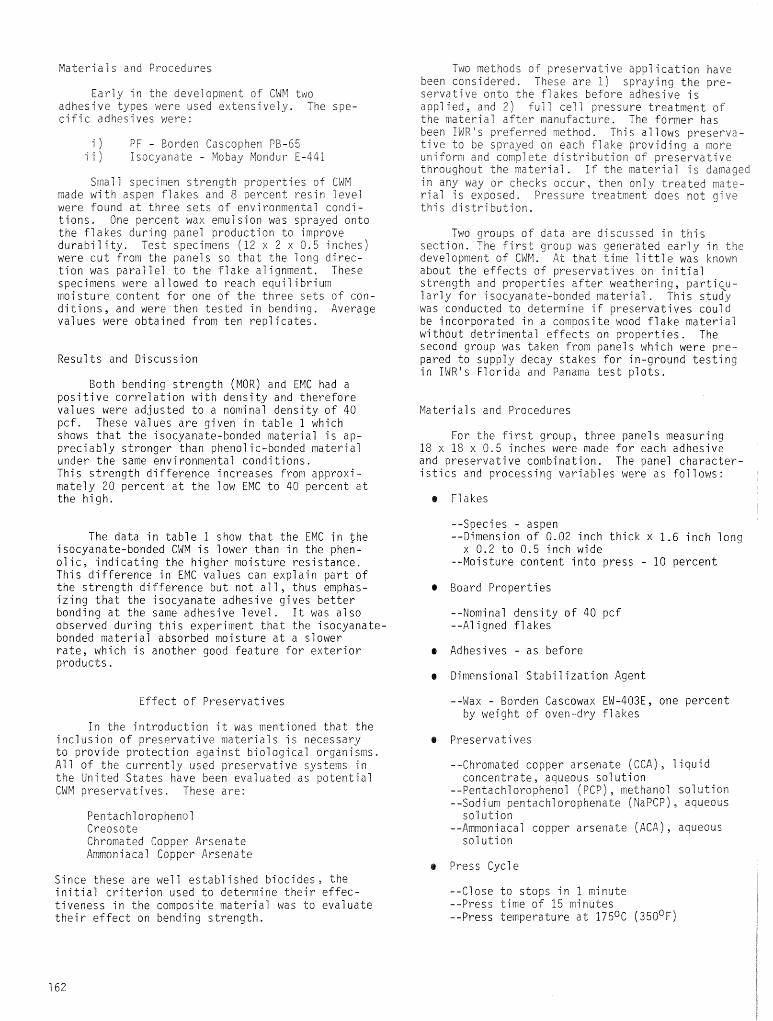
Materials and Procedures
Early in the development of CW?4 two adhesive types were used extensively. The spe- ci f ic adhesives were:
i) FF - Bcrden Gascophen PB-65 i i ) Isocyanate - Nobald Kondur E-441
Small specimen strength properties of GWM made with aspen Flakes and 8 percent resin level were Found at three sets of environmental condi- tions. One percent wax emulsion was sprayed onto the flakes during panel production to improve durability. Test specimens (12 x 2 x 0.5 inches) were cut from the panels so that the long direc- tion was parallel to the flake alignment. These specimens were allowed to reach equilibrium moisture content for one of the three sets of con- ditions, and were then tested in bending. Average values were obtained from ten reolicates.
Results and Discussion
Both bending strength (MOR) and EMC had a positive correlation with density and therefore values were adjusted to a noitrinal density of 40 pcf. These values are given in table 1 which shows that the isocyanate-bonded material is ap- preciably stronger than phenolic-bonded material under the same environmental conditions. This strength difference increases from approxi- mately 20 percent at the low EMC to 40 percent at the high.
The data in table 1 show that the EMC in the isocyanate-bonded CWM is lower than in the phen- olic, indicating the higher moisture resistance. This difference in EMC values can explain part of the strength difference but not all, thus emphas- izing that the isocyanate adhesive gives better bonding at the same adhesive level. It was also observed during this experiment that the isocyanate- bonded material absorbed moisture at a slower rate, which is another good feature for exterior products.
Effect of Preservatives
In the introduction it was mentioned that the inclusion of preservative materials is necessary to provide protection against biological organisms. A1 1 of the currently used preservative systems in the United States have been evaluated as potential C#M preservatives. These are:
Pentachlorophenol Creosote Chromated Copper Arsenate Ammaniacal Copper Arsenate
Since these are well established biocides, the initial criterion used to determine their effec- tiveness in the composite material was to evaluate their effect on bending strength.
Two methods of preservative application have keen considered. These are 1) spraying the prc- servative onto the flakes before adhesive i s applied, and 2) f u l l cel 7 oressure treatment of the material after manufacture. The former has been IWRis preferred method, This allows preserva- t i v e to be sprayed on each flake providing a more uniform and complete distribution of preservative throughout the material, If the materfaf is damaged in any way or checks occur, then only treated mate- rial is exposed. Pressure treatment does not give this distribution.
Two groups of data are discussed in this section. The first group was generated early in the development of CWM. At that time Tittle was known about the effects o f preservatives on initial strength and properties after weathering, partiku- larly for isocyanate-bonded material , This study was conducted to determine if preservatives could be incorporated in a composite wood flake material without detrimental effects on properties. The second group was taken from panels which were pre- pared to supply decay stakes for in-ground testing in IWR's Florida and Panama test plots.
Materials and Procedures
For the first group, three panels measuring 18 x 18 x 0.5 inches were made for each adhesive and preservative combination. The panel character- istics and processing variables were as follows:
e Flakes
--Species - aspen --Dimension of 0.02 inch thick x 1.6 inch long
x 0.2 to 0.5 inch wide --Moisture content into press - 10 percent
@ Board Properties
--Nominal density of 40 pcf --A1 i gned f 1 a kes
0 Adhesives - as before
0 Dimensional Stabilization Agent
--Wax - Borden Cascowax EW-403E, one percent by weight of oven-.dry flakes
e Preservatives
--Chromated copper arsenate (CCA) , 1 iquid concentrate, aqueous solution
- -Pentach1 orophenol (PCP) , methanol sol uti on --Sodi um pentachl orophenate (NaPCP), aqueous solution
--Ammoniacal copper arsenate (ACA), aqueous solution
e Press Cycle
--Close to stops in 1 minute --Press time of 15 minutes --Press temperature at 175OC ( 3 5 0 ~ ~ )
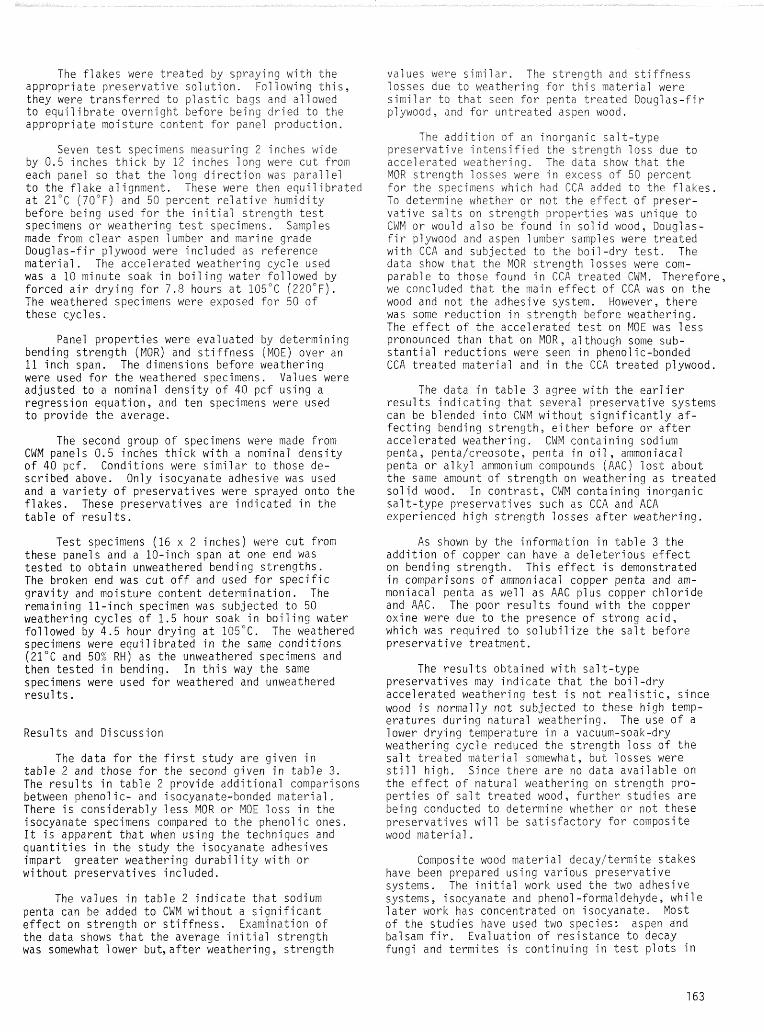
The flakes were treated by spraying with the appropriate preservative solution. Following this, they were transferred to plastic bags and allowed to equi 1 i brate overnight before being dried to the appropriate moisture content For panel production,
Seven test specimens measuring 2 inches wide by 0.5 inches thick by 12 inches long were cut Prom each pane1 so that the long direction was para1 lel to the flake alignment. These were then equilibrated at 21°C (70°F) and 50 percent relative humidity before being used for the initial strength test specimens or weathering test specimens. Samples made from clear aspen lumber and marine grade Doug1 as-f i r plywood were i ncl uded as reference material. The accelerated weathering cycle used was a 10 minute soak in boiling water followed by forced air drying for 7.8 hours at 105°C ( 220°F ) . The weathered specimens were exposed for 50 of these cycles.
Panel properties were evaluated by determining bending strength ( M O R ) and stiffness (MOE) over an 11 inch span. The dimensions before weathering were used for the weathered specimens. Values were adjusted to a nominal density of 40 pcf using a regression equation, and ten specimens were used to provide the average.
The second group of specimens were made from CWM panels 0.5 inches thick with a nominal density of 40 pcf. Conditions were similar to those de- scribed above. Only isocyanate adhesive was used and a variety of preservatives were sprayed onto the flakes. These preservatives are indicated in the table of results.
Test specimens (16 x 2 inches) were cut from these panels and a 10-inch span at one end was tested to obtain unweathered bending strengths. The broken end was cut off and used for specific gravity and moisture content determination. The remaining ll-inch specimen was subjected to 50 weathering cycles of 1.5 hour soak in boiling water followed by 4.5 hour drying at 105°C. The weathered specimens were equilibrated in the same conditions (21°C and 50% RH) as the unweathered specimens and then tested in bending. In this way the same specimens were used for weathered and unweathered results.
Resul ts and Discussion
The data for the first study are given in table 2 and those for the second given in table 3. The results in table 2 provide additional comparisons between phenolic- and isocyanate-bonded material. There is considerably less MOR or HOE loss in the isocyanate specimens compared to the phenolic ones, It is apparent that when using the techniques and quantities in the study the isocyanate adhesives impart greater weathering durability with or wi thout preservatives i ncl uded.
The values in table 2 indicate that sodium penta can be added to CWM without a significant effect on strength or stiffness. Examination of the data shows that the average initial strength was somewhat lower but,after weathering, strength
values were similar. The strength and stiffness losses due to weathering for this material were similar to that seen for penta treated Douglas-fir plywood, and for untreated aspen wood.
The addition of an inorganic salt-type preservative intensified the strength loss due to accelerated weathering. The data show that the MOR strength losses were in excess of 50 percent for t h e specimens which had GCA added to the flakes. To determine whether or not the effect o f preser- vative salts on strength properties was unique to CWM or ~ould also be Found in sol id wood, Douglas- fir plywood and aspen lumber samples were treated with CCA and subjected to the boil -dry test. The data show that the MOR strength losses were com- parable to those found in CCA treated CWM. Therefore, we concluded that the main effect of CCA was on the wood and not the adhesive system. However, there was some reduction in strength before weathering. The effect of the accelerated test on MOE was less pronounced than that on MOR, although some sub- stantial reductions were seen in phenolic-bonded CCA treated material and in the CCA treated plywood.
The data in table 3 agree with the earlier results indicating that several preservative systems can be blended into CWM without significantly af- fecting bending strength, either before or after accelerated weathering. CWM containing sodium penta, pentafcreosote, penta in oil, ammoniacal penta or alkyl ammonium compounds (AAC) lost about the same amount of strength on weathering as treated solid wood. In contrast, CWM containing inorganic salt-type preservatives such as CCA and ACA experienced high strength losses after weathering.
As shown by the information in table 3 the addition of copper can have a deleterious effect on bending strength, This effect is demonstrated in comparisons of ammoniacal copper penta and am- moniacal penta as well as AAC plus copper chloride and AAC. The poor results found with the copper oxine were due to the presence of strong acid, which was required to solubilize the salt before preservative treatment.
The results obtained with sal t-type preservatives may indicate that the boil-dry accelerated weathering test is not realistic, since wood is normally not subjected to these high temp- eratures during natural weathering. The use of a lower drying temperature in a vacuum-soak-dry weathering cycle reduced the strength loss of the salt treated material somewhat, but losses were still high. Since there are no data available on the effect of natural weathering on strength pro- perties of salt treated wood, further studies are being conducted to determine whether or not these preservatives will be satisfactory for composite wood material.
Composite wood material decay/termite stakes have been prepared using various preservative systems. The initial work used the two adhesive systems, isocyanate and phenol-formaldehyde, while later work has concentrated on isocyanate. Most of the studies have used two species: aspen and balsam fir. Evaluation of resistance to decay fungi and termites is continuing in test plots in
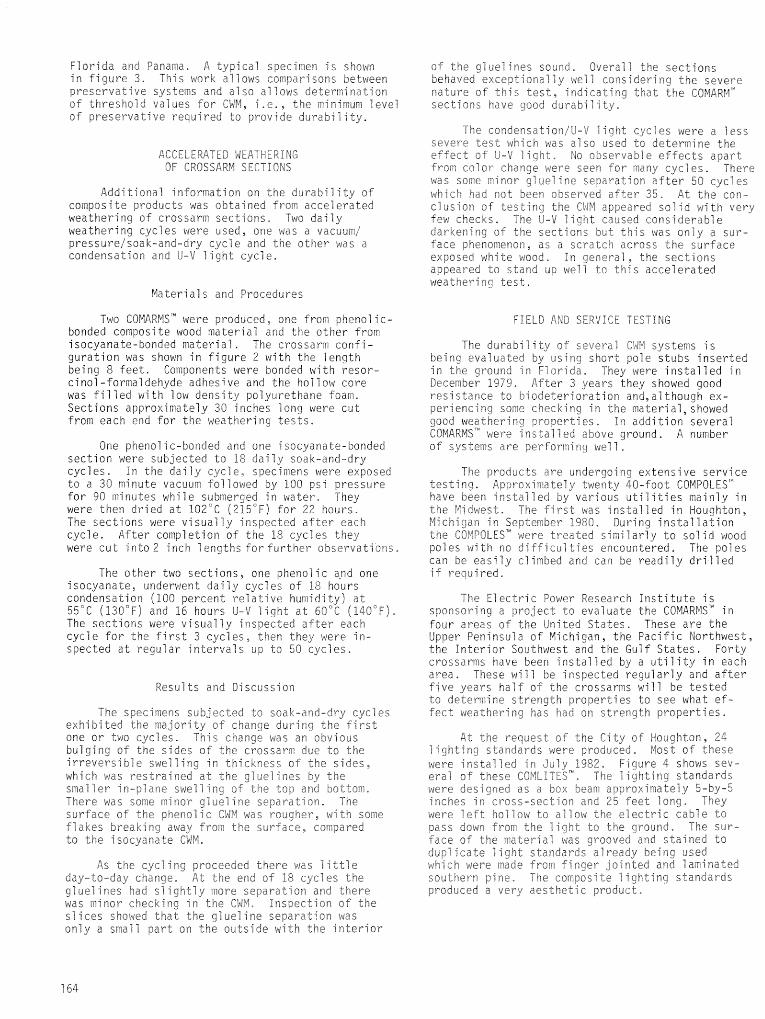
Florida and Panama, A typical specimen is shown in figure 3. T h i s work allows comparisons between preservative systems and also allows determination o f threshold values for C\4M, i.e., the minimum level sf preservative required to provide d u r a b i l i t y .
ACCELERATES !dEXTHERING Of GROSSARM SECTIONS
Additional information on t h e durability of composite products Mas obtained from accelerated weathering o f crossarm sections. Two daily weathering cycles were used, one was a vacuum/ pressure/soak-and-dry cycle and the other was a condensation and U-V light cycle.
Materi a1 s and Procedures
Two COMARMS" were produced, one from phenolic- bonded composite wood material and the other from isocyanate-bonded material. The crossarn: confi- guration was shown in figure 2 with the length being 8 feet. Components were bonded with resor- cinol-formaldehyde adhes"e end the hollow core was Filled with low density polyurethane foam, Sections approximately 30 inches long were cut from each end for t h e weathering tests.
One phenolic-bonded and o n e isocyanate-bonded section were subjected to 18 daily soak-and-dry cycles, In the daily cycle, specimeus were exposed to a 30 minute vacuum follohed by 100 psi pressure for 90 minutes while submerged i n water. They were then dried at 102°C (215°F) for 22 hours. The sectfons were visually inspected after each cycle. After completion of the 18 c y c l e s they were cu t into2 inch 'lengths fo r further observations.
The other two sections, one phenolic and one isocyanate, underwent daily cycles of 1E hours condensation (160 percent relative hu~idity) at 55°C (130°F) and 16 hours 3-V Sight at 60°C (140°F ) . The sections were visually inspected after each cycle for the first 3 cycles, then they were in- spected at regular intervals up to 50 cycles.
Results and Discuss ion
The specime~s subjected tc soak-and-dry cycles exhibited the majority of change duricg the first one or two cycles, T h i s change was an obvious bulging of t h e sides of t h e crossarp due to the irreversible swelling in t h i c k n e s s o f t he s i d e s , which was restrained at the gluelines by the smaller in-p;ane swelling o f t h e top and bottom, There was some micor glueline separation, The surface of the phenolic C W M was rougher, w i t h scme f'izkes breaki'ng away -Fro:n t h e surface, compared to the isocyanate CWM,
As t n e cycliog pnxeeded there was little day-do-day change, At the end of 18 cycles t he gluelines had sliqktly more separation and there was minor checking in the CbJM. Inspection o f t he s f i c e s showed that the glueline separat!oon was only a small oart on t h e outside with the interior
of the glue1 ines sound* Overall tRe sections behaved exceptionally we1 1 c~nsideri ng the severe nature of this test, i n d k a a t l n g tbat the COMARM" sections have good durability.
The condensation/U-:/ light cycles were a less severe test which was a l s o used t o determine the e f f e c t o f U-k ' l i g h t . :ir? observable effects apart fron color change were seen for many cyc les , Tnere was soEe m?nor glueline separa t ion after 50 cycles which had not been observed after 35, At the coc- c lus ion of testins the CBb! appeared sol Sd with very f eb j checks. The U-V light caused considerable darkening of the sections but t h i s was o n l y a sur- face phenoxensn, as a scratch across the sar face exposed white wood. In general, t h e sections appezred to stand up well to th" accelerated weathering test.
FIELD AND SERVICE TESTING
The d u r a b i 1 i ty o f several S!dY systems i s being evaluated by using short pole stubs inserted in the ground in F:or ida , They were installed in December 1979, After 3 years they showed good resistance t o biodeterioration and,although ex- periencjng some checking in the materia1,showed good w e a k h e r k g c r o ~ e r t i e s . In addition several COMARMS" viere instal led above ground. A number o f systems are performing well .
The prcducts are undergoing extensive service testing. Ap~roxi~atel y twenty 4 0 - f o o t GOMPOIES" have been i n s t a l l e d by various utilities mainly in the Midwest. The first was i n s t a l l ed in Houghton, Michigan in September 1980, During installation the COEPOLES" here treated s i ~ i 1 a r l y to sol id wood poles with no difficul ties encountered. The poi es can be easily climbed and can be readily drilled if required,
The Electric Power Research institute is sponsoring a project to evaluate the COMARMS" in four areas of the United States. These are the Upper Peninsula of Michigan, the Pacific Northwest, the Interior Southwest and the Gulf States. Forty crossarms have been installed by a utility in each area, These will be inspected regularly and after f i v e years half of the crossarms w i l l be tested to determine stre~gth properties to see what e f - fect weathering has had en strength properties .
A t t h e request of the CSty o f H o u g h t o n , 24 1"ghting standards were produced. Pos t of these were installed in J k l y 1982, Figure 4 shows sev- eral o f these COMLITES", The 1 i g h t i n g standards were designed as a bcx beam approxinately 5-by-5 inches i n ~ r ~ s s - s e c t i ~ n and 25 f e e t l o n g , They were l e f t hollow to a;law the electric cable to pass @own from t h e light to the g r a u n d , She sur- face of the material was grooved and stajned to duplicate l i g h t standards already being used w h ~ c h were made from Finger jointed and laminated southern p i n e , The con~os i t t e Sightinq standards produced a very aes thet ic probdct.
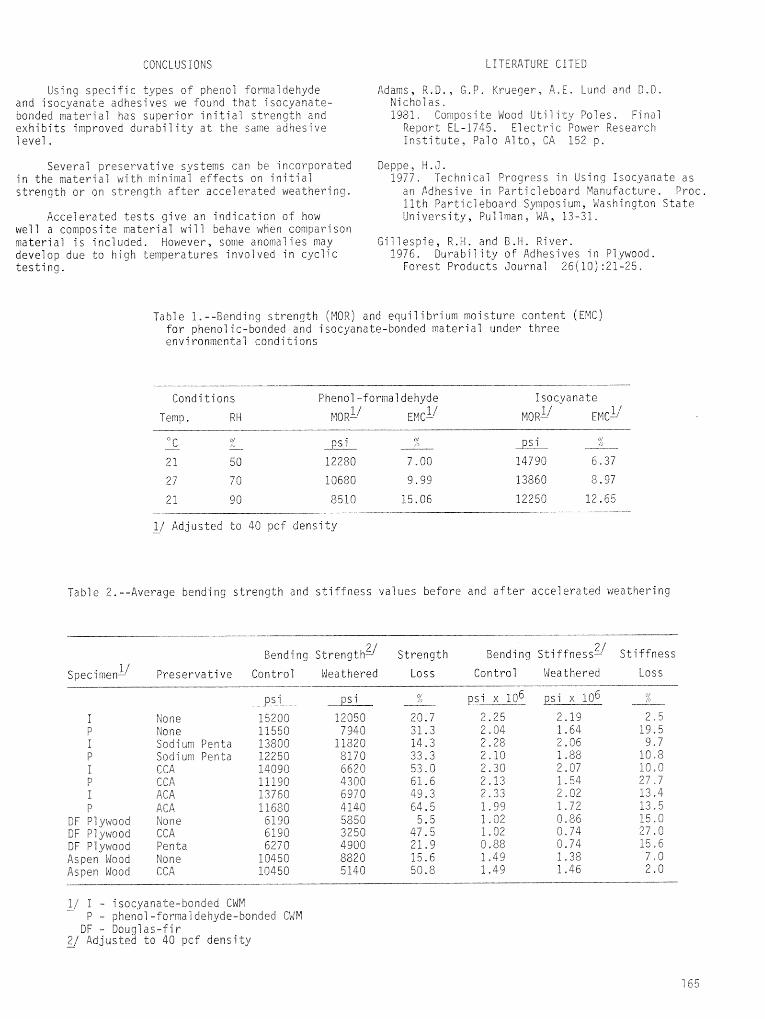
COKCLUSIONS LITERATURE CTTEO
Using specific types o f phenol Formaldehyde Adarns, R.D., G . p , Krueger, k , E . Lund and D.D. and isocyanate adhesives we found that isocyanate- Nicholas. bonded material has superior initial strength and 1981, Composite Nood Utility Poles. Final exhibits improved durability at the same adhesive Report EL-2735, Electric Power Research l eve1 , Institute, Palo Alto, CA 152 p.
Several preservative systems can be incorporated in the material w i t h minimal effects on initial strength or on strength after accelerated weathering.
Accelerated tests give an indication of how well a composite ~ateriai will behave when comparison material is included. However, some anomalies may develop due to high temperatures involved in cyclic testing.
Deppe, M . J . 1977, Technical Progress i n Using isocyanate as
an Adhesive in Pardiclebcard F4anufacture. Proc, 11th Particleboard Symposium, 5:ashington State University, Puf iman, MA, 13-31,
Gillespie, R.H. and B.H. River. 1376. Durability of Adhesives in Plywood.
Forest Products Journal 26(10):2!-25.
Tab1 e 2 . --Bending strength JMOR) and equil i brium moisture content (EMC) for phenolic-bonded and isocyanate-bonded material under three environmental conditions
Conditions Phenol -formaldehyde Isocyanate
Temp. RH EPIC-' MO RY E K C ~ 1 / MO R- l i
" C :4 ps i 3 psi ,-' o/ - -A-
2 1 50 12230 7.00 14790 6 - 3 7
2 7 7 0 10680 9.99 13860 8.97
2 1 90 8510 15.06 12250 12.65 - - -
I/ Adjusted to 40 pcf density -
Table 2.--Average bending strength and stiffness values before and after accelerated weathering
Bending Strengthg/ Strength Bending stiffnessq Stiffness
~pecimenu Preservative Control Weat hered Loss Control Weathered Loss
i P 1 P I P I P
DF Plywood 13F Plywood DF Plywood Aspen Wood Aspen Wood
None pione Sodium Penta Sodium Penta C @A CCA AC A P CA None CCA Pen t a Hone CCFr
psi -
12050 7 940
f 1820 8773 6620 4360 6970 4140 5550 3250 4900 8820 5140
psi x 106 psi x 106 2.25 2.18 2.04 1.64 2.28 2.06 2.10 1.88 2.30 2.07 2-13 1-54 2.33 2-02 1.99 1,724 l .G2 C, 86 1-02 0-74 0.88 0.74 1.49 1.38 i -4.9 1-46
I/ I - isocyan2te-bsnded CA!M - P - phenol -formal dehyde-bonded CUM
DF - Douglas-fir $/ Adjusted to 40 pcf dens i t y -
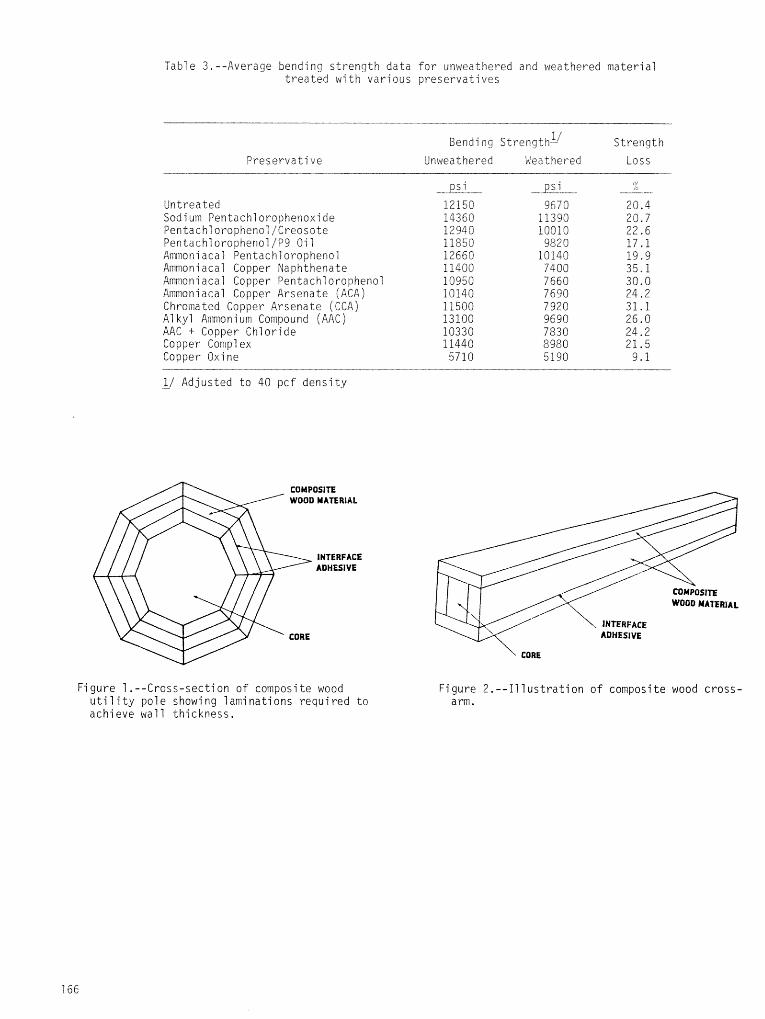
Table 3.--Average bending strength data fo r unweathered a n d weathered material t rea ted w i t h various preservatives
Preservative
1 / B e n d i n g Strength- Strength Unweathered Weathered Loss
Untreated Sodium Pentachlorophenoxide PentachlorophenoI/Creosote Pentachl orophenol /P9 0 i l Ammoni acal Pentachl orophenol Ammoniacal Copper Maphthenate Ammoniacal Copper Pentachlorophenol Ammoniacal Copper Arsenate ( A C A ) Chromated Copper Arsenate ( C C A ) A1 kyl Ammoni urn Compound ( A A C ) AAC + Copper Chloride Copper Cornpl ex Copper Oxi ne
I / Adjusted to 40 pcf density -
COMPOSifE 1 / WOOD MATERIAL
=e INTERFACE ADHESIVE
y ' CORE
Figure 1. --Cross-section of composite wood u t i 1 i t y pole showing 1 ami nations requi red to achieve wall thickness.
\ CORE
Figure 2 . - - I l lu s t r a t ion of composite wood cross- arm.
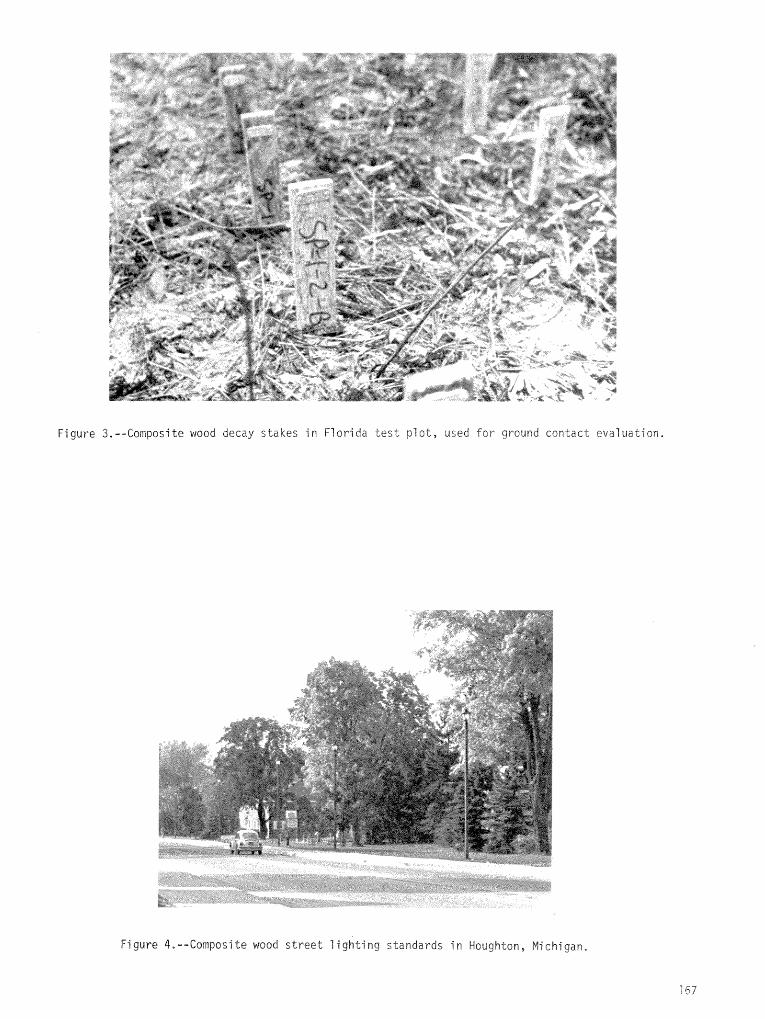
F i g u r e 3.--Cornposi t e wood decay s t ake s i n F lor ida t e s t p l o t , used f o r ground con t ac t e v a l u a t i o n .
Figure 4.--Composite wood s t r e e t l i g h t i n g s tandards i n Houghdon, Michigan,
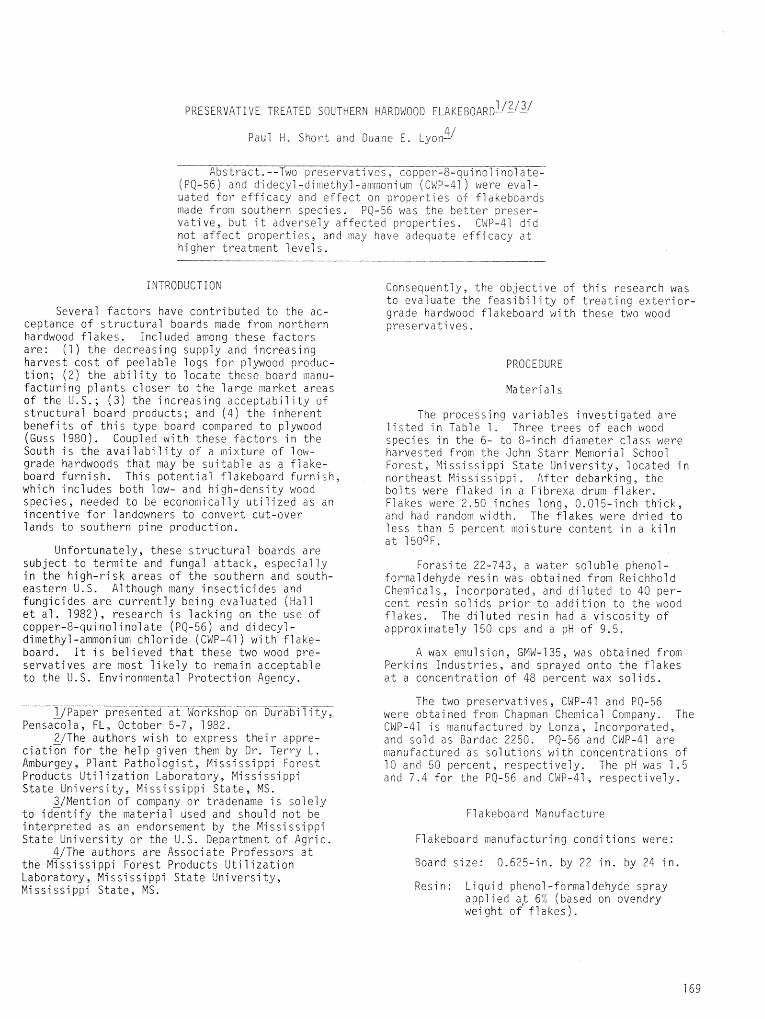
PRESERVATIVE TREATED SOUTHERN HARDMOOD FLAKE BOAR&/^'^/ 4/ Paul H, Short and Duane E . iyon-
Abstract.--Two preservatives, copper-8-quinsiinolate- [PQ-56) and didecyi -dimthy1 -anrnoni urn (CWP-41 ) were eval- uated fo r ef f icacy and e f f e c t on properties of flakeboards made from southern species. PC-56 was t h e better preser- va t ive , but i t adversely af fec ted properties. GWP-41 did not a f f e c t properties, and may have adequate ef f icacy zt higher treatment levels .
INTRODUCTION
Several f ac to r s have contributed t o the ac- ceptance of s t ruc tu ra l boards made from northern hardwood f l akes . Incl uded among these f ac to r s a re : (1 ) the decreasing supply and increasing harvest cos t of peelable logs f o r plywood produc- t ion; ( 2 ) the a b i l i t y t o locate these board rnanu- fac tur ing plants c loser t o the large ~ a r k e t areas of the U.S.; ( 3 ) the increasing acceptabi l i ty of s t ructura l board products ; and ( 4 ) the inherent benefi ts of t h i s type board compared t o plywood (Guss 1980). Coupled with these f ac to r s in the South i s the a v a i l a b i l i t y of a mi xture of low- grade hardwoods tha t may be su i t ab le as a f lake- board furni sh. ?hi s potential flakeboard furnish , which includes both low- and hi gh-densi t y wood species , needed to be economically u t i l i zed as an incentive f o r 1 andowners to convert cut-over lands t o southern pine production.
Unfortunately, these s t ruc tu ra l boards are subject t o termi te and fungal a t t ack , especia l ly in the high-risk areas of the southern and south- eastern U. S. A1 though many insect ic ides and fungicides a r e current ly being evaluated (Hal 1 e t a1. 19821, research i s lacking on the use of copper-8-qui no1 i no1 a t e (PQ-56) and di decyl- dimethyl -ammoni um chloride (CWP-41) with f lake- board. I t i s be1 ieved t h a t these two wood pre- servat ives a r e most l i k e l y t o remain acceptable t o the U.S. Environmental Protection Agency.
]/Paper presented a t Workshop on Durabil i ty, ~ e n s a c o l a , F L , October 5-7, 1982.
2jThe authors wish do express t h e i r appre- c i a t i % f o r the help given them by Br, Terry L . Amburgey, Plant Pathologist , Mississippi Forest Products Ut i l i za t ion Laboratory, Mississippi S ta t e Uni versi t y , Mi s s i s s i ppi S ta t e , MS.
3/Mention of company o r tradename i s so le ly to iden t i fy the material used and should not be in terpre ted as an endorsement by the Mi s s i s s i ppi S ta t e University o r the U.S. Department of Agric.
4/The authors are Associate Professors a t the MTssi s s i ppi Forest Products Uti 1 iza t ion Laboratory, Mississippi S ta t e University, M i s s i s s i ppi S t a t e , MS.
Consequently, the objective of his research was to evaluate the feas i bi 1 i t y of t r ea t ing ex te r io r - grade hardwood flakeboard with these two wood preservatives.
PROCEDURE
Material s
The processi PCJ var iables investigated a re l i s t e d in Table 1 . Three t r ees of each wood species in the 6- t o &inch diameter c lass were harvested From the John S ta r r Memorial School Forest , Mississippi S ta t e University, located in northeast Mi ss1 ssippi . After debarking, the bo1 t s were flaked in a F i brexa drum f l ake r . Flakes were 2.50 inches long, 0.015-inch th i ck , and had random width. The f lakes were dried t o l e s s than 5 percent moisture content in a k i ln a t 15O0F.
Forasi t e 22-743, a water so1 ubl e phenol - formaldehyde res in was obtained from Reichhold Chemicals, Incorporated, and di lu ted t o 40 per- cent res in so l ids pr ior to addit ion t o the wood f lakes . The di lu ted res in had a v iscos i ty of approximately 150 cps and a pH of 9.5.
A wax emu1 s ion, GMW-135, was obtained from Perkins Indust r ies , and sprayed onto the f lakes a t a concentration of 48 percent wax so l ids .
The two preservatives, CWP-41 and PQ-55 were obtained fron Chapman Chemical Company. The CWP-41 i s manufactured by Lonza , Incorporated, and sold as Bardac 2250. PQ-56 and CWP-41 a r e manufactured as solutions with concentrations of 70 and 50 percent, respectively. The pH was 1 .5 and 7 . 4 fo r the PQ-56 and CWP-41, respectively.
F1 akeboard Manufacture
F1 akeboard manufacturing condit ions were:
Board s i ze : 0.625-in. by 22 in . by 24 i n .
Resin: Liquid phenol -formal dehybe spray applied aJ 5% (based on ovendry weight of f l a k e s ) .
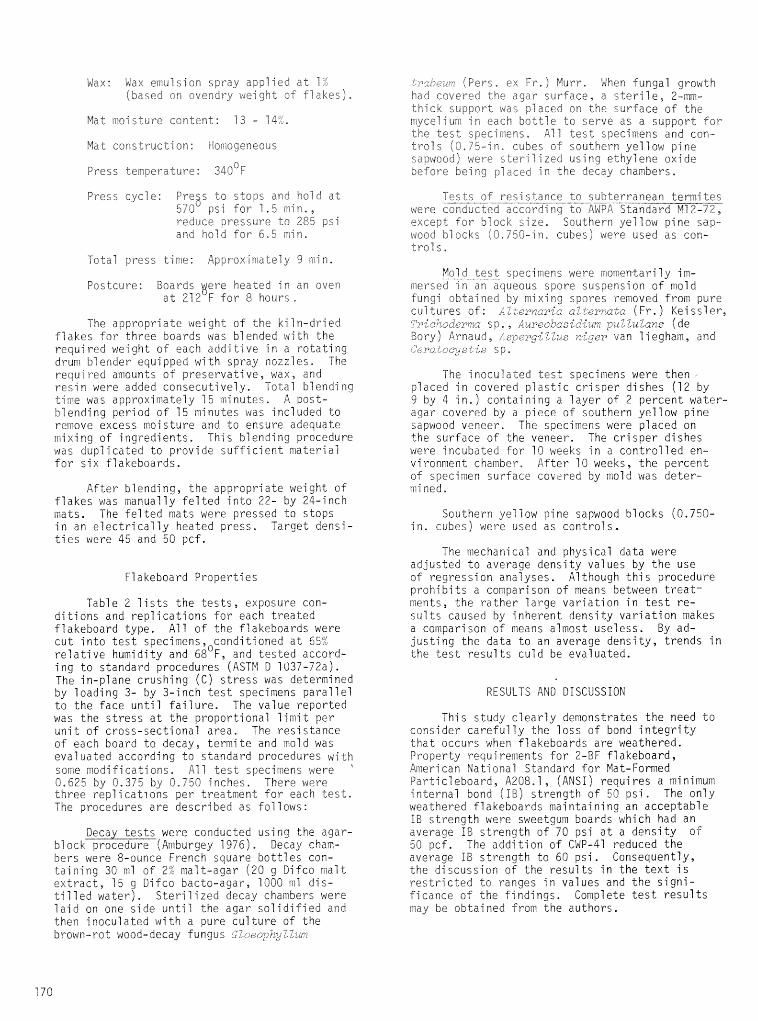
gax: Nax emulsion spray a p p l i e d a t 1" (based on gvendry weight o f f l a k e s ) ,
Mad m o i s t u r e con ten t : 73 - 14"-
Mat construction: Homogeneous
Press temperature: 340'~
Press cycle: Press t o stops and h o l d a t 570 p s i for 1.5 rnin. , reduce pressure to 285 p s i and h o l d f o r 6-5 min.
Total press time: Approxirna"r1y 9 m i n .
Postcure: Boards Were heated i n an oven a t 212 F for 8 hours.
The appropriate weight of the kiln-dried flakes f a r three boards was blended with the required weight of each addi t ive in a rotating drum Slender equipped with spray nozz les . The requi red amounts of preservative, wax, and resin were added consecutively. Total blending t i ~ e was approximately 1 5 minutes. A post- Slending period of 15 minutes was included to remove excess moisture and to ensure adequate mi xi ng of ingredients. This b l ending procedure was duplicated to provide suff ic ient material fo r six flakeboards.
After blending, the appropriate weight of flakes was manually fe l ted into 22- by 24-inch mats. The fel ted mats were pressed do stops in an e lec t r ica l ly heated press. Target densi- t i e s were 45 and 50 pcf.
Fl a keboard Properties
Table 2 l i s t s the t e s t s , exposure con- di t ions and rep1 ications for each treated flakeboard type. A11 of the flakeboards were cut into t e s t ~pecimens,~conditioned a t 65'; re la t ive humidity and 68 F , and tested accord- i ng to standard procedures (ASTM D 1037-72af. The in-plane crushing ( C ) s t ress was determined by loading 3- by 3-inch t e s t specimens para1 1el to the face until f a i lu re . The value reported was the s t ress a t the proportional l imit per unit of cross-sectional area. The resistance of each board to decay, termite and mold was evaluated according t o standard ~rocedures with some modificaticns. A7 1 t e s t specimens were ' 0.625 by 0.375 by 0,750 inches. There were three r ep l i c a t~ons per treatment f o r each t e s t , The procedures are described as follows:
Decay t e s t s were conducted using the agar- block procedure (Amburgey 7976). Decay charn- bers were 8-ounce French square bottles con- taining 30 ml of 2% ma1 t-agar (20 g Difco ma1 t extract , 75 g Difco bacto-agar, 1000 m7 dis- t i l l e d water). Ster i l ized decay chambers were la id on one side unti 1 the agar sol idif ied and then inoculated with a pure culture of the brown-rot wood-decay fungus 7Zoeopkyllm
~ra59i.07 (Pers. ex Fr.) Murr. When Pungal growth had c w e r ~ d t h e a g a r surface, a s t e r i l e , 2-mm- t h i ck s u p p o r t was placed on the surface of the mycelium in each bottle to serve as a support for the t e s t specimens, A13 t e s t specimens and con- t ro ls (0 .75- in . cubes o f southern yellow pine sapwoodj were s ter i I i z e d using ethylene oxide before be ing plzced i n the decay chambers.
T e s t s of resistance t o subterranean termites were conducted according t o AWPA Standard H12-72, except fo r block s ize , Southern yellow pine sap- wood b locks (0.750-in, cubes) were used as con- t rol s .
Mold t e s t specimens were mome~tarily im- mersed fn 30 aqueous spore suspension o f wold fungi o b t a i n e d by mixing spores removed from pure cui tures o f : A 2 e r z a r i d clzernat~ (Fr . ) Kei ssl er, Triekoder~a sp., A~recbasidiir~r p l l u l a n s jde Bory 1 Arnaud, /s?erg%lluc niqer van 1 i egham, and Zeratoe3stis sp.
The incculated t e s t specimens were then placed in covered plast ic crisper dishes (12 by 9 by 4 in. j contai n i ng a layer of 2 percent water- agar covered by a piece of southern ye1 low pine sapwood veneer. The specimens were placed on the surface of the veneer. The crisper dishes were incubated for 10 weeks in a control led en- vironment chamber, After 70 weeks, the percent of specimen surface covdred by mold was deter- mi ned.
Southern ye7 1 ow pine sapwood blocks (0.750- in. cubes) were used as controls.
The mechanical and physical data were adjusted to average density values by the use o f regression analyses. Although t h i s procedure prohibits a cowparison of means between t rea t - ments, the rather large variation in t e s t re- sul t s caused by inherent density variation makes a comparison of means almost useless. By ad- justing the data to an average density, trends in the t e s t resul ts culd be evaluated.
RESULTS A N D DISCUSSION
This study clearly demonstrates the need t o consider carefully the loss of bond in tegr i ty t h a t occurs when flakeboards are weathered. Property requirements fo r 2-BF flakeboard, American National Standard for Mat-Formed Particleboard, A208.1 , (ANSI) requires a minimum internal bond (IB) strength o f 50 psi. The only weathered F l akeboards mai ntai ni ng an acceptable IB strength were sweetgum boards which had an average IB strength of 70 psi a t a deosity of 50 pcf. The add4 tion of CUP-41 reduced the average IB strength to 60 psi. Consequently, the discussion of the resul ts in the tex t i s res t r ic ted t o ranges in values a n d the signi- ficance of the findings. Complete t e s t resu l t s may be obtained from the authors.
Unweathered F l akeboard P r o p e r t i e s
1. Copper-8-quinol ino l - T rea ted F lakes
I t2 ternal bond s t r e n g t h s o f t h e unweathered, PQ-56 t r e a t e d f lakeboards a r e g i v e n i n f i g u r e s 1 and 2, Resu l t s show t h a t t h e a d d i t i o n o f t h i s p r e s e r v a t i v e decreased t h e I B s t r e n g t h s o f t h e t r e a t e d f lakeboards. The amount o f l o s s was dependent on a d d i t i o n l e v e l , f l a k e species and f l a k e b o a r d d e n s i t y . The l a r g e s t l o s s occur red when p i n e f lakeboards a t a d e n s i t y o f 52 p c f were t r e a t e d a t an a d d i t i o n l e v e l a f 0.11 p c f . I B s t r e n g t h decreased f rom 200 t o 10 p s i , a 9570 l o s s . The s m a l l e s t l o s s ( 1 3 % ) occur red when w h i t e oak f lakeboards a t a d e n s i t y o f 48 p c f were t r e a t e d a t an a d d i t i o n l e v e l o f 0.02 p c f o r where I B s t r e n g t h decreased f rom 80 t o 70 p s i . A t t h e 0.02 p c f t rea tment 1 eve1 , a1 1 species except h i c k o r y produced f l akeboards w i t h I B s t r e n g t h s g r e a t e r than t h e r e q u i r e d 50 p s i . A t t h e 0.11 p c f t rea tment l e v e l , o n l y sweetgum f lakeboards had I B s t r e n g t h s g r e a t e r than 50 p s i .
I n a d d i t i o n t o t h e p r e s e r v a t i v e t rea tment e f f e c t s , r e s u l t s i n d i c a t e a s t r o n g dependency o f I B s t r e n g t h on species. T h i s r e s u l t may be due t o a combinat ion o f v a r i a b l e s , i n c l ud i ng species d e n s i t y , f l a k e geometry, pH and b u f f e r i n g e f f e c t s o f t h e s p e c i f i c species.
The lower t h e d e n s i t y o f t h e species, t h e h i g h e r t h e compaction r a t i o o f t h e boards. Com- p a c t i o n r a t i o (CR) i s d e f i n e d as t h e r a t i o o f board t o species d e n s i t y . Compaction r a t i o s f o r t h e v a r i o u s f lakeboard types a r e l i s t e d i n t a b l e 3. A l i n e a r r e g r e s s i o n 05 I B versus CR, I B = 155.0 (CR) -76.2, has a R va lue o f 0.95 f o r t h e 48 p c f boards. Th is c o r r e l a t i o n between I B and CR suppor ts t h e b e l i e f t h a t i n t i m a t e f l a k e con- t a c t appears t o be t h e ma jo r f a c t o r a f f e c t i n g bond i n t e g r i t y i n f l akeboards. Hse e t a1. (1 975), r e p o r t e d s i m i l a r r e s u l t s . The amount o f r e s i n p e r board was cons tan t w i t h i n a d e n s i t y l e v e l , b u t t h e amount o f r e s i n per wood f l a k e would de- pend on t h e s p e c i f i c g r a v i t y o f t h e wood species and f l a k n geometry. There were obv ious d i f - ferences i n t h e f l a k e geometry o f t h e f i v e species, b u t no a t tempt was made t o c o r r e l a t e f l a k e geometry t o f l akeboard p r o p e r t i e s . More research needs t o be done i n t h i s area.
F lake pH and b u f f e r i n g e f f e c t were determined f o r each o f t h e f l a k e species. The r e s u l t s a r e shown i n f i g u r e 3 and summarized i n t a b l e 3. P ine f l a k e s had t h e lowes t i n i t i a l pH, 4.5, and had t h e s t r o n g e s t b u f f e r i n g e f f e c t , 2.1 ( L pHlmi1- 1 imol es NaOH) . Apparent ly , t h e p i n e e x t r a c t i v e s depress t h e f l a k e pH and c o n t r i b u t e t o t h e b u f - f e r i n g e f f e c t a t h i g h pH. H i c k o r y f l a k e s had t h e h i g h e s t i n i t i a l pH, 5.6, and, a long w i t h sweetgum f l a k e s , had t h e weakest b u f f e r i n g e f f e c t , 6.7 ( A pH/rni 11 imo l es NaOH) . There appears t o be a poor l i n e a r c o r r e l a t i o n between IB and i n i t i a l
.14), and a1 so between I B and b u f f e r i n g = 0.12). Consequently, i n i t i a l f l a k e
pH and b u f f e r i n g e f f e c t a re n o t major f a c t o r s r e l a t i n g I B s t r e n g t h t o species.
However, i t i s p l a u s i b l e t h a t t h e combined a c i d i c and b u f f e r i n g c h a r a c t e r i s t i c s o f t h e wood e x t r a c t i v e s and PQ-56 i n f l u e n c e t h e chemical r e a c t i o n s t h a t occur d u r i n g bond f o r m a t i o n be- tween wood f l a k e s . PQ-56 has a pH o f approx i - m a t e l y 1.5. As t h e pH o f t h e r e s i n medium i s reduced, t he a1 kaf i n e b u f f e r o f t h e r e s i n i s n e u t r a l i z e d , causing t h e r e s i n cu re r a t e t o be reduced. Consequent1 y , i n t h e a1 1 o t t e d press t ime bond f o r m a t i o n i n t h e p i n e f lakeboards may n o t have had s u f f i c i e n t r e a c t i o n t ime. P ine f l a k e s had t h e lowes t pH and e x h i b i t e d t h e g r e a t e s t b u f f e r i n g ( t a b l e 3 ) and showed t h e g r e a t e s t l o s s i n I B s t r e n g t h when t r e a t e d w i t h PO- 56.
The decrease i n I B s t r e n g t h o f t h e v a r i o u s f lakeboards a l s o c o u l d be caused by l o c a l i z e d a c i d h y d r o l y s i s o f t h e wood s u b s t r a t e by t h e p r e s e r v a t i v e . Whatever t h e cause, sweetgum f l a k e b o a r d appears t o be t h e o n l y species t e s t e d which can be t r e a t e d w i t h PQ-56 a t 0.11 p c f and m a i n t a i n acceptable I B va lues.
In -p lane c r u s h i n g (C) s t r e s s o f t h e un- weathered PQ-56 t r e a t e d f lakeboards i s g iven i n f i g u r e s 4 and 5. The p i n e and h i c k o r y f l a k e - boards a t a d e n s i t y o f 48 p c f showed an average decrease o f 53% i n C s t r e s s . Note t h a t these two f l a k e b o a r d types a l s o showed t h e g r e a t e s t decrease i n I B s t r e n g t h s when t r e a t e d w i t h PQ-56. S i m i l a r l osses i n C s t r e s s were observed f o r t h e h i g h e r d e n s i t y f lakeboards, 53 p c f . But, t h e h i g h e r d e n s i t y boards had t h e g r e a t e r C va lues due t o t h e g r e a t e r compaction r a t i o s .
Except f o r p i n e f lakeboards , t h e species dependency o f t h e C va lues f o l l o w e d t h e same o r d e r as t h e I B va lues. The average lower C va lue o f t h e p i n e f lakeboards cannot be ex- p la ined . A l though t h i s board p r o p e r t y i s based on a s t a t e o f combined s t resses , t h e l i n e a r r e l a t i o n s h i p between I B and C va lues o f u n t r e a t e d f lakeboards has a R* va lue o f 0.69. The C t e s t i s much q u i c k e r and appears t o be more p r e c i s e than t h e I B t e s t . A lso, t h e C t e s t i s i n d i c a t i v e o f t h e bond i n t e g r i t y o f f l akeboards w i t h o u t t h e dependency o f r a t h e r h i gh-qua1 i t y board sur faces t h a t a r e r e q u i r e d f o r t h e I B t e s t .
Thickness s w e l l (TS) va1 ues o f t h e un- weathered PQ-56 t r e a t e d f lakeboards a r e g iven i n f i g u r e s 6 and 7. Wi thout excep t ion , t h e a d d i t i o n o f t h i s p r e s e r v a t i v e adverse ly a f f e c t e d t h e TS p r o p e r t i e s o f t h e t r e a t e d f lakeboards . A t t h e 0.11 p c f a d d i t i o n 1 eve1 , TS f o r t h e 43 p c f boards ranged f rom 412 f o r t h e sweetgum boards t o 60% f o r t h e p i n e boards. I n c r e a s i n g board d e n s i t y d i d n o t s u b s t a n t i a l l y change t h i s t rend . Except f o r t h e p i n e boards, inc reases i n TS o f f l a k e - boards t r e a t e d a t t h e 0.02 p c f a d d i t i o n l e v e l were s i m i l a r t o inc reases observed f o r t h e h i g h e r a d d i t i o n l e v e l s . Apparent ly , t h e 0.02 p c f add i - t i o n l e v e l i s beyond a t h r e s h o l d va lue f o r i n t e r - fe rence w i t h bond f o r m a t i o n between f l a k e s . Th i s t r e n d i s e x e m p l i f i e d by a f a i r l y genera l i nc rease o f 29% i n TS o f t h e t r e a t e d f lakeboards .
Usually higher density boards swell more t h a n 1 ower densi Gy hoards. Apparently, the difference between t h e two density levels was not la rge enough t o observe the expected dif- ference i n associated TS values,
The v a r i a t i o n in TS w i t h respect to species cou ld be caused by d i f f e r ~ e c e s in species den- stty, f l a k e geonedt-y, e tc , Generally, a t a c o n s t a q t f l akehoard dens i ty , boards made of lower density species will exki bi t greater 15, T h i s i s due to the effects o f the f l ake eompres- s ion previously bescri bed . Results of thickness swell do n o t fo l ' iew "cis expected trend, jmply- ing t h a t f l a k e geometry, chemical make-up, a n d / o r some otber processing parameter i s the c o n t r o l l i n g factor. Consequently, t he expected nega t i ve7 y carrelated re la t i onshi p between IB a n d f S was not observed.
(MOB) and modulus of unweathered PQ-5-6
t reated flakeboards are shown in fiqures 8 throujh 11 A? 1 unweathered flakeboards had avergge MOR values in excess of the minimum 3000 ps? required by ANSI. Only white oak flakeboard ;t a density of 45 pcf did not have the minimum 500 x 703 gsi MOE value required by ANST. Ex- cept for pine flakeboards, the addition of PQ-56 did not greatly decrease the MOR or HOE. A t both 45 and 49 pcf density levels, the pine flakeboards treated a t 0.17 pcf retained approx- imately 46:; and 802 of the i r MOR and MOE values, respectively. These reductions, being greater than 50%, make PQ-56 treated pine flakeboards unacceptable according to ANSI Standards.
The order of the species with respect to decreasing MOR was similar to that found for IB. This would be expected, considering that both bending strength and IB are pssi t ively corre- l a t e d to the C R (Moslemi 7974). In addition to C R , MOR i s also dependent on the different ia l density over the thickness profi 1e (densi ty pro- f i l e ) , whereas I B i s a l s o sensitive to the qual- i t y of bond f o r ~ e d between flakes.
Flake geometry would have a major influence on both the density profile and quality of bond formed during the fabrication of the flakeboards, Maloney (1 977) has reported that a1 though relationships between flake geometry and board properties do ex i s t , the relationships are not c lear ly defined.
Decay resistance of the unweathered @Q-56 t reated flakeboards is shown in fiqures 12 and 13, The efficacy of the PQ-56 as a fungicide a t the 0,57 p c f treatment level was very evident, Although the extent of efficacy was species dependent, the change in flakeboard density from 48 to 52 pcf had l i t t l e effect . A t a flakeboard density of 48 p c f and 0.11 pcf treatment level , average weight losses due to decay ranged from 6.4% for hickory boards to 0 . 3 O L for pine boards. Compared to controls, these values represent a 65% and 98% reduction in weight loss fo r the two species, respectively. Simi 1 a r resul ts were observed for the higher density f l akeboards.
The we1 1 k n o # ~ n natural decay resi stance of white oak was evident (Scheffer and Cowling 1866). Untreated flakeboards a t a density of 48 p c f had average weigh t losses due t o decay r a n g i n g f rom 21 '6% fo r sweetguq bcards t o 14.7" f o r white oak boards ( f i g , 1 2 ) . The average weight loss fo r the untreated pine flakeboards a t a density o f 48 pcf has 17.9', and the p i n 2 wood control blccks had an average weight loss of 16.7%. This, i t appears t h a t the nedium-density pine f lakeboard may have approxi~qately the same decay suscepti- Dil i ty as southern ye1 l o w pine sapwood.
Termite resistance o f the unweathered, PQ-56 treated flakeboards i s shown in figures 74 and 75, This observation i s reasonabt e considering the d a t a on the use of PQ-56 fungicide.
All the flakeboards treated a t 0.11 pcf had less than 47- weight loss , and less than 8% when treated a d 0-02 pcf, These values represent substantial improvements in termite resistance considering that the untreated, 48 pcf flakeboards had weight losses ranging from 14.5% for pine boards to 5,54 for hickory boards. A t the 0.11 pcf treatment level , pine flakeboards had a 3.37 weight loss , and the hickory flakeboards had a 3.06 weight loss . Bcth visual observations of blocks and weight losses of blocks caused by termite Feeding indicate that PQ-56 a t 0.11 pcf was very effective in protecting flakeboards frov attack by subterranean termites. Thus, there was a i 7Z improvement i n term-ite resistance o f the PQ-56 treated pine boards. Hickory flakeboards, with the i r rather high natural resistance to termite a t tack, may not require treatment fo r termite control.
The resul ts on tsrmite resistance are based on weight loss data of treated and untreated flakeboards and a visual evaluation of t e s t speci- mens as established by AWPA Standard M12-72. A1 though the vi sual evaluation i s a subjective evaluation, the resul ts of the visual evaluation complement the weight loss resul ts ( f i g s . 14 and 1 5 ) .
The oaks and hickories appeared t o have a relative1 y higher natural resistance to termi t e attack than the sweetgum and pine boards. Weight loss by terrni t e attack was closely related to the species density; i . e , , as flakeboard density increased, weight loss decreased ( ~ 2 = 0.941, T h i s trend also appeared t o exis t with increasing panel density. The higher density boards had the lowest weight loss due to termite attack. Increasing flakeboard density 8'; decreased weight loss due to termite attack more than 30%.
Control samples of southern ye1 low pine wood blocks had an average weight loss o f 13.7". Thus, i t appears that resistance of pine flakeboards to termite attack i s similar to that f o r sol id wood,
Mold resistance of the unweathered PQ-56 treated flakeboards i s shown in Figures 16 and 47, The effect of the two treatment levels were simi- l a r , and efficacy for controlling the growth of
mold fungi was evident. A t a flakeboard density of 48 pcf, the surface coverage by the mold fungi of the untreated flakeboard t e s t specimens ranged from 100% for pine boards t o 75.0': fo r white oak boards. Untreated hickory flakeboards had a 229 surface coverage. A t the same density level , the surface coverage of the 0.17 pcf treated flakeboards ranged from approximately 40" fo r pine to 6% fo r hickory boards. Compared to con- t r o l s , these values represent an efficacy of 6C% and 73" fo r the pine and hickory boards, respec- t ively. Increasing the board density to 52 pcf improved the efficacy of PQ-56. Pine flakeboards had a surface coverage o f approximately 2Y5, representing a 43% increase in efficacy by in- creasing board density 8%.
Mold fungi do not usually deteriorate the cell wall of wood b u t grow e i ther on the surface or within the cel l lumens, l iving mainly on sugars and starches found in ray parenchyma (Haygreen and Bowyer 1982). A1 though f 1 a ke geometry i s believed not to have an influence on the severity of attack by fungi on flakeboards (Mosl emi 1974) , f 1 ake geometry would be di rect ly related t o the surface density of the associated flakeboards. The greater the surface densifi - cation of the flakeboards, the more d i f f i cu l t i t would be for mold hyphae to penetrate the flake- board surface, Density profiles were not deter- mined for the various flakeboards, but there i s a direct relationship between MOR and mold coverage. The migration of extractives to the surfaces of the flakeboards during board consoli- dation in the hot press may also explain the increase in mold coverage of the higher density boards.
A summary of the efficacy of PQ-56 as a fun- gicide, termi t i c ide and mi ldewcide for flakeboard i s shown in table 4. As expected, the ranking of flakeboard by species with respect to improvement in resistance to biological deterioration was similar fo r both decay and termite t e s t s . Al- though increase in mold resistance in PQ-56 treated samples was somewhat less than the other properties tes ted, mold resistance would not be as c r i t i c a l in most i n-servi ce appl i cations. The siding market would be a noted exception. Considering these bi 01 ogi cal t e s t resul ts to- gether with the observation that treated sweetgum flakeboards were the only boards with acceptable strength properties, i t would be technically feasible to use PQ-56 as a preservative for flakeboards made with sweetgum.
2. Di decyl -Dimethyl -Ammi um Ch1 ori de Tested F1 a kes
Internal bond strengths of the unweathered, CWP-41 treated flakeboards are siven in fiqure 2 . For 52 pcf density flakeboards , - th i s reduced the IB strengths approximately the same amount fo r both treatment levels of 0.2 and 0.3 pcf. Internal bond strength was reduced from 210 to 180 psi for sweetgum, from 200 to 160 psi fo r pine, and from 100 to 70 psi for hickory boards. These values represent strength losses
of 14?, 20R, and 30% fo r the three board types, respectively. B u t a1 7 t reated flakeboards had average IB strengths greater t h a n the i~~inimum ANSI requirement of 50 psi. Test resul ts appear to indicate that the difference between the treatment levels was not great enough to produce noticeable changes in IB strengths. Results do indicate tha t , a t the addition levels tes ted, the CWP-41 preservative did not adversely affect I B resul ts as much as did the PO-56 preservtive. One reason for t h i s could be that CWP-41 has a pH o f approximately 7 . 4 , thus i t kdould cause less interference with the chemical reactions of the bonding mechanism and 1 e s s 1 ocal i zed hydrolysi s than could have occurred hi th the ref atively higher aci di c PQ-56 preservative.
In plane crushing s t ress values of the unweathered CWP-41 treated flakeboards are given in figure 5. Only hickory flakeboards showed a decrease in the C s t ress value from 1360 psi to approximately 990 psi which i s a 27% loss in the C s t ress value. The treatment did not reduce the C s t ress values of e i ther the pine or sweetgum flakeboards. Actually, there did appear to be a s l igh t tendency for the treatment to increase the C s t ress values of these two flakeboard types. Additional research needs to be conducted t o verify t h i s possibi l i ty .
Thickness swell val ues of the unweathered CWP-41 treated flakeboards are siven in f i sure 7. The addition of th i s preservati;e to pine ?lake- boards did not affect the TS values. The pre- servative did adversely a f fec t the TS values of both the sweetgum and hickory boards, b u t not to the same extent as did the PQ-56 treatments. The TS values increased from 7 to 25% for the 0.30 pcf treated sweetgum and from 25 to 38% for the treated hickory f1 akeboards.
Modulus of rupturc and modul us of el a s t i ci ty values of the unweathered CWP-41 treated flake- boards are given in figures 9 and 11 , respec- t ively. Neither the MOR nor MOE properties of the sweetgum and hickory flakeboards were ad- versely affected by the perservative treatment. There appears to be a s l igh t improvement in these properties for the pine flakeboards when treated wi t h CWP-41.
Decay resistance of the unweathered CWP-47 treated flakeboards i s shown in figure 13. Both treatment 1 eve1 s of the preservati ve di d not greatly change the amount of decay resistance of the treated hickory flakeboards. B u t there did appear to be some protection provided by the treatment t o the sweetgbm and pine boards. The amount of decrease in decay resistance was approx- imately 282 and 23% for the sweetgum and pine boards, respectively. Generally, there were no substantial differences between the eff icacies of the two CUP-41 treatment levels.
Termite resistance of the unweathered CWP-41 treated flakeboards i s shown in figure 15. There appears to be substantial improvement in the resistance to termite attack with the addition of
t h i s preservative, especia l ly a t the 0.30 pcf l eve l , B u t , the e f f e c t was only observed f o r the sweetgum and pine boards. Although the weight lo s s due t o termite a t tack of the t r ea ted flakeboards was only about 3% f o r a l l three wood species evaluated, untreated hickory had an average weight loss of only 3%. As with the PQ-56 t r ea ted flakebords, visual evaluation data as es tabl ished by AWPA substantiated the weight lo s s data.
Mold res is tance of the unweathered CWP-41 t r ea ted flakeboards i s shown in f igure 17 . The 0.30 pcf treatment level of preservative did increase the res is tance t o mold of the sweetgum and pine boards by approximately 38%. There appeared t o be very l i t t l e e f f e c t on the re- s i s t ance t o mold by the 0.20 pcf treatment level in a l l three species of flakeboards.
A summary of the ef f icacy of CWP-41 with flakeboard i s shown in t ab le 5, A comparision of the two preservatives, PQ-56 and CWP-41, indi - ca t e s t h a t the ac id ic preservative, PQ-56, i s generally a be t t e r preservative a t approximately one-third the loading r a t e than the neutral pre- se rva t ive , CWP-41 ( t a b l e s 4 and 5 ) . The cos t of PQ-56 i s aproximately 10-fold t h a t of CWP-41. This r a the r large cos t d i f f e r e n t i a l would economi- c a l l y j u s t i f y much higher loading ra t e s of the CWP-41 preservative.
Weathered Flakeboard Properties
Internal bond s t rength of test-fence- weathered, untreated sweetgum flakeboards i s shown i n f igure 18. I t became apparent during t h i s study t h a t the amount of var ia t ion in weathered IB samples was much l a rge r than t h a t of unweathered samples, Thus, the number of IB samples needs t o be ra ther large f o r s t a t i s t i c a l analys is t o be meaningful. Consequently, only trends in IB t e s t r e s u l t s a re reported. Results indica te t h a t the sweetgum flakeboards were the only boards t h a t had an average IB strength greater than 50 psi a f t e r a 3-month exposure. The untreated sweetgum flakeboards decreased from an i n i t i a l IB of 210 psi t o 70 psi a f t e r a 3-month exposure. This i s only a 33% strength re tent ion. After a 6-month exposure, the IB s t rength was below 50 ps i .
The addit ion 50 psi a
PQ-56 t rea ted sweetgum boards, a t both l e v e l s , had average IB s t rengths below
f t e r 3-months on the t e s t fence. The CWP-41 t rea ted sweetgum boards had somewhat higher IB s t rength than the PQ-56 t rea ted boards, but the values were only marginal.
Flakeboards Made with a Species Mixture
Properties of flakeboards made with a mix- tu re of the wood species a re shown i n the respec- t i v e f igu res previously noted. Table 6 contains the ru le of mixture data of the untreated and unweathered flakeboards. Predicted board prop-
e r t i e s were determined using the ru le of mix- tures .
General 1 y , the mechanical , physical , and biological properties fo1 low the ru le of mixtures f a i r l y wel l , For example, the untreated f lake- boards had an actual MOR of 3420 psi and a pre- dicted MOR o f 3720, a 9% difference. The biologi- cal properti es showed simi 1 a r resul t s . Weight loss due t o decay was 19.4" compared t o a pre- dicted los s of 18.1%, a 7% difference. Weight loss due t o termi te a t tack was 10.0% and weight loss due t o mold fungi was 32.0%, representing a 1% and 13% dif ference from the predicted values, respective1 y.
These r e s u l t s indica te t h a t a spec i f i c prop- e r t y of a flakeboard made from a mixture of wood species can generally be predicted from data f o r individual species. Except f o r IB, TS, and mold res is tance , the predicted values were within 10% using the ru le of mixture.
CONCLUSION
These conclusions summarize the f indings of the evaluation of the properties and d u r a b i l i t y of copper-8-quinol i nolate (PQ-56) and didecyl- dimethyl -ammoni u m chloride (CWP-41) t r ea ted 2-BF f 1 a keboard.
1. The ac id ic preservative, PQ-56, a t a loading r a t e of 0.02 pcf adversely a f f e c t s f lake- board qua l i ty .
2. The neutral preservative, CWP-41, a t a loading r a t e of 0.30 pcf does not great ly a f f e c t flakeboard qual i ty .
3. S t a t i c bending s t rength and in ternal bond strength of flakeboards are wood species dependent.
4. Of the f i v e species evaluated, only sweetgum flakeboards had the best weathering durab i l i ty .
5. Efficacy of the PQ-56 preservative a t a loading of 0.02 pcf was demonstrated.
LITERATURE CITED
Amburgey , Terry 1976. Observations on the soil-block and agar-
block methods of evaluating wood decay. Material und Organisimen 11, Heft 4 Verl ag quncker and Humbl a t , 1 000& Eerl in 41.
American Society f o r Testing and Materials 1977. Standard method of t e s t ing wood preser-
vatives by laboratory soil-block cul- t u res . ASTM Design Dl 41 3-76. ASTM, Phi 1 adel phi a , PA.
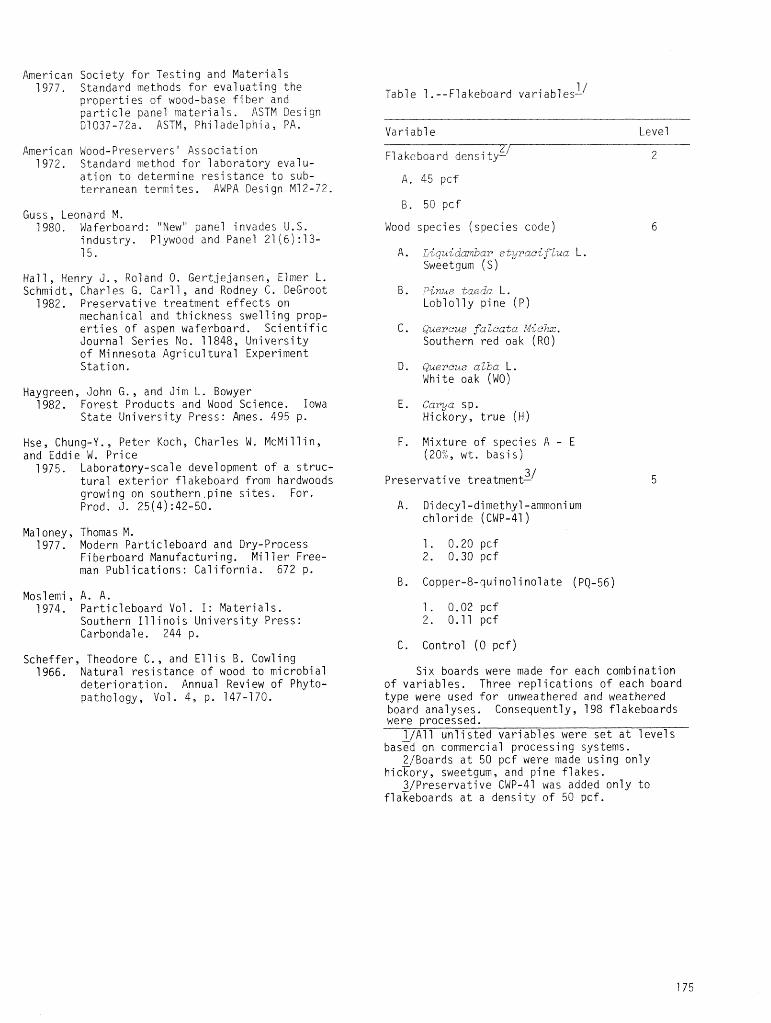
American Society f o r Testi ng and Materi a1 s 1977, Standard methods f o r evaluating the
properti es of wood-base f i b e r and p a r t i c l e panel mater ia ls . ASTM Design 01037-72a. ASTM, Philadelphia, PA.
American Wood-Preserversi Association 1972. Standard method f o r 1 aboratory eval u-
a t ion t o determine res is tance t o sub- terranean termi t e s . AWPA Desi gn Ml2-72.
Guss, Leonard M. 1980. Waferboard: '"ew" panel invades U. S.
industry. Plywood and Panel 21 ( 6 ) : 13- 15.
Hal 1 , Henry J . , Roland 0. Gertjejansen, Elmer L . Schmidt, Char1 es 6. Carl 1 , and Rodney C . DeGroot
1982. Preservative treatment e f f e c t s on mechanical and thickness swelling prop- e r t i e s of aspen waferboard. S c i e n t i f i c Journal Ser ies No. 11 848, University of Mi nnesota Agri cul tu ra l Experiment Sta t ion.
Haygreen, John G . , and Jim L . Bowyer 1982. Forest Products and Wood Science. Iowa
S ta t e University Press: Ames. 495 p.
Hse, Chung-Y. , Peter Koch, Charles W . McMi 11 i n , and Eddie W . Price
1975. Laboratory-scal e development of a s t ruc- tu ra l ex te r io r flakeboard from hardwoods growing on southern, pine s i t e s . For. Prod. J . 25(4) :42-50.
Maloney, Thomas M. 1977. Modern Part icleboard and Dry-Process
Fiberboard Manufacturing. Mi 1 l e r Free- man Pub1 ica t ions : Cal i fo rn ia . 672 p .
Moslemi, A. A . 1974. Part icleboard Vol . I : Materials.
Southern I1 1 i noi s University Press: Carbondale. 244 p.
Scheffer, Theodore C . , and E l l i s B . Cowling 1966. Natural res is tance of wood t o microbial
de te r io ra t ion . Annual Review of Phyto- pathology, Vol. 4, p . 147-770.
1 / Table 1 .--Flakeboard variables-
Variable Level
L / F l akeboard densi ty-- 2
B . 50 pcf
Wood species (species code) 6
A . Liquidmbar s ty rae i f lua L . Sweetgum (S)
b. Pinus taeda L . Loblolly pine (P)
C . Quercus yfakata Fdicka. Southern red oak ( R O )
D . Quercus alba L . White oak (WO)
E . C a r p sp. Hickory, t r u e (H)
F . Mixture of species A - E (20%, w t . bas is )
3/ Preservative treatment-
A. Di decyl -dimethyl -ammoni um chlor ide (CWP-41)
1 . 0.20 pcf 2 . 0 . 3 0 p c f
8. Copper-8-qui no1 i no1 a t e (PQ-56)
1. 0.02 pcf 2 . 0.11 pcf
C . Control (0 pcf)
Six boards were made f o r each combination of var iables . Three repl ica t ions of each board type were used f o r unweathered and weathered board analyses. Consequently, 198 flakeboards were processed.
1/All unl is ted var iables were s e t a t levels baszd on commercial processing systems.
2/Boards a t 50 pcf were made using only hicxory, sweetgum, and pine f lakes .
3IPreservative CWP-41 was added only t o f l a k b o a r d s a t a density of 50 pcf.
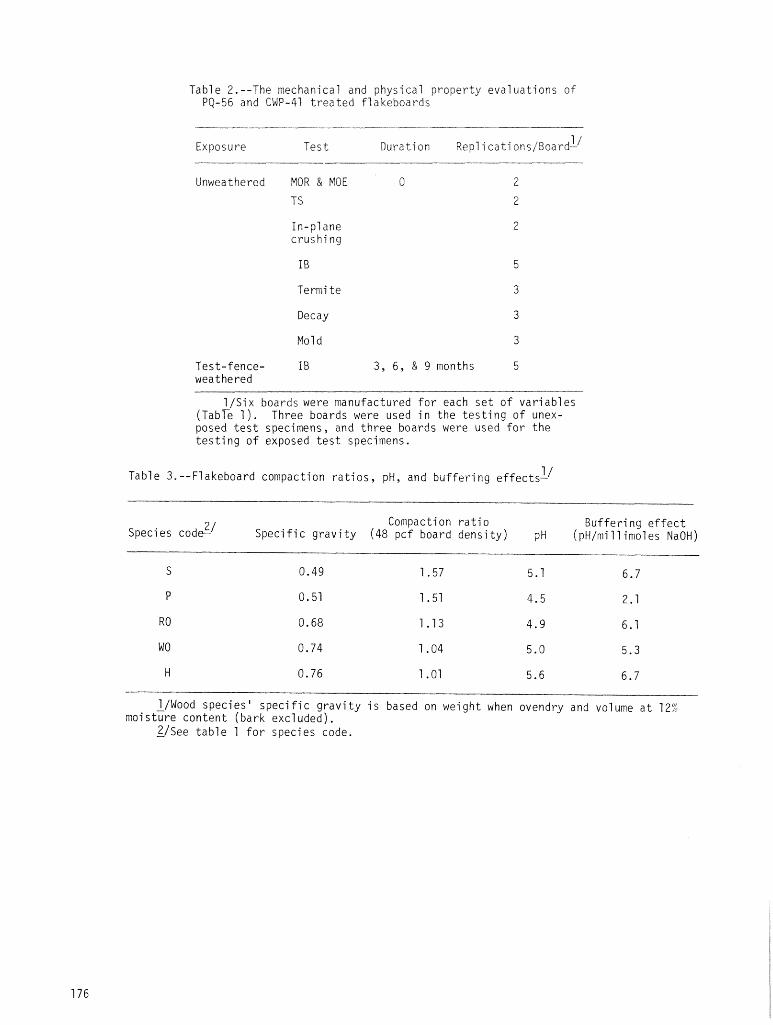
Tab1 e 2 . --The mechanical and physical property evaluations of PQ-56 and CMP-41 treated flakeboards
Exposure Test l / Duration Rep1 i cat i ons /Board-
Unweathered MOR & HOE 0
TS
In-plane crushing
Termi t e
Decay
Mol d
Test-fence- I B 3 , 6 , & 9 months weathered
l/Six boards were manufactured for each se t of variables ( a 1 Three boards were used in the tes t ing of unex- posed t e s t specimens, and three boards were used for the tes t ing of exposed t e s t specimens.
1 / Table 3. --Flakeboard compaction ra t ios , pH, and buffering effects-
Compaction ra t io Buffering e f fec t Species code- 'I' Specific gravity (48 pcf board density) pH (pH/mill imoles NaOH)
l/Wood species' specific gravity i s based on weight when ovendry and volume a t 12% moisture content (bark excluded) .
Z/See table 1 fo r species code. -
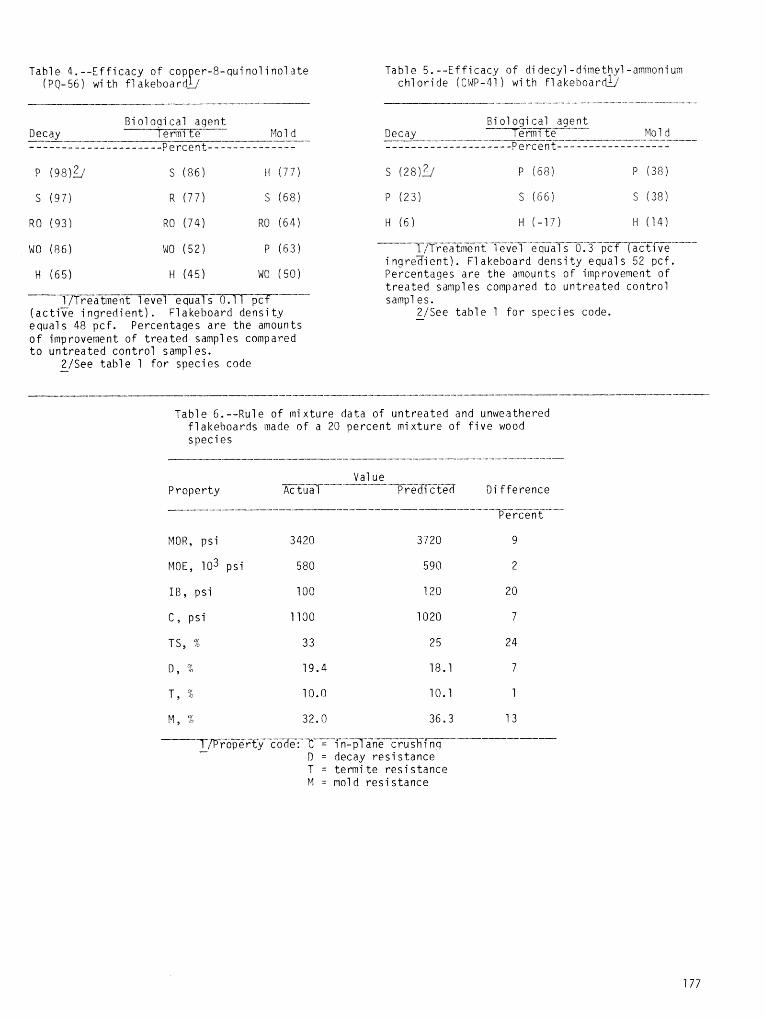
Table 4.--Efficacy of cop er-8-quinolinolate P 1 PQ-561 wi t h f1 a k e h o a r u Table 5.--Efficacy of di decyl -dinethyl -ammonium
chloride (CWP-41) with flakeboar&
B i 01 ogi cal agent Decay ------ 1 erm~ t e Mol d ---- --------------------- Percent--------------
T ~ r e a t m e n t 1 eve1 equal s 0.1 1 pcf (ac t ive ingredient) . Flakeboard density equals 48 pcf. Percentages are the amounts of improvement of treated samples compared t o untreated control samples.
2fSee table 1 for species code -
B i 01 ogi cat agent --Te-fiTt-e----- Decay Mol d -----...-------------- Percent------------------
-- --------------------.- -- lfireatmer~t level equals 0.3 pcfx?f'h%----
i ngrezient). Fl akeboard density equal s 52 pcf. Percentages are the amounts of irnprovenlent of treated samples compared to untreated control sampl es.
2/See table 1 for species code. -
Table 6.--Rule of mixture data of untreated and unweathered flakehoards made of a 20 percent mixture of five wood species
Val ue ------ ----------- ---- Property Actual Predicted Di fference ------------------------------------------ -
Percent
N O R , psi 3420 3720 9
M O E , 103 psi 580 590 2
I B , psi 100 120 20
C , psi 1100 1020 7
TS, % 3 3 2 5 24
1 / P o ~ e T f y - C o i f e - - ~ = - 1 7 - ~ ~ n T c T u 3 - i ~ - - - - - - - - - - - D = decay resistance T = termi t e resi stance N = mold resistance
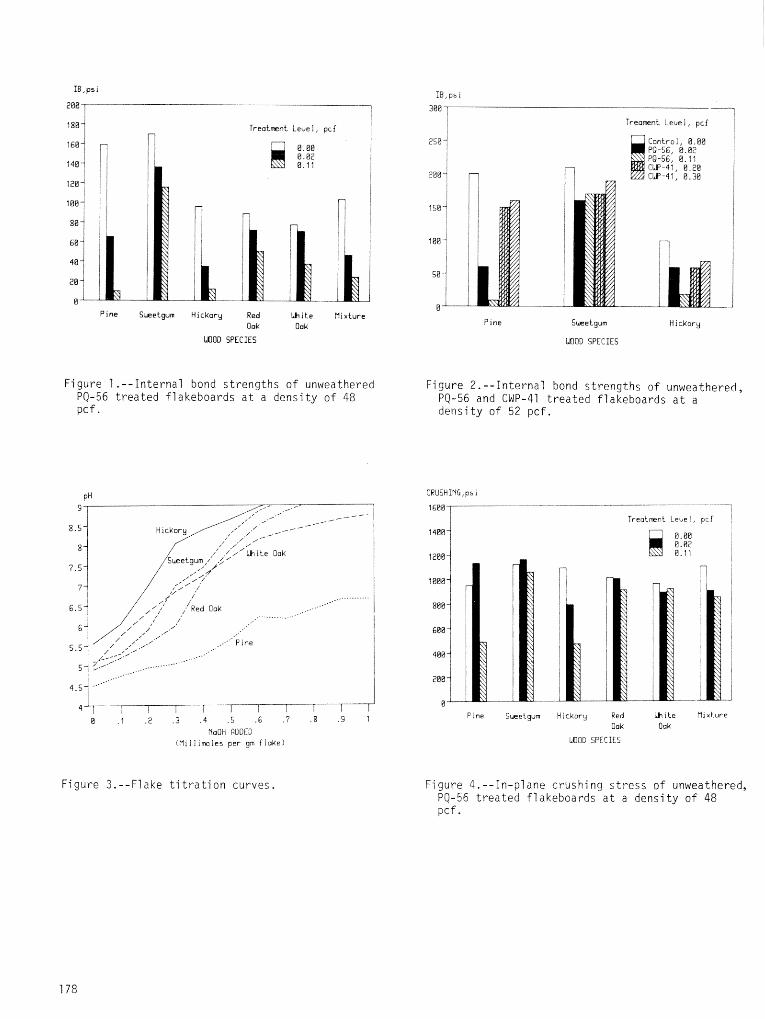
I
T r e o t m n t L e u e i , pcf I
Pine Suzetgum Hickory Red W i t e t l ixture
Oak Oak
WDOD SPECIES
Figure 1.--Internal bond strengths of unweathered PQ-56 t rea ted flakeboards a t a density of 48 pcf.
I T r e o m n t Leuel , pcf
f
C o n t r o l , 8.88 1 PO-56, B.BP I
PO-56, 8.11 I
n CW-47, 8.2B I CW-47,8.38 1 : I I
P i n e Sucetgurn Hickory
WUOD SPECIES
Figure 2.--Internal bond s t rengths of unweathered, PQ-56 and CWP-41 t rea ted flakeboards a t a densi t y of 52 pcf .
CRUSHING, ps i i--------- - 7 Treotment Leue!, pcf ,
. 1 .2 .3 . 4 .5 .6 . 7 .8 .9 1 P ine Sweetgum Hickory Red b i t e Hixt.ure
Oak Ool( NoDH RDDED
( t l i i i i m l e s p e r gn f l a k e ) @OD SPECIES
Figure 3. --Flake t i t r a t i o n curves. Figure 4.--In-plane crushing s t r e s s of unweathered, PQ-56 t rea ted flakeboards a t a density of 48 pcf.
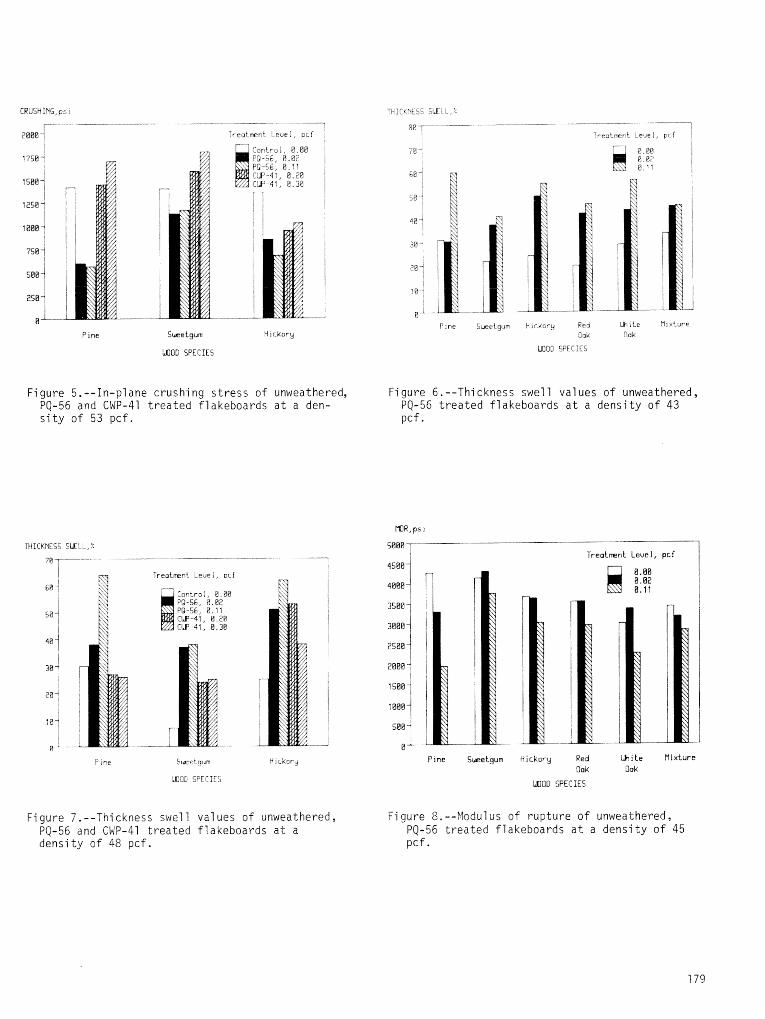
CRUSHING, p s 1
--- - I
2888 4 T r e o t m n t eue i , p r i
Pine Sweetgum Hickory
LGDD SPECIES
F i r e Swetgum Plckorg Reo Jhite R ~ x L u r e 3ok 3ali
MOD SPECIES
Figure 5.--In-plane crushing s t ress of unweathered, PQ-56 and CWP-41 treated flakeboards a t a den- si ty of 53 pcf.
Fi gure 6. --Thickness swell val ues of unweathered, PQ-56 treated flakeboards a t a density of 43 pcf.
i r e o t m n t Leuel , ~ c f 1
Fine Sweetgum Hltkory Red &ite Hixture OoK Dok
WCiD SPECIES
Figure 7.--Thickness swell values of unweathered, PQ-56 a n d CWP-41 treated flakeboards a t a density of 48 pcf.
Figure 8.--Modulus o f rupture of unweathered, PQ-56 treated flakeboards a t a density of 45 pcf.
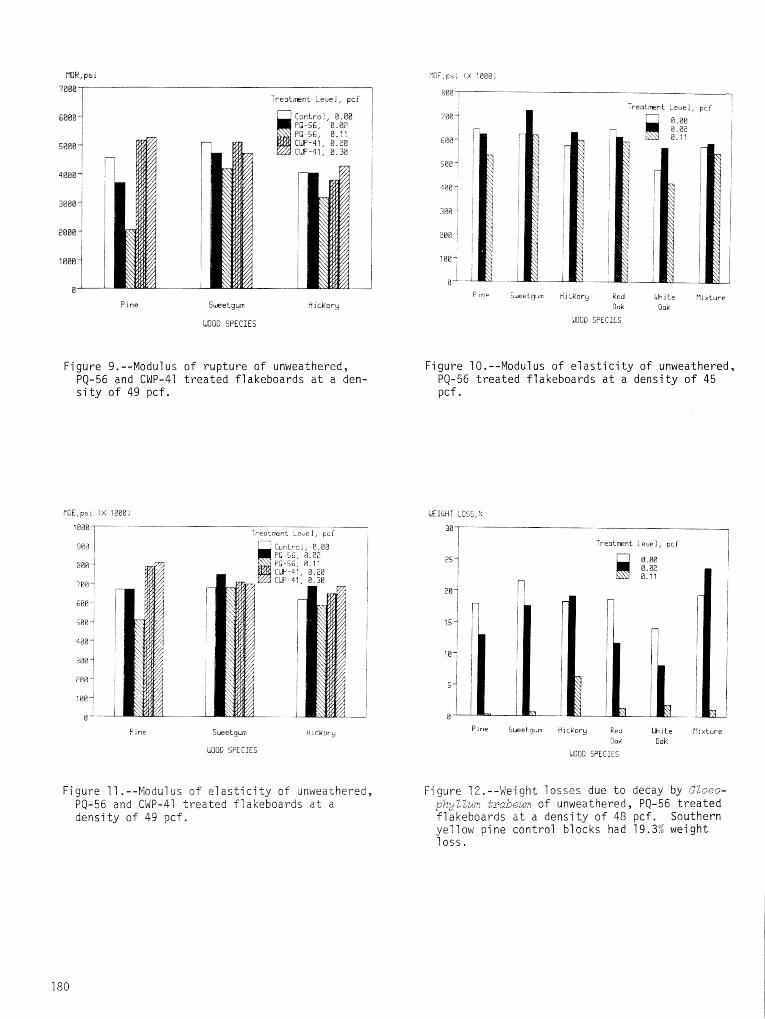
rB;IR, psi
7888 7 T r e o k n t i ebe i , pcf 1 1
C o n t r o l , B.88 PD-56, 8.82 PO-56, 8.11 C'@-41, 8.28 CW-4,, 8.35
P i n e Smetgum H i c k o r y
lJCiOD SPECIES
Figure 9.--Modulus of rupture of unweathered, PQ-56 and CWP-41 t r ea ted flakeboards a t a den- s i t y of 49 pcf.
1088 Trea tment -ewe], pcf I
P i r e S ~ e t g u r n Hickory
LBO0 SPECiES
Figure 11 . --Modul us of e l a s t i c i t y of unweathered, PQ-56 and CWP-41 t r ea ted flakeboards a t a densi t y of 49 pcf .
S r e o t m n t i e v e l , p c f I
F ~ n e Sweeigim Hjckory Red bite r ? i ~ t u r e
Oak Oak
LO00 SPECIES
Figure 10.--Modulus of e l a s t i c i t y of unweathered, PQ-56 t rea ted flakeboards a t a density of 45 pcf.
I Treatment Leue l , pc f I
P i n e Sweetgbm h i c k o r y Red k i t e n l x t u r e 20k OOK
tBJi30D SPECIES
Figure 12. --Weight 1 osses due t o decay by Gloeo- phy ikm trabe-m of unweathered, PQ-56 t r ea ted flakeboards a t a density of 48 pcf. Southern yellow pine control blocks had 19.3% weight 1 oss.
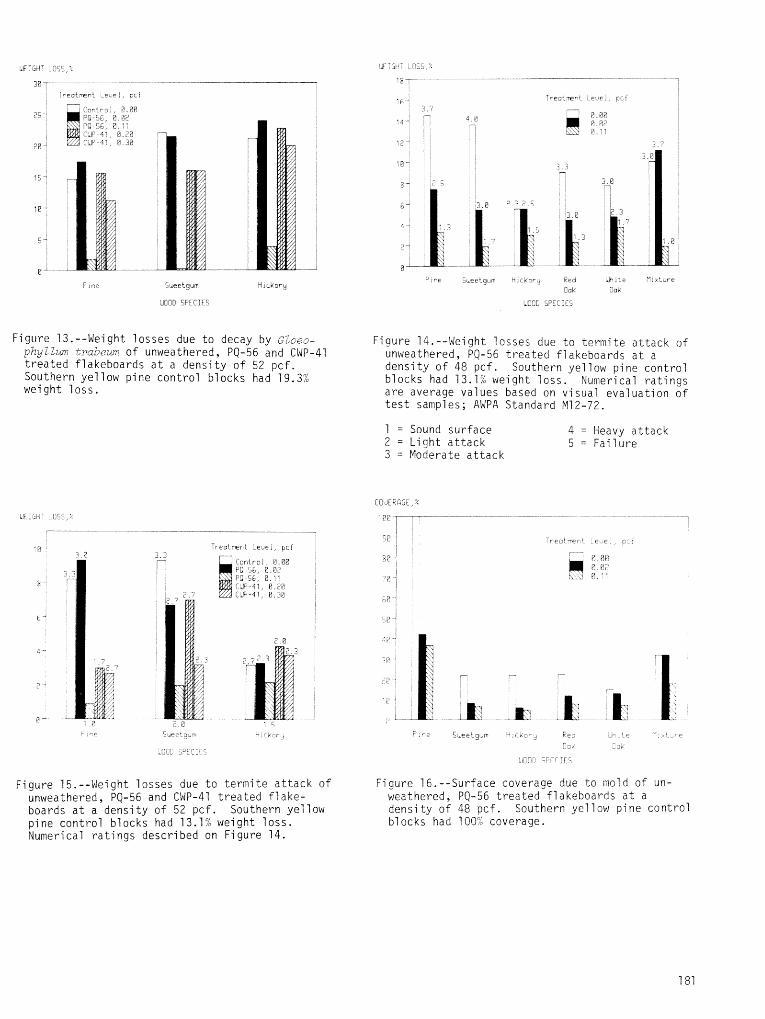
- .qe Sweet gin-
b63C SPECIES
Hickory
F i g o r e 13.--Weight l osses due t o decay by GZoeo- phyll-wri trabeun; o f unweathered, PQ-56 and CWP-41 t r e a t e d f l akeboards a t a d e n s i t y of 52 p c f . Southern ye1 low p i n e c o n t r o l b l o c k s had 19.3% we igh t l o s s .
F i g u r e 15.--Weight l osses due t o t e r m i t e a t t a c k o f unweathered, PQ-56 and CWP-41 t r e a t e d f l a k e - boards a t a d e n s i t y o f 52 p c f . Southern ye1 low p i n e c o n t r o l b l o c k s had 13.1% we igh t l o s s . Numerical r a t i n g s desc r ibed on F i g u r e 14.
- rear re-? c c l 7
2 2z
3'
F i g u r e 14.--Weight l osses due t o t e r m i t e a t t a c k o f unweathered, PQ-56 t r e a t e d f l akeboards a t a d e n s i t y o f 48 pcf . Southern y e l l o w p i n e c o n t r o l b l o c k s had 13.1% we igh t l o s s . Numerical r a t i n g s a r e average va lues based on v i s u a l e v a l u a t i o n of t e s t samples; AWPA Standard M12-72.
1 = Sound s u r f a c e 4 = Heavy a t t a c k 2 = L i g h t a t t a c k 5 = F a i l u r e 3 = Moderate a t t a c k
F i g u r e 16. - -Sur face coverage due t o mold o f un- weathered, PQ-56 t r e a t e d f l akeboards a t a densi t y o f 48 p c f . Southern ye1 1 ow p i n e c o n t r o l b l o c k s had 100% coverage.
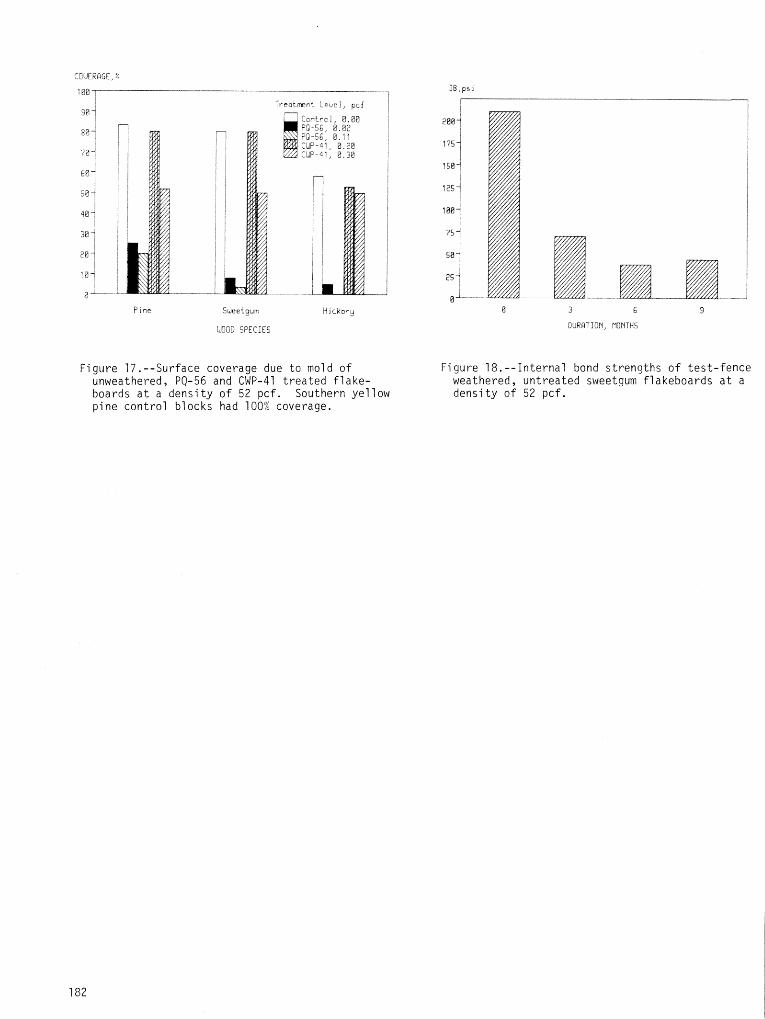
T r e n t m n t Leuei, pcf -
P ~ n e Sheetgum H ~ c k o r g
:MI1113 SPECIES
Figure 17.--Surface coverage due t o mold of Figure 18.--Internal bond strengths of tes t - fence unweathered, PQ-56 and CWP-41 t rea ted f lake- weathered, untreated sweetgum flakeboards a t a boards a t a density of 52 pcf. Southern yellow density of 52 pcf. pine control blocks had 100% coverage.
RESEARCH NEEDS ON DURABI L I T Y OF STRUCTURAL P A N E L S ~
by
E. M. P r i c e and R, C. an&
The developvent o f s t r u c t u r a l panels has taken severa l years and many i n d i v i d u a l s . D u r a b i l i t y and e v a l u a t i o n techniques are s t i l l a ma jo r concern o f t h e i n d u s t r y , s c i e n t i s t s , and users. The conc lud ing sess ion of t h e Workshop on D u r a b i l i t y o f S t r u c t u r a l Panels,October 5-7, 1982, h e l d i n Pensacola, F l o r i d a , and sponsored by Southern F o r e s t Experiment S t a t i o n and Auburn U n i v e r s i t y was devoted t o a d i s c u s s i o n on research needs. The d i s c u s s i o n was conc luded by o b t a i n i n g a l i s t o f 10 d u r a b i l i t y problems and concerns vo iced by t h e 26 p a r t i c i p a n t s , Wi thout p r i o r i t i z a t i o n , t h e concerns vo iced were:
a Real l i f e performance requ i rements based on r e l i a b l e f i e l d da ta a re wanting.
Cur ren t t e s t methods a r e n o t adequate t o p r e d i c t r e a l l i f e performance.
Products a r e o r w i l l be marketed t h a t w i l l n o t l a s t f o r t h e expected s e r v i c e . l i f e .
a A c e n t r a l i z e d body i s needed t o c o o r d i n a t e e f f o r t s d i r e c t e d towards t h e unders tand ing o f d u r a b i l i t y problems and l e a d i n e s t a b l i s h i n g s t a n d a r d i z a t i o n f o r t e s t procedures.
@ An a n a l y s i s t o determine t h e i n f l u e n c e o f major degrada t ion f a c t o r s , such as weathering, b i o l o g i c a l creep, and s t r e s s rup tu re , i s des i red.
a I n c o n s i s t e n c i e s i n p roduc t q u a l i f i c a t i o n procedures e x i s t .
e I n fo rmat ion , approaches, and s o l u t i o n s t o d u r a b i l i t y problems o r o t h e r b u i l d i n g m a t e r i a l s should be more e f f e c t i v e l y u t i l i z e d .
The user i s n o t p r o p e r l y educated about t h e c o r r e c t a p p l i c a t i o n t o o b t a i n maximum produc t performance.
A g r e a t e r p a r t i c i p a t i o n o f a1 1 p a r t i e s (i.e,, users, producers, genera l i n t e r e s t groups) i s r e q u i r e d i n address ing t h e durab i 1 i t y problems.
* Shor t te rm t e s t methodology lapproach f o r manufacturers t o p r e d i c t l o n g term d u r a b i l i t y behav io r o f p roduc ts i s i n s u f f i c i e n t .
l lsummary o f t h e d i s c u s s i o n sess ion a t Workshop on D u r a b i l i t y of Panel Products , Pensacol a, FL, October 5-7, 1982.
ZIAuthors a r e P r i n c i p a l Wood S c i e n t i s t , Southern F o r e s t Experiment S t at'-ibn, F o r e s t Service-USDA, P i n e v i 1 l e , LA 71360, and Pro fessor , Department o f F o r e s t r y , Auburn U n i v e r s i t y , AL 36849,
APPENDIX ATTENDEES
Roy D. Adams I n s t i t u t e o f Wood Research Mi c h i gan Techno1 o g i caf Uni v e r s i t y Houghton, Mich igan 39937
J i m Alexopoulos F o r i n tek Canada Corpora t i o n 800 Mont rea l Road Ottawa, Ontar io , CANADA KlG 325
E. J. B i b l i s Department o f F o r e s t r y Auburn U n i v e r s i t y Auburn U n i v e r s i t y , Ala barn 36849
Frank 6. Rock Georg ia Paci f i c Corpora t i on P. 0. Box 520 Crosse t t , Arkansas 71635
Char les Boye t te Georg ia Paci f i c Corpora t ion P. 0. Box 520 Crosse t t , Arkansas 71634
Norman J. B r i g g s Georg ia Paci f i c Corpora t ion P. .O. Box 520 Crosse t t , Arkansas 71635
Char les G. C a r l 1 F o r e s t Products Labora to ry F o r e s t Sevi ce-USDA P. 0. Box 5130 Madi son, W i sconsin 53705
Poo Chow Department of F o r e s t r y U n i v e r s i t y o f I1 l i n o i s 110 Mumford H a l l 1301 W. Gregory Urbana, I 1 1 i n o i s 61801
Rober t H. G i l l e s p i e F o r e s t Products Labora to ry F o r e s t Serv i ce-USDA P. 0. Box 5130 Madi son, M i sconsi n 53705
Chung-Yun Hse Southern F o r e s t Experiment S t a t i o n F o r e s t Serv i ce-USDA 2 500 Shrevepor t Hi ghway P i n e v i 1 l e y Lou is iana 71360
Michae l 0. Hunt Department o f F o r e s t r y and N a t u r a l Resources Purdue U n i v e r s i t y West L a f a y e t t e , Ind iana 47907
Jay A. Johnson Assoc ia te Pro fessor Col l e g e o f F o r e s t r y U n i v e r s i t y o f Washington S e a t t l e , Washington 98195
Myron W. K e l l y Department o f Wood and Paper Science N o r t h C a r o l i n a S t a t e U n i v e r s i t y P. 0. Box 5488 Raleigh, N o r t h Caro l i n a 27650
Rober t M. Knudson MacMi 1 l a n B l oedel Ltd. 3350 Eas t Broadway Vancouver, 5. C. , CANADA V5M 4E6
Rober t J. L e i c h t i Department o f F o r e s t r y Auburn U n i v e r s i t y Auburn U n i v e r s i t y , Alabama 36549
Rober t H. McAl i s t e r Southeastern F o r e s t Experiment S t a t i o n F o r e s t Serv i ce-USDA F o r e s t r y Sciences t a b o r t o r y Athens, Georgia 30602
J. Dobbin McNatt f o r e s t Products i a b o r a t o r y F o r e s t Serv i ce-USDA P. 0. Box 5130 Madi son, W i sconsi n 53705
Don P e r c i v a l Small Homes Counci l U n i v e r s i t y o f I l l i n o i s 1 East St. Mary 's Road Champaign, I 1 1 i n o i s 61820
Eddie M, P r i c e Southern F o r e s t Experiment S t a t i o n F o r e s t Serv i ce-USDA 2500 Shrevepor t Hi ghway P inev i 1 l e y Lou is iana 71360
Erv Scha f f e r S t a t e and P r i v a t e F o r e s t r y F o r e s t Serv i ce-USDA P. 0. Box 5130 Madi son, Wisconsin 53705
Elmer L. Schmidt P l a n t Pathology U n i v e r s i t y o f Minnesota 314 Stakh St. Paul, Minnesota 55108
Paul H. S h o r t Mi s s i s s i p p i F o r e s t Products Laborao t ry M i s s i s s i p p i S t a t e U n i v e r s i t y P. 0. Drawer FP Mi s s i s s i p p i State, Mi s s i s s i p p i 39762
O t t o M. Suchsland Department o f F o r e s t r y M ich igan S t a t e U n i v e r s i t y Eas t Lansing, Mich igan 48824
John T a l b o t t Col l ege o f Eng ineer ing Washington S t a t e U n i v e r s i t y Pullman, Washington 99164
R. C . Tang Department of F o r e s t r y Auburn U n i v e r s i t y Auburn U n i v e r s i t y , A1 abama 36849
James B. W i 1 son F o r e s t Products Department Oregon S t a t e U n i v e r s i t y C o r v a l l i s , Oregon 97331
George E. Woodson Department o f F o r e s t r y Lou i s iana Tech U n i v e r s i t y Ruston, Lou is iana 71270
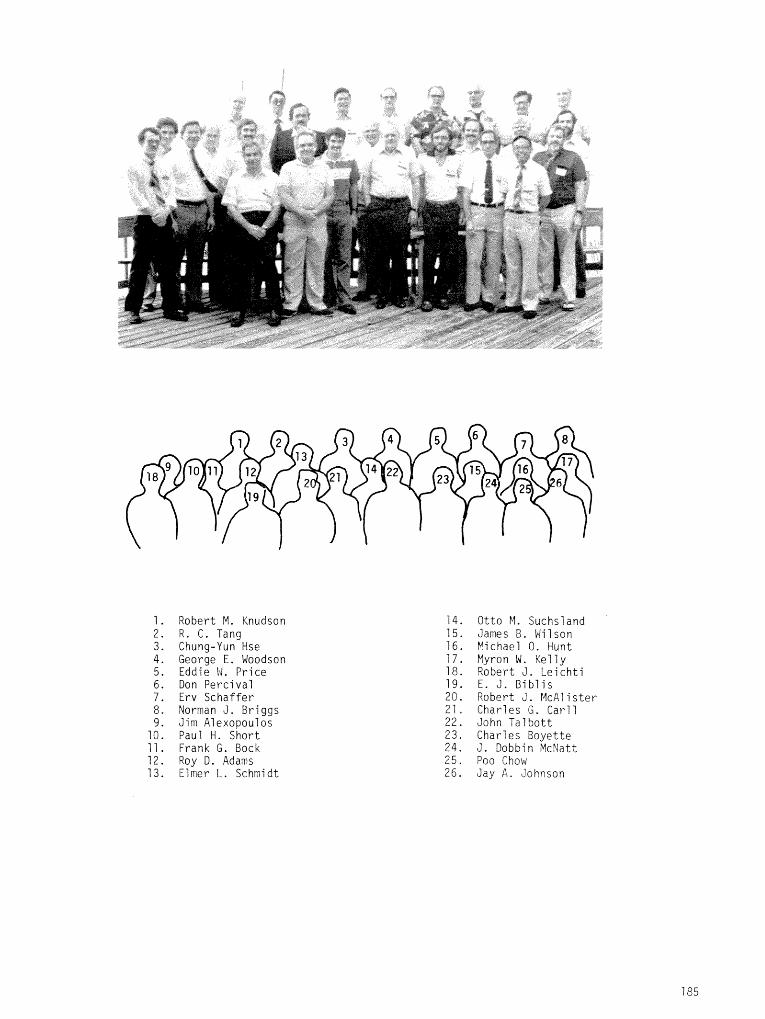
Robert M. Knudson R , C . Tang Chung-Yun Hse George E . Woodson Eddie W. Pr ice Don Percival Erv Schaf fe r Norman J . Briggs Jim Alexopoulos Paul H . Short Frank 6 . Bock Roy D. Adams Elmer L . Schmidt
Otto M. Suchsland James B . Wilson Pichael 0. Hunt Myron W . Kelly Robert J . Le ich t i E . J . B ib l i s Robert J . McAl i s t e r Charles G . Gar11 John Talbot t Charles Boyette J . Dobbin McNatt Poo Chow Jay A . Johnson
The use of t r a d e o r company names o f p roduc ts o r se r - v i c e s i n these Proceedings i s f o r t h e b e n e f i t o f t h e reader. Such use does n o t c o n s t i t u t e an endorsement o r approva l o f any s e r v i c e o r p r o d u c t by t h e Conference sponsors t o t h e e x c l u s i o n o f o t h e r s t h a t may be s u i t a b l e .
Remarks about p e s t i c i d e s and f u n g i c i d e s appear i n some t e c h n i c a l papers c o n t a i n e d i n these Proceedings. P u b l i c a t i o n o f these s ta tements does n o t c o n s t i t u t e endorsement o r recom- mendat ion o f them by t h e Conference sponsors, no r does i t i m p l y t h a t uses d iscussed have been r e g i s t e r e d . Use o f most p e s t i - c i d e s i s r e g u l a t e d by S t a t e o r Federa l law. A p p l i c a b l e requ- l a t i o n s must be o b t a i n e d f rom a p p r o p r i a t e r e g u l a t o r y agencies.
CAUTION: P e s t i c i d e s can be i n j u r i o u s t o humans, domestic animals, d e s i r a b l e p l a n t s , and f i s h o r o t h e r w i l d l i f e - - i f t h e y a r e n o t handled o r a p p l i e d p r o p e r l y . Use a l l p e s t i c i d e s se lec - t i v e l y and c a r e f u l l y . F o l l o w recommended p r a c t i c e s g i v e n on t h e l a b e l f o r use and d i s p o s a l o f p e s t i c i d e s and p e s t i c i d e con ta ine rs .
P r i c e , Eddie W . , e d i t o r . Durabi 1 i t y o f s t r u c t u r a l panels . General Technica l Repor t 50-53, New O r ? eans, LA: U.S. Department o f A g r i c u l t u r e , F o r e s t Serv ice, Southern Fores t Experiment S t a t i o n ; 1984. 185 p.
Twenty papers f r o m t h e proceedings of a workshop a re presented on t h e d u r a b i l i t y of a group o f s t r u c t u r a l panels f o r use i n r o o f , w a l l , and f l o o r sheath ing a p p l i c a t i o n s . The panel t ypes are waferboard, f lake- board, strandboard, o r i e n t e d s t r u c t u r a l board, and s t r u c t u r a l p a r t i c l e b o a r d . A summary o f t h e p roceed i rgs i s g i v e n as t h e f i n a l p r e s e n t a t i o n .
A d d i t i o n a l Keywords: Dimensional s t a b i 1 i t y , p r e s e r v a t i v e t rea tment , l o a d dura t ion , b i o d e t e r i o r a t i ~ n , research needs.


