Embed Size (px)
Citation preview

DURABILITY OF EXPANDED POLYSTYRENE MORTARS
V. Ferrándiz-Mas, E. García-Alcocel
Departamento de Construcciones Arquitectónicas. Universidad de Alicante. Alicante. Spain.
ABSTRACT
The influence of the addition of various types and various concentrations of expanded polystyrene
foam (both commercial and recycled) on the durability of Portland cement mortars is studied. In
particular, the microstructure is studied utilizing the following methods: Capillary absorption of
water, mercury intrusion porosimetry, impedance spectroscopy and open porosity. In addition, the
effects of heat cycles and freeze-thaw cycles on compressive strength are examined. Scanning
electron microscopy is used as a complementary technique. An air-entraining agent, water retainer
additive and superplasticizer additive are used to improve the workability of mortars. The results
show that the presence of expanded polystyrene in mortar results in a decrease in the capillary
absorption coefficient. The mercury intrusion porosimetry technique and the equivalent circuits
previously used by researchers to interpret impedance spectra of ordinary cementitious materials
were found to be inadequate for interpreting the microstructure of mortars with expanded
polystyrene. This is due to the polymeric nature as well as the internal porous structure of
expanded polystyrene. A slight increase of compressive strength is observed in mortars with
expanded polystyrene subjected to heat cycles. The compressive strength of mortars subjected to
freeze-thaw cycles likely improves because expanded polystyrene particles absorb part of the
pressure of ice crystallization. It is concluded that the durability of mortars improve with the
presence of expanded polystyrene, making them viable for more sustainable usage in masonry,
stucco and plaster mortars.
Keywords:
Mortar, Portland cement, expanded polystyrene (EPS), waste, durability, microstructure, porosity,
compression testing.
brought to you by COREView metadata, citation and similar papers at core.ac.uk
provided by Repositorio Institucional de la Universidad de Alicante
2
1. Introduction
Expanded polystyrene foam (EPS) is a thermoplastic polymer with a closed cellular structure. It is
biologically inert and non-toxic. EPS has interesting properties such as being of low density,
thermal insulation, hydrophobicity and chemical resistance when exposed to acids and alkalis.
EPS may be granulated into small particles that can be considered as non-absorbent and a
lightweight polymeric aggregate (less than 300Kg/m3 density) [1-2]. These aggregates may be
used to produce light building materials.
Research in the field of concrete incorporating EPS as an aggregate is mainly devoted to the
characterization of the mechanical properties of the concrete and trying to improve these
properties by characterizing them for various EPS grain sizes, additives, and other additions such
as fly ash and silica fume [3-5]. Other studies characterize both mechanical and thermal EPS
concrete properties using simultaneous optimization of these properties with respect to EPS
parameters. These studies proposed modelling methods to predict and optimize these properties
[6]. Recent articles show the adequacy of wet concrete of a self-compacting lightweight structural
made with nano-SiO2 and EPS [7].
Other studies have used EPS beads to design thermal insulator composites made with foamed
cement pastes as a matrix, using granules of EPS as filler, along with additives to prevent
segregation and improve adherence [8]. EPS has also been used for the manufacture of gypsum
and plaster plates and panels [9] with the plaster matrix reinforced with polypropylene fibres in the
manufacture of industrial components [10] and with mixtures of fly ash and metakaolinite to obtain
light inorganic polymeric materials (light geopolymers) [11].
Expanded polystyrene foam (EPS) represents 0.1% of total municipal solid waste. The recycling of
solid polymeric wastes as components of mortars and concretes requires research that
differentiates the characteristics of the polymers that improve their incorporation into cementitious
materials and demonstrates the value added through their use. Previous work has identified the
influence of the addition of various types and dosages of EPS, both commercial and recycled, on
physical and mechanical characteristics of Portland cement mortars. These studies have
concluded that it is possible to produce mortars with mechanical properties adequate for use in
masonry, rendering and plaster mortars [12] using a high content of EPS waste.
Mortars with EPS
3
The main aim of this study is to evaluate the influence of the addition of EPS on the durability of
Portland cement mortars in order to demonstrate their viability and enhanced usage in the
fabrication of mortars suitable for use as masonry, stucco and plaster mortars. To do this, the
microstructure of mortars containing various types and EPS dosages were studied using water
capillary absorption, mercury intrusion porosimetry and impedance spectroscopy. Additionally, the
compressive strength was tested after subjecting the mortar to heat cycles and freeze-thaw cycles.
2. Experimental programme
2.1. Material and sample preparation
The following materials were used for this study: Portland cement type CEM I 52.5R, silica sand in
compliance with the European standard given in EN 196-1:2005 [13], distilled water, several types
of EPS, and three types of additives.
The types of EPS used were: commercial expanded polystyrene (EPSc), pre-expanded
polystyrene (EPSpex) and ground expanded polystyrene from clean recycled waste (EPSw). In all
cases the EPS used is white, with a 100% material loss on ignition and a softening point
temperature between 80 and 100ºC. Other properties of EPS particles are given in table 1.
The three types of additives used were: an air-entraining agent (A), Basf Rheomix 934; a water
retainer additive (R), Hydroxypropyl methyl cellulose; and a superplasticizer additive (F), Basf
Rheomix GT 205 MA.
Table 2 shows the EPS dosage as addition percentage of total mortar volume, considering as such
the apparent volume of sand (v/v%) and the additive dosage as a percentage of the weight of the
cement. The mortars were prepared with a cement/sand/water ratio (by weight) of 1:3:0,5. All
mortars studied were prepared with the following amounts of materials: 450g of CEM I 52,5R,
1350g of silica sand of 1,67 g/cm3 density and 225g of distilled water.
Mortar workability was tested to determine the amounts of EPS and additive necessary to obtain
adequate consistency of fresh mortar through the use of a flow table according to EN 1015-3:2007
[14]. These results have been published in a previous study [12]. Using the results of this study,
the additive dosages given in table 2 were chosen and are shown as a percentage of the weight of
the cement (w/w %). All mortars were manufactured according to the European standard EN 196-
4
1:2005 [13]. After preparation, the specimens were cured under water at a temperature of 20 ± 2
°C for various curing times depending on the test in which the sample was used.
2.2. Test methods
2.2.1. Capillary absorption
Capillary water absorption of mortars has been determined according to EN 1015-18:2003 [15]. In
order to do this, three specimens of 4x4x16 cm were made for each of the dosages shown in Table
2. The specimens were kept in moulds for 2 days, after which they were removed from their
moulds and were cured underwater for 5 days. After the curing period, specimens were cut in half,
and dried in an oven at a temperature of 65 ± 2ºC. After drying, the lateral sides of each specimen
were sealed with an adhesive plastic film to restrict the water flow along the longitudinal axis. The
water flux through the specimen was measured by partial immersion of the samples at a depth of 5
mm. The gain in water mass was measured by weighing the samples 10 and 90 minutes after
submersion. The capillary absorption coefficient, C90, was estimated from the slope following to the
equation W=a + Ct1/2, where W (Kg/m2) is the capillary absorption, a (Kg/m2) is the initial
absorption, C (Kg/m2min0,5) is the capillary absorption coefficient and t (min) is the absorption time,
using the equation: C90= 0,1(M2-M1), where M1 is the weight of the specimen after 10 minutes of
testing, and M2 is the weight of specimen after 90 minutes of testing according to EN 1015-18:2003
[15].
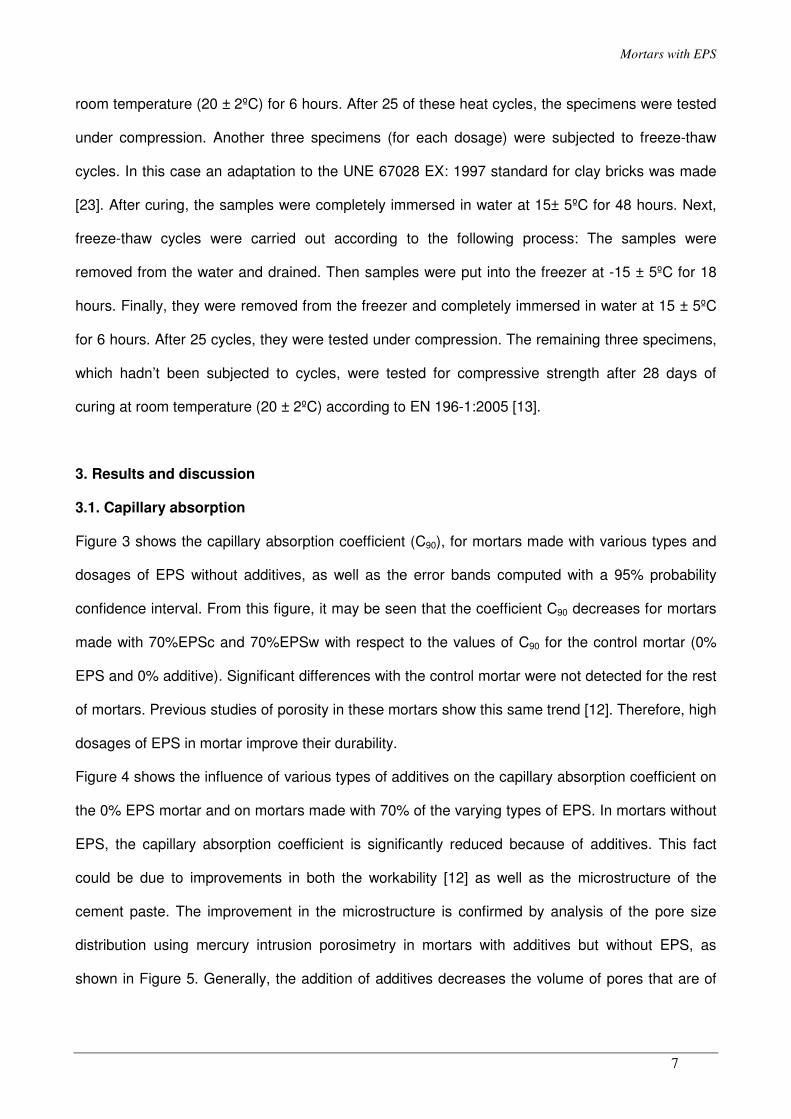
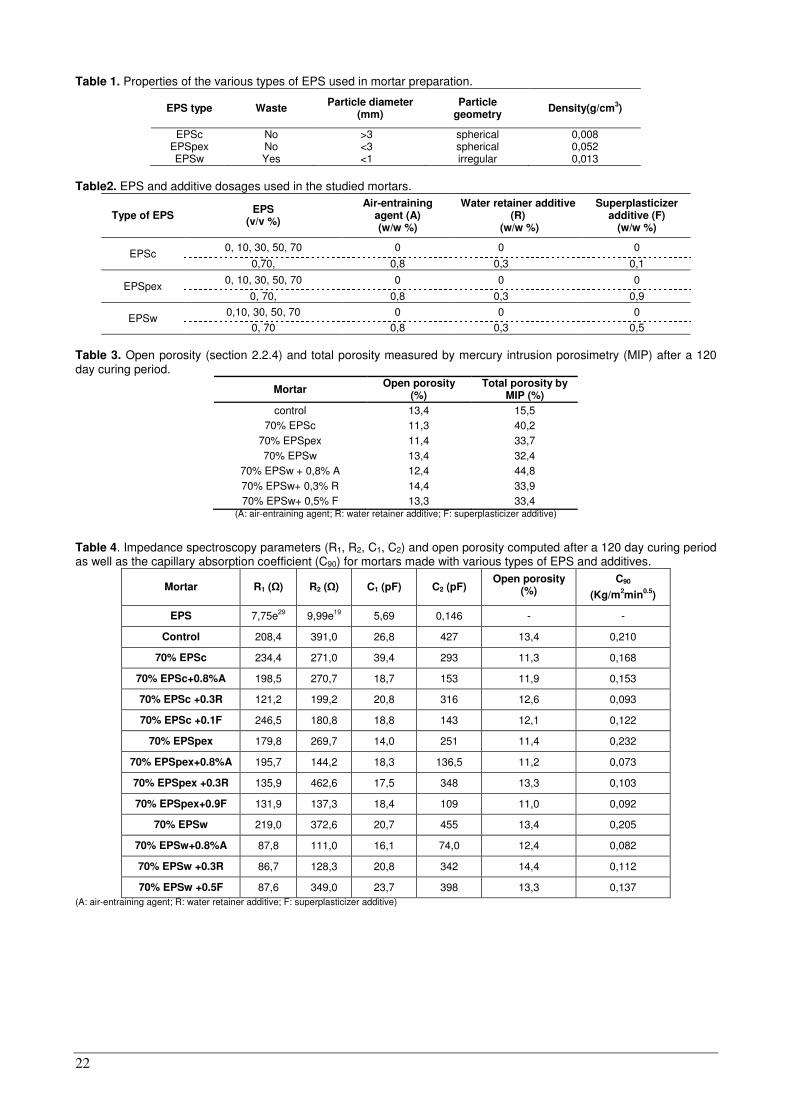
2.2.2. Impedance spectroscopy (IS)
The microstructure of the mortars was studied using impedance spectroscopy for mortars
containing 70% of each of the three types of EPS and additives, as shown in Table 2. For this
study a cylindrical specimen of 10 cm diameter and 16 cm in height was manufactured for each of
the dosages. After 24 hours, the specimens were removed from their moulds and cut into 1 cm
thick disks. Each of the disks was then cured underwater for 120 days. After curing, the discs were
removed from the water bath, and the surface of each disk was then dried with paper. The
impedance spectra were obtained for each disc using an Agilent 4294A impedance analyzer. This
Mortars with EPS
5
model permits capacitance measurements in the range from 10-14 to 0.1 F and has a maximum
resolution of 10-15 F.
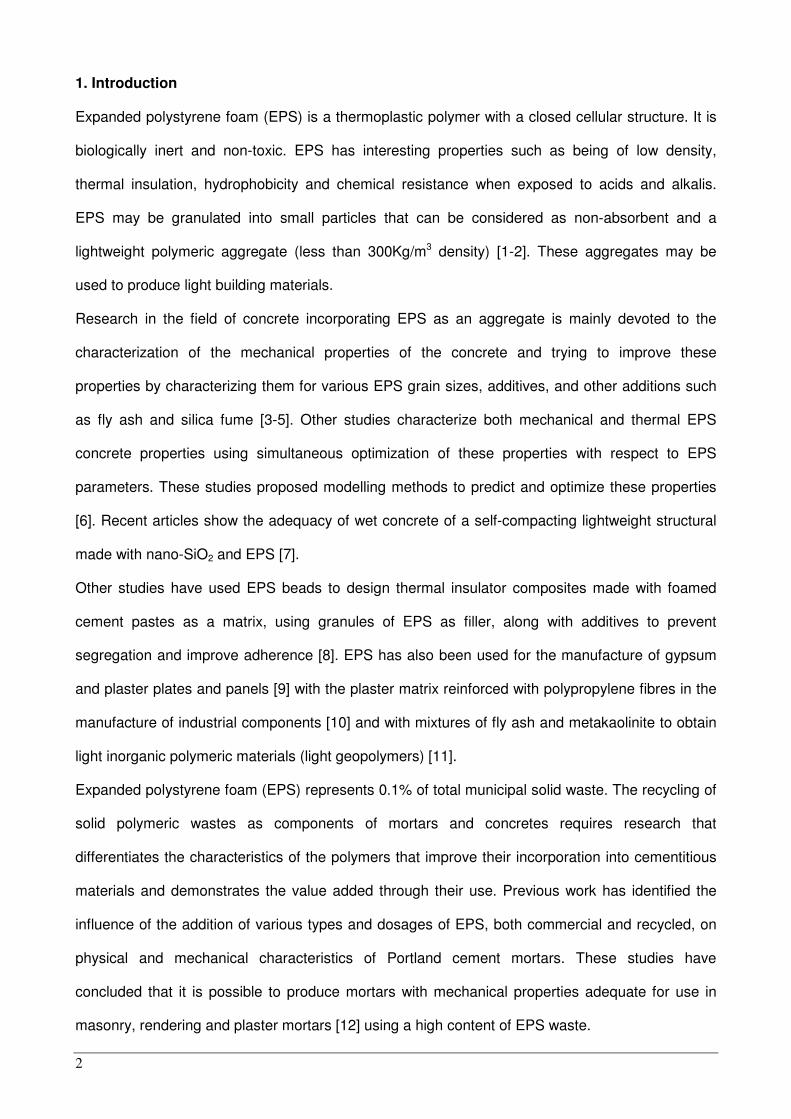
The impedance was measured through both direct contacting and through the non-contacting
method, as shown in Figure 1. The direct contact measurements in Figure 1a were taken by
application of an electrical perturbation through 7 cm diameter flexible graphite electrodes. These
electrodes were placed in direct contact with each side of the sample disc. For the non-contacting
measurements, shown in Figure 1b, the sample-electrode interface is isolated by a 100µm thick
layer of acetate. The impedance of the sample is obtained by subtracting the previously-obtained
impedance of the acetate layer from the total measured impedance.
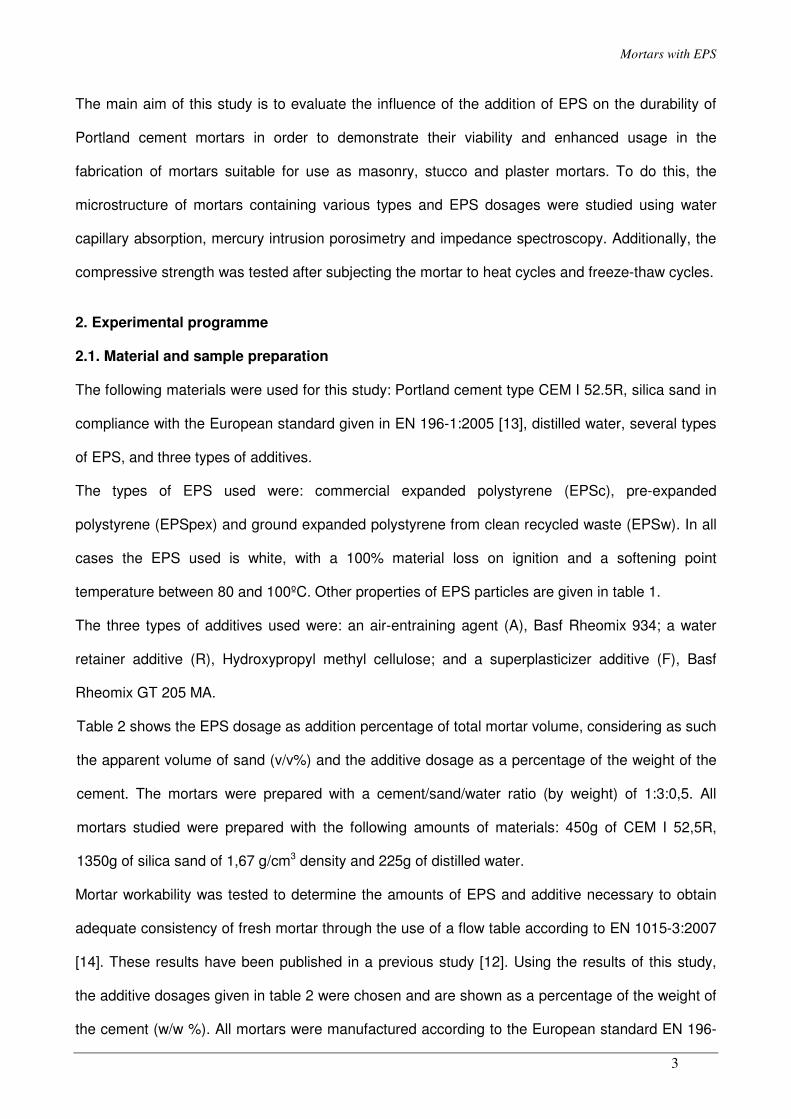
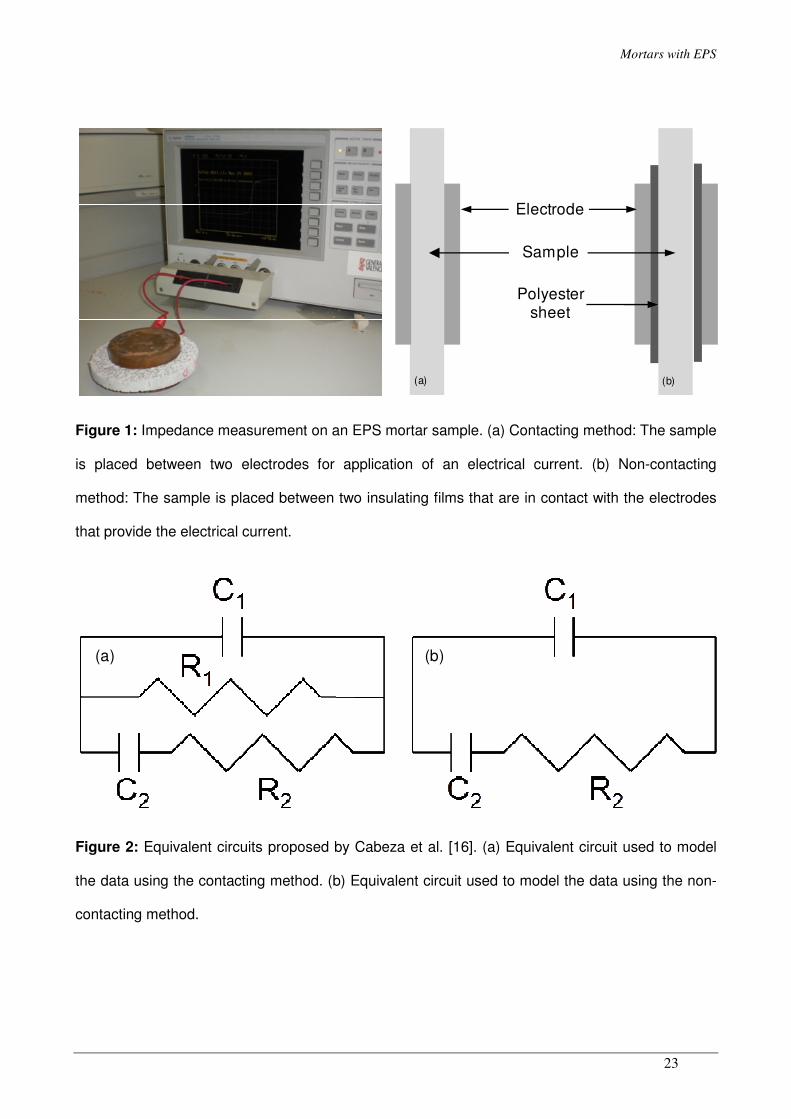
To interpret and study the impedance spectra, two previously proposed equivalent circuits were
used [16] as shown in Figure 2. These circuits have been utilized extensively for Portland cement
pastes, mortars and concrete [16-21]. In this work the parameter R1 was analyzed using the
contacting method (shown in Figure 2a). The parameters C1, C2 and R2 were obtained using non-
contacting measurements, as shown in Figure 2b, given that it can be obtained a biggest
measurement sensitivity calculating these parameters using the method that avoid the contact
between sample and electrode.
In terms of the physical significance of these equivalent circuits, the resistance R1 depends on the
electrolyte in the pores and is associated with the volume of interconnected pores [16] that traverse
the length of the specimen. The resistance R2 is associated with the electrolyte in the occluded
pores, or the pores that do not contribute to the electrical conductivity across the sample [18]. The
capacitance C1 is associated to the dielectric response of the solid fraction of the sample, and
could be used as a parameter to estimate the solid and pore fractions of the material [16]. Its value
decreases as the thickness and porosity of the sample increases. The capacitance C2 has been
shown to be associated to the surface of pore walls in contact with the electrolyte filling the pores
[19, 21]. Its value increases with electrolytic occupancy of the pores and with increasing thickness
of the sample. The analysis of the equivalent parameters using experimental measurements was
made with the software program Zfit, developed by the Department of Construction Engineering,
Public Works and Urban Organization at the University of Alicante.
6
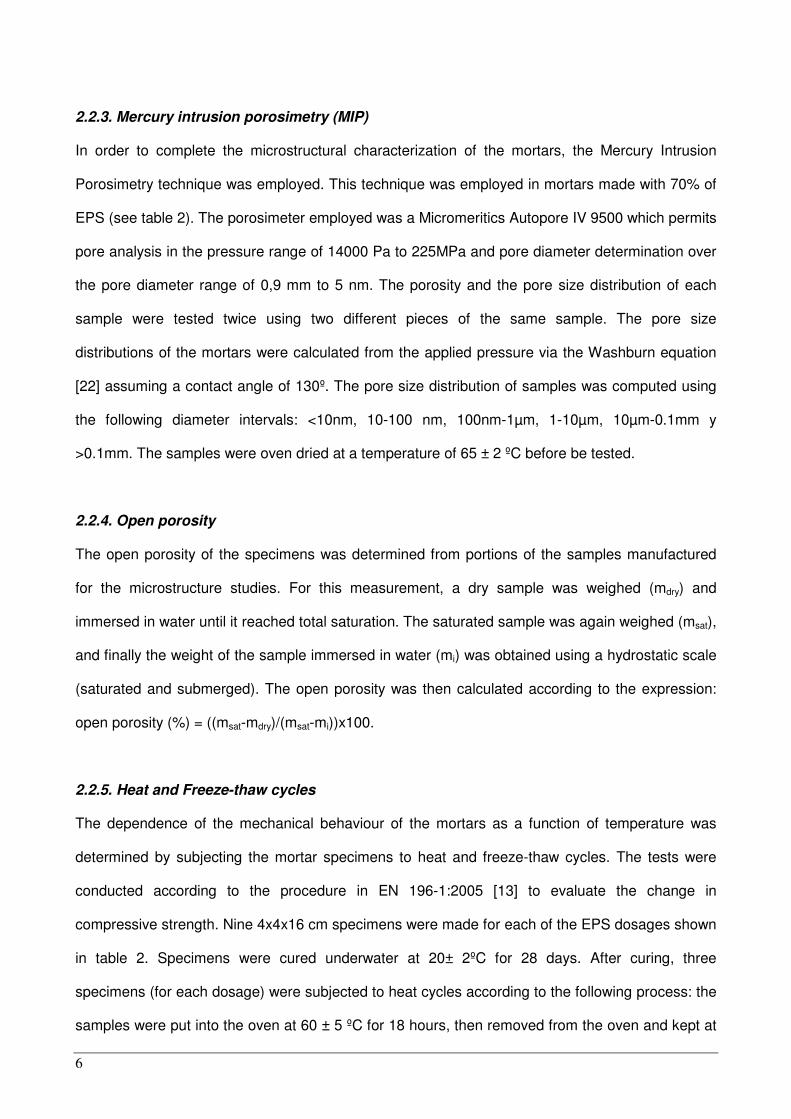
2.2.3. Mercury intrusion porosimetry (MIP)
In order to complete the microstructural characterization of the mortars, the Mercury Intrusion
Porosimetry technique was employed. This technique was employed in mortars made with 70% of
EPS (see table 2). The porosimeter employed was a Micromeritics Autopore IV 9500 which permits
pore analysis in the pressure range of 14000 Pa to 225MPa and pore diameter determination over
the pore diameter range of 0,9 mm to 5 nm. The porosity and the pore size distribution of each
sample were tested twice using two different pieces of the same sample. The pore size
distributions of the mortars were calculated from the applied pressure via the Washburn equation
[22] assuming a contact angle of 130º. The pore size distribution of samples was computed using
the following diameter intervals: <10nm, 10-100 nm, 100nm-1µm, 1-10µm, 10µm-0.1mm y
>0.1mm. The samples were oven dried at a temperature of 65 ± 2 ºC before be tested.
2.2.4. Open porosity
The open porosity of the specimens was determined from portions of the samples manufactured
for the microstructure studies. For this measurement, a dry sample was weighed (mdry) and
immersed in water until it reached total saturation. The saturated sample was again weighed (msat),
and finally the weight of the sample immersed in water (mi) was obtained using a hydrostatic scale
(saturated and submerged). The open porosity was then calculated according to the expression:
open porosity (%) = ((msat-mdry)/(msat-mi))x100.
2.2.5. Heat and Freeze-thaw cycles
The dependence of the mechanical behaviour of the mortars as a function of temperature was
determined by subjecting the mortar specimens to heat and freeze-thaw cycles. The tests were
conducted according to the procedure in EN 196-1:2005 [13] to evaluate the change in
compressive strength. Nine 4x4x16 cm specimens were made for each of the EPS dosages shown
in table 2. Specimens were cured underwater at 20± 2ºC for 28 days. After curing, three
specimens (for each dosage) were subjected to heat cycles according to the following process: the
samples were put into the oven at 60 ± 5 ºC for 18 hours, then removed from the oven and kept at
Mortars with EPS
7
room temperature (20 ± 2ºC) for 6 hours. After 25 of these heat cycles, the specimens were tested
under compression. Another three specimens (for each dosage) were subjected to freeze-thaw
cycles. In this case an adaptation to the UNE 67028 EX: 1997 standard for clay bricks was made
[23]. After curing, the samples were completely immersed in water at 15± 5ºC for 48 hours. Next,
freeze-thaw cycles were carried out according to the following process: The samples were
removed from the water and drained. Then samples were put into the freezer at -15 ± 5ºC for 18
hours. Finally, they were removed from the freezer and completely immersed in water at 15 ± 5ºC
for 6 hours. After 25 cycles, they were tested under compression. The remaining three specimens,
which hadn’t been subjected to cycles, were tested for compressive strength after 28 days of
curing at room temperature (20 ± 2ºC) according to EN 196-1:2005 [13].
3. Results and discussion
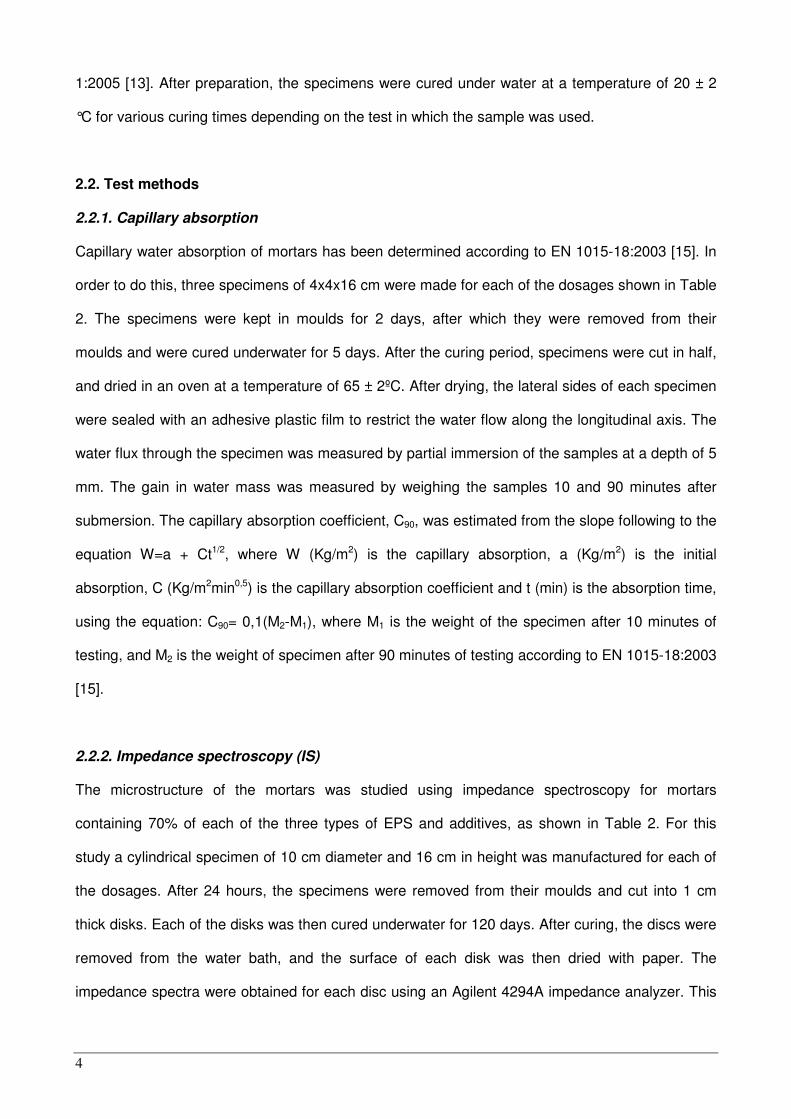
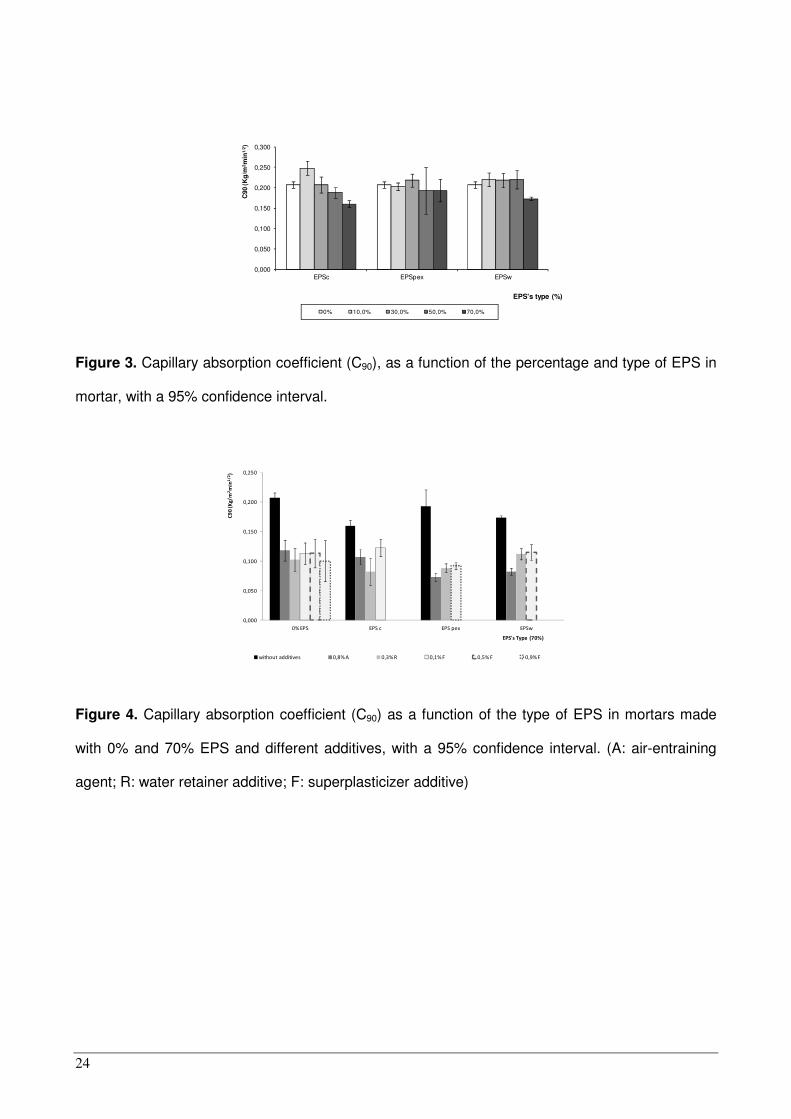
3.1. Capillary absorption
Figure 3 shows the capillary absorption coefficient (C90), for mortars made with various types and
dosages of EPS without additives, as well as the error bands computed with a 95% probability
confidence interval. From this figure, it may be seen that the coefficient C90 decreases for mortars
made with 70%EPSc and 70%EPSw with respect to the values of C90 for the control mortar (0%
EPS and 0% additive). Significant differences with the control mortar were not detected for the rest
of mortars. Previous studies of porosity in these mortars show this same trend [12]. Therefore, high
dosages of EPS in mortar improve their durability.
Figure 4 shows the influence of various types of additives on the capillary absorption coefficient on
the 0% EPS mortar and on mortars made with 70% of the varying types of EPS. In mortars without
EPS, the capillary absorption coefficient is significantly reduced because of additives. This fact
could be due to improvements in both the workability [12] as well as the microstructure of the
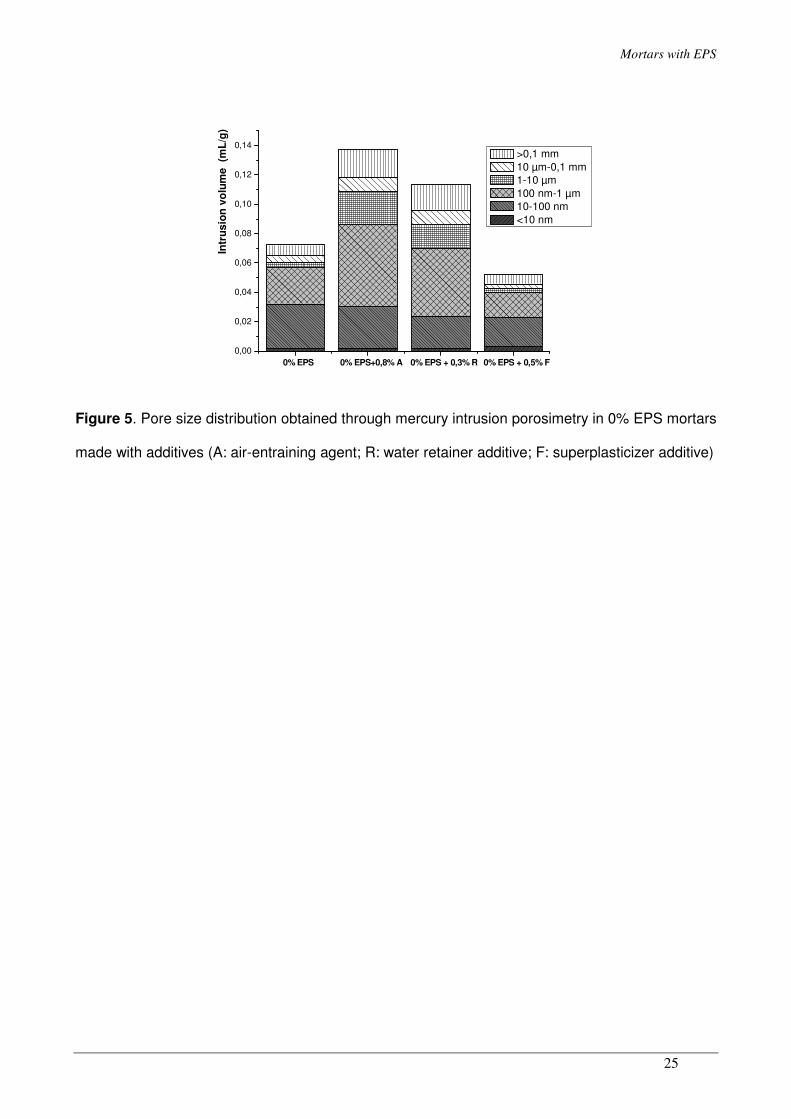
cement paste. The improvement in the microstructure is confirmed by analysis of the pore size
distribution using mercury intrusion porosimetry in mortars with additives but without EPS, as
shown in Figure 5. Generally, the addition of additives decreases the volume of pores that are of
8
less than 100 nm in size, while increasing the volume of pores larger than 100 nm. As a result, the
capillary absorption coefficient decreases by adding additives.
Returning to figure 4, it can seen that additives in mortars made with 70% EPS significantly
decrease the value of C90. As a result, durability improves and is comparable to the durability of
the 0% EPS mortar with additives. Both the particles of EPS and the air bubbles generated by the
air-entraining agent interrupt the continuity the capillary network. For this reason, the lowest
capillary absorption coefficients are observed with this additive. When EPSpex is added to the
mortar, a greater number of EPS particles are required to obtain the same volume of EPS,
because EPSpex has the highest density and intermediate size particle (see table 1). This may
explain the low values obtained for the capillary absorption coefficient for mortars made with
EPSpex. Intermediate values of C90 are observed for mortars made with EPSw. The largest values
of C90 are observed for mortars made with EPSc which have a lower density and fewer EPS
particles for the same volume because of the biggest size.
3.2. Mercury intrusion porosimetry (MIP)
Table 3 gives the results for open porosity (section 2.2.4) and total porosity obtained by mercury
intrusion porosimetry after a 120 day curing period. The values for porosity obtained by mercury
intrusion porosimetry were higher than those obtained through the open porosity method. This is
due to the fact that mercury under pressure accesses a greater pore volume than water, which
only penetrates the pore network by diffusion. As a result, the use of mercury results in greater
connectivity in the pore network. This is clearly seen in the control mortar where the difference
between porosities obtained using the two methods is about 14%.
In the case of mortars made with EPS, the differences in porosity obtained through the two
methods are higher than those observed for the control mortar. The presence of additives does not
change this trend. These differences are not only attributable to the microstructure of the mortar
paste. This fact is supported by the SEM images of these mortars shown in Figure 7. In these
images it is apparent that the EPS particles have a porous structure into which the mercury can
penetrate. The internal cellular structure of the EPS may be observed in Figure 7a. In addition, it
should also be noted that the increased mercury intrusion pressure can break the EPS particles
Mortars with EPS
9
allowing a penetration of a higher volume of mercury into the sample. In Figure 7b it can be
observed that the fine polymer wall that separates the cells may easily be broken by the increase
of pressure imposed by mercury intrusion. This behaviour results in an increase of the porosity
obtained with this technique over the open porosity technique. For this reason, the technique of
mercury intrusion porosimetry is not considered appropriate to study the microstructure of EPS
mortars.
3.3. Impedance spectroscopy.
Table 4 shows impedance parameters and open porosity after a 120 day curing period. In order to
make the analysis easier, values for the capillary absorption coefficient (C90), discussed previously,
are included in this table.
Regarding the parameters obtained in the impedance spectroscopy study, the volume of
interconnected pores may be estimated from R1 parameter. This parameter is related to the
electrolyte which fills the pores and is specifically associated with interconnected pores [16]. R1 is
also related to changes in the dimensions of the pores [18]. Because the samples are submerged
in water for a 120 day curing period, the pores are completely saturated and, as such, variations in
the resistance, R1, are associated only with changes in the volume of the interconnected pores.
The resistance, R1, would be expected to increase with decreasing open porosity or decreasing
interconnected pore size in the sample, because in these cases, the amount of electrolyte in the
interconnected pores is reduced. In general, mortars with EPS follow this trend, regardless of the
type of EPS, except for mortars made with superplasticizer additive. The behaviour of these
mortars may be explained by changes in the dimensions of the pores caused by the additive [24-
25]. This hypothesis wasn’t proven in this work because Mercury Intrusion Porosimetry is not a
suitable technique for determining the pore size distribution in mortars with EPS, as was discussed
in the previous section. R1 may also be related to the capillary absorption coefficient C90.
Generally, an increase in R1 corresponds to a decrease in C90. However, this behaviour was not
fulfilled by EPS mortars. This fact could be explained as follows: The impedance parameters
obtained testing only an EPS sample and testing a control mortar differ greatly, as may be seen in
10
table 4. Effectively, the EPS mortars do not constitute a homogeneous solid phase, which would be
expected in mortars formed by materials with similar properties. According to the capillary
absorption results, the EPS and the mortar cannot be treated alike. The EPSc and EPSpex
particles retain their original closed and hydrophobic spherical shape in the mortar specimens
employed in testing. These spherical particles obstruct the capillary network, reducing the capillary
absorption coefficient C90. In the grinding process used to obtain EPSw, the EPS particles, initially
closed and spherical, are broken up and form an open cellular structure. In mortars made with
EPSw these particles also obstruct the capillary pore network but in spite of their open cellular
structure do not absorb water by capillary action as the surface tension of water is much greater
than the surface energy of EPSw particles. For these reasons, R1 and C90 are not related in
mortars made with EPS. The R2 parameter can be related to the occluded porosity in mortar, that
is, with pores that do not contribute to the electrical connection of the sample [18]. In general, the
R2 parameter and the occluded porosity are inversely related. For a given type of EPS, the mortars
with the highest occluded porosity should be those made with the air-entraining agent. However,
this trend is only fulfilled by mortars made with EPSw.
The parameter C1 could be used to estimate the solid and porous fraction of the material [16]. In
this case, C1 and the sample porosity would be expected to be inversely related. This trend is only
fulfilled by mortars with EPSc. C2 is related to wet pore surface area. For samples with similar R1,
the largest C2 values should be associated with samples with very rough pores with a large pore
surface area, which should lead to an increase in the capillary absorption coefficient. This trend is
observed in mortars made with EPSw and additives.
The results of this section show that there aren't clear relationships among the impedance
parameters and the microstructural characteristics in this study. The differences in the dielectric
properties between EPS and cementitious materials cause significant variability in the dielectric
properties of the EPS mortar system, which doesn’t permit modelling of these mortars as a
homogeneous phase. The lack of symmetry of the system, that is, homogeneity in the dielectric
properties, according to the effective medium theory [26], justifies the necessity of proposing
alternate equivalent circuits for the interpretation of the impedance spectra that discriminate
Mortars with EPS
11
between cementitious and polymer materials. The development of these circuits falls outside of the
scope of this study and should be addressed in future study.
The results presented here concerning the microstructure of EPS mortars show that clear
relationships do not exist between the studied parameters. In addition is not possible justified the
observed trends by Mercury Intrusion Porosimetry. For all of these reasons, the study of
impedance spectra by the equivalent circuits, thoroughly used in the literature for Portland cement
pastes, mortars and concrete, were found to be inadequate for interpreting the microstructure of
EPS mortars.
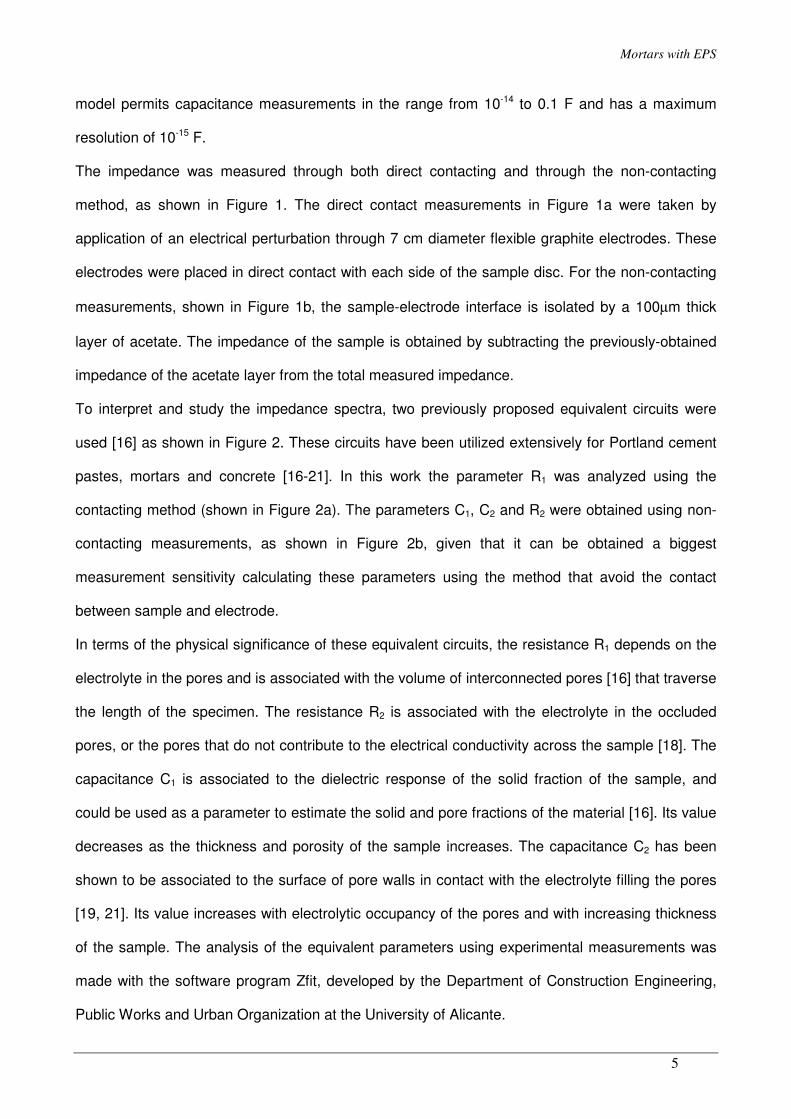
3.4 Heat and freeze-thaw cycles.
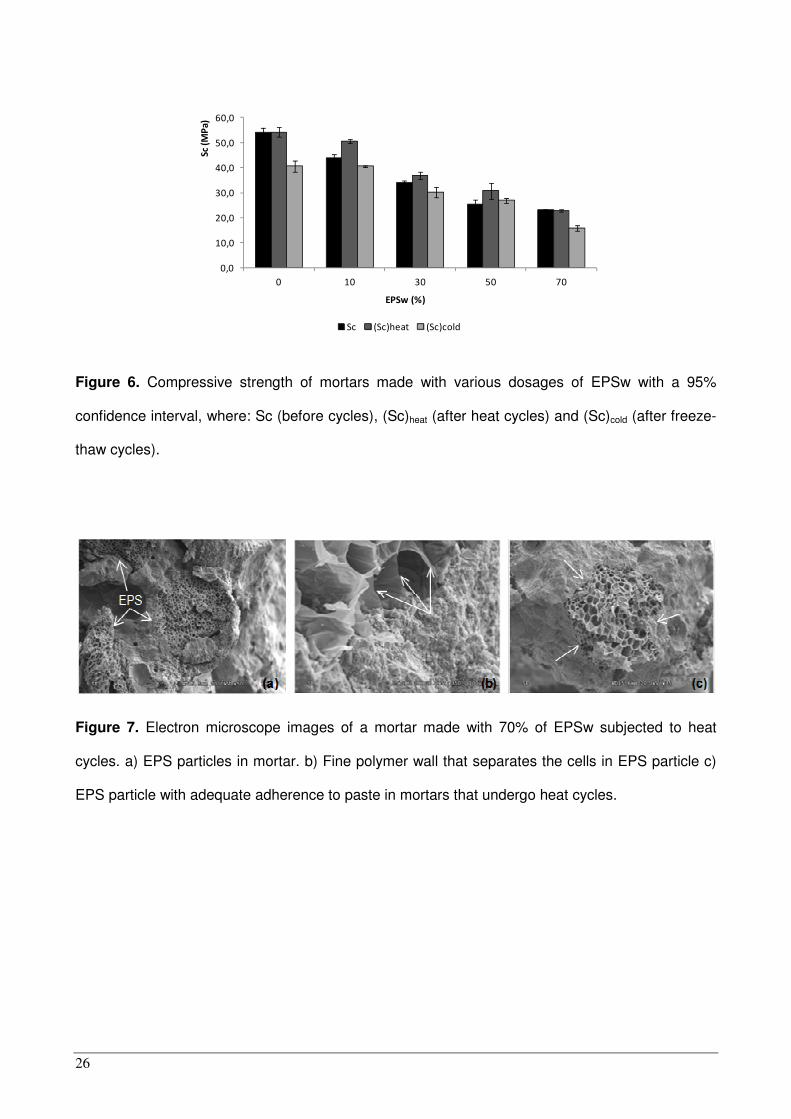
Figure 6 shows the compressive strength of mortars made with various dosages of EPSw before
cycles (Sc), after heat cycles ((Sc)heat) and after freeze-thaw cycles ((Sc)cold). The behaviour of
mortars made with commercial EPS (EPSc and EPSpex) is very similar. The temperature used for
heat cycles is 60 ± 5 ºC and was chosen due to the polymeric nature of the EPS. Figure 6 shows
that EPS has a negative effect on the compressive strength of mortars. This fact is showed by Sc
decreasing as the dosage of EPS increases. However, EPS has a positive influence on the
compressive strength in mortars after heat cycles. Since the chosen temperature of 60 ºC
increased the compressive strength of the control mortar slightly, is able analyzed the combined
influence of EPS and heat cycles in compressive strength. The increase observed in compressive
strength of mortars containing EPS, and therefore in their durability, can therefore be explained by
two possible causes. On one hand, the microstructure of the hydrated cement paste may improve
because the higher temperature allows a more extended hydration reaction. On the other hand, the
hydrated cement paste-EPS interface may improve, allowing more adherence between these
phases. The second assertion can be confirmed by the SEM image in Figure 7, which shows a
sample made with 70% EPSw after heat cycles. In this image, an adequate adherence between
EPS and cement paste (Figure 7c) is evident.
The behaviour of EPS mortars after freeze-thaw cycles is also shown in Figure 6. By comparing
the values of (Sc)cold (for mortars containing EPS) and Sc for a control mortar(0%EPS), it can be
seen that after freeze-thaw cycles in mortars made with EPS, the higher the dosage of EPS, a
12
higher loss in compressive strength is obtained being above 50% at the highest EPS dosages.
This behaviour may be attributed to the poor workability of these mortars, making them more
heterogeneous and dispersed, facilitating the formation of micro cracks by the expansive effect of
ice. The effect of freeze-thaw cycles on these mortars can be seen by comparing the values
(Sc)cold and Sc, for a given mortar. The effect of the freeze-thaw cycles on the control mortar
produces a loss of around 25% in compressive strength. However, the loss of compressive
strength in 10 and 30%EPSw mortars it is only 7% and 11% respectively. Mortars with 50%EPSw
even show a small gain (5%). In these cases, EPS in mortars maintains or improves their durability
to freeze-thaw cycles. The presence of EPS in mortars has a positive influence because EPS
absorbs part of the ice crystallization pressure. As a result, the effect of freeze-thaw cycles in
mortars with EPS is lower than in control mortar and the deterioration decreases. This again
highlights the positive effect of EPS on the durability of mortars. The exception is for mortars
containing 70% EPSw, where the compressive strength loss is greater than in the control mortar,
at 31%. This is again due to the low workability and high heterogeneity of these mortars that
reinforces the need to use additives, especially in mortars with high dosage of EPS.
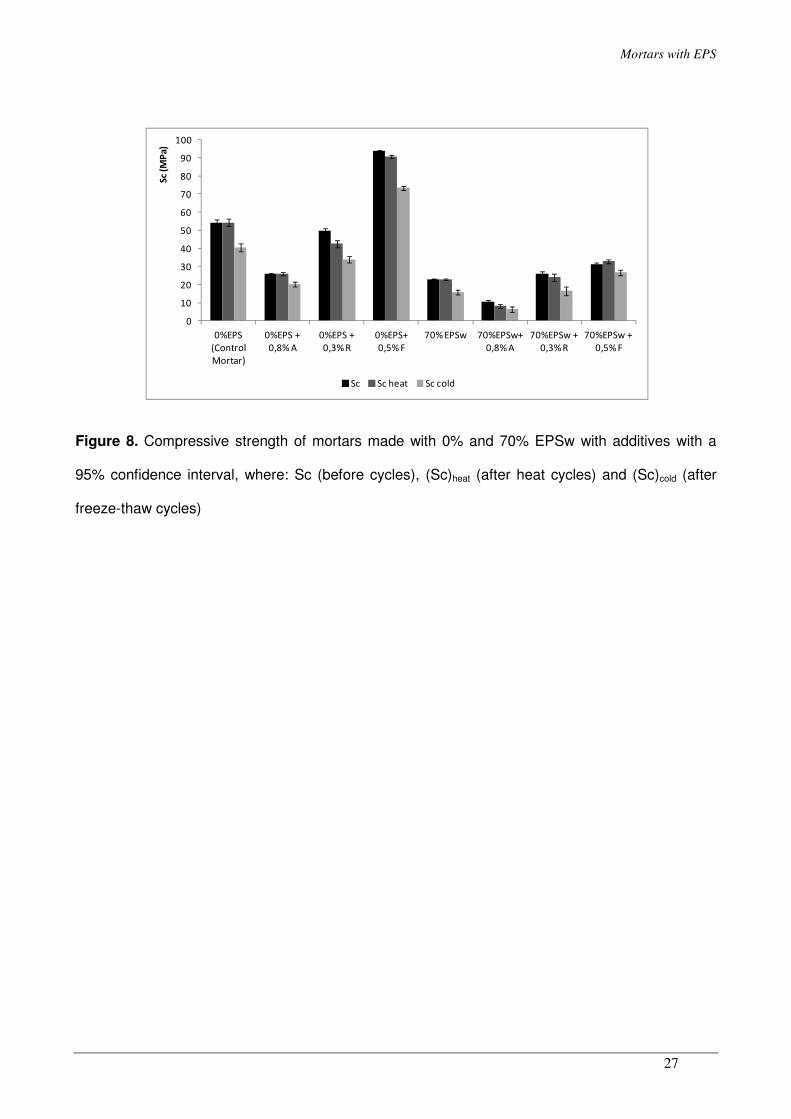
Figure 8 shows compressive strength values for mortars made with 0% and 70% EPSw and
various additives before cycles (Sc), after heat cycles ((Sc)heat) and after freeze-thaw cycles
((Sc)cold). The Sc values for 0%EPS mortars shows the influence of a given additive on the control
mortar (0%EPS and 0% additives). The compressive strength improve using superplasticizer
additive (F) compared with the control mortar. Nevertheless, with the presence of air-entraining
agent (A) and the water retainer additive (R), the compressive strength decrease, which losses of
around 52% and 8% respectively. The air-entraining agent (A) introduces air bubbles that assist in
this reduction of compressive strength, so this result is expected. The (Sc)heat values for 0%EPS
mortars made with air-entraining agent (A) and superplasticizer additive (F) show that after heat
cycles almost retain their compressive strength. Only 0% EPS mortars with water retainer additive
(R) show losses of around 15%. If the value (Sc)heat for 0%EPS mortars and Sc for control mortar
are compared, it may be seen that the combined influence of additives and heat cycles in 0% EPS
mortars produce in compressive strength losses around 52% and 22% for mortars with (A) and (R)
Mortars with EPS
13
additives respectively. Only mortars made with superplasticizer additive (F) improve their
behaviour relative to the control mortar.
The Sc values for 70%EPSw mortars show that the use of additives improve the compressive
strength for mortars made with water retainer additive (R) and superplasticizer additive (F). Mortars
made with air-entraining agent (A) have losses in their compressive strength around 53%
compared to the 70% EPSw mortars without additive. This result is due to the influence of the
aforementioned air-entraining agent. By comparing Sc values for 70%EPSw and Sc for control
mortar, it seems that the use of additives in mortars with EPS do not compensate the losses in
compressive strength produced by the presence of EPS. The greatest losses are observed in
70%EPSw mortars with an air entraining agent additive (A). By comparing Sc values for 70%
EPSw with additives and Sc for 0%EPS with the same additives, it may be seen that the greatest
losses are obtained in 70%EPSw mortars with a superplasticizer additive (F). The influence of the
EPS is so much the worse for mortars made with superplasticizer additive (F). The (Sc)heat values
for 70%EPSw mortars show that heat cycles did not cause significant differences in the
compressive strength of mortars made with EPS and additives. Mortars made with EPS and a
superplasticizer additive (F) show increases of 5% in their compressive strength. Losses of 7 and
24% were obtained in mortars made with water retainer additive (R) and air-entraining agent (A),
respectively. However, the (Sc)heat values for 70%EPSw mortars made with water retainer additive
(R) and superplasticizer additive (F) are better than Sc value for 70%EPSw without additives,
showing the beneficial effect of these additives in EPS mortars subjected to heat cycles.
The (Sc)cold values show the behaviour for mortar subjected to freeze-thaw cycles. Comparing
(Sc)cold values and Sc values for the same mortar, it may be seen that freeze-thaw cycles reduce
the compressive strength of 0% EPS mortar made with additives by 32% for mortar with water
retainer additive (R), and 22% for mortars with air entraining agent (A) and superplasticizer additive
(F). In mortars with 70%EPSw it may be seen that freeze-thaw cycles cause losses in compressive
strength of 15%, 35% and 40% for mortars made with (F), (R), and (A) additive respectively. These
results highlight the suitable behaviour of mortars made with a high amount of EPS after freeze-
thaw cycles. The influence of the additives in 0%EPS mortars subjected to freeze-thaw cycles is
14
observed by comparing (Sc)cold for 0%EPS with additives and the (Sc)cold for control mortar. It can
be deduced that air-entraining agent (A) reduces the compressive strength by 50%, water retainer
additive (R) reduces it by 16%, whereas superplasticizer additive (F) increases the compressive
strength by 81%. The additive influence in EPS mortars subjected to freeze-thaw cycles is
observed comparing (Sc)cold for 70%EPS with additives and the (Sc)cold corresponding to 70%EPS
mortar without additives. It can be deduced that air-entraining agent (A) reduces the compressive
strength 60% and superplasticizer additive (F) increases the compressive strength above than
40%. The use of a water retainer additive does not modify significantly the compressive strength of
these mortars after the freeze-thaw cycles. The combined influence of additives and freeze-thaw
cycles can be seen by comparing (Sc)cold values for 0%EPS mortars and Sc value for control
mortar. The greatest losses are observed in mortars with the air-entraining agent (A). Mortars with
water retainer additive (R) show losses of 35%. One again, only mortars with superplasticizer
additive improve their compressive strength, in this case by around 35%. EPS mortars show a
similar trend: losses in compressive strength around 70% and 25% for mortars with (A) and (R)
additive, respectively. Again, the highest compressive strength is obtained for EPS mortars made
with superplasticizer (F) additive. The higher workability and lower porosity of mortars made with
(F) additive compared to mortars made with other studied additives could be the reason for this
observed behaviour.
Mortars with EPS
15
CONCLUSIONS
The following are the conclusions of this study.
1. The capillary absorption coefficient of EPS mortars makes it possible to conclude that the
presence of EPS in mortars improves their durability. The use of additives allows the
fabrication of mortars with high EPS dosages and better durability when compared to a
control mortar.
2. Mercury intrusion porosimetry is not a suitable technique for studying the microstructure of
mortars made with EPS due to the inner porous structure of the EPS particles.
3. There were no clear relationships between impedance spectroscopy parameters, the open
porosity, and the capillary absorption coefficient. Moreover, it was not posible to justify the
observed trends using mercury intrusion porosimetry. For these reasons, it can be
concluded that the presence of EPS in mortars, due to the polymeric nature and inner
porous structure of the EPS, does not allow a suitable microstructure study using the
equivalent circuits established in the literature for cementious materials. Future studies
must be proposed to address this issue.
4. EPS has a positive effect on the compressive strength of mortars subjected to heat cycles.
Improvements in the microstructure of cement pastes as well as in the cement paste-EPS
interface may be the basis for the observed increase in compressive strength. The mortars
with a highest dosage of EPS and superplasticizer additive are the most durable.
5. The presence of EPS in mortars improves and/or maintains their durability after freeze-thaw
cycles. The EPS absorbs some of the crystallization pressure of ice, contributing to a
reduction of mortar damage and an increase in durability. The optimum behaviour occurs in
mortars made with superplasticizer additives.
ACKNOWLEDGMENTS
The authors wish to thank the Spanish Ministry of Science and Innovation and European Union
(FEDER) for the BIA2007-61170 project funding, in the framework of which this work has been
done, and the FPI scholarship (BES-2009-012166) award to Verónica Ferrándiz Mas which allows
16
her to develop her doctoral thesis, which this present work is part. The authors also wish to thank
Dr. Isidro Sánchez for his support with the impedance study and Holcim Morteros S.A., for the
supply of cement and additives necessary for carrying out this study.
Mortars with EPS
17
REFERENCES
[1] Short A., Kinniburgh W. Lightweight Concrete. 3rd ed., London: Applied Science Publishers:
1978.
[2] Sussman V. Lightweight plastic-aggregate concrete. J Am Concr Inst Proc 1975; 72: 321-323.
[3] Ganesh Babu K, Saradhi Babu D. Behaviour of lightweight expanded polystyrene concrete
containing silica fume. Cem Concr Res 2003; 33: 755-762.
[4] Ganesh Babu K, Saradhi Babu D. Properties of lightweight expanded polystyrene aggregate
concretes containing fly ash. Cem Concr Res 2005; 35: 1218-1223.
[5] Tang WC, Lo Y, Nadeem A. Mechanical and drying shrinkage properties of structural-graded
polystyrene aggregate concrete. Cem Concr Compos 2008; 30: 403-409.
[6] Bouvard D, Chaix JM, Dendievel R, Fazekas A, Létang JM, Peix G, et al. Characterization and
simulation of microstructure and properties of EPS lightweight concrete. Cem Concr Res 2007; 37:
1666-1673.
[7] Madandoust R, Ranjbar MM, Mousavi SY. An investigation on the fresh properties of self-
compacted lightweight concrete containing expanded polystyrene. Construct Build Mater 2011; 25:
3721-3731.
[8] Laukaitis A, Zurauskas R, Keriene J. The effect of foam polystyrene granules on cement
composite properties. Cem Concr Compos 2005; 27: 41-47.
[9] González Madariaga FJ, Lloveras Macia J. EPS (expanded poliestyrene) recycled bends
mixed with plaster or stucco, some applications in building industry. Inf Constr 2008; 60; 509: 35-
43.
[10] García Santos A. PPF-reinforced, ESP-lightened gypsum plaster. Mater Construcc 2009; 59:
293: 105-124.
[11] Wu HC, Sun P. New building materials from fly ash-based lightweight inorganic polymer.
Construct Build Mater 2007; 21: 211-217.
18
[12] Ferrándiz-Mas V, García-Alcocel E. Physical and Mechanical characterization of Portland
cement mortars made with expanded polystyrene particles addition (EPS). Mater Construcc 2012;
62; 308: 547-566.
[13] UNE-EN 196-1:2005: “Methods of cement testing. Part 1: Determination of Mechanical
strengths”.
[14] UNE-EN 1015-3:2007: “Methods of test for mortars for masonry. Part 3. Determination of
consistence of fresh mortar (by flow table)”.
[15] UNE-EN 1015-18:2003: “Methods of test for mortars for masonry. Part 18. Determination of
water absorption coefficient due to capillary action of hardened mortar”.
[16] Cabeza M, Merino P, Miranda A, Nóvoa XR, Sánchez I. Impedance spectroscopy study of
hardened Portland cement paste. Cem Concr Res 2002; 32: 881-891.
[17] Sanchez I, Nóvoa XR, de Vera G, Climent MA. Microestructural modifications in Portland
cement concrete due to forced ionic migration tests. Study by impedance spectroscopy. Cem
Concr Res 2008; 38: 1015-1025.
[18] Sánchez I, López MP, Ortega JM, Climent MA. Impedance spectroscopy: An efficient tool to
determine the non-steady-state chloride diffusion coefficient in building materials. Mater Corros
2011; 62: 139-145.
[19] Cabeza M, Keddam M, Nóvoa XR, Sánchez I, Takenouti H. Impedance spectroscopy to
characterize the pore structure during the hardening process of Portland cement paste.
Electrochim Acta 2006; 51: 1831-1841.
[20] Ortega J.M, Albaladejo A, Pastor J.L, Sánchez I, Climent M.A. Influence of using slag cement
on the microstructure and durability related properties of cement grouts for micropiles. Construct
Build Mater 2013; 38: 84-93.
[21] Cabeza M, Merino P, Nóvoa XR, Sánchez I. Electrical effects generated by mechanical
loading of hardened Portland cement paste. Cem Concr Compos 2003, 25: 351–356.
[22] Washburn EW. Note on method of determining the distribution of pore sizes in porous
materials. Proc Nat Acad Sci U.S.A. 1921; 7; 4: 115-116.
[23] UNE 67028 EX: 1997. Clay bricks. Freezing test.
Mortars with EPS
19
[24] Puertas F; Santos H, Palacios M, Martínez-Ramirez S, Polycarboxylate superplasticizer
admixtures: effect on hydration, microstructure and rheological behavior in cement pastes. Adv
Cem Res 2005; 17; 2: 77-89.
[25] Monografía ACHE nº 16, “Manual de tecnología de aditivos para hormigón”, Asociación
científico-técnica del hormigón estructural; 2010.
[26] Chekaev A. Variational methods for structural optimisation. Springer Verlag. New York. 2000.
p 158-160.
20
FIGURE CAPTIONS
Figure 1: Impedance measurement on an EPS mortar sample. (a) Contacting method: The sample
is placed between two electrodes for application of an electrical current. (b) Non-contacting
method: The sample is placed between two insulating films that are in contact with the electrodes
that provide the electrical current.
Figure 2: Equivalent circuits proposed by Cabeza et al. [16]. (a) Equivalent circuit used to model
the data using the contacting method. (b) Equivalent circuit used to model the data using the non-
contacting method.
Figure 3. Capillary absorption coefficient (C90), as a function of the percentage and type of EPS in
mortar, with a 95% confidence interval.
Figure 4. Capillary absorption coefficient (C90) as a function of the type of EPS in mortars made
with 0% and 70% EPS and different additives, with a 95% confidence interval. (A: air-entraining
agent; R: water retainer additive; F: superplasticizer additive)
Figure 5. Pore size distribution obtained through mercury intrusion porosimetry in 0% EPS mortars
made with additives (A: air-entraining agent; R: water retainer additive; F: superplasticizer additive)
Figure 6. Compressive strength of mortars made with various dosages of EPSw with a 95%
confidence interval, where: Sc (before cycles), (Sc)heat (after heat cycles) and (Sc)cold (after freeze-
thaw cycles).
Figure 7. Electron microscope images of a mortar made with 70% of EPSw subjected to heat
cycles. a) EPS particles in mortar. b) Fine polymer wall that separates the cells in EPS particle c)
EPS particle with adequate adherence to paste in mortars that undergo heat cycles.
Figure 8. Compressive strength of mortars made with 0% and 70% EPSw with additives with a
95% confidence interval, where: Sc (before cycles), (Sc)heat (after heat cycles) and (Sc)cold (after
freeze-thaw cycles).
Mortars with EPS
21
Table 1. Properties of the various types of EPS used in mortar preparation.
Table 2. EPS and additive dosages used in the studied mortars.
Table 3. Open porosity (section 2.2.4) and total porosity measured by mercury intrusion
porosimetry (MIP) after a 120 day curing period.
Table 4. Impedance spectroscopy parameters (R1, R2, C1, C2) and open porosity computed after a
120 day curing period as well as the capillary absorption coefficient (C90) for mortars made with
various types of EPS and additives.
22
Table 1. Properties of the various types of EPS used in mortar preparation.
EPS type Waste Particle diameter
(mm) Particle
geometry Density(g/cm
3)
EPSc No >3 spherical 0,008 EPSpex No <3 spherical 0,052 EPSw Yes <1 irregular 0,013
Table2. EPS and additive dosages used in the studied mortars.
Type of EPS EPS
(v/v %)
Air-entraining agent (A) (w/w %)
Water retainer additive (R)
(w/w %)
Superplasticizer additive (F)
(w/w %)
EPSc 0, 10, 30, 50, 70 0 0 0
0,70, 0,8 0,3 0,1
EPSpex 0, 10, 30, 50, 70 0 0 0
0, 70, 0,8 0,3 0,9
EPSw 0,10, 30, 50, 70 0 0 0
0, 70 0,8 0,3 0,5
Table 3. Open porosity (section 2.2.4) and total porosity measured by mercury intrusion porosimetry (MIP) after a 120 day curing period.
Mortar Open porosity
(%) Total porosity by
MIP (%)
control 13,4 15,5
70% EPSc 11,3 40,2
70% EPSpex 11,4 33,7
70% EPSw 13,4 32,4
70% EPSw + 0,8% A 12,4 44,8
70% EPSw+ 0,3% R 14,4 33,9
70% EPSw+ 0,5% F 13,3 33,4 (A: air-entraining agent; R: water retainer additive; F: superplasticizer additive)
Table 4. Impedance spectroscopy parameters (R1, R2, C1, C2) and open porosity computed after a 120 day curing period as well as the capillary absorption coefficient (C90) for mortars made with various types of EPS and additives.
Mortar R1 (Ω) R2 (Ω) C1 (pF) C2 (pF) Open porosity
(%) C90
(Kg/m2min
0.5)
EPS 7,75e29
9,99e19
5,69 0,146 - -
Control 208,4 391,0 26,8 427 13,4 0,210
70% EPSc 234,4 271,0 39,4 293 11,3 0,168
70% EPSc+0.8%A 198,5 270,7 18,7 153 11,9 0,153
70% EPSc +0.3R 121,2 199,2 20,8 316 12,6 0,093
70% EPSc +0.1F 246,5 180,8 18,8 143 12,1 0,122
70% EPSpex 179,8 269,7 14,0 251 11,4 0,232
70% EPSpex+0.8%A 195,7 144,2 18,3 136,5 11,2 0,073
70% EPSpex +0.3R 135,9 462,6 17,5 348 13,3 0,103
70% EPSpex+0.9F 131,9 137,3 18,4 109 11,0 0,092
70% EPSw 219,0 372,6 20,7 455 13,4 0,205
70% EPSw+0.8%A 87,8 111,0 16,1 74,0 12,4 0,082
70% EPSw +0.3R 86,7 128,3 20,8 342 14,4 0,112
70% EPSw +0.5F 87,6 349,0 23,7 398 13,3 0,137
(A: air-entraining agent; R: water retainer additive; F: superplasticizer additive)
Mortars with EPS
23
Figure 1: Impedance measurement on an EPS mortar sample. (a) Contacting method: The sample
is placed between two electrodes for application of an electrical current. (b) Non-contacting
method: The sample is placed between two insulating films that are in contact with the electrodes
that provide the electrical current.
Figure 2: Equivalent circuits proposed by Cabeza et al. [16]. (a) Equivalent circuit used to model
the data using the contacting method. (b) Equivalent circuit used to model the data using the non-
contacting method.
Electrode
Sample
Polyester sheet
(a) (b)
(a) (b)
24
Figure 3. Capillary absorption coefficient (C90), as a function of the percentage and type of EPS in
mortar, with a 95% confidence interval.
Figure 4. Capillary absorption coefficient (C90) as a function of the type of EPS in mortars made
with 0% and 70% EPS and different additives, with a 95% confidence interval. (A: air-entraining
agent; R: water retainer additive; F: superplasticizer additive)
0,000
0,050
0,100
0,150
0,200
0,250
0,300
EPSc EPSpex EPSw
C90 (
Kg
/m2m
in1
/2)
EPS's type (%)
0% 10,0% 30,0% 50,0% 70,0%
0,000
0,050
0,100
0,150
0,200
0,250
0% EPS EPS c EPS pex EPSw
C9
0 (
Kg/
m2m
in1
/2)
EPS's Type (70%)
without additives 0,8% A 0,3% R 0,1% F 0,5% F 0,9% F
Mortars with EPS
25
0% EPS 0% EPS+0,8% A 0% EPS + 0,3% R 0% EPS + 0,5% F
0,00
0,02
0,04
0,06
0,08
0,10
0,12
0,14
Intr
us
ion
vo
lum
e (m
L/g
)
>0,1 mm
10 µm-0,1 mm
1-10 µm
100 nm-1 µm
10-100 nm
<10 nm
Figure 5. Pore size distribution obtained through mercury intrusion porosimetry in 0% EPS mortars
made with additives (A: air-entraining agent; R: water retainer additive; F: superplasticizer additive)
26
Figure 6. Compressive strength of mortars made with various dosages of EPSw with a 95%
confidence interval, where: Sc (before cycles), (Sc)heat (after heat cycles) and (Sc)cold (after freeze-
thaw cycles).
Figure 7. Electron microscope images of a mortar made with 70% of EPSw subjected to heat
cycles. a) EPS particles in mortar. b) Fine polymer wall that separates the cells in EPS particle c)
EPS particle with adequate adherence to paste in mortars that undergo heat cycles.
0,0
10,0
20,0
30,0
40,0
50,0
60,0
0 10 30 50 70
Sc
(MP
a)
EPSw (%)
Sc (Sc)heat (Sc)cold
Mortars with EPS
27
Figure 8. Compressive strength of mortars made with 0% and 70% EPSw with additives with a
95% confidence interval, where: Sc (before cycles), (Sc)heat (after heat cycles) and (Sc)cold (after
freeze-thaw cycles)
0
10
20
30
40
50
60
70
80
90
100
0%EPS
(Control
Mortar)
0%EPS +
0,8% A
0%EPS +
0,3% R
0%EPS+
0,5% F
70% EPSw 70%EPSw+
0,8% A
70%EPSw +
0,3% R
70%EPSw +
0,5% F
Sc
(MP
a)
Sc Sc heat Sc cold


