Embed Size (px)
Citation preview
352 Int. J. Process Management and Benchmarking, Vol. 1, No. 4, 2006
Copyright © 2006 Inderscience Enterprises Ltd.
Driving improvement opportunities in the food processing industry through benchmarking
Rakesh Jain Faculty of Business and Law, John Foster Building, 98 Mount Pleasant, Liverpool John Moores University, Liverpool L3 5UZ, UK E-mail: [email protected]
Om Prakash Yadav* Department of Industrial and Manufacturing Engineering, 1410 14th Avenue N, 202 CIE Building, North Dakota State University, Fargo ND 58105, USA E-mail: [email protected] *Corresponding author
Abstract: Increasing competition, ever-changing customer needs, and rapid technological advances exert a tremendous amount of pressure on the food processing companies to stay competitive. These companies also have to deal with a growing variety of products, short delivery times, high service level, increased focus on quality, and competitive cost. To compete in the global world, these companies need to learn continuously and use appropriate business improvement tools such as benchmarking, to improve their operation. This paper discusses how benchmarking can be an effective means for the food processing industry to help identify improvement opportunities and implement change process to improve business effectiveness. A benchmarking study of two food-processing companies has been carried out to identify a number of improvement opportunities for both the companies.
Keywords: benchmarking; food processing industry; continuous improvement; change process; process management.
Reference to this paper should be made as follows: Jain, R. and Yadav, O.P. (2006) ‘Driving improvement opportunities in the food processing industry through benchmarking’, Int. J. Process Management and Benchmarking, Vol. 1, No. 4, pp.352–369.
Biographical notes: Rakesh Jain is a Reader in the Mechanical Engineering Department at Malaviya National Institute of Technology, Jaipur, India. He is currently pursuing a PhD programme at Liverpool John Moores University, Liverpool, UK. He has over 15 years of teaching, research, and consulting in India. He has received his BS in Mechanical Engineering from MREC Jaipur and MS in Industrial Engineering from NITIE Bombay (India). He has published over ten research papers in the area of quality, lean manufacturing, and operations management. His research interests are focused around lean manufacturing, supply chain management and total quality management.
Driving improvement opportunities in the food processing industry 353
Om Prakash Yadav is an Assistant Professor in the Industrial and Manufacturing Engineering Department at North Dakota State University. He completed his PhD in Industrial Engineering at Wayne State University, Detroit, USA. He has over 15 years of teaching, research, industry, and consulting experience in India and USA, including over three years in the auto industry in North America. He received his BS in Mechanical Engineering from MREC Jaipur (India) and MS in Industrial Engineering from NITIE Bombay (India). He has published over 20 research papers. His research interests are focused around product development, reliability and quality engineering, concurrent engineering, and manufacturing systems engineering.
1 Introduction
The “flattening of the world” (Friedman, 2005) has promoted business globalisation where companies face challenges from both national and international competitors. Fundamental changes in the role and form of organisations, the way they innovate, the way they do business and the way science and research are conducted, have been brought about. These factors exert tremendous pressure on the organisations to achieve higher customer satisfaction, improve business effectiveness and stay competitive in the global market. Organisations, therefore, are required to continuously identify their core competencies and weaknesses, their existing best practices and opportunities within and outside the industry, and subsequently seek to align their efforts and resources in order to gain sustainable competitive advantage in the market place.
The last decade has shown a remarkable interest in a variety of aspects of food processing and the food processing industry. Furthermore, changes in Information Technology (IT) and supply chain management are influencing the food processing industry. Food processing companies find themselves in a situation characterised by a growing variety of products, fast delivery and competitive cost requirements, and an increasing focus on quality. This changing business environment is likely to affect the food processing industry significantly in the future, with even greater pressure for speed and breadth. It is, therefore, important for the food processing companies to prepare themselves in order to face these growing challenges.
Benchmarking has been widely used by companies in recent times (Port and Smith, 1992) to acquire knowledge and drive improvement initiatives. It is a systematic process for performing critical analysis and improving performance. Benchmarking has disseminated to large parts of the world and thrived in a range of manufacturing and service businesses, including health care and government organisations (Camp, 1995). The concept of benchmarking has been considered as a structured approach to learning from others to achieve superior performance and may entail a continuous global search for organisations that are expert at what they do, irrespective of the industry (Garvin, 1991). It facilitates an organisation to identify its own, and other’s strengths and weaknesses, and to encompass other’s best practices into operations. Therefore, we believe that benchmarking can also be an effective means for the food processing industry to help identify improvement opportunities and implement change processes. Furthermore, it should facilitate organisational improvement when the knowledge gained is transformed into a comprehensive action plan to improve business effectiveness and subsequently achieve competitive advantage.
354 R. Jain and O.P. Yadav
The objective of this paper is to demonstrate the applicability and effectiveness of benchmarking in the food processing industry for identifying improvement opportunities and implementing changes. The paper presents a functional benchmarking study of two food-processing companies and highlights the benefits of this study. The paper is organised in seven sections. The following section presents a literature review on benchmarking. Section 3 provides contextual background on the food processing industry and the challenges that it faces. Section 4 describes the research methodology adopted for conducting the benchmarking study. Section 5 describes two case studies undertaken in the study. Section 6 presents the major outcomes of the benchmarking study in terms of a product, process, and market characteristics comparison, and potential improvement opportunities. Finally, Section 7 summarises the major conclusion of the benchmarking study.
2 Literature review
The concept of benchmarking business processes can be traced back to the late 1970s where it was performed firstly by the Xerox Corporation. The benchmarking initiative was employed by Xerox to enhance understanding with regards to the products and processes used by Japanese photocopier companies (Camp, 1989). It helped Xerox increase design and production competence, and reduce the manufacturing costs of its photocopiers. Xerox was able to slash its warehousing costs by 10% by stocking high volume components just before the packing stations – an approach they adopted from benchmarking L.L. Bean (Port and Smith, 1992). Camp’s (1989) prominent work, based on his experiences as a logistics manager at Xerox, sparked much interest in the benchmarking concept from academia and practitioners (Spendolini, 1992). Other notable illustrations of benchmarking are the cases of Alcoa, Motorola, AT&T, Florida Power and Light, Lucas and General Electric (Longbottom, 2000; Delbridge et al., 1995). Chrysler used the Japanese industries’ new product development techniques as a benchmark for developing its Viper sports car. It cut three billion dollars in developmental costs and reduced development time by one year through creating cross-functional lines of communication and involving suppliers in the project’s earliest stages (Hiebeler, 1993).
Benchmarking can be defined as the search for industry best practices that lead to superior performance. According to Bhutta and Huq
“benchmarking is first and foremost a tool for improvement, achieved through comparison with other organisations recognised as the best within the area.” Bhutta and Huq (1999, p.255)
By identifying how superior companies organise their processes, a company can learn to adopt and adapt the best practices used by these companies. Benchmarking is not only a goal setting process but also a process by which new practices are discovered and understood (Camp, 1989).
A key question within the literature is with regards to what to benchmark. Benchmarking was initially used to compare product or service performance, often of competitors, for the purpose of setting competitive targets; it has now been noticeably spread out to business processes (Voss et al., 1994). Watson (1993) suggests that the focus of benchmarking has gradually shifted since the 1970s and has undergone
Driving improvement opportunities in the food processing industry 355
five phases – reverse engineering, competitive benchmarking, process benchmarking, strategic benchmarking and global benchmarking. The initial focus on continuous and systematic assessment of products and services has shifted to a continuous process of identification, learning and implementation of best practices (Camp, 1989; Zairi and Leaonard, 1994).
According to Bogan and English (1994), organisations can use three types of benchmarking on the basis of “what is being compared?”, namely:
• process benchmarking
• performance benchmarking
• strategic benchmarking.
Process benchmarking analyses the processes involved in a range of business systems such as the procurement system and the order fulfilment system. It indirectly measures the ability of an organisation to perform its operations in the best possible manner for a given set of resource constraints. Performance benchmarking evaluates the competitive position of the organisation through product and service comparisons. Strategic benchmarking seeks to identify the winning strategies of the organisation and influences long-term competitive patterns of an organisation.
Camp (1989) proposed a benchmarking classification based on the type of partner as shown in Table 1. Benchmarking partners may include other units of the same organisation, competitors in the same or different geographical markets, and organisations in related or unrelated industries, in the same or different countries.
Table 1 Benchmarking types
Benchmarking type Description
Internal benchmarking Comparison of performance of units or departments within one organisation
Competitor benchmarking Comparison of own performance with direct product competitors; comparison can be made of products or services and business processes
Functional benchmarking Comparison against the best organisations operating in the same industry group
Generic benchmarking Comparison against the best without regard to industry
Source: Adapted from Camp (1989)
The concept of benchmarking has become synonymous with successful performance in recent times. It has been revealed that increased levels of benchmarking use were associated with higher levels of both adoption of best practices and operational performance (Voss et al., 1997). The literature is replete with dogmatic advice of the best ways in which organisations can employ benchmarking to both observe their own performance and learn from the competition (Spendolini, 1992; Watson, 1993). Benchmarking has also been observed to be a catalyst for the success of a number of change intervention programmes such as process re-engineering (Thor and Jarrett, 1999). The benefits advocated for business organisations to adopt benchmarking are given in Table 2.
356 R. Jain and O.P. Yadav
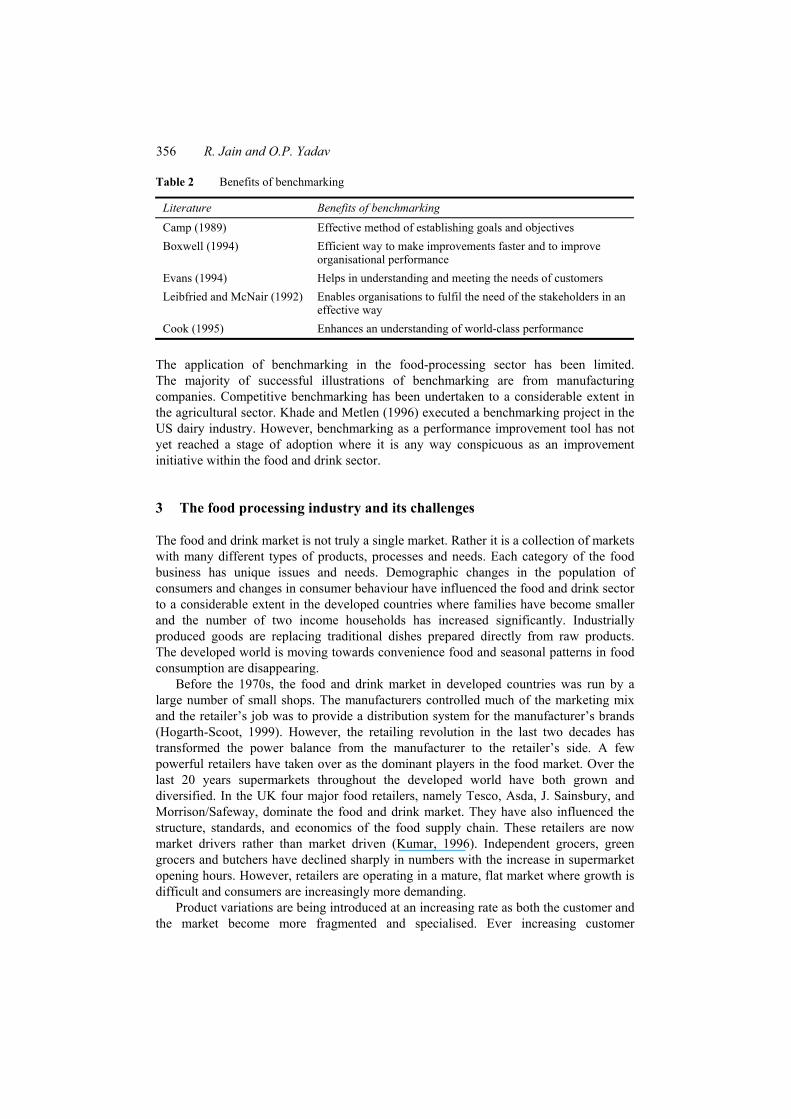
Table 2 Benefits of benchmarking
Literature Benefits of benchmarking Camp (1989) Effective method of establishing goals and objectives Boxwell (1994) Efficient way to make improvements faster and to improve
organisational performance Evans (1994) Helps in understanding and meeting the needs of customers Leibfried and McNair (1992) Enables organisations to fulfil the need of the stakeholders in an
effective way Cook (1995) Enhances an understanding of world-class performance
The application of benchmarking in the food-processing sector has been limited. The majority of successful illustrations of benchmarking are from manufacturing companies. Competitive benchmarking has been undertaken to a considerable extent in the agricultural sector. Khade and Metlen (1996) executed a benchmarking project in the US dairy industry. However, benchmarking as a performance improvement tool has not yet reached a stage of adoption where it is any way conspicuous as an improvement initiative within the food and drink sector.
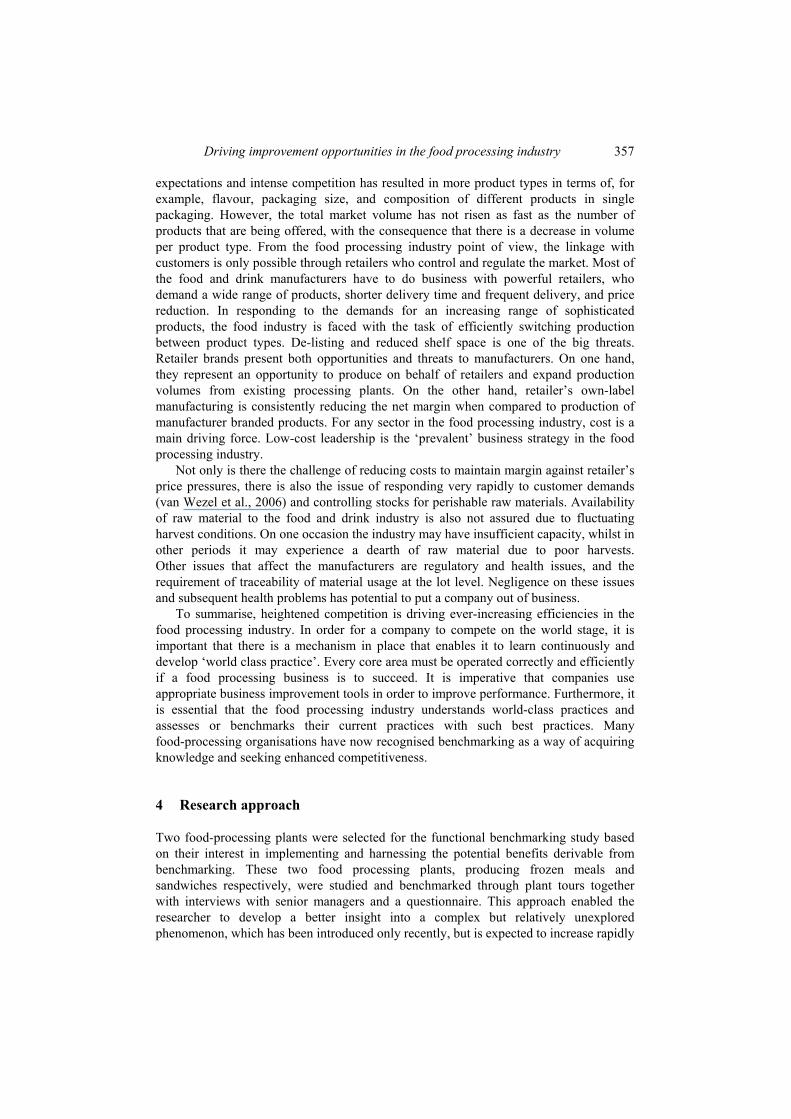
3 The food processing industry and its challenges
The food and drink market is not truly a single market. Rather it is a collection of markets with many different types of products, processes and needs. Each category of the food business has unique issues and needs. Demographic changes in the population of consumers and changes in consumer behaviour have influenced the food and drink sector to a considerable extent in the developed countries where families have become smaller and the number of two income households has increased significantly. Industrially produced goods are replacing traditional dishes prepared directly from raw products. The developed world is moving towards convenience food and seasonal patterns in food consumption are disappearing.
Before the 1970s, the food and drink market in developed countries was run by a large number of small shops. The manufacturers controlled much of the marketing mix and the retailer’s job was to provide a distribution system for the manufacturer’s brands (Hogarth-Scoot, 1999). However, the retailing revolution in the last two decades has transformed the power balance from the manufacturer to the retailer’s side. A few powerful retailers have taken over as the dominant players in the food market. Over the last 20 years supermarkets throughout the developed world have both grown and diversified. In the UK four major food retailers, namely Tesco, Asda, J. Sainsbury, and Morrison/Safeway, dominate the food and drink market. They have also influenced the structure, standards, and economics of the food supply chain. These retailers are now market drivers rather than market driven (Kumar, 1996). Independent grocers, green grocers and butchers have declined sharply in numbers with the increase in supermarket opening hours. However, retailers are operating in a mature, flat market where growth is difficult and consumers are increasingly more demanding.
Product variations are being introduced at an increasing rate as both the customer and the market become more fragmented and specialised. Ever increasing customer
Driving improvement opportunities in the food processing industry 357
expectations and intense competition has resulted in more product types in terms of, for example, flavour, packaging size, and composition of different products in single packaging. However, the total market volume has not risen as fast as the number of products that are being offered, with the consequence that there is a decrease in volume per product type. From the food processing industry point of view, the linkage with customers is only possible through retailers who control and regulate the market. Most of the food and drink manufacturers have to do business with powerful retailers, who demand a wide range of products, shorter delivery time and frequent delivery, and price reduction. In responding to the demands for an increasing range of sophisticated products, the food industry is faced with the task of efficiently switching production between product types. De-listing and reduced shelf space is one of the big threats. Retailer brands present both opportunities and threats to manufacturers. On one hand, they represent an opportunity to produce on behalf of retailers and expand production volumes from existing processing plants. On the other hand, retailer’s own-label manufacturing is consistently reducing the net margin when compared to production of manufacturer branded products. For any sector in the food processing industry, cost is a main driving force. Low-cost leadership is the ‘prevalent’ business strategy in the food processing industry.
Not only is there the challenge of reducing costs to maintain margin against retailer’s price pressures, there is also the issue of responding very rapidly to customer demands (van Wezel et al., 2006) and controlling stocks for perishable raw materials. Availability of raw material to the food and drink industry is also not assured due to fluctuating harvest conditions. On one occasion the industry may have insufficient capacity, whilst in other periods it may experience a dearth of raw material due to poor harvests. Other issues that affect the manufacturers are regulatory and health issues, and the requirement of traceability of material usage at the lot level. Negligence on these issues and subsequent health problems has potential to put a company out of business.
To summarise, heightened competition is driving ever-increasing efficiencies in the food processing industry. In order for a company to compete on the world stage, it is important that there is a mechanism in place that enables it to learn continuously and develop ‘world class practice’. Every core area must be operated correctly and efficiently if a food processing business is to succeed. It is imperative that companies use appropriate business improvement tools in order to improve performance. Furthermore, it is essential that the food processing industry understands world-class practices and assesses or benchmarks their current practices with such best practices. Many food-processing organisations have now recognised benchmarking as a way of acquiring knowledge and seeking enhanced competitiveness.
4 Research approach
Two food-processing plants were selected for the functional benchmarking study based on their interest in implementing and harnessing the potential benefits derivable from benchmarking. These two food processing plants, producing frozen meals and sandwiches respectively, were studied and benchmarked through plant tours together with interviews with senior managers and a questionnaire. This approach enabled the researcher to develop a better insight into a complex but relatively unexplored phenomenon, which has been introduced only recently, but is expected to increase rapidly
358 R. Jain and O.P. Yadav
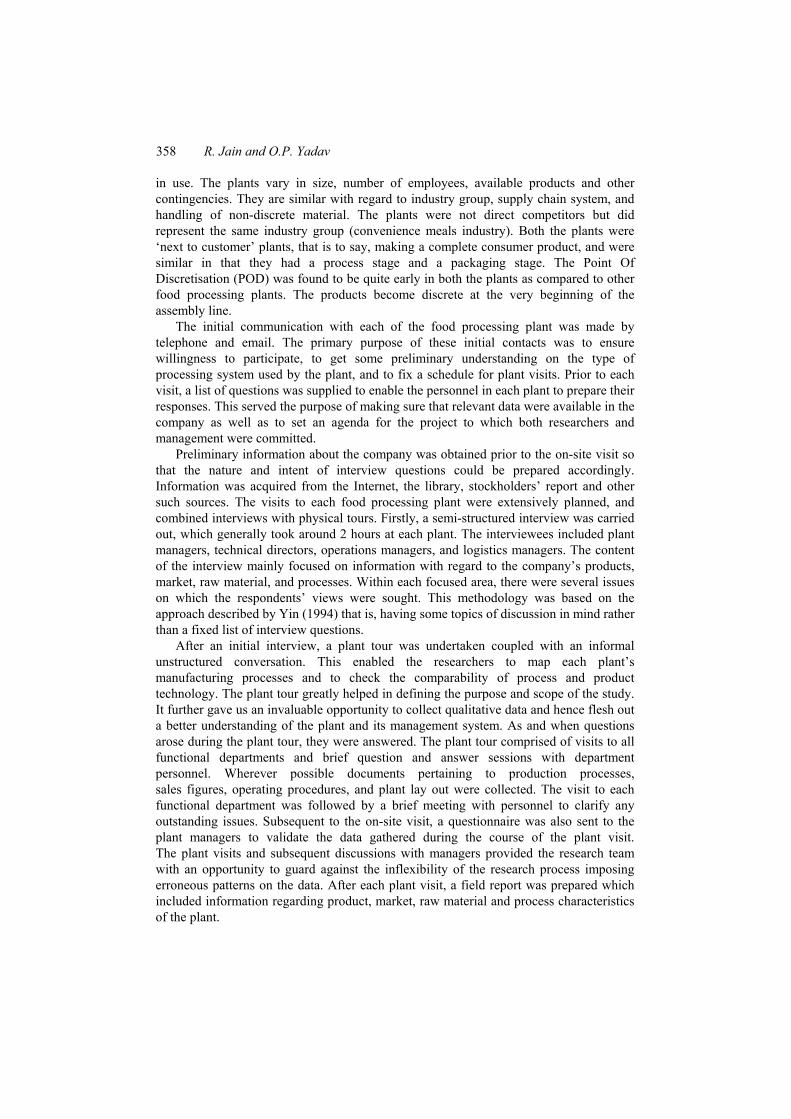
in use. The plants vary in size, number of employees, available products and other contingencies. They are similar with regard to industry group, supply chain system, and handling of non-discrete material. The plants were not direct competitors but did represent the same industry group (convenience meals industry). Both the plants were ‘next to customer’ plants, that is to say, making a complete consumer product, and were similar in that they had a process stage and a packaging stage. The Point Of Discretisation (POD) was found to be quite early in both the plants as compared to other food processing plants. The products become discrete at the very beginning of the assembly line.
The initial communication with each of the food processing plant was made by telephone and email. The primary purpose of these initial contacts was to ensure willingness to participate, to get some preliminary understanding on the type of processing system used by the plant, and to fix a schedule for plant visits. Prior to each visit, a list of questions was supplied to enable the personnel in each plant to prepare their responses. This served the purpose of making sure that relevant data were available in the company as well as to set an agenda for the project to which both researchers and management were committed.
Preliminary information about the company was obtained prior to the on-site visit so that the nature and intent of interview questions could be prepared accordingly. Information was acquired from the Internet, the library, stockholders’ report and other such sources. The visits to each food processing plant were extensively planned, and combined interviews with physical tours. Firstly, a semi-structured interview was carried out, which generally took around 2 hours at each plant. The interviewees included plant managers, technical directors, operations managers, and logistics managers. The content of the interview mainly focused on information with regard to the company’s products, market, raw material, and processes. Within each focused area, there were several issues on which the respondents’ views were sought. This methodology was based on the approach described by Yin (1994) that is, having some topics of discussion in mind rather than a fixed list of interview questions.
After an initial interview, a plant tour was undertaken coupled with an informal unstructured conversation. This enabled the researchers to map each plant’s manufacturing processes and to check the comparability of process and product technology. The plant tour greatly helped in defining the purpose and scope of the study. It further gave us an invaluable opportunity to collect qualitative data and hence flesh out a better understanding of the plant and its management system. As and when questions arose during the plant tour, they were answered. The plant tour comprised of visits to all functional departments and brief question and answer sessions with department personnel. Wherever possible documents pertaining to production processes, sales figures, operating procedures, and plant lay out were collected. The visit to each functional department was followed by a brief meeting with personnel to clarify any outstanding issues. Subsequent to the on-site visit, a questionnaire was also sent to the plant managers to validate the data gathered during the course of the plant visit. The plant visits and subsequent discussions with managers provided the research team with an opportunity to guard against the inflexibility of the research process imposing erroneous patterns on the data. After each plant visit, a field report was prepared which included information regarding product, market, raw material and process characteristics of the plant.
Driving improvement opportunities in the food processing industry 359
In this research investigation different data gathering methods were employed in order to get a clear understanding on current practices in the food processing industry and to address the limitations that this kind of research involves. During data collection, special attention was paid to determine whether evidence from different sources converged on a similar set of facts. All the data and evidence collected during the research were reviewed, documented, and shared with company personnel in order to get their opinion. It was our intention to gain a comprehensive understanding on current practices, but also to document the limitations, if any, that this kind of research involves, through the use of different data gathering methods (data triangulation). Triangulation of several sources of data improves the construct validity (objectivity) of the research (Yin, 1994). Such a review was found to be necessary for validating the data collection process.
5 Case background
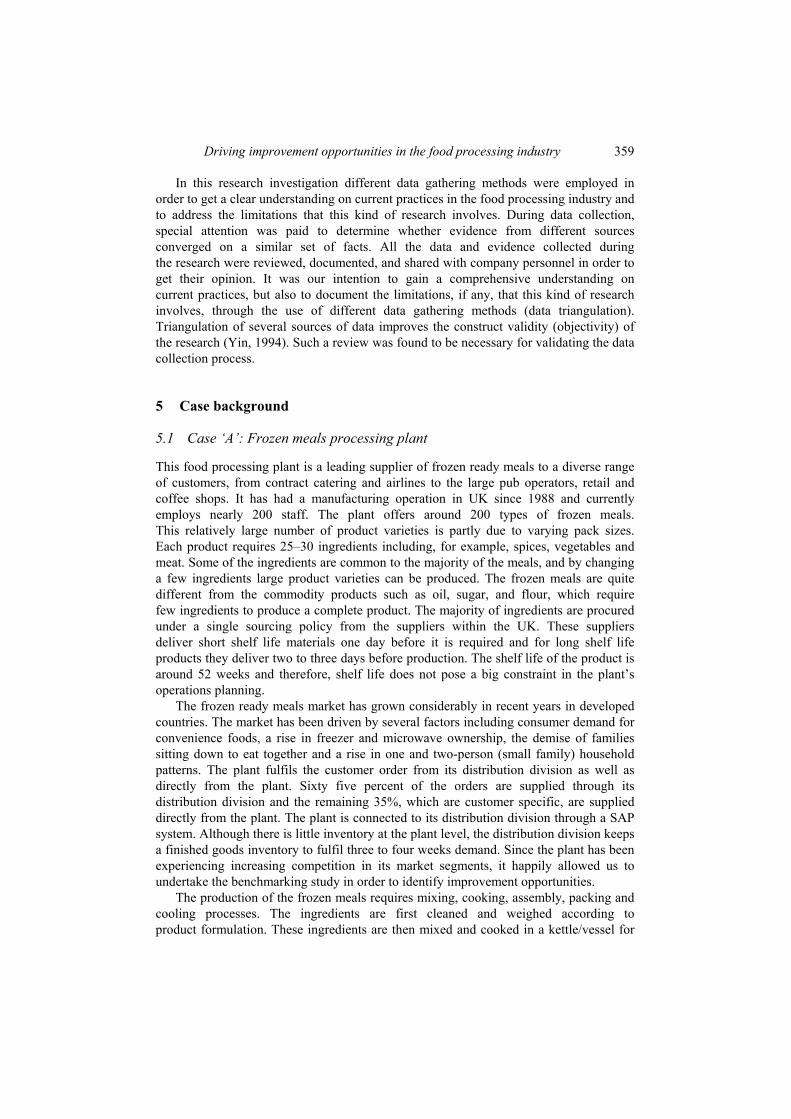
5.1 Case ‘A’: Frozen meals processing plant
This food processing plant is a leading supplier of frozen ready meals to a diverse range of customers, from contract catering and airlines to the large pub operators, retail and coffee shops. It has had a manufacturing operation in UK since 1988 and currently employs nearly 200 staff. The plant offers around 200 types of frozen meals. This relatively large number of product varieties is partly due to varying pack sizes. Each product requires 25–30 ingredients including, for example, spices, vegetables and meat. Some of the ingredients are common to the majority of the meals, and by changing a few ingredients large product varieties can be produced. The frozen meals are quite different from the commodity products such as oil, sugar, and flour, which require few ingredients to produce a complete product. The majority of ingredients are procured under a single sourcing policy from the suppliers within the UK. These suppliers deliver short shelf life materials one day before it is required and for long shelf life products they deliver two to three days before production. The shelf life of the product is around 52 weeks and therefore, shelf life does not pose a big constraint in the plant’s operations planning.
The frozen ready meals market has grown considerably in recent years in developed countries. The market has been driven by several factors including consumer demand for convenience foods, a rise in freezer and microwave ownership, the demise of families sitting down to eat together and a rise in one and two-person (small family) household patterns. The plant fulfils the customer order from its distribution division as well as directly from the plant. Sixty five percent of the orders are supplied through its distribution division and the remaining 35%, which are customer specific, are supplied directly from the plant. The plant is connected to its distribution division through a SAP system. Although there is little inventory at the plant level, the distribution division keeps a finished goods inventory to fulfil three to four weeks demand. Since the plant has been experiencing increasing competition in its market segments, it happily allowed us to undertake the benchmarking study in order to identify improvement opportunities.
The production of the frozen meals requires mixing, cooking, assembly, packing and cooling processes. The ingredients are first cleaned and weighed according to product formulation. These ingredients are then mixed and cooked in a kettle/vessel for
360 R. Jain and O.P. Yadav
30 minutes to two hours based on the type of product. There are seven kettles each of 500 kg capacity and two kettles each of 1000 kg capacity. There are five assembly lines, which produce 200 types of frozen meals. Each assembly line produces 42 meals per minute and on average the whole plant produces one million meals per week. The change over time on the assembly line is between one to two hours and is also constrained by the size of the cooking kettle. So changeover can take place only after the processing of 500 kg of materials. The plant offers high product variety as well as high product volume. Four out of five assembly lines are automated and don’t require a large number of production employees.
The assembly lines are linked to the packing line where the product is stamped and packed. The majority of the labour is employed at the packing stage. The product is then passed through a freezing chamber where the temperature of the products is reduced to –20 degrees centigrade. A few samples are taken from each batch and sent for a microbiological test as well as for a sensory evaluation test. This plant mainly employs general-purpose equipment such as kettle and general assembly line equipment, thus enabling the plant to produce a large variety of products.
The main problem faced by this company is related to a high level of finished good inventory. It appears that the root causes of poor performance are basically related to the lack of an adequate production planning and control system, large kettle capacity and long changeover time.
5.2 Case ‘B’: Sandwich processing plant
This plant was established in 1977 and has grown to become one of the UK’s leading independent suppliers of sandwiches and chilled snacks and offers 90 different types of sandwiches and wraps to the UK market. It produces all types of sandwiches, wraps, rolls, and baguettes for a number of supermarkets, high street retailers, petrol forecourts and convenience stores. Not only does it manufacture a large product variety, it also produces sandwiches in high volume – some one million sandwiches per month.
The plant operates in a very competitive market in the UK where price and service level are the order winning criteria. The customer base is very diverse, from small on-street shops to large retailers such as Asda and Tesco. Large retailers are equipped with EPoS systems and send their orders through EDI, where the small on-street shops place their orders through fax/telephone. Each order needs to be delivered the next day.
The shelf life of sandwiches is extremely short. From the raw material stage to the point of sale, sandwiches have a shelf life of P + 3 days (‘P’ denoting production lead-time). From the P + 3 days, the plant gets one day to manufacture and deliver to the customer and the retailer gets three days at their end to make the sales. If retailers are unable to sell all sandwiches during the available shelf life then the remaining sandwiches have to be discarded and the plant has to bear the cost. This makes the amount of wastage at the retailer’s end a very important performance indicator.
This plant manages 250 different types of raw material. The raw materials are purchased from suppliers located within the UK. Bread, which is clearly an important raw material, is delivered twice a day, whereas ingredients for sandwiches such as fresh vegetables are delivered daily. All other raw materials are delivered once per week. Information with regard to the production plan is shared with the main suppliers, although there is no electronic information exchange with those suppliers. The plant has
Driving improvement opportunities in the food processing industry 361
to purchase the materials from an approved list of suppliers according to customer requirements.
The production process is relatively simple as this plant is an assembly plant where various ingredients are assembled on an assembly line to make a sandwich or wrap. There are three assembly lines for sandwiches. All ingredients go through a preparation process where ingredients are washed, cleaned and chopped before being made available to the assembly operation. It takes 20 minutes to prepare the ingredients for the assembly process. The whole assembly line is divided into two sections, assembly and packing. The assembly operation is manual whereas the packing operation is automated. Each sandwich is assembled individually, which ensures that the POD is at the start of the assembly line.
This plant has been equipped with a computerised production reporting system, which is the backbone for its operation. This production reporting system tracks the current status of each assembly line and creates visibility of the production and helps in managing the large variety and large volume.
It is observed that the plant does not have a regular scheduled maintenance plan which quite often results in disruption in production when problems occur.
6 Case analysis and discussion
The two cases are now compared on the basis of products, processes and market characteristics. It has been observed that both are quite similar with regard to product variety, product volume, equipment type, order-winning criteria, level of raw material and work-in-progress inventory, and the POD. This is summarised in Table 3. These plants represent the same industry group, but are not direct competitors. This suggests that these food-processing plants can meaningfully be compared in order to identify improvement opportunities.
Table 3 Product/process/market characteristics
Case A (Frozen food plant)
Case B (Sandwich plant)
Product Product variety 200 90 Product shelf life 52 weeks 3 days Finished goods inventory in supply chain 3–4 weeks 1–2 days Process Operations strategy (MTS/MTO/ATO) MTS MTO Process type (Batch/Semi-continuous/Continuous)
Batch Flow shop
Number of operations 5 3 Skill input (Low/medium/high) Low Low Production volume (Units/day) 220000 50000 Level of automation (Low/medium/High) Medium Low Number of assembly line 5 3
362 R. Jain and O.P. Yadav
Table 3 Product/process/market characteristics (continued)
Case A (Frozen food plant)
Case B (Sandwich plant)
Process Process flexibility (Low/medium/high) Medium Medium Production employees (No. of employees) 150 200 Point of Discretisation Assembly stage Assembly stage Change over time 1–2 hours ~3 minutes Work in progress (Hours of output) 6–7 hours 1 hour Number of supply chain level 2 2 Market Order winning criterion (Price/quality/service level/ brand/Design)
Price, service level Price, service level
Order qualifying criterion (Price/quality/Service level/ brand/Design)
Quality Quality
Maximum demand deviation from mean demand (%)
~20% ~40%
Case ‘A’ has been able to manage a large production volume due to the setting up of a number of high-speed assembly lines. Although raw material inventory and work-in-progress inventory have been very limited, it keeps three to four weeks of finished goods stock due to the fact that it produces 200 types of meals and change over time is relatively high. Moreover, the minimum batch size is 500 kg, which is due to the size of the mixing and cooking kettles.
The Decoupling Point (DP), which is defined as the point that indicates how deeply the customer order penetrates into the goods flow (van Donk, 2000), is observed to be late. The position of the DP has a great influence on deploying a specific production strategy. It also determines how much a plant can align its production with demand. The upstream location of a DP allows a plant to respond to the customer demand more effectively. However, the location of DP is greatly influenced by certain market and process attributes. These are shown in Table 4.
Table 4 The influence of market and process attributes on the decoupling point
Value/occurrence in the food processing industry
Effect on location of the DP
Market attributes Service level High Downstream Response time Short Downstream Predictability of demand Unpredictable Downstream Specificity of demand High, through great variety and best-
before Upstream
Process attributes Lead times and costs High set-ups/cleaning times Downstream Predictability of raw materials Low Downstream Risk of obsolescence High Upstream Product shelf life Short Upstream
Source: Adapted from van Donk (2000)
Driving improvement opportunities in the food processing industry 363
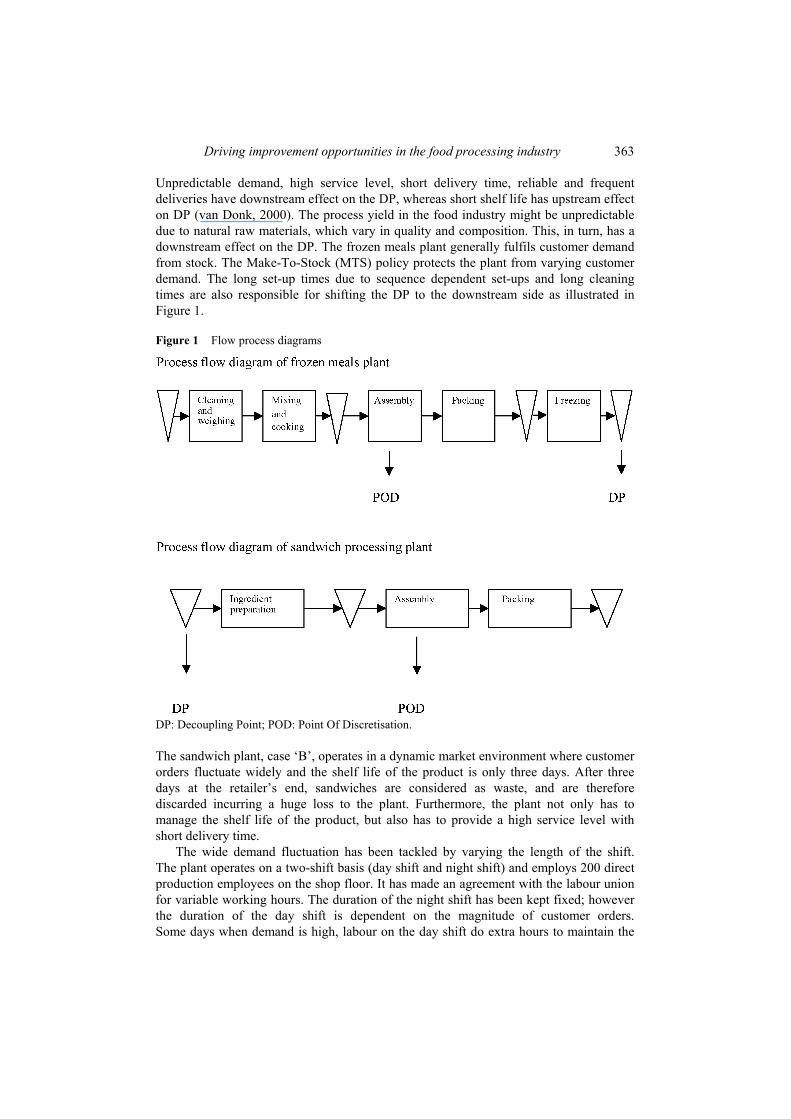
Unpredictable demand, high service level, short delivery time, reliable and frequent deliveries have downstream effect on the DP, whereas short shelf life has upstream effect on DP (van Donk, 2000). The process yield in the food industry might be unpredictable due to natural raw materials, which vary in quality and composition. This, in turn, has a downstream effect on the DP. The frozen meals plant generally fulfils customer demand from stock. The Make-To-Stock (MTS) policy protects the plant from varying customer demand. The long set-up times due to sequence dependent set-ups and long cleaning times are also responsible for shifting the DP to the downstream side as illustrated in Figure 1.
Figure 1 Flow process diagrams
DP: Decoupling Point; POD: Point Of Discretisation.
The sandwich plant, case ‘B’, operates in a dynamic market environment where customer orders fluctuate widely and the shelf life of the product is only three days. After three days at the retailer’s end, sandwiches are considered as waste, and are therefore discarded incurring a huge loss to the plant. Furthermore, the plant not only has to manage the shelf life of the product, but also has to provide a high service level with short delivery time.
The wide demand fluctuation has been tackled by varying the length of the shift. The plant operates on a two-shift basis (day shift and night shift) and employs 200 direct production employees on the shop floor. It has made an agreement with the labour union for variable working hours. The duration of the night shift has been kept fixed; however the duration of the day shift is dependent on the magnitude of customer orders. Some days when demand is high, labour on the day shift do extra hours to maintain the
364 R. Jain and O.P. Yadav
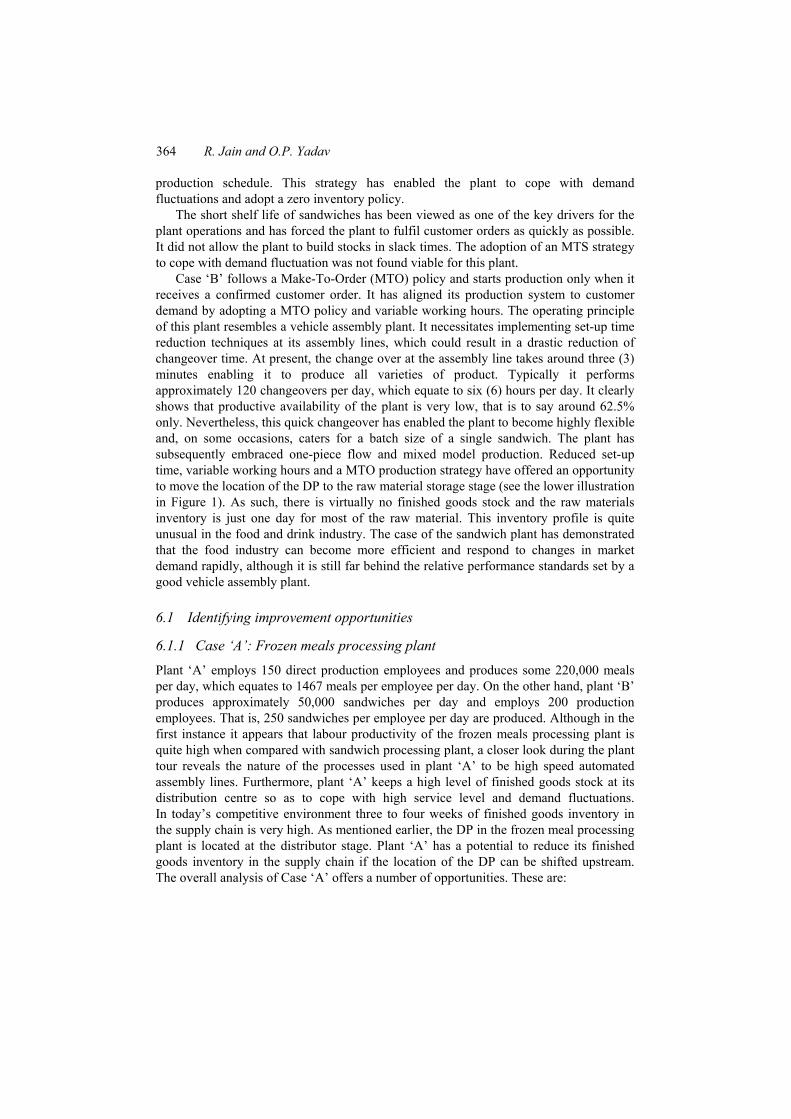
production schedule. This strategy has enabled the plant to cope with demand fluctuations and adopt a zero inventory policy.
The short shelf life of sandwiches has been viewed as one of the key drivers for the plant operations and has forced the plant to fulfil customer orders as quickly as possible. It did not allow the plant to build stocks in slack times. The adoption of an MTS strategy to cope with demand fluctuation was not found viable for this plant.
Case ‘B’ follows a Make-To-Order (MTO) policy and starts production only when it receives a confirmed customer order. It has aligned its production system to customer demand by adopting a MTO policy and variable working hours. The operating principle of this plant resembles a vehicle assembly plant. It necessitates implementing set-up time reduction techniques at its assembly lines, which could result in a drastic reduction of changeover time. At present, the change over at the assembly line takes around three (3) minutes enabling it to produce all varieties of product. Typically it performs approximately 120 changeovers per day, which equate to six (6) hours per day. It clearly shows that productive availability of the plant is very low, that is to say around 62.5% only. Nevertheless, this quick changeover has enabled the plant to become highly flexible and, on some occasions, caters for a batch size of a single sandwich. The plant has subsequently embraced one-piece flow and mixed model production. Reduced set-up time, variable working hours and a MTO production strategy have offered an opportunity to move the location of the DP to the raw material storage stage (see the lower illustration in Figure 1). As such, there is virtually no finished goods stock and the raw materials inventory is just one day for most of the raw material. This inventory profile is quite unusual in the food and drink industry. The case of the sandwich plant has demonstrated that the food industry can become more efficient and respond to changes in market demand rapidly, although it is still far behind the relative performance standards set by a good vehicle assembly plant.
6.1 Identifying improvement opportunities
6.1.1 Case ‘A’: Frozen meals processing plant
Plant ‘A’ employs 150 direct production employees and produces some 220,000 meals per day, which equates to 1467 meals per employee per day. On the other hand, plant ‘B’ produces approximately 50,000 sandwiches per day and employs 200 production employees. That is, 250 sandwiches per employee per day are produced. Although in the first instance it appears that labour productivity of the frozen meals processing plant is quite high when compared with sandwich processing plant, a closer look during the plant tour reveals the nature of the processes used in plant ‘A’ to be high speed automated assembly lines. Furthermore, plant ‘A’ keeps a high level of finished goods stock at its distribution centre so as to cope with high service level and demand fluctuations. In today’s competitive environment three to four weeks of finished goods inventory in the supply chain is very high. As mentioned earlier, the DP in the frozen meal processing plant is located at the distributor stage. Plant ‘A’ has a potential to reduce its finished goods inventory in the supply chain if the location of the DP can be shifted upstream. The overall analysis of Case ‘A’ offers a number of opportunities. These are:
Driving improvement opportunities in the food processing industry 365
• There is a potential to further reduce the changeover time to increase the plant availability. The efforts should be made to reduce changeover time from 1–2 hours to less than 10 minutes, which would then enable the plant to level its production. Consequently, it will help to further reduce finished goods inventory. A reduction in changeover time requires separation of internal and external set up activities (Shingo, 1989). The internal set-up is disruptive to the production processes, and hence this is the portion of the overall set-up process that deserves the most intense attention. Further efforts should be made to convert as mush as possible of the internal set-up to external set-up, and eliminate the adjustment process.
• In order to deal with unanticipated disruptions and demand fluctuations, it is important to maintain a capacity buffer and perform scheduled maintenance (Hopp and Spearman, 2000). By scheduling the facility to less than 24 hours per day the line catches up if it falls behind. The fact that the plant operates on a two-shift basis, offers an opportunity to employ a popular approach to schedule shift – 8-4-8-4 – in which two eight hour shifts are separated by four hours downtime. This arrangement provides a capacity buffer, variable working hours, and provides time to perform scheduled maintenance. In the event of increased demand, scheduled maintenance shifts can be used to produce demand targets. This essentially allows schedule maintenance to be carried out but also provides the flexibility to absorb the high demand scenario. The variable working hours could further enable the company to cope with varying customer demand, which, in turn, can help to reduce finished goods inventory.
• One of the causes of keeping high finished goods inventory and WIP is bigger lot sizes. Plant ‘A’ needs to reduce the existing capacity of kettles from 500/1000 kg to a certain (as yet unknown) optimum level, which will facilitate reducing inventory levels without affecting other factors adversely. This will further help in achieving production smoothing.
• The process flow diagram (see Figure 1) makes it clear that there are four possible locations for the DP:
• the stock of raw materials
• the stock of semi-finished products before the assembly process
• the stock of finished products before the freezing process
• the stock of finished products at the distribution stage.
At present the DP is at the distribution stage due to large product variety, high-expected service level, unanticipated disruptions, and a low predictability of demand. High finished product shelf life due to the freezing process has made it possible to serve the customer order from distribution. Although the DP cannot be shifted to the stock of semi-finished products before the freezing process due to the low shelf life of the semi-finished products, it is possible to move the DP to the stock of raw material or the stock of semi-finished products before the assembly process. Reduction of changeover time, scheduled maintenance, and a better forecasting system through implementation of an EDI linkage with the retailers could make the move of the DP upstream possible. The DP upstream can reduce the inventory costs.
366 R. Jain and O.P. Yadav
• We believe that food-processing companies should also reap the benefits of IT. The frozen meals processing plant can improve its production planning and control system through establishing a computerised production information system which can help track each customer order and manage large product varieties.
• An integrated supply chain framework can be established linking retailers, to track their sales/inventory data and allow real-time alignment of demand and production schedule. Sharing of information particularly on sales can improve planning for effective replenishment, and forecasting can be made more reliable. This would enhance customer order visibility to the plant, enabling reduction in the unpredictability of demand.
6.1.2 Case ‘B’: Sandwich processing plant
Although plant ‘B’ is considered to be an exemplary plant compared to other food and drink companies, it is observed that the labour productivity is quite low due to a lack of technological advancement in sandwich processing. The assembly of sandwiches are purely manual requiring a large number of unskilled workers. Moreover, the potential of this workforce in terms of hand (physical work), heart (attitude) and head (thinking) has not been harnessed effectively by the plant. Although, plant ‘B’ faces some problems arising due to demand fluctuations and high service level expectations, it has aligned its production system with customer demand enabling it to manage the plant with little finished goods inventory. The overall analysis of Case ‘B’ offers a number of improvement opportunities. These are:
• The changeover time for plant ‘B’ is three minutes, which appears to be very short. However, further investigation suggests that it performs approximately 120 changeovers per day, which turns out to be six hours per day. During two-shift production time (16 hours), spending 6 hours on changeover does not indicate effective capacity utilisation. We strongly suggest committing more effort to reduce changeover time to less than three minutes. (For a detailed discussion and guidelines on reducing set-up time, refer to Single Minute Exchange Dies (SMED) principles developed by Shingo (1989)).
• To deal with demand fluctuation, frequent disruptions, high service level, and finished goods inventory related problems, we believe that plant ‘B’ should also implement a popular approach to schedule shifts. This is 8-4-8-4, in which two eight hour shifts are separated by four hour down time. It allows implementation of a systematic scheduled maintenance programme to guard the plant against delay or disruption in production if anything goes wrong.
• This plant should also consider potential benefits offered by the IT revolution, by designing an effective information system, which will allow the sharing of production information with suppliers electronically. It should promote direct access to suppliers to its inventories to create stable schedules and, allow them to check consumption on a real-time basis. This facilitates the integration of suppliers, which would enable suppliers, in turn, to plan their production more realistically and be more responsive. Use of Internet technology can further optimise the supply chain and can create a virtual enterprise where trading partners are able to share information, cut costs and reduce cycle times. A collaborative supplier partnership
Driving improvement opportunities in the food processing industry 367
can then be established at the strategic level to harness gains further by mutually developing quality, delivery and service performance enhancements.
• In order to be more competitive and sustain existing advantages, the company needs to focus its efforts on continuous improvement activities. Standardisation, Kaizen, and employee involvement are a few important activities that the company needs to start implementing. We would like to emphasise here that standardisation exercises should be employee driven, rather than outside consultant or top management driven. Transparency and appropriate incentives will motivate employees to drive continuous improvement efforts.
7 Conclusion
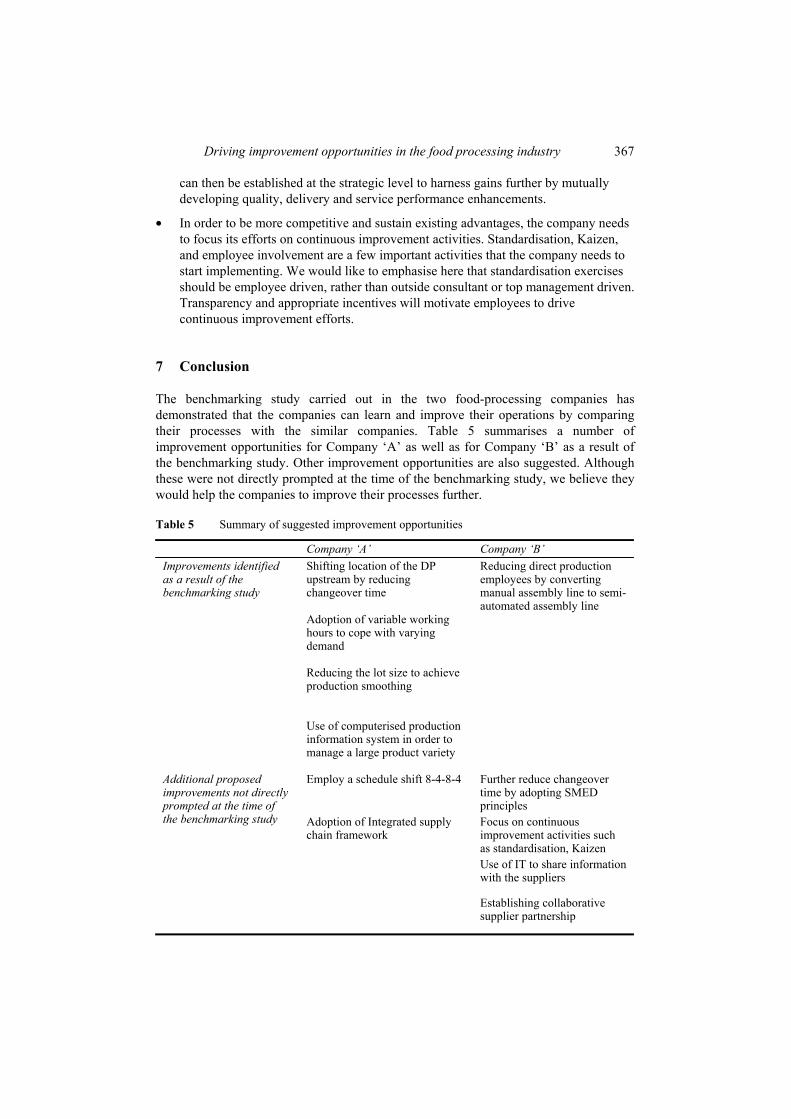
The benchmarking study carried out in the two food-processing companies has demonstrated that the companies can learn and improve their operations by comparing their processes with the similar companies. Table 5 summarises a number of improvement opportunities for Company ‘A’ as well as for Company ‘B’ as a result of the benchmarking study. Other improvement opportunities are also suggested. Although these were not directly prompted at the time of the benchmarking study, we believe they would help the companies to improve their processes further.
Table 5 Summary of suggested improvement opportunities
Company ‘A’ Company ‘B’ Shifting location of the DP upstream by reducing changeover time
Adoption of variable working hours to cope with varying demand
Reducing the lot size to achieve production smoothing
Improvements identified as a result of the benchmarking study
Use of computerised production information system in order to manage a large product variety
Reducing direct production employees by converting manual assembly line to semi-automated assembly line
Employ a schedule shift 8-4-8-4 Further reduce changeover time by adopting SMED principles Focus on continuous improvement activities such as standardisation, Kaizen Use of IT to share information with the suppliers
Additional proposed improvements not directly prompted at the time of the benchmarking study Adoption of Integrated supply
chain framework
Establishing collaborative supplier partnership
368 R. Jain and O.P. Yadav
The results of the benchmarking study have been communicated to the participating companies and the management has proposed an action plan to adopt some of the recommendations suggested. This paper has not dealt with the implementation issues of the action plan and the benefits which may be achieved by implementing the proposed improvements. It would be interesting to examine the impact of the action plans in future research.
The results of this study would have valuable implications to those companies that wish to reap the benefits of the application of this tool, but do not want to disclose operational information to direct competitors. Functional benchmarking – looking at a similar process but in a dissimilar organisation – has many merits including fewer worries about sharing information with competitors and a wide array of potential partners. The success of this kind of study depends on an effective research methodology, which uses multiple data gathering methods and achieves triangulation of data to improve the construct validity of the research. An effective benchmarking exercise can facilitate considerable improvement in production or service processes, and can focus management attention on the finer detail of how operations are working.
Acknowledgements
The authors would like to express their sincere appreciation for the constructive and helpful comments offered by the anonymous reviewers.
References Bhutta, K.S. and Huq, F. (1999) ‘Benchmarking – best practices: an integrated approach’,
Benchmarking: An International Journal, Vol. 6, No. 3, pp.254–268. Bogan, C. and English, M.J. (1994) Benchmarking for Best Practices: Winning through Innovation
Adaptation, McGraw-Hill, New York, NY. Boxwell, R.J. (1994) Benchmarking for Competitive Advantage, McGraw-Hill, New York, NY. Camp, R.C. (1989) Benchmarking: The Search for Industry Best Practices that Lead to Superior
Performance, Quality Press/ASQC, Milwaukee, WI. Camp, R.C. (1995) Business Process Benchmarking – Finding and Implementing Best Practices,
ASQC Quality Press, Milwaukee, WI. Cook, S. (1995) Practical Benchmarking: A Manager’s Guide to Creating a Competitive
Advantage, Kogan Page, London. Delbridge, R., Lowe, J. and Oliver, N. (1995) ‘ The process of benchmarking: a study from
the automotive Industry’, International Journal of Operations and Production Management, Vol. 15, No. 4, pp.50–62.
Evans, A. (1994) Benchmarking: Taking Your Organisation Towards Best Practice!, Business Library, Melbourne.
Friedman, T. (2005) The World is Flat: A Brief History of Globalized World in the 21st Century, Allen Lane, London.
Garvin, D.A. (1991) ‘How the Baldrige Award really works’, Harvard Business Review, November–December, pp.80–93.
Hiebeler, R. (1993) ‘A road map for success’, Financial World, Vol. 242, No. 14, p.28. Hogarth-Scott, S. (1999) ‘Retailer-supplier partnerships: hostages to fortune or the way forward for
the millennium’, British Food Journal, Vol. 101, No. 9, pp.668–682.
Driving improvement opportunities in the food processing industry 369
Hopp, W.J. and Spearman, M.L. (2000) Factory Physics: Foundation of Manufacturing Management, 2nd ed., Irwin McGraw-Hill, Boston.
Khade, A.S. and Metlen, S. (1996) ‘An application of benchmarking in the dairy industry’, Benchmarking for quality Management and Technology, Vol. 3, No. 4, pp.34–41.
Kumar, N. (1996) ‘The power of trust in manufacturer-retailer relationships’, Harvard Business Review, November–December, pp.92–96.
Leibfried, K.H.J. and McNair, C.J. (1992), Benchmarking: A Tool for Continuous Improvement, HarperBusiness, New York, NY.
Longbottom, D. (2000) ‘Benchmarking in the UK: an empirical study of practitioners and academics’, Benchmarking: An international Journal, Vol. 7, No. 2, pp.98–117.
Port, O. and Smith, G. (1992) ‘Beg, borrow and benchmark’, Business Week, November. Shingo, S. (1989) A Study of the Toyota Production System from an Industrial Engineering
Viewpoint, Productivity Press, Portland, OR. Spendolini, M.J. (1992) The Benchmarking Book, AMACOM, New York, NY. Thor, C.G. and Jarrett, J.R. (1999) ‘Benchmarking and reengineering: alternative or partners?’,
International Journal of Technology Management, Vol. 17, Nos.7–8, pp.786–796. van Donk, D.P. (2000) ‘Customer- driven manufacturing in the food processing industry’, British
Food Journal, Vol. 102, No. 10, pp.739–747. van Wezel, W., van Donk, D.P. and Gaalman, G. (2006) ‘The planning flexibility bottleneck in
food processing industries’, Journal of Operations Management, Vol. 24, No. 3, pp.287–300. Voss, C.A., Ahlstrom, P. and Blackmon, K. (1997) ‘Benchmarking and operational performance:
some empirical results’, International Journal of Operations and Production Management, Vol. 17, No. 10, pp.1046–1058.
Voss, C.A., Chisea, V. and Coughlan, P. (1994), ‘Developing benchmarking and self assessment frameworks in manufacturing’, International Journal of Operations and Production Management, Vol. 14, No. 3, pp.83–97.
Watson, G.H. (1993) Strategic Benchmarking: How to Rate your Company’s Performance against the World’s Best, John Wiley & Sons, Inc., New York, NY.
Yin, R. (1994) Case Study Research, Sage Publications, Beverly Hills, CA. Zairi, M. and Leonard, P. (1994) Practical Benchmarking: A Complete Guide, Chapman & Hall,
London.