Embed Size (px)
Citation preview
Does Monopoly Exist in the Stock Market? Detection and Prevention of Trade-Based Market Manipulation
Xin Yan,1 Lawrence R. Klein, Viktoria Dalko,2
Ferenc Gyurcsány and Michael H. Wang
Abstract3
It is common sense that monopoly exists in the goods market. Does monopoly
exist in the stock market? This paper addresses this question in a preliminary manner. By
comparison of competition in the stock market with that in the goods market and
analyzing similarities and differences in achieving monopoly power between the two, we
show conceptually that monopoly can be established in the stock market. Furthermore, it
is the underlying power that enables market manipulation to succeed. Reviewing
historical examples and contemporary litigation cases that have occurred in the stock
markets of the United States, China, India, Japan, Hong Kong and other economies,
demonstrates that market manipulation has been—and still is—chronic, frequent, and
widespread in global stock markets. Occasionally it has been rampant, resulting in severe
stock market crises. In order to find areas for daily detection and prevention of such
systemic risk, we choose to focus on the accumulation-lift-distribution manipulation
scheme, particularly the trade-based tactics in price-lifting. Meanwhile, this paper
presents a full anatomy of an investor’s trades during a given trading day and identifies
nine variables that are at discretion of a large investor. A unified regulatory framework 1 Xin Yan is with the Research Institute of Comprehensive Economics; Lawrence R. Klein with University of Pennsylvania; Viktoria Dalko with Harvard University and Hult International Business School; Ferenc Gyurcsány with Hungarian Parliament; and Michael H. Wang with the Research Institute of Comprehensive Economics.
2 Corresponding author: Viktoria Dalko, [email protected].
3 This paper was accepted for presentation at The 16th World Congress of the International Economic Association, Tsinghua University, Beijing, July 4-8, 2011. Part of this paper was presented at the Asian Finance Association 2011 International Conference: “Frontiers in Finance: Asia-Pacific and Beyond,” Macau, China, July 10-13, 2011.
1
for detection and prevention, composed primarily of eight measures, is subsequently
proposed based on the nine variables. The framework is expected to provide quantifiable,
effective and inexpensive tools for daily operations of securities regulators. As such, this
framework has the potential to be extended for regulatory measures in other financial
markets.
JEL classification: G01; G18; D82; K21; G28
Keyword: Financial Crisis, Price Impact, Trade-Based Manipulation, Imperfect
Information, Monopoly, Antitrust, Securities Regulation.
1. Does monopoly exist in the stock market?
Monopolies are common within the goods market, and exercise of monopolistic power is
detrimental not only to competition and welfare, but also to fundamental values such as
freedom of choice. History has repeatedly proved this point, and competitors repeatedly
outcry for antitrust regulations. The resulting antitrust laws have been formally enacted
since the implementation of the Sherman Act of 1890 (Motta, 2004).
Does monopoly exist in the stock market? Our paper addresses this question using a
qualitative approach. Modeling is a subject of a separate project in our research series
about regulating competition in the stock market.
We refer to monopoly power in the secondary stock market as the power that influences
other investors’ decisions; it makes a stock so attractive (unattractive) that others
voluntarily purchase (sell) the stock according to the design of the monopolist. This
definition of power is paraphrased from Joseph Nye’s definition of soft power in political
science (Nye, 2008). For our purpose, we consider only those monopolists who will be
trading against the induced investors (e.g., if he generates expectations of rising stock
prices, he will sell the stock).
2
At its first approximation, it is not obvious how such monopoly could exist in the stock
market, since there are numerous investors at any time, buying and selling on the same
market, seemingly without interacting with one another besides the trade itself. In our
paper we introduce an alternative approach to the stock market based on empirical
examination and the current data over the last 80 years, in both developed and developing
markets – especially data on market manipulation.
We view the secondary stock market as an institution that facilitates competition for
trading profit. Each investor has seemingly the same chance to profit, and nobody is
supposed to gain above risk-adjusted return in the long run (according to the strong form
of the Efficient Market Hypothesis). However, hundreds of litigation cases and
administrative orders as well as media reports in emerging stock markets, such as that of
China, India, and Brazil, and developed equity markets, such that of the U.S., UK, Japan,
Greece, Australia, and Hong Kong, examined in this paper, demonstrate clearly that there
are practices, some legal and some illegal, over the last two decades that clearly violated
fair competition for trading profit. In addition, the litigation cases from numerous
countries through the decades clearly prove that there are cases of consistently high
return, over longer term, obtained by market manipulators. Occasionally, large-scale
market manipulation episodes can lead to and have resulted in stock market crises.
We call market manipulators those traders who successfully create an image of reality in
the minds of the unsuspecting “induced traders,” and consecutively take advantage of
those traders. There are two ways a manipulator can achieve such a result. One way is
through his trading activity and, as such, generation of implicit information about the
stock’s increased desirability and future higher-than-expected return. The other is through
the generation and announcement of explicit news with price-sensitive content. For
example, an investment “guru” announces that a particular stock has become a great buy
right now. These two types of market manipulations were called trade-based and
information-based manipulation, respectively, by Allen and Gale (1992). The intended
result is the same: induced investors will trade according to the design of the manipulator,
3
and therefore are likely to incur losses in aggregate, while the manipulator profits. We
call such a result an unfair competition and use of monopoly power.
1.1 Differences and similarities in competition between the stock and goods markets
In the financial sector, markets are fragmented and transient to the extreme. Competition
for profit from trading stock X is a different market than the competition for profit from
trading stock Y. The competition five minutes ago is a different one from that of five
minutes later while trading the same stock X. The markets can be different even for
trading the same stock X and at the same time if it is traded in two platforms or countries.
Some externalities may exist and can be more influential at certain times. However, the
extreme fragmentation and transient nature of markets that host the competition for
trading profit is the first unique characteristic of the stock market from the point of view
of the intensity of competition. Such distinction is based on studies of the international
litigation cases. Very large profits can be gained in days, minutes, and even seconds in
today’s markets, trading a single stock, without affecting other stocks, by using
manipulation tactics (Yan et al., 2012a, b & c).
The second difference is that usually the competition for profit is not between large
institutions, as we usually see in the goods market, as they compete for the business of
the same market participants; e.g., the same group of customers. Large traders in the
stock market do not compete with each other in general. Large traders usually compete
against small investors (whom large traders wish to turn into induced investors). This is
because the market fragmentation in space, time, and investment products allows large
traders to divide the markets among each other. This is particularly true in emerging
markets such as that of Shanghai and Mumbay. They may collude, but such information
is rare without insider reports. In some famous historical cases, one large trader tried to
manipulate the same instrument as another large investor, but in the opposite direction.
One typical case is the so-called “Harlem corner,” in which Cornelius Vanderbilt
cornered Daniel Drew in 1864 (Risjord, 2002). Albeit rare today, such clash of the titans
can be particularly threatening to market stability.
4
The third difference is that, in the goods market, monopoly is often based on innovation,
and in this sense monopoly can play a role in development. However, in the financial
markets, monopoly power is not based on the technological innovation of the investors.
The two types of manipulations are based on two types of resources that the manipulator
needs to have. That is, for trade-based manipulation, the large investor needs to have a
large sum of capital to build up a relatively dominant shareholding position in a particular
stock for certain period of time – we call this a concentration monopoly or quantity
monopoly (Yan et al., 2012a). Information-based manipulation is the exercise of
information monopoly (Yan et al., 2012b). Information monopoly4 can exist without any
effort of finding out the hidden truth about the corporation’s performance. Information
monopoly can exist even if the widely disseminated news or rumor is not even true. The
key is that this information being generated, not necessarily discovered, by the
manipulator.
The fourth difference is that, even though there is no barrier to entry to stock trading,
there are de facto barriers to manipulation tools, such as large capital and access to
credible mass media. In other words, anyone can buy and sell a stock that is listed on a
stock exchange. What not everyone can do is amass the required relative dominant
shareholding positions, an action that enables the investor to perform trade-based
manipulation. Also, not everyone has access to credible information disseminators to a
large community of investing public in order to perform information-based manipulation.
Hence, having more investors investing does not eradicate the presence of monopolies in
the stock market.
Is there any sign of learning or complaint on the side of the induced investors? We
present international data that shows the number of market manipulation complaints in
selected developed markets in the last decade, which demonstrate that the general
sentiment that markets are manipulated is very familiar to a great number of investors.
However, so far, such manipulative activities were vied in isolation and did not receive
4 Information monopoly is the power of inducement of price-moving information that is disseminated to a large number of investors by a credible media outlet.
5
appropriate attention from academic circles. Our research series is among the first to aim
to fill such a major gap and link market manipulation data with monopolistic behavior.
In brief, understanding the uniqueness of the competition in the stock market, as
described above, helps us to create basic concepts to explore whether monopoly can or
cannot exist in the stock market.
Next, we investigate the similarity and difference between establishing a monopoly
power in the stock market, from building up a monopoly position in the goods market.
1.2 Similarities and differences between establishing monopoly power in the stock
and goods markets
Similarities and more outstanding differences between establishing monopoly power in
the stock market and goods market are listed below:
(1). Time. In the stock market, length of time regarding monopolies is much shorter in
general. Becoming a monopoly in the goods market normally takes years. Obtaining
monopolistic profit in the stock market can be accomplished in as little as weeks, days,
minutes, or even seconds.
(2). Simplicity. To become a monopolist in the goods market, the effort is multi-faceted,
such as leadership and management; healthy and skillful workforce; innovative ideas;
access to capital, equipment, and real estate; production; and marketing, as well as many
other areas. To form a monopoly in the stock market, it is necessary to have only a large
amount of capital, access to credible mass media, a few staff members, and in some cases
advanced computer technology.
(3). Investment options. In the goods market, a firm can attain monopoly over only one or
few products. In the stock market, an investor can gain monopolistic profit over any stock
6
out of the thousands of stocks and numerous derivative instruments at a moment. Also,
one investor can attain monopoly over multiple stocks at the same time.
(4). Two-way profitability. In the goods market, monopolistic profit is generated either
by increased prices (if it is a monopolistic seller), or by declining prices (if it is a
monopolistic buyer), but not by price changes of the same product in both directions. In
the stock market, depending on the strategy, monopolistic profit can be made from either
the rising or falling price of the same stock (as long as short-selling is not banned).
(5). Secrecy. In the goods market, monopolistic behavior is naturally exposed because
prices have to be public. In the stock market, an investor’s stock purchase and sale price,
his trading strategies, his involvement with media and particular news releases, etc., are
not exposed to other investors. This superior secrecy is crucial to attaining monopoly and
maintaining a monopolistic position until the investment position is closed.
(6). Dynamic and transient market. In the goods market, once a monopolistic position is
achieved over a particular product, the monopoly can hardly switch to a different type of
product. In the stock market, once monopolistic profit is gained, the investor closes the
monopolistic position. But he can switch to another stock to establish a new monopolistic
position immediately after the previous monopoly. Actually, an investor can change
between a monopolistic position and a non-monopolistic position numerous times during
his investing career. A monopolist in the goods market can hardly behave thus, because
the cost in becoming a monopolist is too high and the time it takes is too long. In the
stock market, monopolistic behavior is always transient, exhibited only during a specific
time period, and not continuously. This creates difficulty for law enforcement, which is
basically ex post.
(7). Profit dependence on inducement. In the goods market, the monopoly sets the
monopolistic price. In the stock market, the monopolist sets a higher price than his
purchase price either by engaging in trade-based manipulation involving bid advances or
performing information-based manipulation by inducing other investors who will bid up
7
the price. However, in either scenario, he needs to have induced sufficient buy volumes at
the inflated price to distribute his previously-accumulated shares at excess profit.
(8). Predatory behavior. In the goods market, a monopolistic firm sets a very low
temporary price, or “predatory pricing,” to drive out competitors. In the stock market, a
monopolistic investor “shakes-out” other investors when he accumulates shares. This
process essentially results in the exclusion of competition.
(9). Touting is similar to marketing. When a monopolistic investor engages in
information-based manipulation, he touts the stock he has already held so other investors
will be induced to buy the same stock and bid up the prices. Then he will sell the already-
held shares to the induced traders. Touting is similar to marketing in the goods market.
However, price is set by the firm before marketing in the goods market, while share price
is set mainly by induced investors in the case of information-based manipulation. (There
is also “trashing a stock” when the manipulator initiates shorting trades on that stock.)
(10). Legal risk. The goods market has antitrust enforcement. However, at the moment,
there is still no antitrust law in stock trading. The closest legal risk is market
manipulation. In addition, sell-side analysts are exempt from insider trading laws.
Touting stocks is generally allowed, with some disclosure requirement which has
virtually no impact on reducing market manipulation (Yan et al., 2012b).
Overall, we conclude that it is much easier and more convenient to establish monopoly
power in the stock market, relative to the goods market. There is no reason why large
investors would not try to obtain monopolistic profits. Hundreds of the securities
litigations examined in this paper reveal the varieties of monopolistic behavior in
detected market manipulation cases.
We propose that market manipulation is essentially an exercise of monopoly power in a
trading strategy. This is a fundamental contribution of our paper.
8
1.3 Regulatory proposals to prevent concentration monopoly and trade-based
manipulation
Since the founding of the first, organized stock exchange in Amsterdam 400 years ago,
no systematic economic research results on stock markets obtained by academics have
been implemented in stock market regulation around the world with the aim of crisis
prevention, investor protection, and stability improvement. The contemporary regulatory
framework in stock markets worldwide is based primarily on the Securities Act (1933)
and Securities Exchange Act (1934) passed after the Great Crash of the New York Stock
Exchange. The virtue of the law-centered regulatory framework is that it enabled the
post-war years to pass without major market-wide crisis in the U.S. and perhaps other
developed markets. However, the financial market deregulation, financial instrument
innovation, technological advances, and economic globalization since the 1980s have
made the disclosure-oriented securities regulations insufficient in several ways. First, the
regulations are not preventive, but ex post, making enforcement very difficult. Second,
enforcement—once launched—is not very effective because the required proof of bad
intent has frequently led to dropped prosecutions or settlements. Finally, the efficiency in
the rare successful prosecution is low in terms of the personnel, time, and financial
resources committed, not to mention the majority of unsuccessful prosecutions.
We propose that the powerful but ineffective law-centered approach should be
complimented by a more prudent and accurate approach based on financial reality. It is
imperative to have a thorough understanding of the monopolistic essence in market
manipulation and other fraudulent market practices before devising effective, quantifiable
—thus programmable —and efficient ways to detect and prevent such market
misconduct. Combining the strengths of both current legal measures and the
complimentary measures based on financial reality can enable securities regulators to
conduct daily detective and preventive enforcement activities with a higher efficiency
and improved outcome. Such a combination may substantially reduce systemic risk
before it becomes uncontrollable.
9
This paper is one of the first attempts to explore such complimentary measures in
detection and prevention of market manipulation in the spirit of antitrust. It focuses on
trade-based market manipulation and aims to define effective, quantifiable, and
inexpensive tools for daily enforcement. It focuses on the most popular trade-based
manipulation strategy, the accumulation-lift-distribution scheme. In this scheme, the most
crucial element is to induce numerous buy volumes after the share price has been
substantially increased by using manipulation tactics so that the monopolistic trader can
distribute his previously-accumulated shares. We start from the most fundamental reality
—namely, an investor’s trades during a single trading day. The anatomy of an investor’s
trades during a given trading day enables us to identify the variables that can be used in
trade-based market manipulation. Hundreds of securities prosecution cases from
regulatory agencies in the U.S., China, India, Japan, and Hong Kong are carefully
examined to find the rationale underlying frequently used manipulation tactics, such as
wash sale (or self-dealing), matched orders (or cross-dealing), advancing-the-bid,
marking-the-close, and fake trading. The discovered rationale serves also as guidance to
areas in which detection and prevention can be improved, in antitrust spirit, against the
use of monopoly power in trade-based market manipulation. A unified regulatory
framework for detection and prevention is subsequently proposed based on the nine
variables identified from the investor’s trades during one trading day. The framework,
composed primarily of eight proposals, is aimed to provide quantifiable and thus
programmable, effective and efficient tools for daily operations of securities regulators to
compliment the extant securities laws to improve their effectiveness in detection and
prevention of market manipulation. These proposals are expected to carry the sprit of
antitrust in the stock market, and thus help in the maintenance of fair and transparent
perfect competition, and ultimately prevention of market-wide crisis.
The remaining of this paper is organized as follows. Section 2 reviews historical
evidence exploring stock market manipulation, including several well-known
contemporary cases from numerous countries. The hand-collected database that we
present here from recent litigation cases are drawn from securities regulatory agencies in
the U.S., China, India, Japan, and Hong Kong, clearly demonstrates that market
10
manipulation is widespread, chronic, frequent, and occasionally rampant. In addition, the
database indicates the limited effectiveness of enforcement based on the existing legal
framework. Section 3 identifies those variables that appear frequently in trade-based
manipulation tactics by targeting an investor’s trades during a given trading day. Dozens
of prosecution cases from the aforementioned securities regulatory agencies are closely
examined to determine the characteristics of frequently encountered trade-based
manipulation tactics, which are detailed in Section 4. The examination uncovers several
key areas for detection and prevention by securities regulators which form a unified
regulatory approach presented in Section 5. Section 6 concludes the paper.
2. Can stock markets be manipulated?
Historically, especially prior to the regulatory framework implemented the
Securities Act (SA) (1933), Securities Exchange Act (SEA) (1934), Glass-Steagall Act
(1934), and Commodity Exchange Act (CEA) (1936), manipulation had been pervasive,
chronic and occasionally so rampant to lead to frequent crises in financial markets
(Pirrong, 1995).
The U. S. stock markets enjoyed more stable development after the
implementation of the SA (1933) and the SEA (1934). Since, according to Allen and Gale
(1992), the legislature is disclosure-orientated, action-based manipulation is virtually
eliminated and insider information- based manipulation is also greatly curbed. But how
did this affect market manipulation based on trade and public information?
In 1688, De la Vega described a number of market manipulation tactics resorted
to some of the largest individual or “pooled” large investor groups in the virtually
unregulated Amsterdam stock exchange of the 17th century (De la Vega, 1688). Even
though regulatory frameworks, technological innovations, and societal changes have
rendered today’s worldwide stock markets look different from the earlier Amsterdam
stock exchange, the very fundamental nature of investors’ interest in profit maximization
11
has not changed during the past 400 years. If anything, trading strategies have evolved to
circumvent regulatory rules. A series of U. S. Congressional investigations, i.e., the
Hughs, Pujo and Pecora investigations (White, 1909; Sheldon, 1975; Pecora, 1939),
searched for the causality of the financial panics of 1907, 1913 and 1929, respectively.
Each investigation uncovered major forms of market manipulation such as bull pools,
bear raids, wash sale, and matched orders (Thel, 1990).
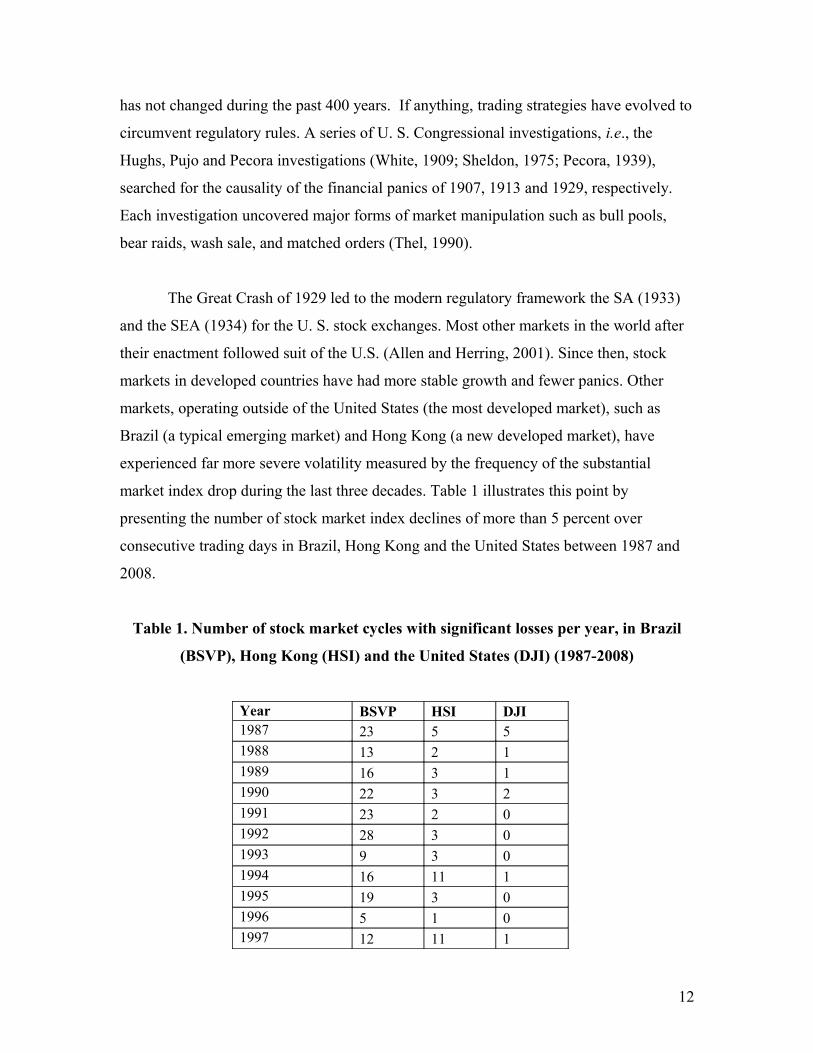
The Great Crash of 1929 led to the modern regulatory framework the SA (1933)
and the SEA (1934) for the U. S. stock exchanges. Most other markets in the world after
their enactment followed suit of the U.S. (Allen and Herring, 2001). Since then, stock
markets in developed countries have had more stable growth and fewer panics. Other
markets, operating outside of the United States (the most developed market), such as
Brazil (a typical emerging market) and Hong Kong (a new developed market), have
experienced far more severe volatility measured by the frequency of the substantial
market index drop during the last three decades. Table 1 illustrates this point by
presenting the number of stock market index declines of more than 5 percent over
consecutive trading days in Brazil, Hong Kong and the United States between 1987 and
2008.
Table 1. Number of stock market cycles with significant losses per year, in Brazil
(BSVP), Hong Kong (HSI) and the United States (DJI) (1987-2008)
Year BSVP HSI DJI1987 23 5 51988 13 2 11989 16 3 11990 22 3 21991 23 2 01992 28 3 01993 9 3 01994 16 11 11995 19 3 01996 5 1 01997 12 11 1
12
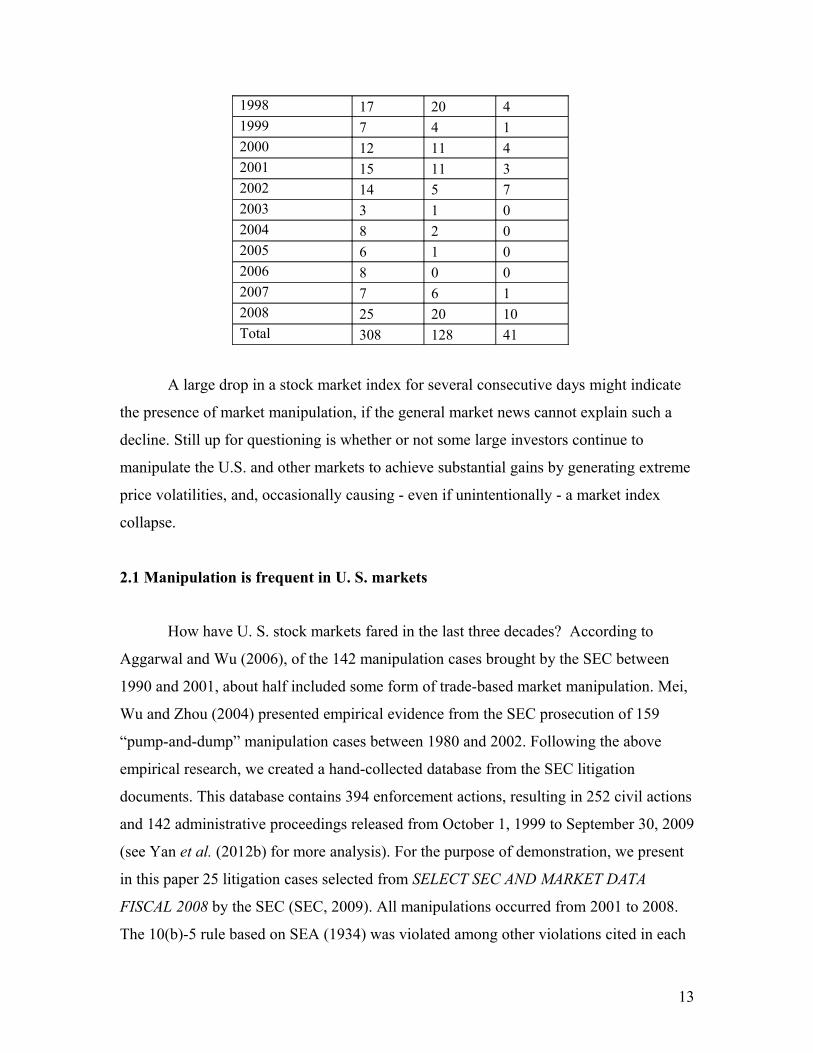
1998 17 20 41999 7 4 12000 12 11 42001 15 11 32002 14 5 72003 3 1 02004 8 2 02005 6 1 02006 8 0 02007 7 6 12008 25 20 10Total 308 128 41
A large drop in a stock market index for several consecutive days might indicate
the presence of market manipulation, if the general market news cannot explain such a
decline. Still up for questioning is whether or not some large investors continue to
manipulate the U.S. and other markets to achieve substantial gains by generating extreme
price volatilities, and, occasionally causing - even if unintentionally - a market index
collapse.
2.1 Manipulation is frequent in U. S. markets
How have U. S. stock markets fared in the last three decades? According to
Aggarwal and Wu (2006), of the 142 manipulation cases brought by the SEC between
1990 and 2001, about half included some form of trade-based market manipulation. Mei,
Wu and Zhou (2004) presented empirical evidence from the SEC prosecution of 159
“pump-and-dump” manipulation cases between 1980 and 2002. Following the above
empirical research, we created a hand-collected database from the SEC litigation
documents. This database contains 394 enforcement actions, resulting in 252 civil actions
and 142 administrative proceedings released from October 1, 1999 to September 30, 2009
(see Yan et al. (2012b) for more analysis). For the purpose of demonstration, we present
in this paper 25 litigation cases selected from SELECT SEC AND MARKET DATA
FISCAL 2008 by the SEC (SEC, 2009). All manipulations occurred from 2001 to 2008.
The 10(b)-5 rule based on SEA (1934) was violated among other violations cited in each
13
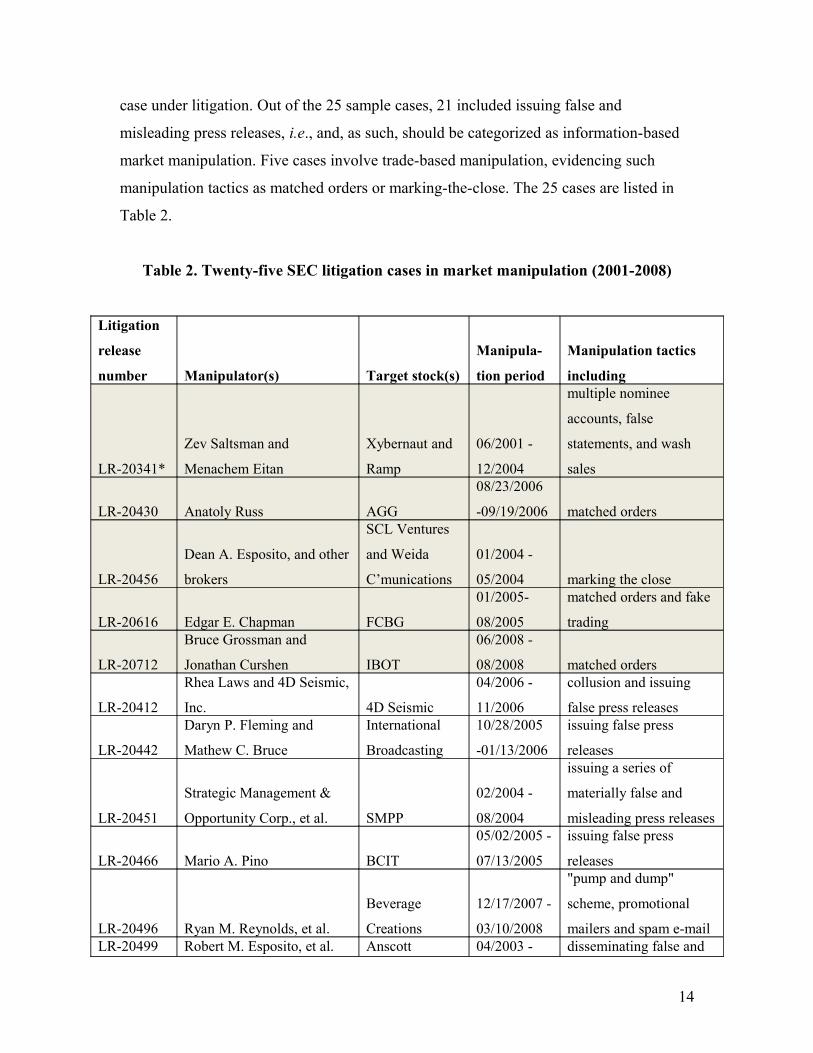
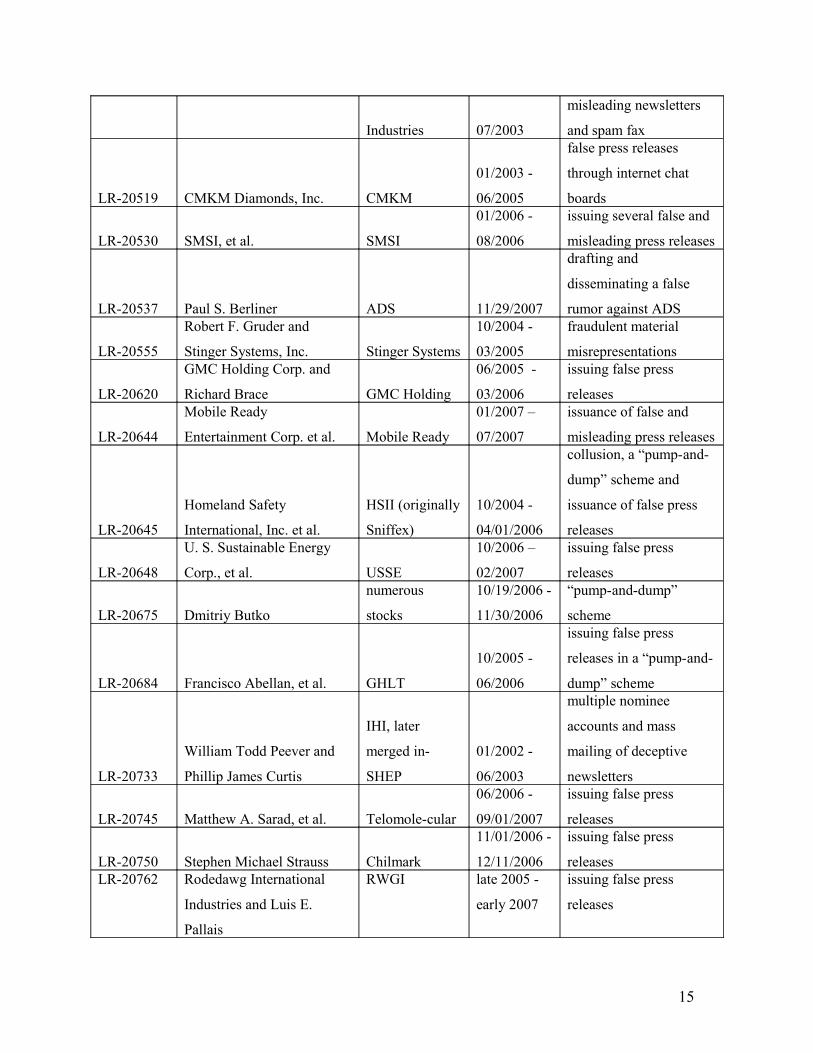
case under litigation. Out of the 25 sample cases, 21 included issuing false and
misleading press releases, i.e., and, as such, should be categorized as information-based
market manipulation. Five cases involve trade-based manipulation, evidencing such
manipulation tactics as matched orders or marking-the-close. The 25 cases are listed in
Table 2.
Table 2. Twenty-five SEC litigation cases in market manipulation (2001-2008)
Litigation
release
number Manipulator(s) Target stock(s)
Manipula-
tion period
Manipulation tactics
including
LR-20341*
Zev Saltsman and
Menachem Eitan
Xybernaut and
Ramp
06/2001 -
12/2004
multiple nominee
accounts, false
statements, and wash
sales
LR-20430 Anatoly Russ AGG
08/23/2006
-09/19/2006 matched orders
LR-20456
Dean A. Esposito, and other
brokers
SCL Ventures
and Weida
C’munications
01/2004 -
05/2004 marking the close
LR-20616 Edgar E. Chapman FCBG
01/2005-
08/2005
matched orders and fake
trading
LR-20712
Bruce Grossman and
Jonathan Curshen IBOT
06/2008 -
08/2008 matched orders
LR-20412
Rhea Laws and 4D Seismic,
Inc. 4D Seismic
04/2006 -
11/2006
collusion and issuing
false press releases
LR-20442
Daryn P. Fleming and
Mathew C. Bruce
International
Broadcasting
10/28/2005
-01/13/2006
issuing false press
releases
LR-20451
Strategic Management &
Opportunity Corp., et al. SMPP
02/2004 -
08/2004
issuing a series of
materially false and
misleading press releases
LR-20466 Mario A. Pino BCIT
05/02/2005 -
07/13/2005
issuing false press
releases
LR-20496 Ryan M. Reynolds, et al.
Beverage
Creations
12/17/2007 -
03/10/2008
"pump and dump"
scheme, promotional
mailers and spam e-mailLR-20499 Robert M. Esposito, et al. Anscott 04/2003 - disseminating false and
14
Industries 07/2003
misleading newsletters
and spam fax
LR-20519 CMKM Diamonds, Inc. CMKM
01/2003 -
06/2005
false press releases
through internet chat
boards
LR-20530 SMSI, et al. SMSI
01/2006 -
08/2006
issuing several false and
misleading press releases
LR-20537 Paul S. Berliner ADS 11/29/2007
drafting and
disseminating a false
rumor against ADS
LR-20555
Robert F. Gruder and
Stinger Systems, Inc. Stinger Systems
10/2004 -
03/2005
fraudulent material
misrepresentations
LR-20620
GMC Holding Corp. and
Richard Brace GMC Holding
06/2005 -
03/2006
issuing false press
releases
LR-20644
Mobile Ready
Entertainment Corp. et al. Mobile Ready
01/2007 –
07/2007
issuance of false and
misleading press releases
LR-20645
Homeland Safety
International, Inc. et al.
HSII (originally
Sniffex)
10/2004 -
04/01/2006
collusion, a “pump-and-
dump” scheme and
issuance of false press
releases
LR-20648
U. S. Sustainable Energy
Corp., et al. USSE
10/2006 –
02/2007
issuing false press
releases
LR-20675 Dmitriy Butko
numerous
stocks
10/19/2006 -
11/30/2006
“pump-and-dump”
scheme
LR-20684 Francisco Abellan, et al. GHLT
10/2005 -
06/2006
issuing false press
releases in a “pump-and-
dump” scheme
LR-20733
William Todd Peever and
Phillip James Curtis
IHI, later
merged in-
SHEP
01/2002 -
06/2003
multiple nominee
accounts and mass
mailing of deceptive
newsletters
LR-20745 Matthew A. Sarad, et al. Telomole-cular
06/2006 -
09/01/2007
issuing false press
releases
LR-20750 Stephen Michael Strauss Chilmark
11/01/2006 -
12/11/2006
issuing false press
releasesLR-20762 Rodedawg International
Industries and Luis E.
Pallais
RWGI late 2005 -
early 2007
issuing false press
releases
15
* Shaded rows indicate that trade-based manipulation is involved.
2.2 Manipulation is occasionally rampant worldwide
How did other stock exchanges perform during the same time period?
Influential and crisis-causing market manipulations were cited, to the knowledge
of the authors, in Latin America, Europe, Asia and Australia. The notorious manipulator
Naji Robert Nahas triggered disastrous stock market crashes in both the Rio de Janeiro
and Sao Paulo Stock Exchanges on June 9, 1989. Within ten trading days, the indices of
both markets dropped 67 percent and 61 percent (local currency), respectively (Brooke,
1989a; Carvajal and Elliot, 2009). As part of his manipulation strategy, Nahas bought
stock options and then forced the markets up by heavily buying and selling shares in
trades that were actually between himself and his partners. Local stockbrokers estimated
that, in the first half of 1989, half of the activity on the Rio exchange was created by
Nahas and his associates. Nahas was indicted by the Brazilian government two months
later (Brooke, 1989b).
Another stock market crisis, caused by Delta Securities, affected the Athens Stock
Exchange on November 6, 1996. The difficulty came from a failed clearing of Delta’s
GRD 2.5 billion position. The crisis not only required passage by the Greek government
an emergency legislative act for settlement, it also triggered the largest investigation in
Greek history of exchange members and their practices. A large-scale stock manipulation
scheme was discovered. The basic practice used by the manipulation scheme was
matched orders. Delta Securities was a strategic manager of the manipulation scheme.
Nineteen individuals were found to be involved in severe price manipulation practices, to
have abused confidential information, and to have conducted artificial transactions. They
were fined for a total of GRD 2 billion (USD 7.3 million) (IOSCO, 2000).
On March 1, 2001, Ketan Parekh, the so-called Bombay Bull, defaulted on nearly
30 million Indian Rupees position on the Calcutta Stock Exchange, which caused the
16
exchange to suffer a massive payments crisis that affected share prices across India.
Following the default, Calcutta Stock Exchange officials had to draw over 500 million
Indian Rupees from a special fund to cover losses; since then, the exchange has still been
fighting to survive (Bhaumik, 2002). During the 8 trading days between March 1 and
March 13, 2001, the indices of the top three stock exchanges of India, i.e., National,
Bombay, and Calcutta Stock Exchanges, dropped 17 percent, 17 percent, and 14 percent,
respectively (GFD, 2009). After the comprehensive investigation by the Securities and
Exchange Board of India (SEBI), Ketan Parekh and 17 other entities were indicted in
2007. Ketan Parekh was found to be the key person involved across the board in all
dimensions of the stock market scam which first surfaced in March 2001. He was also the
mastermind behind large- scale market manipulation of 9 stocks before the crash in the
three major stock markets. The manipulative practices included self deals (i. e., wash
sales), cross deals (i. e., matched orders) and market corners during the period from
October 1999 to March 2001 (SEBI, 2007).
Other internationally known market manipulation cases include Nomura
Securities’ dual-market manipulation in the Australian stock and futures markets in 1996.
Two Nomura manipulators had planned to discount 10 percent to 20 percent to the
closing prices of more than 300 stocks on Australian Securities Exchange on March 28,
1996. The strategy had the potential to trigger a market wide crisis, but failed to be
implemented by local brokers (SFA, 2000). Another well-known case took place in Hong
Kong in 1998. It was called “double play” because both the stock and currency markets
were being manipulated simultaneously by unknown speculators. Their activities almost
caused a crisis, which was averted just in time by intervention by the Hong Kong
Monetary Authority (Tsang, 1998; Corsetti, Pesenti and Roubini, 2001). The more recent
schemes include Jerome Kerviel’s fictitious trading in futures and cash of stock indices in
European stock markets that led the French bank Societé Générale to lose $7 billion in
January 2008. At the time, the amount was the largest single loss any bank had then
suffered (Clark and Jolly, 2008). Winterflood, a market maker on the London Stock
Exchange, was found to be playing a pivotal role in an illegal share ramping scheme by
the UK’s Financial Services Authority (FSA) in June 2008 and indicted the next year
17
(FSA, 2009). The offices of the German automaker Porsche were raided by federal
prosecutors on August 20, 2009, probing the firm’s alleged market manipulation of
Volkswagen shares. The allegation was made by BaFin, the German financial regulator,
to the prosecutor’s office after investigating Porsche’s attempt to gain control of
Volkswagen. (Kirchfeld and Czuczka, 2009).
Each of the cases cited evidenced rampant market manipulations that had the
potential to or actually resulted in stock market crashes or exchange settlement
difficulties during the past three decades. How frequent and chronic are stock market
manipulations in global markets in recent years?
2.3 Manipulation is chronic and frequent in global stock markets
Lang (2004) presented a detailed analysis of how institutions manipulated in
concert the Hong Kong stock market in 2003. Khwaja and Mian (2005) found compelling
evidence for a specific “pump-and-dump” manipulation scheme in the Karachi Stock
Exchange. To study this further, we selected litigation or prosecution by five securities
regulatory bodies in both developed and developing economies. In addition to the earlier
referenced litigation cases brought by the U.S. SEC, there were 18 cases listed by the
China Securities Regulatory Commission (CSRC) that occurred between 2000 and 2008
(CSRC, 2009) (12 cases feature large concentration of shareholding and fictitious trading
(Table 3) while the other six cases involve exclusively fake trading (Table 15)); 13 cases
from 1999 through 2007 prosecuted by Hong Kong Securities and Futures Commission
(HKSFC) (HKSFC, 2009); 25 cases filed for prosecution by the Japan Securities and
Exchange Surveillance Commission (JSESC) between July 1998 and June 2008 (JSESC,
2009); and 28 convicted or settled cases launched by the Securities and Exchange Board
of India (SEBI) that span from 1999 through 2005 (SEBI, 2009). Nearly all of these 109
prosecution cases involve long manipulation strategies, i.e., accumulation-lift-distribution
or “pump-and-dump” strategies.5 These cases are selected as evidence of recent episodes
5 The scheme is characterized by three stages, a trilogy of accumulation, lift and distribution (Lang, 2004). The objective of the accumulation stage is to turn large wealth into a large number of shares at a reasonably low price while reducing the uncertainty in trading costs due to other investors’ following. The essence of
18
of market manipulation in both developed and emerging markets. These cases, except for
JSESC cases, are listed in the following tables and their selection criteria described
below.
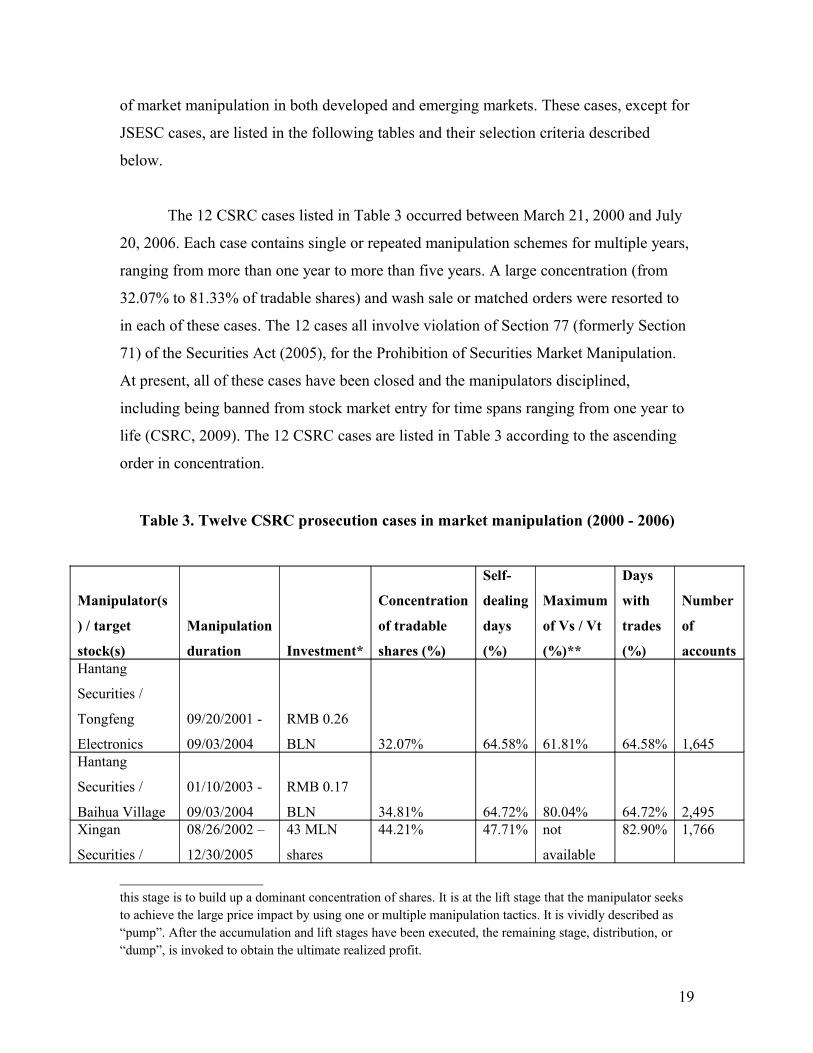
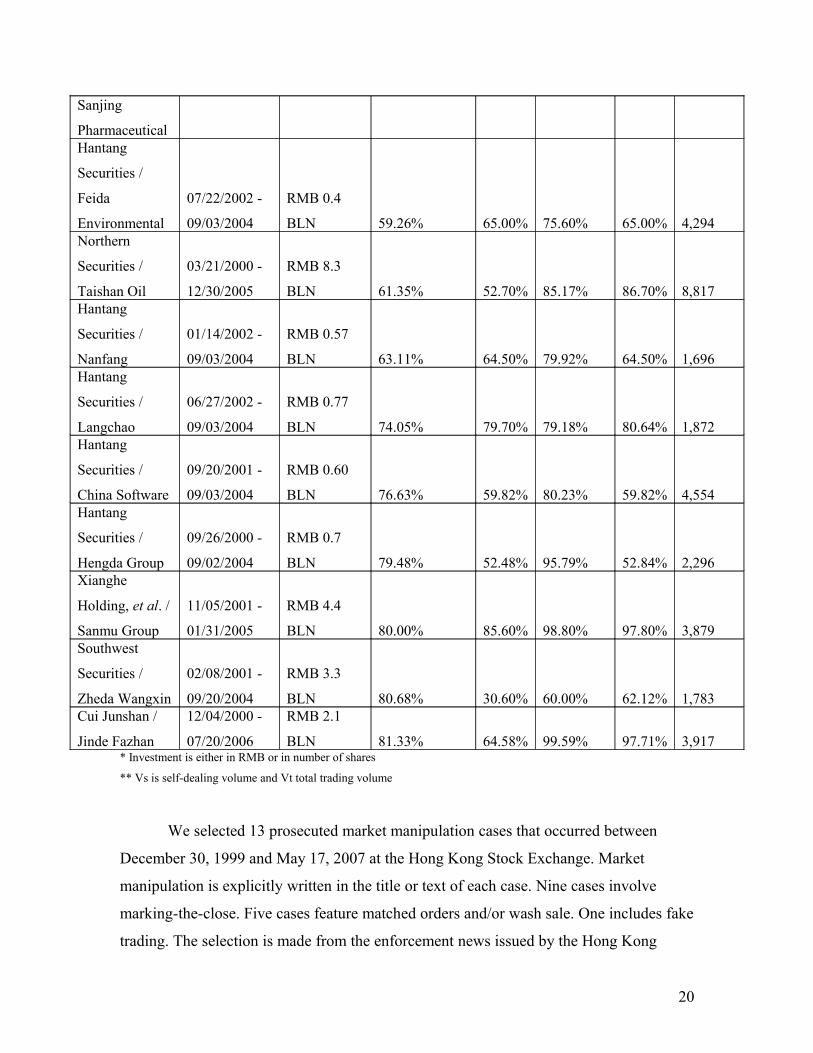
The 12 CSRC cases listed in Table 3 occurred between March 21, 2000 and July
20, 2006. Each case contains single or repeated manipulation schemes for multiple years,
ranging from more than one year to more than five years. A large concentration (from
32.07% to 81.33% of tradable shares) and wash sale or matched orders were resorted to
in each of these cases. The 12 cases all involve violation of Section 77 (formerly Section
71) of the Securities Act (2005), for the Prohibition of Securities Market Manipulation.
At present, all of these cases have been closed and the manipulators disciplined,
including being banned from stock market entry for time spans ranging from one year to
life (CSRC, 2009). The 12 CSRC cases are listed in Table 3 according to the ascending
order in concentration.
Table 3. Twelve CSRC prosecution cases in market manipulation (2000 - 2006)
Manipulator(s
) / target
stock(s)
Manipulation
duration Investment*
Concentration
of tradable
shares (%)
Self-
dealing
days
(%)
Maximum
of Vs / Vt
(%)**
Days
with
trades
(%)
Number
of
accountsHantang
Securities /
Tongfeng
Electronics
09/20/2001 -
09/03/2004
RMB 0.26
BLN 32.07% 64.58% 61.81% 64.58% 1,645Hantang
Securities /
Baihua Village
01/10/2003 -
09/03/2004
RMB 0.17
BLN 34.81% 64.72% 80.04% 64.72% 2,495Xingan
Securities /
08/26/2002 –
12/30/2005
43 MLN
shares
44.21% 47.71% not
available
82.90% 1,766
this stage is to build up a dominant concentration of shares. It is at the lift stage that the manipulator seeks to achieve the large price impact by using one or multiple manipulation tactics. It is vividly described as “pump”. After the accumulation and lift stages have been executed, the remaining stage, distribution, or “dump”, is invoked to obtain the ultimate realized profit.
19
Sanjing
PharmaceuticalHantang
Securities /
Feida
Environmental
07/22/2002 -
09/03/2004
RMB 0.4
BLN 59.26% 65.00% 75.60% 65.00% 4,294Northern
Securities /
Taishan Oil
03/21/2000 -
12/30/2005
RMB 8.3
BLN 61.35% 52.70% 85.17% 86.70% 8,817Hantang
Securities /
Nanfang
01/14/2002 -
09/03/2004
RMB 0.57
BLN 63.11% 64.50% 79.92% 64.50% 1,696Hantang
Securities /
Langchao
06/27/2002 -
09/03/2004
RMB 0.77
BLN 74.05% 79.70% 79.18% 80.64% 1,872Hantang
Securities /
China Software
09/20/2001 -
09/03/2004
RMB 0.60
BLN 76.63% 59.82% 80.23% 59.82% 4,554Hantang
Securities /
Hengda Group
09/26/2000 -
09/02/2004
RMB 0.7
BLN 79.48% 52.48% 95.79% 52.84% 2,296Xianghe
Holding, et al. /
Sanmu Group
11/05/2001 -
01/31/2005
RMB 4.4
BLN 80.00% 85.60% 98.80% 97.80% 3,879Southwest
Securities /
Zheda Wangxin
02/08/2001 -
09/20/2004
RMB 3.3
BLN 80.68% 30.60% 60.00% 62.12% 1,783Cui Junshan /
Jinde Fazhan
12/04/2000 -
07/20/2006
RMB 2.1
BLN 81.33% 64.58% 99.59% 97.71% 3,917* Investment is either in RMB or in number of shares
** Vs is self-dealing volume and Vt total trading volume
We selected 13 prosecuted market manipulation cases that occurred between
December 30, 1999 and May 17, 2007 at the Hong Kong Stock Exchange. Market
manipulation is explicitly written in the title or text of each case. Nine cases involve
marking-the-close. Five cases feature matched orders and/or wash sale. One includes fake
trading. The selection is made from the enforcement news issued by the Hong Kong
20
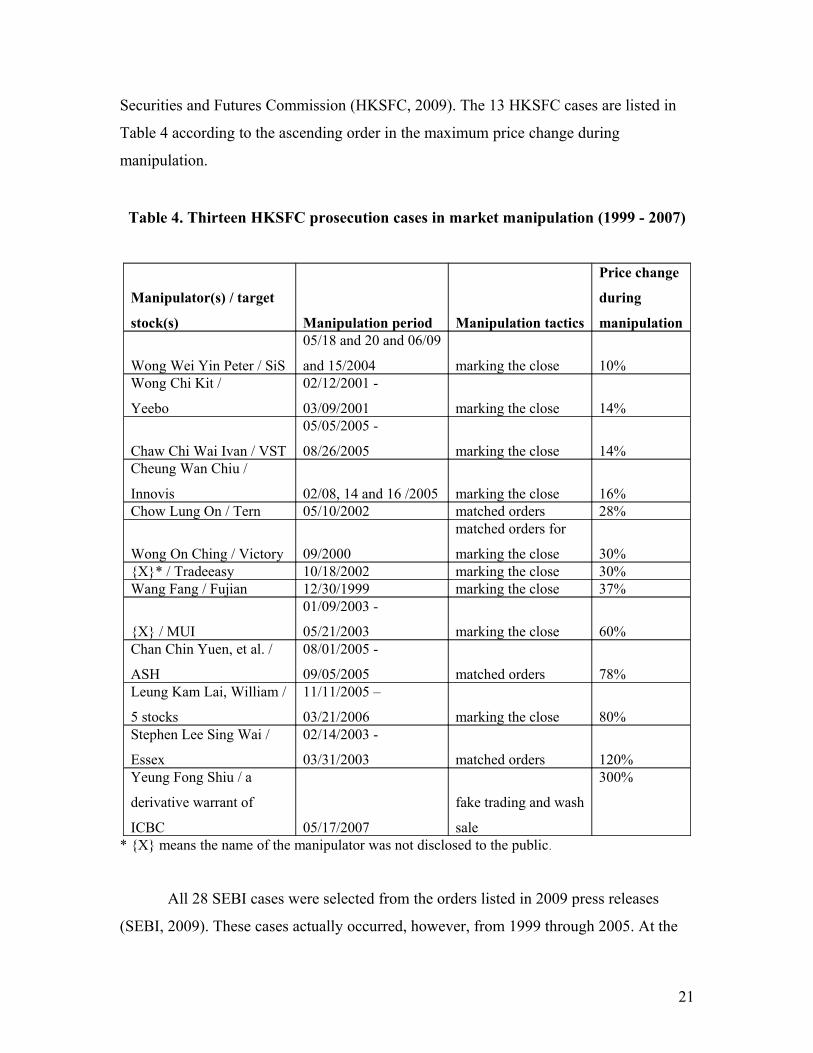
Securities and Futures Commission (HKSFC, 2009). The 13 HKSFC cases are listed in
Table 4 according to the ascending order in the maximum price change during
manipulation.
Table 4. Thirteen HKSFC prosecution cases in market manipulation (1999 - 2007)
Manipulator(s) / target
stock(s) Manipulation period Manipulation tactics
Price change
during
manipulation
Wong Wei Yin Peter / SiS
05/18 and 20 and 06/09
and 15/2004 marking the close 10%Wong Chi Kit /
Yeebo
02/12/2001 -
03/09/2001 marking the close 14%
Chaw Chi Wai Ivan / VST
05/05/2005 -
08/26/2005 marking the close 14%Cheung Wan Chiu /
Innovis 02/08, 14 and 16 /2005 marking the close 16%Chow Lung On / Tern 05/10/2002 matched orders 28%
Wong On Ching / Victory 09/2000
matched orders for
marking the close 30%{X}* / Tradeeasy 10/18/2002 marking the close 30%Wang Fang / Fujian 12/30/1999 marking the close 37%
{X} / MUI
01/09/2003 -
05/21/2003 marking the close 60%Chan Chin Yuen, et al. /
ASH
08/01/2005 -
09/05/2005 matched orders 78%Leung Kam Lai, William /
5 stocks
11/11/2005 –
03/21/2006 marking the close 80%Stephen Lee Sing Wai /
Essex
02/14/2003 -
03/31/2003 matched orders 120%Yeung Fong Shiu / a
derivative warrant of
ICBC 05/17/2007
fake trading and wash
sale
300%
* {X} means the name of the manipulator was not disclosed to the public.
All 28 SEBI cases were selected from the orders listed in 2009 press releases
(SEBI, 2009). These cases actually occurred, however, from 1999 through 2005. At the
21
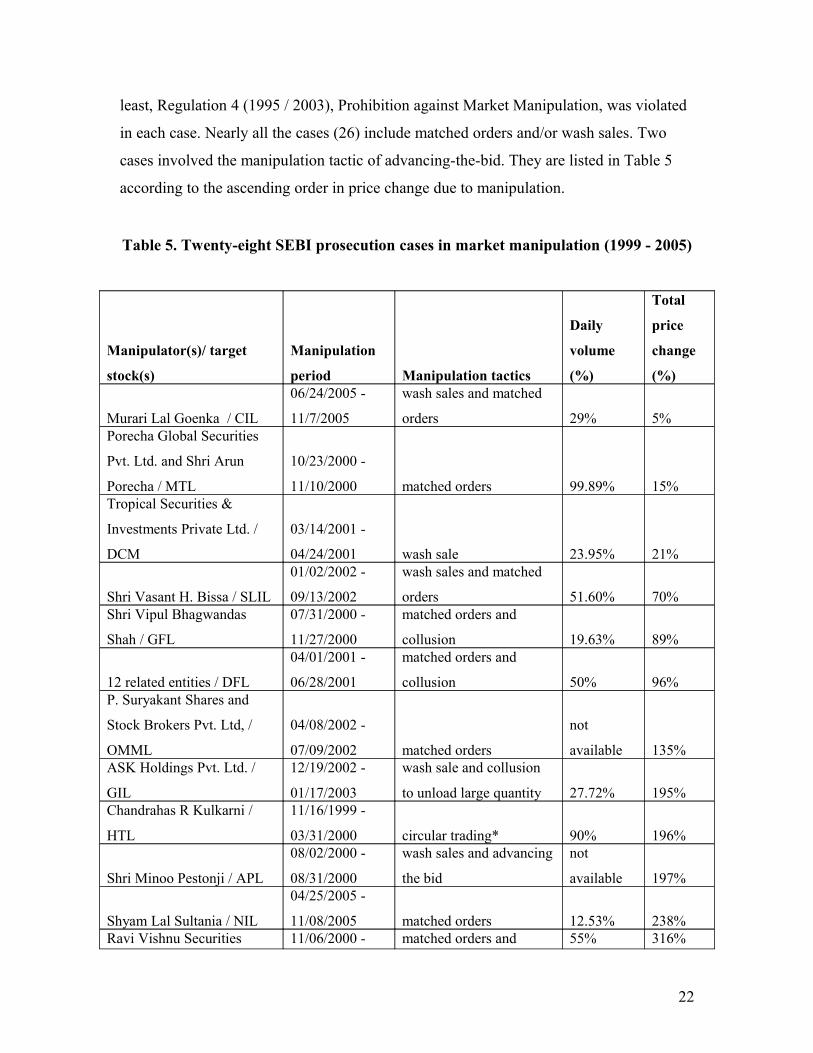
least, Regulation 4 (1995 / 2003), Prohibition against Market Manipulation, was violated
in each case. Nearly all the cases (26) include matched orders and/or wash sales. Two
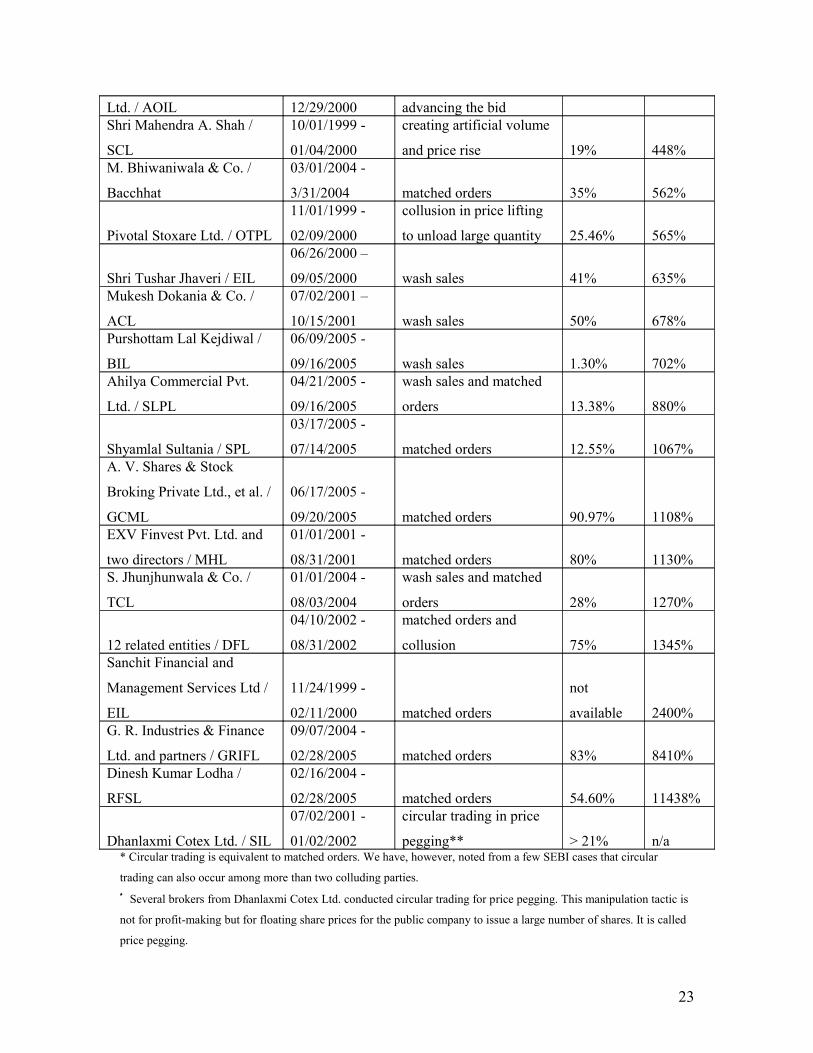
cases involved the manipulation tactic of advancing-the-bid. They are listed in Table 5
according to the ascending order in price change due to manipulation.
Table 5. Twenty-eight SEBI prosecution cases in market manipulation (1999 - 2005)
Manipulator(s)/ target
stock(s)
Manipulation
period Manipulation tactics
Daily
volume
(%)
Total
price
change
(%)
Murari Lal Goenka / CIL
06/24/2005 -
11/7/2005
wash sales and matched
orders 29% 5%Porecha Global Securities
Pvt. Ltd. and Shri Arun
Porecha / MTL
10/23/2000 -
11/10/2000 matched orders 99.89% 15%Tropical Securities &
Investments Private Ltd. /
DCM
03/14/2001 -
04/24/2001 wash sale 23.95% 21%
Shri Vasant H. Bissa / SLIL
01/02/2002 -
09/13/2002
wash sales and matched
orders 51.60% 70%Shri Vipul Bhagwandas
Shah / GFL
07/31/2000 -
11/27/2000
matched orders and
collusion 19.63% 89%
12 related entities / DFL
04/01/2001 -
06/28/2001
matched orders and
collusion 50% 96%P. Suryakant Shares and
Stock Brokers Pvt. Ltd, /
OMML
04/08/2002 -
07/09/2002 matched orders
not
available 135%ASK Holdings Pvt. Ltd. /
GIL
12/19/2002 -
01/17/2003
wash sale and collusion
to unload large quantity 27.72% 195%Chandrahas R Kulkarni /
HTL
11/16/1999 -
03/31/2000 circular trading* 90% 196%
Shri Minoo Pestonji / APL
08/02/2000 -
08/31/2000
wash sales and advancing
the bid
not
available 197%
Shyam Lal Sultania / NIL
04/25/2005 -
11/08/2005 matched orders 12.53% 238%Ravi Vishnu Securities 11/06/2000 - matched orders and 55% 316%
22
Ltd. / AOIL 12/29/2000 advancing the bidShri Mahendra A. Shah /
SCL
10/01/1999 -
01/04/2000
creating artificial volume
and price rise 19% 448%M. Bhiwaniwala & Co. /
Bacchhat
03/01/2004 -
3/31/2004 matched orders 35% 562%
Pivotal Stoxare Ltd. / OTPL
11/01/1999 -
02/09/2000
collusion in price lifting
to unload large quantity 25.46% 565%
Shri Tushar Jhaveri / EIL
06/26/2000 –
09/05/2000 wash sales 41% 635%Mukesh Dokania & Co. /
ACL
07/02/2001 –
10/15/2001 wash sales 50% 678%Purshottam Lal Kejdiwal /
BIL
06/09/2005 -
09/16/2005 wash sales 1.30% 702%Ahilya Commercial Pvt.
Ltd. / SLPL
04/21/2005 -
09/16/2005
wash sales and matched
orders 13.38% 880%
Shyamlal Sultania / SPL
03/17/2005 -
07/14/2005 matched orders 12.55% 1067%A. V. Shares & Stock
Broking Private Ltd., et al. /
GCML
06/17/2005 -
09/20/2005 matched orders 90.97% 1108%EXV Finvest Pvt. Ltd. and
two directors / MHL
01/01/2001 -
08/31/2001 matched orders 80% 1130%S. Jhunjhunwala & Co. /
TCL
01/01/2004 -
08/03/2004
wash sales and matched
orders 28% 1270%
12 related entities / DFL
04/10/2002 -
08/31/2002
matched orders and
collusion 75% 1345%Sanchit Financial and
Management Services Ltd /
EIL
11/24/1999 -
02/11/2000 matched orders
not
available 2400%G. R. Industries & Finance
Ltd. and partners / GRIFL
09/07/2004 -
02/28/2005 matched orders 83% 8410%Dinesh Kumar Lodha /
RFSL
02/16/2004 -
02/28/2005 matched orders 54.60% 11438%
Dhanlaxmi Cotex Ltd. / SIL
07/02/2001 -
01/02/2002
circular trading in price
pegging** > 21% n/a* Circular trading is equivalent to matched orders. We have, however, noted from a few SEBI cases that circular
trading can also occur among more than two colluding parties. ∗∗ Several brokers from Dhanlaxmi Cotex Ltd. conducted circular trading for price pegging. This manipulation tactic is
not for profit-making but for floating share prices for the public company to issue a large number of shares. It is called
price pegging.
23
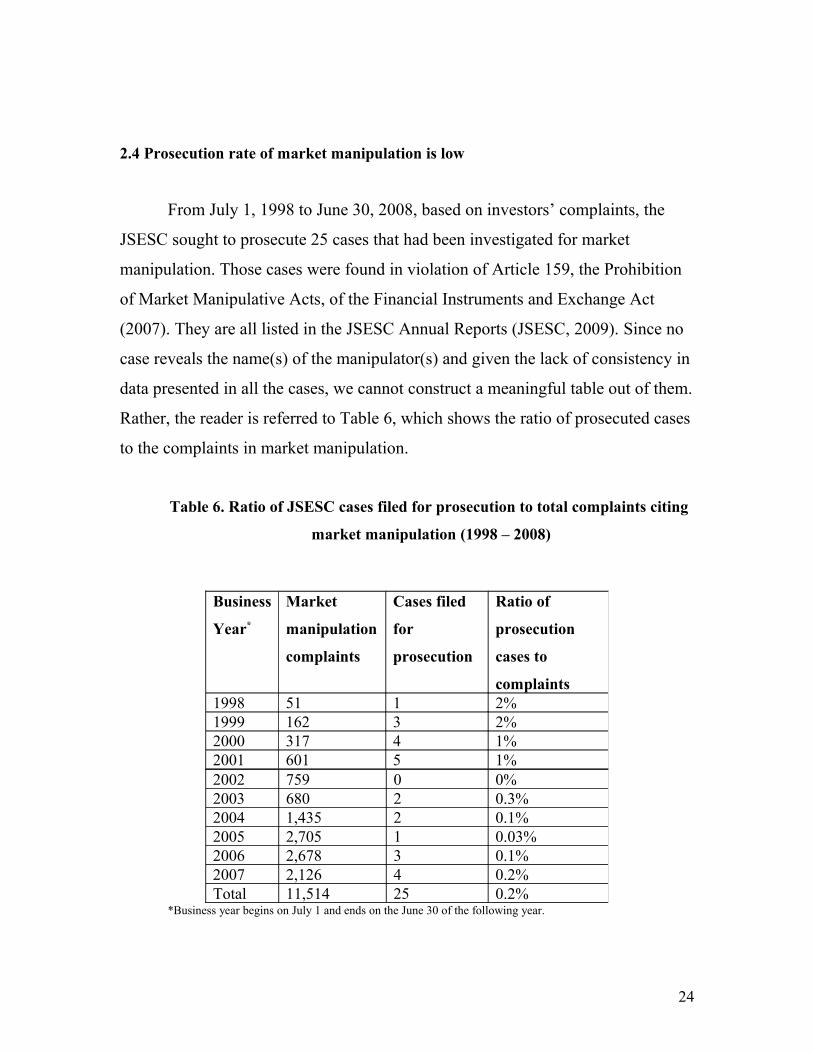
2.4 Prosecution rate of market manipulation is low
From July 1, 1998 to June 30, 2008, based on investors’ complaints, the
JSESC sought to prosecute 25 cases that had been investigated for market
manipulation. Those cases were found in violation of Article 159, the Prohibition
of Market Manipulative Acts, of the Financial Instruments and Exchange Act
(2007). They are all listed in the JSESC Annual Reports (JSESC, 2009). Since no
case reveals the name(s) of the manipulator(s) and given the lack of consistency in
data presented in all the cases, we cannot construct a meaningful table out of them.
Rather, the reader is referred to Table 6, which shows the ratio of prosecuted cases
to the complaints in market manipulation.
Table 6. Ratio of JSESC cases filed for prosecution to total complaints citing
market manipulation (1998 – 2008)
*Business year begins on July 1 and ends on the June 30 of the following year.
Business
Year*
Market
manipulation
complaints
Cases filed
for
prosecution
Ratio of
prosecution
cases to
complaints1998 51 1 2%1999 162 3 2%2000 317 4 1%2001 601 5 1%
24
2002 759 0 0%2003 680 2 0.3%2004 1,435 2 0.1%2005 2,705 1 0.03%2006 2,678 3 0.1%2007 2,126 4 0.2%Total 11,514 25 0.2%
Out of 11,514 public tips stating market manipulation, which were mainly trade
based, only 25 were found through investigation and filed for prosecution during the ten
year span from July 1, 1998 to June 30, 2008. That is a mere 0.2 percent. And, the rate of
conviction can be even lower. One can develop a sense of how poor effectiveness and
low efficiency regarding securities legislature and enforcement procedures can be. This is
mainly because many non-rampant daily manipulations are difficult to detect and even
harder to prosecute if pursued through legal procedural channels.
German securities regulator is said to be toothless. And the country’s weak rules
lead to few market manipulation convictions. For instance, 1,300 tips in 2008 ended up
with 11 cases convicted, or a conviction rate of 0.8 percent (ANE, 2009). There were
6,000 complaints in year 2000 about manipulation in Canadian stock markets. How many
of them were investigated? The convicted manipulator Marino Specogna questioned
(Specogna, 2003).
In emerging stock markets, Goyal (2005) points out that it takes up to two years to
settle a SEBI case in India, and the conviction rate is poor. In 2001-2002, 21 out of 111
cases were completed; the completion rate was 19 percent. The conviction rate is likely
lower. Nageshwaran and Krithivasan (2004) argue that only 16 convictions were handed
down out of total of 775 litigation cases in Malaysia in 2002. The conviction rate based
on litigation is only 2 percent. Those low conviction rates from the regulatory agencies of
both developed and emerging economies obviously justify non-legal measures for daily
regulatory operations.
Other indicators such as how many years does it take to progress from complaint
to conviction, what is the cost to cover all legal procedures, and how many human
resources are involved in each case can be further calculated to measure the effectiveness
and efficiency of the legal approach. We leave this work for future research.
The above cited empirical findings, which only detail instances reported,
investigated and prosecuted, reveal that manipulation remains a chronic, frequent, and
25
occasional rampant issue facing stock markets in the twenty-first century. McGoun
(2008) also argues that markets are indeed inherently manipulable. Chris Cook, former
director of the International Petroleum Exchange in London, observes from the oil futures
market that, “The market is the manipulation” (Cook, 2009). The far-reaching
implications of these cases underscore the convicted Canadian stock market
manipulator’s confession that manipulation of untold numbers of stocks occur every day
(Specogna, 2003).
One fact, however, does remain clear: Every stock market can be manipulated
under the current regulatory framework. Next we anatomize an investor’s trades during a
trading day to understand the well-known tactics used in market manipulation and
discover regulatory measures in detection and prevention.
3. Anatomy of an investor’s trades during a trading day
All seemingly unique manipulation tactics such as wash sale, matched orders,
advancing-the-bid, marking-the-close and fake trading, seek the same objective, i.e., to
achieve the desired price impact. Therefore, going one step further, we suggest a practical
framework that we have derived from careful study of the statistical and individual
characteristics of prosecuted market manipulation cases in the five economies that
provide these data online. The variables we propose provide the space to maneuver for
the manipulator, often standing out in one, two or three of these variables simultaneously
to induce more trades made by others, and for the manipulator to achieve his desired
price. It is unlikely that any one manipulation tactic would be outstanding in every one of
the variables. However, to our best knowledge, the prosecution cases do fit into the
proposed framework. We use one trading day as the time horizon. The framework is as
follows:
(1) Total number of shares to be placed in each order, i.e., order size.
(2) Total number of orders. This measures the frequency of order
26
placement.
(3) Trading direction of orders. This affects the number of orders to be
placed and the net ownership of the shares at the end of the day.
(4) The “distance” of the bid (ask) from the best bid (ask). This is the bid
advance (ask depression). The advancing-the-bid manipulation tactic
provides an excellent example of raising the bid advance to increase
share prices.
(5) Time interval between two consecutive orders. A negligible time
interval between two orders of equal quantities is used in fictitious
trading such as matched orders.
(6) Timing, i.e., when to place orders during the trading day. To place an
order during the closing minutes of the trading day can result in
tangible differences in the closing price. Marking-the-close shows the
importance of timing in manipulation.
(7) Full execution, partial execution, or full cancellation. Voluntary
cancellation of placed buy orders near the best bid (or best ask for sell
orders) raises questions regarding the genuineness of the trades.
(8) More than one trading account. This is also a feature of fictitious
trading.
(9) Collusion with one or more investors. This is critical in matched orders
or cross-dealing which is one type of fictitious trading.
27
These nine variables occur under the investor’s discretion when one examines
trade-based manipulation tactics only.6 However, there are many variables out of the
manipulator’s control. Market environmental variables, such as news from and actions
taken by the issuing company, business media reporting, the sudden entry or exit of large
volumes, and regulation change, are beyond the investor’s expectation. Occasionally,
sudden and large national and international news events, such as the breakout of war,
epidemics, and natural disasters, can affect the entire market substantially. In this article,
we limit our attention to the variables at an investor’s full decision for trade-based market
manipulation. Next we will present the details in some of the SEBI and CSRC
prosecution cases and show how the caught manipulators use some of the nine variables
in their manipulation tactics.
4. The manipulation tactics used in trade-based price-lifting
Out of the 109 prosecution cases drawn from five regulatory agencies, nearly all of 28
SEBI cases explicitly list price and volume data due to manipulation (Table 5). The
average daily price impact in terms of the share price increase due to manipulation is thus
calculated based on the manipulation period and price data.
Out of 28 SEBI cases, six have average daily price impact estimates smaller than
2 percent. They represent only 20.7 percent of the cases. Even though the estimates of the
daily price impact include other investors’ contributions, these percentages still provide
an understanding that there is some degree of correlation between the estimates and the
previous results obtained in the literature which are around 1% (Yan et al., 2012c). At the
same time, there are many estimates above 2 percent (79.3%) or even above 20 percent
(14.29%). This outstanding abnormality warrants closer investigation. One particular
interesting question arises. What are the essential variables behind the tactics used by the
manipulators to achieve very large price impact?
6 The investor can release potentially price-moving information publicly to manipulate the share price up or down. But this is information-based manipulation and has been analyzed in Yan et al. (2012b)).
28
In the lift stage of an accumulation-lift-distribution scheme found in the majority
(107) of the 109 prosecution cases, all manipulation tactics are directed towards marking
up share prices in a relatively short time period. The manipulator can induce large buy
quantities within short time durations so share prices are pushed up mainly by other
investors. The manipulator can also create and sustain regularly and significantly rising
prices. The purpose is to render a fast-rising stock very attractive so that the manipulator
can quietly distribute his holdings when sufficient buy volumes of other investors flow in
at the inflated price level.
During the lift stage of an accumulation-lift-distribution scheme or general price-
lifting, several manipulation tactics are evident among the 109 prosecution cases. They
fall into two main types, trade-based or information-based (Allen and Gale, 1992). Trade-
based manipulation tactics are represented by fictitious trading that includes wash sale
(self-dealing) and matched orders (cross-dealing), advancing-the-bid, marking-the-close,
and fake trading. Trade-based tactics are often carried out with collusion or multiple
nominee accounts. In the following, we will select dozens of typical cases from the 109
cases studied according to the trade-based manipulation tactics, i.e., fictitious trading
(wash sale and matched orders), advancing-the-bid, marking-the-close, and fake trading.
Several cases studied involved more than one type of manipulation tactics.
4.1 Fictitious trading
Fictitious trading includes both wash sale and matched orders, with the former
being self-dealing. The latter, matched orders, is cross-dealing and requires collusion or
multiple nominee accounts. Whether self-dealing or cross-dealing, the essence is the
same in that almost simultaneous trading of two opposite orders of the same quantity and
at the same price is used in either type. In this sense, we do not specifically distinguish
between wash sale and matched orders. Rather, we rely on figures drawn from fictitious
trading in general.
29
Fictitious trading involves several of the nine variables. Two orders are placed
almost simultaneously except when the stock is very thinly traded. The trading directions
of the two orders are always opposite. The numbers of shares in the two orders are
precisely or nearly equal. Most likely, advancing-the-bid is also included even though
exceptions may exist. This is a crucial element that is often ignored by securities
regulators. Without advancing the bid, how can share prices be lifted by a tangible 20
percent with only two fictitious trades of 200 shares each (see Table 10)? Since the bid
of the buy order is equal to the ask of the sell order, it warrants instant execution.
Depending on how heavy daily turnover is in the stock, single to multiple fictitious trades
are both probable. The key is to effectively raise share prices within short time periods
while not even one or a negligible number of costly shares are added to the already
accumulated, less expensive shares. That is, net ownership in the traded stock ends up
without any meaningful change.
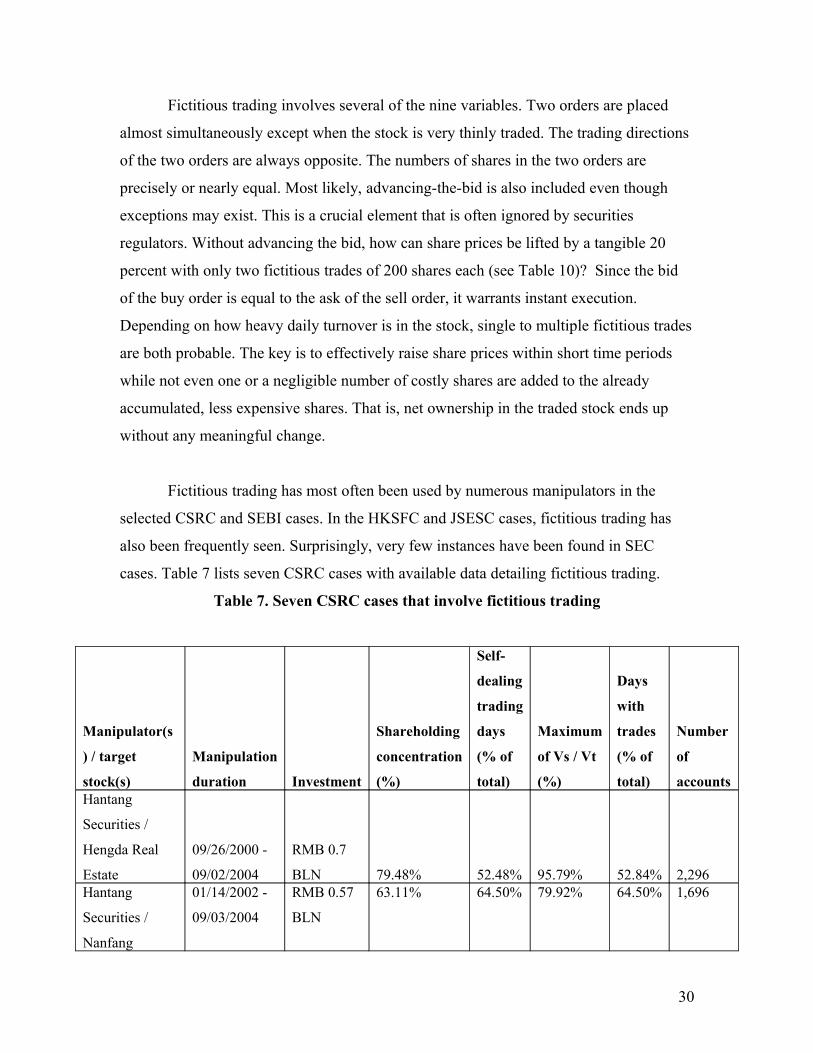
Fictitious trading has most often been used by numerous manipulators in the
selected CSRC and SEBI cases. In the HKSFC and JSESC cases, fictitious trading has
also been frequently seen. Surprisingly, very few instances have been found in SEC
cases. Table 7 lists seven CSRC cases with available data detailing fictitious trading.
Table 7. Seven CSRC cases that involve fictitious trading
Manipulator(s
) / target
stock(s)
Manipulation
duration Investment
Shareholding
concentration
(%)
Self-
dealing
trading
days
(% of
total)
Maximum
of Vs / Vt
(%)
Days
with
trades
(% of
total)
Number
of
accountsHantang
Securities /
Hengda Real
Estate
09/26/2000 -
09/02/2004
RMB 0.7
BLN 79.48% 52.48% 95.79% 52.84% 2,296Hantang
Securities /
Nanfang
01/14/2002 -
09/03/2004
RMB 0.57
BLN
63.11% 64.50% 79.92% 64.50% 1,696
30
ShareholdingCui Junshan /
Jinde Fazhan
12/04/2000 -
07/20/2006
RMB 2.1
BLN 81.33% 64.58% 99.59% 97.71% 3,917Hantang
Securities /
Baihua Village
01/10/2003 -
09/03/2004
RMB 0.17
BLN 34.81% 64.72% 80.04% 64.72% 2,495Hantang
Securities /
Feida
Environmental
07/22/2002 -
09/03/2004
RMB 0.4
BLN 59.26% 65.00% 75.60% 65.00% 4,294Hantang
Securities /
Langchao
Software
06/27/2002 -
09/03/2004
RMB 0.77
BLN 74.05% 79.70% 79.18% 80.64% 1,872Xianghe
Holding, et al. /
Sanmu Group
11/05/2001 -
01/31/2005
RMB 4.4
BLN 80.00% 85.60% 98.80% 97.80% 3,879
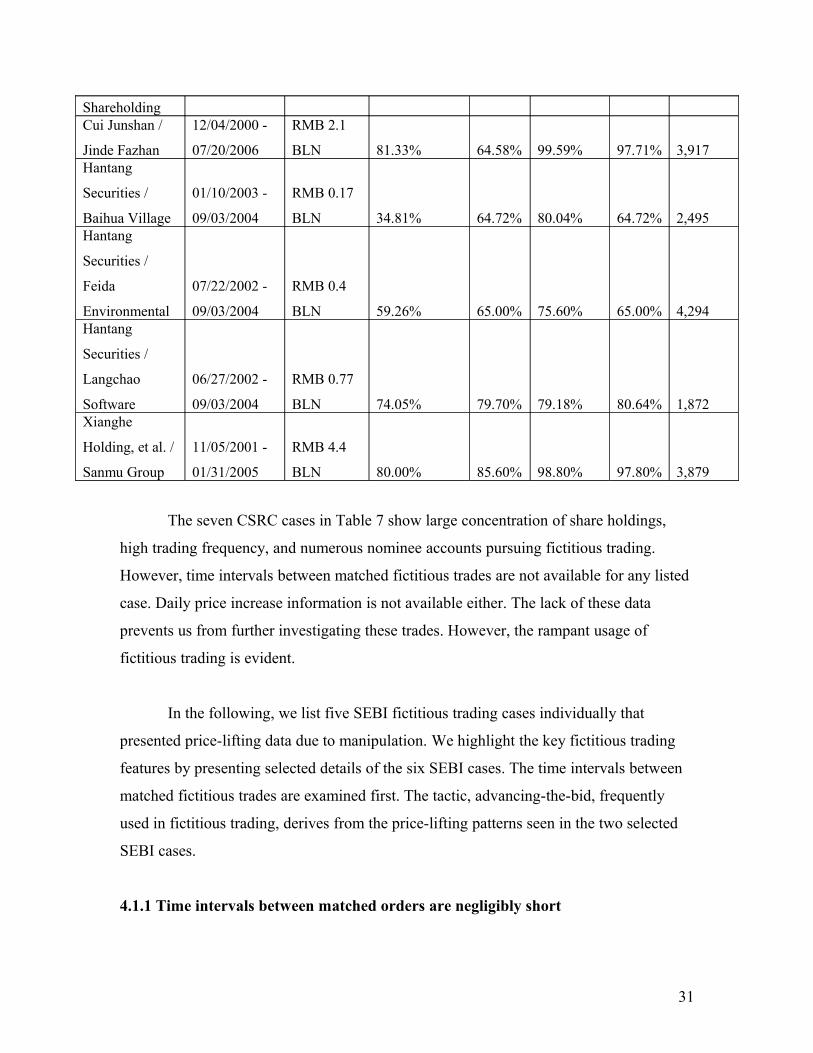
The seven CSRC cases in Table 7 show large concentration of share holdings,
high trading frequency, and numerous nominee accounts pursuing fictitious trading.
However, time intervals between matched fictitious trades are not available for any listed
case. Daily price increase information is not available either. The lack of these data
prevents us from further investigating these trades. However, the rampant usage of
fictitious trading is evident.
In the following, we list five SEBI fictitious trading cases individually that
presented price-lifting data due to manipulation. We highlight the key fictitious trading
features by presenting selected details of the six SEBI cases. The time intervals between
matched fictitious trades are examined first. The tactic, advancing-the-bid, frequently
used in fictitious trading, derives from the price-lifting patterns seen in the two selected
SEBI cases.
4.1.1 Time intervals between matched orders are negligibly short
31
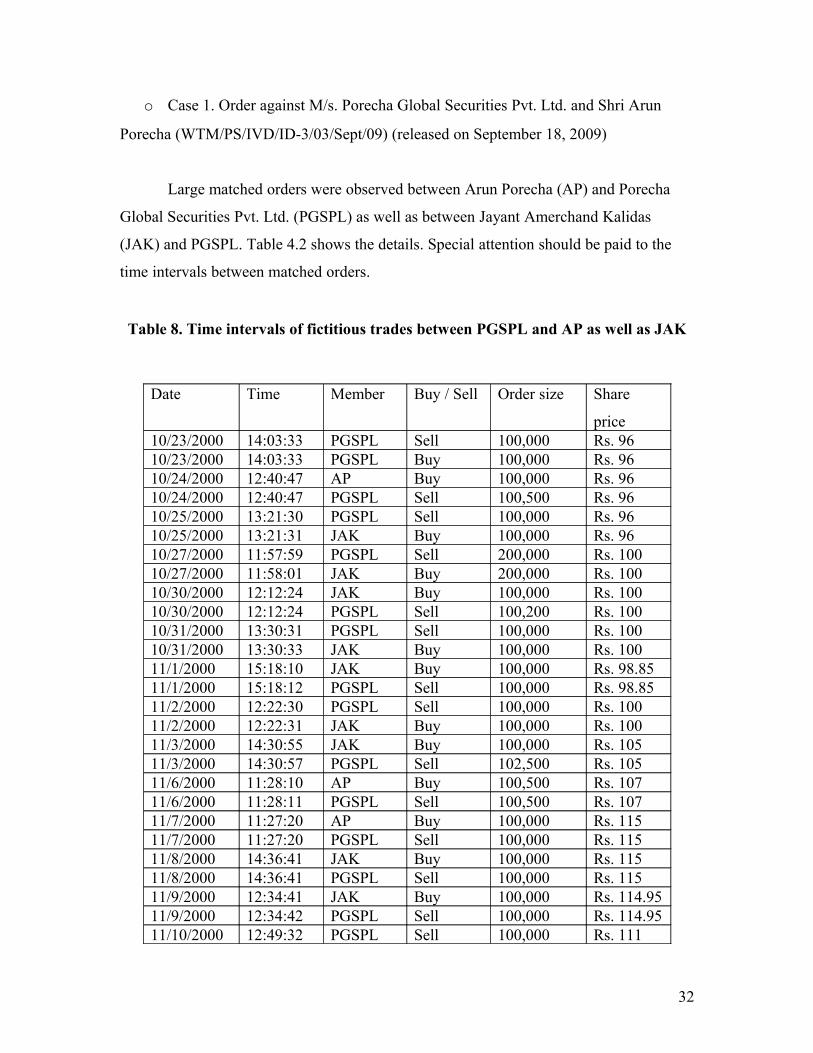
o Case 1. Order against M/s. Porecha Global Securities Pvt. Ltd. and Shri Arun
Porecha (WTM/PS/IVD/ID-3/03/Sept/09) (released on September 18, 2009)
Large matched orders were observed between Arun Porecha (AP) and Porecha
Global Securities Pvt. Ltd. (PGSPL) as well as between Jayant Amerchand Kalidas
(JAK) and PGSPL. Table 4.2 shows the details. Special attention should be paid to the
time intervals between matched orders.
Table 8. Time intervals of fictitious trades between PGSPL and AP as well as JAK
Date Time Member Buy / Sell Order size Share
price10/23/2000 14:03:33 PGSPL Sell 100,000 Rs. 9610/23/2000 14:03:33 PGSPL Buy 100,000 Rs. 9610/24/2000 12:40:47 AP Buy 100,000 Rs. 9610/24/2000 12:40:47 PGSPL Sell 100,500 Rs. 9610/25/2000 13:21:30 PGSPL Sell 100,000 Rs. 9610/25/2000 13:21:31 JAK Buy 100,000 Rs. 9610/27/2000 11:57:59 PGSPL Sell 200,000 Rs. 10010/27/2000 11:58:01 JAK Buy 200,000 Rs. 10010/30/2000 12:12:24 JAK Buy 100,000 Rs. 10010/30/2000 12:12:24 PGSPL Sell 100,200 Rs. 10010/31/2000 13:30:31 PGSPL Sell 100,000 Rs. 10010/31/2000 13:30:33 JAK Buy 100,000 Rs. 10011/1/2000 15:18:10 JAK Buy 100,000 Rs. 98.8511/1/2000 15:18:12 PGSPL Sell 100,000 Rs. 98.8511/2/2000 12:22:30 PGSPL Sell 100,000 Rs. 10011/2/2000 12:22:31 JAK Buy 100,000 Rs. 10011/3/2000 14:30:55 JAK Buy 100,000 Rs. 10511/3/2000 14:30:57 PGSPL Sell 102,500 Rs. 10511/6/2000 11:28:10 AP Buy 100,500 Rs. 10711/6/2000 11:28:11 PGSPL Sell 100,500 Rs. 10711/7/2000 11:27:20 AP Buy 100,000 Rs. 11511/7/2000 11:27:20 PGSPL Sell 100,000 Rs. 11511/8/2000 14:36:41 JAK Buy 100,000 Rs. 11511/8/2000 14:36:41 PGSPL Sell 100,000 Rs. 11511/9/2000 12:34:41 JAK Buy 100,000 Rs. 114.9511/9/2000 12:34:42 PGSPL Sell 100,000 Rs. 114.9511/10/2000 12:49:32 PGSPL Sell 100,000 Rs. 111
32
11/10/2000 12:49:34 JAK Buy 100,000 Rs. 114.9011/10/2000 12:52:39 PGSPL Sell 99,900 Rs. 114.9011/10/2000 12:52:40 JAK Buy 99,900 Rs. 114.9011/10/2000 12:53:46 PGSPL Buy 99,900 Rs. 11111/10/2000 12:53:47 JAK Sell 99,900 Rs. 111
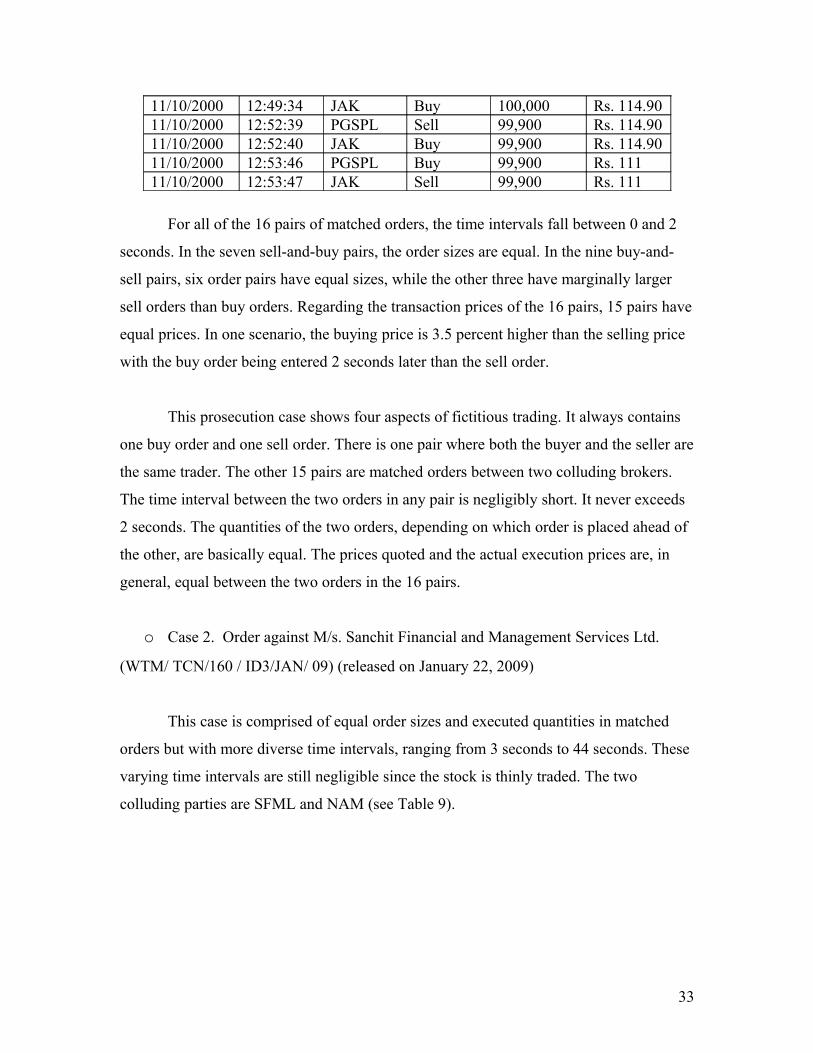
For all of the 16 pairs of matched orders, the time intervals fall between 0 and 2
seconds. In the seven sell-and-buy pairs, the order sizes are equal. In the nine buy-and-
sell pairs, six order pairs have equal sizes, while the other three have marginally larger
sell orders than buy orders. Regarding the transaction prices of the 16 pairs, 15 pairs have
equal prices. In one scenario, the buying price is 3.5 percent higher than the selling price
with the buy order being entered 2 seconds later than the sell order.
This prosecution case shows four aspects of fictitious trading. It always contains
one buy order and one sell order. There is one pair where both the buyer and the seller are
the same trader. The other 15 pairs are matched orders between two colluding brokers.
The time interval between the two orders in any pair is negligibly short. It never exceeds
2 seconds. The quantities of the two orders, depending on which order is placed ahead of
the other, are basically equal. The prices quoted and the actual execution prices are, in
general, equal between the two orders in the 16 pairs.
o Case 2. Order against M/s. Sanchit Financial and Management Services Ltd.
(WTM/ TCN/160 / ID3/JAN/ 09) (released on January 22, 2009)
This case is comprised of equal order sizes and executed quantities in matched
orders but with more diverse time intervals, ranging from 3 seconds to 44 seconds. These
varying time intervals are still negligible since the stock is thinly traded. The two
colluding parties are SFML and NAM (see Table 9).
33
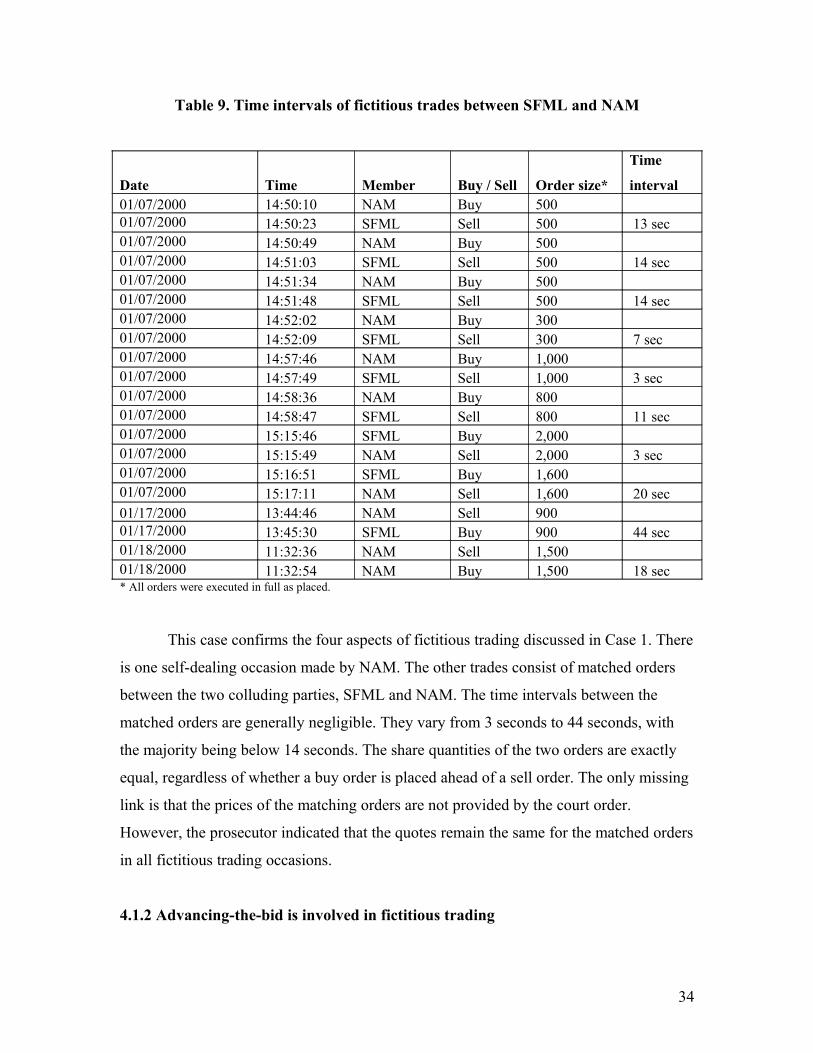
Table 9. Time intervals of fictitious trades between SFML and NAM
Date Time Member Buy / Sell Order size*
Time
interval01/07/2000 14:50:10 NAM Buy 500 01/07/2000 14:50:23 SFML Sell 500 13 sec01/07/2000 14:50:49 NAM Buy 500 01/07/2000 14:51:03 SFML Sell 500 14 sec01/07/2000 14:51:34 NAM Buy 500 01/07/2000 14:51:48 SFML Sell 500 14 sec01/07/2000 14:52:02 NAM Buy 300 01/07/2000 14:52:09 SFML Sell 300 7 sec01/07/2000 14:57:46 NAM Buy 1,000 01/07/2000 14:57:49 SFML Sell 1,000 3 sec01/07/2000 14:58:36 NAM Buy 800 01/07/2000 14:58:47 SFML Sell 800 11 sec01/07/2000 15:15:46 SFML Buy 2,000 01/07/2000 15:15:49 NAM Sell 2,000 3 sec01/07/2000 15:16:51 SFML Buy 1,600 01/07/2000 15:17:11 NAM Sell 1,600 20 sec01/17/2000 13:44:46 NAM Sell 900 01/17/2000 13:45:30 SFML Buy 900 44 sec01/18/2000 11:32:36 NAM Sell 1,500 01/18/2000 11:32:54 NAM Buy 1,500 18 sec* All orders were executed in full as placed.
This case confirms the four aspects of fictitious trading discussed in Case 1. There
is one self-dealing occasion made by NAM. The other trades consist of matched orders
between the two colluding parties, SFML and NAM. The time intervals between the
matched orders are generally negligible. They vary from 3 seconds to 44 seconds, with
the majority being below 14 seconds. The share quantities of the two orders are exactly
equal, regardless of whether a buy order is placed ahead of a sell order. The only missing
link is that the prices of the matching orders are not provided by the court order.
However, the prosecutor indicated that the quotes remain the same for the matched orders
in all fictitious trading occasions.
4.1.2 Advancing-the-bid is involved in fictitious trading
34
o Case 3. Order against M/s. Purshottam Lal Kejdiwal
(WTM/KMA/ERO/IVD/121/08/ 2009) (released on August 21, 2009)
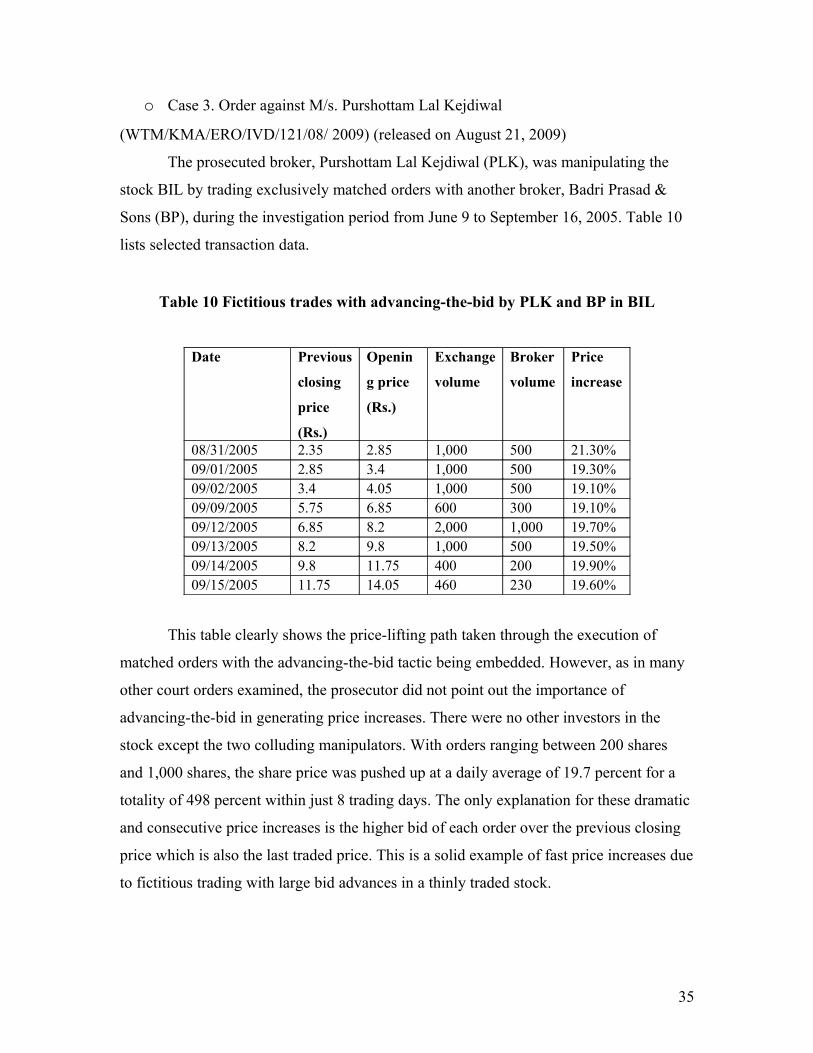
The prosecuted broker, Purshottam Lal Kejdiwal (PLK), was manipulating the
stock BIL by trading exclusively matched orders with another broker, Badri Prasad &
Sons (BP), during the investigation period from June 9 to September 16, 2005. Table 10
lists selected transaction data.
Table 10 Fictitious trades with advancing-the-bid by PLK and BP in BIL
Date Previous
closing
price
(Rs.)
Openin
g price
(Rs.)
Exchange
volume
Broker
volume
Price
increase
08/31/2005 2.35 2.85 1,000 500 21.30%09/01/2005 2.85 3.4 1,000 500 19.30%09/02/2005 3.4 4.05 1,000 500 19.10%09/09/2005 5.75 6.85 600 300 19.10%09/12/2005 6.85 8.2 2,000 1,000 19.70%09/13/2005 8.2 9.8 1,000 500 19.50%09/14/2005 9.8 11.75 400 200 19.90%09/15/2005 11.75 14.05 460 230 19.60%
This table clearly shows the price-lifting path taken through the execution of
matched orders with the advancing-the-bid tactic being embedded. However, as in many
other court orders examined, the prosecutor did not point out the importance of
advancing-the-bid in generating price increases. There were no other investors in the
stock except the two colluding manipulators. With orders ranging between 200 shares
and 1,000 shares, the share price was pushed up at a daily average of 19.7 percent for a
totality of 498 percent within just 8 trading days. The only explanation for these dramatic
and consecutive price increases is the higher bid of each order over the previous closing
price which is also the last traded price. This is a solid example of fast price increases due
to fictitious trading with large bid advances in a thinly traded stock.
35
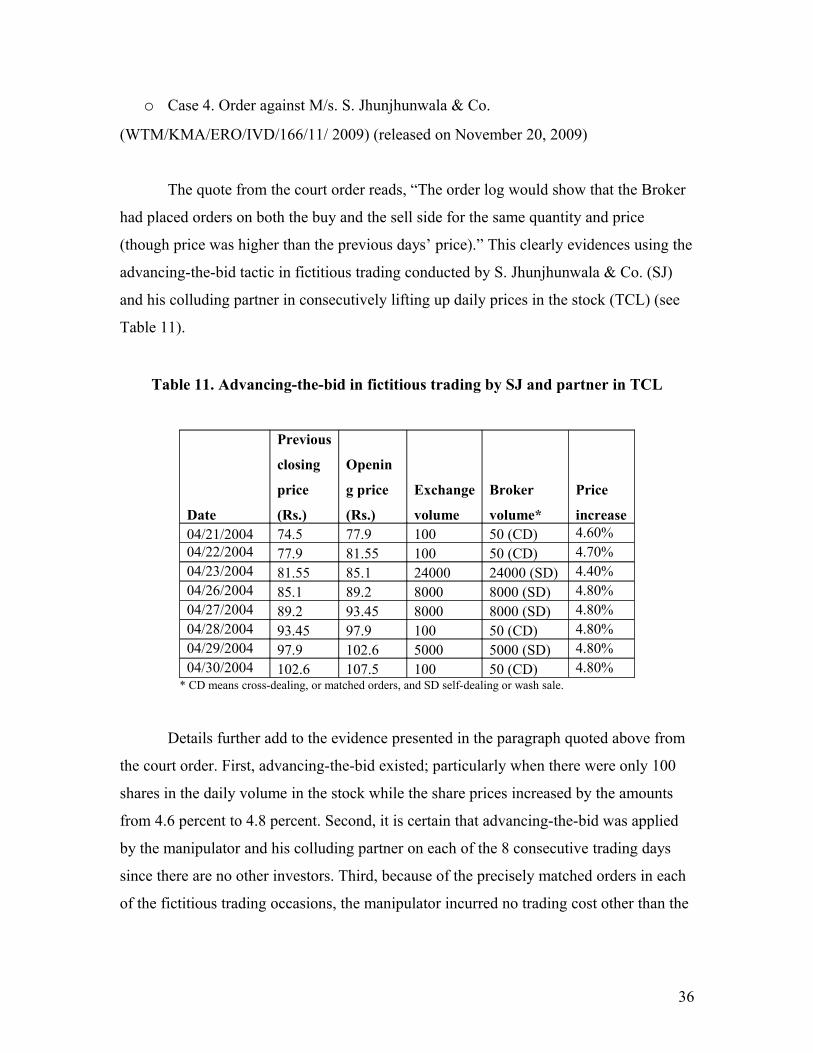
o Case 4. Order against M/s. S. Jhunjhunwala & Co.
(WTM/KMA/ERO/IVD/166/11/ 2009) (released on November 20, 2009)
The quote from the court order reads, “The order log would show that the Broker
had placed orders on both the buy and the sell side for the same quantity and price
(though price was higher than the previous days’ price).” This clearly evidences using the
advancing-the-bid tactic in fictitious trading conducted by S. Jhunjhunwala & Co. (SJ)
and his colluding partner in consecutively lifting up daily prices in the stock (TCL) (see
Table 11).
Table 11. Advancing-the-bid in fictitious trading by SJ and partner in TCL
Date
Previous
closing
price
(Rs.)
Openin
g price
(Rs.)
Exchange
volume
Broker
volume*
Price
increase04/21/2004 74.5 77.9 100 50 (CD) 4.60%04/22/2004 77.9 81.55 100 50 (CD) 4.70%04/23/2004 81.55 85.1 24000 24000 (SD) 4.40%04/26/2004 85.1 89.2 8000 8000 (SD) 4.80%04/27/2004 89.2 93.45 8000 8000 (SD) 4.80%04/28/2004 93.45 97.9 100 50 (CD) 4.80%04/29/2004 97.9 102.6 5000 5000 (SD) 4.80%04/30/2004 102.6 107.5 100 50 (CD) 4.80%
* CD means cross-dealing, or matched orders, and SD self-dealing or wash sale.
Details further add to the evidence presented in the paragraph quoted above from
the court order. First, advancing-the-bid existed; particularly when there were only 100
shares in the daily volume in the stock while the share prices increased by the amounts
from 4.6 percent to 4.8 percent. Second, it is certain that advancing-the-bid was applied
by the manipulator and his colluding partner on each of the 8 consecutive trading days
since there are no other investors. Third, because of the precisely matched orders in each
of the fictitious trading occasions, the manipulator incurred no trading cost other than the
36
commissions but effectively lifted up the share prices by a daily average of 4.7 percent
and in total 44.3 percent in 8 consecutive trading days.
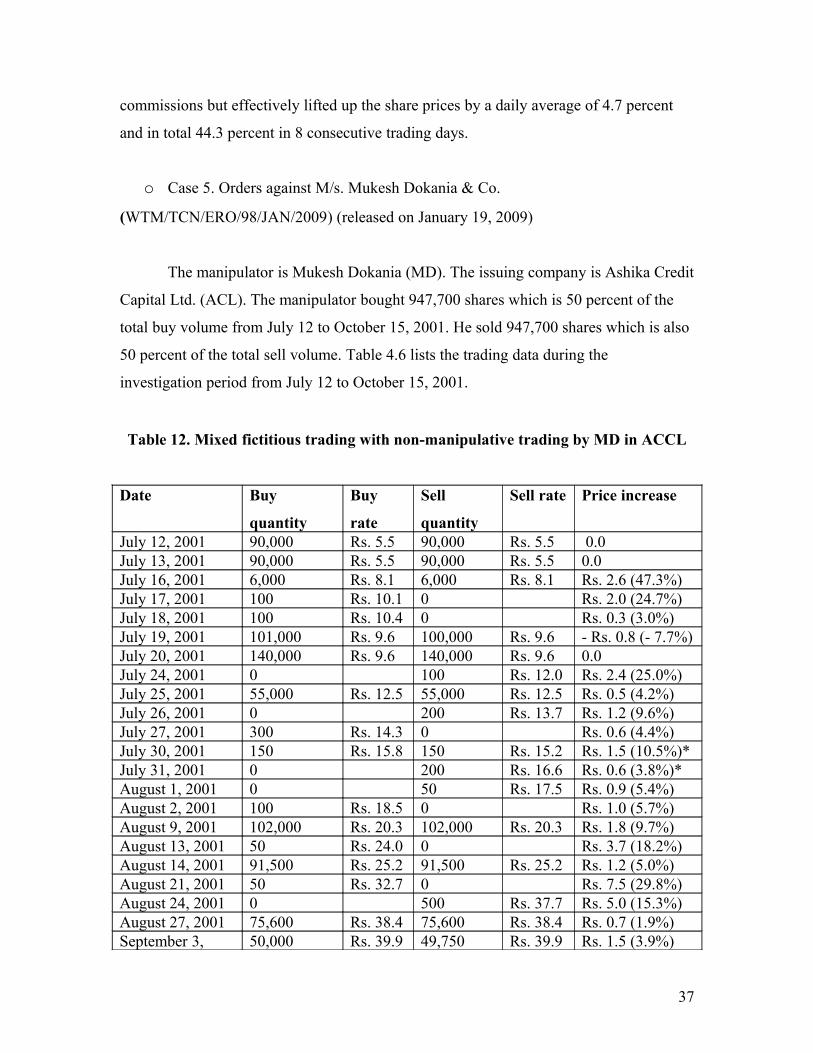
o Case 5. Orders against M/s. Mukesh Dokania & Co.
(WTM/TCN/ERO/98/JAN/2009) (released on January 19, 2009)
The manipulator is Mukesh Dokania (MD). The issuing company is Ashika Credit
Capital Ltd. (ACL). The manipulator bought 947,700 shares which is 50 percent of the
total buy volume from July 12 to October 15, 2001. He sold 947,700 shares which is also
50 percent of the total sell volume. Table 4.6 lists the trading data during the
investigation period from July 12 to October 15, 2001.
Table 12. Mixed fictitious trading with non-manipulative trading by MD in ACCL
Date Buy
quantity
Buy
rate
Sell
quantity
Sell rate Price increase
July 12, 2001 90,000 Rs. 5.5 90,000 Rs. 5.5 0.0July 13, 2001 90,000 Rs. 5.5 90,000 Rs. 5.5 0.0July 16, 2001 6,000 Rs. 8.1 6,000 Rs. 8.1 Rs. 2.6 (47.3%)July 17, 2001 100 Rs. 10.1 0 Rs. 2.0 (24.7%)July 18, 2001 100 Rs. 10.4 0 Rs. 0.3 (3.0%)July 19, 2001 101,000 Rs. 9.6 100,000 Rs. 9.6 - Rs. 0.8 (- 7.7%)July 20, 2001 140,000 Rs. 9.6 140,000 Rs. 9.6 0.0July 24, 2001 0 100 Rs. 12.0 Rs. 2.4 (25.0%)July 25, 2001 55,000 Rs. 12.5 55,000 Rs. 12.5 Rs. 0.5 (4.2%)July 26, 2001 0 200 Rs. 13.7 Rs. 1.2 (9.6%)July 27, 2001 300 Rs. 14.3 0 Rs. 0.6 (4.4%)July 30, 2001 150 Rs. 15.8 150 Rs. 15.2 Rs. 1.5 (10.5%)*July 31, 2001 0 200 Rs. 16.6 Rs. 0.6 (3.8%)*August 1, 2001 0 50 Rs. 17.5 Rs. 0.9 (5.4%)August 2, 2001 100 Rs. 18.5 0 Rs. 1.0 (5.7%)August 9, 2001 102,000 Rs. 20.3 102,000 Rs. 20.3 Rs. 1.8 (9.7%)August 13, 2001 50 Rs. 24.0 0 Rs. 3.7 (18.2%)August 14, 2001 91,500 Rs. 25.2 91,500 Rs. 25.2 Rs. 1.2 (5.0%)August 21, 2001 50 Rs. 32.7 0 Rs. 7.5 (29.8%)August 24, 2001 0 500 Rs. 37.7 Rs. 5.0 (15.3%)August 27, 2001 75,600 Rs. 38.4 75,600 Rs. 38.4 Rs. 0.7 (1.9%)September 3, 50,000 Rs. 39.9 49,750 Rs. 39.9 Rs. 1.5 (3.9%)
37
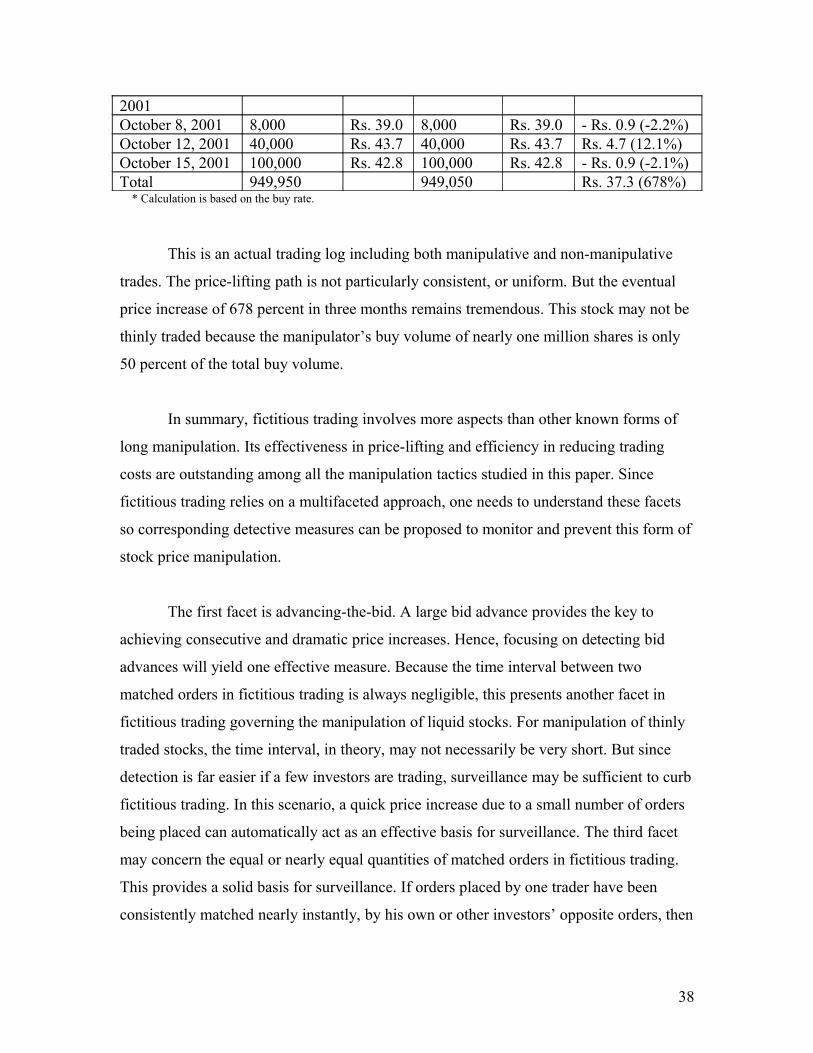
2001October 8, 2001 8,000 Rs. 39.0 8,000 Rs. 39.0 - Rs. 0.9 (-2.2%)October 12, 2001 40,000 Rs. 43.7 40,000 Rs. 43.7 Rs. 4.7 (12.1%)October 15, 2001 100,000 Rs. 42.8 100,000 Rs. 42.8 - Rs. 0.9 (-2.1%)Total 949,950 949,050 Rs. 37.3 (678%) * Calculation is based on the buy rate.
This is an actual trading log including both manipulative and non-manipulative
trades. The price-lifting path is not particularly consistent, or uniform. But the eventual
price increase of 678 percent in three months remains tremendous. This stock may not be
thinly traded because the manipulator’s buy volume of nearly one million shares is only
50 percent of the total buy volume.
In summary, fictitious trading involves more aspects than other known forms of
long manipulation. Its effectiveness in price-lifting and efficiency in reducing trading
costs are outstanding among all the manipulation tactics studied in this paper. Since
fictitious trading relies on a multifaceted approach, one needs to understand these facets
so corresponding detective measures can be proposed to monitor and prevent this form of
stock price manipulation.
The first facet is advancing-the-bid. A large bid advance provides the key to
achieving consecutive and dramatic price increases. Hence, focusing on detecting bid
advances will yield one effective measure. Because the time interval between two
matched orders in fictitious trading is always negligible, this presents another facet in
fictitious trading governing the manipulation of liquid stocks. For manipulation of thinly
traded stocks, the time interval, in theory, may not necessarily be very short. But since
detection is far easier if a few investors are trading, surveillance may be sufficient to curb
fictitious trading. In this scenario, a quick price increase due to a small number of orders
being placed can automatically act as an effective basis for surveillance. The third facet
may concern the equal or nearly equal quantities of matched orders in fictitious trading.
This provides a solid basis for surveillance. If orders placed by one trader have been
consistently matched nearly instantly, by his own or other investors’ opposite orders, then
38
surveillance can readily generate a warning flag for regulators. Detection of no or a
negligible change in net ownership can lead to regulation, too.
4.2 Marking-the-close and advancing-the-bid
Marking-the-close is often combined with advancing-the-bid. The distinction is
that the former refers to advancing-the-bid at the closing minutes only.7 The uniqueness
in marking-the-close is that it gives no time for the market maker or matching computer
when placing large numbers of buy orders in a short time near the close. To ensure a
higher opening price on the next trading day, the bid of each buy order has to be higher
than the best bid in the stock. These orders will pile up and be rolled over to the next
trading day. Thus the opening price will be effectively higher by generating an
accumulation of buy orders at distinctively higher bids. Then the manipulator can sell all
or part of the shares accumulated earlier at inflated prices the morning of the next trading
day. This practice often causes the share prices to drop not too long after their peak in the
morning. This explains many of the scenarios where share prices are marked up in the
closing minutes of the market and the next day’s opening prices are higher than the
previous closing prices. For the first few minutes, the prices continue to rise. Very soon
though, the prices peak and a sharp drop in their value follow.
Since marking-the-close is a special type of the advancing-the-bid manipulation,
we list prosecution cases involving both tactics in the same table. We choose seven
marking-the-close cases that have explicitly or implicitly indicated the closing price
inflation out of 13 HKSFC cases. These are listed in Table 13.
7 Depressing-the-ask is used if the manipulator’s intention is short manipulation. Then marking-the-close will feature a large number of sell orders near the close with the ask much lower than the best ask for the stock.
39
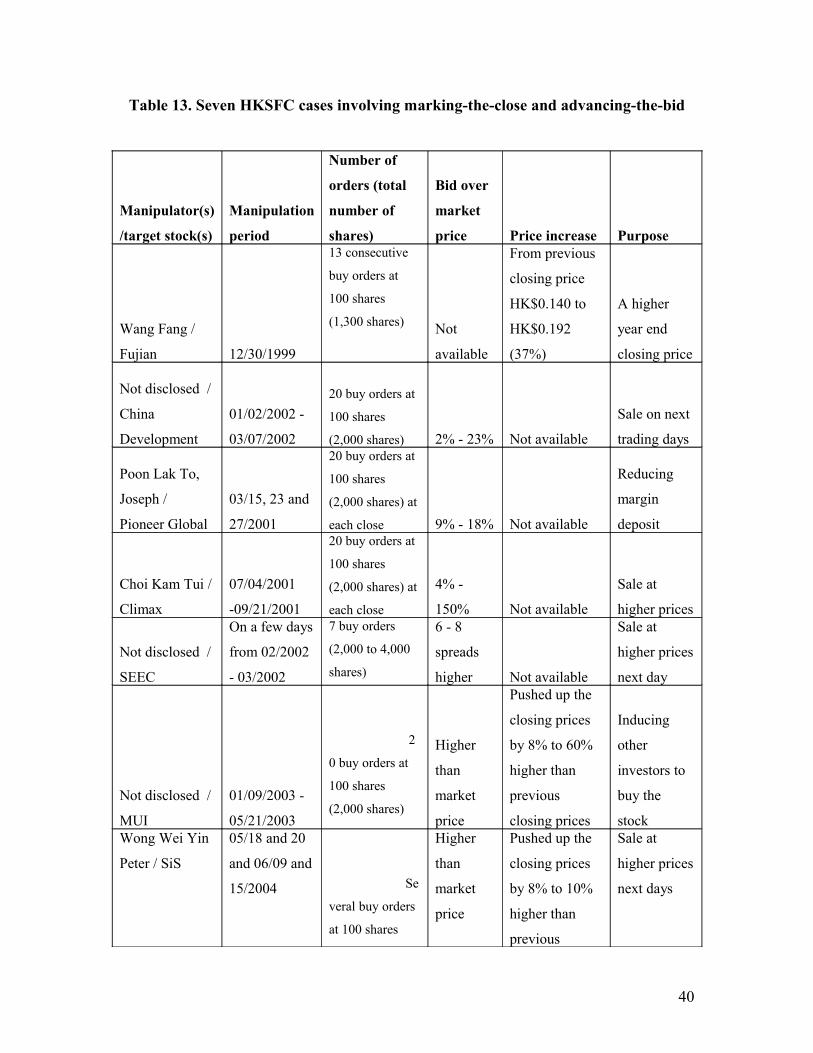
Table 13. Seven HKSFC cases involving marking-the-close and advancing-the-bid
Manipulator(s)
/target stock(s)
Manipulation
period
Number of
orders (total
number of
shares)
Bid over
market
price Price increase Purpose
Wang Fang /
Fujian 12/30/1999
13 consecutive
buy orders at
100 shares
(1,300 shares) Not
available
From previous
closing price
HK$0.140 to
HK$0.192
(37%)
A higher
year end
closing price
Not disclosed /
China
Development
01/02/2002 -
03/07/2002
20 buy orders at
100 shares
(2,000 shares) 2% - 23% Not available
Sale on next
trading days
Poon Lak To,
Joseph /
Pioneer Global
03/15, 23 and
27/2001
20 buy orders at
100 shares
(2,000 shares) at
each close 9% - 18% Not available
Reducing
margin
deposit
Choi Kam Tui /
Climax
07/04/2001
-09/21/2001
20 buy orders at
100 shares
(2,000 shares) at
each close
4% -
150% Not available
Sale at
higher prices
Not disclosed /
SEEC
On a few days
from 02/2002
- 03/2002
7 buy orders
(2,000 to 4,000
shares)
6 - 8
spreads
higher Not available
Sale at
higher prices
next day
Not disclosed /
MUI
01/09/2003 -
05/21/2003
2
0 buy orders at
100 shares
(2,000 shares)
Higher
than
market
price
Pushed up the
closing prices
by 8% to 60%
higher than
previous
closing prices
Inducing
other
investors to
buy the
stock Wong Wei Yin
Peter / SiS
05/18 and 20
and 06/09 and
15/2004 Se
veral buy orders
at 100 shares
Higher
than
market
price
Pushed up the
closing prices
by 8% to 10%
higher than
previous
Sale at
higher prices
next days
40
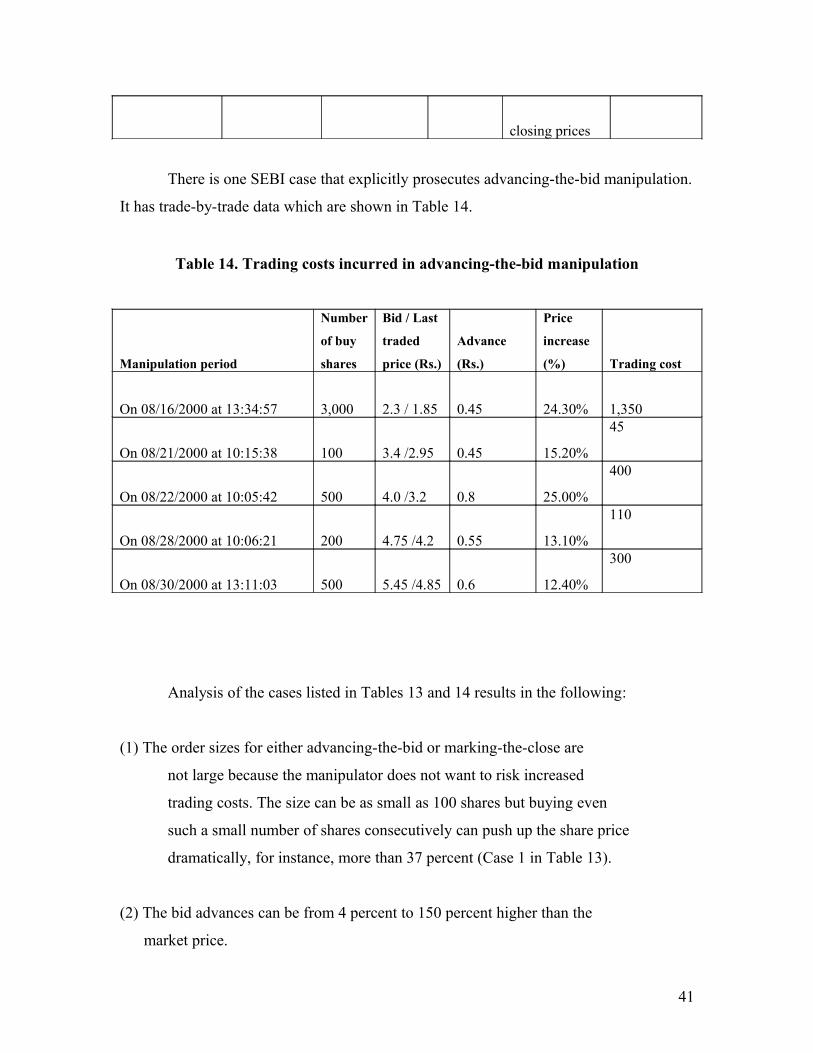
closing prices
There is one SEBI case that explicitly prosecutes advancing-the-bid manipulation.
It has trade-by-trade data which are shown in Table 14.
Table 14. Trading costs incurred in advancing-the-bid manipulation
Manipulation period
Number
of buy
shares
Bid / Last
traded
price (Rs.)
Advance
(Rs.)
Price
increase
(%) Trading cost
On 08/16/2000 at 13:34:57 3,000 2.3 / 1.85 0.45 24.30% 1,350
On 08/21/2000 at 10:15:38 100 3.4 /2.95 0.45 15.20%
45
On 08/22/2000 at 10:05:42 500 4.0 /3.2 0.8 25.00%
400
On 08/28/2000 at 10:06:21 200 4.75 /4.2 0.55 13.10%
110
On 08/30/2000 at 13:11:03 500 5.45 /4.85 0.6 12.40%
300
Analysis of the cases listed in Tables 13 and 14 results in the following:
(1) The order sizes for either advancing-the-bid or marking-the-close are
not large because the manipulator does not want to risk increased
trading costs. The size can be as small as 100 shares but buying even
such a small number of shares consecutively can push up the share price
dramatically, for instance, more than 37 percent (Case 1 in Table 13).
(2) The bid advances can be from 4 percent to 150 percent higher than the
market price.
41
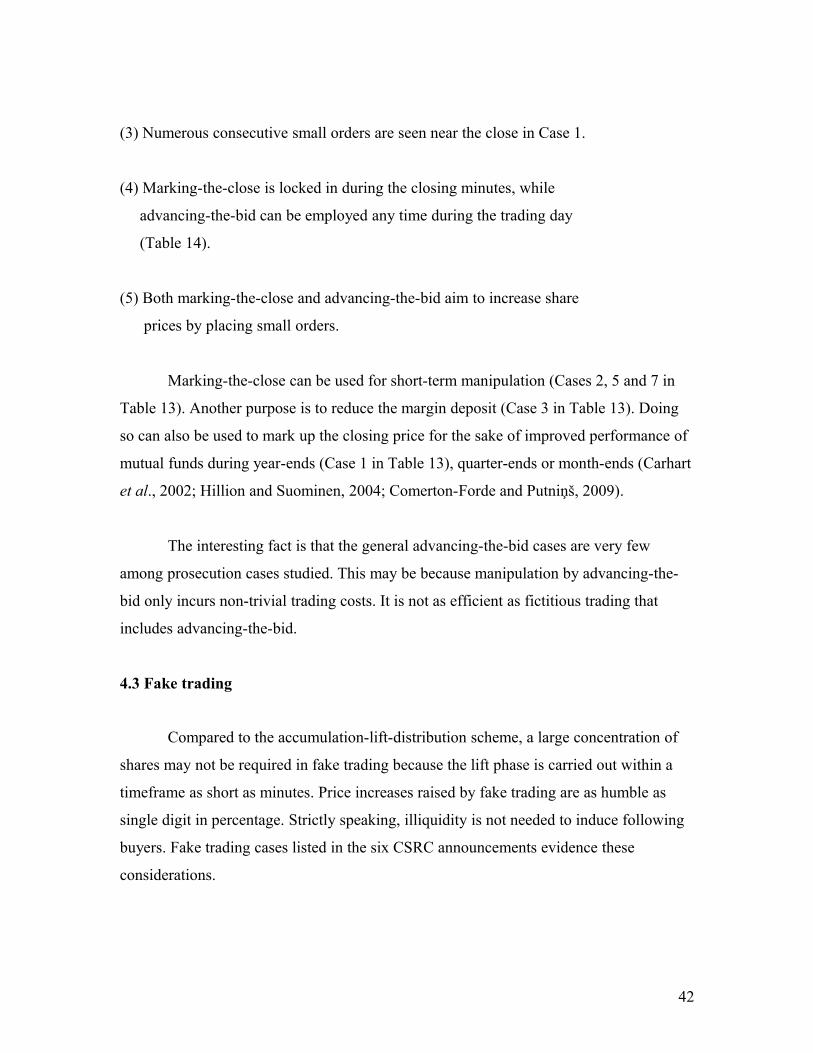
(3) Numerous consecutive small orders are seen near the close in Case 1.
(4) Marking-the-close is locked in during the closing minutes, while
advancing-the-bid can be employed any time during the trading day
(Table 14).
(5) Both marking-the-close and advancing-the-bid aim to increase share
prices by placing small orders.
Marking-the-close can be used for short-term manipulation (Cases 2, 5 and 7 in
Table 13). Another purpose is to reduce the margin deposit (Case 3 in Table 13). Doing
so can also be used to mark up the closing price for the sake of improved performance of
mutual funds during year-ends (Case 1 in Table 13), quarter-ends or month-ends (Carhart
et al., 2002; Hillion and Suominen, 2004; Comerton-Forde and Putniņš, 2009).
The interesting fact is that the general advancing-the-bid cases are very few
among prosecution cases studied. This may be because manipulation by advancing-the-
bid only incurs non-trivial trading costs. It is not as efficient as fictitious trading that
includes advancing-the-bid.
4.3 Fake trading
Compared to the accumulation-lift-distribution scheme, a large concentration of
shares may not be required in fake trading because the lift phase is carried out within a
timeframe as short as minutes. Price increases raised by fake trading are as humble as
single digit in percentage. Strictly speaking, illiquidity is not needed to induce following
buyers. Fake trading cases listed in the six CSRC announcements evidence these
considerations.
42
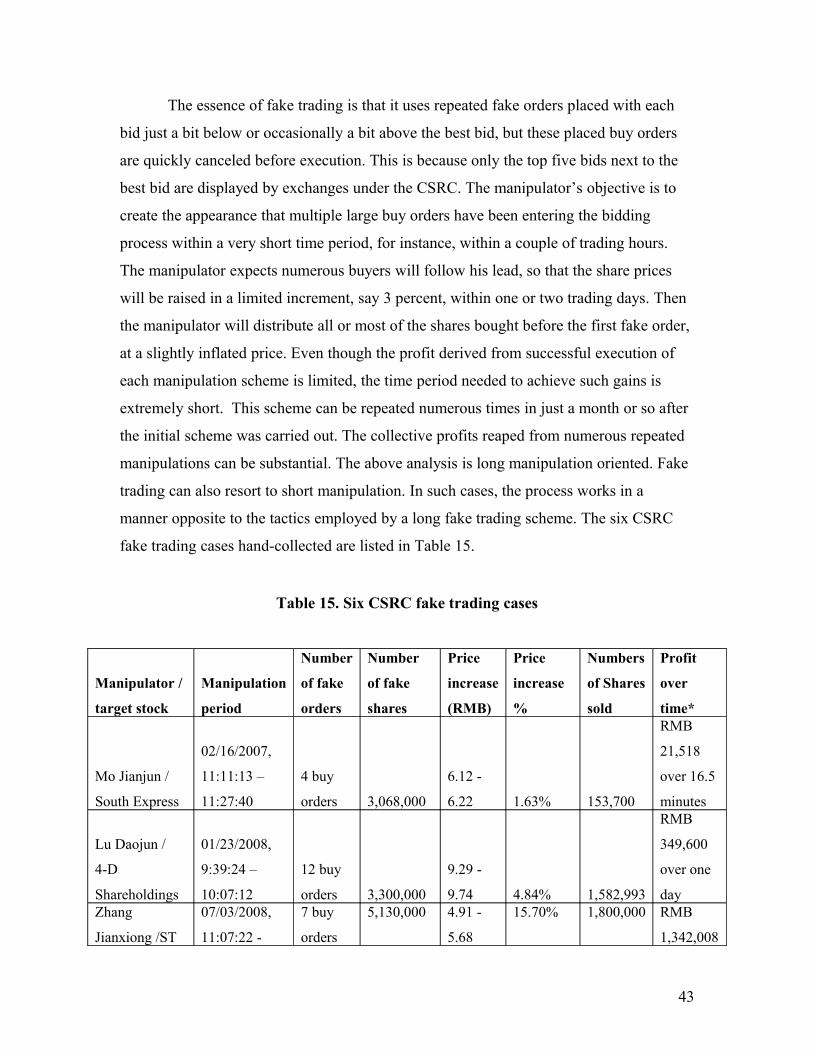
The essence of fake trading is that it uses repeated fake orders placed with each
bid just a bit below or occasionally a bit above the best bid, but these placed buy orders
are quickly canceled before execution. This is because only the top five bids next to the
best bid are displayed by exchanges under the CSRC. The manipulator’s objective is to
create the appearance that multiple large buy orders have been entering the bidding
process within a very short time period, for instance, within a couple of trading hours.
The manipulator expects numerous buyers will follow his lead, so that the share prices
will be raised in a limited increment, say 3 percent, within one or two trading days. Then
the manipulator will distribute all or most of the shares bought before the first fake order,
at a slightly inflated price. Even though the profit derived from successful execution of
each manipulation scheme is limited, the time period needed to achieve such gains is
extremely short. This scheme can be repeated numerous times in just a month or so after
the initial scheme was carried out. The collective profits reaped from numerous repeated
manipulations can be substantial. The above analysis is long manipulation oriented. Fake
trading can also resort to short manipulation. In such cases, the process works in a
manner opposite to the tactics employed by a long fake trading scheme. The six CSRC
fake trading cases hand-collected are listed in Table 15.
Table 15. Six CSRC fake trading cases
Manipulator /
target stock
Manipulation
period
Number
of fake
orders
Number
of fake
shares
Price
increase
(RMB)
Price
increase
%
Numbers
of Shares
sold
Profit
over
time*
Mo Jianjun /
South Express
02/16/2007,
11:11:13 –
11:27:40
4 buy
orders 3,068,000
6.12 -
6.22 1.63% 153,700
RMB
21,518
over 16.5
minutes
Lu Daojun /
4-D
Shareholdings
01/23/2008,
9:39:24 –
10:07:12
12 buy
orders 3,300,000
9.29 -
9.74 4.84% 1,582,993
RMB
349,600
over one
day Zhang
Jianxiong /ST
07/03/2008,
11:07:22 -
7 buy
orders
5,130,000 4.91 -
5.68
15.70% 1,800,000 RMB
1,342,008
43
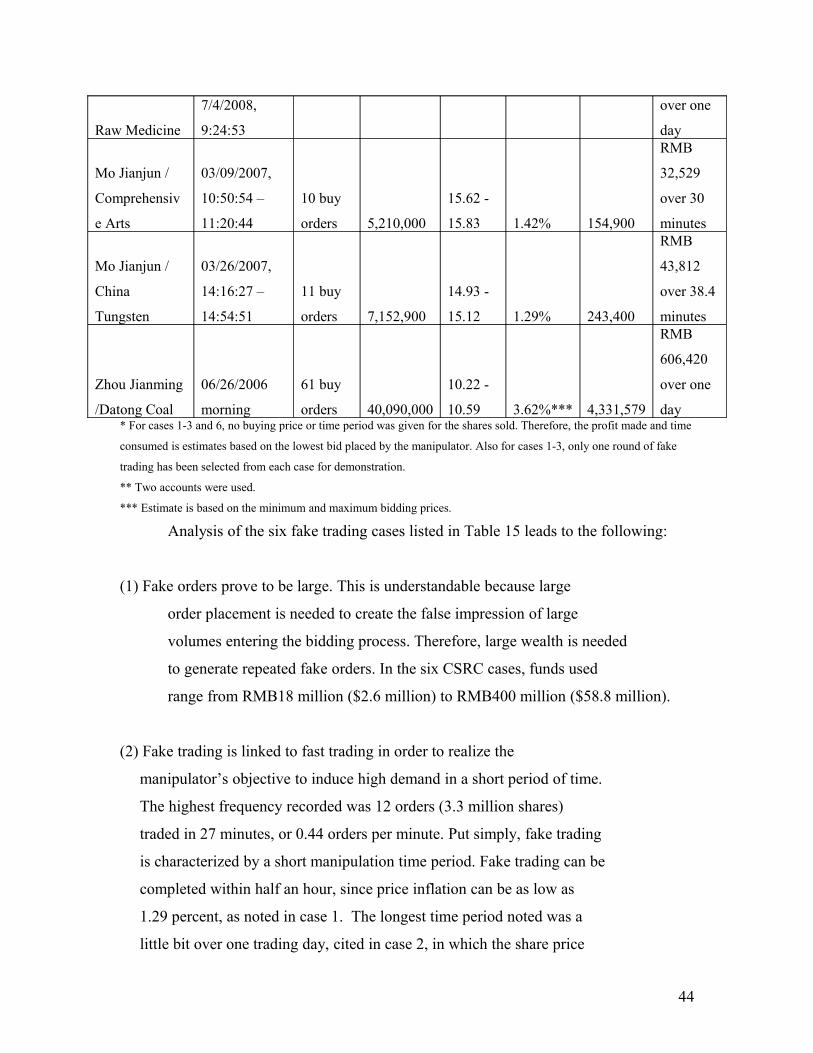
Raw Medicine
7/4/2008,
9:24:53
over one
day
Mo Jianjun /
Comprehensiv
e Arts
03/09/2007,
10:50:54 –
11:20:44
10 buy
orders 5,210,000
15.62 -
15.83 1.42% 154,900
RMB
32,529
over 30
minutes
Mo Jianjun /
China
Tungsten
03/26/2007,
14:16:27 –
14:54:51
11 buy
orders 7,152,900
14.93 -
15.12 1.29% 243,400
RMB
43,812
over 38.4
minutes
Zhou Jianming
/Datong Coal
06/26/2006
morning
61 buy
orders 40,090,000
10.22 -
10.59 3.62%*** 4,331,579
RMB
606,420
over one
day* For cases 1-3 and 6, no buying price or time period was given for the shares sold. Therefore, the profit made and time
consumed is estimates based on the lowest bid placed by the manipulator. Also for cases 1-3, only one round of fake
trading has been selected from each case for demonstration.
** Two accounts were used.
*** Estimate is based on the minimum and maximum bidding prices.
Analysis of the six fake trading cases listed in Table 15 leads to the following:
(1) Fake orders prove to be large. This is understandable because large
order placement is needed to create the false impression of large
volumes entering the bidding process. Therefore, large wealth is needed
to generate repeated fake orders. In the six CSRC cases, funds used
range from RMB18 million ($2.6 million) to RMB400 million ($58.8 million).
(2) Fake trading is linked to fast trading in order to realize the
manipulator’s objective to induce high demand in a short period of time.
The highest frequency recorded was 12 orders (3.3 million shares)
traded in 27 minutes, or 0.44 orders per minute. Put simply, fake trading
is characterized by a short manipulation time period. Fake trading can be
completed within half an hour, since price inflation can be as low as
1.29 percent, as noted in case 1. The longest time period noted was a
little bit over one trading day, cited in case 2, in which the share price
44
rose 4.84 percent.
(3) Fake orders are designed to be seen by other investors in order to create
the false appearance of a continuously increasing high demand for the
stock. In the six cases, the top five bids and the bottom five asks were
displayed momentarily. Not one case involved a bid of a fake order
outside the displayed bids and asks.
(4) Fake trading aims to distribute early accumulated shares at slightly or
largely inflated prices. In the six cases, price inflation varied from 1.29
percent over a span of just 16.5 minutes to 15.7 percent executed in less
than one trading day.
(5) This scheme bears zero cost, thus it is the least expensive among the
studied forms of manipulation used to lift prices within a short period of time.
In summary, there are three elements that are found in a fake trading scheme. The
first involves large orders. The second element is incomplete display. The third feature is
high frequency in order placements. In other words, the time intervals between two
consecutive orders need to be very short. These three elements suggest implications for
the section regarding detection and regulatory proposals, to be discussed shortly.
5. Unified approach to detection and prevention
No matter how many varieties comprise trade-based manipulation tactics, each is
about manipulating one or multiple of the nine variables listed earlier in this paper. A
close examination of the studied prosecution cases reveal numerous lessons that can be
converted into detective methods and preventive measures. Therefore, detective methods
and preventive measures can be proposed based on the nine variables. The following
eight proposals point to the areas to apply detection and preventive measures. That is,
45
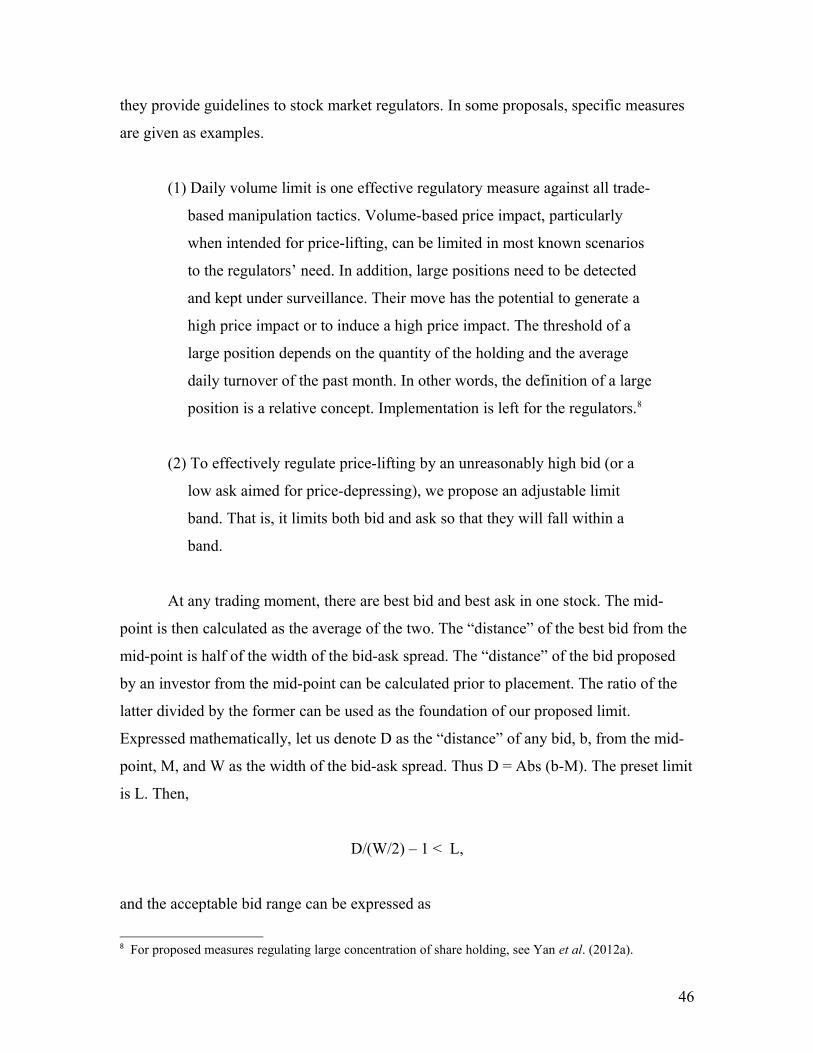
they provide guidelines to stock market regulators. In some proposals, specific measures
are given as examples.
(1) Daily volume limit is one effective regulatory measure against all trade-
based manipulation tactics. Volume-based price impact, particularly
when intended for price-lifting, can be limited in most known scenarios
to the regulators’ need. In addition, large positions need to be detected
and kept under surveillance. Their move has the potential to generate a
high price impact or to induce a high price impact. The threshold of a
large position depends on the quantity of the holding and the average
daily turnover of the past month. In other words, the definition of a large
position is a relative concept. Implementation is left for the regulators.8
(2) To effectively regulate price-lifting by an unreasonably high bid (or a
low ask aimed for price-depressing), we propose an adjustable limit
band. That is, it limits both bid and ask so that they will fall within a
band.
At any trading moment, there are best bid and best ask in one stock. The mid-
point is then calculated as the average of the two. The “distance” of the best bid from the
mid-point is half of the width of the bid-ask spread. The “distance” of the bid proposed
by an investor from the mid-point can be calculated prior to placement. The ratio of the
latter divided by the former can be used as the foundation of our proposed limit.
Expressed mathematically, let us denote D as the “distance” of any bid, b, from the mid-
point, M, and W as the width of the bid-ask spread. Thus D = Abs (b-M). The preset limit
is L. Then,
D/(W/2) – 1 < L,
and the acceptable bid range can be expressed as
8 For proposed measures regulating large concentration of share holding, see Yan et al. (2012a).
46
M – (W/2) × (1 + L) < b < M + (W/2) × (1 + L),
where M + (W/2) × (1 + L) is the maximum value of the allowable bid.
As a numerical example, let us consider that the best bid is $9.99 and the best ask
$10.01. The mid-point is the average of the two, i.e., M = $10. Then W = $0. 02. If L is
set as 1 percent, then D < ($0.02/2)× (1+0.01) < $0.0101. So any bid cannot exceed the
range from $9.9799 to $10.0201. If any bid smaller than the best bid is not going to cause
a concern in price-lifting or price-depressing, only the right hand side of (2) has to be
followed. The trading system needs to reject any bid that exceeds or equals to the
maximum.
For ask, the same range will be obtained. If any ask above the best ask is not a
concern for price-depressing or price-lifting, then only the minimum value, M – (W/2) ×
(1 + L) needs to be observed in practice. That is, no ask is allowed to be smaller than or
equal to the minimum. The trading system needs to reject any ask that is equal to or
smaller than the minimum.
The regulator has the flexibility to adjust the value of L according to market
conditions. If he needs a greater uptrend when he sees more buy volumes, then he may
set L a bit higher. Fine tuning L is an important part of daily regulatory activities.
(3) We propose that the time interval between two consecutive orders by
any investor cannot be less than X minutes at any given time during a
trading day. Of course, this limit can be adjusted by regulators according
to their need. This measure reduces the trading frequency in an
intensified fashion. It decreases greatly the probability of fictitious
trading or fake trading, especially in a frequently traded stock. It also
weakens marking-the-close effectively together with a daily volume
limit and another measure to be proposed shortly.
47
(4) The next important variable to monitor and regulate is net ownership of
shares at the end of the day. If B is denoted as the total buy volume in
the stock by an investor during the trading day, and S as the total sell
volume (positive only), we can use the ratio of Abs [(B – S) / (B + S)] as
a measure of the relative net ownership. If a daily minimum N (0 < N <
1) allowed by regulation is given, then
Abs [(B – S) / (B + S)] > N.
There are two scenarios to consider. One is if B > S. The other is if B < S. Let us
look at the first scenario. Since B – S > 0, solving for B, one gets
B > [(1 + N) / (1 – N)] S.
By the same token, the second scenario yields
B < [(1 - N) / (1 + N)] S.
A numerical example can be examined by setting N as 50 percent. For the total
buy volume exceeding total sell volume, the first inequality gives B > 3 S. Otherwise,
the second inequality yields B < S / 3, or S > 3 B.
The daily minimum N cannot be too small, for instance, being close to 0, it will
raise concerns regarding fictitious trading. N cannot be too large, for instance, being close
to 1, because of the mathematical impossibility. Adjusting N between 0 and 1 is left for
regulators.
(5) Because of proposal two discussed above, advancing-the-bid and
depressing-the-ask are effectively prevented. Marking-the-close is left with
order size and timing. If only market orders are allowed during the final 30
48
minutes of the trading day, then the problem of an intended pile-up of buy
limit orders near the close is eliminated. Subsequently, manipulative price-
lifting near the close is effectively curbed.
(6) The sixth variable concerns the genuineness of trading. This tests if
cancellation of placed orders is too frequent or conducted for the purpose of
display only. Displaying complete information would largely prevent fake
trading.9 Complete information means the entire cycle of an order from
placement to execution or cancellation. A sufficiently long time interval
between two consecutive cancelled orders is another critical means to prevent
fake trading. As an example, one hour can be set as the minimum interval
between any two consecutive voluntarily cancelled orders. The daily volume
limit ensures the number of total canceled shares will be below a certain
value. Combined, these three measures will largely guarantee the
genuineness of trading and prevent large-scale fake trading aimed at
achieving share price manipulation.10
(7) The seventh variable is multiple accounts. This invites surveillance
before any regulatory measures. The true identity requirement of an investor,
whether individual or institutional, to open a trading account may reduce but
cannot eliminate the problem. Devising a penalty for lending one’s identity or
trading account to an investor for the latter’s self-dealing is another effective
deterrence. The third means strives to detect self-dealing in actual
transactions with multiple accounts. Proposals one to four above present
effective measures to reduce fictitious trading to an acceptable frequency and
scale if it cannot be completely eliminated. Therefore, both surveillance and
regulation in multiple dimensions are needed to tackle the problem of
multiple accounts.
9 The alternative is displaying no order placement information but information of executed volumes instead.
10 Some regulators may prefer to limit the number of cancelled orders per trading day. Then a quantitative measure can be made that requires each investor to have voluntary intraday cancelations up to three times, for example.
49
(8) The last variable in the approach is collusion. It also requires both
surveillance and regulation. Collusion generally takes place between two or
more large investors, sometimes including the issuing company and brokers.
Since collusion can take place in numerous fashions, detection before trading
is extremely difficult. However, surveillance of large limit orders can alarm
regulators. If each of one investor’s three large limit orders, for example,
more than 10,000 shares, is matched with the same price within a very short
time interval, this investor can be marked as a candidate for collusion
regulation. If matched orders come from the same investor more than twice,
then this investor can be considered as a colluding partner. This three-and-two
rule, based on the timeframe of three consecutive trading days, can be applied
to multiple colluding partners. This way, at least one manipulator out of the
collusion can be detected. And, a warning or a more serious administrative
order can be issued to the manipulator. Hence the effectiveness in the
surveillance is measurable. On the regulation side, the proposals one, two,
three and four are all applicable and effective.
Among the eight proposals comprising a unified approach, daily regulation of the
total executed volume, the bid-ask spread size, the trading frequency and the net
ownership are the core measures to ensure that an investor’s trading activity is not
manipulative. Proposals five and six prevent orders that do not aim at genuine trades. The
other two deal with more than one trading account. And more surveillance is needed for
the final two proposals. The eight proposals, acting independently or in combination, are
effective, quantifiable and adjustable. They are unified because they are derived by
looking at the nine variables at full disposal by an investor, rather than targeting one type
of manipulation at a time. This approach gives a more complete picture and regulatory
flexibility to securities regulators.
The anatomy of trading in a trading day serves the foundation for the eight
proposals in the unified approach. The unified approach, the authors believe, will
50
effectively detect, prevent, and curb manipulations aiming to induce a large number of
buy volumes and to generate an extraordinary price impact. The cost generated by
implementing the eight proposals will be limited compared to the ultimate goal of
prevention of crises, protection of investors, and enhancement of market stability. Above
all, regulating price impact is an important construct in building fair, transparent and
perfect competition in the stock market.
6. Concluding remarks and future research
The key finding in this paper is that market manipulation is essentially an exercise
of monopoly power. Subsequently, antitrust spirit is carried to anatomize an investor’s
trades during any trading day. The nine variables of the trading activities of any investor
(actually a large investor) provide a practical approach to the improved surveillance and
regulation of stock markets in order to significantly reduce the possibility of
manipulation-induced stock market crises as well as improve market stability and
investor protection. Adopting this approach will enable quantifiable, thus programmable,
measures for the daily detection and prevention of trade-based market manipulation with
improved effectiveness and efficiency.
To make the proposed eight regulatory measures more completely and effectively
implemented, each large investor needs to be monitored according to the nine variables
proposed herein. Thus, surveillance should be extended to large positions and large
orders. Yet coordinated small volumes need to be monitored as well, as do any sudden
spikes or collapses in share prices.
Based on the selected prosecution cases, this paper has focused on price-lifting
using trade-based manipulation tactics. Long manipulation, particularly the lift stage in
the accumulation-lift-distribution scheme, received a more in-depth analysis. The general
objective is to keep price impact well monitored and regulated. If appropriately
implemented, the proposed measures will help move the secondary market one solid step
closer to the ideals of fair and transparent perfect competition.
51
Future work includes modeling a stock market with a monopolistic trader and
numerous retail investors to find out the conditions that can lead to systemic risk such as
a crash in the market. This work has the potential to develop forecasting capacities for
securities regulators. It is a separate project in our research series of regulating
competition in the stock market.
52
References:
Automotive News Europe (ANE). 2009. “Porsche probe shows weakness of German
market manipulation rules: Few are convicted for market manipulation.” Reuters, August
23, 06:01 CET. http://www.autonews.com/article/20090823/ANE02/308219971.
Accessed September 15, 2009.
Aggarwal, Rajesh K. and Guojun Wu. 2006. “Stock market manipulation.” Journal of
Business, 79(4): 1915–1953.
Allen, Franklin and Douglas Gale. 1992. “Stock-Price Manipulation.” Review of
Financial Studies, 3: 503-529.
Allen, Franklin and Richard Herring. 2001. “Banking Regulation versus Securities
Market Regulation.” Working paper, University of Pennsylvania.
Bhaumik, Subir. 2002. “Broker held for Calcutta stock scam.” BBC, Tuesday, December
3, 17:31 GMT.
Brooke, James. 1989a. “Check Bounces, and Brazil Shakes.” The New York Times,
Tuesday, June 20.
Brooke, James. 1989b. “Brazil Indicts 11 People After Market's Crash.” The New York
Times, Monday, August 14.
Carhart, Mark M., Ron Kaniel, David K. Musto, and Adam Reed. 2002. “Leaning for the
tape: Evidence of gaming behavior in equity mutual funds.” Journal of Finance, 57: 661-
693.
53
Carvajal, Ana and Jennifer Elliott. 2009. “The Challenge of Enforcement in Securities
Markets: Mission Impossible?” IMF Working Paper WP/09/168, August, Washington,
D. C.: International Monetary Fund.
China Securities Regulatory Commission (CSRC). 2009.
http://www.csrc.gov.cn/n575458/n776436/n3376288/n3376382/n3418750/index.html.
Accessed September 3, 2009.
Clark, Nicola and David Jolly. 2008. “Societe Generale loses $7 billion in trading fraud.”
The New York Times, Thursday, January 24.
Comerton-Forde, Carole and Tālis J. Putniņš. 2009. “Measuring closing price
manipulation.” Available at SSRN: http://papers.ssrn.com/sol3/papers.cfm?
abstract_id=1009001. Accessed December 29, 2009.
Cook, Chris. 2009. “The ABCs of Oil Manipulation.” Seeking Alpha, July 27.
http://seekingalpha.com/article/151480-the-abcs-of-oil-manipulation. Accessed August
21, 2009.
Corsetti, Giancarlo, Paolo Pesenti and Nouriel Roubini, 2001. “The Role of Large Players
in Currency Crises.” NBER Working Paper No. 8303.
De la Vega, Joseph. 1688. Confusion de Confusiones. New York: Marketplace Books,
1996.
Financial Services Authority (FSA). 2009. “FSA wins market abuse case against
Winterflood.” FSA/PN/046/2009, April 2.
http://www.fsa.gov.uk/pages/Library/Communication/PR/2009/046.shtml. Accessed
September 15, 2009.
54
Global Financial Data (GFD). 2009. A comprehensive economic and financial time-series
database covering 150 countries and 6,500 different data series.
Goyal, Ashima. 2005. “Regulation and De-regulation of the Stock Market in India.”
Available at SSRN: http://ssrn.com/abstract=609322. Accessed October 3, 2009.
Hillion, P. and M. Suominen. 2004. “The manipulation of closing prices.” Journal of
Financial Markets, 7: 351-375.
Hong Kong Securities and Futures Commission (HKSFC). 2009.
http://www.sfc.hk/sfcPressRelease/EN/sfcEnforceNewsServlet. Accessed August 23,
2009.
IOSCO. 2000. “Investigating and prosecuting market manipulation.” Technical
Committee. Madrid, Spain: the International Organization of Securities Commissions.
Japan Securities and Exchange Surveillance Commission (JSESC). 2009.
http://www.sfc.hk/sfcPressRelease/EN/sfcEnforceNewsServlet. Accessed August 29,
2009.
Khwaja, Asim I. and Atif Mian. 2005. “Unchecked Intermediaries: Price Manipulation in
an Emerging Stock Market.” Journal of Financial Economics, 78(1): 203–241.
Kirchfeld, Aaron and Tony Czuczka. 2009. “Porsche Raided on Suspicion of Market
Manipulation (Update2).” Bloomberg. August 20, 12:33 EDT.
http://www.bloomberg.com/apps/news?pid=20601085&sid=a8sCW6BT5MQc. Accessed
September 15, 2009.
Lang, Larry H. P. 2004. Manipulation. Beijing: Oriental Press. (in Chinese).
55
McGoun, Elton G. 2008. “The inherent manipulability of markets.” Accountancy
Business and the Public Interest, 7(2): 89-117.
Mei, Jianping, Guojun Wu, and Chunsheng Zhou. 2004. “Behavior based
manipulation—theory and prosecution evidence.” Unpublished manuscript, New
York University.
Motta, Massimo. 2004. Competition Policy: Theory and Practice. NY: Cambridge
University Press.
Nageswaran V. A. and S. Krithivasan. 2004. “Capital market reforms in India and
ASEAN: avenues for co-operation.” Paper presented at the 1stASEAN-India Roundtable,
February 9-10, Singapore.
Nye, Joseph. 2008. Powers to Lead. NY: Oxford University Press.
Pecora, Ferdinand. 1939. Wall Street under oath: the story of our modern money
changers. New York: Simon and Schuster.
Pirrong, Stephen Craig. 1995. “The self-regulation of commodity exchanges: the case of
market manipulation.” Journal of Law and Economics, 38(1): 141-208.
Risjord, Norman K. 2002. Representative Americans: The Civil War Generation.
Lanham, MD: Rowman & Littlefield Publishers. Inc., pp. 296-298.
Securities and Exchange Commission of the United Sates (SEC). 2009.
http://www.sec.gov/about/secstats2008.pdf. Accessed September 9, 2009.
Securities and Exchange Board of India (SEBI). 2007. Order against Shri Ketan V.
Parekh and his associated entities. http://www.sebi.gov.in/cmorder/ketanorder1.pdf.
Accessed August 26, 2008.
56
Securities and Exchange Board of India (SEBI). 2009. http://www.sebi.gov.in/Index.jsp?
contentDisp=SubSection&sec_id=1&sub_sec_id=1.
Accessed September 1, 2009.
Securities and Futures Authority (SFA). 2000. “Disciplinary action against Nomura
International PLC, Robert Mapstone and Gary Channon.” Board Notice 554, September
26. London: The Securities and Futures Authority Limited.
Sheldon, Richard N. 1975. “The Pujo Committee 1912,” in Arthur M. Schlesinger and Jr.
& Roger Burns. (Eds.) Congress Investigates: A Documented History 1792-1974
(Volume 3), pp. 2251, 2344-2346.
Specogna, Marino. 2003. A Convicted Stock Manipulator’s Guide to Investing. Lincoln,
NE: iUniverse, Inc.
Thel, Steve. 1990. “The Original Conception of Section 10(b) of the Securities Exchange
Act.” Stanford Law Review, 42(385): 424-461.
Tsang, Donald. 1998. Speech at the Hong Kong Trade Development Council in
Frankfurt, September 29.
White, Horace. 1909. “The Hughes Investigation.” Journal of Political Economy, 17(8):
528-540.
Yan, Xin, Lawrence R. Klein, Viktoria Dalko, Ferenc Gyurcsany, and Michael H. Wang.
2012a. Chapter 3: “Preventing stock market crises (I): Regulating share holding
concentration.” In: Klein, Lawrence R., Viktoria Dalko, and Michael H. Wang. (Eds.)
Regulating Competition in Stock Markets: Antitrust Measures to Promote Fairness and
Transparency through Investor Protection and Crisis Prevention (forthcoming).
Hoboken, NJ: John Wiley & Sons, Inc.
57
Yan, Xin, Lawrence R. Klein, Viktoria Dalko, Ferenc Gyurcsany, and Michael H. Wang.
2012b. Chapter 8: “Preventing stock market crises (VI): Regulating information-based
manipulation.” In: Klein, Lawrence R., Viktoria Dalko, and Michael H. Wang. (Eds.)
Regulating Competition in Stock Markets: Antitrust Measures to Promote Fairness and
Transparency through Investor Protection and Crisis Prevention (forthcoming).
Hoboken, NJ: John Wiley & Sons, Inc.
Yan, Xin, Lawrence R. Klein, Viktoria Dalko, Ferenc Gyurcsany, and Michael H. Wang.
2012c. Chapter 4: “Preventing stock market crises (II): Regulating trade-based price-
lifting.” In: Klein, Lawrence R., Viktoria Dalko, and Michael H. Wang. (Eds.)
Regulating Competition in Stock Markets: Antitrust Measures to Promote Fairness and
Transparency through Investor Protection and Crisis Prevention (forthcoming).
Hoboken, NJ: John Wiley & Sons, Inc.
58


