Embed Size (px)
Citation preview
STOCK SCREENER USER GUIDE
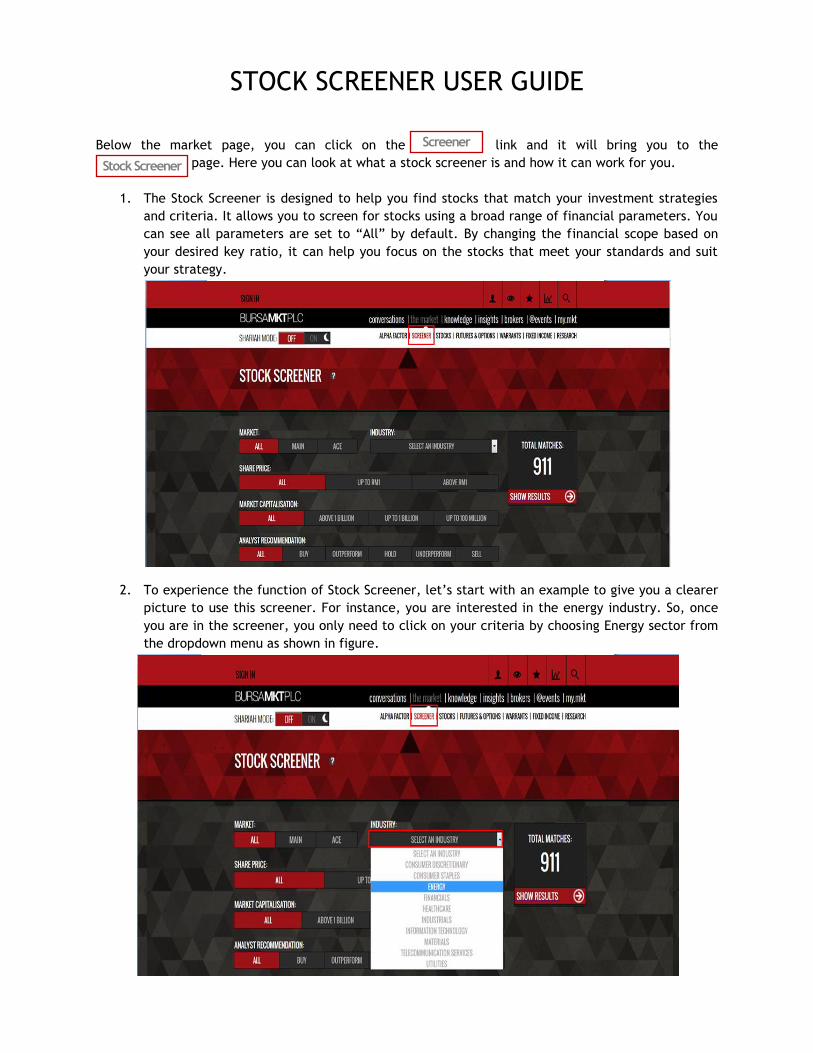
Below the market page, you can click on the link and it will bring you to the
……………………… page. Here you can look at what a stock screener is and how it can work for you.
1. The Stock Screener is designed to help you find stocks that match your investment strategies
and criteria. It allows you to screen for stocks using a broad range of financial parameters. You
can see all parameters are set to “All” by default. By changing the financial scope based on
your desired key ratio, it can help you focus on the stocks that meet your standards and suit
your strategy.
2. To experience the function of Stock Screener, let’s start with an example to give you a clearer
picture to use this screener. For instance, you are interested in the energy industry. So, once
you are in the screener, you only need to click on your criteria by choosing Energy sector from
the dropdown menu as shown in figure.
Stock Screener
Screener
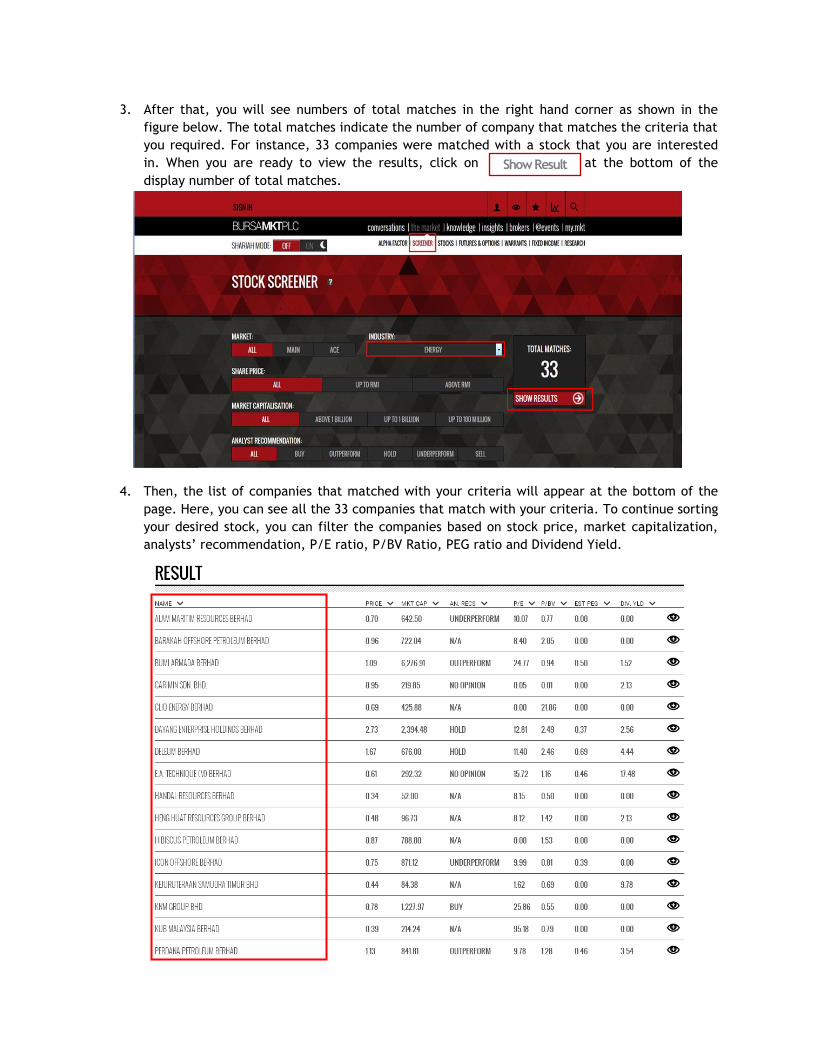
3. After that, you will see numbers of total matches in the right hand corner as shown in the
figure below. The total matches indicate the number of company that matches the criteria that
you required. For instance, 33 companies were matched with a stock that you are interested
in. When you are ready to view the results, click on SHOW RESULTS at the bottom of the
display number of total matches.
4. Then, the list of companies that matched with your criteria will appear at the bottom of the
page. Here, you can see all the 33 companies that match with your criteria. To continue sorting
your desired stock, you can filter the companies based on stock price, market capitalization,
analysts’ recommendation, P/E ratio, P/BV Ratio, PEG ratio and Dividend Yield.
Show Result
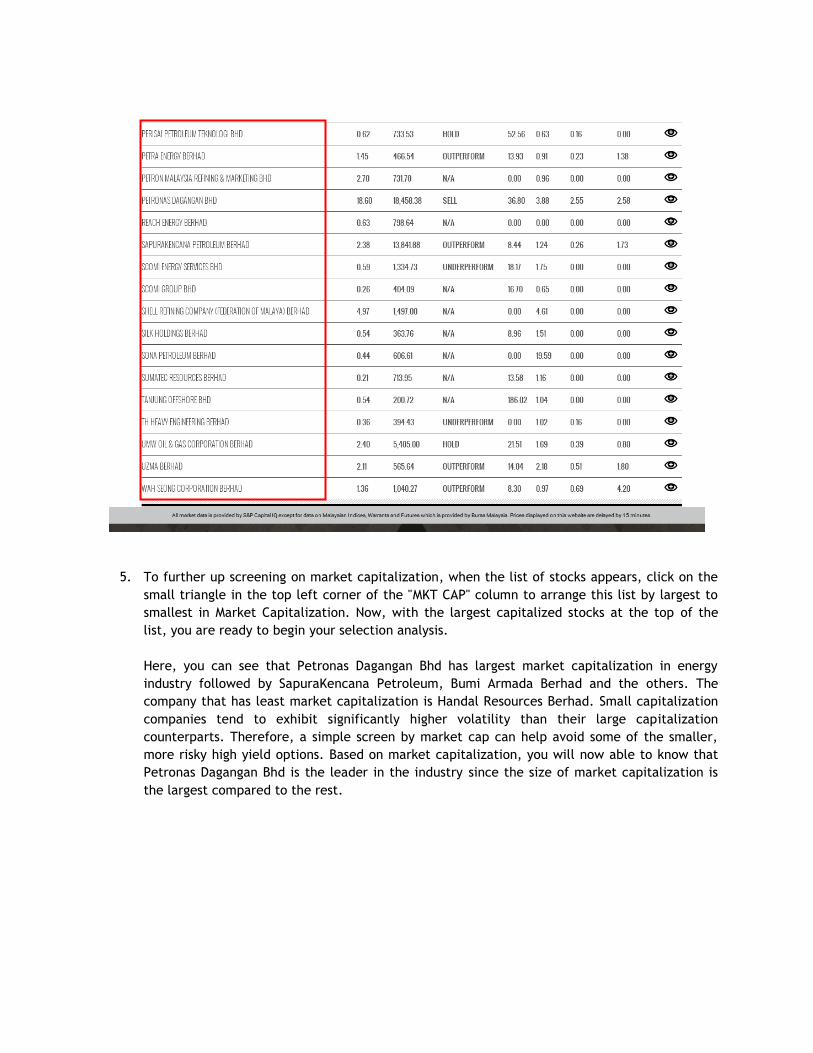
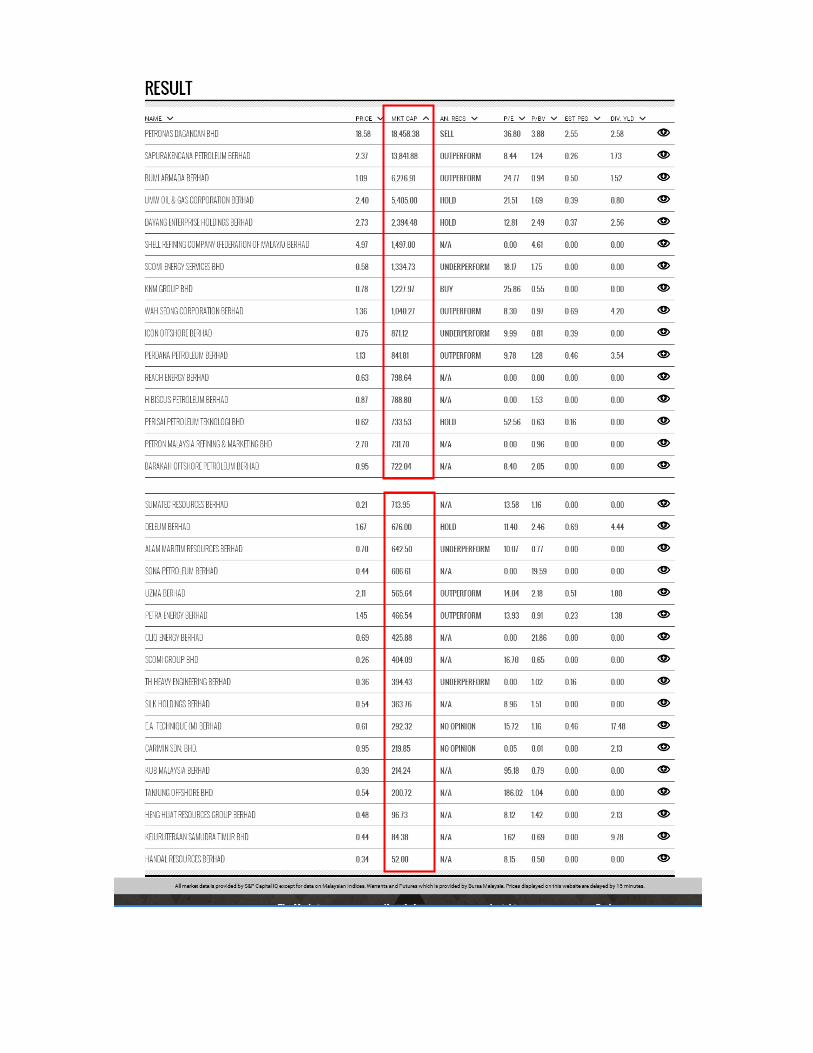
5. To further up screening on market capitalization, when the list of stocks appears, click on the
small triangle in the top left corner of the "MKT CAP" column to arrange this list by largest to
smallest in Market Capitalization. Now, with the largest capitalized stocks at the top of the
list, you are ready to begin your selection analysis.
Here, you can see that Petronas Dagangan Bhd has largest market capitalization in energy
industry followed by SapuraKencana Petroleum, Bumi Armada Berhad and the others. The
company that has least market capitalization is Handal Resources Berhad. Small capitalization
companies tend to exhibit significantly higher volatility than their large capitalization
counterparts. Therefore, a simple screen by market cap can help avoid some of the smaller,
more risky high yield options. Based on market capitalization, you will now able to know that
Petronas Dagangan Bhd is the leader in the industry since the size of market capitalization is
the largest compared to the rest.
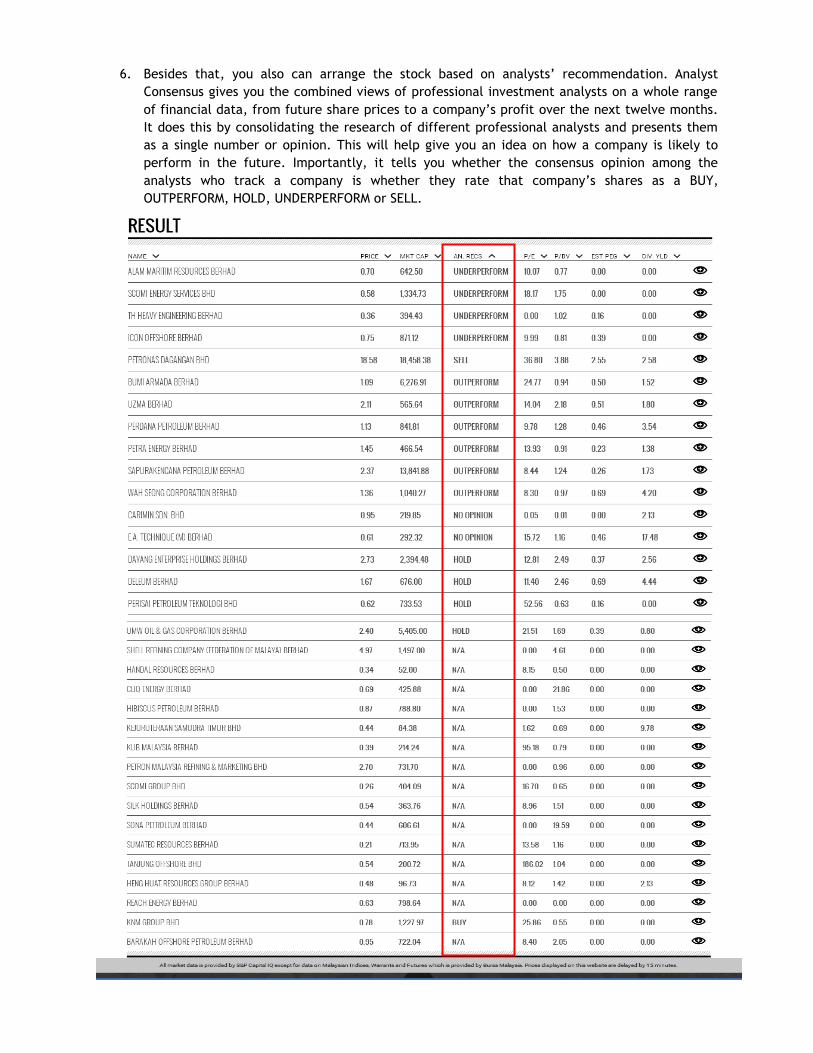
6. Besides that, you also can arrange the stock based on analysts’ recommendation. Analyst
Consensus gives you the combined views of professional investment analysts on a whole range
of financial data, from future share prices to a company’s profit over the next twelve months.
It does this by consolidating the research of different professional analysts and presents them
as a single number or opinion. This will help give you an idea on how a company is likely to
perform in the future. Importantly, it tells you whether the consensus opinion among the
analysts who track a company is whether they rate that company’s shares as a BUY,
OUTPERFORM, HOLD, UNDERPERFORM or SELL.
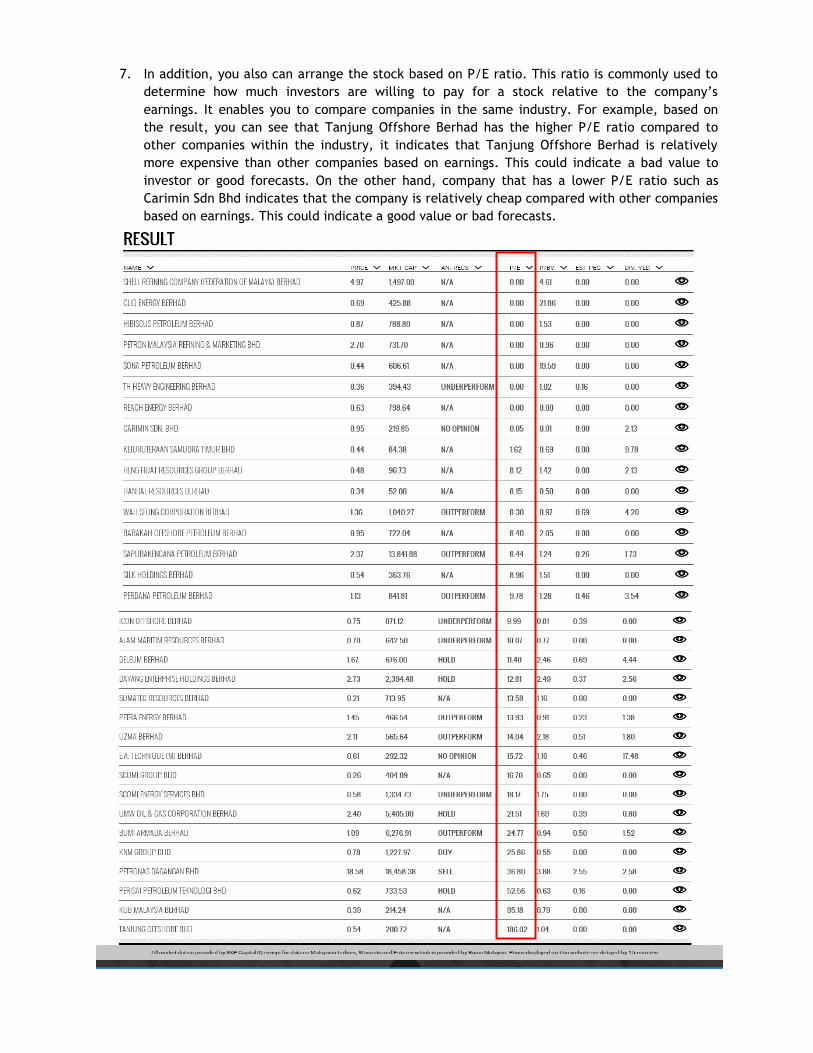
7. In addition, you also can arrange the stock based on P/E ratio. This ratio is commonly used to
determine how much investors are willing to pay for a stock relative to the company’s
earnings. It enables you to compare companies in the same industry. For example, based on
the result, you can see that Tanjung Offshore Berhad has the higher P/E ratio compared to
other companies within the industry, it indicates that Tanjung Offshore Berhad is relatively
more expensive than other companies based on earnings. This could indicate a bad value to
investor or good forecasts. On the other hand, company that has a lower P/E ratio such as
Carimin Sdn Bhd indicates that the company is relatively cheap compared with other companies
based on earnings. This could indicate a good value or bad forecasts.
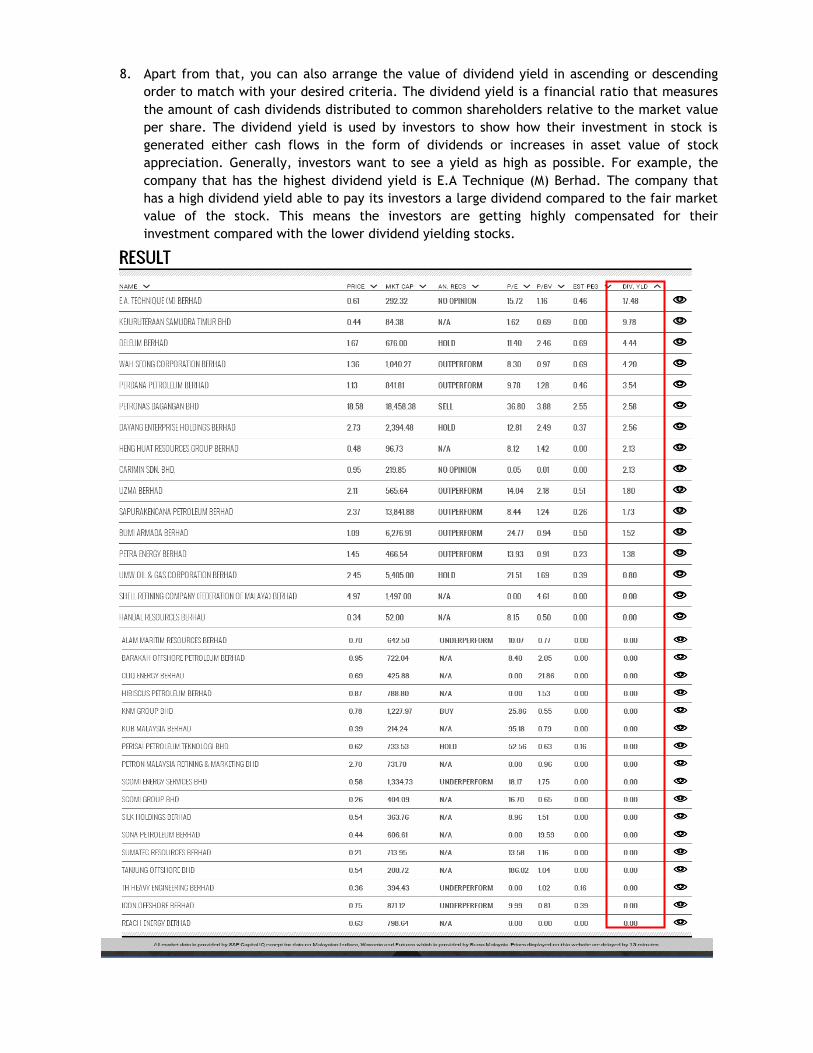
8. Apart from that, you can also arrange the value of dividend yield in ascending or descending
order to match with your desired criteria. The dividend yield is a financial ratio that measures
the amount of cash dividends distributed to common shareholders relative to the market value
per share. The dividend yield is used by investors to show how their investment in stock is
generated either cash flows in the form of dividends or increases in asset value of stock
appreciation. Generally, investors want to see a yield as high as possible. For example, the
company that has the highest dividend yield is E.A Technique (M) Berhad. The company that
has a high dividend yield able to pay its investors a large dividend compared to the fair market
value of the stock. This means the investors are getting highly compensated for their
investment compared with the lower dividend yielding stocks.
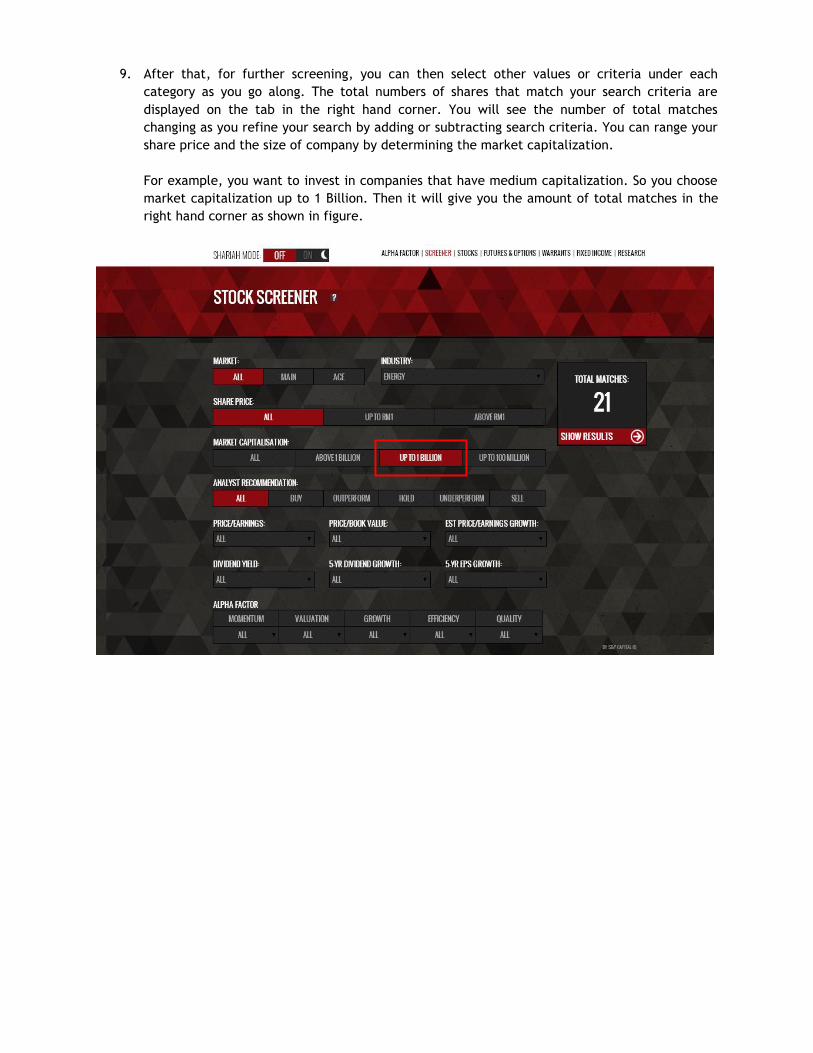
9. After that, for further screening, you can then select other values or criteria under each
category as you go along. The total numbers of shares that match your search criteria are
displayed on the tab in the right hand corner. You will see the number of total matches
changing as you refine your search by adding or subtracting search criteria. You can range your
share price and the size of company by determining the market capitalization.
For example, you want to invest in companies that have medium capitalization. So you choose
market capitalization up to 1 Billion. Then it will give you the amount of total matches in the
right hand corner as shown in figure.
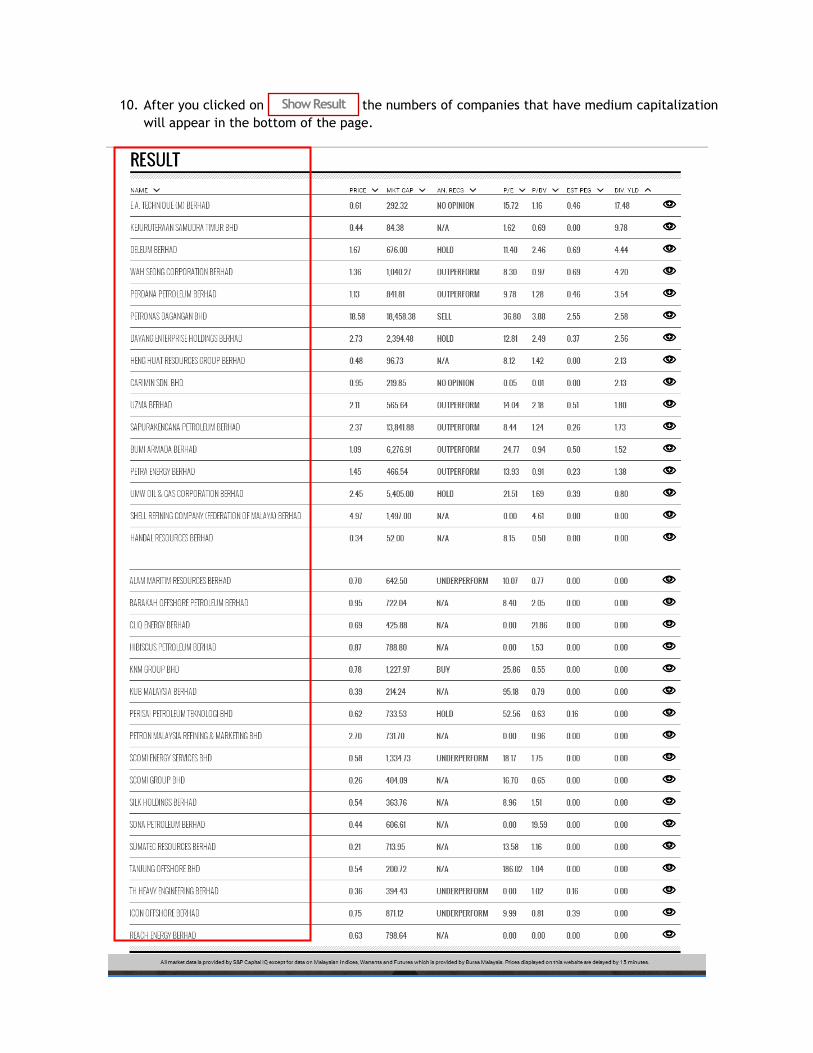
10. After you clicked on the numbers of companies that have medium capitalization
will appear in the bottom of the page.
Show Result
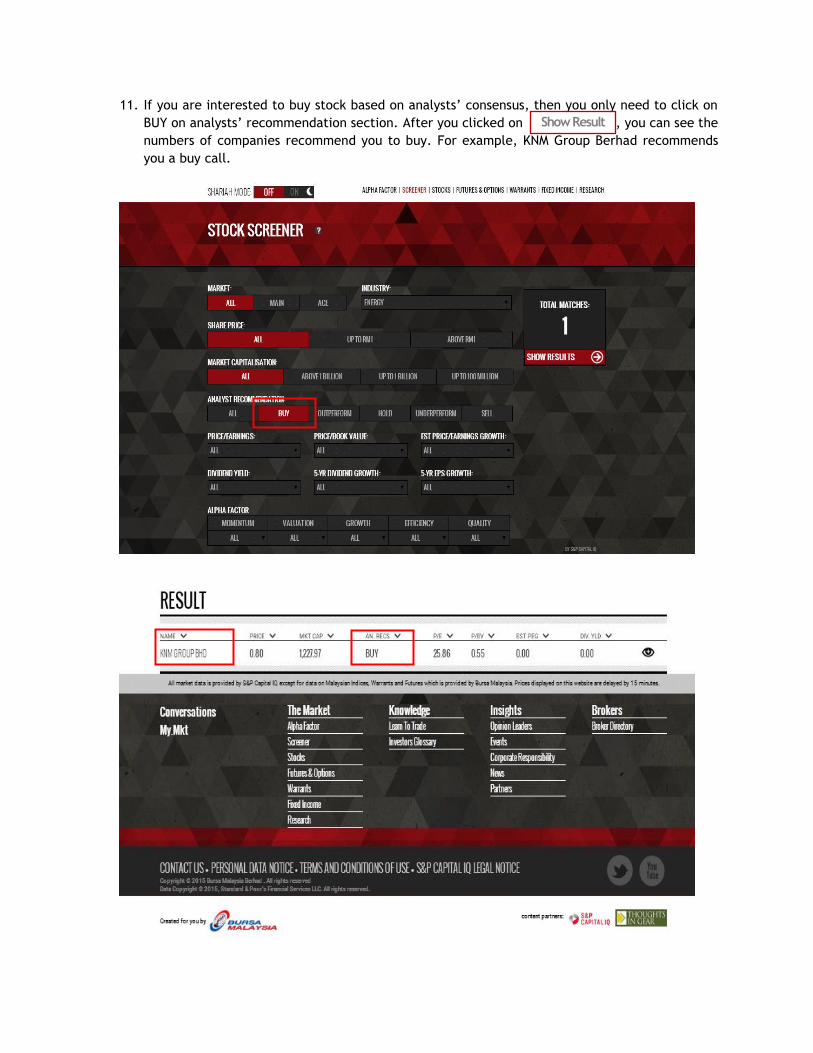
11. If you are interested to buy stock based on analysts’ consensus, then you only need to click on
BUY on analysts’ recommendation section. After you clicked on , you can see the
numbers of companies recommend you to buy. For example, KNM Group Berhad recommends
you a buy call.
Show Result
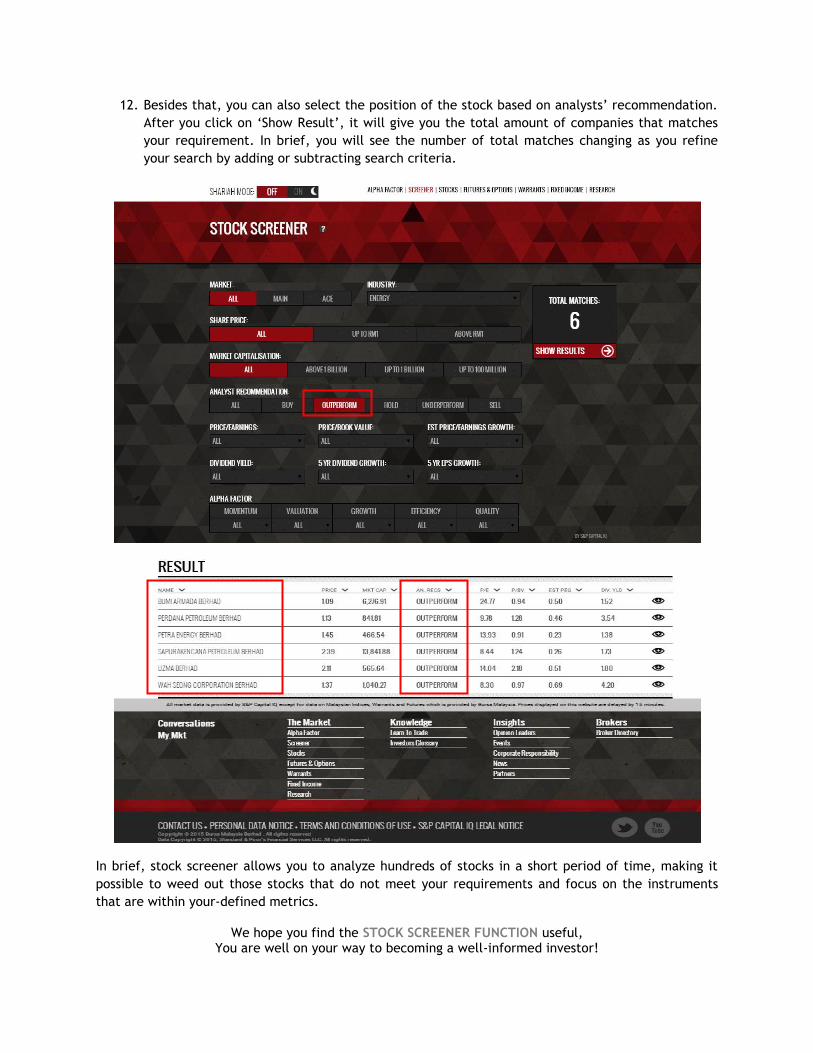
12. Besides that, you can also select the position of the stock based on analysts’ recommendation.
After you click on ‘Show Result’, it will give you the total amount of companies that matches
your requirement. In brief, you will see the number of total matches changing as you refine
your search by adding or subtracting search criteria.
In brief, stock screener allows you to analyze hundreds of stocks in a short period of time, making it
possible to weed out those stocks that do not meet your requirements and focus on the instruments
that are within your-defined metrics.
We hope you find the STOCK SCREENER FUNCTION useful, You are well on your way to becoming a well-informed investor!


