Embed Size (px)
Citation preview
DISTRICT SURVEY REPORT
SAND
VELLORE
DISTRICT
TAMILNADU
As per notification No. S.O.
3611 (E) New Delhi, The
25th July 2018 of Ministry
of Environment, Forest and
Climate Change, Govt. of
India
Page | 1
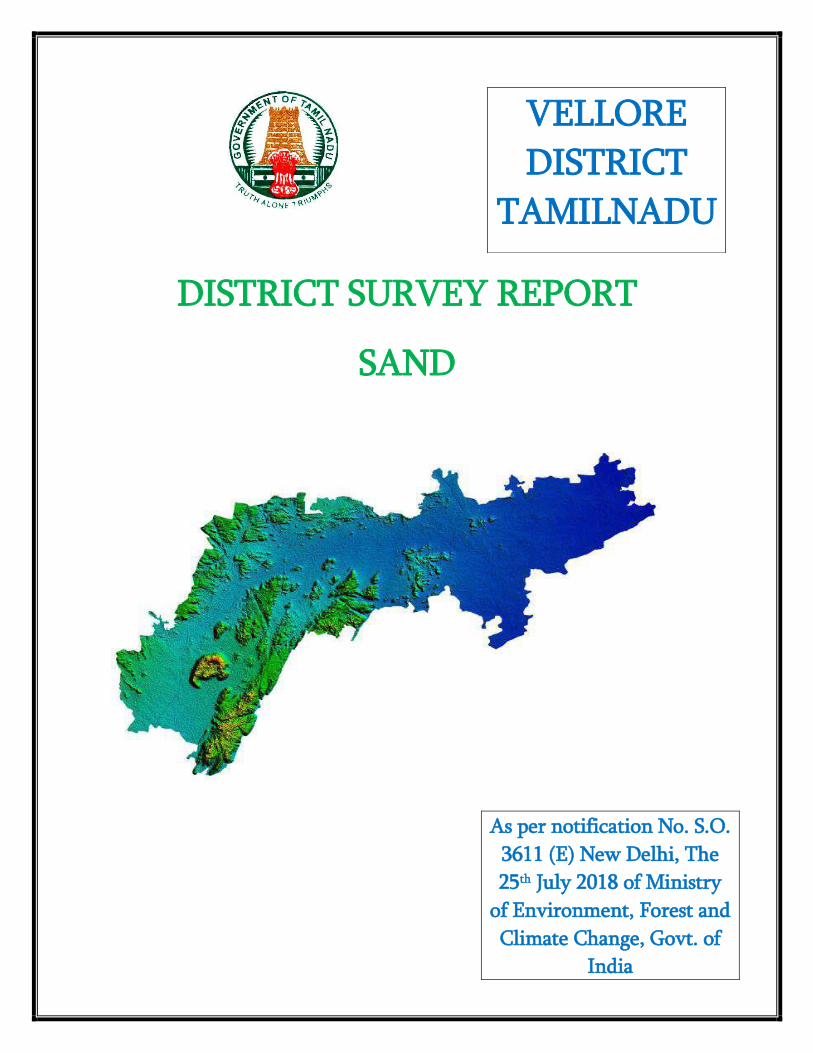
INDEX
DISTRICT SURVEY REPORT-VELLORE
S.No. Particulars Page no
1. Preface 3
2. Introduction 4
3. Overview of mining activities in the district 4
4. List of mining leases in the district 5
5. Details of royalty or revenue received in vellore district
Quarry wise sand revenue details of Vellore district for the year 2015-
2016
11-12
Quarry wise sand revenue details of Vellore district for the year 2016-
2017
13-16
Quarry wise sand revenue details of Vellore district for the year 2017-
2018
16-17
Quarry wise sand revenue details of Vellore district for the year 2018-
2019
17-19
Quarry wise sand sale details of Vellore district for the year 2015-2016 19-22
Quarry wise sand sale details of Vellore district for the year 2016-2017 22-25
Quarry wise sand sale details of Vellore district for the year 2017-2018 25-26
Quarry wise sand sale details of Vellore district for the year 2018-2019 27-28
6. Process of deposition of sediments in the rivers of the district
6.a. Location Map of Irrigation structures
6.b. Palar in Tamilnadu
6.c. Palar River Line diagram
6.d. Palar river basin
6.e. Reservoirs along palar river basin
28
29
30
31
32
36
Page | 2
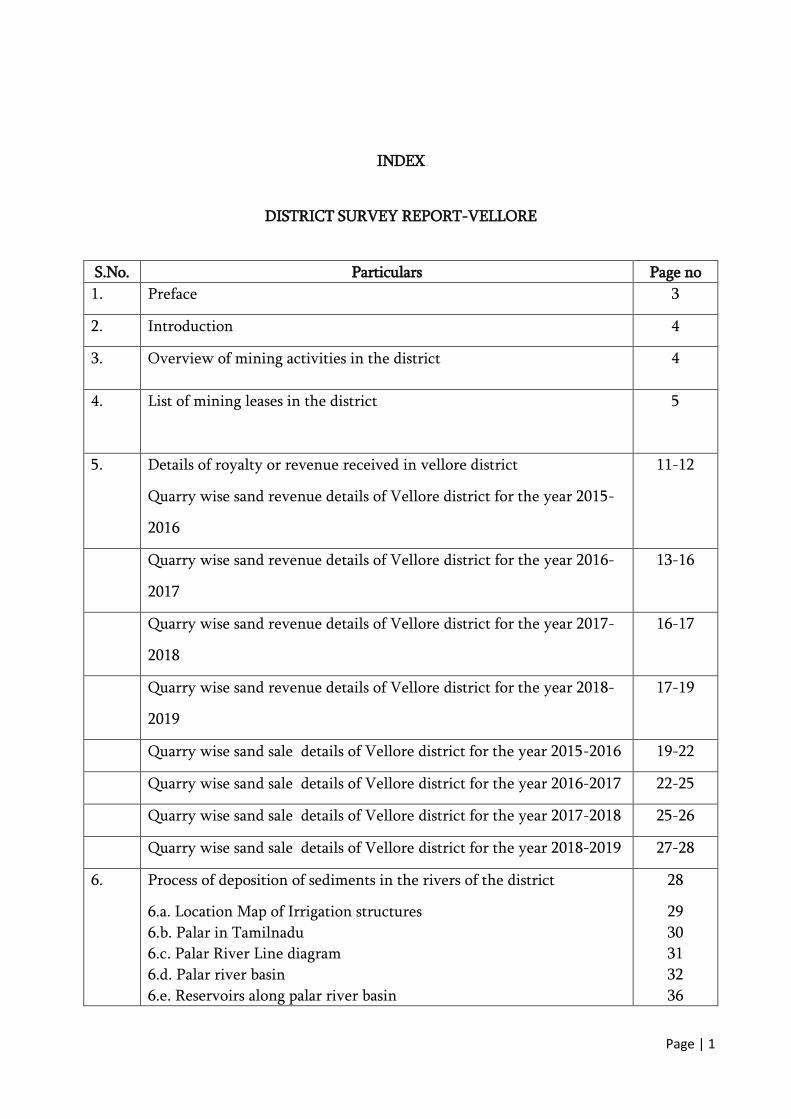
6.f .Shoaling in River bed
6.g. Reduction of River carrying capacity by shoal formation
6.h. Siltation problems U/S of anicut
6.i. Replenishment study for sand
38
38
39
39
7. General profile of the district 40
8. Land Use pattern 43
9. Physiography and regional geology 47
10. Rainfall pattern along palar river basin 51
11. Geology and mineral wealth 54
12. River system
12.a. Palar river
12.b. Catchment
12.c. Sub catchment
12.d. Watershed
12.e. Climatic characteristics: humidity and wind
57
57
58
58
60
61
13. Drainage system with description of main rivers 66
14. Salient features of important rivers and streams 67
15. Mineral potential of the District 67
16. Economic impact of mining 68
17. Conclusion/ Recommendation 68
Page | 3
DISTRICT SURVEY REPORT FOR SAND MINING DISTRICT VELLORE
1. PREFACE
In compliance to the Notification issued by the Ministry of Environment and Forest and
Climate Change notification No. S.O. 3611 (E) New Delhi dated 25-07-2018, the preparation
of District Survey Report of river sand mining in accordance with Appendix X of the
Notification. Every effort have been made to cover sand mining locations, areas and overview
of mining activity in the district with all its relevant features pertaining to geology and
mineral wealth in replenishable and non-replenishable areas of rivers, stream and other sand
sources. This report will be a model and guiding document which is a compendium of
available mineral resources, geographical set up, environmental and ecological setup of the
district and is based on data of various departments, study conducted by renowned
institutions, published reports and websites.
SURVEY REPORT OF VELLORE DISTRICT
As per Gazette Notification No. S.O. 3611 (E) New Delhi dated 25-07-2018 of Ministry of
Environment, Forest and Climate Change, a survey shall be carried out by the District
Environment Impact Assessment Authority (DEIAA) with assistance of Water Resources
Department, Forest Department, Geology and Mining Department and Revenue Department
in the District for preparation for District Survey Report as per sustainable sand mining
guidelines to ensure identification of areas of aggradation or deposition where mining can be
allowed and identification of areas of erosion and proximity to infrastructural structures and
installations where mining should be prohibited and calculation of annual rate of
replenishment and allowing time for replenishment after mining in that area.
The detailed study has been made through IIT, Madras to cover sand mining locations, area
and overview of mining activity in the district with all its relevant features pertaining to
geology and mineral wealth in replenishable and non-replenishable areas of rivers, stream and
other sand sources. The mineral potential is calculated based on field investigation and
geology of the catchment area of the river (or) Streams. The area for removal of the mineral in
a river or stream is decided depending on geomorphology and other factors. The District
Page | 4
Survey Report shall form the basis for application for Environmental Clearance, preparation
of reports and appraisal of projects. The report shall be updated once in five years.
2. INTRODUCTION:
Vellore District is located along the river Palar in Tamil Nadu India. The main town in
Vellore district is the city of Vellore. As on 2011, the district had a population of 39,36,311
with 1034 female for every 1000 males. The district has an area of 6062.35 square kilometres.
The Vellore is a city in the Indian state of Tamil Nadu and the administrative headquarters of
Vellore District. It is the sixth largest municipal corporation in Tamil Nadu. Vellore has a
semi-arid climate. It is in Vellore district of the South Indian state, Tamil Nadu, 135 km
(84 mi) west of the state capital Chennai. Vellore lies in the Eastern Ghats region and Palar
river basin. The topography is almost plain with slopes from west to east. The Palar river
flows through the length of the district and is the principle source of drinking water. The
sand deposits across Palar river up to its confluence point in sea at Kancheepuram District.
The other rivers are Goddar, Agaram aru, Koundinya nathi, Malattar river and Ponnai river
which are seasonal carriers flood water and confluence in to River Palar.
3. OVERVIEW OF MINING ACTIVITIES IN THE DISTRICT.
Mainly two types of Minor minerals constituents such as sand and jelly are required for any
type of construction apart from other mineral like cement and steel. In earlier times, the
houses / buildings were constructed in form of small dwellings with walls made up of mud
plaster, stone and interlocking provided with wooden frames and there were negligible
commercial as well as developmental activities resulting in less demand of binding materials.
However with the percentage of time, new vistas of development activities were started. The
quantity of minor mineral consumption in a particular area is thermometer to assess the
development of the area. Thus with the pace of development activities, the consumption of
minerals also increased. As Tamil Nadu State is highly urbanised state of Indian sub-continent
after Maharashtra, the demand of minor minerals in the Vellore District has started increasing
trend. Besides that the Vellore District is the Northern part of the State and having potential
of sand and rough stone sources, the highly industrialised districts like Chennai,
Page | 5
Kancheepuram, Tiruvallur, Krishnagiri are depending its sand and rough stone need on
Vellore Districts.
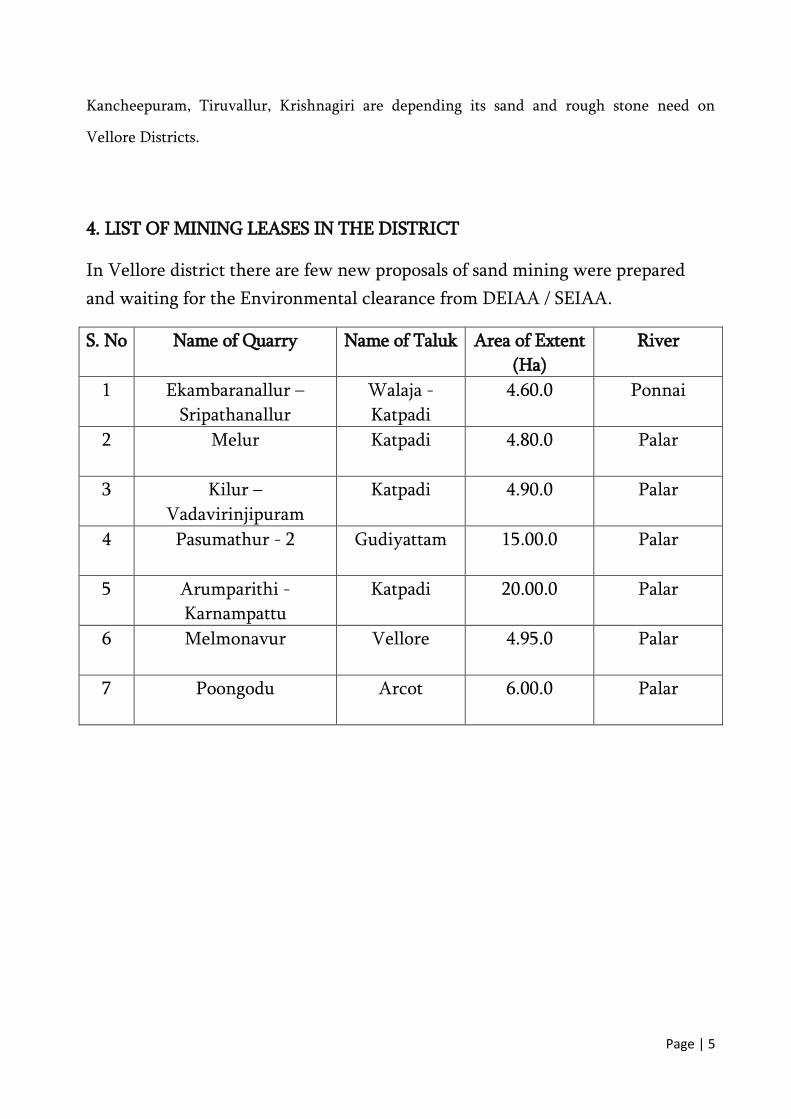
4. LIST OF MINING LEASES IN THE DISTRICT
In Vellore district there are few new proposals of sand mining were prepared
and waiting for the Environmental clearance from DEIAA / SEIAA.
S. No Name of Quarry Name of Taluk Area of Extent
(Ha)
River
1 Ekambaranallur –
Sripathanallur
Walaja -
Katpadi
4.60.0 Ponnai
2 Melur Katpadi 4.80.0 Palar
3 Kilur –
Vadavirinjipuram
Katpadi 4.90.0 Palar
4 Pasumathur - 2 Gudiyattam 15.00.0 Palar
5 Arumparithi -
Karnampattu
Katpadi 20.00.0 Palar
6 Melmonavur Vellore 4.95.0 Palar
7 Poongodu Arcot 6.00.0 Palar
Page | 6
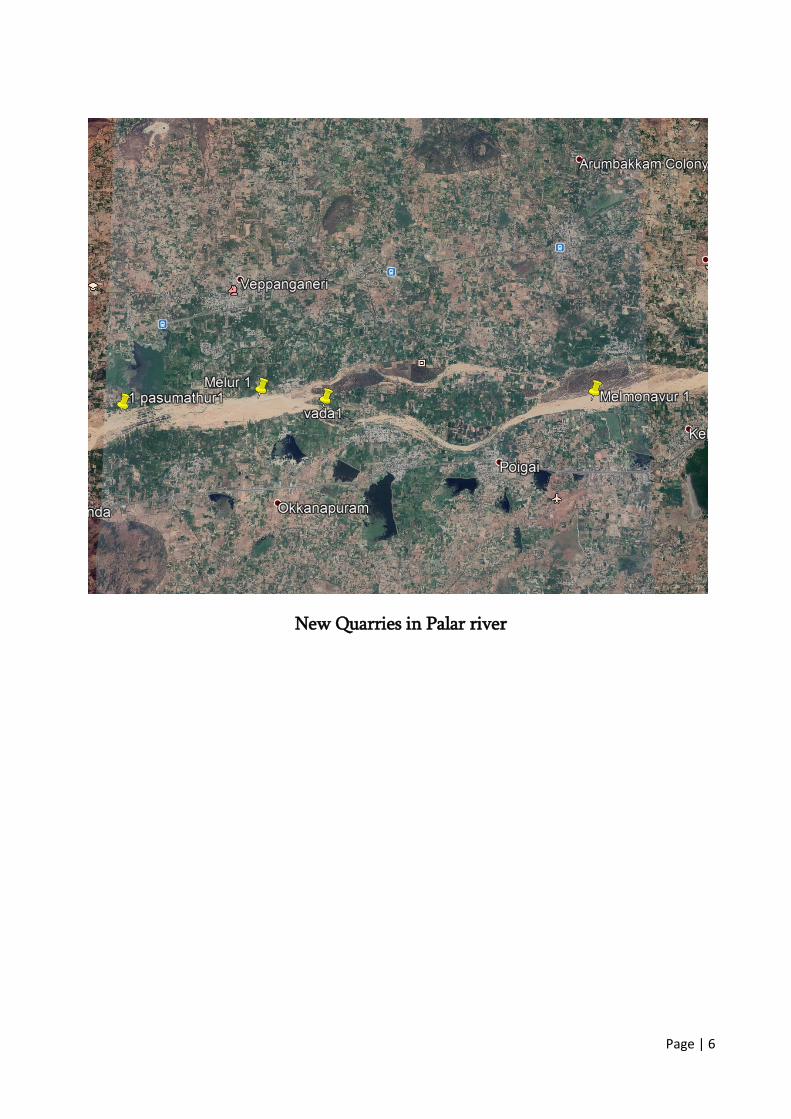
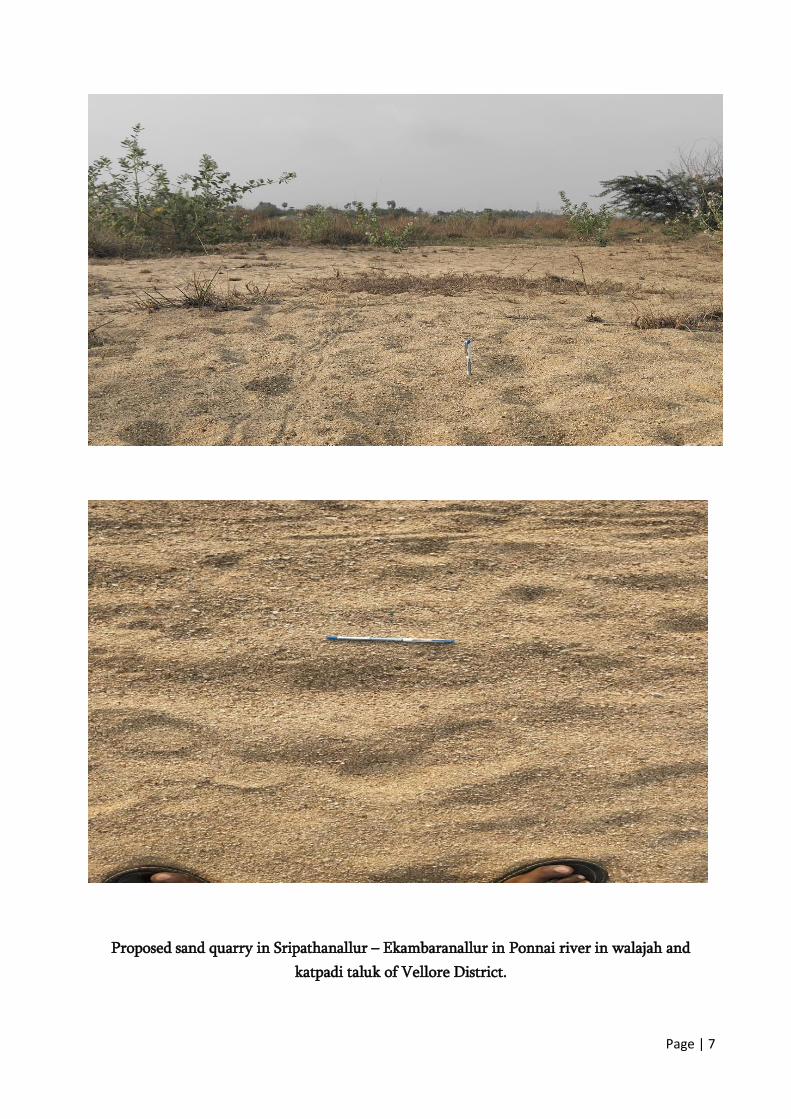
New Quarries in Palar river
Page | 7
Proposed sand quarry in Sripathanallur – Ekambaranallur in Ponnai river in walajah and
katpadi taluk of Vellore District.
Page | 8
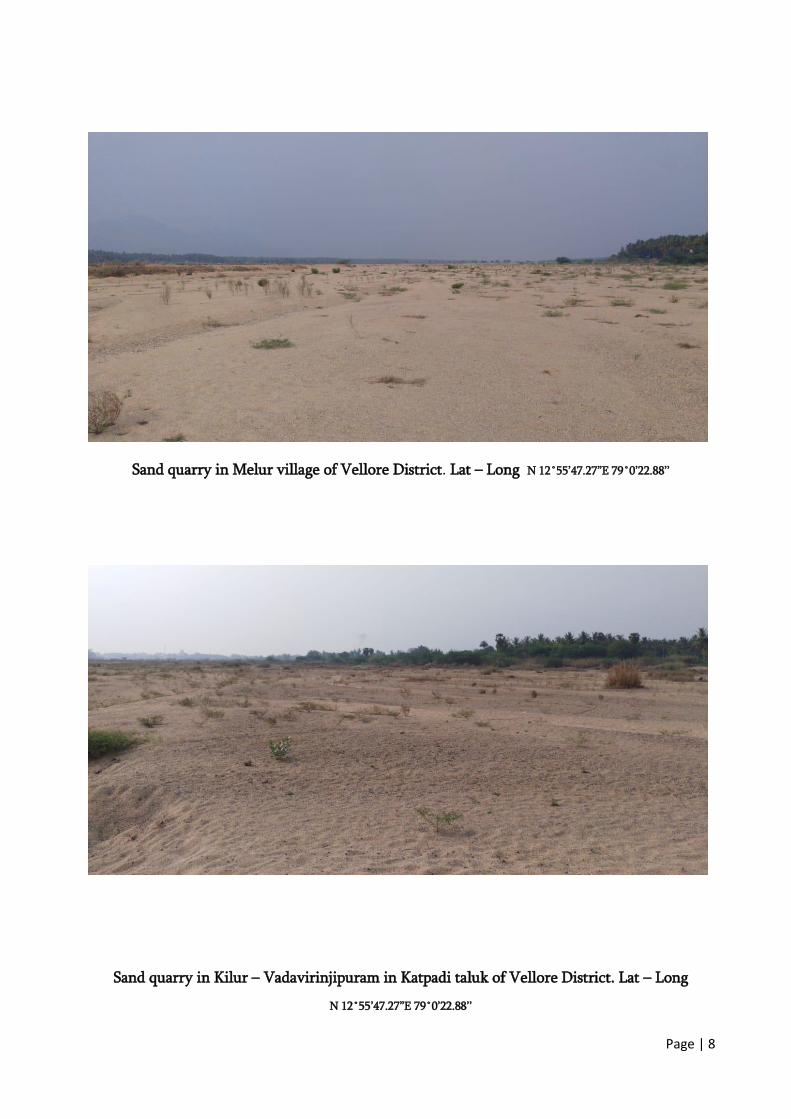
Sand quarry in Melur village of Vellore District. Lat – Long N 12˚55’47.27”E 79˚0’22.88’’
Sand quarry in Kilur – Vadavirinjipuram in Katpadi taluk of Vellore District. Lat – Long
N 12˚55’47.27”E 79˚0’22.88’’
Page | 9
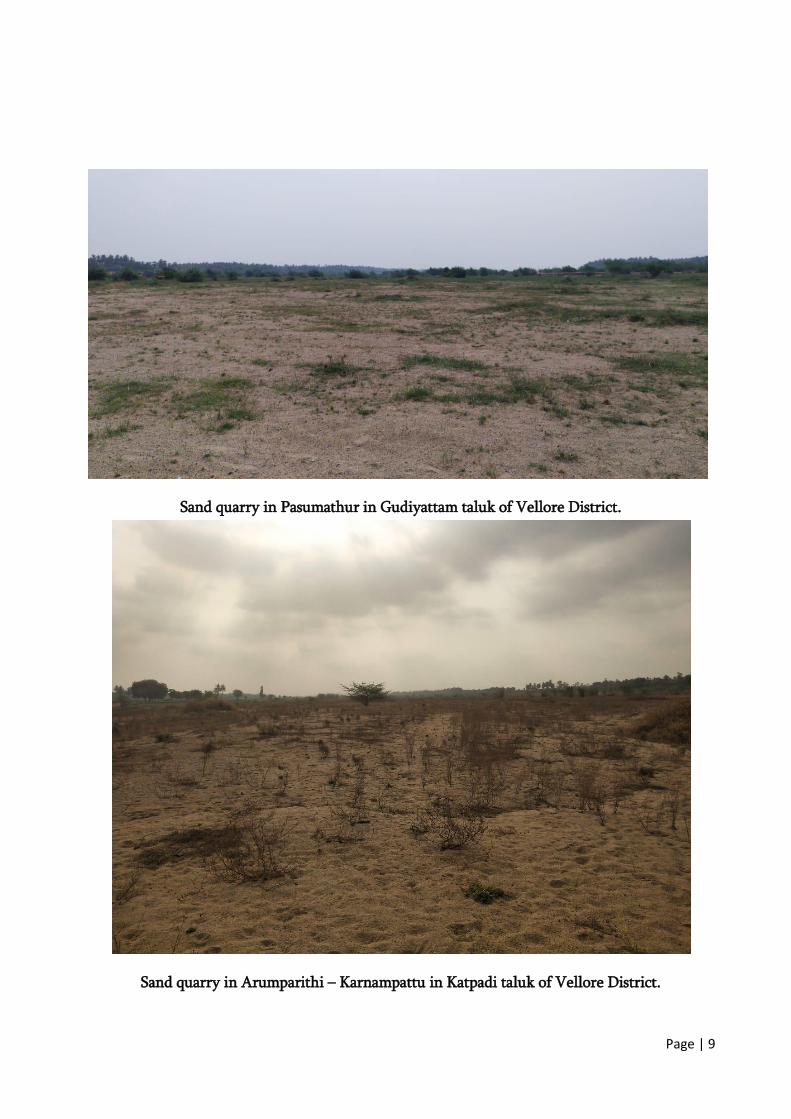
Sand quarry in Pasumathur in Gudiyattam taluk of Vellore District.
Sand quarry in Arumparithi – Karnampattu in Katpadi taluk of Vellore District.
Page | 10
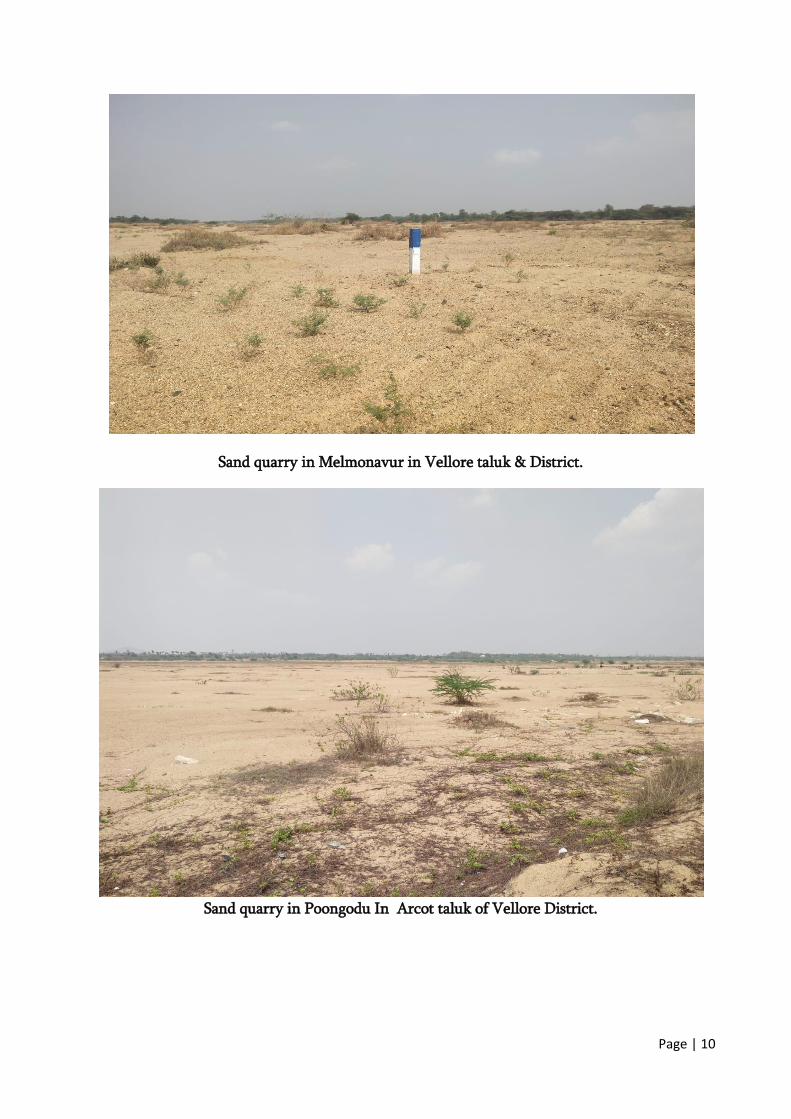
Sand quarry in Melmonavur in Vellore taluk & District.
Sand quarry in Poongodu In Arcot taluk of Vellore District.
Page | 11
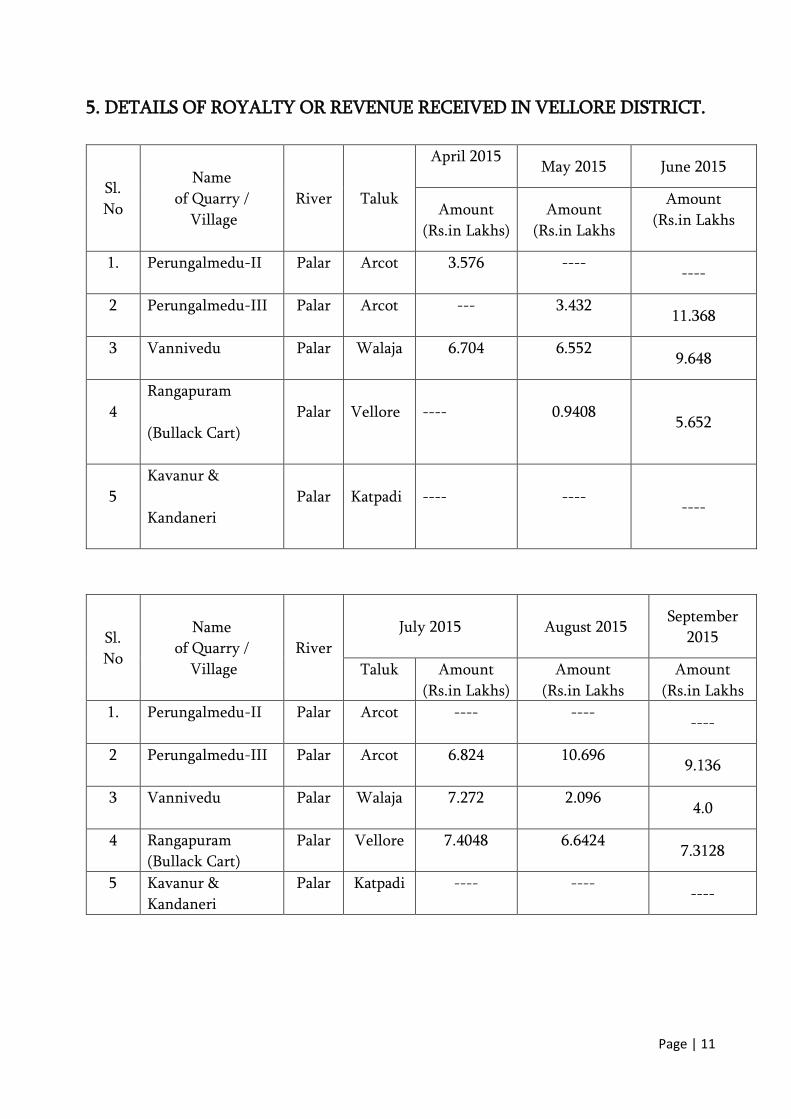
5. DETAILS OF ROYALTY OR REVENUE RECEIVED IN VELLORE DISTRICT.
Sl.
No
Name
of Quarry /
Village
River Taluk
April 2015
May 2015 June 2015
Amount
(Rs.in Lakhs)
Amount
(Rs.in Lakhs
Amount
(Rs.in Lakhs
1. Perungalmedu-II Palar Arcot 3.576 ---- ----
2 Perungalmedu-III Palar Arcot --- 3.432 11.368
3 Vannivedu Palar Walaja 6.704 6.552 9.648
4
Rangapuram
(Bullack Cart)
Palar Vellore ---- 0.9408 5.652
5
Kavanur &
Kandaneri
Palar Katpadi ---- ---- ----
Sl.
No
Name
of Quarry /
Village
River
July 2015
August 2015 September
2015
Taluk Amount
(Rs.in Lakhs)
Amount
(Rs.in Lakhs
Amount
(Rs.in Lakhs
1. Perungalmedu-II Palar Arcot ---- ---- ----
2 Perungalmedu-III Palar Arcot 6.824 10.696 9.136
3 Vannivedu Palar Walaja 7.272 2.096 4.0
4 Rangapuram
(Bullack Cart)
Palar Vellore 7.4048 6.6424 7.3128
5 Kavanur &
Kandaneri
Palar Katpadi ---- ---- ----
Page | 12
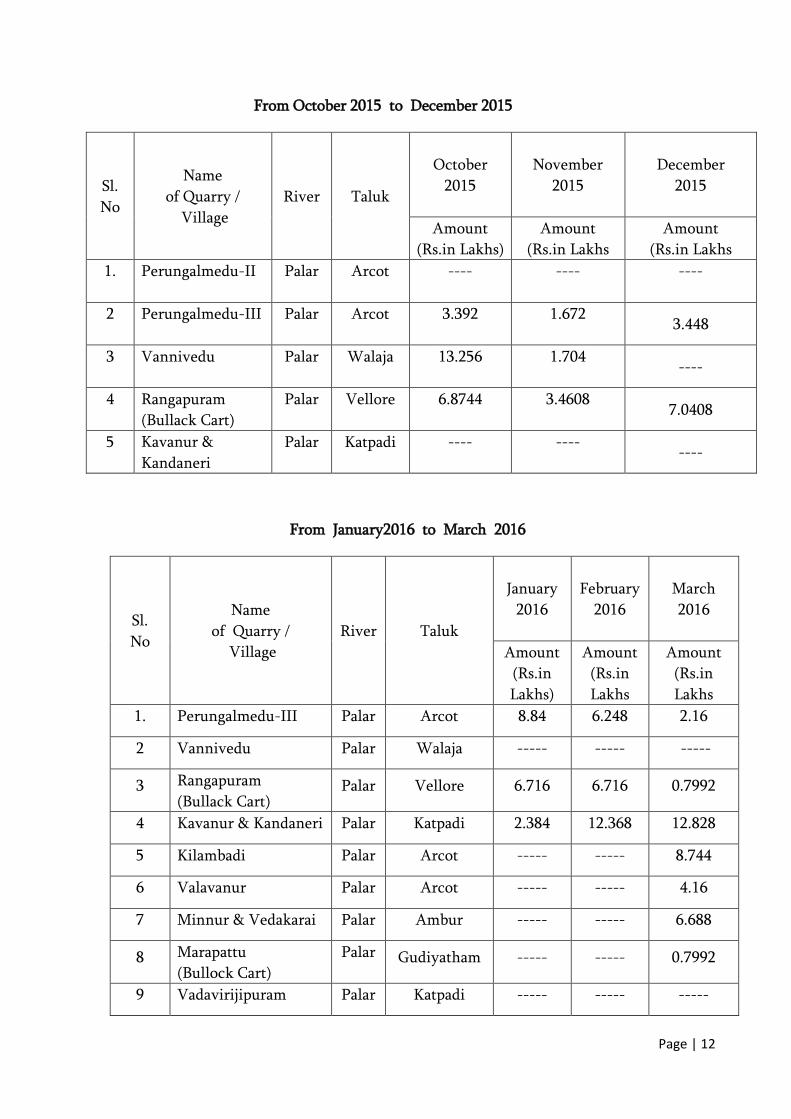
From October 2015 to December 2015
Sl.
No
Name
of Quarry /
Village
River Taluk
October
2015
November
2015
December
2015
Amount
(Rs.in Lakhs)
Amount
(Rs.in Lakhs
Amount
(Rs.in Lakhs
1. Perungalmedu-II Palar Arcot ---- ---- ----
2 Perungalmedu-III Palar Arcot 3.392 1.672 3.448
3 Vannivedu Palar Walaja 13.256 1.704 ----
4 Rangapuram
(Bullack Cart)
Palar Vellore 6.8744 3.4608 7.0408
5 Kavanur &
Kandaneri
Palar Katpadi ---- ---- ----
From January2016 to March 2016
Sl.
No
Name
of Quarry /
Village
River Taluk
January
2016
February
2016
March
2016
Amount
(Rs.in
Lakhs)
Amount
(Rs.in
Lakhs
Amount
(Rs.in
Lakhs
1. Perungalmedu-III Palar Arcot 8.84 6.248 2.16
2 Vannivedu Palar Walaja ----- ----- -----
3 Rangapuram
(Bullack Cart) Palar Vellore 6.716 6.716 0.7992
4 Kavanur & Kandaneri Palar Katpadi 2.384 12.368 12.828
5 Kilambadi Palar Arcot ----- ----- 8.744
6 Valavanur Palar Arcot ----- ----- 4.16
7 Minnur & Vedakarai Palar Ambur ----- ----- 6.688
8 Marapattu
(Bullock Cart)
Palar Gudiyatham ----- ----- 0.7992
9 Vadavirijipuram Palar Katpadi ----- ----- -----
Page | 13
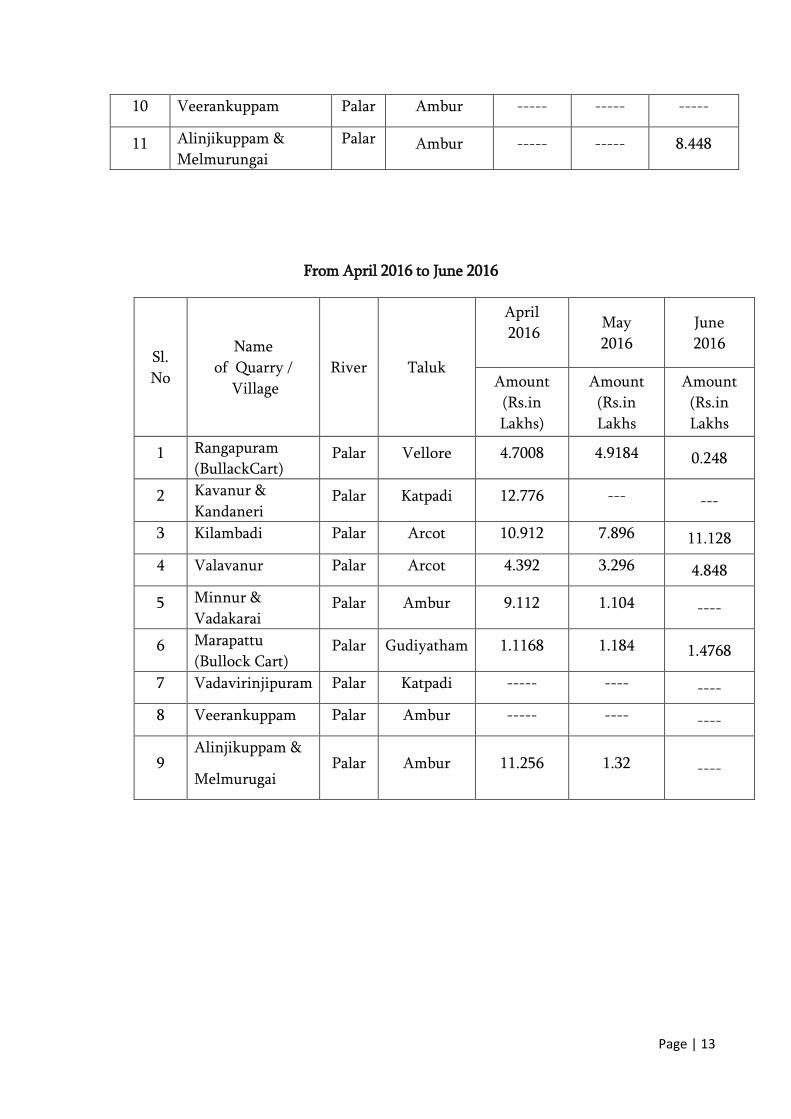
10 Veerankuppam Palar Ambur ----- ----- -----
11 Alinjikuppam &
Melmurungai
Palar Ambur ----- ----- 8.448
From April 2016 to June 2016
Sl.
No
Name
of Quarry /
Village
River Taluk
April
2016
May
2016
June
2016
Amount
(Rs.in
Lakhs)
Amount
(Rs.in
Lakhs
Amount
(Rs.in
Lakhs
1 Rangapuram
(BullackCart) Palar Vellore 4.7008 4.9184 0.248
2 Kavanur &
Kandaneri Palar Katpadi 12.776 --- ---
3 Kilambadi Palar Arcot 10.912 7.896 11.128
4 Valavanur Palar Arcot 4.392 3.296 4.848
5 Minnur &
Vadakarai Palar Ambur 9.112 1.104 ----
6 Marapattu
(Bullock Cart) Palar Gudiyatham 1.1168 1.184 1.4768
7 Vadavirinjipuram Palar Katpadi ----- ---- ----
8 Veerankuppam Palar Ambur ----- ---- ----
9 Alinjikuppam &
Melmurugai Palar Ambur 11.256 1.32 ----
Page | 14
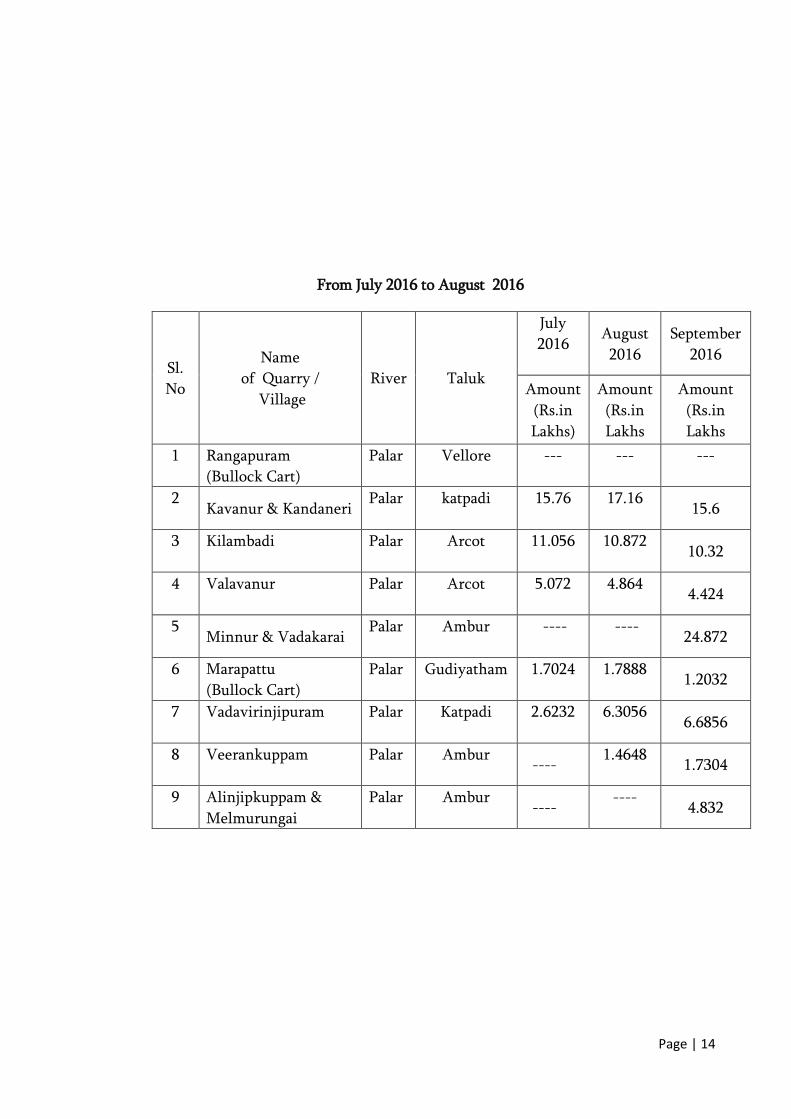
From July 2016 to August 2016
Sl.
No
Name
of Quarry /
Village
River Taluk
July
2016
August
2016
September
2016
Amount
(Rs.in
Lakhs)
Amount
(Rs.in
Lakhs
Amount
(Rs.in
Lakhs
1 Rangapuram
(Bullock Cart)
Palar Vellore --- --- ---
2 Kavanur & Kandaneri
Palar katpadi 15.76 17.16 15.6
3 Kilambadi Palar Arcot 11.056 10.872 10.32
4 Valavanur Palar Arcot 5.072 4.864 4.424
5 Minnur & Vadakarai
Palar Ambur ---- ---- 24.872
6 Marapattu
(Bullock Cart)
Palar Gudiyatham 1.7024 1.7888 1.2032
7 Vadavirinjipuram Palar Katpadi 2.6232 6.3056 6.6856
8 Veerankuppam Palar Ambur ----
1.4648 1.7304
9 Alinjipkuppam &
Melmurungai
Palar Ambur ----
---- 4.832
Page | 15
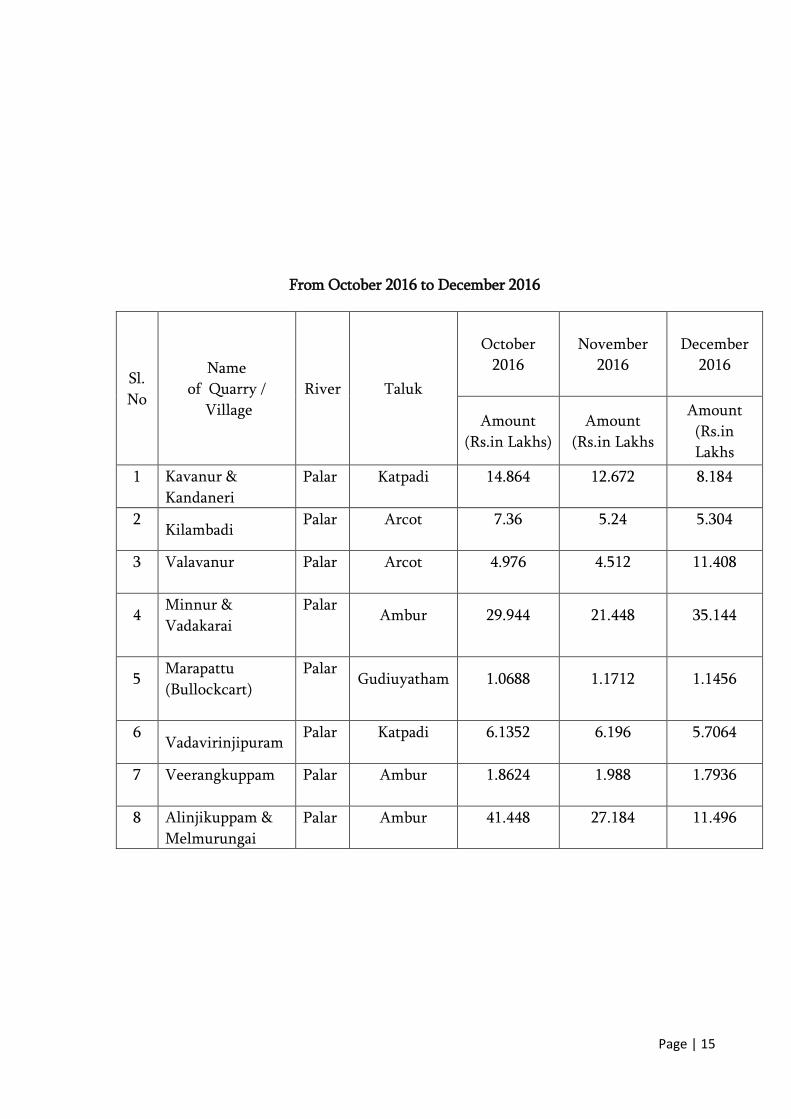
From October 2016 to December 2016
Sl.
No
Name
of Quarry /
Village
River Taluk
October
2016
November
2016
December
2016
Amount
(Rs.in Lakhs)
Amount
(Rs.in Lakhs
Amount
(Rs.in
Lakhs
1 Kavanur &
Kandaneri
Palar Katpadi 14.864 12.672 8.184
2 Kilambadi
Palar Arcot 7.36 5.24 5.304
3 Valavanur Palar Arcot 4.976 4.512 11.408
4 Minnur &
Vadakarai
Palar Ambur 29.944 21.448 35.144
5 Marapattu
(Bullockcart)
Palar Gudiuyatham 1.0688 1.1712 1.1456
6 Vadavirinjipuram
Palar Katpadi 6.1352 6.196 5.7064
7 Veerangkuppam Palar Ambur 1.8624 1.988 1.7936
8 Alinjikuppam &
Melmurungai
Palar Ambur 41.448 27.184 11.496
Page | 16
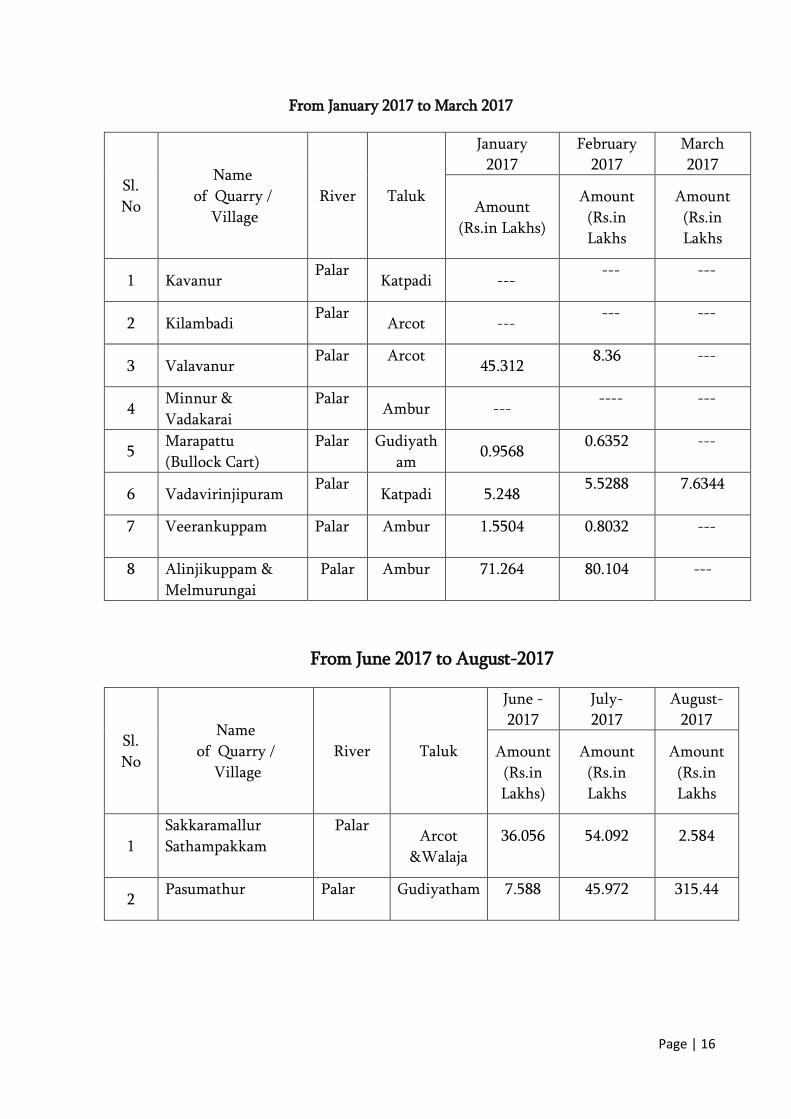
From January 2017 to March 2017
Sl.
No
Name
of Quarry /
Village
River Taluk
January
2017
February
2017
March
2017
Amount
(Rs.in Lakhs)
Amount
(Rs.in
Lakhs
Amount
(Rs.in
Lakhs
1 Kavanur Palar
Katpadi --- --- ---
2 Kilambadi Palar
Arcot --- --- ---
3 Valavanur Palar Arcot
45.312 8.36 ---
4 Minnur &
Vadakarai
Palar Ambur ---
---- ---
5 Marapattu
(Bullock Cart)
Palar Gudiyath
am 0.9568
0.6352 ---
6 Vadavirinjipuram Palar
Katpadi 5.248 5.5288 7.6344
7 Veerankuppam Palar Ambur 1.5504 0.8032 ---
8 Alinjikuppam &
Melmurungai
Palar Ambur 71.264 80.104 ---
From June 2017 to August-2017
Sl.
No
Name
of Quarry /
Village
River Taluk
June -
2017
July-
2017
August-
2017
Amount
(Rs.in
Lakhs)
Amount
(Rs.in
Lakhs
Amount
(Rs.in
Lakhs
1
Sakkaramallur
Sathampakkam
Palar Arcot
&Walaja
36.056 54.092 2.584
2 Pasumathur Palar Gudiyatham 7.588 45.972 315.44
Page | 17
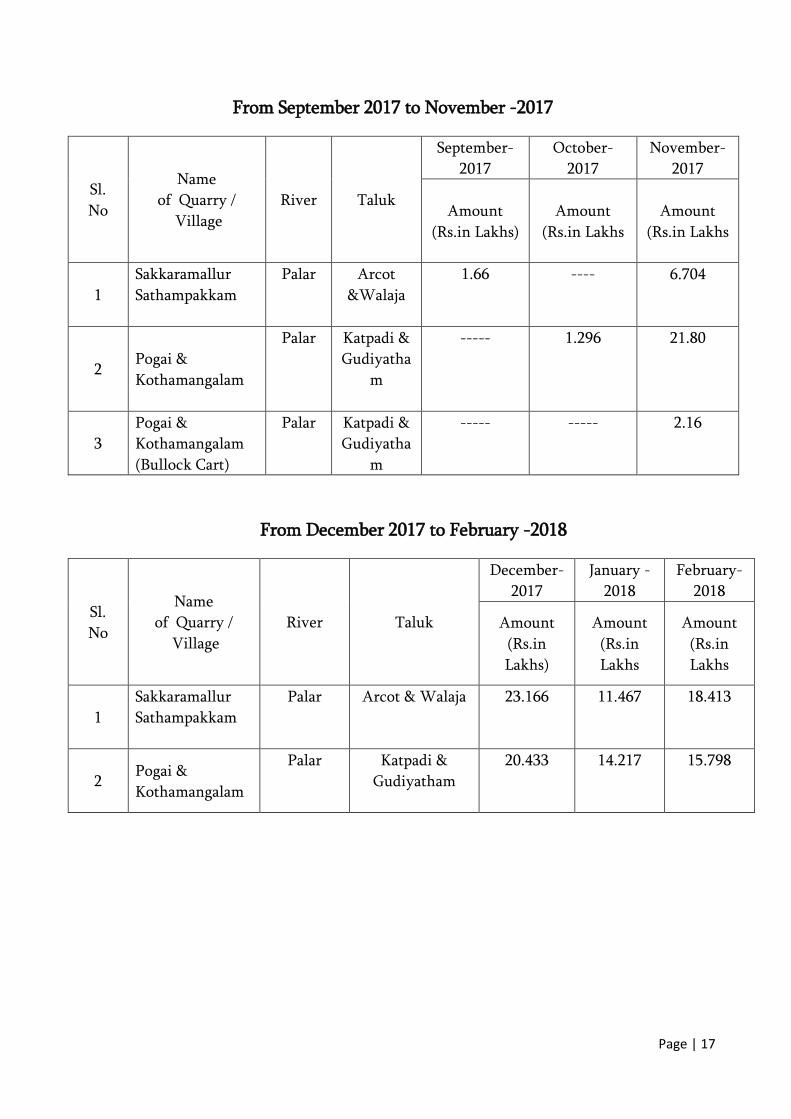
From September 2017 to November -2017
Sl.
No
Name
of Quarry /
Village
River Taluk
September-
2017
October-
2017
November-
2017
Amount
(Rs.in Lakhs)
Amount
(Rs.in Lakhs
Amount
(Rs.in Lakhs
1
Sakkaramallur
Sathampakkam
Palar Arcot
&Walaja
1.66 ---- 6.704
2 Pogai &
Kothamangalam
Palar Katpadi &
Gudiyatha
m
----- 1.296 21.80
3
Pogai &
Kothamangalam
(Bullock Cart)
Palar Katpadi &
Gudiyatha
m
----- ----- 2.16
From December 2017 to February -2018
Sl.
No
Name
of Quarry /
Village
River Taluk
December-
2017
January -
2018
February-
2018
Amount
(Rs.in
Lakhs)
Amount
(Rs.in
Lakhs
Amount
(Rs.in
Lakhs
1
Sakkaramallur
Sathampakkam
Palar Arcot & Walaja 23.166 11.467 18.413
2 Pogai &
Kothamangalam
Palar Katpadi &
Gudiyatham
20.433 14.217 15.798
Page | 18
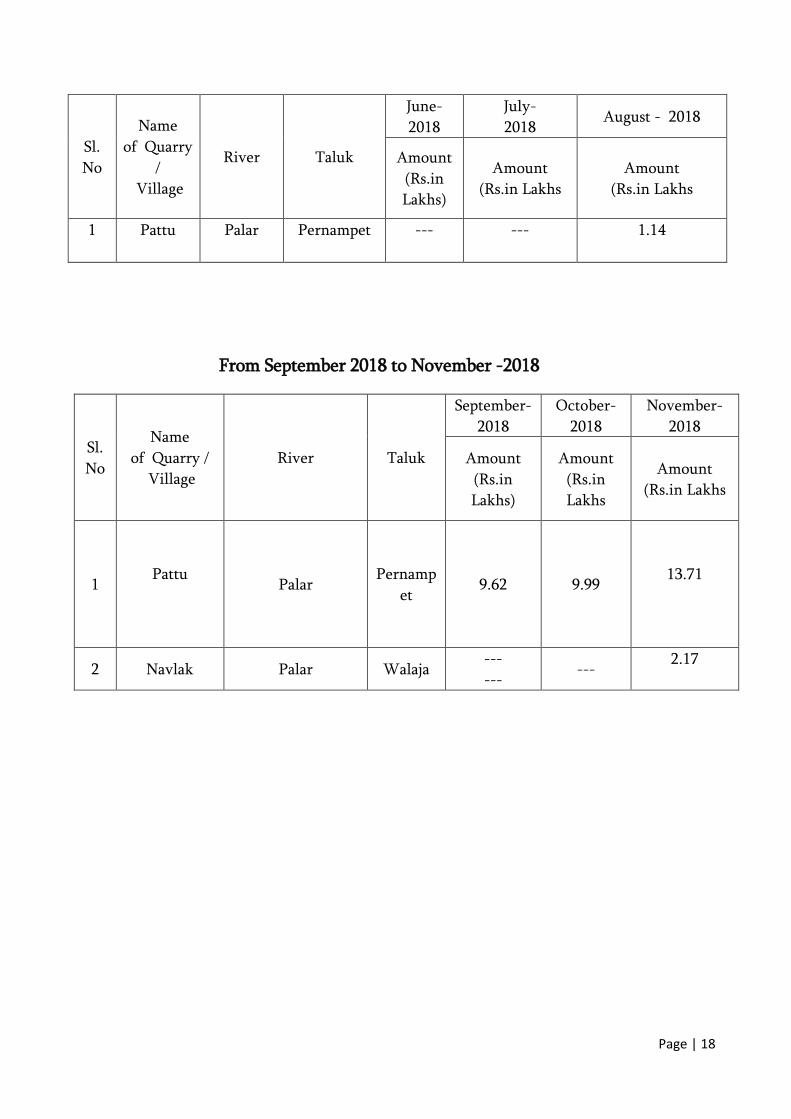
Sl.
No
Name
of Quarry
/
Village
River Taluk
June-
2018
July-
2018 August - 2018
Amount
(Rs.in
Lakhs)
Amount
(Rs.in Lakhs
Amount
(Rs.in Lakhs
1 Pattu
Palar Pernampet --- --- 1.14
From September 2018 to November -2018
Sl.
No
Name
of Quarry /
Village
River Taluk
September-
2018
October-
2018
November-
2018
Amount
(Rs.in
Lakhs)
Amount
(Rs.in
Lakhs
Amount
(Rs.in Lakhs
1 Pattu
Palar
Pernamp
et 9.62 9.99
13.71
2 Navlak Palar Walaja ---
--- ---
2.17
Page | 19
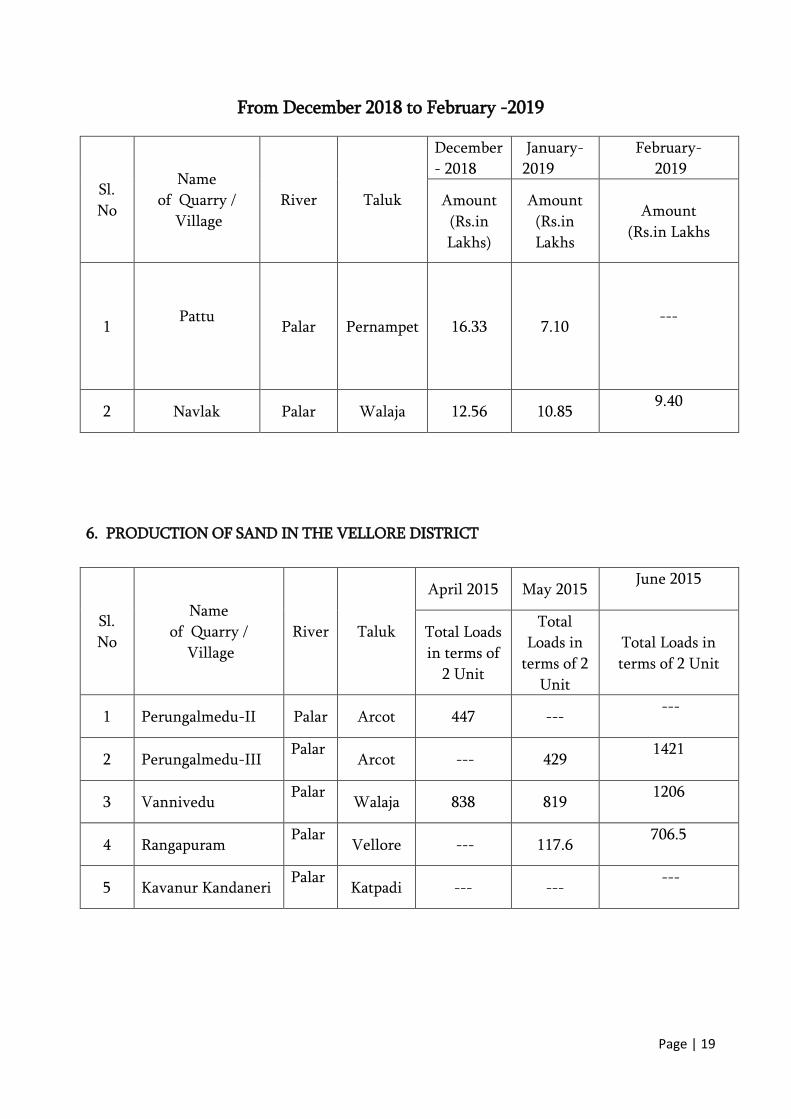
From December 2018 to February -2019
Sl.
No
Name
of Quarry /
Village
River Taluk
December
- 2018
January-
2019
February-
2019
Amount
(Rs.in
Lakhs)
Amount
(Rs.in
Lakhs
Amount
(Rs.in Lakhs
1 Pattu
Palar Pernampet 16.33 7.10
---
2 Navlak Palar Walaja 12.56 10.85 9.40
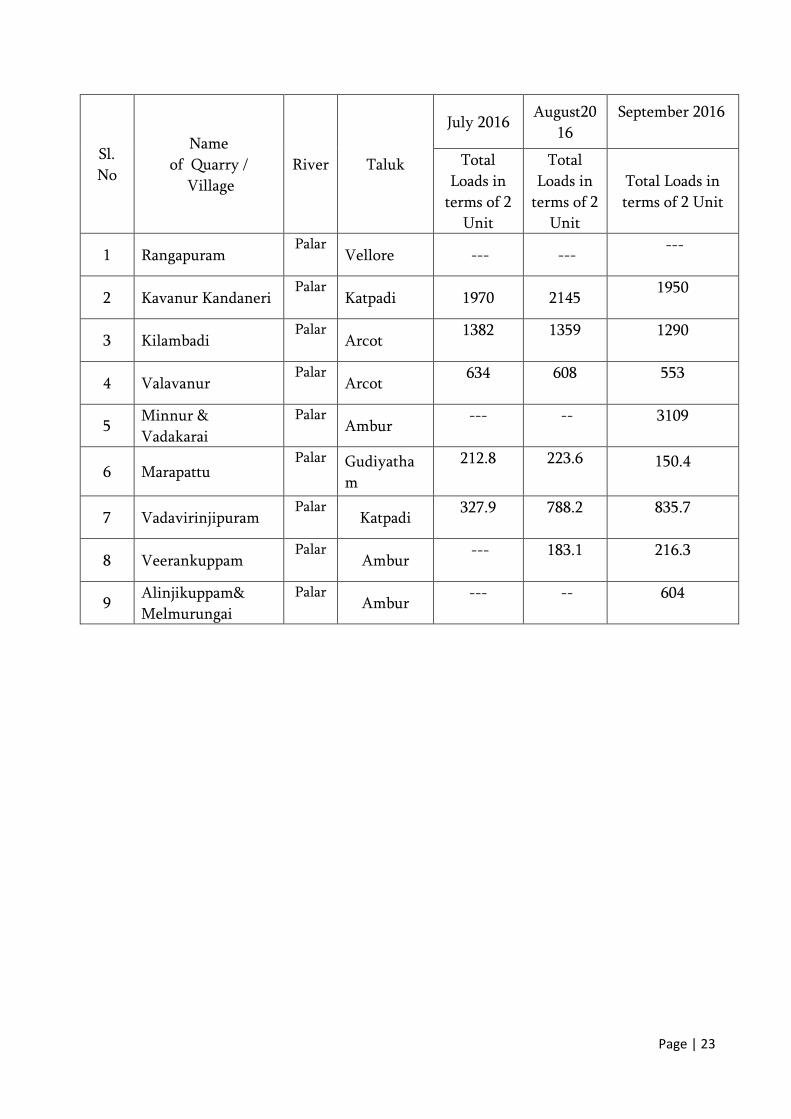
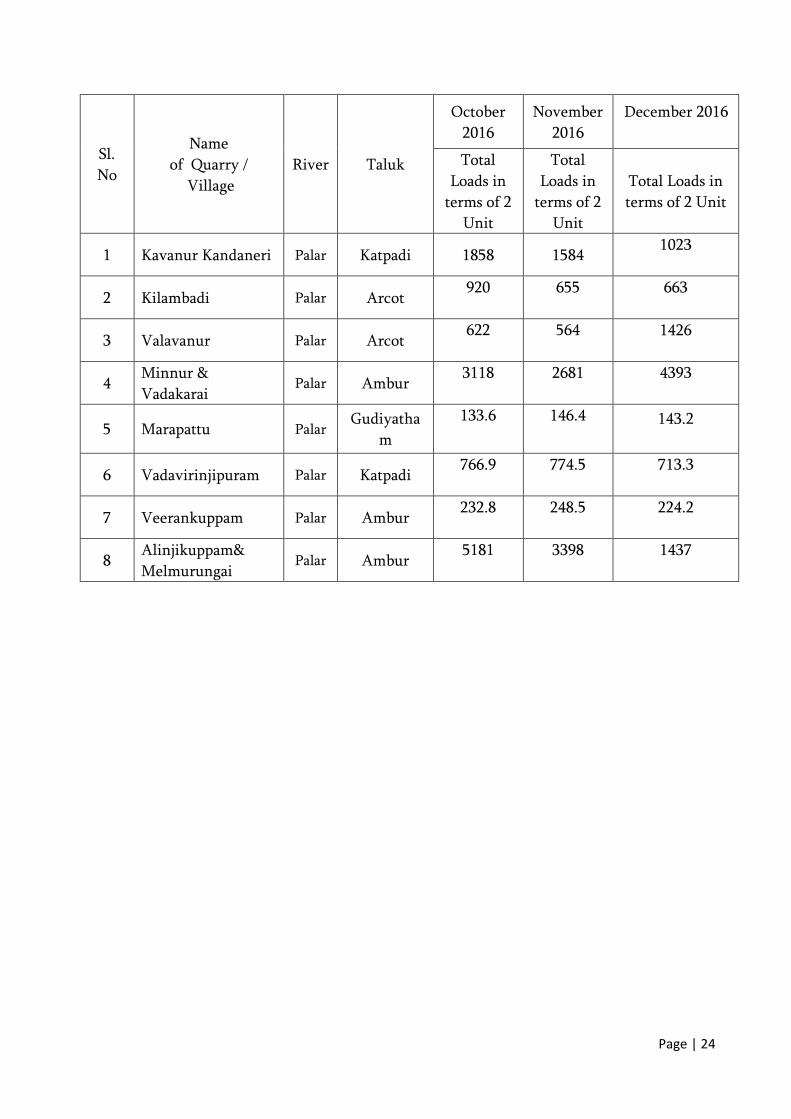
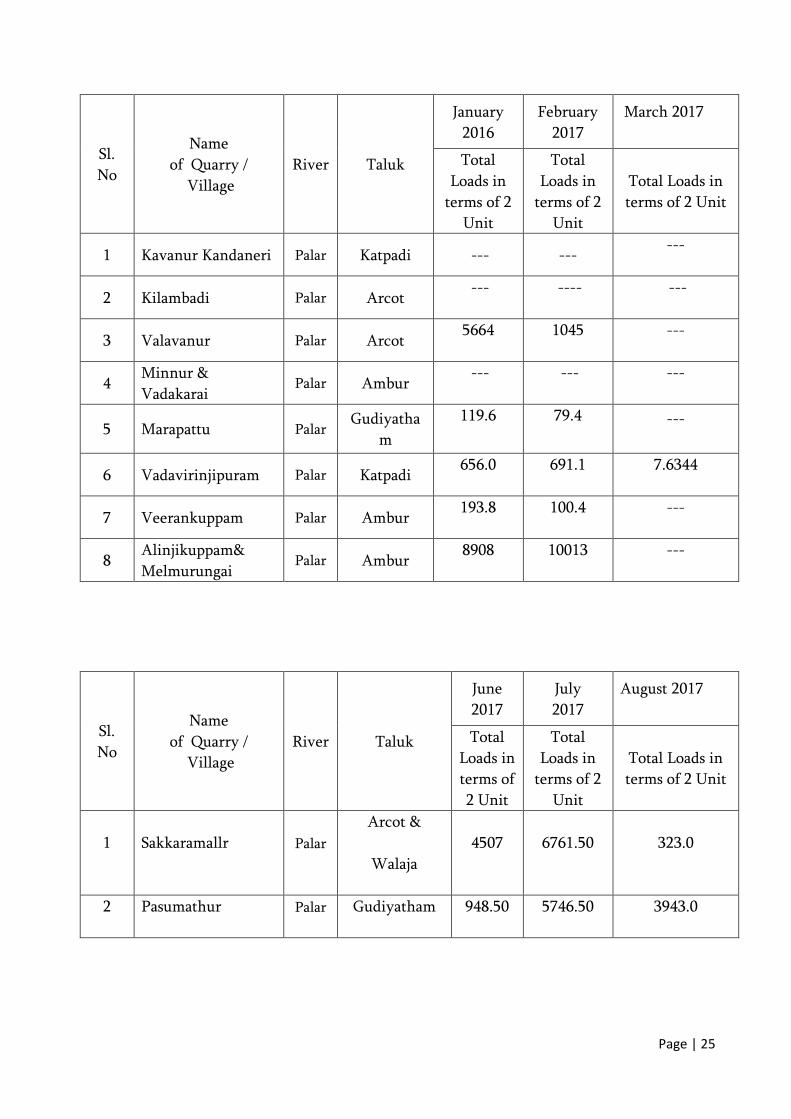
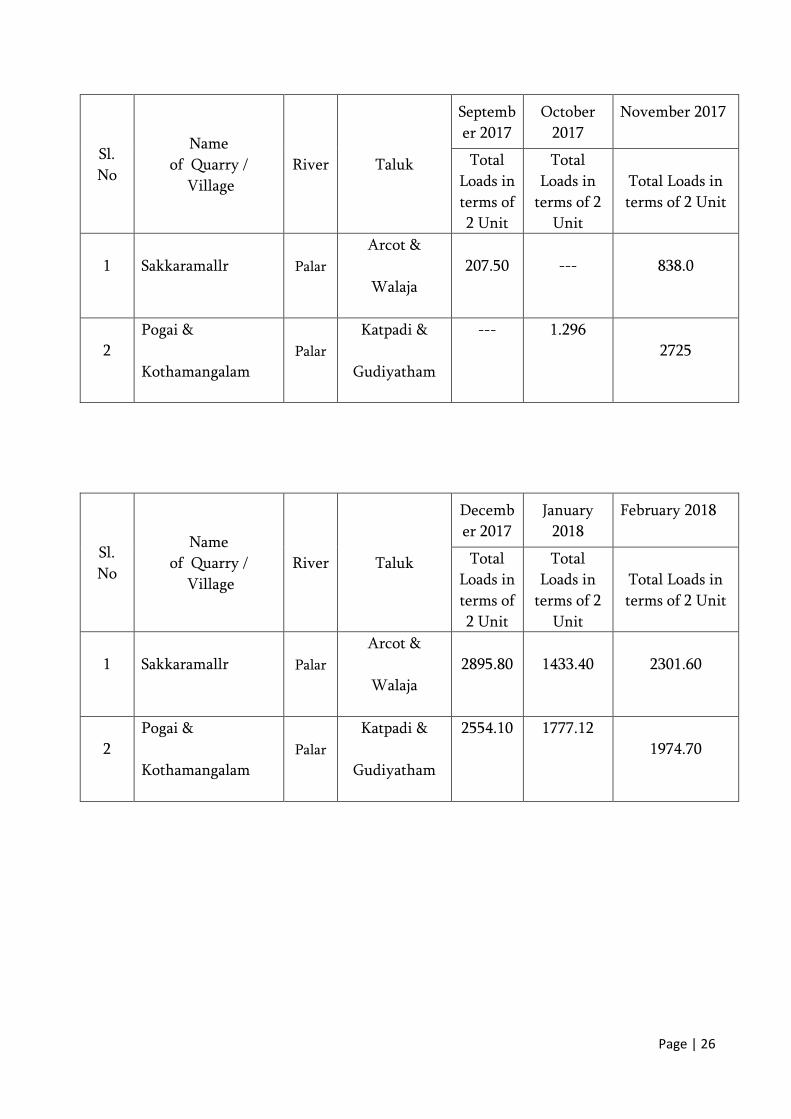
6. PRODUCTION OF SAND IN THE VELLORE DISTRICT
Sl.
No
Name
of Quarry /
Village
River Taluk
April 2015 May 2015 June 2015
Total Loads
in terms of
2 Unit
Total
Loads in
terms of 2
Unit
Total Loads in
terms of 2 Unit
1 Perungalmedu-II Palar Arcot 447 --- ---
2 Perungalmedu-III Palar
Arcot --- 429 1421
3 Vannivedu Palar
Walaja 838 819 1206
4 Rangapuram Palar
Vellore --- 117.6 706.5
5 Kavanur Kandaneri Palar
Katpadi --- --- ---
Page | 20
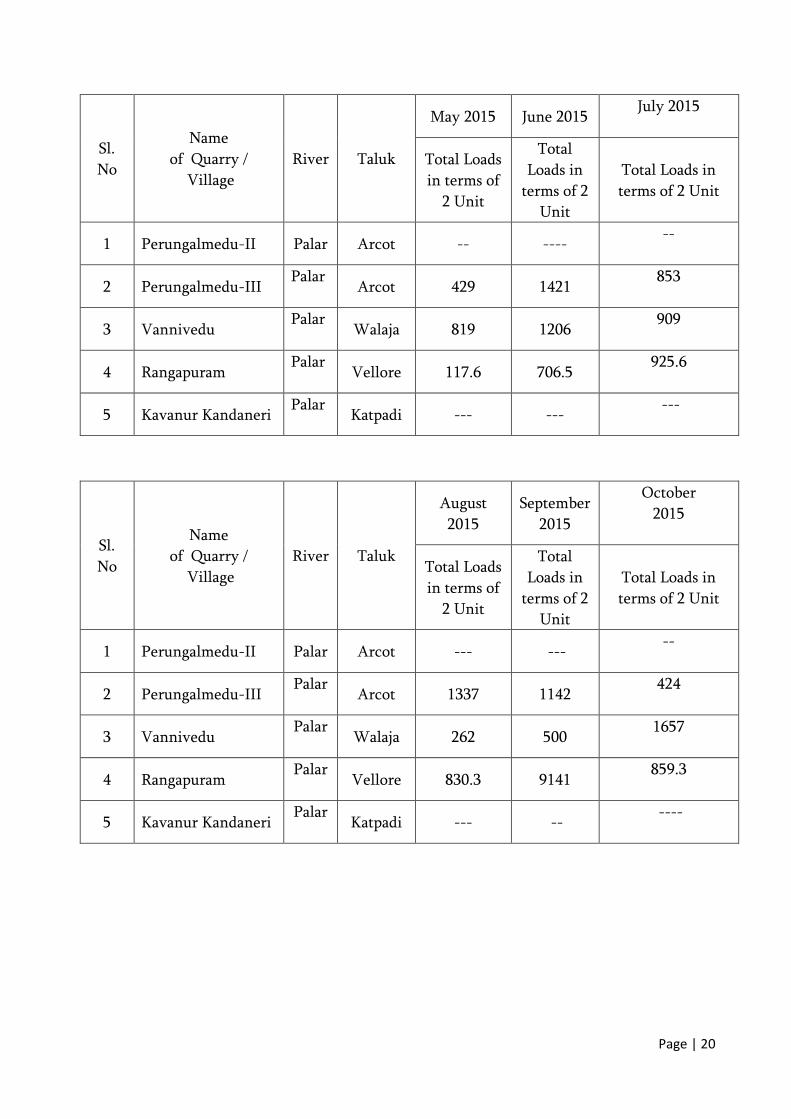
Sl.
No
Name
of Quarry /
Village
River Taluk
May 2015 June 2015 July 2015
Total Loads
in terms of
2 Unit
Total
Loads in
terms of 2
Unit
Total Loads in
terms of 2 Unit
1 Perungalmedu-II Palar Arcot -- ---- --
2 Perungalmedu-III Palar
Arcot 429 1421 853
3 Vannivedu Palar
Walaja 819 1206 909
4 Rangapuram Palar
Vellore 117.6 706.5 925.6
5 Kavanur Kandaneri Palar
Katpadi --- --- ---
Sl.
No
Name
of Quarry /
Village
River Taluk
August
2015
September
2015
October
2015
Total Loads
in terms of
2 Unit
Total
Loads in
terms of 2
Unit
Total Loads in
terms of 2 Unit
1 Perungalmedu-II Palar Arcot --- --- --
2 Perungalmedu-III Palar
Arcot 1337 1142 424
3 Vannivedu Palar
Walaja 262 500 1657
4 Rangapuram Palar
Vellore 830.3 9141 859.3
5 Kavanur Kandaneri Palar
Katpadi --- -- ----
Page | 21
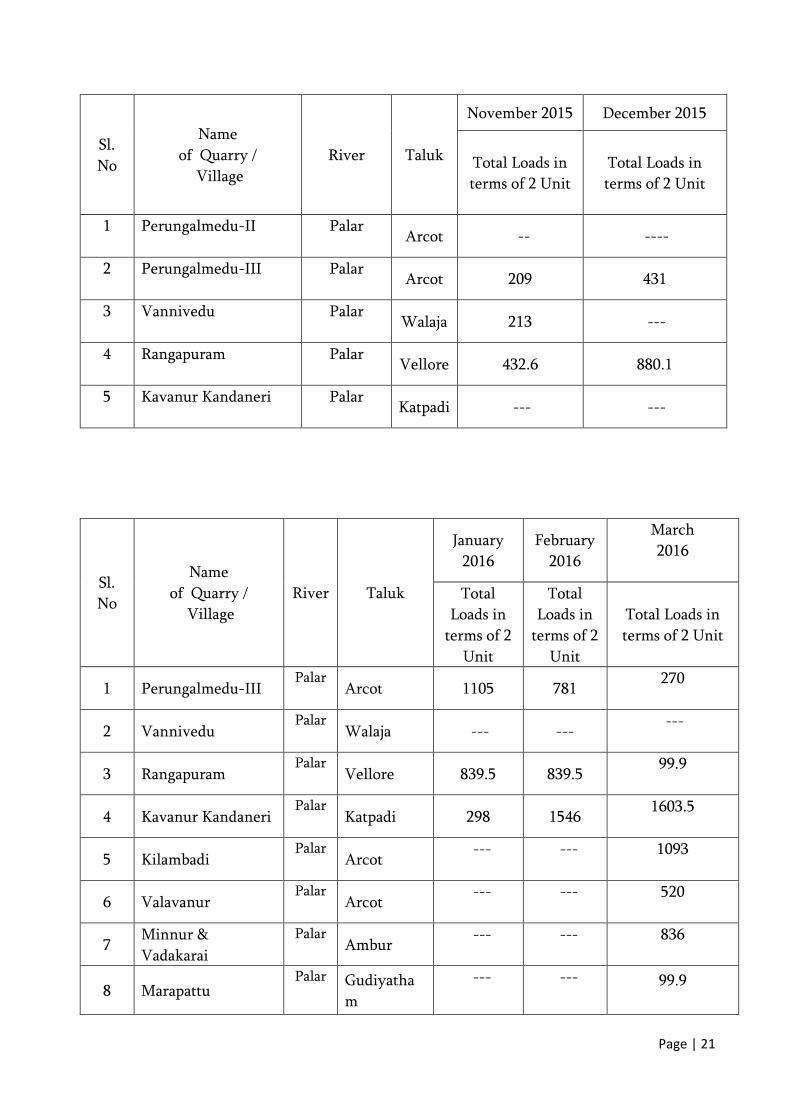
Sl.
No
Name
of Quarry /
Village
River Taluk
November 2015 December 2015
Total Loads in
terms of 2 Unit
Total Loads in
terms of 2 Unit
1 Perungalmedu-II Palar Arcot -- ----
2 Perungalmedu-III Palar Arcot 209 431
3 Vannivedu Palar Walaja 213 ---
4 Rangapuram Palar Vellore 432.6 880.1
5 Kavanur Kandaneri Palar Katpadi --- ---
Sl.
No
Name
of Quarry /
Village
River Taluk
January
2016
February
2016
March
2016
Total
Loads in
terms of 2
Unit
Total
Loads in
terms of 2
Unit
Total Loads in
terms of 2 Unit
1 Perungalmedu-III Palar
Arcot 1105 781 270
2 Vannivedu Palar
Walaja --- --- ---
3 Rangapuram Palar
Vellore 839.5 839.5 99.9
4 Kavanur Kandaneri Palar
Katpadi 298 1546 1603.5
5 Kilambadi Palar
Arcot --- --- 1093
6 Valavanur Palar
Arcot --- --- 520
7 Minnur &
Vadakarai
Palar Ambur
--- --- 836
8 Marapattu Palar Gudiyatha
m
--- --- 99.9
Page | 22
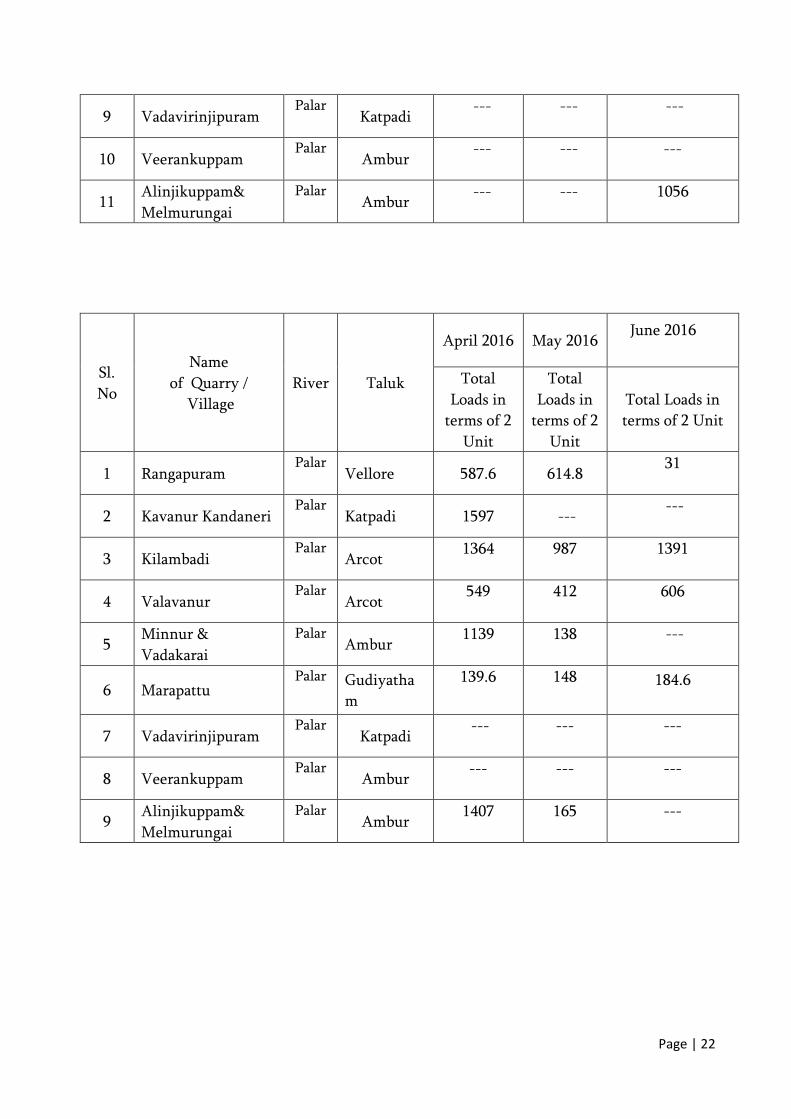
9 Vadavirinjipuram Palar
Katpadi --- --- ---
10 Veerankuppam Palar
Ambur --- --- ---
11 Alinjikuppam&
Melmurungai
Palar Ambur
--- --- 1056
Sl.
No
Name
of Quarry /
Village
River Taluk
April 2016 May 2016 June 2016
Total
Loads in
terms of 2
Unit
Total
Loads in
terms of 2
Unit
Total Loads in
terms of 2 Unit
1 Rangapuram Palar
Vellore 587.6 614.8 31
2 Kavanur Kandaneri Palar
Katpadi 1597 --- ---
3 Kilambadi Palar
Arcot 1364 987 1391
4 Valavanur Palar
Arcot 549 412 606
5 Minnur &
Vadakarai
Palar Ambur
1139 138 ---
6 Marapattu Palar Gudiyatha
m
139.6 148 184.6
7 Vadavirinjipuram Palar
Katpadi --- --- ---
8 Veerankuppam Palar
Ambur --- --- ---
9 Alinjikuppam&
Melmurungai
Palar Ambur
1407 165 ---
Page | 23
Sl.
No
Name
of Quarry /
Village
River Taluk
July 2016 August20
16
September 2016
Total
Loads in
terms of 2
Unit
Total
Loads in
terms of 2
Unit
Total Loads in
terms of 2 Unit
1 Rangapuram Palar
Vellore --- --- ---
2 Kavanur Kandaneri Palar
Katpadi 1970 2145 1950
3 Kilambadi Palar
Arcot 1382 1359 1290
4 Valavanur Palar
Arcot 634 608 553
5 Minnur &
Vadakarai
Palar Ambur
--- -- 3109
6 Marapattu Palar Gudiyatha
m
212.8 223.6 150.4
7 Vadavirinjipuram Palar
Katpadi 327.9 788.2 835.7
8 Veerankuppam Palar
Ambur --- 183.1 216.3
9 Alinjikuppam&
Melmurungai
Palar Ambur
--- -- 604
Page | 24
Sl.
No
Name
of Quarry /
Village
River Taluk
October
2016
November
2016
December 2016
Total
Loads in
terms of 2
Unit
Total
Loads in
terms of 2
Unit
Total Loads in
terms of 2 Unit
1 Kavanur Kandaneri Palar Katpadi 1858 1584 1023
2 Kilambadi Palar Arcot 920 655 663
3 Valavanur Palar Arcot 622 564 1426
4 Minnur &
Vadakarai Palar Ambur
3118 2681 4393
5 Marapattu Palar Gudiyatha
m
133.6 146.4 143.2
6 Vadavirinjipuram Palar Katpadi 766.9 774.5 713.3
7 Veerankuppam Palar Ambur 232.8 248.5 224.2
8 Alinjikuppam&
Melmurungai Palar Ambur
5181 3398 1437
Page | 25
Sl.
No
Name
of Quarry /
Village
River Taluk
January
2016
February
2017
March 2017
Total
Loads in
terms of 2
Unit
Total
Loads in
terms of 2
Unit
Total Loads in
terms of 2 Unit
1 Kavanur Kandaneri Palar Katpadi --- --- ---
2 Kilambadi Palar Arcot --- ---- ---
3 Valavanur Palar Arcot 5664 1045 ---
4 Minnur &
Vadakarai Palar Ambur
--- --- ---
5 Marapattu Palar Gudiyatha
m
119.6 79.4 ---
6 Vadavirinjipuram Palar Katpadi 656.0 691.1 7.6344
7 Veerankuppam Palar Ambur 193.8 100.4 ---
8 Alinjikuppam&
Melmurungai Palar Ambur
8908 10013 ---
Sl.
No
Name
of Quarry /
Village
River Taluk
June
2017
July
2017
August 2017
Total
Loads in
terms of
2 Unit
Total
Loads in
terms of 2
Unit
Total Loads in
terms of 2 Unit
1 Sakkaramallr Palar
Arcot &
Walaja
4507 6761.50 323.0
2 Pasumathur Palar Gudiyatham 948.50 5746.50 3943.0
Page | 26
Sl.
No
Name
of Quarry /
Village
River Taluk
Septemb
er 2017
October
2017
November 2017
Total
Loads in
terms of
2 Unit
Total
Loads in
terms of 2
Unit
Total Loads in
terms of 2 Unit
1 Sakkaramallr Palar
Arcot &
Walaja
207.50 --- 838.0
2
Pogai &
Kothamangalam
Palar
Katpadi &
Gudiyatham
--- 1.296
2725
Sl.
No
Name
of Quarry /
Village
River Taluk
Decemb
er 2017
January
2018
February 2018
Total
Loads in
terms of
2 Unit
Total
Loads in
terms of 2
Unit
Total Loads in
terms of 2 Unit
1 Sakkaramallr Palar
Arcot &
Walaja
2895.80 1433.40 2301.60
2
Pogai &
Kothamangalam
Palar
Katpadi &
Gudiyatham
2554.10 1777.12
1974.70
Page | 27
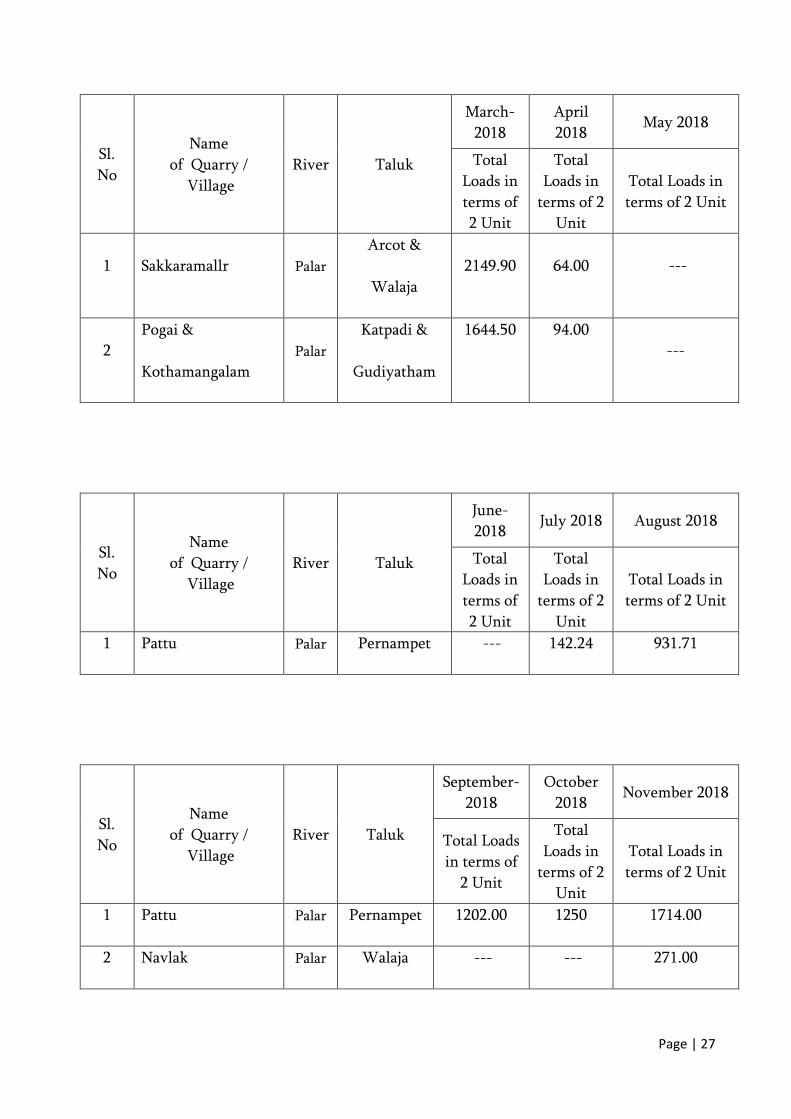
Sl.
No
Name
of Quarry /
Village
River Taluk
March-
2018
April
2018 May 2018
Total
Loads in
terms of
2 Unit
Total
Loads in
terms of 2
Unit
Total Loads in
terms of 2 Unit
1 Sakkaramallr Palar
Arcot &
Walaja
2149.90 64.00 ---
2
Pogai &
Kothamangalam
Palar
Katpadi &
Gudiyatham
1644.50 94.00
---
Sl.
No
Name
of Quarry /
Village
River Taluk
June-
2018 July 2018 August 2018
Total
Loads in
terms of
2 Unit
Total
Loads in
terms of 2
Unit
Total Loads in
terms of 2 Unit
1 Pattu Palar Pernampet --- 142.24 931.71
Sl.
No
Name
of Quarry /
Village
River Taluk
September-
2018
October
2018 November 2018
Total Loads
in terms of
2 Unit
Total
Loads in
terms of 2
Unit
Total Loads in
terms of 2 Unit
1 Pattu Palar Pernampet 1202.00 1250 1714.00
2 Navlak Palar Walaja --- --- 271.00
Page | 28
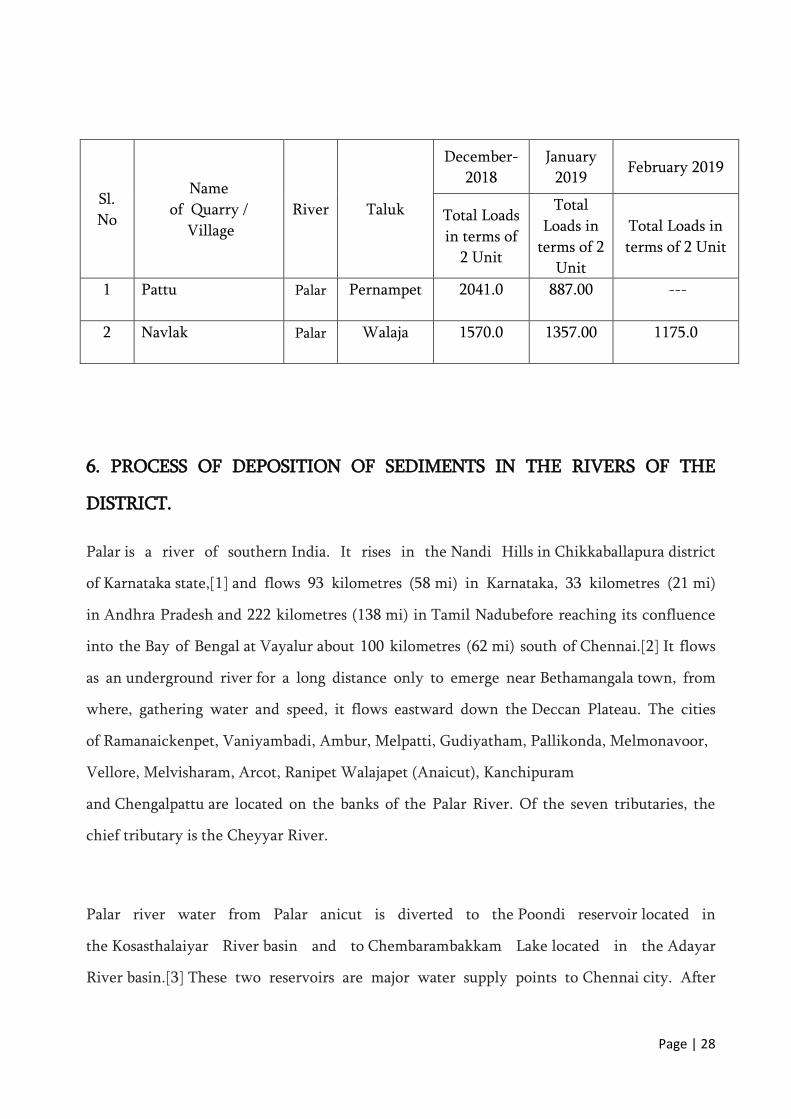
Sl.
No
Name
of Quarry /
Village
River Taluk
December-
2018
January
2019 February 2019
Total Loads
in terms of
2 Unit
Total
Loads in
terms of 2
Unit
Total Loads in
terms of 2 Unit
1 Pattu Palar Pernampet 2041.0 887.00 ---
2 Navlak Palar Walaja 1570.0 1357.00 1175.0
6. PROCESS OF DEPOSITION OF SEDIMENTS IN THE RIVERS OF THE
DISTRICT.
Palar is a river of southern India. It rises in the Nandi Hills in Chikkaballapura district
of Karnataka state,[1] and flows 93 kilometres (58 mi) in Karnataka, 33 kilometres (21 mi)
in Andhra Pradesh and 222 kilometres (138 mi) in Tamil Nadubefore reaching its confluence
into the Bay of Bengal at Vayalur about 100 kilometres (62 mi) south of Chennai.[2] It flows
as an underground river for a long distance only to emerge near Bethamangala town, from
where, gathering water and speed, it flows eastward down the Deccan Plateau. The cities
of Ramanaickenpet, Vaniyambadi, Ambur, Melpatti, Gudiyatham, Pallikonda, Melmonavoor,
Vellore, Melvisharam, Arcot, Ranipet Walajapet (Anaicut), Kanchipuram
and Chengalpattu are located on the banks of the Palar River. Of the seven tributaries, the
chief tributary is the Cheyyar River.
Palar river water from Palar anicut is diverted to the Poondi reservoir located in
the Kosasthalaiyar River basin and to Chembarambakkam Lake located in the Adayar
River basin.[3] These two reservoirs are major water supply points to Chennai city. After
Page | 29
commissioning of the Telugu Ganga project to supply nearly 1000 million litres per day
of Krishna Riverwater to the Chennai city, the dependence on Palar river water has reduced
drastically.
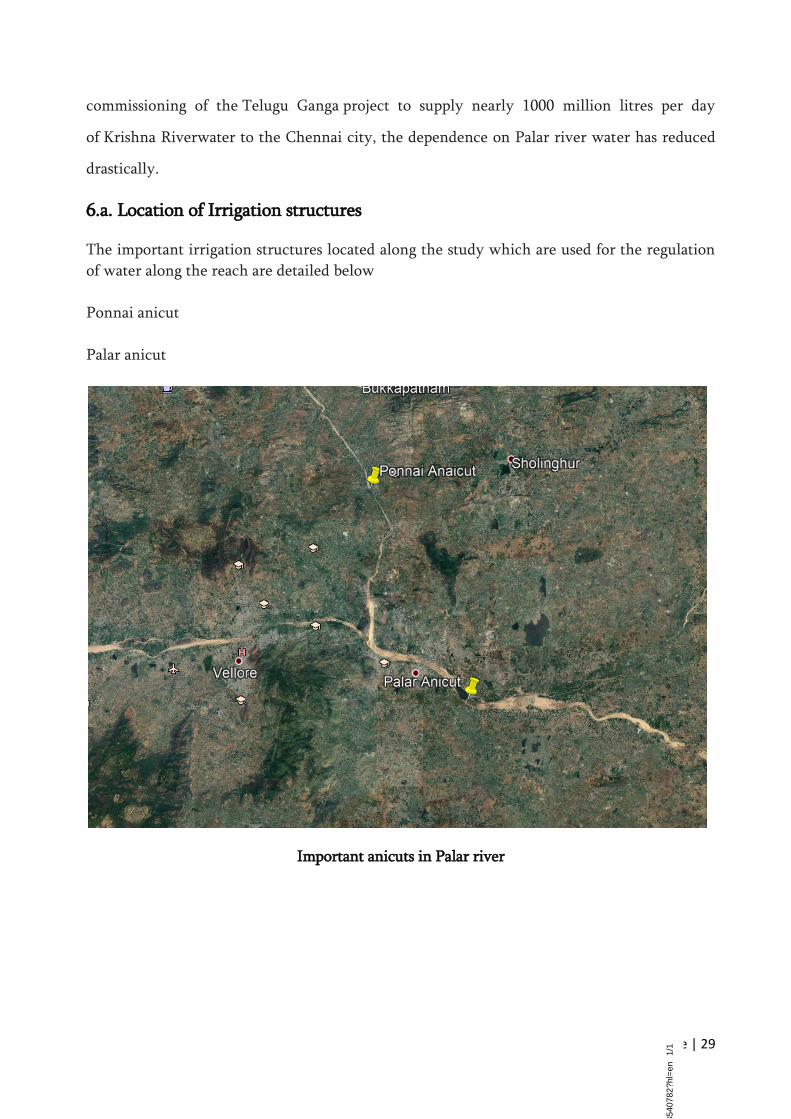
6.a. Location of Irrigation structures
The important irrigation structures located along the study which are used for the regulation
of water along the reach are detailed below
Ponnai anicut
Palar anicut
Important anicuts in Palar river
https://w
ww
.goo
gle
.co.in/m
aps/p
lace/P
ala
r+R
iver/
@12.7
123966,7
9.5
22894
5,8
3733
m/d
ata
=!3
m1!1
e3!4
m5!3
m4!1
s0x3bad07e
374f5
a735:0
xb
6421df9
51139f2
!8m
2!3
d12.7
397174!4
d79
.3540782
?hl=
en
1/1
Page | 30
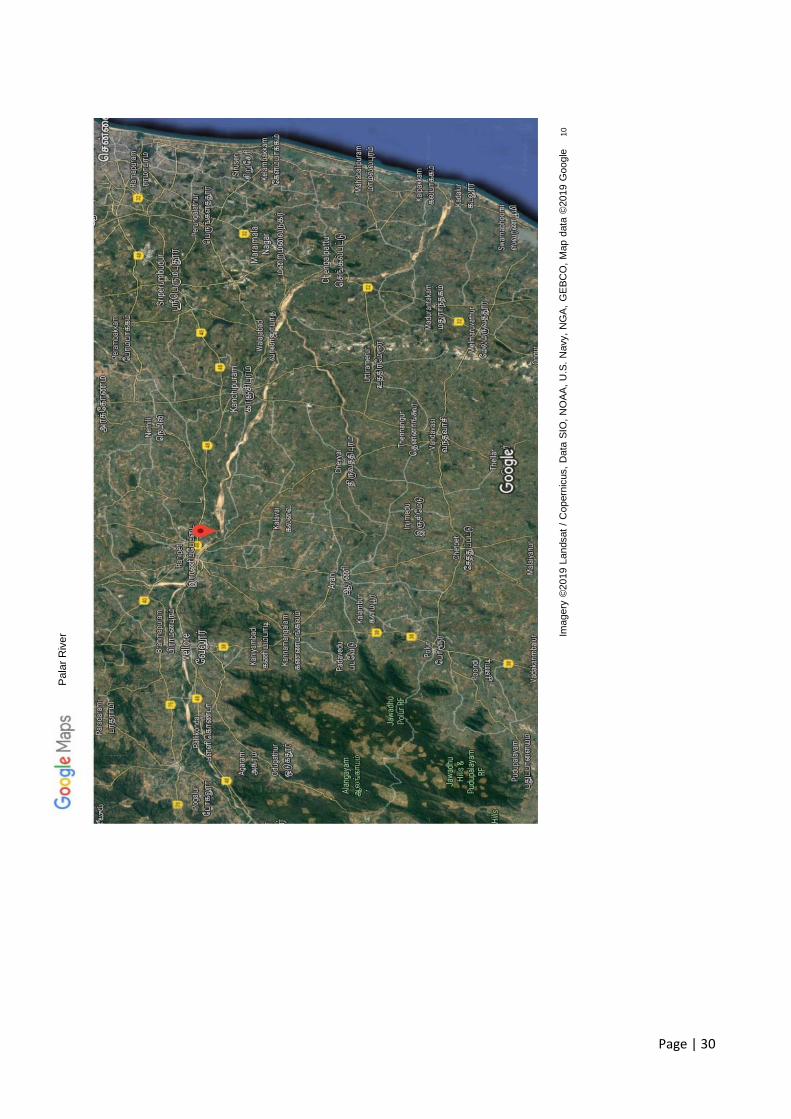
Pala
r R
iver Im
ag
ery
©2
01
9 L
an
dsat
/ C
op
ern
icus,
Da
ta S
IO,
NO
AA
, U
.S.
Navy,
NG
A,
GE
BC
O,
Map
data
©20
19
Go
og
le
10
km
Page | 31
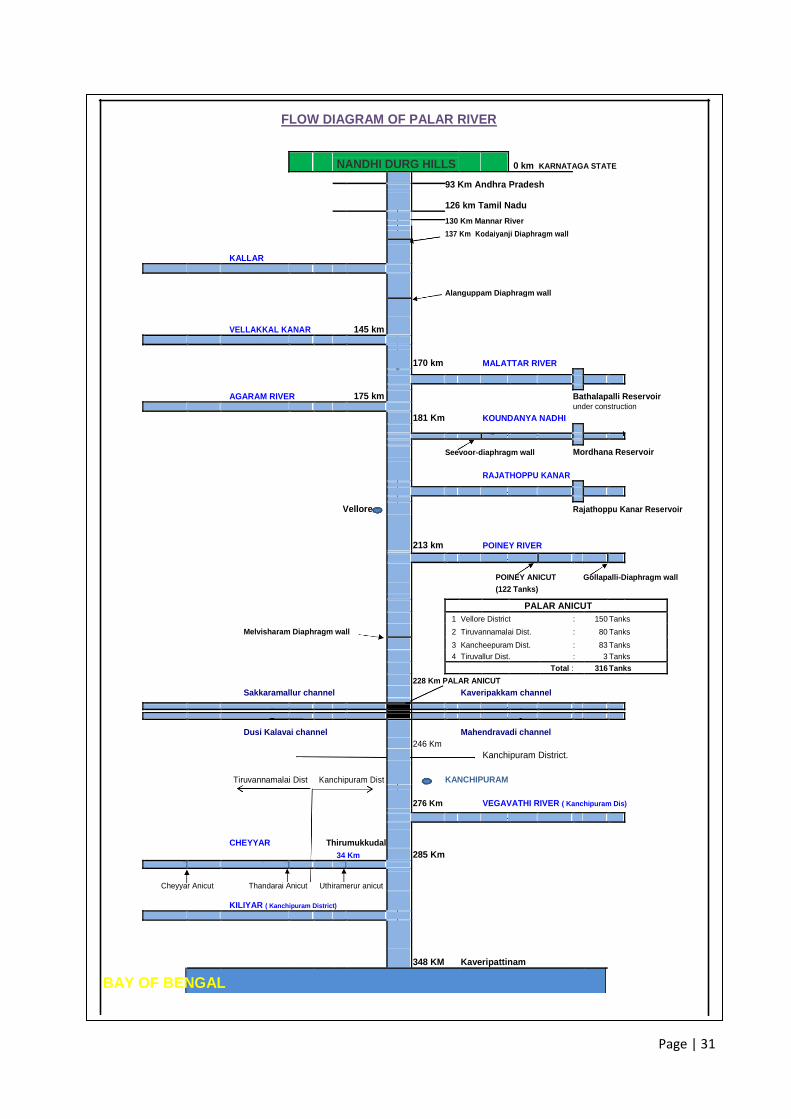
FLOW DIAGRAM OF PALAR RIVER
NANDHI DURG HILLS 0 km KARNATAGA STATE
93 Km Andhra Pradesh
126 km Tamil Nadu
130 Km Mannar River
KALLAR
137 Km Kodaiyanji Diaphragm wall
Alanguppam Diaphragm wall
VELLAKKAL KANAR 145 km
170 km
MALATTAR RIVER
AGARAM RIVER
175 km
Bathalapalli Reservoir
181 Km
KOUNDANYA NADHI
under construction
Seevoor-diaphragm wall Mordhana Reservoir
RAJATHOPPU KANAR
Vellore
Rajathoppu Kanar Reservoir
213 km POINEY RIVER
POINEY ANICUT Gollapalli-Diaphragm wall
(122 Tanks)
PALAR ANICUT
1 Vellore District : 150 Tanks
Melvisharam Diaphragm wall 2 Tiruvannamalai Dist. : 80 Tanks
3 Kancheepuram Dist. : 83 Tanks
4 Tiruvallur Dist. : 3 Tanks
Total : 316 Tanks
228 Km PALAR ANICUT
Sakkaramallur channel Kaveripakkam channel
Dusi Kalavai channel Mahendravadi channel 246 Km
Kanchipuram District.
Tiruvannamalai Dist Kanchipuram Dist KANCHIPURAM
276 Km VEGAVATHI RIVER ( Kanchipuram Dis)
CHEYYAR Thirumukkudal
285 Km
34 Km
Cheyyar Anicut Thandarai Anicut Uthiramerur anicut
KILIYAR ( Kanchipuram District)
348 KM Kaveripattinam
BAY OF BENGAL
Page | 32
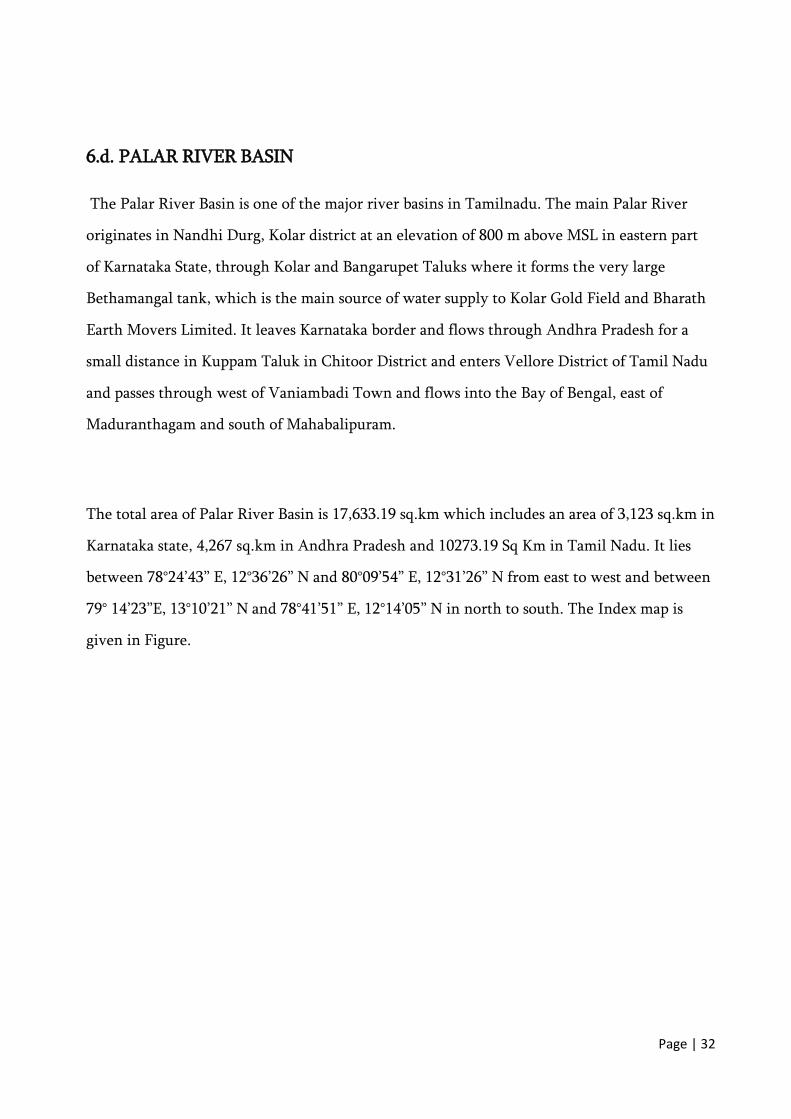
6.d. PALAR RIVER BASIN
The Palar River Basin is one of the major river basins in Tamilnadu. The main Palar River
originates in Nandhi Durg, Kolar district at an elevation of 800 m above MSL in eastern part
of Karnataka State, through Kolar and Bangarupet Taluks where it forms the very large
Bethamangal tank, which is the main source of water supply to Kolar Gold Field and Bharath
Earth Movers Limited. It leaves Karnataka border and flows through Andhra Pradesh for a
small distance in Kuppam Taluk in Chitoor District and enters Vellore District of Tamil Nadu
and passes through west of Vaniambadi Town and flows into the Bay of Bengal, east of
Maduranthagam and south of Mahabalipuram.
The total area of Palar River Basin is 17,633.19 sq.km which includes an area of 3,123 sq.km in
Karnataka state, 4,267 sq.km in Andhra Pradesh and 10273.19 Sq Km in Tamil Nadu. It lies
between 78°24’43” E, 12°36’26” N and 80°09’54” E, 12°31’26” N from east to west and between
79° 14’23”E, 13°10’21” N and 78°41’51” E, 12°14’05” N in north to south. The Index map is
given in Figure.
Page | 33
Index Map of Palar River Basin
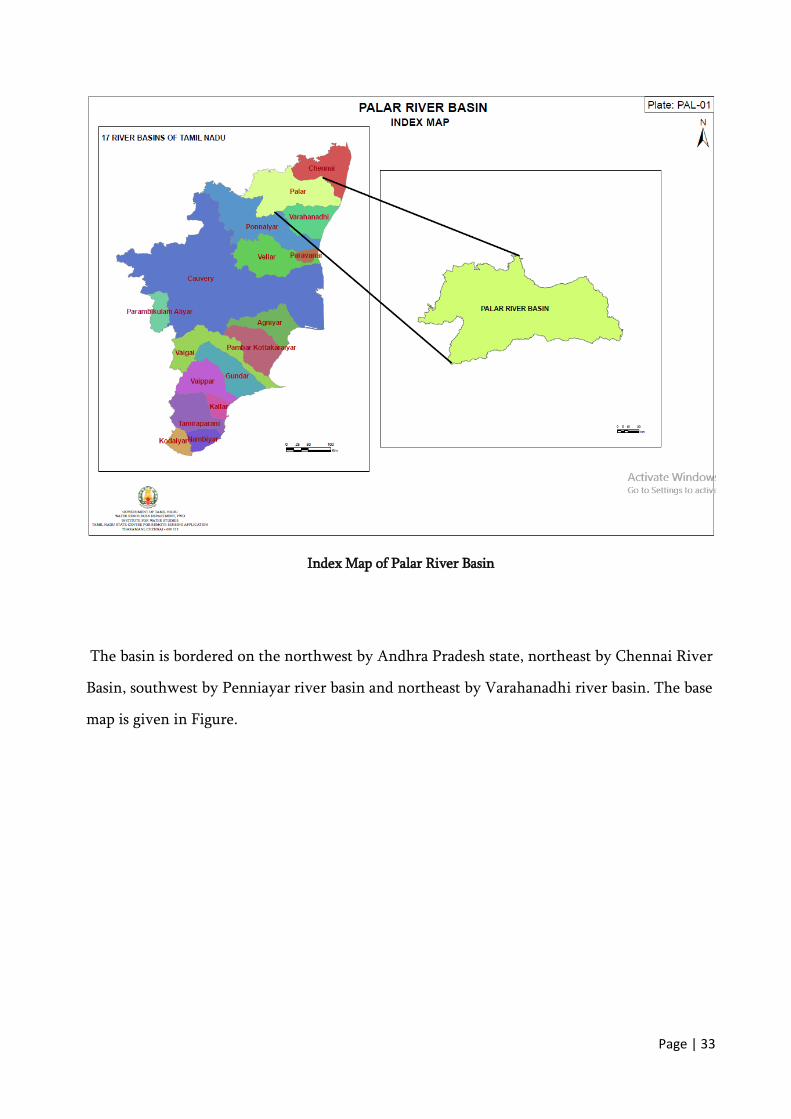
The basin is bordered on the northwest by Andhra Pradesh state, northeast by Chennai River
Basin, southwest by Penniayar river basin and northeast by Varahanadhi river basin. The base
map is given in Figure.
Page | 34
Base Map of Palar River Basin
Page | 35
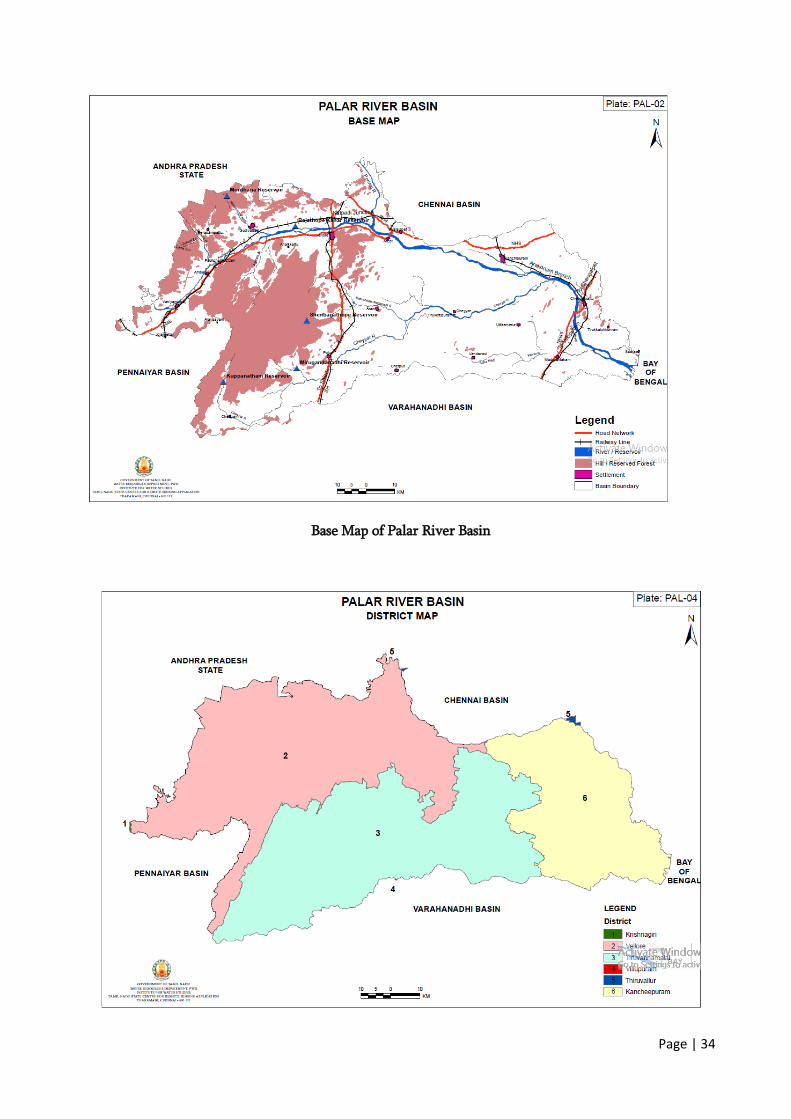
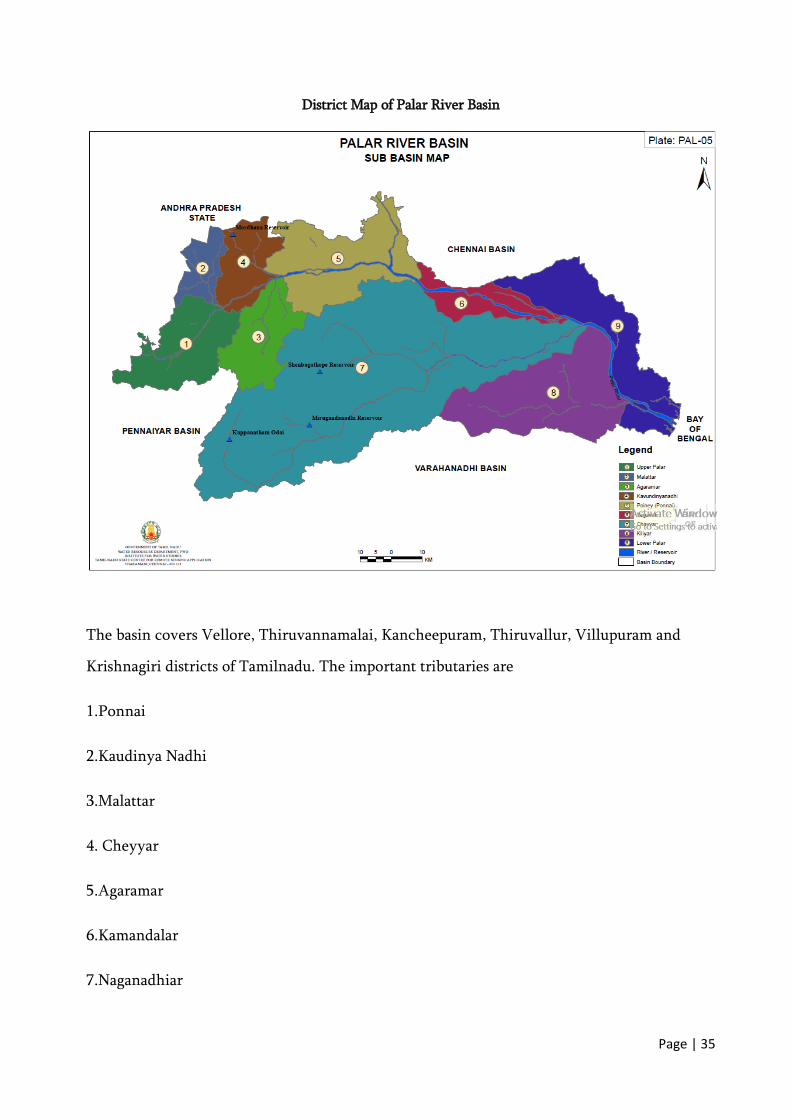
District Map of Palar River Basin
The basin covers Vellore, Thiruvannamalai, Kancheepuram, Thiruvallur, Villupuram and
Krishnagiri districts of Tamilnadu. The important tributaries are
1.Ponnai
2.Kaudinya Nadhi
3.Malattar
4. Cheyyar
5.Agaramar
6.Kamandalar
7.Naganadhiar
Page | 36
8.Killiyar
9.Vegavathiar.
In this basin there are 50 blocks either partly or fully falling in the above districts.
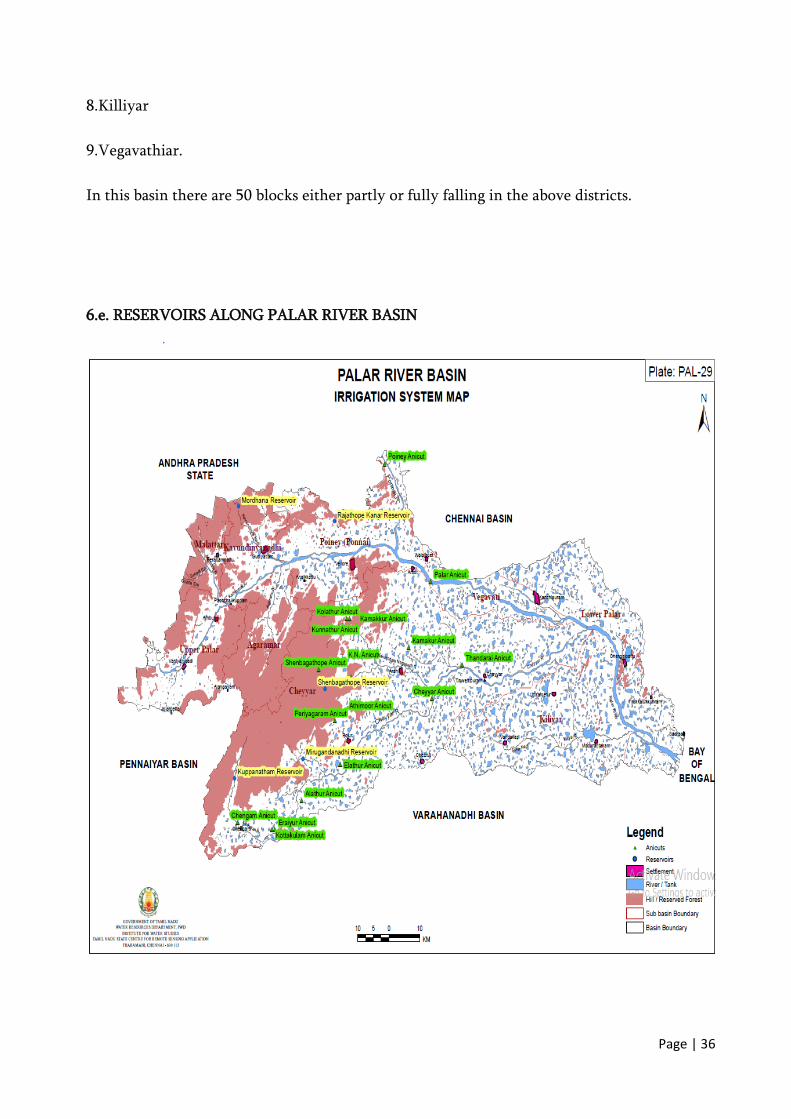
6.e. RESERVOIRS ALONG PALAR RIVER BASIN
Page | 37
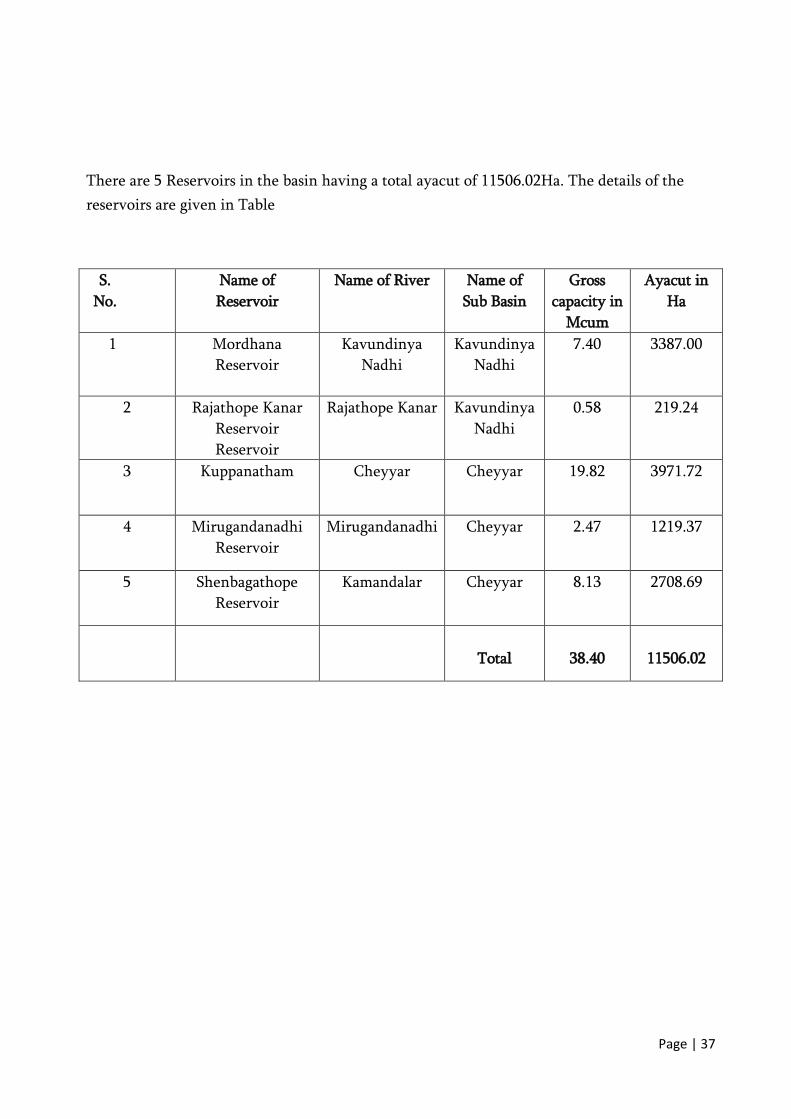
There are 5 Reservoirs in the basin having a total ayacut of 11506.02Ha. The details of the
reservoirs are given in Table
S.
No.
Name of
Reservoir
Name of River
Name of
Sub Basin
Gross
capacity in
Mcum
Ayacut in
Ha
1
Mordhana
Reservoir
Kavundinya
Nadhi
Kavundinya
Nadhi
7.40 3387.00
2 Rajathope Kanar
Reservoir
Reservoir
Rajathope Kanar
Kavundinya
Nadhi
0.58 219.24
3 Kuppanatham Cheyyar Cheyyar 19.82 3971.72
4 Mirugandanadhi
Reservoir
Mirugandanadhi Cheyyar 2.47 1219.37
5 Shenbagathope
Reservoir
Kamandalar Cheyyar 8.13 2708.69
Total
38.40
11506.02
Page | 38
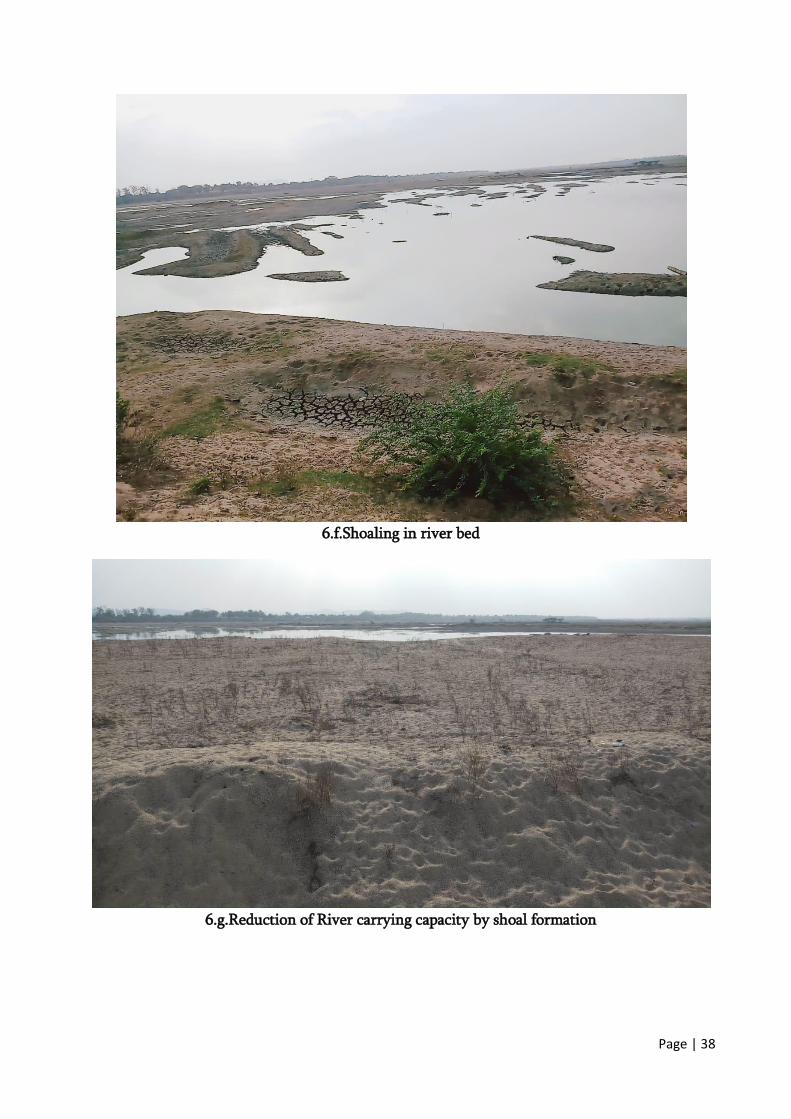
6.f.Shoaling in river bed
6.g.Reduction of River carrying capacity by shoal formation
Page | 39
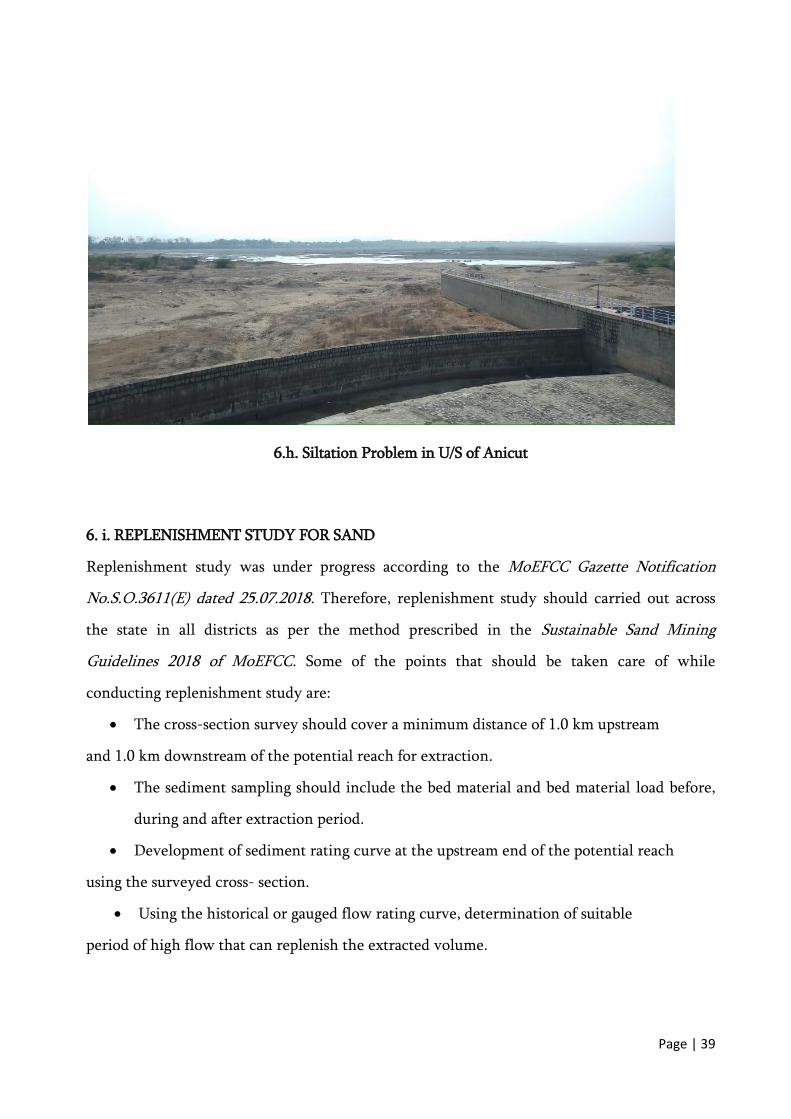
6.h. Siltation Problem in U/S of Anicut
6. i. REPLENISHMENT STUDY FOR SAND
Replenishment study was under progress according to the MoEFCC Gazette Notification
No.S.O.3611(E) dated 25.07.2018. Therefore, replenishment study should carried out across
the state in all districts as per the method prescribed in the Sustainable Sand Mining
Guidelines 2018 of MoEFCC. Some of the points that should be taken care of while
conducting replenishment study are:
• The cross-section survey should cover a minimum distance of 1.0 km upstream
and 1.0 km downstream of the potential reach for extraction.
• The sediment sampling should include the bed material and bed material load before,
during and after extraction period.
• Development of sediment rating curve at the upstream end of the potential reach
using the surveyed cross- section.
• Using the historical or gauged flow rating curve, determination of suitable
period of high flow that can replenish the extracted volume.
Page | 40
7. GENERAL PROFILE OF THE DISTRICT
7.a. PHYSICAL FEATURES AND GEOGRAPHICAL AREA:
Vellore district lies between 12° 15’ to 13° 15’ North latitudes and 78° 20’ to 79°
50’ East longitudes in Tamilnadu State. The geographical area of this district is 6077 sq. k.m.
The total population as per 2011 Census is 39,36,331. Vellore district is located along the river
Palar. The district is bounded in the north by Andhra Pradesh state, in the west by
Krishnagiri District, in the East by Kancheepuram District and in the South by
Thiruvannamalai District,.
The District has 3 divisions and 13 Taluks as follows:
DIVISIONS
1. Vellore
2. Tirupathur
3. Ranipet
TALUKS
1. Vellore
2. Katpadi
3. Gudiyattam
4. Anaicut
5. Pernambut
6. Arakonam
Page | 41
7. Walaja
8. Arcot
9. Nemili
10. Tirupattur
11. Vaniyambadi
12. Ambur
13. Natrampalli
S.No Division Name Taluk Name Revenue Villages Count
1. Vellore Vellore 51
2. Vellore Katpadi 85
3. Vellore Gudiyattam 45
4. Vellore Anaicut 61
5. Vellore Pernambut 52
6. Ranipet Arakonam 68
7. Ranipet Walaja 83
8. Ranipet Arcot 102
9. Ranipet Nemili 77
10. Tirupattur Tirupattur 63
11. Tirupattur Vaniyambadi 48
12. Tirupattur Ambur 77
13. Tirupattur Natrampalli 30
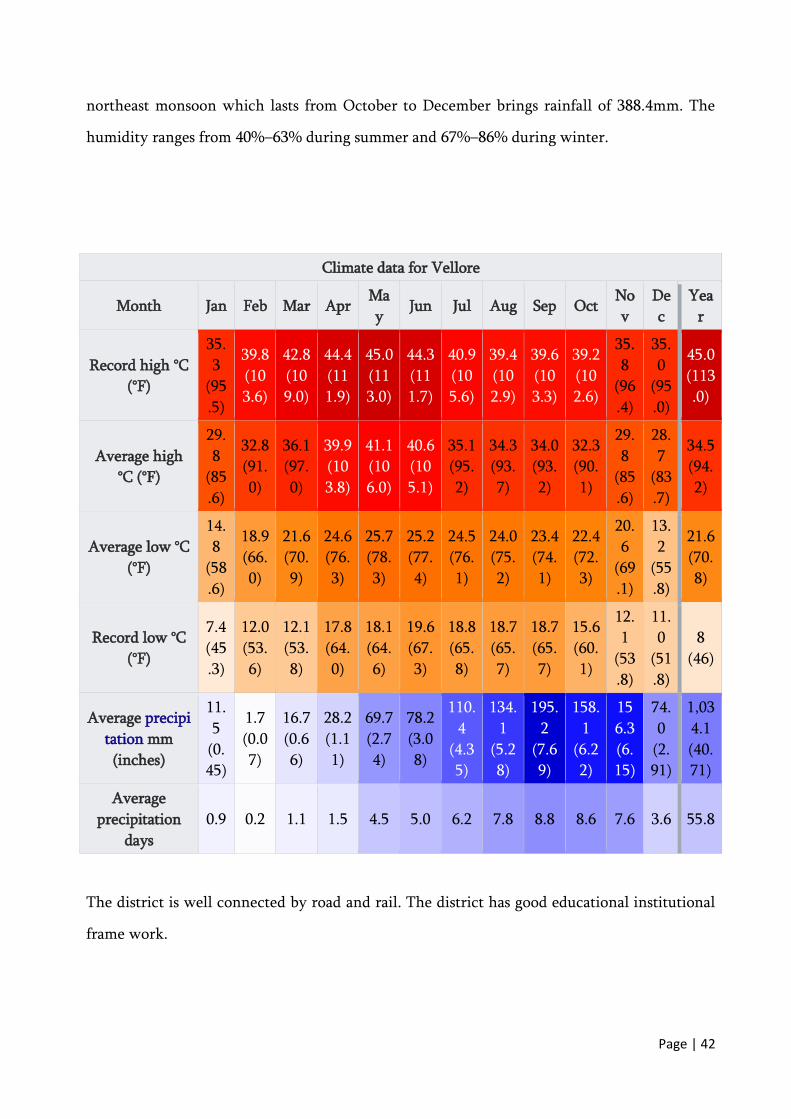
Vellore experiences a tropical savanna climate (Köppen climate classification Aw). The
temperature ranges from a maximum of 39.4 °C (102.9 °F) to a minimum of 13 °C (55 °F). The
Page | 42
northeast monsoon which lasts from October to December brings rainfall of 388.4mm. The
humidity ranges from 40%–63% during summer and 67%–86% during winter.
Climate data for Vellore
Month Jan Feb Mar Apr Ma
y Jun Jul Aug Sep Oct
No
v
De
c
Yea
r
Record high °C
(°F)
35.
3
(95
.5)
39.8
(10
3.6)
42.8
(10
9.0)
44.4
(11
1.9)
45.0
(11
3.0)
44.3
(11
1.7)
40.9
(10
5.6)
39.4
(10
2.9)
39.6
(10
3.3)
39.2
(10
2.6)
35.
8
(96
.4)
35.
0
(95
.0)
45.0
(113
.0)
Average high
°C (°F)
29.
8
(85
.6)
32.8
(91.
0)
36.1
(97.
0)
39.9
(10
3.8)
41.1
(10
6.0)
40.6
(10
5.1)
35.1
(95.
2)
34.3
(93.
7)
34.0
(93.
2)
32.3
(90.
1)
29.
8
(85
.6)
28.
7
(83
.7)
34.5
(94.
2)
Average low °C
(°F)
14.
8
(58
.6)
18.9
(66.
0)
21.6
(70.
9)
24.6
(76.
3)
25.7
(78.
3)
25.2
(77.
4)
24.5
(76.
1)
24.0
(75.
2)
23.4
(74.
1)
22.4
(72.
3)
20.
6
(69
.1)
13.
2
(55
.8)
21.6
(70.
8)
Record low °C
(°F)
7.4
(45
.3)
12.0
(53.
6)
12.1
(53.
8)
17.8
(64.
0)
18.1
(64.
6)
19.6
(67.
3)
18.8
(65.
8)
18.7
(65.
7)
18.7
(65.
7)
15.6
(60.
1)
12.
1
(53
.8)
11.
0
(51
.8)
8
(46)
Average precipi
tation mm
(inches)
11.
5
(0.
45)
1.7
(0.0
7)
16.7
(0.6
6)
28.2
(1.1
1)
69.7
(2.7
4)
78.2
(3.0
8)
110.
4
(4.3
5)
134.
1
(5.2
8)
195.
2
(7.6
9)
158.
1
(6.2
2)
15
6.3
(6.
15)
74.
0
(2.
91)
1,03
4.1
(40.
71)
Average
precipitation
days
0.9 0.2 1.1 1.5 4.5 5.0 6.2 7.8 8.8 8.6 7.6 3.6 55.8
The district is well connected by road and rail. The district has good educational institutional
frame work.
Page | 43
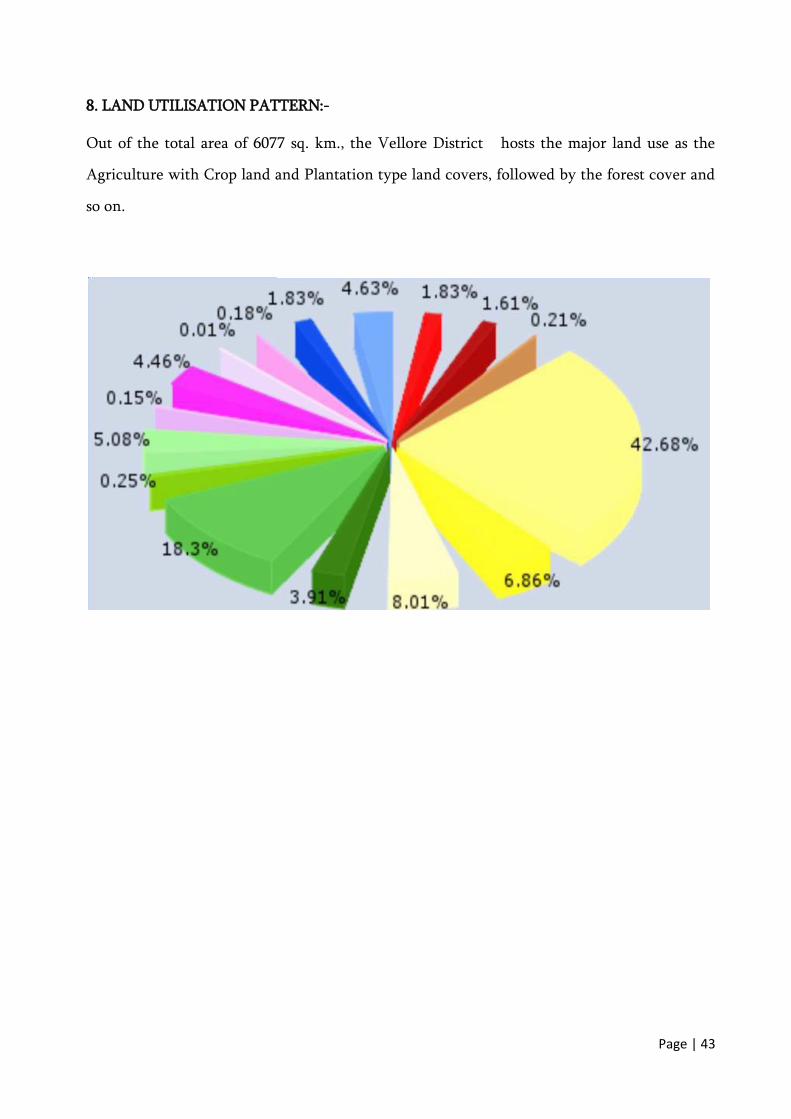
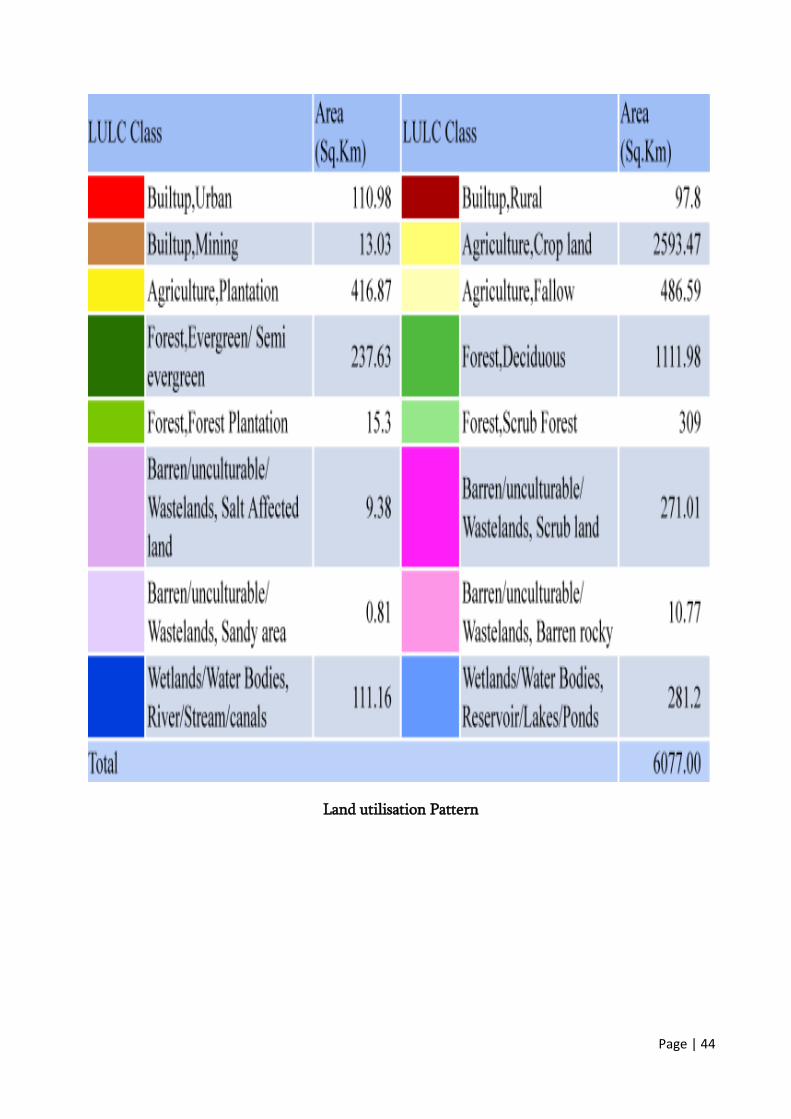
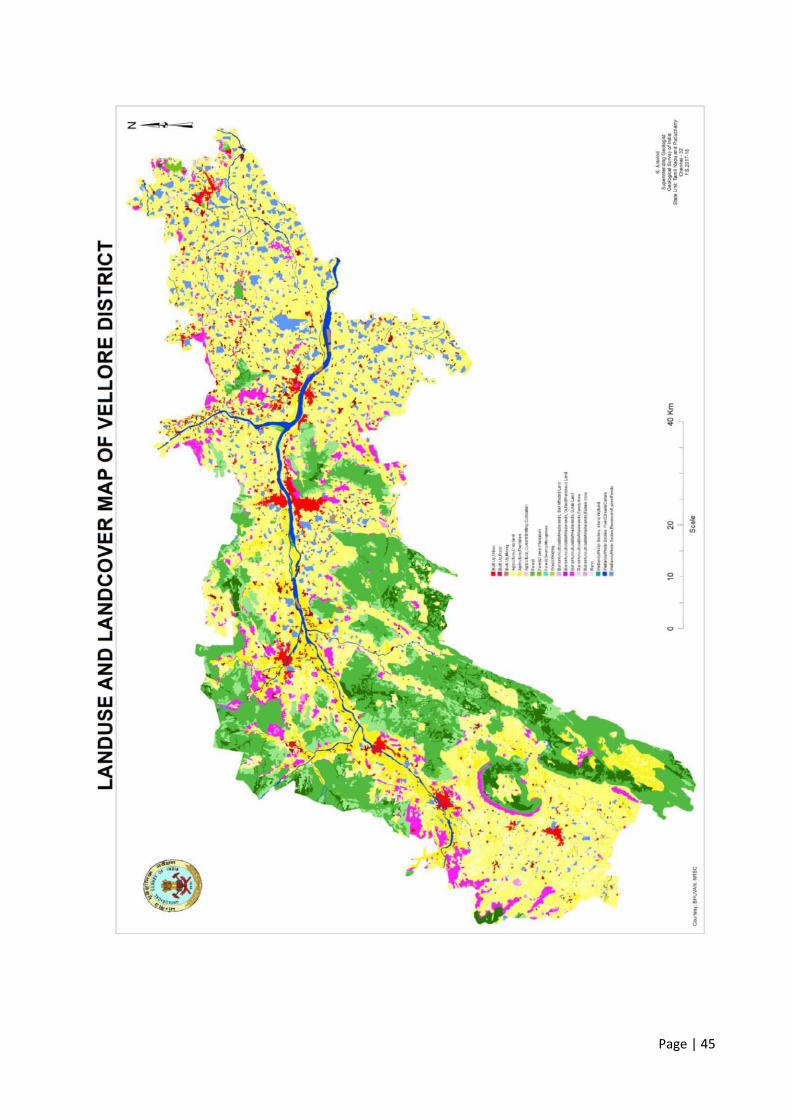
8. LAND UTILISATION PATTERN:-
Out of the total area of 6077 sq. km., the Vellore District hosts the major land use as the
Agriculture with Crop land and Plantation type land covers, followed by the forest cover and
so on.
Page | 44
Land utilisation Pattern
Page | 45
Page | 46
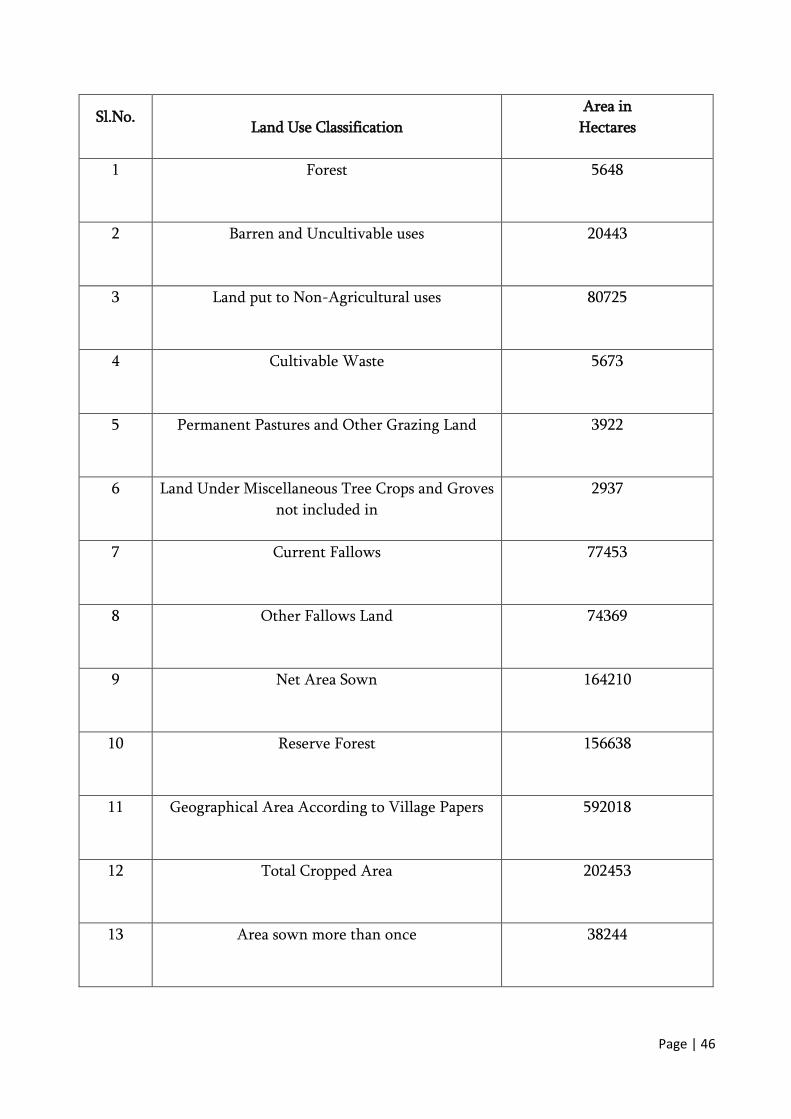
Sl.No.
Land Use Classification
Area in
Hectares
1 Forest 5648
2 Barren and Uncultivable uses 20443
3 Land put to Non-Agricultural uses 80725
4 Cultivable Waste 5673
5 Permanent Pastures and Other Grazing Land 3922
6 Land Under Miscellaneous Tree Crops and Groves
not included in
2937
7 Current Fallows 77453
8 Other Fallows Land 74369
9 Net Area Sown 164210
10 Reserve Forest 156638
11 Geographical Area According to Village Papers 592018
12 Total Cropped Area 202453
13 Area sown more than once 38244
Page | 47
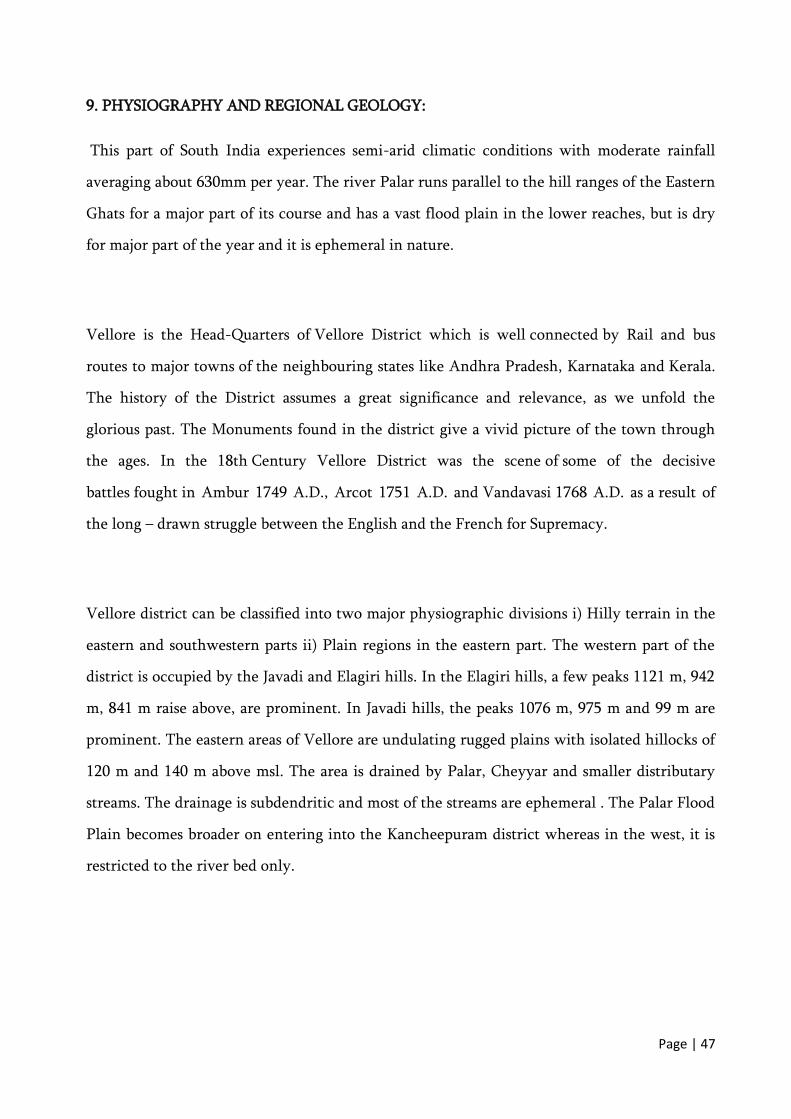
9. PHYSIOGRAPHY AND REGIONAL GEOLOGY:
This part of South India experiences semi-arid climatic conditions with moderate rainfall
averaging about 630mm per year. The river Palar runs parallel to the hill ranges of the Eastern
Ghats for a major part of its course and has a vast flood plain in the lower reaches, but is dry
for major part of the year and it is ephemeral in nature.
Vellore is the Head-Quarters of Vellore District which is well connected by Rail and bus
routes to major towns of the neighbouring states like Andhra Pradesh, Karnataka and Kerala.
The history of the District assumes a great significance and relevance, as we unfold the
glorious past. The Monuments found in the district give a vivid picture of the town through
the ages. In the 18th Century Vellore District was the scene of some of the decisive
battles fought in Ambur 1749 A.D., Arcot 1751 A.D. and Vandavasi 1768 A.D. as a result of
the long – drawn struggle between the English and the French for Supremacy.
Vellore district can be classified into two major physiographic divisions i) Hilly terrain in the
eastern and southwestern parts ii) Plain regions in the eastern part. The western part of the
district is occupied by the Javadi and Elagiri hills. In the Elagiri hills, a few peaks 1121 m, 942
m, 841 m raise above, are prominent. In Javadi hills, the peaks 1076 m, 975 m and 99 m are
prominent. The eastern areas of Vellore are undulating rugged plains with isolated hillocks of
120 m and 140 m above msl. The area is drained by Palar, Cheyyar and smaller distributary
streams. The drainage is subdendritic and most of the streams are ephemeral . The Palar Flood
Plain becomes broader on entering into the Kancheepuram district whereas in the west, it is
restricted to the river bed only.
Page | 48
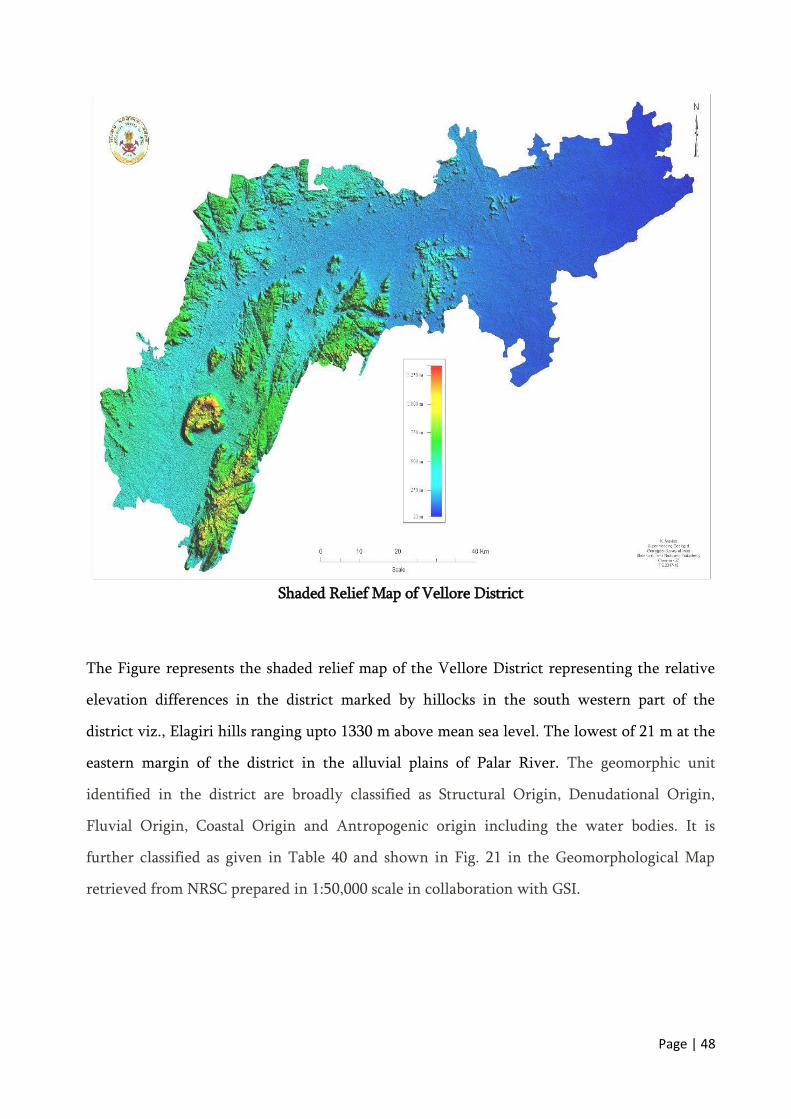
Shaded Relief Map of Vellore District
The Figure represents the shaded relief map of the Vellore District representing the relative
elevation differences in the district marked by hillocks in the south western part of the
district viz., Elagiri hills ranging upto 1330 m above mean sea level. The lowest of 21 m at the
eastern margin of the district in the alluvial plains of Palar River. The geomorphic unit
identified in the district are broadly classified as Structural Origin, Denudational Origin,
Fluvial Origin, Coastal Origin and Antropogenic origin including the water bodies. It is
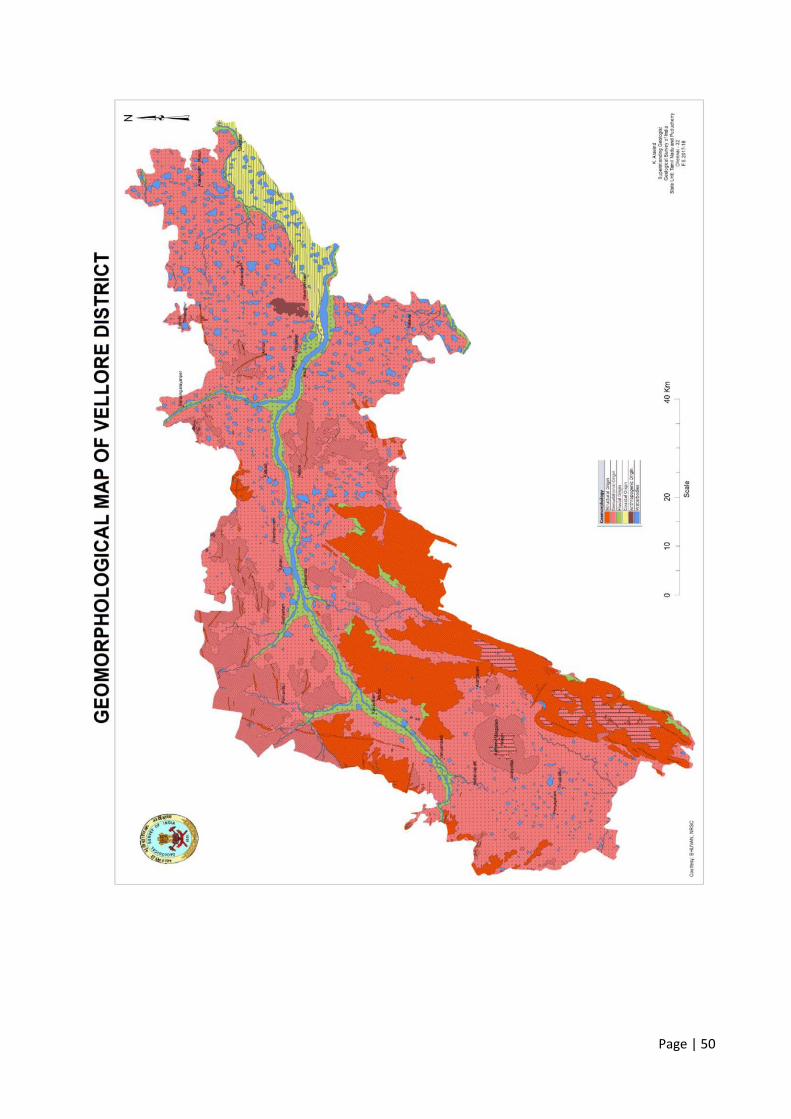
further classified as given in Table 40 and shown in Fig. 21 in the Geomorphological Map
retrieved from NRSC prepared in 1:50,000 scale in collaboration with GSI.
Page | 49
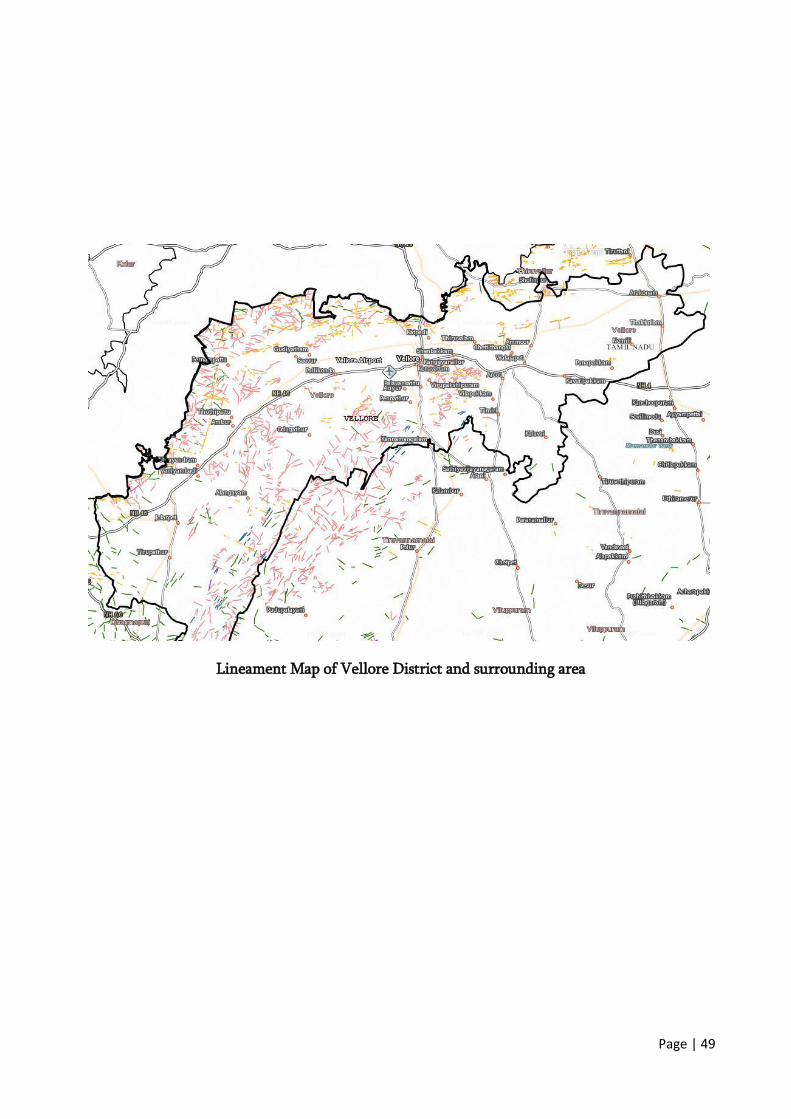
Lineament Map of Vellore District and surrounding area
Page | 50
Page | 51
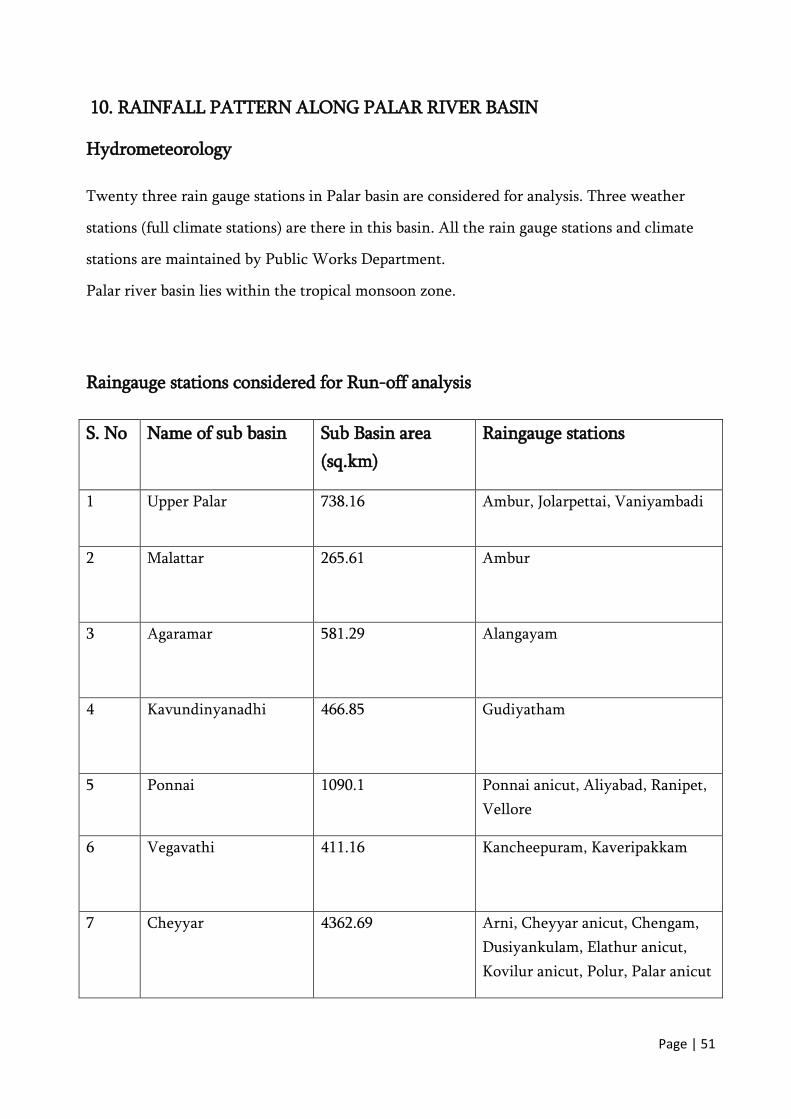
10. RAINFALL PATTERN ALONG PALAR RIVER BASIN
Hydrometeorology
Twenty three rain gauge stations in Palar basin are considered for analysis. Three weather
stations (full climate stations) are there in this basin. All the rain gauge stations and climate
stations are maintained by Public Works Department.
Palar river basin lies within the tropical monsoon zone.
Raingauge stations considered for Run-off analysis
S. No Name of sub basin Sub Basin area
(sq.km)
Raingauge stations
1 Upper Palar 738.16 Ambur, Jolarpettai, Vaniyambadi
2 Malattar 265.61
Ambur
3 Agaramar 581.29
Alangayam
4 Kavundinyanadhi 466.85
Gudiyatham
5 Ponnai 1090.1 Ponnai anicut, Aliyabad, Ranipet,
Vellore
6 Vegavathi 411.16
Kancheepuram, Kaveripakkam
7 Cheyyar 4362.69 Arni, Cheyyar anicut, Chengam,
Dusiyankulam, Elathur anicut,
Kovilur anicut, Polur, Palar anicut
Page | 52
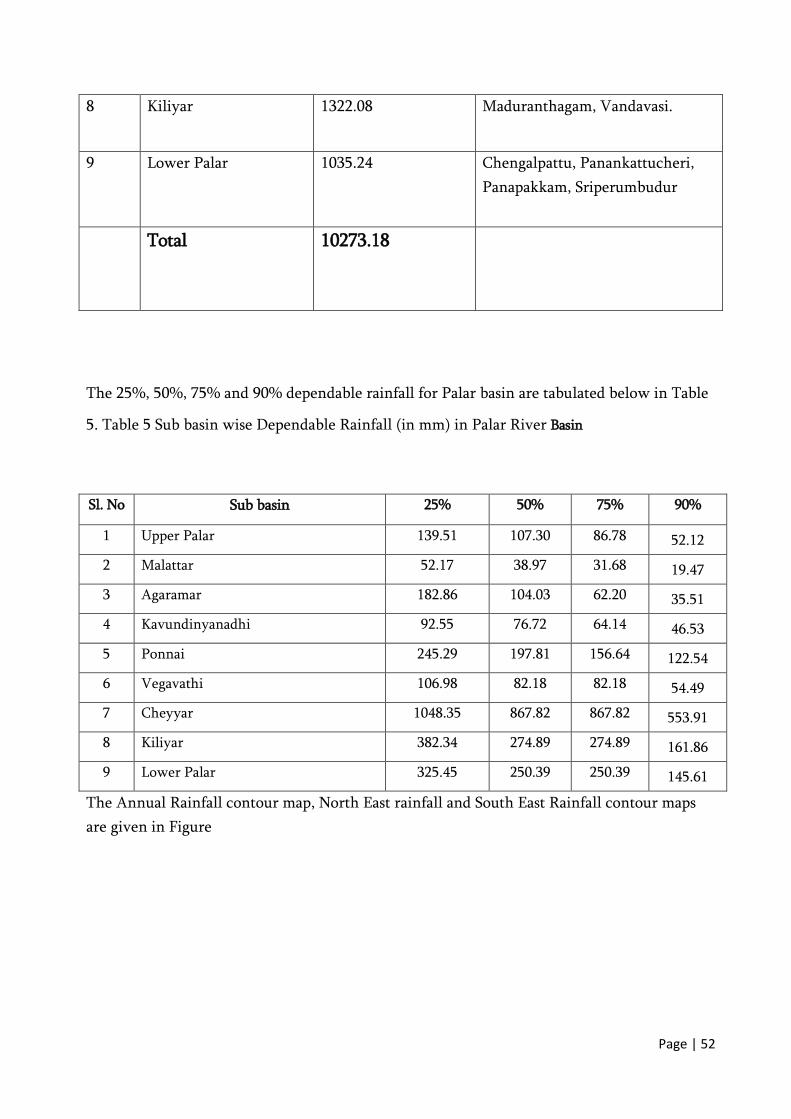
8 Kiliyar 1322.08 Maduranthagam, Vandavasi.
9 Lower Palar
1035.24 Chengalpattu, Panankattucheri,
Panapakkam, Sriperumbudur
Total 10273.18
The 25%, 50%, 75% and 90% dependable rainfall for Palar basin are tabulated below in Table
5. Table 5 Sub basin wise Dependable Rainfall (in mm) in Palar River Basin
Sl. No Sub basin 25% 50% 75% 90%
1 Upper Palar 139.51 107.30 86.78 52.12
2 Malattar 52.17 38.97 31.68 19.47
3 Agaramar 182.86 104.03 62.20 35.51
4 Kavundinyanadhi 92.55 76.72 64.14 46.53
5 Ponnai 245.29 197.81 156.64 122.54
6 Vegavathi 106.98 82.18 82.18 54.49
7 Cheyyar 1048.35 867.82 867.82 553.91
8 Kiliyar 382.34 274.89 274.89 161.86
9 Lower Palar 325.45 250.39 250.39 145.61
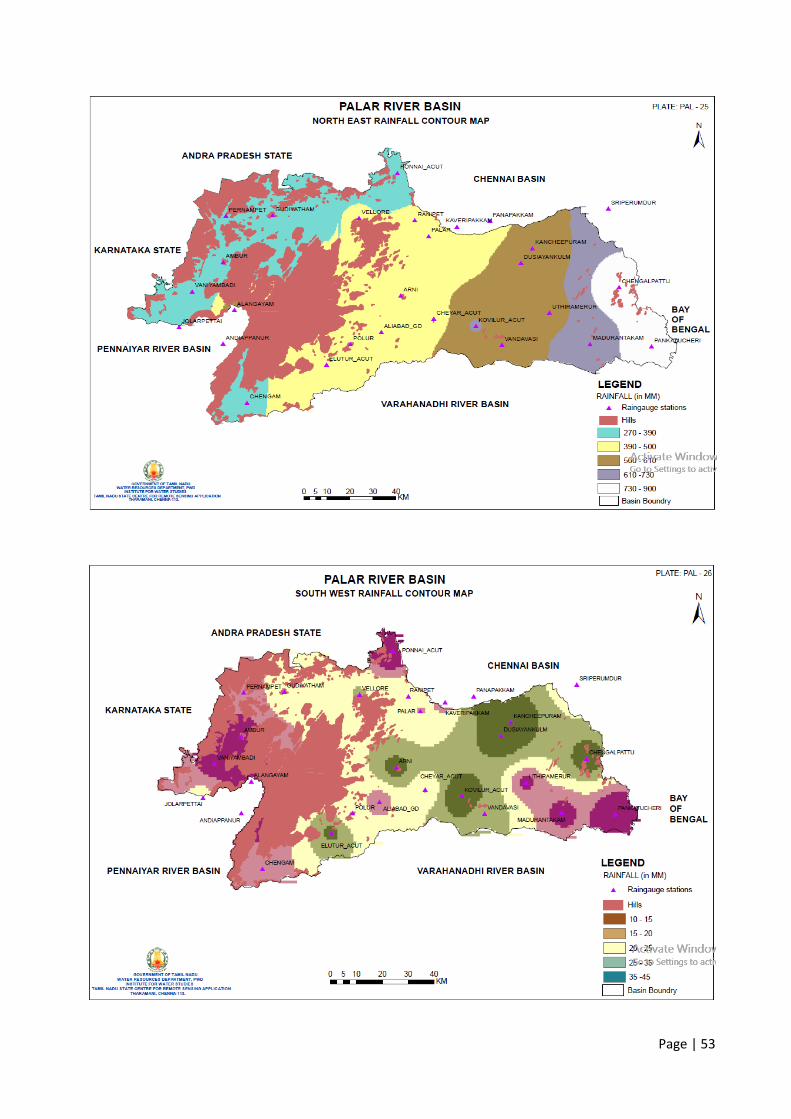
The Annual Rainfall contour map, North East rainfall and South East Rainfall contour maps
are given in Figure
Page | 53
Page | 54
The maximum, minimum and average annual rainfall for the nine sub basins have been given
below.
• Maximum Annual Rainfall of this basin is 2854.10 mm in Agaramar (1985-86)
• Minimum Annual Rainfall of this basin is 203.5 mm in Kavundhiyanadhi (1971-72)
• Average annual rainfall of the Palar basin is 1042.60 mm
11. GEOLOGY AND MINERAL WEALTH
The trace of each and every river/ stream was covered and studied on the following principles
of Geology/River bed mining:
➢ The general geology of the area;
➢ The presence of any major geological structure;
➢ Origin of river;
➢ Pattern of primary / secondary/ tertiary streams;
➢ Total catchments;
➢ General profile of river/streams;
➢ Meandering Pattern;
➢ Bank stability;
➢ Total potential of river bed in reference to minor mineral;
➢ General slope of the river / stream;
➢ Morphogenetic regions.
In Addition to above, presence of the following objects were also studied:- ¾ The presence of
any WSS Schemes
➢ Bridges
➢ Agriculture fields
➢ Bank protection works
➢ Plantation etc.
Following are the important guiding principles considered while recommending the river /
stream bed or part of the river / stream bed for collection for minor minerals:-
Page | 55
• The production of aggregate area is a function of the availability of natural resources,
the size of population, the economy of the area and various developmental and
infrastructural works being undertaken in the area like road construction, hydro-
electric projects etc. Further, being a low- value, high-volume mineral commodity,
the prices are dramatically affected by transportation distances. If the distance
increases, the transportation cost may increase much more than the cost of the
aggregates. x A stable river is able to consistently transport the flow of sediments
produced by watershed such that its dimension (width and depth) pattern and vertical
profile are maintained without aggrading (building up) or degrading ( scouring down)
• The amount of boulders, cobbles, pebbles and sand deposited in river bed equals to the
amount delivered to the river from watershed and from bank erosion minus amount
transported downstream each year.
• It is compulsive nature for river to meander in their belts and therefore they will
have to be provided with adequate corridor for meandering without hindrance. Any
attempt to diminish the width of this corridor (floodway) and curb their freedom to
meander would prove counterproductive. x Erosion and deposition is law of nature.
The river/stream has to complete its geomorphological cycle from youth, mature to
old age.
• River capturing is unavoidable.
• Erosion in upstream and deposition in downstream.
• Tendency of the river / stream toward grade.
• Fundamentally, the lowest point of any stream is fixed by Sea Level.
• The ratio between the width of meander belt and width of the stream decreases as the
width of the stream increases.
• Formation, Bank erosion and Replenishment of any specific riverbed depends
Primarily upon:
➢ The Geology of the area;
➢ River Profile;
Page | 56
➢ Nature of source;
➢ Rainfall in catchments;
➢ Morphogenetic region;
➢ Catchments geomorphology;
➢ Efficiency of River / Stream ( i.e erosive power);
➢ The competency of the river / Stream ( i.e transport heaviest stone);
➢ The capacity of the River/Stream ( i.e volume of transportation);
➢ Hydraulic radius of the River / Stream (ratio between cross sectional area and
length of wetted perimeter)
Secondarily upon:
➢ Geological structures;
➢ Porosity of formation;
➢ Run off in the catchments;
➢ Forest cover;
In addition to the above following man made factors are also involved.
➢ Type of agriculture;
➢ Encroachment on flood plain leaving least space for meandering;
➢ Any barrier on river / stream bed i.e banks , dams and bridge foundations etc;
➢ Throwing of debris into the river/stream course;
➢ Drying up of river courses due to construction of dams, thereby reducing the
efficiency and capacity of the river / stream.
The total potential of the river / stream bed is calculated up to the depth of one meter
and in the workable span. Total potential or annual replenishment is not necessarily
mineable. Mine ability depends upon the availability of approachable roads, distance from the
general conditions of policy viz distances from WSS Schemes, bridges etc and overall on the
Page | 57
market demand etc. Thus keeping these factors into consideration 60% of the total potential
has been taken for the purpose of exploitation of minor minerals.
11. a. Method For calculation of Reserves: For the calculation of total reserves of minor
minerals available in the river bed, length, average width and depth of the river bed for which
the exploitation is to be carried out / allowed under rule / prevailing instructions of the Govt.
was taken into consideration. The volume thus obtained is multiplied with the bulk density
which has been assumed as 1.65 for all types of minor minerals. Thus reserves up to particular
datum line i.e one meter below the surface have been calculated.
Total reserves of minor minerals ( M.T.)= Length x Width x Height i.e Depth x Density. For
the annual replenishment of minor mineral reserves, the average annual mean depth up to
which the replenishment of minor mineral takes place annually, has been taken into
consideration which depends upon the annual rainfall factor and geology of the catchments
area.
12. RIVER SYSTEM
12.a. PALAR RIVER
Major part of the district falls in Palar river basin. Palar River is the major river draining the
district, flowing towards east for a distance of about 295 km. It runs parallel to the hill ranges
of the Eastern Ghats for a major part of its course. It has a vast flood plain in the lower
reaches, but is dry for major part of the year. Ponnaiyar, Cheyyar, Pambar and Malattar are
some of the major tributaries of Palar draining the district. Almost all the streams are
ephemeral in nature and are mostly structurally controlled.
The Palar is the longest of the rivers in the districts bordering Chennai and has been a major
source of drinking water for the State capital and its suburbs. The Palar and its tributaries
irrigate about 300,000 hectares of agricultural land in Kancheepuram, Thiruvallur, Chennai
and Vellore districts. Analysis of surface water samples from Palar River by IAMWARM
project shows pH, Electrical Conductivity, Total Hardness, Chloride and Coliform values are
Page | 58
within the limits. Dissolved Oxygen falls below 5 mg/lit at places such as Koudanaya river,
Nandhiyalam village, Rajakal head sluice, Mottur village and at stretches between Ranipet to
walajah due to mixing of Tannery effluent with water. This affects the aquaculture in the
area. The river water is contaminated with domestic sewage. It is also found that Total
Dissolved Solids is beyond the tolerable limit in tannery-polluted areas. Chloride is above the
acceptable limit but below permissible limit. Total hardness fluctuates above and below
tolerable limits and Biological Oxygen Demand is found to be very high in some head works.
12.b. Catchment:
Each basin has been delineated into Catchment, which are constituted by a single major river,
by a group of small rivers or a major tributary of the major rivers like Vellar. The catchment
in Vellore District is as follows:
S. No Basin
code No
Rivers covered by
the basin
Area Sq. km States covered
1 4C1 Between Cauvery
and Palar
20517.575 Cuddalore, Villupuram,
Salem, Tiruvannamalai,
Vellore.
2 4C2 Between Pennaiyar
and Palar
15997.551 Chenglepet, Vellore,
Kancheepuram, Chittur
(A.P.)
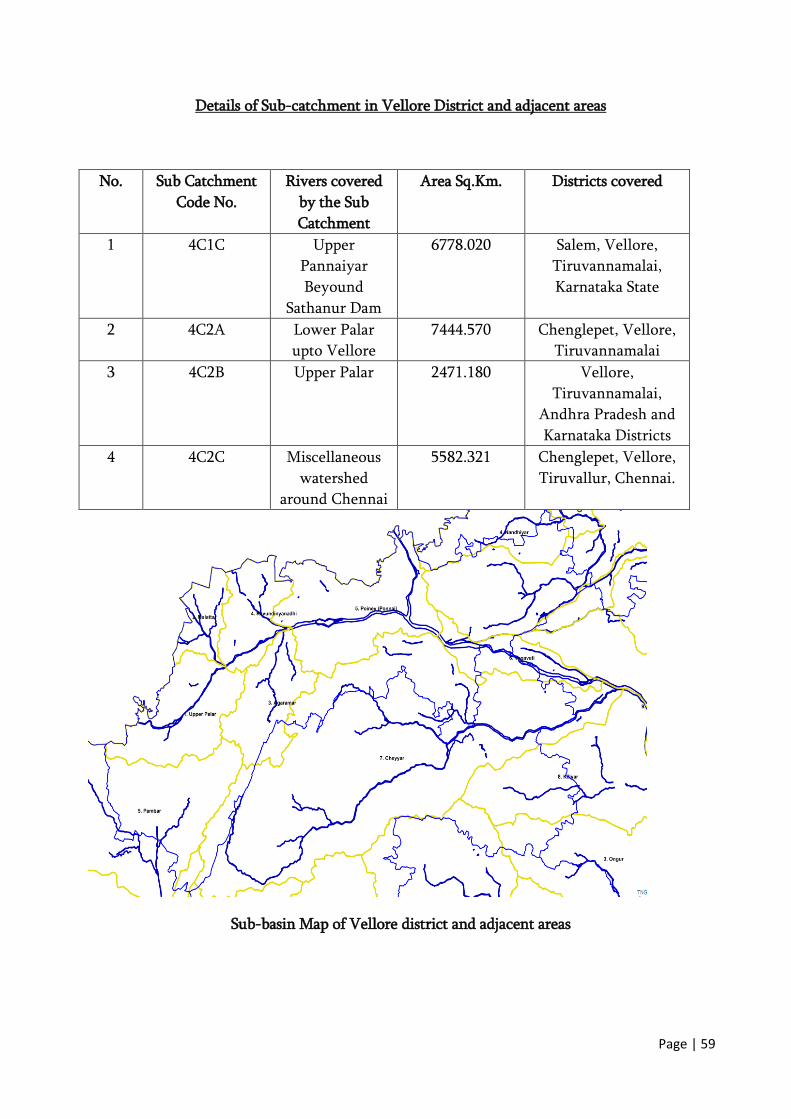
12.c. Sub Catchment:
Each catchment has been delineated into Sub-Catchment which are constituted by a single
river, by a group of small rivers or a major tributary of the major rivers. The Sub Catchment
in Vellore District is as follows:
Page | 59
Details of Sub-catchment in Vellore District and adjacent areas
No. Sub Catchment
Code No.
Rivers covered
by the Sub
Catchment
Area Sq.Km. Districts covered
1 4C1C Upper
Pannaiyar
Beyound
Sathanur Dam
6778.020 Salem, Vellore,
Tiruvannamalai,
Karnataka State
2 4C2A Lower Palar
upto Vellore
7444.570 Chenglepet, Vellore,
Tiruvannamalai
3 4C2B Upper Palar 2471.180 Vellore,
Tiruvannamalai,
Andhra Pradesh and
Karnataka Districts
4 4C2C Miscellaneous
watershed
around Chennai
5582.321 Chenglepet, Vellore,
Tiruvallur, Chennai.
Sub-basin Map of Vellore district and adjacent areas
Page | 60
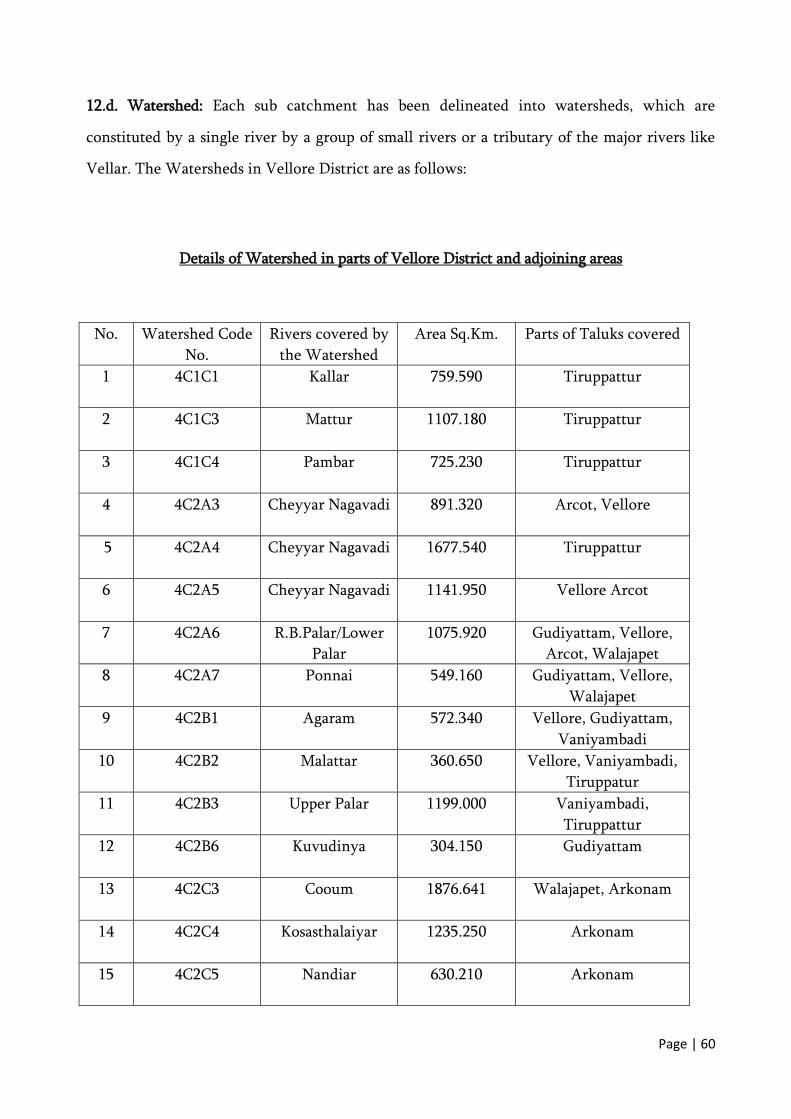
12.d. Watershed: Each sub catchment has been delineated into watersheds, which are
constituted by a single river by a group of small rivers or a tributary of the major rivers like
Vellar. The Watersheds in Vellore District are as follows:
Details of Watershed in parts of Vellore District and adjoining areas
No. Watershed Code
No.
Rivers covered by
the Watershed
Area Sq.Km. Parts of Taluks covered
1 4C1C1 Kallar 759.590 Tiruppattur
2 4C1C3 Mattur 1107.180 Tiruppattur
3 4C1C4 Pambar 725.230 Tiruppattur
4 4C2A3 Cheyyar Nagavadi 891.320 Arcot, Vellore
5 4C2A4 Cheyyar Nagavadi 1677.540 Tiruppattur
6 4C2A5 Cheyyar Nagavadi 1141.950 Vellore Arcot
7 4C2A6 R.B.Palar/Lower
Palar
1075.920 Gudiyattam, Vellore,
Arcot, Walajapet
8 4C2A7 Ponnai 549.160 Gudiyattam, Vellore,
Walajapet
9 4C2B1 Agaram 572.340 Vellore, Gudiyattam,
Vaniyambadi
10 4C2B2 Malattar 360.650 Vellore, Vaniyambadi,
Tiruppatur
11 4C2B3 Upper Palar 1199.000 Vaniyambadi,
Tiruppattur
12 4C2B6 Kuvudinya 304.150 Gudiyattam
13 4C2C3 Cooum 1876.641 Walajapet, Arkonam
14 4C2C4 Kosasthalaiyar 1235.250 Arkonam
15 4C2C5 Nandiar 630.210 Arkonam
Page | 61
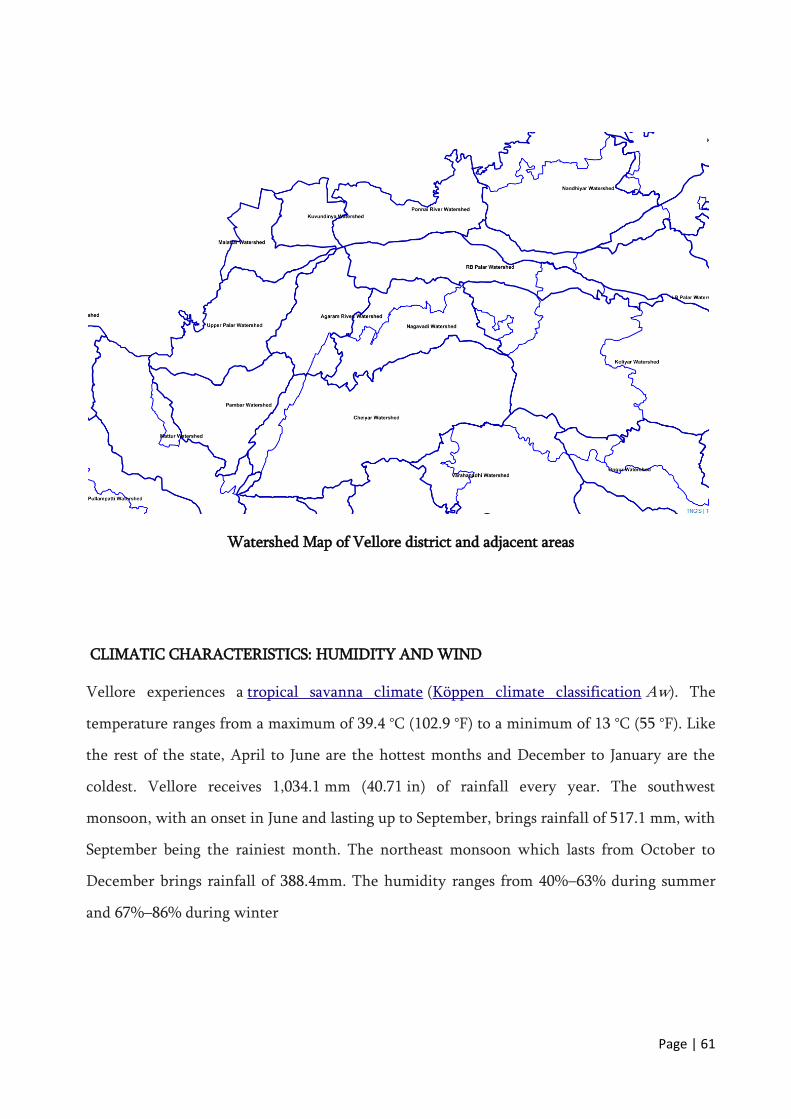
Watershed Map of Vellore district and adjacent areas
CLIMATIC CHARACTERISTICS: HUMIDITY AND WIND
Vellore experiences a tropical savanna climate (Köppen climate classification Aw). The
temperature ranges from a maximum of 39.4 °C (102.9 °F) to a minimum of 13 °C (55 °F). Like
the rest of the state, April to June are the hottest months and December to January are the
coldest. Vellore receives 1,034.1 mm (40.71 in) of rainfall every year. The southwest
monsoon, with an onset in June and lasting up to September, brings rainfall of 517.1 mm, with
September being the rainiest month. The northeast monsoon which lasts from October to
December brings rainfall of 388.4mm. The humidity ranges from 40%–63% during summer
and 67%–86% during winter
Page | 62
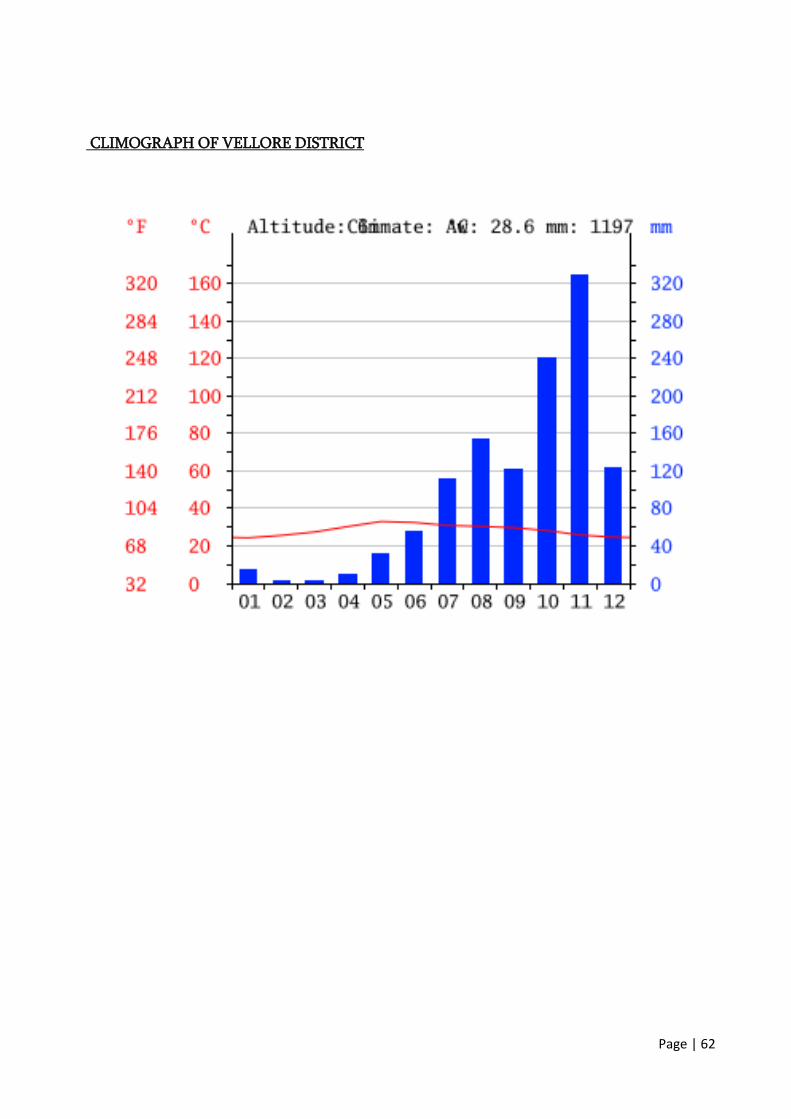
CLIMOGRAPH OF VELLORE DISTRICT
Page | 63
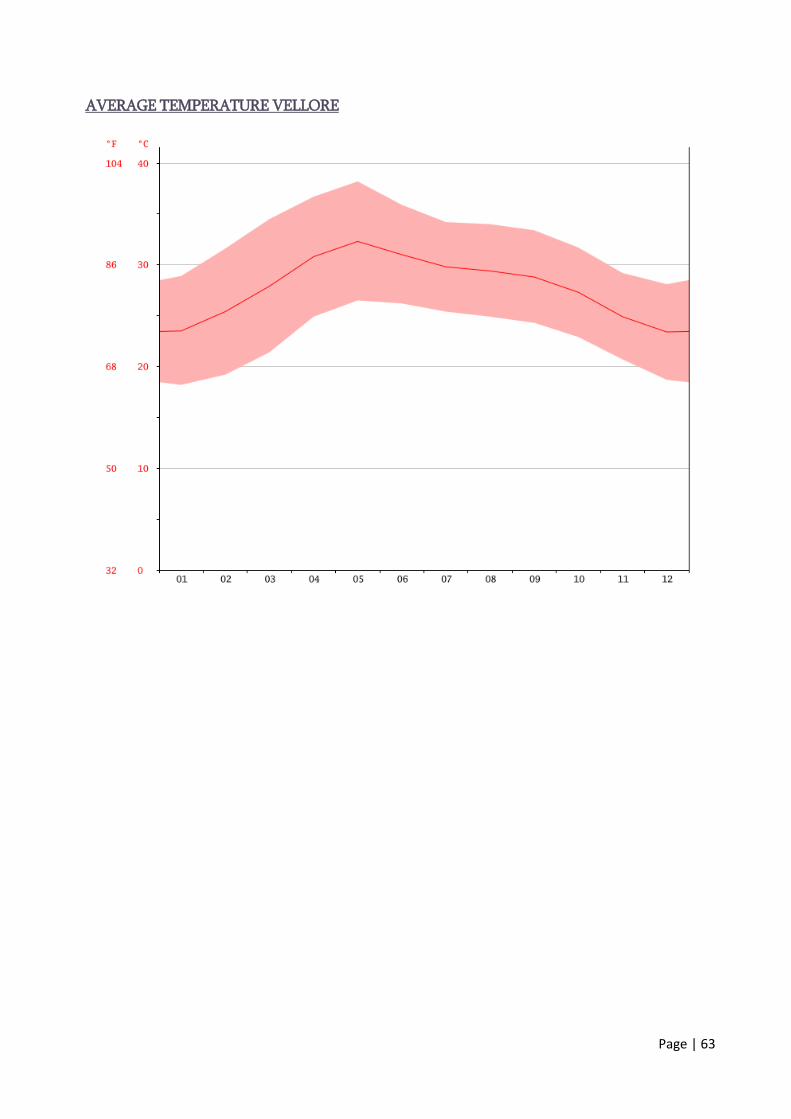
AVERAGE TEMPERATURE VELLORE
Page | 64
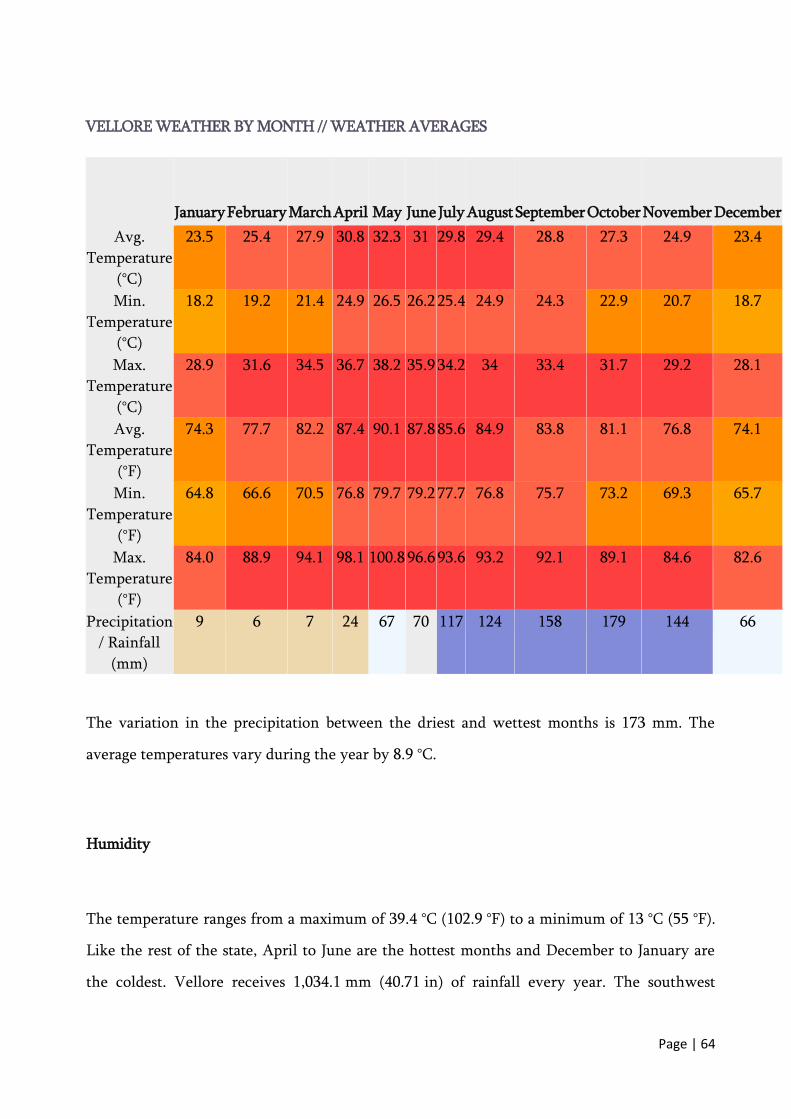
VELLORE WEATHER BY MONTH // WEATHER AVERAGES
January February March April May June July August September October November December
Avg.
Temperature
(°C)
23.5 25.4 27.9 30.8 32.3 31 29.8 29.4 28.8 27.3 24.9 23.4
Min.
Temperature
(°C)
18.2 19.2 21.4 24.9 26.5 26.2 25.4 24.9 24.3 22.9 20.7 18.7
Max.
Temperature
(°C)
28.9 31.6 34.5 36.7 38.2 35.9 34.2 34 33.4 31.7 29.2 28.1
Avg.
Temperature
(°F)
74.3 77.7 82.2 87.4 90.1 87.8 85.6 84.9 83.8 81.1 76.8 74.1
Min.
Temperature
(°F)
64.8 66.6 70.5 76.8 79.7 79.2 77.7 76.8 75.7 73.2 69.3 65.7
Max.
Temperature
(°F)
84.0 88.9 94.1 98.1 100.8 96.6 93.6 93.2 92.1 89.1 84.6 82.6
Precipitation
/ Rainfall
(mm)
9 6 7 24 67 70 117 124 158 179 144 66
The variation in the precipitation between the driest and wettest months is 173 mm. The
average temperatures vary during the year by 8.9 °C.
Humidity
The temperature ranges from a maximum of 39.4 °C (102.9 °F) to a minimum of 13 °C (55 °F).
Like the rest of the state, April to June are the hottest months and December to January are
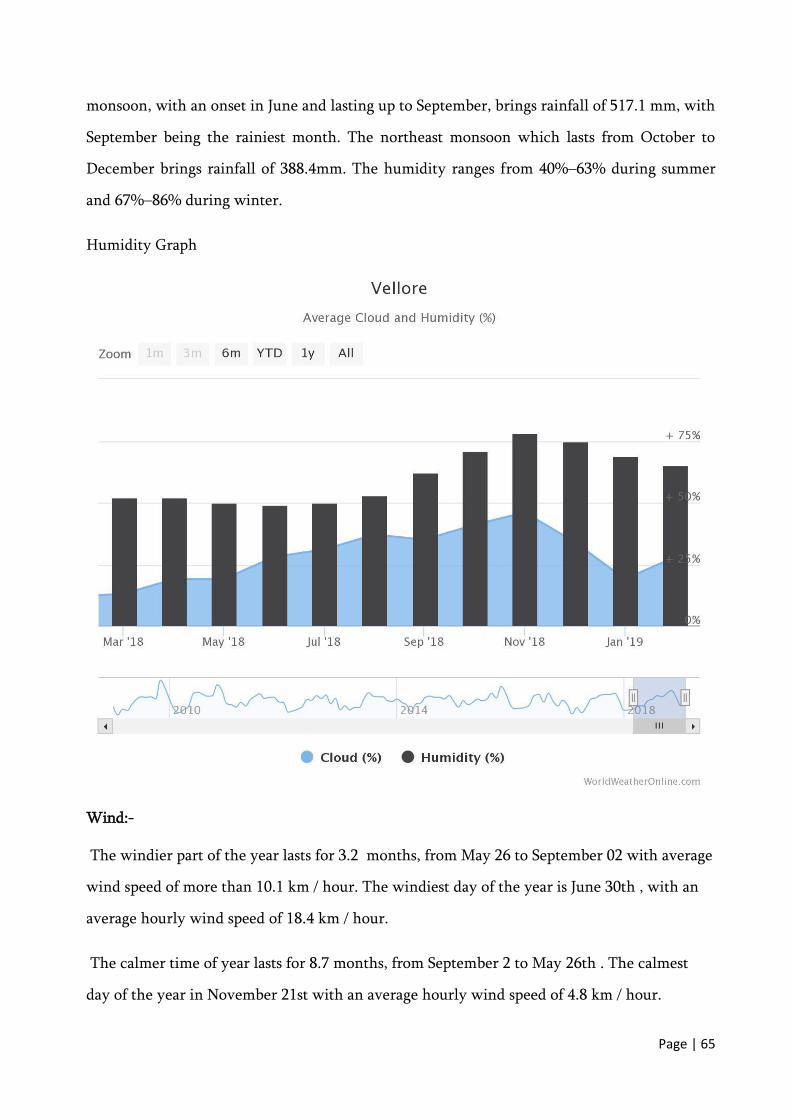
the coldest. Vellore receives 1,034.1 mm (40.71 in) of rainfall every year. The southwest
Page | 65
monsoon, with an onset in June and lasting up to September, brings rainfall of 517.1 mm, with
September being the rainiest month. The northeast monsoon which lasts from October to
December brings rainfall of 388.4mm. The humidity ranges from 40%–63% during summer
and 67%–86% during winter.
Humidity Graph
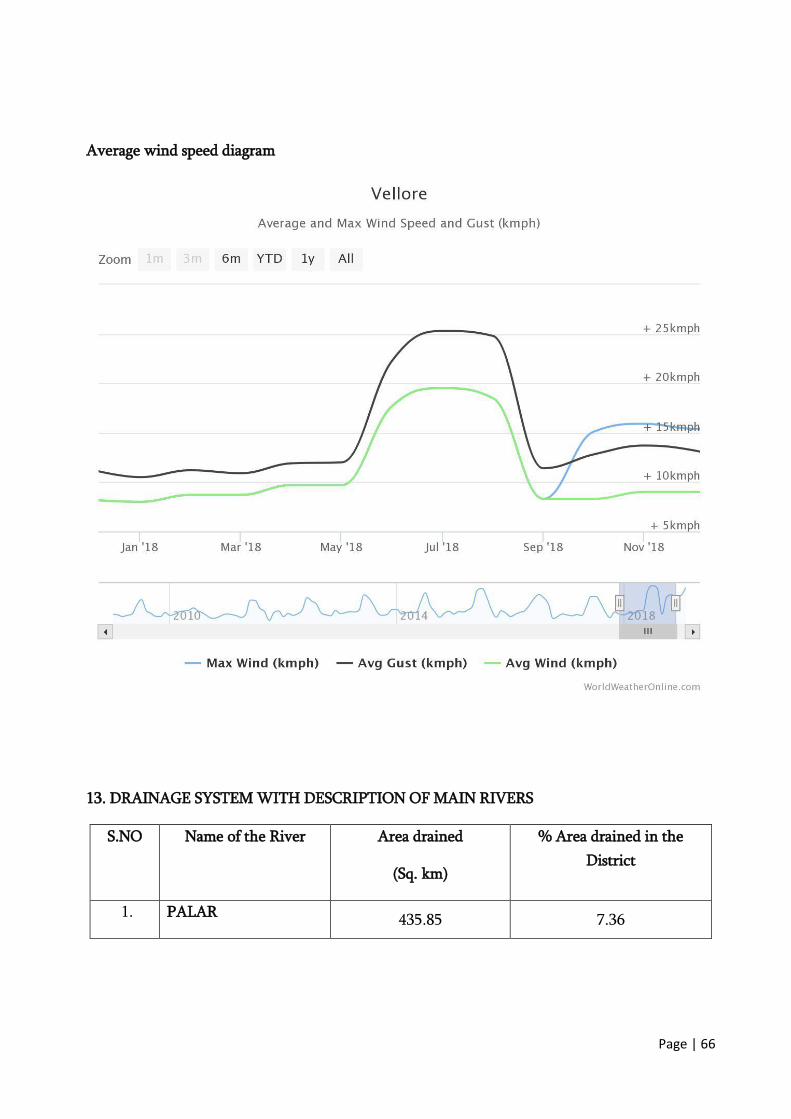
Wind:-
The windier part of the year lasts for 3.2 months, from May 26 to September 02 with average
wind speed of more than 10.1 km / hour. The windiest day of the year is June 30th , with an
average hourly wind speed of 18.4 km / hour.
The calmer time of year lasts for 8.7 months, from September 2 to May 26th . The calmest
day of the year in November 21st with an average hourly wind speed of 4.8 km / hour.
Page | 66
Average wind speed diagram
13. DRAINAGE SYSTEM WITH DESCRIPTION OF MAIN RIVERS
S.NO Name of the River Area drained
(Sq. km)
% Area drained in the
District
1. PALAR 435.85 7.36
Page | 67
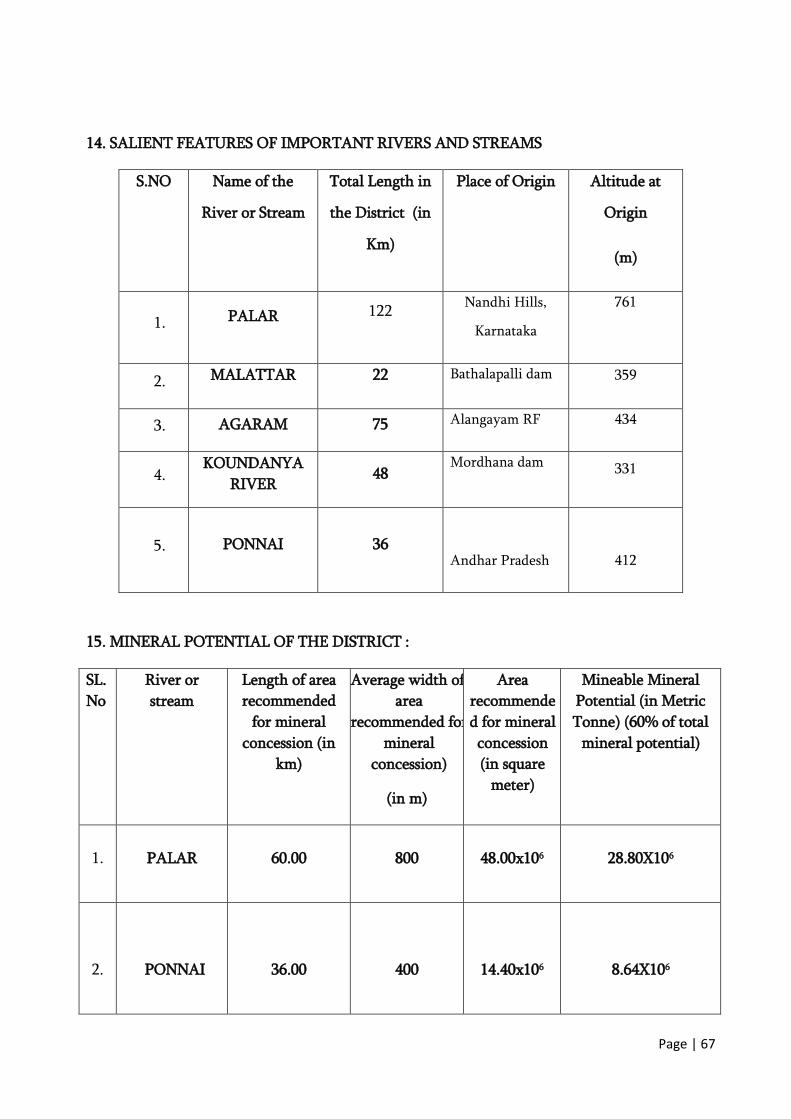
14. SALIENT FEATURES OF IMPORTANT RIVERS AND STREAMS
S.NO Name of the
River or Stream
Total Length in
the District (in
Km)
Place of Origin Altitude at
Origin
(m)
1. PALAR 122 Nandhi Hills,
Karnataka
761
2. MALATTAR 22 Bathalapalli dam 359
3. AGARAM 75 Alangayam RF 434
4. KOUNDANYA
RIVER 48
Mordhana dam 331
5. PONNAI 36
Andhar Pradesh
412
15. MINERAL POTENTIAL OF THE DISTRICT :
SL.
No
River or
stream
Length of area
recommended
for mineral
concession (in
km)
Average width of
area
recommended for
mineral
concession)
(in m)
Area
recommende
d for mineral
concession
(in square
meter)
Mineable Mineral
Potential (in Metric
Tonne) (60% of total
mineral potential)
1. PALAR 60.00 800 48.00x10⁶ 28.80X10⁶
2.
PONNAI 36.00 400 14.40x10⁶ 8.64X10⁶
Page | 68
16. ECONOMIC IMPACT OF MINING
The mining will generate direct and indirect employment during mining operations.
In general, there will be no adverse effect on human health as no blasting or handling of toxic
material involved in sand mining. All the safety measures will be strictly followed to prevent
occupational risk during excavation, loading and transportation.
The State is highly urbanised State after Maharashtra, the sand mining operation in the
district will be the backbone for infrastructural development besides generate the revenue to
the Government. Since the operation is carrying out by the Public Works Department they
properly identify the aggradation area over the river bed in the district It will be useful to
maintain the hydro geological cross section of the river to carry the maximum flood
discharge.
17. CONCLUSION/RECOMMENDATION:
Vellore district of the South Indian state, Tamil Nadu, 135 km (84 mi) west of the state
capital Chennai. Vellore lies in the Eastern Ghats region and Palar river basin. The
topography is almost plain with slopes from west to east.The detailed scientific study reveals
that the Palar River carrying sand sediments whenever there is sufficient flows along its
entire length in the district. This cumulative sediments have resulted in shoal formation and
reduce the carrying capacity of flood. The properly managed sand mining activities are
recommended in Palar and Ponnai. Hence, it is concluded that, the permission of sand
quarries in the potential areas of river in the district will be beneficial for infrastructural
development of the state of Tamil Nadu.
ASSISTANT DIRECTOR, (MINES) Sd//xxxxxx(31.05.2019)
VELLORE DISTRICT DISTRICT COLLECTOR
VELLORE
Page | 69