Embed Size (px)
Citation preview

DEVELOPMENT & PLANNING DEPARTMENT
GOVERNMENT OF WEST BENGAL
DISTRICT
HUMAN
DEVELOPMENT
REPORT
BANKURA

District Human Development Report : Bankura
© Development and Planning Department
Government of West Bengal
First Published
April 2007
All rights reserved. No part of this publication may be reproduced, stored or transmitted
in any form or by any means without the prior permission from the Publisher.
Back Cover Photograph : Manasha Ghat
Published by
HDRCC
Development & Planning Department
Government of West Bengal
Setting and Design by
S P Communications Pvt Ltd
294/2/1 A P C Road
Kolkata 700 009
Printed by
Shishu Sahitya Samsad Pvt Ltd
32A A P C Road
Kolkata 700 009
Type Set in Baskerville
While every care has been taken to reproduce the accurate data, oversights/errors
may occur. If found please convey it to the Development and Planning Department,
Government of West Bengal


The objective of all the interventions is to bring in human development. A district human
development report has to basically address the issue of formulation of a strategy, which will
accelerate the pace of human development. Therefore, the objective of the present exercise
is to build up a developmental path, which will address human development in Bankura.
Normally a human development report covers three aspects related to human development—
standard of living, health and education. Broadly the same format has been maintained in
this exercise. However, a separate chapter has been kept for gender issues. The issue of
vulnerability also requires special attention since it is not just the state and level of human
development that matters. The capacity of people to cope with unfavourable circumstances
and respond to adversity is equally important. In other words, vulnerability of a human being
has to be reduced parallely with the advancement on the ladder of human development.
When we talk of building of a strategy, all concerned who are expected to participate in its
execution must be involved at the formulation stage. In other words, the whole exercise has to
be participatory in nature. An attempt has been made to involve all the line departments in
this exercise. At the same time other stakeholders have also been involved in identification of
the bottlenecks and solutions. We have included a large number of case studies to capture the
success stories from the district itself that can be scaled up to accelerate the pace of human
development.
The formulation of Human Development Index (HDI) has not been attempted here. In the
process of formulation of a strategy, intra-district scenario needs to be brought out. The
quality of data varies from district to district and if the usual data available at the district level
is used to formulate the HDI, the comparison across district may become erroneous. Since
quality of data within a district is likely to be similar, a comparison within a district may
provide us a relative picture of progress and a comparison of blocks over conveniently defined
indicator will not be off the mark. In any case using the normal HDI formulae may not be
able to capture the specific nuances and barriers to human development in different parts of
a district. Since we need to build a strategy we should use a framework, which is flexible
enough to capture the specific need of the district in terms of human development. HDI
formulation is rather complicated and is difficult to comprehend, say, for panchayat level
functionaries who are likely to participate in execution of schemes in the process of human
development.
Considering the above, the Human Development Radar has been attempted which may be
helpful. It is easily understandable and the weak areas can be quickly identified. In addition
,the indicators may be selected as per the district specific issues.
This exercise started with a district level workshop involving all the line departments, Panchayat
functionaries and other government officials. One expert group was formed for each area in
human development at the district level consisting of government officials, Panchayat
functionaries, representatives of non-governmental organisations (NGO) and representatives
from academia. Based on the issues highlighted in the district level workshop weaker pockets
under each sector in the district were identified. This was followed by sample surveys and
focused group discussions involving all the stakeholders in these areas. Block-level workshops
were organized on block-specific weaker areas of human development.This helped in
identification of barriers to human development under each area in this district. The process
of documentation was initiated thereafter. Specific studies were also initiated by various research
Preface

groups and findings have been incorporated. The draft report was presented again at the
district level involving all stakeholders before finalisation.
I put on record my sincere thanks to all who have been involved in this exercise. Natural
Resource Database Management Systems (NRDMS) Centre, Bankura provided the basic data
to initiate the exercise. I believe NRDMS may act as the final repository of all data which
may be updated from time to time. Blocks may act as the nodal point for collection of all data
at the grassroot which may be fed to NRDMS from time to time. I am grateful to the officers
of the line departments including the departments of Land, Forest, Agriculture, Animal
Resource Development, Fisheries, Agri-irrigation, Public Health Engineering, Khadi and
Village Industries, Sericulture, Handloom, Education, Health, Social Welfare and Bureau of
Applied Economics and Statistics. I was assisted by a dedicated band of officers from the
Bankura collectorate which included Sri Soumitra Sengupta, Sri Partha Ghosh and Sri Biswajit
Barat, Centre-in-Charge, NRDMS, Bankura. I am also very thankful to the Sabhadhipati,
Bankura Zilla Parishad for her kind support and to the Karmadhakshya, Siksha Sanskriti
Tathya O Krira Sthayee Samity and other Karmadhakshyas of Bankura Zilla Parishad for
their inputs and involvement in the whole exercise. I express my deep gratitude to the
representatives from academia who have helped us in providing us the framework and
background of this exercise. Special mention may be made of Prof. Tarapada Dhar, Prof.
Pratip Mukherjee, Dr. Himangshu Ghosh, Dr. Mousumi Mukhopadhyay (Patra), Dr. Subikash
Chowdhury, Prof. Priyam Sengupta. Some of the NGOs namely Care India, Pratichi (India)
Trust, Lutheran World Service, PRADAN, Nari Bikash Sangha have contributed immensely
and we are grateful to them.
Finally I express my sincere thanks to the Development & Planning Department, Government
of West Bengal for their kind guidance and constant encouragement.
Prabhat Kumar Mishra
September, 2006 District Magistrate
Bankura Bankura
A. Subject :
Chapter Section Topic Page No.
1 Introduction (Human development and its measurement) 1–14
1.1 Bankura : some key features 1
1.2 SWOT analysis 4
1.3 Bankura in the West Bengal human development ladder 8
1.4 Human Development Radder 9
2 Standard of living 15–114
2.1 Introduction 15
2.2 Structure of production 18
2.3 Wage and employment 20
2.4 Poverty 23
2.5 Livelihood strategy 37
2.6 Building Community-Based Organisations 90
2.7 Land Reforms – a redistributive justice 97
2.8 Panchayat Raj Institutions 104
2.9 Investment climate 108
3 Education 115–140
3.1 Introduction 115
3.2 Adult literacy 115
3.3 Residual illiteracy 117
3.4 Enrolment 118
3.5 Mid-day meal programme in Bankura 131
3.6 Gender and social group disparities 135
3.7 Education of disabled children 138
4 Health 141–178
4.1 Introduction 141
4.2 Reproductive and Child Health 141
4.3 Infrastructure 160
4.4 Public Health 161
4.5 Drinking water and Sanitation in Bankura 171
5 Gender issues 179–218
5.1 Background 179
5.2 Gender issues in Bankura district 179
5.3 Self-help groups (SHGs) and empowerment of women in Bankura 209
5.4 Status of women in Bankura : a summary of observations and
proposals for improving the status 215
Contents

Chapter Section Topic Page No.
6 Vulnerability 219–256
6.1 Conceptual framework 219
6.2 Food security 219
6.3 Migration 237
6.4 Housing 244
6.5 Crime & Violence 244
6.6 Debt burden 246
6.7 Security from natural calamities 246
6.8 Coverage of different social security scheme 247
6.9 Special vulnerable and stress-prone groups 249
Annexure 257–260

1
Chapter 1
Human development is not just economic growth. It
is about growth with expansion of choices, access to
services and participation of people in the process of
development leading to their empowerment. Growth
cannot translate itself into human development unless
it leads to improvement in their knowledge, health
and income. Measuring progress of an administrative
unit in terms of human development – be it a
country, a province, a district or a sub-district unit –
may require a number of indices. However, under
the aegis of United Nations’ Development Programme
(UNDP), a standard methodology for calculation of
Human development attainment has been developed
Human development and
its measurement
since 1990 when the first Global Human
Development report was published. Three basic
indicators were taken up for assessing relative
position of countries in the Human development
ladder – life expectancy at birth representing
attainment in the health sector, literacy rate and
combined gross enrolment in the primary, secondary
and tertiary education indicating attainment in the
domain of knowledge and gross domestic product
indicating attainment in the income sector. Equal
weightage has been given to the three indicators
and thus relative Human Development Index (HDI)
of administrative units is calculated.
1.1 Bankura : some key features :
Map 1.1 Administrative map of Bankura
2
1
Bankura, the fourth largest district of West Bengal is
located in the western part of the state, which is
popularly known as ‘Rarh’ from time immemorial. It
has an area of 6882 sq.km. and according to the
census of 2001, it has a population of 31,92,695. It is
bounded by Paschim Medinipur and Hooghly district
in the east, Purulia district in the west, Bardhaman
district in the north and east. In shape, it resembles
an isosceles triangle wedged in between Purulia and
Bardhaman, with its apex nearly opposite Raniganj
and with an irregular base line resting on Pachim
Medinipur and Hooghly. Bankura is drained by
Damodar, Darkeswar and Kangsabati along with their
tributaries of which Gandeswari, Silai and Kumari
deserve separate mention. This district has a moderate
deposit of coal and a number of good deposits of
china clay. As census, 2001 data reveals, it ranks
twelfth in the state so far as total population is
concerned.
The headquarters of this district is at Bankura, from
which it has derived its name. According to one
tradition, the town was named after a local chieftain
called Bankura Rai, while according to another legend
the town is so called after Bir Bankura, a prince of
Bishnupur. Another hypothesis suggests that the name
is a corruption of Bankunda, meaning five tanks, which
can be found in a Sanskrit verse by Edu Mishra, a
fifteenth century genealogists. In old official records like
Statistical and Geographical Report of the District of
Bancoorah by Lieutenant Col. J. E. Gastrell, we find
the town referred to as “Bancoorah or Bancoodah”.
The district of Bankura acquired its present shape and
dimension in 1879 though till 1881, the district
judgeship was known as West Burdwan. It was given
the name Bankura in 1881 and since then the
administrative and judicial jurisdictions of the district
have been coterminous with the geographical
boundaries of Bankura. Present administrative and
demographic profiles of the district are summarised in
the following Tables.
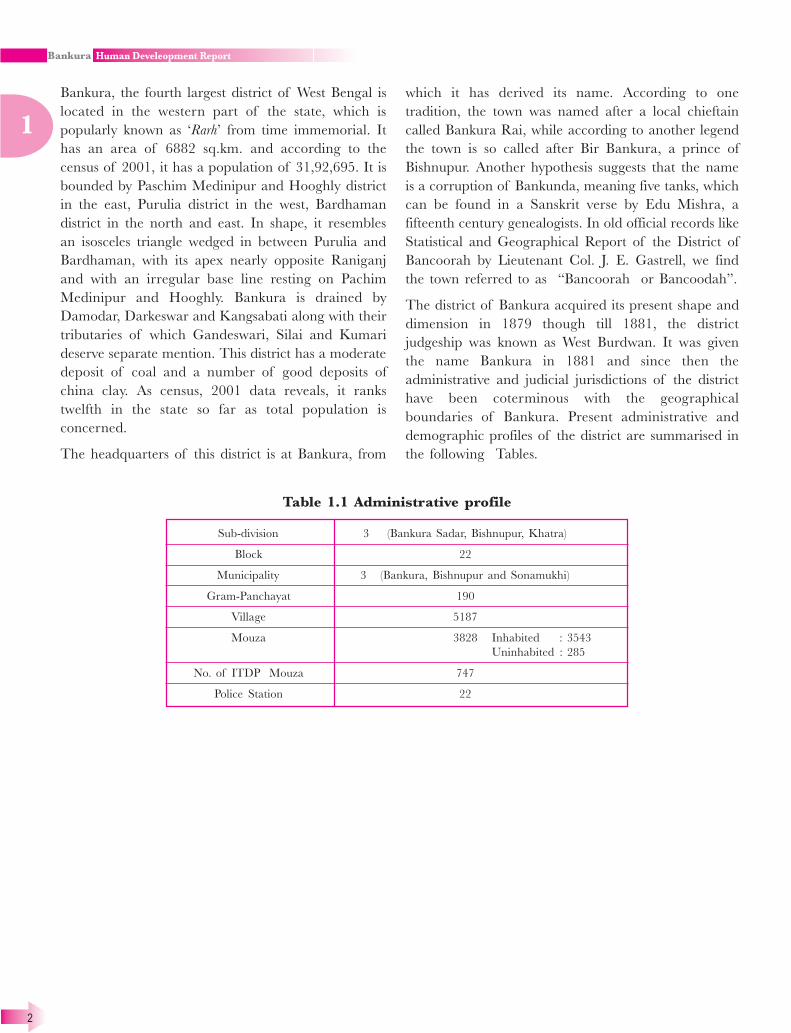
Table 1.1 Administrative profile
Sub-division 3 (Bankura Sadar, Bishnupur, Khatra)
Block 22
Municipality 3 (Bankura, Bishnupur and Sonamukhi)
Gram-Panchayat 190
Village 5187
Mouza 3828 Inhabited : 3543
Uninhabited : 285
No. of ITDP Mouza 747
Police Station 22

3
1
Table 1.2 Administrative structure of Bankura
Rural (22 Blocks)
Sub-Division Name of Total No. Percentage Percentage
the Block/ of Gram- of SC of ST
Municipality Panchayat/ population population
Ward Population (2001census)
Total Male Female
Bankura Sadar Bankura-I 6 95840 49083 46757 36.55 6.66
Bankura-II 7 123415 63330 60085 28.89 2.83
Chhatna 13 169215 85669 83546 27.38 21.82
Saltora 8 121552 62239 59313 33.61 19.01
Mejhia 5 76123 39525 36598 32.88 2.08
Gangagalghati 10 162007 83117 78890 33.65 4.06
Barjora 11 179007 92368 86639 32.47 1.80
Onda 15 220572 112875 107697 32.47 4.78
Khatra Indpur 7 137825 70990 66835 38.17 9.80
Taldangra 9 128747 65713 63034 23.73 13.86
Simlapal 7 127445 65297 62148 24.98 14.82
Khatra 7 102569 52563 50006 24.74 22.24
Hirbandh 5 72502 37301 35201 24.56 28.54
Raipur 10 151293 77252 74041 20.73 28.50
Sarenga 6 95128 48759 46369 27.80 19.81
Ranibandh 8 104326 53168 51158 11.24 47.28
Bishnupur Bishnupur 9 138768 71200 67568 32.71 7.69
Joypur 9 141497 72348 69149 37.58 2.19
Kotulpur 8 167547 86385 81162 34.38 3.31
Sonamukhi 10 142328 73221 69107 41.96 3.56
Patrasayer 10 164060 83517 80543 44.70 2.96
Indus 10 152847 78404 74443 41.77 1.90
Total 190 2974613 1524324 1450289 31.87 11.06
Urban ( 3 Municipalities )
Bankura Sadar Bankura 23 128781 66429 62352 22.99 0.78
Bishnupur Bishnupur 19 61947 31223 30724 21.66 0.49
Bishnupur Sonamukhi 15 27354 14026 13328 23.59 1.30
Total 57 218082 111678 106404 22.69 0.76
Source: Census, 2001 & Office of the District Magistrate, Bankura

4
1
Table 1.3 Demographic features of Bankura
1 Population Total : 31,92,695
(Male : 16,36,002,
Female : 15,56,693)
2 Scheduled Caste 9,97,408 (31.24 percent)
3 Scheduled Tribe 3,30,683 (10.36 percent)
4 Population between 0-6 age group 14.08 percent
5 Main Workers 29.61 percent
6 Marginal workers 15.10 percent
7 Non-workers 55.25 percent
8 Cultivators 13.77 percent
9 Agricultural labourers 15.67 percent
10 Household industries 2.34 percent
11 Other workers 12.59 percent
12 Decennial growth rate in the decade 1991-2001 13.79 percent
13 Literacy rate (excluding 0-6 Population) 63.84 percent
(Male:- 77 percent,
Female:- 49 percent)
14 Percentage of rural population to total 92.63 percent
15 Percentage of urban population to total 7.37 percent
16 Sex ratio (per 1000 Male) 953
17 Density of population (per Square Km.) 464
Source: Census, 2001
1.2 SWOT analysis :
1.2.1 Strength :
(i) Land :
Total area of this district is 688200 hectares out of
which forest area is 147700 hectares, while the high
land and medium land are 1,76,915 and 1,50,611
hectares respectively. The huge land area may be put
to productive use by undertaking plantation and other
activities, which may generate gainful employment.
The population density is 464 per sq. km. (almost half
of the state average!) and per capita land availability
is more.
Again highland covers an area of 1,76,915 Hec. where
traditional cultivation of paddy is not remunerative.
There lies scope for integrated land and water
development under micro-watershed approach. In fact,
on an average Bankura gets a rainfall of 1400 mm.
and there is a huge scope for surface water based
irrigation system.
(ii) Human resources :
Out of a total population of 31,92,695, main worker
and marginal workers constitute 44.71 percent and as
such skilled and unskilled work-force is available in
plenty for making full use of land in agriculture and
allied activities as well as service-oriented activities.
There are a huge number of highly skilled artisans in
the district.
(iii) Agro-climatic condition :
The agro-climatic condition of the district is suitable
for plantation and horticultural crops. The district with
dry climatic condition and vast wasteland has great
potential for undertaking plantation and horticultural
activities like mango, guava, citrus fruits and medicinal
and aromatic plant. At the same time the dry climate is
very suited to animal resource development and seed
production.
(iv) Educational and research organisation :
There are 15 Colleges, 491 Secondary Schools, 3462
Primary Schools, 16 Madhyamik Siksha Kendras and
451 Sishu Siksha Kendras and two Engineering Colleges
and three Polytechnics. In the field of agriculture, there
is one Krishi Vigyan Kendra at Sonamukhi, one
Horticultural Research and Development Centre at
Taldangra, one Rice Research Centre at Bankura, one
Dryland Farming Research Center at Susunia.
5
1
Moreover, there are number of fodder farms in the
district and the infrastructural facilities of Animal
Resource Development Department is sound. These
may be used to the maximum advantage.
(v) Connectivity:
South Eastern Railway connects Bankura with Kolkata,
which passes through this district. Once abandoned
BDR Railway has also been upgraded to broad gauge.
National Highway (NH)-60 that connects NH-2 and
NH-6 passes through Bankura. Bankura has very good
road communication with Durgapur, an important
industrial city of the state. It has excellent road
connectivity with Raniganj-Asansol industrial belt as
well. Moreover, the network of surfaced road is very
good. A large number of very good quality rural roads
has come up under Pradhan Mantri Gram Sarak Yojana
(PMGSY). This has opened up scope for trade and
commerce and also service-oriented activities in the
remote areas.
(vi) People’s participation in development :
Over the last two decades, the Panchayat Raj institutions
have achieved significant maturity and have been
performing commendable role in planning and
implementations of development schemes. There is
tremendous scope for involving community in resource
management with the objective of reduction of poverty.
People in the villages are quite willing to participate in
the process of development — even to the extent of
doing ‘shramdan’. People have also shown cohesion in
taking up group activities and can be easily mobilized
around poverty reduction activities.
1.2.2 Weakness :
(i) Small size of land holdings :
A study on distribution of operational holdings
according to size class reveals that, average size of
holding in the district is 1.02 acre. Out of total of
475605 holding, 318647, i.e. 67 percent belongs to
marginal size class. For marginal class, average size of
holding is 0.53 acre. Besides, small land holding size
class constitutes 21.94 percent. Thus in this district,
marginal and small land holding size classes together
constitute nearly 90 percent of the total land holding.
In other words, size of agricultural holding is less that
one Hectare for 67 percent and less than two Hectares
for 90 percent holding size. Considering the poor
irrigation facilities, low fertility and resultant low
productivity, such holding pattern is not able to make
much impact on the quality of life of people at large.
(ii) Low fertility of soil :
The district is divided into three distinct topographical
regions, viz, the hilly terrain in western part,
undulating central part and alluvial plain in the eastern
part, unidentifiably merging into one another. The hilly
region is characterised by large granite rocks, central
part by red lateritic and eastern part by alluvial and
loamy soil.
The undulating terrain of about 90000 hectares is
susceptible to soil erosion and the hard granite base
leaves lesser scope for economic production. A major
part of the land in the central region is lateritic in
nature and the soil is devoid of many basic nutrients
essential for normal crop. The soil is acidic which
reduces the efficacy of fertilizers.
(iii) Poor irrigation facility :
There is a good surface irrigation network under the
commands of Kangsabati & Damodar canal irrigation
system. Moreover, there is also a good network of
River Lift irrigation (RLI) stations. But these major &
minor irrigation facilities have not been able to operate
at their full potential due to dilapidated and obsolete
distribution network & derelict machinery. Cropping
intensity is as low as 147 percent. Uneven distribution
of rainfall, low water retention capacity of soil,
undulating land structure and recurrent crop failure
are other problem areas. The district is drained by
rivers like Darakeswar, Damodar, Kangsabati, Silabati
and Gandhewari. They are mainly rain-fed and their
flow is mostly seasonal.
(iv) Low agricultural productivity :
The economy of Bankura district is predominantly
agrarian. Moreover, the crop pattern is tilted heavily
towards paddy cultivation using the traditional
agricultural practices. Unconducive topography, very
small size of the land holdings, poor irrigation
coverage, low water retention capacity of soil etc. offer
limited scope for farm mechanization. Use of farm
mechanization in agriculture is low also due to lack of
awareness among farmers. Farm mechanization is

6
1
limited to eastern alluvial tract among comparatively
prosperous farmers. On the other hand response to
crop diversification is poor and the pace of change of
cropping pattern is low.
(v) Lack of entrepreneurship :
The district is predominantly agricultural. Majority of
population depends on agriculture and allied activities.
Though there are large chunks of barren land that
could have been utilized for setting up industrial units
and there are traditional crafts and skilled workforce
that could have been consolidated for drawing larger
economic returns and tapping export potential, the
district witnessed low rate of expansion of industrial
sector. Moreover, the expansion remained limited to
some pockets in the northern region only.
(vi) Illiteracy :
As per Census 2001, Literacy rate is 63.84 percent. It
is much lower than national and state average. Literacy
is even lower in case of female, which is only 49.8
percent. In fact there are 688 number of mouzas in
the district where the female literacy rate is less than
30 percent.
1.2.3 Opportunities :
(i) Plantation and horticulture :
Land utilistion pattern reveals that only 59.5 percent
of total land is under cultivation. The district has a
vast area of cultivable wasteland comprising 2 percent
of total geographical area. A part of that is acidic-
alkaline or sand cast. These areas offer scope for
further development.
On the other hand, the agro-climatic condition of the
district is suitable for plantation/horticulture. Mulberry
and arjun plantation and horticultural crops such as
mango, guava, cashewnut, jackfurit, banana, papaya,
citrus fruits etc. can be grown in large scale. There is
also scope for development of floriculture, medicinal
and aromatic plants in the district. Total area under
horticultural crops in the district in around 4775
Hectare and that under mulberry and arjun plantation
is 4606 Hectare.
Area of culturable wasteland in the district is 18846
hectare, a major part of which can be utilised for the
purpose. There are seven seed farms, one Horticultural
Research & Development Centre at Taldangra and
about two hundred and fifty seed-dealers in the district.
Systematic identification of areas to be covered under
plantation/horticulture, getting timely supply of
planting materials and other inputs like technical advice,
marketing arrangement, market information enabling
the farmers to fetch remunerative price are the need of
the day. The activity will help marginal and small
farmers, to generate employment, improve nutritional
standards through development of wasteland and soil
conservation by peripheral plantation.
(ii) Irrigation & minor irrigation :
The facilities created under the Irrigation & Waterways
as well as Minor Irrigation Departments have not been
utilised to its fullest extent. As per record, 96 percent
of cultivable area is under irrigation coverage. But a
much smaller part of cultivable area gets actual
irrigation. It has earlier been explained that the reasons
behind are dilapidated and obsolete distribution
network, derelict machinery and siltation in canal
system. There lies much scope for system improvement
so that more areas are brought under actual irrigation.
There also lies scope for further exploitation of surface
runoff water. Average annual rainfall in the district is
nearly 1500 mm., which runs off and goes waste. If
this huge runoff water is systematically and planfully
tapped, the scope for irrigation will be enhanced
substantially. At the same time, this will check soil
erosion and recharge ground water.
(iii) Sericulture development :
The land use pattern and climate in certain parts of
the district is suitable for mulbery and arjun plantation
& silkworm rearing. Both mulberry culture and
traditional tasar culture have enough scope for further
development in both eastern & western parts of this
district.
(iv) Scope for medium, small & cottage
industries :
Bankura has great potential for expansion of activity in
medium small scale & cottage industry. The industrial
belts of Asansol, Raniganj & Durgapur are very close to
Barjora & Mejia. Good connectivity of road and rail,
steady power situation, availability of land for setting up
industries and cheap labour, both skilled and unskilled,

7
1
offer ample scope for growth. The district is rich in
minerals like coal, fire clay, china clay, silica etc. and
there is a scope to establish industries using the available
minerals as the raw material. Already a few medium
industries have come up but there lies much greater scope,
especially for cottage and small-scale industries.
The district has rich tradition of ‘Baluchari’ and
‘Swarnachari’ saree in handloom sector. There are
14473 nos. of handlooms & 136183 weavers. But this
sector is facing crisis at present. There remains great
scope for diversification & upgradation in this sector
with much greater employment potential. The growth
of sericulture in the district during last few years has
been very promising. There also lies scope for related
activities, which may generate gainful employment for
women-folk.
The district is famous for some unique traditional crafts;
pottery work of Panchmura, Baluchari silk sarees of
Bishnupur, Dokra work of Bikna, Patrasayer and
Gopalpur, stone craft of Susunia are unique in the state.
There are large pockets in the district where the people
have endogenous skills in manufacturing fishing hook,
fishing net, bamboo craft and manufacturing of babui
rope.
(v) Change in agricultural practices :
Cultivation pattern of this district is predominantly
mono-cropped and paddy is the primary crop of this
district. Proportion of net cropped area to total
geographical area is 56 percent, area under mono-crop
is 35.20 percent. Cropping intensity is 147 percent. In
this district wheat, oilseed and vegetables are other
major crops. High yielding variety (HYV) seeds are used
wherever irrigation is available. Use of chemical fertiliser
is predominant. Hardly any organic manure that helps
to soften hard lateritic soil is applied. Use of bio-
pesticides is very rare.
Hence there is enough opportunity for crop
diversification, changing the cropping pattern,
substitution of chemical manure by bio-fertiliser,
introduction of organic farming leading to the use of
bio-fertilisers, vermiculture composts etc.
(vi) Women’s empowerment and strong
presence of self-help groups (SHG) :
Due to reservation in membership and post of office
bearers in three tiers of Panchayat Raj system, this
district has witnessed rise of women participation in
Panchayat bodies as well as in development
administration at the grass-root.
On the other hand, formation of Self Help Groups
(SHG), imparting skills to the members of SHGs, and
their participation in productive activities have resulted
in enlargement of share of female folk in economic
activities. There still lies huge opportunity for the
women SHGs for taking part in economic activities in
a big way.
1.2.4 Threat :
The mainstay of economic activity of the people of
the district is agriculture and allied. This sector faces
threat from the following factors.
(i) Drought :
Though the district receives average annual rainfall of
1400 mm. in a year, which is not a poor figure so to
say, 80 percent of the total rainfall is received during
the 4 months of the year. Moreover the land being
undulating, lateritic & porous, result in poor subsoil
moisture which becomes a potent threat to the crop.
Fluctuating rainfall, with intermittent drought spell
between two successive rainfalls, makes the crop,
generally the Kharif crop, very vulnerable and
seriously affects the yield. When the drought spell
lengthens it takes a heavy toll on the crop and resultant
low output and low income traps the farmers, with
very small holding size, in a vicious cycle of the loan
from private lenders. Moreover there is a tendency to
overexploit the underground water for the purpose of
irrigation, which is not desirable. In case of Blocks
under Bishnupur Sub-division, there is such
overexploitation of this source. Kotulpur Block has
already been declared a black zone with respect to the
availability of ground water.
(ii) High prices of agricultural inputs and
pesticides :
The farmers are very much dependant upon chemical
fertilizers & pesticides for their agriculture. The prices
of chemical fertilisers and pesticides are increasing with
the passage of time but the prices of agricultural
produces like paddy are decreasing which poses a
serious threat to the prospect of this sector. To be
added with it the fluctuating prices of other
agricultural crops, mainly, oilseed and pulses which has

8
1
also contributed to the vulnerability of the farmers.
Overuse of chemical fertiliser and pesticides is posing
a serious hazard to human health.
(iii) Changes in technology & market trend :
The pace of change in economic activity fails to cope
with the rapid changes in technology as well as market
trend. The future of handloom sub sector with its
products on cotton, silk & Tasar have failed to compete
with the products of synthetic & other imported fibres
and weavers are now at the verge of starvation. The
rapid change in the trend in the market and the failure
of weavers and other small artisans and craftsmen to
adapt to the market trend has made them very
vulnerable and there is hardly any prospect of those
people who are engaged in this activity unless they
adapt themselves to technological innovations and
changes quickly.
In some sectors there are middlemen who are making
a hefty profit and the condition of artisans is very
pathetic. As a result, in Baluchari sector, for example,
the next generation is getting frustrated and wants to
break away from this sector. In all probability,
Baluchari will vanish unless something is done.
1.3 Bankura in the West Bengal
human development ladder :
Following the global pattern, West Bengal Human
Development report published in 2004 has captured
human development attainments of the districts in the
State. As disaggregated data for the bifurcated districts
of Paschim Dinajpur and Medinipur were not available,
those were taken as one single district. Accordingly 17
districts of the State were ranked. Bankura was at a
relatively lower rung of human development, its rank
having been eleventh. The following table shows relative
position of the district in the all West Bengal
perspective.
Relative position of the district in terms of the three
human development indices indicates that in relation to
health and educational attainments, the district is closer
to the state average, whereas in income, it lags far
behind. In income sector Bankura is only second from
the bottom, Purulia having even lower income index.
The District Human Development Report is a sequel
to the State Human development Report and it
endeavours to explore in greater details the issues posed
by the State Human Development Report.
Table 1.4 Human development indices for Bankura vis-à-vis
other districts of West Bengal
District Health Index Income index Education index HDI value HDI rank
Kolkata 0.82 0.73 0.80 0.78 1
Haora 0.77 0.53 0.75 0.68 2
North 24 Paraganas 0.72 0.49 0.76 0.66 3
Darjeeling 0.73 0.49 0.72 0.65 4
Bardhaman 0.74 0.47 0.71 0.64 5
Hugli 0.77 0.46 0.67 0.63 6
Medinipur 0.68 0.45 0.74 0.62 7
South 24 Paragana 0.71 0.40 0.68 0.60 8
Nadia 0.65 0.41 0.66 0.57 9
Jalpaiguri 0.61 0.38 0.60 0.53 10
Koch behar 0.50 0.41 0.65 0.52 11
Bankura 0.67 0.26 0.62 0.52 11
Dinajpur 0.62 0.39 0.53 0.51 13
Birbhum 0.53 0.27 0.61 0.47 14
Murshidabad 0.57 0.29 0.52 0.46 15
Purulia 0.61 0.18 0.55 0.45 16
Malda 0.49 0.36 0.48 0.44 17
West Bengal 0.70 0.43 0.69 0.61
Source: West Bengal Human Development Report, 2004

9
1
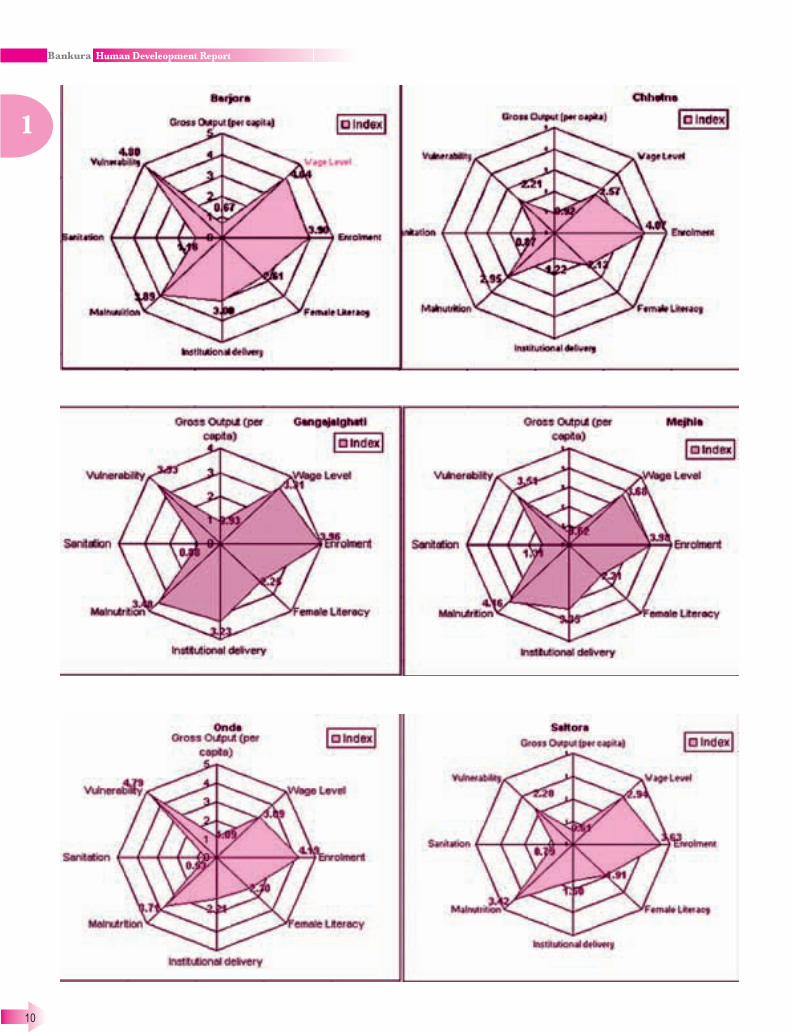
1.4 Human Development Radar :
Whereas standard procedures have evolved in measuring
relative position of larger units of development, viz.,
countries, states and districts in the Human
Development spectrum, no standard processes have as
yet been developed in making comparison amongst
lower units like blocks and Gram-Panchayats in terms
of human development achievement. Lack of standard
data at the disaggregated level is the greatest stumbling
block in arriving at such a yardstick. Faced with this
dilemma, the district weighed the options of developing
some proxy indicators to indicate relative position of
blocks in terms of achievements in the health, education
and livelihood sectors. However, after detailed debate
and discussions at the district level, we have decided to
do away with development of human development
indices for the blocks. As an alternative, we have decided
to construct Human Development Radars for the blocks
of the district. The concept of Human Development
Radar, explored at length in the National Human
Development Report, 2001 has been applied in the
specific context of the district. Using this methodology
eight indicators have been chosen here to capture the
status of human development in different arena. Blocks
have been accordingly ranked. The indicators are:- per
capita gross output, wage level, enrolment,
institutional delivery, malnutrition, sanitation
coverage, female literacy rate and vulnerability.
An effort has been made to capture each area of human
development. However, indicators where the available
data are reasonable accurate. Per capita gross output
has been calculated and normalized with the norm of
$ 1 per person per day delineated in the Millennium
Developmental Goal (MDG). Wage level is another
indicator signifying the standard of living. Average of
the wage level in the lean and peak season has been
taken and normalized with respect to the minimum
wage as applicable under the existing norms.
Enrolment has been taken for the education sector and
institutional delivery to capture the maternal health.
Since malnutrition is one of the biggest reasons of
child death, the same has been adopted. Sanitation
coverage being one of the major weaknesses on human
development attainment in this district, has also been
included. Female literacy has been kept as one of the
indicators to understand the gender status. The last
indicator adopted is vulnerability. This is an indicator
derived from two major aspects which determine
vulnerability in this district – migration and
fluctuations in foodgrain production. Blocks have been
divided into three categories with respect to migration
– severe (1), moderate (0.5) and no migration (0).
Figures in the bracket are meant to quantify the extent
of migration. Similarly standard deviation of
fluctuations in foodgrain production has been
calculated and is normalized with respect to the mean
foodgrain production. Both these parameters have
been given equal weightage while calculating
vulnerability index for a block. For malnutrition and
vulnerability inverse of the actual figure have been
used as per the usual methodology followed for a
human development radar. The Human Development
Radar thus calculated for different Blocks has been
depicted :
10
1

11
1

12
1

13
1
As can be seen, Hirbandh block is lowest on the ladder
of human development and Indas is at the highest rung
of the ladder. Even blocks that are relatively better off
have weaker areas which is a concern and which should
find a place in chalking out a human development
strategy.


15
2
Chapter 2
2.1. Introduction :
As has been indicated earlier, Bankura lags far behind
other districts in terms of the income index- one of the
three human development indicators. As we will see
later, there are also sharp regional disparities in the
district and, therefore, there are pockets in the district
where the gap is even wider. Standard of living is,
therefore, the biggest concern. Livelihood options are,
on the other hand, fairly limited because of poor natural
resource base and related uncertainties. An attempt has
In the book ‘Focus on West Bengal, Problems and
Prospects’, A.K. Maikap has classified the districts of
West Bengal on the basis of their per capita income in
1961. Here, among fifteen districts of the state, Bankura
ranks second from below, the only district with lower
per capita income than it was Purulia (less than Rs.
200.00 at current prices) and the other three districts
belonging to the group of Bankura were Midnapore,
Graph 2.1.1 Per capita gross output (paddy) of the district (rural)
Table 2.1.1 Variation of GDP & per capita GDP with 1980-’81 base price
Year NDP at Per capita NDP at Per capita
current prices income at constant prices income at
current prices constant prices
1993-’94 Rs. 1778.00 crores Rs. 6130.52 Rs. 1778.00 crores Rs. 6130.52
2000-’01 (Q) Rs. 4997.48 crores Rs. 15741.64 Rs. 2971.99 crores Rs. 9361.52
Source: Bureau of Applied Economics and Statistics, Government of West Bengal
been made here to understand reasons behind low
income level and relative income disparities. Possible
solutions to enhance quality of life have also been
explored.
2.1.1 Income approach :
In recent years statistically acceptable and comparable
data of GDP, Net Domestic Product (NDP) and per
capita District Domestic Product (DDP) are available
in both current and constant prices with 1993-’94 as
the base year.
Cooch Behar and Malda (per capita income ranging
from Rs. 201.00 to Rs. 250.00). But by 1981, Bankura
district improved its relative position considerably well
as we see that its rank was tenth among the eighteen
districts of West Bengal.
During 1981-2001, Bankura has continued its upward
journey in the path of higher per capita income and
by 2001 it changed its relative position to seventh.
Standard of Living

16
2
While the Gross Domestic Product (GDP) has been
estimated as indicted above, estimation of Block Level
Domestic Product and thereby income calculation on
similar lines is likely to be very erroneous since similar
assumptions are not valid at the block level and the
data on tertiary sector is very limited. Instead, an
attempt has been made here to take up primary sector
only and rank the blocks accordingly. Since Bankura
economy is mainly agrarian, this approach is expected
to give a fairly good idea about relative picture of
income. Since the resulting indicator cannot strictly be
equated with the concept of per capita income, we have
instead used the term ‘gross output in primary sector’.
It may be reiterated that the output, which adds to the
direct income, has been included (instead of the usual
notion of total goods and services). The graph 2.1.1
shows per capita gross output of paddy for the district
during 1999-2003. It shows a downward trend which is
a cause of worry.
The bar chart 2.1.2 shows the relative position of
different blocks on similar lines for 2003 (taking paddy
and wheat together).
2.1.2 Block-wise per capita gross output of paddy and wheat
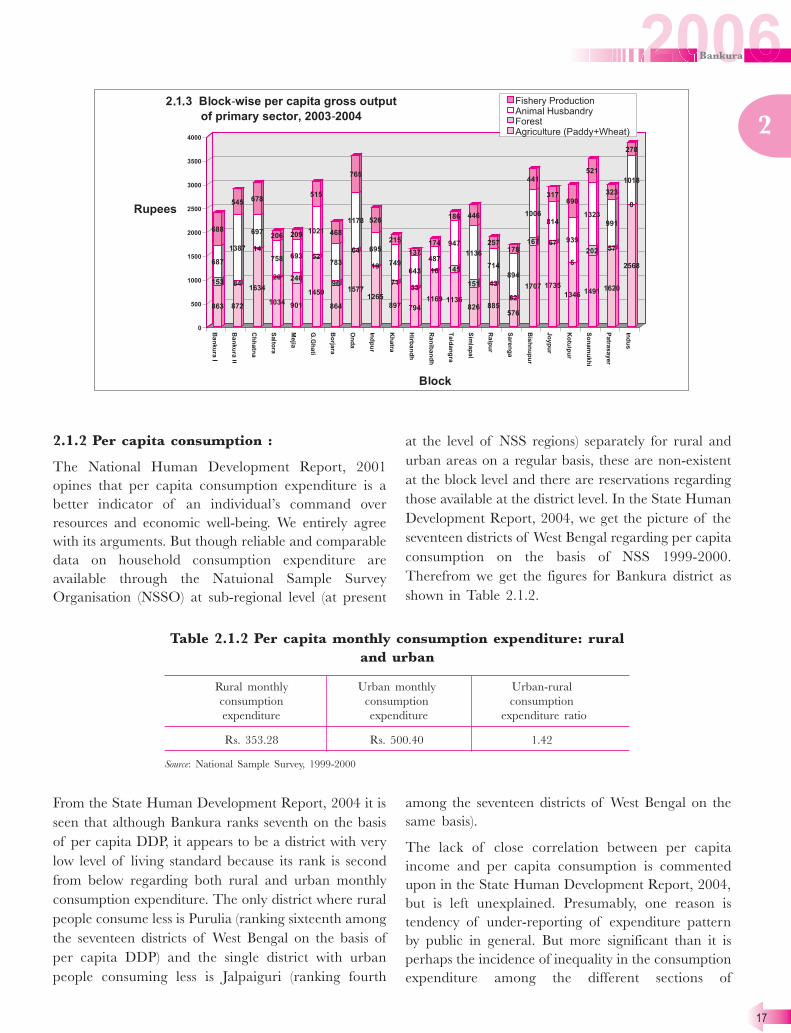
We have similarly calculated the gross per capita output
for the main components in the primary sector for
different blocks, which is indicated in bar diagram
2.1.3. Because of paucity of data only the main
components like milk production, forest timber has
been used for the calculation. As can be seen there are
wide variations and clearly the blocks in Bishnupur
Subdivision with more fertile land and water availability
are better off.
17
2
2.1.2 Per capita consumption :
The National Human Development Report, 2001
opines that per capita consumption expenditure is a
better indicator of an individual’s command over
resources and economic well-being. We entirely agree
with its arguments. But though reliable and comparable
data on household consumption expenditure are
available through the Natuional Sample Survey
Organisation (NSSO) at sub-regional level (at present
Table 2.1.2 Per capita monthly consumption expenditure: rural
and urban
Rural monthly Urban monthly Urban-rural
consumption consumption consumption
expenditure expenditure expenditure ratio
Rs. 353.28 Rs. 500.40 1.42
Source: National Sample Survey, 1999-2000
at the level of NSS regions) separately for rural and
urban areas on a regular basis, these are non-existent
at the block level and there are reservations regarding
those available at the district level. In the State Human
Development Report, 2004, we get the picture of the
seventeen districts of West Bengal regarding per capita
consumption on the basis of NSS 1999-2000.
Therefrom we get the figures for Bankura district as
shown in Table 2.1.2.
From the State Human Development Report, 2004 it is
seen that although Bankura ranks seventh on the basis
of per capita DDP, it appears to be a district with very
low level of living standard because its rank is second
from below regarding both rural and urban monthly
consumption expenditure. The only district where rural
people consume less is Purulia (ranking sixteenth among
the seventeen districts of West Bengal on the basis of
per capita DDP) and the single district with urban
people consuming less is Jalpaiguri (ranking fourth
among the seventeen districts of West Bengal on the
same basis).
The lack of close correlation between per capita
income and per capita consumption is commented
upon in the State Human Development Report, 2004,
but is left unexplained. Presumably, one reason is
tendency of under-reporting of expenditure pattern
by public in general. But more significant than it is
perhaps the incidence of inequality in the consumption
expenditure among the different sections of

18
2
population. This inequality factor is specially operative
in the case of Bankura district as about 40 percent of
the people here belong to Scheduled Caste and
Scheduled Tribe etc. and about 42 percent of the net
cultivated area of the district with a mainly agro-based
economy falls in the drought-prone and near drought-
prone region. Indeed, while inequality has nothing to
do with the concept of per capita income, it has very
serious impact on the per capita consumption figures
in any locality.
2.2 Structure of production :
‘Bankura is one of the few districts in Southern West
Bengal which has, even in recent years of urbanisation
and industrialisation, maintained its overwhelming
agro-economic base’ – this is how Santibhusan Nandi,
an Assistant Anthropologist in the Anthropological
Survey of India, begins his account of ‘Some Aspects
of Social-cultural Life of a Bankura village in 1961.’1.
After the lapse of 45 years, it would not perhaps be
unjustifiable to repeat the same sentence in order to
characterise the district economy of Bankura in 2006.
Agriculture is till now the chief occupation of the
people and while it was the main source of livelihood
of about 81.74 percent in 1961 and 79.7 percent in
1991, 69.7 percent of Bankura people are still
dependent on agriculture for earning their daily
livelihood.
2.2.1 Occupation structure :
That occupational structure is definitely related with the
level of economic development is well known. This
relationship is not so close in the case of human
development level in any country or region. But as non-
agricultural occupation generally generates more
income, and per capita income is considered the first
determinant of the standard of living of people, the
relative importance of agriculture and non-agricultural
occupation of the inhabitants may be taken as an
indicator of their level of living in a locality. The Table
2.2.1 gives us an interesting picture of Bankura district
in relation to some other agrarian districts and also in
relation to the position of the state of West Bengal in
this context.
From the above table it is seen that only two districts,
Bankura and Purulia, have as yet retained
overwhelmingly agriculture-based economy and
agriculture still provides means of livelihood to more or
less 70 percent of population there.
Table 2.2.1 Occupation class: Percentage of people engaged in 2001
District / State Farmers Agricultural Non-
labourers agricultural
occupations
Uttar Dinajpur 38.0% 43.7% 18.3%
Dakshin Dinajpur 34.3% 40.0% 25.7%
Cooch Behar 40.4% 31.8% 27.8%
Purulia 33.3% 38.4% 28.3%
Bankura 32.6% 37.1% 30.3%
West Bengal 25.4% 33.0% 41.6%
Source: West Bengal Human Development Report, 2004, p 96
2.2.2 Trends in agricultural production and
productivity :
After the record achievements (highest rate of growth
of foodgrains production) of West Bengal in the
agricultural sector in the eighties, there had come a
recessionary trend particularly in rice production (Boro
paddy) during the nineties. But though the yield rate
of foodgrain declined in Bankura, Midnapore and
Purulia in the year 1998-’99 due to scanty rainfall, the
district of Bankura ranks very high in terms of its
performance in foodgrains productivity. The bar
diagram 2.2.1 illustrates the point.
It is found that productivity of Bankura is always
higher than the state average and while in 1995-’96, it
came second only to Burdwan (2702 Kg./ Hectare), in
2000-2001 its rank was third, the district of Hooghly

19
2
scoring higher (2512 Kg./Hectare). As regard to the
rate of growth of foodgrains production during 1982-
’83 to 2000-2001, the district of Bankura also exceeds
most of the other districts of West Bengal except
Dinajpur, Jalpaiguri and Murshidabad, its percentage
rate of growth being 3.83 against the state average of
3.26.2
2.2.3 Rest of the Primary Sector :
From a study of the structure of production in Bankura
it is seen that the primary sector contributes 42.23
percent of the NDP of the district in 2000-2001 at
constant (1993-’94) prices. Agriculture shares 37.82
percent of it and the respective shares of forestry, fishery
and mining and quarrying are 0.95 percent, 3.44
percent and 0.02 percent (total share of the allied sectors
is 4.41 percent). In both forestry and fishery, the district
is in a better position in relation to the state average
Diagram 2.2.1 Comparative study of foodgrain productivity in Bankura and West Bengal
(0.63 percent and 2.80 percent respectively). In forestry,
its rank is fifth, Purulia, South 24 Paraganas, Uttar
Dinajpur and Birbhum coming ahead of it and in
fishery, its rank is again fifth, the districts with larger
share in the NDP being Purulia, South 24 Paraganas,
Mindapore and Birbhum.3
2.2.4 Role of the Secondary Sector :
From 1991 Census we find that 9.67 percent of the
main workers of Bankura are engaged in the secondary
sector.4
Nonetheless, the sector contributes only 12.7
percent of the NDP in the district in 2000-2001 and it
stands in this respect much behind not only to the state
average of 20.28 percent but also from the neighboring
agrarian district of Purulia (16.80 percent) and
Midnapore (16.49 percent). The Table 2.2.2 illustrates
its position vis-à-vis some other industrially advanced
districts in West Bengal.

20
2
Table 2.2.2 Share of the secondary sector in NDP at constant
(1993-’94) prices for various districts
District Share of the secondary sector in
NDP at constant (1993-’94) prices Rank
North 24 Paraganas 33.02 1
Howrah 30.32 2
South 24 Paraganas 27.56 3
Hooghly 22.71 4
Burdwan 22.42 5
Jalpaiguri 20.34 6
Murshidabad 19.99 7
Nadia 18.26 8
Purulia 16.80 9
Midnapore 16.49 10
Darjeeling 16.18 11
Kolkata 15.89 12
Bankura 12.71 13
Source: Bureau of Applied Economics & Statistics, Government of West Bengal, 2002
2.2.5 Service sector :
That the pace of economic attainment in the district
has been more rapid in the late nineties is clear from
the fact that while in 1994-’95 the services sector
contributed only 35.89 percent of the NDP of
Bankura at constant (1993-’94) prices, in 2000-2001
the share of the sector has increased to 45.06 percent.
Here the relative position has changed marginally from
sixteenth to fourteenth among the eighteen districts.
Interestingly, the state average of the share of this
sector was 42.87 percent in 1994-95 and it is 52.47
percent in 2000-2001. The districts that have more
than state average share of the domestic product in
2000-2001 (at constant 1993-94 prices) originating
from the tertiary sector are only Kolkata (83.20
percent), Howrah (60.49 percent) and Darjeeling
(59.04 percent). But more interesting than this is the
fact that three neighbouring districts of Purulia (49.65
percent), Birbhum (49.19 percent) and Midnapore
(48.50 percent) have higher share than Bankura which
means that this characteristic feature of the economy
of these districts have, in reality, very little impact on
their fundamental agrarian production structure and
comparatively low ranking in the perspective of human
development within the state.
2.3 Wage and employment :
Among the objective indicators of standard of living of
the people in a community, wages and employment are
no less important than per capita income and per capita
consumption.

21
2
Table 2.3.1 Block-wise change in agricultural wage rate (Rs.)
during peak and lean seasons from 1997-1998 to 2005-2006
Block 1997-1998 1999-2000 2001-2002 2003-2004 2005-2006
Peak Lean Peak Lean Peak Lean Peak Lean Peak Lean
Saltora 40 35 40 35 45 40 50 45 55 50
Taldangra 40 35 40 35 45 40 48 45 50 45
Raipur 35 30 40 35 45 40 50 45 55 52
Simlapal 30 25 32 30 45 40 50 45 55 50
Indpur 30 25 35 30 45 40 45 40 50 45
Gangajalghati 33 29 41 37 44 39 50 45 55 45
Bankura-I 35 30 35 30 40 35 45 40 45 40
Chhatna 25 33 25 33 30 25 35 30 40 30
Ranibandh 35 30 35 30 38 35 42 40 42 40
Hirbandh 32 28 32 28 35 32 40 35 40 35
Sarenga 30 25 30 25 35 30 35 30 40 35
Barjora 37 30 42 37 45 40 50 45 55 45
Bankura-II 50 35 60 35 60 40 60 40 60 40
Onda 35 30 40 35 45 40 52 45 55 50
Khatra 35 30 37 32 40 35 45 40 45 40
Mejhia 37 30 42 37 45 40 50 45 55 45
Bishnupur 42 40 45 42 50 45 55 50 62 55
Joypur 45 40 50 45 50 45 55 50 65 60
Kotulpur 50 48 55 50 60 55 64 60 67 64
Sonamukhi 42 40 50 45 55 50 55 50 65 60
Patrasayer 42 40 45 42 50 45 55 50 65 60
Indus 52 48 55 50 60 55 64 60 65 60
Source: Office of the Assistant Labour Commissioner, Bankura
Wage and employment become more significant in the
context that per capita income computation is not
feasible at the block level whereas per capita
consumption data at the district level have their own
limitations and at the block level these are completely
non-existent.
Wages obviously mean real wages and are interlinked
with price level. To begin with, it is therefore, safe to
remember that both the concepts of wages and
employment are equally beset with conceptual and
practical limitations like per capita income and per
capita consumption.
The Table 2.3.1 illustrates the movement of agricultural
money wages for different blocks in Bankura from the
year 1997-1998 to 2005-2006 (at current prices).
As can be seen there are wide variations in the wage
level prevalent in different blocks and once again the
blocks in the Bishnupur sub-division appear to be better
off. In the blocks which are lagging behind, there are
wide seasonal fluctuations in wages leading to
migration of agriculture labourers to other districts.
The increase of (real) wage over a period of time is
also not satisfactory. Unfortunately migration to
Burdwan and Hooghly districts from Bankura and
specially its drought-prone areas of the western part is
till today an indicator of comparatively low level of
wages and employment for a large section of
population.
2.3.1 Employment situation in the district :
While real wages are very important determinants of
the level of living of a large section of people in a
community, these are, in fact, of little significance if
the wage-earners remain unemployed i.e., in the
condition of high rate of ‘involuntary unemployment’
due to lack of demand for labour and / or structural
rigidities in an economy.
22
2
Table 2.3.2 Share of workers in total population in 1991 & 2001
District 1991 2001 Rank in 2001
Bankura 35.91 44.73 1
Purulia 43.15 44.46 2
Malda 34.69 40.76 3
Dakhin Dinajpur 34.89 40.75 4
Midnapore 35.19 39.06 5
Cooch Behar 32.14 38.99 6
Jalpaiguri 33.79 38.37 7
Uttar Dinajpur 34.25 38.35 8
Kolkata 33.01 37.66 9
Birbhum 33.15 37.42 10
Hooghly 31.14 36.84 11
Burdwan 30.66 35.49 12
Darjeeling 34.22 35.29 13
Nadia 29.34 35.13 14
Murshidabad 31.51 34.14 15
Howrah 29.10 33.71 16
North 24 Paraganas 28.78 33.44 17
South 24 Paraganas 28.29 32.47 18
Source: Towards A District Development Report, by Biswajit Chatterjee and Dilip Kumar Ghosh of SIPRD,
West Bengal, pp 45-46
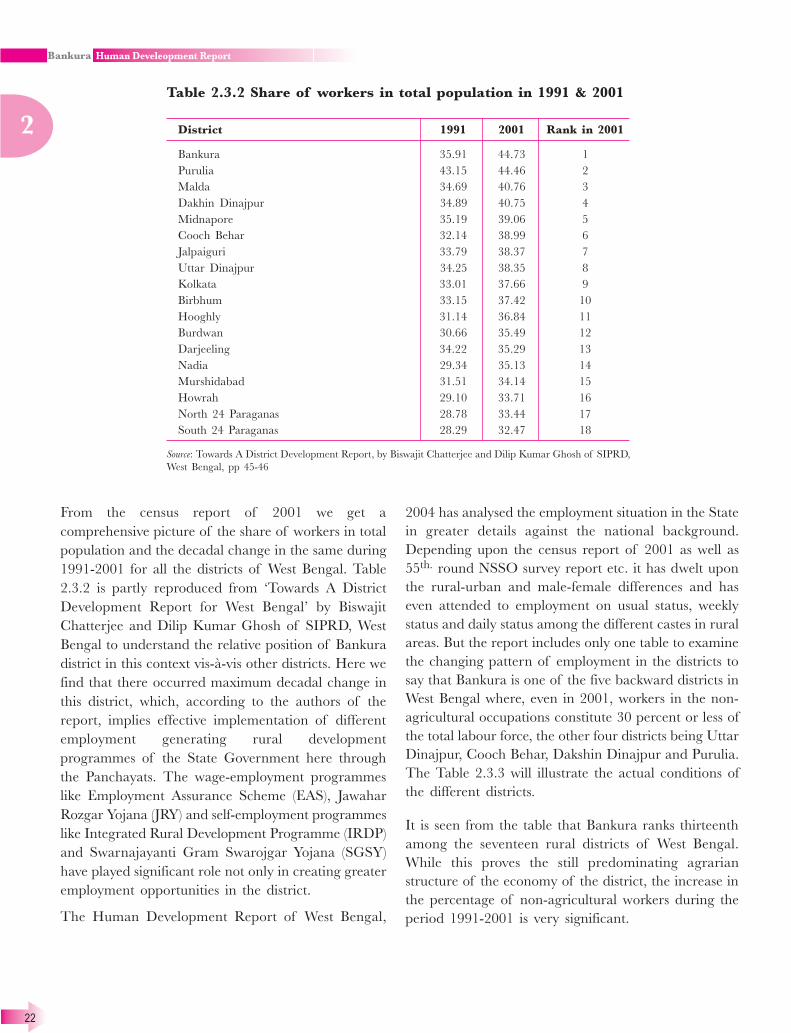
From the census report of 2001 we get a
comprehensive picture of the share of workers in total
population and the decadal change in the same during
1991-2001 for all the districts of West Bengal. Table
2.3.2 is partly reproduced from ‘Towards A District
Development Report for West Bengal’ by Biswajit
Chatterjee and Dilip Kumar Ghosh of SIPRD, West
Bengal to understand the relative position of Bankura
district in this context vis-à-vis other districts. Here we
find that there occurred maximum decadal change in
this district, which, according to the authors of the
report, implies effective implementation of different
employment generating rural development
programmes of the State Government here through
the Panchayats. The wage-employment programmes
like Employment Assurance Scheme (EAS), Jawahar
Rozgar Yojana (JRY) and self-employment programmes
like Integrated Rural Development Programme (IRDP)
and Swarnajayanti Gram Swarojgar Yojana (SGSY)
have played significant role not only in creating greater
employment opportunities in the district.
The Human Development Report of West Bengal,
2004 has analysed the employment situation in the State
in greater details against the national background.
Depending upon the census report of 2001 as well as
55th.
round NSSO survey report etc. it has dwelt upon
the rural-urban and male-female differences and has
even attended to employment on usual status, weekly
status and daily status among the different castes in rural
areas. But the report includes only one table to examine
the changing pattern of employment in the districts to
say that Bankura is one of the five backward districts in
West Bengal where, even in 2001, workers in the non-
agricultural occupations constitute 30 percent or less of
the total labour force, the other four districts being Uttar
Dinajpur, Cooch Behar, Dakshin Dinajpur and Purulia.
The Table 2.3.3 will illustrate the actual conditions of
the different districts.
It is seen from the table that Bankura ranks thirteenth
among the seventeen rural districts of West Bengal.
While this proves the still predominating agrarian
structure of the economy of the district, the increase in
the percentage of non-agricultural workers during the
period 1991-2001 is very significant.

23
2
Table 2.3.3 Rural occupation structure in the districts of
West Bengal
District/State Farmers Agricultural Non-agricultural
labourers labourers
1991 2001 1991 2001 1991 2001
Howrah 21.6 9.9 27.7 19.6 50.7 70.5
Darjeeling 33.5 20.6 16 14.4 50.5 65
Jalpaiguri 33.3 23.6 19.5 20.4 47.2 56
South 24 Paraganas 33.1 18.8 33 30.4 33.9 50.8
North 24 Paraganas 34.2 21 32.4 28.5 33.4 50.5
Murshidabad 33.9 21.3 34.6 32.3 31.5 46.4
Nadia 36.3 24.7 33.1 29.1 30.6 46.2
Malda 35.6 21.9 36.7 32.5 27.7 45.6
Hooghly 29.2 20.9 36.5 34.1 34.3 45
Burdwan 30.1 20.4 36.9 41.9 33 37.7
Midnapore 47.4 30.4 26.1 33.9 26.5 35.7
Birbhum 36.5 24.9 40.7 39.7 22.8 35.4
Bankura 43.2 32.6 36.5 37.1 20.3 30.3
Purulia 52.2 33.3 30.7 38.4 17.1 28.3
Cooch Behar 51.8 40.4 28.2 31.8 20 27.8
Dakshin Dinajpur 46.4 34.3 33.4 40 20.2 25.7
Uttar Dinajpur 42.9 38 38.6 43.7 18.5 18.3
West Bengal 38.4 25.4 32.3 33 29.3 41.6
Source: West Bengal Human Development Report, 2004, p 96
2.4 Poverty :
A possible solution to improve the quality of life and
reduce poverty must first analyse poverty itself. The
meaning and scope of poverty varies with time and
space and there has been consistent effort across the
globe to understand and address it. Poverty is both an
absolute and relative concept. In the context of Bankura
(or at least major part of it) absolute deprivation has
been very visible. Still there is a challenge in terms of
identification of the poor and their aggregation – so
that they can be brought under the focus of intervention.
Here we have made an attempt to understand poverty
in the context of Bankura and its possible reduction
strategies.
2.4.1 Studies on Poverty in the district :
That regional inequality has been the most remarkable
characteristic feature of Bankura is already pointed out
and this is amply testified to in the findings of Prof.
Bandopadhyay of Bankura Sammilani College while
working for a dissertation work (unpublished) regarding
poverty in Bankura district and all other surveys
conducted for the purpose and findings incorporated
in the two volumes of ‘Bankura Zillar Arthanity’
published respectively in March, 1989 and September,
1993. A detailed account of the villages surveyed at
that time and the percentage of people living below
the General Poverty Line and Augmented Poverty Line
is given in the Table 2.4.1.

24
2
Table 2.4.1 Percentage of families living below General Poverty
Line & Augmented Poverty Line in 1990 in four surveyed villages
Village Per capita Percentage of Percentage of
income (in Rs.) families living below families below
(Year) the GPL (Rs.1284 Augmented
at 1983-’84 prices) Poverty Line
Teura
(Block-Sonamukhi) 1017.25 (1990) 2.78 percent 58.33 percent
Mouladanga
(Block-Bankura-II) 2633.33 (1990) 2.91 percent 33.98 percent
Belboni
(Block-Bankura-II) 2027.86 36.73 percent 89.80 percent
Jambedia
(Block Bankura-I) 2787.53 54.17 percent –
Source: Bankura Jelar Arthanity (in Bengali), by Prof. T. Dhar
Assuming that membership in a family is equal for all
the villages, the percentage of inhabitants living below
General Poverty Line is 25.6 percent. The village of
Teura is situated in eastern zone of rich alluvial soil.
Similarly the village Mouladanga is near Bankura town
and this urban area proximity raises the per capita
income level of non-agricultural workers there. The
village Belboni also enjoys facilities of being proximate
to the Bankura-Durgapur road, but villages like
Mauladanga and Jambedia fall in the arid soil zone
without reasonable irrigation potential. The village
Jambedia provides an example of the type of villages
in the western zone of Bankura district, i.e., drought-
prone area without irrigation facilities and adequate
employment opportunities for the landless labourers.
The relatively high per capita income of the village has
other reasons of income inequality among the
inhabitants. Though the data presented here is rather
old, it does reflect the challenges in terms of poverty
reduction in different parts of this district.
Visit to a backward mouza
Some statistics:
Total population: 366
SC population: Nil
ST population: 298
Others: 68
Itamara is a backward village in Hirbandh. In this village misery has mainly been caused by loss of land
in the nearby Kangsavati reservoir. When the dam on the Kangsavati river was first constructed the
adjoining area got submerged. Around 900 acre land of this village was submerged which has caused
serious problem of livelihood for the villagers. Today the village area is only 300 acre of which about
30 acre is homestead land. A major portion of the village land is not cultivable and therefore there is
no source of livelihood for majority of people residing. The problem is so acute that the system of
money lending is also absent since there is no one with adequate resources to lend money. Most of the
villagers migrate to Burdwan for nearly 4 months. The migration takes place a number of times during
a year which causes serious hardship to the community and specially to the children who are deprived
of adequate education and health care during migration. Wage level in the village is hardly Rs. 35 per
day in peak season. Some of the villagers used to do Lac cultivation but some years back the market
price of Lac touched a record minimum throwing many of them out of this profession.

25
2
Twenty five families in the village are receiving rice/wheat in alternate week under the Antyodaya Anna
Yojana. The scale of distribution appears to be as per the prescribed norm. There are three ponds
which, if properly re-excavated, will serve the irrigation need for Rabi crop. There is a primary school
in the village and mid-day meal has been started in the school. This has given a jump to the number
of students attending the school. There is a tube well in the school which somehow meets a part of the
drinking water need of the community. There is another tube well in the village. However two more
tube wells are required to meet the total drinking water requirement of the community. The women folk
collect fuel wood from forests which takes about 4 hours in a day. The ICDS centre is not having
foodgrain and so has gone dry. There is a substantial number of children in the village who are not
attending the ICDS centres.
The villagers have suggested the names of three ladies who, in their opinion, were the poorest in the
village. They were either covered under the Antyodaya Anna Yojana or under the old age pension
scheme of the BCW department. There is one leprosy patient in the village who is undergoing treatment.
He earns his livelihood by attending cows of different villagers. There is no health centre in the village.
The nearest health centre is 2 k.m. away. There is no certain means of transport to the health centre.
Patients are sometimes taken on say a cot which is lifted by villagers. There is no sanitary latrine in the
village. People in this village mostly suffer from diarrhoea and malaria. Because of poverty the food
habit of the villagers is very irregular which frequently results into stomach disorders. The marriage age
in this village is generally higher than 18 years.
Analysis :
It appears that there exist more no. of such villages where submergence of cultivable area has resulted
into poverty of people living in vicinity. The challenge in such villages is to find alternative means of
livelihood where dependence on agricultural land is minimized. This issue has been discussed with the
people. They have suggested that the village has ‘Etel’ type of soil which is perhaps very suited to make
tiles. An effort has been started to form SGSY Self Help Groups in the village and train them on tile
making. It can also cover Terracota tiles in future. Similarly there are a large number of Palash trees in
the village. Villagers are already having the skill for Lac cultivation. Some Self Help Groups are being
formed who can be involved in this activity. Taking care of the health / education needs of children
during migration appears to be quite difficult. If we are able to generate more employment and migration
is stopped, children will perhaps benefit the most. It also appears that women have to spend long hours
on fuelwood collection itself. A plan to go for plantation on the wasteland including the land on both
sides of the road may help. It will provide fuelwood to the women folk from nearby.
As of now the community is in a highly vulnerable state and it has nothing to fall back upon.
(Source: Office of the District Magistrate, Bankura)
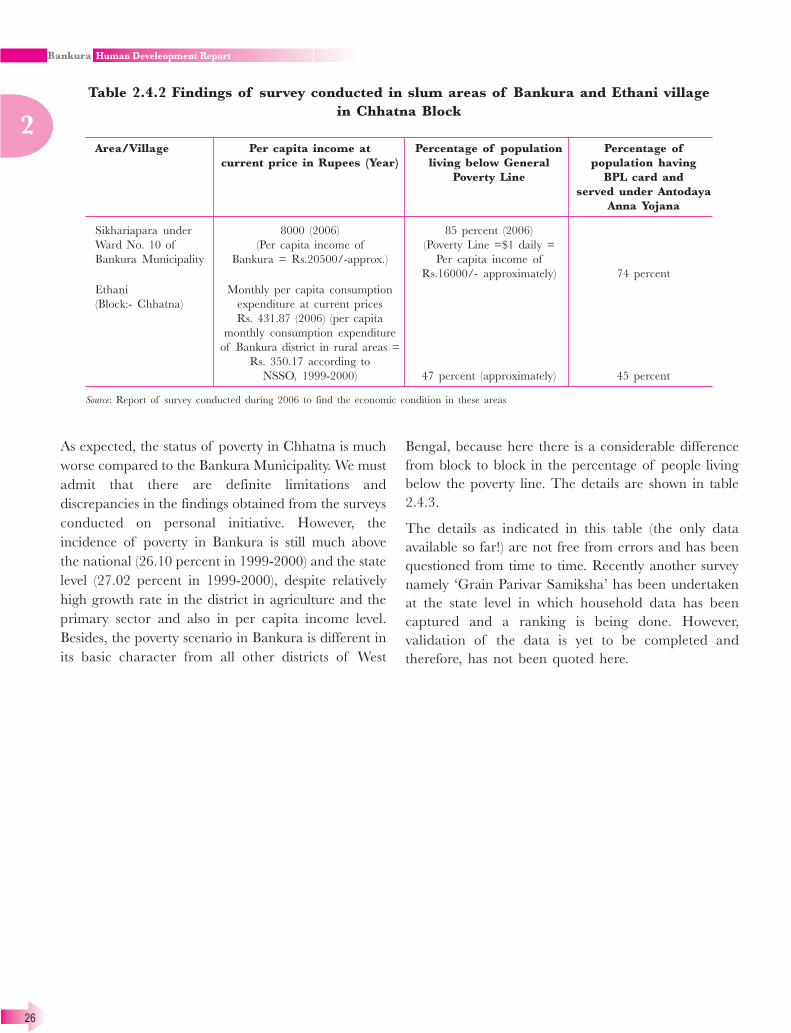
Reference may be made here of two other surveys about
the standard of living in Bankura district – one of them
undertaken in a slum area of Bankura town in 2006
and the second one in a village in the Chhatna Block,
24 Km. west of Bankura town. The findings are shown
in Table 2.4.2.
26
2
Table 2.4.2 Findings of survey conducted in slum areas of Bankura and Ethani village
in Chhatna Block
Area/Village Per capita income at Percentage of population Percentage of
current price in Rupees (Year) living below General population having
Poverty Line BPL card and
served under Antodaya
Anna Yojana
Sikhariapara under 8000 (2006) 85 percent (2006)
Ward No. 10 of (Per capita income of (Poverty Line =$1 daily =
Bankura Municipality Bankura = Rs.20500/-approx.) Per capita income of
Rs.16000/- approximately) 74 percent
Ethani Monthly per capita consumption
(Block:- Chhatna) expenditure at current prices
Rs. 431.87 (2006) (per capita
monthly consumption expenditure
of Bankura district in rural areas =
Rs. 350.17 according to
NSSO, 1999-2000) 47 percent (approximately) 45 percent
Source: Report of survey conducted during 2006 to find the economic condition in these areas
As expected, the status of poverty in Chhatna is much
worse compared to the Bankura Municipality. We must
admit that there are definite limitations and
discrepancies in the findings obtained from the surveys
conducted on personal initiative. However, the
incidence of poverty in Bankura is still much above
the national (26.10 percent in 1999-2000) and the state
level (27.02 percent in 1999-2000), despite relatively
high growth rate in the district in agriculture and the
primary sector and also in per capita income level.
Besides, the poverty scenario in Bankura is different in
its basic character from all other districts of West
Bengal, because here there is a considerable difference
from block to block in the percentage of people living
below the poverty line. The details are shown in table
2.4.3.
The details as indicated in this table (the only data
available so far!) are not free from errors and has been
questioned from time to time. Recently another survey
namely ‘Grain Parivar Samiksha’ has been undertaken
at the state level in which household data has been
captured and a ranking is being done. However,
validation of the data is yet to be completed and
therefore, has not been quoted here.

27
2
Table 2.4.3 Block-wise number of families living below poverty line (BPL)
Block No. of BPL families Percentage of BPL families with
respect to the total number of families
Bankura-I 7447 42.84
Bankura-II 8400 38.48
Chhatna 15960 49.95
Saltora 7689 34.82
Gangajalghati 11167 41.08
Mejhia 5980 45.75
Onda 16671 44.39
Barjora 14452 43.89
Bishnupur 10996 45.21
Joypur 8999 34.37
Kotulpur 8736 29.3
Indas 9017 30.8
Patrasayer 11592 37.63
Sonamukhi 11528 44.47
Taldangra 10824 49.89
Simlapal 10442 46.53
Raipur 11571 49.98
Sarenga 9409 41.57
Ranibandh 10199 49.75
Khatra 8422 46.87
Indpur 11335 48.19
Hirbandh 6790 49.95
Total for Blocks 227626 42.48
Bankura Municipality 7008 27.84
Bishnupur Municipality 4498 35.70
Sonamukhi Municipality 1204 22.51
Total for Municipalities 12710 29.48
Grand Total 240336 41.52
Source: District Rural Development Cell, Bankura Zilla Parishad
2.4.2 Issue of identification and aggregation :
This is the first and perhaps the most important step
while addressing poverty. Normally household survey is
one of the best options to go about it. However,
household survey for entire district at frequent intervals
is expensive and not feasible. Since the economy of
Bankura is mainly agrarian, it can be safely assumed
that the well-being is primarily linked to the
‘endowment’ available in form of resources like land,
water, human capital etc. Thus the first step in such an
exercise may be the identification of areas in this district
that are poorly ranked on this scale. This will help us in
identifying broad areas of deprivation. This is needed
since a large part of the available fund in the district
is normally utilized for development of community
assets, where priority may be assigned to these
backward areas.
We have here made an attempt to identify the
backward Gram-panchayats in this district. Four
parameters have been identified for the study: (i)
proportion of irrigated area to net cultivated area (ii)
percentage of SC/ST to total population (iv) literacy
rate (v) percentage of agricultural labourers to total
population. Equal weightage has been assigned to all
the parameters and backwardness index on the scale
of 100 has been calculated. All the Gram-panchayats

28
2
Map 2.4.1 Gram-Panchayats falling under more backward areas
in the district have been ranked using this methodology.
In this process the Gram-Panchayats (falling in the
more backward category) have been depicted, which is
shown in the map 2.4.1.
As can be seen the backward areas are mostly located
in Western and Southern Bankura (which are resource
poor!) falling in the hilly and lateritic zone. These
areas may be picked up first for intervention. As has
been discussed later, Western and Southern Bankura
has lot of undulations and this area suffers from very
high run off. There is a dynamic relationship between
different undulating parts falling in a watershed and
as such any poverty reduction strategy must pick up
watershed as the unit under focus. One may,
therefore, narrow down from, say, backward Gram-
panchayat to the watershed level. Open/degraded
forest areas and wasteland (as available from the
satellite imageries) in these backward Gram-Panchayat
may easily be utilized to identify the most backward
watershed areas which may be targetted. It has been
generally the experience that there is more food
insecurity in these areas resulting into migration. People
are deprived and it is easier to mobilize them for
watershed activities in a participatory mode. In fact this
methodology has been successfully used in this district
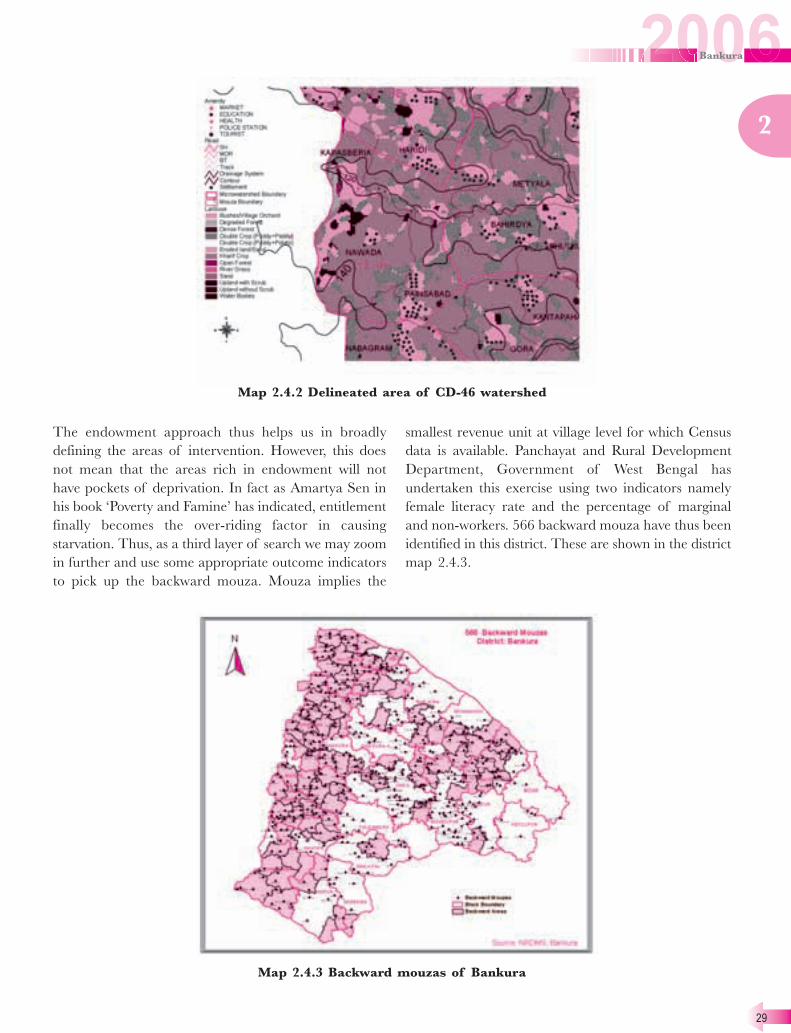
under Rashtriya Sam Vikas Yojana (RSVY). A map
showing watershed in a degraded area in Chhatna
block is shown here as an example. The watershed
CD-46 has larger areas of upland with/without scrub
and hence has been selected under Rashtriya Sam
Vikas Yojana. The watershed layers available in
NRDMS centre Bankura has been utilized for
microplanning by integrating it with local wisdom.
These maps clearly indicate the barren patches of land,
hamlet locations which has helped in maintaining
equity in the microplan.
29
2
Map 2.4.2 Delineated area of CD-46 watershed
The endowment approach thus helps us in broadly
defining the areas of intervention. However, this does
not mean that the areas rich in endowment will not
have pockets of deprivation. In fact as Amartya Sen in
his book ‘Poverty and Famine’ has indicated, entitlement
finally becomes the over-riding factor in causing
starvation. Thus, as a third layer of search we may zoom
in further and use some appropriate outcome indicators
to pick up the backward mouza. Mouza implies the
smallest revenue unit at village level for which Census
data is available. Panchayat and Rural Development
Department, Government of West Bengal has
undertaken this exercise using two indicators namely
female literacy rate and the percentage of marginal
and non-workers. 566 backward mouza have thus been
identified in this district. These are shown in the district
map 2.4.3.
Map 2.4.3 Backward mouzas of Bankura

30
2
It may be seen that most of these backward mouzas
are again clustered towards the western/southern part
of the district. However, there are backward mouza
located in resource rich areas also.
Each mouza has generally 7-10 hamlets and the next
step may be to go for household survey or hamlet
survey (since characteristic of one hamlet is more or
less similar) to understand the root cause of deprivation
in these backward mouza. It may be easier to identify
the poor households at this scale and design
appropriate livelihood interventions.
As the last step one may identify vulnerable groups in
these backward mouzas such as primitive tribes, lepers,
handicapped etc. and interventions for specific target
groups may be taken up. Some of the survey results
for these backward mouzas have been included in the
chapter on vulnerability.
2.4.3 Issue of starvation :
The entitlement to food-grain finally determines food
security of an individual. A person can avoid hunger
if he owns sufficiently and he enjoys a favourable
exchange entitlement for his ownership bundle to
acquire the food needed to avoid starvation.
The set of all the alternative bundle of commodities
that one can acquire in exchange of what one owns
may be called exchange entitlement of what one owns$
.
An attempt has been made here to examine this in
context of Bankura. The first factor, which affects a
person’s exchange entitlement, is his ability to find
employment. In rural Bankura, labour is the only asset
that a poor generally has. In the district the cropping
intensity is 147 percent and most of the backward areas
is mono-copped which generates limited employment
(for example 1 Hec. of Aman paddy cultivation creates
175 mandays). As a result, the wage level is also fairly
low (Rs. 35/- in the peak season and Rs. 25/- in the
lean season). This can, however, be reversed through
creation of adequate water harvesting structures (mainly
the surface water based) and more emphasis on dry-
land farming including horticulture. Increase in
command area in Rabi (winter) crop will certainly
provide added employment to the poor. Areas which
are lying fallow may be brought under social forestry/
horticulture which will create employment.
$
Poverty & Famine- an essay on Entitlement and Deprivation by Prof. Amartya Sen, p3
Intercropping of crops like groundnut and Arhar with
horticulture will also give added cash flow in the initial
years. Micro-irrigation structures like 5 percent model,
30-40 model (described later) etc. also help in arresting
water, increase moisture and enhance scope for added
employment generation. Employment generation
programme like National Rural Employment Guarantee
Scheme has for the first time entitled villagers to get
wage-employment and is surely going to reduce
starvation. It is also likely to increase wage level with a
favourable impact on exchange entitlement.
As far as the non-labour assets are concerned, it is
usually very limited for a villager in backward rural
areas. Animal husbandary is a fairly common
occupation and goatery is usually preferred. Normally
the middlemen take advantage of the weak bargaining
position of the villagers and the goats are sold at a
throwaway price. Because of absence of requisite inputs
(medicine, vaccine etc.) the growth of the goats is also
slow and the illiterate villagers are cheated in assessment
of weight of a goat. A poor person who possesses, say,
a patch of land with cashew plants or a piece of land
with Babui (fairly common in Bankura) is also not better
off. In times of distress the produce is sold off in
advance (at fairly low prices). Though the owner
possesses the asset, his entitlement to its usufruct is only
partial. Those who migrate leave their assets and are
not able to manage and make optimal use of it. A
difficulty with ownership of upland (area not under
cultivation) is that the entitlement slowly becomes
nebulous because of non-use and there are cases of
encroachment.
The next factor, which determines exchange entitlement,
is the capability of an individual to produce an
economic good and the price at which it can be sold.
Generally villagers in Bankura possess low production
capacity. There are of course a large number of rural
artisans who are gifted with very high level of skill.
However, because of poor access to credit and inability
to handle market, they hardly have the opportunity to
transform themselves into entrepreneurs. The fishing
hook makers in Barjora, Baluchari weavers of
Bishnupur or Neera collectors from palmrya and date
palm – all are generally victims of the distorted
production relation with middlemen and operate just
as the wage earners. It is not easy to bring these rural

31
2
artisans out of the clutches of middlemen. Their literacy
level is also low and are frequently cheated when the
accounts are settled. A process of empowerment has to
be initiated including micro-credit linkages and
improvement of literacy to reach a just and fair system.
The exchange entitlement of the poor gets further
affected when a person takes loan (in crisis) from informal
sources like ‘Mahajan’ (the village money lender). The
rate of interest is generally so high (sometimes as high
as 200 percent!) that the person is not able to come out
of the vicious cycle and a large part of his income is
drained away. There have been cases when it has taken
6 months for a labourer to free himself from loan
obligations by giving free labour. This calls for alternative
credit mechanism, which is flexible and soft on the loanee.
The Self Help Group movement has been very effective
in meeting this gap by providing soft loan to the members
in moments of crisis and thereby reduce their
vulnerability. Kisan Credit Card (KCC) has also provided
the farmers the much needed cushion to meet the working
capital need. For artisans in the urban areas the ‘artisan
credit card’ is proving to be a good help.
A person becomes prone to starvation if the exchange
entitlement worsens due to the factors indicated above.
The factors indicated above have been found relevant
for this district. Thus any poverty reduction scheme
must be designed to address them. It is not just
sufficient to initiate livelihood interventions in villages.
The model must be fair and just and should fetch the
poor his due entitlement. In the discussions that follow
later an effort has been made to illustrate this further
through case studies.
Let us now see the variation in exchange entitlement
to food-grain against labour for the six areas in this
district over 1997-2004.
The wages have been obtained from the data available
with the records lying with district officials of Labour
Department, while the food-grain price has been
provided by the Agricultural Marketing Department.
Graph 2.4.4 Exchange rate indices for
Bishnupur
Graph 2.4.5 Exchange rate indices for
Bankura Municipality
Table 2.4.4 Exchange rate indices for Bankura municipality
Year Cost of rice Price index Wage (Rs. Wage Exchange
(common) for rice per day) index rate index : labour
(Rs. per Quintal) (common) vis-à-vis rice (common)
1997 720.00 100 35.00 100 100
1998 780.00 108 35.00 100 92
1999 979.00 136 35.00 100 74
2000 855.00 119 40.00 114 96
2001 797.50 111 40.00 114 103
2002 725.00 101 40.00 114 113
2003 765.00 106 45.00 129 121
2004 845.00 117 45.00 129 110
Source: Office of the Assistant Labour Commissioner, Bankura & Agricultural Marketing Department, Bankura

32
2
(Sources: Department of Agricultural Marketing & Office of the Assistant Labour Commissioner, Bankura)
Graph 2.4.6 Exchange rate indices for
Jhantipahari (Chhatna)
Graph 2.4.7 Exchange rate indices for Kotulpur
Graph 2.4.8 Exchange rate indices for Indas Graph 2.4.9 Exchange rate indices for Khatra
A serious decline in trend of the exchange rate emerges
from the data in the year 1999 for all the six different
regions in the district. The worst affected area is
Jhantipahari (in Chhatna) followed by Bankura. Indus
has been least affected. One may note that Chhatna is
one of the most backward blocks in this district. If
one goes back to the human development ladder, Indus
block has been shown as the best on the human
development ladder and the same relative position
continues here. This is a reflection of the relative state
of possible food insecurity in the district. The monthly
and weekly exchange rate index for 1999 have been
depicted by graphs 2.4.10 & 2.4.11.

33
2
2.4.10 Monthly analysis of exchange rate index for
Jhantipahari in the year 1999
2.4.11 Weekly analysis of exchange rate index for
Jhantipahari for August in the year 1999
As can be seen there has been a decline of the index up
to 33 percent! There are, of course, wide fluctuations
also. However, one finds the situation much worse in
lean season (March-May) since it is mostly a mono-
cropped area. It is in this period that majority of
population migrate to adjoining districts to participate
in Boro (high yielding paddy) cultivation.
Total Rainfall in 1998 is 1241.8 m.m. Total Rainfall in 2004 is 1283.54 m.m.
2.4.12 Monthly rainfall distribution (in mm.) for the years 1998 and 2004
Source: Office of Principal Agricultural Officer, Bankura

34
2
On further analysis the main reason for the decline in
exchange rate index has been found to be nearly 35
percent rise in price of rice (common) in 1999. It is
seen that the production of paddy had reduced
drastically due to erratic rainfall during 1998. The total
rainfall during 1998 was 1241.8 mm, which is normally
sufficient for a good harvest, provided it is well
distributed. We have compared below the production
in 2004-’05 and 1998-’99, the two years for which
rainfall was similar but due to the erratic distribution in
1998 the area under cultivation got reduced and yield
was approximately half of the year 2004-’05. In fact, in
1998 the district suffered a drought-like situation. The
price rise of rice in 1999 might have been primarily
due to low production. However, if rice is made
available from outside and the public distribution system
works well, the price may be stabilized and the exchange
rate may remain favourable.
2.4.14 Aman production in 1998-1999 and
2004-2005
Source: Office of Principal Agricultural Officer, Bankura
2.4.13 Area of Aman cultivation in 1998-1999 and
2004-2005
From the bar diagram 2.4.15 we can have a look at
the off-take of foodgrain through the public
distribution system during the period 1997-2004.
It is seen that in 1999, when the crisis was maximum,
the foodgrain offtake was also minimum which is
definitely alarming. In the bar diagram 2.4.16 we have
depicted the foodgrain procurement during the period
from November, 1998 to October, 1999.
As can be seen the local foodgrain procurement has also
been less during the crisis period. In fact, major portion
of public distribution system is fed from local
procurement. Foodgrain mobilized from outside the
state generally consists of raw rice, which the local
people do not consume. This results into a shortfall of
foodgrain offtake.

35
2
Thus erraticity of rainfall in this area has a large impact
on the extent and depth of starvation in this district. It
is seen that small individual water harvesting structures
located near the agriculture land of marginal farmers
act as a ‘shock absorber’ against the unpredictable
precipitation. Generally the land of the poor is located
away from a water source and as such a portion
(generally 5 percent of his land) may be converted into
a small pond. Such structures have been taken up on a
wide scale in this district under the National
Employment Guarantee Scheme.
Employment generation programmes may be taken up
to provide livelihood in such crop failure situation and
may help increase the wage-level and the purchasing
power of community. Similarly, if one has to take care
of and contain the fluctuations in food-grain production,
one needs to shift to dryland farming in these areas.
High yielding varieties of rice requiring longer spell of
rainfall need to be avoided unless there is scope for
assured alternative sources of irrigation. Similarly the
public distribution system must function effectively to
avoid starvation.
2.4.4 Principles of poverty reduction :
Based on the discussion above and keeping in mind
special features of Bankura, following principles may
be adopted for formulation of poverty reduction strategy
for this district :
a. Identification of backward areas on a broad scale
(say, on a Gram-Panchayat level).
b. Assignment of priority to those areas in terms of
resource flow for community asset creation.
c. Watershed approach for integrated land and water
management in western and southern Bankura
(watershed having larger tracts of wasteland may
be given priority.
d. Identification of backward mouza on suitably
chosen outcome indicators and identification of
backward hamlets within the mouza.
e. Household survey of the backward hamlets to
identify barriers to human development and
design of appropriate intervention at micro-level
for generation of livelihood.
f. Impetus to growth through sectoral intervention.
g. Peoples’ contribution in form of labour, capital or
material to ensure cost-reduction, ownership and
sustainability and peoples’ participation in
planning and implementation.
h. In social sector where government is the prime
service provider – creation of a centralized
database to identify uncovered areas.
i. Special intervention for highly vulnerable groups
(for example, lepers, Sabar community, migrant
population).

36
2
j. Institutional support and capacity building.
k. Financial sustainability either through reinvest-
ment of retained earning or through credit/
revolving fund.
We have already applied some of these principles
earlier in this chapter. A large number of case studies
have been taken up later to elaborate the others.
2.4.5 Relative position of the district
regarding poverty :
The Human Development Report of West Bengal,
2004 gives us an account of poverty in the different
districts of the State, based on the National Sample
Survey Organization (NSSO) 55th.
round (1999-2000)
survey data on consumer expenditure. The state-
specific poverty line for West Bengal as determined by
the Planning Commission is Rs. 350.17 for the rural
and Rs. 409.22 for the urban areas. The overall state-
specific poverty line calculated through assigning
weights to rural and urban poverty line equivalent to
their respective share in total population of the state is
Rs.376.70 per capita per month. The relevant parts are
reproduced in Table 2.4.5.
Thus in 1999-2000, Bankura was the land with more
than 50 percent of its population living below poverty
line in both rural and urban areas. Of other 16 districts,
only Murshidabad (with per capita income of
Rs.13392.29, i.e., much less than that of Bankura) has
nearly 50 percent poor people in its villages and towns.
And while Purulia far surpasses Bankura district
regarding percentage of poor people in the countryside
and Birbhum comes next to Bankura, the urban poverty
is disproportionately low in Purulia and Birbhum also
stands in a better position than Bankura in this context.
The crux of the problem lies in the fact that both
Purulia (with per capita income of Rs.13044.67) and
Birbhum (with per capita income of Rs.12791.72) are
in a lower ladder of development when it is judged only
in terms of income per capita.
Table 2.4.5 Percentage of households living below poverty line
in rural and urban areas
District Percentage of households
living below poverty line
Rural area Urban area
Kolkata – 11.17
Howrah 7.63 1.33
North 24 Paraganas 14.41 9.99
Burdwan 18.99 17.00
Darjeeling 19.66 15.21
Midnapore 19.83 19.25
Hooghly 20.43 11.43
Cooch Behar 25.62 15.44
South 24 Paraganas 26.86 8.50
Dinajpur 27.61 19.29
Nadia 28.35 15.51
Malda 35.40 6.60
Jalpaiguri 35.73 61.53
Murshidabad 46.12 49.56
Birbhum 49.37 21.83
Bankura 59.62 52.38
Purulia 78.72 6.47
Source: West Bengal Human Development Report, 2004, p 78

37
2
2.5 Livelihood strategy :
Having discussed the broad profile of the district,
poverty prevailing therein and its determinants
regarding standard of living in previous chapters, we
now shift our attention to the disaggregated picture of
the district and the possibilities to improve the standard
of living. In this part the focus is on livelihood
generation, which is the key to improve the quality of
life. Resource-based livelihood is most appropriate for
this district. An attempt has been made here to explore
the same.
2.5.1 Management of land and water for
sustainable livelihood :
Land :
This district forms an intermediate tract lying between
the rice-producing alluvial plains of Bengal to the east
and the Chotonagpur plateau on the west. The entire
sub-division of Bishnupur as also some of the eastern
blocks of Sadar and Khatra sub-divisions, namely,
Gangajalghati, Barjora, Onda, Simlapal and Taldangra
may be broadly described as a level country not
materially different from the flat plains of the adjoining
districts of Bardhaman and Hooghly. Along the middle
of the district, the ground-surface rises gradually in
undulating plains. The elevation becomes more
pronounced towards the west where the land is
interspersed with hillocks and broken up into low ridges
and valleys. Along the western boundaries there are
laterite ridges covered with sparse forest growths and
pleasant valleys. Towards the extreme north-west, the
undulations become still more pronounced as the
Chotonagpur plateau is reached. The district may thus
be divided into three topographic regions: the hilly
country to the west, the connecting undulating tract in
the middle, and the level alluvial plains to the east —
one indistinguishably merging into the other.
Agro-ecologically and socio-economically it is the
poorest region in West Bengal. Annual rainfall varies
from 1100 mm. to 1400 mm. But it is erratic and 80-
85 percent of the total rainfall is received during the
three to four months monsoon period from June to
September. Moreover, as the land is undulated and
laterite and porous sub-soil usually contains very poor
moisture, erratic rainfall becomes a potential threat to
the crops. Fluctuating rainfall with intermittent
drought spell between two successive rainfalls make
the crop, generally the Kharif crop, very vulnerable
and affects the yield seriously. In case the drought
spell lengthens, it takes a heavy toll on the crop and
resultant low output and low income traps the
farmers, with very small holding size, in a vicious
cycle of bridging the gap with loan from private
lenders.
“The low-land and medium land are bounded and
levelled. In the eastern part of the district extensive
paddy fields stretching upto the horizon are emerald
during the rains, golden yellow in autumn with the
promise of a rich harvest and parched at dry in hot
weather. The cultivated expanses are fringed by quiet,
restful hamlets nestling amidst clumps of bamboos,
groves of mangoes and plantains with slender palms
raising their leafy heads here and there.” (West Bengal
District Gazetteer). The uplands, which account for
around 25 percent of the total area, are sloping, very
often unbounded and prone to runoff and erosion.
Such soils are shallow and acidic with very poor fertility
and low water holding capacity. In these uplands,
which covers an area of 1,76,915 hectare, cultivation
of paddy in not remunerative.

38
2
Map 2.5.1 Undulation of land with contour of Bankura
(Source: NRDMS, Bankura)

39
2
The process of fluvial and wind erosion and the process
of deposition of eroded materials are two distinct
aspects of the problem of soil erosion. Land of Bankura,
particularly in the northern and western parts, is mostly
lateritic and undulating in nature. Accordingly a good
portion of the uplands is subject to erosion hazards
because of the absence of adequate vegetative cover
and low moisture holding capacity of the soil. The
uplands are, therefore, becoming poorer with the
gradual removal of top soils; the rivers, streams and
even the tanks and other water reservoirs are getting
silted up. In some parts, even the cultivated lands are
often damaged due to deposition of sand and gravels
and eating away of the cultivable lands by expanding
gullies.
The land-use statistics of Bankura as shown in Table
2.5.1 are generated from the INSAT 1C/ 1D satellite
image (year 1999). The utilization pattern is not a
constant feature. It changes with the lapse of year.
Wastelands are reclaimed, more and more areas come
under double-cropping and cropped area varies from
year to year due to changes in natural phenomena,
afforestation is done and, at the same time, through
cutting and felling, area under open forest also
expands.
Table 2.5.1 Land use pattern of Bankura
Total geographical area 687387 Hec.
Area under single crop 241992 Hec.
Area under double crop 106748 Hec.
Forest area 119214 Hec.
Open forest 20712 Hec.
Degraded forest 57084 Hec.
Eroded land 33002 Hec.
Source:- NRDMS, Bankura
The eastern and central parts of the district consisting
of entire Bishnupur sub-division and Bankura are the
most populous. Population density of this tract is 577
per Sq. Km. Population density of the rest of the
district, which covers 68 percent of the geographical
area, is 411 per Sq. Km.
The reasons for the difference in the density of
population in the two aforesaid tracts are not far to seek.
The eastern tract, which forms the lower and richer
parts of Darkeswar and the Damodar basin in the
district, is a fertile alluvial plain capable of sustaining a
denser population. All the municipal towns fall in this
region. The south-western part of the district is
extensively covered with scrub-jungles or forests. It
exhibits a pronounced undulation and there are
numerous groups of hills and isolated peaks in this
area which forms the eastern fringe of the
Chotonagpur plateau. It is accordingly less cultivated
than the former region. There are large expanses of
barren lands here with narrow stretches of cultivable
lands formed of recent alluvium. The density of
population in the two tracts, therefore, varies almost
in proportion to their relative agricultural potential.
The settlement pattern in the district varies from
nucleated villages to dispersed homesteads and
hamlets. Villages are generally located on higher
ground, big villages are divided into smaller hamlets
called ‘para’ or ‘tola’, which are generally based on
caste or lineage or occupations. Poorer and lower castes
live in relative isolation from the central cluster
occupied usually by higher castes. Santal villages are
mostly of a linear type with houses facing each other
along a central road. Again the character of the
villages differs considerably in the east and west of the
district. In the east, where much of the land is rich
loam, able to support a numerous population, we find
closely packed villages, surrounded by picturesque
groves of trees. In the undulating tract to the west,
where only the ridges afford sites for villages and in
the hilly country, one usually finds small and scattered
hamlets.
So, for any analysis regarding deprivation from or
attainment of a decent standard of living, functioning
of agriculture sector remains important. The farming
system of the area is subsistence agriculture, with
slowly emerging cash-based systems. The crop-pattern
here is tilted heavily towards paddy cultivation with
traditional agricultural practices. Low and medium
lands are cropped almost exclusively with Kharif rice.
Unconducive topography, very small size of land
holdings, poor irrigation coverage, low water-retention
capacity of soil, insufficiency of many basic nutrients
essential for normal crop etc. offer limited scope for
increasing productivity. Extent of farm mechanisation
is low due to lack of awareness among farmers. On
the other hand, response to crop diversification is
poor and the pace of change of cropping pattern is
slow.

40
2
Table 2.5.2 Result of testing of 3353 number
of samples of soil at different locations of
Bankura
Ingredient Low Medium High
Nitrogen 41.2% 44.2% 14.6%
Phosphate 76.2% 20.6% 3.2%
Potash 20.6% 71.1% 8.3%
P2
O5
76.20% 20.60% 3.20%
K2
O 20.60% 71.10% 8.30%
Quality Normal Acidic Alkaline
pH of the soil 13.30% 85.10% 1.60%
Source: Office of the Principal Agricultural Officer, Bankura
In the Sadar sub-division and Khatra sub-division, the
local names for different classes of soil and crops
grown on them are as follows. The lowest tracts lying
in the valleys and depressions, where rain-water
percolates from neighboring uplands rendering them
sufficiently moist are called ‘Bahal’, ‘Sol’ or ‘Sali’
lands which are best suited for growing Aman paddy.
The lands just above there on the rise of slopes are
called ‘Kanali’ which are also capable of producing
good Aman. Terraced lands higher up the slopes
constitute the ‘Baid’ lands, which depend largely on
good and evenly distributed rainfall for producing
crops that might fall altogether is a bad year.
Untraced uplands growing a scanty Rabi crop
represent the ‘Tar’ or ‘Danga’ lands, which are of
little use from the agricultural point of view but is
good for horticulture.
In the Bishnupur sub-division, the alluvial soils are
broadly classified into ‘Sali’ and ‘Suna’ land. While
the former are mainly used for the cultivation of paddy,
the latter produce various crops, which are sugarcane,
oil-seeds, and superior varieties of rice. In the richest
Suna land, betel-leaves and vegetables are also grown.
Another important difference between these two kinds
of land is worth mentioning. While Sali lands are
allowed to lie fallow every third or fourth year, the Suna
lands never remain uncultivated.
From the east to the west of the district the land-use
pattern undergoes a pronounced change varying with
differing soil conditions. The alluvial tracts to the east
are best suited for cultivation of crops that require a
good amount of moisture and most of this area is
double-cropped. ‘Patit Danga’ or unculturable waste-
lands are not frequently met although sheet and gully
erosion of the slopes and banks of drainage channels
have rendered some parts of this area totally unfit for
cultivation. Such lands with rock outcrops and cankars
are so difficult for agriculture that they are either left
fallow or are heavily grazed. The Baid lands, occurring
at a level lower than that of the Patit Danga, is covered
with sandy loam and are given to paddy cultivation,
but the yield is very low. The Kanali lands are found at
a still lower level and, with an assured moisture supply,
are given to paddy cultivation, the average yield being
better than that of Baid land. In between Kanali and
marshy area, where the water table is very higher and
the surface moisture ample, occurs Sol or Bahal type of
land with loamy moist or clayey soils suitable for
cultivation of paddy or summer vegetables. Cropping
intensity as a whole is as low as 147 percent. The
uplands, which are locally called Tanrh and Baid
constitute about 47 percent of total land and medium
land, which is called Kanali, constitutes 40 percent of
the total land.
Farm sizes are declining with the rapid growth of
population. Almost all households produce food for
subsistence, though this is usually not sufficient to meet
their needs and so other sources of income are needed.
The most important alternative sources are wage-
labour, collection and sale of non-timber forest produce
(NTFP), wage-employment based public works
schemes, and, in some areas, small industrial and
mining wage-labour. Seasonal migration for wage-
labour is common.

41
2
Map 2.5.2 Physiography of Bankura district (Source:- NRDMS, Bankura)
Ground-water :
Livelihood generation is closely associated with water
availability. Let us now understand the ground-water
condition in the district.
(i) Hydrogeology :
The district of Bankura shows diversified hydrogeological
characters that do not resemble with the plains. Based
on geology and mode of occurrence of ground-water,
the underlying area of the district has been divided into
three sectors: (i) Western sector-covered by crystalling
rocks of Archaean age, (ii) Middle sector-covered by
laterite and Older Alluvium formation of Pleistocene
age and (iii) Eastern sector-covered by recent alluvium.
(a) Western Sector :
The area lying west of the line joining Barjora (230
25¢: 870
18¢), Beliatore (230
19¢: 870
13¢), Bankura
(230
14¢: 870
28¢) and Bibarda (230
03¢: 870
02¢) is
covered by crystalline rocks of Archaean age. The
crystalline rocks viz granite gneiss, mica schist,
amphibolites, hornblende schist, gneiss and anorthosite
etc., are weathered down to varying thickness from 6
mts. to 15 mts. below ground level (BGL) and are well-
jointed, fissured and fractured. In a small area near
Barjora, sedimentary deposits of Gondwana age occur.
They are overlain by laterites and older alluvium
deposits.

42
2
(b) Middle Sector :
The fringe area includes the highlands between the
rivers Damodar and the Jaipanda and is covered by
thick mantle of laterite and older alluvium deposits of
Pleistocene age. To the west thin laterite capping,
primary in nature, overlies the crystalline rocks. The
thickness of laterite capping increases gradually
towards east and south until they are covered by recent
alluvium. Towards east, thick laterite capping of
detritus origin is followed by a thick yellow and gray
colour sticky clay, silt, sandy clay, sand of varying
texture from fine to very coarse and gravel. The
aforesaid succession may extend up to the depth of
300 mts. BGL or more.
The results of exploratory boreholes and other
production well reveal that the basement rock (granite
gneiss) occurs at a depth of 56-60 mts. BGL around
Gobindpur (230
19¢: 870
14¢) and at 280 mts. BGL at
Oanchal (230
13¢: 870
17¢) and no such basement rock
was encountered at a depth of 304 mts. BGL at
Rupatganj (230
19¢: 870
25¢).
(c) Eastern sector :
The area along the river valleys and east of 870
35¢
longitude is underlain by thick alluvial sediments of
various grades ranging from clay to gravel belonging
to late Tertiary and Quaternary age.
(ii) Ground-water condition :
The primary source of ground-water is rainfall, a part
of which is lost as evaporation and transpiration and
another part moves as surface run-off and remaining
part percolates into the ground from direct rainfall or
by lateral infiltration from surface water-bodies to form
saturated ground-water zone. Discharge of ground-
water takes place by sub-surface inflow to contiguous
areas and by seepage to steam channel beside
extraction of water by ground-water structures, viz.,
dugwell, tubewell etc.
Ground-water in the district occurs both under water-
table condition and confined condition. Ground-water
in the near surface aquifers occur under water-table
condition and in deep aquifers, under confined or sub-
artesian condition in favorable terrain.
The water-table generally declines with varying
gradients from west, north-west to east and south-east
direction and broadly conforms to the topographical
slope. In the western sector comprising mainly crystalline
rock ground-water occurs in the weathered mantle of
varying thickness from 6 mts. to 15 mts. under water-
table condition. As the water-bearing formations are
discontinuous and at places ground-water is held under
pressure in the fractured conduits, some water is also
retained in the thin cover of soil and alluvium mantling
the stream channel. The weathered materials mainly
consist of disintegrated products of gneissose and
schistose basement rock. In many parts of the area
lateritic gravel lies on the weathered basement rock that
attributes favorable condition for percolation of
rainwater. The weathered mantle in crystalline rock yields
low discharge and shows slow rate of recuperation of
water in the well, which is due to the poorly sorted nature
of weathered materials and hence indicate low to very
low permeability of the water-bearing formation. The
area is, therefore, not suitable for any type of well
structures. However, large-diameter open-wells excavated
to a depth of 20 mts. or less having diameter of 4 mts.
to 5mts. with large available recharge-area provide more
suitable means for developing ground-water source of
the area. The sites are to be selected in specific locations
having adequate thickness of weathered zone coupled
with crisscross joints or fracture system.
The blocks of Bankura-I, Chhatna, Saltora,
Gangajalghati, Ranibandh, Khatra, Hirbandh and
Indpur fall under this sector.
In the middle sector covered by laterite and older
alluvium, ground-water occurs in the moderately thick
to thin acquifer under unconfined to semi-confined
condition. In this region, the ground-water is mainly
abstracted through open dugwell with limited number
of low-duty tubewells. Heterogeneous character of the
water-bearing formation with complex acquifer
geometry prevails in the area and is feasible for open
dugwells of 10 mts. to 15 mts. depth having 3 mts.
diamts.. The sites are location-specific and hill slopes
are to be avoided. Low-duty tubewells are also feasible
in favourable area. The yield of such low-duty tubewells
(75 mts. to 100 mts. depth) varies from 20 to 25 cubic
metre/hour. One-cusec medium-duty production
tubewells are also feasible in specific location within the
depth of 150 mts. BGL. The complete or part of the
blocks of Bankura-II, Mejia, Taldangra, Simlapal,
Raipur & Sarenga fall under this sector.
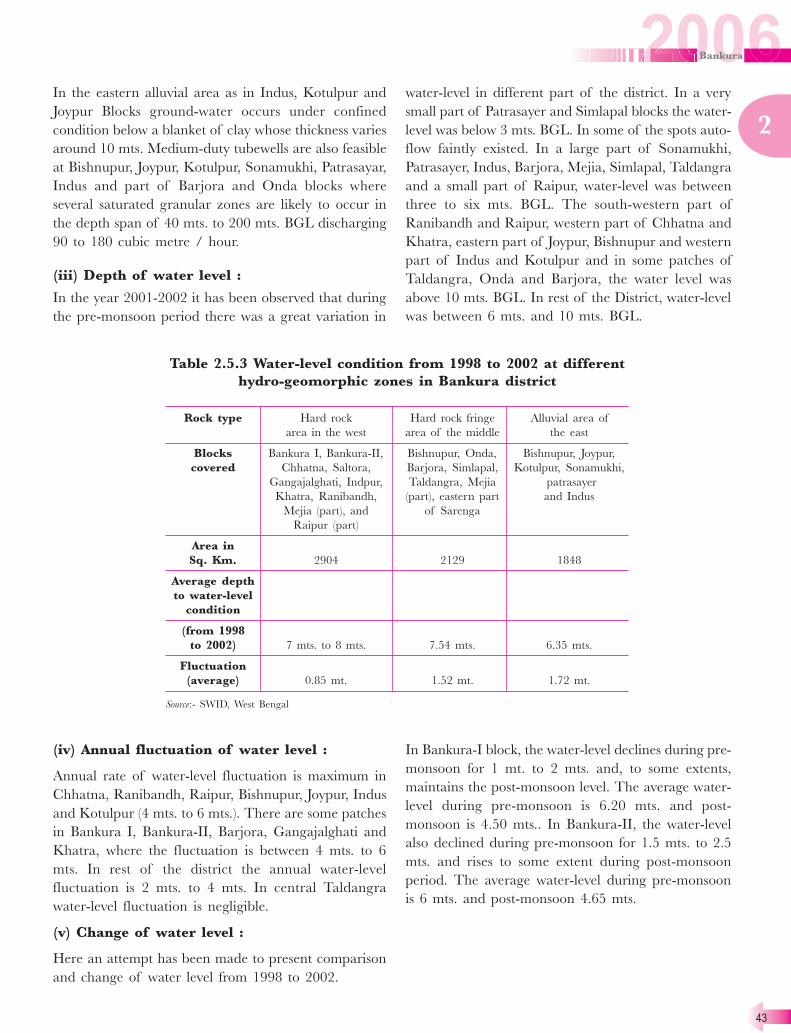
43
2
In the eastern alluvial area as in Indus, Kotulpur and
Joypur Blocks ground-water occurs under confined
condition below a blanket of clay whose thickness varies
around 10 mts. Medium-duty tubewells are also feasible
at Bishnupur, Joypur, Kotulpur, Sonamukhi, Patrasayar,
Indus and part of Barjora and Onda blocks where
several saturated granular zones are likely to occur in
the depth span of 40 mts. to 200 mts. BGL discharging
90 to 180 cubic metre / hour.
(iii) Depth of water level :
In the year 2001-2002 it has been observed that during
the pre-monsoon period there was a great variation in
water-level in different part of the district. In a very
small part of Patrasayer and Simlapal blocks the water-
level was below 3 mts. BGL. In some of the spots auto-
flow faintly existed. In a large part of Sonamukhi,
Patrasayer, Indus, Barjora, Mejia, Simlapal, Taldangra
and a small part of Raipur, water-level was between
three to six mts. BGL. The south-western part of
Ranibandh and Raipur, western part of Chhatna and
Khatra, eastern part of Joypur, Bishnupur and western
part of Indus and Kotulpur and in some patches of
Taldangra, Onda and Barjora, the water level was
above 10 mts. BGL. In rest of the District, water-level
was between 6 mts. and 10 mts. BGL.
(iv) Annual fluctuation of water level :
Annual rate of water-level fluctuation is maximum in
Chhatna, Ranibandh, Raipur, Bishnupur, Joypur, Indus
and Kotulpur (4 mts. to 6 mts.). There are some patches
in Bankura I, Bankura-II, Barjora, Gangajalghati and
Khatra, where the fluctuation is between 4 mts. to 6
mts. In rest of the district the annual water-level
fluctuation is 2 mts. to 4 mts. In central Taldangra
water-level fluctuation is negligible.
(v) Change of water level :
Here an attempt has been made to present comparison
and change of water level from 1998 to 2002.
In Bankura-I block, the water-level declines during pre-
monsoon for 1 mt. to 2 mts. and, to some extents,
maintains the post-monsoon level. The average water-
level during pre-monsoon is 6.20 mts. and post-
monsoon is 4.50 mts.. In Bankura-II, the water-level
also declined during pre-monsoon for 1.5 mts. to 2.5
mts. and rises to some extent during post-monsoon
period. The average water-level during pre-monsoon
is 6 mts. and post-monsoon 4.65 mts.
Table 2.5.3 Water-level condition from 1998 to 2002 at different
hydro-geomorphic zones in Bankura district
Rock type Hard rock Hard rock fringe Alluvial area of
area in the west area of the middle the east
Blocks Bankura I, Bankura-II, Bishnupur, Onda, Bishnupur, Joypur,
covered Chhatna, Saltora, Barjora, Simlapal, Kotulpur, Sonamukhi,
Gangajalghati, Indpur, Taldangra, Mejia patrasayer
Khatra, Ranibandh, (part), eastern part and Indus
Mejia (part), and of Sarenga
Raipur (part)
Area in
Sq. Km. 2904 2129 1848
Average depth
to water-level
condition
(from 1998
to 2002) 7 mts. to 8 mts. 7.54 mts. 6.35 mts.
Fluctuation
(average) 0.85 mt. 1.52 mt. 1.72 mt.
Source:- SWID, West Bengal

44
2
Map 2.5.3 Depth of water level in Bankura district (Source:- NRDMS, Bankura)
At Chhatna block, the water-level decreases for 2 mts.
to 3 mts. during peak summer and rises to some extent
during post-monsoon period from 1 mt. to 1.5 mts..
The average water-level is 7.26 mts. during peak
summer and 5.15 mts. during post-monsoon.
At Saltora block, the condition remains the same as
above. Water-level declines upto 2.5 mts. to 3 mts.
during peak summer and rises upto 1 mt. during post-
monsoon. The average water-level is 6.65 mts. in peak
summer and 4.80 mts. during post-monsoon.
At Mejia and Gangajalghati, Indpur, Khatra,
Ranibandh, it is seen that water level decreases upto 2
mts. in peak summer and rises upto 1 mt. during rainy
season. The reason is due to less infiltration by virtue
of being hard rock disposition. Average pre-monsoon
water level is 8.20 mts., post-monsoon water-level is
5.50 mts..
At Barjora block, the water-level condition is somewhat
good. The average water level from the last five years
is 5.95 mts. during summer and during post-monsoon
the water level is 2.15 mts.. The infiltration rate is good
nearly from 10 to 15 percent. Pre-monsoon average
7.40 mts., post-monsoon being 4.25 mts.
In Sonamukhi block, the water-level during pre-
monsoon is 1.82 mts. (average) and 1.48 mts. during
post-monsoon period. Water-level condition has not
changed much. Similarly the water-level condition of
Bishnupur, Onda, Simlapal, Taldangra and a part of
Raipur is comparatively good. The water-level decreases
only from 0.5 mt. to 1 mt. during peak summer and
rises 1 mt. during post-monsoon period. During the peak
summer the water-level average of Patrasayar block is
3.99 mts. and during post-monsoon 2.80 mts. The
water-level decreased by 1 mt. to 1.5 mts. and rose by
0.50 mt. during rainy season during the last 5 years.
Water-level average in pre-monsoon period is 3.10 mts.
and in post-monsoon period is 2.45 mts.
Irrigation :
(i) Major irrigation :
There is a good surface irrigation network under the
commands of Kangsabati and Damodar irrigation
projects. The area under assured artificial irrigation
increased considerably with the implementation of these
two projects. As the rainfall is uncertain and the farmers
have to depend largely on the mercy of nature, attempts
were made to increase the area under assured irrigation
through major & minor irrigation projects.
There is a barrage across the Damodar from Durgapur
to Pratappur, which is about 700 mts. long. From here
originates the right bank main canal (RBMC), which runs
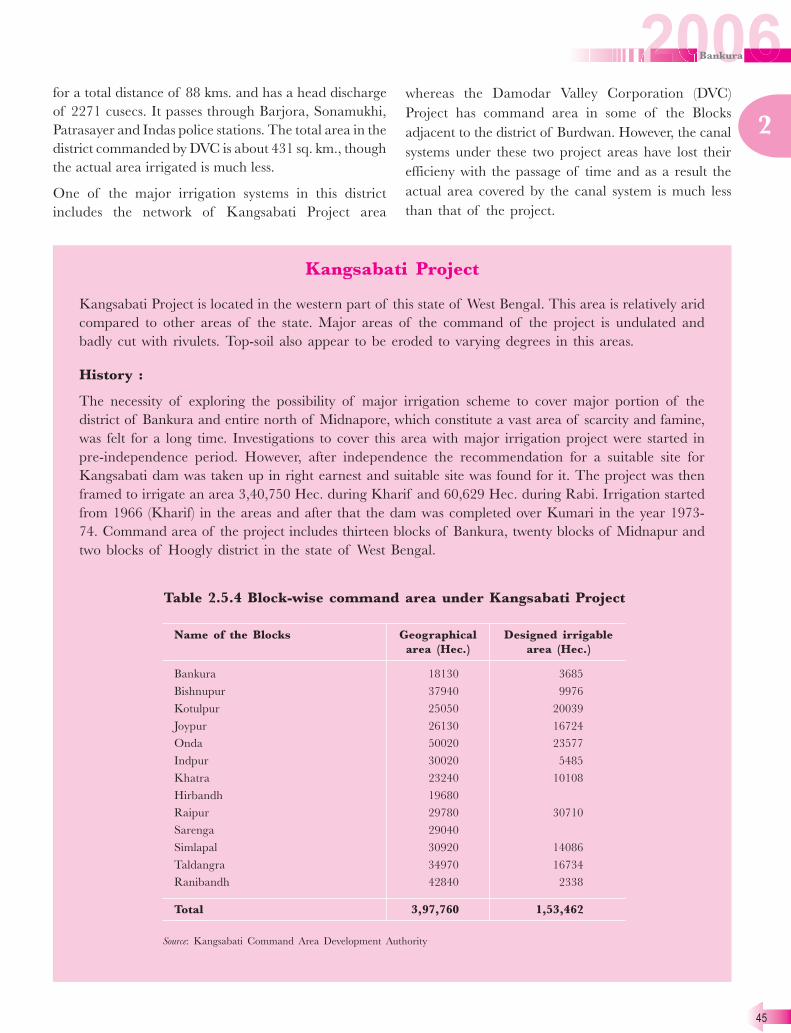
45
2
for a total distance of 88 kms. and has a head discharge
of 2271 cusecs. It passes through Barjora, Sonamukhi,
Patrasayer and Indas police stations. The total area in the
district commanded by DVC is about 431 sq. km., though
the actual area irrigated is much less.
One of the major irrigation systems in this district
includes the network of Kangsabati Project area
whereas the Damodar Valley Corporation (DVC)
Project has command area in some of the Blocks
adjacent to the district of Burdwan. However, the canal
systems under these two project areas have lost their
efficieny with the passage of time and as a result the
actual area covered by the canal system is much less
than that of the project.
Kangsabati Project
Kangsabati Project is located in the western part of this state of West Bengal. This area is relatively arid
compared to other areas of the state. Major areas of the command of the project is undulated and
badly cut with rivulets. Top-soil also appear to be eroded to varying degrees in this areas.
History :
The necessity of exploring the possibility of major irrigation scheme to cover major portion of the
district of Bankura and entire north of Midnapore, which constitute a vast area of scarcity and famine,
was felt for a long time. Investigations to cover this area with major irrigation project were started in
pre-independence period. However, after independence the recommendation for a suitable site for
Kangsabati dam was taken up in right earnest and suitable site was found for it. The project was then
framed to irrigate an area 3,40,750 Hec. during Kharif and 60,629 Hec. during Rabi. Irrigation started
from 1966 (Kharif) in the areas and after that the dam was completed over Kumari in the year 1973-
74. Command area of the project includes thirteen blocks of Bankura, twenty blocks of Midnapur and
two blocks of Hoogly district in the state of West Bengal.
Table 2.5.4 Block-wise command area under Kangsabati Project
Name of the Blocks Geographical Designed irrigable
area (Hec.) area (Hec.)
Bankura 18130 3685
Bishnupur 37940 9976
Kotulpur 25050 20039
Joypur 26130 16724
Onda 50020 23577
Indpur 30020 5485
Khatra 23240 10108
Hirbandh 19680
Raipur 29780 30710
Sarenga 29040
Simlapal 30920 14086
Taldangra 34970 16734
Ranibandh 42840 2338
Total 3,97,760 1,53,462
Source: Kangsabati Command Area Development Authority

46
2
Objectives:
Kangsabati Project was constructed with two major objectives: (i) irrigation & (ii) moderation of flood.
Provision was also kept for supplying drinking water for the human and cattle consumption, as the area
is very much susceptible to domestic water crisis during pre-monsoon period. In the lower areas the
Kangsabati river has innumerable flood protective embankment covering a total flood area of 1600 sq.
km. The designed peak flood discharge at the dam site is 10,600 cusecs. During monsoon period, 24,670
Hec. of reservoir space had been kept for moderating the flood including peak flood to minimise damage
in the flood plain of the river. This space is utilised for post-monsoon cultivation.
Impact:
Before construction of the dam of the Kangsabati Project, the command area was predominately agrarian
with a few cottage industries. Education, electricity and communicating facilities were very much limited.
Rice was the main food for its people and straw was the main fodder crop for the cattle required for the
agriculture operation. After construction of the project, paddy continued to be grown as the major crop
in command area during Kharif season and in due course low yield variety has been replaced by
modern high-yielding varieties in the most project period, Kharif vegetable, such as pumpkin, bitter
gourd etc. are also being grown in large scale in the fallow tracts of the command. Sign of brisk
economic activities are now apparent throughout the command area.
Designed irrigable command of Kangsabati Project in different blocks under Bankura district is given
in Table 2.5.4.
Map 2.5.4 Irrigation canal network in Bankura district

47
2
(Irrigation scheme having CCA not more than 2000 Hec.
individually is classified as minor irrigation scheme.)
Barring the land irrigated by the major irrigation
projects like Kangsabati and DVC Project, about 56494
Hec. of land is being irrigated through the sources of
minor irrigation. Interestingly from the data available
from the Third Minor Irrigation Census Report, it is
(ii) Minor irrigation :
Table 2.5.5 Source-wise CCA/AAI under minor irrigation schemes in different
Blocks of Bankura (in Hec.)
Block Dugwell Shallow tube-well Deep tube-well Surface flow Surface lift
CCA AAI CCA AAI CCA AAI CCA AAI CCA AAI
Bankura-I 264 220 10 9 0 0 3673 2577 106 63
Bankura-II 268 264 927 928 0 0 2666 1970 982 903
Barjora 140 126 2323 2633 130 132 7472 5492 1495 1540
Chhatna 230 178 1 2 0 0 11842 7007 442 355
Gangajalghati 178 181 4 5 0 0 5981 5706 237 235
Mejhia 163 111 157 178 0 0 3425 2757 284 134
Onda 86 77 5124 5973 140 191 4247 2917 562 529
Saltora 105 115 0 0 0 0 5948 5176 207 186
Indpur 90 48 0 0 0 0 6674 3214 3454 515
Khatra 57 42 0 0 0 0 2612 2004 78 61
Hirbandh 154 59 0 0 0 0 3368 2066 479 195
Raipur 275 141 2513 1315 0 0 6581 851 1432 940
Sarenga 24 19 1277 1394 0 0 244 284 210 116
Ranibandh 397 303 0 0 0 0 5231 6373 185 243
Simlapal 61 33 1551 1386 0 0 1376 1014 487 501
Taldangra 61 35 1728 2108 100 114 3956 2294 625 601
Bishnupur 254 211 4193 5925 890 569 1800 1066 1142 1043
Indas 0 0 5617 2296 260 261 2464 1434 66 93
Joypur 292 450 2961 4758 330 400 1540 2207 521 657
Kotulpur 63 56 6263 8240 990 980 1568 533 1210 1177
Patrasayer 22 23 3830 5430 730 353 3446 1679 517 523
Sonamukhi 12 11 4953 7713 770 496 1316 1166 138 148
Total 3196 2703 43432 50293 4340 3496 87430 59787 14859 10758
Source: Third State Minor Irrigation Census, 2000-2001
observed that as far as minor irrigation is concerned,
though the actual area irrigated (AAI) is about 56494
Hec., the culturable command area (CCA) is 50996
Hec. in the district. Actually the ground-water has been
over-exploited and any further effort of harnessing
ground water would be detrimental for the existence
of the people of this district.
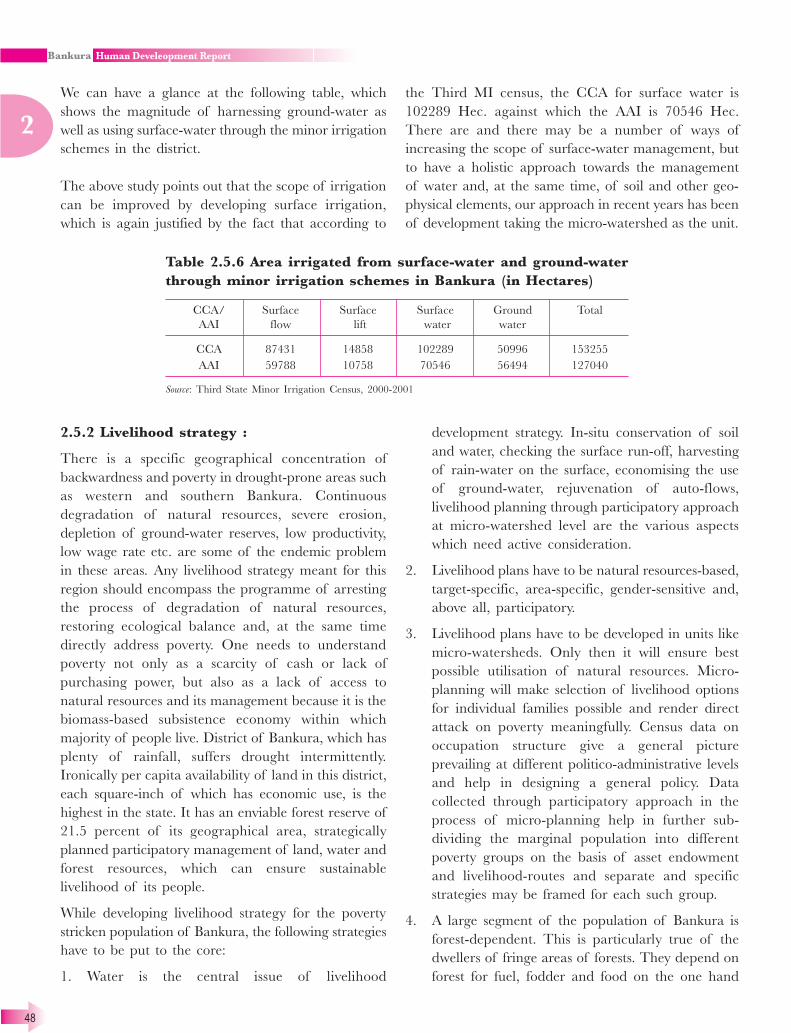
48
2
2.5.2 Livelihood strategy :
There is a specific geographical concentration of
backwardness and poverty in drought-prone areas such
as western and southern Bankura. Continuous
degradation of natural resources, severe erosion,
depletion of ground-water reserves, low productivity,
low wage rate etc. are some of the endemic problem
in these areas. Any livelihood strategy meant for this
region should encompass the programme of arresting
the process of degradation of natural resources,
restoring ecological balance and, at the same time
directly address poverty. One needs to understand
poverty not only as a scarcity of cash or lack of
purchasing power, but also as a lack of access to
natural resources and its management because it is the
biomass-based subsistence economy within which
majority of people live. District of Bankura, which has
plenty of rainfall, suffers drought intermittently.
Ironically per capita availability of land in this district,
each square-inch of which has economic use, is the
highest in the state. It has an enviable forest reserve of
21.5 percent of its geographical area, strategically
planned participatory management of land, water and
forest resources, which can ensure sustainable
livelihood of its people.
While developing livelihood strategy for the poverty
stricken population of Bankura, the following strategies
have to be put to the core:
1. Water is the central issue of livelihood
development strategy. In-situ conservation of soil
and water, checking the surface run-off, harvesting
of rain-water on the surface, economising the use
of ground-water, rejuvenation of auto-flows,
livelihood planning through participatory approach
at micro-watershed level are the various aspects
which need active consideration.
2. Livelihood plans have to be natural resources-based,
target-specific, area-specific, gender-sensitive and,
above all, participatory.
3. Livelihood plans have to be developed in units like
micro-watersheds. Only then it will ensure best
possible utilisation of natural resources. Micro-
planning will make selection of livelihood options
for individual families possible and render direct
attack on poverty meaningfully. Census data on
occupation structure give a general picture
prevailing at different politico-administrative levels
and help in designing a general policy. Data
collected through participatory approach in the
process of micro-planning help in further sub-
dividing the marginal population into different
poverty groups on the basis of asset endowment
and livelihood-routes and separate and specific
strategies may be framed for each such group.
4. A large segment of the population of Bankura is
forest-dependent. This is particularly true of the
dwellers of fringe areas of forests. They depend on
forest for fuel, fodder and food on the one hand
We can have a glance at the following table, which
shows the magnitude of harnessing ground-water as
well as using surface-water through the minor irrigation
schemes in the district.
The above study points out that the scope of irrigation
can be improved by developing surface irrigation,
which is again justified by the fact that according to
the Third MI census, the CCA for surface water is
102289 Hec. against which the AAI is 70546 Hec.
There are and there may be a number of ways of
increasing the scope of surface-water management, but
to have a holistic approach towards the management
of water and, at the same time, of soil and other geo-
physical elements, our approach in recent years has been
of development taking the micro-watershed as the unit.
Table 2.5.6 Area irrigated from surface-water and ground-water
through minor irrigation schemes in Bankura (in Hectares)
CCA/ Surface Surface Surface Ground Total
AAI flow lift water water
CCA 87431 14858 102289 50996 153255
AAI 59788 10758 70546 56494 127040
Source: Third State Minor Irrigation Census, 2000-2001

49
2
and economic activities resulting in cash earning
on the other. Greening of huge quantum of
degraded forestland with appropriate species,
utilisation of degraded forestlands by self-help
groups formed in fringe villages, disposal of
responsibilities by different Departments and
agencies in harmonious manner are the keys to it.
Working of joint forest management (JFM), degree
and extent of involvement of forest protection
committees (FPC) in decision-making, rigid mindset
of forest officials, existing rules & regulations are
to be critically evaluated. Arriving at a true and
optimum forest-based livelihood may entail policy
changes also.
We may now discuss these issues one by one in
more detail.
2.5.2.1 Water management :
As the rivers are mostly rainfed and remain practically
dry over the major part of the area, there is no assured
supply of water from this source for cultivation. On
the other hand, the district receives an annual rainfall
ranging between 1100-1400 mm. Though this
quantum of rainfall is generally sufficient, crops are
liable to fast if the distribution is unconducive. The
greatest damage is caused if rainfall is insufficient in
the months of September and October, when a good
supply of water is needed for grain-filling.
Table 2.5.7 Average month-wise rainfall (in mm.) in Bankura during 1994-2005
Year Jan. Feb. March April May June July Aug. Sept. Oct. Nov. Dec.
1994 28.4 62.8 14.8 63.9 80.7 343.8 394.3 287.6 165.5 65.2 0.2 0
1995 27.2 24.6 5.9 3.4 95.7 175.1 268.6 300 373.1 80.8 129 8.1
1996 22.2 23.6 6.3 17.8 52 326.2 237.2 432.7 135.6 74.8 0 0
1997 15.5 28.9 29.1 87.1 77.1 194.7 348.9 401.1 189.1 66.5 29.1 32
1998 82 50.1 73.4 57.5 45.5 135.1 240.6 149.4 204.8 184.9 28.1 0
1999 0 1.9 0 0 165.6 193.7 289.5 182.4 242.1 90.2 3.8 0.1
2000 2.5 41.7 6.3 72.7 187.1 164.1 319.1 161.9 311.5 42.9 0 0
2001 0 0 57.5 60.1 130.1 323.1 282.4 250.2 122 113.4 1.6 0
2002 27.7 2.4 20.8 68.4 102.7 351 249 291.7 273.4 87.3 13.9 0.1
2003 0.3 21.2 64.4 34.6 59.9 255.1 244.5 179.1 137.4 263.8 12.3 9.1
2004 3.2 0.1 17.3 39.5 89.2 174.4 205 332.2 189.4 117.6 0 1
2005 18.9 38.4 48 29 44.2 152.4 295.9 189.7 157.1 224.5 0 19.4
Average
of the
above
years 19.0 24.6 28.7 44.5 94.2 232.4 281.3 263.2 208.4 117.7 18.2 5.8
Optimum
need 10.9 25.8 28.6 41.4 90 241.4 199.8 296.3 235.4 92.3 18.9 15.1
Source:- Office of the Principal Agricultural Officer, Bankura
The graph 2.5.5 shows the curve of optimum
distribution needed for cultivation of paddy. The
distribution of rainfall is most favourable to the Aman
or winter crop, which is the staple crop, is when
premonitory showers fall in May or early in June. The
rain in the later half of June and in July should be
followed by an interval of fine weather that permits
weeding operations. The September rains have to be
heavy, shading off into fine weather with showers in
October. On the sufficiency of the rainfall in September,
the outturn of Aman depends most.
But, in practicality, the district suffers from the vagaries
of rainfall and hardly a year passes without distress
prevailing in one part of the district or other. Even,
while there is bumper harvest in the eastern blocks of
the district, distress in western region is common.
Rainfall being uneven, the resulting drought condition
causes much suffering to the poorer sections of the
people in addition to the fall in foodgrain production.
In this context, artificial irrigation has always been
important in the district. Except in the eastern parts,
the natural configuration of the terrain is undulating.

50
2
So it is easy and economical to arrange conservation
of water by making embankments across the drainage
lines. These storage pools, set up at a level higher than
the fields to be irrigated are called ‘bundhs’. These
bundhs serve two purposes. First, they prevent the
monsoon rain draining off too quickly and second, they
supply water from the reservoir to adjoining fields. In
the western part of the district such bundhs are a
common feature while towards the east the ordinary
tanks with four-sided embankments are seen.
Artesian water resources rising spontaneously to the
surface are to be found along the course of rivers.
Rejuvenation of such sources may produce ready
supply of water. The sub-soil water reservoirs here are
obviously under some kind of subterranean pressure
and this geo-hydrological phenomenon has been taken
advantage of by the local agriculturists. In fact, they
have had for long the knowledge of the existence of
this favourable geological feature. As is the case with
artesian water everywhere, the water-table at certain
places almost touches the surface. These auto-flows or
‘jharnas’ go on providing water so long as the water
resources in the underground pockets last. Once such
jharnas were traditional and perennial sources of water
for drinking and irrigation purposes, but nowadays
most of such sources have dried up and exist nowhere
except in the memories of some old villagers. This is
due to lack of catchment’s treatment and deforestation.
2.5.2.2 Micro-watershed approach :
Considering the geo-physical characteristics of this
district in general, and its soil-morphology and soil
structure, intensity of rainfall, undulating character of
land, cropping pattern, extent of degradation of forest
areas etc. in particular, development of micro-watershed
becomes a key component of development strategy
concerning Bankura. A watershed can be defined as the
drainage basin or catchment area of a particular stream
or river. Simply stated, it refers to the area wherefrom
the water to a particular drainage system comes. A
micro-watershed consists of an area of 500-1000
Hectare of land. In Bankura, there are 1087 micro-
watersheds. Watershed must be taken up as a unit for
planning in a terrain, which has undulations, and one
geographical unit is dynamically connected to the other
through a common drainage point.
Watershed development refers to the conservation,
regeneration, and judicious use of human and natural
resources within a particular watershed. Watershed
development attempts to bring about the best possible
balance in the environment between natural resources
on one side and man and grazing animals on the other.
There is a need for convergence of Departmental
schemes such as minor-irrigation, social forestry, soil
Graph 2.5.5 Month-wise optimum rainfall required for paddy cultivation
Source:- Office of the Principal Agricultural Officer, Bankura

51
2
Graph 2.5.6 Correlation between rainfall, run-off velocity and water-depth at ‘jore’ (rivulet)
Source: Office of the Block Developmental Officer, Bankura-I
conservation, agriculture, horticulture, fishery, etc, as far
as practicable, through the micro-plans prepared at
watershed level. Thus watershed development may play
a key role.
It is needless to mention that watershed development
involves continuous interaction and exchange between
various sectors and components.
There is a pervading influence of the environment on
the human community living within a micro-watershed
region, as they depend on it for food, fodder, fuel and
water. It is necessary for people to understand the
relationship between their poverty and the degraded
environment in which they live. In the watershed
development programme, they find a good economic
alternative and they willingly let go their short-run
claims on environment in favour of possible long-run
benefits. Environment regeneration is, therefore, possible
only when the local community feels the need for it and
when they enjoy full control over resource mobilisation,
management and conservation.
The watershed development programme, to be
successful, must ensure the participation of the
concerned people and must be related to the
environment in which they live and on which they
depend for fulfilment of their need.
A watershed provides naturally-occurring hydrological
unit and it is also the area on which the inhabitants
depend for survival. It thus becomes a common issue,
drawing the people together, giving rise to a common
interest and fostering a common purpose.
The people must voluntarily come together, accept full
responsibility for regeneration of their environment
from the stage of concept to planning, implementation,
supervision and maintenance of assets created and for
building consensus as to rules, regulation,
organisational mechanism, mitigating conflicts, sharing
of benefits etc. The real challenge is, however, to bring
in cohesion in the community, specially in areas which
are sparsely populated.
To sustain the impact of development and institutional
arrangements, an effort has been made in this district
providing equal emphasis on the micro-plans and the
process leading to the development of micro-plans.
Development of a micro-plan is an empowering tool
for the poor and vulnerable people involved in the
programme. Three basic development philosophies
were kept in mind while deciding on micro-watershed
based micro-planning:

52
2
1. Create peoples’ organisation and strengthen it
and/or strengthen the existing grass-root
organisations;
2. Create development models and methodologies,
which can be replicated and scaled up;
3. Create an asset-base through savings from the
execution of the programme for maintenance.
Table 2.5.8 Report on watershed development programme taken up under
Rashtriya Sam Vikas Yojana (upto 31/7/06) (all amounts are in Lakh Rupees)
Approved Nature of
Sector outlay Number Amount schemes Number Amount Number Amount
Minor 1439.51 238 205.99 Water harvesting structure 238 205.99 238 205.99
Irrigation (including 46 number of
5 percent model)
2 0.71 Construction of guard wall 2 0.71 2 0.71
7 2.86 Construction of irrigation well 7 2.86 7 2.86
5 4.32 Irrigation Channel 5 4.32 5 4.32
32 131.84 Construction of check dam 32 131.84 32 131.84
Total 1439.51 284 345.72 284 345.72 284 345.72
Social 55.20 177 51.01 Plantation of mango 177 51.01 177 51.01
forestry orchard at 107
Hectares of land
Horticulture 24.70 54 22.00 Horticulture at 78 Hectares 54 22.00 54 22.00
of land including vegitable
seedling raising
Soil 117.60 46 28.39 Land levelling at 234 46 28.39 46 28.39
conservation Hectares of land & contour
field binding (CFB) at 107
Hectares of land
15 7.10 Water hervesting structure 15 7.10 15 7.10
2 1.39 Construction of check dam 2 1.39 2 1.39
3 1.71 Gully plugging 3 1.71 3 1.71
1 0.01 Construction of village drain 1 0.01 1 0.01
Total 117.60 67 38.60 67 38.60 67 38.60
Fishery 1.04 1 1.04 Renovation of tank 1 1.04 1 1.04
of 0.3 Hectare area
Agriculture 5.58 347 unit Preparation of 347 units 1.25 347 units 1.25
vermi-compost pits
@ Rs.1000/- per unit
Grand total 1643.63 583 458.37 583 459.62 583 459.62
Source: Office of the District Magistrate, Bankura
Schemes
prepared
Schemes
approved
Schemes taken
up for execution
This way, issue of sustained impact has been
ensured;
4. Providing technical inputs through participation of
line departments
Under Rashtriya Sam Vikas Yojana (RSVY) micro-
planning for forty micro-watersheds have been
completed and the interventions have been started.
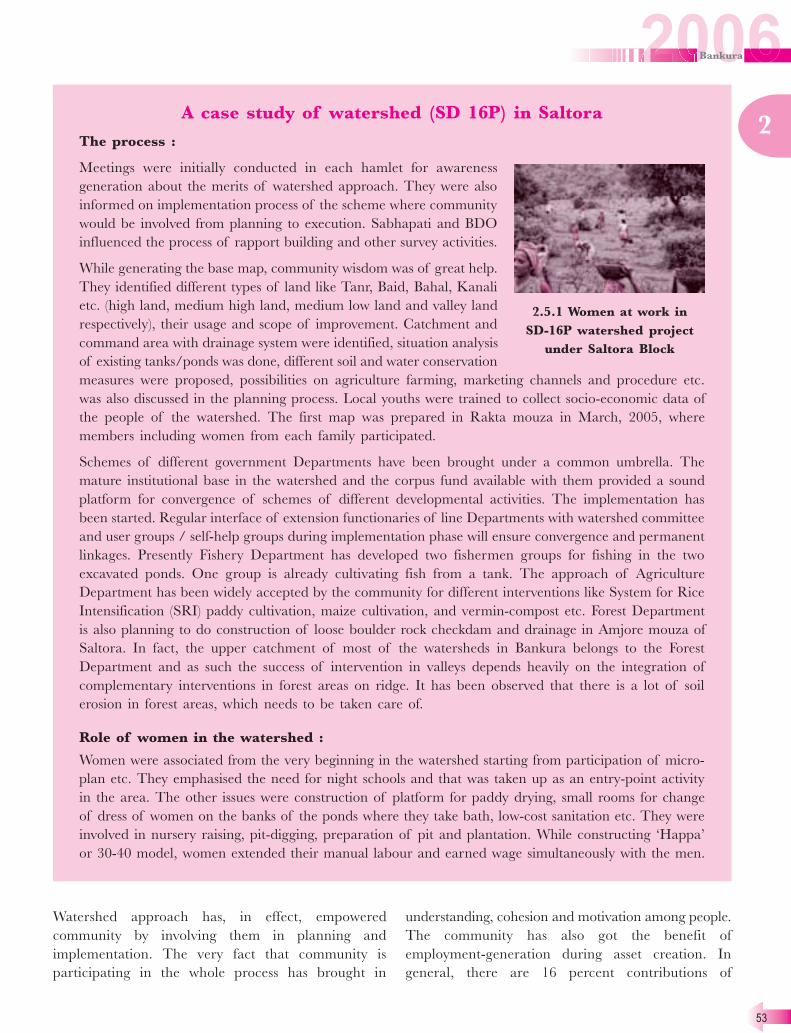
53
2
A case study of watershed (SD 16P) in Saltora
The process :
Meetings were initially conducted in each hamlet for awareness
generation about the merits of watershed approach. They were also
informed on implementation process of the scheme where community
would be involved from planning to execution. Sabhapati and BDO
influenced the process of rapport building and other survey activities.
While generating the base map, community wisdom was of great help.
They identified different types of land like Tanr, Baid, Bahal, Kanali
etc. (high land, medium high land, medium low land and valley land
respectively), their usage and scope of improvement. Catchment and
command area with drainage system were identified, situation analysis
of existing tanks/ponds was done, different soil and water conservation
measures were proposed, possibilities on agriculture farming, marketing channels and procedure etc.
was also discussed in the planning process. Local youths were trained to collect socio-economic data of
the people of the watershed. The first map was prepared in Rakta mouza in March, 2005, where
members including women from each family participated.
Schemes of different government Departments have been brought under a common umbrella. The
mature institutional base in the watershed and the corpus fund available with them provided a sound
platform for convergence of schemes of different developmental activities. The implementation has
been started. Regular interface of extension functionaries of line Departments with watershed committee
and user groups / self-help groups during implementation phase will ensure convergence and permanent
linkages. Presently Fishery Department has developed two fishermen groups for fishing in the two
excavated ponds. One group is already cultivating fish from a tank. The approach of Agriculture
Department has been widely accepted by the community for different interventions like System for Rice
Intensification (SRI) paddy cultivation, maize cultivation, and vermin-compost etc. Forest Department
is also planning to do construction of loose boulder rock checkdam and drainage in Amjore mouza of
Saltora. In fact, the upper catchment of most of the watersheds in Bankura belongs to the Forest
Department and as such the success of intervention in valleys depends heavily on the integration of
complementary interventions in forest areas on ridge. It has been observed that there is a lot of soil
erosion in forest areas, which needs to be taken care of.
Role of women in the watershed :
Women were associated from the very beginning in the watershed starting from participation of micro-
plan etc. They emphasised the need for night schools and that was taken up as an entry-point activity
in the area. The other issues were construction of platform for paddy drying, small rooms for change
of dress of women on the banks of the ponds where they take bath, low-cost sanitation etc. They were
involved in nursery raising, pit-digging, preparation of pit and plantation. While constructing ‘Happa’
or 30-40 model, women extended their manual labour and earned wage simultaneously with the men.
Watershed approach has, in effect, empowered
community by involving them in planning and
implementation. The very fact that community is
participating in the whole process has brought in
understanding, cohesion and motivation among people.
The community has also got the benefit of
employment-generation during asset creation. In
general, there are 16 percent contributions of
2.5.1 Women at work in
SD-16P watershed project
under Saltora Block

54
2
‘Swechha Shram’ (voluntary labour). This has
enhanced the ownership of the assets by community
and has also made it possible to cover larger areas
under the project. The cost of assets is generally lower
and of superior quality.
In a watershed area, total availability of water is caused
through rainfall, dew, hail etc. and gets disposed off
through surface run-off, sub-surface seepage and
evapo-transpiration. On the basis of data received, the
relationship observed among different components is
as follows:-
Total precipitation = surface run-off (1/3rd
. of total
precipitation) + sub-surface seepage (1/3rd
. of total
precipitation) + evapo-transpiration ((1/3rd
. of total
precipitation).
In Bankura (specially the western and southern part),
due to undulation of landscape and soil condition,
most of the rainwater gets drained out to lower ridges
and finally to sea through rivers along with the eroded
top-soil and nutrients therein.
In general, soil in this district in the red laterite zone
is porous and water leaches out fast. However, since
acquifer is shallow,
water seeping into
ground recharges
ponds located
down the slope
and if saturation is
reached, it comes
out in the form of
a rivulet. If ponds
are excavated in
clusters, water
does not leach out
fast and the ponds recharge each other maintaining a
balance. People in the villages in this district also plant
bamboo on the bank of the ponds since it is a good
soil binder and also helps in reducing the evaporation
loss. This helps in
enhancing overall
retention of water in
the ponds. This
methodology has
been applied to
revive the old rivulets
in the district which
have now dried up.
The basic approach
has been to do social forestry / horticulture on the
upland alongwith contour, reexcavation of ponds in
series down the slope and putting a checkdam deep
down on a rivulet (or ‘jore’). This principle is being
applied to river Gandheswari in this district by
construction of small checkdams in series in the upper
catchment. Water trapped in the checkdams will actually
seep into ground and enhance the sub-surface flow
thereby making the river flow perennial. Smaller
checkdams are more suited since the design is simple,
submergence is less and gravity irrigation is possible.
Due to high cost of diesel, pumping up water from a
big reservoir to upland is now-a-days not found cost-
effective. Generally, a semi-circular earthern dam at a
location with natural depression is also very helpful in
harvesting rainwater and recharge sub-surface flow.
Generally hamlets are located on uplands. Water flowing
out of the habitation area follows the downward slope
through gulleys. This can be checked and water may be
stored in the earthern dams constructed on the slopes.
People are generally ready to donate land for this
purpose since there is not much of cultivation on the
slopes, soil is less fertile and they get water as bonus for
the agricultural land down below.
Cost of assets created with the participation of, say,
watershed development committee is always found to
be less since people use local material and go by the
actual market rates instead of following the PWD
schedule.
2.5.2 Checkdam constructed
on a rivulet (‘jore’) in
2.5.3 Construction of an
earthen checkdam going on
in Ranibandh Block
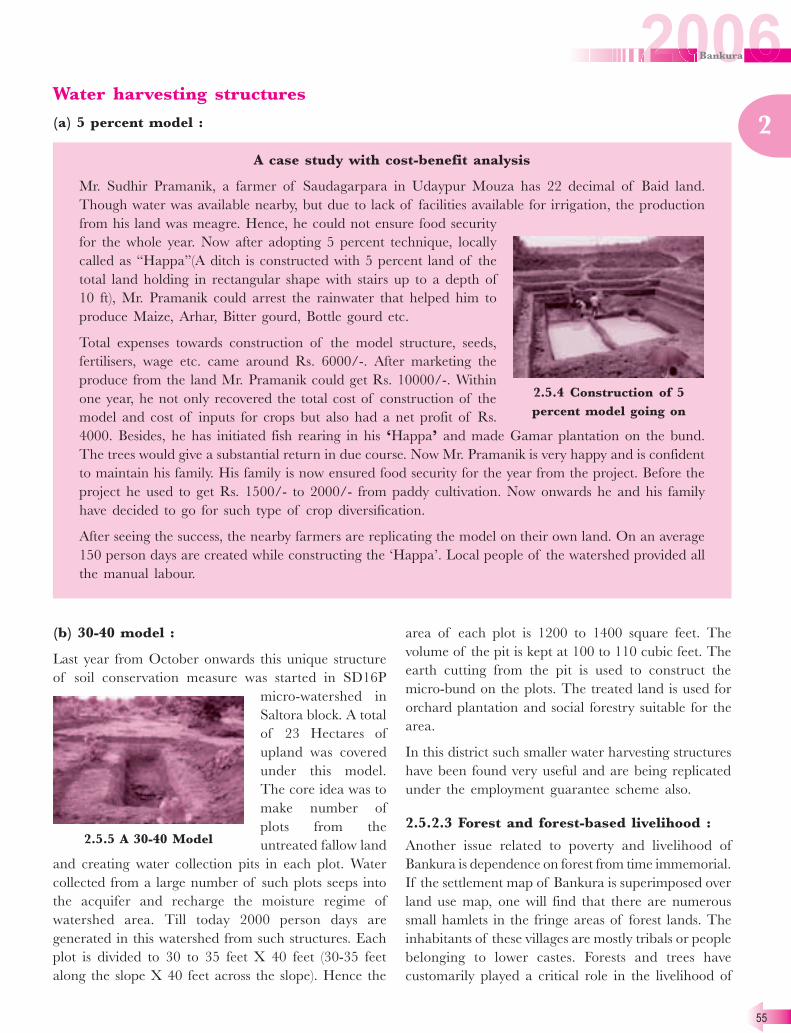
55
2
Water harvesting structures
(a) 5 percent model :
A case study with cost-benefit analysis
Mr. Sudhir Pramanik, a farmer of Saudagarpara in Udaypur Mouza has 22 decimal of Baid land.
Though water was available nearby, but due to lack of facilities available for irrigation, the production
from his land was meagre. Hence, he could not ensure food security
for the whole year. Now after adopting 5 percent technique, locally
called as “Happa”(A ditch is constructed with 5 percent land of the
total land holding in rectangular shape with stairs up to a depth of
10 ft), Mr. Pramanik could arrest the rainwater that helped him to
produce Maize, Arhar, Bitter gourd, Bottle gourd etc.
Total expenses towards construction of the model structure, seeds,
fertilisers, wage etc. came around Rs. 6000/-. After marketing the
produce from the land Mr. Pramanik could get Rs. 10000/-. Within
one year, he not only recovered the total cost of construction of the
model and cost of inputs for crops but also had a net profit of Rs.
4000. Besides, he has initiated fish rearing in his ‘Happa’ and made Gamar plantation on the bund.
The trees would give a substantial return in due course. Now Mr. Pramanik is very happy and is confident
to maintain his family. His family is now ensured food security for the year from the project. Before the
project he used to get Rs. 1500/- to 2000/- from paddy cultivation. Now onwards he and his family
have decided to go for such type of crop diversification.
After seeing the success, the nearby farmers are replicating the model on their own land. On an average
150 person days are created while constructing the ‘Happa’. Local people of the watershed provided all
the manual labour.
(b) 30-40 model :
Last year from October onwards this unique structure
of soil conservation measure was started in SD16P
micro-watershed in
Saltora block. A total
of 23 Hectares of
upland was covered
under this model.
The core idea was to
make number of
plots from the
untreated fallow land
and creating water collection pits in each plot. Water
collected from a large number of such plots seeps into
the acquifer and recharge the moisture regime of
watershed area. Till today 2000 person days are
generated in this watershed from such structures. Each
plot is divided to 30 to 35 feet X 40 feet (30-35 feet
along the slope X 40 feet across the slope). Hence the
area of each plot is 1200 to 1400 square feet. The
volume of the pit is kept at 100 to 110 cubic feet. The
earth cutting from the pit is used to construct the
micro-bund on the plots. The treated land is used for
orchard plantation and social forestry suitable for the
area.
In this district such smaller water harvesting structures
have been found very useful and are being replicated
under the employment guarantee scheme also.
2.5.2.3 Forest and forest-based livelihood :
Another issue related to poverty and livelihood of
Bankura is dependence on forest from time immemorial.
If the settlement map of Bankura is superimposed over
land use map, one will find that there are numerous
small hamlets in the fringe areas of forest lands. The
inhabitants of these villages are mostly tribals or people
belonging to lower castes. Forests and trees have
customarily played a critical role in the livelihood of
2.5.4 Construction of 5
percent model going on
2.5.5 A 30-40 Model

56
2
round shaped. Two
Siapatas are me-
chanically stitched
for making plates.
Each stage, from Sal
leaf to siapata to
plate, involves value-
addition and the
maximum value-ad-
dition takes place in
the process of mak-
ing sal plates. Unfortunately the traders and commer-
cial entrepreneurs dominate in this last stage of value
addition. A shift in this arena is being attempted through
empowerment of the self-help groups.
Economic activities concerning kendu leave starts with
pruning operation. If pruning is not done in time, good
quality leaves will not be available. This operation is
supposed to be done by TDCC engaging the local tribal
labourers. They often fail to do this, which results in
late sprouting and the local collectors miss the Kolkata
markets, which remains dominated by supply of kendu
leaves for Madhya Pradesh or Orissa.
Third component, though strictly speaking is not a forest
produce, that plays very important role is Babui grass.
Babui is cultivated in the uplands where nothing else
can grow. Both male and female members of tribal
families of south Bankura are efficient in making Babui
rope which has steady demand in the markets within
the state, as well as in other states like Uttar Pradesh
and Rajasthan. But in absence of local market facilities
the middlemen dominates which leads to deprivation
of the growers of competitive price. Secondly, though
this species has utility in conservation of soil and water,
Forest Department as a policy discourages its cultivation
and when it is cultivated in fallow uplands within forest
area, the same is uprooted or set ablazed.
Finally, there are infrastructure gaps so for as NTFP-
based livelihood options are concerned. In the absence
of storage facilities, the growers and collectors are very
often compelled to resort to distress-sale. As there is no
market facility that deserves the name and as the TDCC
does not procure such produces in sufficient quantity,
dependence on traders and middlemen persists. Non-
availability of machineries is another drawback that
deprives the collectors of engagement in value-addition
and higher income generation processes.
these people. They depend fully or partly on forest
resources to meet their subsistence needs. They have an
organic link with forest. For them, forests are also a
source of construction material, fuel, medicines, animal
feed and as such they are helplessly dependent on forests.
Most of the dwellers of these forest fringe villages are
landless. In case they possess any land, it is invariably
marginal in quantum and unirrigated, unbounded
uplands in nature. So they cannot depend on
agriculture for subsistence, rather a mainstay of their
subsistence is collection of minor forest produces. It
has been estimated that 20-50 percent of the household
incomes per annum comes from non-timber forest
produce (NTFP).
So excessive deforestation and existence of huge
quantum of degraded forest lands are a serious threat
not only to soil and water base essential for food
production, but it also has a direct bearing upon the
fringe population. With erosion of customary rights
and access to forest resources, the household food
security of this region seems to have been endangered.
Table 2.5.9 Year-wise collection of minor
forest produce by LAMPS in Bankura
(in Quintals)
Year 2004 2005 2006
Kendu leaves (in Quintals) 4437.00 3356.69 4746.00
Sal seeds (in MTs.) 30 202.76 Nil
Source: Regional Manager, TDCC, Bankura
It will be worthwhile to discuss here in brief some
NTFP based economic activities prevalent at Bankura
and problems related thereto. Collection, processing
and sale of Sal leaves, Sal seeds, Kendu leaves, are
among occupations dependent on NTFP. For procuring
such NTFP, Tribal Development Cooperative
Corporation (TDCC) deposits royalty in favour of
Forest Department. Large-sized multi-purpose co-
operative societies (LAMPS) run by TDCC are
supposed to buy the NTFPs collected by tribal people.
In reality, a very insignificant portion of NTFPs is
procured by the LAMPS and payments are made
irregularly leaving enough room for private traders to
intrude and buy NTFPs at distress prices.
Collection of Sal leaf is generally done by the women
folk. They weave Sal leaves to form ‘siapata’ which is
2.5.6 Sal plate preparation
by tribal women
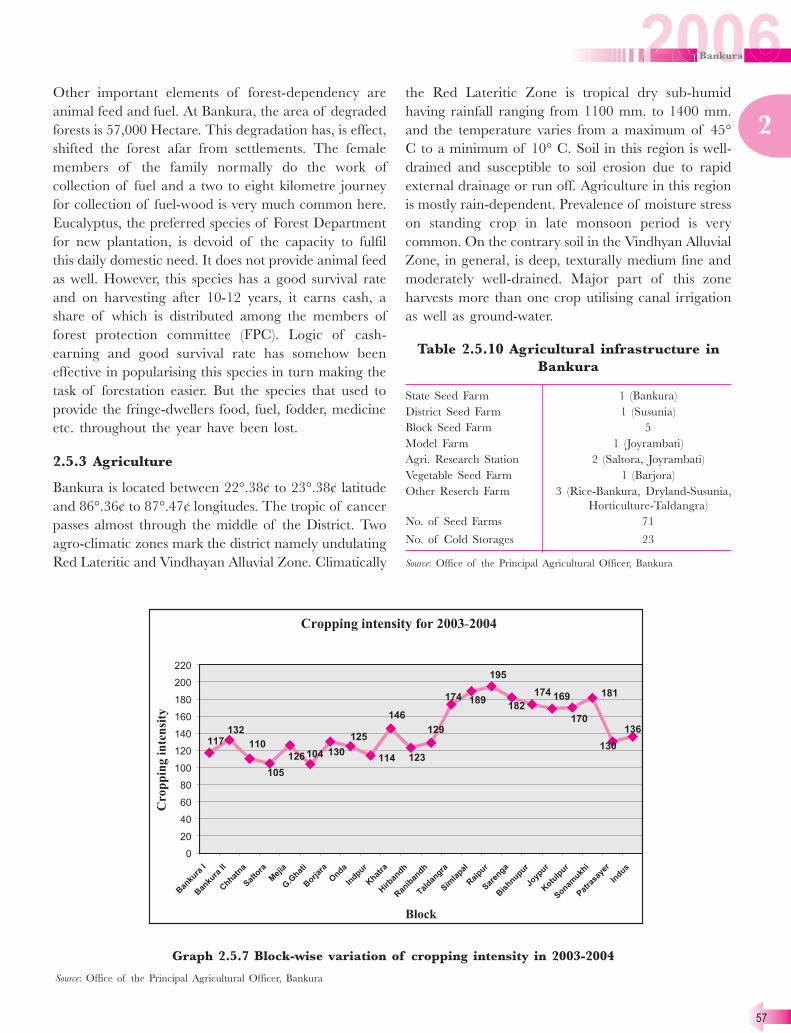
57
2
Other important elements of forest-dependency are
animal feed and fuel. At Bankura, the area of degraded
forests is 57,000 Hectare. This degradation has, is effect,
shifted the forest afar from settlements. The female
members of the family normally do the work of
collection of fuel and a two to eight kilometre journey
for collection of fuel-wood is very much common here.
Eucalyptus, the preferred species of Forest Department
for new plantation, is devoid of the capacity to fulfil
this daily domestic need. It does not provide animal feed
as well. However, this species has a good survival rate
and on harvesting after 10-12 years, it earns cash, a
share of which is distributed among the members of
forest protection committee (FPC). Logic of cash-
earning and good survival rate has somehow been
effective in popularising this species in turn making the
task of forestation easier. But the species that used to
provide the fringe-dwellers food, fuel, fodder, medicine
etc. throughout the year have been lost.
2.5.3 Agriculture
Bankura is located between 22°.38¢ to 23°.38¢ latitude
and 86°.36¢ to 87°.47¢ longitudes. The tropic of cancer
passes almost through the middle of the District. Two
agro-climatic zones mark the district namely undulating
Red Lateritic and Vindhayan Alluvial Zone. Climatically
the Red Lateritic Zone is tropical dry sub-humid
having rainfall ranging from 1100 mm. to 1400 mm.
and the temperature varies from a maximum of 45°
C to a minimum of 10° C. Soil in this region is well-
drained and susceptible to soil erosion due to rapid
external drainage or run off. Agriculture in this region
is mostly rain-dependent. Prevalence of moisture stress
on standing crop in late monsoon period is very
common. On the contrary soil in the Vindhyan Alluvial
Zone, in general, is deep, texturally medium fine and
moderately well-drained. Major part of this zone
harvests more than one crop utilising canal irrigation
as well as ground-water.
Table 2.5.10 Agricultural infrastructure in
Bankura
State Seed Farm 1 (Bankura)
District Seed Farm 1 (Susunia)
Block Seed Farm 5
Model Farm 1 (Joyrambati)
Agri. Research Station 2 (Saltora, Joyrambati)
Vegetable Seed Farm 1 (Barjora)
Other Reserch Farm 3 (Rice-Bankura, Dryland-Susunia,
Horticulture-Taldangra)
No. of Seed Farms 71
No. of Cold Storages 23
Source: Office of the Principal Agricultural Officer, Bankura
Graph 2.5.7 Block-wise variation of cropping intensity in 2003-2004
Source: Office of the Principal Agricultural Officer, Bankura

58
2
It is paradoxical that though Bankura lies in sub-humid
zone having total annual rainfall of 1300 mm to 1400
mm., agriculture is largely dependent on the vagaries
of monsoon. Drought constitutes a major hazard in
the district. Intermittent gaps in precipitation and
moisture stretch during the monsoon give rise to serious
setback in the production of paddy during the Kharif
season, which is the mainstay of agriculture in the
district. In addition, the soil is mostly poor in plant
nutrients, porous with poor water-holding capacity and
very erosion-prone resulting in loss of top-soil thereby
affecting soil fertility. The soil is acidic and the pH
ranges from 4.5 to 5.5, affecting the yield of the land.
The unscientific use of costly chemical fertilisers has
aggravated the problem.
The ground reality being the above, efforts had always
been to bring more agricultural land under the ambit
Table 2.5.11 Block-wise net sown area, gross-cropped area and
cropping intensity in 2003-2004
Name of Net area Area in which Gross Cropping
Block sown more than one cropped intensity
(in Hec.) crop is grown area
(in Hec.) (in Hec.)
Bankura-I 10844 1869 12713 117
Bankura-II 10859 3501 14360 132
Chhatna 24932 2571 27503 110
Saltora 17235 809 18044 105
Mejia 8436 2196 10632 126
Gangajalghati 22335 893 23228 104
Barjora 19806 6025 25831 130
Onda 26981 6712 33693 125
Indpur 16490 2327 18817 114
Khatra 10222 4658 14880 146
Hirbandh 11062 2561 13623 123
Ranibandh 15128 4389 19517 129
Taldangra 16168 11930 28098 174
Simlapal 11282 10075 21357 189
Raipur 11256 10682 21938 195
Sarenga 12947 10601 23548 182
Bishnupur 16123 11904 28027 174
Joypur 14039 9650 23689 169
Kotulpur 17741 12446 30187 170
Sonamukhi 17348 14119 31467 181
Patrasayer 16413 5000 21413 130
Indus 20482 7400 27882 136
Total 348129 142318 490447 141
Source:- Office of the Principal Agricultural Officer, Bankura
of minor irrigation so that the Kharif crop can be
protected from the fluctuation of monsoon and
irrigational support can be extended to pulses and oil-
seed and other cash crops in the Rabi season in order
that the crop intensity may be improved.
It is clear from the analysis of cropping intensity (Graph
2.5.7) that the western and part of southern Bankura is
lagging behind and needs attention. The strategy being
followed in this district is to go for crop diversification.
Farmers are being encouraged to go for dryland
farming. The watershed approach of planning has
enabled us to identify some thrust areas and
interventions, which have become helpful in increasing
the production and productivity in agricultural sector.
Following thrust areas had been identified for
development in recent times and some interventions
have been made:
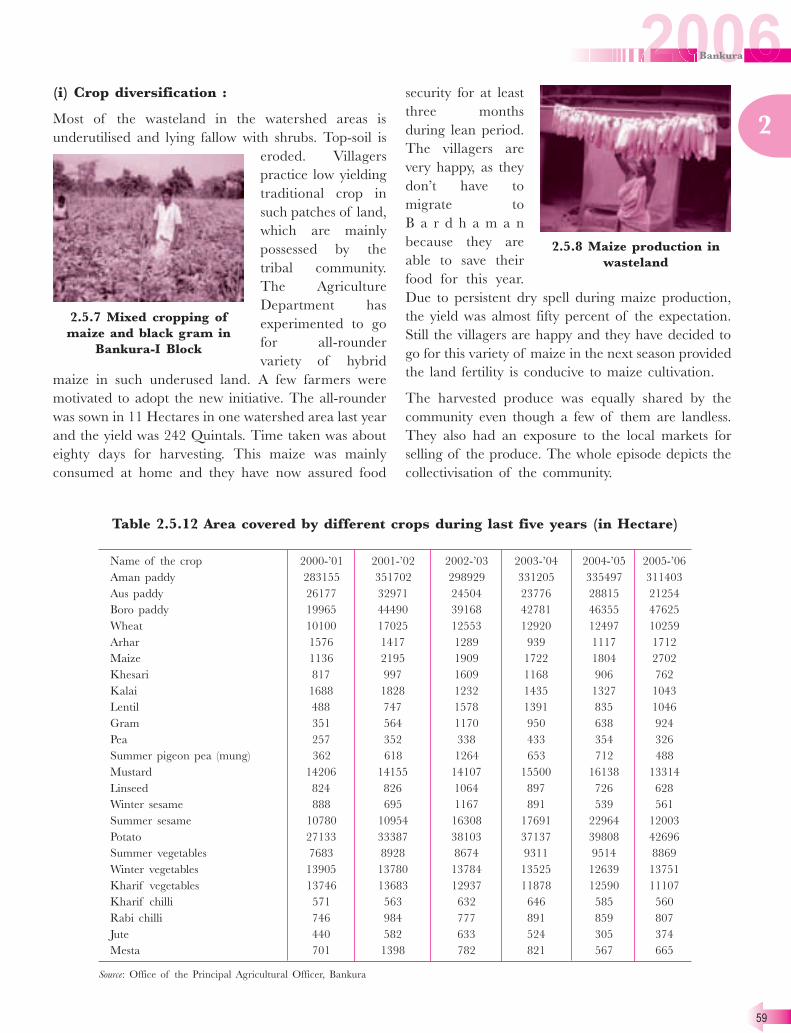
59
2
2.5.7 Mixed cropping of
maize and black gram in
Bankura-I Block
(i) Crop diversification :
Most of the wasteland in the watershed areas is
underutilised and lying fallow with shrubs. Top-soil is
eroded. Villagers
practice low yielding
traditional crop in
such patches of land,
which are mainly
possessed by the
tribal community.
The Agriculture
Department has
experimented to go
for all-rounder
variety of hybrid
maize in such underused land. A few farmers were
motivated to adopt the new initiative. The all-rounder
was sown in 11 Hectares in one watershed area last year
and the yield was 242 Quintals. Time taken was about
eighty days for harvesting. This maize was mainly
consumed at home and they have now assured food
security for at least
three months
during lean period.
The villagers are
very happy, as they
don’t have to
migrate to
B a r d h a m a n
because they are
able to save their
food for this year.
Due to persistent dry spell during maize production,
the yield was almost fifty percent of the expectation.
Still the villagers are happy and they have decided to
go for this variety of maize in the next season provided
the land fertility is conducive to maize cultivation.
The harvested produce was equally shared by the
community even though a few of them are landless.
They also had an exposure to the local markets for
selling of the produce. The whole episode depicts the
collectivisation of the community.
2.5.8 Maize production in
wasteland
Table 2.5.12 Area covered by different crops during last five years (in Hectare)
Name of the crop 2000-’01 2001-’02 2002-’03 2003-’04 2004-’05 2005-’06
Aman paddy 283155 351702 298929 331205 335497 311403
Aus paddy 26177 32971 24504 23776 28815 21254
Boro paddy 19965 44490 39168 42781 46355 47625
Wheat 10100 17025 12553 12920 12497 10259
Arhar 1576 1417 1289 939 1117 1712
Maize 1136 2195 1909 1722 1804 2702
Khesari 817 997 1609 1168 906 762
Kalai 1688 1828 1232 1435 1327 1043
Lentil 488 747 1578 1391 835 1046
Gram 351 564 1170 950 638 924
Pea 257 352 338 433 354 326
Summer pigeon pea (mung) 362 618 1264 653 712 488
Mustard 14206 14155 14107 15500 16138 13314
Linseed 824 826 1064 897 726 628
Winter sesame 888 695 1167 891 539 561
Summer sesame 10780 10954 16308 17691 22964 12003
Potato 27133 33387 38103 37137 39808 42696
Summer vegetables 7683 8928 8674 9311 9514 8869
Winter vegetables 13905 13780 13784 13525 12639 13751
Kharif vegetables 13746 13683 12937 11878 12590 11107
Kharif chilli 571 563 632 646 585 560
Rabi chilli 746 984 777 891 859 807
Jute 440 582 633 524 305 374
Mesta 701 1398 782 821 567 665
Source: Office of the Principal Agricultural Officer, Bankura
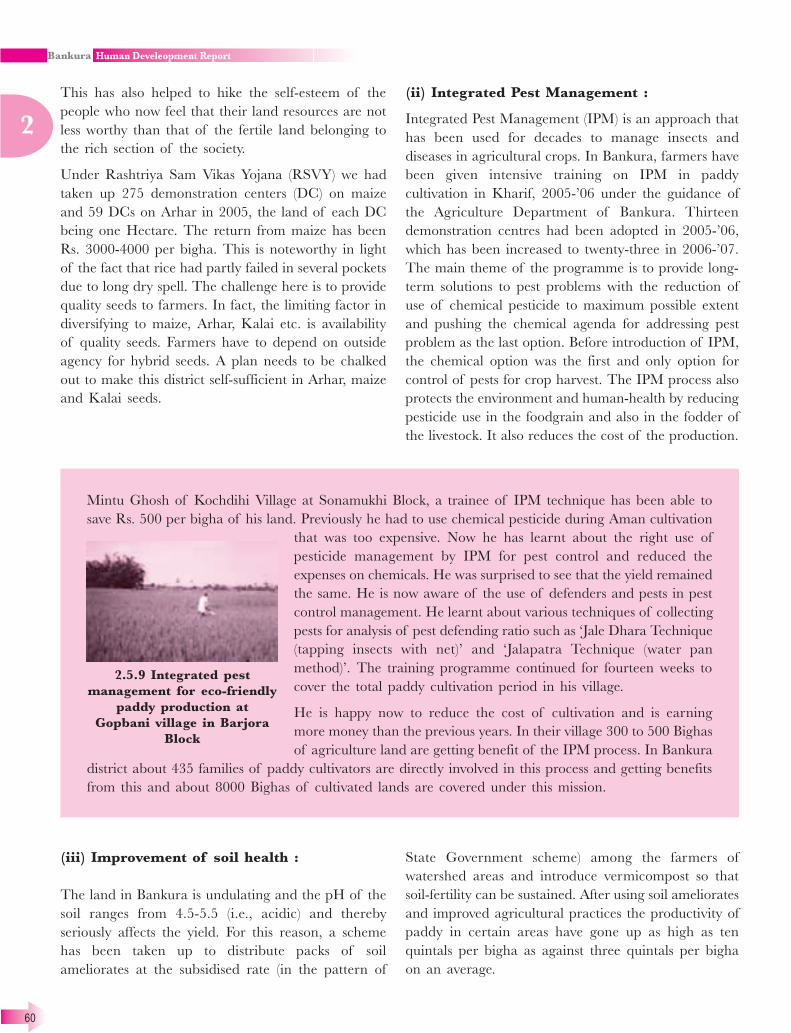
60
2
This has also helped to hike the self-esteem of the
people who now feel that their land resources are not
less worthy than that of the fertile land belonging to
the rich section of the society.
Under Rashtriya Sam Vikas Yojana (RSVY) we had
taken up 275 demonstration centers (DC) on maize
and 59 DCs on Arhar in 2005, the land of each DC
being one Hectare. The return from maize has been
Rs. 3000-4000 per bigha. This is noteworthy in light
of the fact that rice had partly failed in several pockets
due to long dry spell. The challenge here is to provide
quality seeds to farmers. In fact, the limiting factor in
diversifying to maize, Arhar, Kalai etc. is availability
of quality seeds. Farmers have to depend on outside
agency for hybrid seeds. A plan needs to be chalked
out to make this district self-sufficient in Arhar, maize
and Kalai seeds.
Mintu Ghosh of Kochdihi Village at Sonamukhi Block, a trainee of IPM technique has been able to
save Rs. 500 per bigha of his land. Previously he had to use chemical pesticide during Aman cultivation
that was too expensive. Now he has learnt about the right use of
pesticide management by IPM for pest control and reduced the
expenses on chemicals. He was surprised to see that the yield remained
the same. He is now aware of the use of defenders and pests in pest
control management. He learnt about various techniques of collecting
pests for analysis of pest defending ratio such as ‘Jale Dhara Technique
(tapping insects with net)’ and ‘Jalapatra Technique (water pan
method)’. The training programme continued for fourteen weeks to
cover the total paddy cultivation period in his village.
He is happy now to reduce the cost of cultivation and is earning
more money than the previous years. In their village 300 to 500 Bighas
of agriculture land are getting benefit of the IPM process. In Bankura
district about 435 families of paddy cultivators are directly involved in this process and getting benefits
from this and about 8000 Bighas of cultivated lands are covered under this mission.
(ii) Integrated Pest Management :
Integrated Pest Management (IPM) is an approach that
has been used for decades to manage insects and
diseases in agricultural crops. In Bankura, farmers have
been given intensive training on IPM in paddy
cultivation in Kharif, 2005-’06 under the guidance of
the Agriculture Department of Bankura. Thirteen
demonstration centres had been adopted in 2005-’06,
which has been increased to twenty-three in 2006-’07.
The main theme of the programme is to provide long-
term solutions to pest problems with the reduction of
use of chemical pesticide to maximum possible extent
and pushing the chemical agenda for addressing pest
problem as the last option. Before introduction of IPM,
the chemical option was the first and only option for
control of pests for crop harvest. The IPM process also
protects the environment and human-health by reducing
pesticide use in the foodgrain and also in the fodder of
the livestock. It also reduces the cost of the production.
(iii) Improvement of soil health :
The land in Bankura is undulating and the pH of the
soil ranges from 4.5-5.5 (i.e., acidic) and thereby
seriously affects the yield. For this reason, a scheme
has been taken up to distribute packs of soil
ameliorates at the subsidised rate (in the pattern of
2.5.9 Integrated pest
management for eco-friendly
paddy production at
Gopbani village in Barjora
Block
State Government scheme) among the farmers of
watershed areas and introduce vermicompost so that
soil-fertility can be sustained. After using soil ameliorates
and improved agricultural practices the productivity of
paddy in certain areas have gone up as high as ten
quintals per bigha as against three quintals per bigha
on an average.
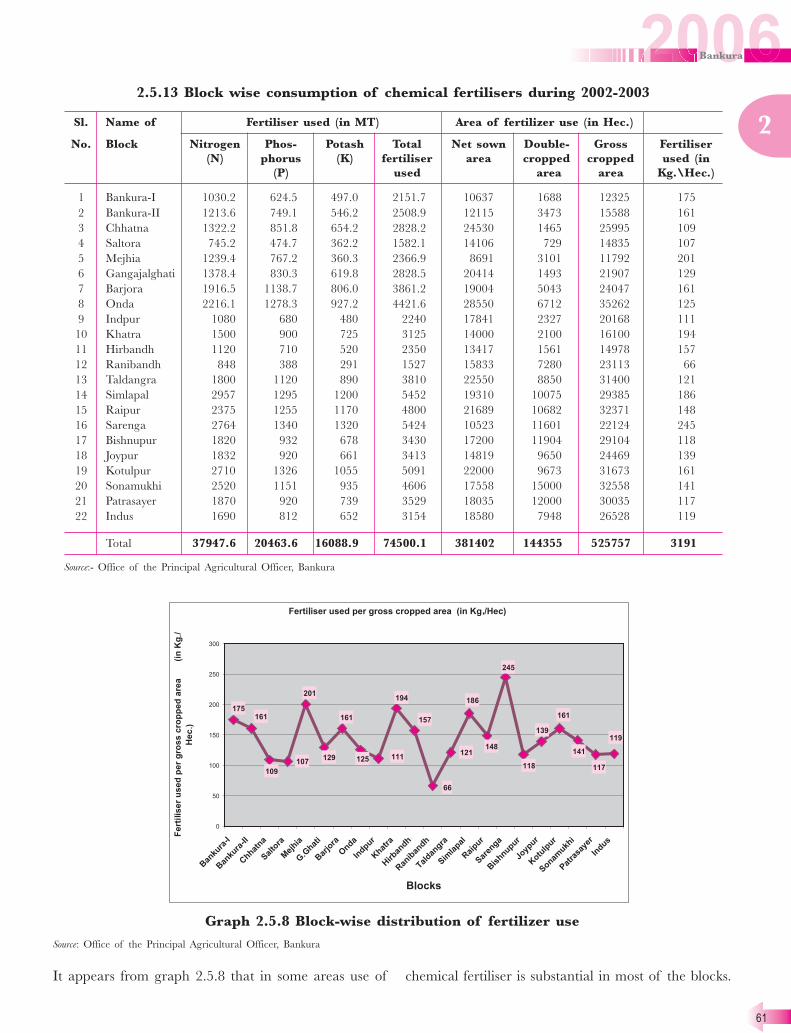
61
2
It appears from graph 2.5.8 that in some areas use of
2.5.13 Block wise consumption of chemical fertilisers during 2002-2003
Sl. Name of Fertiliser used (in MT) Area of fertilizer use (in Hec.)
No. Block Nitrogen Phos- Potash Total Net sown Double- Gross Fertiliser
(N) phorus (K) fertiliser area cropped cropped used (in
(P) used area area Kg.\Hec.)
1 Bankura-I 1030.2 624.5 497.0 2151.7 10637 1688 12325 175
2 Bankura-II 1213.6 749.1 546.2 2508.9 12115 3473 15588 161
3 Chhatna 1322.2 851.8 654.2 2828.2 24530 1465 25995 109
4 Saltora 745.2 474.7 362.2 1582.1 14106 729 14835 107
5 Mejhia 1239.4 767.2 360.3 2366.9 8691 3101 11792 201
6 Gangajalghati 1378.4 830.3 619.8 2828.5 20414 1493 21907 129
7 Barjora 1916.5 1138.7 806.0 3861.2 19004 5043 24047 161
8 Onda 2216.1 1278.3 927.2 4421.6 28550 6712 35262 125
9 Indpur 1080 680 480 2240 17841 2327 20168 111
10 Khatra 1500 900 725 3125 14000 2100 16100 194
11 Hirbandh 1120 710 520 2350 13417 1561 14978 157
12 Ranibandh 848 388 291 1527 15833 7280 23113 66
13 Taldangra 1800 1120 890 3810 22550 8850 31400 121
14 Simlapal 2957 1295 1200 5452 19310 10075 29385 186
15 Raipur 2375 1255 1170 4800 21689 10682 32371 148
16 Sarenga 2764 1340 1320 5424 10523 11601 22124 245
17 Bishnupur 1820 932 678 3430 17200 11904 29104 118
18 Joypur 1832 920 661 3413 14819 9650 24469 139
19 Kotulpur 2710 1326 1055 5091 22000 9673 31673 161
20 Sonamukhi 2520 1151 935 4606 17558 15000 32558 141
21 Patrasayer 1870 920 739 3529 18035 12000 30035 117
22 Indus 1690 812 652 3154 18580 7948 26528 119
Total 37947.6 20463.6 16088.9 74500.1 381402 144355 525757 3191
Source:- Office of the Principal Agricultural Officer, Bankura
chemical fertiliser is substantial in most of the blocks.
Graph 2.5.8 Block-wise distribution of fertilizer use
Source: Office of the Principal Agricultural Officer, Bankura

62
2Vermicompost : a success story
Vermicompost is a unique product in uplifting and sustenance of soil fertility.
Small units for vermicompost preparation were specially designed with the support of non-governmental
organizations (NGO) having past experience on vermicomposting. The objective was that the small-
scale units in large number will make individual farmers self-sufficient in their own organic material
requirement and this will improve the soil fertility of land holding of small and marginal farmers and
also improve the quality of the produce.
Table 2.5.14 Cost-benefit analysis of vermicompost
Cost involved Benefit accrued ( in one year)
Cost of the structure = 400.00 Fertiliser produced 5 quintals (in 6 cycles in a year)
Labour charge = 120.00 @ Rs 5/- = Rs. 2500.00
Cost of worms = 300.00 Sell of worms (2000 nos. approx.)
Total cost = 820.00 @ Rs. 0.50 = Rs. 1000.00
Total income = Rs. 3500.00
Source: RSVY Cell, Office of the District Magistrate, Bankura
Distribution of vermicompost has been included in different crop
demonstration programmes to popularise the material. Total 130
vermicompost pits were demonstrated in 2004–’05, whereas in 2005-
’06, the number of pits was 557.
This model is extremely useful to maintain and enhance the soil
fertility. This is a low-cost innovative technology now practiced in
micro-watersheds in this district. Construction of this structure is made
at home with locally available wood and bamboo.
We have found this extremely relevant for the landless poor in a micro-
watershed area.
(iv) System for Rice Intensification (SRI) : a case study :
Mr. Tarapada Hembram, a marginal farmer of Saudagarpara in Udaypur mouza at Saltora block
experienced a new method of paddy cultivation, called System for Rice Intensification (SRI), in his 17
decimal of Kanali land (medium low-land). Earlier he used to get 2-2.5 quintals of paddy from that
piece of land. In 2005, he followed the SRI method and could double the yield to get 5.76 quintals of
paddy from that land.
The key interventions in SRI method are:
1) Lowering down the seed rate from 10 Kgs./33 decimal to only 1 Kg./ 33 decimal.
2) Using young seedlings of 10-12 days old for transplanting.
3) Maintaining 1 ft x 1 ft spacing in both line-to-line & plant-to-plant direction and using single
seedling for transplanting.
4) Application of fertilisers in split (3-4 times) doses & using potash along with urea for top-dressing.
2.5.10 Replications are going
on in low-cost model of
vermicompost

63
2The cost of cultivation is around Rs. 300/- per decimal (excluding
labour & irrigation costs). Last year during Kharif season about 46
farmers used this method of rice cultivation in 46 bighas of land.
Around 500 farmers of that area were taken to Tarapada’s field to
see the crop and learn from Tarapada’s experience. PRADAN, a non-
governmental organisation conducted a series of training programme
for those farmers of SRI method. Looking at the low input cost, less
labour-intensive practices & high yield, another 450 farmers of Saltora
and Chhatna block are taking up this method of paddy cultivation in
20 Hectares of land in the year 2006-’07.
2.5.11 Farmer with his SRI
paddy
Thus it is obvious that there is plenty of hope in terms
of alternative cropping practices in this part of the
country in which the terrain looks so difficult and
unproductive. The challenge is in dissemination of right
knowledge to the farmers. Village-level institutions such
as farmers’ club, watershed development committee etc.
can be of great help in taking this message to the
grassroot.
2.5.4 Forestry :
In Bankura, sizeable part of the land both in forest areas
and non-forest areas remain vacant. Since land under
Forest Department is approximately 21.5 percent, any
poverty reduction effort will remain incomplete unless
this area is addressed. Approximately 48 percent of the
forest is of degraded type. Moreover the plant cover in
non-forest area is depleting gradually. This in turn builds
up biotic pressure on the existing forest area. Also forest
is an important source of livelihood for the poor people
in rural areas. It provides not only employment and
income but is also an important source of fuel and
fodder for those people. To increase forest area in
Bankura is one of the objectives of present-day
developmental activities.
From the geographical, socio-economic & environmental
consideration, the district offers lot of scope for
development of this activity. In view of governmental
supports for development of this sector, long-term
potential for development through credit may be
estimated at 2500 Hectares for the next five years with
annual phasing of 500 Hectares.
State Government has implemented social forestry
project in the district covering roadside, riverside, railway-
embankment plantation etc. West Bengal Forest
Development Corporation, Pulpwood Development
Corporation are also working for forest and wasteland
development in the district during the past years.
Forest of the district is divided into three divisions.
Under State and Central sponsored programmes,
rejuvenation and re-plantation are taken up to an
average of 1500-1600 Hectares per year. In coming
five years 2000 Hectares of land is also expected to be
developed with non-timber forest. Development of the
activity only on culturable wasteland and fallow land
is being taken up through bank-credit.
2.5.4.1 Joint Forest Management :
The concept of Joint Forest Management (JFM) is
considerably old in West Bengal particularly in
southern part of the state. Although it was formally
started in the year 1989, it had been informally in
practice, sporadically though, in the field of southern
part of the state since early eighties. The tremendous
success of this informal practice actually prompted the
state government to accept it as a better management
practice in forestry and it was formalised by issuance
of series of Government orders.
The forests of Bankura are all erstwhile private
jamindari forests and were subjected to repeated
coppicing. At the time of acquisition by the
Government during 1954-55, those were in an
advanced stage of degradation. Thereafter, the forests
were brought under scientific management.
In 1972, the Socio-economic Research Project for
upliftment of fringe population at Arabari in
Midnapore district (West Bengal) was started. Then
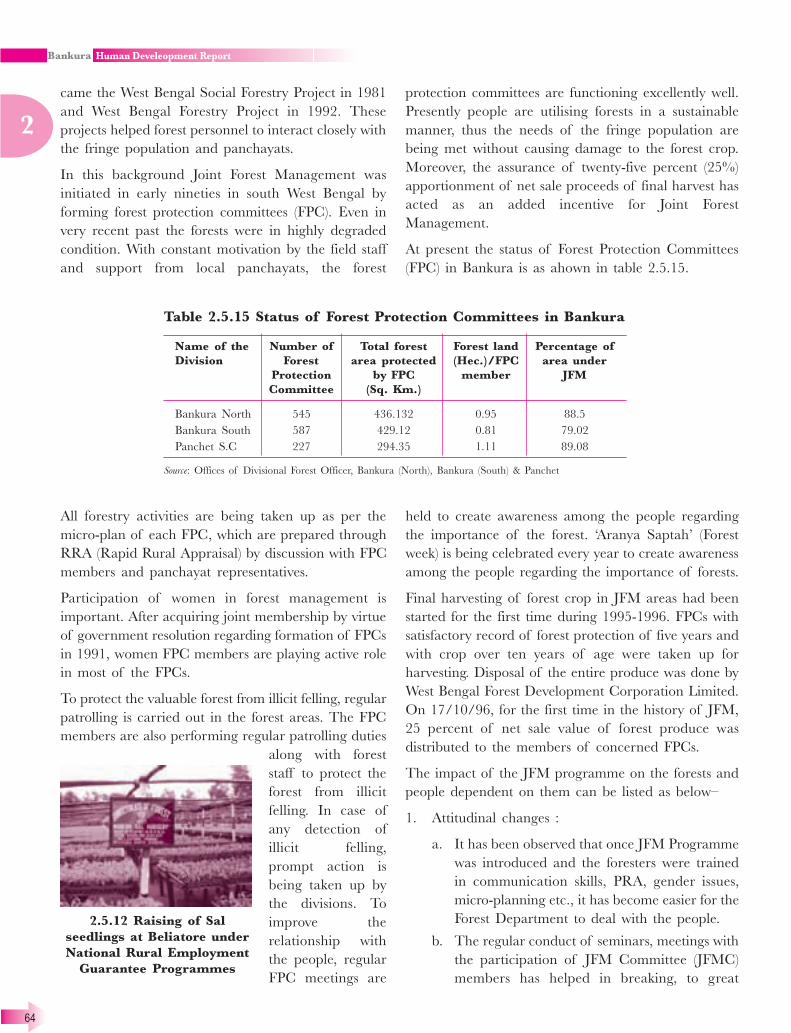
64
2
came the West Bengal Social Forestry Project in 1981
and West Bengal Forestry Project in 1992. These
projects helped forest personnel to interact closely with
the fringe population and panchayats.
In this background Joint Forest Management was
initiated in early nineties in south West Bengal by
forming forest protection committees (FPC). Even in
very recent past the forests were in highly degraded
condition. With constant motivation by the field staff
and support from local panchayats, the forest
protection committees are functioning excellently well.
Presently people are utilising forests in a sustainable
manner, thus the needs of the fringe population are
being met without causing damage to the forest crop.
Moreover, the assurance of twenty-five percent (25%)
apportionment of net sale proceeds of final harvest has
acted as an added incentive for Joint Forest
Management.
At present the status of Forest Protection Committees
(FPC) in Bankura is as ahown in table 2.5.15.
Table 2.5.15 Status of Forest Protection Committees in Bankura
Name of the Number of Total forest Forest land Percentage of
Division Forest area protected (Hec.)/FPC area under
Protection by FPC member JFM
Committee (Sq. Km.)
Bankura North 545 436.132 0.95 88.5
Bankura South 587 429.12 0.81 79.02
Panchet S.C 227 294.35 1.11 89.08
Source: Offices of Divisional Forest Officer, Bankura (North), Bankura (South) & Panchet
All forestry activities are being taken up as per the
micro-plan of each FPC, which are prepared through
RRA (Rapid Rural Appraisal) by discussion with FPC
members and panchayat representatives.
Participation of women in forest management is
important. After acquiring joint membership by virtue
of government resolution regarding formation of FPCs
in 1991, women FPC members are playing active role
in most of the FPCs.
To protect the valuable forest from illicit felling, regular
patrolling is carried out in the forest areas. The FPC
members are also performing regular patrolling duties
along with forest
staff to protect the
forest from illicit
felling. In case of
any detection of
illicit felling,
prompt action is
being taken up by
the divisions. To
improve the
relationship with
the people, regular
FPC meetings are
held to create awareness among the people regarding
the importance of the forest. ‘Aranya Saptah’ (Forest
week) is being celebrated every year to create awareness
among the people regarding the importance of forests.
Final harvesting of forest crop in JFM areas had been
started for the first time during 1995-1996. FPCs with
satisfactory record of forest protection of five years and
with crop over ten years of age were taken up for
harvesting. Disposal of the entire produce was done by
West Bengal Forest Development Corporation Limited.
On 17/10/96, for the first time in the history of JFM,
25 percent of net sale value of forest produce was
distributed to the members of concerned FPCs.
The impact of the JFM programme on the forests and
people dependent on them can be listed as below–
1. Attitudinal changes :
a. It has been observed that once JFM Programme
was introduced and the foresters were trained
in communication skills, PRA, gender issues,
micro-planning etc., it has become easier for the
Forest Department to deal with the people.
b. The regular conduct of seminars, meetings with
the participation of JFM Committee (JFMC)
members has helped in breaking, to great
2.5.12 Raising of Sal
seedlings at Beliatore under
National Rural Employment
Guarantee Programmes
65
2
extent, the psychological barriers that existed
for long between the people and the Forest
Department. For example, it has been observed
that the contribution of people in the protection
of forests has made the job of Forest
Department easier as instead of dealing with
the forest offenders single-handedly, they now
have the willing support of hundreds of JFMC
members.
c. With the improvement of forests, there is also a
change in the attitude of foresters towards the
people.
d. The transparent mechanism for the utilisation
of funds for forestry works in JFM has
contributed greatly to build the confidence of
the people in Forest Department.
2. Sense of belongingness :
a. As a result of the policy of dealing with the
people with a human face and sharing of
usufructs, a sense of belongingness has been
instilled in the minds of JFMC members.
b. The members are guarding the forests like their
own property and there are several instances of
pitched battle between the forest offenders and
JFMC members.
3. Livelihood generation :
The most significant benefits from the implementation
of the JFM programme are to the poorest people living
in forests or forest fringe areas through generation of
employment and income in the forestry operations &
NTFP collection and sale particularly during the lean
agricultural periods.
In this regard a study has been undertaken by Dr. Ajit
Banerjee in collaboration with the University of East
Anglia, UK of three villages in Ranibandh, Taldangra
and Joypur blocks. From the research findings it appears
that on an average the contribution of forest income to
total income of the families is estimated to be 11.18
percent whereas, for the poor, it is as high as 32 percent–
most of it coming from the non-timber forest produce
(i.e., fuelwood collection, Sal leaf collection, Sabai grass
collection). Only around 5 percent is obtained from the
share of timber felling and sale of timber. Thus non-
timber forest produce is equally important, if not more,
for the poor.
4. Drop in migration :
Studies have shown that there had been a significant
drop in migration to towns suggesting that JFM has
successfully generated sufficient income-earning
opportunities to discourage seasonal out-migration.
5. Improvement in living conditions :
a. JFM has improved the living conditions of the
poorest in areas where forests were previously
highly degraded.
b. The regenerating forests are producing greater
quantities of accessible fuel wood and NTFPs
for home consumption.
c. This has had a considerable impact on their
lives, especially women, as they now spend less
time at the daily chores of fuel wood and
fodder collection.
6. Protection of forests :
The single major gain of the JFM programme has
been the protection and regeneration of forests as
shown below :
(i) Control on illicit felling, forest-fires & grazing :
The JFMC members are actively contributing to
the protection of these forests. Consequently, in
JFM areas, the incidences of illicit felling, forest-
fires and indiscriminate grazing have been
significantly reduced.
(ii) Control on smuggling : In areas where the JFMCs
are located on the smuggling routes, the forest is
protected because of constant vigil.
(iii) Control on encroachment : (a) If trees are cut and
removed, there is always a chance of regenerating
the area, but if the land itself is lost due to
encroachment, there is no chance of getting back
the forest.
(b) Not only have the JFMC members stopped the
extension of encroachment in JFM areas they have
succeeded in evicting the encroachments, too,
especially where outsiders were involved.
Though JFM has been quite a success in this district,
there are concerns regarding the species being taken
up for plantation. A major share is Eucalyptus, which
gives good return and coppices fast. However, the
undergrowth of shrubs and other non-timber forest
produce is less in case of Eucalyptus. Originally Sal

66
2
was the main species in this area. It has a very good
timber value and is also very rich in non-timber forest
produce. However, it is difficult to raise Sal since it
requires better soil quality. Wherever good quality
top-soil has eroded over the years, some other species
2.5.5 Animal resource development :
Animal resource development is an important
complementary source of employment and livelihood
for rural people. It is increasingly being recognised that
to improve the rural economy, attention has to be paid
to livestock production, which is a major livelihood
activity in most area. In addition to providing income
through animal and dairy sales, it has an important
function for enhanced crop production by supplying
manure in the field. Thus in the ecologically fragile
semi-arid regions, livestock makes an important
contribution to the survival of the economically weaker
sections. To make it a viable enterprise, it is important
to make available good breeds, fodder and veterinary
services. The major problem with livestock rearing is
the scarcity of fodder and the unavailability of good
quality of commercialised breed of livestock. Provision
of veterinary services and commercialisation by
providing marketing and processing facilities for the
Nursery and plantation raising at Saltora : a case study
People of the area are mainly dependent on rainfed agriculture. Total rainfall was 1116.5 mm in the
year 2005 against an average rainfall of 1300 mm. The topography of the Murlu range is undulating
with a maximum slope of 10 percent. During run-off, it carries fertile
topsoil, which gets deposited into the drainage basin. As a result, the
crop production gets affected. Community uses seepage water
wherever available by tapping through shallow wells (locally called
‘Chuanh’).
The plantation process started with the nursery raising in the Murlu
range with the continuous supervision of Forest (North) Department.
Plantation was made for 6 Hectares of forest land in Goswamidihi
patch. The 165 members of Goswamidihi Gurukundathol Forest
Protection Committee (FPC) were engaged in the job for labour
component. The main activities had been cutting the bushes, pit-
digging, nursery raising, and pit-filling with plantation. The main species of plants are Akashmoni,
Sonajhuri, Ghamar and Bohera. The total persondays created for the work is 345.The Forest Department
and local FPC are sharing the responsibility of maintenance of the patch.
needs to be planted first to bring back the fertility
before Sal is taken up. An effort is being made to
revive Sal under the Rashtriya Sam Vikas Yojana
(RSVY) and the National Rural Employment
Guarantee Scheme.
2.5.13 Nursery raising by the
members of Forest
Protection Committee at
Saltora
dairy and poultry products are some of the areas of
intervention for the development plan proposal of the
district. Bankura has a dry weather, which makes it a
very suitable place for animal resource development.
2.5.5.1 Cattle development :
Development of milch cattle has a very big potential in
this district. Steps have been taken to meet the fodder
requirement by cultivating fodder in blocks like Raipur,
Sonamukhi and Sarenga. Efforts are also being made
to encourage farmers to cultivate fodder on their private
land. Fodder which can be cultivated in dry weather
needing less irrigation like maize, oats, styllo, sorghum
etc. are being emphasized. In Bankura, people cultivate
what is locally known as ‘Ghas Chal’. It provides them
rice-like foodgrains and the plant is very nutritious for
animals. It requires very little water and is very suited
to this area. In fact, it is very difficult to motivate the
farmers not to go for paddy and take up fodder

67
2
cultivation. Some farmers have been seen to be under
false impression that paddy straw has good nutritional
value. In Bankura, where farmers have hardly one crop
in many parts of the district, switching to fodder
cultivation may prove to be very profitable. One artificial
insemination (AI) centre exists in each Block whereas
‘Pranibandhus’ based at each Gram-Panchayat provide
technical support and advice regarding AI, cross-
breeding, vaccination etc. A new approach has been
adopted in which milk cooperative societies are being
trained on AI so that they can meet the requirement
of their members. In this district, which is sparsely
populated, this can be very effective since journey time
of ‘Pranibandhu’ becomes substantial and there is
every likelihood of AI failure. ‘Gabhi-Mela’ are also
being organised to popularize milch-cattle among rural
people. The distribution of cross-breed milch cow is
indicated in table 2.5.16.
Table 2.5.16 Block and municpality-wise number of cross-bred
cattle (as on 15.10.2003)
Subdivision Block/Municipality Number of
cross-bred cattle
Bankura Bankura-I 838
Bankura-II 7988
Barjora 1936
Chhatna 982
Gangajalghati 4423
Mejhia 221
Onda 12625
Saltora 313
Bankura Municipality 723
Bishnupur Bishnupur 2561
Indas 4954
Joypur 5679
Kotulpur 4227
Patrasayer 2424
Sonamukhi 8437
Bishnupur Municipality 1255
Sonamukhi Municipality 200
Khatra Hirbandh 255
Indpur 662
Khatra 770
Raipur 531
Ranibundh 388
Sarenga 1122
Simlapal 3811
Taldangra 1979
District total 69305
Source: 17th. livestock census

68
2
2.5.5.2 Kangsabati Co-operative Milk
Producers’ Union Limited (KAMUL), Bankura :
There is a milk union in this district. The main
function of the milk union is arrangement of
marketing of milk
produced by the
village cattle-
owners at
remunerative price
regularly through
Milk Producers’
C o - o p e r a t i v e
Societies (MPCS).
At the same time it is engaged in augmentation of
milk production in the villages through cattle
development by production of improved variety calves
through artificial insemination of indigenous cows,
green fodder cultivation. KAMUL is also supplying
balanced cattle-feed, green fodder-seeds to the farmers
through these MPCS.
Recently cross-breed cows having the capacity of
production of 6-8 litres milk per day are being
distributed to the scheduled caste women beneficiaries
in the villages of this district under Mahila Samriddhi
Yojana, a project of West Bengal Schedued Caste &
Scheduled Tribe Development & Finance Corporation.
These women beneficiaries have started earning
regularly through milk selling at the MPCS. KAMUL
is also supplying balanced cattle-feed to these women
beneficiaries.
KAMUL has at present 55 MPCS and other 11
women MPCS at Raipur, Sarenga, Simlapal and
Taldangra blocks. Milk is being collected from the
farmers at the MPCSs, and then it is carried to Raipur
milk chilling plant for chilling. After that it is being
supplied to Metro Dairy, Barasat.
A programme for expansion of chilling capacity of
Raipur milk chilling plant from 4000 Kgs. per day to
10000 Kgs. per day has also been taken up under the
Rashtriya Sam Vikas Yojana (RSVY). A pasteurizing
and packaging plant is also coming up. KAMUL has
initiated another programme of engaging unemployed
youth of villages as veterinary field-worker at MPCS
level, who will conduct artifical insemination and
motivate them on introduction of cross-breed cows,
fodder cultivation etc. The milk collection reaches
around 10000 litres per day in the peak season which
2.5.14 Animal health camp
at Khatra
implies that nearly Rupees One Lakh is being pumped
into the economy everyday.
2.5.5.3 Mahila Samriddhi Yojana :
The West Bengal Scheduled Caste & Scheduled Tribe
Development & Finance Corporation has introduced
Mahila Sammriddhi Yojana (MSY) during the year
2003-04 as a self-employment income-generating
scheme for the SC women living below the poverty line.
Under the scheme a SC woman may get maximum Rs.
25,000/-, out of which subsidy component is
Rs.10,000/-. The loan amount alongwith interest @ Rs.
3 percent per annum is repayable in twelve equal
quarterly instalments.
In Bankura district 4088 house-dairy schemes have been
sanctioned under the scheme and an amount of Rs.
4,39,40,000/- received so far for 2200 MSY cases. The
following procedure has been adopted in this district
for effective implementation of MSY cases, especially
for house-dairy scheme :
First of all, Rs. 2,500/- is given to the beneficiaries for
construction of cow- shed.
Map 2.5.9 Raipur chilling plant & Milk Producers’
Co-operative Societies in Raipur, Sarenga,
Simlapal & Taldangra blocks of Bankura
Source: NRDMS, Bankura
(ii) In the second phase Rs. 14,000/- is earmarked for
purchase of milch cow. The cow is purchased
through holding of ‘Gabhi Mela’, where reputed
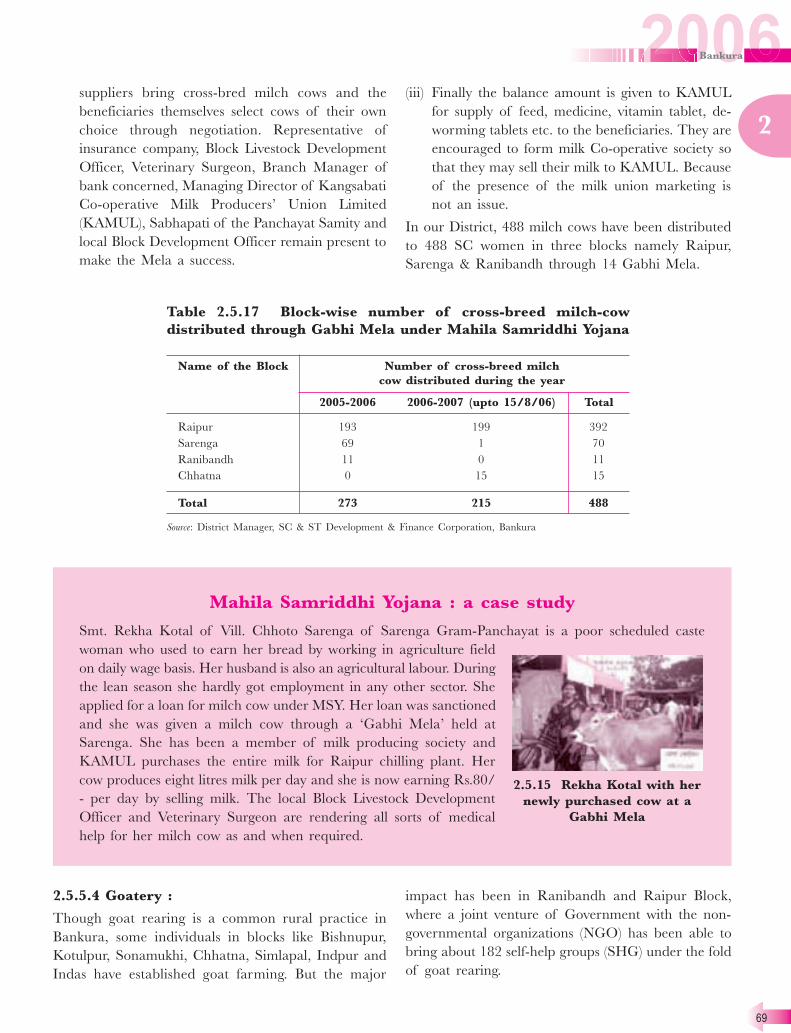
69
2
suppliers bring cross-bred milch cows and the
beneficiaries themselves select cows of their own
choice through negotiation. Representative of
insurance company, Block Livestock Development
Officer, Veterinary Surgeon, Branch Manager of
bank concerned, Managing Director of Kangsabati
Co-operative Milk Producers’ Union Limited
(KAMUL), Sabhapati of the Panchayat Samity and
local Block Development Officer remain present to
make the Mela a success.
Table 2.5.17 Block-wise number of cross-breed milch-cow
distributed through Gabhi Mela under Mahila Samriddhi Yojana
Name of the Block Number of cross-breed milch
cow distributed during the year
2005-2006 2006-2007 (upto 15/8/06) Total
Raipur 193 199 392
Sarenga 69 1 70
Ranibandh 11 0 11
Chhatna 0 15 15
Total 273 215 488
Source: District Manager, SC & ST Development & Finance Corporation, Bankura
(iii) Finally the balance amount is given to KAMUL
for supply of feed, medicine, vitamin tablet, de-
worming tablets etc. to the beneficiaries. They are
encouraged to form milk Co-operative society so
that they may sell their milk to KAMUL. Because
of the presence of the milk union marketing is
not an issue.
In our District, 488 milch cows have been distributed
to 488 SC women in three blocks namely Raipur,
Sarenga & Ranibandh through 14 Gabhi Mela.
Mahila Samriddhi Yojana : a case study
Smt. Rekha Kotal of Vill. Chhoto Sarenga of Sarenga Gram-Panchayat is a poor scheduled caste
woman who used to earn her bread by working in agriculture field
on daily wage basis. Her husband is also an agricultural labour. During
the lean season she hardly got employment in any other sector. She
applied for a loan for milch cow under MSY. Her loan was sanctioned
and she was given a milch cow through a ‘Gabhi Mela’ held at
Sarenga. She has been a member of milk producing society and
KAMUL purchases the entire milk for Raipur chilling plant. Her
cow produces eight litres milk per day and she is now earning Rs.80/
- per day by selling milk. The local Block Livestock Development
Officer and Veterinary Surgeon are rendering all sorts of medical
help for her milch cow as and when required.
2.5.15 Rekha Kotal with her
newly purchased cow at a
Gabhi Mela
2.5.5.4 Goatery :
Though goat rearing is a common rural practice in
Bankura, some individuals in blocks like Bishnupur,
Kotulpur, Sonamukhi, Chhatna, Simlapal, Indpur and
Indas have established goat farming. But the major
impact has been in Ranibandh and Raipur Block,
where a joint venture of Government with the non-
governmental organizations (NGO) has been able to
bring about 182 self-help groups (SHG) under the fold
of goat rearing.
70
2Goat development programme - a case study
Goat rearing is an integral part of the farming system and finds multiple uses for milk, meat, skin &
manure. Goat population in the West Bengal is about 16 million in spite of about 38 percent annual
slaughter rate and approximately 15 percent mortality. It has an ability to thrive on a wide range of
shrubs and herbs and the general practice of goat-owners is to depend on free grazing of common land
& forest. A strategy to harness the potential of goat rearing for gainful self-employment in the rural
areas is possible only if productivity of local goat and fodder resources in the villages are improved.
Effort should be made to improve the nutrition and health through the supplementary feed, de-worming,
and preventive vaccination, controlled grazing and stall-feeding to enhance returns. This will strike a
balance between goat and the eco-system and harness the potential of goat-rearing for gainful self-
employment in the rural area.
General objective :
The overall objective of the project is to demonstrate improved goat-husbandry practices for improving
the productivity of the local black Bengal goats and thereby enhancing the income of the goat keepers.
Specific objective :
� To motivate the goat-keepers to organise themselves into groups for undertaking improved goat-
husbandry practices.
� To demonstrate viability of goat-keeping on a commercial scale without adversely affecting the
environment.
� To promote improved breeding through use of superior breeding bucks.
� To promote the use of sound valuation parameters for better price realisation.
� To strengthen the capacity of local NGO & community workers for undertaking goat development
activities and providing service to the community.
Target area :
Ranibandh & Raipur Block
Implementation strategy under this project :
The main objective for this programme is to make aware the target group and Block & district-level
administration on improved goat management practies. Around 200 members from forty women SHGs
in Ranibandh & 150 members from twenty-five women SHGs in Raipur Block have been participating
in this programme.
Intervention under this project :
� Breeding buck distribution (Thirty-five breeding bucks have been distributed among thirty-five goat
groups at Ranibandh & Raipur block.)
� Insurance coverage
� Vaccination & de-worming
� First-aid treatment and linkages with Animal Resource Development Department
� Castration
� Growth monitoring
� Capacity building of the local community

71
2
Present status :
Table 2.5.18 Progress of improved goat management practice by women SHGs in
Raipur & Ranibandh blocks
Name of Number of goat Number of goat- Number of adult Number of
the Block groups formed keeping families in the female goats maintained bucks required
goat groups formed by the goat-keepers (for breeding)
in the goat groups
Ranibandh 181 814 4414 191
Raipur 115 615 2528 121
Total 296 1429 5057 312
N.B.: Each goat group will get one breeding buck
Source : SEDP, a non-governmental organisation involved in the project
A study was undertaken to assess the potential of goat rearing in rural areas of West Bengal. It was
observed that the potential for goat-rearing as income generating activity can be explored through
improved breeding and goat-husbandry practices. Use of superior buck of Black Bengal breed for
breeding and creating awareness about improved rearing practices are recommended for development
of local goat.
Impact of this programme :
� Mortality rate is reducing due to regular immunisation
� Higher realisation in returns in respect of selling goats
� Weight gain is increasing due to proper nurturing of goats and regular deworming
� Grass-root level Field Guides are working as friend of goat-keepers and giving first-aid and other
services to goats in time.
Conclusion :
This intervention has revealed that goatery scheme is not about distributing goats, but is essentially
providing the right inputs for the goats being reared by the villagers and increasing their capacity for
proper goat-rearing.

72
2
Table 2.5.19 Livestock and poultry in Bankura
Sl. Category Category-wise number of livestock
No. and poultry during the year
1982 1989 1994 1997
1 Cattle Cows 400666 438250 431329 444050
Bulls and Bullocks 357677 382126 403709 415710
Young stock 389594 436152 467707 481508
Total 1141937 1256528 1302745 1341268
2 Buffaloes Cows 19064 22611 23855 24156
Bulls and Bullocks 90856 88702 97918 99155
Young stock 15569 18005 22059 22337
Total 125489 129318 143832 145648
3 Sheep 148008 152392 123392 139460
4 Goats 744506 709905 709198 786134
5 Horses and ponies 23 9 10 10
6 Pigs 77622 93390 105168 113403
7 Other livestock 15 0 0 0
8 Poultry Fowls 917025 1197203 1219098 1339958
Ducks 503245 596675 759863 861010
Others 9507 3214 0 0
Total 1429777 1797092 1978961 2200968
Source: Livestock census report, Government of West Bengal
2.5.5.5 Poultry :
Poultry farming is becoming increasing popular
among the rural youth of Bankura, who run broiler
farms with the capacity of 1000 to 5000 birds. Some
big broiler farms are established by individual farmers
at Krishnanagar (Onda block), Chhatna, Beliatore,
Barjora with a capacity varying from 20,000 to
50,000. Generally broiler chicks are supplied by big
hatcheries who supply chicks, feed, medicines, vaccines
and lift the birds on the 40th.
day and pay the farmers
Rs.2.70 to Rs.3.00 per kg live weight of the birds. In
Chhatna Block, two layer farms are also established
with a capacity of one lakh layer birds, whereas two
resource farms for RIR chicks are developing at
Korapara in Chhatna Block and Masterdanga in
Sonamukhi Block.
There is vast uncultivated land in the district of
Bankura, particulary in the blocks of Sadar and Khatra
Subdivisions. So dairy development, goatery, by
individual and backyard poultry farming, have ample
scope for development. This should be supported by
proper scientific approach, introduction of modern
laboratory facilities and supply of vaccines. Big farming
in all the three sectors have immense scope in Bankura.

73
2Sustainable livelihood for rural women through poultry farm :
a case study
History :
Tillaboni is a tribal village under Raotora Gram-panchayat of Ranibandh in which there are 231
households. Out of 231 households, 108 households migrate due to food scarcity. A total of 222 members
from 201 households have formed eleven women self-help group (SHG) under facilitation of SEDP-
Ranibandh, a non-governmental organisation (NGO). The members have a saving bank account at the
Punjab National Bank, Jhilimili branch and are depositing Rs. 20/- per month. Due to seasonal migration,
monthly meeting was not conducted, but monthly savings is deposited regularly at the bank. Out of the
eleven SHGs, Tilaboni Mahila Self Help Group-9 has twelve members from twelve families. The main
livelihood of these families is agricultural labour and collection & selling of minor forest product. This
group opened a saving bank account on 24th.
June, 2003 and are depositing regularly Rs. 240/- (two
hundred forty) per month. Out of twelve family, four families, i.e., families of Manju Singh, Padma
Patra, Sandhya Singh & Bimla Singh had to go to Burdwan & Hoogly district due to food scarcity.
These families never attended the monthly meeting and were not aware about group intervention.
Process :
The SHG has been provided a shade, which can accommodate 5000 birds. The chicks are supplied by
Arambag Hatchery, a reputed farm in West Bengal. Other inputs like medicine, funds etc. are also
provided by the hatchery. The entire flock is bought back after 42 days.
Table 2.5.20 Analysis of earning through birds (upto June, 2006)
Sl. No. of No. of No. of Mortality Amount
No. days birds supplied birds surviving (in percent) received (Rs.)
1 35 5193 4500 3.35 13,500/-
2 35 5200 4475 2.95 13,425/-
3 35 5200 5096 2.00 15,288/-
4 40 5200 5120 1.54 15,360/-
Total 57,573/-
Source: SEDP, a non-governmental organisation involved in the project
Impact :
� The quality of life of the members of the group has, in general, improved.
� They have engaged tutors for their children for better education.
� Interpersonal understanding has developed among the group members.
� There is no starvaion in these families.
� Regular maintenance of their house has become possible.
� Migration has stopped.
� Neighborhood attitude is developing among the members.
Area of concern :
� Food storage space
� Residential room

74
2
� Lack of light
� Lack of fuel
Increasing animosity with other villagers
Table 2.5.21 Analysis of earning through employments
(upto June, 2006)
Batch No. of mandays No. of Rate Amount
/per day mandays (Rs.) (Rs.)
1 5 35 50/- 8,750/-
2 5 35 50/- 8,750/-
3 5 35 50/- 8,750/-
4 5 40 50/- 10,000/-
Total 36,250/-
Source: SEDP, a non-governmental organisation involved in the project
This experiment has revealed the benefits arising out of the private partnership. All the inputs, extension
services, technology as well as marketing is provided by the private partner.
2.5.6 Horticulture :
In this part of ‘Rarh’ region, horticulture appears to
be one of the most important fronts for economic
development. The agro-climatic condition is well-suited
for development of horticulture. Nearly sixty-seven
percent of total net cropped area in Bankura falls
under rainfed cultivation resulting poor productivity.
Regular return during lean season is also not ensured,
specially on upland (locally known as ‘Tar’ land).
Horticulture can play a vital role in the following areas:
(i) Diversified farming
(ii) Proper utilisation of wasteland/highland/
underutilised land
(iii) Export potentiality
(iv) Sustainable growth
(v) Aesthetics
(vi) Environmental regeneration and eco-friendly
commercial utilisation
(vii) Nutritional safety
The Food Processing Industries & Horticulture
Department, Government of West Bengal, after being
created in the year 1997, has laid emphasis for overall
development of horticulture in the district. The
National Horticulture Mission has been taken up in a
big way with modern technology for increase in area
and production.
The prospect of Bankura as a horticulture-growing
district is as follows:
1. Fruits like Guava, Mosambi, Mango, Cashew-nut,
Bel, Pomegranate may successfully be cultivated on
the red lateritic soils/upland of the district. Since
the soil is acidic in western Bankura, it is very much
suited for citrous fruits.
2. For spices & condiments cultivation of Corriander,
Chilli, Ginger, Turmeric have great potentiality.
3. Area expansion of Betel-vine may be taken up.
4. Commercial medicinal plants cultivation like
Sarpgandha, Vasaka, Kalmegh, Safed musli, Stevia,
Nayantara may be attempted.
5. Preservation of vegetables like Tomato etc. can
prevent glut during the peak production time. The
fruit & vegetable preservation units of Agricultural
Marketing Department can facilitate assistance in
this aspect.
6. The minor fruits like Amola, Custard apple,
Karonda, Sapota, Tamarind, Bael, Jamun,
Drumstick also have good potentiality in the agro-

75
2
Wadi programme : a case study
In Gujarati, ‘Wadi’ means a small orchard. For about last ten years, National Bank for Agriculture and
Rural Development (NABARD) began to implement Wadi in collaboration with Bharat Agro-Industries
Foundation (BAIF) under its Tribal Development Fund in the states of Gujarat and Maharashtra. The
programme was later extended to Orissa, Chattisgarh and lately in West Bengal where two blocks, one
in Purulia and one in Bankura, have been selected to implement Wadi.
In Bankura, Ranibandh was selected for being a tribal dominated block, and Nari Bikash Sangha was
identified by the State Government and NABARD as the project implementing Agency. The project is
being jointly funded by Backward Classes Welfare Department of the State and NABARD.
The Nari Bikash Sangha, after a quick survey in the block, prepared a detailed project report and
submitted it to the state government and NABARD. The report was approved and the project was
formally launched in February, 2006.
The main objective of the project is to improve the quality of life of 1000 tribal households of the block
by enhancing their income and employment potential through land-based alternative livelihood options
and by supporting social development of participating families including women’s empowerment process.
The project targets 1000 tribal families of the block in a phased manner, 200 in the first year and 400
each in the next two years. Each tribal farmer possessing land holding up to 5 acres is eligible to
participate in the project and one acre of marginal land out of this will be developed as an orchard
(Wadi) to be managed and owned by the tribal household.
After consultation with the participating farmers and horticultural experts, it has been decided that each
Wadi will be planted with 70 fruit trees, 40 mango and 30 cashew, and 350 useful forest species as
boundary plantation for firewood, fodder and timber.
Average cost of raising one acre Wadi up to fruit-bearing stage is slightly more than Rs. 30,000. A one
acre Wadi is estimated to provide a net farm income of Rs. 17,000 in the first year of fruit-bearing and
double this amount from the 12th.
year onwards. With this kind of annual income from one acre Wadi
and agricultural income from the rest of land, a tribal household is expected to cross not only the poverty
threshold but to be forever free from the compulsion of migrating as seasonal agricultural labour.
The project funding will meet the full cost of all planting materials, fertilisers and pesticides, tools and
equipment, soil conservation and water resource development measures, women’s development,
climatic conditions of the Bankura district.
7. In social forestry programme, 30-40 percent
horticultural plantation of fruit-plants like Mango,
Jamun, Jackfruit may be included to get fruit,
timber, shade and other need of the rural
community.
8. Cultivation of flowers like Marigold, Tuberose,
Jasmine in open field and Rose, Carnation,
Gerbera, Chrysanthemum in poly-houses/glass-
houses can bring a new change in the farming
scenario.
9. Jasmine and Rose cultivation for perfumery
business and extraction of essential oil may be
taken on a pilot scale.
The district faces some constraints like lack of storage,
processing and marketing facilities, poor technological
knowhow and non-availability of good quality seeds
and sapling, which stand on the way of horticultural
production.
The small and marginal farmer population in the
district can take up the activity as backyard plantation
and plantation on wasteland.

76
2
community health, training and capacity building initiatives, and 70 per cent of labour cost. It is
estimated that 1800 Metric Tonnes of mango and 210 Metric Tonnes of cashew will be produced per
annum after the stabilisation of yield. An estimated 2.72 lakh person-days of employment will be
generated during the project period, and 30,000 per annum after the project period. Institutional
arrangement in the nature of Wadi participant groups, village planning committee and a co-operative
has been envisaged in the project.
In Bankura, there is a large number of cashew trees but the quality is poor. An effort is being made to
introduce Vengurla-4 and H-2/16 variety, which has very good commercial value. It has been seen that
people are highly motivated in taking up this scheme since their own land is utilized for plantation and
the ownership level is very high.
WADI programme also envisages in due course formation of co-operatives, which will take care of fruit
processing and marketing. Computerised land record was of great help in identification of villagers
having Tar (i.e. upland classification) land between 0.5 acre to 1.0 acre.
2.5.7 Fishery :
Pisciculture is an important livelihood option for people
in rural areas. It is estimated that for every fisherman
engaged in fishing activity, about four others will
benefit by way of additional employment generated
through post-harvest operations like marketing and
other allied activities. Pisciculture is one of the major
areas of intervention in the district. The idea is to
increase the income of the fishermen engaged in the
fishing by providing better facilities and training to the
fishermen and also by bringing in more area under
pisciculture.
Under Rashtriya Sam Vikas Yojana (RSVY), nearly 81
Hec. of pond area has been excavated. The scheme has
been implemented through fishermen’s groups in a
participatory mode. The fishermen’s groups have been
encouraged to share a small part of the produce with the
Primary Schools to make it a part of the mid-day meal.
This has created a stake of community at large in the
project which has been very helpful in its execution.
2.5.16 Lalbandh at
Sonamukhi, ready for
pisciculture (a RSVY project)
2.5.17 Work in progress at
Chhatna where both men &
women SHGs are working
together (a RSVY project)
Table 2.5.22 Pisciculture in Bankura : some
statistics
(as on 1.1.2006)
Total water area 52341 Hec.
Total impounded water area 22697 Hec.
Water area under river,
canal/khal, beel, baor 29644 Hec.
Water area under pisciculture 14400 Hec.
People engaged in fishery 1,85,000 (approx.)
Fishermen population 37,500
Annual production of table fish 21,750 Metric Tonnes
Number of Central Fishermen’s
Co-operative Societies 2
Number of Primary Fishermen’s
Co-operative Societies 40
Fish production groups 15
Fisher-women trained in net-making 760
Fishermen receiving Old Age Pension 67
Source: Office of the Additional Director of Fisheries, Bankura

77
2
2.5.7.1 Seedling production at Ramsagar in
Onda Block:
So far as the acitivities of fishery sector in Bankura is
concenred, fish-breeding industries in Ramsagar and
surrounding zone requires special mention. Transaction
of about Rs. 6-7 crores through spawn production of
about 50,000 million numbers in 225 to 250 numbers of
hatcheries per annum occurs in that zone. About 1500 to
2000 workers are directly involved in production system
and many other enterprises have grown by correlated
activities. Spawn purchasers from different parts of India
come here every year to purchase various types of spawn.
Of late, the spawn producers are facing some problems
relating to infrastructural support. Proper maintenance
of link road from the hatchery site to the main road,
electrical facilities, shelter for spawn purchasers are
essential to run the industry smoothly. There is a need
to create marketing infrastructure in the form of kiosks
to bring in transparency and discourage middlemen
who have entered the game since the life span of fish
spawn is very small. It is also difficult to ensure quality
checks during sale/purchase.
2.5.8 Sericulture :
Sericulture of Bankura district has a long heritage.
Century-old Baluchari silk sarees has a wide
international name. Tasar silkworm rearing at natural
forest has traditional practice among the poor tribal folks
of this district. Sericulture may provide good scope for
upliftment of the villages and reduce disparity in village
economy.
Sericulture industry in the district may be classified into
two sectors, viz., mulberry and tasar. Silk is concentrated
in northern and eastern part while tasar is practiced,
mostly by tribal people, in southern and western parts
of the district. The tasar rearers of this district are
decidedly the best rearers of West Bengal in their skill.
So far as mulberry cultivation is concerned, new areas
have been brought under cultivation and replacement of
local varieties and replantation with high-yielding
varieties are being made. In order to maintain and
supply of quality disease-free layings (dfls) to the rearers
at subsidised rate, grainage units have been started.
Tasar host plantation (Arjun) has also come up in a
big way since 1980 in the district. The most unfertile,
Table 2.5.23 Fish seed (IMC and exotic carps), fingerlings production in Bankura
Fingerling production
Year Number of Water area Number Weight Sale value Production Net profit Average sale
rearing covered (in million) (in MT) (Rs. in lakh) cost (Rs. in value
ponds (in Hec.) (Rs. in lakh) lakh) (Rs. per Kg.)
2000-’01 1018 544.0 456 5472 1915.00 638.00 1277.00 35
2001-’02 1086 575.5 486 5832 2041.20 680.00 1360.00 35
2002-’03 1121 599.5 502 6024 2168.64 722.88 1445.76 35-37
2003-’04 1228 612.0 554 6648 2393.28 797.76 1595.52 35-37
2004-’05 1445 664.5 585 7020 2597.40 865.80 1731.60 35-38
Source: Office of the Additional Director of Fisheries, Bankura
Table 2.5.24 Fish production in Bankura district
Year No. of Water area Fish Sale value Total sale Total pro- Net profit Average sale
stocking covered production (Rs. MT) value duction cost (Rs. in value
ponds (in ha.) (MT) (Rs. in lakh) (Rs. in lakh) lakh) (Rs. per Kg.)
2000-’01 22213 19620.40 49051.61 36000 17658.57 3433.61 14224.96 36
2001-’02 22342 19700.65 49744.16 38000 18902.78 3730.81 15171.97 38
2002-’03 22411 19715.25 50273.88 40000 20109.55 3803.21 1630.34 40
2003-’04 22437 19722.50 50785.43 40000 20314.17 3948.56 16365.61 40
Source: Office of the Additional Director of Fisheries, Bankura

78
2
barren wasteland, hillocks and fallow land have been
covered by Arjun providing livelihood to the poor
tribals and has become one of the primary source of
income. The improved technology is being used in
order to improve upon and maintain the quality of
disease-free layings (dfl) consistently and in turn to
improve the productivity.
Table 2.5.25 Some facts on sericulture (as on 31.3.2005)
Area under Mulberry 111.22 Acres
Area under Tasar plant 4606 Acres
Number of rearers Mulbery 140
Tasar 3300 families
Infrastructure at Government level
Mulberry Basic seed farm 5
Grainage 1
Cocoon market 1
Tasar Pilot project centre (seed farm) 2
Grainage 3
Technical service centre 4
Growth centre 2
Reeling training-cum-servicing centre, Bishnupur 1
Reeling devices Mulberry 4
Tasar 3
Tasar spinning devices 3
Infrastructure under private sector Drying chamber 5
Khadi handloom co-operative on post-cocoon sector 12
NGO under sericulture 2
Women groups 36
Tasar grainage groups 34
Reeling device 57
Spinning device 53
Reeler (Mulberry) 10
Reeler (Tasar) 243
Spinner (Tasar) 388
Weaver 3000
Twisting unit plant 10
Extension area Number of Blocks covered 19
Number of Gram-Panchayats 85
Number of sericulture villages 191
Source: Deputy Director, Sericulture, Bankura
Strength:
1. Enormous quantum of wastelands and uplands on
which Arjun can grow without irrigation facility.
2. Existence of tribal habitation in the vicinity of
wastelands and uplands. Tribal people are
accustomed with and efficient in tasar rearing.
3. Wide infrasutructural facilities in the form of seed
farms, grainage, technical service centre etc.
4. Existence of non-governmental organisations
(NGO) having experience in the field, women
groups, tasar grainage groups, reelers, spinners
and weavers.
Opportunities:
1. Scope for new plantation
2. Regeneration of existing plantation
3. Use of mechanical reeling/spinning devices
4. Encouraging post-cocoon activities
Strategy:
1. New plantation of 400 acres at every three years
interval
2. Regeneration of 400 acres of existing plantation
3. Renovation of existing grainage
4. Creation of two grainage groups per year.
5. Training in reeling/spinning activities
6. Introduction of inter-cropping of shade-loving
species of plants in Arjun orchards.

79
2
Table 2.5.27 Status of tasar culture in Bankura (as on 31.3.2005)
Sl. Name of Plantation No. of rearers involved No. of dfls. No. of Approx. value Mandays
No. the Block (acre) reared cocons of production generated
Male Female obtained (Rs.) (mandays)
1 Ranibandh 1554.54 1840 730 56,536 2,436,649 1,522,905.00 56,536
2 Raipur 939.71 1626 498 35,250 1,568,625 980,390.00 35,250
3 Hirbandh 1148.22 1478 525 43,800 1,943,406 1,214,628.00 43,800
4 Khatra 289.13 560 400 25,050 1,216,434 760,271.00 25,050
5 Sarenga 62.50 232 20 5,500 207,500 129,687.00 5,500
6 Chatna 214.68 465 25 11,135 296,000 185,000.00 11,135
7 Bankura-I 25.00 45 X 2,475 91,405 57,128.00 2,475
8 Onda 48.75 170 30 4,500 100,800 63,000.00 4,500
9 Taldangra 45.78 10 X 6,800 274,578 171,611.00 6,800
10 Patrasayer 25.00 60 8 5,750 121,356 75,847.00 5,750
11 Bishnupur 30.00 50 X 4,000 148,850 93,031.00 4,000
12 Joypur 4.00 10 X 600 15,920 9,950.00 600
13 Indpur 259.49 380 40 11,050 383,368 239,605.00 11,050
14 Borjora 12.50 20 X 1,400 12,500 7,812.00 1,400
15 Simlapal 24.50 30 X 2,000 40,000 25,000.00 2,000
16 Kotulpur 0.50 5 X 200 6,295 3,934.00 200
17 Saltora 25.00 30 X 200 10,000 6,250.00 200
Total 4709.30 7011 2276 216,246 88,73,686 5,546,049.00 216,246
Source: Deputy Director, Sericulture, Bankura
It appears from the above figures that within last few
years the district has moved ahead in utilising available
land and human resource for gainful employment.
Intercropping with Tasar is now being attempted to
enhance the return. Mechanical reeling and spinning
is yet to start in the district on a big scale.
Case study on Tasar culture at Ranibandh
Bankura district was once famous for its Tasar industry. In one part of the district, farmers reared tasar
cocoons on forest trees and in another part, these cocoons used to be converted into beautiful fabric. By
late seventies, both the sectors had a declining trend.
In order to give a boost in production of raw material, viz. cocoon, an inter-state Tasar project was
initiated in early eighties in the district to set up the needed infrastructure. By late seventies and early
eighties, the research and development division of the Central Silk Board had come up with a technology
Table 2.5.26 Production status of tasar-national vis-à-vis state vis-à-vis district (as on 31.03.2005)
Country/State/ Production of Percentage of Raw silk Percentage of
District tasar cocoons contribution production (MT) contribution
India 2368 lakh – 452 –
West Bengal 252 lakh 11.36
(with respect to India) 41 9.07
Bankura 116 lakh 46.03
(with respect to West Bengal) 15.7 39.25
Source: Deputy Director, Sericulture, Bankura
80
2package on tropical tasar, through economic bush plantation of Tasar host trees, mainly Asan and
Arjun, at proper spacing and height, thus reducing the hazards of rearing on high trees as is done on
forest trees and using wasteland in rainfed conditions for productive purpose. Except the improved
technique of propagation of Arjun plants, the package includes improved rearing techniques, producing
disease-free layings, control of disease and pests of tasar silk worm and host plants, chemical analysis
of food plants and silkworm and improved method of silk extraction through new technologies, both for
pierced and un-pierced cocoons etc.
It may be remembered that Tasar silk industry is sharply divided into two sectors. Producers of raw
material, viz. cocoon, are hardly engaged in processing activity known as post-cocoon sector. While in
the post-cocoon process, large number of women were involved in silk extraction, women’s involvement
in rearing of cocoons was totally absent due to physical problem of climbing high trees, but most
importantly women’s touch was considered defiling and as rearing was to be done in the open, women’s
sexuality could not be put to risk.
In this existing scenario, an affiliated Mahila Samiti of Nari Bikash Sangha (NBS) in Ranibandh block
raised its first economic bush plantation on a seven acres of absolute wasteland in 1981. The land was
gifted to the Mahila Samiti by the community at the instance of the-then persuasive Minister for Land
Reforms and Panchayat. The trees were nursed to maturity and the time came for the first rearing. A
trainer from the local station of Central Silk Board agreed to come down to the plantation to train the
prospective women rearers. Economic bush plantation under controlled height was ideally suited for
rearing by women. At this point, the community struck. ‘Who has ever heard of women rearing tasar
cocoon?’, retorted the men, who themselves never reared tasar silkworm. The same excuse was given,
‘women’s touch will kill the worms as they are impure’. When parallel examples were given of many
things not dying which women touched, men agreed with a visible grudge and a lurid expectation that
the worms should die. Women on their part performed a puja, approached soothsayers and promised
a goat and began to rear for the first time in their life. It was a fairly successful harvest at the end and
the men relented.
The turning point of tryst with Tasar culture on wasteland by NBS was definitely the Baroghutu
plantation raised in 1985-1986. The NBS was flooded with the request from several villages in Ranibandh,
Khatra, Raipur and distant villages of Purulia with offer of wasteland and a group of tribal women
eager to come together. Nari Bikash Sangha went about slowly with the fund from International Labour
organization (ILO) and a few other philanthropic donors to raise several hundred acres of plantations
in Bankura and neighbouring districts to play the role of the front-runner in reviving the dying pre-
cocoon sector.
Admittedly, the real boost in this sector was given by the UNDP-supported Tasar Development Project
in 2000. The project introduced new technology, improved seed, and management system and training.
The best component of the project was in the area of decentralisation of grainages and a well-trained
group of women involved in the activity. During the last six years, tasar culture has become a movement
in south-western Bankura and production of cocoon has reached a new height. The credit for this
development can safely be given to Nari Bikash Sangha. The unfinished agenda before NBS is to press
for fair and remunerative price of cocoon in comparison to the price of fabric.
Finally, as an attempt to integrate the pre-cocoon and post-cocoon sectors, the NBS has plans to begin
with reeling and spinning activity in the coming years, and to arrange for needed infrastructure creation
and required training process.

81
2
2.5.8.1 Initiatives under Rashtriya Sam Vikas
Yojana (RSVY) :
(a) Baraghutu Gramin Mahila Samity of Khatra block
planted Arjun seedlings under the scheme of
‘creation of new Arjun plantation’ on 43 acres of
vested land by adopting the technology provided
by the Department.
2924 numbers of
person-days have
been created during
first year for
plantation, nursery
raising, pit-digging
and transplantation.
A total of 51,600
numbers Arjun
seedlings were
transplanted with weeding and manuring. Rs.
2,16,043 was provided as wage to the group, which
includes cost of fertiliser also. Manure cost was
worth Rs. 37,840. The group, consisting of 52
women members, was formed on 5th.
April, 2005.
Since last twenty years the members were earning
their wage through Tasar rearing, reeling etc. on
individual basis. Now, working in group mode, these
tribal people are empowered to earn their livelihood
in a better way reducing the seasonal and forceful
migration.
(b) Introduction of mechanised reeling and spinning:-
Weaving is the largest non-farm activity of Bankura
district. There are two types of weaving activities
prevailing in this district:- (i) cotton fabrics made
out of coarse yarn and silk & (ii) Tasar fabrics,
which are made out of finer count of mulbery silk
and Tassar silk yarn. Weaving, in general, is a family
activity, in which a good number of women are
attached.
It is roughly estimated that around 2500 to 3000 women
living in Bishnupur, Sonamukhi, Changdoba and
Birsingh etc. areas are engaged in Tassar yam reeling &
spinning through traditional thigh reeling method,
which is very disgraceful for women as well as
hazardous. Yet they have been compelled to do so to
manage their livelihood.
Recently Central Silk Board has developed
mechanised reeling & spinning device with a view to
improve productivity of each spinner and to protect
their self-respect at their working place. Under RSVY,
a special intervention programme for skill-
development on Tasar reeling and spinning was
organised by Khadi & Village Industries Board and
Directorate of Sericulture at Kurampur (Bhatpara)
under Sonamukhi block during 2005-’06 in which 24
numbers of women were imparted training for two
months on mechanised reeling and spinnings. During
training these women formed two self-help groups,
deposited a portion of their earning in the bank
account of the group and decided to carry on reeling
activities as an additional source of income. All the
participants developed operational skill during training
and quality of tasar yarn improved considerably.
Efforts are on to impart training to more women
engaged in thigh reeling and spinning through
traditional means.
2.5.9 Khadi, Village & Small Scale industries :
This chapter basically describes the status of Rural
Non-Farm Sector (RNFS) activities in the district. The
observations are based on the information available
with the District Industries Centre, Khadi & Village
Industries Board (KVIB), other concerned
Government Departments, Banks, resources & activity
maps available from Natural Resource Data
Management System (NRDMS) Centre, Bankura.
Assesment of the status is also based on the
observations made during the field-visits and sample
survey conducted in selected blocks, villages & clusters
of the district.
No authentic data is available regarding distribution
of the work-force in different activities in the RNFS.
However, on discussion with various agencies, the
approximate numbers of people engaged in various
types of activities were collected in 2002 and are
indicated in the Table 2.5.28.
2.5.18 Arjun nursery at
Baraghutu
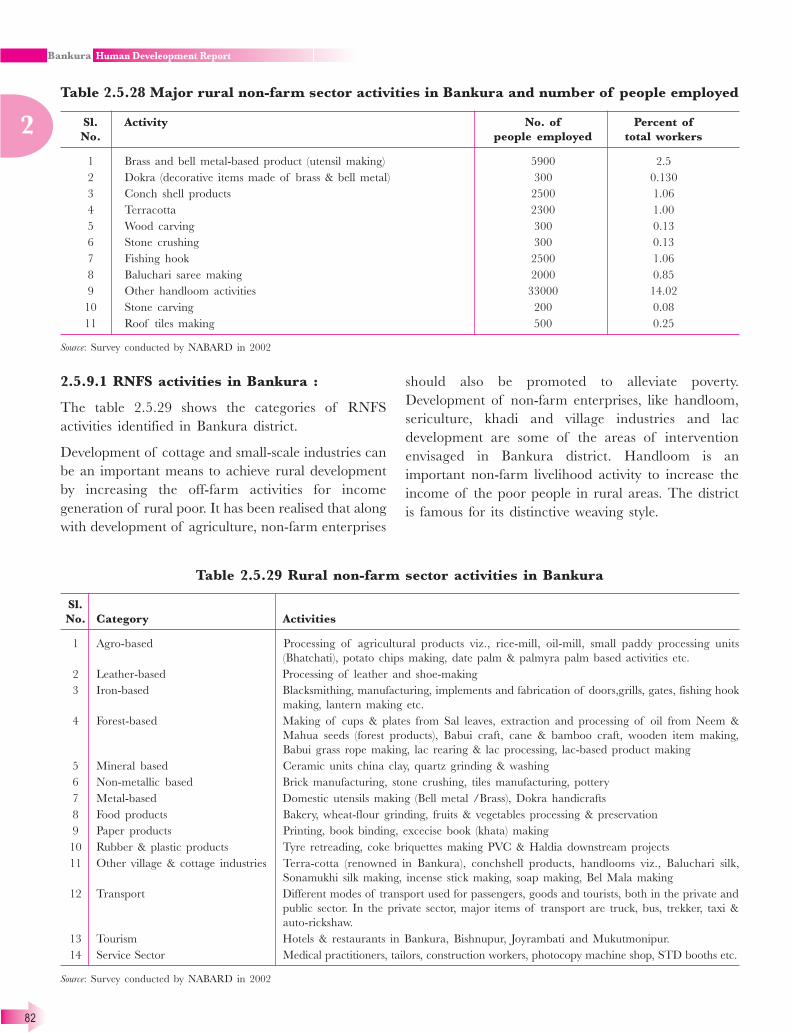
82
2
2.5.9.1 RNFS activities in Bankura :
The table 2.5.29 shows the categories of RNFS
activities identified in Bankura district.
Development of cottage and small-scale industries can
be an important means to achieve rural development
by increasing the off-farm activities for income
generation of rural poor. It has been realised that along
with development of agriculture, non-farm enterprises
should also be promoted to alleviate poverty.
Development of non-farm enterprises, like handloom,
sericulture, khadi and village industries and lac
development are some of the areas of intervention
envisaged in Bankura district. Handloom is an
important non-farm livelihood activity to increase the
income of the poor people in rural areas. The district
is famous for its distinctive weaving style.
Table 2.5.28 Major rural non-farm sector activities in Bankura and number of people employed
Sl. Activity No. of Percent of
No. people employed total workers
1 Brass and bell metal-based product (utensil making) 5900 2.5
2 Dokra (decorative items made of brass & bell metal) 300 0.130
3 Conch shell products 2500 1.06
4 Terracotta 2300 1.00
5 Wood carving 300 0.13
6 Stone crushing 300 0.13
7 Fishing hook 2500 1.06
8 Baluchari saree making 2000 0.85
9 Other handloom activities 33000 14.02
10 Stone carving 200 0.08
11 Roof tiles making 500 0.25
Source: Survey conducted by NABARD in 2002
Table 2.5.29 Rural non-farm sector activities in Bankura
Sl.
No. Category Activities
1 Agro-based Processing of agricultural products viz., rice-mill, oil-mill, small paddy processing units
(Bhatchati), potato chips making, date palm & palmyra palm based activities etc.
2 Leather-based Processing of leather and shoe-making
3 Iron-based Blacksmithing, manufacturing, implements and fabrication of doors,grills, gates, fishing hook
making, lantern making etc.
4 Forest-based Making of cups & plates from Sal leaves, extraction and processing of oil from Neem &
Mahua seeds (forest products), Babui craft, cane & bamboo craft, wooden item making,
Babui grass rope making, lac rearing & lac processing, lac-based product making
5 Mineral based Ceramic units china clay, quartz grinding & washing
6 Non-metallic based Brick manufacturing, stone crushing, tiles manufacturing, pottery
7 Metal-based Domestic utensils making (Bell metal /Brass), Dokra handicrafts
8 Food products Bakery, wheat-flour grinding, fruits & vegetables processing & preservation
9 Paper products Printing, book binding, excecise book (khata) making
10 Rubber & plastic products Tyre retreading, coke briquettes making PVC & Haldia downstream projects
11 Other village & cottage industries Terra-cotta (renowned in Bankura), conchshell products, handlooms viz., Baluchari silk,
Sonamukhi silk making, incense stick making, soap making, Bel Mala making
12 Transport Different modes of transport used for passengers, goods and tourists, both in the private and
public sector. In the private sector, major items of transport are truck, bus, trekker, taxi &
auto-rickshaw.
13 Tourism Hotels & restaurants in Bankura, Bishnupur, Joyrambati and Mukutmonipur.
14 Service Sector Medical practitioners, tailors, construction workers, photocopy machine shop, STD booths etc.
Source: Survey conducted by NABARD in 2002

83
2
Table 2.5.30 Block-wise distribution of pottery artisans together with their household labour-
use pattern and product range
Block Product Number of household Average number of household labour Average number
category engaged in the craft engaged in each unit of hired labour
(with percentage engaged in each
of total) Male Female Child unit
Saltora A 70 (2.2) 2 � � 5
C 120 (3.7) 3 2 � �
Taldangra B 122 (3.8) 3 1 � �
Raipur A 128 (4) 2 1 � �
Sarenga A 127 (4.0) 3 1 � �
Ranibandh A 285 (8.9) 1 1 1 �
Bankura-I B 115 (3.6) 3 2 � �
Bankura-II B 63 (2) 2 2 1 �
Khatra A 45 (1.4) 2 � � �
Hirbandh B 95 (3.0) 2 � � �
Sonamukhi B 76 (2.4) 2 1 � �
Patrasayer A 225 (7.1) 2 1 1 �
Indus A 166 (5.2) 1 1 1 �
Kotulpur A 137 (4.3) 2 1 � �
Joypur B 160 (5.0) 2 1 1 �
Bishnuur A 135 (4.2) 3 � � �
Indpur A 144 4.5) 2 1 1 �
Onda A 234 (7.3) 2 2 � �
Chhatna A 212 (6.6) 2 1 1 �
Gangajalghati A 65 (2.0) 2 1 1 �
Mejia A 116 (3.6) 2 1 � �
Barjora A 160 (5.0) 2 2 � �
Simlapal A & C 20 0.6) 2 � � 4
Total number
of households 3200 (100)
A – Aomestic utility items
B – Terracotta products for decorative & religious use and mixed items
C – Heavy pottery items like tiles, well-rings etc.
Source: Survey conducted by NABARD in 2002
Major activity clusters :
Major activity clusters in different RNFS activities in
the district are handicrafts, handlooms, rice mill, oil mill
and other SSI units like bell metal processing, stone
crushing, tiles making, terra-cotta, Dokra, etc. Against
the total number of main workers to the extent of
921591 (as per 1991 census), the workers engaged in
Rural Non-Farm Sector were 235320 i.e. constituting
about 25.53 percent of the total main work force.
Whereas in the context of women work force in the
district, their participation in RNFS activities was about
3.26 percent. In case of male workers engaged in RNFS
activities, this percentage was 22.27 percent.
The participation of women is more in the traditional
handicrafts and handlooms sector which are mainly
household based. Slightly bigger SSI units, service
sector activities have a concentration of male work
force only. Traditional handicrafts sectors are mostly
wage dependent.
2.5.9.2 Pottery in Bankura :
The incomparable excellence of Bankura potters is
now well-known all over the country. In the distant
past, this craft-based industry had developed in rural
areas to meet the requirements of their local clients,
a significant portion of which are rural poor. The art

84
2
of making terracotta figurine falls under the potter’s
craft. In ancient India, pottery was recognised as one
of the eighteen industries. Though it is mainly a
family-based cottage industry, there are evidences of
making pottery in large scale in ancient India. In
between 200 BC and 50 AD, unprecedented growth
of this industry and trade took place with the progress
of urbanisation. The growing demand lasted upto the
Gupta period (300-600 AD) and thereafter a slow
decay was perceptible. However, the art of terracotta
panels for temple decoration flourished in the Pala
period and reached a high level of excellence. After
a rather long gap, terracotta plaques carved with
beautiful figures began to re-appear to decorate the
temples erected under the impulses of Vaishnavism in
sixteenth and seventeenth centuries. The figures on
the terracotta plaques of seventeenth century temples
presented in low relief and profile manner resemble
more to the art of wood-carving than to the art of
potters. Now the potters of Bankura have engaged
themselves in making curio articles and images of
Gods and Goddesses for religious and decorative use.
The famous wheel-thrown terracotta horse of
Bankura potters is now a legend for its virile design
evolved out of sheer imagination.
According to the soil-distribution map of the
Department of Agriculture, West Bengal, the clay of
major areas of concentration of potters in this district
belongs mainly to the group of red soil sandy loam and
sandy clay loam. In the absence of enough
diversification of this industry, a large number of the
artisans, particularly the less affluent ones, continue to
produce the traditional household items serving the
poorest section of the rural populace. The relatively
high-prices terracotta products find their market
amongst the urban population. Unfortunately, however,
the demand for these products in the urban market is
now on the decline, specially because of the fragile
nature of the items. They are being replaced by
imitations in metal, wooden and stone-made products.
Lack of suitable technological-institutional innovations
including market promotion activities is further limiting
the market for potters’ terracotta products.
A section of the potters are successfully fabricating
roofing tiles for rural housing, which are sold to semi-
urban areas of Bankura and adjoining areas of Purulia
and Bihar. This group of artisans underwent
diversification from traditional products quite some time
ago in view of the high demand for rural housing and
also because the characteristics of clay in this region
made this deversification attempt possible through
commercial production of such items.
Table 2.5.31 Blockwise distribution of product range of pottery
Utility item Block Products
Domestic utilities Indpur, Gangajalghati, Ranibandh, Khatra, Hirbandh, Kalsi, Hari (cooking utensils) pitcher, water
Sonamukhi, Indus, Mejia, Raipur, Sarenga, Onda, container, glass, pot, and other domestic
Saltora, Chhatna, Joypur, Bankura-I, Bankura-II, utilities
Taldangra, Simlapal, Barjora, Bishnupur, Patrasayer
Terracota & other Taldangra, Sonamukhi, Sarenga, Bankura-I, Bankura-II Horses, elephant, flower vase, Mansa Saj, ash-tray,
decorative items Ox, Tiger & other items of religious use
Roofing tiles & other Saltora, Simlapal Roofing tiles, well-rings
heavy pottery items
Source:- Survey conducted by NABARD in 2002
Normally clay is collected by the artisans themselves
from the nearby fields free of cost. Only the transport
charge for each clay load is paid out of pocket. But
the tile-making potters, who have a large scale of
commercial operation, almost invariably purchase clay
from the local suppliers. The producers of household
utility items and terracotta items do not use any
machine for processing of clay. The affluent tile-makers,
however, use power-driven and hand-driven pugging
mill for mixing and processing. Coal is used as the major
fuel for firing the tiles and is purchased from the open
market.
It is seen nowadays that clay is not readily available to
the potters. In Panchmura, which is famous for

85
2
Table 2.5.32 Particulars of handloom production in 2004-2005
Sl. Name of the No. of Total handloom Cost of Wages paid
No. Block / Looms production production (in Rs.)
Municipality (in Rs.) (in Rs.)
1 Bankura-I 762 6700000 3500000 2200000
2 Bankura-II 686 5430000 2800000 1800000
3 Chhatna 1112 8600000 4380000 2920000
4 Mehia 169 100000 52000 33000
5 Gangajalghati 427 4300000 2193000 1452000
6 Barjora 256 2000000 1020000 680000
7 Saltora 127 820000 410000 350000
8 Onda 749 7400000 3850000 2550000
9 Taldangra 395 12200000 6240000 4140000
10 Simlapal 507 4600000 3162000 2108000
11 Khatra I 404 3200000 1632000 1088000
12 Hirbandh 407 2300000 1173000 782000
13 Raipur I 251 800000 450000 330000
14 Sarenga 305 1400000 680000 400000
15 Indpur 1665 12300000 6290000 4449000
16 Ranibandh 177 400000 195000 135000
17 Bishnupur Block (Silk) 154 1400000 680000 400000
18 Joypur 575 2800000 1400000 520000
19 Katulpur 508 3600000 1835000 1225000
20 Indus 339 1560000 796000 530000
21 Patrasayer (Silk) 546 2030000 1036000 690000
22 Sonamukhi Block (Silk) 79 800000 408000 272000
23 Bankura Municipality 2126 7700000 3927000 2618000
24 Bishnupur Municipality 1220 16000000 8160000 5440000
25 Sonamukhi Municipality 527 13400000 9600000 5800000
Total 14473 121840000 65869000 42912000
Source: Handloom Development Officer, Bankura
terracotta horses, the artisans are finding it difficult to
identify unused patches where they can extract the clay
(which is normally collected from seven metres depth).
The price of land has also shot up due to increase in
demand.
2.5.9.3 Handloom industry :
This is a very important sector for Bankura since this
engages largest number of persons in the non-farm sector.
The condition of the weavers is very precarious. They
have been using coarser yarn where return is less.
In handloom sector, training on diversified production
and familiarisation with sophisticated products of state
has been undertaken recently under Rashtriya Sam
Vikas Yojana with the objective of upgradation of the
skill of the weavers who are habituated in production
of traditional items of coarser count of yarn like bed-
sheet, bed-cover, door-screen, napkins etc. The objective
is diversification of their products with finer count of
yarn which has greater marketability. Special emphasis
has been laid on Indpur and Gangajalghati blocks of
the district where traditional weavers are living.

86
2Improvement in weaving technique and use of fine yarn
Steps for skill upgaradtion in weaving and use of fine yarn had been taken up in recent years under
RSVY. In the programme, participants were selected for the training from the self-help groups (SHG).
The Handloom Department sought support from the Gram-
Panchayat and the non-governmental organisations (NGO) for
primarily identifying the SHGs. The Handloom Development Officer
and other officials then selected the trainees from the groups who
were already engaged in this kind of activity. Capacity building of
the weavers was taken up first and the trainees were then given inputs
like two looms, thread etc. Linkages had also been made with the
banks, co-operatives, marketing agencies like Tantuja, Tantushri etc.
These groups are now very much willing in regeneration of assets
and marketing channel. They are also involved in the decision-making
and planning processes. So far 400 persons have been trained, out of which about 40 percent are
women. The quality of the products has also changed substantially and they are now weaving finer
products like bed-sheet, bed-cover, napkin, shirting etc.
2.5.19 Women group engaged
in handloom activity
Baluchari :
Background:
In the history of textile in Bengal, Baluchari came
much after Muslin. Two hundred years ago Baluchari
was used to be practised in a small village called
Baluchar in Murshidabad district, from where it got
the name Baluchari. In the eighteenth century,
Murshidkuli Khan, Nawab of Bengal patronized its
rich weaving tradition and Baluchari flourished from
that time onwards. But this flourishing trend later
declined, specially during British rule, due to political
and financial reasons and it became a dying craft as
most of the weavers were compelled to give up the
profession.
Later in the first half of twentieth century, Subho
Thakur, a famous artist, felt the need of recultivating
the rich tradition of Baluchari craft. Though
Bishnupur was always famous for its silk, he invited
Akshay Kumar Das, a master weaver of Bishnupur to
his center to learn the technique of jacquard weaving.
Sri Das then went back to Bishnupur and worked hard
to weave Baluchari on their looms.
Once Bishnupur was the capital of Malla dynasty and
different kinds of crafts flourished during their period
under the patronage of Malla kings. Temples made of
terracotta bricks were one achievement of these rulers.
A major influence of these temples can be seen in
Baluchari sarees. Mythological stories taken from the
walls of temples and woven on Baluchari sarees, is a
common feature in Bishnupur.
Market & profit:
Baluchari has a wide market in big cities like Kolkata,
Delhi, Mumbai, Bangalore etc. It also has a very good
market in various cities of West Bengal. But in the
marketing process, the ‘Mahajans’ play the role of
middlemen between the weavers and the customers and
the margin of profit of the weavers is eaten away.
Normally one weaver can prepare four to five sarees in
a month and gets about Rs.1000/- if he possesses a
loom of his own, but gets between Rs. 450/- to Rs.
500/- per saree in case he does not weave on his own
loom.
Other issues:
Women of the weaver families take part in the process,
specially in yarn processing. In some cases they weave
materials like shawl etc. Other items whereas weaving
of saree is exclusively done by men.
As women twist the thread from cocoon on their thigh,
it poses serious health-hazard to them. Also as the

87
2
weavers work with very fine designs under insufficient
light, which is strenuous for their eyes and their eye-
sight gets lost at their old age. Also most of them face
the problem of abdominal pain. Even children are
involved in feeding the yarn.
Problems & prospect:
Most of the weavers are poor and face the problem of
capital, a factor that gives inroad to the middlemen who
take a major share of the profit. Sampling and
categorisation system of the Baluchari products are not
done and also no proper record of their previous works
are maintained. Product diversification in the form of
design and variation in colour shades is a need of the
hour for the Baluchari.
Of late, the market of Baluchari has started declining
due to repetition of same design and non-
standardization of colour. One design sometimes costs
as high as Rs.40,000/-. Young girls are involved in
making the jacquard and the work-conditions are
pathetic. The cost prompts the weaver to keep on using
it as long as possible (sometimes as long as seven years).
This has resulted into repetitive design. An effort is being
made under RSVY scheme to use computer-aided
design (CAD) for the weavers. The weavers are illiterate
and are exploited by Mahajans even in calculations of
the adjustment of advane money that they deposit with
Mahajan for procurement of yarn etc. on their behalf.
Therefore, literacy drive is likely to be helpful in
ameliorating their hardship.
2.5.9.4 Lac development :
Lac is a product of commercial value from which resin,
dye and wax can be obtained. It is derived from a
specialised group of insects known as lac insects. The lac
insect secrets a resinous covering for protecting itself and
its young ones. For its survival it depends on certain plants
called as lac hosts. It derives its nutrition by sucking the
juices of these host plants. Lac culture is the process of
culturing these insects on host plants to obtain lac. Only
certain species of lac insect are useful for producing lac
resinous covering and KERRIA LACCA is the type
commonly used in our country. Abundance of Palash
trees (lac host) in this district has become helpful in lac
development, in which pruning operation is required to
remove unsuitable shoots of host plant to ensure putting
forth of new good, healthy and large number of succulent
shoots for lac insect settlement.
One of the major constraints in lac cultivation is the
non-availability of broodlac at proper time and at the
reasonable rate within affordable limit of the poor
cultivators. In consideration of the facts, lac cultivation
work was undertaken in a special manner during June-
July, 2005 season, giving due attention to the seasonal
operation, viz. pruning, selection of broodlac, brood
binding, innoculation etc. As such 30.16 quintals of
Ranginee variety broodlac was produced and
innoculation operation was effected on 6010 number
of pruned host trees.
2.5.9.5 DOKRA- the traditional art of metal
casting :
Brass metal craft, a migratory craft in the late medieval
period emerged as the second largest industry of
undivided Bengal in the late nineteenth century. The
craft had its origin in Dhalbhum of Singhbhum area
and has entered Bengal through Purulia-Bankura-
Midnapur trail, which was the exit route of metal to
the copper port of Tamralipta. The utensils made of
copper-based alloys had its early growth in the western
part of Bengal. With the rapid growth in the early
eighteenth century, there emerged a sub-caste of
Karmakar named Kansari. Kansaris were later sub-
divided into various small groups like Dokra-Kamar,
Ghatra-Kamar etc.
The Dokra Kamars of Bengal migrated from
Chhatishgarh. The proximity of this region to the
copper source and easier
trade-link with market
transformed their migratory
character to settle in groups in
different parts of Bengal. But
the craft did not expand and
remained in the periphery of
artisan activities.
Cire Pur Due, a French term
meaning lost wax, is the name
given to method of Dokra
casting. Many of the world’s
famous statues have been
made through this process.
The earliest bronze figure of a dancing girl, which was
unearthed in the buried city of Mohen-jo-daro, shows
the high degree of skill attained in this art.
There are two traditions of castings. Once is the lost-
2.5.20 Heated
mould prepared for
production of
DOKRA crafts

88
2
wax solid casting and the other is the lost-wax hollow
casting. Both traditions are practiced in Bankura.
Pure bee wax, dammer resin and mustard oil etc are
used in the preparation of mouldable wax. Coating of
wax is applied on the surface of the master mould,
but in case of hollow casting the master mould is made
out of clay. The wax-coated model thus covered with
clay and a slit is provided for draining out liquid wax
after heating.
The Dokra artisans of Bankura District have been
pursuing this occupation for over 50 years based on
their inherited skill. The traditional mode of
production lacks flexibility in production, suffers from
low productivity and high cost of input raw materials.
This has resulted limitation in marketing of Dokra
products beyond a geographical area restricted mostly
within the state. Generation of gainful employment in
the trade is possible only through extending the scope
of marketing. However, extension of market of Dokra
items calls for introduction of flexibility in the
production technique, improvement in quality and
increase in productivity. All such requirements could be
met through blending new innovation in the traditional
production stages. During last 10-15 years, initiative
have been taken by various government and semi-
government agencies like Council of Scientific &
Industrial Research, Khadi & Village Industries
Commission etc. to provide technological inputs to the
Dokra artisans of Bikna village, for their skill
development and increase in productivity.
It is interesting to note that during last few years some
young artisans of Ghatra Kamar community (utensil-
maker) have adopted the skill of Dokra crafts and have
engaged themselves in commercial production of Dokra
items. As a result the traditional Dokra crafts of Bankura
has spread outside Bikna village & small clusters of
Dokra artisans are coming up at Patrasayer, Molian,
Bangopalpur, Kesiakole with the support of various
government and semi-government agencies. Under
RSVY, the product diversification has been taken up
and the results are very satisfactory.
“Moon appears behind the cloud” — a success story of Jyotsna Hanri
Jyotsna Hanri, daughter of Ajit and Asha Hanri, is a resident of village Molian under Hirbandh block.
She is a 26 years old destitute woman struggling to establish herself in the society. When she was six
years old, her parent arranged her marriage as per existing social
norm. But she had to left her husband’s house after 6-7 years of her
marriage due to severe physical and mental torture by her in-laws.
After that she returned to her father’s house and started working with
the local mason as Kamin (women laborer) to earn her daily livelihood.
During this period she engaged herself in fishing-hook making like
other local women. When she was twenty, she went to Bishnupur to
undergo a short-term training on metal crafts organised by National
Institute of Science, Technology & Development Studies (NISTAD).
After returning from training she did not find any opportunity in craft-
work. Again she started working as a maidservant at Molian. But she continued her passion of craft-
work with metals. Later she came to the notice of the Khadi and Village Industries Board (KVIB) and
they appreciated her work. KVIB arranged training for the women of the village and formed a self-help
group named Matangini Hazra Mahila Swambhar Gosthi with ten female members. She became the
team-leader of the group. The KVIB facilitated the process of Dokra craft work with financial help
through RSVY and installed women-friendly furnace (costing Rs. 7200/-), better raw-materials of alloy
metals and formed a workshop to develop this art. The group has diversified its activity into various
types of ornaments, mementos, few other framed products that are highly appreciated by all corners
with an increasing demand. The training period continued for four month with twenty days in a month.
Jyostna today earns Rs. 1800/-to Rs. 2000/- per month by producing and selling the crafts to the
wholesellers and in open market.
2.5.21 Finishing touch given
to DOKRA products

89
2
2.5.22 ‘Neera’ collection
by tree trapping
2.5.9.6 Date palm and palmyra palm based activities :
Table 2.5.33 Outcome of date palm and palmyra palm based
activities (during training programme)
Juice collected 434054 litres
Value of products produced Rs. 12,74,571.00
Average income of tapper and Rs. 55.00 to Rs. 75.00 per day for 170
other associates days in two seasons of the year
Source: District Officer, KVIB, Bankura
In India, palm-based activities are about 4000 years old
and pursued as an essential traditional village industry.
Traditionally a good number of people depend on these
two activities, which is based on existing natural
resources, but a major portion of the resources lie
untapped and unextracted. Also due to factors like lack
of awareness, use of traditional methodology without
using modern technology, market inaccessibility, the
activities based on these resources, which have immense
potentiality, have remained dormant. Under RSVY,
steps have been taken for skill development in date palm
and palmyra palm-based activities with the objective of
creating sustainable employment opportunities through
value addition and product diversification.
The physical target of the schemes undertaken under
RSVY was to set up 325 numbers of household units
of date palm and palmyra palm in seven blocks so
that employment opportunities are created for 200-220
days each year and migration and poverty is reduced.
Starting from March, 2005, training programmes of
forty batches have been completed, the participants of
which are engaged in the activities, which have
provided scope of their additional income during lean
season.
Recently training programme for palm fibre separation
and brush-making from the fibres has been completed,
which will further diversify the activities and enhance
scope of income generation.
Lakshimiram Hansda, polio effected youth (aged 28 years) of Suilibona
Gram-panchayat under Chhatna block has been associated with the
palmyra tapping, collection of juice (‘neera’), production of Gur, syrup,
candy etc. since last summer. He is one of the group members of Atmadeep
Foundation Swambhar Gosthi (an eleven member group). Earlier he used
to cultivate paddy and vegetables in his four bighas of land after the demise
of his father at his eight years of age. He has to take the responsibility of
his family members that hindered him to carry out his education beyond
eighth standard. As erratic rainfall prevails in the district, the return from
agriculture did not suffice; hence he had to migrate to east (Burdwan
district) on a regular basis. Now after getting involved into the new initiative,
Lakshiram is able to sustain his family with an additional income of Rs.
55 a day (on an average) for 90 days through selling of this produce. His
whole family is happy as he is engaged locally to ensure the livelihood of
the family and could avoid migration. Non-recurring materials like tray, bowl, chemicals etc. along with
technical support was provided to the group by the district KVIB towards achieving this success, which
was not in practice since years.

90
2
2.5.10 Conclusion :
A large number of resource based livelihood options
have been discussed above for illustration. Examples
have been picked up from different sectors to capture
the employment generation potential in this district. It
is a fact that if properly implemented, these livelihood
interventions have tremendous impact on quality of
life. One may, however, note that this has to be
implemented in a participatory mode. In addition it is
not just sufficient to provide inputs. It is equally
important to build village level institutions to sustain
the effort and take it forward. The discussion which
follows describes it in more details.
2.6 Building Community-Based
Organisations
The benefits of participatory approach for poverty
reduction strategy for enhancing quality of life are well
known. Peoples’ participation is a must if we want to
bring in sustainability in the developmental interventions.
On the other hand, inclusive growth on social, economic
and political front is possible only if community-based
organisations (CBO) constituting vulnerable sections of
society are acknowledged and involved in
conceptualisation and implementation of schemes.
Thus formation and strengthening of community-based
organisations is essential to accelerate the process of
human development. They become the vehicle of
growth and provide a conduit to enhance access to the
social and economic services. These organisations bring
in cohesion in community, which is a pre-condition for
success of any intervention. In Bankura an attempt is
being made to build and strengthen these organisations.
Some examples have been picked up as illustrations.
Various community based organisations have been
discussed here in context of this district. Most of them
have been an outcome of the implementation of
various schemes. It may be remembered that there are
other traditional village institutions in Bankura (viz.
Solo Ana Committee) including institutions in tribal
societies. These can be nurtured and involved in the
process of development in a big way.
2.6.1 Watershed Development Committee
Considering the geo-physical characteristics of Bankura
in general, and its soil-morphology and soil structure,
intensity of rainfall, undulating character of land, cropping
pattern, extent of degradation of forest areas etc., in
particular, approach of development in this district is based
on micro-watershed. All activities in a micro-watershed is
executed through watershed development committee.
a. Formation
Initially a group of 20-30 representatives from the
community, preferably comprised of equal numbers of
men and women across various age-group and
maintaining neighbourhood representative criteria are
selected to carry on the participatory exercises. Community
opinion leaders like the respected persons, teachers, social
workers, Panchayat representatives, Government
representatives etc. from the community are taken as
group-members and are termed as ‘key informants’ who
gather and generate information on different socio-
economic dimensions of the villages, resource-potential,
existing practices, etc. in the watershed area.
Table 2.6.1 Block-wise number of micro-
watershed project taken up under Rashtriya
Sam Vikas Yojana
Block Number of micro-watershed project
Sonamukhi 1
Borjora 4
Raipur 2
Khatra 3
Chhatna 5
Hirbandh 1
Ranibandh 2
Sarenga 1
Gangajalghati 1
Mejia 2
Bankura-I 9
Saltora 7
Indpur 2
Total 40
Source: Office of the District Magistrate, Bankura
To institutionalize the whole thing, one Watershed
Association (WA) and one Watershed Development
Committee (WDC) are formed at the watershed level.
Watershed Association is formed with one representative
from each of the families directly or indirectly
dependent on or benefitted from the watershed area.
The Watershed Association oversees the formulation of
micro-plan, review the progress of works, approve the
statement of accounts, oversee formation of self-help

91
2
groups (SHG) and users’ groups and constitute and
reconstitute watershed development committee, which
is the executive body of the watershed association. Since
every household is represented in the Watershed
Association, it cuts across all sections of society and,
therefore, is expected to be the best representative.
The WDC is formed with the members as mentioned in
table 2.6.2. If the members of SHGs or users’ groups
are more than four and five respectively, representatives
of SHGs and users’ groups are selected by rotation.
The WDC has at least 4-5 women members and it is
also ensured that scheduled caste and scheduled tribe
communities are adequately represented. So far 18
WDC have been formed in the district.
b. Flow of fund
Fund is released in favour of Watershed Development
Committee through account payee cheque to be credited
to its bank account. Subject to the overall supervision
and control of the WA, the day-to-day activities of the
watershed development project are carried out by the
watershed development committee. No fund is with-
drawn from bank unless a resolution of WDC to that
effect is taken. So far as execution of any watershed
development scheme is concerned, the WDC under-
takes the task of procurement of materials, arrange-
ment for supply of labour, selection of job-worker etc.
The committee takes into account the technical
suggestions of the respective departmental officers.
Table 2.6.2 Structure of Watershed Development Committee
1 President of the Watershed Association President
2 Secretary of the Watershed Association Secretary
3 Four representatives of self-help groups (SHG) Member
4 Five representative of users’ groups Member
5 Elected members of Gram-Panchayat constituencies falling,
fully or partly, within the micro-watershed area Member
6 Two representatives of the block-level core committee
looking after the programme Member
Source:- Office of the District Magistrate, Bankura
Watershed development programme at Saltora – a case study
In Bankura, several scattered hamlets (villages) constitute a micro-watershed. At the very beginning,
hamlet committees are formed for each hamlet involving those who are dynamic and found committed
during plan-preparation. Each hamlet committee identify one member
to represent in the watershed development committee. Out of nine
members of the committee, four are women. WDC and hamlet
committees convene separate meeting every fortnight to discuss the
implementation process. They have their own documented rules and
regulations and maintain registers like resolution-register, cash-book,
muster roll etc. The committee
maintains accounts as per their
norms. Every hamlet committee
has selected a ‘job worker’ on wage
basis. Job-worker maintains all measurements, perform cash
transactions and submits utilisation certificate to the Secretary of the
WDC. They have been trained to take the measurement of the
activities and to keep accounts. The Secretary of WDC collects list
for the activities in advance from the job-worker and gets money
2.6.1 Delineation of
watershed going on
2.6.2 Meeting of the hamlet
committee going on

92
2
2.6.3 Night school taken as
entry-point activity
through withdrawal slip from bank, where Block Core Committee
member is a co-signatory. The WDC has opened an account at the
bank for financial transactions for the watershed. Block core
committee has been formed with two representatives of the Block,
one is Block Fisheries Extension Officer and another is Sub-Assistant
Engineer.
Exposure tour of the communities to a nearby developed watershed
at Purulia also had a significant contribution in achieving the desired
result.
Entry point activity
Women were vocal to stress on their needs and aspirations expected from the watershed. During the
meetings held in the villages, the women in particular stressed on the need of night-school, as most of
them are illiterate and not even able to sign their names. Seven numbers of such night-schools were
established as an entry-point activity. Black board, pencils, slates, kerosene, lamps etc. were provided to
run the school. An overwhelming response was seen from the women, especially the elders one. About
10-15 students attended their class in each school.
Table 2.6.3 Block-wise number of SGSY groups
Sl. Name of Number of Number of Number of Number of
No. the Block SGSY groups groups who groups who credit-linked
have passed have passed groups
Grade–I Grade–II
1 Bankura-I 433 149 19 1
2 Bankura-II 303 422 41 0
3 Barjora 131 28 4 2
4 Chhatna 581 417 65 0
5 Onda 378 255 33 8
6 Mejhia 140 127 13 0
7 Gangajalghati 177 44 8 0
8 Saltora 110 37 4 2
9 Sonamukhi 448 228 24 5
10 Kotulpur 133 52 2 1
11 Joypur 195 108 8 0
12 Bishnupur 197 127 20 3
13 Patrasayer 182 93 45 9
14 Indus 144 21 3 0
15 Khatra 426 290 54 15
16 Sarenga 655 392 24 3
17 Hirbandh 155 26 0 0
18 Ranibandh 596 441 49 15
19 Indpur 353 184 26 0
20 Taldangra 280 146 16 0
21 Simlapal 456 170 32 23
22 Raipur 467 189 0 0
Total 6940 3946 490 87
Source:- Project Director, District Rural Development Agency, Bankura
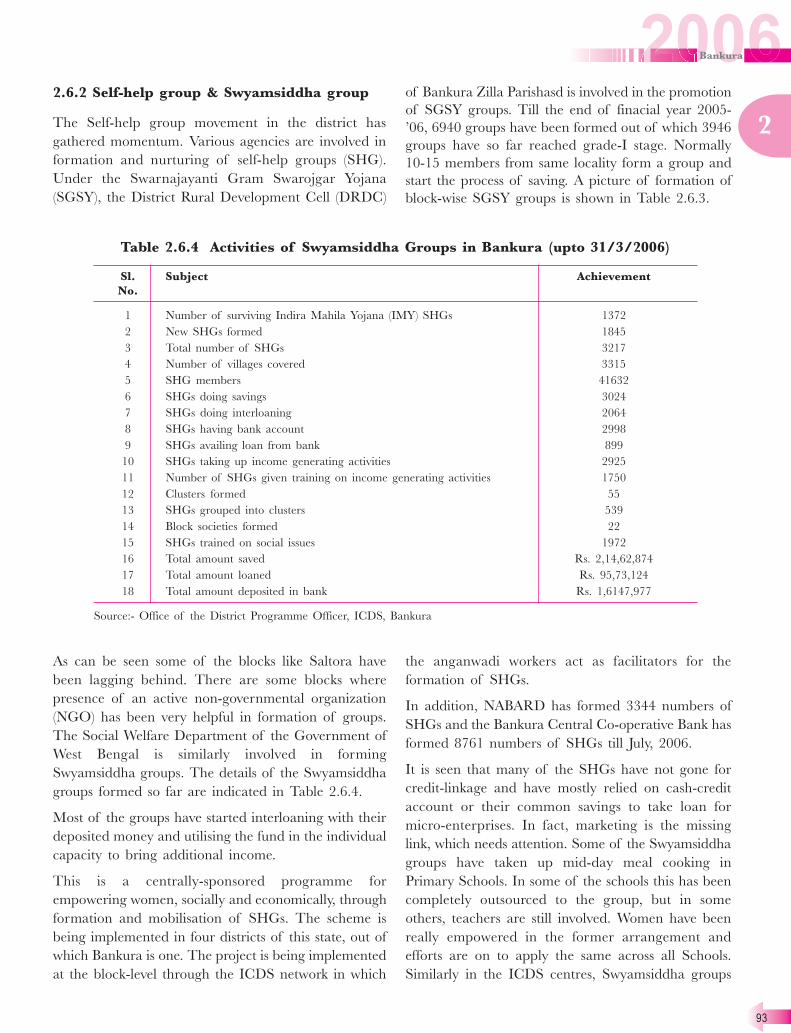
93
2
As can be seen some of the blocks like Saltora have
been lagging behind. There are some blocks where
presence of an active non-governmental organization
(NGO) has been very helpful in formation of groups.
The Social Welfare Department of the Government of
West Bengal is similarly involved in forming
Swyamsiddha groups. The details of the Swyamsiddha
groups formed so far are indicated in Table 2.6.4.
Most of the groups have started interloaning with their
deposited money and utilising the fund in the individual
capacity to bring additional income.
This is a centrally-sponsored programme for
empowering women, socially and economically, through
formation and mobilisation of SHGs. The scheme is
being implemented in four districts of this state, out of
which Bankura is one. The project is being implemented
at the block-level through the ICDS network in which
2.6.2 Self-help group & Swyamsiddha group
The Self-help group movement in the district has
gathered momentum. Various agencies are involved in
formation and nurturing of self-help groups (SHG).
Under the Swarnajayanti Gram Swarojgar Yojana
(SGSY), the District Rural Development Cell (DRDC)
of Bankura Zilla Parishasd is involved in the promotion
of SGSY groups. Till the end of finacial year 2005-
’06, 6940 groups have been formed out of which 3946
groups have so far reached grade-I stage. Normally
10-15 members from same locality form a group and
start the process of saving. A picture of formation of
block-wise SGSY groups is shown in Table 2.6.3.
the anganwadi workers act as facilitators for the
formation of SHGs.
In addition, NABARD has formed 3344 numbers of
SHGs and the Bankura Central Co-operative Bank has
formed 8761 numbers of SHGs till July, 2006.
It is seen that many of the SHGs have not gone for
credit-linkage and have mostly relied on cash-credit
account or their common savings to take loan for
micro-enterprises. In fact, marketing is the missing
link, which needs attention. Some of the Swyamsiddha
groups have taken up mid-day meal cooking in
Primary Schools. In some of the schools this has been
completely outsourced to the group, but in some
others, teachers are still involved. Women have been
really empowered in the former arrangement and
efforts are on to apply the same across all Schools.
Similarly in the ICDS centres, Swyamsiddha groups
Table 2.6.4 Activities of Swyamsiddha Groups in Bankura (upto 31/3/2006)
Sl. Subject Achievement
No.
1 Number of surviving Indira Mahila Yojana (IMY) SHGs 1372
2 New SHGs formed 1845
3 Total number of SHGs 3217
4 Number of villages covered 3315
5 SHG members 41632
6 SHGs doing savings 3024
7 SHGs doing interloaning 2064
8 SHGs having bank account 2998
9 SHGs availing loan from bank 899
10 SHGs taking up income generating activities 2925
11 Number of SHGs given training on income generating activities 1750
12 Clusters formed 55
13 SHGs grouped into clusters 539
14 Block societies formed 22
15 SHGs trained on social issues 1972
16 Total amount saved Rs. 2,14,62,874
17 Total amount loaned Rs. 95,73,124
18 Total amount deposited in bank Rs. 1,6147,977
Source:- Office of the District Programme Officer, ICDS, Bankura

94
2
are now being involved to supply vegetables and eggs.
In Sarenga block, Swyamsiddha groups have been
involved in paddy-to-rice making and supplying it to
the ICDS centres. The quality of rice has been
remarkable and the overall costs and overheads have
also been less.
Case studies
1. Sal plate making in Ranibandh block
This is a case where a technological input may enhance the income of a self-help group. South Bankura
is full of Sal plantation and almost every family, a major share of them from tribal community, is
making sal plate.
Ranibandh, a block having more than 50 percent tribal population, is situated far from district headquarters.
More than 50 percent of this Block is forest land and SHGs comprising with scheduled caste (SC) and
scheduled tribe (ST) people live in forest fringe areas and depend on minor forest produce (MFP), since
the nature of the soil is barren and unfertile for agriculture and the irrigation facility is also poor.
Table 2.6.5 Self-help groups involved in Sal plate making acitivty at Ranibandh
Name of the self-help group Number of members
Laledi Mahila SHG 16
Punshya Mahila SHG 15
Barpal Mahila SHg 12
Mithyam Mahila SHG 15
Bardanga Mahila SHG 19
Bheduasole Dompara SHG 13
Bheduasole Marangburu Swanirbhar Dal 13
Jabla Ma Kali Swanirbhar Dal 10
Jabla Ma Durga Swanirbhar Dal 17
Basdiha Karmakarpara SHG 10
Source:- Project Director, District Rural Development Agency, Bankura
The matter of providing suitable intervention on Sal leaves was considered necessary at the first stage
in the villages like Laledi, Punshya, Mithyam, Barpal, Bardanga and others where SC and ST
concentration is very high. Thorough discussion was made with the women SHGs who collect Sal
leaves, get it semi-dried in open air and then traditionally tie the leaves with neem-stick to give it a shape
of improvised Sal Thali (plate) and sell it to the local vendor, who visits their villages for purchasing
those plates at regular intervals at a rate of Rs. 5-7/- per hundred ‘thali’.
It was learnt that the Indian Institute of Technology (IIT), Kharagpur has designed a biomass fuel
operated Sal plate and bowl moulding machine, which does not require electricity for making moulded
Sal plate and bowls.
Women from ten SHGs were then selected by Ranibandh Panchayat Samity for training and a five days
training was organised with the master trainers provided by IIT, Kharagpur for preparation of moulded
sal plates and bowls.
After successful completion of training, each SHG was provided with one such Sal plate moulding
machine and one sewing machine. In the meantime, it has been experienced that the poor SC/ST
people do not have adequate space in their respective houses and as such, one workshed with low-cost
design was thought of and subsequently provided. Ranibandh Panchyat Samity entrusted the SHG to

95
2
construct their own workshed and they have set up the workshed in right earnest and enthusiasm (even
with pucca roof-top by their own labour and savings). With the completion of workshed and starting of
preparation of Sal plate and bowl by the group members, the SHGs are now getting Rs.22/- per
hundred moulded Sal plate as against Rs. 7/- per hundred Sal plate, which they used to earn previously.
The members of the SHGs informed the villagers that they are exploring local market in the neighboring
villages where marriage ceremony or other ceremony takes place and has the demand of such moulded
plate. The SHG members are now concentrating to explore the marketability of such moulded plate
outside Ranibandh and for that purpose, they have selected two SHGs amongst themselves who would
act as marketing groups. Ranibandh Panchyat Samity has also extended its co-operation and is going
to provide them a space in the marketing complex at Ranibandh Bazar, from where the marketing
group intends to operate.
2. Goatary at Chichinga under Indas Block
Eleven number of youths, all of them belonging to poor families formed Chichinga Milan Gosthi on
30.07.2002 and opened a bank account with Mallabhum Gramin Bank, Indus branch.
Once the group became stable, the group-members intended to take up a joint venture of goatary
activity by taking a piece of land on lease in the middle of the village and constructed a mud-build
goatary shed to set up a farm for goats. They underwent seven day’s training on goatary from the Block
Livestock Development Officer, Indas. The group successfully passed Grade-I on 27.03.2003 and received
an amount of Rs. 10,000/- as the revolving fund from DRDC, Bankura and Rs. 16,000/- as the bank
portion of cash credit loan. From this fund they purchased 35 numbers of goats from the vicinity and
started goat-rearing and breeding in the goatary-shed constructed by their own effort. With the
intervention of higher skill development for goat-rearing and improved breeding skill imparted to them
by the Animal Resource Development Department, they contemplated to go for goat-breeding activity
with superior quality of Black Bengal bucks breed.
In the meantime, more and more SHGs (at least twelve numbers of SHGs) have been formed in that
village and neighboring village and are encouraged to see the activity of Chichinga Milan Goshthi and
its overall performance for producing good quality goat kids. The group has set up a direct market link
with those SHGs who wanted to go for goat rearing and breeding activity by purchasing good quality
goat-kids from Chichinga Milan Goshthi out of thrift savings and cash loan. The Chichinga Milan
Goshthi has also taken a lease of two bighas of fallow land by the side of their original lease-land and
started fodder cultivation (Napier Grass). DRDC Bankura has funded them through Indus Panchayat
Samity to construct a goat-shed with an estimated amount of Rs. 1.90 lakh. The construction work has
been undertaken by the group members themselves and the work has been completed.
In the meantime, the said SHG, being highly encouraged has taken lease of one big pond measuring
an area of 1.63 acre in the vicinity and has gone for pisciculture in the month of November 2004. The
fishery activity enabled them an amount of Rs. 35,000/- within six months and they have taken lease
of four numbers of ponds, which were lying idle in the Chichinga village and started pisciculture. It is
estimated that within another one year or so, the members of the SHG would rise above poverty line
with sheer perseverance, labour and skill.
The SHG members have engaged themselves to realise the outstanding dues of the bank and till now
they have realised an amount of Rs. 50,000/-, which was declared as NPA and thus earned a commission
offered to them by Mallabhum Gramin Bank, Indus. They also have taken active initiative to sensitize
the villagers to install sanitary latrine at each and every household and have also acted as a good
motivator in installing those latrines and ensure that the villagers actually use it.

96
2
Co-operative is a system of people voluntarily
associated, working together on terms of equality to
eliminate their economic exploitation by middleman
in respect of any economic need common to them. It
is voluntary and democratic in nature and emphasises
service instead of profits. It is a joint effort of self-
help, which is of benefit to the whole community. The
characteristics of co-operative include voluntarism,
mutuality, equality, democracy, autonomy and
universality.
Like other districts in West Bengal, the co-operative
movement has been progressing with the active
participation of district administration as well as the
Bankura District Co-operative Union, Bankura District
Central Co-operative Bank Limited, Bankura District
Co-operative Agricultural & Rural Development Bank
Limited, BENFED, Bankura, IFFCO, Bankura,
Wholesale Consumer Co-operative Society Limited
and others.
2.6.3.1 Bankura District Co-operative Union
For promotion and development of the co-operative
movement, it is necessary to educate the members,
employees of co-operative institutions and the general
public regarding the principles and aims of co-
operative movement. In view of the above, the
Bankura District Co-operative Union has been working
2.6.3 Co-operatives
Table 2.6.6 Achievement of Bankura District Central
Co-operative Bank Limited
Sl. Particulars Achievement
No. (Rupees in lakh)
2004-2005 2005-2006
1 Loans & advances issued 10,627.66 11,346.20
Crop loan disbursed 4,41.98 5,330.10
2 Deposits 18,494.00 20,582.00
3 Performance of self-help groups
Number of groups formed 6,659 8,668
Total members 58,633 78,205
Deposits 267.13 427.45
Loans issued to groups 609.63 1,008.64
4 Net profit 384.49 647.68
Source:- Assistant Registrar of Co-operative Societies, Bankura
remarkably by organising co-operative training
programmes, seminars, meetings, conferences and
exhibitions to spread the message an ideals of co-
operative movement in the district.
2.6.3.2 Bankura District Central Co-operative
Bank Limited
The Bankura District Central Co-operative Bank
Limited is working with its seventeen branches all over
the district by providing primary economic support to
the common people through its member societies or
directly. The role of the bank for socio-economic growth
of the people of Bankura throughout the district is
reflected in Table 2.6.6.
2.6.3.3 Primary Agricultural Co-operative
Credit Societies
The Primary Agricultural Co-operative Credit Societies
(PACS) are playing the pivotal role in the development
of socio-economic condition of the rural farmers.
There are 420 numbers of PACS in the district.
However, it is revealed that a large number of common
people as well as rural farmers are still not getting any
benefit of co-operative movement. A programme of re-
organisation of PACS has been undertaken with an
aim to bring all the areas in the district under the cover
of co-operatives.

97
2
Table 2.7.7 Co-operatives in Bankura – at a glance
Sl. Type of society Number Number Working
No. of society of members capital
(in lakh Rupees)
1 Central co-operative bank 1 1,270 37,246.53
2 Wholesale consumers co-operative 1 49 111.21
3 Primary land mortgage bank 1 8,040 1,679.94
4 Urban co-operative bank 3 63,653 6,243.27
5 Agricultural credit society
Samabay krishi unnayan samity 392 1,71,213 8,702.25
Farmers’ service co-operative society 10 27,053 983.56
Large-sized multipurpose co-operative society 18 14,283 505.21
6 Non-agricultural credit society
Mahila credit society 2 1,885 66.55
Employees credit society 302 12,167 4,823.10
7 Non-credit society
Primary Agricultural Marketing Society 18 14,283 379.23
Consumers Cooperative 102 17,703 15.23
Engineers Cooperative 117 1,162 148.56
Labour contract co-operative 110 5,893 41.47
Housing co-operative 33 318 Not available
Source:- Assistant Registrar of Co-operative Societies, Bankura
2.6.3.4 Rajgram Co-operative Society Limited:
an appraisal
Rajgram Co-operative Society Limited was registered
in the year 1944 by the weavers of Rajagram, which
has a long tradition of weaving products like bed-
sheets, bed-cover, napkin etc. for household use. At
present total number of members of the society is 962,
out of which only 71 members are engaged in working.
The society has forty-five employees and the products
of the society are sold through four outlets, which are
situated at Rajagram, Durgapur, Purulia & Bankura.
The sale turnover of the society in the year 2005-2006
was Rs, 21.56 lakh from own production and Rs. 15.79
lakh from goods purchased from outside, whereas the
loss of the society by the end of that financial year
was Rs.11.58 lakh. The present performance of the
society is very poor due to huge administrative cost
compared to the productivity, selling capacity and
profit-margin.
Whereas reduction of administrative cost is definitely
an issue to reduce the loss incurred by the society, skill
up-gradation of the weavers and diversification of
products are the major issues, which need to be
addressed to keep the society and the age-old weaving
tradition of Rajagram alive.
2.7 Land reforms- a redistributive
justice
Land reforms have been one of the most remarkable
interventions to reduce poverty and bring in
improvement in the quality of life in this district. This
has been achieved through the process of re-
distribution of landholdings in the form of distribution
of ceiling surplus land to the landless agricultural
labourers known as ‘Pattadars’, registration of the
names of ‘Bargadars’ working as tillers of the soil of
absentee landlords, providing credits, supplying low-
cost or free-of-cost seeds, fertilisers, pesticides to these
small and marginal farmers.
In the next paras, different aspects of land reforms
have been discussed and how land reforms can be, not
the sole, but one of the main sources of impetus of
different aspects of human development interrelated
to one another. The discussion will be confined to the
district of Bankura. Lastly analysis of the reasons of
failures in achieving the desired goals in some aspects
will also be discussed.
2.7.1 Land reforms
It has been defined in various ways. In its narrow sense,

98
2
it is a programme from distribution of ceiling surplus
land to the landless and the near landless. In its
comprehensive sense, it is an integrated programme
which seeks to remove obstacles to agricultural
production by an equitable and rational restructuring
of the land tenure system including pattern of land
ownership, provisions of supportive measures like
agricultural inputs for the beneficiaries and reform of
various agricultural service institutions. It ultimately
aims at improvement in the quality of life and poverty
reduction.
2.7.1.1 Land reforms – first phase
Land reforms started in West Bengal in the mid-fifties
along with other States and till mid-sixties, it witnessed
abolition of intermediaries and vesting of ceiling-
surplus land. Since 1977-’78, significant progress could
be achieved in the areas of distribution of vested land,
recording of Bargardars, conferment of further rights
to them, grant of ownership rights on homestead land
to certain sections of rural disadvantaged class. These
reforms have been carried out through synergy of
bureaucratic involvement, participation of peasants’
organisation and the beneficiaries themselves along
with participation of revitalised Panchayats.
2.7.1.2 Bargadars
By definition, a Bargadar means a person who
cultivates the land of another person on condition of
delivery of a specified share of the produce. After a
sustained peasant movement, the West Bengal Bargadars
Act, 1950 was enacted and the rights and safeguards of
the Bargadars were codified. He has no right of land,
but a right of its cultivation. On his death, his lawful
heirs select one from themselves to succeed the rights
of cultivation of deceased Bargadar. On certain
stringent conditions, the rights of Bargadars can be
terminated by an order of authorised Revenue Officer.
A Bargadar can also voluntarily surrender his right of
cultivation under certain conditions.
Sharing of produce between a Bargadar and land-owner
was different from time to time. The latest West Bengal
Land Reforms Act, 1955 simplified the pattern. If all
inputs of agricultural production are provided by the
Bargadar, the share will be 75: 25, the former in favour
of Bargadar. If all expenses of production are borne by
the landlord, the share will be 50: 50 between them.
2.7.1.3 Operation Barga
It is for more than a century that the names of
Bargadars are being incorporated in to the Record-of-
Rights as part and parcel of revenue record writing. An
evaluation made by the Board of Revenue revealed a
dismal picture and in 1978, the Government of West
Bengal launched a programme styled ‘Operation Barga’
to accelerate the process of Barga-recording as a
measure of tenancy reform – an exercise ever
undertaken in India.

99
2
Table 2.7.1 Block-wise break-up of the progress of recording
of Bargadars and Pattadars (upto 15th. July, 2006)
Block Bargadar Pattadar
Number of Area involved Number of Area involved
Recorded (in Acre) recorded (in Acre)
Bargadars Pattadars
Bankura-I 2419 806.42 3813 1265.24
Bankura-II 3378 1903.25 2238 4125.2
Chhatna 3089 2145.25 6676 3957.84
Saltora 2596 2580.78 6322 4469.26
Mejia 1837 1558.25 3983 2586.25
Gangajalghati 4469 2054.22 5980 1903.12
Barjora 6101 4837.25 10572 3562.33
Onda 11514 7715.25 7481 2780.21
Taldangra 5195 3206.45 11182 4140.52
Simlapal 3173 2605.25 7733 2572.2
Khatra 1440 869.23 3295 1212.2
Hirbandh 543 505.2 2832 1410.61
Indpur 1836 1025.25 4005 2990.18
Raipur 1884 1225.12 10898 1620.2
Seranga 1685 2225.2 3983 2320.2
Ranibandh 1488 949.26 3827 1795.25
Bishnupur 10218 2598.25 15225 5187.15
Joypur 12455 4480.25 8108 2163.25
Kotulpur 11407 4125.25 7369 2966.3
Sonamukhi 10343 9626.03 9454 2087.2
Patrasayer 12591 7815.05 18141 4200.25
Indus 7039 4875.25 18736 3181.86
Total 116700 69731.71 171853 62496.82
Source:- Office of the District Land & Land Reforms Officer, Bankura
The Table 2.7.1 shows the progress of recording of
Bargadars and Pattadars upto mid-July, 2006 in different
blocks of Bankura.
2.7.1.4 Pattadars
Pattadars are the persons with whom land at the disposal
of the government including the land vested to the state
as ceiling-surplus are distributed following the limit of
upto 1.00 Acre per landless person. For a Bargadar, half
of the land cultivated by him as Bargadar, shall be taken
into account in determining his entitlement. Pattadars
are the direct beneficiaries of distributed land reforms.
They are not permitted to sell the land, but may
mortgage the same for specific purposes like
development of the land and the like. Subject to the
ceiling, a Pattadar may own one piece of land as a
raiyat, he may cultivate other land as a Bargadar.
Pattadars are owner-cultivators whereas Bargadars are
tenant-cultivators.

100
2
Table 2.7.2 Distribution of Pattadars and Bargadars among the various social
groups (upto 15/7/2006)
Block Number of Pattadars Number of Bargadar
SC ST Others Total SC ST Others Total
Bankura-I 2286 766 761 3813 738 158 1523 2419
Bankura-II 1335 359 544 2238 534 189 2655 3378
Chhatna 3197 2141 1338 6676 895 736 1458 3089
Saltora 3285 1747 1290 6322 721 483 1392 2596
Mejia 2313 331 1339 3983 402 50 1385 1837
Gangajalghati 2997 1048 1935 5980 1383 226 2860 4469
Barjora 5327 3283 1962 10572 1324 185 4592 6101
Onda 5570 247 1664 7481 3078 924 7512 11514
Taldangra 6055 2329 2798 11182 1631 1045 2519 5195
Simlapal 2788 2334 2611 7733 850 776 1547 3173
Khatra 1228 1079 988 3295 426 667 347 1440
Hirbandh 921 1194 717 2832 265 60 218 543
Indpur 2580 737 688 4005 752 352 732 1836
Raipur 3657 4033 3208 10898 689 485 710 1884
Seranga 2260 608 1115 3983 501 528 656 1685
Ranibandh 504 1948 1375 3827 196 782 510 1488
Bishnupur 4872 4374 5979 15225 3984 1940 4294 10218
Joypur 5545 633 1930 8108 2101 472 9882 12455
Kotulpur 3523 1955 1891 7369 5924 234 5249 11407
Sonamukhi 5382 766 3306 9454 2197 281 7865 10343
Patrasayer 12330 1485 4326 18141 2883 500 9208 12591
Indus 12701 1518 4517 18736 385 1452 5202 7039
Total 90656 34915 46282 171853 31859 12525 72316 116700
Source: Office of the District Land & Land Reforms Officer, Bankura
Table 2.7.3 Distribution of Pattadars according to land-
ownership status before conferment of Patta rights (March, 2002)
(Bracket shows percentage figure.)
District/State Number of Pattadars
Landed Landless Total
Bankura 35062 104707 139769
(25.09) (74.91) (100)
West Bengal 711470 1452813 2164283
(32.87) (67.13) (100)
Source: Office of the District Land & Land Reforms Officer, Bankura
Table 2.7.2 gives a picture of the benefits of the land
reform to the vulnerable sections of the society, i.e.,
the people belonging to the scheduled castes (SC) and
scheduled tribes (ST).
Thus a large portion of the beneficiaries was the landed
people in the state, though Bankura of course shows a
better picture.

101
2
2.7.1.5 Other inputs in land reforms
In a land reforms initiative supplementary inputs like
credit, quality seed, irrigation are equally important.
With the active participation of Panchayat etc., the state
government launched a programme to provide
Bargadars, Pattadars institutional finance to free them
from the clutches of money-lenders in order to minimize
dependency relationship. With a modest beginning, upto
1983-’84, it was possible to bring 3.5 lakhs Pattadars
and Bargadars under its coverage in West Bengal, but it
could not be sustained.
A study by Prof. A. K. Chakraborty and others in 2003
have brought out several findings in regard to credit,
extension services, convergence of benefits etc. to them.
An insignificance percentage of Pattadars could be
brought under the co-operative credit system.
Extension services have hardly reached them and the
linkage of local Agriculture Department with land
reforms was found to be quite week. The study clearly
brought out that the crucial issue of providing
supplementary inputs to Pattadars deserved more
attention at least at the grass root level.
Table 2.7.4 Distribution of Patta and Barga land according to
availability of irrigation for Patta/Barga land (all figure in percent)
(as on November, 2005)
District/State Patta land Bargadar
Irrigation Irrigation Total Irrigation Irrigation Total
available not available not
available available
Bankura 46.09 53.91 100 56.49 43.51 100
West Bengal 60.44 39.56 100 64.51 35.49 100
Source: Office of the Director of Land Records & Survey, West Bengal
It may be noted that in Bankura, the percentage of non-
irrigated Patta land is much higher compared to the
state average. Similar is the case for Barga land though
the gap is smaller. Thus the supplementary inputs in
the form of irrigation sources are must if land reforms
have to make an impact on poverty in Bankura. Efforts
are on in terms of bringing in Patta land under the
ambit of the National Rural Employment Guarantee
Scheme and make it remunerative through land
development and drought proofing measures.
Table 2.7.5 Distribution of Pattadars and Bargadars according
to use of chemical fertiliser
(as on November, 2005)
(Bracket shows percentage figure.)
District/State Pattadar using fertiliser Bargadar using fertiliser
Using Not Total Using Not Total
fertiliser Using fertiliser Using
fertiliser fertiliser
Bankura 122548 17221 139769 104538 2560 107098
(87.68) (12.32) (100) (97.61) (2.39) (100)
West Bengal 1888219 276064 2164283 1382810 104875 1487685
(87.24) (12.76) (100) (92.95) (7.05) (100)
Source: Office of the Director of Land Records & Survey, West Bengal

102
2
Though use of chemical fertiliser is reasonably high
much is yet to be acheivedin terms of use of bio-
fertilisers and bio-pesticides.
2.7.1.6 Findings and suggestions
(i) At the State level 13.23 percent of the Pattadars
Table 2.7.6 Distribution of Pattadars according to alienation /
loss of possession of Patta land (as on November, 2005)
(Bracket shows percentage figure.)
Distribution of Pattadars according
to the reasons of alienation
District/ Not Alienated Total Inability to Family Others
State alienated invest in composition
cultivation
Bankura 118180 21589 139769 672 569 20348
(84.55) (15.45) (100) (3.11) (2.63) (94.26)
West Bengal 1878021 286262 2164283 12935 55010 218316
(86.77) (13.23) (100) (4.52) (19.22) (76.26)
Source: Office of the Director of Land Records & Survey, West Bengal
have been disposed of their Patta land due to various
reasons upto the month of November, 2005. Out of
these, only 2.73 percent of them have sold off their land.
For the district of Bankura the figures are 15.45 percent
and 0.41 percent respectively.
Table 2.7.7 Number of pattadar of Sabar
community
Block Number of Pattadar
Ranibandh 82
Raipur 219
Khatra 19
Total 320
Source: Office of the District Land & Land Reforms Officer, Bankura
Land alienation is a serious issue. Though there is no
adequate data, it has been observed that in some cases,
Patta was handed over to the beneficiaries but they
were not given possession of land. An effort is being
made to find out such cases, give possession of land
and provide them support through the National Rural
Emplyment Guarantee Scheme for land development
and social forestry/ horticulture. Now that it is obvious
that most of the Patta land is degraded, there is an
urgent need to reclaim and bring it to proper use
through land development. Otherwise the dream of
poverty reduction through land reform will remain half
fulfilled.
The Table 2.7.7 shows Patta land given to Sabar (which
is a primitive tribe) community. A large portion of the
same has not been given possession.
Generally it is seen that the quality of Patta land is
inferior. In a village scenario land is one of the most
precious commodity. The poor has traditionally been
dependent on local money-lenders for loan to survive
in distress. At times, they have to mortgage their land
for the said loan. In the past, several such cases of
mortgage or registration of sale-deed have been
reportedly done in this district which ultimately resulted
into transfer of land since the loan could never be
repaid! When the provision of ceiling came into effect,
the big rayats safely relinquished the worst part of their
possession and as a result vested land turned out to be
of inferior quality.
Vested land if left undistributed (and hence unattended!)
slowly degrades further because of undulations resulting
into surface run-off and soil-erosion. It is estimated
(though there is no reliable data) that more than 50
percent of vested land in this district is degraded.

103
2
(ii) Land Reforms is a necessary but not sufficient
condition to bring about improvement in
agricultural production. Provisions of material
inputs like credit and other rural services are
necessary to complement land reforms. The
emerging scenario is distressing which brings out a
feeble linkage of agricultural institution and land
reforms. A very small section of Pattadars and
Bargadars is member of Primary Agricultural
Credit Societies crucial for procurement of critical
inputs like fertilizer, seed, credit etc.
Table 2.7.8 Distribution of Pattadars and Bargadars according
to alienation and dispossession (as on November, 2005)
District/ Alienation Dispossession
State through sale through eviction
Bankura 0.41 % 2.25 %
West Bengal 2.73 % 3.02 %
Source: Office of the Director of Land Records & Survey, West Bengal
(iii) Insignificant coverage of women in land
distribution programme is another worrying aspect.
The state government has adopted a policy of issue
of joint Patta in 1994-1995 when a huge numbers
of single Patta have already been issued. In view
of the cruciality of the issue, a well thought out
programme is needed.
(iv) Large chunks of undistributed and fallow vested
land is a resource which is losing its value. Block-
wise details of undistributed vested land is shown
in Table 2.7.10.
As per an order issued by the Land and Land Reforms
department in 1987 management of undistributed
vested land may be assigned to community for taking
up social forestry or such other activity. Now that self-
help groups have developed as a powerful institution,
this process may be initiated with mutually agreed
sharing of usufructs between the local bodies and the
self-help groups.
A recent development in the arena of land reforms is
a new scheme namely ‘Chash-O-Basobaser Bhumi
Dan Prakalpa’ introduced from 1st
. February, 2006 to
purchase and distribute agricultural land to the land
less agricultural families living below poverty line with
special priority to SC, ST and OBC families. The price
offered per acre at present is Rs.80000 for mono crop,
Rs.100000 for double crop and Rs.120000 for treble
crop land. The idea is novel and Rs. 10 crores has
been allotted during this current financial year and
more fund will be allotted in the next year depending
Table 2.7.9 Distribution of Pattadars and Bargadars according
to membership of primary agricultural credit societies (PACS)
(as on November, 2005)
(Bracket shows percentage figure.)
District/ Number of Pattadar Number of Bargadar
State Member Non- Total Member Non- Total
Member Member
Bankura 15581 124188 139769 23931 83167 107098
(11.15) (88.85) (100) (22.34) (77.66) (100)
State 316450 1847833 2164283 306369 1181316 1487685
(14.62) (85.38) (100) (20.59) (79.41) (100)
Source: Office of the Director of Land Records & Survey, West Bengal
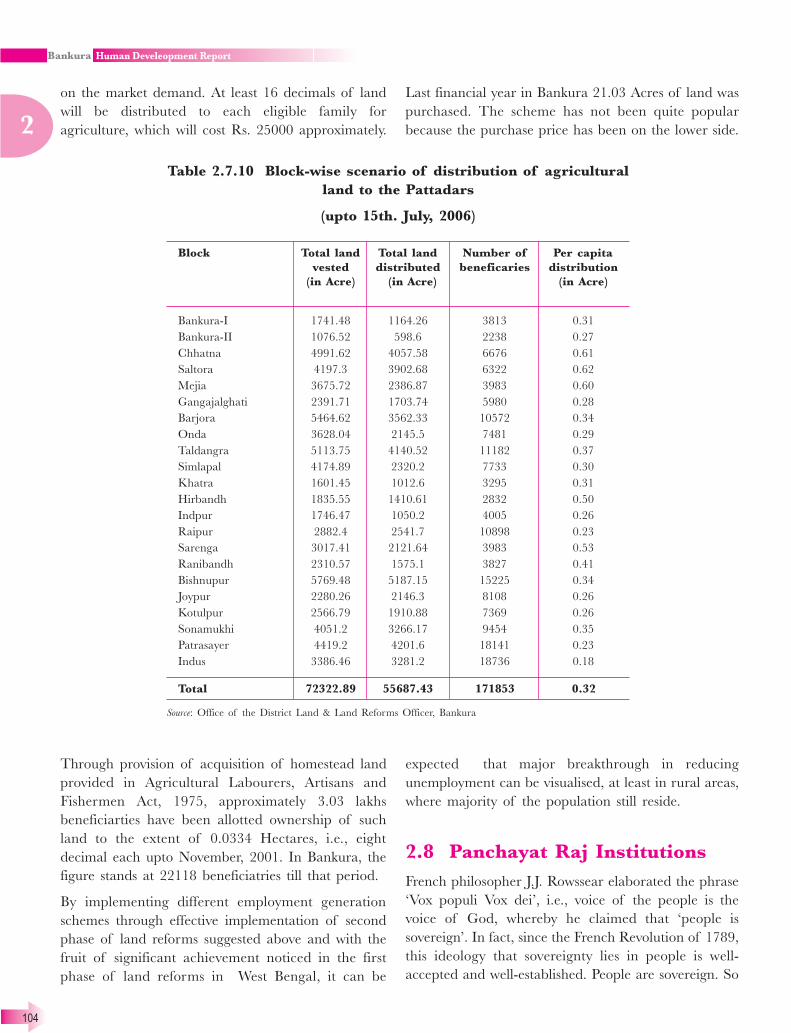
104
2
on the market demand. At least 16 decimals of land
will be distributed to each eligible family for
agriculture, which will cost Rs. 25000 approximately.
Last financial year in Bankura 21.03 Acres of land was
purchased. The scheme has not been quite popular
because the purchase price has been on the lower side.
Table 2.7.10 Block-wise scenario of distribution of agricultural
land to the Pattadars
(upto 15th. July, 2006)
Block Total land Total land Number of Per capita
vested distributed beneficaries distribution
(in Acre) (in Acre) (in Acre)
Bankura-I 1741.48 1164.26 3813 0.31
Bankura-II 1076.52 598.6 2238 0.27
Chhatna 4991.62 4057.58 6676 0.61
Saltora 4197.3 3902.68 6322 0.62
Mejia 3675.72 2386.87 3983 0.60
Gangajalghati 2391.71 1703.74 5980 0.28
Barjora 5464.62 3562.33 10572 0.34
Onda 3628.04 2145.5 7481 0.29
Taldangra 5113.75 4140.52 11182 0.37
Simlapal 4174.89 2320.2 7733 0.30
Khatra 1601.45 1012.6 3295 0.31
Hirbandh 1835.55 1410.61 2832 0.50
Indpur 1746.47 1050.2 4005 0.26
Raipur 2882.4 2541.7 10898 0.23
Sarenga 3017.41 2121.64 3983 0.53
Ranibandh 2310.57 1575.1 3827 0.41
Bishnupur 5769.48 5187.15 15225 0.34
Joypur 2280.26 2146.3 8108 0.26
Kotulpur 2566.79 1910.88 7369 0.26
Sonamukhi 4051.2 3266.17 9454 0.35
Patrasayer 4419.2 4201.6 18141 0.23
Indus 3386.46 3281.2 18736 0.18
Total 72322.89 55687.43 171853 0.32
Source: Office of the District Land & Land Reforms Officer, Bankura
Through provision of acquisition of homestead land
provided in Agricultural Labourers, Artisans and
Fishermen Act, 1975, approximately 3.03 lakhs
beneficiarties have been allotted ownership of such
land to the extent of 0.0334 Hectares, i.e., eight
decimal each upto November, 2001. In Bankura, the
figure stands at 22118 beneficiatries till that period.
By implementing different employment generation
schemes through effective implementation of second
phase of land reforms suggested above and with the
fruit of significant achievement noticed in the first
phase of land reforms in West Bengal, it can be
expected that major breakthrough in reducing
unemployment can be visualised, at least in rural areas,
where majority of the population still reside.
2.8 Panchayat Raj Institutions
French philosopher J.J. Rowssear elaborated the phrase
‘Vox populi Vox dei’, i.e., voice of the people is the
voice of God, whereby he claimed that ‘people is
sovereign’. In fact, since the French Revolution of 1789,
this ideology that sovereignty lies in people is well-
accepted and well-established. People are sovereign. So

105
2
they should take part in day-to-day functioning of the
government. For this reason, his concept of participatory
democracy gained prominence over the years with the
aim of involving people in the process of decision-
making through grass-root level institutions like
Panchayat and Municipality.
For development of an area, people’s participation is
considered advantageous because it helps in seeking co-
operation from people in giving a new thrust to
programmes of which they are the beneficiaries
accomplishing the project-goals through participative
decision-making, mobilisation of local resources,
completing specific programmes within prescribed time-
limit, conducting social audit, promoting their own
development as well as developing a spirit of self-
reliance, improving local initiative and developing
leadership.
2.8.1 History of decentralisation in Bankura
The origin of Bankura as a single administrative unit
does not, however, date earlier than 1765, the year of
the grant of the Diwani to the East India Company
and, in true official sense, Bankura district as an
administrative unit dates from 1881 by the order of H.A
Cookerell, the- then Secretary to the Government of
Bengal. Bankura has a long history of democratic
decentralisation process.
In West Bengal, the West Bengal Panchayat Act 1957
was enacted after independence replacing Bengal
Village Self-government Act of 1919 (two-tier structure)
to promote democratic decentralisation at the grass-root
level.
Besides, in an endeavour to integrate the Panchayat
institutions with community development programme
framework in West Bengal, Zilla Parishads Act, 1963
was enacted. This Act introduced two more tiers of local
self-government, i.e., Zilla Parishad at the district level
and Anchalik Parishad at the block level. Altogether 15
Zilla Parishads and 325 Anchalik parishads were
constituted.
Subsequently in 1973, West Bengal Panchayat Act was
passed annulling the previous two Acts. The four-tier
structure was replaced by three-tier all-India pattern of
Gram-Panchayat, Panchayat Samiti and Zilla Parishad.
The new Gram-Panchayat is similar to the Anchal
Panchayat of 1957 act as consisting of a group of
villages with a population of approximately 10,000.
Following the recommendations of B. Mehta
committee, Panchayat Samities were made
coterminous with blocks and Zilla Parishands were
made coterminous with districts. The act provided for
the direct election of members of all the three tiers
for a five-year term. The Prodhans of Gram-
Panchayats were ex-officio members of Panchayat
Samities and the Sabhapatis of Panchayat Samities are
similarly ex-officio members of Zilla Parishads. The
act also provided for nominations of officials without
voting rights into the standing committees of Zilla
Parishad and local MLA and MPs as ex-officio
members of both block and district tiers. The West
Bengal Panchayat Act, 1973 remains in vogue though
there are several amendments, specially after 73rd.
constitutional amendment of 1992.
2.8.2 Present scenario
The present Panchyat System, unlike earlier ones,
comprises three tiers. The lowest tier is the Gram-
Panchayat consisting of a group of villages as its
constituent parts and having a maximum population
of 7000. The number of total members of Gram-
Panchayats varies between 5 to 30 according to the
number of voters. In Bankura, there are at present
190 Gram-Panchayats with 2632 members (source:-
Economic Review, 2005-’06, p 218). The middle tier
is called the Panchayat Samiti at the Block level. In
Bankura, there are at present 22 Panchayat Samities
with 978 members (source:- Economic Review, 2005-
’06, p 218). The Zilla Parishad at the District level is
the highest tier of the Panchayat system. Each block
contains one to three constituencies consisiting of
contiguous Gram-Panchayats depending on the
number of electors in those Gram-Panchayats.
Lastly, we must add two more points in discussing
people’s participation is Bankura. Like all other districts
there is a provision for reserving seats at the three levels
of Panchayat for scheduled castes (SC) and scheduled
tribes (ST), based on population. In addition, since
1992 one-third of the seats have been reserved for
women (including women belonging to SCs and STs).
In 1977, the Left Front came into power and according
to their 36-point programme, the Panchayat Raj
institutions (PRI) were constituted by direct election at
all levels. Indeed, West Bengal in general and Bankura
in particular started the process of ‘revival’ of
106
2
Panchayat system through a new kind of grassroot
leadership.
Present day grassroot leadership of Bankura shows a
significant variation if it is compared with earlier
composition. Age-wise, younger people are now seen
in all the tiers of Panchayat. About 67.64 percent
Pradhans nowadays belong to the age-group of below
40 years and only 7.89 percent are above the age-group
of 50 years. At the Block level, none is above 50 years
of age and 72.73 percent Block-level representatives
belong to the age-group of below 40 years. At the
District level also most of the leaders (86.37 percent)
are within the age-group of 50 years and only 13.63
leaders are above. It may be safely concluded that age
is losing its significance as a criterion for selection of
representatives.
It is seen that power at the grassroot level, which was
previously monopolised by the higher castes, specially
the Brahmins, is now slowly but perceptibly shared by
other castes also. Within a short span of three decades
both SCs and STs have doubled their strength from
4.42 percent and 5.52 percent respectively to 10.00
percent and 13.16 percent respectively in 1988 election
at Gram-Panchayat level. However, their position at
Block-level and District-level is yet to improve. In fact,
social inequality in between the so-called ‘Bhadralok’
and ‘Chhotolok’, an ignominious and offensive divide,
will take some time to be routed and the process which
has started at the grassroot level will ultimately lead to
a new kind of realignment of social forces and this
change will come from within the village society and
not from without.
As regards sex, the malefolk still dominate with an
overwhelming majority at all the three levels of
Panchayat bodies. Though there are women
representatives due to the reservations, many of them
(as is true in other parts of India) are yet to fully
participate in the process of decision-maiking.
Involvement of women is surely going to address the
need of women and children in the long run.
From the stand point of education it can be safely said
that more and more educated people are taking part
at the grassroot levels, which is definitely a healthy sign
for a participatory democracy.
Again, from the economic point of view it is revealed
that though economically well-off people are still in
dominant position at the grassroot level, dut to structural
change in rural area, presence of the poor cannot be
ignored at the same time. About 30 percent of the
leaders at the Gram-Panchayat level belong to low-
income group. Similarly, at the Block level 40.91 percent
and 20.45 percent at the district level belong to this
category. In real terms they are just above the poverty
line.
Moreover, it can be said that the grassroot leadership,
which was mainly controlled by the land-owning class
(‘Jotedars’), has now been shifted to the teaching
community. At the Gram-Panchayat level, Block-level
and District-level respectively 29 percent, 49 percent
and 62 percent (approximately) representatives are
teachers. This trend is described by Nirmal Mukherjee
as ‘teacher caucus in West Bengal’. It has been found
on enquiry that the teachers are both highly esteemed
as well as economically well-off (due to pay revision
measures adopted by the Left Front Government). So
they receive support from the bulk of the people.
Finally, as regards the class-origin of grassroot leaders,
the middle-class peasants are gaining ground at all the
three levels of Panchayati Raj institutions. The presence
of poor peasants, marginal farmers, day-labourers, and
artisans at all the levels are on the increase. This is
definitely a healthy sign in developing democracy and
it can be safely concluded that pro-poor character, which
is the ultimate aim of this system, is gradually emerging.
Also all office-bearers of Panchayat (Pradhan, Upa-
Pradhan, Sabhapati, Sarakari Sabhapati, Sabhadhipati
and Sahakari Sabhadhipati and so on) are whole-timers
and receive monthly honorarium from the government.
Naturally the teaching community who were having
political patronage has lost the ground and a new group
of people who can devote as whole-time workers are
getting involved.
Since 1980, West Bengal government entrusted the
Panchayats with the implementation of as many as 27
development programmes. The list included some of
major developmental schemes, such as rural
reconstruction programme, rural water supply, rural
housing scheme, distribution of agricultural inputs,
programme of reconstruction of school building,
employment generation programme etc.
Decentralisation means devolution of fund, function and
functionaries to the local bodies. While function has
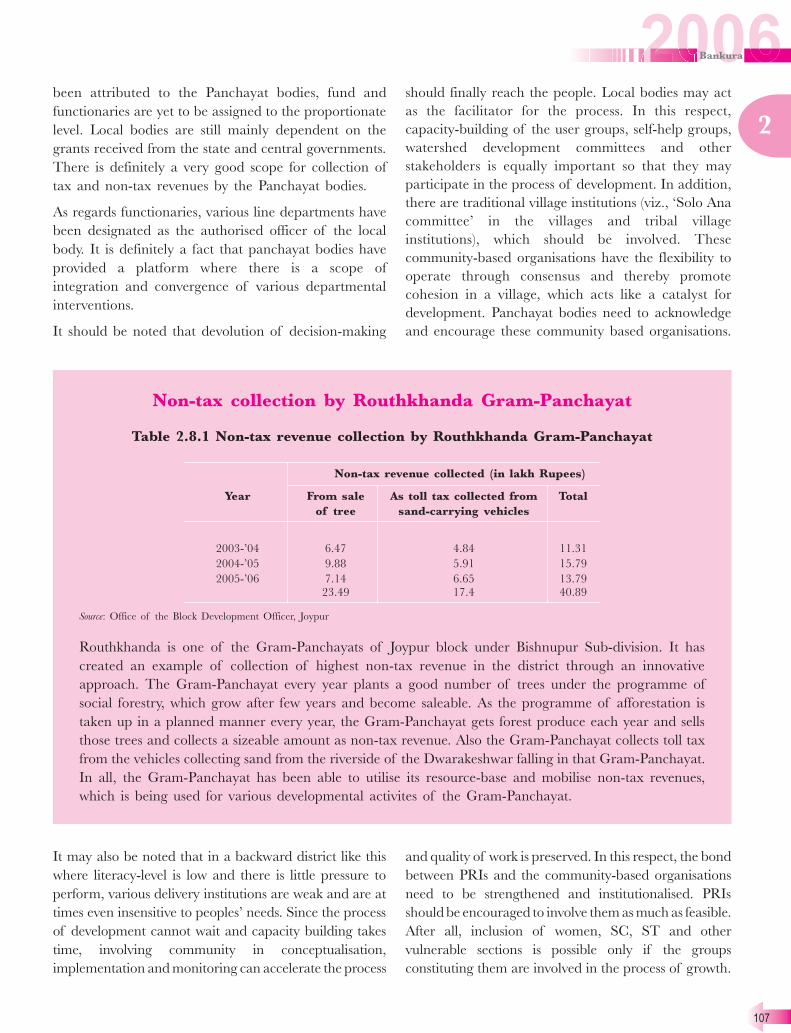
107
2
been attributed to the Panchayat bodies, fund and
functionaries are yet to be assigned to the proportionate
level. Local bodies are still mainly dependent on the
grants received from the state and central governments.
There is definitely a very good scope for collection of
tax and non-tax revenues by the Panchayat bodies.
As regards functionaries, various line departments have
been designated as the authorised officer of the local
body. It is definitely a fact that panchayat bodies have
provided a platform where there is a scope of
integration and convergence of various departmental
interventions.
It should be noted that devolution of decision-making
should finally reach the people. Local bodies may act
as the facilitator for the process. In this respect,
capacity-building of the user groups, self-help groups,
watershed development committees and other
stakeholders is equally important so that they may
participate in the process of development. In addition,
there are traditional village institutions (viz., ‘Solo Ana
committee’ in the villages and tribal village
institutions), which should be involved. These
community-based organisations have the flexibility to
operate through consensus and thereby promote
cohesion in a village, which acts like a catalyst for
development. Panchayat bodies need to acknowledge
and encourage these community based organisations.
Non-tax collection by Routhkhanda Gram-Panchayat
Table 2.8.1 Non-tax revenue collection by Routhkhanda Gram-Panchayat
Non-tax revenue collected (in lakh Rupees)
Year From sale As toll tax collected from Total
of tree sand-carrying vehicles
2003-’04 6.47 4.84 11.31
2004-’05 9.88 5.91 15.79
2005-’06 7.14 6.65 13.79
23.49 17.4 40.89
Source: Office of the Block Development Officer, Joypur
Routhkhanda is one of the Gram-Panchayats of Joypur block under Bishnupur Sub-division. It has
created an example of collection of highest non-tax revenue in the district through an innovative
approach. The Gram-Panchayat every year plants a good number of trees under the programme of
social forestry, which grow after few years and become saleable. As the programme of afforestation is
taken up in a planned manner every year, the Gram-Panchayat gets forest produce each year and sells
those trees and collects a sizeable amount as non-tax revenue. Also the Gram-Panchayat collects toll tax
from the vehicles collecting sand from the riverside of the Dwarakeshwar falling in that Gram-Panchayat.
In all, the Gram-Panchayat has been able to utilise its resource-base and mobilise non-tax revenues,
which is being used for various developmental activites of the Gram-Panchayat.
It may also be noted that in a backward district like this
where literacy-level is low and there is little pressure to
perform, various delivery institutions are weak and are at
times even insensitive to peoples’ needs. Since the process
of development cannot wait and capacity building takes
time, involving community in conceptualisation,
implementation and monitoring can accelerate the process
and quality of work is preserved. In this respect, the bond
between PRIs and the community-based organisations
need to be strengthened and institutionalised. PRIs
should be encouraged to involve them as much as feasible.
After all, inclusion of women, SC, ST and other
vulnerable sections is possible only if the groups
constituting them are involved in the process of growth.

108
2
It is also seen that peoples’ participation in Panchayat
is not optimum. Average attendance at Gram-Sansad
at Gram-Sabha meetings has been relatively low and
declining (10-12 percent). There is also evidence of
cases when the attendance at meetings falls below the
quorum. This is definitely a cause of worry since it
partly reflects a loss of interest of common people in
such institutions. There is, however, adequate evidence
to the positive role played by Panchayat bodies in
conflict resolution. This has resulted into a situation
in which felt need of people is getting reflected into
the action plan of the Panchayat bodies.
2.9 Investment climate
The economy of Bankura is mainly agrarian. Yet there
is a large scope of employment generation through
industrialisation. The district is broadly divisible into
two regions, the alluvial plains in the east and the
undulating tract to the west. Within the district and
even within these regions, there is wide variation in
geographical features as well as in the economic and
social life patterns.
The pace of industrialisation in the district has
historically remained slow. Despite the proximity to
Durgapur-Asansol industrial belt, there were no worth
mentioning large and medium-scale industries, till
some years ago, except a few like Mejhia Thermal
Power Project, Kangsabati Spinning Mill etc. This has,
however, picked up in recent years. There are many
factors conducive for industrialization in this district.
2.9.1 Mineral resources
Bankura is very rich in minerals like coal, copper,
Tungsten, cayanide, cheoline, ciotite, calc, red oxide,
felsper, lead, and mica etc. There is a big potential to
tap this resource and put up related industries.
Coal: The main mineral of the district is coal. The
coal mines are situated in Saltora, Mejhia, Barjora and
Gangajalghati area. Mejhia itself holds 10 coal mines.
Quantity of coal estimated to be present in Bankura is
11 million ton throughout an area of 33.5 Square Km.
Unfortunately illegal coal mining has become a big
nuisance. Around 5000 people are involved in this
activity. The returns are very good and as a result it is
very difficult to pull the community out of this activity.
Since the whole thing is illegal, the community is very
reluctant to sit with administrative agencies and sort it
out. The gap can only be bridged by some well-meaning
non-governmental organisations. People need to be
motivated to earn their livelihood in a dignified manner.
The only long-term solution is perhaps to regularise this
by allowing mining for captive use.
Copper: The district has a deposit of copper at Damdi,
Mukutmanipur, Khatra, Sarong, Nilgiri and
Narayanpur. Near Kangsaboti Dam, a 2 Km. long ridge
of copper has been found.
Tungsten: It’s a rare metal with vast demand in India
and other countries. Chhendapathar and Porapahar
have the deposit of this metal in the whole state.
Cayanite: This is another valuable mineral used in
heater, high temperature instruments etc. At Balarampur
(near Mukutmanipur), a huge amount of deposit (20
Km. long) has been found.
Cheoline: An excessive deposit of cheoline or china-
clay can be found at Jalahari Pahar, Dhatara, Malti,
Thakurdungry etc. and in many places of Taldangra
police station.
Mica: Bankura is one of the three districts of West
Bengal in which mica is available. Almost 100 numbers of
pegmatite have been found in Khatra, Indpur, Bankura
Town, Gangajalghati and Jhilimily though most of them
are in the form of either small shaped sheets or powder.
Biotite: Biotite is another metal almost alike mica. It
has been found in Karanjora, Dantkigora, Itadangra,
and Gourangadihi near Khatra sub-division and at
Mankanaly in Bankura.
Talc: This is one of the valuable minerals of Bankura. It’s
a very soft mineral used in making talcum powder. Rudra
and Matgoda of this district are enriched with talc.
2.9.2 Land
Bankura has a varied physiographic feature. As most
of the land in this district (specially the Sadar
subdivision) is mono-cropped with cropping intensity of
147 percent and the general productivity being low, the
cost of land is less than that of the industrialised
districts, a factor which can be conducive for setting up
the new industries.
Northern Bankura definitely has a clear advantage of
low cost of land, the area being mono-cropped and its
proximity to Durgapur and Asansol.

109
2
Table 2.9.1 Cost of land : a picture
Sub-division Class of land Cost per bigha (in Rs.)
Bankura Sadar Tara 40,000/- to 50,000/-
Baid 40,000/- to 50,000/-
Kanali 55,000/- to 65,000/-
Bishnupur Tara 45,000/- to 55,000/-
Baid 45,000/- to 55,000/-
Kanali 55,000/- to 65,000/-
Khatra Tara 45,000/- to 55,000/-
Baid 45,000/- to 55,000/-
Kanali 55,000/- to 65,000/-
Source:- Office of the District Registrar, Bankura
2.9.3 Water
Bankura is very poor in ground-water resources because
of crystalline basement. The average annual rainfall
reaches as high as 1400 mm., but a major part of the
precipitation passes away as surface run-off with only a
minor proportion contributing to the groundwater by
infiltration and percolation.
On the other hand, so far as surface flow is concerned,
the drainage of the district is mainly controlled by the
Damodar, the Dwarakeswar and the Kangsabati rivers
along with their network of tributaries. They have, in
general, south-easterly flow. The courses of the principal
rivers are approximately parallel to each other. Damodar
river rises in hilly country of Palamau district of
Chhotonagpur and before it touches Bankura district,
it receives the water of many smaller streams including
those of the Barakar, its principal tributary.
Dwarakeswar flows approximately through the middle
of the district and divides it into two halves. The
Kangsabati or the Kasai is the third largest river in the
district, which rises in the hilly terrain of Jhalda block
in the adjoining district of Purulia and enters Bankura
district in Khatra block. Also some other rivers or
tributaries, like Gandheswari, Sali, Arkasha, Birai, Bodai
etc. play an important role in the irrigation of the
district. Most of the rivers are seasonal. Damodar plays
an important role in providing water to the industries
based in north Bankura. Of course, the present sources
need augmentation to fulfil the requirement of the new
industries.
In this backdrop the scope of harnessing ground-water
as well as the scope of getting round-the-year abundant
water from river-lifting is limited for industry except
in the vicinity of the river of Damodar, which flows
throughout the year. Hence there can be an area-wise
variation of industries, in which industries with low-
water requirement may be set up in the western and
southern parts, whereas the eastern and north-eastern
parts of the district adjacent to the Damodar may be
ideal place for other industries.
2.9.4 Labour
The district has abundance of surplus labour, a fact
that is reflected from the statistics of the Census, 2001,
where it is mentioned that the number of non-workers
is 55.25 percent. A majority of these non-workers can
be engaged in the industries at reasonable wages. The
wage level is in any case low because of low demand.
A sizeable population goes for seasonal migration every
year, which indicates that there is surplus labour. Also
the expansion of technical and technological institutes
has been able to produce sizeable number of skilled
youths in recent times that can contribute to these
industries.

110
2
Table 2.9.2 Classification of workers
Sl. No. Category Percentage with respect to the population
1 Main workers 29.61
2 Marginal workers 15.10
3 Non-workers 55.25
4 Cultivators 13.77
5 Agricultural labourers 15.67
6 Household industries 2.34
7 Other workers 12.59
Source:- Census, 2001
2.9.5 Electricity
The existence of Mejhia Thermal Power Plant within
the district and other thermal power plants in
Durgapur and Kolaghat can be a boon for the
proposed industries for Bankura, as transmission-loss
can be minimum due to proximity of the district to
these power plants. The electrical grid in the district is
well-knit with the existence of two 132/33/11 KV
sub-station and twenty-four 33/11 KV sub-stations.
On the otherhand, per capita domestic consumption of
electricity is also very low compared to the adjoining
districts. Thus abundance of electricity can be used for
setting up of industries in the entire district.
In North Bankura there is an augmentation plan to have
an augmentation of 2 X 500 MW in the Mejhia
Thermal Power Plant which is going to be an added
advantage for the new industries coming up in this part
of the district.
Table 2.9.3 Block-wise number of mouzas electrified upto 2005-2006
Sl. Name of Total number Number of Percentage of
No. Blocks of mouzas mouzas electrified mouzas electrified
1 Bankura-I 150 120 80.0
2 Bankura-II 154 128 83.1
3 Barjora 199 172 86.4
4 Bishnupur 161 128 79.5
5 Chhatna 288 205 71.2
6 Gangajalghati 165 146 88.5
7 Indpur 222 135 60.8
8 Indus 131 124 94.7
9 Joypur 139 127 91.4
10 Khatra 155 113 72.9
11 Hirbandh 121 93 76.9
12 Kotulpur 170 148 87.1
13 Mejia 75 69 92.0
14 Onda 291 231 79.4
15 Patrasayer 160 137 85.6
16 Raipur 206 60 29.1
17 Ranibandh 186 102 54.8
18 Saltora 157 107 68.2
19 Sarenga 166 126 75.9
20 Simlapal 203 144 70.9
21 Sonamukhi 186 155 83.3
22 Taldangra 145 120 82.8
Total 3830 2890 75.5
Source:- Office of the Divisional Engineer (Rural Electrification), WBSEB

111
2
2.9.6 Communication network
Another factor which is important with respect to
building investment climate in the district is the
communication network.
2.9.6.1 Rail & road connectivity
Since the economy of Bankura district is still agrarian in
character and the settlement pattern scattered and rural,
the network of roads and bridges constitute a critical role
with regard to transportation of essential goods and
services. The existing road transportation system connects
different parts of the district with Kolkata and other
important towns. It is located 231 Km. from Kolkata
and connected to it through a good rail and road
network. It is connected to Durgapur (50 Km. away), an
industrialised town. Since this district is a continuation
of the Chhotonagpur plateau, the availability of raw
materials for black-top road on one hand and the
characteristic of soil, on the other hand, is favorable for
road-construction works. Railway system is also good.
The district is mainly served by the South-Eastern
Railway. The existing railway track passing through the
district has connectivity to the important places like
Kolkata, Asansol, Kharagpur, Ranchi, Tatanagar
etc. and new railway lines are also coming up.
Table 2.9.4 Length of railway track and different classes of
roads in the district (in Kms.as on 2003-2004 (provisional)
National highways State highways District roads Railway track
70 126 355 385
Source: Bureau of Applied Economics and Statistics, West Bengal
Map 2.9.1 Status of telephone coverage in Bankura

112
2
2.9.6.2 Telecommunication facility
Telecommunication facility is one of the important
modes of communication today and a recent study of the
land-line and mobile telephone services available shows
that most part of the district is under the coverage of land-
line or mobile telephone service or both. This telephonic
connectivity is also a positive factor for the setting up of new
industries in various corners of the district.
2.9.2 Investment in Bankura from 2003-’04 to 2005-’06
2.9.7 Investment status
Though Bankura has good potential for
industrialization, the investment scenario has been very
bleak till 1999. However, investment went up
substantially thereafter as the diagram 2.9.2 indicates.
Most of these are centered at the eastern side of the
district, which is close to the Durgapur-Asansol
industrial region.
The type of industries that have come up along with
the number of units and number of persons employed
is shown in table 2.9.5. A large number of sponge iron
units have also come up during the period.
Table 2.9.5 Industries set-up from 2003-’04 to 2005-’06
Year Number Number Types of
of units of persons units
set-up employed
2003-2004 7 681 Newspaper printing, bleaching, dyeing and
printing of cotton textile, ferro-chrome, ferro-
manganese & silico-manganese, dairy milk, potato
preservation, steel products, sponge iron,
alluminium and steel product, warehouse of agro-
products, pig iron and hot metal, fly-ash
2004-2005 21 2617
2005-2006 16 5896
Source:- Annual report and quarterly report published by the Directorate of industries, West Bengal
From 1999-2000, sponge iron industries began to
spring up in Bankura. Till date quite a few such
industries, with plant sizes varying from small to
medium, have came into existence. For a resource-
starved district as Bankura, this was seen to be a
welcome respite.
Sponge iron is relatively easy to produce as compared
to other varieties of iron. There is always a moderate
demand for sponge iron in the market. For Bankura
based plants, the market was Kolkata and Durgapur.
However, there are some areas of concern. A
medium-sized sponge iron plant need 3,00,000 litres

113
2
of water per day. The ground water level in areas
around these industries have already lowered
alarmingly. Everyday, volume of water that would
have sufficed to have met the water requirement of
50,000 people is being consumed by each of the
sponge iron plants. This raises more concern in the
light of the fact that this is happening in such a
drought prone district as Bankura.
In addition, many of these plants do not operate the
Electrostatic Precipitator (ESP), the pollution control
device. Shortage of ground-water is a genuine problem
and it is suggested that those kind of industries may be
encouraged in this district which requires less water.
2.9.8 Prospect
The mines and minerals play a vital role in the economy
of Bankura. In areas like Chhatna, Saltora, Khatra,
Ranibundh, Bankura to Indpur stretch, Raipur,
Taldangra, the prospects for setting up of mineral-based
industries are indeed bright, subject to environmental
clearance.
The blocks like Bishnupur, Sonamukhi, Patrasayer,
Indus, Joypur, Kotulpur have been setting up
agriculture-based industries like rice and oil-mills. There
is scope for more. The climate is also conducive for food
processing ventures.
The forest wealth of Khatra and Ranibandh areas has
always been remarkable. Various forest produce and
medicinal flora and fauna are routinely exported to
neighboring districts and also outside the State. On one
hand, industries can be developed to extract non-edible
oils and on the other, different medicinal plants and
ayurvedic formulations can be produced here. Such
development will not only generate employment
opportunities for local people, but also accomplish the
task of conservation of forest. Apart from this, in this
district large chunk of areas are having undulated
lateritic soil which cannot retain water. Consequently,
most of these areas is either under mono-crop
production or lying fallow. Certain aromatic plants and
foriculture, which require little irrigation, can be taken
up in this area. Moreover, new species of herbs and
medicinal plants may be planted in the vacant areas
and unutilized forest land.
Cottage & small-scale industry constitutes a major
segment of the district’s economy. It provides
maximum employment opportunity next to agriculture
and accounts nearly nine percent of the district’s
income. There is ample scope of development in this
sector with provision of modern technology and other
infrastructural facilities. Effort has been taken up for
the improvement of designs, marketing assistance and
finance etc. specially in case of brass & bell-metal craft,
conch-shell products, fishing-hook, pottery and leather
products etc. through different development agencies,
which could be promoted in a bigger way.
Bibliography :
1. District Gazetteer of Bankura, ed. by Amiya
Kumar Banerjee, IAS, p 223
2. Towards A District Development Report, by
Biswajit Chatterjee and Dilip Kumar Ghosh of
SIPRD, West Bengal, pp 51-52
3. Estimates of SDP and DDP of West Bengal, 1993-
’94 to 2000-2001, Bureau of Applied Economics
& Statistics, Govt. of West Bengal, 2002, p 75
4. Manab Unnayan: Paschimbanger Jelachitra (in
Bengali), by S. Dutta Roy, p 93

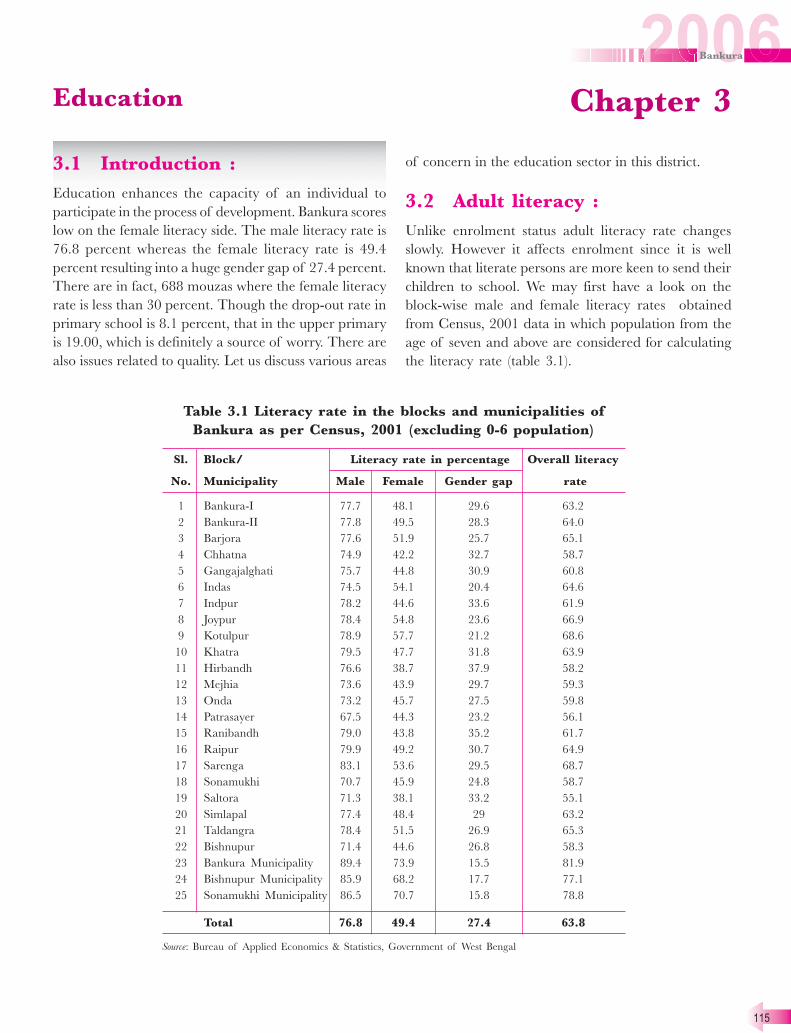
115
Chapter 3
3.1 Introduction :
Education enhances the capacity of an individual to
participate in the process of development. Bankura scores
low on the female literacy side. The male literacy rate is
76.8 percent whereas the female literacy rate is 49.4
percent resulting into a huge gender gap of 27.4 percent.
There are in fact, 688 mouzas where the female literacy
rate is less than 30 percent. Though the drop-out rate in
primary school is 8.1 percent, that in the upper primary
is 19.00, which is definitely a source of worry. There are
also issues related to quality. Let us discuss various areas
Education
of concern in the education sector in this district.
3.2 Adult literacy :
Unlike enrolment status adult literacy rate changes
slowly. However it affects enrolment since it is well
known that literate persons are more keen to send their
children to school. We may first have a look on the
block-wise male and female literacy rates obtained
from Census, 2001 data in which population from the
age of seven and above are considered for calculating
the literacy rate (table 3.1).
Table 3.1 Literacy rate in the blocks and municipalities of
Bankura as per Census, 2001 (excluding 0-6 population)
Sl. Block/ Literacy rate in percentage Overall literacy
No. Municipality Male Female Gender gap rate
1 Bankura-I 77.7 48.1 29.6 63.2
2 Bankura-II 77.8 49.5 28.3 64.0
3 Barjora 77.6 51.9 25.7 65.1
4 Chhatna 74.9 42.2 32.7 58.7
5 Gangajalghati 75.7 44.8 30.9 60.8
6 Indas 74.5 54.1 20.4 64.6
7 Indpur 78.2 44.6 33.6 61.9
8 Joypur 78.4 54.8 23.6 66.9
9 Kotulpur 78.9 57.7 21.2 68.6
10 Khatra 79.5 47.7 31.8 63.9
11 Hirbandh 76.6 38.7 37.9 58.2
12 Mejhia 73.6 43.9 29.7 59.3
13 Onda 73.2 45.7 27.5 59.8
14 Patrasayer 67.5 44.3 23.2 56.1
15 Ranibandh 79.0 43.8 35.2 61.7
16 Raipur 79.9 49.2 30.7 64.9
17 Sarenga 83.1 53.6 29.5 68.7
18 Sonamukhi 70.7 45.9 24.8 58.7
19 Saltora 71.3 38.1 33.2 55.1
20 Simlapal 77.4 48.4 29 63.2
21 Taldangra 78.4 51.5 26.9 65.3
22 Bishnupur 71.4 44.6 26.8 58.3
23 Bankura Municipality 89.4 73.9 15.5 81.9
24 Bishnupur Municipality 85.9 68.2 17.7 77.1
25 Sonamukhi Municipality 86.5 70.7 15.8 78.8
Total 76.8 49.4 27.4 63.8
Source: Bureau of Applied Economics & Statistics, Government of West Bengal
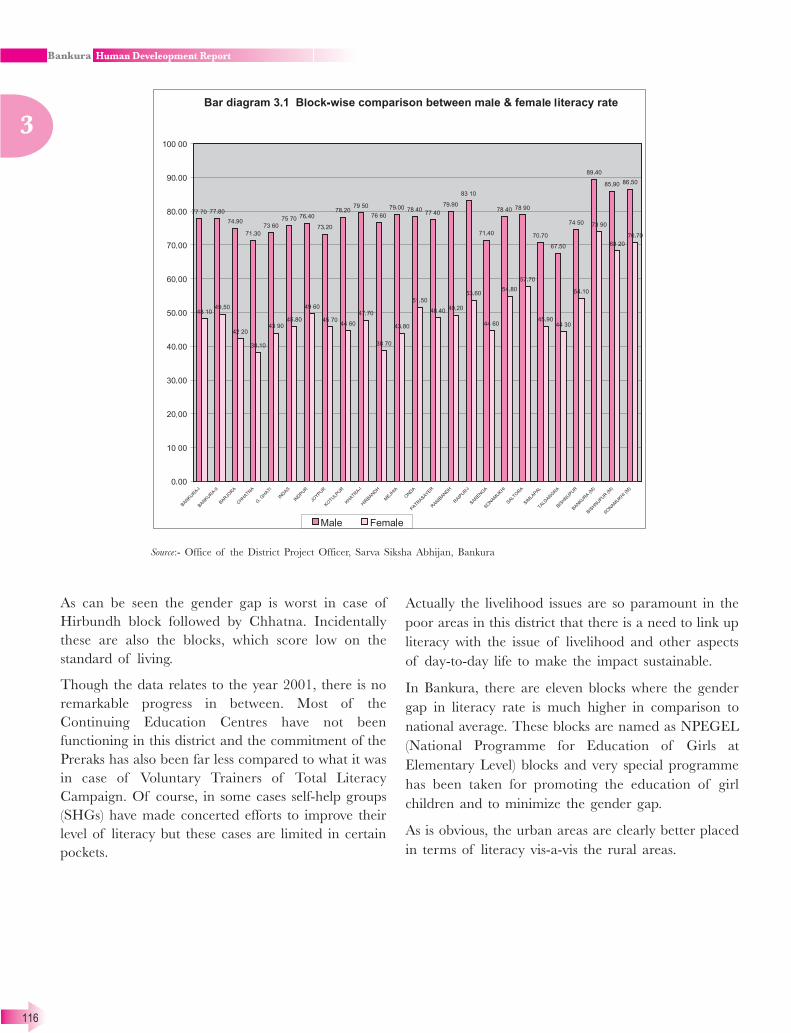
116
3
Source:- Office of the District Project Officer, Sarva Siksha Abhijan, Bankura
As can be seen the gender gap is worst in case of
Hirbundh block followed by Chhatna. Incidentally
these are also the blocks, which score low on the
standard of living.
Though the data relates to the year 2001, there is no
remarkable progress in between. Most of the
Continuing Education Centres have not been
functioning in this district and the commitment of the
Preraks has also been far less compared to what it was
in case of Voluntary Trainers of Total Literacy
Campaign. Of course, in some cases self-help groups
(SHGs) have made concerted efforts to improve their
level of literacy but these cases are limited in certain
pockets.
Actually the livelihood issues are so paramount in the
poor areas in this district that there is a need to link up
literacy with the issue of livelihood and other aspects
of day-to-day life to make the impact sustainable.
In Bankura, there are eleven blocks where the gender
gap in literacy rate is much higher in comparison to
national average. These blocks are named as NPEGEL
(National Programme for Education of Girls at
Elementary Level) blocks and very special programme
has been taken for promoting the education of girl
children and to minimize the gender gap.
As is obvious, the urban areas are clearly better placed
in terms of literacy vis-a-vis the rural areas.

117
3
Table 3.2 List of NPEGEL Blocks in Bankura & corresponding
female literacy rate
Sl. Name of Block Number of Female
No. Gram-Panchayats literacy rate
1 Saltora 8 38.1
2 Hirbandh 5 38.7
3 Chhatna 13 42.2
4 Ranibandh 8 43.8
5 Mejhia 5 43.9
6 Patrasayer 10 44.3
7 Indpur 7 44.6
8 Bishnupur 9 44.6
9 Gangajalghati 10 44.8
10 Onda 15 45.7
11 Sonamukhi 10 45.9
Source:- Office of the District Project Officer, Sarva Siksha Abhijan, Bankura
3.2 Residual illiteracy :
The district launched the Total Literacy Campaign
(TLC) in the year 1990. The objective of the campaign
was to achieve literacy for the age group 9-14 years and
15-50 years. The campaign started with whole-hearted
support of the Panchayats, all political parties and with
total involvement of the administration. The final
evaluation was made in June, 1992. After completion
of TLC, Post Literacy Project was initiated with the
objective of helping the semi and neo-literates in
strengthening and stabilising their acquired literacy skill
and to create congenial atmosphere for Continuing
Education Programme, which was launched in April
1999.
Table 3.3 Literacy scenario in Bankura
Total population 31,92,695
Population in (0-6) age-group 4,58,790 (14.37%)
Literacy rate of the district 63.44 %
Total literate excluding (0-6) age-group 17,34,386 (54.32%)
Total illiterate excluding (0-6) age-group 9,99,519 (31.30%)
Source:- Office of the District Magistrate, Bankura
A programme to eradicate the residual illiteracy has
been taken up with the following objectives:
1. To develop a strong human capital for the
development of the underdeveloped district.
2. To achieve total literacy based on the present
situation
3. To give special emphasis on the 15-35 age-group
with a special attention to the residual illiterates
among women, scheduled castes, scheduled tribes
minority communities and such vulnerable groups.
The project has been designed to cover about
three lakhs of illiterates between 15-35 age-group in
the Table 3.4 :
Table 3.4 Coverage of programme for
eradication of residual illiteracy
Number of phase Duration Stage
Phase-I 3 months Preparatory
Next 6 months Teaching learning process
Next 2 months Evaluation
Phase-II 6 months Teaching learning process
Next 2 months Evaluation
Source: Office of the District Magistrate, Bankura
The learning centres are planned to be opened in those
mouzas where the female literacy rate is less than 30
percent.

118
3Evening School for drop out students at Kabirdanga in
Ward No. 1 of Bishnupur Municipality
In the area of Bishnupur municipality under ward-number 1, Kabirdanga is a locality of 114 population.
This is the slum where IBRAD first intervened for implementing the project (Human Development)
activity. After collecting all the base line data and forming a SICO
group named by Kabirdanga Mahaprabhu Manab Unnayan Dal in
that slum, it was revealed that most of the children of this locality are
unable to go to school as they have been engaged in stone crasher
factory. SICO members informed that they are interested to send their
children to school but as the primary school is far from their locality
their wish was not fulfilled. But it would take some time to find a
solution. After a brief discussion with all the SICO members and
with the ward councilor on 23/06/06 at 6 am., the school was opened
with 45 students and two teachers which brought happiness and
satisfaction all over the locality. Vidyasagar Shishu Shiksha Kendra
has been set up for children of Kabardanga under Bishnupur Municipality .
It was decided that one evening school can be opened in the locality where the all drop out students will
go for education. One SICO member, Bandana, came forward to teach those children.
The school was opened on 21/03/06 with 21 students and one teacher. After the name of Vidyasagar
the school was named as Kabirdanga Vidyasagar Evening School. It opens for 5 days in a week.
Today the total number of students in this school is 30. Parents from other locality are also sending their
children in this school for the better future of their child. The parents are very satisfied with the opening
of evening school. With all the needed assistance from IBRAD the school, named by Rabindranath
Sishu Shikha Kendra, was inaugurated by ward councillor.
The main achievements of starting the school was Gurupada Manna, the father-in-law, of the school
teacher Bandana has left taking alcohol daily which posed a big problem for their family. He has realized
that since the students are coming to his house for learning it would hamper a healthy environment if
he takes alcohol. Thus, this school has brought consciousness and awareness among the local people in
a different way making the society awaken.
3.1 Growing interest towards
studies
3.4 Enrolment :
Progress in literacy and education depends upon the
propensity of children to go to school and also to
complete education at least up to the primary level.
Enabling all children to obtain Primary Education is
the key challenge particularly in some blocks in this
district. Total out of school children in this district for
primary segment (age 5+ to 9) are 17370 and for upper
primary (age 9+ to 14) it is 31564.These figures have
been obtained from child register which is maintained
for each Gram Sansad. The data, however, could not
be validated completely and there is every likelihood
that this will further go up. In terms of percentage this
is 4.44 percent and 10.08 percent respectively. Table
3.5 and 3.6 give a block wise break up of out of school
children.

119
3
Table 3.5 Out-of-School children in the district of Bankura ( 5+ to 8 + age group)
(As on 30.09.2005)
Sl. Name of Block/ Enrolment Out of school children Child Population in Percen-
No. Municipality in 5+ to 8+ age group in 5+ to 8+ age group 5+ to 8+ age group tage of
out-of
school
Male Female Total Male Female Total Male Female Total children
1 Bankura I 5886 5460 11346 392 423 815 6278 5883 12161 6.7
2 Banklura II 6794 6123 12917 265 287 552 7059 6410 13469 4.1
3 Barjora 9506 8740 18246 499 517 1016 10005 9257 19262 5.27
4 Chhatna 10180 9285 19465 536 555 1091 10716 9840 20556 5.31
5 Gangajalghati 9269 8187 17456 973 1011 1984 10242 9198 19440 10.21
6 Indas 8692 8186 16878 293 303 596 8985 8489 17474 3.41
7 Indpur 8729 8521 17250 255 263 518 8984 8784 17768 2.92
8 Joypur 8559 8356 16915 121 124 245 8680 8480 17160 1.43
9 Kotulpur 10032 9716 19748 238 246 484 10270 9962 20232 2.39
10 Khatra 7008 6760 13768 168 173 341 7176 6933 14109 2.42
11 Hirbandh 4463 4103 8566 251 261 512 4714 4364 9078 5.64
12 Mejhia 4178 3904 8082 257 266 523 4435 4170 8605 6.08
13 Onda 13385 12257 25642 598 620 1218 13983 12877 26860 4.53
14 Patrasayer 11548 10702 22250 860 894 1754 12408 11596 24004 7.31
15 Ranibandh 6474 6346 12820 200 207 407 6674 6553 13227 3.08
16 Raipur 8459 8665 17124 139 143 282 8598 8808 17406 1.62
17 Sarenga 5423 5621 11044 57 59 116 5480 5680 11160 1.04
18 Sonamukhi 10606 9831 20437 347 362 709 10953 10193 21146 3.35
19 Saltora 7316 6410 13726 846 880 1726 8162 7290 15452 11.17
20 Simlapal 8320 7962 16282 152 158 310 8472 8120 16592 1.87
21 Taldangra 8276 7888 16164 144 149 293 8420 8037 16457 1.78
22 Bishnupur 10347 9436 19783 509 530 1039 10856 9966 20822 4.99
23 Bankura Municipality 5197 5720 10917 326 340 666 5523 6060 11583 5.75
24 Bishnupur Municipality 2202 2238 4440 20 21 41 2222 2259 4481 0.91
25 Sonamukhi Municipality 1400 1266 2666 65 67 132 1465 1333 2798 4.72
Total 192249 181683 373932 8511 8859 17370 200760 190542 391302 4.44
Source: Office of the District Project Officer, Sarva Siksha Abhijan, Bankura
In blocks like Gangajalghati, Patrasayer, Saltora, Mejhia,
Bankura-I the percentage of out of school children of
total child population (5+ to 8+) group are 10.21, 7.31,
11.17, 6.08, 6.70 respectively. These are the blocks
where percentage of the out of school children is
relatively higher.
Following parameters need to be examined with respect
to the enrolment scenario in this district.
1. Lack of access to school for large number of
children.
2. Infrastructure.
3. Low level of completion of Primary education due
to drop out & repetition.
4. Low level of learning of students.
5. Migration related problems.

120
3
The first step is increasing access to primary school
and to provide adequate infrastructure. Bankura suffers
from poor access to social services due to low
population density, which is 464 per square km.
compared to the state average of 904 per square km.
Table 3.6 Out-of-School children in the district of Bankura ( 9+ to 13 + age group)
(As on 30.09.2005)
Sl. Name of Block/ Enrolment in 9+ to Out of School Children Child Population in Percen-
No. Municipality 13+ age group 9+ to 13+ age group 9+ to 13+ age group tage of
out-of
school
Male Female Total Male Female Total Male Female Total children
1 Bankura-I 4455 3797 8252 736 766 1502 5191 4563 9754 15.40
2 Bankura-II 5375 4399 9774 743 774 1517 6118 5173 11291 13.44
3 Barjora 8013 6964 14977 944 984 1928 8957 7948 16905 11.40
4 Chhatna 7626 5511 13137 1049 1091 2140 8675 6602 15277 14.01
5 Gangajalghati 7757 5963 13720 1199 1228 2427 8956 7191 16147 15.03
6 Indas 6641 5907 12548 643 669 1312 7284 6576 13860 9.47
7 Indpur 7967 5628 13595 642 668 1310 8609 6296 14905 8.79
8 Joypur 7054 5516 12570 154 161 315 7208 5677 12885 2.44
9 Kotulpur 7251 6492 13743 266 276 542 7517 6768 14285 3.79
10 Khatra-I 6285 4406 10691 339 353 692 6624 4759 11383 6.08
11 Hirbandh 4103 2859 6962 272 285 557 4375 3144 7419 7.41
12 Mejhia 3648 2857 6505 540 563 1103 4188 3420 7608 14.50
13 Onda 10779 7987 18766 1469 1528 2997 12248 9515 21763 13.77
14 Patrasayer 7562 5855 13417 1179 1228 2407 8741 7083 15824 15.21
15 Ranibandh 6034 4296 10330 380 397 777 6414 4693 11107 7.00
16 Raipur-I 9181 7389 16570 256 266 522 9437 7655 17092 3.05
17 Sarenga 6077 4590 10667 301 314 615 6378 4904 11282 5.45
18 Sonamukhi 5819 4587 10406 840 875 1715 6659 5462 12121 14.15
19 Saltora 4812 3534 8346 1158 1207 2365 5970 4741 10711 22.08
20 Simlapal 7143 5906 13049 349 366 715 7492 6272 13764 5.19
21 Taldangra 5733 4996 10729 434 453 887 6167 5449 11616 7.64
22 Bishnupur 5952 4621 10573 888 927 1815 6840 5548 12388 14.65
23 Bankura
Municipality 6268 5282 11550 318 333 651 6586 5615 12201 5.34
24 Bishnupur
Municipality 3227 3044 6271 167 176 343 3394 3220 6614 5.19
25 Sonamukhi
Municipality 2545 1909 4454 200 210 410 2745 2119 4864 8.43
Total 157307 124295 281602 15466 16098 31564 172773 140393 313066 10.08
Source: Office of the District Project Officer, Sarva Siksha Abhijan, Bankura
In addition there are natural barriers and small
habitations in forest areas. There are 64 backward
mouza in this district where there is no primary school
or Sishu Siksha Kendra (SSK) within 1 km. (Table 3.7).
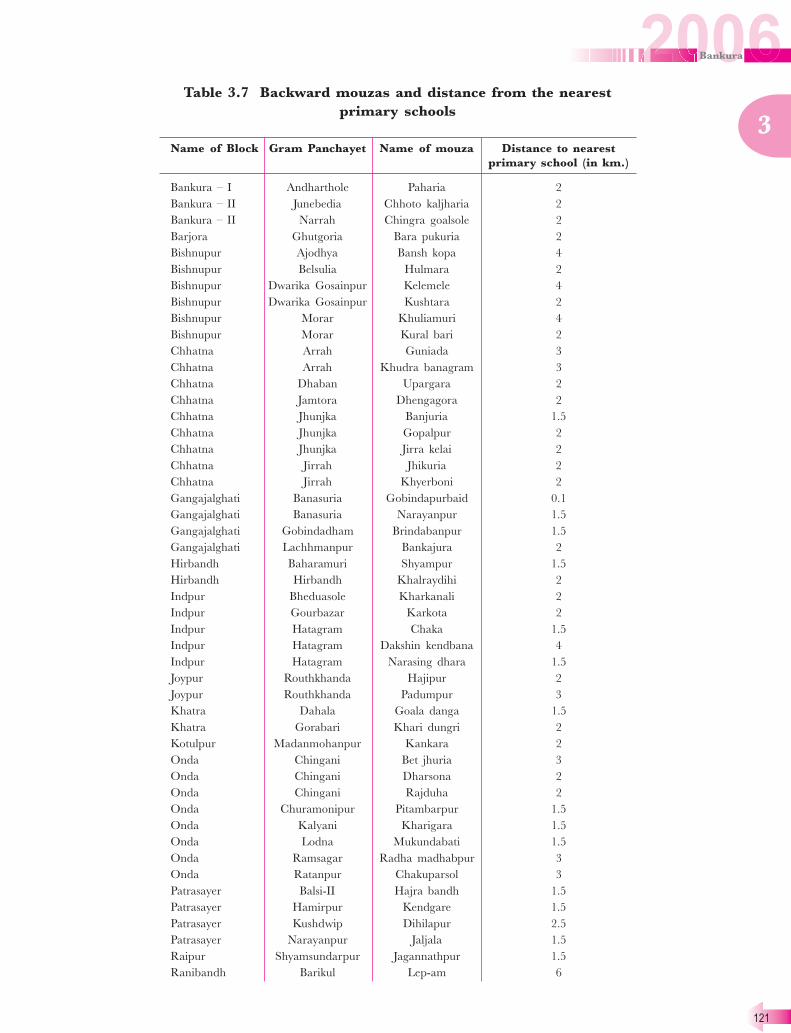
121
3
Table 3.7 Backward mouzas and distance from the nearest
primary schools
Name of Block Gram Panchayet Name of mouza Distance to nearest
primary school (in km.)
Bankura – I Andharthole Paharia 2
Bankura – II Junebedia Chhoto kaljharia 2
Bankura – II Narrah Chingra goalsole 2
Barjora Ghutgoria Bara pukuria 2
Bishnupur Ajodhya Bansh kopa 4
Bishnupur Belsulia Hulmara 2
Bishnupur Dwarika Gosainpur Kelemele 4
Bishnupur Dwarika Gosainpur Kushtara 2
Bishnupur Morar Khuliamuri 4
Bishnupur Morar Kural bari 2
Chhatna Arrah Guniada 3
Chhatna Arrah Khudra banagram 3
Chhatna Dhaban Upargara 2
Chhatna Jamtora Dhengagora 2
Chhatna Jhunjka Banjuria 1.5
Chhatna Jhunjka Gopalpur 2
Chhatna Jhunjka Jirra kelai 2
Chhatna Jirrah Jhikuria 2
Chhatna Jirrah Khyerboni 2
Gangajalghati Banasuria Gobindapurbaid 0.1
Gangajalghati Banasuria Narayanpur 1.5
Gangajalghati Gobindadham Brindabanpur 1.5
Gangajalghati Lachhmanpur Bankajura 2
Hirbandh Baharamuri Shyampur 1.5
Hirbandh Hirbandh Khalraydihi 2
Indpur Bheduasole Kharkanali 2
Indpur Gourbazar Karkota 2
Indpur Hatagram Chaka 1.5
Indpur Hatagram Dakshin kendbana 4
Indpur Hatagram Narasing dhara 1.5
Joypur Routhkhanda Hajipur 2
Joypur Routhkhanda Padumpur 3
Khatra Dahala Goala danga 1.5
Khatra Gorabari Khari dungri 2
Kotulpur Madanmohanpur Kankara 2
Onda Chingani Bet jhuria 3
Onda Chingani Dharsona 2
Onda Chingani Rajduha 2
Onda Churamonipur Pitambarpur 1.5
Onda Kalyani Kharigara 1.5
Onda Lodna Mukundabati 1.5
Onda Ramsagar Radha madhabpur 3
Onda Ratanpur Chakuparsol 3
Patrasayer Balsi-II Hajra bandh 1.5
Patrasayer Hamirpur Kendgare 1.5
Patrasayer Kushdwip Dihilapur 2.5
Patrasayer Narayanpur Jaljala 1.5
Raipur Shyamsundarpur Jagannathpur 1.5
Ranibandh Barikul Lep-am 6

122
3
This has further been analysed using GIS-based
habitation mapping. An attempt has been made to map
the location of primary schools and SSKs including
the layer showing habitation (from Survey of India
toposheet). The gap areas have been identified which
in turn will be validated from field verification. The
exercise has been completed for all the blocks. Here
an illustration has been made for Ranibundh block.
As can be seen there are more uncovered areas in south
Ranibandh which has more forest. New Sishu Siksha
Kendra (i.e. non-formal schools) may be proposed
using this methodology in the gap areas.
Even for the mouza where the distance of a primary
school/SSK is less than 1 km., small children find it
difficult to attend because of presence of, say, a rivulet
which may be full in the rainy season or a busy road.
It is a fact that parents are generally very interested in
sending these children to school but are at the same
time are worried about their security.
Similarly there are 23 backward mouza in this district
where the nearest upper primary school or a
Madhyamik Shiksha Kendra (MSK) is located at a
distance of more than 3 km. The list is shown below
on table 3.8.
Name of Block Gram Panchayet Name of mouza Distance to nearest
primary school (in km.)
Ranibandh Barikul Singlahar 2
Ranibandh Puddi Barunia 3
Ranibandh Puddi Gosaindihi 2
Saltora Bamuntore Krishnapur 2
Saltora Salma Dahuka 3
Saltora Tiluri Chakbaga 1.5
Saltora Tiluri Siakuldoba 2
Simlapal Bikrampur Bhudrubad 3
Simlapal Dubrajpur Bagnada 2.5
Simlapal Machatora Memouli 4
Simlapal Machatora Suknabad 4
Sonamukhi Dhansimla Amghata 5
Sonamukhi Dhansimla Indkata 5
Sonamukhi Hamirhati Paschim nabasan 3
Taldangra Panchmura Chakjambedia 1.5
Source: Office of the District Project Officer, Sarva Siksha Abhijan, Bankura
Map 3.2 Outreach pockets of Primary Schools and
Sishu Siksha Kendras in Ranibandh block

123
3
Table 3.8 Block level data on distance from government-run
Upper Primary school
Name of Block Gram Panchayet Name of mouza If no Upper Primary
School, then distance of
the nearest Upper
Primary School (in km.)
Chhatna Jhunjka Banjuria 5
Joypur Routhkhanda Padumpur 4
Onda Chingani Bet jhuria 7
Onda Chingani Dharsona 5
Onda Chingani Rajduha 7
Onda Kalyani Kharigara 6
Onda Ratanpur Chakuparsol 4
Patrasayer Kushdwip Dihilapur 5
Patrasayer Balsi-II Hajrabandh 4
Ranibandh Barikul Lep-am 13
Ranibandh Puddi Barunia 10
Ranibandh Puddi Gosaindihi 14
Saltora Salma Dahuka 4
Saltora Tiluri Siakuldoba 5
Simlapal Bikrampur Bhudrubad 7
Simlapal Machatora Memouli 8
Taldangra Panchmura Chakjambedia 2
Bishnupur Ajodhya Bansh kopa 4
Bishnupur Belsulia Hulmara 3
Bishnupur Dwarika Gosainpur Kelemele 3
Bishnupur Dwarika Gosainpur Kushtara 2
Bishnupur Morar Khuliamuri 3
Bishnupur Morar Kural Bari 2
Source:- Office of the District Project Officer, Sarva Siksha Abhijan, Bankura
As can be seen there are mouza where the distance is
as high as 14 km. Large distance in general a big
impediment and is more so for a girl child.
Infrastructure is definitely a very important issue. The
national norm is to provide 10 square feet for each child.
As per the DISE 2005 data*
there are 2188 primary
schools in this district where space-student ratio is less
than 7 sq.ft. All the schools have been indexed as per
*
It is conducted once in a year in each district to build what is known as the District Information on School Education (DISE).
the space-student ratio in this district and the schools
having the worst ratio is being given priority for
additional class room under the Sarba Siksha Abhijan
(SSA).
The block wise number of primary schools where the
space-student ratio is less than 7 sq. ft. is indicated
below in Table 3.9. During 2005-’06, 624 schools have
been covered.

124
3
In municipal areas there are a large number of
primary schools which are having space problem. A
serious negotiation with community is necessary in this
regard so that private land is obtained for setting up
of schools. In extreme cases, Land Acquisition can be
the only answer.
Migration is another big issue in this district. There is
a seasonal migration of 1-6 months from this district
in search of livelihood. Normally young children
accompany their parents during migration and
therefore miss out the vital primary education.
In view of the bottleneck indicated above following
interventions have been taken up to improve enrolment
in this district :
� Reduction of the cost of sending children to
Table 3.9 Space-student ratio in Primary Schools
Name of the Block Number of school where No of additional
space-student ratio is less class rooms provided
than or equal to 7 sq. ft. during the year
2005-‘06
Bankura-I 55 22
Bankura Municipality 54 14
Bankura-II 86 25
Chhatna 123 22
Barjoura 122 25
Gangajalghati 103 19
Bishnupur 95 37
Bishnupur Municipality 13 1
Indas 86 37
Indpur 111 20
Joypur 97 36
Kotulpur 118 50
Hirbandh 63 22
Khatra 78 30
Mejhia 32 18
Onda 159 26
Patrasayer 93 36
Ranibandh 90 21
Raipur 105 32
Sarernga 92 19
Sonamukhi 110 32
Saltora 79 21
Simlapal 113 31
Taldangra 96 26
Sonamukhi Municipality 15 2
Total 2188 624
Source:- Office of the District Project Officer, Sarva Siksha Abhijan, Bankura
schools by giving incentives like Free Textbooks,
School Uniform etc. has been found to be effective.
� The recent study reveals that the demand for school
attendance has been created by Mid-day Meal
Programme and has significantly increased the
attendance of pupils.
� The demand for education may be enhanced
through active community and parents’
participation. Therefore the mother-teachers’
association, Village Education Committee (VEC)
needs to be activated. The construction of school
class rooms/toilets have been entrusted to VEC in
this district and the results are very satisfactory.
They have been able to construct structures with
more floor area with the same amount.

125
3
� Attainment of high level of learning also requires
requisite tools for teaching and learning i.e.
Teaching and Learning Material (TLM) is to be
used at the time of teaching. Unfortunately most
of the achievement tests are held at the end of the
year rather than periodic test of students’
achievement. Use of TLM is generally less in class
room interactions.
The issue of girl child :
Achieving Universal Primary completion of education
is as important as achieving universal Primary
enrolment. The main reason of out of school children
Table 3.10 Out-of-school girls
Name of Name of Reasons Number of out of
the Block the Gram- school Girls
Panchayat
5+ to 8+ 9+ to 14 Total
Gangajalghati Lakshmanpur Economic Problem 190 235 425
Household Works 110 50 160
Others 20 0 20
Total 320 285 605
Source: Office of the District Project Officer, Sarva Siksha Abhijan, Bankura
There are of course some cases where distance is a
problem but the main reason is economic. A vocational
training programme has been initiated in that area for
out of school girl children. There is also a plan to start
a community library to ensure reading skill in girl
children which will equip them to improve their
learning. There is also a need to start Rabindra Mukta
is often household economic factors. Poverty finally is
the key issue and is more so for this district with high
migration in search of livelihood.
A study was conducted to understand the reasons
behind out-of-school girl children of 5+ to 14 age-
group in Lakshmanpur Gram-Panchayat in
Gangajalghati block. The picture which has emerged
reveals similar story. 94 percent school girls (5+ to 8+)
in primary level and 100 percent out of school girls
(9+ to 14) in upper primary level have been found to
have left schools due to poverty, household works and
other factors.
Vidyalaya – an initiative under Sarba Siksha Abhijan
on the distance learning methodology with flexible
timings suited to the out of school girl children.
However, the state norm on minimum number of girl
children for opening such vidyalaya should be raised
in view of the lower population density.
Community village library in Raipur block — a case study
Pratham, an NGO, recently collaborated with two West Bengal based NGOs, Calcutta Foundation and
Inspiration to pilot a “Library based accelerated reading programme”, in this district.
The objective of the programme is to impart reading skills/ enhance reading ability of every child
between 4 and 14, of every target village and supplement the efforts of the Government in universalising
education.
The selection of blocks and panchayats were made by Inspiration. The villages were recommended by
the panchayats. The preparatory work to start the Community Village Libraries began with a meeting
with the BDO of Raipur and visits to each and every panchayat, by a member, each from Calcutta

126
3Foundation, Inspiration and Pratham, where they met the Panchayat
members, village elders and of course the children to assess the need
of starting the libraries. The response was overwhelming. They not
only welcomed the endeavour, but also helped with the selection of
the village community volunteers to run the village community
libraries.
In Bankura, four villages of Raipur block have been identified for
piloting the pregramme.
After the block training in Raipur which was held in mid May, a
door to door survey was carried out in each village, together with village mapping.
Table 3.11 Baseline test for Raipur
Village Number of Number Number of
children tested of readers children able
to do subtraction
Phulkusma colony 46 23 23
Jashpara 131 105 119
Simli 260 118 83
Sarigari 137 92 89
Siarbeda 138 80 81
A base line test was also carried out at the time of survey. Children were tested in two areas, reading
of simple paragraphs and simple two digit subtractions. Every child in the survey agreed to be tested.
As can be seen from the above result there has been substantial gap in quality learning in these villages.
3.2 A village rural library
In two months of implementation there has been
remarkable support of the panchayat and village elders
together with substantial daily attendance of demanding
children.
Success stories
Tanushree Dey, aged 12 years, Std II (Jashpara): After 2
months, she cannot only read stories, but also has learnt
to write words without referring to books and subtract
Rashu Duley, aged 9 years, Std II, (Phulkusma): “Now
I can read fluently and also subtract. I love coming here
more than going to school-because I can draw and sing”.
Table 3.12 Enrolment per library (As on 1st
August, 2006)
Village/Location of Library Total Number Enrolled in Average daily
of children Libraries attendance
(3-14 yaers) till 31st
July,
2006
Phulkusma colony 147 144 80
Jashpara 171 110 75
Simli 324 156 55
Sarigari 204 147 60
Siarbeda 221 100 60

127
3
We may now make an attempt to understand drop out
scenario in this district. A study through sample survey
had been conducted to understand the dropout scenario
Bar diagram 3.3 Block wise analysis for primary education
CRF:- Completion rate in four years, ECR:- Ever completion rate
in different blocks and the results are indicated on
Table 3.13:

128
3
As can be seen the dropout is the maximum in the
first year. It is highest in Sonamukhi municipality
followed by Taldangra and Indus. For Sonamukhi it is
expected that switching to private schools might be one
of the reasons for the high dropout. Completion rate
is worst in Simlapal followed by Sarengra and Raipur.
Similarly the percentage of repeaters is highest for
Simlapal followed by Sarengra and Raipur.
The problem of dropout and repetition is linked closely
Table 3.13 Block and municipality-wise scenario of primary education (as on 30.04.2004)
(as revealed from COHORT sample study)
No. % No. %
Bankura-I 702 503 72 199 28 78 4 13 0 95 14 51 28 17 3 99 14
Bankura-II 809 526 65 283 35 35 39 12 0 86 11 110 27 17 6 160 20
Barjora 1047 856 82 191 18 47 33 9 0 89 9 49 21 9 3 82 8
Chhatna 906 681 75 225 25 23 41 26 1 91 10 44 33 18 7 102 11
Gangajalghati 852 715 84 137 16 18 13 12 0 43 5 18 24 27 5 74 9
Indas 1048 753 72 295 28 94 48 37 0 179 17 71 20 15 0 106 10
Indpur 886 742 84 144 16 3 14 8 1 26 3 39 23 32 14 108 12
Joypur 1240 977 79 263 21 49 13 6 1 69 6 132 20 1 0 153 12
Kotulpur 1110 914 82 196 18 18 13 15 1 47 4 83 16 13 4 116 10
Khatra 754 522 69 232 31 3 10 10 0 23 3 66 89 32 8 195 26
Hirbandh 477 436 91 41 9 0 6 1 0 7 1 0 2 32 0 34 7
Mejhia 491 361 74 130 26 9 33 24 0 66 13 5 11 17 3 36 7
Onda 1364 900 66 464 34 49 41 9 1 100 7 142 52 94 11 299 22
Patrasayer 924 644 70 280 30 13 7 5 1 26 3 191 29 17 2 239 26
Ranibandh 949 573 60 376 40 18 2 6 0 26 3 238 35 48 1 322 34
Raipur 933 434 47 499 53 43 11 10 0 64 7 289 59 43 17 408 44
Sarenga 875 397 45 478 55 27 53 14 0 94 11 249 58 17 13 337 39
Sonamukhi 977 722 74 255 26 47 16 4 2 69 7 146 19 14 5 184 19
Saltora 642 597 93 45 7 5 9 0 0 14 2 0 0 0 0 0 0
Simlapal 948 319 34 629 66 43 39 29 0 111 12 320 58 90 14 482 51
Taldangra 974 521 53 453 47 41 81 33 1 156 16 202 30 21 4 257 26
Bishnupur 740 600 81 140 19 57 21 5 3 86 12 15 14 17 1 47 6
Bankura
Municipality 736 401 54 335 46 47 15 9 0 71 10 77 48 21 3 149 20
Bishnupur
Municipality 288 247 86 41 14 2 3 21 0 26 9 1 4 3 2 10 3
Sonamukhi
Municipality 111 72 65 39 35 13 7 2 0 22 20 8 4 1 0 13 12
Total 20783 14413 69 6370 31 782 572 320 12 1686 8 2546 724 616 126 4012 19
Source: Office of the District Project Officer, Sarva Siksha Abhijan, Bankura
To
tal S
tu
den
t S
urveyed
Name of the
Block/
Municipality
Students who
have
completed
primary
education in
four years
Students who
have
completed
primary
education in
more than
four years
Name of dropout students in
First year
Seco
nd
year
Th
ird
year
Fo
urth
year
To
tal n
um
ber o
f
dro
p-o
ut stu
den
ts
Percen
tage o
f d
ro
p-
ou
t stu
den
ts
Number of repeaters
First year
Seco
nd
year
Th
ird
year
Fo
urth
year
To
tal n
um
ber o
f
rep
eaters
Percen
tage o
f
rep
eaters
with quality of education. Poor quality schooling
reduces completion rate. Even for upper primary level
the dropout rate in class V is highest. The main reason
is found to be the poor level of learning of Class IV
children.
Teacher-student ratio is definitely an important factor
in imparting quality education. Let us have a look at
the teacher-student ratio in different levels of education
in this district.

129
3
Table 3.14 Block-wise pupil-teacher ratio at the levels of primary,
middle and higher education (2003-2004)
Bankura–I 105 10153 262 38.7 4 910 26 35 8 3754 103 36.4
Bankura–II 123 11779 320 36.8 4 1279 35 36.5 8 3860 100 38.6
Chhatna 239 16223 483 33.5 6 1564 39 40.1 11 6116 129 47.4
Saltora 119 10673 250 42.6 3 672 19 35.3 9 3889 112 34.7
Mejia 72 7477 177 42.2 2 863 12 71.9 5 2887 63 45.8
Gangajalghati 162 14791 369 40.0 6 1803 38 47.4 11 6117 145 42.1
Barjora 190 17532 474 36.9 4 911 26 35.0 14 7392 170 43.4
Onda 243 22586 617 36.6 3 407 19 21.4 17 11096 235 47.2
Indpur 166 16030 380 42.1 10 1939 65 29.8 10 5732 135 42.4
Khatra 116 11180 283 39.5 4 889 25 35.5 9 5674 118 48.0
Hirbandh 90 8008 180 44.4 4 998 26 38.3 7 4020 93 43.2
Ranibandh 155 12899 326 39.5 4 712 25 28.4 8 4759 103 46.2
Taldangra 164 15820 459 34.4 8 2467 51 48.3 10 4760 133 35.7
Simlapal 171 16227 385 42.1 8 2141 52 41.1 10 4994 127 39.3
Raipur 153 13334 350 38.0 11 2728 70 38.9 16 10002 221 45.2
Sarenga 156 13994 362 38.6 3 1293 19 68.0 8 5631 112 50.2
Bishnupur 147 14210 400 35.5 3 947 19 49.8 8 6248 121 51.6
Joypur 157 15267 519 29.4 6 1554 26 59.7 7 4509 98 46.0
Kotulpur 159 17176 539 31.8 6 1698 25 67.9 13 7846 187 41.9
Sonamukhi 153 15599 385 40.5 3 1058 19 55.6 5 3772 69 54.6
Patrasayer 140 17687 369 47.9 6 1427 27 52.8 7 2002 91 22
Indus 141 15520 404 38.4 8 1777 51 34.8 6 3116 78 39.9
Block
Primary Middle High
In
stitu
tio
n
Stu
den
t
Teach
er
Pu
pil T
each
er
Ratio
In
stitu
tio
n
Stu
den
t
Teach
er
Pu
pil T
each
er
Ratio
In
stitu
tio
n
Stu
den
t
Teach
er
Pu
pil T
each
er
Ratio
Source: Office of the District Project Officer, Sarva Siksha Abhijan, Bankura
Though the overall pupil-teacher ratio in primary
education is 37.4, it is seen that in many blocks the ratio
is much worse. A proper rationalization of distribution
of teachers is essential in order to bring the quality of
learning to a reasonable level.
There are also non-formal education systems such as
Shishu Shiksha Kendra, Madhyamik Shiksha Kendra
functioning in this district. A study suggests that the
quality of learning in Shishu Shiksha Kendra (SSK) and
Madhyamik Shiksha Kendra (MSK) is better than that
in primary schools and upper primary schools. The
dedication of contractual Siksha Sahayika in SSK and
Samprasarak in MSK is more than the regular teachers
and that may be one of the reasons. Actually the
Sahayika/Samprasarak are from the same area and
are generally committed and responsible to the
community. The coverage of students by these non-
formal systems is far less as the table 3.15 suggests.

130
3
Table 3.16 Block wise enrolment in Madhyamik Siksha Kendras (MSK)
(As on 30.09.2005)
Sub- Sl. Block No. of Class–V Class–VI Class–VII Class–VIII Total for
Division No. MSK all classes
Bankura Sadar 1 Bankura – I 2 120 108 97 85 410
2 Bankura - II 2 95 86 78 36 295
3 Barjora 2 100 92 82 35 309
4 Chhatna 2 110 98 86 0 294
5 Gangajalghati 3 185 165 147 81 578
6 Saltora 3 137 124 114 75 450
7 Onda 6 314 275 208 85 882
8 Mejia 2 130 118 107 28 383
Bishnupur 9 Bishnupur 4 198 178 160 35 571
10 Joypur 4 243 220 201 78 742
11 Kotulpur 3 147 133 120 81 481
12 Sonamukhi 5 292 267 242 105 906
13 Patrasayer 9 385 348 320 76 1129
14 Indus 3 155 141 125 29 450
Khatra 15 Ranibandh 7 370 338 306 58 1072
16 Taldangra 6 275 253 230 103 861
17 Simlapal 1 45 37 33 26 141
18 Sarenga 1 60 54 45 28 187
19 Raipur 4 244 223 42 30 539
Grand Total 69 3605 3258 2743 1074 10680
Source: Office of the District Panchayat & Rural Development Officer, Bankura
Table 3.15 Block wise total number of Shishu Siksha Kendra
(SSK) & total number of learners (As on 30.09.2005)
Name of Block No. of SSK No. of boys No. of girls Total
Bankura-I 18 442 498 940
Bankura-II 21 425 481 906
Barjora 21 546 556 1102
Bishnupur 22 548 525 1073
Chhatna 16 403 378 781
Gangajalghati 22 589 564 1153
Hirbandh 11 267 271 538
Indpur 19 438 452 890
Indus 26 607 657 1264
Joypur 34 660 718 1378
Khatra 14 436 457 893
Kotulpur 27 632 664 1296
Mejia 6 161 151 312
Onda 33 862 875 1737
Patrasayer 29 825 905 1730
Raipur 21 532 492 1024
Ranibandh 9 194 217 411
Saltora 15 331 357 688
Sarenga 15 334 335 669
Simlapal 21 575 608 1183
Sonamukhi 23 600 616 1216
Taldangra 24 446 527 973
Total : 447 10853 11304 22157
Source: Office of the District Panchayat & Rural Development Officer, Bankura

131
3
3.5 Mid-day meal programme
in Bankura*
Launched primarily with a very small number of
selected primary schools (100 to be exact) of Ranibandh
and Indus blocks of the district in January 2004, the
Cooked Mid-day Meal programme took a remarkably
quicker pace to cover all the primary schools and Sishu
Siksha Kendras (SSK) by March 2005. And, at the time
of writing this brief account of the Mid-day Meal
programme in the district preparations were reportly
going on in full swing to overcome the difficulties to
cover the upper primary and high schools and
Madhyamik Sishu Siksha Kendras (MSK) under the
scheme. As regards the number of children provided
with this immensely important entitlement was 3,44,746
(83.25 percent of the children studying in primary
classes) from 3460 primary schools and 453 SSKs. The
district administration has reportedly made a plan to
implement with priority - to extend this opportunity to
the rest 69,397 children who were enrolled in the upper
primary and high schools and MSKs (in class 5).1
The Plan of Implementation
The strength of the programme lies, perhaps in its
planning which made the implementation procedure
much simpler. As such, the implementation of the Mid-
day Meal programme in West Bengal is quite instructive
in itself – there have been the strengths as well as the
weaknesses, which are discussed elsewhere.2
Nevertheless, one of the major strength of the
programme seems to be the flexibility in the operational
aspects of the programme. With a general guideline
provided by the state government (which is again based
on the central guideline) the different district
administrations developed their own strategies of
implementation. The diversification in planning the
implementation, however, produced mixed results:
there have been large variations in the degree of
effectiveness of the plans. The plan adopted for
implementation in Bankura is much straight forward
in nature that allows the various implementing
constituents (block, school, etc.) larger space for
focussing on actual works than on the bureaucratic
formalities. According to the plan, the grain and fund
are made available to the schools on a regular scale.
The actual implementation (accounts related to
number of children provided with meal, expenditure,
and so on) is reported back to the District
Administration through a very simple format. Also the
implementation procedure made much larger room for
the SHGs to get involved in the programme in a bigger
way – not only cooking, but also procuring the
vegetables and ingredients, etc. As a result, most of
the teachers interviewed by us, unlike in some other
districts, maintained that they did not have to sacrifice
the teaching and learning activities for the Mid-day
Meal programme.
The district administration was also found to be much
active in making provision of cooking sheds in the
primary schools and SSKs. A co-ordinated linkage of
various departments has made it possible to establish
kitchen sheds in 3298 primary schools and 225 SSKs.
Rest of the institutions would be covered within 2006.
The Impact
That the programme in Bankura districts has been
following the countrywide trend3
of exerting several
impacts on child nutrition and education was re-
affirmed by different stakeholders, viz. parents, teachers,
children and others. While the major outcome of the
* NOTE: This study has been conducted by Pratichi trust. Earlier, Pratichi has carried out a study on the mid-day meal programme
in Birbhum district in2004, the usefulness of which has been recognised by the state and central Government and other agencies. The
present study is based on a visit to fifteen primary schools across three blocks of the district (Bankura I, Mejhia, and Hirbandh) and
also the findings of the study carried out by the Sarva Siksha Abhiyaan, Bankura.
1 As a general practice in West Bengal, most of the primary schools have classes up to 4th standard and 5th standard is generally
taught in upper primary and high schools and MSKs. The main difficulty of implementing the scheme in these schools is the
attachment of the highest primary class with the classes above 5 which are not entitled to benefit from the cooked meal programme.
How could only the class 5 children be served the meal ignoring the presence of others who are equally hungry is a practical
problem.
2 Rana, Kumar, (2005), ‘Food for Thought’, The Little Magazine, Vol. 6, Issue 1 &2, Delhi. Also, Pratichi Research Team (forthcoming),
3 Dreze Jean and Aparajita Goel (2003), ‘Future of Mid-Day Meals’, Economic and Political Weekly, Vol XXXVIII, No. 44, November 1
132
3
programme was the increase in the level of attendance
of the children and teachers, there have been several
other influences of far reaching effect.
The increase in the rate of attendance is a critically
important issue, and in Bankura district this
achievement indicates a much bigger advancement. To
illustrate, Bankura has a high concentration of socially
and economically backward communities. The
Scheduled Caste (SC) and the Scheduled Tribe (ST)
population consist about 41 percent of the total
population – SC 31 percent and ST 10 percent. Again,
the socio-economic level of the SC communities of
Bankura is much below the state average. While,
according to the 2001 Census, the literacy rate of the
SCs in West Bengal is 59 percent, the corresponding
figure for Bankura is a meagre 43 percent (SC female
literacy being appallingly low – 27 percent). Again,
while the state average of proportion of agricultural
labourer to main workers among the SCs in West
Bengal is about 38 percent, the figure for Bankura
district shows a much higher percentage (60) of SC
population engaged as agricultural labourer. Even the
condition of the STs is Bankura is marginally better
than the SCs. The literacy rate among the STs in
Bankura is about 50 percent (female literacy being 29
percent), which is considered to be very poor but better
than the state average (43 percent). A large proportion
of the STs in the district are engaged as agricultural
labourers (53 percent of the main workers).4
The
particular socio-economic background of the SC and
ST communities of the district has added enormously
to the relevance of the Mid-day Meal programme. The
success of the programme in raising the level of
attendance of the children is clearly linked with the
uplift of the disadvantaged groups in terms of realising
the educational facilities in an effective way.
No wonder thus, that while the increase in the level of
attendance among the caste Hindu children veered
around 10 percent, the corresponding figures for the
SC and ST children were much higher – 18 percent
and 21 percent respectively. This clearly relates the
effectiveness of the programme with bringing the
children of the disadvantaged groups into the realm
of primary education who suffered from the traditional
weakness of virtual inaccessibility of primary schooling.
4 Census of India (2001), Primary Census Abstract, West Bengal, SC&ST
At the same time the programme has seemingly linked
itself with the success related to eradicating classroom
hunger as well as under nutrition among the children
of the underprivileged groups. Many of the parents and
children have been seeing this programme as a major
state intervention in their favour.
Aside from these vital advancements there have been
several other impacts of the intervention. The increased
rate of attendance of the children – and in many cases
teachers – has had a positive role in the functioning of
the schools. Barring a few exceptions all the schools
visited were seen to be running in schedule keeping the
teaching and learning activities in the centre. This
clearly nullifies the anticipation of a larger section of
the media, intelligentsia, relatively richer parents and
others who predicted a total collapse in teaching and
learning activities.
In addition, the programme has achieved some major
successes in reducing the gap between the different caste
hierarchies. At the initial phase of the implementation
of the programme some of the primary schools of
Bankura hit the headlines owing to their encountering
of some conflicts based on caste line. Any keen social
observer knows how obvious caste discriminations are
in a society with strong class-caste compatibility, and
how various social interventions could reduce such
discriminations. The Mid-day Meal programme seems
to have offered an opportunity, however limited it may
be, to reduce the sense of distance between the children
of different social groups. In many of the schools,
teachers maintained that the high caste children have
started sharing the food with others, shredding off their
earlier inhibitions. In some schools some children were
said to have been following the instructions of their
parents as not to share the food with the children of
chhotolok families, but only in the days when the food
was not delicious: however strict the instructions might
be, the high caste children were seen to defy them when
a delicious meal (with eggs, fish or meat) was served.
Aside from the above, the programme seems to have
some other impacts, viz., the expansion of opportunities
of gainful employment among the women organized in
self-help groups. As such the remuneration they receive
as cooks is much less than just: it is much lower than

133
3
the declared minimum wage and calls forth a
restructuring at the state and central level. Yet, the
involvement in the programme has certainly created
larger scope of income generating activities for the
women in the form of supplying ingredients (fish,
vegetables, eggs, spices, etc.) to the schools, not only by
procuring from market but also by producing the same.
Of the various positive results of the programme one
of the major advancement certainly deserves a mention:
the programme, as across the state, has helped the
primary education system attracting larger public
attention. Most of the teachers said that on the one
hand it had made the parents and other members of
the public keener on the functioning of the primary
schools. On the other it has helped dragging the
attention of the authorities towards the primary schools
some of which were not even visited by any official for
two-three years by any official. As a villager pointed
out, “now, even the District Magistrate has also visited
the village.” Needless to mention, a visit by the District
Magistrate to a geographically remote village, inhabited
by very poor, was an event for the villagers.
Complaints on some problems
It is not, however, free from hindrances. There have
been several problems that the implementing agencies
in the district have to take suitable measures to solve.
While some of the problems have to be addressed at
the centre and state level some of them could certainly
be taken care of at the district and locality level.
Let’s take up the problems arose of the central design.
The total schooling days as per the list provided by the
District Primary School Council were 248, but the
provision made by the central government for the meal
to be served was for 220 days. Again, in several schools
complaints were raised that the quantity of meal served
was not up to the need of the children. Both the cooks
and teachers reported that the allotted 100 grams of
rice per child was found inadequate for a large section
of the children, and it was demanded that the quantity
be increased. Similar demands were also heard in many
other schools across the state. Also most of the teachers
demanded an increase in the conversion cost (which was
Rs 2 per child, and again from which 10 paise was
deducted for paying the cooks). The third complaint
relates to the perceived injustice towards the cook, who
are paid a pittance, which was much less than the
declared minimum wage. The teachers and some
parents also supported the cooks and demanded that
the cook be paid at least the minimum wage for the
manual labourers fixed by the government.
While the above problems need the attention of the
central and state governments some of the problems
were found to be related with the local dynamics and
programme implementations. One of the problems
of much serious nature, as has been the case across
the state, appeared to be the hindrances and
complications concerning the appointment of cooks.
Owing to the severe want of employment opportunity
the programme was seen by a large number of women
as a prospect, however meagre the remuneration might
be. This desperation for gainful employment was found
to have led to competition and eventually conflicts
among the women that, in some places, even resulted
in stopping the programme. In some places, the local
party-political dynamics had reportedly played a
counterproductive role. These problems need to be
sorted out with prompt and resolute actions.
Secondly, in some cases the local authorities seem to
have failed to understand the spirit of the programme.
This guided them to implement the programme in a
mechanical manner. For example, the programme was
found not to be in operation in some of the schools in
the month of May, though the schools were open.
When enquired about the fact an official said that he
was following the norm that provided meals for 10
months in the year. Unfortunate as it was the official
did not consider adjusting the days of stopping meals
with the vacations and other holidays. Similarly, while
some of the blocks have made excellent use of the
funds available for establishing kitchen sheds some
seemingly could not overcome the bureaucratic
hangover that resulted in a lacklustre construction of
the kitchen sheds which were far too inadequate to
serve the purpose. Indeed, we have seen some schools
to abandon the newly built kitchen sheds, as they did
not even have any ventilation.
Thirdly, the programme as a whole and the supervision
and monitoring system in particular seems to be
severely understaffed (this, nevertheless, has larger
connection with the state level policies). There is
probably a need for serious consideration on this aspect
in order to fortify the programme from probable
damages and run it more effectively.

134
3
Table 3.17 Statement of enrolment vis-à-vis month wise sub-allotment of
mid-day meal rice for the year 2006 – 2007 for the month of July, 2006
1 Bankura-I 119 9376 2049 2 120 18 940 12485 222.86
2 * Bankura-II 136 11136 2211 2 95 21 898 14340 95.00
3 Chhatna 262 16068 3353 2 110 16 820 20351 363.27
4 Gangajalghati 185 14727 3078 3 185 22 1147 19137 341.60
5 Saltora 134 10469 2343 3 137 16 725 13674 244.08
6 * Barjora 214 17018 3006 2 100 21 1102 1 84 21310 300.00
7 Onda 269 22581 4661 5 264 33 1734 1 280 29520 526.93
8 Mejhia 81 7203 1326 2 130 6 312 8971 160.13
9 Khatra 132 11314 2567 0 0 15 956 14837 264.84
10 Hirbandh 103 7542 1933 0 0 11 544 10019 178.84
11 * Indpur 192 15700 3379 0 0 19 899 19978 296.61
12 Raipur 217 16328 4464 1 76 21 1027 21895 390.83
13 Sarenga 135 10137 2710 1 60 15 679 13586 242.51
14 * Simlapal 194 15520 3159 1 45 21 1190 19914 255.46
15 * Taldangra 187 15007 2738 6 275 25 1009 19029 139.00
16 Ranibandh 171 12394 2848 7 370 10 461 1 162 16235 289.79
17 Bishnupur 164 14268 2945 4 198 22 1087 18498 330.19
18 Sonamukhi 167 15514 2687 5 292 25 1309 19802 353.47
19 * Patrasayer 159 17719 3309 9 410 29 1800 23238 414.80
20 * Indus 162 14640 3233 3 155 26 1260 1 215 19503 348.13
21 Joypur 176 14576 2951 4 243 34 1391 19161 342.02
22 Kotulpur 184 17132 3421 3 147 27 1295 1 66 22061 393.79
23 Bankura
Municipality 99 10231 2704 0 0 0 0 11 580 13515 241.24
24 Bishnupur
Municipality 40 3615 1505 0 0 0 0 1 60 5180 92.46
25 Sonamukhi
Municipality 34 2450 817 0 0 0 0 5 235 3502 62.51
Total 3916 322665 69397 65 3412 453 22585 22 1682 419741 6890.36
Source : Office of the District Panchayat & Rural Development Officer, Bankura
Sl.
No.
Block/
Municipality
Primary and Upper
Primary SchoolsMSK SSK
Schools run by
Local body
Total
enrol-
ment
Rice
allotted
for the
month of
July (in
Qtl.)
Number
o f
Schools
Enrolment
Class
I–IV
Class
V
Number
Enrol-
mentNumber NumberLearners
Enrol-
ment
Fourthly, some complaints regarding the poor quality
of rice supplied by the FCI was raised by some cooks
and teachers. Though such complaints were not found
to great expanse, there is a need for particular vigilance
on this aspect. Also there have been some complaints
regarding shortages in quantity and delay in supply,
which need to be addressed.
Finally, the functioning of the Mid-day Meal
programme in the district, as elsewhere, was found to
have strong attachments with the overall functioning of
the schools that depended on several factors including,
public participation, number of teacher, infrastructure
and so on. There has been a strong correlation between
larger public involvement in the programme and its level
of success. This adds to the urgency of modifying the plan
in order that enough room could be created for parents
and other locales to take part in the delivery of the
programme as well the governance of the schools. Also
there is a great need for immediate intervention in
streamlining the distribution of teachers in order to equip
all the schools with more than one teacher. The shortages
in terms of infrastructure cannot also be ignored.

135
3
Despite several constraints the cooked meal programme
in the district has achieved several successes. It has, in
particular, contributed to the aspiration of visualising
the dream of the poor people of acquiring education
by their children. The determination and activeness that
the district administration has shown in realising the
programme, one can hope, would continue and
eradicate the problems. The programme is a lesson for
itself and also for others.
Table 3.18 Gram-Panchayet wise number of migrant family of Bankura
Name of Block Name of Circle Name of Gram-Panchayat Number of
migrating families
Bankura-I Sadar (W) Kalpathar, Kenjakura 228
Chhatna Chhatna & Chhatna (S) Chhatna-II, Chinabari 191
Indpur Indpur & Indpur (W) Gourbazar, Brahmandiha, Raghunathpur 561
Khatra Khatra (E) & Khatra (E)-II Khatra-II, Supur, Baidyanathpur 316
Mejhia Mejhia Kushtore 73
Ranibandh Ranibandh & Ranibandh (N) Barikul, Ranibandh, Routora, Rudra 616
Simlapal Simlapal & Simlapal (W) Simlapal, Lakshmisagar 121
Source: Office of the District Project Officer, Sarva Siksha Abhijan, Bankura
Besides migration is one of major causes of drop-out
in some area of this district. Families from Bankura-I,
Chhatna, Indpur, Khatra, Ranibandh, Simlapal blocks
migrate to the Eastern district as agriculture labour in
Boro and Kharif season. Children also are compelled
to go with their families. They remain detached from
studies and schools. Table 3.18 depicts the block-wise
number of migrating families for highly migrating-
prone blocks.
If the migrant children are admitted to a primary school
through a system of migration card, the problem will
reduce. But the real solution is completely stopping
migration.
Community Participation:
It is widely recognized that basic education can be
more effectively provided in schooling system where
monitoring responsibility is devolved at the village
level – where the community, the main stakeholder,
plays an active role in local decision making. Most of
the Village Education Committees do not take interest
for overall development of education. To strengthen
the pedagogical and technical support, to reduce
teachers absence, improvement in the quality of
teaching, and increase in students enrolment and
attendance and improve communication between
schools and VEC the monitoring unit has to be
strengthened. There are S.I. of schools in every
Cluster Level Resource Centre but there is an
administrative confusion due to ambiguity about the
exact role of Sub Inspector of schools. Involvement
of the Mothers’ Group may be very effective since
they are the biggest stakeholders.
3.6 Gender and social group
disparities :
“If you educate a man, you educate a person; but if
you educate a woman you educate a family”.
No society is even liberate itself, economically,
politically or socially without a sound base of educated
women.
The number of out-of-school boys and girls in primary
and upper primary level, as is reflected by the DISE
survey conducted under the Sarva Siksha Abhijan,
Bankura is indicated in the Table 3.19.

136
3
Table 3.19 Social group wise break-up of out-of-school children
(As on 30.09.2005)
Section Age Sex Social groups
SC ST Minorities Others Total
Primary 5+ to 8+ Boys 4596 596 1021 2298 8511
Girls 4784 620 1063 2392 8859
Total 9380 1216 2084 4690 17370
Upper Primary 9+ to 13+ Boys 8351 1083 1856 4176 15466
Girls 8693 1127 1932 4346 16098
Total 17044 2210 3788 8522 31564
Grand total 26424 3426 5872 13212 48934
Source:- Office of the District Project Officer, Sarva Siksha Abhijan, Bankura
Source : Office of the District Project Officer, Sarva Siksha Abhijan, Bankura
Bar diagram 3.5 Out-of-school
children in Upper Primary section
Bar diagram 3.4 Out-of-school
children in Primary section
Source : Office of the District Project Officer, Sarva Siksha Abhijan, Bankura
Pie chart 3.7 Social group-wise
break-up of out-of school children
(upper primary level)
Pie chart 3.6 Social group-wise
break-up of out-of school children
(primary level)

137
3
The reasons for gender gap in education are similar
throughout the district. Poverty has an enormous
bearing on girls’ chances of schooling. When household
income is limited boys generally tend to get preference
over girls for schooling. The distance of schools is
another factor. Schools located in distant places keeps
them away from domestic work for longer period of
time. This factor is prominent for girls students in Upper
Primary system because the distance between two Upper
Primary schools is more or less 7 to 10 km. in Bankura.
In this regard, problem of communication is also a
major reason for non-attendance of the girl students in
Upper Primary schools.
Infrastructure related factors also play an important role
in motivating girls to enrol and stay in schools. Other
important factors are toilet facility, drinking water facility
in schools and relevant gender sensitive curriculum.
Suggested strategy :
1. Advocacy for girls’ education. This is the most
important step for raising awareness in society
about the benefit of girls’ education. Parents need
to be convinced about benefits of educating their
girl children. Vocational training has been
conducted for 15 days at Hadal Narayanpur Gram
Panchayet in Patrasayer block with 109 no. of girls
of which 49 were out of school girls. The training
has been based mainly on sewing and stitching.
Vocational training coupled with awareness
generation is also likely to enable them to postpone
their early marriage.
2. Promotion of vocational training courses.
Community participation in planning development
and management of education programme needs
to be addressed. In this district Mother Teacher
Association has been formed in all Primary schools.
3. Promotion of adult literacy specially for women
to be combined with skill training and income
generating activities.
Table 3.20 Availability of drinking water and sanitation in Primary Schools
Name of the Primary Number of Primary Schools
Block/Municipality Schools Without drinking water facility Without toilet facility
Bankura-I 104 14 19
Bankura-II 122 13 71
Barjora 190 43 102
Chhatna 239 45 160
Gangajalghati 162 32 101
Indas 141 14 1
Indpur 166 38 149
Joypur 157 10 34
Kotulpur 159 3 17
Khatra 116 14 43
Hirbandh 90 25 60
Mejhia 72 6 40
Onda 243 32 155
Patrasayer 140 8 63
Ranibandh 155 20 66
Raipur 193 44 158
Sarenga 114 7 61
Sonamukhi 153 11 61
Saltora 119 28 81
Simlapal 171 15 124
Taldangra 164 42 115
Bishnupur 147 14 22
Bankura Municipality 81 32 56
Bishnupur Municipality 33 22 27
Sonamukhi Municipality 29 12 18
Total 3460 * 544 ** 1804
Source: DISE, 2005 conducted by the Office of the District Project Officer, Sarva Siksha Abhijan, Bankura
[* Fund already allotted for 310 no. of tube wells.
** As on today no. of Primary Schools without toilet facilities : 826 (Fund already allotted for 725 no. of Primary schools)]

138
3
3.7 Education of disabled children
Education is a fundamental right of every child as it is
mentioned in the Indian Constitution. Universalisation
of elementary education of disabled children in the age
group of 5+ to 18 years is equally important. It is found
on screening and survey that at the end of June, 2006,
total number of identified disabled children requiring
special needs is 12073 in the district out of which 8779
number of children have been enrolled so far. Special
integrated camps were held at Bankura-I, Hirbandh,
Bishnupur and Bankura-II. Aids and appliances were
distributed to 434 disabled children. It has been felt that
the disability identification camp may be held for
identification of all disabled people and then dovetailing
of fund may be done to address the issue of the disabled
children. Special Intervention on screening and
assessment of the disabled children has been continuing
in this district for issuance of the Identity Card for the
disabled from among the disabled persons with
convergence of three government departments like
Education, Health and Social Welfare. It is expected that
the people with different types of disabilities of this
district may be covered under this intervention.
As mentioned in the Disabled Act, 1995 the children
with Mild and Moderate disabilities should be enrolled
in the formal Primary and Upper Primary schools and
it is being followed in this district for which Special
Educators have been engaged through the District Level
Resource Organisation (DLRO) for day to day checking
up of physical and mental health of the disabled
children. Ramp for disabled children has been
constructed in almost all primary schools in this district.
Table 3.21 Category-wise disabled children (As on 01-07-2006)
Name of Block/ Category-wise disabled children
Municipality OH VI MR CP HI MD AUT LD Total
Bankura-I 111 37 93 61 68 47 0 2 419
Bankura-II 195 59 67 21 76 26 1 6 451
Barjora 76 67 98 69 140 20 14 9 493
Chhatna 159 75 69 68 105 37 0 12 525
Gangajalghati 211 69 98 14 98 60 3 25 578
Hirbandh 122 69 56 19 85 40 0 20 411
Indpur 87 70 60 25 81 20 0 20 363
Indas 229 103 129 70 113 31 0 15 690
Mejhia 103 47 131 13 79 21 2 16 412
Joypur 211 148 143 69 143 74 03 22 813
Kotulpur 122 69 185 24 108 36 1 32 577
Khatra 97 41 51 4 80 21 00 13 307
Raipur 142 76 130 9 107 14 0 44 522
Ranibandh 89 23 51 16 67 17 0 27 290
Simlapal 123 70 91 8 117 39 3 20 471
Sarenga 79 39 73 67 68 40 0 59 425
Saltora 120 76 84 1 92 5 0 13 391
Sonamukhi 290 86 135 42 191 60 2 24 830
Taldangra 194 59 85 5 96 7 0 0 446
Bishnupur 123 28 75 27 71 18 0 58 400
Onda 204 45 71 8 126 33 0 17 504
Patrasayer 198 84 109 90 126 26 0 5 638
Bankura Municipality 108 28 36 69 64 19 0 3 327
Bishnupur Municipality 41 8 17 7 11 4 0 12 100
Sonamukhi Municipality 229 103 129 70 113 31 0 15 690
Total 3663 1579 2266 876 2425 746 29 489 12073
OH : Orthopedically handicapped MR : Mentally retarded CP: Cerebral Palsy LD:
Locomotor disability
VI : Visually impaired HI : Hearing impaired MD: Multiple disabilities
AUT: Autism
Source :- Office of the District Project Officer, Sarva Siksha Abhijan, Bankura

139
3
The highest numbers of disabled children are in
Sonamukhi municipality and Indus block.
It is mentioned here that Special Educators should
similarly be engaged in the alternative schooling system
(i.e. SSK/MSK/Rabindra Mukta Vidyalaya) etc.
It is suggested that community based Rehabilitation
Centres may be opened at Village Education
Committee/Ward Education Committee and Cluster
Resource Centre level like where physical and mental
care of the children with severe and profound disability
may be taken regularly.
Further, it is found that the rate of drop out in this
district is to some extent high from class-IV to V and
this high drop out rate is found among the disabled
children because of the problem of distance between
the residence and the school. Under Sarva Shiksha
Abhiyan (SSA), Aids and Appliances have been
distributed to the disabled children from time to time
for attending the schools regularly.
It is needless to mention here that the problem of
communication between the teachers and the students
(mainly for the Hearing Impaired and Mentally
Retarded children) is the major cause of drop out.
Children can be first brought to school through
vocational inputs and after an interest is developed and
the rapport is established the normal learning process
may be started.


141
Chapter 4
4.1 Introduction
Bankura district has an area of 6,882 sq. kilometers and
a population of 31,92,695 as per Census, 2001. The
area of the district is large and it is thinly populated.
This makes it quite difficult to make quality health
services available to the community. Traditionally
Bankura has been known for the problem of leprosy,
malaria and filaria. On the other hand, the percentage
of malnutrition and infant mortality rate have also been
substantial. There are remote areas where accessibility
is also a problem. Health is, therefore, a major concern
in this district. It is also closely linked to the livelihood
issue since the manday loss due to health problem has
an impact in villages where majority of population falls
under the category of daily wage earners. If the earning
member of a family falls critically ill, the whole family
becomes vulnerable and invariably falls into debt trap.
Let us analyse the various aspects of health in Bankura
one by one.
4.2 Reproductive and Child Health
“Of the 130 million babies born every year, about 4
million die in the first 4 weeks of life – the neonatal
Health
period. A similar number of babies are stillborn…”1
The global scenario is very prominently reflected by
the above statement. The level of infant and child
mortality is a basic indicator of the quality of life in a
society. The global community also declared a
commitment to create an environment at national and
also at the global levels alike. This declaration led to
an agreement on the millennium development goals.
Central among those goals are two that aim to reduce
maternal and child mortality. Investment in maternal,
newborn, and child health is not only a priority in
saving lives, but also critical to advancing other goals
related to human welfare, equity, and poverty
reduction.
4.2.1 Infant mortality – an overview :
Although Health department and Integrated Child
Development Service (ICDS) do capture data on a
periodic basis, but getting an authentic and complete
data remains a challenge. The reporting of death of
children is often taxing for mothers and the family;
some mothers may be reluctant to report childhood
deaths at all, as not getting it documented provides
some emotional comfort to the family.
Graph 4.1 Improvement in the infant mortality rate in India from 1981 to 2000
1. source: www.thelancet.com, March, 2005

142
4
The socioeconomic consequences of maternal,
newborn and child morbidity are also significant.
Many conditions, such as obstructed labor or
premature birth, can cause severe disabilities for
survivors, adding stress to already fragile communities
and health system. A mother’s death or illness can
jeopardize an entire family’s well being; the care
The infant mortality rate for West Bengal for the five-
year period immediately preceding the National
Family Health Survey- 2 (NFHS–2) is estimated to have
been forty nine per thousand live births. This means
that five out of every hundred children born in West
Bengal did not survive till their first birthday. There
has been, however, a steady mortality decline over the
three five-year periods in the infant and child mortality
rates for all five-age intervals for the state as a whole.
Among all the challenges to bring down the IMR of
the district the biggest of all would be to identify the
different factors which contribute to infant mortality
and its effective management. Let us look at the trend
of the IMR of our country. The figure reflects that
the main drop in IMR has been in the post-neonatal
required for disabled or sick children burdens families;
and the loss of current or future earnings exacerbated
the cycle of poverty and poor health for families and
societies. All these become much more critical for this
district which is among one of the lowest in terms of
per capita income in West Bengal.
Graph: 4.2 Current interventions & improvement in neonatal mortality in India
Source:- World Health Organization
phase, whereas the early neo-natal and late period
remained almost unchanged. Within aggregate infant
mortality, nearly 42 per cent of the deaths occur within
the first week. Deaths in the next three weeks account
for fifteen per cent, while deaths in the remaining 11
months amount to forty three per cent of the total infant
mortality (West Bengal Human Development Report
2004). This clearly reflects that, for any further
intervention to bring down the IMR, the focus area
should be the early neonatal phase (form the day of
birth to 28 days after delivery). The child survival
programmes in the developing world have tended to
focus on pneumonia, diarrhea, malaria and vaccine
preventable diseases, which are important causes of
death after the first month of life.

143
4
4.2.2. Infant mortality in Bankura :
Table 4.1 Block-wise infant mortality rate for male and female
for the year 2005
Name of Block Male Female All
Bankura-I 47.87 46.04 46.99
Chhatna 32.29 24.22 28.40
Saltora 42.32 48.04 45.00
Gangajalghati 19.89 29.26 24.32
Khatra 21.22 17.74 19.65
Ranibandh 27.90 34.78 31.05
Raipur 12.54 11.08 11.88
Indpur 24.52 46.44 34.78
Sonamukhi 27.46 16.22 22.41
Indus 24.41 14.07 19.61
Patrasayer 9.61 12.22 10.89
Kotulpur 25.27 23.65 24.49
Hirbandh 21.16 3.11 12.56
Taldangra 2.86 3.55 3.17
Bankura - II 15.63 3.53 9.95
Sarenga 26.62 31.84 29.07
Simlapal 2.90 0.00 1.53
Mejhia 17.86 11.01 14.61
Onda 27.64 25.76 26.77
Borjora 12.70 17.06 14.63
Bishnupur 29.98 23.31 26.79
Joypur 23.50 29.27 26.26
Source:- District Programme Officer, ICDS, Bankura
Infant mortality in Bankura represents a significant
block wise variation. Bankura-I, Saltora, Ranibandh,
and Indpur are among the blocks representing higher
infant mortality rate with respect to district IMR (source:
ICDS MPR Jan.-Dec., 2005). Special strategies need to
be evolved to address the disparities that exist among
the blocks. Bankura I and Saltora are among the worst
performing blocks with respect to IMR with IMR as
high as 46.99 and 45 respectively. Taldangra and
simlapal are among the better performing blocks of
Bankura. Sex-wise variation among different blocks
represents an interesting pattern. In most of the blocks
the sex wise differentiation do not represent wide
variation, but among few blocks the gap seems to be
alarmingly high. Infant mortality of female child in
Indpur is 46.44 where as their male siblings score 24.52
similarly in Gangajalghati, IMR (female) is 29.26
corresponding to 19.89 in case of IMR (male). Simlapal
is also among these blocks where more female children
are dying with respect to their male siblings. Though
male preference does exist in Bankura, which does
reflect in some form or other, it becomes extremely
important to know if the preference of male child is
represented in these blocks in its most cruel form. It is
also interesting to note that cases of selective abortions
has also been reported from Saltora and Gangajalghati
from some villages in these blocks. Though no
correlation could be established but it becomes critical
to note that in Indpur we have a large population of
Utkal Bramhins community, among which dowry
system is quite rigid.
4.2.3. Anaemia among women and children :
Anaemia is a condition that results when the level of
hemoglobin in the blood is too low. Oxygen is
transported by hemoglobin, in the red blood cells, from
the lungs to other tissues and organs in the body, so
that these tissues and organs can perform their
functions. A deficiency of hemoglobin means a
deficiency of the body’s ability to deliver oxygen to

144
4
those tissues and organs. Anaemia usually results from
a nutritional deficiency of iron, vitamin B12 and some
other nutrients. This type of anaemia is commonly
referred to as iron deficiency anaemia.
Anaemia has detrimental effects on the health of
women and children and may become an underlying
cause of maternal death, antenatal loss and prenatal
loss. Anaemia among children can be associated with
impaired cognitive performance, co-ordination,
language development and scholastic achievement, as
well as increased morbidity from infectious diseases.
Early detection of anaemia can help prevent
complications during pregnancy and delivery as well
as the above-mentioned child development problems.
Measurement of the prevalence of anaemia can
provide important information for development of
health intervention program, such as iron fortification,
to prevent anaemia among women and children.
The proportion of children with anaemia in West
Bengal (78 per cent) is higher compared to the Indian
average of 74 per cent (West Bengal HDR 2004).
However the proportion of children with severe
anaemia is marginally lower, at 5.2 per cent compared
to national average of 5.4 per cent. It would be
interesting to see if anaemia does have a relationship
with age, that it increases with number of living children
(being highest for women with four or more children)
and among adolescents. Unfortunately there is little
data on anaemia which makes the analysis very difficult.
4.2.4 Adolescent health in Bankura :
Methodology :
The sample survey was done in two different schools
of Kotulpur and Indpur of Bankura district. The
purpose of the survey was to understand the status of
adolescent health in the district. The sample study was
felt important as no reliable study or data were
available to substantiate the adolescent health in the
district.
For these purpose 50 students from class VIII and class
XI in both the schools were given a questionnaire and
their responses were consolidated and analyzed. The
analysis of the survey is mentioned below and the
details are given in Annexure-I at the end of this
report.
4.2.4.1. Personal hygiene:
Tap water has been identified as the chief source for
drinking among both adolescent boys and girls in all
age group. Toothpaste is commonly used for brushing
teeth. In Indpur only 33 percent of the adolescent boys
in standard VIII used neem for the purpose. Washing
hand before food is a positive practice being followed
by them. With respect to use of sanitary latrine at home
in Indpur, only 21 percent of girls and 27 percent of
boys follow the practice in standard VIII while 63
percent of girls follow the practice 87 percent of boys
follow the practice in standard XI. In Kotulpur Block,
64 percent of the adolescent girls and 29 percent of the
adolescent boys follow the practice respectively. It is to
be noted here that in Indpur, nearly 73 percent of girls
and 66 percentof boys in standard VIII and 27 percent
of the adolescent girls and 18 percent of the adolescent
boys in standard XI do not have access to sanitary
latrine at home. However in Kotulpur, 33 percent of
the adolescent girls and 70 percent of the adolescent
boys do not have access to sanitary latrine at home
respectively. Taking school sanitation into consideration,
we find that the rate of school based sanitary latrine
facility is very poor in Indpur, nearly 68 percent of the
schools accommodating girls and 55 percent of the
schools accommodating boys do not provide the
infrastructure in standard VIII Inspite of 45 percent of
the schools provide the facility, significantly 63 percent
remain unused. While in standard XI nearly 63 percent
of the schools accommodating girls do not provide the
infrastructure, significantly 27 percent of the schools
provide the facility, 27 percent remain unused. 95
percent of the schools accommodating boys provides
the infrastructure, only 5 percent remain unused. In the
schools accommodating girls at Kotulpur, the rate of
school based sanitary latrine facility and its use rate is
very high nearly 92 percent while 58 percent of the of
the schools accommodating boys do not provide the
infrastructure only 35 percent provide but remain
unused. In Indpur, 78 percent of girls and 61 percent
of the boys in standard VIII and 54 percent of girls
and 45 percent of the boys in standard XI accessed
pond for the purpose of bathing while in Kotulpur, 59
percent of girls and 20 percent of the boys accessed
pond for the same purpose, however only 20 percent of
the boys had in-house facility.

145
4
4.2.4.2. Physiological status :
In Indpur, about 89 percent of the adolescent girls in
standard VIII undergo regular menstruation cycle and
about 72 percent of the adolescent girls in standard XI
undergo regular menstruation cycle. In Kotulpur, about
58 percent of the adolescent girls undergo regular
menstruation cycle and nearly 36 percent suffered from
irregular cycle. High percentage of the adolescent girls
as traditional method use cloth for the purpose.
4.2.4.3. Consumption pattern :
In Indpur, 52 percent of the adolescent girls received
one square meal a day and 61 percent of the adolescent
boys received square meal a day at standard VIII In
the context of consumption pattern, there is an existing
gap (9 percent) in terms of frequency of food intake
between adolescent boys and girls, however there is no
deviance in relation to the quality of food consumed on
a regular basis. And 90 percent of the adolescent girls
and 77 percent of the adolescent boys received square
meal a day at standard XI respectively. In Kotulpur, 76
percent of the adolescent girls and 90 percent of the
adolescent boys received square meal a day.
Carbohydrate is the chief dietary source identified in
their basic food group, which comprise of cereals, pulses
and vegetables. Milk and milk products and animal
protein are seldom consumed.
4.2.4.4. Level of awareness:
In Indpur and Kotulpur, on the issue related to age of
marriage, high percentage of adolescents considered 18
years for female as the approved age for marriage, both
socially and legally but possessed difference of opinion
in respect to age of marriage for male. Only 41 percent
of girls and 66 percent of the boys at standard VIII in
Indpur possessed knowledge on the contraceptive
measures for birth planning while in standard XI, 72
percent of girls and marginal percentage of adolescent
boys possessed knowledge on the contraceptive measures
for birth planning. In Kotulpur, 82 percent of adolescent
boys and marginal percentage of adolescent girls
possessed knowledge on the contraceptive measures for
birth planning. In Indpur, 35 percent and 44 percent of
the girls and boys respectively in standard VIII and in
standard XI 90 percent of the girls and 45 percent of
boys knew HIV/AIDS and its mode of transfer. In
Kotulpur, 28 percent girls and 47 percent boys knew
HIV/AIDS and its mode of transfer respectively.
4.2.4.5. Behavioral constraints:
In Indpur, rate of substance abuse is 10 percent in the
form of chewing tobacco among girls and among the
boys, 22 percent in the form of chewing tobacco and
smoking in standard VIII. One incident of molestation
has been identified from among the respondent group.
With respect to adolescent boys and girls in standard
XI, substance abuse is totally absent among the girls.
Seven incidents of molestation have been identified
from among the respondent group. Rate of substance
abuse among the boys is 38 percent in the form of
chewing tobacco, smoking and betel leaf consumption.
Ten incidents of molestation have been identified from
among the respondent group. In Kotulpur, rate of
substance abuse is 17 percent in the form of chewing
tobacco among the girls and rate of substance abuse
is 11 percent in the form of chewing tobacco among
the boys. No incident of molestation has been
identified from among the respondent groups.
4.2.5. Maternal mortality :
In spite of the growing concern about reproductive
health, information on levels, trends and differentials
in maternal mortality remains in most developing
countries. For India, the National Family Health
Survey of 1992-93 was the first to provide a national-
level estimate of 437 maternal deaths per 100,000
births for the two-year period preceding the survey
(International Institute for Population Sciences, 1995).
But in spite of surveying nearly 90,000 households, it
could not provide estimates at regional or state-levels
owing to the smallness of the sample. Even at the
national level, the sample inadequacies of the NFHS
came into sharp focus when the second round of the
survey in 1998-99 produced a maternal mortality
estimate of 520, but failed to confirm statistically the
possible rise in the level of maternal mortality
(International Institute for Population Sciences and
ORC-Macro, 2000).
The application of sisterhood method to the data from
the Human Development Profile Survey of 1994 yields
an estimate of maternal mortality of 544 deaths per
100,000 births in rural India for a period roughly 12
years before the survey. It also shows that maternal
mortality ratio was more than 600 in east and north-
central India, while it was between 300 to 400 in north-
western and southern India.
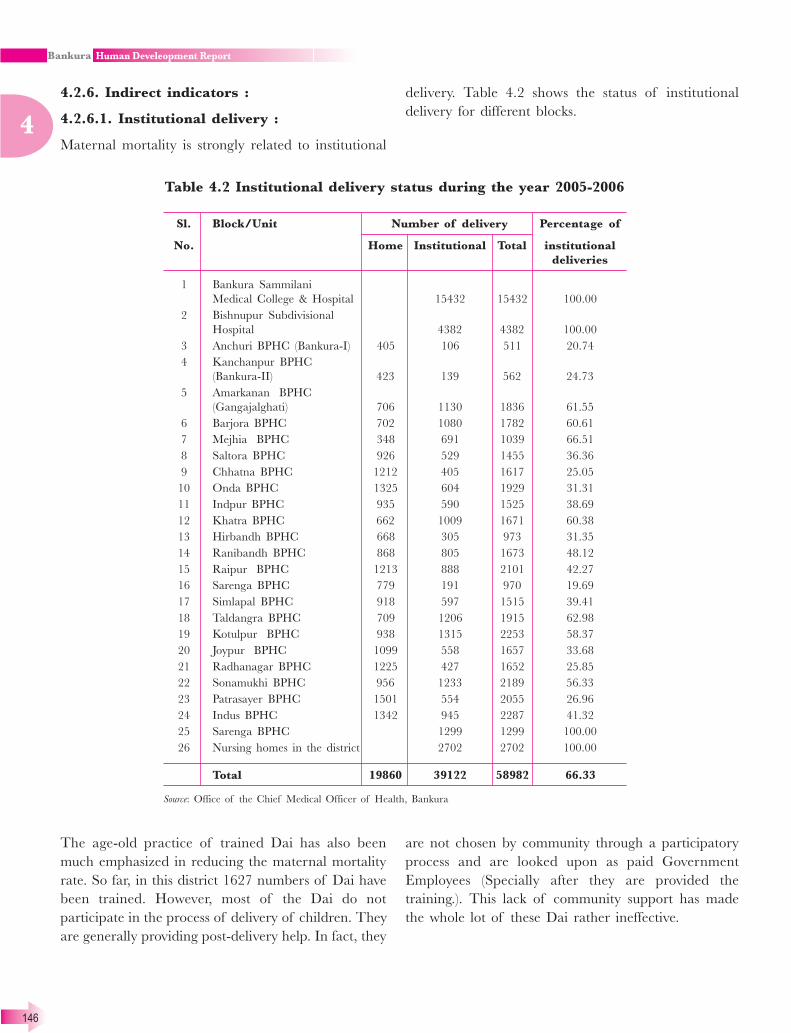
146
4
4.2.6. Indirect indicators :
4.2.6.1. Institutional delivery :
Maternal mortality is strongly related to institutional
The age-old practice of trained Dai has also been
much emphasized in reducing the maternal mortality
rate. So far, in this district 1627 numbers of Dai have
been trained. However, most of the Dai do not
participate in the process of delivery of children. They
are generally providing post-delivery help. In fact, they
Table 4.2 Institutional delivery status during the year 2005-2006
Sl. Block/Unit Number of delivery Percentage of
No. Home Institutional Total institutional
deliveries
1 Bankura Sammilani
Medical College & Hospital 15432 15432 100.00
2 Bishnupur Subdivisional
Hospital 4382 4382 100.00
3 Anchuri BPHC (Bankura-I) 405 106 511 20.74
4 Kanchanpur BPHC
(Bankura-II) 423 139 562 24.73
5 Amarkanan BPHC
(Gangajalghati) 706 1130 1836 61.55
6 Barjora BPHC 702 1080 1782 60.61
7 Mejhia BPHC 348 691 1039 66.51
8 Saltora BPHC 926 529 1455 36.36
9 Chhatna BPHC 1212 405 1617 25.05
10 Onda BPHC 1325 604 1929 31.31
11 Indpur BPHC 935 590 1525 38.69
12 Khatra BPHC 662 1009 1671 60.38
13 Hirbandh BPHC 668 305 973 31.35
14 Ranibandh BPHC 868 805 1673 48.12
15 Raipur BPHC 1213 888 2101 42.27
16 Sarenga BPHC 779 191 970 19.69
17 Simlapal BPHC 918 597 1515 39.41
18 Taldangra BPHC 709 1206 1915 62.98
19 Kotulpur BPHC 938 1315 2253 58.37
20 Joypur BPHC 1099 558 1657 33.68
21 Radhanagar BPHC 1225 427 1652 25.85
22 Sonamukhi BPHC 956 1233 2189 56.33
23 Patrasayer BPHC 1501 554 2055 26.96
24 Indus BPHC 1342 945 2287 41.32
25 Sarenga BPHC 1299 1299 100.00
26 Nursing homes in the district 2702 2702 100.00
Total 19860 39122 58982 66.33
Source: Office of the Chief Medical Officer of Health, Bankura
delivery. Table 4.2 shows the status of institutional
delivery for different blocks.
are not chosen by community through a participatory
process and are looked upon as paid Government
Employees (Specially after they are provided the
training.). This lack of community support has made
the whole lot of these Dai rather ineffective.
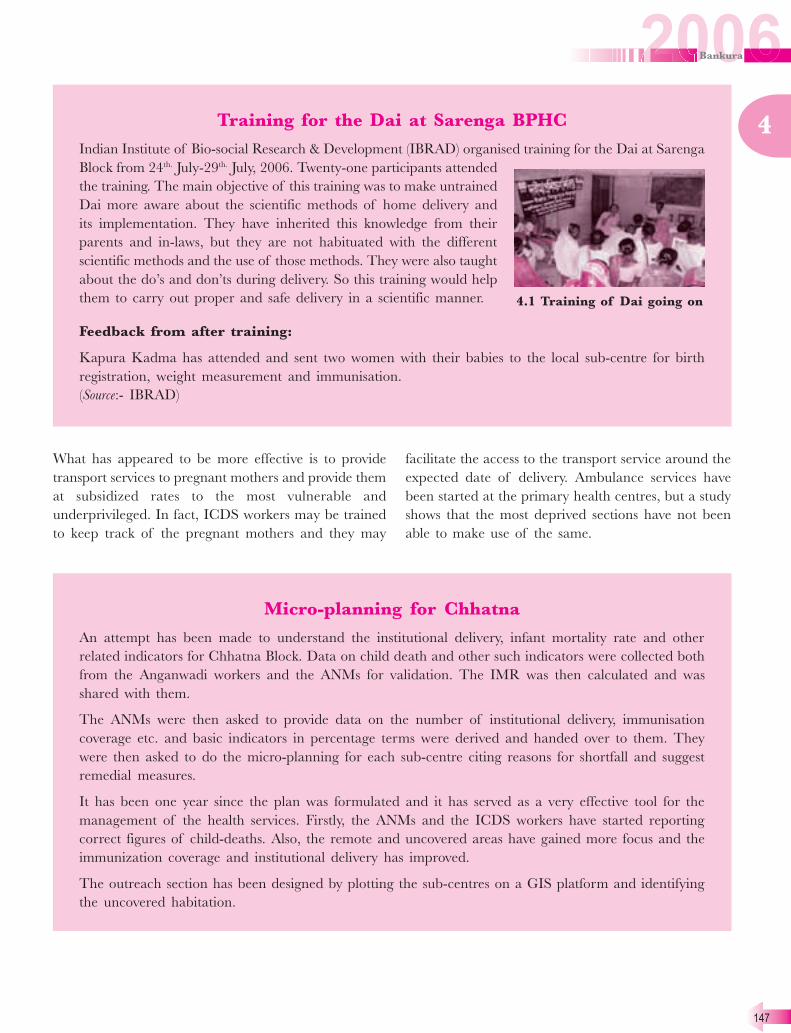
147
4Training for the Dai at Sarenga BPHC
Indian Institute of Bio-social Research & Development (IBRAD) organised training for the Dai at Sarenga
Block from 24th.
July-29th.
July, 2006. Twenty-one participants attended
the training. The main objective of this training was to make untrained
Dai more aware about the scientific methods of home delivery and
its implementation. They have inherited this knowledge from their
parents and in-laws, but they are not habituated with the different
scientific methods and the use of those methods. They were also taught
about the do’s and don’ts during delivery. So this training would help
them to carry out proper and safe delivery in a scientific manner.
Feedback from after training:
Kapura Kadma has attended and sent two women with their babies to the local sub-centre for birth
registration, weight measurement and immunisation.
(Source:- IBRAD)
4.1 Training of Dai going on
What has appeared to be more effective is to provide
transport services to pregnant mothers and provide them
at subsidized rates to the most vulnerable and
underprivileged. In fact, ICDS workers may be trained
to keep track of the pregnant mothers and they may
facilitate the access to the transport service around the
expected date of delivery. Ambulance services have
been started at the primary health centres, but a study
shows that the most deprived sections have not been
able to make use of the same.
Micro-planning for Chhatna
An attempt has been made to understand the institutional delivery, infant mortality rate and other
related indicators for Chhatna Block. Data on child death and other such indicators were collected both
from the Anganwadi workers and the ANMs for validation. The IMR was then calculated and was
shared with them.
The ANMs were then asked to provide data on the number of institutional delivery, immunisation
coverage etc. and basic indicators in percentage terms were derived and handed over to them. They
were then asked to do the micro-planning for each sub-centre citing reasons for shortfall and suggest
remedial measures.
It has been one year since the plan was formulated and it has served as a very effective tool for the
management of the health services. Firstly, the ANMs and the ICDS workers have started reporting
correct figures of child-deaths. Also, the remote and uncovered areas have gained more focus and the
immunization coverage and institutional delivery has improved.
The outreach section has been designed by plotting the sub-centres on a GIS platform and identifying
the uncovered habitation.

148
4
4.2.6.2. Sex ratio :
Although the recent Indian census has brought
favorable figures for the better half of the society, a
rise of 6 more females per 1000 males than the 927 of
previous census. However, the fall in sex ratio of 0-6
population is continuing as well as intensifying. The
census of India has revealed the stunning fact that the
sex ratio in the age-group 0-6 years in India has further
gone down sharply from 945 females per 1000 males
in 1991 to 927 in 2001. Sex ratio at birth declines
with maternal age, paternal age and parity; it has been
associated with decline in coital frequency (William
James, 1983). At the national level, for women giving
birth at younger ages, sex ratio at birth is high and it
subsequently goes down for older age group.
Analysis of health perspectives related with this ratio
Map 4.3 Outreach pockets of health service in Chhatna Block
(Source:- NRDMS, Bankura)
in two surveys, namely National Family Health Survey-
I (1993) and National Family Health Survey-II (2000)
shows that, those who have never experienced stillbirths
or spontaneous abortions contribute more masculinity
to the population. As for the mothers having the
experience of either stillbirths or spontaneous abortion
or both of them the, ratio of male to female births is
less than the average 104, while it is more in case of
those who have never experienced any of them. This
finding is consistent with the assumption that the sex
ratio of the new born became more masculine as the
conditions of childbearing become ameliorate, health
care improves and proportion of stillbirth comes down
(William James, 1983; Griffiths et. al., 2000). The sex
ratio gradually stabilizes at the age of five (chances of
having 1:1 sex ratio).
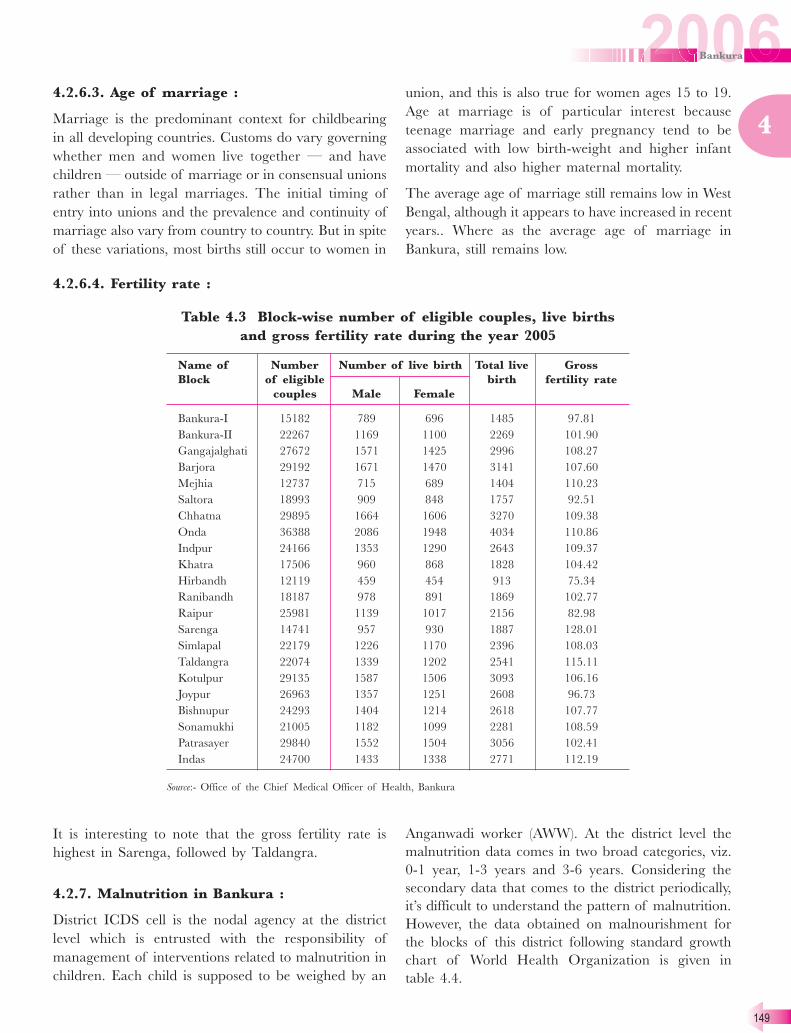
149
4
4.2.6.3. Age of marriage :
Marriage is the predominant context for childbearing
in all developing countries. Customs do vary governing
whether men and women live together — and have
children — outside of marriage or in consensual unions
rather than in legal marriages. The initial timing of
entry into unions and the prevalence and continuity of
marriage also vary from country to country. But in spite
of these variations, most births still occur to women in
union, and this is also true for women ages 15 to 19.
Age at marriage is of particular interest because
teenage marriage and early pregnancy tend to be
associated with low birth-weight and higher infant
mortality and also higher maternal mortality.
The average age of marriage still remains low in West
Bengal, although it appears to have increased in recent
years.. Where as the average age of marriage in
Bankura, still remains low.
It is interesting to note that the gross fertility rate is
highest in Sarenga, followed by Taldangra.
4.2.7. Malnutrition in Bankura :
District ICDS cell is the nodal agency at the district
level which is entrusted with the responsibility of
management of interventions related to malnutrition in
children. Each child is supposed to be weighed by an
Anganwadi worker (AWW). At the district level the
malnutrition data comes in two broad categories, viz.
0-1 year, 1-3 years and 3-6 years. Considering the
secondary data that comes to the district periodically,
it’s difficult to understand the pattern of malnutrition.
However, the data obtained on malnourishment for
the blocks of this district following standard growth
chart of World Health Organization is given in
table 4.4.
Table 4.3 Block-wise number of eligible couples, live births
and gross fertility rate during the year 2005
Name of Number Number of live birth Total live Gross
Block of eligible birth fertility rate
couples Male Female
Bankura-I 15182 789 696 1485 97.81
Bankura-II 22267 1169 1100 2269 101.90
Gangajalghati 27672 1571 1425 2996 108.27
Barjora 29192 1671 1470 3141 107.60
Mejhia 12737 715 689 1404 110.23
Saltora 18993 909 848 1757 92.51
Chhatna 29895 1664 1606 3270 109.38
Onda 36388 2086 1948 4034 110.86
Indpur 24166 1353 1290 2643 109.37
Khatra 17506 960 868 1828 104.42
Hirbandh 12119 459 454 913 75.34
Ranibandh 18187 978 891 1869 102.77
Raipur 25981 1139 1017 2156 82.98
Sarenga 14741 957 930 1887 128.01
Simlapal 22179 1226 1170 2396 108.03
Taldangra 22074 1339 1202 2541 115.11
Kotulpur 29135 1587 1506 3093 106.16
Joypur 26963 1357 1251 2608 96.73
Bishnupur 24293 1404 1214 2618 107.77
Sonamukhi 21005 1182 1099 2281 108.59
Patrasayer 29840 1552 1504 3056 102.41
Indas 24700 1433 1338 2771 112.19
Source:- Office of the Chief Medical Officer of Health, Bankura
4.2.6.4. Fertility rate :

150
4
Also the Rapid Assessment Programme (RAP) study
conducted by CARE (September, 2005) has been taken
into consideration to capture the trend of proportion
of malnourishment across Bankura over the first two
Table 4.4 Malnutrition status of 0-6 year children in Bankura as
on May, 2006
Sl. Name of Total children Total children Malnourish children
No. Block (0-6 years) (0-6 years) (0-6 years) per 1000
weighted malnourished children weighted
1 Bankura-I 7792 4912 630
2 Chhatna 12521 7296 583
3 Saltora 8252 5296 642
4 Gangajalghati 10555 6210 588
5 Khatra 7757 4623 596
6 Ranibandh 9268 5138 554
7 Raipur 8133 4933 607
8 Indpur 9470 5786 611
9 Sonamukhi 9828 6138 625
10 Indus 9724 5681 584
11 Patrasayer 8126 5218 642
12 Kotulpur 10328 5895 571
13 Hirbandh 4608 287 62
14 Taldangra 7448 3123 419
15 Bankura-II 11235 7102 632
16 Sarenga 4336 2255 520
17 Simlapal 6012 2972 494
18 Mejhia 3501 1217 348
19 Onda 14792 9344 632
20 Barjora 9430 5619 596
21 Bishnupur 10710 6698 625
22 Joypur 8817 4948 561
Total 192643 110691 575
(Part of the Hirbandh data is included in that of Khatra)
Source: Office of the District Programme Officer, Bankura (ICDS), Bankura
years of birth. The methodology of RAP study
conducted by CARE is given in Annexure-II at the end
of this book.

151
4
Graph 4.4 Trends of proportion of malnourishment across Bankura over the first two years (based on
RAP data)
Source : CARE Survey (September, 2005)
Malnutrition as in other parts of the country is also a
chronic problem in Bankura. In Bankura more than 90
percent of the children born (both institutional and
home delivery) are normal (birth weight more than
2.5kg). It is important to note that malnutrition curve
remain constant till the age of 6-7 months. Thereafter
the curve represents a sudden decrease of normal
children from 90 percent to 30 percent. That means
within a period of 11-12 months the percentage of
normal children comes down by 60 percent. Once the
children reached 17 months of age, the curve stabilises
further and don’t represent further rise. But the fact
remains that even if one feeds the child adequately after
17 months, the condition doesn’t improve. Thus the
window of opportunity is between 6 months to 17
months. This is the period where the children need to
be appropriately fed and taken care of. Experience says
that once the children are severely malnourished it
becomes very difficult to bring them back to normalcy
unless they get clinical assistance. So the challenge is
to hold those children who were born as normal
beyond 6 months of age.
The time the children reach the anganwadi centres
(AWCs) more than half the children are malnourished.
In order to make a sustainable dent in improving the
nutritional status of children, the major focus should
be towards those children who are below 17-18 months
old. All nutrition related intervention (below 17
months) needs sharpening. This suggests a radical
change from pre-schooling to more and meaningful
home contacts by service provider to take care of above
age group.
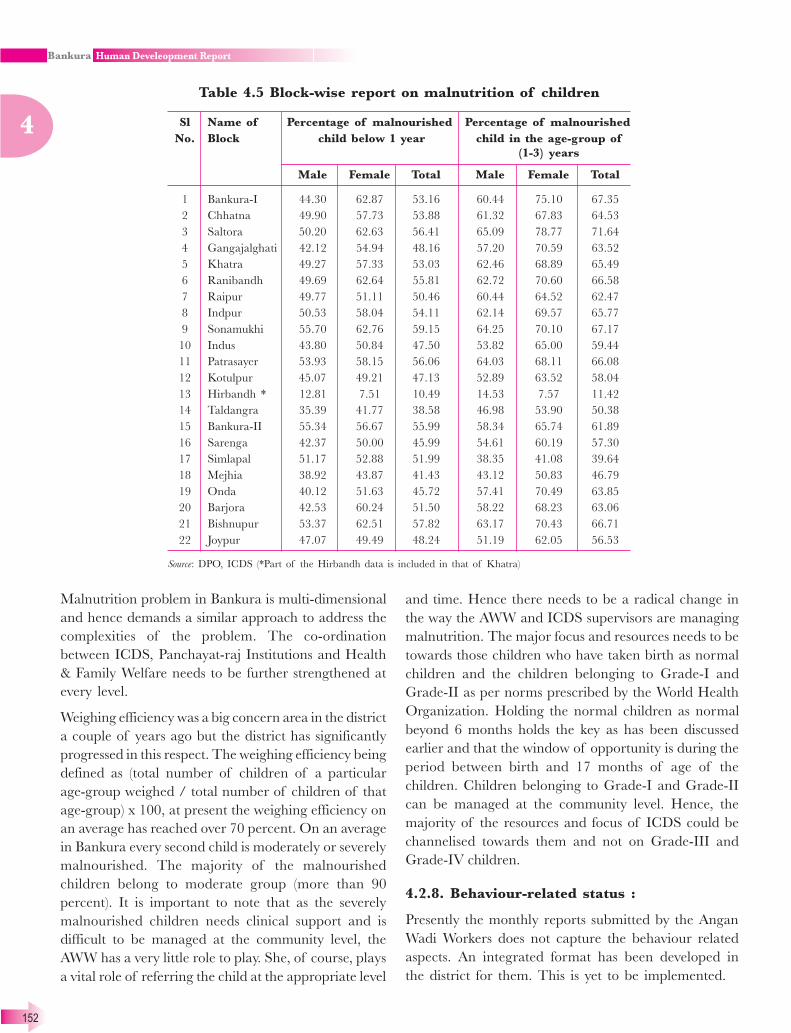
152
4
Table 4.5 Block-wise report on malnutrition of children
Sl Name of Percentage of malnourished Percentage of malnourished
No. Block child below 1 year child in the age-group of
(1-3) years
Male Female Total Male Female Total
1 Bankura-I 44.30 62.87 53.16 60.44 75.10 67.35
2 Chhatna 49.90 57.73 53.88 61.32 67.83 64.53
3 Saltora 50.20 62.63 56.41 65.09 78.77 71.64
4 Gangajalghati 42.12 54.94 48.16 57.20 70.59 63.52
5 Khatra 49.27 57.33 53.03 62.46 68.89 65.49
6 Ranibandh 49.69 62.64 55.81 62.72 70.60 66.58
7 Raipur 49.77 51.11 50.46 60.44 64.52 62.47
8 Indpur 50.53 58.04 54.11 62.14 69.57 65.77
9 Sonamukhi 55.70 62.76 59.15 64.25 70.10 67.17
10 Indus 43.80 50.84 47.50 53.82 65.00 59.44
11 Patrasayer 53.93 58.15 56.06 64.03 68.11 66.08
12 Kotulpur 45.07 49.21 47.13 52.89 63.52 58.04
13 Hirbandh * 12.81 7.51 10.49 14.53 7.57 11.42
14 Taldangra 35.39 41.77 38.58 46.98 53.90 50.38
15 Bankura-II 55.34 56.67 55.99 58.34 65.74 61.89
16 Sarenga 42.37 50.00 45.99 54.61 60.19 57.30
17 Simlapal 51.17 52.88 51.99 38.35 41.08 39.64
18 Mejhia 38.92 43.87 41.43 43.12 50.83 46.79
19 Onda 40.12 51.63 45.72 57.41 70.49 63.85
20 Barjora 42.53 60.24 51.50 58.22 68.23 63.06
21 Bishnupur 53.37 62.51 57.82 63.17 70.43 66.71
22 Joypur 47.07 49.49 48.24 51.19 62.05 56.53
Source: DPO, ICDS (*Part of the Hirbandh data is included in that of Khatra)
Malnutrition problem in Bankura is multi-dimensional
and hence demands a similar approach to address the
complexities of the problem. The co-ordination
between ICDS, Panchayat-raj Institutions and Health
& Family Welfare needs to be further strengthened at
every level.
Weighing efficiency was a big concern area in the district
a couple of years ago but the district has significantly
progressed in this respect. The weighing efficiency being
defined as (total number of children of a particular
age-group weighed / total number of children of that
age-group) x 100, at present the weighing efficiency on
an average has reached over 70 percent. On an average
in Bankura every second child is moderately or severely
malnourished. The majority of the malnourished
children belong to moderate group (more than 90
percent). It is important to note that as the severely
malnourished children needs clinical support and is
difficult to be managed at the community level, the
AWW has a very little role to play. She, of course, plays
a vital role of referring the child at the appropriate level
and time. Hence there needs to be a radical change in
the way the AWW and ICDS supervisors are managing
malnutrition. The major focus and resources needs to be
towards those children who have taken birth as normal
children and the children belonging to Grade-I and
Grade-II as per norms prescribed by the World Health
Organization. Holding the normal children as normal
beyond 6 months holds the key as has been discussed
earlier and that the window of opportunity is during the
period between birth and 17 months of age of the
children. Children belonging to Grade-I and Grade-II
can be managed at the community level. Hence, the
majority of the resources and focus of ICDS could be
channelised towards them and not on Grade-III and
Grade-IV children.
4.2.8. Behaviour-related status :
Presently the monthly reports submitted by the Angan
Wadi Workers does not capture the behaviour related
aspects. An integrated format has been developed in
the district for them. This is yet to be implemented.
153
4
The behaviour-related data were primarily captured from RAP (Rapid Assessment Programme) data. In
Bankura 3 rounds of RAP data are available at the district. To capture the data 3 different and
independent agencies were identified and the survey was done with the support from CARE-India.]
ROUND AGENCY
R I- TNS MODE (Sept 2003)
R II- AC Nielsen ORG MARG (September, 2004)
R III- EPOS Health Consultant (September, 2005)
(The methodology of these surveys is given in Annexure-II at the end of this book)
4.2.8.1. Behaviour-related status with respect to
new-born care:-
Some results :
Newborn care at the community level still remains a
critical area in Bankura. Though the institutional delivery
has gone up from 45.7 percent (Sept 03 RAP I, TNS
Mode) to 59.1 percent (Sept 05 RAP III, EPOS), but still
new born care at the community level remains a critical
area as 39.9 percent of the deliveries are still at the
community level. More over it becomes much more
critical when home delivery by untrained personnel is as
high as 53 percent (Sept 05 RAP III, EPOS).
Initiation of breast-feeding within 1 hour of birth has
shown a significant improvement from 84.7 percent to
91.5 percent (low socio-economic status 83.3 percent to
92.2 percent) RII-RIII. Early and Exclusive breast-
feeding has increased from 52.5 percent to 62 percent
(Low socio-economic status 53.3 percent to 69.9 percent)
RII-RIII. Exclusive breast-feeding dropped by more
than 30 percent by 4 - 5 months though early breast-
feeding within one hour remains as high as 91.5 percent.
But the issue remains that in case of more than 68
percent of the total deliveries, the baby is not wiped
and dried immediately after the birth.
With respect to five cleans, desired level of change and
level of understanding is shown (clean thread and new
blade was reported to be as high as 90 percent, Sept 05
RAP III, EPOS). Worst among all the five cleans
remains the clean hands. All five cleans not practiced
in case of home deliveries is as high as 49 percent.
Another significant area is the extent the mothers are
aware of the danger signs of the newborn. Mothers
not aware about even one-danger sign of newborn
remains as high as 33 percent.
Every weighed (3-5 months) has increased from
47.1percent to 83.5 percent (low socio-economic status
from 44.6 percent to 87 percent (Sept 04 RAP II, AC
Nelson ORG MARG –Sept 05 RIII, EPOS). Babies
weighed within 3 days of birth have also increased
from 19.6 percent to 46.8 percent (Low socio-economic
status 16.2 percent to 48.1percent) RII-RIII. But the
issue remains that, more than 50 percent of the babies
taking their birth at the community level do not have
their birth weight recorded till the third day of delivery.
Factors which have contributed towards the
improvement :
Increased contact :
AWW ever visited during the first week of delivery
has increased from 17.2 percent to 24.6 percent (low
socio-economic status from 11.7 percent to 24 percent)
RII-RIII. AWW/ ANM visited anytime during 2-7
days after delivery increased from 17.9 percent to 25.4
percent (Low socio-economic status from 10 percent
to 27.1 percent) RII-RIII. Any service provider or local
person ever visited during the first week of delivery
has increased from 21.2 percent to 29.9 percent (Low
socio-economic status from 14.6 percent to 13.2
percent) RII-RIII.
Content of the contact :
Any advice related to breastfeeding has increased from
39.4 percent to 78.6percent (Low socio-economic status
from 33.3 percent to 76.7 percent) RII-RIII. Advice
regarding colostrum / first milk has increased from
24.4 percent to 47.6 percent (Low socio-economic
status from 26.7 percent to 40 percent) RII-RIII.
Advice regarding giving only breast milk until 6
months has increased from 24.2percent to 47.6 percent
154
4
(Low socio-economic status from 26.7 percent to 40
percent) RII-RIII. Told that the baby is weak has
increased from 9.1percent to 21.4 percent (Low socio-
economic status from 6.75 to 16.7 percent) RII-RIII.
Challenges :
One of the major challenges that remain to be
addressed is planning the critical contact period.
Contact of AWW of the ANM on the day of delivery
as low as 1.5 percent and in case of AWW 9 percent.
Contact within 1st
week of delivery in case of ANM 7
percent and AWW 24 percent (Survey done during
Sept 05 RAP III, EPOS).
4.2.8.2. Behaviour-related status with respect
to pregnancy and ante-natal care:
Women check at least once by ANM has gone up from
29.3 percent to 45.7 percent (low socio-economic status
34 percent to 51 percent) RI-RII. Received 3+
checkups during pregnancy from 34.1 percent to 40.7
percent to further to 54 percent in case of RI-RIII
(low socio-economic status 31.8 percent to 40.9
percent). Women checked at least once by ANM in
the last trimester have also increased from 22.6 percent
to 39.3 percent (Low socio-economic status 25.8
percent to 43.8 percent) RI-RII.
Challenges:
But the major issue remains that more than 46 percent
of the women are not receiving 3+ ANC. ANM
contacts during the 3rd
. trimester also remains low. Of
the total pregnant women, only 59 percent have been
reported to have been contacted by any service
provider during the last trimester of her pregnancy.
AWW ever contacted during pregnancy numbers 50
percent and those cases that have received at least 90
IFA numbers 54 percent.
IFA:
Mean number of tablets received by those who
received any IFA incresed from 72.21 to 83.06 (Low
socio-economic status from 75.44 to 85.47) RI-RII
(Denominator: Mothers of children 0-5 months who
received 90+IFA). Consumed 90+ tablets (or
equivalent), among those who received 90 tablets
increased from 49.4 percent to 63.5percent (Low socio-
economic status 42.9percent to 63.8percent) RI-RII.
Mean number of tablets consumed by those who
receipt 90+ IFA increased from 53.91 to 69.41 (Low
socio-economic status 53.74 to 71.23) RI-RII.
Challenges:
Almost half the pregnant women’s are not receiving 90
percent IFA. Received at least 90+ IFA remains as low
as 54 percent (Sept.,’05 RAP III, EPOS). More than 10
percent of the pregnant population has not consumed
even a single tablet of IFA (Consumed any amount - 89
percent, Sept.,’05 RAP III, EPOS). Consumed at least
90 among those received 90-57 percent.
Factors which have contributed towards the
improvement:
Contacts during pregnancy:
AWW ever met during pregnancy, for any purpose from
has increased from 40.4 percent to 50 percent RII-RIII
and any contact in the last trimester in which health
was discussed has also increased from 40.4 percent to
46.3 percent RII-RIII.
Home visit of ANM during the last trimester has
increased from 12.4 percent to 20 percent RII-RIII.
Home visit in last trimester by any Service Provider has
increased from 35.7 percent to 39.1 percent RII-RIII.
Advice / content of the contact:
Advice provided by anyone who has received any check
ups has increased 39.8 percent to 63.8 percent (Low
socio-economic status from 28.8 percent to 39.7 percent)
RII-RIII. Advice provided by ANM has also increased
from 39.9 percent to 53.5 percent (Low socio-economic
status from 28.8 percent to 39.7 percent). Advice
received about breastfeeding during pregnancy (women
who delivered at home and contacted in last trimester)
from 8.5 percent to 51.1 percent (Low socio-economic
status 2.8 percent to 44.8 percent) RI-RII and from 51.1
percent to 70.4 percent (Low socio-economic status from
49.3 percent to 67.7 percent) RII-RIII. Among 0-5
months old who were ever visited at home in last
trimester and advised about breast feedings has
increased from 60.2 percent to 79.9 percent (Low socio-
economic status 52.3 percent to 80 percent) RII-RIII.
4.2.8.3. Behaviour-related status with respect to
complementary feeding:
This is an area, which requires immediate attention.
Children of 6 - 8 months age not having half the

155
4
recommended quantity of food is as high as 77percent
(Sept 05 RAP III, EPOS) and children of 9-11 months
not having half the recommended quantity of food is
53 percent. This is an area, which demands serious
attention in Bankura.
Typical malnutrition curve of Bankura shows that
during the time of birth most of the children are born
normal but by the time they reach 6-7 months there is
a sharp fall and the fall continues till they are 17 months
old. This means that, by the time the children reaches
AWCs, the majority of them are already malnourished.
Different studies substantiate that no matter how actively
one feeds the malnourished children once they are 2
years old they never improve in terms of their nutritional
status. So a point of realization is that the children, those
who are coming to the AWCs for pre schooling,
comprises just the tip of the iceberg.
4.2.8.4. Behaviour-related status with respect to
supplementary nutrition :
Take Home Ration (Ever received Take Home Ration
(THR) on the day of Nutrition and Health Day (NHD)-
there has been increase in women ever receiving THR,
having children 0-5 months old from 33.4 percent to
45.5 percent (RI-RII) (Increase in Low socio-economic
status from 42.5 percent to 62.8 percent) and further
from 45.5 percent to 73.8 percent (RII-RIII). (More than
40 percent increase)
Ever received supplementary nutrition (during 0-5
months of child’s age) increased from 59 percent to 70.1
percent (Low socio-economic status from 62.9 percent
to 70.6 percent) RII-RIII. (More than 10 percent
increase).
4.2.8.5Nutrition and Health Day:
Any set day, which occurs at least once in a
month, when Take Home Rations are
distributed in the AWC and an ANM visits
the AWC and offers immunization and / or
ANC services.
The supplementary nutrition programme run by the
ICDS prior to the initiation of NH Day required the
beneficiary to come to the centre on a daily basis to get
their ration. Studies as well as field observations revealed
that the coverage rate of intended beneficiaries was low
especially in the Rural and Tribal pockets. Reasons
were obvious -
� Scattered housing patterns that explained large
distances covered to reach the AWC.
� Nature of occupation in rural/tribal areas & other
household priorities.
The concept of THR was promising and had distinct
advantages that were subsequently experienced.
Accordingly, State Government agreed in principle to
provide supplementary food as THR especially to
under 3 children, Pregnant and Lactating women (non
BPL) during each monthly / fortnight NHD at all
AWCs along with other health services provided by
ANM / AWW.
On the other hand, the grass-root workers of the
Health Department were having a tough time pursuing
the eligible beneficiaries for delivering essential services,
like immunization, drug supply, counseling, ANC
services. Keeping track was all the more difficult and
left-outs easily evaded the sight as well as the mind.
The tough grind faced by the ANMs in making door-
to-door visits for the beneficiaries to avail the services
was not rewarding. Most of the cases required constant
follow-ups but she would never find all beneficiaries as
a single group.
Thus the “Nutrition and Health Day” strategy was
envisaged, with a view to improve access and utilization
of services by eligible women and children especially
from the inaccessible pockets where magnitude of
malnutrition and mortality is very high. The THR-
TAKE HOME RATION component linked to it had
twin objectives:
� To improve the coverage of outreach target
population who go out of village in search of
livelihood and miss out on the feeding;
� To provide daily ration to U3 children, pregnant
and lactating mothers during each monthly
Nutrition and Health Day with counseling, basic
curative care and family planning services from
the ANM. THR would be used as incentive to
improve the coverage of health facilities like
immunization, drugs supply, ANC services, growth
monitoring, imparting health education and
counseling services.
Our experience in Bankura of Monthly Take Home

156
4
Ration as part of fixed Nutrition and Health Day
initiated by Women and Child Development
Department with support of Health and Family Welfare
Department. Government of West Bengal is as follow:-
Enrollment and coverage of U3, pregnant and
lactating mothers have been increased from out reach
pockets significantly. The data collected in absolute
number from one of the AWCs of Sonamukhi block
substantiate the above statement.
1. Mother attendance for weighing of the children
(less than 3 years) has been increased from 30
percent to 73 percent during the implementation
period.
2. Take Home Ration collection is relatively better
among rural, tribal, nuclear families, working
mothers & families from villages with 3 Km. of
the Anganwadi centres.
3. The provision of THR at demonstration sites
showed a statistically significant increase in
immunization among young children including
Table 4.6 Impact of Nutrition & Health Day
Beneficiary Enrolment prior Enrolment Actual coverage Actual coverage
category to Nutrition & after Nutrition prior to after Nutrition
Health Day & Health Day Nutrition & & Health Day
Health Day
0-3 28 71 20 56
P/L women 16 34 14 28
Source:- Care India
TT among pregnant women,.
4. Take Home Ration also ensured ICDS and Health
program convergence by bringing ANMs and
Anganwadi workers together on a fixed Nutrition
and Health Day for the following activities –
antenatal care, IFA distribution, weighing of U3
children and plotting their weight on the growth
chart, Health and Nutrition education to women &
distribution of ration in presence of community
representative, which minimizes ration dilution at
the centre level.
5. Social status of Anganwadi workers has improved
in the eyes of the community because of their
intense involvement in delivering health services
along with food.
By and large INHP experiences reveal that Take Home
Ration as part of fixed Nutrition and Health day is an
effective strategy to ensure better ICDS and health
program convergence, increased compliance of health
interventions, and increased coverage of beneficiaries
from the outreach pockets.
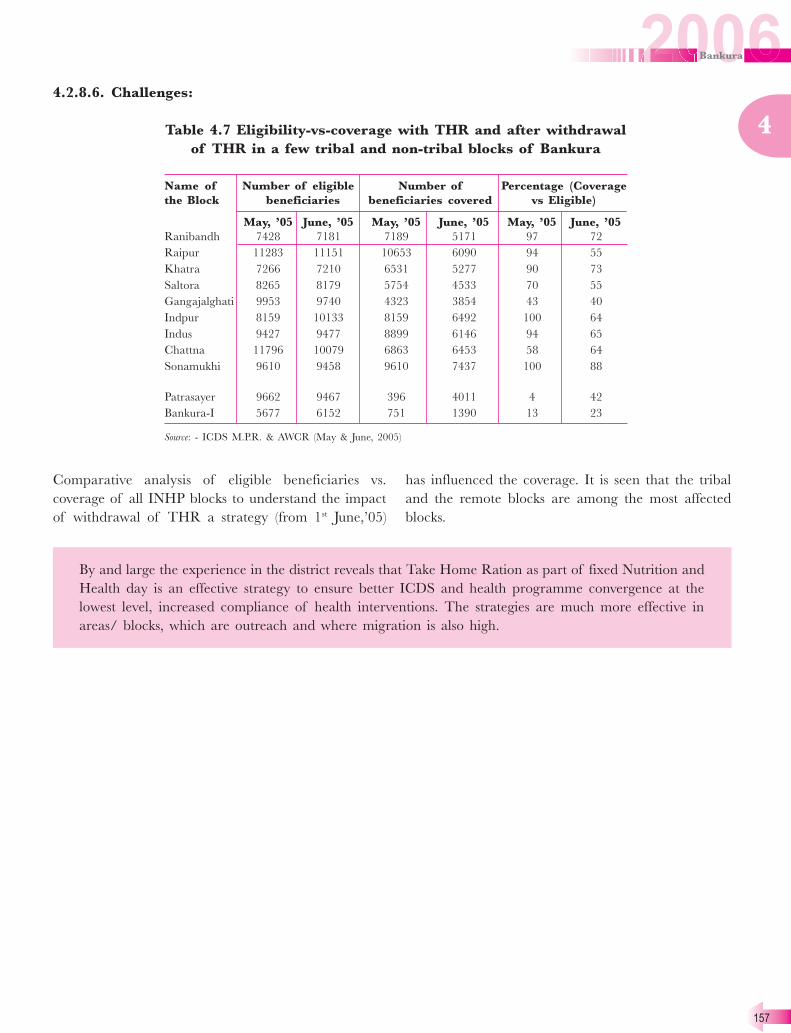
157
4
4.2.8.6. Challenges:
Table 4.7 Eligibility-vs-coverage with THR and after withdrawal
of THR in a few tribal and non-tribal blocks of Bankura
Name of Number of eligible Number of Percentage (Coverage
the Block beneficiaries beneficiaries covered vs Eligible)
May, ’05 June, ’05 May, ’05 June, ’05 May, ’05 June, ’05
Ranibandh 7428 7181 7189 5171 97 72
Raipur 11283 11151 10653 6090 94 55
Khatra 7266 7210 6531 5277 90 73
Saltora 8265 8179 5754 4533 70 55
Gangajalghati 9953 9740 4323 3854 43 40
Indpur 8159 10133 8159 6492 100 64
Indus 9427 9477 8899 6146 94 65
Chattna 11796 10079 6863 6453 58 64
Sonamukhi 9610 9458 9610 7437 100 88
Patrasayer 9662 9467 396 4011 4 42
Bankura-I 5677 6152 751 1390 13 23
Source: - ICDS M.P.R. & AWCR (May & June, 2005)
Comparative analysis of eligible beneficiaries vs.
coverage of all INHP blocks to understand the impact
of withdrawal of THR a strategy (from 1st
June,’05)
has influenced the coverage. It is seen that the tribal
and the remote blocks are among the most affected
blocks.
By and large the experience in the district reveals that Take Home Ration as part of fixed Nutrition and
Health day is an effective strategy to ensure better ICDS and health programme convergence at the
lowest level, increased compliance of health interventions. The strategies are much more effective in
areas/ blocks, which are outreach and where migration is also high.

158
4Towards a baby-friendly community – an initiative
It’s a tale of a village – Belowa of Sonamukhi block. Alpana Das, the Anganwadi Worker of the village
works hard-day in and day out to promote newborn care, better mother and child nutrition and minimize
infant death at the community level. She gets the support of active Change Agents, Self Help Groups
including Belowa Bijoya Sangha (the SHG Cluster of that area) to ensure community health and nutrition.
Even today, Alochona breaks into tears while speaking about her child’s birth and how Anganwadi
Worker and Change Agents of the village guided her to ensure safe motherhood. The ‘Kantha’ she
displays today as a tool for self-monitoring speaks of her success story. Every stitch on the piece of cloth
sewed by her, reflects one leap forward towards safe motherhood
Self-monitoring Tool (Picture 4.2)
Behaviour Change Communication (BCC) found the strongest strategy
to bring behaviour change at the household level. Pregnant and
lactating mothers demonstrating the positive behaviours stitch self-
monitoring tool in the form of ‘kantha’.
Earlier child malnutrition was a growing concern of the village. Debidi
– cluster leader recalls the day when the group monitoring tool was
reviewed at their cluster meeting in presence of the AWW. “We could
see with our own eyes that the nutritional status of our children was alarming;”
Group-Monitoring Tool (Picture 4.3)
Behaviour Change Communication (BCC) initiatives at the community
level speak of community empowerment process. The underlying
objective of this is to facilitate replication of positive behaviours with
special focus on improved childcare, feeding practices and growth
monitoring.
This called for immediate attention and integrated efforts of the
community, service providers, members of Panchayat Raj Institution. As part of the community initiative
(Cluster based management process with adequate support from all levels), it was decided to promote
Anganwadi Centre (AWC) based nutrition garden to supplement quality nutrition to the food cooked at
the AWC, promote adequate quantity through household level counseling and regulate growth monitoring
(especially for malnourished and younger children).
Community Based Nutrition Garden (Picture
4.4 & 4.5)
Anganwadi Centre (AWC) based Nutrition Garden
is a community based management initiative. It is
to supplement quality nutrition to the food cooked
at the AWC and promote adequate quantity and
thus regulate growth monitoring.
Now the Belowa Bijoya Sangha could start a nutrition garden on the land of a member of the cluster
close to the AWC. They had purchased seeds of vegetables, fenced the garden, planted the seed by their
own, watering from the neighbour’s tube-well. Debi feels excited to see the day when they would be fed

159
4
with nutrition-rich food and grow. They have planned to distribute the products to the poorest families
at the free of cost for their domestic consumption. This tale is being echoed in other areas of Bankura.
With the objective to reduce malnutrition in children, ‘Sabujer Abhijan’ (journey to the green) initiative
have been processed through community growth chart where monthly growth tracking of individual
children (under-2) is being monitored by SHG/Cluster to identify malnutrition in children. This speaks
for a move in the making community based care and management initiative towards “health for all”.
4.2.8.7. Immunisation :
Mothers of 12-23 month old children BCG vaccines
received (card only) increased from 95.5 percent to 97.3
percent to 98.2 percent (RI-RII-RIII). DPT 3 vaccines
received (card + Recall) increased from 86.7 percent to
84.4 percent to 89.2 percent (RI-RII-RIII). Measles
vaccines received (card only) increased from 65.1 percent
to 86.4 percent to 86.7 percent (RI-RII-RIII) (More than
20percent improvement). Measles vaccine received (card
+ recall) increased from 64.8 percent to 81.7 percent to
85 percent (RI-RII-RIII) (More than 20percent
improvement)
Fully immunized (card only) increased from 62 percent
to 81.8 percent to 84.2 percent (RI-RII-RIII) (More than
22 percent improvement). Timely completion of the
measles vaccine increased from 57.5 percent to 65.5
percent to 75.1 percent (RI-RII-RIII) (More than 18
percent improvement). Fully Immunized (card + Recall)
increased from 59.9 percent to 72.5 percent to 75.8
percent (RI-RII-RIII). Fully immunized on time
increased from 53.8 percent to 59.5 percent to 63.5
percent (RI-RII-RIII) (More than 20 percent
improvement). Drop outs from BCG to measles
vaccination (card + Recall) reduced from 31.1 percent
to 16 percent to 11.8 percent (RI-RII-RIII) (More than
20 percent drop).
When the respondents were asked about how they know
about the immunization day, 29.2 percent respondent
replied that it is held on a fixed day, which they know.
This particular indicator is showing an upward trend
from 17 percent to 29.2 percent (RII- RIII).
VITAMIN-A:
First dose of VITAMIN A (12-23 MO):
Card +Recall has increased from 69.8 percent to 76.1
percent to 84.4 percent (25 percent increase) from RI-
RII-RIII (More than 15 percent improvement). Recall
only has increased from 47 percent to 69 percent RII-
RIII (More than 22 percent improvement). Card alone
has increased from 79.4 percent to 82 percent RII-
RIII (10-17 MO).
Second dose (18-23 MO):
Card alone has increased from 18 percent to 40
percent (Low socio-economic status from 13.5 percent
to 37.9 percent) RII-RIII (More than 22 percent
improvement). Recall alone has increased from 25
percent to 50 percent (Low socio-economic status 23
percent to 75 percent) RII-RIII. (More than 25 percent
improvement)
Challenges:
A couple of years back the coverage of Vita-A in
Bankura was quite poor, more particularly from the
third doze onwards. Realizing the potential of the
AWW in terms of strengthening the coverage of
Vitamin a pilot initiative was take up in the district, to
make the AWW the depot holder of Vita A.
Experience and data substantiate that the strategy has
been working well. There is a need to strengthen the
initiatives further and to scale up the strategy across
the district.
Strategies which needs to be strengthened:
� Nutritional Health Day calendar to be
strengthened (To strengthen contacts)-Possibility to
make this as part of monthly reporting system.
� AWC as depot holder of IFA and Vita-A
� A health and Nutrition card to be implemented
to track and ensure services during migration.
� Developing models for baby friendly communities.
Promotion of active feeding for improving IYCF
practices (quality, active feeding, feeding during
and after illness) including personal hygiene and
growth promotion.

160
4
� In order to ensure critical contacts the home visit
planner and the centre visit supervisory checklist
to be periodically updated and monitored.
� House hold level behavior tracking & micro
planning through community participation using
people friendly tool to capture household level
behavior.
� Strengthening CHCMI programme through PRI
and involving CA/SHG - how do we
institutionalize.
� Using different channels of communication (IEC)
for promoting household level feeding behavior of
younger children.
4.2.8.8. Other issues :
� One of the biggest challenges that lie in front is
how to address nutritional security and other
health services to the migratory population. In
Bankura about 21percent of the households
migrates for more than 6 months in a year and
about 16percent of the households migrates with
the entire family (base line survey of 59 RSVY
Mouza, AC Nelson ORG MARG). Migration for
more than 6 months hinders any institution
building processes within the community. As the
migratory population is among the most
vulnerable, the challenge is even bigger.
� The density of population is almost half the west
Bengal average, which means dispersed population
and people residing in small hamlets and often
resulting to geographical exclusion. The
geographical exclusion and social exclusion in the
district has been overlapping.
� There are also problems with the food-grain supply
to the ICDS centres. There are delays and the
quality is also not up to the mark. There have been
efforts to supply foodgrains by the self-help groups
(SHGs) in this district. The quality has been very
satisfactory and the accountability of the groups to
community is very high.
� In Bankura Medical College, there are about
16000 deliveries per year. There is an urgent need
to starst a neo-natal care unit in the hospital. It is
going to help in a big way in reducing IMR in the
district.
4.3. Infrastructure :
Good infrastructure is a necessary condition for
providing quality services. In this district hardly 20
percent of ICDS centres have their own infrastructure.
Mostly, the centres are located in the clubs, private
houses, or the primary schools. Since clubs, private
buildings may not be located optimally, there is always
a possibility of exclusion of certain parts. We made an
analysis of the coverage of ICDS Centres in Chhatna
Block on a GIS Platform. It has been observed that the
uncovered areas are high in SC/ST percentage. A
similar mapping has been undertaken for all the blocks.

161
4
4.5 Anganwadi centres with outreach pockets in Chhatna block
(Source : NRDMS, Bankura)
Habitation layers have been superimposed from Survey
of India maps. This has helped in identification of
uncovered pockets. In fact, the district has recently
obtained a sanction of additional 506 centres. Location
for the same has been planned using the GIS Decision
Support System as indicated above. Natural barriers like
river, forest, are also considered while selecting the
location of a new ICDS Centre. Parallely there has been
an effort to locate land for existing ICDS Centres so
that building may be constructed. Land for ICDS
centres are generally available provided it is looked for
in the area where target children (generally the deprived
lot) reside. A detailed land bank has been prepared for
all the ICDS Centres in the district.
4.4 Public Health :
4.4.1. Revised National Tuberculosis
Programme (RNTCP) :
Tuberculosis is a major public Health problem &
Number One killer of adults among all infectious
diseases in India. Direct Observe Treatment (DOT) is
the best strategy to cut the chain of transmission in
the community. 50 percent of the population are

162
4
already infected with Microbacteria Tuberculai &
recently co-infection with HIV worsened the situation.
HIV infection increased the risk of TB infection more
than 60 percent.
Bankura is the 4th
biggest district situated in the South-
Western part of the State. The Projected Population
of the district is 3408408 (Projected 2006). The Tribal
Population in the District 9 lakh & nearly 80 percent
of the population live in rural area. The district is
divided into 8 sub-districts (Tuberculosis Unit). Each
TB Unit approximately covering 5 lakh population,
except in the Tribal area (2.5 lakh/TB Unit).
RNTCP programme started on 14th
November 2000.
The approach today is totally decentralized. At present
there are 35 designated Microscopy Centres situated
in all BPHC & a few PHC. Sputum microscopy is the
diagnostic criteria & one of the most important
component of DOTS strategy. There are presently 570
DOTS Centres. There are four DOTS centres run by
the NGOs.
The goal of RNTCP is to decrease mortality &
morbidity due to TB and cut transmission of infection
until TB ceases to be a major public health problem.
To reach the goal we have two objectives (1) Cure rate
85 percent among newly detected infectious cases
(Sputum Smear Positive) (2) Case detection of 70
percent of such cases.
ARTI (Annual Rate of Tubercular Infection) in east
zone of India is 1.5 on this basis at least 203 patient/
lakh/year in a community should be detected.
Though Bankura District has achieved both the
objectives yet we are lagging behind in total case
detection i.e. 203/lakh population/year. The total case
detection rate was 128/lakh in 2005. Cure rate is 89
percent, & Case detection rate is 82 percent, death rate
is 4 percent, and defaulter is less than 2 percent.
The major constraints of the programme are:
i) Less detection of Sputum Negative and Pulmonary
Tuberculosis.
ii) DOTS strategy not taken up for the Municipal
areas.
iii) Involvement of the general practitioner, Private
Hospital & Poly clinic.
To overcome the situation the district has taken the
initiative to:-
i) Retraining the Medical Officers to diagnose the
sputum negative case.
ii) X-ray facilities to be available in remote PHC
(Including Mobile Tuberculosis Facility).
iii) To conduct sensitization programme through IMA
for general practitioner.
iv) To implement DOTS intervention in municipal
areas through other programmes.
v) Involvement of the NGO for DOT provision.
vi) Involvement of tribal chieftains in disseminating
information and motivating the villagers
Performance on RNTCP at Bankura District (Period November, 2000 to June, 2006)
Total No. of Patients put on Treatment up to June 2006 : 24285
Result of Treatment Outcome upto June, 2005
A) Total number of patients put on treatment : 20015
B) Outcome
i) Number of patients cured : 17851
ii) Number of patients died : 753
iii) Number of patient-failure, i.e., number of
patients with sputum positive at the end of treatment : 220
iv) Number of default, i.e., number of patients
who have given up the treatment : 1119
v) Number of patients transferred out : 72

163
4Table 4.8 Age-wise distribution of Smear Positive new cases in the year 2004 & 2005
Age-wise distribution in 2005 (Smear Positive new case)
Age-group (Years)
0-14 15-24 25-24 35-44 45-54 55-64 65 & Above Total
M F M F M F M F M F M F M F M F Total
10 12 222 142 302 168 376 131 346 64 221 50 123 27 1600 594 2194
Age-wise distribution in 2004 (Smear Positive new case)
Age-group (Years)
0-14 15-24 25-24 35-44 45-54 55-64 65 & Above Total
M F M F M F M F M F M F M F M F Total
15 17 223 155 311 153 368 128 339 59 205 41 98 15 1559 568 2127
Source:- Office of the Chief Medical Officer for Health, Bankura
We may now have a look at the age profile of the newly detected cases :
4.6 Age-wise smear-positive new cases
(Source : Office of the Chief Medical Officer of Health, Bankura)
As can be seen, the proportion of women cases has
decreased sharply for the age group of more than 15
years. As discussed earlier, the total new case detection
is also less than the target estimated. This suggests that
the detection of cases in women may not be happening
properly. This is mainly because of self-abrogating
nature of women and their tendency to ignore
physical ailments to the maximum extent possible.
Collection of sputum by NGOs has been found to be
very helpful in reaching out to the people, especially
women. There seems to be a necessity to enhance this
further.

164
4
Micro-filaria rate is defined as number of persons
having micro-filaria out of thousand population and
disease rate is defined as number of persons affected
by the disease out of one thousand population on an
average.
Filaria is endemic in Bankura district. All the blocks are
more or less affected, but urban filaria control
programme is the only ongoing programme in Bankura
& Bishnupur Municipality, for which staff and logistics
The following steps have been taken to combat the
situation:
1. All Block Primary Health Centres (BPHCs) have
been provided with sufficient D.E.C. Tabs to treat
all filaria cases reporting to BPHC.
2. State government has been asked to provide fund
& logistic to carry out active search for filaria case
through night blood survey in all blocks.
3. To reduce morbidity, hydrocele operation is being
done in rural hospitals through camps.
Recommendation
Rural filarial control programme should also be adapted
in line with the urban filarial control programme.
Table 4.9 Prevalence of filaria in Bankura
Micro-filaria
(MF) rate 2000 2001 2002 2003 2004 2005
Bankura 5.06 2 3.69 2.45 2.68 3.03
Bishnupur 5.7 3.47 3.95 2.9 1.56 3.30
Disease rate 2000 2001 2002 2003 2004 2005
Bankura 5.68 6.32 11 9.6 5.56 10.9
Bishnupur 2.28 2.26 3.06 4.36 3.75 3.8
Source: Office of the Chief Medical Officer of Health, Bankura
4.4.2. Filaria:
are available. Therefore, the data on prevalence of filaria
in the rural area is not available. During survey, it is seen
that some villages are highly infected with Filaria. In
2004, one survey revealed that Arkama village of Khatra
Block has 5.8 percent of m.f. infection & Indpur village
of Indpur block has 7.3 percent of m.f. infection.
National Filaria Day is observed for one day in a year
except the normal activities of Health & Family Welfare
Department of the government.
4.4.3. Diarrohea:
Diarrhoea occurs in almost all theblocks of Bankura
district throughout the year. Sporadic outbreak occurs
mainly in late summer. Two reasons for this disease are
identified :
1. During summer, source of water is scarce. Some
water is used for washing and other house hold
purposes, which very often infects the drinking
water.
2. Early showers of rain washes the night soil of
catchment area of dug-wells used for purpose of
drinking water and the infected subsoil water drains
into the kutcha dug-well & even tube-well.
Table 4.10 Observance of National Filaria Day
2004 2005
Number of Percent Number of Percent
patients patients
Targetted population 3120259 100 3067482 100
Population covered 1587874 50.88 2353725 76.73
Total population who
have consumed DEC tablets 1587874 50.88 2353725 76.7
Source: Office of the Chief Medical Officer of Health, Bankura

165
4
Diarroheal diseases :
There is a steady increase in diarrhoeal diseases, both in
incidence and death. But the apparent increase is not
the true scenario, as the increase is due to the fact that
there is increased vigilance and better reporting in
comparison to the previous years. There has been an
increase in the safe drinking water supply, even in remote
Recommendation
For the above reasons, every village is prone to
diarrhoeal outbreak in the season as well as any time
during the year. To combat the situation, the following
measures are to be taken.
1. Provision of safe drinking water by pipe water
supply & deep tube-well construction.
2. Provision of sanitary latrine for every family has to
be ensured. In addition, I.E.C. is the key factor. It
is done during the outbreak season by miking,
leaflet distribution, video show, public meeting &
door-to-door visit.
4.4.4. Malaria:
Malaria is a major public health problem in Bankura
District. Majority of the cases occur in Ranibandh
Block, which is a hilly and tribal block .
The causes of increase in Malaria and action taken
there of is summarized below:
Resistance to DDT : Since 2002, vector (Anoph.
Culicifacis) has become 100 percent resistant to DDT.
State government has been requested to change to the
insecticide malathion which has not been supplied to
Table 4.11 Prevalence of dysentery and diarrhoreal diseases
Acute Bacillary Diarrhoreal Total number of
Year Gastro-Enteritis Dysentery Diseases patients
Number of patient Number of patient Number of patient
Affected Died Affected Died Affected Died Affected Died
2002 8986 23 55 0 23219 1 32260 24
2003 14824 24 278 0 15708 2 30810 26
2004 21932 30 796 0 25913 3 48641 33
2005 26911 23 616 0 30841 3 58368 26
Source: Office of the Chief Medical Officer of Health, Bankura
villages. Still, the target remains unfulfilled. It can be
achieved only by creating public awareness to use safe
drinking water and early recognition of signs of
dehydration, so that corrective measures can be initiated
at the earliest by providing Home Available fluid, ORS
or hospitalisation. The figure below gives an account
of trend of Diarrhoeal diseases in Bankura District.
West Bengal by Central government till now, we are
compelled to continue to spray with DDT, as it reduces
the infection from mosquito to some extent.
Resistance to chloroquine : Malaria parasites have
shown resistance to chloroquine in Ranibandh and it
has crossed 25 percent mark in 2004. So this year
alternative drug policy has been adopted since June,
2005. Now patients in Ranibandh Block are being
administered with alternative drug in combipack
(Sulfadoxin and Pyrimethaprin), which is more effective
& easier to use.
Inaccessibility : Large portion of the hilly & forest
area was not easily reachable by health staff from block
level. To combat this, all vacant posts of Health
Assistant (Female) has been filled up and 165 drug
distribution centres has been established by trained
Anganwadi Workers at village level.
Lack of personal protection : Poor & illiterate
villages are not in a position to afford personal
protection like use of mosquito net. So one thousand
mosquito nets has already been procured and
distributed in most affected villages, ensuring that every
individual uses insecticide-treated mosquito net.

166
4
Graph 4.7 Trend of malaria in Bankura
Source: Office of the Chief Medical Officer of Health, Bankura
The above data clearly shows that the incidence of
malaria has declined during 2006 compared to the year
2005. The success has been due to the following facts:
1. Intensive mass survey and administration of Fever
Radical Treatment (FRT) in most affected villages
of the most affected block, i,e. Ranibandh and
contiguous blocks i.e. Raipur & Sarenga . An effort
has been made to do mass radical treatment for
those who are not suffering from fever. However, it
is generally not possible to find villagers since they
normally go out for work and coverage is only
partial. To start this process prevalence of malaria
was first plotted on a GIS based map as shown in
map 4.7.
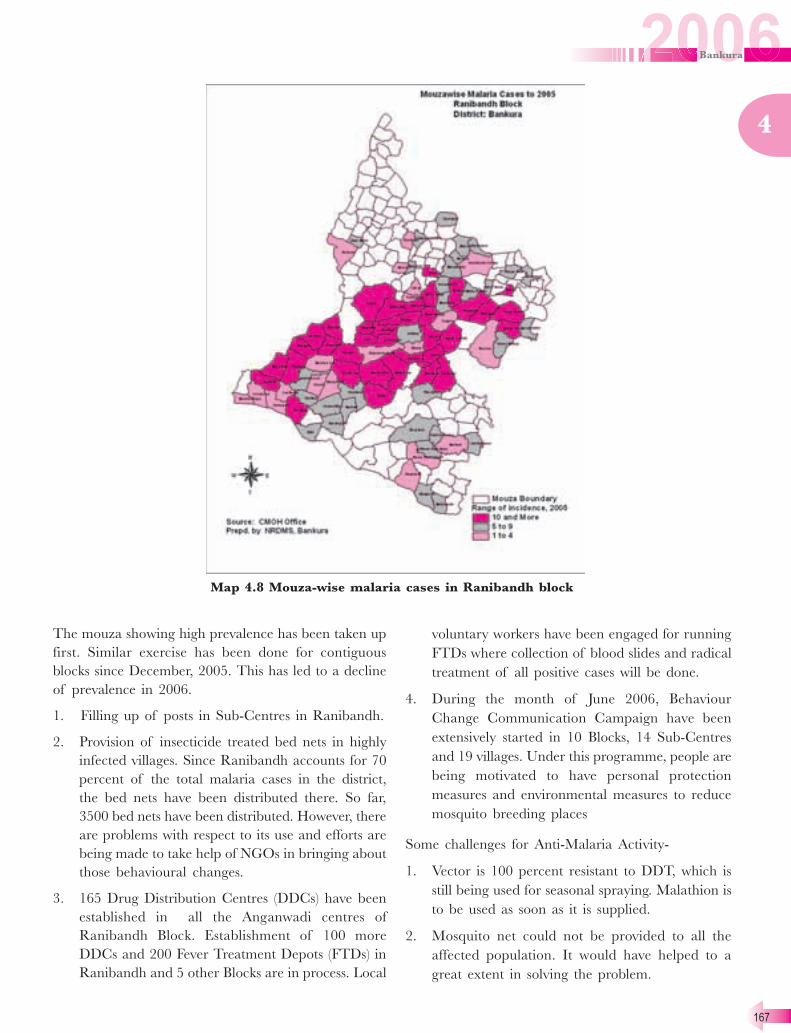
167
4
The mouza showing high prevalence has been taken up
first. Similar exercise has been done for contiguous
blocks since December, 2005. This has led to a decline
of prevalence in 2006.
1. Filling up of posts in Sub-Centres in Ranibandh.
2. Provision of insecticide treated bed nets in highly
infected villages. Since Ranibandh accounts for 70
percent of the total malaria cases in the district,
the bed nets have been distributed there. So far,
3500 bed nets have been distributed. However, there
are problems with respect to its use and efforts are
being made to take help of NGOs in bringing about
those behavioural changes.
3. 165 Drug Distribution Centres (DDCs) have been
established in all the Anganwadi centres of
Ranibandh Block. Establishment of 100 more
DDCs and 200 Fever Treatment Depots (FTDs) in
Ranibandh and 5 other Blocks are in process. Local
Map 4.8 Mouza-wise malaria cases in Ranibandh block
voluntary workers have been engaged for running
FTDs where collection of blood slides and radical
treatment of all positive cases will be done.
4. During the month of June 2006, Behaviour
Change Communication Campaign have been
extensively started in 10 Blocks, 14 Sub-Centres
and 19 villages. Under this programme, people are
being motivated to have personal protection
measures and environmental measures to reduce
mosquito breeding places
Some challenges for Anti-Malaria Activity-
1. Vector is 100 percent resistant to DDT, which is
still being used for seasonal spraying. Malathion is
to be used as soon as it is supplied.
2. Mosquito net could not be provided to all the
affected population. It would have helped to a
great extent in solving the problem.

168
4
June’ 05 July’ 05 Aug’ 05 Sep’ 05 Oct’ 05 Nov’ 05 Dec’ 05 Jan’ 06 Feb’ 06 Mar’ 06 Apr’ 06 May’ 06 June’ 06
15.34 14.37 14.01 13.56 12.93 11.05 9.35 9.26 7.78 6.98 6.88 6.18 5.83
3. Inaccessible jungles having permanent source of
Anopheles breeding place with hamlets within
flying range of vector.
4.4.5. Leprosy :
Leprosy has been a major problem in Bankura for a
very long time.
At the time of starting MDT in 1988 the Prevalence
Rate was 72/ 10000 and over a period of time MDT
come to be applied through out the district in a
substantial way. Leprosy was regarded as a perennial
problem with no solution in sight and the introduction
of Multi Drug Therapy (MDT) during the last 20 years
resulted in enormous progress towards combating the
disease. The leadership provided by the authorities, the
strong commitment of the staff and the support of
June’ 05 July’ 05 Aug’ 05 Sep’ 05 Oct’ 05 Nov’ 05 Dec’ 05 Jan’ 06 Feb’ 06 Mar’ 06 Apr’ 06 May’ 06 June’ 06
5.78 5.60 5.38 5.21 5.24 5.09 4.64 4.18 3.61 3.34 3.13 2.99 2.95
NGOs have together helped to reduce the burden of
Leprosy by almost 80 percent.
The case strategy for Leprosy elimination is to identify
all leprosy cases and cure them with MDT. For too long,
the responsibility for identifying cases of leprosy was
held solely by Health Services, particularly the specialized
(Vertical) leprosy services. While the approach had certain
advantages in certain situations, the major disadvantage
was the relatively poor coverage of the population by
these specialized services. This resulted in a large number
of patients remaining undetected.
In the year 2003, April, the Basic Health Services to
take over responsibility for specialized leprosy control
services. ANMs’ working close to the rural community
were to take the responsibility for leprosy treatment in
their Sub-Health Centre areas.
The improvement is achieved by regular visit to Sub-
Centre, PHC and BPHC, validation of the new cases,
regular IEC, defaulter tracing, improvement in MDT
After integration of vertical programme of Leprosy
with the general Health Care Staff the position of the
district is improved. P.R. is one of the indicator to show
the improvement of the district status. PR status of
Bankura district from June ’05 to June ’06 is given below.
Comparison with the previous years the achievement
is as follows:
March’02 March’03 March’04 March’05 March’06
6.68 6.36 6.63 6.33 3.34
In case of Ranibandh Block, where PR is highest in the district, the progress is as follows:
distribution, and regular training to the general Health
Care Staff.

169
4
Table 4.12 Block and Municipality-wise balance caseload with their
PR (as on July, 2006)
Bankura sub-division
Sl. Name of the Total PB MB Grand P.R.
No. Block population total
Ad. Ch. Total Ad. Ch. Total
1 Gangajalghati 175852 32 2 34 34 6 40 74 4.20
2 Bankura-I 104030 21 1 22 30 0 30 52 4.99
3 Bankura-II 133961 12 3 15 34 3 37 52 3.88
4 Chhatna 183675 23 7 30 28 3 31 61 3.32
5 Barjora 194305 14 2 16 42 3 45 61 3.14
6 Mejia 82629 8 1 9 10 0 10 19 2.30
7 Onda 239421 25 4 29 45 2 47 76 3.74
8 Saltora 131940 11 3 14 48 5 53 67 5.07
Total 1245813 146 23 169 271 22 293 462 3.71
Bishnupur sub-division
Sl. Name of the Total PB MB Grand P.R.
No. Block population total
Ad. Ch. Total Ad. Ch. Total
1 Sonamukhi 154491 8 3 11 14 0 14 25 1.62
2 Patrasayer 178080 7 0 7 14 1 15 22 1.23
3 Indus 165909 4 0 4 17 1 18 22 1.33
4 Joypur 153589 0 0 0 13 0 13 13 0.85
5 Bishnupur 150627 15 1 16 16 1 17 33 2.20
6 Kotulpur 181865 7 1 8 8 0 8 16 0.88
Total 984561 41 5 46 82 3 85 131 1.33
Khatra sub-division
Sl. Name of the Total PB MB Grand P.R.
No. Block population total
Ad. Ch. Total Ad. Ch. Total
1 Khatra 111334 10 1 11 21 1 22 33 2.96
2 Ranibandh 113242 17 0 17 37 6 43 60 5.30
3 Hirbandh 78697 13 1 14 12 0 12 26 3.30
4 Raipur 164222 35 4 39 24 2 26 65 3.96
5 Sarenga 103257 9 0 9 12 0 12 21 2.03
6 Simlapal 138336 8 2 10 32 0 32 42 3.04
7 Taldangra 139750 11 1 12 20 0 20 32 2.29
8 Indpur 149603 14 2 16 41 3 44 60 4.01
Total 998441 117 11 128 199 12 211 339 3.39

170
4
Municipalities
Sl. Name of the Total PB MB Grand P.R.
No. Block population total
Ad. Ch. Total Ad. Ch. Total
1 Bankura 139785 30 43 73 37 6 43 116 6.15
2 Bishnupur 67242 3 1 4 23 0 23 27 4.01
3 Sonamukhi 29691 2 0 2 2 0 2 4 1.34
Total 236718 35 44 79 62 6 68 147 4.94
Total caseload with
PR 3465533 339 83 422 614 43 657 1079 3.02
Balance case load = Number of persons having leprosy at a particular time
Prevalence rate (PR) = Balance case load per 10,000 population at a particular time
PB : Pauci-Bacillary, MB : Multi-Bacillary, Child (Ch.) : Person below 14 years, Adult (Ad.) : Person above 14 years
Source: Zonal Leprosy Officer, Bankura
Strategy :
1. Promoting genuine community involvement and
community action.
2. Building the capacity of General Health Care
Services and motivating them to ‘own’ leprosy
work.
3. Supporting the General Health Services through
special teams in order to improve their
performance.
4. Ensuring supply of drugs and other materials.
5. Regular I.E.C. and workshop.
6. Improve the urban area activities.
7. Try to prevent disability by the training to the
health workers and teach the old treated patients
about the ‘self care’. Arrangement for the
Reconstructive Surgery.
8. Rehabilitation of the age old and homeless leprosy
patients.
9. Coordinating the activities of all partners.
Promoting community involvement and
community action:-
Activities in these areas, particularly to create and
improve awareness, have been part of the National
Leprosy Programme (NLEP) for many years. These
activities were also widely promoted during the
Modified Leprosy Elimination Campaigns (MLEC)
and Block Leprosy Awareness Campaigns (BLAC). The
programmes were highly successful because
communities accepted ownership of their problems and
institutions such as Panchayati Raj taking the initiative
in discussing leprosy and seeking help and collaboration
from the health services. In tribal areas involvement of
tribal chieftain had been found to be very helpful.
Integration and building the capacity of general
health services
It is easy to say that leprosy should be integrated within
the general health services in order to improve coverage.
But such integration has not been easy in practice. First,
the historical burden of the vertical approach to leprosy,
with its specialized workers, makes it difficult for general
health services to accept leprosy work. In addition, even
where some progress has been made towards
integration, the specialized workers are unwilling to part
with their ownership of leprosy work. They create
impediments to integration specially in areas where
supervision was weak.
Apart from these there is an urgent need to build the
capacity of general health services and motivate them.
In past, leprosy was once a difficult disease to deal with.
Now the technology for diagnosis and treatment has
been simplified to a very great extent.
4.4.6. AIDS :
There has been a upsurge of HIV/AIDS in Bankura
district. Though it is still much lower than the incidence

171
4
rate in West Bengal, the situation is alarming as
Durgapur shows a upward trend in infection among
pregnant women, which is the sign of percolation of
infection among general public from the high risk group.
Efforts are being made to spread the message of ways
of AIDS prevention, by various methods like training
to health and allied personnel, awareness among truck
drivers, forest dept. employees, Anganwadi Workers and
NGOs. As awareness is the best tool of AIDS
prevention, every effort is being made to reach out to
the people.
In a few cases AIDS has been observed in migrating
population. Since the migration happens on a regular
basis, the population is vulnerable.
4.5 Drinking water & Sanitation
in Bankura
4.5.1. Drinking water:
4.5.1.1. Availability of drinking-water in
Bankura :-
The district of Bankura is known as drought-prone and
in dry season water for drinking and other uses is a
major problem for this area. Majority of the shallow
wells go dry or retain scanty water, which dry up
during winter and summer. The water level varies in
the district from 1.5 mts. to 22 mts. A number of
flowing tubewells exist along the banks of the
Dwarakeshwar river, the Jaipanda river and the
Champa stream. Artesian flows are generally obtained
from acquifers occurring between the depth spans of
30 mts. to 75 mts. In the Dwarakeshwar river basin,
free flow of 25 to 34 litres per minute is obtained
from 50 mm. diameter tubewell. The artesian pressure
is weak and varies from 1.1 mts. to 6.5 mts. above
land surface.
A survey was conducted by the Public Health
Engineering Department to assses the pocket
uncovered by the drinking water sources. The survey
was conducted in 2003. 228 habitations had been
found to have no source of drinking water and 359
habitations were partly covered on a scale of one tube-
well per 250 population in a habitation. Habitation in
this context refers to some households living together
in a hamlet, ‘para’, ‘tola’ etc., whatever small the size
of the population residing there may be. The scenario
may have changed with the installation of new
tubewells between 2003 & 2006, but the sorry state of
affairs is that most of the tubewells go dry during
summer leaving a sizeable population of the district
without any safe source of drinking water and
compelling them to take recourse to dugwells and other
sources of water for drinking.
Hand-boring is done for installation of tubewells in
most parts of the blocks like Bishnupur, Sonamukhi,
Patrasayer, Taldangra, Barjora, Onda and parts of
Sarenga and Raipur. In other parts of the district
machine-boring is the only way for installation of
tubewells due to hard rocks. Even in some areas,
machine-boring even fails and efforts are being taken
to extend piped-water facility to those areas.

172
4
Table 4.13 Extent of coverage of habitation with drinking
water facility
Sl. Name of Number of habitations Number of habitations
No. Block not covered partially covered
1 Bankura-I 1 27
2 Bankura-II 0 28
3 Indpur 6 17
4 Saltora 1 0
5 Chhatna 12 19
6 Mejia 5 1
7 Gangajalghati 2 11
8 Barjora 8 42
9 Bishnupur 13 22
10 Kotulpur 5 29
11 Joypur 5 14
12 Indas 0 7
13 Sonamukhi 13 2
14 Patrasayer 21 10
15 Onda 6 7
16 Khatra 32 15
17 Ranibandh 18 10
18 Taldangra 8 19
19 Simlapal 32 9
20 Sarenga 10 14
21 Raipur 29 43
22 Hirbandh 1 13
Total 228 359
Source: Office of the Executive Engineer, Public Health Engineering Directorate (Civil), Bankura
Table 4.14 Coverage of rural piped water supply scheme
Programme Number of Number of Number of Population
piped water villages habitations covered
supply scheme covered covered (as per 2001
Census)
Minimum Need Programme 10 95 172 134409
Augmented Rural Water Supply Programme 14 180 374 222407
Pradhan Mantri Gramoday Yojana 6 21 34 18103
Augmented Urban Water Supply Programme 1 1 1 16632
Total 31 297 581 391551
Source:- Office of the Executive Engineer, Public Health Engineering Directorate (Civil), Bankura
The district has taken up the work of rain-water
harvesting through micro-watershed approach, which
will accelerate recharge of the ground water. It is
expected that the process will raise the water table,
which will enhance overall availability of water in the
area.
4.5.1.2. Fluoride contamination in ground
water in Bankura:-
Fluorine is a fairly common element that does not occur
in the elemental state in nature because of its high
reactivity. It accounts for about 0.3 gm/kg of the earth’s
crust and exists in the form of fluorides in a number of

173
4
minerals. Fluoride is found almost everywhere in the
environment. It is available in air, water and virtually
all foodstuffs. In sea-water, a total concentration of 1.3
mg/litre has been reported. In areas rich in fluoride-
containing minerals, well-waters may contain up to 10
mg or more fluoride per liter. Level of daily exposure
to fluoride depends mainly on the geographical area.
Daily intakes ranging from 0.46 to 3.6-5.4 mg have been
reported in several studies.
After oral intake, water-soluble fluorides are rapidly and
almost completely absorbed in the gastrointestinal tract.
Fluorides less soluble in water are absorbed to a lesser
degree. Absorbed fluoride is transported via the blood;
with prolonged intake of fluoride from drinking water,
concentration in the blood is the same as those in the
drinking water, a relationship that remains valid up to
a concentration of drinking water of 10 mg/litre. In
warmer areas like Bankura, dental fluorosis occurs at
a concentration below 1.5-2.0 mg/litre of drinking
water, skeletal fluorosis takes place at a concentration
of 3.6 mg/litre, crippling skeletal fluorosis develops
where drinking water contains over 10 mg/litre of
fluoride.
A study of samples tested from various districts is
shown in the following table from which it is seen that
Bankura has the highest concentration so far as
presence of fluoride in ground-water is concerned.
Table 4.16 Gram-Sansads having high fluoride concentration
Sl. Name of Number of Number of Population affected
No. District affected Blocks affected (as per Census,
Gram-Sansads 2001)
1 Bankura 10 38 1372970
2 Birbhum 7 15 966202
3 Purulia 17 127 2089256
4 Dakshin Dinajpur 5 37 882742
5 Uttar Dinajpur 1 3 249500
6 Malda 2 4 288078
7 South 24 Paraganas 1 1 351569
Total 43 225 6200317
Source: UNICEF
Table 4.15 Concentration of fluoride in ground-water
Sl. Name of Number of Total number Concentration-wise (in Max. conc.
No. District Blocks where of samples mg/litre) number of samples of F (mg/l)
testing done tested
F<1.0 1.0<F<1.5 F>1.5
1 Bankura 20 2198 2081 79 38 8.61
2 Birbhum 17 1905 1769 121 15
3 Purulia 18 1629 1325 177 127 7.70
4 Bardhaman 6 730 728 2 0 0.689
5 Purba Midnapur 2 203 203 0 0 0.394
6 Paschim Midnapur 10 1198 1190 8 0 1.38
7 Cooch Behar 4 1576 1575 1 0 1.20
8 Uttar Dinajpur 3 1296 1279 14 3 1.84
9 Dakshin Dinajpur 6 1358 1233 88 37 6.41
10 Malda 6 1195 1177 14 4 2.54
11 Murshidabad 4 507 507 0 0 0.703
12 South 24 Paraganas 5 856 855 0 1 1.57
Total 101 14651 13922 504 225 33.036
Source : UNICEF
174
4
4.5.1.3. Iron contamination in ground water in
Bankura:
Though iron content in drinking water may not affect
the human system as a simple dietary overload, but in
the long run prolonged accumulation of iron in the body
may result in homochromatosis, a disease in which
tissues are damaged. In Bankura quite high
concentration of iron in ground-water has been found in
Sonamukhi Municipality and areas of Sonamukhi Block
adjacent to that Municipality. Iron concentration as high
as 4.70 mg/litre has been found in that area whereas the
maximum permissible limit of iron is 1 mg/litre.
Effective preventive steps are required to be taken up at
the right earnest so that the people consuming the
contaminated water are not affected in future.
Table 4.17 Concentration of iron in some
tubewells at Sonamukhi Municipality and
adjacent area
Sl. Site of tubewell Iron concentration
No. (mg/litre)
1 Banerjee Para 4.70
2 Sonamukhi Hospital outdoor 1.53
3 Barasanko 1.17
4 Block Office 1.27
5 Amalnagar 1.68
6 Naiphela 1.67
Source: Office of the Executive Engineer, Public Health Engineering
Directorate (Civil), Bankura
4.5.1.4 Drinking water problems in municipa-
lity areas:
Like rural areas the three Municipalities face some
specific problems related to the drinking water.
Bankura Municipality:
Bankura Municipality was established in the year 1865.
At that time water of ponds and rivers were mainly
used as drinking water and household water. Concept
of dugwell started in the nineteenth century and the
municipality took up this work by digging many wells
and gradually developed the water supply system by
establishing different pump houses. In twentieth
century, first project of water lifting from river started.
Gradually a network of water supply system has been
developed in the municipality and the present
infrastructure is shown in table 4.18.
Except the fact that only 65 percent of the population is
being supplied with piped water supply, during summer
the piped water supply decreases by 35 percent to 40
percent due to non-availability of water from source as
water level from river bed goes down. To combat the
situation and to keep the water supply smooth in summer
season, different steps has been taken, but the actual
demand of municipal area has not been fulfilled.
Following strategy has been chalked out to address the
issue :
1. Revival of the river Gandheswari:- Gandheswari
in its total span of 32 kms. has emerged from Murlu
range in Saltora and has flown into the river
Dwarakeshar at Bhutsahar in Onda. Thus
Gandheswari with its tributaries like Dhankora,
Bankajore, Haroka, Amagora has its catchment in
Bankura and as the history reveals, it was one
potential river of the district influencing the lives
and occupation of the people of catchment area
throughout its course. According to the District
Gazetteer of O, Malley, it was once the biggest
tributary of Dwarakeswar. But of late, it has lost its
relevance as the river-bed has silted and the water
has become polluted due to effluents, specially from
Bankura municipality. Water flows during the
months of monsoon, but during other parts of the
year, the river remains dry.
In the past, Gandheswari had a major role in providing
drinking water to the inhabitants of adjacent areas with
the people taking water from small pits on the river-
beds, as the river was then alive for major parts of the
year. With the purpose of increasing the flow of the
river in the dry seasons of the year, it has been decided
to construct a number of check-dams over the main
river and its tributaries in the catchment area which
will recharge the groundwater and enhance the stream
over the surface. Effluent treatment plants are being
thought about in the municipality area so that pollution
of river-water does not occur. The groundwater
recharge is expected to be enhanced by a number of
check-dams and the deep tubewells at the river-bed will
then be able to supply water to the municipality people.
2. Water resource mapping of the municipal area
would be done to ascertain the recharge and
discharge zones so that pond excavation may be
taken up in the recharge zones, which will improve
the groundwater availability.

175
4
3. Roof rain water harvesting would be propagated in
educational institutions, industrial establishments
and buildings which would newly come up.
1. Since the acquifer is very shallow for the rivers
Gandheswari and Darakeswar near Bankura
municipality area, all sand excavation near the two
rivers would be stopped.
2. A sub-surface dike would be constructed at the
confluence of Darakeswar and Gandheswari for
more ground-water recharge.
3. A few existing big ponds will be re-excavated so
that the water of these ponds after treatment will
meet the requirement of some areas of the
municipality.
4. In addition a pricing mechanism will be worked
out for piped water supply so that people continue
to use tube wells also for other purposes. As of now,
when piped water supply is adequate, the tube wells
are not used and slowly go defunct.
Bishnupur Municipality:
In Bishnupur Municipality area, although 45 percent of
the population has been brought under coverage of the
piped water supply scheme, yet per capita supply is still
quite inadequate than actual requirement. Spot water
sources like hand pump tube-wells and deep tube-wells
function to fulfill the remaining need of the area covered
with piped water supply line, but such insufficient spot
water sources is not able to serve the purpose.
The scarcity of water in the entire area is particularly
due to location of this municipality in a tropical zone,
which is a drought-prone region with scanty rainfall,
hard and gritty soil, inadequate ground-recharge
capacity. Two-pronged approach of recharging the
ground-water and using the water of the existing big
tanks around Bishnupur are being thought about to
solve the problem.
Sonamukhi Municipality:
Like two other municipalities, piped water supply has
not been able to provide drinking water to all the
inhabitants of this municipality and people have to
take recourse to tubewells for drinking water. But the
high iron concentration in the tubewells of the area is
a major area of concern, which can be solved by
bringing all people under the coverage of piped water
supply and setting up of iron treatment plants.
Similarly, roof-top rainwater harvesting may help.
4.5.1.5. Schools having no drinking water
source:
For the last few years stress has been laid on the
installation of tubewell at each Primary School of the
district so that the children are not deprived in getting
potable drinking water. Effort is now on to complete
the job so that no Primary School remains without
tubewell by the end of 2006-2007. A review of the
progress made so far (table below) implies that the
target is achievable:
Table 4.18 Some statistics on drinking water for Bankura Municipality
Population (as per 2001 census report) 128811
Source of water Ground water (river bed of Dwarakeswar and Gandheswari)
No. of Pump House 5 Nos.
No. of reservoir 7 Nos.
Per day requirement of water 25,20,000 Gallon
Actual supply made 16,79,400 Gallon i.e. 8mld (million litres / day)
Population covered by piped water 65percent
Population not covered by piped water 35percent
Hand tubewells 850 nos.
Street stand-post 3000 nos.
House hold connection 10106
Length of distribution network 500 kms.
Source: Bankura Municipality
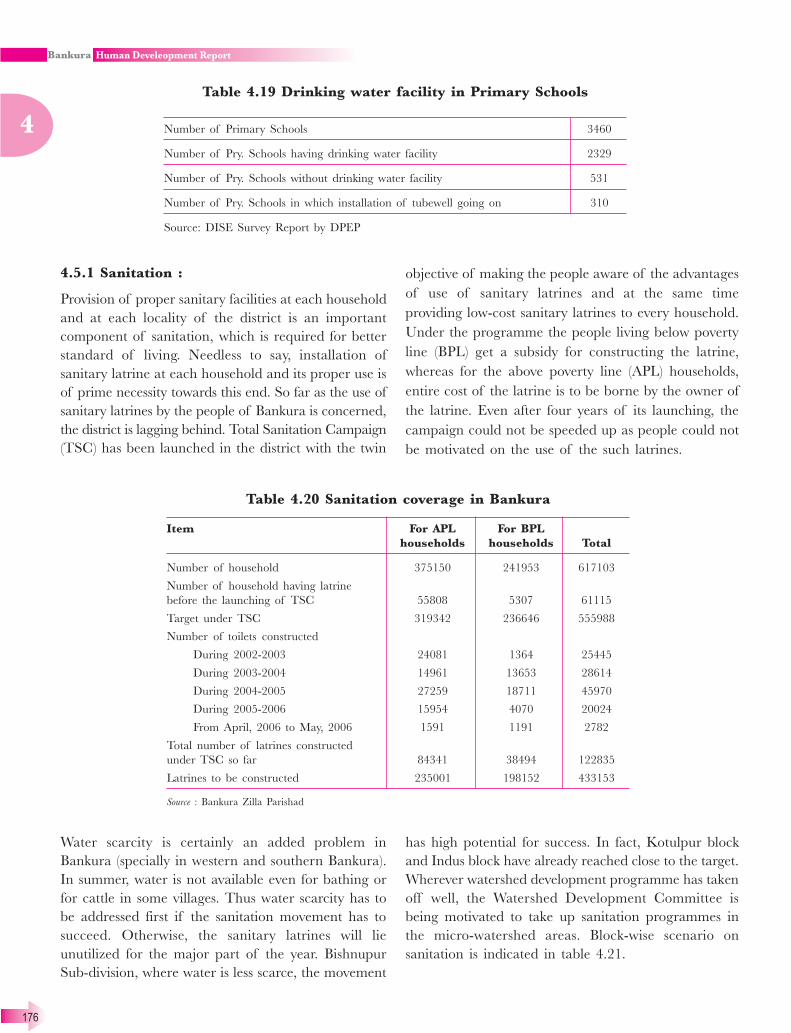
176
4
Table 4.19 Drinking water facility in Primary Schools
Number of Primary Schools 3460
Number of Pry. Schools having drinking water facility 2329
Number of Pry. Schools without drinking water facility 531
Number of Pry. Schools in which installation of tubewell going on 310
Source: DISE Survey Report by DPEP
4.5.1 Sanitation :
Provision of proper sanitary facilities at each household
and at each locality of the district is an important
component of sanitation, which is required for better
standard of living. Needless to say, installation of
sanitary latrine at each household and its proper use is
of prime necessity towards this end. So far as the use of
sanitary latrines by the people of Bankura is concerned,
the district is lagging behind. Total Sanitation Campaign
(TSC) has been launched in the district with the twin
objective of making the people aware of the advantages
of use of sanitary latrines and at the same time
providing low-cost sanitary latrines to every household.
Under the programme the people living below poverty
line (BPL) get a subsidy for constructing the latrine,
whereas for the above poverty line (APL) households,
entire cost of the latrine is to be borne by the owner of
the latrine. Even after four years of its launching, the
campaign could not be speeded up as people could not
be motivated on the use of the such latrines.
Water scarcity is certainly an added problem in
Bankura (specially in western and southern Bankura).
In summer, water is not available even for bathing or
for cattle in some villages. Thus water scarcity has to
be addressed first if the sanitation movement has to
succeed. Otherwise, the sanitary latrines will lie
unutilized for the major part of the year. Bishnupur
Sub-division, where water is less scarce, the movement
has high potential for success. In fact, Kotulpur block
and Indus block have already reached close to the target.
Wherever watershed development programme has taken
off well, the Watershed Development Committee is
being motivated to take up sanitation programmes in
the micro-watershed areas. Block-wise scenario on
sanitation is indicated in table 4.21.
Table 4.20 Sanitation coverage in Bankura
Item For APL For BPL
households households Total
Number of household 375150 241953 617103
Number of household having latrine
before the launching of TSC 55808 5307 61115
Target under TSC 319342 236646 555988
Number of toilets constructed
During 2002-2003 24081 1364 25445
During 2003-2004 14961 13653 28614
During 2004-2005 27259 18711 45970
During 2005-2006 15954 4070 20024
From April, 2006 to May, 2006 1591 1191 2782
Total number of latrines constructed
under TSC so far 84341 38494 122835
Latrines to be constructed 235001 198152 433153
Source : Bankura Zilla Parishad

177
4
4.5.2.1 School sanitation:
School sanitation has been taken up more vigorously
since schools are expected to act as the nodal point to
disseminate the message on sanitation. The objective
of the programme is as follows:
� Provision of water and sanitation facilities in the
school.
� To get the facilites used and maintained by the
students and teachers of the school without any
external support.
� To promote Health and Hygiene Education
(HHE) to the students and also promote the same
to the community through the school students.
We can have a glance at the progress made so far:
Table 4.21 Block-wise scenario on sanitation
Sl. Blocks Installation of household latrines
No. Target under Total Achievement under Total
Sanitation Campaign Sanitation Campaign
For APL For BPL Total For APL For BPL Total
households households households households
1 Bankura I 9667 8103 17770 5412 2349 7761
2 Bankura II 13358 7184 20542 3142 2028 5170
3 Chhatna 19466 16196 35662 2838 730 3568
4 Onda 24365 16771 41136 1468 495 1963
5 Gangajalghati 16867 11474 28341 3297 540 3837
6 Mejhia 8123 5818 13941 1987 125 2112
7 Saltora 15629 7513 23142 2240 667 2907
8 Barjora 18720 14396 33116 1591 58 1649
9 Bishnupur 15865 10574 26439 3725 1111 4836
10 Kotulpur 18853 8185 27038 18853 8185 27038
11 Joypur 13475 9085 22560 3677 2743 6420
12 Sonamukhi 16544 11874 28418 3037 1801 4838
13 Patrasayer 15352 17332 32684 365 35 400
14 Indas 16248 10235 26483 15663 10235 25898
15 Khatra 10245 8950 19195 2095 1066 3161
16 Sarenga 8836 9335 18171 630 240 870
17 Taldangra 13945 10753 24698 878 97 975
18 Indpur 14075 13019 27094 7139 2591 9730
19 Hirbandh 6651 7651 14302 1316 445 1761
20 Simlapal 13345 10378 23723 1047 226 1273
21 Ranibandh 11559 10257 21816 3620 2631 6251
22 Raipur 17750 11967 29717 321 96 417
Total 318938 237050 555988 84341 38494 122835
Source : Bankura Zilla Parishad
Table 4.22 Sanitation coverage in Primary Schools
Total number of Primary Schools 3460
No. of Pry. School sanitary latrines constructed during
Year 2002-2003 NIL
Year 2003-2004 161
Year 2004-2005 616
Year 2005-2006 1001
April, 2006 to May, 2006 218
Total Cumulative (May’06) 1996
Toilets constructed from other source 638
Number of Pry. Schools without sanitary latrines 826
Number of pry. Schools in which construction of sanitary latrines is going on 725
Source: Bankura Zilla Parishad
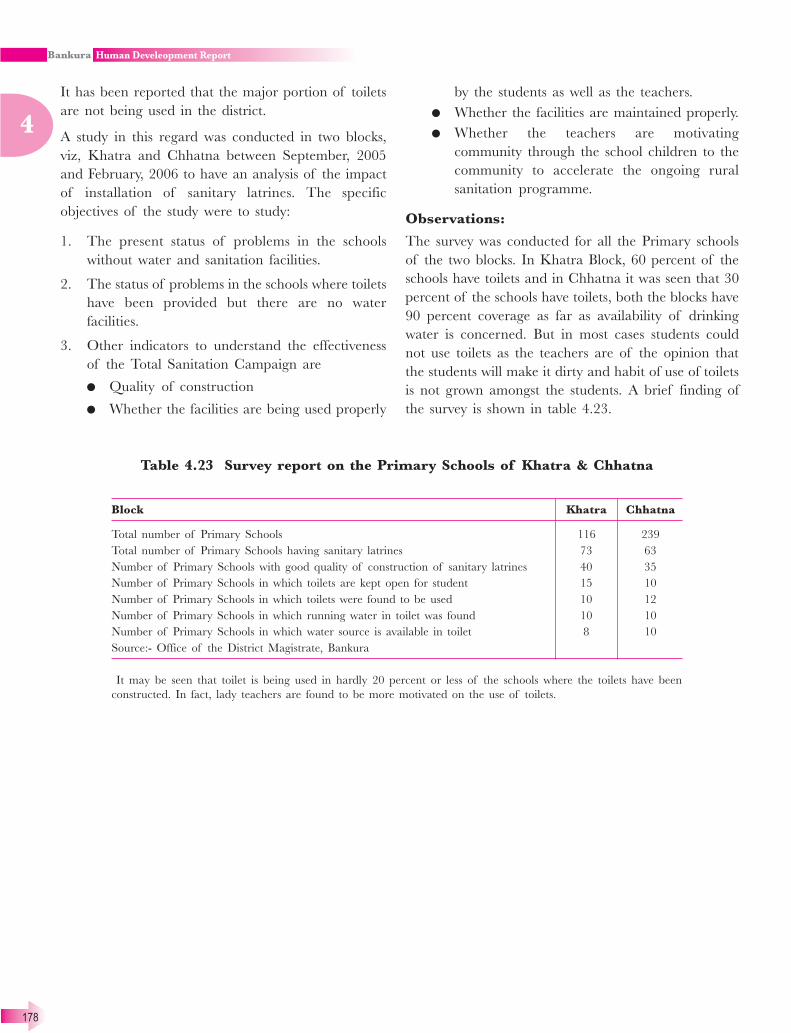
178
4
Table 4.23 Survey report on the Primary Schools of Khatra & Chhatna
Block Khatra Chhatna
Total number of Primary Schools 116 239
Total number of Primary Schools having sanitary latrines 73 63
Number of Primary Schools with good quality of construction of sanitary latrines 40 35
Number of Primary Schools in which toilets are kept open for student 15 10
Number of Primary Schools in which toilets were found to be used 10 12
Number of Primary Schools in which running water in toilet was found 10 10
Number of Primary Schools in which water source is available in toilet 8 10
Source:- Office of the District Magistrate, Bankura
It may be seen that toilet is being used in hardly 20 percent or less of the schools where the toilets have been
constructed. In fact, lady teachers are found to be more motivated on the use of toilets.
It has been reported that the major portion of toilets
are not being used in the district.
A study in this regard was conducted in two blocks,
viz, Khatra and Chhatna between September, 2005
and February, 2006 to have an analysis of the impact
of installation of sanitary latrines. The specific
objectives of the study were to study:
1. The present status of problems in the schools
without water and sanitation facilities.
2. The status of problems in the schools where toilets
have been provided but there are no water
facilities.
3. Other indicators to understand the effectiveness
of the Total Sanitation Campaign are
� Quality of construction
� Whether the facilities are being used properly
by the students as well as the teachers.
� Whether the facilities are maintained properly.
� Whether the teachers are motivating
community through the school children to the
community to accelerate the ongoing rural
sanitation programme.
Observations:
The survey was conducted for all the Primary schools
of the two blocks. In Khatra Block, 60 percent of the
schools have toilets and in Chhatna it was seen that 30
percent of the schools have toilets, both the blocks have
90 percent coverage as far as availability of drinking
water is concerned. But in most cases students could
not use toilets as the teachers are of the opinion that
the students will make it dirty and habit of use of toilets
is not grown amongst the students. A brief finding of
the survey is shown in table 4.23.

179
Chapter 5Gender Issues
5.1 Introduction
The debate on women and development had already
begun to take shape in the decades of 1970s and 1980s
(UN decade for women 1975-85). The issue came at the
center stage in the international arena in 1995 because
of United Nation’s Fourth International Conference of
Women at Beijing as well as United Nations Social
Summit Conference at Copenhagen in March 1995. The
central message of the UNDP Human Development
Report 1995 was ‘Human Development If not
Engendered is Endangered”. Accordingly UNDP
suggested construction of gender related development
index (GDI) and gender empowerment measure (GEM).
In West Bengal Human Development Report, 2004,
Gender Development Indices for the whole state and
for different districts were published. For West Bengal
the index was calculated to be equal to 0.549. As far as
different districts are concerned, Kolkata occupied the
highest rank (0.642) and Maldaha was at the lowest rank
(0.416). Bankura was placed in the tenth position (0.494)
in this comparison standard.
The sex ratio (2001 census) was 934 for West Bengal
and varied between 828 (Kolkata) and 955 (Midnapore)
in different districts. In Bankura sex ratio was 953.
Female literacy rate in West Bengal was 60.2% as
against the overall state level rate of 68.2 percent.
Female literacy in different districts varied between 37.2
percent (Purulia, North Dinajpore) and 77.9 percent
(Kolkata). In Bankura district female literacy rate was
49.8 percent as against male literacy rate of 76.8
percent.
Infant mortality rate among female children in different
districts varied between 18 (Kolkata) and 89 (Maldaha)
as against the corresponding lower and upper limits of
male infant mortality of 15 (Kolkata) and 76 (Cooch
Behar). In Bankura district the female infant mortality
rate was 45 percent as against male infant mortality of
41 percent.
Main and marginal rural female workers in West Bengal
constituted 29.70 percent of rural female population as
against the corresponding male workers percentage of
54.30. In the urban area gender gap in this context was
more prominent – work force participation rate for
female and male workers were 11.13 percent and 54.08
percent respectively.
5.2 Gender issues in Bankura
district :
5.2.1 Our approach :
To analyse the status of women and the extent of
gender discrimination in Bankura district, construction
of gender related indices will be too complicated with
too narrow perception of the actual problem.
‘Ultimately the impact of development on gender must
be measured in terms of changes in life options for
women’ (Meena Acharya, Puspa Ghimire, EPW, 2005).
Not only material aspects of women’s life determine
life options for women but also by the whole context
of women’s existence – economic, political and social
aspects. Hence, the approach adopted here is to select
broad indicators of gender discrimination in Bankura
district – some of which are objective indicators and
some are subjective.
Objective indicators are those, which can be directly
measured. For example, economic indicators like work
force participation rate, ownership of economic
resources by women, social indicator like sex ratio,
educational indicators like literacy rate, enrolment
ratio, health indicators like infant mortality rate,
fertility rate etc. are measurable either in percentage
or as ‘number of women per thousand men’. For these
indicators we have to depend on secondary data.
On the other hand, subjective indicators cannot be
directly measured and their status are to be realized
from qualitative standpoint with the help of case
studies, focus group discussion (FGD) personal
interviews and participatory rural appraisal (PRA) For
example, to analyse the extent of women’s political and
social empowerment in Bankura district, we have to
conduct subjective studies in different blocks and
municipality areas regarding women’s participation in
community based committees, their inheritance on
parental property, their status of control over family
income and family resources, their average age of

180
5
marriage (since it is not recorded through compulsory
registration), extent of different types of violence
against women ( physical and mental; within the family
and outside), overall decision making power of women
and the social status of single women.
The District of Bankura is situated on the western fringe
of West Bengal and is one of the dry and drought
prone areas of the state. The geography and topography
distinctly differ in the northern and southern parts of
Bankura. The area closer to Burdwan, which is the
northeastern part, is fertile with multiple cropping and
irrigation facilities. On the other hand the southwestern
region is dry, arid and undulated. The livelihood pattern
is mostly dependent on geography and topography of
the region and it also determines the cultural pattern
and gender roles and responsibilities.
Though women by and large are subjected to similar
social discriminations and suffer from similar health
problems across the country, subjective studies are
essential to understand the impact of certain specific
factors like caste, community, migration, scarcity of
water, poor infrastructure etc on gender issues.
Hence, to have an in-depth realisation of the status of
different subjective indicators of gender issues seven
blocks have been selected on the basis of random
sampling method. The block outcome of random
sampling was Saltora, Chhatna, Gangajalghati,
Bankura-II, Ranibandh, Indpur, and Bankura-I. We
selected seven villages from the first six blocks and one
locality in the Bankura municipality’s area. Except these
randomized sample villages, we purposefully included
Indus block in our study to serve as a case study of ‘all-
women Panchayat’. In each village/locality we came
into contact with groups of women, mostly representing
different Self-Help Groups. Each group constituted 30
to 40 women of several age groups. Thus, we discussed
with about 360 women from different corners of
Bankura district. Additionally, in three villages we talked
to male groups also to examine males’ perception
regarding women’s status. Surveyed villages and
localities represented a total population of about 17,000.
For this focus group discussion (FGD) we used semi-
structured questionnaires. We asked the questions
through informal discussion and recorded their
responses and answers. Moreover, for PRA chart papers
and markers were supplied to them to describe women’s
daily routine in a clock-format.
The details of the type of villages visited was as follows:
1. Tribal village: Udaypur: Saltora, Bhalukgoria:
Chhatna, Kamo: Ranibandh, Udaypur: Indpur,
Kelia: Gangajalghati (1 tola)
2. Scheduled caste village: Kelia: Gangajalghati,
Bisinda : Gangajalghati (1 Tola), Barogobindapur,
Ruidaspara: Indas
3. General caste village: Bisinda: Gangajalghati,
Arjunpur: Bankura-II
4. Urban slum: Ward No.19, Shitpara, Bankura
Municipality.
5.2.2 Purpose of study :
Through the study we were looking for some basic
behaviors and social norms, which are integral parts of
the lives of women in Bankura as a whole. These
systems become very important influencing factors for
the health and decision-making power of women, which
is a major component of development as a whole. This
insight will help in determining the underlying causes
behind certain behaviour, understand the logic behind
the secondary data and also design strategies. The
purpose of the study was not to develop a very scientific
survey but to get a feel of the extent of disparity that
exists in the District and whether there are any issues
very specific to Bankura.
Besides our own survey, we have also used some other
field works in similar lines :
1. Baseline and Techno-Economic Survey of
Swayamsidha in Bankura, by State Institute of
Panchayat Rural Development (2003)
2. A Survey of six blocks in Bankura district by CARE
India-West Bengal to identify male perception
regarding physiology, care, social and Financial
Location of women (2003).
3. A field survey report of two all-women FPCs in
Bankura district conducted by Ritajyoti
Bandyopadhyay, Jadavpur University.
5.2.3 Indicators of gender discrimination in
Bankura district :
5.2.3.1Sex ratio :
(i) One indicator used to assess society’s treatment for
women is the population sex ratio. The sex ratio in
India has seen a downward trend throughout the
20th century reaching 927 in 1991 as against 972

181
5
in 1901. In 2001, however, the sex ratio improved
marginally to 933 (0.6 percent). In West Bengal the
sex ratio improved from 917 in 1991 to 934 in 2001
(1.8 percent increase). In Bankura district the sex
ratio improved by a negligible percentage from 951
in 1991 to 953 in 2001, i.e. by 0.2 percent.
In twenty-two blocks of Bankura district and in three
municipalities sex ratio varied between 971 (Patrasayer)
and 928 (Indpur) in 1991, while the upper and lower
limits changed to 984 (Bishnupur Municipality) and
926(Mejia) respectively in 2001. Thus the range of
variability in different regions of Bankura district
increased between 1991 and 2001. While the sex ratio
in Bankura Municipality, Chhatna, Saltora,
Gangajalghati, Indpur, Khatra, Hirbandh, Ranibandh,
Bishnupur Municipality and Joypur improved, the sex
ratio in Bankura –I, Mejia, Barjora, Onda, Taldangra,
Simlapal, Raipur, Sarenga, Bishnupur, Kotulpur,
Sonamukhi, Sonamukhi Municipality, Patrasayer and
Indus declined over the period 1991-2001. In Bankura-
II block the sex ratio remained constant at a level 949.
A complete data set in this sphere is given in table 5.1.
From column 3 of this table, we see that improvement
in sex ratio is highest in Bankura municipal area
(Bankura Municipality) – an increase by 2.18 percent,
while decrease in sex ratio is highest in Bankura-I block
(a decrease by 1.45 percent) followed by Kotulpur block
(a decrease by 1.37 percent). In 1991 Patrasayer block
witnessed the highest sex ratio. However with a
decrease of .72 percent by 2001 the position of this
block comes down to rank 3 in a decreasing order
ranking of sex ratios of different regions. In 2001,
Bishnupur municipality area (Bishnupur Municipality)
occupies the highest rank followed by Chhatna block.
In Bishnupur sub-division (except for the Bishnupur
Municipality and marginal increase in Joypur), sex
ratio has declined in all the blocks. In fact the instance
of Kotulpur (which is considered relatively better off
in terms of standard of living) the decline of sex-ratio
reveals that it has no correlation with the income level
of the family
Lowest sex ratio in Mejia may be due to the fact that
most of migrated male workers and service holders do
not shift their families from original place of residence.
Table 5.1 Sex ratio in different blocks and municipalities of Bankura district
(Figures within brackets in third and fourth columns show ranks)
Sl. No. Block/Municipality 1991 Census 2001 Census Percent change
1. Bankura-I 967(2) 953(9) -1.45
2. Bankura Municipality 919(13) 939(16) 2.18
3. Bankura-II 949(12) 949(13) 00
4. Chhatna 963(3) 975(2) 1.25
5. Saltora 950(11) 953(9) 0.32
6. Mejia 929(16) 926(18) -0.32
7. Gangajalghati 946(13) 949(13) 0.32
8. Borjora 944(15) 938(17) -0.64
9. Onda 958(6) 954(8) -0.42
10. Indpur 928(17) 941(15) 1.40
11. Khatra 941(14) 951(10) 1.06
12. Hirbandh 941(14) 944(14) 0.32
13. Ranibandh 949(12) 962(4) 1.79
14. Taldangra 960(5) 959(5) -0.10
15. Simlapal 953(8) 952(10) -0.10
16. Raipur 962(4) 958(6) -0.42
17. Sarenga 952(9) 951(11) -0.11
18. Bishnupur 954(7) 950(12) -0.42
19. Bishnupur Municipality 967(2) 984(1) 1.75
20. Joypur 953(8) 956(7) 0.31
21. Kotulpur 952(9) 939(16) -1.37
22. Sonamukhi 951(10) 944(14) -0.72
23. Sonamukhi Municipality 953(8) 950(12) -0.31
24. Patrasayer 971(1) 964(3) -0.72
25. Indus 953(8) 949(13) -0.42
District 951 953 0.20
Source: Census Reports 1991, 2001: reproduced from District Statistical Handbook, 2004

182
5
Adverse sex ratio can be attributed to a number of
factors – (i) strong preference for sons, (ii) high infant
mortality rate among female babies, (iii) early marriage
of women and death of adolescent mothers – adolescent
mothers are twice as likely to die from complications
during pregnancy as are women 20 years or older.
Care India-West Bengal conducted a survey of five
blocks (Gangajalghati, Indpur, Saltora, Bankura,
Raipur) covering 1396 households of 24 villages. In
this survey, males were interviewed to analyse their
perception regarding community’s preference for child
– son or daughter, 84 percent of the respondents tried
to establish strong preference for a male child while
16 percent revealed indifference between male and
female child. The interviewee expressed different
dimensions of privileges of being a male child –
(i) more share of food, (ii) Preference in education,
(iii) better quality food, (iv) better healthcare (v) right
to opinion sharing and (vi) right to get property.
This study, though small in coverage, reflects clearly the
social gender bias in Bankura district – which can largely
explain the adverse sex ratio in the district.
In the table 5.2, we present sex ratio for different social
groups in different blocks of Bankura district. The table
shows that sex ratio for general castes in almost all the
blocks and municipalities (except Hirbandh block and
Sonamukhi Municipality) are lower than the sex ratio
for scheduled castes and scheduled tribes. In Hirbandh
block the sex ratio for scheduled castes (941) is
marginally lower than that for general castes (943). In
15 blocks out of 22, sex ratio of scheduled tribes are
higher than sex ratio for scheduled castes. In rural area
as a whole sex ratio for scheduled tribes is higher than
the sex ratio for scheduled castes. In urban area,
however sex ratio for scheduled tribes is lower than that
for scheduled as well as general castes.
Table 5.2 Sex-ratio in different blocks and municipalities
of Bankura district for different social groups
District /Sub-Division Sex ratio for people belonging to
Scheduled caste Scheduled tribe General caste
Sadar subdivision 971 987 933
Bankura-I 963 944 947
Bankura Municipality 975 984 927
Bankura-II 986 955 933
Chhatna 971 1013 962
Saltora 965 975 936
Mejia 953 927 913
Gangajalghati 973 976 935
Barjora 958 980 927
Onda 983 981 938
Khatra Sub-Division 958 986 937
Indpur 951 974 928
Khatra 962 990 931
Hirbandh 941 947 943
Ranibandh 951 980 946
Taldangra 963 997 950
Simlapal 975 1003 930
Raipur 958 995 939
Sarenga 954 1003 930
Bishnupur Sub-Division 971 962 940
Bishnupur 981 953 931
Bishnupur Municipality 1041 1034 975
Joypur 965 954 950
Kotulpur 956 963 929
Sonamukhi 964 960 927
Sonamukhi Municipality 960 659 953
Patrasayer 981 1007 948
Indus 963 974 939
District 968 984 937
Rural 966 984 937
Urban 990 916 941
Source: Census 2001: compiled from District Statistical Handbook, 2004

183
5
Thus, from table 5.2, we may infer that
(i) Gender discrimination among tribal population is
less prominent compared to scheduled castes and
general castes. This is supported by our survey of
some tribal villages (Udaypur: saltora block,
Udaypur: Indpur block, Kamo: Ranibandh block,
Kelia: Gangajalghati block)
(ii) Among general castes, considerably lower sex
ratio indicates the possibilities of malnutrition,
negligence of girl children, high infant mortality
among female babies due to lack of proper care,
unnatural death of women due to social evils like
dowry, molestation, illegal sex determination
before birth etc. If we could analyse the
behaviour of different income groups of general
caste people separately, gender discrimination
among poorer section and lower middle class
would appear to be more evident compared to
the richer section. The attitude towards girl child
has been changing favorably among higher
incomes groups.
(iii) Lower sex ratio among urban tribes reflects
immobility of tribal women to the urban areas
compared to scheduled caste and general caste
population.
5.2.3.1 Infant mortality rate :
At birth, females enjoy a biological edge over males in
survival. For this reason, child mortality rates (up to
age five) all over the world are lower for girls than for
boys. However, in some developing countries, more
girls than boys die at a young age – which reflects a
marked departure from the biological pattern observed
in most countries. In these cases, it can be said that
there is discrimination against the girl child in the
provision of health and nutrition.
In West Bengal State Human Development Report it
was stated that infant mortality rate (IMR) for girls
would be higher than that of boys. In Bankura district
the female IMR is reported to be 45 as against male
IMR of 41. The sex segregated infant mortality rate is
shown in graph 5.1.
Graph 5.1 Sex-segregated IMR
Source: ICDS Monthly Progress Reports, Jan., ’05 to Dec., ’05
5.2.3.3 Fertility rate :
Fertility depends on (i) age at which females marry, (ii)
duration of the period of fertile union and the (iii)
rapidity with which they build their families.
General fertility rate (GFR) is a common measure of
fertility, which is obtained by relating the number of
live births to the number of females in the childbearing
ages. GFR is a true probability rate as the denominator
of the formula of GFR consists of the entire female
population, which is exposed to the risk of producing
children. According to the data set compiled by
Biswajit Chatterjee & D.K Ghosh (Towards a District
Development Report for West Bengal p.99), GFR in
Bankura district was 93.87 in 2001 as against 78.40 in
West Bengal.
The following table (Table 5.3) records the GFR in

184
5
different blocks of Bankura district and in the district
as a whole for the period 2005. From the table it is
observed that GFR is lowest in Hirbandh block (75.34
and highest in Sagenga (128.01), while the district GFR
lies in between (104.94).
Table 5.3 Block-wise variation of general fertility rate
Block Name GFR Block Name GFR
Bankura-I 97.81 Ranibandh 102.77
Bankura-II 101.90 Taldangra 115.11
Chhatna 109.38 Simlapal 108.03
Saltora 92.51 Raipur 82.98
Mejia 110.23 Sarenga 128.01
Gangajalghati 108.27 Bishnupur 107.77
Borjora 107.60 Joypur 96.73
Onda 110.86 Kotulpur 106.16
Indpur 109.37 Sonamukhi 108.59
Khatra 104.42 Patrasayer 102.41
Hirbandh 75.34 Indus 112.19
District Total 104.94
Source: N.R.D.M.S., Bankura
Fertility seems to have strong correlation with the
educational level of the mother. Average number of
children born to a woman in the India (according to
the Census of 1991) was 4.3. This figure for illiterates
was 4.4: for those who were middle but below matric,
it declined to 3.8: but for those who got education up
to matric, but below graduate, it was only 3.0 and for
those with a graduate degree and above, it was only
2.3. Fertility in every category was higher in rural areas
than in urban areas.
In Bankura district, however, data for specific
education level vis-à-vis fertility rate is not available
either in district level or in block levels. However, in
the Baseline and Techno-economic Survey of
Swayamsidha in Bankura by SIPRD, 2003 (henceforth,
we shall refer to this as SIPRD Survey), a close
relationship between female literacy and family
planning practices was noticed among the seven blocks
selected (Chhatna, Indpur, Gangajalghati, Ranibandh,
Sonamukhi, Khatra and Saltora).
5.2.3.4 Indicators for education :
Education has been regarded both as an end in itself
and as a means of realizing other desirable ends. It
develops the personality and rationality of individuals,
qualifiers them to fulfill certain economic, political and
cultural functions and thereby improves their socio-
economic status. The universal declarations of human
rights regard education as one of the basic rights of
every human being. According to a World Bank study,
increased education for women is not only a matter of
justice but would yield exceptional returns in terms of
world food security. The study concluded that if women
received the same amount of education as men, farm
yields would rise by between 7 and 22 percent.
Increasing women’s primary schooling alone could
increase agricultural output by 24 percent. The benefits
of schooling for women are not limited to increased
productivity. Education can play a major role in
improving the status of women and would significantly
improve household health and nutrition, lower child
morbidity and mortality and slow population growth.
According to one UN study, child mortality would be
reduced more effectively by providing women with ten
years of education rather than by doubling their income,
providing sanitation and piped water and turning every
agricultural worker into a white-collar worker. In the
agricultural context, education not only helps women
to achieve higher productivity and enhances their social
and professional status, but also enables them to
implement measures to protect environment.

185
5
Table 5.4 Block-wise information regarding literacy rate
Sub-Divisions/Blocks/ Literacy rate (percent) Ranks show
Municipalities as per Census, 2001 highest to
lowest (among
Male Female Total the blocks)
Sadar Sub-Division 76.7 48.7 63.0
Bankura-I 77.7 48.1 63.2 11
Bankura Municipality 89.4 73.9 81.9
Bankura-II 77.8 49.5 64.0 7
Chhatna 74.9 42.2 58.7 20
Saltora 71.3 38.1 55.1 22
Mejia 73.6 43.9 59.3 18
Gangajalghati 75.7 44.8 60.8 15
Barjora 77.6 51.9 65.1 5
Onda 73.2 45.7 59.8 14
Khatra Sub-Division 79.0 47.6 63.7
Indpur 78.2 44.6 61.9 16
Khatra 79.5 47.7 63.9 12
Hirbandh 76.6 38.7 58.2 21
Ranibandh 79.0 43.8 61.7 19
Taldangra 78.4 51.5 65.3 6
Simlapal 77.4 48.4 63.2 10
Raipur 79.9 49.2 64.9 9
Sarenga 83.1 53.6 68.7 4
Bishnupur Sub-Division 74.8 52.1 63.7
Bishnupur 71.4 44.6 58.3 16
Bishnupur Municipality 85.9 68.2 77.1
Joypur 78.4 54.8 67.9 2
Kotulpur 78.9 57.7 68.6 1
Sonamukhi 70.7 45.9 58.7 13
Sonamukhi Municipality 86.5 70.7 78.8
Patrasayer 67.5 44.3 56.1 17
Indus 74.5 54.1 64.6 3
District (as per Census, 2001) 76.8 49.4 63.4
District (as per Census, 1991) 66.7 36.5 52.0
Source: Census, 2001 & Census, 1991
In India, in spite of all the expansion that has taken
place in the formal educational system, a sizeable
number of Indian women have remained outside the
reach of all education and are illiterate. In West Bengal,
the level of literacy is higher than the national level.
According to Census Report, 2001, the overall literacy
rate in India was 65.4 percent, literacy for male was
75.8 percent and for female, 52.1 percent. In West
Bengal, the overall literacy was 68.2 percent while the
female literacy rate was 60.2 percent. In the district of
Bankura, the overall literacy rate was 63.4 percent and
female literacy rate was 49.4 percent (as against male
literacy rate of 76.8 percent). Thus, the literacy status
(overall as well as female literacy) of Bankura district
is lower than the state level as well as national level.
In Table 5.4, we record the block-wise data for literacy
rate of Bankura district.

186
5
Table 5.5 Sex ratio of enrolment (Primary & Upper Primary
level), 2004-2005
Name of Block/ Girls enrolment per thousand boys
Municipalities (Ranks are given in brackets)
Bankura Municipality 995(2)
Bishnupur Municipality 1019(1)
Sonamukhi Municipality 927(3)
Bankura-I 997(1)
Bankura-II 918(13)
Chhatna 879(19)
Saltora 874(20)
Mejia 914(14)
Gangajalghati 864(21)
Barjora 941(10)
Onda 883(18)
Indpur 949(9)
Khatra 899(17)
Hirbandh 900(16)
Ranibandh 931(12)
Taldangra 980(4)
Simlapal 959(7)
Raipur 977(5)
Sarenga 983(2)
Bishnupur 908(15)
Joypur 956(8)
Kotulpur 973(6)
Sonamukhi 941(10)
Patrasayer 940(11)
Indus 982(3)
District 937
Source: N.R.D.M.S., Bankura
Female literacy rates in different blocks (according to
Census 2001) vary between a highest of 57.7 percent
(Kotulpur block) and a lowest of 38 percent (Saltora
block). In the three municipalities, i.e.; in urban area,
female literacy is higher; highest in Bankura
Municipality (73.9 percent) followed by Sonamukhi
(70.7 percent) and Bishnupur (68.2 percent)
Municipalities. Thus female literacy in rural area is
much lower than female literacy in urban area.
Moreover in 16 out of 22 blocks, female literacy is less
than 50 percent, implying that the majority of rural
women in Bankura are illiterate. Thus, district level
female literacy comes to be 49.4 percent. On the other
hand, male literacy rate in all blocks and municipalities
is more than 70 percent and district level male literacy
rate becomes 76.8 percent. However, between 1991
and 2001 percentage increase in female literacy is
higher (35 percent) than the percentage increase in male
literacy (15.14 percent),
Lower female literacy rate compared to male literacy
rate is naturally matched by lower enrolment of girls
compared to enrolment of boys in primary and upper
primary levels.
The table 5.5 shows the sex ratio of formal education
(at primary and upper primary levels). The product of
the ratio of total girls enrolled to total boys enrolled on
a base of 1000.
Six blocks with highest ranks in female literacy rate in
(Kotulpur, Joypur, Indus, Sarenga, Barjora, Taldangra)
show high girls’ enrolment also. On the other hand,
blocks like Saltora, Gangajalghati, and Chhatna show
low enrolment ratio for girls as well as low female
literacy rate. In Bankura-I, rank for female literacy is

187
5
11 (48.1 percent) while rank for enrolment is highest
with an enrolment ratio of 997. This reflects that the
literacy rate among younger female generation of this
block is much higher than the overall female
population.
Another set of information regarding enrolment of
boys and girls in classes I, II, III, IV, V and VI (DISE
analysis, Sarva Siksha Abhijan) show that as class level
goes up, girls’ enrolment as percent of total enrolment
decreases. This is recorded in the graph 5.2.
Graph 5.2 Comparison between boys and girls in class-wise enrolment
Source: DISE analysis of Sarva Siksha Abhijan, Bankura
From the graph, it is clear that with higher classes, girls’
enrolment decreases and drop out increases. In fact, high
rate of school drop out among female students is
significantly responsible for poor educational status of
women in Bankura.
In our sample survey of seven villages in six blocks,
school drop out cases among the reported women in
our focused group discussion (FGD) vary between 50
percent and 100 percent of total school enrolment of
female population. The cases of high rates of school
drop out have been enquired.
An in depth analysis of the causes of high school
dropout rates among females (as came out from the
FGD) is important for chalking out corrective ‘action
plans’ for the district:
(i) Working mother: girls manage household work in
absence of mother: Generally it was found that it
is absolutely imperative that a woman must be
skilled at executing the duties assigned as ‘women’s
job’. This is a necessary requisite for marriage, so
supporting mother at home is of prime importance.
Most of the adolescents shared that they had very
little time for school work after attending the
household chores.
(ii) Difficulty to cope with syllabus:- Many of the
women also mentioned that their daughters were
dull and lacked the ability to cope with school
syllabus. The quality of education at the primary
school is also perceived as poor, as it ceases to
make the children capable enough to cope with
high school syllabus.
(iii) Cost of providing formal education:- The
majority felt that the biggest hindrance was the
cost of providing private tuition, which was
indispensable and also buying books and
stationery. Books are provided free of cost only
at the primary level.
(iv) Long distance of schools:- Poor road conditions
and distance over 3-4 km. makes the schools
difficult to access. Especially for girls it becomes
both physically difficult as well as insecure.
(v) Early age of marriage:- The tradition of early
marriage of girls makes parents reluctant to school
going girls.

188
5
(vi) Concept of practical utility of education among
girls:-In one of the tribal villages, the community
mentioned that as long as they are able to read
and write it is enough for them. They do not
expect to get employment, so the need to pursue
education up to class X and beyond is not felt
necessary.
(vii) Inadequate nutrition and other supports to
continue with formal education: - Most people of
the villages survive on two square meals a day,
once in the morning and once in the evening. High
schools do not have provision for any snacks/
meals. Children have to walk for 4-6 km up and
down, hence they are starved and it reduces their
concentration. Basic requirements like stationery,
electricity/ fuel for lamps are all scarce in the
villages. The present generation is the first
generation literate in many households and there is
no supportive environment at home. People are
aware about the importance of education but
circumstances are not conducive for engaging
adolescents in schools.
In the sample survey of seven villages in six blocks, the
percentage of women having attended school and able
to read and write is 90 percent among the general caste,
40 percent among schedule Tribes (Except Ranibandh
with 21 percent) and as low as 9 percent to 10 percent
among the schedule castes. There are some exceptions
like Udaipur, a Tribal village in Indpur where 81 percent
of the women interviewed were literate.
Kelia in Gangajalghati is exclusively a SC and ST village. Tribal population was sending their children
to school and 40 percent – 50 percent of the women were literate. It was interestingly noted that within
the same environment the scheduled caste did not send their children to school and 100 percent of the
women were illiterate. The SC women complained that their children were not treated well and that
there were frequent fight among the children. There was a feeling of exclusion and non-acceptance
from others in the school.
The general caste villages Bisinda and Arjunpur have
primary as well as high schools within the village so
accessibility is better and the number of girls enrolled
is also high. The 2 out of 5 hamlets of the ST and SC
were within half a kilometer from the primary school
and all 5 were 2 or more kilometers from the high
schools.
Though the literacy rate is quite high amongst the
general caste, school drop out is also as high as
approximately 65 percent. There were some graduates
from the village but on an average the women drop
out of schools from classes VII & VIII onwards.
Compared to the general caste community the hard
ship is greater in the tribal villages,’ inspite of that the
tendency to attend school is quite good, but drop out
rate is as high as 90 percent. Even in Indpur the drop
out was as high as 56 percent.
The situation is not very different for boys from the
Tribal communities. Discrimination was not very
conspicuous among the Tribal. Among the general
caste the men are given greater preference for higher
education (Graduation). Educated men with or without
employment can fetch high amounts of dowry, which
helps the family to get the daughters married.
5.2.3.5 Female work participation rate :
In India all over, women are traditionally attached to
household affairs, while men are primarily responsible
for earning money through economic activities.
Women’s going out for work is considered primarily to
supplement the income for betterment of the living
conditions or to make both ends meet. Even when a
woman is employed she has to take full responsibility
of the house and family. “We hardly find man
exclusively engaged in household affairs (i.e. cooking,
cleaning utensils, housekeeping etc.), even when he is
not employed or many be doing such jobs in other’s
house or establishments such as hotels etc.” (Ray, P.K;
Yojana, 1997). Against this traditional background,
GAD (Gender and Development) approach towards
gender issues claim that direct female participation in
gainful economic activity is a necessary condition for
women’s empowerment. According to Harish (1991), the

189
5
female participation in economic activity, besides
increasing total participation and output, have other
important implications. Firstly, it tends to reduce fertility
and population growth, thereby raising per capita
income and consumption. Secondly, women
participation will result in their greater access to
educational opportunities, Thirdly, female participation
in economic activity affects the structure and operation
of labour market.
According to 2001 census, in India, female work
participation rate was 25.7 percent as against male work
participation rate of 51.9 percent. In rural area female
work participation rate was 31.01 percent and in urban
area the rate come to be 11 percent as against the
corresponding male participation rates of 52.4 percent
and 50.9 percent. In West Bengal percentage of female
workers in total female population in rural area was
13.07 percent in 1991 and 20.70 percent in 2001 (the
corresponding male percentages were 52.09 percent and
54.30 percent). In urban area, the percentage of female
workers to total female population was 6.20 percent in
1991 (male – 49.65 percent) and 11.13 percent in 2001
(male 54.08 percent), (West Bengal Human
Development Report, 2004).
In Bankura district, female work participation rate
according to 2001 census was 32.04 percent, which
was 24.66 percent higher than the national level female
work participation rate and 3.35 percent higher than
national rural female work participation rate.
This is mainly due to the fact that the economy of
Bankura district is predominantly a rural economy and
the rural economy is seriously backward with poor
standard of living and poor infrastructure. Therefore,
in addition to their domestic chores rural women have
to go out to work in the fields along with their
husbands in order to supplement their family income.
Hence female occupation pattern in Bankura district
shows that female workers are predominantly
agricultural labourers. Women’s participation in the
service sector is marginal.
Table 5.6 Occupational structure of female workers in Bankura
as per Census, 2001
Category Number of female workers Percentage of female
engaged in different workers in different
categories of work categories of work
Cultivators 108032 21.66
Agricultural labourers 243115 48.74
Household industry 48498 9.72
Other workers 99191 19.88
Total 498836 100
Source: District Statistical Handbook, Bankura, 2004

190
5
In the table 5.7 we reproduce female work
participation rates for different municipalities and
blocks of Bankura district as given in 1991 and 2001
census reports
From table 5.7, it is seen that female work participation
rate is highest in Ranibandh (44.67) and lowest in
Barjora (27.48). However, by and large, Bishnupur sub-
division by and large the growth in female work
participation is much higher.
Thus, it is clear that in Bankura, whatever the pattern
of female occupation is, 68.04 percent of female work
force in the district as a whole remain outside the
mainstream of economic activities. Even in the block
with highest female work participation (Ranibandh), the
percentage of unemployed female workforce is as high
as 55.33 percent.
In the SIPRD Survey, it was reported that in three
blocks, viz, Chhatna, Sonamukhi and Khatra more than
50 percent women of the productive age group in the
sample families are out of the workforce. In general,
women’s engagement in the tertiary sector is minimum.
Women are mainly engaged in traditional activities of
the secondary sector, viz. rice pounding, muri-chira
making, broom stick making, traditional handicrafts etc.
Table 5.7 Female work participation rate in Bankura
Sl. Name of Block/ Female work participation rate (in percentage)
No. Municipality
As per As per Increase/decrease
Census, 1991 Census, 2001 between 1991 & 2001
1 Bankura-I 25.31 31.14 23.03
2 Bankura Municipality 11.45 17.96 56.85
3 Bankura-II 20.36 36.34 78.49
4 Chhatna 31.72 39.06 23.14
5 Saltora 35.98 39.13 8.75
6 Mejhia 24.31 28.32 16.50
7 Gangajalghati 32.04 32.36 1.00
8 Borjora 22.01 27.48 24.85
9 Onda 22.66 38.90 71.67
10 Indpur 27.68 34.69 23.33
11 Khatra 32.62 35.72 9.50
12 Hirbandh 31.37 36.57 16.58
13 Ranibandh 37.39 44.67 19.47
14 Taldangra 26.77 30.24 12.96
15 Simlapal 30.71 33.47 8.99
16 Raipur 37.81 35.94 -4.95
17 Sarenga 37.6 35.19 -6.41
18 Bishnupur 26.93 20.32 -24.55
19 Bishnupur Municipality 16.91 17.96 0.30
20 Joypur 13.84 35.44 156.07
21 Kotulpur 11.17 41.04 267.41
22 Sonamukhi 23.29 35.64 53.03
23 Sonamukhi Municipality 16.01 24.49 52.97
24 Patrasayer 21.39 38.39 79.48
25 Indus 15.21 31.77 108.88
District 19.21 31.96 66.37
Source:- District Statistical Handbook, Bankura, 2004

191
5
Since agriculture and allied activities represent major
occupation of female work force in rural area, women’s
right to land is significant not only for poverty reduction
among women, but also for gender mainstreaming
through enhanced women’s voice and equality. In the
district of Bankura, women’s control and access to land
is very limited within the households. Even in the
Government Programme for redistribution of ceiling
surplus land, women are not getting land in their names.
This is clear from official statistics (Table 5.8).
Table 5.8 reveals that upto December, 2005, share of
women among total Patta is only 5.61 percent as against
men’s share of 74.80 percent. Percentage of joint Patta
to total Patta is 19.59. Among different blocks, share of
the single woman Patta is lowest in Joypur (0.31 percent)
and highest is Bankura-II (16.34 percent).
5.2.3.6 Reservation of seats for women in
Panchayat bodies: decision-making by women :
Inclusion of women into the political process or
governance is one of the major components of the
process of gender mainstreaming. Since in Bankura
district, 92.63 per cent of female population is rural
and village Panchayats represent grass root of the
federal structure of Indian polity, it is important to
analyse women’s empowerment, through Panchayati
Raj in Bankura district. Seventy-third and seventy-
fourth amendments to Indian Constitution resulted
into 73rd.
amendment Act in 1992. This Act gave a
new lease of life to the Panchayats in India. With this
Act, not less than one third of the total seats in the
Panchayats and Municipalities (urban local bodies) are
5.2.3.6 Land ownership :
Table 5.8 Block-wise number of joint Patta holders & single
women Patta holders upto December, 2005
1 Bankura-I 643 251 2928 3822 16.82 6.57
2 Bankura-II 578 371 1322 2271 25.45 16.34
3 Chhatna 897 107 3654 4658 19.26 2.30
4 Saltora 561 197 5564 6322 8.87 3.12
5 MeJhia 416 32 3555 4003 10.39 0.80
6 Gangajalghati 1771 278 3900 5949 29.77 4.67
7 Barjora 1749 753 8671 11173 15.65 6.74
8 Onda 3645 825 3711 8181 44.55 10.08
9 Taldangra 891 824 9600 11315 7.87 7.28
10 Simlapal 1962 133 5367 7462 26.29 1.78
11 Khatra 460 150 2585 3195 14.40 4.69
12 Hirbundh 426 30 2239 2695 15.81 1.11
13 Indpur 221 231 3363 3815 5.79 6.06
14 Raipur 2156 918 7162 10236 21.06 8.97
15 Sarenga 3041 174 1009 4224 71.99 4.12
16 Ranibandh 290 91 3427 3808 7.62 2.39
17 Bishnupur 2329 366 4294 6989 33.32 5.24
18 Joypur 755 25 7326 8106 9.31 0.31
19 Katulpur 881 183 6219 7283 12.10 2.51
20 Sanamukhi 2073 301 7354 9728 21.31 3.09
21 Patrasayer 899 50 7913 8862 10.14 0.56
22 Indus 3363 2296 13379 19038 17.66 12.06
Total 30007 8586 114542 153135 19.59 5.61
Source : Office of the District Land & Land Reforms Officer, Bankura
Sl.
No.
Name of
the Block
Number
of joint
Patta
holders
Number of single
Patta holders
Total
number
of Patta
holders
Percen-
tage of
joint
Patta
holders
Percen-
tage of
single
women
Patta
holders
Women Others
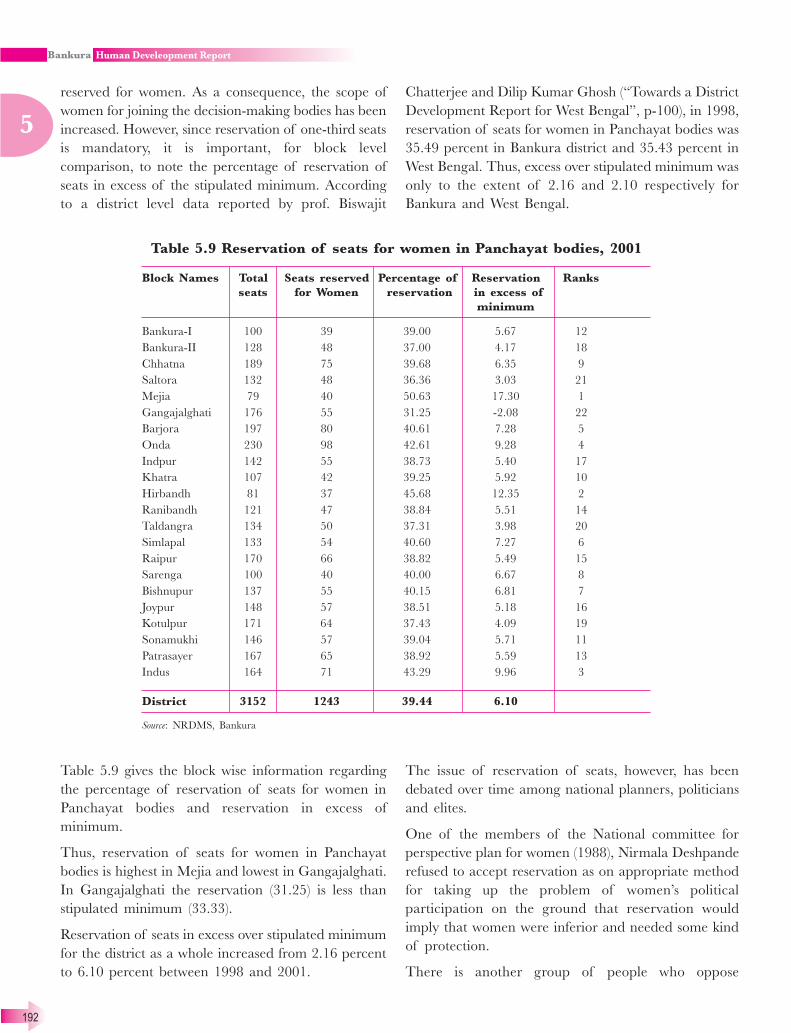
192
5
reserved for women. As a consequence, the scope of
women for joining the decision-making bodies has been
increased. However, since reservation of one-third seats
is mandatory, it is important, for block level
comparison, to note the percentage of reservation of
seats in excess of the stipulated minimum. According
to a district level data reported by prof. Biswajit
Chatterjee and Dilip Kumar Ghosh (“Towards a District
Development Report for West Bengal”, p-100), in 1998,
reservation of seats for women in Panchayat bodies was
35.49 percent in Bankura district and 35.43 percent in
West Bengal. Thus, excess over stipulated minimum was
only to the extent of 2.16 and 2.10 respectively for
Bankura and West Bengal.
Table 5.9 Reservation of seats for women in Panchayat bodies, 2001
Block Names Total Seats reserved Percentage of Reservation Ranks
seats for Women reservation in excess of
minimum
Bankura-I 100 39 39.00 5.67 12
Bankura-II 128 48 37.00 4.17 18
Chhatna 189 75 39.68 6.35 9
Saltora 132 48 36.36 3.03 21
Mejia 79 40 50.63 17.30 1
Gangajalghati 176 55 31.25 -2.08 22
Barjora 197 80 40.61 7.28 5
Onda 230 98 42.61 9.28 4
Indpur 142 55 38.73 5.40 17
Khatra 107 42 39.25 5.92 10
Hirbandh 81 37 45.68 12.35 2
Ranibandh 121 47 38.84 5.51 14
Taldangra 134 50 37.31 3.98 20
Simlapal 133 54 40.60 7.27 6
Raipur 170 66 38.82 5.49 15
Sarenga 100 40 40.00 6.67 8
Bishnupur 137 55 40.15 6.81 7
Joypur 148 57 38.51 5.18 16
Kotulpur 171 64 37.43 4.09 19
Sonamukhi 146 57 39.04 5.71 11
Patrasayer 167 65 38.92 5.59 13
Indus 164 71 43.29 9.96 3
District 3152 1243 39.44 6.10
Source: NRDMS, Bankura
Table 5.9 gives the block wise information regarding
the percentage of reservation of seats for women in
Panchayat bodies and reservation in excess of
minimum.
Thus, reservation of seats for women in Panchayat
bodies is highest in Mejia and lowest in Gangajalghati.
In Gangajalghati the reservation (31.25) is less than
stipulated minimum (33.33).
Reservation of seats in excess over stipulated minimum
for the district as a whole increased from 2.16 percent
to 6.10 percent between 1998 and 2001.
The issue of reservation of seats, however, has been
debated over time among national planners, politicians
and elites.
One of the members of the National committee for
perspective plan for women (1988), Nirmala Deshpande
refused to accept reservation as on appropriate method
for taking up the problem of women’s political
participation on the ground that reservation would
imply that women were inferior and needed some kind
of protection.
There is another group of people who oppose
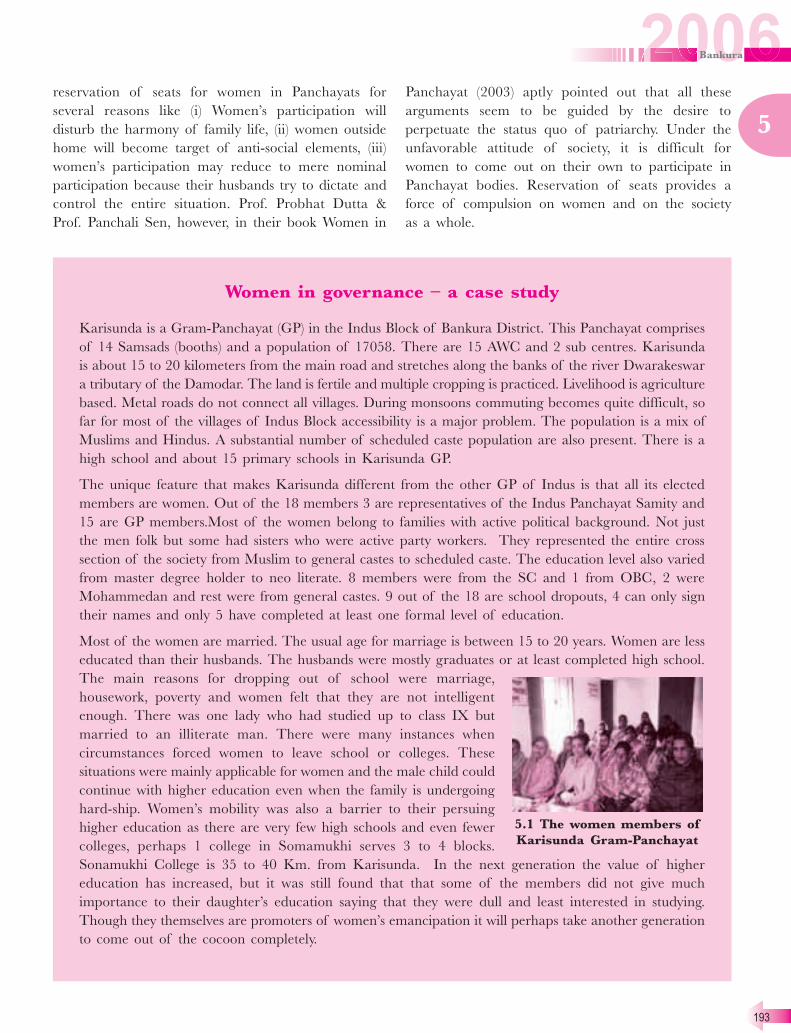
193
5
reservation of seats for women in Panchayats for
several reasons like (i) Women’s participation will
disturb the harmony of family life, (ii) women outside
home will become target of anti-social elements, (iii)
women’s participation may reduce to mere nominal
participation because their husbands try to dictate and
control the entire situation. Prof. Probhat Dutta &
Prof. Panchali Sen, however, in their book Women in
Panchayat (2003) aptly pointed out that all these
arguments seem to be guided by the desire to
perpetuate the status quo of patriarchy. Under the
unfavorable attitude of society, it is difficult for
women to come out on their own to participate in
Panchayat bodies. Reservation of seats provides a
force of compulsion on women and on the society
as a whole.
Women in governance – a case study
Karisunda is a Gram-Panchayat (GP) in the Indus Block of Bankura District. This Panchayat comprises
of 14 Samsads (booths) and a population of 17058. There are 15 AWC and 2 sub centres. Karisunda
is about 15 to 20 kilometers from the main road and stretches along the banks of the river Dwarakeswar
a tributary of the Damodar. The land is fertile and multiple cropping is practiced. Livelihood is agriculture
based. Metal roads do not connect all villages. During monsoons commuting becomes quite difficult, so
far for most of the villages of Indus Block accessibility is a major problem. The population is a mix of
Muslims and Hindus. A substantial number of scheduled caste population are also present. There is a
high school and about 15 primary schools in Karisunda GP.
The unique feature that makes Karisunda different from the other GP of Indus is that all its elected
members are women. Out of the 18 members 3 are representatives of the Indus Panchayat Samity and
15 are GP members.Most of the women belong to families with active political background. Not just
the men folk but some had sisters who were active party workers. They represented the entire cross
section of the society from Muslim to general castes to scheduled caste. The education level also varied
from master degree holder to neo literate. 8 members were from the SC and 1 from OBC, 2 were
Mohammedan and rest were from general castes. 9 out of the 18 are school dropouts, 4 can only sign
their names and only 5 have completed at least one formal level of education.
Most of the women are married. The usual age for marriage is between 15 to 20 years. Women are less
educated than their husbands. The husbands were mostly graduates or at least completed high school.
The main reasons for dropping out of school were marriage,
housework, poverty and women felt that they are not intelligent
enough. There was one lady who had studied up to class IX but
married to an illiterate man. There were many instances when
circumstances forced women to leave school or colleges. These
situations were mainly applicable for women and the male child could
continue with higher education even when the family is undergoing
hard-ship. Women’s mobility was also a barrier to their persuing
higher education as there are very few high schools and even fewer
colleges, perhaps 1 college in Somamukhi serves 3 to 4 blocks.
Sonamukhi College is 35 to 40 Km. from Karisunda. In the next generation the value of higher
education has increased, but it was still found that that some of the members did not give much
importance to their daughter’s education saying that they were dull and least interested in studying.
Though they themselves are promoters of women’s emancipation it will perhaps take another generation
to come out of the cocoon completely.
5.1 The women members of
Karisunda Gram-Panchayat

194
5Women have to carry out their entire household chores before attending their Panchayat activities. They
even mentioned that though their husbands were eager to see them as Panchayat members they were
not ready to share the housework. In spite of the inconvenience the members were extremely enthusiastic
and eager to develop themselves. As the members were not engaged in any kind of employment
generation activity they seemed to be able to provide more quality time to their role as the peoples
representative.
The women Panchayat members were more competent in handling the public health issues. This was
evident from the fact that Karisunda has been declared as a ‘Nirmal Gram’ or complete sanitation.
Issues like Industrial & Infrastructural development and agriculture seemed to be an area of weakness.
Perhaps women’s lack of exposure about these issues, coupled with the mindset that these are the ‘man’s
world’ has restricted them from getting more involved. They themselves feel that their biggest strength
is that they are extremely disciplined, they attend every meeting, carry out their work meticulously and
want to do much better. They are aware that they do have a few weaknesses but are confident that they
can overcome them with support. Talking of support it can be mentioned that a number of gentlemen
were also present during the focus group discussion. These men seemed to be the mentors and the main
support system. They were active members of the local political party and took this up as a challenge
to develop a Panchayat with all women to see if women’s commitment and sincerity can make a difference
in the governance. The experiment will help the community at large to realise that women can play a
different role other than that set by the society and also discourage dowry, school drop out and violence
on women. Karisunda has seen a lot of positive changes over the last few years which has made them
stand out in performance amongst other GPs of the same Block. It is felt that a little more formal
capacity building initiative by the Block officials and Zilla Parishad needs to be extended for this Gram
Panchayat to make the experiment successful.
Table 5.10 The women members of Karisunda Gram-Panchayat
Name Social group/ Designation Education
Community
Syed Manowarjahan
Begum Mohammedan Pradhan HS
Kajak Majhi SC Upa Pradhan Neo literate
Rita Chandra OBC Panchayat Samity member School final
Molina Pal General Panchayat member Class V
Chaya Ruidas SC Panchayat Samity member Class IX
Hara Bagdi SC Panchayat member Neo literate
Arati Mete SC Panchayat member Class V
Umarani Majhi SC Panchayat member Class IV
Kalpana Majhi SC Panchayat member Neo literate
Krishna Bhattacharya General Panchayat member HS
Chandana Majhi SC Panchayat member V
Gauri Ruidas SC Panchayat member Neo literate
Sabita Pandit General Panchayat Samity member Class IX
Sayed Fazila Begum Mohammedan Nari Sishu Sanchalak Class VIII
Nupur Nandi General Shikhya Sanchalak MA, B ED
Kanchan Dey General Shilpo O Parikahtamo Sanchalak BA
Aparna Mulick General Krishi O Tran Sanchalak IX
Shikha Pal General Panchayat member IV
Source: Office of the Block Development Officer, Indus
195
5
In the other seven villages that we surveyed except the
village (Barogobindapur) in Karisunda G.P., women’s
participation in Panchayat bodies as well as in other
community forums like water shed Management
committee, Forest protection committee (Ban Surakha
committee under joint forest management JFM), village
Education committee (VEC), ICDS beneficiary
committee, Gram Soloyana/Salishi Sabha etc., is either
nil or negligible. Females interviewed in the villages of
Kelai (Gangajalghati), Bisindia (Gangajalghati),
Udaypur (Saltora) Komo (Ranibandh) and Udaypur
(Indpur) do not even know anything, about the existence
a committee like ICDS beneficiary committee. In
Bhalukgaria (Chhatna) there are two women members
in the ICDS beneficiary committee, but the members
do not actively participate in the meeting. VEC is
unknown to females of the villages of Kelai, Kamo
Udaypur (Indpur) and Arjunpur, while in Udaypur
(Saltora), Bhalukgaria and Bisinda, there are women
members in VEC, but their participation is passive and
ineffective. The villages of Udaypur, Barakuli and
Fatepur (saltora) have recently been brought under the
watershed management scheme (RSVY) and a
watershed Management Committee has been formed.
There is one woman member in this committee from
Fatepur – Salmoni Tudu. But women interviewed from
the group were not aware about it.
Soloyana/Salishi sabha is an internal meeting of the
villages to resolve disputes related to land, family feuds
and disputes over marriage, cattle etc. Women are not
included or consulted during such meeting. Men see no
role of women here and only if the matter concerns a
woman, she is consulted and that too separately inside
the house. Women are not allowed to sit with the men.
In words of some women in our focus group discussion,
“amra o gulo korbo kakhan? Kath ante hobe, kato kaj,
purush shashito samaj!” (when should we involve in
all these matters? We have to bring firewoods and so
many household work to do-we are in a patriarchic
society!)
In rare cases, if women attend Gram Samsad meetings,
they play the role of silent spectators. They say.
“Panchayat a katha bolte sahas a kulaina, sasur bhasur
thakle kathainei” (we don’t have the forwardness to
speak in Panchayat- and not at all if our father in law or
brother in laws are present there in the same meeting.”
Among the eight villages surveyed Bansuraksha
Committee (Forest Protection Committee-FPC) exists
in Udaypur (Saltora) only. There is no female in the
committee. Women have brought up the issue through
their Self help Group but the forest department (FD)
has not made any amendment.
The State Forest Report 2000 shows that in West
Bengal, 75.20 percent of Non Timber Forest produce
(NTFP) is gathered by women of forest villages. While
NTFP gathering and its marketing constitutes the
economic backbone of the system and women are
principal users and gatherers of it, women’s
involvement in Joint Forest Management is insignificant
(5.7 percent as against male participation of 94.30
percent). Realising this situation, West Bengal Forest
Department made an effort to establish a unique
management system of women FPCs in West Bengal.
To this end, 17 all women FPCs had been established,
though where forest coverage is more than one fifth of
the total area. We set a snap-shot of two such all
women FPCs in Bankura-district from a survey report
by Ritajyoti Bandyopadhyay of Jadavpur University.
In case study (2) we reproduce these two cases.
All women Forest Protection Committee at Brindabanpur- a case study
(Forest Range-Joypur, Forest Division Bishnupur P.S.C) and Tribanka (West) (Forest Range-Bishnupur,
Forest Division-Bishnupur P.S.C)
Brindabanpur is a homogeneous village with 56 Scheduled Caste Households (HHs) containing 290
inhabitants. They are all landless. 35 out of 56 HHs are dependent on wage labour, 17 HHs are engaged
in government/non government services while rest 4 HHs are engaged in business. The village does not
have any primary school or health center. Recently, a Sishu Siksha Kendra (SSK) has been established

196
5in Brindabanpur, which caters to the need of the mothers and children of the locality. Still the village
lacks a motorable road and electricity. Literacy level is very low. Only two male members – Madan and
Bikash Lohar can read and write in vernacular. The women interviewed can only sign their names.
Tribanka is a slightly developed village with a predominant Scheduled Caste population (SC 101 +
general 18 = total 119) 2 HHs has large holdings, 3 have medium holdings, 44 HHs represent small
farmers and 70 HHs can be designated as marginal farmers. Six HHs earn their livelihood by wage
earning. The remaining HHs are involved in either service sector or in business. The village does have
a primary school (though with negligible infrastructure) but lacks a health center or a good communication
with Basudevpur. Five male members have education up to secondary level, while women have no
education. Some of them can only sign their names.
In both the villages the male villagers initially formed some FPCs. But they failed to protect the forest
cover. They insisted the Forest Department to dissolve their own committees and form new ones by
incorporating women since women were traditional users of forest. A separate group interview with the
male members of both the villages further reveals that they were less inclined to protect the forest since
they, at that time, did not understand the economic magnitude of JFM. They failed to envisage the
benefits that they could accrue from JFM in future. As a result, they ‘left the place for women’ so quietly.
But, …… after JFM attained a certain stage of prosperity, the men folk came back in the Programme
with much interest.
It was not easy for Mr. Swapan Banerjee (former Range officer, who implemented JFM in Joypur range)
to ‘persuade’ women to take ‘public responsibilities.’ It was decided that they would go for patrolling on
rotation basis but two forest guards would accompany them. In course of time they became confident
enough to go for patrolling without the help of forest guards.
The women members of Brindabanpur FPC were given a kisan nursery to raise seedling and after
selling them they earned Rs. 3, 000/- and opened an account in favour of FPC in the Bank. Different
trainings were given to them from time to time. They started the protection in a group on roaster basis
and successfully detected the cases. In 1988, one pond was excavated and pisciculture was started. In
the very next year they released fish fingerlings and earned 3000/-. One community hall, one singwell
Paddy thrasher were given to them from time to time as JFM support activities. By selling the rice
gathered by women as ‘musthy sanchaya’ (collection of fistful rice from the daily routine of the family),
they kept the sold money in a common account.
The women FPC members of the village were also benefited from the growth of micro credit system.
The women accumulated a portion of their wage earnings from JFM activities in a bank account. Then
they themselves use the money for warring it to members when they are in urgent need of it.
The same thing in a larger magnitude took place in Tribanka. The better functioning of FPC unit has
resulted in substantial increase in additional income of the members, for instance, from the share of
usufructs, collection and sell of different items of NTFP, pisciculture and above all expansion of irrigated
agriculture. (Thus) JFM has returned the dignity of women head loaders. Before the introduction of
JFM, the women collectors were considered to be offenders and quite often treated in a much-undignified
manner. In words of Parul Lohar, ‘before the introduction of JFM, we used to destroy the forests, now
we protect them. Many of us had the experiences of eating burnt bread in police custody. Now we love
our forests, because we have nurtured them. The foresters are our relatives.’
[Source: Sustainable Development and Gender: The Experience of Participatory Forest Management in West Bengal, India,” Ritajyoti
Bandyopadhyay, Jadavpur University.]

197
5
Along with this success story, however, there is also a
fear of failure in near future. Although women initially
gained a voice, they may fail to sustain it owing to their
incapability to handle newly generated resources – they
are deprived of getting primary preconditions of
development i.e., health care, education, land etc. The
men with 3 ‘R’s, may very soon capture the authority.
Thus it is clear that the smooth running of the processes
of political empowerment and enhancing decision-
making power of women are hindered by many hurdles.
At the individual and family level, women face three
difficulties – (1) financial dependence on their husbands
or other family member (2) lack of education and lack
of confidence – they cannot interact freely and
effectively. [In the all-women Panchayat of karisunda
GP we experienced that even the graduate and
postgraduate members are not competent enough to
discuss the issues like industrial, agricultural and
infrastructural development within their own G.P. Thus
not only formal education but also handholding is
required for effective involvement]. (3) The family is yet
to change its outlook towards women members as
different decision-making bodies. It was expected that
husbands or the other member in the family would be
sharing household work with them. But this has not
happened.
At the social and political levels, there are quite a few
problems – (1) the meetings are often held at
inconvenient hours and women members cannot attend
due to their household responsibilities. (2) The
environment within which they operate has such
inherent problems of crime against women, which
restrict their free movement. (3) Women are often
divided on the basis of political belief, caste etc. They
are yet to realize that they should get together on
women’s issues forgetting their petty self-interest.
Self-help groups (SHGs) in different regions of Bankura
district can play an important role in increasing women’s
own capabilities, self confidence and thereby contribute
to women’s economic and political empowerment. In
the next section (5.3) we analyse the performance of a
number of SHGs in different regions of Bankura
district.
5.2.3.8 Health issues :
Health is the basic need and the most precious
possession, next perhaps only to life itself. Good health
is particularly important to women, because lack of it
affects them for a variety of reasons. As potential
mother requiring care and attention women need
specialized services related to the reproductive services.
As mothers they become responsible for the health of
their children and family. As workers outside and inside
the house they often have to shoulder double burdens.
Consequently they are overburdened, subject to poor
working conditions and suffer undue overstrain and
mental stress. They are more dependent on the Health
system than men. However, women in India suffer from
different health problems from the very beginning of
their life. Girl children do not achieve their full weight
and high potential on account of dietary deficiency.
Several micro studies found that girl’s diet is inferior,
both in quality and quantity to a boy’s diet. Girl
children are breast-fed for shorter periods and receive
less supplementary food than boys. Under-nourishment
and poor health are making them more susceptible to
diseases. Over 60 percent of female population in India
suffers from anaemia.
The SIPRD Survey recorded the frequency of taking
protein-contained food by women in seven blocks of
Bankura district. Women were categorized into three
classes – (i) Maximum protein intake group represented
by the women taking protein-rich food articles in 3
days or more in a week, (2) minimum protein intake
group which included women taking protein-rich food
items in less than 3 days and (3) women not taking
protein-rich food at all.
The table given by SIPRD is reproduced in table 5.11.
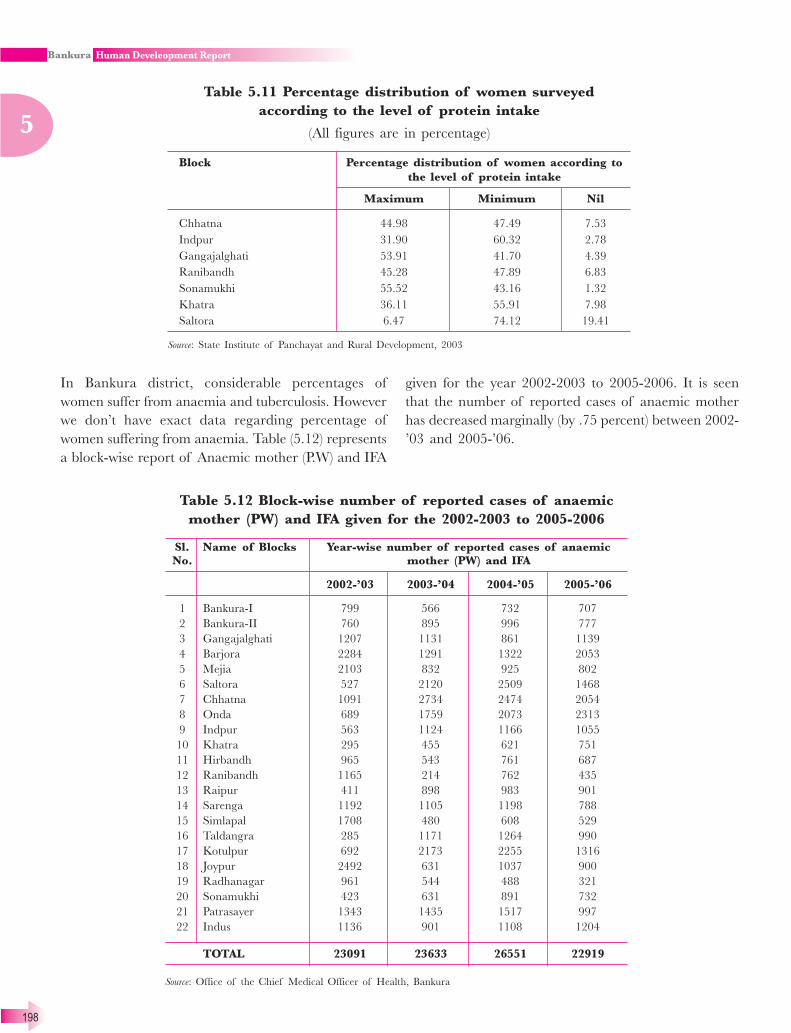
198
5
Table 5.11 Percentage distribution of women surveyed
according to the level of protein intake
(All figures are in percentage)
Block Percentage distribution of women according to
the level of protein intake
Maximum Minimum Nil
Chhatna 44.98 47.49 7.53
Indpur 31.90 60.32 2.78
Gangajalghati 53.91 41.70 4.39
Ranibandh 45.28 47.89 6.83
Sonamukhi 55.52 43.16 1.32
Khatra 36.11 55.91 7.98
Saltora 6.47 74.12 19.41
Source: State Institute of Panchayat and Rural Development, 2003
In Bankura district, considerable percentages of
women suffer from anaemia and tuberculosis. However
we don’t have exact data regarding percentage of
women suffering from anaemia. Table (5.12) represents
a block-wise report of Anaemic mother (P.W) and IFA
given for the year 2002-2003 to 2005-2006. It is seen
that the number of reported cases of anaemic mother
has decreased marginally (by .75 percent) between 2002-
’03 and 2005-’06.
Table 5.12 Block-wise number of reported cases of anaemic
mother (PW) and IFA given for the 2002-2003 to 2005-2006
Sl. Name of Blocks Year-wise number of reported cases of anaemic
No. mother (PW) and IFA
2002-’03 2003-’04 2004-’05 2005-’06
1 Bankura-I 799 566 732 707
2 Bankura-II 760 895 996 777
3 Gangajalghati 1207 1131 861 1139
4 Barjora 2284 1291 1322 2053
5 Mejia 2103 832 925 802
6 Saltora 527 2120 2509 1468
7 Chhatna 1091 2734 2474 2054
8 Onda 689 1759 2073 2313
9 Indpur 563 1124 1166 1055
10 Khatra 295 455 621 751
11 Hirbandh 965 543 761 687
12 Ranibandh 1165 214 762 435
13 Raipur 411 898 983 901
14 Sarenga 1192 1105 1198 788
15 Simlapal 1708 480 608 529
16 Taldangra 285 1171 1264 990
17 Kotulpur 692 2173 2255 1316
18 Joypur 2492 631 1037 900
19 Radhanagar 961 544 488 321
20 Sonamukhi 423 631 891 732
21 Patrasayer 1343 1435 1517 997
22 Indus 1136 901 1108 1204
TOTAL 23091 23633 26551 22919
Source: Office of the Chief Medical Officer of Health, Bankura

199
5
Table-5.13 Year-wise number of patients of tuberculosis with
social group/community-wise break-up
Unit Year General SC ST Minority
community
Male Female Male Female Male Female Male Female
District Tuberculosis 2004 135 63 142 72 35 11 20 12
Center TU 2005 133 50 160 68 31 16 12 8
(DTC TU) Total 268 113 302 140 66 27 32 20
Bishnupur 2004 144 38 155 49 98 30 38 12
TU 2005 141 45 177 45 98 33 30 19
Total 285 83 332 94 196 63 68 31
Amarkanan 2004 138 72 179 43 49 18 0 0
TU 2005 100 52 158 54 39 36 0 0
Total 238 124 337 97 88 54
Sonamukhi 2004 111 45 262 98 41 14 64 20
TU 2005 87 30 235 92 38 11 53 23
Total 198 75 497 190 79 25 117 43
Taldangra 2004 114 57 154 81 170 64 18 11
TU 2005 103 51 154 88 173 69 27 11
Total 217 108 308 169 343 133 45 22
Raipur 2004 36 15 123 36 265 94 1 0
TU 2005 23 8 94 24 296 98 1 1
Total 59 23 217 60 561 192 2 1
Khatra 2004 110 38 110 37 114 33 7 4
TU 2005 92 43 91 36 87 39 3 5
Total 202 81 201 73 201 72 10 9
Chhatna 2004 59 23 162 59 192 64 9 3
TU 2005 74 40 150 72 185 70 2 1
Total 133 63 312 131 377 134 11 4
District 2004 847 351 1287 475 964 328 157 62
total 2005 753 319 1219 479 947 372 128 68
District total for
2004 & 2005 1600 670 2506 954 1911 700 285 130
Source: Office of the Chief Medical Officer of Health, Bankura
Table 5.13 shows that the number of TB patients in all
the social groups and community strata is higher for
men compared to women. This may be due to the fact
that percentage of TB affected patients brought under
proper treatment is lower for women compared to men.
Number of general caste female TB patients under
treatment in all the TUs decreased between 2004 and
2005 while the same increased marginally for SC, ST
and minority community between 2004 and 2005.
In our own survey work for gender issues, women’s
health problems occupied the central position in FGD.
Majority of the women needed quite a bit of persuasion
and prompting to get them talking about their health
problems. There was a sense of exasperation, as they
themselves and the society at large did not give much
importance to it. Women have to live with their
problems and due to financial crisis the first priority
was given to men and children’s health treatment. The
community accesses government sub centers for
children’s vaccination, ANC and family spacing
services mainly. The private practitioners treat other
health problems. There is very little faith of the
government services. Distance from the BPHC is also
a cause for seeking services from private practitioners.
On an average it is seen that the sub centers were 2 –
3 Km from the villages. As reported by women, the
outreach services by health are really poor in the areas

200
5
and ANMs and other health workers are hardly visible
except for pulse polio Immunization. The community
said that health workers do not hold regular health
camps at the village, common ailments like aches,
chronic indigestion & diarrhoea, white discharge, etc
are not treated. In Bankura Sadar majority seek service
of private practitioner spending large amounts of
money.
The most common ailments that came up during
discussion were diarrhoea, cough & cold, indigestion,
back pain, fever, and TB. Worms, loose motions,
amebiosis, indigestion and white discharge are so
chronic that it is treated as a part of life and treatment
is also not sought. Due to heavy workload back pain
among middle-aged women was very common. In
Ranibandh women also mentioned malaria and
jaundice. Skin problems like rashes, boils, fungal
infections, etc. were also common. Leprosy, as a health
problem was mentioned only in kelia village of
Gangajalghati. In Bhalukgoria, Chhatna they also
mentioned epilepsy.
Institution deliveries are preferred for first time cases.
With the subsequent deliveries there is less time
available for transportation and the deliveries are
mostly at home. There are trained birth attendants,
but in most of the cases the birth attendants comes
after the delivery is almost complete. The role of the
birth attendants is to cut the umbilical cord and
provide post delivery care to the mother and child.
Institution delivery turns out be quite expensive as, they
need to buy medicines from markets and the cost of
travel is very high even though bed charges are free in
hospital. For normal delivery the total cost incurred is
almost Rs. 700-800/- including vehicle and medicine.
In most of the cases villagers need to borrow money
from neighbours or local moneylenders at the rate of
120 percent interest. In only one village (Udaypur),
where local NGOs arranged group savings and lending
facilities, the interest rate is relatively low (24 percent).
As an alternative, they can conduct at home delivery,
not only to save transportation cost but also to
minimize the hazards of delivery while traveling.
Therefore, unless any danger symptoms are identified,
home deliveries are preferred to institution deliveries.
Across Bankura there is a fear of episiotomy and the
harsh behavior of the attendants at the government
hospitals.
5.2.3.9 Age of marriage, dowry control over
household resources and decision-making
within the family :
In a still feudalistic framework of Indian society women
became objects of pleasure and the practices of
polygamy and child marriage continue unabated. Being
married at early age they are deprived of proper
education, proper health care and get accustomed to
live according to others’ will. According to census
reports, the average age of marriage for males has
increased from 20.2 during 1901-11 to 23.3 in 1981-
91. For females, the comparable figures are 13.3 and
18.3.
For Bankura district we don’t have any published data
in this issue since marriages are not compulsorily
registered. In the SIPRD survey, it was observed that in
all the seven blocks selected, a considerable number of
women get married before attaining the age of 18. The
study found a positive correlation between mean age of
marriage and literacy level. In our own survey work for
Gender issues in Bankura district, the issue of age of
marriage came to be an important focus of FGD.
The mean age of marriage amongst SC/ST
communities of Gangajal Ghati, Saltora, Indpur,
Ranibandh, Chhatna and Bankura Sadar was found to
be 15 years. Amongst these the least (13) was found in
Udaipur village, Saltora.
There are exceptions also. During the group discussions
2 Tribal girls were found around the age of 20- 21 years
and were still single. They lived with their parents and
brothers family. Girls who remain unmarried till late
years have to bear with taunting and other verbal abuse
from even family members like sister in law. To avoid
remarks they have to contribute substantially in the
household chores. Parents are not much perturbed over
unmarried daughters in tribal families. The marriage
proposal always has to come from the groom’s family,
there is no dowry system, on the contrary it is the
groom’s family who pays a nominal amount to the
brides parents and also gives jewelery to the bride. The
bride’s parents have to provide utensils and bear the
cost of feeding the guests. The tribal women are well
aware about the legal age for marriage but they fear to
refuse a proposal in case there are none in future. The
women also said, “at a younger age girls are more
attractive it is easier to find a groom”, so marriages take
place quite early.

201
5
The scheduled caste women that we met were mostly
illiterate and the dowry system was prevalent amongst
them. The Scheduled castes of kamo village Ranibandh
were more influenced by the Tribal cultures and had
no dowry system but those living in the vicinity of the
general castes gave dowry during marriage. The paying
of dowry system was found in Indus, Gangajalghati and
Bankura II. Parents of daughters have to either take
cash loans or mortgage whatever little land they have
to pay for the dowry.
Amongst the general castes the mean age for marriage
was 18. Bisinda, in Gangajalghati had a higher age for
marriage and also a larger amount of dowry, ranging
between Rs. 50,000/- to Rs. 4,00,000/-. In Arjunpur
the dowry ranged between Rs.50,000/-to Rs. 1,50,000/
- and the mean age for marriage was 17 years. The
people are mostly landowners and also service holders
in both the villages. Along with the dowry gold is also
given to the daughters, which is usually passed down
from mother to daughter. Homestead land is mostly sold
or mortgaged to pay for the dowry. For the mortgaged
land, usually the family has to cultivate on the land and
pay back in terms of crops. As a result they continue to
remain indebted over long periods.
The dowry system also has an unofficial influence on the
control of resources by women. The amount of money
with which the parents of a daughter are ‘penalised’
generally goes to the husband or the father-in-law of the
bride. The head of the family controls the money that
is paid as dowry, the women who brings it does not have
any say/control over it. She is only left with a guilty
feeling that for her sake her parents had to spend so
much. The women cannot claim share of parental
property, though she is aware about her legal right to it.
As the parental family has already paid for dowry by
selling land or mortgaging property the family pressurises
women to sacrifice her share. As a result women are left
with no resources and no decision making power. All the
resources-financial and physical in the in-laws house are
beyond women’s control, especially for housewives who
do not have any financial independence.
According to the SIPRD survey, more than 45 percent
of the women in the sample population (of seven blocks)
have their own earnings. However, on an average of
these around half of them have their own saving. Mostly
male members of the families take purchasing decision
in respect of their families and control the family
expenses. Around 40 to 50 percent women can take
birth control decisions of their own and around 50-60
percent women can move outside their residence for
any purpose without taking permission from male
members of their families.
5.2.3.10 Access and control over community
resources/services :
Access to community resources and services like water
sources, roads, railways and the transport facilities,
community health services, education services etc
builds the infrastructure for economic development.
Poor infrastructure is one the major causes for women’s
inability to access community services. The
infrastructural constraints are:
1) Physical distance from the service centers (health,
education)
2) Bad condition of roads – lack of proper transport
facilities
3) Shortage of safe drinking water as well inadequacy
of water sources for other important daily uses.
4) Low teacher-student ratio in primary and
secondary schools.
5) No electricity in the interior villages.
6) Lack of awareness about existing Government
schemes.
The most serious problem of the majority of
population in Bankura district is scarcity of water -
drinking water as well as water for other uses. Most of
the women in rural, semi urban and in even urban
areas are hard hit by this infrastructural backwardness
as, collection of water is an activity assigned for women
no matter the high degree of hardship attached to it.
Women in villages spend at least 2 hours and
maximum 4-5 hours just to collect enough water for
the family including the cattle. The number of tube
wells against the total population of villages varies over
a wide range. In our sample survey, we found komo
Mouza (Ranibandh block) with only two tube wells
serving 2350 population and another village Bisinda
(Gangajalghati) with 12 tube wells for 2237 population.
In table 5.14 we show the matrix on our major findings
on drinking water in the villages visited by the Gender
issue Group of DHDR Cell, Bankura. We came to
know from FGD that the ponds are used for bathing
and washing of clothes and utensils. During dry
seasons the water becomes murky and unusable, but

202
5
there is no alternative. Diseases are bound to spread
during dry seasons. Some said that small trenches are
dug out, where water accumulates during monsoon;
this water is used later, which is also muddy and full
of insects and moss. Using such water for bathing,
cleaning utensils etc is largely responsible for the
common ailments like diarrhoea and worms.
Table 5.14 Matrix on major findings on drinking water
Block Village Population Drinking water source Situation
Chhatna Bhalukgoria 250–300 1 tubewell and 2 well There is only 1 tube well for drinking water. During dry
season the water level drops, so water has to be collected
from the riverbed. The river is half kilometer from the village
and women carrying two containers (one on the head &
other on the waist) have to walk that distance 10 to 16 times
in a day (up & down). They have to fetch water even during
pregnancy; during the third trimester they carry water only
on their heads. Considering the severe summers of Bankura
this becomes a Herculean task.
Bankura II Arjunpur 1500–2000 4–5 tubewell provided by Many families have their tube wells. The iron content of the
the Panchayat and some water is very high in the drinking water. Drinking water is
in personal houses a problem. People prefer drinking well water.
Bankura Shit para & 9400 Municipal supply water Water is collected from municipality supply. There are not
Municipality Kethar enough connections, hence a large number of people collect
Danga water from the taps. Some families collect water for washing
and bathing from the municipality supplies, others use the
river for washing clothes, utensils and bathing. Water takes
up a lot of time and energy.
Gangajal- Bisinda 2237 12 tubewell provided by There are 12 tube wells provided by the Government and
ghati the Panchayat and 9 around 9 houses have their own tube wells. However on the
in personal houses event of tube wells breaking down it is 1-2 months before
those are repaired. Each para or hamlet has a tube well. In
case the one in the scheduled caste mohalla stops functioning
they have to wait till all the upper caste finish taking water.
Untouchability still prevails, women hold on to it strictly.
Men when out side their houses do not maintain the norms
but when at home do not defy the norms.
Gangajal- Kelai 30–40 1 tubewell There is only 1 tube well for drinking water. During dry
ghati Household season the water level drops and there is acute scarcity, one
of woman said “ the scarcity is so acute at times that if
there is a fire we will have to stand and watch our child
burn to death, since there is no water ”. A large part of time
is spent on fetching water.
Indpur Udaipur 194 1 tubewell There is 1 tube well provided by the Government for drinking
water. During peak summer the water level drops drastically.
Ranibandh Lagapukur 785 1 tubewell and 2 wells There is only 1 tube well for drinking water. During summer
(Kamo the water level falls so villagers have to drink water from
Mouza) the wells. Women have to fetch drinking water 3 – 4 times a
day during summer, as they have to provide water for the
cattle also. There are long queues at the tube well and
women from one side of the village have to walk across to
the other end, hence collection of drinking water is time
taking.
Saltora Udaipur 930 1 tubewell and 2 wells There is only 1 tube well for drinking water. During summer
the water level falls so villagers have to drink water from the
wells. Women have to fetch drinking water 3–4 times a day
during summer, as they have to provide water for the cattle
also. There are long queues at the tube well hence collection
of drinking water is time taking.
Source: Survey and focussed group discussion

203
5
Table 5.15 Percentage of population covered by supply of
drinking water
Sl. Blocks Total population Total population Percentage Rank
No. as per Census, covered by of within the
2001 supply of coverage district
drinking water
1 Sonamukhi 142328 142328 100.00 1
2 Indus 152847 151831 99.34 2
3 Onda 220572 217636 98.67 3
4 Gangajalghati 162007 158957 98.12 4
5 Mejia 76123 74671 98.09 5
6 Taldangra 128747 126213 98.03 6
7 Joypur 141497 138589 97.94 7
8 Indpur 137825 134024 97.24 8
9 Saltora 121552 118182 97.23 9
10 Patrasayer 164060 159504 97.22 10
11 Ranibandh 104326 101391 97.19 11
12 Chhatna 169215 163978 96.91 12
13 Hirbandh 72502 70223 96.86 13
14 Kotulpur 167547 160044 95.52 14
15 Simlapal 127445 121379 95.24 15
16 Bankura-II 123415 117283 95.03 16
17 Bishnupur 138768 130956 94.37 17
18 Sarenga 95128 88146 92.66 18
19 Khatra 102569 94419 92.05 19
20 Barjora 179007 164205 91.73 20
21 Raipur 151293 137320 90.76 21
22 Bankura-I 95840 83536 87.16 22
Source: NRDMS, Bankura
‘Coverage’ is conceptualised by the standard of ‘one
tube well with a maximum population of 250’. From
the table we find that in Sonamukhi block there is cent
percent coverage of population with drinking water
facilities, whereas the lowest coverage is in Bankura-I
(87.16 percent).
As far as the transportation facilities are concerned we
found that the most commonly available transportation
facility to carry patients is “Van Rickshaw” for nearby
health points. Public transportation facilities are really
weak in most of the areas. During emergency,
villagers need to hire four wheelers, which cost around
200-400/- depending on distance. This huge cost of
transportation is unbearable for the villagers and
restricts villagers in availing institutional facilities unless
it is very urgent.
In some of the villages, the connecting roads are mud
tracts, which are broken and difficult to travel. This also
restricts movement for seeking health, education, etc.
services from distant places. In 3 of the villages, women
reported that they delivered their baby on the vehicle
while approaching the nearby hospital.
Lack of awareness about existing Government schemes
– Most of the villagers were totally unaware of the
existing Government health facilities and schemes like
“Janani Suraksha Yojna” etc and never availed those
services.
The use of sanitary latrines is extremely poor in the
majority of the places visited. Scarcity of water and
lack of awareness seems to be the major problem for
not using sanitary latrines. Most of the latrines
prepared by the government are now used as
storerooms or are used only during emergencies. The
community is not convinced about the quality of the
low cost latrines and there is a feeling that the pits will
collapse or water may over flow causing more
environmental pollution. The community also said that
the quality of the pans is not good enough and cannot
be cleaned. Very soon the pans become blackish with
moss and slime. Many of them said that there is no

204
5
space for construction of toilets within the house.
Women also feel a lack of privacy to use the toilets
within the household.
Coverage of electricity in villages of different blocks is
still partial, the extent of coverage varying among
blocks.
Electricity coverage in villages of the seven blocks
selected by SIPRD study and village coverage of
electricity in the district are as shown below:
Block Percentage of villages electrified
Sonamukhi 75.00%
Khatra 74.20%
Chhatna 58.91%
Saltora 57.32%
Indpur 56.00%
Ranibandh 51.48%
Gangajalghati 31.38%
District 67.70%
Among the seven villages surveyed by the Gender
Group of DHDR Cell, Bankura, five villages have no
access to electricity facility. These villages are Kelai
(Gangajalghati), Udaipur (Saltora), Bhalukgaria
(Chhatna), Lagapukur (Ranibandh) and Udaipur
(Indpur). Of these villages, women in the FGD of
Udaypur (Indpur) expressed their feeling of high priority
for electricity, as it is very difficult for their wards to
study in the evening under kerosene lamp.
5.2.3.11 Work load of women :
Besides working as agricultural worker women are
generally engaged in strenuous and hazardous work like
Stone Crushing, Collection and selling of Firewood,
Loading/Unloading brick, sand etc. along with their
regular household work. All these work take full days
since they go to distant places in search of livelihood
(travel time 3-4 hours a day). They continue all these
activities even during pregnancy, which leads to general
and reproductive health complication for the women as
reported during FGD.
Women who do not work out side contribute as labour
for their own agricultural land. This involves a lot of
heavy work. At home almost all women make “moori”
or puffed rice and par boil paddy. Both these activities
involve sitting by the fire for long stretches and doing
other heavy work. Along with this all the women have
to perform the regular household chores like cooking,
washing, fetching water, caring the cattle, fetching
firewood and of course attending the baby.
Table 5.16 gives the daily work profile of females as
obtained through PRA in the villages visited.
Table 5.16 Daily work profile of female
Time line Household work profile of female
Udaypur 05:00 a.m. to 09:00 a.m. Wake up, fresh up, clean house, fetch water, cooking, clean utensils, sweeping, prepare children
for school, boil paddy, wash cloths, Maruli Deoa
09:00 a.m. to 01:00 p.m. Go to jungle for firewood or work in agricultural work (during agricultural season)
01:00 p.m. to 03:00 p.m. Cutting wood into pieces + sweeping floor + serving food to children, Feeding animals,
fetching water
03:00 p.m. to 06:00 p.m. Go to nearest market (Tiluri-1½ km to sell firewood + buy vegetables etc.
06:00-10.00 p.m. Cooking, serving food, wash utensils, fetch water
Bhulukgaria 04:00 a.m. to 08:00 a.m. Wake up, fresh up, clean house, sweeping, take tea and Muri, Bring water from river (1 km away)
08:00 a.m. to 07:00 p.m. Loading /Unloading Brick/Sand on Truck
08:00 - 10:00 p.m. Cooking, serving food, wash utensils, fetch water
Bisinda 04:00 a.m. to 06:00 a.m. Clean house, sweeping, boil paddy
06:00 a.m. to 10:00 p.m. Cooking, serving food, wash utensils, fetch water
10:00 a.m. to 6:00 p.m. Bring firewood from jungle/work in paddy field
6.p.m. to 10. p.m. Household work
Kamo 04:00 a.m. to 09:00 a.m. Sweeping cleaning house, clean utensils, Maruli deoa etc.
09:00 a.m. to 3:00 p.m. Go to jungle, collect Shal leaf, firewood
3:00 a.m. to 10:00 p.m. Cooking, serving food, boil paddy, make leaf plate, sweeping, bring water etc.
Source: Survey and focused group discussion

205
5
Table 5.17 Distance (in Km.) covered by women in backward
mouzas of Bankura district (Block-wise) for collection of fire
source
Block Number of villages where women collect firewood by traveling
Less than Above 1 Km. Above 5 Km. More than
1 Km. to 5 Km. to 10 Km. 10 Km. Total
Bankura-I 6 19 2 27
Bankura-II 6 12 1 19
Chhatna 19 11 30
Mejia 13 12 5 1 31
Indpur 8 19 27
Khatra 1 20 4 1 26
Ranibandh 28 24 1 53
Simlapal 18 22 1 41
Sarenga 4 3 1 9 17
Kotulpur 3 1 3 7
Sonamukhi 24 24 2 50
Patrasayer 24 20 7 3 54
Source: Backward mouza survey conducted by the office of the District Magistrate, Bankura
Even during pregnancy women continue all the
household and paid work up to 9 months of pregnancy.
Within General caste female the situation is different.
In Arjunpur, women reported that during pregnancy
their husband and family members helped them doing
the heavy work like fetch water from tube well, washing
cloths etc.
In tribal community, the major contribution in income
comes from women. They are engaged in both paid and
non-paid (household work) activities. Though men are
engaged in paid work, during dry season, when income is
uncertain, they pass their leisure by sitting idle or chatting.
They do not share the household work with women unless
there is any emergency (when women are bedridden).
There is inter-district migration in search livelihood.
In most of the cases total family is migrated during
harvesting season. The most preferred choice for
migration is Burdwan. It was reported by women that
in Burdwan, the wage rate is relatively high and the
landowner also provides shelter and utensils for staying
there and work is available throughout the year since
paddy cultivation takes place more than once. So
migration out is profitable for them than staying in
Bankura.
Table 5.17 gives an idea regarding the hardship women
face in different backward Mouzas of Bankura district
to collect fire source.
In Ranibandh women of 28 villages collect firewood
from nearby forest, whereas, women of other 24 villages
collect fire source by walking upto 5 kms. per trip. In
Sonamukhi and Patrasayer women from 24 and 20
(respectively) villages collect fire source by walking the
same distance. For the table, we come to know that in
Mejia, Khatra, Sarenga, Kotulpur and Patrasayer,
women of some villages have to bear the responsibility
of collecting firewood even from a place at a distance
more than 10 kms.

206
5
5.2.3.12 Violence against women :
Violence against women refers to any act of gender
based violence that results in, or is likely to result in,
physical, sexual or psychological harm or suffering to
women, including threats of such acts, coercion or
arbitrary deprivation of liberty, whether accruing in
public or private life.
Women become more and more easy preys of
molestation and rape. Incidents of child-rape are
regular features of newspapers. The number of sex
related crimes are increasing day by day. Various
national and international agencies present women’s
body as a piece of titillating object despite the Indecent
Representation of Women Act. Moreover, there are
constant evidences of violence against women in their
day to day life - which may not be physical torture
always; it may be mental torture in different forms and
these types of violence, although known to everybody,
is difficult to be recorded due to suppression and
misrepresentation of facts.
For Bankura district, the only data we could avail of in
this regard are the reported cases in different police
stations under Bankura Police (Table 5.19).
From Table 5.19, it is found that the number of
reported cases of violence against women increased by
6.06 percent between 2000 and 2001, decreased by
5.24 percent between 2001 and 2002, again increased
by 25.19 percent, 18.05 percent and 3.83 percent
during the next three consecutive years. Thus during
six years 2000 and 2005, the number of reported
cases of violence against women increased by 64.65
percent.
Table 5.18 Important interventions needed for improving the lives of the women
Village Block Immediate requirement
Kelai Gangajalghati ‘Water for drinking and other uses; ‘Alternative livelihood: excavation of
ponds; this would create livelihood opportunities as well as minimize water
scarcity’
Bisinda Gangajalghati ‘Provision for another pond and a bathing ‘ghat’ for women’
Udaypur Saltora ‘Enhance women’s education: This would involve alternative livelihood
opportunities for the family so that children can be less involved in
economic activities; higher teacher-student ratio for quality education:
“teachers are busy with the Mid-day-meal”;
‘Availability of water: less disease, less time spent on fetching water, more
scope for growing vegetable & farming.”
Bhalukgaria, Chhatna Chhatna ‘Enhance women’s opportunity to participate in decision-making bodies
and to have access to information’, ‘availability of drinking water; less
disease, less time spent on fetching drinking water’; ‘improved irrigation
facilities’ – excavation of ponds – improvement of livelihood opportunities:
this will leave more time and money to invest in other activities within the
village. Mother won’t have to stay out of home for the whole day and will
be able to look after their children.
Lagapukur Ranibandh ‘Availability of water – less disease, less time spent on fetching drinking
water, more scope for growing vegetable & farming, more time and money
to invest in other activities.’
Udaipur Indpur ‘Provision of another pond, drinking water, roads, AWC and schools,
Electricity, irrigation canal.’
Shit Para Bankura “Improve the availability of water, sanitation, Prevent alcoholism (Women
Municipality had tried to stop the opening of a liquor shop in the locality, but the shop
owner set it up with the support of the administration), cleaning and
excavation of the ponds in the locality”
Source: - Survey and focussed group discussion

207
5
Table 5.19 Number of reported cases of violence against women
Police Station 2000 2001 2002 2003 2004 2005
Bankura PS 50 39 43 32 50 65
Onda PS 10 11 23 24 28 14
Taldangra PS 10 8 9 11 9 10
Gangajal Ghati PS 13 11 9 11 20 7
Barjora PS 5 11 6 7 22 9
Mejia PS 3 9 4 10 11 14
Saltora PS 7 7 9 7 6 3
Chhatna PS 11 10 9 15 15 11
Beliatore PS - - 4 2 6 4
Khatra PS 16 21 20 16 18 27
Ranibandh PS 6 9 5 8 5 13
Barikul PS - - - - - 4
Raipur PS 11 4 6 17 15 18
Indpur PS 6 11 6 11 11 12
Simlapal PS 6 4 4 4 10 9
Sarenga PS 4 1 3 5 7 12
Bishnupur PS 10 9 5 15 20 14
Joypur PS 5 8 8 13 10 12
Kotulpur PS 7 10 8 8 12 21
Sonamukhi PS 9 6 9 18 13 20
Patrasayer PS 4 8 3 7 14 16
Indus PS 5 3 6 22 12 9
Total 198 210 199 266 314 326
Source: Office of the Superintendent of Police, Bankura
In our FGD, when we enquired of domestic violence
against women, the females in the groups initially
hesitated, but finally reported that it is a common
practice of some husbands in ‘drunk condition’ to
assault their wives physically for nothing or for trifle
household matters of dispute. There is sometimes dowry
related violence also. In Arjunpur, we met a middle
aged woman whose daughter was tortured to death in
her in-laws house due to her inability to fulfill her
husband’s ever-increasing demand for money from her
parental house.
“Amar meye ke biye diye chilam, swamir atyachar-e mara jaye”, this was the narration of a middle-aged
lady while discussing the dowry system and it’s impact on the lives of women. Kalyani is a widow. With
2 daughters and 1 son, Kalyani was finding it difficult to run the family. All 3 children were studying
and as they reached the higher classes expenses on education was soaring. She said, “gramer lok bole
meye baro hoyechye biye dilo na” and so she managed to get the daughter married at the age of 17 with
a dowry of Rs. 25000/- and some jewelery. A few days later they asked for more and more money and
finally tortured the girl to death. Kalyani’s son is a graduate and jobless. She has got him married. Her
daughter in law also had to pay a dowry, otherwise how would she pay the dowry for her younger
daughter’s marriage? ‘I married off my daughter, she died from torture her husband’. ‘Village people
were telling that you are not marrying off your grown-up girl’.

208
5
5.2.3.13 Influence of social groups and
communities on women :
Majority of the places that were visited had a mix of
both scheduled caste and scheduled tribe or scheduled
caste and general caste. There were some Muslim
women only in Bankura municipality. At every village
women preferred sitting in-groups corresponding to
their caste. Initially a conscious effort was made to make
them sit together, but gradually it was found that the
higher and richer castes were dominating the discussion
and their problems also differed to some extent.
In Kelia village of Gangajalghati it was found that,
even the scheduled castes and scheduled tribes were
comfortable sitting in separate groups even though they
were living in the same hamlet. Every thing about their
regular lives starting from livelihood, land ownership,
education, health seeking behavior, work load, etc, all
differed. The services available to them were common
like schools, health centers, hand pumps, etc. but there
was a subtle rule about who would use it first. In certain
villages where the schedule castes and general castes
lived together the general caste had the right to use the
hand pump first. Women did not speak about it but it
came up while discussion. We very strongly felt that the
scheduled caste, especially Bauri’s, who are actually a
large percentage of the society in Bankura district, are
isolated. Though they have the right to all services
provided by the Government, they do not access them.
They are the poorest of the poor. Service providers like
AWW and ANM say that even when contacted they do
not comply. Their unhygienic life styles and poor personal
hygiene also becomes an underlying reason for AWW
avoiding home visits and maintaining poor interpersonal
communication. Bauri’s do not access the Panchayat as
they feel intimidated and ignored by the people in power.
Many Bauri families do not have BPL cards or
Annapurna Antardaya cards inspite of being the poorest
in the community. Women belonging to these families
are subject to extensive psychological and physical
pressure. Violence is also an integral part of their day-
to-day lives. Bauris are mostly land less, working as daily
wage labourers. Percentage of illiteracy is highest
amongst them. Their extreme poverty, poor health
conditions, lack of awareness about rights and poor living
conditions are some of the important factors behind
their inability to join the main stream. Perhaps it is not
always the “untouchability” factor that isolates them but
it is the issue of ‘haves and have nots’ that separates
them from others in public places like schools, health
centers, markets, etc.
In the urban slums economic status is more or less same
irrespective of caste creed and religion. The struggle
for survival is most crucial so there is very little social
discrimination.
Some observation on Kethardanga, a muslim slum
Kethardanga is predominantly a Mohammedan slum in Bankura municipality. The residents have been
living here since quite some time and marriages take place within the community. The population
density is very high and living conditions are extremely poor and unhygienic. We spoke to approximately
35 women of different ages. It was quite surprisingly found that almost all women could read and write
Urdu but had no knowledge of Bengali/Hindi. Girls are not encouraged to go to school but taught
Urdu in the local Mosque. There was a madrasa in the locality and also a girl’s school that had classes
only up to the eight. As for primary schools the women complained that the school did not admit their
children. We found that the number of schools were not enough to accommodate the large number of
children. As a result the teachers adopted an elimination process by which a child with absolutely no
knowledge of the 3R was discouraged to come to school. It was also found that due to the lack of
parental guidance the children did not maintain regularity in attendance and performed very poorly. As
a result majority of the children did not attend school.
The family size was rather large with a minimum of 7–8 children in each family. The deliveries were
often at home and conducted by untrained persons. Multiple marriage, violence on women and lack of
mobility among women has made them extremely vulnerable.

209
5
The major problems that women faced here are their lack of decision making power, easy divorce
system and lack of income. Among the other day to day issues, safe drinking water and sanitation are
the major problems.
Most of the men work as daily wage labours and are often jobless. Alcoholism and violence on women
are very common. Women stay at home. They are eager to take up different income generation
programmes which they feel will make them self-reliant and enhance their self-esteem.
In general women’s status in the family do not differ
much from the various studies as far as decision making,
education, control over household resources and
mobility are concerned.
5.3. Self-help groups (SHGs) and
empowerment of women in
Bankura :
The importance of self-help group for empowering
women gained focus of attention in 1987 with the
expansion of ‘Development of women and children in
rural Areas’ (DWCRA), as a sub-scheme of IRDP. The
main objective of the scheme was to help and promote
self-employment among rural women below poverty line
by providing training in vocations through formation
of groups of 15-20 women. Along with the promotion
of economic and social self-reliance of women, there
would also be provision for care of the children of the
working women by providing an improved environment
care and food.
Across India, the scheme is more or less successful to
enable BPL women to cross the poverty line. This has
encouraged formation of self-help groups on an
expanded scale covering different other categories of
rural women in addition to BPL category. Initiation in
this line has been taken by individuals, groups, NGOs
and also by government machineries. In the year 2000-
2001, West Bengal Women Development undertaking
and the Department of women and child Development
and social welfare took an attempt to empower (rural)
women through self-help group in the connotation of
Swayamsidha. Swayamsidha was announced as an
integrated programme with a vision to develop
empowered women who will: (i) demand their right from
family, community and government, (ii) have increased
access to and control over material, social and political
resources, (iii) have enhanced awareness and improved
skills and (iv) be able to raise issues of common
concern through mobilization and networking. In
Bankura district all blocks were covered by the
Swayamsidha scheme.
5.3.1. Studies on SHGs in Bankura :
The SIPRD Survey (2003) focused on the present
performance and future scope of self-help groups
(SHGs) in seven blocks of Bankura district. The
District Programme Officer (DPO), ICDS, Bankura
conducted a survey of Sayamsidha groups across
Bankura district in 2005. With the help of these two
survey reports and our own survey work, we may try
to analyse the role of SHGs in Bankura district.
5.3.2 Activities taken up by SHGs :
The survey administered by DPO, ICDS covered
twenty-two blocks of Bankura district. Although there
were certain gaps in compilation of answers of the
queries of the survey questionnaire, we can gather
some important information regarding the
performance of the self-help group (SHGs) in Bankura
district for the period 1997-2005.
Table 5.20 show that a total of 7421 SHGs (including
SGSY groups) have been formed in the twenty-two
blocks of Bankura district upto the end of the financial
year 2004-2005. Among these groups, seventy were
formed between 1997-2000 and the rest were
established between 2001-2005. All these SHGs, after
being formed, open a bank account on behalf of the
group, where each group member deposits equally and
regularly the sum decided by the group.

210
5
Table 5.20 Percentage of rural households covered under self-
help groups upto 2004-2005
Name of the Block Number of self-help Percentage of coverage under
groups (SHG) SHG with respect to total number
of households in the Block
Bankura-I 445 2.5
Bankura-II 308 1.3
Chhanta 594 1.8
Saltora 126 0.58
Mejia 276 2.0
Gangajalghati 195 0.65
Barjora 143 0.41
Onda 388 0.95
Indpur 370 1.50
Khatra 501 2.50
Hirbandh 162 1.10
Ranibandh 630 2.90
Simlapal 468 1.90
Raipur 477 1.60
Sarenga 665 3.60
Bishnupur 211 0.80
Joypur 205 0.74
Kotulpur 142 0.44
Sonamukhi 474 1.70
Indus 215 0.71
Total 7421 1.32
Source: District Rural Development Cell, Bankura Zilla Parishad
From the savings the groups perform the activities like
(1) Credit to members (against the bank deposits the
groups may avail of bank loans for different purposes)
(2) Initiation of income generating activities in
agricultural, manufacturing and trading sector and (3)
Upgrading the quality of the existing roads, schools,
ponds, grounds, buildings etc. (4) Any other loan to
tide over any family crisis.
For example, the group with highest savings in the
district, Banagram Swayambar Mahila Group) G.P.-
Andharthole, Block-Bankura-I with savings of
Rs 2,41,641 is reported to take up income generating
activities like goat rearing, cattle rearing, duckery, cattle
trading, ‘bhachati’ (making rice by parboiling paddy
in exchange of some payment either in kind or in cash)
cooking Mid-day-meal, grocery and vegetable
cultivation. In addition to rendering financial
autonomy to members through these activities, the
group has also contributed to improve the condition
of village infrastructure. The members are involved in
various programmes to improve the health conditions
of women and children. The group has made a ‘grain
gola’ and a tube well with its own initiative.
Other SHGs in Bankura-I block are also reported to
take part in similar economic activities, e.g., vegetable
cultivation, fishery, cooking mid-day-meal, making
brooms, goat and cattle rearing, poultry, piggery, making
paper packets, tailoring, trading in grocery in stationary
shops, arranging for school-van transport services,
carpentry, etc. As a part of social involvement, the
groups help AWWs to look after and care the children,
settling family disputes, organizing activities for
improvement of women’s and children’s health care,
formation of ‘grain gola’, etc. The Bhaturi Malpara
Mahila group has been reported to take successful action
against alcohol producing centre (‘Mad Bhata’).
In Ranibandh block the list of activities include selling
babui grass, goat rearing, cattle rearing, fish trading,
muri-trading, making muri, ‘bhachati, sewing of sal
leaves, kendu leaves collection, etc. some of the groups
have taken up initation in excavation of ponds (e.g.,

211
5
Deuli self help women Group consisting of 15 members,
all in APL and ST category, GP-Rajakata).
In Gangajalghati block, as the ICDS survey reported,
different SHGs have taken up activities like piggery,
poultry, goat rearing, bael mala (flower garland)
making, ‘bhachati’, grinding spices, paper packet
making, frying and selling of ‘batato bara’ ‘chap’
(snacks) etc. making and selling of tools for fish
catching, paddy trading, muri-making, dairy business,
tailoring wool knitting etc.
Similar activities in Hirbandh include groupwise
vegetable cultivation and fishery, agricultural activities
with application of fertilisers, etc.
In Kotulpur block, the Kanakabati Kalimata self help
Group (Laugram GP, member-16: SC, 10 and general
caste 6) is reported to trade products of Hindustan
Lever Co.
Self help groups in Indpur, operate on activities like
cattle rearing, piggery, goat rearing, spices grinding,
duckery, poultry, ‘bhachati business’, tailoring etc. The
Puara IMK Group of Bheduasole GP has been
running a telephone booth under group initiation.
The groups also work for health caring of women and
children improvement of water supply condition,
protection of housewives from domestic violence and
prohibition of use and production of alcohol.
Installation of smokeless chulla by the members of self-help groups
Due to dearth of trained maker of smokeless chulla, the installation
and use of smokeless chulla was almost nil in Bankura-I block. In
order to overcome this short-comings and, at the same time, to
empower poor rural women folk, a four day training session for fifteen
number of self-help groups (SHG) from all the six Gram-Panchayats
of the block was organised at block campus. These trained women
started installation of smokeless chulla at backward Jemradhi village
so far installed in about twenty-eight households. The installation of
smokeless chulla at rural households has reduced health hazards of
housewives and has also reduced the cost of fuel.
Stone grafting of mango saplings by the members of self-help groups
Training was imparted to six SHGs of Sunukpahari, one of the
backward mouzas of Bankura-I block for converting mango seedlings
into grafted plants.
The cost of raising one such grafted sapling is almost Rs. 3/- to
Rs. 4/-, while the sale price of one grafted sapling will be Rs. 22/- to
Rs. 25/-. Hence successful implementation of the scheme will open
up new avenue of earning for poor families and boost up horticulture
in Bankura-I block. This is a new economic activity for the SHGs.5.3 Stone grafting of mango
saplings by SHG women
5.2 Training on installation
of smokeless chulla going on
In Sonamukhi block, along with the common income
generating activities, the female groups are also
interested in Paper making, embroidery work etc.
The SHGs of Mejia block, in addition to the traditional
activities like muri making, goat rearing, duckery,
vegetable cultivation etc, women in groups try to make
soaps (Mahamaya Group, established Feb, 2004)
Kustore GP, members 15 : BPL-8, APL-7, SC-14,
ST-1), make dishes from sal leaves, wool knitting with
machine tailoring, making ‘badi papad’, and making
incense sticks, trading ‘chhatu’ (ground gram & wheat),
etc.

212
5
Table 5.21 Type of Activities to be undertaken through SHGs
Traditional Activities Non-traditional activities
(i) Agricultural activities (as labourer or as cultivators) (i) Tailoring
(ii) Working in brick fields (ii) Wool knitting
(iii) Working in stone crushing units (iii) Tasar cultivation
(iv) Working in tiles manufacturing units (iv) Plate dish, etc. making from sal leaves
(v) Working in construction units (v) Medicinal plants cultivation
(vi) Vegetable cultivation (vi) Mahua seed collection and extraction of oil from mahua
(vii) Vegetable vending (vii) Pisciculture
(viii) Rice processing (viii) Food processing from tomato, lemon, mango (preparation sauce,
of squash, jelly, pickles etc.)
(ix) Muri-Chira making (ix) Mushroom cultivation
(x) Collection of fuel wood, kendu leaves and sal leaves (x) Handicrafts from a babui rope
(xi) Beedi making (xi) Spice grinding
(xii) Babui rope making (xii) Handloom product diversification
(xiii) Bael-mala making (xiii) Preparation of Bael dust as purgative
(xiv) Live stock rearing (xiv) Embroidery
(xv) Paper packet (‘thonga’) making (xv) Incense stick making
(xvi) Basket etc. making from bamboos (xvi) Floriculture
(xvii) Talai making (from date palm leaves) (xvii) Bamboo handicrafts
(xviii) Badi making (xviii) Brass metal works
Source: District Rural Development Cell, Bankura Zilla Parishad
In our own survey work, we reported four self-help
groups in the village of Bhalukgaria (GP Chinabari,
block-Chhatna). Two of these groups have taken loans
from the Bank. They have set up a pump near the
river and grown wheat, grass (for cattle) and saplings
of Arjun trees. These saplings have been sold to the
village. Within two years the trees will be ready for
sericulture. The women have bought goats with their
earnings and plan to sell goat meat and build poultries.
We found that the women had become quite active
through these SHGs and had developed alternative
livelihoods and seemed quite vocal and confident.
In the report of SIPRD survey, activities taken up or
activities that women may undertake are classified into
broad categories, viz. traditional and non-traditional
activities, Non traditional activities are those which are
not frequently undertaken by women at present but have
the potentialities on the basis of available local resources.
Through all these activities SHGs of women play a four-
fold role across the district: (1) increased financial
autonomy of women which has high degree of
correlation with decision making power within the
family (2) cultivation of a feeling of togetherness among
women of a particular locality; they start to work
together, and think together, to make their own social
development (3) collective solution of social problems
(4) upgrading the quality of the existing community
services and infrastructural facilities.

213
5Women empowerment – a case study of Indpur
Swayamsiddha groups of ICDS in Bankura are involved in construction of 20 Anganwadi Centers
under RSVY project. The members are arranging for mason, procuring building materials from the
market, assisting during
construction to earn their wage and
supervise the implementation to
ensure the quality of work. District
RSVY Cell is supporting them with
facilitation from CARE. Savitri
Swayam Siddha Group of
Choukighata village, Indpur formed
three years back and graded, is one
of the 20 such groups that took up
the challenge in construction work.
Now the center is almost in the final
stage. Site was selected by the group and got the approval from the
Panchayat and ICDS office after negotiation. The 12-member team distributed the work; two of them
were responsible for purchase of “good” quality bricks, two were responsible for procuring cement and
iron rods etc. The brick group traveled 40 km to search the best quality brick are available in Bankura.
They brought 5 samples, soaked them in water for two days and went to the Block Sub Assistant
Engineer asking which variety should be used for the center construction. The members decided to buy
the best. They have bought best quality cement and iron rods and therefore zeroed down to TATA
product. They went to the cement dealer, who initially did not take them seriously, but the women could
eventually bargain with the dealer a discount saying “ we will pay in cash on the day of purchase and
hence you should give us a discount”. Market will never benefit the poor, but poor can develop capacities
to negotiate with the market as has been done here.
The foundation has been so strong, that a three-storied building can be supported. But the women’s
views are; within the approved budget such strong foundation has been possible. The members of the
groups are aware that the village children will go to these centers and so quality cannot be compromised.
The estimated cost per AWC is Rs. 200,000. 15 percent of the total cost is wage component where
women are saving Rs 32 per day out of their daily wage of Rs.68.
The money from the district directly reaches the group through a demand draft, thereby reducing the
“ hidden cost” in the transaction.
A number of visitors are making visit to the center to discuss with the groups members. In the initial
days the members were shaky and used to fumble in front of the outsiders. Now they can face the
visitors and interact boldly without any hesitation. [Source: - CARE India]
5.5 Selection of building
materials where quality
makes a difference
5.4 A signal of self- esteem
with proud of ownership of
the group members
5.3.3 SHG Coverage among women in different
blocks of Bankura district :
It is, however, disappointing to note that the SHG
coverage is very low across the district notwithstanding
the enough potentiality of Swayamsidha and other self-
help groups. In fact, not all the existing SHGs are
successful in making a change in the way of life among
women. Root cause of this seems to be the lack of
realization of the basic importance of the groups. In
most of the cases, where group members are
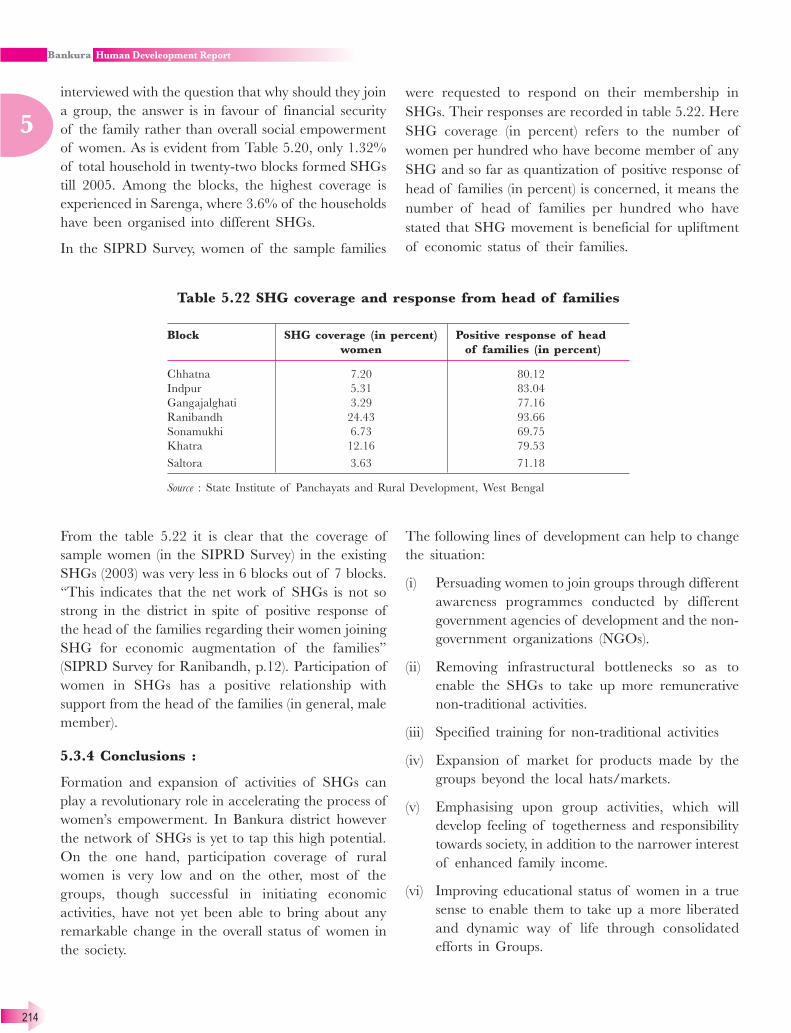
214
5
interviewed with the question that why should they join
a group, the answer is in favour of financial security
of the family rather than overall social empowerment
of women. As is evident from Table 5.20, only 1.32%
of total household in twenty-two blocks formed SHGs
till 2005. Among the blocks, the highest coverage is
experienced in Sarenga, where 3.6% of the households
have been organised into different SHGs.
In the SIPRD Survey, women of the sample families
were requested to respond on their membership in
SHGs. Their responses are recorded in table 5.22. Here
SHG coverage (in percent) refers to the number of
women per hundred who have become member of any
SHG and so far as quantization of positive response of
head of families (in percent) is concerned, it means the
number of head of families per hundred who have
stated that SHG movement is beneficial for upliftment
of economic status of their families.
Table 5.22 SHG coverage and response from head of families
Block SHG coverage (in percent) Positive response of head
women of families (in percent)
Chhatna 7.20 80.12
Indpur 5.31 83.04
Gangajalghati 3.29 77.16
Ranibandh 24.43 93.66
Sonamukhi 6.73 69.75
Khatra 12.16 79.53
Saltora 3.63 71.18
Source : State Institute of Panchayats and Rural Development, West Bengal
From the table 5.22 it is clear that the coverage of
sample women (in the SIPRD Survey) in the existing
SHGs (2003) was very less in 6 blocks out of 7 blocks.
“This indicates that the net work of SHGs is not so
strong in the district in spite of positive response of
the head of the families regarding their women joining
SHG for economic augmentation of the families”
(SIPRD Survey for Ranibandh, p.12). Participation of
women in SHGs has a positive relationship with
support from the head of the families (in general, male
member).
5.3.4 Conclusions :
Formation and expansion of activities of SHGs can
play a revolutionary role in accelerating the process of
women’s empowerment. In Bankura district however
the network of SHGs is yet to tap this high potential.
On the one hand, participation coverage of rural
women is very low and on the other, most of the
groups, though successful in initiating economic
activities, have not yet been able to bring about any
remarkable change in the overall status of women in
the society.
The following lines of development can help to change
the situation:
(i) Persuading women to join groups through different
awareness programmes conducted by different
government agencies of development and the non-
government organizations (NGOs).
(ii) Removing infrastructural bottlenecks so as to
enable the SHGs to take up more remunerative
non-traditional activities.
(iii) Specified training for non-traditional activities
(iv) Expansion of market for products made by the
groups beyond the local hats/markets.
(v) Emphasising upon group activities, which will
develop feeling of togetherness and responsibility
towards society, in addition to the narrower interest
of enhanced family income.
(vi) Improving educational status of women in a true
sense to enable them to take up a more liberated
and dynamic way of life through consolidated
efforts in Groups.
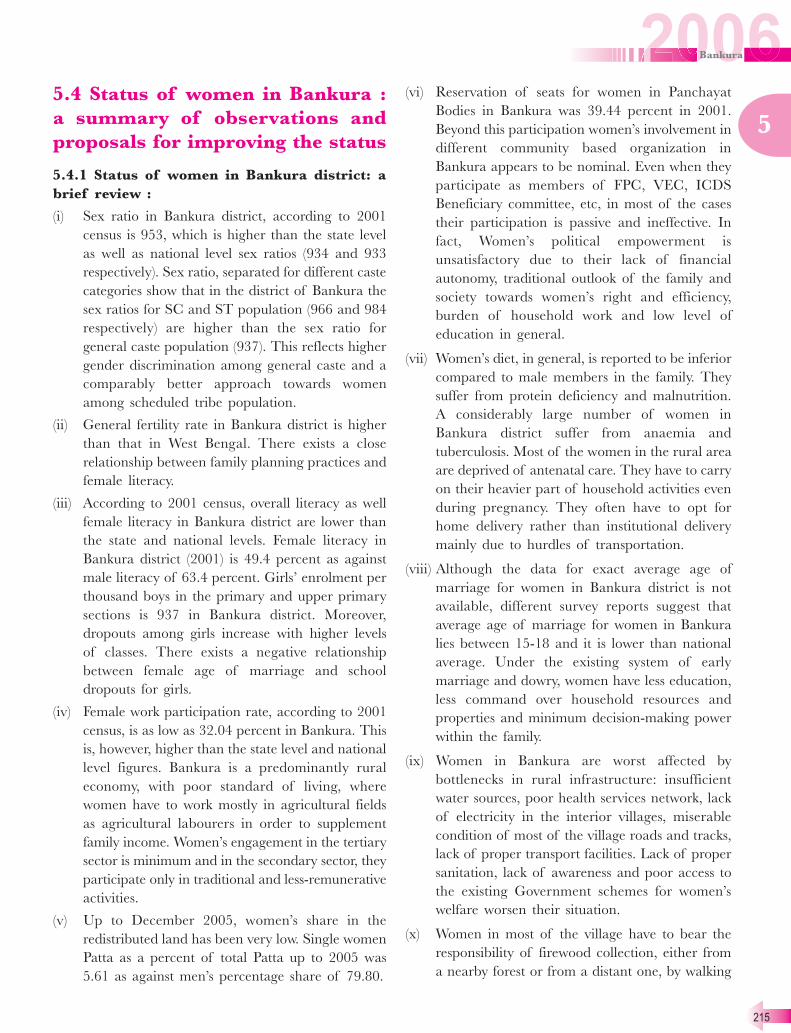
215
5
5.4 Status of women in Bankura :
a summary of observations and
proposals for improving the status
5.4.1 Status of women in Bankura district: a
brief review :
(i) Sex ratio in Bankura district, according to 2001
census is 953, which is higher than the state level
as well as national level sex ratios (934 and 933
respectively). Sex ratio, separated for different caste
categories show that in the district of Bankura the
sex ratios for SC and ST population (966 and 984
respectively) are higher than the sex ratio for
general caste population (937). This reflects higher
gender discrimination among general caste and a
comparably better approach towards women
among scheduled tribe population.
(ii) General fertility rate in Bankura district is higher
than that in West Bengal. There exists a close
relationship between family planning practices and
female literacy.
(iii) According to 2001 census, overall literacy as well
female literacy in Bankura district are lower than
the state and national levels. Female literacy in
Bankura district (2001) is 49.4 percent as against
male literacy of 63.4 percent. Girls’ enrolment per
thousand boys in the primary and upper primary
sections is 937 in Bankura district. Moreover,
dropouts among girls increase with higher levels
of classes. There exists a negative relationship
between female age of marriage and school
dropouts for girls.
(iv) Female work participation rate, according to 2001
census, is as low as 32.04 percent in Bankura. This
is, however, higher than the state level and national
level figures. Bankura is a predominantly rural
economy, with poor standard of living, where
women have to work mostly in agricultural fields
as agricultural labourers in order to supplement
family income. Women’s engagement in the tertiary
sector is minimum and in the secondary sector, they
participate only in traditional and less-remunerative
activities.
(v) Up to December 2005, women’s share in the
redistributed land has been very low. Single women
Patta as a percent of total Patta up to 2005 was
5.61 as against men’s percentage share of 79.80.
(vi) Reservation of seats for women in Panchayat
Bodies in Bankura was 39.44 percent in 2001.
Beyond this participation women’s involvement in
different community based organization in
Bankura appears to be nominal. Even when they
participate as members of FPC, VEC, ICDS
Beneficiary committee, etc, in most of the cases
their participation is passive and ineffective. In
fact, Women’s political empowerment is
unsatisfactory due to their lack of financial
autonomy, traditional outlook of the family and
society towards women’s right and efficiency,
burden of household work and low level of
education in general.
(vii) Women’s diet, in general, is reported to be inferior
compared to male members in the family. They
suffer from protein deficiency and malnutrition.
A considerably large number of women in
Bankura district suffer from anaemia and
tuberculosis. Most of the women in the rural area
are deprived of antenatal care. They have to carry
on their heavier part of household activities even
during pregnancy. They often have to opt for
home delivery rather than institutional delivery
mainly due to hurdles of transportation.
(viii) Although the data for exact average age of
marriage for women in Bankura district is not
available, different survey reports suggest that
average age of marriage for women in Bankura
lies between 15-18 and it is lower than national
average. Under the existing system of early
marriage and dowry, women have less education,
less command over household resources and
properties and minimum decision-making power
within the family.
(ix) Women in Bankura are worst affected by
bottlenecks in rural infrastructure: insufficient
water sources, poor health services network, lack
of electricity in the interior villages, miserable
condition of most of the village roads and tracks,
lack of proper transport facilities. Lack of proper
sanitation, lack of awareness and poor access to
the existing Government schemes for women’s
welfare worsen their situation.
(x) Women in most of the village have to bear the
responsibility of firewood collection, either from
a nearby forest or from a distant one, by walking
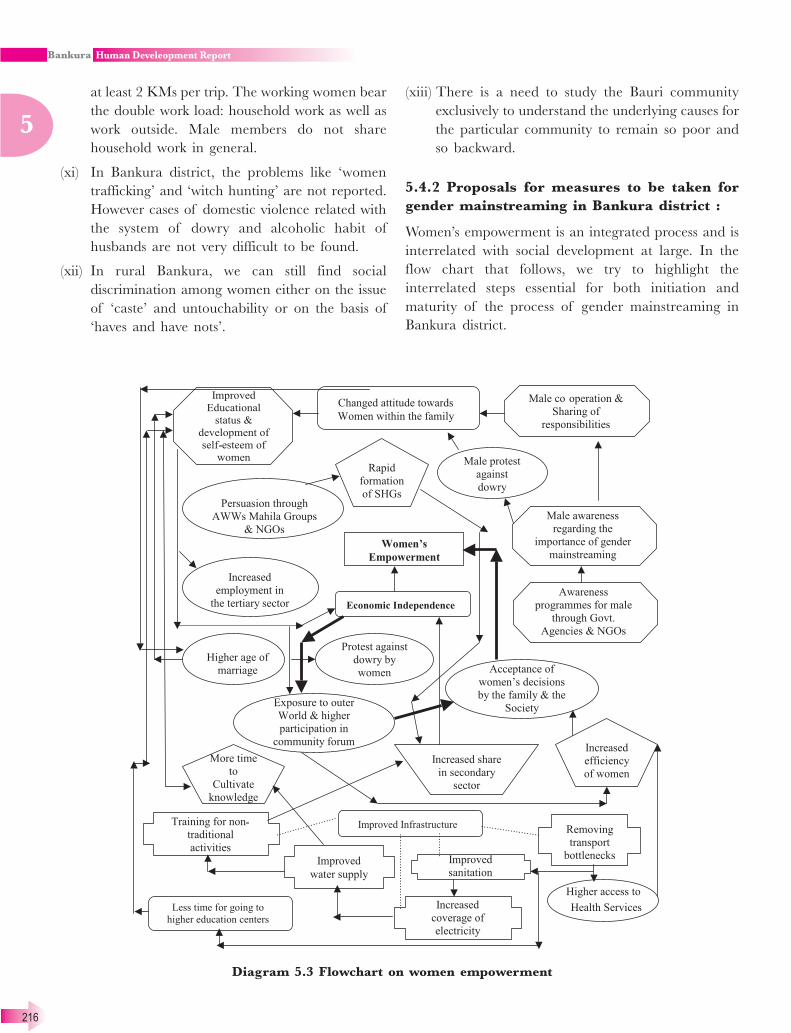
216
5
at least 2 KMs per trip. The working women bear
the double work load: household work as well as
work outside. Male members do not share
household work in general.
(xi) In Bankura district, the problems like ‘women
trafficking’ and ‘witch hunting’ are not reported.
However cases of domestic violence related with
the system of dowry and alcoholic habit of
husbands are not very difficult to be found.
(xii) In rural Bankura, we can still find social
discrimination among women either on the issue
of ‘caste’ and untouchability or on the basis of
‘haves and have nots’.
(xiii) There is a need to study the Bauri community
exclusively to understand the underlying causes for
the particular community to remain so poor and
so backward.
5.4.2 Proposals for measures to be taken for
gender mainstreaming in Bankura district :
Women’s empowerment is an integrated process and is
interrelated with social development at large. In the
flow chart that follows, we try to highlight the
interrelated steps essential for both initiation and
maturity of the process of gender mainstreaming in
Bankura district.
Diagram 5.3 Flowchart on women empowerment

217
5
Any favourable change in women’s status must be
initiated from the family, the basic social unit. It is the
family, which recognises the virtuous role of women:
women’s traditional role of rearing of children, care for
home, husband and family is associated with some
important moral virtues, such as altruistic concern,
responsiveness to the needs of others and a willingness
to sacrifice one’s own interest for those of others. Thus,
love and care do exist in families. On the other hand, it
is also true that family has been a major oppression of
women. Domestic violence, child sexual abuse, under-
nutrition of girls, unequal health care, unequal
educational opportunities etc, take root within the
family. In many instances the damage women suffer in
the family takes a particular form: the women is treated
not as an end in herself, but as an adjunct or instrument
of the needs of others, as a mere reproducer, cook,
cleaner, sexual outlet, caretaker, rather than as a source
of energy and worth in her own right. It is this attitude
towards women, which must be changed to start the
process of gender mainstreaming.
Change in this attitude will enable women to have better
access to education and to develop their own knowledge
base, which in turn will help to develop self-esteem
among women, so that they themselves, with their very
existence, can foster changes within the family.
However, women live under patriarchy, it would not be
possible for them alone to change things with their own
culture and education. Men always hold higher positions
of power and decision making within the family, in
economic, political spheres. This necessitates men’s
commitment to the process of women’s empowerment.
This, however, may not be automatic and spontaneous-
involvement from outside will be required. Male
awareness regarding the importance of gender
mainstreaming should be generated in the short run
through different awareness programmes of government
agencies and NGOs. In the long run, the virtue of
respect for women may be cultivated from the very
beginning through the formal education system. In fact,
the role of men in stopping gender-based violence and
gender inequality has become an important aspect in
the international and national movements to end
violence against women. It has been realized that it is
crucial to involve men in establishment of gender
equality and in combating violence against women.
Thus, it is very important to activate and involve men
through different awareness programmes in Bankura
district so as to stake up personal commitments as follows:
� “Accept that women are equal and reflect equality
of men and women through our behaviour and
attitudes.
� Re-educate our sons and daughters that men and
women are equal.
� Advocate in our religious groups, youth groups
and men’s groups that violence against women is
a crime that must be eliminated.
� Be actively involved and supportive of all
Government and NGO programmes that promote
equality among men and women.
� Oppose the system of dowry at any cost.”
If social campaigns can effectively change men’s
perception towards women, men’s co-operation will be
generated in the spheres of reproductive health,
rearing of children and sharing of household activities.
Helping ‘wives’ in domestic activities by ‘husbands’ will
not be any more ridiculed as an inferior job for men.
As we have observed, dowry is a deep-rooted social
malice in Bankura district, which is prevalent even
amongst the highly educated and well-off people. It
can not be prevented by a mere change of laws.
Development of self-esteem among women and
attitudinal changes of men will attack the evil of dowry
from both sides-supply and demand. Educated and
liberated girls will protest against and will not agree to
marry if dowry is demanded. On the other hand, male
awareness will raise a sense of morality among dowry-
seekers and “there will be a public outcry against the
vulgar display of wealth.”
Such a milieu has to be created from both sides so
that even the mention of word ‘dowry’ is considered
vulgar and is condemned outright.
The ICDS workers, Mahila Samitis and Groups and
the NGOs should work on a stronger footing and may
involve in door-to-door campaigning for encouraging
the family to form self-help groups.
On the macro level, women should be provided with
all the necessary infrastructural facilities:
(i) improvement in water supply system (increasing
number of tube wells, excavation of ponds and
increasing access to municipality water in urban areas,
(ii) improved sanitation and increased coverage of
electricity (in interior villages) and (iii) utilization of
barren land for increasing supply of firewood will
reduce women’s toil and time for daily work and
household activities and will save time to be spent for
develop themselves; (iv) removing transport bottlenecks
and increasing the access to health services by rural
women. Introduction of micro level training
218
5
programmes for adoption of non-traditional activities
by SHGs will help women to engage in more
remunerative work and will improve their economic
empowerment. This, together with improved
educational status will raise the share of women’s
employment in the tertiary and secondary sector.
Higher attention at the family level for education of
girls of the present generation and higher economic
and social empowerment of present generation mothers
will increase the percentage of women with higher
education in Bankura district. The higher education
institutions (general colleges, professional institutes and
open universities) should also take part in the process
of ‘cultivating’ enlightened and empowered women,
not only formally educated, but also educated in true
sense to take part in all the responsibilities of the
mainstream of development process.
To be specific, some suggestions for training and
assistance can be made here:
(i) Making plate/dish etc from sal and palash leaves
through indigenous process does not fetch
remunerative prices to women in rural areas.
Introduction of machines (technology up-
gradation) can reduce the monotony of women
on the one hand and will give remunerative prices
to them on the other.
(ii) Mushroom cultivation is gradually becoming
popular in Bankura district. SHGs can be
provided with training in this area.
(iii) Training should be imparted on tailoring, wool
knitting and embroidery with the introduction of
sewing machine, knitting machine and
embroidery machine.
(iv) Training on food processing to produce tomato sauce,
lemon squash, vegetable and mango pickles, etc.
(v) Short duration training on pisciculture
(vi) Training on incense stick making
(vii) Assistance for plantation of medicinal plants like
neem, haritaki, bahera, amlaki, etc. and
protection of these forest products for proper
marketing.
(viii) Training on live stock rearing through the
Department of Animal Husbandry and Livestock.
(ix) The Panchayat bodies are yet to take adequate
interest in SHG formation and initiating income-
generating activities. Convergence with District
Rural Development cell (DRDC) will help to
strengthen skill development process and to
enhance irrigation facilities through construction
of dug wells. Enhanced irrigation facilities will
encourage cultivation of vegetable, floriculture,
medicinal plants and herbs.
Bibliography :
Acharya, M and Ghimire, P (2005) “ Gender Indicators of
Equality, Inclusion and Poverty Reduction”, Economic
And Political Weekly, October, 29.
Bandyopadhyay, R “ Sustainable Development and ‘Gender’:
The Experience of Participatory Forest Management in
West Bengal India,” Jadavpur University.
Chatterjee, B and Ghosh, D.K (2003) Towards a District
Development Report for West Bengal, SIPRD, Kalyani.
Datta, P and Sen, P (2003) Women in Panchayats, Dasgupta
and Co. Pvt. Ltd.
Dreze, J and Sen, A (eds) (1991) The political Economy of
Hunger: Vol-III. Clarendon Press, Oxford
Economic and social commission for Asia and the Pacific,
UN (2003) Gender Indicators
Economic and social commission for Asia and the Pacific
(2003) Elimination of Violence against Women in
Partnership with Man. Gender & Development: Discussion
Paper series No. 15.
Goulet, D (1971) The Cruel choice: A new concept on the
Theory of Development, Atheneum, New York
Joshi, U (1997) “ Rural women: a more purposeful role,”
Kurukshetra, August.
Kochar, J and Pandya, R.D (1992) “Status of women in
India”, Kurukshetra, March.
Mahajan, N (1992) “Women’s contribution in economic
growth,” Kurukshetra, March.
N. Prem Kumar and A. Rahul Kumar (1992) “DWCRA: A
case Study”, Yojana, March 31.
Nussbaum Martha “Women, Family and Human
Development”, Text of Esther Boserup Memorial Lecture.
Sarkhel J, Salim, S and Bhukta, A (2005) “Economic
Development: Institutions, Theory And Policy.” Book
Syndicate (P) Ltd., Kolkata.
Sen, A (1983) ‘Development: Which Way Now?’ Economic
Journal, December.
Sen A (1984) Poverty And Famines: An Essay in Entitlement
and Deprivation, Clarendon Press, Oxford.
State Development and Planning Department, West Bengal.
West Bengal Human Development Report, 2004.
State Institute of Panchayats & Rural Development Kalyani
(2003) Baseline and Techno-economic Survey of
Swayamsidha in Bankura.
Thirlwall, A.P. (1999) Growth And Development, Machrillan
press ltd.
UNDP, Human Development Report, 1990, 1995;
UNDP, Human Development in South Asia, 2000
UNDP, Human Development Report in India, 2001

219
Chapter 6Vulnerability
6.1 Introduction
Vulnerability refers to the cushion available to a
community to combat any kind of threat to human well-
being and existence. Vulnerability is a dynamic concept
in which we try to understand as to how a system
responds to an external trigger and how resilient it is in
maintaining its stability. Vulnerability has emerged as a
leading concept in the field of development economics.
UNEP’s Global Environment Outlook (GEO) had
formed a working group on vulnerability. The group
has defined vulnerability as “the exposure to hazard by
external activity (e.g. the climate change) and coping
capacity of the people to reduce the risk at a particular
point of time.” A broad conceptual framework has been
developed to assess human vulnerability. Selected criteria
for vulnerability include social (health, poverty),
economic (economic losses, loss of intellectual property
rights etc.), natural (loss of natural heritage, extreme
events), and institutional (conflict).
The Human Development Report of 1994 has
differentiated the concept of Human Security from
Human Development. It mentioned: “In defining
security, it is important that human security not be
equated with human development. Human development
is a broader concept – defined in previous Human
Development Reports as a process of widening the
range of people’s choices. Human Security means that
people can exercise these choices safely and freely – and
that they can be relatively confident that the
opportunities they have today are not totally lost
tomorrow”.
Thus development is a necessary, but not sufficient
condition to ensure ‘Human Security’.
In the present exercise we have attempted to understand
the nature and source of vulnerability in Bankura.
Following areas have been identified for analysis:
1. Food security
2. Migration
3. Housing
4. Crime and violence
5. Debt burden
6. Security from natural calamities
7. Social security
8. Special vulnerable and stress-prone groups
6.2 Food security :
6.2.1 The scenario :
Technically sustainable food security is defined as
“Physical, economic, social and ecological access to
balanced diet and safe drinking water so as to enable
every individual to lead a productive and healthy life
in perpetuity”.$
To analyse and understand the food
security, there are five major dimensions. The first
factor is availability of food—which is related to
purchasing power, distribution within the family,
absorption of food in the body which is determined
by the availability of safe drinking water and
environmental hygiene. The other factors are primary
health care, primary education, vulnerability to
transient hunger, which is related to natural and
manmade calamities and disasters and sustainability
of production which is influenced by the extent of
attention given to the ecological foundations essential
for sustained advances in production.
In the context of resource poor and marginalized
families, amongst the multiple vulnerability factors,
access to food is the most important one. To them,
food security implies managing two square meals in a
day for all the family members from assured livelihood
sources.
In the livelihood pattern of the marginalized families
of Bankura district, survival means constitute a few
limited options which may or may not be of their
liking. There are large uncertainties associated with
these options too, based on their very limited capacity
to manage natural resources. If means within their
control (viz. cultivation from own land holding) is
hampered due to drought-like phenomenon or after
acute or chronic natural disaster, vulnerability is
compounded due to uncertainty of getting alternative
employment, lower wage rate, more dependency on
money-lender, selling of domestic assets etc.$
M.S.Swaminathan, Food security and sustainable development
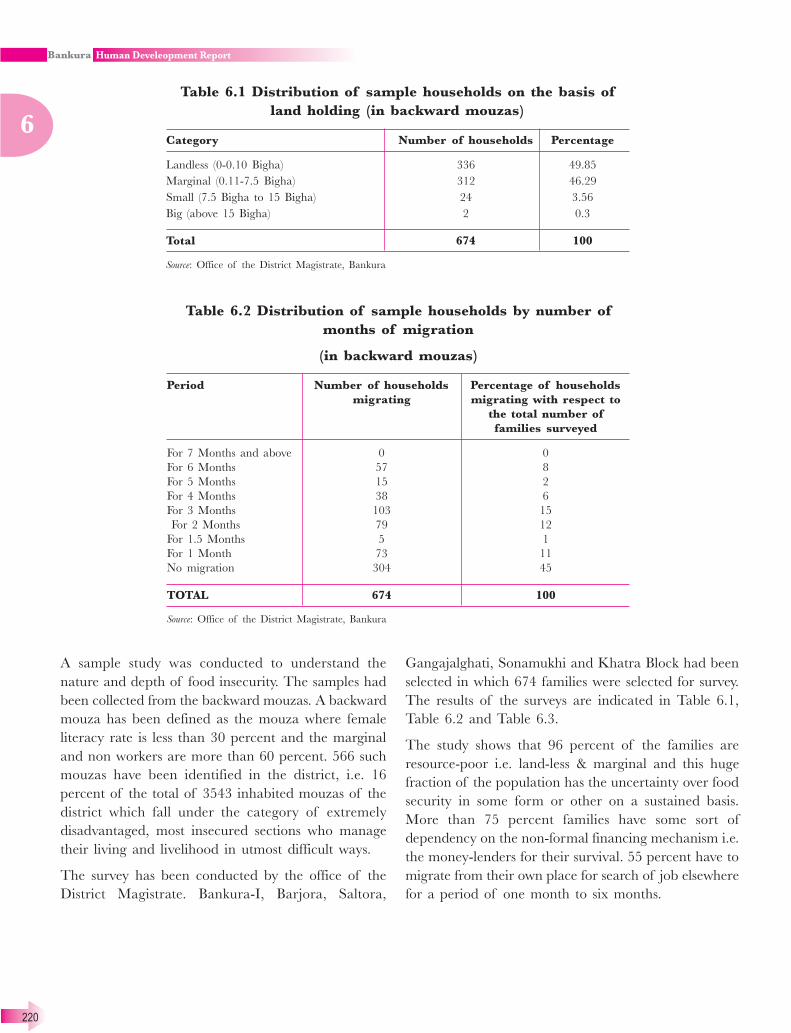
220
6
A sample study was conducted to understand the
nature and depth of food insecurity. The samples had
been collected from the backward mouzas. A backward
mouza has been defined as the mouza where female
literacy rate is less than 30 percent and the marginal
and non workers are more than 60 percent. 566 such
mouzas have been identified in the district, i.e. 16
percent of the total of 3543 inhabited mouzas of the
district which fall under the category of extremely
disadvantaged, most insecured sections who manage
their living and livelihood in utmost difficult ways.
The survey has been conducted by the office of the
District Magistrate. Bankura-I, Barjora, Saltora,
Table 6.2 Distribution of sample households by number of
months of migration
(in backward mouzas)
Period Number of households Percentage of households
migrating migrating with respect to
the total number of
families surveyed
For 7 Months and above 0 0
For 6 Months 57 8
For 5 Months 15 2
For 4 Months 38 6
For 3 Months 103 15
For 2 Months 79 12
For 1.5 Months 5 1
For 1 Month 73 11
No migration 304 45
TOTAL 674 100
Source: Office of the District Magistrate, Bankura
Gangajalghati, Sonamukhi and Khatra Block had been
selected in which 674 families were selected for survey.
The results of the surveys are indicated in Table 6.1,
Table 6.2 and Table 6.3.
The study shows that 96 percent of the families are
resource-poor i.e. land-less & marginal and this huge
fraction of the population has the uncertainty over food
security in some form or other on a sustained basis.
More than 75 percent families have some sort of
dependency on the non-formal financing mechanism i.e.
the money-lenders for their survival. 55 percent have to
migrate from their own place for search of job elsewhere
for a period of one month to six months.
Table 6.1 Distribution of sample households on the basis of
land holding (in backward mouzas)
Category Number of households Percentage
Landless (0-0.10 Bigha) 336 49.85
Marginal (0.11-7.5 Bigha) 312 46.29
Small (7.5 Bigha to 15 Bigha) 24 3.56
Big (above 15 Bigha) 2 0.3
Total 674 100
Source: Office of the District Magistrate, Bankura

221
6
Table 6.3 Distribution of sample households by number of months depending on money-
lenders for sustenance (in backward mouzas)
Number of households depending on money-lenders Number of households not depending Total number
for sustenance for a period upon money-lenders at all of families
Upto 2 Upto 2+ From 4+ From 6+ From 8+
months to 4 to 6 to 8 months to
months months months 1 year
266 180 47 20 10 151 674
Source: Office of the District Magistrate, Bankura
As can be seen 92 percent families (620 out of 674)
have to depend on daily wages for some period within
the year and the range varies from one month to twelve
months. It appears from the pie chart shown below that
95.4 percent of the population is not able to manage
their yearly food requirement from their own agriculture
production. On the other hand, 96.1 percent of the
families are landless/marginal with respect to land
holding.
Thus it is clear that the landless and marginal farmers
are not able to manage the food requirement for the
whole year.
Table 6.4 Distribution of sample households by number of months
depending on daily wage for sustenance (in backward mouzas)
Number Number of households Percentage to the total number
of months depending on daily wage of households surveyed
12 12 1.78
11 4 0.59
10 5 0.74
9 29 4.30
8 60 10.09
7 66 9.79
6 121 17.95
5 57 8.46
4 40 5.93
3 46 6.82
2 70 10.39
1 54 8.01
Total 674 100.00
Source : Office of the District Magistrate, Bankura
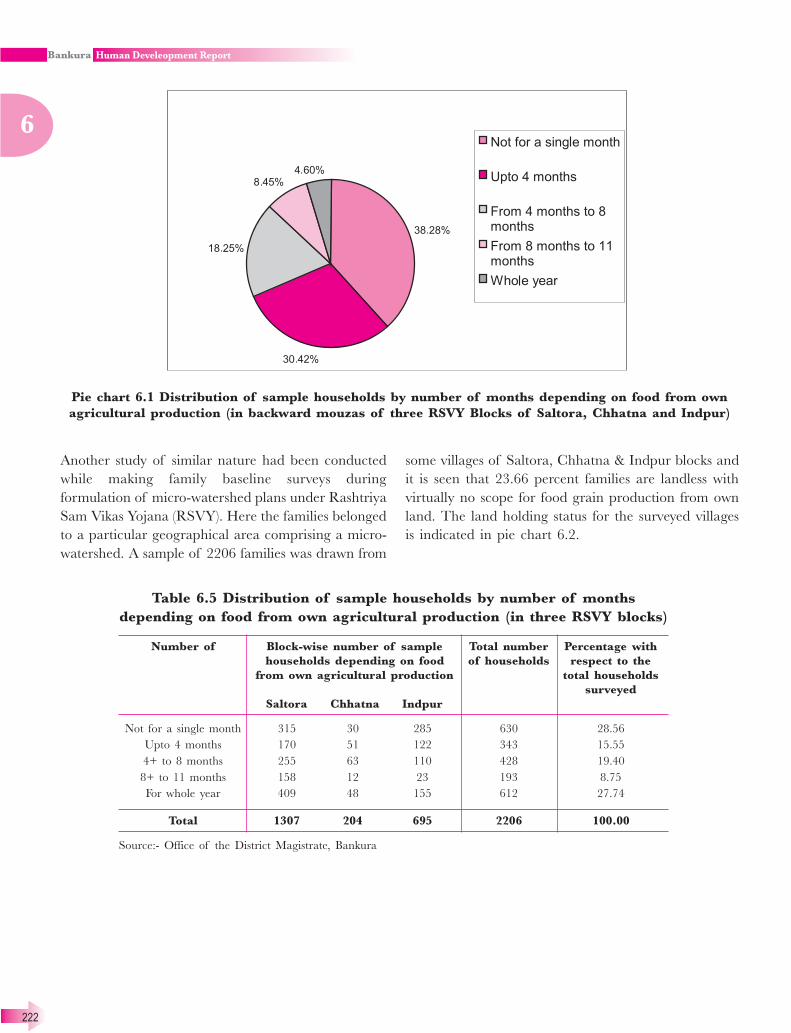
222
6
Another study of similar nature had been conducted
while making family baseline surveys during
formulation of micro-watershed plans under Rashtriya
Sam Vikas Yojana (RSVY). Here the families belonged
to a particular geographical area comprising a micro-
watershed. A sample of 2206 families was drawn from
Table 6.5 Distribution of sample households by number of months
depending on food from own agricultural production (in three RSVY blocks)
Number of Block-wise number of sample Total number Percentage with
households depending on food of households respect to the
from own agricultural production total households
surveyed
Saltora Chhatna Indpur
Not for a single month 315 30 285 630 28.56
Upto 4 months 170 51 122 343 15.55
4+ to 8 months 255 63 110 428 19.40
8+ to 11 months 158 12 23 193 8.75
For whole year 409 48 155 612 27.74
Total 1307 204 695 2206 100.00
Source:- Office of the District Magistrate, Bankura
Pie chart 6.1 Distribution of sample households by number of months depending on food from own
agricultural production (in backward mouzas of three RSVY Blocks of Saltora, Chhatna and Indpur)
some villages of Saltora, Chhatna & Indpur blocks and
it is seen that 23.66 percent families are landless with
virtually no scope for food grain production from own
land. The land holding status for the surveyed villages
is indicated in pie chart 6.2.

223
6
Pie Chart 6.2 Distribution of sample households on the basis of land holding (in three RSVY blocks of
Saltora, Chhatna and Indpur)
(Source: Office of the District Magistrate, Bankura)
Table 6.6 Distribution of sample households by number of
months migrating (in three RSVY blocks of Saltora, Chhatna
and Indpur)
Period Number of Percentage of households
households migrating with respect to the
migrating total number to families surveyed
More than 7 months 20 0.91
6 months 10 0.45
5 months 4 0.18
4 months 37 1.68
3 months 166 7.52
2 months 211 9.56
1 months 53 2.40
No migration 1705 77.29
Total 2206 100
Source:- Office of the District Magistrate, Bankura
60.24 percent families are marginal with less than 2.5
acres of land-holding and with the given geophysical
condition of the district, are living at the subsistence
level, i.e., very vulnerable to any stressed situations like
natural calamities, illness or other acute need in the
families etc. As far as migration is concerned, 22.71
percent families migrate to other areas from 1 to 6
months in a year mostly to combat food crisis. The table
6.6 shows the status of migration from the study area
in the micro-watershed.
Out of the food-grain from their controlled means i.e.
production from own land, 27.74 percent families
manage for the whole year.
About 28.56 percent of the families have to totally
depend on other sources for their livelihood as they
don’t have any agricultural production.

224
6
Period of an year for which livelihood is sustained from agricultural production in own land
(in three RSVY micro-watersheds)
(Source:- Survey conducted by the Office of the District Magistrate, Bankura)
Pie chart 6.3
Pie chart 6.5
Pie chart 6.4
The distribution of daily wage-earners in shown in table 6.7.
Table 6.7 Distribution of sample households by number of months
depending on daily wage for sustenance (in three RSVY blocks)
Number of Number of households Percentage to the total number
months depending on daily wage of households surveyed
12 170 7.71
11 22 1.00
10 111 5.03
9 106 4.81
8 223 10.11
7 116 5.26
6 228 10.34
5 68 3.08
4 153 6.94
3 121 5.49
2 155 7.03
1 42 1.90
0 691 31.32
Total 2206 100
Source: Office of the District Magistrate, Bankura

225
6
As is seen 68.68 percent of the families have to depend
on daily wages for some period of the year to manage
their food requirement. There is also substantial
dependence on the money-lenders as is revealed from
Table 6.8.
It is seen that 35.77 percent families have to take loan
from the money-lender for at least some period of the
year to maintain their livelihood.
The two categories of surveys reveal that the people
living in backward mouza are the most vulnerable.
Micro-watershed is a bigger geographical area which
averages out the level of deprivation.
Table 6.8 Distribution of sample households by number of months
depending on money-lenders for sustenance (in three RSVY blocks)
Number of households depending on Number of households Total number
money-lenders for sustenance for a period not depending upon of families
Upto 2 Upto 2+ From 4+ From 6+ From 8+ money-lenders at all
months to 4 to 6 to 8 months
months months months to 1 year
621 164 3 0 1 1417 2206
Source:- Office of the District Magistrate, Bankura
6.2.2 Food-grain availability :
In Bankura, the net sown area is 348130 Hectare, which
is 50.59 percent of the whole geographical area of the
district. Forest area is 147700 Hectare, i.e., 21.46 percent
of the whole geographical area. Altogether 72.05
percent area of the district is productive area or
potentially productive area. As the figure reveal in
Table 6.9, under a favourable natural condition,
Bankura district appears to be self-sufficient in food-
grain production.
But if we analyse the area-wise distribution in
agricultural production taking into account the three
years’ moving averages of production, we will see that
in most of the blocks there is no rising trend and there
are wide variations in the food production between year
to year (except Indus). Fluctuations in foodgrain lead to
high state of vulnerability. Specially Hirbandh appears
to be more vulnerable in this respect. Mostly farmers
are habituated to grow paddy even on the upper land
(locally known as ‘baid’ land). This results in crop
failure in low rainfall condition, which causes
uncertainty. In any case, in most of the areas,
agriculture is rainfed and if the precipitation is not at
the appropriate time, there is a crop loss. Block-wise
foodgrain production is graphically depicted in the
following pages.
Table 6.9 Food-grain production in Bankura in the year 2003-04
(in thousand tones)
Rice Wheat Maize Other Total Total Total
Aus Aman Boro Total cereals cereals pulses foodgrains
54.2 707.0 105.8 867.0 19.6 0.7 0.3 887.6 0.7 888.3
Source:- Bureau of Applied Economics & Statistics, West Bengal

226
6
Graph 6.7 Bankura-II BlockGraph 6.6 Bankura-I Block
Graph 6.8 Chhatna Block Graph 6.9 Saltora Block
Graph 6.12 Barjora Block Graph 6.13 Onda Block
Graph 6.11 Gangajalghati Block
Graph 6.10 Mejhia Block

227
6
Graph 6.14 Indpur Block Graph 6.15 Khatra Block
Graph 6.16 Hirbandh BlockGraph 6.17 Ranibandh Block
Graph 6.18 Taldangra BlockGraph 6.19 Simlapal Block
Graph 6.20 Raipur Block Graph 6.21 Sarenga Block
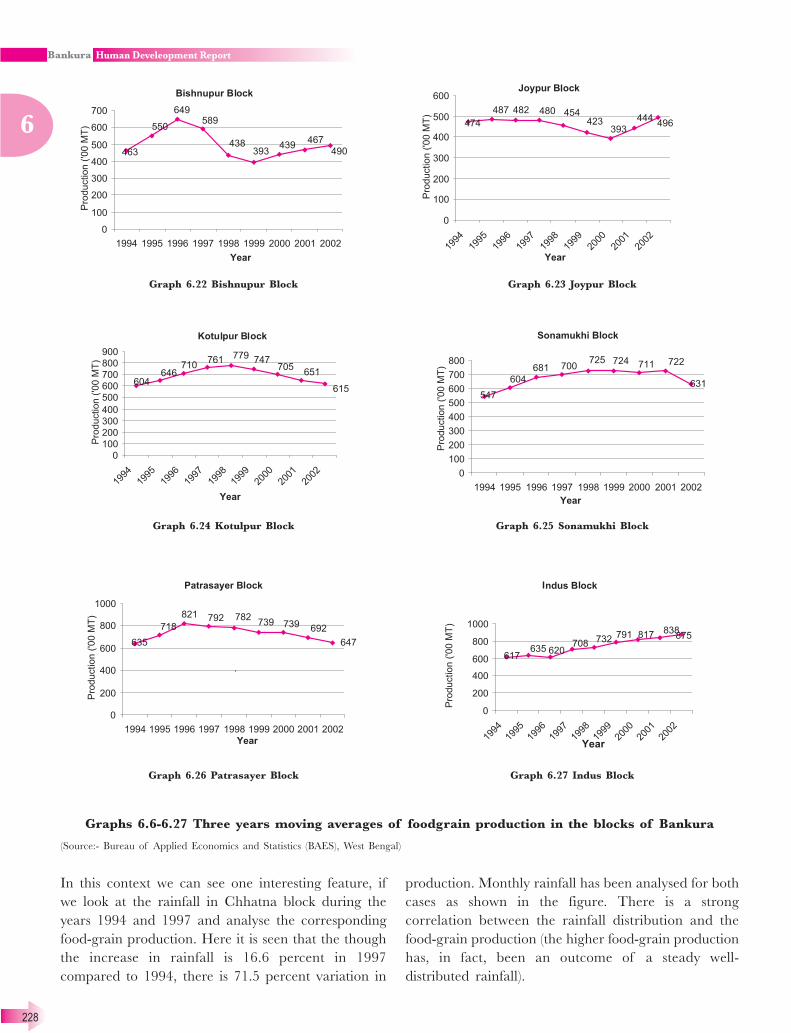
228
6
Graphs 6.6-6.27 Three years moving averages of foodgrain production in the blocks of Bankura
(Source:- Bureau of Applied Economics and Statistics (BAES), West Bengal)
Graph 6.27 Indus Block
Graph 6.25 Sonamukhi Block
Graph 6.23 Joypur BlockGraph 6.22 Bishnupur Block
Graph 6.24 Kotulpur Block
Graph 6.26 Patrasayer Block
In this context we can see one interesting feature, if
we look at the rainfall in Chhatna block during the
years 1994 and 1997 and analyse the corresponding
food-grain production. Here it is seen that the though
the increase in rainfall is 16.6 percent in 1997
compared to 1994, there is 71.5 percent variation in
production. Monthly rainfall has been analysed for both
cases as shown in the figure. There is a strong
correlation between the rainfall distribution and the
food-grain production (the higher food-grain production
has, in fact, been an outcome of a steady well-
distributed rainfall).

229
6
Graph 6.28 Rainfall distribution in Chhatna Block during 1994 and 1997
(Source:- Office of the Principal Agricultural Office, Bankura)
6.2.3 Building food security :
We can at this stage find three conditions, if fulfilled,
ensure food security:
i) Adequate food production.
ii) Availability of food grains at affordable prices for
the economically weaker section of the population.
iii) Adequate purchasing power of the people.
We have analysed the productivity in different blocks in
the district. For the sake of simplicity we have taken
aman paddy production and net cropped area. As can
be seen different blocks are at different levels of
productivity with Indus being at the peak. The soil type
of eastern Bankura (mainly Indus, Patrasayer and
Joypur) is alluvial which has contributed to the high
productivity. Assured canal irrigation is another factor.
The western red lateritic zone is certainly at a
disadvantage, which makes it more vulnerable. The
efficacy of fertilizer is less in this part because of acidity
of the soil. We have taken up following interventions
in this regard which has shown good results and may
be scaled up:
1. Use of soil ameliorates to take care of soil acidity
2. Crop diversification: Demonstration Centres (DC)
of maize, arhar, khesari under RSVY
3. Grain Bank
4. Programmes undertaken under employment
guarantee scheme
5. Distribution of foodgrain under Antodaya Anna
Yojana (AAY) and Annapurna Yojana.
Graphs 6.29 Productivity in different Blocks (Yield rate of Aman) (Sources:- BAES, West Bengal)

230
6
6.30 Variation of yield after introducion of soil ameliorates, bio-pesticides in RSVY blocks
Sources:- Office of the District Magistrate, West Bengal
They experienced these positive effects for 3-4 years
after one application. In the programme some
additional supportive measures like use of improved
quality seeds, promotion of organic manure (compost,
green manure) in appropriate quantity and of
improved quality were taken. All the supported families
experienced improved production from 50 percent to
100 percent. Provision for second cropping was possible
with water management and situation-specific cropping
practices. Also from an average base level of 45
percent, food security of 80 percent on an average was
achieved.
6.2.3.1 Soil ameliorates and organic farming
The general pH level of this district is low (i.e. acidic)
and in many cases analysis report shows that it is as
low as 4.5, which is posing hindrances in enhancing
productivity of crop due to low fertilizer-use efficiency.
Following the practice of agriculturally advanced
districts, the small and marginal farmers of Bankura
tend to apply chemical fertilizers on agricultural lands
with a hope of improved production. But as the soil is
acidic, it affects the plants growth by reducing the
absorption of nutrients from the soil.
The other important factor is lack of micro-nutrients.
In acidic soil there is generally a deficiency of micro-
nutrient and, in Bankura soil, there is a deficiency of
zinc and boron.
During 1998-2001 an N.G.O. undertook a special
intervention in some selected areas of Chhatna and
Indpur in which after testing of soil, corrective measures
were taken by application of basic slag/lime and use of
organic manure compost pit was promoted. The
changes as perceived by the farmers are mentioned
below:
1. Loosening of the soil from the next season as
‘ploughing became very easy and comfortable’;
2. Growth of the crop (paddy) was very encouraging,
it remained green till maturity;
3. The grain was almost full with very few chaffs, ears
were longer;
4. Length of the straw also increased
Considering the results, steps have been taken under
RSVY for supply of dolomatic lime as soil ameliorate
so that the poor farmers get higher productivity thus
gaining yield with lower dose of chemical fertilizer,
which would result in lower production cost and uplift
their economic status. In the strategy the soil testing
isbeing done for the land and then as per soil-testing
report, the dose of dolomatic lime is applied to the
extent of 1.5 MT. per hectare. Application is made at
least 21 days before final ploughing for transplanting of
rice or sowing of other crops. The beneficiaries are
contributing 10 percent of the total cost.

231
6
6.2.3.2 Crop diversification :
Crop Demonstration had been planned for capacity
building on improved agriculture and for enhancement
of crop production. During the period of 2004-’05 and
2005-’06 Agriculture Department of the district has
started Demonstration Centres (DC) in 13 RSVY blocks.
The crops are mainly maize, rice, Arhar, Kalai, wheat,
mustard, lentil, gram, Til etc.
Maize is a crop,
which can change
the economy of the
resource-crunch area
like unutilized and
underutilized terrain
lying in the district.
This has been proved
in 275 hectare of
land by introducing
Kharif maize DC in
different parts of 13 RSVY blocks during 2005-06. No
prime and fertile land was utilized for this DC and no
major irrigation was needed. Average income through
sale of production was Rs. 50,000/- per hectare. The
department of Agriculture selected one hectare as a unit
where 5 farmers’ family gave their labour. The benefit
6.1 Maize cultivation under
RSVY
accrued per family after meeting all costs was Rs.
6,000/-. In fact, the return was substantial even when
the paddy on similar plots failed due to low rainfall.
(i) Maize :
Table 6.10 Area under maize cultivation in
the district
Year 2003-’04 2004-’05 2005-’06
Area (in Hec.) 1722 1804.2 2702
Source:- Office of the Principal Agricultural Office, Bankura
(ii) Arahar :
In the district of Bankura there is vast underutilised
and unutilised upland that remain practically fallow
throughout the year. This uncultivated upland is very
much prone to soil erosion. The top soil gets eroded
with the flow of rain water causing siltation of the
rural ponds decreasing water storage area and low
water availability for irrigation purpose. ‘Arahar’
(Cajanas Cajan L.) is a unique pulse crop for these
upland. Arahar is a moderately deep-rooted crop
which can thrive well in the intermittent drought
situation, which is a common phenomenon of this
district due to erratic nature of the monsoon and it is
6.31 Area under cultivation in the district
(Source:- Office of the Principal Agricultural Office, Bankura)

232
6
seen that this crop gives economic yield even in
locations where other crops can not survive. So a vast
untapped area of this district can be brought under
the cultivation of Arahar crop to bring a change in
rural economy. Besides checking soil erosion, this crop
provides good amount of fuel-wood, thus reducing
pressure on the existing forest. Nowadays, varieties of
Arahar of 120 to 130 days duration are available.
Arahar can also be grown with kharif groundnut and
kharif maize very effectively. Such intercropping gives
two types of crop from a single location and guarantees
yield from at least one crop in case of failure of other
crop.
In the year 2005, demonstration centers of 59 hec. of
Arahar was organized in the thirteen RSVY blocks of
this district. In no case existing crop of a particular
location was replaced and the total intervention area
was on unutilised fallow land . The average yield was
1000 Kg. per hec. with net profit of Rs. 16000/- per
hec.
(iii) Khesari :
In the district, vast tract of land remain fallow after
harvesting of Kharif paddy due to scarcity of
irrigation source. However, it is seen that almost every
year this district receives rainfall in later part of season
and in the maturity stage of Aman paddy on several
occasions. The agro-climatic condition is very much
suited for cultivation of Khersai (Lathyrus Sativus L.),
a pulse crop with tougher morphological and
physiological character in comparison to other pulse
crops. This crop can be easily grown as paira (relay
cropping) by utilising the stored residual soil moisture
after Aman paddy is harvested without incurring any
additional expenditure for tillage of land or application
of chemical
fertilizer.
In the year 2005-
’06, demonstrations
centres of 100 hec.
were taken up
under RSVY. The
result has been very
encouraging with
the average yield
being as high as 900 Kgs./hec. and net return Rs.
11,600/- per hectare.
6.2 Paddy DC in Hirbandh
Block
Except introduction of non-conventional crops, rice
DCs have been designed in RSVY blocks in a unique
manner with most scientific intervention like use of soil
ameliorates, introduction of bio-pesticides and
remarkable results have been achieved. Whereas the
district average yield of Aman paddy in 2005-’06 was
4296 Kg./hec., the average yield of the RSVY Aman
paddy DC was 4550 Kg./hec.
6.2.4 Grain Bank :
(A) Background and purpose of the Grain Banks
While working with the marginalized poor & landless
communities, to ensure their regular & active
participation in the community development process
and to analyse their socio-economic challenges, one
critical factor is indebtedness to the money-lenders due
to food crisis in certain period of the year. This crisis
usually comes during the lean period, i.e., from August
to October month of the year (lack of labour-oriented
work) and in critical
conditions (like
drought etc.) on even
earlier and at any
time of the year.
During the lean
season they have two
options — either to
contact the money-
lender or well-off
persons in the area to
take loan mostly in the form of food grain, or if there
is a possibility, migrate to other areas for labour oriented
job.
While they take loan from the moneylenders, they have
to repay it after harvest, i.e, in the month of November-
December with 50 percent interest (in 3-4 months), and
this vicious cycle goes on worsening their situation year
after year. The repayment is in kind and thus it is a real
rate of interest.
To address this food crisis issue, the idea of establishing
community-managed grain bank has been evolved after
series of discussions with the affected families. It is an
effective measure to solve the food-crisis of the poor
and marginal families and bringing them out of the
clutches of the money-lenders within 3-5 years, if
conditions otherwise remain normal (like no natural
calamity, disaster etc.).
6.3 Grain bank at Nidaya
(Tulsi), a tribal village under
Bankura-I Block

233
6
The accounting and management is very simple and is
done by the group itself after inculcating desired credit
discipline amongst the members.
(B) Goals and objectives :
The goals and objectives of the project is:-
1. To establish food security;
2. To stop migration so that their education, health
and other livelihood issues are properly addressed
and they can contribute significantly to reduce their
vulnerability through continued and active
participation in the development process.
(C) Processes involved :
1. Rapport building with the community
2. Identification of the food-deficit families, their
source of livelihood etc. through PRA exercises
(along with other socio-economic status assessment
like education, health, agriculture etc.)
3. Analysis of the root cause of food insecurity
through group meetings in general and
identification of the means of their survival in
existing situation, finding out alternatives and
support from the communities both affected and
non-affected. All these discussions culminate into
the establishment of a self-managed sustainable
grain bank. The next step is the capacity assessment
to raise contribution from the community, external
support needed etc. This process needs several
sittings with the community so that they internalise
the whole issue of the problem analysis, and solving
alternatives. Total quantity of grain required to
solve the problem is also assessed.
4. On understanding the issue of self-management
and development of ownership, the members are
encouraged to contribute as per their capacity after
the harvest. The quantity for initial contribution to
form the nucleus of the grain bank is decided by
the groups. Usually they are not able to make the
contribution of more than 20-25 kgs. per family,
since they have also to repay the past loans.
5. Membership for a grain bank is usually kept
between 15-30 for better management. However
few exceptional cases may be there.
6. Initial external grain support is 8-10 quintal,
depending upon the size of the group.
7. Altogether 10-12 quintal becomes their seed
capital to start the process. Quantity of grain to
be provided to each member family is decided by
the group, sometimes at the initial stage.
8. Repayment period/date is decided during
distribution and informed to all members.
9. For repayment, usually the groups decide 20 to
25 percent additional quantities on distributed
amount. In case, when they get good harvest due
to favourable natural condition, they even pay
more, as they feel whatever they are depositing is
after all their own and who knows ‘what will be
the situation next year, if there is some untoward
natural condition, drought, cyclone etc.’
10. Once started, the process goes on. It is not only a
sharing of grain from their own bank, it is also a
matter of dignity and prestige to them, as wife or
husband of the family do not have to pay visit to the
money-lender, sit in a corner of the courtyard,
bowed head, to face some derogatory comments
from the money-lender while filling their bag of loan.
11. There are 67 grain banks till date at RDP Bankura
Unit, of LWS-India. On the same concept 116
grain banks have been taken up under RSVY in
the district.
12. Usually January-April is the time for grain bank
support, structure is constructed according to
quantity stocked by the group and usually after
one or two cycle. Till then the groups stock the
quantity in traditionally built structures or in bags
in some member’s custody.
(D) Budget at current cost :
1. Approximately Rs.13,000/- to Rs.15000/-
depending upon group-size/capacity.
2. Expenses related to maintenance, record keeping
etc are borne by the communities/groups.
(E) Conclusion :
The concept of grain bank is not new. The success of
grain bank in this district may be attributed to two
factors. Firstly, the project design is participatory
wherein the community also contributes in terms of
food-grain and also the management. Secondly, the
hamlets, which are actually facing food deficit, are
taken up. A mechanical implementation of this kind
of intervention without adequate stress on the above
two issues may lead to the failure of such interventions.
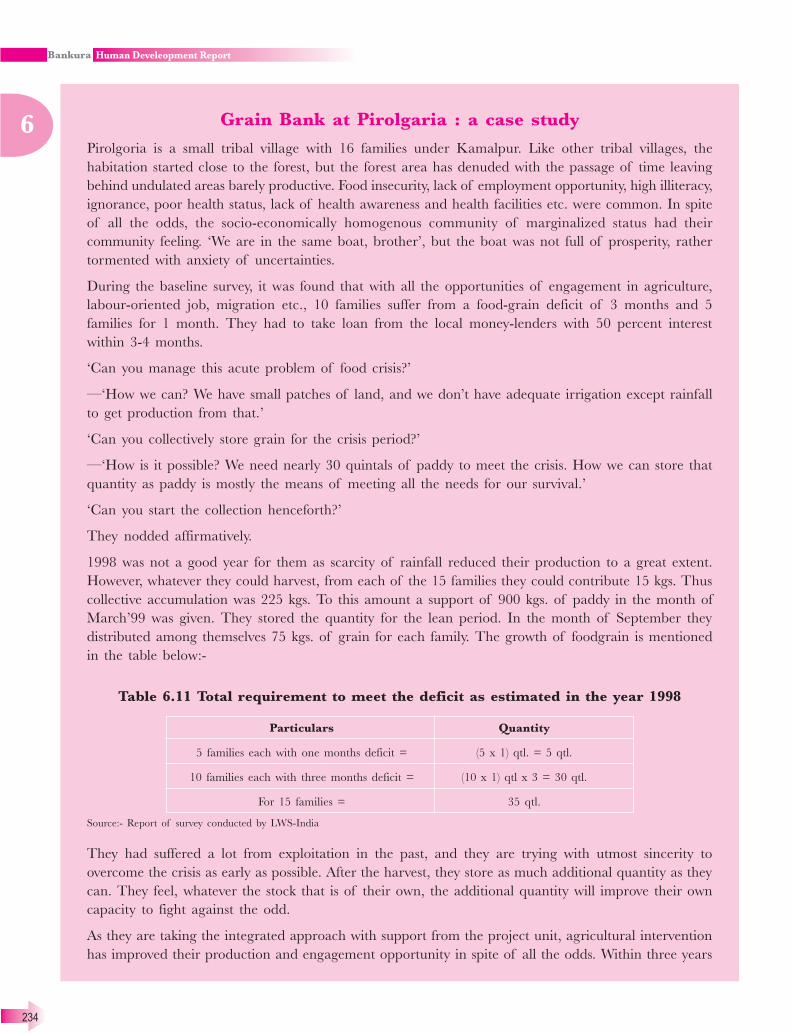
234
6Grain Bank at Pirolgaria : a case study
Pirolgoria is a small tribal village with 16 families under Kamalpur. Like other tribal villages, the
habitation started close to the forest, but the forest area has denuded with the passage of time leaving
behind undulated areas barely productive. Food insecurity, lack of employment opportunity, high illiteracy,
ignorance, poor health status, lack of health awareness and health facilities etc. were common. In spite
of all the odds, the socio-economically homogenous community of marginalized status had their
community feeling. ‘We are in the same boat, brother’, but the boat was not full of prosperity, rather
tormented with anxiety of uncertainties.
During the baseline survey, it was found that with all the opportunities of engagement in agriculture,
labour-oriented job, migration etc., 10 families suffer from a food-grain deficit of 3 months and 5
families for 1 month. They had to take loan from the local money-lenders with 50 percent interest
within 3-4 months.
‘Can you manage this acute problem of food crisis?’
—‘How we can? We have small patches of land, and we don’t have adequate irrigation except rainfall
to get production from that.’
‘Can you collectively store grain for the crisis period?’
—‘How is it possible? We need nearly 30 quintals of paddy to meet the crisis. How we can store that
quantity as paddy is mostly the means of meeting all the needs for our survival.’
‘Can you start the collection henceforth?’
They nodded affirmatively.
1998 was not a good year for them as scarcity of rainfall reduced their production to a great extent.
However, whatever they could harvest, from each of the 15 families they could contribute 15 kgs. Thus
collective accumulation was 225 kgs. To this amount a support of 900 kgs. of paddy in the month of
March’99 was given. They stored the quantity for the lean period. In the month of September they
distributed among themselves 75 kgs. of grain for each family. The growth of foodgrain is mentioned
in the table below:-
Table 6.11 Total requirement to meet the deficit as estimated in the year 1998
Particulars Quantity
5 families each with one months deficit = (5 x 1) qtl. = 5 qtl.
10 families each with three months deficit = (10 x 1) qtl x 3 = 30 qtl.
For 15 families = 35 qtl.
Source:- Report of survey conducted by LWS-India
They had suffered a lot from exploitation in the past, and they are trying with utmost sincerity to
overcome the crisis as early as possible. After the harvest, they store as much additional quantity as they
can. They feel, whatever the stock that is of their own, the additional quantity will improve their own
capacity to fight against the odd.
As they are taking the integrated approach with support from the project unit, agricultural intervention
has improved their production and engagement opportunity in spite of all the odds. Within three years
235
6
of successful operation of grain bank and additional production from agricultural intervention, migration
for want of engagement and food declined gradually. While in the year 1998-99, seasonal migration was
more or less common to all and four families migrated for most of the period of the year, during the
year 2001, member from three families migrated during the transplanting period only.
Table 6.12 Distribution and recovery pattern
Year Quantity distributed Quantity returned Additional quantity
in return
No. of Quantity Total No. of Quantity Total
families per family quantity families per family quantity Qty. Percent
(kg) (kg) (kg) (kg) (kg)
1999 15 75 1125 15 92 1380 225 22.66
2000 15 92 1380 15 122 1830 450 32.60
2001 15 122 1830 15 146 2190 360 20.00
2002 15 145 2190 15 175 2630 440 20.00
2003 15 175 2630 15 210 3150 520 20.00
2004 15 210 3150 15 252 3780 630 20.00
Source:- Report of survey conducted by LWS-India
Till the year 2001, seven families could overcome the crisis of lean period and eight families had crisis
for food-grain for one month only.
The year 2001 was the rare favourable year for the area as there was regular and satisfactory rainfall
during the monsoon. They planned to store at least 40 percent additional quantity, so that there was no
anxiety for two square meals in a day for all the members in the community.
6.2.5 Activities undertaken under employment
generation programmes :
The employment generation programmes undertaken
by the government are taken up with the objective of
providing gainful employment to the rural people so that
they can manage their livelihood specially during the
lean seasons of the year. However, due to limited scope
and timely availability of fund, the schemes have not
always achieved desired results so far as providing
employment and food security is concerned.
Table 6.13 Progress under National Rural Employment
Guarantee Programme (up to 31st. July, 2006)
Sl. No. Item Achievement
1 Job-card issued (no.) 299771
2 Employment provided to households (no.) 64063
3 Employment provided to individuals (no.) 138482
4 Works completed (no.) 127
5 Works in progress (no.) 901
6 Expenditure (in Rs. Crores) 12.29
7 Person-days created (no.) 1362938
Source: Office of the District Magistrate, Bankura

236
6
Recently under the National Rural Employment
Guarantee Programme (NREGP) the government has
taken up the task of providing 100 days of gainful
employment to a family whose members are willing to
do the work of unskilled labour.
As there is a
provision of
demanding job by
such job-card
holders and the
government has to
provide the job
within 15 days of
such demand, the
present structure
will be able to ensure food security and contain
migration to other districts. The projects have been
taken up in consultation with community and is being
implemented in close co-ordination with self-help groups
(SHG) and other community-based organizations
(CBO). This is the first scheme in which entitlement of
a villager has been addressed. In Bankura, the schemes
has been launched with the twin objective of providing
gainful employment as well as creation of assets. Since
water is the central issue in the district, re-excavation
of ponds, construction of checkdams and afforestation
has been given priority.
6.2.6 Antodaya Anna Yojana & Annapurna
Yojana :
The two schemes started functioning towards the end
of the year 2001 with the aim to provide food security
to the families facing food crisis so that starvation is
avoided. The Annapurna Yojana aims at offering 10
6.4 Work under NREGP
going on
6.14 Block and Municipality-wise number of beneficiaries
under Antyodaya Anna Yojana & Annapurna Anna Yojana
Block/Municipality No. of families covered Persons covered by
by Antyodaya Anna Yojana Annapurna Yojana
Bankura-I 4538 93
Bankura-II 5301 118
Chhatna 9094 177
Saltora 6317 123
Mejhia 3532 77
Barjora 7883 160
Gangajalghati 7302 158
Onda 10193 215
Indpur 6784 138
Khatra 4797 100
Hirbandh 3938 70
Ranibandh 5961 144
Raipur 7496 172
Sarenga 4563 129
Simlapal 5914 143
Taldangra 5694 127
Bishnupur 6146 129
Joypur 6080 136
Kotulpur 6896 158
Sonamukhi 6361 138
Patrasayer 7314 147
Indus 6499 149
Bankura Municipality 4639 163
Bishnupur Municipality 2268 86
Sonamukhi Municipality 1080 46
Grand Total 146590 3296
Source:- Office of the District Panchayat & Rural Development Officer, Bankura

237
6
Kgs. of food-grains free of cost per month to each
identified indigent destitute of the age of 65 years and
above and not being covered under old age pension
scheme. The Antyodaya Anna Yojana covers other
below poverty line (BPL) families, in which each family
get 35 kgs. of foodgrain per month at a subsidized rate,
the rate of rice being Rs. 3.00 per Kg. and the rate of
wheat, Rs. 2.00 per Kg. A thorough enquiry has been
specially conducted to sensure that the poorest of the
poor get the priority. People living in backward mouza
have been given special attention while selection.
6.3 Migration :
In Bankura, migration has been the single factor which
enhances vulnerability of community to a very high
degree. Though there is no authentic data available,
migration has been observed in following blocks of
Bankura district – Bankura-I, Chhatna, Saltora, Indpur,
Ranibandh, Hirbandh, Khatra, Raipur, Sarenga. A
sample survey has been done to understand the nature
and cause of migration in these blocks. Firstly a sample
survey was conducted at Bankura bus stand to identify
the areas, demographic profile of the migrants and
the areas to which they migrate. Based on the findings
some of the areas with high incidence of migration
were selected for detailed community level survey.
Table 6.15 and Table 6.16 give the findings of the
study. As can be seen, on an average, 67.3 percent
families migrate from these vulnerable blocks. The
range varies from 54.5 percent to 85.4 percent.
Another study conducted during the micro-watershed
planning under Rashtriya Sam Vikas Yojana (RSVY)
shows that 23 percent families across all the socio-
economic strata from the underprivileged blocks
located in western and southern Bankura migrate to
other areas for some period or other.
238
6
6.3.1 Characteristics of migration from
Bankura :
Migration in this district is basically a distress sale of
labour outside his/her own place of living for a period
of 15 day to 6 months (even in a few cases for eight
months) in a year. It is a very common phenomenon
to the socio-economically marginalised, mostly SC and
ST population of the district. It has the following
common characteristics:
� The migrant leaves his/her own place for search
of employment elsewhere (mostly outside the
district)
� Have to stay there continuously for the period
� Duration is 15 days to 6 months in a year and more
or less on regular basis (which is influencing or
affecting his/her family, social life).
� The employment is mostly in unorganised sector
as labourers with individual owners as provider of
work. Example:- agriculture work, labourer in brick-
field, construction site etc.
In addition, distress sale of assets like livestock and
A dialogue with a migrant family at Bankura Bus Stand
“Since how long are you going to ‘Poob’ for search of employment?” 1
-“Look at our baby”, Rabi pointed to a three months old baby sleeping on the floor of the passenger’s
retiring hall (a place with concrete roof but open on all side), “As our ‘beta’ is accompanying us, I used
to accompany my parents in the same manner.” This is how Rabi explains his period of migration, his
wife giving a patient hearing to it.
It was in the month of January with chilling cold. “Makar Parab aschhe na. Sei janya ato jar”, (The
Poush-Sankranti festival is at the door. That’s why so much of cold) substantiates Rabi’s wife, paying a
helpless but sympathetic look at the baby, with a deep sigh.
* * * * *
“Whom have you left at home to take care of your household?”
—“My old mother and six years old daughter. She can’t move much, so Sulekha, our youngest daughter
is left behind to take care of her”, replied Jiten, a 35 years old landless from Hirbandh block of Bankura
district.
“How could they manage there, your mother is so old and daughter is so tender aged?”
—“My daughter can cook rice. A little bit of green leafy vegetable in addition is enough for them. We
have taken some loan from the mahajan (money-lender) before leaving our home and made arrangement
for a month for them”, added Jiten in a tone of desperation.
“What about if any of them fall sick?”
—“We have entrusted one of our neighbour, who is my good friend since I attended the primary school
with him. I have requested our local ‘daktarbabu’ to give whatever medicines are required. We pay all
the dues to him if it happens. He is a very kindhearted man. He has been looking after all of us for a
long time. We will pay the mahajan also. Otherwise he will not help us next time.”
“How much do you pay as interest?”
—“Rs.10/- per 100/- per month. It’s a bit high. But who else is there to help us?”
* * * * *

239
6
homestead assets, land mortgage, indebtedness to
informal lending source (mahajan) etc. is part of the
vicious cycle.
Period of migration :
� At least twice in a year, in general — kharif
transplanting and harvesting. The duration is from
one and half months to two months in a year.
� Three to four times for the landless and extremely
marginalised—kharif transplanting and harvest,
winter crop (potato) cultivation and harvest,
summer paddy (Boro) transplantation and harvest.
In this case the duration is four to six months in
a year.
Reasons for migration :
There are several reasons for migration. But the most
common reason is to meet the food deficit in the
families. Sample survey shows that around 84 percent
migration is to meet the food crisis, 10 percent migrate
to meet other family need, 4 percent migrate as
additional working hand in the families, 1-2 percent
have to migrate if there is serious natural calamity and
the most common calamity in the area is drought.
Table 6.15 Findings on migration in Bankura
No. % No. % No. % No. % No. % No. % No.
Chhatna 11 595 324 120 37.03 141 43.51 63 19.44 297 91.66 2 0.6 3 0.9 22
6.79
Indpur 7 213 182 42 23.07 109 59.89 31 17.03 156 85.71 15 8.24 11 6.04 –
Saltora 9 616 468 99 21.15 177 37.82 192 41.02 367 78.41 75 16.02 26 5.5 –
Ranibandh 10 776 559 402 71.91 110 19.67 47 8.40 559 100 – – – – –
Hirbandh 18 509 291 286 92.09 16 5.49 7 2.40 291 100 – – – – 22
Total 2709 931 51.04 553 30.31 340 18.64 1670 91.55 92 5.04 40 1.20
Source : Office of the District Magistrate, Bankura
Blocks
Number of member migrating from each family Reason for migration
Number
o f
hamlets
Covered
Total
family
in the
hamlets
Total
families
migra-
ting
1 to 2 members
for the family
Majority from
the family
All members
from the family
To meet food
deficit
To meet other
need
Additional
working in
member in
family
Others
reasons
(natural
calamity
etc.)
Table 6.16 Findings on migration in Bankura
No. % No. % No. % No. %
Chhatna 11 595 177 54.62 89 27.46 58 17.90 324 54.45
Indpur 7 213 76 41.75 82 45.05 24 17.73 182 85.44
Saltora 9 616 366 78.20 95 13.86 7 1.49 468 75.97
Ranibandh 10 776 559 100 - - - - 559 72.03
Hirbandh 18 509 273 93.81 12 4.12 6 2.06 291 57.17
Total : 2709 1468 80.46 284 15.57 108 5.92 1824 67.33
Source : Office of the District Magistrate, Bankura
Block Number
o f
hamlets
covered
Total
family in
the hamlets
15 days to 2 months 2 to 4 months 4 to 6 months Total families
migrating
Number of families migrating
Engagement and Remuneration :
Place of engagement:
Mostly different Blocks of Burdwan and Hooghly
districts. In some cases Gujarat & Maharashtra as
construction labour.
For Burdwan and Hooghly districts, wage & other
facilities are as follows:

240
6
� Wage is Rs. 38/- to Rs. 42/- in cash and 2 kgs. of
rice per day.
� Temporary shelter or shelter-construction
materials (bamboo, straw etc) and fuel are
provided by the employer.
� One side fare is often provided during kharif
paddy transplantation.
In case of construction labour migrating Gujarat &
Maharashtra, wage & other facilities are as follows:
� Wage is Rs. 100/- to Rs. 120/- per day with over
time facility of Rs. 10/- per hour.
� No other facilities are provided.
� Incase of illness during the period, treatment is
done at own cost, mostly with own arrangement.
Involvement of family members :
� Migration is mostly with family members, leaving
behind one or two members to take care of the
household, domestic cattle (if any).
� In cases of nuclear family, full family migrate with
infant, children.
� Usually they form a group from the same
community or from the neighbouring communities;
the relatives from different places are also there.
Status & background at their own place :
� Most of them are migrating by generations—two
generation members are common in the groups.
� Most of them are not covered by the poverty
alleviation programme.
� Except a few, they are not members of any self-
help group (as their stay in the villages is not
continuous).
A few respondent said that they received some support
under the schemes of District Rural Development Cell
years back, but whatever amount was received after
adjustment of the subsidy with loan amount was not
sufficient enough to take up any viable income
generating venture.
6.3.2 Effect of migration :
How life goes on ………
Kalpana Roy, 13 years old girl belongs to Katagora village under Purulia District, neighbouring Pirolgoria
village of Metyala G.P. of Bankura District.
She was living with his seven years old brother, a pair of goats and few domestic birds. Her father
Sudhir Roy along with her mother, one sister and youngest brother had gone for search of some
employment in the agricultural field of Burdwan or Hooghly district. She didn’t know where they had
gone, but knew that they may come back in the first or second week of Jaistha. This arrangement would
go on 4-5 times in a year. When she was a very tender child, she accompanied them, but now she had
grown enough to take care of the house, brother, a younger brother and a few other assets. Her second
sister, who is around ten years old, had gone with her parents to look after her youngest brother there,
when their parents will be engaged in field-work.
Arrangement for some food-grain was made by their father when they left and he had also requested
their neighbour to help them, if they faced any problem.
Sometimes the domestic animals behave like wild, birds try to be free in the open nature, they are lost
temporarily, or engage themselves in grazing with utmost sincerity behind some bush.
It was a scorching hot day in the month of May, and as one goat was not being found, both sister and
brother went searching for it in the sun. There were not much food-grain in the house and may be they
didn’t get their full meal. Both of them were blaming each other for not shouldering their responsibility
properly. Suddenly Kalpana couldn’t control herself, she went inside the room, pour the remaining

241
6
This case may be one of the worst effects of migration,
but stress & strain, psychological trauma, agony,
uncertainly etc. are always there with the left over
members in the family particularly to the tender children
and aged persons-old, widows etc.
In many cases, mainly during pre-monsoon and
monsoon migration, damage to the household due to
high velocity or cyclonic wind, along with rainfall cause
moderate to severe damage to their houses. Often the
roof is blown away, walls get eroded, leaking and
leaching of water damage domestic utilities including
food grain, floor of the house etc. So after their return,
a major share of their earning is spent for the repairing
of houses.
Migrating families are resource-poor. They can’t make
optimum use of available resources. They cannot think
of taking up even activities like horticulture or rearing
of domestic cattle etc. They are forced to do ‘once
transplanting and once harvesting’ paddy cultivation
with no care in between (as they migrate in between). It
can be assumed that they are able to tap only 25-40
percent of the resources available with them in the form
of land, livestock etc.
Health care :
Health care is grossly affected particularly to the
expectant and nourishing mothers and children.
Essential and routine health services like antenatal &
post-natal care, immunisation, nutritional
supplementation etc. are grossly neglected. Delivery in
the working field and migration even with a seven days
old baby has also been reported during the survey.
Moreover sexual exploitation to the women & adolescent
girls in the whole journey of migration is not very
quantity of kerosene oil left in the house and set herself on fire. Seeing this, her little brother was at a
loss, shouting for help and running here and there around the house. When their neighbors reached
within few minutes, Kalpana was found burnt almost fully. She was brought to Bankura Medical College
and Hospital, but was beyond all treatment.
The brother didn’t know where exactly their parents had gone to earn some means of livelihood for
them. The neighbours didn’t know. After query and searching for two days they were found in a distant
village of Hooghly district.
When Sudhir and his family came back they even couldn’t find the local guardian.
uncommon which is a serious issue in the transmission
of sexually transmitted disease & HIV.
Reports of serious illness, death has also been observed
during the survey.
Education :
Education to the children is seriously affected for the
migrating families due to obvious reason of irregularity.
Normally children accompanying their parents till the
age of 8-10 years. Later they become over-aged for a
Primary school.
Other issues :
Very often migrants have to take loan from the money-
lenders for temporary arrangement for the left over
family members, travelling cost etc. and on return they
have to repay the money-lender with lump sum
interest. Sometimes they mortgage household utilities
and find it difficult to recover it since the loan is given
normally at a very high rate of interest.
In spite of all the odds it is very much heart-rendering
to hear from the aged, “we are still surviving only
because of Hooghly and Burdwan; otherwise we would
have died in hunger. Whenever we get some kind of
employment opportunity (working in the agriculture
field) in our area, we have to compromise even with
less then half payment, as we are much larger in
number and the opportunities are few.”
Is there a remedy ?
Natural resources in and around the area and
their utilisation :
From the sample survey, on an average, the migrating
families are found to be having 1.5 to 2.25 bighas of
242
6
land. If we consider the total land in the migrating
hamlet on an average per family land works out to be
5-6 bighas. On an average wasteland per family is 1 to
2.5 bighas. There is forest land in migrating hamlets
and per family availability of the same works out to
be 1 to 10 bighas.
Whatever the resources are there within their access
and control are not optimally used due to the following
reasons:-
i) Lack of irrigation water, lack of knowledge of
alternative cropping practices, access to know-how
and inputs, poor investment capacity.
ii) Domestic cattle-rearing is not perceived as a
regular income generating activity but is looked
upon as buffer to meet a sudden crisis in the family
– illness, and other social need. Risk coverage,
market knowledge are also limited.
Their ‘thought’ about alternatives & future :
On discussion at length the followings suggestions came
out:
1. Creation of irrigation facilities in their respective
areas can increase possibility of two crops, which
will generate additional employment each year.
2. Animal husbandry can be the other option, though
they have doubts on its viability due to a numbers
of associated risk factors.
3. Lack of investment capacity is also a major
hindrance to alternative options of livelihood.
Kajal - the other name of survival strategy
Kajal Murmu, a woman of Araboni village under Teghori Gram-Panchayat of Chhatna Block could
fight against many odds of poverty including migration. From a nowhere situation at one time, she is
now owner of three bighas of land, a pair of bullock, five pigs, thirty poultry birds, a bank account etc.
On the top of it, she is continuing education of her three daughters in school (two are in high school)
and has bought a cycle for them.
The only tragedy she could not get over is the death of her husband in 1998. After that she had to fight
her battle for survival alone, but never accepted defeat.
The different milestones in Kajal’s life and livelihood is stated below :-
1985 - Kajal, as 15 years old girl, became a member of the migrating group consisting her father, elder
brother etc. They could migrate for 8 - 10 months in a year.
1988 - Being introduced for some period while in migration, Kajal got married with Thakurdas Murmu
of Araboni village. That was the only change in her life but livelihood sources remained same, change
of hand from father and elder brother to husband and his family. She used to get Rs. 20/- per day and
one Kg. of rice, working as migratory labour at Burdwan district. Their first daughter was born 3 years
after marriage and other two daughters in succession within two and half years. With only 2 bighas of
high land as productive resource their life became tougher with the introduction of three new members
in their family.
1995 - Kajal went to Burdwan leaving the eldest daughter at the custody of a neighbour. However
trouble didn’t leave them, their youngest daughter fell seriously ill at their working place, Kajal returned
back without completing her term for that season. Here she found the good neighbour has engaged her
four and half years old daughter for cattle grazing. The scene only increased the severity of pain of
helplessness, her only pray to God was for ‘two square meals’ in a day for all the family members.
1997 - LWS-India came into their village and urged them for self-dependence and self-reliance from
within.
243
6
1998 - They got some training on situation-specific improved agricultural practices organised by LWS-
India, followed by some improved seed and fertilizer assistance to cultivate in those 2 bighas of agricultural
land. But the most unfortunate event happened in Kajal’s life when her husband died in the month of
September after suffering from fever for three days. Helpless Kajal went to Hooghly with her 3 daughters
to work as labourer for potato cultivation. She earned some money, but on returning back found her
house grossly damaged, roofing materials were blown away by the stormy wind of October. She took
loan amounting Rs. 500/- from the ‘Village Samity’ and could repair her house to the minimal extent.
1999 - She underwent some agricultural training sessions, received some input assistance (seeds, fertilizer)
for improved paddy cultivation. She managed the year by the following means:- six months from kharif
paddy, potato and mustard crop supported her one month, two months from loan from money-lender
and three months by migration. She had to work as ‘bonded labour’ in the field of money-lender for six
months for the loan she received.
2000 - Kajal took two bighas of land from a person of Tisra village for ‘share cropping’. This year she
could manage food-grain for seven months from paddy cultivation, three months as labourer in a pond
re-excavation work, weeding in paddy fields etc., one month from potato, mustard cultivation and one
month by loan from money-lender. She started vegetable cultivation this year, consumed optimally in
the family and sold some quantity also.
2001 - Kajal could manage food-grain for nine months from paddy cultivation in own land and share
cropping. Cultivated some newer crop like pumpkin, oilseed (linseed), potato etc. She earned Rs. 500-
by selling pumpkin, Rs. 1000/- by selling linseed and Rs. 700/- by selling potato. Two months were
managed as daily labourer and support for one month came from ‘Grain Bank’, as grain bank was
established in their village. She didn’t migrate.
2002 – She purchased one bigha of land with saving and selling a pair of ear-ring. Land development
activities were taken up with support and assistance from ‘Village Samity’. She could sell pumpkin
amounting Rs. 3000/- apart from other vegetable cultivation and paddy amounting Rs. 1000/-. Bought
first cycle for the daughters who are reading in a High School, 5 Kms. away from their village.
2003 - Kajal became free from the agony of migration and food insecurity.
2004 - She repaid all the dues to ‘Village Samity’ and self-help group. She had also created some assets.
Intervention to reduce migration in the District
Long term measures:
Avenues to utilize natural and human resource are to
be found out to generate additional livelihood. Each
family needs to be equipped with knowledge of
alternative practices in agriculture, horticulture, animal
husbandry and other income generation opportunities
to reduce the risk and vulnerability. Each family having
land must have access to some sort of irrigation
resources. Five percent irrigation models may be tried.
Everyone should have access to credit facilities
(preferably from community-based organization (CBO)
or group managed fund) in the form of kinds like food-
grain, or cash on soft interest but greater accountability
to the group / CBO.
As indicated in the case study above, a migrating family
with barely 2 bigha of land can be made self sustaining
by a mix of measures such as creation of irrigation
source, training in production of attractive and more
remunerative crops including cash-crops, grain bank
and capital provided by the common resource of the
community band organization .
Short term measures:
Targetted implementation of employment generation
and employment guarantee scheme can be a fruitful

244
6
measure to curb the migration, as the lack of food
security is the main reason behind migration. The
district has been continuously striving to completely
stop migration by implementation of schemes like
National Food For Work Programme (NFFWP) and
National Rural Employment Guarantee Programme
(NREGP). Under NREGP, any unskilled person can
get the work by applying to the appropriate authority,
who will provide work within fifteen days of
application. This provision will help people not to go
beyond the district in search of livelihood. In fact, there
is evidence that migration from some pockets of
Ranibandh block was arrested upto fifty percent by
timely implementation of NFFWP schemes and
interventions under the microwatershed programme.
However, if other agriculture inputs and training are
also provided along with the creation of water
harvesting structures, the added income may help in
stopping migration completely.
6.4 Housing :
Right to shelter is one of the basic human rights. The
welfare of the community largely depends on the
conditions of living. Absence or poor condition of living
is a serious deprivation. So, how people are safeguarded
against the problem of homelessness is a major issue to
be considered. Census, 2001 published a detail account
of the living condition of the people of Bankura. We
have calculated the relative positions of different blocks
in the districts by taking the percentage of
“Good+Livable” households. The preliminary analysis
of our study shows that the condition of housing is best
at Sarenga, Raipur and Onda. The condition is very
bad in Beliatore and Simlapal. The conditions of other
blocks are lying in between. Providing dwelling house
to sabar community is another area of challenge. Issues
related to behavioural changes also needs to be
addressed while handling their requirement of shelter.
6.5 Crime & Violence :
Protection against crime and violence is probably the
most important issue for human security. How well
people are protected from threats of crime is a major
issue. For opportunities to be retained, safety against
violence is required. One of the major problem with
crime data is its reliability. The only source is the
government figures. The main problem with
government data is the under-reporting of incidences.
Due to various legal hassles and the prevailing fear
among the masses about the government machinery,
common people avoid reporting to Police Station (PS)
unless and until the incidence is grave.
In case of Bankura district, we have Police Station-wise
information. Among Police Stations, Bankura PS has
been most crime-prone over the years. Offences against
women, theft and other crimes are prevalent in Bankura
PS. But most significant result comes out, if we look at
Table 6.17 Houses provided to rural families under
Government sponsored schemes
Scheme Year Category House completed
SC ST Others
Pradhanmantri 2003-’04 New Construction 43 28 47
Gramoday Yojana Up-gradation 15 6 13
(Grameen Awaas) 2004-’05 New Construction 120 41 104
Up-gradation 76 27 61
2005-’06 New Construction 7 2 6
Up-gradation 7 2 6
Indira Awaas Yojana 2003-’04 New Construction 947 336 817
Up-gradation 464 164 394
2004-’05 New Construction 1626 629 1424
Up-gradation 867 293 664
2005-’06 New Construction 1650 555 1448
Up-gradation 807 268 709
Source:- Bankura Zilla Parishad

245
6
offences reported, cases tried, persons convicted for
different classes of crimes in the district of Bankura over
the years. The most interesting part is the sudden
emergence of minor crimes after 1999. The figure of
cases reported, cases tried and persons convicted under
minor crime have jumped to 2896, 1829 and 1989
respectively in 2000 from zero in 1999. This seems quite
abnormal and lacks rationality. Similarly crime against
women is also fairly large. Another alarming thing is the
proportion of people finally convicted involved in crimes
against women. In 2002, only 2 persons were convicted
against 208 cases reported. Beside this, however, crime
figures of Bankura in 2005 shows that the situation is
not worse in the district compared to the other districts
in West Bengal. In fact, in most of the cases the situation
is better than the other parts of the state.
1 Bankura 53 10 25 28 13 280 72 335 0 2 2 0
2 Birbhum 47 16 11 31 15 231 189 400 0 0 0 0
3 Burdwan 137 28 16 33 44 690 278 1003 0 4 9 0
4 Coochbehar 33 6 1 3 3 119 20 423 10 0 0 0
5 Darjeeling 50 39 3 7 4 333 23 197 1 1 0 0
6 Dakshin Dinajpur 27 15 2 9 5 100 24 280 20 0 0 0
7 Howrah 81 18 9 35 11 626 141 633 3 0 0 1
8 Howrah GRP 7 2 1 1 0 281 12 11 3 0 0 0
9 Hooghly 58 23 9 21 64 469 337 717 0 1 0 1
10 Jalpaiguri 67 42 9 20 40 712 53 564 2 0 0 0
11 Khargpur GRP 2 2 2 2 0 100 3 6 0 0 0 1
12 Malda 61 21 7 18 20 335 64 591 24 0 0 0
13 Mururshidabad 115 46 7 18 17 536 139 1362 21 0 0 0
14 Nadia 100 12 11 16 2 772 233 1067 4 0 0 0
15 North 24 Paraganas 168 38 18 39 78 1564 203 1604 16 1 1 1
16 Paschim Midnapore 79 14 25 27 35 353 184 574 0 1 0 1
17 Purba Midnapore 42 17 7 8 8 219 155 555 6 1 0 0
18 Purulia 61 9 3 14 4 143 43 224 0 1 0 0
19 South 24 Paraganas 131 39 17 21 231 690 214 1443 2 0 0 1
20 Sealdah GRP 20 2 0 4 0 188 3 15 0 0 0 0
21 Siliguri GRP 2 1 1 1 0 98 0 4 1 0 0 0
22 Uttar Dinajpur 49 13 11 16 9 256 30 325 4 0 0 0
Source: Office of the Superintendent of Police, Bankura
Table 6.18 District-wise crime figure during 2005
Sl
No
District Mur-
der
Cul-
pable
homi-
cide
Dacoity Rob-
bery
Burg-
lary
Theft Riots Crime
aga-
inst
women
Crime
aga-
inst
childr-
en
Crime
aga-
inst
SC by
non-
SC
Crime
aginst
ST by
non-
ST
Police
perso-
nnel
invol-
ved in
crime
The crime situation in Bankura also reflects to some
extent, the socio-economic strain that the district is
currently having. Increase in number of minor crimes
may be one indication of this.
In Bankura, dowry has always been a very common
problem in marriages. This problem is present
irrespective of class, income status and most importantly
the educational level of the families involved. However,
crime records do not project the problem in this case.
This is mostly due to poor reportage.
Legal Aid Clinic and Lok Adalat are being organized
regularly in this district. These needs to be continued
in a bigger way because of the prevailing poverty in
the district.

246
6
6.6 Debt burden :
Sources of funding are an important issue for the
smooth functioning of the production process. Debt
for unproductive purposes are, however, also vital in
this context. It is very much desired that the poor
producers are not exploited to obtain basic capital to
carry on production. Their interests should be
protected and the terms of loan should remain easy
and flexible as far as feasible. Availability of loans/
credits on easy repayment term for both productive
and non-productive purposes is a pre-requisite for
internal security. In West Bengal, a large portion of
source of credit is still informal, specially in rural areas.
The terms and conditions of the credit from informal
sources are very harsh (In Bankura an interest rate of
200 percent per annum is observed in certain villages!).
This adds to the vulnerability of a community. Hence
an even spread of formal sources of credit is essential
to remove this kind of vulnerability.
From the analysis of data available in District Credit
Plan, 2001-02 regarding the block-wise allocation of
credit by different Banks, it has been found that the
availability of credit is best in Bankura-I and Kotulpur.
The situation is grave in Saltora, Ranibandh and
Mejhia. Other blocks are in between in terms of
position in this respect. In fact the Self Help Group
(SHG) movement has contributed a great deal in
ameliorating the precarious condition of the poor by
providing loan to the members at a reasonable rate of
interest. It has acted as a shock absorber for the
community at large in periods of misery and
starvation.
A peculiar production relation exists in this district
which increases vulnerability of rural poor. Due to
non-availability of financial resources at proper time,
the poor small and marginal farmers are compelled to
take loans from local money-lenders on the condition
that after the production in his agricultural land, a
portion of the produce would go to the money-lenders
as principal and interest of the loan. The rates of
interest in such cases are generally abnormally high.
The value of produce is calculated at a lower rate than
the market price with a heavy bias in favour of the
money lender. There are examples that producers of
Babui take ‘dadan’ (loan) from the middlemen on such
conditions and after the maturity of babui grass, they
just hand over their produce. These examples have
proven that rural poverty cannot be reduced unless there
is access to credit for the poor at affordable cost.
6.7 Security from natural
calamities :
This is probably the most unpredictable factor causing
vulnerability in this district. Bankura being an arid area
is vulnerable to drought problems. Insufficient rainfall
has always been an age-old problem for Bankura.
During the months of summer like May and June, due
to severe heat, a few pockets of the district notice
drought-like situation, which is a common geo-physical
nature of the district. Reports of life-losses due to
sunstroke are received from some pockets of the district
during these months. Incidents of flash-flood, cyclone
and hailstorm also take place in the district resulting in
agricultural and financial damages. Moreover there are
five rainfed rivers in Bankura. The water levels of these
rivers often fluctuate and several areas are inundated at
their banks. According to the Disaster Management
Plan for the year 2005-06 published by the Relief
Section, Bankura, the drought-prone blocks of Bankura
are Ranibandh, Khatra, Hirbandh, Raipur, Simlapal,
Taldangra, Indpur, Saltora, Chhatna, Gangajalghati,
Mejhia, Barjora, Bankura-I and Bankura-II. The flood-
prone blocks are Mejhia, Barjora, Sonamukhi,
Patrasayer and Indus.
During summer, water level sinks down considerably
giving rise to acute shortage of water. Scarcity of drinking
water forces people to drink polluted water from small
collection of water in the wells. Therefore, various water-
borne diseases are reported sporadically. During
monsoon, water-logging occurs in some regions. Though
normally no loss of life occurs, public health problems
like water-borne diseases, insect-borne disasters, snake-
bites are reported following water logging.
There are another two sources of vulnerability, which
are closely related to the natural and environmental
degradation:
(i) Pollution from various newly set-up industries,
specially sponge iron industries
(ii) Attack of wild animals, specially elephants
The district is facing a new environmental degradation
problem owing to presence of several hazardous
industrial units in different parts of the district, specially

247
6
in Bankura Sadar subdivision. On the other hand, the
problem regarding invasion of wild elephant in the
harvest season is an increasing menace, specially in areas
adjacent to forests (mostly in Barjora and Sonamukhi
blocks).
6.7.1 Pollution from sponge iron industries :
Since 1999-2000, sponge iron industries were setup in
Bankura. Till date quite a few such industries, with plant
sizes varying from small to medium, have come into
existence. For a resource-starved district as Bankura, this
was seen to be a welcome respite.
Considering the production rate according to the
prevailing market demand at present, a medium-sized
sponge iron plant would require around 3,00,000
litres of water every day. Extraction of such huge
quantity of ground-water is lowering the ground-
water level alarmingly in this drought-prone district.
Also to control the pollution from these industries,
catalytic converter and the electrostatic precipitator
(ESP) and a host of other devices are recommended
to be used. Some of the plant-owners do not install
these devices and flout the pollution-norms to
maximize their profits.
This is causing health hazards upon the people and
animals in the locality and has an adverse impact on
the productivity of paddy and other crops. This has
enhanced the vulnerability of the people in the area.
6.7.2 Attack of wild elephants :
From the last few years, the areas of Barjora and
Sonamukhi Block, which are adjacent to forest, are
facing the attack of wild elephants, which come from
the Dalma range of Chhotanagpur plateau, mainly
because of the non-availability of food within their
habitat. As this takes place during the harvesting season,
damage of crops occurs coupled with loss of lives by
the attack of the elephants.
Recently crops like ginger, turmeric etc. are being
promoted in these areas which cannot be damaged by
elephants.
Table 6.19 Damage due to attack of wild elephants
Year 2005-2006
Human Casualty 6
Staff Injury 9 including 3 Forest Deptt. employees
Staff Casualty Nil
Crop Damage 959.3 Hec.
Hut Damage 167
Death of elephant 1
Source:- Three Divisional Forest Offices, Bankura
6.8 Coverage of different social
security schemes :
In this section we will try to measure the situation of
the existing safety nets for the vulnerable population
of the district. There are several schemes at present
operating at the grass root level. We will discuss some
of these schemes briefly.
(A) National Old Age Pension Scheme (NOAPS)
: Under this scheme, people above the age group
of 65 years, are entitled to receive Rs.100 per
month, if the person does not have any other
Table 6.20 Population in the age group of 60 and above (all number in thousand)
Rural Urban
Male Female Total Male Female Total
Number Percentage Number Percentage Number Percentage Number Percentage Number Percentage Number Percentage
74.55.66 86.0 6.85 160.5 6.24 7.2 6.0 8.0 7.10 15.2 6.54
Source:- Census, 1991

248
6
source of income and the family belongs to the
below poverty line (BPL) category. At present
42308 persons are getting the benefit of the
scheme, which is helping them to sustain their
livelihood.
(B) National Family Benefit Scheme (NFBS) :
The target group under this scheme is of BPL
category. If the main earning member of such a
family dies, the family receives a onetime help of
Rs.10000/-. 319 families received the benefit during
2005-2006, which helped them to come out of the
financial crisis due to sudden loss of the sole earning
member of the family.
(C) National Maternity Benefit Scheme (NMBS)
: Here also the target group is BPL category. Under
this scheme, a pregnant woman is entitled to obtain
a lump sum amount of Rs.500 (one time) for her
first two pregnancies.
(D) Pension for fishermen : Under this scheme,
67 number of fisherman above 60 years of age
and having no other source of financial help is
getting Rs.300 per month.
(E) Pension for artisan : 498 artisans above 60
years of age and having no regular source of
income are getting financial help are provided
Rs.1200 each month.
(F) Tribal pension : About 4458 number of tribal
persons of 14 ITDP Blocks, who are above 60 years
of age and of BPL category, are getting monthly
pension of Rs. 500 per month.
Table 6.21 Coverage under old age, widow and disability pension programme
Number of beneficiaries covered
Sl. Name of th National Old Old age Widow Disability
No. Block/Municipality Age Pension pension pension pension
Scheme
1 Bankura-I 1264 50 21 11
2 Bankura-II 1609 69 26 18
3 Chhatna 2360 93 30 20
4 Saltora 1621 67 22 14
5 Mejia 974 42 14 9
6 Gangajalghati 2217 90 27 19
7 Barjora 2463 99 31 20
8 Onda 2812 121 38 25
9 Indpur 1781 75 25 16
10 Taldangra 1670 72 20 14
11 Simlapal 1672 72 21 14
12 Khatra 1344 56 18 12
13 Hirbundh 987 40 13 8
14 Raipur 2127 77 22 16
15 Sarenga 1258 58 17 11
16 Ranibandh 1485 56 19 12
17 Bishnupur 1688 76 23 14
18 Joypur 1806 77 24 16
19 Kotulpur 2173 92 27 19
20 Sonamukhi 1793 77 24 14
21 Patrasayer 2077 89 22 17
22 Indua 2017 81 27 18
23 Bankura Municipality 1810 78 40 24
24 Bishnupur Municipality 900 34 12 7
25 Sonamukhi Municipality 400 15 9 5
Total 42308 1756 572 373
Source:- Offices of the District Panchayat & Rural Development Officer, Bankura & District Social Welfare Officer, Bankura
249
6
Table 6.22 Block-wise coverage under tribal pension scheme
Hir- Raipur Sarenga Simlapal Onda Indpur Taldangra Khatra Saltora Ganga- Ban- Ban Rani- Chhatna Total
bandh jalghati kura-I kura-II bandh
428 488 361 340 139 124 172 352 300 78 62 25 780 809 4458
Source: Office of the Project Officer-cum-District Welfare Officer, Bankura
(G) Old Age Pension:- In the scheme a destitute old
age person gets an amount of Rs. 500 per month, the
conditions of getting the benefit is similar to that of
NOAPS. In the district 1756 persons are presently
covered by the programme.
(H) Disability Pension :- Any physically or mentally
handicapped person, incapable of participating in
productive activities, is entitled to obtain Rs.400 under
this scheme. The beneficiary should be a permanent
resident of the state for at least 10 years. Now 373
disabled persons are getting the benefit of the pension
in the district.
(I) Widow Pension:- This scheme is providing
financial assistance of Rs.500 per month per head
to the 572 number of destitute widows.
(J) Provident Fund for Landless Agricultural
Labourers (PROFLAL) :- Every landless
agricultural labourer under the age group of 18 to
50 years are eligible to get benefit under this
scheme. For every ten rupees deposited per month
to the local Panchayat office, the government gives
a matching grant of another ten rupees and the
total amount, along with the interest, is accumulated
amount with due interest from government. 107451
landless agricultural labourers have so far been
covered under the programme.
(K) Balika Samriddhi Yojana:- It is the scheme for
awarding gift of Rs. 500/- (Rupees Five Hundred
only) on birth of girl child to her mother to ensure
welcome of the new-comers by birth. The scheme
has been implementing to the girl child who born
after august, 1997. A few supportive actions are also
included in the scheme. Gift of Rs. 500/- in form
of an instrument like KVP/ NSC has been given
to 9268 number of beneficiaries.
As can be seen the coverage of these schemes is
fairly low and is insufficient to reduce vulnerability
of people at large.
6.9 Special vulnerable and stress-
prone groups :
In the process of development, it is often found that
some particular groups of people remain lagging
behind. They require special attention because of the
disability associated with their existence. In Bankura
also we have figured out few groups, which may be
termed vulnerable. These are
(i) Child labour
(ii) Lepers
(iii) Sabar community
6.9.1 Child labour :
Bankura, like other parts of the country, is not free from
the menace of child labour, as is reflected from the
outcome of a survey conducted in 2005, which shows
that a total of 21,634 number of children were found
assisting in hazardous and non-hazardous industries.
Table 6.23 Category-wise disabled persons in the age group of 0+ to 18+
OH VI MR CP HI MD AUT LD TOTAL
3298 1450 2094 860 2196 704 29 447 11078
30 13 19 8 20 6 0 4
NB:- OH:- Orthopaedically handicapped, HI:- Hearing impaired, VI:- Visually impaired, MD:-Multiple disability, MR:- mental retardation, AUT:-
Autisim, CP:- Cerebral Palsy, LD:- Learning disability
Source: Office of the District Programme Officer, Sarba Siksha Abhijan, Bankura

250
6
Following factors seem to be responsible for child
labour :
1. Adult unemployment
2. Large family size
3. Parents do not see any advantage in their children
getting educated as they find educated
unemployed persons in the society
4. Parents stake the future of their children for
immediate livelihood. Being illiterate themselves,
they do not perceive the long-term benefits of
education. They are also ignorant about the
consequences of children being engaged in work.
5. Poor learning achievement among children
6. Social acceptance of child labour and lack of
critical consciousness
Though 16 hazardous industries have been identified in
this district in which children are engaged, their
concentration is high in industries like stone-crushing and
breaking, brick-kilns, and construction industries. On the
other hand, out of eight non-hazardous occupations
identified, they are mostly seen in domestic work, working
in hotels and restaurants, working in different shops and
establishments, small cottage industries etc.
In keeping with the National Child Labour Policy, 1987
and aim of the State Government to eliminate child
labour in hazardous industries and gradually moving to
the complete elimination of child labour as well as the
rehabilitation and social integration of children released
from the worst fronts of child labour, the following
objectives have been set up for the district to address
the problem:-
Table 6.24 Block & Municipality-wise number of child labour
Sl. Block/ Hazardous work Non-hazrdous works Total
No. Municipality
Male Female Total Male Female Total Male Female Total
1 Bankura-I 5 0 5 349 201 550 354 201 555
2 Bankura-II 222 126 348 315 159 474 537 285 822
3 Indpur 19 8 27 302 280 582 321 288 609
4 Saltora 295 328 623 1097 987 2084 1392 1315 2707
5 Chhatna 82 66 148 510 466 976 592 532 1124
6 Mejia 63 71 134 98 38 136 161 109 270
7 Gangajalghati 111 78 189 754 759 1513 865 837 1702
8 Barjora 170 53 223 711 670 1381 881 723 1604
9 Bishnupur 10 5 15 228 172 400 238 177 415
10 Kotulpur 61 0 61 216 61 277 277 61 338
11 Joypur 65 3 68 430 279 709 495 282 777
12 Indas 88 9 97 571 333 904 659 342 1001
13 Sonamukhi 97 32 129 962 900 1862 1059 932 1991
14 Patrasayer 104 11 115 984 662 1646 1088 673 1761
15 Onda 68 38 106 115 45 160 183 83 266
16 Khatra 106 62 168 287 227 514 393 289 682
17 Ranibandh 228 301 529 200 217 417 428 518 946
18 Taldangra 58 2 60 91 29 120 149 31 180
19 Simlapal 124 72 196 124 51 175 248 123 371
20 Sarenga 74 50 124 161 73 234 235 123 358
21 Raipur 24 2 26 325 181 506 349 183 532
22 Hirbandh 168 235 403 73 134 207 241 369 610
23 Bankura Mun. 251 178 429 287 341 628 538 519 1057
24 Bishnupur Mun. 174 36 210 160 226 386 334 262 596
25 Sonamukhi Mun. 94 31 125 100 135 235 194 166 360
TOTAL 2761 1797 4558 9450 7626 17076 12211 9423 21634
Source:- Office of the District Magistrate, Bankura
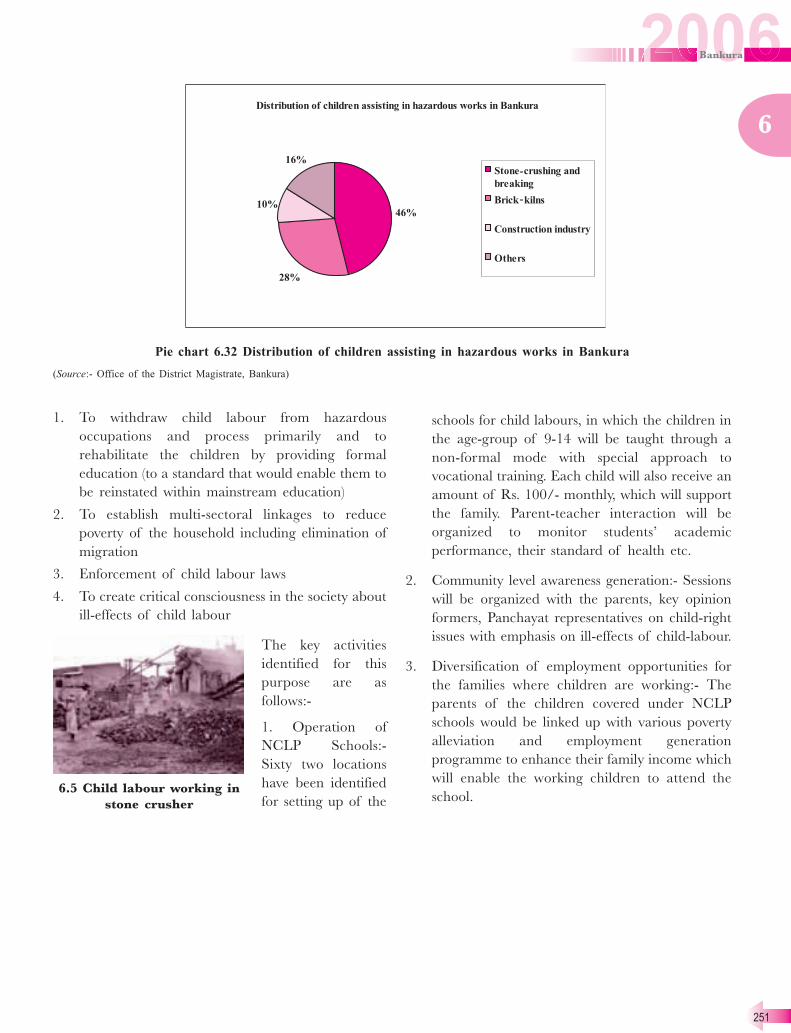
251
6
Pie chart 6.32 Distribution of children assisting in hazardous works in Bankura
(Source:- Office of the District Magistrate, Bankura)
1. To withdraw child labour from hazardous
occupations and process primarily and to
rehabilitate the children by providing formal
education (to a standard that would enable them to
be reinstated within mainstream education)
2. To establish multi-sectoral linkages to reduce
poverty of the household including elimination of
migration
3. Enforcement of child labour laws
4. To create critical consciousness in the society about
ill-effects of child labour
The key activities
identified for this
purpose are as
follows:-
1. Operation of
NCLP Schools:-
Sixty two locations
have been identified
for setting up of the
schools for child labours, in which the children in
the age-group of 9-14 will be taught through a
non-formal mode with special approach to
vocational training. Each child will also receive an
amount of Rs. 100/- monthly, which will support
the family. Parent-teacher interaction will be
organized to monitor students’ academic
performance, their standard of health etc.
2. Community level awareness generation:- Sessions
will be organized with the parents, key opinion
formers, Panchayat representatives on child-right
issues with emphasis on ill-effects of child-labour.
3. Diversification of employment opportunities for
the families where children are working:- The
parents of the children covered under NCLP
schools would be linked up with various poverty
alleviation and employment generation
programme to enhance their family income which
will enable the working children to attend the
school.
6.5 Child labour working in
stone crusher

252
66.9.1 Lepers :
A. Leprosy - the dreaded disease !
“Look at my hands - with these hands I could draw beautiful pictures. I was famous for the art. We are
‘Chitrakar’ - you know. But now !” This is how Prabir Chitrakar described his past, raising both his
hands in a gesture of ‘namaskar’, his eyes full of tears.
Prabir has lost his fingers. He continues, “My wife is a cancer patient. She has been operated. She is
now getting ray (radio therapy) from Gobindanagar hospital. Treatment is free. But I find it difficult to
bring her to the hospital from Kalyanpur. The transport cost is Rs. 20/-. Doctors are prescribing some
medicines, vitamins as she is very sick. How can I manage?”
“I used to cultivate in a patch of land. But I had to sell it for the treatment of my wife. You know I am
not supposed to beg. I don’t like it too ………. . But destiny has brought me to this stage.”
Prabir Kumar Chitrakar is one of the ‘beggars’ who drop down at Bankura Station every Saturday,
early in the morning and with deformity in different parts of their body, go door to door even dragging
their ulcerated feet.
* * * * *
“A home away from home”- this corporate ad’ doesn’t bring ‘moments of happiness’’ at least to Lakshmi
Rakshit, who is an inmate of Kustha (leprosy) colony of Nabajibanpur.
She was a housewife of Jugipara in Bankura town but staying for last seventeen years with ten other
deserted women like her in this colony barely 2-3 km. away from her house. On query Lakshmi replied,
“Yes, I have my husband, children, but since I came here I have not met them.”
“ How can I……? “ Lakshmi concluded with a deep sigh. She has accepted the judgement of the
greater society.
* * * * *
“Water, water everywhere, but not a drop to drink” - this famous quote appears to be true to the lives
of Rajen and sixteen other members of ‘Piardoba Leprosy After Care Colony’, so far the economic
access and control is concerned. They have grown an orchard over 173 Acres of land.
We also take care, guard the orchard during fruiting, it is sold on tender, the money is kept in a bank
account, this amount is utilized to manage our monthly grant of Rs. 500/- per family.
“ Can’t you market it?”
“How can we? We are fewer in number; we don’t know how to market this huge quantity of product.
On few occasion we tried to sell mango locally by vending but found it extremely difficult to ‘push’ the
fruits of more than 2000 plants in local market. We were offered very meagre price from the local
households.”
“A food processing unit could help us to some extent. As apart from selling the fruits on tender, at least
50 quintals of green mango perished this year, which fell from the trees due to stormy wind. Pickles and
other food products could have been made………..”, added Asimbabu, a local School teacher, ex-
Pradhan and a well-wisher to these families, whose effort has contributed a lot to the development of
this orchard with 2800 mango trees, 400 lichi, 4000 cashew, 2000 guava, 200 ber and 200 grape trees.
The land was allotted to this colony for their livelihood.
253
6
These are few examples of areas of vulnerability to a
section of our society who unfortunately got affected by
a disease, which is more of a social problem than
medical problem.
In Bankura District there are several settlement
established for the leprosy-affected physically challenged
persons. The names of the colonies are Nabajibanpur,
Kalyanpur, Mangalchandi, Jamunabandh, Piyardoba,
Bishnupur etc.
Of these, Nabajibanpur, and Kalyanpur are bigger
settlement, having 273 and 200 odd families respectively
and the rest having 16 to 50 families.
They are established from twelve to more than fifty years
back, to rehabilitate the medically treated and cured
leprosy patient who couldn’t go back to their families
mainly due to social stigma.
Though a lot of work has been done in rural
electrification, most of these colonies have no power
supply. The aged, deserted mothers of Nabajibanpur
Kustha Ashram, take their dinner at 5.00 p.m. as they
don’t have even a kerosene lamp.
Formation and structure of the families here have its
own uniqueness. The older colonies are continuing for
generations. In most of the colonies a few extremely
vulnerable and mostly aged women neither
accompanied by their family members nor finding any
partner here are staying alone. But picture of children
accompanied or born in the colonies and living healthy
life is also common in some of these colonies.
But the wide range of variations in their support and
assistance has made life and living condition quite
different from one colony to another colony.
Whereas in Nabajibanpur colony, the Department of
Social Welfare is providing some sort of support and
assistance to all the vulnerable and needy groups like
residential and fooding support to invalid persons and
students, the residents of other colonies have no such
support system.
‘Piyardoba Leprosy After Care Colony’ with sixteen
families as inmate settled in a deserted army camp have
access to 173 acre of productive land (orchard), but not
much of control over the production, as they only rear
and care for the whole asset. They have provision for
support in the form of Rs. 500/- per month as grant to
each family, but due to paucity of special fund they are
not getting it regularly. Amounts collected from ‘tender
sale’ of the orchard are used for maintaining this
monthly grant. Whenever they don’t get the grant they
receive rice @ 12 Kgs. per adult member per month
from the gratuitous relief scheme of the government.
The students of these colonies don’t receive any special
grant or attention for continuing their education.
Residents of Kalyanpur, Mangalchandi colonies (close
to Gouripur Leprosy Hospital) are even less fortunate.
They receive only 12 Kgs. of rice per month per enlisted
disabled member (very often one member in the family).
The residents of Kalyanpur colony can only boast of
a sizeable number of votes from their colony, but for
the support and service, they hardly can cite any bright
example. They constitute the major number of the
beggars from leprosy colonies in the district.
As far as education is concerned, some parents are
managing the educational need of their wards from
the earning of begging, a few students are staying at
‘Udayan Home’, Barrackpur. No specials grant for
continuing education for the students from these
families is available.
At Jamunabandh Colony (Bishnupur) nearly 45 families
stay. This colony is looked after by West Bengal Kustha
Kalyan Samity. They receive rice of 12 Kgs. per month
per adult head. No other support is provided, as stated
by the inmates of the colony. They also contribute a
substantial number in the beggar group.
B. What can be done :
“Don’t look into our disability, look at our ability.” This
perhaps will be the best approach while handling
lepers. Dealing with human values can lift their morale
to a considerable high, which is the need of the day.
They have the educated disease-free children who can
be socio-economically uplifted, if special effort is
extended to them in nurturing their potentiality and
providing opportunity. Mostly the unorganised section
can be organised into self-help groups (a few have been
recently initiated) and involved actively in their own
socio-economic development process.
Structured training and support can encourage them
to take up some viable venture. Currently most of them
are engaged in labour-oriented insecure jobs (rickshaw
pulling, unskilled labour etc.). Children from these
families have to be treated as special focus group

254
6
irrespective of their caste, creed, ethnicity etc. The
status of Nabajibanpur colony is much better than
others, where more than 150 persons are engaged in
Bankura Municipality as regular or casual employee.
Other employees including school-teachers are also
from this colony.
Whatever may be the socio-economic status, residents
of all the colonies have expressed lack of minimum
medical care in case of illness especially to the persons
with physical deformity. Treatment facilities for minor
ailments, dressing of wound are lacking and in spite
of all the effort not all the health workers feel
comfortable to dress a wound of a leprosy patient.
Training a couple of youth in each colonies on the
kind of services they need for day-to-day ailments and
providing them with required medicines and material
can do a lot to their morale and psyche.
6.9.3 Sabar community :
Sabars are the most backward among the tribal
population of this district. Many of them are houseless
and practically have no ostensible mean of income &
live on minor forest produce and income from minor
odd jobs. The concentration of Sabar people is high
in the blocks of Ranibandh and Raipur. The non-
availability of regular source of livelihood, dependence
on forest, lack of health and sanitation facilities have
kept them away from the mainstream of modern
civilization. Providing sources of livelihood for their
sustenance is a major and immediate need. However,
their assimilation into the social mainstream is a
delicate area, which requires finer touch.
Most of these families have no ancestral agricultural
land of their own, but some of them have received
patta lands from the government. However, traditional
agricultural practice on the unproductive soil of these
patta lands has not been able to improve their level of
income and remove their sufferings. At the time of
sowing of paddy, they primarily cultivate their own
land, which a few families possess, and work as
agricultural labourers on the lands of other people. As
the availability of job at local areas is not sufficient to
feed them, they migrate to the districts of Burdwan
and Hooghly to work there. At the time of harvesting
also, a sizeable number of Sabar people migrate to
those districts for otherwise they would remain jobless
and face starvation. However, throughout the year they
collect local forest produces like honey, various fruits,
roots etc. either for sale or for own consumption and
they also hunt animals like pig, snake, bird, frog etc. in
local forests to consume them.
Their dwelling condition is also far from satisfactory
with some of them even living in forest areas in scattered
hamlets (locally called ‘tola’). The literacy rate amongst
the Sabars is very low with about 2.42 percent of them
educated. Lack of educational facilities at their doorstep
coupled with lack of interest on their part and frequent
migration to neighbouring districts for livelihood has
become responsible for the poor educational coverage.
A survey on educational status of Sabar children was
conducted (results shown in table 6.25) and the results
are quite alarming.
Inadequate drinking water supply, lack of health and
family welfare services at their doorstep, lack of
communication facilities have all contributed to their
remaining distant and aloof from mainstream of
modern civilisation.
A concerted effort for making provision of irrigation at
micro-level, introduction of horticulture at otherwise
unproductive small patches of patta lands, income-
generating activities through formation of self-help
groups, construction of houses, improvement of
educational and health-related infrastructure in Sabar
hamlets, if taken up in a bigger way, can improve the
quality of their lives and reduce migration.
Under the Rashtriya Sam Vikas Yojana (RSVY), some
programme have been proposed for the Sabar
community which include:
i) Houses in cluster form for Sabar community in the
model of Indira Awaas Yojana
ii) Provision for safe drinking water
iii) Development of land so that it become cultivable
and generate income on a sustained basis
iv) Supports in areas like health and education
The lack of food security of Sabar families has always
remained a matter of concern, as most of them have
no regular source of income generation. 789 Sabar
families have so far been brought under the scope of
Antodaya Anna Yojana, with 419 familes in Ranibandh
and 252 in Raipur Block respectively. A sizeable number
of individuals are also getting foodgrains free of cost
under the Annapurna Yojana. Unfortunately Sabar

255
6
Table 6.25 Report of survey conducted on attainment of primary education by the
children of Sabar community
Number of Number of Total number of children in Total number of children in 5+ Total of drop-out children in
villages households 5+ to 14+ age-group to 14+ age-group attended school 5+ to 14+ age-group
surveyed surveyed
Boys Girls Boys Girls Boys Girls
40 528 360 412 99 104 87 79
(28 %) (25 %) (24 %) (19%)
Source:- Office of the District Programme Officer, Sarva Siksha Abhijan, Bankura ( The survey was conducted in four blocks Ranibandh,
Raipur, Khatra & Hirbandh.)
males are addicted to liquor and the environment at
this home is generally not conducive for proper
development of their children. An attempt is bring made
to bring their children to Ashram hostels and provide
them a healthy environment.
Bibliography :
1. M. S. Swaminathan, Food Security and Sustainable
Development
2. Amartya Sen, Poverty & Famines, Oxford University Press


257
Part-I: Personal Hygiene
Tap water has been identified as the chief source for
drinking. Toothpaste is commonly used for brushing
teeth. With respect to use of sanitary latrine at home,
only 21 percent follow the practice and nearly 73
percent do not have access to sanitary latrine at home.
The rate of school based sanitary latrine facility is very
poor, nearly 68 percent of the schools do not provide
the infrastructure. After defecation, the material
commonly used include ash and soap. Nearly, 78 percent
of the adolescent girls accessed pond for the purpose
of bathing. As part of common practice, 89 percent
washed hand before taking food.
Part-II: Physiological Status
About 89 percent of the adolescent girls undergo regular
menstruation cycle. For nearly 63 percent, usually the
cycle continues for 4-5 days. Only 36 percent of them
suffer from pain during the period. 60 percent of them,
as traditional method, use cloth for the purpose.
Part-III: Consumption Pattern
52 percent of the adolescent girls received square meal
a day. Carbohydrate is the chief dietary source identified
in their basic food group, which comprise of cereals,
pulses and vegetables. Milk and milk products and
animal protein are seldom consumed.
Part-IV: Level of Awareness
On the issue related to age of marriage, 31 percent
considered 21 years for male and 57 percent considered
18 years for female as the approved age for marriage,
both socially and legally. Only 41 percent of them
possessed knowledge on the contraceptive measures for
birth planning. Tubectomy, Vasectomy and use of Oral
Pills were the referred methods of contraception. HIV/
AIDS and its mode of transfer were known to 35
percent of them. They identified sexual relation as the
channel for transmission of HIV/AIDS.
Part-V: Behavioral Constraints
Rate of substance abuse is 10 percent in the form of
chewing tobacco. One incident of molestation has been
IAnnexure
identified from among the respondent group.
Part-I: Personal Hygiene
94 percent of the boys used tap water as the chief
source for drinking. Toothpaste is commonly used for
brushing teeth, only 33 percent used neem for the
purpose. Washing hand before food is a positive
practice being followed by them. With respect to use
of sanitary latrine at home, only 27 percent follow the
practice and nearly 66 percent do not have access to
sanitary latrine at home. The rate of school based
sanitary latrine facility is very poor, nearly 55 percent
of the schools do not provide the infrastructure.
Though 45 percent of the schools provide the facility,
of these, 63 percent remain unused. After defecation
the material commonly used include ash and soap. 61
percent accessed the pond for the purpose of bathing.
Part-II: Consumption Pattern
61 percent of the adolescent boys received one square
meal a day. Carbohydrate is the chief dietary source
identified in their basic food group, which comprise
of cereals, pulses and vegetables. Milk and milk
products and animal protein are seldom consumed.
Note: In the context of consumption pattern, there is
an existing gap (9 percent) in terms of frequency of
food intake between adolescent boys and girls, however
there is no deviance in relation to the quality of food
consumed on a regular basis.
Part-III: Level of Awareness
Regarding the issue of age of marriage, only 44
percent considered 21 years for male and 72 percent
considered 18 years for female as the approved age for
marriage, both socially and legally. 66 percent of them
possessed knowledge on the contraceptive measures for
birth planning. Tubectomy, Vasectomy, Condoms and
use of Oral Pills were the referred methods of
contraception. HIV/AIDS and its mode of transfer
were known to 44 percent of them. They identified
sexual relation and intra-venal needle as the channel
for transmission of HIV/AIDS.
Part-IV: Behavioral Constraints

258
AI
Rate of substance abuse is 22 percent in the form of
chewing tobacco and smoking. One incident of
molestation has been identified from among the
respondent group.
Part-I: Personal Hygiene
Tap water has been identified as the chief source for
drinking. Toothpaste is commonly used for brushing
teeth. Washing hand before food is a positive practice
being followed by them. With respect to use of sanitary
latrine at home, only 63 percent follow the practice
and 27 percent do not have access to sanitary latrine
at home. The rate of school based sanitary latrine
facility is very poor, nearly 63 percent of the schools
do not have the infrastructure. Significantly 27 percent
of the schools provide the facility, but 27 percent
remain unused. After defecation the material
commonly used include ash and soap. 54 percent
accessed ponds for the purpose of bathing.
Part-II: Physiological Status
About 72 percent of the adolescent girls undergo
regular menstruation cycle. For nearly 81 percent,
usually the cycle continues for 4-5 days. Nearly 72
percent of them suffer from pain during the period.
80 percent of them as traditional method use cloth for
the purpose.
Part-III: Consumption Pattern
90 percent of the adolescent girls received one square
meal a day. Carbohydrate is the chief dietary source
identified in their basic food group, which comprise
of cereals, pulses and vegetables. Milk and milk
products and animal protein are seldom consumed.
Part-IV: Level Of Awareness
Regarding the issue of age of marriage, only 45
percent considered 21 years for male and 90 percent
considered 18 years for female as the approved age for
marriage, both socially and legally. 72 percent of them
possessed knowledge on the contraceptive measures for
birth planning. Tubectomy and Condoms were the
referred methods of contraception. HIV/AIDS and
its mode of transfer were known to 90 percent of them.
They identified sexual relation and intra-venal needle
as the channel for transmission of HIV/AIDS.
Part-V: Behavioural Constraints
Substance abuse is totally absent. Seven incidents of
molestation have been identified from among the
respondent group.
Part-I: Personal Hygiene
Tap water has been the common source for drinking.
Toothpaste is commonly used for brushing teeth.
Washing hand before food is a positive practice being
followed by them. With respect to use of sanitary latrine
at home, 87 percent follow the practice and 18 percent
do not have access to sanitary latrine at home. The
status of school based sanitary latrine facility is very
high, nearly 95 percent of the schools do provide the
infrastructure and only 5 percent remain unused. After
defecation the material mostly used include soap, nearly
63 percent. About 35 percent accessed ponds and 45
percent accessed tap/tube well for the purpose of
bathing.
Part-II: Consumption Pattern
Above 77 percent of the adolescent boys received one
square meal a day. Carbohydrate is the chief dietary
source identified in their basic food group, which
comprise of cereals, pulses and vegetables. Milk and
milk products and animal protein are seldom consumed.
Part-III: Level Of Awareness
Regarding the issue of age of marriage, only 43 percent
considered 21 years for male and 63 percent considered
18 years for female as the approved age for marriage,
both socially and legally. Marginal percentage possessed
knowledge on the contraceptive measures for birth
planning. Tubectomy, Vasectomy, Condoms and use of
Oral Pills were the referred methods of contraception.
HIV/AIDS and its mode of transfer were known to 45
percent of them. They identified blood transfusion,
sexual relation and intra-venal needle as the channel
for transmission of HIV/AIDS.
Part-IV: Behavioural Constraints
Rate of substance abuse is 38 percent in the form of
chewing tobacco, smoking and betel leaf consumption.
Ten incidents of molestation have been identified from
among the respondent group.

259
AI
Part-I: Personal Hygiene
Tap water has been the common source for drinking.
Toothpaste is commonly used for brushing teeth.
Washing hand before food is a positive practice being
followed by them. With respect to use of sanitary latrine
at home, 64 percent follow the practice and nearly 33
percent do not have access to sanitary latrine at home.
The rate of school based sanitary latrine facility and its
use rate is very high nearly 92 percent. After defecation
nearly 77 percent used soap and 13 percent used ash.
59 percent accessed the pond for the purpose of bathing
and only 20 percent had in-house facility.
Part-II: Physiological Status
About 58 percent of the adolescent girls undergo regular
menstruation cycle and nearly 36 percent suffered from
irregular cycle. For nearly 71 percent, usually the cycle
continues for 4-5 days. Nearly 76 percent of them suffer
from pain during the period. 74 percent of them as
traditional method use cloth for the purpose.
Part-III: Consumption Pattern
Above 76 percent of the adolescent girls received one
square meal a day. Carbohydrate is the chief dietary
source identified in their basic food group, which
comprise of cereals, pulses and vegetables. Milk and
milk products and animal protein are seldom consumed.
Part-IV: Level of Awareness
Regarding the issue of age of marriage, only 41 percent
considered 21 years for male and 87 percent considered
18 years for female as the approved age for marriage,
both socially and legally. Marginal percentage possessed
knowledge on the contraceptive measures for birth
planning. Tubectomy and Vasectomy were the referred
methods of contraception. HIV/AIDS and its mode
of transfer were known to 28 percent of them. They
identified sexual relation, from affected mother to her
child and intra-venal needle as the channel for
transmission of HIV/AIDS.
Part-V: Behavioural Constraints
Rate of substance abuse is 17 percent in the form of
chewing tobacco. No incident of molestation as been
identified from among the respondent group.
Part-I: Personal Hygiene
Tap water has been the common source for drinking.
Toothpaste is commonly used for brushing teeth, only
24 percent used neem for the purpose. Washing hand
before food is a positive practice being followed by
them. With respect to use of sanitary latrine at home,
only 29 percent follow the practice and nearly 70
percent do not have access to sanitary latrine at home.
The rate of school based sanitary latrine facility is very
poor, nearly 58 percent of the schools do not provide
the infrastructure. Significantly 35 percent of the
schools provide the facility, however, it remain unused.
After defecation the material commonly used include
ash and soap. 59 percent accessed the pond for the
purpose of bathing.
Part-II: Consumption Pattern
Above 90 percent of the adolescent boys received one
square meal a day. Carbohydrate is the chief dietary
source identified in their basic food group, which
comprise of cereals, pulses and vegetables. Milk and
milk products and animal protein are seldom
consumed.
Part-III: Level of Awareness
Regarding the issue of age of marriage, only 41
percent considered 21 years for male and 76 percent
considered 18 years for female as the approved age for
marriage, both socially and legally. 82 percent of them
possessed knowledge on the contraceptive measures for
birth planning. Tubectomy, Vasectomy, Condoms and
use of Oral Pills were the referred methods of
contraception. HIV/AIDS and its mode of transfer
were known to 47 percent of them. They identified
sexual relation and intra-venal needle as the channel
for transmission of HIV/AIDS.
Part-IV: Behavioral Constraints
Rate of substance abuse is 11 percent in the form of
chewing tobacco. No incident of molestation has been
identified from among the respondent group

260
Methodology for Rapid Assessment
Programme (RAP) study
Sampling methodology :
� The universe for the sample consists of all mothers
of currently 0-2 year old children (reference date
to be determined) in villages (areas covered by
anganwadi centers) included as replication sites for
the first phase of replication under INHP II
(Integrated Nutrition and Health Programme).
These are sites where INHP II had planned to
establish interventions by September 03, and
formed the universe of the baseline RAP in
November 03 as well.
� The survey used two different index groups to
estimate various outcome indicators. These index
groups are:
1. Mothers with children up to 6 months of age to
estimate outcome indicators related to pregnancy,
delivery and newborn care, and aspects of child
care in the first six months.
2. Mothers with children 6-23 completed months of
age to estimate outcome indicators related to
infant feeding practices, immunization and vitamin
A.
� The service providers were interviewed to assess
their knowledge and practices. Service providers
include Aanganwadi Workers (AWW), Auxillary
Nurse and Mid Wife (ANM) and Change Agents
(community volunteers trained by CARE)
� The minimum sample size required is mothers of
approximately 540 children in each age group for
each district with at least 90% capture rate.
Selection of AWCs
The envisaged sample of mothers of 540 children in
each group is to be selected from household lists from
sampled AWCs .
IIAnnexure
House-listing :
In each of the selected AWC, the entire catchment area
of the AWC has been listed. A working map of the AWC
area, depicting all the structures, needs to be constructed
by the deputed agency. Care should be taken that no
household in the AWC area is left out. In the case of large
villages containing more than one AWC, it should be
ensured that only those households falling in the
geographical area of the selected AWC are listed/
mapped. The help of the AWW should be taken to
identify the geographical boundaries of the AWC.
Only the usually resident mothers will be listed, during
the house-listing exercise. Non-usual residents present in
the households at the time of listing will not be considered
for the survey and hence, will not be listed. This will mean
fewer women will be available in the 0-5 months age
group than expected according to birth-rate based
estimates. However, it is expected that sufficient numbers
will be found in 90 AWCs put together.
Selection of index women :
Two separate lists of children will be generated, one
comprising children 0-5 months of age and the other
6-23 months of age. The sample of 540 children in the
age group 0-5 months and 540 children in the age
group 6-23 months will be drawn from these lists using
a simple random sampling technique such that each
eligible household in the 90 selected AWCs has an equal
opportunity of being selected to be interviewed. Thus,
the households to be sampled will be determined before
the interviewers set out for fieldwork. While it is
expected that the number to be sampled will be available
from the 90 villages selected, any shortfall in the sample
will be compensated for by choosing more AWCs as
needed to make up the sample, even while house-listing
is in progress.
There will be no replacements in the sample drawn and
an achievement level of 90% separately for each group
in each district is expected.


