Embed Size (px)
Citation preview

0273-1177/$34
doi:10.1016/j.a
www.elsevier.com/locate/asr
Available online at www.sciencedirect.com
Advances in Space Research 42 (2008) 1777–1785
Distributing space weather monitoring instrumentsand educational materials worldwide for IHY 2007:
The AWESOME and SID project
Deborah Scherrer a,*, Morris Cohen b, Todd Hoeksema c, Umran Inan b,Ray Mitchell a, Philip Scherrer c
a Stanford Solar Center, Stanford University, HEPL-4085, 491 South Service Road, Stanford, CA 94305-4085, USAb STAR Lab, MC9515, Stanford University, Stanford, CA 94305-9515, USA
c Solar Observatories Group, Stanford University, HEPL-4085, Stanford,CA 94305-408, USA
Received 30 January 2007; received in revised form 5 December 2007; accepted 20 December 2007
Abstract
The International Heliophysical Year (IHY) aims to advance our understanding of the fundamental processes that govern the Sun, Earth,and heliosphere. The IHY Education and Outreach Program is dedicated to inspiring the next generation of space and Earth scientists as wellas spreading the knowledge, beauty, and relevance of our solar system to the people of the world. In our Space Weather Monitor project wedeploy a global network of sensors to high schools and universities to provide quantitative diagnostics of solar-induced ionospheric distur-bances, thunderstorm intensity, and magnetospheric activity. We bring real scientific instruments and data in a cost-effective way to studentsthroughout the world. Instruments meet the objectives of being sensitive enough to produce research-quality data, yet inexpensive enoughfor placement in high schools and universities. The instruments and data have been shown to be appropriate to, and usable by, high schoolage and early university students. Data contributed to the Stanford data center is openly shared and partnerships between groups in differentnations develop naturally. Students and teachers have direct access to scientific expertise.
The result is a world-wide collaboration of scientists, teachers, and students to investigate the variability of the ionosphere. Theresearch-quality AWESOME (Atmospheric Weather Electromagnetic System of Observation, Modeling, and Education) instrumentshave been selected as a participating program by the United Nations Basic Space Science Initiative (UNBSSI). The IHY Committeefor International Education and Public Outreach has designated the simpler SID (Sudden Ionospheric Disturbance) monitors to be pro-vided to teacher/student teams in each of the 192 countries of the world.� 2008 COSPAR. Published by Elsevier Ltd. All rights reserved.
Keywords: Science education; Ionosphere; Space weather; Remote sensing; IHY; Solar flares
1. Introduction
How best could we address the goals of the IHY? Couldwe find a way to bring real scientific instruments and datain a cost-effective way to researchers and students?
Through hands-on science, could students relate to thegoals of IHY by advancing our understanding of the fun-damental processes that govern the Sun, Earth, and helio-sphere? Would it inspire the next generation of scientistsand help spread the knowledge of our solar system andthe exciting process of scientific exploration?
To find out, we undertook a 4 year test program todevelop and provide space weather monitoring instrumentsto high schools and universities throughout the US and atselected sites around the world.
* Corresponding author. Tel.: +1 650 723 1495; fax: +1 650 7252333.E-mail addresses: [email protected] (D. Scherrer), mco-
[email protected] (M. Cohen), [email protected] (T. Hoeksema),[email protected] (U. Inan), [email protected] (R. Mitchell),[email protected] (P. Scherrer).
� 2008 COSPAR. Published by Elsevier Ltd. All rights reserved.
sr.2007.12.013

Our two-part program provides a network of spaceweather monitor sensors to a worldwide team who can per-form quantitative investigations of ionospheric distur-bances. The network consists of two classes of receivers:(a) a research-grade, electromagnetic receiver sensitive toVery Low Frequencies (VLF, 3–30 kHz) and ExtremelyLow Frequencies (ELF, 300–3000 Hz), able to detect abroad range of ionospheric phenomena (Fig. 1), and (b)low cost monitors sensitive to solar flare-induced VLF sud-den ionospheric disturbances and appropriate for studentuse (Fig. 2). Thus the program features both researchand educational components. This paper explains both,emphasizing the educational aspects.
2. Monitoring the ionosphere
2.1. Science objectives
Our chief scientific goal is quantitative comparison oflocal ionospheric disturbances, magnetospheric activity,and thunderstorm intensity across much of the globethrough the method of ELF/VLF monitoring. ELF/VLFmonitoring involves the study of three types of signals.
The first are VLF transmissions in the 20–30 kHz range,operated by various navies for long-range communicationswith their submarines. Second, short-duration radiationfrom lightning strikes, known as radio atmospherics, orsferics, are guided in a similar manner between the Earthand ionosphere, enabling detection and localization oflightning strikes from thousands of kilometers away(Wood and Inan, 2004). Finally, so-called whistler signalspropagating in the magnetosphere, often generated bylightning strikes, can couple into the atmosphere (Helliwellet al., 1973) and be detected by VLF receivers on theground, often in association with ionospheric disturbances.AWESOME monitors can detect these lightning-induceddisturbances. VLF methods are uniquely suited for studiesof these phenomena, since many physical processes createmeasurable effects of more than one of these three types,each of which provides a different perspective on a givenevent. Although such VLF monitoring methods are widelyemployed, a number of scientific questions and techniquescan only be answered with the existence of a world-widenetwork of instruments.
2.2. The problem
ELF/VLF remote sensing enables study of an extraordi-narily broad set of phenomena, each of which impacts theionosphere in a unique way, including solar flares, cosmicgamma ray bursts, lightning strikes and lightning-relatedeffects, earthquakes, electron precipitation, aurora, andmore. Due to the extremely sensitive nature of the lowerionosphere, even small changes can be readily detected withthe proper instrumentation. Waves at ELF/VLF frequen-cies are efficiently guided between the Earth and lower ion-osphere, and thus can be detected at global distances. Wemonitor world-wide transmissions in the 20–30 kHz range,a band containing many signals sent by various navies forlong-range communications with submarines. Solar- andlightning-induced transient lower ionospheric disturbancescan be monitored by measuring changes in the amplitudeand phase of waves from these transmitters.
Although ionospheric monitors already existed, ourteam was required to develop new technology to meet pro-ject objectives:
� Instruments must be sensitive enough to produceresearch-quality data, yet inexpensive enough for place-ment in high schools and universities around the world.� The instruments, data, and supporting educational
materials must be effective, appropriate to, and usableby, high school age and early university students.� Students must be able to share data and communicate
with each other.� There must be a way for teachers and students to
quickly access scientific expertise.� The project must have minimal needs requirements (e.g.
require no expensive additional equipment) and beextendable to developing nations and wide distribution.
Fig. 1. AWESOME research-quality ionospheric monitor designed foruniversities.
Fig. 2. SID ionospheric monitor, designed for high school use.
1778 D. Scherrer et al. / Advances in Space Research 42 (2008) 1777–1785

� The project must educate, enthuse, and excite students,hopefully encouraging them to continue in studies forscience, technology, engineering, and math (STEM)careers.
2.3. Our new monitors: SID and AWESOME
The Sudden Ionospheric Disturbance (SID) monitorswere inspired by a suggestion from Paul Mortfield thatthe Stanford Solar Center deploy an instrument alreadyin use by the AAVSO, the American Association of Vari-able Star Observers (AAVSO website). The AAVSO mon-itors measure a single selected radio frequency to detect theeffects of solar events on VLF radio wave propagationwithin the Earth’s ionosphere. However, the AAVSOinstrument required extensive construction, testing, tuning,and equipment (Scherrer and Scherrer, 2005) which werenot feasible for high school classes. With funding fromthe NSF Center for Integrated Space – Weather Modeling(CISM), in conjunction with Ray Mitchell and WilliamClark, local teachers selected for their electronics expertise,we undertook a 2-year redesign of the SID monitors. Theresult was a preassembled new instrument appropriate forhigh schools, at the low cost of about US$250.
Stanford’s Holographic Array for Ionospheric Light-ning (HAIL) project was already studying the physical nat-ure of quiescent and transient changes in the lowerionosphere. HAIL instrumentation consisted of fully digi-tal VLF receivers deployed at nine high schools. While suc-cessful, the instruments cost about US$30,000, beyondwhat could be supported in a large distribution. Again withfunding from CISM, Morris Cohen and Justin Tan under-took a 2-year redesign of the original HAIL instrument.The outcome was the Atmospheric Weather Electromag-netic System for Observation, Modeling, and Education(AWESOME) monitor, designed to do what SID does(narrowband amplitude), but also to measure narrowbandphase, provide higher sensitivity, and save the full ELF/VLF electromagnetic waveform (broadband data,100 kHz). The new AWESOME took advantage ofadvances in GPS technology, circuit board fabrication,and computing resources – resulting in the minimal costof about US$3,000 each.
Both monitors come preassembled, but students‘‘buy in” by designing and building their own antenna,which costs little and takes a few hours to assemble. Par-ticipants also provide a simple PC to record the dataand, if possible, an internet connection to share theirdata with the rest of the team. We chose to provideready-built technology because it is more easily incorpo-rated into classrooms and it encourages students to focuson the science rather than getting bogged down in thetime-consuming complication of equipment assembly, cal-ibration, and testing. Stanford collects the data and pro-vides access to researchers and scientific and technicalassistance to participants.
3. Ionospheric phenomena
A solar flare is a sudden, rapid, and intense variation inbrightness occurring when magnetic energy that has builtup in the solar atmosphere is suddenly released. Radiationis emitted across the entire electromagnetic spectrum. Theenergy released during a flare is typically on the order of1027to 1032 ergs/s. Sudden Ionospheric Disturbances (SIDs)occur in association with solar flares and have a very strongand relatively long-lasting effect on the ionosphere (Thom-son and Cliverd, 2001). Strong solar flares have been knownto knock out satellite and network communications. Earth’sdayside ionosphere responds quickly and dramatically(�2.5 min 1/e rise time) to the X-ray and EUV input byan abrupt increase in total electron content.
Lightning can also indirectly generate ionospheric dis-turbances, when some of the released energy escapes theatmosphere and enters the magnetosphere in the form ofwhistler waves. Whistler waves can exchange energy withVan Allen radiation belt particles trapped in the magneto-sphere through gyroresonance (Inan and Helliwell, 1978).This not only causes the whistler waves to grow in power,but also redirects the particles so that they precipitate ontothe ionosphere where they produce measurable changes inthe electron density profile (Helliwell et al., 1973). Theseso-called Lightning-induced Electron Precipitation (LEP)events may play a dominant role in the loss processes ofthe radiation belts.
Cosmic Gamma-ray Bursts (GRB) also have a verylarge effect on the ionospheric profile (Inan et al., 1999).They can produce enormous effects (20 dB or more) lastingmany minutes on the signals propagating through theionosphere.
The recent discovery of Terrestrial Gamma-ray Flashes(TGFs) by the CGRO spacecraft (Fishman et al., 1994)and subsequent detection by the RHESSI spacecraft(Smith et al., 2005), open broad questions about the natureof the physical processes associated with lightning strikesthat produce the extremely high electric fields and highlyrelativistic electrons responsible for gamma-ray emission.Energy levels from these TGFs exceed 20 MeV (Smithet al., 2005), rivaling the energy levels of powerful cosmicsources such as black holes and collapsing stars, exceptthey originate in our own atmosphere. Though most TGFsare closely linked with individual lightning strokes (Inanet al., 1996; Cohen et al., 2006), the nature of the physicalprocesses that generate TGFs remains unknown.
Finally, limited but elusive evidence exists that iono-spheric disturbances may occur in association with, orprior to, strong earthquakes (Freund, 2005). ELF emis-sions have been detected at short range from the epicenter(Fraser-Smith et al., 1990), and longer range VLF monitor-ing may detect shifts in the diurnal variations of VLFtransmitter signals (Hayakawa et al., 1996; Molchanovand Hayakawa, 1998; Chakrabarti et al., 2005). Earth-quakes are spread globally and occur unpredictably. It isdifficult to distinguish small earthquake-related effects from
D. Scherrer et al. / Advances in Space Research 42 (2008) 1777–1785 1779
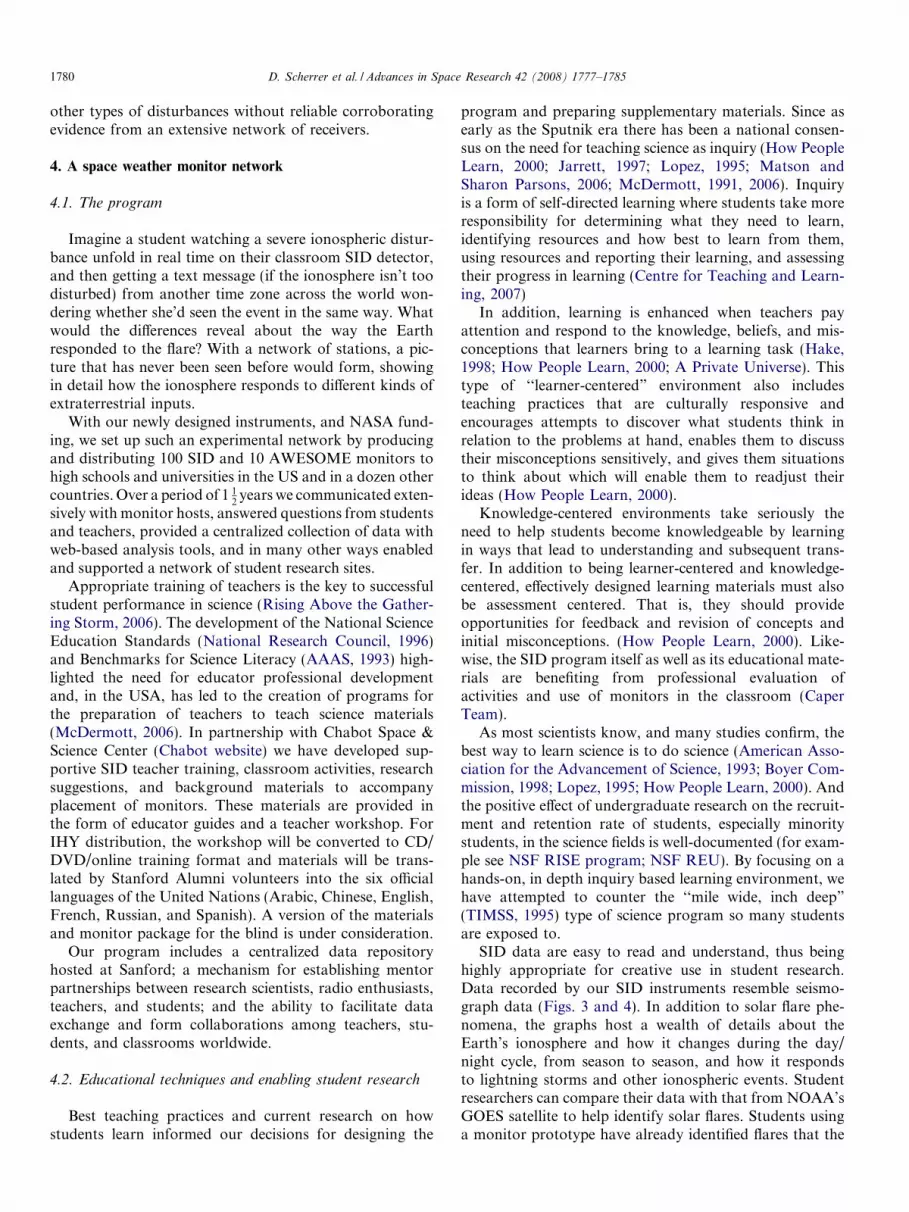
other types of disturbances without reliable corroboratingevidence from an extensive network of receivers.
4. A space weather monitor network
4.1. The program
Imagine a student watching a severe ionospheric distur-bance unfold in real time on their classroom SID detector,and then getting a text message (if the ionosphere isn’t toodisturbed) from another time zone across the world won-dering whether she’d seen the event in the same way. Whatwould the differences reveal about the way the Earthresponded to the flare? With a network of stations, a pic-ture that has never been seen before would form, showingin detail how the ionosphere responds to different kinds ofextraterrestrial inputs.
With our newly designed instruments, and NASA fund-ing, we set up such an experimental network by producingand distributing 100 SID and 10 AWESOME monitors tohigh schools and universities in the US and in a dozen othercountries. Over a period of 1 1
2years we communicated exten-
sively with monitor hosts, answered questions from studentsand teachers, provided a centralized collection of data withweb-based analysis tools, and in many other ways enabledand supported a network of student research sites.
Appropriate training of teachers is the key to successfulstudent performance in science (Rising Above the Gather-ing Storm, 2006). The development of the National ScienceEducation Standards (National Research Council, 1996)and Benchmarks for Science Literacy (AAAS, 1993) high-lighted the need for educator professional developmentand, in the USA, has led to the creation of programs forthe preparation of teachers to teach science materials(McDermott, 2006). In partnership with Chabot Space &Science Center (Chabot website) we have developed sup-portive SID teacher training, classroom activities, researchsuggestions, and background materials to accompanyplacement of monitors. These materials are provided inthe form of educator guides and a teacher workshop. ForIHY distribution, the workshop will be converted to CD/DVD/online training format and materials will be trans-lated by Stanford Alumni volunteers into the six officiallanguages of the United Nations (Arabic, Chinese, English,French, Russian, and Spanish). A version of the materialsand monitor package for the blind is under consideration.
Our program includes a centralized data repositoryhosted at Sanford; a mechanism for establishing mentorpartnerships between research scientists, radio enthusiasts,teachers, and students; and the ability to facilitate dataexchange and form collaborations among teachers, stu-dents, and classrooms worldwide.
4.2. Educational techniques and enabling student research
Best teaching practices and current research on howstudents learn informed our decisions for designing the
program and preparing supplementary materials. Since asearly as the Sputnik era there has been a national consen-sus on the need for teaching science as inquiry (How PeopleLearn, 2000; Jarrett, 1997; Lopez, 1995; Matson andSharon Parsons, 2006; McDermott, 1991, 2006). Inquiryis a form of self-directed learning where students take moreresponsibility for determining what they need to learn,identifying resources and how best to learn from them,using resources and reporting their learning, and assessingtheir progress in learning (Centre for Teaching and Learn-ing, 2007)
In addition, learning is enhanced when teachers payattention and respond to the knowledge, beliefs, and mis-conceptions that learners bring to a learning task (Hake,1998; How People Learn, 2000; A Private Universe). Thistype of ‘‘learner-centered” environment also includesteaching practices that are culturally responsive andencourages attempts to discover what students think inrelation to the problems at hand, enables them to discusstheir misconceptions sensitively, and gives them situationsto think about which will enable them to readjust theirideas (How People Learn, 2000).
Knowledge-centered environments take seriously theneed to help students become knowledgeable by learningin ways that lead to understanding and subsequent trans-fer. In addition to being learner-centered and knowledge-centered, effectively designed learning materials must alsobe assessment centered. That is, they should provideopportunities for feedback and revision of concepts andinitial misconceptions. (How People Learn, 2000). Like-wise, the SID program itself as well as its educational mate-rials are benefiting from professional evaluation ofactivities and use of monitors in the classroom (CaperTeam).
As most scientists know, and many studies confirm, thebest way to learn science is to do science (American Asso-ciation for the Advancement of Science, 1993; Boyer Com-mission, 1998; Lopez, 1995; How People Learn, 2000). Andthe positive effect of undergraduate research on the recruit-ment and retention rate of students, especially minoritystudents, in the science fields is well-documented (for exam-ple see NSF RISE program; NSF REU). By focusing on ahands-on, in depth inquiry based learning environment, wehave attempted to counter the ‘‘mile wide, inch deep”
(TIMSS, 1995) type of science program so many studentsare exposed to.
SID data are easy to read and understand, thus beinghighly appropriate for creative use in student research.Data recorded by our SID instruments resemble seismo-graph data (Figs. 3 and 4). In addition to solar flare phe-nomena, the graphs host a wealth of details about theEarth’s ionosphere and how it changes during the day/night cycle, from season to season, and how it respondsto lightning storms and other ionospheric events. Studentresearchers can compare their data with that from NOAA’sGOES satellite to help identify solar flares. Students usinga monitor prototype have already identified flares that the
1780 D. Scherrer et al. / Advances in Space Research 42 (2008) 1777–1785

GOES catalog ‘‘missed” perhaps due to human error.Students can trace events back to specific active regionson the Sun and can view corresponding images fromNASA solar observatories such as SOHO/MDI, SOHO/EIT, TRACE, STEREO, and eventually SDO.
To meet the goal of exciting the next generation ofscientists, we provided a collection of potential researchprojects and ideas modeled on inquiry-based formats anddesigned to inspire and engage, as well as a start-upresearch lab activity, thoroughly documented and designed
Fig. 3. SID Data. Note the characteristic sunrise/sunset patterns. Solar flares show up as spikes. The amplitude and phase of these signals vary accordingto diurnal, seasonal, and transient changes in the ionosphere.
Fig. 4. Data from the AWESOME monitor is typically viewed in one of two forms shown here: the spectrograms (above) show broadband data while theVLF transmitter plots (below) show narrowband data. In the spectrograph, received at Palmer Station, Antarctica, the frequent vertical lines known asradio atmospherics, or sferics, originate from lightning strikes anywhere on Earth. These sferics often launch ‘‘whistler” signals, which can escape theatmosphere entirely, propagate in the magnetosphere and land on the other end. These can be seen as the curved shape features near the bottom in the1–5 kHz range. The horizontal lines represent the signals from VLF radio transmitters.
D. Scherrer et al. / Advances in Space Research 42 (2008) 1777–1785 1781

to develop techniques for, and expertise in, understandingand analyzing SID data. Research suggestions emphasizecollaboration and include comparing and understandingsunrise and sunset ionospheric phenomena at different lat-itudes, longitudes, and seasons; monitoring solar flares andtracing their history on the Sun; monitoring and under-standing ionization effects such as day/night cycles, andthe effects of events like solar eclipses, lightning storms,meteors, and gamma ray events; antenna design and itsaffect on performance; prediction of solar events and theiraffects on the ionosphere; identification of unknown signa-tures in SID data; and ionospheric changes as earthquakepredictors.
About 50 students have undertaken successful researchprojects on all subjects save the prediction of solar events(for which an activity is being designed) and earthquakemonitoring, which necessarily relies on the sporadic natureof earthquakes. Though these suggested activities were tar-geted for high school level, there is a rich set of physics thatcan be creatively investigated at levels through introduc-tory college.
4.3. Case study – alignment with science standards
To assure effectiveness, we closely aligned our projectwith the US National Science Education Standards(National Research Council, 1996). The Standards empha-size science as inquiry. Unifying concepts and processesparallel those in the Standards, and include focus on thefundamental aspects of solar activity and their effects onthe Earth, on obtaining data, taking measurements, onobserving and understanding change and constancy, andlearning to interpret and explain results from data.
To initially test our hypothesis that alignment with stan-dards and hands-on access to data could improve scienceunderstanding, early in the program we placed prototypeSID monitors with students in Richard Styner’s sopho-more science class at San Leandro High School in Califor-nia USA, a minority-serving institution. Student teamschose to correlate their captured solar events with environ-mental changes on Earth. They collected data on localoccurrences such as hospital emergency admissions, wild-fires, student behavioral referrals, and police activity, andcompared these with solar activity recorded by their SIDmonitor. Students performed analyses and drew conclu-sions, generated written reports, and gave presentationson their research, which Solar Center staff attended. Fromthe presentations and written reports, it was clear that stu-dents could successfully work with the monitors and hadachieved a general understanding of the heliophysical pro-cesses that govern the Sun and Earth.
The students also learned a great deal about the chal-lenges in collecting environmental data, hence furtheringtheir understanding of the nature of scientific knowledgeand science as a human endeavor, as encouraged by theStandards. The pairing of the instrument with scientificinquiry improved student understanding of technological
design and the functions technology can play in science.Finally, as the Standards encourage, the project facilitatedteachers and students working directly with scientists andreal data, providing them unique opportunities to experi-ence the nature of scientific inquiry. Although the USNational Science Standards do not specifically apply toother nations, we found the concepts and guiding princi-ples were strong and valid models for teaching studentsin this inner-city environment and could feasibly beextended throughout the world.
4.4. Case study – encouraging students into STEM careers
A recent report by the National Academies (2006) notesthe need to ‘‘increase America’s [and presumably theworld’s] talent pool by vastly improving K-12 science andmathematics education” in order to ‘‘sustain andstrengthen the Nation’s traditional commitment to long-term basic research.” As noted earlier, abundant evidenceshows that high school and college science teaching isimproved when the students engage in doing real scienceon real data. We wanted to contribute to the training,involvement in, and enthusiasm for science, technology,engineering, and math (STEM) careers, and especiallyencourage better representation from members of under-served and underutilized groups. Our target of high schoolage classrooms allowed us to focus on students while theyare still able to ‘‘take the next step” (e.g. complete requiredmath and science subjects) before choosing a major orcareer target. The enthusiasm generated by working withtheir own hands-on solar activity monitor, their introduc-tion to information technology through our data and com-munications facilities, and their direct experience withScientist Mentors as role models should encourage studentsto go farther and consider career choices in science andtechnology.
As an example, Leandra Merola, a student at South SideHigh School in Rockville Centre, New York USA, under-took a three-month SID-based research project, ‘‘A Studyof the Effects of Sunrise and Sunset on the Ionosphere asObserved by VLF Wave Behavior.” Her teacher was Rich-ard Kurtz and Stanford Solar Center put Ms. Merola intouch with mentors Nick Gross, of CISM, and Don Rice,Center for Atmospheric and Space Sciences, Utah StateUniversity. She also had access to Miriam Forman, atthe State University of New York at Stony Brook. Ms.Merola defined her own project, set her own goals,installed the SID monitor, captured data for severalmonths, and undertook analyses of how solar-inducedchanges to the ionosphere affected the sunrise and sunsetsignatures of VLF waves propagating through the iono-sphere. Her project was entered in the prestigious Intel Sci-ence Talent Search competition, ‘‘America’s oldest andmost highly regarded pre-college science competi-tion. . .often referred to as the junior Nobel Prize” (Intelwebsite). Her work was also selected to be presented atthe Regional Round of the Junior Science and Humanities
1782 D. Scherrer et al. / Advances in Space Research 42 (2008) 1777–1785

Symposium (Junior Science and Humanities Symposium,website), a highly competitive gathering where Ms. Merolaplaced third of 120 students invited. Ms. Merola hasreceived a full scholarship based partially on her accom-plishments with the SID monitor, and intends to pursuea career in science.
With the expansion of our network, we hope tostrengthen the world’s future workforce by developingthe critical skills and capabilities needed by engaging stu-
dents in hands-on research with real scientific data to givethem direct experience in STEM fields (Fig. 5).
5. Extension to IHY
Because of the success of our test project, our AWE-SOME monitors have been selected by the IHY UnitedNations Basic Space Science Initiative (UNBSSI) as a Par-ticipating Program (United Nations, 2005). The IHY Inter-national Committee for Education and Public Outreachhas designated our SID program to be of particular interestfor use in their pre-college education program (Rabello-Soares, 2006). AWESOME monitors have already beenplaced in ten countries and SIDs in twelve countries as betatests of the functionality of the program at internationalsites. Our plan is to place 25 additional AWESOME mon-itors with science teams in developing nations and provideSID monitors to interested educators in each of the 68countries of the world with identified IHY National Coor-dinators. Supplemental funding is being sought to allow usto place SID monitors in each of the remaining �124 coun-tries of the world.
6. Summary
Through the Space Weather Monitor Project, we havebrought real scientific instruments and data in a cost-effec-tive way to students and researchers throughout the world.Instruments meet the objectives of being sensitive enoughto produce research-quality data, yet inexpensive enoughfor placement in high schools and universities. The instru-ments, data, and supporting educational materials havebeen shown to be appropriate to, and usable by, highschool age and early university students. Data contributedto the Stanford data center is openly shared and partner-ships between groups in different nations develop naturally.Students and teachers have direct access to scientific exper-tise. Finally, the project has been shown to educate,enthuse, and excite students, encouraging them to continuein studies for STEM careers.
The IHY provides a unique opportunity to expand, on atruly global level, the lessons learned from our monitorplacement and to support deployment of scientific instru-ments to a network of students, teachers, and researchersin developing nations and around the world. This is a steptowards meeting the IHY goals of advancing our under-standing of the fundamental processes that govern theSun, Earth, and heliosphere and also inspiring the nextgeneration of space and Earth scientists and spreadingthe knowledge, beauty, and relevance of our solar systemto the people of the world.
Acknowledgements
This project was originally developed and funded by theNational Science Foundation’s Center for Integrated SpaceWeather Modeling, NSF contract 00-67. Additional fund-
Fig. 5. Students at Deer Valley High School in Antioch, California, USAexperiment with their monitors.
D. Scherrer et al. / Advances in Space Research 42 (2008) 1777–1785 1783

ing was provided by NASA contract NNG05GH15G,supporting the MDI instrument onboard the Solar andHeliospheric Observatory (SOHO). SOHO is a project ofinternational cooperation between ESA and NASA.Further funding was provided by NASA contractNAS5-01239 for the Helioseismic and Magnetic Imager(HMI) instrument for NASA’s Solar Dynamics Observa-tory. Support for the IHY distribution is being providedby NASA and by Stanford University.
References
A Private Universe, video produced by Matthew Schneps and the ScienceMedia Group of the Harvard-Smithsonian Center for Astrophysics.
AAVSO, American Association of Variable Star Observers, ‘‘SIDs –Sudden Ionospheric Disturbances”. Available from: <http://www.aavso.org/observing/programs/solar/sid.shtml/>.
‘‘Benchmarks for Science Literacy: Project 2061.” American Associationfor the Advancement of Science. Oxford University Press, New York,NY, USA, 1993.
The Boyer Commission on Educating Undergraduates in the ResearchUniversity: Reinventing Undergraduate Education: a Blueprint forAmerica’s Research Universities; State University of New York, NewYork, NY 1998. Available from: <http://naples.cc.sunysb.edu/Pres/boyer.nsf/>.
Caper Team, University of Arizona, Tucson, AZ. Available from: <http://caperteam.as.arizona.edu/>.
Centre for Teaching and Learning, ‘‘Good practice – Inquiry-basedLearning”. Available from: <http://www.queensu.ca/ctl/goodpractice/inquiry/>.
Chabot Space & Science Center. Available from: <http://www.chabotspace.org/>.
Chakrabarti, S.K., Saha, M., Khan, R., Mandal, S., Acharyya, K., Saha,R., Unusual Sunset Terminator Behavior of VLF Signals at 17 kHzduring the Earthquake Episode of Dec. 2004. Presentation at theXXVIIIth URSI General Assembly in New Delhi, India, 2005.Available from: <http://www.ursi.org/Proceedings/ProcGA05/pdf/EP.18(01596).pdf/>.
Cohen, M.B., Inan, U.S., Fishman, G. Terrestrial gamma ray flashesobserved aboard the compton gamma ray observatory/burst andtransient source experiment and ELF/VLF radio atmospherics. J.Geophys. Res. 111, D24109, doi:10.1029/2005JD006987, 2006.
Fishman, G.J., Bhat, P.N., Mallozzi, R., Horack, J.M., Koshut, T.,Kouveliotou, C., Pendleton, G.N., Meegan, C.A., Wilson, R.B.,Paciesas, W.S., Goodman, S.J., Christian, H.J. Discovery of intensegamma-ray flashes of atmospheric origin. Science 264, 1313, 1994.
Fraser-Smith, A.C., Bernardi, A., McGill, P.R., Ladd, M.E., Helliwell,R.A., Villard Jr., O.G. Low-frequency magnetic field measurementsnear the epicenter of the Ms 7.1 Loma Prieta earthquake. Geophys.Res. Lett. 17, 1465–1468, 1990.
Friedemann, F. Predicting earthquakes. The Economist 14 (December),145–146. Available online at, 2005 http://www.economist.com/science/displaystory.cfm?story_id=E1_VNJJJGR , 1990.
Hake, Richard R. Interactive engagement versus traditional methods: asix-thousand-student survey of mechanics test data for introductoryphysics courses. Am. J. Phys. 66 (1), 64–74, 1998.
Hayakawa, M., Molchanov, O.A., Ondoh, T., Kawai, E. The precursorysignature effect of the Kobe earthquake on VLF subionosphericsignals. J. Commun. Res., Tokyo 43, 169–180, 1996.
Helliwell, R.A., Katsufrakis, J.P., Trimpi, M. Whistler-induced amplitudeperturbation in VLF propagation. J. Geophys. Res. 78 (22), 4679–4688, 1973.
‘‘How People Learn: Brain, Mind, Experience, and School”; NationalResearch Council, National Academies Press, Washington, D.C., 2000.
Inan, U.S., Lehtinen, N.G., Lev-Tov, S.J., Johnson, M.P., Bell, T.F.,Hurley, K. Ionization of the lower ionosphere by gamma-rays from amagnetar: detection of a low energy (3–10 keV) component. Geophys.Res. Lett. 26 (22), 3357–3360, 1999.
Inan, U.S., Reising, S.C., Fishman, G.J., Horack, J.M. On theassociation of terrestrial gamma-ray bursts with lightning andimplications for sprites. Geophys. Res. Lett. 23 (9), 1017–1020,1996.
Inan, U.S., Bell, T.F., Helliwell, R.A. Nonlinear pitch angle scattering ofenergetic electrons by coherent VLF waves in the magnetosphere. J.Geophys. Res. 83 (A7), 3235–3253, 1978.
Intel Science Talent Search. Available from: <http://www.intel.com/education/sts/>.
Jarrett, D., ‘‘Inquiry Strategies for Science and Mathematics Learning,”Northwest Regional Educational Laboratory, Portland, Oregon, 1997.Available from: <http://www.nwrel.org/msec/images/resources/justgood/05.97.pdf/>.
Junior Science and Humanities Symposium. Available from: <http://www.jshs.org/>.
Lopez, Ramon E., Tuomi, Jan Student-centered inquiry. Educ. Leadersh.52, 78–79, 1995.
Matson, John O., Parsons, Sharon Misconceptions about the nature ofscience, inquiry-based instruction, and constructivism: creatingconfusion in the science classroom. Electron. J. Lit. Sci. 5 (6).Available from:, 2006 <http://ejlts.ucdavis.edu/current_issue/articles/Matson%20&%20Parsons.pdf/> , 1995.
McDermott, Lillian C. Millikan lecture 1990: what we teach and what islearned – closing the gap. Am. J. Physics. 59 (4), 301–315. Availablefrom:, 1991 http://scitation.aip.org/vsearch/servlet/VerityServlet?KEY=AJPIAS&smode=strresults&sort=chron&maxdisp=25&threshold=0&possible1=mcdermott&possible1zone=article&fromvolume=59&tovolume=59&fromissue=4&toissue=4&OUTLOG=NO&view-abs=AJPIAS&key=DISPLAY&docID=1&page=1&chapter=0, 1995.
McDermott, Lillian C. Editorial: preparing K-12 teachers in physics:insights from history, experience, and research. Am. J. Phys. 74 (9),758–762. Available from:, 2006 <http://scitation.aip.org/getabs/servlet/GetabsServlet?prog=normal&id=AJPIAS000074000009000758000001&idtype=cvips&gifs=yes/> , 1995.
Molchanov, O.A., Hayakawa, M. Subionospheric VLF signal perturba-tions possibly related to earthquakes. J. Geophys. Res. 103, 17, 489,1998.
National Research Council, ‘‘National Science Education Standards”,National Academies Press, Washington, D.C., 1996. ISBN:0309053269.
National Science Foundation, Research Experiences for Undergraduates.Available from: <http://www.nsf.gov/funding/pgm_summ.jsp?pim-s_id=5517&from=fund/>.
National Science Foundation, ‘‘RISE Program Proves that Undergrad-uate Research Experiences Help Recruit Minority Scientists;” 2005.Available from: <http://www.nsf.gov/discoveries/disc_summ.jsp?cnt-n_id=104562/>.
Rabello-Soares, M.C., Personal correspondence to Professor Philip H.Scherrer, director of the Stanford Observatories Group, 8 September2006.
‘‘Rising Above the Gathering Storm: Energizing and Employing Americafor a Brighter Economic Future”, National Academies Press, Wash-ington, D.C., 2006.
Scherrer, P., Scherrer, D. personal experience showed that about 20–25hours of assembly, testing and tuning requiring the educated use of anoscilloscope were necessary to build and install an AAVSO SIDmonitor, 2005.
Smith, D.M., Lopez, L.I., Lin, R.P., Barrington-Leigh, C.P. Terrestrialgamma-ray flashes observed up to 20 MeV. Science 307, 1085–1088,2005.
Thomson, N.R., Cliverd, M.A. Solar flare induced ionospheric D-regionenhancements from VLF amplitude observations. J. Atmos. Sol. Terr.Phys. 63, 1729–1737, 2001.
1784 D. Scherrer et al. / Advances in Space Research 42 (2008) 1777–1785

Trends in International Mathematics and Science Study (TIMSS); Institutefor Education Sciences, US Department of Education; data collected in1995, 1999, and 2003. Available from: <http://nces.ed.gov/timss/>.
United Nations, A/AC.105/856 – 8 December 2005.
Wood, T.G., Inan, U.S. Localization of individual lightning discharges viadirectional and temporal triangulation of Sferic measurements at twodistant sites. J. Geophys. Res. 109, D21109, doi:10.1029/2004JD005204, 2004.
D. Scherrer et al. / Advances in Space Research 42 (2008) 1777–1785 1785