Embed Size (px)
Citation preview

10.1101/gr.164095.113Access the most recent version at doi: published online June 5, 2014Genome Res.
Anton Kratz, Pascal Beguin, Megumi Kaneko, et al. of Purkinje neuronsDigital expression profiling of the compartmentalized translatome
Material
Supplemental
http://genome.cshlp.org/content/suppl/2014/06/05/gr.164095.113.DC1.html
P<P
Published online June 5, 2014 in advance of the print journal.
Preprint
Accepted
likely to differ from the final, published version. Peer-reviewed and accepted for publication but not copyedited or typeset; preprint is
Open Access
Open Access option.Genome ResearchFreely available online through the
License
Commons Creative
.http://creativecommons.org/licenses/by-nc/3.0/Unported), as described at
available under a Creative Commons License (Attribution-NonCommercial 3.0 , isGenome ResearchThis manuscript is Open Access.This article, published in
ServiceEmail Alerting
click here.top right corner of the article or
Receive free email alerts when new articles cite this article - sign up in the box at the
object identifier (DOIs) and date of initial publication. by PubMed from initial publication. Citations to Advance online articles must include the digital publication). Advance online articles are citable and establish publication priority; they are indexedappeared in the paper journal (edited, typeset versions may be posted when available prior to final Advance online articles have been peer reviewed and accepted for publication but have not yet
http://genome.cshlp.org/subscriptionsgo to: Genome Research To subscribe to
Published by Cold Spring Harbor Laboratory Press
Cold Spring Harbor Laboratory Press on June 8, 2014 - Published by genome.cshlp.orgDownloaded from Cold Spring Harbor Laboratory Press on June 8, 2014 - Published by genome.cshlp.orgDownloaded from
Digital expression profiling of the compartmentalized
translatome of Purkinje neurons
Anton Kratz1,*,$, Pascal Beguin2,*, Megumi Kaneko2, Takahiko Chimura2,3, Ana Maria Suzuki1,$, Atsuko
Matsunaga2, Sachi Kato1,$, Nicolas Bertin1,4,$, Timo Lassmann1,$, Réjan Vigot2, Piero Carninci1,$,
Charles Plessy1,5,$, Thomas Launey2,5
1RIKEN Center for Life Science Technologies, Division of Genomic Technologies, Yokohama,
Kanagawa, 230-0045 Japan
2RIKEN Brain Science Institute, Launey Research Unit, Wako, Saitama, 351-0198 Japan
3Present address: University of Tokyo, The Institute of Medical Science, Tokyo, 108-8639 Japan
4Present address: The Cancer Science Institute of Singapore, 12th Fl., Unit 01, MD6 Center for
Translational Medicine, National University of Singapore, Yong Loo Lin School of Medicine, 14
Medical Dr., Singapore 117599
5Corresponding authors
Charles Plessy, RIKEN Center for Life Science Technologies, Division of Genomic Technologies,
Yokohama, Kanagawa, 230-0045 Japan. Tel: (+81) 45 503 9111 email: [email protected]
Thomas Launey, RIKEN Brain Science Institute, Launey Research Unit, Wako, Saitama, 351-0198
Japan. Tel: (+81) 48 467 5484, email: [email protected]
$ These members of CLST belonged to RIKEN OSC before the RIKEN reorganization of April 1st 2013
* These authors contributed equally to this work.
Keywords: cerebellum, Purkinje cells, transcriptomics, translatomics, neurogenomics
Page 1 of 44
Cold Spring Harbor Laboratory Press on June 8, 2014 - Published by genome.cshlp.orgDownloaded from
1 Abstract
Underlying the complexity of the mammalian brain is its network of neuronal connections, but also the
molecular networks of signaling pathways, protein interactions and regulated gene expression within
each individual neuron. The diversity and complexity of the spatially intermingled neurons poses a
serious challenge to the identification and quantification of single neuron components. To address this
challenge, we present a novel approach for the study of the ribosome-associated transcriptome – the
translatome – from selected sub-cellular domains of specific neurons, and apply it to the Purkinje cells
(PC) in the rat cerebellum.
We combined microdissection, Translating Ribosome Affinity Purification (TRAP) in non-transgenic
animals and quantitative nanoCAGE sequencing to obtain a snapshot of RNAs bound to cytoplasmic or
rough endoplasmic reticulum (rER)-associated ribosomes, in the PC and its dendrites. This allowed us
to discover novel markers of PCs, to determine structural aspects of genes, to find hitherto
uncharacterized transcripts, and to quantify biophysically relevant genes of membrane proteins
controlling ion homeostasis and neuronal electrical activities.
Page 2 of 44
Cold Spring Harbor Laboratory Press on June 8, 2014 - Published by genome.cshlp.orgDownloaded from
2 Introduction
The emergence of the system approach to the study of neuron function came from the realization that
no protein or process can function in isolation but is often embedded in a network of regulating
interactions. While often detailed, no study of signaling networks can claim to be exhaustive, for lack
of a “parts list” of all the components, and also because of the limited precision regarding the
concentration of the ones known to be involved. For many neurons the presence of an extended
dendritic arbor provides spatial constraints and additional complexity since remote or semi-isolated
compartments may create local and transient conditions. The consequence is that biophysical in-silico
models remain inefficient for predicting alteration of electrical activities under disease or exposure to
drugs. Thus, rather than yielding a unique model, fitting of available experimental data results in sets of
equally good (and equally bad) non-unique models (Achard and De Schutter 2006) that are also
incomplete. For instance, for Purkinje cells (PC), the most complete and realistic models only include
less than 20 distinct proteins (Miyasho et al. 2001, Korogod and Tyc-Dumont 2009).
The cataloging of building parts is further complicated by its dynamic nature, with protein
concentration being modified through transcriptional and post-transcriptional regulation, as well as
local destruction or synthesis of components. These modifications are nevertheless functionally
important as protein synthesis in general and especially local synthesis in dendrites is required for
synapse maturation and plasticity (Liu-Yesucevitz et al. 2011, Martin and Ephrussi 2008). This has
motivated several recent efforts for large-scale transcriptome analysis both for single neuronal-type
translatome (Heiman et al. 2008, Doyle et al. 2008, Knight et al. 2012) and specifically for the
dendrite/neuropil compartments (Cajigas et al. 2012, Zhong et al. 2006, Poon et al. 2006, Suzuki 2007).
Page 3 of 44
Cold Spring Harbor Laboratory Press on June 8, 2014 - Published by genome.cshlp.orgDownloaded from
Part of the PC transcriptome has been previously explored using purification strategies based on
differential expression between wild type and a PC-devoid mutant (Rong et al. 2004), laser
microdissection (Friedrich et al. 2012) or neuron-type specific capture of ribosome (Heiman et al.
2008, Doyle et al. 2008). This last approach termed Translating Ribosome Affinity Purification (TRAP)
is especially attractive as it targets RNAs bound to ribosomes (the “translatome”) rather than the full
population of transcribed RNAs. Currently, however, this approach and the related RiboTag strategy
(Sanz et al. 2009) have been used to establish all-or-none gene expression by specific cell type, while
the quantitative estimation of RNA translation has not been exploited. Quantification of translating
mRNA is expected to be a better proxy measurement of protein synthesis (Schwanhäusser et al. 2011)
than the total mRNA level, which has long been recognized as a poor predictor of protein abundance
(Gygi et al. 1999). The use of both TRAP and RiboTag is practically limited to mice since these
strategies require transgenic animals engineered to express a modified ribosomal protein (RPL10 for
TRAP and RPL22 for RiboTag). In addition, detailed analysis of the generated datasets identified the
need for extensive processing and filtering to remove contaminants and non-linearities (Dougherty et
al. 2010).
Here, we combined several of the approaches presented above to identify RNAs present in the PC and
in its dendrites, associated either with the cytoplasmic or endoplasmic reticulum-bound fraction of the
ribosomes (Fig. 1A). To detect and quantify RNAs in the PC's translatome, we used the CAGE method
(Cap Analysis of Gene Expression), which detects predominantly the transcription start sites (TSS) and
measures their abundance by quantitatively sequencing the 5' end of cDNAs from capped mRNAs
(Shiraki et al. 2003), independently of transcript length or presence of a polyadenylated tail. In our
study, since the available RNA was limited in quantity and the genome of the chosen model animal,
Page 4 of 44
Cold Spring Harbor Laboratory Press on June 8, 2014 - Published by genome.cshlp.orgDownloaded from
Rattus norvegicus is not annotated as extensively as for mouse or human, we chose the high-sensitivity
paired-end nanoCAGE/CAGEscan implementation of CAGE (Plessy et al. 2010) to identify TSS
independently of existing annotation.
3 Results
3.1 Ribosome capture followed by sequencing reveals the translatome of
a specific neuronal cell type
To target specifically an EYFP-RPL10A ribosome-capture construct to PCs without the generation of
transgenic animals, we used a mosaic AAV virus (AAV2/2-8) combining capsid proteins from the
AAV2 and AAV8 isotypes, to maximize transduction in PCs (Broekman 2006). Preliminary
comparisons showed that AAV1 and AAV2 are less efficient (for both) and less specific (for AAV1) to
transduce PCs, confirming the observation of Broekman et al. Intra-cerebellar injection of AAV2/2-8 at
P4 resulted in intense expression of the EYFP-RPL10A construct in up to 8 lobules of the vermis
(Fig. 1B), variable spread to lateral hemisphere (Fig. S1), and expression restricted to PCs, both in mice
(not shown) and rat (Fig. 1B-E). The specificity achieved through capsid selection allowed us to use a
strong CAG promoter, without interfering with PC's endogenous promoters (Fig. 1D, E). The EYFP
variant (Miyawaki et al. 1999) chosen here is brighter than the EGFP used by Heiman et al. (2008),
allowing microdissection of the cerebellar cortex under fluorescence illumination (Fig. 1C). The 40S
ribosome proteins RPL29 or RPL36, previously found to be enriched in PCs (Sato et al. 2008) were
also examined as an alternative to RPL10A, as the ribosome anchor for the TRAP construct (Doyle et
al. 2008, Heiman et al. 2008). We did not observe any evidence for differential distribution or
Page 5 of 44
Cold Spring Harbor Laboratory Press on June 8, 2014 - Published by genome.cshlp.orgDownloaded from
abundance for any of the tested proteins relative to RPL10A (data not shown). Since RPL10A itself was
found to be present in Purkinje dendrites (see below), we used it as the ribosome-targeting component
of the probe.
By microdissection of live cerebellar vermal slices, 9 pools comprising the Purkinje and molecular
layers of 57 ± 7 lobules, restricted to lobules IV to IX (692 in total, Table S1) were prepared. Only the
cerebellar vermis was studied since this is most relevant as comparison with electrophysiological
studies of cerebellar plasticity and since PCs in this region show homogeneous gene expression while
the cerebellar lateral hemispheres show region-specific gene expression (Oberdick et al. 1993). To
provide functional context to our characterization of the PC translatome, each sample was separated
into a cytoplasmic and a rER-bound fraction. The transcripts from the two fractions showed different
size profiles (Fig. S2A-D), with longer RNAs in the cytoplasm compared to the rER, and yielded in
average 260 ± 51 and 188 ± 35 ng of total RNA respectively. In addition, to analyze the dendritic
translatome, we pooled the tissue from 80 lobules, microdissected to isolate the upper 2/3 of the
molecular layer, containing the dendritic trees of the PCs, yielding 7.79 ng of RNA (Fig. S2E, F). For
two pools, we sequenced the supernatants remaining after the immuno-purification, in order to assess
the quality and specificity of ribosome capture.
To analyze the 5' transcriptome of these sub-microgram samples, we prepared a total of 24 nanoCAGE
libraries, using random reverse-transcription primers in order to detect transcripts regardless of the
presence or absence of a poly-A tail. After quantitative sequencing of the libraries, we could align
73,544,526 paired-end reads to the rat genome. PCR noise was canceled by collapsing identically
aligned pairs, for a final number of 27,740,924 CAGE tags. A detailed count of the tags in each library
before and after alignment is available in Table S1.
Page 6 of 44
Cold Spring Harbor Laboratory Press on June 8, 2014 - Published by genome.cshlp.orgDownloaded from
CAGEscan libraries have more PCR duplicates than RNA-seq libraries because the first read in CAGE
is anchored to the 5′ end of cDNAs, while RNA-seq reads represent randomly fragmented cDNAs. Our
libraries had 1.2 ± 0.8 million reads after removing PCR duplicates (see Table S1). Random sub-
sampling of our data confirmed that diminishing returns would be expected when increasing
sequencing depth, both in terms of number of significant differences in statistical comparisons and the
fold change of these differences (Fig. S3 and S4).
3.2 Clustering and machine learning identifies a subset of high-
confidence promoters
We grouped the whole single-nucleotide resolution CAGE signal into clusters representing functional
units. In this manuscript, we use the term TSS as in Sequence Ontology (Eilbeck et al. 2005) term
SO:0000315, “the first base where RNA polymerase begins to synthesize the RNA transcript”, and the
term “cluster” for groups of neighboring 5' ends of CAGE tags.
Using the Paraclu peak calling algorithm (Frith et al. 2008) and setting a maximum length of 100 bp,
we obtained 48,049 clusters. Each Paraclu cluster was then used as a seed position to assemble a
CAGEscan cluster, consisting of the original Paraclu cluster, followed by the collated 3'-mates of the
pairs originating from it (Fig. 2A, File S1). The sequencing depth was sufficient to make CAGEscan
clusters resemble the intron-exon structure of assembled transcripts. Clusters were then matched with
annotated Ensembl transcripts (Flicek 2013), overlapping in sense. Of the 48,049 clusters, 40,321 could
be annotated with 9,550 different genes, while 7,728 clusters could not be annotated and may
correspond to novel promoters of known transcripts, or promoters of entirely novel transcripts. Among
the annotated clusters 5,879 would not have an annotation if not using CAGEscan (Fig. 2B).
Page 7 of 44
Cold Spring Harbor Laboratory Press on June 8, 2014 - Published by genome.cshlp.orgDownloaded from

The nanoCAGE protocol enriches for capped RNA and therefore the 5' mates should map to the
beginning of annotated transcripts. Nevertheless, a considerable amount of tags map within coding
exons and intronic regions (Fig. 2C), with some clusters located deep within known transcripts. 6,065
genes are represented by more than one cluster, and while some of these could represent alternative
downstream TSSs, some of this background noise may stem from capped processed transcripts (Fejes-
Toth 2009) or present features that render them easy to capture by template-switching. To separate true
signal from potential background, we reasoned that if a large number of basal promoters shared some
sequence features, it would be possible to separate clusters representing promoters from the other
clusters. We therefore constructed a machine learning classifier and trained it with known promoters.
The classifier models the distributions of all 4-mers in a 2 kb window surrounding the TSSs. After
training, it separated 33,865 low confidence clusters (not resembling known promoters) and 14,184
high confidence clusters (resembling known promoters) (Fig. 2A, D). In some of the downstream
analysis we discard all low-confidence clusters, because they are less likely to represent full-length
transcripts and thus do not have the functionality implied by their associated gene symbol and Gene
Ontology terms (Ashburner 2000).
3.3 The translatome of Purkinje cells
To quantify the relative transcript enrichment after ribosome capture, we compared the expression
scores in the immunoprecipitated and control supernatant samples (Fig. 3A) using generalized linear
models (GLMs) as implemented in edgeR (Robinson et al. 2009, McCarthy et al. 2012), and identified
1,809 clusters significantly enriched (FDR ≤ 0.1), representing 16.8 ± 1% of the total expression count
(Table 1 shows the top 25 enriched clusters and table S2 the full list). 129 of these clusters did not have
an Ensembl annotation. We could rescue 84 of them, for instance where they would overlap with a
Page 8 of 44
Cold Spring Harbor Laboratory Press on June 8, 2014 - Published by genome.cshlp.orgDownloaded from
RefSeq model or be in a long 3' UTR (Miura et al. 2013) that is documented in human or mouse, but
not rat transcript models. In total, we detected 866 different genes significantly enriched by the capture
(Table S3), including abundant transcripts that were missed by previous works (Fig. 3B).
To confirm the selectivity of the enrichment, we examined marker genes selected through literature
mining as representatives of cytoplasmic, plasma membrane and ER membrane proteins. For each
gene, we selected the most representative cluster, based on promoter classification and expression
level. We then quantified the relative abundance of the markers for PCs (Calb1, Dlg2, Pcp2, Pcp4,
Itpr1, Lhx1, Ppp1r17, Car8, Grid2, Prkg1, Plcb4, Cacna1g, Homer3, Clmn, Gnaq, Rora) as well as
markers for glial cells (Gfap, Slc1a3, S100b, Ppap2b, Fabp7, Sept4) and neuronal cells other than PCs
(Calb2, Car4, Crtam, Reln, Grin2c, Grm4, Kcnd2, Chn2, Gprc5c, Serpini1, Pax6, Cacng2, Rbfox3).
The average log-fold changes for each of the three groups were 4.3 ± 2.3, -0.1 ± 2.8 and 0.7 ± 1.6,
respectively, confirming the enrichment of Purkinje marker genes in the ribosome-captured libraries
(Fig. 3A). Thus, while the PC population represents a fraction of the cells in the cerebellar cortex and
were not all expressing the L10A-EYFP construct, we observed a specific enrichment of characterized
PC marker genes, and at the same time a general depletion of marker genes of glial cells and neurons
other than PC.
A recent assessment (Okaty et al. 2011) indicated that TRAP applied to large brain regions suffers from
higher contamination than methods using cell microdissection. Here we combined both approaches and
evaluated the specificity of the capture by comparison with an orthogonal index of transcript
expression, based on the in situ hybridization (ISH) micrographs of mouse cerebellum of the Allen
Institute (Lein et al. 2006). Using microarrays, Doyle et al. (2008) identified 2,320 known genes
enriched in ribosome-captured RNA of PCs. We scored all the genes enriched by our ribosome capture
Page 9 of 44
Cold Spring Harbor Laboratory Press on June 8, 2014 - Published by genome.cshlp.orgDownloaded from
(6,590) and in the dataset from Doyle et al. by inspecting the ISH staining pattern in the Purkinje layer
relative to white matter, granular layer and molecular layer, similar to the approach recently described
by Dougherty et al. (2010). This Allen Brain Atlas-derived score (ABA score) for each gene was 0 for
ubiquitous or null expression, 0.5 for moderate to high relative intensity in Purkinje layer, 1 for high to
specific expression. When our dataset and Doyle et al.'s were independently ranked according to FDR
(False Discovery Rate) and compared against mean ABA score calculated over a sliding window
(Fig. 4A), we observed the expected decreasing trend. Remarkably, although the Doyle et al. gene list
and ours only partially overlap (Fig. 4A inset and 4B), the trend slopes are very similar. To evaluate this
analysis against the null hypothesis (no enrichment), we randomly selected 700 genes from the Allen
ISH dataset and scored them as before. The ABA score for the first ~2,150 genes of the ranked Doyle
dataset and first ~2,520 genes in ours are above the score of this random selection. Comparison with
the ABA score, albeit imperfect because it indicates enrichment in Purkinje layer rather than in PCs and
thus also includes Bergman glia, suggests that microdissection and the use of nanoCAGE improves
detection selectivity and sensitivity. This also suggests that the FDR threshold (0.1) chosen here is very
conservative.
To assess the comprehensiveness of our search, we compared our list of enriched clusters to two related
works in mouse (Fig. 4B). First, 292 out of the 2,320 known genes enriched in PCs in the Doyle et al.
dataset were also significantly enriched in our libraries (33.7% overlap). Second, we also interrogated
RIKEN's Cerebellar Development Transcriptome Database (Sato et al. 2008), which reports 1,337
genes expressed in PCs, of which 98 were enriched in our experiment (11.3% overlap). This cross-
species validation further increases the confidence in the observed enrichment. The overlap between
the three lists consists of 32 genes. Together with our finding of novel highly expressed markers
Page 10 of 44
Cold Spring Harbor Laboratory Press on June 8, 2014 - Published by genome.cshlp.orgDownloaded from
(Fig. 3B), this suggests that none of the lists covers the PC-enriched translatome exhaustively.
Extending our set of symbols to match the size of the Doyle et al. list by taking a FDR threshold of 0.5
still resulted in an overlap of less than 30% (Fig. 4A inset). Thus, the 358 gene symbols common to our
libraries and one of the two other datasets at the FDR threshold of 0.1 should be regarded as a high-
confidence list of Purkinje-enriched mRNA. The clusters in each set of Fig. 4B can be found in Table
S4.
To obtain an orthogonal evaluation of translating mRNAs enrichment in PCs and of its relevance to
relative expression among cerebellar cortical cells, we quantified by immuno-fluorescence (IF) the
presence of selected proteins in cerebellar primary cultures (Fig. 4C-F). Using calbindin staining to
delineate PC and nuclei staining to assess local cell density, we computed the staining intensity of PCs
for various proteins, relative to the staining of surrounding cells. The markers were selected based on
availability of specific antibodies and to obtain samples evenly spaced along our ranked list of enriched
transcripts. For transcripts within the top 2,500 rank, we observed an approximate correlation between
transcript rank and relative IF intensity (Fig. 4C). For transcripts above this rank (i.e. without any
evidence of enrichment in PCs), the IF staining intensity was similar in PCs and non-PCs (Fig. 4C, E)
for all tested proteins, except PAX2 which is selectively expressed by cerebellar interneurons (Fig. 4F).
While the relative density of neuronal and glial populations may differ between cerebellum and
cerebellar culture, the near-monolayer allowed for precise quantification with minimum staining
background. Hence, these results confirm that the enrichment of translating RNAs measured in PCs is
consistent with enrichment at the protein level.
Page 11 of 44
Cold Spring Harbor Laboratory Press on June 8, 2014 - Published by genome.cshlp.orgDownloaded from

3.4 Motif search in promoters identifies a set of Purkinje-specific
transcription factor binding sites
Next, we searched for transcription factors (TFs) regulating the PC translatome, by looking for binding
sites overrepresented in the regulatory regions of promoters enriched in the ribosome capture compared
with a background of cerebellar genes. Using the Clover algorithm (Frith et al. 2004), we identified 29
overrepresented motifs (Table 2, File S2); of these, two belong to TFs required for normal cerebellar
development (FOXC1 (Aldinger et al. 2009), ZFP423 (Warming et al. 2006)) while the RORA_2 motif
is related to the RORA protein (isoform 2 in human) implicated in the function and maintenance of the
PC layer (Boukhtouche et al. 2006). Conversely, we also identified 18 depleted motifs (Table 2).
Among these, the depletion of the PAX6 motif is consistent with the high expression of the Pax6 gene
in the granular layer and with reports that it can also act as repressor (Duncan et al. 1998, Weasner et al.
2009). The enriched motifs had between 304 and 1,569 potential targets (Table 2), suggesting that the
transcriptome of PCs is regulated by large networks of genes.
Motif search is restricted to predefined binding patterns. To identify entirely novel motifs that would be
specifically enriched in PCs, we attempted a de novo motif discovery with AMD (Shi et al. 2011),
which identified two short core motifs (GCGCGG and GCCGCG). However as these two motifs are
very short and not very distinctive, we could not find a known TF binding site convincingly
corresponding to any of them.
3.5 The cytoplasmic and rER-bound translatome
We then investigated the difference between the cytoplasmic and rER-bound translatomes. In line with
the different size profiles of the RNAs (Fig. S2), the mean cDNA size was significantly smaller in the
Page 12 of 44
Cold Spring Harbor Laboratory Press on June 8, 2014 - Published by genome.cshlp.orgDownloaded from

rER-bound ribosomes (288.8 vs 724.8 bp, p = 5.0 × 10⁻⁵). We next compared how specialized the
translatomes in the different compartments are, by calculating a richness score (Hurlbert 1971). It is
defined as the mathematical expected value for the number of clusters to be observed if only 1,000 tags
per sample were distributed among them. High scores indicate that many clusters express similar
numbers of tags and low scores indicate that a few clusters are expressed much higher than the others.
Because it is the expected value of a strong down-sampling, richness is very comparable across
libraries that have very different sequencing depths, provided that they were prepared with the same
method. The rER-bound translatomes were significantly richer than their cytoplasmic counterparts
(908.6 and 893.5 respectively, p = 0.0065, paired t-test) (Fig. S5A). This is consistent with the
expression profile expected for a neuron, with a high diversity of membrane proteins involved in cell-
cell interactions, ion homeostasis and neurotransmission.
Ribosomes translating proteins addressed to the rER are first assembled in the cytoplasm and then
bound by the Signal Recognition Particle (SRP) before being transferred to the rER. As an independent
evidence that the isolated membrane fractions are enriched in ribosomes bound to the rER, we
estimated the expression levels of the RNA component of the SRP ribonucleoprotein (SRP RNA, see
Supplemental Methods), and observed a significant enrichment in this fraction compared with the
cytoplasmic one (81.4 and 44.0 tags-per-million respectively, p = 0.0004, paired t-test). Altogether, this
shows that libraries from the membrane-containing fractions are enriched in transcripts bound to ER-
associated ribosomes, either directly for translation, or indirectly like the SRP RNA.
To identify mRNAs significantly over-represented in either the rER or the cytoplasmic compartment,
we compared 6 pairs of replicated libraries with GLMs, as previously. We detected respectively 9,372
and 9,950 clusters with an adjusted FDR-value ≤ 0.1 (Fig. S5B, Table S3), corresponding to 6,565
Page 13 of 44
Cold Spring Harbor Laboratory Press on June 8, 2014 - Published by genome.cshlp.orgDownloaded from
unique Ensembl symbols. We then searched for Gene Ontology terms overrepresented in the 2,201
gene symbols enriched in the rER, using the 7,531 gene symbols of all other clusters as background.
Using GOrilla (Eden et al. 2009), we identified terms in each GO domain (Table S5) and used
REVIGO (Supek et al. 2011) for clustering and visualization of the terms as a treemap (Fig. S5C).
Study of the cellular components confirmed the expected presence of transmembrane, luminal or
secreted proteins, with terms in branches of the ontology such as endoplasmic reticulum part, cation
channel complex, neuron projection and synapse part. Similar results were found with the biological
process and molecular function domains (Fig. S6; Table S5).
3.6 Biophysical translatome
Our purification procedure gives access to a quantitative estimation of the relative transcript abundance
in PCs and especially to the plasma-membrane proteins controlling the electrical properties of neurons.
Accurate quantification of translating mRNAs may thus represent a proxy for measurement of protein
synthesis. We identified 3,068 clusters for 484 genes related to the control of PC membrane potential
and ion homeostasis, including ionotropic and metabotropic synaptic transmission, ion channels,
electrogenic ion transport and calcium binding proteins. For detection robustness, we focused on the
high confidence, PCs-enriched (LogFC ≥ 0) clusters, for a total of 113 unique genes (Table S6).
Expression is represented as the relative abundance of each transcript in the libraries (Fig. 5 left hand
ordinate and Table S3) and, for comparison with biophysical models, relative to the amount of the
Grid2 transcript, among 9 replicates (Fig. 5, right hand ordinate). The Grid2 product (glutamate
receptor, ionotropic delta 2) is specifically expressed in PCs at the dendritic synapse and is thus
relevant to describe the relative abundance of the transcripts related to electrical/synaptic activity.
Page 14 of 44
Cold Spring Harbor Laboratory Press on June 8, 2014 - Published by genome.cshlp.orgDownloaded from

Our biophysical translatome appears to densely sample all major ion channels and includes all the
conductances previously used to build a biophysical model of PC, with realistic simulated electrical
activity (De Schutter and Bower 1994, Miyasho et al. 2001). A comprehensive inspection of relative
transcripts expression is described in the supplemental discussion. Interestingly, both for sodium and
potassium channels, we observed near stoichiometric ratio of the transcripts for the pore forming
proteins and their respective regulatory subunits. This suggests that expression might be co-regulated
and also that the amount of translating transcript might be, for some proteins, a suitable proxy for
relative protein level.
It should be noted that previous studies of the PC translatome (Doyle et al. 2008, Heinman et al. 2008,
Dougherty et al. 2010, all based on the same dataset), only identified a fraction (~28%) of these
proteins, essentially the cytoplasmic beta subunits with a marked deficit for the pore-forming
transmembrane subunits (~11%). This suggests that separate isolation of ER-bound ribosomes is
indispensable to detect the low-abundance but highly relevant transcripts of the ion channels, all highly
enriched in the ER-bound fraction (Fig. 5, color-coded gene names).
In summary, the above analysis suggests that our approaches can be used to identify and quantify the
full complement of the transcripts for proteins involved in the generation of PC's electrical activity and
integration of synaptic signals.
3.7 The dendritic translatome
While numerous mRNAs have been identified in dendrites, only a handful have been verified to be
translated locally under resting conditions, in the absence of plasticity-producing stimuli. To study
long-distance RNA localization, we sequenced the cytoplasmic and rER-bound translatomes of the
Page 15 of 44
Cold Spring Harbor Laboratory Press on June 8, 2014 - Published by genome.cshlp.orgDownloaded from
Purkinje dendrites themselves (Table S3). EYFP-RPL10A expression in PC dendrites was barely
detectable during dissection of live slices. This was in agreement with the weaker distribution of the
endogenous RPL10A, as revealed by immunofluorescence compared to the strong somatic signal, as
expected for the scattered distribution of dendritic polysomes (Fig. S7 and Spacek et al. 1997).
We isolated the dendritic RNA of PCs by separating the Purkinje soma layer from the upper two thirds
of the molecular layer. RER can be found in the proximal dendrites of PCs and polysomes are present
even in the distal dendrites (Spacek et al. 1997). The quantity of RNA harvested from >80 lobules was
enough to prepare libraries with our standard protocol, albeit with a reduced precision on the
expression values. We therefore focused on a qualitative exploration of the dendritic transcriptome. For
additional immunity against contamination, a cluster (and its mRNA) was considered to be present in
dendrites only if its expression from both rER and cytoplasmic fractions is in the upper quartile of total
expression from dendrites.
To characterize the dendritic transcripts, we searched for GO terms enriched in the dendritic clusters
compared to all remaining clusters (Table S7). Terms related to the mitochondria and energy production
were among the most visible in all three sub-ontologies, in particular Cellular Component (Fig. S8). We
also observed terms related to the synapse and its vesicles. In line with reports of local translation, we
also found enrichment for terms related to ribosomal proteins and protein folding. More surprisingly,
terms related to transport and cargo were also found, suggesting that the site of delivery takes an active
part in this process.
To identify transcripts specifically enriched in dendrites relative to soma, we compared the dendritic
ribosomes and each of the whole PC fractions using GLMs as previously, identifying 29 clusters (20
genes) with specific dendritic enrichment (Table 3). Consistent with a specific enrichment of translating
Page 16 of 44
Cold Spring Harbor Laboratory Press on June 8, 2014 - Published by genome.cshlp.orgDownloaded from
mRNA from Purkinje dendrites, several of the identified mRNA are known to be locally translated in
dendrites and to be highly enriched in PCs relative to other neurons in the cerebellar cortex (Camk2a:
(Ouyanget al. 1999), Pcp2: (Wanneret al. 2000, Zhanget al. 2008), Shank1: (Bockerset al. 2004)).
While there have been several previous attempts to profile localized transcriptomes using a variety of
experimental methods and model systems (Miyashiro et al. 1994, Moccia et al. 2003, Zhong et al.
2006, Poon et al. 2006, Suzuki 2007), recently Cajigas et al. (2012) took advantage of the higher
sensitivity of digital expression profiling to define the transcriptome in synaptic neuropil, where they
report a set of 2,550 genes being expressed. This set has an overlap of only 256 of the dendritic genes
identified in our experiment (Table 3). Such a small overlap was to be expected, as the two data sets
have very different characteristics: we sequenced only ribosome-bound transcripts, while (Cajigas et al.
2012) sequenced the general transcriptome. Furthermore, two different technologies were used (RNA-
seq and CAGEscan), and the experiments have been done on two different cell types in different brain
regions. Therefore, the small set of gene symbols that do overlap between the two studies can be
expected to identify genes that are an essential part of the biology of dendrites and not specific to any
particular neuronal type.
3.8 The non-coding RNAs of the translatome
Non-coding RNAs such as H19, Uchl1os or Igf2as have been reported to be bound to polysomes in
other systems (Li et al. 1998, Carrieri et al. 2012, Duart-Garcia and Braunschweig 2013) and may
modify translation of specific target mRNAs. To identify potential novel regulatory non-coding genes,
we inspected the 45 significantly captured CAGEscan clusters that did not have an annotation. We
discarded 4 as potential template-switching artifacts (Tang et al. 2013), and 8 others that aligned in
Page 17 of 44
Cold Spring Harbor Laboratory Press on June 8, 2014 - Published by genome.cshlp.orgDownloaded from
pseudogenes. We also excluded 7 clusters that were hundreds of kb long and spanned multiple loci.
Among the 15 clusters marked “high confidence” promoters by our classifier, some were overlapping
with repeat elements, while others were uncharacterized transcripts head to head with Cbln1, Lhx1,
Oxsm, all supported by conserved synteny and cross-aligned mouse cDNAs.
SINEUPs are a new class of functional long non-coding RNA, of which so far only two members have
been identified (Carrieri et al. 2012). They overlap head to head with a protein-coding mRNA, and at
the same time with a SINE B2 repeat element downstream. This arrangement has been shown to
increase protein-translation levels of Uchl1 and Uxt respectively, while not increasing the mRNA levels
of these protein-encoding genes. Here, we found two candidate SINEUP RNAs, in Htr1b (5-
hydroxytryptamine (serotonin) receptor 1B, G protein-coupled, Fig. 6A) and Srp72 (signal recognition
particle 72). All Htr1b CAGEscan clusters were enriched in PCs, and showed rER localization, in line
with the transmembrane structure of the encoded protein. The potential SINEUP (which we term
Htr1bos (5-hydroxytryptamine (serotonin) receptor 1B, G protein-coupled, opposite strand);
S. Laulederkind, pers. comm.) is found at higher levels in the cytoplasm compared to the rER,
suggesting that the potential sense-antisense interaction may be dynamic.
We next validated the co-expression of both transcripts in live cerebellar primary culture (Fig. 6B-G).
Transcripts for Htr1b, its SINEUP antisense and the PC marker Pcp2 were detected in live cells, using
SmartFlares (Seferoset al. 2007) – gold nanoparticles attached to oligonucleotidic probes duplexed to a
fluorophore-conjugated strand, which are taken up into live cells by endocytosis. To confirm the
presence of both the Htr1b transcript and the HTR1B protein specifically in PC, we used Cy3-coupled
Pcp2 probes together with Cy5-coupled probes for Htr1b mRNA. In addition, we combined SmartFlare
detection with anti-HTR1B immunofluorescence with CALB1 as a PC-specific protein marker (Fig.
Page 18 of 44
Cold Spring Harbor Laboratory Press on June 8, 2014 - Published by genome.cshlp.orgDownloaded from
6B, E). The Htr1b staining was strongest in PCs, both at the protein (Fig. 6C) and RNA levels (Fig.
S9). Similarly, Htr1bos was only detected in PCs (Fig. 6F and Fig. S9). Observation of the same cells
in the live culture and after fixation/immuno-staining allowed unambiguous identification of PCs and
colocalization of the probes and markers (Fig. 6E, G). 49 out of 49 PCP2+ PCs (from 3 culture batches)
were found to be positive for Htr1b and 67/67 (2 distinct 5' UTR probes, from 3 batches) were positive
for Htr1bos. This demonstrates that expression of the Htr1b mRNA/protein and the antisense transcript
is restricted to PCs, and provides strong evidence of co-expression of the putative SINE ncRNA with
its cogent target.
4 Discussion
Here, we present an innovative approach to determine the translatome of a specific neuron. Targeting of
a ribosome-capturing transgene to rat Purkinje neuron by engineered AAV, coupled with
microdissection and cellular fractionation led to the identification of the translatomes of PC's
subcellular compartments (dendrites, cytoplasm and rER). Combined with quantitative sequencing with
the nanoCAGE and CAGEscan methods, we report a complete description of these defined
compartments, which have a specific translational profile. In comparison with previous works using
transgenics and microarrays, our study uncovered new markers and non-coding RNAs, demonstrating
that our approach is fruitful even in systems that were previously screened. The use of AA viruses also
opens the way to studies outside the short list of organisms where transgenesis is possible.
In the mouse BAC PCP2-EGFP-RPL10A transgenics previously used by Doyle et al. (2008), it has
recently been estimated that ~1% of the polyribosomes extracted from the cerebellum carry the tag
(Darnell et al. 2011). This probably represents the amount of poly-ribosomes in Purkinje cells relative
Page 19 of 44
Cold Spring Harbor Laboratory Press on June 8, 2014 - Published by genome.cshlp.orgDownloaded from
to the total number of ribosomes present in all the cells of the cerebellum and stresses the necessity for
efficient PC-specific ribosome capture. The BAC transgenic used the weak Pcp2 promoter, while we
used post-natal virus-mediated expression of RPL10A-EYFP under a strong synthetic promoter (CAG).
In practice both are PC-specific and efficiently compete with the endogenous RPL10A for binding the
ribosome complex. Our virus-based expression of the ribosome-capture probe however eliminates the
dependency on transgenic mice (TRAP and RiboTag) and can be used in all species infected by AAV,
including primates. While none of the known surface receptors for AAV2 and AAV8 (proteoglycan
molecules, FGFR-1 receptor, LamR1; (Akache et al. 2006, Summerford et al. 1999)) are specifically
expressed by PCs, we could obtain selective transduction of our EYFP-L10A probe by combining these
serotypes. In the present context, this is fortunate as the expression of the transgene under a synthetic
promoter is less likely to interfere with expression of endogenous transcripts.
Ribosome capture should be most efficient for polyribosomes since the immunoprecipitation
simultaneously binds several ribosomes bound to the same mRNA. The polyribosome is typically a
cytoplasmic structure and we are not aware of a similar structure having been described for ER-bound
ribosomes. In spite of this potential difficulty, our fractionation approach proved to be very efficient to
analyze the translatome of rER-bound ribosomes, as shown by the massive enrichment for mRNAs
encoding transmembrane proteins (Fig. S5C).
The overlap with the neuropil transcriptome recently described by (Cajigas et al. 2012) suggests that
some transcripts are necessarily translated in dendrites, irrespective of the large difference in
transcriptome observed for widely different neurons such as the CA1 pyramidal neuron and the PC. In
addition to confirming the presence of specific transcripts in dendrites, their association with ribosomes
adds evidence that they are locally translated and suggest that this dendritic synthesis is the norm for a
Page 20 of 44
Cold Spring Harbor Laboratory Press on June 8, 2014 - Published by genome.cshlp.orgDownloaded from
much wider population of transcripts than previously thought. Considering that dendrites are ill-
equipped in terms of specific organelles for maturation of proteins containing transmembrane domains,
it was surprising that the dendritic translatome includes a large number of transcripts from the rER
fraction, with many of them encoding secreted or membrane-spanning proteins. As observed in
pyramidal neurons (Kacharmina et al. 2000, Horton and Ehlers 2003), the protein-synthesis
competence of PC dendrites does not appear to be limited to soluble cytoplasmic proteins. This is
correlated with the presence of N-glycosylation enzymes in distal regions of PC dendrites (Zanetta et
al. 1983). We speculate that the positive bias toward rER is caused by a majority of dendritic
polysomes being associated with a membranous structure, maybe even when translating soluble
proteins.
Interestingly, comparison of our dendritic translatome with a recent analysis of PC synapse proteome
indicated a large overlap (see Table S1 from (Selimi et al. 2009)). Out of 36 synaptic proteins identified
by Selimi et al. with high confidence, we found that 21 transcripts were present in our dendritic
translatome suggesting that these synaptic proteins are locally synthesized. This notably includes
proteins known for their critical involvement in synaptic regulation such as receptors (Grid2, Gria2,
Itpr1), scaffolding protein (Shank1, Grid2ip, Dlg2) and plasticity-related signaling (Camk2a). In
addition, we identified dendritic transcripts for several proteins (Col18a1, Sptnb2, Actb) which were
considered likely to be contaminants in the proteomics-based study of Selimi and collaborators (2009).
Since these transcripts are ribosome-bound and since it is unlikely that both a protein and its mRNA
have non-specific interaction during immunoprecipitation, we conclude that these transcripts and
proteins are genuinely present in PC dendrites. This suggests that as much as two thirds of synaptic
proteins may be locally synthesized in dendrites. This supports previous conclusions based on analysis
Page 21 of 44
Cold Spring Harbor Laboratory Press on June 8, 2014 - Published by genome.cshlp.orgDownloaded from

of hippocampal neuropil (Cajigas et al. 2012) and synapse-associated transcripts in the forebrain
(Suzuki et al. 2007). The successful parallel detection and quantification of dendritically translated
mRNA with this approach opens new possibilities for large-scale detection of the protein synthesis
associated with PC long-term synaptic plasticity (Karachot et al. 2001, Linden 1996, Murashima and
Hirano 1999).
While most of the transcripts captured were expected to be protein-coding genes, the translatome
consists of all RNA associated with ribosomes, and this includes functional non-coding RNA, such as
the SRP RNA, and some instances of transcripts that could be functional ncRNA captured through
antisense binding to their target. It is known that ncRNA generally have lower expression levels than
mRNA (Djebali 2012), so we expect that increasing the number of control supernatant libraries would
allow to detect more instances of possibly functional ncRNA in the translatome. We currently do not
know whether the instances of ncRNA detected in our dataset represent regulatory RNA with
exceptionally high copy number (i.e. the “tip of the iceberg”) or a small subclass of ribosome-
associated ncRNAs. Further work would be needed to extend the coverage to capture small ncRNAs,
that were recently reported to be interacting with ribosomes in a regulatory manner (Zywicki et al.
2012, Gebetsberger et al. 2012), as to our knowledge there is no whole-transcriptome method to
quantify long and short RNAs at the same time.
The advances that we introduced here for cell-specific translatome study in non-transgenic animals
covers different aspects that have been individually optimized for collection of ribosomes from specific
sub-cellular neuronal compartments with distinct properties. Beyond the immediate interest for the
description of Purkinje cells, we believe that the present approach can serve as a template for the study
of other neurons in the central nervous system of rodents and primates.
Page 22 of 44
Cold Spring Harbor Laboratory Press on June 8, 2014 - Published by genome.cshlp.orgDownloaded from
5 Methods
5.1 Virus transfection
All procedures were approved by the RIKEN Ethic Committee on Animal Research (#H25-2-245). The
EYFP-RPL10A construct was packaged into a mosaic AAV2/2-8 (Applied viromics LLC, Fremont,
CA). Four days old rat pups received intracerebellar 10 μl injection of virus at 3×10¹¹ gc/ml. Acute
cerebellar slices (350 μm) were prepared 28-32 days later and we microdissected lobules IV to IX to
isolate Purkinje layer and/or molecular layer. For each of the biological replicates, we pooled 50 to 64
lobules to eliminate influence of sex, batch and lobule (see Supplemental Methods for details).
5.2 Ribosome capture and RNA extraction
Ribosome captures were mainly carried out as already described (Heiman et al. 2008) with
modifications to extract separate fractions enriched in cytosolic ribosomes or ER-bound ribosomes by
centrifugation (Fig. 1A), before solubilization in NP40 (1%) and DHPC (diheptanoyl-sn-
phosphatidylcholine, 30 mM) detergent and immunoprecipitation using magnetic beads coated with
rabbit polyclonal anti-GFP antibody (Abcam, ab290). RNA was extracted using the PureLink RNA
micro kit (Invitrogen). See Supplemental Methods for details of the procedure and reagents.
5.3 CAGEscan libraries
The CAGEscan libraries were prepared as in (Salimullah et al. 2011 and Tang et al. 2012) using half of
the recovered RNA. The multiplex indexes (“barcodes”) used for each libraries and their loading
concentrations are indicated in Table S1. The libraries NChi10050~53 were outsourced to DNAFORM,
Page 23 of 44
Cold Spring Harbor Laboratory Press on June 8, 2014 - Published by genome.cshlp.orgDownloaded from
K.K. (Japan). The libraries were sequenced paired-end on HiSeq 2000 (Illumina) with a read length of
51 bases, de-multiplexed, filtered and aligned on the rn4 rat genome (Gibbs et al. 2004) paired-end
using BWA version 0.5.9 (Li et al. 2009); see Supplemental Methods for details. The CAGEscan 5'
mates were grouped in 48,049 clusters using the peak calling algorithm Paraclu (Frith et al. 2008)
version 5 with default parameters. The 48,049 CAGEscan clusters seeded from these Paraclu clusters
using the “CAGEscan-Clustering” software (http://fantom.gsc.riken.jp/software) can be found in File
S1. Each CAGEscan cluster was annotated with all gene symbols of Ensembl (downloaded 19 March
2013) that it intersects in sense-orientation. The transcript classifier used on the CAGEscan clusters is
available at http://tometools.sourceforge.net/.
5.4 Statistical analysis
T-tests were calculated with the R language and environment for statistical computing version 2.15.1
(The R Development Core Team 2003) and richness (Hurlbert 1971) was calculated using the Vegan R
package (Oksanen et al. 2012) version 2.0-3.
5.5 SmartFlares
The presence of Htr1b mRNA and antisense in live cerebellar primary culture was tested using
SmartFlares (Merck Millipore; original method published as “nano-flares” in Seferos et al. 2007).
Probes were prepared for Pcp2 (GGTTGAAGAAGCCTTCCTGGTCAGGTG), Htr1b
(CTTCATCATCTCCCTGGTGATGCCTAT) and Htr1bos
(AGCAGTCCAGCACCTCCTCCTCCGCTT and GCATCACCAGGGAGATGATGAAGAAGG), as
well as scrambled control sequence. The probes were added to culture medium for 6-10 hours before
live imaging in a phenol-red-free saline solution. After fixation in 4% paraformaldehyde, the cultures
Page 24 of 44
Cold Spring Harbor Laboratory Press on June 8, 2014 - Published by genome.cshlp.orgDownloaded from

were processed for immuno-fluorescence detection of the Purkinje marker protein calbindin1 (mAb
300, Swant, SZ) and HTR1B (ab85937, abcam, UK). Both the SmartFlare images of live culture and
the immunofluorescence datasets included phase-contrast images, used for co-registration of the
images. Note that immuno-staining after fixation and permeabilization revealed more PCs than initially
assessed by Pcp2 mRNA detection in live culture. Since both Pcp2 and Calb1 are robust PC markers
and the high density cerebellar culture is not mono-layer, this observation suggests that the intensity of
the SmartFlare staining may be reduced when PCs are covered by other neurons and glia.
5.6 Immuno-histofluorescence quantification
Primary cerebellar cultures prepared from P19 embryonic primordium were fixed (4%
paraformaldehyde, 9.25% sucrose) after 21-24 days in vitro. Triple-staining was performed overnight
with anti-calbindin D28k (1/1000, mAb, Swant, SZ, Alexa594-conjugated secondary antibody,
A21203) and antibodies (all 1/100, rabbit) against one of the target protein (see Table S8) and a donkey
anti-rabbit Alexa488-conjugated secondary antibody (1/1000, A21206, Life Technologies), before
counterstaining all nuclei with DAPI. Image analysis is detailed in the Supplemental Methods.
6 Data access
The CAGEscan libraries were submitted to the DNA Data Bank of Japan Sequence Read Archive
(DRA), http://trace.ddbj.nig.ac.jp/dra/index_e.html, under the accession number DRA000893.
7 Acknowledgements
AK was supported by the JSPS Fellowship for Foreign Researchers (ID No. P 13704) from the
Page 25 of 44
Cold Spring Harbor Laboratory Press on June 8, 2014 - Published by genome.cshlp.orgDownloaded from
Japanese Society for the Promotion of Science. This work was supported by a RIKEN presidential
grant, by a research grant from the Japanese Ministry of Education, Culture, Sports, Science and
Technology (MEXT) for the RIKEN Omics Science Center to Yoshihide Hayashizaki, and by a
research grant from MEXT to the RIKEN Center for Life Science Technologies. We thank Tomomi
Shimogori for confirming construct expression in rat embryos, Reiko Yoshida for building the pCAG
EYFP-L10 plasmid, Alan Urban for sequence verification and supervision of AAV1 production,
RIKEN, Japan, for an allocation of computing resources on the RIKEN Integrated Cluster of Clusters
(RICC) system, RIKEN Genome Network Analysis Service (GeNAS) for library sequencing, RIKEN
Support Unit for Bio-Material analysis for the use of its imaging equipment, Martin Frith for helpful
discussions regarding motif search, and Merck Millipore for providing early access to the SmartFlare
products. We are also indebted to Erin Schuman for giving us access to her neuropil sequencing data
and to Charles Yokoyama for editorial advices.
8 Author contributions
RV, PC, CP and ThL designed the project. PB, MK, TC, AM and ThL performed the experiments. AMS
and SK prepared libraries. AK, NB, TiL, CP and ThL designed and conducted the bioinformatics
analysis. AK, CP and ThL wrote the manuscript.
9 Disclosure declaration
The authors declare no conflict of interest.
Page 26 of 44
Cold Spring Harbor Laboratory Press on June 8, 2014 - Published by genome.cshlp.orgDownloaded from
10 Tables
10.1 Table 1
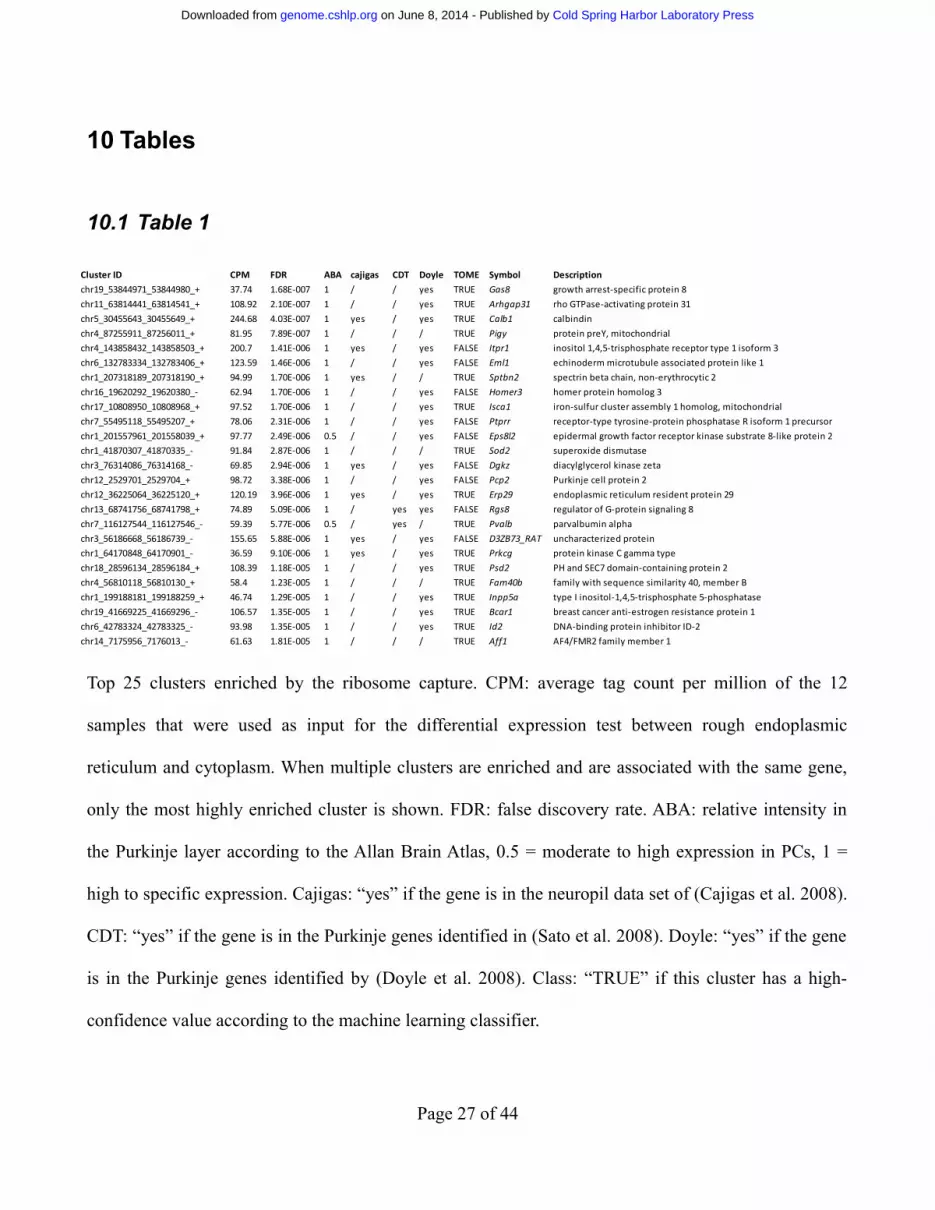
Top 25 clusters enriched by the ribosome capture. CPM: average tag count per million of the 12
samples that were used as input for the differential expression test between rough endoplasmic
reticulum and cytoplasm. When multiple clusters are enriched and are associated with the same gene,
only the most highly enriched cluster is shown. FDR: false discovery rate. ABA: relative intensity in
the Purkinje layer according to the Allan Brain Atlas, 0.5 = moderate to high expression in PCs, 1 =
high to specific expression. Cajigas: “yes” if the gene is in the neuropil data set of (Cajigas et al. 2008).
CDT: “yes” if the gene is in the Purkinje genes identified in (Sato et al. 2008). Doyle: “yes” if the gene
is in the Purkinje genes identified by (Doyle et al. 2008). Class: “TRUE” if this cluster has a high-
confidence value according to the machine learning classifier.
Page 27 of 44
Cluster ID CPM FDR ABA cajigas CDT Doyle TOME Symbol Description
chr19_53844971_53844980_+ 37.74 1.68E-007 1 / / yes TRUE Gas8 growth arrest-specific protein 8
chr11_63814441_63814541_+ 108.92 2.10E-007 1 / / yes TRUE Arhgap31 rho GTPase-activating protein 31
chr5_30455643_30455649_+ 244.68 4.03E-007 1 yes / yes TRUE Calb1 calbindin
chr4_87255911_87256011_+ 81.95 7.89E-007 1 / / / TRUE Pigy protein preY, mitochondrial
chr4_143858432_143858503_+ 200.7 1.41E-006 1 yes / yes FALSE Itpr1 inositol 1,4,5-trisphosphate receptor type 1 isoform 3
chr6_132783334_132783406_+ 123.59 1.46E-006 1 / / yes FALSE Eml1 echinoderm microtubule associated protein like 1
chr1_207318189_207318190_+ 94.99 1.70E-006 1 yes / / TRUE Sptbn2 spectrin beta chain, non-erythrocytic 2
chr16_19620292_19620380_- 62.94 1.70E-006 1 / / yes FALSE Homer3 homer protein homolog 3
chr17_10808950_10808968_+ 97.52 1.70E-006 1 / / yes TRUE Isca1 iron-sulfur cluster assembly 1 homolog, mitochondrial
chr7_55495118_55495207_+ 78.06 2.31E-006 1 / / yes FALSE Ptprr receptor-type tyrosine-protein phosphatase R isoform 1 precursor
chr1_201557961_201558039_+ 97.77 2.49E-006 0.5 / / yes FALSE Eps8l2 epidermal growth factor receptor kinase substrate 8-like protein 2
chr1_41870307_41870335_- 91.84 2.87E-006 1 / / / TRUE Sod2 superoxide dismutase
chr3_76314086_76314168_- 69.85 2.94E-006 1 yes / yes FALSE Dgkz diacylglycerol kinase zeta
chr12_2529701_2529704_+ 98.72 3.38E-006 1 / / yes FALSE Pcp2 Purkinje cell protein 2
chr12_36225064_36225120_+ 120.19 3.96E-006 1 yes / yes TRUE Erp29 endoplasmic reticulum resident protein 29
chr13_68741756_68741798_+ 74.89 5.09E-006 1 / yes yes FALSE Rgs8 regulator of G-protein signaling 8
chr7_116127544_116127546_- 59.39 5.77E-006 0.5 / yes / TRUE Pvalb parvalbumin alpha
chr3_56186668_56186739_- 155.65 5.88E-006 1 yes / yes FALSE D3ZB73_RAT uncharacterized protein
chr1_64170848_64170901_- 36.59 9.10E-006 1 yes / yes TRUE Prkcg protein kinase C gamma type
chr18_28596134_28596184_+ 108.39 1.18E-005 1 / / yes TRUE Psd2 PH and SEC7 domain-containing protein 2
chr4_56810118_56810130_+ 58.4 1.23E-005 1 / / / TRUE Fam40b family with sequence similarity 40, member B
chr1_199188181_199188259_+ 46.74 1.29E-005 1 / / yes TRUE Inpp5a type I inositol-1,4,5-trisphosphate 5-phosphatase
chr19_41669225_41669296_- 106.57 1.35E-005 1 / / yes TRUE Bcar1 breast cancer anti-estrogen resistance protein 1
chr6_42783324_42783325_- 93.98 1.35E-005 1 / / yes TRUE Id2 DNA-binding protein inhibitor ID-2
chr14_7175956_7176013_- 61.63 1.81E-005 1 / / / TRUE Aff1 AF4/FMR2 family member 1
Cold Spring Harbor Laboratory Press on June 8, 2014 - Published by genome.cshlp.orgDownloaded from

10.2 Table 2
Result of the search for motifs from the JASPAR Core database for vertebrates in the +/-500 bp vicinity
of representative clusters of genes enriched by the ribosome capture. Potential targets: number of
nanoCAGE clusters potentially under control of this (ID, name) transcription factor binding motif.
Consensus: IUPAC representation of this TF binding motif. Expression: average expression level of
that gene in tags-per-million. If the gene has multiple promoters, the most highly expressed cluster was
chosen. p-val: statistical significance of the enrichment determined by Clover.
Page 28 of 44
Enriched motifs Depleted motifs
ID name potential targets consensus expression p-val ID name potential targets consensus expression p-val
MA0055.1 MYF 1569 CAGCAGCTGCTG 0 MA0079.2 SP1 2099 CCCCGCCCCC 1
MA0038.1 GFI 1568 CAAATCACTG 0 MA0080.2 SPI1 2081 AGGAAGT 1
MA0084.1 SRY 1549 GTAAACAAT 0 MA0152.1 NFATC2 2010 TTTTCCA 1
MA0092.1 HAND1::TCFE2A 1516 GGTCTGGCAT 3.06902 0 MA0056.1 MZF1_1-4 1837 TGGGGA 4.76935 1
MA0109.1 HLTF 1433 AACCTTATAT 17.5449 0 MA0039.2 KLF4 1703 TGGGTGGGGC 1
MA0099.2 AP1 1294 TGACTCA 0.001 MA0002.2 RUNX1 1551 GTCTGTGGTTT 1
MA0095.1 YY1 1266 GCCATC 37.3449 0 MA0028.1 ELK1 1538 GAGCCGGAAG 1
MA0102.2 CEBPA 1177 TTTCGCAAT 0.002 MA0157.1 FOXO3 1438 TGTAAACA 9.19944 1
MA0141.1 ESRRB 1134 AGCTCAAGGTCA 0 MA0098.1 ETS1 1337 YTTCCG 1
MA0063.1 NKX2-5 1121 TTAATTG 0 MA0088.1 ZNF143 1295 GATTTCCCATMATGCCTTGC 28.9556 1
MA0075.1 PRRX2 1117 AATTA 0.006 MA0137.2 STAT1 1057 CATTTCCCGGAAACC 4.12551 0.994
MA0117.1 MAFB 1108 GCTGACGS 0 MA0162.1 EGR1 1053 TGCGTGGGCGK 1
MA0108.2 TBP 1073 GTATAAAAGGCGGGG 68.7487 0 MA0018.2 CREB1 937 TGACGTCA 1
MA0087.1 SOX5 986 WAACAAT 0 MA0060.1 NFYA 896 CTCAGCCAATCAGCGC 11.1021 1
MA0150.1 NFE2L2 868 ATGACTCAGCA 0.003 MA0024.1 E2F1 795 TTTGGCGC 1
MA0124.1 NKX3-1 865 ATACTTA 24.4568 0 MA0007.1 AR 611 ATAAGAACAYCSTGTACCCGCC 1
MA0030.1 FOXF2 862 CAAACGTAAACAAT 0 MA0131.1 MIZF 476 TAACGTCCGC 0.996
MA0033.1 FOXL1 856 TATACATA 0 MA0115.1 NR1H2::RXRA 122 AAAGGTCAAAGGTCAAC 23.5141 1
MA0019.1 DDIT3::CEBPA 843 AGATGCAATCCC 92.7215 0
MA0153.1 HNF1B 821 TTAATATTTAAC 0
MA0051.1 IRF2 811 GGAAAGYGAAASCAAAAC 0.006
MA0091.1 TAL1::TCF3 684 CGACCATCTGTT 0
MA0043.1 HLF 673 GGTTACGYAATH 0
MA0069.1 PAX6 632 TTCACGCATGAGTT 4.39744 0
MA0093.1 USF1 619 CACGTGG 28.2363 0.003
MA0116.1 ZFP423 557 GGCACCCAGGGGTGC 2.97445 0
MA0052.1 MEF2A 556 CTATTTATAG 0.002
MA0072.1 RORA_2 442 TATAAGTAGGTCAA 0
MA0032.1 FOXC1 304 GGTAAGTA 0.001
Cold Spring Harbor Laboratory Press on June 8, 2014 - Published by genome.cshlp.orgDownloaded from
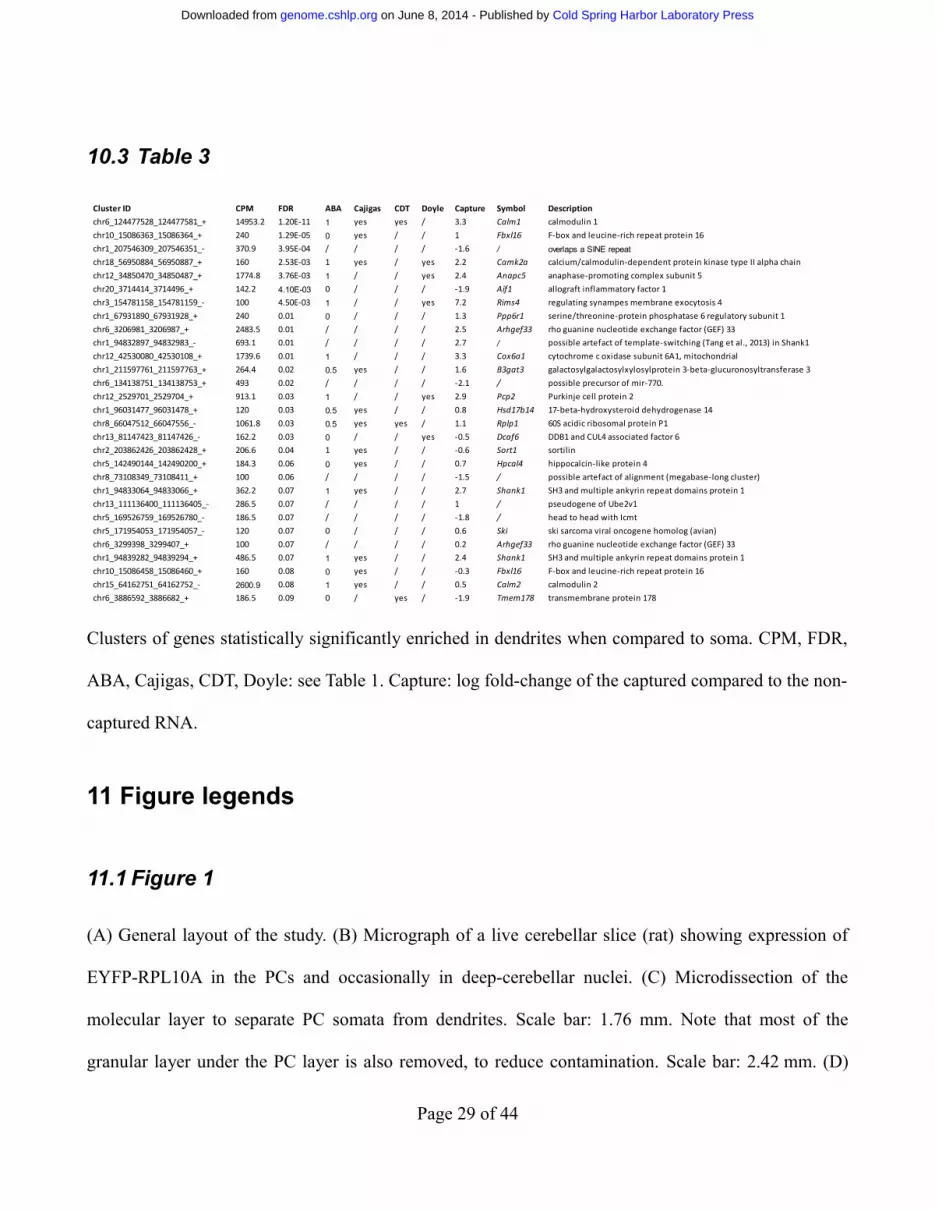
10.3 Table 3
Clusters of genes statistically significantly enriched in dendrites when compared to soma. CPM, FDR,
ABA, Cajigas, CDT, Doyle: see Table 1. Capture: log fold-change of the captured compared to the non-
captured RNA.
11 Figure legends
11.1 Figure 1
(A) General layout of the study. (B) Micrograph of a live cerebellar slice (rat) showing expression of
EYFP-RPL10A in the PCs and occasionally in deep-cerebellar nuclei. (C) Microdissection of the
molecular layer to separate PC somata from dendrites. Scale bar: 1.76 mm. Note that most of the
granular layer under the PC layer is also removed, to reduce contamination. Scale bar: 2.42 mm. (D)
Page 29 of 44
Cluster ID CPM FDR ABA Cajigas CDT Doyle Capture Symbol Description
chr6_124477528_124477581_+ 14953.2 1.20E-11 1 yes yes / 3.3 Calm1 calmodulin 1
chr10_15086363_15086364_+ 240 1.29E-05 0 yes / / 1 Fbxl16 F-box and leucine-rich repeat protein 16
chr1_207546309_207546351_- 370.9 3.95E-04 / / / / -1.6 / overlaps a SINE repeat
chr18_56950884_56950887_+ 160 2.53E-03 1 yes / yes 2.2 Camk2a calcium/calmodulin-dependent protein kinase type II alpha chain
chr12_34850470_34850487_+ 1774.8 3.76E-03 1 / / yes 2.4 Anapc5 anaphase-promoting complex subunit 5
chr20_3714414_3714496_+ 142.2 4.10E-03 0 / / / -1.9 Aif1 allograft inflammatory factor 1
chr3_154781158_154781159_- 100 4.50E-03 1 / / yes 7.2 Rims4 regulating synampes membrane exocytosis 4
chr1_67931890_67931928_+ 240 0.01 0 / / / 1.3 Ppp6r1 serine/threonine-protein phosphatase 6 regulatory subunit 1
chr6_3206981_3206987_+ 2483.5 0.01 / / / / 2.5 Arhgef33 rho guanine nucleotide exchange factor (GEF) 33
chr1_94832897_94832983_- 693.1 0.01 / / / / 2.7 / possible artefact of template-switching (Tang et al., 2013) in Shank1
chr12_42530080_42530108_+ 1739.6 0.01 1 / / / 3.3 Cox6a1 cytochrome c oxidase subunit 6A1, mitochondrial
chr1_211597761_211597763_+ 264.4 0.02 0.5 yes / / 1.6 B3gat3 galactosylgalactosylxylosylprotein 3-beta-glucuronosyltransferase 3
chr6_134138751_134138753_+ 493 0.02 / / / / -2.1 / possible precursor of mir-770.
chr12_2529701_2529704_+ 913.1 0.03 1 / / yes 2.9 Pcp2 Purkinje cell protein 2
chr1_96031477_96031478_+ 120 0.03 0.5 yes / / 0.8 Hsd17b14 17-beta-hydroxysteroid dehydrogenase 14
chr8_66047512_66047556_- 1061.8 0.03 0.5 yes yes / 1.1 Rplp1 60S acidic ribosomal protein P1
chr13_81147423_81147426_- 162.2 0.03 0 / / yes -0.5 Dcaf6 DDB1 and CUL4 associated factor 6
chr2_203862426_203862428_+ 206.6 0.04 1 yes / / -0.6 Sort1 sortilin
chr5_142490144_142490200_+ 184.3 0.06 0 yes / / 0.7 Hpcal4 hippocalcin-like protein 4
chr8_73108349_73108411_+ 100 0.06 / / / / -1.5 / possible artefact of alignment (megabase-long cluster)
chr1_94833064_94833066_+ 362.2 0.07 1 yes / / 2.7 Shank1 SH3 and multiple ankyrin repeat domains protein 1
chr13_111136400_111136405_- 286.5 0.07 / / / / 1 / pseudogene of Ube2v1
chr5_169526759_169526780_- 186.5 0.07 / / / / -1.8 / head to head with Icmt
chr5_171954053_171954057_- 120 0.07 0 / / / 0.6 Ski ski sarcoma viral oncogene homolog (avian)
chr6_3299398_3299407_+ 100 0.07 / / / / 0.2 Arhgef33 rho guanine nucleotide exchange factor (GEF) 33
chr1_94839282_94839294_+ 486.5 0.07 1 yes / / 2.4 Shank1 SH3 and multiple ankyrin repeat domains protein 1
chr10_15086458_15086460_+ 160 0.08 0 yes / / -0.3 Fbxl16 F-box and leucine-rich repeat protein 16
chr15_64162751_64162752_- 2600.9 0.08 1 yes / / 0.5 Calm2 calmodulin 2
chr6_3886592_3886682_+ 186.5 0.09 0 / yes / -1.9 Tmem178 transmembrane protein 178
Cold Spring Harbor Laboratory Press on June 8, 2014 - Published by genome.cshlp.orgDownloaded from
Immunofluorescence detection of EYFP-L10A (anti-GFP) after fixation, showing intense staining of
PC somata and weaker signal in dendrites. (E) Single optical section of combined staining for EYFP-
L10A (green), calbindin (red), DAPI (blue). Scale bar for D and E: 58 μm.
11.2 Figure 2
(A) Genomic representation of the PC marker Itpr1. Below the chromosomal coordinates are shown:
Top: quantitative representation of CAGE tag abundance on the positive strand. Middle: Paraclu
followed by CAGEscan clustering groups tags into clusters, here color-coded according to the cluster’s
classification score. (B) Paraclu clusters annotated with an Ensembl gene by direct overlap or via
CAGEscan. (C) Percentages of the first 5’ nucleotide sequences that fall into 5’ untranslated regions,
exons, introns and 3’ untranslated regions of Ensembl (downloaded 28. March 2012) genes. (D)
Promoter classification.
11.3 Figure 3
(A) Differential gene expression between the ribosome-captured (up) and control supernatant (down)
samples. Each dot corresponds to a CAGEscan cluster. Horizontal-axis: gene expression level
normalized by edgeR (Log Count per Million). Vertical-axis: log2 fold change (FC) between the
samples. The most extreme changes, where clusters group far from the main cloud of points, reflect a
null expression in one of the samples. Open red symbols indicate clusters significantly enriched
(positive FC)/depleted (negative FC) in PCs. Some clusters were annotated with markers for neuronal
cells other than PC, including granule cells (light green); glia markers (dark green); PC markers (dark
magenta) and twelve clusters with strong enrichment in the bound fraction (light magenta), which can
serve as novel PC markers. (B) Micrographs of sagittal sections showing in-situ hybridization (Allen
Page 30 of 44
Cold Spring Harbor Laboratory Press on June 8, 2014 - Published by genome.cshlp.orgDownloaded from
Brain Atlas) for the twelve new PC markers in mouse brain. Scale bar: 300 μm.
11.4 Figure 4
(A) Comparison of capture selectivity against a published dataset and against noise. Horizontal axis:
200 points moving window (+/- s.e.m.) averaging the ABA scores for our dataset and Doyle et al's,
ranked by p-value. Noise was estimated from similar scoring of randomly selected rat genes. Inset:
number of gene symbols unique or common to the 2,320 first clusters plotted in this graph for each
dataset. (B) Venn-diagram of the number of gene symbols unique or common to the sets of Purkinje-
specific genes defined by this work, the experiment of Doyle et al., and the CDT-DB. The gene
symbols can be found in Table S4. (C) Comparison of transcript enrichment in PC to the relative
distribution of selected proteins, detected by immunofluoescence, in vitro. Anti-calbindin D28k
(Alexa546) images were thresholded to define PC region-of-interest. For all tested proteins, median
fluorescence intensity in non-PC area was expressed relative to intensity in PCs (with 0 indicating
exclusive expression by PCs). Measurements beloning to the same replicate are coded in the same color
(red, green, blue). Note that DELTA2R (Grid2) appears here as an outlier because its most intense
5' UTR cluster (rank: 129, LogCPM: 3.35) was not recognized as a promoter-binding region. (D, E, F)
representative micrographs for DELTA2R (D), emerin (E), and PAX2 (F), all co-stained with anti-
calbindin (red) and DAPI (blue). Scale bar 50 µm.
11.5 Figure 5
Relative expression of biophysically relevant transcripts coding for receptors, Na+, K+, Ca++ channels,
ion pumps and Ca++-binding proteins. Expression levels are expressed relative to other transcripts in the
libray (right hand axis) and relative to the Grid2 transcript coding for the PC synapse-specific
Page 31 of 44
Cold Spring Harbor Laboratory Press on June 8, 2014 - Published by genome.cshlp.orgDownloaded from
glutamate receptor, ionotropic delta 2. Gene name are colorized according to differential expression
between cytoplasm and ER fractions.
11.6 Figure 6
(A) Visualization of the Htr1b locus. (B-D) Immunofluorescence detection of (B) CALB1, (C) HTR1B
receptor, (D) combined immunofluorescence signals and DAPI staining. (E) SmartFlare Pcp2, (F)
SmartFlare Htr1bos, (G) combined SmartFlare signals. Scale bar: 100 µm.
12 Supplemental Tables
12.1Table S1: Summary of the libraries produced for this study
Name: unique identifier for the library. Lane: identifier indicating which libraries were multiplexed
together. Barcode: sequence identifier used for the multiplexing. Compartment: M, rER-bound; C,
cytoplasmic. Capture: Bound, immunoprecipitated; Unbound, control supernatant. Cellular fraction:
whole or dendrite (dissected molecular layer). Replicate: identifier indicating pools of lobules (from
multiple animals). Lobules: number of lobules in the pool. RNA: number of nanograms of total RNA
extracted. RIN: RNA Integrity Number. Extracted pairs: number of pairs identified by the sequence
barcode for this library. Artifacts removed: number of pairs removed because they resembled empty
constructs or oligonucleotide artifacts. Ribosome map count: number of pairs removed because they
had significant homology with rRNA sequences. Reads aligned: number of pairs aligned to the rat
genome. Proper pairs: number of pairs marked as “proper” by the BWA aligner. Unique pairs: number
of pairs after collapsing all the pairs having the same external coordinates. 5' UTR exon, coding exon,
intron, 3’UTR exon: number of CAGE 5’ ends contained in these four areas defined by the UCSC
Page 32 of 44
Cold Spring Harbor Laboratory Press on June 8, 2014 - Published by genome.cshlp.orgDownloaded from
genome browser (Kent et al. 2002). Intergenic: remaining pairs. Median insert size: median distance
between the extremities of the pairs (on the genome).
12.2Table S2: Clusters enriched by pulldown
List of 1,809 clusters enriched by pulldown, together with detected fold-change, normalized
expression, and associated gene symbol.
12.3Table S3: Expression and statistical analysis
48,049 clusters together with results from the differential expression experiments (counts-per-million,
false discovery rate, rank) for the comparison of captured vs non-captured as well as rER-bound vs
cyoplasmic; annotations including gene symbol, biotype and description; information about the
presence of the respective gene in the datasets published in (Sato et al. 2008, Doyle et al. 2008, Kirsch
et al. 2012, Cajigas et al. 2012), and several rankings which make the data more accessible. A detailed
description of each field can be found on the second worksheet (named “legend”).
12.4Table S4: Clusters unique or common to previously published
research by others
Gene symbols contained in the seven sets of the Venn diagram in Fig. 4B.
12.5Table S5: Gene Ontology analysis of the differential expression
between the subcellular compartments
9,372 rER-specific, Purkinje-enriched genes have been compared to the remaining 38,580 clusters
Page 33 of 44
Cold Spring Harbor Laboratory Press on June 8, 2014 - Published by genome.cshlp.orgDownloaded from
using GOrilla (Eden et al. 2009). The resulting lists of statistically enriched Gene Ontology terms have
then been used as input to REVIGO (Supek et al. 2011) to summarize the GO domains as treemaps,
shown in Fig. S5C, S6 and S8. This table contains the lists of statistically enriched terms identified by
the differential expression test, separated into three sheets for Molecular Function, Biological Process
and Cellular Component.
12.6Table S6: Clusters comprising the biophysical translatome
This table shows the clusters involved in PC membrane potential control and ion homeostasis. A
detailed description of each field can be found on the second worksheet (named “legend”).
12.7Table S7: Gene Ontology analysis of the dendritic clusters
Overrepresentation (determined with GOrilla (Eden et al. 2009)) of Gene Ontology terms of the 974
dendritic clusters, when compared to the remaining 47,075 clusters, separated into three sheets for
Molecular Function, Biological Process and Cellular Component.
12.8Table S8: Antibodies
Table describing the antibodies used for the immuno-histofluorescence quantification, the gene
encoding the protein which is targeted by the respective antibody (as shown in Fig. 4 C), manufacturer
and catalogue number.
Page 34 of 44
Cold Spring Harbor Laboratory Press on June 8, 2014 - Published by genome.cshlp.orgDownloaded from
13 References
Achard P, De Schutter E. 2006. Complex parameter landscape for a complex neuron model. PLoS
Comput Biol 2: e94.
Akache B, Grimm D, Pandey K, Yant SR, Xu H, Kay MA. 2006. The 37/67-kilodalton laminin receptor
is a receptor for adeno-associated virus serotypes 8, 2, 3, and 9. J Virol 80: 9831–9836.
Aldinger KA, Lehmann OJ, Hudgins L, Chizhikov VV, Bassuk AG, Ades LC, Krantz ID, Dobyns WB,
Millen KJ. 2009. FOXC1 is required for normal cerebellar development and is a major contributor to
chromosome 6p25.3 Dandy-Walker malformation. Nat Genet 41: 1037–1042.
Ashburner M, Ball CA, Blake JA, Botstein D, Butler H, Cherry JM, Davis AP, Dolinski K, Dwight SS,
Eppig JT, et al. 2000. Gene ontology: tool for the unification of biology. The Gene Ontology
Consortium. Nat Genet 25: 25–29.
Böckers TM, Segger-Junius M, Iglauer P, Bockmann J, Gundelfinger ED, Kreutz MR, Richter D,
Kindler S, Kreienkamp H-J. 2004. Differential expression and dendritic transcript localization of Shank
family members: identification of a dendritic targeting element in the 3’ untranslated region of Shank1
mRNA. Mol Cell Neurosci 26: 182–190.
Boukhtouche F, Doulazmi M, Frederic F, Dusart I, Brugg B, Mariani J. 2006. RORalpha, a pivotal
nuclear receptor for Purkinje neuron survival and differentiation: from development to ageing.
Cerebellum 5: 97–104.
Broekman MLD, 2006. AAV vectors as gene delivery vehicles in the central nervous system. Utrecht
University. Retrieved from http://igitur-archive.library.uu.nl/dissertations/2006-0726-201713/index.htm
Cajigas IJ, Tushev G, Will TJ, tom Dieck S, Fuerst N, Schuman EM. 2012. The local transcriptome in
Page 35 of 44
Cold Spring Harbor Laboratory Press on June 8, 2014 - Published by genome.cshlp.orgDownloaded from

the synaptic neuropil revealed by deep sequencing and high-resolution imaging. Neuron 74: 453–466.
Carrieri C, Cimatti L, Biagioli M, Beugnet A, Zucchelli S, Fedele S, Pesce E, Ferrer I, Collavin L,
Santoro C, et al. 2012. Long non-coding antisense RNA controls Uchl1 translation through an
embedded SINEB2 repeat. Nature 491: 454–457.
Darnell JC, Van Driesche SJ, Zhang C, Hung KYS, Mele A, Fraser CE, Stone EF, Chen C, Fak JJ, Chi
SW, et al. 2011. FMRP stalls ribosomal translocation on mRNAs linked to synaptic function and
autism. Cell 146: 247–261.
Dougherty JD, Schmidt EF, Nakajima M, Heintz N. 2010. Analytical approaches to RNA profiling data
for the identification of genes enriched in specific cells. Nucleic Acids Res 38: 4218–4230.
Doyle JP, Dougherty JD, Heiman M, Schmidt EF, Stevens TR, Ma G, Bupp S, Shrestha P, Shah RD,
Doughty ML, et al. 2008. Application of a translational profiling approach for the comparative analysis
of CNS cell types. Cell 135: 749–762.
Duart-Garcia C, Braunschweig MH. 2013. The Igf2as transcript is exported into cytoplasm and
associated with polysomes. Biochem Genet 51: 119–130.
Duncan MK, Haynes JI 2nd, Cvekl A, Piatigorsky J. 1998. Dual roles for Pax-6: a transcriptional
repressor of lens fiber cell-specific beta-crystallin genes. Mol Cell Biol 18: 5579–5586.
Djebali S, Davis CA, Merkel A, Dobin A, Lassmann T, Mortazavi A, Tanzer A, Lagarde J, Lin W,
Schlesinger F, et al. 2012. Landscape of transcription in human cells. Nature 489: 101–108.
Eden E, Navon R, Steinfeld I, Lipson D, Yakhini Z. 2009. GOrilla: a tool for discovery and
visualization of enriched GO terms in ranked gene lists. BMC Bioinformatics 10: 48.
Eilbeck K, Lewis SE, Mungall CJ, Yandell M, Stein L, Durbin R, Ashburner M. 2005. The Sequence
Page 36 of 44
Cold Spring Harbor Laboratory Press on June 8, 2014 - Published by genome.cshlp.orgDownloaded from

Ontology: a tool for the unification of genome annotations. Genome Biol 6: R44.
Fejes-Toth K, Sotirova V, Sachidanandam R, Assaf G, Hannon GJ, Kapranov P, Foissac S, Willingham
AT, Duttagupta R, Dumais E, et al. 2009. Post-transcriptional processing generates a diversity of 5′-
modified long and short RNAs. Nature 457: 1028–1032
Flicek P, Ahmed I, Amode MR, Barrell D, Beal K, Brent S, Carvalho-Silva D, Clapham P, Coates G,
Fairley S, et al. 2013. Ensembl 2013. Nucleic Acids Res 41: D48–55.
Friedrich B, Euler P, Ziegler R, Kuhn A, Landwehrmeyer BG, Luthi-Carter R, Weiller C, Hellwig S,
Zucker B. 2012. Comparative analyses of Purkinje cell gene expression profiles reveal shared
molecular abnormalities in models of different polyglutamine diseases. Brain Res 1481: 37–48.
Frith MC, Fu Y, Yu L, Chen J-F, Hansen U, Weng Z. 2004. Detection of functional DNA motifs via
statistical over-representation. Nucleic Acids Res 32: 1372–1381.
Frith MC, Valen E, Krogh A, Hayashizaki Y, Carninci P, Sandelin A. 2008. A code for transcription
initiation in mammalian genomes. Genome Res 18: 1–12.
Gebetsberger J, Zywicki M, Künzi A, Polacek N. 2012. tRNA-derived fragments target the ribosome
and function as regulatory non-coding RNA in Haloferax volcanii. Archaea 2012: 260909.
Gibbs RA, Weinstock GM, Metzker ML, Muzny DM, Sodergren EJ, Scherer S, Scott G, Steffen D,
Worley KC, Burch PE, et al. 2004. Genome sequence of the Brown Norway rat yields insights into
mammalian evolution. Nature 428: 493–521.
Gygi SP, Rochon Y, Franza BR, Aebersold R. 1999. Correlation between protein and mRNA abundance
in yeast. Mol Cell Biol 19: 1720–1730.
Heiman M, Schaefer A, Gong S, Peterson JD, Day M, Ramsey KE, Suárez-Fariñas M, Schwarz C,
Page 37 of 44
Cold Spring Harbor Laboratory Press on June 8, 2014 - Published by genome.cshlp.orgDownloaded from

Stephan DA, Surmeier DJ, et al. 2008. A translational profiling approach for the molecular
characterization of CNS cell types. Cell 135: 738–748.
Horton AC, Ehlers MD. 2003. Dual modes of endoplasmic reticulum-to-Golgi transport in dendrites
revealed by live-cell imaging. J Neurosci 23: 6188–6199.
Hurlbert SH. 1971. The Nonconcept of Species Diversity: A Critique and Alternative Parameters.
Ecology 52: 577.
Kacharmina JE, Job C, Crino P, Eberwine J. 2000. Stimulation of glutamate receptor protein synthesis
and membrane insertion within isolated neuronal dendrites. Proc Natl Acad Sci USA 97: 11545–11550.
Karachot L, Shirai Y, Vigot R, Yamamori T, Ito M. 2001. Induction of long-term depression in
cerebellar Purkinje cells requires a rapidly turned over protein. J Neurophysiol 86: 280–289.
Kent WJ, Sugnet CW, Furey TS, Roskin KM, Pringle TH, Zahler AM, Haussler a. D. 2002. The Human
Genome Browser at UCSC. Genome Research 12: 996–1006.
Kirsch L, Liscovitch N, Chechik G. 2012. Localizing genes to cerebellar layers by classifying ISH
images. PLoS Comput Biol 8: e1002790.
Knight ZA, Tan K, Birsoy K, Schmidt S, Garrison JL, Wysocki RW, Emiliano A, Ekstrand MI,
Friedman JM. 2012. Molecular profiling of activated neurons by phosphorylated ribosome capture.
Cell 151: 1126–1137.
Korogod S M, Tyc-Dumont S. 2009. Chapter 13: Dendritic space as a coder of the temporal output
patterns. Electrical dynamics of the dendritic space. 173-194. Cambridge University press, Cambridge,
New York, Melbourne.
Lein ES, Hawrylycz MJ, Ao N, Ayres M, Bensinger A, Bernard A, Boe AF, Boguski MS, Brockway
Page 38 of 44
Cold Spring Harbor Laboratory Press on June 8, 2014 - Published by genome.cshlp.orgDownloaded from
KS, Byrnes EJ, et al. 2007. Genome-wide atlas of gene expression in the adult mouse brain. Nature
445: 168–176.
Li H, Durbin R. 2009. Fast and accurate short read alignment with Burrows-Wheeler transform.
Bioinformatics 25: 1754–1760.
Li YM, Franklin G, Cui HM, Svensson K, He XB, Adam G, Ohlsson R, Pfeifer S. 1998. The H19
transcript is associated with polysomes and may regulate IGF2 expression in trans. J Biol Chem 273:
28247–28252.
Linden DJ. 1996. A protein synthesis-dependent late phase of cerebellar long-term depression. Neuron
17: 483–490.
Martin KC, Ephrussi A. 2009. mRNA localization: gene expression in the spatial dimension. Cell 136:
719–730.
McCarthy DJ, Chen Y, Smyth GK. 2012. Differential expression analysis of multifactor RNA-Seq
experiments with respect to biological variation. Nucleic Acids Res 40: 4288–4297.
Miura P, Shenker S, Andreu-Agullo C, Westholm JO, Lai EC. 2013. Widespread and extensive
lengthening of 3’ UTRs in the mammalian brain. Genome Res 23: 812–825.
Miyashiro K, Dichter M, Eberwine J. 1994. On the nature and differential distribution of mRNAs in
hippocampal neurites: implications for neuronal functioning. Proc Natl Acad Sci USA 91: 10800–
10804.
Miyasho T, Takagi H, Suzuki H, Watanabe S, Inoue M, Kudo Y, Miyakawa H. 2001. Low-threshold
potassium channels and a low-threshold calcium channel regulate Ca2+ spike firing in the dendrites of
cerebellar Purkinje neurons: a modeling study. Brain Res 891: 106–115.
Page 39 of 44
Cold Spring Harbor Laboratory Press on June 8, 2014 - Published by genome.cshlp.orgDownloaded from
Miyawaki A, Griesbeck O, Heim R, Tsien RY. 1999. Dynamic and quantitative Ca2+ measurements
using improved cameleons. Proc Natl Acad Sci USA 96: 2135–2140.
Moccia R, Chen D, Lyles V, Kapuya E, E Y, Kalachikov S, Spahn CMT, Frank J, Kandel ER, Barad M,
et al. 2003. An unbiased cDNA library prepared from isolated Aplysia sensory neuron processes is
enriched for cytoskeletal and translational mRNAs. J Neurosci 23: 9409–9417.
Murashima M, Hirano T. 1999. Entire course and distinct phases of day-lasting depression of miniature
EPSC amplitudes in cultured Purkinje neurons. J Neurosci 19: 7326–7333.
Oberdick J, Schilling K, Smeyne RJ, Corbin JG, Bocchiaro C, Morgan JI. 1993. Control of segment-
like patterns of gene expression in the mouse cerebellum. Neuron 10: 1007–1018.
Okaty BW, Sugino K, Nelson SB. 2011. Cell type-specific transcriptomics in the brain. J Neurosci 31:
6939–6943.
Oksanen J, Blanchet FG, Kindt R, Legendre P, O’Hara RB, Simpson GL,Solymos P, Stevens MHH,
Wagner, H. 2010. Vegan: Community EcologyPackage. R package version 1.18-16/r1371. http://cran.r-
project.org/web/packages/vegan/index.html.
Ouyang Y, Rosenstein A, Kreiman G, Schuman EM, Kennedy MB. 1999. Tetanic stimulation leads to
increased accumulation of Ca(2+)/calmodulin-dependent protein kinase II via dendritic protein
synthesis in hippocampal neurons. J Neurosci 19: 7823–7833.
Plessy C, Bertin N, Takahashi H, Simone R, Salimullah M, Lassmann T, Vitezic M, Severin J,
Olivarius S, Lazarevic D, et al. 2010. Linking promoters to functional transcripts in small samples with
nanoCAGE and CAGEscan. Nat Methods 7: 528–534.
Poon MM, Choi S-H, Jamieson CAM, Geschwind DH, Martin KC. 2006. Identification of process-
Page 40 of 44
Cold Spring Harbor Laboratory Press on June 8, 2014 - Published by genome.cshlp.orgDownloaded from

localized mRNAs from cultured rodent hippocampal neurons. J Neurosci 26: 13390–13399.
The R Development Core Team. 2003. R: A language and environment for statistical computing. R
Foundation for Statistical Computing, Vienna, Austria.
Robinson MD, McCarthy DJ, Smyth GK. 2010. edgeR: a Bioconductor package for differential
expression analysis of digital gene expression data. Bioinformatics 26: 139–140.
Rong Y, Wang T, Morgan JI. 2004. Identification of candidate Purkinje cell-specific markers by gene
expression profiling in wild-type and pcd(3J) mice. Brain Res Mol Brain Res 132: 128–145.
Salimullah M, Sakai M, Mizuho S, Plessy C, Carninci P. 2011. NanoCAGE: a high-resolution
technique to discover and interrogate cell transcriptomes. Cold Spring Harb Protoc 2011:
pdb.prot5559.
Sandelin A, Alkema W, Engström P, Wasserman WW, Lenhard B. 2004. JASPAR: an open-access
database for eukaryotic transcription factor binding profiles. Nucleic Acids Res 32: D91–94.
Sanz E, Yang L, Su T, Morris DR, McKnight GS, Amieux PS. 2009. Cell-type-specific isolation of
ribosome-associated mRNA from complex tissues. Proc Natl Acad Sci USA 106: 13939–13944.
Sato A, Sekine Y, Saruta C, Nishibe H, Morita N, Sato Y, Sadakata T, Shinoda Y, Kojima T, Furuichi T.
2008. Cerebellar development transcriptome database (CDT-DB): profiling of spatio-temporal gene
expression during the postnatal development of mouse cerebellum. Neural Netw 21: 1056–1069.
Saxena A, Wagatsuma A, Noro Y, Kuji T, Asaka-Oba A, Watahiki A, Gurnot C, Fagiolini M, Hensch
TK, Carninci P. 2012. Trehalose-enhanced isolation of neuronal sub-types from adult mouse brain.
Biotechniques 52: 381–385.
De Schutter E, Bower JM. 1994. An active membrane model of the cerebellar Purkinje cell. I.
Page 41 of 44
Cold Spring Harbor Laboratory Press on June 8, 2014 - Published by genome.cshlp.orgDownloaded from

Simulation of current clamps in slice. J Neurophysiol 71: 375–400.
Schwanhäusser B, Busse D, Li N, Dittmar G, Schuchhardt J, Wolf J, Chen W, Selbach M. 2011. Global
quantification of mammalian gene expression control. Nature 473: 337–342.
Seferos DS, Giljohann DA, Hill HD, Prigodich AE, Mirkin CA. 2007. Nano-flares: probes for
transfection and mRNA detection in living cells. J Am Chem Soc 129: 15477–15479.
Selimi F, Cristea IM, Heller E, Chait BT, Heintz N. 2009. Proteomic studies of a single CNS synapse
type: the parallel fiber/purkinje cell synapse. PLoS Biol 7: e83.
Shi J, Yang W, Chen M, Du Y, Zhang J, Wang K. 2011. AMD, an automated motif discovery tool using
stepwise refinement of gapped consensuses. PLoS ONE 6: e24576.
Shiraki T, Kondo S, Katayama S, Waki K, Kasukawa T, Kawaji H, Kodzius R, Watahiki A, Nakamura
M, Arakawa T, et al. 2003. Cap analysis gene expression for high-throughput analysis of transcriptional
starting point and identification of promoter usage. Proc Natl Acad Sci USA 100: 15776–15781.
Spacek J, Harris KM. 1997. Three-dimensional organization of smooth endoplasmic reticulum in
hippocampal CA1 dendrites and dendritic spines of the immature and mature rat. J Neurosci 17: 190–
203.
Summerford C, Bartlett JS, Samulski RJ. 1999. AlphaVbeta5 integrin: a co-receptor for adeno-
associated virus type 2 infection. Nat Med 5: 78–82.
Supek F, Bošnjak M, Škunca N, Šmuc T. 2011. REVIGO summarizes and visualizes long lists of gene
ontology terms. PLoS ONE 6: e21800.
Suzuki T, Tian QB, Kuromitsu J, Kawai T, Endo S. 2007. Characterization of mRNA species that are
associated with postsynaptic density fraction by gene chip microarray analysis. Neurosci Res 57: 61–
Page 42 of 44
Cold Spring Harbor Laboratory Press on June 8, 2014 - Published by genome.cshlp.orgDownloaded from
85.
Tang DTP, Plessy C, Salimullah M, Suzuki AM, Calligaris R, Gustincich S, Carninci P. 2013.
Suppression of artifacts and barcode bias in high-throughput transcriptome analyses utilizing template
switching. Nucleic Acids Res 41: e44.
Wanner I, Baader SL, Oberdick J, Schilling K. 2000. Changing subcellular distribution and activity-
dependent utilization of a dendritically localized mRNA in developing Purkinje cells. Mol Cell
Neurosci 15: 275–287.
Warming S, Rachel RA, Jenkins NA, Copeland NG. 2006. Zfp423 is required for normal cerebellar
development. Mol Cell Biol 26: 6913–6922.
Weasner BM, Weasner B, Deyoung SM, Michaels SD, Kumar JP. 2009. Transcriptional activities of the
Pax6 gene eyeless regulate tissue specificity of ectopic eye formation in Drosophila. Dev Biol 334:
492–502.
Liu-Yesucevitz L, Bassell GJ, Gitler AD, Hart AC, Klann E, Richter JD, Warren ST, Wolozin B. 2011.
Local RNA translation at the synapse and in disease. J Neurosci 31: 16086–16093.
Zanetta JP, Roussel G, Dontenwill M, Vincendon G. 1983. Immunohistochemical localization of alpha-
mannosidase during postnatal development of the rat cerebellum. J Neurochem 40: 202–208.
Zhang R, Zhang X, Bian F, Pu X, Schilling K, Oberdick J. 2008. 3’UTR-dependent localization of a
Purkinje cell messenger RNA in dendrites. Cerebellum 7: 482–493.
Zhong J, Zhang T, Bloch LM. 2006. Dendritic mRNAs encode diversified functionalities in
hippocampal pyramidal neurons. BMC Neurosci 7: 17.
Zywicki M, Bakowska-Zywicka K, Polacek N. 2012. Revealing stable processing products from
Page 43 of 44
Cold Spring Harbor Laboratory Press on June 8, 2014 - Published by genome.cshlp.orgDownloaded from

ribosome-associated small RNAs by deep-sequencing data analysis. Nucleic Acids Res 40: 4013–4024.
Page 44 of 44
Cold Spring Harbor Laboratory Press on June 8, 2014 - Published by genome.cshlp.orgDownloaded from
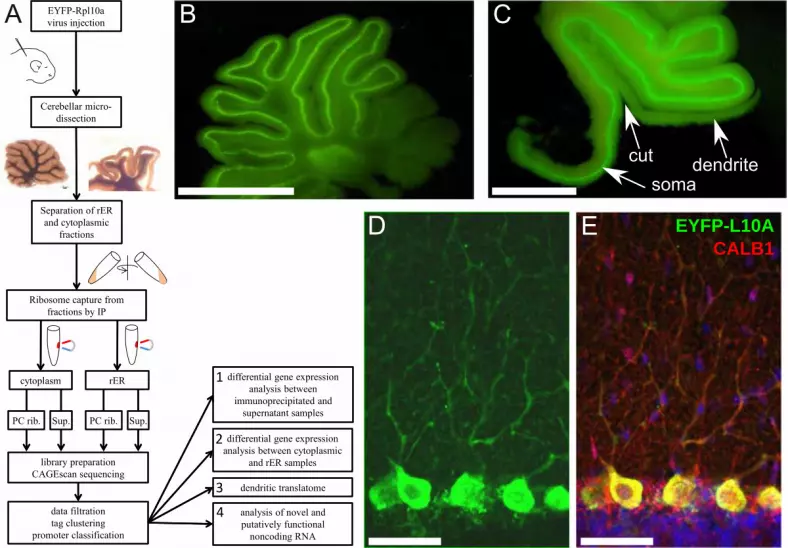
EYFP-Rpl10a
virus injection
Cerebellar micro-
dissection
Separation of rER
and cytoplasmic
fractions
Ribosome capture from
fractions by IP
cytoplasm rER
PC rib. Sup. PC rib. Sup.
library preparation
CAGEscan sequencing
data filtration
tag clustering
promoter classification
differential gene expression
analysis between
immunoprecipitated and
supernatant samples
differential gene expression
analysis between cytoplasmic
and rER samples
dendritic translatome
analysis of novel and
putatively functional
noncoding RNA
1
2
4
3
D E
B CA
cut
somadendrite
EYFP-L10ACALB1

chr4:
Itpr1
100Ikb rn4
143-750-000 143-800-000 143-850-000 143-900-000 143-950-000 144-000-000 144-050-000
rawIexpressionIofIallI26IsamplesIpooledI5positiveIstrandIonly8
CAGEscanIclustersI5red:IhighPconfidence-Igrey:IlowPconfidence8
EnsemblIGeneIPredictionsIPIEnsemblI68
3012I_
1I_
C T G C T T C A A A G T G C A G T A A C C A T G T
rawIexpressionIofIallI26IsamplesIpooledI5positiveIstrandIonly8
ICAGEscanIclusters
3012I_
3I_
P
0g 10g 20g 30g 40g 50g 60g 70g 80g 90g 100g
unbound 7g 26g 25g 6g 36g
dendrites 6g 37g 9g 9g 39g
bound,Tcytoplasm 12g 39g 10g 7g 32g
bound,Tmembrane 8g 45g 9g 10g 29g
5prime_UTR_Exons_rn4_sense Coding_Exons_rn4_sense Introns_rn4_sense
3prime_UTR_Exons_rn4_sense other
C
0h 10h 20h 30h 40h 50h 60h 70h 80h 90h 100h
34,442
72h
5,879
12h
7,728
16h
ParaclubclusterbdirectlyboverlapsbEnsembl ParaclubclusterboverlapsbEnsemblbviabCAGEscan
ParaclubclusterbcanbnotbbebannotatedbwithbEnsembl
B
D
A

0 2 4 6 8 10 12
−5
05
10
logCPM
logF
C
Purkinje cell markersNew Purkinje cell markersNon−PC neuronal markersGlia markers
BA
Fam40b Ndufa10 Fam107b Stoml2
Hspa4l Fam21c Myo18a Setd7
Aatf Pigy Thumpd1 Ngfrap1
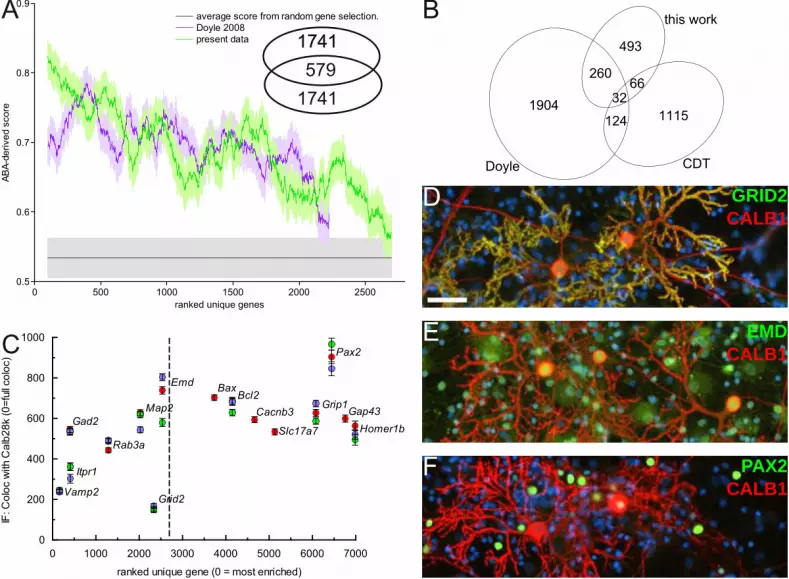
11151904
493
26066
124
32
this work
CDTDoyle
B
0 500 1000 1500 2000 25000.5
0.6
0.7
0.8
0.9A
BA
-de
rive
dks
co
reaveragekscorekfromkrandomkgenekselection.
Doylek2008
presentkdata
rankedkuniquekgenes
A
579
1 741
1 7411 741
0 1000 2000 3000 4000 5000 6000 7000
0
200
400
600
800
1000
ranked:unique:gene:(0:=:most:enriched)
IF::C
olo
c:w
ith:C
alb
28
k:(
0=
full:
co
loc):
Vamp2
Gad2
Rab3a
Map2
Grid2
EmdBax
Bcl2
Cacnb3
Slc17a7
Grip1Gap43
Homer1b
Pax2
Itpr1
C
D
E
F
GRID2CALB1
EMDCALB1
PAX2CALB1

Recep
tor
Na ch
anne
l
K chan
nel
Ca ch
anne
ls
Na/K p
umps
Ca-bin
ding
prot
.
Ca pu
mps
1
10
100
Exp
ress
ion
rela
tive
to G
rid
2
Itpr1
Kcnmb4
Gria3Gria4
Grm1
Grin1Grik1
Gria2Gabra1Trpm7
Gabbr2Ryr1
Trpc3Grik4Grid2
Scn2b
Scn1a
Scn1b
Scn8a
Scn4b
Kcnc3
Kcna1Kcnab2
Kcnma1Kcnj10Kcnc1Kcna2Kcnd1Kcnn3
Cacnb4
Cacnb2Cacna1g
Cacna1a
Cacna2d3Cacna2d2
Cacng7
Atp1b1
Atp1a1
Atp1a3
Calm3Calm1
Myl12b
Sptan1Calb1
Canx
Calu
SncbSdf4
PvalbHpca
Anxa6Clstn3
Capns1
Ppp3r1
Plcd4Syt7
Cdk5r1
Atp2b1Atp2b2
Atp2a2
-3.00 4.00ER enrichment (Log2)
3
4
5
6
7
8
9
10
Tra
nscr
ipt a
bun
dan
ce (
CP
M, L
og
2)

Scale
chr8:
chr8_86700435_86700449_-
chr8_86700377_86700384_F
chr8_86700628_86700637_F
chr8_86701566_86701570_-
chr8_86702212_86702266_-
SmartFlares
Htr1b
108kb rn4
86k705k000 86k710k000 86k715k000 86k720k000 86k725k000 86k730k000
SINE8Repeat8B3Ak8family8B2
CAGEscan8clusters
E F G
B C D
CALB1 HTR1 B CALB1 , HTR1 B, DAPI
Pcp2 RNA Htr1bos RNA Pcp2 and Htr1bos RNA
A


