Embed Size (px)
Citation preview

This is the final draft of a chapter forthcoming in Handbook of New Urban Studies, (eds. John Hannigan and Greg Richards, London: Sage) please cite the official publication.
Differentiated Residential Orientations of Class Fractions
Willem Boterman and Sako Musterd
Urban Geography/Urban Studies
University of Amsterdam
Abstract
Neighbourhoods can be seen as units that have a function in certain phases of the lives of people. The ideal seems to be that they more or less ‘match’ the household type. Because of frequent changes in the household and also because of changes or inertia in several neighbourhoods mismatches may develop and therefore, when able, households will frequently try to ‘rematch’ their relationship with the neighbourhood. If we assume that the housing market is functioning reasonably well, a cross-sectional view on where household types have settled down will reveal relevant information about the relationship between household types and neighbourhoods. In this contribution we investigate that relationship in great detail. We apply a large dataset with individual level register data for the whole population of the metropolitan region of Amsterdam from which we can construct class fractions, which form the basis for explaining different neighbourhood orientations. The class fractions are constructed with information of the precise economic sector people are working in combined with – individual level – information on disposable income. We focus on low, middle and high income individuals, who are employed within fifteen contrasting employment sectors and for which we can analyse their neighbourhood orientation. For that purpose we constructed a large number of different neighbourhood types in the urban region of Amsterdam. The types were based on whether: 1) the location is in the urban core or not; 2) the population density of the neighbourhood and the size of the municipality; 3) housing real estate values in the neighbourhood; 4) and whether the neighbourhood consists of housing which is predominantly pre-war or not. While the relationship between class fractions and neighbourhood types is central to our investigations, we controlled for other obvious factors that impact upon residential orientations, such as age, family type, gender, and country of origin. We show that creative cultural class fractions are strongly overrepresented in the most urban milieus, more precisely Amsterdam milieus with middle status or high status. The most overrepresented class fractions in the metropolitan area, which are in urban high status neighbourhoods in the city of Amsterdam, are self-employed (independent) and high-income lawyers, followed by high-income professionals in the arts and book publishing sectors, as well as highest income class fractions employed at the university. Self-employed architects are most overrepresented in suburban high status neighbourhoods in Amsterdam.
1

Differentiated Residential Orientations of Class Fractions
Willem Boterman and Sako Musterd
Urban Geography/Urban Studies
University of Amsterdam
Introduction
Households and neighbourhoods are firmly interlinked. Urban Geography taught us almost a century ago that households can be found in certain types of urban environments depending on their individual position in economic, demographic, and cultural spheres, and depending on the history of the urban environment. Strong regularities were discovered in ‘classic’ studies such as those performed by Burgess (1924), who presented the concentric ring theory while trying to understand the social spatial pattern (social rings) of the city of Chicago; and by Hoyt (1939) who developed a sector theory, which was based on the observation that especially income differentiation developed in the form of sectors in the city. These studies were followed by a range of empirical and theoretical elaborations and refinements, which, among other things, suggested that the Burgess model was more based on socio-demographic distinctions, while Hoyt’s model was especially characterised by socio-economic difference (see Robson, 1975). However, some forty years ago large-scale ecological and quantitative urban social patterning studies, which revealed neighbourhood orientations of various types of households, were increasingly associated with naïve de-politicised and reductionist positivism and the authors were accused of not asking the relevant and critical questions. This eventually led to a ban on such studies in social science. Ostendorf and Musterd (2012: 490) called this a typical case of “throwing the baby out with the bath water”. They acknowledged that it was wise to reject naïve positivism that was not asking critical questions, but argued that much large-scale empirical modelling was actually based on relevant and realistic questions, which did address urban and housing issues in a more critical way and that a continuation with more advanced data and advanced methods would have contributed to the body of knowledge that was needed much earlier.
In fact, the changes that are going on in society, and in the built environment, urgently demand new empirical and theoretical analysis. Indeed, we cannot expect the social, demographic and cultural structures to be frozen. It is not difficult to notice that structures have changed over time through complex societal changes, giving way to new urbanisation and suburbanisation processes, while also various phases of international migration add to new social, demographic and cultural compositions and processes of gentrification and decline, of upgrading and downgrading. Societal changes, rooted in globalisation and economic restructuring, and triggered by increasingly neo-liberal models of accumulation of wealth, have various impacts on households. In advanced economies education levels, and therewith cultural capital, rapidly increased while job opportunities for low-skilled individuals continue to decline in manufacturing industries but are increasing in consumer services sectors. Employment in cultural or creative sectors also rapidly grows, which again might have created new urban orientations with important consequences for urban economic and social space. At the same time, social inequality is rising too, but more in some places than in others;
2

professionalization (overall upward socio-economic tendencies where ‘everyone’ experiences social progress) (Hamnett, 1994), and which reflects a process common to many modern cities, currently and increasingly seems to be replaced by social polarisation processes, in particular in urban contexts that are firmly embedded in global economic networks. These changes in the structure of the economy have brought about a new urban geography of class (Butler et al., 2008; Hamnett, 1994).
Household differentiation also seems to increase. This is expressed in a reduction of the number of marriages, a growth of the number of partnerships, by increasing divorce rates, larger shares of small households, more same sex partners, a growth of single-parent households and an increase of labour market participation of women, with important consequences for the economic position of many households.
The changes will have resulted in new ways of life of a range of households; in more (upper) middle class households in economic terms; and in a growth of the number of households with (also) much cultural capital. The latter dimension was hardly paid attention to in the ‘classic’ social area studies, yet all of that will have affected the spatial distribution of households across various residential milieus in cities and urban regions. As Benson (2014: 3109) put it: “this ‘fit’ [between households and residential milieus] may be made, re-made, challenged and even dismantled as a result of the dynamic relationship between neighbourhood and identity.”
Some types of households may have become more attracted to specific neighbourhoods, while others may be victims of forced displacement. In other words, the urban geography of households will likely have changed into new forms of super-differentiation of class fractions in urban regions. We expect to find – for example – new urban orientations of middle class households with children and much cultural capital and a much stronger suburban orientation of the original ordinary urban (‘white’) middle class. We also expect more demand for the most urban residential milieus from class fractions with creative cultural professions, although income positions will also play a role.
Since dynamic urban change has multiple implications for urban life in general, for a wide range of activities, for urban and housing and social policies and for the directions restructuring should go, it is extremely relevant to increase our knowledge of the neighbourhood orientations of different cultural and economic class fractions. In this paper we aim to do that in the footsteps of the human ecologists we referred to, but applying large-scale individual level data on residential orientations of a range of class fractions. We aim to answer the following two questions:
1. What is the distribution of various class fractions over a wide range of urban and suburban residential milieus in the metropolitan area of Amsterdam?
2. To what extent are residential orientations understood by the variation of cultural and economic class fractions, after controlling for important other factors, predominantly demographic, that also impact on residential locations?
In the following section we will first elaborate on a selection of the recent literature on residential orientations of various types of households and on some of the most important dynamic aspects of the orientations. This will be followed by an explication of how key concepts are defined, such as class fractions and residential milieus and how they are expected to relate to each other and to other concepts. In the data and methods section we will briefly elaborate on the individual register
3

data we were able to work with, and explain how we developed the household and residential milieu typologies that are used in the analysis. This will be followed by a results section, and finally a conclusion and discussion.
Framing the analysis in recent literature
When we try to problematize the spatial distribution of households across urban space, only a few steps are required before we enter debates on segregation and divided cities. Academics and governments frequently express their concern about the development of urban social realities that show relatively high levels of spatial differentiation. They fear the dual or divided or segregated city (Mollenkopf and Castells, 1991; Fainstein et al., 1992) and (urban) governments therefore develop programmes that appear to be aiming at a reduction of such spatial inequalities (De Decker et al., 2003; Goetz, 2003; Lupton and Tunstall, 2008; Musterd and Ostendorf, 2008). The fear for the development of ‘fragmented cities’ , characterised by socially homogenous (both rich and poor) islands in urban and suburban settings, occupied by specific class fractions, is strong and is also more outspoken in social urban debates. It is based on experiences in clearly divided spatial contexts, where ghettos and gated middle class communities manifest themselves abundantly (Atkinson, 2006; Wacquant, 2007). Much literature about segregation centres on concentrations of poverty or specific disadvantaged ethnic groups (Musterd, 2006). Although abundant evidence exists of the clustering of lower classes, observations from various urban contexts, both highly and more moderately segregated, show that socio-economic segregation distributions take on a so-called skewed U shape. The highest levels of segregation can be found on both ends of the social distribution. Lower class groups may have relative high levels of segregation, the very highest are recorded at the most affluent (upper) middle class end (see for example Reardon and Bischoff, 2011; Musterd et al., 2015). Disaffiliation strategies by the higher ends of social space are thus also a key motor for spatial segregation. Since more resource-rich households are better able to convert housing preferences into practice their residential locations could be expected to be more differentiated. It therefore makes sense not just to focus on poor households but to shift our attention also to (upper) middle class orientations. This is what we will primarily do in this study. Although we will demonstrate residential orientations of various class fractions (including lower strata) we focus our attention on the residential locations of different middle class households.
Building on Bourdieu’s perspectives on class (1984, 1990) several scholars have pointed to differentiation within the middle classes. What is particularly emphasised in this literature is the distinction between middle classes in inner-urban environments and middle classes in suburban orientations. Middle class professionals living in urban areas, the agents of gentrification, are argued to constitute a specific new fraction of the middle classes who attempt to set themselves apart from the traditional middle classes in the suburbs (Bridge, 2001; Butler and Robson, 2001, 2003b; May, 1996; Watt, 2005). It is generally argued that some fractions of the middle classes have a particular urban lifestyle with specific patterns of consumption, types of employment, housing preferences and liberal political attitudes (Ley, 2003). Butler and Robson (2001, 2003a, b) argued that specific orientations of capital (what they call ‘mini-habituses’ 2003a: 67) are related to the various positions in the fields of housing, employment, education and consumption. These mini habituses (forms of capital) are associated with different residential orientations.
4

Most of the studies into the differentiation of the middle classes have focussed on gentrifiers and their specific residential practices. However, this differentiation extends beyond a simple urban-suburban dichotomy. In recent comparative work on London and Paris (Benson and Jackson, 2013; Benson, 2014) the practices of middle classes were studied in five different residential milieus. Although the selection of that study was made based on the milieus and not on the habitus of the middle classes, it is evident that the gated communities, the exurban, suburban, and the gentrified and gentrifying neighbourhoods accommodated different subsections within the middle classes. Similar conclusions about mini-habituses that stretch beyond a simple dichotomy can be found in work carried out in Amsterdam (Boterman, 2013; Boterman and Karsten, 2014). These studies demonstrate that middle classes with various orientations of capital and various divisions of labour within the household are spatially concentrated in different areas. By looking specifically into the residential practices of families Boterman (2012) demonstrated that differentiations within the middle classes also continue after middle class households settle down and have children. It thus seems that it is time to revisit some of the social-ecological perspectives on who lives where and why. The increased diversification of both class fractions (habituses) and residential milieus in metropolitan areas has resulted in a new and complex urban social geography of which our knowledge is still quite fragmented. Only a few studies focus on the differentiation in entire metropolitan areas and even fewer concentrate on the association of differentiated milieus and class fractions. One of the forerunners of this study has been a survey of the residential orientation of employees in some selected economic sectors in the Amsterdam region. It was demonstrated that employees working in creative sectors (architecture, advertising, and media) and employees in higher education in the cultural and social sciences in Amsterdam were disproportionately living in Amsterdam. In contrast, employees working in selected firms in the Amsterdam financial sector (accountants, bank employees) and in the ICT sector tended to opt for a suburban residential location (Musterd, 2006). When zooming in on the residential differentiation within the city of Amsterdam, a similar distinction could be found: those employed in the creative sector were more centrally located; those in finance and ICT more peripheral (Musterd, 2004).
In this study we draw on individual register data, which allows us to empirically survey the residential practices of a variety of class fractions in the metropolitan area of Amsterdam.
Defining Key concepts
Class fractions
Social class is obviously a very complex and, more importantly, a relational concept. The various dimensions of class and how class positions are played out in practice cannot be established in the analysis we conduct in this contribution. Instead we focus on two dimensions of social class which primarily serve as proxies for social position: income (economic capital) and employment sector. The latter is a well-established method by which class fractions are identified (Jenkins, 2002). In fact, the combination of income and occupation is also the key method for Bourdieu (1984) to identify the positions in social space. Employment is a key social field that both reflects practices that are the result of historical experiences (socialisation) and at the same time shapes the formation of habitus. In this study we draw on detailed information about employment sector, measured via standardised 5-digit Standaardbedrijfsindeling (SBI) which corresponds with international ISIC-codes.
5

Cultural producers Professions Service jobs Manual work
Cultural Capital + Cultural Capital -Arts
Architects
Publishers
Law Firms
Notary Firms
Hospital
GP's Dentistry ConstructionAccountancy
Advertisement
Police
Childcare
Air travel
Higher education
For the analysis we included individual level data of all inhabitants of 16 years and older, living in the metropolitan area of Amsterdam. From this population a selection was made of 15 different employment groups. These groups were selected based on two main criteria: first, they represent different class positions in social space (Bourdieu, 1984); and second, these groups are well represented in the study area and hence large enough to be compared. The 15 groups that represent different positions of cultural capital were selected based on Bourdieu’s original scheme (1984). These fifteen groups fall into four (broad) categories: Arts and other creative services (Artists, Curators; Advertisement; Architects; Book Publishers); professions (Lawyers, Medical Staff; GP’s; Dentists) ; public and private services (Child care worker; Police; Accountants); and manual labour (Builders: carpenters, plumbers), which are expected to differ from each other in terms of the capital orientation (Figure 1; see also Ley, 2003; Hamnett, 1994; Butler and Robson, 2003, De Wijs-Mulkens, 1999; Boterman, 2012).
Figure 1. Class fractions based on cultural positions
At the individual level membership of one of the employment groups was subdivided into three income categories based on the income decile distribution of the metropolitan population: low (the first four deciles); middle (deciles 5, 6, and 7) and high (the top three deciles). Self-employed workers were also identified for those worker groups to which this applied (see Table 1). For this category, the income category is unknown, since their incomes fluctuate greatly and are interrelated with business activity. In total we thus could distinguish between 54 class fractions.
Table 1. Number of individuals per employment sector, N per class fraction
Employment sector Low Middle High Self-employed
Hospital staff 9523 12850 7318Dental clinic staff 1725 484 300 1228General Practitioner 986 424 103 1095Accountancy offices 2484 2571 4723 1948Police 869 3825 4504Child care centres 8383 2571 272Builders (plumbing, carpenting, painting) 1696 2956 1459 3899Architecture firms 874 1192 1404 1524Higher education 1614 3099 3149Law firms 1439 1517 3216 634
6

Publishers (books) 523 629 838 191Art & Museums 2357 1853 1245 6687Air Travel (no travel agents) 1998 6116 9820Advertising 1534 1636 2164 3389Notary firm 535 420 413Source: Statistics Netherlands: Social Statistical Database 2009; own calculations
Based on the literature section it is evident that cultural and socio-economic class fractions have to be considered to understand current residential structures and patterns in urban regions. However, we know that these are not the only dimensions that impact upon the differentiation in space. From the perspective of the household, also life-course and other demographic characteristics are highly relevant. Smaller households without children, for example, are generally more urban oriented than larger households with children. Outdoor-oriented lifestyles, space requirements and proximity to services that fit the household composition play an important role.
Demographic factors
Such demographic factors therefore may also affect the residential orientation of households. Therefore, in this study, where class fractions based on socio-economic and cultural positions will be centre stage, we control for demographic positions. The analysis includes household composition (single, couple, family, single parent and other), age, and gender as key demographic factors.
Etnicity
Furthermore, there is also abundant literature that has emphasised the role of ethnicity in residential patterns. In fact, together with class and demography ethnicity is one of the three key pillars of traditional social-ecological analysis (Robson, 1975). Although in this contribution we do not focus on ethnicity per se or intersections of ethnicity and class (see Musterd et al., 2015) we include ethnicity in our analysis in order to control for this effect. Our models include the six main ethnic groups in the Netherlands, (Native Dutch, Caribbean, Turkish, Moroccan, other non-Western and Western). It should be mentioned here that we are aware of the intersections of class and ethnicity (for instance an overrepresentation of Western migrants in financial industries), but for the sake of not overloading this chapter, we do not explore these intersections here.
Residential milieus
As the literature review has clarified, we ought to expect an increasing differentiation of various household categories, living in a wide range of different residential milieus. For that reason we developed a typology of residential milieus with 15 different types within the metropolitan region. These milieus were based on four different criteria: is the neighbourhood located within Amsterdam or not; the urbanity of the area1; the dominant building period (only for suburban areas) and the average real estate value divided into three categories2 (see Figure 2). These criteria encompass issues of levels urbanity, suburban atmosphere (old, varied, multifunctional versus new, less varied, monofunctional), and various residential social status positions.
1 This is defined as municipalities larger than 100,000 inhabitants and neighbourhoods defined as very strongly urban.2 Real estate values (2008) are classified into three categories below €200,000; €200,000-€300,000, and more than €300,000
7

Although we suggest already a rather detailed typology of milieus there is a range of supply side dimensions, such as the structural economic and institutional contexts which are also driving much of the spatial distribution of the housing supply that are not included. The types of dwellings, the share of rental dwellings, access to different amenities are also important factors which are not (directly) measured. In this contribution we focus our attention on the demand side factors and measure the supply side only via the 15 residential milieus proposed in Figure 2.
Figure 2. A typology of (15) residential milieus based on location in the region; density (urbanity); dominant building period and average real estate value.
Data and Methods
Individual level register data is used, provided by Statistics Netherlands. Since 1970, the Netherlands abolished data collection through the ten-annual Census and decided to provide most information derived from a wide range of registers, such as population registers, housing registers, tax registers, (un) employment registers, firms sector registrations, etcetera. These registers are at individual level and provided annually. The information from different registers can be linked (merged) applying unique identification codes. This provides new opportunities for research on entire populations, not samples, while analysis can be performed at individual and other levels, avoiding ecological fallacies. For this contribution we selected all individuals of 16 years and older who were registered in the Metropolitan region of Amsterdam in 2008. Apart from the multivariate typologies we constructed, we used location quotients to describe the relative over or underrepresentation of a class fraction in each of the residential milieus. To come to a better understanding of the residential practices that is, living in one of the fifteen residential milieus of the individuals on the basis of their individual sector of employment and socio-economic position combined, we developed a number of multinomial and
8
Amsterdam Region
Density high
Density high
Density low
Density low
Pre-war Post-war
Low Status
Middle status
High status
Low Status
Middle status
High status
Low Status
Middle status
High status
Low Status
Middle status
High status
Low Status
Middle status
High status

binary logistic regression models, while controlling for a range of factors that also impact upon residential orientation (age, gender, ethnicity and household composition).
Results
For each of the 54 class fractions location quotients were calculated based on the real distribution of the population of each class fraction over the 15 residential milieus. Table 2 presents the relative over- or underrepresentation of the various class fractions.
9
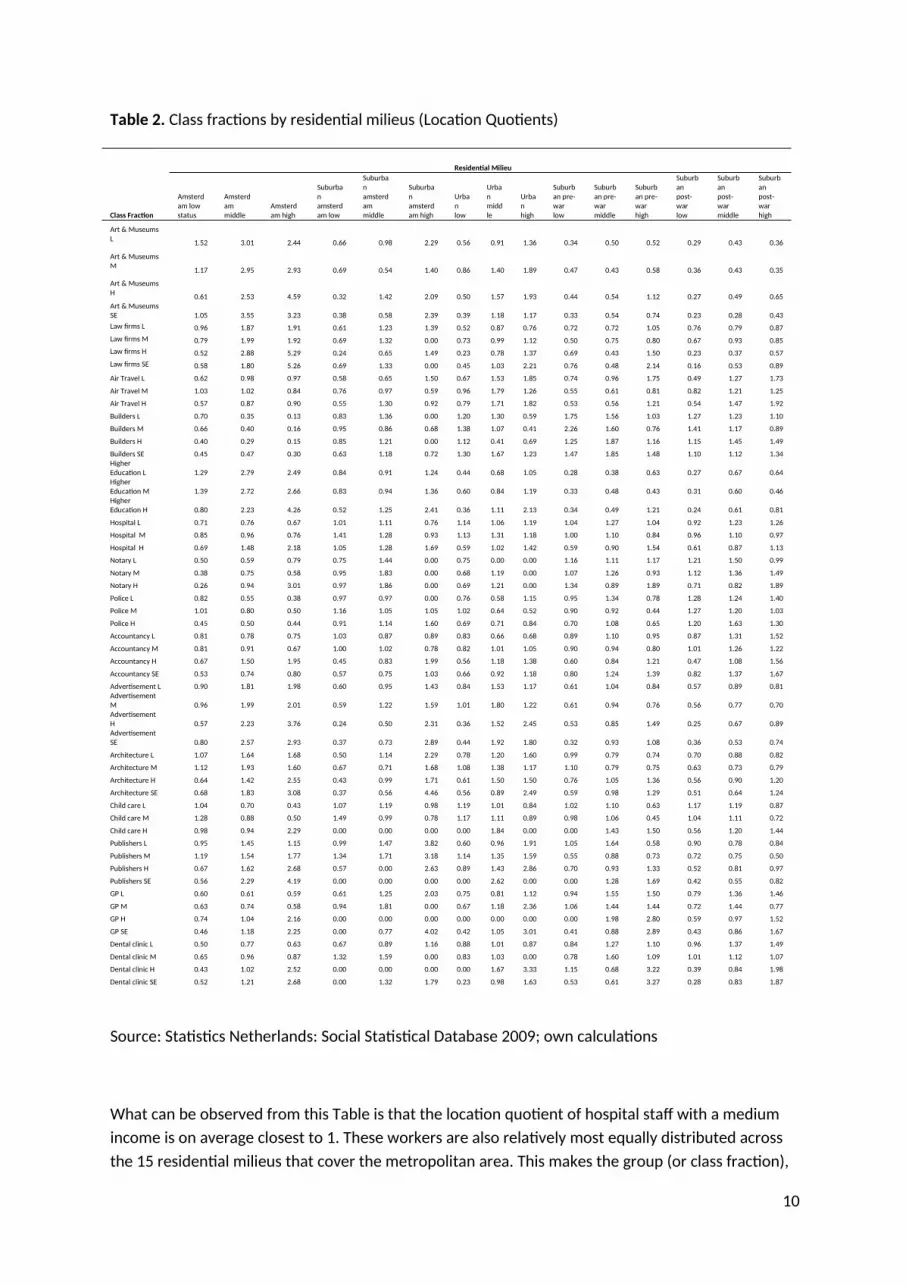
Table 2. Class fractions by residential milieus (Location Quotients)
Residential Milieu
Class Fraction
Amsterdam low status
Amsterdam middle
Amsterdam high
Suburban amsterdam low
Suburban amsterdam middle
Suburban amsterdam high
Urban low
Urban middle
Urban high
Suburban pre-war low
Suburban pre-war middle
Suburban pre-war high
Suburban post-war low
Suburban post-war middle
Suburban post-war high
Art & Museums L 1.52 3.01 2.44 0.66 0.98 2.29 0.56 0.91 1.36 0.34 0.50 0.52 0.29 0.43 0.36
Art & Museums M 1.17 2.95 2.93 0.69 0.54 1.40 0.86 1.40 1.89 0.47 0.43 0.58 0.36 0.43 0.35
Art & Museums H 0.61 2.53 4.59 0.32 1.42 2.09 0.50 1.57 1.93 0.44 0.54 1.12 0.27 0.49 0.65Art & Museums SE 1.05 3.55 3.23 0.38 0.58 2.39 0.39 1.18 1.17 0.33 0.54 0.74 0.23 0.28 0.43Law firms L 0.96 1.87 1.91 0.61 1.23 1.39 0.52 0.87 0.76 0.72 0.72 1.05 0.76 0.79 0.87Law firms M 0.79 1.99 1.92 0.69 1.32 0.00 0.73 0.99 1.12 0.50 0.75 0.80 0.67 0.93 0.85Law firms H 0.52 2.88 5.29 0.24 0.65 1.49 0.23 0.78 1.37 0.69 0.43 1.50 0.23 0.37 0.57Law firms SE 0.58 1.80 5.26 0.69 1.33 0.00 0.45 1.03 2.21 0.76 0.48 2.14 0.16 0.53 0.89
Air Travel L 0.62 0.98 0.97 0.58 0.65 1.50 0.67 1.53 1.85 0.74 0.96 1.75 0.49 1.27 1.73
Air Travel M 1.03 1.02 0.84 0.76 0.97 0.59 0.96 1.79 1.26 0.55 0.61 0.81 0.82 1.21 1.25
Air Travel H 0.57 0.87 0.90 0.55 1.30 0.92 0.79 1.71 1.82 0.53 0.56 1.21 0.54 1.47 1.92
Builders L 0.70 0.35 0.13 0.83 1.36 0.00 1.20 1.30 0.59 1.75 1.56 1.03 1.27 1.23 1.10
Builders M 0.66 0.40 0.16 0.95 0.86 0.68 1.38 1.07 0.41 2.26 1.60 0.76 1.41 1.17 0.89
Builders H 0.40 0.29 0.15 0.85 1.21 0.00 1.12 0.41 0.69 1.25 1.87 1.16 1.15 1.45 1.49
Builders SE 0.45 0.47 0.30 0.63 1.18 0.72 1.30 1.67 1.23 1.47 1.85 1.48 1.10 1.12 1.34Higher Education L 1.29 2.79 2.49 0.84 0.91 1.24 0.44 0.68 1.05 0.28 0.38 0.63 0.27 0.67 0.64Higher Education M 1.39 2.72 2.66 0.83 0.94 1.36 0.60 0.84 1.19 0.33 0.48 0.43 0.31 0.60 0.46Higher Education H 0.80 2.23 4.26 0.52 1.25 2.41 0.36 1.11 2.13 0.34 0.49 1.21 0.24 0.61 0.81
Hospital L 0.71 0.76 0.67 1.01 1.11 0.76 1.14 1.06 1.19 1.04 1.27 1.04 0.92 1.23 1.26
Hospital M 0.85 0.96 0.76 1.41 1.28 0.93 1.13 1.31 1.18 1.00 1.10 0.84 0.96 1.10 0.97
Hospital H 0.69 1.48 2.18 1.05 1.28 1.69 0.59 1.02 1.42 0.59 0.90 1.54 0.61 0.87 1.13
Notary L 0.50 0.59 0.79 0.75 1.44 0.00 0.75 0.00 0.00 1.16 1.11 1.17 1.21 1.50 0.99
Notary M 0.38 0.75 0.58 0.95 1.83 0.00 0.68 1.19 0.00 1.07 1.26 0.93 1.12 1.36 1.49
Notary H 0.26 0.94 3.01 0.97 1.86 0.00 0.69 1.21 0.00 1.34 0.89 1.89 0.71 0.82 1.89
Police L 0.82 0.55 0.38 0.97 0.97 0.00 0.76 0.58 1.15 0.95 1.34 0.78 1.28 1.24 1.40
Police M 1.01 0.80 0.50 1.16 1.05 1.05 1.02 0.64 0.52 0.90 0.92 0.44 1.27 1.20 1.03
Police H 0.45 0.50 0.44 0.91 1.14 1.60 0.69 0.71 0.84 0.70 1.08 0.65 1.20 1.63 1.30
Accountancy L 0.81 0.78 0.75 1.03 0.87 0.89 0.83 0.66 0.68 0.89 1.10 0.95 0.87 1.31 1.52
Accountancy M 0.81 0.91 0.67 1.00 1.02 0.78 0.82 1.01 1.05 0.90 0.94 0.80 1.01 1.26 1.22
Accountancy H 0.67 1.50 1.95 0.45 0.83 1.99 0.56 1.18 1.38 0.60 0.84 1.21 0.47 1.08 1.56
Accountancy SE 0.53 0.74 0.80 0.57 0.75 1.03 0.66 0.92 1.18 0.80 1.24 1.39 0.82 1.37 1.67
Advertisement L 0.90 1.81 1.98 0.60 0.95 1.43 0.84 1.53 1.17 0.61 1.04 0.84 0.57 0.89 0.81Advertisement M 0.96 1.99 2.01 0.59 1.22 1.59 1.01 1.80 1.22 0.61 0.94 0.76 0.56 0.77 0.70Advertisement H 0.57 2.23 3.76 0.24 0.50 2.31 0.36 1.52 2.45 0.53 0.85 1.49 0.25 0.67 0.89Advertisement SE 0.80 2.57 2.93 0.37 0.73 2.89 0.44 1.92 1.80 0.32 0.93 1.08 0.36 0.53 0.74
Architecture L 1.07 1.64 1.68 0.50 1.14 2.29 0.78 1.20 1.60 0.99 0.79 0.74 0.70 0.88 0.82
Architecture M 1.12 1.93 1.60 0.67 0.71 1.68 1.08 1.38 1.17 1.10 0.79 0.75 0.63 0.73 0.79
Architecture H 0.64 1.42 2.55 0.43 0.99 1.71 0.61 1.50 1.50 0.76 1.05 1.36 0.56 0.90 1.20
Architecture SE 0.68 1.83 3.08 0.37 0.56 4.46 0.56 0.89 2.49 0.59 0.98 1.29 0.51 0.64 1.24
Child care L 1.04 0.70 0.43 1.07 1.19 0.98 1.19 1.01 0.84 1.02 1.10 0.63 1.17 1.19 0.87
Child care M 1.28 0.88 0.50 1.49 0.99 0.78 1.17 1.11 0.89 0.98 1.06 0.45 1.04 1.11 0.72
Child care H 0.98 0.94 2.29 0.00 0.00 0.00 0.00 1.84 0.00 0.00 1.43 1.50 0.56 1.20 1.44
Publishers L 0.95 1.45 1.15 0.99 1.47 3.82 0.60 0.96 1.91 1.05 1.64 0.58 0.90 0.78 0.84
Publishers M 1.19 1.54 1.77 1.34 1.71 3.18 1.14 1.35 1.59 0.55 0.88 0.73 0.72 0.75 0.50
Publishers H 0.67 1.62 2.68 0.57 0.00 2.63 0.89 1.43 2.86 0.70 0.93 1.33 0.52 0.81 0.97
Publishers SE 0.56 2.29 4.19 0.00 0.00 0.00 0.00 2.62 0.00 0.00 1.28 1.69 0.42 0.55 0.82
GP L 0.60 0.61 0.59 0.61 1.25 2.03 0.75 0.81 1.12 0.94 1.55 1.50 0.79 1.36 1.46
GP M 0.63 0.74 0.58 0.94 1.81 0.00 0.67 1.18 2.36 1.06 1.44 1.44 0.72 1.44 0.77
GP H 0.74 1.04 2.16 0.00 0.00 0.00 0.00 0.00 0.00 0.00 1.98 2.80 0.59 0.97 1.52
GP SE 0.46 1.18 2.25 0.00 0.77 4.02 0.42 1.05 3.01 0.41 0.88 2.89 0.43 0.86 1.67
Dental clinic L 0.50 0.77 0.63 0.67 0.89 1.16 0.88 1.01 0.87 0.84 1.27 1.10 0.96 1.37 1.49
Dental clinic M 0.65 0.96 0.87 1.32 1.59 0.00 0.83 1.03 0.00 0.78 1.60 1.09 1.01 1.12 1.07
Dental clinic H 0.43 1.02 2.52 0.00 0.00 0.00 0.00 1.67 3.33 1.15 0.68 3.22 0.39 0.84 1.98
Dental clinic SE 0.52 1.21 2.68 0.00 1.32 1.79 0.23 0.98 1.63 0.53 0.61 3.27 0.28 0.83 1.87
Source: Statistics Netherlands: Social Statistical Database 2009; own calculations
What can be observed from this Table is that the location quotient of hospital staff with a medium income is on average closest to 1. These workers are also relatively most equally distributed across the 15 residential milieus that cover the metropolitan area. This makes the group (or class fraction),
10

which is also by the literature often regarded as in the centre of social space, a suitable reference category with which other class fractions can be compared. It also appears from the Table that employees of law firms with high incomes and self-employed lawyers have a particularly strong focus on the high-status neighbourhoods of central Amsterdam. Also workers and entrepreneurs in the Arts sector are strongly overrepresented in the most urban parts of Amsterdam, while particularly those who are employed in the building industry (carpenters, plumbers and painters) are outright anti-urban. Irrespective of their income, builders are heavily underrepresented in the city of Amsterdam. They have a penchant to live in suburban areas (both post and pre-war). Generally, from this Table it appears that workers in cultural and creative professions, arts, advertisement, publishing, higher education and architecture are overrepresented in urban areas, particularly in the urban area of Amsterdam; while employees working for the police, accountancy firms, notary firms, and in air travel are clearly more orientated towards suburban areas. Medical personnel (hospital, GP’s and dentists) occupy an intermediate position. Figures 3a, b, c, in which only class fractions are shown, in rank-order, with location quotients of at least 2, confirm the general findings, but also shows which fractions are (potentially) getting most disaffiliated from others and where they prefer to settle.
Figure 3a. Class fractions with strong overrepresentation (LQ > 2) in Urban Amsterdam Middle Status Neighbourhoods. sorted by overrepresentation
Advertising High
University High
Bookpublisher Independent
Arts High
Advertising Independent
University Middle
University Low
Lawyer High
Arts Middle
Arts Low
Arts Independent
0 1 2 3 4
11

Figure 3b. Class fractions with strong overrepresentation (LQ > 2) in Urban Amsterdam High Status Neighbourhoods. sorted by overrepresentation
Advertising Middle
Hospital High
Childcare High
Arts Low
University Low
Architect High
University Middle
Book Publisher High
Arts Middle
Advertising Independent
Architect Independent
Notary High
Arts Independent
Advertising High
University High
Bookpublisher Independent
Arts High
Lawyer High
Lawyer Independent
0 1 2 3 4 5 6
12

Figure 3c. Class fractions with strong overrepresentation (LQ > 2) in Suburban Amsterdam High Status Neighbourhoods. sorted by overrepresentation
Arts High
Architect Low
Arts Low
Advertising High
Arts Independent
University High
Book Publisher High
Advertising Independent
Architect Independent
0 1 2 3 4 5
Interestingly, most extreme overrepresentations can only be found in the city of Amsterdam, in urban middle class and urban upper class neighbourhoods as well as in the suburban upper class neighbourhoods in Amsterdam. There are also some clear overrepresentations in post-war more peripheral suburban settings, but location quotients of class fractions do not go beyond the value 2, except for high-income notary; other fractions with relatively high scores include accountants and all social classes working in air traffic business (from stewardesses to pilots). The descriptive analysis confirms various studies we referred to before that argued that specific class fractions have different residential orientations. In order to test this hypothesis further we performed a range of analyses that also control for important demographic factors impacting on residential locations. Even though these factors may also correlate with employment groups and thus the effect may be even stronger, we have included ethnicity, age, gender and household composition (family status) into the analysis.
Multinomial regression
Table 3 describes the multinominal model for the class fractions. The dependent variable: residential milieu is analysed by comparing the different categories to the reference category: post-war middle status suburbs. The independent variable class fraction is compared to the middle income employees in hospitals. Both reference categories are chosen because of their size (they are the largest) and because of their ‘intermediacy’, that is they are most average in terms of their distribution. Since the complete model describes the odds for 14 milieus compared to post-war middle status suburbs it would be quite a large table. The table below summarises the effects for four other middle status milieus compared to the reference category.
13

As appears from the table, controlling for ethnicity, age, gender and household composition the image that arose from the location quotients remains intact. Compared to post-war suburbs, generally, workers in the arts and creative sectors such as architecture, higher education, publishing and advertising display a higher chance of living in Amsterdam and other urban middle status neighbourhoods than the average middle income hospital worker. There are some differences between the income categories but by and large this is the general image for these groups.
For builders, police, accountants and employees in child care the picture appears to be the opposite: generally, these groups have a smaller chance of living in Amsterdam middle status neighbourhoods and other urban middle status neighbourhoods than in post-war suburbs. However, the chance that they live in pre-war suburbs is higher for builders, but lower for accountants and police.
Table 3. Multinomial regression model (selection of results)
Dependent variables (Post war suburb = REF)
Amsterdam middle status
Amsterdam suburb middle
Prewar suburb middle
Urban middle status
Independent variables Exp (B) sig Exp (B) sig Exp (B) sig Exp (B) sig
Hospital M (REF) 0 0 0 0
Art & Museums L 6.828 *** 2.038 *** 1.157 1.611 ***
Art & Museums M 7.195 *** 1.124 .993 2.555 ***
Art & Museums H 6.288 *** 2.693 *** 1.123 2.717 ***
Art & Museums SE 13.396 *** 1.850 *** 1.889 *** 3.302 ***
Law firms L 2.550 *** 1.293 .920 .913
Law firms M 2.254 *** 1.205 .803 .847
Law firms H 8.765 *** 1.631 ** 1.123 1.618 ***
Law firms SE 4.191 *** 2.237 ** .945 1.677 *
Air Travel L 1.058 .436 *** .805 * 1.197
Air Travel M .834 *** .613 *** .558 *** 1.252 **
Air Travel H .663 *** .760 ** .403 *** .977
Builders L .394 *** .995 1.302 ** .966
Builders M .431 *** .661 ** 1.402 *** .783 *
Builders H .300 *** .818 1.300 ** .253 ***
Builders SE .567 *** .995 1.664 *** 1.293 **
Higher Education L 3.949 *** 1.196 .550 *** .745Higher Education
M 4.445 *** 1.370 * .793 * 1.065
Higher Education H 4.736 *** 1.960 *** .806 1.549 ***
Dental clinic M .837 .951 1.435 * .516 *
Dental clinic H 1.134 1.026 .693 .987
Dental clinic SE 1.667 *** 1.353 .791 1.024
Notary L .578 *** .608 .736 .178 ***
Notary M .542 *** .849 .880 .450 **
Notary H 1.334 1.058 1.056 .927
Police L .583 *** .686 1.092 .333 ***
Police M .782 *** .759 * .771 *** .445 ***
14

Police H .410 *** .658 *** .665 *** .375 ***
Accountancy L .722 *** .558 *** .875 .465 ***
Accountancy M .732 *** .664 ** .766 ** .643 ***
Accountancy H 1.486 *** .711 ** .774 *** .841
Accountancy SE .655 *** .498 *** .891 .550 ***
Advertisement L 2.288 *** .947 1.171 1.423 **
Advertisement M 2.558 *** 1.437 * 1.182 1.739 ***
Advertisement H 3.908 *** .701 1.271 * 1.882 ***
Advertisement SE 5.901 *** 1.291 1.739 *** 2.986 ***
Architecture L 2.115 *** 1.129 .932 1.168
Architecture M 2.821 *** .868 1.081 1.489 **
Architecture H 2.077 *** 1.059 1.162 1.409 *
Architecture SE 3.740 *** .832 1.542 *** 1.181
Child care L .837 *** .816 * .965 .855
Child care M .837 ** .715 * .969 .830
Child care H 1.208 .817 1.241 .770
Publishers L 2.091 *** 1.315 2.111 *** 1.012
Publishers M 2.209 *** 1.913 ** 1.178 1.455
Publishers H 2.374 *** .422 * 1.120 1.432
Publishers SE 4.469 *** 2.098 1.254 ** 1.789
GP L .799 .842 1.156 .626 *
GP M .640 ** .562 .971 .629
GP H 1.990 * .696 1.282 1.079
GP SE 1.964 *** .848 1.041 1.118
Dental clinic L .779 ** .567 ** .945 .723 *
Hospital L .858 *** .789 ** 1.047 .815 **
Hospital H 2.022 *** 1.350 ** 1.024 .962
Pseudo R2 (Nagelkerke) .344
* p<0.1 ** p<.0.5 *** p< .01
Source: Statistics Netherlands: Social Statistical Database 2009; own calculations
15

Logistic regression
In order to reduce some of the complexity of the multinomial analysis and also facilitate easier interpretation of the results, the models presented in this section only include workers in the middle income deciles. We argue that the middle group will be least outspoken in their residential location, which makes it more suitable to study the impact of the employment sector they are working in on their residential location. Furthermore, we have focused the analyses on the residential milieus where one would expect middle range incomes to live most: the middle status neighbourhoods. Here we present four models. Each of them deals with one of the four specific middle status milieus, which form the dichotomous dependent variable. The four models estimate the odds to live in: 1) middle status neighbourhoods in central Amsterdam; 2) middle status neighbourhoods in other urban areas in the region; 3) middle status neighbourhoods in pre-war suburbs; 4) middle status neighbourhoods in post-war suburbs. Table 4 presents the results for each model.
Table 4. Four logistic regression models explaining the odds to live in (resp.) four middle status residential milieus; explanatory dimensions include combined cultural (employment) position and socio-economic (income) class position with middle incomes (M). as well as demographic position. (Source: Statistics Netherlands: Social Statistical Database 2008; own calculations)
Dependent Variables
Independent variables
Amsterdam middle status
Sig. Postwar suburban middle status
Sig. Urban low/middle status
Sig. Pre-war suburbanmiddle status
Sig
Hospital M (REF) ***Law firms M 2.200 *** .865 * 1.014 .701 *Air Travel M .963 1.315 *** 1.363 * .663 ***Builders M .405 *** 1.151 ** .416 ** 1.531 ***Higher Education M 2.963 *** .575 *** 1.201 .481 ***Art & Museums M 3.557 *** .373 *** 1.810 ** .432 ***Notary M .698 * 1.399 ** .579 1.114Police M .792 *** 1.223 *** .507 ** .853Accountancy M .867 * 1.362 *** .938 .918Advertisement M 1.949 *** .746 *** 1.168 .860Architecture M 1.973 *** .695 *** 1.265 .754Child care M .847 * 1.105 * .857 1.054Publishers M 1.588 *** .702 ** 1.153 .859GP M .833 1.420 ** 1.891 * 1.286Dental clinic M .906 1.075 .713 1.557 *Native Dutch (REF)Caribbean .889 * .712 *** .147 *** .142 ***Turkish 1.383 *** .320 *** .000 .183 ***Moroccan 1.256 * .381 *** .427 .423 ***Other non-western 1.358 *** .776 *** .511 * .287 ***Western 1.567 *** .829 *** .605 ** .606 ***Family (REF)Single 3.925 *** .368 *** .739 * .639 ***Couple 2.140 *** .702 *** .724 ** .923Other 3.274 *** .322 *** .171 .676
16

Single parent 1.975 *** .625 *** .484 ** .775 *Male 1.057 .866 *** .731 ** .905Age .994 *** 1.007 *** 1.010 * 1.001
Model fit .143 .073 .026 .044* p<0.1 ** p<.0.5 *** p< .01
Middle status Amsterdam
As can be observed from Table 3 the picture that emerged from the descriptive analysis remains largely unchanged. When looking into the probability of living in the middle-status neighbourhoods in Amsterdam people working in arts, law, and higher education have a much higher likelihood of living there than the hospital workers. Also employees in the architecture, publishing and advertising sectors are overrepresented in the middle status neighbourhoods in Amsterdam. Correspondingly, people working in construction, air travel, accountancy, child care and those that work for the police have a much smaller chance of living in this milieu than workers in hospitals. The odds of other medical workers do not deviate from the odds of hospital workers. It is also interesting to note that compared to family households all other household types have a much bigger chance of living in Amsterdam. For ethnicity it appears that compared to native Dutch, all other ethnic groups have a higher chance of living in the city of Amsterdam. Only Caribbean-Dutch have a lower chance than native Dutch of living in middle status Amsterdam neighbourhoods.
Middle status post-war suburbs
The almost reverse image appears when we assess the chance of living in post-war suburban areas with a medium status, after controlling for demographic position. Here the builders, police workers, accountants and airline staff have a higher chance of living there than hospital workers. The general practitioners also have a higher chance of living in this milieu than hospital workers. In contrast, employees working in arts, law, higher education, architecture, publishing and advertisement have a lower chance. It thus seems that the post-war suburbs and central Amsterdam are each other’s inverse. So, it is not the income position or economic status that makes the difference here, but the type of work one is involved in, which is likely more connected to cultural values and related preferences. The middle status post-war suburban residential milieu is also significantly less inhabited by ethnic groups other than native Dutch. When we read the regression output as a model in which we control for cultural and socio-economic class fractions, we may notice that these suburbs are primarily a domain for families. That is, other household types than families have a smaller chance of living in this milieu.
Middle status urban (not Amsterdam)
This milieu is less of a discriminator. Most employment categories do not differ significantly from the hospital workers. Only people working in the arts sector have a higher chance of living here, while builders and police workers clearly have a lower chance. Remarkably, general practitioners also have a higher chance of living in this milieu. Also in ethnic terms the differences seem smaller. Nonetheless, most ethnic groups have a smaller chance of living in this type of neighbourhood.
17

Finally, compared to families most other household types have a smaller chance of living in this residential milieu.
Middle status pre-war suburbs
Pre-war suburbs seem to provide an image that – in general – resembles that of the post-war suburbs. Compared to hospital workers builders and dentists have a higher chance of living in these areas, while employees of law firms, workers in the arts and employees in higher education have a smaller chance of living there. People working in air travel have a smaller chance than hospital workers of living in this type of area, while they had a higher chance in post-war suburban areas. The effect of ethnicity is clear: all other ethnic groups have a much smaller chance of living in this milieu than native Dutch. Compared to families, singles have a smaller chance of living in pre-war suburbs.
Conclusion and discussion
The analysis of the relationship between on the one hand combined socio-economic and employment sector and on the other hand a wide range of residential milieus, distinguished on the basis of combined information on density, status, building period and location, revealed very detailed insights on the residential practices of various class fractions. Drawing on an extensive body of literature (Bourdieu, 1984, Butler and Robson, 2003a) we assumed that the combination of being employed in a certain sector and having a particular income is a good indicator of social position. We expected these social positions to correspond with specific residential orientations. The outcomes of the study seem to support that assumption.
We demonstrated that especially class fractions that connect to creative and cultural professional spheres are strongly overrepresented in the most urban milieus we distinguished, which can be found in the core municipality of the region: the city of Amsterdam. They were much overrepresented in middle status and high status urban neighbourhoods in Amsterdam. It can be assumed that this is related to the kind of identity that is connected to the type of employment, and which has become connected with certain social and built environments. Although our take on class is quite different than that of Florida (2002), these findings are reminiscent of hypotheses about the urban orientation of what is referred to as the ‘creative class’. It also confirms arguments made about the inner-urban orientation of specific sections of the middle classes (Bridge, 2006; Butler and Robson, 2001, Boterman, 2012). Interestingly, this does not only apply to lower income, so somewhat more marginal middle classes who are living in gentrifying areas in the central city. For certain upper middle class fractions such as high-income lawyers, or high-income professionals in the arts and book publishing sectors, it seems simply ‘not done’ not to live in such highly urban environments. The same holds for high income class fractions employed in higher education.
Correspondingly, other class fractions also clearly display specific residential orientations. Accountants, high-income notary and all income classes employed in the airline sector, for example, are clearly overrepresented in post-war more peripheral high-status suburban settings. Skilled workers who in this study are represented by those who are employed in the building industry seem to be outright anti-urban. Only very few, particularly middle and high income builders live in urban environments; they are to be found in pre and post-war suburban neighbourhoods in particular. This
18

is very much in line with arguments about the profound change in urban social geography of urban areas, like Amsterdam, in the past decades. The gradual decline of manual labour in cities (Hamnett, 1994) is clearly evident in this study. The suburbanisation of large shares of the skilled workers and lower middle classes is reflected in the low concentrations of these groups in urban areas –particularly the more expensive ones- and the high quotients in low and middle status post-war and pre-war suburbs.
To control for the life course and ethnic effects that are also major factors in explaining residential orientations, we also analysed the fraction-environment relation via various logistic models. In this paper we concentrated on class fractions that belonged to the middle income categories, and we also limited ourselves to the middle status neighbourhoods. These selections were made to get a better understanding of the extent to which being employed in a specific economic sector would make a difference in terms of neighbourhood orientation. The results first of all supported the descriptive analysis. When we just analyse the chance of living in middle-status neighbourhoods in Amsterdam those who were employed – with middle class incomes – in the arts, law, and higher education sectors as well as in architecture, publishing and advertising, appeared to have a much higher likelihood of living there than our reference category: the hospital workers. The typical urban character of these environments is also shown through strong over-representation of the whole range of household types, except family households; and also the multi-ethnic character of these neighbourhoods is striking.
The middle status post-war suburbs show almost the opposite picture. After controlling for demographic characteristics, we find a relative over-representation of middle income employees in the construction sector, the police, accountancy, as well as those middle incomes employed in the airline and child care sectors. Middle income employees working in the creative sectors, law and education are significantly underrepresented. The residential milieus are also clearly the domain of the ‘native Dutch’ and of family households.
Since the segregation and dual city debates of the 1980s and 1990s and since the ‘classic’ pre-war social ecology studies of cities the social geography of cities has changed quite profoundly. Due to economic restructuring and processes of gentrification skilled workers and blue collar class fractions largely disappeared from inner city milieus, while new middle class fractions have moved in. At the same time, international migration and demographic change fundamentally altered the social fabric of cities. The increasing differentiation in class fractions that intersect with ethnicity, life course and gender as well as the differentiation of residential milieus has made the metropolitan regions more and more like a social kaleidoscope. In spite of these trends, in the Dutch context, most neighbourhoods are inhabited by many class fractions simultaneously. In most neighbourhoods there is a significant mix in terms of ethnicity, age, life course and class fractions. The residential environments in which we see most clear connections with specific class fractions are to be found in the core area of the metropolitan region: in urban middle class and urban and suburban upper class neighbourhoods in Amsterdam. The most extreme location quotient values are shown by independent lawyers and by high-income lawyers in high status urban Amsterdam, with scores more than five times higher than in the metropolitan region as a whole. Also the higher income fractions of the arts, book publishing and advertising sectors, and high-paid university employees are strongly overrepresented in the same residential neighbourhoods. However, such a figure also illustrates that so far there is no absolute segregation between these dominant class fractions and other fractions.
19

The regression models we developed do not show clear-cut divisions either. It seems that so far the metropolitan area of Amsterdam has developed in such a way that we still can regard the area overall as a fairly mixed one. It would, nevertheless, be interesting to investigate how these residential patterns are developing over time. When looking back to the residential orientation of income classes in the Amsterdam area, we find that only some three decades ago a ‘revaluation’ of central city living had started and that only recently the city reached a level that is more or less ‘in balance’ with the surrounding municipalities in the metropolitan area (Musterd and Ostendorf, 1998). The signals from Dutch middle class literature as discussed in this contribution point, however, into a direction of a rapid change in the balance between neighbourhoods in the Amsterdam metropolitan region, with potentially large impacts on all types of neighbourhoods the region has to offer.
20

References
Atkinson, R. (2006) ‘Padding the bunker: Strategies of middle-class disaffiliation and colonisation in the city’, Urban Studies, 43 (4): 819-832.
Benson, M. (2014) ‘Trajectories of middle-class belonging: The dynamics of place attachment and classed identities’, Urban Studies 51 (14): 3097-112.
Benson, M., and Jackson, E. (2013) ‘Place-making and Place Maintenance: Performativity, Place and Belonging among the Middle Classes’, Sociology, 47(4): 793-809.
Boterman, W.R. (2012) ‘Residential Mobility of Urban Middle Classes in the Field of Parenthood’, Environment and Planning A, 44 (10): 2397-412.
Boterman, W.R. (2013) ‘Dealing with Diversity: Middle-class Family Households and the Issue of 'Black' and 'White' Schools in Amsterdam’, Urban Studies, 50(5): 1130-47.
Boterman, W.R. and Karsten, L. (2014) ‘On the spatial dimension of the gender division of paid work in two-parent families: the case of Amsterdam, the Netherlands’, Tijdschrift voor Economische en Sociale Geografie 105 (1): 107-16.
Bourdieu, P. (1984) Distinction, a social critique of the judgement of taste. London: Routledge.
Bourdieu, P. (1990) The Logic of Practice. Cambridge: Polity Press.
Burgess, E.W. (1924) ‘The growth of the city: an introduction to a research project’, Publications of the American Sociological Society, 18: 85-97.
Butler, T. and Robson, G. (2001) ‘Social Capital, Gentrification and Neighbourhood Change in London: A Comparison of Three South London Neighbourhoods’, Urban Studies 38 (12): 2145-62.
Butler, T. and Robson, G. (2003a) London calling: the middle classes and the re-making of inner London. London: Berg Publishers.
Butler, T. and Robson, G. (2003b) ‘Negotiating their way in: the middle classes, gentrification and the deployment of capital in a globalising metropolis’, Urban Studies, 40(9): 1791-1809.
Butler, T., Hamnett, C., and Ramsden, M. (2008) ‘Inward and upward: marking out social class change in London, 1981—2001’, Urban Studies, 45(1): 67-88.
Bridge, G. (2001) ‘Estate agents as interpreters of economic and cultural capital: the gentrification premium in the Sydney housing market’, International Journal of Urban and Regional Research, 25: 87-101.
Decker, P. de, Vranken, J., Beaumont, J.,and Nieuwnhuyze, I. van (eds) (2003) On the Origins of Urban Development Programmes in Nine European Countries. Antwerp: Garant.
Fainstein S.S., Gordon I. and Harloe, M. (1992) Divided Cities: New York and London in the Contemporary World. Oxford, UK: Blackwell.
21

Florida, R. (2002) The rise of the creative class, and how it’s transforming work, leisure, community and everyday life. New York: Basic Books.
Goetz, E.G. (2003) Clearing the Way: Deconcentrating the Poor in Urban America. Washington, DC: Urban Institute Press.
Hamnett, C. (1994) ‘Socio-economic change in London: Professionalisation not polarisation’, Built Environment, 20: 192-203.
Hoyt, H. (1939) The structure and growth of residential neighborhoods in American cities. Washington DC: Federal Housing Administration.
Jenkins, R (2002) Pierre Bourdieu, London: Routledge.
Ley, D (2003) ‘Artists, aestheticisation and the field of gentrification’, Urban Studies, 40(12): 2527-44.
Lupton, R. and Tunstall, R. (2008) ‘Neighbourhood regeneration through mixed communities: A “social justice dilemma”’, Journal of Education Policy 23(2): 105–17.
May, J.R. (1996) ‘Globalization and the Politics of Place: Place and Identity in an Inner London Neighbourhood’, Transactions of the Institute of British Geographers 21: 194-215.
Mollenkopf, J. and Castells, M. (eds) (1991) Dual City: Restructuring NewYork. New York: Russell Sage Foundation.
Musterd, S. (2004) ‘Amsterdam as a Creative Cultural Knowledge City; Some Conditions’, Built Environment, 30 (3): 225-234.
Musterd, S. (2006) ‘Segregation, Urban Space and the Resurgent City’, Urban Studies 43(8): 1325-40.
Musterd, S. and Ostendorf, W. (1998) ‘The Changing Distribution of Incomes in Dutch Cities: Myth and Reality’, Geojournal 46: 29-38.
Musterd, S. and Ostendorf, W. (2008) ‘Integrated Urban Renewal in The Netherlands: A Critical Appraisal’, Urban Research and Practice. 1(1): 78-92.
Musterd, S., Gent, W. van, Das,M. and Latten, J. (2015) ‘Adaptive Behaviour in Urban Space; Residential Mobility in Response to Social Distance’, Urban Studies, Online first, DOI: 10.1177/0042098014562344
Ostendorf, W. and Musterd, S. (2012) ‘Social Spaces and Urban Policies’, in Susan J. Smith, Marja Elsinga, Lorna Fox O’Mahony, Ong Seow Eng, Susan Wachter, Montserrat Pareja Eastaway (eds) International Encyclopedia of Housing and Home volume 6, Oxford: Elsevier. Pp. 489-501.
Reardon, S. F. and Bischoff, K. (2011) ‘Income inequality and income segregation’, American Journal of Sociology 116 (4): 1092-1153.
Robson, B.T. (1975) Urban Social Areas. London: Oxford University Press.
22

Wacquant, L. (2007) Urban Outcasts: A Comparative Sociology of Advanced Marginality. Cambridge, UK: Polity Press.
Watt P. (2005) ‘Housing Histories and Fragmented Middle-class Careers: The Case of Marginal Professionals in London Council Housing’, Housing Studies 20: 359-81.
Wijs-Mulkens, E. de (1999) Wonen op stand; lifestyles en landschappen van de culturele en economische elite. Amsterdam: Het Spinhuis.
23


