Embed Size (px)
Citation preview

arX
iv:1
002.
1964
v1 [
astr
o-ph
.CO
] 9
Feb
201
0
Mon. Not. R. Astron. Soc. 000, 1–17 (2010) Printed 9 February 2010 (MN LATEX style file v2.2)
The Large-Scale Orientations of Disk Galaxies
Oliver Hahn1,2⋆, Romain Teyssier3,4 and C. Marcella Carollo11Department of Physics, ETH Zurich, CH-8093 Zurich, Switzerland2KIPAC, Stanford University, 2575 Sand Hill Road, Menlo Park, CA 94025, USA3Institute for Theoretical Physics, University of Zurich, CH-8057 Zurich, Switzerland4CEA Saclay, DSM/IRFU/SAP, Batiment 709, F-91191 Gif-sur-Yvette, Cedex, France
draft v.2
ABSTRACT
We use a 380 h−1pc resolution hydrodynamic AMR simulation of a cosmic filament toinvestigate the orientations of a sample of ∼ 100 well-resolved galactic disks spanningtwo orders of magnitude in both stellar and halo mass. We find: (i) At z = 0, thereis an almost perfect alignment at a median angle of 18, in the inner dark matterhalo regions where the disks reside, between the spin vector of the gaseous and stellargalactic disks and that of their inner host haloes. The alignment between galaxyspin and spin of the entire host halo is however significantly weaker, ranging from amedian of ∼ 46 at z = 1 to ∼ 50 at z = 0. (ii) The most massive galaxy diskshave spins preferentially aligned so as to point along their host filaments. (iii) Thespin of disks in lower-mass haloes shows, at redshifts above z ∼ 0.5 and in regionsof low environmental density, a clear signature of alignment with the intermediateprincipal axis of the large-scale tidal field. This behavior is consistent with predictionsof linear tidal torque theory. This alignment decreases with increasing environmentaldensity, and vanishes in the highest density regions. Non-linear effects in the highdensity environments are plausibly responsible for establishing this density-alignmentcorrelation. We expect that our numerical results provide important insights for bothunderstanding intrinsic alignment in weak lensing from the astrophysical perspectiveand formation and evolution processes of galactic disks in a cosmological context.
Key words: cosmology: theory, large-scale structure of Universe – galaxies: forma-tion, evolution – methods: numerical
1 INTRODUCTION
Numerical simulations and analytic calculations have shownthat the gravitational growth of tiny density perturbationsin the ΛCDM cosmological model leads to a wealth of struc-tures over cosmic time. The spatial distribution of gravi-tationally bound structures follows a web-like pattern com-posed of dense clusters, filaments, sheets and otherwise near-empty void regions (see e.g. Shandarin & Zeldovich 1989;Bond et al. 1996). This “cosmic web” is the weakly non-linear manifestation of the large-scale tidal field and itsformation can be readily understood in the first order La-grangian perturbation theory of the Zel’dovich approxima-tion (Zel’Dovich 1970). Recent large scale galaxy surveyshave observationally confirmed the presence of the cosmicweb in the Universe (e.g. Colless et al. 2001; Tegmark et al.2004).
Since galaxies form and evolve together with the cos-mic web in which they are embedded, it is a question of
⋆ E-mail: [email protected]
high relevance whether the properties of galaxies depend onscales beyond the most immediate vicinity and thus reflectthe effect of large-scale tidal fields on the assembly of thegalaxy. General ellipsoidal density perturbations collapse se-quentially along their three axes leading to matter accretingfirst onto a sheet, then collapsing to a filament before matterfinally streams along the filaments into the densest regions.As a consequence of these processes, the large-scale mor-phology of the cosmic web might leave its imprint on theorientations of galaxies through the anisotropy of accretionand mergers.
Recently, evidence has accumulated that galaxies areindeed not oriented randomly with respect to one another.On small scales, several studies report a radial alignmentof satellite galaxies towards the centre of mass of thegroup or cluster in which they reside (e.g. Yang et al. 2006;Faltenbacher et al. 2007, 2008). Such an alignment is pre-dicted by N-body simulations of dark matter halos (e.g.Bailin & Steinmetz 2005; Pereira et al. 2008; Knebe et al.2008). It is commonly believed that tidal torques are re-sponsible for this radial alignment (e.g. Pereira et al. 2008),
2 O. Hahn et al.
as tidal forces on these relatively small scales (. 1 Mpc) aresufficiently strong to affect halo shapes on short time-scales.
More surprisingly, however, observational results indi-cate that the orientations of galaxies are correlated up toscales of order ∼ 100 times larger than the virial radii of theirhost haloes. Mandelbaum et al. (2006), Okumura et al.(2009) and Faltenbacher et al. (2009) detect an alignmentof galaxy shapes for the luminous red galaxies (LRGs) inthe SDSS survey out to the largest probed scales (∼ 80Mpc). Hirata et al. (2007) report a similar result for red-shifts 0.4 < z < 0.8. For lower luminosity galaxies, in par-ticular for L < L∗, no alignment has been detected yet(see also Slosar & White 2009) although some results us-ing N-body simulations indicate spin alignment around voids(Brunino et al. 2007; Cuesta et al. 2008). Correlations of thespin of galaxies have been the subject of several analyticalmodels (see e.g. Schafer 2009, for a review, and referencestherein).
Compared with more local effects, the relative weaknesson galaxy scales of tidal forces arising from the ≫ 1Mpcscales requires that such effects maintain spatial coherenceover rather long time scales for them to be able to affectgalaxy properties. Also it is not clear how they are coun-teracted by local non-linear effects in the most immediatevicinity of the galaxy: non-linear gravitational effects as wellas ram pressure exerted on the disk gas could potentiallylead to a reorientation of galactic angular momentum. Fur-thermore, the impact of hot in contrast to cold mode accre-tion separated by a halo mass of ∼ 4 × 10¹¹ h−1M⊙ of gasonto galaxies (cf. Birnboim & Dekel 2003; Keres et al. 2005;Dekel & Birnboim 2006; Ocvirk et al. 2008) on the orienta-tion of the resulting disks is not clear.
While understanding the formation of galaxies in thecontext of their host large-scale structure is a key ques-tion for galaxy formation theory, a precise knowledge ofcorrelated galaxy orientations is of high importance alsofor future high-precision weak lensing studies of dark en-ergy. Weak lensing signals can be severely affected bysystematic contaminations due to large-scale alignmentsin the spatial distribution of cosmic matter on scalesfrom a few to more than a hundred Mpc (due to galaxyellipticity-ellipticity alignment: Catelan et al. (2001); anddue to the much more problematic shear-ellipticity align-ment: Hirata & Seljak (2004)). Approaches that have beensuggested so far to remove the contamination due to shear-ellipticity alignment suffer from several limitations and un-certainties: the statistical down-weighting of the effect pro-posed by Joachimi & Schneider (2008) relies on precisiondeterminations of photometric galaxy redshifts; other tech-niques, such as proposed by e.g. King (2005), depend heavilyon toy models (e.g. Catelan et al. 2001) which do not includeany (as yet unknown) dependence of alignments on galaxyluminosity, mass, or redshift. Several studies using N-bodysimulations however find evidence for a dependence of thestrength of halo-LSS alignment on mass and redshift (seee.g. Hahn et al. 2007b; Aragon-Calvo et al. 2007; Paz et al.2008) .
Unfortunately, it is currently still computationally un-feasible to use hydrodynamical simulations of galaxy forma-tion of the necessary resolution in a sufficiently large volumeto investigate the correlation function of galaxy shapes andspins. To circumvent this barrier, some authors have used
large-volume N-body simulations together with a prescrip-tion to assign galactic disk orientations to the dark mat-ter haloes which typically either assumes perfect alignmentwith the DM halo spin or some random misalignment anglebetween the two (e.g. Heymans et al. 2006). Also analyticmodels based on the halo model have been developed thatinclude prescriptions for small scale satellite-central align-ments (Schneider & Bridle 2009). Probability distributionsfor the angles between halo and galaxy spins have been de-termined by various authors (e.g. van den Bosch et al. 2002;Bailin et al. 2005; Sharma & Steinmetz 2005; Croft et al.2008; Bett et al. 2009).
Accepting the current unfeasibility of large volume hy-drodynamic simulations, we propose a different approach.Combining local measurements of the alignment of galax-ies with the large-scale structure – as has been investigatedby Hahn et al. (2007a,b) and Aragon-Calvo et al. (2007)in pure N-body simulations – circumvents the need forlarge volumes but can still provide constraints on the de-gree of galaxy alignment to be expected. The results ofNavarro et al. (2004) on the basis of four SPH simulationsof the formation of single isolated galaxies indicate an align-ment of the spin of these galaxies with the intermediate prin-cipal axis of the tidal field at turnaround that persists to aslightly weaker degree also to z = 0.
In this paper, we study the orientation of a sample of∼ 100 galactic discs with respect to their larger scale envi-ronment in a hydrodynamical cosmological simulation of theformation of a large filament. We have chosen this partic-ular large-scale environment as it provides an environmentwhere the gravitational shear is expected to be relativelylarge so that weak lensing shear should have good signal-to-noise. Any intrinsic alignment of galaxies on these scaleswill thus impact the measurements through the GI-lensingterm. Prior investigations in dark matter cosmological simu-lations have shown evidence for alignment of halo spin withfilaments. However, considering the gas component ratherthan dark matter, the filament is a high pressure environ-ment so that hydrodynamic effects, such as ram-pressure,are expected to play a role in the evolution of the simulatedgalaxies.
This paper is organised as follows: we describe the de-tails of our numerical simulation, the method to identifygalaxies and the selection of galaxies for our analysis in Sec-tion 2. We first study the alignments between the gas, stel-lar, dark matter angular momenta and the total halo spin inSection 3. Then, we investigate in Section 4 the alignmentof the various components with the cosmic large-scale struc-ture, quantitatively described by the tidal field. In Section Awe discuss the numerical convergence of our results, beforea comparison of our results to observations is given in Sec-tion 5. Finally, we summarise and provide our conclusionsin Section 6.
2 NUMERICAL METHODS
2.1 Specifics of the Cosmological Simulation
We simulate the formation of a large cosmic filament andthe galaxies embedded in it using the AMR code Ramses
(Teyssier 2002) to evolve dark matter, gas and stars. Gas dy-namics is computed using a second-order unsplit Godunov
Orientations of Disk Galaxies 3
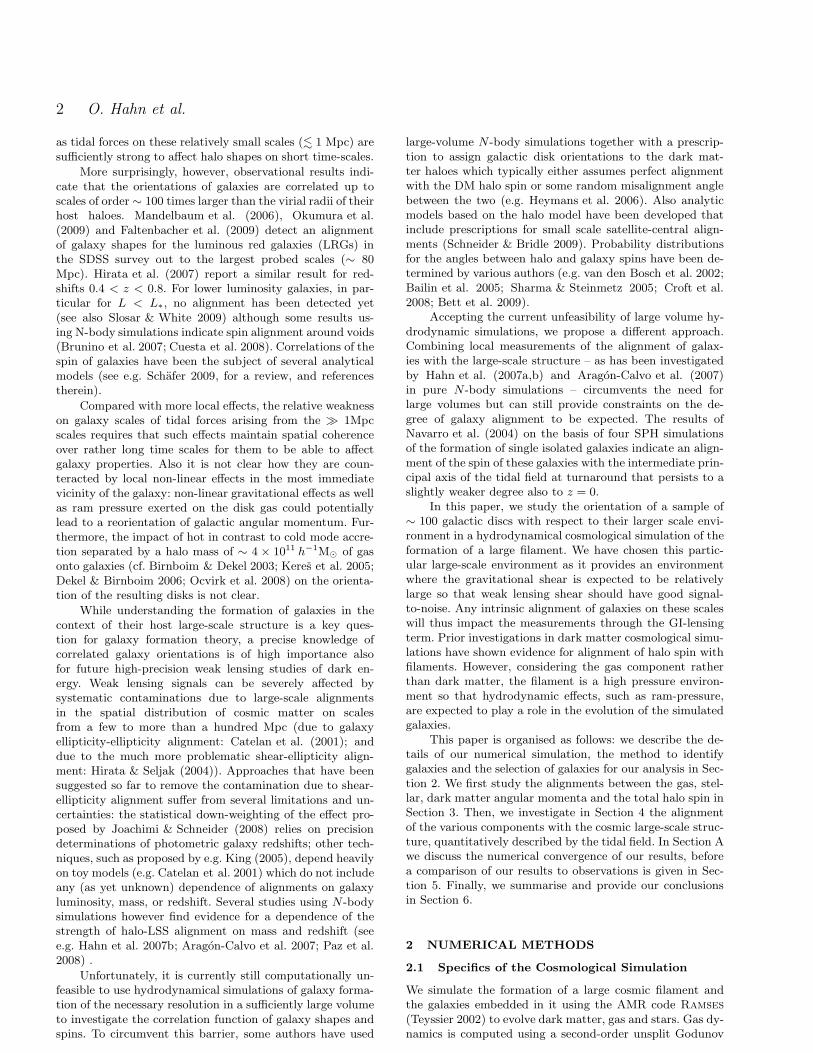
Figure 1. The simulated filament at redshift z = 0. The images extend over 20h−1Mpc × 20h−1Mpc and have a projection depth of10h−1Mpc. (Left panel:) the dark matter particle distribution, (Right panel:) a composite RGB colour image of the gas distribution, thered image channel was assigned to the pressure, the green channel to the metallicity of the gas and the blue channel to the density. Sincemetal enriched gas is produced only in galaxies, each of the green blobs corresponds to a galaxy. The white circles in the right panelindicate the virial radii of those host haloes within the filament that have been excluded from refinement for most part of the simulationor are too close to a low-resolution region in the high resolution run (cf. Section 2.1) and are thus not considered in our analysis. Allother galaxies are treated with full resolution and are not affected by low resolution outside of the zoom region.
scheme, particles (dark matter and stars) are evolved usingthe particle-mesh method. The simulation includes standardrecipes for star formation (Rasera & Teyssier 2006), super-nova feedback and chemical enrichment (Dubois & Teyssier2008). We do not repeat details of these sub-grid modelsbut kindly refer the reader to the mentioned papers. Thefilament was chosen by visual inspection of the environmentof the most massive haloes in a dark-matter-only preflightsimulation. We then chose a filament that is very prominent(and thus relatively massive) and not criss-crossed by toomany smaller scale filaments.
Initial conditions were generated using the Grafic-2
tool from a power spectrum computed with Linger. Weadopt cosmological parameters as obtained from the WMAP5th year data release (Komatsu et al. 2009), i.e. we use thedensity parameters Ωm = 0.276, Ωb = 0.046, ΩΛ = 0.724, apower spectrum normalisation of σ8 = 0.811 and a spectralindex ns = 0.961 for the primordial spectrum, as well asa Hubble constant of H0 = 100 h kms−1 Mpc−1 with h =0.703.
The filament is simulated using the “zoom-in” techniqueas a high-resolution region of 25 h−1Mpc diameter at red-shift z = 0 inside of a comoving 100 h−1Mpc cosmologicalbox. The effective initial resolution of our simulation is 10243
particles and grid points inside this high-resolution region,dropping in steps of 8 to 1283 in the remainder of the box.Additional refinements are confined to the high-resolutionregion only. We adopt a refinement strategy based on den-sity threshold so that the number of particles per cell (andthe baryon mass per cell) remains roughly constant in time.Since the filament moves slightly in space, we introduce a“colour” field to mark the Lagrangian volume of the fila-ment. This field is passively advected during the formationof the structures and thus follows the evolution of the fila-
ment perfectly. In order to save memory, we used as colour-ing variable the metallicity of the gas, with a very low (butnon-zero) value of 10−3 solar in the high resolution regionand exactly zero outside. Additional refinements are onlyallowed where the metallicity exceeds one tenth of this ini-tial value. In addition, cooling and star formation are alsoswitched off in non-coloured regions. The maximum resolu-tion of our simulation is physical 0.38 h−1kpc at all times. Inaddition, our Lagrangian volume excludes the most massivegalaxy groups (halo mass above 5 × 10¹³ h−1M⊙ at z = 0)in order to speed up computation as we are only interestedin smaller objects in this study.
The two panels of Figure 1 give a visual impressionof the filament at z = 0. We show two panels, the firstillustrating the distribution of dark matter, the second isa composite image representing the density, pressure andmetallicity distribution in the gas. Note that the main fila-ment is entirely wrapped by an accretion shock. It is thusclearly a high pressure environment. The less massive fila-ments remain cold except at node points where the moremassive haloes reside. An inspection of the time-evolutionof the simulation reveals that this accretion shock emergesfirst from the most massive haloes along the filament butthen grows along the filament boundaries until the entirefilament is enclosed by a shock.
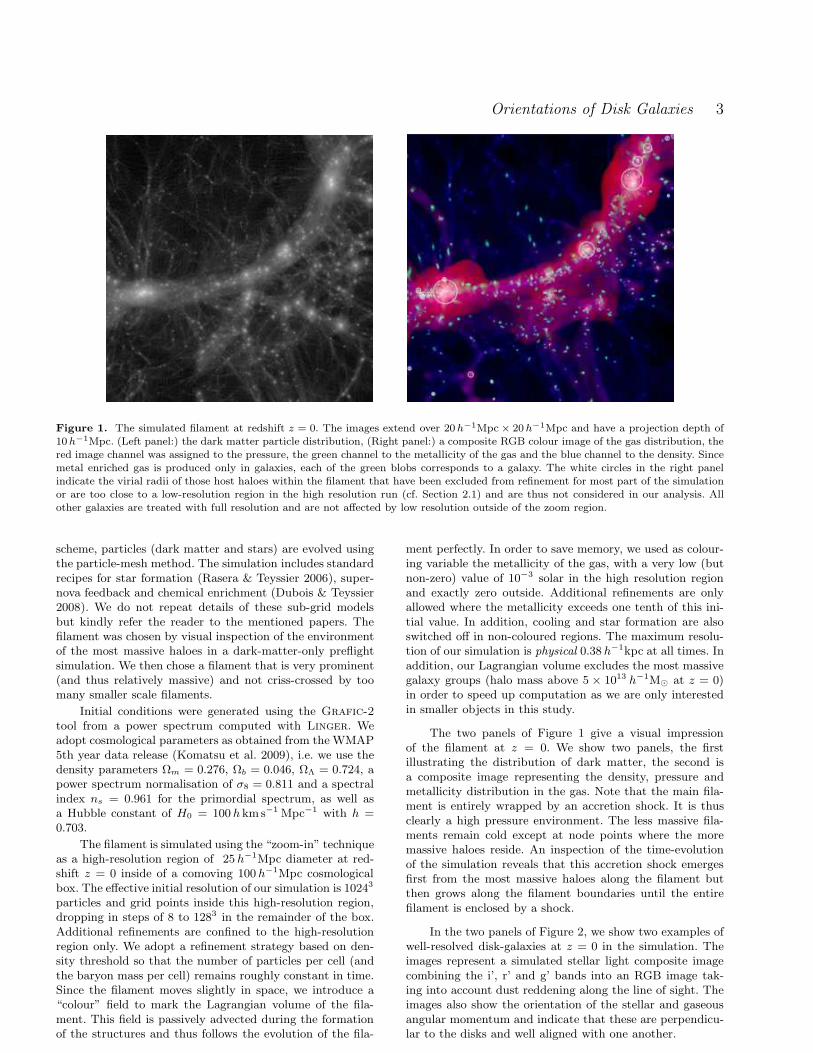
In the two panels of Figure 2, we show two examples ofwell-resolved disk-galaxies at z = 0 in the simulation. Theimages represent a simulated stellar light composite imagecombining the i’, r’ and g’ bands into an RGB image tak-ing into account dust reddening along the line of sight. Theimages also show the orientation of the stellar and gaseousangular momentum and indicate that these are perpendicu-lar to the disks and well aligned with one another.
4 O. Hahn et al.
Figure 2. Simulated stellar light composite images of two well-resolved disk-galaxies using the i′, r′ and g′ band light and takinginto account dust absorption. The white circles correspond to theradius containing 95 per cent of the stellar mass. The yellow linecorresponds to the stellar angular momentum vector direction,the red line to the gas angular momentum.
2.2 Identification of Galaxies
In order to identify galaxies in the simulated data, we di-rectly use the AMR mesh structure and label contiguous vol-umes exceeding a density threshold. First, we pick the high-est refinement level which exceeds 1h−1kpc resolution in or-der to smooth out galactic substructure. Next, we keep onlythose cells on this level, which exceed a threshold δb = 50000in baryonic overdensity. This particular choice of δb has beenfound to be in excellent agreement with a visual identifica-tion of the galaxies. In a final step we label all contiguousregions that are left. This labelling is performed using a par-allel implementation of the Hoshen-Kopelman cluster find-ing algorithm (Hoshen & Kopelman 1976). Finally, all starparticles and gas cells (also on higher refinement levels) areassigned to the mesh cluster Gk, i.e. the “galaxy”, in whichthey reside.
Galaxy stellar centres are then determined by itera-tively computing the stellar centre of mass within shrink-ing spherical apertures and moving the aperture to the newcentre in each iteration. The procedure is stopped once lessthan 50 particles are contained within the aperture. The
centre of the gaseous disk is defined as the densest gas cellin the galaxy and the centre of the inner dark matter halo isdefined as the most bound dark matter particle when eval-uating the potential for all dark matter particles that arecontained in the galaxy patch.
In order to determine halo masses and virial radii, wegrow spheres around each galaxy centre until the enclosedmatter overdensity falls below the overdensity ∆c of a viri-alised spherical perturbation in a ΛCDM cosmology as givenby the fitting formula of Bryan & Norman (1998). In a nextstep, we determine equivalence classes of galaxies that arecontained within the virial radii of each other. The galaxywith the highest stellar mass in each equivalence class we callthe “central galaxy”, all other class members are “satellitegalaxies”. We do not consider these satellite galaxies furtherin this study.
Finally, unresolved galaxies are identified by trackingthe dark matter particles that end up in galaxies back to theinitial conditions and requiring that none of them started ina region that was not initially marked for cooling and re-finement. These unresolved galaxies are then removed fromthe galaxy catalogue.
The central galaxies in our samples have stellar radiir95 (which is the radius that contains 95 per cent of thestellar mass) that are at most 0.11 at z = 1, 0.095 at z =0.5 and 0.077 at z = 0 of the virial radius of their parenthalo. This makes us confident that the identified galaxiesare not contaminated by other satellites in the halo andthus constitute clean samples of central galaxies.
2.3 The Fiducial Galaxy Samples
For our analysis, we keep only the best resolved galaxies withat least 25000 star particles, corresponding to a minimumstellar mass of ∼ 7.5 × 10⁹h−1M⊙. For these galaxies, r80,the radius containing 80% of the stellar mass is resolved byat least 8 resolution elements. Furthermore, this requirementimplies that we can compare our results to a lower resolutionrun (see Appendix A) for which the minimum star particlenumber for galaxies of equal mass is then a factor of 8 lower,but still above 3000.
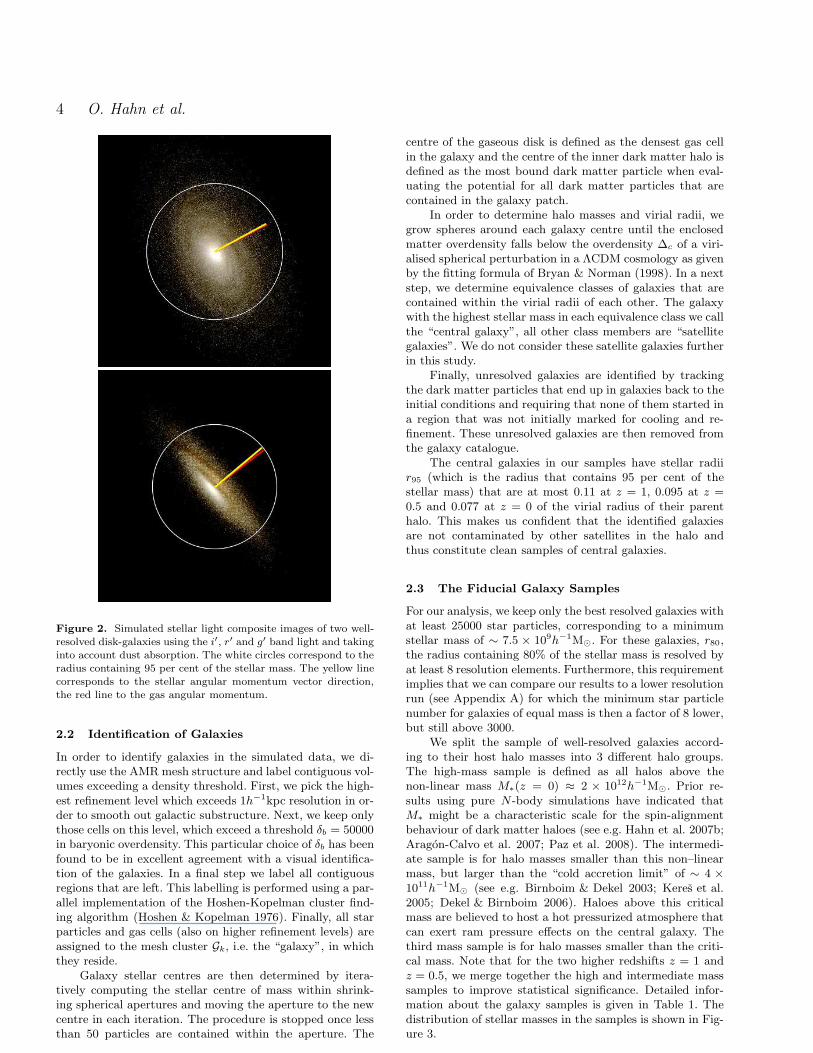
We split the sample of well-resolved galaxies accord-ing to their host halo masses into 3 different halo groups.The high-mass sample is defined as all halos above thenon-linear mass M∗(z = 0) ≈ 2 × 10¹²h−1M⊙. Prior re-sults using pure N-body simulations have indicated thatM∗ might be a characteristic scale for the spin-alignmentbehaviour of dark matter haloes (see e.g. Hahn et al. 2007b;Aragon-Calvo et al. 2007; Paz et al. 2008). The intermedi-ate sample is for halo masses smaller than this non–linearmass, but larger than the “cold accretion limit” of ∼ 4 ×10¹¹h−1M⊙ (see e.g. Birnboim & Dekel 2003; Keres et al.2005; Dekel & Birnboim 2006). Haloes above this criticalmass are believed to host a hot pressurized atmosphere thatcan exert ram pressure effects on the central galaxy. Thethird mass sample is for halo masses smaller than the criti-cal mass. Note that for the two higher redshifts z = 1 andz = 0.5, we merge together the high and intermediate masssamples to improve statistical significance. Detailed infor-mation about the galaxy samples is given in Table 1. Thedistribution of stellar masses in the samples is shown in Fig-ure 3.
Orientations of Disk Galaxies 5
LM MM HM
z = 0:Mhalo / h−1M⊙ 1− 4× 10¹¹ 5× 10¹¹ − 2× 10¹² > 2× 10¹²
median Mstellar / h−1M⊙ 1.3× 10¹⁰ 6.8× 10¹⁰ 4.2× 10¹¹
number of galaxies 70 39 12
z = 0.5:Mhalo / h−1M⊙ 1− 4× 10¹¹ - > 4× 10¹¹
median Mstellar / h−1M⊙ 1.3× 10¹⁰ - 6.7× 10¹⁰
number of galaxies 48 - 28
z = 1:Mhalo / h−1M⊙ 1− 4× 10¹¹ - > 4× 10¹¹
median Mstellar / h−1M⊙ 1.3× 10¹⁰ - 6.3× 10¹⁰
number of galaxies 58 - 31
Table 1. The galaxy samples used in our analysis. We split central galaxies according to their host halo mass in a low mass (LM) andhigh mass (HM) bin at redshifts z = 1 and z = 0.5 and an additional medium mass (MM) bin at z = 0. For each mass bin and eachredshift, the median stellar mass as well as the number of galaxies in the bin is given. See Figure 3 for histograms of stellar masses foreach of the galaxy samples.
10.5 11 11.50
5
10
15
20
25
30
35
40
N
LM(z=1)HM(z=1)
10.5 11 11.5log
10 M
stars / h−1 M
solar
LM(z=0.5)HM(z=0.5)
10.5 11 11.5
LM(z=0)MM(z=0)HM(z=0)
Figure 3. Distributions of galaxy stellar masses in the two/three galaxy samples used in our analysis (see Table 1 for details) at redshiftsz = 1 (left), z = 0.5 (middle) and z = 0 (right).
2.4 Measured Galactic Properties
In this study, we are interested in the orientation of diskgalaxies. Since we exclude the most massive (large group-scale and above) haloes from refinement, indeed all galaxiesconsidered are disky. We can thus simply quantify the diskorientation by the angular momenta of the various disk con-stituents: gas, stars and dark matter.
We compute the angular momentum for each galaxy Gk
by evaluating the sum
Jk =∑
i∈Gk
mi(ri − rk)× (vi − vk), (1)
where rk is the stellar centre of the kth galaxy inner region(see previous section), and vk is the centre of mass velocity.The sum is evaluated separately for all star particles thatare part of an identified galaxy Gk to yield the stellar angu-lar momentum JS
k, as well as for all DM particles that arecontained within a sphere of the radius of the most distantstar particle in the galaxy JDM
k . Finally, we also computethe gas angular momentum JG
k by summing over all leafcells of the AMR tree that are contained in the galaxy (andare thus effectively bounded by an iso-density surface – see
Section 2.2 for details). For gas, rk refers to the densest cellin the galaxy patch and vk to the centre of mass velocitycomputed over all leaf cells in Gk, while for dark matter rkrefers to the most bound dark matter particle and vk to thecentre of mass velocity of the dark matter particles in thesphere containing Gk (see also Section 2.2). In order to de-termine the total halo angular momentum, we evaluate eq.(1) summing over all components and up to the virial radiusto obtain Jtot.
2.5 Quantifying Large-Scale Structure with the
Tidal Field
In analogy to the approach followed by Hahn et al.(2007a,b), we use the eigenvectors of the tidal field ten-sor smoothed on some scale Rs to probe alignments withthe large-scale structure. This approach has two mainadvantages: (1) as demonstrated in Hahn et al. (2007a),the tidal field provides a natural dynamical quantifica-tion of the geometry of the large-scale structure; and(2) any local alignments with the tidal field directlytranslate into shear-ellipticity alignments in weak lensing
6 O. Hahn et al.
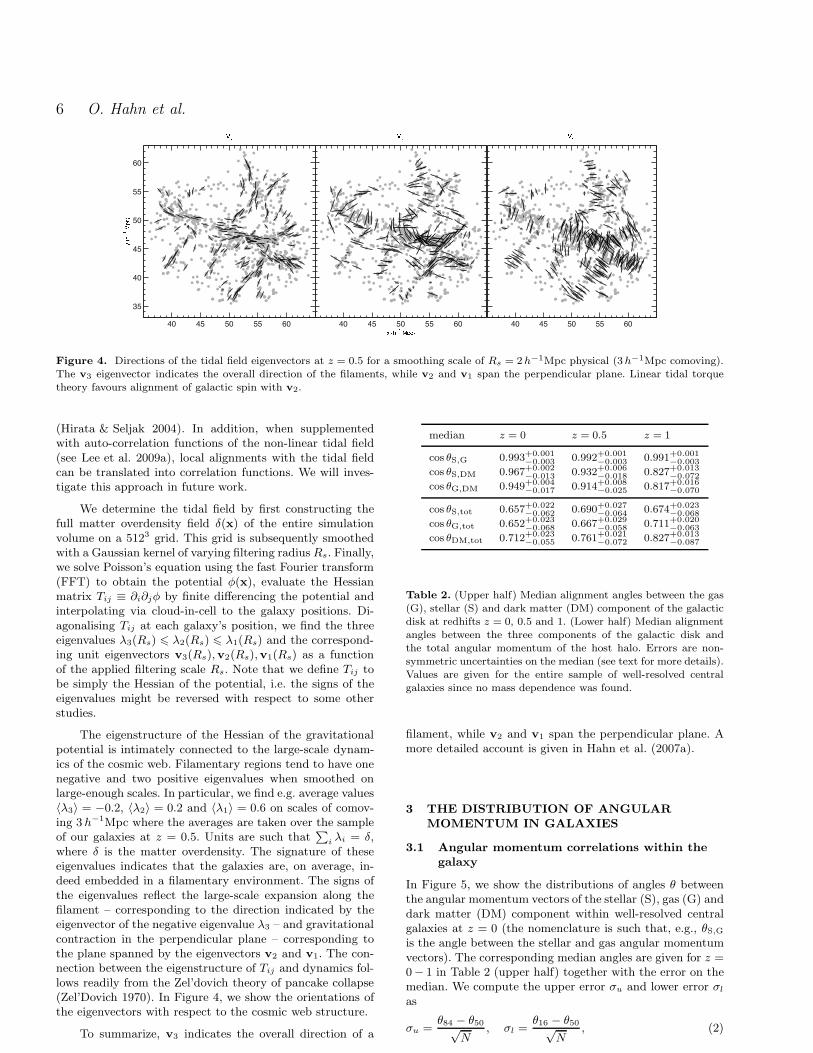
Figure 4. Directions of the tidal field eigenvectors at z = 0.5 for a smoothing scale of Rs = 2h−1Mpc physical (3h−1Mpc comoving).The v3 eigenvector indicates the overall direction of the filaments, while v2 and v1 span the perpendicular plane. Linear tidal torquetheory favours alignment of galactic spin with v2.
(Hirata & Seljak 2004). In addition, when supplementedwith auto-correlation functions of the non-linear tidal field(see Lee et al. 2009a), local alignments with the tidal fieldcan be translated into correlation functions. We will inves-tigate this approach in future work.
We determine the tidal field by first constructing thefull matter overdensity field δ(x) of the entire simulationvolume on a 5123 grid. This grid is subsequently smoothedwith a Gaussian kernel of varying filtering radius Rs. Finally,we solve Poisson’s equation using the fast Fourier transform(FFT) to obtain the potential φ(x), evaluate the Hessianmatrix Tij ≡ ∂i∂jφ by finite differencing the potential andinterpolating via cloud-in-cell to the galaxy positions. Di-agonalising Tij at each galaxy’s position, we find the threeeigenvalues λ3(Rs) 6 λ2(Rs) 6 λ1(Rs) and the correspond-ing unit eigenvectors v3(Rs),v2(Rs),v1(Rs) as a functionof the applied filtering scale Rs. Note that we define Tij tobe simply the Hessian of the potential, i.e. the signs of theeigenvalues might be reversed with respect to some otherstudies.
The eigenstructure of the Hessian of the gravitationalpotential is intimately connected to the large-scale dynam-ics of the cosmic web. Filamentary regions tend to have onenegative and two positive eigenvalues when smoothed onlarge-enough scales. In particular, we find e.g. average values〈λ3〉 = −0.2, 〈λ2〉 = 0.2 and 〈λ1〉 = 0.6 on scales of comov-ing 3 h−1Mpc where the averages are taken over the sampleof our galaxies at z = 0.5. Units are such that
∑
i λi = δ,where δ is the matter overdensity. The signature of theseeigenvalues indicates that the galaxies are, on average, in-deed embedded in a filamentary environment. The signs ofthe eigenvalues reflect the large-scale expansion along thefilament – corresponding to the direction indicated by theeigenvector of the negative eigenvalue λ3 – and gravitationalcontraction in the perpendicular plane – corresponding tothe plane spanned by the eigenvectors v2 and v1. The con-nection between the eigenstructure of Tij and dynamics fol-lows readily from the Zel’dovich theory of pancake collapse(Zel’Dovich 1970). In Figure 4, we show the orientations ofthe eigenvectors with respect to the cosmic web structure.
To summarize, v3 indicates the overall direction of a
median z = 0 z = 0.5 z = 1
cos θS,G 0.993+0.001−0.003 0.992+0.001
−0.003 0.991+0.001−0.003
cos θS,DM 0.967+0.002−0.013 0.932+0.006
−0.018 0.827+0.013−0.072
cos θG,DM 0.949+0.004−0.017 0.914+0.008
−0.025 0.817+0.016−0.070
cos θS,tot 0.657+0.022−0.062 0.690+0.027
−0.064 0.674+0.023−0.068
cos θG,tot 0.652+0.023−0.068 0.667+0.029
−0.058 0.711+0.020−0.063
cos θDM,tot 0.712+0.023−0.055 0.761+0.021
−0.072 0.827+0.013−0.087
Table 2. (Upper half) Median alignment angles between the gas(G), stellar (S) and dark matter (DM) component of the galacticdisk at redhifts z = 0, 0.5 and 1. (Lower half) Median alignmentangles between the three components of the galactic disk andthe total angular momentum of the host halo. Errors are non-symmetric uncertainties on the median (see text for more details).Values are given for the entire sample of well-resolved centralgalaxies since no mass dependence was found.
filament, while v2 and v1 span the perpendicular plane. Amore detailed account is given in Hahn et al. (2007a).
3 THE DISTRIBUTION OF ANGULAR
MOMENTUM IN GALAXIES
3.1 Angular momentum correlations within the
galaxy
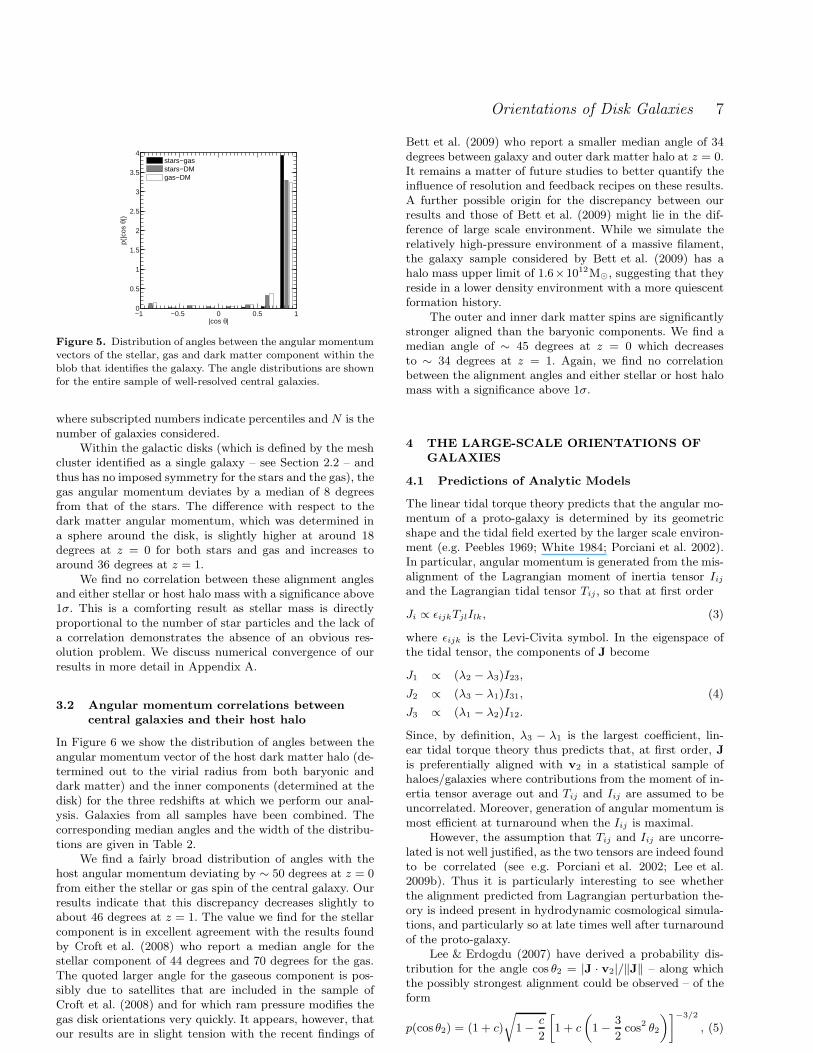
In Figure 5, we show the distributions of angles θ betweenthe angular momentum vectors of the stellar (S), gas (G) anddark matter (DM) component within well-resolved centralgalaxies at z = 0 (the nomenclature is such that, e.g., θS,Gis the angle between the stellar and gas angular momentumvectors). The corresponding median angles are given for z =0− 1 in Table 2 (upper half) together with the error on themedian. We compute the upper error σu and lower error σl
as
σu =θ84 − θ50√
N, σl =
θ16 − θ50√N
, (2)
Orientations of Disk Galaxies 7
|cos θ|
p(|c
os θ
|)
−1 −0.5 0 0.5 10
0.5
1
1.5
2
2.5
3
3.5
4stars−gasstars−DMgas−DM
Figure 5. Distribution of angles between the angular momentumvectors of the stellar, gas and dark matter component within theblob that identifies the galaxy. The angle distributions are shownfor the entire sample of well-resolved central galaxies.
where subscripted numbers indicate percentiles and N is thenumber of galaxies considered.
Within the galactic disks (which is defined by the meshcluster identified as a single galaxy – see Section 2.2 – andthus has no imposed symmetry for the stars and the gas), thegas angular momentum deviates by a median of 8 degreesfrom that of the stars. The difference with respect to thedark matter angular momentum, which was determined ina sphere around the disk, is slightly higher at around 18degrees at z = 0 for both stars and gas and increases toaround 36 degrees at z = 1.
We find no correlation between these alignment anglesand either stellar or host halo mass with a significance above1σ. This is a comforting result as stellar mass is directlyproportional to the number of star particles and the lack ofa correlation demonstrates the absence of an obvious res-olution problem. We discuss numerical convergence of ourresults in more detail in Appendix A.
3.2 Angular momentum correlations between
central galaxies and their host halo
In Figure 6 we show the distribution of angles between theangular momentum vector of the host dark matter halo (de-termined out to the virial radius from both baryonic anddark matter) and the inner components (determined at thedisk) for the three redshifts at which we perform our anal-ysis. Galaxies from all samples have been combined. Thecorresponding median angles and the width of the distribu-tions are given in Table 2.
We find a fairly broad distribution of angles with thehost angular momentum deviating by ∼ 50 degrees at z = 0from either the stellar or gas spin of the central galaxy. Ourresults indicate that this discrepancy decreases slightly toabout 46 degrees at z = 1. The value we find for the stellarcomponent is in excellent agreement with the results foundby Croft et al. (2008) who report a median angle for thestellar component of 44 degrees and 70 degrees for the gas.The quoted larger angle for the gaseous component is pos-sibly due to satellites that are included in the sample ofCroft et al. (2008) and for which ram pressure modifies thegas disk orientations very quickly. It appears, however, thatour results are in slight tension with the recent findings of
Bett et al. (2009) who report a smaller median angle of 34degrees between galaxy and outer dark matter halo at z = 0.It remains a matter of future studies to better quantify theinfluence of resolution and feedback recipes on these results.A further possible origin for the discrepancy between ourresults and those of Bett et al. (2009) might lie in the dif-ference of large scale environment. While we simulate therelatively high-pressure environment of a massive filament,the galaxy sample considered by Bett et al. (2009) has ahalo mass upper limit of 1.6×10¹²M⊙, suggesting that theyreside in a lower density environment with a more quiescentformation history.
The outer and inner dark matter spins are significantlystronger aligned than the baryonic components. We find amedian angle of ∼ 45 degrees at z = 0 which decreasesto ∼ 34 degrees at z = 1. Again, we find no correlationbetween the alignment angles and either stellar or host halomass with a significance above 1σ.
4 THE LARGE-SCALE ORIENTATIONS OF
GALAXIES
4.1 Predictions of Analytic Models
The linear tidal torque theory predicts that the angular mo-mentum of a proto-galaxy is determined by its geometricshape and the tidal field exerted by the larger scale environ-ment (e.g. Peebles 1969; White 1984; Porciani et al. 2002).In particular, angular momentum is generated from the mis-alignment of the Lagrangian moment of inertia tensor Iijand the Lagrangian tidal tensor Tij , so that at first order
Ji ∝ ǫijkTjlIlk, (3)
where ǫijk is the Levi-Civita symbol. In the eigenspace ofthe tidal tensor, the components of J become
J1 ∝ (λ2 − λ3)I23,
J2 ∝ (λ3 − λ1)I31, (4)
J3 ∝ (λ1 − λ2)I12.
Since, by definition, λ3 − λ1 is the largest coefficient, lin-ear tidal torque theory thus predicts that, at first order, Jis preferentially aligned with v2 in a statistical sample ofhaloes/galaxies where contributions from the moment of in-ertia tensor average out and Tij and Iij are assumed to beuncorrelated. Moreover, generation of angular momentum ismost efficient at turnaround when the Iij is maximal.
However, the assumption that Tij and Iij are uncorre-lated is not well justified, as the two tensors are indeed foundto be correlated (see e.g. Porciani et al. 2002; Lee et al.2009b). Thus it is particularly interesting to see whetherthe alignment predicted from Lagrangian perturbation the-ory is indeed present in hydrodynamic cosmological simula-tions, and particularly so at late times well after turnaroundof the proto-galaxy.
Lee & Erdogdu (2007) have derived a probability dis-tribution for the angle cos θ2 = |J · v2|/‖J‖ – along whichthe possibly strongest alignment could be observed – of theform
p(cos θ2) = (1 + c)
√
1− c
2
[
1 + c
(
1− 3
2cos2 θ2
)]−3/2
, (5)
8 O. Hahn et al.
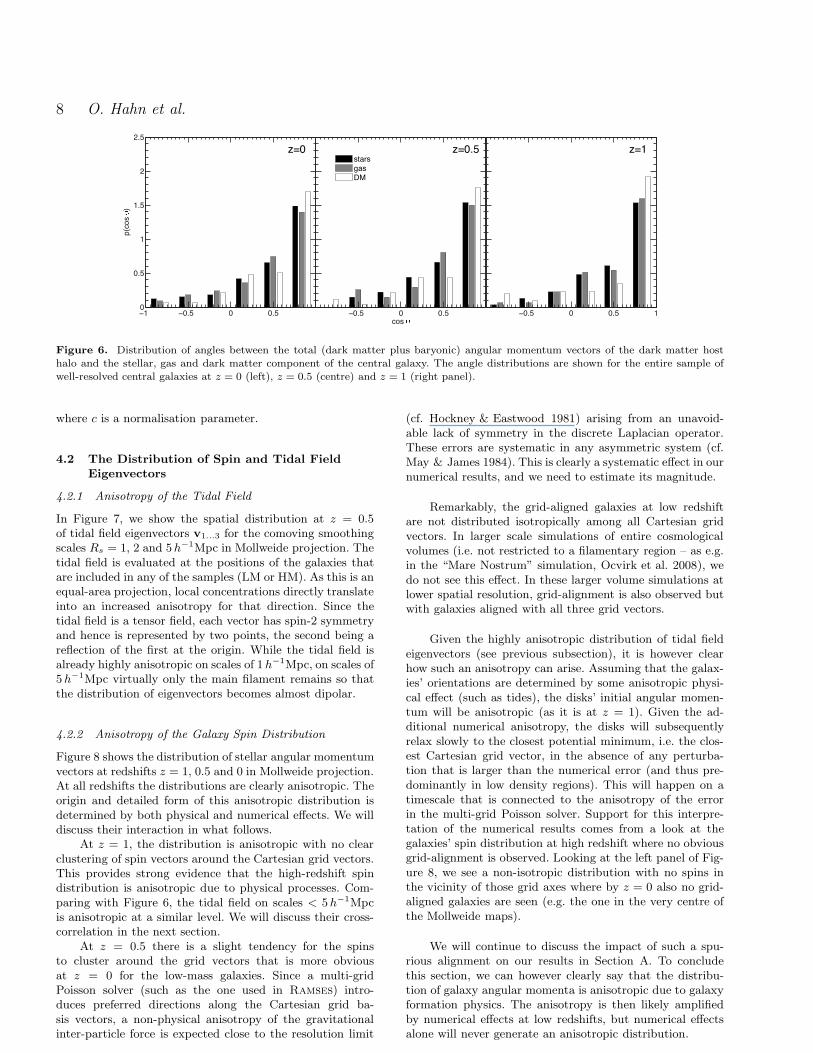
Figure 6. Distribution of angles between the total (dark matter plus baryonic) angular momentum vectors of the dark matter hosthalo and the stellar, gas and dark matter component of the central galaxy. The angle distributions are shown for the entire sample ofwell-resolved central galaxies at z = 0 (left), z = 0.5 (centre) and z = 1 (right panel).
where c is a normalisation parameter.
4.2 The Distribution of Spin and Tidal Field
Eigenvectors
4.2.1 Anisotropy of the Tidal Field
In Figure 7, we show the spatial distribution at z = 0.5of tidal field eigenvectors v1...3 for the comoving smoothingscales Rs = 1, 2 and 5h−1Mpc in Mollweide projection. Thetidal field is evaluated at the positions of the galaxies thatare included in any of the samples (LM or HM). As this is anequal-area projection, local concentrations directly translateinto an increased anisotropy for that direction. Since thetidal field is a tensor field, each vector has spin-2 symmetryand hence is represented by two points, the second being areflection of the first at the origin. While the tidal field isalready highly anisotropic on scales of 1h−1Mpc, on scales of5h−1Mpc virtually only the main filament remains so thatthe distribution of eigenvectors becomes almost dipolar.
4.2.2 Anisotropy of the Galaxy Spin Distribution
Figure 8 shows the distribution of stellar angular momentumvectors at redshifts z = 1, 0.5 and 0 in Mollweide projection.At all redshifts the distributions are clearly anisotropic. Theorigin and detailed form of this anisotropic distribution isdetermined by both physical and numerical effects. We willdiscuss their interaction in what follows.
At z = 1, the distribution is anisotropic with no clearclustering of spin vectors around the Cartesian grid vectors.This provides strong evidence that the high-redshift spindistribution is anisotropic due to physical processes. Com-paring with Figure 6, the tidal field on scales < 5h−1Mpcis anisotropic at a similar level. We will discuss their cross-correlation in the next section.
At z = 0.5 there is a slight tendency for the spinsto cluster around the grid vectors that is more obviousat z = 0 for the low-mass galaxies. Since a multi-gridPoisson solver (such as the one used in Ramses) intro-duces preferred directions along the Cartesian grid ba-sis vectors, a non-physical anisotropy of the gravitationalinter-particle force is expected close to the resolution limit
(cf. Hockney & Eastwood 1981) arising from an unavoid-able lack of symmetry in the discrete Laplacian operator.These errors are systematic in any asymmetric system (cf.May & James 1984). This is clearly a systematic effect in ournumerical results, and we need to estimate its magnitude.
Remarkably, the grid-aligned galaxies at low redshiftare not distributed isotropically among all Cartesian gridvectors. In larger scale simulations of entire cosmologicalvolumes (i.e. not restricted to a filamentary region – as e.g.in the “Mare Nostrum” simulation, Ocvirk et al. 2008), wedo not see this effect. In these larger volume simulations atlower spatial resolution, grid-alignment is also observed butwith galaxies aligned with all three grid vectors.
Given the highly anisotropic distribution of tidal fieldeigenvectors (see previous subsection), it is however clearhow such an anisotropy can arise. Assuming that the galax-ies’ orientations are determined by some anisotropic physi-cal effect (such as tides), the disks’ initial angular momen-tum will be anisotropic (as it is at z = 1). Given the ad-ditional numerical anisotropy, the disks will subsequentlyrelax slowly to the closest potential minimum, i.e. the clos-est Cartesian grid vector, in the absence of any perturba-tion that is larger than the numerical error (and thus pre-dominantly in low density regions). This will happen on atimescale that is connected to the anisotropy of the errorin the multi-grid Poisson solver. Support for this interpre-tation of the numerical results comes from a look at thegalaxies’ spin distribution at high redshift where no obviousgrid-alignment is observed. Looking at the left panel of Fig-ure 8, we see a non-isotropic distribution with no spins inthe vicinity of those grid axes where by z = 0 also no grid-aligned galaxies are seen (e.g. the one in the very centre ofthe Mollweide maps).
We will continue to discuss the impact of such a spu-rious alignment on our results in Section A. To concludethis section, we can however clearly say that the distribu-tion of galaxy angular momenta is anisotropic due to galaxyformation physics. The anisotropy is then likely amplifiedby numerical effects at low redshifts, but numerical effectsalone will never generate an anisotropic distribution.
Orientations of Disk Galaxies 9
Rs=1.0 h−1Mpc
v3
Rs=1.0 h−1Mpc
v2
Rs=1.0 h−1Mpc
v1
Rs=2.0 h−1Mpc
v3
Rs=2.0 h−1Mpc
v2
Rs=2.0 h−1Mpc
v1
Rs=5.0 h−1Mpc
v3
Rs=5.0 h−1Mpc
v2
Rs=5.0 h−1Mpc
v1
Figure 7. Mollweide sphere projections of the three eigenvalues of the tidal field at the positions of the galaxies for three smoothingscales, 1h−1Mpc (top), 2h−1Mpc (middle) and 5h−1Mpc (bottom). All data is for redshift z = 0.5. Since the tidal field has a spin-2symmetry, each vector is represented by two points. The Mollweide projection is an area preserving projection.
Figure 8. The orientations of galaxy stellar angular momenta at redshifts z = 1 (left), z = 0.5 (middle) and z = 0 (right). The angular
momentum vectors are shown in the Mollweide projection. The circled crosses indicate the Cartesian basis vectors of the AMR grid.
4.3 Correlations with the tidal field
As outlined in Section 4.1, linear tidal torque theory indi-cates that galaxies might show a preferential alignment withthe intermediate principal axis of the tidal field. In this Sec-tion, we investigate whether such an alignment persists alsoat times after the turnaround of the proto-galaxy in oursimulation. Unfortunately, the scale on which the tidal fieldshould be computed is not known a priori so that we presentthe degree of alignment for a range of smoothing scales.Since these scales are likely to be different for galaxies ofdifferent masses, and galaxies of different halo masses mayalso experiences differences in the details of their formation,all results are split into different halo masses as described inSection sec:galsamples. In addition, we distinguish low-massgalaxies in high-density and in low-density environments.
In Figure 9, we show the scale dependence of the cosineof the angles | cos θi| between the angular momentum vec-tors of the galaxies and the tidal field eigenvectors vi for theinner dark matter, gas and stellar components. The panelsrepresent the alignments with the 3 eigenvectors (vertical)for the 2 mass bins (horizontal). We additionally split thelow mass bin (LM) into an overdense bin δ > δ50 and an un-derdense bin δ < δ50, where here δ is the matter overdensityfield smoothed on a 2h−1Mpc physical scale and δ50 is the
median overdensity for the galaxies in the respective massbin. The values of δ50 for our sample of galaxies turn out tobe: 0.27 at z = 1, 0.54 at z = 0.5 and 1.16 at z = 0.
Using a two-tailed Kolmogorov-Smirnov test, we as-sess the inconsistency of the angle distributions on a scaleof physical 2h−1Mpc with a flat (i.e. random distribution)prand(| cos θi|) = 1. The significance levels are given in unitsof σ in Table 3.
At z = 1, we find the strongest alignment for thelow-mass low-density sample, where on scales of physical2h−1Mpc, the alignment signal with the intermediate prin-cipal axes of the tidal field peaks at a median angle of| cos θ2| ∼ 0.7 for the stellar angular momentum component.The deviation from a random angle distribution is significantat 2.75σ. The alignment of the gas disk is slightly weaker,while that of the inner dark matter is slightly stronger. Thereis a weaker counter-alignment with the third principal axison these scales, while the alignment with the first axis isconsistent with random.
For the low-mass high-density sample, we find a sig-nificant alignment only with the first principal axis for thestellar and gas component, while the dark matter angularmomentum is consistent with random at almost all scales.
Finally, for the high-mass sample, we find a significantalignment of the stellar and gas component with the third
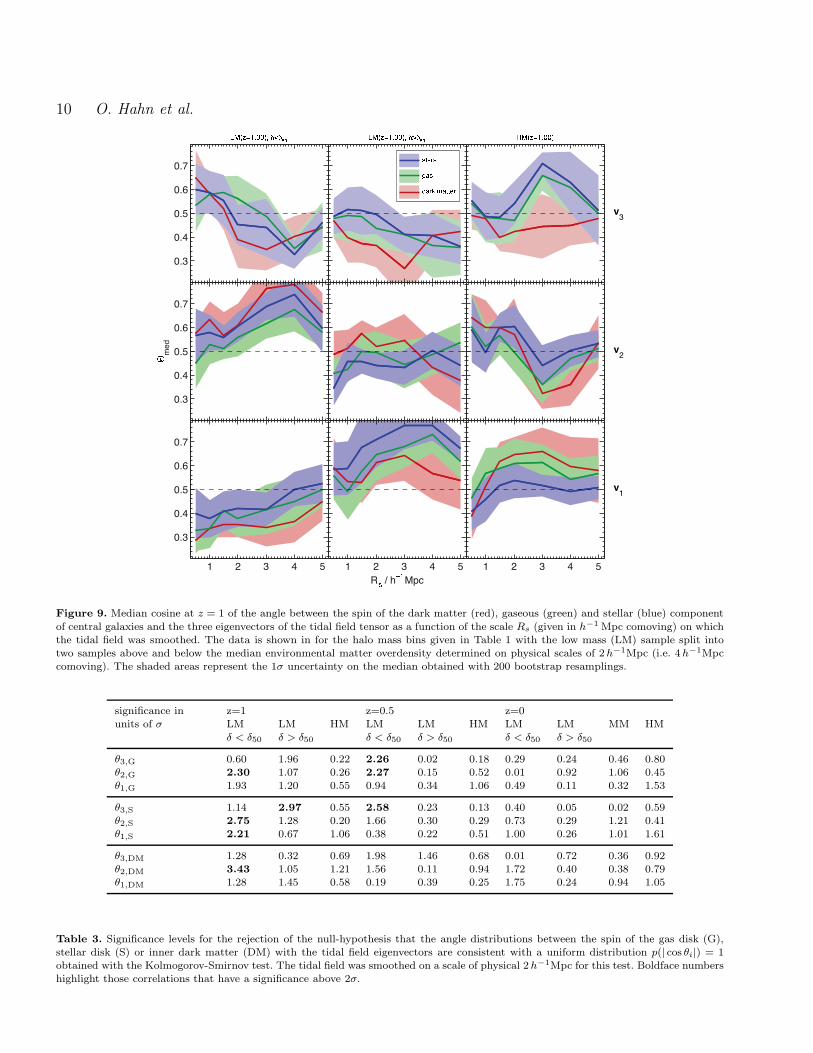
10 O. Hahn et al.
Figure 9. Median cosine at z = 1 of the angle between the spin of the dark matter (red), gaseous (green) and stellar (blue) component
of central galaxies and the three eigenvectors of the tidal field tensor as a function of the scale Rs (given in h−1 Mpc comoving) on whichthe tidal field was smoothed. The data is shown in for the halo mass bins given in Table 1 with the low mass (LM) sample split intotwo samples above and below the median environmental matter overdensity determined on physical scales of 2h−1Mpc (i.e. 4h−1Mpccomoving). The shaded areas represent the 1σ uncertainty on the median obtained with 200 bootstrap resamplings.
significance in z=1 z=0.5 z=0units of σ LM LM HM LM LM HM LM LM MM HM
δ < δ50 δ > δ50 δ < δ50 δ > δ50 δ < δ50 δ > δ50
θ3,G 0.60 1.96 0.22 2.26 0.02 0.18 0.29 0.24 0.46 0.80θ2,G 2.30 1.07 0.26 2.27 0.15 0.52 0.01 0.92 1.06 0.45θ1,G 1.93 1.20 0.55 0.94 0.34 1.06 0.49 0.11 0.32 1.53
θ3,S 1.14 2.97 0.55 2.58 0.23 0.13 0.40 0.05 0.02 0.59θ2,S 2.75 1.28 0.20 1.66 0.30 0.29 0.73 0.29 1.21 0.41θ1,S 2.21 0.67 1.06 0.38 0.22 0.51 1.00 0.26 1.01 1.61
θ3,DM 1.28 0.32 0.69 1.98 1.46 0.68 0.01 0.72 0.36 0.92θ2,DM 3.43 1.05 1.21 1.56 0.11 0.94 1.72 0.40 0.38 0.79θ1,DM 1.28 1.45 0.58 0.19 0.39 0.25 1.75 0.24 0.94 1.05
Table 3. Significance levels for the rejection of the null-hypothesis that the angle distributions between the spin of the gas disk (G),stellar disk (S) or inner dark matter (DM) with the tidal field eigenvectors are consistent with a uniform distribution p(| cos θi|) = 1obtained with the Kolmogorov-Smirnov test. The tidal field was smoothed on a scale of physical 2h−1Mpc for this test. Boldface numbershighlight those correlations that have a significance above 2σ.
Orientations of Disk Galaxies 11
principal axis on comoving scales of 3h−1Mpc which is how-ever not seen for the inner dark matter component at z = 1.At lower redshifts, this alignment decreases slightly but isalso seen for the dark matter component.
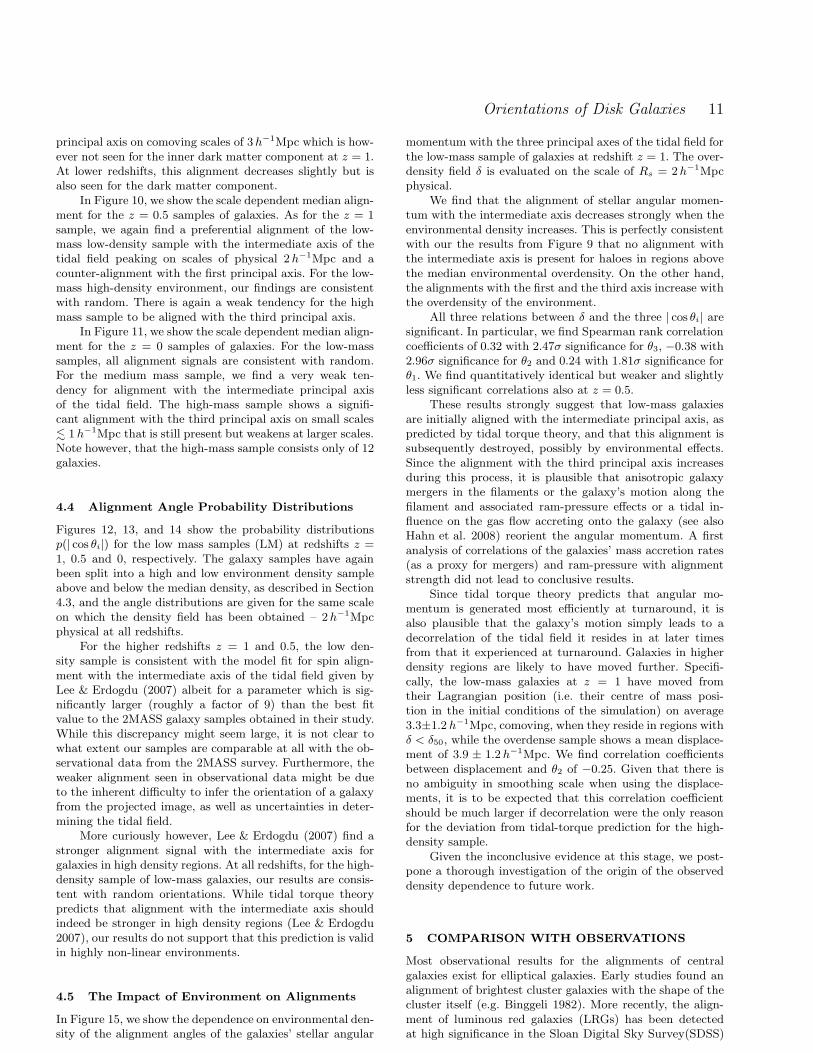
In Figure 10, we show the scale dependent median align-ment for the z = 0.5 samples of galaxies. As for the z = 1sample, we again find a preferential alignment of the low-mass low-density sample with the intermediate axis of thetidal field peaking on scales of physical 2h−1Mpc and acounter-alignment with the first principal axis. For the low-mass high-density environment, our findings are consistentwith random. There is again a weak tendency for the highmass sample to be aligned with the third principal axis.
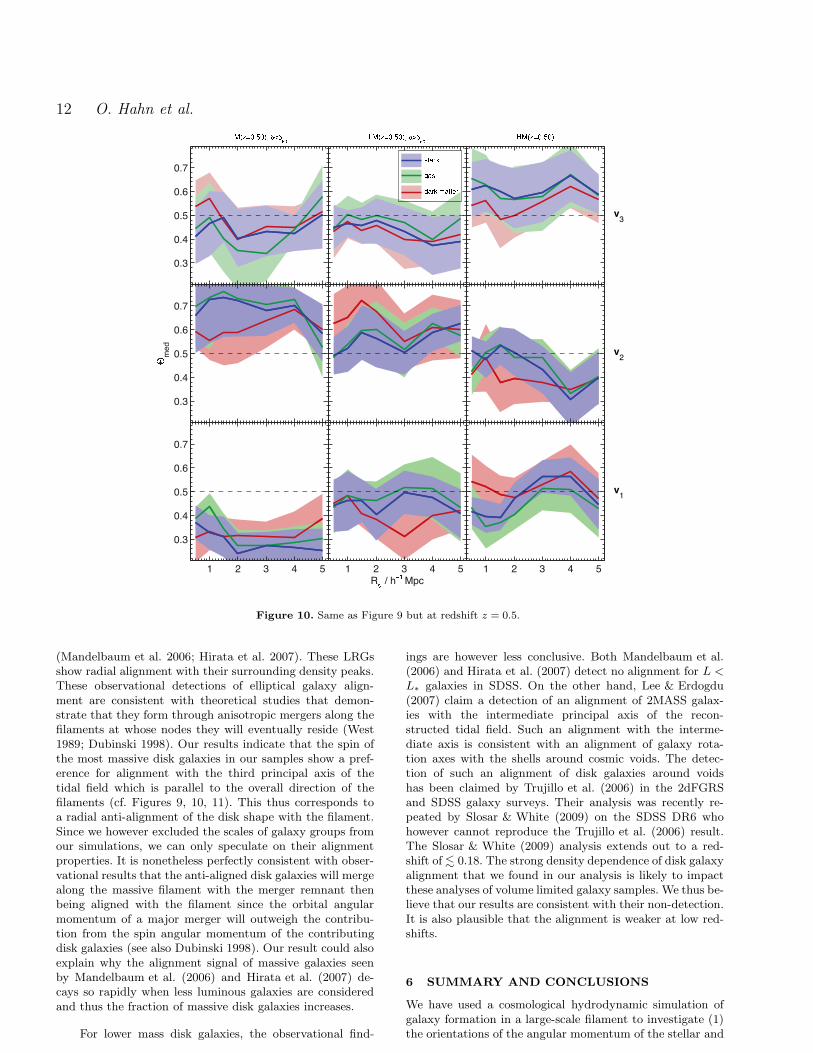
In Figure 11, we show the scale dependent median align-ment for the z = 0 samples of galaxies. For the low-masssamples, all alignment signals are consistent with random.For the medium mass sample, we find a very weak ten-dency for alignment with the intermediate principal axisof the tidal field. The high-mass sample shows a signifi-cant alignment with the third principal axis on small scales. 1 h−1Mpc that is still present but weakens at larger scales.Note however, that the high-mass sample consists only of 12galaxies.
4.4 Alignment Angle Probability Distributions
Figures 12, 13, and 14 show the probability distributionsp(| cos θi|) for the low mass samples (LM) at redshifts z =1, 0.5 and 0, respectively. The galaxy samples have againbeen split into a high and low environment density sampleabove and below the median density, as described in Section4.3, and the angle distributions are given for the same scaleon which the density field has been obtained – 2h−1Mpcphysical at all redshifts.
For the higher redshifts z = 1 and 0.5, the low den-sity sample is consistent with the model fit for spin align-ment with the intermediate axis of the tidal field given byLee & Erdogdu (2007) albeit for a parameter which is sig-nificantly larger (roughly a factor of 9) than the best fitvalue to the 2MASS galaxy samples obtained in their study.While this discrepancy might seem large, it is not clear towhat extent our samples are comparable at all with the ob-servational data from the 2MASS survey. Furthermore, theweaker alignment seen in observational data might be dueto the inherent difficulty to infer the orientation of a galaxyfrom the projected image, as well as uncertainties in deter-mining the tidal field.
More curiously however, Lee & Erdogdu (2007) find astronger alignment signal with the intermediate axis forgalaxies in high density regions. At all redshifts, for the high-density sample of low-mass galaxies, our results are consis-tent with random orientations. While tidal torque theorypredicts that alignment with the intermediate axis shouldindeed be stronger in high density regions (Lee & Erdogdu2007), our results do not support that this prediction is validin highly non-linear environments.
4.5 The Impact of Environment on Alignments
In Figure 15, we show the dependence on environmental den-sity of the alignment angles of the galaxies’ stellar angular
momentum with the three principal axes of the tidal field forthe low-mass sample of galaxies at redshift z = 1. The over-density field δ is evaluated on the scale of Rs = 2h−1Mpcphysical.
We find that the alignment of stellar angular momen-tum with the intermediate axis decreases strongly when theenvironmental density increases. This is perfectly consistentwith our the results from Figure 9 that no alignment withthe intermediate axis is present for haloes in regions abovethe median environmental overdensity. On the other hand,the alignments with the first and the third axis increase withthe overdensity of the environment.
All three relations between δ and the three | cos θi| aresignificant. In particular, we find Spearman rank correlationcoefficients of 0.32 with 2.47σ significance for θ3, −0.38 with2.96σ significance for θ2 and 0.24 with 1.81σ significance forθ1. We find quantitatively identical but weaker and slightlyless significant correlations also at z = 0.5.
These results strongly suggest that low-mass galaxiesare initially aligned with the intermediate principal axis, aspredicted by tidal torque theory, and that this alignment issubsequently destroyed, possibly by environmental effects.Since the alignment with the third principal axis increasesduring this process, it is plausible that anisotropic galaxymergers in the filaments or the galaxy’s motion along thefilament and associated ram-pressure effects or a tidal in-fluence on the gas flow accreting onto the galaxy (see alsoHahn et al. 2008) reorient the angular momentum. A firstanalysis of correlations of the galaxies’ mass accretion rates(as a proxy for mergers) and ram-pressure with alignmentstrength did not lead to conclusive results.
Since tidal torque theory predicts that angular mo-mentum is generated most efficiently at turnaround, it isalso plausible that the galaxy’s motion simply leads to adecorrelation of the tidal field it resides in at later timesfrom that it experienced at turnaround. Galaxies in higherdensity regions are likely to have moved further. Specifi-cally, the low-mass galaxies at z = 1 have moved fromtheir Lagrangian position (i.e. their centre of mass posi-tion in the initial conditions of the simulation) on average3.3±1.2 h−1Mpc, comoving, when they reside in regions withδ < δ50, while the overdense sample shows a mean displace-ment of 3.9 ± 1.2 h−1Mpc. We find correlation coefficientsbetween displacement and θ2 of −0.25. Given that there isno ambiguity in smoothing scale when using the displace-ments, it is to be expected that this correlation coefficientshould be much larger if decorrelation were the only reasonfor the deviation from tidal-torque prediction for the high-density sample.
Given the inconclusive evidence at this stage, we post-pone a thorough investigation of the origin of the observeddensity dependence to future work.
5 COMPARISON WITH OBSERVATIONS
Most observational results for the alignments of centralgalaxies exist for elliptical galaxies. Early studies found analignment of brightest cluster galaxies with the shape of thecluster itself (e.g. Binggeli 1982). More recently, the align-ment of luminous red galaxies (LRGs) has been detectedat high significance in the Sloan Digital Sky Survey(SDSS)
12 O. Hahn et al.
Figure 10. Same as Figure 9 but at redshift z = 0.5.
(Mandelbaum et al. 2006; Hirata et al. 2007). These LRGsshow radial alignment with their surrounding density peaks.These observational detections of elliptical galaxy align-ment are consistent with theoretical studies that demon-strate that they form through anisotropic mergers along thefilaments at whose nodes they will eventually reside (West1989; Dubinski 1998). Our results indicate that the spin ofthe most massive disk galaxies in our samples show a pref-erence for alignment with the third principal axis of thetidal field which is parallel to the overall direction of thefilaments (cf. Figures 9, 10, 11). This thus corresponds toa radial anti-alignment of the disk shape with the filament.Since we however excluded the scales of galaxy groups fromour simulations, we can only speculate on their alignmentproperties. It is nonetheless perfectly consistent with obser-vational results that the anti-aligned disk galaxies will mergealong the massive filament with the merger remnant thenbeing aligned with the filament since the orbital angularmomentum of a major merger will outweigh the contribu-tion from the spin angular momentum of the contributingdisk galaxies (see also Dubinski 1998). Our result could alsoexplain why the alignment signal of massive galaxies seenby Mandelbaum et al. (2006) and Hirata et al. (2007) de-cays so rapidly when less luminous galaxies are consideredand thus the fraction of massive disk galaxies increases.
For lower mass disk galaxies, the observational find-
ings are however less conclusive. Both Mandelbaum et al.(2006) and Hirata et al. (2007) detect no alignment for L <L∗ galaxies in SDSS. On the other hand, Lee & Erdogdu(2007) claim a detection of an alignment of 2MASS galax-ies with the intermediate principal axis of the recon-structed tidal field. Such an alignment with the interme-diate axis is consistent with an alignment of galaxy rota-tion axes with the shells around cosmic voids. The detec-tion of such an alignment of disk galaxies around voidshas been claimed by Trujillo et al. (2006) in the 2dFGRSand SDSS galaxy surveys. Their analysis was recently re-peated by Slosar & White (2009) on the SDSS DR6 whohowever cannot reproduce the Trujillo et al. (2006) result.The Slosar & White (2009) analysis extends out to a red-shift of . 0.18. The strong density dependence of disk galaxyalignment that we found in our analysis is likely to impactthese analyses of volume limited galaxy samples. We thus be-lieve that our results are consistent with their non-detection.It is also plausible that the alignment is weaker at low red-shifts.
6 SUMMARY AND CONCLUSIONS
We have used a cosmological hydrodynamic simulation ofgalaxy formation in a large-scale filament to investigate (1)the orientations of the angular momentum of the stellar and
Orientations of Disk Galaxies 13
Figure 11. Same as Figure 9 but at redshift z = 0.
gaseous disk of central galaxies, as well as the inner part oftheir dark matter halo with respect to the total angular mo-mentum of the host halo; and (2) the orientations of theirangular momentum with the surrounding large-scale struc-ture by computing scale-dependent alignments with the tidalfield eigenvectors.
The simulation provides us with a sample of ∼ 100disk galaxies at 380 h−1pc resolution down to z = 0, span-ning halo masses between 1011 and 1013 h−1M⊙ and stellarmasses between 7.5×10⁹ and 8×10¹¹ h−1M⊙. We focus thisfirst analysis on the three simulation snapshots at redshifts0, 0.5 and 1. We split our sample of galaxies into low-massgalaxies, which are those with a halo mass below the coldaccretion limit of ∼ 4×10¹¹ h−1M⊙, and high-mass galaxiesabove this limit. At z = 0, we consider an additional mediummass bin bridging the gap between the cold accretion limitand the non-linear mass scale of ∼ 2 × 10¹² h−1M⊙. Ourmain results are summarised as follows:
• There is an almost perfect alignment at a median of∼ 18 degrees of the stellar, gaseous and inner dark mat-ter angular momenta at low redshifts. At z = 1, there is aslightly weaker alignment at ∼ 36 degrees of the stellar andgaseous spins with the dark matter spin, likely due to thehigher fraction of unrelaxed galaxies at that epoch. We do
not find any dependence of this alignment signal either onenvironmental density, or halo mass or stellar mass.
• The distribution of angles between the spin of the cen-tral galaxy and the entire host halo is significantly broader,the corresponding median angles larger. We find a medianangle of ∼ 50 degrees between both the stellar and the gasdisk and the total halo angular momentum at z = 0. Thismedian angle decreases slightly at higher redshifts to a me-dian of ∼ 46 degrees at z = 1. The spin of the inner darkmatter halo is slightly stronger aligned with the total halo.We find a median of ∼ 45 degrees at z = 0 and ∼ 34 degreesat z = 1. Again, there is no dependence of this alignmentsignal on either stellar or halo mass, or on environmentaldensity.
• Low-mass galaxies in low density regions are alignedwith the intermediate axis of the large-scale tidal field ten-sor, peaking on scales of physical 2 h−1Mpc (i.e. 4h−1Mpccomoving) at z = 1 with very high significance. Such analignment is consistent with the predictions from linear tidaltorque theory.
• In density regions above the median overdensity, onscales of physical 2 h−1Mpc, we find however no evidencefor alignment of the low-mass galaxies with the intermedi-ate principal axis of the tidal field – at any redshift sincez = 1. Instead, we find alignment with the first principalaxis at z = 1, which disappears at later epochs.
14 O. Hahn et al.
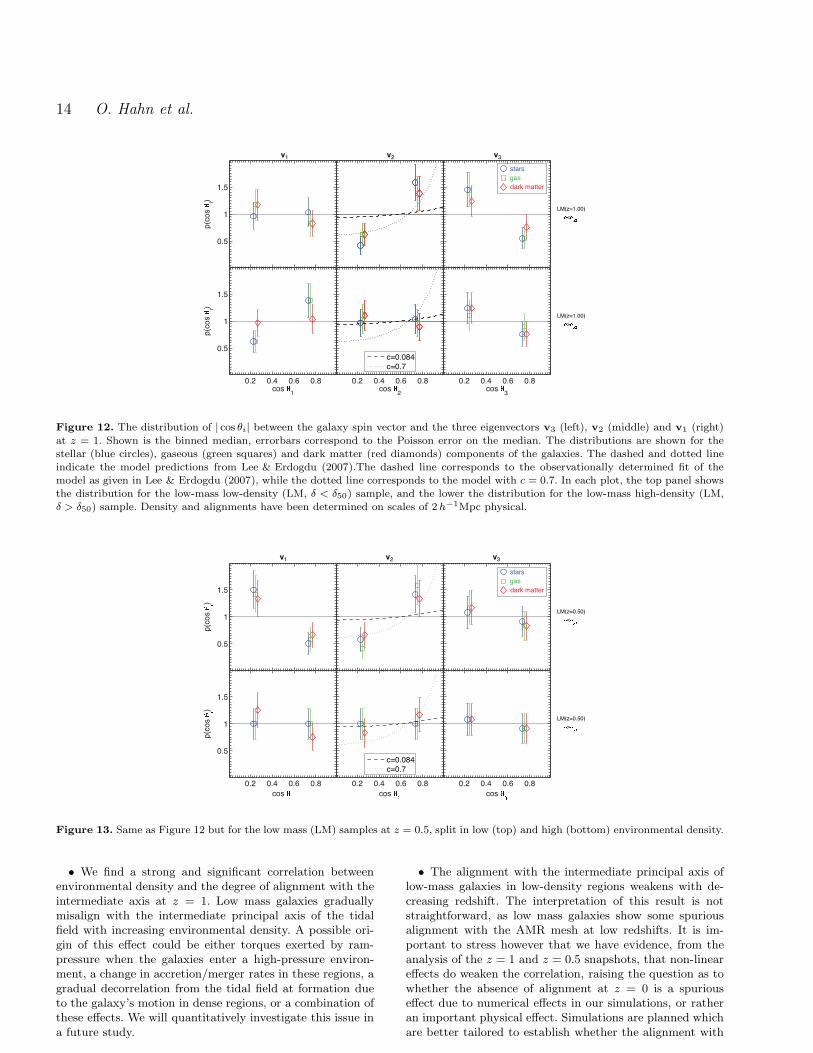
Figure 12. The distribution of | cos θi| between the galaxy spin vector and the three eigenvectors v3 (left), v2 (middle) and v1 (right)
at z = 1. Shown is the binned median, errorbars correspond to the Poisson error on the median. The distributions are shown for thestellar (blue circles), gaseous (green squares) and dark matter (red diamonds) components of the galaxies. The dashed and dotted lineindicate the model predictions from Lee & Erdogdu (2007).The dashed line corresponds to the observationally determined fit of themodel as given in Lee & Erdogdu (2007), while the dotted line corresponds to the model with c = 0.7. In each plot, the top panel showsthe distribution for the low-mass low-density (LM, δ < δ50) sample, and the lower the distribution for the low-mass high-density (LM,δ > δ50) sample. Density and alignments have been determined on scales of 2h−1Mpc physical.
Figure 13. Same as Figure 12 but for the low mass (LM) samples at z = 0.5, split in low (top) and high (bottom) environmental density.
• We find a strong and significant correlation betweenenvironmental density and the degree of alignment with theintermediate axis at z = 1. Low mass galaxies graduallymisalign with the intermediate principal axis of the tidalfield with increasing environmental density. A possible ori-gin of this effect could be either torques exerted by ram-pressure when the galaxies enter a high-pressure environ-ment, a change in accretion/merger rates in these regions, agradual decorrelation from the tidal field at formation dueto the galaxy’s motion in dense regions, or a combination ofthese effects. We will quantitatively investigate this issue ina future study.
• The alignment with the intermediate principal axis oflow-mass galaxies in low-density regions weakens with de-creasing redshift. The interpretation of this result is notstraightforward, as low mass galaxies show some spuriousalignment with the AMR mesh at low redshifts. It is im-portant to stress however that we have evidence, from theanalysis of the z = 1 and z = 0.5 snapshots, that non-lineareffects do weaken the correlation, raising the question as towhether the absence of alignment at z = 0 is a spuriouseffect due to numerical effects in our simulations, or ratheran important physical effect. Simulations are planned whichare better tailored to establish whether the alignment with
Orientations of Disk Galaxies 15
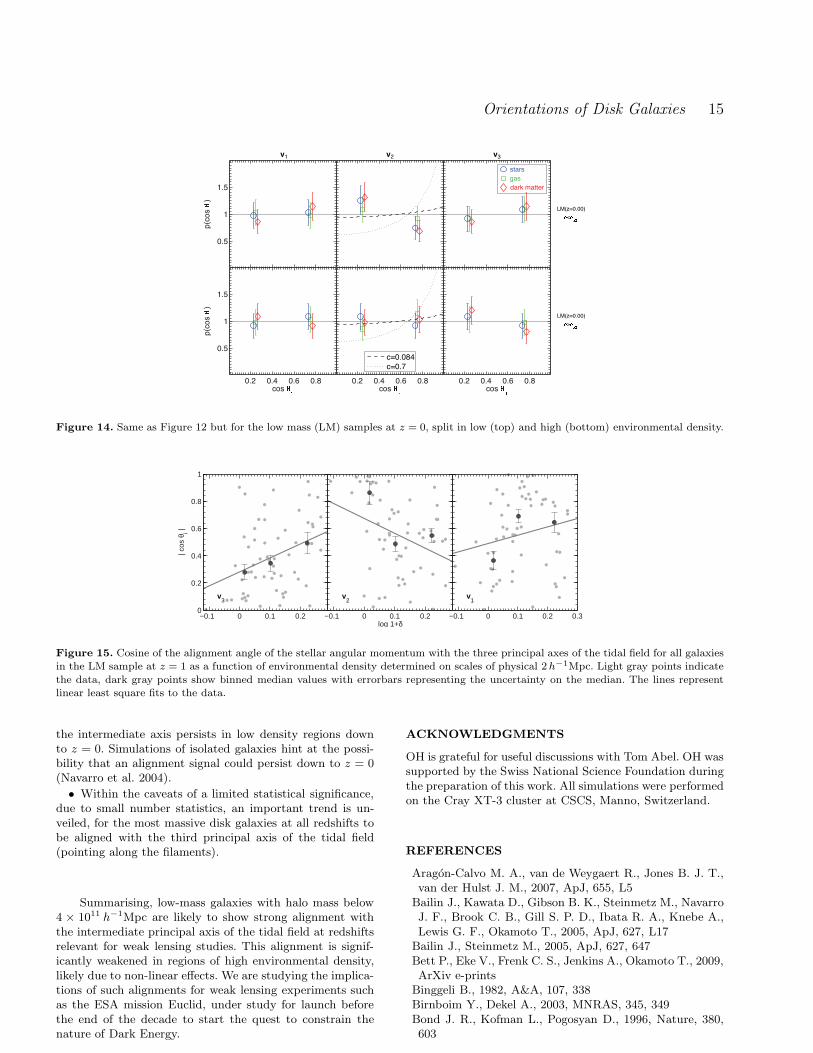
Figure 14. Same as Figure 12 but for the low mass (LM) samples at z = 0, split in low (top) and high (bottom) environmental density.
| cos
θi |
v3
−0.1 0 0.1 0.20
0.2
0.4
0.6
0.8
1
log 1+δ
v2
−0.1 0 0.1 0.2
v1
−0.1 0 0.1 0.2 0.3
Figure 15. Cosine of the alignment angle of the stellar angular momentum with the three principal axes of the tidal field for all galaxiesin the LM sample at z = 1 as a function of environmental density determined on scales of physical 2h−1Mpc. Light gray points indicate
the data, dark gray points show binned median values with errorbars representing the uncertainty on the median. The lines representlinear least square fits to the data.
the intermediate axis persists in low density regions downto z = 0. Simulations of isolated galaxies hint at the possi-bility that an alignment signal could persist down to z = 0(Navarro et al. 2004).
• Within the caveats of a limited statistical significance,due to small number statistics, an important trend is un-veiled, for the most massive disk galaxies at all redshifts tobe aligned with the third principal axis of the tidal field(pointing along the filaments).
Summarising, low-mass galaxies with halo mass below4 × 1011 h−1Mpc are likely to show strong alignment withthe intermediate principal axis of the tidal field at redshiftsrelevant for weak lensing studies. This alignment is signif-icantly weakened in regions of high environmental density,likely due to non-linear effects. We are studying the implica-tions of such alignments for weak lensing experiments suchas the ESA mission Euclid, under study for launch beforethe end of the decade to start the quest to constrain thenature of Dark Energy.
ACKNOWLEDGMENTS
OH is grateful for useful discussions with Tom Abel. OH wassupported by the Swiss National Science Foundation duringthe preparation of this work. All simulations were performedon the Cray XT-3 cluster at CSCS, Manno, Switzerland.
REFERENCES
Aragon-Calvo M. A., van de Weygaert R., Jones B. J. T.,van der Hulst J. M., 2007, ApJ, 655, L5
Bailin J., Kawata D., Gibson B. K., Steinmetz M., NavarroJ. F., Brook C. B., Gill S. P. D., Ibata R. A., Knebe A.,Lewis G. F., Okamoto T., 2005, ApJ, 627, L17
Bailin J., Steinmetz M., 2005, ApJ, 627, 647Bett P., Eke V., Frenk C. S., Jenkins A., Okamoto T., 2009,ArXiv e-prints
Binggeli B., 1982, A&A, 107, 338Birnboim Y., Dekel A., 2003, MNRAS, 345, 349Bond J. R., Kofman L., Pogosyan D., 1996, Nature, 380,603
16 O. Hahn et al.
Brunino R., Trujillo I., Pearce F. R., Thomas P. A., 2007,MNRAS, 375, 184
Bryan G. L., Norman M. L., 1998, ApJ, 495, 80Catelan P., Kamionkowski M., Blandford R. D., 2001, MN-RAS, 320, L7
Colless M., Dalton G., Maddox the 2dF collaboration 2001,MNRAS, 328, 1039
Croft R. A. C., Di Matteo T., Springel V., Hernquist L.,2008, ArXiv e-prints
Cuesta A. J., Betancort-Rijo J. E., Gottlober S., PatiriS. G., Yepes G., Prada F., 2008, MNRAS, 385, 867
Dekel A., Birnboim Y., 2006, MNRAS, 368, 2Dubinski J., 1998, ApJ, 502, 141Dubois Y., Teyssier R., 2008, A&A, 477, 79Fakhouri O., Ma C.-P., 2009, MNRAS, 394, 1825Faltenbacher A., Jing Y. P., Li C., Mao S., Mo H. J.,Pasquali A., van den Bosch F. C., 2008, ApJ, 675, 146
Faltenbacher A., Li C., Mao S., van den Bosch F. C., YangX., Jing Y. P., Pasquali A., Mo H. J., 2007, ApJ, 662, L71
Faltenbacher A., Li C., White S. D. M., Jing Y.-P., Shu-DeMao Wang J., 2009, Research in Astronomy and As-trophysics, 9, 41
Hahn O., Carollo C. M., Porciani C., Dekel A., 2007b, MN-RAS, 381, 41
Hahn O., Porciani C., Carollo C. M., Dekel A., 2007a, MN-RAS, 375, 489
Hahn O., Porciani C., Dekel A., Carollo C. M., 2008, ArXive-prints
Heymans C., White M., Heavens A., Vale C., van WaerbekeL., 2006, MNRAS, 371, 750
Hirata C. M., Mandelbaum R., Ishak M., Seljak U., NicholR., Pimbblet K. A., Ross N. P., Wake D., 2007, MNRAS,381, 1197
Hirata C. M., Seljak U., 2004, Phys. Rev. D, 70, 063526Hockney R. W., Eastwood J. W., 1981, Computer simula-tion using particles, MacGraw-Hill, USA.
Hoshen J., Kopelman R., 1976, Phys. Rev. B, 14, 3438Joachimi B., Schneider P., 2008, A&A, 488, 829Keres D., Katz N., Weinberg D. H., Dave R., 2005, MN-RAS, 363, 2
King L. J., 2005, A&A, 441, 47Knebe A., Draganova N., Power C., Yepes G., Hoffman Y.,Gottlober S., Gibson B. K., 2008, MNRAS, 386, L52
Komatsu E., Dunkley J., Nolta M. R., Bennett C. L., theWMAP collaboration 2009, ApJS, 180, 330
Lee J., Erdogdu P., 2007, ApJ, 671, 1248Lee J., Hahn O., Porciani C., 2009a, ArXiv e-printsLee J., Hahn O., Porciani C., 2009b, arXiv:0906.5163Mandelbaum R., Hirata C. M., Ishak M., Seljak U.,Brinkmann J., 2006, MNRAS, 367, 611
May A., James R. A., 1984, MNRAS, 206, 691Navarro J. F., Abadi M. G., Steinmetz M., 2004, ApJ, 613,L41
Ocvirk P., Pichon C., Teyssier R., 2008, MNRAS, 390, 1326Okumura T., Jing Y. P., Li C., 2009, ApJ, 694, 214Paz D. J., Stasyszyn F., Padilla N. D., 2008, MNRAS, 389,1127
Peebles P. J. E., 1969, ApJ, 155, 393Pereira M. J., Bryan G. L., Gill S. P. D., 2008, ApJ, 672,825
Porciani C., Dekel A., Hoffman Y., 2002, MNRAS, 332, 325Rasera Y., Teyssier R., 2006, A&A, 445, 1
Schafer B. M., 2009, International Journal of ModernPhysics D, 18, 173
Schneider M. D., Bridle S., 2009, ArXiv e-printsShandarin S. F., Zeldovich Y. B., 1989, Reviews of ModernPhysics, 61, 185
Sharma S., Steinmetz M., 2005, ApJ, 628, 21Slosar A., White M., 2009, Journal of Cosmology andAstro-Particle Physics, 6, 9
Tegmark M., Blanton M. R., Strauss M. A., the SDSS col-laboration 2004, ApJ, 606, 702
Teyssier R., 2002, A&A, 385, 337Trujillo I., Carretero C., Patiri S. G., 2006, ApJ, 640, L111van den Bosch F. C., Abel T., Croft R. A. C., HernquistL., White S. D. M., 2002, ApJ, 576, 21
West M. J., 1989, ApJ, 347, 610White S. D. M., 1984, ApJ, 286, 38Yang X., van den Bosch F. C., Mo H. J., Mao S., Kang X.,Weinmann S. M., Guo Y., Jing Y. P., 2006, MNRAS, 369,1293
Zel’Dovich Y. B., 1970, A&A, 5, 84
APPENDIX A: ASSESSMENT OF NUMERICAL
EFFECTS ON GALAXY ORIENTATIONS
A1 The Lower Resolution Simulation
We also performed a simulation of the filament describedin Section 2.1 at identical mass resolution but with a lowermaximum refinement level so that the maximum spatial res-olution is 0.76 h−1kpc at all times, a factor of 2 lower thanthe simulation used in our analysis. We analysed this simu-lation in an identical way as the higher resolution one andquantify the differences in what follows in order to deter-mine the numerical reliability of our results. The lower spa-tial resolution should especially demonstrate whether thegalaxy orientations are affected by force anisotropy at theresolution level.
We decide to keep the mass samples identical to thosein the previous sections so that galaxies on average contain8 times less star particles (and thus more than 3000) butan equal amount of dark matter particles. We compare ourresults at z = 0 as spurious grid alignment effects are ex-pected to be strongest in the dark energy dominated periodwhere the merger rates decline substantially and the galaxiesthus could potentially relax to the grid. The low-resolutionsimulation contains slightly more galaxies since additionalrefinement, cooling and star formation were not restrictedto not contain the massive groups. These group galaxies arehowever not included in our comparison as we restrict our-selves to the central galaxies of haloes that are resolved inboth simulations.
A2 Angular Momentum Correlations in the
Galaxy and with the Host Halo
In Table A1, we give the median angles between the stel-lar, gas and dark matter component within the galaxies andwith the total halo angular momentum at z = 0 for thelow-resolution run. Comparing these angles with those ofthe high-resolution run in Table 2, we find that the me-dian alignment angles obtained at lower spatial resolution
Orientations of Disk Galaxies 17
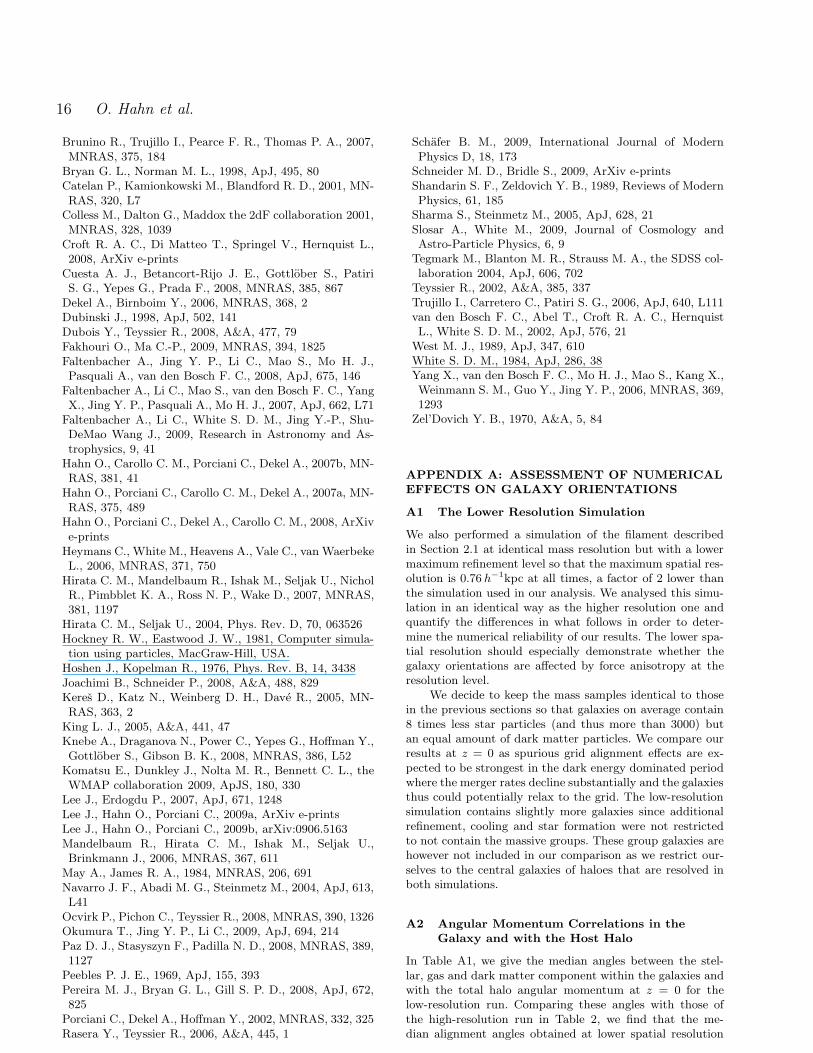
median z = 0
cos θS,G 0.988+0.001−0.002
cos θS,DM 0.953+0.002−0.019
cos θG,DM 0.924+0.004−0.022
cos θS,tot 0.627+0.018−0.055
cos θG,tot 0.594+0.013−0.052
cos θDM,tot 0.745+0.013−0.048
Table A1. Same as Table 2 but for the simulation with two-timeslower spatial resolution.
Figure A1. Same as Figure 8 but for the low-resolution run atz = 0.
are marginally larger, the corresponding vectors thus lessaligned. Given the width of the distributions, the resultscan however be considered consistent at high significance.
A3 Isotropy of the Galaxy Spins
In Figure A1, we show the orientations of stellar angularmomentum vectors for the low-resolution simulation. Thisshould be compared with the corresponding Figure 8 for thehigh-resolution run. Visually, we see a stronger clustering ofspin vectors around the Cartesian mesh basis vectors thanfor the high-resolution run. Spurious grid alignment is thuspresent at z = 0 in both simulations to some degree.
A4 Alignments with the Tidal Field
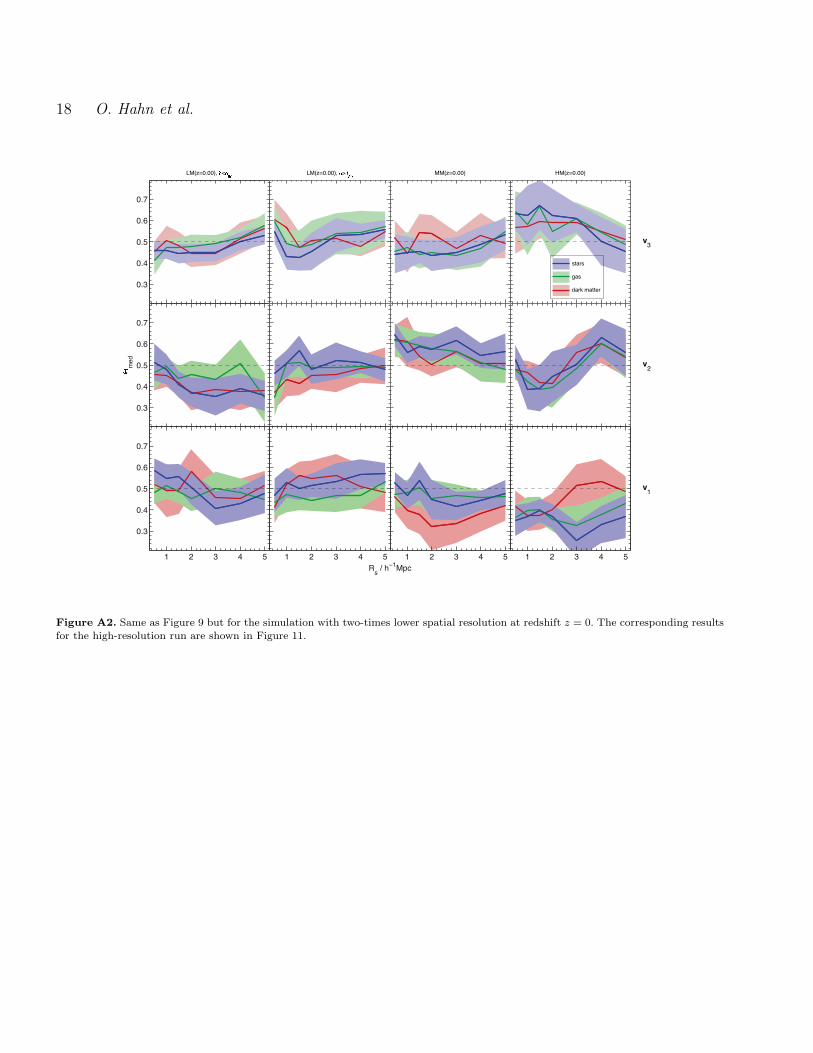
In Figure A2 we show the scale dependence of the alignmentbetween the galaxy stellar, gas and dark matter angular mo-mentum and the three eigenvectors of the tidal field for thelow-resolution run. These results should be compared withresults for the high-resolution simulation given in Figure 11.We find that the results are perfectly consistent for all sam-ples except the low-density low-mass bin where we find aslightly stronger anti-alignment with the intermediate prin-cipal axis of the tidal field in the low-resolution run. Also,the weak anti-alignment with the third principal axis is notseen in the high-resolution run. It is likely that this differ-ence for low-mass galaxies in low density regions is due to theanisotropy induced by the Cartesian mesh which is expectedto be stronger for the low-resolution run. We conclude thatthe resolution of our high resolution run is still insufficientfor galaxy orientations to be not affected by spurious gridrelaxation in low density regions at low redshifts. It is thusnot clear whether the alignment of spins with the interme-diate axis that we find at higher redshifts would persist in
low-density environments also down to z = 0 in the absenceof numerical effects. This question has to be addressed witheven higher resolution simulations than the ones we used inour analysis. The results of Navarro et al. (2004), who finda survival of alignment with the intermediate axis for thefour isolated galaxies they simulated, is however indicativethat such alignment should persist to some degree.
18 O. Hahn et al.
Figure A2. Same as Figure 9 but for the simulation with two-times lower spatial resolution at redshift z = 0. The corresponding resultsfor the high-resolution run are shown in Figure 11.


![Wpmen]^ - Flying Disc Museum](https://img.dokumen.tips/doc/110x75/633c817562e54755e7023f2c/wpmen-flying-disc-museum.jpg)


