Embed Size (px)
Citation preview
�����������������
Citation: Cangioli, L.; Mancini, M.;
Napoli, M.; Fagorzi, C.; Orlandini, S.;
Vaccaro, F.; Mengoni, A. Differential
Response of Wheat Rhizosphere
Bacterial Community to Plant Variety
and Fertilization. Int. J. Mol. Sci. 2022,
23, 3616. https://doi.org/10.3390/
ijms23073616
Academic Editors: Yangrong Cao and
Hari B. Krishnan
Received: 10 February 2022
Accepted: 23 March 2022
Published: 25 March 2022
Publisher’s Note: MDPI stays neutral
with regard to jurisdictional claims in
published maps and institutional affil-
iations.
Copyright: © 2022 by the authors.
Licensee MDPI, Basel, Switzerland.
This article is an open access article
distributed under the terms and
conditions of the Creative Commons
Attribution (CC BY) license (https://
creativecommons.org/licenses/by/
4.0/).
International Journal of
Molecular Sciences
Article
Differential Response of Wheat Rhizosphere BacterialCommunity to Plant Variety and FertilizationLisa Cangioli 1, Marco Mancini 2, Marco Napoli 2,* , Camilla Fagorzi 1 , Simone Orlandini 2 ,Francesca Vaccaro 1 and Alessio Mengoni 1,*
1 Department of Biology, University of Florence, Via Madonna del Piano 6, 50019 Sesto Fiorentino, Italy;[email protected] (L.C.); [email protected] (C.F.); [email protected] (F.V.)
2 Department of Agriculture, Food, Environment and Forestry (DAGRI), University of Florence,Piazzale delle Cascine 18, 50144 Florence, Italy; [email protected] (M.M.);[email protected] (S.O.)
* Correspondence: [email protected] (M.N.); [email protected] (A.M.)
Abstract: The taxonomic assemblage and functions of the plant bacterial community are stronglyinfluenced by soil and host plant genotype. Crop breeding, especially after the massive use ofnitrogen fertilizers which led to varieties responding better to nitrogen fertilization, has implicitlymodified the ability of the plant root to recruit an effective bacterial community. Among the prioritiesfor harnessing the plant bacterial community, plant genotype-by-microbiome interactions are stirringattention. Here, we analyzed the effect of plant variety and fertilization on the rhizosphere bacterialcommunity. In particular, we clarified the presence in the bacterial community of a varietal effectof N and P fertilization treatment. 16S rRNA gene amplicon sequence analysis of rhizospheric soil,collected from four wheat varieties grown under four N-P fertilization regimes, and quantification offunctional bacterial genes involved in the nitrogen cycle (nifH; amoA; nirK and nosZ) were performed.Results showed that variety played the most important role and that treatments did not affect eitherbacterial community diversity or bacterial phyla abundance. Variety-specific response of rhizospherebacterial community was detected, both in relation to taxa (Nitrospira) and metabolic functions.In particular, the changes related to amino acid and aerobic metabolism and abundance of genesinvolved in the nitrogen cycle (amoA and nosZ), suggested that plant variety may lead to functionalchanges in the cycling of the plant-assimilable nitrogen.
Keywords: wheat; rhizosphere; bacterial community; ecosystem functions
1. Introduction
The plant bacterial community, and especially the rhizospheric bacterial community,has been clearly related to crop yield and resistance to biotic and abiotic stresses [1–6]. Do-mestication and breeding have strongly influenced plant bacterial community [7,8], resultingin some cases in a reduced ability of the plant to attract an adequate rhizosphere bacterialcommunity [9]. Since the diversity of the plant bacterial community is contributing to the re-silience and sustainability of agroecosystems to multiple stressors, including climate change,increased diversity of the crop-associated bacterial community can contribute to conjugatingsustainable yield with a reduced footprint of agriculture on the environment. Indeed, in gen-eral terms, plant genotype is a relevant factor affecting diversity and functions of the plantbacterial community and influencing soil bacterial community [3,10–12]. Consequently, thereis a growing focus on considering the recruited plant bacterial community for future cropbreeding programs [3]. Among the priorities for harnessing the plant bacterial community,plant genotype ×microbiome × environment ×management interactions are stirring atten-tion [13]. In fact, not only the species, but also the individuality of genotypes, viz. germplasmor varieties, show peculiarities in the associated bacterial community stresses [5,8,14].
Int. J. Mol. Sci. 2022, 23, 3616. https://doi.org/10.3390/ijms23073616 https://www.mdpi.com/journal/ijms
Int. J. Mol. Sci. 2022, 23, 3616 2 of 17
With the increasing food demand [15,16], winter wheat grain production needs toexpand by 11% by 2026 [17]. To increase the grain yield and protein production perhectare, intensive breeding of winter wheat started in the second half of the twentiethcentury [18]. Winter wheat cultivars before the late 1960s are commonly called “old”, whilethose registered later are called “modern” [19]. In particular, the introduction of growthrepressor (Rht) genes led to the development of semi-dwarf genotypes [20] which arecharacterized by improved efficiency of partitioning photosynthetic assimilates and lodgingresistance [18,21], are highly productive, homogeneous, with high protein production perhectare, and with a gluten composition suitable for industrial processing [19,22–24]. On theother hand, the intensive breeding of winter wheat led to lower vitamin and micronutrientconcentrations in grains [25] as a consequence of the “yield dilution phenomenon” in“modern” varieties [26]. Furthermore, the smaller root system induced by the dwarfismgene [27] makes the “modern” varieties less able to explore the soil and therefore morereliant on chemical fertilization than the “old” ones [28]. Further, the breeding process mayalso have influenced the characteristics and quantity of root exudates in “modern” varieties,thus influencing the composition of the rhizosphere [20]. These features suggest that “old”and “modern” wheat varieties may harbor different root-associated microbiota related tothe different nutrient requirements and root systems. In fact, concerning wheat-associatedbacterial communities, a clear effect of variety on the rhizosphere bacterial communityhas been shown [29–31], as well as nitrogen fertilization [20,32]. Recently, a hypothesis ofreduction of the level of plant-bacterial community interaction along wheat domesticationhas been proposed [33,34]. In this context, bacterial communities in the rhizosphere of“old” wheat varieties were found to be more taxonomically diverse than that detected for“modern wheat”, probably due to differences in root exudates [35].
Given the resurged importance of old wheat varieties as a source of germplasmfor breeding to develop varieties with higher nutritional value and better use of soilnutrients, here, we wanted to identify in a panel of three old and one modern variety ifthe wheat rhizosphere bacterial community was more affected by the variety or by thefertilization. In particular, we aimed to investigate the presence of a differential effect thatthe same N and P fertilization treatment may have on different varieties. We answered thisquestion by performing 16S rRNA gene amplicon sequencing analysis of rhizospheric soil,collected from three old and one modern wheat varieties grown under four N-P fertilizationregimes. Taxonomic profiling and putative functional attribution were produced, as well asquantification of functional bacterial genes involved in the nitrogen cycle (nitrogen fixation,nifH; nitrification, amoA; denitrification, nirK and nosZ), to estimate the combined effect ofwheat variety and fertilization on rhizosphere bacterial community ecosystem functions.
2. Results2.1. Physicochemical Characterization of the Soil
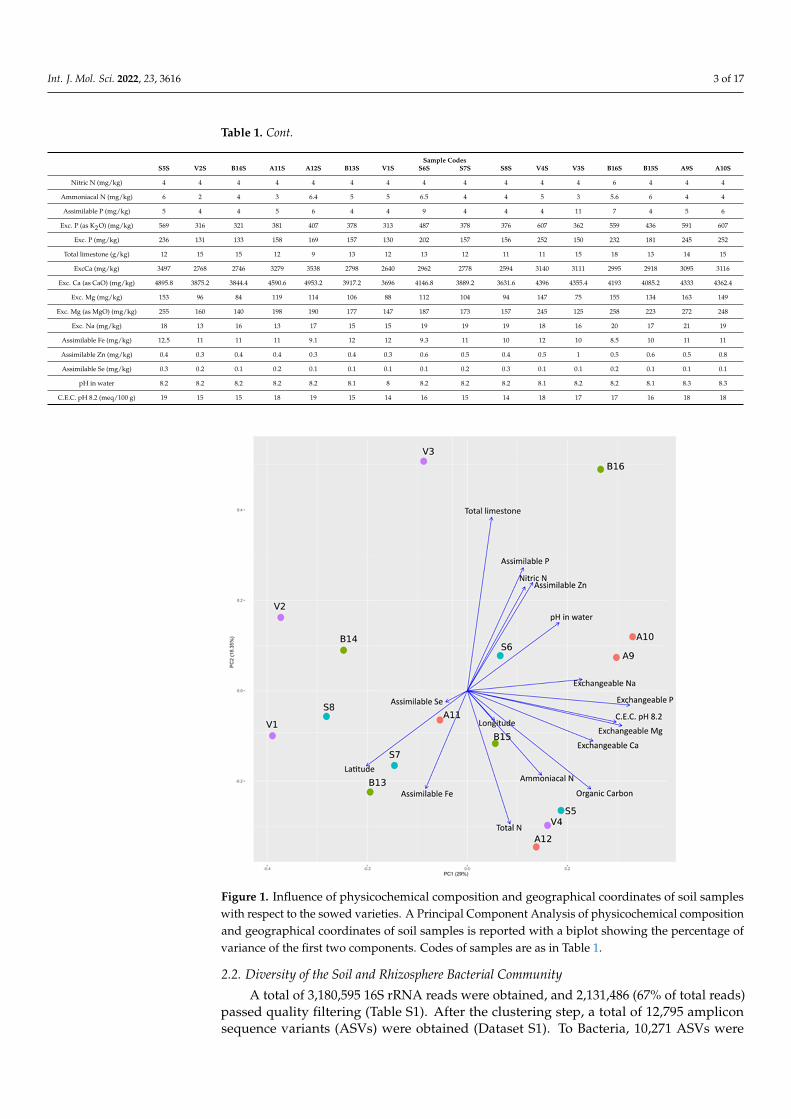
Results of the physicochemical analysis of the soil samples are reported in Table 1.For each plot, the analysis was performed on bulk soil samples. A Principal Compo-nent Analysis (PCA) was performed on soil physicochemical parameters and the locationof sample collection (i.e., latitude and longitude of the plots). No evident clusteringwas detected, either with respect to physicochemical parameters and geographical coordi-nates (Figure 1).
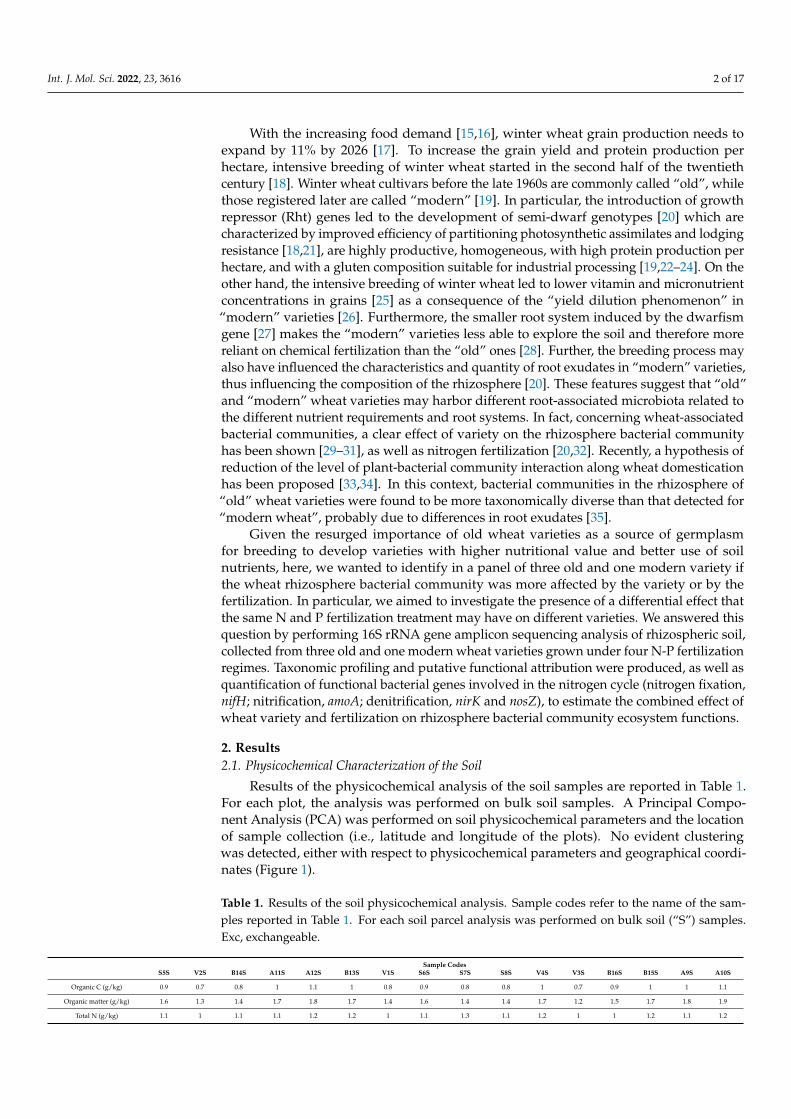
Table 1. Results of the soil physicochemical analysis. Sample codes refer to the name of the sam-ples reported in Table 1. For each soil parcel analysis was performed on bulk soil (“S”) samples.Exc, exchangeable.
Sample CodesS5S V2S B14S A11S A12S B13S V1S S6S S7S S8S V4S V3S B16S B15S A9S A10S
Organic C (g/kg) 0.9 0.7 0.8 1 1.1 1 0.8 0.9 0.8 0.8 1 0.7 0.9 1 1 1.1
Organic matter (g/kg) 1.6 1.3 1.4 1.7 1.8 1.7 1.4 1.6 1.4 1.4 1.7 1.2 1.5 1.7 1.8 1.9
Total N (g/kg) 1.1 1 1.1 1.1 1.2 1.2 1 1.1 1.3 1.1 1.2 1 1 1.2 1.1 1.2
Int. J. Mol. Sci. 2022, 23, 3616 3 of 17
Table 1. Cont.
Sample CodesS5S V2S B14S A11S A12S B13S V1S S6S S7S S8S V4S V3S B16S B15S A9S A10S
Nitric N (mg/kg) 4 4 4 4 4 4 4 4 4 4 4 4 6 4 4 4
Ammoniacal N (mg/kg) 6 2 4 3 6.4 5 5 6.5 4 4 5 3 5.6 6 4 4
Assimilable P (mg/kg) 5 4 4 5 6 4 4 9 4 4 4 11 7 4 5 6
Exc. P (as K2O) (mg/kg) 569 316 321 381 407 378 313 487 378 376 607 362 559 436 591 607
Exc. P (mg/kg) 236 131 133 158 169 157 130 202 157 156 252 150 232 181 245 252
Total limestone (g/kg) 12 15 15 12 9 13 12 13 12 11 11 15 18 13 14 15
ExcCa (mg/kg) 3497 2768 2746 3279 3538 2798 2640 2962 2778 2594 3140 3111 2995 2918 3095 3116
Exc. Ca (as CaO) (mg/kg) 4895.8 3875.2 3844.4 4590.6 4953.2 3917.2 3696 4146.8 3889.2 3631.6 4396 4355.4 4193 4085.2 4333 4362.4
Exc. Mg (mg/kg) 153 96 84 119 114 106 88 112 104 94 147 75 155 134 163 149
Exc. Mg (as MgO) (mg/kg) 255 160 140 198 190 177 147 187 173 157 245 125 258 223 272 248
Exc. Na (mg/kg) 18 13 16 13 17 15 15 19 19 19 18 16 20 17 21 19
Assimilable Fe (mg/kg) 12.5 11 11 11 9.1 12 12 9.3 11 10 12 10 8.5 10 11 11
Assimilable Zn (mg/kg) 0.4 0.3 0.4 0.4 0.3 0.4 0.3 0.6 0.5 0.4 0.5 1 0.5 0.6 0.5 0.8
Assimilable Se (mg/kg) 0.3 0.2 0.1 0.2 0.1 0.1 0.1 0.1 0.2 0.3 0.1 0.1 0.2 0.1 0.1 0.1
pH in water 8.2 8.2 8.2 8.2 8.2 8.1 8 8.2 8.2 8.2 8.1 8.2 8.2 8.1 8.3 8.3
C.E.C. pH 8.2 (meq/100 g) 19 15 15 18 19 15 14 16 15 14 18 17 17 16 18 18
Int. J. Mol. Sci. 2022, 23, 3616 4 of 18
Figure 1. Influence of physicochemical composition and geographical coordinates of soil samples with respect to the sowed varieties. A Principal Component Analysis of physicochemical composi-tion and geographical coordinates of soil samples is reported with a biplot showing the percentage of variance of the first two components. Codes of samples are as in Table 1.
2.2. Diversity of the Soil and Rhizosphere Bacterial Community A total of 3,180,595 16S rRNA reads were obtained, and 2,131,486 (67% of total reads)
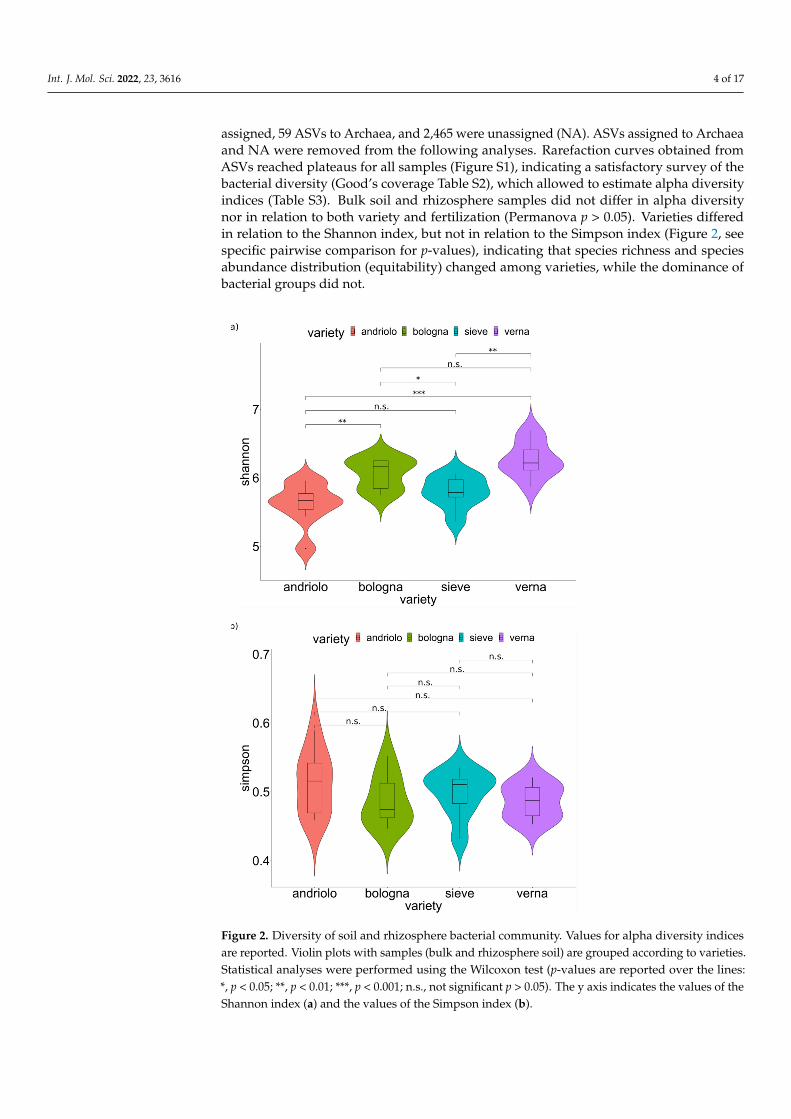
passed quality filtering (Table S1). After the clustering step, a total of 12,795 amplicon se-quence variants (ASVs) were obtained (Dataset S1). To Bacteria, 10,271 ASVs were assigned, 59 ASVs to Archaea, and 2,465 were unassigned (NA). ASVs assigned to Archaea and NA were removed from the following analyses. Rarefaction curves obtained from ASVs reached plateaus for all samples (Figure S1), indicating a satisfactory survey of the bacterial diversity (Good’s coverage Table S2), which allowed to estimate alpha diversity indices (Table S3). Bulk soil and rhizosphere samples did not differ in alpha diversity nor in relation to both variety and fertilization (Permanova p > 0.05). Varieties differed in relation to the Shannon index, but not in relation to the Simpson index (Figure 2, see specific pairwise comparison for p-values), indicating that species richness and species abundance distribution (equitabil-ity) changed among varieties, while the dominance of bacterial groups did not.
Figure 1. Influence of physicochemical composition and geographical coordinates of soil sampleswith respect to the sowed varieties. A Principal Component Analysis of physicochemical compositionand geographical coordinates of soil samples is reported with a biplot showing the percentage ofvariance of the first two components. Codes of samples are as in Table 1.
2.2. Diversity of the Soil and Rhizosphere Bacterial Community
A total of 3,180,595 16S rRNA reads were obtained, and 2,131,486 (67% of total reads)passed quality filtering (Table S1). After the clustering step, a total of 12,795 ampliconsequence variants (ASVs) were obtained (Dataset S1). To Bacteria, 10,271 ASVs were
Int. J. Mol. Sci. 2022, 23, 3616 4 of 17
assigned, 59 ASVs to Archaea, and 2,465 were unassigned (NA). ASVs assigned to Archaeaand NA were removed from the following analyses. Rarefaction curves obtained fromASVs reached plateaus for all samples (Figure S1), indicating a satisfactory survey of thebacterial diversity (Good’s coverage Table S2), which allowed to estimate alpha diversityindices (Table S3). Bulk soil and rhizosphere samples did not differ in alpha diversitynor in relation to both variety and fertilization (Permanova p > 0.05). Varieties differedin relation to the Shannon index, but not in relation to the Simpson index (Figure 2, seespecific pairwise comparison for p-values), indicating that species richness and speciesabundance distribution (equitability) changed among varieties, while the dominance ofbacterial groups did not.Int. J. Mol. Sci. 2022, 23, 3616 5 of 18
Figure 2. Diversity of soil and rhizosphere bacterial community. Values for alpha diversity indices are reported. Violin plots with samples (bulk and rhizosphere soil) are grouped according to varie-ties. Statistical analyses were performed using the Wilcoxon test (p-values are reported over the lines: *, p < 0.05; **, p < 0.01; ***, p < 0.001; n.s., not significant p > 0.05). The y axis indicates the values of the Shannon index (a) and the values of the Simpson index (b).
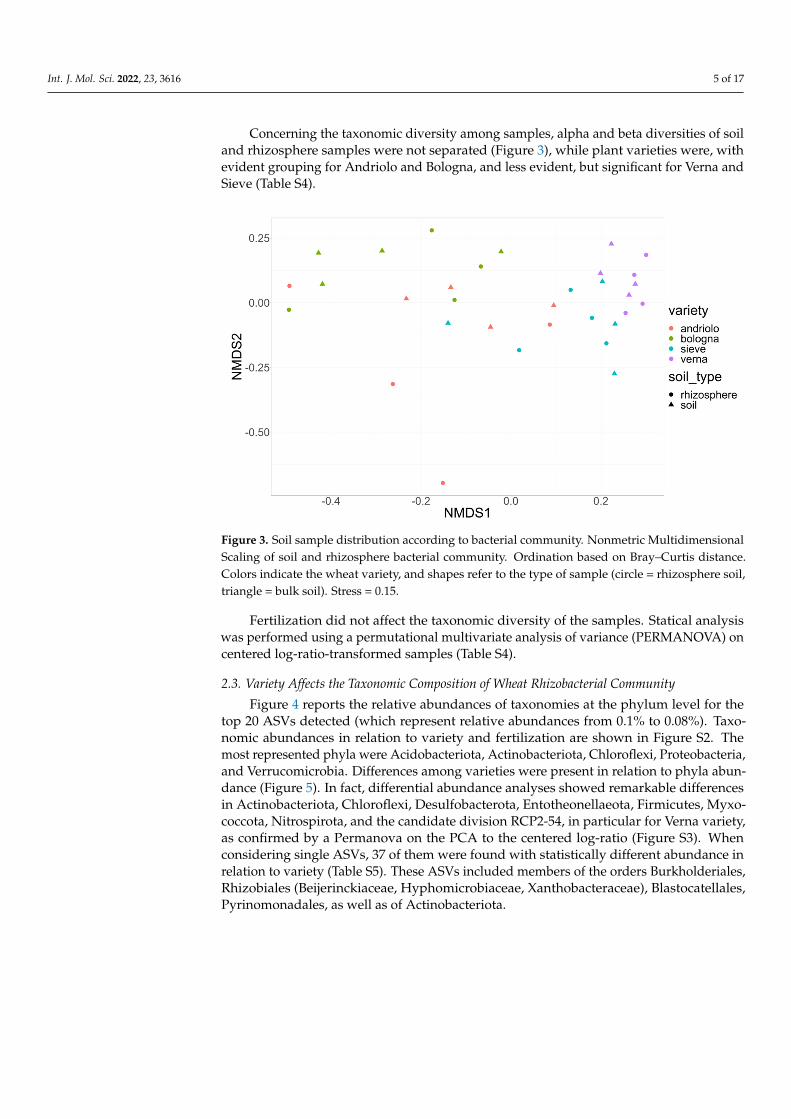
Concerning the taxonomic diversity among samples, alpha and beta diversities of soil and rhizosphere samples were not separated (Figure 3), while plant varieties were, with evident grouping for Andriolo and Bologna, and less evident, but significant for Verna and Sieve (Table S4).
Figure 2. Diversity of soil and rhizosphere bacterial community. Values for alpha diversity indicesare reported. Violin plots with samples (bulk and rhizosphere soil) are grouped according to varieties.Statistical analyses were performed using the Wilcoxon test (p-values are reported over the lines:*, p < 0.05; **, p < 0.01; ***, p < 0.001; n.s., not significant p > 0.05). The y axis indicates the values of theShannon index (a) and the values of the Simpson index (b).
Int. J. Mol. Sci. 2022, 23, 3616 5 of 17
Concerning the taxonomic diversity among samples, alpha and beta diversities of soiland rhizosphere samples were not separated (Figure 3), while plant varieties were, withevident grouping for Andriolo and Bologna, and less evident, but significant for Verna andSieve (Table S4).
Int. J. Mol. Sci. 2022, 23, 3616 6 of 18
Figure 3. Soil sample distribution according to bacterial community. Nonmetric Multidimensional Scaling of soil and rhizosphere bacterial community. Ordination based on Bray–Curtis distance. Colors indicate the wheat variety, and shapes refer to the type of sample (circle = rhizosphere soil, triangle = bulk soil). Stress = 0.15.
Fertilization did not affect the taxonomic diversity of the samples. Statical analysis was performed using a permutational multivariate analysis of variance (PERMANOVA) on centered log-ratio-transformed samples (Table S4).
2.3. Variety Affects the Taxonomic Composition of Wheat Rhizobacterial Community Figure 4 reports the relative abundances of taxonomies at the phylum level for the
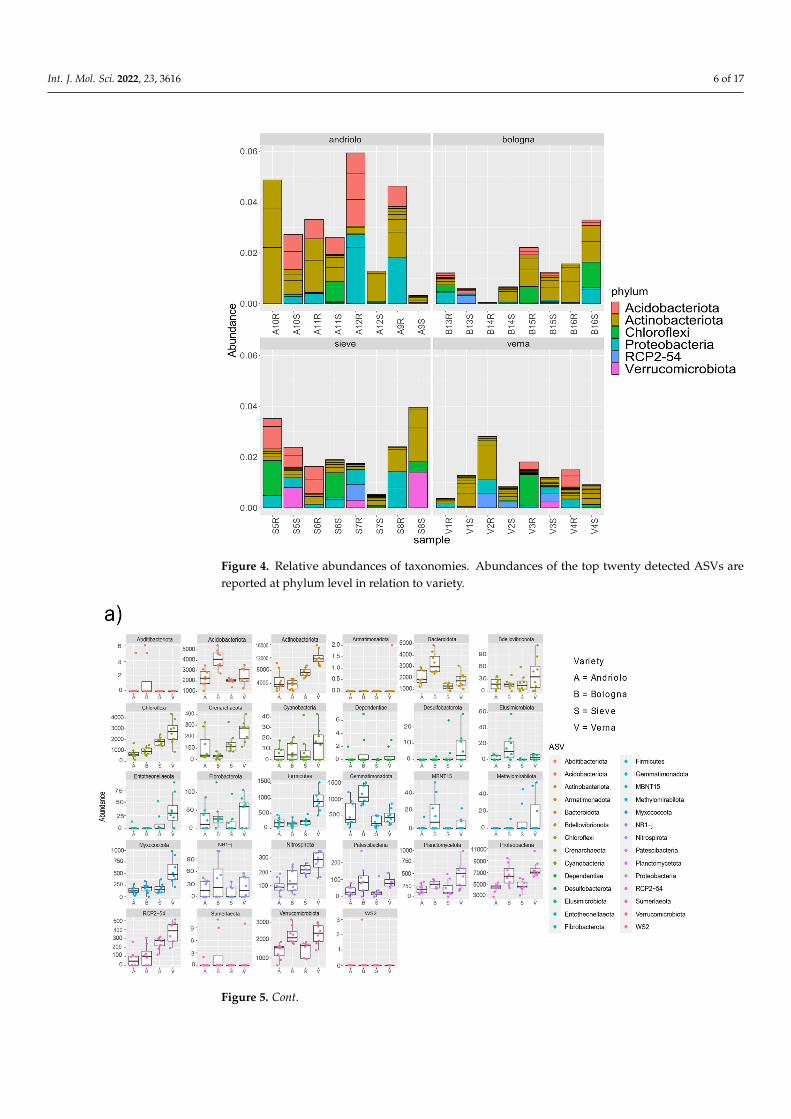
top 20 ASVs detected (which represent relative abundances from 0.1% to 0.08%). Taxo-nomic abundances in relation to variety and fertilization are shown in Figure S2. The most represented phyla were Acidobacteriota, Actinobacteriota, Chloroflexi, Proteobacteria, and Verrucomicrobia. Differences among varieties were present in relation to phyla abun-dance (Figure 5). In fact, differential abundance analyses showed remarkable differences in Actinobacteriota, Chloroflexi, Desulfobacterota, Entotheonellaeota, Firmicutes, Myxo-coccota, Nitrospirota, and the candidate division RCP2-54, in particular for Verna variety, as confirmed by a Permanova on the PCA to the centered log-ratio (Figure S3). When con-sidering single ASVs, 37 of them were found with statistically different abundance in re-lation to variety (Table S5). These ASVs included members of the orders Burkholderiales, Rhizobiales (Beijerinckiaceae, Hyphomicrobiaceae, Xanthobacteraceae), Blastocatellales, Pyrinomonadales, as well as of Actinobacteriota.
Figure 3. Soil sample distribution according to bacterial community. Nonmetric MultidimensionalScaling of soil and rhizosphere bacterial community. Ordination based on Bray–Curtis distance.Colors indicate the wheat variety, and shapes refer to the type of sample (circle = rhizosphere soil,triangle = bulk soil). Stress = 0.15.
Fertilization did not affect the taxonomic diversity of the samples. Statical analysiswas performed using a permutational multivariate analysis of variance (PERMANOVA) oncentered log-ratio-transformed samples (Table S4).
2.3. Variety Affects the Taxonomic Composition of Wheat Rhizobacterial Community
Figure 4 reports the relative abundances of taxonomies at the phylum level for thetop 20 ASVs detected (which represent relative abundances from 0.1% to 0.08%). Taxo-nomic abundances in relation to variety and fertilization are shown in Figure S2. Themost represented phyla were Acidobacteriota, Actinobacteriota, Chloroflexi, Proteobacteria,and Verrucomicrobia. Differences among varieties were present in relation to phyla abun-dance (Figure 5). In fact, differential abundance analyses showed remarkable differencesin Actinobacteriota, Chloroflexi, Desulfobacterota, Entotheonellaeota, Firmicutes, Myxo-coccota, Nitrospirota, and the candidate division RCP2-54, in particular for Verna variety,as confirmed by a Permanova on the PCA to the centered log-ratio (Figure S3). Whenconsidering single ASVs, 37 of them were found with statistically different abundance inrelation to variety (Table S5). These ASVs included members of the orders Burkholderiales,Rhizobiales (Beijerinckiaceae, Hyphomicrobiaceae, Xanthobacteraceae), Blastocatellales,Pyrinomonadales, as well as of Actinobacteriota.
Int. J. Mol. Sci. 2022, 23, 3616 6 of 17Int. J. Mol. Sci. 2022, 23, 3616 7 of 18
Figure 4. Relative abundances of taxonomies. Abundances of the top twenty detected ASVs are reported at phylum level in relation to variety.
Figure 4. Relative abundances of taxonomies. Abundances of the top twenty detected ASVs arereported at phylum level in relation to variety.
Int. J. Mol. Sci. 2022, 23, 3616 8 of 18
Figure 5. Variety and fertilization affect specific bacterial phyla abundances. Differential abun-dances of bacterial phyla in relation to wheat varieties and fertilization is reported from DeSeq2
Figure 5. Cont.
Int. J. Mol. Sci. 2022, 23, 3616 7 of 17
Int. J. Mol. Sci. 2022, 23, 3616 8 of 18
Figure 5. Variety and fertilization affect specific bacterial phyla abundances. Differential abun-dances of bacterial phyla in relation to wheat varieties and fertilization is reported from DeSeq2
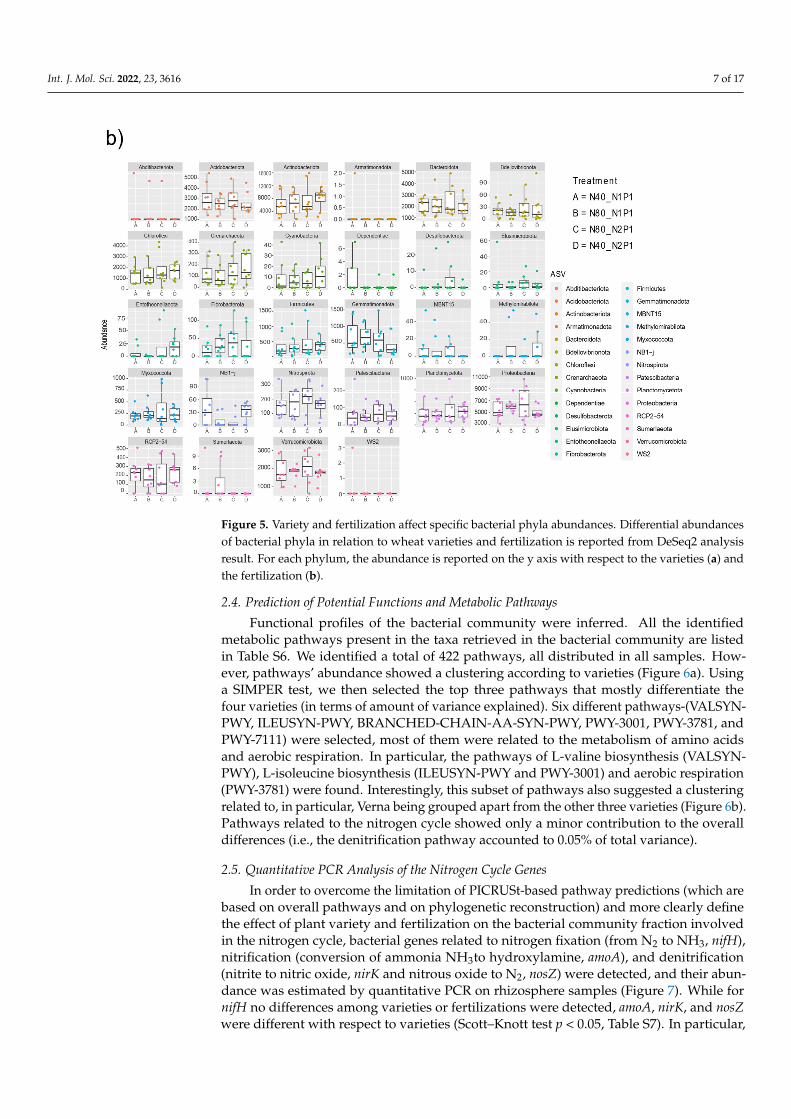
Figure 5. Variety and fertilization affect specific bacterial phyla abundances. Differential abundancesof bacterial phyla in relation to wheat varieties and fertilization is reported from DeSeq2 analysisresult. For each phylum, the abundance is reported on the y axis with respect to the varieties (a) andthe fertilization (b).
2.4. Prediction of Potential Functions and Metabolic Pathways
Functional profiles of the bacterial community were inferred. All the identifiedmetabolic pathways present in the taxa retrieved in the bacterial community are listedin Table S6. We identified a total of 422 pathways, all distributed in all samples. How-ever, pathways’ abundance showed a clustering according to varieties (Figure 6a). Usinga SIMPER test, we then selected the top three pathways that mostly differentiate thefour varieties (in terms of amount of variance explained). Six different pathways-(VALSYN-PWY, ILEUSYN-PWY, BRANCHED-CHAIN-AA-SYN-PWY, PWY-3001, PWY-3781, andPWY-7111) were selected, most of them were related to the metabolism of amino acidsand aerobic respiration. In particular, the pathways of L-valine biosynthesis (VALSYN-PWY), L-isoleucine biosynthesis (ILEUSYN-PWY and PWY-3001) and aerobic respiration(PWY-3781) were found. Interestingly, this subset of pathways also suggested a clusteringrelated to, in particular, Verna being grouped apart from the other three varieties (Figure 6b).Pathways related to the nitrogen cycle showed only a minor contribution to the overalldifferences (i.e., the denitrification pathway accounted to 0.05% of total variance).
2.5. Quantitative PCR Analysis of the Nitrogen Cycle Genes
In order to overcome the limitation of PICRUSt-based pathway predictions (which arebased on overall pathways and on phylogenetic reconstruction) and more clearly definethe effect of plant variety and fertilization on the bacterial community fraction involvedin the nitrogen cycle, bacterial genes related to nitrogen fixation (from N2 to NH3, nifH),nitrification (conversion of ammonia NH3to hydroxylamine, amoA), and denitrification(nitrite to nitric oxide, nirK and nitrous oxide to N2, nosZ) were detected, and their abun-dance was estimated by quantitative PCR on rhizosphere samples (Figure 7). While fornifH no differences among varieties or fertilizations were detected, amoA, nirK, and nosZwere different with respect to varieties (Scott–Knott test p < 0.05, Table S7). In particular,
Int. J. Mol. Sci. 2022, 23, 3616 8 of 17
Andriolo and Bologna showed higher abundance of nirK and amoA genes than Sieve andVerna did. Verna also had lower nosZ values than the other three varieties did, suggestingthat the denitrification pathway could be less effective on the rhizosphere of this variety.
Int. J. Mol. Sci. 2022, 23, 3616 9 of 18
analysis result. For each phylum, the abundance is reported on the y axis with respect to the varie-ties (a) and the fertilization (b).
2.4. Prediction of Potential Functions and Metabolic Pathways Functional profiles of the bacterial community were inferred. All the identified met-
abolic pathways present in the taxa retrieved in the bacterial community are listed in Table S6. We identified a total of 422 pathways, all distributed in all samples. However, path-ways’ abundance showed a clustering according to varieties (Figure 6a). Using a SIMPER test, we then selected the top three pathways that mostly differentiate the four varieties (in terms of amount of variance explained). Six different pathways-(VALSYN-PWY, ILE-USYN-PWY, BRANCHED-CHAIN-AA-SYN-PWY, PWY-3001, PWY-3781, and PWY-7111) were selected, most of them were related to the metabolism of amino acids and aer-obic respiration. In particular, the pathways of L-valine biosynthesis (VALSYN-PWY), L-isoleucine biosynthesis (ILEUSYN-PWY and PWY-3001) and aerobic respiration (PWY-3781) were found. Interestingly, this subset of pathways also suggested a clustering re-lated to, in particular, Verna being grouped apart from the other three varieties (Figure 6b). Pathways related to the nitrogen cycle showed only a minor contribution to the over-all differences (i.e., the denitrification pathway accounted to 0.05% of total variance).
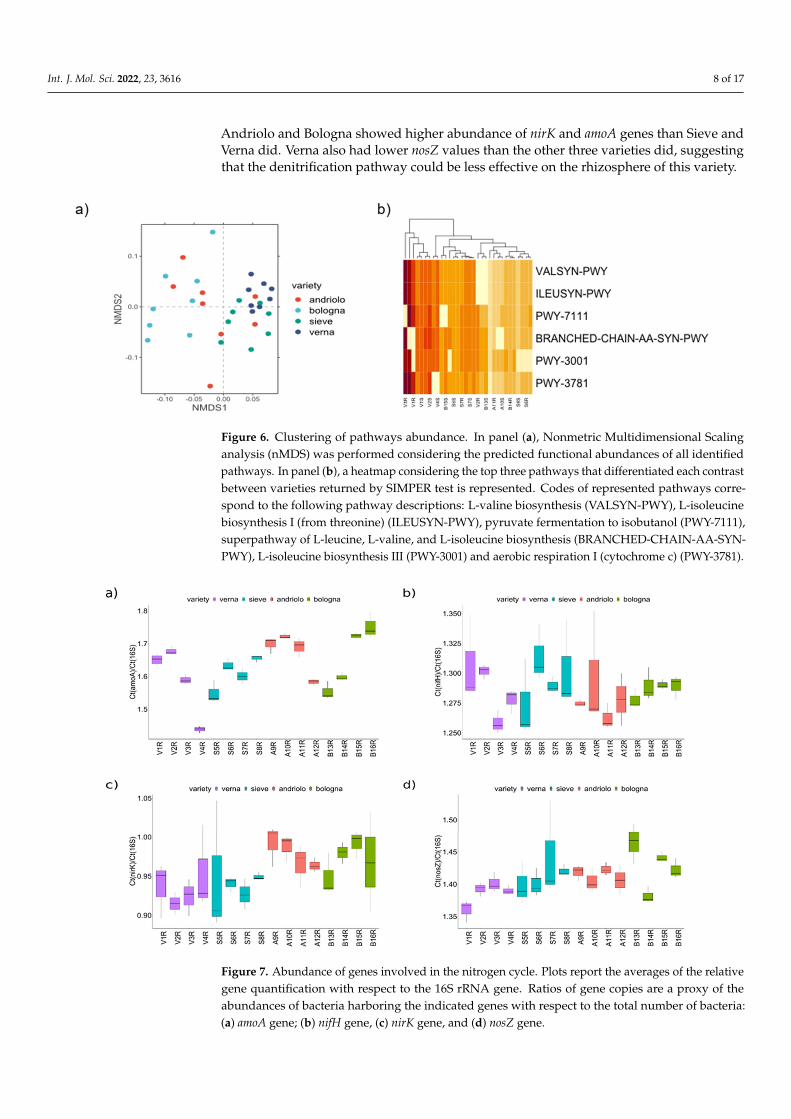
Figure 6. Clustering of pathways abundance. In panel (a), Nonmetric Multidimensional Scaling anal-ysis (nMDS) was performed considering the predicted functional abundances of all identified path-ways. In panel (b), a heatmap considering the top three pathways that differentiated each contrast between varieties returned by SIMPER test is represented. Codes of represented pathways correspond to the following pathway descriptions: L-valine biosynthesis (VALSYN-PWY), L-isoleucine biosynthe-sis I (from threonine) (ILEUSYN-PWY), pyruvate fermentation to isobutanol (PWY-7111), super-pathway of L-leucine, L-valine, and L-isoleucine biosynthesis (BRANCHED-CHAIN-AA-SYN-PWY), L-isoleucine biosynthesis III (PWY-3001) and aerobic respiration I (cytochrome c) (PWY-3781).
2.5. Quantitative PCR Analysis of the Nitrogen Cycle Genes In order to overcome the limitation of PICRUSt-based pathway predictions (which
are based on overall pathways and on phylogenetic reconstruction) and more clearly de-fine the effect of plant variety and fertilization on the bacterial community fraction in-volved in the nitrogen cycle, bacterial genes related to nitrogen fixation (from N2 to NH3, nifH), nitrification (conversion of ammonia NH3to hydroxylamine, amoA), and denitrifica-tion (nitrite to nitric oxide, nirK and nitrous oxide to N2, nosZ) were detected, and their abundance was estimated by quantitative PCR on rhizosphere samples (Figure 7). While for nifH no differences among varieties or fertilizations were detected, amoA, nirK, and
Figure 6. Clustering of pathways abundance. In panel (a), Nonmetric Multidimensional Scalinganalysis (nMDS) was performed considering the predicted functional abundances of all identifiedpathways. In panel (b), a heatmap considering the top three pathways that differentiated each contrastbetween varieties returned by SIMPER test is represented. Codes of represented pathways corre-spond to the following pathway descriptions: L-valine biosynthesis (VALSYN-PWY), L-isoleucinebiosynthesis I (from threonine) (ILEUSYN-PWY), pyruvate fermentation to isobutanol (PWY-7111),superpathway of L-leucine, L-valine, and L-isoleucine biosynthesis (BRANCHED-CHAIN-AA-SYN-PWY), L-isoleucine biosynthesis III (PWY-3001) and aerobic respiration I (cytochrome c) (PWY-3781).
Int. J. Mol. Sci. 2022, 23, 3616 10 of 18
nosZ were different with respect to varieties (Scott–Knott test p < 0.05, Table S7). In particu-lar, Andriolo and Bologna showed higher abundance of nirK and amoA genes than Sieve and Verna did. Verna also had lower nosZ values than the other three varieties did, suggest-ing that the denitrification pathway could be less effective on the rhizosphere of this variety.
Figure 7. Abundance of genes involved in the nitrogen cycle. Plots report the averages of the relative gene quantification with respect to the 16S rRNA gene. Ratios of gene copies are a proxy of the abundances of bacteria harboring the indicated genes with respect to the total number of bacteria: (a) amoA gene; (b) nifH gene, (c) nirK gene, and (d) nosZ gene.
3. Discussion The taxonomic assemblage and functions of the plant bacterial community are
strongly influenced by soil and host plant genotype [5,7,8]. Crop breeding, especially after the massive use of nitrogen fertilizers which led to varieties responding better to nitrogen fertilization [36], has implicitly decreased the pressure toward plant genotypes highly ef-ficient in the use of native soil nutritional resources, then indirectly reducing the ability of the plant root to recruit an effective bacterial community [7,8,37]. Tough physicochemical analysis of soil did not detect evident groupings according to wheat varieties (apart from Andriolo), and the analysis of the bacterial community did, clearly differentiating the four varieties under study (Andriolo being the most heterogeneous, Figure 3). In fact, the over-all body of our results showed that variety played the most important role and that ferti-lization did not affect either bacterial community diversity or bacterial phyla abundance. Interestingly, rhizosphere bacterial community and bulk soil bacterial community were highly similar, suggesting that under the plant density and the depth we sampled, the root apparatus could extend its effects at a certain distance from the plant stem (30 cm). This bacterial community was in agreement with the extensive root apparatus of wheat, which allows affecting the soil at a distance from the plant [38]. Consequently, we may consider “bona fide” our bulk soil samples as very close to a low-bound rhizosphere soil. It would be interesting to evaluate the extent in space around the plant of this assimilation of soil on the rhizosphere bacterial community, which can have relevance for the setting-
Figure 7. Abundance of genes involved in the nitrogen cycle. Plots report the averages of the relativegene quantification with respect to the 16S rRNA gene. Ratios of gene copies are a proxy of theabundances of bacteria harboring the indicated genes with respect to the total number of bacteria:(a) amoA gene; (b) nifH gene, (c) nirK gene, and (d) nosZ gene.
Int. J. Mol. Sci. 2022, 23, 3616 9 of 17
3. Discussion
The taxonomic assemblage and functions of the plant bacterial community are stronglyinfluenced by soil and host plant genotype [5,7,8]. Crop breeding, especially after themassive use of nitrogen fertilizers which led to varieties responding better to nitrogenfertilization [36], has implicitly decreased the pressure toward plant genotypes highlyefficient in the use of native soil nutritional resources, then indirectly reducing the ability ofthe plant root to recruit an effective bacterial community [7,8,37]. Tough physicochemicalanalysis of soil did not detect evident groupings according to wheat varieties (apart fromAndriolo), and the analysis of the bacterial community did, clearly differentiating the fourvarieties under study (Andriolo being the most heterogeneous, Figure 3). In fact, the overallbody of our results showed that variety played the most important role and that fertil-ization did not affect either bacterial community diversity or bacterial phyla abundance.Interestingly, rhizosphere bacterial community and bulk soil bacterial community werehighly similar, suggesting that under the plant density and the depth we sampled, theroot apparatus could extend its effects at a certain distance from the plant stem (30 cm).This bacterial community was in agreement with the extensive root apparatus of wheat,which allows affecting the soil at a distance from the plant [38]. Consequently, we mayconsider “bona fide” our bulk soil samples as very close to a low-bound rhizosphere soil. Itwould be interesting to evaluate the extent in space around the plant of this assimilation ofsoil on the rhizosphere bacterial community, which can have relevance for the setting-upand interpretation of results from intercropping trials [39]. The three old varieties andthe modern Bologna variety showed a differential abundance of several microbial taxa.Among them, Acidobacteriota, Bacteroidota, Chloroflexi, Firmicutes, and Nitrospirota wereparticularly relevant. Previous studies on wheat rhizosphere showed that N fertilizationdecreased the abundance of Acidobacteria and increased Bacteroidetes [20]. In our work,a decrease of Acidobacteriota was shown by Andriolo variety in the plots with increasedP-fertilization (Figure S2), which may suggest that this variety may respond differentlyto P fertilization, in turn affecting its rhizosphere bacterial community. However, bothAndriolo and Bologna showed levels of abundance of members of phyla Acidobacteriotaand Bacteroidota higher than that of Sieve and Verna varieties. Since both Sieve and Vernaderive from breeds with “Est Mottin 72”, we could not a priori exclude that the lower levelsof Acidobacteriota and Bacteroidota in their rhizosphere may reflect this partially commongenetic basis, highlighting a contribution of plant genotype to the interaction with specificbacterial phyla. If confirmed in following experiments, these bacterial phyla could be goodcandidates for quantitative trait loci (QTL) analysis identifying in breeds from the old Vernavariety and the modern Bologna. The high abundance of members of Acidobacteriotaalso agrees with previous reports (see, for instance, [33,40]). Moreover, Bacteroidota, Chlo-roflexi, and Firmicutes phyla were recognized as important in differentiating wheat species(T. durum Desf. and T. aestivum L.) [33] and soil-varieties combinations [31], suggestingthe presence of loci in the wheat genome which can be identified for interaction with therhizosphere microbiota. To date, few loci/genes in a relatively small number of plantspecies have been identified as related to the recruitment of microbiota [41], and no studieshave been performed on wheat. Interestingly, ASVs affiliated to the uncultured phylumRCP2-54 were found more abundantly in Sieve and mainly in Verna, compared to Bolognaand Andriolo. The functional role of this phylum is still unknown; however, previousworks showed its presence in the rhizosphere and in differentiating tomato and maizevarieties under water deficit conditions [42], again suggesting a possible genetic basis in theplant for its differential recruitment. At the level of ASVs it was relevant to find membersof Blastocatellales and Pyrinomonadales. A recent paper investigating soil suppressivenessto Fusarium culmorum in wheat, found Blastocatellales in the network associated withpathogen suppression [43], and Pyrinomonadales were reported to vary in abundance inwheat rhizosphere in relation to soil nitrate level [44]. This evidence may suggest thatthe four varieties in our study may be able to differentially recruit a fraction of the soilbacterial community able to improve plant health and contributing differently to plant
Int. J. Mol. Sci. 2022, 23, 3616 10 of 17
use of nitrogen. Bologna variety had the highest levels of both Blastocatellales and Pyri-nomonadales, although high variation between plots was present (Figure S4). The role ofthese bacterial groups on plant tolerance to pathogenic fungi and nitrogen use may deservefurther attention.
Under the light of possible functional differences among the bacterial communityrecruited by the four plant varieties, PICRUSt2 results (Figure 6) mirrored in part thetaxonomic profiling in varieties differentiation. In particular, Verna grouped separatelyfrom the other three varieties, similarly to the pattern shown in the nMDS analysis of ASVs(Figure 3). Interestingly, the metabolic pathways which mostly differentiated Verna fromthe other varieties were related to aerobic respiration and amino acid biosynthesis. We mayspeculate that root exudates from the four varieties differed in the amino acid composi-tion, hence differentially promoting the growth of bacteria harboring specific biosynthesispathways. Indeed, root exudates are rich in amino acids, and previous work showed thatamino acid content strongly varies among different plant varieties. Concerning the aerobicrespiration pathway, Verna showed a more abundant representation than the other varietiesdid, though with differences among fertilization regimes. This may suggest that the othervarieties could hold a higher fraction of anaerobic bacteria/anaerobic metabolism. Vernarhizosphere bacterial community contained a higher amount of Actinobacteriota and Fir-micutes, phyla including several aerobic bacterial groups thriving in soil, as Streptomycesand Bacillus.
Concerning possible differences in nitrogen cycling by the rhizosphere bacterial com-munity (which is partially related to anaerobic metabolism), variation in the abundanceof members of Nitrospirota was found in Verna and Sieve varieties compared to that inBologna and Andriolo varieties. Nitrospirota includes Nitrospira, a well-known genus ofnitrite oxidizers present in agricultural soil and in the plant rhizosphere [45]. Interestingly,this result agrees with qPCR estimation of functional gene abundance. In fact, the analysisof genes involved in the nitrogen cycle showed that amoA (nitrification) and nosZ (denitrifi-cation) were differentially abundant with respect to varieties, suggesting that variety maylead to functional changes in the cycling of the plant-assimilable nitrogen. However, wecould not a priori exclude fertilization may partially contribute to this difference. Experi-ments with bulk soil samples taken at higher distances from the plant may be helpful toclarify how much of the differences resulted from the sole fertilization. Indeed, it wouldhighly relevant from the perspective of low-input precision agriculture to clarify the extentand impact on plant productivity of such variety–fertilization interaction in the rhizospherebacterial community, to exploit the potentialities of variety-specific bacterial community.Multiple seasons and long-term field experiments in different soil and climatic conditionswould be needed to fully address this question.
4. Materials and Methods4.1. Experimental Field and Plant Genotypes
An experimental field was established in October 2019 at the “Grappi Luchino” organicfarm (43.0507◦ N, 11.6912◦ E) close to Pienza (Tuscany, Italy). The soil was a moderatelyalkaline (pH 8.2) silty clay, with 10.5% sand, 49% silt, and 40.5% clay. The 0–40 cm layer(the most affected by either plant root apparatus and agronomic practices) contained131 (3.1) g kg−1 total lime, 9.3 (0.2) g kg−1 total organic carbon, 1119 (10) mg kg−1 totalnitrogen (N), 5.5 (0.3) mg kg−1 available phosphorus (P), and 189.2 (6) mg kg−1 availablepotassium (K). Cultivation of crops was performed under an organic farming system.Chickpea (Cicer arietinum, L.) was the previous crop. Residues from the previous crop wereused as manure.
Four Italian varieties of winter wheat (Triticum aestivum, L.) were used in this study,including three “old” genotypes (namely Andriolo, Sieve, and Verna) [19,24,28], andone dwarf registered cultivar (namely Bologna). According to Migliorini et al., (2016),the germplasm of the four varieties has different origins: Verna is an awn-less cultivarestablished in 1953 from a breed between “Est Mottin 72”× “Mont Calme 245” [28]. Sieve is
Int. J. Mol. Sci. 2022, 23, 3616 11 of 17
an awn-less cultivar constituted in 1966 from “Est Mottin 72”× “Bellevue II” [46]. Andriolois a Tuscan landrace having an unknown pedigree and dating back to the early 1900 [28].Bologna is one of the most cultivated modern varieties in Italy owing to its quality andhigh yield stability; Bologna was bred in 1999 from (“H89092” × “H89136”) × “Soissons”by Società Italiana Sementi (Italy) [47].
The experiment included 16 treatments (parcels), which were combinations of four va-rieties of winter wheat, two nitrogen (N) fertilization levels (40 and 80 kg N ha−1 yr−1, N40and N80, respectively), and two nitrogen-to-phosphoric anhydride (N:P2O5) fertilizationratios (NP) (N:P2O5 1:1 and 2:1, N1P1, and N2P1).
Soil tillage was carried out to a depth of 0.4 m with a moldboard plow in October 2019, fol-lowed by a tandem disk harrow (0.1 m depth) to break clods. The organic fertilizer “EnduranceN8” (Unimer s.p.a., Milano, Italy), containing organic nitrogen from animal protein source, andthe organic soft rock phosphate “GAFSA 27” (Panfertil s.p.a, Ravenna, Italy) were used as Nand P2O5 sources, respectively. On 27 November, 2019, both fertilizers were broadcasted onthe soil surface, immediately followed by spike tooth harrow (0.05 m depth) to incorporate thefertilized and prepare the false seedbed. Weeds were uprooted to a depth of 0.05 m using aspring tine harrow on 7 and 17 December 2019. Winter wheat seeds were sown 90 kg ha−1
on 17 December 2019 with a row spacing of 0.13 m. Grain harvesting was performed at cropcommercial maturity (grain moisture lower than 13%) on 15 July 2020.
4.2. Sampling and Samples Treatment
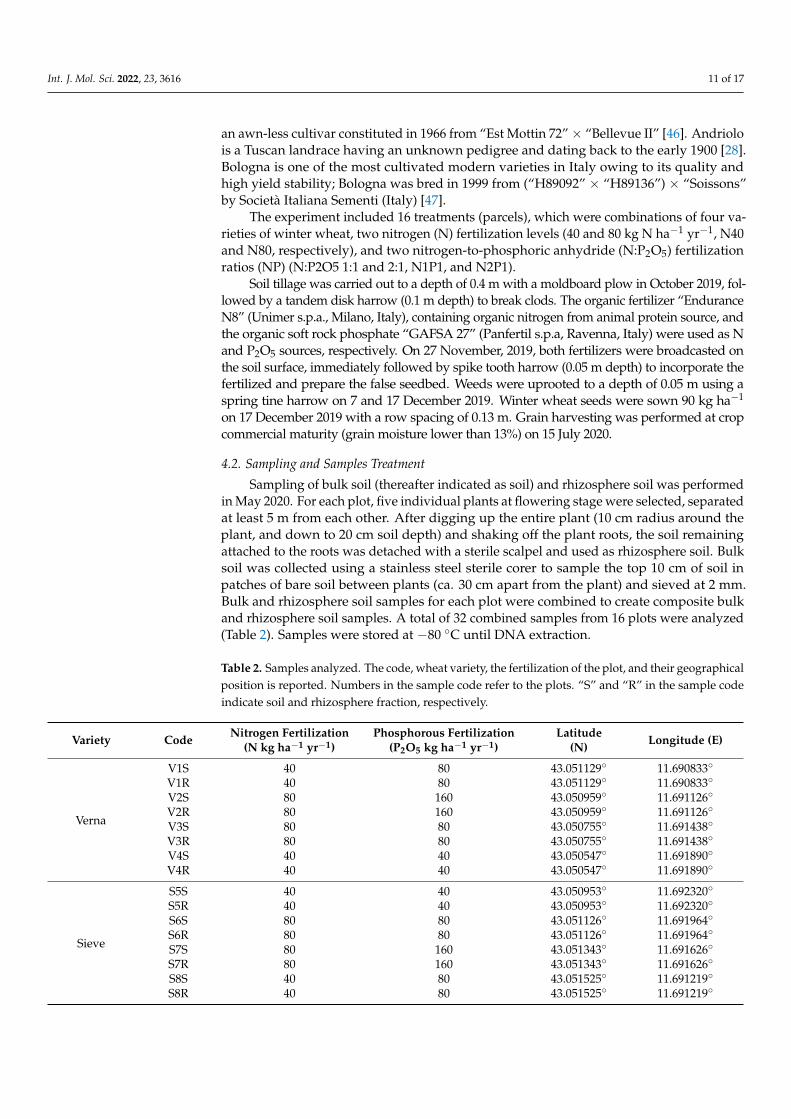
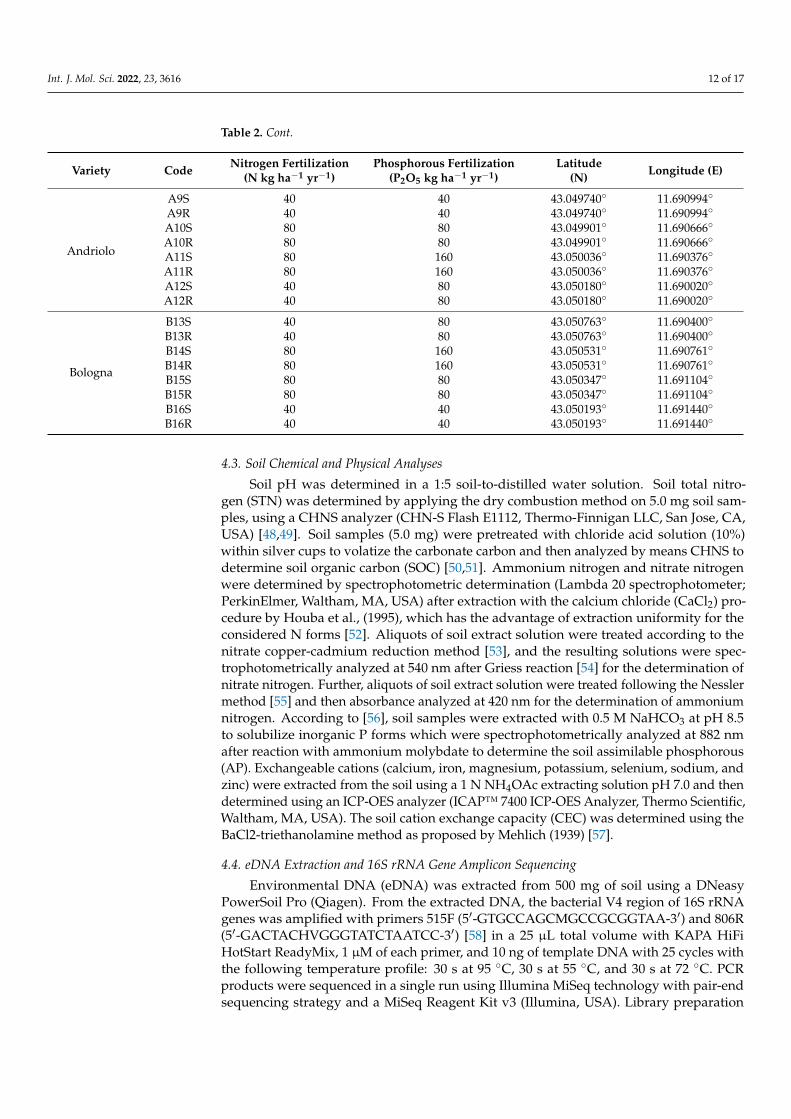
Sampling of bulk soil (thereafter indicated as soil) and rhizosphere soil was performedin May 2020. For each plot, five individual plants at flowering stage were selected, separatedat least 5 m from each other. After digging up the entire plant (10 cm radius around theplant, and down to 20 cm soil depth) and shaking off the plant roots, the soil remainingattached to the roots was detached with a sterile scalpel and used as rhizosphere soil. Bulksoil was collected using a stainless steel sterile corer to sample the top 10 cm of soil inpatches of bare soil between plants (ca. 30 cm apart from the plant) and sieved at 2 mm.Bulk and rhizosphere soil samples for each plot were combined to create composite bulkand rhizosphere soil samples. A total of 32 combined samples from 16 plots were analyzed(Table 2). Samples were stored at −80 ◦C until DNA extraction.
Table 2. Samples analyzed. The code, wheat variety, the fertilization of the plot, and their geographicalposition is reported. Numbers in the sample code refer to the plots. “S” and “R” in the sample codeindicate soil and rhizosphere fraction, respectively.
Variety Code Nitrogen Fertilization(N kg ha−1 yr−1)
Phosphorous Fertilization(P2O5 kg ha−1 yr−1)
Latitude(N) Longitude (E)
Verna
V1S 40 80 43.051129◦ 11.690833◦
V1R 40 80 43.051129◦ 11.690833◦
V2S 80 160 43.050959◦ 11.691126◦
V2R 80 160 43.050959◦ 11.691126◦
V3S 80 80 43.050755◦ 11.691438◦
V3R 80 80 43.050755◦ 11.691438◦
V4S 40 40 43.050547◦ 11.691890◦
V4R 40 40 43.050547◦ 11.691890◦
Sieve
S5S 40 40 43.050953◦ 11.692320◦
S5R 40 40 43.050953◦ 11.692320◦
S6S 80 80 43.051126◦ 11.691964◦
S6R 80 80 43.051126◦ 11.691964◦
S7S 80 160 43.051343◦ 11.691626◦
S7R 80 160 43.051343◦ 11.691626◦
S8S 40 80 43.051525◦ 11.691219◦
S8R 40 80 43.051525◦ 11.691219◦
Int. J. Mol. Sci. 2022, 23, 3616 12 of 17
Table 2. Cont.
Variety Code Nitrogen Fertilization(N kg ha−1 yr−1)
Phosphorous Fertilization(P2O5 kg ha−1 yr−1)
Latitude(N) Longitude (E)
Andriolo
A9S 40 40 43.049740◦ 11.690994◦
A9R 40 40 43.049740◦ 11.690994◦
A10S 80 80 43.049901◦ 11.690666◦
A10R 80 80 43.049901◦ 11.690666◦
A11S 80 160 43.050036◦ 11.690376◦
A11R 80 160 43.050036◦ 11.690376◦
A12S 40 80 43.050180◦ 11.690020◦
A12R 40 80 43.050180◦ 11.690020◦
Bologna
B13S 40 80 43.050763◦ 11.690400◦
B13R 40 80 43.050763◦ 11.690400◦
B14S 80 160 43.050531◦ 11.690761◦
B14R 80 160 43.050531◦ 11.690761◦
B15S 80 80 43.050347◦ 11.691104◦
B15R 80 80 43.050347◦ 11.691104◦
B16S 40 40 43.050193◦ 11.691440◦
B16R 40 40 43.050193◦ 11.691440◦
4.3. Soil Chemical and Physical Analyses
Soil pH was determined in a 1:5 soil-to-distilled water solution. Soil total nitro-gen (STN) was determined by applying the dry combustion method on 5.0 mg soil sam-ples, using a CHNS analyzer (CHN-S Flash E1112, Thermo-Finnigan LLC, San Jose, CA,USA) [48,49]. Soil samples (5.0 mg) were pretreated with chloride acid solution (10%)within silver cups to volatize the carbonate carbon and then analyzed by means CHNS todetermine soil organic carbon (SOC) [50,51]. Ammonium nitrogen and nitrate nitrogenwere determined by spectrophotometric determination (Lambda 20 spectrophotometer;PerkinElmer, Waltham, MA, USA) after extraction with the calcium chloride (CaCl2) pro-cedure by Houba et al., (1995), which has the advantage of extraction uniformity for theconsidered N forms [52]. Aliquots of soil extract solution were treated according to thenitrate copper-cadmium reduction method [53], and the resulting solutions were spec-trophotometrically analyzed at 540 nm after Griess reaction [54] for the determination ofnitrate nitrogen. Further, aliquots of soil extract solution were treated following the Nesslermethod [55] and then absorbance analyzed at 420 nm for the determination of ammoniumnitrogen. According to [56], soil samples were extracted with 0.5 M NaHCO3 at pH 8.5to solubilize inorganic P forms which were spectrophotometrically analyzed at 882 nmafter reaction with ammonium molybdate to determine the soil assimilable phosphorous(AP). Exchangeable cations (calcium, iron, magnesium, potassium, selenium, sodium, andzinc) were extracted from the soil using a 1 N NH4OAc extracting solution pH 7.0 and thendetermined using an ICP-OES analyzer (ICAP™ 7400 ICP-OES Analyzer, Thermo Scientific,Waltham, MA, USA). The soil cation exchange capacity (CEC) was determined using theBaCl2-triethanolamine method as proposed by Mehlich (1939) [57].
4.4. eDNA Extraction and 16S rRNA Gene Amplicon Sequencing
Environmental DNA (eDNA) was extracted from 500 mg of soil using a DNeasyPowerSoil Pro (Qiagen). From the extracted DNA, the bacterial V4 region of 16S rRNAgenes was amplified with primers 515F (5′-GTGCCAGCMGCCGCGGTAA-3′) and 806R(5′-GACTACHVGGGTATCTAATCC-3′) [58] in a 25 µL total volume with KAPA HiFiHotStart ReadyMix, 1 µM of each primer, and 10 ng of template DNA with 25 cycles withthe following temperature profile: 30 s at 95 ◦C, 30 s at 55 ◦C, and 30 s at 72 ◦C. PCRproducts were sequenced in a single run using Illumina MiSeq technology with pair-endsequencing strategy and a MiSeq Reagent Kit v3 (Illumina, USA). Library preparation
Int. J. Mol. Sci. 2022, 23, 3616 13 of 17
(Nextera XT, Illumina, San Diego, CA, USA) and demultiplexing were performed followingIllumina’s standard pipeline as previously reported [10].
4.5. Quantitative PCR of Genes Involved in the Nitrogen Cycle
Quantitative PCR was performed on eDNA using primers for the amplification ofnifH, amoA, nosZ, nirK genes (primer sequences and citations are reported in Table S8).Total bacterial load was estimated on the 16S rRNA gene. Reactions were performedwith 5 ng of template DNA in 10 µL total volume on a QuantStudio7 Flexi apparatus(Applied Biosystems) with Sybr Green technology (Maxima SYBR Green qPCR Master Mix,Thermofisher). Reactions were performed in triplicates. Relative abundance of nifH, amoA,nosZ, nirK genes was expressed in relation to 16SrRNA, as previously reported [59,60].
4.6. Bioinformatic and Statistical Analyses
Illumina reads were trimmed using the “Trim Galore!” tool on Galaxy server (https://usegalaxy.org/, last accessed on 21 December 2021). Paired-end sequences were clusteredinto Amplicon Sequence Variants (ASVs) following the DADA2 pipeline (version 1.16) [61].After filtering the sequences and removing the chimeras, the taxonomy assignment wascarried out comparing our data against the SILVA NR99rel138 standard database ofbacteria [62] using “DECIPHER” R package (version 2.18.1) [63] as implementation ofDADA2 (SSU version 138 available at: http://www2.decipher.codes/Downloads.html, lastaccessed on 21 December 2021). Annotated ASVs count tables were processed in Phyloseqpackage in R environment version 4.0.5 [64].
The analysis of microbial communities was performed through the “Phyloseq” R pack-age (version 1.34.0) [64]. For alpha diversity analysis, the Shannon and Simpson indiceswere calculated and plotted using the function “diversity()” within “microbiome” R pack-age (version 1.12.0) [65]. Good’s coverage and Evenness indices were calculated throughthe R functions “goods()” and “evenness()”, respectively, within the “microbiome” R pack-age (version 1.12.0). A Wilcoxon test for multiple comparison of averages was performedon alpha diversity indices using the “ggviolin()” and “stat_compare_means()” within the“ggpubr” R package (version 0.4.0). For ordination plots of phyloseq objects, a multivari-ate analysis based on Bray–Curtis distance and NMDS ordination generated using the“ordinate” function was performed, and plots were generated using the “plot_ordination()”function within phyloseq package. Rarefaction curves were generated using the “ggplot2”(version 3.3.3) [66] and “ranacapa” (version 0.1.0) [67] R packages using the “ggrare()”function on the phyloseq object. The “ggplot2” R package (version 3.3.3) was used togenerate relative abundance plots.
Different community structures were analyzed using permutational multivariateanalysis of variance (PERMANOVA) performed using the R packages “ggplot2”(version 3.3.3), “vegan” (version 2.5-7), and “pairwise.Adonis” (version 0.0.1) using thefunctions “adonis2()” and “pairwise.adonis()”, respectively. Clustering analysis for relation-ship discovery was performed using the “hclust()” R function selecting the agglomerationmethod “complete” on the distance matrix produced by the “dist()” function within the“stats” R package (version 4.0.5).
Statistical analyses for quantitative PCR data were performed in R environment(version 4.0.5) calculating the ratio between the threshold cycles of the target genes and16S gene. Graphics of the ratio averages were performed using the “ggboxplot()” functionwithin the “ggplot2′ R package (version 3.3.3). A Scott–Knott test was performed onaverages using the functions “with()” and “SK()” within the “ScottKnott” R package(version 1.2-7) [68].
4.7. Prediction of Functional Abundances
The software PICRUSt2 (Phylogenetic Investigation of Communities by Reconstructionof Unobserved States, https://github.com/picrust/picrust2, last accessed on 21 December2021) was utilized to investigate and predict the functional potential for each determined
Int. J. Mol. Sci. 2022, 23, 3616 14 of 17
sequence in the microbial community. PICRUSt2 pipeline returned as output the metabolicpathway abundances, and functional gene profiling by comparison with MetaCyc andKyoto Encyclopedia of Genes and Genomes databases [69]. Ranking of the most relevantpathways for varieties differentiation was conducted by running a SIMPER test using thefunction “simper()” with the “vegan” R package (version 2.5-7). For each contrast betweenvarieties, the top three differentially expressed pathways were selected, and analyses werecarried out using the function “metaMDS()” in the “vegan” R package (version 2.5-7) toperform nonmetric multidimensional scaling (nMDS) and the function “heatmap()” in the“stats” R package (version 4.0.5) to graphically represent results.
4.8. Links to Deposited Data
The sequences dataset was deposited in the SRA database under the BioProjectPRJNA720503 (last accessed on 21 December 2021).
Supplementary Materials: The following supporting information can be downloaded at: https://www.mdpi.com/article/10.3390/ijms23073616/s1.
Author Contributions: Conceptualization, M.M., M.N., S.O., A.M. and L.C.; methodology, L.C.;M.N.; validation, M.N., M.M., L.C., C.F. and F.V.; formal analysis, L.C.; investigation, L.C., C.F., F.V.and M.N.; resources, M.N., M.M., S.O. and A.M.; data curation, A.M., L.C.; writing—original draftpreparation, A.M., L.C. and M.N.; writing—review and editing, M.N., M.M., S.O., A.M., L.C. andC.F.; supervision, A.M. and L.C.; project administration, A.M.; funding acquisition, A.M., S.O. andM.M. All authors have read and agreed to the published version of the manuscript.
Funding: This research received no external funding.
Data Availability Statement: Data are available at https://www.ncbi.nlm.nih.gov/bioproject/?term=PRJNA720503, accessed on 1 February 2022.
Acknowledgments: This work was partially supported by the grant MICRO4Legumes, D.M.n.89267(Italian Ministry of Agriculture) to A.M. The project was part of Measure 16.2 “FACS Frumenti Antichie Coltivazioni Sostenibili”, founded by the 2014–2020 Rural Development Programme for Tuscany.The authors want to thank Roberto Vivoli, Carolina Fabbri, and Stefania Truschi of DAGRI for theirtechnical support. A special thank is given to “Azienda Agricola Grappi Luchino”.
Conflicts of Interest: The authors declare no conflict of interests.
References1. Bulgarelli, D.; Schlaeppi, K.; Spaepen, S.; Van Themaat, E.V.L.; Schulze-Lefert, P. Structure and functions of the bacterial microbiota
of plants. Annu. Rev. Plant Biol. 2013, 64, 807–838. [CrossRef] [PubMed]2. Schlaeppi, K.; Bulgarelli, D. The Plant Microbiome at Work. Mol. Plant-Microbe Interact. MPMI 2015, 212, 212–217. [CrossRef]
[PubMed]3. Compant, S.; Samad, A.; Faist, H.; Sessitsch, A. A review on the plant microbiome: Ecology, functions, and emerging trends in
microbial application. J. Adv. Res. 2019, 19, 29–37. [CrossRef] [PubMed]4. Sánchez-Cañizares, C.; Jorrín, B.; Poole, P.S.; Tkacz, A. Understanding the holobiont: The interdependence of plants and their
microbiome. Curr. Opin. Microbiol. 2017, 38, 188–196. [CrossRef]5. Vandenkoornhuyse, P.; Quaiser, A.; Duhamel, M.; Le Van, A.; Dufresne, A. The importance of the microbiome of the plant
holobiont. New Phytol. 2015, 206, 1196–1206. [CrossRef]6. Agler, M.T.; Ruhe, J.; Kroll, S.; Morhenn, C.; Kim, S.T.; Weigel, D.; Kemen, E.M. Microbial Hub Taxa Link Host and Abiotic Factors
to Plant Microbiome Variation. PLoS Biol. 2016, 14, e1002352. [CrossRef]7. Martínez-Romero, E.; Aguirre-Noyola, J.L.; Taco-Taype, N.; Martínez-Romero, J.; Zuñiga-Dávila, D. Plant microbiota modified by
plant domestication. Syst. Appl. Microbiol. 2020, 43, 126106. [CrossRef]8. Bulgarelli, D.; Garrido-Oter, R.; Münch, P.C.; Weiman, A.; Dröge, J.; Pan, Y.; McHardy, A.C.; Schulze-Lefert, P. Structure and
function of the bacterial root microbiota in wild and domesticated barley. Cell Host Microbe 2015, 17, 392–403. [CrossRef]9. Escudero-Martinez, C.; Bulgarelli, D. Tracing the evolutionary routes of plant–microbiota interactions. Curr. Opin. Microbiol. 2019,
49, 34–40. [CrossRef]
Int. J. Mol. Sci. 2022, 23, 3616 15 of 17
10. Checcucci, A.; Maida, I.; Bacci, G.; Ninno, C.; Bilia, A.R.; Biffi, S.; Firenzuoli, F.; Flamini, G.; Fani, R.; Mengoni, A. Is theplant-associated microbiota of Thymus spp. adapted to plant essential oil? Res. Microbiol. 2017, 168, 276–282. [CrossRef]
11. Kristin, A.; Miranda, H. The root microbiota—A fingerprint in the soil? Plant Soil 2013, 671–686. [CrossRef]12. Fagorzi, C.; Bacci, G.; Huang, R.; Cangioli, L.; Checcucci, A.; Fini, M.; Perrin, E.; Natali, C.; diCenzo, G.C.; Mengoni, A.
Nonadditive transcriptomic signatures of genotype-by-genotype interactions during the initiation of plant-rhizobium symbiosis.mSystems 2021, 6, 00974-20. [CrossRef] [PubMed]
13. Busby, P.E.; Soman, C.; Wagner, M.R.; Friesen, M.L.; Kremer, J.; Bennett, A.; Morsy, M.; Eisen, J.A.; Leach, J.E.; Dangl, J.L. Researchpriorities for harnessing plant microbiomes in sustainable agriculture. PLoS Biol. 2017, 15, e2001793. [CrossRef] [PubMed]
14. Stopnisek, N.; Shade, A. Prioritizing persistent microbiome members in the common bean rhizosphere: An integrated analysis ofspace, time, and plant genotype. ISME J. 2021, 15, 2708–2722. [CrossRef] [PubMed]
15. Poole, N.; Donovan, J.; Erenstein, O. Viewpoint: Agri-nutrition research: Revisiting the contribution of maize and wheat tohuman nutrition and health. Food Policy 2021, 100, 101976. [CrossRef]
16. Fróna, D.; Szenderák, J.; Harangi-Rákos, M. The Challenge of Feeding the World. Sustainability 2019, 11, 5816. [CrossRef]17. OECD-FAO. OECD-FAO Agricultural Outlook 2017-2026; OECD-FAO Agricultural Outlook; OECD: Paris, France, 2017.18. Herrera, J.M.; Levy Häner, L.; Mascher, F.; Hiltbrunner, J.; Fossati, D.; Brabant, C.; Charles, R.; Pellet, D. Lessons from 20 Years of
Studies of Wheat Genotypes in Multiple Environments and under Contrasting Production Systems. Front. Plant Sci. 2020, 10, 1745.[CrossRef]
19. Guerrini, L.; Napoli, M.; Mancini, M.; Masella, P.; Cappelli, A.; Parenti, A.; Orlandini, S. Wheat grain composition, dough rheologyand bread quality as affected by nitrogen and sulfur fertilization and seeding density. Agronomy 2020, 10, 233. [CrossRef]
20. Kavamura, V.N.; Robinson, R.J.; Hughes, D.; Clark, I.; Rossmann, M.; Soares de Melo, I.; Hirsch, P.R.; Mendes, R.; Mauchline, T.H.Wheat Dwarfing Influences Selection of the Rhizosphere Microbiome. Sci. Rep. 2020, 10, 1452. [CrossRef]
21. Ellis, M.; Rebetzke, G.; Chandler, P.; Bonnett, D.; Spielmeyer, W.; Richards, R. The effect of different height reducing genes on theearly growth of wheat. Funct. Plant Biol. 2004, 31, 583–589. [CrossRef]
22. Arshad, M.A. A Review on Wheat Management, Strategies, Current Problems and Future Perspectives. Haya Saudi J. Life Sci.2021, 6, 14–18. [CrossRef]
23. Sanchez-Garcia, M.; Álvaro, F.; Peremarti, A.; Martín-Sánchez, J.A.; Royo, C. Changes in bread-making quality attributes of breadwheat varieties cultivated in Spain during the 20th century. Eur. J. Agron. 2015, 63, 79–88. [CrossRef]
24. Migliorini, P.; Spagnolo, S.; Torri, L.; Arnoulet, M.; Lazzerini, G.; Ceccarelli, S. Agronomic and quality characteristics of old,modern and mixture wheat varieties and landraces for organic bread chain in diverse environments of northern Italy. Eur. J.Agron. 2016, 79, 131–141. [CrossRef]
25. Fan, M.S.; Zhao, F.J.; Fairweather-Tait, S.J.; Poulton, P.R.; Dunham, S.J.; McGrath, S.P. Evidence of decreasing mineral density inwheat grain over the last 160 years. J. Trace Elem. Med. Biol. 2008, 22, 315–324. [CrossRef] [PubMed]
26. Shewry, P.R.; Hey, S. Do “ancient” wheat species differ from modern bread wheat in their contents of bioactive components?J. Cereal Sci. 2015, 65, 236–243. [CrossRef]
27. Arzani, A.; Ashraf, M. Cultivated Ancient Wheats (Triticum spp.): A Potential Source of Health-Beneficial Food Products. Compr.Rev. Food Sci. Food Saf. 2017, 16, 477–488. [CrossRef]
28. Ghiselli, L.; Rossi, E.; Whittaker, A.; Dinelli, G.; Baglio, A.P.; Andrenelli, L.; Benedettelli, S. Nutritional characteristics of ancientTuscan varieties of Triticum aestivum L. Ital. J. Agron. 2016, 11, 237–245. [CrossRef]
29. Donn, S.; Kirkegaard, J.A.; Perera, G.; Richardson, A.E.; Watt, M. Evolution of bacterial communities in the wheat crop rhizosphere.Environ. Microbiol. 2015, 17, 610–621. [CrossRef]
30. Wolinska, A.; Kuzniar, A.; Galazka, A. Biodiversity in the Rhizosphere of selected winter wheat (Triticum aestivum L.) cultivars-genetic and catabolic fingerprinting. Agronomy 2020, 10, 953. [CrossRef]
31. Simonin, M.; Dasilva, C.; Terzi, V.; Ngonkeu, E.L.M.; DIouf, D.; Kane, A.; Béna, G.; Moulin, L. Influence of plant genotype and soilon the wheat rhizosphere microbiome: Evidences for a core microbiome across eight African and European soils. FEMS Microbiol.Ecol. 2020, 96, fiaa067. [CrossRef]
32. Chen, S.; Waghmode, T.R.; Sun, R.; Kuramae, E.E.; Hu, C.; Liu, B. Root-associated microbiomes of wheat under the combinedeffect of plant development and nitrogen fertilization. Microbiome 2019, 7, 136. [CrossRef] [PubMed]
33. Tkacz, A.; Pini, F.; Turner, T.R.; Bestion, E.; Simmonds, J.; Howell, P.; Greenland, A.; Cheema, J.; Emms, D.M.; Uauy, C.; et al.Agricultural Selection of Wheat Has Been Shaped by Plant-Microbe Interactions. Front. Microbiol. 2020, 11, 132. [CrossRef][PubMed]
34. Spor, A.; Roucou, A.; Mounier, A.; Bru, D.; Breuil, M.C.; Fort, F.; Vile, D.; Roumet, P.; Philippot, L.; Violle, C. Domestication-drivenchanges in plant traits associated with changes in the assembly of the rhizosphere microbiota in tetraploid wheat. Sci. Rep. 2020,10, 12234. [CrossRef]
35. Germida, J.; Siciliano, S. Taxonomic diversity of bacteria associated with the roots of modern, recent and ancient wheat cultivars.Biol. Fertil. Soils 2001, 33, 410–415. [CrossRef]
36. Evenson, R.E.; Gollin, D. Assessing the impact of the Green Revolution, 1960 to 2000. Science 2003, 300, 758–762. [CrossRef]37. Fan, K.; Delgado-Baquerizo, M.; Guo, X.; Wang, D.; Wu, Y.; Zhu, M.; Yu, W.; Yao, H.; Zhu, Y.G.; Chu, H. Suppressed N fixation
and diazotrophs after four decades of fertilization. Microbiome 2019, 7, 1–10. [CrossRef]
Int. J. Mol. Sci. 2022, 23, 3616 16 of 17
38. Iannucci, A.; Canfora, L.; Nigro, F.; De Vita, P.; Beleggia, R. Relationships between root morphology, root exudate compounds andrhizosphere microbial community in durum wheat. Appl. Soil Ecol. 2021, 158, 103781. [CrossRef]
39. Mamine, F.; Farès, M.H. Barriers and levers to developing wheat–pea intercropping in Europe: A review. Sustainability 2020, 12, 6962.[CrossRef]
40. Lee, S.H.; Ka, J.O.; Cho, J.C. Members of the phylum Acidobacteria are dominant and metabolically active in rhizosphere soil.FEMS Microbiol. Lett. 2008, 285, 263–269. [CrossRef]
41. Deng, S.; Caddell, D.F.; Xu, G.; Dahlen, L.; Washington, L.; Yang, J.; Coleman-Derr, D. Genome wide association study revealsplant loci controlling heritability of the rhizosphere microbiome. ISME J. 2021, 15, 3181–3194. [CrossRef]
42. Muhammad, I.; Yang, L.; Ahmad, S.; Zeeshan, M.; Farooq, S.; Ali, I.; Khan, A.; Zhou, X.B. Irrigation and nitrogen fertilization altersoil bacterial communities, soil enzyme activities, and nutrient availability in maize crop. Front. Microbiol. 2022, 105, 833758.[CrossRef] [PubMed]
43. Ossowicki, A.; Tracanna, V.; Petrus, M.L.C.; van Wezel, G.; Raaijmakers, J.M.; Medema, M.H.; Garbeva, P. Microbial and volatileprofiling of soils suppressive to Fusarium culmorum of wheat. Proc. R. Soc. B Biol. Sci. 2020, 287, 20192527. [CrossRef] [PubMed]
44. Cai, Y.; Shen, J.P.; Di, H.J.; Zhang, L.M.; Zhang, C.; He, J.Z. Variation of soil nitrate and bacterial diversity along soil profiles inmanure disposal maize field and adjacent woodland. J. Soils Sediments 2020, 20, 3557–3568. [CrossRef]
45. Wang, X.; Wang, S.; Jiang, Y.; Zhou, J.; Han, C.; Zhu, G. Comammox bacterial abundance, activity, and contribution in agriculturalrhizosphere soils. Sci. Total Environ. 2020, 727, 138563. [CrossRef] [PubMed]
46. Wilhelmi, K.D.; Kuhr, S.L.; Johnson, V.A.; Mattern, P.J.; Schmidt, J.W. Results of the Seventh International Winter Wheat PerformanceNursery Grown in 1975; ral Resources, Agricultural Experiment Station: Lincoln, NB, USA, 1977.
47. Verrillo, F.; Badeck, F.-W.; Terzi, V.; Rizza, F.; Bernardo, L.; Di Maro, A.; Fares, C.; Zaldei, A.; Miglietta, F.; Moschella, A.; et al.Elevated field atmospheric CO2 concentrations affect the characteristics of winter wheat (cv. Bologna) grains. Crop Pasture Sci.2017, 68, 713–725. [CrossRef]
48. Jimenez, R.R.; Ladha, J.K. Automated elemental analysis: A rapid and reliable but expensive measurement of total carbon andnitrogen in plant and soil samples. Commun. Soil Sci. Plant Anal. 2008, 24, 1897–1924. [CrossRef]
49. Matejovic, I. Determination of carbon and nitrogen in samples of various soils by the dry combustion. Commun. Soil Sci. PlantAnal. 1997, 28, 1499–1511. [CrossRef]
50. Vitti, C.; Stellacci, A.M.; Leogrande, R.; Mastrangelo, M.; Cazzato, E.; Ventrella, D. Assessment of organic carbon in soils:A comparison between the Springer–Klee wet digestion and the dry combustion methods in Mediterranean soils (Southern Italy).CATENA 2016, 137, 113–119. [CrossRef]
51. Verardo, D.J.; Froelich, P.N.; McIntyre, A. Determination of organic carbon and nitrogen in marine sediments using the CarloErba NA-1500 analyzer. Deep Sea Res. Part A. Oceanogr. Res. Pap. 1990, 37, 157–165. [CrossRef]
52. Houba, V.J.G.; Huijbregts, A.W.M.; Wilting, P.; Novozamsky, I.; Gort, G. Sugar yield, nitrogen uptake by sugar beet and optimalnitrogen fertilization in relation to nitrogen soil analyses and several additional factors. Biol. Fertil. Soils 1995, 19, 55–59. [CrossRef]
53. APHA; APHA Standard Methods, Method 4500-NO3-E—Cadmium Reduction Method. 22nd ed. America Public HealthAssociation: Washington, DC, USA, 2000.
54. EPA EPA Method 353.2; Determination of Nitrate-Nitrite Nitrogen by Automated Colorimetry. Revision 2.0. August 1993. UnitedStates Environmental Protection Agency: Cincinnati, OH, USA, 19 August 1993.
55. ASTM D1426-15; Standard Test Methods for Ammonia Nitrogen in Water. ASTM International: West Conshohocken, PA, USA, 2015.56. Olsen, S.R.; Sommers, L.E. Phosphorus. In Methods of Soil Analysis Part 2 Chemical and Microbiological Properties; Page, A.L., Ed.;
American Society of Agronomy, Soil Science Society of America: Madison, WI, USA, 1982; pp. 403–430.57. Mehlich, A. Use of Triethanolamine Acetate-Barium Hydroxide Buffer for the Determination of Some Base Exchange Properties
and Lime Requirement of Soil. Soil Sci. Soc. Am. J. 1939, 3, 162–166. [CrossRef]58. Klindworth, A.; Pruesse, E.; Schweer, T.; Peplies, J.; Quast, C.; Horn, M.; Glöckner, F.O. Evaluation of general 16S ribosomal RNA
gene PCR primers for classical and next-generation sequencing-based diversity studies. Nucleic Acids Res. 2013, 41, e1. [CrossRef][PubMed]
59. Russo, E.; Bacci, G.; Chiellini, C.; Fagorzi, C.; Niccolai, E.; Taddei, A.; Ricci, F.; Ringressi, M.N.; Borrelli, R.; Melli, F.; et al.Preliminary comparison of oral and intestinal human microbiota in patients with colorectal cancer: A pilot study. Front. Microbiol.2018, 8, 2699. [CrossRef] [PubMed]
60. Abdelrhman, K.F.A.; Bacci, G.; Nistri, A.; Mengoni, A.; Ugolini, A. Diet and gut microbiota of two supralittoral amphipodsOrchestia montagui and Talitrus saltator living in different microhabitats. Estuar. Coast. Shelf Sci. 2017, 197, 119–125. [CrossRef]
61. Callahan, B.J.; McMurdie, P.J.; Rosen, M.J.; Han, A.W.; Johnson, A.J.A.; Holmes, S.P. DADA2: High-resolution sample inferencefrom Illumina amplicon data. Nat. Methods 2016, 13, 581–583. [CrossRef]
62. Quast, C.; Pruesse, E.; Yilmaz, P.; Gerken, J.; Schweer, T.; Yarza, P.; Peplies, J.; Glöckner, F. The SILVA ribosomal RNA genedatabase project: Improved data processing and web-based tools. Nucleic Acids Res. 2013, 41, D590–D596. [CrossRef]
63. Wright, E.S.; Yilmaz, L.S.; Noguera, D.R. DECIPHER, a search-based approach to chimera identification for 16S rRNA sequences.Appl. Environ. Microbiol. 2012, 78, 717–725. [CrossRef]
64. McMurdie, P.J.; Holmes, S. Phyloseq: An R Package for Reproducible Interactive Analysis and Graphics of Microbiome CensusData. PLoS ONE 2013, 8, e61217. [CrossRef]
65. Shetty, S.A.; Lahti, L. Microbiome data science. J. Biosci. 2019, 44, 115. [CrossRef]

Int. J. Mol. Sci. 2022, 23, 3616 17 of 17
66. Wickham Hadley ggplot2: Elegant Graphics for Data Analysis; Springer: New York, NY, USA, 2009; ISBN 978-0-387-98140-6.67. Kandlikar, G.S.; Gold, Z.J.; Cowen, M.C.; Meyer, R.S.; Freise, A.C.; Kraft, N.J.B.; Moberg-Parker, J.; Sprague, J.; Kushner, D.J.;
Curd, E.E. ranacapa: An R package and Shiny web app to explore environmental DNA data with exploratory statistics andinteractive visualizations. F1000Research 2018, 7, 1734. [CrossRef]
68. Jelihovschi, E.; Faria, J.C.; Allaman, I.B.; Allaman, M.I.B. ScottKnott: A package for performing the Scott-Knott clusteringalgorithm in R. TEMA 2014, 15, 3–17. [CrossRef]
69. Douglas, G.M.; Maffei, V.J.; Zaneveld, J.; Yurgel, S.N.; Brown, J.R.; Taylor, C.M.; Huttenhower, C.; Langille, M.G.I. PICRUSt2: Forprediction of metagenome functions. Nat Biotechnol. 2020, 38, 685–688. [CrossRef] [PubMed]


