Embed Size (px)
Citation preview
Differential Growth, Political Instability
and Violent Conflict
Paper presented to the International Studies Association 46th Annual Convention
Honululu, HI, 1 – 5 March, 2005
Panel SA11: Demography, Political Instability and Violent Conflict
Saturday 5 March, 8:30 – 10:15 AM
Håvard Strand & Henrik Urdal
University of Oslo & Centre for the Study of Civil War (CSCW)
The International Peace Research Institute, Oslo (PRIO)
This is a paper in progress, pleas do not cite without the authors’ permission
Abstract There is a large pool of rigorous empirical studies investigating the relationship between ethnic heterogeneity and armed conflict. A general finding is that ethnicity matters, although not as much as portrayed in popular media. But a largely neglected aspect of these quantitative studies is how changes in the relative strength of groups affect conflict. Toft (2002) argues that differential growth may destabilize heterogeneous democracies internally. In democratic societies, political power is distributed according to popular support in elections. A changing balance between groups may thus alter the distribution of power and potentially lead to political instability and ultimately violent conflict. We argue that the relationship between differential growth and instability and violence may be even more important in semi-democracies with electoral systems, but with weak and inconsistent political institutions. In a cross-national time-series study we do a first empirical test of this notion. Starting from the premise that for differential growth to become a potential driver of conflict and instability, information of such change has to be recorded with a national census and actually published. Not yet having completed a reliable dataset on actual change between censuses, this paper investigates whether countries publishing identity data from consecutive censuses are at a greater risk of experiencing violence and political instability. Investigating the census data in two models of civil war and regime duration, we find no empirical support for the expectation that publishing identity data increases the risk of violent conflict and political instability.
1
1.0 Introduction
A number of prominent studies of ethnic1 conflict have suggested that when ethnic
groups grow at different rates, this may lead to fears of an altered political balance,
potentially causing political instability and violent conflict (Brown, 2001; DeVotta,
2002; Goldstone, 2002; Horowitz, 2001; Krebs & Levy, 2001; Lake & Rotschield,
2001; Toft, 2002; Weiner & Teitelbaum, 2001; Wriggins & Guyot, 1973). Anecdotal
evidence for such connection is ample. In Lebanon, censuses were suspended
altogether to avoid conflict over the distribution of ethnic quotas for parliamentary
elections (Baaklini, 1983; Krebs & Levy, 2001). In Bosnia-Herzegovina in the early
1990s, radical Serb leaders were agitating for the secession of ‘Serbian’ areas in
Bosnia-Herzegovina by instigating popular fears that Serbs would soon be
outnumbered by a growing Muslim population heading for the establishment of a
Sharia state (Urdal, 2001). In Northern Ireland, the Catholic population is estimated to
form a majority of the electorate within a few decades.
Although popular perceptions of ancient hatreds and protracted identity
conflict are widespread, comparative empirical studies suggest a modest impact of
ethnic heterogeneity on violent conflict (Ellingsen, 2000; Fearon & Laitin, 2001;
Henderson & Singer, 2000). It has also been suggested that ethnic conflicts may have
different causes than other conflicts (Sambanis, 2001; Besancon, 2005). As it is clear
that multiethnicity in itself is not a strong predictor of conflict, we should focus on
what contextual factors makes identity politically relevant. In societies where political
power, and thus scarce resources, is partly distributed according to ethnic divisions,
we would like to know what mechanisms can trigger political violence.
The political influence of an ethnic group is often at least partly a function of
it’s size. And to the extent that numbers matter, it is also reasonable to expect that
changes in the balance between ethnic groups matter. Despite often being mentioned
as a potential driver of ethnic conflict, surprisingly few attempts have been made to
deepen our understanding of how and when unequal growth rates can influence
conflict behavior. Nor have there been any attempts at empirically testing the notion
of differential growth related violence over a large sample of countries and time.
1 We will be using ‘ethnic group’ and ‘ethnicity’ for identity groups separated by linguistic, religious or
ethnic divisions.
2
This study does not attempt to answer how identity becomes politically
relevant. Rather, we recognize the relevance of identity in many societies and
empirically assess in a large-N statistical model whether differential growth rates
between ethnic groups competing over power increase the likelihood that states will
experience political instability and political violence.
Critical to the very idea that differential growth rates may matter is that
information about the growth of competing ethnic groups is available, not only to
decision-makers, but also to the population of a country at large. While not the only
public source to such information, a census will often be the most authoritative source
to estimates of the ethnic composition and change of populations. For this reason, and
for the purpose of cross-national comparison, we will be focusing on the role of
censuses in collecting and disseminating information about ethnic group size and
changes. Lacking a reliable dataset of inter-census changes between ethnic groups,2
we have limited the analysis to investigate whether countries that do publish data on
ethnic composition from consecutive censuses are more prone to violent conflict and
political instability. The publishing of such data is, in our view, a necessary condition
for differential growth to influence the risk of conflict and instability Our initial
investigation suggests that publishing such data does not increase the risk of violent
conflict and political instability.
2.0 Ethnicity, differential growth and political violence
The numerousness of ethnic groups is generally related to their political influence.
Horowitz argues that it is not only the numbers as such that matter, but that the
‘apprehensions about numbers are equally important’ (2001: 170). Fears of being
outnumbered may cynically be exploited for political purposes even where higher
minority growth poses no real threat to overwhelm a majority. DeVotta (2002) shows
how differential growth is exploited by Hindu fundamentalists to stir up inter-
communal tensions even under the impossible scenario that the 10% Muslims in India
2 As discussed below we have tried to use data from Ellingsen (2000) to create a trial dataset on
differential growth based only on data that originated from censuses. The dataset did not provide
reliable estimates change between censuses, not least due to the great change in what categories
constituted the two largest groups over time within the same country. Using these data in our statistical
models, differential growth was estimated to significantly reduce the risk of violence and instability.

3
will outnumber the Hindu population for the next several hundred years. As Krebs &
Levy (2001: 82) note, ‘ethnic groups in a society generally have different fertility
rates and different rates of immigration’, and hold that the differential growth
argument overstates the relationship. We agree, of course, that differential growth
does not always lead to serious episodes of instability and conflict. Rather, the
relationship is conditioned on several factors that will be addressed below. Krebs &
Levy (2001: 82) go on to argue that the differential growth hypothesis fails to
recognize that ethnicity is neither constant nor exclusive. In our view, this goes to the
heart of the problem of comparing multietnicity crossnationally and temporally as
there are no universal criteria employed for determining what constitutes a separate
identity group and thus for measuring multiethnicity. Census categories as well as
subjective self-identification can change significantly within the same country over
time. In our view, this is a more fundamental critique of large-N empirical studies of
ethnic heterogeneity and conflict. For the differential growth argument, the question
of whether ethnic categories are ‘true’ or exclusive is of lesser importance.
Furthermore, changes in census categories or people’s self-identification are an
integral part of popular apprehension of changes in relative strength. But as Horowitz
(2001: 170) notes, ‘the significance of numbers, real or apprehended, should not be
overestimated. Numbers often have something to do with political power, but not
always, not everywhere, and not everything’. Our aim with this paper is to try to
answer whether differential growth can contribute sometimes, under some conditions
to some forms of political instability and conflict.
2.1 Ethnicity and conflict
Literature on nations and nationalism draws a distinction between an ‘East-European’
and culturally oriented, and a ‘West European’ and ‘civic’ concept of a nation (e.g.
Smith, 1998). The ‘civic’ nation describes the process of nation-building and cultural
standardization that happened within already established states like France and the
UK, and connotes an open and assimilative nation where the inhabitants voluntarily
joins on the basis of loyalty to the state. The cultural nation exists despite or even in
direct conflict with the state as a political entity, and is based on a set of shared
cultural characteristics like language, religion or ethnic identity. And while ‘civic’
colonial powers of Western Europe banned cultural categories in their own censuses,
they promoted ethnical categorization elsewhere through colonial censuses (Kertzer &
4
Arel, 2001: 10). The two forms of national identity can exist simultaneously as
competing forms of identity, like in former Yugoslavia where census respondents
could register either as belonging to an ethnic group, or as Yugoslavs (Urdal, 2001).
Competing forms of identity adds to the fluidity of identity, and may lead to
substantial changes in self-identification following for instance political
developments, as happened in Bosnia-Herzegovina.
The reasons why some identities come to the fore while other cultural
divisions are irrelevant, vary between contexts. While religion plays a huge difference
distinguishing groups in Bosnia-Herzegovina, language and shared history has taken
prominence and made the same religious cleavages largely irrelevant in neighboring
Albania. The relevance of identity is strengthened where group competition is formed
along ethnic lines (Lake & Rotschild, 2001: 130), and weakened ‘if ethnic antagonism
cuts across other divisions in society’ (Guelke, 2004: 245). While it is beyond the
scope of this paper to explain how and why certain identities become politically
relevant, such relevance is crucial to the differential growth argument developed
below.
Lake & Rotschild (2001: 126) argue that ethnic conflict most often arise as a
result of lack of credible commitments on the part of the dominant ethnic group,
leading to collective fears of the future. Ethnic activists and political entrepreneurs
build up and exploit fears of being subdued a system of political dominance and
exclusion. ‘Collective fears of the future arise when states lose their ability to arbitrate
between groups or provide credible guarantees of protection for groups’ (Lake &
Rotschild, 2001: 128).
As long as the balance of power does not change, and is not perceived to
change, this enables ethnic groups to preserve contracts to avoid violent conflict
despite differing policy preferences (Lake & Rotschild, 2001: 135). The problem is
that the balance of power most often changes over time, and even more so is
perceived to change as a result of differential growth. ‘Problems of credible
commitment arise, as Fearon shows, whenever the balance of ethnic power shifts.[…]
The checks and balances that safeguard the agreement today become insufficient
tomorrow. Even if the group that is growing stronger promises not to exploit the
weaker group in the future, there is nothing to prevent it from breaking its promise
when it actually is stronger.’ (Lake & Rotschild, 2001: 135). This leaves the ethnic

5
group that is growing weaker with the option of taking up arms today, or accepting a
contract that becomes increasingly insecure.
2.2 Ethnicity, democracy and conflict
To what degree is differential growth a problem confined to democratic
regimes? Even in autocratic states, there is generally a positive relationship between
relative group size and political power, although group resources and the ability and
skills to mobilize and organize effectively are also crucial factors (Bookman, 2002:
25; Lake & Rotschild, 2001: 135). Horowitz (2001: 25) holds that if an ethnic
minority is able to effectively control a state with small numbers and without having
to face democratic elections, there is actually an incentive to keep the size of the
group that shares the benefits of inclusion low. But in most authoritarian regimes,
declining ruling elites are likely to experience an increasing pressure in the longer run,
while excluded groups can be encouraged by increasing numbers. Kertzer & Arel
(2002: 23) provide interesting examples of how autocratic regimes have suspended
censuses in fear of being shown to be a minority.
But there is little doubt that differential growth is a more direct and imminent
threat to stability and peace in societies where the political power is distributed
primarily through elections, as suggested by Toft (2002). Horowitz (1994: 36) argues
that ethnically divided societies where resources are distributed according to ethnic
lines, have ‘a special version of the usual democratic problem of assuring decent
treatment of the opposition’. A multi-party democracy in a society where identity is
highly politically relevant is at great risk of being reorganized along ethnic lines,
distributing political power according to group size (Weiner & Teitelbaum, 2001: 23;
Wimmer, 2002: 107). But as the number of ethnic groups grows, and the smaller the
largest groups are, differential growth becomes less relevant. Such situation does not
preclude ethnic dominance, but makes it less likely since groups necessarily have to
enter into alliances with others.
One solution that has been suggested as a remedy for highly ethnically divided
countries is wide-ranging autonomy or federalism. Provided that ethnic groups to a
large extent live in different geographical areas, a federalist solution will also mute
the problem of differential growth. However, as argued by Lapidoth (1996: 40), ‘a
disadvantage of territorial autonomy is that since people move from one place to
another, the composition of the population of a given region may change. The purpose

6
of autonomy may be lost’. Kertzer & Arel (2002: 30) argue that groups ‘fear
becoming a minority in the territory that matters most to them, which can be
conceived either as a state, a province, or a district’. So in autonomous regions where
the polarization between ethnic groups is high, we would expect to see an equally
increased risk of violence and politically instability as predicted on national level for
multiethnic states in general. This may be particularly problematic if changes in
population balances regionally are encouraged by central governments (Lapidoth
1996: 40).
2.3 Census and the numbers game
In terms of quantifying ethnic groups, censuses are by far the most important and
authoritative tool. According to Kertzer & Arel (2002: 30), the census tends to
become politically contested because it is the most important means by which
‘majorities’ and ‘minorities’ are being officialized. ‘The acts of categorizing and
measuring become parts of society’s struggles, both directly – for they set the size of
various groups’ claims on scarce resources – and indirectly – for they contribute to
crystallizing people’s identities’ (Uvin, 2002: 170). But not only do census categories
contribute to cementing ethnic identity. There are also examples of campaigning from
‘below’, to make census categories better correspond to subjective identification.
The census is an indication of whose country it is, and needs to be ‘won’
(Horowitz, 1985: 194, 196). In fact, in many countries, the instrumental dimensions of
census politics are immense, and the prize for winning similarly large. The measuring
of ethnic groups may be used to inform policies such as the establishment of social
programs based on sizes of ethnic minorities, establishing quotas for ethnic
representation in parliament or public administration, and the designation and use of
official languages in schools and public administration, nationally or locally.
While changes in relative size between groups is often popularly portrayed as
being a result of high fertility and immigration, aspects about the census itself may
also be important reasons why groups change over time. Ethnic identities are not
mutually exclusive or clear cut. This presents challenges to census enumerators trying
to fit individuals into often preset ethnic categories. Colonial powers often struggled
to find categories that could place their colonial subjects in the racial hierarchy,
colonial censuses in Malaysia show ‘an extraordinarily rapid, superficially arbitrary,
series of changes, in which categories are continuously agglomerated, disaggregated,

7
recombined, intermixed, and reordered’ (Anderson, 1992: 164, summarizing original
studies by Charles Hirschman). Significant changes in categories happen quite
frequently, even in US censuses (Nobles, 2002, in K&A). While changes in categories
most often result from governmental initiatives, there are also examples that popular
pressure has forced governments to recognize new categories. A prominent example
is the massive registration by Slavic Muslims as ‘uncategorized Yugoslavs’ in the
1953 census finally leading to the recognition of ‘Muslims’ as a separate category in
the 1971 census (Urdal, 2001).
In addition to altered identity categories, changes in perceptions among the
respondents may also account for substantial variation in the support for ethnic
groups. Kertzer & Arel (2002: 28-29) describe how groups have been campaigning
for respondents to report specific identities. Following a grassroots campaign against
the ‘balkanization’ of Canada, the share of registered ‘Canadiens’ on the ‘ethnic
origin’ question, increased from 3.3 to 24.1 per cent between 1991 and 1996 (Kertzer
& Arel 2002: 16). Categories appearing as ambiguous to respondents may equally
lead to unforeseen and shifting results. On the race question in the 1981 US census,
55.6 per cent of all Hispanics considered themselves to be white, while the other half
either reported ‘other’ or ‘black’ (Thernstrom, 1987: 315). Identity groups that are
listed as examples are also increasingly likely to be reported, as shown for the
ancestry question in the 1970 US census (Kertzer & Arel, 2002: 17).
The assumption made here is that publishing data on ethnicity showing
differential growth may be exploited by political entrepreneurs to create fears of being
outnumbered. In France, asking questions on ethnicity, language or religion is
prohibited by law. In Lebanon, censuses were suspended after the 1932 census
showing a narrow Christian majority. In Pakistan the government postponed the
census five times between 1991 and 1998, fearing violence by groups likely to claim
that they were undercounted. When the results finally were published they showed the
highly unlikely result that there had been no change in relative group size since 1981
(Kertzer & Arel, 2002: 23). In Burundi, ethnicity categories have been officially ruled
out to mask the rule of the Tutsi minority, while in Mauretania, the results of the 1978
census were suppressed by the minority Moor government (Kertzer & Arel, 2002:
23).
Hence, we would like to know whether a country that publishes data showing
a changed balance between ethnic, religious or linguistic groups more likely to

8
experience political violence, ceteris paribus. From this follows the next question:
Under what conditions is public knowledge on differential growth dangerous?
2.4 Differential growth and violence
Under what conditions may differential growth between ethnic groups result in
political instability and violence? As argued above, to the extent that numbers
constitute an element in the distribution of political power and resources between
groups, a change in numbers is a factor that may alter the balance of power and
potentially lead to instability and violence (Kerzer & Arel, 2002: 30; Toft, 2002: 75;
Weiner & Teitelbaum, 2001: 32).
We contend that for differential growth to be an important driver of instability
and violence, proof of such changes has to be publicized and known among the
population. It is not primarily slow, actual changes ‘on the ground’ that matters, but
rather fears of being outnumbered, usually instigated by political entrepreneurs. As
noted by Weiner & Teitelbaum (2001: 32), groups often perceive differences in their
relative size and growth rates as affecting the distribution of political power for the
future. Hence, current population trends projected into the future may be thought to
foretell changes in future political fortunes of competing ethnic groups. While not the
only source to such information, we have chosen to focus on the publication of
identity data from censuses, including religion, ethnicity, and language.
There are a number of factors that have been argued to increase the risk that
differential growth results in instability and violence. The most important contextual
factor is type of governance. In heterogeneous societies where political power is
distributed through open elections, a changing balance between identity groups is
most likely to be perceived as a threat to the political balance (Toft, 2002; Weiner &
Teitelbaum, 2001). But also aspects about the composition are likely to affect conflict
propensity. The larger the share that the two largest groups make up of the total
population and the closer they are in size, the more likely is it that differential growth
will lead to violence and conflict (Toft, 2002). We argue that a more relevant
distinction is that of institutionally consistent regimes (‘ideal’ democracies and
autocracies), and semi-democracies that allow some competition over power, usually
in the form of elections, but where institutions are inconsistent and weak.
It can be difficult to separate meaningfully between the process that leads to a
regime shift and the process that leads to civil war. We are agnostic as to what
9
outcome is more likely, ceteris paribus, from a differential growth process, but we do
believe that the political regime type is an important factor in either case. A regime
with absolutely no form of power-sharing institutions, such as totalitarian
dictatorships3, is known to be fairly capable in handling all forms of opposition,
whether it is identity-based or ideology-based. Likewise, liberal democracies are also
less exposed to violent political action, most probably because the open channels
prove more effective (Hegre et al. 2001). The interesting category is the semi-
democratic states, where some democratic institutions are present, but not all. These
regimes do not possess the autocratic regime’s ability to repress mobilization, and do
not feature democratic responsiveness. This regime type is thus an unfortunate mix of
opportunity and frustration. When we add identity to this nexus, we fulfill Ellingsen’s
(2000) criteria for armed conflict onset.
We believe that differential growth is dependent on political entrepreneurship,
and we therefore see the political competition as an interaction among political elites.
Przeworski (1991) models democratic stability as a game between an incumbent and
opposing candidate. Strand (2005) shows how this model can be used to separate
between different aspects of the relationship between political regimes, political
events, and armed conflict.
(1) Ua = Cl + p[r(Cw)+(1-r)(Cl)], Uo = q(Caut),
(1) describes the incumbents perceived payoff from either accepting defeat and
attempting to win the next election (with probability r) which might or might not be
held (with probability p)or attempting to overthrow the election outcome with
probability of success equal to q (q(Caut)). The model posits that if the expected utility
from overthrowing democracy is larger than the expected utility from accepting
defeat, a regime shift will be attempted, which also can lead to a civil war. Strand
(2005) find evidence indicating that the level of institutional constraints on the
executive branch reduce increase the likelihood that the incumbent will accept defeat,
as it increases the likelihood for another election at a later stage (parameter p).
3 Fortunately the world is increasingly getting rid of totalitarian regimes, but countries such as North
Korea still exists.
10
In our model, we find it very likely that differential growth rates between
different politically relevant groups can affect the perceived likelihood of winning
another election (parameter r), which also gives the incumbent and his/hers supporters
incentives for both election cheating and political reforms.
In this paper we will empirically investigate the following hypotheses:
H1: Countries publishing identity data from consecutive censuses are more likely to
experience violent conflict and political instability.
H2: Semi-democracies are more likely to experience violence and political instability
when consecutively publishing census data on ethnic group size.
For later versions of the paper we want to broaden the empirical investigation to
include the following hypotheses:
H3: Countries where the two largest ethnic, religious or linguistic groups grow at
different rates are more likely to experience violent conflict and political instability.
H4: Differential growth is increasingly likely to lead to violence and instability the
more equal in size the two largest groups are.
H5: Among democracies, federations are less likely to experience violence and
political instability as a result of differential growth.
H6: Periods following censuses with an ethnic/religious/linguistic count are more
associated with violence and instability.
H7: Countries that seize recording ethnicity, religion and/or language are less
susceptible to violence and instability.

11
3.0 Data and Methods
We aim at discovering whether publishing data documenting shifts within a country’s
demographic composition is associated with civil unrest. Unfortunately, the effect
group is quite heterogeneous. There are a number of possible scenarios that results in
no identity data being published. First, it is those countries that lack the capacity to
conduct a survey. Somalia has not held any census in 20 years, for obvious reasons. A
wide range of authors agree that low state capacity is highly correlated with armed
conflict. Furthermore, as we already have pointed out, a number of high income
countries have banned by law gathering of identity affiliation data in combination
with censuses. These countries can be labeled ‘Do not want to know’-countries. These
countries are very often characterized by strong ‘rule of law’-institutions, and
therefore often very low conflict propensity. Finally, there are the countries that
gather data, but then decline to publish them, for unknown reasons. Let us label these
as “Do not want to tell”-countries. A priori, there must be some reason for why this
information is withheld, and regardless of what the real motivation is, political
entrepreneurs are likely to build upon the uncertainty introduced by the government’s
failure to publish. Figure 1 presents the different categories:
Figure 1: Four Different Possible Categories
Census held?
yes no
Identity information collected?
no
yes
Identity information published
yes no
Type 1
Type 2
Type 3
Type 4
12
Regimes that are unable to complete a census are as argued above probably very weak
states, and as such more likely to experience instability and violence. These regimes
are categorized as Type 4. The regimes we really are most interested in are Type 2
and Type 3. Together these regimes include all regimes which gather data on identity
composition along with census data. If the pessimistic claim that publishing such data
is correct, then we should expect Type 3 to be less at risk for experiencing political
instability than Type 2 regimes. However, if there is a strategic component behind this
choice, it might be that Type 2 regimes publish data because they are certain that the
data either contains no explosive information or that the information presented can be
handled within the current political institutions. In this view, Type 2 regimes are
predicted to be more stable than Type 3. Unfortunately, we can only observe whether
a census was held, and whether identity data where published. Therefore, we can’t
empirically separate Type 3 and Type 1 regimes.
We base our indicator on the source data behind Ellingsen (2000), which in
turn is based on the data published in the UN publication Demographic Yearbook. For
each time a composition data is published on religion, ethnicity or language, we
calculate the net change between the two largest groups between the newly published
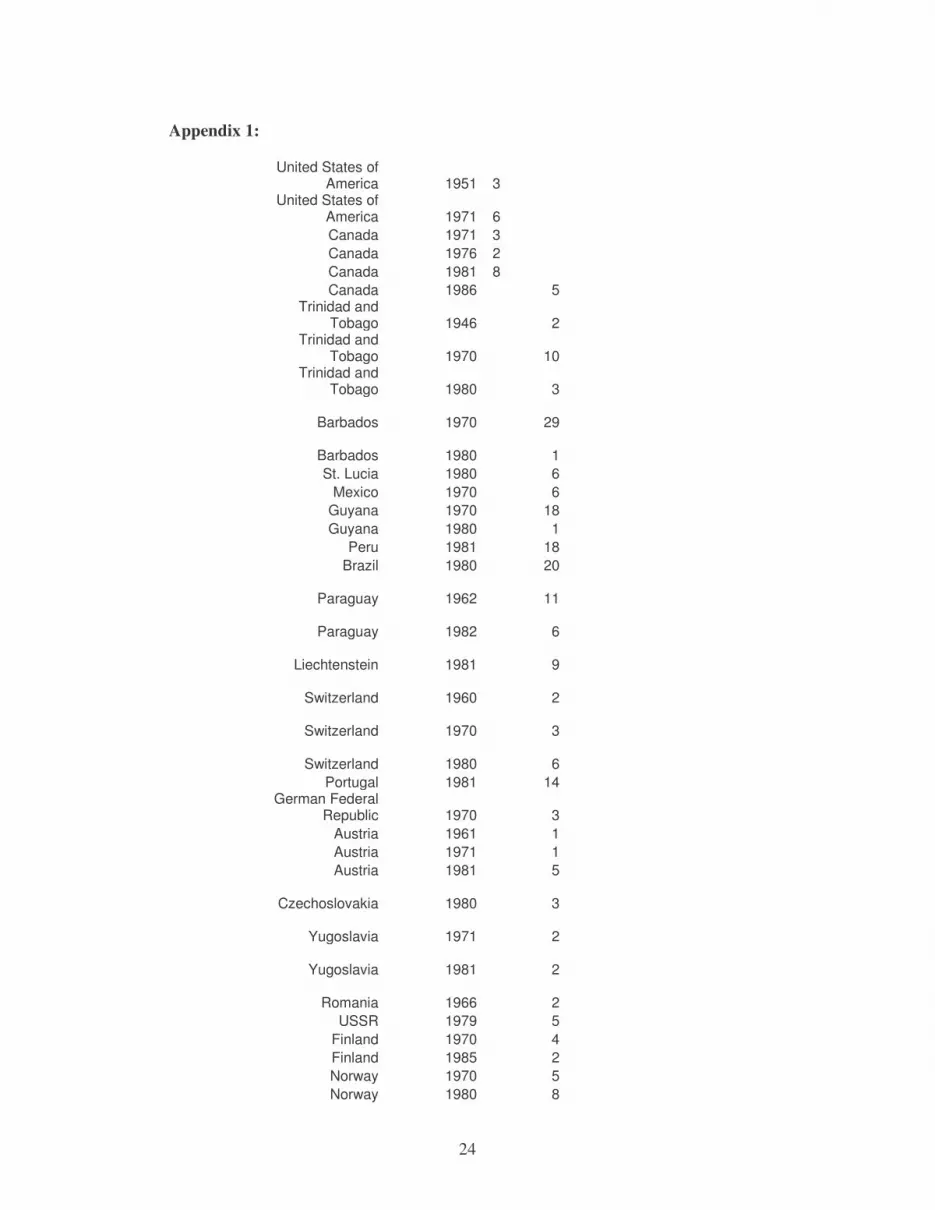
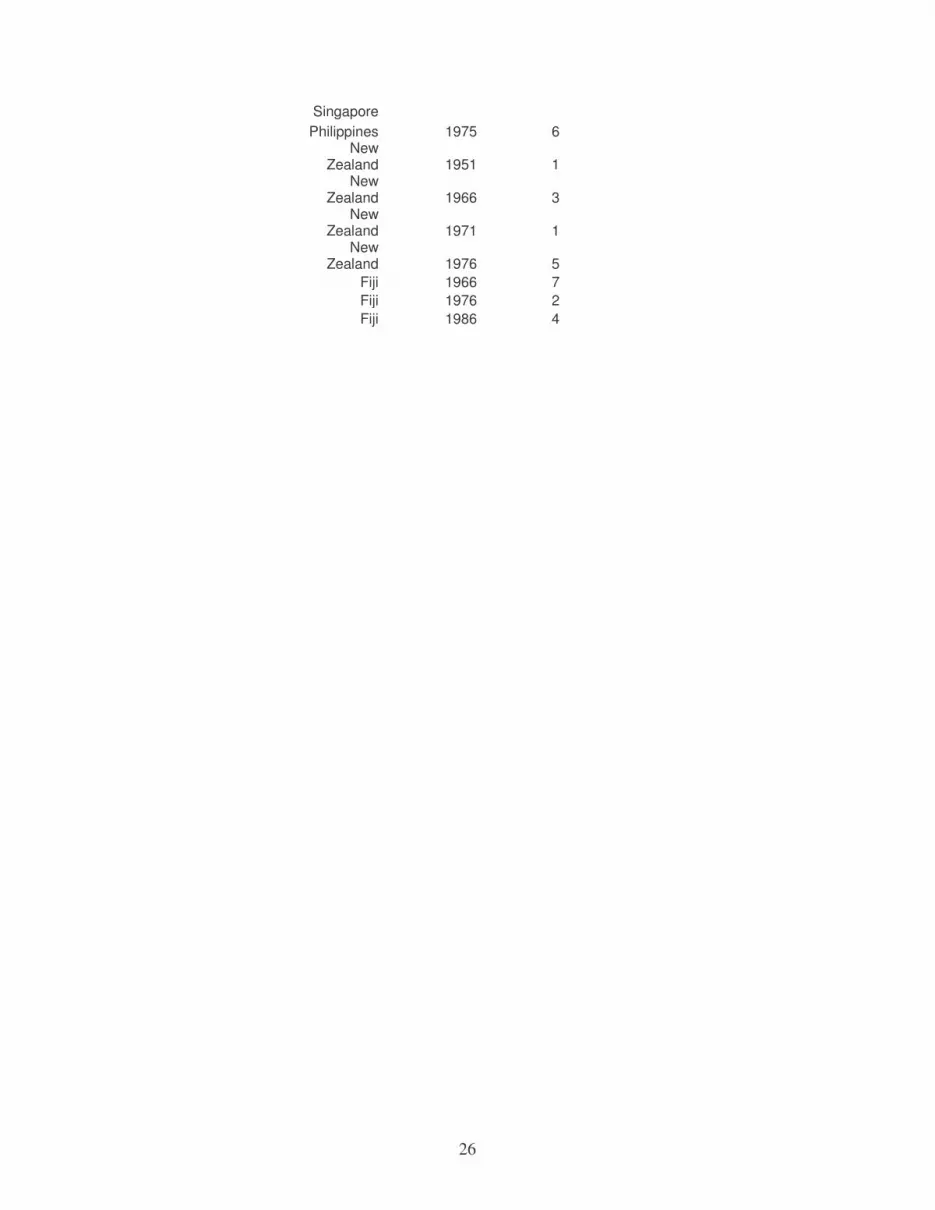
study and the previously known study. In the end, we find 88 data points from 50
countries. A list of these can be found in Appendix 1.
We calculate the variable as shown in (1) for each of the three indicators. The
change in the percentage difference of the two largest groups between two censuses is
our main indicator.
(1)
1)group%largest 2.-group%largest ()group%largest 2.-group%largest ( −−= ttdiff
There are potentially three such differences, if the census has data on ethnicity,
religion and language. If there is more than one group present, we choose the largest
difference. We do not have any strong expectations with regard to the direction of the
difference, and we therefore take the absolute value.
Unfortunately, our data are marred with some measurement errors. There is a
component of random error in all form of data gathering, and also in censuses. There
are probably a division among different censuses that make some more reliable than
others, but since the problem can be assumed to take a random character. More
13
problematic is it that the definition of the identity groups can change from census to
census, so we are as such not certain that the groups we compare over time really are
comparable. In the end, the difference defined in (1) is therefore a poor fundament for
making any predictions. However, we can still compare regimes that publish ethnic
data with regimes that either doesn’t publish them or doesn’t ask at all. This variable
is a dummy variable where the effect group has the value 1 and the control group is
identified as 0’es.
Our dependent variable is vaguely defined. Civil unrest can manifest itself in a
number of phenomena. Civil unrest can take form as demonstrations or strikes. It can
lead to a strengthened political mobilization along identity lines, demand for political
reforms, such as democratization or autocratization, demands for secession or for
autonomy. In the worst scenario, it can be a civil war. Some forms of civil unrest are
more dangerous than others. Civil wars and regime failure are two of the worse
outcomes, and we start by investigating these two outcomes. These phenomena are
theoretically very different, and the way we observe them force us to use drastically
different models to investigate them. Following Gates et al. (2005) we define a
political regime along three dimensions, Constraints on the Executive, Participation,
and Recruitment of the Executive. Therefore, a regime change can happen in several
directions, and is multi-dimensional by nature. This is in stark contrast to the onset of
a civil war, which we view as a one-dimensional dichotomous event. We will base
these preliminary analyses on two models which already exist in the literature, and
add our variables to these studies.
We base our analysis of civil war onset on Collier-Höffler model (Collier &
Höffler, 2002), which is based on observations of onset within five-year periods. This
model is interesting for our study, since it includes a measure for polarization and it is
based on fairly long observation intervals. Collier & Höffler (2002) do not find that
polarization poses a danger for conflict, which in itself is not contrary to our
hypothesis. Our test is to see whether the CH model will report a positive relationship
between polarization and conflict if the growth rate of either of the major groups in
that society is uneven.
We believe that the conflict onset most likely will take place within the same
five-year period as the census data are released, Since census data have a tendency to
be recorded in the first year of a decade, the likelihood of an inverse causation is
comparably low.
14
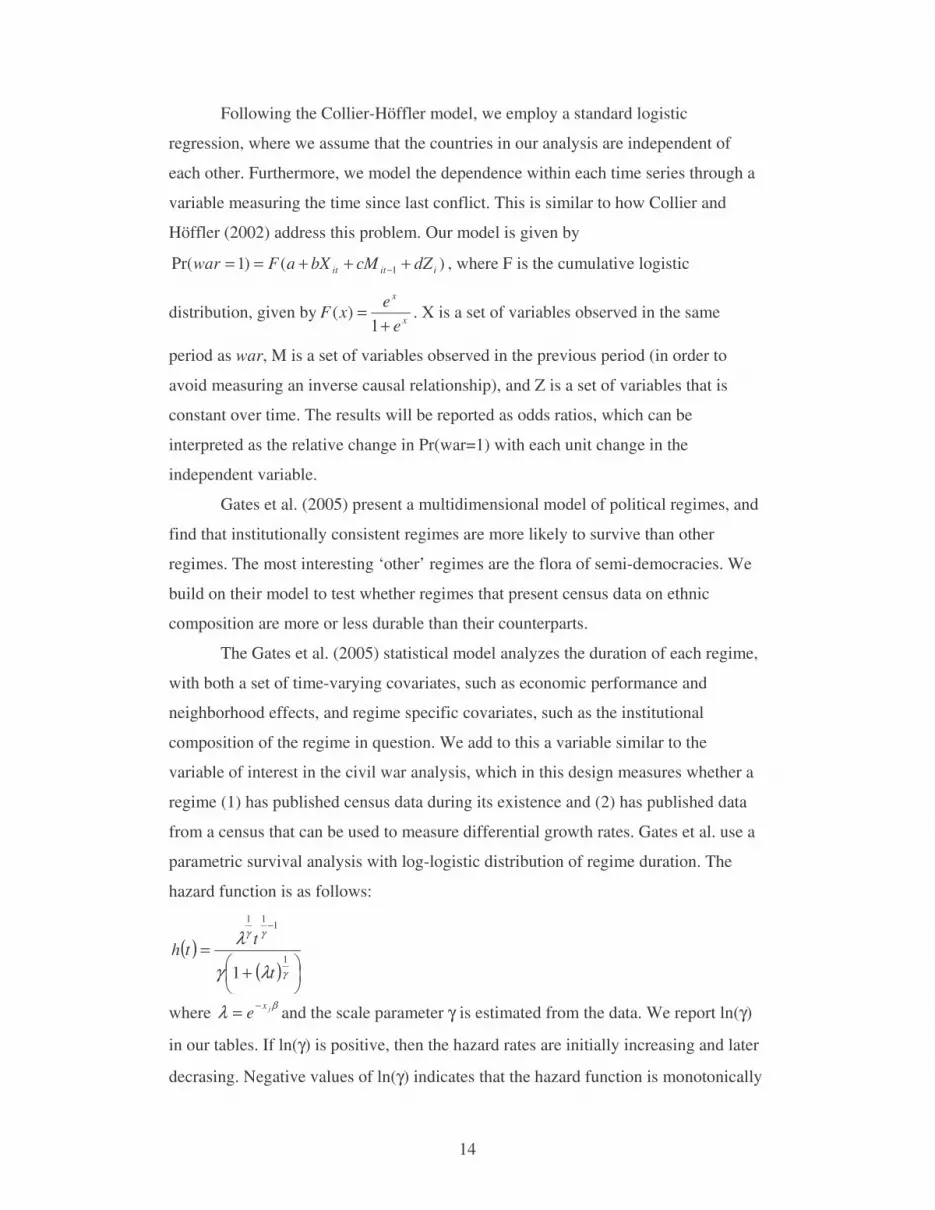
Following the Collier-Höffler model, we employ a standard logistic
regression, where we assume that the countries in our analysis are independent of
each other. Furthermore, we model the dependence within each time series through a
variable measuring the time since last conflict. This is similar to how Collier and
Höffler (2002) address this problem. Our model is given by
)()1Pr( 1 iitit dZcMbXaFwar +++== − , where F is the cumulative logistic
distribution, given byx
x
e
exF
+=
1)( . X is a set of variables observed in the same
period as war, M is a set of variables observed in the previous period (in order to
avoid measuring an inverse causal relationship), and Z is a set of variables that is
constant over time. The results will be reported as odds ratios, which can be
interpreted as the relative change in Pr(war=1) with each unit change in the
independent variable.
Gates et al. (2005) present a multidimensional model of political regimes, and
find that institutionally consistent regimes are more likely to survive than other
regimes. The most interesting ‘other’ regimes are the flora of semi-democracies. We
build on their model to test whether regimes that present census data on ethnic
composition are more or less durable than their counterparts.
The Gates et al. (2005) statistical model analyzes the duration of each regime,
with both a set of time-varying covariates, such as economic performance and
neighborhood effects, and regime specific covariates, such as the institutional
composition of the regime in question. We add to this a variable similar to the
variable of interest in the civil war analysis, which in this design measures whether a
regime (1) has published census data during its existence and (2) has published data
from a census that can be used to measure differential growth rates. Gates et al. use a
parametric survival analysis with log-logistic distribution of regime duration. The
hazard function is as follows:
( )( )
+
=
−
γ
γγ
λγ
λ1
111
1 t
tth
where β
λ jxe
−= and the scale parameter γ is estimated from the data. We report ln(γ)
in our tables. If ln(γ) is positive, then the hazard rates are initially increasing and later
decrasing. Negative values of ln(γ) indicates that the hazard function is monotonically
15
decreasing, which is an indication that political regimes become more stable over
time.
We report our results as time ratios. These ratios tell us how many times
longer or shorter the median regime is expected to last given one unit increase in an
independent variable. Our variables of interest are dummy variables, which eases
interpretation of the time ratios.
4.0 Results
The civil war analysis reveals some interesting results. Model 1 in Table I is the
Collier-Höffler model, our point of departure. In Model 2 we add dummy variables
for whether no census has been held for ten years, and for whether a census has been
held and identity data has been published. These dummies represent Type 4 and Type
2 in Figure 1. The combined category consisting of Types 1 and 3 is the reference
category in our analysis. Model 2 seems to support a claim that there is no difference
between our categories with regard to civil war onset. Both categories are
insignificant and the change in Log-likelihood is insignificant. However, when we
separate the analysis between semi-democracies on the one hand and consistent
democracies and autocracies on the other hand, we find interesting results.
- Table I here -
Following Strand (2005), we find that there is not significant difference
between rich and poor semi-democracies with regard to economic development.
Furthermore, the cold war dummy is significant, which probably reflects the last part
of the third wave of democratization. For us, the most interesting difference between
Model 3 and 4 is that the signs change with respect to the analyses of census
influence. In Model 3, which is based on consistent regimes, countries that do not
hold censuses are at greater risk of experiencing civil war than countries that have
performed a census within the last decade. There is no significant difference between
those countries that publish identity data and those that do not. For the inconsistent
regimes in Model 4, the picture is the opposite: the ones that do not collect census
information at all are most peaceful, albeit the difference is only borderline
significant. The difference between Types 3 and 1, and Type 2 is negative in this
model, but again far from significant.

16
Table II: Predicted mean pr(war) for each category:
Type 1+3 Type 2 Type 4
Semidemocracies 13.2 % 14.0 % 6.3 %
Consistent regimes 3.5 % 6.5 % 8.5 %
The mean of the predicted probabilities in each cell indicate two very different
patterns. Among semi-democratic countries, those regimes that do not gather census
data at all are more than twice as peaceful as the other categories. It does not seem to
make a difference whether a census is published with or without indicators of
differential growth. On the other hand, among consistent and predictably stable
regimes, there is seemingly a pattern, where the regimes that do not gather census data
are more at risk than those who do gather such data. Furthermore, those regimes that
publish data on differential growth are slightly more at risk than the Type 1+3
category. However, these differences are rather small and their importance should not
be over exaggerated.
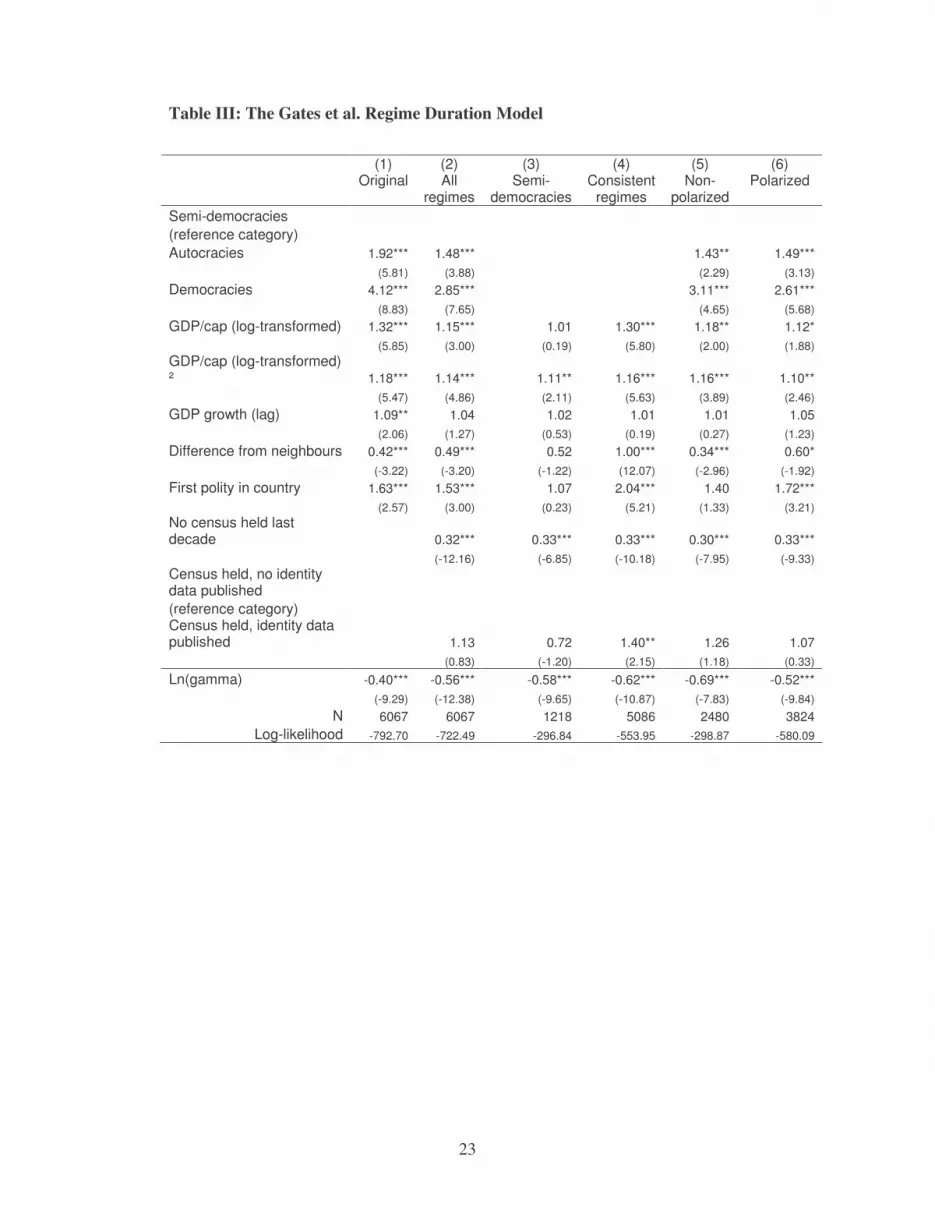
- Table III here -
The results from the duration analysis are less dramatic. The most inspiring
result is that adding the census categories to the Gates et al. model is a real
improvement, since the log-likelihood value is almost 9% lower in model 2 compared
with model 1. Compared with regimes that do not publish census data at all, regimes
that publish census data with or without identity are between three and four times
more likely to survive. Regimes that publish identity data with the census results are
more likely to survive than regimes publishing census data without identity, but only
by a very small fraction.
Model 3 and 4 compare semi-democracies (3) with consistent regimes (4). We
find the same results, but there are some interesting differences. The difference
between Type 2-regimes and the joint Type 1+3 category is much smaller for semi-
democratic regimes, and semi-democracies that do not publish identity information
are more likely to survive than regimes that do. On the other hand, consistent regimes
are significantly more stable if they publishing identity information than not. Regimes
in the Type 2-category are predicted to last 40% longer than the Type 1+3 regimes.
17
All regimes that collect census data are, as predicted, very much more likely to
survive than regimes which do not collect census data.
Models 5 and 6 compare ethnically non-polarized countries (5) with polarized
countries (6). We find the same pattern here as we do when we compared Models 3
and 4. There is no significant difference between different regimes that collect census
data, but all of these regimes are much more stable than the regimes which do not
publish data.
The results from the duration analysis indicate that publishing data on
differential growth is at least not harmful, except perhaps for semi-democratic
countries. In four of our five models, the regimes which publish such data are
estimated to be more durable than the regimes which do not. Among regimes that are
predicted to be fairly stable, pure democracies and pure autocracies, the difference is
in fact significant.
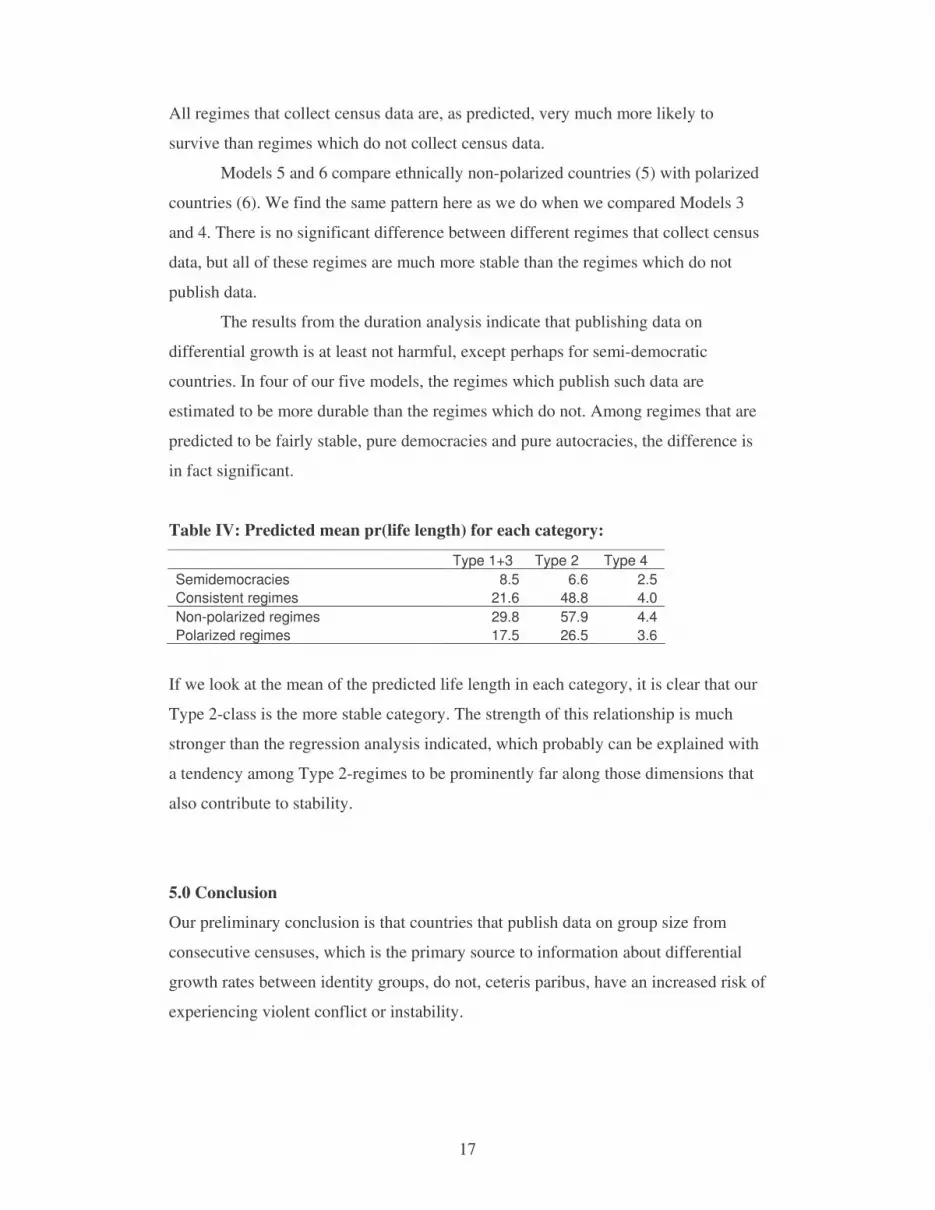
Table IV: Predicted mean pr(life length) for each category:
Type 1+3 Type 2 Type 4
Semidemocracies 8.5 6.6 2.5
Consistent regimes 21.6 48.8 4.0
Non-polarized regimes 29.8 57.9 4.4
Polarized regimes 17.5 26.5 3.6
If we look at the mean of the predicted life length in each category, it is clear that our
Type 2-class is the more stable category. The strength of this relationship is much
stronger than the regression analysis indicated, which probably can be explained with
a tendency among Type 2-regimes to be prominently far along those dimensions that
also contribute to stability.
5.0 Conclusion
Our preliminary conclusion is that countries that publish data on group size from
consecutive censuses, which is the primary source to information about differential
growth rates between identity groups, do not, ceteris paribus, have an increased risk of
experiencing violent conflict or instability.
18
6.0 References
Anderson, Benedict, 1992. Imagined Communities. Revised Version. London & New
York: Verso.
Baaklini, Abdo I., 1983. ’Ethnicity and Politics in Contemporary Lebanon’, in
William C. McCready, ed., Culture, Ethnicity, and Identity. New York: Academic
Press (17–56).
Besançon, Marie L., 2005. ‘Relative Resources: Inequality in Ethnic Wars,
Revolutions, and Genocides’, Journal of Peace Research 42(4): forthcoming.
Bookman, Milica Zarkovic, 2002. ‘Demographic Engineering and the Struggle for
Power’, Journal of International Affairs 56(1): 25–51.
Brown, Michael E., 2001. ‘The Causes of Internal Conflict: An Overview’, in Michael
E. Brown et al., eds, Nationalism and Ethnic Conflict. Cambridge, MA & London:
MIT Press (3–25).
Collier, Paul & Anke Höffler, 2002. ‘On the Incidence of Civil War in Africa’.
Journal of Conflict Resolution 46:13-28.
DeVotta, Neil, 2002. ‘Demography and Communalism in India’, Journal of
International Affairs 56(1): 53–70.
Ellingsen, Tanja, 2000. ‘Colorful Community or Ethnic Witches' Brew?
Multiethnicity and Domestic Conflict During and After the Cold War’, Journal of
Conflict Resolution 44(2): 228–249.
Fearon, James D. & David D. Laitin, 2003. ‘Ethnicity, Insurgency, and Civil War’,
American Political Science Review 97(1): 75–90.
Gates, Scott; Håvard Hegre; Mark P. Jones & Håvard Strand, 2005. ‘Institutional
Inconsistency and Political Instability: Persistence and Change in Political Systems
Revisited, 1800-1998’. Mimeo: The International Peace Research Institute, Oslo
(PRIO).
Goldstone, Jack A., 2002. ‘Population and Security: How Demographic Change Can
Lead to Violent Conflict’, Journal of International Affairs 56(1): 3–21.

19
Guelke, Adrian, 2004. ‘Conclusion: Democracy and Ethnic Conflict’, in Adrian
Guelke, ed., Democracy and Ethnic Conflict: Advancing Peace in Deeply Divided
Societies. Houndmills, Basingstoke: Palgrave Macmillan (239–251).
Hegre, Håvard; Tanja Ellingsen, Scott Gates & Nils Petter Gleditsch, 2001. ‘Toward a
Democratic Civil Peace? Democracy, Political Change, and Civil War, 1816–1992’,
American Political Science Review 95(1): 33–48
Henderson, Errol A. & J. David Singer, 2000. ‘Civil War in the Post-Colonial World,
1946–92’, Journal of Peace Research 37(3): 275–299.
Horowitz, Donald L., 1985. Ethnic Groups in Conflict. Berkeley, CA: University of
California Press.
Horowitz, Donald L., 1994. ‘Democracy in Divided Societies’ in Larry Diamond &
Marc F. Plattner, eds, Nationalism, Ethnic Conflict, and Democracy. Baltimore, MD:
John Hopkins University Press (35–55).
Horowitz, Donald L., 2001. The Deadly Ethnic Riot. Berkeley, CA: University of
California Press.
Kertzer, David I. & Dominique Arel, 2002. ‘Censuses, Identity Formation, and the
Struggle for Political Power’, in David I. Kertzer & Dominique Arel, eds, Census and
Identity: The Politics of Race, Ethnicity, and Language in National Censuses.
London: Cambridge University Press (1–42).
Krebs, Ronald R. & Jack S. Levy, 2001. ‘Demographic Change and the Sources of
International Conflict’, in Myron Weiner & Sharon S. Russel, eds, Demography and
National Security. New York/Oxford: Berghahn (62–105).
Lake, David & Donald Rotchild, 2001. ‘Containing Fear: The Origins and
Management of Ethnic Conflict’, in Michael E. Brown et al., eds, Nationalism and
Ethnic Conflict. Cambridge, MA & London: MIT Press (126–160).
Lapidoth, Ruth, 1996. Autonomy: Flexible Solutions to Ethnic Conflicts. Washington,
DC: United States Institute of Peace Press.
Nobles, Melissa, 2002. ‘Racial Categorization and Censuses’, in David I. Kertzer &
Dominique Arel, eds, Census and Identity: The Politics of Race, Ethnicity, and
Language in National Censuses. London: Cambridge University Press (43–70).
20
Przeworski, Adam, 1991. Democracy and the Market: Political and Economic
Reforms in Eastern Europe and Latin America. Cambridge : Cambridge University
Press.
Sambanis, Nicholas, 2001. ‘Do Ethnic and Nonethnic Civil Wars Have the Same
Causes? A Theoretical and Empirical Inquiry (part 1)’, Journal of Conflict Resolution
45(3): 259–282.
Smith, Anthony S., 1998. Nationalism and Modernism. London & New York:
Routledge.
Strand, Håvard, 2005. A Theory of Democratic Elections and Armed Conflict Onset.
Paper presented to the Annual National Conference in Political Science.
Thernstrom, Abigail, 1987. ‘Statistics and the Politics of Minority Representation:
The Evolution of the Voting Rights Act Since 1965’, in William Alonso & Paul Starr,
eds, The Politics of Numbers. New York: Russel Sage Foundation (303–327).
Toft, Monica Duffy, 2002. ‘Differential Demographic Growth in Multinational States:
Israel’s Two-Front War’, Journal of International Affairs 56(1): 71–94.
Urdal, Henrik, 2001. ‘Nasjoner som kategorier. En analyse av folketellingene i
Bosnia-Hercegovina’ [Nations as Categories: An Analusis of the Censuses in Bosnia-
Herzegovina], Tidsskrift for Samfunnsforskning 42(4): 571-589.
Uvin, Peter, 2002. ‘On Counting, Categorizing, and Violence in Burundi and
Rwanda’, in David I. Kertzer & Dominique Arel, eds, Census and Identity: The
Politics of Race, Ethnicity, and Language in National Censuses. London: Cambridge
University Press (148–175).
Weiner, Myron & Sharon S. Russel, eds, 2001. Demography and National Security.
New York/Oxford: Berghahn.
Weiner, Myron & Michael S. Teitelbaum, 2001. Political Demography, Demographic
Engineering. New York/Oxford: Berghahn.
Wimmer, Andreas, 2002. Nationalist Exclusion and Ethnic Conflict: Shadows of
Modernity. Cambridge, UK: Cambridge University Press.
Wriggins, W. Howard & James F. Guyot, 1973. ‘Demographic Change and Politics:
An Introduction’ in W. Howard Wriggins & James F. Guyot, eds, Population,
21
Politics, and the Future of Southern Asia. New York & London: Columbia University
Press (1–32).

22
Table I: The Collier-Höffler Civil War Model
(1) Original
(2) All
regimes
(3) Consistent
regimes
(4) Semi-
democracies
Primary Commodity Exports/GDP 21.55*** 21.93*** 23.77*** 13.86
(3.36) (3.40) (2.93) (0.97)
(Primary Commodity Exports/GDP)² -32.16*** -32.75*** -38.72** -12.54
(-2.57) (-2.60) (-2.40) (-0.55)
Cold War Period -0.37 -0.30 0.29 -2.33*
(-0.80) (-0.63) (0.54) (-1.66)
Male Sec. Schooling -0.0056 -0.0046 -0.0099 0.017
(-0.42) (-0.34) (-0.59) (0.45)
GDP/cap (log-transformed) -0.93** -0.93** -0.92** -0.70
(-2.45) (-2.44) (-2.05) (-0.61)
GDP growth (t-1) -0.11** -0.10** -0.10** -0.24
(-2.33) (-2.24) (-2.03) (-1.41)
Peace Duration -0.0032*** -0.0032*** -0.0041*** -0.0015
(-2.78) (-2.75) (-2.96) (-0.44)
Mountainous Terrain 0.011 0.012 0.0092 -0.0022
(1.22) (1.26) (0.84) (-0.07)
Geographic Dispersion -2.53** -2.51** -3.14** -3.97
(-2.21) (-2.19) (-2.26) (-1.21)
Population (log-transformed) 0.69*** 0.68*** 0.72*** 0.98*
(3.92) (3.86) (3.41) (1.89)
Social Fractionalization -0.00020 -0.00020 -0.00029 0.00049
(-0.63) (-0.65) (-0.75) (0.32)
Ethnic Fractionalization 0.0039 0.0046 -0.00050 0.064
(0.28) (0.33) (-0.03) (0.99)
Religious Fractionalization -0.014 -0.014 -0.018 -0.053
(-0.73) (-0.75) (-0.79) (-0.46)
Polarization 3.78 3.17 5.19 22.37
(0.69) (0.57) (0.75) (0.95)
Constant -6.21 -6.34 -6.50 -16.21
(-1.58) (-1.60) (-1.41) (-1.11)
Census held, no identity data published (reference category)
No census held last decade 0.34 0.96** -1.72*
(0.90) (1.99) (-1.70)
Census held, identity data published 0.57 0.58 -0.84
(0.82) (0.60) (-0.68)
N 689 689 571 118
Log-likelihood -124.72 -124.17 -89.28 -22.82
23
Table III: The Gates et al. Regime Duration Model
(1) Original
(2) All
regimes
(3) Semi-
democracies
(4) Consistent
regimes
(5) Non-
polarized
(6) Polarized
Semi-democracies
(reference category)
Autocracies 1.92*** 1.48*** 1.43** 1.49***
(5.81) (3.88) (2.29) (3.13)
Democracies 4.12*** 2.85*** 3.11*** 2.61***
(8.83) (7.65) (4.65) (5.68)
GDP/cap (log-transformed) 1.32*** 1.15*** 1.01 1.30*** 1.18** 1.12*
(5.85) (3.00) (0.19) (5.80) (2.00) (1.88)
GDP/cap (log-transformed) ² 1.18*** 1.14*** 1.11** 1.16*** 1.16*** 1.10**
(5.47) (4.86) (2.11) (5.63) (3.89) (2.46)
GDP growth (lag) 1.09** 1.04 1.02 1.01 1.01 1.05
(2.06) (1.27) (0.53) (0.19) (0.27) (1.23)
Difference from neighbours 0.42*** 0.49*** 0.52 1.00*** 0.34*** 0.60*
(-3.22) (-3.20) (-1.22) (12.07) (-2.96) (-1.92)
First polity in country 1.63*** 1.53*** 1.07 2.04*** 1.40 1.72***
(2.57) (3.00) (0.23) (5.21) (1.33) (3.21)
No census held last decade 0.32*** 0.33*** 0.33*** 0.30*** 0.33***
(-12.16) (-6.85) (-10.18) (-7.95) (-9.33)
Census held, no identity data published
(reference category)
Census held, identity data published 1.13 0.72 1.40** 1.26 1.07
(0.83) (-1.20) (2.15) (1.18) (0.33)
Ln(gamma) -0.40*** -0.56*** -0.58*** -0.62*** -0.69*** -0.52***
(-9.29) (-12.38) (-9.65) (-10.87) (-7.83) (-9.84)
N 6067 6067 1218 5086 2480 3824
Log-likelihood -792.70 -722.49 -296.84 -553.95 -298.87 -580.09
24
Appendix 1:
United States of America 1951 3
United States of America 1971 6
Canada 1971 3
Canada 1976 2
Canada 1981 8
Canada 1986 5 Trinidad and
Tobago 1946 2 Trinidad and
Tobago 1970 10 Trinidad and
Tobago 1980 3
Barbados 1970 29
Barbados 1980 1
St. Lucia 1980 6
Mexico 1970 6
Guyana 1970 18
Guyana 1980 1
Peru 1981 18
Brazil 1980 20
Paraguay 1962 11
Paraguay 1982 6
Liechtenstein 1981 9
Switzerland 1960 2
Switzerland 1970 3
Switzerland 1980 6
Portugal 1981 14 German Federal
Republic 1970 3
Austria 1961 1
Austria 1971 1
Austria 1981 5
Czechoslovakia 1980 3
Yugoslavia 1971 2
Yugoslavia 1981 2
Romania 1966 2
USSR 1979 5
Finland 1970 4
Finland 1985 2
Norway 1970 5
Norway 1980 8

25
Nigeria 1963 7 Congo, People's
Republic 1974 65
Kenya 1962 90
Kenya 1969 1
Rwanda 1978 21
Angola 1960 4
Angola 1970 3 Northern
Rhodesia 1963 2
Zambia 1969 2
Rhodesia 1969 24
Zimbabwe 1982 1 South
Africa 1970 3 South
Africa 1980 3 South
Africa 1985 2
Swaziland 1966 1
Mauritius 1962 2
Mauritius 1972 13
Mauritius 1983 14
Algeria 1966 6
Libya 1973 5
Turkey 1950 2
Turkey 1960 4
Turkey 1965 1 United Arab
Republic 1966 2
Egypt 1976 2
Israel 1983 29 Aden and the
Protectorate of S 1955 9
Kuwait 1970 1
Bahrain 1981 15 United Arab
Emirates 1975 11
India 1961 2
India 1971 3
India 1981 2
Bangladesh 1981 3
Ceylon 1953 1
Ceylon 1963 3
Ceylon 1971 2
Sri Lanka 1981 5
Nepal 1981 7
Thailand 1970 1
Malaysia 1980 12
Singapore 1970 5
1980 1
26
Singapore
Philippines 1975 6 New
Zealand 1951 1 New
Zealand 1966 3 New
Zealand 1971 1 New
Zealand 1976 5
Fiji 1966 7
Fiji 1976 2
Fiji 1986 4