Embed Size (px)
Citation preview

Differential development of high-level visual cortexcorrelates with category-specific recognition memory
Golijeh Golarai1,4, Dara G Ghahremani1,2, S Whitfield-Gabrieli1,3, Allan Reiss4,5, Jennifer L Eberhardt1,John D E Gabrieli1,3 & Kalanit Grill-Spector1,5
High-level visual cortex in humans includes functionally defined regions that preferentially respond to objects, faces and places. It
is unknown how these regions develop and whether their development relates to recognition memory. We used functional magnetic
resonance imaging to examine the development of several functionally defined regions including object (lateral occipital complex,
LOC)-, face (‘fusiform face area’, FFA; superior temporal sulcus, STS)- and place (‘parahippocampal place area’, PPA)-selective
cortices in children (ages 7–11), adolescents (12–16) and adults. Right FFA and left PPA volumes were substantially larger in
adults than in children. This development occurred by expansion of FFA and PPA into surrounding cortex and was correlated
with improved recognition memory for faces and places, respectively. In contrast, LOC and STS volumes and object-recognition
memory remained constant across ages. Thus, the ventral stream undergoes a prolonged maturation that varies temporally across
functional regions, is determined by brain region rather than stimulus category, and is correlated with the development of
category-specific recognition memory.
Functional magnetic resonance imaging (fMRI) studies of humanoccipitotemporal cortex have revealed a consistent organization thatis characterized by regions that preferentially respond to differenttypes of visual stimuli. These regions include the LOC, which respondsmore to a wide range of objects than to scrambled images1; a regionin the fusiform gyrus, the FFA, which responds more to faces than toother objects or scenes2 and is involved in face perception3,4 andmemory5–7; and a region in the parahippocampal gyrus (PHG), thePPA8, which responds more to scenes than to faces or objects and isinvolved in scene memory7,9,10. Discovery of these functionally definedregions has generated debate about the nature of functional specializa-tion in the ventral visual stream and the role of experience in shapingit11–14. Despite a plethora of research, surprisingly little is knownabout how these regions develop in the human ventral stream, orhow their development relates to proficiency in object, face or scenerecognition memory.
Here, we used fMRI to examine the development of the LOC, FFAand PPA from age 7 to young adulthood, relating brain development torecognition-memory ability for objects, faces and scenes. We consid-ered three hypotheses regarding the development of functional regionsin the ventral stream. First, these regions may develop early. Accord-ingly, specialized face processing is evident from early infancy15–17.Second, extensive experience with objects, faces and scenes may benecessary for the development of these cortical regions18,19. Indeed,face-recognition memory reaches adult levels late in development,
around age 16 (refs. 20,21). Thus, the entire ventral stream mayapproach maturity only in adolescence, in tandem with recognition-memory proficiency. Third, there may be distinct developmentaltrajectories, in which more category-selective regions such as the FFAand PPA may mature later than less category-selective regions such asthe LOC. Furthermore, it is important to determine whether the timingof development is specific to visual categories or cortical regions. Forexample, do face-selective responses in the STS develop in tandem withthe FFA or differentially?
We also asked how the development of these regions manifests infMRI measurements. One possibility is that the spatial extent of theLOC, FFA and PPA is similar in adults and children. Maturationand experience-dependent gains in perceptual proficiency andmemory may be reflected in the response amplitude to objects, facesor scenes. Indeed, adult FFA response amplitudes vary with subjectiveperception and subsequent memory for faces3–7. A second possibilityis that selectivity in the ventral cortex emerges slowly during child-hood with accumulated experience. This hypothesis predicts smallerselective regions in children (as compared with adults) that increasein size with age and improved perceptual skills, analogous to theexpansion of somatosensory representations with training22. A thirdpossibility is that weaker visual proficiency in children is associatedwith a larger spatial extent of activation and less efficient processingin children than in adults. Thus, experience may lead to more focaland selective regions for processing specific stimuli in adults, analogous
Received 26 December 2006; accepted 6 February 2007; published online 11 March 2007; doi:10.1038/nn1865
1Department of Psychology, Jordan Hall (Bldg. 420), Stanford University, Stanford, California 94305-2130, USA. 2Department of Psychology, Franz Hall, University ofCalifornia, Los Angeles, Los Angeles, CA 90095-1563, USA. 3Harvard-MIT Division of Health Sciences and Technology (HST) and Department of Brain and CognitiveSciences, Massachusetts Institute of Technology, 77 Massachusetts Avenue, Building 46-4033, Cambridge, Massachusetts 02139, USA. 4Department of Psychiatry andBehavioral Sciences, Stanford University School of Medicine, 401 Quary, Stanford, California 94305-5722, USA. 5Program in Neuroscience, Stanford University, Stanford,California 94305-2130, USA. Correspondence should be addressed to G.G. ([email protected]).
512 VOLUME 10 [ NUMBER 4 [ APRIL 2007 NATURE NEUROSCIENCE
ART ICLES©
2007
Nat
ure
Pub
lishi
ng G
roup
ht
tp://
ww
w.n
atur
e.co
m/n
atur
eneu
rosc
ienc
e

to greater activation of primary auditory cortex in non-musicians thanin musicians23.
None of these possibilities has yet been eliminated, as the fewimaging studies of occipitotemporal cortex development vary in theirfindings. A PET study found greater responses to faces than to geo-metric shapes in the ventral occipitotemporal cortex of 2-month-old
infants24, but other studies have reported the absence of face-selectiveresponses (relative to objects or houses) in the fusiform gyri of children5–8- (ref. 25) and 8–10-years old (ref. 26). These studies did not localizethe LOC or PPA or relate cortical maturation to recognition-memoryimprovements. Furthermore, these studies did not consider possibleconfounds in comparing activations across age groups—including age-related differences in anatomical size (for example, the fusiform gyrus)or in blood oxygenation level–dependent (BOLD) signals that indexneural activity in fMRI.
To characterize the development of cortical specialization for faces,places and objects, we used a combination of fMRI and behavioralmethods with children (ages 7–11), adolescents (ages 12–16) andadults. In Experiment 1, we performed fMRI while subjects viewedblocks of faces, scenes, abstract sculptures and textures. For eachindividual, we functionally defined the FFA, STS, LOC and PPA. Weexamined the relation between age and the spatial extent, magnitudeand selectivity of activations in these regions, while controlling forpossible age-related confounds. In Experiment 2, we measured recog-nition memory for faces, novel objects and scenes in the same subjectsoutside the scanner, and related recognition-memory performance tothe fMRI results.
RESULTS
FMRI of face-, object- and place-selective cortex
In Experiment 1 during fMRI, subjects viewed blocks of images of faces,abstract sculptures, scenes and textures (created by scrambling objectimages, Fig. 1), and pressed a button when an image was presentedtwice successively (14% of images, occurring randomly). Accuracy was
a
b
100
80
60
Per
cent
age
accu
racy
Res
pons
e tim
e (m
s)
40
20
0
200
400
600
800
1,000
0
7–11-year-olds 12–16-year-olds Adults
Figure 1 Behavioral data during scan. Accuracy (a) and response times
(b) in a one-back task during the scan, for faces, abstract sculptures,
scenes and textures (scrambled objects). Light gray, children ages 7–11;
dark gray, children ages 12–16; black, adults. Error bars show s.e.m. for
each age group.
a b
>P < 10–3
Adult
Child(8.8-year–old)
FFA size
Mid-fusiform gyrus (mFG) size
Total activated voxels in mFG
Left
3,000
Vol
ume
(mm
3 )V
olum
e (m
m3 )
No.
of v
oxel
s
2,000
1,000
0
2,000
4,000
6,000
8,000
0
10
20
30
40
01 2 3 4
–Log (P) –Log (P)5 6 1 2 3 4 5 6
10
20
30
40
0
2,000
4,000
6,000
8,000
0
3,000
2,000
1,000
0
Right
*
c
d
e
7–11-year-olds12–16-year-oldsAdults
7–11-year-olds12–16-year-oldsAdults
Matched
Figure 2 Face-selective activations in the fusiform gyrus as a function of age. (a) The FFA
was defined as faces 4 objects (P o 10–3, uncorrected). Blue lines point to the rFFA in
coronal, sagittal and horizontal views from a representative adult subject. (b) Same as a, but
data are from a representative 8.8-year-old child. (c) Left, lFFA volume; right, rFFA volume.
Bars show the volume of the FFA, as defined in (a,b), averaged across 20 children aged
7–11 (light gray), 10 adolescents aged 12–16 (dark gray) and 15 adults (black). Error bars
show group s.e.m. Red bars show data from groups that were matched for BOLD-related
confounds (Supplementary Note 1), and include 10 children, 9 adolescents and 13 adults.
* Children o adults; P o 0.02. (d) The volume of anatomically defined mFG. Bars
represent data as in c. (e) The total number of face-selective voxels (faces 4 objects) within
the anatomically defined left or right mFG (anatomical ROIs in d), regardless of contiguity,
were plotted against the minus logarithm (base 10) of six statistical thresholds (10–1 to10–6, uncorrected) for a subset of subjects, who were matched for BOLD-related confounds
in mFG in each age group. Circles, children (ages 7–11, n ¼ 10); squares, adolescents
(ages 12–16, n ¼ 9); triangles, adults (n ¼ 13). Error bars show s.e.m for each age group.
NATURE NEUROSCIENCE VOLUME 10 [ NUMBER 4 [ APRIL 2007 513
ART ICLES©
2007
Nat
ure
Pub
lishi
ng G
roup
ht
tp://
ww
w.n
atur
e.co
m/n
atur
eneu
rosc
ienc
e

high during this ‘one-back’ task (490%) across age groups and imagecategories (Fig. 1a), showing no significant effects of age (F2,42 ¼ 0.29,P¼ 0.74), age � image-category interaction (F4,84 ¼ 0.51, P¼ 0.61) orimage category (excluding textures, F2,42 ¼ 0.14, P ¼ 0.7). Responsetimes were longer for children (ages 7–11) than for adolescents(ages 12 –16, t28 ¼ 4.6, P o 0.0001) or adults (t33 ¼ 5.67,P o 0.0001; Fig. 1b). Response times showed no significant effectsof image category (F3,84 ¼ 0.09, P ¼ 0.8) and no interactions betweenage and image category (F6,126 ¼ 0.91, P ¼ 0.4).
Smaller fusiform face area (FFA) in children than adults
The FFA was defined in each subject as a contiguous cluster of voxelspeaking in the fusiform gyrus that responded more to faces than toobjects (Po 10–3, uncorrected, Fig. 2a,b). The FFA was detected morereliably in adults (right FFA: rFFA, 15/15 subjects; left FFA: lFFA, 14/15)and adolescents (rFFA, 10/10; lFFA, 8/10) than in children (rFFA, 17/20; lFFA, 14/20). The rFFA increased in size with age (F2,42 ¼ 5.63,P o 0.007), and was 3.3-fold larger in adults than in children(t33 ¼ 3.34, P o 0.002; Fig. 2c). There were nonsignificant trendstoward larger rFFA size in adults than in adolescents (t23 ¼ 1.72,P ¼ 0.09, one-tailed) and larger lFFA size in adults compared withchildren (t33 ¼ 1.98 P ¼ 0.07, one-tailed; Fig. 2c).
These results may indicate age-dependent differences in corticalselectivity for faces. Alternatively, they may reflect any combinationof the following in children: (i) larger BOLD-related confounds27,28,(ii) smaller anatomical size of the fusiform gyrus, (iii) less clustering of
face selective voxels in the fusiform gyrus and (iv) lower responseamplitudes. We examined each of these alternatives.
In each subject, we quantified several BOLD-related confounds:subject motion, BOLD fluctuations during baseline (%cv_BOLD)and residual error (%Res) from the general linear model (GLM,Methods and Supplementary Note 1 online). Higher BOLD-relatedconfounds in children could potentially compromise the detection ofselective voxels using the GLM. In general, BOLD-related confoundswere higher in children than in adults, but only %cv_BOLD in the leftmid fusiform gyrus (mFG) and subject motion were significantlyhigher in children than in adults (Supplementary Table 1 online).
To test whether children’s smaller rFFAs were due to between-groupdifferences in BOLD-related confounds, we compared rFFA size acrossa subset of subjects that were matched across age groups for theseconfounds (Supplementary Note 1 and Supplementary Table 1). Inthis subset of subjects, the rFFA was significantly larger in adults than inchildren (t21 ¼ 2.41, P o 0.02; Fig. 2c). Thus, the smaller rFFA inchildren was not due to BOLD-related confounds.
There were no significant differences across age groups in wholebrain volumes (F2,42 ¼ 1.16, P ¼ 0.32, data not shown) or volume ofthe right or left mFG (Fig. 2d), despite a trend toward larger averagemFG size in children than in adults (right mFG: t33 ¼ 1.50, P ¼ 0.07,one-tailed; left mFG: t33 ¼ 1.50, P ¼ 0.09 one-tailed).
We also examined whether children’s smaller rFFAs reflected lessclustering of face-selective voxels by counting, regardless of contiguity,the number of voxels in the mFG that activated more strongly for faces
lFFAa b
c d
e
1.2
0.9
0.6
Per
cent
age
sign
al c
hang
eFa
ce s
elec
tivity
Per
cent
age
sign
al c
hang
e
0.3
0.0
–0.2
ROI 1P
ROI
ROI 5
*
1P3P Child Adult Adult150%
23P23 4
Child3 45
150%5 7 86
0.0
0.2
0.4
0.6
–0.2
0.0
0.2
0.4
0.6
0.0
0.2
0.4
0.6
0.8
1.0
1.2
0.9
0.6
0.3
0.0
rFFA
7–11-year-olds12–16-year-oldsAdults
7–11-year-olds12–16-year-oldsAdults
Matched
Figure 3 BOLD response amplitudes in the FFA
and face selectivity. (a,b) Percent BOLD signals
relative to fixation background for each image
category and age-group in the left (a) and right (b)
hemisphere. Bars represent data as in Figures 1
and 2. (c,d) Average face selectivity (face –
object)/(face + object), is plotted for age groups
matched for BOLD-related confounds(Supplementary Note 1) in the left (c) and right
hemisphere (d). Positive values along the y-axis
indicate preference for faces, negative values
preference for objects. Circles, children (ages
7–11); squares, adolescents (ages 12–16);
triangles, adults. Error bars show group s.e.m.
(c) Average face selectivity in a series of
concentric ROIs (constant-sized across subjects)
in the left hemisphere: P, voxel with the highest
t-value for faces 4 objects in mFG (lFFA peak);
3P, similarly, three contiguous voxels with the
highest t-values. Three spherical ROIs were
centered at the lFFA peak in each subject, and
sized to match the group average lFFA size in
children (Child), adults (Adult) and 150% of the
average lFFA size in adults (150%). (d) Average
face selectivity in a series of concentric spherical
ROIs (P, 3P, Child, Adult and 150%) were defined
as in (c), but centered on the rFFA peak. Threeadditional concentric shell ROIs were created as
the region in Child excluding 3P (ROI 3), Adult
excluding Child (ROI 5) and 150% excluding
Adult (ROI 7). Yellow arrow: face selectivity was
significantly lower among children (n ¼ 10) than
among adults (n ¼ 13), in the shell representing
the penumbral region of the rFFA in children (ROI
5, P o 0.05). (e) Percent BOLD amplitude for
faces and objects versus fixation baseline in the
penumbral region of rFFA in children (ROI 5,
* children o adults, P o 0.05). Data are
presented as in (a). Error bars show group s.e.m.
514 VOLUME 10 [ NUMBER 4 [ APRIL 2007 NATURE NEUROSCIENCE
ART ICLES©
2007
Nat
ure
Pub
lishi
ng G
roup
ht
tp://
ww
w.n
atur
e.co
m/n
atur
eneu
rosc
ienc
e

than for objects, at six different thresholds (10–6 o P o 10–1,uncorrected). The number of face-selective voxels in the right mFGwas lower in children than in adults at every threshold tested (subjectsmatched for BOLD-related confounds: P o 0.05, corrected for multi-ple comparisons; Fig. 2e; all subjects P o 0.05, corrected for multiplecomparisons, data not shown).
FFA response amplitudes and selectivity
There were no significant differences in FFA response amplitudesamong age groups (rFFA: F2,39 ¼ 1.24, P ¼ 0.30; lFFA: F2,33 ¼ 0.38,P¼ 0.69) or interaction between age and stimulus type (rFFA: F6,111 ¼1.23, P ¼ 0.30; lFFA: F6,96 ¼ 0.87, P ¼ 0.43; Fig. 3a,b). Results weresimilar for subjects matched for BOLD-related confounds (amplitude,rFFA: F2,27 ¼ 0.70, P ¼ 0.50; lFFA: F2,24 ¼ 0.26, P ¼ 0.79; interactionage � stimulus type, rFFA: F6,78 ¼ 0.09, P ¼ 0.91; lFFA: F6,72 ¼ 0.91,P ¼ 0.40; Fig. 3a,b).
Our finding of a smaller rFFA in children predicts a smaller face-selective cortical region surrounding the peak of the rFFA. Accordingly,in subjects matched for BOLD-related confounds, we calculated a faceselectivity index (face – object)/(face + object) in an expanding series ofregions of interest (ROIs), from the peak FFA voxel to an ROI that was150% of the adult FFA size. We repeated this analysis by two inde-pendent methods, one using constant-sized ROIs (Methods, Fig. 3c,d)and another using shape-preserved ROIs (Methods, SupplementaryFig. 1 online). Face selectivity was significantly lower in children thanin adults in the right hemisphere in the ROI matched to the averageadult rFFA size (constant-sized: t21 ¼ 1.90, P o 0.04, one-tailed,Fig. 3d, ROI 6; shape-preserved: t21 ¼ 2.69, Po 0.012, SupplementaryFig. 1). Furthermore, in the region between the two ROIs, one matchedin size to the average child rFFA and one to the average adult rFFA, onlyadults showed face selectivity. Accordingly, face selectivity in this regionwas significantly lower in children than in adults (constant-sized:t21 ¼ 2.1, P o 0.05; Fig. 3d, ROI 5; shape-preserved: t21 ¼ 3.9,
P o 0.001; Supplementary Fig. 1). Thus, a region immediatelysurrounding the nascent rFFA in children is less selective for facesthan the corresponding region (falling in the rFFA) in adults.
Children’s lower face selectivity in this region was associated withsignificantly lower responses to faces in children than in adults(constant-sized: t21 ¼ 1.89, P o 0.04, one-tailed, Fig. 3e; shape-preserved: t21 ¼ 1.73, P o 0.05, one-tailed, Supplementary Fig. 1),but there were no between-group differences in responses to objects(t21 ¼ 0.97, P ¼ 0.3; Fig. 3e; shape-preserved: t21 ¼ 0.92, P ¼ 0.9,Supplementary Fig. 1). Thus, maturation of the rFFA involves aspecific increase in face selectivity and responsiveness in a regionimmediately surrounding children’s rFFA.
No age-related changes in the size of STS or LOC
We defined a face-selective region in each subject’s STS (faces 4objects, P o 10–3, uncorrected; Fig. 4a,b). This region was detectedin children (right STS: rSTS, 18/20; left STS: lSTS, 15/20), adolescents(rSTS: 8/10; lSTS: 8/10) and adults (rSTS: 14/15; lSTS 12/15). Unlikethe rFFA, there were no significant differences among age groups in thesize of the STS face-selective region (rSTS: F2,42 ¼ 0.55, P¼ 0.57; lSTS:F2,42 ¼ 0.07, P ¼ 0.93, Fig. 4c). Similarly, there were no differences inresponse amplitudes across age groups (rSTS: F37,2 ¼ 0.25, P ¼ 0.78;lSTS: F32,2 ¼ 0.02, P ¼ 0.97, Fig. 4d) or interaction between age andstimulus category (rSTS: F37,2 ¼ 0.10, P ¼ 0.90; lSTS: F32,2 ¼ 0.20,P ¼ 0.81). Thus, the smaller rFFA in children is not associated withgenerally smaller or less responsive face-selective regions.
The LOC was defined in each subject (objects 4 textures, Po 10–5,uncorrected, Fig. 5a,b) and was detected in children (right LOC: rLOC,20/20; left LOC: lLOC, 19/20), adolescents (rLOC: 10/10; lLOC: 9/10)and adults (rLOC: 15/15; lLOC 15/15). There were no significantdifferences between groups in LOC size (rLOC: F2,42 ¼ 0.21,P¼ 0.81; lLOC: F2,42 ¼ 0.07, P¼ 0.93, Fig. 5c) or response amplitudes(rLOC: F2,42 ¼ 0.31, P ¼ 0.73; lLOC: F2,40 ¼ 0.02, P ¼ 0.97;
>
P < 10–3
Adult
Child(8.8-year–old)
a c
db
STS size
STS signals
Left Right7–11-year-olds12–16-year-oldsAdults3,000
2,000
1,000
–0.1
0.0
0.1
0.2
0.3
0.4
0.5
–0.1
0.0
0.1
0.2
0.3
0.4
0.5
0
3,000
2,000
1,000
0
Vol
ume
(mm
3 )
Per
cent
age
sign
al c
hang
e
Figure 4 Face-selective activations in the STS as a function of age. (a) The STS was defined in the posterior aspect of the superior temporal sulcus, as
a cluster of contiguously activated voxels that responded more strongly to faces than to objects (P o 10–3, uncorrected). Blue lines point to the rSTS in
activation maps from the same representative adult subject as in Figure 2a. (b) Analogous to a, but data are from the same 8.8-year-old child as in Figure 2b.
(c) Average volume of the functionally defined STS (as in a and b) across children (n ¼ 20), adolescents (n ¼ 10) and adults (n ¼ 15). (d) Average BOLD
response amplitudes in STS across stimuli and age groups. Bar graphs represent age groups as in Figure 1. Error bars show group s.e.m.
NATURE NEUROSCIENCE VOLUME 10 [ NUMBER 4 [ APRIL 2007 515
ART ICLES©
2007
Nat
ure
Pub
lishi
ng G
roup
ht
tp://
ww
w.n
atur
e.co
m/n
atur
eneu
rosc
ienc
e

age � stimulus category: rLOC: F6,126 ¼ 1.35, P ¼ 0.24; lLOC:F6,120 ¼ 0.36, P ¼ 0.90, Fig. 5d). Thus, the LOC reaches adult-likevolume and responses by age 7.
Smaller PPA in children than in adults
The PPA was defined in each subject as a cluster of contiguous voxelspeaking in the PHG that responded more strongly to places than toobjects (Po 10–4, uncorrected, Fig. 6a,b) and was detected in children(right PPA: rPPA, 17/20; left PPA: lPPA, 16/20), adolescents (rPPA: 10/10; lPPA: 9/10) and adults (rPPA: 15/15; lPPA 13/15). The lPPAincreased in size with age (F42,2 ¼ 4.12, Po 0.02) and was significantlylarger in adults than in children by a factor of 2.6 (t33 ¼ 2.87,P o 0.007). The size of the lPPA in adolescents was not significantlydifferent from that in children (t28 ¼ 0.95, P ¼ 0.34), but it showeda nonsignificant trend toward smaller size compared with adults(t33 ¼ 1.52, P ¼ 0.07, one-tailed, Fig. 6c). The lPPA was also largerin adults than in children, in the subset of subjects matched for BOLD-related confounds (t19 ¼ 2.06, P o 0.05, Fig. 6c, SupplementaryNote 1 and Supplementary Table 2 online). In contrast, rPPA sizeshowed no age effects (F2,42 ¼ 0.52, P ¼ 0.6, Fig. 6c). Also, theanatomical volumes of the PHGs were not significantly different across
age groups (right: F2,42 ¼ 1.11, P ¼ 0.33; left:F2,42 ¼ 0.22, P ¼ 0.80, Fig. 6d).
Independent of statistical thresholds tested,there were more place-selective voxels withinthe anatomical boundaries of the left PHG inadults than in children (t33 4 5.0, P o0.0006, corrected for multiple comparisons;data not shown). This result held for subsetsof these groups matched for BOLD-relatedconfounds (t33 4 5.14, Po 0.0006, correctedfor multiple comparisons; Fig. 6e). Thus, thelPPA undergoes maturation after age 7,increasing in size into adolescence.
PPA response amplitudes and selectivity
Response amplitudes to visual stimuli in thePPA were not different across age groups(rPPA: F2,39 ¼ 0.07, P ¼ 0.93; lPPA: F2,35 ¼0.10, P ¼ 0.90; Fig. 7a,b). Likewise, therewere no significant interactions between ageand stimulus category (rPPA: F6,111 ¼ 0.20,P¼ 0.82; lPPA: F6,99 ¼ 1.03, P¼ 0.37). Resultswere similar for subjects matchedfor BOLD-related confounds (responseamplitude, rPPA: F2,30 ¼ 0.07, P ¼ 0.93;lPPA: F2,24 ¼ 0.09, P ¼ 0.91; interactionbetween age and stimulus, rPPA: F6,84 ¼0.09, P ¼ 0.91; lPPA: F6,69 ¼ 1.32, P ¼ 0.28).
In each BOLD-artifact–matched subject,we calculated place selectivity (places –objects)/(places + objects) at the peaks oflPPA and rPPA and in an expanding seriesof ROIs (Fig. 7c,d and SupplementaryFig. 1). Consistent with a smaller lPPA sizein children, in the region between two ROIsthat were respectively matched to the size ofthe average lPPA in children and adults, placeselectivity was significantly lower in childrenthan in adults (constant-sized: t19 ¼ 2.74, Po0.01, Fig. 7c, ROI5; shape-preserved: t19 ¼
4.16, P o 0.0001 Supplementary Fig. 1). In this region, responses toplaces were lower in children than in adults (constant-sized: t19 ¼ 2.07,P o 0.05, Fig. 7e; shape-preserved: t19 ¼ 3.31, P o 0.003, Supple-mentary Fig. 1), but responses to objects were not different (constant-sized: t19 ¼ 0.38, P ¼ 0.71, Fig. 7e; shape-preserved: t19 ¼ 0.54, P ¼0.59, Supplementary Fig. 1). These findings suggest that lPPA matura-tion involves a specific increase in place responsiveness in the regionimmediately surrounding children’s lPPA.
Recognition memory for faces, objects, and places
The subjects of Experiment 1 later participated in Experiment 2, wherethey viewed a new set of faces, objects and places in blocks andperformed a one-back task (encoding session). Performance (accuracyand response time) was similar to that in Experiment 1 (Supplemen-tary Note 2 online). Ten to 15 min later, subjects participated in a self-paced unexpected recognition test, serially viewing images that wererandomly mixed by category and novelty status (‘old’, seen duringencoding, or ‘new’, not seen before), and identified them as old ornew. For faces, adults’ memory was better than children’s (t33 ¼ 5.57,P o 0.0001) and adolescents’ (t23 ¼ 2.25, P o 0.03), and adolescents’memory was better than children’s (t27 ¼ 2.25, P o 0.03, Fig. 8a).
>
P < 10–5
Adult
a
c
d
b
Child(8.8-year–old)
LOC size
LOC signals
Left Right 7–11-year-olds12–16-year-oldsAdults
1,500
3,000
4,500
6,000
0
1.4
1.2
1.0
0.8
0.6
0.4
0.2
0.0
1.4
1.2
1.0
0.8
0.6
0.4
0.2
0.0
1,500
3,000
4,500
6,000
0
Vol
ume
(mm
3 )P
erce
ntag
e si
gnal
cha
nge
Figure 5 Object-selective activations in the LOC as a function of age. (a) The LOC was defined in each
lateral occipital cortex, as a cluster of contiguously activated voxels that responded more to objects
than textures (P o 10–5, uncorrected). Blue lines point to the rLOC from the same representative
adult subject as in Figure 2a. (b) Analogous to a, but data are from the same 8.8-year-old child as
in Figure 2b. (c) Average volume of the functionally defined LOC (as in a and b) across age groups.
(d) Average BOLD response amplitudes in the LOC for each age group and category. Bar graphs
represent age groups as in Figure 1. Error bars show group s.e.m.
516 VOLUME 10 [ NUMBER 4 [ APRIL 2007 NATURE NEUROSCIENCE
ART ICLES©
2007
Nat
ure
Pub
lishi
ng G
roup
ht
tp://
ww
w.n
atur
e.co
m/n
atur
eneu
rosc
ienc
e

Similarly, for places, adults’ memory was better than children’s(t33 ¼ 4.84, P o 0.0001), showing a trend toward better memoryrelative to adolescents’ (t23 ¼ 1.48, P¼ 0.07), and adolescents’ memorywas better than children’s (t27 ¼ 2.65, Po 0.01). There were no effectsof age on memory for objects (F2,42 ¼ 0.49, P ¼ 0.6).
We asked whether memory performance for faces, objects or placeswas specifically related to the size of particular cortical regions in theventral stream. We regressed memory performance for each category(face, place and object) against multiple factors of age, FFA, PPA, STSand LOC size. Face-recognition memory was significantly correlatedwith age (r¼ 0.47, Po 0.001) and rFFA size (r¼ 0.31, Po 0.035), butnot with the size of other ROIs tested (P values 4 0.18). Face-recognition memory and rFFA size were significantly correlated inchildren (r¼ 0.49, Po 0.03, n¼ 20, Fig. 8b) and adolescents (r¼ 0.61,P o 0.03, one-tailed, n ¼ 10), but not in adults (r ¼ 0.32, P o 0.24,n ¼ 15), perhaps as a result of a more restricted range of memoryperformance among the latter group. Place-recognition memory wassignificantly correlated with age (r ¼ 0.45, P o 0.001) and the size ofthe lPPA (r ¼ 0.44, P o 0.001), but not with the size of other ROIstested (P 4 0.3). Place-recognition memory and lPPA size weresignificantly correlated in all groups (children r ¼ 0.79, P o 0.0001,n ¼ 20, adolescents r ¼ 0.80, Po 0.009, n ¼ 10, adults r ¼ 0.59, P o0.03, n¼ 15, Fig. 8c). Object-recognition memory was not significantlycorrelated with age, with the size of the LOC (Fig. 8d,e) or with the sizeof any ROI tested (P 4 0.4). A complementary analysis showed thatrFFA size correlated with face but not place and object memory, andlPPA size correlated with place but not object and face memory(Supplementary Note 2). These findings support the hypothesis
that memory improvements for faces and places are related to age-dependent increases in the size of the rFFA and lPPA, respectively,during childhood and adolescence.
DISCUSSION
We found evidence for prolonged development of the lPPA and rFFA,which were about three-fold larger in adults than in children ages 7–11.In children, the nascent rFFA and lPPA were associated with adult-likeresponse amplitudes and selectivity, and were surrounded by function-ally immature cortex that did not exhibit face or place selectivity. Theseage-related increases in rFFA and lPPA volumes were specificallyassociated with improvements in recognition memory for faces andplaces, respectively. In contrast, activation volumes for faces in the STSor objects in the LOC remained essentially constant across ages, asdid recognition memory for objects. Taken together, these findingssuggest that the human ventral stream undergoes a differential matura-tion process, whereby the LOC develops before the face- or place-selective regions of the rFFA and lPPA, which increased in size at leastthrough age 11, in association with improved category-specific visualrecognition memory.
Our controls indicated that the age-related increases in the size of therFFA and lPPA were not due to possible confounds of developmentalfunctional neuroimaging27,28. First, results were not due to differencesin behavioral performance during scanning. Children’s response accu-racy was adult-like and their longer response times did not vary acrosscategories during the one-back task. Second, results were not driven bypotential age-dependent differences in brain size, shape or preciselocation of functional regions, as ROIs were defined in each subjectwithout spatial normalization. Third, results remained similar in asubset of children and adults who were matched for several factors thatcould account for age-related confounds, such as subject motion,BOLD signal variability and goodness-of-fit of the GLM. Fourth, ourresults did not reflect age-related differences in anatomical volumesbecause mid-fusiform and parahippocampal volumes remainedunchanged across age groups. Finally, our results were robust acrossa wide range of thresholds on statistical maps.
Overall, our data may explain previous failures to detect the FFA in5–8-year-olds25 or 8–10-year-olds26 using normalized group analysesand concur with a report of smaller FFA in children (and delayedmaturation relative to LOC) during viewing of movie segments of faces,places and common objects (K.S. Scherf et al., Soc. Cog. Neurosci. Abstr.E138 2006). Developmental expansions of functional regions werecorrelated with developmental changes in visual recognition memory.
P < 10–4
AdultChild
(8.8-year-old)
7–11-year-olds12–16-year-oldsAdultsMatched
Left RightPPA size
PHG size
*
4,000
2,000
0
4,000
2,000
0
Vol
ume
(mm
3 )
6,000
4,000
2,000
0
6,000
4,000
2,000
0
Vol
ume
(mm
3 )
Total activated voxels in PHG
120
80
40
0No.
of V
oxel
s
Adults12–16-year-olds7–11-year-olds
1 2 3 4 5 6–Log (P)
120
80
40
01 2 3 4 5 6
–Log (P)
a
c
d
e
bL L
Figure 6 Place-selective activations in the PHG as a function of age. (a) The
PPA was defined as places 4 objects (P o 10–4 uncorrected). Blue lines
point to the lPPA in activation maps from the same representative adult
subject as in Figure 2a. (b) Analogous to (a), but data are from the same
8.8-year-old child as in Figure 2b. (c–e) Gray scale bars represent age groups
as in Figure 2. Red bars represent data from groups that were matched for
BOLD-related confounds in PHG (Supplementary Note 1; right, 10 children,
9 adolescents and 11 adults; left, 10 children, 9 adolescents and 12 adults).Error bars show group s.e.m. (c) Left, lPPA volume (* children o adults;
P o 0.05); right, rPPA volume. (d) The volume of anatomically defined PHG
in each hemisphere. (e) The total number of place-selective voxels (places
4 objects) within the anatomically defined left and right PHG (anatomical
ROIs in d), regardless of contiguity, were plotted against the minus logarithm
(base 10) of six statistical thresholds (10–1 to 10–6, uncorrected) for the
subset of subjects who were matched for BOLD-related confounds in the
PHG in each age group. Circles, children (ages 7–11, n ¼ 10); squares,
adolescents (ages 12–16, n ¼ 9); triangles, adults (n ¼ 13). Error bars
show group s.e.m.
NATURE NEUROSCIENCE VOLUME 10 [ NUMBER 4 [ APRIL 2007 517
ART ICLES©
2007
Nat
ure
Pub
lishi
ng G
roup
ht
tp://
ww
w.n
atur
e.co
m/n
atur
eneu
rosc
ienc
e

Children performed similarly to adults inrecognition-memory accuracy for objects,but showed lower accuracy for faces andplaces than adults. Critically, between agegroups, accuracy for faces and for placescorrelated specifically with the volume of rFFA and lPPA, respectively.It is well established that children reach adult-like proficiency in face-recognition memory around age 16 (refs. 20,21). Accordingly, adultsoutperformed adolescents, ages 12–16, in our study. However, we showhere for the first time that memory for places also undergoes aprolonged development. The apparent coupling between the expansionof category-specific visual cortices and recognition-memory abilitieswarrants further examination for other visual and mnemonic cate-gories29–31 and other tasks. For example, FFA responses, in particular,have been related to face detection and identification4,32, but little isknown about the development of these perceptual abilities or theirrelation to brain function in children.
Prolonged development of rFFA and lPPA manifested as an expan-sion in the spatial extent of these regions. Children’s rFFA was a third ofadult size, but still evident in 85% of child subjects. Further, regardlessof whether we used a clustering criterion, we found that children,compared with adults, had fewer face- and place-preferring voxels inthe fusiform and PHG, respectively, rather than more spatially scatteredactivations for these stimuli.
In all functionally defined regions, whether smaller than or equal toadult size, children showed adult-like response magnitudes and selec-tivity. The smaller rFFA and lPPA in children were surrounded bycortices with adult-like responses to objects, but no selectivity for facesor places, respectively. Thus, our findings suggest that prolonged FFAand PPA development is associated with an expansion of a stimulus-
selective region, by means of increased category-specific responseamplitudes in an immature penumbral region.
The mechanisms underlying this expansion are unknown, but mayinclude regional increases in the number and/or sharper tuning of face-or place-responsive neurons33. Indeed, electrophysiological recordingsin monkeys show that training to recognize novel visual stimuliincreases the number of neurons responsive to the learned categoryin the anterior inferotemporal cortex of monkeys over periods ofseveral months to years34. Thus, with accumulated experience, moreneurons may code for the preferred category in the penumbral regionsof the rFFA and lPPA, leading to improved proficiency in face and placerecognition, respectively.
Maturation of FFA and PPA regions may involve a variety ofmechanisms. For example, there may be age-dependent variations inface and place viewing patterns. It has previously been found35 thatatypical patterns of fixation on face parts in autism were associated withlower levels of fusiform gyrus responses to faces. There is currently noevidence indicative of differences between children and adults inpatterns of fixation36 or face or place viewing. However, our findingssuggest the usefulness of future developmental studies of face and placeviewing patterns and their relationship to FFA and PPA responses.Additional factors that may modulate FFA responses include the levelof expertise with stimuli18,19, stimulus similarity37 and age-of-the-facestimuli (as there is evidence for a small but observable bias for betterrecognition of own-age faces, especially among adults38). Future studies
7–11-year-olds12–16-year-oldsAdults
7–11-year-olds12–16-year-oldsAdultsMatched
0.7
lPPA rPPA
Per
cent
age
sign
al c
hang
e
0.5
0.3
0.1
–0.1
1ROI
ROI 5
*
Pla
ce s
elec
tivity
P
1
P0.5
0.4
0.3
0.2
0.1
0.0
0.4
Per
cent
age
sign
al c
hang
e
0.3
0.2
0.1
0.0
ROI
0.5
0.4
0.3
0.2
0.1
0.0
3P Child Adult 150%
2
3P
23
Child
34
Adult
45
150%
56 7 8
0.7
0.5
0.3
0.1
–0.1
a
c
e
d
bFigure 7 BOLD response amplitudes in the PPA
and place selectivity. (a,b) Percent BOLD signals
relative to fixation background for each image
category and age-group in the left (a) and right
(b) hemisphere. (c,d) Average place selectivity,
(place – object)/(place + object), in concentric
ROIs (constant-sized across subjects) is plotted
for age groups matched for BOLD-relatedconfounds in the PHG (Supplementary Note 1) in
the left (c) and right hemisphere (d). (c)Average
place selectivity in a series of concentric ROIs
(constant-sized across subjects, ROI 1 to 8)
centered at the lPPA peak in each subject.
Spherical ROIs were sized to match the group
averaged lPPA size in children (Child) and in
adults (Adult) and 150% of the average lPPA size
in adults (150%). Shell ROIs were defined as the
region in Child excluding 3P (ROI 3), Adult
excluding Child (ROI 5) and 150% excluding
Adult (ROI 7 ). Yellow arrow: place selectivity was
significantly lower among children (n ¼ 10) than
among adults (n ¼ 12), in the shell representing
the penumbral region of the lPPA in children
(ROI 5, P o 0.01). (d) Average place selectivity in
a series of concentric ROIs (ROI 1 to 5) as in (c),
but centered at the peak of the rPPA in individual
subjects and relative to the average size of therPPA in children and adults. Place selectivity was
not statistically different among the age groups,
for any of these ROIs in rPPA. (e) Average BOLD
response amplitudes to places and objects within
the ROI representing the penumbral region of
the lPPA in children (ROI 5, children o adults,
*P o 0.05). Error bars show group s.e.m.
518 VOLUME 10 [ NUMBER 4 [ APRIL 2007 NATURE NEUROSCIENCE
ART ICLES©
2007
Nat
ure
Pub
lishi
ng G
roup
ht
tp://
ww
w.n
atur
e.co
m/n
atur
eneu
rosc
ienc
e

will be instrumental in examining the role of these factors in explainingthe development of FFA responses.
The differential time course of development across high-level visualcortex varied across regions, not just perceptual categories. In children,there was a dissociation between the smaller volume of rFFA and theadult-like volumes of face-selective regions in lFFA and bilateral STS.Similarly, we found a dissociation between the smaller volume of lPPAin children and their adult-like volume of rPPA. The slower growth ofthe rFFA is noteworthy, as there is evidence suggesting that faceprocessing is right-hemisphere dominant39–41. Consistent with pre-vious fMRI studies, the rFFA in adults was more reliably found andtwo-fold larger than the lFFA. Thus, the slower development of rFFAmay be a limiting factor in the maturation of face perception andmemory. In contrast, the more rapid maturation of STS relative torFFA suggests that functions associated with the STS (such as proces-sing of gaze direction and other socially communicative cues42) maydevelop more rapidly than functions associated with the FFA (such asface recognition).
The PPA’s unexpected asymmetry of development is more difficult tointerpret, as currently there is no evidence for hemispheric specializationfor place perception. Thus, this finding awaits, and may eventuallycontribute to, a better understanding of PPA’s functional asymmetry.
The reasons for different rates of development in high-level visualcortex are unknown. One possibility is that the types of representations
supported by rFFA and lPPA take longer to mature than thosesupported by LOC or STS. FFA and PPA have been implicated inholistic processing13,19,43, which is disrupted by inversion of faces44 andplaces43. Acquiring the capacity for holistic representation of a categorymay take longer than for feature-based representations that may occurin LOC45,46. Second, rFFA and lPPA may retain more plasticity (even inadulthood) than LOC and STS, as at least FFA responses are modulatedin adults by their level of expertise18,19. Third, prior experience withstimuli may affect brain regions and behavior differentially, dependingon stimulus category. Although all study stimuli were novel, oursubjects were likely to have had more prior experience with facesthan abstract sculptures. However, prior experience had little effect onLOC responses or on recognition memory in adults, which was equalfor faces and objects (but worse for places). Using stimuli that arevaried systematically for similarity37 and participants’ prior experi-ence18,19,29 may further reveal the role of experience in ventral streamactivations and recognition-memory performance.
Our finding of differential development across the ventral streamspeaks to developmental theories of high-level vision. First, it is evidentthat at least some areas have a prolonged development that is notcompleted in early childhood. Second, our findings indicate that theentire visual ventral stream is not maturing at the same rate. Rather,there are different temporal trajectories toward reaching adult-likevolumes of fMRI activation, and these trajectories seem to relate moreto brain regions rather than to stimulus categories. Another implica-tion of our data is that experience may have a more extended role inshaping the brain organization of perception and memory for faces andplaces than for objects. Finally, our findings form a framework for abetter understanding of the normal development of high-level visualcortex in children and the neural basis of developmental disorders offace processing.
METHODSSubjects. Healthy children ages 7–11 (N ¼ 23, 13 females), adolescents ages
12–16 (N ¼ 10, 5 females) and adults ages 18–35 (N ¼ 17, 8 females)
participated in Experiment 1 (in scanner) and Experiment 2 (outside scanner).
Subjects were right handed with normal or corrected vision and without any
past or current neurological or psychiatric conditions, or structural brain
abnormalities. Children and adolescents were recruited from the Palo Alto
school district through advertisements in school newspapers and contact with
parents, evaluated with a battery of cognitive and perceptual tests, and included
if their performance was within the age-appropriate normal range. Adult
subjects were Stanford University students. Informed consent was obtained
according to the requirements of the Panel on Human Subjects in Medical
Research at Stanford University. All subjects were acclimated to the scanning
environment by participating (on a previous day) in an anatomical scanning
session (unrelated to the fMRI experiments reported here).
Experiment 1. Stimuli. During fMRI, subjects viewed 60 gray-scale photo-
graphic images of each of the following five categories: faces, abstract sculptures
*
**
†
‡
7–11-year-olds12–16-year-oldsAdults
7–11-year-olds 12–16-year-olds Adults
0.8
0.6
0.4
0.2
0.0
Per
cent
age
accu
racy
1.0
0.8
0.7
0.6
0.4
0.2
0.0
–0.20 2,400 5,400 8,400
rFFA volume (mm3)
0 2,000 5,000 14,00010,000
rLOC volume (mm3)
Fac
e re
cogn
ition
mem
ory
1.0
0.8
0.7
0.6
0.4
0.2
0.0
Obj
ect r
ecog
nitio
n m
emor
y
0 2,000 6,000 10,000 14,000
lLOC volume (mm3)
1.21.2
1.0
0.8
0.7
0.6
0.4
0.2
0.0
Obj
ect
reco
gniti
on m
emor
y
0.8
0.7
0.6
0.5
0.4
0.3
0.2
0.10 2,400 5,400 8,400 11,400
lPPA volume (mm3)
Pla
ce r
ecog
nitio
n m
emor
y
a
b
d
c
e
Figure 8 Performance of different age groups on an independent recognition-
memory test for faces, abstract sculptures and places. (a) Recognition
accuracy (percent accuracy ¼ (hit – false alarm)/total) for faces, places and
objects. Face-recognition-memory performance in adults was higher than
children’s (*P o 0.0001) or adolescents’ (**P o 0.03). Adolescents’ face-
recognition-memory performance was higher than children’s (**P o 0.03).
Place-recognition-memory performance in adults was higher than children’s
(wP o 0.0001). Adolescents’ memory for places was higher than children’s(zP o 0.01). Error bars show group s.e.m. (b) Correlations for face-
recognition memory and rFFA size are shown for each age group.
(c) Correlations for place-recognition memory and lPPA size are shown for
each age group. (d,e) Correlations for object-recognition memory and right or
left LOC size are shown for each age group.
NATURE NEUROSCIENCE VOLUME 10 [ NUMBER 4 [ APRIL 2007 519
ART ICLES©
2007
Nat
ure
Pub
lishi
ng G
roup
ht
tp://
ww
w.n
atur
e.co
m/n
atur
eneu
rosc
ienc
e

(objects), indoor and outdoor scenes, and textures (created by randomly
scrambling object pictures into 225, 8 � 8–pixel squares; Fig. 1a). All faces
were of European-American males in a frontal view, displaying a neutral
expression with no eyeglasses or jewelry. We chose abstract sculptures, rather
than common objects, as exemplars of the object category to selectively activate
the LOC1,47 and to equate stimulus novelty and the level of verbal labeling
across categories.
Behavioral task during fMRI. Each stimulus type was presented during five
pseudo-randomly ordered blocks. Blocks were 14 s long followed by 14 s of
fixation. Images were presented at 1-s intervals, each for 970 ms, followed by a
30-ms fixation baseline. Each image was presented only once, except for two
random images per block, which were presented twice in succession (14% of
presentations). Subjects were instructed to fixate on each image and press a
button using their right index finger whenever they detected identical images
appearing successively (a one-back task).
Images were projected onto a mirror mounted on the MRI coil (visual angle
B151). Images were presented and responses were recorded via a Macintosh
G3 computer using Matlab 5.0 (Mathworks) and Psychtoolbox extensions
(http://www.psychtoolbox.org).
Behavioral responses. Percent accuracy during the one-back task was calcu-
lated for each subject separately for each image category as 100% � (hits/
number of repeated images) – (false alarms/number of nonrepeated images).
Response times during the one-back task were calculated for each image
category as the median time for correct responses for each subject.
Scanning. Brain imaging was performed on a 3-Tesla whole-body General
Electric Signa MRI scanner (General Electric) at the Lucas Imaging Center,
Stanford University, equipped with a quadrature birdcage head coil. Subjects
were instructed to relax and stay still. We placed ample padding around each
subject’s head and also made use of a bite bar (made of Impression Compound
Type I, Kerr Corporation) to stabilize the head position and reduce motion-
related artifacts during the scans. First, a high-resolution three-dimensional
Fast SPGR anatomical scan (124 sagittal slices, 0.938 mm � 0.938 mm, 1.5-mm
slice thickness, 256 � 256 image matrix) of the whole brain was obtained. Next,
a T2-weighted fast spin echo in-plane with a slice prescription identical to that
of the functional scan was acquired. Functional images were obtained using a
T2*-sensitive gradient echo spiral-in/out pulse sequence using BOLD con-
trast48. Full brain volumes were imaged using 21 slices (4 mm thick plus 1 mm
skip), oriented parallel to the line connecting the anterior and posterior
commissures. Brain volume images were acquired continuously with TR
1,400 ms, TE 30 ms, flip angle 701, field of view 240 mm, 3.75 mm � 3.75
mm in-plane resolution and 64 � 64 image matrix. Data acquisition time for
Experiment 1 was approximately 14 min.
Preprocessing. The first ten functional volumes were discarded to allow for
T1 equilibration. Functional images were ‘median-filtered’ to reduce transient
BOLD artifacts using an in-house algorithm, realigned to correct for motion,
spatially smoothed using a 6 mm full-width-half-maximum kernel, and
temporally filtered (high-pass, 56 s cut-off) using the Statistical Parametric
Map software package (SPM2, Wellcome Department of Cognitive Neurology).
Data were not spatially normalized. Data from three children and two adults
were not used for further analysis due to excessive motion (42 mm).
General linear model. For each subject, statistical modeling was performed
using a GLM in SPM2 on preprocessed functional images, excluding images
with an average BOLD signal exceeding 2 s.d. from the mean. In a given
subject, the number of excluded images did not exceed 15 out of 600 (2.5% of
the time series).
The resulting t-maps corresponding to the contrast and threshold of interest
(uncorrected for multiple comparisons) were overlaid on the individual’s high-
resolution T1 image (which was co-registered to the mean motion-corrected
and non-smoothed functional image).
Whole brain volumes. Brain volume analyses were performed using the
FMRIB Software Library (FSL, http://www.fmrib.ox.ac.uk/fsl/). For each sub-
ject, non-brain parts were automatically removed using FMRIB’s Brain
Extraction Tool49. Volumes were estimated by counting nonzero voxels within
these images.
ROI creation. Five types of ROIs (that is, anatomical, functional-cluster,
functional-noncluster, constant-sized and shape-preserved) were created for
each subject.
1. Anatomical ROIs of the right and left mid-fusiform and PHGs were hand
drawn (MRIcro, http://www.mricro.com) for each subject, based on their non-
normalized high-resolution anatomical image (SPGR). All of the anatomical
ROIs were drawn by a well-trained person who was blind to the identity and
age of the brains. The anatomical ROIs of the mFG in all subjects included the
fusiform gyrus between the occipito-temporal sulcus, and the lateral bank of
the collateral sulcus. The anterior–to-posterior extent of the fusiform gyrus was
limited to a region between the posterior edge of the amygdala and the
midpoint along the calcarine fissure. The anatomical ROIs of the PHG included
a region between the medial bank of the collateral sulcus and the hippocampus,
and posteriorly, the isthmus. The anteroposterior extent of the ROI was limited
by the posterior edge of entorhinal and anterior calcarine sulcus50.
2. Functional (cluster) ROIs for FFA, STS, LOC and PPA were defined in
each subject as contiguous suprathreshold voxels with the following properties
and locations: FFA, faces 4 abstract objects (P o 10–3) peaking in the mFG;
STS, faces 4 abstract objects (Po 10–3) in the superior temporal sulcus; LOC,
abstract objects 4 scrambled (P o 10–5) in the posterior and lateral aspects of
the occipital cortex; PPA, places 4 abstract objects (P o 10–4) peaking in the
PHG. The statistical thresholds we used were based on conventional definitions.
3. Functional (noncluster) ROIs included all suprathreshold voxels (regard-
less of clustering) within the relevant anatomical ROI (the mFG for FFA and
the PHG for the PPA) for the contrast of interest (that is, faces 4 abstract
objects for FFA, places 4 abstract objects for PPA) at six different statistical
thresholds (10–1 o P o 10–6). Thresholds were based on whole brain analysis,
uncorrected for multiple comparisons.
4. Constant-sized ROIs included all voxels (whether or not they exceeded
a statistical threshold) within a predefined volume in the vicinity of the FFA
or the PPA. For the FFA, spherical ROIs were all centered at the individual’s
FFA peak (faces 4 objects, P o 10–3, see Fig. 3). When no FFA was found,
spherical ROIs were centered at the subject’s most face-responsive voxel
(highest t-value for faces 4 textures) in the mid-fusiform gyrus. For each
hemisphere, the size of these ROIs were fixed to include the volume defining
(i) the peak voxel (P), (ii) three contiguous voxels with the highest t-values
(3P), (iii) the average size of the FFA in the children’s group (Child), (iv) the
average size of the FFA in the adult group (Adult) and (v) a region 150%
of the average FFA in adults (150%). A series of concentric shells were also
defined as the regions between spherical ROIs (ROI 3: voxels of Child exclud-
ing 3P voxels; ROI 5: Adult excluding Child; ROI 7: %150 excluding Adult).
For the PPA, spherical and shell ROIs were similarly created and centered
at the PPA peak, or in the cases where no PPA was found, the most place-
selective voxel (highest t-value for places 4 scrambled) in the PHG in each
subject and hemisphere (Fig. 7). The sizes of the PPA-peak centered spherical
ROIs were based on the group averaged PPA size in adults or children in
each hemisphere.
5. Shape-preserved ROIs were created by growing or shrinking subject-
specific functional ROIs. This involved adding or removing voxels starting from
the border of the functional ROI to reach a specific target volume, while
preserving its original shape. Each ROI image (containing ones and zeros with
ROI voxels having the value of one) was spatially smoothed in three dimensions
using a 6-mm full-width-half-maximum isotropic kernel, then a series of
thresholds were iteratively applied to this image until the target volume was
reached. New voxels that appeared outside the cortex during this procedure
were excluded (results in Supplementary Fig. 1).
Extraction of BOLD signals from ROIs. To measure BOLD signals, the raw
time-course data was extracted from each ROI (see above). These data were
then high-pass filtered (0.0052 Hz cutoff) and shifted in time by 3 s to account
for hemodynamic lag. The average BOLD signals during each image condition
and base line (fixation blocks) were estimated from the mean of the signal
during each block after accounting for hemodynamic lag. The percent BOLD
signal change for each image category was calculated relative to the average
BOLD signal across fixation blocks:
100 � ðcategory � fixationÞfixation
:
Estimation of factors associated with BOLD-related confounds. Results of
these analyses are presented in Supplementary Note 1 and Supplementary
Tables 1 and 2.
520 VOLUME 10 [ NUMBER 4 [ APRIL 2007 NATURE NEUROSCIENCE
ART ICLES©
2007
Nat
ure
Pub
lishi
ng G
roup
ht
tp://
ww
w.n
atur
e.co
m/n
atur
eneu
rosc
ienc
e

1. Motion. The translational movement during the scan was calculated
in millimeters (d ¼P
x2, y2, z2)1/2 and the rotational motion in radians
(r ¼P
pitch, roll, yaw) based on the SPM2 parameters for motion correction
of the functional images in each subject.
2. Fluctuation of BOLD responses during the fixation baseline –
%cv_BOLD. We used this measure because it reflects fluctuations of the
BOLD signal independently of the stimuli. %cv_BOLD was calculated per
voxel as the coefficient of BOLD variation during fixation relative to the mean
amplitude of the voxel across the entire time course and then averaged across
the anatomical ROI:
%cv BOLD ¼ 100� 1
N
XNi¼1
sim i
where N is the number of voxels in the anatomical ROI, si is the amplitude of
noise fluctuations in a voxel during baseline and mi is the mean amplitude of
the voxel’s response. % cv_BOLD was calculated for the anatomical ROIs of the
mFG bilaterally and the PHG bilaterally.
3. Residual error of GLM (%Res). This reflects the discrepancy between the
GLM estimates and the time-course BOLD data, and thus is an inclusive
measure of BOLD-related noise and goodness of GLM fit. The residual variance
of the GLM was estimated per voxel using ResMS.img generated by SPM2
during model estimation. We then measured the mean residual error across
anatomical ROIs:
%Res ¼ 100�
1
N
ffiffiffiffiffiffiffiffiffiffiffiffiffiffiffiffiffiffiffiffiffiffiffiffiffiffiXNi¼1
ResMsðiÞ
vuut
Mean Amp
where N is the number of voxels in the anatomical ROI and MeanAmp is the
mean amplitude of the BOLD response across the ROI,
MeanAmp ¼ 1
N
XNi¼1
mi
The %Res was calculated across the anatomical ROIs of the mFG and the PHG
(Supplementary Note 1). We then reanalyzed our data for subjects matched for
BOLD-related confounds (details of matching procedure and results in
Supplementary Note 1).
Experiment 2. Stimuli and data analysis. Outside the scanner, subjects
participated in an independent recognition-memory task. During encoding,
they viewed ten images (never seen before) of each of the categories including
faces, abstract sculptures and scenes. All stimuli were gray-scale photographic
images similarly prepared and presented as in Experiment 1. Subjects were
instructed to perform a one-back task while viewing the images. Ten to 15 min
later, during a self-paced subsequent recognition-memory test, subjects were
presented with all the images from the encoding session plus an equal number
(ten) of new images per category. Image categories and old and new pictures
were randomly distributed during the session. Subjects were instructed to
indicate whether they had seen the image before or not by pressing one of two
buttons, as accurately and as quickly as possible. They were informed that none
of the images were from the previous fMRI session. Performance accuracy and
reaction times for the one-back task during encoding were calculated as
described above. Accuracy for the subsequent recognition-memory task was
calculated as 100 � [hits (old) – false alarms (new)] / number of old images,
separately per image category and subject.
A post hoc analysis of recognition-memory performance per image—that is,
100
N
XNi¼1
correct responsesðiÞ
where i ¼ 1 – N; N ¼ number of subjects—showed that the percentage of
correct responses per image was above 30% for adults and above 40% for
children, suggesting that results were not driven by specific images that were
particularly difficult to identify as old or new.
Statistical methods for between age-group comparisons. Subjects’ data were
averaged for each of the three age groups: 7–11-year-olds, 12–16-year-olds and
adults. Between-group differences were evaluated by two-tailed ANOVA and
t-tests, unless otherwise noted.
For between-group comparisons of the size of the functional or anatomically
defined ROIs, we used one-way ANOVAs with the factor age. For between-
group comparisons of the size of the functional ROIs, subjects who showed no
activations fulfilling the definition of the particular functional ROI were
assigned zero for the size of the ROI and included in the analysis. However,
for between-group comparison of the percent BOLD signals within functionally
defined ROIs, only subjects who showed activations fulfilling the definition of
the functional ROI were included in the analysis. For between-group compar-
ison of the number of voxels within the anatomical boundaries of the FFA or
PPA, we used a GLM with the number of voxels as within-subject repeated
measures. For between-group comparisons of responses (behavioral or BOLD
signals) to the various image categories, we used a GLM with responses across
categories as the within-subject repeated measures.
Note: Supplementary information is available on the Nature Neuroscience website.
ACKNOWLEDGMENTSThanks to A. Greenwood, G. Glover, P. Mazaika, C. Rorden and B. Wandelfor useful suggestions, to S. Dean and L. Wood for help with scanning andbehavioral tests, and to the participants in our experiments. This work wassupported by US National Institutes of Health grants 5R21DA15893,1R21MH66747, 1R21EY017741, T32 MH19908 and National ScienceFoundation grant BCS-0617688.
AUTHOR CONTRIBUTIONSG.G., D.G.G., J.D.E.G. and K.G.-S. participated in all phases of this study. G.G.participated in designing the experiments, conducting fMRI and behavioralexperiments, analyzing the data and preparing the manuscript. D.G.G. developedcode for fMRI experiments and data analyses, helped with data collection andanalysis and contributed to the manuscript. S.W.-G. contributed to code anddata analyses. J.L.E. and A.R. contributed to the study design and themanuscript. K.G.-S. and J.D.E.G. supervised the study and contributed toexperimental design, data collection and analysis, and the manuscript.
COMPETING INTERESTS STATEMENTThe authors declare no competing financial interests.
Published online at http://www.nature.com/natureneuroscience
Reprints and permissions information is available online at http://npg.nature.com/
reprintsandpermissions
1. Malach, R. et al. Object-related activity revealed by functional magnetic resonanceimaging in human occipital cortex. Proc. Natl. Acad. Sci. USA 92, 8135–8139 (1995).
2. Kanwisher, N., McDermott, J. & Chun, M.M. The fusiform face area: a module inhuman extrastriate cortex specialized for face perception. J. Neurosci. 17, 4302–4311(1997).
3. Tong, F., Nakayama, K., Vaughan, J.T. & Kanwisher, N. Binocular rivalry and visualawareness in human extrastriate cortex. Neuron 21, 753–759 (1998).
4. Grill-Spector, K., Knouf, N. & Kanwisher, N. The fusiform face area subserves faceperception, not generic within-category identification. Nat. Neurosci. 7, 555–562(2004).
5. Golby, A.J., Gabrieli, J.D.E., Chiao, J.Y. & Eberhardt, J.L. Differential responses in thefusiform region to same-race and other-race faces. Nat. Neurosci. 4, 845–850(2001).
6. Nichols, E.A., Kao, Y.C., Verfaellie, M. & Gabrieli, J.D. Working memory and long-termmemory for faces: evidence from fMRI and global amnesia for involvement of the medialtemporal lobes. Hippocampus 16, 604–616 (2006).
7. Ranganath, C., DeGutis, J. & D’Esposito, M. Category-specific modulation of inferiortemporal activity during working memory encoding and maintenance. Brain Res. Cogn.Brain Res. 20, 37–45 (2004).
8. Epstein, R. & Kanwisher, N. A cortical representation of the local visual environment.Nature 392, 598–601 (1998).
9. Stern, C.E. et al. The hippocampal formation participates in novel picture encoding:evidence from functional magnetic resonance imaging. Proc. Natl. Acad. Sci. USA 93,8660–8665 (1996).
10. Brewer, J.B., Zhao, Z., Desmond, J.E., Glover, G.H. & Gabrieli, J.D. Making memories:brain activity that predicts how well visual experience will be remembered. Science281,1185–1187 (1998).
11. Kanwisher, N. Domain specificity in face perception. Nat. Neurosci. 3, 759–763(2000).
12. Gauthier, I. What constrains the organization of the ventral temporal cortex? TrendsCogn. Sci. 4, 1–2 (2000).
NATURE NEUROSCIENCE VOLUME 10 [ NUMBER 4 [ APRIL 2007 521
ART ICLES©
2007
Nat
ure
Pub
lishi
ng G
roup
ht
tp://
ww
w.n
atur
e.co
m/n
atur
eneu
rosc
ienc
e

13. Tarr, M.J. & Gauthier, I. FFA: a flexible fusiform area for subordinate-level visualprocessing automatized by expertise. Nat. Neurosci. 3, 764–769 (2000).
14. Haxby, J.V. et al. Distributed and overlapping representations of faces and objects inventral temporal cortex. Science 293, 2425–2430 (2001).
15. Goren, C.C., Sarty, M. & Wu, P.Y. Visual following and pattern discrimination of face-likestimuli by newborn infants. Pediatrics 56, 544–549 (1975).
16. Johnson, M.H., Dziurawiec, S., Ellis, H. & Morton, J. Newborns’ preferential tracking offace-like stimuli and its subsequent decline. Cognition 40, 1–19 (1991).
17. de Haan, M. & Nelson, C.A. Brain activity differentiates face and object processing in6-month-old infants. Dev. Psychol. 35, 1113–1121 (1999).
18. Gauthier, I., Tarr, M.J., Anderson, A.W., Skudlarski, P. & Gore, J.C. Activation of themiddle fusiform ‘face area’ increases with expertise in recognizing novel objects.Nat. Neurosci. 2, 568–573 (1999).
19. Gauthier, I., Skudlarski, P., Gore, J.C. & Anderson, A.W. Expertise for cars and birdsrecruits brain areas involved in face recognition. Nat. Neurosci. 3, 191–197 (2000).
20. Chance, J.E., Turner, A.L. & Goldstein, A.G. Development of differential recognition forown- and other-race faces. J. Psychol. 112, 29–37 (1982).
21. Carey, S., Diamond, R. & Woods, B. The development of face recognition- a maturationcomponent? Dev. Psychol. 16, 257–269 (1980).
22. Jenkins, W.M., Merzenich, M.M. & Recanzone, G. Neocortical representationaldynamics in adult primates: implications for neuropsychology. Neuropsychologia 28,573–584 (1990).
23. Haslinger, B. et al. Reduced recruitment of motor association areas during bimanualcoordination in concert pianists. Hum. Brain Mapp. 22, 206–215 (2004).
24. Tzourio-Mazoyer, N. et al. Neural correlates of woman face processing by 2-month-oldinfants. Neuroimage 15, 454–461 (2002).
25. Gathers, A.D., Bhatt, R., Corbly, C.R., Farley, A.B. & Joseph, J.E. Developmental shifts incortical loci for face and object recognition. Neuroreport 15, 1549–1553 (2004).
26. Aylward, E.H. et al.Brain activation during face perception: evidence of a developmentalchange. J. Cogn. Neurosci. 17, 308–319 (2005).
27. Huettel, S.A., Singerman, J.D. & McCarthy, G. The effects of aging upon the hemody-namic response measured by functional MRI. Neuroimage 13, 161–175 (2001).
28. Thomason, M.E., Burrows, B.E., Gabrieli, J.D. & Glover, G.H. Breath holding revealsdifferences in fMRI BOLD signal in children and adults. Neuroimage 25, 824–837(2005).
29. Weisberg, J., van Turennout, M. & Martin, A. A neural system for learning about objectfunction. Cereb. Cortex, 17, 513–521 (2007).
30. Downing, P.E., Jiang, Y., Shuman, M. & Kanwisher, N. A cortical area selective for visualprocessing of the human body. Science 293, 2470–2473 (2001).
31. Kronbichler, M. et al. The visual word form area and the frequency with which words areencountered: evidence from a parametric fMRI study. Neuroimage 21, 946–953(2004).
32. Grill-Spector, K., Kushnir, T., Hendler, T. & Malach, R. The dynamics of object-selective activation correlate with recognition performance in humans. Nat. Neurosci.3, 837–843 (2000).
33. Grill-Spector, K., Sayres, R. & Ress, D. High-resolution imaging reveals highly selectivenonface clusters in the fusiform face area. Nat. Neurosci. 9, 1177–1185 (2006).
34. Kobatake, E., Wang, G. & Tanaka, K. Effects of shape-discrimination training on theselectivity of inferotemporal cells in adult monkeys. J. Neurophysiol. 80, 324–330(1998).
35. Dalton, K.M. et al. Gaze fixation and the neural circuitry of face processing in autism.Nat. Neurosci. 8, 519–526 (2005).
36. Conner, I.P., Sharma, S., Lemieux, S.K. & Mendola, J.D. Retinotopic organization inchildren measured with fMRI. J. Vis. 4, 509–523 (2004).
37. Yue, X., Tjan, B.S. & Biederman, I. What makes faces special? Vision Res. 46,3802–3811 (2006).
38. Anastasi, J.S. & Rhodes, M.G. An own-age bias in face recognition for children and olderadults. Psychon. Bull. Rev. 12, 1043–1047 (2005).
39. Gilbert, C. & Bakan, P. Visual asymmetry in perception of faces. Neuropsychologia11, 355–362 (1973).
40. De Renzi, E., Perani, D., Carlesimo, G.A., Silveri, M.C. & Fazio, F. Prosopagnosia can beassociated with damage confined to the right hemisphere–an MRI and PET study and areview of the literature. Neuropsychologia 32, 893–902 (1994).
41. Rossion, B. et al. Hemispheric asymmetries for whole-based and part-based faceprocessing in the human fusiform gyrus. J. Cogn. Neurosci. 12, 793–802 (2000).
42. Allison, T., Puce, A. & McCarthy, G. Social perception from visual cues: role of the STSregion. Trends Cogn. Sci. 4, 267–278 (2000).
43. Epstein, R.A., Higgins, J.S., Parker, W., Aguirre, G.K. & Cooperman, S. Corticalcorrelates of face and scene inversion: a comparison. Neuropsychologia 44,1145–1158 (2006).
44. Yovel, G. & Kanwisher, N. Face perception: domain specific, not process specific.Neuron 44, 889–898 (2004).
45. Grill-Spector, K. et al. A sequence of object-processing stages revealed by fMRI in thehuman occipital lobe. Hum. Brain Mapp. 6, 316–328 (1998).
46. Lerner, Y., Hendler, T., Ben-Bashat, D., Harel, M. & Malach, R. A hierarchical axis ofobject processing stages in the human visual cortex. Cereb. Cortex 11, 287–297(2001).
47. Grill-Spector, K. The neural basis of object perception. Curr. Opin. Neurobiol. 13,159–166 (2003).
48. Glover, G.H. & Law, C.S. Spiral-in/out BOLD fMRI for increased SNR and reducedsusceptibility artifacts. Magn. Reson. Med. 46, 515–522 (2001).
49. Smith, S.M. Fast robust automated brain extraction. Hum. Brain Mapp. 17, 143–155(2002).
50. Duvernoy, H. The Human Brain (Springer, Wien and New York, 1999).
522 VOLUME 10 [ NUMBER 4 [ APRIL 2007 NATURE NEUROSCIENCE
ART ICLES©
2007
Nat
ure
Pub
lishi
ng G
roup
ht
tp://
ww
w.n
atur
e.co
m/n
atur
eneu
rosc
ienc
e


1
SUPPLEMENTAL NOTE 1: Analysis of BOLD-related confounds across age_groups
As is standard in SPM analyses, the brain activation maps that we examined in
our study were based on T statistics which were proportional to the contrast among
signal estimates (βi) for conditions of interest relative to the residual error (ResMs),
which were determined by fitting a general linear model (GLM) to the BOLD time course
at each voxel. Thus, T ∝
€
∆βResMs
. Therefore, factors that are associated with BOLD-
related confounds such as noise or poorer fit of the GLM among children might, a priori,
contribute to the smaller extent of activations we observed in children’s rFFA and lPPA.
We examined three factors that are associated with BOLD-related noise and poor fit of
GLM: (1) subject motion, (2) BOLD signal fluctuation during fixation and (3) residual
error of the GLM, which is an inclusive measure of BOLD noise and goodness of fit of
the GLM. Given that the latter two measures may spatially vary across brain regions, we
estimated the local level of these factors within the anatomical ROIs of the mid-fusiform
gyrus (mFG) or parahippocapal gyrus (PHG) in each subject and hemisphere.
(1) Motion during scan was estimated as total translation (d) and rotation (r) for
each subject (see Methods & Suppl. Table 1). Total translational motion during scan
was higher in children compared to adults (t33 = 1.92, P < 0.04, 1-tailed). Total rotational
motion during the scan was not significantly different across age groups (F2 42 = 0.91, P =
0.41).
(2) Local fluctuation of BOLD during baseline (%cv_BOLD) reflects BOLD-related
noise in the absence of visual stimuli of interest in our study. This was calculated as the
percent of BOLD variation during the fixation condition within the anatomical ROIs of the
mFG or PHG (Methods). We found a significantly higher %cv_BOLD in children than
adults in the left mFG (t33 = 2.51, P < 0.02, Suppl. Table 1) and left PHG (t33 = 1.61, P <
0.003, Suppl. Table 2).

2
(3) Percent residual error (%Res) was calculated from the residual sum of mean
squared error of the GLM, relative to the average of BOLD time course averaged across
each anatomically defined ROI (details in Methods). In the right mFG, %Res showed a
non-significant trend towards higher values in children compared to adults (t33 = 1.28, P
= 0.07, 1-tailed, Suppl. Table 1), and significantly higher values in adolescents
compared to adults (t28 = 1.8, P < 0.04, 1-tailed, Suppl. Table 1).
Overall, factors associated with BOLD-related confounds showed a trend
towards larger values in children and adolescents compared to adults, reaching
statistical significance in some cases. Thus, we tested the possibility that larger BOLD-
related confounds may account for our findings of smaller rFFA and lPPA in children. We
reasoned that, if our results were due to more BOLD-related confounds in children, the
size of rFFA and lPPA would not be different between age-groups for the participants
that were matched for these confounds. Alternatively, if the rFFA and lPPA were smaller
among children who were matched to adults for measures of BOLD-related confounds,
then our findings would be independent of such confounds. To test these alternatives we
repeated our analyses of the FFA and PPA size, including only the participants that were
matched for the three factors above.
Matching groups for BOLD-related confounds:
In matching BOLD-related confounds, our goal was to equate or lessen the level
of BOLD-related confounds in children relative to adults, especially in the rFFA and
lPPA. Factors associated with BOLD-related confounds (%cv_BOLD and %Res), may
vary spatially across the brain. Therefore we matched groups for movement and local
levels of %cv_BOLD and %Res in a given anatomical ROI (e.g. right middle fusiform
gyrus: R_mFG, left parahippocampal gyrus: L_PHG) and then reexamined the size of
the corresponding functional ROI (e.g. rFFA) in the subset of subjects matched for
BOLD-related confounds. We repeated this procedure four times for each pair of

3
anatomical and functional ROI: (i) R_mFG and rFFA, (ii) L_mFG and lFFA, (iii) right
parahippocampal gyrus (R_PHG) and rPPA, (iv) L_PHG and lPPA. Measures of BOLD-
related confounds and subject information for each analysis before and after matching
groups are summarized in Supplementary Tables 1 and 2.
Procedure for matching subjects:
1- For a given functional ROI (e.g. rFFA) we examined between-group differences
in local %cv_BOLD and %Res within the relevant anatomical ROI (e.g. right
mFG), including all subjects in each age group (Suppl. Table 1, 2).
2- Within each age group we ranked subjects for the factor that showed the greatest
between group difference.
3- We matched age group averages for the factor of interest by excluding subjects
with the highest or lowest values within their age group. Given that for most ROIs
the average values for BOLD-related confounds were higher in children and
adolescents, we matched subjects by removing children and adolescents with
the highest levels of the factor of interest. If the measure of interest was not
matched after excluding 10 children, we removed adults with the lowest levels for
the factor of interest. This ensured sufficient statistical power for subsequent
between-group comparison of the size of the function ROI.
If the remaining children or adolescents were not matched to or lower than adults for
other BOLD-related confounds, we repeated this procedure for the remaining subjects.
Importantly, we found that in the subset of subjects that were matched for BOLD-related
confounds, the rFFA and lPPA size were significantly smaller in children (ages 7- 11)
than in adults (P < 0.05, Fig. 2c and Fig. 6c-red bars). These analyses confirm that the
smaller rFFA and lPPA size in children is not due to larger BOLD-related confounds in
children.

Supplementary Table 1. Between-group comparison of noise-related measures, including total motion during the scan, BOLD-fluctuations
during baseline (%cv-BOLD) and goodness of GLM fit (%Res) within the anatomical boundaries of the right (R_mFG) and left (L_mFG) mid-
fusiform gyrus.
All Subjects mFG %cv_BOLD & %Res matched Subjects Children
N = 20 Ages = 7–11
Mean age = 9.0
Adolescents N = 10
Ages = 12–16 Mean age =14.0
Adults N = 15
Ages =19–31 Mean age =23.4
Children N = 10
Ages = 7–11 Mean age = 9.2
Adolescents N = 9
Ages = 12–14 Mean age = 14.2
Adults N = 13
Ages =19–31 Mean age = 23.4
d (mm)
“
0.29 ± 0.19*
“
0.21 ± 0.11
“
0.20 ± 0.1
N = 10
Ages = 7-11 Mean age = 9.2
0.19 ± 0.13
N = 10
Ages = 7-11 Mean age = 9.2
0.19 ± 0.09
N = 13
Ages = 19-27 Mean age = 24
0.19 ± 0.07
Participants
included
R_mFG
L_mFG
Motion1
% cv_BOLD
% Res
Participants
excluded
r (rad)
R L
R L
R_mFG
L_mFG
0.005 ± 0.006
0.54 ± 0.04 0.46 ± 0.03**
0.054 ± 0.004 0.047 ± 0.004
__
__
0.003 ± 0.003
0.45 ± 0.10 0.43 ± 0.07
0.058 ± 0.010 0.049 ± 0.009
__
__
0.002 ± 0.002
0.47 ± 0.04 0.32 ± 0.03
0.043 ± 0.003 0.039 ± 0.003
__
__
0.002 ± 0.002
0.42 ± 0.04 0.43 ± 0.04
0.039 ± 0.002 0.038 ± 0.002
N = 10
Ages = 7–11 Mean age = 8.9
N = 10
Ages = 7–11 Mean age = 9.0
0.003 ± 0.002
0.36 ± 0.03 0.44 ± 0.07
0.042 ± 0.002
0.038 ± 0.0.002
N = 1 Ages = 12
N = 1 Ages = 12
0.002 ± 0.002
0.46 ± 0.04 0.33 ± 0.03
0.043 ± 0.003 0.039 ± 0.035
N = 2
Ages = 23, 24 Mean age =23.5
N = 2
Ages = 19, 31 Mean age = 25
1. Motion parameters on the right are listed for the subset of subjects matched for motion and for %cv_BOLD, and %Res in the right mid-fusiform
gyrus.
* vs. adults, p < 0.04, ** vs. adults p < 0.02, 2-tailed t-test.
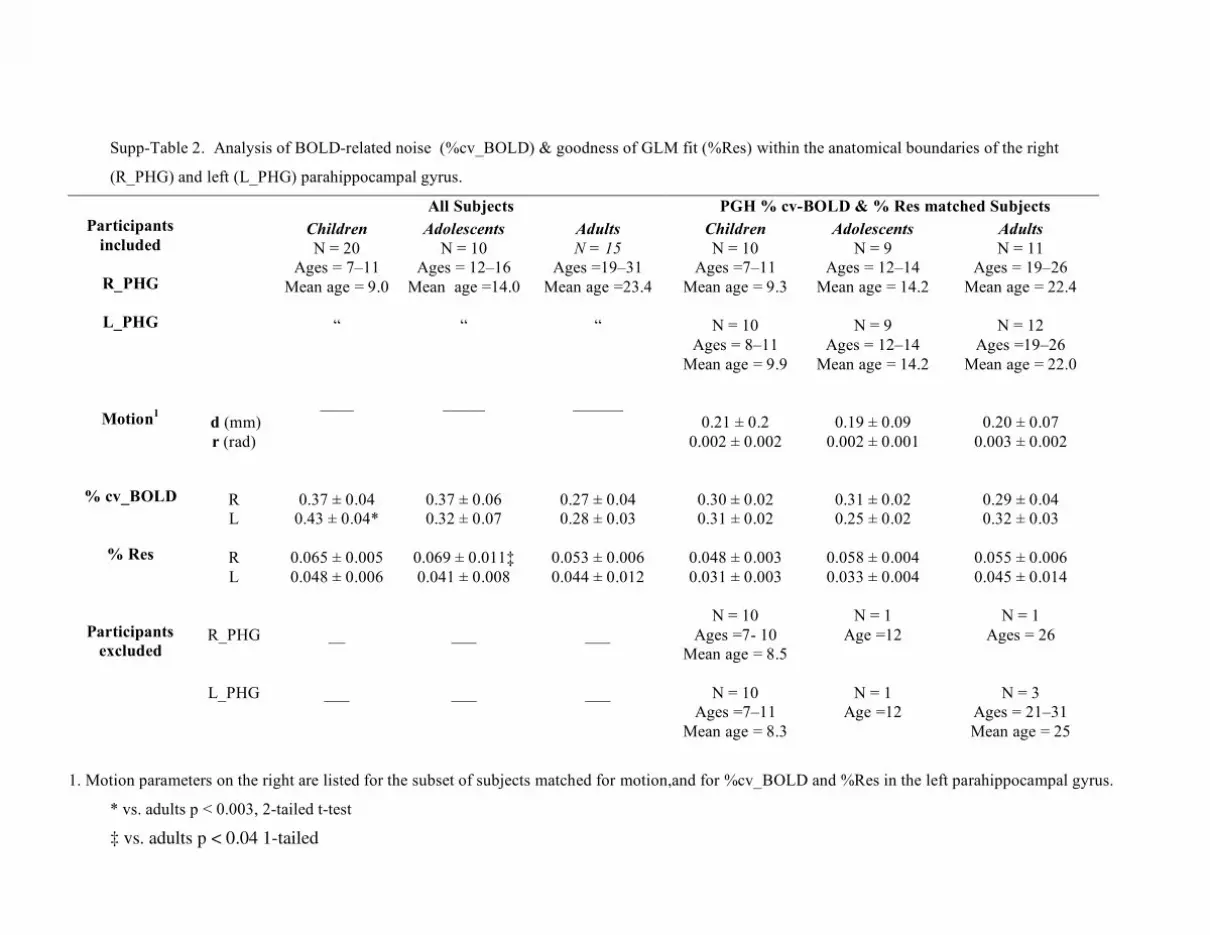
Supp-Table 2. Analysis of BOLD-related noise (%cv_BOLD) & goodness of GLM fit (%Res) within the anatomical boundaries of the right
(R_PHG) and left (L_PHG) parahippocampal gyrus.
All Subjects PGH % cv-BOLD & % Res matched Subjects Children
N = 20 Ages = 7–11
Mean age = 9.0
Adolescents N = 10
Ages = 12–16 Mean age =14.0
Adults N = 15
Ages =19–31 Mean age =23.4
Children N = 10
Ages =7–11 Mean age = 9.3
Adolescents N = 9
Ages = 12–14 Mean age = 14.2
Adults N = 11
Ages = 19–26 Mean age = 22.4
Participants
included
R_PHG
L_PHG
Motion1
% cv_BOLD
% Res
Participants excluded
d (mm) r (rad)
R L
R L
R_PHG
L_PHG
“
____
0.37 ± 0.04 0.43 ± 0.04*
0.065 ± 0.005 0.048 ± 0.006
__
___
“
_____
0.37 ± 0.06 0.32 ± 0.07
0.069 ± 0.011‡ 0.041 ± 0.008
___
___
“
______
0.27 ± 0.04 0.28 ± 0.03
0.053 ± 0.006 0.044 ± 0.012
___
___
N = 10
Ages = 8–11 Mean age = 9.9
0.21 ± 0.2 0.002 ± 0.002
0.30 ± 0.02 0.31 ± 0.02
0.048 ± 0.003 0.031 ± 0.003
N = 10
Ages =7- 10 Mean age = 8.5
N = 10
Ages =7–11 Mean age = 8.3
N = 9
Ages = 12–14 Mean age = 14.2
0.19 ± 0.09
0.002 ± 0.001
0.31 ± 0.02 0.25 ± 0.02
0.058 ± 0.004 0.033 ± 0.004
N = 1
Age =12
N = 1 Age =12
N = 12
Ages =19–26 Mean age = 22.0
0.20 ± 0.07 0.003 ± 0.002
0.29 ± 0.04 0.32 ± 0.03
0.055 ± 0.006 0.045 ± 0.014
N = 1
Ages = 26
N = 3 Ages = 21–31 Mean age = 25
1. Motion parameters on the right are listed for the subset of subjects matched for motion,and for %cv_BOLD and %Res in the left parahippocampal gyrus.
* vs. adults p < 0.003, 2-tailed t-test
‡ vs. adults p < 0.04 1-tailed

1
Supplemental Note 2: Recognition memory for faces, objects and places
During the encoding session, participants viewed blocks of images of faces,
abstract objects and scenes, and pressed a button when an image was presented twice
successively (one-back task on 1.4% of images). Accuracy was high during the one-
back task (> 90%) across age groups and image categories, showing no significant
effects of age (F2, 42 = 1.0, P = 0.38), image category (F2,42 = 0.07, P = 0.79) or age by
image-category interaction (F6, 264 = 0.31, P = 0.74). Response times were longer for
children (ages 7 – 11) than adolescents (ages 12 –16, t28 = 2.20, P < 0.03) and adults
(t33 = 4.75 P < 0.0001) with no significant effects of image category (F2, 42 = 1.07, P =
0.35), or interactions between age and image category (F6, 264 = 0.84, P = 0.44).
We asked whether the size of the rFFA was specifically associated with face
recognition memory or more generally with memory for other image categories as well,
by applying a multivariate analysis of variance (MANOVA) with the dependent variables
of face, object and place memory, and covariates of age and FFA size, among subjects
matched for rFFA BOLD-related confounds (Suppl. Table 1). Results showed main
effects of age (F2, 29 = 5.44, P < 0.006) and rFFA size (F2, 29 = 3.27, P < 0.04), and an
age by rFFA-size interaction (F = 2.70, P < 0.04, 1-tailed). This interaction occurred
because there was a significant correlation between rFFA size and face recognition
memory for children (all children: r = 0.49, P < 0.03, n = 20; BOLD-confound-matched
children: r = 0.66, P < 0.04, n = 10) and adolescents (all adolescents: r = 0.61, P < 0.03,
n = 10; BOLD-confound-matched adolescents: r = 0.63, P < 0.03, 1-tailed n = 9), but no
correlation for adults (r = 0.32, P = 0.24, n = 15), perhaps due to the limited variance in
adults’ performance. Nonetheless, across age groups the size of the rFFA was a
significant factor for explaining recognition-memory performance for faces (F2, 29 = 10.04,
P < 0.004), but not objects (F2, 29 = 0.13, P = 0.72) or places (F2, 29 = 3.50, P = 0.17).

2
We performed a similar analysis for the lPPA on the subset of subjects that were
matched for BOLD-related confounds (Suppl, Table 2), using age and lPPA size as
covariates. Results showed main effects of age (F2, 27 = 4.02, P < 0.02) and lPPA size
(F2, 27 = 3.63, P < 0.03), and age by lPPA-size interaction (F = 4.26, P < 0.05). We found
that lPPA size was a significant factor for explaining memory for places (F2, 27 = 9.45, P <
0.005), but not faces (F2, 27 = 0.06, P = 0.80) or objects (F2, 27 = 0.72, P = 0.40).