Embed Size (px)
Citation preview
Journal of Autism and Developmental Disorders, Vol. 26, No. 1, 1996
Diagnosis and Classification in Autism 1
Lynn W a t e r h o u s e 2 Trenton State College
Robin M o r r i s Georgia State University
Doris Mien and Michelle Dnnn Albert Einstein College of Medicine
Deborah Fein University of Connecticut
Carl Feinstein Kennedy Krieger Institute and The Johns Hopkins Medical School
Isabelle Rapin Albert Einstein College of Medicine
L o r n a Wing Centre for Social and Communication D/sorders, Bromley Ken~ England
This study compared four systems for the diagnosis o f autism (DSM-III, DSM-III-R, DSM-I~, and ICD-IO) with two empirically derived taxa o f autism, and with three social subgroups o f autism (Aloof, Passive, and
IThis study was supported in part by National Institutes of Health grant NS 20489 to the Autism and Language Disorders Collaborative Project: Preschool Study Group. The authors gratefully acknowledge the contributions of Robert Golden, Dorothy Aram, and Barbara Wilson to this study. The authors thank Dolores Drake and Maura McGovern Graber for assistance in the preparation of this paper, and thank Cathy Lord and several anonymous reviewers for their help in developing the structure of this paper.
2Address all correspondence to Lynn Waterhouse, 226 Bray Hall, Trenton State College, Trenton, New Jersey 08650-4700.
59
0162-3257/96/02004)059509.50/0 O 1996 Plenum Publishing Corporation
60 Waterhouse et al.
Active-but-Odd) in 194 preschool children with salient social impairment. There were significant behavior and IQ differences between autistic and other-PDD groups for all four diagnostic systems, and a significant association was found (a) for Taxon B, diagnoses of autism, and the Aloof subgroup, and (b) for Taxon A, other-PDD, and the Active-but-Odd subgroup. Findings offer support for two major overlapping continua within idiopathic Pervasive Developmental Disorder.
Autism is found in association with many different levels of language im- pairment and social impairment, with variant neural deficits and mental ages, and with a range of etiologies. This heterogeneity has been attributed to the structure of the diagnostic systems (Parks, 1983), and to the incorrect use of diagnostic systems (Cohen, Paul, & Volkmar, 1986; Meehl, 1986). Identifying more homogeneous behavioral subgroups would increase the inferential power of developmental, genetic, imaging, neuroanatomic, and neurophysiological studies of autism (Dahl, Cohen, & Provence, 1986; Eaves, Ho, & Eaves, 1994; Horowitz & Rumsey, 1994; Piven & Folstein, 1994; Rapin, 1991; Reichler & Lee, 1987; Tsai & Ghaziuddin, 1992; Wa- terhouse, 1994).
Efforts to limit heterogeneity have included the creation of sub- groups (a) by clinical consensus and field trials (DSM-III, American Psy- chiatric Association [APA], 1980; DSM-III-R, APA, 1987; DSM-II(, APA, 1994; ICD-IO World Health Organization [WHO], 1993); (b) by IQ (Co- hen, Paul, & Volkmar, 1987; Freeman et al., 1981; Tsai, 1992); (c) by social functioning--Aloof, Passive, Active-but-Odd (Borden & Ollendick, 1994; Castelloe & Dawson, 1993; Volkmar, Cohen, Bregman, Hooks, & Stevenson, 1989; Wing, 1988; Wing & Gould, 1979); (d) by cognitive pro- files (Fein, Waterhouse, Lucci, & Snyder, 1985); (e) by presence of or- ganic features (Cohen et al., 1987); (f) by cluster analysis of sets of variables (Eaves et al., 1994; Siegel, Anders, Ciarenello, Bienenstock, & Kraemer, 1986); and, (g) by cluster and taxometric analysis together (Golden & Mayer, 1995; Rapin, in press).
Formal diagnostic systems have assumed there is a core syndrome-- Infantile Autism, DSM-III (1980); Childhood Autism, ICD-IO (1993); Autis- tic Disorder, DSM-III-R (1987), DSM-1V (1994)--and other noncore autistic-like groups. Developmental research, however, has suggested an autistic continuum rather than a sharp boundary between core autism and noncore groups (Dalai et al., 1986; Provence & Dalai, 1987; Waterhouse, Wing, & Fein, 1989; Wing, 1988; Wing & Attwood, 1988). Furthermore, researchers reviewing clinical studies have proposed that there may be two
Diagnosis and Classification in Autism 61
major forms of the autistic syndrome: high functioning and low functioning (Cohen et al., 1987; Tsai, 1992).
To compare these three proposals--1. An autism core group; 2. An autistic continuum; 3. High and low functioning autism--we have explored associations between four diagnostic systems for autism--DSM-III, DSM- Ili-R, DSM-II(, and ICD-lO--with two statistically derived taxa of autism (Golden & Mayer, 1995; Rapin, in press), and with three social subgroups of autism (Aloof, Passive, and Active-but-Odd) (Wing, 1988) in a multisite preschool sample of 194 children diagnosed as having Pervasive Develop- mental Disorder (PDD). Findings presented in the Results section suggest support for a fourth proposal, two major overlapping autistic subgroups of differential severity whose behavioral continua together form a larger con- tinuum.
METHOD
Subjects
Preschool Study Sample
For a longitudinal study of children with communication disorders we recruited more than 700 children ages 3 to 7 in three groups by prior clini- cal diagnosis: developmental language disorder (DLD), autistic disorder (AD), and nonautistic mental retardation (NAMR). A sample of 46 normal children provided normative data for nonstandardized measures of spon- taneous language, sociability, and play.
Children were recruited by clinical referral and by solicited participa- tion of special schools and programs in Atlanta, Boston, Bronx NY, Cleve- land, Manhasset NY, and Trenton. The project was not designed as an epidemiological study: Complete sampling in discrete geographic regions was not conducted.
Inclusionary and exclusionary criteria were (a) age 3-7 years; (b) Eng- lish speaking; (c) normal hearing (25 Db or better); (d) no known brain lesions or neural disease; (e) no known genetic disorder; (f) no frequent seizures; (g) no significant motor or sensory handicaps; (h) not on high doses of anticonvulsants or behavior-altering medications. Six hundred thirty-three children met these criteria; 36 children did not complete all core measures and 41 dropped out of the study. These 77 did not differ significantly from the remaining 556 children (Rapin, in press).

62 Waterhouse et al.
Autistic Sample
Two-Phase Screening for Social Impairment. Two hundred fifty-three chil- dren recruited for the autistic sample had been screened by a clinician as having significant impairment in social relatedness and social communica- tion. For a second level screening the child's mother or teacher was inter- viewed with the three-section 21-item Wing Autistic Disorder Interview (WADIC, Wing, 1985). Interrater kappas computed for each of the 21 WADIC items during the field trials of DSM-IIIR ranged from a low of .51 for C5 to a high of .92 for A1 (see Appendix A; Waterhouse, 1986; Water- house, W'mg, Spitzer, & Siegel, 1992). A child was included in the study if the child's mother or teacher endorsed two of nine items in section A, or one item for each of the three sections-- (A) social impairment, (B) impair- ment in social communication, (C) repetitive or restricted activities. Of the 253 children recruited 221 were included by this second level screening.
Psychiatric Evaluation. All 221 screened children were evaluated by a child psychiatrist who (a) determined a DSM-II1 PDD (1980) diagnosis with endorsement of a detailed DSM-111 feature/symptom checklist; (b) deter- mined a DSM-II1-R PDD (1987) diagnosis with endorsement of a detailed DSM-III-R feature/symptom checklist; (c) completed two checklists of social abnormalities; and (d) coded the child's level of social relatedness--Aloof, Passive, Active-but-Odd--by means of Wing and Gould's (1979) description of each group (see Rapin, in press, for details). Of the 221 children 194 were diagnosed by child psychiatrists as having some form of PDD. Inter- rater agreement (Fleiss, Spitzer, Endicott, & Cohen, 1972; Krippendorff, 1970) between the site child psychiatrists and research clinician (N = 8) was computed for a representative subsample of 65 PDD children (52 boys; 13 girls) with a mental age of 18 to 106 months: for DSM-111 Infantile Autism versus other-PDD, the kappa was .88; for DSM-1I-R Autistic Dis- order versus other-PDD the kappa was .91.
Diagnostic Algorithm Classification. Using DSM-III and DSM-III-R symptom endorsements from the original psychiatric interviews, the abnor- malities checklists from the psychiatric interview, and symptom endorse- ments from a developmental history interview with parents, we constructed diagnostic algorithms to determine both an ICD-IO (1993) and a DSM-1V (1994) PDD classification for each of the 194 children originally evaluated in 1986. Appendix B provides exemplars of algorithm equivalencies. Com- plete algorithms are published elsewhere (Rapin, in press; Waterhouse, Feinstein, Allen, & Morris, 1993).
In the sample of 194 PDD children, child psychiatrists diagnosed 51% with DSM-III Infantile Autism and 91% with DSM-III-R (1987) Autistic Disorder. The diagnostic algorithm identified 59% with DSM-IV Autistic
Diagnosis and Classification in Autism 63
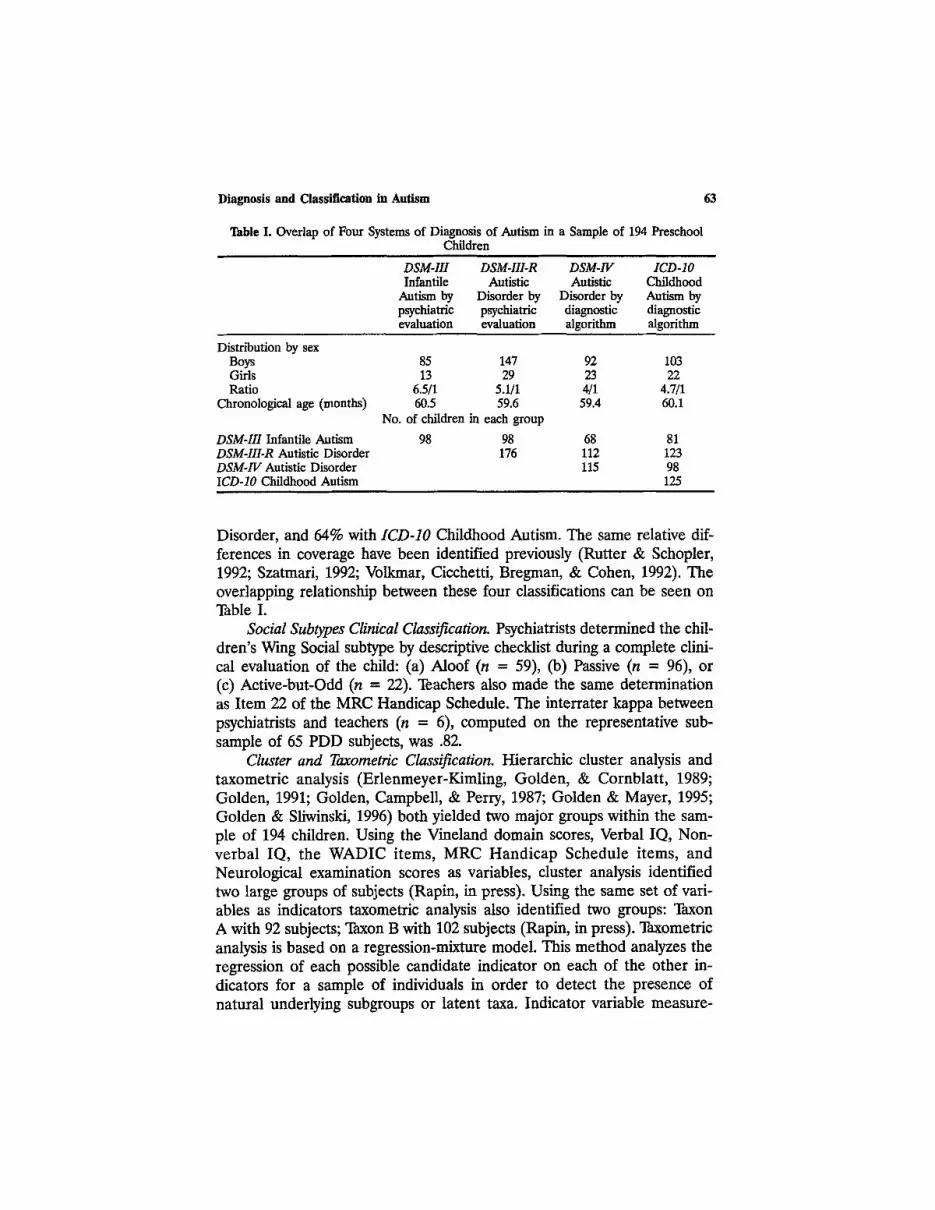
Table I. Overlap of Four Systems of Diagnosis of Autism in a Sample of 194 Preschool Children
DSM-III DSM-III-R DSM-IV ICD-IO Infantile Autistic Autistic Childhood
Autism by Disorder by Disorder by Autism by psychiatric psychiatric diagnostic diagnostic evaluation evaluation algorithm algorithm
Distribution by sex Boys 85 147 92 103 Girls 13 29 23 22 Ratio 6.5/1 5.1/1 4/1 4.7/1
Chronological age (months) 60.5 59.6 59.4 60.1 No. of children in each group
DSM-II1 Infantile Autism 98 98 68 81 DSM-IlI-R Autistic Disorder 176 112 123 DSM-IV Autistic Disorder 115 98 ICD-IO Childhood Autism 125
Disorder, and 64% with ICD-IO Childhood Autism. The same relative dif- ferences in coverage have been identified previously (Rutter & Schopler, 1992; Szatmari, 1992; Volkmar, Cicchetti, Bregman, & Cohen, 1992). The overlapping relationship between these four classifications can be seen on Table I.
Social Subtypes Clinical Classification. Psychiatrists determined the chil- dren's Wing Social subtype by descriptive checklist during a complete clini- cal evaluation of the child: (a) Aloof (n = 59), (b) Passive (n = 96), or (c) Active-but-Odd (n = 22). Teachers also made the same determination as Item 22 of the MRC Handicap Schedule. The interrater kappa between psychiatrists and teachers (n = 6), computed on the representative sub- sample of 65 PDD subjects, was .82.
Cluster and Taxometric Classification. Hierarchic cluster analysis and taxometric analysis (Erlenmeyer-Kimling, Golden, & Cornblatt, 1989; Golden, 1991; Golden, Campbell, & Perry, 1987; Golden & Mayer, 1995; Golden & Sliwinski, 1996) both yielded two major groups within the sam- ple of 194 children. Using the Vineland domain scores, Verbal IQ, Non- verbal IQ, the WADIC items, MRC Handicap Schedule items, and Neurological examination scores as variables, cluster analysis identified two large groups of subjects (Rapin, in press). Using the same set of vari- ables as indicators taxometric analysis also identified two groups: Taxon A with 92 subjects; Taxon B with 102 subjects (Rapin, in press). Taxometric analysis is based on a regression-mixture model. This method analyzes the regression of each possible candidate indicator on each of the other in- dicators for a sample of individuals in order to detect the presence of natural underlying subgroups or latent taxa. Indicator variable measure-

64 Waterhouse et al.
ments are assumed to be determined by a wide range of causal factors. Unlike cluster analysis, which will always form groups in a dataset, taxometric analysis yields three possible outcomes: (a) evidence for no la- tent groups, i.e., suggesting a continuum; or (b) evidence identifying one taxonic group and a remainder; or, (c) evidence suggesting two taxonic groups. Taxometric analysis in the sample of 194 suggested two possible taxonie groups with partially overlapping distributions of variance. The dearest contributor to the two taxa was developmental status. Taxon A children are older (A, mean age = 62.9 months; B, mean age = 55.0 months), and better functioning (A, mean verbal IQ = 55.2; B, mean ver- bal IQ = 24.6) than Taxon B children. The empirically derived taxa, how- ever, are not equivalent to high and low functioning in terms of IQ. Making an IQ cut at 70 in the sample of 194 will wrongly group 42 indi- viduals: approximately 21% of Taxon A have IQs below 70, and 23% of Taxon B have IQs above 70 (Waterhouse et al., 1993).
Contrast Sample
In addition to the 194 PDD children, we tested 252 children with clini- cally diagnosed developmental language disorder (mean age 49 months) and 110 nonautistic mentally retarded children with IQs below 80 (mean age 56 months). While data from these clinical study populations are re- ported elsewhere (Rapin, in press), data from the 362 children on the WADIC screening instrument are reported here for comparison.
Measures
Interview Schedules
After the WADIC interview, mothers of children who passed the screen were interviewed with the Vineland Adaptive Behavior Scales (VABS; Sparrow, BaUa, & Cicchetti, 1984) to assess communication, daily living, socialization, and motor skills. Teachers of the 194 children were interviewed with the Medical Research Council Handicaps, Behaviour and Skills schedule (Wing & Gould, 1978) to assess language, play, abnormal sensory and motor behavior, daily living skills, behavior problems, attention, and social skills.
Diagnosis and Classification in Autism 65
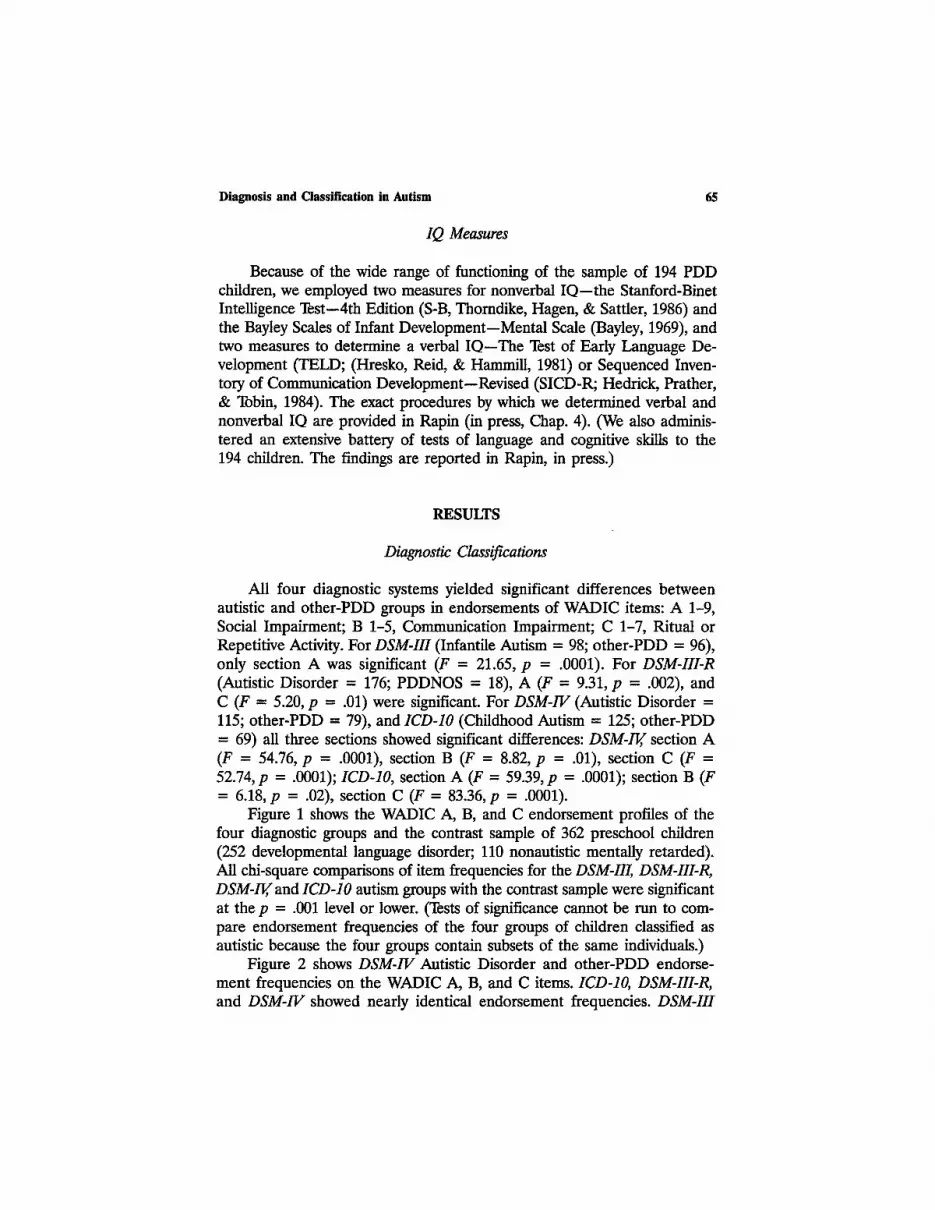
IQ Measures
Because of the wide range of functioning of the sample of 194 PDD children, we employed two measures for nonverbal IQ--the Stanford-Binet Intelligence Test--4th Edition (S-B, Thomdike, Hagen, & Satfler, 1986) and the Bayley Scales of Infant Development--Mental Scale (Bayley, 1969), and two measures to determine a verbal IQ--The Test of Early Language De- velopment (TELD; (Hresko, Reid, & Hammill, 1981) or Sequenced Inven- tory of Communication Development--Revised (SICD-R; Hedrick, Prather, & Tobin, 1984). The exact procedures by which we determined verbal and nonverbal IQ are provided in Rapin (in press, Chap. 4). (We also adminis- tered an extensive battery of tests of language and cognitive skills to the 194 children. The findings are reported in Rapin, in press.)
RESULTS
Diagnostic Classifications
All four diagnostic systems yielded significant differences between autistic and other-PDD groups in endorsements of WADIC items: A 1-9, Social Impairment; B 1-5, Communication Impairment; C 1-7, Ritual or Repetitive Activity. For DSM-III (Infantile Autism = 98; other-PDD = 96), only section A was significant (F = 21.65, p = .0001). For DSM-III-R (Autistic Disorder = 176; PDDNOS = 18), A (F = 9.31, p = .002), and C (F = 5.20, p = .01) were significant. For DSM-IV (Autistic Disorder = 115; other-PDD = 79), and 1CD-IO (Childhood Autism = 125; other-PDD = 69) all three sections showed significant differences: DSM-II( section A (F = 54.76, p = .0001), section B (F = 8.82, p = .01), section C (F = 52.74, p = .0001), ICD-IO, section A (F = 59.39, p = .0001); section B (F = 6.18, p = .02), section C (F = 83.36, p = .0001).
Figure 1 shows the WADIC A, B, and C endorsement profiles of the four diagnostic groups and the contrast sample of 362 preschool children (252 developmental language disorder; 110 nonautistic mentally retarded). All chi-square comparisons of item frequencies for the DSM-III, DSM-III-R, DSM-11(and ICD-IO autism groups with the contrast sample were significant at the p = .001 level or lower. (Tests of significance cannot be run to com- pare endorsement frequencies of the four groups of children classified as autistic because the four groups contain subsets of the same individuals.)
Figure 2 shows DSM-IV Autistic Disorder and other-PDD endorse- ment frequencies on the WADIC A, B, and C items. ICD-IO, DSM-III-R, and DSM-1V showed nearly identical endorsement frequencies. DSM-IH

1oo
90-
0 80- uJ
7 0 .
Z ' " 5 0 " I-,-
4o
tlJ O.
�9 . ~ . / " ~,
20" ~176 ~ ~.* "~,
10-" " " "~ ' . . . ~ . . . . . . . . - - " " " "" ""
0/~1 A2 A3 A4 A5 A6 A7 A8 A9
DIAGNOSTIC GROUPS NINE SOCIAL IMPAIRMENT BEHAVIORS
DSM III IA
OSM III R AD
DSM IV AD
ICD. 10 CA ~ m m .
NON - PDD CLINICAL CONTRAST SAMPLE
Waterhouse et aL
r~ uJ
0 0 Z LU I--
Q.
100:
90
80
70
60
50
40
30
20
10 ~o~ ~176 o~ ~176176 o,~~176176
DSM III IA
DSM III R AO
DSM IV AD
ICD - 10 CA
NON o PDD CLINICAL CONTRAST SAMPLE
B1 132 133 B4 B5
DIAGNOSTIC GROUPS FIVE COMMUNICATION IMPAIRMENT BEHAVIORS
lOG
9 0
80' uJ 70.
~ . Z W
W
' * ~ ~ DsM I[I iA
DSM ul R A~ 50 . . . . . ~. os.__My_Ao 3 o - ~ ,c_.o-_,o_cA 20' NON - PDD
CLINICAL 10- CONTRAST
~- ~. ~ - .~ SAMPLE
C1 C2 C3 C4 C5 C6 C7
DIAGNOSTIC GROUPS SEVEN RITUAL OR REPETITIVE ACTIVITIES
Fig. 1. Comparison of the frequency of endorsed items on the WADIC for groups of preschool children diagnosed as autistic by four diagnostic systems ( D S M - I I I , n = 98; D S M - I I I - R , n = 176; D S M - I I ( n = 115; I C D -
10, n = 125), and a COntrast sample of 362 children (252 with develop- mental language disorder; 100 with nonautistic mental retardation).

Diagnosis and Classification in Autism 67
100
8 0
7 0 60 -... y..-" "-..i
40 30 20. 1 0 0
DSM IV AUTISTIC DISORDER
DSM IV OTHER PDD
A1 A2 A3 A4 A5 A6 A7 A8 A9
DSM IV AUTISTIC DISORDER AND NON.AUTISTIC PDD NINE SOCIAL IMPAIRMENT BEHAVIORS
100
90-
8 8o "/0
Z 50 ". " " " DSM IV "'"". . '" AUTISTIC 40 ...... ." DISORDER
DS ,V OTHER
l o ~ ..p.?.O. ..... 0 B1 B2 B3 B4 B5
DSM IV AUTISTIC DISORDER AND NON-AUTISTIC PDD FIVE COMMUNICATION IMPAIRMENT BEHAVIORS
z DSM IV Z ~ AUTISTIC
; . .......... 20 .. ......................... ... DSM IV
" . . . . . . . . . OTHER 10 PDD
0 C1 C2 C3 CA C5 C6 C7
DSM IV AUTISTIC DISORDER AND NON-AUTISTIC PDD SEVEN RITUAL OR REPETITVE ACTIVITIES
Fig, 2. Comparison of the frequency of endorsed items on the WADIC for 115 preschool children classified with Autistic Disor- der by a DSM-IV diagnostic algorithm, and 78 children classified as other-PDD by DSM-IV.
68
100
9O
O 80 iJJ ~ 70 ~ z ' " 50 I-- z 4O gl
~ 30 a. 20
10
DSM III INFANTILE AUTISM
DSM III OTHER PDD
0 A1 A,?. A3 A4 A5 A6 A7 A8 A9
DSM Ill INFANTILE AUTISM AND NON-AUTISTIC PDD NINE SOCIAL IMPAIRMENT BEHAVIORS
Waterhouse et al.
ILl r ri- g Z UJ I-- Z ill
w
100
90
80
70
60
50
40
30
20
10
0
DSM III INFANTILE AUTISM
DSM In OTHER PDD
B1 132 B3 B4 B5
DSM Ill INFANTILE AUTISM AND NON-AUTISTIC PDD FIVE COMMUNICATION IMPAIRMENT BEHAVIORS
aoo /
1 ~ 80 ~ 70
~ - .
~ 40 ~ 30 w ~ 20
10
....... I DSM Ill �9 .. :." "...\ .. . . . . . ., / INFANTILE -.,...
" I UIMI- PI J POD
C1 C2 C3 C4 C5 C6 C7
DSM 111 INFANTILE AUTISM AND NON-AUTISTIC PDD
SEVEN RITUAL OR R E P E T I T V E ACTIVITIES
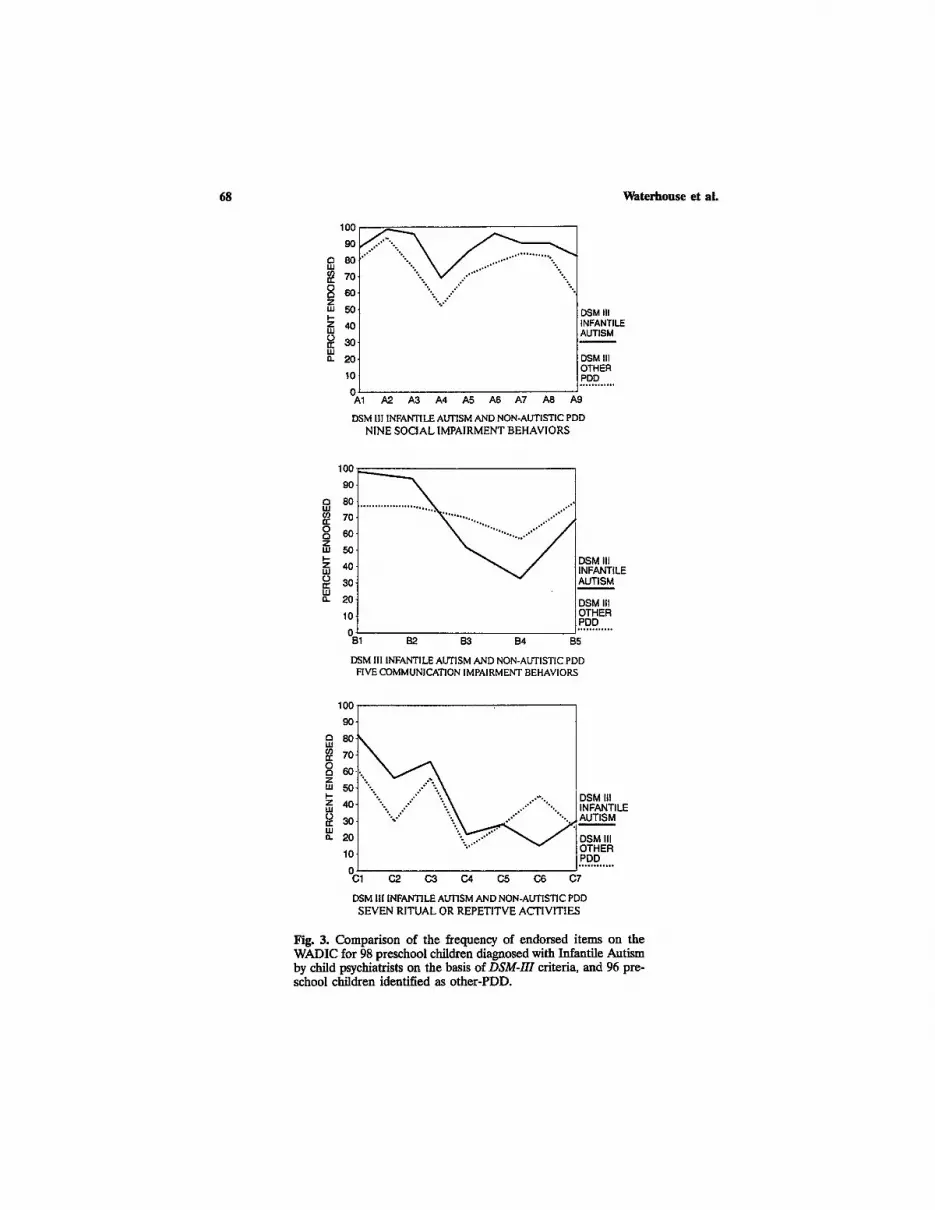
Fig. 3. Comparison of the frequency of endorsed items on the WADIC for 98 preschool children diagnosed with Infantile Autism by child psychiatrists on the basis of DSM-H1 criteria, and 96 pre- school children identified as other-PDD.
Diagnosis and Classification in Autism 69
showed a different pattern (Figure 3). The DSM-III other-PDD children were significantly more often endorsed for bizarre speech patterns (B3), impaired prosody (B4), impaired symbolizing (B5), and preservative inter- ests (C6). All chi-square comparisons were p = .04 or lower.
Distribution of Diagnoses, Taxa A and B, and Social Subtypes
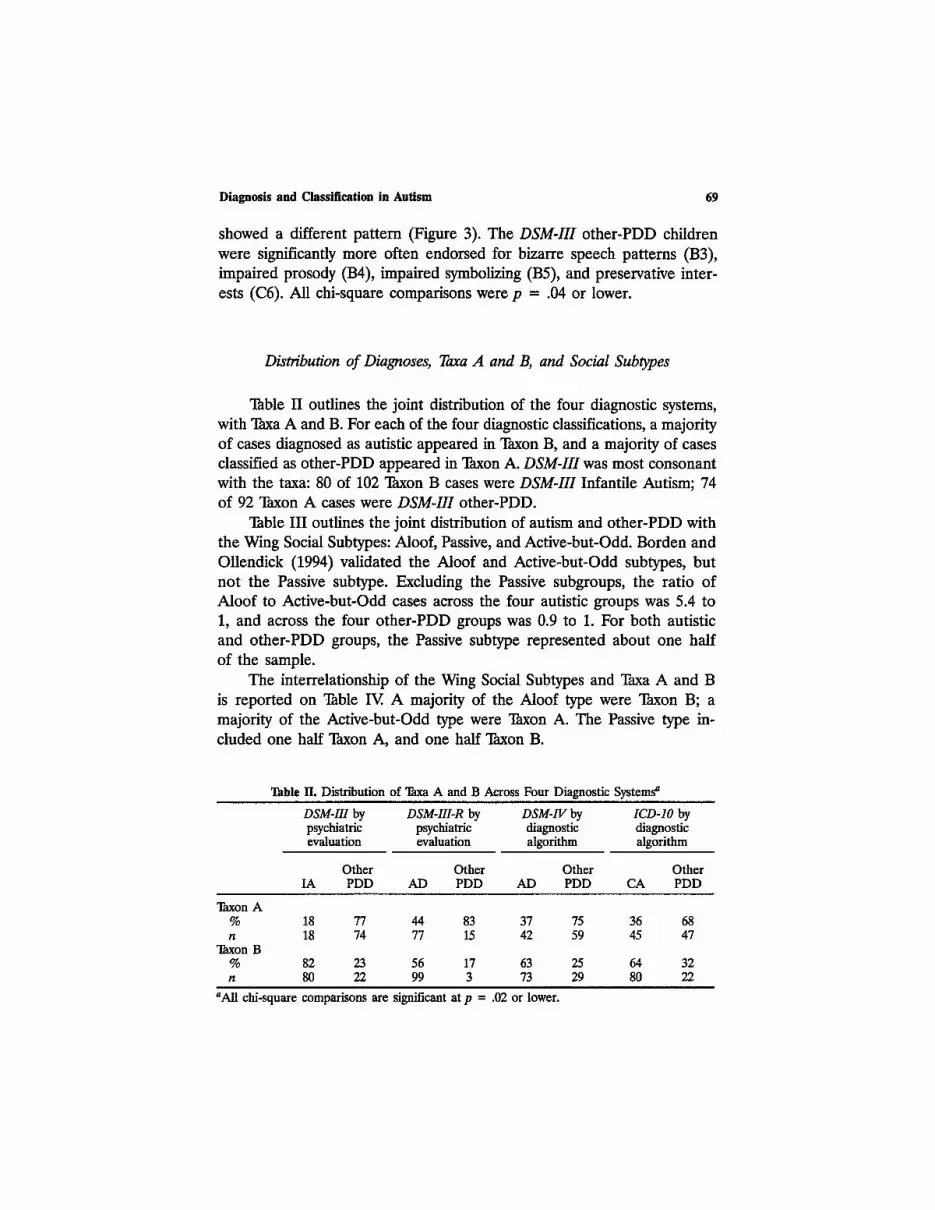
Table II outlines the joint distribution of the four diagnostic systems, with Taxa A and B. For each of the four diagnostic classifications, a majority of cases diagnosed as autistic appeared in Taxon B, and a majority of cases classified as other-PDD appeared in Taxon A. DSM-111 was most consonant with the taxa: 80 of 102 Taxon B cases were DSM-III Infantile Autism; 74 of 92 Taxon A cases were DSM-III other-PDD.
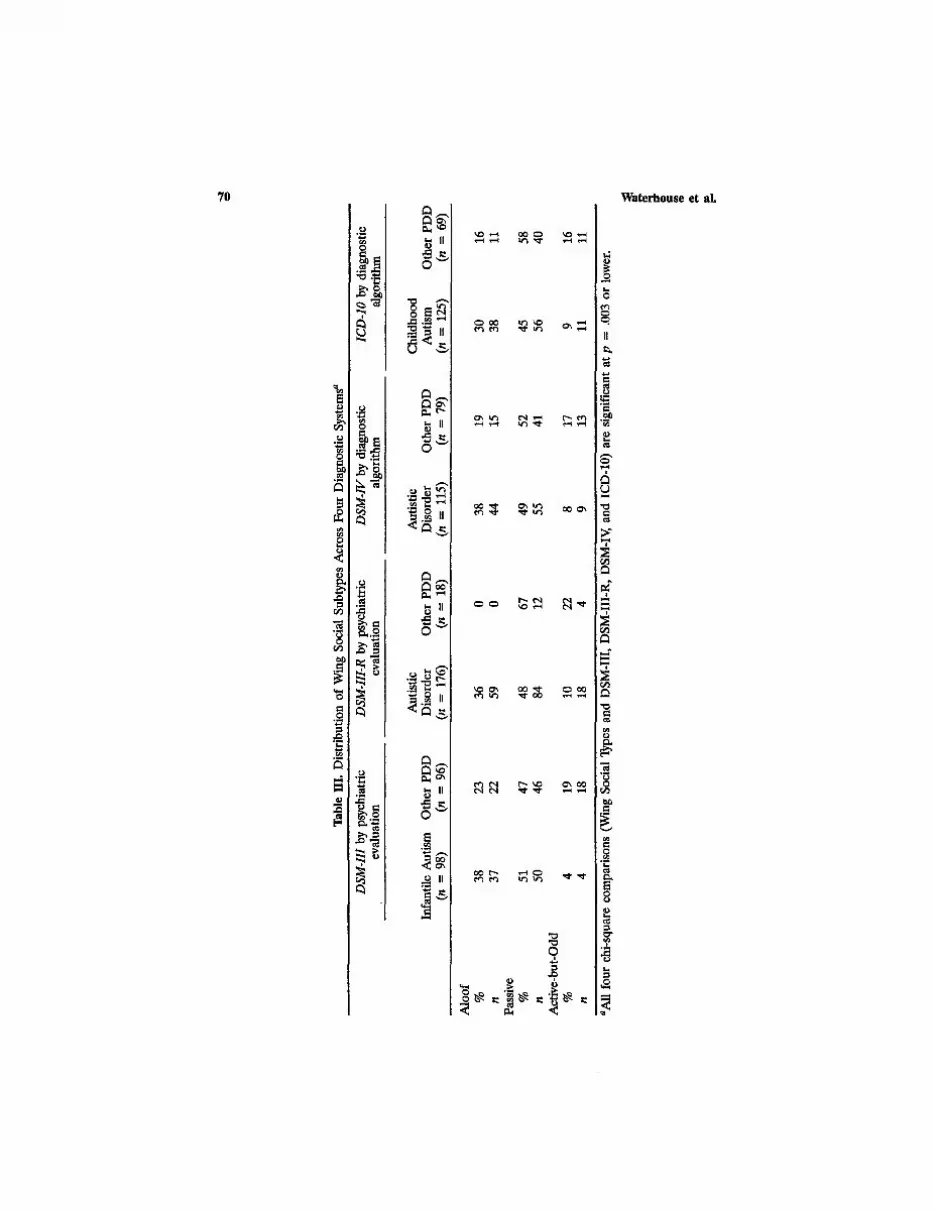
Table III outlines the joint distribution of autism and other-PDD with the Wing Social Subtypes: Aloof, Passive, and Active-but-Odd. Borden and Ollendick (1994) validated the Aloof and Active-but-Odd subtypes, but not the Passive subtype. Excluding the Passive subgroups, the ratio of Aloof to Active-but-Odd cases across the four autistic groups was 5.4 to 1, and across the four other-PDD groups was 0.9 to 1. For both autistic and other-PDD groups, the Passive subtype represented about one half of the sample.
The interrelationship of the Wing Social Subtypes and Taxa A and B is reported on 1hble IV. A majority of the Aloof type were Taxon B; a majority of the Active-but-Odd type were "Ihxon A. The Passive type in- cluded one half Taxon A, and one half Taxon B.
Table IL Distribution of "lhxa A and B Across Four Diagnostic Systems a
DSM-II1 by DSM-III-R by DSM-1V by ICD-IO by psychiatric psychiatric diagnostic diagnostic evaluation evaluation algorithm algorithm
Other Other Other Other IA PDD AD PDD AD PDD CA PDD
Taxon A % 18 77 44 83 37 75 36 68 n 18 74 77 15 42 59 45 47
Taxon B % 82 23 56 17 63 25 64 32 n 80 22 99 3 73 29 80 22
aAll chi-square comparisons arc significant at p = .02 or lower.
Tab
le I
H.
Dis
trib
utio
n of
Win
g So
cial
Sub
type
s A
cros
s F
our
Dia
gnos
tic
Syst
ems a
DSM
-III
by
psyc
hiat
ric
DSM
-III
-R b
y ps
ychi
atri
c D
SM
-IV
by
diag
nost
ic
ICD
-IO
by
diag
nost
ic
eval
uati
on
eval
uati
on
algo
rith
m
algo
rith
m
Aut
isti
c A
utis
tic
Chi
ldho
od
Infa
ntil
e A
utis
m
Oth
er P
DD
D
isor
der
Oth
er P
DD
D
isor
der
Oth
er P
DD
A
utis
m
Oth
er P
DD
(n
=
98)
(n =
96
) (n
=
176)
(n
=
18)
(n =
11
5)
(n =
79
) (n
=
125)
(n
=
69)
Alo
of
%
38
23
36
0 38
19
30
16
n
37
22
59
0 44
15
38
11
Pa
ssiv
e %
51
47
48
67
49
52
45
58
n
50
46
84
12
55
41
56
40
Act
ive-
but-
Odd
%
4
19
10
22
8 17
9
16
n 4
18
18
4 9
13
11
11
aAll
fou
r ch
i-sq
uare
com
pari
sons
(W
ing
Soci
al T
ypes
and
DS
M-I
II,
DS
M-I
II-R
, D
SM-I
V,
and
ICD
-10)
are
sig
nifi
cant
at p
=
.003
or
low
er.
Diagnosis and Classification in Autism 71
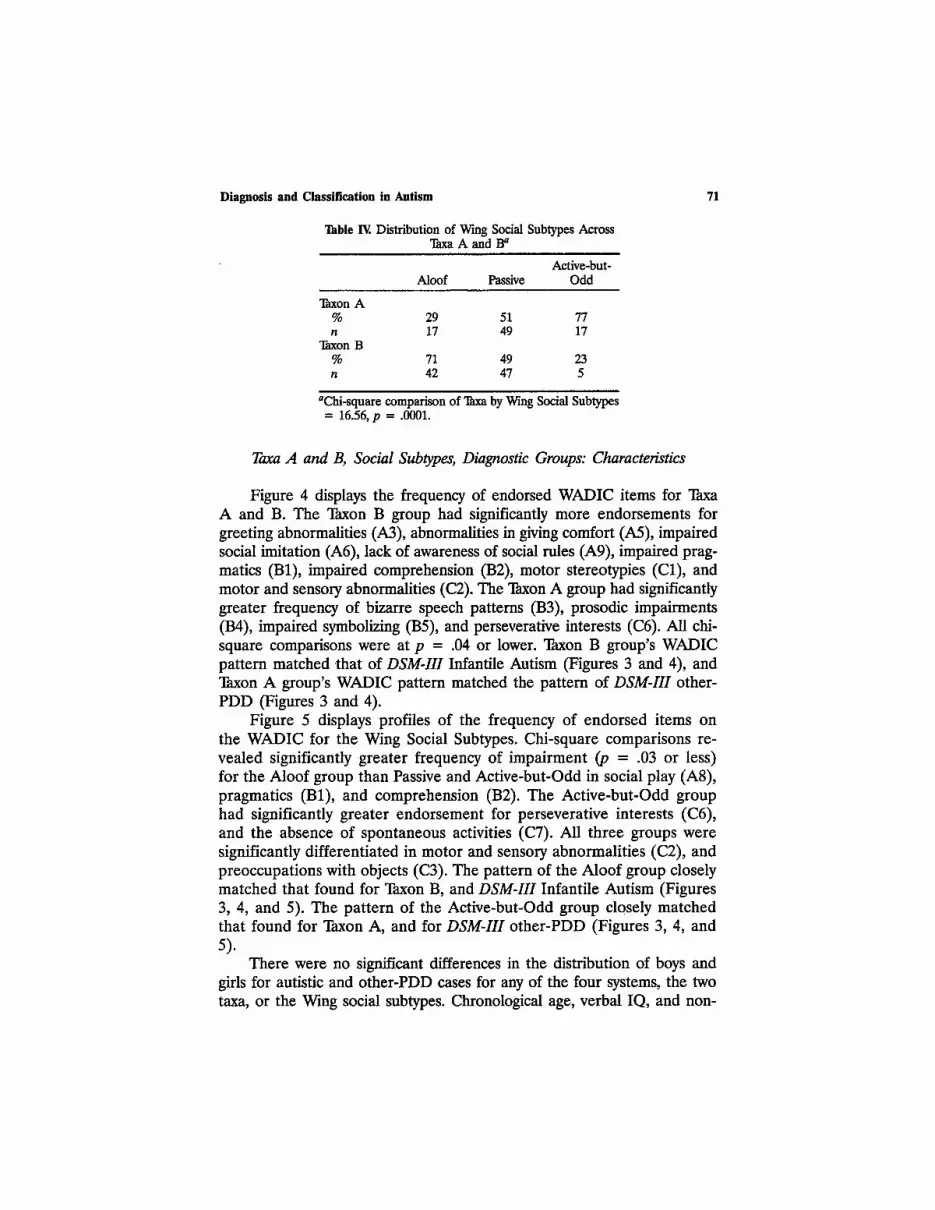
Table I~. Distribution of Wing Social Subtypes Across qTaxa A and B a
Active-but- Aloof Passive Odd
Taxon A % 29 51 77 n 17 49 17
Taxon B % 71 49 23 n 42 47 5
aChi-square comparison of "lhxa by Wing Social Subtypes = 16.56, p = .0001.
Taxa A and B, Social SubO~pes, Diagnostic Groups: Characteristics
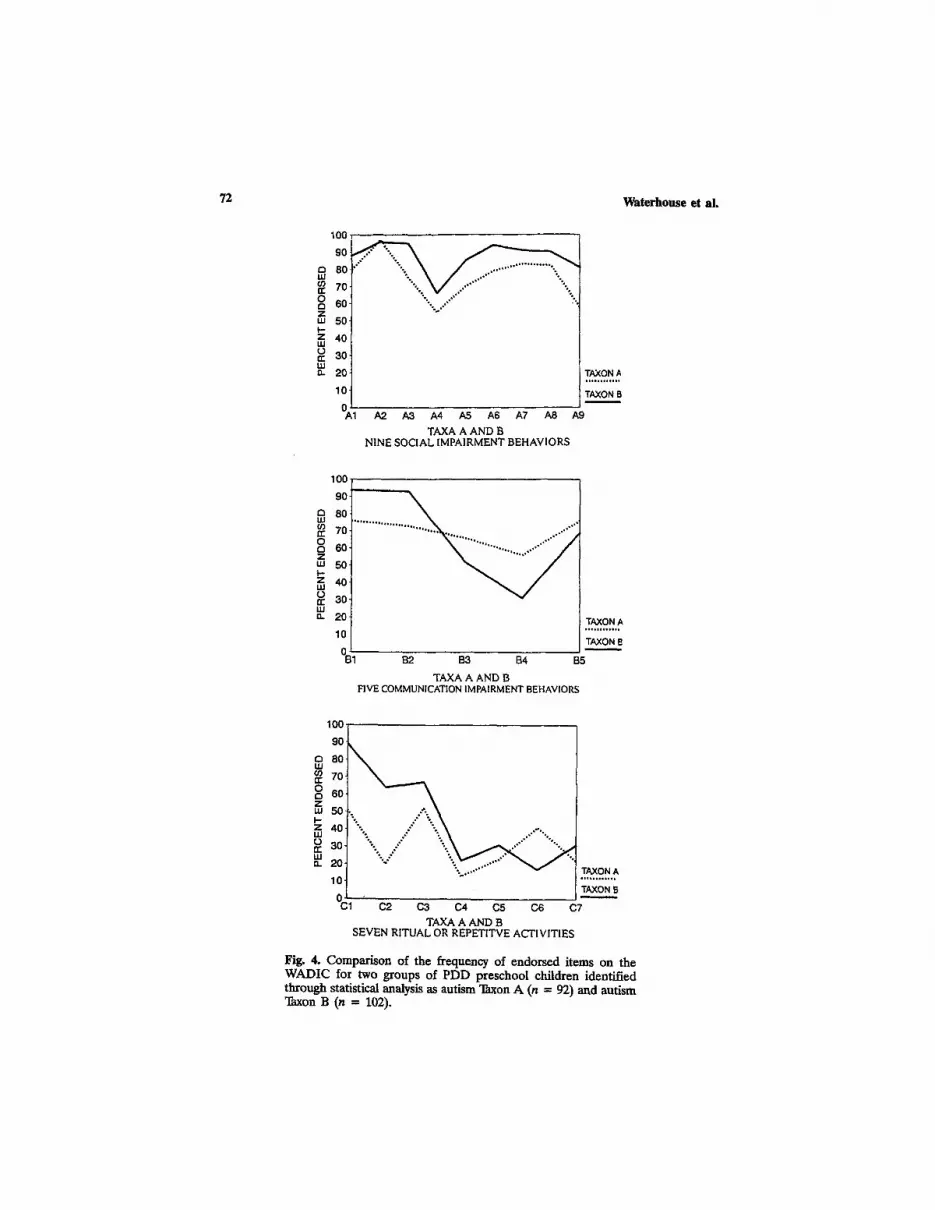
Figure 4 displays the frequency of endorsed WADIC items for Taxa A and B. The Taxon B group had significantly more endorsements for greeting abnormalities (A3), abnormalities in giving comfort (A5), impaired social imitation (A6), lack of awareness of social rules (A9), impaired prag- matics (B1), impaired comprehension (B2), motor stereotypies (C1), and motor and sensory abnormalities (C2). The Taxon A group had significantly greater frequency of bizarre speech patterns (B3), prosodic impairments (B4), impaired symbolizing (B5), and perseverative interests (C6). All chi- square comparisons were at p = .04 or lower. Taxon B group's WADIC pattern matched that of DSM-1II Infantile Autism (Figures 3 and 4), and Taxon A group's WADIC pattern matched the pattern of DSM-III other- PDD (Figures 3 and 4).
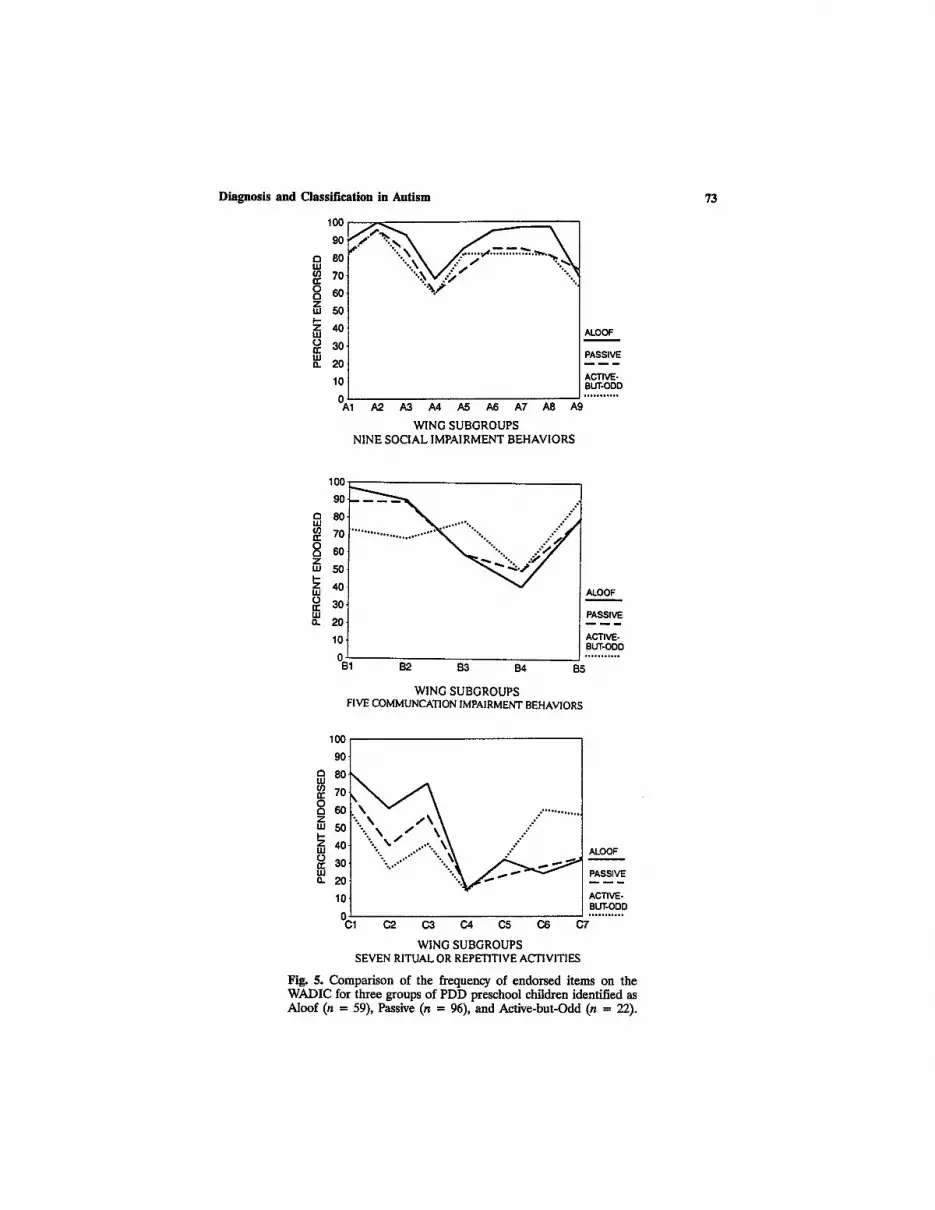
Figure 5 displays profiles of the frequency of endorsed items on the WADIC for the Wing Social Subtypes. Chi-square comparisons re- vealed significantly greater frequency of impairment (p = .03 or less) for the Aloof group than Passive and Active-but-Odd in social play (A8), pragmatics (B1), and comprehension (B2). The Active-but-Odd group had significantly greater endorsement for perseverative interests (C6), and the absence of spontaneous activities (C7). All three groups were significantly differentiated in motor and sensory abnormalities (C2), and preoccupations with objects (C3). The pattern of the Aloof group closely matched that found for Taxon B, and DSM-III Infantile Autism (Figures 3, 4, and 5). The pattern of the Active-but-Odd group closely matched that found for Taxon A, and for DSM-III other-PDD (Figures 3, 4, and 5).
There were no significant differences in the distribution of boys and girls for autistic and other-PDD cases for any of the four systems, the two taxa, or the Wing social subtypes. Chronological age, verbal IQ, and non-
72 Waterhouse et al,
lOO
90
80
70
60
50
40
30
20
lO
A ..... 1
..,- - ...... ~ . . . . ~
...........
A2. A3 A4 A5 A6 A7 A8
TAXA A AND B NINE SOCIAL IMPAIRMENT BEHAVIORS
TAXON A , , , , , , , , , , , ,
TAXON B
A9
100
90
80
70
60
50
40
30
20
10
0
TAXON A . . . . . , , , . , , ,
TAXON B
B1 B2 B3 B4 B5
TAXA A AND B FIVE COMMUNICATION IMPAIRMENT BEHAVIORS
100 "'
I so 7O
~ 50 ~ 4o ,O.o
~ 30 ,Y" "'.. =. 2o "" .:~x:.'."~w"."
10 TAXON B 0 " C1 C2 C3 C,4 C5 C6 C7
TAXA A AND B SEVEN RITUAL OR REPETITVE ACTIVITIES
Fig. 4. Comparison of the frequency of endorsed items on the WADIC for two groups of PDD preschool children identified through statistical analysis as autism "lhxon A (n = 92) and autism Taxon B (n = 102).
Diagnosis an d Class i f i ca t ion in Aut ism
100 ,,,
8or ' .~ .~ \ / . . . " J ........... " . ~ . ~ 70 "".~M.~" "".~
8 60 "-x/ Z " ' 50
Z 40 u.I ALOOF ~ so tu PASSIVE O. 20 -----
ACTIVE- 10 BUT-ODD
/ A2 A3 A4 A5 A6 A7 A8 A9
WING SUBGROUPS NINE SOCIAL IMPAIRMENT BEHAVIORS
73
a uJ
o
Z LU I-. Z ILl =o LU n
100-
90-
80
70
60
50
40
30
20
10 , 1
~176176176 ...... ~176176176176 ".~176 ~ ~176176 . ' ~
B2 B3 B4
WING SUBGROUPS FIVE COMMUNCATION IMPAIRMENT BEHAVIORS
ALOOF
PASSIVE
ACTIVE- BUT-ODD . . . . . . . , , . ,
[35
~ 70 60 : ............
O 50 ...::" '
~ 40 ALOOF I -
20 PASSIVE
- ~ ACTIVE- BUT-ODD
0 ~ . . . . . . . . . . . C1 C2 C3 C4 C5 C6 C7
WING SUBGROUPS SEVEN RITUAL OR REPETITIVE ACTIVITIES
Fig. 5. Compar ison of the frequency of endorsed i tems on the W ADIC for thre~ groups of PDD preschool children identified as Aloof (n = 59), Passive (n = 96), and Active-but-Odd (n = 22).

Tab
le V
. Chr
onol
ogic
al A
ge a
nd I
Q f
or F
our
Dia
gnos
tic
Gro
ups,
Tw
o T
axa,
and
Thr
ee W
ing
Soci
al S
ubty
pes a
Chr
onol
ogic
al a
ge
in m
onth
s V
erba
l IQ
N
onve
rbal
IQ
n M
S
D
M
SD
M
S
D
DSM
-III
In
fant
ile
Aut
ism
98
60
.54
16.7
7 28
.50
17.3
3 48
.96
26.6
4 O
ther
PD
D
96
57.7
6 15
.18
50.0
0 28
.40
77.6
9 32
.33
DSM
-III
-R
Aut
isti
c D
isor
der
176
59.1
2 16
.20
37.4
4 24
.93
62.3
0 33
.20
Oth
er P
DD
18
59
.61
14.6
5 55
.72
28.6
9 72
.50
28.4
6
DSM
-1V
A
utis
tic
Dis
orde
r 11
5 59
.38
15.9
3 34
.14
22.5
1 57
.66
31.3
8 O
ther
PD
D
79
58.8
5 16
.27
46.4
2 28
.50
71.3
2 33
.45
ICD
-IO
C
hild
hood
Aut
ism
12
5 60
.09
16.5
3 36
.10
23.9
5 57
.70
31.6
8 O
ther
PD
D
69
57.4
9 15
.04
44.6
5 28
.13
73.2
2 32
.78
Tax
on A
92
62
.90
16.2
3 55
.23
24.5
3 85
.62
28.3
2 T
axon
B
102
55.0
2 14
.05
24.6
3 16
.69
42.8
7 21
.51
Alo
of
59
58.5
4 17
.96
30.9
5 23
.12
59.0
3 34
.96
Pass
ive
96
59.3
4 15
.02
38.3
1 24
.90
61.8
8 32
.30
Act
ive-
but-
Odd
22
59
.91
14.7
6 55
.00
26.1
4 73
.68
25.3
3
aAll
ver
bal
and
nonv
erba
l IQ
AN
OV
A g
roup
com
pari
sons
sig
nifi
cant
at
p =
.03
or l
ower
. g
Tab
le V
I. V
inel
and
Ada
ptiv
e B
ehav
ior
Sco
res
for
Fou
r D
iagn
osti
c G
roup
s, T
wo
Tax
a, a
nd T
hree
Win
g So
cial
Sub
type
s a
Com
mun
icat
ion
Dai
ly L
ivin
g M
alad
apti
ve
dom
ain
Dom
ain
Mot
or D
omai
n So
cial
Dom
ain
Com
posi
te
Scal
es I
+
II
n M
S
D
M
SD
M
S
D
M
SD
M
S
D
M
SD
r
DS
M-I
II
IA
98
50.5
7 12
.32
49.7
6 14
.89
59.4
3 16
.19
54.5
0 9.
38
48.7
8 10
.77
20.1
3 9.
56
Oth
er P
DD
95
72
.96
19.7
1 66
.32
16.1
3 72
.64
16.3
0 66
.60
11.5
9 63
.98
13.9
3 14
.64
7.39
D
SM-I
II-R
A
D
175
60.4
1 19
.83
56.7
1 17
.68
64.9
0 17
.17
59.6
1 11
.86
54.8
4 14
.67
18.1
7 9.
04
Oth
er P
DD
18
73
.06
16.0
2 69
.56
11.0
8 80
.39
14.4
7 68
.67
11.9
0 66
.78
10.1
2 11
.93
6.26
D
SM
-IV
A
D
114
58.3
4 18
.75
54.6
3 17
.30
63.9
0 17
.87
58.4
2 12
.48
53.4
7 14
.95
18.4
4 9.
79
Oth
er P
DD
79
66
.28
20.4
9 62
.63
16.9
5 69
.65
16.4
3 63
.39
11.0
2 59
.54
13.6
5 16
.14
7.63
IC
D-I
O
CA
12
4 58
.11
20.2
4 53
.86
17.4
8 63
.71
17.0
0 57
.79
11.8
6 52
.91
14.7
5 19
.25
9.19
P
DD
69
67
.84
17.4
9 65
.17
15.3
1 70
.73
17.5
7 65
.25
11.1
5 61
.62
12.9
0 14
.30
7.69
Tax
on A
91
71
.10
15.9
9 70
.76
12.1
2 75
.19
15.5
5 69
.73
9.89
67
.93
10.4
7 13
.96
7.68
T
axon
B
102
47.1
3 8.
41
48.4
4 13
.18
55.7
1 13
.33
52.1
9 6.
78
45.2
8 8.
32
20.4
5 8.
96
Alo
of
59
56.5
1 19
.67
52.8
0 16
.63
64.1
1 16
.99
56.2
7 12
.67
51.8
0 13
.89
19.2
4 9.
58
Pass
ive
95
61.2
3 18
.10
59.0
3 18
.15
65.6
5 17
.18
60.2
7 10
.04
55.7
8 13
.93
18.1
8 8.
84
Act
ive-
but-
22
77
.18
20.2
1 66
.18
10.8
9 75
.25
20.0
2 67
.81
11.5
3 66
.41
13.3
2 12
.88
5.29
O
dd
aAll
Dia
gnos
tic
Gro
up a
nd T
axon
AN
OV
A a
re s
igni
fica
nt a
t p
= .0
1 W
ing
Soci
al S
ubty
pes
at p
=
.01
or l
ower
. or
low
er.
All
but
the
Vin
elan
d M
otor
Dom
ain
AN
OV
A a
re s
igni
fica
nt f
or t
he
~o
B
76 Waterhouse et aL
verbal IQ for autistic and other-PDD cases for the four diagnostic systems, for the two taxa (A and B), and for the three Wing Social Subgroups are reported on Table V. Only Taxa A and B were significantly different in age. We found higher verbal and nonverbal IQ for the four other-PDD groups than the four autistic groups, and significantly higher verbal and nonverbal IQ for "Ihxon A than Taxon B. The Wing Social Subtypes were significantly different in verbal IQ, but not in nonverbal IQ.
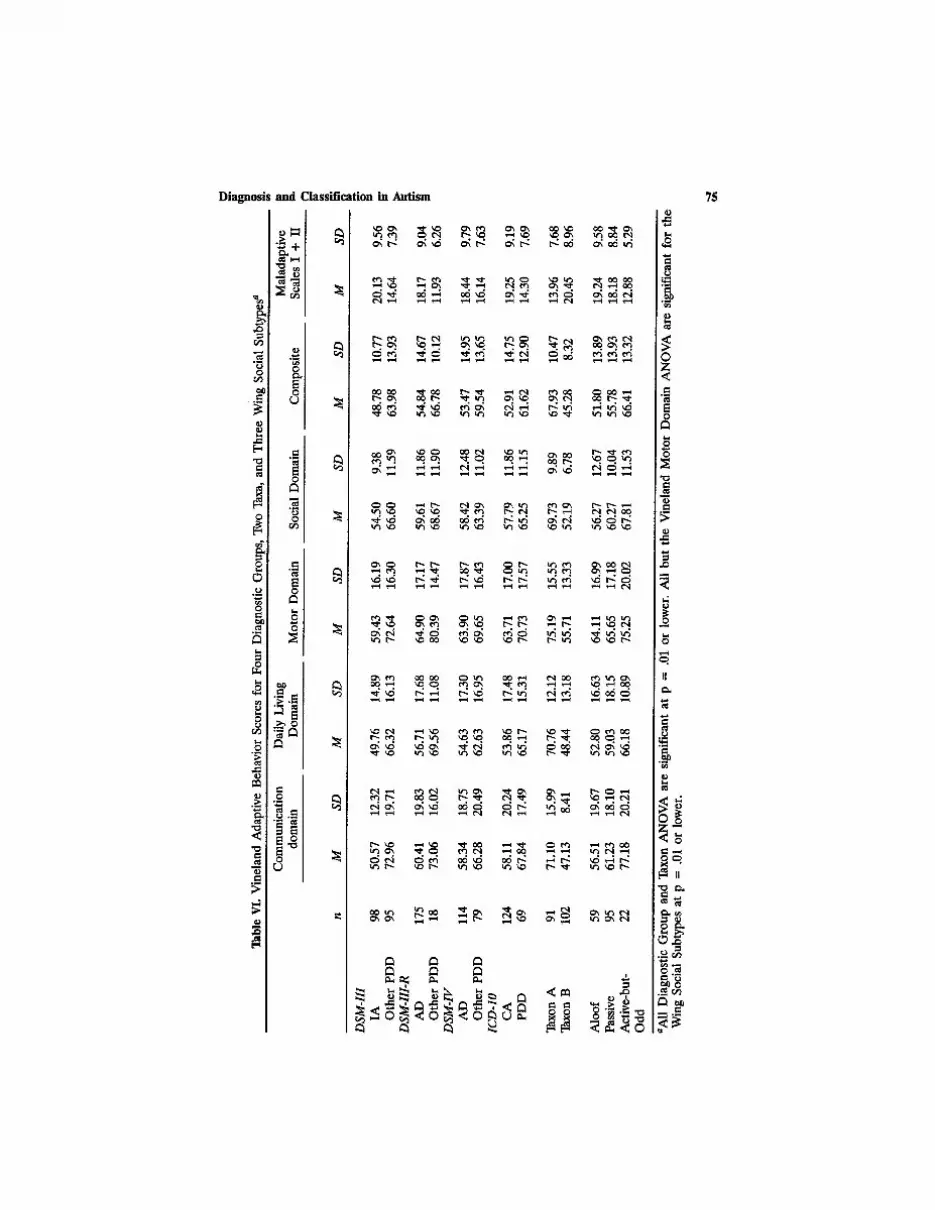
Table VI presents the VABS scores for four domains (Communica- tion, Daily Living, Motor Skills, Social), a VABS composite score, and a combined score for the VABS Maladaptive Behavior Scales I and II for autistic and other-PDD for the four diagnostic systems, for Taxa A and B, and for the three Wing Social Subtypes. Scores for all four autistic groups were significantly lower than the four other-PDD groups on all four Vineland domains, and on the Vineland composite score. With the exception of DSM-1V, the Vineland Maladaptive Behavior Scales I and II scores were significantly higher for autistic groups than for the other-PDD groups.
Taxon A and Taxon B groups showed the sharpest differentiation of Vineland domain and composite scores, with Taxon B lower than A in every comparison. The Aloof group showed greatest developmental impairment and the Active-but-Odd group showed the least developmental impairment, with the Passive subgroup falling in-between.
DISCUSSION
In the introduction we outlined three proposals for the relationship of autism to PDD: (1) PDD comprising an autistic core with other-PDD re- mainder groups; (2) PDD comprising an autistic spectrum without a bounded core; and, (3) PDD comprising two major autistic groups based on functioning level. We interpret present data as supporting a fourth pro- posal binding proposals (2) and (3): (4) two major overlapping autistic con- t inua differentiated by functioning level together forming a large continuum. We have organized the discussion of our interpretation by ex- amining the findings as they relate to each proposal.
Proposal 1: Do These Data Support a Bounded Autistic Core?
The present dataset provides problems for the core autism proposal. Cohen and colleagues (1987) proposed core autism as "autistic individuals with a nonverbal IQ of 70 or above and/or a global IQ of 55" because they

Diagnosis and Classification in Autism 77
"appear to mirror most closely Kanner's (1943) original description of the autistic syndrome" (Cohen et al., 1987, p. 30). However, in this sample, fewer than 20% of what would be core autism cases by four diagnostic systems (IA, AD, CA) fell within this IQ range. Kanner and Eisenberg (1956) operationalized Kanner's criteria to include profound lack of affec- tive contact; (b) preservation of sameness in the child's own elaborate re- petitive routines; (c) fascination with objects which are handled with skill in fine motor movements; (d) mutism or language not intended to com- municate with others; (e) good cognitive potential shown in feats of mem- ory; and, (f) onset before 30 months. Current diagnostic criteria (DSM-III IA, DSM-II1-R AD, DSM-IV AD, and lCD-lO CA), however, do not include "good cognitive potential shown in feats of memory" or "fascination with objects which are handled with skill in fine motor movements," thus current criteria are less likely to identify core autism as the high-functioning indi- viduals Kanner and Eisenberg outlined. In fact, for all four diagnostic for- mulations it is the group excluded from a diagnosis of core autism that had the highest IQs.
However, all four diagnostic systems (DSM-III, DSM-III-R, DSM-11( 1CD-IO) do provide diagnostic criteria to identify autistic core groups. These four autistic groups are all significantly lower in IQ and adaptive functioning, and express significantly more autistic symptomatology than the four other-PDD groups that each of these systems excludes from a diagnosis of autism. Because of these significant differences any one of these four autistic groups could be justified as a core. Current justifications for particular sets of criteria, however, do not address the central assump- tion that a core group exists. Consensus of clinical experts on criteria (DSM- Ili, III-R, Ill, and 1CD-IO) has generated core paradigms shared by those clinicians. Appeal to historical precedent for criteria, for example, most like Karmer's original description (Cohen et al., 1987), frames a core with a single clinical vision. Evaluating existing core criteria pragmatically for example, selection of the system with the greatest coverage (Waterhouse; 1994), can only modify the size or character of the core group. Identifying those criteria that best fit with current clinical practice (e.g., choosing the highest specificity and sensitivity by generating a statistical "gold standard," Szatmari, Volkmar, & Walter, 1995) will only ensure better criterial reali- zation of an assumed core paradigm.
The present data make the assumption of a single core group ex- tremely difficult. Most important, all four other-PDD groups in our sample of 194 subjects expressed an overall pattern of autistic characteristics that is nearly identical to the pattern found for "core autism" (see Figures 2 and 3). This pattern identity between core autism and other-PDD obtained even for DSM-III-R, the diagnostic system with the greatest coverage (91%)
78 Waterhouse et al.
for Autistic Disorder. The parallel pattern of abnormal behaviors on the WADIC (Figures 2 and 3) identifies other-PDD groups as very autistic-like. The significant differences between core autism and other-PDD on the Vineland and IQ measures (Tables V and VI) and the greater frequency of the more severe Aloof subtype in the core autism groups (Table III), therefore, suggest that differential diagnosis of core autism from other- PDD depends on degree of developmental compromise rather than pres- ence or absence of a pattern of autistic syrnptomatology.
Proposal 2: Do These Data Support an Autistic Continuum?
There is support for a continuum of developmental severity in these data. No matter how few or how many autistic cases a diagnostic system captured in this sample of 194 (ranging from DSM-I11 IA 98 to DSM-II1-R AD 176), the positively diagnosed group was always significantly more se- verely affected than the other-PDD group excluded from a diagnosis of core autism, nonetheless the other-PDD group still had parallel autistic pattern symptomatology. Moreover, in a total project combined sample of 505 preschool children (194 PDD children, 201 children with developmen- tal language disorder, and 110 children with nonautistic mental retarda- tion), we found the base rate of autistic symptomatology endorsed was very high for the lowest IQ children and decreased monotonically to zero for the highest IQ range of the 505 children (Golden, in preparation; Golden, Dunn, Rapin, & Morris, 1996; Rapin, in press). These data support a de- velopmental severity continuum of autistic symptomatology.
Proposal 3: Do These Data Support Two Autistic Groups Within PDD?
Monte Carlo methods applied to the complete dataset of indicators (V'meland ABS, WADIC, Verbal IQ, Nonverbal IQ, MRC Handicap Sched- ule, and scores from a neurological examination) suggested a taxonic divi- sion of the sample of 194 children (Golden, Duma, Rapin, & Morris, 1996; Rapin, in press). If there were a single developmental severity continuum, the taxometric analysis would have identified one large continuum of 194 cases. Instead, taxometric analyses have indicated regression nonlinearity in the combined group of variable indicators. The taxometric analyses, along with supporting cluster analyses, have identified two overlapping dis- tributions, and have pointed to the possibility of an underlying hypothesized neurobiological taxonic factor that would define the two distributions.

Diagnosis and Classification in Autism 79
The significant association of the two taxa with the diagnostic division of autisrn/other-PDD, and with the W'mg social subtypes, Aloof and Ac- tive-but-Odd, indicates convergent validity. Taxometric analysis, diagnostic divisions, and the two Wing subtypes which have been shown to have va- lidity (Borden & Ollendick, 1994) unite to identify two groups. Group A includes taxon A/other-PDD/Active-but-Odd and shows significantly higher cognitive and adaptive functioning and relatively fewer autistic behaviors. Group B includes Taxon B/autistic/Aloof and shows significantly lower cog- nitive and adaptive functioning and relatively more autistic behaviors.
Furthermore, the motor-based impairments, including absent social imi- tation, absent language production, motor stereotypies, and motor and sensory abnormalities appeared with significantly greater frequency for the Taxon B/autistic/Aloof groups than for the Taxon A/other-PDD/Active-but-Odd groups. These motor abnormalities have been interpreted as a general marker for severity. However, it may be that these motor-based impairments mark a meaningful symptom cluster identifying Group B autism within the severe end of the overall continuum of motor impairment. Although the aberrant speech content and abnormal emotional intonation of Group A autism may appear as a pseudosymptom cluster because nearly all the children (59/63; 95%) with little or no speech were included in Group B, and thus did not express either measurable speech content or intonation, nonetheless presence versus absence of speech marks a general difference between Group A and Group B. Ritual and repetitive behaviors that appeared significantly more often in Group A autism (Taxon A/other-PDD/Active-but-Odd groups) may also mark a mean- ingful symptom cluster identifying Group A autism within the less severe end of the overall continuum of autistic social and cognitive impairment.
Finally, data from this sample of preschool children studied at school age (Dunn, in preparation) indicated that the same two taxa appear in taxometric analyses of indicator variables in this sample at school age. Taxon A and Taxon B individuals developed differently: Taxon A individuals at school age showed improvement in social skills, but an increase and intensifying of ritual and repetitive activities; Taxon B individuals at school age showed a lessening in motor stereotypies, and no improvement in social functioning. Communication skills in both groups improved slightly. These findings suggest support for a continued taxonic differentiation across development.
Proposal 4: Do These Data Support Two Overlapping Autistic Continua Within PDD ?
We infer that there are two autistic groups, but they do have overlap- ping continua of IQ, adaptive functioning, and expressed severity of autistic

80 Waterhouse et al.
symptomatology. We infer that the lower functioning and higher functioning division serves as a rough indicator of the point of overlap of two continua of autism. Our inference rests on these fmdings: (a) Clinical diagnosis and taxometric analysis have shown significant association in identifying an over- lapping division of two groups; (b) there are symptom clusters that mark significant differences between the two groups; (c) the two groups have shown significant developmental stability and continued developmental dif- ferentiation of the identifying symptom clusters; (d) the character of these groups was predicted (Tsai, 1992) on the basis of a review of prior research; (e) cognitive and adaptive functioning level--though most often interpreted as a confound for understanding "pure" autism--is an extremely powerful discriminator for the two groups; and yet, (f) the two overlapping groups together form one large continuum of developmental severity.
Conclusion
As current diagnostic systems determine core autism by counting the number of autistic abnormalities, and as the number of autistic abnormali- ties is reciprocally linked to developmental status, diagnostic systems iden- tify a higher symptom count/lower IQ group as core autism (IA, AD, CA). We have concluded that diagnostic systems should also separately identify a lower symptom count/higher IQ autistic group because this higher func- tioning group: (a) has an autistic symptom profile; (b) is significantly linked to the autistic social subtype Active-but-Odd; (c) is significantly associated with a meaningful and developmentally consistent autistic symptom cluster; and (d) was predicted explicitly on review of research (Tsai, 1992). More- over, because autistic symptoms are reciprocally related to cognitive and adaptive functioning, we concur with Cohen et al. (1987) and Tsai (1992) that functioning level is an integral aspect of each of the two proposed autistic groups.
Because the two proposed groups have significant behavioral overlap, it may prove difficult to form clinical criteria. The general pattern of autistic impairment is similar for both groups, but higher verbal and nonverbal IQ, presence of speech with bizarre features and impaired prosody, and pres- ence of perseverative behaviors may identify Group A individuals, while lower verbal and nonverbal IQ, presence of motor stereotypies and sensory abnormalities, with significantly impaired language comprehension, and im- paired social imitation may serve to identify Group B. However, because of the overlap, clinical diagnosis of the taxa necessarily involve associative probabilities of levels of verbal and nonverbal IQ for the expression of sev-

Diagnosis and Classification in Autism 81
eral diagnostic variables. Nonetheless, this may offer clinical utility when established as reference tables (Fein et al., 1996; Rapin, in press).
Researchers have selected small samples of higher IQ/high symptom count (IA, AD, or CA) autistic individuals in order to improve inferential power by studying autism as a pure group without the presumptive con- found of impaired functioning level (Gaffney & Tsai, 1987; Ozonoff, Pen- nington, & Rogers, 1991; Wainwright-Sharp & Bryson, 1993). We argue that the findings of the present study suggest that this research strategy is more likely to capture a mixed group than a pure group because it selects subjects from the mixed overlap zone of the highest functioning end of the high symptom/lower IQ group continuum and the low functioning end of the fewer symptom/higher IQ group continuum. Future studies might fruitfully include high and low functioning groups of autistic and PDD individuals to further explore the possibility that there may be two autistic subgroups of PDD.
Because we excluded all PDD children with known lesions, seizures, neurological or genetic disorders, in Cohen et al.'s typology (1987) our sam- ple of 194 PDD children included idiopathic autism (no observable bio- logical condition) and stigmatic autism ("soft" neurological findings not clearly marking any known syndrome), but excluded syndromic autism (a known biological syndrome is diagnosed along with autism). Therefore the two groups identified in our study may not be successful in characterizing autism linked to known biological conditions. Moreover, because each of the two groups comprises a continuum of functioning, it is possible that there are subgroups within these groups. Further behavioral and neurobi- ological research is required to determine the coverage, internal structure, and external validity of two proposed autistic groups.
The present data may have relevance for future family studies of autism. Our sample of autistic children is comparable to that of a current large-scale family study (Bolton et al., 1994) in three ways. First, in our sample we found a rate of 6.6% of siblings with autism or other-PDD (Rapin, in press). This is consonant with the 5.8% rate of autistic proband siblings with autism, atypical autism, or Asperger syndrome reported by Bolton et al. (1994). Second, in our sample, through morphometric analyses of neural imaging, we found significantly enlarged brain volumes for autistic and other-PDD cases, with larger volumes for high functioning individuals than low functioning (Filipek et al., 1992). This is consistent with the in- creased head circumference in autism that has been reported by Bolton et al. (1994) and Bailey et al. (1995).
Third, Bolton et al. (1994) reported evidence for a much milder ver- sion (lesser variant) of autism in some family members of autistic probands. Our study was not a family study, but we cannot interpret our higher func-
82 Waterhouse et al.
tioning Group A as a lesser variant of autism because (a) they had been clinically identified as autistic; Co) they showed a complete pattern of autis- tic symptomatology (Figures 2 and 3); (c) they included the majority of Active-but-Odd cases; (d) they were identified by taxometric analyses as a taxa of autism; and, (e) their symptoms were much more severe than that proposed by Bolton et al. for the lesser variant. However, Bolton et al. did report that in autistic probands with speech, the number of the proband's autistic symptoms was significantly associated with number of relatives (de- gree of familial loading) who expressed the milder version of autism. This association did not appear in the families of autistic individuals without speech (Bolton, et al., 1994, p. 892). As the majority of autistic children in our sample without speech were included in lower functioning Group B (59/63, 95%), it may be that Bolton and colleagues' findings point to the possibility of a variant genetic basis for the two groups of idiopathic autism we have proposed.
A P P E N D I X A
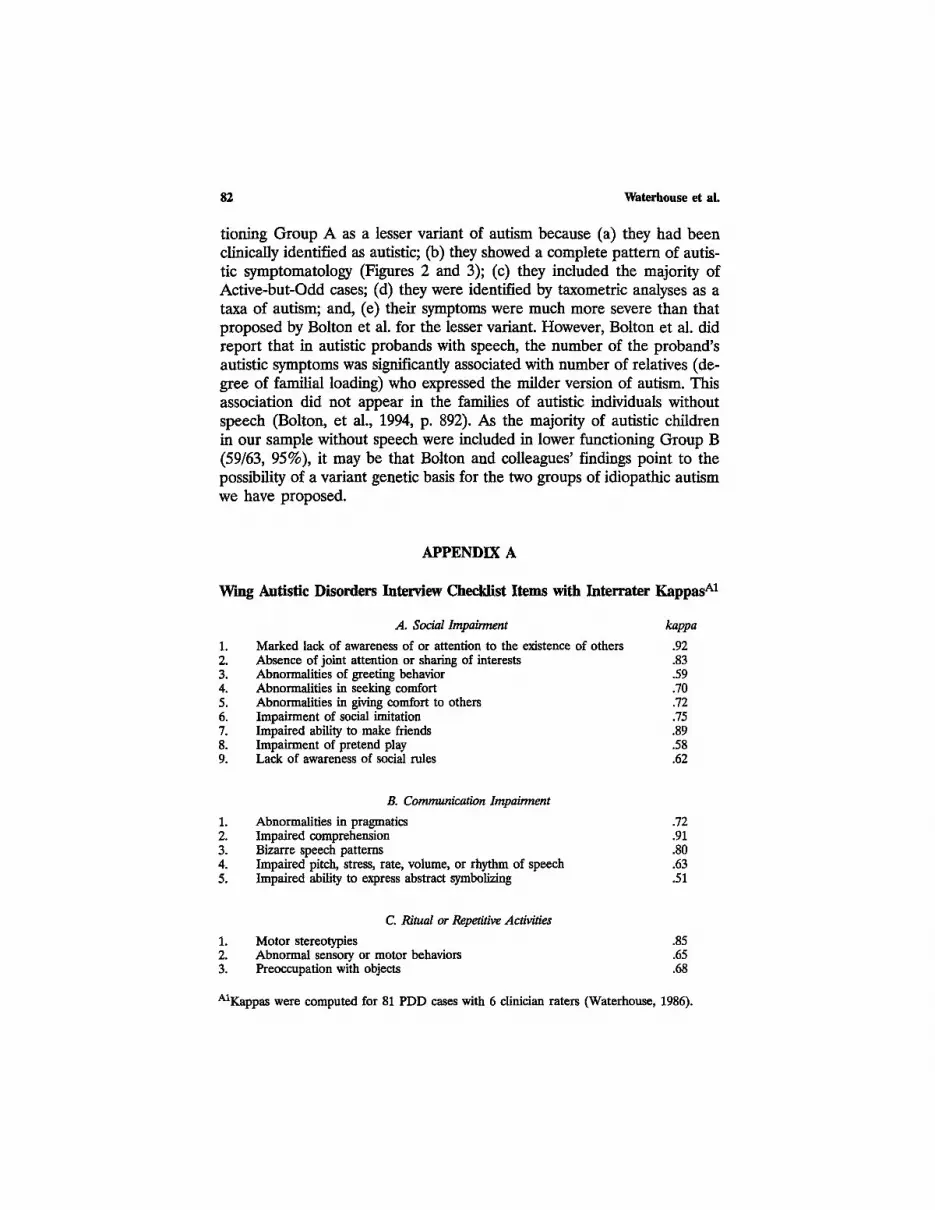
Wing Autistic Disorders Interview Checklist Items with Interrater Kappas A1
1~ 2. 3. 4. 5. 6. 7. 8. 9.
A. Social Impairment kappa
Marked lack of awareness of or attention to the existence of others .92 Absence of joint attention or sharing of interests .83 Abnormalities of greeting behavior .59 Abnormalities in seeking comfort .70 Abnormalities in giving comfort to others .72 Impairment of social imitation .75 Impaired ability to make friends .89 Impairment of pretend play .58 Lack of awareness of social rules .62
13. Communication Impairment
1. Abnormalities in pragmatics .72 2. Impaired comprehension .91 3. Bizarre speech patterns .80 4. Impaired pitch, stress, rate, volume, or rhythm of speech .63 5. Impaired ability to express abstract symbolizing .51
C. Ritual or Repetitive Activities
1. Motor stereotypies .85 2. Abnormal sensory or motor behaviors .65 3. Preoccupation with objects .68
A1Kappas were computed for 81 PDD cases with 6 clinician raters (Waterhouse, 1986).

Diagnosis and Classification in Autism
4. Need to maintain sameness in environment .66 5. Fixed routines .70 6. Restricted and/or perseverative interests .77 7. Absence of spontaneous interest and activities .77
83
APPENDIX B
Diagnostic Algorithm Equivalences
Sample of DSM-1V Algorithms
DSM-IVAutistic Disorder Criteria A (1) (a), p. 70. Marked impairment in the use of multiple nonverbal behaviors such as eye-to-eye gaze, facial expression, body postures, and gestures to regulate social interaction.
Algorithm Equivalent = WADIC A(1). Absence or impairment of use of eye-to-eye gaze, facial expression, body posture and gestures to initiate and modulate reciprocal interaction.
DSM-IV Autistic Disorder Criteria C, p. 71. The disturbance is not better accounted for by Rett's Disorder or Childhood Disintegrative Disorder.
Algorithm Equivalent. Coded items from Neurological Examination by a pediatric neurologist, and coded items from the Developmental History In- terview with mother or caretaker. Exclusion of any subject meeting criteria for Rett syndrome by the presence of the following: normal prenatal or per- inatal development; normal development for the first 6 months; normal head circumference at delivery; deceleration of head growth up to 4 years of age; loss of hand skills; emergence of hand wringing stereotypy; social impairment.
Sample of an ICD-IO Algorithm
ICD-IO Childhood Autism Criteria B (1) (d) p. 148.'Lack of spontane- ous seeking to share enjoyment, interests or achievements with other peo- ple (e.g., a lack of showing, bringing, or pointing out to other people objects of interest to the individual).
Algorithm Equivalent = WADIC A (2) (a). Does not spontaneously bring toys or other possessions to show other people to share pleasure or interest.
REFERENCES
American Psychiatric Association. (1980). Diagnostic and statistical manual of mental disorders (3rd ed.), Washington, DC: Author.

84 Waterhouse et al.
American Psychiatric Association. (1987). Diagnostic and statistical manual of mental disorders (3rd ed., rev.). Washington, DC: Author.
American Psychiatric Association (1994). Diagnostic and statislical manual of mental disorders (4th ed.). Washington, DC: Author.
Bailey, A., Le Couteur, A., Gottesman, I., Bolton, R, Simonoff, E., Yuzda, E., & Rutter, M. (1995). Autism as a strongly genetic disorder:evidence from a British twin study. Psycho- logical Medicine, 25, 63-77.
Bayley, N. (1969). Barley Scales of Infant Development--Mental Scale. Berkeley, CA: Psycho- logical Corp.
Bolton, R, MacDonald, H., Pickles, A., Rios, P., Goode, S., Crowson, M., Bailey, A., & Rntter, M. (1994). A case-control family history study of autism. Journal of Child Psychology and Psychiatry, 35, 877-900.
Borden, M. C., & Ollendick, T H. (1994). An examination of the validity of social subtypes in autism. Journal of Autism and Developmental Disorders, 24, 23-37.
Castelloe, P., & Dawson, G. (1993). Subelassification of children with Autism and Pervasive Developmental Disorder: A questionnaire based on Wing's subgrouping scheme. Journal of Autism and Developmental Disorders, 23, 225-237.
Cohen, D. J., Paul, R., & Volkmar, E R. (1986). Issues in the classification of pervasive and other developmental disorders: Toward DSM-IV. Journal of the American Academy of Child Psychiatry, 25, 213-220.
Cohen, D. J., Paul, R., & Volkmar, E R. (1987). Issues in the classification of pervasive de- velopmental disorders and associated conditions. In D. J. Cohen, A. M. Donnellan, & R. Paul (Eds.), Handbook of autism and pervasive developmental disorders (pp. 20-40), New York: W'dey.
Dahl, IC, Cohen, D. J., & Provence, S. (1986). Clinical and multivariate approaches to nosol- ogy of PDD. Journal of the American Academy of Child Psychiatry, 25, 170-180.
Eaves, L. C., Ho, H. H, & Eaves, D. M. (1984). Subtypes of autism by cluster analysis. Journal of Autism and Developmental Disorders, 24, 3-22.
Erlenmeyer-Kimling, L, Golden, R. R., & Cornblatt, B. (1989). Taxometric analysis of cog- nitive and neuromotor variables in children at risk for schizophrenia. Journal of Abnormal Psychology, 98, 203-208.
Fein, D., Golden, R., Allen, D., Dunn, M., Rapin, R., and Waterhonse, L. (1996). Taxa in aut/sm. Manuscript in preparation.
Fein, D., Waterhouse, L., I_,ucci, D., & Snyder, D. (1985). Cognitive subtypes in developmen- tally disabled children: A pilot study. Journal of Au~m and Developmental Disorders, 15, 77-96.
Filipek, R A., Richelme, C., Kennedy, D. N., Rademacher, J., Pitcher, D. A. 7.1del, S. Y., & Caviness, V. S., Jr. (1992). Morphometdc analysis of the brain in developmental language disorders and autism. Annals of Neurology, 32, 475.
Fleiss, J. L., Spitzer, R. L., Endicott, J., & Cohen. (1972). Quantifcation of agreement in multiple psychiatric diagnosis. Archives of General Psychiatry, 26, 168-171.
Freeman, B. J., Ritvo, E. R., Schroth, P. C., Tonick, I., Guthrie, D., & Wake, L. (1981). Be- havioral characteristics of high- and low-IQ autistic children. American Journal of Psy- chiatry, 138, 25-29.
Gaffney, G. R., & Tsai, L. Y. (1987). Magnetic resonance imaging of high level autism. Journal of Autism and Developmental Disorders, 17, 433-438.
Golden, R. R. (1991). Bootstrapping taxometrics: on the development of a method for de- tection of a single major gene. In D. Ciechetti & W. Grove (Eds.), Thinking clear~ about psychology. Minneapolis: University of Minnesota Press.
Golden, R. R., Campbell, M., & Perry, R. (1987). A taxometric method for diagnosis of tardive dyskinesia. Journal of Psychiatric Research, 21, 101-109.
Golden, R. R., Dunn, M., Rapin, L, & Morris, R. (1996). Using neuropsychological indicators for the detection of autism and language taxa in preschool children with communication disorders. Manuscript in preparation.

Diagnosis and Classification in Autism 85
Golden, R. R., & Mayer, M. J. (1995). A model of pseudo-taxonicity. In R. V. Dawls & D. Lubinsld (Eds.),Assessing individual differences in human behavior. New concepts, methods, and fmdings (pp. 93-115). Palo Alto, CA: Davies-Black Publishing.
Golden, R. R., & Sliwinski, M. J. (1996). A regression mkture model for the early detection of dementia. Manuscript in preparation.
Hedriek, D. L., Prather, E. M., & Tobin, A. R. (1984). Sequenced inventory of communication development--Revised (SICD-R). Seattle: University of Washington Press.
Horowitz, B., & Rumsey, J. (1994). Positron emission tomography: Implications for cerebral dysfunction in autism. In M. L Bauman & "1: L. Kemper (Eds.), The neurobiology of autism (pp. 102-118). Baltimore, MD: Johns Hopkins University Press.
Hresko, W. P., Reid, D. IC, & Hammill, D. D. (1981). The test of early language development (TELD). Austin, TX: Pro-Ed.
Kanner, L. (1943). Autistic disturbances of affective contact. Nervous Child, 2, 217-250. Kanner, L , & Eisenberg, L. (1956). Early infantile autism 1943-1955. American Journal of
Orthopsychiatry, 26, 55-65. Krippendorff, K. (1970). Bivariate agreement coefficients for reliability of data. In E. E Bor-
gatta (Ed.) Sociological methodology (pp. 139-150). San Francisco: Jossey Bass. Meehl, E (1986). Diagnostic tara as open concepts: Metatheoretical and statistical questions
about reliability and construct validity in the grand strategy of nosological revision. In "1: Millon & G. L Klerman (Eds.), Contemporary directions in psychopathology: Toward the DSM-1V (pp. 215-232). New York: Guilford.
Ozonoff, S., Pennington, B. E, & Rogers, S. J. (1991). Executive function deficits in high- functioning autistic individuals: Relationship to theory of mind. Journal of Child Psychol- ogy and Psychiatry, 32, 1081-1105.
Parks, S. (1983). The assessment of autistic ehildren: A selective review of available instru- ments. Journal of Autism and Developmental Disorders, 13, 255-267.
Piven, J., & Folstein, S. (1994). The genetics of autism. In M. L. Bauman & "E L. Kemper (Eds.), The neurobiology of autism (pp. 18-44). Baltimore, MD: Johns Hopkins University Press.
Provence, S., & Dalai, K. (1987). Disorders of atypical development: diagnostic issues raised by a spectrum disorder. In D. Cohen, A. Donnellan, & R. Paul (Eds.), Handbook of autism and pervasive developmental disorders (pp. 677-689). New York: Wiley.
Rapin, I. (1991). Autistic children: Diagnosis and clinical features. Pediatrics 87 (Suppl.), 751- 760.
Rapin, I. (Ed.) (in press). Preschool children with inadequate communication: Developmental language disorder, autism, mental retardation. Clinics in Developmental Medicine.
Reichler, R. J., & Lee, M. C. L. (1987). Overview of biomedical issues in autism. In E. Schopler & G. B. Mesibov (Eds.), Neurobiological issues in autism (pp. 14-43). New York: Plenum Press.
Rutter, M., & Sehopler, E. (1992). Classification of pervasive developmental disorders: Some concepts and practical considerations. Journal of Autism and Developmental Disorders, 22, 459-482.
Siegel, B., Anders, T., Ciarenello, R., Bienenstock, B. & Kraemer, H. (1986). Empirically de- rived subclassification of the autistic syndrome. Journal of Autism and Developmental Dis- orders, 16, 275-294.
Sparrow, S. S., Balla, D. A., & Cicchetti, D. V. (1984). Vineland Adaptive Behavior Scales-- Interview edition. Circle Pines, MN: American Guidance Service.
Szatmari, P. (1992). Review of DSM-III-R criteria for autistic disorder. Journal of Autism and Developmental Disorders, 22, 507-523.
Szatmari, P., Volkmar, E, & Walter, S. (1995). Evaluation of diagnostic criteria for autism using latent class models. Journal of the American Academy of Child and Adolescent Psy- chiatry, 34, 216-222.
Thorndike, R. L., Hagen, E. R, & Sattler, J. M. (1986). Stanford-Binet Intelligence Test--4th edition. Chicago, IL: Riverside.
Tsai, L. (1992). Diagnostic issues in high functioning autism. In E. Sehopler & G. Mesibov (Eds.), High functioning individuals with autism (pp. 11-40). New York: Plenum Press.
86 Waterhouse et al.
"I~ai, L., & Ghaziuddin, M. (1992). Biomedical research in autism. In D. E. Berkell (Ed.), Autism: Identification, education and treatment (.pp. 53-74). Hillsdale, NJ: Erlbanm.
Volkmar, E R., Cicchetti, D., Bregman, J. D., & Cohen, D. J. (1992). Three diagnostic systems for autism: DSM-III, DSM-IIIR, and ICD-10. Journal of Autism and Developmental Dis- orders, 22, 483-492.
Volkmar, E R., Cohen, D. J. Bregman, J. D., Hooks, M. Y., & Stevenson, J. M. (1989). An examination of social typologies found in autism. Journal of the American Academy of Child and Adolescent Psychiatry, 28, 82-86.
Wainwright-Sharp, J. A., & Bryson, S. E. (1993). Visual orienting deficits in high-functioning people with autism. Journal of Autism and Developmental Disorders, 23, 1-13.
Waterhonse, L. (1986, January). Report on PDD for DSM-1IIR on the 21 Wing Checklist Items. Working Group on PDD.
Waterhouse, L. (1994). Severity of impairment in autism. In S. H. Broman & J. Grafman (Eds.) Atypical cognitive deficits in developmental disorders: Implications for brain function (pp. 159-180). Hillsdale, NJ: Erlbaum.
Waterhouse, L., Wing, L., & Fein, D. (1989). Reevaluating the syndrome of autism in the light of empirical research. In G. Dawson & S. Segalowitz (Eds.), Autism: Perspectives on diagnosis, nature and treatment (pp. 263-281). New York: Guilford.
Waterhouse, L., Wing. L, Spitzer, R., & Siegel, B. (1992). PDD: From DSM-III to DSM-III-R. Journal of Autism and Developmental Disorders, 22, 525-549.
Waterhouse, L., Feinstein, C., Allen, D., & Morris, R. (1993, February). Behavior in high and low functioning autistic spectrum preschool children. In I. Rapin (Organizer), Autism and language disorder collaborative project: Preschool study. Symposium conducted at the meet- ing of the International Neuropsychologieal Society, Galveston, Tx~
Wing, L. (1985). Autistic Disorder Interview. London: MRC Social Psychiatry Unit, Institute of Psychiatry.
Wing, L. (1988). The continuum of autistic characteristics. In E. Schopler & G. Mesibov (Eds.), Diagnosis and assessment in autism (pp. 91-110). New York: Plenum Press.
Wing, L., & Attwood, A. (1987). Syndromes of autism and atypical development. In D. Cohen, A. Donnellan, & R. Paul (Eds.), Handbook of autism and pervasive developmental disorders (pp. 3-19). New York: Wiley.
Wing, L., & Gould, J. (1978). Systematic recording of behaviors and skills of retarded and psychotic children. Journal of Autism and Childhood Schizophrenia, 8, 79-97.
Wing, L., & Gould, J. (1979). Severe impairments of social interaction and associated abnor- malities in children: Epidemiology and classification. Journal of Autism and Developmental Disorders, 9, 11-30.
World Health Organization. (1993). Mental disorders: The ICD-IO classifiazatlon of mental and behavioural disorders. Diagnostic criteria for research. Geneva, Switzerland: Author.


