Embed Size (px)
Citation preview
Girish R. DesaleDesign Drawing and Workshop Engineering
Department,
C.S.M.C.R.I. Bhavnagar-364 002, India
Bhupendra K. Gandhi
S. C. Jain
Department of Mechanical & Industrial
Engineering,
Indian Institute of Technology,
Roorkee- 247 667, India
Development of Correlations forPredicting the Slurry Erosion ofDuctile MaterialsMaterial loss due to erosion is a serious problem associated with the flow of solid-liquidmixtures. In the present work, erosion wear tests have been carried out in a slurry pot tes-ter for seven different ductile type materials namely aluminum alloy (AA6063), copper,brass, mild steel, AISI 304L stainless steel, AISI 316L stainless steel, and turbine bladegrade steel using three different erodents namely, quartz, alumina, and silicon carbide.Experiments have been performed at different orientation angles of target material at thevelocities of 3, 6, and 8.33 m/s for solid concentrations of 10%, 20%, and 30% (byweight) and particle sizes of 363, 550, and 655 lm. The contribution of cutting wear inthe total wear of ductile material at various orientation angles has been determined. It isobserved that the maximum cutting wear angle for the ductile material depends on itshardness and a correlation is developed for its prediction. Also a methodology is pro-posed for estimation of the total erosion wear rate as a contribution of cutting and defor-mation wear rates. It is seen that this procedure results in an error of 618% inestimation of erosion wear rate for the present experimental data.[DOI: 10.1115/1.4004342]
Keywords: cutting wear, maximum cutting wear angle, ductile material, hardness of tar-get, slurry erosion
1 Introduction
Slurry erosion limits the useful life of equipment and is there-fore a critical parameter for design, selection, and operation of ahydraulic transportation system. A fundamental requirement froman engineering perspective is to estimate the service life of equip-ment/components subjected to slurry erosion and to investigatethe possibilities of enhancement of their life. Many investigators[1–10] have attempted to develop correlations for estimating theerosion rate. Analytical models were developed for gas-solid ero-sion; however such models are not available for slurry erosion. Ithas been reported that the wear mechanisms remain same for gas-solid and solid-liquid erosion [11]. Bitter [2,3] assumed that thewear at any impact angle is contributed by parallel and perpendic-ular components of particle velocity with respect to target surfaceand termed them as cutting and deformation wear, respectively.Based on this assumption, he first developed an analytical modelfor deformation wear of ductile materials assuming that succes-sive impacts makes the material hard and brittle due to plastic de-formation until it is removed from the surface. He then proposedtwo alternate models of cutting wear being caused by the particlevelocity component parallel to the wear surface and then esti-mated total wear rate as sum of deformation and cutting wearrates. Bitter [2,3] model was found reasonable to represent thebehavior of gas-solid erosion. However this needs experimentaldata to evaluate the wear coefficients for cutting and deformationwear for a given material; thus the whole procedure has degener-ated into a merely curve-fitting exercise [7]. Additionally, thisexercise involves lengthy and complex calculations. Alternatively,a simple approach was proposed by Neilson and Gilchrist [4] toestimate the contribution due to cutting wear and deformationwear at any angle. According to them, the total wear at normalimpact angle was assumed to be contributed by only deformationwear and a deformation factor is determined from the experimen-tal data obtained for 90 deg impact angle. This deformation factor
was assumed as constant for estimating the deformation wearcomponent at other impact angles and the corresponding cuttingwear was estimated by subtracting the deformation wear from thetotal wear. Tilly [5] developed a two-stage model for erosion wearof ductile materials. In the first stage, the particles were assumedto indent the target surface and chips were formed. Some materialwas gouged and extruded around the scar. In the second stage,particles broke down during impact and their fragments flowedaway radially through the surface. He concluded that the firststage predominates at low impact angles, whereas the secondstage predominates at normal impact angle.
Many investigators [12–17] have proposed empirical correla-tions for estimation of slurry erosion wear based on a large num-ber of experimental data developed through laboratory test rigs.An empirical correlation is generally expressed as
Ew ¼ K1VgdcCWuf ðaÞ (1)
where g, c, and u are constants whose values depend on the mate-rial properties of solids, target material, and carrier fluid. Thevalue of the constants varied over a wide range because of varia-tion in the experimental conditions and materials used [12–15,18–20]. In a nutshell, no universally accepted correlation exists forestimation of the slurry erosion wear rate.
For 90 deg impact angle and at velocities higher than 30 m/s ofspherical particles, Hutchings [21] observed that the gas-solid ero-sion is a function of particle kinetic energy and target materialproperties like dynamic hardness and ductility and proposed amodel for estimation of the material removal rate as a function ofcritical plastic strain energy of the material. For slurry erosionwear under normal impact conditions, Desale et al. [22] havedeveloped the following functional relationship:
ED90 ¼ 6:62� 10�14KðHP=HT ÞV2:02d1:62C�0:29
W (2)
The present work has been carried out to investigate the param-eters affecting erosion wear of ductile materials at differentimpact conditions. Experiments have been carried out using a
Contributed by the Tribology Division of ASME for publication in the JOURNAL
OF TRIBOLOGY. Manuscript received November 7, 2010; final manuscript receivedJune 6, 2011; published online July 25, 2011. Assoc. Editor: Mitjan Kalin.
Journal of Tribology JULY 2011, Vol. 133 / 031603-1Copyright VC 2011 by ASME
Downloaded 26 Jul 2011 to 210.212.58.111. Redistribution subject to ASME license or copyright; see http://www.asme.org/terms/Terms_Use.cfm
slurry pot tester by orienting the wear specimens at differentangles with respect to their rotational direction at different solidconcentrations and particle sizes of solid-liquid mixture. Sevendifferent ductile materials and three erodents were selected tovary the hardness ratio in the range 4.2 to 27.5. Attempts havebeen made to quantify the effect of hardness ratio on erosion wearunder any impact condition of ductile materials. Furthermore, theeffects of velocity, particle size, and concentration of quartz par-ticles on erosion of AA6063 material have been investigated. Em-pirical correlations have been developed to predict the erosionwear rate at different impact conditions.
2 Experimental Program
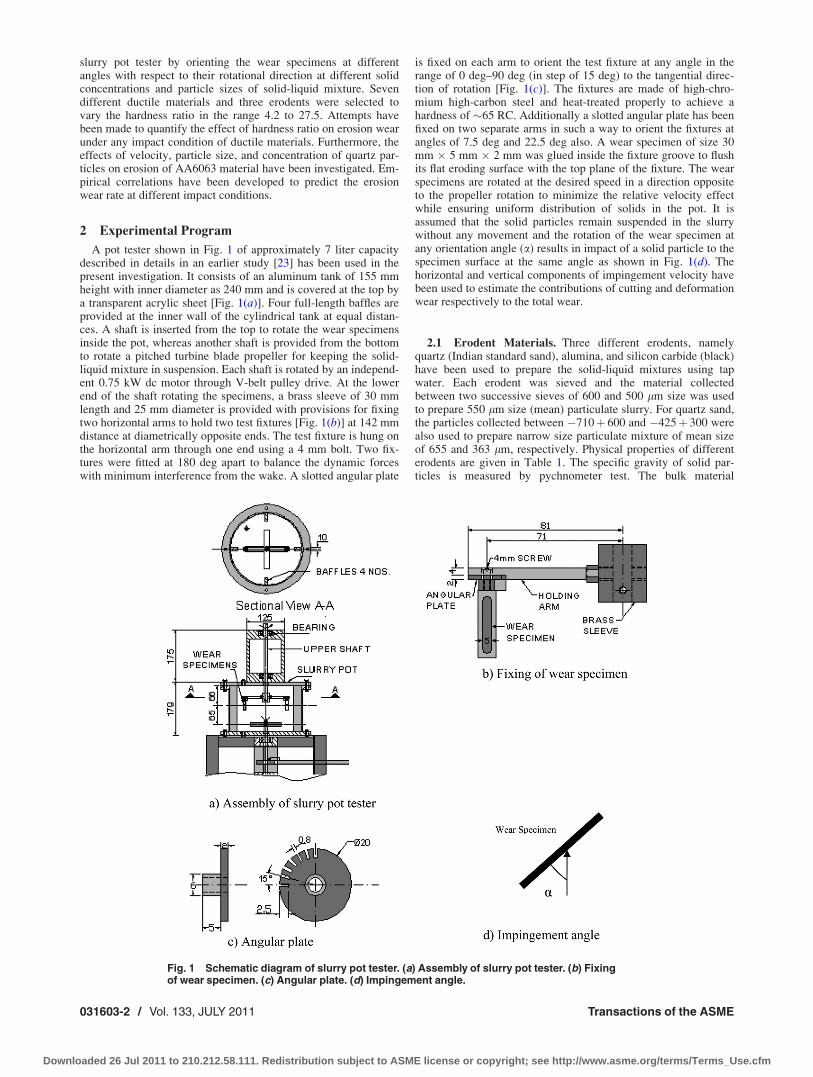
A pot tester shown in Fig. 1 of approximately 7 liter capacitydescribed in details in an earlier study [23] has been used in thepresent investigation. It consists of an aluminum tank of 155 mmheight with inner diameter as 240 mm and is covered at the top bya transparent acrylic sheet [Fig. 1(a)]. Four full-length baffles areprovided at the inner wall of the cylindrical tank at equal distan-ces. A shaft is inserted from the top to rotate the wear specimensinside the pot, whereas another shaft is provided from the bottomto rotate a pitched turbine blade propeller for keeping the solid-liquid mixture in suspension. Each shaft is rotated by an independ-ent 0.75 kW dc motor through V-belt pulley drive. At the lowerend of the shaft rotating the specimens, a brass sleeve of 30 mmlength and 25 mm diameter is provided with provisions for fixingtwo horizontal arms to hold two test fixtures [Fig. 1(b)] at 142 mmdistance at diametrically opposite ends. The test fixture is hung onthe horizontal arm through one end using a 4 mm bolt. Two fix-tures were fitted at 180 deg apart to balance the dynamic forceswith minimum interference from the wake. A slotted angular plate
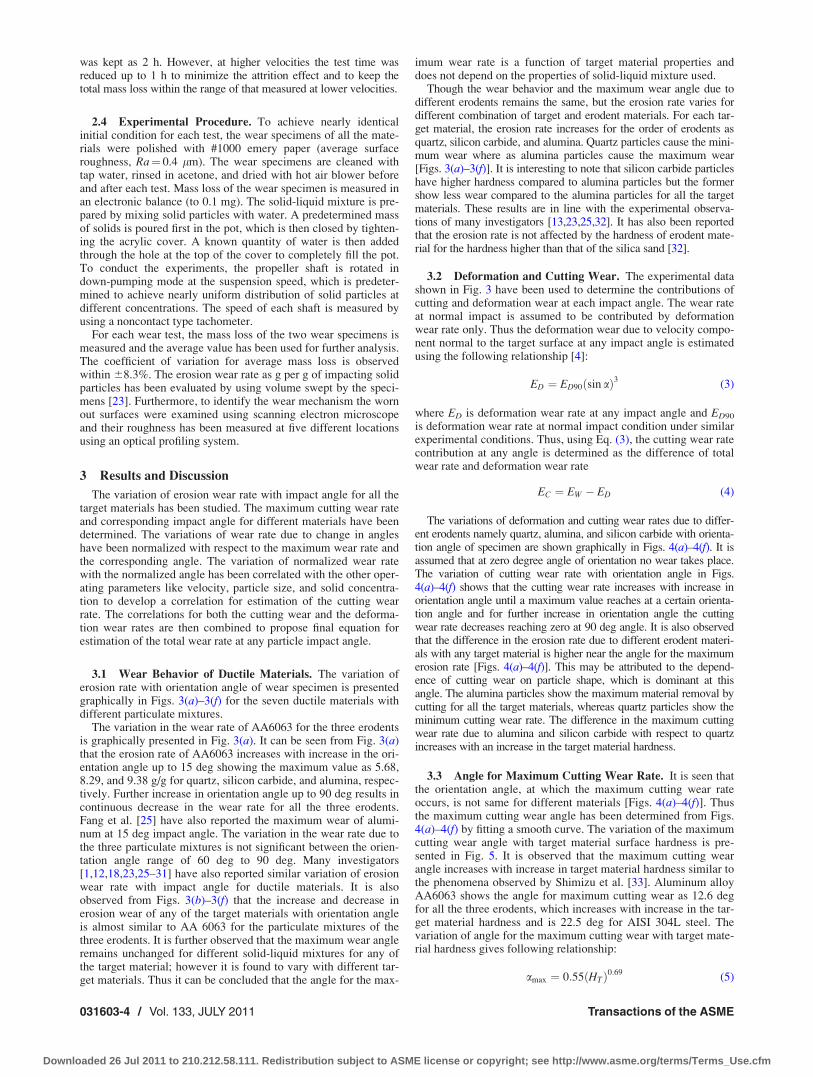
is fixed on each arm to orient the test fixture at any angle in therange of 0 deg–90 deg (in step of 15 deg) to the tangential direc-tion of rotation [Fig. 1(c)]. The fixtures are made of high-chro-mium high-carbon steel and heat-treated properly to achieve ahardness of �65 RC. Additionally a slotted angular plate has beenfixed on two separate arms in such a way to orient the fixtures atangles of 7.5 deg and 22.5 deg also. A wear specimen of size 30mm � 5 mm � 2 mm was glued inside the fixture groove to flushits flat eroding surface with the top plane of the fixture. The wearspecimens are rotated at the desired speed in a direction oppositeto the propeller rotation to minimize the relative velocity effectwhile ensuring uniform distribution of solids in the pot. It isassumed that the solid particles remain suspended in the slurrywithout any movement and the rotation of the wear specimen atany orientation angle (a) results in impact of a solid particle to thespecimen surface at the same angle as shown in Fig. 1(d). Thehorizontal and vertical components of impingement velocity havebeen used to estimate the contributions of cutting and deformationwear respectively to the total wear.
2.1 Erodent Materials. Three different erodents, namelyquartz (Indian standard sand), alumina, and silicon carbide (black)have been used to prepare the solid-liquid mixtures using tapwater. Each erodent was sieved and the material collectedbetween two successive sieves of 600 and 500 lm size was usedto prepare 550 lm size (mean) particulate slurry. For quartz sand,the particles collected between �710þ 600 and �425þ 300 werealso used to prepare narrow size particulate mixture of mean sizeof 655 and 363 lm, respectively. Physical properties of differenterodents are given in Table 1. The specific gravity of solid par-ticles is measured by pychnometer test. The bulk material
Fig. 1 Schematic diagram of slurry pot tester. (a) Assembly of slurry pot tester. (b) Fixingof wear specimen. (c) Angular plate. (d) Impingement angle.
031603-2 / Vol. 133, JULY 2011 Transactions of the ASME
Downloaded 26 Jul 2011 to 210.212.58.111. Redistribution subject to ASME license or copyright; see http://www.asme.org/terms/Terms_Use.cfm
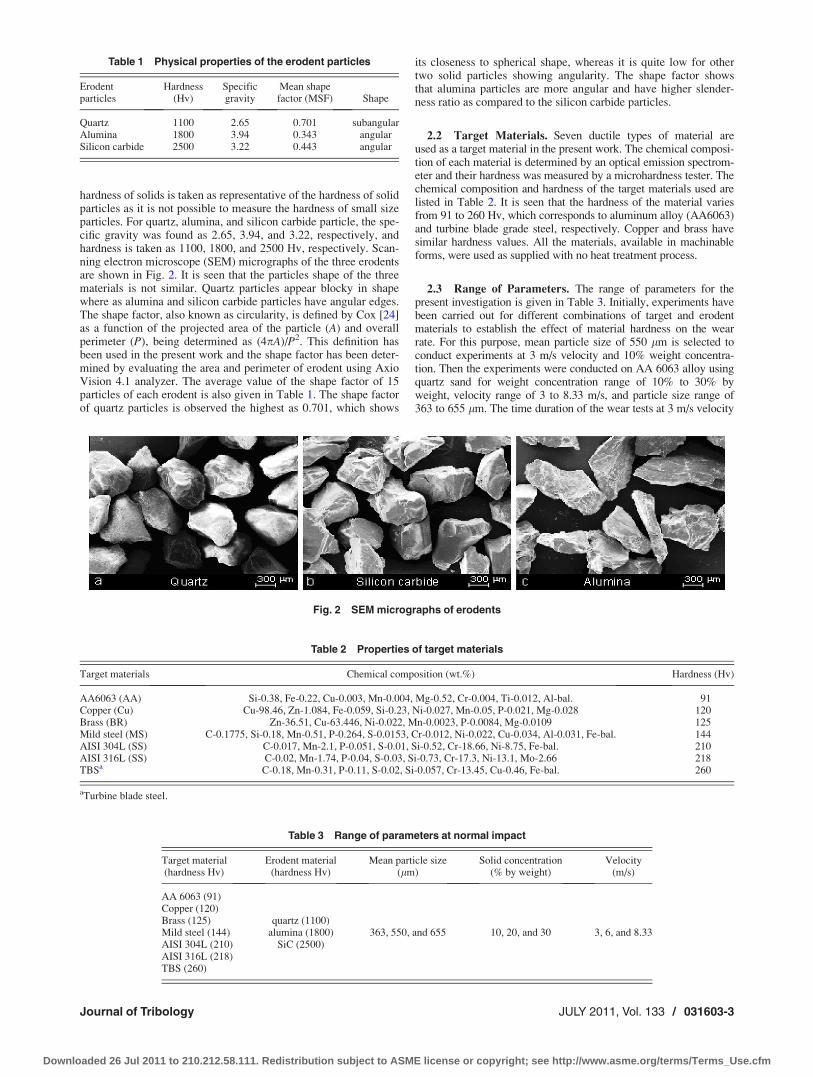
hardness of solids is taken as representative of the hardness of solidparticles as it is not possible to measure the hardness of small sizeparticles. For quartz, alumina, and silicon carbide particle, the spe-cific gravity was found as 2.65, 3.94, and 3.22, respectively, andhardness is taken as 1100, 1800, and 2500 Hv, respectively. Scan-ning electron microscope (SEM) micrographs of the three erodentsare shown in Fig. 2. It is seen that the particles shape of the threematerials is not similar. Quartz particles appear blocky in shapewhere as alumina and silicon carbide particles have angular edges.The shape factor, also known as circularity, is defined by Cox [24]as a function of the projected area of the particle (A) and overallperimeter (P), being determined as (4pA)/P2. This definition hasbeen used in the present work and the shape factor has been deter-mined by evaluating the area and perimeter of erodent using AxioVision 4.1 analyzer. The average value of the shape factor of 15particles of each erodent is also given in Table 1. The shape factorof quartz particles is observed the highest as 0.701, which shows
its closeness to spherical shape, whereas it is quite low for othertwo solid particles showing angularity. The shape factor showsthat alumina particles are more angular and have higher slender-ness ratio as compared to the silicon carbide particles.
2.2 Target Materials. Seven ductile types of material areused as a target material in the present work. The chemical composi-tion of each material is determined by an optical emission spectrom-eter and their hardness was measured by a microhardness tester. Thechemical composition and hardness of the target materials used arelisted in Table 2. It is seen that the hardness of the material variesfrom 91 to 260 Hv, which corresponds to aluminum alloy (AA6063)and turbine blade grade steel, respectively. Copper and brass havesimilar hardness values. All the materials, available in machinableforms, were used as supplied with no heat treatment process.
2.3 Range of Parameters. The range of parameters for thepresent investigation is given in Table 3. Initially, experiments havebeen carried out for different combinations of target and erodentmaterials to establish the effect of material hardness on the wearrate. For this purpose, mean particle size of 550 lm is selected toconduct experiments at 3 m/s velocity and 10% weight concentra-tion. Then the experiments were conducted on AA 6063 alloy usingquartz sand for weight concentration range of 10% to 30% byweight, velocity range of 3 to 8.33 m/s, and particle size range of363 to 655 lm. The time duration of the wear tests at 3 m/s velocity
Table 1 Physical properties of the erodent particles
Erodentparticles
Hardness(Hv)
Specificgravity
Mean shapefactor (MSF) Shape
Quartz 1100 2.65 0.701 subangularAlumina 1800 3.94 0.343 angularSilicon carbide 2500 3.22 0.443 angular
Fig. 2 SEM micrographs of erodents
Table 2 Properties of target materials
Target materials Chemical composition (wt.%) Hardness (Hv)
AA6063 (AA) Si-0.38, Fe-0.22, Cu-0.003, Mn-0.004, Mg-0.52, Cr-0.004, Ti-0.012, Al-bal. 91Copper (Cu) Cu-98.46, Zn-1.084, Fe-0.059, Si-0.23, Ni-0.027, Mn-0.05, P-0.021, Mg-0.028 120Brass (BR) Zn-36.51, Cu-63.446, Ni-0.022, Mn-0.0023, P-0.0084, Mg-0.0109 125Mild steel (MS) C-0.1775, Si-0.18, Mn-0.51, P-0.264, S-0.0153, Cr-0.012, Ni-0.022, Cu-0.034, Al-0.031, Fe-bal. 144AISI 304L (SS) C-0.017, Mn-2.1, P-0.051, S-0.01, Si-0.52, Cr-18.66, Ni-8.75, Fe-bal. 210AISI 316L (SS) C-0.02, Mn-1.74, P-0.04, S-0.03, Si-0.73, Cr-17.3, Ni-13.1, Mo-2.66 218TBSa C-0.18, Mn-0.31, P-0.11, S-0.02, Si-0.057, Cr-13.45, Cu-0.46, Fe-bal. 260
aTurbine blade steel.
Table 3 Range of parameters at normal impact
Target material Erodent material Mean particle size Solid concentration Velocity(hardness Hv) (hardness Hv) (lm) (% by weight) (m/s)
AA 6063 (91)Copper (120)Brass (125) quartz (1100)Mild steel (144) alumina (1800) 363, 550, and 655 10, 20, and 30 3, 6, and 8.33AISI 304L (210) SiC (2500)AISI 316L (218)TBS (260)
Journal of Tribology JULY 2011, Vol. 133 / 031603-3
Downloaded 26 Jul 2011 to 210.212.58.111. Redistribution subject to ASME license or copyright; see http://www.asme.org/terms/Terms_Use.cfm
was kept as 2 h. However, at higher velocities the test time wasreduced up to 1 h to minimize the attrition effect and to keep thetotal mass loss within the range of that measured at lower velocities.
2.4 Experimental Procedure. To achieve nearly identicalinitial condition for each test, the wear specimens of all the mate-rials were polished with #1000 emery paper (average surfaceroughness, Ra¼ 0.4 lm). The wear specimens are cleaned withtap water, rinsed in acetone, and dried with hot air blower beforeand after each test. Mass loss of the wear specimen is measured inan electronic balance (to 0.1 mg). The solid-liquid mixture is pre-pared by mixing solid particles with water. A predetermined massof solids is poured first in the pot, which is then closed by tighten-ing the acrylic cover. A known quantity of water is then addedthrough the hole at the top of the cover to completely fill the pot.To conduct the experiments, the propeller shaft is rotated indown-pumping mode at the suspension speed, which is predeter-mined to achieve nearly uniform distribution of solid particles atdifferent concentrations. The speed of each shaft is measured byusing a noncontact type tachometer.
For each wear test, the mass loss of the two wear specimens ismeasured and the average value has been used for further analysis.The coefficient of variation for average mass loss is observedwithin 68.3%. The erosion wear rate as g per g of impacting solidparticles has been evaluated by using volume swept by the speci-mens [23]. Furthermore, to identify the wear mechanism the wornout surfaces were examined using scanning electron microscopeand their roughness has been measured at five different locationsusing an optical profiling system.
3 Results and Discussion
The variation of erosion wear rate with impact angle for all thetarget materials has been studied. The maximum cutting wear rateand corresponding impact angle for different materials have beendetermined. The variations of wear rate due to change in angleshave been normalized with respect to the maximum wear rate andthe corresponding angle. The variation of normalized wear ratewith the normalized angle has been correlated with the other oper-ating parameters like velocity, particle size, and solid concentra-tion to develop a correlation for estimation of the cutting wearrate. The correlations for both the cutting wear and the deforma-tion wear rates are then combined to propose final equation forestimation of the total wear rate at any particle impact angle.
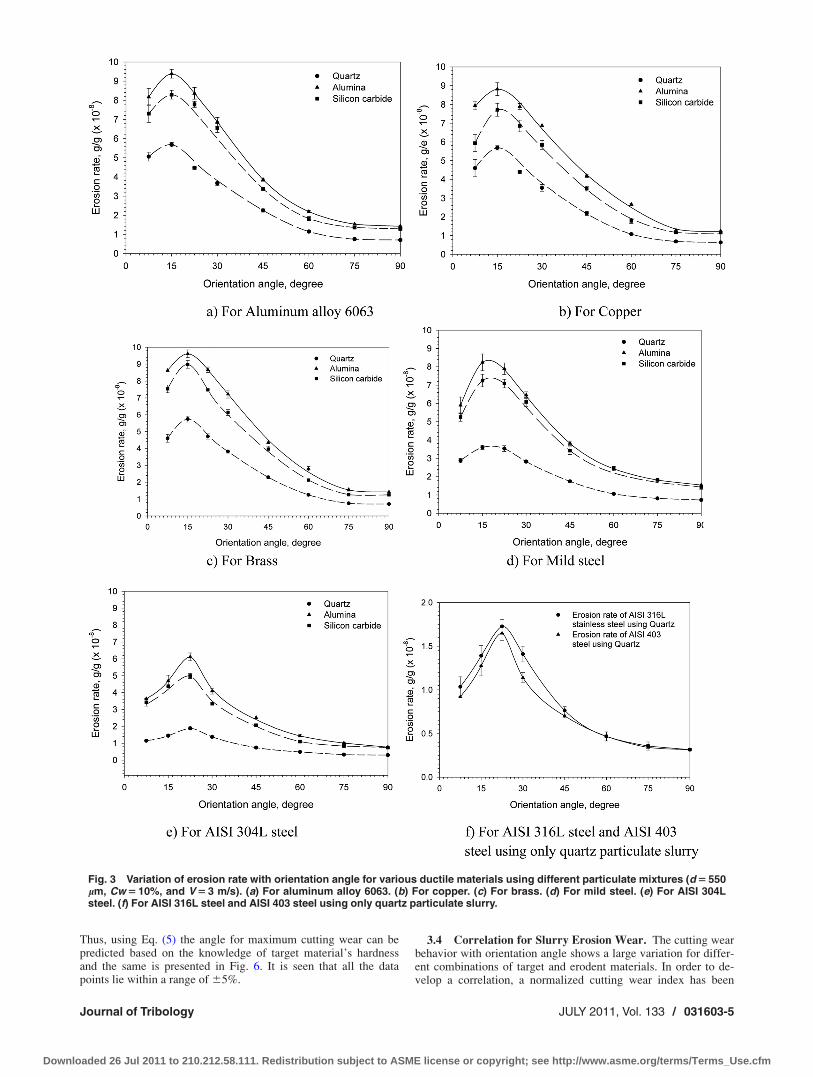
3.1 Wear Behavior of Ductile Materials. The variation oferosion rate with orientation angle of wear specimen is presentedgraphically in Figs. 3(a)–3(f) for the seven ductile materials withdifferent particulate mixtures.
The variation in the wear rate of AA6063 for the three erodentsis graphically presented in Fig. 3(a). It can be seen from Fig. 3(a)that the erosion rate of AA6063 increases with increase in the ori-entation angle up to 15 deg showing the maximum value as 5.68,8.29, and 9.38 g/g for quartz, silicon carbide, and alumina, respec-tively. Further increase in orientation angle up to 90 deg results incontinuous decrease in the wear rate for all the three erodents.Fang et al. [25] have also reported the maximum wear of alumi-num at 15 deg impact angle. The variation in the wear rate due tothe three particulate mixtures is not significant between the orien-tation angle range of 60 deg to 90 deg. Many investigators[1,12,18,23,25–31] have also reported similar variation of erosionwear rate with impact angle for ductile materials. It is alsoobserved from Figs. 3(b)–3(f) that the increase and decrease inerosion wear of any of the target materials with orientation angleis almost similar to AA 6063 for the particulate mixtures of thethree erodents. It is further observed that the maximum wear angleremains unchanged for different solid-liquid mixtures for any ofthe target material; however it is found to vary with different tar-get materials. Thus it can be concluded that the angle for the max-
imum wear rate is a function of target material properties anddoes not depend on the properties of solid-liquid mixture used.
Though the wear behavior and the maximum wear angle due todifferent erodents remains the same, but the erosion rate varies fordifferent combination of target and erodent materials. For each tar-get material, the erosion rate increases for the order of erodents asquartz, silicon carbide, and alumina. Quartz particles cause the mini-mum wear where as alumina particles cause the maximum wear[Figs. 3(a)–3(f)]. It is interesting to note that silicon carbide particleshave higher hardness compared to alumina particles but the formershow less wear compared to the alumina particles for all the targetmaterials. These results are in line with the experimental observa-tions of many investigators [13,23,25,32]. It has also been reportedthat the erosion rate is not affected by the hardness of erodent mate-rial for the hardness higher than that of the silica sand [32].
3.2 Deformation and Cutting Wear. The experimental datashown in Fig. 3 have been used to determine the contributions ofcutting and deformation wear at each impact angle. The wear rateat normal impact is assumed to be contributed by deformationwear rate only. Thus the deformation wear due to velocity compo-nent normal to the target surface at any impact angle is estimatedusing the following relationship [4]:
ED ¼ ED90ðsin aÞ3 (3)
where ED is deformation wear rate at any impact angle and ED90
is deformation wear rate at normal impact condition under similarexperimental conditions. Thus, using Eq. (3), the cutting wear ratecontribution at any angle is determined as the difference of totalwear rate and deformation wear rate
EC ¼ EW � ED (4)
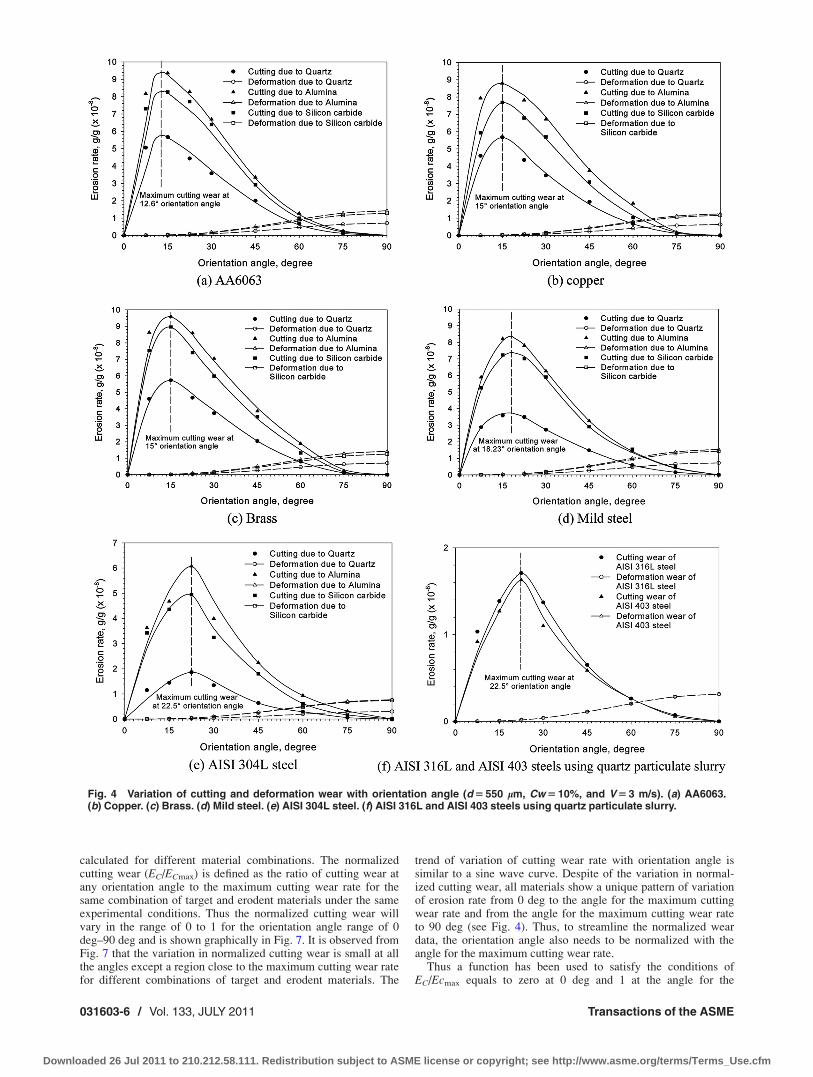
The variations of deformation and cutting wear rates due to differ-ent erodents namely quartz, alumina, and silicon carbide with orienta-tion angle of specimen are shown graphically in Figs. 4(a)–4(f). It isassumed that at zero degree angle of orientation no wear takes place.The variation of cutting wear rate with orientation angle in Figs.4(a)–4(f) shows that the cutting wear rate increases with increase inorientation angle until a maximum value reaches at a certain orienta-tion angle and for further increase in orientation angle the cuttingwear rate decreases reaching zero at 90 deg angle. It is also observedthat the difference in the erosion rate due to different erodent materi-als with any target material is higher near the angle for the maximumerosion rate [Figs. 4(a)–4(f)]. This may be attributed to the depend-ence of cutting wear on particle shape, which is dominant at thisangle. The alumina particles show the maximum material removal bycutting for all the target materials, whereas quartz particles show theminimum cutting wear rate. The difference in the maximum cuttingwear rate due to alumina and silicon carbide with respect to quartzincreases with an increase in the target material hardness.
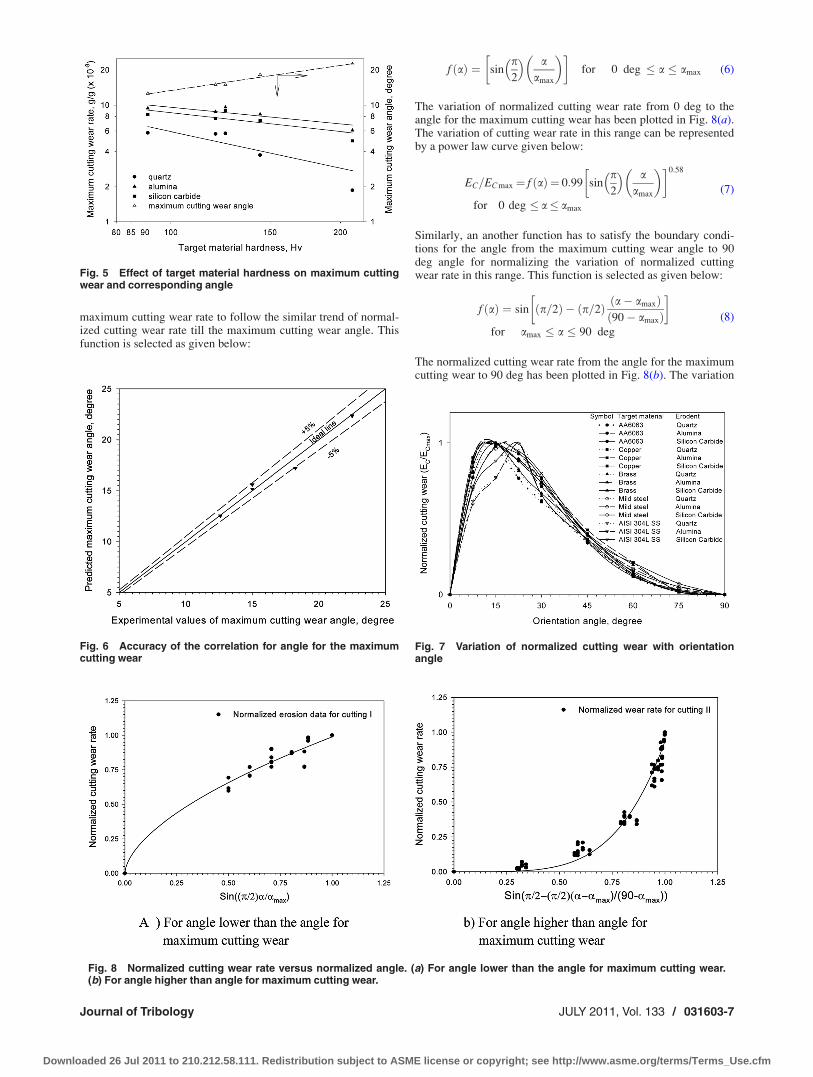
3.3 Angle for Maximum Cutting Wear Rate. It is seen thatthe orientation angle, at which the maximum cutting wear rateoccurs, is not same for different materials [Figs. 4(a)–4(f)]. Thusthe maximum cutting wear angle has been determined from Figs.4(a)–4(f) by fitting a smooth curve. The variation of the maximumcutting wear angle with target material surface hardness is pre-sented in Fig. 5. It is observed that the maximum cutting wearangle increases with increase in target material hardness similar tothe phenomena observed by Shimizu et al. [33]. Aluminum alloyAA6063 shows the angle for maximum cutting wear as 12.6 degfor all the three erodents, which increases with increase in the tar-get material hardness and is 22.5 deg for AISI 304L steel. Thevariation of angle for the maximum cutting wear with target mate-rial hardness gives following relationship:
amax ¼ 0:55 HTð Þ0:69(5)
031603-4 / Vol. 133, JULY 2011 Transactions of the ASME
Downloaded 26 Jul 2011 to 210.212.58.111. Redistribution subject to ASME license or copyright; see http://www.asme.org/terms/Terms_Use.cfm
Thus, using Eq. (5) the angle for maximum cutting wear can bepredicted based on the knowledge of target material’s hardnessand the same is presented in Fig. 6. It is seen that all the datapoints lie within a range of 65%.
3.4 Correlation for Slurry Erosion Wear. The cutting wearbehavior with orientation angle shows a large variation for differ-ent combinations of target and erodent materials. In order to de-velop a correlation, a normalized cutting wear index has been
Fig. 3 Variation of erosion rate with orientation angle for various ductile materials using different particulate mixtures (d 5 550lm, Cw 5 10%, and V 5 3 m/s). (a) For aluminum alloy 6063. (b) For copper. (c) For brass. (d) For mild steel. (e) For AISI 304Lsteel. (f) For AISI 316L steel and AISI 403 steel using only quartz particulate slurry.
Journal of Tribology JULY 2011, Vol. 133 / 031603-5
Downloaded 26 Jul 2011 to 210.212.58.111. Redistribution subject to ASME license or copyright; see http://www.asme.org/terms/Terms_Use.cfm
calculated for different material combinations. The normalizedcutting wear (EC/ECmax) is defined as the ratio of cutting wear atany orientation angle to the maximum cutting wear rate for thesame combination of target and erodent materials under the sameexperimental conditions. Thus the normalized cutting wear willvary in the range of 0 to 1 for the orientation angle range of 0deg–90 deg and is shown graphically in Fig. 7. It is observed fromFig. 7 that the variation in normalized cutting wear is small at allthe angles except a region close to the maximum cutting wear ratefor different combinations of target and erodent materials. The
trend of variation of cutting wear rate with orientation angle issimilar to a sine wave curve. Despite of the variation in normal-ized cutting wear, all materials show a unique pattern of variationof erosion rate from 0 deg to the angle for the maximum cuttingwear rate and from the angle for the maximum cutting wear rateto 90 deg (see Fig. 4). Thus, to streamline the normalized weardata, the orientation angle also needs to be normalized with theangle for the maximum cutting wear rate.
Thus a function has been used to satisfy the conditions ofEC/Ecmax equals to zero at 0 deg and 1 at the angle for the
Fig. 4 Variation of cutting and deformation wear with orientation angle (d 5 550 lm, Cw 5 10%, and V 5 3 m/s). (a) AA6063.(b) Copper. (c) Brass. (d) Mild steel. (e) AISI 304L steel. (f) AISI 316L and AISI 403 steels using quartz particulate slurry.
031603-6 / Vol. 133, JULY 2011 Transactions of the ASME
Downloaded 26 Jul 2011 to 210.212.58.111. Redistribution subject to ASME license or copyright; see http://www.asme.org/terms/Terms_Use.cfm
maximum cutting wear rate to follow the similar trend of normal-ized cutting wear rate till the maximum cutting wear angle. Thisfunction is selected as given below:
f ðaÞ ¼ sinp2
� � aamax
� �� �for 0 deg � a � amax (6)
The variation of normalized cutting wear rate from 0 deg to theangle for the maximum cutting wear has been plotted in Fig. 8(a).The variation of cutting wear rate in this range can be representedby a power law curve given below:
EC=ECmax ¼ f ðaÞ ¼ 0:99 sinp2
� � aamax
� �� �0:58
for 0 deg � a� amax
(7)
Similarly, an another function has to satisfy the boundary condi-tions for the angle from the maximum cutting wear angle to 90deg angle for normalizing the variation of normalized cuttingwear rate in this range. This function is selected as given below:
f ðaÞ ¼ sin p=2ð Þ � p=2ð Þ ða� amaxÞð90� amaxÞ
� �
for amax � a � 90 deg
(8)
The normalized cutting wear rate from the angle for the maximumcutting wear to 90 deg has been plotted in Fig. 8(b). The variation
Fig. 5 Effect of target material hardness on maximum cuttingwear and corresponding angle
Fig. 6 Accuracy of the correlation for angle for the maximumcutting wear
Fig. 7 Variation of normalized cutting wear with orientationangle
Fig. 8 Normalized cutting wear rate versus normalized angle. (a) For angle lower than the angle for maximum cutting wear.(b) For angle higher than angle for maximum cutting wear.
Journal of Tribology JULY 2011, Vol. 133 / 031603-7
Downloaded 26 Jul 2011 to 210.212.58.111. Redistribution subject to ASME license or copyright; see http://www.asme.org/terms/Terms_Use.cfm
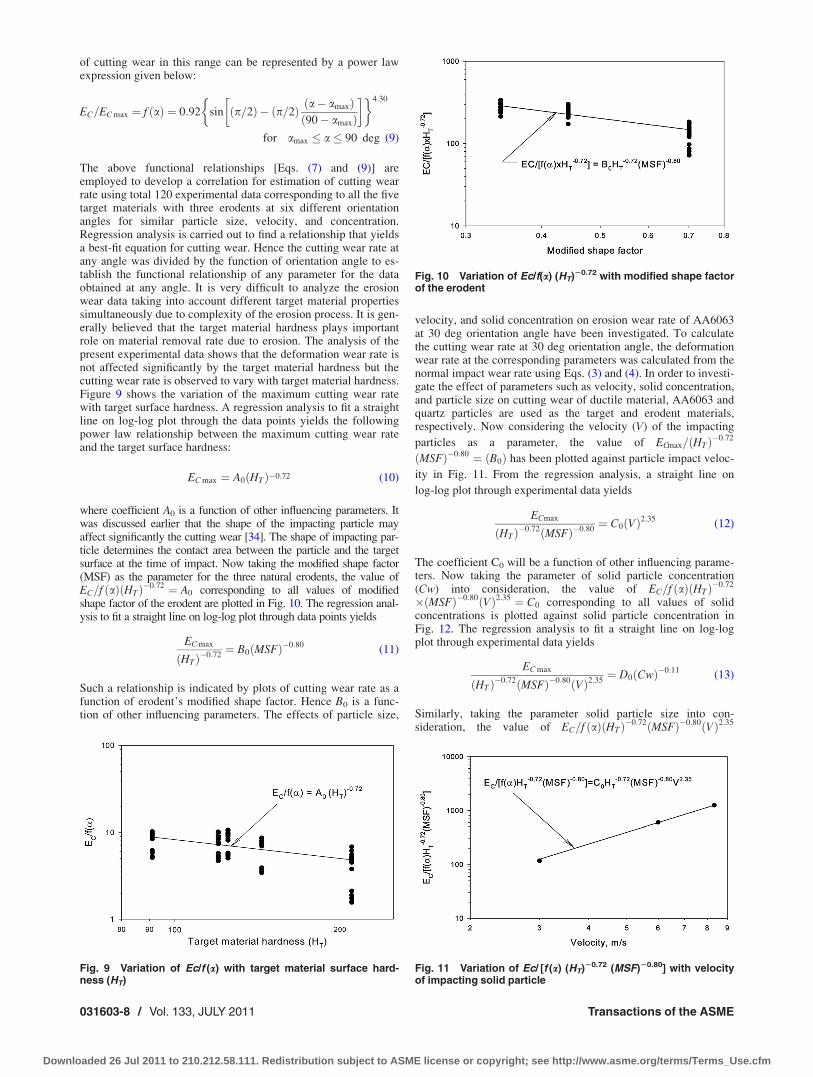
of cutting wear in this range can be represented by a power lawexpression given below:
EC=EC max ¼ f ðaÞ ¼ 0:92 sin p=2ð Þ � p=2ð Þ ða� amaxÞð90� amaxÞ
� �� 4:30
for amax � a � 90 deg (9)
The above functional relationships [Eqs. (7) and (9)] areemployed to develop a correlation for estimation of cutting wearrate using total 120 experimental data corresponding to all the fivetarget materials with three erodents at six different orientationangles for similar particle size, velocity, and concentration.Regression analysis is carried out to find a relationship that yieldsa best-fit equation for cutting wear. Hence the cutting wear rate atany angle was divided by the function of orientation angle to es-tablish the functional relationship of any parameter for the dataobtained at any angle. It is very difficult to analyze the erosionwear data taking into account different target material propertiessimultaneously due to complexity of the erosion process. It is gen-erally believed that the target material hardness plays importantrole on material removal rate due to erosion. The analysis of thepresent experimental data shows that the deformation wear rate isnot affected significantly by the target material hardness but thecutting wear rate is observed to vary with target material hardness.Figure 9 shows the variation of the maximum cutting wear ratewith target surface hardness. A regression analysis to fit a straightline on log-log plot through the data points yields the followingpower law relationship between the maximum cutting wear rateand the target surface hardness:
EC max ¼ A0ðHTÞ�0:72 (10)
where coefficient A0 is a function of other influencing parameters. Itwas discussed earlier that the shape of the impacting particle mayaffect significantly the cutting wear [34]. The shape of impacting par-ticle determines the contact area between the particle and the targetsurface at the time of impact. Now taking the modified shape factor(MSF) as the parameter for the three natural erodents, the value ofEC=f ðaÞðHTÞ�0:72 ¼ A0 corresponding to all values of modifiedshape factor of the erodent are plotted in Fig. 10. The regression anal-ysis to fit a straight line on log-log plot through data points yields
EC max
ðHTÞ�0:72¼ B0ðMSFÞ�0:80
(11)
Such a relationship is indicated by plots of cutting wear rate as afunction of erodent’s modified shape factor. Hence B0 is a func-tion of other influencing parameters. The effects of particle size,
velocity, and solid concentration on erosion wear rate of AA6063at 30 deg orientation angle have been investigated. To calculatethe cutting wear rate at 30 deg orientation angle, the deformationwear rate at the corresponding parameters was calculated from thenormal impact wear rate using Eqs. (3) and (4). In order to investi-gate the effect of parameters such as velocity, solid concentration,and particle size on cutting wear of ductile material, AA6063 andquartz particles are used as the target and erodent materials,respectively. Now considering the velocity (V) of the impacting
particles as a parameter, the value of ECmax=ðHTÞ�0:72
ðMSFÞ�0:80 ¼ ðB0Þ has been plotted against particle impact veloc-
ity in Fig. 11. From the regression analysis, a straight line on
log-log plot through experimental data yields
ECmax
ðHTÞ�0:72ðMSFÞ�0:80¼ C0ðVÞ2:35
(12)
The coefficient C0 will be a function of other influencing parame-ters. Now taking the parameter of solid particle concentration(Cw) into consideration, the value of EC=f ðaÞðHTÞ�0:72
�ðMSFÞ�0:80ðVÞ2:35 ¼ C0 corresponding to all values of solidconcentrations is plotted against solid particle concentration inFig. 12. The regression analysis to fit a straight line on log-logplot through experimental data yields
EC max
ðHTÞ�0:72ðMSFÞ�0:80ðVÞ2:35¼ D0ðCwÞ�0:11
(13)
Similarly, taking the parameter solid particle size into con-sideration, the value of EC=f ðaÞðHTÞ�0:72ðMSFÞ�0:80ðVÞ2:35
Fig. 9 Variation of Ec/f (a) with target material surface hard-ness (HT)
Fig. 10 Variation of Ec/f(a) (HT)20.72 with modified shape factorof the erodent
Fig. 11 Variation of Ec/ [f (a) (HT)20.72 (MSF)20.80] with velocityof impacting solid particle
031603-8 / Vol. 133, JULY 2011 Transactions of the ASME
Downloaded 26 Jul 2011 to 210.212.58.111. Redistribution subject to ASME license or copyright; see http://www.asme.org/terms/Terms_Use.cfm
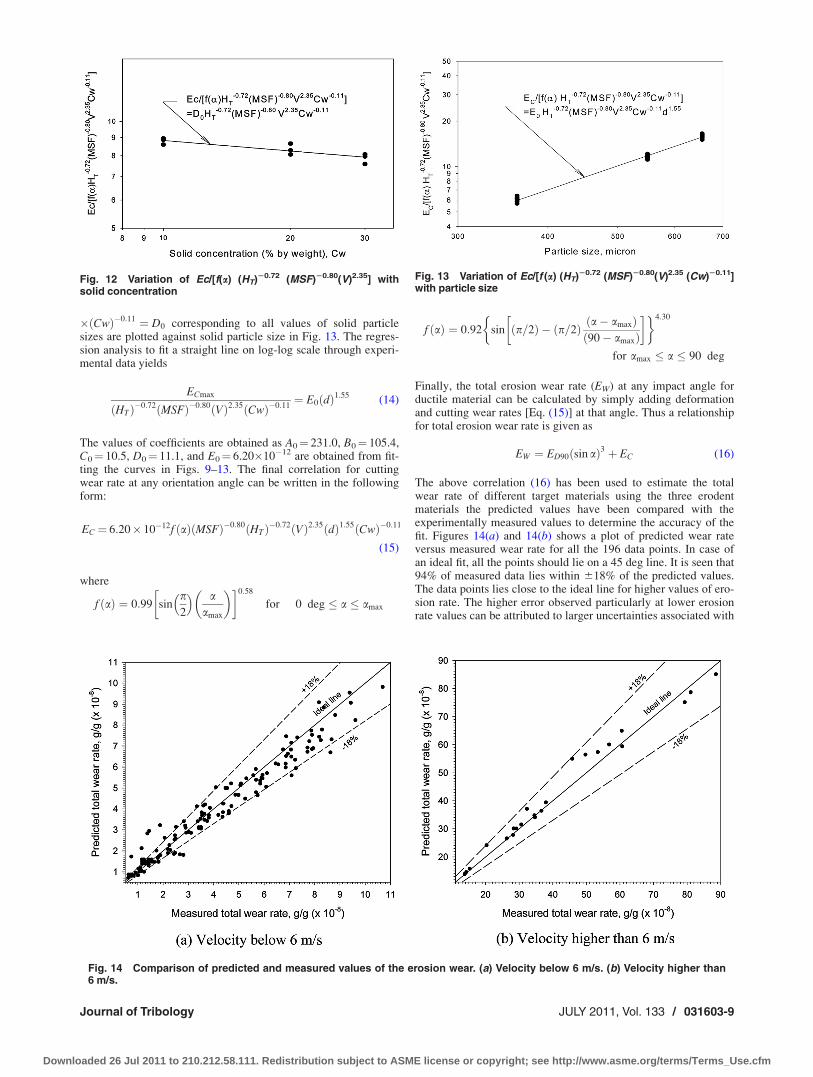
�ðCwÞ�0:11 ¼ D0 corresponding to all values of solid particlesizes are plotted against solid particle size in Fig. 13. The regres-sion analysis to fit a straight line on log-log scale through experi-mental data yields
ECmax
ðHTÞ�0:72ðMSFÞ�0:80ðVÞ2:35ðCwÞ�0:11¼ E0ðdÞ1:55
(14)
The values of coefficients are obtained as A0¼ 231.0, B0¼ 105.4,C0¼ 10.5, D0¼ 11.1, and E0¼ 6.20�10�12 are obtained from fit-ting the curves in Figs. 9–13. The final correlation for cuttingwear rate at any orientation angle can be written in the followingform:
EC ¼ 6:20� 10�12f ðaÞ MSFð Þ�0:80ðHTÞ�0:72ðVÞ2:35 dð Þ1:55ðCwÞ�0:11
(15)
where
f ðaÞ ¼ 0:99 sinp2
� � aamax
� �� �0:58
for 0 deg � a � amax
f ðaÞ ¼ 0:92 sin p=2ð Þ � p=2ð Þ ða� amaxÞð90� amaxÞ
� �� 4:30
for amax � a � 90 deg
Finally, the total erosion wear rate (EW) at any impact angle forductile material can be calculated by simply adding deformationand cutting wear rates [Eq. (15)] at that angle. Thus a relationshipfor total erosion wear rate is given as
EW ¼ ED90ðsin aÞ3 þ EC (16)
The above correlation (16) has been used to estimate the totalwear rate of different target materials using the three erodentmaterials the predicted values have been compared with theexperimentally measured values to determine the accuracy of thefit. Figures 14(a) and 14(b) shows a plot of predicted wear rateversus measured wear rate for all the 196 data points. In case ofan ideal fit, all the points should lie on a 45 deg line. It is seen that94% of measured data lies within 618% of the predicted values.The data points lies close to the ideal line for higher values of ero-sion rate. The higher error observed particularly at lower erosionrate values can be attributed to larger uncertainties associated with
Fig. 12 Variation of Ec/[f(a) (HT)20.72 (MSF)20.80(V)2.35] withsolid concentration
Fig. 13 Variation of Ec/[f (a) (HT)20.72 (MSF)20.80(V)2.35 (Cw)20.11]with particle size
Fig. 14 Comparison of predicted and measured values of the erosion wear. (a) Velocity below 6 m/s. (b) Velocity higher than6 m/s.
Journal of Tribology JULY 2011, Vol. 133 / 031603-9
Downloaded 26 Jul 2011 to 210.212.58.111. Redistribution subject to ASME license or copyright; see http://www.asme.org/terms/Terms_Use.cfm
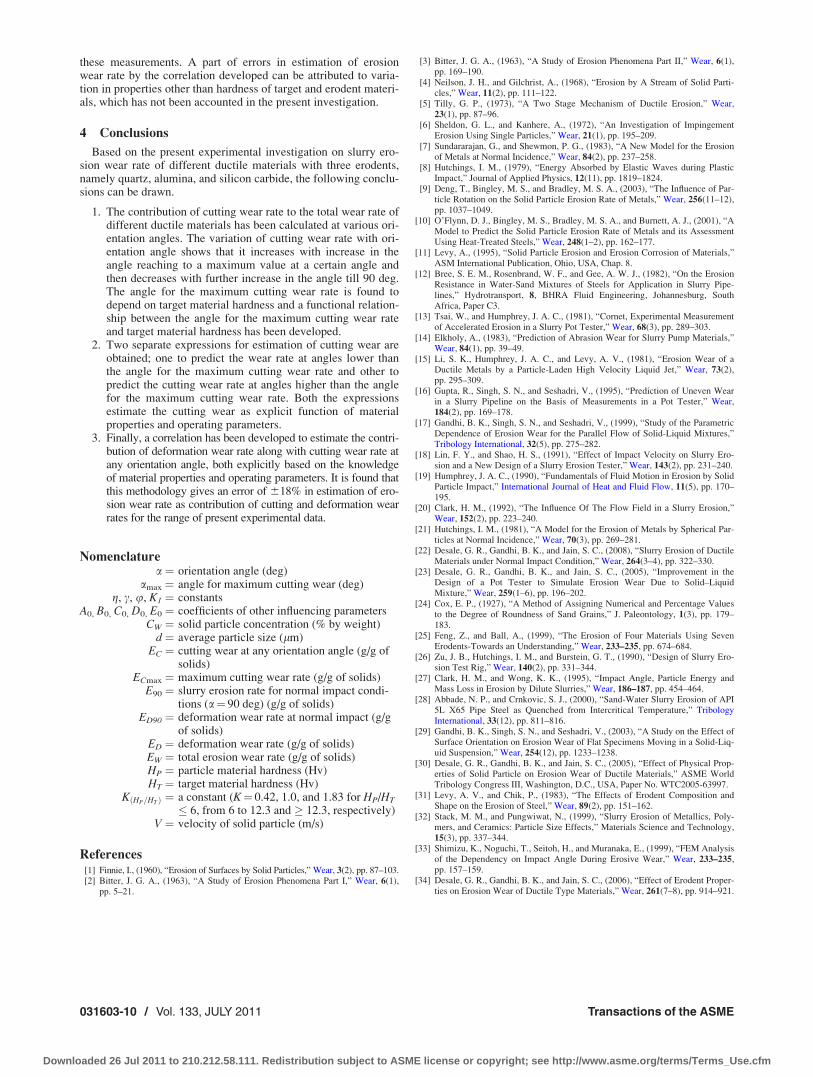
these measurements. A part of errors in estimation of erosionwear rate by the correlation developed can be attributed to varia-tion in properties other than hardness of target and erodent materi-als, which has not been accounted in the present investigation.
4 Conclusions
Based on the present experimental investigation on slurry ero-sion wear rate of different ductile materials with three erodents,namely quartz, alumina, and silicon carbide, the following conclu-sions can be drawn.
1. The contribution of cutting wear rate to the total wear rate ofdifferent ductile materials has been calculated at various ori-entation angles. The variation of cutting wear rate with ori-entation angle shows that it increases with increase in theangle reaching to a maximum value at a certain angle andthen decreases with further increase in the angle till 90 deg.The angle for the maximum cutting wear rate is found todepend on target material hardness and a functional relation-ship between the angle for the maximum cutting wear rateand target material hardness has been developed.
2. Two separate expressions for estimation of cutting wear areobtained; one to predict the wear rate at angles lower thanthe angle for the maximum cutting wear rate and other topredict the cutting wear rate at angles higher than the anglefor the maximum cutting wear rate. Both the expressionsestimate the cutting wear as explicit function of materialproperties and operating parameters.
3. Finally, a correlation has been developed to estimate the contri-bution of deformation wear rate along with cutting wear rate atany orientation angle, both explicitly based on the knowledgeof material properties and operating parameters. It is found thatthis methodology gives an error of 618% in estimation of ero-sion wear rate as contribution of cutting and deformation wearrates for the range of present experimental data.
Nomenclaturea ¼ orientation angle (deg)
amax ¼ angle for maximum cutting wear (deg)g, c, u, K1 ¼ constants
A0, B0, C0, D0, E0 ¼ coefficients of other influencing parametersCW ¼ solid particle concentration (% by weight)
d ¼ average particle size (lm)EC ¼ cutting wear at any orientation angle (g/g of
solids)ECmax ¼ maximum cutting wear rate (g/g of solids)
E90 ¼ slurry erosion rate for normal impact condi-tions (a¼ 90 deg) (g/g of solids)
ED90 ¼ deformation wear rate at normal impact (g/gof solids)
ED ¼ deformation wear rate (g/g of solids)EW ¼ total erosion wear rate (g/g of solids)HP ¼ particle material hardness (Hv)HT ¼ target material hardness (Hv)
KðHP=HTÞ ¼ a constant (K¼ 0.42, 1.0, and 1.83 for HP/HT
� 6, from 6 to 12.3 and � 12.3, respectively)V ¼ velocity of solid particle (m/s)
References[1] Finnie, I., (1960), “Erosion of Surfaces by Solid Particles,” Wear, 3(2), pp. 87–103.[2] Bitter, J. G. A., (1963), “A Study of Erosion Phenomena Part I,” Wear, 6(1),
pp. 5–21.
[3] Bitter, J. G. A., (1963), “A Study of Erosion Phenomena Part II,” Wear, 6(1),pp. 169–190.
[4] Neilson, J. H., and Gilchrist, A., (1968), “Erosion by A Stream of Solid Parti-cles,” Wear, 11(2), pp. 111–122.
[5] Tilly, G. P., (1973), “A Two Stage Mechanism of Ductile Erosion,” Wear,23(1), pp. 87–96.
[6] Sheldon, G. L., and Kanhere, A., (1972), “An Investigation of ImpingementErosion Using Single Particles,” Wear, 21(1), pp. 195–209.
[7] Sundararajan, G., and Shewmon, P. G., (1983), “A New Model for the Erosionof Metals at Normal Incidence,” Wear, 84(2), pp. 237–258.
[8] Hutchings, I. M., (1979), “Energy Absorbed by Elastic Waves during PlasticImpact,” Journal of Applied Physics, 12(11), pp. 1819–1824.
[9] Deng, T., Bingley, M. S., and Bradley, M. S. A., (2003), “The Influence of Par-ticle Rotation on the Solid Particle Erosion Rate of Metals,” Wear, 256(11–12),pp. 1037–1049.
[10] O’Flynn, D. J., Bingley, M. S., Bradley, M. S. A., and Burnett, A. J., (2001), “AModel to Predict the Solid Particle Erosion Rate of Metals and its AssessmentUsing Heat-Treated Steels,” Wear, 248(1–2), pp. 162–177.
[11] Levy, A., (1995), “Solid Particle Erosion and Erosion Corrosion of Materials,”ASM International Publication, Ohio, USA, Chap. 8.
[12] Bree, S. E. M., Rosenbrand, W. F., and Gee, A. W. J., (1982), “On the ErosionResistance in Water-Sand Mixtures of Steels for Application in Slurry Pipe-lines,” Hydrotransport, 8, BHRA Fluid Engineering, Johannesburg, SouthAfrica, Paper C3.
[13] Tsai, W., and Humphrey, J. A. C., (1981), “Cornet, Experimental Measurementof Accelerated Erosion in a Slurry Pot Tester,” Wear, 68(3), pp. 289–303.
[14] Elkholy, A., (1983), “Prediction of Abrasion Wear for Slurry Pump Materials,”Wear, 84(1), pp. 39–49.
[15] Li, S. K., Humphrey, J. A. C., and Levy, A. V., (1981), “Erosion Wear of aDuctile Metals by a Particle-Laden High Velocity Liquid Jet,” Wear, 73(2),pp. 295–309.
[16] Gupta, R., Singh, S. N., and Seshadri, V., (1995), “Prediction of Uneven Wearin a Slurry Pipeline on the Basis of Measurements in a Pot Tester,” Wear,184(2), pp. 169–178.
[17] Gandhi, B. K., Singh, S. N., and Seshadri, V., (1999), “Study of the ParametricDependence of Erosion Wear for the Parallel Flow of Solid-Liquid Mixtures,”Tribology International, 32(5), pp. 275–282.
[18] Lin, F. Y., and Shao, H. S., (1991), “Effect of Impact Velocity on Slurry Ero-sion and a New Design of a Slurry Erosion Tester,” Wear, 143(2), pp. 231–240.
[19] Humphrey, J. A. C., (1990), “Fundamentals of Fluid Motion in Erosion by SolidParticle Impact,” International Journal of Heat and Fluid Flow, 11(5), pp. 170–195.
[20] Clark, H. M., (1992), “The Influence Of The Flow Field in a Slurry Erosion,”Wear, 152(2), pp. 223–240.
[21] Hutchings, I. M., (1981), “A Model for the Erosion of Metals by Spherical Par-ticles at Normal Incidence,” Wear, 70(3), pp. 269–281.
[22] Desale, G. R., Gandhi, B. K., and Jain, S. C., (2008), “Slurry Erosion of DuctileMaterials under Normal Impact Condition,” Wear, 264(3–4), pp. 322–330.
[23] Desale, G. R., Gandhi, B. K., and Jain, S. C., (2005), “Improvement in theDesign of a Pot Tester to Simulate Erosion Wear Due to Solid–LiquidMixture,” Wear, 259(1–6), pp. 196–202.
[24] Cox, E. P., (1927), “A Method of Assigning Numerical and Percentage Valuesto the Degree of Roundness of Sand Grains,” J. Paleontology, 1(3), pp. 179–183.
[25] Feng, Z., and Ball, A., (1999), “The Erosion of Four Materials Using SevenErodents-Towards an Understanding,” Wear, 233–235, pp. 674–684.
[26] Zu, J. B., Hutchings, I. M., and Burstein, G. T., (1990), “Design of Slurry Ero-sion Test Rig,” Wear, 140(2), pp. 331–344.
[27] Clark, H. M., and Wong, K. K., (1995), “Impact Angle, Particle Energy andMass Loss in Erosion by Dilute Slurries,” Wear, 186–187, pp. 454–464.
[28] Abbade, N. P., and Crnkovic, S. J., (2000), “Sand-Water Slurry Erosion of API5L X65 Pipe Steel as Quenched from Intercritical Temperature,” TribologyInternational, 33(12), pp. 811–816.
[29] Gandhi, B. K., Singh, S. N., and Seshadri, V., (2003), “A Study on the Effect ofSurface Orientation on Erosion Wear of Flat Specimens Moving in a Solid-Liq-uid Suspension,” Wear, 254(12), pp. 1233–1238.
[30] Desale, G. R., Gandhi, B. K., and Jain, S. C., (2005), “Effect of Physical Prop-erties of Solid Particle on Erosion Wear of Ductile Materials,” ASME WorldTribology Congress III, Washington, D.C., USA, Paper No. WTC2005-63997.
[31] Levy, A. V., and Chik, P., (1983), “The Effects of Erodent Composition andShape on the Erosion of Steel,” Wear, 89(2), pp. 151–162.
[32] Stack, M. M., and Pungwiwat, N., (1999), “Slurry Erosion of Metallics, Poly-mers, and Ceramics: Particle Size Effects,” Materials Science and Technology,15(3), pp. 337–344.
[33] Shimizu, K., Noguchi, T., Seitoh, H., and Muranaka, E., (1999), “FEM Analysisof the Dependency on Impact Angle During Erosive Wear,” Wear, 233–235,pp. 157–159.
[34] Desale, G. R., Gandhi, B. K., and Jain, S. C., (2006), “Effect of Erodent Proper-ties on Erosion Wear of Ductile Type Materials,” Wear, 261(7–8), pp. 914–921.
031603-10 / Vol. 133, JULY 2011 Transactions of the ASME
Downloaded 26 Jul 2011 to 210.212.58.111. Redistribution subject to ASME license or copyright; see http://www.asme.org/terms/Terms_Use.cfm


