Embed Size (px)
Citation preview
Seismic performance of new hybrid ductile-rockingbraced frame system
by
Justin Binder
A thesis submitted in conformity with the requirementsfor the degree of Master of Applied ScienceGraduate Department of Civil Engineering
University of Toronto
© Copyright 2016 by Justin Binder
Seismic performance of new hybrid ductile-rockingbraced frame system
Justin Binder
Master of Applied Science
Graduate Department of Civil Engineering
University of Toronto
2016
A new hybrid ductile-rocking (HDR) seismic-resistant system is proposed which consists of
a code-designed buckling-restrained braced frame (BRBF) that is free to rock on its foundation.
The goal of this system is to reduce the disadvantages associated with BRBFs, such as excessive
drift concentrations and residual deformations, while maintaining their reliable limit on forces and
accelerations. A lockup device ensures the full code-compliant strength at a predetermined column
uplift, and supplemental energy dissipation elements reduce the overall response.
Buildings of 2, 4, and 6-storeys in height were designed for Los Angeles, California, and studies
were performed to investigate how the energy dissipation strength, lockup base rotation, and verti-
cal mass modelling choices affected the system’s performance and dynamic response. An example
detail was developed that included a cast steel energy dissipating device. These studies showed
that the HDR system achieved a significant reduction in brace damage over conventional BRBF
structures.
ii
Acknowledgements
I would like to thank Professor Constantin Christopoulos for serving as my supervisor, and pro-
viding support, motivation, and an inspiring vision for the future of earthquake engineering. I want
to thank Dr. Michael Gray, my industry supervisor at Cast Connex Corporation, for being an end-
less source of encouragement, motivation, and technical guidance, and for constantly encouraging
me to ”just do it!”. As well, my thanks go to Carlos De Oliveira and the rest of the Cast Connex
team for supporting this research and exposing me to incredible engineering projects. I am grateful
to Tarana Haque for listening to me practice my presentation and giving useful feedback.
I want to thank Professor Oh-Sung Kwon for his thoughtful review of this thesis, and my col-
leagues at the University of Toronto, in particular Deepak Pant, for helping to resolve challenging
technical problems.
My thanks go to Jacob Binder, Raquel Binder, Jake Yanowski, Giselle Hausman, David Gut-
stein, and my band Pudding for always being there for me.
Most importantly, I want to thank my parents, Sari and David Binder, for their love, wisdom,
and support.
iii
Contents
1 Introduction 1
1.1 Conventional ductile design versus base-rocking . . . . . . . . . . . . . . . . . . . 1
1.2 Objectives and organization . . . . . . . . . . . . . . . . . . . . . . . . . . . . . 4
2 Background and literature review 7
2.1 Buckling-restrained braced frames . . . . . . . . . . . . . . . . . . . . . . . . . . 7
2.1.1 Overview . . . . . . . . . . . . . . . . . . . . . . . . . . . . . . . . . . . 8
2.1.2 Seismic performance . . . . . . . . . . . . . . . . . . . . . . . . . . . . . 9
2.1.3 Summary . . . . . . . . . . . . . . . . . . . . . . . . . . . . . . . . . . . 11
2.2 Base rocking structures . . . . . . . . . . . . . . . . . . . . . . . . . . . . . . . . 11
2.2.1 Flag-shaped hysteresis . . . . . . . . . . . . . . . . . . . . . . . . . . . . 12
2.2.2 Early studies of rocking structures . . . . . . . . . . . . . . . . . . . . . . 12
2.2.3 The PRESSS program and rocking of concrete walls . . . . . . . . . . . . 14
2.2.4 Rocking steel systems . . . . . . . . . . . . . . . . . . . . . . . . . . . . 15
2.2.5 Higher mode effects in controlled rocking structures . . . . . . . . . . . . 19
2.2.6 Compatibility between rocking frame and rest of structure . . . . . . . . . 22
2.3 Combining BRBs and base rocking for improved performance . . . . . . . . . . . 23
2.3.1 Examples of combined self-centering and plastic systems . . . . . . . . . . 23
2.3.2 Proposed combined seismic system . . . . . . . . . . . . . . . . . . . . . 24
2.4 Chapter summary . . . . . . . . . . . . . . . . . . . . . . . . . . . . . . . . . . . 24
iv
3 Mechanics of hybrid ductile-rocking 25
3.1 Mechanics of a rocking joint . . . . . . . . . . . . . . . . . . . . . . . . . . . . . 25
3.2 Modifying conventional structures to become a HDR system . . . . . . . . . . . . 28
3.2.1 Drifts from brace deformation and rocking . . . . . . . . . . . . . . . . . 28
3.2.2 Overview and mechanics . . . . . . . . . . . . . . . . . . . . . . . . . . . 30
3.2.3 P �� effects in HDR systems . . . . . . . . . . . . . . . . . . . . . . . 34
3.2.4 Residual drifts in HDR systems . . . . . . . . . . . . . . . . . . . . . . . 37
3.3 Chapter summary . . . . . . . . . . . . . . . . . . . . . . . . . . . . . . . . . . . 38
4 Reference structures 40
4.1 Modeling assumptions . . . . . . . . . . . . . . . . . . . . . . . . . . . . . . . . 40
4.2 Nonlinear time-history analyses . . . . . . . . . . . . . . . . . . . . . . . . . . . 44
4.2.1 Selection and scaling of ground motions . . . . . . . . . . . . . . . . . . . 44
4.2.2 Dynamic modeling assumptions . . . . . . . . . . . . . . . . . . . . . . . 46
4.2.3 Reference structure results . . . . . . . . . . . . . . . . . . . . . . . . . . 46
Peak interstorey drifts . . . . . . . . . . . . . . . . . . . . . . . . . . . . 46
Peak floor displacements . . . . . . . . . . . . . . . . . . . . . . . . . . 49
Peak residual interstorey drifts . . . . . . . . . . . . . . . . . . . . . . . . 49
Peak storey shears . . . . . . . . . . . . . . . . . . . . . . . . . . . . . . 51
Peak storey overturning moment . . . . . . . . . . . . . . . . . . . . . . . 52
Peak column compression . . . . . . . . . . . . . . . . . . . . . . . . . . 53
Peak storey accelerations . . . . . . . . . . . . . . . . . . . . . . . . . . . 54
4.3 Chapter summary . . . . . . . . . . . . . . . . . . . . . . . . . . . . . . . . . . . 54
5 Parametric study 56
5.1 Overview of parametric study . . . . . . . . . . . . . . . . . . . . . . . . . . . . 56
5.1.1 Parameters . . . . . . . . . . . . . . . . . . . . . . . . . . . . . . . . . . 56
5.1.2 Modeling assumptions . . . . . . . . . . . . . . . . . . . . . . . . . . . . 60
v
5.2 Response of example structure . . . . . . . . . . . . . . . . . . . . . . . . . . . . 61
5.2.1 Pushover response . . . . . . . . . . . . . . . . . . . . . . . . . . . . . . 61
5.2.2 Push-pull response . . . . . . . . . . . . . . . . . . . . . . . . . . . . . . 64
5.2.3 Sample record . . . . . . . . . . . . . . . . . . . . . . . . . . . . . . . . 64
5.3 Results of parametric study . . . . . . . . . . . . . . . . . . . . . . . . . . . . . . 70
Peak interstorey drifts . . . . . . . . . . . . . . . . . . . . . . . . . . . . 70
Peak base rotation . . . . . . . . . . . . . . . . . . . . . . . . . . . . . . 73
Peak drift minus base rotation . . . . . . . . . . . . . . . . . . . . . . . . 76
Residual drifts . . . . . . . . . . . . . . . . . . . . . . . . . . . . . . . . 79
Residual base rotations . . . . . . . . . . . . . . . . . . . . . . . . . . . . 79
Global uplift . . . . . . . . . . . . . . . . . . . . . . . . . . . . . . . . . 82
Number of records that engaged the lockup device . . . . . . . . . . . . . 82
Energy dissipated by buckling restrained braces . . . . . . . . . . . . . . . 85
Maximum foundation tension . . . . . . . . . . . . . . . . . . . . . . . . 87
Maximum column compressive force . . . . . . . . . . . . . . . . . . . . 89
Maximum base overturning moment . . . . . . . . . . . . . . . . . . . . . 89
Maximum base shear . . . . . . . . . . . . . . . . . . . . . . . . . . . . . 92
Maximum storey accelerations . . . . . . . . . . . . . . . . . . . . . . . . 94
Summary of parametric study conclusions . . . . . . . . . . . . . . . . . . 94
5.4 Investigation of vertical mass modeling on analysis results . . . . . . . . . . . . . 97
5.4.1 Literature review of rocking studies relevant to vertical mass modeling . . 97
5.4.2 Parametric study on vertical mass modeling . . . . . . . . . . . . . . . . . 101
5.5 Chapter summary . . . . . . . . . . . . . . . . . . . . . . . . . . . . . . . . . . . 108
6 Example design of 6-storey BRB HDR structure with cast steel energy dissipation el-
ements 110
6.1 Cast steel yielding connector used as rocking fuse element . . . . . . . . . . . . . 111
Yielding brace system properties . . . . . . . . . . . . . . . . . . . . . . . 111
vi
6.2 Validation of cast steel material in OpenSees . . . . . . . . . . . . . . . . . . . . 112
6.3 Design of 6-storey HDR frame . . . . . . . . . . . . . . . . . . . . . . . . . . . . 114
6.3.1 Superstructure design . . . . . . . . . . . . . . . . . . . . . . . . . . . . . 114
6.3.2 Fuse and lockup properties . . . . . . . . . . . . . . . . . . . . . . . . . . 114
6.3.3 Modeling assumptions . . . . . . . . . . . . . . . . . . . . . . . . . . . . 115
6.3.4 Pushover response . . . . . . . . . . . . . . . . . . . . . . . . . . . . . . 116
6.3.5 Push-pull response . . . . . . . . . . . . . . . . . . . . . . . . . . . . . . 116
6.3.6 Time-history results under a sample record . . . . . . . . . . . . . . . . . 119
6.3.7 Response of HDR structure to suites of records . . . . . . . . . . . . . . . 123
Peak interstorey drift and drift minus base rotation . . . . . . . . . . . . . 123
Peak floor displacements . . . . . . . . . . . . . . . . . . . . . . . . . . . 126
Base rotation . . . . . . . . . . . . . . . . . . . . . . . . . . . . . . . . . 126
Residual drifts . . . . . . . . . . . . . . . . . . . . . . . . . . . . . . . . 127
Energy dissipated by buckling restrained braces . . . . . . . . . . . . . . . 127
Maximum foundation tension . . . . . . . . . . . . . . . . . . . . . . . . 128
Maximum column compressive force . . . . . . . . . . . . . . . . . . . . 129
Maximum storey overturning moment . . . . . . . . . . . . . . . . . . . . 130
Maximum storey shear . . . . . . . . . . . . . . . . . . . . . . . . . . . . 130
Maximum storey accelerations . . . . . . . . . . . . . . . . . . . . . . . . 131
6.4 Preliminary Detail Design . . . . . . . . . . . . . . . . . . . . . . . . . . . . . . 131
6.4.1 Overview of detail . . . . . . . . . . . . . . . . . . . . . . . . . . . . . . 132
6.4.2 Design forces and material properties . . . . . . . . . . . . . . . . . . . . 135
6.4.3 Energy dissipation elements . . . . . . . . . . . . . . . . . . . . . . . . . 136
6.4.4 Gusset plates . . . . . . . . . . . . . . . . . . . . . . . . . . . . . . . . . 137
6.4.5 Base plate assembly . . . . . . . . . . . . . . . . . . . . . . . . . . . . . 139
6.5 Chapter summary . . . . . . . . . . . . . . . . . . . . . . . . . . . . . . . . . . . 141
vii
7 Summary and conclusions 143
7.1 Background and literature review . . . . . . . . . . . . . . . . . . . . . . . . . . . 143
7.2 Mechanics of the HDR system . . . . . . . . . . . . . . . . . . . . . . . . . . . . 144
7.3 Parametric study on hybrid ductile-rocking BRBFs . . . . . . . . . . . . . . . . . 145
7.4 Detail design of 6-storey BRB HDR frame with cast steel fuse . . . . . . . . . . . 147
7.5 Framework for application . . . . . . . . . . . . . . . . . . . . . . . . . . . . . . 148
7.6 Low-damage, economical seismic design . . . . . . . . . . . . . . . . . . . . . . 150
A Design of reference structures 159
A.1 Description of reference structures and preliminary design . . . . . . . . . . . . . 159
A.2 Dynamic Analysis . . . . . . . . . . . . . . . . . . . . . . . . . . . . . . . . . . . 166
A.3 Design of Structural Members . . . . . . . . . . . . . . . . . . . . . . . . . . . . 170
B Push-pull analysis overview of building models for parametric study 176
viii
List of Figures
1.1 Comparison of seismic design philosophies . . . . . . . . . . . . . . . . . . . . . 2
2.1 CBF and BRB hystereses . . . . . . . . . . . . . . . . . . . . . . . . . . . . . . . 8
2.2 Anatomy of a buckling restrained brace . . . . . . . . . . . . . . . . . . . . . . . 9
2.3 Example of failed BRB . . . . . . . . . . . . . . . . . . . . . . . . . . . . . . . . 10
2.4 Typical flag shaped hysteresis . . . . . . . . . . . . . . . . . . . . . . . . . . . . 12
2.5 Concrete bridge pier designed to step . . . . . . . . . . . . . . . . . . . . . . . . . 13
2.6 Moment frame with column uplift and energy absorbing devices . . . . . . . . . . 14
2.7 Yielding base plate . . . . . . . . . . . . . . . . . . . . . . . . . . . . . . . . . . 16
2.8 Retrofitted bridge steel truss pier using controlled rocking approach . . . . . . . . 18
2.9 Test structure with bumper detail and shear fuse . . . . . . . . . . . . . . . . . . . 20
2.10 Experimental setup of controlled rocking steel frame with higher mode mitigation 21
2.11 Possible details for connecting rocking frame to diaphragm and collectors . . . . . 22
2.12 SCED brace setup for testing and hysteretic behavior . . . . . . . . . . . . . . . . 23
3.1 Rocking structure mechanics . . . . . . . . . . . . . . . . . . . . . . . . . . . . . 26
3.2 Contribution to system deformations from two ductile mechanisms . . . . . . . . . 28
3.3 Mechanics of hybrid ductile-rocking under smaller amplitude displacements . . . . 31
3.4 Mechanics of hybrid ductile-rocking under larger amplitude displacements . . . . . 32
3.5 P-Delta effect . . . . . . . . . . . . . . . . . . . . . . . . . . . . . . . . . . . . . 35
3.6 Effect of loading history on residual drifts in conventional and HDR structures . . 38
ix
4.1 Plan and elevation of reference structures . . . . . . . . . . . . . . . . . . . . . . 40
4.2 Calibration of BRB OpenSees model to test results . . . . . . . . . . . . . . . . . 42
4.3 Schematic of Numerical Model . . . . . . . . . . . . . . . . . . . . . . . . . . . . 43
4.4 Summary of ground motion suite scaled to DBE . . . . . . . . . . . . . . . . . . . 47
4.5 Acceleration and displacement spectra of scaled ground motion suite . . . . . . . . 48
4.6 Peak interstorey drift results for reference structures . . . . . . . . . . . . . . . . . 48
4.7 Peak floor displacement results for reference structures . . . . . . . . . . . . . . . 49
4.8 Residual drift results for reference structures . . . . . . . . . . . . . . . . . . . . . 50
4.9 Storey shear results for reference structures . . . . . . . . . . . . . . . . . . . . . 51
4.10 Overturning moment results for reference structures . . . . . . . . . . . . . . . . . 52
4.11 Peak column compression results for reference structures . . . . . . . . . . . . . . 53
4.12 Acceleration results for reference structures . . . . . . . . . . . . . . . . . . . . . 54
5.1 Photos of Yielding Brace System . . . . . . . . . . . . . . . . . . . . . . . . . . . 58
5.2 Schematic of rocking joint modeling assumptions . . . . . . . . . . . . . . . . . . 61
5.3 Pushover response of 6-storey fixed base frame and 6-storey frame with ✓lock = 1%
and � = 1.0 . . . . . . . . . . . . . . . . . . . . . . . . . . . . . . . . . . . . . . 62
5.4 Push-pull response of 6-storey fixed base frame and 6-storey framewith ✓lock = 1%
and � = 1.0 . . . . . . . . . . . . . . . . . . . . . . . . . . . . . . . . . . . . . . 65
5.5 Foundation element behaviour . . . . . . . . . . . . . . . . . . . . . . . . . . . . 66
5.6 Roof displacement and system forces of example model compared to fixed base
response . . . . . . . . . . . . . . . . . . . . . . . . . . . . . . . . . . . . . . . . 68
5.7 Hysteretic response of 6-storey fixed base and HDR frames . . . . . . . . . . . . . 69
5.8 Median peak interstorey drift results . . . . . . . . . . . . . . . . . . . . . . . . . 71
5.9 Median drift profiles for 6-storey structure, � = 0 . . . . . . . . . . . . . . . . . . 73
5.10 Median peak base rotation results . . . . . . . . . . . . . . . . . . . . . . . . . . . 74
5.11 Median peak interstorey drift minus base rotation results from parametric study . . 77
5.12 Median drift minus base rotation profiles for 6-storey structure, � = 0 . . . . . . . 78
x
5.13 Median peak residual drift results . . . . . . . . . . . . . . . . . . . . . . . . . . . 80
5.14 Residual base rotation results from parametric study . . . . . . . . . . . . . . . . . 81
5.15 Median peak global uplift results . . . . . . . . . . . . . . . . . . . . . . . . . . . 83
5.16 Number of records that engaged the lockup device . . . . . . . . . . . . . . . . . . 84
5.17 Median total energy dissipated by braces results . . . . . . . . . . . . . . . . . . . 86
5.18 Median peak foundation tension . . . . . . . . . . . . . . . . . . . . . . . . . . . 88
5.19 Median peak first storey column compression results . . . . . . . . . . . . . . . . 90
5.20 Median peak base overturning moment results . . . . . . . . . . . . . . . . . . . . 91
5.21 Base moment example results for 2, 4, and 6-storey frames with � = 1.0 and
✓lock = 1.0%, record ID#1 scaled to DBE . . . . . . . . . . . . . . . . . . . . . . 92
5.22 Median peak base shear results . . . . . . . . . . . . . . . . . . . . . . . . . . . . 93
5.23 Median peak storey acceleration results . . . . . . . . . . . . . . . . . . . . . . . 95
5.24 Examples of column force spikes in literature . . . . . . . . . . . . . . . . . . . . 99
5.25 Schematic of vertical mass modeling assumptions . . . . . . . . . . . . . . . . . . 102
5.26 2-storey response with different vertical mass modeling assumptions . . . . . . . . 104
5.27 4-storey response with different vertical mass modeling assumptions . . . . . . . . 105
5.28 6-storey response with different vertical mass modeling assumptions . . . . . . . . 106
5.29 Peak drift profiles for 2, 4, and 6-storey structures with different vertical mass mod-
eling assumptions . . . . . . . . . . . . . . . . . . . . . . . . . . . . . . . . . . . 108
6.1 Cast steel yielding fuse numerical model calibration . . . . . . . . . . . . . . . . . 112
6.2 Pushover response of 6-storey fixed base frame and 6-storey frame with cast steel
fuse and ✓lock = 1% and � = 1.0 . . . . . . . . . . . . . . . . . . . . . . . . . . . 117
6.3 Push-pull response of 6-storey fixed base frame and 6-storey frame with cast steel
fuse and ✓lock = 1% and � = 1.0 . . . . . . . . . . . . . . . . . . . . . . . . . . . 118
6.4 Foundation element behaviour for model with YBS fuse . . . . . . . . . . . . . . 120
6.5 Roof displacement and system forces of HDR example design with cast steel fuse
compared to fixed base response . . . . . . . . . . . . . . . . . . . . . . . . . . . 121
xi
6.6 Hysteretic response of 6-storey fixed base structure and HDR structure with cast
steel fuses . . . . . . . . . . . . . . . . . . . . . . . . . . . . . . . . . . . . . . . 122
6.7 Peak interstorey drift results . . . . . . . . . . . . . . . . . . . . . . . . . . . . . 125
6.8 Peak floor displacement results for fixed base and HDR frames . . . . . . . . . . . 126
6.9 Residual drifts results for fixed base and HDR structure . . . . . . . . . . . . . . . 128
6.10 Peak column compression results for 6-storey fixed base and HDR frames . . . . . 129
6.11 Peak storey overturning moment results for fixed base and HDR frames . . . . . . 130
6.12 Peak storey shear results for fixed base and HDR frames . . . . . . . . . . . . . . 131
6.13 Peak storey acceleration results for fixed base and HDR structures . . . . . . . . . 132
6.14 Overview of HDR column-foundation detail . . . . . . . . . . . . . . . . . . . . . 133
6.15 Overview of proposed construction sequence for HDR column-foundation detail . 134
6.16 Cast steel energy dissipating supplemental fuse for HDR column-foundation con-
nection . . . . . . . . . . . . . . . . . . . . . . . . . . . . . . . . . . . . . . . . . 137
6.17 Gusset plate and column detail . . . . . . . . . . . . . . . . . . . . . . . . . . . . 138
6.18 Base plate assembly . . . . . . . . . . . . . . . . . . . . . . . . . . . . . . . . . . 139
6.19 Components of base plate assembly drawings . . . . . . . . . . . . . . . . . . . . 140
A.1 Mode shapes from SAP2000 modal analysis . . . . . . . . . . . . . . . . . . . . . 168
A.2 Unbalanced force on beams in BRBFs . . . . . . . . . . . . . . . . . . . . . . . . 172
B.1 Push-pull response of 2 storey structures for � = 0, � = 0.5, and � = 1.0 . . . . . 177
B.2 Push-pull response of 2 storey structures for � = 1.2, � = 1.4, and � = 1.6 . . . . 178
B.3 Push-pull response of 4 storey structures for � = 0, � = 0.5, and � = 1.0 . . . . . 179
B.4 Push-pull response of 4 storey structures for � = 1.2, � = 1.4, and � = 1.6 . . . . 180
B.5 Push-pull response of 6 storey structures for � = 0, � = 0.5, and � = 1.0 . . . . . 181
B.6 Push-pull response of 6 storey structures for � = 1.2, � = 1.4, and � = 1.6 . . . . 182
xii
List of Tables
4.1 Reference frame elements . . . . . . . . . . . . . . . . . . . . . . . . . . . . . . . 41
4.2 Material parameters for nonlinear buckling restrained brace elements . . . . . . . . 42
4.3 Earthquake records . . . . . . . . . . . . . . . . . . . . . . . . . . . . . . . . . . 45
5.1 Parameters for parametric study . . . . . . . . . . . . . . . . . . . . . . . . . . . 57
5.2 Yielding brace system device characteristics . . . . . . . . . . . . . . . . . . . . . 58
5.3 Value of ED for each building model . . . . . . . . . . . . . . . . . . . . . . . . . 59
5.4 Ratio of rocking moment to yield moment . . . . . . . . . . . . . . . . . . . . . . 60
5.5 Total energy dissipated by braces in fixed base structures . . . . . . . . . . . . . . 85
5.6 Summary of first storey response for vertical mass parametric study . . . . . . . . 107
6.1 YBS fuse geometric parameters for OpenSees calibration . . . . . . . . . . . . . . 113
6.2 YBS fuse material modeling parameters for OpenSees calibration . . . . . . . . . 113
6.3 Example design fuse properties . . . . . . . . . . . . . . . . . . . . . . . . . . . . 115
6.4 Summary of statistical results . . . . . . . . . . . . . . . . . . . . . . . . . . . . . 124
6.5 HDR structure lockup engagement . . . . . . . . . . . . . . . . . . . . . . . . . . 127
6.6 Connection design forces . . . . . . . . . . . . . . . . . . . . . . . . . . . . . . . 135
6.7 Material properties for detail design . . . . . . . . . . . . . . . . . . . . . . . . . 136
A.1 Material properties . . . . . . . . . . . . . . . . . . . . . . . . . . . . . . . . . . 160
A.2 Seismic loading parameters . . . . . . . . . . . . . . . . . . . . . . . . . . . . . 161
A.3 Gravity loading . . . . . . . . . . . . . . . . . . . . . . . . . . . . . . . . . . . . 161
xiii
A.4 Live loads . . . . . . . . . . . . . . . . . . . . . . . . . . . . . . . . . . . . . . . 162
A.5 Effective seismic weight . . . . . . . . . . . . . . . . . . . . . . . . . . . . . . . 163
A.6 Determination of approximate fundamental period . . . . . . . . . . . . . . . . . . 163
A.7 Calculation of seismic base shear . . . . . . . . . . . . . . . . . . . . . . . . . . . 164
A.8 Lateral seismic force calculations . . . . . . . . . . . . . . . . . . . . . . . . . . . 165
A.9 Modal analysis results . . . . . . . . . . . . . . . . . . . . . . . . . . . . . . . . . 167
A.10 Response spectrum analysis parameters . . . . . . . . . . . . . . . . . . . . . . . 169
A.11 Storey deflection and drift calculations . . . . . . . . . . . . . . . . . . . . . . . . 169
A.12 Buckling restrained brace parameters . . . . . . . . . . . . . . . . . . . . . . . . . 171
A.13 BRB design parameters . . . . . . . . . . . . . . . . . . . . . . . . . . . . . . . . 171
A.14 Column sections, design forces, and resistances . . . . . . . . . . . . . . . . . . . 172
A.15 Forces and resistances of beams . . . . . . . . . . . . . . . . . . . . . . . . . . . 173
A.16 BRB frame forces and beam calculations . . . . . . . . . . . . . . . . . . . . . . . 175
xiv
Chapter 1
Introduction
1.1 Conventional ductile design versus base-rocking
Current conventional earthquake design procedures prescribed in modern building codes (eg.
ASCE (2010a)) intentionally allow for severe damage to carefully designed structural elements
to achieve a stable seismic response that ensures life safety. During an earthquake, the seismic
force resisting system (SFRS) is designed to experience inelastic deformations in fuse elements,
which dissipate the input energy from the ground motion and protect the rest of the elements of
the SFRS from being overloaded as per capacity design principals (eg. Filiatrault et al. (2013)).
Engineers achieve economical designs by reducing system strength and capacity design forces. As
such, SFRSs with large inelastic deformation capacity and low post-yield stiffness can be cost-
effectively designed for lower system forces.
Buckling restrained braced frames (BRBFs) are one of such very efficient ductile systems.
Buckling restrained braces (BRBs), which are steel braces that are restrained from buckling by
a confining material, yield symmetrically in both tension and compression and have a very low
inelastic stiffness. These features allow for the largest allowable strength reduction factor (R=8
in ASCE (2010a)) as well as low capacity design forces. When distributed along the height of
an SFRS in a braced frame configuration, BRB systems have a large energy-dissipation capability
1
2 CHAPTER 1. INTRODUCTION
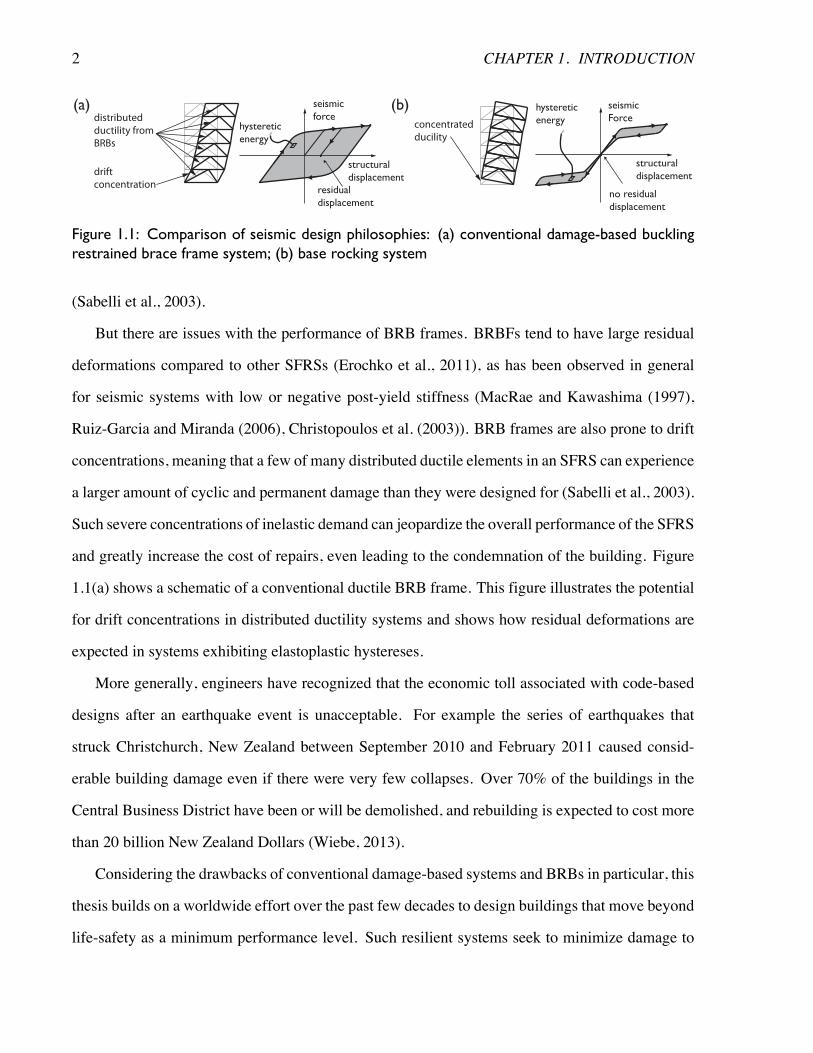
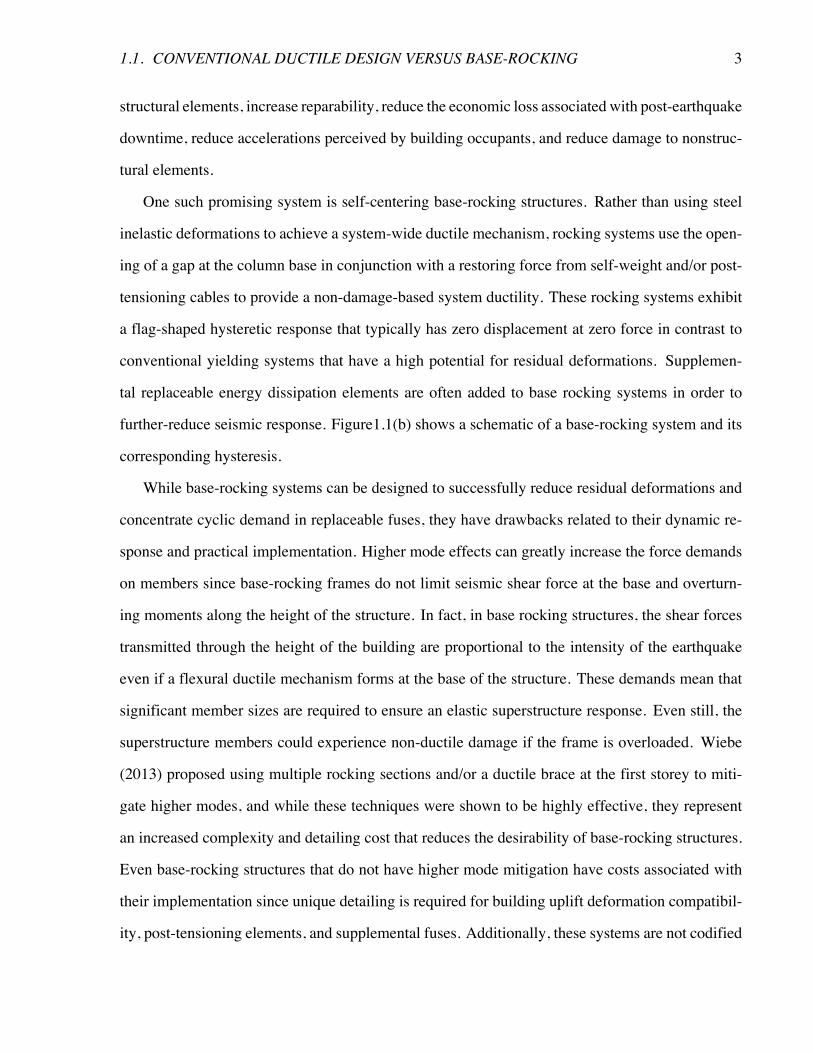
(a) (b)concentratedducility
seismic Force
structural displacement
no residual displacement
hystereticenergydistributed
ductility fromBRBs
driftconcentration
seismic force
structural displacement
residual displacement
hystereticenergy
Figure 1.1: Comparison of seismic design philosophies: (a) conventional damage-based bucklingrestrained brace frame system; (b) base rocking system
(Sabelli et al., 2003).
But there are issues with the performance of BRB frames. BRBFs tend to have large residual
deformations compared to other SFRSs (Erochko et al., 2011), as has been observed in general
for seismic systems with low or negative post-yield stiffness (MacRae and Kawashima (1997),
Ruiz-Garcia and Miranda (2006), Christopoulos et al. (2003)). BRB frames are also prone to drift
concentrations, meaning that a few of many distributed ductile elements in an SFRS can experience
a larger amount of cyclic and permanent damage than they were designed for (Sabelli et al., 2003).
Such severe concentrations of inelastic demand can jeopardize the overall performance of the SFRS
and greatly increase the cost of repairs, even leading to the condemnation of the building. Figure
1.1(a) shows a schematic of a conventional ductile BRB frame. This figure illustrates the potential
for drift concentrations in distributed ductility systems and shows how residual deformations are
expected in systems exhibiting elastoplastic hystereses.
More generally, engineers have recognized that the economic toll associated with code-based
designs after an earthquake event is unacceptable. For example the series of earthquakes that
struck Christchurch, New Zealand between September 2010 and February 2011 caused consid-
erable building damage even if there were very few collapses. Over 70% of the buildings in the
Central Business District have been or will be demolished, and rebuilding is expected to cost more
than 20 billion New Zealand Dollars (Wiebe, 2013).
Considering the drawbacks of conventional damage-based systems and BRBs in particular, this
thesis builds on a worldwide effort over the past few decades to design buildings that move beyond
life-safety as a minimum performance level. Such resilient systems seek to minimize damage to
1.1. CONVENTIONAL DUCTILE DESIGN VERSUS BASE-ROCKING 3
structural elements, increase reparability, reduce the economic loss associated with post-earthquake
downtime, reduce accelerations perceived by building occupants, and reduce damage to nonstruc-
tural elements.
One such promising system is self-centering base-rocking structures. Rather than using steel
inelastic deformations to achieve a system-wide ductile mechanism, rocking systems use the open-
ing of a gap at the column base in conjunction with a restoring force from self-weight and/or post-
tensioning cables to provide a non-damage-based system ductility. These rocking systems exhibit
a flag-shaped hysteretic response that typically has zero displacement at zero force in contrast to
conventional yielding systems that have a high potential for residual deformations. Supplemen-
tal replaceable energy dissipation elements are often added to base rocking systems in order to
further-reduce seismic response. Figure1.1(b) shows a schematic of a base-rocking system and its
corresponding hysteresis.
While base-rocking systems can be designed to successfully reduce residual deformations and
concentrate cyclic demand in replaceable fuses, they have drawbacks related to their dynamic re-
sponse and practical implementation. Higher mode effects can greatly increase the force demands
on members since base-rocking frames do not limit seismic shear force at the base and overturn-
ing moments along the height of the structure. In fact, in base rocking structures, the shear forces
transmitted through the height of the building are proportional to the intensity of the earthquake
even if a flexural ductile mechanism forms at the base of the structure. These demands mean that
significant member sizes are required to ensure an elastic superstructure response. Even still, the
superstructure members could experience non-ductile damage if the frame is overloaded. Wiebe
(2013) proposed using multiple rocking sections and/or a ductile brace at the first storey to miti-
gate higher modes, and while these techniques were shown to be highly effective, they represent
an increased complexity and detailing cost that reduces the desirability of base-rocking structures.
Even base-rocking structures that do not have higher mode mitigation have costs associated with
their implementation since unique detailing is required for building uplift deformation compatibil-
ity, post-tensioning elements, and supplemental fuses. Additionally, these systems are not codified
4 CHAPTER 1. INTRODUCTION
and thus are not as easily implementable as damage-based ductile systems.
Conventionally designed BRB frames and base-rocking structures represent two alternate seis-
mic design philosophies. On one hand, BRBFs are code-approved, relatively easy and cheap to
construct, and feature distributed ductility that ensures low system forces over the height of the
building. However implicit in such a damage-based system are drift concentrations, permanent
deformations, severe damage of ductile elements and potentially large repair or even complete de-
molition costs. On the other hand, controlled rocking frames offer little or no structural damage but
tend to be complicated to detail, expensive, and not necessarily very effective in reducing systems
forces from higher mode effects.
This thesis is aimed at examining the possible benefits of combining buckling restrained braced
frames with base rocking in an optimal way so as to take advantage of the positive aspects of each
system while reducing their respective drawbacks. The proposed system is referred as the hybrid
ductile-rocking system (HDR), and consists of a conventionally designed BRB frame that has a
specially designed column-foundation connection that permits vertical uplift. A lockup is provided
to ensure the full code-designed resistance of the ductile frame after a predetermined amount of
rocking, and supplemental energy dissipation is used to dissipate earthquake energy and reduce the
response of the rocking joint.
1.2 Objectives and organization
The following objectives were developed for this thesis:
1. to present a literature review that gives an overview of BRBFs and rocking structures, and
demonstrates how the performance deficiencies related to BRBs are improved in rocking
frames.
2. to explain using first principles how a conventional ductile system can be modified with base
rocking to achieve the proposed hybrid ductile-rocking system.
1.2. OBJECTIVES AND ORGANIZATION 5
3. to apply this concept to six, four, and two-storey BRB frames, and study the effect of varying
different system parameters during nonlinear time-history analysis.
4. to design and analyze a six-storey frame with a cast-steel yielding fuse and detail that accom-
modates the hybrid ductile-rocking system.
These objectives are addressed in the following chapters as follows. Chapter 2 provides back-
ground on BRBFs and base-rocking structures, and highlights important research relevant to their
development and performance.
Chapter 3 overviews the mechanics of the proposed combined seismic system. It is shown
that by incorporating supplemental energy dissipation and a lockup device, base-rocking can be
added to a ductile frame in order to reduce structural damage. The P �Δ effect is highlighted as it
can reduce system strength during monotonic loading when yielding is expected to occur at large
deformations, and the sensitivity of residual drifts to individual earthquake records is explained.
Chapter 4 presents three reference BRBFs designed for Los Angeles, California, and presents
the validation of these designs using nonlinear analysis. Chapter 5 then uses these frames as the
basis of a parametric study that investigates how conventional ductility and base-rocking can be
optimally combined. This study highlights the energy dissipation strength and amount of rock-
ing allowed at the foundation as two important parameters, and shows that while peak drifts are
relatively similar no matter how much rocking is allowed, BRB displacements, cyclic damage,
and residual drifts can be significantly reduced for modest amounts of allowable rocking before
lockup. It was noted, however, that these benefits were diminished for shorter period structures,
and for cases when the energy dissipation strength was very large.
Chapter 6 presents a detailed 6 storey frame design. A cast steel rocking fuse is selected and
numerically modeled to capture its unique hysteretic properties. This design is analyzed numeri-
cally in order to highlight performance benefits compared to the conventional 6 storey frame. A
column-foundation detail is presented to demonstrate an example of how the combined BRB and
rocking system could be implemented.

6 CHAPTER 1. INTRODUCTION
This thesis concludes in Chapter 7 with an overview of important results and a discussion of
future research.
Chapter 2
Background and literature review
This chapter presents an overview of buckling restrained braced frames and rocking structures.
Important studies that demonstrate the performance of these two distinct systems are presented in
order to justify the focus of the thesis, which is to study the merits of combining these two systems
into a new seismic design approach to improve seismic resilience of framed structures.
2.1 Buckling-restrained braced frames
This thesis includes buckling restrained braced frames (BRBFs) as a prime example of con-
ventionally ductile steel frames. While there are many other common types of damage-based steel
seismic force resisting systems, BRBFs were chosen for the purpose of this study for the following
reasons:
• BRBFs are common systems in areas of high seismicity.
• Their stable, symmetric hysteric response is readily modeled numerically.
• BRBFs are prone to damage concentrations and large residual drifts, damage states that are
greatly improved in rocking structures.
7
8 CHAPTER 2. BACKGROUND AND LITERATURE REVIEW
Force
Deformation
Decreased bucklingresistance
Peak compressive load is greater than peak tensile load
Deformation
Force(b)(a)
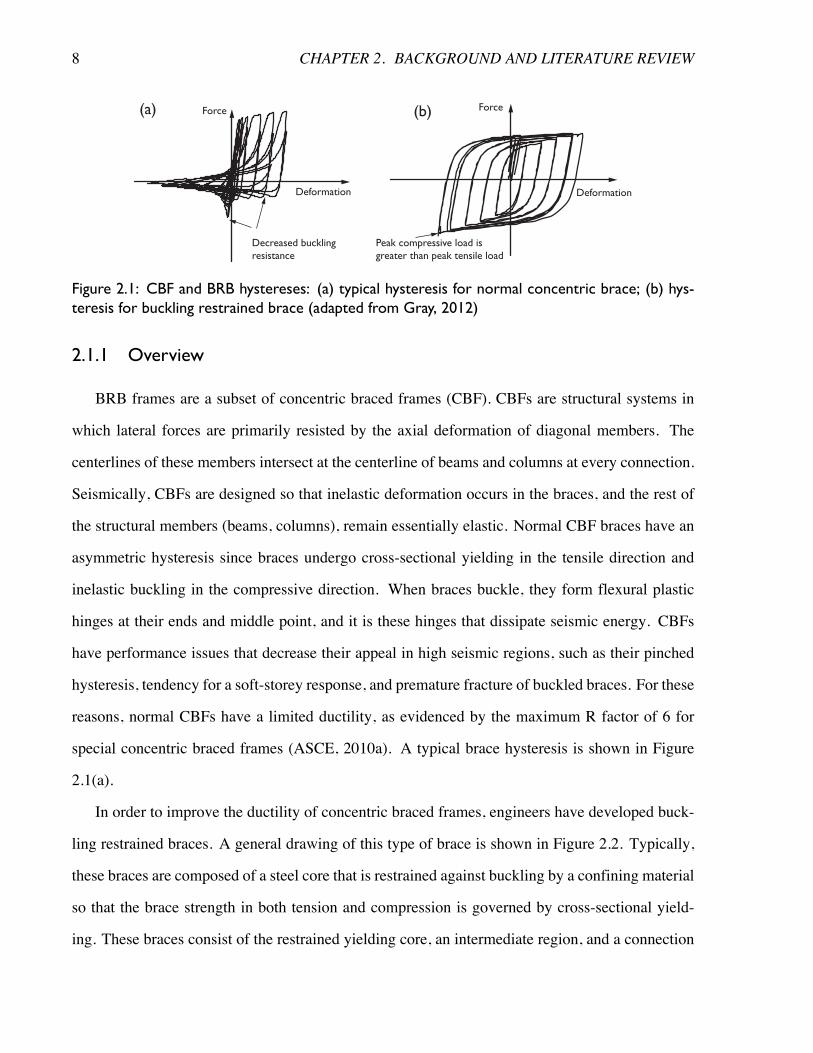
Figure 2.1: CBF and BRB hystereses: (a) typical hysteresis for normal concentric brace; (b) hys-teresis for buckling restrained brace (adapted from Gray, 2012)
2.1.1 Overview
BRB frames are a subset of concentric braced frames (CBF). CBFs are structural systems in
which lateral forces are primarily resisted by the axial deformation of diagonal members. The
centerlines of these members intersect at the centerline of beams and columns at every connection.
Seismically, CBFs are designed so that inelastic deformation occurs in the braces, and the rest of
the structural members (beams, columns), remain essentially elastic. Normal CBF braces have an
asymmetric hysteresis since braces undergo cross-sectional yielding in the tensile direction and
inelastic buckling in the compressive direction. When braces buckle, they form flexural plastic
hinges at their ends and middle point, and it is these hinges that dissipate seismic energy. CBFs
have performance issues that decrease their appeal in high seismic regions, such as their pinched
hysteresis, tendency for a soft-storey response, and premature fracture of buckled braces. For these
reasons, normal CBFs have a limited ductility, as evidenced by the maximum R factor of 6 for
special concentric braced frames (ASCE, 2010a). A typical brace hysteresis is shown in Figure
2.1(a).
In order to improve the ductility of concentric braced frames, engineers have developed buck-
ling restrained braces. A general drawing of this type of brace is shown in Figure 2.2. Typically,
these braces are composed of a steel core that is restrained against buckling by a confining material
so that the brace strength in both tension and compression is governed by cross-sectional yield-
ing. These braces consist of the restrained yielding core, an intermediate region, and a connection
2.1. BUCKLING-RESTRAINED BRACED FRAMES 9
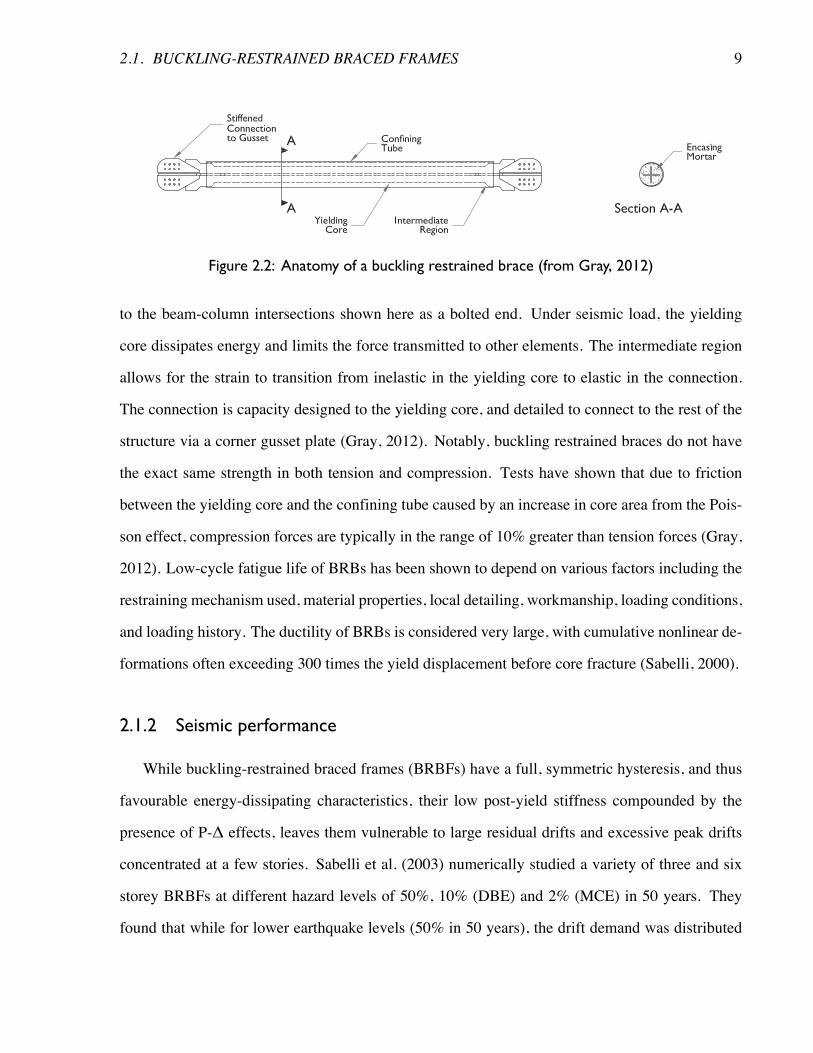
Figure 2.2: Anatomy of a buckling restrained brace (from Gray, 2012)
to the beam-column intersections shown here as a bolted end. Under seismic load, the yielding
core dissipates energy and limits the force transmitted to other elements. The intermediate region
allows for the strain to transition from inelastic in the yielding core to elastic in the connection.
The connection is capacity designed to the yielding core, and detailed to connect to the rest of the
structure via a corner gusset plate (Gray, 2012). Notably, buckling restrained braces do not have
the exact same strength in both tension and compression. Tests have shown that due to friction
between the yielding core and the confining tube caused by an increase in core area from the Pois-
son effect, compression forces are typically in the range of 10% greater than tension forces (Gray,
2012). Low-cycle fatigue life of BRBs has been shown to depend on various factors including the
restraining mechanism used, material properties, local detailing, workmanship, loading conditions,
and loading history. The ductility of BRBs is considered very large, with cumulative nonlinear de-
formations often exceeding 300 times the yield displacement before core fracture (Sabelli, 2000).
2.1.2 Seismic performance
While buckling-restrained braced frames (BRBFs) have a full, symmetric hysteresis, and thus
favourable energy-dissipating characteristics, their low post-yield stiffness compounded by the
presence of P-Δ effects, leaves them vulnerable to large residual drifts and excessive peak drifts
concentrated at a few stories. Sabelli et al. (2003) numerically studied a variety of three and six
storey BRBFs at different hazard levels of 50%, 10% (DBE) and 2% (MCE) in 50 years. They
found that while for lower earthquake levels (50% in 50 years), the drift demand was distributed
10 CHAPTER 2. BACKGROUND AND LITERATURE REVIEW
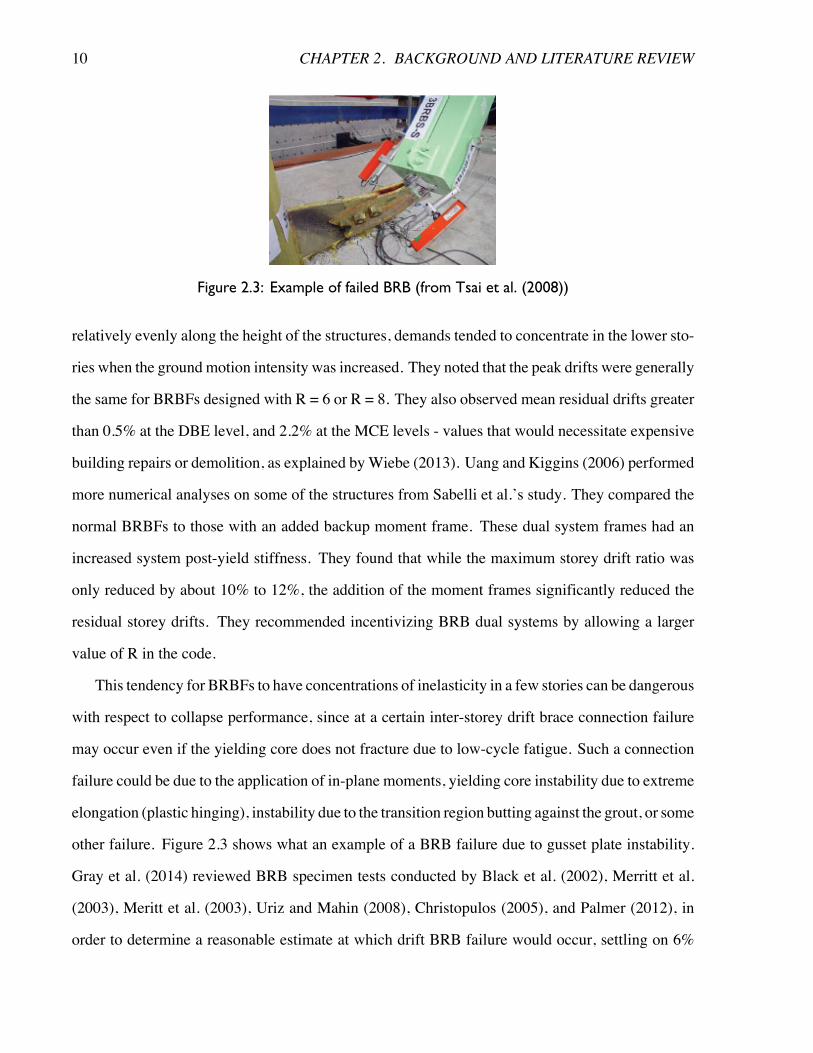
Figure 2.3: Example of failed BRB (from Tsai et al. (2008))
relatively evenly along the height of the structures, demands tended to concentrate in the lower sto-
ries when the groundmotion intensity was increased. They noted that the peak drifts were generally
the same for BRBFs designed with R = 6 or R = 8. They also observed mean residual drifts greater
than 0.5% at the DBE level, and 2.2% at the MCE levels - values that would necessitate expensive
building repairs or demolition, as explained byWiebe (2013). Uang and Kiggins (2006) performed
more numerical analyses on some of the structures from Sabelli et al.’s study. They compared the
normal BRBFs to those with an added backup moment frame. These dual system frames had an
increased system post-yield stiffness. They found that while the maximum storey drift ratio was
only reduced by about 10% to 12%, the addition of the moment frames significantly reduced the
residual storey drifts. They recommended incentivizing BRB dual systems by allowing a larger
value of R in the code.
This tendency for BRBFs to have concentrations of inelasticity in a few stories can be dangerous
with respect to collapse performance, since at a certain inter-storey drift brace connection failure
may occur even if the yielding core does not fracture due to low-cycle fatigue. Such a connection
failure could be due to the application of in-plane moments, yielding core instability due to extreme
elongation (plastic hinging), instability due to the transition region butting against the grout, or some
other failure. Figure 2.3 shows what an example of a BRB failure due to gusset plate instability.
Gray et al. (2014) reviewed BRB specimen tests conducted by Black et al. (2002), Merritt et al.
(2003), Meritt et al. (2003), Uriz and Mahin (2008), Christopulos (2005), and Palmer (2012), in
order to determine a reasonable estimate at which drift BRB failure would occur, settling on 6%
2.2. BASE ROCKING STRUCTURES 11
interstorey drift. In their subsequent numerical analysis of a twelve storey BRB frame, they found
that drift tended to concentrate in the lower stories, and that the mean peak drift of seven records
scaled to DBE was around 3%. Under MCE, four of the seven records caused collapse due to the
concentration of drift at the lower stories.
While they tend to accumulate excessive residual and cyclic damage, BRBFs can, on the other
hand, have a very beneficial storey acceleration response. Choi et al. (2008) compared the acceler-
ation response of numerical models of BRBFs, self-centering energy-dissipating (SCED) frames,
and moment-resisting frames (MRF) and found that while the MRF and SCED frame structures
tended to have storey accelerations that exceeded the peak ground acceleration (especially the
MRFs), the BRB frames tended to have storey accelerations that were equivalent or lower than
the peak ground accelerations thus confirming the excellent performance of such ductile structures
with respect to controlling forces and accelerations along the height of the structure.
2.1.3 Summary
Buckling restrained braced frames offer the economy and simple design method of damage-
based concentric frames without the poor performance associated with conventional braces that
can buckle. While they have favorable energy dissipation and storey acceleration performance,
they are prone to large residual drifts. As well, even though their yielding cores are highly ductile,
drift concentrations can cause excessive deformation demands at one storey that can lead to failure
modes besides core fracture.
2.2 Base rocking structures
Base rocking structures are structures that offer improved performance over damage-based de-
signs since most or all residual drifts can be precluded. This section presents an explanation of the
basic self-centering force-deformation response, and a history of studies and tests on base rocking
structures with a discussion of their performance benefits and limitations.
12 CHAPTER 2. BACKGROUND AND LITERATURE REVIEW
1
1ko
αkof
y
Force
Deformation
βfy
Figure 2.4: Typical flag shaped hysteresis (adapted from Wiebe, 2013)
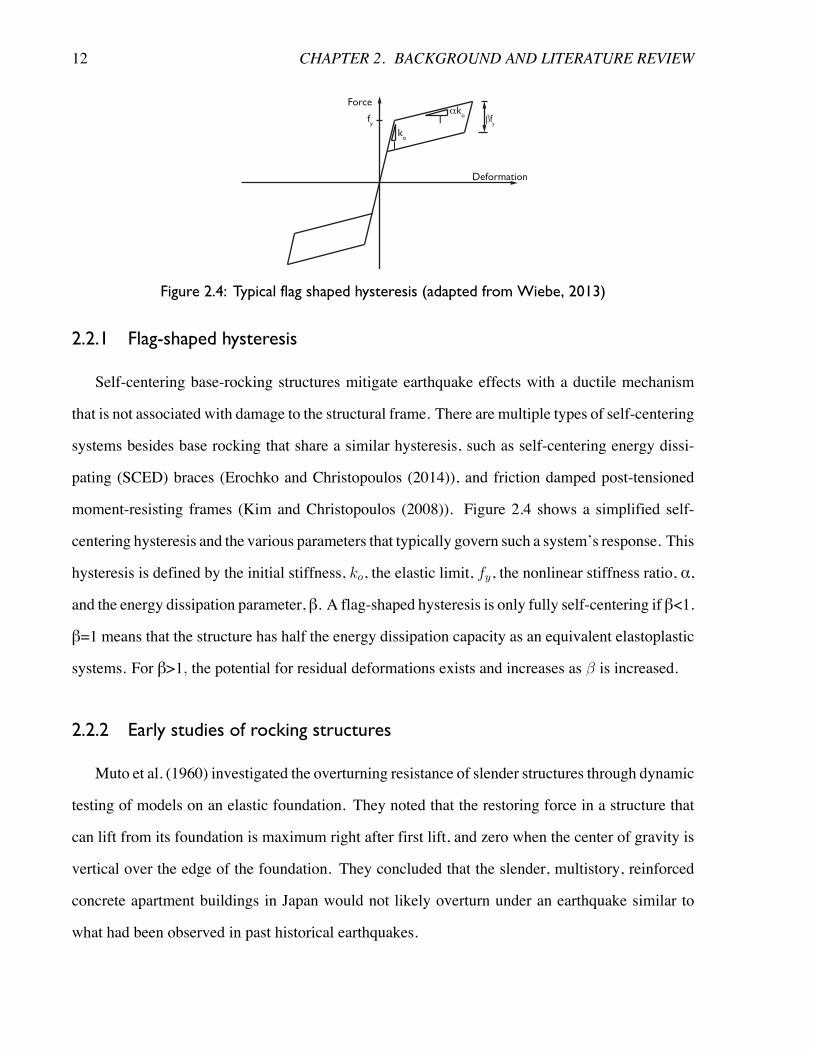
2.2.1 Flag-shaped hysteresis
Self-centering base-rocking structures mitigate earthquake effects with a ductile mechanism
that is not associated with damage to the structural frame. There are multiple types of self-centering
systems besides base rocking that share a similar hysteresis, such as self-centering energy dissi-
pating (SCED) braces (Erochko and Christopoulos (2014)), and friction damped post-tensioned
moment-resisting frames (Kim and Christopoulos (2008)). Figure 2.4 shows a simplified self-
centering hysteresis and the various parameters that typically govern such a system’s response. This
hysteresis is defined by the initial stiffness, ko, the elastic limit, fy, the nonlinear stiffness ratio, α,
and the energy dissipation parameter, β. A flag-shaped hysteresis is only fully self-centering if β<1.
β=1 means that the structure has half the energy dissipation capacity as an equivalent elastoplastic
systems. For β>1, the potential for residual deformations exists and increases as � is increased.
2.2.2 Early studies of rocking structures
Muto et al. (1960) investigated the overturning resistance of slender structures through dynamic
testing of models on an elastic foundation. They noted that the restoring force in a structure that
can lift from its foundation is maximum right after first lift, and zero when the center of gravity is
vertical over the edge of the foundation. They concluded that the slender, multistory, reinforced
concrete apartment buildings in Japan would not likely overturn under an earthquake similar to
what had been observed in past historical earthquakes.
2.2. BASE ROCKING STRUCTURES 13
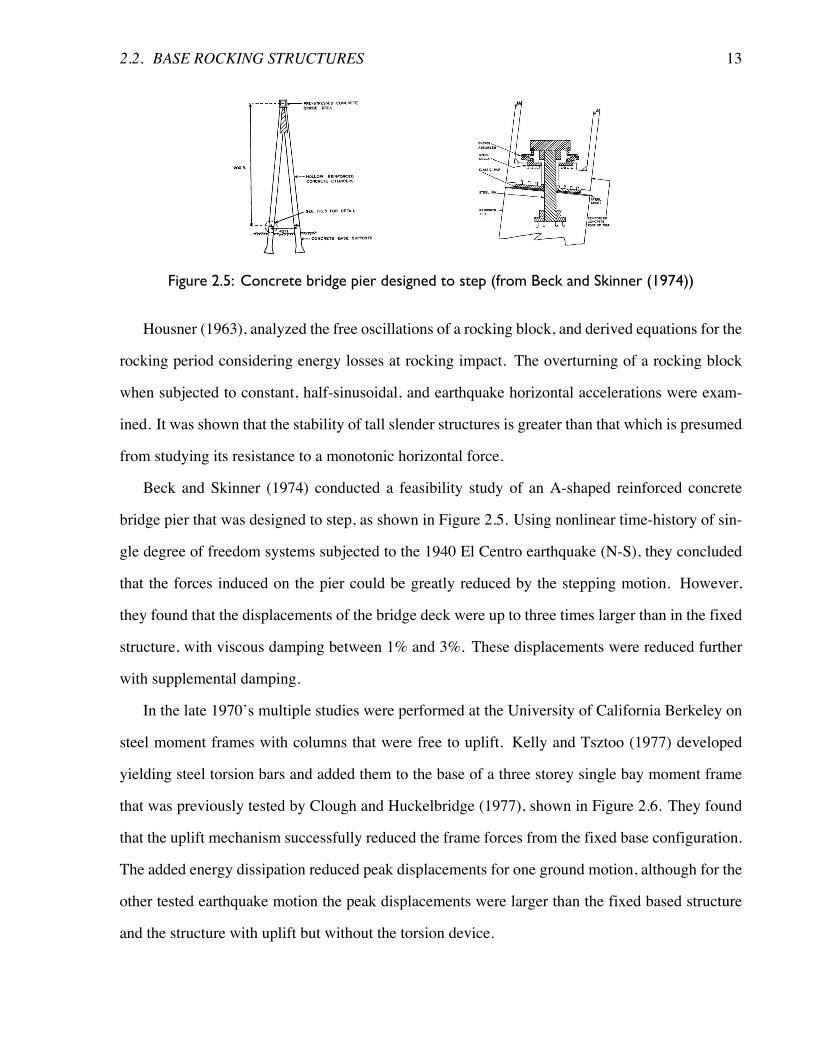
Figure 2.5: Concrete bridge pier designed to step (from Beck and Skinner (1974))
Housner (1963), analyzed the free oscillations of a rocking block, and derived equations for the
rocking period considering energy losses at rocking impact. The overturning of a rocking block
when subjected to constant, half-sinusoidal, and earthquake horizontal accelerations were exam-
ined. It was shown that the stability of tall slender structures is greater than that which is presumed
from studying its resistance to a monotonic horizontal force.
Beck and Skinner (1974) conducted a feasibility study of an A-shaped reinforced concrete
bridge pier that was designed to step, as shown in Figure 2.5. Using nonlinear time-history of sin-
gle degree of freedom systems subjected to the 1940 El Centro earthquake (N-S), they concluded
that the forces induced on the pier could be greatly reduced by the stepping motion. However,
they found that the displacements of the bridge deck were up to three times larger than in the fixed
structure, with viscous damping between 1% and 3%. These displacements were reduced further
with supplemental damping.
In the late 1970’s multiple studies were performed at the University of California Berkeley on
steel moment frames with columns that were free to uplift. Kelly and Tsztoo (1977) developed
yielding steel torsion bars and added them to the base of a three storey single bay moment frame
that was previously tested by Clough and Huckelbridge (1977), shown in Figure 2.6. They found
that the uplift mechanism successfully reduced the frame forces from the fixed base configuration.
The added energy dissipation reduced peak displacements for one ground motion, although for the
other tested earthquake motion the peak displacements were larger than the fixed based structure
and the structure with uplift but without the torsion device.
14 CHAPTER 2. BACKGROUND AND LITERATURE REVIEW
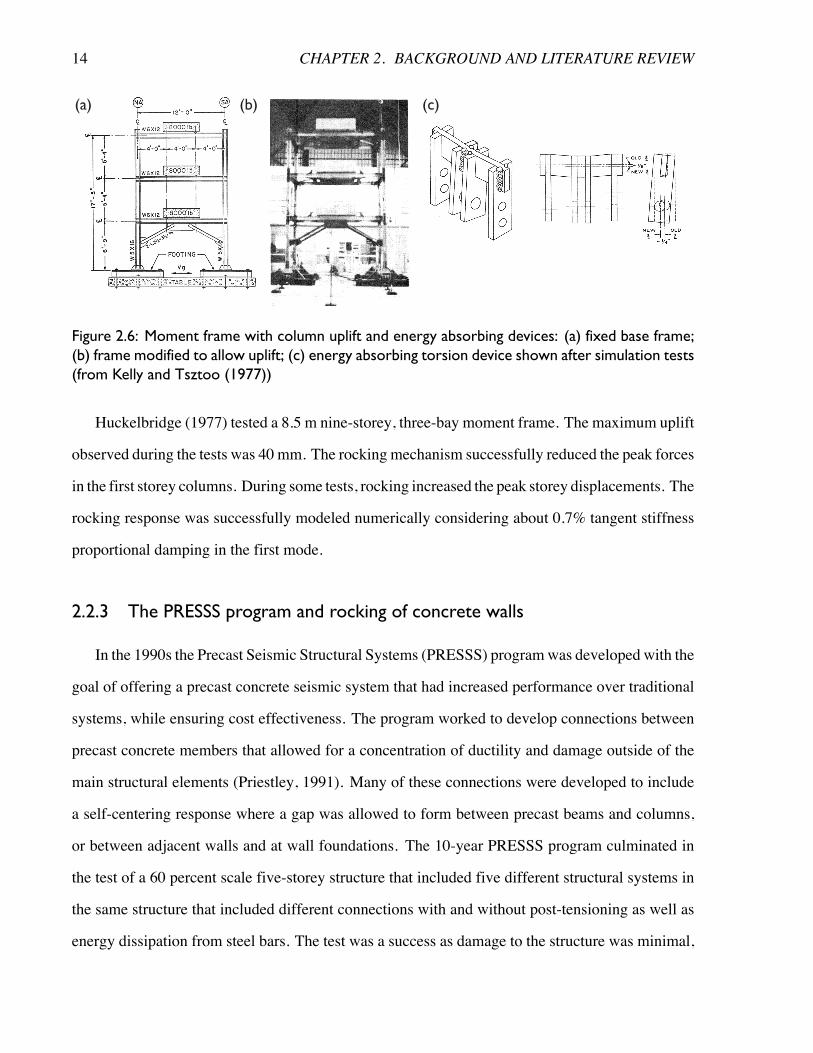
(a) (c)(b)
Figure 2.6: Moment frame with column uplift and energy absorbing devices: (a) fixed base frame;(b) frame modified to allow uplift; (c) energy absorbing torsion device shown after simulation tests(from Kelly and Tsztoo (1977))
Huckelbridge (1977) tested a 8.5 m nine-storey, three-bay moment frame. The maximum uplift
observed during the tests was 40 mm. The rocking mechanism successfully reduced the peak forces
in the first storey columns. During some tests, rocking increased the peak storey displacements. The
rocking response was successfully modeled numerically considering about 0.7% tangent stiffness
proportional damping in the first mode.
2.2.3 The PRESSS program and rocking of concrete walls
In the 1990s the Precast Seismic Structural Systems (PRESSS) programwas developed with the
goal of offering a precast concrete seismic system that had increased performance over traditional
systems, while ensuring cost effectiveness. The program worked to develop connections between
precast concrete members that allowed for a concentration of ductility and damage outside of the
main structural elements (Priestley, 1991). Many of these connections were developed to include
a self-centering response where a gap was allowed to form between precast beams and columns,
or between adjacent walls and at wall foundations. The 10-year PRESSS program culminated in
the test of a 60 percent scale five-storey structure that included five different structural systems in
the same structure that included different connections with and without post-tensioning as well as
energy dissipation from steel bars. The test was a success as damage to the structure was minimal,
2.2. BASE ROCKING STRUCTURES 15
especially when compared to a conventional reinforced concrete frame subjected to similar drift
demands. Relatively small levels of residual drifts and damage were reported, and the structure
confirmed the direct-displacement design method that was used to design the structure. Higher
than expected floor forces that were recorded during the tests were attributed to higher mode effects
(Priestley, 1999).
Holden et al. (2003) performed tests on a conventional code-designed concrete wall and a pre-
cast wall with vertical carbon fiber post-tensioning and yielding bars that was allowed to rock.
They observed that the code-designed wall performed well in terms of displacement capacity and
energy dissipation, although damage was extensive even at a relatively moderate level of 1% drift
with residual cracks of up to 2 mm wide being observed. At a larger drift of 2.5%, the capacity
of the unit was significantly degraded. In contrast, the post-tensioned rocking wall successfully
precluded damage at drifts exceeding 2.5%.
2.2.4 Rocking steel systems
Wada et al. (2001), studied truss structures that included yielding column splices. Specimen
tests were performed that showed that the damper devices provided excellent deformation capacity
and energy absorbing ability. The displacement, bending moment, and column force responses
were all decreased during a nonlinear analysis of a 16 storeywarehousewith these devices subjected
to one earthquake record. A full-scale test confirmed that the devices protected the truss structure
from column compressive buckling.
Midorikawa et al. (2002) numerically studied a five storey moment resisting frame that had
ductile base plates, and compared it to a similar frame that was fixed to the ground, and a rocking
frame without a ductile fuse. They analyzed the structures under the 1940 El Centro NS and 1995
Kobe NS ground motions, with a time scale shortened to 1/p3, using 0.5% initial stiffness propor-
tional rayleigh viscous damping in the first and second modes. They found that the structures with
ductile base plates reduced the storey shears from the fixed base structure and were similar to the
simple rocking structure, and that the roof displacements and axial forces were similar to the fixed
16 CHAPTER 2. BACKGROUND AND LITERATURE REVIEW
(a) (b) (c)
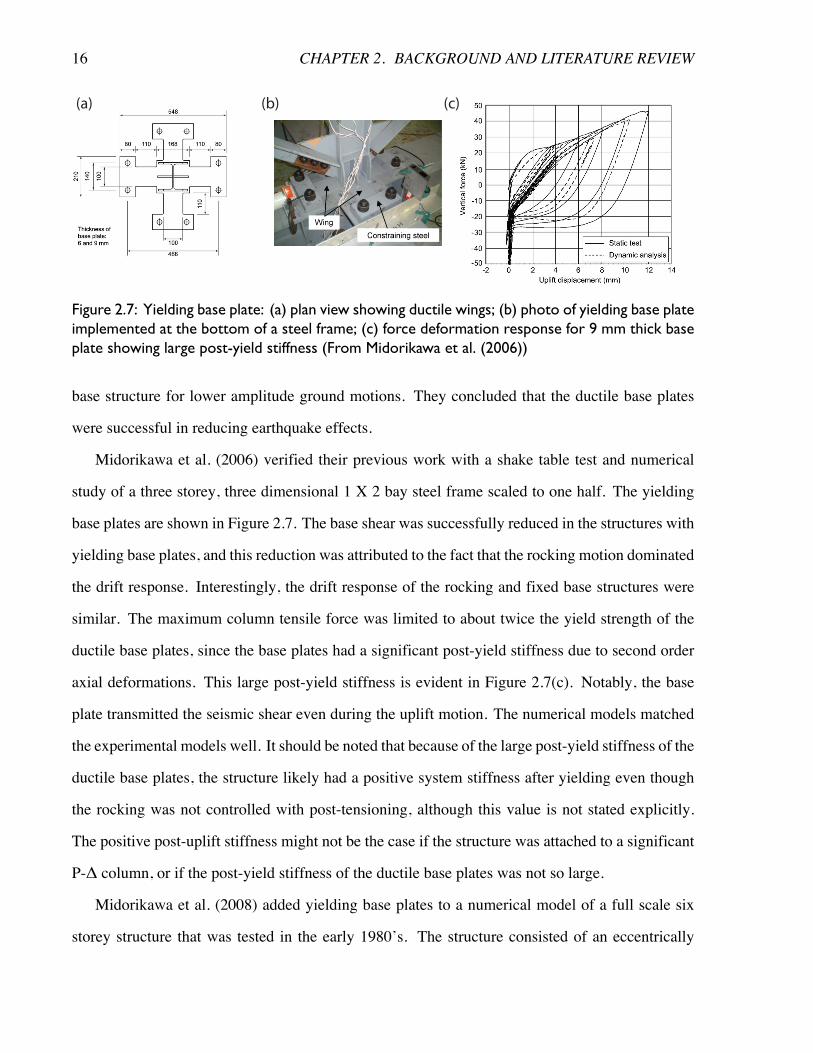
Figure 2.7: Yielding base plate: (a) plan view showing ductile wings; (b) photo of yielding base plateimplemented at the bottom of a steel frame; (c) force deformation response for 9 mm thick baseplate showing large post-yield stiffness (From Midorikawa et al. (2006))
base structure for lower amplitude ground motions. They concluded that the ductile base plates
were successful in reducing earthquake effects.
Midorikawa et al. (2006) verified their previous work with a shake table test and numerical
study of a three storey, three dimensional 1 X 2 bay steel frame scaled to one half. The yielding
base plates are shown in Figure 2.7. The base shear was successfully reduced in the structures with
yielding base plates, and this reduction was attributed to the fact that the rocking motion dominated
the drift response. Interestingly, the drift response of the rocking and fixed base structures were
similar. The maximum column tensile force was limited to about twice the yield strength of the
ductile base plates, since the base plates had a significant post-yield stiffness due to second order
axial deformations. This large post-yield stiffness is evident in Figure 2.7(c). Notably, the base
plate transmitted the seismic shear even during the uplift motion. The numerical models matched
the experimental models well. It should be noted that because of the large post-yield stiffness of the
ductile base plates, the structure likely had a positive system stiffness after yielding even though
the rocking was not controlled with post-tensioning, although this value is not stated explicitly.
The positive post-uplift stiffness might not be the case if the structure was attached to a significant
P-Δ column, or if the post-yield stiffness of the ductile base plates was not so large.
Midorikawa et al. (2008) added yielding base plates to a numerical model of a full scale six
storey structure that was tested in the early 1980’s. The structure consisted of an eccentrically
2.2. BASE ROCKING STRUCTURES 17
braced frame and moment-resisting frames, and the uplift connections were placed at the bottom of
the braced frame bay. They validated their model of the original fixed braced frame by comparing
numerical results to the test results. They showed that the base shears in the model with the ductile
base plates were significantly reduced from the fixed base model. However, the peak drifts for
both the records that were considered were much larger for the uplift models than the fixed based
configuration, and in turn the inelastic deformation in the moment-resisting frames were greater
than for the fixed-based model. This large increase in drifts was attributed to the reduced system
stiffness after uplift.
Azuhata et al. (2006) added the ductile base plates to the numerical model of a three bay, ten
storey moment resisting frame. Bracing was also added to the uplift models in two configurations:
in the middle bay in the first storey, and in the middle bay in every storey. As well, a fixed base
model was analyzed with bracing in the middle bay. As mentioned above in previous studies,
the yielding base plates had a high post-yield stiffness, modeled as twenty percent of the elastic
stiffness of the fuses, which were determined from previous static tests. The peak displacements of
the rocking structures were less than the fixed structure, although greater than the fixed structure
with braces added. The rocking motion successfully reduced damage compared to both fixed based
frames, although a small amount of damage was observed in the beam ends even in the rocking
configurations.
Tremblay et al. (2004) proposed a new braced frame configuration where BRBs were used
as the columns in the first and second stories of a one bay braced frame that had a continuous
column running down its middle. The rest of the columns were not continuous between floors, but
rather were interrupted by floor beams that extended from the columns of the next bay, through
to the central column. Under seismic response, the bracing bay deformed in global flexure, and
the BRBs deformed inelastically. This is similar to the rocking systems described above, although
there was no gap in this system. Rather than from post-tensioning, a restoring force was contributed
by the flexural deformation of the beams at each storey, as well as the strain hardening in the BRBs.
The authors proposed placing additional BRBs along the height of the structure in order to reduce
18 CHAPTER 2. BACKGROUND AND LITERATURE REVIEW
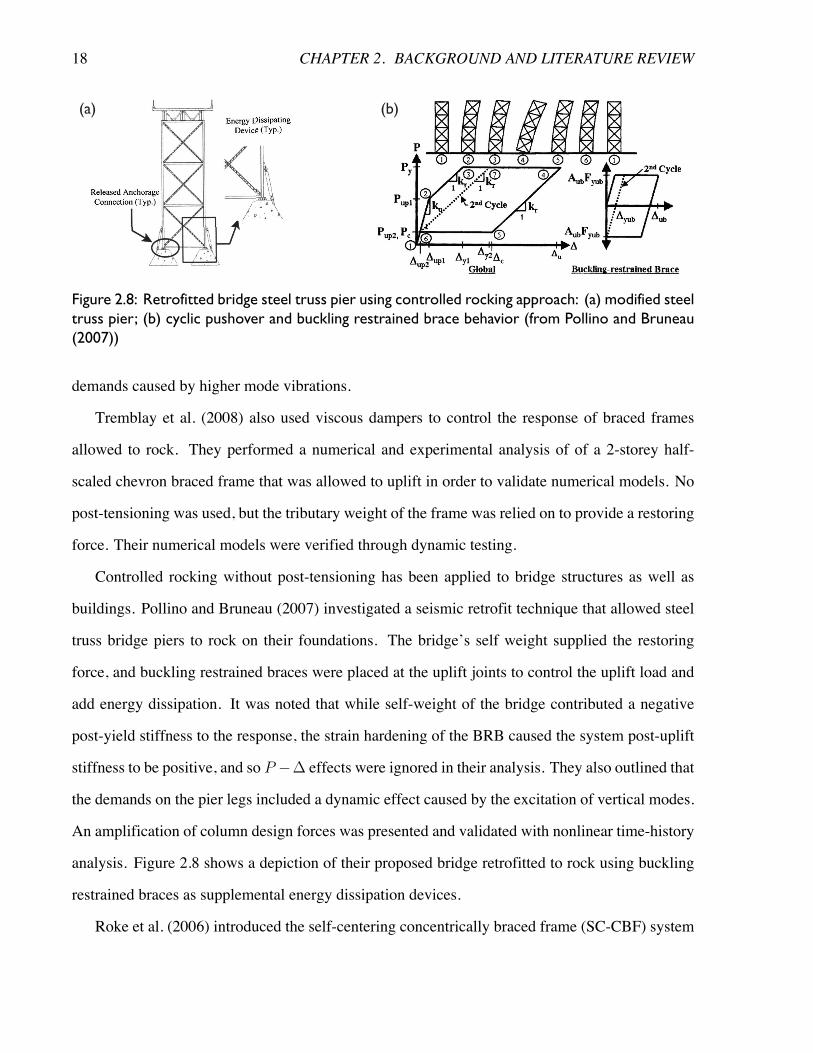
(a) (b)
Figure 2.8: Retrofitted bridge steel truss pier using controlled rocking approach: (a) modified steeltruss pier; (b) cyclic pushover and buckling restrained brace behavior (from Pollino and Bruneau(2007))
demands caused by higher mode vibrations.
Tremblay et al. (2008) also used viscous dampers to control the response of braced frames
allowed to rock. They performed a numerical and experimental analysis of of a 2-storey half-
scaled chevron braced frame that was allowed to uplift in order to validate numerical models. No
post-tensioning was used, but the tributary weight of the frame was relied on to provide a restoring
force. Their numerical models were verified through dynamic testing.
Controlled rocking without post-tensioning has been applied to bridge structures as well as
buildings. Pollino and Bruneau (2007) investigated a seismic retrofit technique that allowed steel
truss bridge piers to rock on their foundations. The bridge’s self weight supplied the restoring
force, and buckling restrained braces were placed at the uplift joints to control the uplift load and
add energy dissipation. It was noted that while self-weight of the bridge contributed a negative
post-yield stiffness to the response, the strain hardening of the BRB caused the system post-uplift
stiffness to be positive, and so P �� effects were ignored in their analysis. They also outlined that
the demands on the pier legs included a dynamic effect caused by the excitation of vertical modes.
An amplification of column design forces was presented and validated with nonlinear time-history
analysis. Figure 2.8 shows a depiction of their proposed bridge retrofitted to rock using buckling
restrained braces as supplemental energy dissipation devices.
Roke et al. (2006) introduced the self-centering concentrically braced frame (SC-CBF) system
2.2. BASE ROCKING STRUCTURES 19
concept, which consisted of beams, columns, and braces arranged in a conventional CBF config-
uration, but with columns permitted to uplift. Post-tensioning tendons and gravity forces were
intended to supply restoring forces after uplift. Four limit states were identified and included (1)
column decompression; (2) yielding of the PT steel; (3) significant yielding of beams, columns,
and braces, and; (4) failure of beams, columns, and braces. Only limit state (1) was associated with
an immediate occupancy performance level since the other limit states include permanent damage.
Pushover analyses confirmed the intended limit states for a few different configurations of PT and
energy dissipation, and nonlinear analysis confirmed that supplemental energy dissipation elements
can have an important effect on the considered response quantities including uplift displacement.
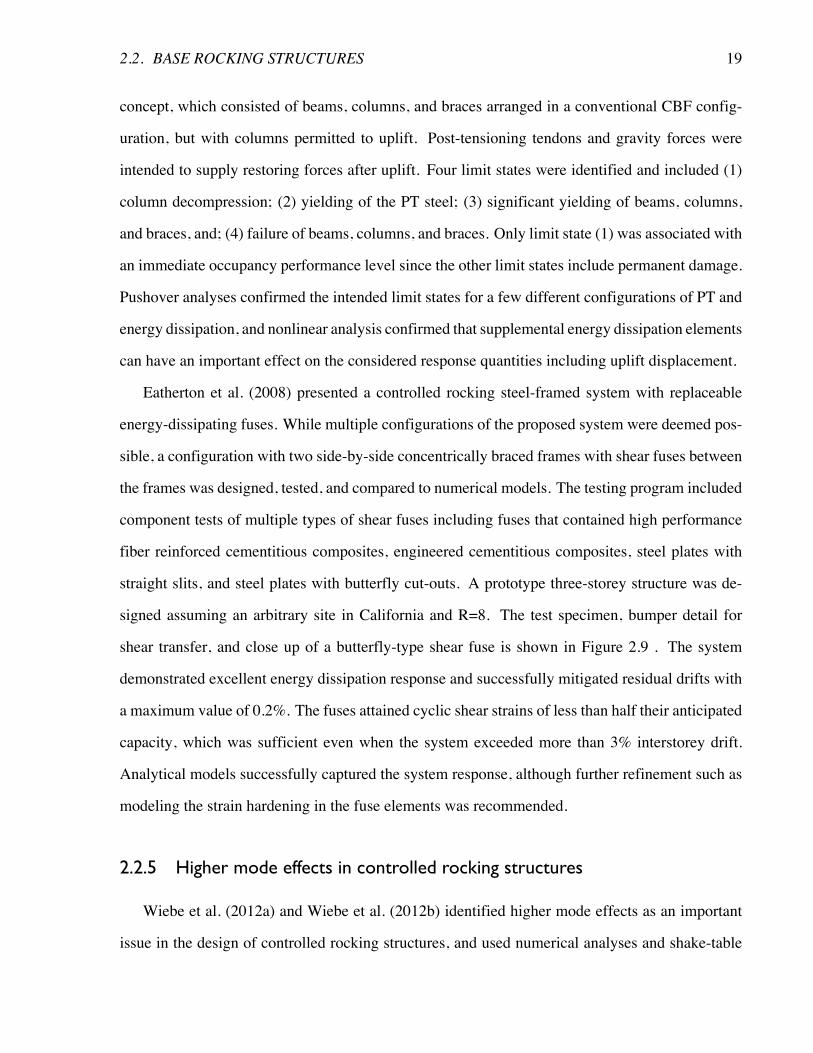
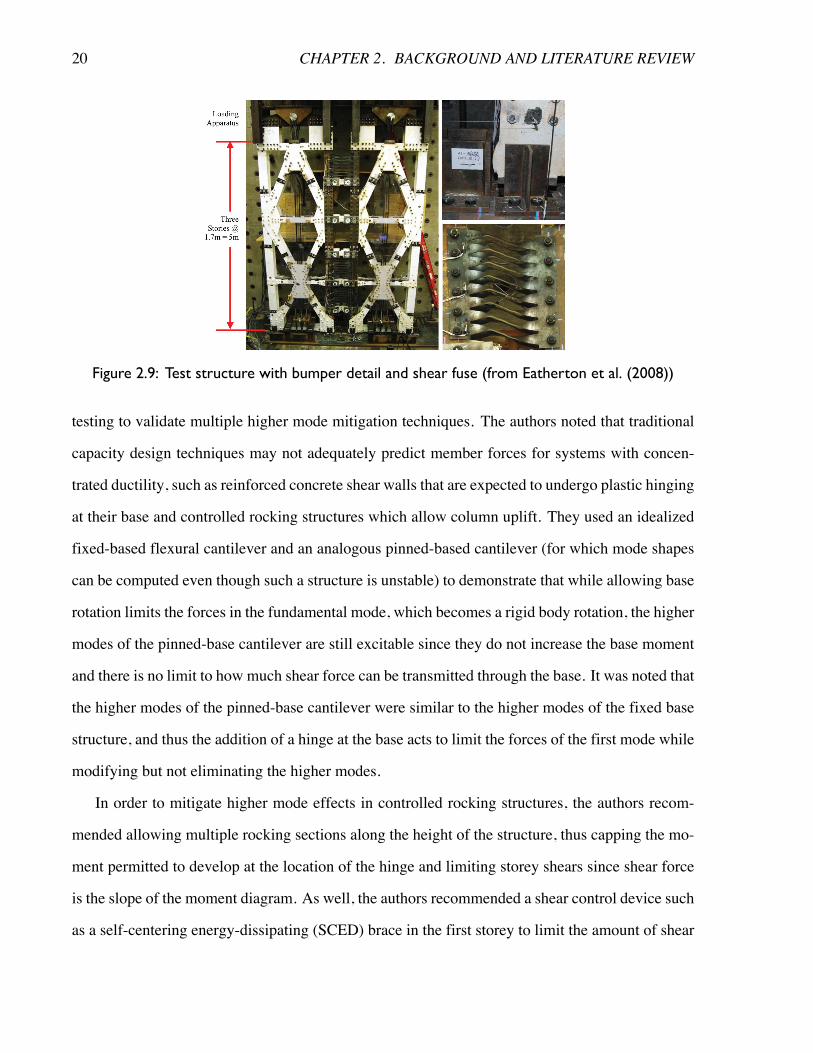
Eatherton et al. (2008) presented a controlled rocking steel-framed system with replaceable
energy-dissipating fuses. While multiple configurations of the proposed system were deemed pos-
sible, a configuration with two side-by-side concentrically braced frames with shear fuses between
the frames was designed, tested, and compared to numerical models. The testing program included
component tests of multiple types of shear fuses including fuses that contained high performance
fiber reinforced cementitious composites, engineered cementitious composites, steel plates with
straight slits, and steel plates with butterfly cut-outs. A prototype three-storey structure was de-
signed assuming an arbitrary site in California and R=8. The test specimen, bumper detail for
shear transfer, and close up of a butterfly-type shear fuse is shown in Figure 2.9 . The system
demonstrated excellent energy dissipation response and successfully mitigated residual drifts with
a maximum value of 0.2%. The fuses attained cyclic shear strains of less than half their anticipated
capacity, which was sufficient even when the system exceeded more than 3% interstorey drift.
Analytical models successfully captured the system response, although further refinement such as
modeling the strain hardening in the fuse elements was recommended.
2.2.5 Higher mode effects in controlled rocking structures
Wiebe et al. (2012a) and Wiebe et al. (2012b) identified higher mode effects as an important
issue in the design of controlled rocking structures, and used numerical analyses and shake-table
20 CHAPTER 2. BACKGROUND AND LITERATURE REVIEW
Figure 2.9: Test structure with bumper detail and shear fuse (from Eatherton et al. (2008))
testing to validate multiple higher mode mitigation techniques. The authors noted that traditional
capacity design techniques may not adequately predict member forces for systems with concen-
trated ductility, such as reinforced concrete shear walls that are expected to undergo plastic hinging
at their base and controlled rocking structures which allow column uplift. They used an idealized
fixed-based flexural cantilever and an analogous pinned-based cantilever (for which mode shapes
can be computed even though such a structure is unstable) to demonstrate that while allowing base
rotation limits the forces in the fundamental mode, which becomes a rigid body rotation, the higher
modes of the pinned-base cantilever are still excitable since they do not increase the base moment
and there is no limit to how much shear force can be transmitted through the base. It was noted that
the higher modes of the pinned-base cantilever were similar to the higher modes of the fixed base
structure, and thus the addition of a hinge at the base acts to limit the forces of the first mode while
modifying but not eliminating the higher modes.
In order to mitigate higher mode effects in controlled rocking structures, the authors recom-
mended allowing multiple rocking sections along the height of the structure, thus capping the mo-
ment permitted to develop at the location of the hinge and limiting storey shears since shear force
is the slope of the moment diagram. As well, the authors recommended a shear control device such
as a self-centering energy-dissipating (SCED) brace in the first storey to limit the amount of shear
2.2. BASE ROCKING STRUCTURES 21
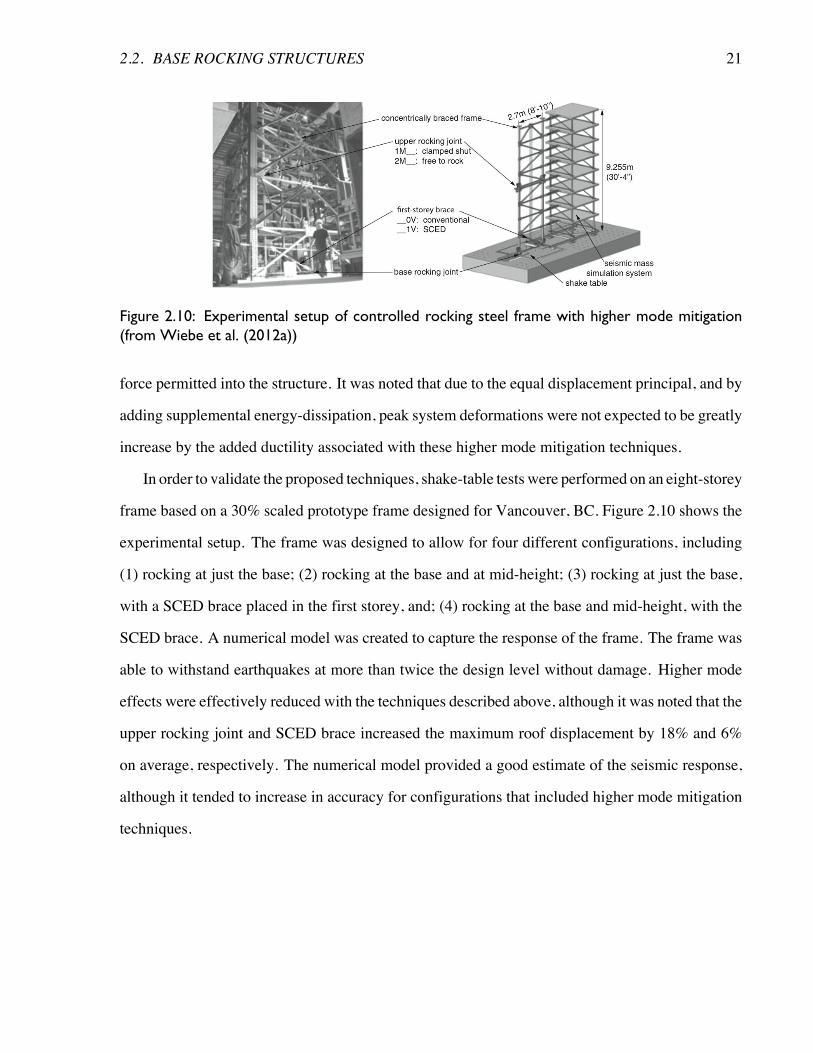
Figure 2.10: Experimental setup of controlled rocking steel frame with higher mode mitigation(from Wiebe et al. (2012a))
force permitted into the structure. It was noted that due to the equal displacement principal, and by
adding supplemental energy-dissipation, peak system deformations were not expected to be greatly
increase by the added ductility associated with these higher mode mitigation techniques.
In order to validate the proposed techniques, shake-table tests were performed on an eight-storey
frame based on a 30% scaled prototype frame designed for Vancouver, BC. Figure 2.10 shows the
experimental setup. The frame was designed to allow for four different configurations, including
(1) rocking at just the base; (2) rocking at the base and at mid-height; (3) rocking at just the base,
with a SCED brace placed in the first storey, and; (4) rocking at the base and mid-height, with the
SCED brace. A numerical model was created to capture the response of the frame. The frame was
able to withstand earthquakes at more than twice the design level without damage. Higher mode
effects were effectively reduced with the techniques described above, although it was noted that the
upper rocking joint and SCED brace increased the maximum roof displacement by 18% and 6%
on average, respectively. The numerical model provided a good estimate of the seismic response,
although it tended to increase in accuracy for configurations that included higher mode mitigation
techniques.
22 CHAPTER 2. BACKGROUND AND LITERATURE REVIEW
(a) (b) (c) (d)
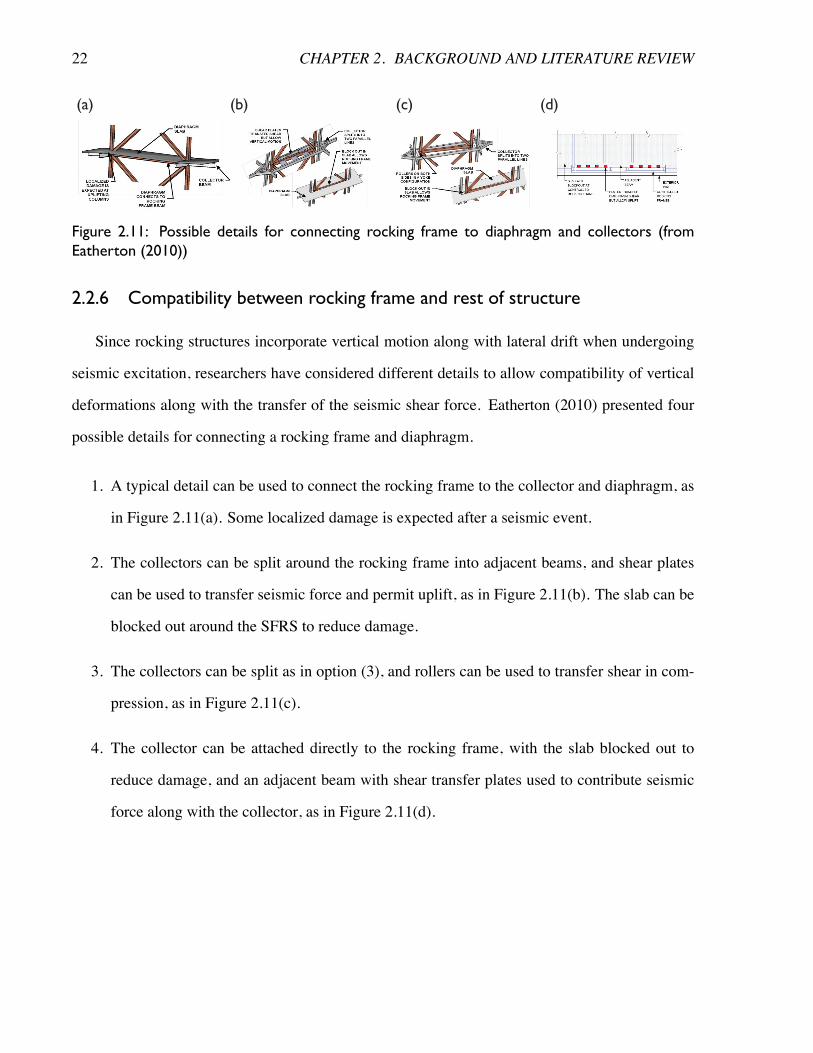
Figure 2.11: Possible details for connecting rocking frame to diaphragm and collectors (fromEatherton (2010))
2.2.6 Compatibility between rocking frame and rest of structure
Since rocking structures incorporate vertical motion along with lateral drift when undergoing
seismic excitation, researchers have considered different details to allow compatibility of vertical
deformations along with the transfer of the seismic shear force. Eatherton (2010) presented four
possible details for connecting a rocking frame and diaphragm.
1. A typical detail can be used to connect the rocking frame to the collector and diaphragm, as
in Figure 2.11(a). Some localized damage is expected after a seismic event.
2. The collectors can be split around the rocking frame into adjacent beams, and shear plates
can be used to transfer seismic force and permit uplift, as in Figure 2.11(b). The slab can be
blocked out around the SFRS to reduce damage.
3. The collectors can be split as in option (3), and rollers can be used to transfer shear in com-
pression, as in Figure 2.11(c).
4. The collector can be attached directly to the rocking frame, with the slab blocked out to
reduce damage, and an adjacent beam with shear transfer plates used to contribute seismic
force along with the collector, as in Figure 2.11(d).
2.3. COMBINING BRBS AND BASE ROCKING FOR IMPROVED PERFORMANCE 23
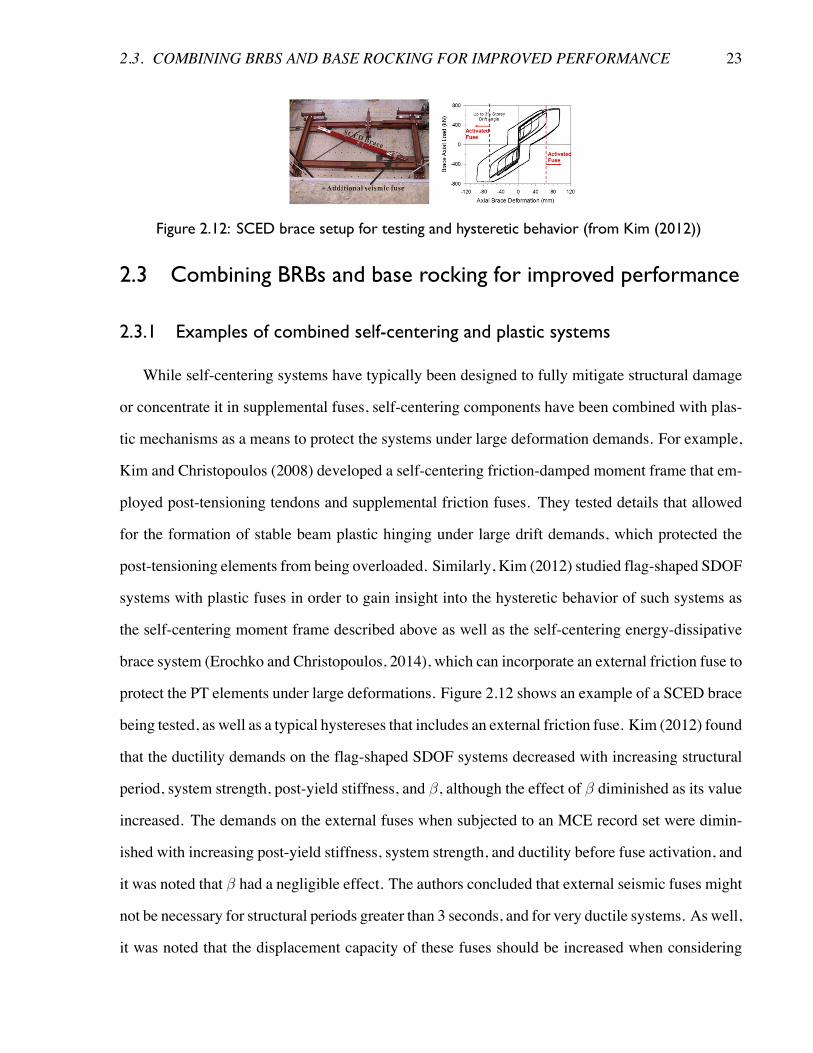
Figure 2.12: SCED brace setup for testing and hysteretic behavior (from Kim (2012))
2.3 Combining BRBs and base rocking for improved performance
2.3.1 Examples of combined self-centering and plastic systems
While self-centering systems have typically been designed to fully mitigate structural damage
or concentrate it in supplemental fuses, self-centering components have been combined with plas-
tic mechanisms as a means to protect the systems under large deformation demands. For example,
Kim and Christopoulos (2008) developed a self-centering friction-damped moment frame that em-
ployed post-tensioning tendons and supplemental friction fuses. They tested details that allowed
for the formation of stable beam plastic hinging under large drift demands, which protected the
post-tensioning elements from being overloaded. Similarly, Kim (2012) studied flag-shaped SDOF
systems with plastic fuses in order to gain insight into the hysteretic behavior of such systems as
the self-centering moment frame described above as well as the self-centering energy-dissipative
brace system (Erochko and Christopoulos, 2014), which can incorporate an external friction fuse to
protect the PT elements under large deformations. Figure 2.12 shows an example of a SCED brace
being tested, as well as a typical hystereses that includes an external friction fuse. Kim (2012) found
that the ductility demands on the flag-shaped SDOF systems decreased with increasing structural
period, system strength, post-yield stiffness, and �, although the effect of � diminished as its value
increased. The demands on the external fuses when subjected to an MCE record set were dimin-
ished with increasing post-yield stiffness, system strength, and ductility before fuse activation, and
it was noted that � had a negligible effect. The authors concluded that external seismic fuses might
not be necessary for structural periods greater than 3 seconds, and for very ductile systems. As well,
it was noted that the displacement capacity of these fuses should be increased when considering
24 CHAPTER 2. BACKGROUND AND LITERATURE REVIEW
near-fault effects.
2.3.2 Proposed combined seismic system
As described in Chapter 1 the aim of this thesis is to allow some rocking in conventional BRB
frames so as to incorporate the best of each system. This proposed systemwill feature the beneficial
characteristics of BRBFs, including significant force-reduction, acceleration control, and ease of
design. In turn, the performance drawbacks of BRBFs such as large peak and residual deformations
will be lessened by the incorporation of limited base rocking since base rocking structures have
favourable drift concentration and residual drift responses.
2.4 Chapter summary
Section 2.1 provided an overview of buckling restrained braced frames and highlighted their
important performance benefits and drawbacks. BRBFs are highly ductile and exhibit a low post-
yield stiffness, and as such are very effective at reducing system forces and capacity design forces.
Aswell, BRBFs tend to have a favourable storey acceleration response as compared to other SFRFs.
Conversely, the low post-yield stiffness of these systems can cause very large residual drifts and
drift concentrations potentially requiring expensive repairs or even demolition.
In Section 2.2 base rocking systems were briefly reviewed. The fundamental flag-shaped hys-
teretic behaviour of self-centering systems was described, and a history of important studies on
structures that were allowed to rock was presented. It was noted that higher mode effects can lead
to greatly increased system forces even if the force reduction factor associated with the rocking
joint is large. As well, slab-frame compatibility was highlighted as an important detailing issue
related to rocking structures.
Finally, Section 2.3 overviewed previous seismic systems that featured a combination of self-
centering and plastic behaviours, and briefly summarized the benefits of incorporating base-rocking
into BRBFs.
Chapter 3
Mechanics of hybrid ductile-rocking
This section presents an overview of how a conventionally ductile frame can be modified to in-
clude a self-centering response to enhance the performance of conventional highly ductile systems.
3.1 Mechanics of a rocking joint
Wiebe (2013) derived the fundamental behavior of rocking structures by assuming that the
rocking body is perfectly rigid. His equations to describe the behaviour of the rocking joint are
summarized here with the post-tensioning terms removed as they represent the basis of the proposed
system. This derivation corresponds to the rigid rocking body in Figure 3.1(a). As shown in Figure
3.1(b), these equations assume that a rigid frame has a weight,Wself , that acts vertically through the
centroid of the rocking frame, a horizontal distance of dw from the rocking toe. Energy dissipation
elements are provided at the base of the structure, a distance dEDfrom the rocking toe. The energy
dissipation elements are assumed to have a rigid-perfectly-plastic hysteresis, and a yield load of
ED. These energy dissipation elements represents an idealization of a steel yielding device or
friction fuse. This rocking body is associated with the rest of a structure that has a tributary weight
Wtrib, and thus the weight contributing to P-Δ effects not acting on the frame itself,Wtrib �Wself ,
acts on a leaning column. This derivation could be extended to other configurations of energy
dissipation and post-tensioning if desired by adjusting the equations below.
25
26 CHAPTER 3. MECHANICS OF HYBRID DUCTILE-ROCKING
(a)
dw
dED
energy dissipationelement with yield load ED
leaning column
rockingbody
Wself
Mb,rock
dMbreverse
krigid,rock
Wtrib
-Wself
Hw
(b)
Wself
ED
Mb
1
θbase
Wtrib
-Wself
(c)
Wself
ED
θbase
θbase
Wtrib
-Wself
(d) (e)
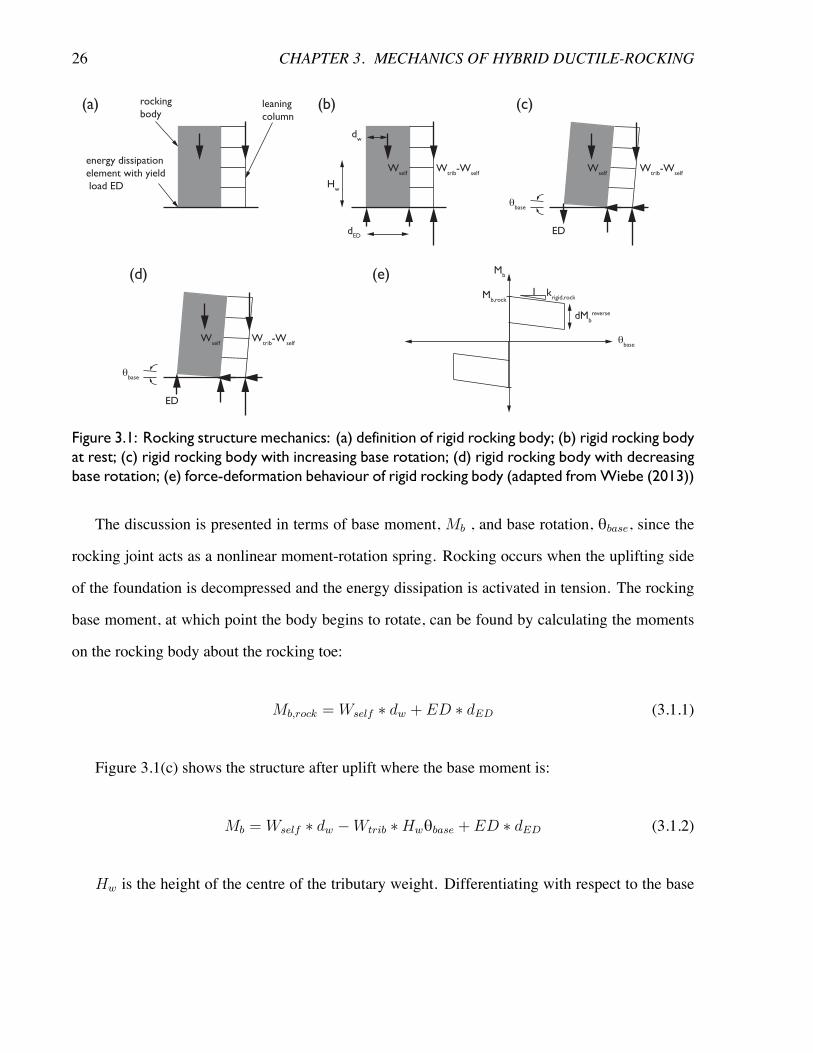
Figure 3.1: Rocking structure mechanics: (a) definition of rigid rocking body; (b) rigid rocking bodyat rest; (c) rigid rocking body with increasing base rotation; (d) rigid rocking body with decreasingbase rotation; (e) force-deformation behaviour of rigid rocking body (adapted fromWiebe (2013))
The discussion is presented in terms of base moment, Mb , and base rotation, θbase, since the
rocking joint acts as a nonlinear moment-rotation spring. Rocking occurs when the uplifting side
of the foundation is decompressed and the energy dissipation is activated in tension. The rocking
base moment, at which point the body begins to rotate, can be found by calculating the moments
on the rocking body about the rocking toe:
Mb,rock = Wself ⇤ dw + ED ⇤ dED (3.1.1)
Figure 3.1(c) shows the structure after uplift where the base moment is:
Mb = Wself ⇤ dw �Wtrib ⇤Hwθbase + ED ⇤ dED (3.1.2)
Hw is the height of the centre of the tributary weight. Differentiating with respect to the base
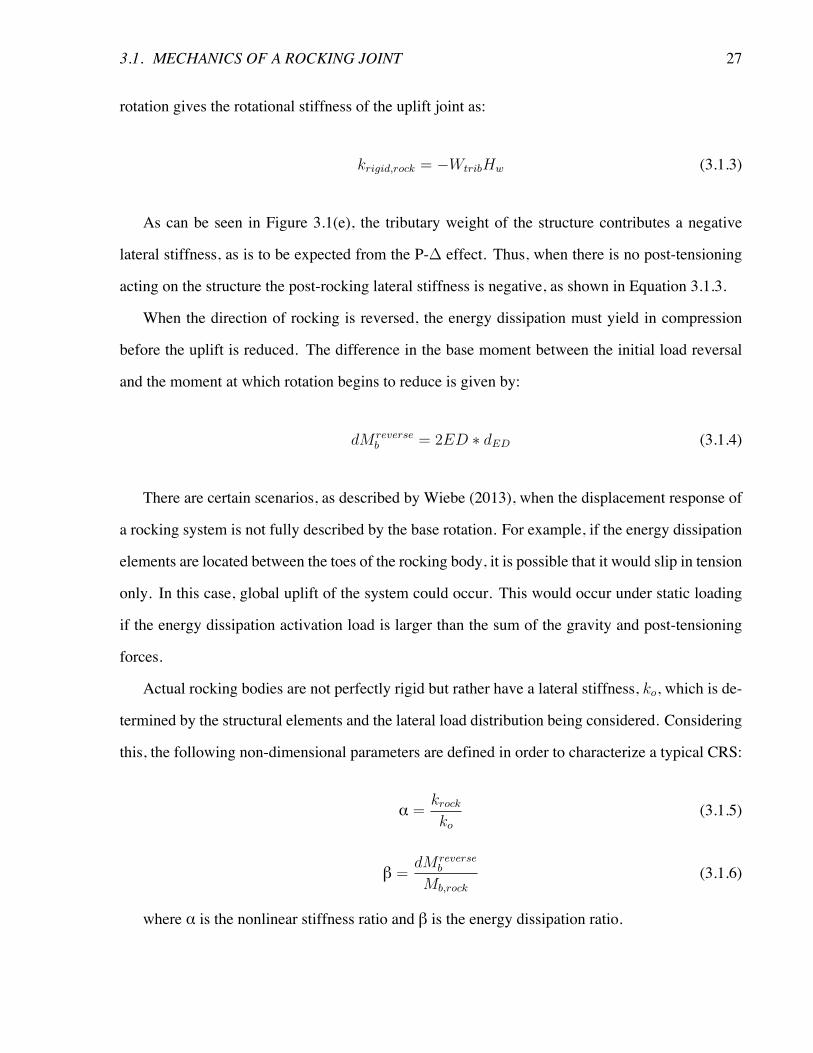
3.1. MECHANICS OF A ROCKING JOINT 27
rotation gives the rotational stiffness of the uplift joint as:
krigid,rock = �WtribHw (3.1.3)
As can be seen in Figure 3.1(e), the tributary weight of the structure contributes a negative
lateral stiffness, as is to be expected from the P-� effect. Thus, when there is no post-tensioning
acting on the structure the post-rocking lateral stiffness is negative, as shown in Equation 3.1.3.
When the direction of rocking is reversed, the energy dissipation must yield in compression
before the uplift is reduced. The difference in the base moment between the initial load reversal
and the moment at which rotation begins to reduce is given by:
dM reverseb = 2ED ⇤ dED (3.1.4)
There are certain scenarios, as described by Wiebe (2013), when the displacement response of
a rocking system is not fully described by the base rotation. For example, if the energy dissipation
elements are located between the toes of the rocking body, it is possible that it would slip in tension
only. In this case, global uplift of the system could occur. This would occur under static loading
if the energy dissipation activation load is larger than the sum of the gravity and post-tensioning
forces.
Actual rocking bodies are not perfectly rigid but rather have a lateral stiffness, ko, which is de-
termined by the structural elements and the lateral load distribution being considered. Considering
this, the following non-dimensional parameters are defined in order to characterize a typical CRS:
α =krockko
(3.1.5)
β =dM reverse
b
Mb,rock
(3.1.6)
where α is the nonlinear stiffness ratio and β is the energy dissipation ratio.
28 CHAPTER 3. MECHANICS OF HYBRID DUCTILE-ROCKING
(a) (b)
Ψ
W
θ
θ
hn
h2
h1
up
δ1
δbrace,1
δbrace,2
δbrace,n
δ2
δn
δ1
δ2
δn
1st Storey
2nd Storey
Nth Storey
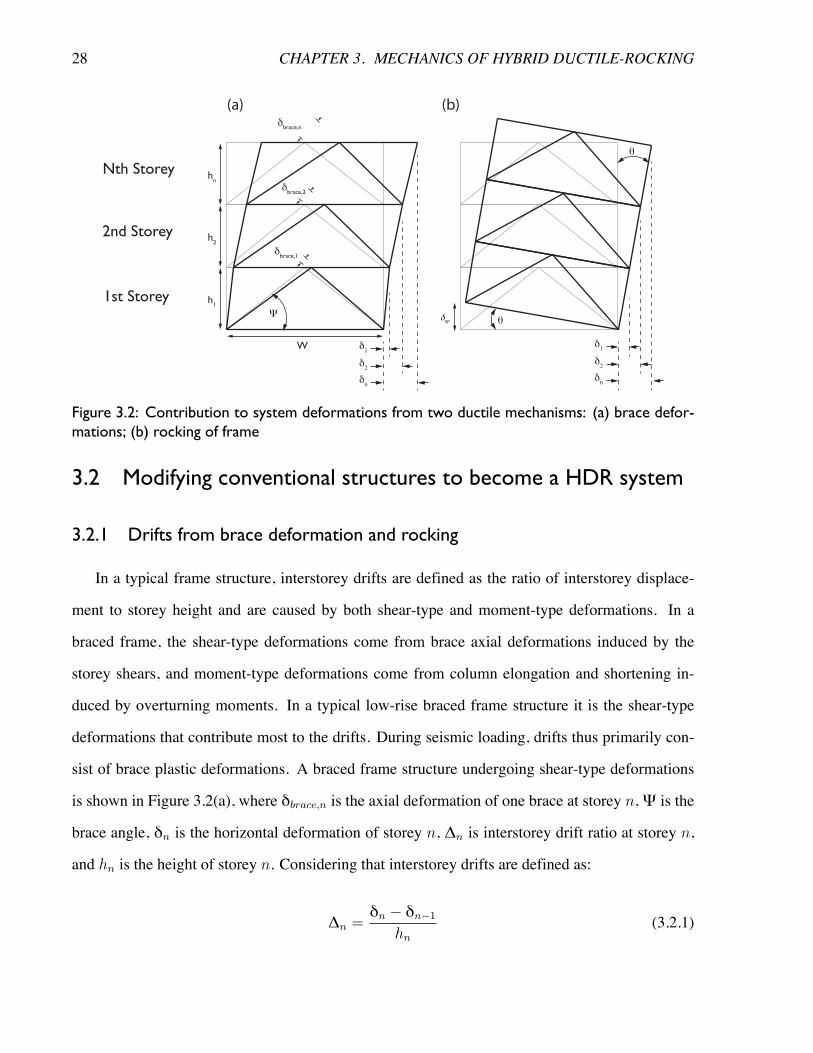
Figure 3.2: Contribution to system deformations from two ductile mechanisms: (a) brace defor-mations; (b) rocking of frame
3.2 Modifying conventional structures to become a HDR system
3.2.1 Drifts from brace deformation and rocking
In a typical frame structure, interstorey drifts are defined as the ratio of interstorey displace-
ment to storey height and are caused by both shear-type and moment-type deformations. In a
braced frame, the shear-type deformations come from brace axial deformations induced by the
storey shears, and moment-type deformations come from column elongation and shortening in-
duced by overturning moments. In a typical low-rise braced frame structure it is the shear-type
deformations that contribute most to the drifts. During seismic loading, drifts thus primarily con-
sist of brace plastic deformations. A braced frame structure undergoing shear-type deformations
is shown in Figure 3.2(a), where δbrace,n is the axial deformation of one brace at storey n, Ψ is the
brace angle, δn is the horizontal deformation of storey n, Δn is interstorey drift ratio at storey n,
and hn is the height of storey n. Considering that interstorey drifts are defined as:
Δn =δn � δn�1
hn
(3.2.1)
3.2. MODIFYING CONVENTIONAL STRUCTURES TO BECOME A HDR SYSTEM 29
and interstorey displacement can be determined from brace geometry as:
δn � δn�1 =δbracecos(Ψ)
(3.2.2)
interstorey drifts from braces can then be defined from brace deformation, assuming there is only
minimal contribution from column shortening:
Δn,brace =δbrace
cos(Ψ)hn
(3.2.3)
If a braced frame is allowed to rock, and neglecting elastic frame deformations, then the drift is
the same value as the rotation angle, as seen in 3.2(b). This can be derived by considering that the
interstorey displacement can be defined as:
δn � δn�1 = θhn (3.2.4)
and thus, using Equation 3.2.1, drift from rocking can be defined as:
Δn,rocking = θ (3.2.5)
Column uplift can be defined as:
δup = θW (3.2.6)
For example, for a 10 m wide braced frame bay, a rotation of 1% (corresponding to 10 cm of
vertical uplift) causes a 1% interstorey drift. This derivation assumes the frame deformation is a
pure rigid-body rotation and neglects the frame elastic deformations.
In an HDR structure, some brace yielding is expected along with rocking. The drift minus base
rotation, �DMR, can be calculated in order to quantify the contribution to drifts from the braces,
which is directly related to the damage in the frame. This value can be computed as:
30 CHAPTER 3. MECHANICS OF HYBRID DUCTILE-ROCKING
�DMR = �n � ✓ (3.2.7)
This value can be approximated using Equation 3.2.3.
It should be noted that one primary difference between these two sources of system deforma-
tions is that, assuming a rigid-body response, the drifts from rocking are constant along the height
of the structure. This is in contrast to the drifts from brace deformations, which for a given storey
are calculated solely based on the brace deformations at that storey.
3.2.2 Overview and mechanics
The two types of drifts described in Section 3.2.1 can be combined by incorporating a lockup
device to create the HDR system. The mechanics of an HDR structure are explained in Figure
3.3 and Figure 3.4. These figures present a one-storey flexible structure as a simplified example.
The structure consists of one set of chevron braces with a presumed idealized elastoplastic bilinear
hysteretic behavior with a positive post-yield stiffness. P � � effects are not considered in this
explanation, though they can have a non-trivial effect on the HDR system and are examined in
further detail in Section 3.2.3. There is gravity load acting on the columns of the structure, and it
is this load that serves as the restoring force after uplift. The columns and braces are presumed to
meet at a pin-connection that is not fastened to the ground. Rather, there is a lockup device that
allows a gap to formwhen the columns are decompressed. That gap is limited to a value determined
by the designer. As well, an energy dissipation element is located at the base of the columns in the
gap. This element is idealized as rigid-plastic for this derivation, similar to the way a friction fuse
or a stiff yielding damper with negligible strain hardening would behave.
Figure 3.3(a) shows free-body diagrams of different stages in the structure’s response during a
smaller amplitude displacement cycle. In this context, smaller amplitude displacements refers to
system displacements that do not engage the lockup device. The actual value of these displacements
is set by the design engineer. The effect of different amounts of allowable lockup on the seismic
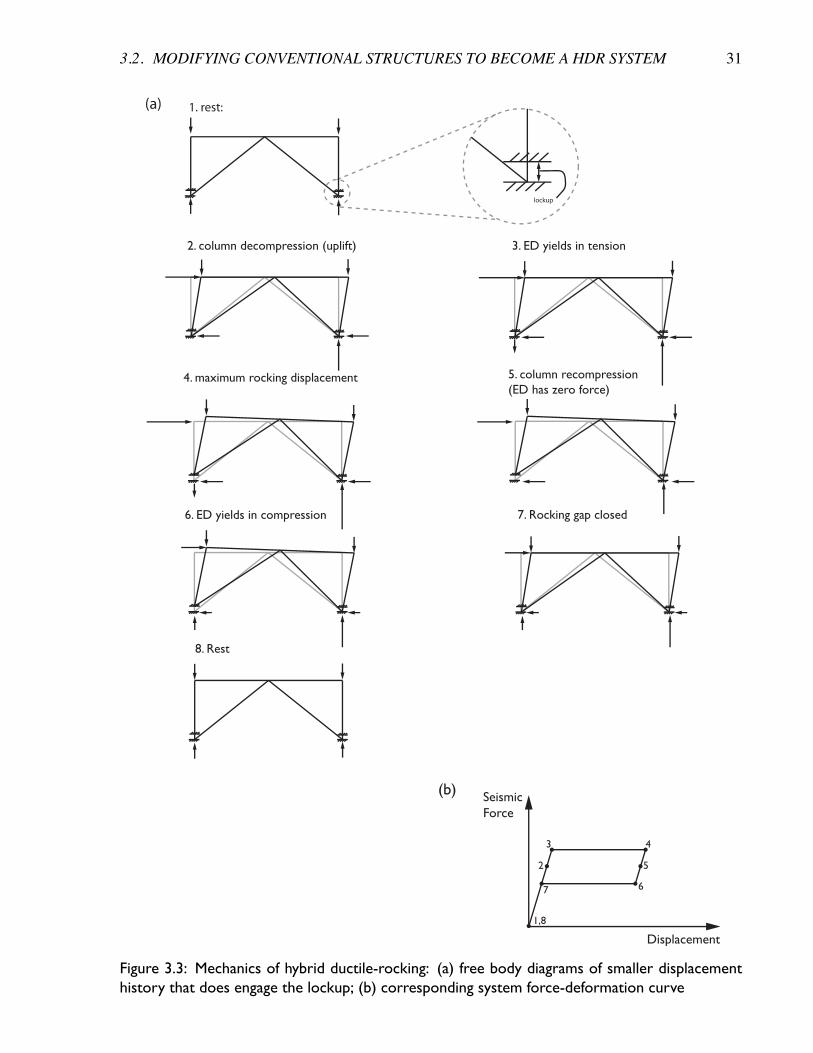
3.2. MODIFYING CONVENTIONAL STRUCTURES TO BECOME A HDR SYSTEM 31
lockup
1. rest:
2. column decompression (uplift) 3. ED yields in tension
6. ED yields in compression
5. column recompression (ED has zero force)
7. Rocking gap closed
8. Rest
4. maximum rocking displacement
SeismicForce
Displacement
(a)
1,8
2
3 4
5
67
(b)
Figure 3.3: Mechanics of hybrid ductile-rocking: (a) free body diagrams of smaller displacementhistory that does engage the lockup; (b) corresponding system force-deformation curve
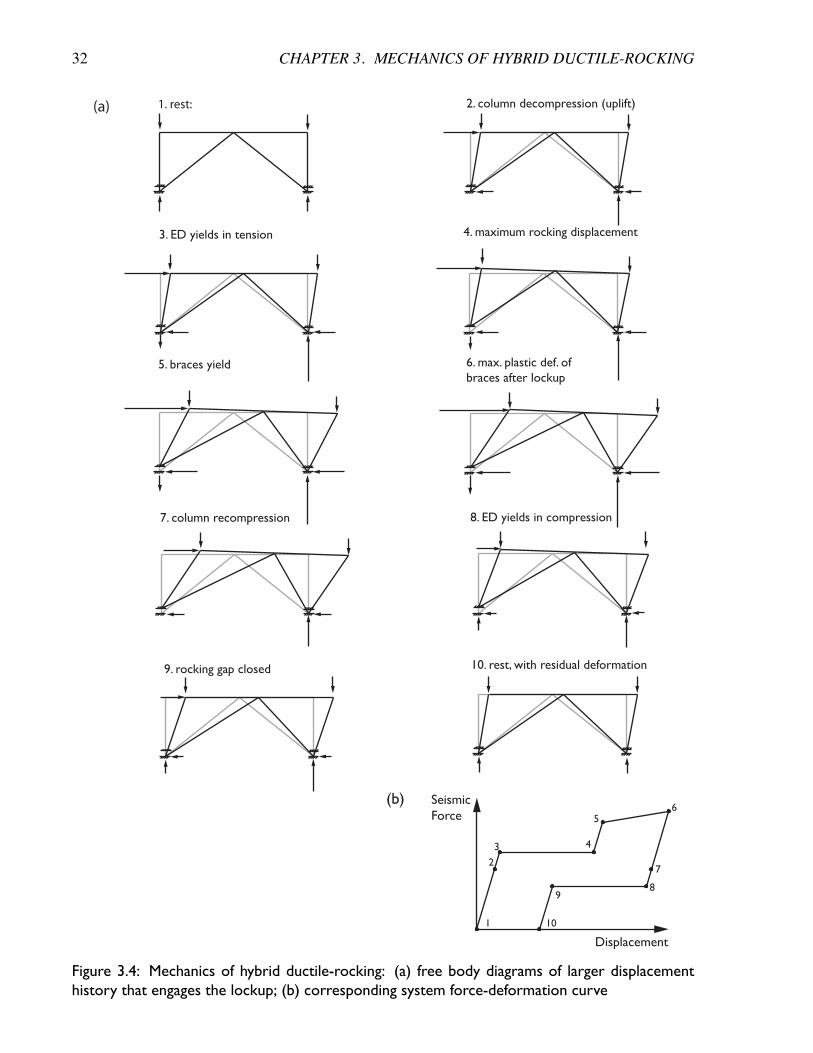
32 CHAPTER 3. MECHANICS OF HYBRID DUCTILE-ROCKING
1. rest: 2. column decompression (uplift)
3. ED yields in tension 4. maximum rocking displacement
SeismicForce
Displacement
(a)
1
2
3 4
56
7
89
10
(b)
5. braces yield 6. max. plastic def. ofbraces after lockup
7. column recompression 8. ED yields in compression
9. rocking gap closed 10. rest, with residual deformation
Figure 3.4: Mechanics of hybrid ductile-rocking: (a) free body diagrams of larger displacementhistory that engages the lockup; (b) corresponding system force-deformation curve
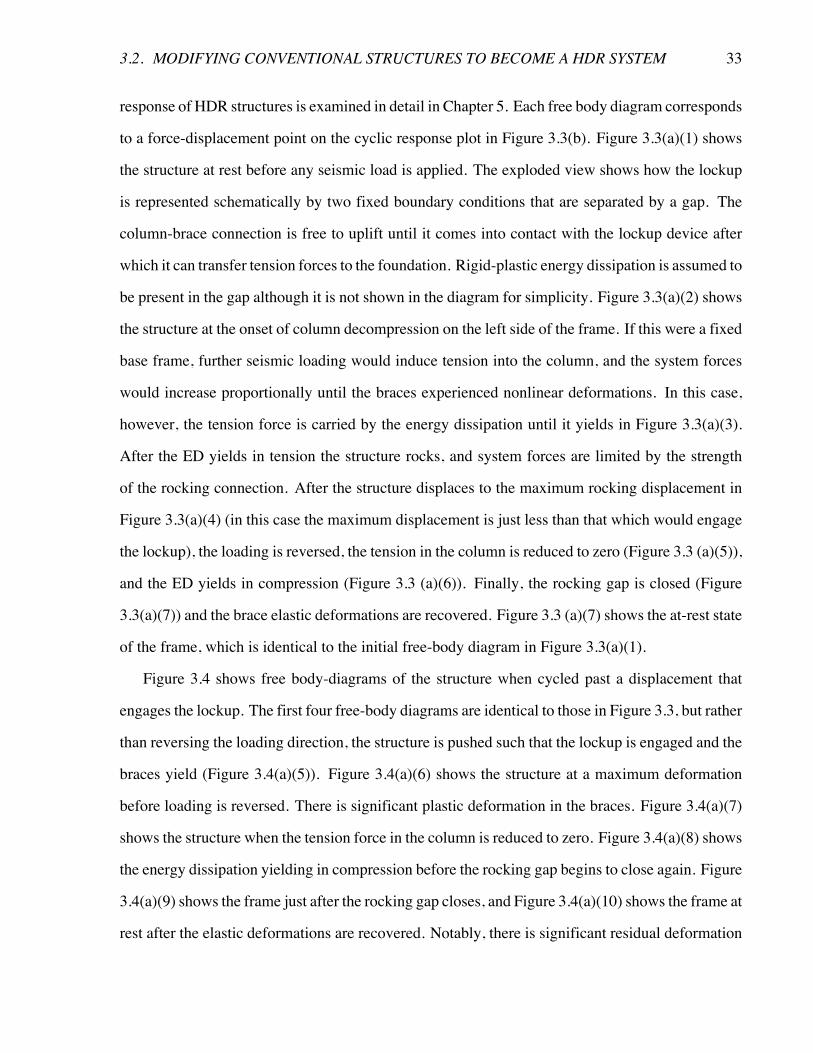
3.2. MODIFYING CONVENTIONAL STRUCTURES TO BECOME A HDR SYSTEM 33
response of HDR structures is examined in detail in Chapter 5. Each free body diagram corresponds
to a force-displacement point on the cyclic response plot in Figure 3.3(b). Figure 3.3(a)(1) shows
the structure at rest before any seismic load is applied. The exploded view shows how the lockup
is represented schematically by two fixed boundary conditions that are separated by a gap. The
column-brace connection is free to uplift until it comes into contact with the lockup device after
which it can transfer tension forces to the foundation. Rigid-plastic energy dissipation is assumed to
be present in the gap although it is not shown in the diagram for simplicity. Figure 3.3(a)(2) shows
the structure at the onset of column decompression on the left side of the frame. If this were a fixed
base frame, further seismic loading would induce tension into the column, and the system forces
would increase proportionally until the braces experienced nonlinear deformations. In this case,
however, the tension force is carried by the energy dissipation until it yields in Figure 3.3(a)(3).
After the ED yields in tension the structure rocks, and system forces are limited by the strength
of the rocking connection. After the structure displaces to the maximum rocking displacement in
Figure 3.3(a)(4) (in this case the maximum displacement is just less than that which would engage
the lockup), the loading is reversed, the tension in the column is reduced to zero (Figure 3.3 (a)(5)),
and the ED yields in compression (Figure 3.3 (a)(6)). Finally, the rocking gap is closed (Figure
3.3(a)(7)) and the brace elastic deformations are recovered. Figure 3.3 (a)(7) shows the at-rest state
of the frame, which is identical to the initial free-body diagram in Figure 3.3(a)(1).
Figure 3.4 shows free body-diagrams of the structure when cycled past a displacement that
engages the lockup. The first four free-body diagrams are identical to those in Figure 3.3, but rather
than reversing the loading direction, the structure is pushed such that the lockup is engaged and the
braces yield (Figure 3.4(a)(5)). Figure 3.4(a)(6) shows the structure at a maximum deformation
before loading is reversed. There is significant plastic deformation in the braces. Figure 3.4(a)(7)
shows the structure when the tension force in the column is reduced to zero. Figure 3.4(a)(8) shows
the energy dissipation yielding in compression before the rocking gap begins to close again. Figure
3.4(a)(9) shows the frame just after the rocking gap closes, and Figure 3.4(a)(10) shows the frame at
rest after the elastic deformations are recovered. Notably, there is significant residual deformation
34 CHAPTER 3. MECHANICS OF HYBRID DUCTILE-ROCKING
from the braces which was not present after the smaller loading excursion shown in Figure 3.3. A
schematic of the corresponding seismic load-deformation response is shown in Figure 3.4(b).
3.2.3 P �� effects in HDR systems
The P � Δ effect, or the second-order effect caused by building gravity loads, can reduce a
structure’s effective strength and post-yield stiffness. However as P � Δ effects are proportional
to lateral displacement, they typically do not have a large impact on braced frames as such struc-
tures have high elastic stiffnesses and thus typically yield at relatively small displacements (MRFs,
for example, are more flexible and are more prone to strength reductions from the P � Δ effect).
The same cannot be said for a braced frames with hybrid ductile-rocking, as while the storey shear
strength is the same as a fixed-base frame the braces are expected to yield at a larger system dis-
placement.
P �� effect and Pushover Response
Figure 3.2.3 shows how the P �Δ effect changes the pushover behavior of a conventional and
HDR frame with varying hysteretic properties. In this figure P is the gravity load acting on the
whole structure (not just the SFRS),H is the effective structural height, V is the seismic force, and
� is the system displacement.
The change in stiffness and strength caused by the P �Δ effect for a conventional elastoplastic
structure (like a braced frame) with zero post-yield is shown in 3.2.3(a). Here, the reduction in
yield strength is:
Vreduction =PδyH
(3.2.8)
where δy is the system yield displacement.
As well as strength reduction, the P � Δ effect reduces system stiffness. For the system with
zero post-yield stiffness in 3.2.3(a), the resulting post-yield stiffness is negative. If the system had
a positive post-yield stiffness, the P � Δ effect would reduce that stiffness while not necessarily
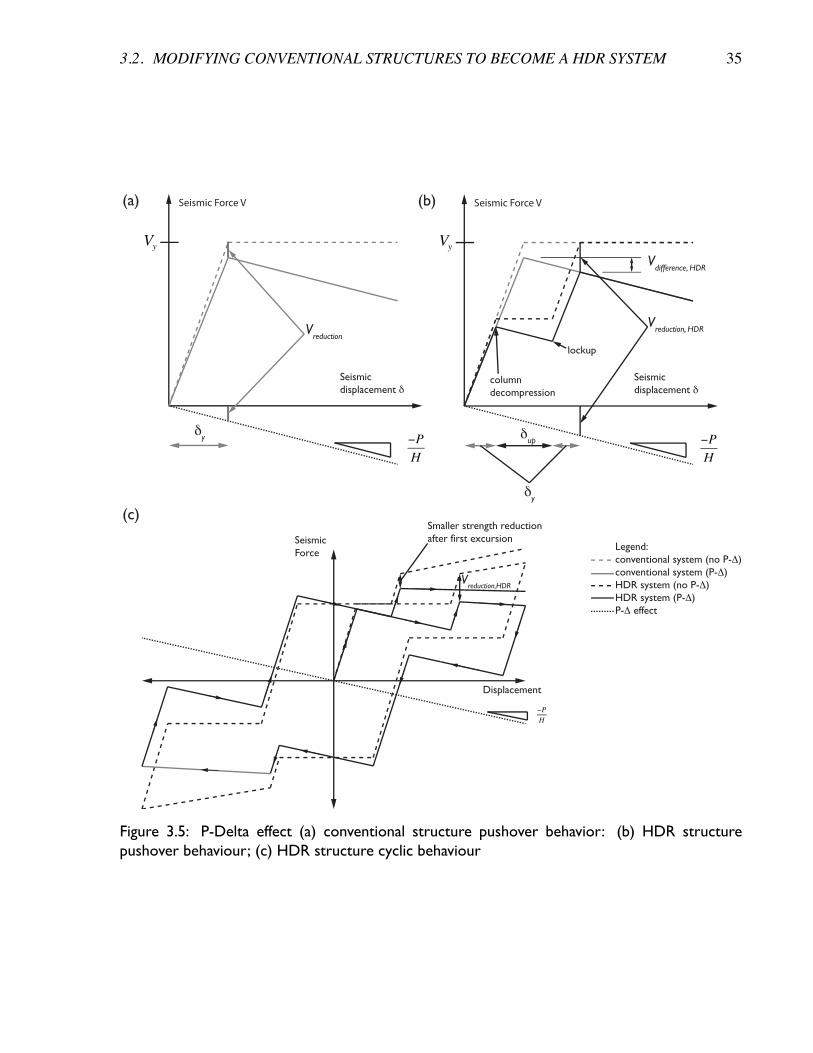
3.2. MODIFYING CONVENTIONAL STRUCTURES TO BECOME A HDR SYSTEM 35
P
H
Vy
(a)
(c)
Seismic Force V
Seismic displacement δ
Vreduction
δy
δy
δup P
H
Vy
(b) Seismic Force V
Seismic displacement δ
Vreduction, HDR
Vdifference, HDR
SeismicForce
Displacement
P
H
Vreduction,HDR
Smaller strength reductionafter first excursion
Legend:conventional system (no P-Δ)conventional system (P-Δ)HDR system (no P-Δ)HDR system (P-Δ)P-Δ effect
columndecompression
lockup
Figure 3.5: P-Delta effect (a) conventional structure pushover behavior: (b) HDR structurepushover behaviour; (c) HDR structure cyclic behaviour
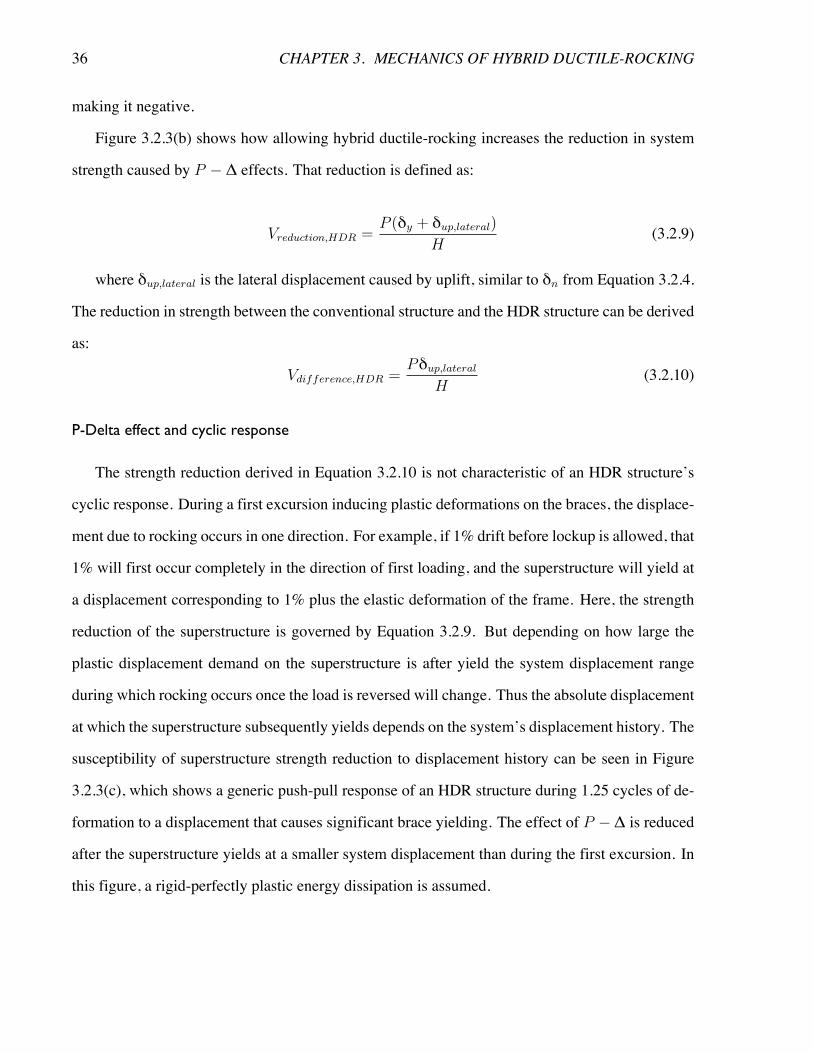
36 CHAPTER 3. MECHANICS OF HYBRID DUCTILE-ROCKING
making it negative.
Figure 3.2.3(b) shows how allowing hybrid ductile-rocking increases the reduction in system
strength caused by P � Δ effects. That reduction is defined as:
Vreduction,HDR =P (δy + δup,lateral)
H(3.2.9)
where δup,lateral is the lateral displacement caused by uplift, similar to δn from Equation 3.2.4.
The reduction in strength between the conventional structure and the HDR structure can be derived
as:
Vdifference,HDR =Pδup,lateral
H(3.2.10)
P-Delta effect and cyclic response
The strength reduction derived in Equation 3.2.10 is not characteristic of an HDR structure’s
cyclic response. During a first excursion inducing plastic deformations on the braces, the displace-
ment due to rocking occurs in one direction. For example, if 1% drift before lockup is allowed, that
1% will first occur completely in the direction of first loading, and the superstructure will yield at
a displacement corresponding to 1% plus the elastic deformation of the frame. Here, the strength
reduction of the superstructure is governed by Equation 3.2.9. But depending on how large the
plastic displacement demand on the superstructure is after yield the system displacement range
during which rocking occurs once the load is reversed will change. Thus the absolute displacement
at which the superstructure subsequently yields depends on the system’s displacement history. The
susceptibility of superstructure strength reduction to displacement history can be seen in Figure
3.2.3(c), which shows a generic push-pull response of an HDR structure during 1.25 cycles of de-
formation to a displacement that causes significant brace yielding. The effect of P �Δ is reduced
after the superstructure yields at a smaller system displacement than during the first excursion. In
this figure, a rigid-perfectly plastic energy dissipation is assumed.
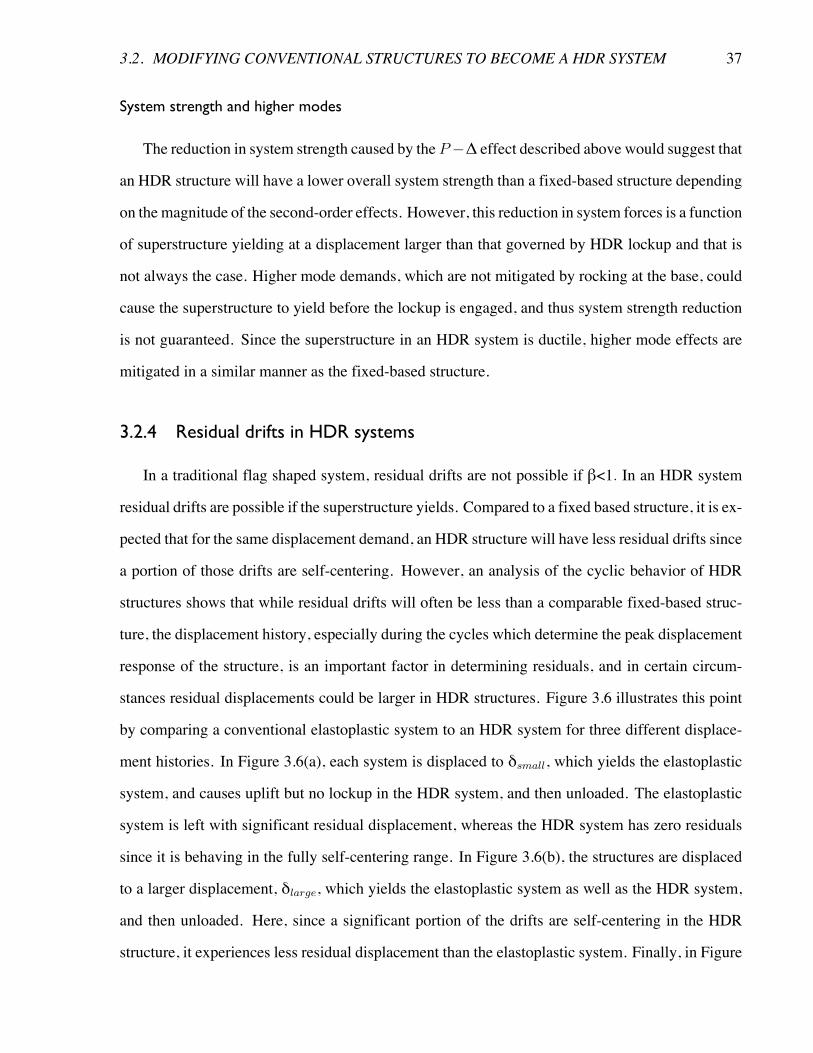
3.2. MODIFYING CONVENTIONAL STRUCTURES TO BECOME A HDR SYSTEM 37
System strength and higher modes
The reduction in system strength caused by the P�Δ effect described above would suggest that
an HDR structure will have a lower overall system strength than a fixed-based structure depending
on the magnitude of the second-order effects. However, this reduction in system forces is a function
of superstructure yielding at a displacement larger than that governed by HDR lockup and that is
not always the case. Higher mode demands, which are not mitigated by rocking at the base, could
cause the superstructure to yield before the lockup is engaged, and thus system strength reduction
is not guaranteed. Since the superstructure in an HDR system is ductile, higher mode effects are
mitigated in a similar manner as the fixed-based structure.
3.2.4 Residual drifts in HDR systems
In a traditional flag shaped system, residual drifts are not possible if β<1. In an HDR system
residual drifts are possible if the superstructure yields. Compared to a fixed based structure, it is ex-
pected that for the same displacement demand, an HDR structure will have less residual drifts since
a portion of those drifts are self-centering. However, an analysis of the cyclic behavior of HDR
structures shows that while residual drifts will often be less than a comparable fixed-based struc-
ture, the displacement history, especially during the cycles which determine the peak displacement
response of the structure, is an important factor in determining residuals, and in certain circum-
stances residual displacements could be larger in HDR structures. Figure 3.6 illustrates this point
by comparing a conventional elastoplastic system to an HDR system for three different displace-
ment histories. In Figure 3.6(a), each system is displaced to δsmall, which yields the elastoplastic
system, and causes uplift but no lockup in the HDR system, and then unloaded. The elastoplastic
system is left with significant residual displacement, whereas the HDR system has zero residuals
since it is behaving in the fully self-centering range. In Figure 3.6(b), the structures are displaced
to a larger displacement, δlarge, which yields the elastoplastic system as well as the HDR system,
and then unloaded. Here, since a significant portion of the drifts are self-centering in the HDR
structure, it experiences less residual displacement than the elastoplastic system. Finally, in Figure
38 CHAPTER 3. MECHANICS OF HYBRID DUCTILE-ROCKING
SeismicForce
Elasto-Plastic:
HDR:
(a) Displace to δsmall
, unload (b) Displace to δlarge
, unload (c) Displace to δlarge
, displace back to negative yield displacement, unload
Displacement
Displacement
SeismicForce
residualdisplacement
residualdisplacement
residualdisplacement
residualdisplacement
SeismicForce
no residualdisplacement
δsmall
δsmall
δlarge
δlarge
δlarge
δlarge
no residualdisplacement
Figure 3.6: Effect of loading history on residual drifts in conventional and HDR structures
3.6(c), the systems are displaced to δlarge, displaced back to the negative yield displacement of the
elastoplastic system, and then unloaded. In this case, the residual displacement of the elastoplastic
system is zero whereas the HDR structure has a significant residual deformation.
Thus, it is expected that HDR structures will have less residual drifts than fixed-based structures
when the lockup is not engaged. However, when the lockup is engaged, residual drifts could be
less or more, depending on the earthquake time-history. As well, it should be noted that higher
mode effects can cause residual deformations along the height of the superstructure regardless of
whether or not the lockup is engaged.
3.3 Chapter summary
This chapter overviewed themechanics of HDR structures. Equations for calculating drifts from
two ductile mechanisms – brace inelastic deformations and rocking – were presented. Combining
these mechanisms by incorporating a column lockup and energy dissipation device gives the HDR
3.3. CHAPTER SUMMARY 39
seismic system. Free-body diagrams were presented that showed the different system behavior
under smaller and larger amplitude displacements.
The P �Δ effect and its influence on the response of HDR systems was examined more closely
as well. These second order effects can reduce structural strength in an HDR systemmore than they
would in a conventional structure, although the magnitude of that strength reduction depends on
the earthquake time history after the first yielding excursion.
Finally, it was shown that loading history has a large effect on residual displacements in HDR
structures.
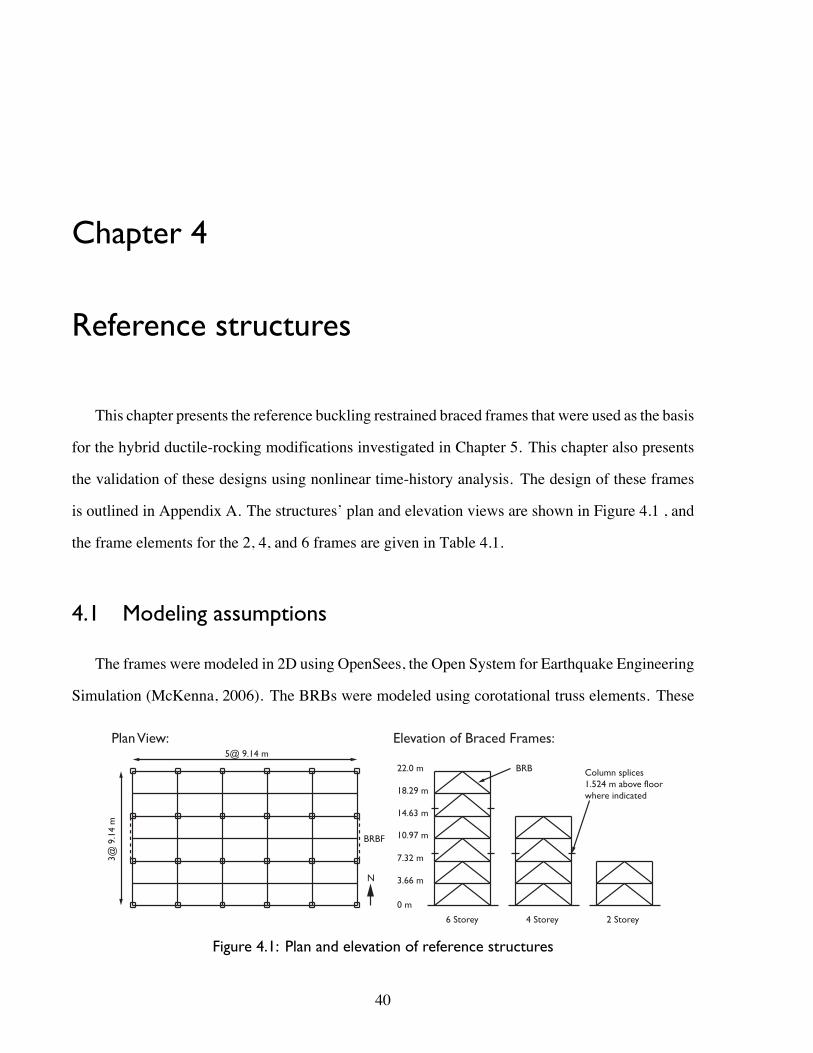
Chapter 4
Reference structures
This chapter presents the reference buckling restrained braced frames that were used as the basis
for the hybrid ductile-rocking modifications investigated in Chapter 5. This chapter also presents
the validation of these designs using nonlinear time-history analysis. The design of these frames
is outlined in Appendix A. The structures’ plan and elevation views are shown in Figure 4.1 , and
the frame elements for the 2, 4, and 6 frames are given in Table 4.1.
4.1 Modeling assumptions
The frames were modeled in 2D using OpenSees, the Open System for Earthquake Engineering
Simulation (McKenna, 2006). The BRBs were modeled using corotational truss elements. These
5@ 9.14 m
3@ 9
.14
m
BRBF
Plan View: Elevation of Braced Frames:
0 m
3.66 m
7.32 m
10.97 m
14.63 m
18.29 m
22.0 m BRB Column splices1.524 m above floorwhere indicated
6 Storey 4 Storey 2 Storey
N
Figure 4.1: Plan and elevation of reference structures
40
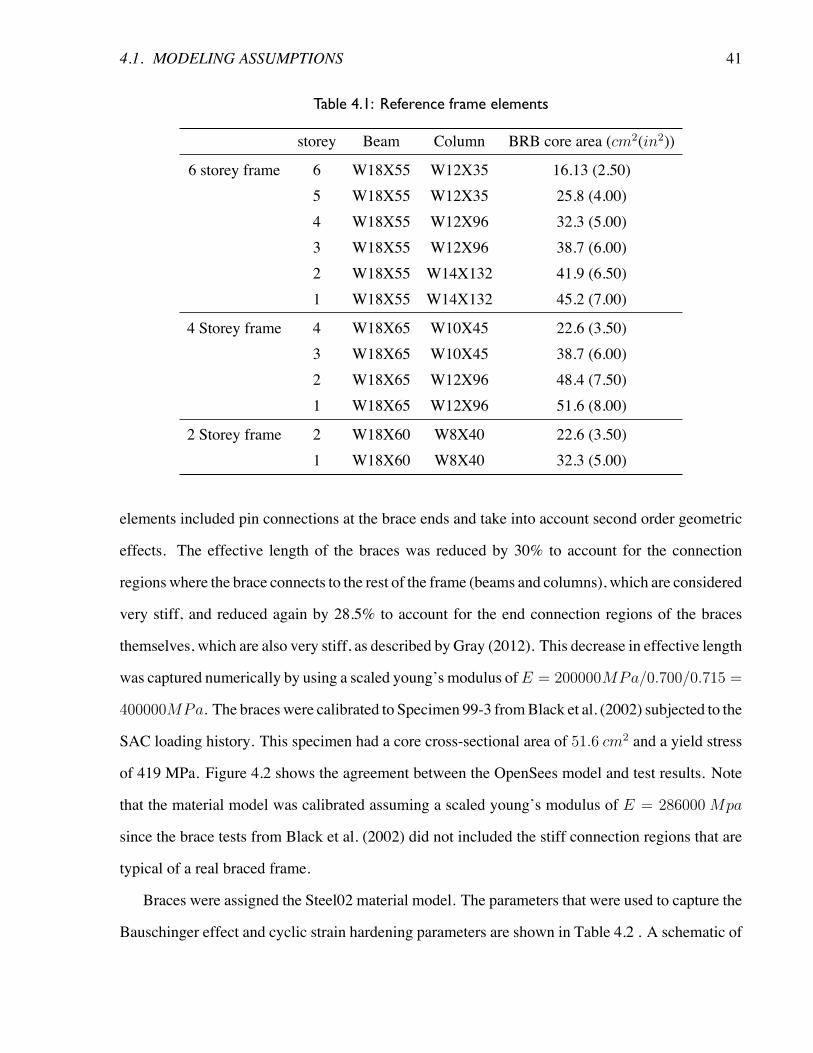
4.1. MODELING ASSUMPTIONS 41
Table 4.1: Reference frame elements
storey Beam Column BRB core area (cm2(in2))
6 storey frame 6 W18X55 W12X35 16.13 (2.50)5 W18X55 W12X35 25.8 (4.00)4 W18X55 W12X96 32.3 (5.00)3 W18X55 W12X96 38.7 (6.00)2 W18X55 W14X132 41.9 (6.50)1 W18X55 W14X132 45.2 (7.00)
4 Storey frame 4 W18X65 W10X45 22.6 (3.50)3 W18X65 W10X45 38.7 (6.00)2 W18X65 W12X96 48.4 (7.50)1 W18X65 W12X96 51.6 (8.00)
2 Storey frame 2 W18X60 W8X40 22.6 (3.50)1 W18X60 W8X40 32.3 (5.00)
elements included pin connections at the brace ends and take into account second order geometric
effects. The effective length of the braces was reduced by 30% to account for the connection
regionswhere the brace connects to the rest of the frame (beams and columns), which are considered
very stiff, and reduced again by 28.5% to account for the end connection regions of the braces
themselves, which are also very stiff, as described by Gray (2012). This decrease in effective length
was captured numerically by using a scaled young’s modulus ofE = 200000MPa/0.700/0.715 =
400000MPa. The braceswere calibrated to Specimen 99-3 fromBlack et al. (2002) subjected to the
SAC loading history. This specimen had a core cross-sectional area of 51.6 cm2 and a yield stress
of 419 MPa. Figure 4.2 shows the agreement between the OpenSees model and test results. Note
that the material model was calibrated assuming a scaled young’s modulus of E = 286000 Mpa
since the brace tests from Black et al. (2002) did not included the stiff connection regions that are
typical of a real braced frame.
Braces were assigned the Steel02 material model. The parameters that were used to capture the
Bauschinger effect and cyclic strain hardening parameters are shown in Table 4.2 . A schematic of
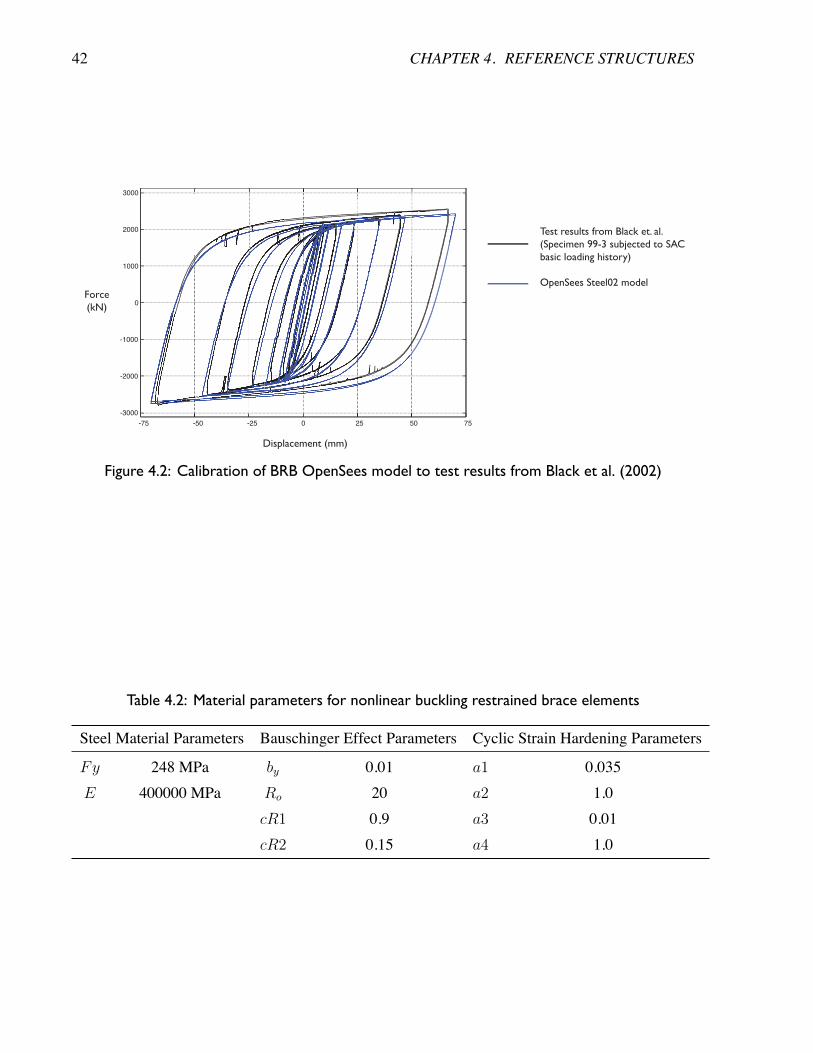
42 CHAPTER 4. REFERENCE STRUCTURES
Force(kN)
Displacement (mm)
Test results from Black et. al.(Specimen 99-3 subjected to SACbasic loading history)
OpenSees Steel02 model
-75 -50 -25 0 25 50 75
-3000
-2000
-1000
0
1000
2000
3000
Figure 4.2: Calibration of BRB OpenSees model to test results from Black et al. (2002)
Table 4.2: Material parameters for nonlinear buckling restrained brace elements
Steel Material Parameters Bauschinger Effect Parameters Cyclic Strain Hardening Parameters
Fy 248 MPa by 0.01 a1 0.035E 400000 MPa Ro 20 a2 1.0
cR1 0.9 a3 0.01cR2 0.15 a4 1.0
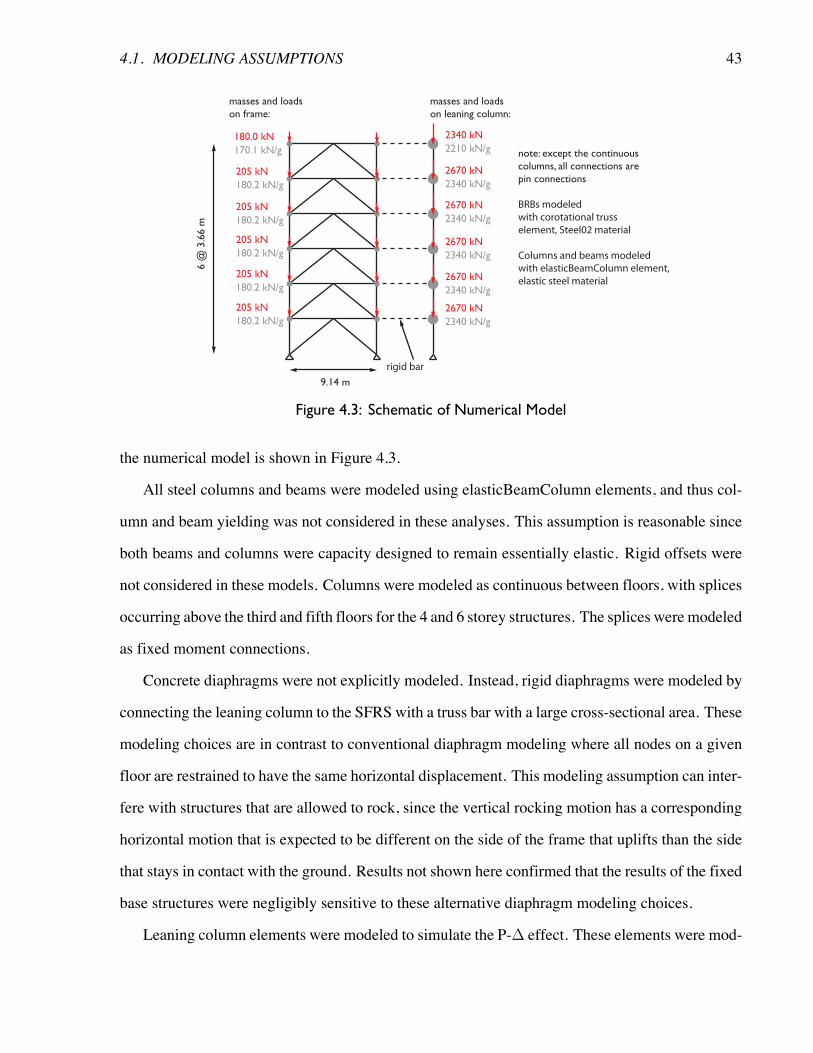
4.1. MODELING ASSUMPTIONS 43
2210 kN/g2340 kN
170.1 kN/g180.0 kN
180.2 kN/g205 kN
180.2 kN/g205 kN
180.2 kN/g205 kN
180.2 kN/g205 kN
180.2 kN/g205 kN
2340 kN/g2670 kN
2340 kN/g2670 kN
2340 kN/g2670 kN
2340 kN/g2670 kN
2340 kN/g2670 kN
9.14 m
masses and loadson frame:
masses and loadson leaning column:
note: except the continuouscolumns, all connections arepin connections
BRBs modeledwith corotational trusselement, Steel02 material
Columns and beams modeledwith elasticBeamColumn element,elastic steel material
6 @
3.6
6 m
rigid bar
Figure 4.3: Schematic of Numerical Model
the numerical model is shown in Figure 4.3.
All steel columns and beams were modeled using elasticBeamColumn elements, and thus col-
umn and beam yielding was not considered in these analyses. This assumption is reasonable since
both beams and columns were capacity designed to remain essentially elastic. Rigid offsets were
not considered in these models. Columns were modeled as continuous between floors, with splices
occurring above the third and fifth floors for the 4 and 6 storey structures. The splices were modeled
as fixed moment connections.
Concrete diaphragms were not explicitly modeled. Instead, rigid diaphragms were modeled by
connecting the leaning column to the SFRS with a truss bar with a large cross-sectional area. These
modeling choices are in contrast to conventional diaphragm modeling where all nodes on a given
floor are restrained to have the same horizontal displacement. This modeling assumption can inter-
fere with structures that are allowed to rock, since the vertical rocking motion has a corresponding
horizontal motion that is expected to be different on the side of the frame that uplifts than the side
that stays in contact with the ground. Results not shown here confirmed that the results of the fixed
base structures were negligibly sensitive to these alternative diaphragm modeling choices.
Leaning column elements were modeled to simulate the P-� effect. These elements were mod-
44 CHAPTER 4. REFERENCE STRUCTURES
eled as pinned at each floor and therefore do not contribute to the lateral resistance of the structure.
This assumption is commonly used in numerical analysis, although it is noted that some interstorey
resistance is expected from continuous gravity columns in real buildings. The leaning column was
loaded to represent the gravity loads for half of the tributary area of the structure, minus the tribu-
tary area of the columns in the BRB frames. As per ASCE 7-10 (ASCE, 2010a), the loads applied
to the leaning column correspond to 1.0D+0.25L, whereD is the dead load and L is the unreduced
live load. It is understood that the 0.25 applied to the live load considers the statistical unlikelihood
of (1) the full live load occurring throughout the full building at the same time and (2) the full live
load and earthquake load occurring at the same time, as described byMalley et al. (2010). Note that
the seismic mass assigned to each storey did not include the effect of live load, as it was assumed
that live loads do not contribute to the inertial response of the structure. This assumption would not
be valid if the structure were used as a storage facility, as described in ASCE 7-10 section 12.7.2
(ASCE, 2010a).
Masses were modeled by lumping the horizontal mass associated with the tributary area of the
building that does not act on the SFRS on the leaning column. The rest of the mass was specified as
both vertical and horizontal and placed at the beam column joints. This mass modeling assumption
is discussed in more detail in Section 5.4.
4.2 Nonlinear time-history analyses
4.2.1 Selection and scaling of ground motions
Ten records were selected and scaled to match the DBE spectrum for the reference design
using the two-step scaling procedure described in Wiebe (2013) which is based on the procedure
from FEMA (2009). First, the records were normalized by their peak ground velocities. Next, a
lognormal distribution of spectral accelerations was assumed and the median acceleration spectrum
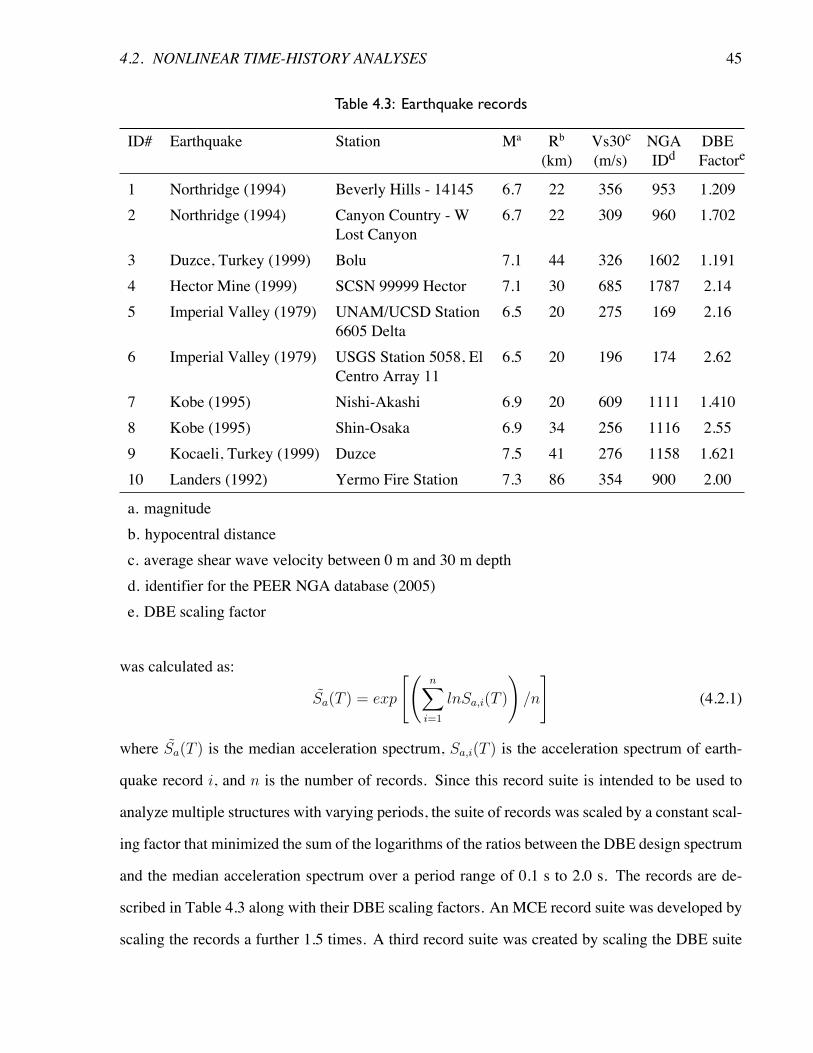
4.2. NONLINEAR TIME-HISTORY ANALYSES 45
Table 4.3: Earthquake records
ID# Earthquake Station Ma Rb
(km)Vs30c(m/s)
NGAIDd
DBEFactore
1 Northridge (1994) Beverly Hills - 14145 6.7 22 356 953 1.2092 Northridge (1994) Canyon Country - W
Lost Canyon6.7 22 309 960 1.702
3 Duzce, Turkey (1999) Bolu 7.1 44 326 1602 1.1914 Hector Mine (1999) SCSN 99999 Hector 7.1 30 685 1787 2.145 Imperial Valley (1979) UNAM/UCSD Station
6605 Delta6.5 20 275 169 2.16
6 Imperial Valley (1979) USGS Station 5058, ElCentro Array 11
6.5 20 196 174 2.62
7 Kobe (1995) Nishi-Akashi 6.9 20 609 1111 1.4108 Kobe (1995) Shin-Osaka 6.9 34 256 1116 2.559 Kocaeli, Turkey (1999) Duzce 7.5 41 276 1158 1.62110 Landers (1992) Yermo Fire Station 7.3 86 354 900 2.00
a. magnitudeb. hypocentral distancec. average shear wave velocity between 0 m and 30 m depthd. identifier for the PEER NGA database (2005)e. DBE scaling factor
was calculated as:
S̃a(T ) = exp
" nX
i=1
lnSa,i(T )
!/n
#(4.2.1)
where S̃a(T ) is the median acceleration spectrum, Sa,i(T ) is the acceleration spectrum of earth-
quake record i, and n is the number of records. Since this record suite is intended to be used to
analyze multiple structures with varying periods, the suite of records was scaled by a constant scal-
ing factor that minimized the sum of the logarithms of the ratios between the DBE design spectrum
and the median acceleration spectrum over a period range of 0.1 s to 2.0 s. The records are de-
scribed in Table 4.3 along with their DBE scaling factors. An MCE record suite was developed by
scaling the records a further 1.5 times. A third record suite was created by scaling the DBE suite
46 CHAPTER 4. REFERENCE STRUCTURES
by 50% in order to represent a lower intensity, more frequent earthquake. Figure 4.4 shows the
time history of each ground motion scaled to DBE, along with their acceleration and displacement
spectra compared to the design spectrum. Figure 4.5 shows all ten acceleration and displacement
spectra with their mean and mean plus standard deviation, along with the design spectra.
4.2.2 Dynamic modeling assumptions
Inherent damping was modeled as 3% Rayleigh tangent stiffness damping in modes 1 and 2,
as used in Choi et al. (2008). A Krylov-Newton algorithm was used, as has been recommended
by Wiebe (2013) for dynamic analysis of structures with column uplift, which are presented in
subsequent sections of this thesis. A time step of 0.001 s was used for analysis which ensured
convergence of relevant parameters while allowing for the analyses to be performed in a timely
manner.
4.2.3 Reference structure results
Peak interstorey drifts
Figure 4.6 shows the peak interstorey drift profiles for the three references structures at the three
different earthquake scaling factors. Interstorey drifts were calculated at each analysis timestep as
the difference in adjacent storey displacements divided by the storey height. It is clear from the
results that all three of the structures had drift concentrations at the lower stories, with the upper
storeys contributing less to overall system lateral deformations. For the 2 storey structure, the
median peak drift at the first storey was significantly larger than the second storey at the DBE level,
and it failed the 2.5% drift requirement stipulated in the code. Similarly, in the 4 storey structure,
the drift in the first two storeys was clearly larger than the third and fourth storey and that structure
failed the 2.5% drift requirement. Finally, the six storey structure also had drift concentrations in
the lower stories and failed the code drift limit of 2%.
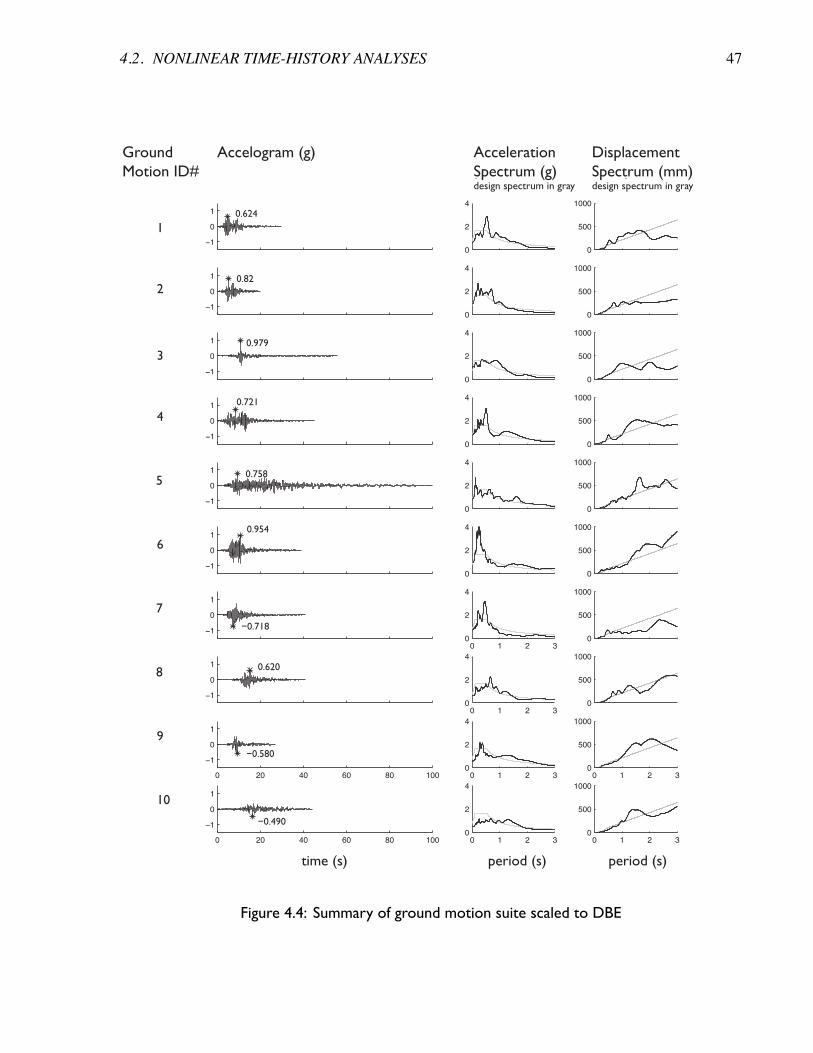
4.2. NONLINEAR TIME-HISTORY ANALYSES 47
time (s) period (s) period (s)
Ground Motion ID#
Accelogram (g) AccelerationSpectrum (g)design spectrum in gray
Displacement Spectrum (mm)design spectrum in gray
1
2
3
4
5
6
7
8
9
10
−1
0
1 0.624
0
2
4
0
500
1000
−1
0
1 0.82
0
2
4
0
500
1000
−1
0
1 0.979
0
2
4
0
500
1000
−1
0
1 0.721
0
2
4
0
500
1000
−1
0
1 0.758
0
2
4
0
500
1000
−1
0
1 0.954
0
2
4
0
500
1000
−1
0
1
−0.718
0 1 2 30
2
4
0
500
1000
−1
0
1 0.620
0 1 2 30
2
4
0
500
1000
0 20 40 60 80 100
−1
0
1
−0.580
0 1 2 30
2
4
0 1 2 30
500
1000
0 20 40 60 80 100
−1
0
1
−0.490
0 1 2 30
2
4
0 1 2 30
500
1000
Figure 4.4: Summary of ground motion suite scaled to DBE
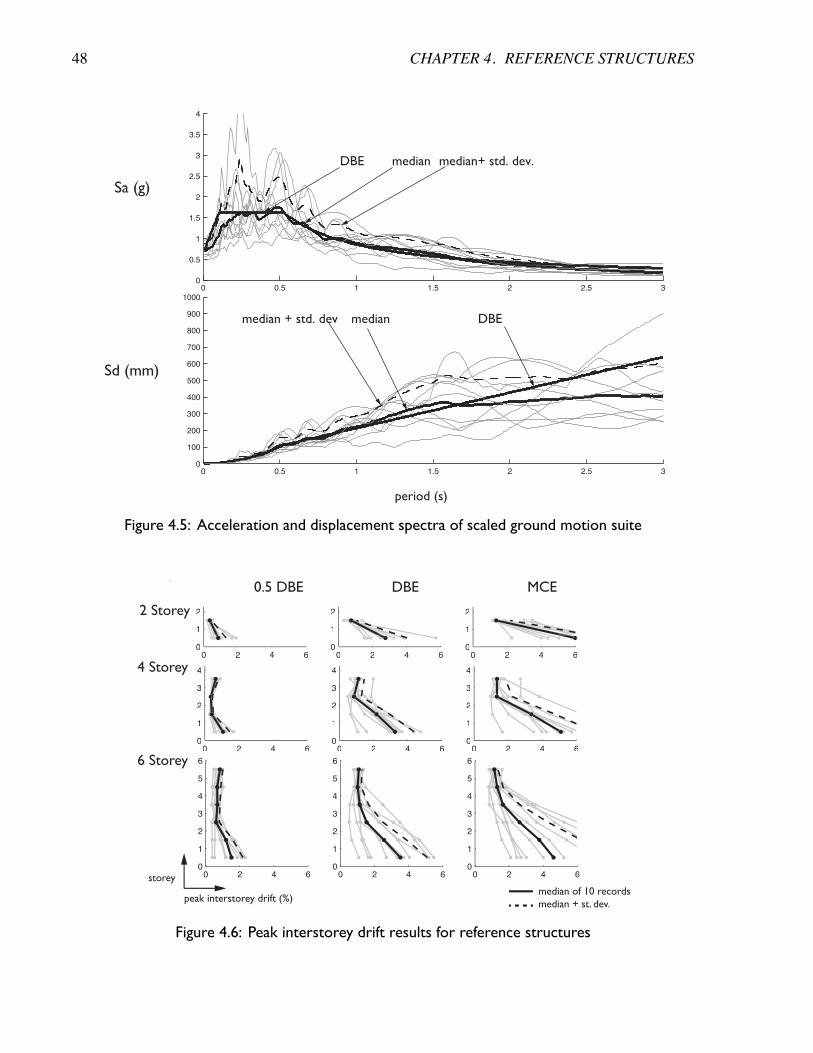
48 CHAPTER 4. REFERENCE STRUCTURES
0 0.5 1 1.5 2 2.5 30
0.5
1
1.5
2
2.5
3
3.5
4
0 0.5 1 1.5 2 2.5 30
100
200
300
400
500
600
700
800
900
1000
Sa (g)
period (s)
Sd (mm)
DBE median median+ std. dev.
DBEmedianmedian + std. dev
Figure 4.5: Acceleration and displacement spectra of scaled ground motion suite
3
4
3
4
3
4
0 2 4 60
1
2
3
4
5
6
0 2 4 60
1
2
3
4
5
6
0 2 4 60
1
2
3
4
5
6
5
6
5
6
5
6
0 2 4 60
1
2
3
4
0 2 4 60
1
2
3
4
0 2 4 60
1
2
3
4
333
444
333
444
333
444
000 2 4 66055
166
2
0000 2 4 666055
166
2
0000 2 4 666055
166
2
storeymedian of 10 recordsmedian + st. dev.
peak interstorey drift (%)
2 Storey
4 Storey
6 Storey
0.5 DBE DBE MCE
Figure 4.6: Peak interstorey drift results for reference structures
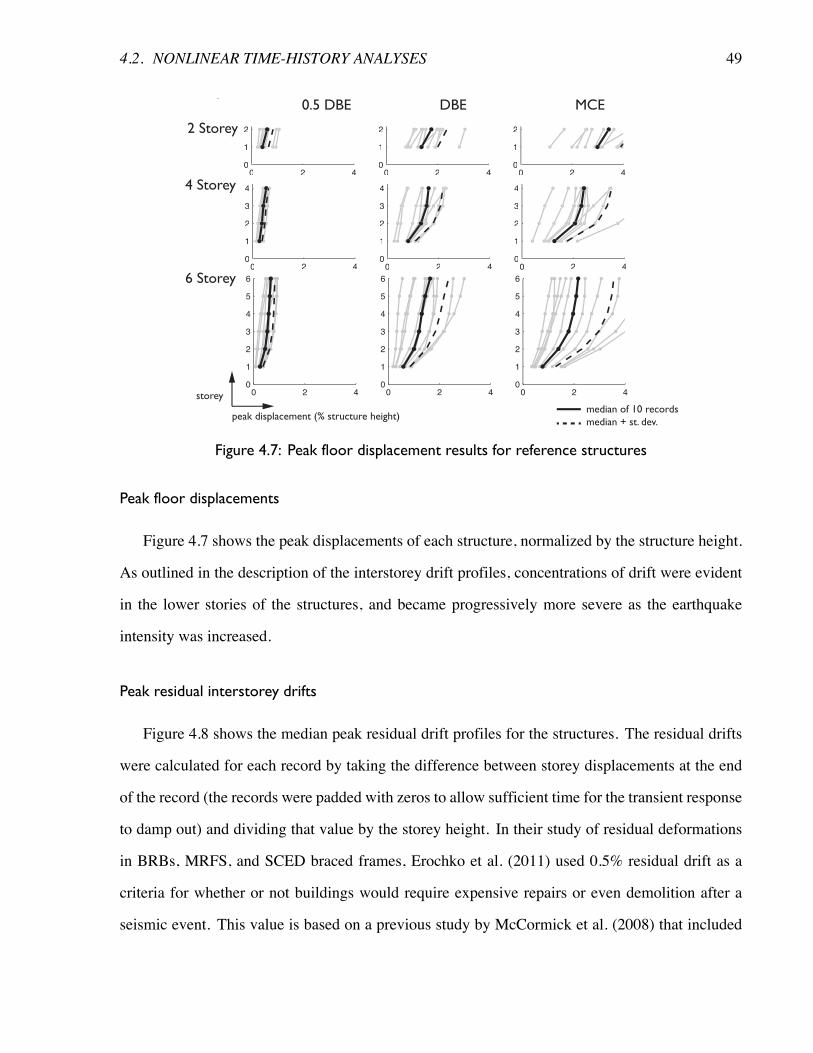
4.2. NONLINEAR TIME-HISTORY ANALYSES 49
3
4
3
4
3
4
storeymedian of 10 recordsmedian + st. dev.
0 2 40
1
2
3
4
5
6
0 2 40
1
2
3
4
5
6
0 2 40
1
2
3
4
5
6
5
6
5
6
5
6
0 2 40
1
2
3
4
0 2 40
1
2
3
4
0 2 40
1
2
3
4
333
444
333
444
333
444
000 2 44055
1
2
0000 2 444055
1
2
0000 2 444055
1
2
peak displacement (% structure height)
2 Storey
4 Storey
6 Storey
0.5 DBE DBE MCE
Figure 4.7: Peak floor displacement results for reference structures
Peak floor displacements
Figure 4.7 shows the peak displacements of each structure, normalized by the structure height.
As outlined in the description of the interstorey drift profiles, concentrations of drift were evident
in the lower stories of the structures, and became progressively more severe as the earthquake
intensity was increased.
Peak residual interstorey drifts
Figure 4.8 shows the median peak residual drift profiles for the structures. The residual drifts
were calculated for each record by taking the difference between storey displacements at the end
of the record (the records were padded with zeros to allow sufficient time for the transient response
to damp out) and dividing that value by the storey height. In their study of residual deformations
in BRBs, MRFS, and SCED braced frames, Erochko et al. (2011) used 0.5% residual drift as a
criteria for whether or not buildings would require expensive repairs or even demolition after a
seismic event. This value is based on a previous study by McCormick et al. (2008) that included
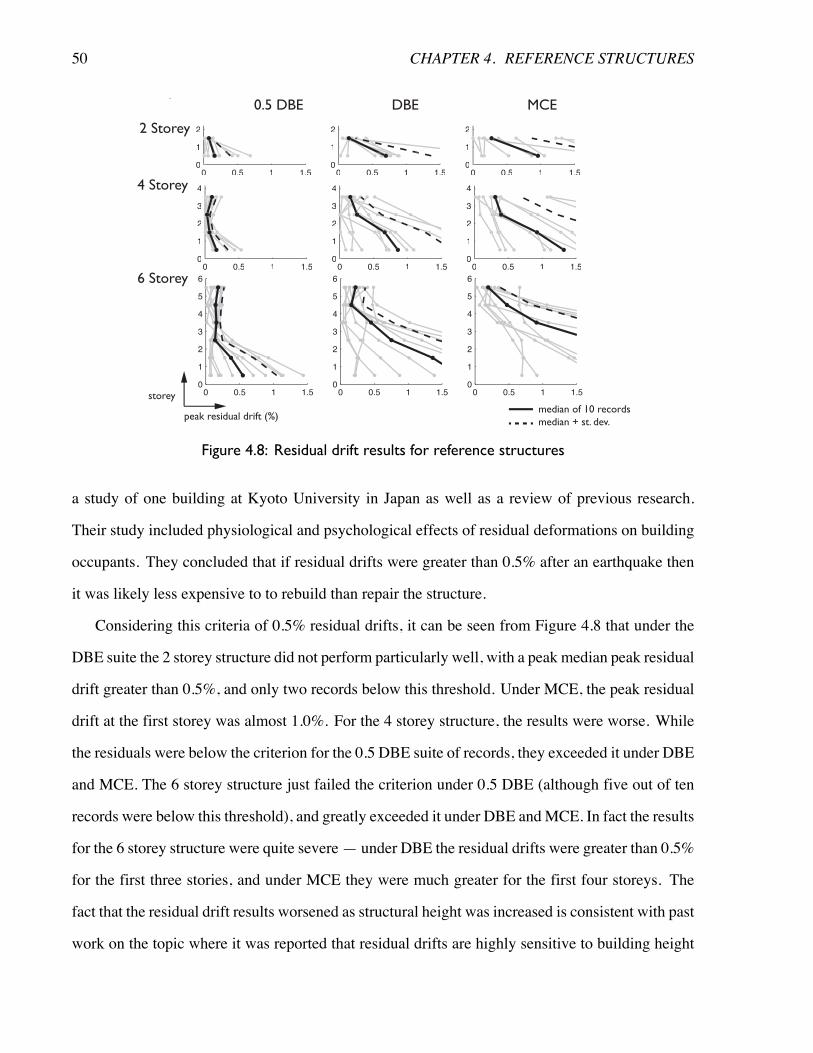
50 CHAPTER 4. REFERENCE STRUCTURES
3
4
3
4
3
4
0 0.5 1 1.50
1
2
3
4
5
6
0 0.5 1 1.50
1
2
3
4
5
6
0 0.5 1 1.50
1
2
3
4
5
6
5
6
5
6
5
6
0 0.5 1 1.50
1
2
3
4
0 0.5 1 1.50
1
2
3
4
0 0.5 1 1.50
1
2
3
44 4 4
333
444
333
444
333
444
000 0.5 1 1.51.5055
1
2
0000 0.5 1 1.51.51.5055
1
2
0000 0.5 1 1.51.51.5055
1
2
storeymedian of 10 recordsmedian + st. dev.
peak residual drift (%)
2 Storey
4 Storey
6 Storey
0.5 DBE DBE MCE
Figure 4.8: Residual drift results for reference structures
a study of one building at Kyoto University in Japan as well as a review of previous research.
Their study included physiological and psychological effects of residual deformations on building
occupants. They concluded that if residual drifts were greater than 0.5% after an earthquake then
it was likely less expensive to to rebuild than repair the structure.
Considering this criteria of 0.5% residual drifts, it can be seen from Figure 4.8 that under the
DBE suite the 2 storey structure did not perform particularly well, with a peak median peak residual
drift greater than 0.5%, and only two records below this threshold. Under MCE, the peak residual
drift at the first storey was almost 1.0%. For the 4 storey structure, the results were worse. While
the residuals were below the criterion for the 0.5 DBE suite of records, they exceeded it under DBE
and MCE. The 6 storey structure just failed the criterion under 0.5 DBE (although five out of ten
records were below this threshold), and greatly exceeded it under DBE andMCE. In fact the results
for the 6 storey structure were quite severe— under DBE the residual drifts were greater than 0.5%
for the first three stories, and under MCE they were much greater for the first four storeys. The
fact that the residual drift results worsened as structural height was increased is consistent with past
work on the topic where it was reported that residual drifts are highly sensitive to building height
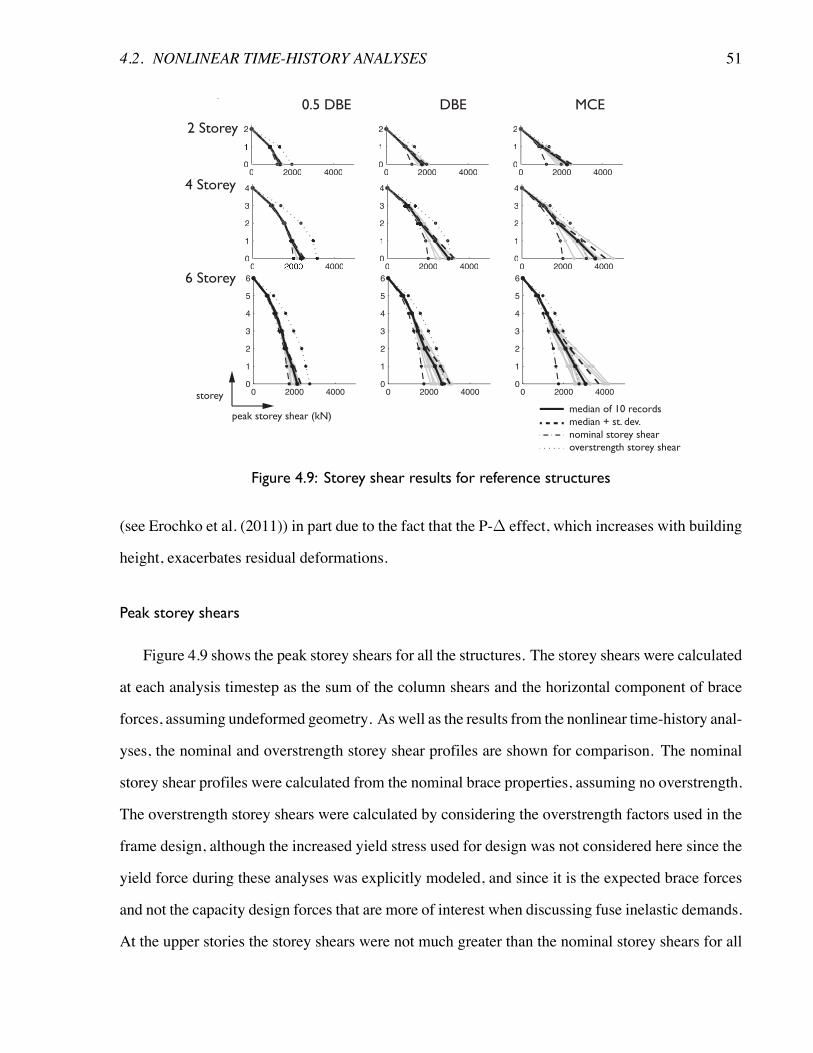
4.2. NONLINEAR TIME-HISTORY ANALYSES 51
storeymedian of 10 recordsmedian + st. dev.nominal storey shearoverstrength storey shear
0 2000 40000
1
2
3
4
5
6
0 2000 40000
1
2
3
4
5
6
0 2000 40000
1
2
3
4
5
6
5 5
6
5
6
0 40000
1
2
3
4
0 2000 40000
1
2
3
4
0 2000 40000
1
2
3
4
3
4
3
4
3
4
000 2000 40000
2
0000 2000 40000
1
2
0000 2000 40000
1
2
0
2
peak storey shear (kN)
2 Storey
4 Storey
6 Storey
0.5 DBE DBE MCE
Figure 4.9: Storey shear results for reference structures
(see Erochko et al. (2011)) in part due to the fact that the P-� effect, which increases with building
height, exacerbates residual deformations.
Peak storey shears
Figure 4.9 shows the peak storey shears for all the structures. The storey shears were calculated
at each analysis timestep as the sum of the column shears and the horizontal component of brace
forces, assuming undeformed geometry. As well as the results from the nonlinear time-history anal-
yses, the nominal and overstrength storey shear profiles are shown for comparison. The nominal
storey shear profiles were calculated from the nominal brace properties, assuming no overstrength.
The overstrength storey shears were calculated by considering the overstrength factors used in the
frame design, although the increased yield stress used for design was not considered here since the
yield force during these analyses was explicitly modeled, and since it is the expected brace forces
and not the capacity design forces that are more of interest when discussing fuse inelastic demands.
At the upper stories the storey shears were not much greater than the nominal storey shears for all
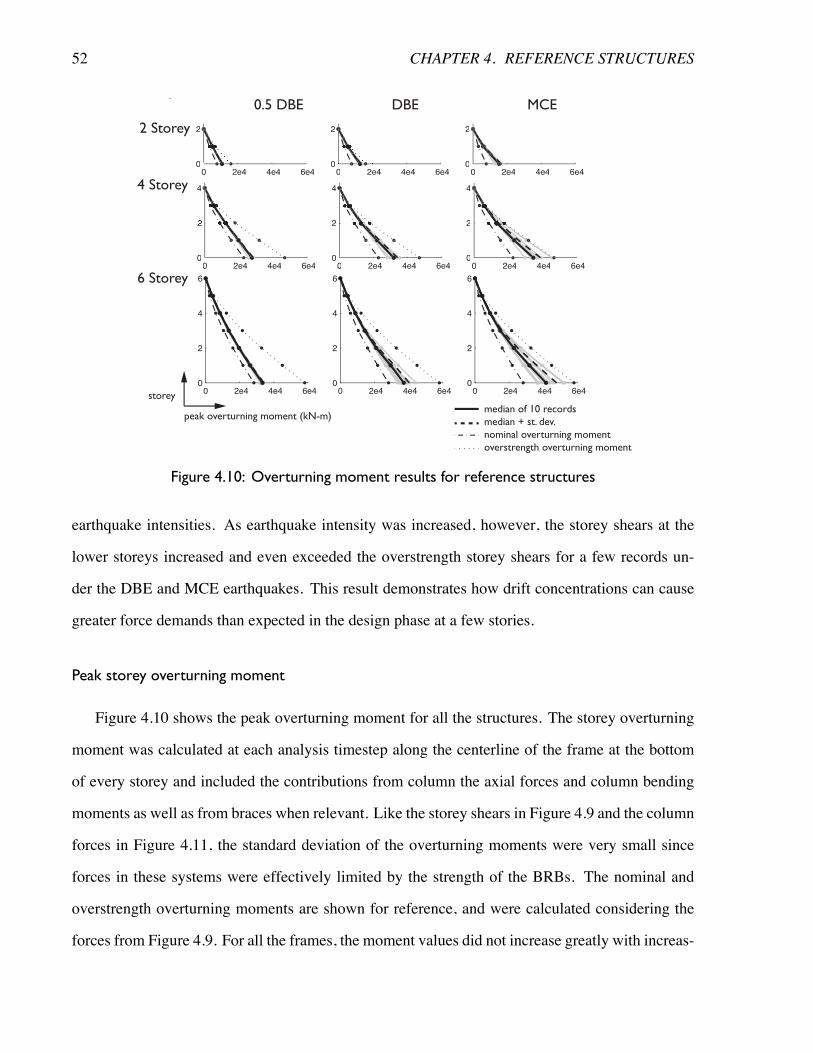
52 CHAPTER 4. REFERENCE STRUCTURES
0 2e4 4e4 6e40
2
4
6
0 2e4 4e4 6e40
2
4
6
0 2e4 4e4 6e40
2
4
6
6 6
0 2e4 4e4 6e40
4
0 2e4 4e4 6e40
2
4
0 2e4 4e4 6e40
2
4
4 4 4
00 2e4 4e4 6e46e40
2
000 2e4 4e4 6e46e46e40
2
000 2e4 4e4 6e46e46e40
2
6e4
storeymedian of 10 recordsmedian + st. dev.nominal overturning momentoverstrength overturning moment
peak overturning moment (kN-m)
2 Storey
4 Storey
6 Storey
0.5 DBE DBE MCE
Figure 4.10: Overturning moment results for reference structures
earthquake intensities. As earthquake intensity was increased, however, the storey shears at the
lower storeys increased and even exceeded the overstrength storey shears for a few records un-
der the DBE and MCE earthquakes. This result demonstrates how drift concentrations can cause
greater force demands than expected in the design phase at a few stories.
Peak storey overturning moment
Figure 4.10 shows the peak overturning moment for all the structures. The storey overturning
moment was calculated at each analysis timestep along the centerline of the frame at the bottom
of every storey and included the contributions from column the axial forces and column bending
moments as well as from braces when relevant. Like the storey shears in Figure 4.9 and the column
forces in Figure 4.11, the standard deviation of the overturning moments were very small since
forces in these systems were effectively limited by the strength of the BRBs. The nominal and
overstrength overturning moments are shown for reference, and were calculated considering the
forces from Figure 4.9. For all the frames, the moment values did not increase greatly with increas-
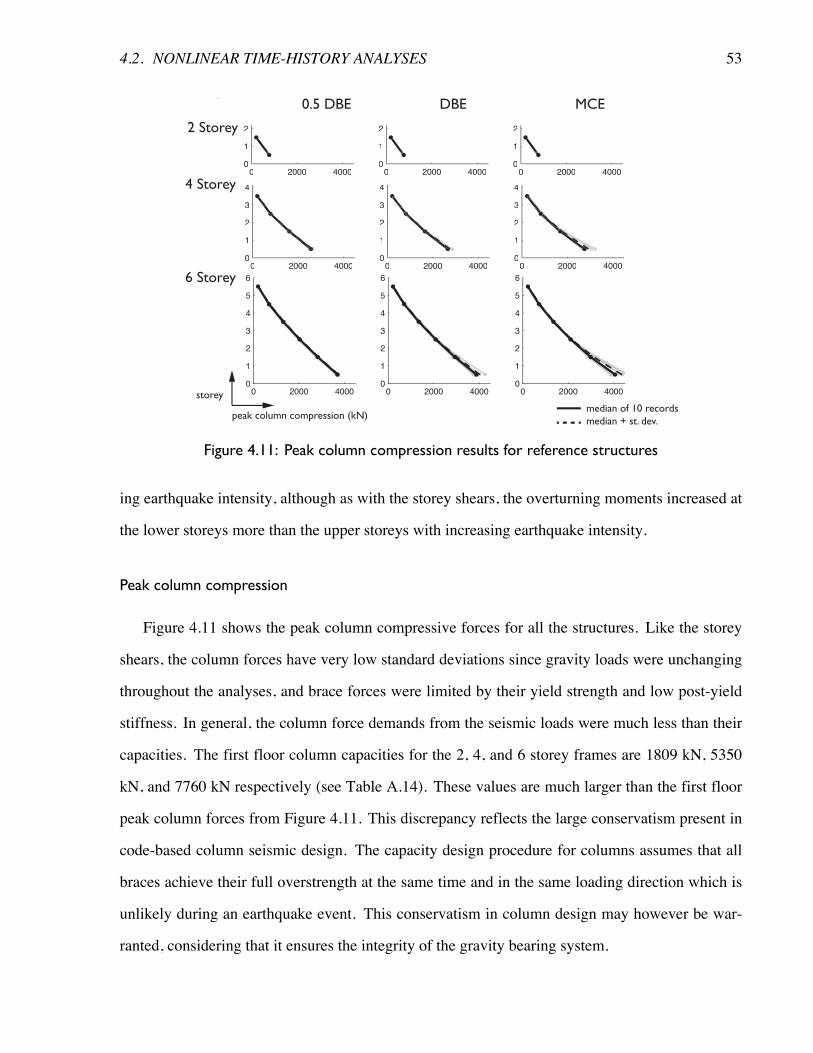
4.2. NONLINEAR TIME-HISTORY ANALYSES 53
3
4
3
4
3
4
0 2000 40000
1
2
3
4
5
6
0 2000 40000
1
2
3
4
5
6
0 2000 40000
1
2
3
4
5
6
5
6
5
6
5
6
0 2000 40000
1
2
3
4
0 2000 40000
1
2
3
4
0 2000 40000
1
2
3
44 4 4
333
444
333
444
333
444
000 2000 4000055
166
2
0000 2000 4000055
166
2
0000 2000 4000055
166
2
storeymedian of 10 recordsmedian + st. dev.
peak column compression (kN)
2 Storey
4 Storey
6 Storey
0.5 DBE DBE MCE
Figure 4.11: Peak column compression results for reference structures
ing earthquake intensity, although as with the storey shears, the overturning moments increased at
the lower storeys more than the upper storeys with increasing earthquake intensity.
Peak column compression
Figure 4.11 shows the peak column compressive forces for all the structures. Like the storey
shears, the column forces have very low standard deviations since gravity loads were unchanging
throughout the analyses, and brace forces were limited by their yield strength and low post-yield
stiffness. In general, the column force demands from the seismic loads were much less than their
capacities. The first floor column capacities for the 2, 4, and 6 storey frames are 1809 kN, 5350
kN, and 7760 kN respectively (see Table A.14). These values are much larger than the first floor
peak column forces from Figure 4.11. This discrepancy reflects the large conservatism present in
code-based column seismic design. The capacity design procedure for columns assumes that all
braces achieve their full overstrength at the same time and in the same loading direction which is
unlikely during an earthquake event. This conservatism in column design may however be war-
ranted, considering that it ensures the integrity of the gravity bearing system.
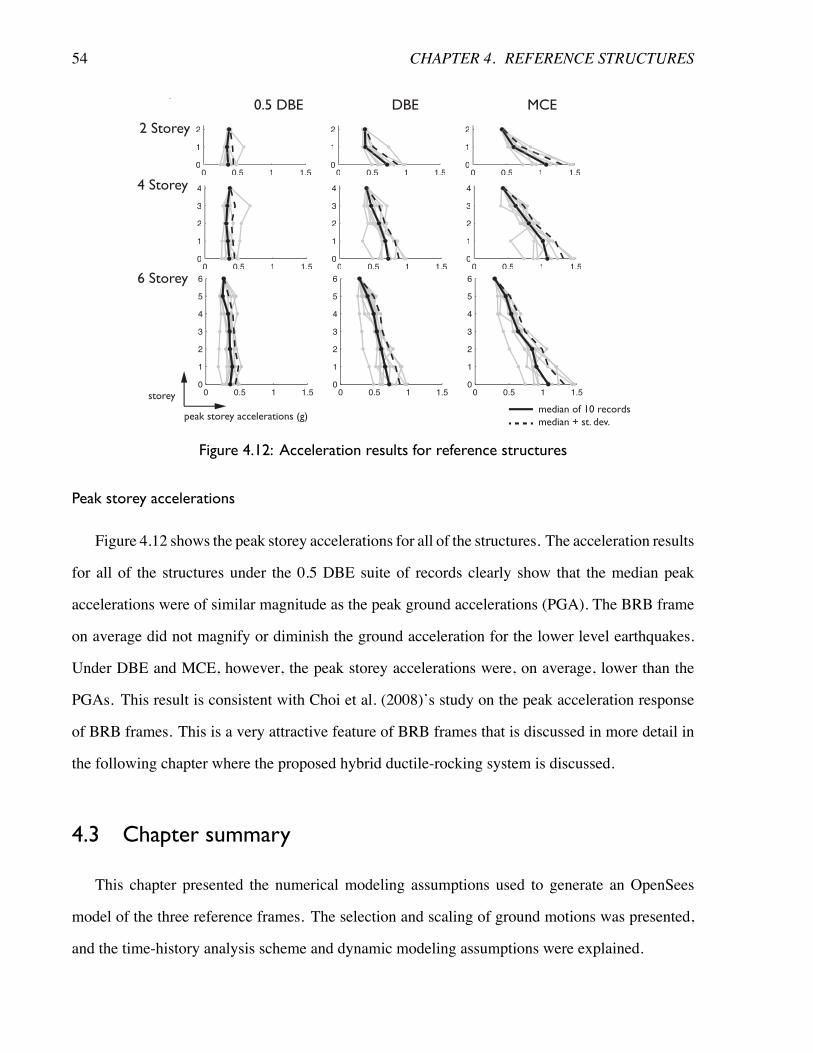
54 CHAPTER 4. REFERENCE STRUCTURES
3
4
3
4
3
4
0 0.5 1 1.50
1
2
3
4
5
6
0 0.5 1 1.50
1
2
3
4
5
6
0 0.5 1 1.50
1
2
3
4
5
6
5
6
5
6
5
6
0 0.5 1 1.50
1
2
3
4
0 0.5 1 1.50
1
2
3
4
0 0.5 1 1.50
1
2
3
44 4 4
333
444
333
444
333
444
000 0.5 1 1.51.5055
1
2
0000 0.5 1 1.51.51.5055
1
2
0000 0.5 1 1.51.51.5055
1
2
storeymedian of 10 recordsmedian + st. dev.
peak storey accelerations (g)
2 Storey
4 Storey
6 Storey
0.5 DBE DBE MCE
Figure 4.12: Acceleration results for reference structures
Peak storey accelerations
Figure 4.12 shows the peak storey accelerations for all of the structures. The acceleration results
for all of the structures under the 0.5 DBE suite of records clearly show that the median peak
accelerations were of similar magnitude as the peak ground accelerations (PGA). The BRB frame
on average did not magnify or diminish the ground acceleration for the lower level earthquakes.
Under DBE and MCE, however, the peak storey accelerations were, on average, lower than the
PGAs. This result is consistent with Choi et al. (2008)’s study on the peak acceleration response
of BRB frames. This is a very attractive feature of BRB frames that is discussed in more detail in
the following chapter where the proposed hybrid ductile-rocking system is discussed.
4.3 Chapter summary
This chapter presented the numerical modeling assumptions used to generate an OpenSees
model of the three reference frames. The selection and scaling of ground motions was presented,
and the time-history analysis scheme and dynamic modeling assumptions were explained.
4.3. CHAPTER SUMMARY 55
The results of the dynamic time-history analyses were presented. The displacement results
demonstrated that concentrations of inelasticity in the lower stories of the reference frames was
an important issue influencing the overall performance of these frames, especially for the 6 storey
structure. As well, the structures fared poorly with regard to residual drifts when compared to
the suggested 0.5% criteria for repairs/demolition from the literature. The system force results
confirmed that the buckling restrained braces effectively reduced the force demand on the system,
although some increased force demands at the lower storeys, where drift concentrations occurred,
were noted.
Chapter 5
Parametric study
This chapter presents the results of a parametric study investigating the seismic response of
BRB frames with the hybrid ductile-rocking system compared to the reference structures that were
presented in Chapter 4. The study explores how the energy dissipation parameter and the amount
of allowable uplift before lockup affect the three reference structures’ seismic performance.
5.1 Overview of parametric study
5.1.1 Parameters
The three parameters considered in this study were the energy dissipation parameter, β, the base
rotation angle before lockup, θlock, and the structure height. Table 5.1 shows the chosen parameters.
β is directly related to the energy dissipation element strength, ED, as a function of the self-weight
acting as a restoring force, Wself , described in Section 3.1. The required ED strength in kN for a
given β can be determined by substituting Equations 3.1.1 and 3.1.4 into Equation 3.1.6 and solving
for ED:
ED =�WselfdwdED(2� β)
(5.1.1)
Six values of � were chosen. � of 0 corresponds to structures with no supplemental energy
56
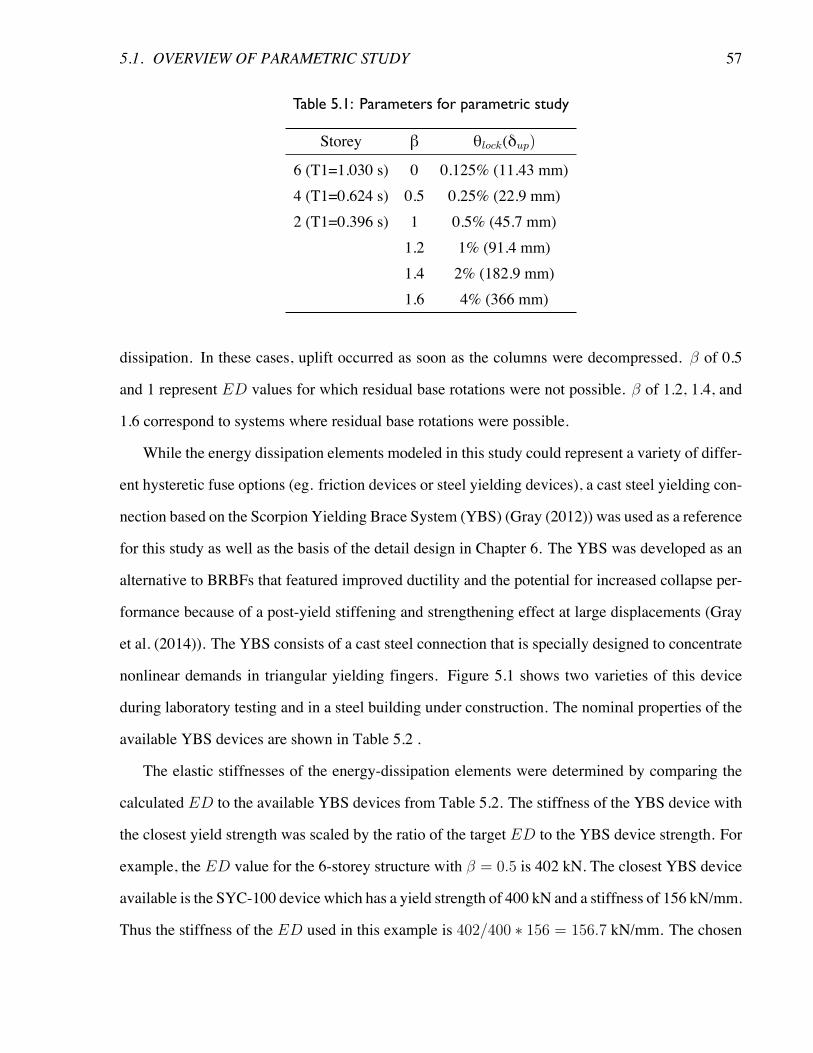
5.1. OVERVIEW OF PARAMETRIC STUDY 57
Table 5.1: Parameters for parametric study
Storey β θlock(δup)
6 (T1=1.030 s) 0 0.125% (11.43 mm)4 (T1=0.624 s) 0.5 0.25% (22.9 mm)2 (T1=0.396 s) 1 0.5% (45.7 mm)
1.2 1% (91.4 mm)1.4 2% (182.9 mm)1.6 4% (366 mm)
dissipation. In these cases, uplift occurred as soon as the columns were decompressed. � of 0.5
and 1 represent ED values for which residual base rotations were not possible. � of 1.2, 1.4, and
1.6 correspond to systems where residual base rotations were possible.
While the energy dissipation elements modeled in this study could represent a variety of differ-
ent hysteretic fuse options (eg. friction devices or steel yielding devices), a cast steel yielding con-
nection based on the Scorpion Yielding Brace System (YBS) (Gray (2012)) was used as a reference
for this study as well as the basis of the detail design in Chapter 6. The YBS was developed as an
alternative to BRBFs that featured improved ductility and the potential for increased collapse per-
formance because of a post-yield stiffening and strengthening effect at large displacements (Gray
et al. (2014)). The YBS consists of a cast steel connection that is specially designed to concentrate
nonlinear demands in triangular yielding fingers. Figure 5.1 shows two varieties of this device
during laboratory testing and in a steel building under construction. The nominal properties of the
available YBS devices are shown in Table 5.2 .
The elastic stiffnesses of the energy-dissipation elements were determined by comparing the
calculated ED to the available YBS devices from Table 5.2. The stiffness of the YBS device with
the closest yield strength was scaled by the ratio of the target ED to the YBS device strength. For
example, the ED value for the 6-storey structure with � = 0.5 is 402 kN. The closest YBS device
available is the SYC-100 device which has a yield strength of 400 kN and a stiffness of 156 kN/mm.
Thus the stiffness of the ED used in this example is 402/400 ⇤ 156 = 156.7 kN/mm. The chosen
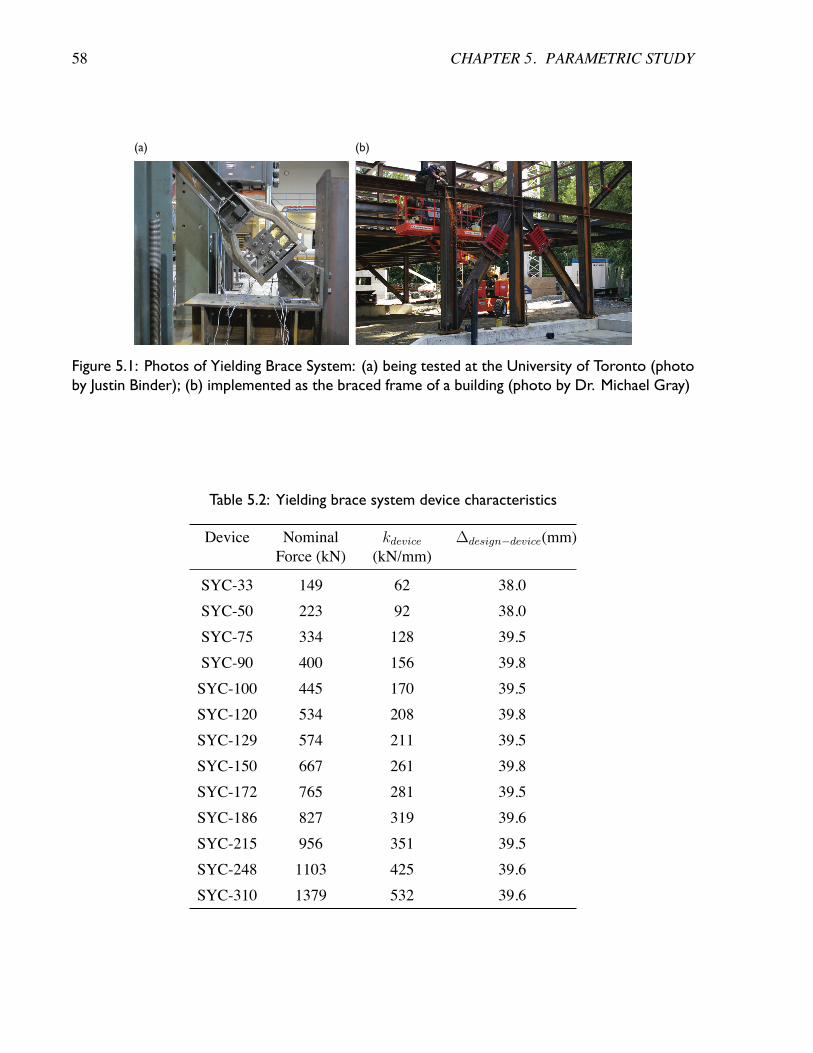
58 CHAPTER 5. PARAMETRIC STUDY
(a) (b)
Figure 5.1: Photos of Yielding Brace System: (a) being tested at the University of Toronto (photoby Justin Binder); (b) implemented as the braced frame of a building (photo by Dr. Michael Gray)
Table 5.2: Yielding brace system device characteristics
Device NominalForce (kN)
kdevice(kN/mm)
�design�device(mm)
SYC-33 149 62 38.0SYC-50 223 92 38.0SYC-75 334 128 39.5SYC-90 400 156 39.8SYC-100 445 170 39.5SYC-120 534 208 39.8SYC-129 574 211 39.5SYC-150 667 261 39.8SYC-172 765 281 39.5SYC-186 827 319 39.6SYC-215 956 351 39.5SYC-248 1103 425 39.6SYC-310 1379 532 39.6
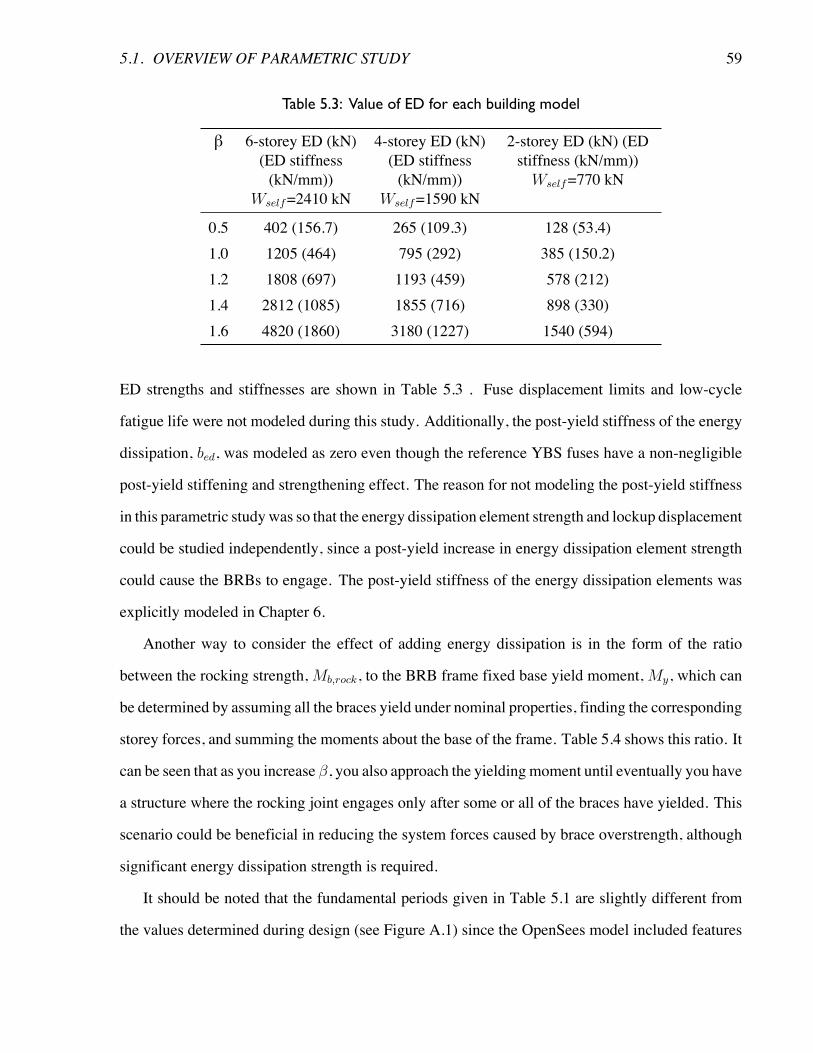
5.1. OVERVIEW OF PARAMETRIC STUDY 59
Table 5.3: Value of ED for each building model
β 6-storey ED (kN)(ED stiffness(kN/mm))
Wself=2410 kN
4-storey ED (kN)(ED stiffness(kN/mm))
Wself=1590 kN
2-storey ED (kN) (EDstiffness (kN/mm))Wself=770 kN
0.5 402 (156.7) 265 (109.3) 128 (53.4)1.0 1205 (464) 795 (292) 385 (150.2)1.2 1808 (697) 1193 (459) 578 (212)1.4 2812 (1085) 1855 (716) 898 (330)1.6 4820 (1860) 3180 (1227) 1540 (594)
ED strengths and stiffnesses are shown in Table 5.3 . Fuse displacement limits and low-cycle
fatigue life were not modeled during this study. Additionally, the post-yield stiffness of the energy
dissipation, bed, was modeled as zero even though the reference YBS fuses have a non-negligible
post-yield stiffening and strengthening effect. The reason for not modeling the post-yield stiffness
in this parametric studywas so that the energy dissipation element strength and lockup displacement
could be studied independently, since a post-yield increase in energy dissipation element strength
could cause the BRBs to engage. The post-yield stiffness of the energy dissipation elements was
explicitly modeled in Chapter 6.
Another way to consider the effect of adding energy dissipation is in the form of the ratio
between the rocking strength,Mb,rock, to the BRB frame fixed base yield moment,My, which can
be determined by assuming all the braces yield under nominal properties, finding the corresponding
storey forces, and summing the moments about the base of the frame. Table 5.4 shows this ratio. It
can be seen that as you increase �, you also approach the yieldingmoment until eventually you have
a structure where the rocking joint engages only after some or all of the braces have yielded. This
scenario could be beneficial in reducing the system forces caused by brace overstrength, although
significant energy dissipation strength is required.
It should be noted that the fundamental periods given in Table 5.1 are slightly different from
the values determined during design (see Figure A.1) since the OpenSees model included features
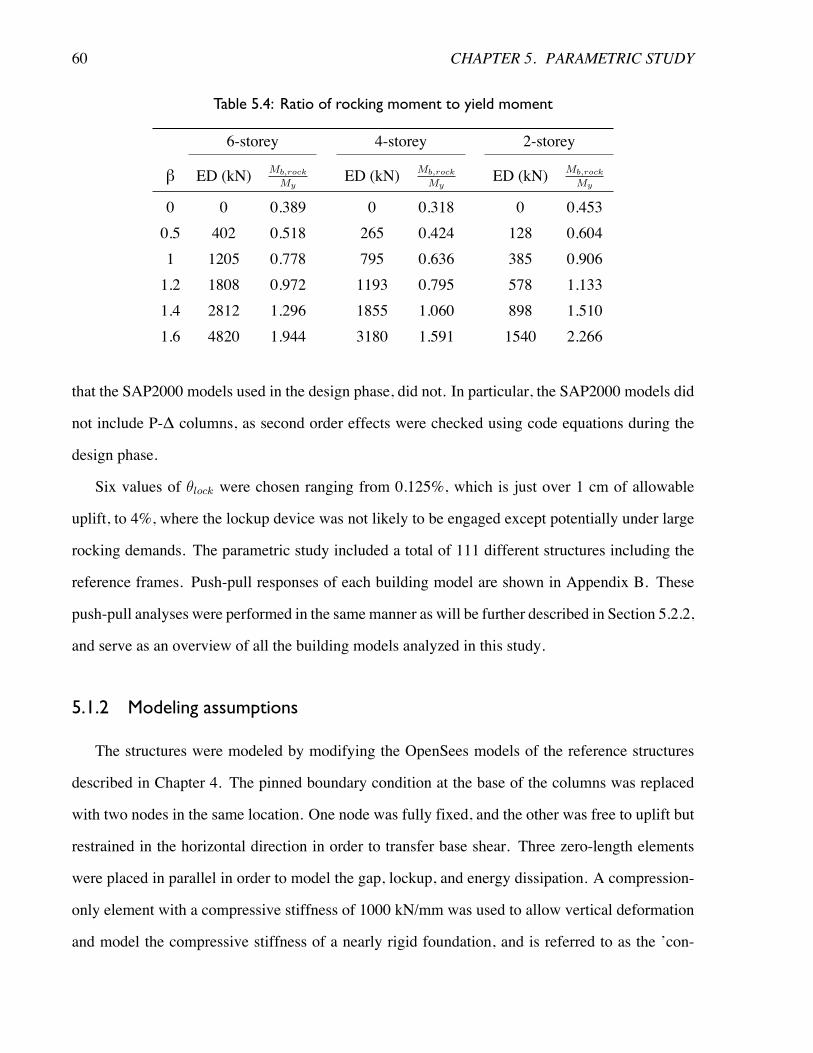
60 CHAPTER 5. PARAMETRIC STUDY
Table 5.4: Ratio of rocking moment to yield moment
6-storey 4-storey 2-storey
β ED (kN) Mb,rock
My
ED (kN) Mb,rock
My
ED (kN) Mb,rock
My
0 0 0.389 0 0.318 0 0.4530.5 402 0.518 265 0.424 128 0.6041 1205 0.778 795 0.636 385 0.9061.2 1808 0.972 1193 0.795 578 1.1331.4 2812 1.296 1855 1.060 898 1.5101.6 4820 1.944 3180 1.591 1540 2.266
that the SAP2000 models used in the design phase, did not. In particular, the SAP2000 models did
not include P-Δ columns, as second order effects were checked using code equations during the
design phase.
Six values of ✓lock were chosen ranging from 0.125%, which is just over 1 cm of allowable
uplift, to 4%, where the lockup device was not likely to be engaged except potentially under large
rocking demands. The parametric study included a total of 111 different structures including the
reference frames. Push-pull responses of each building model are shown in Appendix B. These
push-pull analyses were performed in the samemanner as will be further described in Section 5.2.2,
and serve as an overview of all the building models analyzed in this study.
5.1.2 Modeling assumptions
The structures were modeled by modifying the OpenSees models of the reference structures
described in Chapter 4. The pinned boundary condition at the base of the columns was replaced
with two nodes in the same location. One node was fully fixed, and the other was free to uplift but
restrained in the horizontal direction in order to transfer base shear. Three zero-length elements
were placed in parallel in order to model the gap, lockup, and energy dissipation. A compression-
only element with a compressive stiffness of 1000 kN/mm was used to allow vertical deformation
and model the compressive stiffness of a nearly rigid foundation, and is referred to as the ’con-
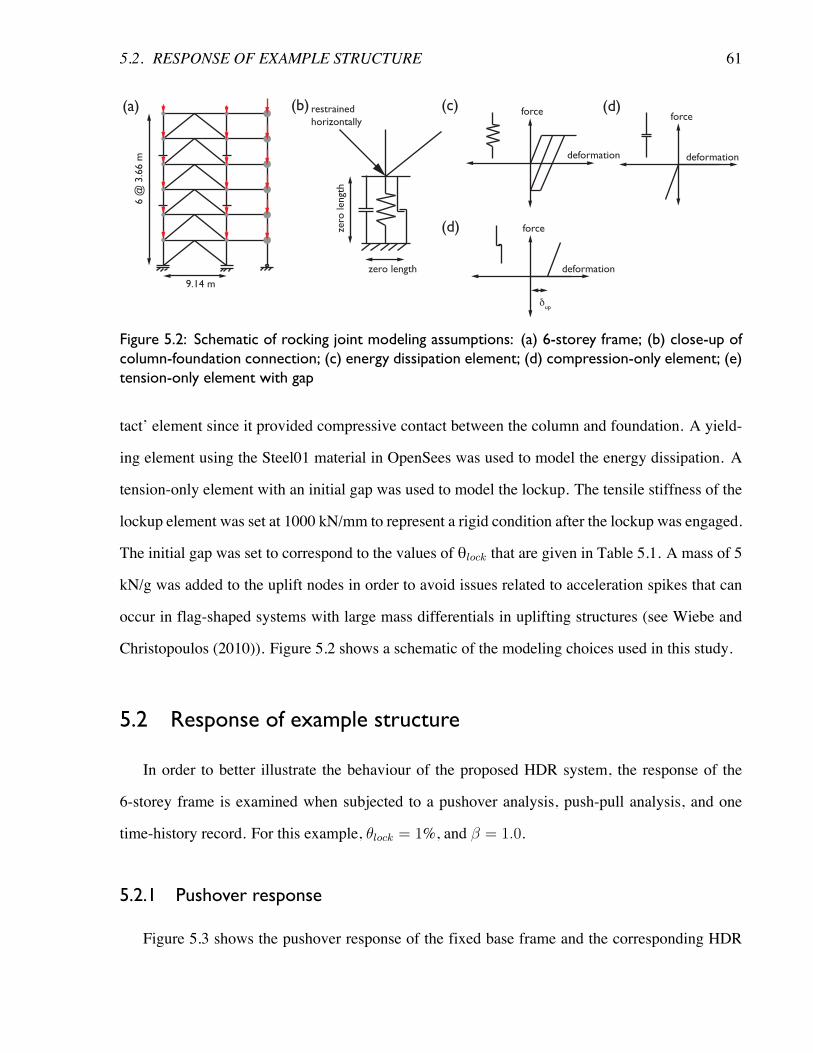
5.2. RESPONSE OF EXAMPLE STRUCTURE 61
restrainedhorizontally
(a) (c) (d)(b)
zero
leng
th
zero length
δup
force force
deformation deformation
(d) force
deformation
9.14 m
6 @
3.6
6 m
Figure 5.2: Schematic of rocking joint modeling assumptions: (a) 6-storey frame; (b) close-up ofcolumn-foundation connection; (c) energy dissipation element; (d) compression-only element; (e)tension-only element with gap
tact’ element since it provided compressive contact between the column and foundation. A yield-
ing element using the Steel01 material in OpenSees was used to model the energy dissipation. A
tension-only element with an initial gap was used to model the lockup. The tensile stiffness of the
lockup element was set at 1000 kN/mm to represent a rigid condition after the lockup was engaged.
The initial gap was set to correspond to the values of θlock that are given in Table 5.1. A mass of 5
kN/g was added to the uplift nodes in order to avoid issues related to acceleration spikes that can
occur in flag-shaped systems with large mass differentials in uplifting structures (see Wiebe and
Christopoulos (2010)). Figure 5.2 shows a schematic of the modeling choices used in this study.
5.2 Response of example structure
In order to better illustrate the behaviour of the proposed HDR system, the response of the
6-storey frame is examined when subjected to a pushover analysis, push-pull analysis, and one
time-history record. For this example, ✓lock = 1%, and � = 1.0.
5.2.1 Pushover response
Figure 5.3 shows the pushover response of the fixed base frame and the corresponding HDR
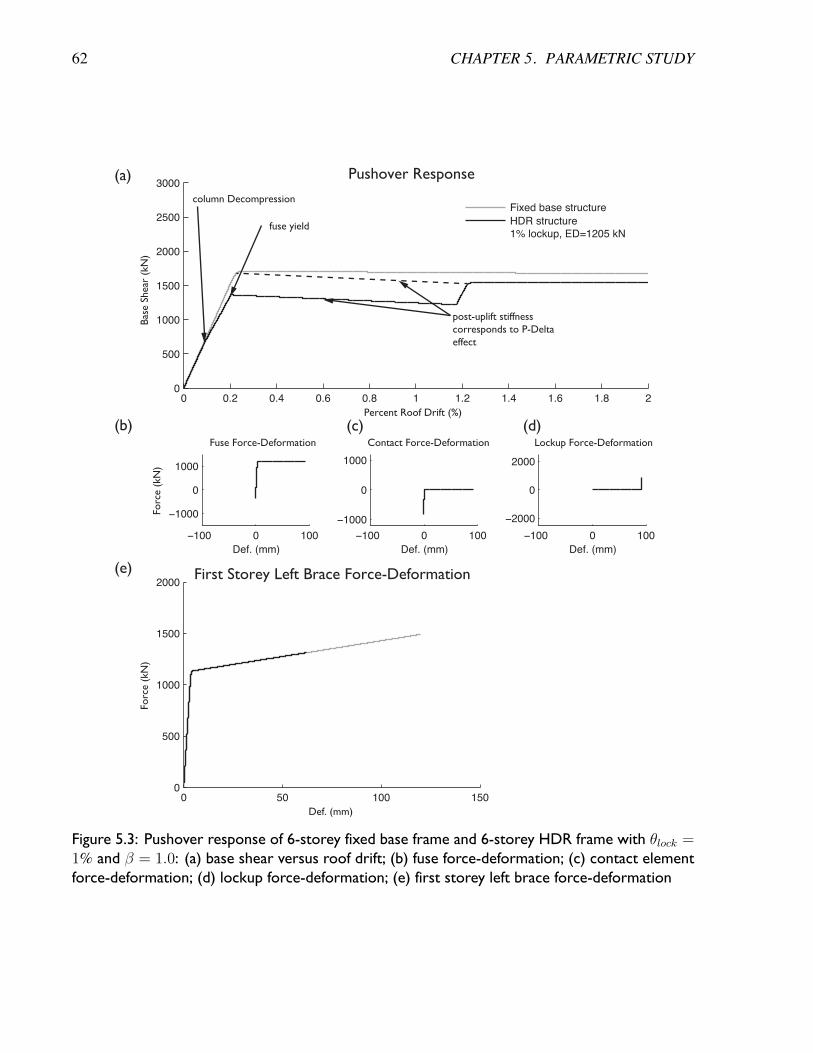
62 CHAPTER 5. PARAMETRIC STUDY
Percent Roof Drift (%)
Bas
e Sh
ear
(kN
)
Pushover Response
Fuse Force-Deformation
Def. (mm)
Forc
e (k
N)
Contact Force-Deformation
Def. (mm)
Lockup Force-Deformation
Def. (mm)
First Storey Left Brace Force-Deformation
Def. (mm)
Forc
e (k
N)
0 0.2 0.4 0.6 0.8 1 1.2 1.4 1.6 1.8 20
500
1000
1500
2000
2500
3000
Fixed base structure
HDR structure1% lockup, ED=1205 kN
−100 0 100
−1000
0
1000
−100 0 100
−1000
0
1000
−100 0 100
−2000
0
2000
0 50 100 1500
500
1000
1500
2000
column Decompression
fuse yield
post-uplift stiffnesscorresponds to P-Deltaeffect
(a)
(b)
(e)
(d)(c)
Figure 5.3: Pushover response of 6-storey fixed base frame and 6-storey HDR frame with ✓lock =1% and � = 1.0: (a) base shear versus roof drift; (b) fuse force-deformation; (c) contact elementforce-deformation; (d) lockup force-deformation; (e) first storey left brace force-deformation
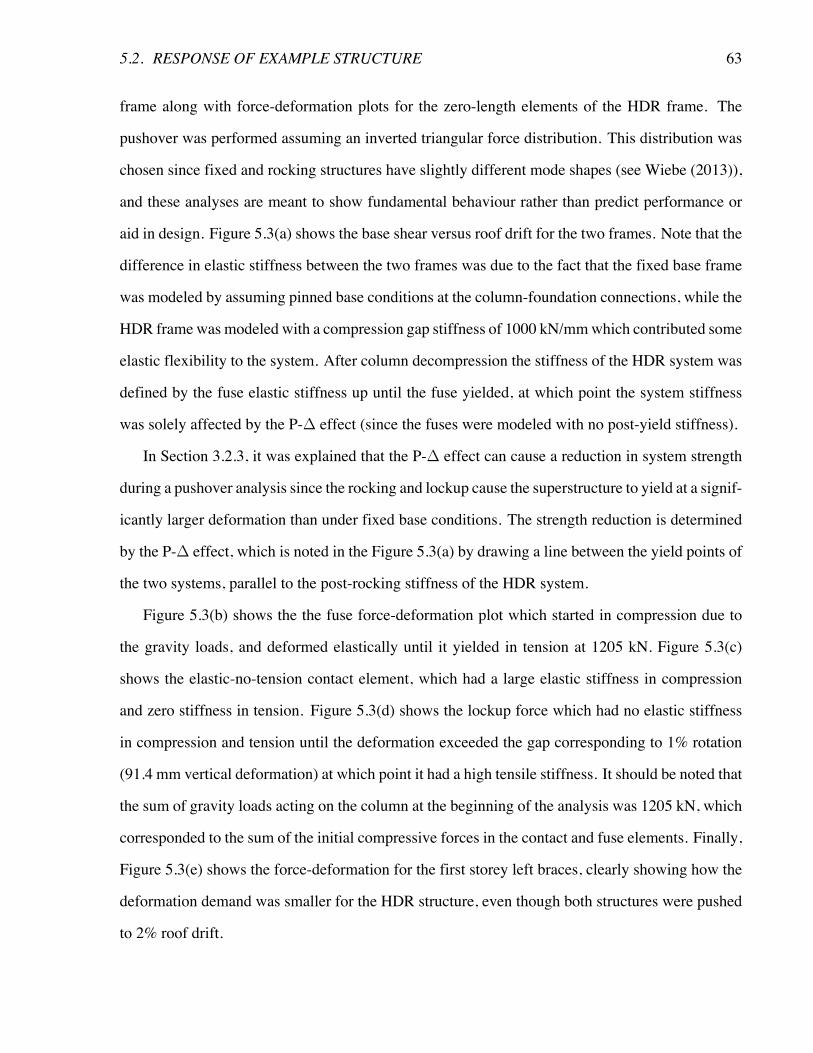
5.2. RESPONSE OF EXAMPLE STRUCTURE 63
frame along with force-deformation plots for the zero-length elements of the HDR frame. The
pushover was performed assuming an inverted triangular force distribution. This distribution was
chosen since fixed and rocking structures have slightly different mode shapes (see Wiebe (2013)),
and these analyses are meant to show fundamental behaviour rather than predict performance or
aid in design. Figure 5.3(a) shows the base shear versus roof drift for the two frames. Note that the
difference in elastic stiffness between the two frames was due to the fact that the fixed base frame
was modeled by assuming pinned base conditions at the column-foundation connections, while the
HDR frame was modeled with a compression gap stiffness of 1000 kN/mmwhich contributed some
elastic flexibility to the system. After column decompression the stiffness of the HDR system was
defined by the fuse elastic stiffness up until the fuse yielded, at which point the system stiffness
was solely affected by the P-� effect (since the fuses were modeled with no post-yield stiffness).
In Section 3.2.3, it was explained that the P-� effect can cause a reduction in system strength
during a pushover analysis since the rocking and lockup cause the superstructure to yield at a signif-
icantly larger deformation than under fixed base conditions. The strength reduction is determined
by the P-� effect, which is noted in the Figure 5.3(a) by drawing a line between the yield points of
the two systems, parallel to the post-rocking stiffness of the HDR system.
Figure 5.3(b) shows the the fuse force-deformation plot which started in compression due to
the gravity loads, and deformed elastically until it yielded in tension at 1205 kN. Figure 5.3(c)
shows the elastic-no-tension contact element, which had a large elastic stiffness in compression
and zero stiffness in tension. Figure 5.3(d) shows the lockup force which had no elastic stiffness
in compression and tension until the deformation exceeded the gap corresponding to 1% rotation
(91.4 mm vertical deformation) at which point it had a high tensile stiffness. It should be noted that
the sum of gravity loads acting on the column at the beginning of the analysis was 1205 kN, which
corresponded to the sum of the initial compressive forces in the contact and fuse elements. Finally,
Figure 5.3(e) shows the force-deformation for the first storey left braces, clearly showing how the
deformation demand was smaller for the HDR structure, even though both structures were pushed
to 2% roof drift.
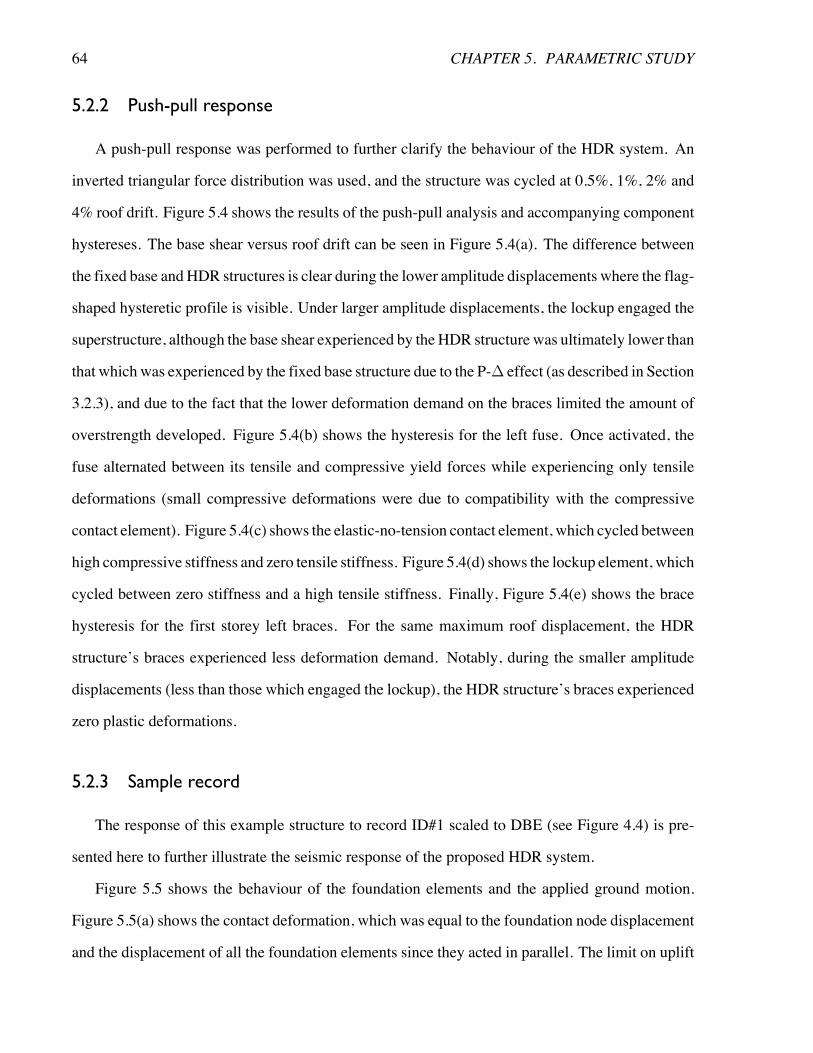
64 CHAPTER 5. PARAMETRIC STUDY
5.2.2 Push-pull response
A push-pull response was performed to further clarify the behaviour of the HDR system. An
inverted triangular force distribution was used, and the structure was cycled at 0.5%, 1%, 2% and
4% roof drift. Figure 5.4 shows the results of the push-pull analysis and accompanying component
hystereses. The base shear versus roof drift can be seen in Figure 5.4(a). The difference between
the fixed base andHDR structures is clear during the lower amplitude displacements where the flag-
shaped hysteretic profile is visible. Under larger amplitude displacements, the lockup engaged the
superstructure, although the base shear experienced by the HDR structure was ultimately lower than
that which was experienced by the fixed base structure due to the P-� effect (as described in Section
3.2.3), and due to the fact that the lower deformation demand on the braces limited the amount of
overstrength developed. Figure 5.4(b) shows the hysteresis for the left fuse. Once activated, the
fuse alternated between its tensile and compressive yield forces while experiencing only tensile
deformations (small compressive deformations were due to compatibility with the compressive
contact element). Figure 5.4(c) shows the elastic-no-tension contact element, which cycled between
high compressive stiffness and zero tensile stiffness. Figure 5.4(d) shows the lockup element, which
cycled between zero stiffness and a high tensile stiffness. Finally, Figure 5.4(e) shows the brace
hysteresis for the first storey left braces. For the same maximum roof displacement, the HDR
structure’s braces experienced less deformation demand. Notably, during the smaller amplitude
displacements (less than those which engaged the lockup), the HDR structure’s braces experienced
zero plastic deformations.
5.2.3 Sample record
The response of this example structure to record ID#1 scaled to DBE (see Figure 4.4) is pre-
sented here to further illustrate the seismic response of the proposed HDR system.
Figure 5.5 shows the behaviour of the foundation elements and the applied ground motion.
Figure 5.5(a) shows the contact deformation, which was equal to the foundation node displacement
and the displacement of all the foundation elements since they acted in parallel. The limit on uplift
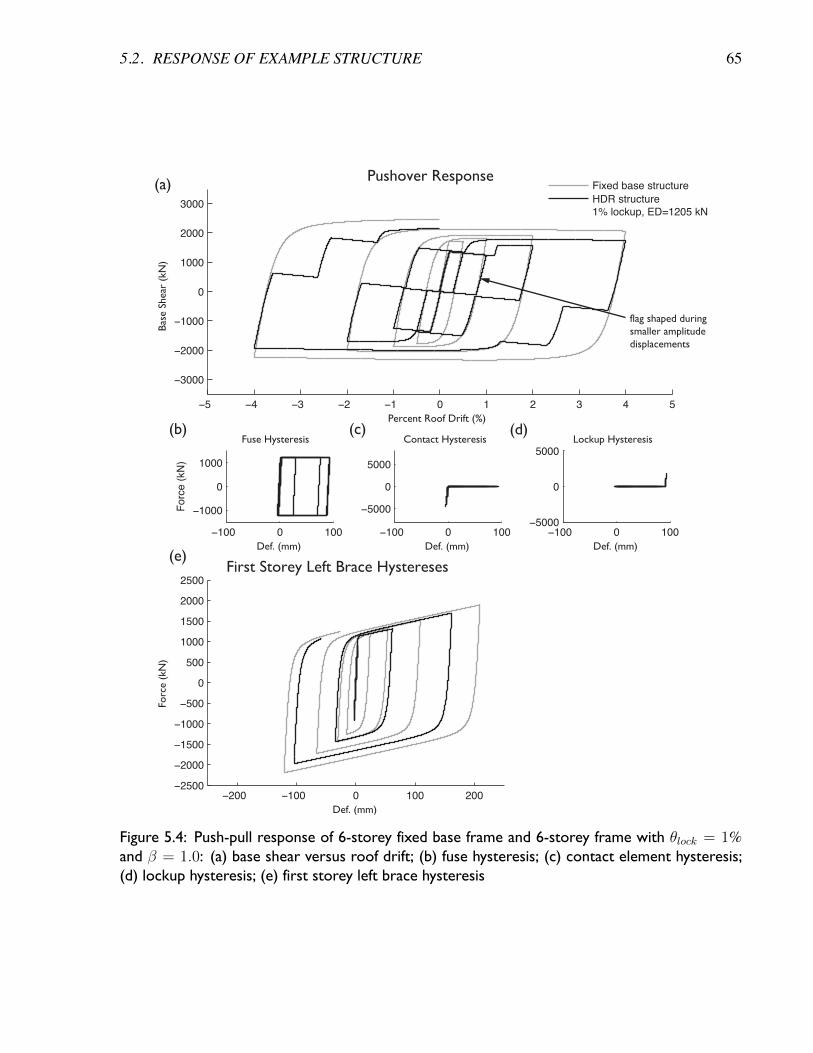
5.2. RESPONSE OF EXAMPLE STRUCTURE 65
Percent Roof Drift (%)
Bas
e Sh
ear
(kN
)
Pushover Response
Fuse Hysteresis
Def. (mm)
Fo
rce
(kN
)
Contact Hysteresis
Def. (mm)
Lockup Hysteresis
Def. (mm)
First Storey Left Brace Hystereses
Def. (mm)
Forc
e (k
N)
−5 −4 −3 −2 −1 0 1 2 3 4 5
−3000
−2000
−1000
0
1000
2000
3000
−100 0 100
−1000
0
1000
−100 0 100
−5000
0
5000
−100 0 100−5000
0
5000
−200 −100 0 100 200−2500
−2000
−1500
−1000
−500
0
500
1000
1500
2000
2500
Fixed base structure
HDR structure1% lockup, ED=1205 kN
(a)
(b)
(e)
(d)(c)
flag shaped duringsmaller amplitudedisplacements
Figure 5.4: Push-pull response of 6-storey fixed base frame and 6-storey frame with ✓lock = 1%and � = 1.0: (a) base shear versus roof drift; (b) fuse hysteresis; (c) contact element hysteresis;(d) lockup hysteresis; (e) first storey left brace hysteresis
66 CHAPTER 5. PARAMETRIC STUDY
0 2 4 6 8 10 12 14 16 18 20−50
0
50
100
0 2 4 6 8 10 12 14 16 18 20−4000
−3000
−2000
−1000
0
1000
0 2 4 6 8 10 12 14 16 18 200
500
1000
1500
2000
2500
time (s)
0 2 4 6 8 10 12 14 16 18 20−3000
−2000
−1000
0
1000
2000
3000
time (s)
0 2 4 6 8 10 12 14 16 18 20−1
−0.5
0
0.5
1
0.624
Contact Deformation
(mm)
Contact Force(kN)
Lockup Force(kN)
Fuse Force(kN)
(a)
(b)
(c)
(d)
Groundacceleration
(g)
(e)
Left side
Right side
time (s)
Figure 5.5: Foundation element behaviour: (a) elastic-no-tension contact element deformation;(b) contact force; (c) lockup force; (d) fuse force; (e) ground acceleration (ID#1)
5.2. RESPONSE OF EXAMPLE STRUCTURE 67
from the lockup in this model was set to 91.4 mm, and the lockup was only engaged once on the left
side during the time-history. Figure 5.5(b) shows the elastic-no-tension element force for the left
and right sides of the frame. The elements began in compression due to the initial gravity loading
on the building, and subsequently went into more and less compression as the frame swayed back
and forth, with tension forces prohibited by the uplift. Figure 5.5(c) shows the lockup force, which
was only engaged on the left side once and corresponded to when the left uplift deformation reached
91.4 mm in Figure 5.5(a). Finally, Figure 5.5(d) shows the fuse force on the left and right sides of
the frame. The fuse forces were limited by the yield force of 1205 kN. The compression in the fuses
at the beginning of the time-history was due to the compatibility of deformations between the fuse
and the elastic-no-tension contact element under gravity loads. The sum of the initial compression
in the contact element and the fuse force was equal to the total gravity load acting on the column,
in this case 1205 kN (coincidentally the same value as the fuse yield force).
The roof displacement response and corresponding system forces are shown in Figure 5.6, as
compared to the fixed base structure. The peak roof displacement of the HDR structure was greater
than that of the fixed structure, as observed in Figure 5.6(a). That being said, the rigid body rotation
of the structure shown in gray (calculated as the difference in base uplift between the left and right
side of the frame divided by the frame width) accounts for most of the lateral displacement of the
frame. The difference between the roof displacement and rigid body rotation is shown as a dashed
line and further demonstrates how most of the system displacement is caused by the base rotation.
Figure 5.6(b) compares the base shear response between the fixed and HDR structures. The simi-
larity between the magnitude of the responses is reasonable since the strength of the rocking joint
was close to that of the superstructure (see Figure 5.3), and forces due to higher mode effects were
capped off by the BRBs in both frames. The overturning moment response, shown in Figure 5.6(c),
demonstrates how the rocking joint successfully limited the response, except when the lockup was
engaged and a spike in the base moment was observed (which was subsequently limited by the
braces, as in the fixed structure).
The response of the hysteretic elements in the frames is shown in Figure 5.7. Figure 5.7(a)
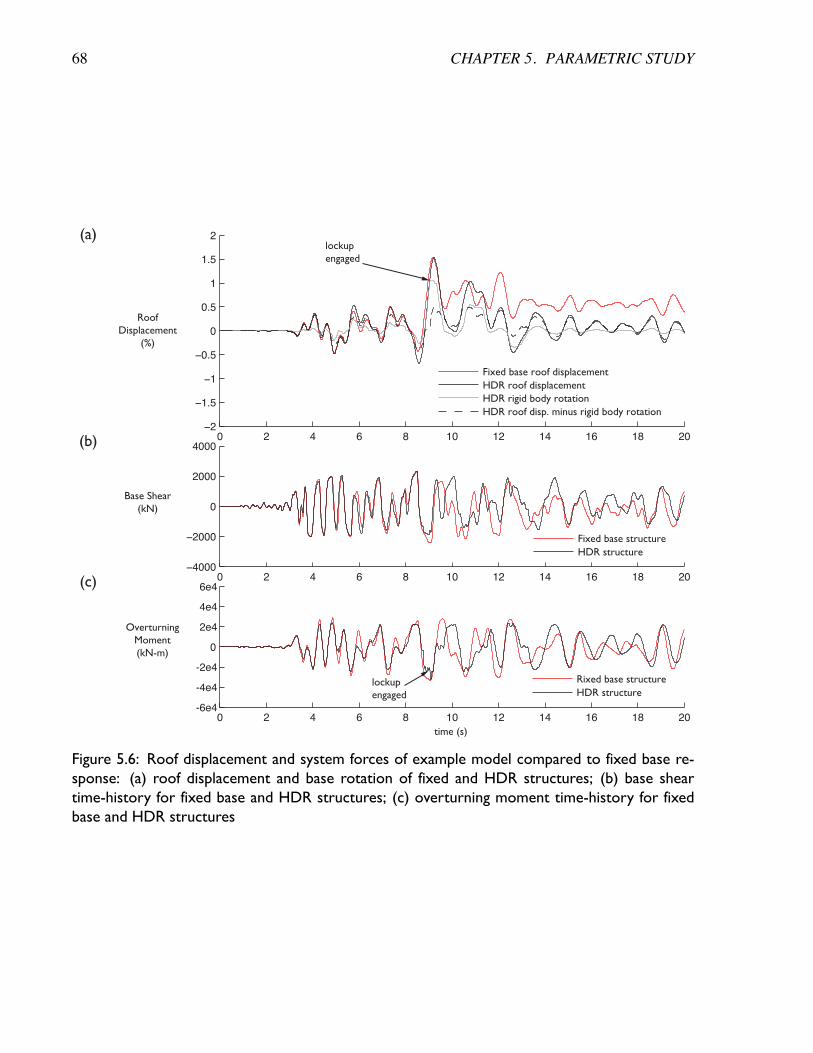
68 CHAPTER 5. PARAMETRIC STUDY
0 2 4 6 8 10 12 14 16 18 20−2
−1.5
−1
−0.5
0
0.5
1
1.5
2
time (s)
0 2 4 6 8 10 12 14 16 18 20−4000
−2000
0
2000
4000
0 2 4 6 8 10 12 14 16 18 20-6e4
-4e4
-2e4
0
2e4
4e4
6e4
time (s)
RoofDisplacement
(%)
Base Shear(kN)
OverturningMoment(kN-m)
(a)
(b)
(c)
lockupengaged
lockupengaged
Fixed base roof displacementHDR roof displacementHDR rigid body rotationHDR roof disp. minus rigid body rotation
Fixed base structureHDR structure
Rixed base structureHDR structure
Figure 5.6: Roof displacement and system forces of example model compared to fixed base re-sponse: (a) roof displacement and base rotation of fixed and HDR structures; (b) base sheartime-history for fixed base and HDR structures; (c) overturning moment time-history for fixedbase and HDR structures
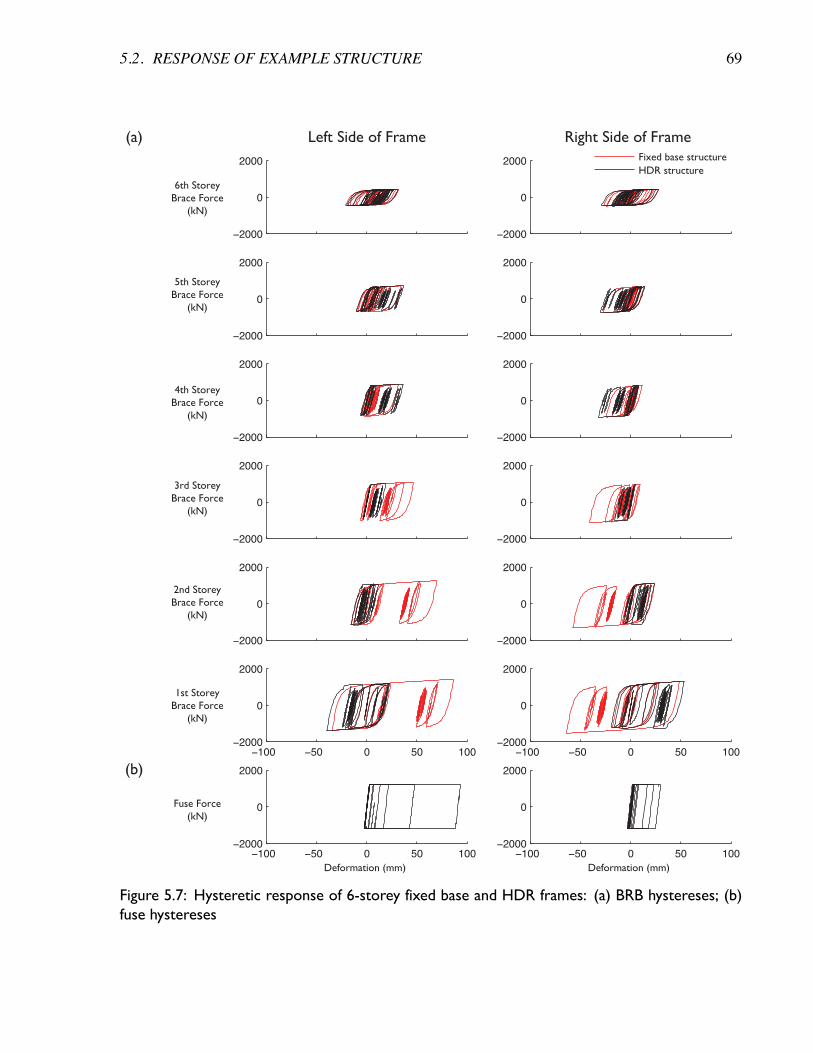
5.2. RESPONSE OF EXAMPLE STRUCTURE 69
−100 −50 0 50 100−2000
0
2000
−100 −50 0 50 100−2000
0
2000
−2000
0
2000
−2000
0
2000
−2000
0
2000
−2000
0
2000
−2000
0
2000
−2000
0
2000
−2000
0
2000
−2000
0
2000
−2000
0
2000
−2000
0
2000
−100 −50 0 50 100−2000
0
2000
−100 −50 0 50 100−2000
0
2000
Fixed base structureHDR structure
6th StoreyBrace Force
(kN)
5th StoreyBrace Force
(kN)
4th StoreyBrace Force
(kN)
3rd StoreyBrace Force
(kN)
2nd StoreyBrace Force
(kN)
1st StoreyBrace Force
(kN)
Deformation (mm)
Fuse Force(kN)
Deformation (mm)
(a) Left Side of Frame Right Side of Frame
(b)
Figure 5.7: Hysteretic response of 6-storey fixed base and HDR frames: (a) BRB hystereses; (b)fuse hystereses
70 CHAPTER 5. PARAMETRIC STUDY
shows the brace hysteresis. From this example, it is clear that the addition of limited base rocking
has reduced the displacement demand relative to the fixed base structure, most evidently in the
lower stories. As well, the residual drifts were visibly reduced, again especially in the lower stories.
Figure 5.7 (b) shows the fuses hystereses for both sides of the frame. The left side fuse was limited
to 91.4 mmwhich was as much as was allowed by the lockup. The right side fuse did not experience
a displacement large enough to engage the lockup on that side.
5.3 Results of parametric study
This section presents the statistical results of the entire parametric study. The response pa-
rameters that were studied were the peak interstorey drifts, peak base rotations, peak drifts minus
base rotations (drift demand on the frame), residual drifts, residual base rotations, global uplift,
number of records that engaged the lockup, energy dissipated by the braces, peak foundation ten-
sion, peak column compression, peak base overturning moment, peak base shear, and peak storey
accelerations.
Peak interstorey drifts
Figure 5.8 shows the median and median plus standard deviation peak interstorey drift results.
The results are organized in groups corresponding to a given value of �, with each group showing
the effect of increasing ✓lock with each bar that is plotted within the group. The black bar always
refers to the corresponding fixed base frame, and is repeated in each group for reference.
A preliminary understanding of these results can be attempted in the context of the equal dis-
placement observation. Considering that the displacements associated with self-centering struc-
tures tend to be similar to those of plastic systems (as was observed in a study of SDOF flag-shaped
and elastoplastic systems by Christopoulos et al. (2002)), a combination of the two systems using
a lockup might mean that the total drifts from the two mechanisms are expected to be similar. That
being said, the drifts from self-centering systems are dependent on various system parameters (�,
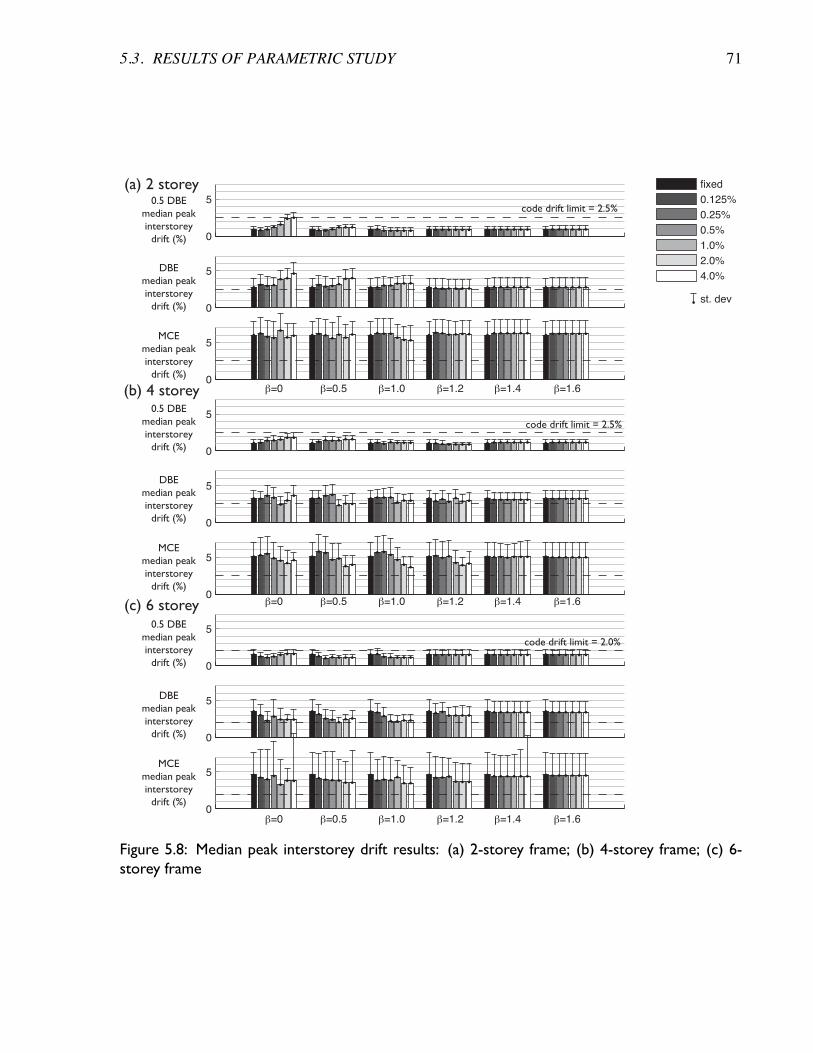
5.3. RESULTS OF PARAMETRIC STUDY 71
0
5
0
5
0
5
0
5
0
5
0
5
0
5
0
5
0
5
0.5 DBEmedian peakinterstorey
drift (%)
DBEmedian peakinterstorey
drift (%)
MCEmedian peakinterstorey
drift (%)
0.5 DBEmedian peakinterstorey
drift (%)
DBEmedian peakinterstorey
drift (%)
MCEmedian peakinterstorey
drift (%)
0.5 DBEmedian peakinterstorey
drift (%)
DBEmedian peakinterstorey
drift (%)
MCEmedian peakinterstorey
drift (%)
(a) 2 storey
(b) 4 storey
(c) 6 storey
fixed
0.125%
0.25%
0.5%
1.0%
2.0%
4.0%
st. dev
β=0 β=0.5 β=1.0 β=1.2 β=1.4 β=1.6
β=0 β=0.5 β=1.0 β=1.2 β=1.4 β=1.6
β=0 β=0.5 β=1.0 β=1.2 β=1.4 β=1.6
code drift limit = 2.5%
code drift limit = 2.5%
code drift limit = 2.0%
Figure 5.8: Median peak interstorey drift results: (a) 2-storey frame; (b) 4-storey frame; (c) 6-storey frame
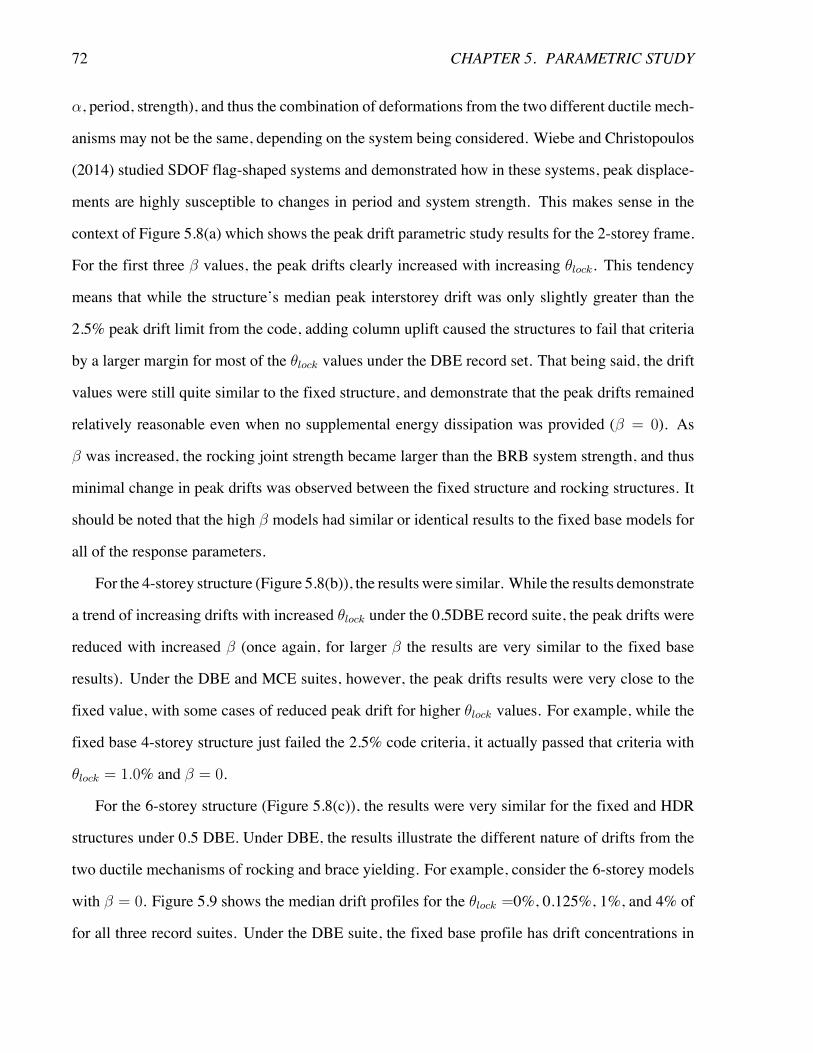
72 CHAPTER 5. PARAMETRIC STUDY
↵, period, strength), and thus the combination of deformations from the two different ductile mech-
anisms may not be the same, depending on the system being considered. Wiebe and Christopoulos
(2014) studied SDOF flag-shaped systems and demonstrated how in these systems, peak displace-
ments are highly susceptible to changes in period and system strength. This makes sense in the
context of Figure 5.8(a) which shows the peak drift parametric study results for the 2-storey frame.
For the first three � values, the peak drifts clearly increased with increasing ✓lock. This tendency
means that while the structure’s median peak interstorey drift was only slightly greater than the
2.5% peak drift limit from the code, adding column uplift caused the structures to fail that criteria
by a larger margin for most of the ✓lock values under the DBE record set. That being said, the drift
values were still quite similar to the fixed structure, and demonstrate that the peak drifts remained
relatively reasonable even when no supplemental energy dissipation was provided (� = 0). As
� was increased, the rocking joint strength became larger than the BRB system strength, and thus
minimal change in peak drifts was observed between the fixed structure and rocking structures. It
should be noted that the high � models had similar or identical results to the fixed base models for
all of the response parameters.
For the 4-storey structure (Figure 5.8(b)), the results were similar. While the results demonstrate
a trend of increasing drifts with increased ✓lock under the 0.5DBE record suite, the peak drifts were
reduced with increased � (once again, for larger � the results are very similar to the fixed base
results). Under the DBE and MCE suites, however, the peak drifts results were very close to the
fixed value, with some cases of reduced peak drift for higher ✓lock values. For example, while the
fixed base 4-storey structure just failed the 2.5% code criteria, it actually passed that criteria with
✓lock = 1.0% and � = 0.
For the 6-storey structure (Figure 5.8(c)), the results were very similar for the fixed and HDR
structures under 0.5 DBE. Under DBE, the results illustrate the different nature of drifts from the
two ductile mechanisms of rocking and brace yielding. For example, consider the 6-storey models
with � = 0. Figure 5.9 shows the median drift profiles for the ✓lock =0%, 0.125%, 1%, and 4% of
for all three record suites. Under the DBE suite, the fixed base profile has drift concentrations in
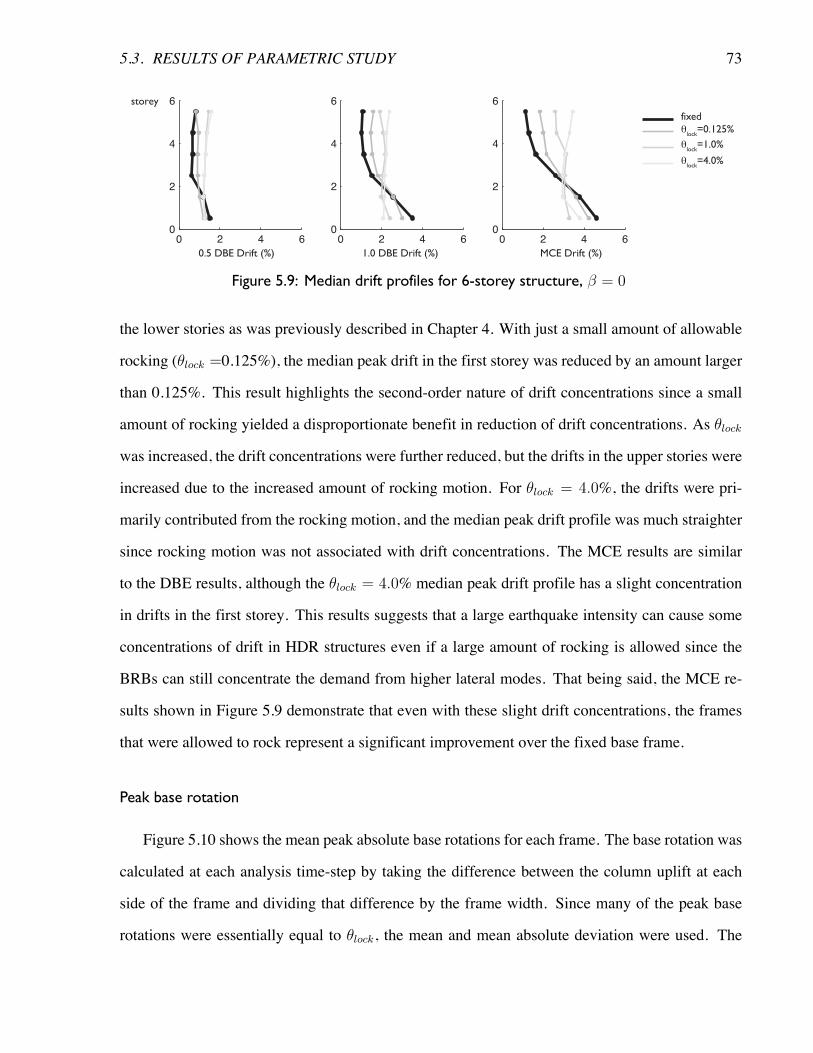
5.3. RESULTS OF PARAMETRIC STUDY 73
0 2 4 60
2
4
6
0 2 4 60
2
4
6
0 2 4 60
2
4
6
0.5 DBE Drift (%) 1.0 DBE Drift (%) MCE Drift (%)
storey
fixedθ
lock=0.125%
θlock
=1.0%
θlock
=4.0%
Figure 5.9: Median drift profiles for 6-storey structure, � = 0
the lower stories as was previously described in Chapter 4. With just a small amount of allowable
rocking (✓lock =0.125%), the median peak drift in the first storey was reduced by an amount larger
than 0.125%. This result highlights the second-order nature of drift concentrations since a small
amount of rocking yielded a disproportionate benefit in reduction of drift concentrations. As ✓lock
was increased, the drift concentrations were further reduced, but the drifts in the upper stories were
increased due to the increased amount of rocking motion. For ✓lock = 4.0%, the drifts were pri-
marily contributed from the rocking motion, and the median peak drift profile was much straighter
since rocking motion was not associated with drift concentrations. The MCE results are similar
to the DBE results, although the ✓lock = 4.0% median peak drift profile has a slight concentration
in drifts in the first storey. This results suggests that a large earthquake intensity can cause some
concentrations of drift in HDR structures even if a large amount of rocking is allowed since the
BRBs can still concentrate the demand from higher lateral modes. That being said, the MCE re-
sults shown in Figure 5.9 demonstrate that even with these slight drift concentrations, the frames
that were allowed to rock represent a significant improvement over the fixed base frame.
Peak base rotation
Figure 5.10 shows the mean peak absolute base rotations for each frame. The base rotation was
calculated at each analysis time-step by taking the difference between the column uplift at each
side of the frame and dividing that difference by the frame width. Since many of the peak base
rotations were essentially equal to ✓lock, the mean and mean absolute deviation were used. The
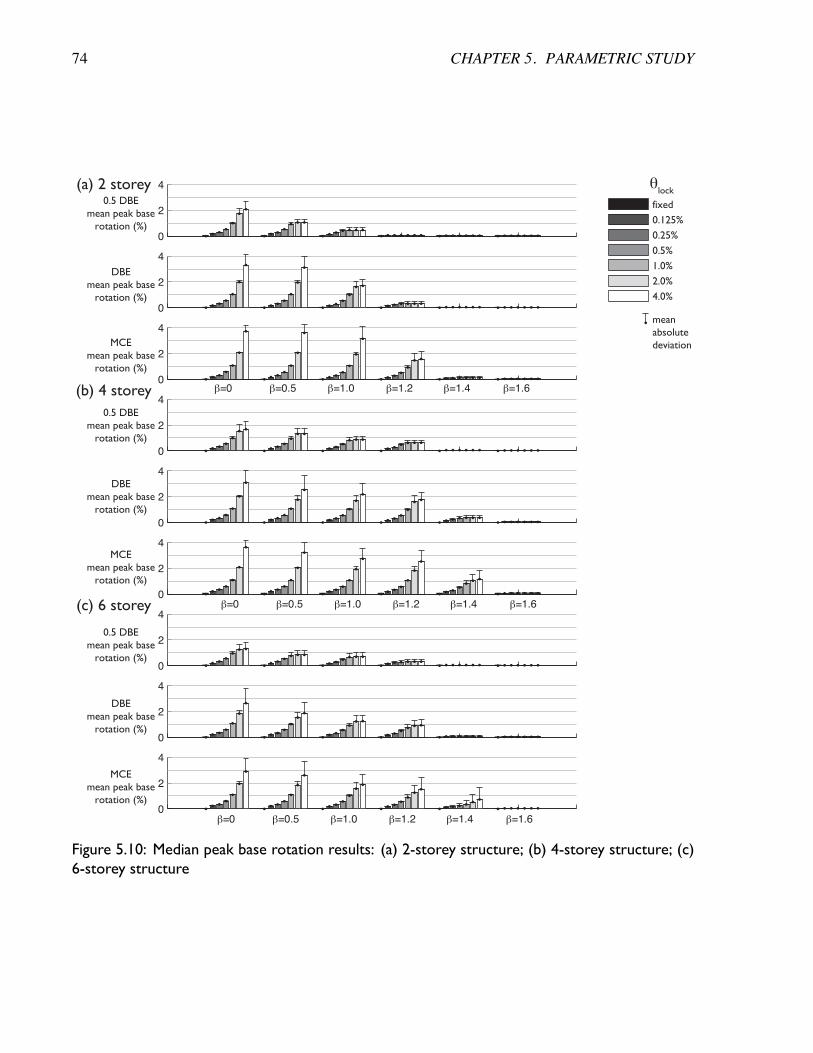
74 CHAPTER 5. PARAMETRIC STUDY
0
2
4
0
2
4
0
2
4
0
2
4
0
2
4
0
2
4
0
2
4
0
2
4
0
2
4
0.5 DBEmean peak base
rotation (%)
DBEmean peak base
rotation (%)
MCEmean peak base
rotation (%)
0.5 DBEmean peak base
rotation (%)
DBEmean peak base
rotation (%)
MCEmean peak base
rotation (%)
0.5 DBEmean peak base
rotation (%)
DBEmean peak base
rotation (%)
MCEmean peak base
rotation (%)
β=0 β=0.5 β=1.0 β=1.2 β=1.4 β=1.6
β=0 β=0.5 β=1.0 β=1.2 β=1.4 β=1.6
β=0 β=0.5 β=1.0 β=1.2 β=1.4 β=1.6
(a) 2 storey
(b) 4 storey
(c) 6 storey
0.125%
0.25%
0.5%
1.0%
2.0%
4.0%
meanabsolutedeviation
fixed
θlock
Figure 5.10: Median peak base rotation results: (a) 2-storey structure; (b) 4-storey structure; (c)6-storey structure
5.3. RESULTS OF PARAMETRIC STUDY 75
results for the 2-storey frame are shown in Figure 5.10(a). The peak base rotations were limited
by the lockup device for lower levels of ✓lock. For example, under DBE, the peak rotations for the
� = 0 models were essentially equal to the ✓lock values (the peak rotations were slightly greater
than ✓lock because of the elastic deformations of the elastic-no-tension and lockup elements) except
for ✓lock = 4.0%, when the peak rotation was less than ✓lock. This is explained by the fact that the
lockups restrained the base rotation only if they were engaged, and the large amount of allowable
rotation for the ✓lock = 4.0% models meant that the lockups were not necessarily engaged. In
general, the peak rotations decreased with increased � and for large � values there was little or no
base rotation at all. Interestingly, for the � = 1.2 models, the base joint was barely engaged under
0.5 DBE, slightly engaged under DBE, and moderately engaged under MCE. This trend can be
understood by looking at the push-pull behaviour of the models in Appendix B. For the 2-storey
� = 1.2 model, the rocking joint engaged after the BRBs yielded, and so the amount of demand
on the rocking joint depended on how much overstrength developed in the BRBs. This effect was
diminished in the larger values of �, (�=1.4 and 1.6), since the rocking joint strength was too strong
to be engaged. These models with high values of � performed similarly to the fixed base structure.
Figure 5.10(b) shows the base rotation results for the 4-storey frame. The results are similar to
the 2-storey frame, although the � = 1.2models engaged the rocking joint before the BRBs yielded
(see Figure B). This difference between the hysteretic response of the 2 and 4-storey structures
was due to the different superstructure strengths (the results are organized by � and not Mb,rock
My
from
Table 5.4, and so a given value of � will have a different Mb,rock
My
ratio for two different frame
designs).
The base rotation results were similar for the 6-storey frame (Figure 5.10(c)). The rotations
were limited by ✓lock for lower ✓lock values, and are less than ✓lock for larger values. As well, the
rotations were reduced with increased �. Notably, the median peak rotation for ✓lock = 4.0% is
less than 4.0% even under MCE for all � values.
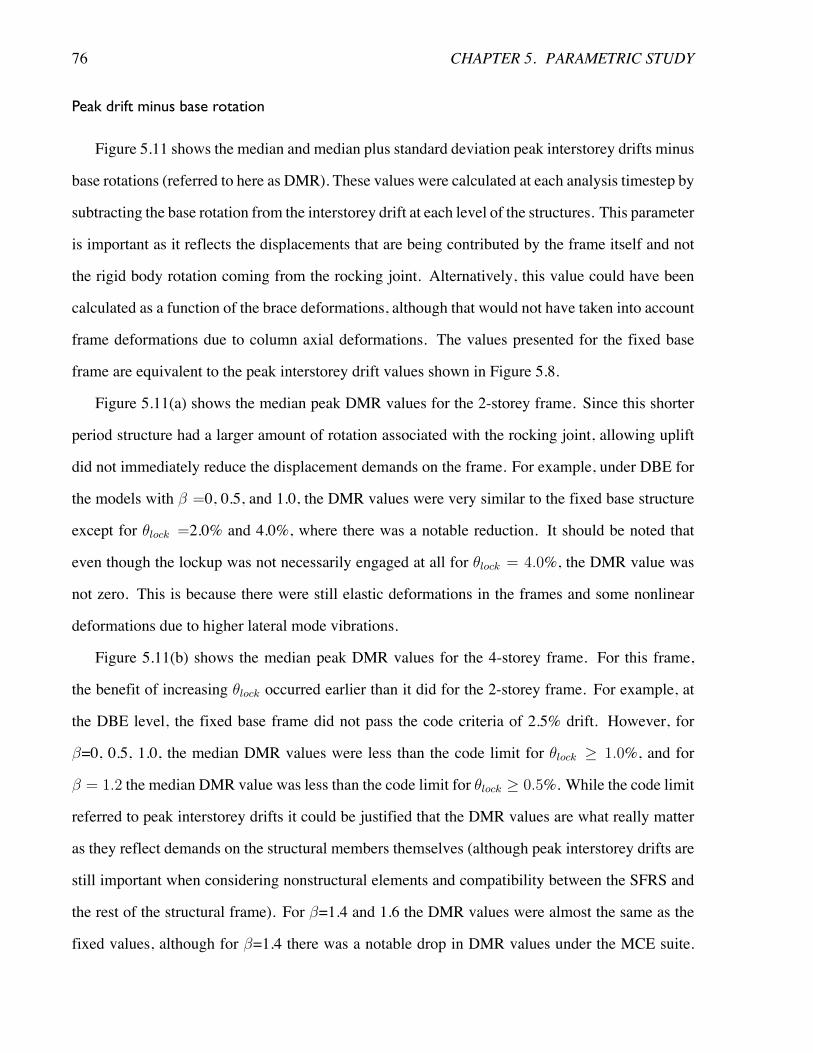
76 CHAPTER 5. PARAMETRIC STUDY
Peak drift minus base rotation
Figure 5.11 shows the median and median plus standard deviation peak interstorey drifts minus
base rotations (referred to here as DMR). These values were calculated at each analysis timestep by
subtracting the base rotation from the interstorey drift at each level of the structures. This parameter
is important as it reflects the displacements that are being contributed by the frame itself and not
the rigid body rotation coming from the rocking joint. Alternatively, this value could have been
calculated as a function of the brace deformations, although that would not have taken into account
frame deformations due to column axial deformations. The values presented for the fixed base
frame are equivalent to the peak interstorey drift values shown in Figure 5.8.
Figure 5.11(a) shows the median peak DMR values for the 2-storey frame. Since this shorter
period structure had a larger amount of rotation associated with the rocking joint, allowing uplift
did not immediately reduce the displacement demands on the frame. For example, under DBE for
the models with � =0, 0.5, and 1.0, the DMR values were very similar to the fixed base structure
except for ✓lock =2.0% and 4.0%, where there was a notable reduction. It should be noted that
even though the lockup was not necessarily engaged at all for ✓lock = 4.0%, the DMR value was
not zero. This is because there were still elastic deformations in the frames and some nonlinear
deformations due to higher lateral mode vibrations.
Figure 5.11(b) shows the median peak DMR values for the 4-storey frame. For this frame,
the benefit of increasing ✓lock occurred earlier than it did for the 2-storey frame. For example, at
the DBE level, the fixed base frame did not pass the code criteria of 2.5% drift. However, for
�=0, 0.5, 1.0, the median DMR values were less than the code limit for ✓lock � 1.0%, and for
� = 1.2 the median DMR value was less than the code limit for ✓lock � 0.5%. While the code limit
referred to peak interstorey drifts it could be justified that the DMR values are what really matter
as they reflect demands on the structural members themselves (although peak interstorey drifts are
still important when considering nonstructural elements and compatibility between the SFRS and
the rest of the structural frame). For �=1.4 and 1.6 the DMR values were almost the same as the
fixed values, although for �=1.4 there was a notable drop in DMR values under the MCE suite.
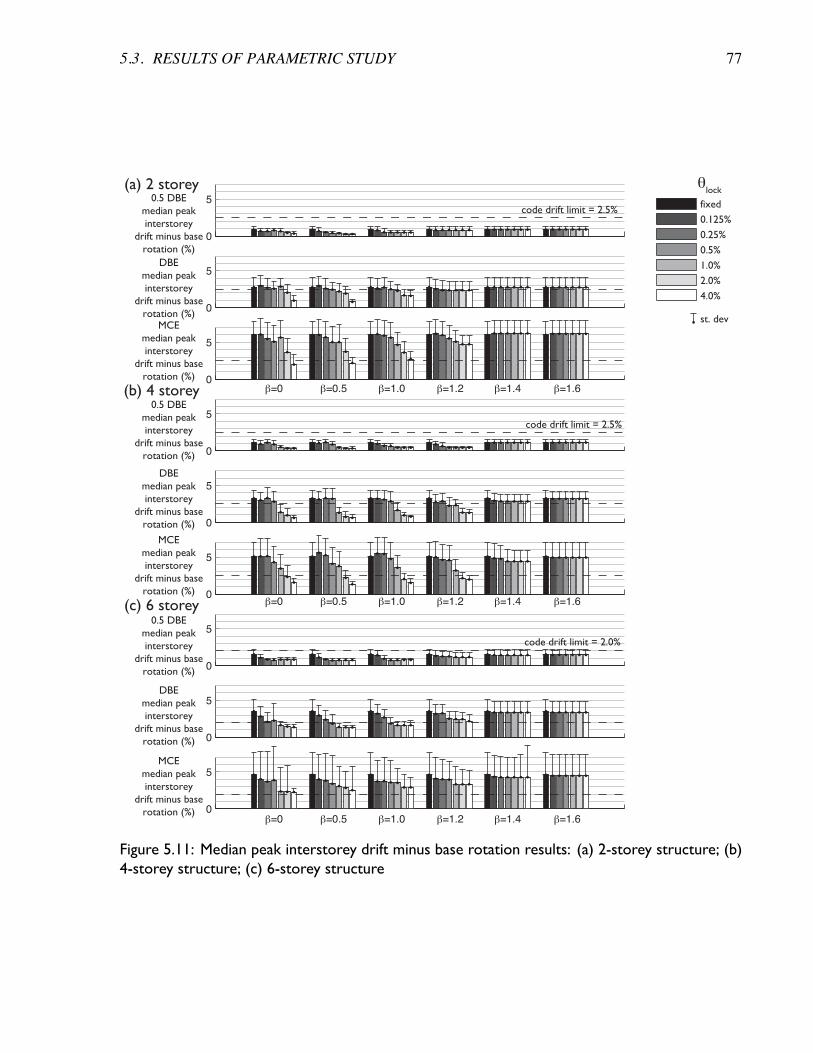
5.3. RESULTS OF PARAMETRIC STUDY 77
0
5
0
5
0
5
0
5
0
5
0
5
0
5
0
5
0
5
0.5 DBEmedian peakinterstorey
drift minus baserotation (%)
DBEmedian peakinterstorey
drift minus baserotation (%)
MCEmedian peakinterstorey
drift minus baserotation (%)
0.5 DBEmedian peakinterstorey
drift minus baserotation (%)
DBEmedian peakinterstorey
drift minus baserotation (%)
MCEmedian peakinterstorey
drift minus baserotation (%)
0.5 DBEmedian peakinterstorey
drift minus baserotation (%)
DBEmedian peakinterstorey
drift minus baserotation (%)
MCEmedian peakinterstorey
drift minus baserotation (%)
(a) 2 storey
(b) 4 storey
(c) 6 storey
β=0 β=0.5 β=1.0 β=1.2 β=1.4 β=1.6
β=0 β=0.5 β=1.0 β=1.2 β=1.4 β=1.6
β=0 β=0.5 β=1.0 β=1.2 β=1.4 β=1.6
0.125%
0.25%
0.5%
1.0%
2.0%
4.0%
st. dev
fixed
θlock
code drift limit = 2.5%
code drift limit = 2.5%
code drift limit = 2.0%
Figure 5.11: Median peak interstorey drift minus base rotation results: (a) 2-storey structure; (b)4-storey structure; (c) 6-storey structure
78 CHAPTER 5. PARAMETRIC STUDY
0.5 DBE Drift minus baserotation (%)
1.0 DBE Drift minus base rotation (%)
MCE Drift minus baserotation (%)
storey
fixedθ
lock=0.125%
θlock
=1.0%
θlock
=4.0%
0 2 4 60
2
4
6
0 2 4 60
2
4
6
0 2 4 60
2
4
6
Figure 5.12: Median drift minus base rotation profiles for 6-storey structure, � = 0
This implies that even if the rocking joint had a larger strength than the superstructure it could still
reduce displacement demands on the frame if it was engaged by a large earthquake. However this
trend essentially disappeared for �=1.6.
Figure 5.11(c) shows the median peak DMR values for the 6-storey frame. Under the 0.5 DBE
suite of records, there was a notable drop in DMR values for small amounts of ✓lock for � 1.0.
Under the DBE suite the DMR values dropped significantly even with a small amount of ✓lock. For
example, for � = 0.5 the DMR value was less than the code drift limit of 2%, while the fixed base
structure median peak drift was greater than 3%. Under the MCE suite the DMR values reduced
less at smaller values of ✓lock since the larger earthquakes engaged the smaller ✓lock lockups. Once
again the � � 1.2 models behaved like the fixed base structures although � = 1.2 still showed
some reduction in DMR values under DBE and MCE.
DMR drift profiles are shown in Figure 5.12, similar to Figure 5.9. These profiles help to
understand how the deformation demands on the SFRS were reduced by allowing column uplift.
Under 0.5 DBE, allowing ✓lock = 0.125% yielded an almost identical profile to the fixed result
although there was a slight reduction in the first storey value, implying that the concentration of
drift at this storey was slightly reduced. Allowing ✓lock = 1.0% and 4.0% greatly reduced the
demands at this lower earthquake level. Under the DBE suite of records it is clear that allowing
more base rotation reduced the demands on the superstructure beginning with the lower stories. The
✓lock = 4.0% model had almost no demand at the middle stories, although there was still demand
at the lower and upper floors — likely due to higher mode effects. Finally, the MCE results were
5.3. RESULTS OF PARAMETRIC STUDY 79
similar to the DBE results, with increased ✓lock greatly reducing the DMR values at the mid-height
of the structure.
Residual drifts
Figure 5.13 shows the median and median plus standard deviation peak residual drift results.
The 2-storey results (Figure 5.13(a)) demonstrate that the residual drifts were not necessarily re-
duced even when the rocking joints were fully self-centering. This phenomena was explained in
Section 3.2.4 and is related to the sensitivity of residual drifts to the individual characteristic of
each earthquake record.
Figure 5.13(b) shows the residual drift results for the 4-storey structure. Under the 0.5 DBE,
DBE, and MCE suites of records the residual drifts increased for smaller values of ✓lock and de-
creased to almost zero for larger values, except for when � � 1.2, when the structure behaved like
the fixed base frame. From this result it becomes apparent that combining the rocking and plastic
ductile mechanisms could have a negative effect on residual drifts. As well, the standard deviations
for most of the models were quite large, reflecting how residual drift results were highly sensitive
to the earthquake record.
The results were more promising for the 6-storey frame (5.13 (c)). While allowing just a small
amount of rocking (✓lock = 0.125%) increased the residuals under the 0.5 DBE suite for � = 1.0,
all other values of ✓lock reduced the residual drifts, even when � � 1.2. Under DBE and MCE the
results were similarly beneficial: increasing ✓lock reduced residual drifts.
Residual base rotations
Even though the drifts contributed from column uplift were intended to be self-centering, they
were not necessarily fully recoverable. Figure 5.14 shows the mean and mean plus absolute devi-
ation residual base rotations results. All of the 2-storey frames (Figure 5.14(a)) experienced negli-
gible residual base rotations. The 4-storey frames (Figure 5.14(b)) experienced some residual base
rotations under the MCE suite for a few of the models. For the 6-storey frames (Figure 5.14(c)),
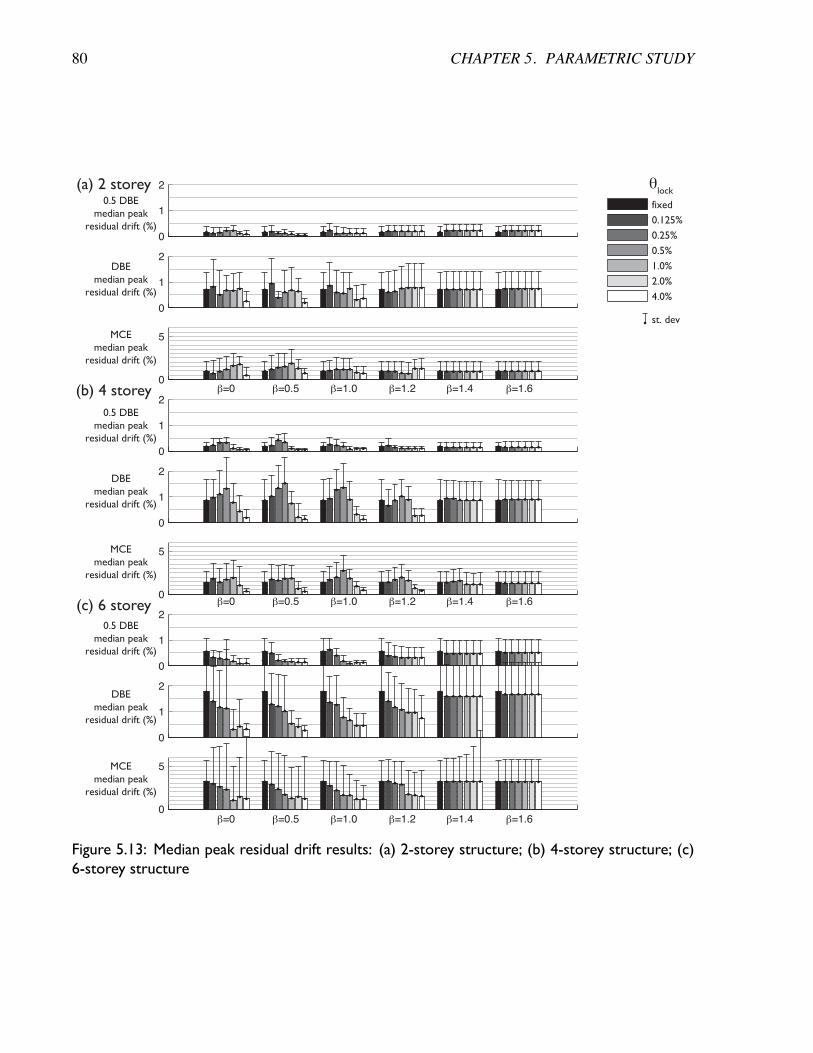
80 CHAPTER 5. PARAMETRIC STUDY
0
1
2
0
1
2
0
5
0
1
2
0
1
2
0
5
0
1
2
0
1
2
0
5
0.5 DBEmedian peak
residual drift (%)
DBEmedian peak
residual drift (%)
MCEmedian peak
residual drift (%)
0.5 DBEmedian peak
residual drift (%)
DBEmedian peak
residual drift (%)
MCEmedian peak
residual drift (%)
0.5 DBEmedian peak
residual drift (%)
DBEmedian peak
residual drift (%)
MCEmedian peak
residual drift (%)
(a) 2 storey
(b) 4 storey
(c) 6 storey
β=0 β=0.5 β=1.0 β=1.2 β=1.4 β=1.6
β=0 β=0.5 β=1.0 β=1.2 β=1.4 β=1.6
β=0 β=0.5 β=1.0 β=1.2 β=1.4 β=1.6
0.125%
0.25%
0.5%
1.0%
2.0%
4.0%
st. dev
fixed
θlock
Figure 5.13: Median peak residual drift results: (a) 2-storey structure; (b) 4-storey structure; (c)6-storey structure
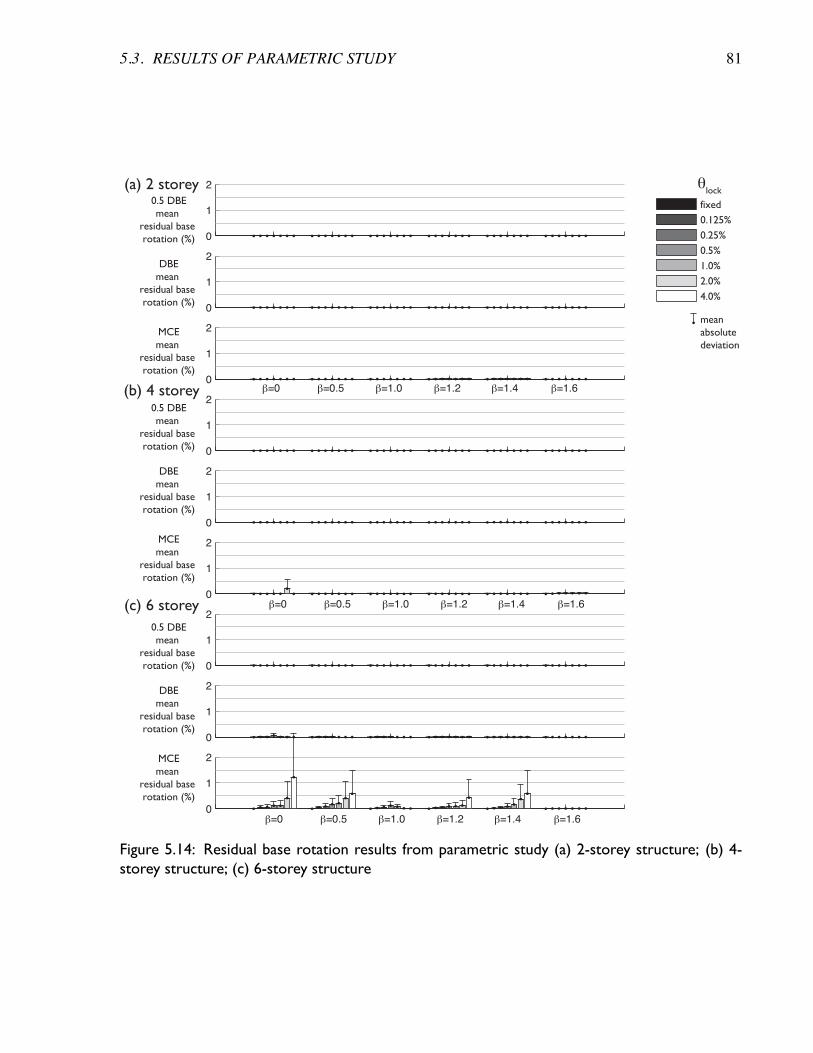
5.3. RESULTS OF PARAMETRIC STUDY 81
0.5 DBEmean
residual base rotation (%)
DBEmean
residual base rotation (%)
MCEmean
residual base rotation (%)
0.5 DBEmean
residual base rotation (%)
DBEmean
residual base rotation (%)
MCEmean
residual base rotation (%)
0.5 DBEmean
residual base rotation (%)
DBEmean
residual base rotation (%)
MCEmean
residual base rotation (%)
β=0 β=0.5 β=1.0 β=1.2 β=1.4 β=1.6
β=0 β=0.5 β=1.0 β=1.2 β=1.4 β=1.6
β=0 β=0.5 β=1.0 β=1.2 β=1.4 β=1.6
(a) 2 storey
(b) 4 storey
(c) 6 storey
0.125%
0.25%
0.5%
1.0%
2.0%
4.0%
meanabsolutedeviation
fixed
θlock
0
1
2
0
1
2
0
1
2
0
1
2
0
1
2
0
1
2
0
1
2
0
1
2
0
1
2
Figure 5.14: Residual base rotation results from parametric study (a) 2-storey structure; (b) 4-storey structure; (c) 6-storey structure
82 CHAPTER 5. PARAMETRIC STUDY
while the median residual base rotations were all near zero for all the models, there were a few
records — especially under the MCE suite — that experienced significant residual base rotations.
During these instances the residual base rotations were equal to the ✓lock value for that model. This
means that the frame essentially became stuck against the lockup on one side. Such a phenom-
ena is a product of the negative stiffness of the systems’ post-rocking response, and implies that
if the lockup were not present a global collapse might have occurred. This phenomena might be
avoidable by incorporating energy dissipation elements with a positive post-yield stiffness.
Global uplift
Figure 5.15 shows the median peak global uplift results for all the structures. Global uplift
was calculated at each analysis timestep as the lesser of the left and right rocking joint vertical
deformations. In general global uplift was negligible except for the lower � values for the 2-storey
frame. The larger global uplift values for this frame were due to the excitation of vertical mass that
is described in more detail in Section 5.4.
Number of records that engaged the lockup device
Figure 5.11 showed how the drift demands experienced by a frame’s ductile elements can be
reduced when a portion of the total drifts are contributed from rigid body rotation associated with
column uplift. In order to fully understand these results, it is important to realized that for a given
✓lock, not every record engaged the lockup. Figure 5.16 shows the number of records that engaged
the lockup device, Nlockup, for each building model and record suite. For small ✓lock values, all or
most of the 10 records engaged the lockup. As ✓lock was increased, less records engaged the lockup.
More records engaged the lockup with increasing earthquake intensity, and less records engaged it
with increased �. For example, for the 4-storey structure (Figure 5.16 (b)), the ✓lock = 1.0% and
� = 0 model engaged the lockup during 9 records under the 0.5 DBE suite, and 10 records under
the DBE and MCE suites. For the 0.5 DBE suite, as � was increasedNlockup dropped from 9 to 7 to
1, and finally to 0 for � > 1.2. In general, the larger � models (�=1.2, 1.4, and 1.6) did not engage
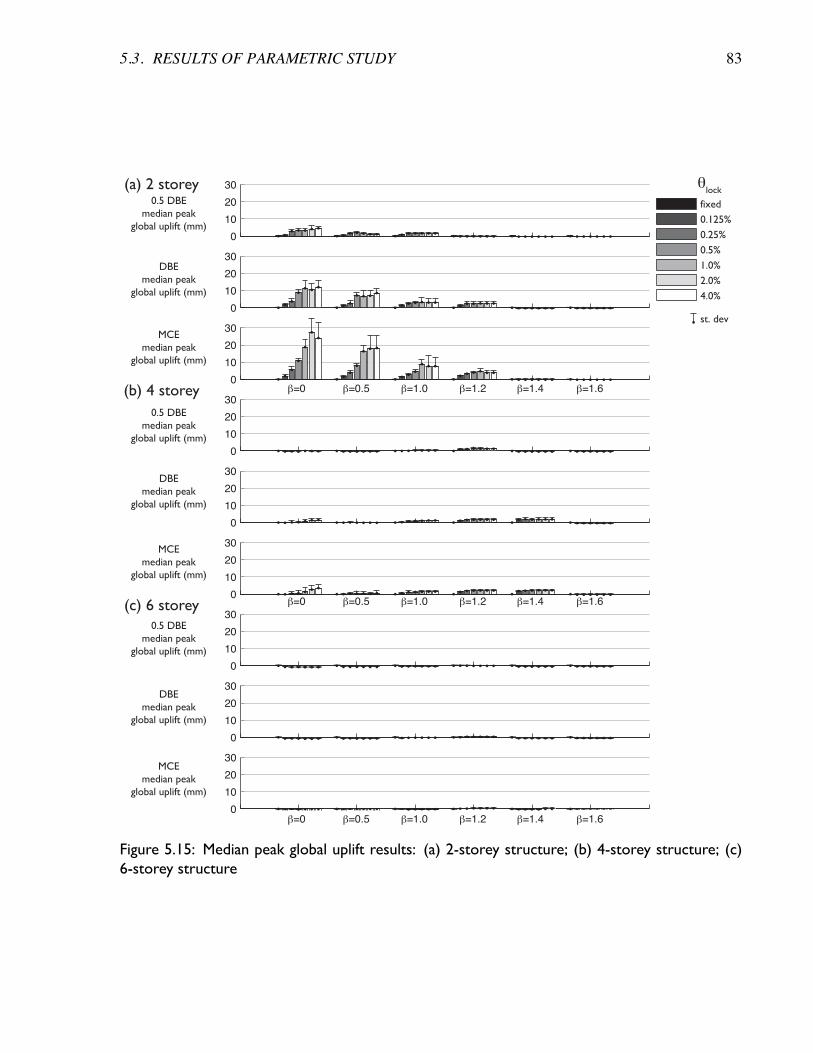
5.3. RESULTS OF PARAMETRIC STUDY 83
0.5 DBEmedian peak
global uplift (mm)
DBEmedian peak
global uplift (mm)
MCEmedian peak
global uplift (mm)
0.5 DBEmedian peak
global uplift (mm)
DBEmedian peak
global uplift (mm)
MCEmedian peak
global uplift (mm)
0.5 DBEmedian peak
global uplift (mm)
DBEmedian peak
global uplift (mm)
MCEmedian peak
global uplift (mm)
(a) 2 storey
(b) 4 storey
(c) 6 storey
β=0 β=0.5 β=1.0 β=1.2 β=1.4 β=1.6
β=0 β=0.5 β=1.0 β=1.2 β=1.4 β=1.6
β=0 β=0.5 β=1.0 β=1.2 β=1.4 β=1.6
0.125%
0.25%
0.5%
1.0%
2.0%
4.0%
st. dev
fixed
θlock
0
10
20
30
0
10
20
30
0
10
20
30
0
10
20
30
0
10
20
30
0
10
20
30
0
10
20
30
0
10
20
30
0
10
20
30
Figure 5.15: Median peak global uplift results: (a) 2-storey structure; (b) 4-storey structure; (c)6-storey structure
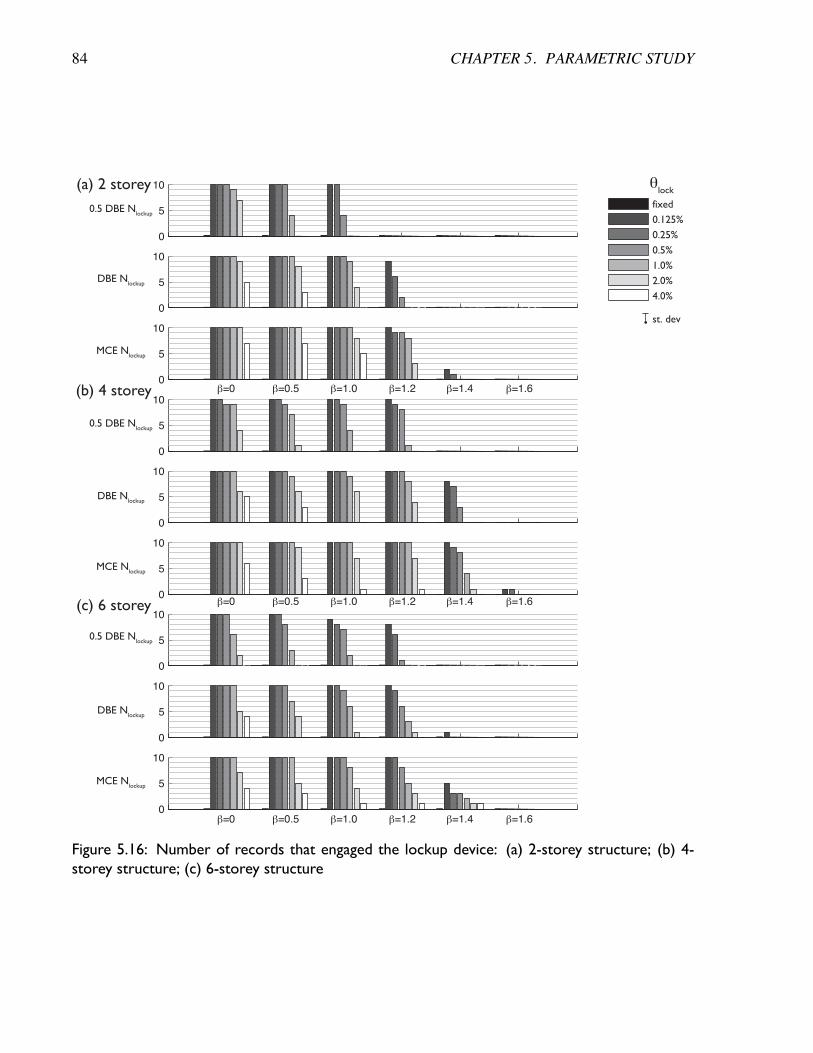
84 CHAPTER 5. PARAMETRIC STUDY
0.5 DBE Nlockup
DBE Nlockup
MCE Nlockup
0.5 DBE Nlockup
DBE Nlockup
MCE Nlockup
0.5 DBE Nlockup
DBE Nlockup
MCE Nlockup
(a) 2 storey
(b) 4 storey
(c) 6 storey
0.125%
0.25%
0.5%
1.0%
2.0%
4.0%
st. dev
β=0 β=0.5 β=1.0 β=1.2 β=1.4 β=1.6
β=0 β=0.5 β=1.0 β=1.2 β=1.4 β=1.6
β=0 β=0.5 β=1.0 β=1.2 β=1.4 β=1.6
θlock
0
5
10
0
5
10
0
5
10
0
5
10
0
5
10
0
5
10
0
5
10
0
5
10
0
5
10
fixed
Figure 5.16: Number of records that engaged the lockup device: (a) 2-storey structure; (b) 4-storey structure; (c) 6-storey structure
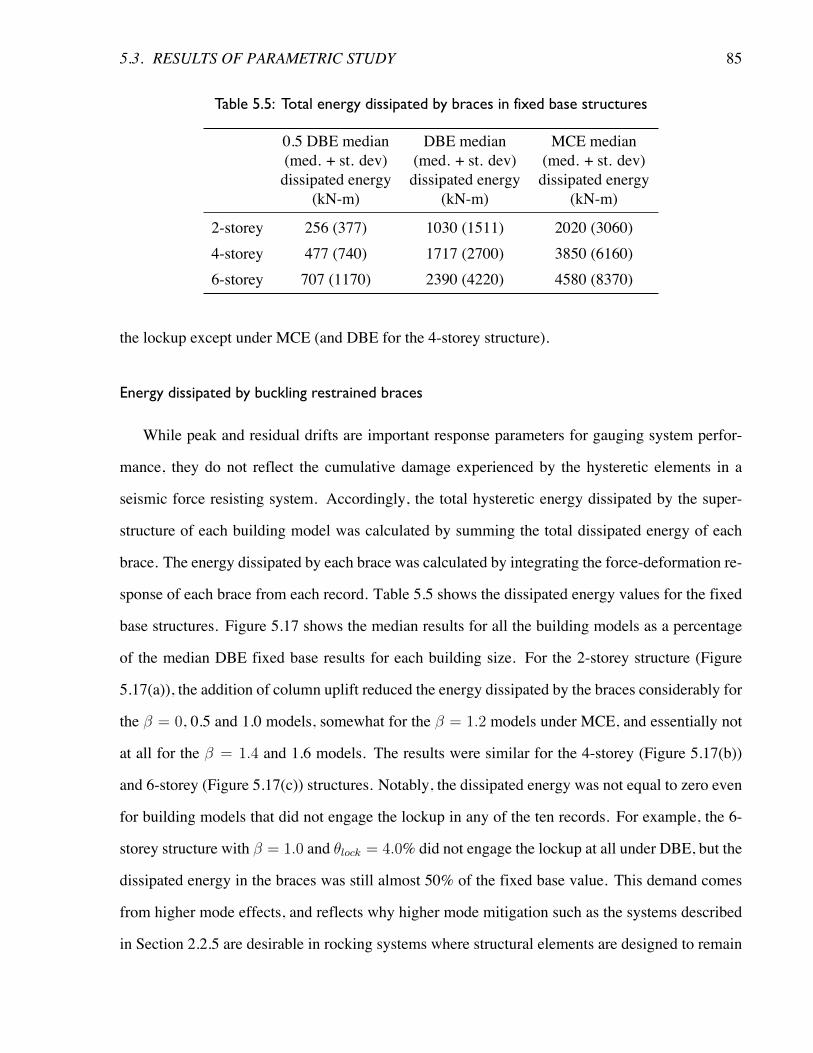
5.3. RESULTS OF PARAMETRIC STUDY 85
Table 5.5: Total energy dissipated by braces in fixed base structures
0.5 DBE median(med. + st. dev)dissipated energy
(kN-m)
DBE median(med. + st. dev)dissipated energy
(kN-m)
MCE median(med. + st. dev)dissipated energy
(kN-m)
2-storey 256 (377) 1030 (1511) 2020 (3060)4-storey 477 (740) 1717 (2700) 3850 (6160)6-storey 707 (1170) 2390 (4220) 4580 (8370)
the lockup except under MCE (and DBE for the 4-storey structure).
Energy dissipated by buckling restrained braces
While peak and residual drifts are important response parameters for gauging system perfor-
mance, they do not reflect the cumulative damage experienced by the hysteretic elements in a
seismic force resisting system. Accordingly, the total hysteretic energy dissipated by the super-
structure of each building model was calculated by summing the total dissipated energy of each
brace. The energy dissipated by each brace was calculated by integrating the force-deformation re-
sponse of each brace from each record. Table 5.5 shows the dissipated energy values for the fixed
base structures. Figure 5.17 shows the median results for all the building models as a percentage
of the median DBE fixed base results for each building size. For the 2-storey structure (Figure
5.17(a)), the addition of column uplift reduced the energy dissipated by the braces considerably for
the � = 0, 0.5 and 1.0 models, somewhat for the � = 1.2 models under MCE, and essentially not
at all for the � = 1.4 and 1.6 models. The results were similar for the 4-storey (Figure 5.17(b))
and 6-storey (Figure 5.17(c)) structures. Notably, the dissipated energy was not equal to zero even
for building models that did not engage the lockup in any of the ten records. For example, the 6-
storey structure with � = 1.0 and ✓lock = 4.0% did not engage the lockup at all under DBE, but the
dissipated energy in the braces was still almost 50% of the fixed base value. This demand comes
from higher mode effects, and reflects why higher mode mitigation such as the systems described
in Section 2.2.5 are desirable in rocking systems where structural elements are designed to remain
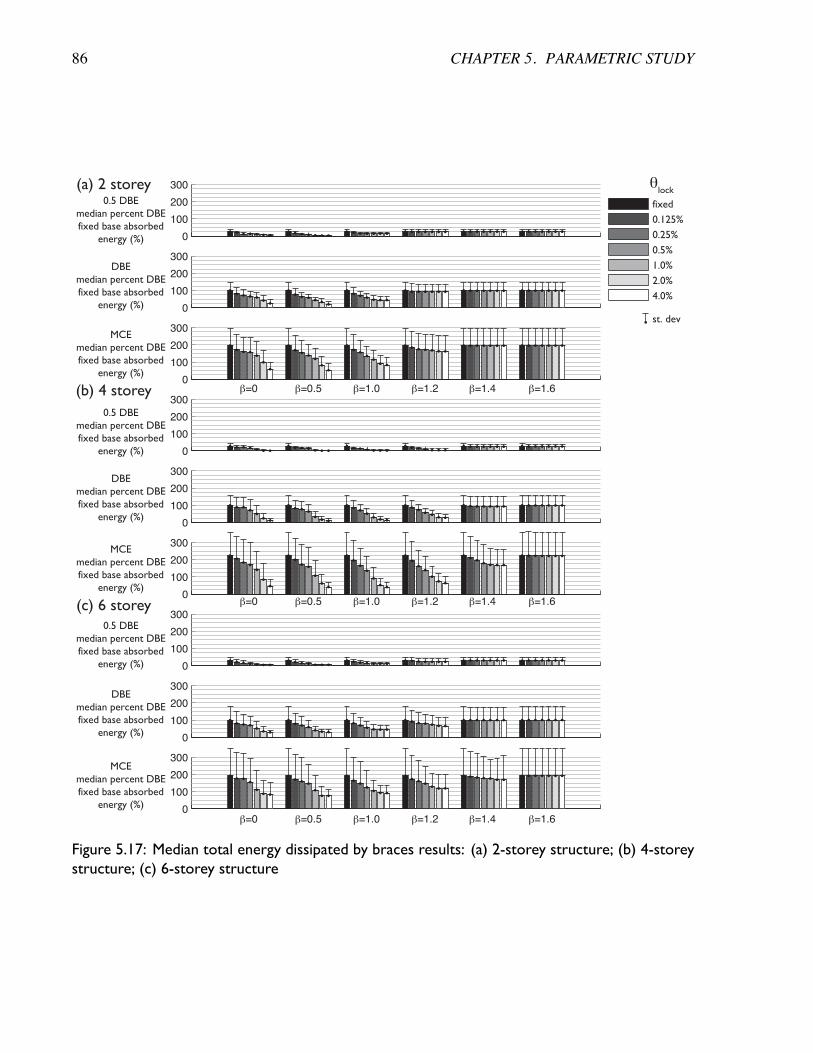
86 CHAPTER 5. PARAMETRIC STUDY
0.5 DBEmedian percent DBEfixed base absorbed
energy (%)
DBEmedian percent DBEfixed base absorbed
energy (%)
MCEmedian percent DBEfixed base absorbed
energy (%)
0.5 DBEmedian percent DBEfixed base absorbed
energy (%)
DBEmedian percent DBEfixed base absorbed
energy (%)
MCEmedian percent DBEfixed base absorbed
energy (%)
0.5 DBEmedian percent DBEfixed base absorbed
energy (%)
DBEmedian percent DBEfixed base absorbed
energy (%)
MCEmedian percent DBEfixed base absorbed
energy (%)
(a) 2 storey
(b) 4 storey
(c) 6 storey
β=0 β=0.5 β=1.0 β=1.2 β=1.4 β=1.6
β=0 β=0.5 β=1.0 β=1.2 β=1.4 β=1.6
β=0 β=0.5 β=1.0 β=1.2 β=1.4 β=1.6
0.125%
0.25%
0.5%
1.0%
2.0%
4.0%
st. dev
fixed
θlock
0
100
200
300
0
100
200
300
0
100
200
300
0
100
200
300
0
100
200
300
0
100
200
300
0
100
200
300
0
100
200
300
0
100
200
300
Figure 5.17: Median total energy dissipated by braces results: (a) 2-storey structure; (b) 4-storeystructure; (c) 6-storey structure
5.3. RESULTS OF PARAMETRIC STUDY 87
essentially elastic. As well, this demand further justifies the benefits of combining rocking with
ductile braces such as BRBs.
TheMCE level results revealed an important conclusion regarding frame collapse performance.
For the 2-storey structure (Figure 5.17(a)) the median dissipated energy dropped from over 200%
the DBE fixed base value to 100% and less for � = 0, � = 0.5, and � = 1.0, and ✓lock � 1.0%.
The results were similar for the 4 and 6-storey frames. While the largest reduction always occurred
at ✓lock = 4.0%, Figure 5.17 shows that there was still a large benefit in terms of dissipated energy
for smaller values of ✓lock. This results suggests that if a conventional fixed base structure was
able to survive a single MCE level event without collapsing (which is the inherent goal of conven-
tional seismic resistant systems), it could withstand two such events if hybrid ductile-rocking was
incorporated.
Maximum foundation tension
Figure 5.18 shows the median and median plus standard deviation of the peak foundation ten-
sion for all the building models. For the models with foundation uplift, this value was calculated as
the sum of the tension induced by the energy dissipation and lockup when engaged. Considering
the principles of capacity design, the force in the lockup device should be no greater than the tensile
force expected in the fixed base structures. In fact if supplemental energy dissipation elements are
provided, the ED elements will reduce the load on the lockup as it pulls down on the frame once it
has yielded in the tension. Consequently, the lockup force should be less than the foundation tension
in the fixed base structure since the braces are not expected to undergo as large nonlinear defor-
mations when rocking is permitted, and thus the overstrength forces applied to the system ought to
be smaller than under fixed-base conditions. The parametric study results, however, show that the
lockup force can exceed that of the fixed-base structure. This is evident from Figure 5.18 as the
foundation tension was amplified in many models compared to the fixed base structure. The forces
were reduced for larger values of ✓lock primarily because not every record engaged the lockup. The
most important amplification of the foundation tension was in the 2-storey frame (Figure 5.18 (a)).
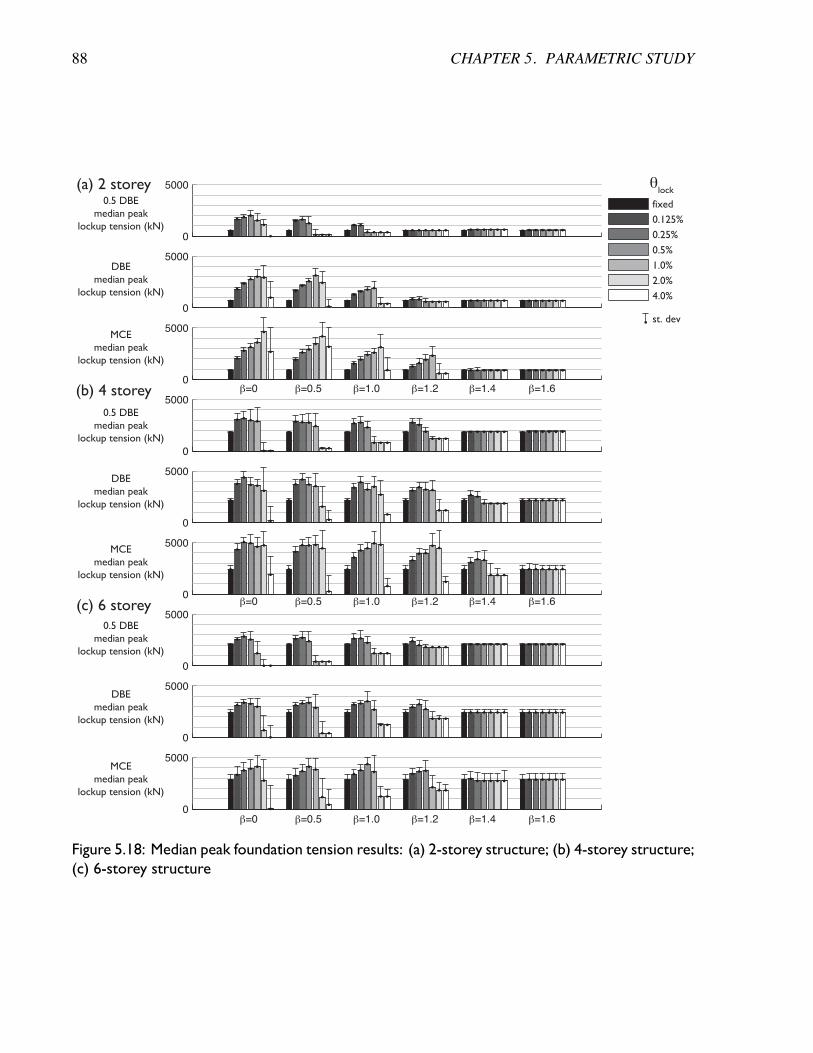
88 CHAPTER 5. PARAMETRIC STUDY
0.5 DBEmedian peak
lockup tension (kN)
DBEmedian peak
lockup tension (kN)
MCEmedian peak
lockup tension (kN)
0.5 DBEmedian peak
lockup tension (kN)
DBEmedian peak
lockup tension (kN)
MCEmedian peak
lockup tension (kN)
0.5 DBEmedian peak
lockup tension (kN)
DBEmedian peak
lockup tension (kN)
MCEmedian peak
lockup tension (kN)
(a) 2 storey
(b) 4 storey
(c) 6 storey
β=0 β=0.5 β=1.0 β=1.2 β=1.4 β=1.6
β=0 β=0.5 β=1.0 β=1.2 β=1.4 β=1.6
β=0 β=0.5 β=1.0 β=1.2 β=1.4 β=1.6
0.125%
0.25%
0.5%
1.0%
2.0%
4.0%
st. dev
fixed
θlock
0
5000
0
5000
0
5000
0
5000
0
5000
0
5000
0
5000
0
5000
0
5000
Figure 5.18: Median peak foundation tension results: (a) 2-storey structure; (b) 4-storey structure;(c) 6-storey structure
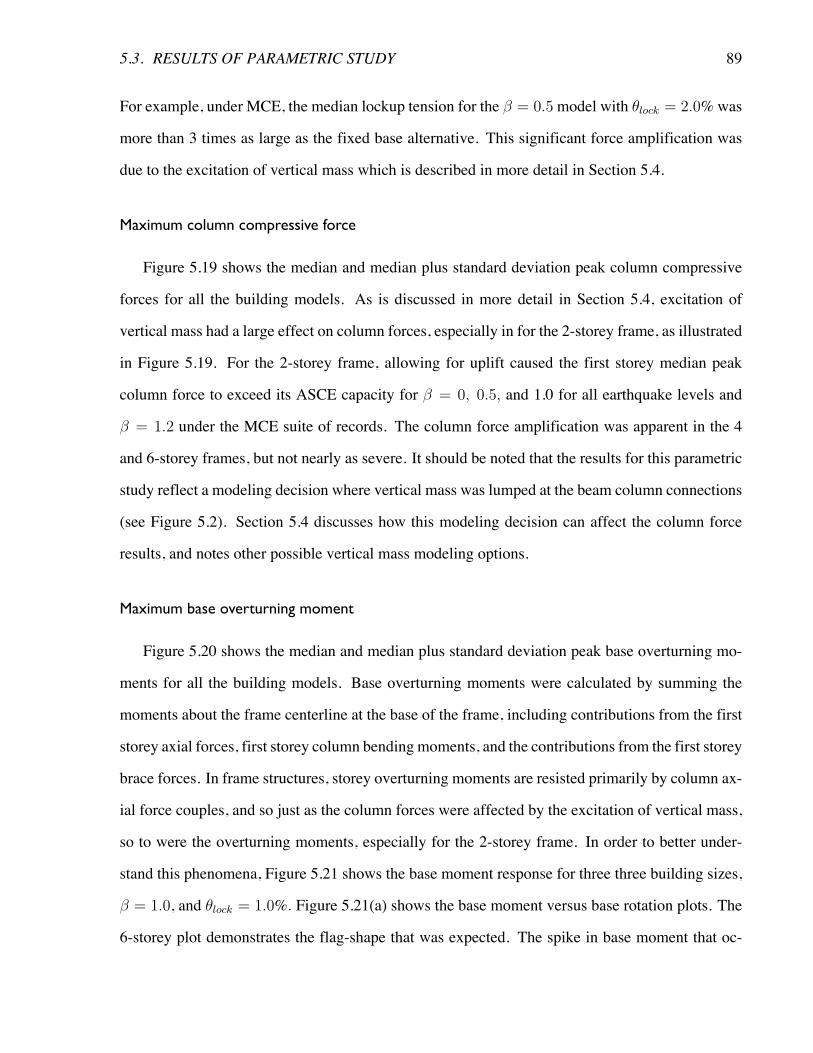
5.3. RESULTS OF PARAMETRIC STUDY 89
For example, under MCE, the median lockup tension for the � = 0.5model with ✓lock = 2.0%was
more than 3 times as large as the fixed base alternative. This significant force amplification was
due to the excitation of vertical mass which is described in more detail in Section 5.4.
Maximum column compressive force
Figure 5.19 shows the median and median plus standard deviation peak column compressive
forces for all the building models. As is discussed in more detail in Section 5.4, excitation of
vertical mass had a large effect on column forces, especially in for the 2-storey frame, as illustrated
in Figure 5.19. For the 2-storey frame, allowing for uplift caused the first storey median peak
column force to exceed its ASCE capacity for � = 0, 0.5, and 1.0 for all earthquake levels and
� = 1.2 under the MCE suite of records. The column force amplification was apparent in the 4
and 6-storey frames, but not nearly as severe. It should be noted that the results for this parametric
study reflect a modeling decision where vertical mass was lumped at the beam column connections
(see Figure 5.2). Section 5.4 discusses how this modeling decision can affect the column force
results, and notes other possible vertical mass modeling options.
Maximum base overturning moment
Figure 5.20 shows the median and median plus standard deviation peak base overturning mo-
ments for all the building models. Base overturning moments were calculated by summing the
moments about the frame centerline at the base of the frame, including contributions from the first
storey axial forces, first storey column bending moments, and the contributions from the first storey
brace forces. In frame structures, storey overturning moments are resisted primarily by column ax-
ial force couples, and so just as the column forces were affected by the excitation of vertical mass,
so to were the overturning moments, especially for the 2-storey frame. In order to better under-
stand this phenomena, Figure 5.21 shows the base moment response for three three building sizes,
� = 1.0, and ✓lock = 1.0%. Figure 5.21(a) shows the base moment versus base rotation plots. The
6-storey plot demonstrates the flag-shape that was expected. The spike in base moment that oc-
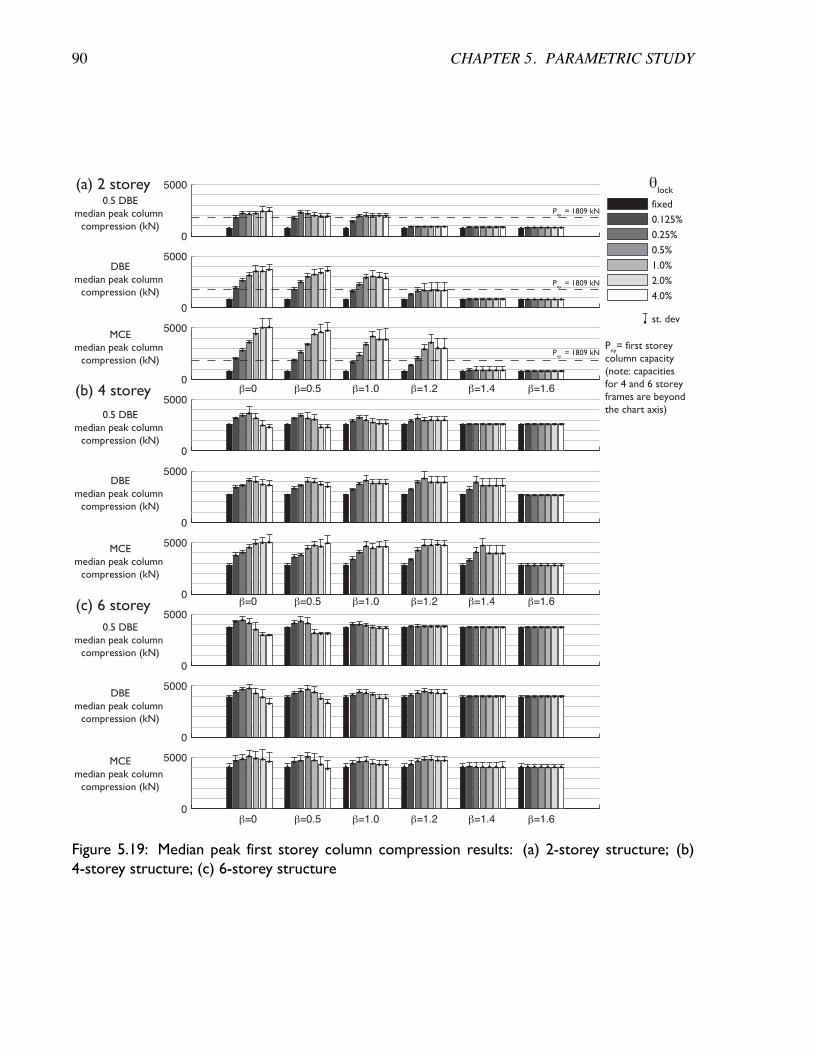
90 CHAPTER 5. PARAMETRIC STUDY
0.5 DBEmedian peak column
compression (kN)
DBEmedian peak column
compression (kN)
MCEmedian peak column
compression (kN)
0.5 DBEmedian peak column
compression (kN)
DBEmedian peak column
compression (kN)
MCEmedian peak column
compression (kN)
0.5 DBEmedian peak column
compression (kN)
DBEmedian peak column
compression (kN)
MCEmedian peak column
compression (kN)
(a) 2 storey
(b) 4 storey
(c) 6 storey
β=0 β=0.5 β=1.0 β=1.2 β=1.4 β=1.6
β=0 β=0.5 β=1.0 β=1.2 β=1.4 β=1.6
β=0 β=0.5 β=1.0 β=1.2 β=1.4 β=1.6
0.125%
0.25%
0.5%
1.0%
2.0%
4.0%
st. dev
fixed
θlock
0
5000
0
5000
0
5000
0
5000
0
5000
0
5000
0
5000
0
5000
0
5000
Pny
= 1809 kN
Pny
= 1809 kN
Pny
= 1809 kNP
ny= first storey
column capacity(note: capacitiesfor 4 and 6 storeyframes are beyondthe chart axis)
Figure 5.19: Median peak first storey column compression results: (a) 2-storey structure; (b)4-storey structure; (c) 6-storey structure
5.3. RESULTS OF PARAMETRIC STUDY 91
0
5x 10
4
0
5x 10
4
0
5x 10
4
0
5x 10
4
0
5x 10
4
0
5x 10
4
0
5x 10
4
0
5x 10
4
0
5x 10
4
0.5 DBEmedian peak base
overturningmoment (kN)
DBEmedian peak base
overturningmoment (kN)
MCEmedian peak base
overturningmoment (kN)
0.5 DBEmedian peak base
overturningmoment (kN)
DBEmedian peak base
overturningmoment (kN)
MCEmedian peak base
overturningmoment (kN)
0.5 DBEmedian peak base
overturningmoment (kN)
DBEmedian peak base
overturningmoment (kN)
MCEmedian peak base
aoverturningmoment (kN)
(a) 2 storey
(b) 4 storey
(c) 6 storey
β=0 β=0.5 β=1.0 β=1.2 β=1.4 β=1.6
β=0 β=0.5 β=1.0 β=1.2 β=1.4 β=1.6
β=0 β=0.5 β=1.0 β=1.2 β=1.4 β=1.6
0.125%
0.25%
0.5%
1.0%
2.0%
4.0%
st. dev
fixed
θlock
My =
7770 kN-m
My =
7770 kN-m
My =
7770 kN-m
My =
22900 kN-m
My =
22900 kN-m
My =
22900 kN-m
My =
28300 kN-m
My =
28300 kN-m
My =
28300 kN-m
My= yield moment
considering nominalbrace strengths
Figure 5.20: Median peak base overturning moment results: (a) 2-storey structure; (b) 4-storeystructure; (c) 6-storey structure
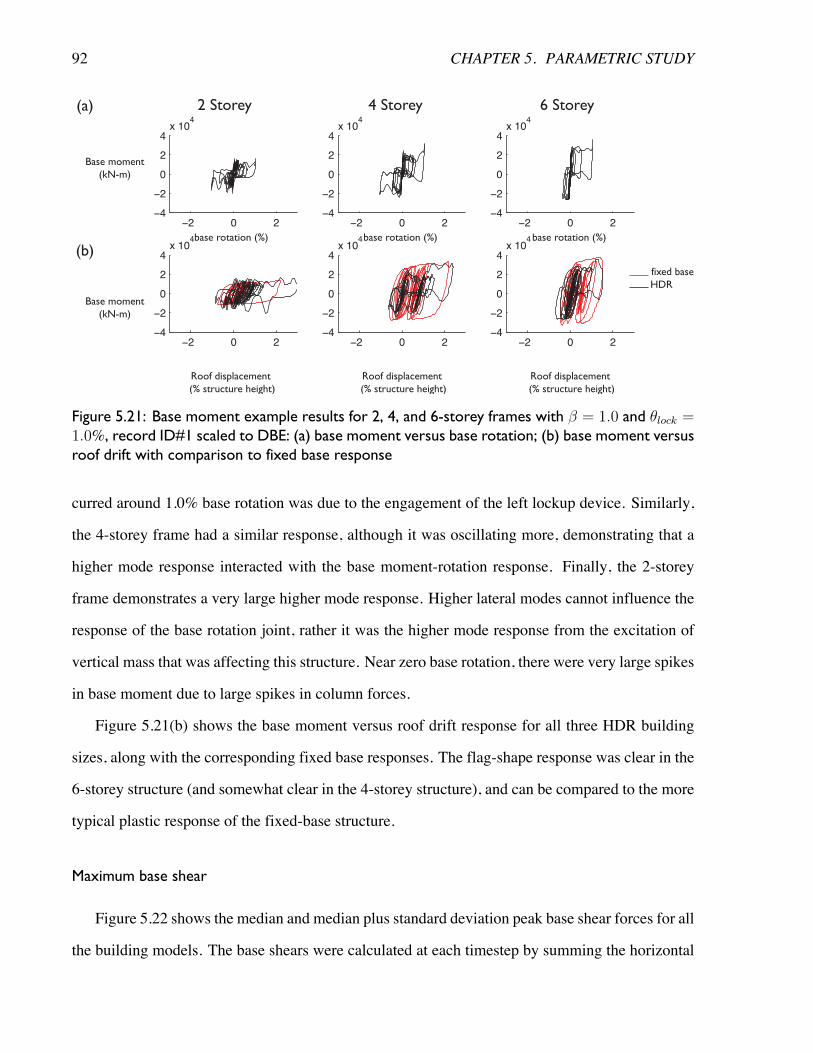
92 CHAPTER 5. PARAMETRIC STUDY
−2 0 2−4
−2
0
2
4x 10
4
−2 0 2−4
−2
0
2
4x 10
4
−2 0 2−4
−2
0
2
4x 10
4
−2 0 2−4
−2
0
2
4x 10
4
−2 0 2−4
−2
0
2
4x 10
4
−2 0 2−4
−2
0
2
4x 10
4
2 Storey 4 Storey 6 Storey
Base moment(kN-m)
Base moment(kN-m)
Roof displacement (% structure height)
(a)
(b)fixed baseHDR
base rotation (%) base rotation (%) base rotation (%)
Roof displacement (% structure height)
Roof displacement (% structure height)
Figure 5.21: Base moment example results for 2, 4, and 6-storey frames with � = 1.0 and ✓lock =1.0%, record ID#1 scaled to DBE: (a) base moment versus base rotation; (b) base moment versusroof drift with comparison to fixed base response
curred around 1.0% base rotation was due to the engagement of the left lockup device. Similarly,
the 4-storey frame had a similar response, although it was oscillating more, demonstrating that a
higher mode response interacted with the base moment-rotation response. Finally, the 2-storey
frame demonstrates a very large higher mode response. Higher lateral modes cannot influence the
response of the base rotation joint, rather it was the higher mode response from the excitation of
vertical mass that was affecting this structure. Near zero base rotation, there were very large spikes
in base moment due to large spikes in column forces.
Figure 5.21(b) shows the base moment versus roof drift response for all three HDR building
sizes, along with the corresponding fixed base responses. The flag-shape response was clear in the
6-storey structure (and somewhat clear in the 4-storey structure), and can be compared to the more
typical plastic response of the fixed-base structure.
Maximum base shear
Figure 5.22 shows the median and median plus standard deviation peak base shear forces for all
the building models. The base shears were calculated at each timestep by summing the horizontal
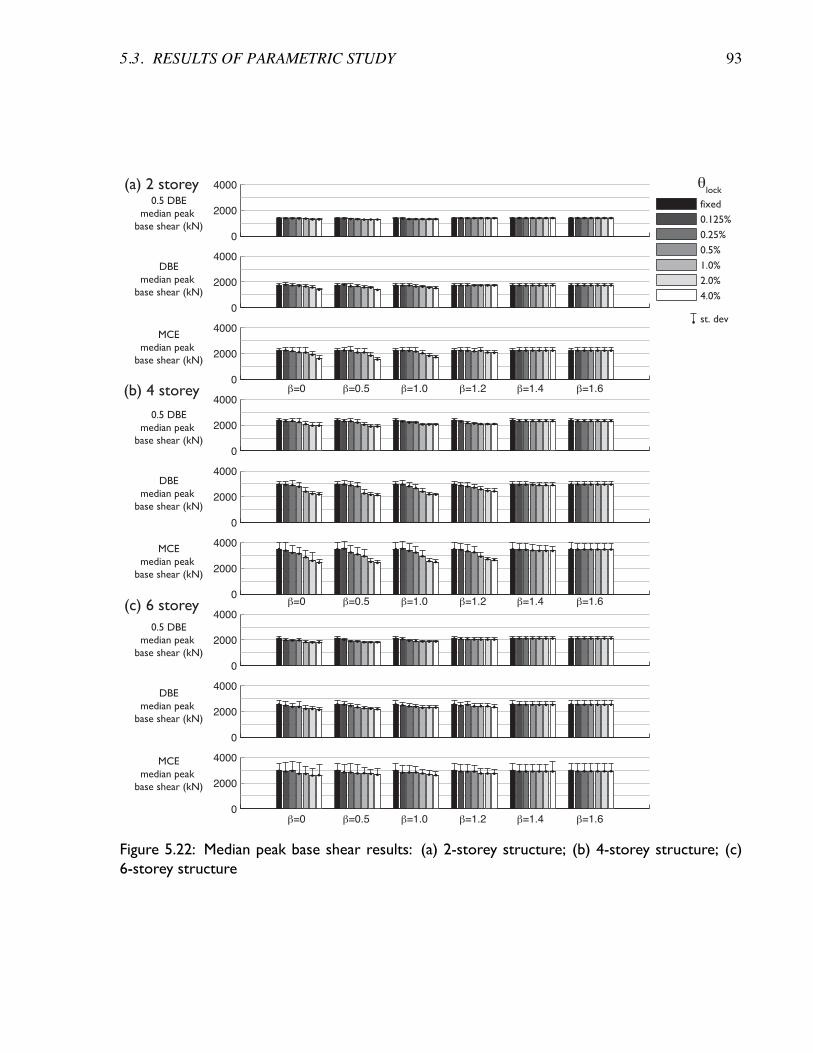
5.3. RESULTS OF PARAMETRIC STUDY 93
0
2000
4000
0
2000
4000
0
2000
4000
0
2000
4000
0
2000
4000
0
2000
4000
0
2000
4000
0
2000
4000
0
2000
4000
0.5 DBEmedian peak
base shear (kN)
DBEmedian peak
base shear (kN)
MCEmedian peak
base shear (kN)
0.5 DBEmedian peak
base shear (kN)
DBEmedian peak
base shear (kN)
MCEmedian peak
base shear (kN)
0.5 DBEmedian peak
base shear (kN)
DBEmedian peak
base shear (kN)
MCEmedian peak
base shear (kN)
(a) 2 storey
(b) 4 storey
(c) 6 storey
β=0 β=0.5 β=1.0 β=1.2 β=1.4 β=1.6
β=0 β=0.5 β=1.0 β=1.2 β=1.4 β=1.6
β=0 β=0.5 β=1.0 β=1.2 β=1.4 β=1.6
0.125%
0.25%
0.5%
1.0%
2.0%
4.0%
st. dev
fixed
θlock
Figure 5.22: Median peak base shear results: (a) 2-storey structure; (b) 4-storey structure; (c)6-storey structure
94 CHAPTER 5. PARAMETRIC STUDY
component of the first storey brace forces and the first storey column shears. The base shears were
similar between the fixed base and HDR structures. This is explained by the fact that in both types
of frames the brace strengths limited the force experienced by the systems. Some reduction in base
shear can be observed in Figure 5.22 for lower � values in all three structures. Even though base
shear was limited by the brace strengths in both the fixed and HDR structures, the HDR structures
reduced the deformation demand on the braces, and thus the base shear was less since the braces did
not necessarily deform plastically as much as in the fixed-base structure, and thus they experienced
less overstrength. This is most apparent during the MCE suite of records where concentrations of
drift in the lower stories were most severe.
Maximum storey accelerations
Figure 5.23 shows the median and median plus standard deviation peak absolute storey accel-
erations for all the building models. The results are very similar for all of the different building
models as the beneficial acceleration control characteristics of the distributed ductility BRBFs were
maintained no matter how much allowable rocking or energy dissipation was provided.
Summary of parametric study conclusions
Considering the response parameters presented in this section, the following general conclu-
sions were drawn.
For models with a rocking strength lower than the superstructure strength (� = 0, 0.5, and 1.0
and � = 1.2 for the 4-storey frame):
• Peak interstorey drifts were similar for all values of ✓lock, although the shorter period 2-
storey frame experienced an increase in peak drifts when there was little or no supplemental
energy dissipation at the level of the rocking joint. This result demonstrates that seismic
displacement demand can be shared between a conventional plastic ductile mechanism and
a rocking mechanism with little or no penalty to peak drifts.
• For the 6-storey frame, peak drifts were generally reduced with increasing ✓lock.
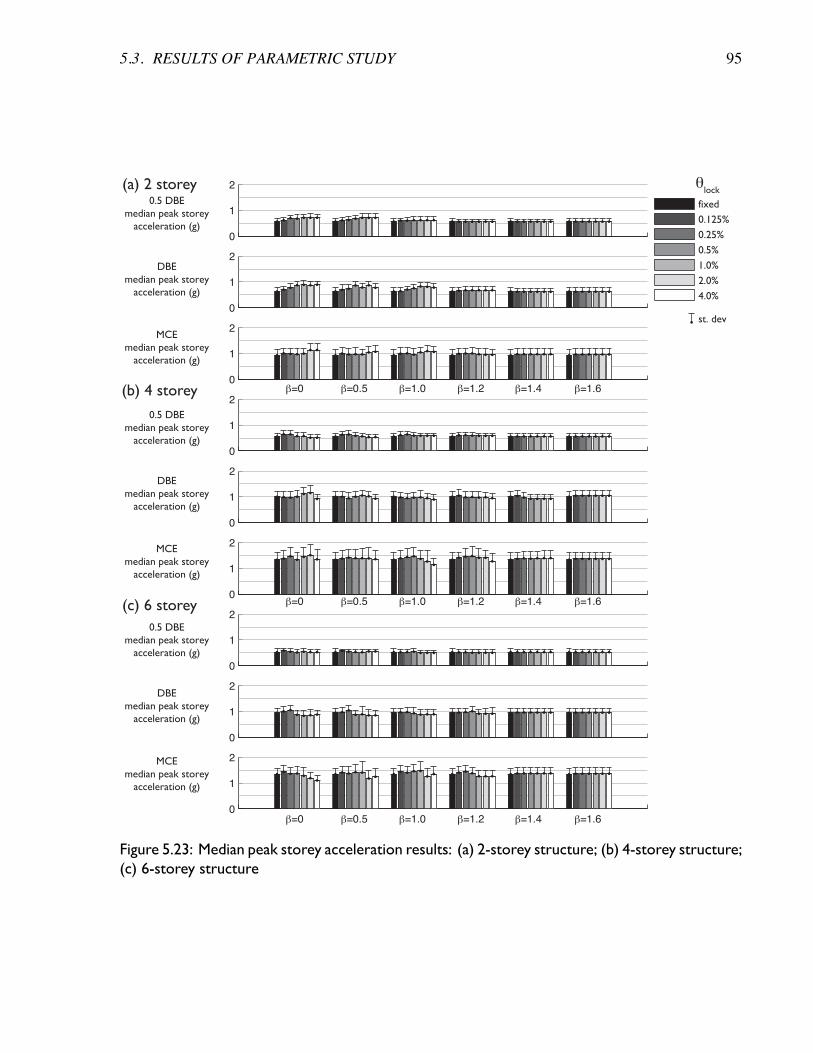
5.3. RESULTS OF PARAMETRIC STUDY 95
0.5 DBEmedian peak storey
acceleration (g)
DBEmedian peak storey
acceleration (g)
MCEmedian peak storey
acceleration (g)
0.5 DBEmedian peak storey
acceleration (g)
DBEmedian peak storey
acceleration (g)
MCEmedian peak storey
acceleration (g)
0.5 DBEmedian peak storey
acceleration (g)
DBEmedian peak storey
acceleration (g)
MCEmedian peak storey
acceleration (g)
(a) 2 storey
(b) 4 storey
(c) 6 storey
β=0 β=0.5 β=1.0 β=1.2 β=1.4 β=1.6
β=0 β=0.5 β=1.0 β=1.2 β=1.4 β=1.6
β=0 β=0.5 β=1.0 β=1.2 β=1.4 β=1.6
0.125%
0.25%
0.5%
1.0%
2.0%
4.0%
st. dev
fixed
θlock
0
1
2
0
1
2
0
1
2
0
1
2
0
1
2
0
1
2
0
1
2
0
1
2
0
1
2
Figure 5.23: Median peak storey acceleration results: (a) 2-storey structure; (b) 4-storey structure;(c) 6-storey structure
96 CHAPTER 5. PARAMETRIC STUDY
• Peak base rotations were limited by the lockup device as well as increased energy dissipation
strength.
• The drift demand on the frame itself (calculated by subtracting the base rotation from the
interstorey drifts), was reduced with increasing ✓lock, although it did not become zero for
large ✓lock due to higher mode demands on the frame and elastic frame deformations.
• Residual drifts were reduced for lower level earthquakes, but not necessarily reduced for
larger earthquakes due to the sensitivity of residual drifts to the characteristics of individual
earthquake records. For many models the residual drifts were increased.
• The residual base rotations were all zero except for a few cases (primarily in the 6-storey
frame under the MCE suite), when the frame became stuck against the lockup.
• The energy dissipated by the BRBs was greatly reduced with increased ✓lock. Under theMCE
suite, the braces dissipated half or less energy than the corresponding fixed base structure for
✓lock � 1.0.
• The foundation tension was amplified compared to the tensile foundation force experienced
by the fixed base structure due to excitation of vertical mass in the models, especially in the
2-storey frame
• The base overturning moment experienced some amplification, especially in the 2-storey
structure, due to the excitation of vertical mass. For the 4 and 6-storey structures with larger
values of ✓lock, the base moment was sometimes reduced.
• The base shear was similar between the fixed and HDR structures, although some reduction
in base shear was noted since the brace’s experience less nonlinear deformations and thus
less overstrength.
• The storey accelerations were similar between the fixed and HDR structures.
5.4. INVESTIGATION OF VERTICAL MASS MODELING ON ANALYSIS RESULTS 97
For models with a rocking strength larger than the superstructure strength, the responses were very
similar to the fixed base structures.
5.4 Investigation of vertical mass modeling on analysis results
It was observed in the analyses that certain response parameters were sensitive to vertical mass
modeling choices. This sensitivity was most pronounced in the 2-storey structure and seemed
to affect the column forces and foundation tension more than other response parameters. Since
rocking includes a vertical displacement along with the horizontal displacement, and since this
thesis considers the dead load of the building as the primary restoring moment after uplift, it is
crucial to discuss if and how vertical mass should be modeled. For the parametric study models,
vertical mass was lumped at beam-column connections. This is in contrast to conventional analysis
practices where mass is typically modeled as a lumped horizontal point mass representing the entire
tributary area of the building, and no vertical mass is considered.
This section presents a review of literature that focusses on rocking structure analyses and tests
that have relied on self-weight for the restoring moment. Examples of a column force amplification
are noted, and decisions and methods for modeling vertical mass are discussed.
A small parametric study is then performed by modeling the 2, 4, and 6, storey structures using
four different vertical mass options, including the lumped assumption from the parametric study.
A discussion of these results is presented.
5.4.1 Literature review of rocking studies relevant to vertical mass modeling
In their test of a 3-storeymoment resisting frame allowed to rock, Kelly and Tsztoo (1977) noted
that the compressive forces in the first storey columns were not critical, although it is apparent from
their column force time-histories that the column forces are greater in compression than tension for
the rocking configurations when dead load is not considered. The support under each column was
alternating layers of steel plate and neoprene rubber epoxied together, designed to cushion the
98 CHAPTER 5. PARAMETRIC STUDY
supports from impact following uplift. The stiffness of these composite pads was about 400 kips/in
(70 kN/mm). The axial stiffness of the first storey column, a W5X16 section 2060 mm long, was
295 kN/mm. Figure 5.24(a) notes a spike in column force upon impact for one test result for a
frame configuration that included a steel energy dissipation device.
Azuhata et al. (2003) studied numerical models of 5-storey moment and braced frames that
had yielding base plates that permitted column uplift. The mass of the structures was modeled by
lumping two thirds of the storey weight at the center of the beams, and one sixth of the weight
at each beam-column joint. It was observed in the numerical results that while tension force in
the columns was limited by the yielding base plates, the compression force was amplified due to
impact. These column spikes were as much as three times the value of the tension force when dead
load was subtracted. An example of these column force spikes can be seen in Figure 5.24(b).
Building on their earlier work, Azuhata et al. (2004) developed prediction models for their
yielding base plate system, and applied those models to the results of a 3-storey shake table test.
Expressions to determine column impact force were determined based on the velocity of the frame
at impact and by considering the excitation of the vertical mass mode along the height of a column.
These expressions conservatively predicted the column compressive forces. Figure 5.24(d) shows
the excited vertical mass mode described in their paper. The authors defined the compressive force
in the base of each column at a given floor, i, as:
N ic = �N i
T + IMPi (5.4.1)
where N iT is the variable and vertical tensile force at the column base on the i-th floor. If there
were no impact effects, thanN ic would be equal to �N i
T as the column forces would effectively be
limited by the rocking joint. In order to estimate IMP i the initial velocity shown in Figure 5.24(d)
is calculated by:
v0 =2⇡
Tuplift
�uplift,max (5.4.2)
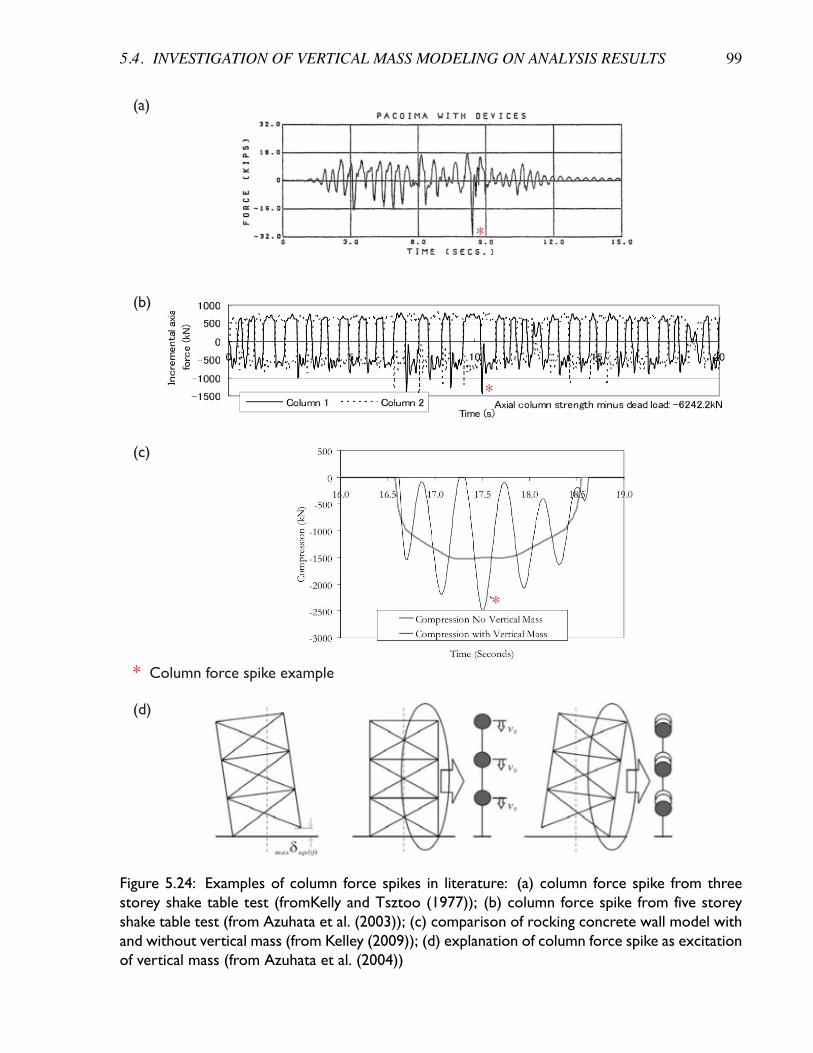
5.4. INVESTIGATION OF VERTICAL MASS MODELING ON ANALYSIS RESULTS 99
(a)
(b)
(c)
(d)
Column force spike example
*
*
*
*
Figure 5.24: Examples of column force spikes in literature: (a) column force spike from threestorey shake table test (fromKelly and Tsztoo (1977)); (b) column force spike from five storeyshake table test (from Azuhata et al. (2003)); (c) comparison of rocking concrete wall model withand without vertical mass (from Kelley (2009)); (d) explanation of column force spike as excitationof vertical mass (from Azuhata et al. (2004))
100 CHAPTER 5. PARAMETRIC STUDY
where, Tuplift is the response vibration period of uplift which can be determined using the
equivalent linear stiffness of the whole system. �uplift,max is the maximum uplift. The maximum
value of IMP i can be evaluated using the maximum vertical deformation of the equivalent one-
mass system of the multi-mass-spring model shown in Figure 5.24(d):
�max =Tv
2⇡vo (5.4.3)
where Tvis the first natural period of the mass-spring model shown in Figure 5.24(d).
Midorikawa et al. (2006) presented the shake table results described by Azuhata et al. (2004),
along with results from a numerical model of these same tests. In their model, mass was placed
at 7 evenly spaced nodes distributed along each beam, and 4 along each column. The test results
again showed spikes in column forces of almost three times the tension force when dead load is not
considered. Their numerical model underestimated these column spikes by 20%.
Poirier (2008) presented a parametric study and shake table test of a viscously damped rocking
braced frame system. The parametric study considered 2, 4, and 6-storey frame heights in Van-
couver, Montreal, and Los Angeles. Vertical mass was not modeled for this study. However, for
the 2-storey shake table test, vertical mass was modeled by considering point masses at the beam-
column connections. Interestingly, while the numerical model predicted the drift response well,
it significantly underestimated the axial force response of the columns and braces as compared
to the experimental values, although the axial force response was predicted well under sinusoidal
and triangular input. The authors attributed this discrepancy to a high frequency response that was
not measured in the experimental program and concluded that the model could benefit from added
damping in the higher modes.
Kelley (2009) presented design guidelines for rocking walls and included the results of non-
linear time-history analysis on walls ranging from 1 to 6-storeys. These analyses did not consider
vertical mass, as per normal design office practice, but the effect of vertical mass was considered
on a subset of analyses. Figure 5.24(c) shows how including vertical mass caused a high frequency
response in the compressive reaction force, which was significantly larger than the maximum com-
5.4. INVESTIGATION OF VERTICAL MASS MODELING ON ANALYSIS RESULTS 101
pression without vertical mass. It was noted that the actual behavior of impact is more complex
than that which was captured by simply adding vertical mass to the model. Soil nonlinearity and
radiation damping, for example, would reduce the high frequency column resonance, and thus the
column force is likely to be less than what was predicted in the analyses.
The above references highlight how vertical mass can be excited by rocking motion, and that
different modeling choices will have different results for some response parameters, especially
column forces.
5.4.2 Parametric study on vertical mass modeling
A parametric study was performed on a few of the structures considered in this thesis in order to
investigate how vertical mass modeling choices influenced the dynamic analysis results. The 2, 4,
and 6-storey structures were modeled with four different vertical mass configurations. These mod-
els were allowed to uplift with a lockup at 1% allowable rotation, and no energy dissipation was
considered. The four different modeling choices are shown in Figure 5.25 for the 2-storey struc-
ture, and were determined based on the references noted above. The modeling choices are referred
to here as M1, M2, M3, and M4. An extra bay of gravity frame on each side of the braced frame
was modeled along with the lateral-force-resisting-system in order to more accurately capture how
the tributary vertical mass relates to the lateral system. In all scenarios the tributary gravity load
was modeled as point loads at the beam column connections. This decision was justified since the
load in the column (and thus the restoring moment after uplift) can relatively reliably be determined
from the tributary area of the columns no matter how much of that tributary mass is excited verti-
cally. Horizontal mass was modeled on the leaning columns, not shown in Figure 5.25. Note that
the gravity loads on the structures (in red in Figure 5.25) are larger than the weight of the associated
masses (in gray in Figure 5.25) since they were calculated considering 25% of the live load, while
the masses consider only the dead load, as per common analysis practice (although it is noted that
live load could potentially contribute an inertial response if excited vertically). All beam-column
connections were pins, and all columns were pinned at their base. Composite slab action was not
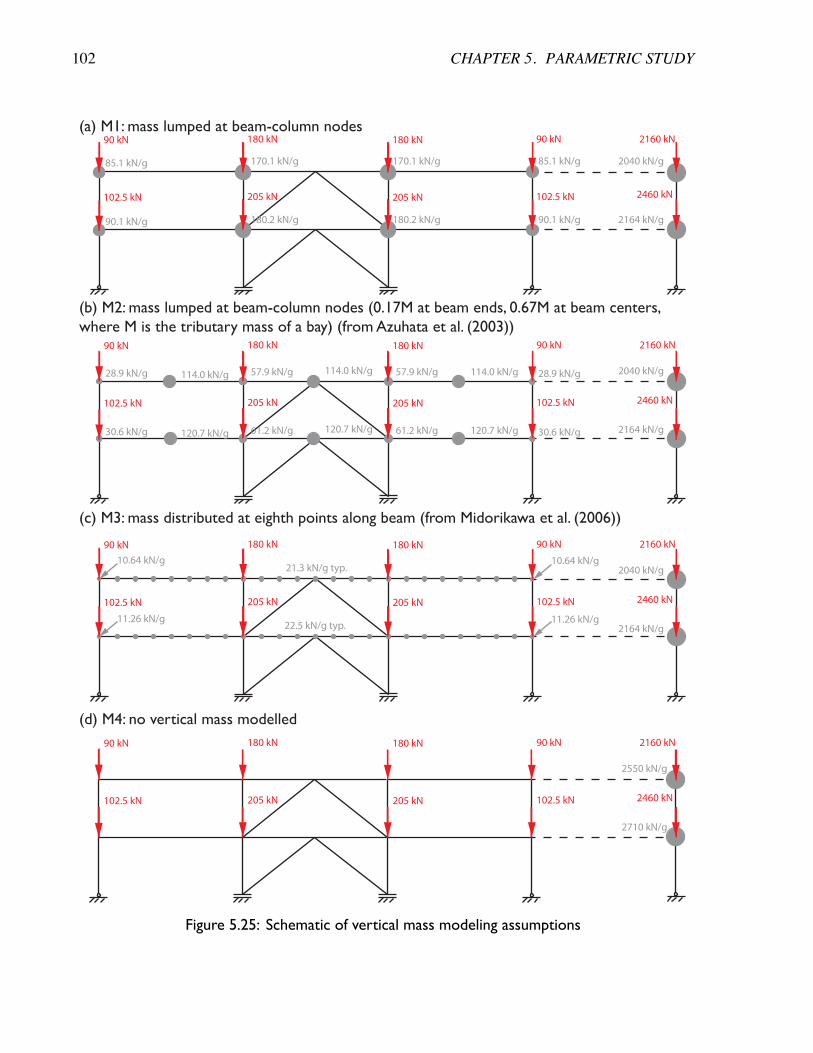
102 CHAPTER 5. PARAMETRIC STUDY
(a) M1: mass lumped at beam-column nodes
(b) M2: mass lumped at beam-column nodes (0.17M at beam ends, 0.67M at beam centers,where M is the tributary mass of a bay) (from Azuhata et al. (2003))
(c) M3: mass distributed at eighth points along beam (from Midorikawa et al. (2006))
(d) M4: no vertical mass modelled
90 kN
102.5 kN
90 kN 2160 kN
102.5 kN 2460 kN
180 kN
205 kN
180 kN
205 kN
90 kN
102.5 kN
90 kN 2160 kN
102.5 kN 2460 kN
180 kN
205 kN
180 kN
205 kN
90 kN
102.5 kN
90 kN 2160 kN
102.5 kN 2460 kN
180 kN
205 kN
180 kN
205 kN
90 kN
102.5 kN
90 kN 2160 kN
102.5 kN 2460 kN
180 kN
205 kN
180 kN
205 kN
85.1 kN/g 85.1 kN/g
90.1 kN/g
28.9 kN/g
30.6 kN/g
10.64 kN/g
22.5 kN/g typ.11.26 kN/g
21.3 kN/g typ.
28.9 kN/g
30.6 kN/g
114.0 kN/g
120.7 kN/g
57.9 kN/g
61.2 kN/g
57.9 kN/g
61.2 kN/g
114.0 kN/g
120.7 kN/g
114.0 kN/g
120.7 kN/g
170.1 kN/g
180.2 kN/g
170.1 kN/g
180.2 kN/g 90.1 kN/g
2040 kN/g
2164 kN/g
2040 kN/g
2164 kN/g
2040 kN/g
2164 kN/g
2550 kN/g
2710 kN/g
10.64 kN/g
11.26 kN/g
Figure 5.25: Schematic of vertical mass modeling assumptions
5.4. INVESTIGATION OF VERTICAL MASS MODELING ON ANALYSIS RESULTS 103
considered as a simplifying assumption, although it should be noted that the most accurate rep-
resentation of vertical mass excitation should consider the added stiffness and strength associated
with composite action, as well as the the stiffness of the slab across the the beam-column joints that
is not considered in these analyses since beams were assumed to be pinned. The structures were
subjected to ground motion ID#2 scaled to DBE (see Figure 4.4).
Responses considered in this analysis were the first storey left column axial force, the left lockup
device force, the first storey left brace force and deformation, and the first storey horizontal acceler-
ation recorded at the leaning column where the horizontal mass was placed. Figures 5.26, 5.27, and
5.28 show the time history results for the three structures for the first 20 seconds of the response.
It is clear from these responses that the vertical mass modeling seemed to have a large affect on
the 2-storey structure’s response, but minimal affect on the 4 and 6-storey responses. The column
forces in the two storey frame were amplified in compression, and that amplification is greatly de-
pendent on the vertical mass modeling choice. M1, the lumped mass assumption, yields the largest
amplification of column forces.ed
Figure 5.29 shows the peak interstorey drift profiles for the three structures with different mass
modeling assumptions. The drift profiles for the three structures were not greatly affected by the
different vertical mass modeling choices, although the 2-storey structure was more affected than
the 4 and 6-storey structures.
The peak results of the study can be compared in Table 5.6 . It can be seen from these results
that for the 2-storey structure that the M1 andM2 configurations caused the column force to exceed
the code capacity of 1809 kN. The peak compressive force in the M1 configuration was 4320 kN,
a greater than 500% increase over the peak compressive force for the M4 configuration of 797
kN, where no vertical mass was modeled. For the four storey structure the M1 compressive force
exceeded the M4 force by 26.6%, and for the six storey structure the M1 compressive force was
very similar to the M4 force.
Similarly to the column compressive force, the force in the lockup device was also greatly
influenced by themodeling of vertical mass. For the 2-storey structure themaximum tensile force in
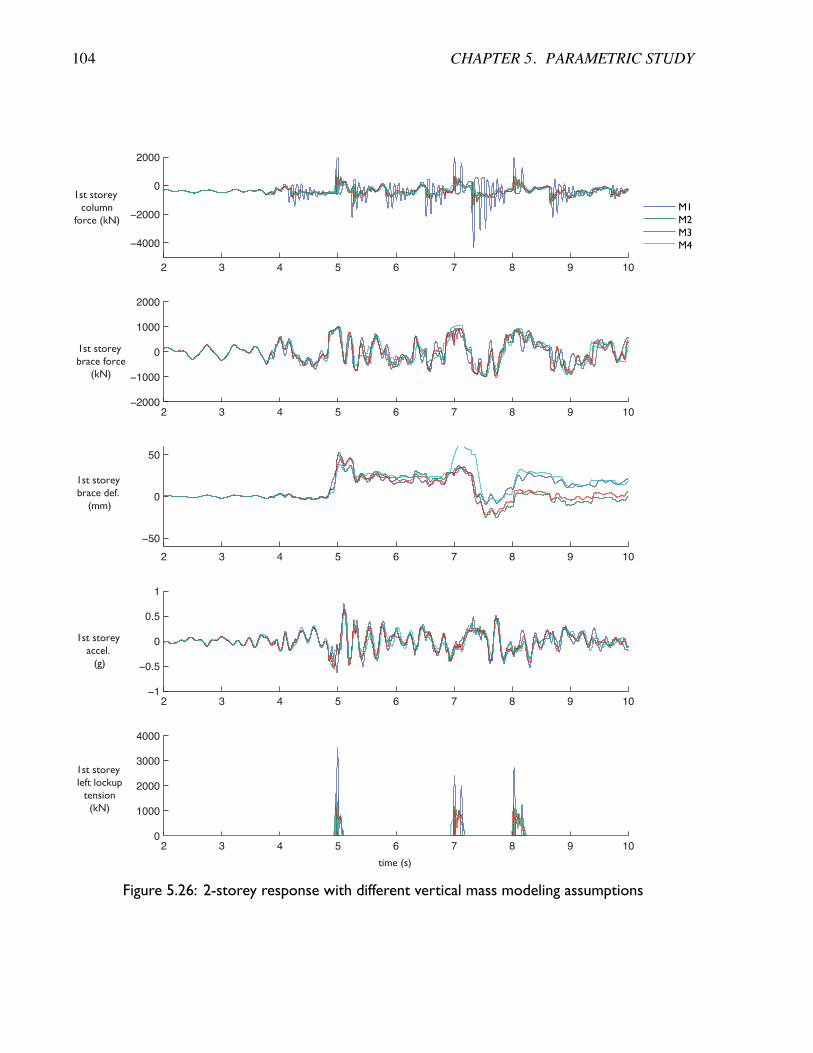
104 CHAPTER 5. PARAMETRIC STUDY
1st storey column
force (kN)
1st storey brace force
(kN)
1st storey brace def.
(mm)
time (s)
1st storey accel.
(g)
1st storey left lockup
tension(kN)
M1M2M3M4
2 3 4 5 6 7 8 9 10
−4000
−2000
0
2000
2 3 4 5 6 7 8 9 10−2000
−1000
0
1000
2000
2 3 4 5 6 7 8 9 10
−50
0
50
2 3 4 5 6 7 8 9 10−1
−0.5
0
0.5
1
2 3 4 5 6 7 8 9 100
1000
2000
3000
4000
Figure 5.26: 2-storey response with different vertical mass modeling assumptions
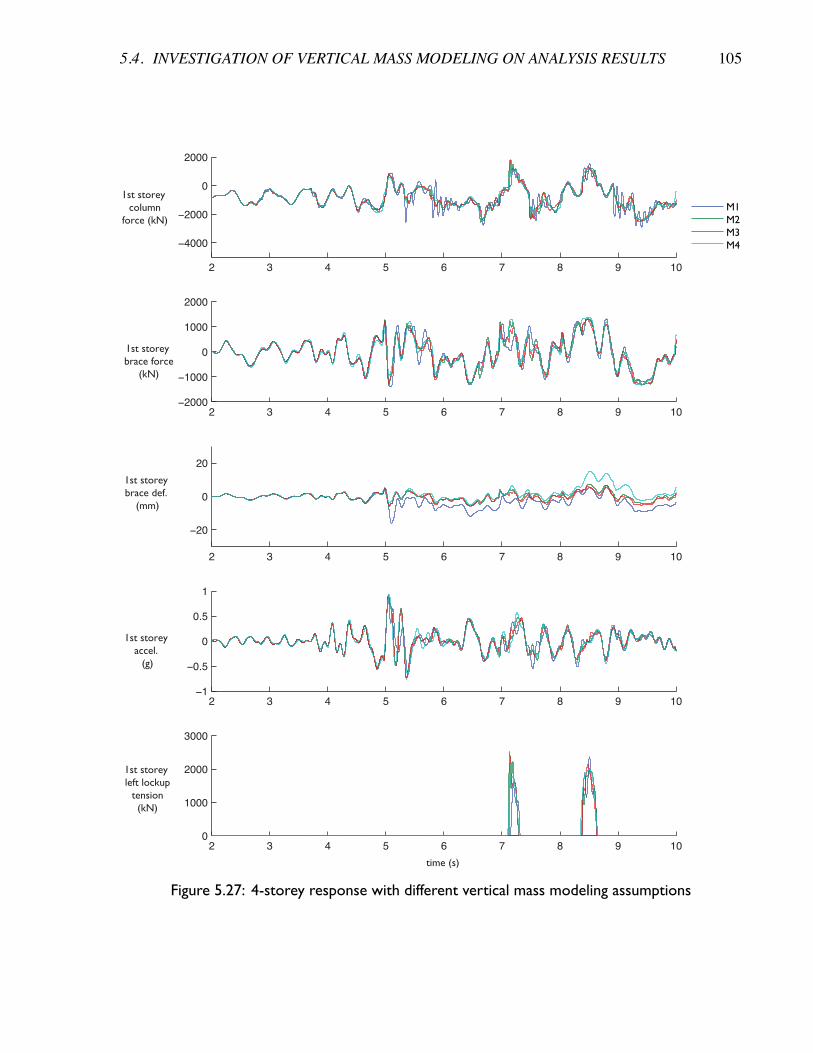
5.4. INVESTIGATION OF VERTICAL MASS MODELING ON ANALYSIS RESULTS 105
1st storey column
force (kN)
1st storey brace force
(kN)
1st storey brace def.
(mm)
time (s)
1st storey accel.
(g)
1st storey left lockup
tension(kN)
M1M2M3M4
2 3 4 5 6 7 8 9 10
−4000
−2000
0
2000
2 3 4 5 6 7 8 9 10−2000
−1000
0
1000
2000
2 3 4 5 6 7 8 9 10
−20
0
20
2 3 4 5 6 7 8 9 10−1
−0.5
0
0.5
1
2 3 4 5 6 7 8 9 100
1000
2000
3000
Figure 5.27: 4-storey response with different vertical mass modeling assumptions
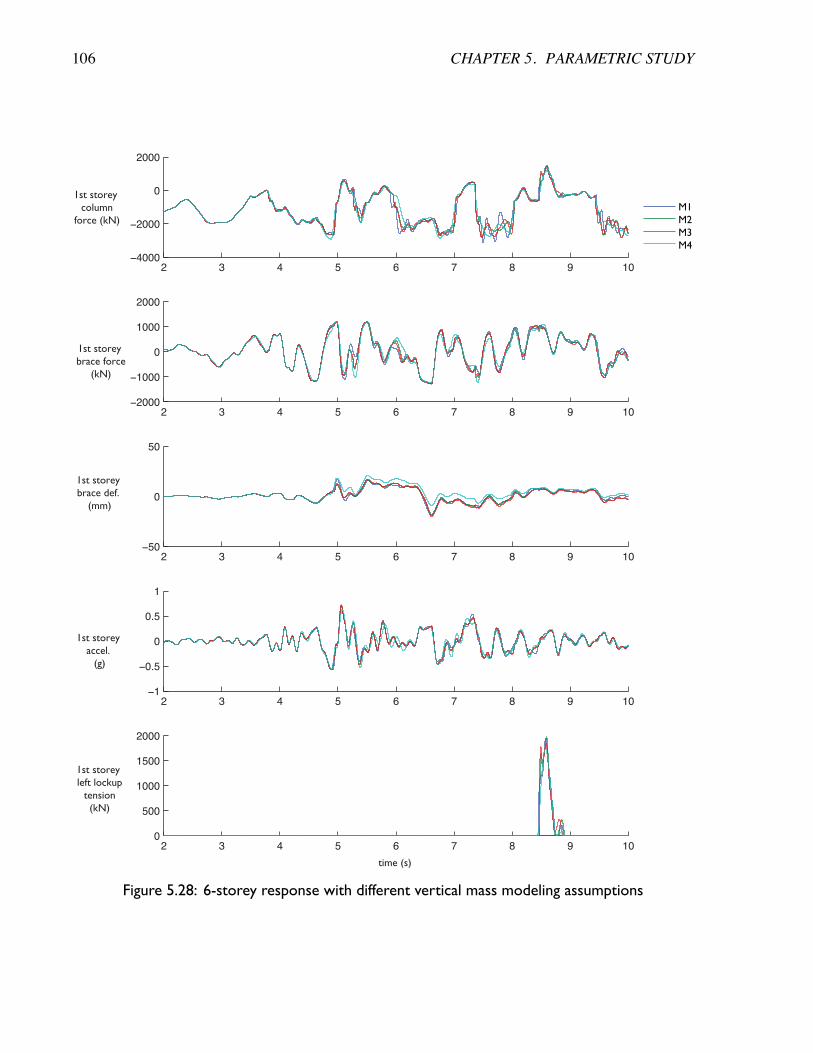
106 CHAPTER 5. PARAMETRIC STUDY
1st storey column
force (kN)
1st storey brace force
(kN)
1st storey brace def.
(mm)
time (s)
1st storey accel.
(g)
1st storey left lockup
tension(kN)
M1M2M3M4
2 3 4 5 6 7 8 9 10−4000
−2000
0
2000
2 3 4 5 6 7 8 9 10−2000
−1000
0
1000
2000
2 3 4 5 6 7 8 9 10−50
0
50
2 3 4 5 6 7 8 9 10−1
−0.5
0
0.5
1
2 3 4 5 6 7 8 9 100
500
1000
1500
2000
Figure 5.28: 6-storey response with different vertical mass modeling assumptions
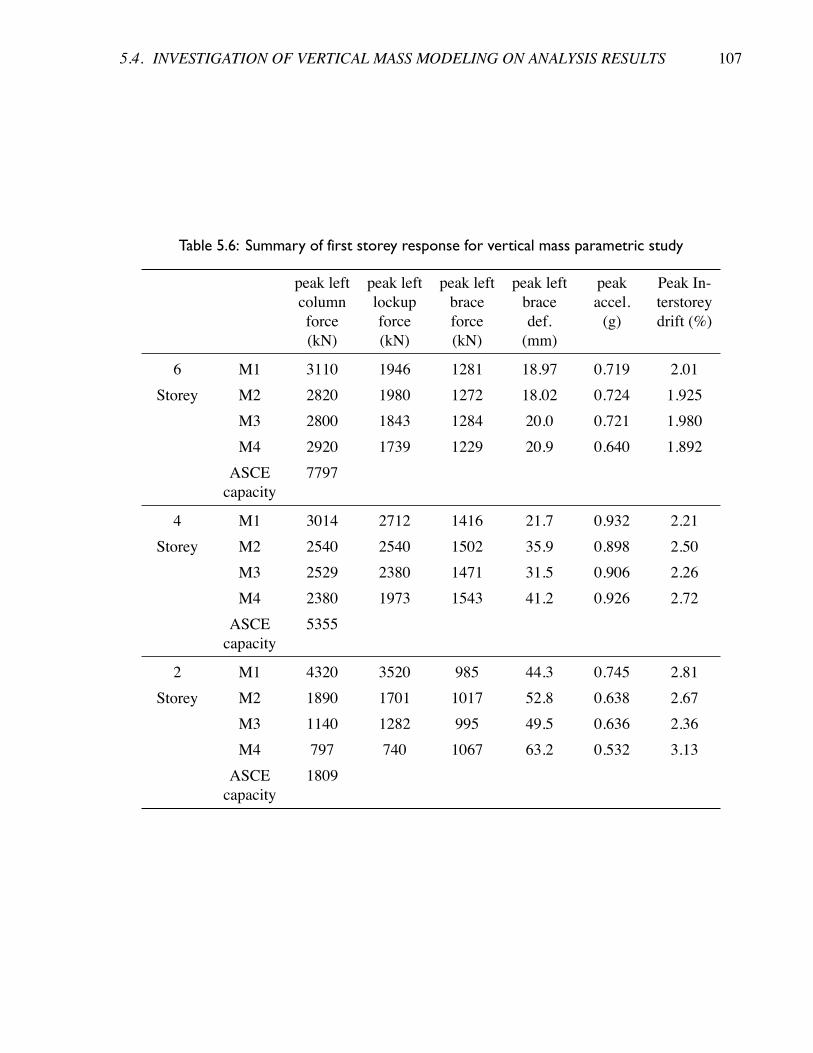
5.4. INVESTIGATION OF VERTICAL MASS MODELING ON ANALYSIS RESULTS 107
Table 5.6: Summary of first storey response for vertical mass parametric study
peak leftcolumnforce(kN)
peak leftlockupforce(kN)
peak leftbraceforce(kN)
peak leftbracedef.(mm)
peakaccel.(g)
Peak In-terstoreydrift (%)
6 M1 3110 1946 1281 18.97 0.719 2.01Storey M2 2820 1980 1272 18.02 0.724 1.925
M3 2800 1843 1284 20.0 0.721 1.980M4 2920 1739 1229 20.9 0.640 1.892
ASCEcapacity
7797
4 M1 3014 2712 1416 21.7 0.932 2.21Storey M2 2540 2540 1502 35.9 0.898 2.50
M3 2529 2380 1471 31.5 0.906 2.26M4 2380 1973 1543 41.2 0.926 2.72
ASCEcapacity
5355
2 M1 4320 3520 985 44.3 0.745 2.81Storey M2 1890 1701 1017 52.8 0.638 2.67
M3 1140 1282 995 49.5 0.636 2.36M4 797 740 1067 63.2 0.532 3.13
ASCEcapacity
1809
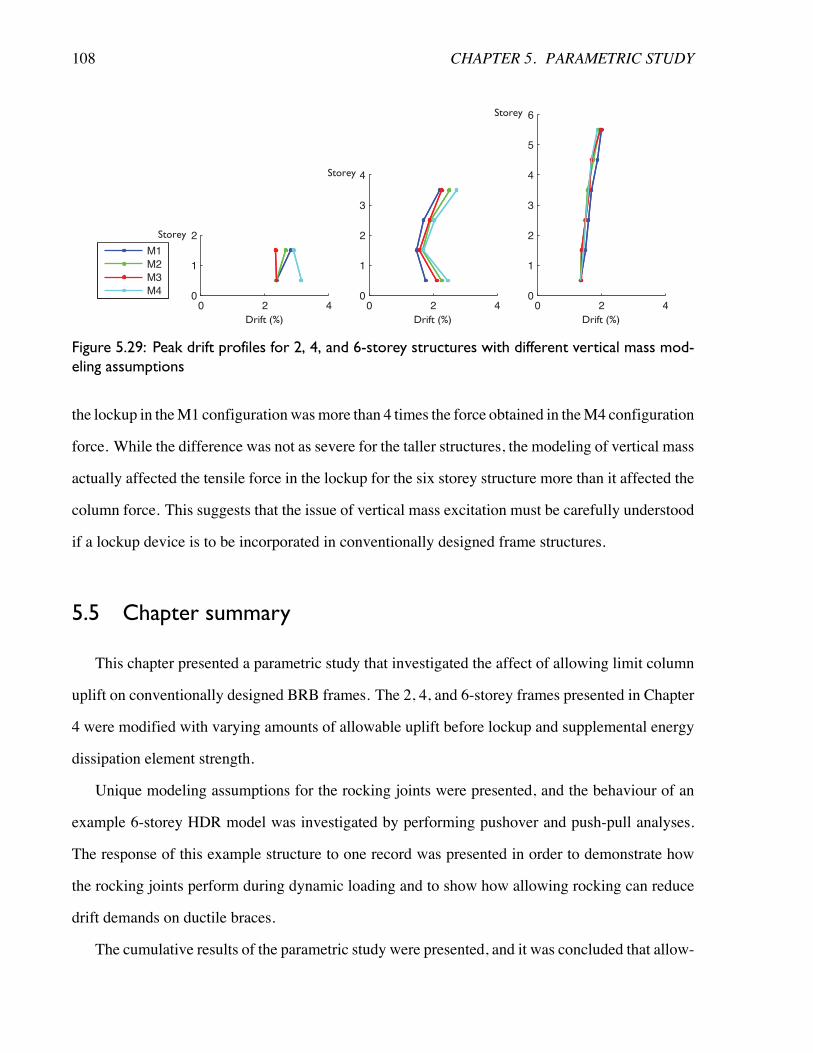
108 CHAPTER 5. PARAMETRIC STUDY
0 2 40
1
2
0 2 40
1
2
3
4
0 2 40
1
2
3
4
5
6
Drift (%)
Storey
Storey
Storey
Drift (%) Drift (%)
M1
M2
M3
M4
Figure 5.29: Peak drift profiles for 2, 4, and 6-storey structures with different vertical mass mod-eling assumptions
the lockup in theM1 configurationwasmore than 4 times the force obtained in theM4 configuration
force. While the difference was not as severe for the taller structures, the modeling of vertical mass
actually affected the tensile force in the lockup for the six storey structure more than it affected the
column force. This suggests that the issue of vertical mass excitation must be carefully understood
if a lockup device is to be incorporated in conventionally designed frame structures.
5.5 Chapter summary
This chapter presented a parametric study that investigated the affect of allowing limit column
uplift on conventionally designed BRB frames. The 2, 4, and 6-storey frames presented in Chapter
4 were modified with varying amounts of allowable uplift before lockup and supplemental energy
dissipation element strength.
Unique modeling assumptions for the rocking joints were presented, and the behaviour of an
example 6-storey HDR model was investigated by performing pushover and push-pull analyses.
The response of this example structure to one record was presented in order to demonstrate how
the rocking joints perform during dynamic loading and to show how allowing rocking can reduce
drift demands on ductile braces.
The cumulative results of the parametric study were presented, and it was concluded that allow-
5.5. CHAPTER SUMMARY 109
ing rocking can be beneficial for reducing displacement demands and residual drifts on distributed
ductility structures. It was noted that residual drifts were increased in some of the models, espe-
cially the lower storey buildings.
Finally, a side study was performed in order to investigate how vertical mass modeling choices
can affect results. Significant excitation of vertical mass was observed in structures where that
mass was modeled as lumped at beam-column joints, especially in the 2-storey structure. This
dynamic effect was lessened by spreading the mass to nodes along the beams, and by not modeling
vertical mass at all. Further research is required to better understand under which scenarios vertical
mass excitation is an issue for rocking structures, and how vertical mass should be modeled during
numerical analysis.
Chapter 6
Example design of 6-storey BRB HDR
structure with cast steel energy dissipation
elements
This chapter presents the design and analysis of a 6-storey BRB HDR frame that was carried out
to further validate the HDR concept that was developed in this thesis. The frame superstructure
is the 6-storey reference frame first presented in Chapter 4. The column-foundation connections
were designed to incorporate the hybrid ductile-rocking modifications, based on the results of the
parametric study in Chapter 5. The energy dissipation elements were designed based on the cast
steel yielding brace system from Section 5.1. This chapter begins by presenting an overview of the
cast steel triangular yielding fingers, and demonstrates how such a fuse can be modeled numerically
in the context of an HDR system. Next, the design of the HDR rocking joint is outlined, and the
properties of the fuse elements that were selected are described. The results of nonlinear time-
history analyses of the six-storey frame with the cast steel fuse are then presented and compared to
the response of the fixed base BRB structure. Finally, the design of a column-foundation detail is
presented that includes the cast steel fuse and lockup device.
110
6.1. CAST STEEL YIELDING CONNECTOR USED AS ROCKING FUSE ELEMENT 111
6.1 Cast steel yielding connector used as rocking fuse element
Chapter 5 presented a brief overview of the yielding brace system, which was initially devel-
oped as an alternative to buckling restrained braces (Gray, 2012). The yielding brace system uses
cantilevered triangular-shaped yielding fingers made of cast steel that can accommodate large non-
linear cyclic displacement demands since the profile of the fingers matches the bending moment
diagram for a cantilever, and thus nonlinear strains are distributed along the entire length of the
finger, rather than at a concentrated location. While the YBS system was initially envisioned as an
alternative non-buckling brace system that offers similar, albeit improved (see Gray et al. (2014))
system performance to BRBs, the small size and large ductility of the components makes them an
attractive option for a rocking system fuse.
Yielding brace system properties
Gray (2012) showed that the yield strength for cast steel yielding brace system connector, Pp
is:
Pp =nboh
2
4LFy (6.1.1)
where n is the number of yielding fingers, bo is the width of the yielding finger at the widest
point, L is the length of each finger, h is the height of each finger, and Fy is the yield stress of
the connector material. This strength expression is based on the plastic section modulus of each
yielding finger. The elastic stiffness of the connection, Kp, is given by:
Kp =nboEh3
6L3(6.1.2)
and the monotonic backbone curve after yielding can be expressed considering second order
geometric deformations of the fingers by the following closed-form equation:
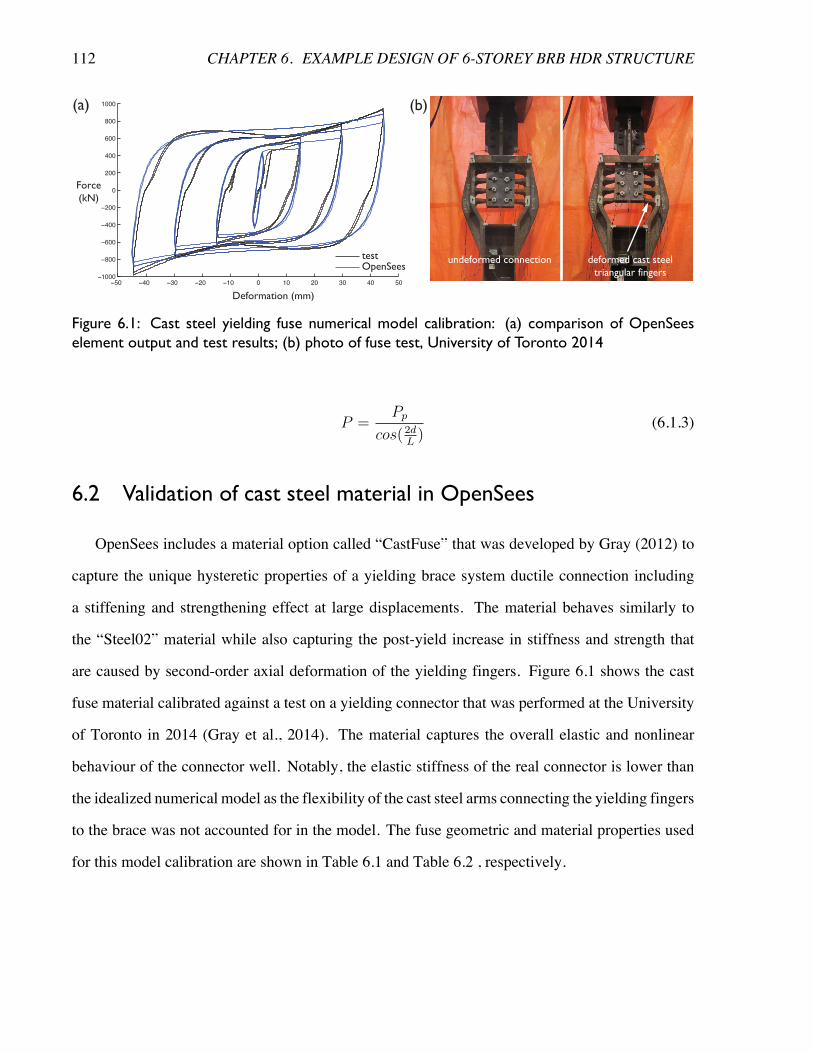
112 CHAPTER 6. EXAMPLE DESIGN OF 6-STOREY BRB HDR STRUCTURE
(a) (b)
−50 −40 −30 −20 −10 0 10 20 30 40 50−1000
−800
−600
−400
−200
0
200
400
600
800
1000
Deformation (mm)
Force(kN)
testOpenSees
deformed cast steeltriangular fingers
undeformed connection
Figure 6.1: Cast steel yielding fuse numerical model calibration: (a) comparison of OpenSeeselement output and test results; (b) photo of fuse test, University of Toronto 2014
P =Pp
cos(2dL)
(6.1.3)
6.2 Validation of cast steel material in OpenSees
OpenSees includes a material option called “CastFuse” that was developed by Gray (2012) to
capture the unique hysteretic properties of a yielding brace system ductile connection including
a stiffening and strengthening effect at large displacements. The material behaves similarly to
the “Steel02” material while also capturing the post-yield increase in stiffness and strength that
are caused by second-order axial deformation of the yielding fingers. Figure 6.1 shows the cast
fuse material calibrated against a test on a yielding connector that was performed at the University
of Toronto in 2014 (Gray et al., 2014). The material captures the overall elastic and nonlinear
behaviour of the connector well. Notably, the elastic stiffness of the real connector is lower than
the idealized numerical model as the flexibility of the cast steel arms connecting the yielding fingers
to the brace was not accounted for in the model. The fuse geometric and material properties used
for this model calibration are shown in Table 6.1 and Table 6.2 , respectively.
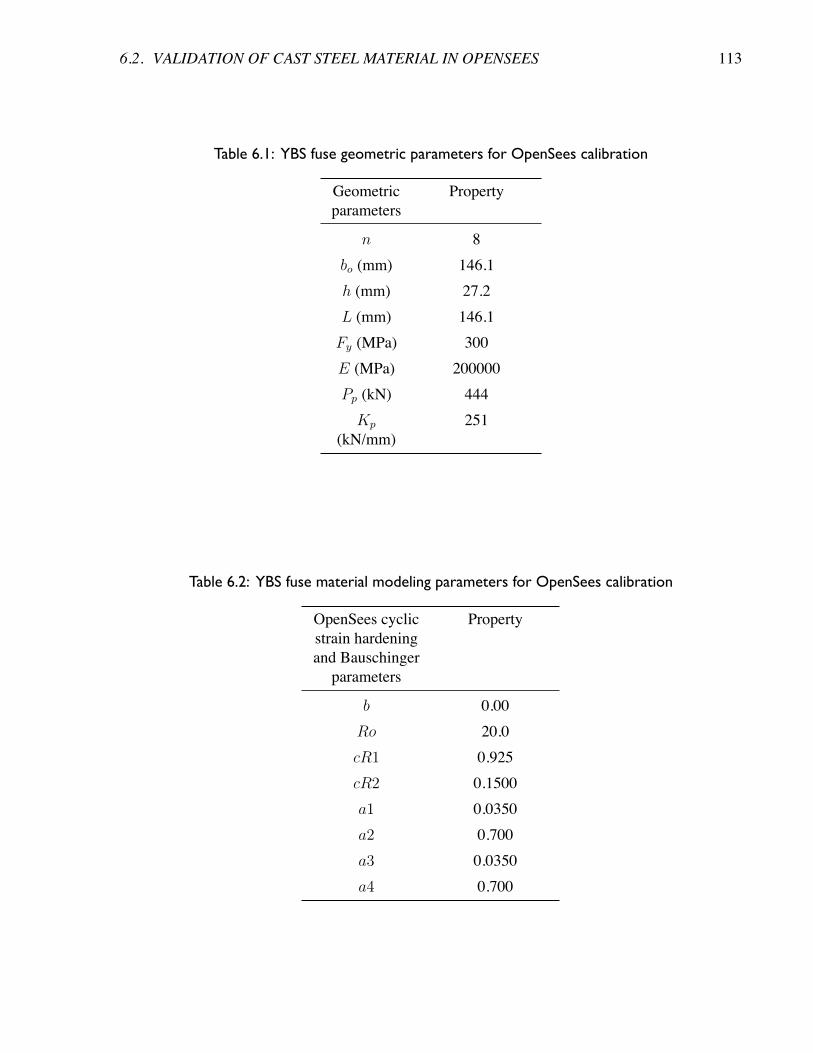
6.2. VALIDATION OF CAST STEEL MATERIAL IN OPENSEES 113
Table 6.1: YBS fuse geometric parameters for OpenSees calibration
Geometricparameters
Property
n 8bo (mm) 146.1h (mm) 27.2L (mm) 146.1Fy (MPa) 300E (MPa) 200000Pp (kN) 444Kp
(kN/mm)251
Table 6.2: YBS fuse material modeling parameters for OpenSees calibration
OpenSees cyclicstrain hardeningand Bauschinger
parameters
Property
b 0.00Ro 20.0cR1 0.925cR2 0.1500a1 0.0350a2 0.700a3 0.0350a4 0.700
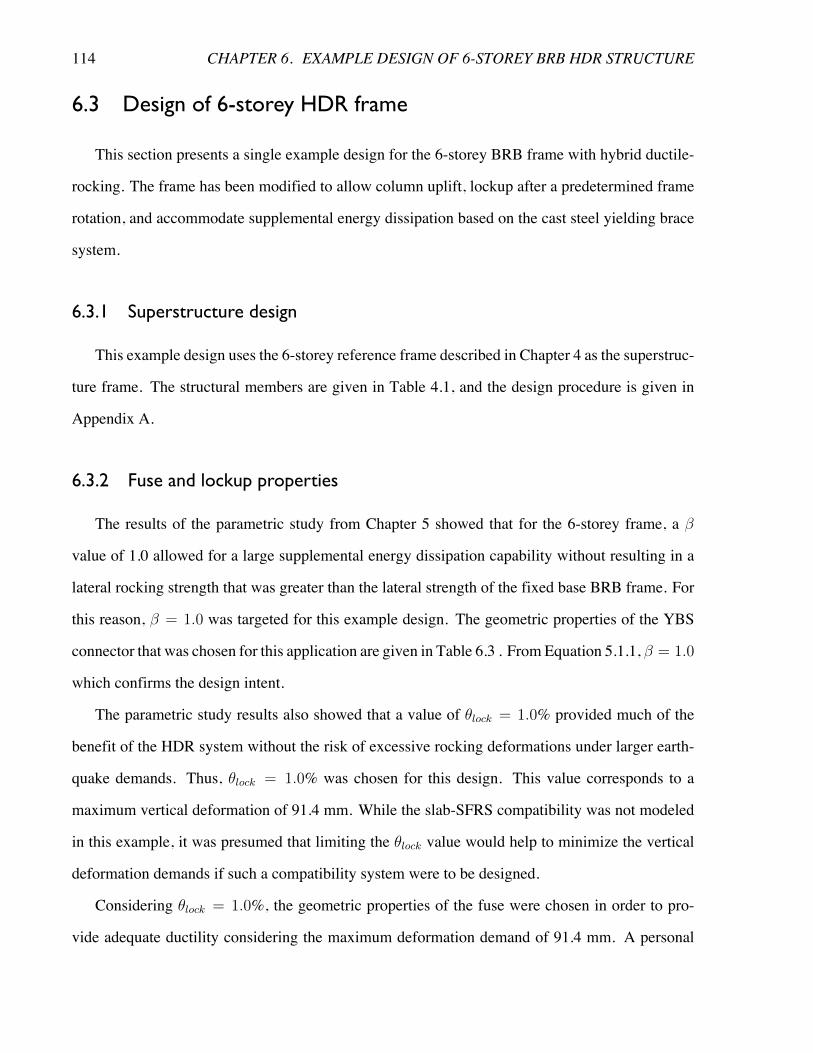
114 CHAPTER 6. EXAMPLE DESIGN OF 6-STOREY BRB HDR STRUCTURE
6.3 Design of 6-storey HDR frame
This section presents a single example design for the 6-storey BRB frame with hybrid ductile-
rocking. The frame has been modified to allow column uplift, lockup after a predetermined frame
rotation, and accommodate supplemental energy dissipation based on the cast steel yielding brace
system.
6.3.1 Superstructure design
This example design uses the 6-storey reference frame described in Chapter 4 as the superstruc-
ture frame. The structural members are given in Table 4.1, and the design procedure is given in
Appendix A.
6.3.2 Fuse and lockup properties
The results of the parametric study from Chapter 5 showed that for the 6-storey frame, a �
value of 1.0 allowed for a large supplemental energy dissipation capability without resulting in a
lateral rocking strength that was greater than the lateral strength of the fixed base BRB frame. For
this reason, � = 1.0 was targeted for this example design. The geometric properties of the YBS
connector that was chosen for this application are given in Table 6.3 . From Equation 5.1.1, � = 1.0
which confirms the design intent.
The parametric study results also showed that a value of ✓lock = 1.0% provided much of the
benefit of the HDR system without the risk of excessive rocking deformations under larger earth-
quake demands. Thus, ✓lock = 1.0% was chosen for this design. This value corresponds to a
maximum vertical deformation of 91.4 mm. While the slab-SFRS compatibility was not modeled
in this example, it was presumed that limiting the ✓lock value would help to minimize the vertical
deformation demands if such a compatibility system were to be designed.
Considering ✓lock = 1.0%, the geometric properties of the fuse were chosen in order to pro-
vide adequate ductility considering the maximum deformation demand of 91.4 mm. A personal
6.3. DESIGN OF 6-STOREY HDR FRAME 115
Table 6.3: Example design fuse properties
Geometricparameters
Fuse property
n 10bo (mm) 200h (mm) 49L (mm) 300Fy (MPa) 300E (MPa) 200000Pp (kN) 1201Kp
(kN/mm)290
communication with Cast Connex Corporation, the commercial providers of the YBS devices, was
engaged in order to determine a satisfactory fuse design that met this ductility requirement. It is
noted that since the rocking connection can only deform vertically in one direction, the cyclic de-
mands on such a fuse detail are effectively half of the demands on a conventional YBS fuse cycled
to the same deformation in both directions. This characteristic of the rocking joint is beneficial in
terms of the low-cycle fatigue life of the connection.
6.3.3 Modeling assumptions
The fixed base and HDR frames were modeled in a similar way as in Chapters 4 and 5 except
for a few notable differences. The columns were modeled using the “beamwithhinges” elements in
OpenSees in order to allow for plastic hinging under larger displacement demands. For the HDR
frame, the energy dissipation was modeled using the “CastFuse” material as described and cali-
brated above, rather than the elasto-plastic material that was used Chapter 5. An analysis timestep
of 0.0005 seconds was used. Vertical mass was lumped at the beam column connections. This
assumption corresponds to the M1 scenario described in Section 5.4, and likely represents an upper
bound on forces related to the excitation of vertical mass.
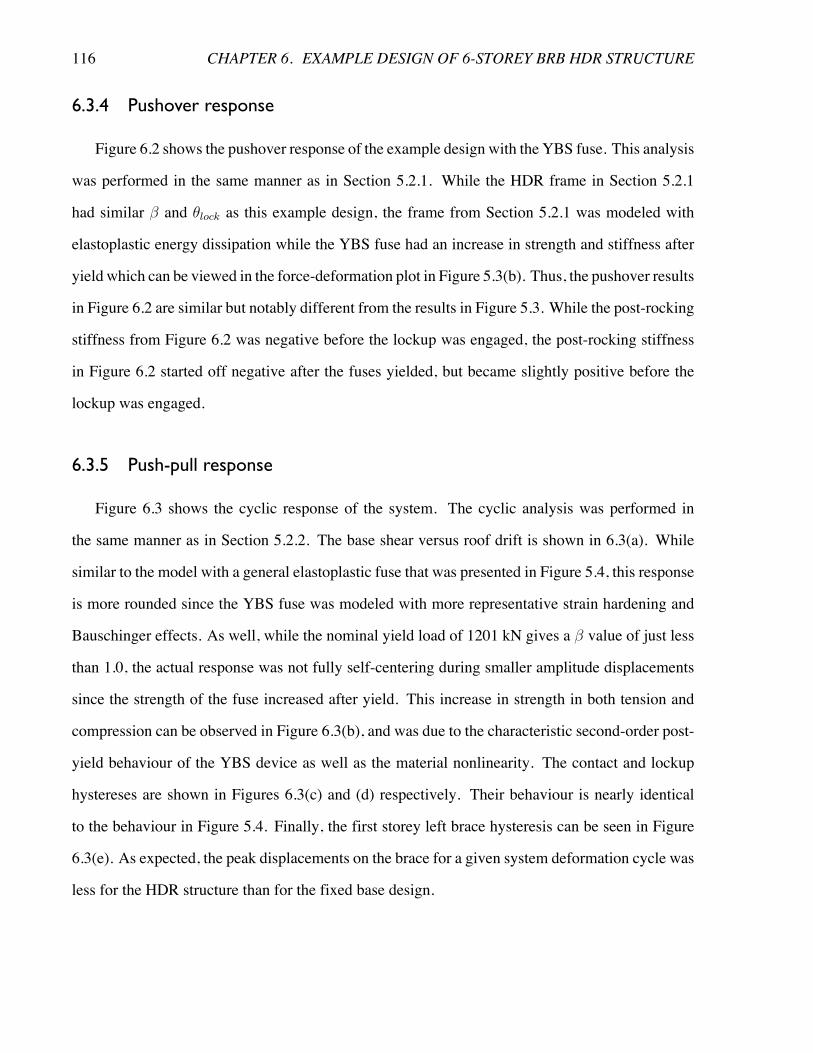
116 CHAPTER 6. EXAMPLE DESIGN OF 6-STOREY BRB HDR STRUCTURE
6.3.4 Pushover response
Figure 6.2 shows the pushover response of the example design with the YBS fuse. This analysis
was performed in the same manner as in Section 5.2.1. While the HDR frame in Section 5.2.1
had similar � and ✓lock as this example design, the frame from Section 5.2.1 was modeled with
elastoplastic energy dissipation while the YBS fuse had an increase in strength and stiffness after
yield which can be viewed in the force-deformation plot in Figure 5.3(b). Thus, the pushover results
in Figure 6.2 are similar but notably different from the results in Figure 5.3. While the post-rocking
stiffness from Figure 6.2 was negative before the lockup was engaged, the post-rocking stiffness
in Figure 6.2 started off negative after the fuses yielded, but became slightly positive before the
lockup was engaged.
6.3.5 Push-pull response
Figure 6.3 shows the cyclic response of the system. The cyclic analysis was performed in
the same manner as in Section 5.2.2. The base shear versus roof drift is shown in 6.3(a). While
similar to the model with a general elastoplastic fuse that was presented in Figure 5.4, this response
is more rounded since the YBS fuse was modeled with more representative strain hardening and
Bauschinger effects. As well, while the nominal yield load of 1201 kN gives a � value of just less
than 1.0, the actual response was not fully self-centering during smaller amplitude displacements
since the strength of the fuse increased after yield. This increase in strength in both tension and
compression can be observed in Figure 6.3(b), and was due to the characteristic second-order post-
yield behaviour of the YBS device as well as the material nonlinearity. The contact and lockup
hystereses are shown in Figures 6.3(c) and (d) respectively. Their behaviour is nearly identical
to the behaviour in Figure 5.4. Finally, the first storey left brace hysteresis can be seen in Figure
6.3(e). As expected, the peak displacements on the brace for a given system deformation cycle was
less for the HDR structure than for the fixed base design.
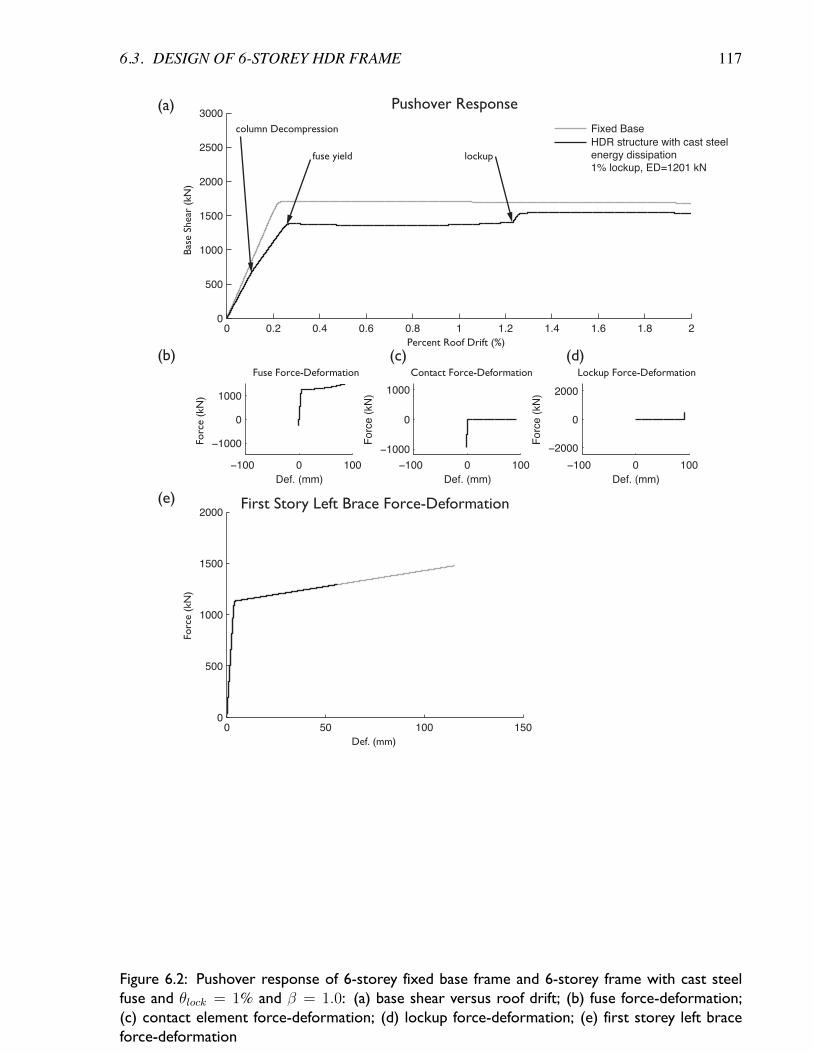
6.3. DESIGN OF 6-STOREY HDR FRAME 117
Percent Roof Drift (%)
Bas
e Sh
ear
(kN
)
Pushover Response
Fixed BaseHDR structure with cast steelenergy dissipation1% lockup, ED=1201 kN
Fuse Force-Deformation
Def. (mm)
Forc
e (k
N)
Contact Force-Deformation
Def. (mm)
Fo
rce
(kN
)Lockup Force-Deformation
Def. (mm)
Fo
rce
(kN
)
Def. (mm)
Forc
e (k
N)
0 0.2 0.4 0.6 0.8 1 1.2 1.4 1.6 1.8 20
500
1000
1500
2000
2500
3000
−100 0 100
−1000
0
1000
−100 0 100
−1000
0
1000
−100 0 100
−2000
0
2000
0 50 100 1500
500
1000
1500
2000First Story Left Brace Force-Deformation
column Decompression
fuse yield lockup
(a)
(b)
(e)
(d)(c)
Figure 6.2: Pushover response of 6-storey fixed base frame and 6-storey frame with cast steelfuse and ✓lock = 1% and � = 1.0: (a) base shear versus roof drift; (b) fuse force-deformation;(c) contact element force-deformation; (d) lockup force-deformation; (e) first storey left braceforce-deformation
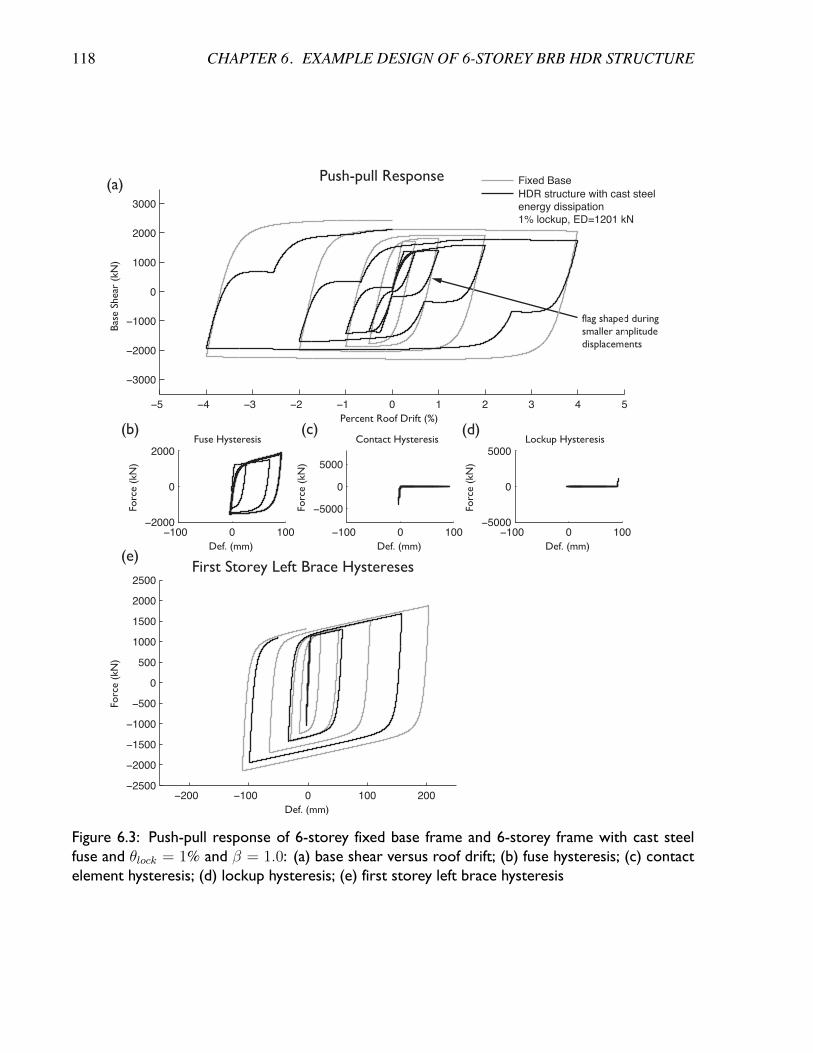
118 CHAPTER 6. EXAMPLE DESIGN OF 6-STOREY BRB HDR STRUCTURE
Percent Roof Drift (%)
Bas
e Sh
ear
(kN
)
Push-pull Response
Fuse Hysteresis
Def. (mm)
Forc
e (k
N)
Contact Hysteresis
Def. (mm)
Forc
e (k
N)
Lockup Hysteresis
Def. (mm)
Forc
e (k
N)
First Storey Left Brace Hystereses
Def. (mm)
Forc
e (k
N)
(a)
(b)
(e)
(d)(c)
flag shaped duringsmaller amplitudedisplacements
−5 −4 −3 −2 −1 0 1 2 3 4 5
−3000
−2000
−1000
0
1000
2000
3000
−100 0 100−2000
0
2000
−100 0 100
−5000
0
5000
−100 0 100−5000
0
5000
−200 −100 0 100 200−2500
−2000
−1500
−1000
−500
0
500
1000
1500
2000
2500
Fixed Base
HDR structure with cast steelenergy dissipation1% lockup, ED=1201 kN
Figure 6.3: Push-pull response of 6-storey fixed base frame and 6-storey frame with cast steelfuse and ✓lock = 1% and � = 1.0: (a) base shear versus roof drift; (b) fuse hysteresis; (c) contactelement hysteresis; (d) lockup hysteresis; (e) first storey left brace hysteresis
6.3. DESIGN OF 6-STOREY HDR FRAME 119
6.3.6 Time-history results under a sample record
The response of the example design subjected to record ID#1 scaled to DBE is presented here.
This response is very similar to the HDR model from Section 5.2.3 since the fuses are almost the
same strength.
Figure 6.4 shows the behaviour of the frame’s foundation elements, including the elastic-no-
tension contact element deformation and force, the lockup force, and the energy dissipation element
force. Figure 6.4(a) shows the contact element deformation, which is equal to the deformation of
the other foundation elements since the elements act in parallel. The left side engaged the lockup
once, while the right side did not at all. Figure 6.4(b) shows the elastic-no-tension contact element
forces. These elements began in compression due to gravity loading and did not go into tension
at all during the record. Figure 6.4(c) shows the lockup force. Figure 6.4(d) shows the force in
the fuses. The forces began slightly negative since some gravity load flowed through the fuses
before the transient response began. After first yield, the force alternated between the positive and
negative yield force plus the increased strength due to strain hardening. Figure 6.4(e) shows the
corresponding ground motion.
The roof displacement, base shear, and base overturning moment responses are shown in Figure
6.5. Overall the response is very similar to the response that was presented in Figure 5.6 that
included the elastoplastic fuse from the parametric study. Figure 6.5(a) shows how the displacement
demand on the HDR frame was primarily contributed to from the base rotation, whereas the fixed
base roof displacement, which was similar in magnitude to the HDR structure, was primarily due
to brace axial deformations. Figure 6.5(b) shows how the base shear response was similar between
the two frames, and Figure 6.5(c) shows how the overturning moments in the HDR frame were less
than the corresponding fixed frame except when the lockup engaged, at which point the moments
were of similar magnitude, since after lockup the system moments were limited by the capacity of
the BRBs.
The hysteretic response of the braces and fuses is shown in Figure 6.6. As in Figure 5.7, the
addition of rocking significantly reduced the displacement demand on the BRBs, especially in the
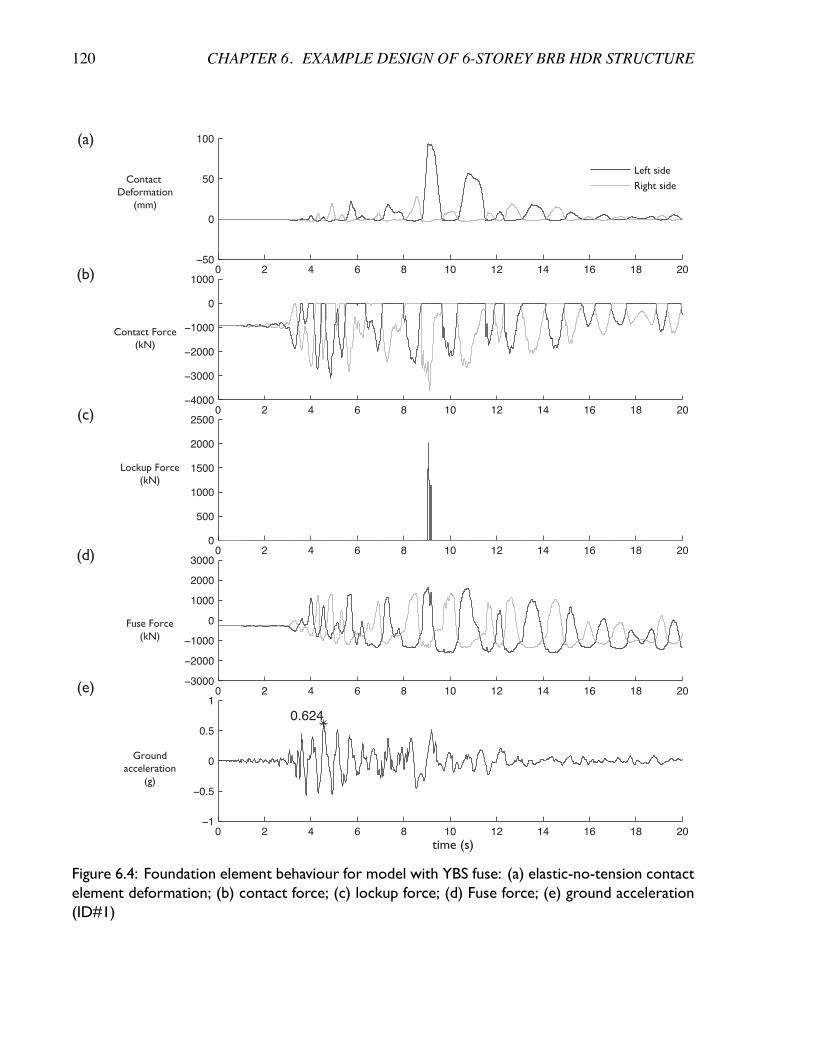
120 CHAPTER 6. EXAMPLE DESIGN OF 6-STOREY BRB HDR STRUCTURE
0 2 4 6 8 10 12 14 16 18 20−50
0
50
100
0 2 4 6 8 10 12 14 16 18 20−4000
−3000
−2000
−1000
0
1000
0 2 4 6 8 10 12 14 16 18 200
500
1000
1500
2000
2500
time (s)
0 2 4 6 8 10 12 14 16 18 20−3000
−2000
−1000
0
1000
2000
3000
time (s)
0 2 4 6 8 10 12 14 16 18 20−1
−0.5
0
0.5
1
0.624
Contact Deformation
(mm)
Contact Force(kN)
Lockup Force(kN)
Fuse Force(kN)
(a)
(b)
(c)
(d)
Groundacceleration
(g)
(e)
Left side
Right side
time (s)
Figure 6.4: Foundation element behaviour for model with YBS fuse: (a) elastic-no-tension contactelement deformation; (b) contact force; (c) lockup force; (d) Fuse force; (e) ground acceleration(ID#1)
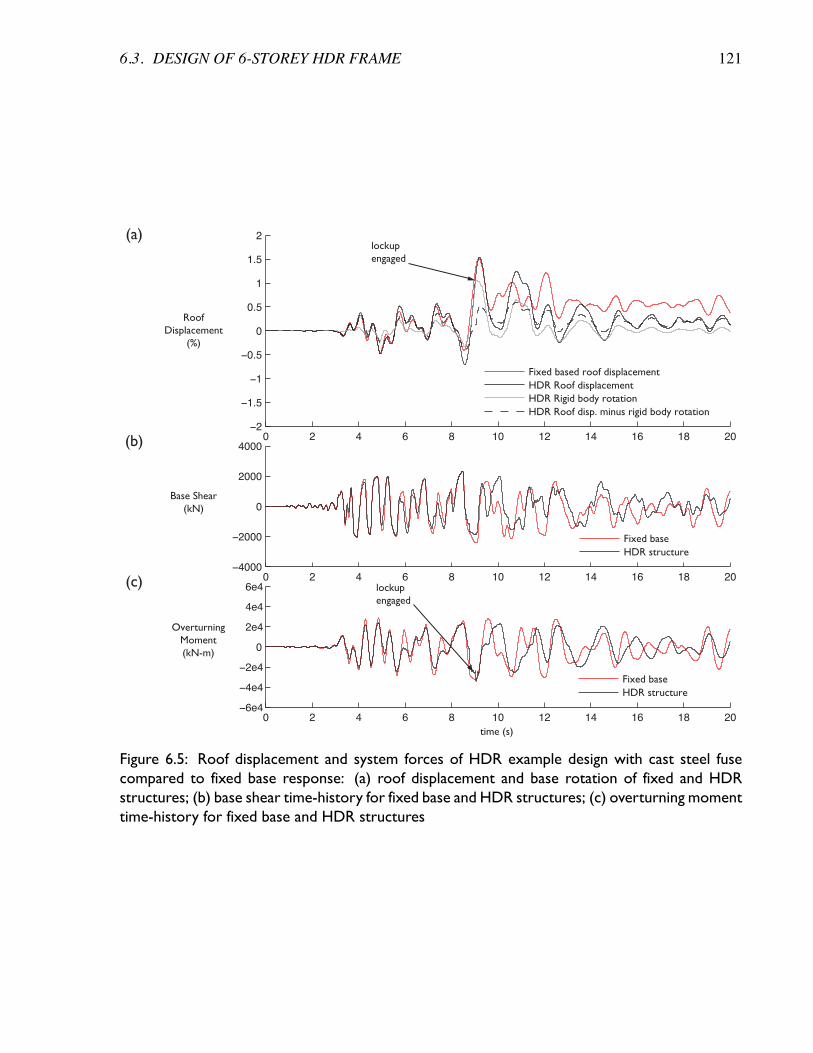
6.3. DESIGN OF 6-STOREY HDR FRAME 121
0 2 4 6 8 10 12 14 16 18 20−2
−1.5
−1
−0.5
0
0.5
1
1.5
2
time (s)
0 2 4 6 8 10 12 14 16 18 20−4000
−2000
0
2000
4000
0 2 4 6 8 10 12 14 16 18 20−6e4
−4e4
−2e4
0
2e4
4e4
6e4
RoofDisplacement
(%)
Base Shear(kN)
OverturningMoment(kN-m)
(a)
(b)
(c)
lockupengaged
lockupengaged
time (s)
Fixed based roof displacementHDR Roof displacementHDR Rigid body rotationHDR Roof disp. minus rigid body rotation
Fixed baseHDR structure
Fixed baseHDR structure
Figure 6.5: Roof displacement and system forces of HDR example design with cast steel fusecompared to fixed base response: (a) roof displacement and base rotation of fixed and HDRstructures; (b) base shear time-history for fixed base and HDR structures; (c) overturning momenttime-history for fixed base and HDR structures
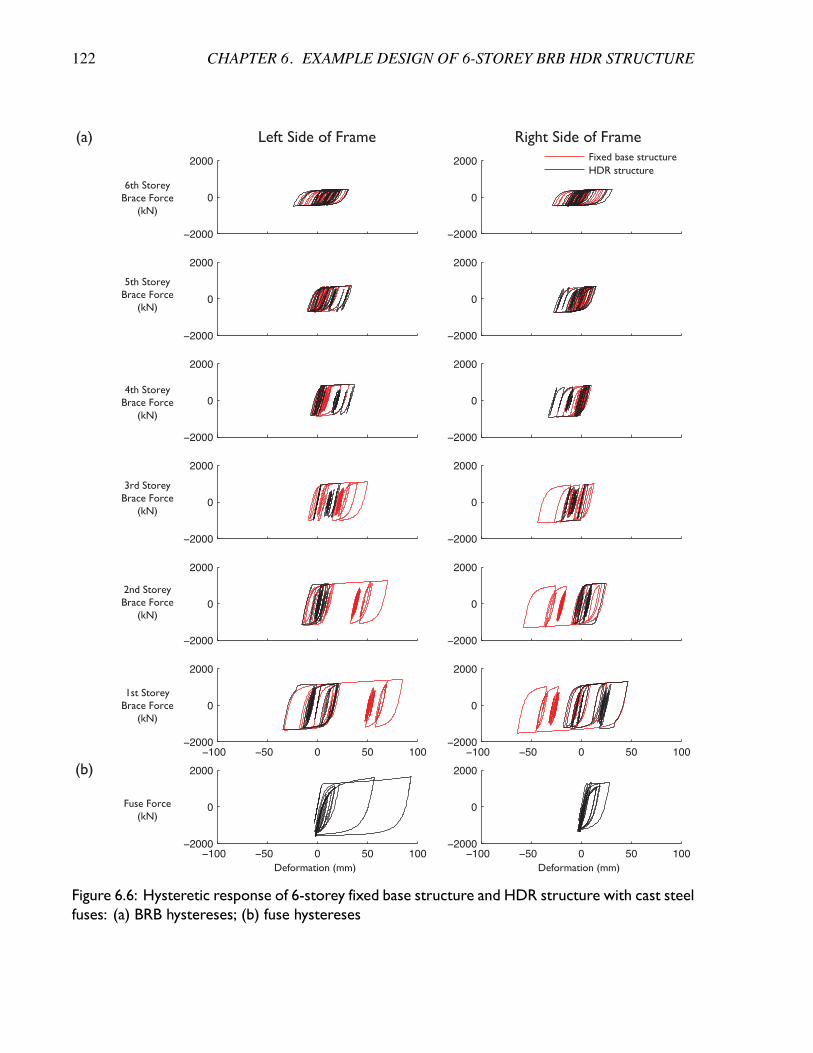
122 CHAPTER 6. EXAMPLE DESIGN OF 6-STOREY BRB HDR STRUCTURE
−100 −50 0 50 100−2000
0
2000
−100 −50 0 50 100−2000
0
2000
−2000
0
2000
−2000
0
2000
−2000
0
2000
−2000
0
2000
−2000
0
2000
−2000
0
2000
−2000
0
2000
−2000
0
2000
−2000
0
2000
−2000
0
2000
−100 −50 0 50 100−2000
0
2000
−100 −50 0 50 100−2000
0
2000
6th StoreyBrace Force
(kN)
5th StoreyBrace Force
(kN)
4th StoreyBrace Force
(kN)
3rd StoreyBrace Force
(kN)
2nd StoreyBrace Force
(kN)
1st StoreyBrace Force
(kN)
Deformation (mm)
Fuse Force(kN)
Deformation (mm)
(a) Left Side of Frame Right Side of Frame
(b)
Fixed base structureHDR structure
Figure 6.6: Hysteretic response of 6-storey fixed base structure and HDR structure with cast steelfuses: (a) BRB hystereses; (b) fuse hystereses
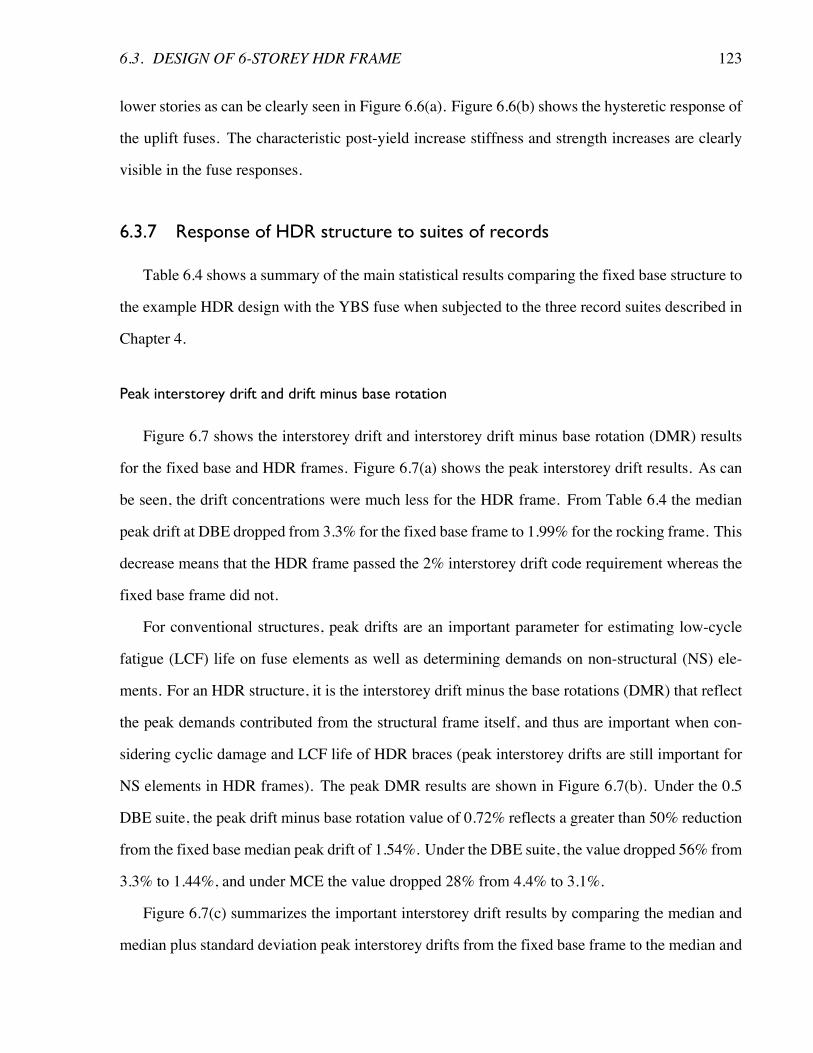
6.3. DESIGN OF 6-STOREY HDR FRAME 123
lower stories as can be clearly seen in Figure 6.6(a). Figure 6.6(b) shows the hysteretic response of
the uplift fuses. The characteristic post-yield increase stiffness and strength increases are clearly
visible in the fuse responses.
6.3.7 Response of HDR structure to suites of records
Table 6.4 shows a summary of the main statistical results comparing the fixed base structure to
the example HDR design with the YBS fuse when subjected to the three record suites described in
Chapter 4.
Peak interstorey drift and drift minus base rotation
Figure 6.7 shows the interstorey drift and interstorey drift minus base rotation (DMR) results
for the fixed base and HDR frames. Figure 6.7(a) shows the peak interstorey drift results. As can
be seen, the drift concentrations were much less for the HDR frame. From Table 6.4 the median
peak drift at DBE dropped from 3.3% for the fixed base frame to 1.99% for the rocking frame. This
decrease means that the HDR frame passed the 2% interstorey drift code requirement whereas the
fixed base frame did not.
For conventional structures, peak drifts are an important parameter for estimating low-cycle
fatigue (LCF) life on fuse elements as well as determining demands on non-structural (NS) ele-
ments. For an HDR structure, it is the interstorey drift minus the base rotations (DMR) that reflect
the peak demands contributed from the structural frame itself, and thus are important when con-
sidering cyclic damage and LCF life of HDR braces (peak interstorey drifts are still important for
NS elements in HDR frames). The peak DMR results are shown in Figure 6.7(b). Under the 0.5
DBE suite, the peak drift minus base rotation value of 0.72% reflects a greater than 50% reduction
from the fixed base median peak drift of 1.54%. Under the DBE suite, the value dropped 56% from
3.3% to 1.44%, and under MCE the value dropped 28% from 4.4% to 3.1%.
Figure 6.7(c) summarizes the important interstorey drift results by comparing the median and
median plus standard deviation peak interstorey drifts from the fixed base frame to the median and
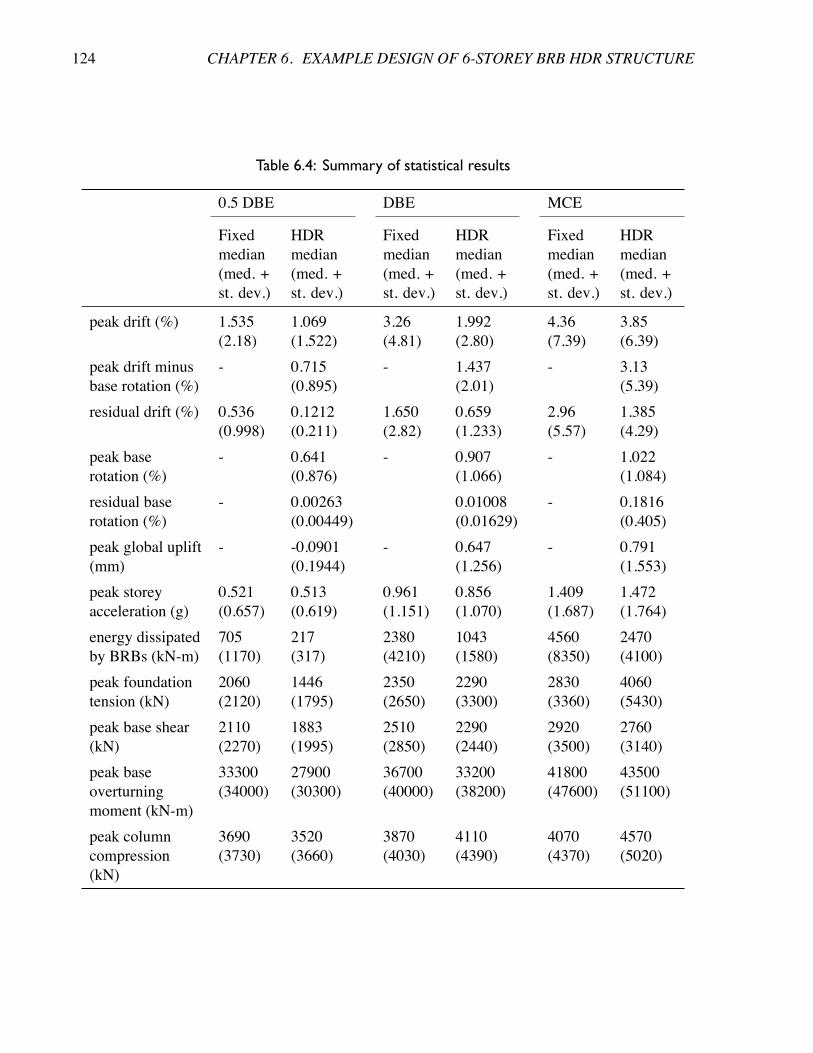
124 CHAPTER 6. EXAMPLE DESIGN OF 6-STOREY BRB HDR STRUCTURE
Table 6.4: Summary of statistical results
0.5 DBE DBE MCE
Fixedmedian(med. +st. dev.)
HDRmedian(med. +st. dev.)
Fixedmedian(med. +st. dev.)
HDRmedian(med. +st. dev.)
Fixedmedian(med. +st. dev.)
HDRmedian(med. +st. dev.)
peak drift (%) 1.535(2.18)
1.069(1.522)
3.26(4.81)
1.992(2.80)
4.36(7.39)
3.85(6.39)
peak drift minusbase rotation (%)
- 0.715(0.895)
- 1.437(2.01)
- 3.13(5.39)
residual drift (%) 0.536(0.998)
0.1212(0.211)
1.650(2.82)
0.659(1.233)
2.96(5.57)
1.385(4.29)
peak baserotation (%)
- 0.641(0.876)
- 0.907(1.066)
- 1.022(1.084)
residual baserotation (%)
- 0.00263(0.00449)
0.01008(0.01629)
- 0.1816(0.405)
peak global uplift(mm)
- -0.0901(0.1944)
- 0.647(1.256)
- 0.791(1.553)
peak storeyacceleration (g)
0.521(0.657)
0.513(0.619)
0.961(1.151)
0.856(1.070)
1.409(1.687)
1.472(1.764)
energy dissipatedby BRBs (kN-m)
705(1170)
217(317)
2380(4210)
1043(1580)
4560(8350)
2470(4100)
peak foundationtension (kN)
2060(2120)
1446(1795)
2350(2650)
2290(3300)
2830(3360)
4060(5430)
peak base shear(kN)
2110(2270)
1883(1995)
2510(2850)
2290(2440)
2920(3500)
2760(3140)
peak baseoverturningmoment (kN-m)
33300(34000)
27900(30300)
36700(40000)
33200(38200)
41800(47600)
43500(51100)
peak columncompression(kN)
3690(3730)
3520(3660)
3870(4030)
4110(4390)
4070(4370)
4570(5020)
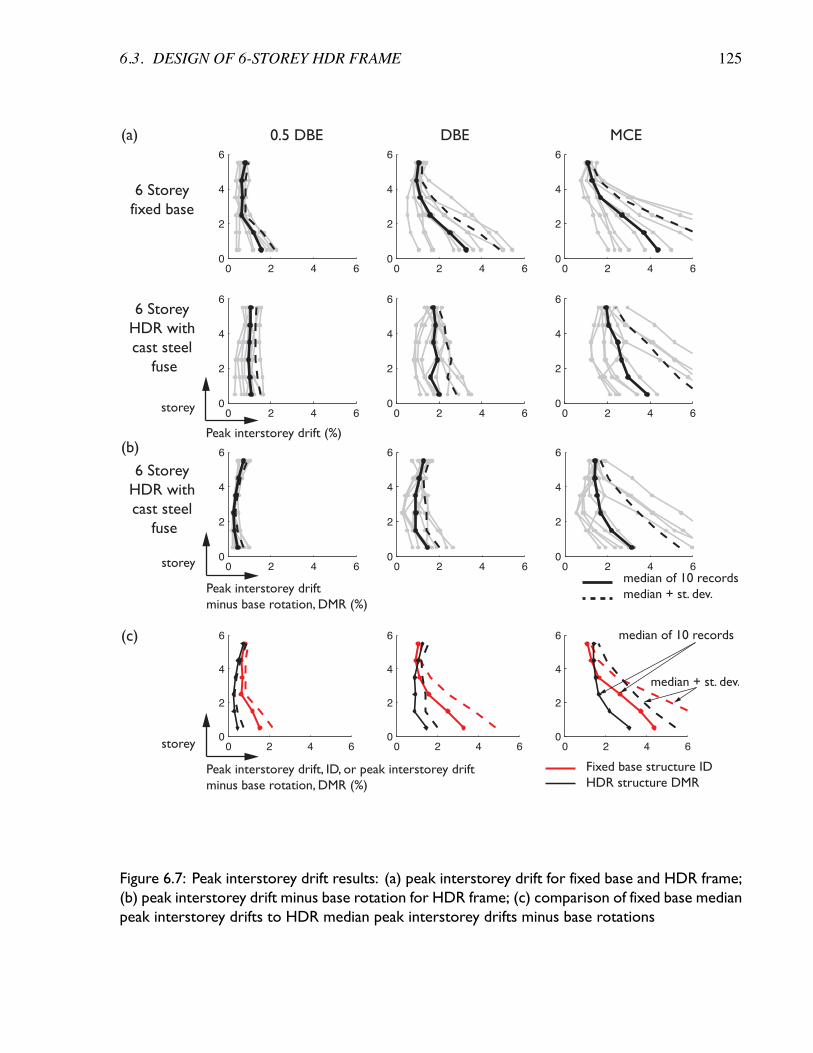
6.3. DESIGN OF 6-STOREY HDR FRAME 125
Peak interstorey drift (%)
Peak interstorey driftminus base rotation, DMR (%)
Peak interstorey drift, ID, or peak interstorey driftminus base rotation, DMR (%)
6 StoreyHDR withcast steel
fuse
6 Storeyfixed base
0.5 DBE DBE MCE(a)
(b)
(c)
0 2 4 60
2
4
6
0 2 4 60
2
4
6
0 2 4 60
2
4
6
6 StoreyHDR withcast steel
fuse
0 2 4 60
2
4
6
0 2 4 60
2
4
6
0 2 4 60
2
4
6
0 2 4 60
2
4
6
0 2 4 60
2
4
6
0 2 4 60
2
4
6
0 2 4 60
2
4
6
0 2 4 60
2
4
6
0 2 4 60
2
4
6
storey
storey
storey
median of 10 recordsmedian + st. dev.
Fixed base structure IDHDR structure DMR
median of 10 records
median + st. dev.
Figure 6.7: Peak interstorey drift results: (a) peak interstorey drift for fixed base and HDR frame;(b) peak interstorey drift minus base rotation for HDR frame; (c) comparison of fixed base medianpeak interstorey drifts to HDR median peak interstorey drifts minus base rotations
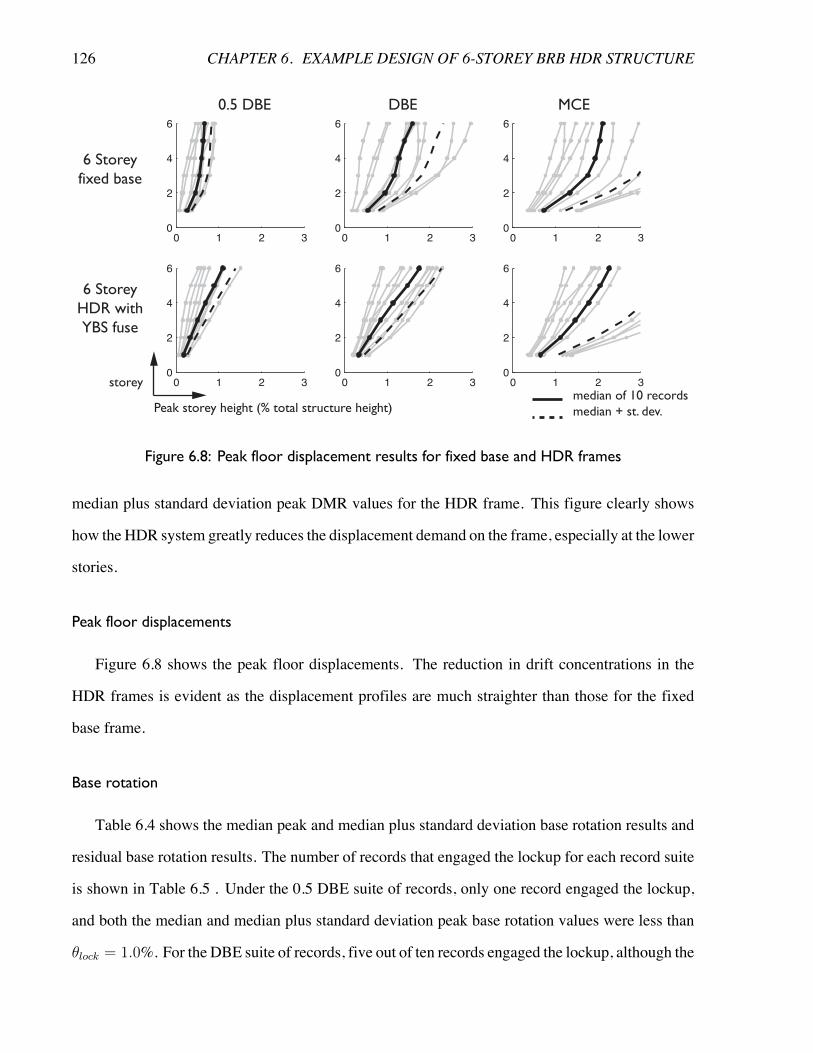
126 CHAPTER 6. EXAMPLE DESIGN OF 6-STOREY BRB HDR STRUCTURE
0 1 2 30
2
4
6
0 1 2 30
2
4
6
0 1 2 30
2
4
6
0 1 2 30
2
4
6
0 1 2 30
2
4
6
0 1 2 30
2
4
6
storeymedian of 10 recordsmedian + st. dev.
Peak storey height (% total structure height)
6 StoreyHDR withYBS fuse
6 Storeyfixed base
0.5 DBE DBE MCE
Figure 6.8: Peak floor displacement results for fixed base and HDR frames
median plus standard deviation peak DMR values for the HDR frame. This figure clearly shows
how the HDR system greatly reduces the displacement demand on the frame, especially at the lower
stories.
Peak floor displacements
Figure 6.8 shows the peak floor displacements. The reduction in drift concentrations in the
HDR frames is evident as the displacement profiles are much straighter than those for the fixed
base frame.
Base rotation
Table 6.4 shows the median peak and median plus standard deviation base rotation results and
residual base rotation results. The number of records that engaged the lockup for each record suite
is shown in Table 6.5 . Under the 0.5 DBE suite of records, only one record engaged the lockup,
and both the median and median plus standard deviation peak base rotation values were less than
✓lock = 1.0%. For the DBE suite of records, five out of ten records engaged the lockup, although the
6.3. DESIGN OF 6-STOREY HDR FRAME 127
Table 6.5: HDR structure lockup engagement
0.5 DBE DBE MCE
# of records that engaged thelockup
1 5 8
median peak base rotation was still less than ✓lock = 1.0%. For both the 0.5 DBE and DBE suites
the residual base rotation was effectively 0%. Under the MCE suite, eight of ten records engaged
the lockup, and the median and median plus standard deviation peak base rotation results were both
essentially equal to ✓lock = 1.0%. They were slightly greater since there was some elastic flexibility
in the lockup and the foundation. There were some residual base rotations under the MCE suite.
These residuals were possible because the post-yield strengthening of the HDR energy dissipation
meant that the moment-rotation joint at the base of the structure was not fully self-centering, even
if it was designed for � < 1 based on nominal properties.
Residual drifts
Figure 6.9 shows the median and median plus standard deviation residual drift results for the
fixed base and HDR frames. The addition of hybrid ductile-rocking effectively reduced residual
drifts under all the earthquake levels. Notably, while the median values for the fixed base structure
exceeded the 0.5% residual drift criterion described in Section 4.2.3, under the DBE suite in the first
four storeys the HDR frame was below this threshold at all levels except for the first storey. That
being said a substantial number of records still failed the criteria even with the HDRmodifications.
Under the 0.5 DBE suite, however, the HDR frame passed the criteria for all the records, while the
fixed base frame failed for six out of ten records.
Energy dissipated by buckling restrained braces
Table 6.4 shows the median and median plus standard deviation results for the total energy
dissipated by the buckling restrained braces. The reduction in dissipated energy during the 0.5
DBE, DBE, and MCE suites between the fixed and HDR frames was 69.2%, 56.2%, and 45.8%
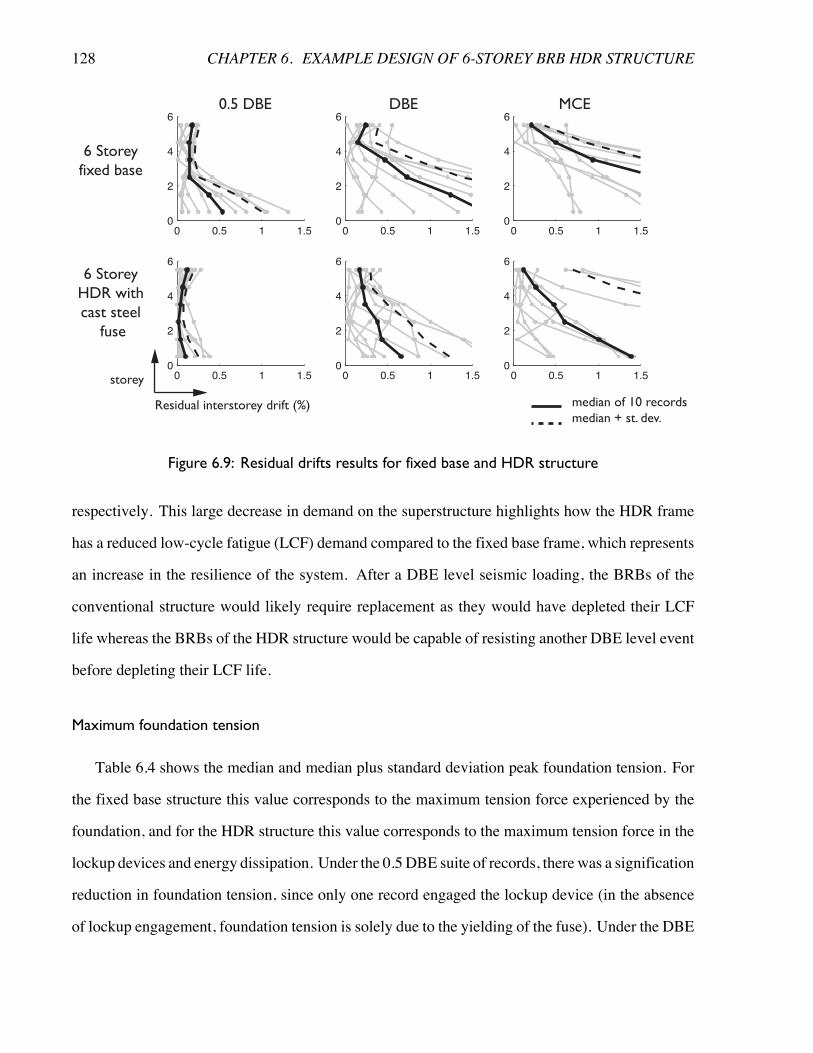
128 CHAPTER 6. EXAMPLE DESIGN OF 6-STOREY BRB HDR STRUCTURE
0 0.5 1 1.50
2
4
6
0 0.5 1 1.50
2
4
6
0 0.5 1 1.50
2
4
6
0 0.5 1 1.50
2
4
6
0 0.5 1 1.50
2
4
6
0 0.5 1 1.50
2
4
6
storey
median of 10 recordsmedian + st. dev.
Residual interstorey drift (%)
6 StoreyHDR withcast steel
fuse
6 Storeyfixed base
0.5 DBE DBE MCE
Figure 6.9: Residual drifts results for fixed base and HDR structure
respectively. This large decrease in demand on the superstructure highlights how the HDR frame
has a reduced low-cycle fatigue (LCF) demand compared to the fixed base frame, which represents
an increase in the resilience of the system. After a DBE level seismic loading, the BRBs of the
conventional structure would likely require replacement as they would have depleted their LCF
life whereas the BRBs of the HDR structure would be capable of resisting another DBE level event
before depleting their LCF life.
Maximum foundation tension
Table 6.4 shows the median and median plus standard deviation peak foundation tension. For
the fixed base structure this value corresponds to the maximum tension force experienced by the
foundation, and for the HDR structure this value corresponds to the maximum tension force in the
lockup devices and energy dissipation. Under the 0.5 DBE suite of records, there was a signification
reduction in foundation tension, since only one record engaged the lockup device (in the absence
of lockup engagement, foundation tension is solely due to the yielding of the fuse). Under the DBE
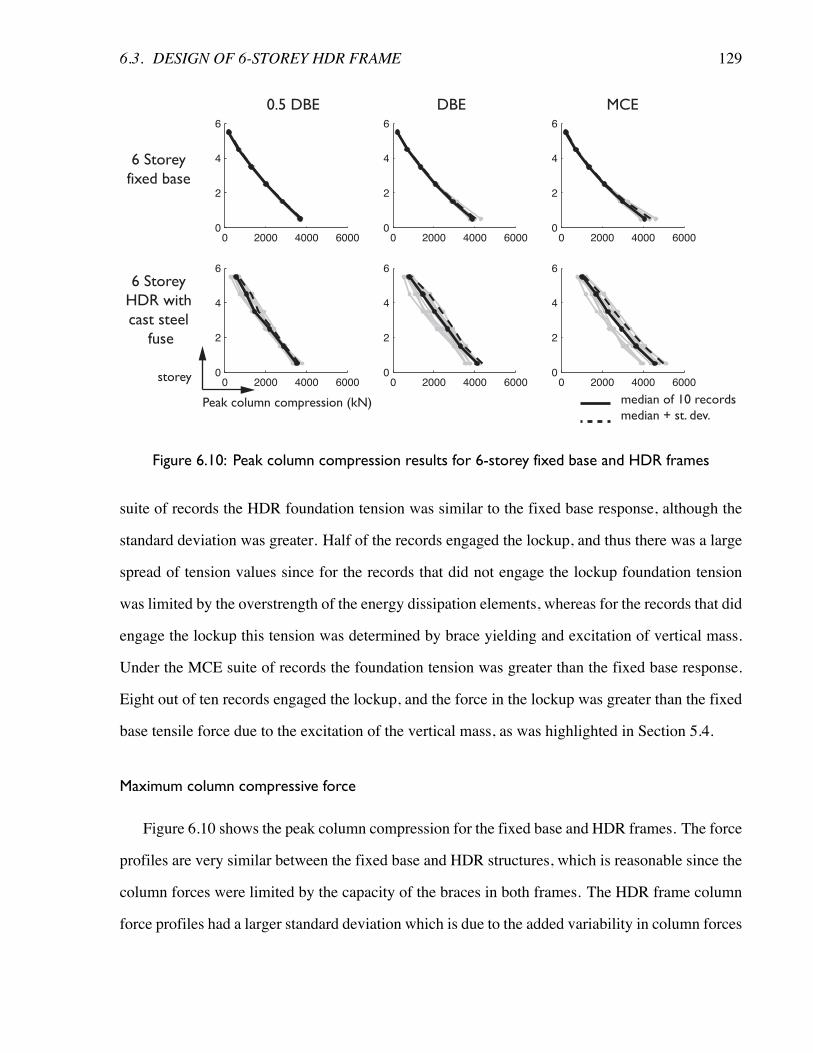
6.3. DESIGN OF 6-STOREY HDR FRAME 129
0 2000 4000 60000
2
4
6
0 2000 4000 60000
2
4
6
0 2000 4000 60000
2
4
6
0 2000 4000 60000
2
4
6
0 2000 4000 60000
2
4
6
0 2000 4000 60000
2
4
6
storey
median of 10 recordsmedian + st. dev.
Peak column compression (kN)
6 StoreyHDR withcast steel
fuse
6 Storeyfixed base
0.5 DBE DBE MCE
Figure 6.10: Peak column compression results for 6-storey fixed base and HDR frames
suite of records the HDR foundation tension was similar to the fixed base response, although the
standard deviation was greater. Half of the records engaged the lockup, and thus there was a large
spread of tension values since for the records that did not engage the lockup foundation tension
was limited by the overstrength of the energy dissipation elements, whereas for the records that did
engage the lockup this tension was determined by brace yielding and excitation of vertical mass.
Under the MCE suite of records the foundation tension was greater than the fixed base response.
Eight out of ten records engaged the lockup, and the force in the lockup was greater than the fixed
base tensile force due to the excitation of the vertical mass, as was highlighted in Section 5.4.
Maximum column compressive force
Figure 6.10 shows the peak column compression for the fixed base and HDR frames. The force
profiles are very similar between the fixed base and HDR structures, which is reasonable since the
column forces were limited by the capacity of the braces in both frames. The HDR frame column
force profiles had a larger standard deviation which is due to the added variability in column forces
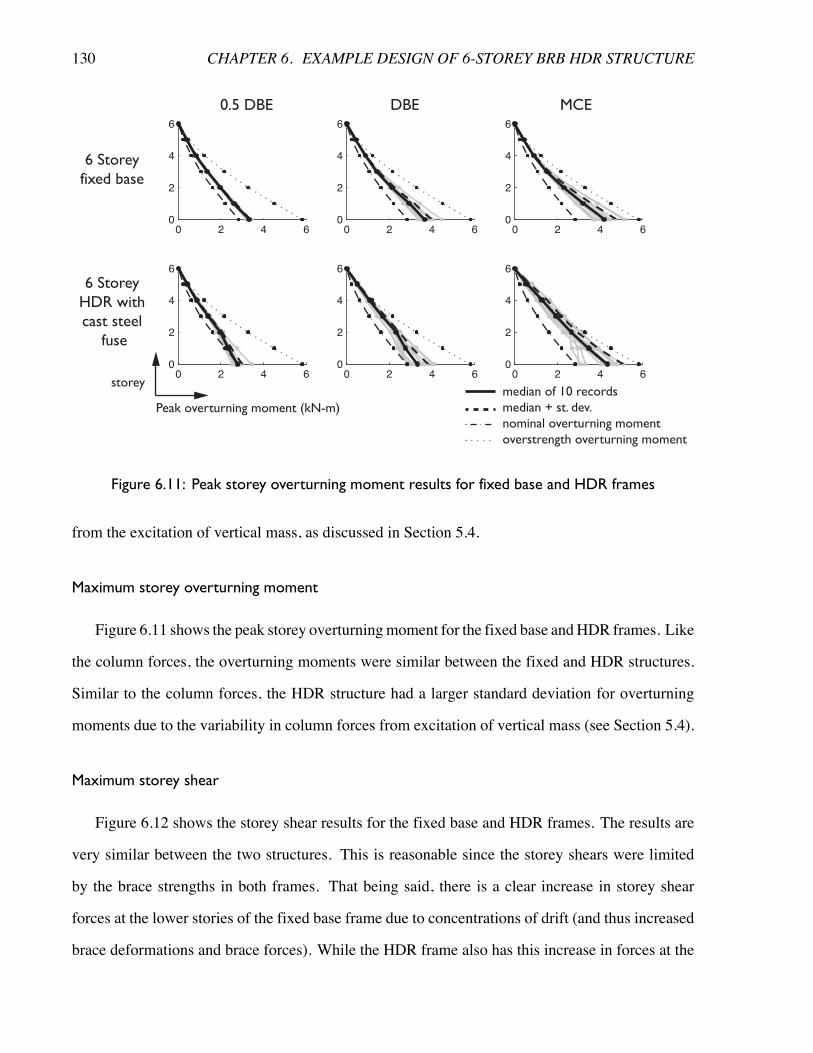
130 CHAPTER 6. EXAMPLE DESIGN OF 6-STOREY BRB HDR STRUCTURE
0 2 4 60
2
4
6
0 2 4 60
2
4
6
0 2 4 60
2
4
6
0 2 4 60
2
4
6
0 2 4 60
2
4
6
0 2 4 60
2
4
6
storeymedian of 10 recordsmedian + st. dev.nominal overturning momentoverstrength overturning moment
Peak overturning moment (kN-m)
6 Storeyfixed base
0.5 DBE DBE MCE
6 StoreyHDR withcast steel
fuse
Figure 6.11: Peak storey overturning moment results for fixed base and HDR frames
from the excitation of vertical mass, as discussed in Section 5.4.
Maximum storey overturning moment
Figure 6.11 shows the peak storey overturningmoment for the fixed base andHDR frames. Like
the column forces, the overturning moments were similar between the fixed and HDR structures.
Similar to the column forces, the HDR structure had a larger standard deviation for overturning
moments due to the variability in column forces from excitation of vertical mass (see Section 5.4).
Maximum storey shear
Figure 6.12 shows the storey shear results for the fixed base and HDR frames. The results are
very similar between the two structures. This is reasonable since the storey shears were limited
by the brace strengths in both frames. That being said, there is a clear increase in storey shear
forces at the lower stories of the fixed base frame due to concentrations of drift (and thus increased
brace deformations and brace forces). While the HDR frame also has this increase in forces at the
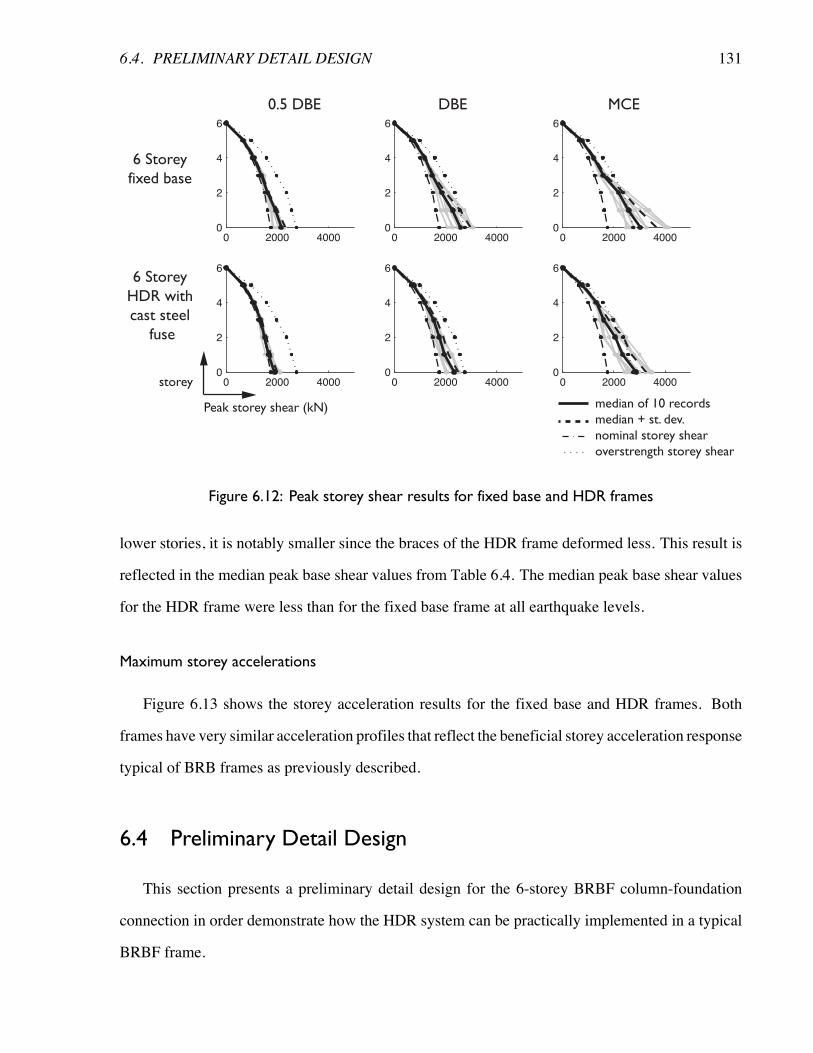
6.4. PRELIMINARY DETAIL DESIGN 131
storey
Peak storey shear (kN)
6 StoreyHDR withcast steel
fuse
6 Storeyfixed base
0.5 DBE DBE MCE
median of 10 recordsmedian + st. dev.nominal storey shearoverstrength storey shear
0 2000 40000
2
4
6
0 2000 40000
2
4
6
0 2000 40000
2
4
6
0 2000 40000
2
4
6
0 2000 40000
2
4
6
0 2000 40000
2
4
6
Figure 6.12: Peak storey shear results for fixed base and HDR frames
lower stories, it is notably smaller since the braces of the HDR frame deformed less. This result is
reflected in the median peak base shear values from Table 6.4. The median peak base shear values
for the HDR frame were less than for the fixed base frame at all earthquake levels.
Maximum storey accelerations
Figure 6.13 shows the storey acceleration results for the fixed base and HDR frames. Both
frames have very similar acceleration profiles that reflect the beneficial storey acceleration response
typical of BRB frames as previously described.
6.4 Preliminary Detail Design
This section presents a preliminary detail design for the 6-storey BRBF column-foundation
connection in order demonstrate how the HDR system can be practically implemented in a typical
BRBF frame.
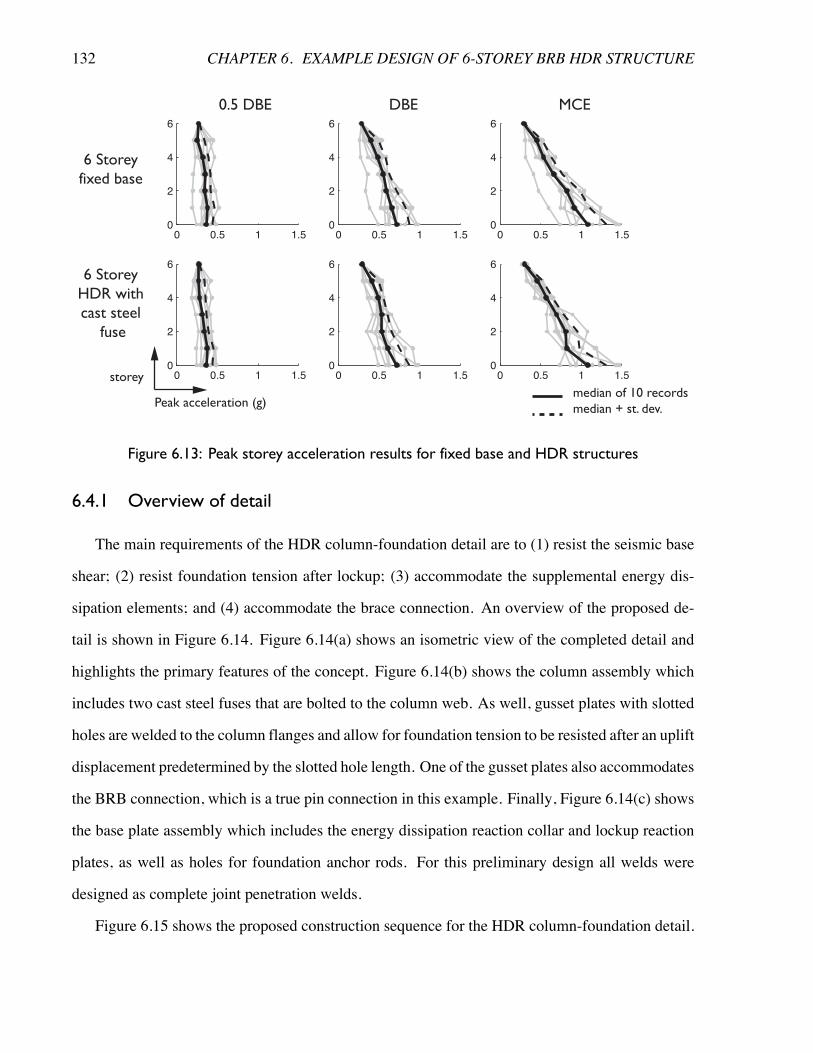
132 CHAPTER 6. EXAMPLE DESIGN OF 6-STOREY BRB HDR STRUCTURE
storeymedian of 10 recordsmedian + st. dev.
Peak acceleration (g)
6 StoreyHDR withcast steel
fuse
6 Storeyfixed base
0.5 DBE DBE MCE
0 0.5 1 1.50
2
4
6
0 0.5 1 1.50
2
4
6
0 0.5 1 1.50
2
4
6
0 0.5 1 1.50
2
4
6
0 0.5 1 1.50
2
4
6
0 0.5 1 1.50
2
4
6
Figure 6.13: Peak storey acceleration results for fixed base and HDR structures
6.4.1 Overview of detail
The main requirements of the HDR column-foundation detail are to (1) resist the seismic base
shear; (2) resist foundation tension after lockup; (3) accommodate the supplemental energy dis-
sipation elements; and (4) accommodate the brace connection. An overview of the proposed de-
tail is shown in Figure 6.14. Figure 6.14(a) shows an isometric view of the completed detail and
highlights the primary features of the concept. Figure 6.14(b) shows the column assembly which
includes two cast steel fuses that are bolted to the column web. As well, gusset plates with slotted
holes are welded to the column flanges and allow for foundation tension to be resisted after an uplift
displacement predetermined by the slotted hole length. One of the gusset plates also accommodates
the BRB connection, which is a true pin connection in this example. Finally, Figure 6.14(c) shows
the base plate assembly which includes the energy dissipation reaction collar and lockup reaction
plates, as well as holes for foundation anchor rods. For this preliminary design all welds were
designed as complete joint penetration welds.
Figure 6.15 shows the proposed construction sequence for the HDR column-foundation detail.
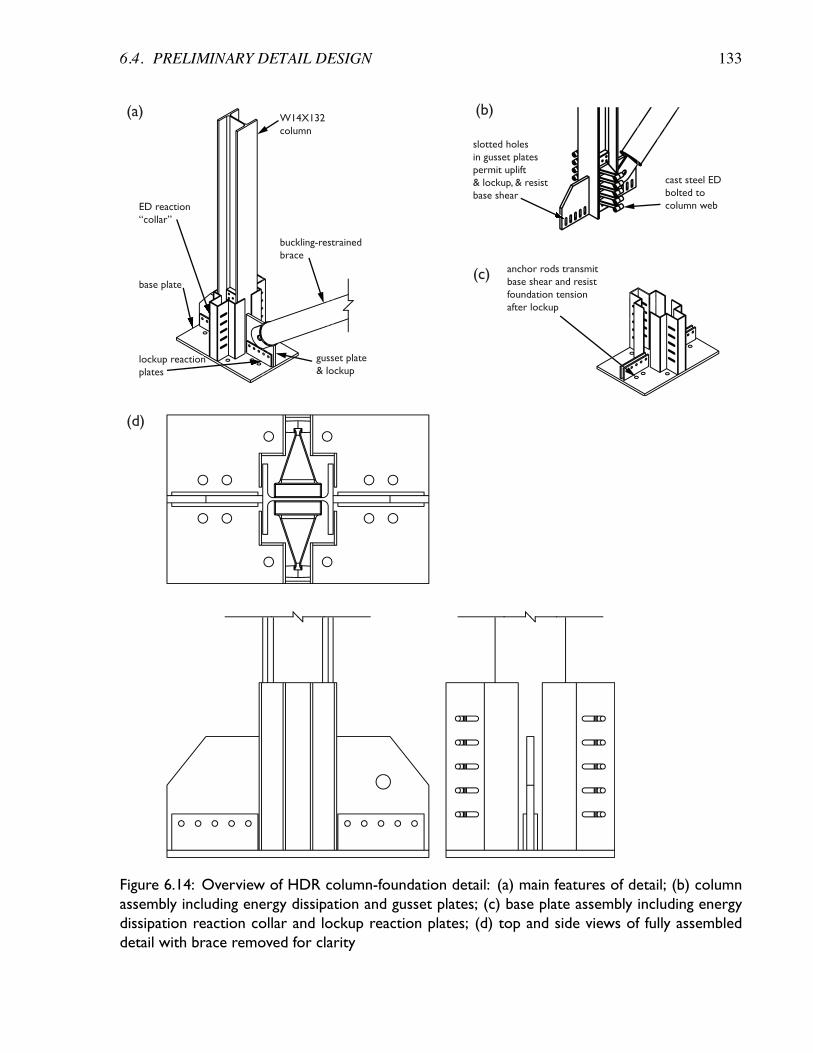
6.4. PRELIMINARY DETAIL DESIGN 133
(a) (b)
(c)
(d)
gusset plate& lockup
cast steel EDbolted tocolumn web
anchor rods transmitbase shear and resistfoundation tensionafter lockup
slotted holesin gusset platespermit uplift& lockup, & resistbase shear
ED reaction“collar”
lockup reactionplates
base plate
W14X132column
buckling-restrainedbrace
ion gusset plate& lockup
buckling-restrai
ods transmitbase shear and rfoundation tension
in gusset platespermit uplift& lockupbase shear
Figure 6.14: Overview of HDR column-foundation detail: (a) main features of detail; (b) columnassembly including energy dissipation and gusset plates; (c) base plate assembly including energydissipation reaction collar and lockup reaction plates; (d) top and side views of fully assembleddetail with brace removed for clarity
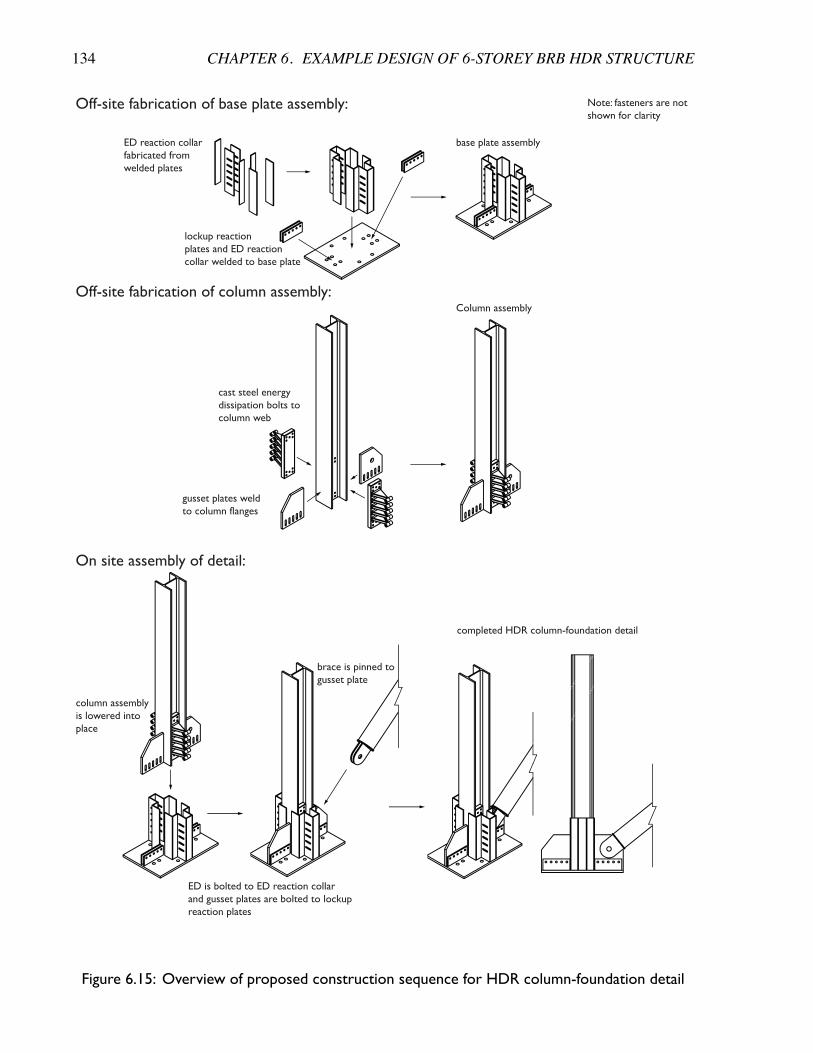
134 CHAPTER 6. EXAMPLE DESIGN OF 6-STOREY BRB HDR STRUCTURE
Off-site fabrication of base plate assembly:
Off-site fabrication of column assembly:
On site assembly of detail:
ED reaction collarfabricated fromwelded plates
lockup reactionplates and ED reactioncollar welded to base plate
base plate assembly
Note: fasteners are notshown for clarity
Column assembly
cast steel energydissipation bolts tocolumn web
gusset plates weldto column flanges
column assemblyis lowered intoplace
brace is pinned togusset plate
ED is bolted to ED reaction collarand gusset plates are bolted to lockupreaction plates
completed HDR column-foundation detail
Figure 6.15: Overview of proposed construction sequence for HDR column-foundation detail
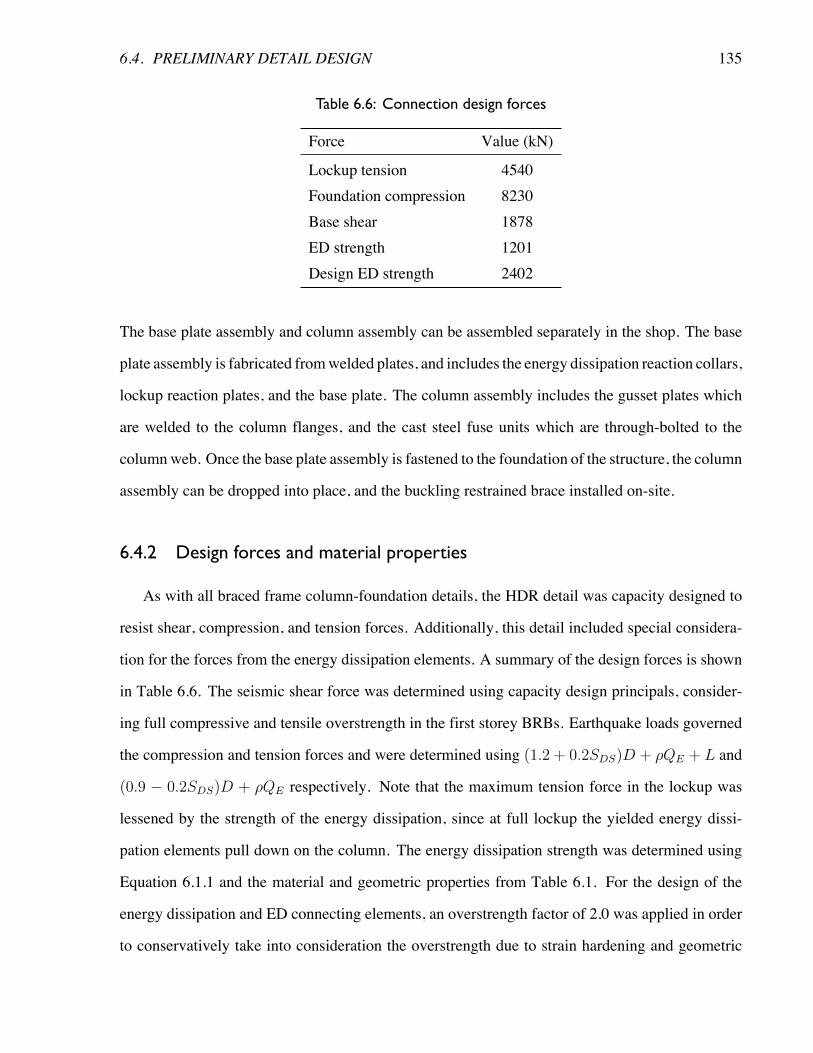
6.4. PRELIMINARY DETAIL DESIGN 135
Table 6.6: Connection design forces
Force Value (kN)
Lockup tension 4540Foundation compression 8230Base shear 1878ED strength 1201Design ED strength 2402
The base plate assembly and column assembly can be assembled separately in the shop. The base
plate assembly is fabricated fromwelded plates, and includes the energy dissipation reaction collars,
lockup reaction plates, and the base plate. The column assembly includes the gusset plates which
are welded to the column flanges, and the cast steel fuse units which are through-bolted to the
columnweb. Once the base plate assembly is fastened to the foundation of the structure, the column
assembly can be dropped into place, and the buckling restrained brace installed on-site.
6.4.2 Design forces and material properties
As with all braced frame column-foundation details, the HDR detail was capacity designed to
resist shear, compression, and tension forces. Additionally, this detail included special considera-
tion for the forces from the energy dissipation elements. A summary of the design forces is shown
in Table 6.6. The seismic shear force was determined using capacity design principals, consider-
ing full compressive and tensile overstrength in the first storey BRBs. Earthquake loads governed
the compression and tension forces and were determined using (1.2 + 0.2SDS)D + ⇢QE + L and
(0.9 � 0.2SDS)D + ⇢QE respectively. Note that the maximum tension force in the lockup was
lessened by the strength of the energy dissipation, since at full lockup the yielded energy dissi-
pation elements pull down on the column. The energy dissipation strength was determined using
Equation 6.1.1 and the material and geometric properties from Table 6.1. For the design of the
energy dissipation and ED connecting elements, an overstrength factor of 2.0 was applied in order
to conservatively take into consideration the overstrength due to strain hardening and geometric
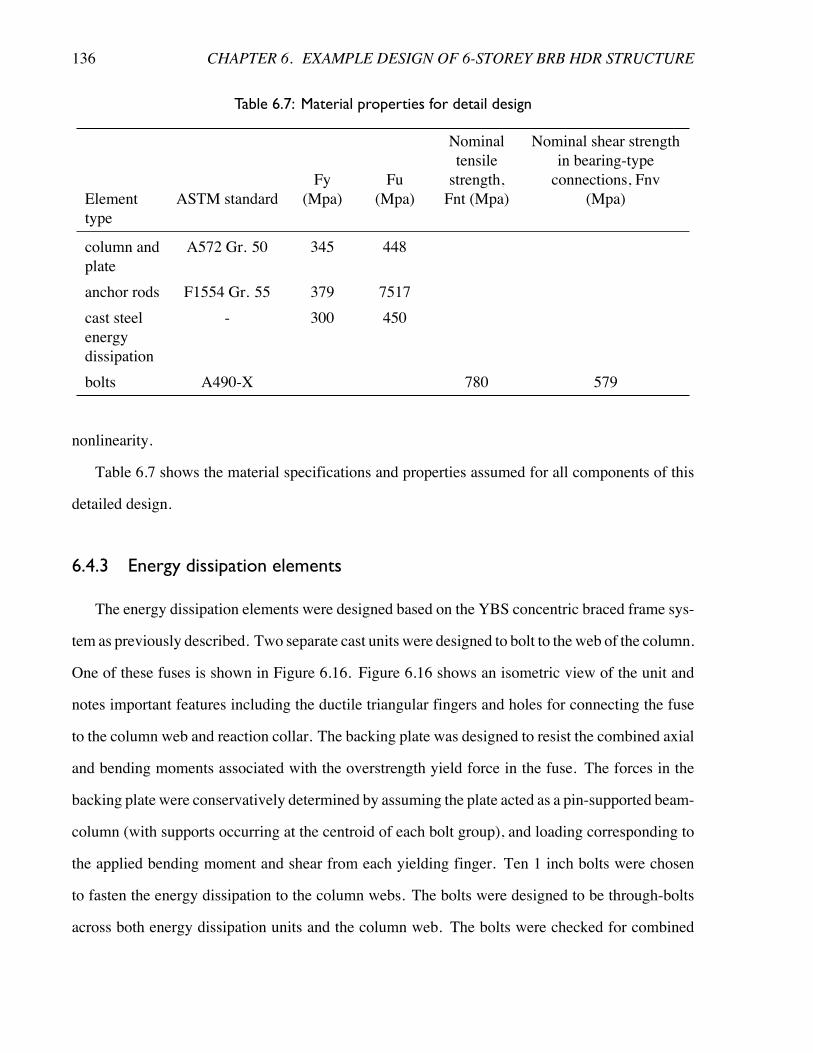
136 CHAPTER 6. EXAMPLE DESIGN OF 6-STOREY BRB HDR STRUCTURE
Table 6.7: Material properties for detail design
Elementtype
ASTM standardFy
(Mpa)Fu
(Mpa)
Nominaltensilestrength,Fnt (Mpa)
Nominal shear strengthin bearing-typeconnections, Fnv
(Mpa)
column andplate
A572 Gr. 50 345 448
anchor rods F1554 Gr. 55 379 7517cast steelenergydissipation
- 300 450
bolts A490-X 780 579
nonlinearity.
Table 6.7 shows the material specifications and properties assumed for all components of this
detailed design.
6.4.3 Energy dissipation elements
The energy dissipation elements were designed based on the YBS concentric braced frame sys-
tem as previously described. Two separate cast units were designed to bolt to the web of the column.
One of these fuses is shown in Figure 6.16. Figure 6.16 shows an isometric view of the unit and
notes important features including the ductile triangular fingers and holes for connecting the fuse
to the column web and reaction collar. The backing plate was designed to resist the combined axial
and bending moments associated with the overstrength yield force in the fuse. The forces in the
backing plate were conservatively determined by assuming the plate acted as a pin-supported beam-
column (with supports occurring at the centroid of each bolt group), and loading corresponding to
the applied bending moment and shear from each yielding finger. Ten 1 inch bolts were chosen
to fasten the energy dissipation to the column webs. The bolts were designed to be through-bolts
across both energy dissipation units and the column web. The bolts were checked for combined
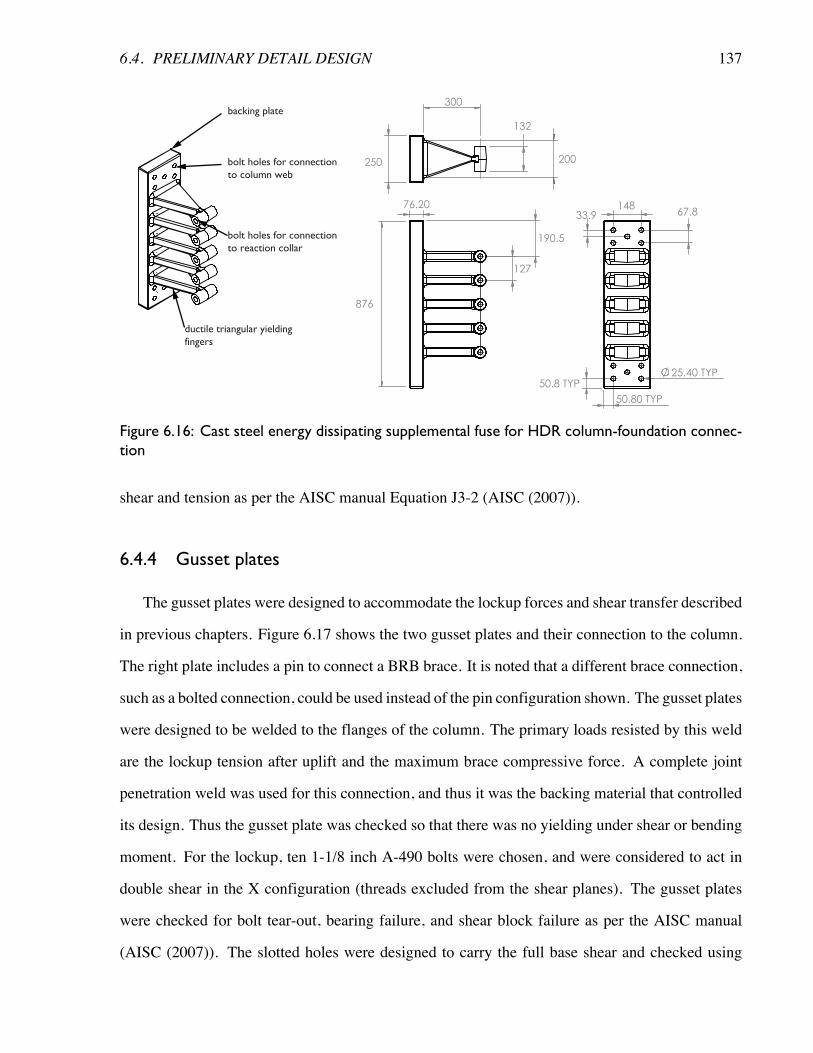
6.4. PRELIMINARY DETAIL DESIGN 137
876
76.20
127
190.5
300
250
132
200
148 67.8 33.9
50.8 TYP
50.80 TYP
25.40 TYP
backing plate
bolt holes for connectionto column web
bolt holes for connectionto reaction collar
ductile triangular yieldingfingers
Figure 6.16: Cast steel energy dissipating supplemental fuse for HDR column-foundation connec-tion
shear and tension as per the AISC manual Equation J3-2 (AISC (2007)).
6.4.4 Gusset plates
The gusset plates were designed to accommodate the lockup forces and shear transfer described
in previous chapters. Figure 6.17 shows the two gusset plates and their connection to the column.
The right plate includes a pin to connect a BRB brace. It is noted that a different brace connection,
such as a bolted connection, could be used instead of the pin configuration shown. The gusset plates
were designed to be welded to the flanges of the column. The primary loads resisted by this weld
are the lockup tension after uplift and the maximum brace compressive force. A complete joint
penetration weld was used for this connection, and thus it was the backing material that controlled
its design. Thus the gusset plate was checked so that there was no yielding under shear or bending
moment. For the lockup, ten 1-1/8 inch A-490 bolts were chosen, and were considered to act in
double shear in the X configuration (threads excluded from the shear planes). The gusset plates
were checked for bolt tear-out, bearing failure, and shear block failure as per the AISC manual
(AISC (2007)). The slotted holes were designed to carry the full base shear and checked using
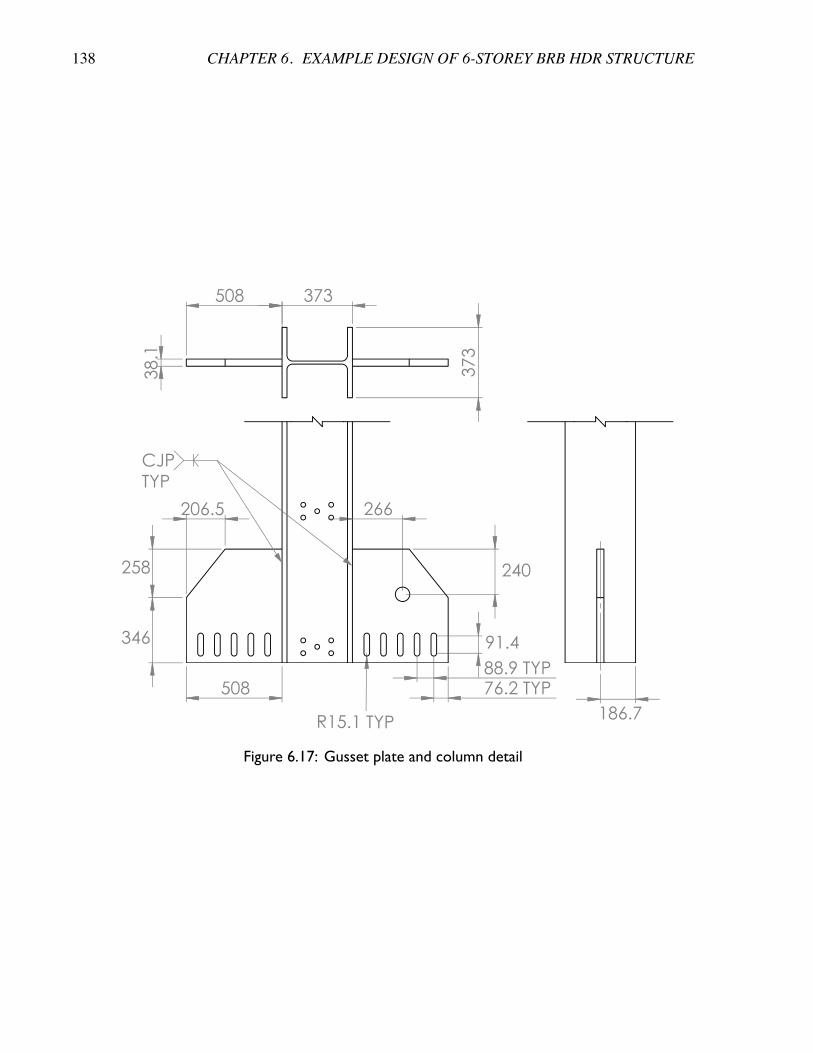
138 CHAPTER 6. EXAMPLE DESIGN OF 6-STOREY BRB HDR STRUCTURE
266
91.4
76.2 TYP
88.9 TYP
240
346
206.5
258
508
PYT 1.51R 186.7
373
38.1
373
508
CJP
TYP
Figure 6.17: Gusset plate and column detail
6.4. PRELIMINARY DETAIL DESIGN 139
1389
895
52.4 TYP
540
115
346
191 127
19
CJP
TYP
CJP
TYP
Figure 6.18: Base plate assembly
AISC manual Equation J3-6c (AISC (2007)).
6.4.5 Base plate assembly
The base plate assembly consists of the energy dissipation reaction collar, lockup reaction
plates, and base plate. An overview of this assembly is shown in Figure 6.18.
The energy dissipation reaction collar was designed to connect the energy dissipation elements
to the foundation and is shown in Figure 6.19 (a). The collar consists of a welded plate assembly
that is in turn welded to the base plate. Slotted holes allow for the fuses to react without causing
excessive tension forces in the yielding fingers due to second order geometric effects (see Gray
(2012)). Since the energy dissipation elements act eccentrically to the centroid of this built up
section, each half of the reaction collar was checked to ensure that the section did not yield under
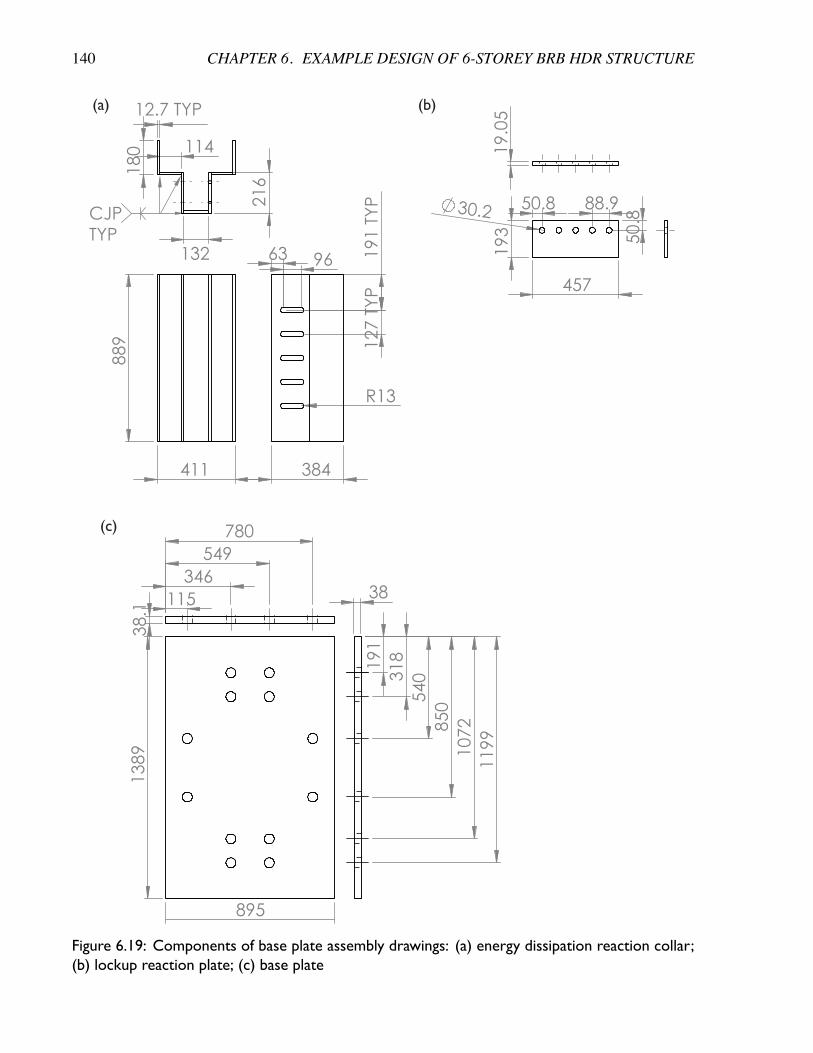
140 CHAPTER 6. EXAMPLE DESIGN OF 6-STOREY BRB HDR STRUCTURE
(a) (b)
(c)
411
889
12.7 TYP
180
CJP
TYP
114
216
132
384
191 T
YP
1
27 T
YP
R13
63 96 193
457
30.2 88.9 50.8
50.8
19.0
5
1389
895
191
318
540
850
1072
1199
38.1
115
346
549
780
38
Figure 6.19: Components of base plate assembly drawings: (a) energy dissipation reaction collar;(b) lockup reaction plate; (c) base plate
6.5. CHAPTER SUMMARY 141
combined axial forces and bending moments. Complete joint penetration welds were specified to
fabricate the collar and connect it to the base plate. A 1/4 inch gap was left between the column
and the reaction collar in order to allow for some rotation of the column after uplift. It is noted,
however, that the collar could serve as a secondary base shear transfer if the gusset plate bolts were
damaged during an earthquake.
The lockup reaction plates were designed to weld to the base plate on each side of the gusset
plate. 1-1/8 inch bolts are fastened through all three plates and ensure that the seismic base shear
is transferred perpendicular to the direction of the slotted holes in the gusset plates, and that the
lockup tension is transferred vertically. A detail drawing of one lockup reaction plate is shown in
Figure 6.19(b).
Finally, the base plate was designed to transfer the tension, compression, and shear force to the
foundation via a series of 50.8 mm diameter anchor rods. A 38.1 mm thick base plate was chosen,
which satisfies the minimum thickness requirement from AISC manual section 14-4.
6.5 Chapter summary
This chapter presented the design of a six storey buckling restrained braced frame that was mod-
ified with hybrid ductile-rocking (HDR) and included supplemental energy dissipation elements.
Section 6.1 described the yielding brace system, and how that system could be adapted as a sup-
plemental damper in a rocking structure. Equations for strength, stiffness, and post-yield stiffness
of a YBS element were presented. Section 6.2 showed how a YBS connector could be modeled in
OpenSees using a special hysteretic element that considers the unique strengthening and stiffening
properties associated with the ductile yielding fingers. A numerical model of a YBS element was
compared to real test results from tests performed at the University of Toronto and shown to be in
good agreement.
Section 6.3 presented an example HDR design based on the 6-storey reference structure. ✓lock =
1.0% was chosen based on the results from Chapter 5, as this amount of allowable lockup in the
142 CHAPTER 6. EXAMPLE DESIGN OF 6-STOREY BRB HDR STRUCTURE
6-storey frame provided improved performance over the fixed base BRB while limiting the possi-
bility of excessive uplift and rocking drift under larger earthquake demands. Fuse properties were
chosen with a target energy dissipation parameter of � = 1.0. Pushover and push-pull results
were presented in order to show how this more realistic fuse model changed the system behaviour
compared to the idealized elastoplastic fuses that were presented in Chapter 5. Finally, results of a
nonlinear time-history analysis were presented to highlight the improved system performance over
the conventional fixed base BRBF.
Section 6.4 presented a preliminary detail design for the column-foundation connection from
the example design in Section 6.3. The detail used two cast steel supplemental hysteretic dampers
in order to achieve the desired energy dissipating characteristics of the rocking joint. The fuses were
designed to bolt to the column web, and connect to the base plate by bolting to an assembly made of
welded plates. Gusset plates with ten slotted holes were designed to transfer base shear and allow
for uplift and lockup after 91.4mmof vertical deformation. TheBRBbracewas designed to connect
to one of these gusset plates. This detail design demonstrated that by making relatively simple
modifications to the column-foundation connections of conventional BRB frames, the performance
gains highlighted in Section 6.3 can be achieved. This detail design further highlighted the fact that
the HDR concept could be readily applied in the design and construction of steel buildings without
major modifications or particular challenges in the field.
Chapter 7
Summary and conclusions
This chapter presents a summary of the main aspects of this thesis. It also provides a discus-
sion on the viability of the proposed HDR system in the context of current building codes, and
recommendations for future research.
7.1 Background and literature review
Chapter 2 provided an overview of the mechanics and performance issues related to buckling
restrained brace frames and rocking frames. BRBFs are an attractive seismic-resistant system since
their high levels of ductility and low post-yield stiffness allow for low system forces and thus
economical designs. Despite this advantage, the low post-yield stiffness the system exhibits can
also lead to drifts accumulating in a few stories, excessive cyclic and residual damage, and in turn
necessitate the expensive repair or even demolition of the entire building.
On the other hand, rocking structures are usually not associated with large drift concentra-
tions or residual drifts as most of the inelastic action is accommodated at the base of the rocking
structure. Researchers have developed these systems in recent years so that the SFRS structural el-
ements are designed to remain essentially elastic, and system ductility occurs as a geometric frame
rotation that is not associated with damage, except possibly in supplemental energy dissipation
elements which can be replaced after a seismic event. While these systems are highly promising
143
144 CHAPTER 7. SUMMARY AND CONCLUSIONS
low-damage alternatives to conventional damage-based seismic systems, they too have drawbacks.
As shown byWiebe (2013), rocking structures do not limit the shear at the base of the structure and
overturning moments along the frame’s height, and thus higher mode demands can severely limit
the force-reduction capability of these systems. While Wiebe (2013) developed and tested highly
effective options for mitigating these higher-mode effects, these solutions represent an increased
design complexity and detailing cost that reduces the desirability of such controlled rocking frames.
If higher modes are not mitigated, large frame members are required to ensure an elastic response,
and even still these members could experience non-ductile damage if they are overloaded. As well,
the post-tensioning elements and slab-frame compatibility required for controlled rocking struc-
tures represent an increased complexity and cost that are not features of conventionally designed
BRBFs.
Thus, the hybrid ductile-rocking system that was proposed in this thesis allows some rocking
in a conventionally designed code-compliant BRB frame. The large force reduction, energy dis-
sipation, and acceleration control characteristics of the BRBs are maintained, while the tendency
to accumulate excessive cyclic and residual damage is reduced since a portion of the system dis-
placements is contributed by a base-rocking connection. A lockup device is provided at the base
in order to allow for the BRBF to develop its code-prescribed resistance under a larger earthquake
demand. The lockup also serves to limit the vertical displacement of the system as well as the
possible excessive deformation on supplemental energy dissipation elements.
7.2 Mechanics of the HDR system
Chapter 3 derived the basic mechanics of the HDR system and highlighted important charac-
teristics of the proposed system related to the P-Δ effect and residual deformations. Equations that
describe a base-rocking joint were presented based on the mechanics derivation for controlled rock-
ing structures from Wiebe (2013). A series of free body diagrams of a one-storey HDR structure
were presented in order to demonstrate the distinction between smaller system deformations that do
7.3. PARAMETRIC STUDY ON HYBRID DUCTILE-ROCKING BRBFS 145
not engage the lockup, and larger deformations that do engage it. Considering a single-degree-of-
freedom response, such smaller deformations are not associated with residual drifts in the braces
whereas if the lockup is engaged, residual deformations in the braces are possible. It was noted
that in a real multi-storey structure, higher mode demands can cause cyclic inelastic loading and
residual deformations even if the lockup is not engaged.
The pushover and push-pull behaviour of the HDR system was investigated. During a mono-
tonic pushover loading, since brace yielding is expected at a larger system displacement than for
a conventional fixed base structure, a reduction in system strength is expected because of the P-Δ
effects. During cyclic loading, however, that reduction depends on the specific loading history
since brace yielding can occur at any system displacement. Finally, in this chapter it was noted that
the residual drifts in HDR structures are sensitive to the loading history.
7.3 Parametric study on hybrid ductile-rocking BRBFs
Chapter 4 presented the reference buckling restrained braced frames used in this thesis: 2, 4,
and 6-storey frames were designed for Los Angeles, California (as outlined in Appendix A), and
models of these frames were created using OpenSees. Nonlinear elements were used to model
the buckling restrained braces and were calibrated to BRB tests by Black et al. (2002). Three
record suites of 10 records representing 0.5 DBE, DBE, and MCE were selected and scaled, and
the building models were analyzed using nonlinear time-history analysis. In general, the BRBs
accomplished their design intent of limiting system forces, including storey shears, overturning
moments, and column forces. That being said, cyclic and permanent deformations were excessive
especially at the lower stories of all three frames. The reference frame results suggested that these
buildings would require expensive repairs or, more likely, demolition after a design-level seismic
event due to excessive damage and permanent deformations concentrated at the first few floors.
In Chapter 5, a parametric study was performed on a total of 111 different building models
incorporating the HDR concept that investigated how the energy dissipation parameter, � (which is
146 CHAPTER 7. SUMMARY AND CONCLUSIONS
directly related to the supplemental energy dissipation strength) and allowable base rotation before
lockup, θlock, affected the response of the reference frames. The results demonstrated a number
of different trends. While peak drifts were relatively similar or smaller for the HDR system as
compared to the fixed base frames for the 4 and 6-storey structures, allowing rocking generally
caused an increase in peak drifts for the 2-storey frame when there was little or no supplemental
energy dissipation. This result is in line with previous observations on deformations in flag-shaped
systems with short periods (see Christopoulos et al. (2002) and Wiebe and Christopoulos (2014)).
It was noted that while peak drifts are related to the low-cycle fatigue life of conventional fixed base
structures, it is the peak drift minus the base rotation (DMR) that helps predict LCF life in HDR
structures. Thus, the DMR values were calculated, and were shown to decrease with increased
θlock. Residual drifts were reduced for the 0.5 DBE suite, under which the lockup devices were
less frequently engaged, but were not necessarily reduced for the larger earthquake levels in the 2
and 4-storey frames. There was a notable reduction in residual deformations in the 6-storey frame.
The energy dissipated by the braces was shown to be significantly reduced with increased θlock.
System forces were shown to be similar between the HDR structures and the fixed base response
since in both cases forces were limited by the capacity of the braces. That being said, the storey
shears were somewhat reduced in many of the HDR frames since the overstrength demand on
the braces was lessened. An increase in overturning moment and column forces was observed,
especially for the shorter-period 2-storey frame, and was determined to be related to a dynamic
excitation of the lumped vertical masses.
Considering the observed excitation of vertical mass, a small study was performed in order to
investigate how vertical mass modeling choices affected the analysis results. A review of previous
experimental and numerical rocking investigations showed that while excitation of vertical mass is
a physical phenomena that can cause spikes in column forces, numerical techniques for approximat-
ing this effect are varied across different historical studies. A study was performed to investigate
how four different vertical mass modeling techniques observed in the literature affect the results.
It was determined that lumping the vertical mass at the beam-column connections likely represents
7.4. DETAIL DESIGN OF 6-STOREY BRB HDR FRAME WITH CAST STEEL FUSE 147
an upper bound on the column force amplification, and that this effect is much more pronounced
in shorter period structures. Further, even if the column forces were amplified, the brace force and
drift results were not greatly affected by the different vertical mass modeling techniques.
7.4 Detail design of 6-storey BRB HDR frame with cast steel fuse
In order to more clearly demonstrate the performance benefits of the proposed HDR system,
an example design and analysis was carried out. The 6-storey reference frame was modified to
incorporate the hybrid ductile-rocking system and HDR parameters were chosen based on the the
results of the parametric study in Chapter 5. A cast steel supplemental fuse based on the yielding
brace system (see Gray (2012)) was designed in order to provide adequate ductility at an expected
maximum deformation corresponding to θlock = 1.0%, and a numerical model of this fuse was
calibrated based on laboratory tests. This model explicitly captured the characteristic post-yield
stiffening and strengthening associated with the ductile yielding fingers of the YBS devices.
A nonlinear time-history analysis was carried out on this modified 6-storey frame as well as the
fixed base frame, and the results were compared. The HDR frame demonstrated a greatly improved
seismic performance across a number of response parameters. The peak drift profile of the HDR
frame did not feature large drift concentrations, and the DMRprofile demonstrated a large reduction
in seismic demand on the BRBs. This result was further emphasized by the roughly 50% reduction
in energy dissipated by the braces across all three earthquake intensities. The HDR frame’s residual
drifts were significantly less than the fixed base frame at all earthquake levels.
TheHDR systemmaximum seismic force values were very similar to the fixed base values since
in both frames the forces were limited by the capacities of the BRBs. Even still, the storey shears in
the lower stories of the HDR frame were lower than for the fixed frame since the HDR frame was
not associated with large deformation concentrations, and thus the BRBs did not experience as large
nonlinear overstrength forces. Furthermore, both the HDR and fixed frames similarly experienced
the beneficial storey acceleration characteristics of BRB frames.
148 CHAPTER 7. SUMMARY AND CONCLUSIONS
Finally, a column-foundation detail concept was developed in order to demonstrate how the
HDR system could be practically implemented. Gusset plates with slotted holes were designed
to transfer the base shear and permit uplift and lockup. Cast steel energy dissipation elements
were designed to be through-bolted across the column web and connect to the base plate via a
collar fabricated from welded plates. The buckling restrained brace was designed to connect to
one of the gusset plates and was designed as a true-pin connection for this example. A proposed
construction sequence was developed to demonstrate how much of the fabrication of this detail can
be accomplished off-site so that no welding is required on-site.
This example design demonstrated that by modifying the column-foundation connections of
a conventionally designed BRBF to allow for a controlled uplift, the seismic performance and
resilience of the frame can be greatly improved.
7.5 Framework for application of HDR system and discussion of
future research
While controlled rocking structures (CRS), such as those proposed by Eatherton et al. (2008),
Roke et al. (2006), andWiebe (2013), are not yet codified seismic systems, theHDR system features
a code-compliant ductile BRB frame as its superstructure, and a lockup device that ensures, after a
predetermined amount of allowable base rocking, the development of the full superstructure codi-
fied specified lateral resistance and ductility. Thus, the HDR system is effectively a code-compliant
with respect to the strength requirements of the code. With respect to the global deformations of
the structure (which are linked to the global stability of the system), the parametric study in Chapter
5 and the analysis of the 6-storey example design in Chapter 6 showed that the peak drifts in the
HDR systems were typically similar if not smaller when compared to the conventional fixed-base
frames. Based on these results, it could then be inferred that the HDR structures considered in this
thesis do therefore meet the intent of the current seismic design codes with respect to the global
deformations of the system. In fact, the results of this thesis suggest that the collapse performance
7.5. FRAMEWORK FOR APPLICATION 149
of the HDR system should be improved over conventional fixed-base structures since the structure
can have similar or smaller peak drifts, interstorey drifts which are more evenly distributed along
the building height, and less inelastic deformation demand on the BRBs. Future research is recom-
mended in order to further confirm that the collapse performance of the HDR system is similar if
not improved over conventional fixed base structures.
It should also be noted that the idea of allowing small amounts of foundation uplift is already
recognized in current codes, even if rocking is not explicitly intended as an approved seismic sys-
tem. For example, AISC (2010) allows for column forces in an SFRS to be limited by the forces
that are associated with “the resistance of the foundation to overturning uplift”. Additionally, the
National Building Code of Canada (NBCC 2010) addresses foundation rocking in two clauses.
Clause 4.1.8.15(8) states that the design forces for the SFRS can be limited to the values associ-
ated with foundation rocking as long as the force modification factors correspond to those for the
chosen SFRS, and the foundations are designed according to clause 4.1.8.16(1). Clause 4.1.8.16(1)
states that when foundations are allowed to rock, the design forces for the foundation can be lim-
ited to those determined using an RdRo equal to 2.0. In the context of these code clauses, the HDR
column-foundation detail could be considered a form of foundation rocking in a conventional SFRS
that is already recognized by the building code.
While the HDR system requires modifications to a frame’s column-foundation detail, and thus
additional design complexity compared to conventional fixed base frame, the HDR system is not
as complex to design and detail as a controlled rocking structure. Controlled rocking structures
often use post-tensioning tendons to control rocking strength and post-uplift stiffness, while the
HDR systems studied in this thesis relied on gravity loads to supply the post-uplift restoring mo-
ment. As well, the higher-mode mitigation techniques presented byWiebe (2013), while achieving
significant response improvements, are in fact associated with increased design complexity and
construction cost. In the HDR system, the control of higher mode effects is achieved through the
ductile superstructure that limits forces. The HDR system does, however, require a slab-SFRS de-
tail that can accommodate column uplift while transferring dead load and inertial forces. Further
150 CHAPTER 7. SUMMARY AND CONCLUSIONS
research is required in order to study details that can accommodate this displacement compatibility,
including how a conventional detail would perform under the uplift demands of the HDR system. It
is noted that the lockup device used in the HDR details in this thesis can limit the amount of vertical
uplift that is expected, and thus the amount of vertical slab deformation required is ultimately up
to the design engineer. The parametric study demonstrated that allowing 1.0% base rotation can
achieve significant performance benefits, and so research should be performed to determine sever-
ity of slab damage under roughly 90 mm of vertical uplift, depending on the frame proportions. As
well, the effect of the excitation of vertical mass studied in Section 5.4 should be further character-
ized considering how different slab-SFRS details may affect how gravity load is transferred to the
HDR frame and how the vertical loads are amplified as a result of this vertical vibration.
This thesis only considered the two-dimensional response of the seismic force resisting-systems
that were studied. Since the HDR system behaves similarly to a conventional frame, it should be
able to accommodate three dimensional effects in the same manner as a conventional frame. In that
respect, further analyses should be performed that confirm the column-foundation detail’s ability
to accommodate out of plane rotations due to building deformations that are perpendicular to the
plane of the lateral frame.
Further research is recommended to expand the HDR system to include other SFRSs besides
BRBFs that are prone to excessive damage, including conventional concentric braced frames (CBF),
moment resisting frames (MRF), or eccentrically braced frames (EBF). Additionally, the HDR con-
cept could be used to increase the seismic force reduction factor of a lower-ductility system. For
example, a special concentrically braced frame (SCBF), which has an R factor of 6 (ASCE, 2010a)
could be designed with a larger R factor if it was designed as an HDR system.
7.6 Low-damage, economical seismic design
This thesis presented a new hybrid ductile-rocking steel frame seismic system. It was shown
that while conventional codified structures may be relatively simple to design and inexpensive to
7.6. LOW-DAMAGE, ECONOMICAL SEISMIC DESIGN 151
construct, excessive damage can result in their total loss even after experiencing a single design-
level earthquake. While controlled rocking structures are promising high-performance systems
since they can be designed to withstand multiple earthquakes while sustaining little or no dam-
age, higher mode demands and increased detailing requirements make them more complex and
expensive options as compared to conventional ductile systems. Thus, the HDR system combines
the positive aspects of conventional ductility and rocking frames in order to achieve a low dam-
age, cost effective seismic system that offers improved performance and resilience over current
damage-based systems. The result from the example structure that was presented in Chapter 6 in-
dicated that with the HDR detail the cyclic inelastic demands were reduced in the BRBs to such an
extent during even an MCE event that the structure could potentially resist a second MCE event (as
long as the residual interstorey drifts were not excessive after the first MCE record), thus greatly
enhancing the resilience of this highly ductile codified steel BRBF.
While this thesis focused on BRBFs as an example of conventional systems, the HDR concept
can be extended to other damage-based, distributed-ductility, codified seismic systems such as
CBFs, MRFs, and/or EBFs and be further developed as a general strategy to enhance the resilience
of current codified ductile structures.
References
AISC (2007). Steel Construction Manual, Thirteenth Edition. American Institute of Steel Con-
struction (AISC).
AISC (2010). Seismic Provisions for Structural Steel Buildings. AISC (American Institute of Steel
Construction).
ASCE (2010a). Minimum Design Loads for Buildings and Other Structures (7-10 ed.). ASCE
(American Society of Civil Engineers).
ASCE (2010b). Specification for Structural Steel Buildings. AISC (American Institute of Steel
Construction).
Azuhata, T., T. Ishihara, M. Midorikawa, and A. Wada (2006). Siesmic response reduction of steel
frames with multi-spans by applying rocking structural system. In STESSA.
Azuhata, T., M. Midorikawa, T. Ishihara, and A. Wada (2004, August). Simplified prediction
method for seismic response of rocking structural systems with yielding base plates. 13th World
Conference on Earthquake Engineering (371).
Azuhata, T., M. Midorikawa, and A. Wada (2003). Study on applicability of rocking structural
systems to building structures. Smart Structures and Materials.
Beck, J. L. and R. I. Skinner (1974). The seismic response of a reinforced concrete bridge pier
designed to step. Earthquake Engineering and Structural Dynamics 2, 343–358.
152
REFERENCES 153
Black, C., N. Makris, and I. Aiken (2002). Component testing, stability analysis and characteriza-
tion of bukcking-restrained unbonded braces. Technical report, Pacific Earthquake Engineering
Research Center.
Choi, H., J. Erochko, C. Christopoulos, and R. Tremblay (2008). Comparison of the seismic
response of steel buildings incorporating self-centering energy-dissipative braces, buckling re-
strained braces and moment-resisting frames. Universty of Toronto and École Polytechnique.
Christopoulos, C., A. Filiatrault, and B. Folz (2002). Seismic response of self-centring hysteretic
sdof systems. Earthquake Engineering and Structural Dynamics 31, 1131–1150.
Christopoulos, C., S. Pampanin, andM. J. N. Priestley (2003). Performance-based seismic response
of frame structures including residual deformations. part 1: Single degree of freedom systems.
Journal of Earthquake Engineering 7(1), 97–118.
Christopulos, A. S. (2005). Improved Seismic Performance of Buckling Restrained Braced Frames.
Ph. D. thesis, University of Washington.
Clough, R. W. and A. A. Huckelbridge (1977, August). Preliminary Experimental Study of Seismic
Uplift of a Steel Frame. Earthquake Engineering Research Center.
Eatherton, M., J. Hajjar, G. Deierlein, H. Krawlinker, S. Billington, and X. Ma (2008). Controlled
rocking of steel-framed buildings with replaceable energy-dissipating fuses. In The 14th World
Conference on Earthquake Engineering.
Eatherton, M. R. (2010). Large-Scale Cyclic and Hybrid Simulation Testing and Development of
a Controlled-Rocking Steel Building System with Replaceable Fuses. Ph. D. thesis, University
of Illionois at Urbana-Champaign.
Erochko, J. and C. Christopoulos (2014). Self-centering energy-dissipative (sced) brace: Overview
of recent developments and potential applications for tall buildings. Sustainable Development of
Critical Insfrastructure CDRM 8.
154 REFERENCES
Erochko, J., C. Christopoulos, R. Tremblay, and H. Choi (2011). Residual drift response of smrfs
and brb frames in steel buildings design according to asce 7-05. Journal of Structural Engineer-
ing 137, 589–599.
FEMA (2009). Quantification of Building Seismic Performance Factors. Applied Technology
Council and Federal Emergency Management Agency.
Filiatrault, A., R. Tremblay, C. Christopoulos, B. Folz, and D. Pettinga (2013). Elements of Earth-
quake Engineering and Structural Dynamics (3 ed.). Presses Internationales Polytechnique.
Gray, M. (2012). Cast Steel Yielding Brace System for Concentrically Braced Frames. Ph. D.
thesis, University of Toronto.
Gray,M., C. D. Oliveira, andC. Christopoulos (2014). Yielding Brace System Tests Internal Report.
Cast Connex Corporation.
Gray, M. G., J. C. de Oliveira, C. Christopoulos, and J. I. Binder (2014). Effects of post-yield
stiffening and strengthening on the collapse performance of non-buckling braced frames. In
National Conference on Earthquake Engineering.
Holden, T., J. Restrepo, and J. B. Mander (2003). Seismic performance of precast reinforced and
prestressed concrete walls. Journal of Structural Engineering 129, 286–296.
Housner, G. W. (1963, February). The behavior of inverted pendulum structures during earth-
quakes. Bulletin of the Seismological Society of America 53(2), 403–417.
Huckelbridge, A. A. (1977, August). Earthquake Simulation Tests of a Nine Story Steel Frame
with Columns Allowed to Uplift. Earthquake Engineering Research Center.
Kelley, T. E. (2009). Tentative seismic design guidelines for rocking structures. Bulletin of the
New Zealand Society for Earthquake Engineering 42(4).
REFERENCES 155
Kelly, J. M. and D. F. Tsztoo (1977, December). Earthquake simulation of a stepping frame
with energy-absorbing devices. Bulletin of the New Zealand Society for Earthquake Engineer-
ing 10(4), 196–207.
Kim, H.-J. (2012, December). Seismic response of flag-shaped hysteretic sdof systemswith seismic
fuses. International Journal of Steel Structures 12(4), 523–535.
Kim, H.-J. and C. Christopoulos (2008). Friction damped posttensioned self-centering steel
moment-resisting frames. Journal of Structural Engineering.
MacRae, G. A. and K. Kawashima (1997). Post-earthquake residual displacements of bilinear
oscilators. Earthquake Engineering and Structural Dynamics 26, 701–716.
Malley, J. O., G. Deierlein, H. Krawlinkler, J. R. Maffei, M. Pourzanjani, J. Wallace, and J. A.
Heintz (2010). Peer/ atc-72-1: Modeling and acceptance criteria for seismic design and analysis
of tall buildings. Technical report, Pacific Earthquake Engineering Research Center.
McCormick, J., H. Aburano, M. Ikenaga, and M. Nakashima (2008). Permissible residual defor-
mation levels for building structures consid- ering both safety and human elements. In Proc.
14th World Conf. Earthquake Engineering, Volume Paper ID 05-06-0071. Seismological Press
of China, Beijing.
McKenna, F. (2006). Open system for earthquake engineering simulation.
Meritt, S., C.-M. Uang, and G. Benzoni (2003). Subassemblage testing of star seismic buckling-
restrained braces. Technical report, Department of Structural Engineering, University of Cali-
fornia, San Diego.
Merritt, S., C.-M. Uang, and G. Benzoni (2003). Subassemblage testing of corebrace buckling-
restrained braces. Technical report, Department of Structural Engineering, University of Cali-
fornia, San Diego.
156 REFERENCES
Midorikawa, M., T. Azuhata, T. Ishihara, Y. Matsuba, Y. Matsushima, and A.Wada (2002). Earth-
quake response reduction of buildings by rocking structural systems. Smart Structures and Ma-
terials (265-272).
Midorikawa, M., T. Azuhata, T. Ishihara, and A. Wada (2006, July). Shaking table tests on seismic
response of steel braced frames with column uplift. Earthquake Engineering and Structural
Dynamics 35, 1767–1785.
Midorikawa, M., S. Toyomaki, H. Hori, T. Asari, T. Azuhata, and T. Ishihara (2008). Seismic
response of six-story eccentrically braced steel frames with columns partially allowed to uplift.
In The 14th World Conference on Earthquake Engineering.
Muto, K., H. Umemura, and Y. Sonobe (1960). Study of the overturning vibration of slender
structures. Technical report, University of Tokyo.
Palmer, K. D. (2012). Seismic Behavior, Performance and Design of Steel Concentrically Braced
Frame Systems. Ph. D. thesis, University of Washington.
Poirier, L.-P. (2008). Viscously damped controlled rocking response for cost effective seismic
design of steel structures. Master’s thesis, Universite De Montreal.
Pollino, M. and M. Bruneau (2007). Seismic retrofit of bridge steel truss piers using a controlled
rocking approach. Journal of Bridge engineering, 600–610.
Priestley, M. J. N. (1991, July-August). Overview of presss research program. PCI Journal, 50–57.
Priestley, M. J. N. (1999, November-December). Preliminary results and conclusions from the
presss five-story precast concrete test building. PCI Journal.
Roke, D., R. Sause, J. M. Ricles, C.-Y. Seo, and K.-S. Lee (2006). Self-centering seismic-resistant
steel concentrically-braced frames. In Proceedings of the 8th US National Conference on Earth-
quake Engineering, San Francisco, CA.
REFERENCES 157
Ruiz-Garcia, J. and E. Miranda (2006). Residual displaement ratios for assessment of existing
structures. Earthquake Engineering and Structural Dynamics 35(315-336).
Sabelli, R. (2000). Research on improving the design and analysis of earthquake-resistant steel-
braced frames. Technical report, The 2000 NEHRP Professional Fellowship Report.
Sabelli, R., S. Mahin, and C. Chang (2003). Seismic demands on steel braced frame buildings with
buckling-restrained braces. Engineering Structures 25, 655–666.
Tremblay, R., M. B. Ftima, and R. Sabelli (2004). An innovative bracing configuration for im-
proved seismic response. Proceedings of Recent Advances and New Trends in Structural Design
International Collquium.
Tremblay, R., L.-P. Poirier, N. Bouaanani, M. Leclerc, V. Rene, L. Fronteddu, and S. Rivest (2008).
Innovative viscously damped rocking braced steel frames. The 14th World Conference on Earth-
quake Engineering.
Tsai, K.-C., P.-C. Hsiao, K.-J.Wang, Y.-T.Weng, M.-L. Lin, K.-C. Lin, C.-H. Chen, J.-W. Lai, and
S.-L. Lin (2008). Pseudo-dynamic tests of a full-scale cft/brb frame — part i: Specimen design,
experiment and analysis. Earthquake Engineering and Structural Dynamiccs 37, 1081–1098.
Uang, C.-M. and S. Kiggins (2006). Reducing residual drift of buckling-restrained braced frames
as a dual system. Engineering Structures 28, 1525–1532.
Uriz, P. and S. A. Mahin (2008). Toward earthquake-resistant design of steel concentrically braced
steel-frame structures. Technical report, Pacific Earthquake Engineering Research Center.
Wada, A., S. Yamada, O. Fukata, and M. Tanigawa (2001, October). Passive controlled slender
structures having special devises at column connections. 7th International Seminar on Seismic
Isolation, Passive Energy Dissipation and Active Control of Vibrations of Structures.
Wiebe, L. and C. Christopoulos (2010). Characterizing acceleration spikes due to stiffness changes
in nonlinear systems. Earthquake Engineering and Structural Dynamics 39, 1653–1670.
158 REFERENCES
Wiebe, L. and C. Christopoulos (2014). Performance-based seismic design of controlled rocking
steel braced frames. 1: Methodological framework and design of base rocking joint. Journal of
Structural Engineering.
Wiebe, L., C. Christopoulos, R. Tremblay, and M. Leclerc (2012a). Mechanisms to limit higher
mode effects in a controlled rocking steel frame. 1: Concept, modelling, and low-amplitude shake
table testing. Earthquake Engineering and Structural Dynamics (42), 1053–1068.
Wiebe, L., C. Christopoulos, R. Tremblay, and M. Leclerc (2012b). Mechanisms to limit higher
mode effects in a controlled rocking steel frame. 2: Large-amplitude shake table testing. Earth-
quake Engineering and Structural Dynamics 42, 1069–1086.
Wiebe, L. D. A. (2013). Design of controlled rocking steel frames to limit higher mode effects. Ph.
D. thesis, University of Toronto.
Appendix A
Design of reference structures
This section describes the design process for the reference structures. The structures used in this
study were designed based on similar structures from Choi et al. (2008). The frames were designed
using the loading defined by ASCE 7-10 Minimum Design Loads for Buildings and Other Struc-
tures ASCE (2010a). The steel members were designed according to the provisions of AISC 360-10
Load and Resistance Factor Design Specification for Structural Steel Buildings ASCE (2010b), and
ANSI/AISC 341-10 Seismic Provisions for Structural Steel Buildings (including Supplement No.
1) (AISC, 2010).
A.1 Description of reference structures and preliminary design
A typical steel frame office building located in downtown Los Angeles, California was chosen.
The plan of the office building consisted of three 9.14 m bays in the north-south direction, and
five 9.14 m bays in the east-west direction. The lateral force-resisting system in the north-south
direction consisted of two BRB braced frames, along the east and west edges of the building. The
planwas symmetrical in both the north-south and east-west direction, and thus there was no inherent
torsion in this structure. The design of the lateral system in the east-west direction is not described
in this thesis. Figure 4.1shows the building plan and elevation. Table A.1 shows the steel material
properties used in the design. Lateral load resisting beams and columns were designed with ASTM
159
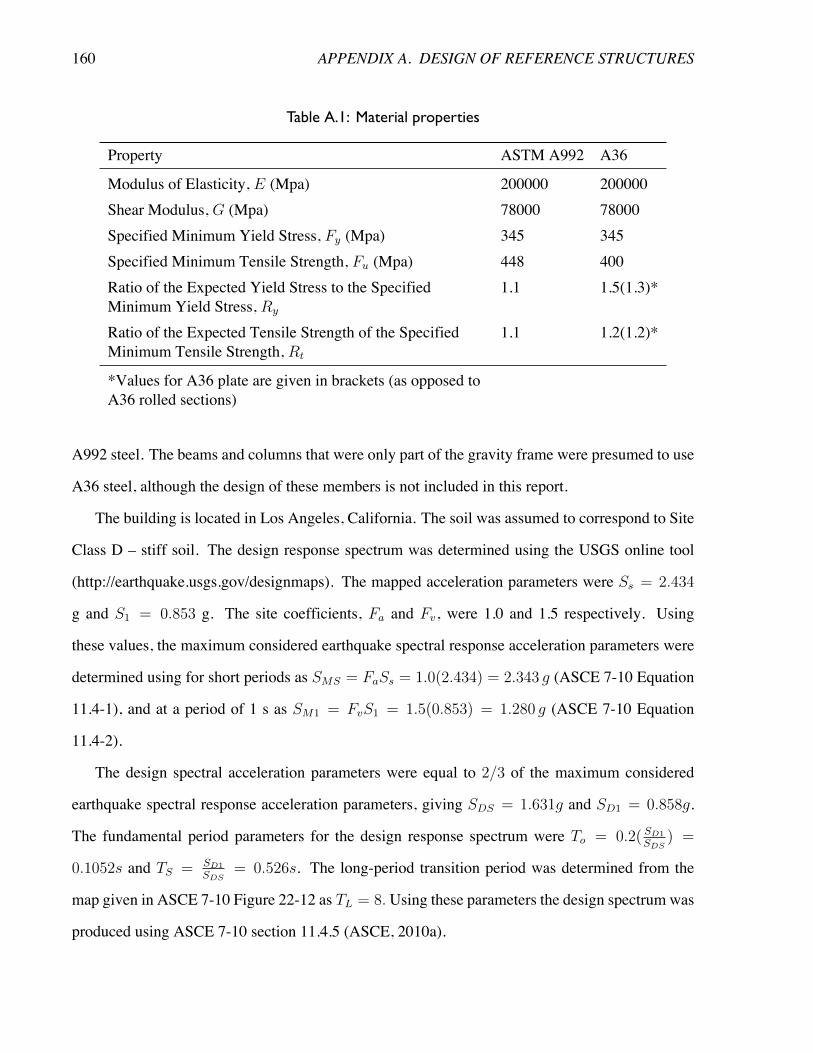
160 APPENDIX A. DESIGN OF REFERENCE STRUCTURES
Table A.1: Material properties
Property ASTM A992 A36
Modulus of Elasticity, E (Mpa) 200000 200000Shear Modulus, G (Mpa) 78000 78000Specified Minimum Yield Stress, Fy (Mpa) 345 345Specified Minimum Tensile Strength, Fu (Mpa) 448 400Ratio of the Expected Yield Stress to the SpecifiedMinimum Yield Stress, Ry
1.1 1.5(1.3)*
Ratio of the Expected Tensile Strength of the SpecifiedMinimum Tensile Strength, Rt
1.1 1.2(1.2)*
*Values for A36 plate are given in brackets (as opposed toA36 rolled sections)
A992 steel. The beams and columns that were only part of the gravity frame were presumed to use
A36 steel, although the design of these members is not included in this report.
The building is located in Los Angeles, California. The soil was assumed to correspond to Site
Class D – stiff soil. The design response spectrum was determined using the USGS online tool
(http://earthquake.usgs.gov/designmaps). The mapped acceleration parameters were Ss = 2.434
g and S1 = 0.853 g. The site coefficients, Fa and Fv, were 1.0 and 1.5 respectively. Using
these values, the maximum considered earthquake spectral response acceleration parameters were
determined using for short periods as SMS = FaSs = 1.0(2.434) = 2.343 g (ASCE 7-10 Equation
11.4-1), and at a period of 1 s as SM1 = FvS1 = 1.5(0.853) = 1.280 g (ASCE 7-10 Equation
11.4-2).
The design spectral acceleration parameters were equal to 2/3 of the maximum considered
earthquake spectral response acceleration parameters, giving SDS = 1.631g and SD1 = 0.858g.
The fundamental period parameters for the design response spectrum were To = 0.2( SD1SDS
) =
0.1052s and TS = SD1
SDS
= 0.526s. The long-period transition period was determined from the
map given in ASCE 7-10 Figure 22-12 as TL = 8.Using these parameters the design spectrum was
produced using ASCE 7-10 section 11.4.5 (ASCE, 2010a).
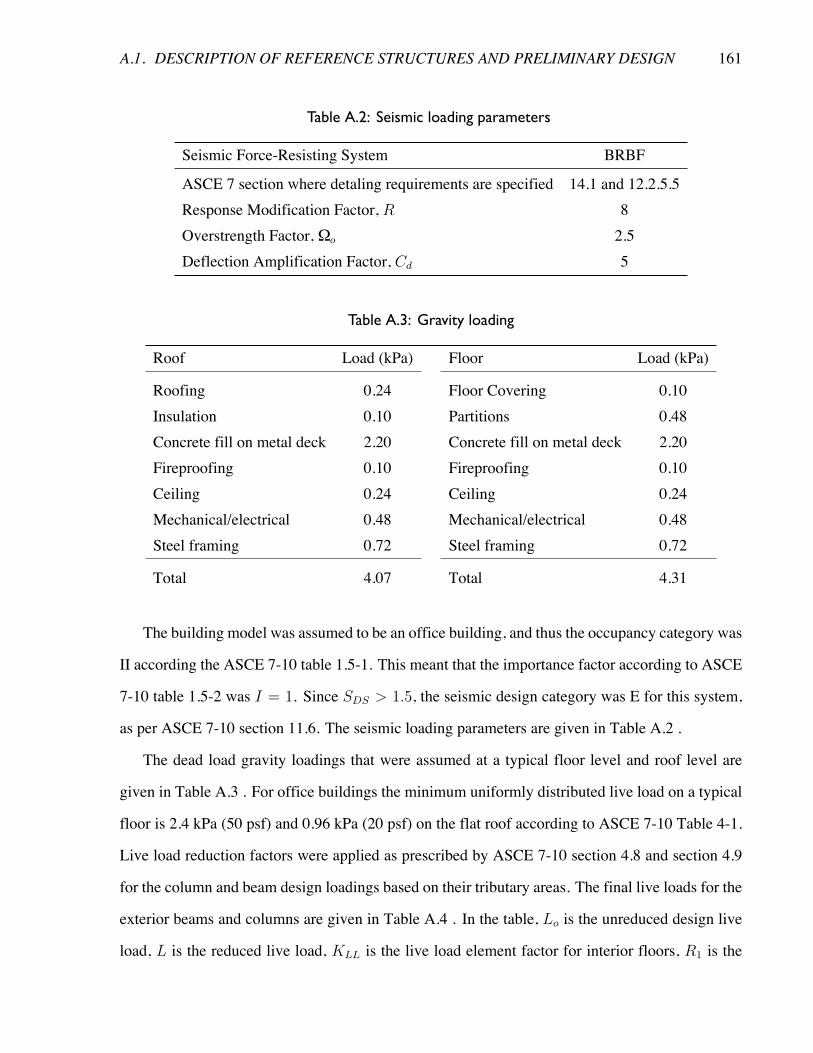
A.1. DESCRIPTION OF REFERENCE STRUCTURES AND PRELIMINARY DESIGN 161
Table A.2: Seismic loading parameters
Seismic Force-Resisting System BRBF
ASCE 7 section where detaling requirements are specified 14.1 and 12.2.5.5Response Modification Factor, R 8Overstrength Factor, Ωo 2.5Deflection Amplification Factor, Cd 5
Table A.3: Gravity loading
Roof Load (kPa) Floor Load (kPa)
Roofing 0.24 Floor Covering 0.10Insulation 0.10 Partitions 0.48Concrete fill on metal deck 2.20 Concrete fill on metal deck 2.20Fireproofing 0.10 Fireproofing 0.10Ceiling 0.24 Ceiling 0.24Mechanical/electrical 0.48 Mechanical/electrical 0.48Steel framing 0.72 Steel framing 0.72
Total 4.07 Total 4.31
The building model was assumed to be an office building, and thus the occupancy category was
II according the ASCE 7-10 table 1.5-1. This meant that the importance factor according to ASCE
7-10 table 1.5-2 was I = 1. Since SDS > 1.5, the seismic design category was E for this system,
as per ASCE 7-10 section 11.6. The seismic loading parameters are given in Table A.2 .
The dead load gravity loadings that were assumed at a typical floor level and roof level are
given in Table A.3 . For office buildings the minimum uniformly distributed live load on a typical
floor is 2.4 kPa (50 psf) and 0.96 kPa (20 psf) on the flat roof according to ASCE 7-10 Table 4-1.
Live load reduction factors were applied as prescribed by ASCE 7-10 section 4.8 and section 4.9
for the column and beam design loadings based on their tributary areas. The final live loads for the
exterior beams and columns are given in Table A.4 . In the table, Lo is the unreduced design live
load, L is the reduced live load, KLL is the live load element factor for interior floors, R1 is the
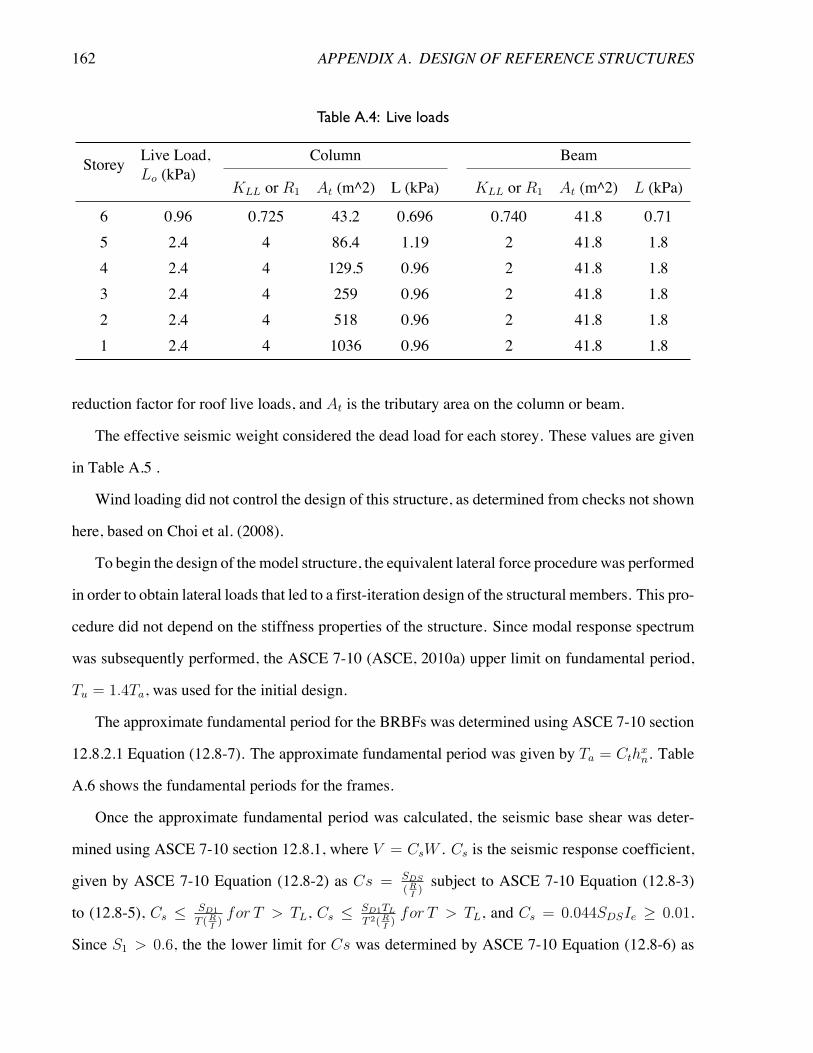
162 APPENDIX A. DESIGN OF REFERENCE STRUCTURES
Table A.4: Live loads
Storey Live Load,Lo (kPa)
Column Beam
KLL or R1 At (m^2) L (kPa) KLL or R1 At (m^2) L (kPa)
6 0.96 0.725 43.2 0.696 0.740 41.8 0.715 2.4 4 86.4 1.19 2 41.8 1.84 2.4 4 129.5 0.96 2 41.8 1.83 2.4 4 259 0.96 2 41.8 1.82 2.4 4 518 0.96 2 41.8 1.81 2.4 4 1036 0.96 2 41.8 1.8
reduction factor for roof live loads, and At is the tributary area on the column or beam.
The effective seismic weight considered the dead load for each storey. These values are given
in Table A.5 .
Wind loading did not control the design of this structure, as determined from checks not shown
here, based on Choi et al. (2008).
To begin the design of the model structure, the equivalent lateral force procedure was performed
in order to obtain lateral loads that led to a first-iteration design of the structural members. This pro-
cedure did not depend on the stiffness properties of the structure. Since modal response spectrum
was subsequently performed, the ASCE 7-10 (ASCE, 2010a) upper limit on fundamental period,
Tu = 1.4Ta, was used for the initial design.
The approximate fundamental period for the BRBFs was determined using ASCE 7-10 section
12.8.2.1 Equation (12.8-7). The approximate fundamental period was given by Ta = Cthxn. Table
A.6 shows the fundamental periods for the frames.
Once the approximate fundamental period was calculated, the seismic base shear was deter-
mined using ASCE 7-10 section 12.8.1, where V = CsW . Cs is the seismic response coefficient,
given by ASCE 7-10 Equation (12.8-2) as Cs = SDS
(RI
)subject to ASCE 7-10 Equation (12.8-3)
to (12.8-5), Cs SD1
T (RI
)for T > TL, Cs S
D1TL
T 2(RI
)for T > TL, and Cs = 0.044SDSIe � 0.01.
Since S1 > 0.6, the the lower limit for Cs was determined by ASCE 7-10 Equation (12.8-6) as
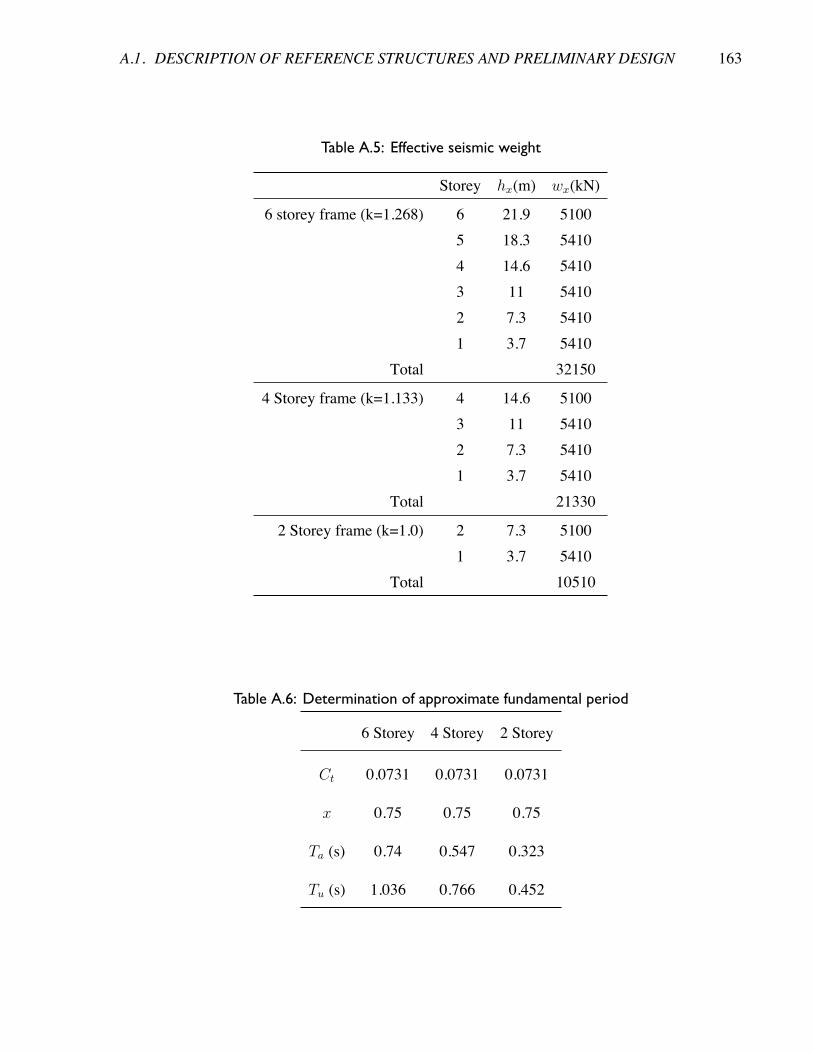
A.1. DESCRIPTION OF REFERENCE STRUCTURES AND PRELIMINARY DESIGN 163
Table A.5: Effective seismic weight
Storey hx(m) wx(kN)
6 storey frame (k=1.268) 6 21.9 51005 18.3 54104 14.6 54103 11 54102 7.3 54101 3.7 5410
Total 32150
4 Storey frame (k=1.133) 4 14.6 51003 11 54102 7.3 54101 3.7 5410
Total 21330
2 Storey frame (k=1.0) 2 7.3 51001 3.7 5410
Total 10510
Table A.6: Determination of approximate fundamental period
6 Storey 4 Storey 2 Storey
Ct 0.0731 0.0731 0.0731
x 0.75 0.75 0.75
Ta (s) 0.74 0.547 0.323
Tu (s) 1.036 0.766 0.452
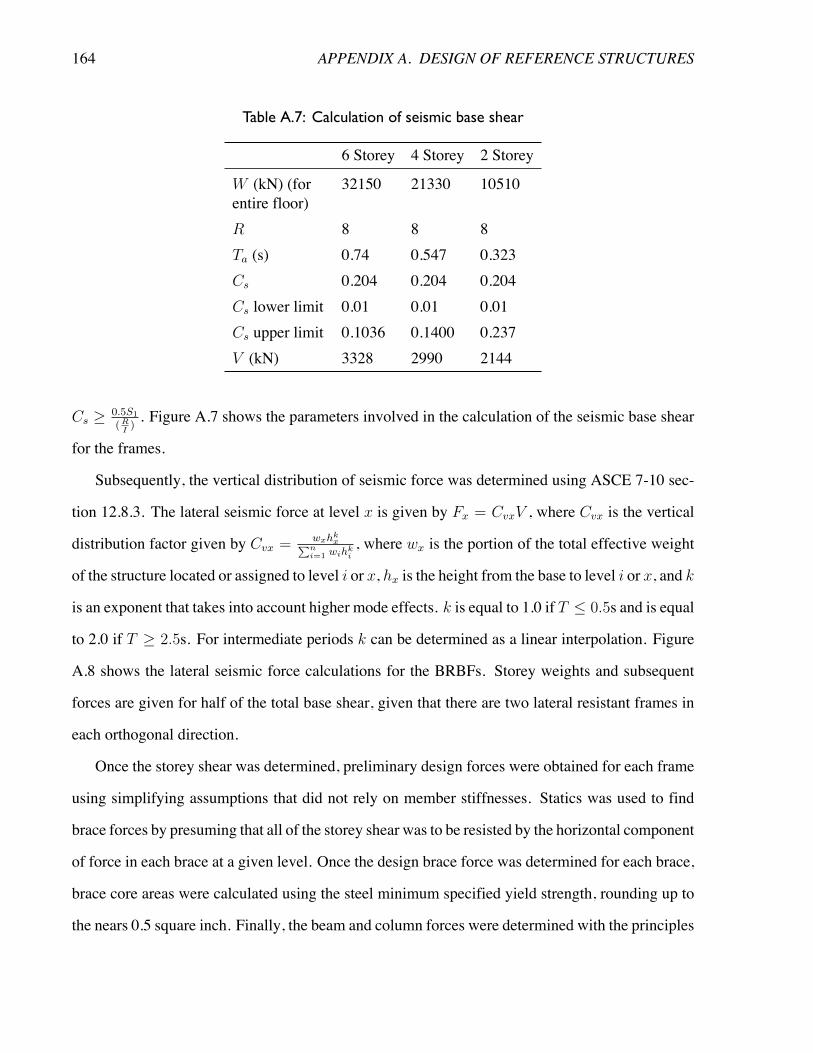
164 APPENDIX A. DESIGN OF REFERENCE STRUCTURES
Table A.7: Calculation of seismic base shear
6 Storey 4 Storey 2 Storey
W (kN) (forentire floor)
32150 21330 10510
R 8 8 8Ta (s) 0.74 0.547 0.323Cs 0.204 0.204 0.204Cs lower limit 0.01 0.01 0.01Cs upper limit 0.1036 0.1400 0.237V (kN) 3328 2990 2144
Cs � 0.5S1
(RI
). Figure A.7 shows the parameters involved in the calculation of the seismic base shear
for the frames.
Subsequently, the vertical distribution of seismic force was determined using ASCE 7-10 sec-
tion 12.8.3. The lateral seismic force at level x is given by Fx = CvxV , where Cvx is the vertical
distribution factor given by Cvx = wx
hk
xPn
i=1 wi
hk
i
, where wx is the portion of the total effective weight
of the structure located or assigned to level i or x, hx is the height from the base to level i or x, and k
is an exponent that takes into account higher mode effects. k is equal to 1.0 if T 0.5s and is equal
to 2.0 if T � 2.5s. For intermediate periods k can be determined as a linear interpolation. Figure
A.8 shows the lateral seismic force calculations for the BRBFs. Storey weights and subsequent
forces are given for half of the total base shear, given that there are two lateral resistant frames in
each orthogonal direction.
Once the storey shear was determined, preliminary design forces were obtained for each frame
using simplifying assumptions that did not rely on member stiffnesses. Statics was used to find
brace forces by presuming that all of the storey shear was to be resisted by the horizontal component
of force in each brace at a given level. Once the design brace force was determined for each brace,
brace core areas were calculated using the steel minimum specified yield strength, rounding up to
the nears 0.5 square inch. Finally, the beam and column forces were determined with the principles
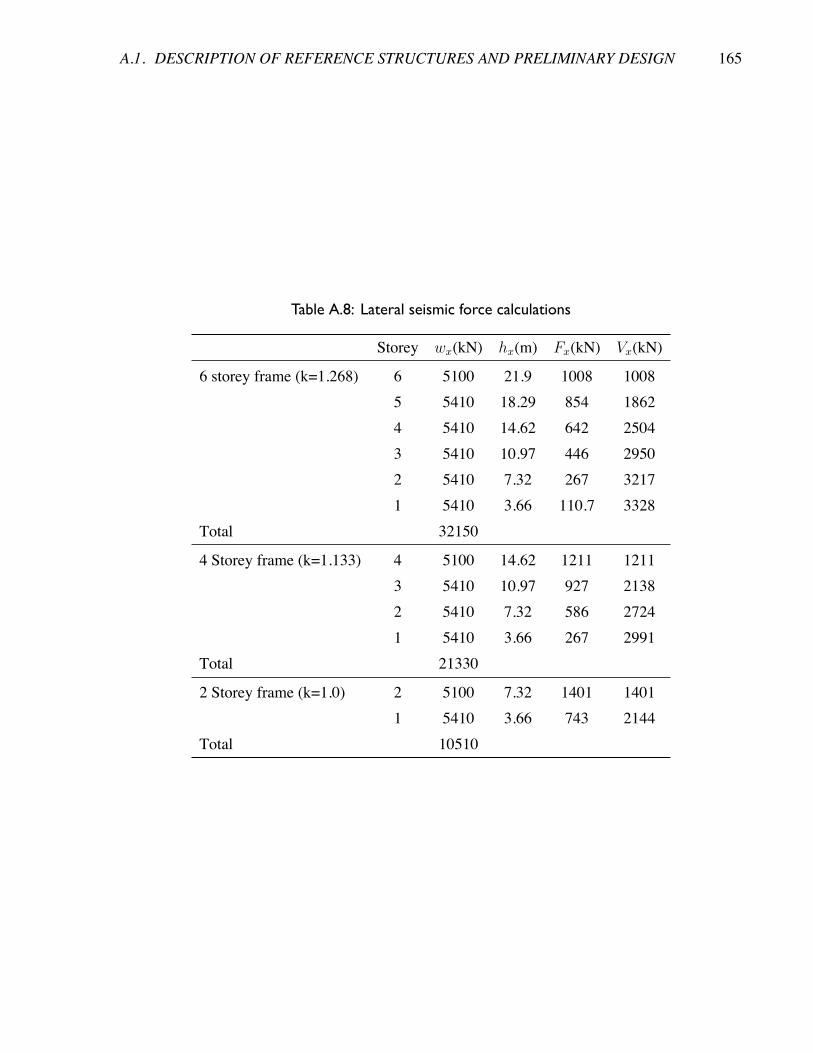
A.1. DESCRIPTION OF REFERENCE STRUCTURES AND PRELIMINARY DESIGN 165
Table A.8: Lateral seismic force calculations
Storey wx(kN) hx(m) Fx(kN) Vx(kN)
6 storey frame (k=1.268) 6 5100 21.9 1008 10085 5410 18.29 854 18624 5410 14.62 642 25043 5410 10.97 446 29502 5410 7.32 267 32171 5410 3.66 110.7 3328
Total 32150
4 Storey frame (k=1.133) 4 5100 14.62 1211 12113 5410 10.97 927 21382 5410 7.32 586 27241 5410 3.66 267 2991
Total 21330
2 Storey frame (k=1.0) 2 5100 7.32 1401 14011 5410 3.66 743 2144
Total 10510
166 APPENDIX A. DESIGN OF REFERENCE STRUCTURES
of capacity design.
In order to account for the effect of accidental torsion, the storey shear values determined from
the equivalent lateral force procedure were multiplied by 1.1, representing a 10 per cent increase
in the forces in each frame due to the offset of the centre of mass by 5 per cent from the center in
each orthogonal direction.
A.2 Dynamic Analysis
2D numerical models were constructed using SAP2000 in order to perform a modal analysis
for each frame. Once the preliminary design was determined using the equivalent lateral force
procedure, a modal analysis was performed in order to accurately determine earthquake loads and
drifts. The structures were then redesigned to reflect the new design forces, and then reanalyzed.
This process was repeated until the design converged. Only the final design is described in this
thesis.
In order to accurately approximate the increased stiffness of the BRBs due to the stiff connec-
tions regions and transitions of the braces, the elastic modulus of the braces was multiplied by 2.0,
as explained in the OpenSees modeling description in Section 4.1. Centerline beam-column ele-
ments were used to model the beams and columns. Columns were continuous between floors and
column splices were modeled as fixed moment connections. Beam-column connections and brace
connections were modeled as pins. Masses were modeled as lumped horizontal mass at each storey
corresponding to half the seismic weight from Table A.5 since only one frame was modeled which
carries half of the tributary weight of the entire structure.
Response spectrum analysis was performed in SAP2000. For the four and six storey structures
three modes were considered, while twomodes were considered for the two storey structure. Modal
analysis results for both structural systems, including � are listed in Table A.9 , and themode shapes
are shown in Figure A.1 .
Table A.10 shows mass participation factors for the structures, and indicates that a sufficient
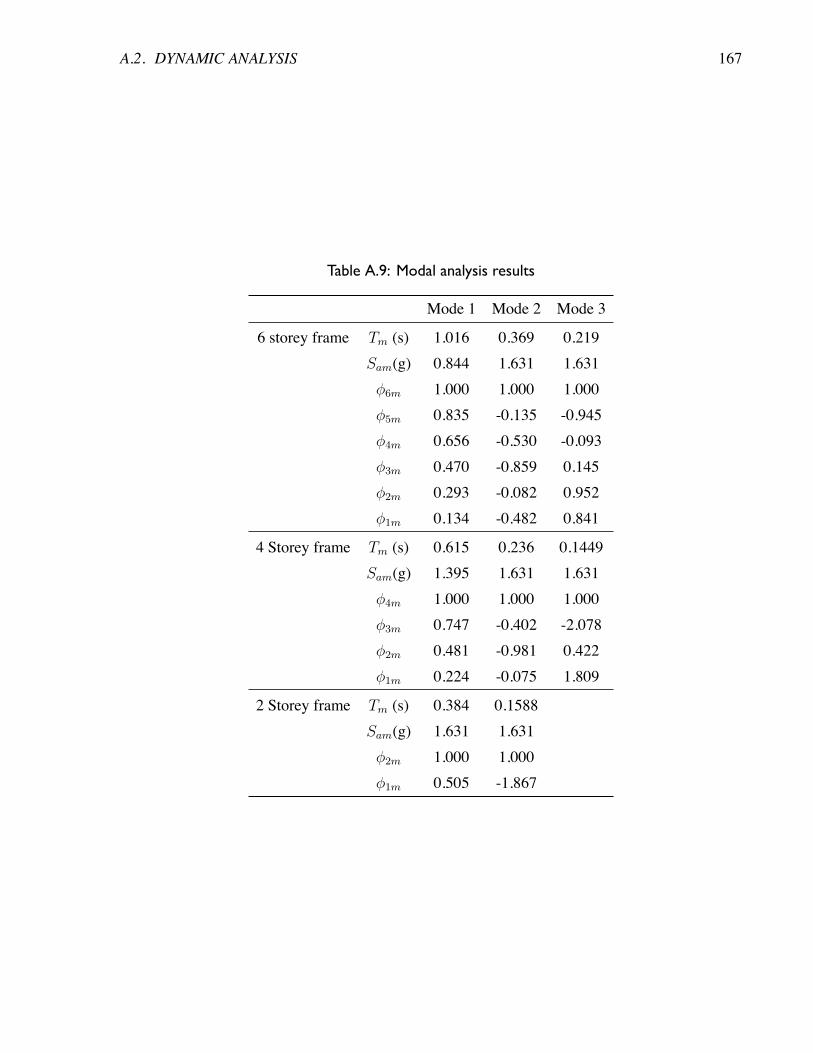
A.2. DYNAMIC ANALYSIS 167
Table A.9: Modal analysis results
Mode 1 Mode 2 Mode 3
6 storey frame Tm (s) 1.016 0.369 0.219Sam(g) 0.844 1.631 1.631�6m 1.000 1.000 1.000�5m 0.835 -0.135 -0.945�4m 0.656 -0.530 -0.093�3m 0.470 -0.859 0.145�2m 0.293 -0.082 0.952�1m 0.134 -0.482 0.841
4 Storey frame Tm (s) 0.615 0.236 0.1449Sam(g) 1.395 1.631 1.631�4m 1.000 1.000 1.000�3m 0.747 -0.402 -2.078�2m 0.481 -0.981 0.422�1m 0.224 -0.075 1.809
2 Storey frame Tm (s) 0.384 0.1588Sam(g) 1.631 1.631�2m 1.000 1.000�1m 0.505 -1.867
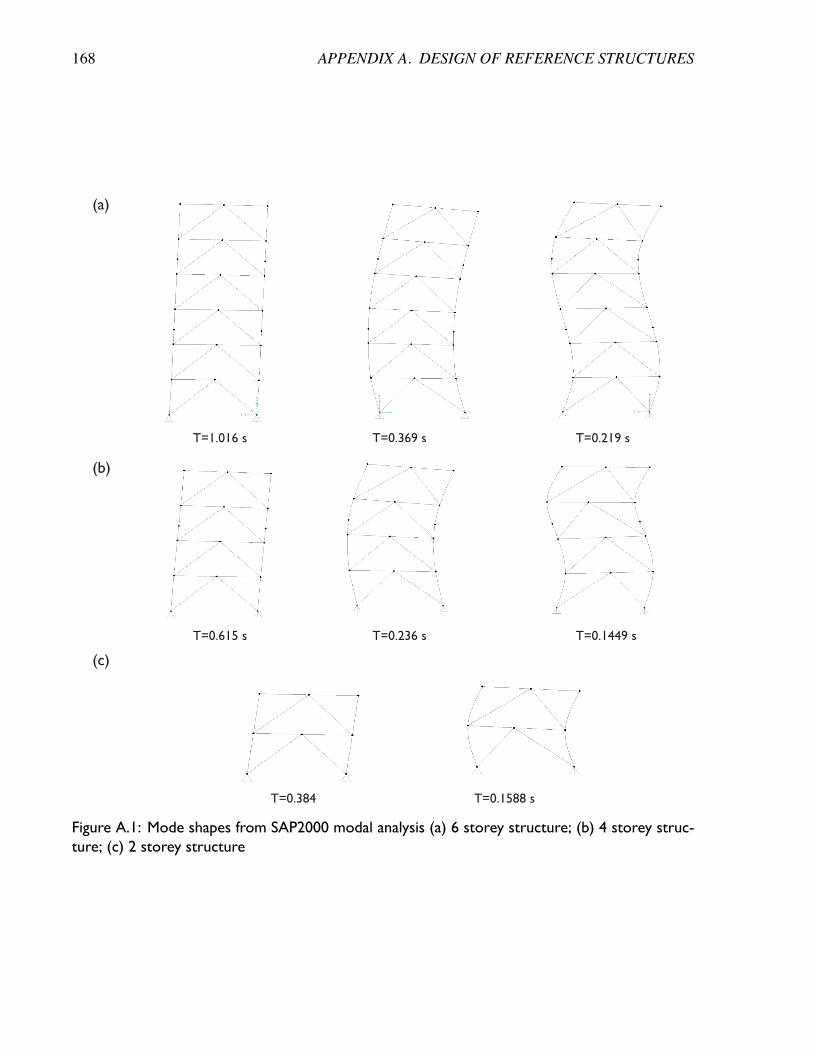
168 APPENDIX A. DESIGN OF REFERENCE STRUCTURES
(a)
T=1.016 s T=0.369 s T=0.219 s
T=0.615 s T=0.236 s T=0.1449 s
T=0.384 T=0.1588 s
(b)
(c)
T=0.369 s
Figure A.1: Mode shapes from SAP2000 modal analysis (a) 6 storey structure; (b) 4 storey struc-ture; (c) 2 storey structure
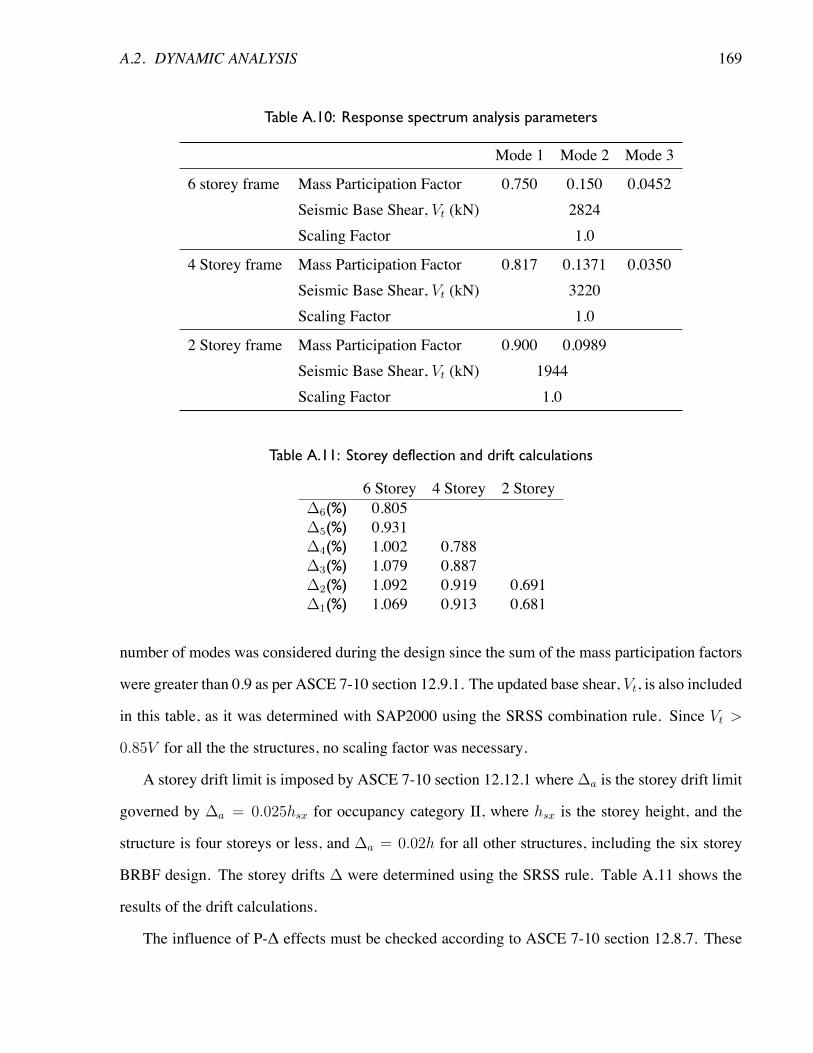
A.2. DYNAMIC ANALYSIS 169
Table A.10: Response spectrum analysis parameters
Mode 1 Mode 2 Mode 3
6 storey frame Mass Participation Factor 0.750 0.150 0.0452Seismic Base Shear, Vt (kN) 2824Scaling Factor 1.0
4 Storey frame Mass Participation Factor 0.817 0.1371 0.0350Seismic Base Shear, Vt (kN) 3220Scaling Factor 1.0
2 Storey frame Mass Participation Factor 0.900 0.0989Seismic Base Shear, Vt (kN) 1944Scaling Factor 1.0
Table A.11: Storey deflection and drift calculations
6 Storey 4 Storey 2 Storey�6(%) 0.805�5(%) 0.931�4(%) 1.002 0.788�3(%) 1.079 0.887�2(%) 1.092 0.919 0.691�1(%) 1.069 0.913 0.681
number of modes was considered during the design since the sum of the mass participation factors
were greater than 0.9 as per ASCE 7-10 section 12.9.1. The updated base shear, Vt, is also included
in this table, as it was determined with SAP2000 using the SRSS combination rule. Since Vt >
0.85V for all the the structures, no scaling factor was necessary.
A storey drift limit is imposed by ASCE 7-10 section 12.12.1 where�a is the storey drift limit
governed by �a = 0.025hsx for occupancy category II, where hsx is the storey height, and the
structure is four storeys or less, and �a = 0.02h for all other structures, including the six storey
BRBF design. The storey drifts � were determined using the SRSS rule. Table A.11 shows the
results of the drift calculations.
The influence of P-Δ effects must be checked according to ASCE 7-10 section 12.8.7. These
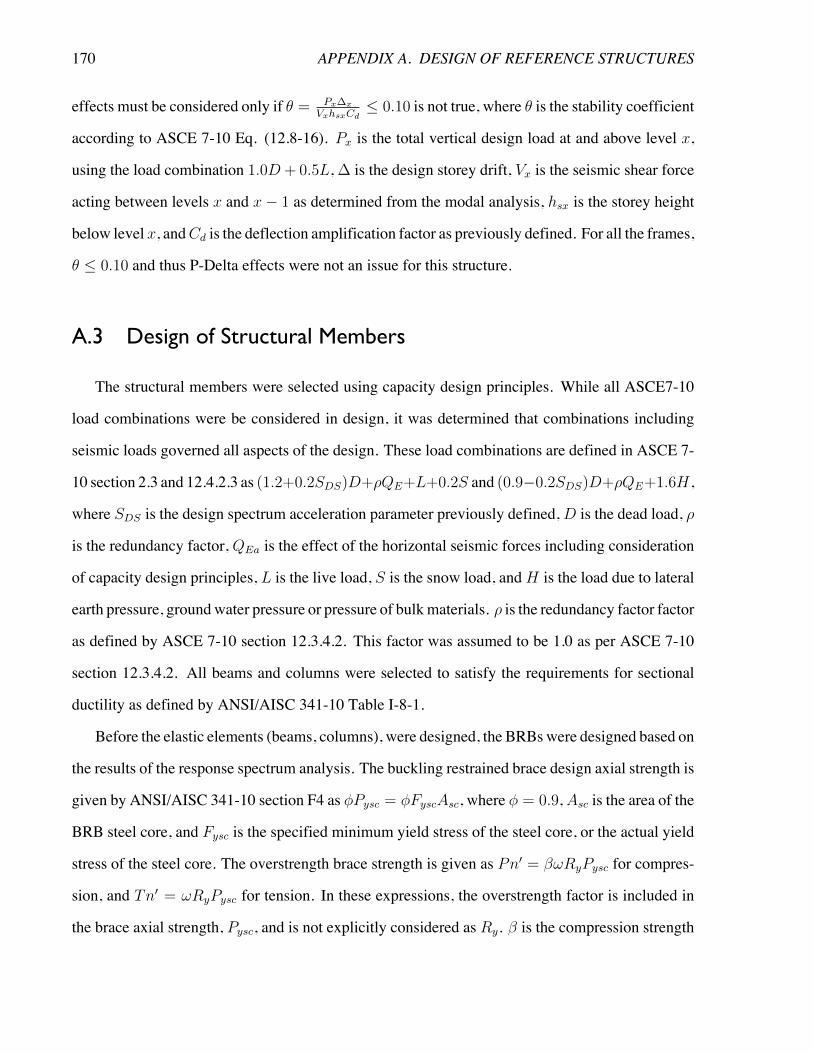
170 APPENDIX A. DESIGN OF REFERENCE STRUCTURES
effects must be considered only if ✓ = Px
�x
Vx
hsx
Cd
0.10 is not true, where ✓ is the stability coefficient
according to ASCE 7-10 Eq. (12.8-16). Px is the total vertical design load at and above level x,
using the load combination 1.0D+ 0.5L,� is the design storey drift, Vx is the seismic shear force
acting between levels x and x� 1 as determined from the modal analysis, hsx is the storey height
below level x, andCd is the deflection amplification factor as previously defined. For all the frames,
✓ 0.10 and thus P-Delta effects were not an issue for this structure.
A.3 Design of Structural Members
The structural members were selected using capacity design principles. While all ASCE7-10
load combinations were be considered in design, it was determined that combinations including
seismic loads governed all aspects of the design. These load combinations are defined in ASCE 7-
10 section 2.3 and 12.4.2.3 as (1.2+0.2SDS)D+⇢QE+L+0.2S and (0.9�0.2SDS)D+⇢QE+1.6H ,
where SDS is the design spectrum acceleration parameter previously defined,D is the dead load, ⇢
is the redundancy factor, QEa is the effect of the horizontal seismic forces including consideration
of capacity design principles, L is the live load, S is the snow load, andH is the load due to lateral
earth pressure, groundwater pressure or pressure of bulkmaterials. ⇢ is the redundancy factor factor
as defined by ASCE 7-10 section 12.3.4.2. This factor was assumed to be 1.0 as per ASCE 7-10
section 12.3.4.2. All beams and columns were selected to satisfy the requirements for sectional
ductility as defined by ANSI/AISC 341-10 Table I-8-1.
Before the elastic elements (beams, columns), were designed, the BRBswere designed based on
the results of the response spectrum analysis. The buckling restrained brace design axial strength is
given by ANSI/AISC 341-10 section F4 as �Pysc = �FyscAsc, where � = 0.9,Asc is the area of the
BRB steel core, and Fysc is the specified minimum yield stress of the steel core, or the actual yield
stress of the steel core. The overstrength brace strength is given as Pn0 = �!RyPysc for compres-
sion, and Tn0 = !RyPysc for tension. In these expressions, the overstrength factor is included in
the brace axial strength, Pysc, and is not explicitly considered as Ry. � is the compression strength
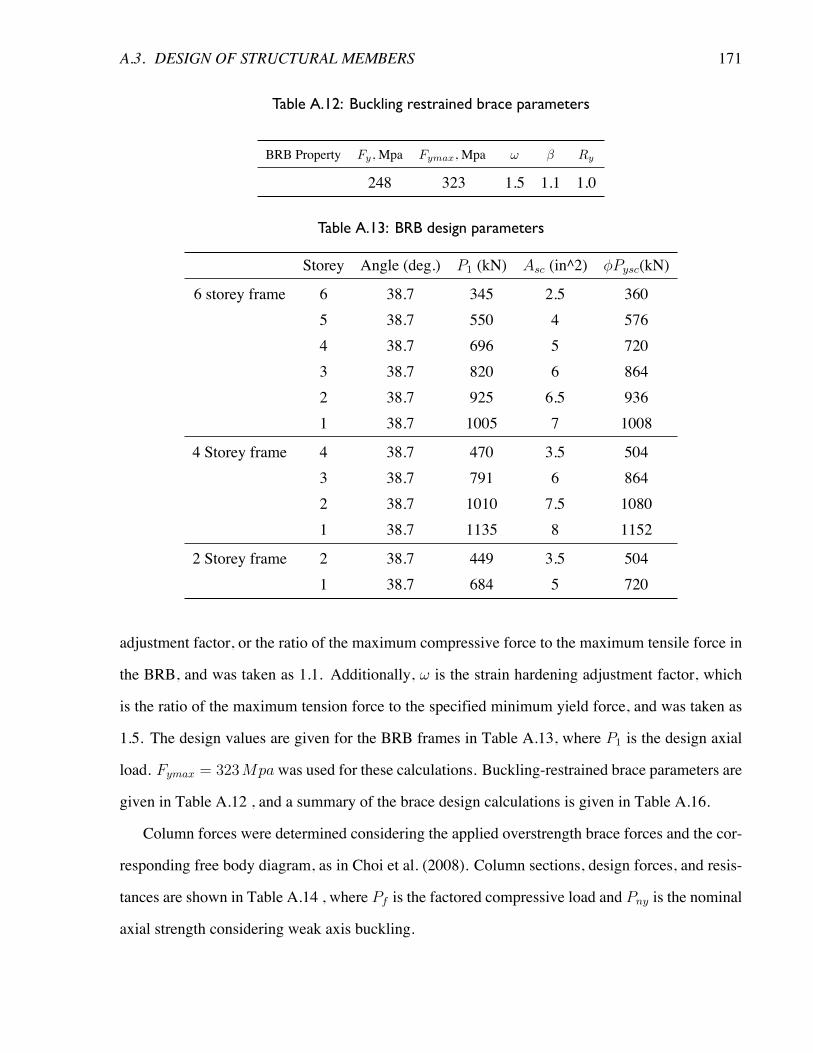
A.3. DESIGN OF STRUCTURAL MEMBERS 171
Table A.12: Buckling restrained brace parameters
BRB Property Fy
, Mpa Fymax
, Mpa ! � Ry
248 323 1.5 1.1 1.0
Table A.13: BRB design parameters
Storey Angle (deg.) P1 (kN) Asc (in^2) �Pysc(kN)
6 storey frame 6 38.7 345 2.5 3605 38.7 550 4 5764 38.7 696 5 7203 38.7 820 6 8642 38.7 925 6.5 9361 38.7 1005 7 1008
4 Storey frame 4 38.7 470 3.5 5043 38.7 791 6 8642 38.7 1010 7.5 10801 38.7 1135 8 1152
2 Storey frame 2 38.7 449 3.5 5041 38.7 684 5 720
adjustment factor, or the ratio of the maximum compressive force to the maximum tensile force in
the BRB, and was taken as 1.1. Additionally, ! is the strain hardening adjustment factor, which
is the ratio of the maximum tension force to the specified minimum yield force, and was taken as
1.5. The design values are given for the BRB frames in Table A.13, where P1 is the design axial
load. Fymax = 323Mpa was used for these calculations. Buckling-restrained brace parameters are
given in Table A.12 , and a summary of the brace design calculations is given in Table A.16.
Column forces were determined considering the applied overstrength brace forces and the cor-
responding free body diagram, as in Choi et al. (2008). Column sections, design forces, and resis-
tances are shown in Table A.14 , where Pf is the factored compressive load and Pny is the nominal
axial strength considering weak axis buckling.
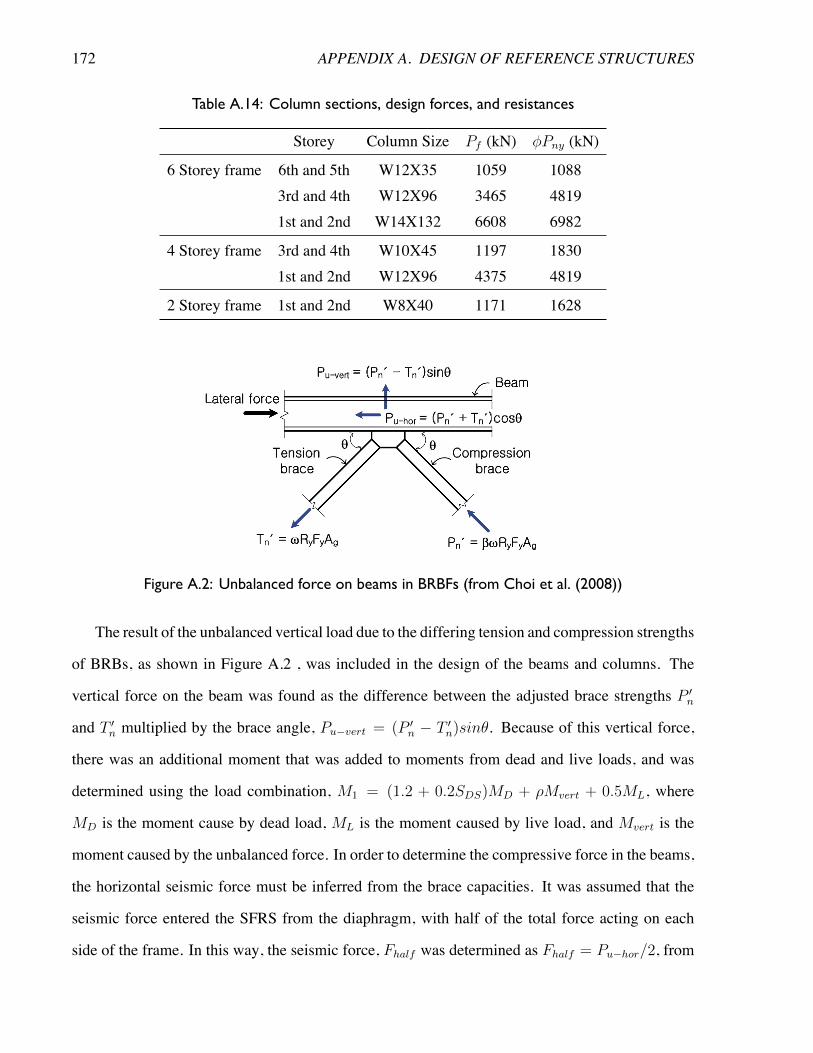
172 APPENDIX A. DESIGN OF REFERENCE STRUCTURES
Table A.14: Column sections, design forces, and resistances
Storey Column Size Pf (kN) �Pny (kN)
6 Storey frame 6th and 5th W12X35 1059 10883rd and 4th W12X96 3465 48191st and 2nd W14X132 6608 6982
4 Storey frame 3rd and 4th W10X45 1197 18301st and 2nd W12X96 4375 4819
2 Storey frame 1st and 2nd W8X40 1171 1628
Figure A.2: Unbalanced force on beams in BRBFs (from Choi et al. (2008))
The result of the unbalanced vertical load due to the differing tension and compression strengths
of BRBs, as shown in Figure A.2 , was included in the design of the beams and columns. The
vertical force on the beam was found as the difference between the adjusted brace strengths P 0n
and T 0n multiplied by the brace angle, Pu�vert = (P 0
n � T 0n)sin✓. Because of this vertical force,
there was an additional moment that was added to moments from dead and live loads, and was
determined using the load combination, M1 = (1.2 + 0.2SDS)MD + ⇢Mvert + 0.5ML, where
MD is the moment cause by dead load, ML is the moment caused by live load, and Mvert is the
moment caused by the unbalanced force. In order to determine the compressive force in the beams,
the horizontal seismic force must be inferred from the brace capacities. It was assumed that the
seismic force entered the SFRS from the diaphragm, with half of the total force acting on each
side of the frame. In this way, the seismic force, Fhalf was determined as Fhalf = Pu�hor/2, from
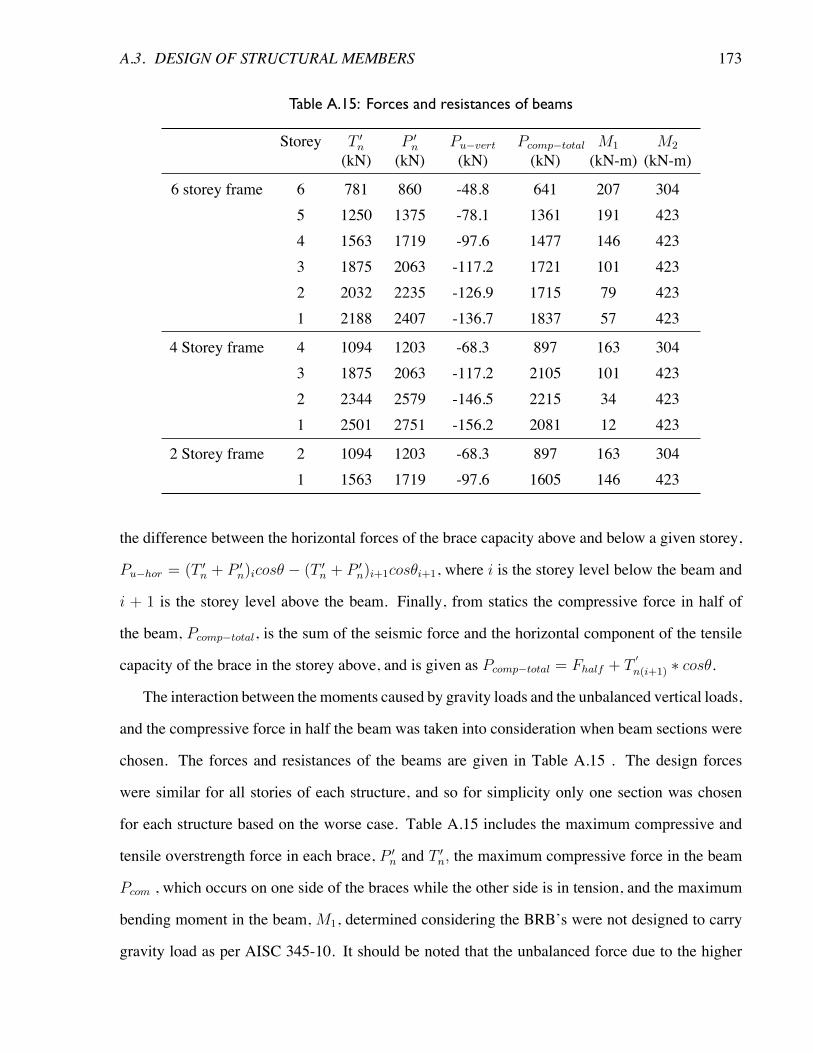
A.3. DESIGN OF STRUCTURAL MEMBERS 173
Table A.15: Forces and resistances of beams
Storey T 0n
(kN)P 0n
(kN)Pu�vert
(kN)Pcomp�total
(kN)M1
(kN-m)M2
(kN-m)
6 storey frame 6 781 860 -48.8 641 207 3045 1250 1375 -78.1 1361 191 4234 1563 1719 -97.6 1477 146 4233 1875 2063 -117.2 1721 101 4232 2032 2235 -126.9 1715 79 4231 2188 2407 -136.7 1837 57 423
4 Storey frame 4 1094 1203 -68.3 897 163 3043 1875 2063 -117.2 2105 101 4232 2344 2579 -146.5 2215 34 4231 2501 2751 -156.2 2081 12 423
2 Storey frame 2 1094 1203 -68.3 897 163 3041 1563 1719 -97.6 1605 146 423
the difference between the horizontal forces of the brace capacity above and below a given storey,
Pu�hor = (T 0n + P 0
n)icos✓ � (T 0n + P 0
n)i+1cos✓i+1, where i is the storey level below the beam and
i + 1 is the storey level above the beam. Finally, from statics the compressive force in half of
the beam, Pcomp�total, is the sum of the seismic force and the horizontal component of the tensile
capacity of the brace in the storey above, and is given as Pcomp�total = Fhalf + T0
n(i+1) ⇤ cos✓.
The interaction between themoments caused by gravity loads and the unbalanced vertical loads,
and the compressive force in half the beam was taken into consideration when beam sections were
chosen. The forces and resistances of the beams are given in Table A.15 . The design forces
were similar for all stories of each structure, and so for simplicity only one section was chosen
for each structure based on the worse case. Table A.15 includes the maximum compressive and
tensile overstrength force in each brace, P 0n and T 0
n, the maximum compressive force in the beam
Pcom , which occurs on one side of the braces while the other side is in tension, and the maximum
bending moment in the beam, M1, determined considering the BRB’s were not designed to carry
gravity load as per AISC 345-10. It should be noted that the unbalanced force due to the higher
174 APPENDIX A. DESIGN OF REFERENCE STRUCTURES
compressive overstrength axial force in the brace led to an unequal net force that the braces applied
to the beam. The vertical component of this force acts upwards on the beam, and tends to counteract
the effect of gravity. Considering this, the non-seismic load combinations, especially 1.2D+1.6L,
was considered for beam design, and is given as M2 in Table A.15. However, in this case the
lower seismic bending moment acts with a high compressive force in the beam, and this combined
axial-bending loading condition controlled the design of all beams.
Axial-bending interaction can be verified using AISC 360-10 equations (H1-1a), and (H1-1b)
Pr
Pc
+8
9
✓Mrx
Mcx
+Mry
Mcy
◆ 1.0For
Pr
Pc
� 0.2 (A.3.1)
Pr
2Pc
+
✓Mrx
Mcx
+Mry
Mcy
◆ 1.0For
Pr
Pc
where Pr and Pc are the required and available axial compressive strength, respectively, and
Mrand Mc are the required available flexural strength. As shown in Table A.16, the interaction
ratios are all less than 1.0, and the flexural strength of the beams is greater than the bending moment
from gravity load.
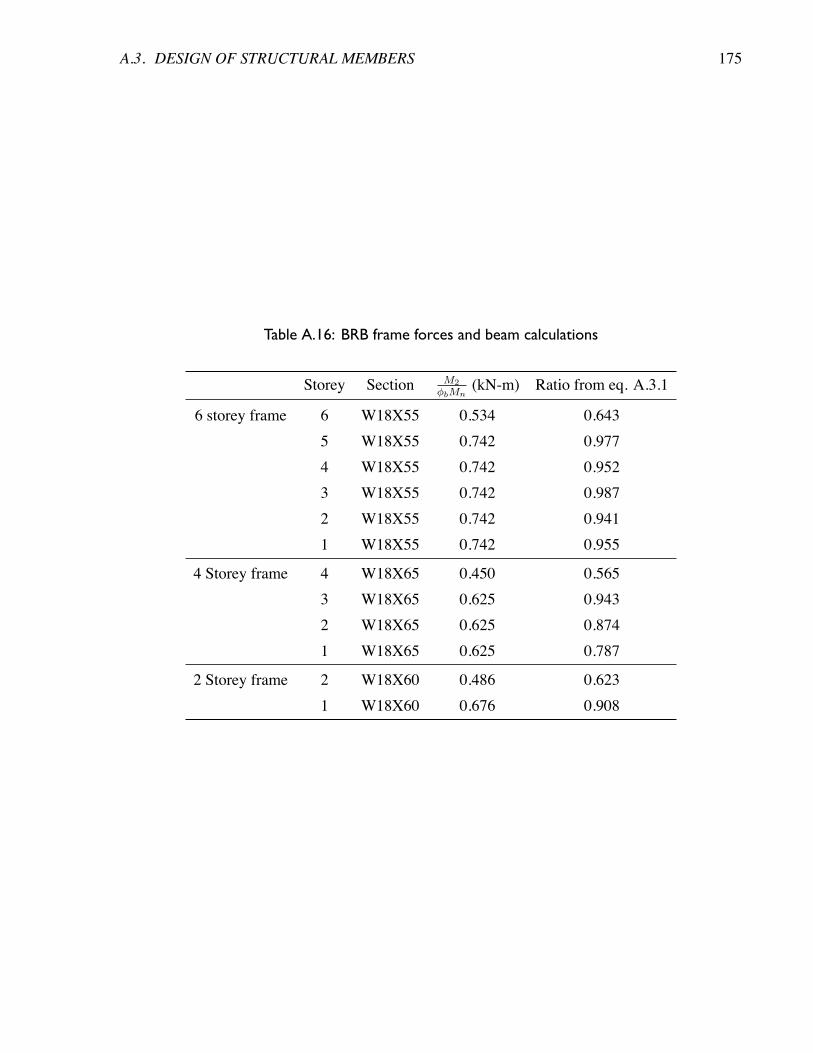
A.3. DESIGN OF STRUCTURAL MEMBERS 175
Table A.16: BRB frame forces and beam calculations
Storey Section M2�b
Mn
(kN-m) Ratio from eq. A.3.1
6 storey frame 6 W18X55 0.534 0.6435 W18X55 0.742 0.9774 W18X55 0.742 0.9523 W18X55 0.742 0.9872 W18X55 0.742 0.9411 W18X55 0.742 0.955
4 Storey frame 4 W18X65 0.450 0.5653 W18X65 0.625 0.9432 W18X65 0.625 0.8741 W18X65 0.625 0.787
2 Storey frame 2 W18X60 0.486 0.6231 W18X60 0.676 0.908
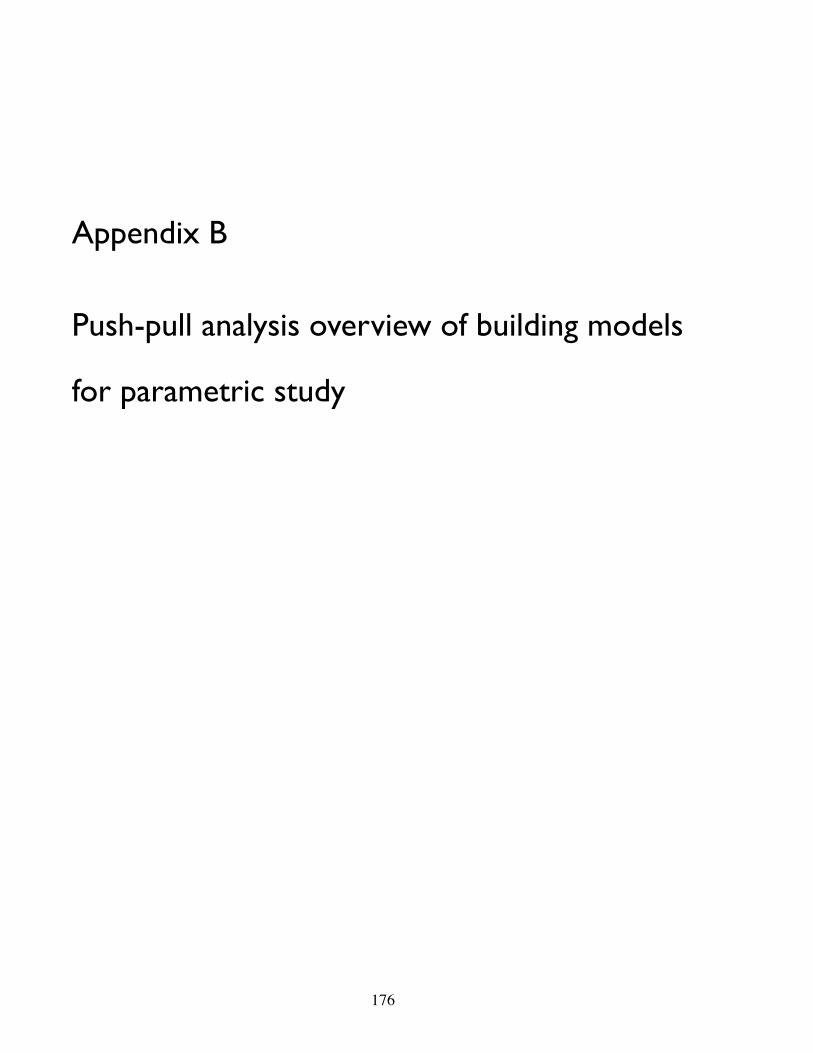
Appendix B
Push-pull analysis overview of building models
for parametric study
176
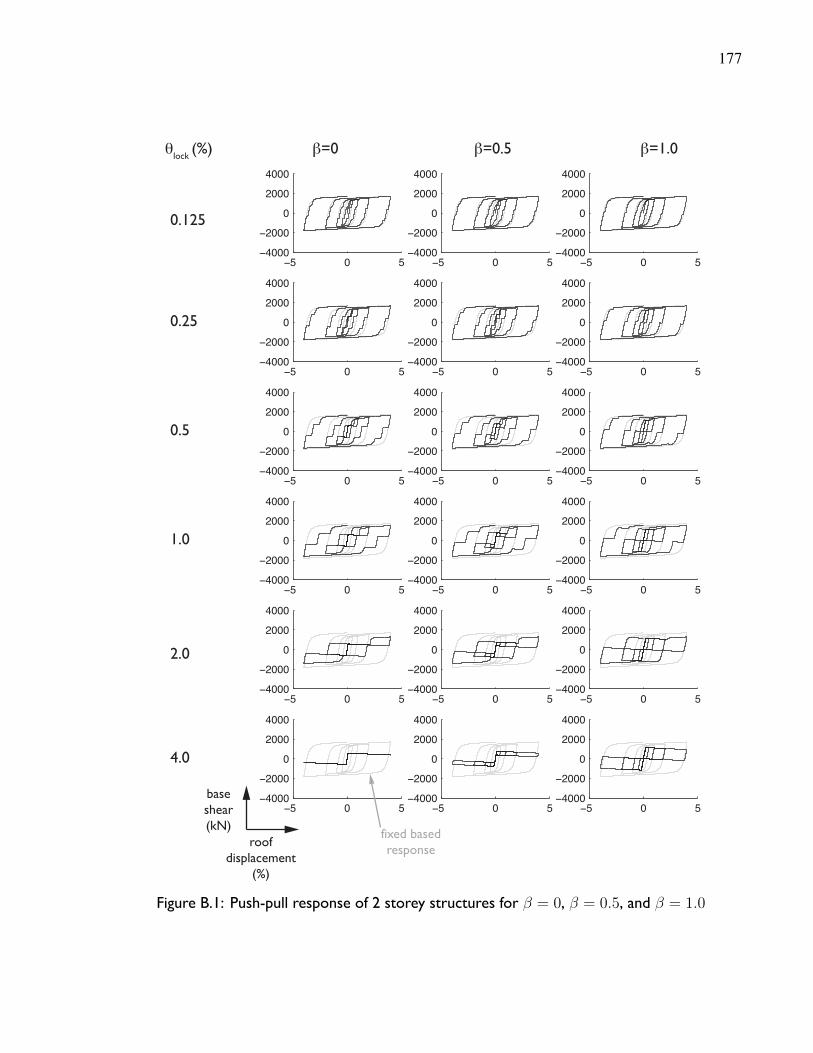
177
−5 0 5−4000
−2000
0
2000
4000
−5 0 5−4000
−2000
0
2000
4000
−5 0 5−4000
−2000
0
2000
4000
−5 0 5−4000
−2000
0
2000
4000
−5 0 5−4000
−2000
0
2000
4000
−5 0 5−4000
−2000
0
2000
4000
−5 0 5−4000
−2000
0
2000
4000
−5 0 5−4000
−2000
0
2000
4000
−5 0 5−4000
−2000
0
2000
4000
−5 0 5−4000
−2000
0
2000
4000
−5 0 5−4000
−2000
0
2000
4000
−5 0 5−4000
−2000
0
2000
4000
−5 0 5−4000
−2000
0
2000
4000
−5 0 5−4000
−2000
0
2000
4000
−5 0 5−4000
−2000
0
2000
4000
−5 0 5−4000
−2000
0
2000
4000
−5 0 5−4000
−2000
0
2000
4000
−5 0 5−4000
−2000
0
2000
4000
θlock
(%) β=0 β=0.5 β=1.0
0.125
0.25
0.5
1.0
2.0
4.0
roofdisplacement
(%)
baseshear(kN)
fixed basedresponse
Figure B.1: Push-pull response of 2 storey structures for � = 0, � = 0.5, and � = 1.0
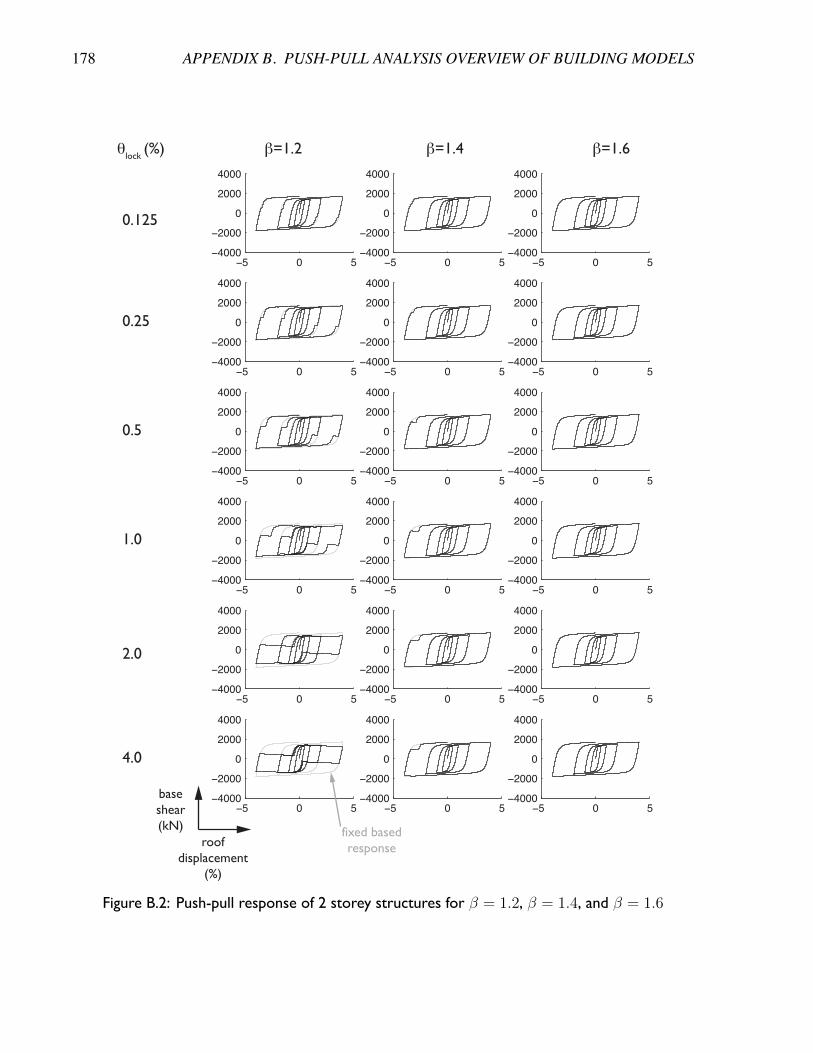
178 APPENDIX B. PUSH-PULL ANALYSIS OVERVIEW OF BUILDING MODELS
−5 0 5−4000
−2000
0
2000
4000
−5 0 5−4000
−2000
0
2000
4000
−5 0 5−4000
−2000
0
2000
4000
−5 0 5−4000
−2000
0
2000
4000
−5 0 5−4000
−2000
0
2000
4000
−5 0 5−4000
−2000
0
2000
4000
−5 0 5−4000
−2000
0
2000
4000
−5 0 5−4000
−2000
0
2000
4000
−5 0 5−4000
−2000
0
2000
4000
−5 0 5−4000
−2000
0
2000
4000
−5 0 5−4000
−2000
0
2000
4000
−5 0 5−4000
−2000
0
2000
4000
−5 0 5−4000
−2000
0
2000
4000
−5 0 5−4000
−2000
0
2000
4000
−5 0 5−4000
−2000
0
2000
4000
−5 0 5−4000
−2000
0
2000
4000
−5 0 5−4000
−2000
0
2000
4000
−5 0 5−4000
−2000
0
2000
4000
θlock
(%) β=1.2 β=1.4 β=1.6
0.125
0.25
0.5
1.0
2.0
4.0
fixed basedresponseroof
displacement(%)
baseshear(kN)
Figure B.2: Push-pull response of 2 storey structures for � = 1.2, � = 1.4, and � = 1.6
179
−5 0 5−4000
−2000
0
2000
4000
−5 0 5−4000
−2000
0
2000
4000
−5 0 5−4000
−2000
0
2000
4000
−5 0 5−4000
−2000
0
2000
4000
−5 0 5−4000
−2000
0
2000
4000
−5 0 5−4000
−2000
0
2000
4000
−5 0 5−4000
−2000
0
2000
4000
−5 0 5−4000
−2000
0
2000
4000
−5 0 5−4000
−2000
0
2000
4000
−5 0 5−4000
−2000
0
2000
4000
−5 0 5−4000
−2000
0
2000
4000
−5 0 5−4000
−2000
0
2000
4000
−5 0 5−4000
−2000
0
2000
4000
−5 0 5−4000
−2000
0
2000
4000
−5 0 5−4000
−2000
0
2000
4000
−5 0 5−4000
−2000
0
2000
4000
−5 0 5−4000
−2000
0
2000
4000
−5 0 5−4000
−2000
0
2000
4000
θlock
(%) β=0 β=0.5 β=1.0
0.125
0.25
0.5
1.0
2.0
4.0
roofdisplacement
(%)
baseshear(kN)
fixed basedresponse
Figure B.3: Push-pull response of 4 storey structures for � = 0, � = 0.5, and � = 1.0

180 APPENDIX B. PUSH-PULL ANALYSIS OVERVIEW OF BUILDING MODELS
−5 0 5−4000
−2000
0
2000
4000
−5 0 5−4000
−2000
0
2000
4000
−5 0 5−4000
−2000
0
2000
4000
−5 0 5−4000
−2000
0
2000
4000
−5 0 5−4000
−2000
0
2000
4000
−5 0 5−4000
−2000
0
2000
4000
−5 0 5−4000
−2000
0
2000
4000
−5 0 5−4000
−2000
0
2000
4000
−5 0 5−4000
−2000
0
2000
4000
−5 0 5−4000
−2000
0
2000
4000
−5 0 5−4000
−2000
0
2000
4000
−5 0 5−4000
−2000
0
2000
4000
−5 0 5−4000
−2000
0
2000
4000
−5 0 5−4000
−2000
0
2000
4000
−5 0 5−4000
−2000
0
2000
4000
−5 0 5−4000
−2000
0
2000
4000
−5 0 5−4000
−2000
0
2000
4000
−5 0 5−4000
−2000
0
2000
4000
θlock
(%) β=1.2 β=1.4 β=1.6
0.125
0.25
0.5
1.0
2.0
4.0
fixed basedresponseroof
displacement(%)
baseshear(kN)
Figure B.4: Push-pull response of 4 storey structures for � = 1.2, � = 1.4, and � = 1.6
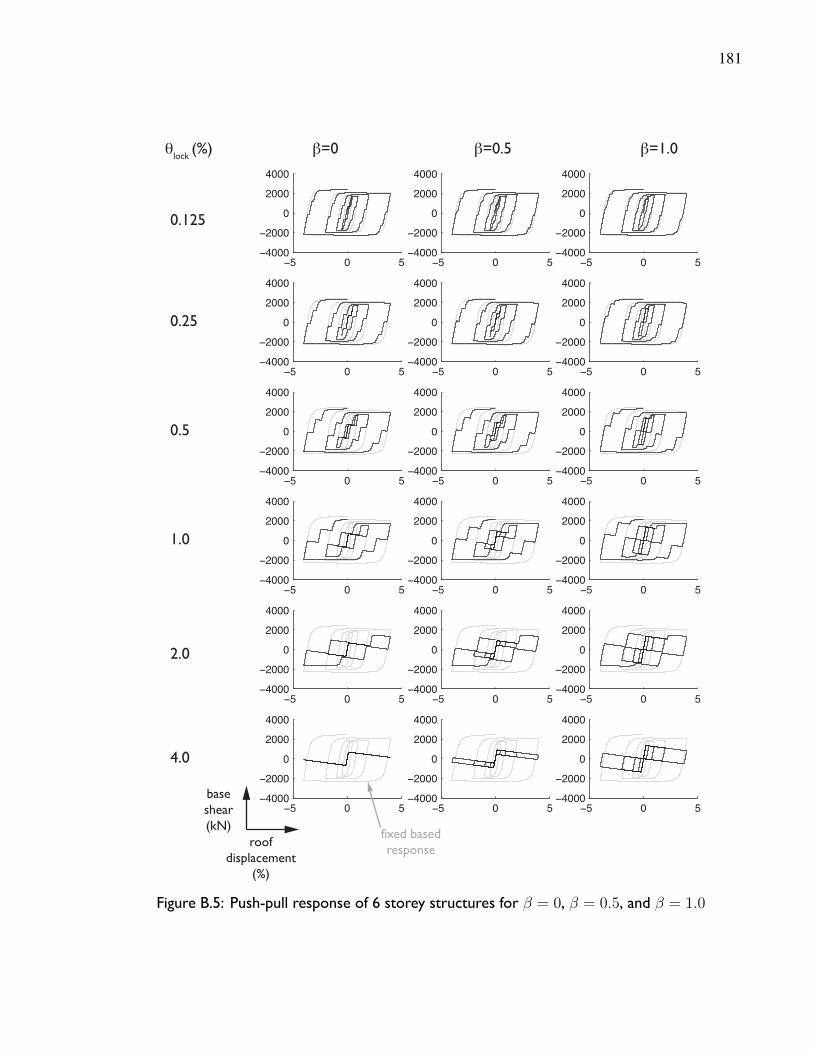
181
−5 0 5−4000
−2000
0
2000
4000
−5 0 5−4000
−2000
0
2000
4000
−5 0 5−4000
−2000
0
2000
4000
−5 0 5−4000
−2000
0
2000
4000
−5 0 5−4000
−2000
0
2000
4000
−5 0 5−4000
−2000
0
2000
4000
−5 0 5−4000
−2000
0
2000
4000
−5 0 5−4000
−2000
0
2000
4000
−5 0 5−4000
−2000
0
2000
4000
−5 0 5−4000
−2000
0
2000
4000
−5 0 5−4000
−2000
0
2000
4000
−5 0 5−4000
−2000
0
2000
4000
−5 0 5−4000
−2000
0
2000
4000
−5 0 5−4000
−2000
0
2000
4000
−5 0 5−4000
−2000
0
2000
4000
−5 0 5−4000
−2000
0
2000
4000
−5 0 5−4000
−2000
0
2000
4000
−5 0 5−4000
−2000
0
2000
4000
θlock
(%) β=0 β=0.5 β=1.0
0.125
0.25
0.5
1.0
2.0
4.0
roofdisplacement
(%)
baseshear(kN)
fixed basedresponse
Figure B.5: Push-pull response of 6 storey structures for � = 0, � = 0.5, and � = 1.0
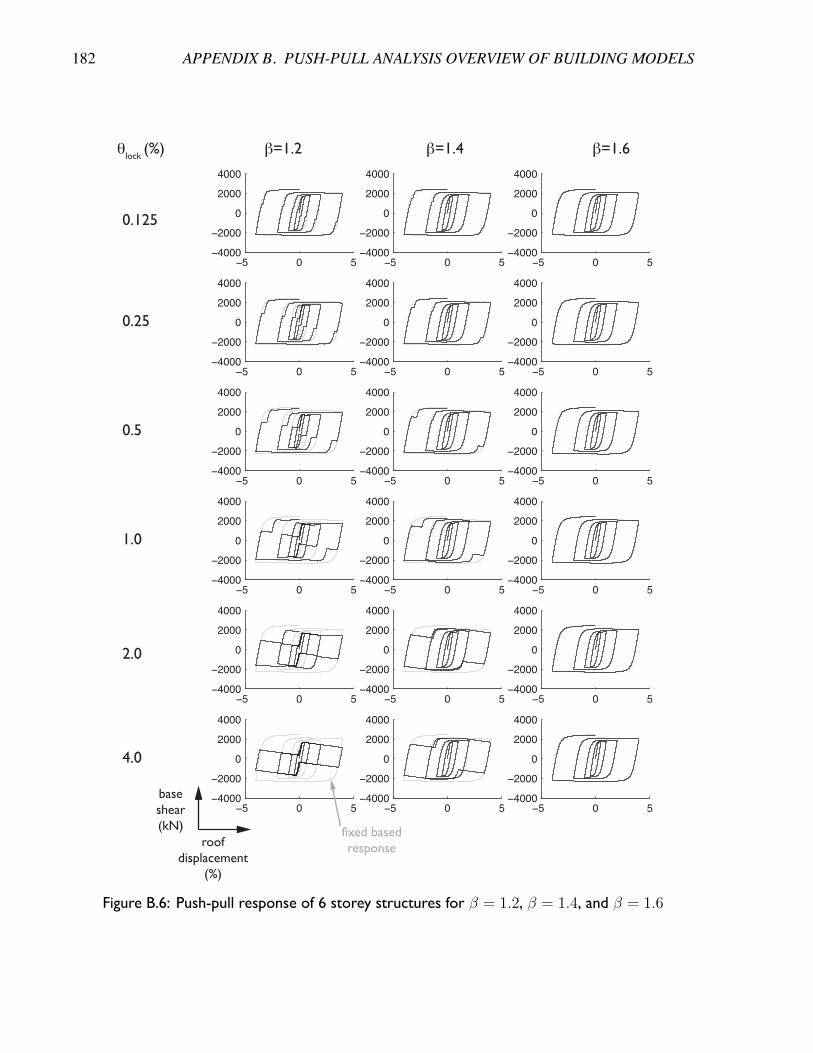
182 APPENDIX B. PUSH-PULL ANALYSIS OVERVIEW OF BUILDING MODELS
−5 0 5−4000
−2000
0
2000
4000
−5 0 5−4000
−2000
0
2000
4000
−5 0 5−4000
−2000
0
2000
4000
−5 0 5−4000
−2000
0
2000
4000
−5 0 5−4000
−2000
0
2000
4000
−5 0 5−4000
−2000
0
2000
4000
−5 0 5−4000
−2000
0
2000
4000
−5 0 5−4000
−2000
0
2000
4000
−5 0 5−4000
−2000
0
2000
4000
−5 0 5−4000
−2000
0
2000
4000
−5 0 5−4000
−2000
0
2000
4000
−5 0 5−4000
−2000
0
2000
4000
−5 0 5−4000
−2000
0
2000
4000
−5 0 5−4000
−2000
0
2000
4000
−5 0 5−4000
−2000
0
2000
4000
−5 0 5−4000
−2000
0
2000
4000
−5 0 5−4000
−2000
0
2000
4000
−5 0 5−4000
−2000
0
2000
4000
θlock
(%) β=1.2 β=1.4 β=1.6
0.125
0.25
0.5
1.0
2.0
4.0
fixed basedresponseroof
displacement(%)
baseshear(kN)
Figure B.6: Push-pull response of 6 storey structures for � = 1.2, � = 1.4, and � = 1.6


