Embed Size (px)
Citation preview
Instructions for use
Title Development of a smart sprayer system for rice fields in the Vietnamese Mekong Delta
Author(s) NGUYEN, TINH THANH
Citation 北海道大学. 博士(農学) 甲第14212号
Issue Date 2020-09-25
DOI 10.14943/doctoral.k14212
Doc URL http://hdl.handle.net/2115/79576
Type theses (doctoral)
File Information Nguyen_Tinh_Thanh.pdf
Hokkaido University Collection of Scholarly and Academic Papers : HUSCAP
1
Development of a smart sprayer system for rice
fields in the Vietnamese Mekong Delta
(ベトナムメコンデルタ水田用スマート 防除システムの開発)
Hokkaido University Graduate School of Agriculture
Division of Environmental Resource Doctor Course
Nguyen Thanh Tinh
2
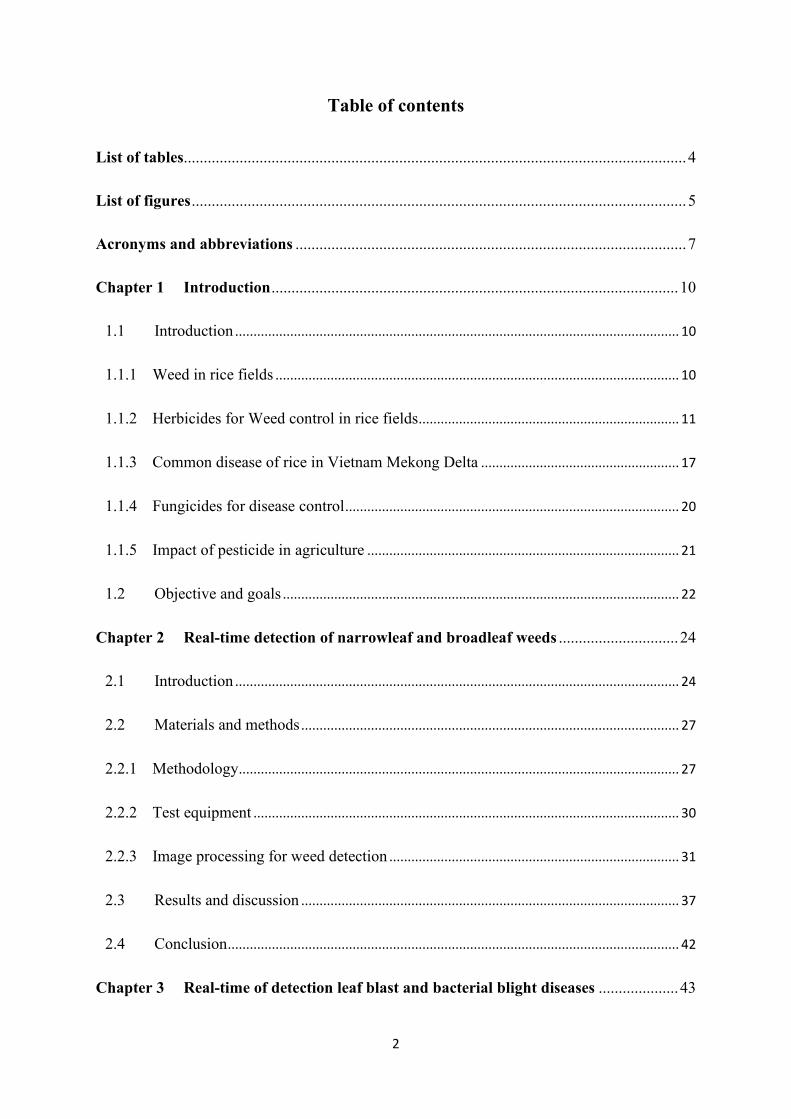
Table of contents
List of tables.............................................................................................................................. 4
List of figures ............................................................................................................................ 5
Acronyms and abbreviations .................................................................................................. 7
Chapter 1 Introduction ...................................................................................................... 10
1.1 Introduction ......................................................................................................................... 10
1.1.1 Weed in rice fields .............................................................................................................. 10
1.1.2 Herbicides for Weed control in rice fields ....................................................................... 11
1.1.3 Common disease of rice in Vietnam Mekong Delta ...................................................... 17
1.1.4 Fungicides for disease control ........................................................................................... 20
1.1.5 Impact of pesticide in agriculture ..................................................................................... 21
1.2 Objective and goals ............................................................................................................ 22
Chapter 2 Real-time detection of narrowleaf and broadleaf weeds .............................. 24
2.1 Introduction ......................................................................................................................... 24
2.2 Materials and methods ....................................................................................................... 27
2.2.1 Methodology ........................................................................................................................ 27
2.2.2 Test equipment .................................................................................................................... 30
2.2.3 Image processing for weed detection ............................................................................... 31
2.3 Results and discussion ....................................................................................................... 37
2.4 Conclusion ........................................................................................................................... 42
Chapter 3 Real-time of detection leaf blast and bacterial blight diseases .................... 43
3
3.1 Introduction ......................................................................................................................... 43
3.2 Materials and methods ....................................................................................................... 47
3.3 Results and discussion ....................................................................................................... 60
3.4 Conclusion ........................................................................................................................... 65
Chapter 4 Development of a smart sprayer utilizing a commercialized sprayer ......... 67
4.1 Introduction ......................................................................................................................... 67
4.2 Materials and methods ....................................................................................................... 69
4.2.1 Smart sprayer hardware component ................................................................................. 69
4.2.2 Image processing hardware and software development ................................................ 74
4.3 Result and discussion ......................................................................................................... 76
4.4 Conclusion ........................................................................................................................... 79
Chapter 5 Conclusions and recommendations ................................................................ 81
5.1 Conclusions ......................................................................................................................... 81
5.2 Recommendations .............................................................................................................. 82
5.3 Contributions to knowledge .............................................................................................. 83
References ............................................................................................................................... 85
4
List of tables
Table 1 Quantity of commercial pesticides used in Vietnam from 1990-2003 ..................... 16
Table 2 Commercial pesticides used in Vietnam from 1991-2004 ........................................ 16
Table 3 Pesticide using in Vietnam (2016) ............................................................................ 21
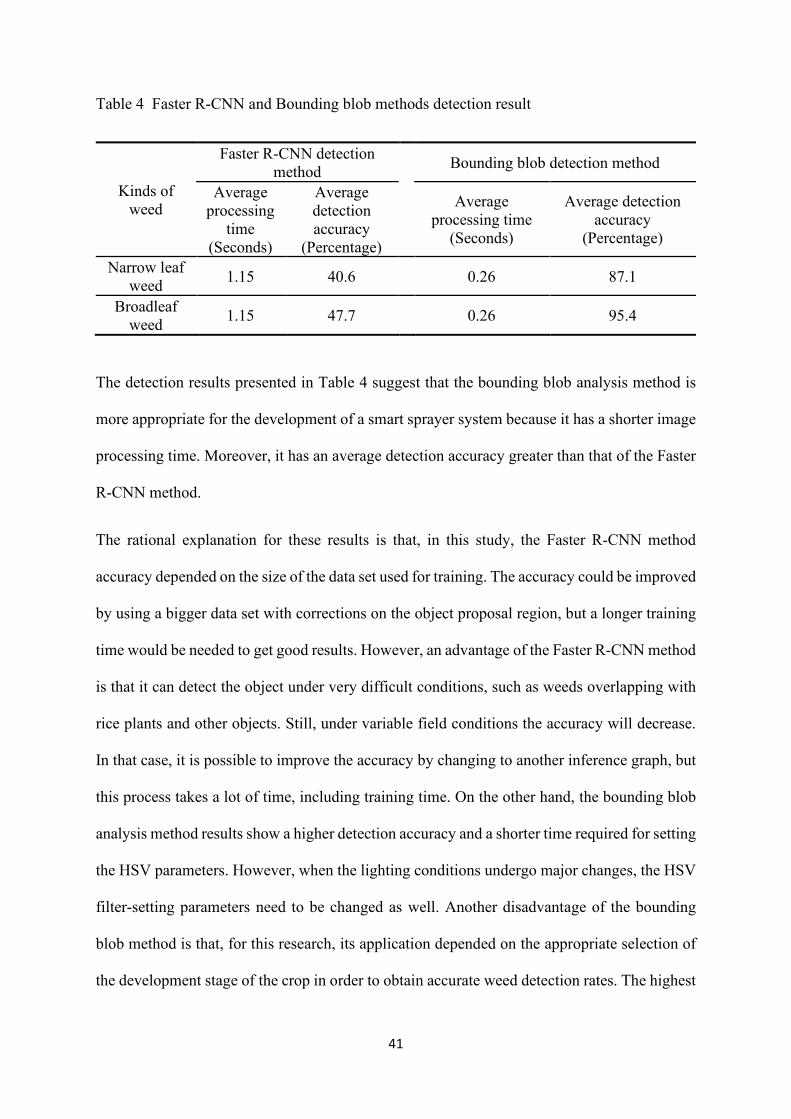
Table 4 Faster R-CNN and Bounding blob methods detection result ................................... 41
Table 5 Results of Gaussian Naïve Bayes classifier with RGB color space. ........................ 60
Table 6 Result of Gaussian Naïve Bayes classifier with HSI color space. ............................ 60
Table 7 Results of KNN classifier with RGB and HSI color spaces. .................................... 61
Table 8 Comparison between Gaussian Naïve Bayes and KNN. .......................................... 62
Table 9 Comparison processing times between Gaussian Naïve Bayes and KNN when
increasing training dataset. ...................................................................................... 62
5
List of figures
Fig. 1 Common kind of weed in VND. ......................................................................................... 11
Fig. 2 Soil preparation. .................................................................................................................. 12
Fig. 3 Mechanical weeding (Weeder tool). ................................................................................... 13
Fig. 4 Pre-mergence herbicide application. .................................................................................. 14
Fig. 5 International survey of herbicide-resistant weed. ............................................................... 15
Fig. 6 Different kinds of rice blast disease. ................................................................................... 18
Fig. 7 Conidia of blast disease pathogen....................................................................................... 19
Fig. 8 Bacterial blight infected rice leaf and fields. ...................................................................... 19
Fig. 9 Chart of distribution plant and chemical in agriculture. ..................................................... 22
Fig. 10 Two kinds of weeds (narrow leaf and broadleaf weed) from rice in VMD. ..................... 28
Fig. 11 Weed overview during the post-emergence stage. ........................................................... 29
Fig. 12 Equipment used for image collection on the rice fields in Vietnam. ................................ 30
Fig. 13 Architecture of the Faster R-CNN method. ...................................................................... 32
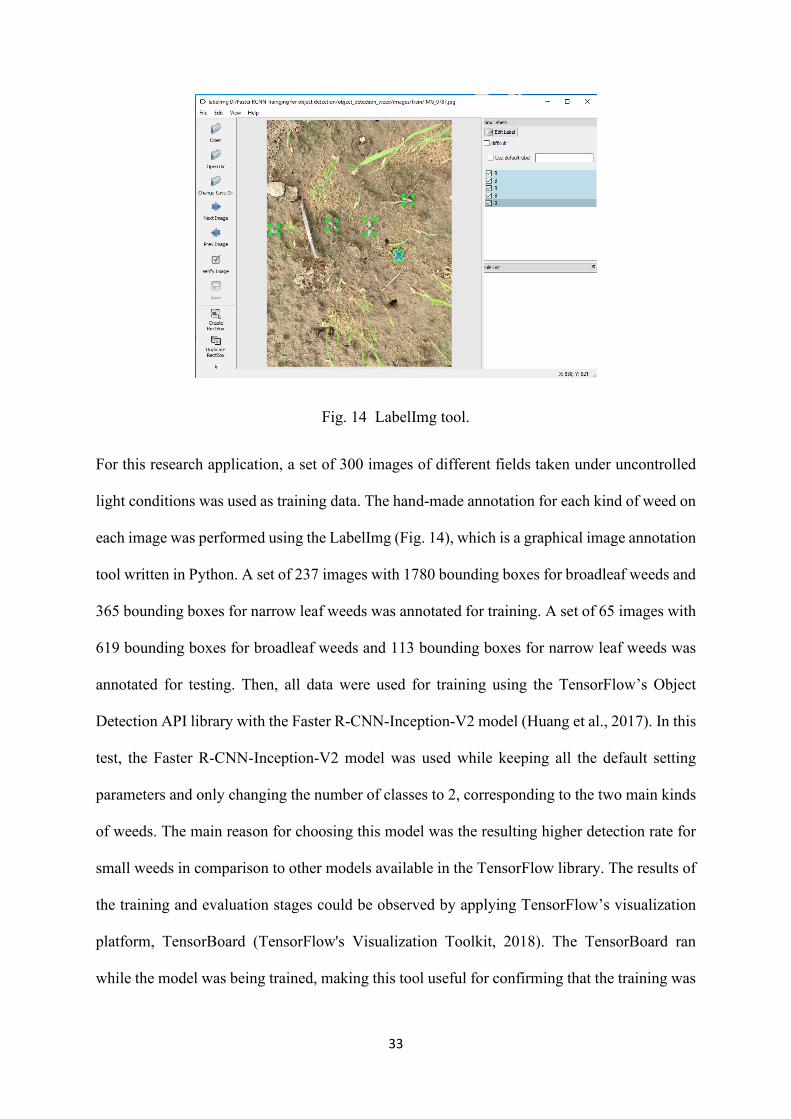
Fig. 14 LabelImg tool. .................................................................................................................. 33
Fig. 15 Bounding blob analysis algorithm process. ...................................................................... 34
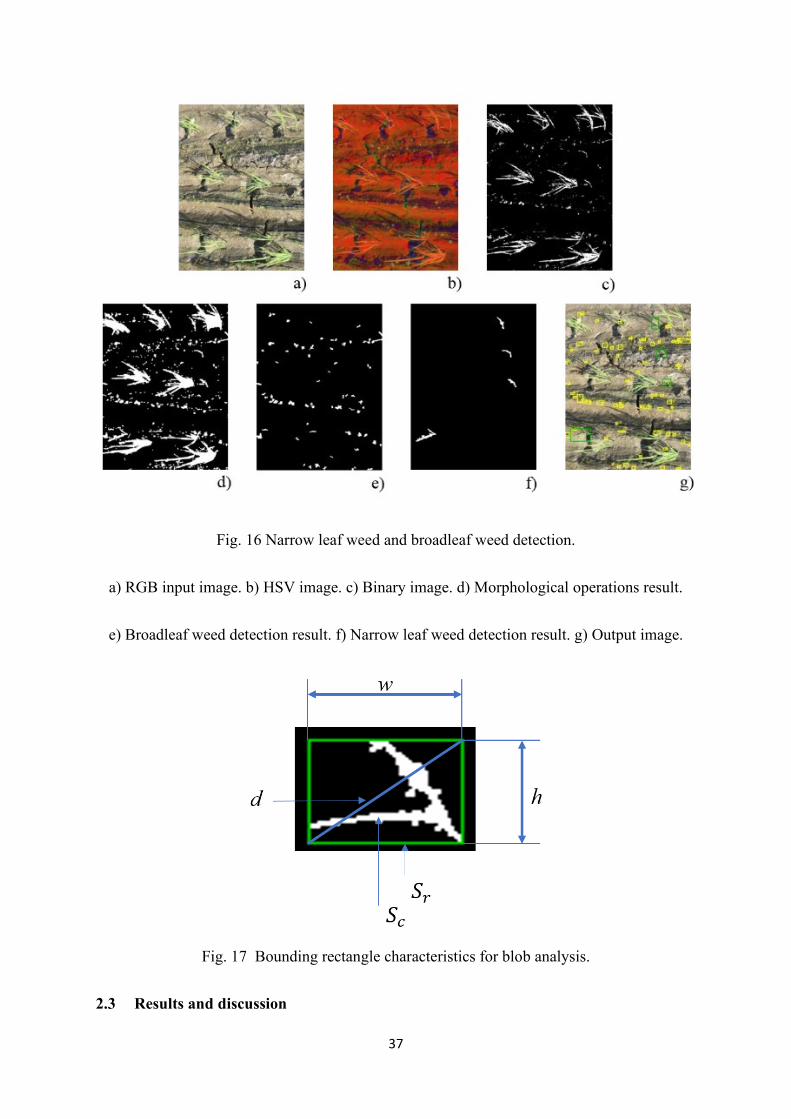
Fig. 16 Narrow leaf weed and broadleaf weed detection. ............................................................. 37
Fig. 17 Bounding rectangle characteristics for blob analysis. ...................................................... 37
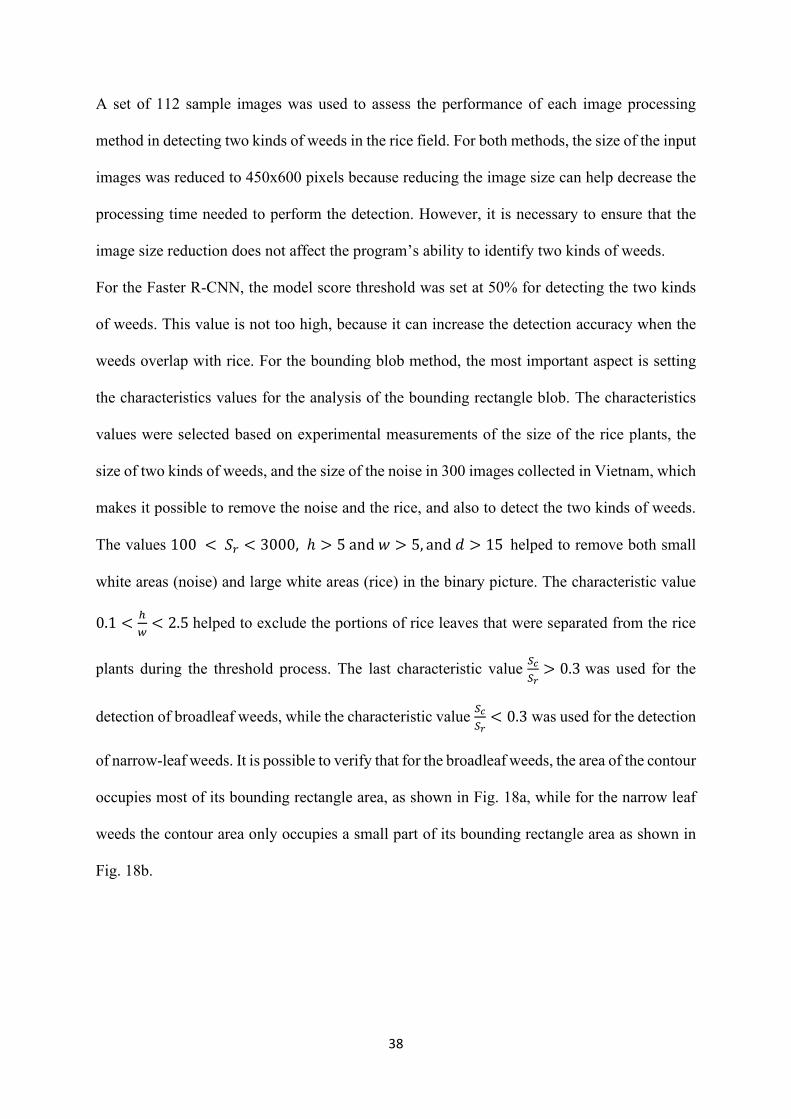
Fig. 18 Weeds characteristic difference. ....................................................................................... 39
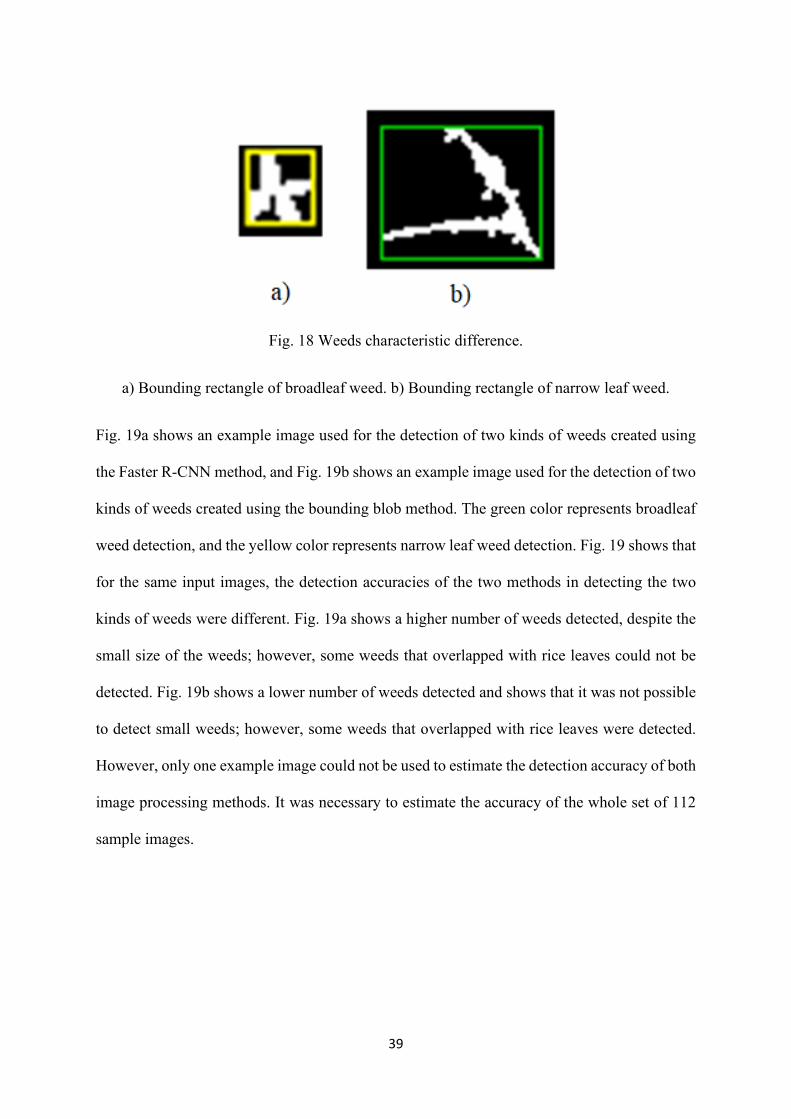
Fig. 19 Result of narrow leaf and broadleaf weed detection. ....................................................... 40
Fig. 20 Leaf blast disease on early stage. ...................................................................................... 45
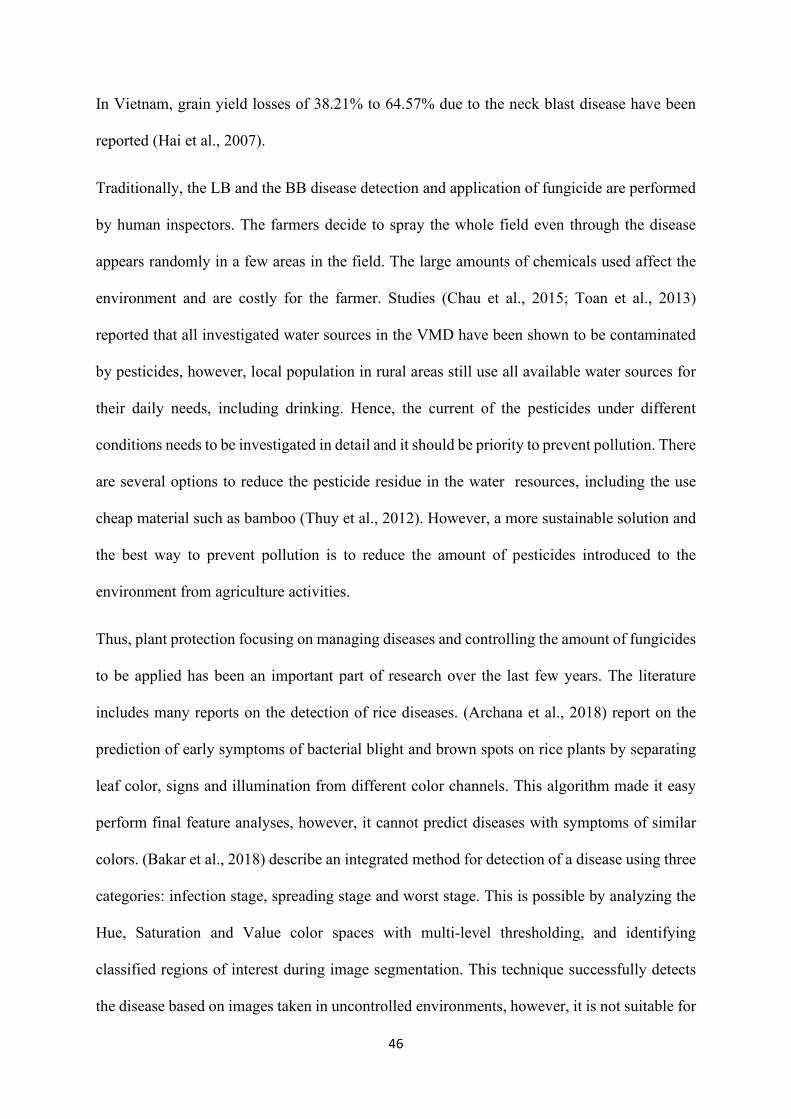
Fig. 21 Leaf scald disease on early stage. ..................................................................................... 45
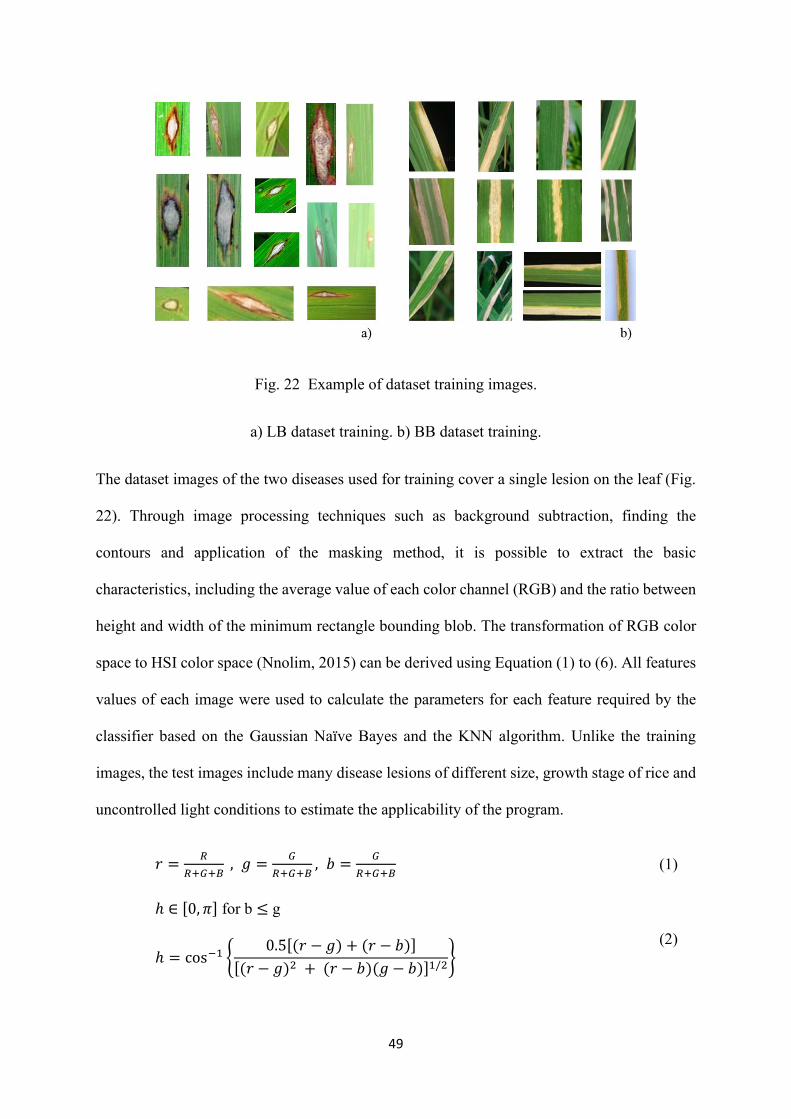
Fig. 22 Example of dataset training images. ................................................................................. 49
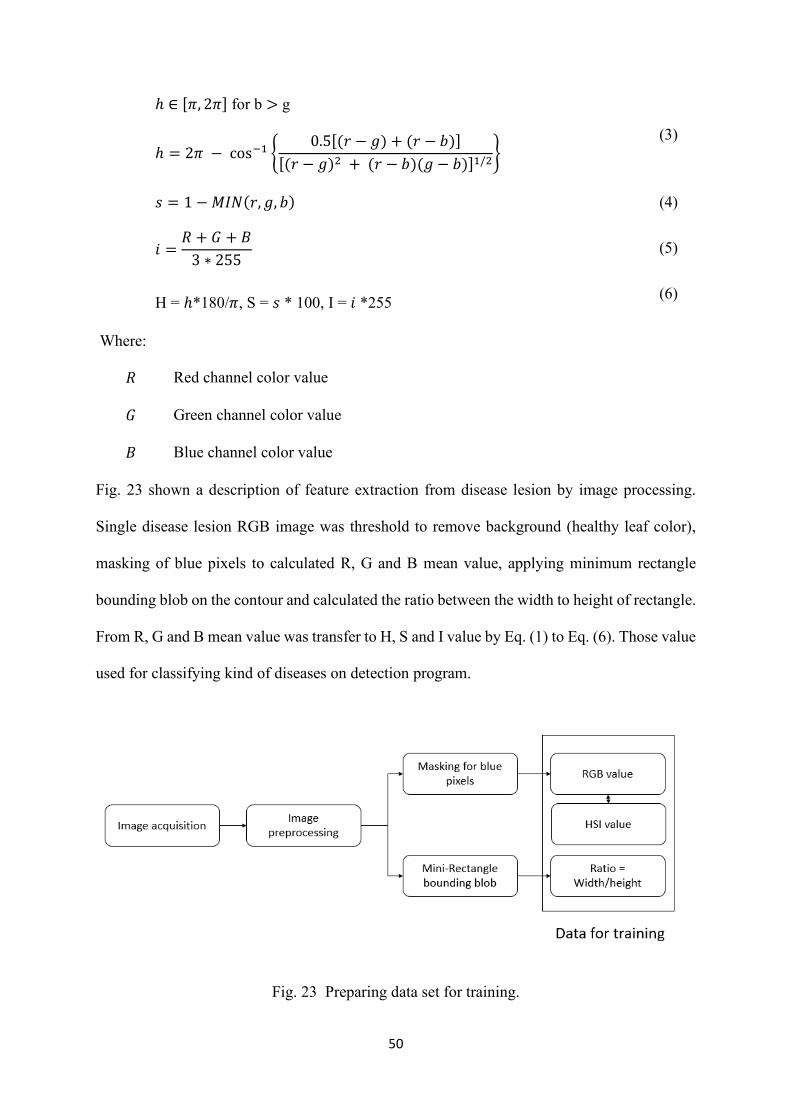
Fig. 23 Preparing data set for training........................................................................................... 50
Fig. 24 Algorithm of LB and BB disease detection with RGB color space.................................. 51
6
Fig. 25 Detection of LB and BB on rice leaves using the Gaussian Naïve Bayes classifier for
RGB color spaces. ........................................................................................................... 54
Fig. 26 Algorithm of LB and BB disease detection with HSI color space. .................................. 55
Fig. 27 Detection of LB and BB disease on rice leaves using Gaussian Naïve Bayes classifier
from HSI color space. ..................................................................................................... 56
Fig. 28 Feature subtraction. .......................................................................................................... 57
Fig. 29 LB and BB disease detection result. ................................................................................. 64
Fig. 30 LB and BB disease detection results by KNN method. .................................................... 65
Fig. 31 Sprayer prototype. ............................................................................................................ 69
Fig. 32 Accessories equipment and connection diagram of prototype. ....................................... 71
Fig. 33 Utility vehicle (Iseki JK-14). ............................................................................................ 72
Fig. 34 Schematic diagram showing the main component of machine vision and individual
nozzle section control setup. ........................................................................................... 72
Fig. 35 Sprayer boom and camera mounting design. .................................................................... 73
Fig. 36 The experiment setup of sprayer system into Iseki machine. ........................................... 74
Fig. 37 Image processing program user interface development for see the number of detection
and count number of sprayers. ........................................................................................ 75
Fig. 38 Device section and individual control nozzle. .................................................................. 76
Fig. 39 The calibration of volumnce of each sprayer. .................................................................. 77
Fig. 40 The calibration ROI of nozzle. ......................................................................................... 77
Fig. 41 Proper overlap with a flat-fan type nozzle on 0.4 m nozzle spacing. ............................... 78
Fig. 42 Experiment of real time detection and sprayer. ................................................................ 79
7
Acronyms and abbreviations
a� average value
B blue color mean value
cm centimeters
CPU central processing unit
Ex Example
g gram
G green color mean value
GB gigabyte
GHz gigaherts
GPU graphics processing unit
h height of rectangle bounding blob
H2S Hydrogen Sulfide
ha hectare
HSI Hue, Saturation and Intensity
HSV hue, saturation and value
K bounding rectangle width to height ratio
kg kilogram
kW kilowatt
l liter
LED light-emitting diodes
m meter
maxB maximum value in blue
maxG maximum value in green
maxK maximum value in K
8
maxR maximum value in red
minB minimum value in blue
minG minimum value in green
minK minimum value in K
minR minimum value in red
ml milliliter
NN Neural network
PC laptop computer
pH power of hydrogen
R red color mean value
RAM random access memory
R-CNN Region-based convolutional neural network
RGB Red, Green and Blue color space
ROI region of interest
RPN region proposal network
s second
Sc area of contour
Sr area of rectangle bounding blob
SATA serial advance technology attachment
UAVs Unmanned aerial vehicles
var variance value
VIPA Vietnam Pesticide Association
VMD Vietnamese Mekong Delta
w width of rectangle bounding blob
WS wheel steering

9
Acknowledgment
Many people need to be recognized for their help and support throughout my graduate studies
at Vehicle Robotics Laboratory - Hokkaido University. First and foremost, I great gratitude to
my supervisor Prof. Noboru Noguchi and Dr. Ricardo Ospina for their knowledgeable guidance
and continued support that helps me accomplish my project. I am very thankful to Prof. Ishi
and Prof. Okamoto for their support, guidance, time and expertise throughout my project
deliverables. All my committee members have provided a vast amount of advice and
inspiration over the past three years.
I thank Dr. Truong Chi Thanh (Yanmar Agriculture Research Institute – Can Tho University),
Mr. Kunio Doi (Yanmar Group Company) for allowing me to take images of the spot seeding
field and transplanting field projects in Dinh Thanh, An Giang, Viet Nam. I also thank Dr.
Nguyen Thanh Tam (Mekong Delta Development Research Institute Can Tho University) for
sharing his knowledge about the kinds of weeds and kind of diseases in rice fields.
This study was funded in part of Can Tho Univesity Improvement Project VN14-P6, supported
by a Japanese ODA loan.
10
Chapter 1 Introduction
1.1 Introduction
1.1.1 Weed in rice fields
Weed in the rice fields are any plant which is not rice growing in a location where they are un-
wanted. Weeds typically are damaging to the rice crop and limit harvestable yields as they
compete for water, nutrients, sunlight and space. Weed infestations are a concern for every
farmer. Depending on the type of rice production system, farmers across Asia often contend
with the same or similar weed species (Caton et al., 2010). Vietnam has tropical and subtropical
plant ecosystems. Thus, a wide range of weed species occur, causing great interference to both
lowland and upland crops. (Chin, 1995) estimated that ≈ 400 weed species occur in Vietnam,
of which the Poaceae and Cyperaceae families are the most troublesome, with 167 species.
The other nuisance weed families include Asteraceae (26 species), Scrophulariaceae (18),
Fabaceae (14), Lythraceae (10) and Laminaceae (9). Another survey in the Red River Delta
showed that 60 weed species belonging to 19 families were found in the rice fields, of which
Poaceae and Cyperaceae accounted for 21 and 11 species, respectively, or 35% and 18% of
total paddy weeds, respectively (Chin, 2001). Echinochloa crus-galli (barnyardgrass) and
L.chinesis are probably the most damaging species in the entire Vietnamese rice fields. Base
on the growth characteristics of weeds, we can classify weed become two groups that are
narrow leaf weed and broadleaf weed.
Broadleaf (Dicotyledon weed). As the name implies, these usually have relatively wide leaf
blades compared to grasses, whose leaves tend to be long, narrow and pointed. Narrow leaf
weed (and other monocotyledon weed, grasses, sedges) have parallel venation, meaning that
all of the veins in their leaves run parallel to one another. Fig. 1 shows the common kinds of
weed in Vietnamese Mekong Delta (VMD), with a b c d are narrow leaf weed, e and f are
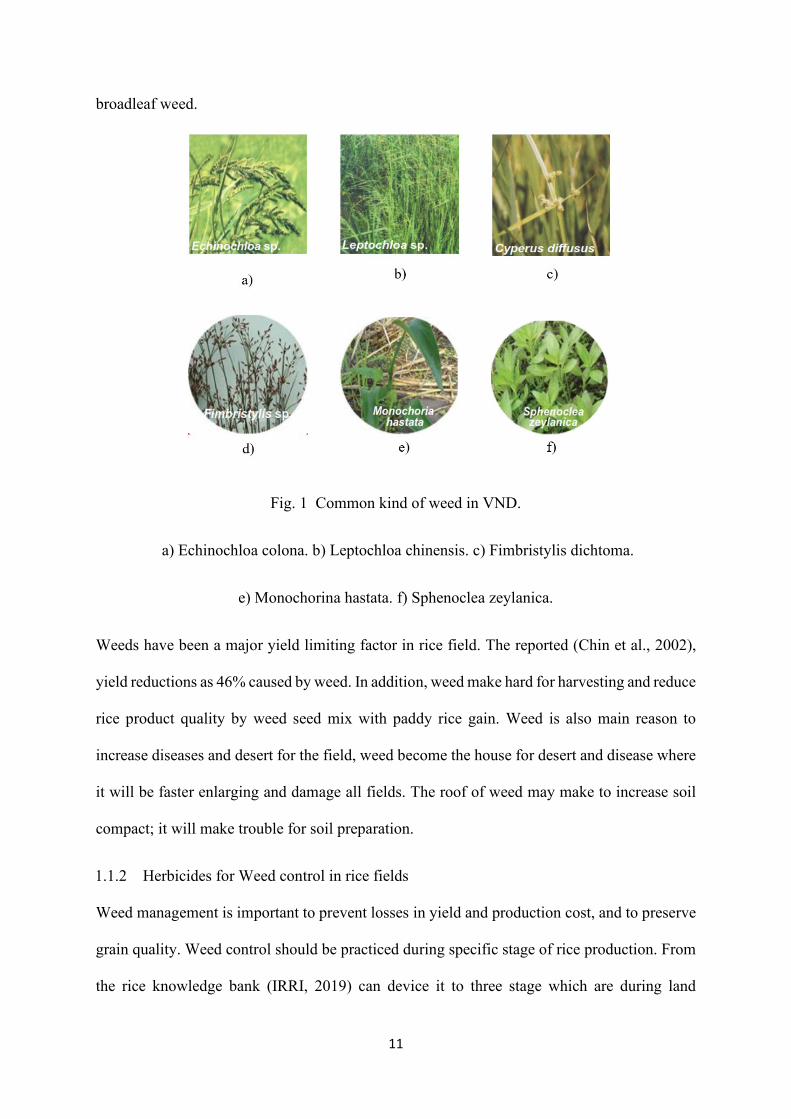
11
broadleaf weed.
Fig. 1 Common kind of weed in VND.
a) Echinochloa colona. b) Leptochloa chinensis. c) Fimbristylis dichtoma.
e) Monochorina hastata. f) Sphenoclea zeylanica.
Weeds have been a major yield limiting factor in rice field. The reported (Chin et al., 2002),
yield reductions as 46% caused by weed. In addition, weed make hard for harvesting and reduce
rice product quality by weed seed mix with paddy rice gain. Weed is also main reason to
increase diseases and desert for the field, weed become the house for desert and disease where
it will be faster enlarging and damage all fields. The roof of weed may make to increase soil
compact; it will make trouble for soil preparation.
1.1.2 Herbicides for Weed control in rice fields
Weed management is important to prevent losses in yield and production cost, and to preserve
grain quality. Weed control should be practiced during specific stage of rice production. From
the rice knowledge bank (IRRI, 2019) can device it to three stage which are during land
12
preparation, nursery stage and during early crop growth stage.
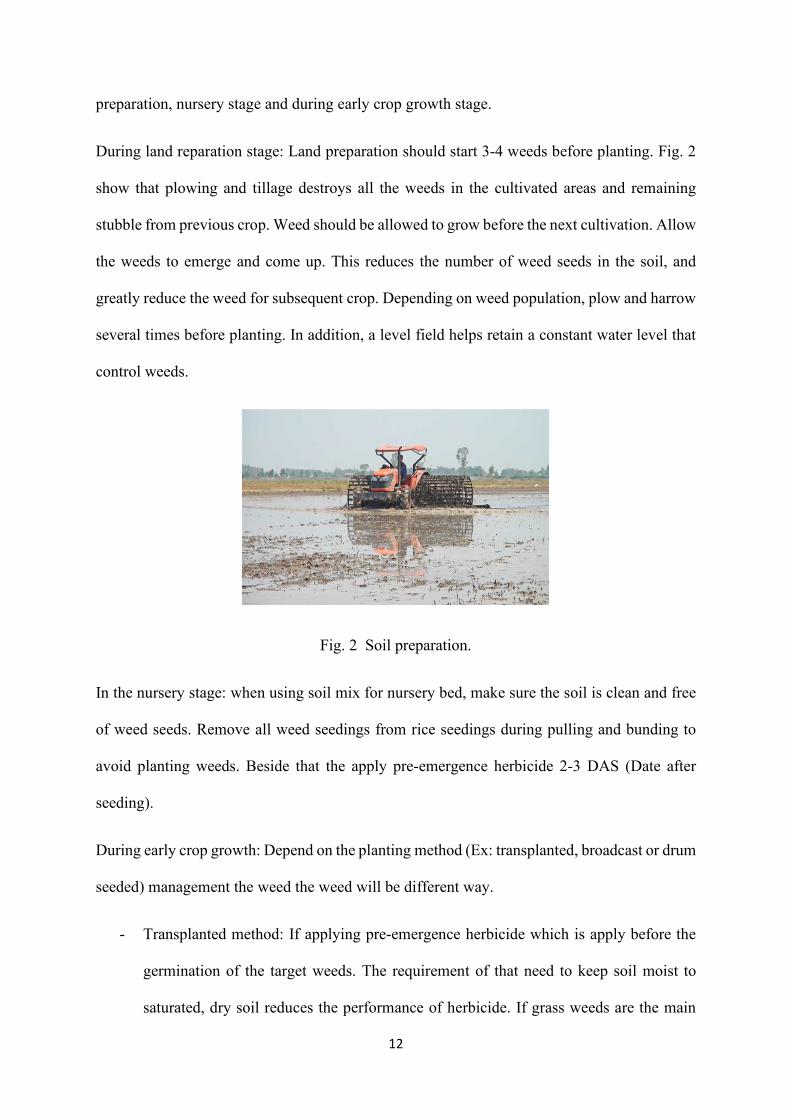
During land reparation stage: Land preparation should start 3-4 weeds before planting. Fig. 2
show that plowing and tillage destroys all the weeds in the cultivated areas and remaining
stubble from previous crop. Weed should be allowed to grow before the next cultivation. Allow
the weeds to emerge and come up. This reduces the number of weed seeds in the soil, and
greatly reduce the weed for subsequent crop. Depending on weed population, plow and harrow
several times before planting. In addition, a level field helps retain a constant water level that
control weeds.
Fig. 2 Soil preparation.
In the nursery stage: when using soil mix for nursery bed, make sure the soil is clean and free
of weed seeds. Remove all weed seedings from rice seedings during pulling and bunding to
avoid planting weeds. Beside that the apply pre-emergence herbicide 2-3 DAS (Date after
seeding).
During early crop growth: Depend on the planting method (Ex: transplanted, broadcast or drum
seeded) management the weed the weed will be different way.
- Transplanted method: If applying pre-emergence herbicide which is apply before the
germination of the target weeds. The requirement of that need to keep soil moist to
saturated, dry soil reduces the performance of herbicide. If grass weeds are the main
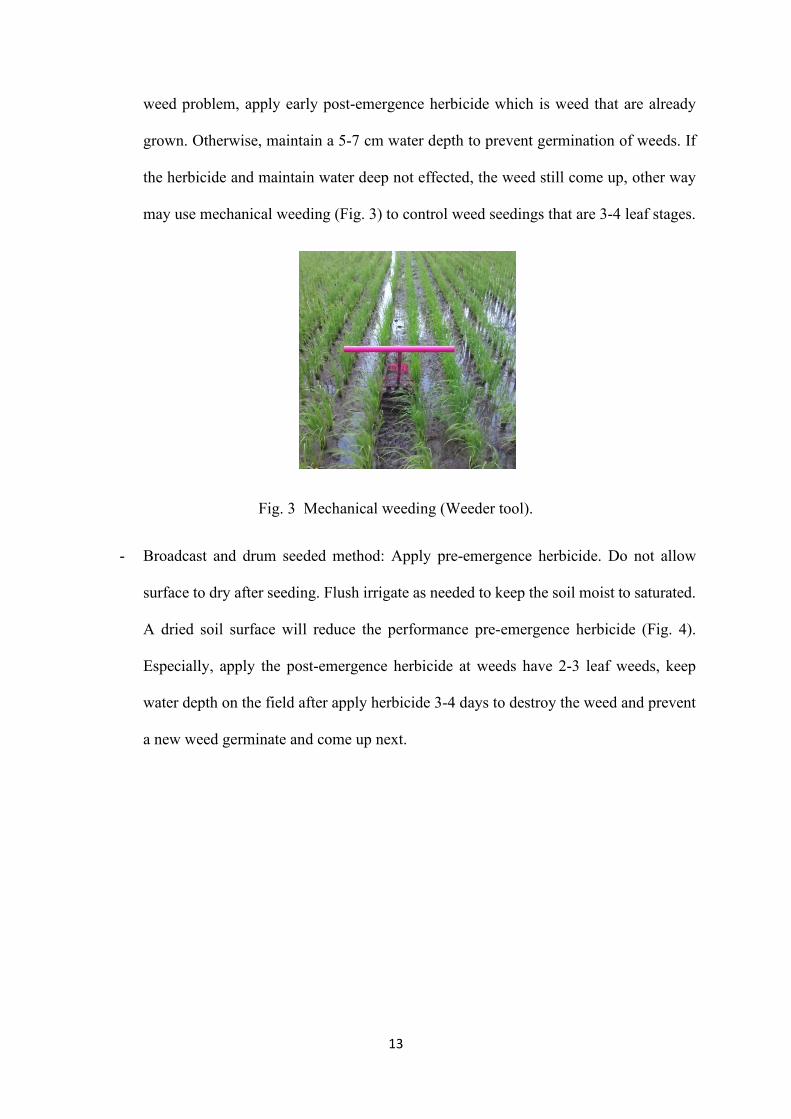
13
weed problem, apply early post-emergence herbicide which is weed that are already
grown. Otherwise, maintain a 5-7 cm water depth to prevent germination of weeds. If
the herbicide and maintain water deep not effected, the weed still come up, other way
may use mechanical weeding (Fig. 3) to control weed seedings that are 3-4 leaf stages.
Fig. 3 Mechanical weeding (Weeder tool).
- Broadcast and drum seeded method: Apply pre-emergence herbicide. Do not allow
surface to dry after seeding. Flush irrigate as needed to keep the soil moist to saturated.
A dried soil surface will reduce the performance pre-emergence herbicide (Fig. 4).
Especially, apply the post-emergence herbicide at weeds have 2-3 leaf weeds, keep
water depth on the field after apply herbicide 3-4 days to destroy the weed and prevent
a new weed germinate and come up next.
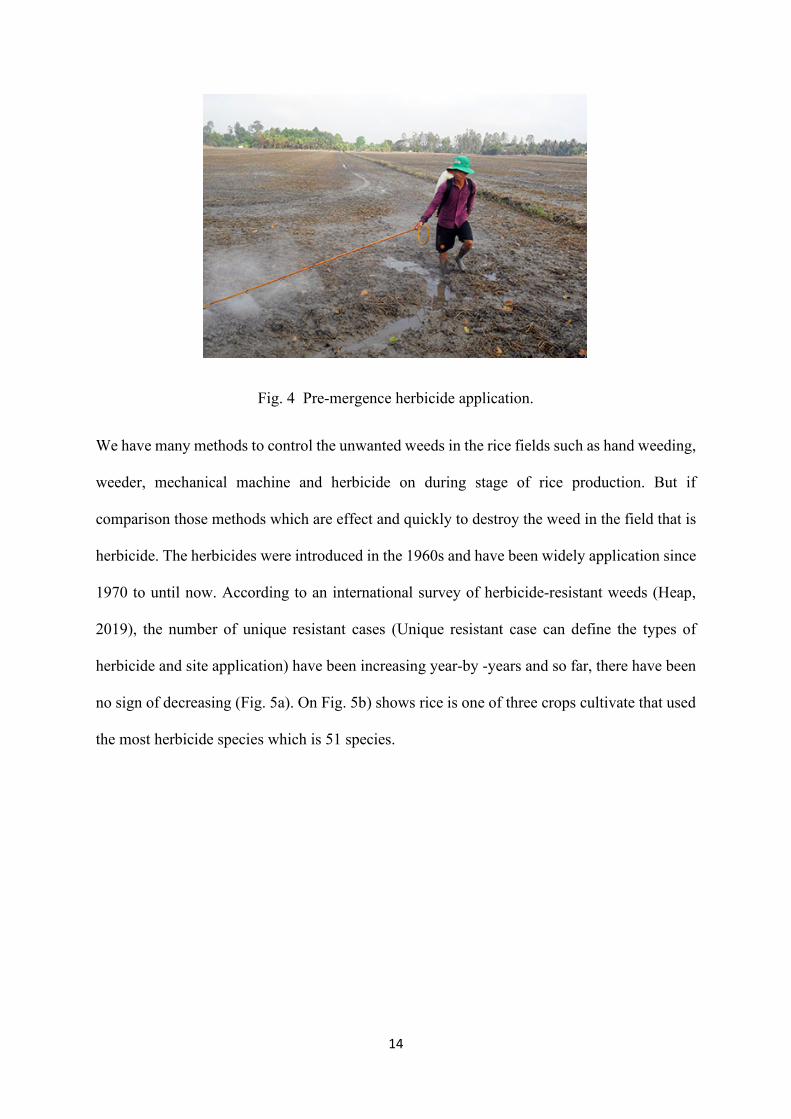
14
Fig. 4 Pre-mergence herbicide application.
We have many methods to control the unwanted weeds in the rice fields such as hand weeding,
weeder, mechanical machine and herbicide on during stage of rice production. But if
comparison those methods which are effect and quickly to destroy the weed in the field that is
herbicide. The herbicides were introduced in the 1960s and have been widely application since
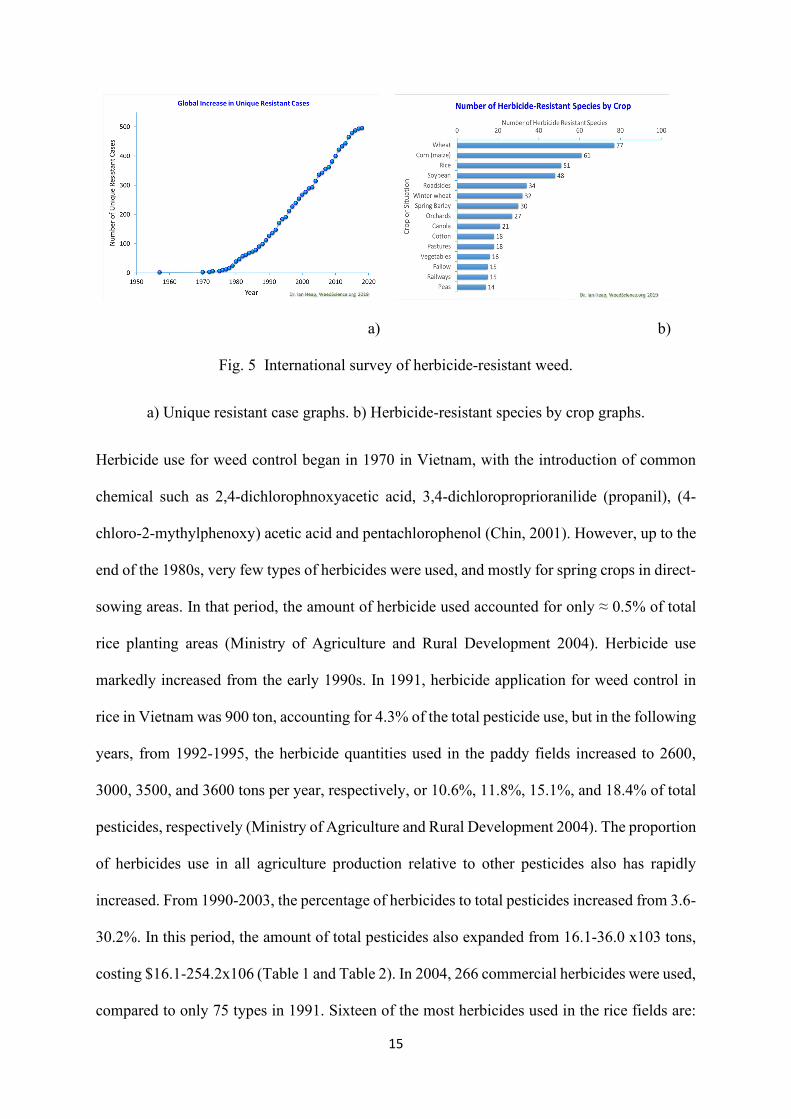
1970 to until now. According to an international survey of herbicide-resistant weeds (Heap,
2019), the number of unique resistant cases (Unique resistant case can define the types of
herbicide and site application) have been increasing year-by -years and so far, there have been
no sign of decreasing (Fig. 5a). On Fig. 5b) shows rice is one of three crops cultivate that used
the most herbicide species which is 51 species.
15
a)
b)
Fig. 5 International survey of herbicide-resistant weed.
a) Unique resistant case graphs. b) Herbicide-resistant species by crop graphs.
Herbicide use for weed control began in 1970 in Vietnam, with the introduction of common
chemical such as 2,4-dichlorophnoxyacetic acid, 3,4-dichloroproprioranilide (propanil), (4-
chloro-2-mythylphenoxy) acetic acid and pentachlorophenol (Chin, 2001). However, up to the
end of the 1980s, very few types of herbicides were used, and mostly for spring crops in direct-
sowing areas. In that period, the amount of herbicide used accounted for only ≈ 0.5% of total
rice planting areas (Ministry of Agriculture and Rural Development 2004). Herbicide use
markedly increased from the early 1990s. In 1991, herbicide application for weed control in
rice in Vietnam was 900 ton, accounting for 4.3% of the total pesticide use, but in the following
years, from 1992-1995, the herbicide quantities used in the paddy fields increased to 2600,
3000, 3500, and 3600 tons per year, respectively, or 10.6%, 11.8%, 15.1%, and 18.4% of total
pesticides, respectively (Ministry of Agriculture and Rural Development 2004). The proportion
of herbicides use in all agriculture production relative to other pesticides also has rapidly
increased. From 1990-2003, the percentage of herbicides to total pesticides increased from 3.6-
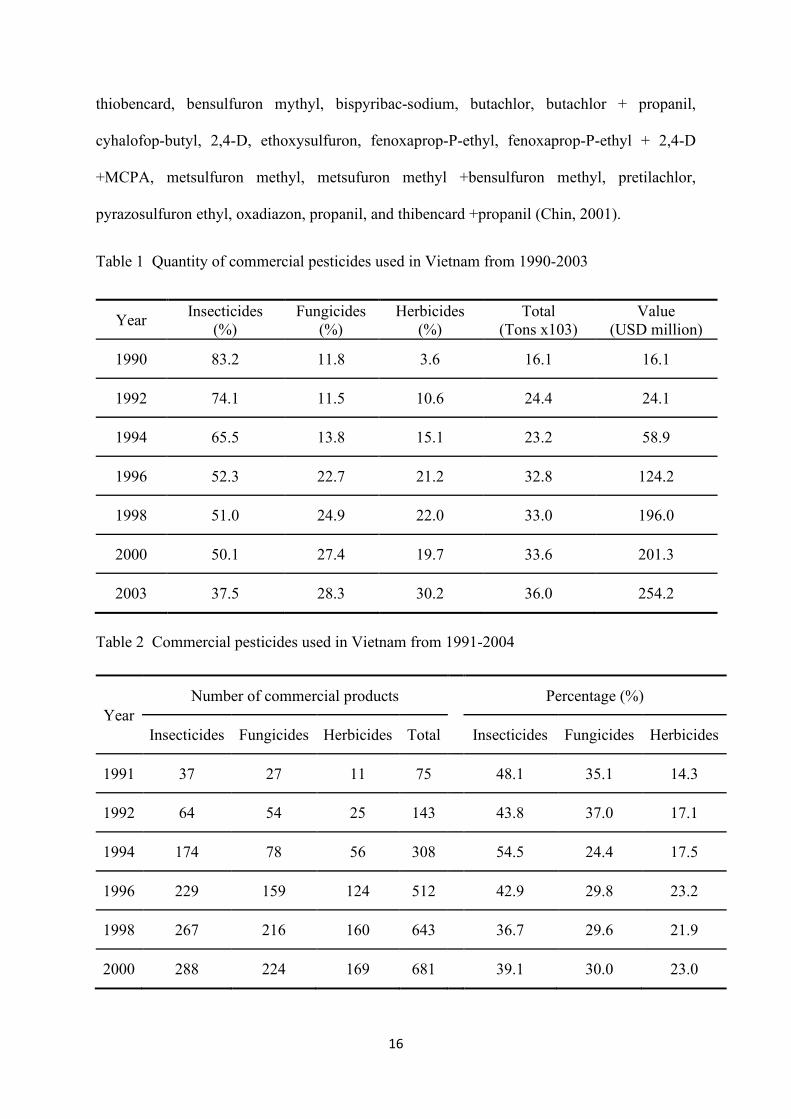
30.2%. In this period, the amount of total pesticides also expanded from 16.1-36.0 x10³ tons,
costing $16.1-254.2x10⁶ (Table 1 and Table 2). In 2004, 266 commercial herbicides were used,
compared to only 75 types in 1991. Sixteen of the most herbicides used in the rice fields are:
16
thiobencard, bensulfuron mythyl, bispyribac-sodium, butachlor, butachlor + propanil,
cyhalofop-butyl, 2,4-D, ethoxysulfuron, fenoxaprop-P-ethyl, fenoxaprop-P-ethyl + 2,4-D
+MCPA, metsulfuron methyl, metsufuron methyl +bensulfuron methyl, pretilachlor,
pyrazosulfuron ethyl, oxadiazon, propanil, and thibencard +propanil (Chin, 2001).
Table 1 Quantity of commercial pesticides used in Vietnam from 1990-2003
Year Insecticides (%)
Fungicides (%)
Herbicides (%)
Total (Tons x103)
Value (USD million)
1990 83.2 11.8 3.6 16.1 16.1
1992 74.1 11.5 10.6 24.4 24.1
1994 65.5 13.8 15.1 23.2 58.9
1996 52.3 22.7 21.2 32.8 124.2
1998 51.0 24.9 22.0 33.0 196.0
2000 50.1 27.4 19.7 33.6 201.3
2003 37.5 28.3 30.2 36.0 254.2
Table 2 Commercial pesticides used in Vietnam from 1991-2004
Year Number of commercial products Percentage (%)
Insecticides Fungicides Herbicides Total Insecticides Fungicides Herbicides
1991 37 27 11 75 48.1 35.1 14.3
1992 64 54 25 143 43.8 37.0 17.1
1994 174 78 56 308 54.5 24.4 17.5
1996 229 159 124 512 42.9 29.8 23.2
1998 267 216 160 643 36.7 29.6 21.9
2000 288 224 169 681 39.1 30.0 23.0
17
2002 394 287 206 887 44.4 32.3 23.2
2004 499 364 266 1129 44.2 32.2 23.6
1.1.3 Common disease of rice in Vietnam Mekong Delta
Disease is an abnormal condition that injures the plant or causes it to function improperly.
Disease are readily recognized by their symptoms associated visible changes in the plant. The
organisms that cause diseases are known as pathogens. Many species of bacteria, fungus,
nematode, virus and mycoplasma like organisms cause disease in rice. Disorders or
abnormalities may also cause by abiotic factors such as low or high temperature beyond the
limits for normal growth of rice, deficiency or excess of nutrients in the soil and water, pH and
other soil conditions which affect the availability and uptake of nutrient, toxic substances such
as H2S produced in soil, water stress and reduce light.
Many species disease in the rice field have been diagnosis from symptoms and causal organism
by (Francisco et al., 2003). However, here we will cover only the common diseases of rice in
VND which is the biggest rice field in Vietnam those cause by the pathogen.
The Mekong Delta is a vast rice-growing plant criss-crossed by canals and rivers. The yearly
weather cycle in this region includes very wet on rain season as well as dry on hot season
periods. Such weather can also lead to crop stress and favour some diseases, especially of the
fungal disease caused by pathogens that moisture in the field. Indeed, waterlogging and poor
drainage are major factors favouring the diseases in VMD. Furthermore, one third of the 90
rice variety could be under threat due to these changes. This context is favorable to the
development of the fungal and bacterial diseases particularly rice blast disease and bacterial
blight disease.
a) Rice blast disease (Pyricularia grisea (Cooke) Sacc.)
18
- Symptoms
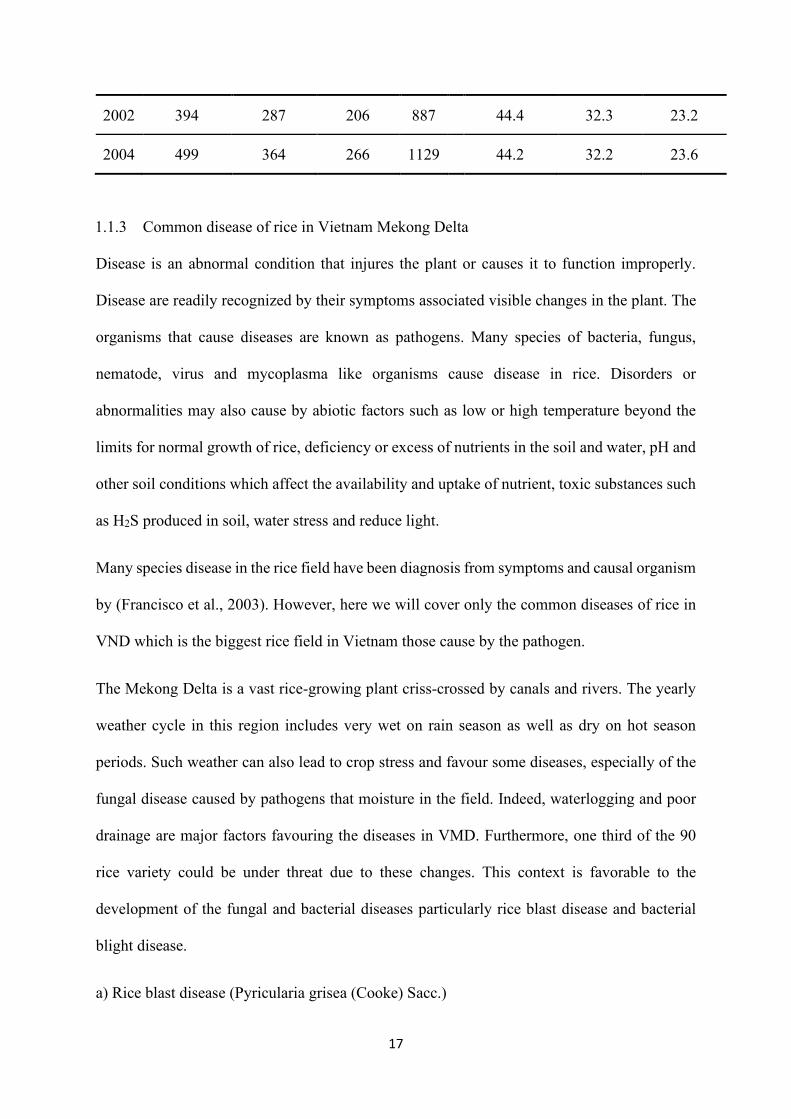
The fungus attacks all aboveground parts of the rice plant. Depending on the site of the
symptom rice blast is referred as leaf blast, collar blast, node blast and neck blast. In the leaf
blast, the lesions on leaf blade are elliptical or spindle shaped with brown borders and gray
centers (Fig. 6). Under favorable conditions, lesions enlarge and coalesce eventually killing the
leaves. Collar blast occurs when the pathogen infects the collar that can kill the entire leaf blade.
The pathogen also effects the node of the stem that turns blackish and breaks easily, this
condition is called node blast. Neck of the panicle can also be infected. Infected neck is girdled
by grayish brown lesion that makes panicle fall over when infection is severe. The pathogen
also causes brown lesions on the branches of panicles.
Fig. 6 Different kinds of rice blast disease.
- Causal organism
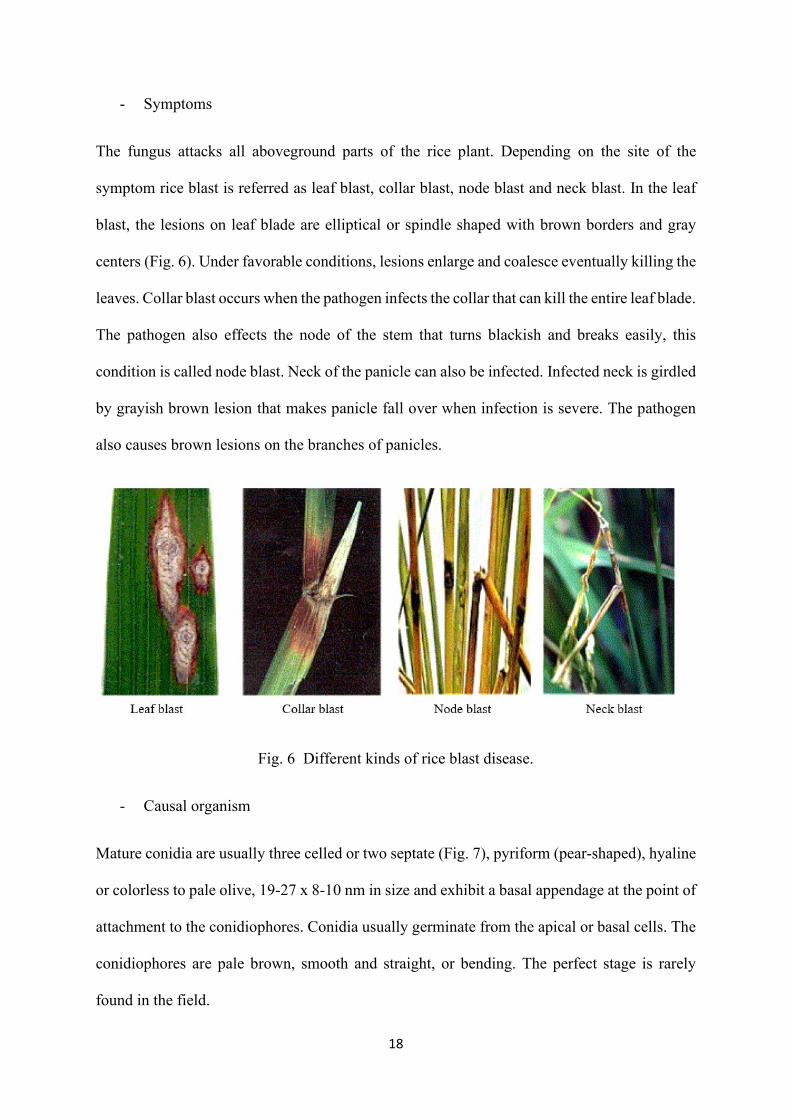
Mature conidia are usually three celled or two septate (Fig. 7), pyriform (pear-shaped), hyaline
or colorless to pale olive, 19-27 x 8-10 nm in size and exhibit a basal appendage at the point of
attachment to the conidiophores. Conidia usually germinate from the apical or basal cells. The
conidiophores are pale brown, smooth and straight, or bending. The perfect stage is rarely
found in the field.
19
Fig. 7 Conidia of blast disease pathogen.
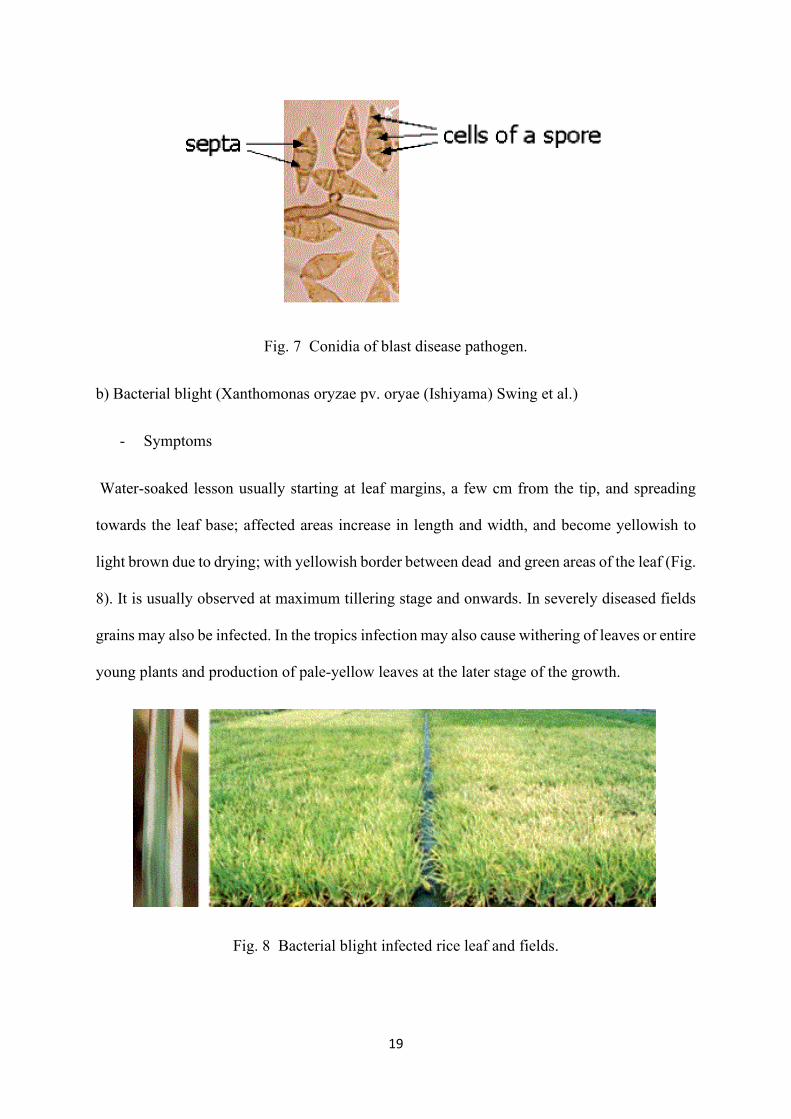
b) Bacterial blight (Xanthomonas oryzae pv. oryae (Ishiyama) Swing et al.)
- Symptoms
Water-soaked lesson usually starting at leaf margins, a few cm from the tip, and spreading
towards the leaf base; affected areas increase in length and width, and become yellowish to
light brown due to drying; with yellowish border between dead and green areas of the leaf (Fig.
8). It is usually observed at maximum tillering stage and onwards. In severely diseased fields
grains may also be infected. In the tropics infection may also cause withering of leaves or entire
young plants and production of pale-yellow leaves at the later stage of the growth.
Fig. 8 Bacterial blight infected rice leaf and fields.
20
1.1.4 Fungicides for disease control
Rice diseases are very dangerous. Especially, fungal leaf blast and bacterial blight disease
which are two common disease that can directly affected to rice yield. There are many methods
to preventively and treatment diseases on rice such as cultural, nutrient, chemical, biological,
forecasting, botanical management and use of resistant cultivar (Rijal et al., 2019). This paper
proposed that labor cost and time are major causes which makes unable to complete control
blast disease. For the productive results and increase in production of rice must followed
integrated management of rice blast. Isoprothiolane @ 1.5 ml/l and Tricyclazole 22 % +
Hexaconazole 3% SC (thrice from booting stage at weekly interval) are best chemical,
Pseudomonas fluorescens strain Pf1 @ 10g/kg, SPM5C-1 and SPM5C-2 (aliphatic compounds
obtained from Streptomyces sp), Bacillus tequilensis (GYLH001) and pseudomonad EA105
effectively inhibit the growth of M. oryzae. Gene Pyramiding and use of multiline varieties is
efficient and able to overcome pesticide hazards. Neem extract 4ml/15ml, Coffee
arabica@25%, Nicotiana tabacum@10% are effective, garlic extract @higher doses and neem
extract @ 4ml/15 ml are best for complete control. 4 g Si/L in green house condition observed
greatest reduction of blast incidence. Among them development of variety and Biological are
best option.
The seed treatment with benomyl (0.3%) and Pseudomonas fluorescens (0.5%) to rice seeds
along with cultural practices like soil application of rice husk ash (RHA) at sowing on raised
beds @ 1 kg m-2 as well as soil application of rice straw (RS) @ 2 tones ha-1 at transplanting
followed by three sprays of propiconazole (0.1%) or carbendazim (0.1 %) at 15 days interval
starting first spray at disease appearance are recommended as a integrate disease management
module for effective management of leaf blast, neck blast and node blast diseases and
increasing the grain and straw yields of paddy as well as monitory returns. This recommend
was proposed by (Balgude et al., 2019).
21
Beside to choosing good resistant varieties of rice, using chemical for treatment seeds before
seeding, a void use high amount of fertilizer and reasonable planting density to prevent blast
and bacterial blight disease. Farmers should be regularly to visit the fields to early detecting
disease on early stages, using the fungicides to spray directly on areas with disease to avoid
diseases enlarge and affected to rice yield.
1.1.5 Impact of pesticide in agriculture
Pesticides can further be divided based on their function (Example: herbicide, fungicide,
insecticides, biopesticides, etc.). Pesticides are often considered a quick, easy, and inexpensive
solution for controlling weeds, diseases and insect pests in agriculture. However, pesticide use
comes a significant cost. Pesticides has contaminated almost every part of our environment.
Pesticides residues are found in soil and air, and in surface and ground water across the
countries, and urban pesticide uses contribute to the problem. Pesticide contamination poses
significant risks to the environment and not-target organisms ranging from beneficial soil
misconceptions, even herbicides can cause harm to the environment. In fact, weed killer can
be especially problematic because they are used in relatively large volumes (Aktar et al., 2009).
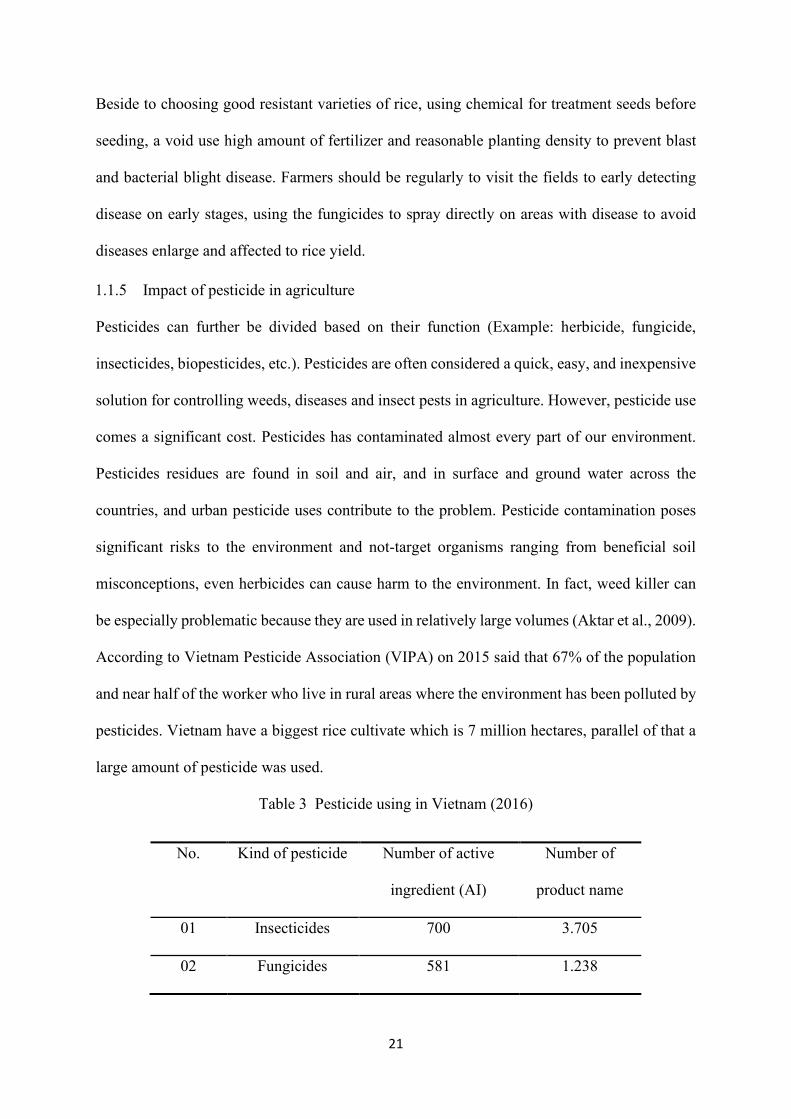
According to Vietnam Pesticide Association (VIPA) on 2015 said that 67% of the population
and near half of the worker who live in rural areas where the environment has been polluted by
pesticides. Vietnam have a biggest rice cultivate which is 7 million hectares, parallel of that a
large amount of pesticide was used.
Table 3 Pesticide using in Vietnam (2016)
No. Kind of pesticide Number of active
ingredient (AI)
Number of
product name
01 Insecticides 700 3.705
02 Fungicides 581 1.238
22
03 Herbicides 232 681
04 Rodenticides 11 27
05 Growth regulators 45 136
06 Molluscicides 25 140
07 Other 58 77
Source: Vipesco’s marketing department
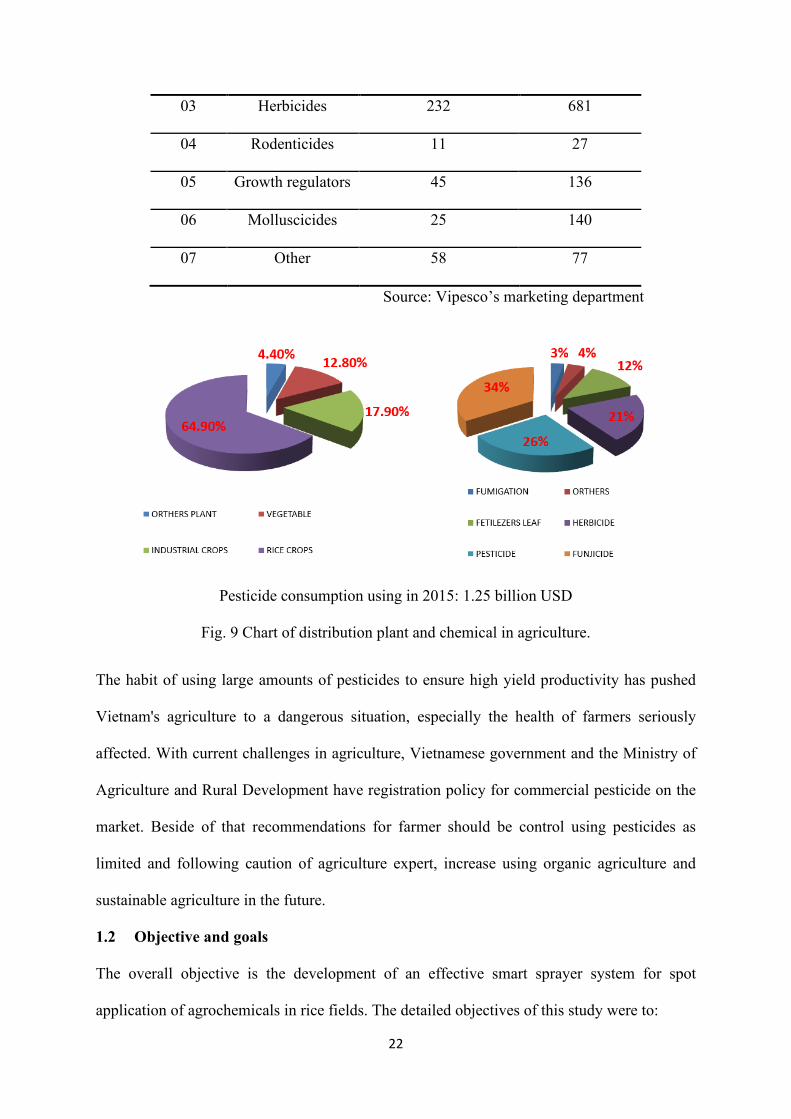
Pesticide consumption using in 2015: 1.25 billion USD
Fig. 9 Chart of distribution plant and chemical in agriculture.
The habit of using large amounts of pesticides to ensure high yield productivity has pushed
Vietnam's agriculture to a dangerous situation, especially the health of farmers seriously
affected. With current challenges in agriculture, Vietnamese government and the Ministry of
Agriculture and Rural Development have registration policy for commercial pesticide on the
market. Beside of that recommendations for farmer should be control using pesticides as
limited and following caution of agriculture expert, increase using organic agriculture and
sustainable agriculture in the future.
1.2 Objective and goals
The overall objective is the development of an effective smart sprayer system for spot
application of agrochemicals in rice fields. The detailed objectives of this study were to:

23
a. Develop a prototype sprayer for spot application of agrochemicals in rice field.
b. Image processing program for real time detection broadleaf weed and narrow leaf weed
in rice field from RGB camera capture.
c. Image processing program for real time detection fungal leaf blast disease and bacterial
blight disease in rice field from RGB camera capture.
d. Design full smart sprayer system in rice field.
24
Chapter 2 Real-time detection of narrowleaf and broadleaf weeds
This chapter introduces an image processing method capable of performing real-time detection
of two kinds of weeds in the rice fields of the Vietnamese Mekong Delta (VMD). Two image
processing methods were applied and compared in this research: Faster region-based
convolutional neural network (R-CNN) and bounding blob analysis. The input images were
recorded using a red, green, and blue (RGB) camera. The weeds detection accuracy and
processing time were estimated for each method using the same image source data from
Vietnam. Both methods were able to detect narrow-leaf and broadleaf weeds on the weed post-
emergence stage under uncontrolled light conditions in the rice fields. The results show that
bounding blob analysis is simple but effective, with a shorter processing time and higher
accuracy than Faster R-CNN.
2.1 Introduction
Agricultural production in Vietnam is facing increasing environmental impacts due to the use
of large amounts of herbicide on various species of crops. According to an international survey
of herbicide-resistant weeds (Heap, 2019), the types of herbicide and site application have been
increasing year-by-year. The reason for this is that agricultural productivity and product
quantity need to be increased to cover the food demands of a global population of more than 7
billion. Vietnam has an agriculture-based economy and is a top rice exporter in the world
market. The country’s land area is 65% cultivated land ranging from the north to the south,
with cultivated land especially concentrated in the Mekong Delta, which is the biggest
cultivated region in Vietnam. The government has issued many special policies designed to
increase the quantity and productivity of rice (Dung et al., 1999). The traditional herbicide
application method consists of spraying large amounts of herbicide over the whole surface of
the rice fields due to the lack of an effective and efficient method to detect weeds. Such a weed-
25
detection method would allow the use of spot spraying. However, using large amounts of
herbicides causes damage to the environment and to human health and has an adverse effect
on sustainable agriculture. Therefore, plant protection that is focused on eliminating weeds and
controlling the amount of herbicide applied has been an important topic of research over the
last few years. Many results reported in the literature show developments in the detection of
weeds (Tian, 2002), such as the development of a real-time spraying system that can work
under variable lighting conditions by using multiple CCD cameras to cover the target area. In
this case, the weed infestation conditions in each of the zones were detected, and then each
individual spray nozzle applied herbicide to the specific weed zone. In other research (Bossu
et al., 2008), a monochrome CCD camera was used to collect images. Then, by using the Gabor
filter and a region-based segmentation and blob-coloring method, it is possible to detect only
inter-row weeds. By using the camera pinhole model to transform the weed patch image
coordinates to real-world coordinates, it is possible to spray weeds at the right moment.
However, the method used in this research cannot detect intra-row weeds. Another application
(Burgos-Artizzu et al., 2011) successfully discriminates between weed patches and crop rows
under uncontrolled lighting conditions in real time. This research introduced the combination
of a fast image processing method that delivered results in real time (Fast Image Processing)
and a slower and more accurate processing method (Robust Crop Row Detection). This latter
method showed very high accuracy, with an average weed detection rate of 95% and a crop
detection rate of 80% in maize fields. However, this method cannot detect intra-row weeds
either. In addition, another study (Aravind et al., 2015) reported a method of detecting
broadleaf weeds mixed with narrow leaf plants, and also used nozzle sprayers for the real-time
application of herbicide on the weed area. This method determines the number of white pixels
present in a region of interest (ROI) after image binarization; regions with a white pixel count
higher than the predefined threshold is considered to be weeds. The error in this technique
26
increases when the plant density of the crop is unbalanced due to natural variations in the
vegetation.
Some recent research has shown the detection of plants mixed with weeds under difficult
conditions by using deep learning convolution neural network (CNN) algorithms (dos Santos
Ferreira et al., 2017), and also showed the application of CNN for the detection of two kinds
of weeds, both grass and broadleaf weeds, in soybean fields. A large image data set (15,000
images) captured by unmanned aerial vehicles (UAVs) was used to train the algorithm, giving
a 99.5% average accuracy. However, this result cannot be applied in real-time weed detection.
Another study (Barrero et al., 2016) presented a method of detecting weed plants in rice fields
through the use of neural networks (NN). The trained NN obtained a 99% detection accuracy.
However, the processing and detection take a lot of time during the mature weed stage. A
different approach (Dyrmann et al., 2017) uses a fully convolutional NN for the detection of
weeds in cereal fields. The results show that the algorithm can detect 46% of weeds in a field,
even though many of the weeds overlap with wheat plants. However, this algorithm encounters
problems in detecting very small weeds.
All current research shows that the methods of detecting weeds among crops have different
advantages and disadvantages. Almost all of the methods studies were applied to vegetable
crops and could only detect inter-row weeds; some other studies showed that some conditions
for detection, such as weed overlap with the crops, were very difficult to work with. Some
studies showed highly accurate weed detection results, but they have no practical use if the
image processing speed is too low. Moreover, there is no application that can be adapted to the
conditions of the rice fields of the Vietnamese Mekong Delta (VMD), such as the detection of
both intra-row weeds and inter-row weeds and the identification of at least two kinds of weeds.
Identifying two different kinds of weeds is a matter of importance, because different kinds of
weeds require different types and amounts of herbicide. In addition, an application with
27
sufficient image processing speed that makes it possible to perform real-time weed detection
is also necessary because it could be used in a real herbicide spraying system.
This study aims to resolve these problems by implementing an image processing method
capable of identifying in real time the two main kinds of weeds present in the rice fields of the
VMD. The image processing method is intended to be used in a smart spraying system in the
future. The Faster region-based convolutional neural network (R-CNN) algorithm is presented
as the first alternative due to its increasing popularity and its capability to detect many kinds
of objects quickly and accurately. An alternative method consisting of bounding blob analysis
is also presented. Despite its simplicity, the bounding blob method has been used in many kinds
of object-detection applications and has shown high accuracy and real-time detection, thus
proving its effectiveness and efficiency. Both methods were evaluated for the detection of two
kinds of weeds, that is narrow-leaf and broadleaf weeds, during the post-emergence stage under
uncontrolled light conditions in several rice fields of the VMD. The processing time and
accuracy of each method will be estimated as the main parameters with which to judge which
method can be practically applied in a smart sprayer in the future.
2.2 Materials and methods
2.2.1 Methodology
Weed infestation is a concern for every famer. Depending on the type of rice production system,
farmers across Asia often contend with the same or similar weed species. The common weeds
present in rice fields across Vietnam are not different from the common weeds throughout Asia.
There are several types of commercial herbicides available based on the biological
characteristics of weeds. Typically, there are two main kinds of weeds present in the rice fields
of the VMD, as shown in Fig. 10. Echinochloa colona and Fimbristylis dichotoma can be
classified as broadleaf types, whereas Commelina benghalensis and Cphenoclea zeylanica can
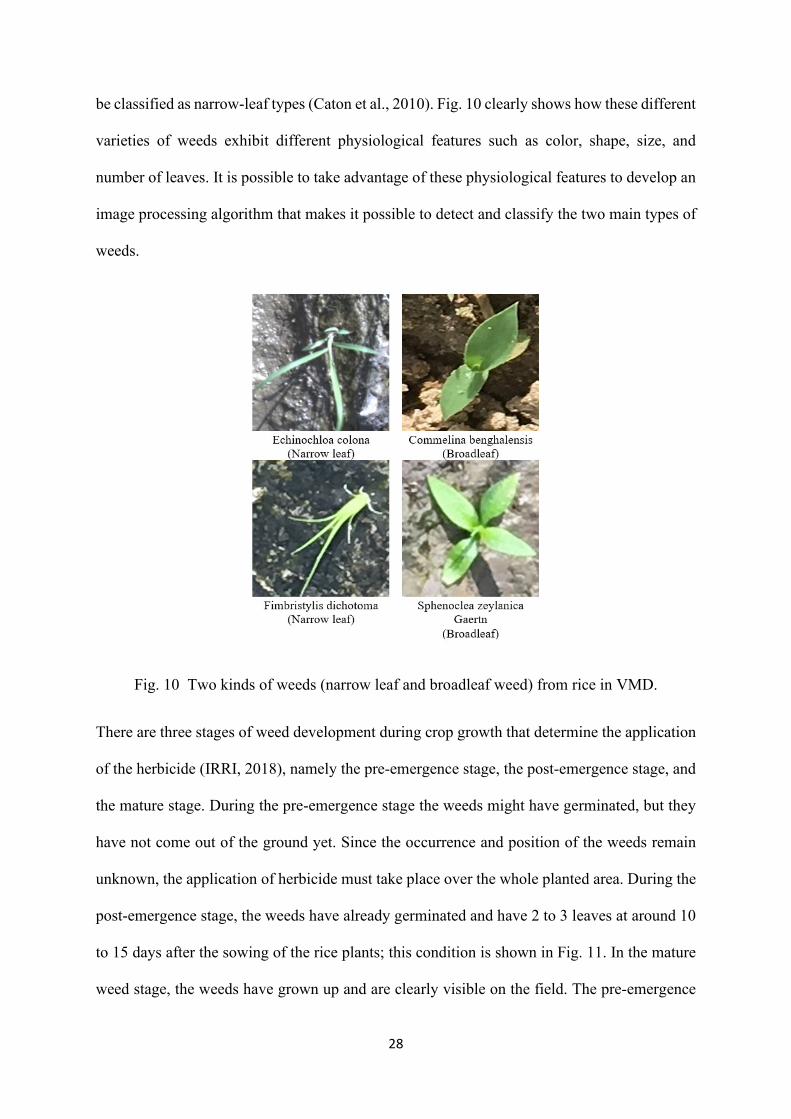
28
be classified as narrow-leaf types (Caton et al., 2010). Fig. 10 clearly shows how these different
varieties of weeds exhibit different physiological features such as color, shape, size, and
number of leaves. It is possible to take advantage of these physiological features to develop an
image processing algorithm that makes it possible to detect and classify the two main types of
weeds.
Fig. 10 Two kinds of weeds (narrow leaf and broadleaf weed) from rice in VMD.
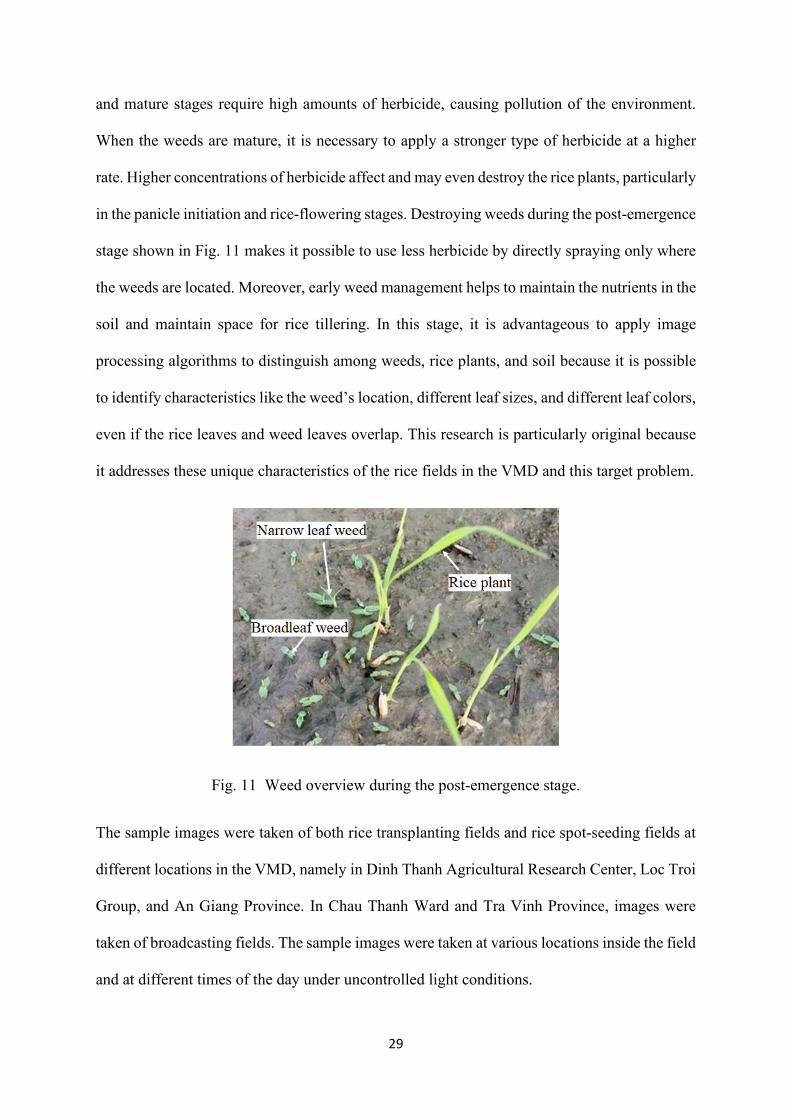
There are three stages of weed development during crop growth that determine the application
of the herbicide (IRRI, 2018), namely the pre-emergence stage, the post-emergence stage, and
the mature stage. During the pre-emergence stage the weeds might have germinated, but they
have not come out of the ground yet. Since the occurrence and position of the weeds remain
unknown, the application of herbicide must take place over the whole planted area. During the
post-emergence stage, the weeds have already germinated and have 2 to 3 leaves at around 10
to 15 days after the sowing of the rice plants; this condition is shown in Fig. 11. In the mature
weed stage, the weeds have grown up and are clearly visible on the field. The pre-emergence
29
and mature stages require high amounts of herbicide, causing pollution of the environment.
When the weeds are mature, it is necessary to apply a stronger type of herbicide at a higher
rate. Higher concentrations of herbicide affect and may even destroy the rice plants, particularly
in the panicle initiation and rice-flowering stages. Destroying weeds during the post-emergence
stage shown in Fig. 11 makes it possible to use less herbicide by directly spraying only where
the weeds are located. Moreover, early weed management helps to maintain the nutrients in the
soil and maintain space for rice tillering. In this stage, it is advantageous to apply image
processing algorithms to distinguish among weeds, rice plants, and soil because it is possible
to identify characteristics like the weed’s location, different leaf sizes, and different leaf colors,
even if the rice leaves and weed leaves overlap. This research is particularly original because
it addresses these unique characteristics of the rice fields in the VMD and this target problem.
Fig. 11 Weed overview during the post-emergence stage.
The sample images were taken of both rice transplanting fields and rice spot-seeding fields at
different locations in the VMD, namely in Dinh Thanh Agricultural Research Center, Loc Troi
Group, and An Giang Province. In Chau Thanh Ward and Tra Vinh Province, images were
taken of broadcasting fields. The sample images were taken at various locations inside the field
and at different times of the day under uncontrolled light conditions.
30
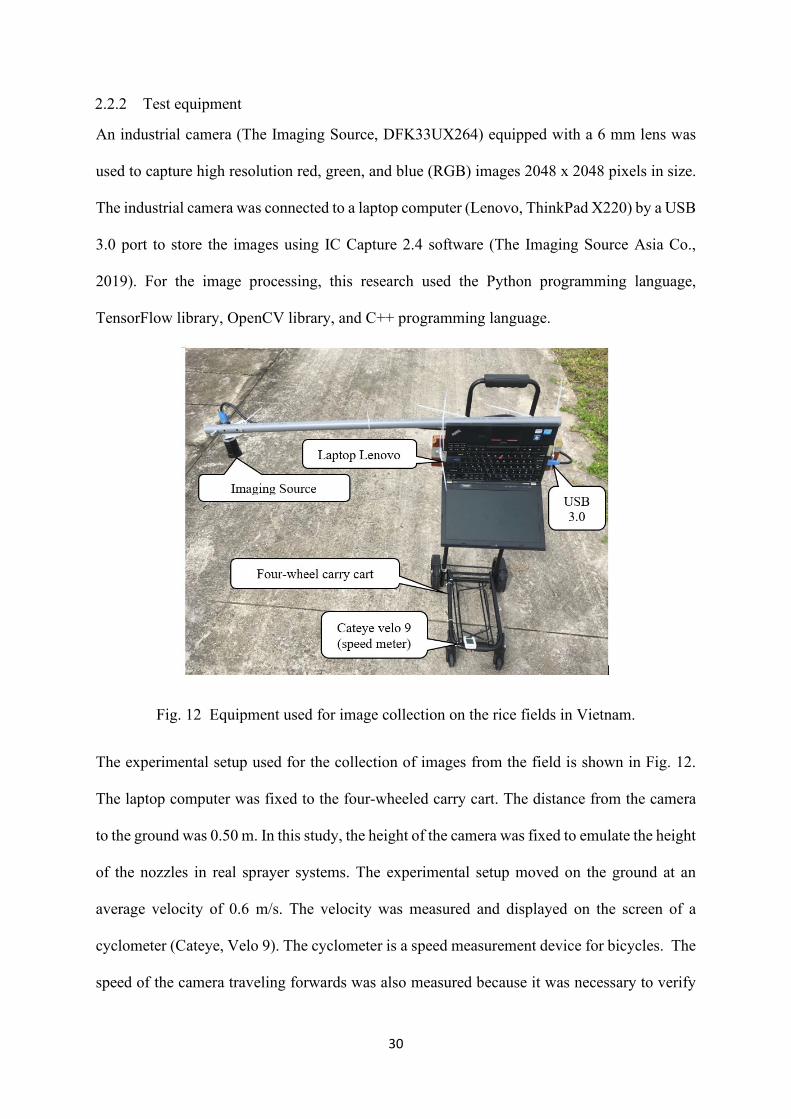
2.2.2 Test equipment
An industrial camera (The Imaging Source, DFK33UX264) equipped with a 6 mm lens was
used to capture high resolution red, green, and blue (RGB) images 2048 x 2048 pixels in size.
The industrial camera was connected to a laptop computer (Lenovo, ThinkPad X220) by a USB
3.0 port to store the images using IC Capture 2.4 software (The Imaging Source Asia Co.,
2019). For the image processing, this research used the Python programming language,
TensorFlow library, OpenCV library, and C++ programming language.
Fig. 12 Equipment used for image collection on the rice fields in Vietnam.
The experimental setup used for the collection of images from the field is shown in Fig. 12.
The laptop computer was fixed to the four-wheeled carry cart. The distance from the camera
to the ground was 0.50 m. In this study, the height of the camera was fixed to emulate the height
of the nozzles in real sprayer systems. The experimental setup moved on the ground at an
average velocity of 0.6 m/s. The velocity was measured and displayed on the screen of a
cyclometer (Cateye, Velo 9). The cyclometer is a speed measurement device for bicycles. The
speed of the camera traveling forwards was also measured because it was necessary to verify
31
that the conditions were the same as those occurring during herbicide spraying in the field, for
example, by using a boom sprayer mounted on a tractor. Specifically, it was necessary to obtain
an estimation of the image processing speed to guarantee the synchrony between shooting the
images and activating the spraying nozzles according to the camera’s traveling speed.
2.2.3 Image processing for weed detection
Two image processing methods were tested for the detection of two kinds of weeds, namely
the Faster R-CNN method and the bounding blob analysis method. The Faster R-CNN method
was tested using the Python programming language, the OpenCV library, and the TensorFlow
library. The bounding blob analysis method was tested using the C++ programming language
and the OpenCV library.
Faster R-CNN was introduced by (Ren et al., 2015). It is not the newest algorithm of machine
learning. However, this algorithm is accurate, with a low graphics processing unit (GPU) time-
delay and not very high hardware requirements. Faster R-CNN builds on the previous R-CNN
and Fast R-CNN approaches to efficiently classify object proposals using deep convolutional
networks. Compared to the previous approaches, Faster R-CNN employs a region proposal
network (RPN) and does not require an external method for candidate region proposals. This
method claims to be almost real-time fast, although it has some restrictions depending on the
application (Zhang et al., 2016). Fig. 13 shows the architecture of the Faster R-CNN method.
Basically, the Faster R-CNN consist of two networks; the first network is an RPN that generates
candidate areas, or region proposals, which are regions in the input image where the object
might be located. This network is contained in the dashed rectangle depicted in Fig. 13. The
second network, represented by the steps outside the dashed rectangle depicted in Fig. 13, uses
these region proposals to detect objects. The Faster R-CNN method’s predecessor, the Fast R-
CNN method, uses a selective search to generate region proposals, which is a time-consuming
process. The time cost of generating these region proposals is much smaller in the RPN because
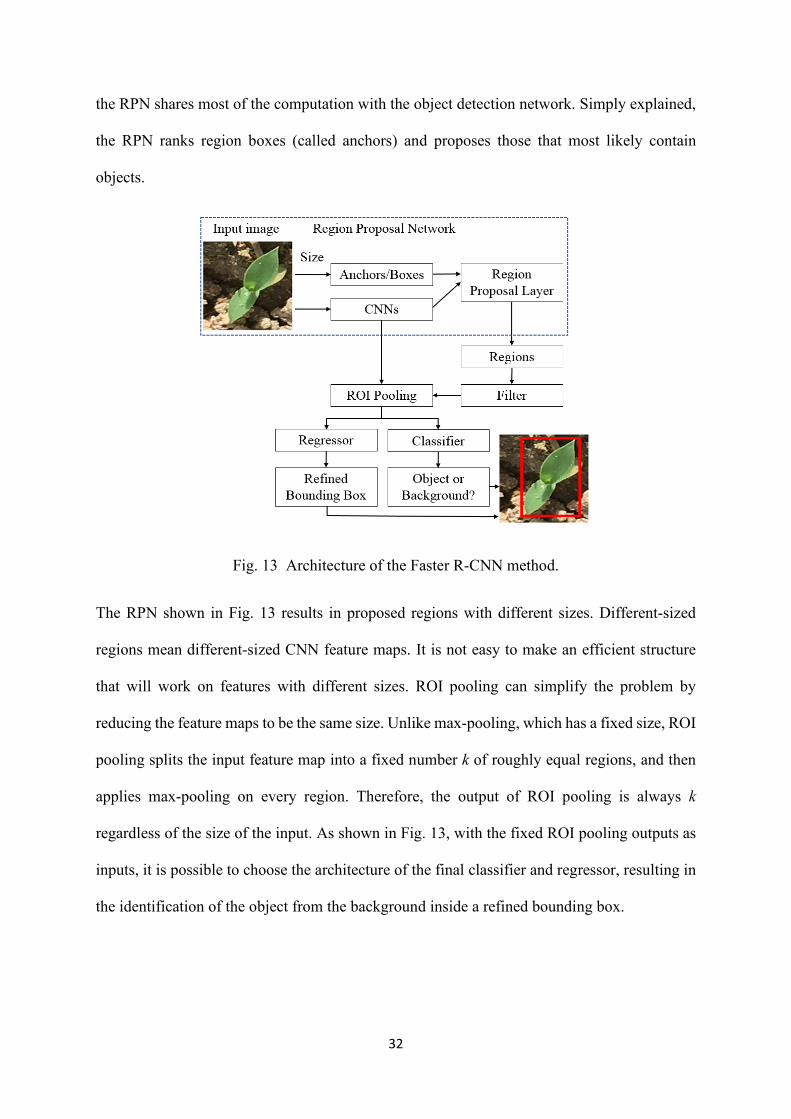
32
the RPN shares most of the computation with the object detection network. Simply explained,
the RPN ranks region boxes (called anchors) and proposes those that most likely contain
objects.
Fig. 13 Architecture of the Faster R-CNN method.
The RPN shown in Fig. 13 results in proposed regions with different sizes. Different-sized
regions mean different-sized CNN feature maps. It is not easy to make an efficient structure
that will work on features with different sizes. ROI pooling can simplify the problem by
reducing the feature maps to be the same size. Unlike max-pooling, which has a fixed size, ROI
pooling splits the input feature map into a fixed number k of roughly equal regions, and then
applies max-pooling on every region. Therefore, the output of ROI pooling is always k
regardless of the size of the input. As shown in Fig. 13, with the fixed ROI pooling outputs as
inputs, it is possible to choose the architecture of the final classifier and regressor, resulting in
the identification of the object from the background inside a refined bounding box.
33
Fig. 14 LabelImg tool.
For this research application, a set of 300 images of different fields taken under uncontrolled
light conditions was used as training data. The hand-made annotation for each kind of weed on
each image was performed using the LabelImg (Fig. 14), which is a graphical image annotation
tool written in Python. A set of 237 images with 1780 bounding boxes for broadleaf weeds and
365 bounding boxes for narrow leaf weeds was annotated for training. A set of 65 images with
619 bounding boxes for broadleaf weeds and 113 bounding boxes for narrow leaf weeds was
annotated for testing. Then, all data were used for training using the TensorFlow’s Object
Detection API library with the Faster R-CNN-Inception-V2 model (Huang et al., 2017). In this
test, the Faster R-CNN-Inception-V2 model was used while keeping all the default setting
parameters and only changing the number of classes to 2, corresponding to the two main kinds
of weeds. The main reason for choosing this model was the resulting higher detection rate for
small weeds in comparison to other models available in the TensorFlow library. The results of
the training and evaluation stages could be observed by applying TensorFlow’s visualization
platform, TensorBoard (TensorFlow's Visualization Toolkit, 2018). The TensorBoard ran
while the model was being trained, making this tool useful for confirming that the training was
34
going in the right direction. In this training, the TotallLoss graph showed that the training was
going in the right direction and the loss function was going from high to low. The loss function
started at around 3.0 and dropped to 0.4, which took 32262 steps over about 22 hours. If the
training continued, then the loss function would continue to decrease and minimize its value,
which means that the accuracy of prediction would be higher. However, when the loss function
is near its minimum value, the training time needed for the loss function to go down will
increase. That is why the training stopped after 22 hours. When the training is finished, the
program exports an inference graph which is used for inference detection. The result of the
detection shown on the image is also dependent on the model score threshold selected, among
other critical parameters. If the model score threshold is selected at 50%, the number of
detected objects will be high. The original code used for this test was obtained from a GitHub
web page (EdjeElictronic, 2019).
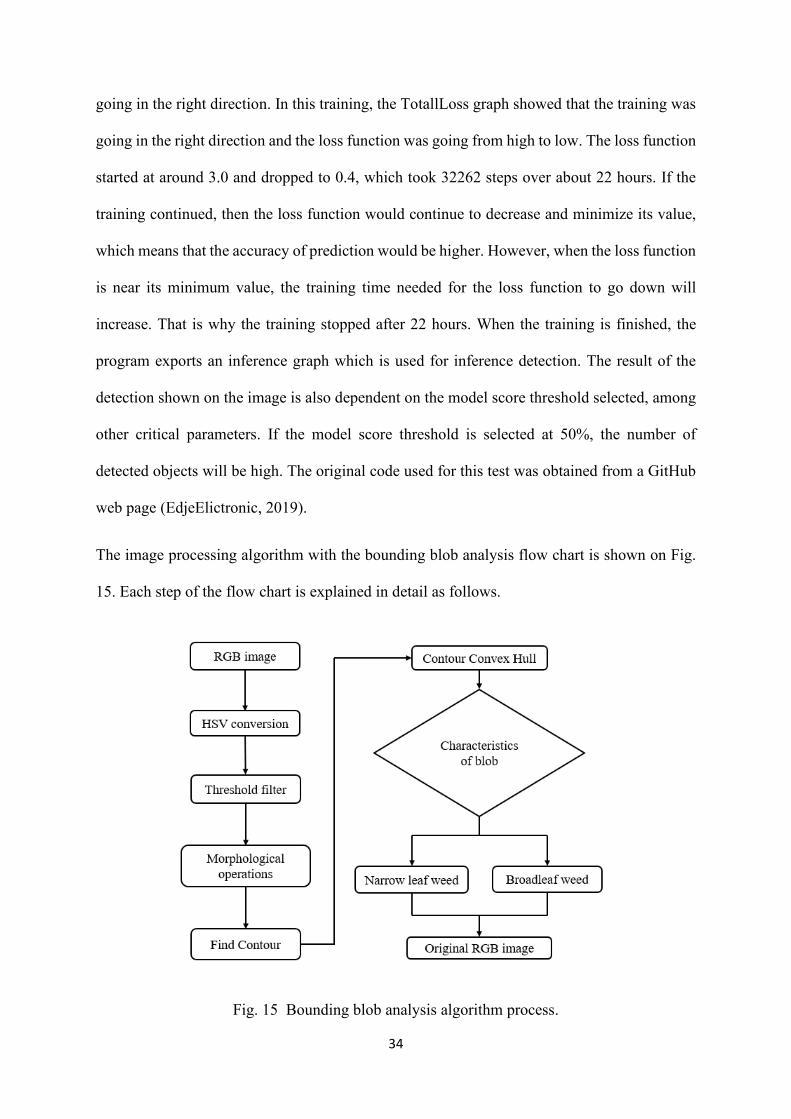
The image processing algorithm with the bounding blob analysis flow chart is shown on Fig.
15. Each step of the flow chart is explained in detail as follows.
Fig. 15 Bounding blob analysis algorithm process.
35
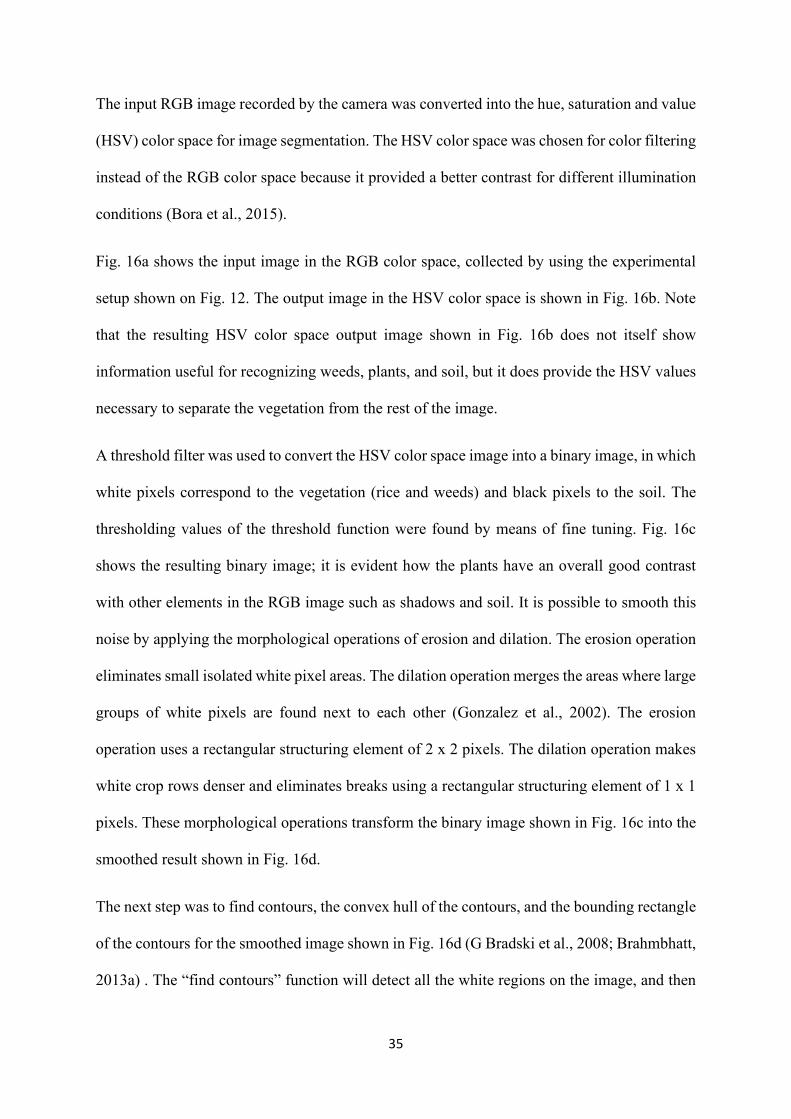
The input RGB image recorded by the camera was converted into the hue, saturation and value
(HSV) color space for image segmentation. The HSV color space was chosen for color filtering
instead of the RGB color space because it provided a better contrast for different illumination
conditions (Bora et al., 2015).
Fig. 16a shows the input image in the RGB color space, collected by using the experimental
setup shown on Fig. 12. The output image in the HSV color space is shown in Fig. 16b. Note
that the resulting HSV color space output image shown in Fig. 16b does not itself show
information useful for recognizing weeds, plants, and soil, but it does provide the HSV values
necessary to separate the vegetation from the rest of the image.
A threshold filter was used to convert the HSV color space image into a binary image, in which
white pixels correspond to the vegetation (rice and weeds) and black pixels to the soil. The
thresholding values of the threshold function were found by means of fine tuning. Fig. 16c
shows the resulting binary image; it is evident how the plants have an overall good contrast
with other elements in the RGB image such as shadows and soil. It is possible to smooth this
noise by applying the morphological operations of erosion and dilation. The erosion operation
eliminates small isolated white pixel areas. The dilation operation merges the areas where large
groups of white pixels are found next to each other (Gonzalez et al., 2002). The erosion
operation uses a rectangular structuring element of 2 x 2 pixels. The dilation operation makes
white crop rows denser and eliminates breaks using a rectangular structuring element of 1 x 1
pixels. These morphological operations transform the binary image shown in Fig. 16c into the
smoothed result shown in Fig. 16d.
The next step was to find contours, the convex hull of the contours, and the bounding rectangle
of the contours for the smoothed image shown in Fig. 16d (G Bradski et al., 2008; Brahmbhatt,
2013a) . The “find contours” function will detect all the white regions on the image, and then
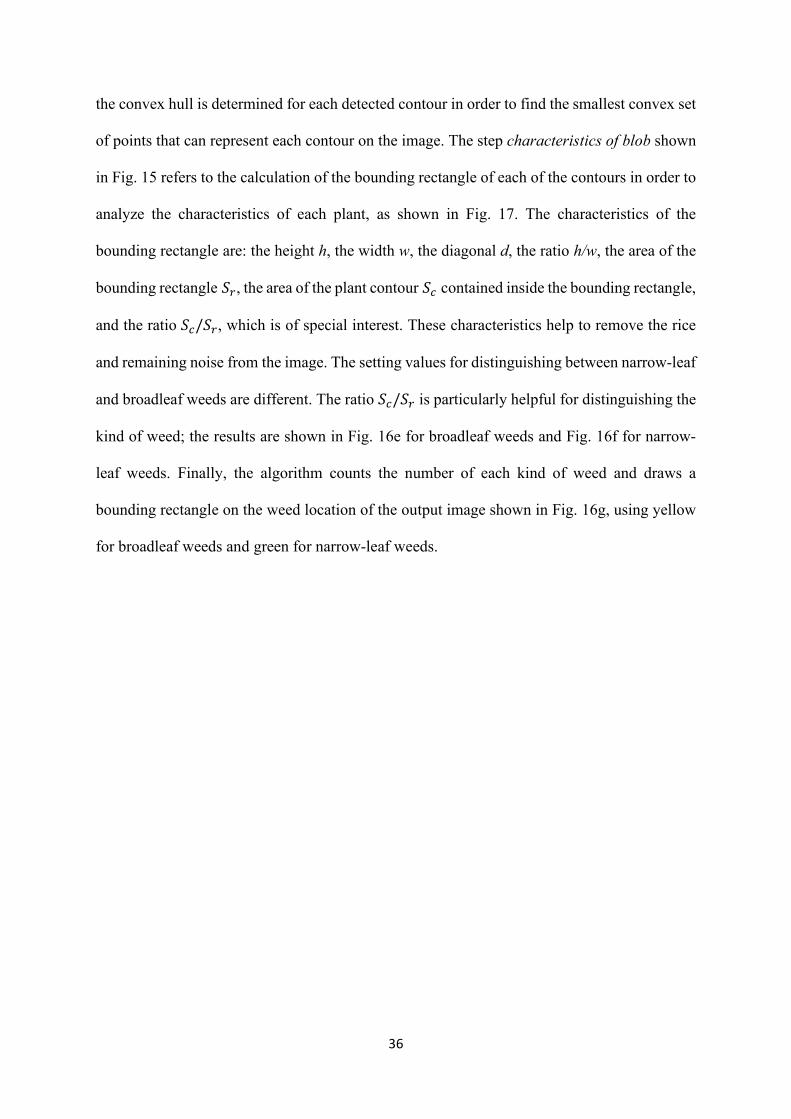
36
the convex hull is determined for each detected contour in order to find the smallest convex set
of points that can represent each contour on the image. The step characteristics of blob shown
in Fig. 15 refers to the calculation of the bounding rectangle of each of the contours in order to
analyze the characteristics of each plant, as shown in Fig. 17. The characteristics of the
bounding rectangle are: the height h, the width w, the diagonal d, the ratio h/w, the area of the
bounding rectangle 𝑆𝑆𝑟𝑟, the area of the plant contour 𝑆𝑆𝑐𝑐 contained inside the bounding rectangle,
and the ratio 𝑆𝑆𝑐𝑐/𝑆𝑆𝑟𝑟, which is of special interest. These characteristics help to remove the rice
and remaining noise from the image. The setting values for distinguishing between narrow-leaf
and broadleaf weeds are different. The ratio 𝑆𝑆𝑐𝑐/𝑆𝑆𝑟𝑟 is particularly helpful for distinguishing the
kind of weed; the results are shown in Fig. 16e for broadleaf weeds and Fig. 16f for narrow-
leaf weeds. Finally, the algorithm counts the number of each kind of weed and draws a
bounding rectangle on the weed location of the output image shown in Fig. 16g, using yellow
for broadleaf weeds and green for narrow-leaf weeds.
37
Fig. 16 Narrow leaf weed and broadleaf weed detection.
a) RGB input image. b) HSV image. c) Binary image. d) Morphological operations result.
e) Broadleaf weed detection result. f) Narrow leaf weed detection result. g) Output image.
Fig. 17 Bounding rectangle characteristics for blob analysis.
2.3 Results and discussion
38
A set of 112 sample images was used to assess the performance of each image processing
method in detecting two kinds of weeds in the rice field. For both methods, the size of the input
images was reduced to 450x600 pixels because reducing the image size can help decrease the
processing time needed to perform the detection. However, it is necessary to ensure that the
image size reduction does not affect the program’s ability to identify two kinds of weeds.
For the Faster R-CNN, the model score threshold was set at 50% for detecting the two kinds
of weeds. This value is not too high, because it can increase the detection accuracy when the
weeds overlap with rice. For the bounding blob method, the most important aspect is setting
the characteristics values for the analysis of the bounding rectangle blob. The characteristics
values were selected based on experimental measurements of the size of the rice plants, the
size of two kinds of weeds, and the size of the noise in 300 images collected in Vietnam, which
makes it possible to remove the noise and the rice, and also to detect the two kinds of weeds.
The values 100 < 𝑆𝑆𝑟𝑟 < 3000, ℎ > 5 and 𝑤𝑤 > 5, and 𝑑𝑑 > 15 helped to remove both small
white areas (noise) and large white areas (rice) in the binary picture. The characteristic value
0.1 < ℎ𝑤𝑤
< 2.5 helped to exclude the portions of rice leaves that were separated from the rice
plants during the threshold process. The last characteristic value 𝑆𝑆𝑐𝑐𝑆𝑆𝑟𝑟
> 0.3 was used for the
detection of broadleaf weeds, while the characteristic value 𝑆𝑆𝑐𝑐𝑆𝑆𝑟𝑟
< 0.3 was used for the detection
of narrow-leaf weeds. It is possible to verify that for the broadleaf weeds, the area of the contour
occupies most of its bounding rectangle area, as shown in Fig. 18a, while for the narrow leaf
weeds the contour area only occupies a small part of its bounding rectangle area as shown in
Fig. 18b.
39
Fig. 18 Weeds characteristic difference.
a) Bounding rectangle of broadleaf weed. b) Bounding rectangle of narrow leaf weed.
Fig. 19a shows an example image used for the detection of two kinds of weeds created using
the Faster R-CNN method, and Fig. 19b shows an example image used for the detection of two
kinds of weeds created using the bounding blob method. The green color represents broadleaf
weed detection, and the yellow color represents narrow leaf weed detection. Fig. 19 shows that
for the same input images, the detection accuracies of the two methods in detecting the two
kinds of weeds were different. Fig. 19a shows a higher number of weeds detected, despite the
small size of the weeds; however, some weeds that overlapped with rice leaves could not be
detected. Fig. 19b shows a lower number of weeds detected and shows that it was not possible
to detect small weeds; however, some weeds that overlapped with rice leaves were detected.
However, only one example image could not be used to estimate the detection accuracy of both
image processing methods. It was necessary to estimate the accuracy of the whole set of 112
sample images.
40
Fig. 19 Result of narrow leaf and broadleaf weed detection.
a) Bounding blob method. b) Faster R-CNN method.
Each of the 112 images were tested with both the Faster R-CNN and bounding blob methods.
The test consisted of calculating the processing time that each image processing method
required to identify the weeds present in one single image. In addition, the detection accuracy
was calculated as the percentage of detected weeds over the actual number of the two kinds of
weeds present on each of the images. The actual numbers of the two kinds of weeds were
calculated for each sample picture based on an expert criterion. Finally, the average processing
time and the average detection accuracy were calculated for all 112 images. The results are
summarized in Table 4 .
41
Table 4 Faster R-CNN and Bounding blob methods detection result
Kinds of weed
Faster R-CNN detection method
Bounding blob detection method
Average processing
time (Seconds)
Average detection accuracy
(Percentage)
Average processing time
(Seconds)
Average detection accuracy
(Percentage)
Narrow leaf weed 1.15 40.6 0.26 87.1
Broadleaf weed 1.15 47.7 0.26 95.4
The detection results presented in Table 4 suggest that the bounding blob analysis method is
more appropriate for the development of a smart sprayer system because it has a shorter image
processing time. Moreover, it has an average detection accuracy greater than that of the Faster
R-CNN method.
The rational explanation for these results is that, in this study, the Faster R-CNN method
accuracy depended on the size of the data set used for training. The accuracy could be improved
by using a bigger data set with corrections on the object proposal region, but a longer training
time would be needed to get good results. However, an advantage of the Faster R-CNN method
is that it can detect the object under very difficult conditions, such as weeds overlapping with
rice plants and other objects. Still, under variable field conditions the accuracy will decrease.
In that case, it is possible to improve the accuracy by changing to another inference graph, but
this process takes a lot of time, including training time. On the other hand, the bounding blob
analysis method results show a higher detection accuracy and a shorter time required for setting
the HSV parameters. However, when the lighting conditions undergo major changes, the HSV
filter-setting parameters need to be changed as well. Another disadvantage of the bounding
blob method is that, for this research, its application depended on the appropriate selection of
the development stage of the crop in order to obtain accurate weed detection rates. The highest
42
accuracy can be obtained when rice leaves do not cover the weeds, in particular during the
post-emergence stage.
The Faster R-CNN method could be used for real-time weed detection if a faster computer with
a high-performance graphics card is used to reduce the image processing time (Zhang et al.,
2016). On the other hand, the bounding blob method works well without the need for high-
performance hardware. Therefore, the bounding blob analysis method can be practically
applied for the real-time detection of weeds present in the rice fields of the VMD and may be
applied in the future development of a smart spraying machine.
2.4 Conclusion
This study has shown that the bounding blob analysis method is better than Faster R-CNN for
detecting two kinds of weeds. Both methods can detect two kinds of weeds with different levels
of accuracy and different processing times. However, bounding blob analysis has the advantage
of high accuracy and a low processing time. Based on this result, the bounding blob method
should be selected for the detection of weeds in rice fields. The goals for future work include
the development of a smart sprayer based on the bounding blob method for weed detection and
involving a set of cameras and a set of spraying nozzles.
43
Chapter 3 Real-time of detection leaf blast and bacterial blight diseases
This chapter introduces an image processing method capable of performing real-time detection
of two common diseases, leaf blast (LB) disease and bacterial blight (BB) disease, in the paddy
fields of the Vietnamese Mekong Delta (VMD). The input images were recorded with an RGB
camera. The discrimination of the diseases on rice leaves was obtained by an image processing
method based on the extraction of texture and color features from disease lesions, in
conjunction with either the Gaussian Naïve Bayes classifier or the K-Nearest Neighbors (KNN)
algorithm, to classify the disease into various categories. Both methods perform real-time
detection of LB and BB disease in the early stages of development with uncontrolled light
conditions in rice fields. Our results show that Gaussian Naïve Bayes is simple but effective,
with a shorter processing time and higher detection accuracy than KNN. The result of this
method is ideal for practical application of a smart sprayer system, which can use small
amounts of pesticides by only spraying in diseases areas (spot spray).
3.1 Introduction
The Vietnamese Mekong Delta (VMD) is the main rice-producing region in Vietnam, and is
critical to both food security and rice exports. Every year, the VMD contributes more than 90%
of Vietnam’s exported rice, and it accounted for approximately 60% of the country’s rice area
and production in 2014 (Nguyen, 2017) . However, to ensure productivity and rice yield, the
farmers in the VMD try to increase the number of crops per year and increase the amount of
fertilizers and pesticides used, which seriously affects the environment in this area. An
overview of the agriculture pollution in Vietnam (Nguyen, 2017) reported that every year some
1,790 active ingredients (ai) tons of molluscicides, 210 ai tons of herbicides, 1,224 ai tons of
insecticides, and 4,245 ai tons fungicides are wasted from excessive or unnecessary use in rice
production in the VMD. These chemicals are directly and indirectly cause air, water, and soil
44
pollution in addition to human health problems. The use of these chemicals also increases the
production costs and reduces the quality of rice products from Vietnam.
In rice cultivation, the majority of pesticides are used focusing in three main problems:
herbicides for weed management, fungicide for disease management and insecticide for pest
management. The Food and Agricultural Organization reports ratios of pesticide application in
rice fields in Vietnam on 2002 of 25.3% herbicides, 32.6% fungicides, and 40.3% insecticides
(FAO, 2005). Fungal leaf blast disease and bacterial leaf blight disease are common and well-
known diseases found in the rice fields of Vietnam.
A disease is an abnormal condition that injures the plant or causes it to function improperly.
Diseases are readily recognized by their symptoms – associated visible changes in the plant.
The organisms that cause diseases are known as pathogens. Many species of bacteria, fungus,
nematode, virus and mycoplasma-like organisms cause diseases in rice. Disorders or
abnormalities may also be caused by abiotic factors such as low or high temperature beyond
the limits for normal growth of rice, deficiency or excess of nutrients in the soil and water, pH
and other soil conditions which effect the availability and uptake of nutrients, toxic substances
such as H2S produced in the soil, water stress and reduced light (Francisco & Zahirul, 2003).
The rice blast Pyricularia Oryzae cause a fungal disease common in the rice field (Francisco
& Zahirul, 2003). Depending on the site of symptom, rice blast is referred to as leaf blast, collar
blast, node blast and neck blast. In the leaf blast on early stage (Fig. 20), the lesions on the leaf
blade are elliptical or spindle shaped with brown borders and gray centers. Under favorable
conditions, lesions enlarge killing the leaves. Collar blast occurs when the pathogen infects the
collar, which can kill the entire leaf blade. The pathogen also infects the node of the stem,
which turns blackish and breaks easily; this condition is called node blast. Finally, for the neck
blast the neck of the panicle can also be infected.
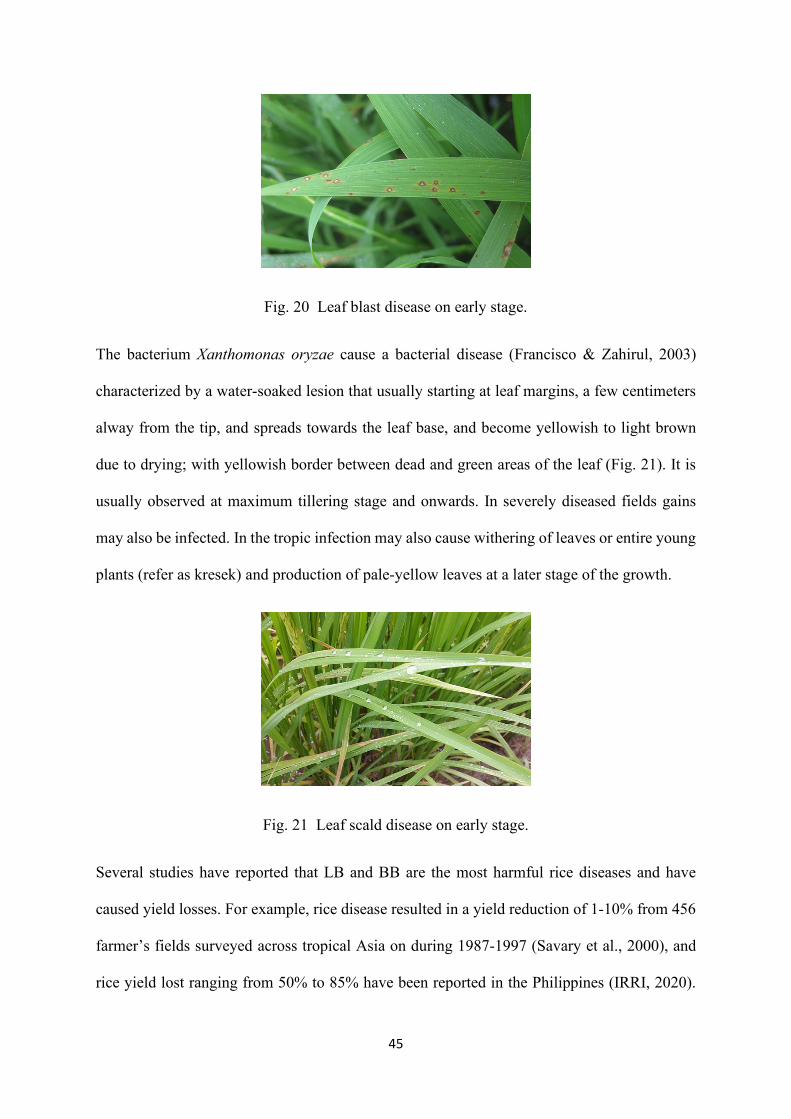
45
Fig. 20 Leaf blast disease on early stage.
The bacterium Xanthomonas oryzae cause a bacterial disease (Francisco & Zahirul, 2003)
characterized by a water-soaked lesion that usually starting at leaf margins, a few centimeters
alway from the tip, and spreads towards the leaf base, and become yellowish to light brown
due to drying; with yellowish border between dead and green areas of the leaf (Fig. 21). It is
usually observed at maximum tillering stage and onwards. In severely diseased fields gains
may also be infected. In the tropic infection may also cause withering of leaves or entire young
plants (refer as kresek) and production of pale-yellow leaves at a later stage of the growth.
Fig. 21 Leaf scald disease on early stage.
Several studies have reported that LB and BB are the most harmful rice diseases and have
caused yield losses. For example, rice disease resulted in a yield reduction of 1-10% from 456
farmer’s fields surveyed across tropical Asia on during 1987-1997 (Savary et al., 2000), and
rice yield lost ranging from 50% to 85% have been reported in the Philippines (IRRI, 2020).
46
In Vietnam, grain yield losses of 38.21% to 64.57% due to the neck blast disease have been
reported (Hai et al., 2007).
Traditionally, the LB and the BB disease detection and application of fungicide are performed
by human inspectors. The farmers decide to spray the whole field even through the disease
appears randomly in a few areas in the field. The large amounts of chemicals used affect the
environment and are costly for the farmer. Studies (Chau et al., 2015; Toan et al., 2013)
reported that all investigated water sources in the VMD have been shown to be contaminated
by pesticides, however, local population in rural areas still use all available water sources for
their daily needs, including drinking. Hence, the current of the pesticides under different
conditions needs to be investigated in detail and it should be priority to prevent pollution. There
are several options to reduce the pesticide residue in the water resources, including the use
cheap material such as bamboo (Thuy et al., 2012). However, a more sustainable solution and
the best way to prevent pollution is to reduce the amount of pesticides introduced to the
environment from agriculture activities.
Thus, plant protection focusing on managing diseases and controlling the amount of fungicides
to be applied has been an important part of research over the last few years. The literature
includes many reports on the detection of rice diseases. (Archana et al., 2018) report on the
prediction of early symptoms of bacterial blight and brown spots on rice plants by separating
leaf color, signs and illumination from different color channels. This algorithm made it easy
perform final feature analyses, however, it cannot predict diseases with symptoms of similar
colors. (Bakar et al., 2018) describe an integrated method for detection of a disease using three
categories: infection stage, spreading stage and worst stage. This is possible by analyzing the
Hue, Saturation and Value color spaces with multi-level thresholding, and identifying
classified regions of interest during image segmentation. This technique successfully detects
the disease based on images taken in uncontrolled environments, however, it is not suitable for

47
the detection of other diseases with similar features. In another study, (Islam et al., 2018)
present the Gaussian Naïve Bayes method to classify the disease based on the percentage of
RGB values of the affected portion using image processing. This method has successfully
detected three rice diseases, namely brown spot, rice bacterial blight, and rice blast. This
method has successfully detected three rice diseases, brown spot, rice bacterial blight, and rice
blast, and has a fast processing time and high accuracy, however, it cannot detect a disease with
similar color features but a different shape.
Some recent research shows robustness to detect many kinds of diseases on rice leaves by using
deep learning CNN algorithms (Lu et al., 2017; Mique et al., 2018). These algorithms show
high accuracy, however, their application and testing are limited to an individual leaf, and the
processing time is not good for real-time application. Thus, current research application for
rice disease detection only focus on the development of a tool to help humans to evaluate
diseases. To solve these problems, this study used an algorithm based on the mini-bounding
rectangle blob as a shape feature, and the mean values of three color channels as the color
features for both Red, Green and Blue (RGB) color spaces and Hue, Saturation and Intensity
(HSI) color spaces. Those features were used by the Gaussian Naïve Bayes classifier and the
K-Nearest Neighbors (KNN) algorithm for real-time detection of the two dataset training
diseases, LB and BB, which are native to the rice fields of the VMD. In addition, the processing
time and accuracy of each method were estimated as the primary parameters for selecting the
method to be used in the development of a smart sprayer for rice fields.
3.2 Materials and methods
Rice disease is always a concern for every farmer in the VMD, where the weather is favorable
for the proliferation of insects and diseases in the crops with high temperatures and humidity,
a large annual rainfall, and abrupt temperature changes between day and night. Fungal diseases
such as rice blast and bacterial diseases as bacterial blight usually appear at the end of the
48
tillering, panicle formation and flowering stages. During those stages, the high density of leaves
covering each other increases humidity, creating favorable conditions for disease development.
The development of the rice blast and bacterial blight diseases can be divided into three stages:
(i) the early stage of the disease, in which small lesions appear on the leaves;
(ii) the disease spreads into the body and neck of the flower; and
(iii) the disease spreads widely, surrounding the leaves and killing the rice.
Therefore, farmers must frequently check their fields to detect the early stages of disease and
to begin spraying fungicides. When disease reaches the second or third stage, it requires a high
amount of fungicides, polluting the environment, however, at this point, the rice plant cannot
be recovered, and rice yield is seriously reduced.
The present research addresses early stage disease detection. Images were collected during the
early stage of disease from several places in the VMD, including Dinh Thanh – An Giang, Co
Do – Can Tho, and Chau Thanh – Tra Vinh. A normal RGB camera was used to capture images
of the rice fields under uncontrolled illumination conditions such as mornings and afternoons
on different days. All input images were stored in a computer and then used for training and
testing the image processing detection of LB and BB. The output data can be used by
agriculture experts to take further action.
49
Fig. 22 Example of dataset training images.
a) LB dataset training. b) BB dataset training.
The dataset images of the two diseases used for training cover a single lesion on the leaf (Fig.
22). Through image processing techniques such as background subtraction, finding the
contours and application of the masking method, it is possible to extract the basic
characteristics, including the average value of each color channel (RGB) and the ratio between
height and width of the minimum rectangle bounding blob. The transformation of RGB color
space to HSI color space (Nnolim, 2015) can be derived using Equation (1) to (6). All features
values of each image were used to calculate the parameters for each feature required by the
classifier based on the Gaussian Naïve Bayes and the KNN algorithm. Unlike the training
images, the test images include many disease lesions of different size, growth stage of rice and
uncontrolled light conditions to estimate the applicability of the program.
𝑟𝑟 = 𝑅𝑅𝑅𝑅+𝐺𝐺+𝐵𝐵
, 𝑔𝑔 = 𝐺𝐺𝑅𝑅+𝐺𝐺+𝐵𝐵
, 𝑏𝑏 = 𝐺𝐺𝑅𝑅+𝐺𝐺+𝐵𝐵
(1)
ℎ ∈ [0,𝜋𝜋] for b ≤ g
ℎ = cos−1 �0.5[(𝑟𝑟 − 𝑔𝑔) + (𝑟𝑟 − 𝑏𝑏)]
[(𝑟𝑟 − 𝑔𝑔)2 + (𝑟𝑟 − 𝑏𝑏)(𝑔𝑔 − 𝑏𝑏)]1/2�
(2)
50
ℎ ∈ [𝜋𝜋, 2𝜋𝜋] for b > g
ℎ = 2𝜋𝜋 − cos−1 �0.5[(𝑟𝑟 − 𝑔𝑔) + (𝑟𝑟 − 𝑏𝑏)]
[(𝑟𝑟 − 𝑔𝑔)2 + (𝑟𝑟 − 𝑏𝑏)(𝑔𝑔 − 𝑏𝑏)]1/2�
(3)
𝑠𝑠 = 1 −𝑀𝑀𝑀𝑀𝑀𝑀(𝑟𝑟,𝑔𝑔, 𝑏𝑏)
(4)
𝑖𝑖 =𝑅𝑅 + 𝐺𝐺 + 𝐵𝐵
3 ∗ 255
(5)
H = ℎ*180/𝜋𝜋, S = 𝑠𝑠 * 100, I = 𝑖𝑖 *255 (6)
Where:
𝑅𝑅 Red channel color value
𝐺𝐺 Green channel color value
𝐵𝐵 Blue channel color value
Fig. 23 shown a description of feature extraction from disease lesion by image processing.
Single disease lesion RGB image was threshold to remove background (healthy leaf color),
masking of blue pixels to calculated R, G and B mean value, applying minimum rectangle
bounding blob on the contour and calculated the ratio between the width to height of rectangle.
From R, G and B mean value was transfer to H, S and I value by Eq. (1) to Eq. (6). Those value
used for classifying kind of diseases on detection program.
Fig. 23 Preparing data set for training.
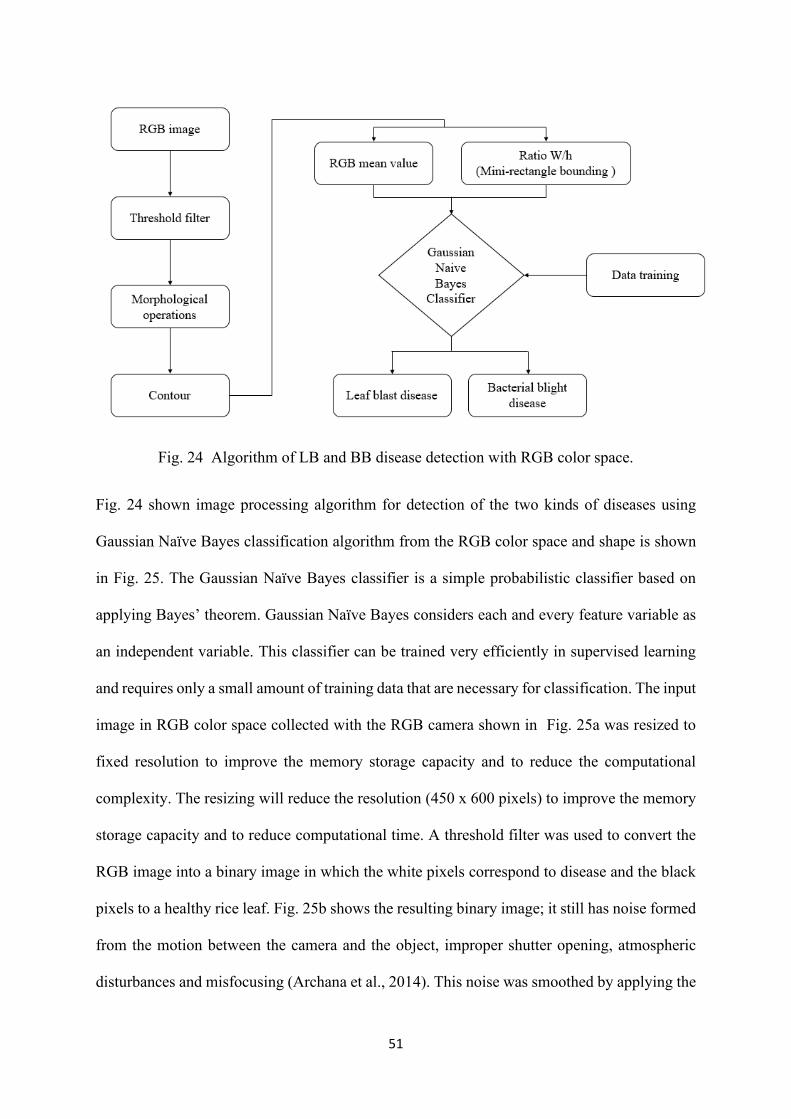
51
Fig. 24 Algorithm of LB and BB disease detection with RGB color space.
Fig. 24 shown image processing algorithm for detection of the two kinds of diseases using
Gaussian Naïve Bayes classification algorithm from the RGB color space and shape is shown
in Fig. 25. The Gaussian Naïve Bayes classifier is a simple probabilistic classifier based on
applying Bayes’ theorem. Gaussian Naïve Bayes considers each and every feature variable as
an independent variable. This classifier can be trained very efficiently in supervised learning
and requires only a small amount of training data that are necessary for classification. The input
image in RGB color space collected with the RGB camera shown in Fig. 25a was resized to
fixed resolution to improve the memory storage capacity and to reduce the computational
complexity. The resizing will reduce the resolution (450 x 600 pixels) to improve the memory
storage capacity and to reduce computational time. A threshold filter was used to convert the
RGB image into a binary image in which the white pixels correspond to disease and the black
pixels to a healthy rice leaf. Fig. 25b shows the resulting binary image; it still has noise formed
from the motion between the camera and the object, improper shutter opening, atmospheric
disturbances and misfocusing (Archana et al., 2014). This noise was smoothed by applying the
52
morphological operation of erosion and dilation. The erosion operation eliminates small
isolated white pixel areas. The dilation operation merges the areas where large groups of white
pixels are found next to each other (R.C. Gonzalez et al., 2002). The erosion operation uses a
rectangular shape structuring element of 2 x 2 pixels. The dilation operation makes the white
areas denser and eliminates breaks using a rectangular shape structuring element of 1 x 1 pixels.
These morphological operations transformed the binary image shown in Fig. 25b into the
smoothed result shown in Fig. 25c.
The next step is to find contours from the image shown in Fig. 25c (G. Bradski et al., 2008;
Brahmbhatt, 2013b). The contours produced the characteristics of the bounding blob, namely:
the height h, the width w, the area of the minimum rectangle bounding 𝑆𝑆𝑟𝑟 and the ratio w/h.
The resulting ratios are shown in Fig. 25d. Parallel to finding characteristics of the bounding
blob, the subtraction of the background from the original RGB image takes place based on the
contour; all the background outside of the contour was removed using a masking method. It
was then possible to calculate the RGB mean values inside each contour. The mean values of
the three channels are shown in Fig. 25e. Finally, the classifier used was based on the Gaussian
Naïve Bayes classifier (Mitchell, 1997) described by Equation (7) to (11) with the training
dataset in the RGB. The average of each feature given by Eq. (7) and the variance given by Eq.
(8) were calculated from the dataset for training and were then applied to Eq. (9) to calculate
the likelihood of each feature. Equation (9) was applied to each contour in the image with red
mean value 𝑅𝑅, green mean value 𝐺𝐺 , blue mean value 𝐵𝐵 and ratio 𝐾𝐾. Equation (10) is the
prediction value for the blast disease and Eq. (11) is the prediction value for the blight disease.
𝑎𝑎� =1𝑛𝑛�𝑥𝑥𝑖𝑖
𝑛𝑛
𝑖𝑖=1
(7)
53
𝑣𝑣𝑎𝑎𝑟𝑟 =1
𝑛𝑛 − 1�(𝑎𝑎𝑖𝑖 − 𝑎𝑎�)2𝑛𝑛
𝑖𝑖=1
(8)
𝑝𝑝(𝑅𝑅𝑅𝑅𝑑𝑑|𝑅𝑅) =1
�2.𝜋𝜋. 𝑣𝑣𝑎𝑎𝑟𝑟𝑟𝑟𝑅𝑅−
(𝑅𝑅−𝑎𝑎𝑟𝑟����)22.𝑣𝑣𝑎𝑎𝑟𝑟𝑟𝑟
𝑝𝑝(𝐺𝐺𝑟𝑟𝑅𝑅𝑅𝑅𝑛𝑛|𝐺𝐺) =1
�2.𝜋𝜋. 𝑣𝑣𝑎𝑎𝑟𝑟𝑔𝑔𝑅𝑅−
(𝐺𝐺−𝑎𝑎𝑔𝑔����)22.𝑣𝑣𝑎𝑎𝑟𝑟𝑔𝑔
𝑝𝑝(𝐵𝐵𝐵𝐵𝐵𝐵𝑅𝑅|𝐵𝐵) =1
�2.𝜋𝜋. 𝑣𝑣𝑎𝑎𝑟𝑟𝑏𝑏𝑅𝑅−
(𝐵𝐵−𝑎𝑎𝑏𝑏����)22.𝑣𝑣𝑎𝑎𝑟𝑟𝑏𝑏
𝑝𝑝(𝑅𝑅𝑎𝑎𝑅𝑅𝑖𝑖𝑅𝑅|𝐾𝐾) =1
�2.𝜋𝜋. 𝑣𝑣𝑎𝑎𝑟𝑟𝑘𝑘𝑅𝑅−
(𝐾𝐾−𝑎𝑎𝑘𝑘����)22.𝑣𝑣𝑎𝑎𝑟𝑟𝑘𝑘
(9)
𝑃𝑃𝑅𝑅𝑠𝑠𝑅𝑅𝑅𝑅𝑟𝑟𝑖𝑖𝑅𝑅𝑟𝑟(𝐵𝐵𝐵𝐵𝑎𝑎𝑠𝑠𝑅𝑅) = 𝑝𝑝(𝑅𝑅𝑅𝑅𝑑𝑑|𝑅𝑅) ∗ 𝑝𝑝(𝐺𝐺𝑟𝑟𝑅𝑅𝑅𝑅𝑛𝑛|𝐺𝐺) ∗ 𝑝𝑝(𝐵𝐵𝐵𝐵𝐵𝐵𝑅𝑅|𝐵𝐵) ∗ 𝑝𝑝(𝑅𝑅𝑎𝑎𝑅𝑅𝑖𝑖𝑅𝑅|𝐾𝐾) (10)
𝑃𝑃𝑅𝑅𝑠𝑠𝑅𝑅𝑅𝑅𝑟𝑟𝑖𝑖𝑅𝑅𝑟𝑟(𝐵𝐵𝐵𝐵𝑖𝑖𝑔𝑔ℎ𝑅𝑅) = 𝑝𝑝(𝑅𝑅𝑅𝑅𝑑𝑑|𝑅𝑅) ∗ 𝑝𝑝(𝐺𝐺𝑟𝑟𝑅𝑅𝑅𝑅𝑛𝑛|𝐺𝐺) ∗ 𝑝𝑝(𝐵𝐵𝐵𝐵𝐵𝐵𝑅𝑅|𝐵𝐵) ∗ 𝑝𝑝(𝑅𝑅𝑎𝑎𝑅𝑅𝑖𝑖𝑅𝑅|𝐾𝐾) (11)
Where:
𝑎𝑎� Average value of each feature
𝑣𝑣𝑎𝑎𝑟𝑟 Variance value of each feature
𝑅𝑅 Red channel color mean value
𝐺𝐺 Green channel color mean value
𝐵𝐵 Blue channel color mean value
𝐾𝐾 Bounding rectangle width to height ratio 𝐾𝐾 = w/h
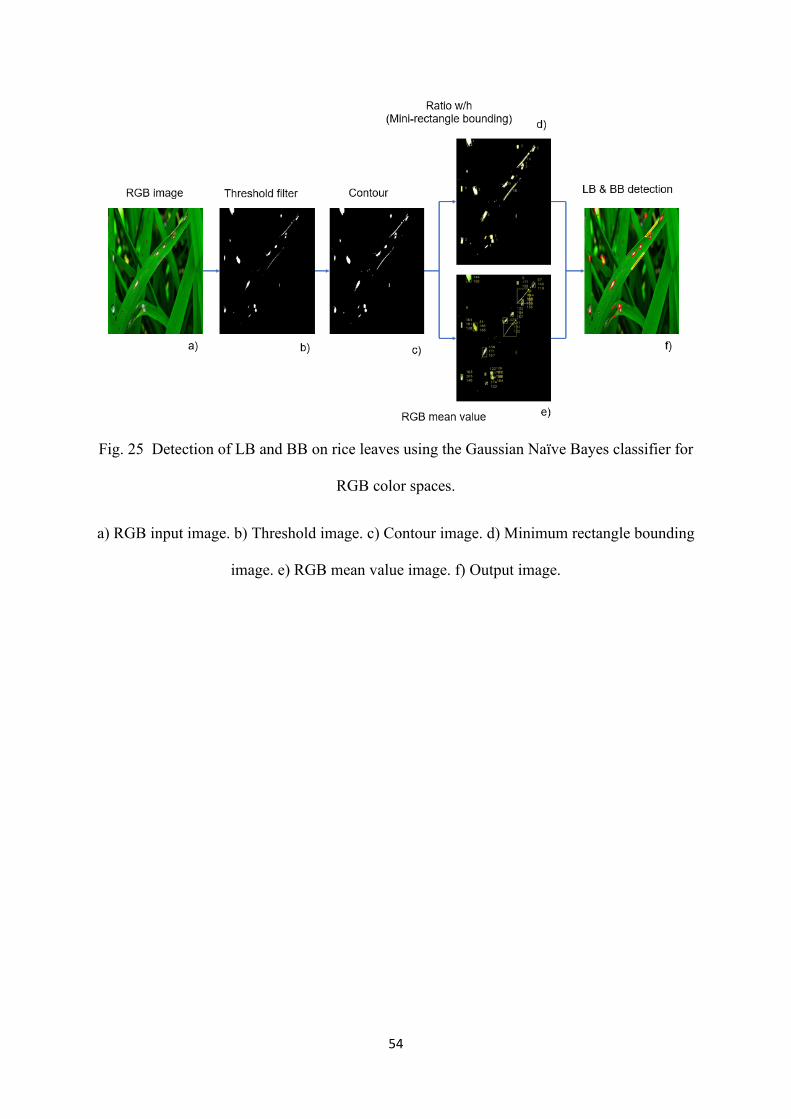
54
Fig. 25 Detection of LB and BB on rice leaves using the Gaussian Naïve Bayes classifier for
RGB color spaces.
a) RGB input image. b) Threshold image. c) Contour image. d) Minimum rectangle bounding
image. e) RGB mean value image. f) Output image.
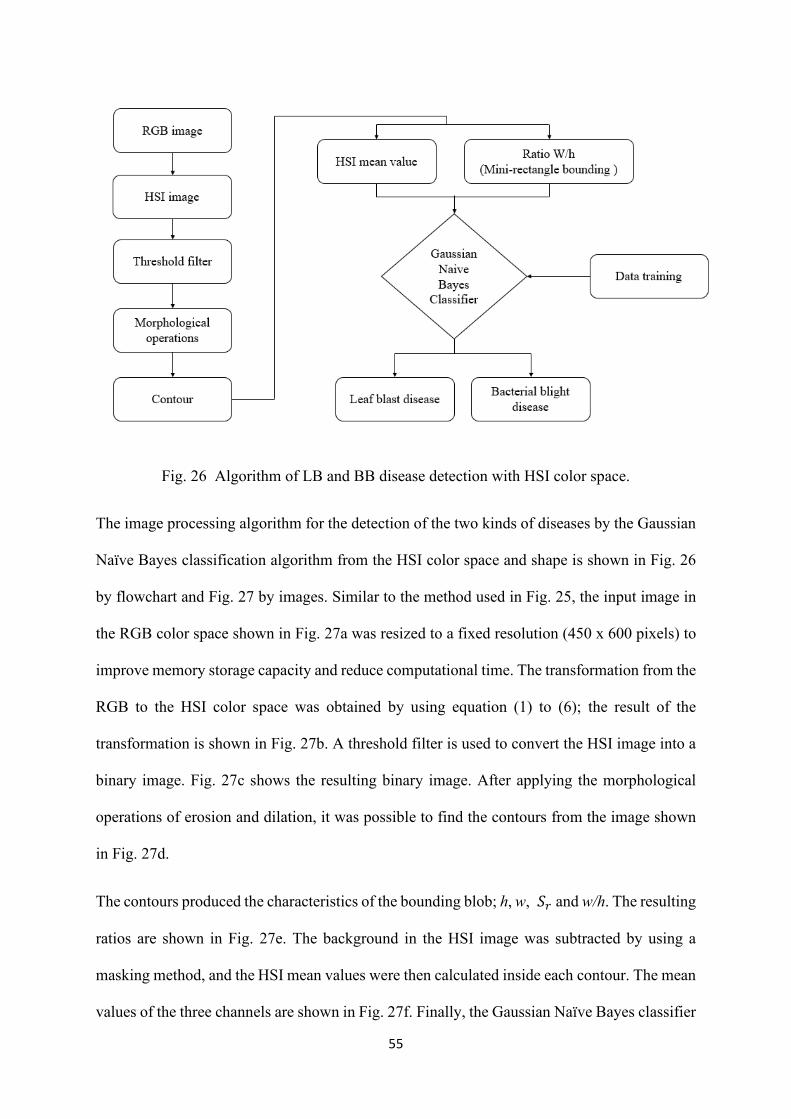
55
Fig. 26 Algorithm of LB and BB disease detection with HSI color space.
The image processing algorithm for the detection of the two kinds of diseases by the Gaussian
Naïve Bayes classification algorithm from the HSI color space and shape is shown in Fig. 26
by flowchart and Fig. 27 by images. Similar to the method used in Fig. 25, the input image in
the RGB color space shown in Fig. 27a was resized to a fixed resolution (450 x 600 pixels) to
improve memory storage capacity and reduce computational time. The transformation from the
RGB to the HSI color space was obtained by using equation (1) to (6); the result of the
transformation is shown in Fig. 27b. A threshold filter is used to convert the HSI image into a
binary image. Fig. 27c shows the resulting binary image. After applying the morphological
operations of erosion and dilation, it was possible to find the contours from the image shown
in Fig. 27d.
The contours produced the characteristics of the bounding blob; h, w, 𝑆𝑆𝑟𝑟 and w/h. The resulting
ratios are shown in Fig. 27e. The background in the HSI image was subtracted by using a
masking method, and the HSI mean values were then calculated inside each contour. The mean
values of the three channels are shown in Fig. 27f. Finally, the Gaussian Naïve Bayes classifier
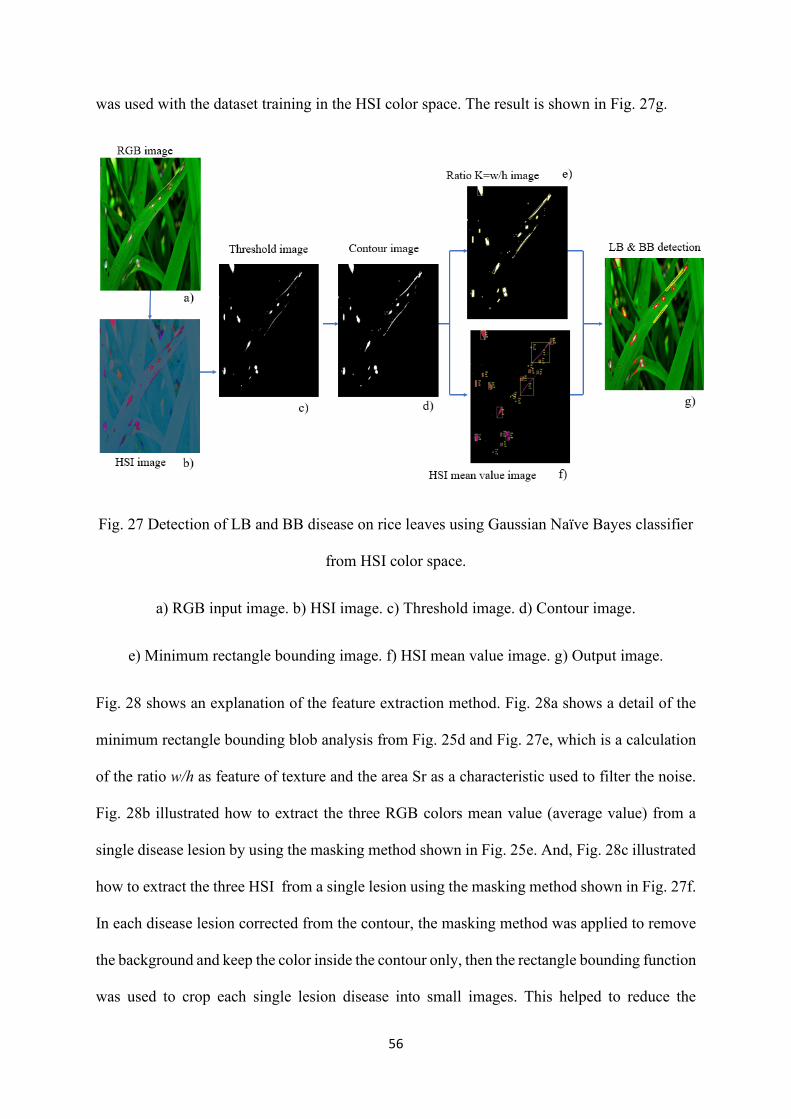
56
was used with the dataset training in the HSI color space. The result is shown in Fig. 27g.
Fig. 27 Detection of LB and BB disease on rice leaves using Gaussian Naïve Bayes classifier
from HSI color space.
a) RGB input image. b) HSI image. c) Threshold image. d) Contour image.
e) Minimum rectangle bounding image. f) HSI mean value image. g) Output image.
Fig. 28 shows an explanation of the feature extraction method. Fig. 28a shows a detail of the
minimum rectangle bounding blob analysis from Fig. 25d and Fig. 27e, which is a calculation
of the ratio w/h as feature of texture and the area Sr as a characteristic used to filter the noise.
Fig. 28b illustrated how to extract the three RGB colors mean value (average value) from a
single disease lesion by using the masking method shown in Fig. 25e. And, Fig. 28c illustrated
how to extract the three HSI from a single lesion using the masking method shown in Fig. 27f.
In each disease lesion corrected from the contour, the masking method was applied to remove
the background and keep the color inside the contour only, then the rectangle bounding function
was used to crop each single lesion disease into small images. This helped to reduce the
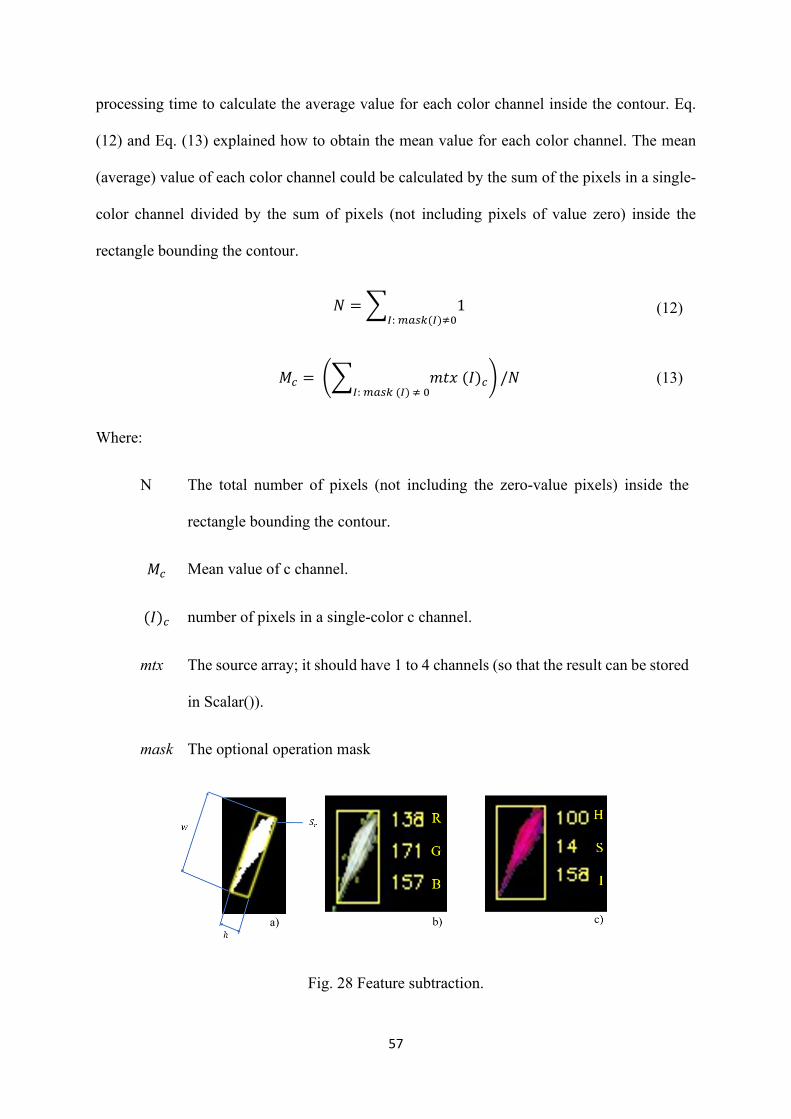
57
processing time to calculate the average value for each color channel inside the contour. Eq.
(12) and Eq. (13) explained how to obtain the mean value for each color channel. The mean
(average) value of each color channel could be calculated by the sum of the pixels in a single-
color channel divided by the sum of pixels (not including pixels of value zero) inside the
rectangle bounding the contour.
𝑀𝑀 = � 1𝐼𝐼: 𝑚𝑚𝑎𝑎𝑚𝑚𝑘𝑘(𝐼𝐼)≠0
(12)
𝑀𝑀𝑐𝑐 = �� 𝑚𝑚𝑅𝑅𝑥𝑥 (𝑀𝑀)𝑐𝑐
𝐼𝐼: 𝑚𝑚𝑎𝑎𝑚𝑚𝑘𝑘 (𝐼𝐼) ≠ 0� /𝑀𝑀 (13)
Where:
N The total number of pixels (not including the zero-value pixels) inside the
rectangle bounding the contour.
𝑀𝑀𝑐𝑐 Mean value of c channel.
(𝑀𝑀)𝑐𝑐 number of pixels in a single-color c channel.
mtx The source array; it should have 1 to 4 channels (so that the result can be stored
in Scalar()).
mask The optional operation mask
Fig. 28 Feature subtraction.
58
a) Minimum bounding analysis. b) RGB mean value analysis. c) HSI mean values analysis
It was also possible to perform the same image processing for diseases detection on both RGB
and HSI color spaces with a dataset for training and a dataset for testing, but modifying the
final step of the method to replace the Gaussian Naïve Bayes classifier step with the KNN
classifier. The KNN is one of the statistical classification algorithms used for classifying based
on the closest training examples in the feature space (Cover et al., 1967). It is a sample learning
algorithm in which the KNN is approximated locally and all computations are deferred until
classification. No learning is performed during the training step, although a training dataset is
required. The training data is needed during the testing step. When an instance whose class is
unknow is presented for evaluation, the algorithm computes its K-nearest neighbors, and the
class is assigned by voting among those neighbors. This is why the training step is very fast for
the KNN algorithm, while the testing step is costly in terms of both time and memory.
The KNN algorithm consists of two steps: a training step and a testing step. In the training step,
the training examples were vectors (each with a class label) in a multidimensional feature space.
In this step, the feature vectors and the class labels of the training samples were stored. In the
testing step, k was a user-defined constant, and a test point was classified by assigning a label,
which was the most recurrent among the k training samples nearest to that query point. In other
words, the KNN method compared query points based on their distance to points in the training
dataset. This is a simple yet effective way of classifying new points.
The KNN method of classifying objects requires only two parameters to tune, k and the distance
metric, to achieve sufficiently high classification accuracy. Thus, in KNN-based
implementations, it is critical to find the best choice of k and the distance metric to compute
the nearest. Generally, larger values of k reduced the effect of noise but made boundaries
between classes less distinct. The special case in which the class is predicted to be the class of
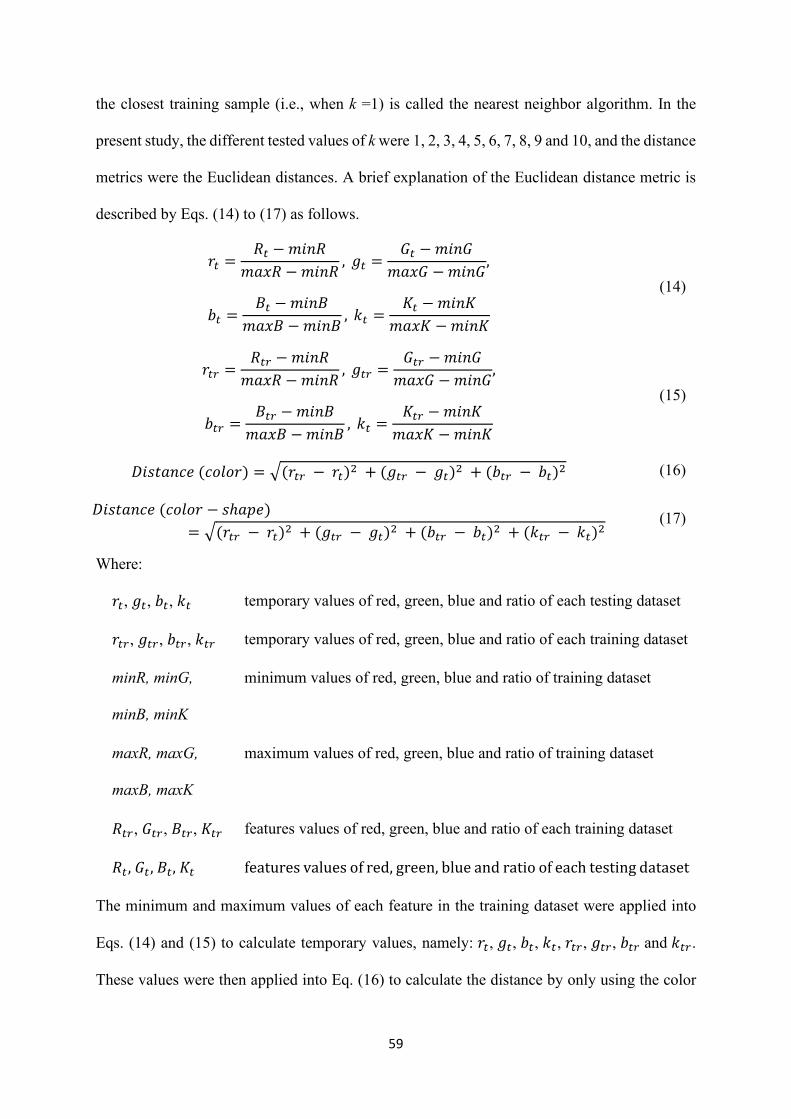
59
the closest training sample (i.e., when k =1) is called the nearest neighbor algorithm. In the
present study, the different tested values of k were 1, 2, 3, 4, 5, 6, 7, 8, 9 and 10, and the distance
metrics were the Euclidean distances. A brief explanation of the Euclidean distance metric is
described by Eqs. (14) to (17) as follows.
𝑟𝑟𝑡𝑡 =𝑅𝑅𝑡𝑡 − 𝑚𝑚𝑖𝑖𝑛𝑛𝑅𝑅
𝑚𝑚𝑎𝑎𝑥𝑥𝑅𝑅 −𝑚𝑚𝑖𝑖𝑛𝑛𝑅𝑅, 𝑔𝑔𝑡𝑡 =
𝐺𝐺𝑡𝑡 − 𝑚𝑚𝑖𝑖𝑛𝑛𝐺𝐺𝑚𝑚𝑎𝑎𝑥𝑥𝐺𝐺 −𝑚𝑚𝑖𝑖𝑛𝑛𝐺𝐺
,
𝑏𝑏𝑡𝑡 =𝐵𝐵𝑡𝑡 − 𝑚𝑚𝑖𝑖𝑛𝑛𝐵𝐵
𝑚𝑚𝑎𝑎𝑥𝑥𝐵𝐵 −𝑚𝑚𝑖𝑖𝑛𝑛𝐵𝐵, 𝑘𝑘𝑡𝑡 =
𝐾𝐾𝑡𝑡 − 𝑚𝑚𝑖𝑖𝑛𝑛𝐾𝐾𝑚𝑚𝑎𝑎𝑥𝑥𝐾𝐾 −𝑚𝑚𝑖𝑖𝑛𝑛𝐾𝐾
(14)
𝑟𝑟𝑡𝑡𝑟𝑟 =𝑅𝑅𝑡𝑡𝑟𝑟 − 𝑚𝑚𝑖𝑖𝑛𝑛𝑅𝑅𝑚𝑚𝑎𝑎𝑥𝑥𝑅𝑅 −𝑚𝑚𝑖𝑖𝑛𝑛𝑅𝑅
, 𝑔𝑔𝑡𝑡𝑟𝑟 =𝐺𝐺𝑡𝑡𝑟𝑟 −𝑚𝑚𝑖𝑖𝑛𝑛𝐺𝐺𝑚𝑚𝑎𝑎𝑥𝑥𝐺𝐺 −𝑚𝑚𝑖𝑖𝑛𝑛𝐺𝐺
,
𝑏𝑏𝑡𝑡𝑟𝑟 =𝐵𝐵𝑡𝑡𝑟𝑟 − 𝑚𝑚𝑖𝑖𝑛𝑛𝐵𝐵𝑚𝑚𝑎𝑎𝑥𝑥𝐵𝐵 −𝑚𝑚𝑖𝑖𝑛𝑛𝐵𝐵
, 𝑘𝑘𝑡𝑡 =𝐾𝐾𝑡𝑡𝑟𝑟 − 𝑚𝑚𝑖𝑖𝑛𝑛𝐾𝐾
𝑚𝑚𝑎𝑎𝑥𝑥𝐾𝐾 −𝑚𝑚𝑖𝑖𝑛𝑛𝐾𝐾
(15)
𝐷𝐷𝑖𝑖𝑠𝑠𝑅𝑅𝑎𝑎𝑛𝑛𝐷𝐷𝑅𝑅 (𝐷𝐷𝑅𝑅𝐵𝐵𝑅𝑅𝑟𝑟) = �(𝑟𝑟𝑡𝑡𝑟𝑟 − 𝑟𝑟𝑡𝑡)2 + (𝑔𝑔𝑡𝑡𝑟𝑟 − 𝑔𝑔𝑡𝑡)2 + (𝑏𝑏𝑡𝑡𝑟𝑟 − 𝑏𝑏𝑡𝑡)2
(16)
𝐷𝐷𝑖𝑖𝑠𝑠𝑅𝑅𝑎𝑎𝑛𝑛𝐷𝐷𝑅𝑅 (𝐷𝐷𝑅𝑅𝐵𝐵𝑅𝑅𝑟𝑟 − 𝑠𝑠ℎ𝑎𝑎𝑝𝑝𝑅𝑅) = �(𝑟𝑟𝑡𝑡𝑟𝑟 − 𝑟𝑟𝑡𝑡)2 + (𝑔𝑔𝑡𝑡𝑟𝑟 − 𝑔𝑔𝑡𝑡)2 + (𝑏𝑏𝑡𝑡𝑟𝑟 − 𝑏𝑏𝑡𝑡)2 + (𝑘𝑘𝑡𝑡𝑟𝑟 − 𝑘𝑘𝑡𝑡)2
(17)
Where:
𝑟𝑟𝑡𝑡, 𝑔𝑔𝑡𝑡, 𝑏𝑏𝑡𝑡, 𝑘𝑘𝑡𝑡 temporary values of red, green, blue and ratio of each testing dataset
𝑟𝑟𝑡𝑡𝑟𝑟, 𝑔𝑔𝑡𝑡𝑟𝑟, 𝑏𝑏𝑡𝑡𝑟𝑟, 𝑘𝑘𝑡𝑡𝑟𝑟 temporary values of red, green, blue and ratio of each training dataset
minR, minG,
minB, minK
minimum values of red, green, blue and ratio of training dataset
maxR, maxG,
maxB, maxK
maximum values of red, green, blue and ratio of training dataset
𝑅𝑅𝑡𝑡𝑟𝑟, 𝐺𝐺𝑡𝑡𝑟𝑟, 𝐵𝐵𝑡𝑡𝑟𝑟, 𝐾𝐾𝑡𝑡𝑟𝑟 features values of red, green, blue and ratio of each training dataset
𝑅𝑅𝑡𝑡, 𝐺𝐺𝑡𝑡, 𝐵𝐵𝑡𝑡, 𝐾𝐾𝑡𝑡 features values of red, green, blue and ratio of each testing dataset
The minimum and maximum values of each feature in the training dataset were applied into
Eqs. (14) and (15) to calculate temporary values, namely: 𝑟𝑟𝑡𝑡, 𝑔𝑔𝑡𝑡, 𝑏𝑏𝑡𝑡, 𝑘𝑘𝑡𝑡, 𝑟𝑟𝑡𝑡𝑟𝑟, 𝑔𝑔𝑡𝑡𝑟𝑟, 𝑏𝑏𝑡𝑡𝑟𝑟 and 𝑘𝑘𝑡𝑡𝑟𝑟.
These values were then applied into Eq. (16) to calculate the distance by only using the color
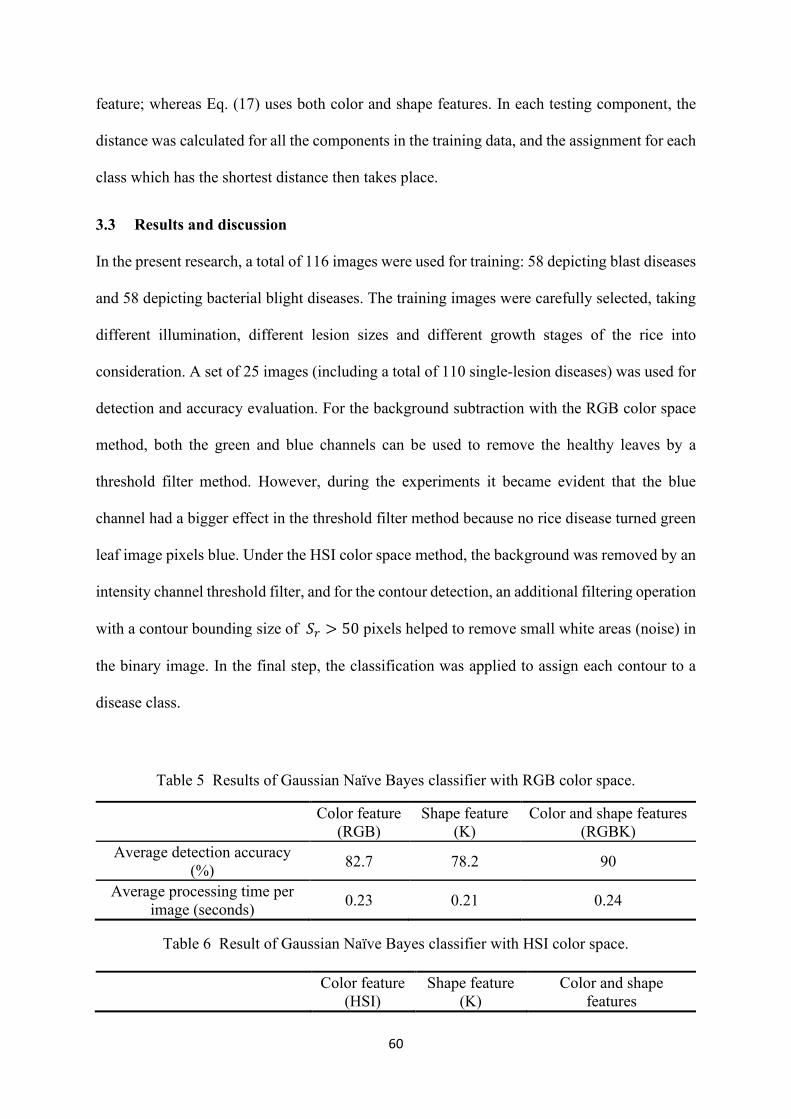
60
feature; whereas Eq. (17) uses both color and shape features. In each testing component, the
distance was calculated for all the components in the training data, and the assignment for each
class which has the shortest distance then takes place.
3.3 Results and discussion
In the present research, a total of 116 images were used for training: 58 depicting blast diseases
and 58 depicting bacterial blight diseases. The training images were carefully selected, taking
different illumination, different lesion sizes and different growth stages of the rice into
consideration. A set of 25 images (including a total of 110 single-lesion diseases) was used for
detection and accuracy evaluation. For the background subtraction with the RGB color space
method, both the green and blue channels can be used to remove the healthy leaves by a
threshold filter method. However, during the experiments it became evident that the blue
channel had a bigger effect in the threshold filter method because no rice disease turned green
leaf image pixels blue. Under the HSI color space method, the background was removed by an
intensity channel threshold filter, and for the contour detection, an additional filtering operation
with a contour bounding size of 𝑆𝑆𝑟𝑟 > 50 pixels helped to remove small white areas (noise) in
the binary image. In the final step, the classification was applied to assign each contour to a
disease class.
Table 5 Results of Gaussian Naïve Bayes classifier with RGB color space.
Color feature (RGB)
Shape feature (K)
Color and shape features (RGBK)
Average detection accuracy (%) 82.7 78.2 90
Average processing time per image (seconds) 0.23 0.21 0.24
Table 6 Result of Gaussian Naïve Bayes classifier with HSI color space.
Color feature (HSI)
Shape feature (K)
Color and shape features
61
(HSIK)
Average detection accuracy (%) 80.0 78.2 83.6
Average processing time per image (seconds) 0.23 0.21 0.24
Table 3 and Table 4 show the results for detection accuracy and processing time when using
the Gaussian Naïve Bayes classifier; Table 3 refers to results using the RGB color space and
Table 4 refers to results using the HSI color space. In each color space, the accuracy and
processing time were calculated with different features applied to the Gaussian Naïve Bayes
equation. In this study, we separated the features in three ways: using the color feature (R, G,
B) only, using the shape feature (K) only, and using both color and shape features (R, G, B, K)
combined. Our results show that detection accuracy was increased when the color and shape
features were combined, and the RGB color space yielded better detection accuracy than the
HSI color space. Increasing the number of features for the classifier also increased the
processing time slightly (by only 0.01 seconds); this could be acceptable to achieve a higher
accuracy criterion.
Table 7 Results of KNN classifier with RGB and HSI color spaces.
k = 1 k = 2 k = 3 k = 4 k = 5 k = 6 k = 7 k = 8 k = 9 k = 10
RGB (%) 77.27 85.45 77.27 79.09 79.09 77.27 78.18 76.36 77.27 78.18
RGBK (%) 80.0 80.0 80.0 81.82 81.82 81.82 80.91 80.0 80.91 80.91
HSI (%) 74.54 72.72 72.27 75.45 76.36 73.63 73.63 72.72 71.82 72.72
HSIK (%) 80.0 80.91 80.91 80.91 80.91 81.82 81.82 81.82 80.0 80.0
Table 5 shows the results when using the KNN classifier, summarizing the detection accuracy
with different k values (from 1 to 10) for the color feature only, and for the color and shape
features using both the RGB and HSI color spaces. Similar to the Gaussian Naïve Bayes
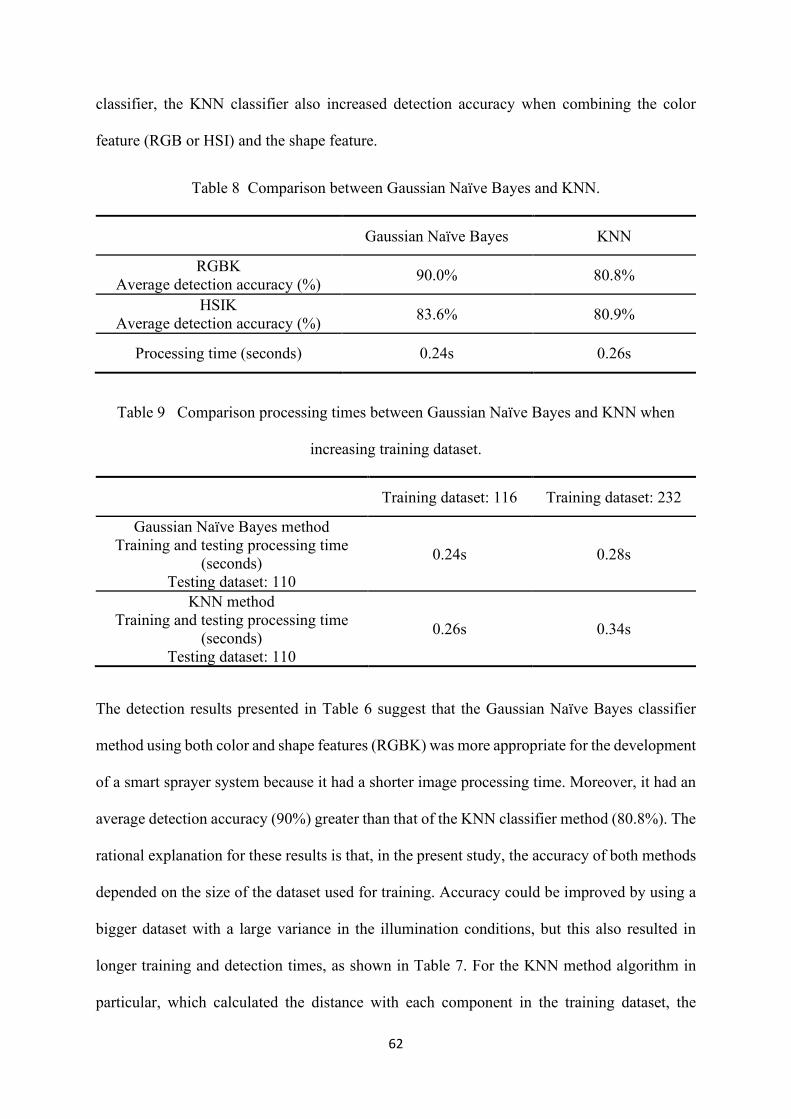
62
classifier, the KNN classifier also increased detection accuracy when combining the color
feature (RGB or HSI) and the shape feature.
Table 8 Comparison between Gaussian Naïve Bayes and KNN.
Gaussian Naïve Bayes KNN
RGBK Average detection accuracy (%) 90.0% 80.8%
HSIK Average detection accuracy (%) 83.6% 80.9%
Processing time (seconds) 0.24s 0.26s
Table 9 Comparison processing times between Gaussian Naïve Bayes and KNN when
increasing training dataset.
Training dataset: 116 Training dataset: 232
Gaussian Naïve Bayes method Training and testing processing time
(seconds) Testing dataset: 110
0.24s 0.28s
KNN method Training and testing processing time
(seconds) Testing dataset: 110
0.26s 0.34s
The detection results presented in Table 6 suggest that the Gaussian Naïve Bayes classifier
method using both color and shape features (RGBK) was more appropriate for the development
of a smart sprayer system because it had a shorter image processing time. Moreover, it had an
average detection accuracy (90%) greater than that of the KNN classifier method (80.8%). The
rational explanation for these results is that, in the present study, the accuracy of both methods
depended on the size of the dataset used for training. Accuracy could be improved by using a
bigger dataset with a large variance in the illumination conditions, but this also resulted in
longer training and detection times, as shown in Table 7. For the KNN method algorithm in
particular, which calculated the distance with each component in the training dataset, the
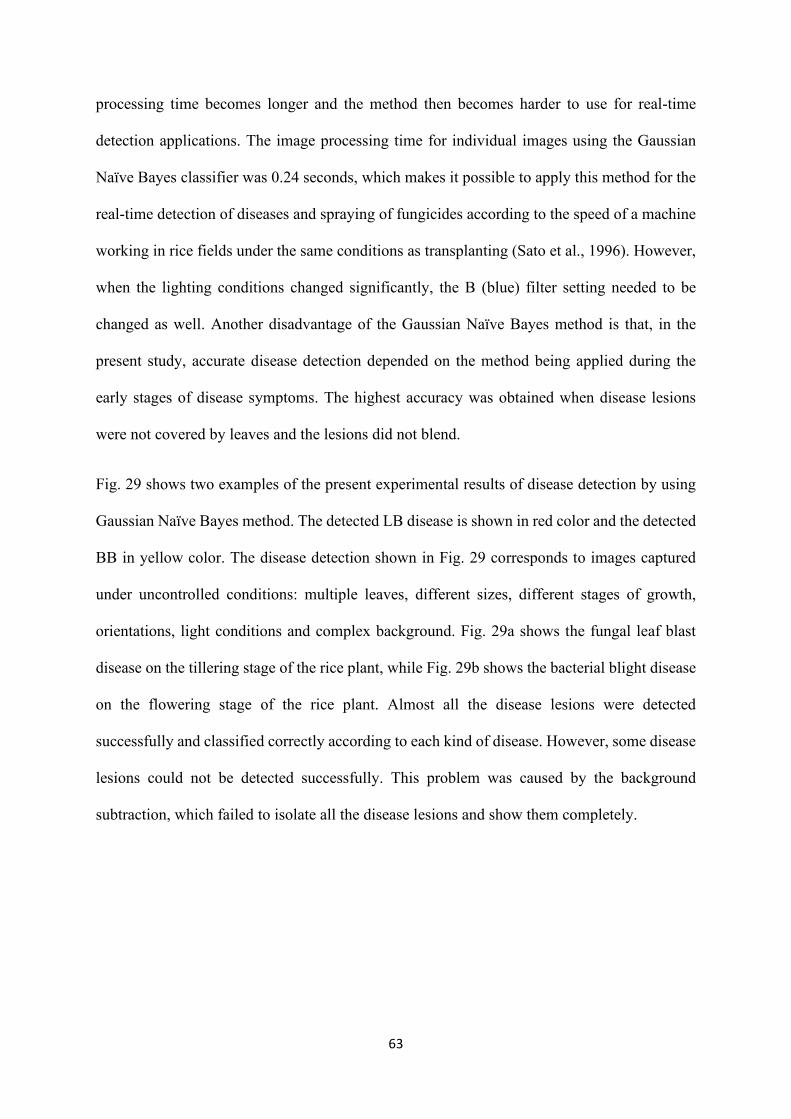
63
processing time becomes longer and the method then becomes harder to use for real-time
detection applications. The image processing time for individual images using the Gaussian
Naïve Bayes classifier was 0.24 seconds, which makes it possible to apply this method for the
real-time detection of diseases and spraying of fungicides according to the speed of a machine
working in rice fields under the same conditions as transplanting (Sato et al., 1996). However,
when the lighting conditions changed significantly, the B (blue) filter setting needed to be
changed as well. Another disadvantage of the Gaussian Naïve Bayes method is that, in the
present study, accurate disease detection depended on the method being applied during the
early stages of disease symptoms. The highest accuracy was obtained when disease lesions
were not covered by leaves and the lesions did not blend.
Fig. 29 shows two examples of the present experimental results of disease detection by using
Gaussian Naïve Bayes method. The detected LB disease is shown in red color and the detected
BB in yellow color. The disease detection shown in Fig. 29 corresponds to images captured
under uncontrolled conditions: multiple leaves, different sizes, different stages of growth,
orientations, light conditions and complex background. Fig. 29a shows the fungal leaf blast
disease on the tillering stage of the rice plant, while Fig. 29b shows the bacterial blight disease
on the flowering stage of the rice plant. Almost all the disease lesions were detected
successfully and classified correctly according to each kind of disease. However, some disease
lesions could not be detected successfully. This problem was caused by the background
subtraction, which failed to isolate all the disease lesions and show them completely.
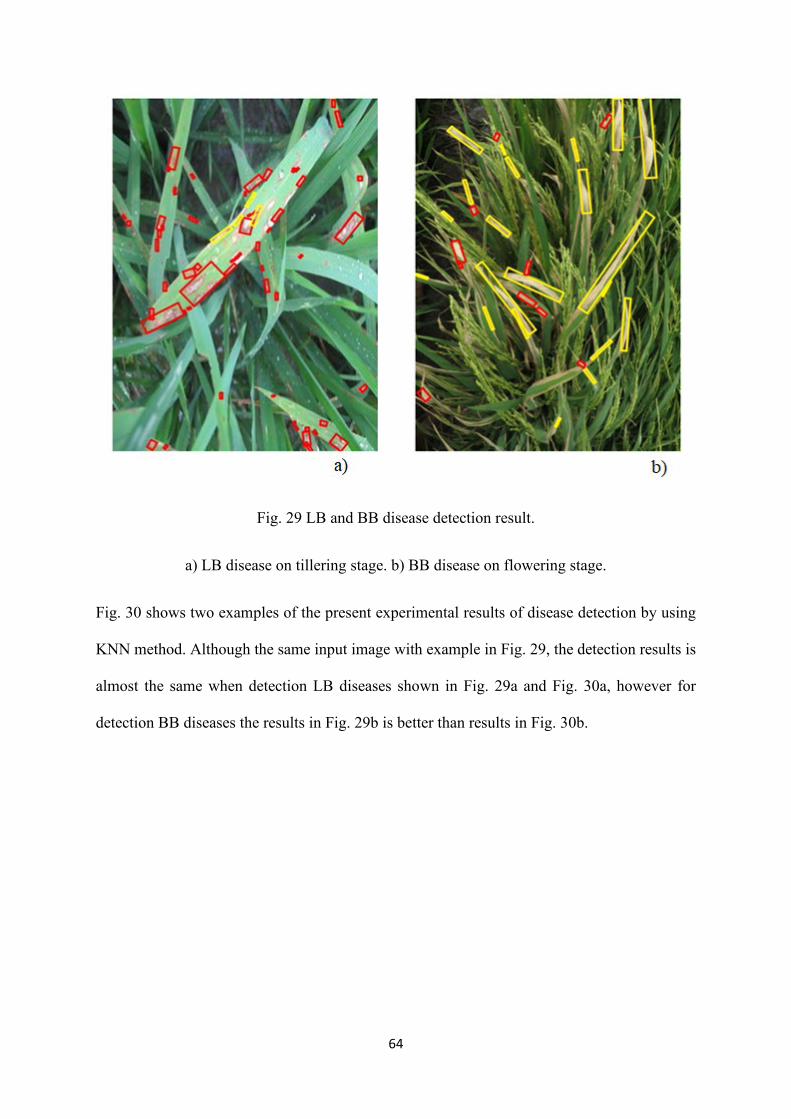
64
Fig. 29 LB and BB disease detection result.
a) LB disease on tillering stage. b) BB disease on flowering stage.
Fig. 30 shows two examples of the present experimental results of disease detection by using
KNN method. Although the same input image with example in Fig. 29, the detection results is
almost the same when detection LB diseases shown in Fig. 29a and Fig. 30a, however for
detection BB diseases the results in Fig. 29b is better than results in Fig. 30b.
65
Fig. 30 LB and BB disease detection results by KNN method.
a) LB disease in the tillering stage. b) BB disease in the flowering stage.
VMD is the biggest rice cultivate in Vietnam, which is 3.8 million hectares including 12
provinces. Especially, some provinces can yield triple-cropped rice per year such as An Giang,
Dong Thap, Vinh Long, Can Tho, Hau Giang and Tra Vinh. Therefore, the amount of fungicide
application in a province with high density of crop rice becomes high on a year basis. By
successfully detecting two common dangerous diseases in this study, a smart sprayer machine
will be developed; which can spray only on a specific treatment area, which can help to reduce
the amount of the fungicides by 70% - 80%. This helps to reduce the chemical residue effects
in the environment and to increase the income of the farmers in this area.
3.4 Conclusion
66
This study demonstrates that the Gaussian Naïve Bayes classifier method is better than the
KNN algorithm method for detecting two kinds of diseases, rice blast disease and bacterial
blight disease, in the early stages under uncontrolled illumination conditions. This study also
discusses the effects of color features (RGB, HSI) and shape features on the detection accuracy
of the two methods. Both methods are able to detect both kinds of disease, though with different
levels of accuracy and different processing times. The Gaussian Naïve Bayes method has the
advantages of high accuracy and a low processing time. Although the present results were
satisfactory, however, this method might yield lower accuracy when disease lesions become
wide and blend, or when lighting conditions change or the spraying machine’s speed increases.
As future work, it is proposed to improve the processing time. Also, a new mechanical design
is required to improve the balance and reduce the vibration on the camera.
67
Chapter 4 Development of a smart sprayer utilizing a commercialized
sprayer
In this chapter was introduced a prototype smart sprayer of herbicide to the weed and fungicides
to the fungal disease in rice field. The smart sprayer consist of RGB camera were connected
via USB 3.0 to a laptop. The cameras were capable of capturing the images and custom
software was develop for processing the images to detect weeds and diseases in real-time. The
triggering signals were sent to the nozzle where the weeds or diseases had been detected.
4.1 Introduction
Rice yields are highly dependent on agrochemicals (herbicides, fungicides, and insecticides)
for adequate weed, diseases and insect control. Traditionally, these agrochemicals are applied
uniformly without considering significant bare spots and weed patches that exist within fields.
The repeated and excessive use of agrochemicals not only increases the cost of production, but
it is also impacting to environment, for health human, for natural landscape, and rice plants.
(Chau et al., 2015; Toan et al., 2013) reported that all investigated water sources in the VMD
have been shown to contaminated by pesticides. Local population in rural area still use all
available water sources for their daily needs including drinking. Therefore, the face of currently
used pesticides under different conditions needs to be further investigated. Despite the available
options to reduce pesticide residue concentration in water resources, prevent pollution should
be a priority. Although there are several solutions to reduce pesticide residue in water by cheap
material such as bamboo (Thuy et al., 2012). However, the more sustainable solution and the
best way is to reduce the amount of pesticides introduced to the environment from agriculture
activities.
Many researchers have attempted to develop variable rate technologies for various crops.
(Zaman et al., 2014) proposed the variable rate sprayer proved very efficient for in-season spot-
68
application of herbicides to eradicate tall weeds <55cm (taller than plants) in wild blueberry
fields. The sensor for detection the weed on this research base on segmentation images input
from ultrasonic camera. Although the percent area coverage of the sprayed targets with spot-
application and uniform application was limited on the taller weeds in both fields and chemical
spraying at early weed growth stage is needed to avoid less spray coverage on the taller weeds,
it should be possible to increases the variable rate sprayer’s performance to achieve enough
coverage on weeds.
(Tian et al., 1999) proposed a real time machine vision sensing system with an automatic
herbicide sprayer to create an intelligent sensing and spraying system and testing in corn fields.
Multiple video images (hyper spectral camera) were used to cover the target area. Each camera
was controlled 6 individual nozzles. The integrated system was tested to evaluate the
effectiveness and performance under varying field conditions. With the current system design
and 0.5% weed coverage as the control zone threshold, herbicide saving of 48% could be
realized.
Another research, precision spot spray system using image analysis and plant identification in
sugarcane (Rees et al., 2009). This research was used an RGB camera to collect the image and
processing for segmentation base on analysis the different color of weed and number of edge
detection on target detection areas. The image analysis operating at nighttime with the white
LED illumination produced satisfactory results on mature green panic and guinea grass.
However, the algorithm did not perform satisfactorily for smaller weeds or sugarcane. This
research was successfully demonstrated to be effective at precision application. The cost
benefit analysis demonstrated potential significant cost saving to grower though reduced
chemical and weed management costs while providing beneficial outcomes to the environment
through reduced chemical application.
Many precision spraying applications was success for vegetable. However, rice field is a
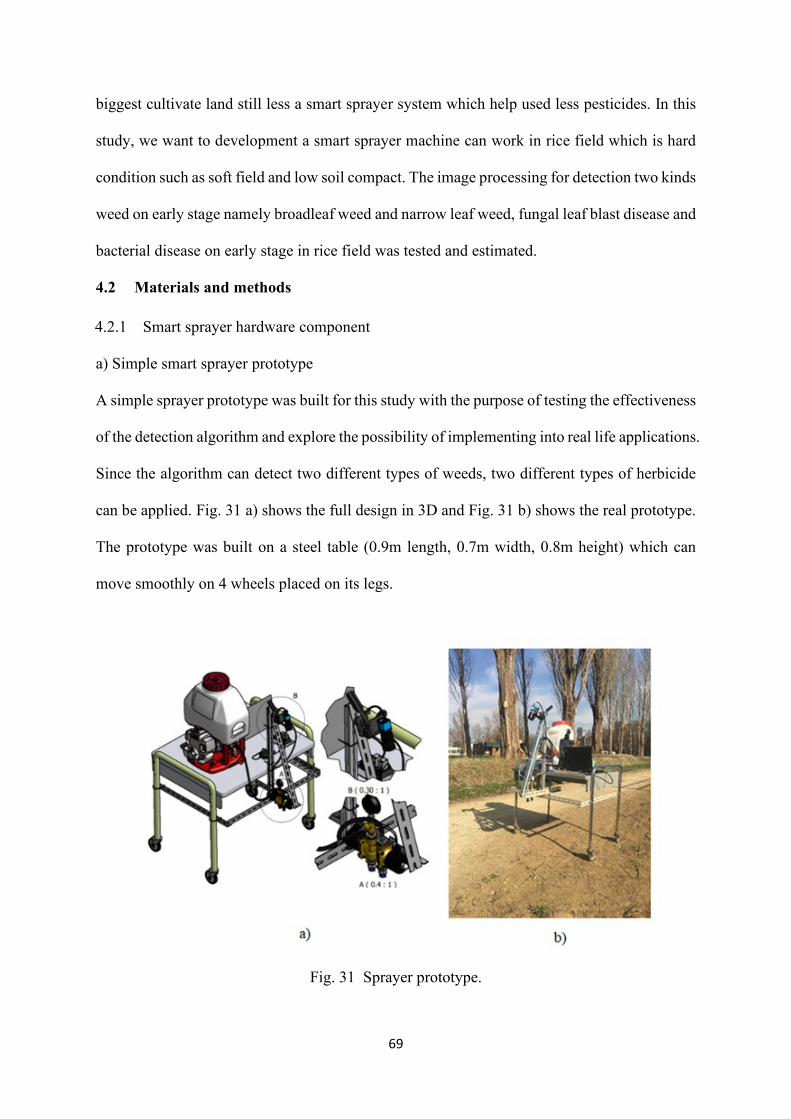
69
biggest cultivate land still less a smart sprayer system which help used less pesticides. In this
study, we want to development a smart sprayer machine can work in rice field which is hard
condition such as soft field and low soil compact. The image processing for detection two kinds
weed on early stage namely broadleaf weed and narrow leaf weed, fungal leaf blast disease and
bacterial disease on early stage in rice field was tested and estimated.
4.2 Materials and methods
4.2.1 Smart sprayer hardware component
a) Simple smart sprayer prototype
A simple sprayer prototype was built for this study with the purpose of testing the effectiveness
of the detection algorithm and explore the possibility of implementing into real life applications.
Since the algorithm can detect two different types of weeds, two different types of herbicide
can be applied. Fig. 31 a) shows the full design in 3D and Fig. 31 b) shows the real prototype.
The prototype was built on a steel table (0.9m length, 0.7m width, 0.8m height) which can
move smoothly on 4 wheels placed on its legs.
Fig. 31 Sprayer prototype.
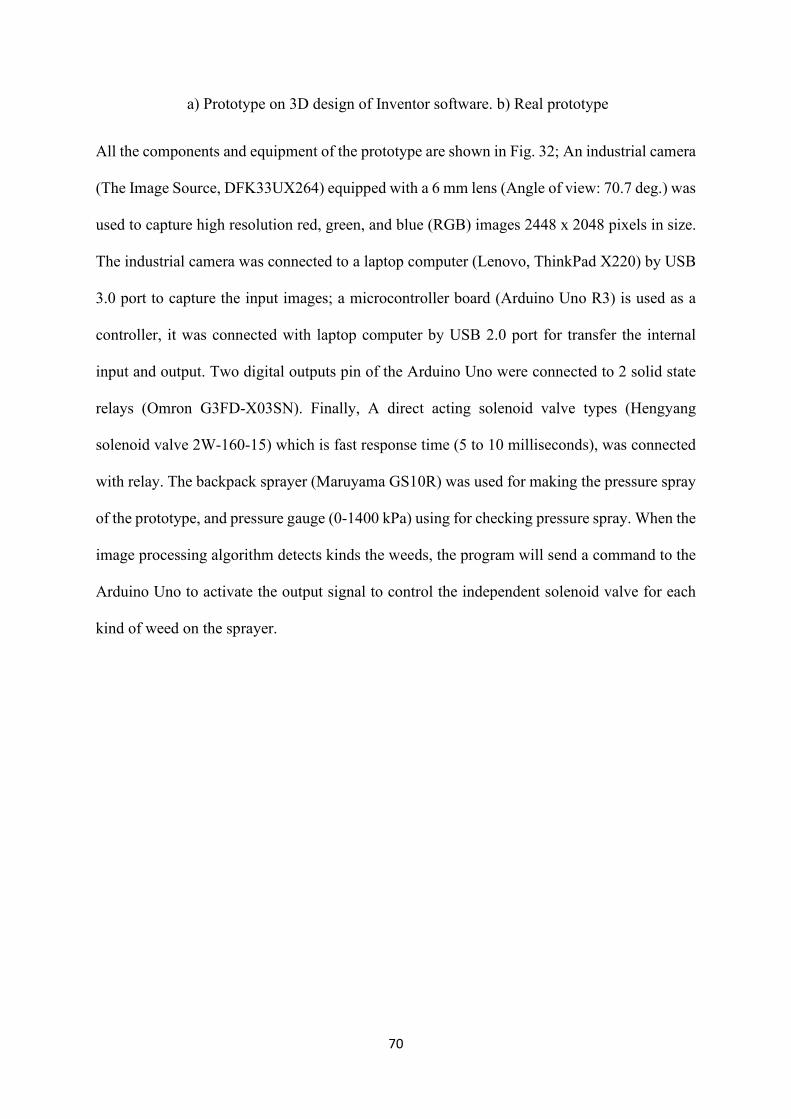
70
a) Prototype on 3D design of Inventor software. b) Real prototype
All the components and equipment of the prototype are shown in Fig. 32; An industrial camera
(The Image Source, DFK33UX264) equipped with a 6 mm lens (Angle of view: 70.7 deg.) was
used to capture high resolution red, green, and blue (RGB) images 2448 x 2048 pixels in size.
The industrial camera was connected to a laptop computer (Lenovo, ThinkPad X220) by USB
3.0 port to capture the input images; a microcontroller board (Arduino Uno R3) is used as a
controller, it was connected with laptop computer by USB 2.0 port for transfer the internal
input and output. Two digital outputs pin of the Arduino Uno were connected to 2 solid state
relays (Omron G3FD-X03SN). Finally, A direct acting solenoid valve types (Hengyang
solenoid valve 2W-160-15) which is fast response time (5 to 10 milliseconds), was connected
with relay. The backpack sprayer (Maruyama GS10R) was used for making the pressure spray
of the prototype, and pressure gauge (0-1400 kPa) using for checking pressure spray. When the
image processing algorithm detects kinds the weeds, the program will send a command to the
Arduino Uno to activate the output signal to control the independent solenoid valve for each
kind of weed on the sprayer.
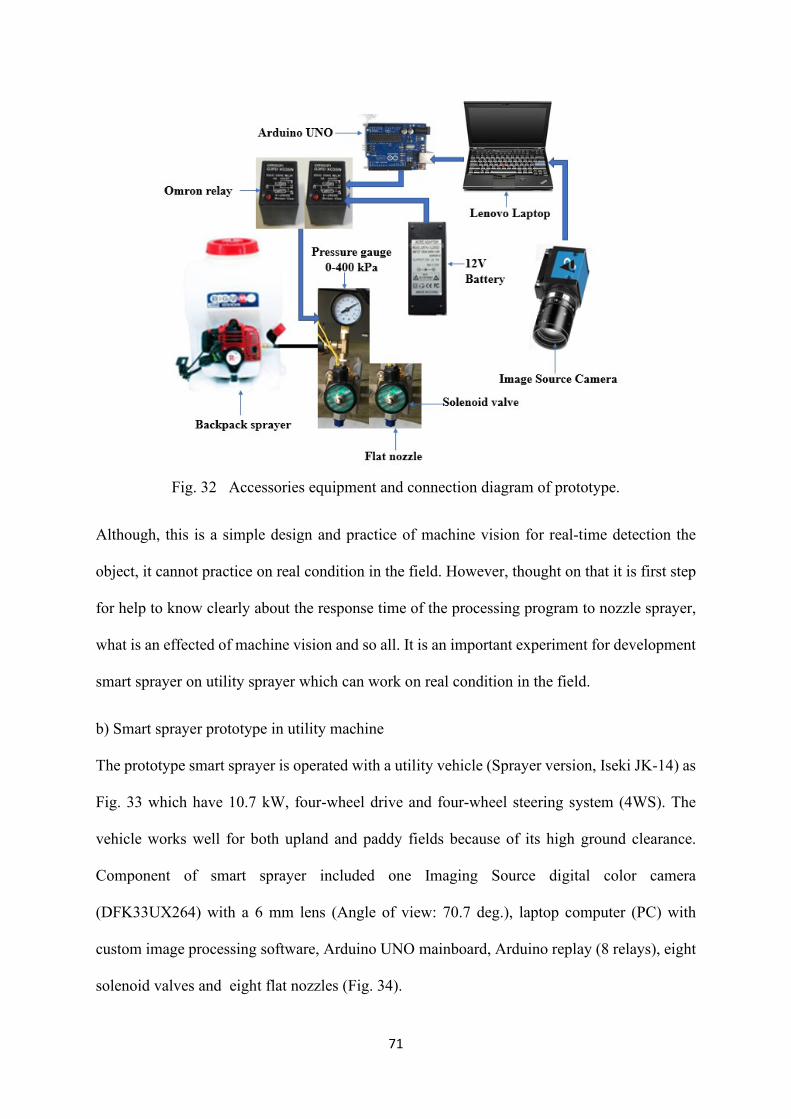
71
Fig. 32 Accessories equipment and connection diagram of prototype.
Although, this is a simple design and practice of machine vision for real-time detection the
object, it cannot practice on real condition in the field. However, thought on that it is first step
for help to know clearly about the response time of the processing program to nozzle sprayer,
what is an effected of machine vision and so all. It is an important experiment for development
smart sprayer on utility sprayer which can work on real condition in the field.
b) Smart sprayer prototype in utility machine
The prototype smart sprayer is operated with a utility vehicle (Sprayer version, Iseki JK-14) as
Fig. 33 which have 10.7 kW, four-wheel drive and four-wheel steering system (4WS). The
vehicle works well for both upland and paddy fields because of its high ground clearance.
Component of smart sprayer included one Imaging Source digital color camera
(DFK33UX264) with a 6 mm lens (Angle of view: 70.7 deg.), laptop computer (PC) with
custom image processing software, Arduino UNO mainboard, Arduino replay (8 relays), eight
solenoid valves and eight flat nozzles (Fig. 34).
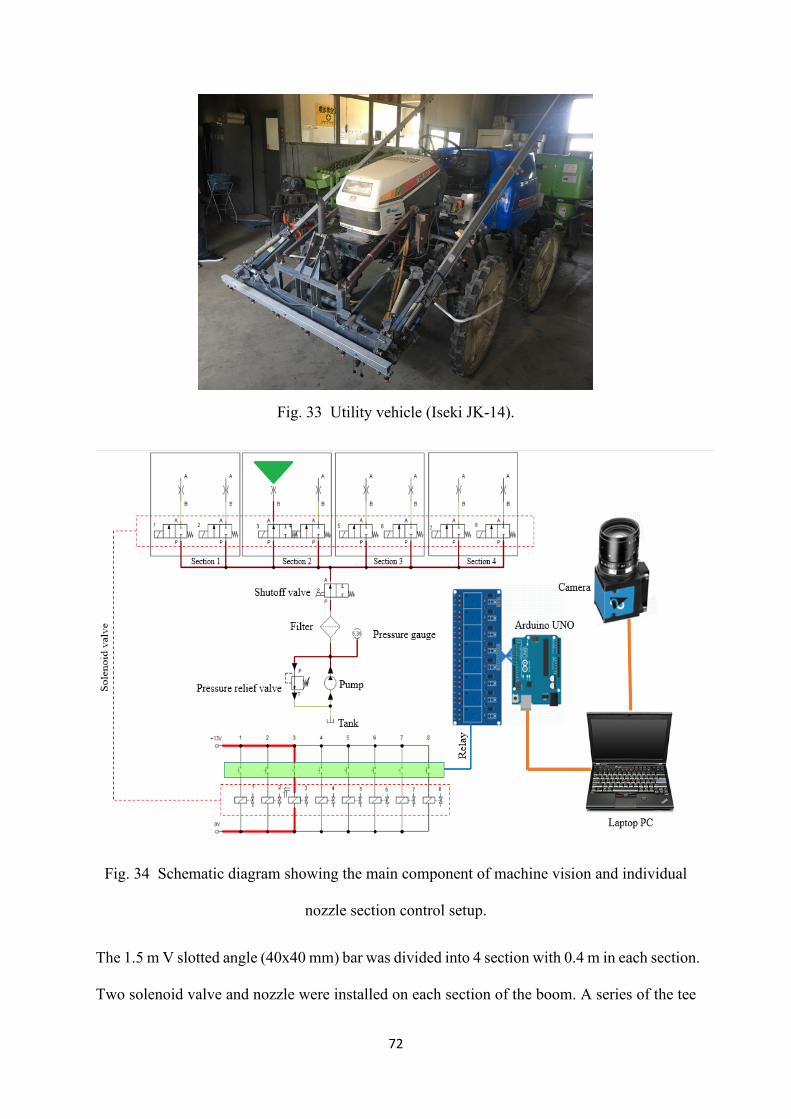
72
Fig. 33 Utility vehicle (Iseki JK-14).
Fig. 34 Schematic diagram showing the main component of machine vision and individual
nozzle section control setup.
The 1.5 m V slotted angle (40x40 mm) bar was divided into 4 section with 0.4 m in each section.
Two solenoid valve and nozzle were installed on each section of the boom. A series of the tee
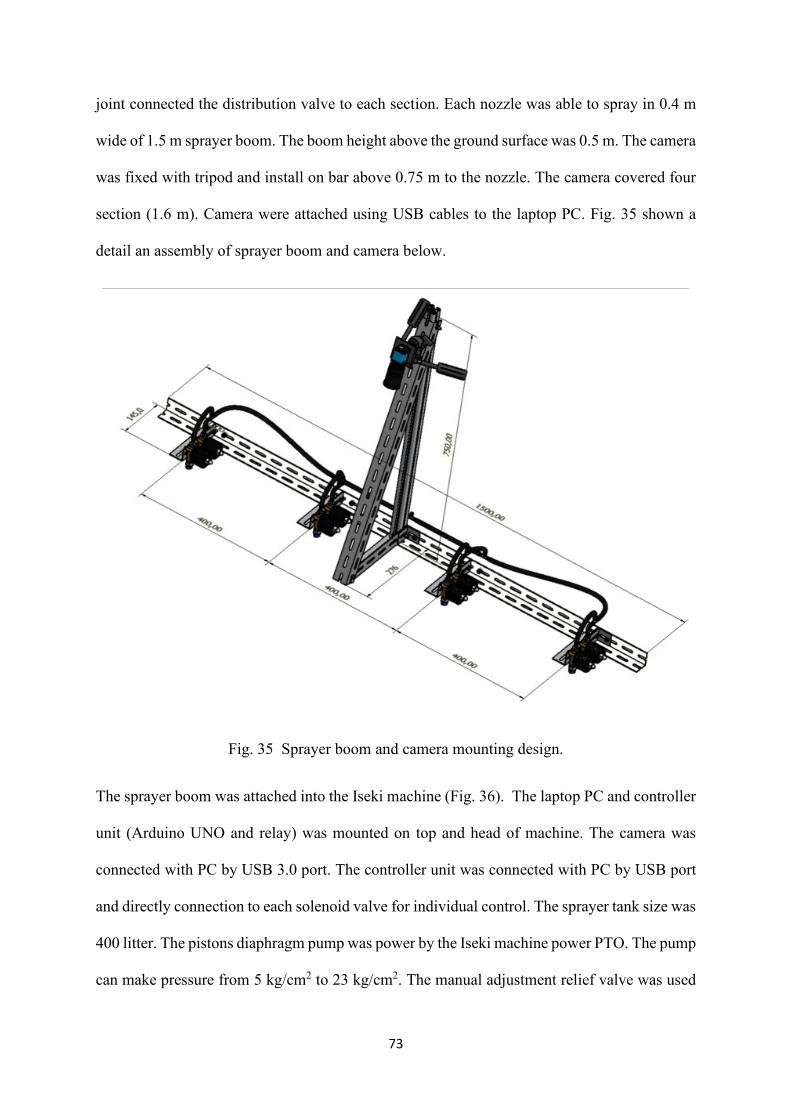
73
joint connected the distribution valve to each section. Each nozzle was able to spray in 0.4 m
wide of 1.5 m sprayer boom. The boom height above the ground surface was 0.5 m. The camera
was fixed with tripod and install on bar above 0.75 m to the nozzle. The camera covered four
section (1.6 m). Camera were attached using USB cables to the laptop PC. Fig. 35 shown a
detail an assembly of sprayer boom and camera below.
Fig. 35 Sprayer boom and camera mounting design.
The sprayer boom was attached into the Iseki machine (Fig. 36). The laptop PC and controller
unit (Arduino UNO and relay) was mounted on top and head of machine. The camera was
connected with PC by USB 3.0 port. The controller unit was connected with PC by USB port
and directly connection to each solenoid valve for individual control. The sprayer tank size was
400 litter. The pistons diaphragm pump was power by the Iseki machine power PTO. The pump
can make pressure from 5 kg/cm2 to 23 kg/cm2. The manual adjustment relief valve was used
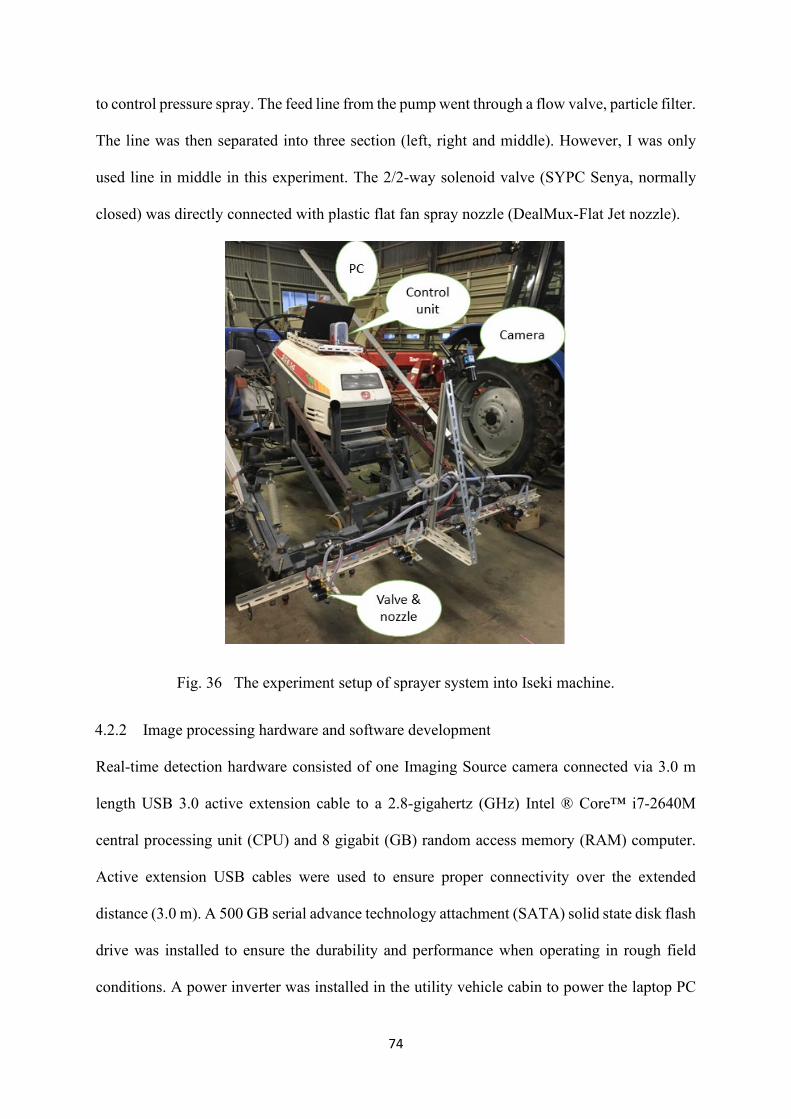
74
to control pressure spray. The feed line from the pump went through a flow valve, particle filter.
The line was then separated into three section (left, right and middle). However, I was only
used line in middle in this experiment. The 2/2-way solenoid valve (SYPC Senya, normally
closed) was directly connected with plastic flat fan spray nozzle (DealMux-Flat Jet nozzle).
Fig. 36 The experiment setup of sprayer system into Iseki machine.
4.2.2 Image processing hardware and software development
Real-time detection hardware consisted of one Imaging Source camera connected via 3.0 m
length USB 3.0 active extension cable to a 2.8-gigahertz (GHz) Intel ® Core™ i7-2640M
central processing unit (CPU) and 8 gigabit (GB) random access memory (RAM) computer.
Active extension USB cables were used to ensure proper connectivity over the extended
distance (3.0 m). A 500 GB serial advance technology attachment (SATA) solid state disk flash
drive was installed to ensure the durability and performance when operating in rough field
conditions. A power inverter was installed in the utility vehicle cabin to power the laptop PC
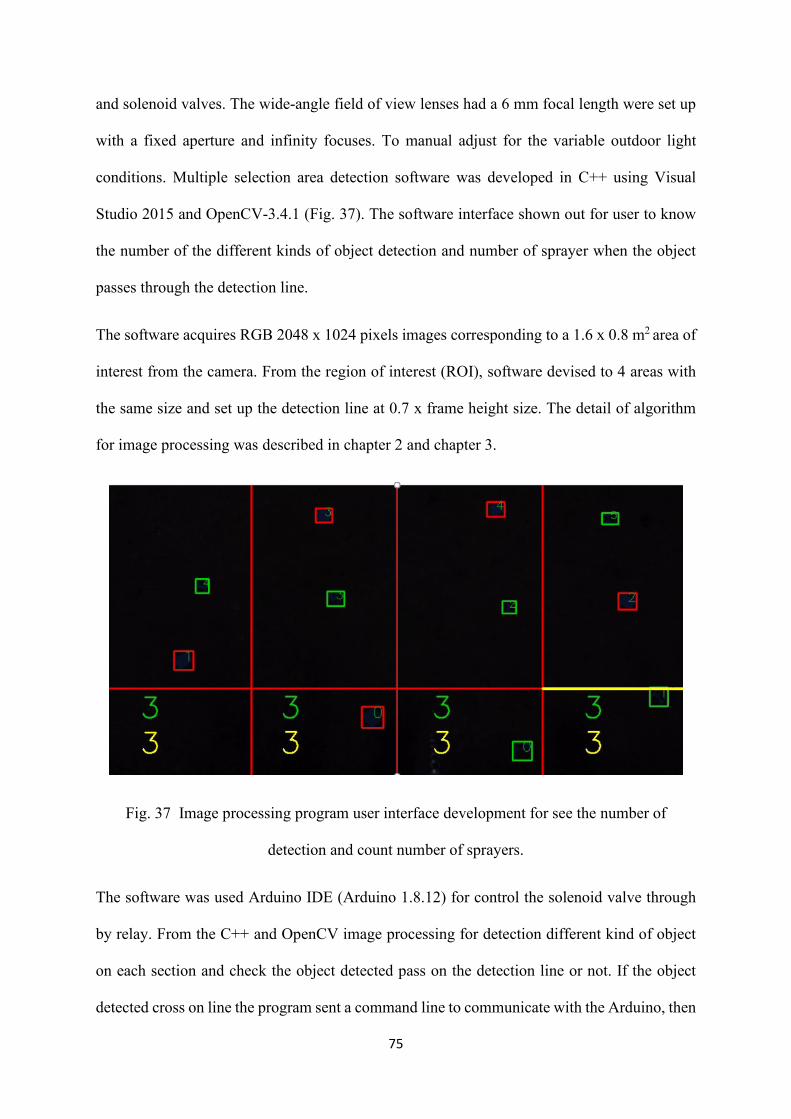
75
and solenoid valves. The wide-angle field of view lenses had a 6 mm focal length were set up
with a fixed aperture and infinity focuses. To manual adjust for the variable outdoor light
conditions. Multiple selection area detection software was developed in C++ using Visual
Studio 2015 and OpenCV-3.4.1 (Fig. 37). The software interface shown out for user to know
the number of the different kinds of object detection and number of sprayer when the object
passes through the detection line.
The software acquires RGB 2048 x 1024 pixels images corresponding to a 1.6 x 0.8 m2 area of
interest from the camera. From the region of interest (ROI), software devised to 4 areas with
the same size and set up the detection line at 0.7 x frame height size. The detail of algorithm
for image processing was described in chapter 2 and chapter 3.
Fig. 37 Image processing program user interface development for see the number of
detection and count number of sprayers.
The software was used Arduino IDE (Arduino 1.8.12) for control the solenoid valve through
by relay. From the C++ and OpenCV image processing for detection different kind of object
on each section and check the object detected pass on the detection line or not. If the object
detected cross on line the program sent a command line to communicate with the Arduino, then
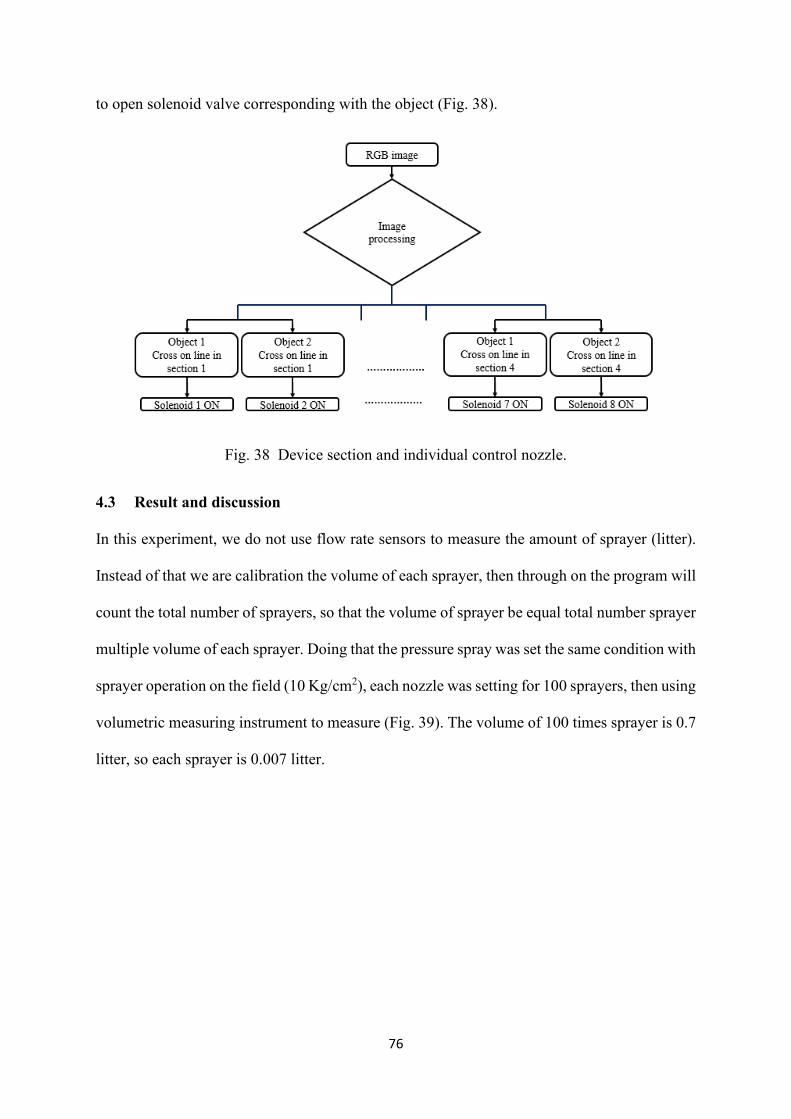
76
to open solenoid valve corresponding with the object (Fig. 38).
Fig. 38 Device section and individual control nozzle.
4.3 Result and discussion
In this experiment, we do not use flow rate sensors to measure the amount of sprayer (litter).
Instead of that we are calibration the volume of each sprayer, then through on the program will
count the total number of sprayers, so that the volume of sprayer be equal total number sprayer
multiple volume of each sprayer. Doing that the pressure spray was set the same condition with
sprayer operation on the field (10 Kg/cm2), each nozzle was setting for 100 sprayers, then using
volumetric measuring instrument to measure (Fig. 39). The volume of 100 times sprayer is 0.7
litter, so each sprayer is 0.007 litter.
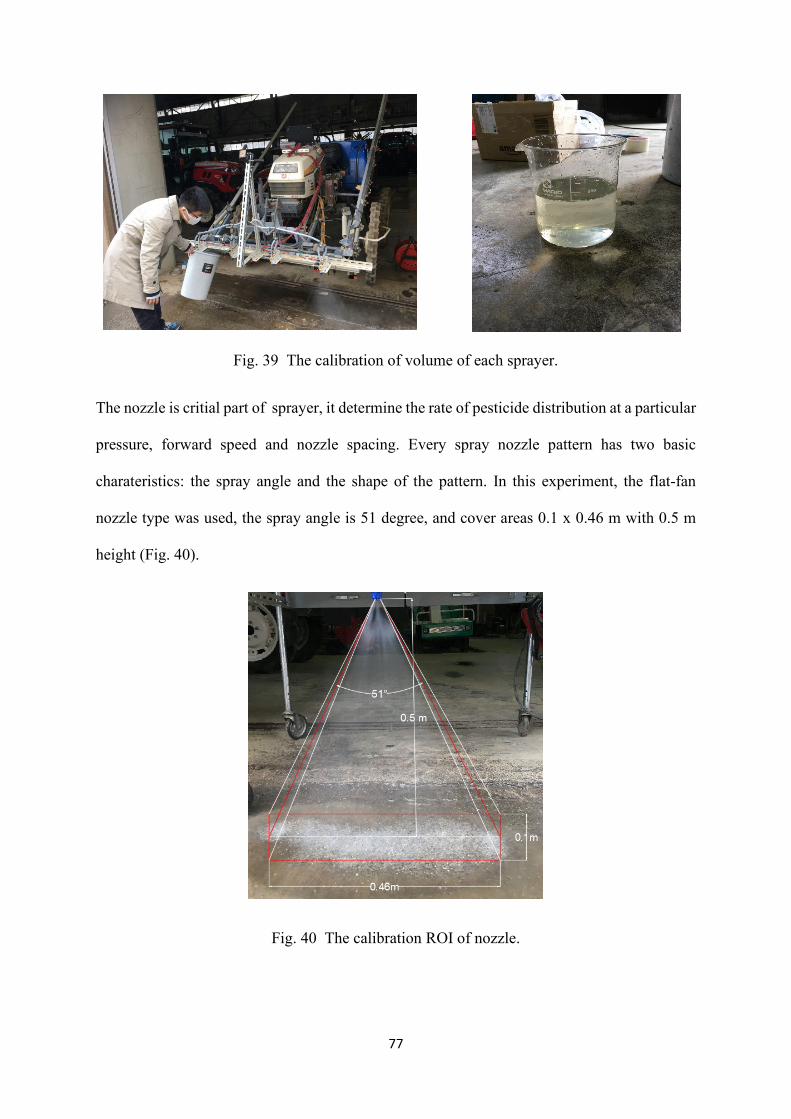
77
Fig. 39 The calibration of volume of each sprayer.
The nozzle is critial part of sprayer, it determine the rate of pesticide distribution at a particular
pressure, forward speed and nozzle spacing. Every spray nozzle pattern has two basic
charateristics: the spray angle and the shape of the pattern. In this experiment, the flat-fan
nozzle type was used, the spray angle is 51 degree, and cover areas 0.1 x 0.46 m with 0.5 m
height (Fig. 40).
Fig. 40 The calibration ROI of nozzle.
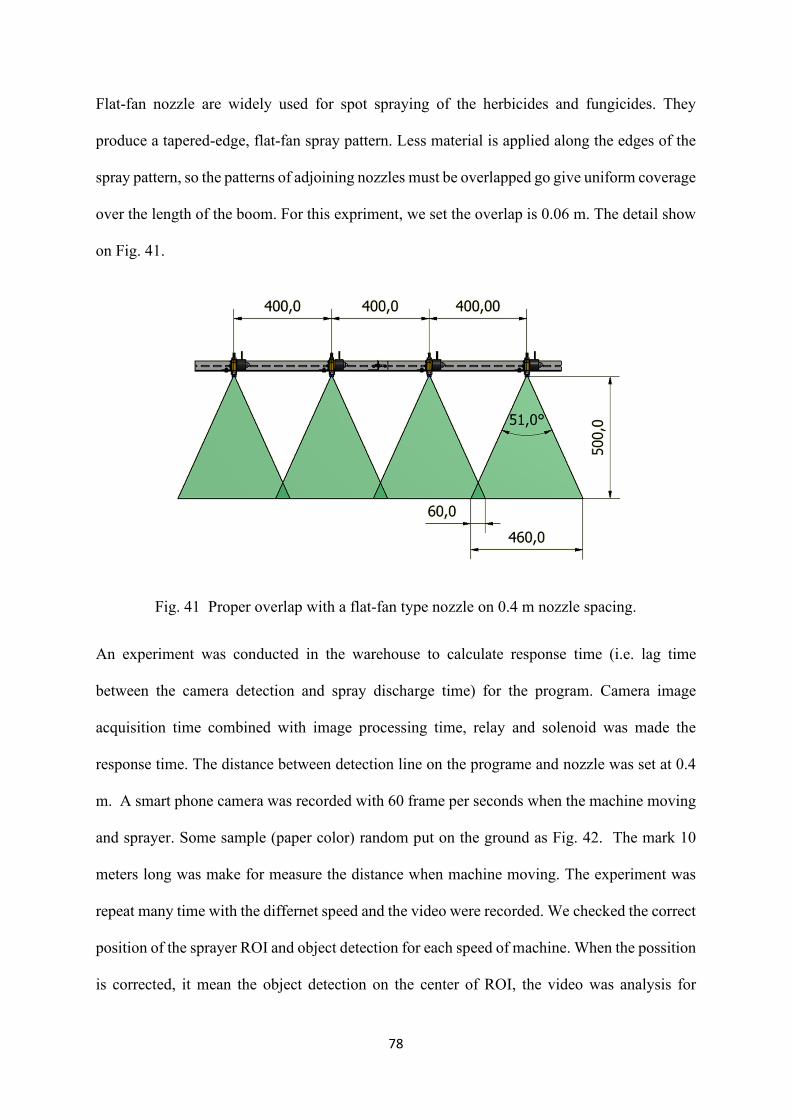
78
Flat-fan nozzle are widely used for spot spraying of the herbicides and fungicides. They
produce a tapered-edge, flat-fan spray pattern. Less material is applied along the edges of the
spray pattern, so the patterns of adjoining nozzles must be overlapped go give uniform coverage
over the length of the boom. For this expriment, we set the overlap is 0.06 m. The detail show
on Fig. 41.
Fig. 41 Proper overlap with a flat-fan type nozzle on 0.4 m nozzle spacing.
An experiment was conducted in the warehouse to calculate response time (i.e. lag time
between the camera detection and spray discharge time) for the program. Camera image
acquisition time combined with image processing time, relay and solenoid was made the
response time. The distance between detection line on the programe and nozzle was set at 0.4
m. A smart phone camera was recorded with 60 frame per seconds when the machine moving
and sprayer. Some sample (paper color) random put on the ground as Fig. 42. The mark 10
meters long was make for measure the distance when machine moving. The experiment was
repeat many time with the differnet speed and the video were recorded. We checked the correct
position of the sprayer ROI and object detection for each speed of machine. When the possition
is corrected, it mean the object detection on the center of ROI, the video was analysis for
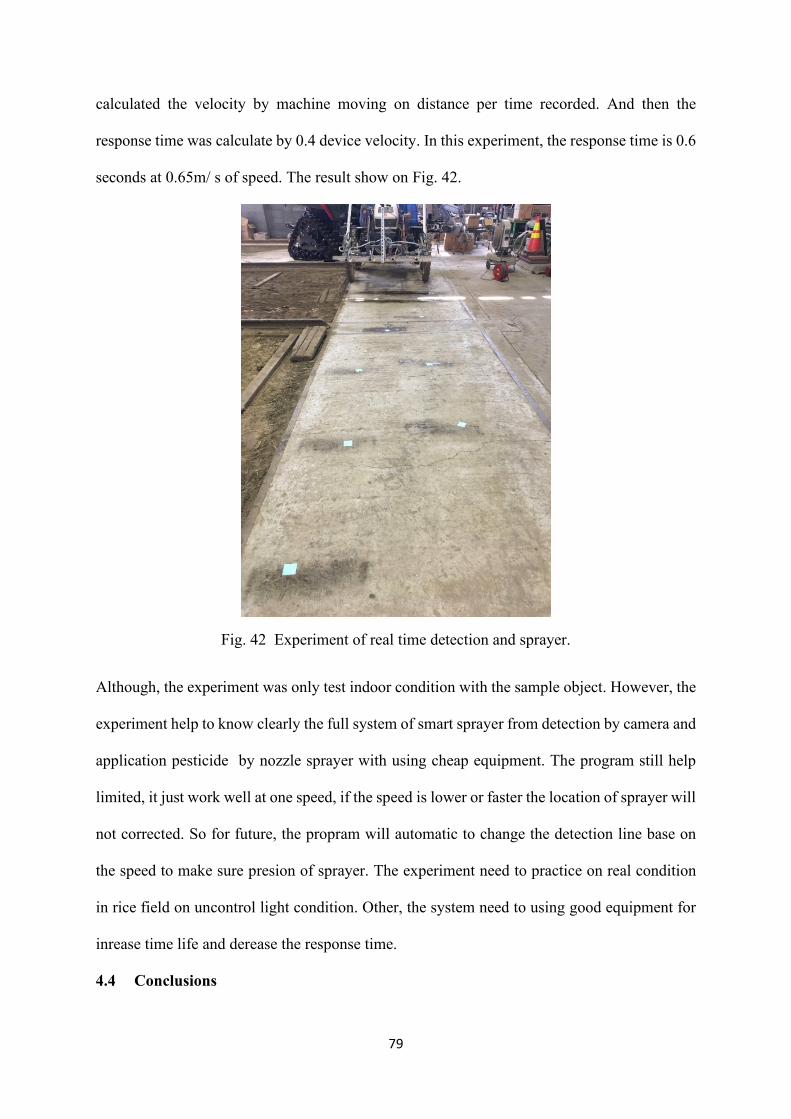
79
calculated the velocity by machine moving on distance per time recorded. And then the
response time was calculate by 0.4 device velocity. In this experiment, the response time is 0.6
seconds at 0.65m/ s of speed. The result show on Fig. 42.
Fig. 42 Experiment of real time detection and sprayer.
Although, the experiment was only test indoor condition with the sample object. However, the
experiment help to know clearly the full system of smart sprayer from detection by camera and
application pesticide by nozzle sprayer with using cheap equipment. The program still help
limited, it just work well at one speed, if the speed is lower or faster the location of sprayer will
not corrected. So for future, the propram will automatic to change the detection line base on
the speed to make sure presion of sprayer. The experiment need to practice on real condition
in rice field on uncontrol light condition. Other, the system need to using good equipment for
inrease time life and derease the response time.
4.4 Conclusions
80
The sensing and control system of the prototype commercial smart sprayer proved to be very
efficient at detecting two kind of weeds and spraying correctly at target areas with an actual
lag time of 0.6s. Although, the system does not use flow sensor for measurement the sprayer’s
volume. However, through on calibration volume of each sprayer and counting number of
weeds or disease by detection program provides the monitor density of object detection in field.
Based on the results of this study, the prototype commercial smart sprayer performed well for
targeting weeds and disease in rice fields.
The successful target applications of the developed smart sprayer resulted in an increased
interest within rice field farmer’s community, as they could see the benefits of this technology.
However, one of their concerns about the developed sprayer was that it can only work during
daytime and wind speed is typically low. In addition, the productivity is not high due to moving
speed low for adapted detection accuracy. In order to address this industrial need and make this
smart sprayer an effective option for rice field growers, an artificial light source system was
required to be developed and implemented into the smart sprayer to perform agrochemical
application in any condition.
81
Chapter 5 Conclusions and recommendations
5.1 Conclusions
The overall goal of this study was to develop and evaluate a smart sprayer for spot application
of agrochemicals for field rice production. An integrated automated system comprising of
Image source digital color cameras, a laptop PC, custom image processing software, Arduino
UNO main board and relay, individual nozzle control using solenoid valves was developed.
The developed system (hardware and software) was incorporated onto a traditional sprayer
along with the Iseki sprayer for real-time spot-application of selected agrochemicals primarily
used for rice field.
The key smart sprayer components were tested in the vehicle robotics laboratory. Results of
calibrations performance testing that the developed smart sprayer was effective method for
spot-application of agrochemical. Result confirmed that the smart sprayer system was more
cost-effective and easier to operate with cameras mounted near nozzle sprayer. The machine
vision system was be able to operate fast enough to open spray nozzles with d distance 0.2 m
between the line detection on the camera and the spray nozzle.
Although it is limited because it has not been practical in the field of rice fields in Vietnam.
However, the machine vision of image processing program for detection two kinds of weeds
(broadleaf and narrow leaf weeds) was based on bounding blob analysis and detection two
kinds of diseases (leaf blast and bacterial blight) based on mean color and shape feature
analysis has been tested in real videos and images recorded from Vietnam. The results show
that the detection success with high accuracy (broadleaf: 95.4%, narrow leaf: 87.1%, leaf blast:
89.23 %, bacterial blight: 91.11 %) and short processing time (0.3 second per frame), this is
suitable for real-time sprayer development.
An economic analysis comparing a basic sprayer to precision control sprayer as well as
82
proposed smart sprayer gave the perspective cost benefits of technology. According to Vietnam
Pesticide Association (VPA) reported on 2015 show that pesticide consumption using is 1.23
billion USD/ year and it will be increase around 2-3% per year. The amount of pesticides used
in rice production account for 64.9%. The smart sprayer system can reduce high amount of
pesticides. Depending on density of treatment areas, it can reduce 70-80% amount of pesticides.
So that we can reduce around 0.5 billion USD/ year. It will be helpful to increase farmer’s
income and reduce an effected to environment condition.
5.2 Recommendations
In this study, the smart sprayer used simple and cheap equipment with short life operation.
Future need to select good equipment with stability and long-life operation. The cameras have
vibration that is make unclear images and effected to detection accuracy, camera should be
using an isolation to reduce vibration.
Further improvements can be increase detection accuracy of the image processing software and
reduce time processing. The program can automatically change the detection line to precision
spot spray based on speed of sprayer system moving. Other improvements could be adding a
streamlined graphical interface that allows the user tabs that adjust the content being displayed
on the screen. It would be essential for the commercial application to have software with the
ability to be user programmable allowing for the increase or decrease in number of smart
sprayer cameras based on the sprayer boom width.
This study was designed for the rice field, but the same technology could be applied in other
cropping system that require spot-application at specific target locations. Farmers growing row
crops looking to reduce the amount of herbicide application to non-target areas could benefit
from adaptation of the smart sprayer technology. A technology transfer may be applicable for
golf courses that need spot treatment of different herbicides, fungicides or fertilizers based on
83
the conditions.
5.3 Contributions to knowledge
This PhD thesis presents the development a smart sprayer system for the rice field cropping
system. An integrated machine vision system with custom image processing software equipped
with a custom control box and fast acting solenoid valves for individual nozzle control was
developed and mounted on a farm tractor for spot-applications of agrochemicals. Many
researchers have tested spot-sprayers for a variety of different crops. However, the rice field
cropping system has had little focus from a research and development perspective of smart
spraying technologies.
An engineering design process was utilized that started with defining the problem of excess
agrochemicals being applied uniformly to rice fields. Idea generation and brainstorming
involved a literature search of related technology used to address over application of
agrochemicals in non-target areas in other cropping systems. A list of possible solutions to the
problem was developed and after choosing the most feasible option, a prototype was developed
based on the design criteria. The prototype was tested and evaluated with a series of lab. After
a sequence of refinements and re-evaluations, each step of the engineering design process has
been an important stage in improving the design and functionality of the smart sprayer system.
The original smart system involved an added one sensor of cabling and control two nozzles.
The smart sprayer was refined by increase the nozzle number on one sensor. The smart sprayer
system in its latest stage is fairly simplistic in terms of components required for converting
from a typical commercial agricultural boom sprayer. This simplification and refinement of the
smart sprayer through the various stages of the engineering design process have led to a unique
and practical solution for spot applications of agrochemical for the rice field cropping system.
Long time ago many rice fields could be grown without the need for intense and precise
herbicide and fungicide applications. However, with some weeds, diseases, and pest becoming
84
more resistant to pesticides applications and the increased yields, the farmers are applying more
and more inputs to their fields. At the same time many farmers are realizing the issues with
uniform blanket applications that can lead to soil erosion and environmental contamination.
The uniform application of agrochemical is also costing amount of money (1.6 billion USD per
year). This trend has sparked its initiative to develop a smart sprayer technology to lower the
amount of inputs while still maintaining maximum output yields.
Knowledge of the various components included with the smart sprayer could be adapted for
use and application for other cropping systems for lowering input requirements. The same
technology could be adapted for use with fertilizer spreaders to apply more appropriate rates
based on the real-time field variations that commonly exist. A database collected from the smart
sprayer could be compiled each year to determine the effectiveness of the agrochemicals being
applied. The data could also be compared to yield
maps to determine relationships between the different inputs, and their impact on the yield to
propose best management practices.
The rice production aims to increase harvestable yields at lower production cost, which can be
achieved by adopting this technology. This PhD project is unique, as it directly addresses one
of the major industrial problems. This research has found that spot applications of
agrochemicals on target locations has the ability to increase harvestable yields while at the
same time lowering agrochemical inputs. Results has shown a significant reduction in producer
cost required for agrochemical input using the smart sprayer as compared to the uniform
amounts of agrochemicals applied on commercial rice fields. Adoption of this smart sprayer
for commercial agrochemical applications can increase profit margins for rice field farmers,
with the added advantage of achieving sustainable production, which is of paramount
importance in the evolving world.
85
References
Aktar, M. W., Sengupta, D., & Chowdhury, A. (2009). Impact of pesticides use in agriculture:
their benefits and hazards. Interdiscip Toxicol, 2(1), 1-12.
Aravind, R., Daman, M., & Kariyappa, B. S. (2015). Design and development of automatic
weed detection and smart herbicide sprayer robot. Paper presented at the 2015 IEEE
Recent Advances in Intelligent Computational Systems (RAICS) conference,
Trivandrum, India, 257-261.
Archana, S., & Cchabra, A. (2014). Comprehensive review of denoising techniques in image
restoration. International Journal of innovative research in computer and
communication Engineering, 2(6), 4597-4602.
Bakar, M. A., Abdullah, A., Rahim, N. A., Yazid, H., Misman, S., & Masnan, M. (2018). Rice
Leaf Blast Disease Detection Using Multi-Level Colour Image Thresholding. Journal
of Telecommunication, Electronic and Computer Engineering (JTEC), 10(1-15), 1-6.
Balgude, Y. S., & Gaikwad, A. P. (2019). Integrated management of blast of rice. International
Journal of Chemical Studies, 7(1), 1557-1563.
Barrero, O., Rojas, D., Gonzalez, C., & Perdomo, S. (2016). Weed detection in rice fields using
aerial images and neural networks. Paper presented at the 2016 XXI Symposium on
Signal Processing, Images and Artificial Vision (STSIVA) conference. Bucaramanga,
Colombia, 31-34.
Bora, D. J., Gupta, A. K., & Khan, F. A. (2015). Comparing the performance of L* A* B* and
HSV color spaces with respect to color image segmentation. International Journal of
Emerging Technology and Advanced Engineering (IJETAE), 5(2), 192-203
Bossu, J., Gee, C., & Truchetet, F. (2008). Development of a machine vision system for a real
time precision sprayer. Electric Letter on Computer Vision and Image Analysis
(ELCVIA), 7(3), 54-66.
86
Bradski, G., & Kaehler, A. (2008). Learning OpenCV: O'Reilly Media, Inc., 1005 Gravenstein
Highway North, Sebastopol, California, 222-264.
Brahmbhatt, S. (2013a). Practical OpenCV. New York: Apress.
Brahmbhatt, S. (2013b). Practice OpenCV. New York: Apress.
Burgos-Artizzu, X. P., Ribeiro, A., Guijarro, M., & Pajares, G. (2011). Real-time image
processing for crop/weed discrimination in maize fields. Computers and Electronics in
Agriculture, 75(2), 337-346.
Caton, B. P., Mortiner, M., Hill, J. E., & Johnson, D. E. (2010). A Practice Field Guide to
Weeds of Rice in Asia, Second Edittion, IRRI, Phillipines, 22-114.
Chau, N. D., Sebesvari, Z., Amelung, W., & Renaud, F. G. (2015). Pesticide pollution of
multiple drinking water sources in the Mekong Delta, Vietnam: evidence from two
provinces. Environ Sci Pollut Res Int, 22(12), 9042-9058.
Chin, D. (1995). Present status of herbicide use in Vietnam. Paper presented at the Proceedings
of the 15th Asian-Pacific Weed Science Society Conference (Tsukuba, Japan, 24-28
July 1995), Tsukuba, Japan.
Chin, D., & Mortimer, M. (2002). Weed management in direct-seeded rice in South Vietnam.
Direct seeding: research strategies and opportunities. Los Banos, Philippines:
International Rice Research Institute, 349-356.
Chin, D. V. (2001). Biology and management of barnyardgrass, red sprangletop and weedy
rice. Weed Biology and Management, 1(1), 37-41.
Cover, T., & Hart, P. (1967). Nearest neighbor pattern classification. IEEE transactions on
information theory, 13(1), 21-27.
dos Santos Ferreira, A., Matte Freitas, D., Gonçalves da Silva, G., Pistori, H., & Theophilo
Folhes, M. (2017). Weed detection in soybean crops using ConvNets. Computers and
Electronics in Agriculture, 143, 314-324.
87
Dung, N. H., & Dung, T. T. T. (1999). Economic and health consequences of pesticide use in
paddy production in the Mekong Delta, Vietnam. EEPSEA research report series/IDRC.
Regional Office for Southeast and East Asia, Economy and Environment Program for
Southeast Asia.
Dyrmann, M., Jørgensen, R. N., & Midtiby, H. S. (2017). RoboWeedSupport-Detection of
weed locations in leaf occluded cereal crops using a fully convolutional neural network.
Advances in Animal Biosciences, 8(2), 842-847.
EdjeElictronic. (2019). TensorFlow-Object-Detection-API-Tutorial-Train-Multiple-Objects-
Windows-10, The open source from https://github.com/EdjeElectronics/TensorFlow-
Object-Detection-API-Tutorial-Train-Multiple-Objects-Windows-10
FAO. (2005). Food and agriculture organization of the united nations regional office for aisa
and the pacigic: http://www.fao.org/3/af340e/af340e00.htm#Contents, at 2. Country
Reports, 2.17 Viet Nam.
Francisco, E., Zahirul, I. (2003). Diagnosis of common diseases of rice. IRRI, Phillipines, 13-
22.
Gonzalez, R. C., & Woods, R. E. (2002). Digital image processing, Second Edittion, Prentice
Hall, Upper Saddle River, 523-527.
Hai, L., Kim, P. V., Du, P. V., & Thuy, T. (2007). Grain yield and grain-milling quality as
affected by rice blast disease (Pyricularia grisea), at My Thanh Nam, Cai Lay, Tien
Giang. Omonrice, 15, 102-107.
Heap, I. (2019). International survey of herbicide-resistant weeds,
from http://www.weedscience.org/, Accessed Jan 28, 2019.
Huang, J., Rathod, V., Sun, C., Zhu, M., Korattikara, A., Fathi, A., Fischer, I., Wojna, Z., Song,
Y., & Guadarrama, S. (2017). Speed/accuracy trade-offs for modern convolutional
88
object detectors. Paper presented at the Proceedings of the IEEE conference on
computer vision and pattern recognition, 3296-3305.
IRRI. (2018). Herbicide - when to apply, from http://www.knowledgebank.irri.org/step-by-
step-production/growth/weed-management/herbicides, Accessed Jan 28, 2018.
IRRI. (2019). Weed management. Rice knowledgement bank, from
http://www.knowledgebank.irri.org/step-by-step-production/growth/weed-
management, Accessed Jan 28, 2019.
IRRI. (2020). Disease and pest resistant rice, from https://www.irri.org/disease-and-pest-
resistant-rice, Accessed Jan 28, 2020.
Islam, T., Sah, M., Baral, S., & RoyChoudhury, R. (2018). A Faster Technique on Rice Disease
Detectionusing Image Processing of Affected Area in Agro-Field. Paper presented at
the 2018 Second International Conference on Inventive Communication and
Computational Technologies (ICICCT), Coimnatore, India, 62-66.
Archana, K, S., Sahayadhas, A. (2018). Automatic rice leaf disease segmentation using image
processing techniques, 7(3.27), 182-185.
Lu, Y., Yi, S., Zeng, N., Liu, Y., & Zhang, Y. (2017). Identification of Rice Diseases using
Deep Convolutional Neural Networks. Neurocomputing Jounral, 267, 378-384.
Mique, E., & Palaoag, T. (2018). Rice Pest and Disease Detection Using Convolutional Neural
Network. International Confernce on Information (ICSS), Jeju, Republic of Korea,
147-151.
Mitchell, T. (1997). Machine Leaning. McGraw-Hill, 154-199.
Nguyen, T. H. (2017). An Overview of Agriculture Pollution in Vietnam: The Crops Sector.
The World Bank's Agriculture and Environment and Natural Resources Global
Practices.
89
Nnolim, U. A. (2015). Design and implementation of novel, fast, pipelined HSI2RGB and log-
hybrid RGB2HSI colour converter architectures for image enhancement.
Microprocessors and Microsystems, 39(4-5), 223-236.
Rees, S., McCarthy, C., Artizzu, X., Baillie, C., & Dunn, M. (2009). Development of a
prototype precision spot spray system using image analysis and plant identification
technology. Paper presented at the Proceedings of the 2009 CIGR International
Symposium of the Australian Society for Engineering in Agriculture (SEAg 2009).
Ren, S., He, K., Girshick, R., & Sun, J. (2015). Faster r-cnn: Towards real-time object detection
with region proposal networks. Paper presented at the Advances in Neural Information
Processing Systems (NIPS) conference, Montreal, Canada.
Rijal, S., & Devkota, Y. (2019). A review on various management method of rice blast disease.
Malysian Journal of Sustainable Agriculture (MJSA), 4(1), 14-18.
Sato, J.-i., Shigeta, K., & Nagasaka, Y. (1996). Automatic operation of light tractor with
sprayer in paddy fields. JARQ (Japan).
Savary, S., Willocquet, L., Elazegui, F. A., Castilla, N. P., & Teng, P. S. (2000). Rice pest
constraints in tropical Asia: quantification of yield losses due to rice pests in a range of
production situations. Plant disease, 84(3), 357-369.
TensorFlow's Visualization Toolkit. (2018). TensorBoard Key Concepts Summary Ops :
How TensorBoard gets data from TensorFlow, from
https://github.com/tensorflow/tensorboard
The Imaging Source Asia Co., L. (2019). DFK 33UX264 USB 3.0 color microscope camera,
from https://www.theimagingsource.com/products/microscope-cameras/usb-3.0-
color/dfk33ux264/
90
Thuy, P. T., Anh, N. V., & Van der Bruggen, B. (2012). Evaluation of Two Low‐Cost–High‐
Performance Adsorbent Materials in the Waste‐to‐Product Approach for the Removal
of Pesticides from Drinking Water. CLEAN–Soil, Air, Water, 40(3), 246-253.
Tian, L. (2002). Development of a sensor-based precision herbicide application system.
Computers and Electronics in Agriculture, 36(2-3), 133-149.
Tian, L., Reid, J. F., & Hummel, J. W. (1999). Development of a Precision Sprayer for Site-
Specific Weed Management. Transactions of the ASAE, 42(4), 893-900.
Toan, P. V., Sebesvari, Z., Blasing, M., Rosendahl, I., & Renaud, F. G. (2013). Pesticide
management and their residues in sediments and surface and drinking water in the
Mekong Delta, Vietnam. Sci Total Environ, 452-453, 28-39.
Zaman, Q. U., Esau, T. J., Schumann, A. W., Percival, D. C., & Chang, Y. K. (2014). Prototype
Variable Rate Sprayer for Spot-Application of Agrochemicals in Wild Blueberry.
Applied Engineering in Agriculture, 717-725.
Zhang, L., Lin, L., Liang, X., & He, K. (2016). Is faster r-cnn doing well for pedestrian
detection ?. European Conference on Computer Vision (ECCV), Amsterdam,
Netherlands, 443-457.