Embed Size (px)
Citation preview
i
DEVELOPMENT OF A NANOCOMPOSITE MICRONEEDLE
BIOSENSOR FOR RAPID INTRADERMAL BIOANALYSIS
ELDHOSE SKARIA
PhD 2018
i
ABSTRACT
Intradermal bioanalysis via microneedle array (MNA) based electrodes are attracting significant research interests because their active components can be modified to selectively detect and monitor analytes of clinical interest in real-time; ranging from biofluids to solid tissues in a minimally invasive manner. The electrochemical detection strategies employed by these sensors are distinctly advantageous as they are generally low-cost, non-complex and can be effectively utilised by a minimally trained individual. However, clinical acceptability of MNA-based electrochemical sensors is dependent on developing highly selective and sensitive electrodes through a scalable fabrication strategy. The aim of this research was to therefore evaluate the potential of using carbon nanotubes (CNT’s) based polymeric nanocomposites to develop electrochemical MNA-based electrodes.
A simple fabrication strategy of dispersing CNT’s into epoxy resin via add/solution mixing and casting as MNA’s was initially investigated. However, a poor interfacial interaction between the epoxy-resin and CNT’s was found. Thus, a biodegradable polymer (poly (lactic) acid – PLA) was chosen as an alternative for the production of nanocomposites. A combinatorial approach involving carboxyl-functionalised MWCNT’s and sonication produced nanocomposites with excellent interfacial interaction and minimal aggregation. Using this approach, nanocomposite MNA’s were fabricated effectively at a maximum CNT loading of 6 wt%, at which the MNA’s displayed improved mechanical strength and the optimal electrochemical properties. The nanocomposite MNA’s were able to detect varying concentrations of ascorbic acid (AA), and demonstrated a linear oxidative response with a limit of detection (LOD) at 164.38M and 16.79M using differential pulse voltammetric (DPV) and amperometric, respectively. In situ electrochemical performance was further assessed in porcine skin. MNA’s could detect active changes in the skin, characterised by the appearance of two oxidative peaks. Upon inducing an artificial burn wound, the oxidative response was significantly attenuated, and importantly the impact of the burn could be measured at progressive distances from the burn site.
Further optimisation was however required to reduce the MNA’s resistive behaviour. Firstly, the method of sonication was investigated. Replacing the bath sonicator with a probe-type sonicator improved dispersions. The resultant 6 wt% CNT-loaded MNA’s had a better LOD of 0.51µM for AA, when measured amperometrically. Secondly, the influence of different dimensionalities (i.e. shorter lengths and smaller diameters) and functional groups (-NH2, -N2 and -COOH) were evaluated. Results highlighted the need to lower the concentration at which the CNT’s (particularly -NH2 and -N2 functionalised MWCNT’s) were dispersed. The maximum loading that could be incorporated for the shorter MWCNT’s with various functional groups was found to be 1 wt%. At this low CNT loading, the performance of -N2 functionalised MWCNT-based MNA’s was comparable to the sonication-optimised MNA’s.
The biocompatibility of -N2 and -COOH MNA’s was then assessed in vitro. Exposure to MNA device-based extracts on the human keratinocyte cell line (HaCaT) and human malignant melanoma cell line (A375) produced contradictory results, possibly due the influence of released nanoparticulates from the MNA’s. Toxicity was however only evident after a prolonged exposure to the extracts (i.e. ≥24 hrs). Further assessment using DPV and amperometric simulations showed no evidence of voltage-mediated cell toxicity.
In conclusion, this research highlights the potential of using CNT’s based nanocomposites to produce electroactive MNA’s, with limited toxicity, for bioanalytical studies. The fabrication steps are simple and easy to scale-up, and result in the development of MNA based electrodes in a single step.
ii
CONTENTS
ABSTRACT ........................................................................................................................ i LIST OF TABLES ...............................................................................................................v LIST OF FIGURES ........................................................................................................... vi ABBREVIATIONS ............................................................................................................ ix ACKNOWLEDGMENTS ................................................................................................ xii AUTHOR’S DECLARATION ........................................................................................ xiii Chapter 1. Introduction and literature review ..................................................................1
1.1 Introduction ............................................................................................................1 1.2 Continuous glucose monitoring .............................................................................2
1.2.1 Microfluidic sensors .......................................................................................4 1.3 Other Analytes .....................................................................................................22
1.3.1 Single analyte detection ...............................................................................22 1.3.2 Multi-analyte detection ................................................................................30
1.4 Discussion and Future directions .........................................................................32 1.5 Aims and objectives .............................................................................................34
Chapter 2. General materials and methods .....................................................................37
2.1 Overview ..............................................................................................................37 2.2 Fabrication............................................................................................................37
2.2.1 Development of micromoulds ......................................................................37 2.2.2 Development of MNA’s ...............................................................................37
2.3 Characterisation and evaluation ...........................................................................40 2.3.1 Mechanical characterisation .........................................................................40 2.3.2 Electrochemical characterisation .................................................................42
2.4 Cell culture techniques .........................................................................................53 2.4.1 Thawing, culture, subculture and storage ....................................................54 2.4.2 Quantification of cell number using a haemocytometer ..............................54
2.5 Statistical analysis ................................................................................................55 Chapter 3. Investigating the potential for developing Epoxy/Carbon Nanotube composites based MNA electrodes ....................................................................................56
3.1 Introduction ..........................................................................................................56 3.1.1 Carbon Nanotubes ........................................................................................57 3.1.2 Processing of epoxy and their composites ...................................................60
3.2 Aims and objectives .............................................................................................66 3.3 Materials and methods .........................................................................................67
3.3.1 Fabrication of PLA and Epoxy MNA’s .......................................................67 3.3.2 Fabrication of nanocomposite MNA’s .........................................................68 3.3.3 Mechanical characterisation .........................................................................69 3.3.4 Skin penetration ...........................................................................................70 3.3.5 Imaging ........................................................................................................70 3.3.6 Statistical analysis ........................................................................................70
3.4 Results ..................................................................................................................71 3.4.1 Fabrication of Epoxy MN’s .........................................................................71 3.4.2 Skin Penetration ...........................................................................................72 3.4.3 Development of a standardised protocol for evaluating mechanical properties ......................................................................................................................73
iii
3.4.4 Mechanical characterisation of epoxy microneedles ...................................76 3.4.5 Epoxy/MWCNT Composite MNA ..............................................................78
3.5 Discussion ............................................................................................................81 3.6 Conclusions ..........................................................................................................85 3.7 Future work ..........................................................................................................86
Chapter 4. Synthesis and characterisation of poly (lactic acid)/f-MWCNT composite MNA’s ......................................................................................................................87
4.1 Introduction ..........................................................................................................87 4.1.1 Polymer nanocomposites .............................................................................88 4.1.2 Fabrication of nanocomposites ....................................................................88
4.2 Aims and objectives ...........................................................................................102 4.3 Materials and methods .......................................................................................103
4.3.1 Fabrication of PLA/f-MWCNT composites...............................................103 4.3.2 Micromoulding ...........................................................................................104 4.3.3 Mechanical characterisations .....................................................................104 4.3.4 Electrochemical characterisation ...............................................................104 4.3.5 Ascorbic acid ..............................................................................................106 4.3.6 In situ electrochemical characterisation .....................................................107 4.3.7 Imaging ......................................................................................................108 4.3.8 Statistical analysis ......................................................................................108
4.4 Results ................................................................................................................109 4.4.1 Fabrication of nanocomposite films ...........................................................109 4.4.2 Fabrication of nanocomposite MNA’s .......................................................109 4.4.3 Mechanical characterisation .......................................................................111 4.4.4 Electrochemical characterisation ...............................................................112 4.4.5 Ascorbic acid analysis ................................................................................117 4.4.6 In situ analysis ............................................................................................119
4.5 Discussion ..........................................................................................................123 4.6 Conclusions ........................................................................................................128 4.7 Further work .......................................................................................................129
Chapter 5. Optimisation of MNA’s electrochemical behaviour ..................................130
5.1 Introduction ........................................................................................................130 5.1.1 Optimisation of sonication parameters ......................................................131 5.1.2 Surfactants ..................................................................................................132 5.1.3 MWCNT functional and structural evaluations .........................................136
5.2 Aims and objectives ...........................................................................................138 5.3 Materials and methods .......................................................................................139
5.3.1 Optimisation of dispersion by sonic probe ................................................139 5.3.2 Surfactant assisted dispersion ....................................................................139 5.3.3 Evaluating length and functional groups....................................................140 5.3.4 Mechanical characterisation .......................................................................141 5.3.5 Electrochemical characterisation ...............................................................141 5.3.6 Statistical analysis ......................................................................................141
5.4 Results ................................................................................................................142 5.4.1 Optimising the dispersion of CNT’s via probe sonication .........................142 5.4.2 Surfactants ..................................................................................................148 5.4.3 Evaluation of different functional groups ..................................................157
5.5 Discussion ..........................................................................................................166
iv
5.6 Conclusions ........................................................................................................173 Chapter 6. Toxicity evaluations of MNA’s ....................................................................174
6.1 Introduction ........................................................................................................174 6.2 Aims and objectives ...........................................................................................177 6.3 Materials and Methods .......................................................................................178
6.3.1 Cell lines and culture conditions ................................................................178 6.3.2 Toxicity evaluation using MNA extracts ...................................................178 6.3.3 Cytotoxicity evaluation by LDH assay ......................................................180 6.3.4 Electrochemical measurement-induced toxicity evaluation.......................180 6.3.5 Microscopic imaging of the cell monolayer...............................................182 6.3.6 Statistical analysis ......................................................................................182
6.4 Results ................................................................................................................183 6.4.1 Seeding density ..........................................................................................183 6.4.2 Exposure to device extracts ........................................................................183 6.4.3 Cytotoxicity assessment via LDH release ..................................................188 6.4.4 Electrochemical measurement-induced toxicity ........................................192 6.4.5 Cell viability evaluation on DPV recordings .............................................192 6.4.6 Cell viability evaluation on amperometric measurements .........................194
6.5 Discussion ..........................................................................................................195 6.6 Conclusions ........................................................................................................200 6.7 Further work .......................................................................................................201
Chapter 7. General discussion and future work ...........................................................202
7.1 General discussion .............................................................................................202 7.2 Future directions.................................................................................................211
REFERENCES .................................................................................................................213

v
LIST OF TABLES
Table 1.1 Comparison of performance between type 1 and type 2 chips against a stand-alone biosensor (control) at the optimal sampling time of 30s ..............................................18
Table 4.1 Mechanical properties of solution/solvent casted nanocomposites. ....................92
Table 4.2: Electrical conductivity measures of solution/solvent casted nanocomposites ....97
Table 6.1: Extract and exposure conditions for both cell lines ..........................................179
vi
LIST OF FIGURES
Figure 1.1. Continuous glucose monitoring from ISF using MiniMed CGMsTM compared with finger stick measurements ......................................................................................3
Figure 1.2. Schematic representation of the three generations of glucose sensors ................5
Figure 1.3. Fabrication and functioning of the intelligent mosquito .....................................7
Figure 1.4. Functioning of the elastic self-recovery actuator integrated with a hollow nickel microneedle ..................................................................................................................10
Figure 1.5. Bi-component design. ........................................................................................11
Figure 1.6. Microneedle architecture and complete device .................................................15
Figure 1.7. Two independent MNA device performance over 72 hours .............................16
Figure 1.8. Alcohol biosensor. .............................................................................................24
Figure 1.9. Detection of NO levels ......................................................................................29
Figure 2.1 Model of electrical layer .....................................................................................45
Figure 2.2 Capacitor .............................................................................................................45
Figure 2.3 Various pathways to an electrochemical reaction. .............................................47
Figure 2.4 Cyclic voltammetric process...............................................................................51
Figure 2.5 Differential pulse voltammetry. ..........................................................................53
Figure 3.1 Three different structural forms of CNT’s..........................................................58
Figure 3.2. Epoxide group ....................................................................................................60
Figure 3.3. Structure of DGEBA..........................................................................................61
Figure 3.4. Experimental set-up for measuring AFS and SFS .............................................69
Figure 3.5. Optimisation of fabrication conditions for epoxy MNA’s ................................71
Figure 3.6. Before and after images of microneedles following skin, penetration tests done using the three grades of epoxy MNAs. .......................................................................73
Figure 3.7. Typical axial load profile of a PLA microneedle ..............................................74
Figure 3.8. Shear strength measurement of PLA microneedles. ..........................................75
Figure 3.9. Cantilever effect ................................................................................................76
Figure 3.10. AFS and SFS tests for standard epoxy, medium epoxy and hard epoxy. ........77
Figure 3.11. Measurement of AFS and SFS ........................................................................78
Figure 3.12. Medium Epoxy/f-MWCNT composite MNA’s. ..............................................80
Figure 4.1. Nanocomposite film synthesis .........................................................................103
Figure 4.2. Designing an electrical contact ........................................................................106
Figure 4.3. SEM images of 6% f-MWCNT/PLA composite MNA ...................................110
Figure 4.4. Mechanical characterisation of composite vs PLA MNA’s using texture analyser ....................................................................................................................................112
Figure 4.5. Electrochemical response of MNA’s towards 1mM Fe(CN)6. ........................113
vii
Figure 4.6. Digital image of an optimised MNA fabricated using the nanocomposite material ....................................................................................................................................115
Figure 4.7. Electrochemical response of the MNA’s towards 1mM Fe(CN)6 after optimising the weight of the composites. .....................................................................................116
Figure 4.8. Quantitative determination of ascorbic acid. ...................................................118
Figure 4.9 In situ bioanalysis .............................................................................................120
Figure 4.10. Burn wound model ........................................................................................122
Figure 5.1. Schematic of investigation ...............................................................................130
Figure 5.2. Particle size vs sonication time ........................................................................143
Figure 5.3. UV-Vis spectral analysis .................................................................................144
Figure 5.4. Electrochemical response of the MNA’s towards 1mM Fe(CN)6 after sonication optimisation ................................................................................................................145
Figure 5.5. Amperometric calibration plots of AA ............................................................147
Figure 5.6. Dispersions above and below TK .....................................................................148
Figure 5.7. PDI of surfactants at different temperatures against control (i.e. no surfactant) ....................................................................................................................................149
Figure 5.8 UV-Vis absorbance measured at ~260 nm for evaluating the effect of temperature ....................................................................................................................................150
Figure 5.9. Evaluating different concentrations of surfactants ..........................................152
Figure 5.10. PDI of CNT’s at different concentrations of surfactant ................................153
Figure 5.11. Digital photographs of nanocomposite suspensions ......................................154
Figure 5.12. Mechanical characterisation. .........................................................................155
Figure 5.13. Electrochemical response of the MNA’s towards 1mM Fe(CN)6 after surfactant incorporation. .............................................................................................................156
Figure 5.14. Comparison of amperometric responses from surfactant incorporated MNA devices, against the base and the probe optimised MNA’s ........................................157
Figure 5.15. Electrochemical response from varyingly functionalised MNA’s towards 1mM Fe(CN)6 ......................................................................................................................158
Figure 5.16. Dispersion analysis on varying CNT concentrations.....................................160
Figure 5.17. UV-vis absorbance measured at ~260nm ......................................................161
Figure 5.18. Characterising fabricational limits .................................................................162
Figure 5.19. Mechanical characterisation of different functional groups and dimensional parameters. .................................................................................................................163
Figure 5.20. Electrochemical response of the MNA’s towards 1mM Fe(CN)6 with different functional groups ........................................................................................................164
Figure 5.21. Amperometric responses towards varying concentration of AA from MNA devices fabrication with MWCNT’s of different functionalities and dimensions .....165
Figure 6.1. Experimental set-up for evaluation of electrochemical measurement induced toxicity. ......................................................................................................................181
viii
Figure 6.2 Seeding density determined by MTT assay ......................................................183
Figure 6.3. Viability of A375 and HaCaT cells post exposure to different concentrations of extracts prepared from 1 wt% -N2 functionalised MWCNT/PLA based MNA devices ....................................................................................................................................185
Figure 6.4. Viability of A375 and HaCaT cells post exposure to different concentrations of extracts prepared from 6 wt% -COOH functionalised MWCNT/PLA based MNA devices ........................................................................................................................187
Figure 6.5 Cytotoxic effects on A375 and HaCaT cells post exposure to different concentrations of extracts prepared from 1 wt% –N2 functionalised MWCNT/PLA based MNA devices ...................................................................................................189
Figure 6.6. Cytotoxic effects on A375 and HaCaT cells post exposure to different concentrations of extracts prepared from 6 wt% -COOH functionalised MWCNT/PLA based MNA devices ...................................................................................................191
Figure 6.7. Images of the experimental set-up. ..................................................................192
Figure 6.8. Assessment of viability via trypan blue exclusion following DPV stimulation. ....................................................................................................................................193
Figure 6.9 Micrographs of HaCaT cells before and after electrical stimulation ................193
Figure 6.10. Assessment of viability via trypan blue exclusion following amperometric stimulation ..................................................................................................................194
ix
ABBREVIATIONS
AA Ascorbic acid ACT Acetaminophen AE Auxiliary Pt electrode AFS Axial fracture strength ANOVA Analysis of variance BFC Biofuel-cell BSA Bovine serum albumin CCVD Catalytic chemical vapour deposition CE Counter electrode CGM Continuous glucose monitoring CMC Critical micelle concentration CNT’s Carbon nanotubes CP Conductive polymers CPE Carbon plate electrode CPyCl Cetylpyridinium chloride CTAB Cetyltrimethyl ammonium bromide CTAC Cetyltrimethyl ammonium chloride CV Cyclic voltammetric CY Cysteine DA Dopamine DAB Droplet-borne air blowing DCM Dichloromethane DGEBA Diglycidyl ether of bisphenol A DLS Dynamic light scattering DMEM Dubelcco’s Modified Eagle Medium DMSO Dimethyl sulphoxide DPV Differential pulse voltammetry DRIE Deep reactive ion etching EDC 1-Ethyl-3-(3-dimethylaminoproprly) carbodiimide EDM Electrical discharge machining ELISA Enzyme-linked immunosorbent assay EMI Electromagnetic interference FBS Foetal bovine serum FDA Food and drug administration f-MWCNT Carboxyl-functionalised multiwalled carbon nanotubes GCE’s Glassy carbon electrodes GOx Glucose oxidase HIPCO High pressure carbon monoxide ISE Ion-selective-electrode ISF Interstitial fluid ISO International organisation of standardisation IV Intravenous
x
LCP Liquid crystal polymer LDH Lactate dehydrogenase LOD Limit of detection LSV Linear sweep voltammetry MEMS Microelectromechanical systems MNA Microneedle arrays MPA 3-Mercaptopropionic acid MPOx Methyl paraoxon MTT 3-(4,5-Dimethylthiazol-2-yl)-2,5-diphenyl-2H-tetrazolium
bromide MWCNT Multiwalled carbon nanotubes NADH Nicotinamide adenine dinucleotide NHS N-hydroxyscucciniminde N-IUCD Nitrogen incorporated ultrananocrystalline diamond NO Nitric oxide OCT Optical coherence tomography OD Optical density OPH Organophosphorus hydrolase PAA Polyamic acid PB Prussian blue PBS Phosphate buffered saline PC Pyrolysed carbon PC Polycarbonate PCL Polycaprolactone Pd Palladium PD polydopamine PDMS Polydimethylsiloxane PEDOT Poly(3,4-ethylenedioxythiophene) PEI Polyethyleneimine PG Porous graphene PGA Polyglycolic acid PI Polyimide PLA Poly(lactic acid) PLGA Poly(lactic-co-glycolic acid) PMMA Poly(methyl methacrylate) POC Point-of-care PPD Poly(o-phenylenediamine) PS Polystyrene Pt Platinum PU Polyurethane RE Reference electrode RSD Relative standard deviation RT Room temperature SAM Self-assembled monolayer
xi
SDBS Sodium dodecyl benzene sulfonate SFS Shear fracture strength SMA Shape memory actuator SSMA Straight silicon microneedle array SWCNT Single walled carbon nanotubes SWV Square wave voltammetry T1D Type 1 diabetes TA Texture analyser TS Tensile strength TSMA Tapered silicon microneedle array TTF Tetrathiafulvalene UA Uric acid UHA Ultrahigh aspect ratio VAS Visual Analogue Scale WE Working electrode YM Young’s modulus

xii
ACKNOWLEDGMENTS
I, first and foremost, wish to sincerely thank my supervisors Dr. Keng Wooi Ng, Dr. Melanie S. Flint and Dr. Bhavik A Patel Meikle for their continued guidance and support throughout the course of my PhD. They have been great mentors and a source of inspiration. I am particularly grateful to them for entrusting me with the confidence to independently develop my owns research ideas and pursue them deeply. I would also like to formally acknowledge the School of Pharmacy and Biomolecular Sciences for not only awarding this PhD studentship, but also for their continued investment in supporting national and international conferences.
I wish to extend my gratitude to colleagues of past and present who have helped me with various aspects along the course of this PhD. In particular, Dr. Andrew Flint for help with SEM; Mr Chris Morris and Mr Maurizio Valeri for help and support with tissue culture, Dr. Diapak Sarker for help with contact angle measurements and surfactant work and Dr. Santanu Ray for XPS-based analysis and experimentation. I also wish to thank the technical support team, especially Mrs Christine Smith. Lastly, I am thankful to Dr. Ryan Waters (Pirbright Institute, Pirbright, UK) for donating the porcine ears used in this research.
I am extremely grateful for the encouragement, care and support that I have received through the many friendships created. They have had a huge role in every step of this journey and helped create many and unforgettable joyous memories. In particular, I wish to thank Megi Kamenica, who has gone above and beyond to help me at challenging times. My lab partners Ella Sirjani, Gennaro, Blaise Geohegan who were at hand to help when needed and were a continued source of entertainment. Special mentions to Renee Flaherty, Haya Intabli, Myrthe Mampay and Marta Falcinell.
Above all, I wish to thank my parents, Mr. Skaria V Joseph and Mrs. Reeni Skaria; who have dedicated their life towards giving me the best opportunities in life. Without their support, love and innumerous packed meals none of this would have been possible. I want to thank my brother, Edin, who has been keeping my parents entertained for the long years I have been away. Last and but not least, to my dearest girlfriend, Rahaf Issa, you have been amazing. If I were to write to what I was thankful for, the list would be longer than my abbreviations list. You have helped in more ways than I could imagine, and I will never forget any of it; from the very first coffee together to the countless meals and discussions we have enjoyed, and more recently our fur-child, Frank. I look up to you professionally and personally. Needless to say, I yearn towards making a great team with you one day.
Finally, thank you to the prayers and blessing of my grandparents and loved ones.
xiii
AUTHOR’S DECLARATION
I declare that the research contained in this thesis, unless otherwise formally indicated within
the text, is the original work of the author. The thesis has not been previously submitted to
this or any other university for a degree, and does not incorporate any material already
submitted for a degree.
Signed
Dated 06-Aug-2018
1
Chapter 1. Introduction and literature review
1.1 Introduction
Microneedle arrays (MNA’s) are medical devices consisting of several miniaturised
replica of hypodermic needles that are designed to penetrate and target specific regions of
biological membranes in a minimally invasive manner. By design, there are various classes
of MNA’s i.e. solid, coated, hollow, dissolving and hydrogel forming; that are produced
from a wide variety of materials, in different sizes and shapes. Typically, individual
microneedles feature lengths of up to 1mm and are hundreds of micrometres wide. These
devices have been designed as microarray patches to perforate the skin, but their use on
other organs has been explored, including the eye1 and colon2.
The concept of using skin-perforating needles, ‘preferably 1-2mm in length’ was first
recorded in 1948 for drug delivery applications3. Descriptions of such devices for similar
applications did not appear until a decade later4 and the first patent, submitted by Gerstel
and Place, was approved in 1976 for applications in drug delivery, based on a device
consisting of a plurality of micron-sized projections extending from a drug reservoir5.
However, microneedle research only intensified in the mid 1990’s, as the microelectronics
industry revolutionised manufacturing tools that facilitated precise and scalable fabrication
of microneedles6. Research group led by Prausnitz then coined the term ‘microneedle’ and
published a novel study on micro-fabricated needles to enhance transdermal drug delivery7.
This earmarked the beginning of a plethora of researches over the next decade, describing
novel applications in dermal immunisation8, delivery of macromolecules and nanoparticles9,
bioanalytical sensors based on both dermal interstitial fluid (ISF) extraction and analysis10
or in situ monitoring11,12 and finally, point-of-care (POC) molecular diagnostic devices13.
Intensified research efforts in these areas has now helped establish MNA’s as an enabling
medical device technology, supported by the public and clinicians for their use in clinical
practice.
Transdermal delivery of drugs and vaccines represents the most studied applications
in microneedle research to date. The transdermal route offers distinct advantageous over
conventional means such as oral administration and injections. These include: (1) avoidance
of degradation in the gastro-intestinal tract and bypassing the hepatic first-pass effect of the
liver; (2) maintenance of a relatively constant plasma concentrations; thereby avoiding
2
toxicity and inefficiency associated with fluctuations; (3) potential for targeted delivery,
especially of vaccines to antigen-presenting cells in the skin, and finally, (4) those associated
with microneedles themselves i.e. elimination of pain, discomfort and needle phobia
resulting in improved patient compliance, reduced risk of infection and potential for self-
administration by the patients themselves6,14–16.
The aim of this review is to highlight recent findings on MNA based diagnostic and
bioanalytical sensors with particular emphasis given towards their fabrication, architecture
and method of analysis. Research concerning these applications is continually emerging and
offering divergent applications aside of MNA based Continuous Glucose Monitoring
(CGM) devices; which remains to the most active area of research in this field to date. The
skin in replete with disease markers, small molecules, proteins and lipids that are either
circulating or constitutively present. As such it offers a unique window to monitor the
body’s health17. However, skin chemistry is rarely used in routine clinical practice due to a
lack of convenient and standardised method for routine collection of biomolecules from the
skin. Histopathological analysis, though is the gold standard, is limited by its qualitative and
variable nature18,19. Developing MNA based sensors is therefore most advantageous as it
can be utilised to extract quantitative information in a fast, reliable and pain-free manner for
frequent monitoring and diagnostic purposes. Moreover, transdermal biosensing via MNA
based devices that are integrated with biochips, offers the potential to move laboratory scale
instruments into miniaturised platforms that can be utilised by a minimally trained
individuals20. Thus, it can radically transform clinical practice into a more efficient,
economically viable and highly accessible format.
MNA based transdermal sensors can be broadly distinguished into two types i.e. one
that can extract biofluid for analysis outside of the skin and the other capable of performing
in situ bioanalysis. Initially research into CGM devices are discussed by differentiating
various formats of such sensors. This is followed by an in-depth analysis of current literature
on bioanalytical and diagnostics devices, again differentiated by their design. Finally, future
directions are pointed out and discussed in line with the goal of this thesis.
1.2 Continuous glucose monitoring
The primary form of treatment for type 1 (where insulin is not produced) and some
advanced type 2 diabetes (associated with the inability to use the insulin effectively) is
insulin replacement21,22. This entails periodic monitoring of blood glucose levels and
3
intermittent insulin injections into the subcutaneous tissue to maintain normoglycemia.
Subcutaneous injections using syringe needles causes pain and trauma, all of which
negatively influence patient adherence to an optimal treatment regime23,24. Since insulin
production is non-linear and injections cannot replicate optimum levels, this form of
treatment is rather, “approximate” (Figure 1.1)23,25. Therefore, minimally invasive CGM
devices combined with optimal drug delivery methods offers much effectiveness, improves
compliance and are convenient for the patients. CGM devices were first approved by the
Food and Drug Administration (FDA) for managing diabetes in 199924,26. However, they
were used mainly from a diagnostic viewpoint i.e. to identify episodes of hyperglycaemia
(high blood glucose) and hypoglycaemia (low blood glucose), in order to adapt insulin
therapy24. Commercially available continuous CGM devices are based on an
electrochemical technique i.e. amperometry, utilising the enzyme glucose oxidase (GOx) to
detect glucose in the ISF10,27.
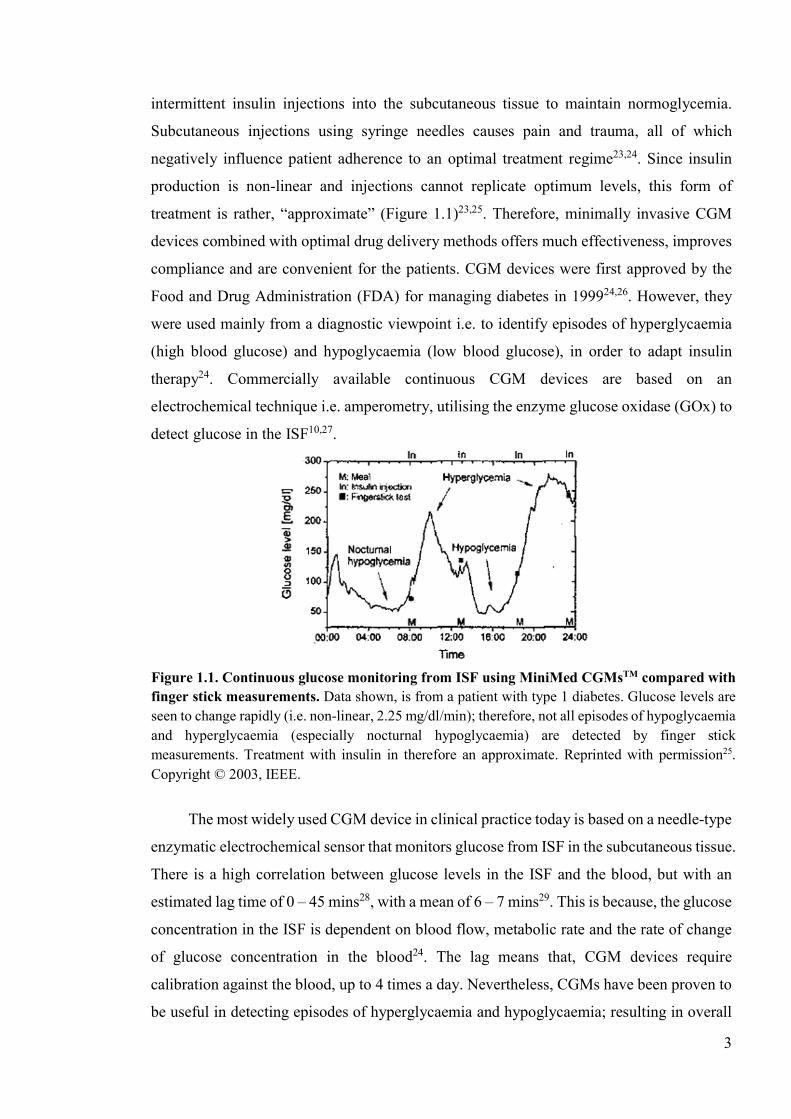
The most widely used CGM device in clinical practice today is based on a needle-type
enzymatic electrochemical sensor that monitors glucose from ISF in the subcutaneous tissue.
There is a high correlation between glucose levels in the ISF and the blood, but with an
estimated lag time of 0 – 45 mins28, with a mean of 6 – 7 mins29. This is because, the glucose
concentration in the ISF is dependent on blood flow, metabolic rate and the rate of change
of glucose concentration in the blood24. The lag means that, CGM devices require
calibration against the blood, up to 4 times a day. Nevertheless, CGMs have been proven to
be useful in detecting episodes of hyperglycaemia and hypoglycaemia; resulting in overall
Figure 1.1. Continuous glucose monitoring from ISF using MiniMed CGMsTM compared with finger stick measurements. Data shown, is from a patient with type 1 diabetes. Glucose levels are seen to change rapidly (i.e. non-linear, 2.25 mg/dl/min); therefore, not all episodes of hypoglycaemia and hyperglycaemia (especially nocturnal hypoglycaemia) are detected by finger stick measurements. Treatment with insulin in therefore an approximate. Reprinted with permission25. Copyright © 2003, IEEE.
4
better glycemia control. On quantification of the effectiveness of CGM devices on regular
usage has shown that, for every 1-day increase in sensor usage per week, the levels of
glycated haemoglobin (HbA1c) was reduced by 0.15%30. Despite these advantages, their
major limitation is associated with invasiveness and discomfort, which reduces patient
compliance over long-term usage31. Functionally, the sensor accuracy of CGM devices have
been demonstrated to be reduced over the hypoglycaemic range, whilst surface deposition
of proteins and cells, alongside tissue encapsulation results in signal drift, reduced accuracy
and limited life span31,32. Microelectromechanical systems (MEMS) technologies are ideally
positioned to address the limitations associated with the CGM devices, including MNA
based devices25.
MNA based CGM sensors are being developed with the aim of reducing invasiveness,
whilst improving sensor accuracy and life span by its transdermal application; and have
been predicted to be significantly better than current CGM devices. Research into MNA
based CGM devices at the early stages were primarily concerned with the extraction of
blood or ISF using microneedles for measurement of glucose via a standard off-line
commercial method or by in-line microfluidic devices. However, recent research has now
showcased various in situ devices capable of monitoring glucose content in the ISF
continuously.
1.2.1 Microfluidic sensors
Biofluid extraction using microneedles have been typically carried out using hollow
microneedles. In this approach, blood or ISF is draw up into cavities of the hollow
microneedles via capillary action by combination of surface tension and adhesive forces.
This fluid is then fed into an analytical chamber through a microfluidic system for analysis
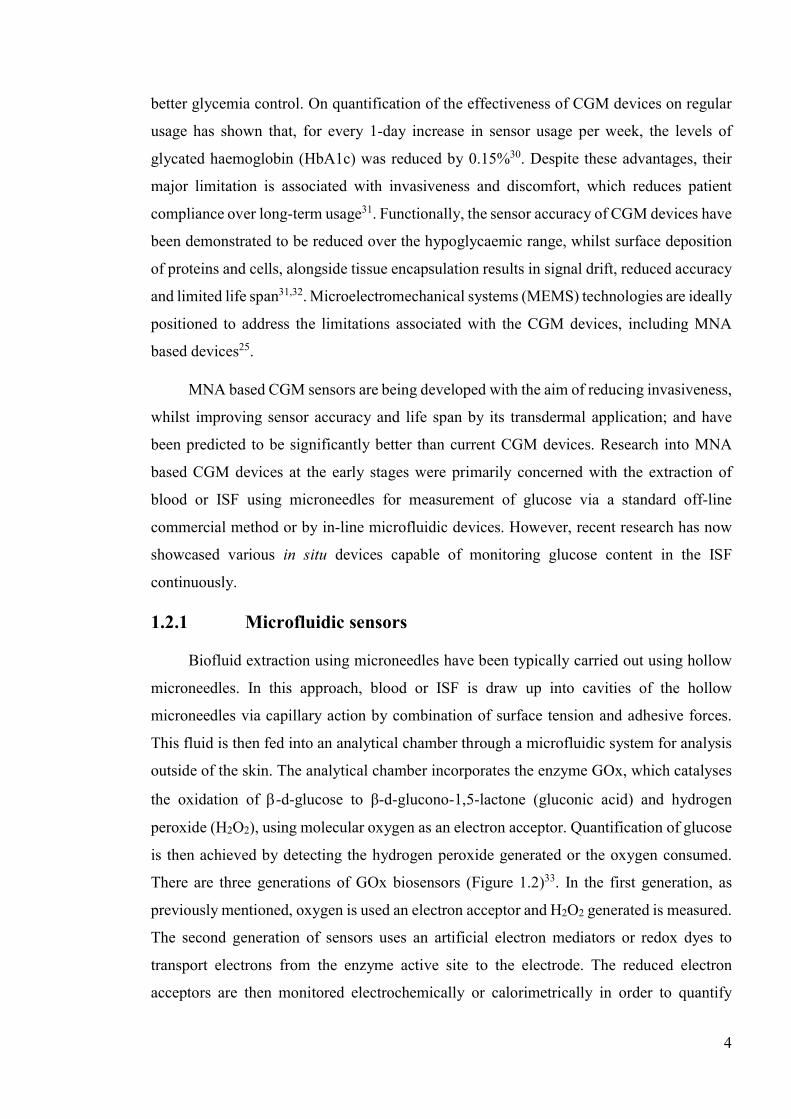
outside of the skin. The analytical chamber incorporates the enzyme GOx, which catalyses
the oxidation of -d-glucose to β-d-glucono-1,5-lactone (gluconic acid) and hydrogen
peroxide (H2O2), using molecular oxygen as an electron acceptor. Quantification of glucose
is then achieved by detecting the hydrogen peroxide generated or the oxygen consumed.
There are three generations of GOx biosensors (Figure 1.2)33. In the first generation, as
previously mentioned, oxygen is used an electron acceptor and H2O2 generated is measured.
The second generation of sensors uses an artificial electron mediators or redox dyes to
transport electrons from the enzyme active site to the electrode. The reduced electron
acceptors are then monitored electrochemically or calorimetrically in order to quantify
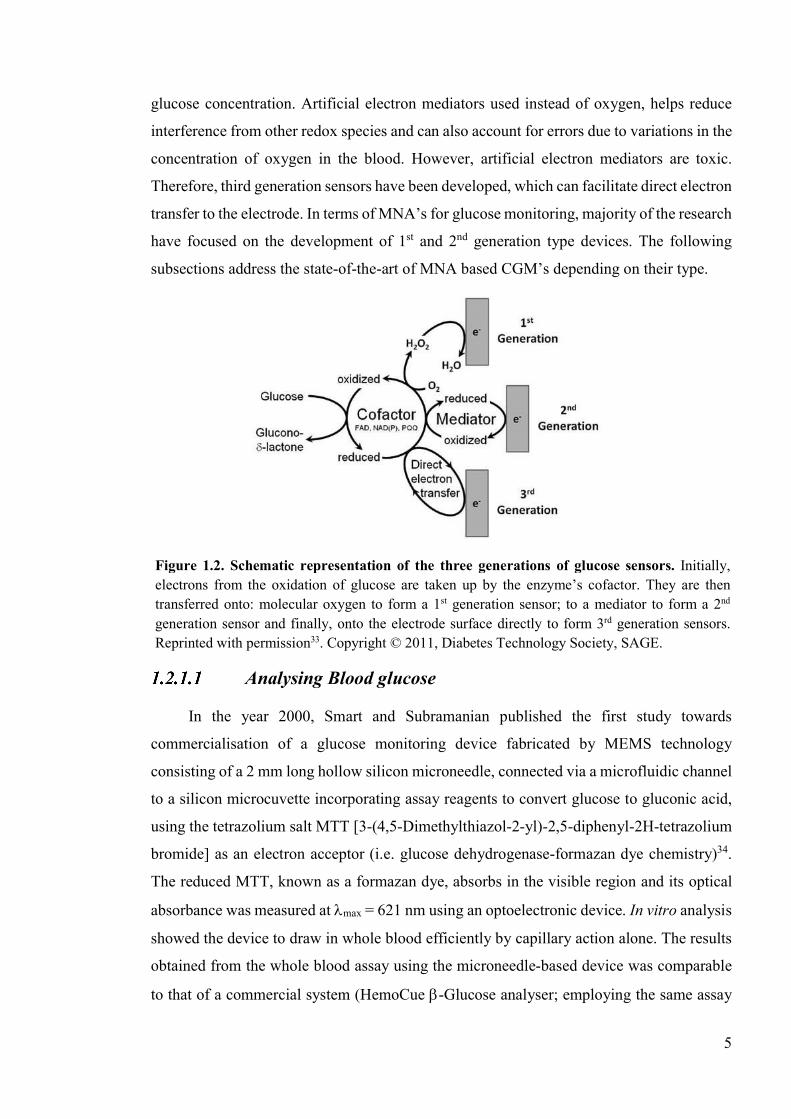
5
glucose concentration. Artificial electron mediators used instead of oxygen, helps reduce
interference from other redox species and can also account for errors due to variations in the
concentration of oxygen in the blood. However, artificial electron mediators are toxic.
Therefore, third generation sensors have been developed, which can facilitate direct electron
transfer to the electrode. In terms of MNA’s for glucose monitoring, majority of the research
have focused on the development of 1st and 2nd generation type devices. The following
subsections address the state-of-the-art of MNA based CGM’s depending on their type.
Analysing Blood glucose
In the year 2000, Smart and Subramanian published the first study towards
commercialisation of a glucose monitoring device fabricated by MEMS technology
consisting of a 2 mm long hollow silicon microneedle, connected via a microfluidic channel
to a silicon microcuvette incorporating assay reagents to convert glucose to gluconic acid,
using the tetrazolium salt MTT [3-(4,5-Dimethylthiazol-2-yl)-2,5-diphenyl-2H-tetrazolium
bromide] as an electron acceptor (i.e. glucose dehydrogenase-formazan dye chemistry)34.
The reduced MTT, known as a formazan dye, absorbs in the visible region and its optical
absorbance was measured at max = 621 nm using an optoelectronic device. In vitro analysis
showed the device to draw in whole blood efficiently by capillary action alone. The results
obtained from the whole blood assay using the microneedle-based device was comparable
to that of a commercial system (HemoCue -Glucose analyser; employing the same assay
Figure 1.2. Schematic representation of the three generations of glucose sensors. Initially, electrons from the oxidation of glucose are taken up by the enzyme’s cofactor. They are then transferred onto: molecular oxygen to form a 1st generation sensor; to a mediator to form a 2nd generation sensor and finally, onto the electrode surface directly to form 3rd generation sensors. Reprinted with permission33. Copyright © 2011, Diabetes Technology Society, SAGE.
6
chemistry), with an average coefficient of variation at 5.12%. Clinical studies showed good
mechanical robustness, and importantly, out of the 62 subjects tests, 73% percent said the
pain to be barely/non-noticeable. Only 2% said the device was somewhat painful. Despite
these results, a calibration for the glucose assay was not given and the silicon microchip
used was for single usage. Significant challenges were also pointed out in terms of reagent
formulation, sterilisation procedure, optimisation of shelf-life and finally, integration of an
electrochemical sensor in their system.
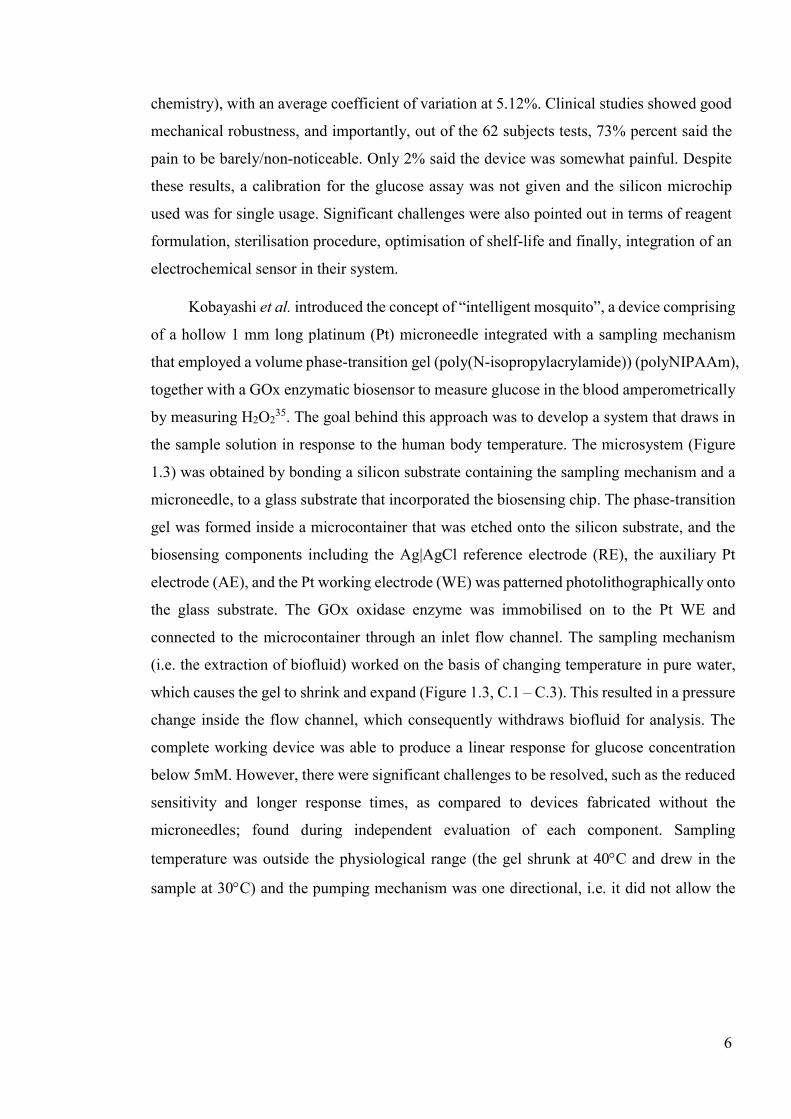
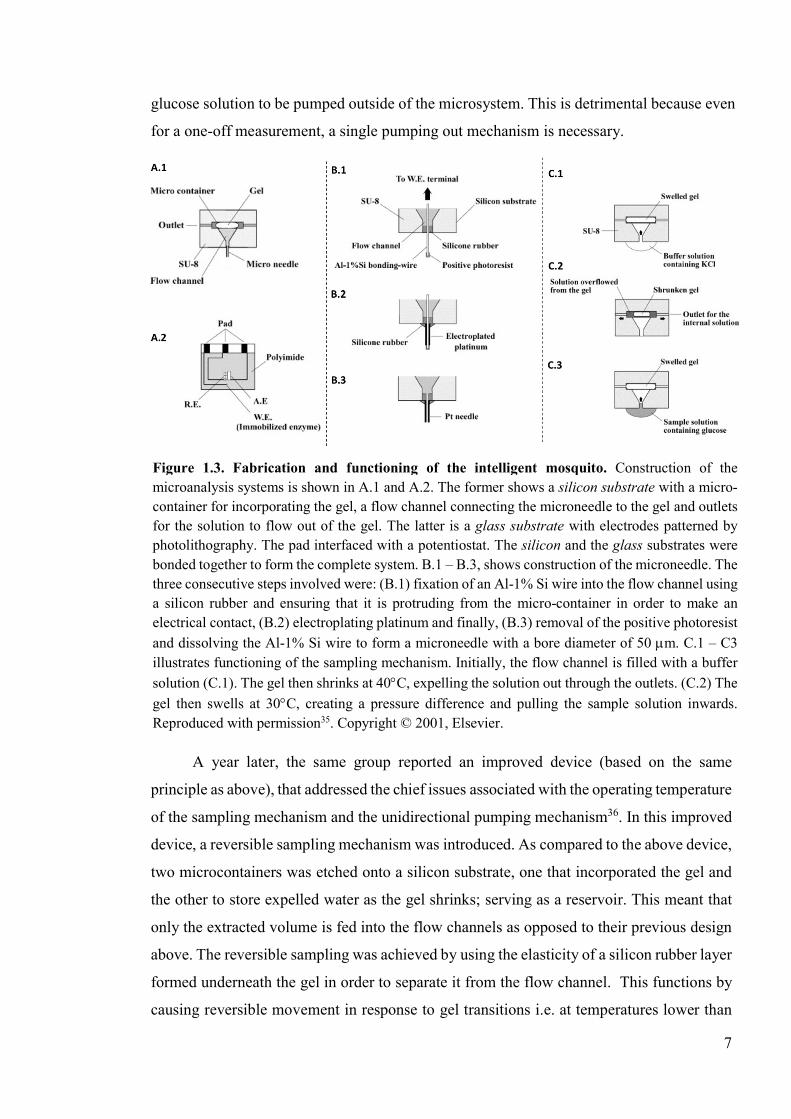
Kobayashi et al. introduced the concept of “intelligent mosquito”, a device comprising
of a hollow 1 mm long platinum (Pt) microneedle integrated with a sampling mechanism
that employed a volume phase-transition gel (poly(N-isopropylacrylamide)) (polyNIPAAm),
together with a GOx enzymatic biosensor to measure glucose in the blood amperometrically
by measuring H2O235. The goal behind this approach was to develop a system that draws in
the sample solution in response to the human body temperature. The microsystem (Figure
1.3) was obtained by bonding a silicon substrate containing the sampling mechanism and a
microneedle, to a glass substrate that incorporated the biosensing chip. The phase-transition
gel was formed inside a microcontainer that was etched onto the silicon substrate, and the
biosensing components including the Ag|AgCl reference electrode (RE), the auxiliary Pt
electrode (AE), and the Pt working electrode (WE) was patterned photolithographically onto
the glass substrate. The GOx oxidase enzyme was immobilised on to the Pt WE and
connected to the microcontainer through an inlet flow channel. The sampling mechanism
(i.e. the extraction of biofluid) worked on the basis of changing temperature in pure water,
which causes the gel to shrink and expand (Figure 1.3, C.1 – C.3). This resulted in a pressure
change inside the flow channel, which consequently withdraws biofluid for analysis. The
complete working device was able to produce a linear response for glucose concentration
below 5mM. However, there were significant challenges to be resolved, such as the reduced
sensitivity and longer response times, as compared to devices fabricated without the
microneedles; found during independent evaluation of each component. Sampling
temperature was outside the physiological range (the gel shrunk at 40C and drew in the
sample at 30C) and the pumping mechanism was one directional, i.e. it did not allow the
7
glucose solution to be pumped outside of the microsystem. This is detrimental because even
for a one-off measurement, a single pumping out mechanism is necessary.
A year later, the same group reported an improved device (based on the same
principle as above), that addressed the chief issues associated with the operating temperature
of the sampling mechanism and the unidirectional pumping mechanism36. In this improved
device, a reversible sampling mechanism was introduced. As compared to the above device,
two microcontainers was etched onto a silicon substrate, one that incorporated the gel and
the other to store expelled water as the gel shrinks; serving as a reservoir. This meant that
only the extracted volume is fed into the flow channels as opposed to their previous design
above. The reversible sampling was achieved by using the elasticity of a silicon rubber layer
formed underneath the gel in order to separate it from the flow channel. This functions by
causing reversible movement in response to gel transitions i.e. at temperatures lower than
Figure 1.3. Fabrication and functioning of the intelligent mosquito. Construction of the microanalysis systems is shown in A.1 and A.2. The former shows a silicon substrate with a micro-container for incorporating the gel, a flow channel connecting the microneedle to the gel and outlets for the solution to flow out of the gel. The latter is a glass substrate with electrodes patterned by photolithography. The pad interfaced with a potentiostat. The silicon and the glass substrates were bonded together to form the complete system. B.1 – B.3, shows construction of the microneedle. The three consecutive steps involved were: (B.1) fixation of an Al-1% Si wire into the flow channel using a silicon rubber and ensuring that it is protruding from the micro-container in order to make an electrical contact, (B.2) electroplating platinum and finally, (B.3) removal of the positive photoresist
and dissolving the Al-1% Si wire to form a microneedle with a bore diameter of 50 m. C.1 – C3 illustrates functioning of the sampling mechanism. Initially, the flow channel is filled with a buffer
solution (C.1). The gel then shrinks at 40C, expelling the solution out through the outlets. (C.2) The
gel then swells at 30C, creating a pressure difference and pulling the sample solution inwards. Reproduced with permission35. Copyright © 2001, Elsevier.
8
the gel transition temperature, water from the reservoir is absorbed by the gel, pushing the
silicon rubber into the flow channel; whereas when the external solution is sucked in at
higher transition temperature, the gel shrinks, and the silicon pushes inwards preventing the
collection of expelled water along the with sample. The functioning of this device was
successfully demonstrated in vitro, detecting glucose concentrations in the range of 0 – 12
mM glucose, up to 8 mM in the linear range (improved response as opposed to the previous
device). The response time of the biosensor had also improved; from 1 – 4 mins in the
previous device to 30 – 40 s in the device described here. However, the authors described
continuous sampling to become more time consuming and laborious, because of the small
inner diameter of the microneedle.
In the work that followed, a disposable continuous sampling and monitoring device
was described as opposed to the single use devices above37. The same components were
used, but adaptations were made to enable continuous sampling. GOx enzyme was
immobilised on a Nafion layer to prevent interfering compounds, and enzyme layer was
coated with a diffusion-limiting membrane of poly(2-hydroxyethylmethacrylate)
(polyHEMA) to reduce the consumption of glucose. The microneedle was made of stainless
steel, with 1 mm length and bore diameter of 50 m. Continuous sampling needed a larger
volume change and a low sampling rate, therefore polyNIPAAm was copolymerised with
acrylic acid to introduce ionized moieties in the polymer backbone. In general, as the
ionisation increases, the transition temperature and the volume change increases. However,
this modification alone cannot induce sufficient volume change, hence three other
functionally related factors were also investigated i.e. variation in temperature (20 to 37C),
temperature and pH (alkaline buffer in the gel and acidic buffer in the reservoir), and GOx
enzyme loaded gel (5 mM KH2PO4–NaOH buffer solution at pH 7.0), where the gel shrunk,
in response to pH change caused by the production of gluconic acid. It was found that, the
sampling rate slowed down more effectively with the GOx enzyme loaded gel as compared
to the other two where the sampling rate was 73 and 24 l h-1, respectively. The sampling
rate for the enzyme loaded gel was 4 l h-1 and it withdrew solutions continuously for 10
hrs. Hence, the GOx enzyme gel system was utilised in the microsystem and biosensor was
evaluated with randomly changing glucose concentration over the range of 0 to 20 mM. The
calibration curve obtained as a result showed a linear response from device. The authors
described the major challenge that remained, is associated with the fabrication of
9
microneedles with sufficient mechanical strength and appropriate shape, so that it penetrates
without breaking and remains in the skin.
Another microneedle-based blood sampling system for glucose monitoring was
reported by Tsuchiya et al.38. This device consisted of a hollow 1 mm long titanium
microneedle with a bore diameter of 25 m; an indentation unit making use of shape
memory actuator (SMA) for microneedle insertion into the skin; a bimorph piezoelectric
actuator (i.e. micropumping system) to generate negative pressure for extracting blood and
lastly, a biosensing component for detection and evaluation of glucose. In vitro
characterisation was completed with another microneedle device however, made of stainless
steel with a bore diameter of 100 m, operating at a resonant frequency of 25 kHz (applied
voltage of 20 V). The sampling rate of whole blood using this device was 2 l min-1,
comparable to that of a female mosquito. Glucose detection was demonstrated by a single
measurement at 0.5 mM, after an extraction time of 30 s. Therefore, no calibration was
provided. On monitoring the output voltage of the biosensor, a voltage peak was identified
at 30 s, which decreased until 120 sec, where a steady state was reached.
Due to challenges associated with miniaturisation, systems integrations, and
complexity of the devices in achieving good reliability and reproducibility, progressive
research on the devices above were not carried out and in fact the concept of blood sampling
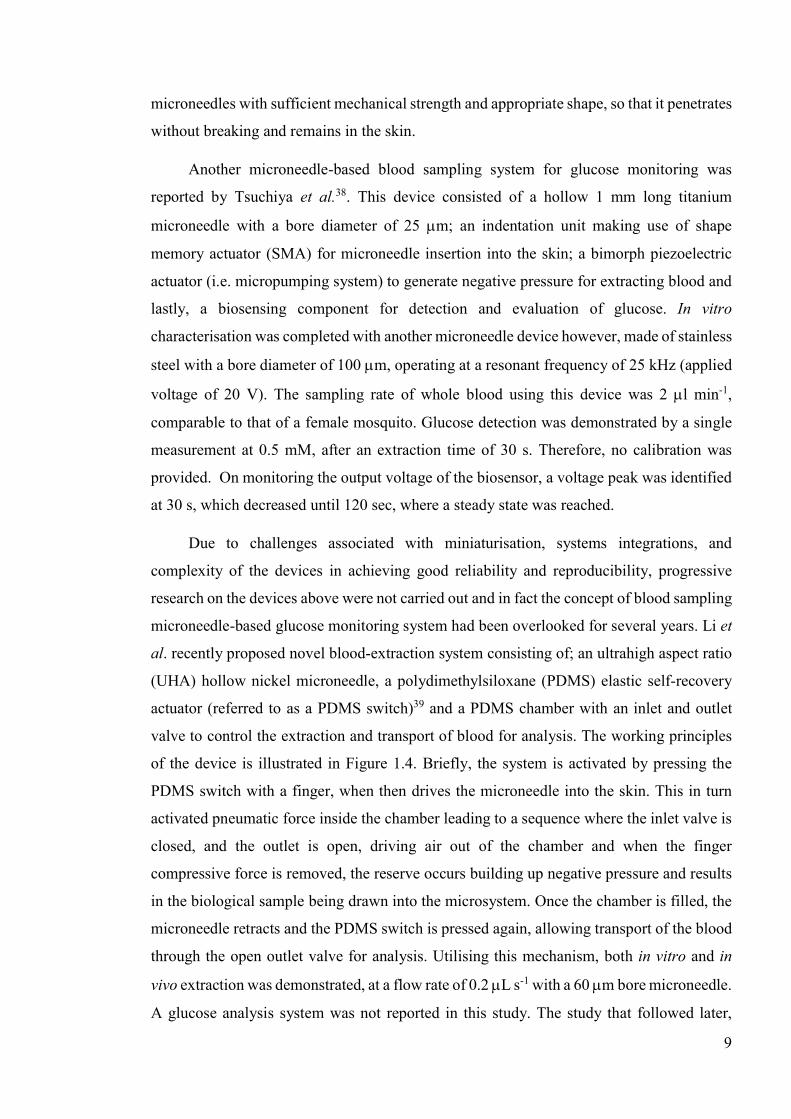
microneedle-based glucose monitoring system had been overlooked for several years. Li et
al. recently proposed novel blood-extraction system consisting of; an ultrahigh aspect ratio
(UHA) hollow nickel microneedle, a polydimethylsiloxane (PDMS) elastic self-recovery
actuator (referred to as a PDMS switch)39 and a PDMS chamber with an inlet and outlet
valve to control the extraction and transport of blood for analysis. The working principles
of the device is illustrated in Figure 1.4. Briefly, the system is activated by pressing the
PDMS switch with a finger, when then drives the microneedle into the skin. This in turn
activated pneumatic force inside the chamber leading to a sequence where the inlet valve is
closed, and the outlet is open, driving air out of the chamber and when the finger
compressive force is removed, the reserve occurs building up negative pressure and results
in the biological sample being drawn into the microsystem. Once the chamber is filled, the
microneedle retracts and the PDMS switch is pressed again, allowing transport of the blood
through the open outlet valve for analysis. Utilising this mechanism, both in vitro and in
vivo extraction was demonstrated, at a flow rate of 0.2 L s-1 with a 60 m bore microneedle.
A glucose analysis system was not reported in this study. The study that followed later,
10
assessed the characteristics of the microneedles themselves i.e. inner diameter (bore), tip
diameter and bevelled tip angles40. Nickel was the metal utilised. The optimum dimensions
for a fixed length microneedle (i.e. 1,800 m long with an outer dimeter of 120 m) that is
mechanically strong and can penetrate the skin effectively was required to have a bore
diameter of 60 m, and a bevelled tip angle of 15C. The extraction rate for this device was
0.8 L s-1; demonstrated in vivo. An analysis system was not fabricated here either and
moreover, haemolysis of blood following extraction and biocompatibility issues associated
with nickel are issues that needs careful consideration before clinical translation.
Importantly, the current format of the device is for single usage only.
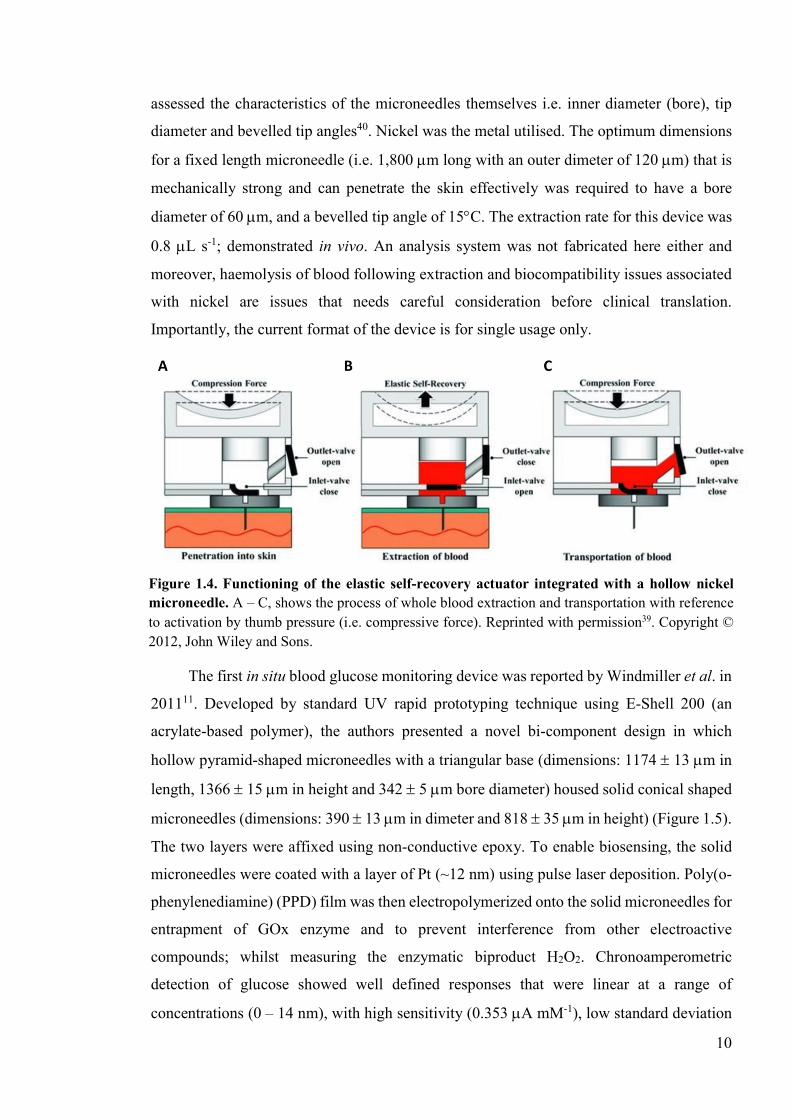
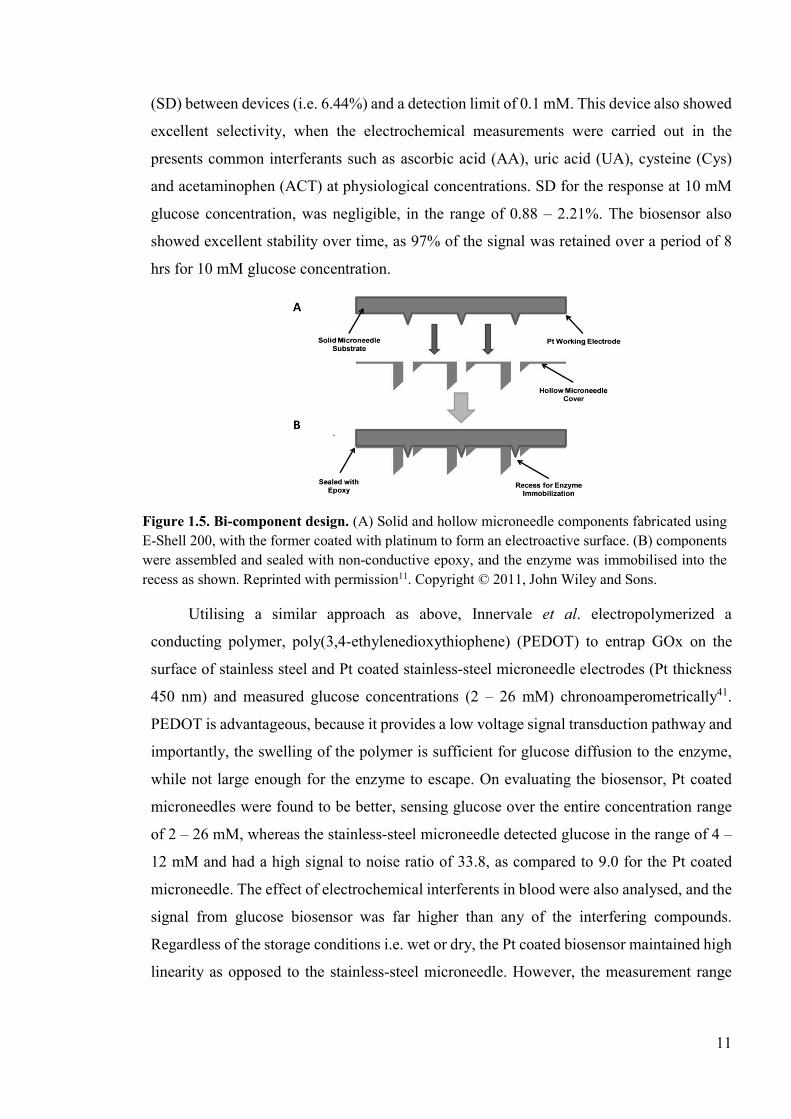
The first in situ blood glucose monitoring device was reported by Windmiller et al. in
201111. Developed by standard UV rapid prototyping technique using E-Shell 200 (an
acrylate-based polymer), the authors presented a novel bi-component design in which
hollow pyramid-shaped microneedles with a triangular base (dimensions: 1174 13 m in
length, 1366 15 m in height and 342 5 m bore diameter) housed solid conical shaped
microneedles (dimensions: 390 13 m in dimeter and 818 35 m in height) (Figure 1.5).
The two layers were affixed using non-conductive epoxy. To enable biosensing, the solid
microneedles were coated with a layer of Pt (~12 nm) using pulse laser deposition. Poly(o-
phenylenediamine) (PPD) film was then electropolymerized onto the solid microneedles for
entrapment of GOx enzyme and to prevent interference from other electroactive
compounds; whilst measuring the enzymatic biproduct H2O2. Chronoamperometric
detection of glucose showed well defined responses that were linear at a range of
concentrations (0 – 14 nm), with high sensitivity (0.353 A mM-1), low standard deviation
Figure 1.4. Functioning of the elastic self-recovery actuator integrated with a hollow nickel microneedle. A – C, shows the process of whole blood extraction and transportation with reference to activation by thumb pressure (i.e. compressive force). Reprinted with permission39. Copyright © 2012, John Wiley and Sons.
11
(SD) between devices (i.e. 6.44%) and a detection limit of 0.1 mM. This device also showed
excellent selectivity, when the electrochemical measurements were carried out in the
presents common interferants such as ascorbic acid (AA), uric acid (UA), cysteine (Cys)
and acetaminophen (ACT) at physiological concentrations. SD for the response at 10 mM
glucose concentration, was negligible, in the range of 0.88 – 2.21%. The biosensor also
showed excellent stability over time, as 97% of the signal was retained over a period of 8
hrs for 10 mM glucose concentration.
Utilising a similar approach as above, Innervale et al. electropolymerized a
conducting polymer, poly(3,4-ethylenedioxythiophene) (PEDOT) to entrap GOx on the
surface of stainless steel and Pt coated stainless-steel microneedle electrodes (Pt thickness
450 nm) and measured glucose concentrations (2 – 26 mM) chronoamperometrically41.
PEDOT is advantageous, because it provides a low voltage signal transduction pathway and
importantly, the swelling of the polymer is sufficient for glucose diffusion to the enzyme,
while not large enough for the enzyme to escape. On evaluating the biosensor, Pt coated
microneedles were found to be better, sensing glucose over the entire concentration range
of 2 – 26 mM, whereas the stainless-steel microneedle detected glucose in the range of 4 –
12 mM and had a high signal to noise ratio of 33.8, as compared to 9.0 for the Pt coated
microneedle. The effect of electrochemical interferents in blood were also analysed, and the
signal from glucose biosensor was far higher than any of the interfering compounds.
Regardless of the storage conditions i.e. wet or dry, the Pt coated biosensor maintained high
linearity as opposed to the stainless-steel microneedle. However, the measurement range
Figure 1.5. Bi-component design. (A) Solid and hollow microneedle components fabricated using E-Shell 200, with the former coated with platinum to form an electroactive surface. (B) components were assembled and sealed with non-conductive epoxy, and the enzyme was immobilised into the recess as shown. Reprinted with permission11. Copyright © 2011, John Wiley and Sons.
12
was higher at ~22 mM when stored in PBS in comparison to dry storage conditions, where
it was reduced to ~14 mM.
An integrated microneedle-based three-electrode enzyme free sensor and its
characterisation in vitro was reported by Yoon et al.42. The enzyme free sensor is beneficial,
as it avoids problems associated with stability and loss of activity from long-term storage.
Importantly, the performance of GOx enzyme-based electrodes is limited by the fact the
enzymes’ active centre is covered by a protein shell, making electron transfer between the
enzyme and the electrode a difficult process. This can be overcome by using nano-scale
electrodes, which provides a greater electroactive surface area, resulting in enhanced
electrocatalysis. Therefore, Yoon et al. fabricated silicon microneedles that were 380 m in
height and achieved a tip diameter smaller than 1 m through an anisotropic dry etching
process to form micropillars, followed by a wet etching process. A 500nm layer of silicon
dioxide was then deposited onto silicon microneedles by plasma enhanced chemical vapour
deposition. This was followed by iron catalyst deposition by electron beam evaporation in
specified areas on the array (through a shadow mask) to create the WE and counter
electrodes (CE). In order to increase the electroactive surface area on the microneedles, a
vertically aligned forest of multiwalled carbon nanotubes (MWCNT’s) were grown directly
on iron-coated silicon microneedles and moreover, Pt nanoparticles was electrodeposited on
the surface for enhancing non-enzymatic electrochemical reaction. An integrated RE was
fabricated similarly, but after a selectively deposition a layer of titanium, followed by silver
(Ag) deposition. The silver layer was then chlorinated with 1 M KCl/HCl buffer with
applied current to form Ag/AgCl reference electrode. This three-electrode sensor was tested
by chronoamperometry to measure different concentrations of glucose (i.e. 3 – 20 mM) in
vitro. A linear response was seen, in response to additions of glucose at 3 mM concentration
at regular intervals. The sensitivity of this microneedle-based sensor was 17.73 3 A mM-
1, which is on par with or higher than other non-enzymatic sensors reported in the literature.
This is owed to the enhanced surface area provided by the MWCNT forest and the Pt
nanoparticles.
ISF based glucose monitoring
1.2.1.2.1 Microfluidic devices
Over the period of 2003 to 2005, it was addressed whether microneedle technologies
can be utilised to extract ISF rather than blood. Zimmerman et al. was the first to develop
13
an in-device self-calibrating enzymatic glucose sensor, monitoring ISF, in 200325. Eight
“volcano-like” hollow microneedles were made out of silicon by means of both anisotropic
and isotropic etching steps, with a length of 200 m and a bore dimeter of 40 m. These
effectively pierced the skin and sampled ISF from the epidermis by capillary forces. For in-
line electrochemical detection, the ISF was then transported to a porous poly-silicon dialysis
membrane, where the larger proteins are retained (in order to improve long-term sensor
stability) and the remainder was mixed with a buffer solution and pumped past an integrated
enzyme-based flow through sensor. H2O2 derived as by product of the catalysis was oxidised
at the working electrode and the resultant current was measured. Preliminary calibration of
the biosensor for glucose concentrations in the range of 0 – 600 mg dL-1 indicated a linear
response between 0 – 160 mg dL-1, at an optimum flow rate of 25 L min-1. When the
measurements were made in the skin, a significant sensor response was seen, however it
was found that there were large variations in the measured current; resultant of the fact that
capillarity was insufficient to maintain a constant flow rate through the microneedle. As a
result, a calibration of the whole microsystem was not provided.
In contrast, Mukerjee et al. demonstrated that ISF extraction is possible by capillary
action alone43. The microsystem was made of a silicon/glass bilayer chip with a 20 x 20
array of hollow silicon microneedles that were integrated with fluidic channels for ISF
extraction on the front side and a reservoir for storage of the extracted ISF via microchannels
on the back side. The microneedles were fabricated by a combination of processes such as
deep reactive ion etching (DRIE), diamond blade circular sawing and isotropic etching. An
array consisted of 400 microneedles, that were 250 – 350 m tall, with a base dimeter of
120 m. ISF extraction by capillary action occurred through the microneedle bores with a
diameter of 10 – 15 μm in approximately 10% of the 400 microneedles per chip (i.e. only
those in centre were hollow, and the others were solid; which aided in skin penetration by
stretching the skin and also ensured good anchorage). Although different designs were
evaluated i.e. volcano-like, micro-hypodermic and snake-fang; only snake-fang shaped
microneedles were used to demonstrate ISF extraction. In order to evaluate the performance
of the microsystem, the microneedle was pressed against the authors earlobe and held in
place for collection of ISF. It was found that, between 20 – 30 mins was initially required
to fill the reservoir. In order to validate that the fluid filled was indeed ISF, a simple glucose
detection assay was performed by placing a commercial calorimetric glucose strip inside
the reservoir. The colour change from clear to deep blue indicated glucose concentration in
14
the range of 80 – 20 mg/dl and this correlated well with blood glucose measurements using
the same type. Contrary to that of Zimmerman’s device, an opening at the distal end of the
reservoir allowed evaporation to take place and thus a pressure gradient was built up
allowing for continuous draw of ISF from the skin. However, no calibration against glucose
concentration was provided yet again.
Wang et al. applied negative pressure by vacuum to resolve the time lag using
physiologically inert glass microneedles and demonstrated in vivo extraction followed by in
vitro glucose detection10. A thermal puller was used to fabricate individual or an array of
microneedle of conical shape with a tip radius of 15 – 40 m, to penetrate 700 – 1500 m
deep into the skin. Although the microneedles had a hollow bore, the tips were sealed by
melting glass to increase mechanical strength. Thereby, the function of the microneedle was
only to pierce a hole in skin for ISF, as a form of bloodless lancet. The authors claimed that
separate experiments were carried to determine whether ISF could be extracted through the
bore of the microneedle, but it failed to do so. Hence in this study, ISF was extracted by
applying a negative pressure of 200 – 500 mm Hg for either 2 – 10 mins in rat or 5 – 20
mins in humans. The ISF samples were immediately analysed using a glucose strip. In
agreement with previous findings, Clark’s Error Grid Analysis demonstrated excellent
correlation on comparing blood glucose and ISF levels with 95% and 100% of
measurements (in 15 rats and 6 human subjects respectively) falling in the clinically relevant
A + B region. Finally, a kinetic study evaluated glucose levels in ISF and blood glucose
levels at 20 min intervals before and after 1 U of intraperitoneal insulin injection. The
measurements showed a rapid decrease in blood glucose levels following insulin injection
in blood, followed closely by glucose levels in the ISF. Given the resolution of the device
was 20 mins, there was no significant time lag between ISF and blood glucose levels.
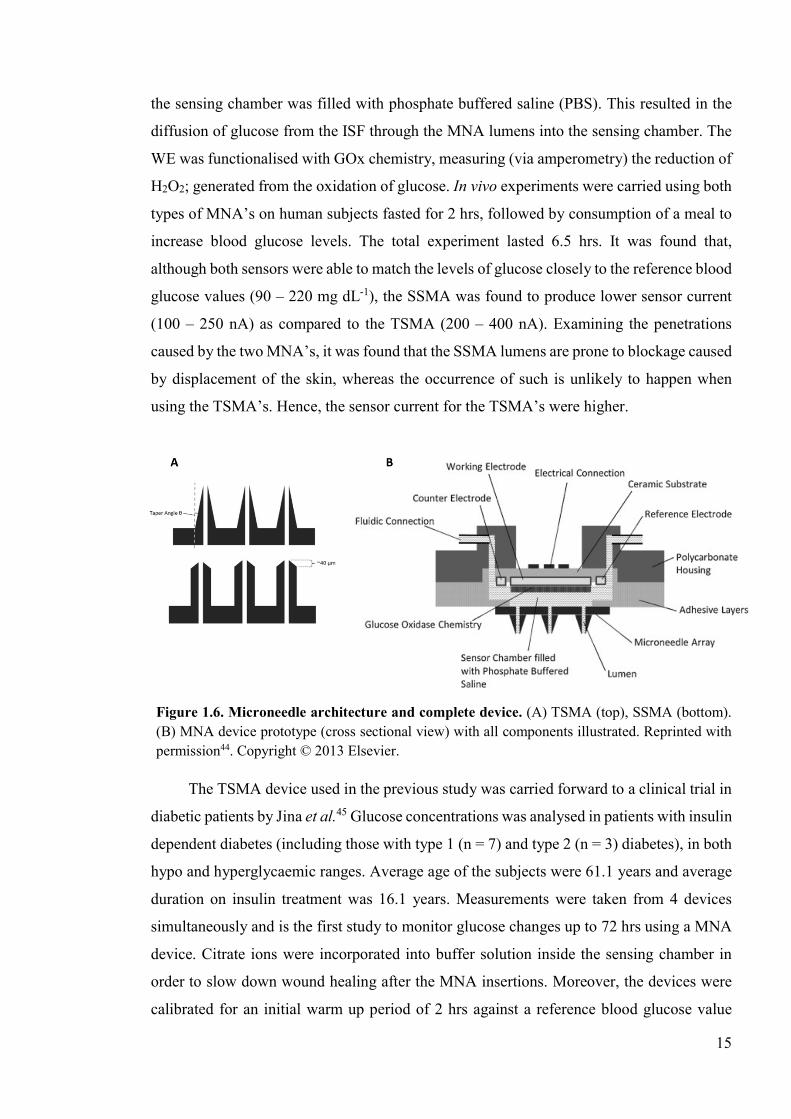
More recently, Chua et al. reported the use of hollow silicon MNA for CGM44. The
study investigated impact of microneedle shape in facilitating efficient uptake of ISF and
measurement of glucose levels. By employing silicon micromachining, two different shapes
of microneedles were produced; a straight silicon microneedle array (SSMA) and a tapered
silicon microneedle array (TSMA) (Figure 1.6, A). Both devices contained a similar number
of microneedles; were similar in height and had a bore diameter of 50 m. A CGM system
was assembled, by having an electrochemical biosensor (with screen printed Pt WE and
Ag|AgCl RE and CE) and the MNA affixed on the opposite sides of a sensor chamber
(Figure 1.6, B). After application of the MNA into the skin (application velocity ~10 ms-1),
15
the sensing chamber was filled with phosphate buffered saline (PBS). This resulted in the
diffusion of glucose from the ISF through the MNA lumens into the sensing chamber. The
WE was functionalised with GOx chemistry, measuring (via amperometry) the reduction of
H2O2; generated from the oxidation of glucose. In vivo experiments were carried using both
types of MNA’s on human subjects fasted for 2 hrs, followed by consumption of a meal to
increase blood glucose levels. The total experiment lasted 6.5 hrs. It was found that,
although both sensors were able to match the levels of glucose closely to the reference blood
glucose values (90 – 220 mg dL-1), the SSMA was found to produce lower sensor current
(100 – 250 nA) as compared to the TSMA (200 – 400 nA). Examining the penetrations
caused by the two MNA’s, it was found that the SSMA lumens are prone to blockage caused
by displacement of the skin, whereas the occurrence of such is unlikely to happen when
using the TSMA’s. Hence, the sensor current for the TSMA’s were higher.
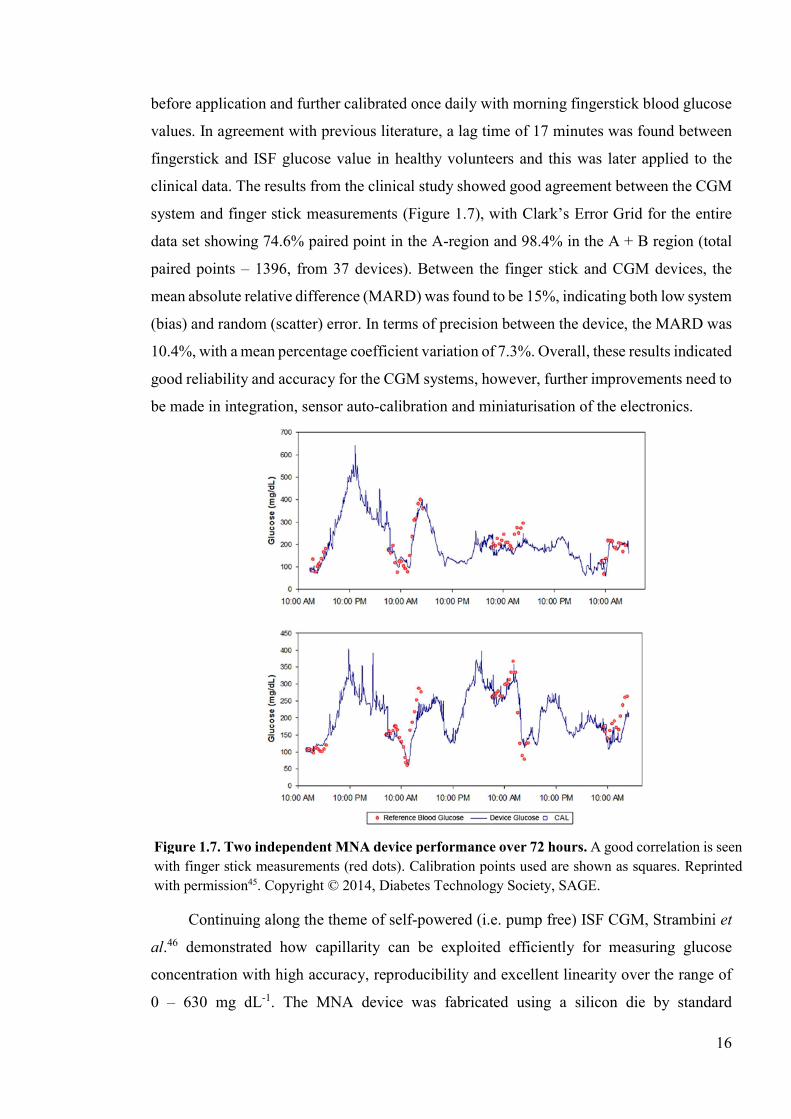
The TSMA device used in the previous study was carried forward to a clinical trial in
diabetic patients by Jina et al.45 Glucose concentrations was analysed in patients with insulin
dependent diabetes (including those with type 1 (n = 7) and type 2 (n = 3) diabetes), in both
hypo and hyperglycaemic ranges. Average age of the subjects were 61.1 years and average
duration on insulin treatment was 16.1 years. Measurements were taken from 4 devices
simultaneously and is the first study to monitor glucose changes up to 72 hrs using a MNA
device. Citrate ions were incorporated into buffer solution inside the sensing chamber in
order to slow down wound healing after the MNA insertions. Moreover, the devices were
calibrated for an initial warm up period of 2 hrs against a reference blood glucose value
Figure 1.6. Microneedle architecture and complete device. (A) TSMA (top), SSMA (bottom). (B) MNA device prototype (cross sectional view) with all components illustrated. Reprinted with permission44. Copyright © 2013 Elsevier.
16
before application and further calibrated once daily with morning fingerstick blood glucose
values. In agreement with previous literature, a lag time of 17 minutes was found between
fingerstick and ISF glucose value in healthy volunteers and this was later applied to the
clinical data. The results from the clinical study showed good agreement between the CGM
system and finger stick measurements (Figure 1.7), with Clark’s Error Grid for the entire
data set showing 74.6% paired point in the A-region and 98.4% in the A + B region (total
paired points – 1396, from 37 devices). Between the finger stick and CGM devices, the
mean absolute relative difference (MARD) was found to be 15%, indicating both low system
(bias) and random (scatter) error. In terms of precision between the device, the MARD was
10.4%, with a mean percentage coefficient variation of 7.3%. Overall, these results indicated
good reliability and accuracy for the CGM systems, however, further improvements need to
be made in integration, sensor auto-calibration and miniaturisation of the electronics.
Continuing along the theme of self-powered (i.e. pump free) ISF CGM, Strambini et
al.46 demonstrated how capillarity can be exploited efficiently for measuring glucose
concentration with high accuracy, reproducibility and excellent linearity over the range of
0 – 630 mg dL-1. The MNA device was fabricated using a silicon die by standard
Figure 1.7. Two independent MNA device performance over 72 hours. A good correlation is seen with finger stick measurements (red dots). Calibration points used are shown as squares. Reprinted with permission45. Copyright © 2014, Diabetes Technology Society, SAGE.
17
lithographic and etching processes to produce 100 m long microneedles on the front side
and a reservoir grooved onto the back-side. A 200 m long internal channel connected the
microneedle to the reservoir. Two different types of MNA devices were fabricated; type 1
chip had a bore diameter of 4 m and was densely packed (1 x 10⁶ needles/cm2); whereas
type 2 chip had a bore diameter of 7 m and density of 6.25 x 10⁵ needles/cm2. These devices
were used to test capillarity in three solutions i.e. deionised water, PBS and artificial ISF. It
was found that fluid uptake was faster for the densely packed microneedles with smallest
bore diameter; type 1 chip taking only 5 seconds to fill the reservoir in comparison to 35
seconds for the type 2 chip. These results showed that bore size and high density of
microneedles can significantly influence capillary forces. In order to develop these chips as
biosensors, screen printed electrodes (WE and CE’s) were fabricated and modified with
GOx enzyme and potassium ferricyanide (K3[Fe(CN6)]). The biosensor was inserted deep
enough into the reservoir that, the working volume was reduced to just 5 l.
Chronoamperometric measurements of glucose over the range of 0 – 35 mM were measured
in vitro using artificial ISF and PBS (control) using both type 1 and type 2 chips.
Performance was evaluated at 10 s steps for different sampling times from 5 – 200 s through
quantification of several analytical parameters (accuracy, linearity, reproducibility,
sensitivity, and resolution). In all test conditions, both MNA devices showed good linearity
over the entire concentration range, at any given sampling time and was comparable to the
stand-alone sensors (controls – without microneedles). Sampling over 5 and 200 s, the
current and sensitivity deceased over time; but the best performance, in terms of
compromise between sensitivity, accuracy and reproducibility was obtained for a sampling
time of 30 s, for which the type 1 chip recorded accuracy within 20% of actual glucose
levels over 96% of measures completed. Hence, this result was in agreement with FDA
standards, indicating that for glucose concentrations above 75 mg dL-1 (4.2 mM), 95% of
measurements have to be within 20 % of actual glucose levels. The limit of detection
(LOD) for type 1 chip was 0.3 mM in ISF. Refer to Table 1.1 for more details on the
aforementioned analytical parameters for both devices.
18
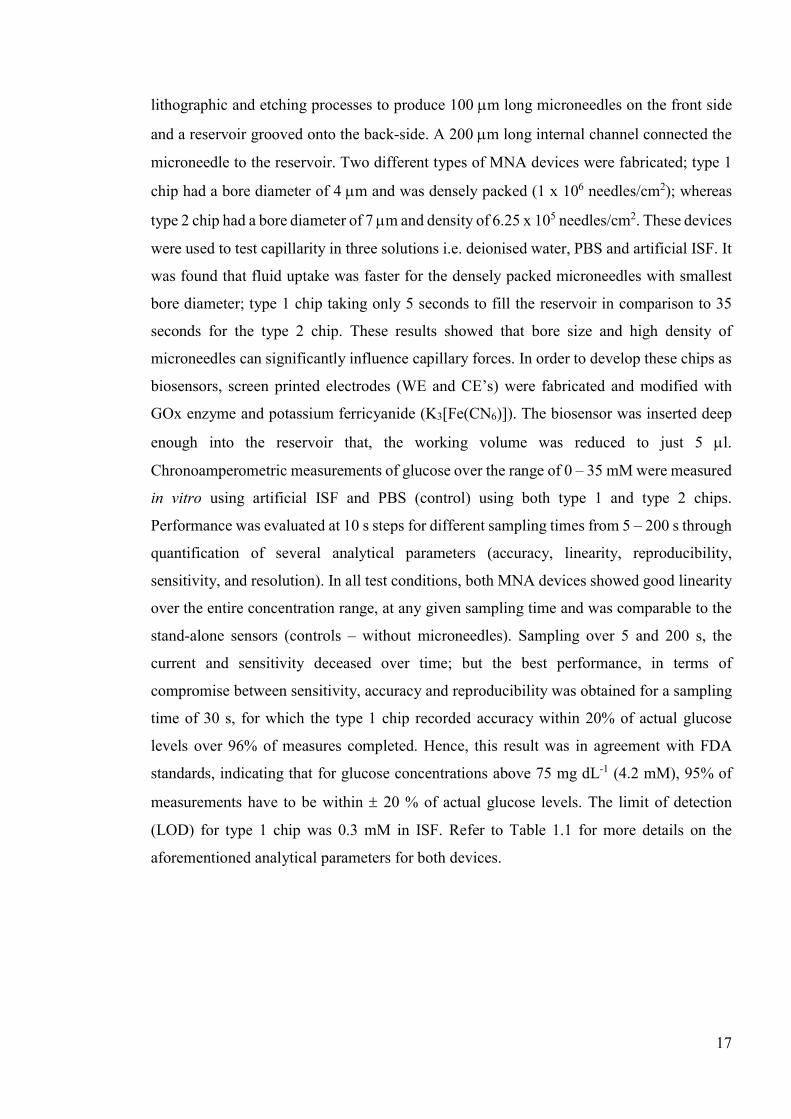
Table 1.1 Comparison of performance between type 1 and type 2 chips against a stand-alone biosensor (control) at the optimal sampling time of 30 s, in terms of analytical parameters such as accuracy, linearity, reproducibility, sensitivity, and resolution; for glucose concentrations in the range 0–35 mM, in both ISF and PBS. Reprinted with permission46. Copyright © 2015 Elsevier.
Type 1 biosensor Type 2 biosensor
Stand-alone biosensor
ISF PBS ISF PBS ISF PBS Accuracy (A) (measures within ±20%)
96% 92% 92% 96% 96% 99%
Linearity (R2) (0−35 mM) 0.995 0.993 0.998 0.998 0.994 0.999 Reproducibility (%CVav) 8.56% 6.37% 8.74% 7.06% 6.55% 7.42%
Sensitivity (S) (μA/mM) 0.43 0.46 0.46 0.43 0.49 0.46 Resolution (LoD) (mM) 0.3 0.2 0.9 0.5 0.6 0.51
1.2.1.2.2 Solid MNA based glucose biosensors
As discussed in previous sections, early studies into MNA based glucose monitoring
in the ISF were primarily concerned with the development of microfluidic glucose sensors.
These adapted technology from the MEMS industry and mostly utilised silicon as a raw
material to fabricate the sensors due to their high compatibility with the manufacturing
processes. However, in line with the more recent studies reporting in situ glucose sensors
assaying whole blood, recently, several authors have successfully demonstrated solid MNA-
based in situ glucose sensors measuring in the ISF. Moreover, simpler fabricational
strategies have also been demonstrated alongside such innovations. In this section, devices
that are strictly developed for the purpose of glucose monitoring have been described.
One of the first works that described a solid MNA for CGM in the ISF was reported
by Moniz et al. in 201212. Here, the MNA’s were fabricated photolithographically using
backside exposure of SU-8 (epoxy-based negative photoresist). The microneedles were
500–750 μm in height and had a tip diameter of 10 m. These microneedles were coated
with gold (Au) and assembled with GOx by 1-Ethyl-3-(3-dimethylaminoproprly)
carbodiimide (EDC)/N-hydroxyscucciniminde (NHS) coupling, followed by the addition of
a nafion membrane incorporating an electron transfer mediator; tetrathiafulvalene (TTF). In
vitro amperometric evaluation demonstrated that these MNA devices can perform well in
the clinically relevant range (2 – 20 mM) with a linear response in current, measured in the
microampere domain. Using a similar approach, Hwa et al. developed a glucose sensor on
Au electrode by assembling GOx enzyme using the activated carboxy terminus (EDC-NHS
chemistry) of a self-assembled monolayer (SAM) with 3-Mercaptopropionic acid (MPA)47.
A silver (Ag) coated microneedle was used as the RE and an Au microneedle as the CE.
19
This set up was arranged onto a base plate, with an integrated Bluetooth device on the top
side for data transfer to a computer. In vitro characterisation using agarose gel prepared with
different concentrations of glucose showed a linear response for glucose concentrations
ranging from 50 mg dL-1 to 400 mg dL-1. The stability of the sensor was also analysed, and
it was found that 80% of the enzyme activity can be retained over 7 days. This is resultant
of the enhanced stability of glucose immobilised on a SAM of MPA. However, the stability
of the GOx enzyme needs to be improved further, especially to improve shelf-life, therefore
the authors point towards the addition of a hydrogel layer on top of the enzyme layer or
layer by layer assembly of GOx using suitable polymers.
Valdes-Ramirez et al. described a microneedle-based self-powered biofuel-cell (BFC)
sensor for subdermal glucose monitoring48. On-body BFC’s are attractive because they
eliminate the need for external power source by harvesting biochemical energy from the
wearers transdermal fluid (via the conversion of chemical to electrical energy from
electrochemical reactions involving biochemical pathways) and provide power signals that
are proportional to the concentration of the analyte. The microneedle-based BFC glucose
sensor was realised by incorporating modified carbon pastes into the bores of a hollow MNA
forming a bioanode and a cathode. Of the electrode material available, carbon pastes are
attractive because they offer optimal plasticity for efficient packing into the hollow
microneedles. They are widely employed in electroanalysis and these electrodes offer the
advantage of low background current, low cost, easy fabrication and convenience for
modification (via the inclusion of modifiers). The bioanode was developed by mixing
carbon paste (graphite powder – 87%) with GOx (10%) and a mediator - tetrathiafulvalene
(TTF- 3%), whereas the cathode was formed by mixing carbon paste with Pt black in a 1:1
weight ratio. These pastes were extruded into six hollow microneedles, with three acting as
the bioanode and three as the cathode. For electrochemical characterisation, the circuit was
completed with an Ag|AgCl reference electrode and a Pt wire counter electrode. Artificial
ISF containing glucose over the concentration rage of 0 – 25 mM was used for evaluating
the performance of the biosensor. Power density as a function of concentration was found
to show a linear behaviour, with proportional increase in current over the entire
concentration range. The power density for control solution (i.e. without glucose) was 0.4
W cm-2, which continued to increase between 3 – 5 W cm-2 over the normal glucose
concentration rage of 5 – 10 mM and the highest power density value recorded at 7 W cm-
2 for 25 mM glucose. Stability of the BFC glucose biosensor was also evaluated over a
20
continuous measurement period of 60 hrs with ISF containing 10 mM glucose and 20.6 mg
mL-1 BSA. The results showed that 75% of the original power density can be retained for
over 60 hrs; indicating good resistance to biofouling effects. Moreover, selectivity was
further analysed in the presence of common electrochemical interferants such as ACT, AA,
UA and lactic acid, under physiological conditions. The interferants were found to have no
significant effect on the power density obtained for 10 mM glucose obtained by the BFC
sensor. This is in fact a distinct advantage to the self-powered BFC glucose sensor when
compared to common amperometric devices. The authors claim further improvements to
this device, such as the integration of an energy storage device and a responsive closed-loop
insulin delivery system.
More recently, Sharma et al. described a cost-effective fabrication strategy to produce
MNA-based biosensors for CGM49. Here, the base MNA was developed by micromoulding
using SU8 50 (negative epoxy-based photoresist). Master templates were initially developed
using aluminium through electrical discharge machining (EDM) and used to create PDMS
micromoulds. By a process of spinning and vacuuming, SU8 50 was cast into the mould.
This was then cross-linked using UV to produce a base MNA with 64 microneedles arranged
as four 4 x 4 arrays. A two-electrode configuration was then realised by selective
metallisation of the arrays. To produce the WE, three of the arrays were coated with titanium
(15 nm) and platinum (50 nm) by conformal sputtering. By masking these arrays, the
remaining array was metallised with silver (100 nm) and treated with FeCl3 to obtain the
Ag|AgCl reference electrode. GOx enzyme was then electropolymerized onto the working
electrodes using phenol. The microneedles were ~ 1000 m in length and had a base
diameter of ~ 600 m. Optical coherence tomography (OCT) showed the penetration depth
achieved by a similar shape MNA made out polycarbonate, with the same dimensions to be
800 m, thus 80% of the microneedle length is anticipated to be in contact with the ISF and
mass transport driven by diffusion of glucose to the MNA surface. In vitro studies showed
that the sensor could measure glucose concentration as low as 0.5 mM, with a response time
15 2 s and detect glucose over a range of 0 – 30 mM at +0.7 V against the integrated RE
and CE. However, after sterilisation by gamma irradiation (of 25 kGy), the Imax values were
found to decrease, potentially indicating a lesser enzymatic activity. In vivo studies were
carried out for short period (i.e. 3 to 6 hrs) using the sterilised MNA devices. Here, the
MNA’s were applied to the forearm of healthy volunteers. It was seen that device needed
an hour to reach a stable baseline and this was because of the time it takes for polyphenol
21
films entrapped with GOx to equilibrate with the dermal fluid. The sensor was able to match
responses from finger stick measurements and was also able to match active changes
induced by diet (post the consumption of a slice of cake – bolus), but with a time lag as
reported previously (i.e. 0 – 45 mins)28. The major challenge denoted by the authors is
associated with fixing the sensor in the subdermal space.
Sharma et al., further published a study addressing optimisations based on in vivo
studies in humans50. The device fabrication and the GOx immobilising strategy used was
the same as before49, however, SU8 50 was replaced for polycarbonate to form
micromoulded MNA arrays. Four individual MNA’s were fabricated, with three metallised
using platinum (WE) and one with silver (CE) using the same procedure outlined above.
The CGM devices were applied to the foreman of the volunteer by application of moderate
thumb pressure for 1 min and secured using a tape. In vivo study was conducted in three
phases: (1) 6 hr measurements in healthy volunteers; evaluating tolerability (2) 24 hr
measurements in healthy volunteers; evaluating tolerability and skin penetration and (3) 24
hr measurements in patients with Type 1 diabetes (T1D); evaluateing performance against
a standard laboratory method. Pain was scored using Visual Analogue Scale (VAS).
Tolerability was measured using a 100 mm – VAS to evaluate pain from insertion and from
continuous wear throughout the study and compared against the insertion of a 20-G
intravenous (IV) cannula. In order to determine both the insertion depth and their placement
throughout the study, OCT was utilised. In phase 1, tolerability measurements were
analysed in 8 healthy volunteers. Out of the 8, 7 subjects had barely noticeable skin response
following insertion and removal, whereas 1 had mild erythema. Any visible skin reaction
was found to disappear within an hour of removal. Median tolerability score for the MNA
was 10, which is at the low end of the scale indicating mild pain (5 – 44); whereas for the
IV cannula the median score was 30. In phase 2, the median score obtained from 100 mm
VAS was 10 for the MNA and 39 for the IV cannula. OCT evaluation showed no significant
variation in penetration depth from the time of insertion (i.e. 0 hrs – 495 m) up to 24 hrs,
with a median penetration depth of 440 m. On evaluating the performance in vivo in 10
patients with T1D, the current measured successfully tracked venous blood glucose
concentrations, showing a clinically acceptable correlation. The mean absolute relative
difference (MARD) was 9% when compared with venous blood glucose values and 96.6% (out
of 205 data points) of the values were in the clinically relevant A + B region in Clark’s Error
Grid Analysis. The percentage absolute relative difference between two sensors on the same
22
device was only 1%. The variation on the same device is associated with masking during the
process of metallisation, creating a difference in the overall electroactive surface area on the
microneedles. However as mentioned in their previous study, the devices required pre-
calibration for 2 hrs before insertion, chronoamperometric data indicated a lag-time of up to 15
mins and significantly, two devices were found to lack functionality completely, following
sterilisation via gamma irradiation method. Overall, this research indicates good clinical
acceptability for the device.
1.3 Other Analytes
Microneedle research is gaining more and more significance into the detection of
molecules other than glucose. The ISF present in skin microenvironment offers a unique
opportunity to measure dynamics of therapeutic drugs, biomarkers, electrolytes, pH, small
molecules and neurotransmitters in a minimally invasive manner as part of routine
monitoring during treatment, rapid detection and or POC diagnostics. There are reports
suggesting that as many as 80 markers are present in skin microenvironment that shows a
good correlation with venous blood17. An attractive feature of MNA based devices is that,
each microneedle can be modified independently, so as to enable multi-analyte detection in
real-time. The following sections gives account of studies reporting single and multi-analyte
detection using MNA based electrochemical sensors.
1.3.1 Single analyte detection
Using hollow MNA made out of E-shell 200 by standard UV rapid prototyping system,
Windmiller et al. packed modified carbon paste into individual needles to realise low
potential electrochemical detection of lactate51. Lactate monitoring is important because,
high concentrations (i.e. 1 – 2 mM at rest) in blood, can reduce pH and induce damage to
the muscle tissues. The hollow microneedles used were pyramidal in shape, with a height
of 1500 m and possessed a diameter of 425 m. Carbon pastes were modified initially with
rhodium (100 mg), as it is known for its low potential detection of H2O2 and thereby
minimises the interference from co-existing electroactive species. The modified paste was
then combined with lactate oxidase (10 mg) and homogenised along with the addition of
mineral oil as a binder and polyethyleneimine (PEI) as an enzyme stabiliser (providing
electrostatic entrapment of lactate oxidase within the matrix). Attaching the hollow
microneedle to a 3 ml syringe, the carbon paste was extruded into the microneedle; ensuring
complete packing, whilst a copper wire was also being inserted alongside to form an
23
electrical contact. Excess paste was then removed, the external surface of the paste
smoothened with a wax paper and any residues removed by ultrasonication. The
performance of this biosensor was evaluated through chronoamperometric experiments at -
0.15 V against Ag|AgCl RE, over a concentration range of 0 – 8 mM for lactate in 1mM
increments. The calibration curve showed a high linearity over the entire concentration
range (R2 = 0.990), with low SD ( < 10 nA) and a detection limit of 0.42 mM. The influence
of electrochemical interferants such as AA, UA and ACT was found to be negligible, with
a resultant SD of just 1.5%; when measuring a lactate concentration of 1 mM. Moreover,
the sensor was found to have excellent stability, as repeated measurements over a period of
2 hrs with 2 mM lactate resulted in a rise in current of only 9.7%.
Utilising a similar approach, research from the same group later developed MNA
based in situ biosensor for continuous alcohol monitoring52 and detection of
organophosphorus nerve agents53. In the former, hollow microneedles were fabricated using
a medical grade liquid crystal polymer (LCP) by injection moulding. These microneedles
possessed a height of 800 m and a microneedle bore of 100 m. A press-fitting process
was then adopted for scalable fabrication of electrochemical transducers by inserting Pt and
Ag wires of 100 m dimeter into lumen of the microneedles to produce an integrated three-
electrode system. The platinum wire was then electropolymersied with PPD film to prevent
electroactive interferents. Alcohol oxidase was then immobilised on to the PPD modified Pt
WE by using chitosan as a binder (for stability and biocompatibility). Finally, the biosensor
was modified with a nafion layer in order to prevent leaching of biosensing elements and to
exclude negatively-charged interferents. The analytical performance of the biosensor was
measured over a concentration range of 0 – 80 mM of ethanol, by chronoamperometry for
35 s at an applied potential of 0.6 V (vs Ag|AgCl). The current was found to increase linearly
over the entire concentration range (R2 = 0.9886), with a sensitivity of 0.062 nA mM-1 and
the RSD between responses from five devices was only 3.3%. A similar response was seen
from the biosensor when evaluated in artificial ISF, where a linear response was seen over
the entire concentration range as above (R2 = 0.9930), with a sensitivity of 0.0452 nA mM-
1 and an RSD of 3.56% (n = 5). Results from an interference study (using 20 mM ethanol)
in the presence of 100 µM of AC, UA and L-cysteine; as well as 10 µM AA only showed a
negligible deviation of 6%. As the device was intended for continuous alcohol monitoring,
the response stability of the biosensor was further analysed in artificial ISF containing 20.1
mg mL-1 BSA. Chronoamperometric scans using 30 mM ethanol was recorded over a period
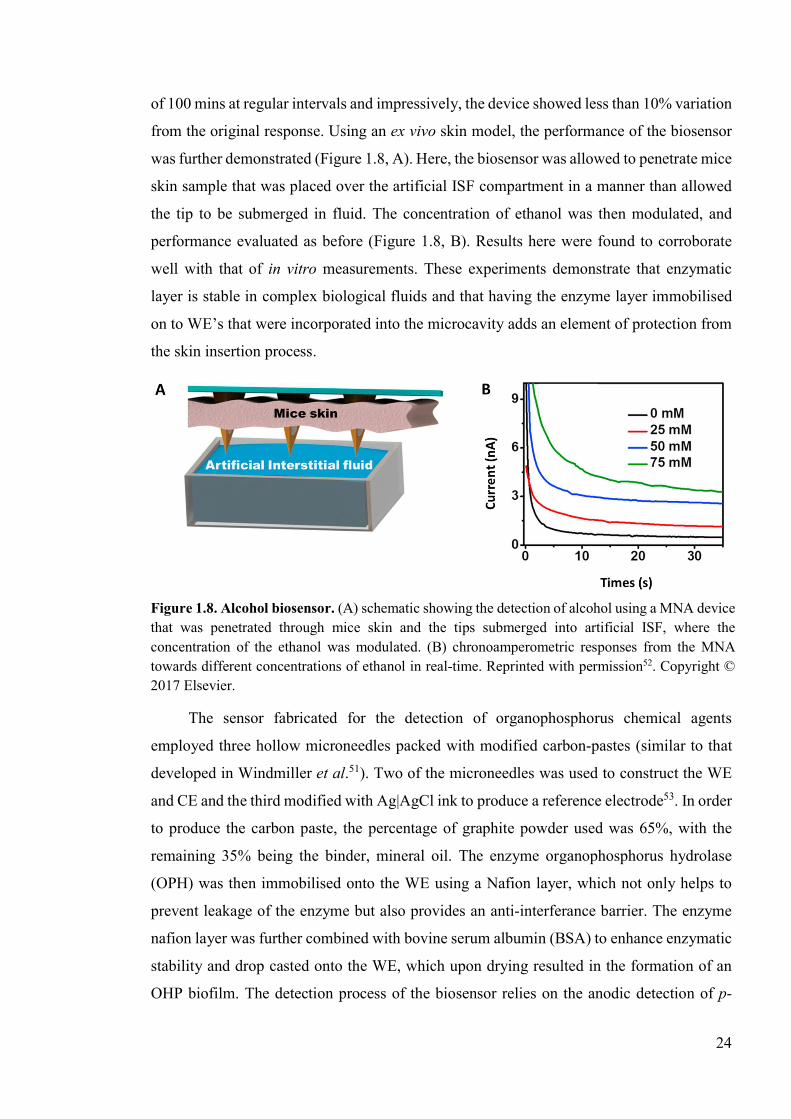
24
of 100 mins at regular intervals and impressively, the device showed less than 10% variation
from the original response. Using an ex vivo skin model, the performance of the biosensor
was further demonstrated (Figure 1.8, A). Here, the biosensor was allowed to penetrate mice
skin sample that was placed over the artificial ISF compartment in a manner than allowed
the tip to be submerged in fluid. The concentration of ethanol was then modulated, and
performance evaluated as before (Figure 1.8, B). Results here were found to corroborate
well with that of in vitro measurements. These experiments demonstrate that enzymatic
layer is stable in complex biological fluids and that having the enzyme layer immobilised
on to WE’s that were incorporated into the microcavity adds an element of protection from
the skin insertion process.
The sensor fabricated for the detection of organophosphorus chemical agents
employed three hollow microneedles packed with modified carbon-pastes (similar to that
developed in Windmiller et al.51). Two of the microneedles was used to construct the WE
and CE and the third modified with Ag|AgCl ink to produce a reference electrode53. In order
to produce the carbon paste, the percentage of graphite powder used was 65%, with the
remaining 35% being the binder, mineral oil. The enzyme organophosphorus hydrolase
(OPH) was then immobilised onto the WE using a Nafion layer, which not only helps to
prevent leakage of the enzyme but also provides an anti-interferance barrier. The enzyme
nafion layer was further combined with bovine serum albumin (BSA) to enhance enzymatic
stability and drop casted onto the WE, which upon drying resulted in the formation of an
OHP biofilm. The detection process of the biosensor relies on the anodic detection of p-
Figure 1.8. Alcohol biosensor. (A) schematic showing the detection of alcohol using a MNA device that was penetrated through mice skin and the tips submerged into artificial ISF, where the concentration of the ethanol was modulated. (B) chronoamperometric responses from the MNA towards different concentrations of ethanol in real-time. Reprinted with permission52. Copyright © 2017 Elsevier.
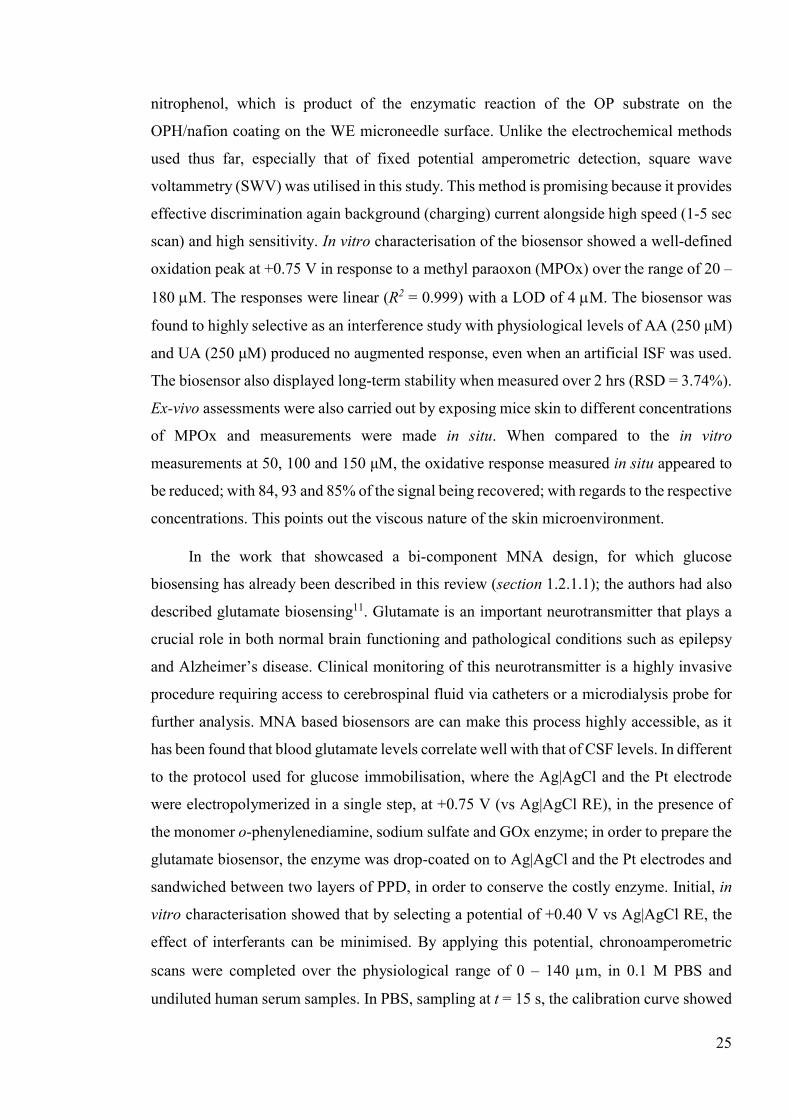
25
nitrophenol, which is product of the enzymatic reaction of the OP substrate on the
OPH/nafion coating on the WE microneedle surface. Unlike the electrochemical methods
used thus far, especially that of fixed potential amperometric detection, square wave
voltammetry (SWV) was utilised in this study. This method is promising because it provides
effective discrimination again background (charging) current alongside high speed (1-5 sec
scan) and high sensitivity. In vitro characterisation of the biosensor showed a well-defined
oxidation peak at +0.75 V in response to a methyl paraoxon (MPOx) over the range of 20 –
180 M. The responses were linear (R2 = 0.999) with a LOD of 4 M. The biosensor was
found to highly selective as an interference study with physiological levels of AA (250 μM)
and UA (250 μM) produced no augmented response, even when an artificial ISF was used.
The biosensor also displayed long-term stability when measured over 2 hrs (RSD = 3.74%).
Ex-vivo assessments were also carried out by exposing mice skin to different concentrations
of MPOx and measurements were made in situ. When compared to the in vitro
measurements at 50, 100 and 150 μM, the oxidative response measured in situ appeared to
be reduced; with 84, 93 and 85% of the signal being recovered; with regards to the respective
concentrations. This points out the viscous nature of the skin microenvironment.
In the work that showcased a bi-component MNA design, for which glucose
biosensing has already been described in this review (section 1.2.1.1); the authors had also
described glutamate biosensing11. Glutamate is an important neurotransmitter that plays a
crucial role in both normal brain functioning and pathological conditions such as epilepsy
and Alzheimer’s disease. Clinical monitoring of this neurotransmitter is a highly invasive
procedure requiring access to cerebrospinal fluid via catheters or a microdialysis probe for
further analysis. MNA based biosensors are can make this process highly accessible, as it
has been found that blood glutamate levels correlate well with that of CSF levels. In different
to the protocol used for glucose immobilisation, where the Ag|AgCl and the Pt electrode
were electropolymerized in a single step, at +0.75 V (vs Ag|AgCl RE), in the presence of
the monomer o-phenylenediamine, sodium sulfate and GOx enzyme; in order to prepare the
glutamate biosensor, the enzyme was drop-coated on to Ag|AgCl and the Pt electrodes and
sandwiched between two layers of PPD, in order to conserve the costly enzyme. Initial, in
vitro characterisation showed that by selecting a potential of +0.40 V vs Ag|AgCl RE, the
effect of interferants can be minimised. By applying this potential, chronoamperometric
scans were completed over the physiological range of 0 – 140 m, in 0.1 M PBS and
undiluted human serum samples. In PBS, sampling at t = 15 s, the calibration curve showed
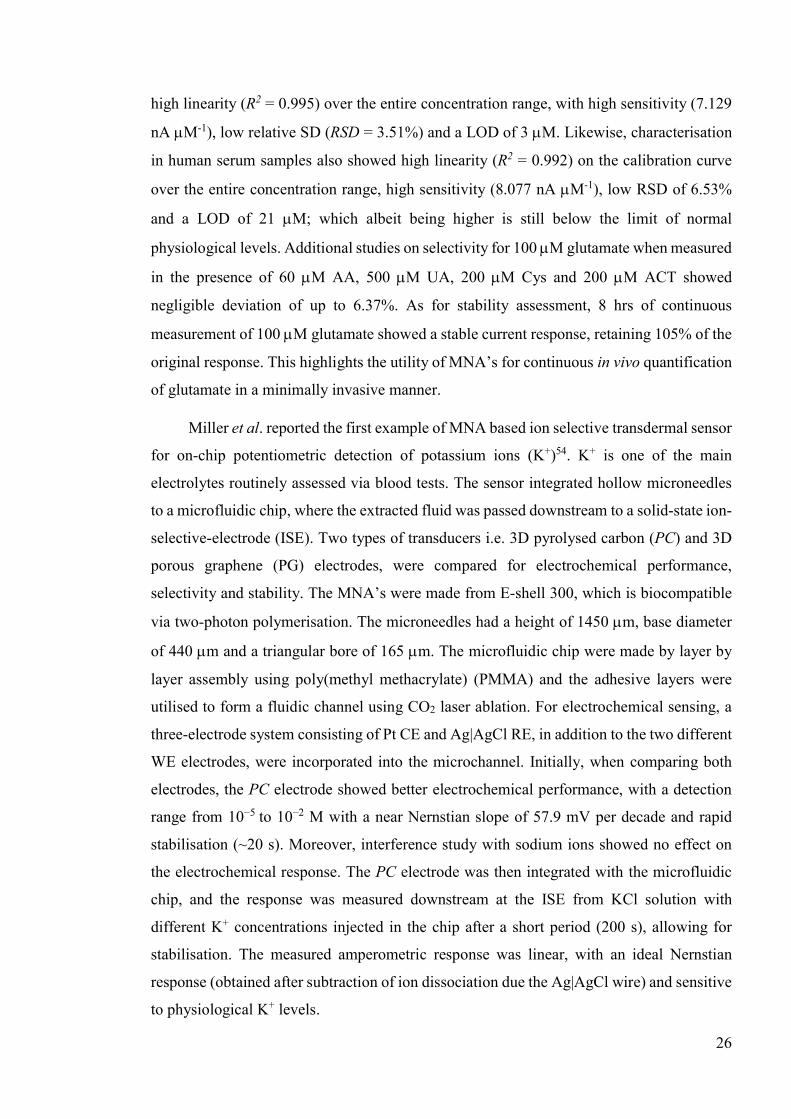
26
high linearity (R2 = 0.995) over the entire concentration range, with high sensitivity (7.129
nA M-1), low relative SD (RSD = 3.51%) and a LOD of 3 M. Likewise, characterisation
in human serum samples also showed high linearity (R2 = 0.992) on the calibration curve
over the entire concentration range, high sensitivity (8.077 nA M-1), low RSD of 6.53%
and a LOD of 21 M; which albeit being higher is still below the limit of normal
physiological levels. Additional studies on selectivity for 100 M glutamate when measured
in the presence of 60 M AA, 500 M UA, 200 M Cys and 200 M ACT showed
negligible deviation of up to 6.37%. As for stability assessment, 8 hrs of continuous
measurement of 100 M glutamate showed a stable current response, retaining 105% of the
original response. This highlights the utility of MNA’s for continuous in vivo quantification
of glutamate in a minimally invasive manner.
Miller et al. reported the first example of MNA based ion selective transdermal sensor
for on-chip potentiometric detection of potassium ions (K+)54. K+ is one of the main
electrolytes routinely assessed via blood tests. The sensor integrated hollow microneedles
to a microfluidic chip, where the extracted fluid was passed downstream to a solid-state ion-
selective-electrode (ISE). Two types of transducers i.e. 3D pyrolysed carbon (PC) and 3D
porous graphene (PG) electrodes, were compared for electrochemical performance,
selectivity and stability. The MNA’s were made from E-shell 300, which is biocompatible
via two-photon polymerisation. The microneedles had a height of 1450 m, base diameter
of 440 m and a triangular bore of 165 m. The microfluidic chip were made by layer by
layer assembly using poly(methyl methacrylate) (PMMA) and the adhesive layers were
utilised to form a fluidic channel using CO2 laser ablation. For electrochemical sensing, a
three-electrode system consisting of Pt CE and Ag|AgCl RE, in addition to the two different
WE electrodes, were incorporated into the microchannel. Initially, when comparing both
electrodes, the PC electrode showed better electrochemical performance, with a detection
range from 10−5 to 10−2 M with a near Nernstian slope of 57.9 mV per decade and rapid
stabilisation (~20 s). Moreover, interference study with sodium ions showed no effect on
the electrochemical response. The PC electrode was then integrated with the microfluidic
chip, and the response was measured downstream at the ISE from KCl solution with
different K+ concentrations injected in the chip after a short period (200 s), allowing for
stabilisation. The measured amperometric response was linear, with an ideal Nernstian
response (obtained after subtraction of ion dissociation due the Ag|AgCl wire) and sensitive
to physiological K+ levels.
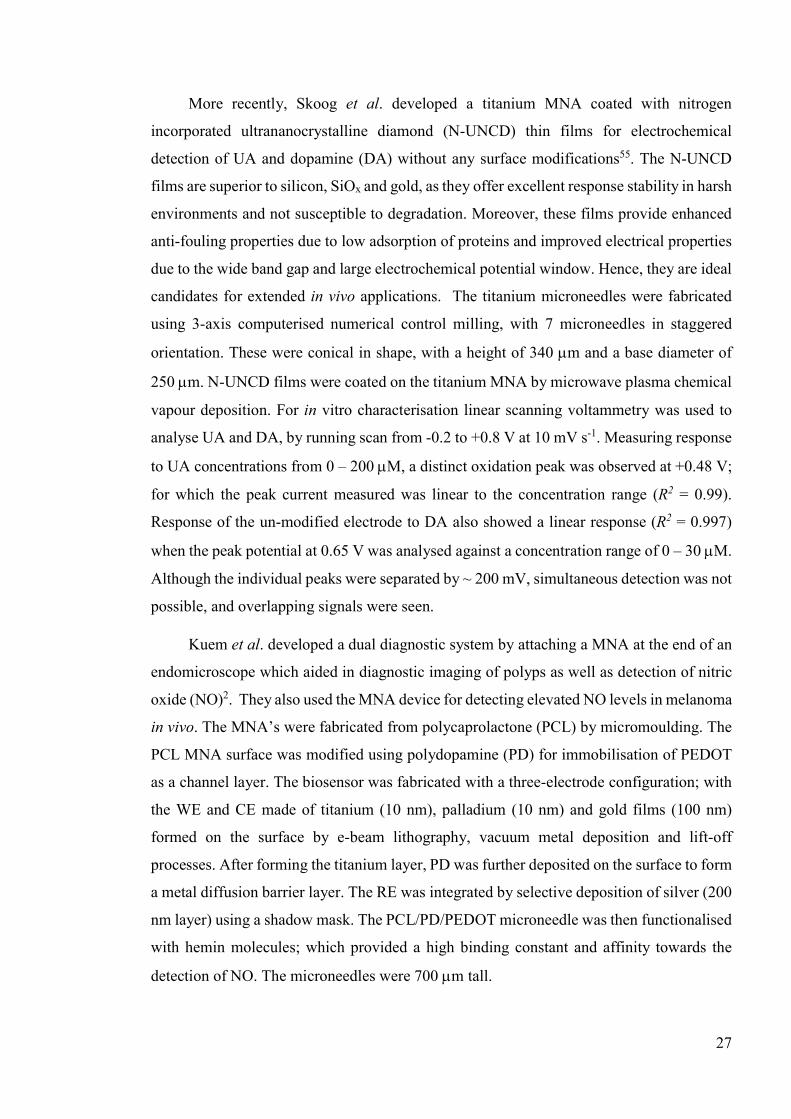
27
More recently, Skoog et al. developed a titanium MNA coated with nitrogen
incorporated ultrananocrystalline diamond (N-UNCD) thin films for electrochemical
detection of UA and dopamine (DA) without any surface modifications55. The N-UNCD
films are superior to silicon, SiOx and gold, as they offer excellent response stability in harsh
environments and not susceptible to degradation. Moreover, these films provide enhanced
anti-fouling properties due to low adsorption of proteins and improved electrical properties
due to the wide band gap and large electrochemical potential window. Hence, they are ideal
candidates for extended in vivo applications. The titanium microneedles were fabricated
using 3-axis computerised numerical control milling, with 7 microneedles in staggered
orientation. These were conical in shape, with a height of 340 m and a base diameter of
250 m. N-UNCD films were coated on the titanium MNA by microwave plasma chemical
vapour deposition. For in vitro characterisation linear scanning voltammetry was used to
analyse UA and DA, by running scan from -0.2 to +0.8 V at 10 mV s-1. Measuring response
to UA concentrations from 0 – 200 M, a distinct oxidation peak was observed at +0.48 V;
for which the peak current measured was linear to the concentration range (R2 = 0.99).
Response of the un-modified electrode to DA also showed a linear response (R2 = 0.997)
when the peak potential at 0.65 V was analysed against a concentration range of 0 – 30 M.
Although the individual peaks were separated by ~ 200 mV, simultaneous detection was not
possible, and overlapping signals were seen.
Kuem et al. developed a dual diagnostic system by attaching a MNA at the end of an
endomicroscope which aided in diagnostic imaging of polyps as well as detection of nitric
oxide (NO)2. They also used the MNA device for detecting elevated NO levels in melanoma
in vivo. The MNA’s were fabricated from polycaprolactone (PCL) by micromoulding. The
PCL MNA surface was modified using polydopamine (PD) for immobilisation of PEDOT
as a channel layer. The biosensor was fabricated with a three-electrode configuration; with
the WE and CE made of titanium (10 nm), palladium (10 nm) and gold films (100 nm)
formed on the surface by e-beam lithography, vacuum metal deposition and lift-off
processes. After forming the titanium layer, PD was further deposited on the surface to form
a metal diffusion barrier layer. The RE was integrated by selective deposition of silver (200
nm layer) using a shadow mask. The PCL/PD/PEDOT microneedle was then functionalised
with hemin molecules; which provided a high binding constant and affinity towards the
detection of NO. The microneedles were 700 m tall.
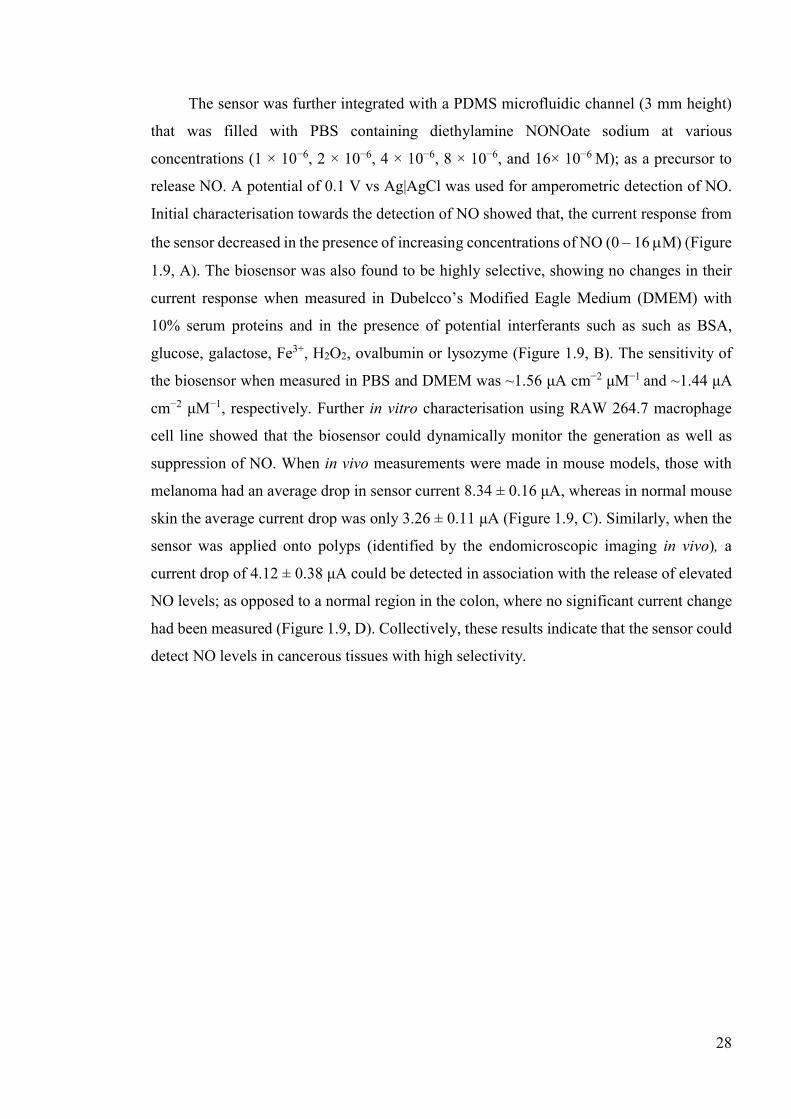
28
The sensor was further integrated with a PDMS microfluidic channel (3 mm height)
that was filled with PBS containing diethylamine NONOate sodium at various
concentrations (1 × 10⁻⁶, 2 × 10⁻⁶, 4 × 10⁻⁶, 8 × 10⁻⁶, and 16× 10−6 M); as a precursor to
release NO. A potential of 0.1 V vs Ag|AgCl was used for amperometric detection of NO.
Initial characterisation towards the detection of NO showed that, the current response from
the sensor decreased in the presence of increasing concentrations of NO (0 – 16 M) (Figure
1.9, A). The biosensor was also found to be highly selective, showing no changes in their
current response when measured in Dubelcco’s Modified Eagle Medium (DMEM) with
10% serum proteins and in the presence of potential interferants such as such as BSA,
glucose, galactose, Fe3+, H2O2, ovalbumin or lysozyme (Figure 1.9, B). The sensitivity of
the biosensor when measured in PBS and DMEM was ~1.56 μA cm−2 μM−1 and ~1.44 μA
cm−2 μM−1, respectively. Further in vitro characterisation using RAW 264.7 macrophage
cell line showed that the biosensor could dynamically monitor the generation as well as
suppression of NO. When in vivo measurements were made in mouse models, those with
melanoma had an average drop in sensor current 8.34 ± 0.16 μA, whereas in normal mouse
skin the average current drop was only 3.26 ± 0.11 μA (Figure 1.9, C). Similarly, when the
sensor was applied onto polyps (identified by the endomicroscopic imaging in vivo), a
current drop of 4.12 ± 0.38 μA could be detected in association with the release of elevated
NO levels; as opposed to a normal region in the colon, where no significant current change
had been measured (Figure 1.9, D). Collectively, these results indicate that the sensor could
detect NO levels in cancerous tissues with high selectivity.
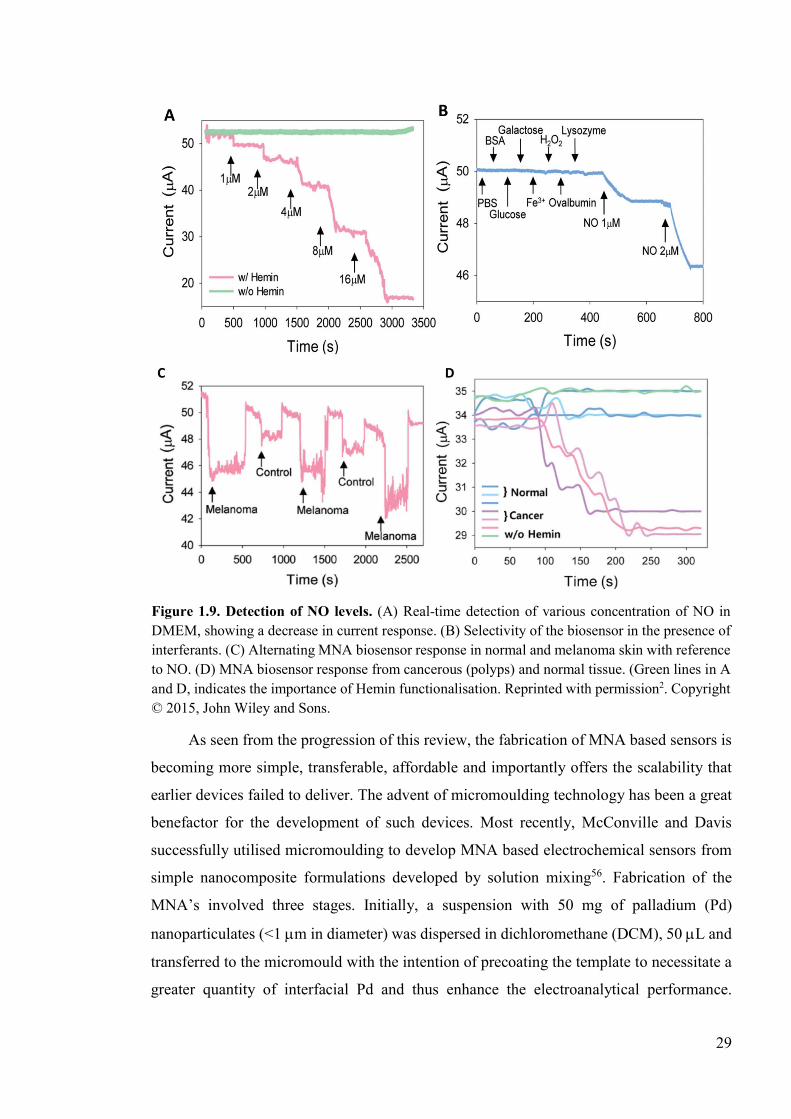
29
As seen from the progression of this review, the fabrication of MNA based sensors is
becoming more simple, transferable, affordable and importantly offers the scalability that
earlier devices failed to deliver. The advent of micromoulding technology has been a great
benefactor for the development of such devices. Most recently, McConville and Davis
successfully utilised micromoulding to develop MNA based electrochemical sensors from
simple nanocomposite formulations developed by solution mixing56. Fabrication of the
MNA’s involved three stages. Initially, a suspension with 50 mg of palladium (Pd)
nanoparticulates (<1 m in diameter) was dispersed in dichloromethane (DCM), 50 L and
transferred to the micromould with the intention of precoating the template to necessitate a
greater quantity of interfacial Pd and thus enhance the electroanalytical performance.
Figure 1.9. Detection of NO levels. (A) Real-time detection of various concentration of NO in DMEM, showing a decrease in current response. (B) Selectivity of the biosensor in the presence of interferants. (C) Alternating MNA biosensor response in normal and melanoma skin with reference to NO. (D) MNA biosensor response from cancerous (polyps) and normal tissue. (Green lines in A and D, indicates the importance of Hemin functionalisation. Reprinted with permission2. Copyright © 2015, John Wiley and Sons.
30
Secondly, the bulk of the MNA was formed by solution casting 50 mg of Pd within 50 µL
of a 50% w/v solution of polystyrene (PS)/polycarbonate (PC) in DCM. Finally, 50 L of
the same composition (containing 50 mg of Pd) was further added to form the top of the
baseplate backing. This was followed by centrifugation; to remove air bubbles and for
efficient packing of the polymer/nanoparticle mixture within the structure of the
microneedles. To solidify the MNA, DCM was then allowed to evaporate at room
temperature and pressure for 4 hours; with the MNA demoulded afterwards. The MNA
surface was further modified through self-assembly of L-cysteine in order to improve
electron transfer kinetics. The microneedles were 350 m in height and had tip diameter of
7.2 m. Cyclic voltammetric (CV) characterisation of the MNA biosensor using a redox
couple, potassium ferrocyanide showed that, modification with L-cysteine was pivotal in
enhancing the electrode kinetics as without out it, their MNA electrode did not show the
reversible redox processes that is associated with ferrocyanide. The above characterisation
involved the whole of the MNA, therefore a skin mimic was prepared by entrapping the
redox couple into a hydrogel formulation and then layered with Parafilm. The MNA
biosensor was then allowed to pierce through the Parafilm barrier layer, into the hydrogel
for evaluation of the redox couple. In response, the MNA biosensor produced a lower
current response as the overall electroactive surface area of the microneedle was reduced.
Nevertheless, a good electrochemical response was seen towards the redox couple, but with
larger peak to peak separation. Although this study showcased a versatile strategy towards
the fabrication of MNA based electrochemical sensors, major challenges remain, especially
to that associated with the optimisation of the filler to matrix ratio, in order to obtain good
mechanical characteristics as well as to improve electrode kinetics. Only the fabrication of
the WE’s were demonstrated here. Moreover, there needs to be a careful evaluation of
biocompatibility of the composite MNAs, especially concerning the release of Pd following
in situ application, because the microneedle surfaces were found to be highly granular.
1.3.2 Multi-analyte detection
In 2011, Miller et al. reported the first study on the development of MNA based
biosensors towards simultaneous detection of AA and H2O2 using modified carbon fibre
electrodes integrated within in hollow microneedles57. The hollow microneedles were
fabricated from E-shell 200 by digital micromirror device based stereolithographic process,
which allows rapid prototyping of microneedles; over 200 devices in 3 hrs. The
31
microneedles were tetrahedral in shape, with a height of 1030 m, had a triangular base with
side lengths of 1120 m and the bore measured 375 m in diameter. The carbon fibres were
modified selectively with Pd (by electrodeposition) and o-aminophenol (in situ
diazotination and electrografting of the diazonium salt) to enable simultaneous
electrochemical detection of H2O2 and AA, respectively. With the help of a precision
alignment tool, the fibres were then inserted in the hollow aperture of the microneedles and
secured with an acrylic adhesive on a PMMA substrate. Preliminary electrochemical
characterisation via CV towards the detection of the redox probe ferrocyanide at 5 mM
concentration showed a well-defined oxidation and reduction peak, with the average formal
potential measured at 20 mV vs Ag|AgCl reference electrode. The average peak separation
was 125 mV. Pd catalysed oxidation of H2O2 was then investigated. Measuring over the
range 0 – 500 M, the CV showed a linear increase in reductive current, exhibiting a linear
range over 100 – 500 M, with an LOD of ~15 M. Similarly, AA was detected using linear
sweep voltammetry (LSV), which consequently demonstrated selective detection of AA, at
a low potential of 195 mV. A calibration for this was not provided and although the device
was developed to showcase simultaneous detection, this feature was not showcased.
One year later however, utilising the same strategy as shown above, the same group
proposed the use of MNA based electrochemical sensors for simulation detection of three
different analytes58. Here, the carbon fibres were replaced with modified carbon pastes in
order to detect pH, glucose and lactate. The modified carbon pastes housed within each
hollow microneedle were separately connected to wires on a flexible flat cable to enable
simultaneous detection of analytes. Electrochemical detection of pH was achieved by
chemically depositing RR diazonium salt; whereas for selective detection of lactate and
glucose, the carbon pastes were modified with rhodium incorporating the respective
enzymes. Detection of pH was demonstrated through CV scans run from -0.7 V to 0.8 V at
100 mV s-1, at a regular interval of 0.5 pH units, over the range of 5.0 – 8.0 pH. The response
was measured by evaluating the shift on the anodic peak potential of the quinone moiety on
the RR diazonium salt. The results showed a highly linear (R2 = 0.99) negative shift in the
oxidative peak potential with increasing buffer acidity over the entire pH range studied.
Detection of glucose and lactate was then performed by chronoamperometric scans at a
fixed potential of -0.05 V and +0.15 V, respectively; for different pH values (i.e. 5.0, 6.0,
7.0 and 7.5). The calibration curves obtained were linear for both analytes over a
concentration range of 2 – 12 mM; with the current decreasing over more acidic pH. This
32
study also demonstrated multiplexed detection by analysing the selectivity of the sensor
when using a mixed buffer solution (0.1 M PBS). For example, the response of the lactate
biosensor was analysed when the sample was a mixture of glucose and lactate at a
concentration of 4 mM. No response was seen from the lactate sensor when glucose was
added, but addition of lactate produced a current response of 38 nA; similar to that obtained
from its individual characterisation. Similarly, the glucose biosensor did not produce any
response when lactate was added, but the current response increased by 10 nA, when 4 mM
glucose was added to the buffer solution. Additionally, the MNA biosensor was able to
confirm the pH values simultaneously. This shows that, by individually addressing each
microneedle-based electrode in an array, simultaneous detection of analytes is possible.
1.4 Discussion and Future directions
Over the past two decades, research efforts have intensified into developing MNA
based biosensors. Predominantly, the focus of such research is on developing CGM devices
for diabetes management. This is driven by the increasing number of deaths associated with
diabetes (and related complications). The World Health Organisations (WHO) recent global
report on diabetes estimated that approximately 422 million adults are living with diabetes
in 201459. The number of deaths reported in 2012, directly from diabetes was 1.5 million;
whilst an additional 2.2 million deaths were resultant of higher-than-optimal blood glucose,
increasing the risk for cardiovascular and other diseases. These numbers will continue to
rise due to a lack of access to core facilities for glucose analysis using venous plasma and
or POC devices, particularly in the developing countries; difficulty in distinguishing
between Type 1 and Type 2 diabetes and lack of patient adherence to a strict treatment
regime. Research into MNA based diagnostic and CGM devices are ideally positioned to
address these key issues, but several challenges needs to be overcome. These includes: (1)
low cost and efficient fabrication (including efficient miniaturisation of the devices with on-
chip sensor, integrated with transducers and read-out systems) to ensure that the technology
is globally accessible. (2) efficient interaction with the skin in term of both skin penetration
without mechanical/functional failure and efficient interlocking of the microneedle within
the skin, in order to avoid displacement through patient movements; (3) reliable collection
of biofluids through the microneedle for in line quantification (where microfluidic devices
are employed) or efficiency in analysing the biofluid in situ (where solid MNA based
sensors employed). In both cases, sensors should account for a high degree of accuracy,
selectivity, sensitivity, LOD and reproducibility20.
33
As seen from the studies concerned with glucose monitoring, tremendous progress has
been made despite the relatively short period of research into MNA based devices. This has
led to the several clinical studies, and even commercialisation of CGM (by Arkal Medical)
based on the principles reported in the studies by Chua et al. and Jina et al.; whereby glucose
diffuses passively from the ISF to a biosensor external to the chip44,45. This device named,
Glucopod, functions by employing the classical GOx chemistry, consisting of a
disposable sensor, reusable transmitter and wireless smart receiver. Recent trend on CGM
devices have stepped away from the hollow MNA devices and have successfully utilised
solid electroactive microneedles for in situ biosensing. These are less complex in terms of
the sensor design and integration, and more advantageous in the sense that the larger
electroactive surface of the solid microneedles can help detection of biomolecules with high
sensitivity60. In line with this progress, fabrication strategies are becoming simpler,
embarking on the use of technologies associated with micromoulding. However, a major
challenge is associated with micromould maintenance, which may require constant
replacement in order to replicate the finite structure of the microneedles with high accuracy.
Recent works have now demonstrated extended use of MNA based sensors in
detecting clinically relevant analytes and molecules, both in terms of diagnostics and
continuous monitoring purposes. Some promising applications has been demonstrated such
as the continuous monitoring of alcohol, detection of elevated NO levels in cancer,
monitoring of pH and detection of organophosphorus chemical agents. In terms of
fabrication, prominent approaches that have been employed thus far includes; a bi-
component microneedle design (where solid electroactive microneedles are inserted into the
aperture of a hollow microneedle), incorporation of modified carbon fibres and pastes within
the hollow microneedles, and solid microneedles that are metallised to form electroactive
surfaces. Although the earlier studies relied heavily on silicon as the material of choice,
increasingly polymers are used to fabricate both solid and hollow microneedles. The
detection is based on passive accumulation of analytes on the surface of the MNA-based
electrodes once they are inserted in the skin. With MNA based sensors whether it is used
for detection of glucose or other biomolecules, two key factors that are currently overlooked
and needs to be addressed involves: (1) effective placement within the skin, unhindered by
muscle movements especially when considering long-term on-body monitoring and (2)
miniaturisation of the device20.
34
Although MNA platforms developed for biosensing appears to be transferable towards
the detection of several analytes in situ, research is still focused on fabrication. Such studies
are primarily focusing on easier fabricational strategies alongside an attempt to improve
analytical sensitivity towards a range of analytes. This is of course relevant, as there are a
plethora of molecules and markers that requires the device to possess a high sensitivity and
selectivity in order for it to be detected. This in particular includes, detection of disease
specific biomarkers. There are numerous studies indicating the potential for MNA’s to be
used as rapid immunodiagnostics devices, by successfully utilising the principles of
enzyme-linked immunosorbent assay (ELISA)13,61–63. Overall, the technological gap,
combined with the fact that, microneedle-based sensor technology is yet to take full
advantage of the skin biochemistry to address a large range of clinical applications, will
undoubtedly drive the field forward.
1.5 Aims and objectives
Dermal biosensing using MNA-based electrodes have attracted significant research
interests because the active components of the electrodes can be modified independently to
detect in real-time, and continuously monitor, biomolecules of clinical interest from
biofluids within solid tissues in a minimally invasive manner. The electrochemical detection
strategies employed by these sensors are distinctly advantageous as they are generally low
cost, non-complex and can be effectively utilised by a minimally trained individual at the
POC20. Research thus far has demonstrated biosensing devices employing hollow and solid
designs as well as their combinations i.e. hollow microneedle accommodating a solid
microneedle /modified carbon fibre/Pt wire WE’s as well as those filled with modified
carbon pastes. Though the early studies were dependant on sophisticated micromachining
and lithographic process using silicon as the choice of material for fabrication, progress over
recent years have made polymers an ideal alternative and employing micromoulding as a
facile fabrication strategy to produce MNA-based sensors64. Solid microneedle designs are
highly compatible with such a fabrication strategy, and by utilising injection moulding or
hot embossing processes, scalability for the device manufacturing can be improved
drastically65. Conventionally, solid polymeric microneedles produced in this manner is
subsequently metallised by coating with gold or platinum using e-beam lithography or by
sputtering to develop electroactive surfaces. Although metallisation with gold and platinum
renders excellent electroactive surfaces for biomolecular detection, it is still not as cost-
effective, especially when envisaging a global accessibility. In line with progress of research
35
presented in this thesis, McConville and Davis, very recently published research undertaken
to develop MNA-based biosensors by micromoulding using composite formulation
involving PS or PC matrix and Pd microparticles56. Composite formulations are an attractive
option because, cost-effective and versatile formulations can be produced with desirable
functional and mechanical properties using a wide range of materials. However, the major
challenge associated with composite formulations is to achieve the right mechanical and
electrochemical characteristics by incorporating an optimal level of the conductive filler. In
order to obtain a good electrochemical behaviour in a non-conjugated matrix it is often the
case that a high amount of filler is to be incorporated as found by McConviller and Davis,
where 50% of the sensor was made of Pd microparticles. Hence, careful considerations must
be given to the choice of the active material, their functional properties (i.e. electrochemical
and mechanical) and the processing conditions under which they are effectively
incorporated into the non-conjugated matrix.
The principal aim for this thesis was to develop MNA biosensors using nanocomposite
formulations for rapid intradermal bioanalysis. Nanocomposite formulations was chosen
due to their adaptability in fabricating a biosensor with the desired functional properties.
Importantly, composites maintain processability similar to their polymeric matrices, hence
they favour a highly scalable fabrication method such as injection moulding, which
consequently enables the fabrication of MNA based electrodes in a single step66.
Carbon nanotubes (CNT’s), characterised by their ultra-high specific surface area, and
excellent mechanical, electrical and electrocatalytic properties are ideally suited as active
materials within polymeric matrices to form nanocomposite MNA based electrodes67.
Electrochemical sensing based on CNT’s is an established field, as their material properties
allow for rapid-electrode kinetics, reduce the overvoltage, lower the limits of detection and
further impart antifouling properties towards the electrochemical processes of many
analytes68. In relation to the fabrication of various electrochemical sensors, CNT’s have
been typically used as modifiers of glassy carbon electrodes (GCE’s) or Au electrodes.
However, they can also be fabricated as electrodes themselves; as indicted by CNT-paste
electrodes69–71. This implies that MNA’s developed from CNT based polymeric
nanocomposites have the potential to replace metallic and or metallised MNA’s for
transdermal biosensing. While the improvement in mechanical and electrical properties
upon the inclusion of the CNT’s into polymeric matrices have been extensively investigated,
the challenge here was to determine, whether such composites will adhere to the finite
36
structure of the MNA’s and the feasible ratios that may define optimal electroactivity
without compromising mechanical integrity.
In order to realise the fabrication of CNT-based nanocomposite MNA’s towards
intradermal bioanalysis, the following objectives were assessed in subsequent chapters:
1. Investigate the suitability of epoxy to form nanocomposite MNA’s. This was
divided into three stages: (a) Develop a methodology to fabricate MNA’s using
neat epoxy by evaluating different epoxy formulations, (b) validate a
methodology for evaluating mechanical properties of the MNA’s and (c) assess
strategies to incorporate CNT’s into epoxy and utilise or further adapt the
fabrication strategy developed initially to develop nanocomposite MNA’s.
(Chapter 3)
2. Investigate the suitability of Poly (lactic acid) (PLA) to form nanocomposite
MNA’s. This involved: (a) fabrication of MNA’s from neat PLA by
micromoulding, (b) developing a methodology towards the incorporation of
CNT’s into PLA, (c) assessment of mechanical characteristics of the MNA’s,
(d) optimisation and evaluation of electrochemical performance in vitro and ex
vivo. (Chapter 4)
3. Improve the electrochemical behaviour of the nanocomposite MNA’s.
Optimisations were carried out by critically evaluating the processing conditions
(i.e. sonication), incorporation of surfactants and evaluating the influence of
differing lengths and diameters of CNT’s alongside differing functional groups.
(Chapter 5)
4. Cytotoxicity evaluation of the nanocomposite MNA’s. Toxicity assessment
from indirect contact and the effect of electrochemical measurements on cells.
(Chapter 6)
37
Chapter 2. General materials and methods
2.1 Overview
The overall aim of the research presented in this thesis was to develop solid
electroactive MNA-based electrodes for rapid intradermal bioanalysis. This chapter
describes the generic methods implemented during fabrication, characterisation and
evaluation of developmental strategies as well as functional performance of the MNA’s.
Methods developed to investigate specific experimental aims are detailed in respective
chapters.
2.2 Fabrication
2.2.1 Development of micromoulds
Micromoulds were developed using a Sylgard® 184 silicone elastomer kit; purchased
from Dow Corning (Midland, MI, USA). A commercially available MNA i.e. Derma Stamp
(amazon.co.uk, ASIN: B007ATO220I), consisting of 35 microneedles with a length of 1
mm was used as the template. In order to fabricate the negatives, the two-part silicon
elastomer was mixed in a ratio of 10:1 and poured into a flat bottom container made of
aluminium foil, with a dimeter of 3 – 4 cm. The MNA stamp was then immersed fully into
this mixture and degassed at a low vacuum pressure of ~10 mbar for 2 – 3 hrs; ensuring
complete removal of trapped air-bubbles. The container with the MNA stamp was then
placed on a hot plate and the stamp was affixed upright after raising it slightly above the
base of the container. In this set-up, the elastomer was cured at 90°C for 2 – 3 hours. The
MNA stamp was then manually ejected, and the foil peeled off to reveal the micromould.
These micromoulds were used throughout this body of work to fabricate MNA’s from the
various materials utilised.
2.2.2 Development of MNA’s
In this body of work, development of nanocomposite MNA-based electrodes was
attempted by using epoxy and PLA as the matrix component. With reference to this, MNA’s
were initially fabricated from the matrix material alone and mechanically characterised. This
was followed by evaluations of the processing conditions under which functionalised
MWCNT’s can be successfully incorporated into the polymeric matrices. Finally, the utility
38
of such nanocomposites to be developed as electroactive MNA’s with good mechanical
properties was determined.
The methods used for fabrication and optimisation of nanocomposite formulations
and MNA’s were developed throughout the course of this thesis and are thus
comprehensively detailed in the relevant chapters. Therefore, in the following sections, only
a brief account of the final optimised method that was used to develop MNA’s from various
materials are detailed.
Poly (lactic acid) MNA fabrication
The PLA used throughout the body of work presented in this thesis was filaments
commonly used for 3D printing (Makerbot, Germany). Employing a micromoulding
approach, PLA based MNA’s were fabricated by melting centimetre long segmented pieces
of the filament at 180°C, under low vacuum (~20 mbar), inside the micromould for 4 hrs63.
Upon cooling, solid PLA based MNA devices were manually ejected from the micromould.
Epoxy MNA fabrication
Three different epoxy formulations were evaluated towards the development
nanocomposite MNA’s. (1) a commonly used 2-part epoxy resin, RX771/C (Robnor Resins
Ltd (Swindon, Wilshire, UK); (2) medium epoxy formulation fabricated using an electron
microscopy (EM) grade Agar 100 resin (Agar Scientific, Stanstead, Essex, UK) and (3) a
hard epoxy formulation fabricated using the same EM grade Agar 100 resin. Initially, the
development of MNA’s from the various epoxy formulations alone were investigated. The
optimised method found, involved application of a low vacuum pressure of 200 mbar for 45
mins prior to thermal curing inside the micromould at respective temperatures overnight.
Further details can be found in Chapter 3, section 3.3.1. Attempted fabrication methods for
developing epoxy-nanocomposite MNA-based electrodes are also detailed in Chapter 3,
section 3.3.2.
PLA/CNT nanocomposite MNA fabrication
Carboxyl functionalised MWCNT’s (f-MWCNT) with a length and diameter of 10 –
30 m and 20 – 30 nm respectively, was purchased from Cheap Tubes Inc. (Cambridgeport,
USA) and used to fabricate PLA-based nanocomposite MNA’s by employing a solution
mixing approach. In chapter 4, nanocomposite MNA based electrodes were fabricated using
the following method. Initially, the f-MWCNT’s (at different loadings) were dispersed in an
39
organic solvent (chloroform) by bath sonication (operation at 37 kHz) for an hour. Filaments
of PLA constituting the appropriate weight fractions were then added to the solvent/f-
MWCNT mixture and allowed to dissolve completely by magnetic stirring at 45°C for 1.5
hrs. Bath sonication was then employed for another hour, so that the PLA-f-MWCNT
mixture can be intercalated efficiently. This process was aided by maintaining the
temperature on the sonic water bath at ~45°C. Once this process was completed, the whole
mixture was homogenised further by stirring on a hot plate at 45C for 48 hours. The mixture
was then poured into a glass petri dish and the solvent was evaporated at room temperature
(RT) for 48 hours to develop nanocomposite films. To ensure removal of solvent completely
from the nanocomposite films, they were further dried in a thermal oven at 60C overnight.
Further details on the development of nanocomposite films can be found in Chapter 4,
section 4.3.1.
The dried nanocomposite films were used to fabricate nanocomposite MNA’s by
micromoulding. Briefly, the optimised method found involved; sectioning the
nanocomposite films in to ~1 x 1 cm pieces and filling them into the micromould at a
specified weight of 0.175 grams. Electrochemical response stabilisation by using a specified
weight of the nanocomposite films in order to achieve a define base-plate thickness is
described in section 4.3.4 and evaluated in section 4.4.4. The nanocomposite filled
micromould was then heated in a thermal oven at 200°C. The resultant pliable material was
then manually compressed into microcavities of the micromould to form the microneedles.
Manual compression was repeated three time at 30 min intervals to ensure complete MNA
formation in the micromould. An electrical contact was then made by minimally
compressing a coiled wire into the backing of the base-plate surface during fabrication. This
wire covered ~85% of the base-plate surface. Design and optimisation of an electrical
contact is further detailed in Chapter 4, section 4.3.4. The micromould was then removed
from the thermal oven and allowed to cool at RT for 30 mins to ensure firm connection of
the electrical wire with the MNA-base plate. To seal the electric contact and to form a thick
base, the micromould was filled with polycaprolactone (PCL) pellets (Polymorph®,
Mindsets ltd, Essex, UK) and melted it over the base-plate at 100°C for 2 hours. After further
cooling at RT, a nanocomposite MNA, complete with the electrical contact was ejected from
the micromould manually. For electrochemical evaluation base-plate was concealed by
allowing the microneedles to pierce through a layer of ParafilmTM and sealing it around the
40
microneedles by application of heat at 40°C for 2 mins. Optimisations involving ParafilmTM
is further detailed in Chapter 4, sections 4.3.4 and 4.4.4.
In chapter 5, attempts were made to improve the functional performance of the MNA’s.
In relation to this a successful approach found was to replace the bath-type sonicator with a
probe-type sonicator (model: Q705, Fisherbrand™, Loughborough, UK). With reference to
sample processing, using a probe-type sonicator caused a rapid rise in temperature with time,
therefore, an acetonitrile dry ice bath was employed to keep the sample temperature low.
The sonic probe was inserted half way into the container for even circulation of sonication
energy at 100 % amplitude. The sonication energy was further delivered in pulses of 20 sec
with a 30 sec rest period in between to prevent equipment and sample overheating. For
dispersion of f-MWCNT, an optimised sonication time of 3 mins was used and for efficient
intercalation with the polymer, an additional minute of sonication was employed after
dissolution of PLA into the f-MWCNT dispersed. Further details relating to this method
optimisation can be found in Chapter 5, sections 5.3.1 and 5.4.1.
In addition to the long ‒COOH functionalised MWCNT’s used to fabricate the
nanocomposite MNA’s thus far, shorter versions of the nanotubes (l = 1 – 12 µm and O.D
< 20 nm) with same and different functional groups (i.e. –COOH, –N2, ‒NH2), were
additionally utilised to analyse the influence of MWCNT dimensions and functional groups
on the performance of the nanocomposite MNA’s. This required a method optimisation,
whereby the concentration at which the MWCNT’s were dispersed was altered from 0.5 to
0.05 wt%, whilst also adopting the improved sonication strategy. Further details to this
optimisation can be found in Chapter 5, sections 5.3.3 and 5.4.3. As lowering the
concentration maybe beneficial in improving the dispersion of all types of MWCNT’s
evaluated in the thesis, this final optimisation was applied to develop MNA based
nanocomposite MNA’s universally; regardless of the functional group or dimensions.
2.3 Characterisation and evaluation
2.3.1 Mechanical characterisation
Evaluation of axial and shear fracture strengths
At present, there exists no standardised tests and equipment to demonstrate the
mechanical performance and safety profiles of MNA’s72. However, a combination of tests,
involving evaluation of axial fracture strength (AFS) and shear fracture strength (SFS) are
41
generally accepted to give a more complete profile of the mechanical behaviour of MNA’s
that can be correlated with successful insertion and removal from the skin. AFS measures
the force required for a microneedle to fail under axial stresses (i.e. force applied parallel to
the microneedle vertical axis)73–75. SFS on the other hand, measures lateral forces that a
microneedle can withstand74. The mode of failure can be associated with bending, buckling
or even fracture of the microneedles72. In this body of work, a texture analyser (TA)
equipped with a video capture and synchronisation system (Stable Microsystems Ltd,
Surrey, UK) was adopted to carry out the mechanical evaluation of all MNA’s fabricated75.
TA was used, because unlike the commonly used displacement force test stations, no further
adaptations to the equipment was necessary as probes and fixtures were commercially
available for effective placement and measurement from the microneedles76. AFS and SFS
was evaluated by using the compressional mode of operation on the texture analyser.
Envisioning the development of nanocomposite MNA-based electrodes, certain
inhomogeneity between the microneedles were anticipated, due to improper dispersion.
Therefore, the mechanical behaviour of a single microneedle was evaluated for both tests
throughout the research presented in this thesis. A detailed account of the experimental
parameters involved, and discussion of the methodology is given in Chapter 3, sections 3.3.3,
3.4.3 and 3.5.
Skin penetration studies
For skin penetration studies (and in situ biosensing studies detailed in Chapter 4,
section 4.3.6), freshly excised ears were recovered from pigs that had been euthanised for
unrelated studies at the Pirbright Institute (Pirbright, UK) and reused in accordance with the
3Rs (replacement, reduction and refinement) principles and ARRIVE guidelines. Full-
thickness skin was removed from these freshly excised ears by blunt dissection and stored
at - 80°C prior to usage. (For in situ biosensing studies, the porcine ears were transported
on ice to the laboratory and used with 3 hours of excision).
MNA’s were inserted into the skin by gradually applying a force up to 15 N using the
thumb and holding it for 30 s before removal. An electronic weighing scale was used to
carry out these penetration tests. Thereafter, the perforations were visualised by staining
with saturated methylene blue solution, which selectively stain cells of the viable epidermis
and not the stratum corneum. Assessment of penetration depth was not demonstrated at
present and therefore the images obtained post-staining served as a quick qualitative test.
42
2.3.2 Electrochemical characterisation
During the different stages of fabrication, optimisation and evaluation, the
performance of the nanocomposite MNA-based electrodes were evaluated using various
electrochemical methods such as Cyclic voltammetry (CV), differential pulse voltammetry
(DPV) and amperometry. In the section that follows, a brief technical background on these
electrochemical methods are given. These are based mainly on popular texts by Joseph
Wang, V.S. Bagotsky; and Allen J Bard, Larry R. Faulkner77–80.
Fundamentals of electrochemistry
The field of electrochemistry is concerned with the interplay between electrical and
chemical effects i.e. the measurement of electrical quantities such as current, potential, or
charge and their relationship to chemical parameters77. Electrochemical systems study
processes and factors that affect charge transfer across the interface between an electronic
conductor (an electrode) and an ionic conductor (an electrolyte); referred to as the electrode-
solution interface and these are heterogenous in nature due to different phases involved. The
transfer of charge occurs through the movement of electrons in a solid phase and by the
movements of ions in the solution phase. There are two types of electrochemical
measurements, namely potentiometric and potentiostatic. Both types require at least two
electrodes and an electrolyte solution, which constitute the electrochemical cell. The
electrode that responds to the target analyte or where the reaction of interest is occurring is
referred to as the working electrode. The second is termed as the reference electrode; which
is of constant potential (i.e. independent of the solution properties, used as point of reference
for potential control and measurement). An electrochemical cell can be classified as
galvanic if electrical energy is produced through a spontaneous redox reaction, or
electrolytic if an external potential is supplied to drive the charge transfer process.
Potentiometry is a static or passive technique (i.e. there is zero/negligible flow of
current) that measures potential differences between the two electrodes in a system under
equilibrium conditions; providing information about ion activity. Whereas, potentiostatic
(i.e. controlled-potential) techniques; employed throughout this thesis, are based on
dynamic (non-zero current) situations, in order to study the charge-transfer at the electrode-
solution interface. More specifically, an electrode potential is used to drive a charge-transfer
reaction and the resultant current is measured. In effect, the applied potential can force an
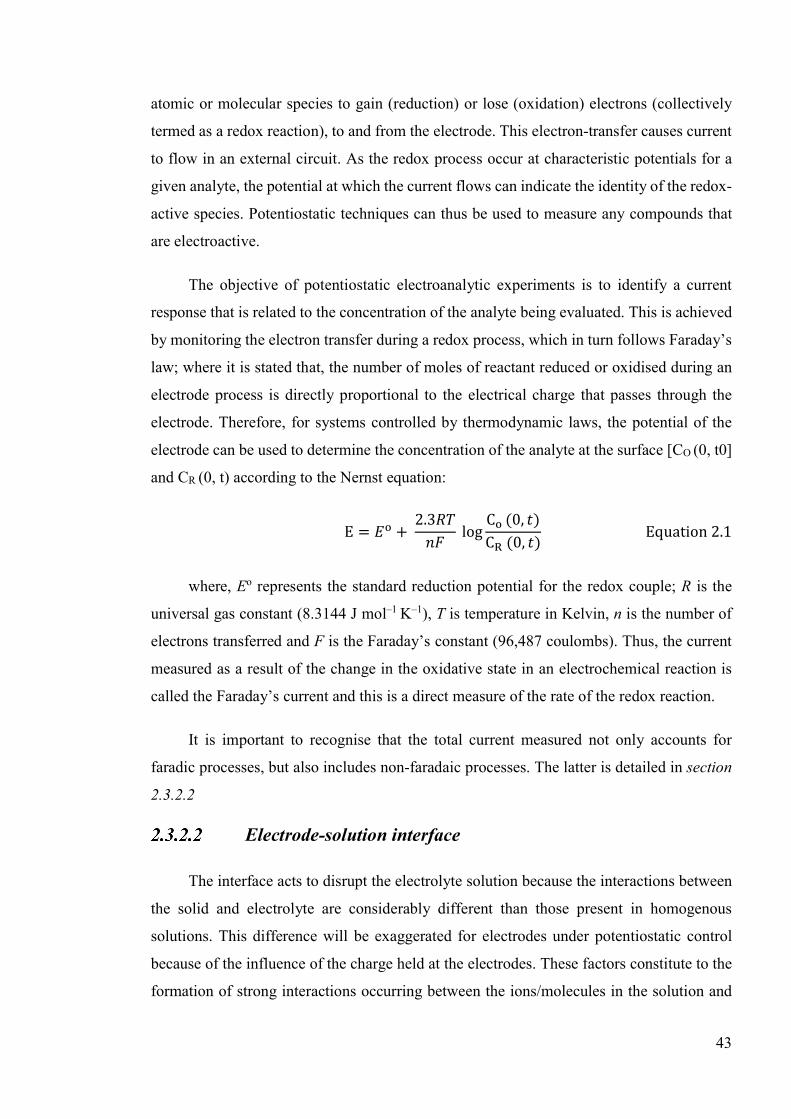
43
atomic or molecular species to gain (reduction) or lose (oxidation) electrons (collectively
termed as a redox reaction), to and from the electrode. This electron-transfer causes current
to flow in an external circuit. As the redox process occur at characteristic potentials for a
given analyte, the potential at which the current flows can indicate the identity of the redox-
active species. Potentiostatic techniques can thus be used to measure any compounds that
are electroactive.
The objective of potentiostatic electroanalytic experiments is to identify a current
response that is related to the concentration of the analyte being evaluated. This is achieved
by monitoring the electron transfer during a redox process, which in turn follows Faraday’s
law; where it is stated that, the number of moles of reactant reduced or oxidised during an
electrode process is directly proportional to the electrical charge that passes through the
electrode. Therefore, for systems controlled by thermodynamic laws, the potential of the
electrode can be used to determine the concentration of the analyte at the surface [CO (0, t0]
and CR (0, t) according to the Nernst equation:
E = 𝐸 + 2.3𝑅𝑇
𝑛𝐹 log
C (0, 𝑡)
C (0, 𝑡) Equation 2.1
where, Eo represents the standard reduction potential for the redox couple; R is the
universal gas constant (8.3144 J mol–1 K–1), T is temperature in Kelvin, n is the number of
electrons transferred and F is the Faraday’s constant (96,487 coulombs). Thus, the current
measured as a result of the change in the oxidative state in an electrochemical reaction is
called the Faraday’s current and this is a direct measure of the rate of the redox reaction.
It is important to recognise that the total current measured not only accounts for
faradic processes, but also includes non-faradaic processes. The latter is detailed in section
2.3.2.2
Electrode-solution interface
The interface acts to disrupt the electrolyte solution because the interactions between
the solid and electrolyte are considerably different than those present in homogenous
solutions. This difference will be exaggerated for electrodes under potentiostatic control
because of the influence of the charge held at the electrodes. These factors constitute to the
formation of strong interactions occurring between the ions/molecules in the solution and
44
the electrode surface; giving rise to a region called the electrical double layer. A brief
explanation of this is given below.
The term, “electrical double layer” was first proposed by Helmholtz in 1850. This
model assumed no electron transfer process to be occurring at the electrode surface and the
solution to be composed entirely of electrolytes. The interaction of ions in solutions with
the electrode surface was assumed to be electrostatic due to the fact that, the electrodes holds
a charge density resulting from the excess or deficiency of electrons at the electrode surface.
In order for the interface to remain neutral, ionic zones are formed (through redistribution
of ions) with opposite charge close to the electrode surface. A positively charged electrode
thus attracts a layer of negative ions from the electrolyte (and vice versa). As shown in
Figure 2.1, the electrical double layer is in fact made up of several distinct parts. The
innermost layer (i.e. closest to the electrode) is known as inner Helmholtz plane (IHP). This
contains solvent molecules and non-fully solvated specifically absorbed ions. This plane
cuts through the centre of the absorbed species. The next layer is termed, the outer
Helmholtz plane (OHP) and it cuts through the centre of solvated counter-ions approaching
closest to the surface. They are attracted to the surface by long range coulombic forces and
they lower the electrical potential at points adjacent to the particle surface. Collectively,
both these layers are called the compact layer. The Helmholtz model however does not take
into account thermal agitations, which acts to loosen the compact layer. This limitation was
addressed by Gouy-Chapman; adding a diffuse layer. This is a three-dimensional region of
scattered ions extending from the OHP to the bulk solution and it reflects a dynamic balance
between the electrostatic attraction and the tendency to diffuse away through random
thermal motion. Based on these opposing forces, the concentration of ions at the diffusion
layer decreases exponentially at a given distance from the electrode. Overall, the surface
charge forming a layer and diffuse shield forming the other layer, is the basis of electrical
double layer.
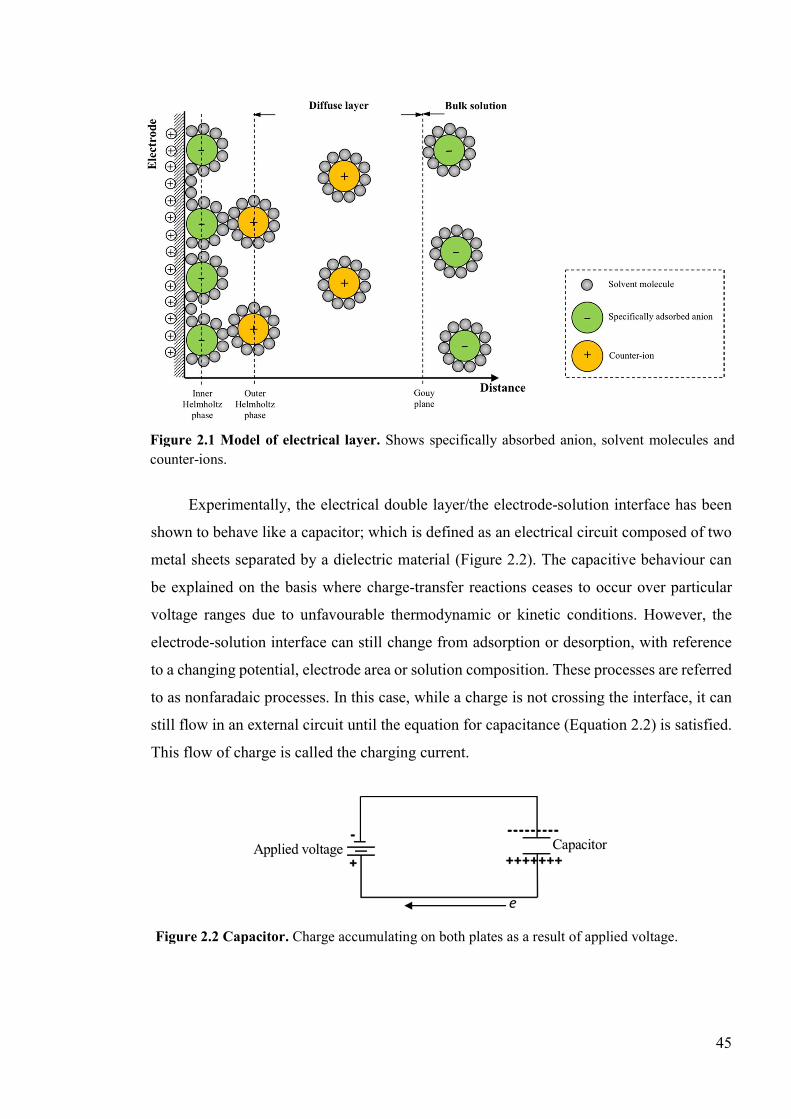
45
Experimentally, the electrical double layer/the electrode-solution interface has been
shown to behave like a capacitor; which is defined as an electrical circuit composed of two
metal sheets separated by a dielectric material (Figure 2.2). The capacitive behaviour can
be explained on the basis where charge-transfer reactions ceases to occur over particular
voltage ranges due to unfavourable thermodynamic or kinetic conditions. However, the
electrode-solution interface can still change from adsorption or desorption, with reference
to a changing potential, electrode area or solution composition. These processes are referred
to as nonfaradaic processes. In this case, while a charge is not crossing the interface, it can
still flow in an external circuit until the equation for capacitance (Equation 2.2) is satisfied.
This flow of charge is called the charging current.
Figure 2.1 Model of electrical layer. Shows specifically absorbed anion, solvent molecules and counter-ions.
Figure 2.2 Capacitor. Charge accumulating on both plates as a result of applied voltage.
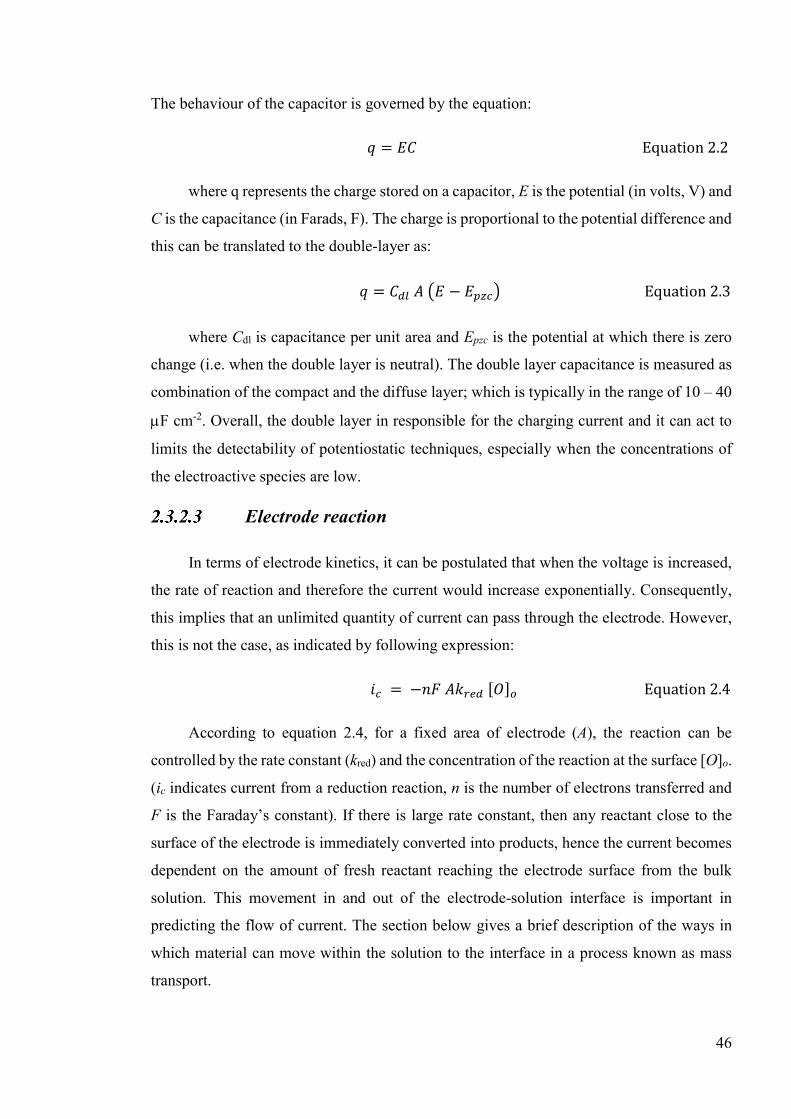
46
The behaviour of the capacitor is governed by the equation:
𝑞 = 𝐸𝐶 Equation 2.2
where q represents the charge stored on a capacitor, E is the potential (in volts, V) and
C is the capacitance (in Farads, F). The charge is proportional to the potential difference and
this can be translated to the double-layer as:
𝑞 = 𝐶 𝐴 𝐸 − 𝐸 Equation 2.3
where Cdl is capacitance per unit area and Epzc is the potential at which there is zero
change (i.e. when the double layer is neutral). The double layer capacitance is measured as
combination of the compact and the diffuse layer; which is typically in the range of 10 – 40
F cm-2. Overall, the double layer in responsible for the charging current and it can act to
limits the detectability of potentiostatic techniques, especially when the concentrations of
the electroactive species are low.
Electrode reaction
In terms of electrode kinetics, it can be postulated that when the voltage is increased,
the rate of reaction and therefore the current would increase exponentially. Consequently,
this implies that an unlimited quantity of current can pass through the electrode. However,
this is not the case, as indicated by following expression:
𝑖 = −𝑛𝐹 𝐴𝑘 [𝑂] Equation 2.4
According to equation 2.4, for a fixed area of electrode (A), the reaction can be
controlled by the rate constant (kred) and the concentration of the reaction at the surface [O]o.
(ic indicates current from a reduction reaction, n is the number of electrons transferred and
F is the Faraday’s constant). If there is large rate constant, then any reactant close to the
surface of the electrode is immediately converted into products, hence the current becomes
dependent on the amount of fresh reactant reaching the electrode surface from the bulk
solution. This movement in and out of the electrode-solution interface is important in
predicting the flow of current. The section below gives a brief description of the ways in
which material can move within the solution to the interface in a process known as mass
transport.
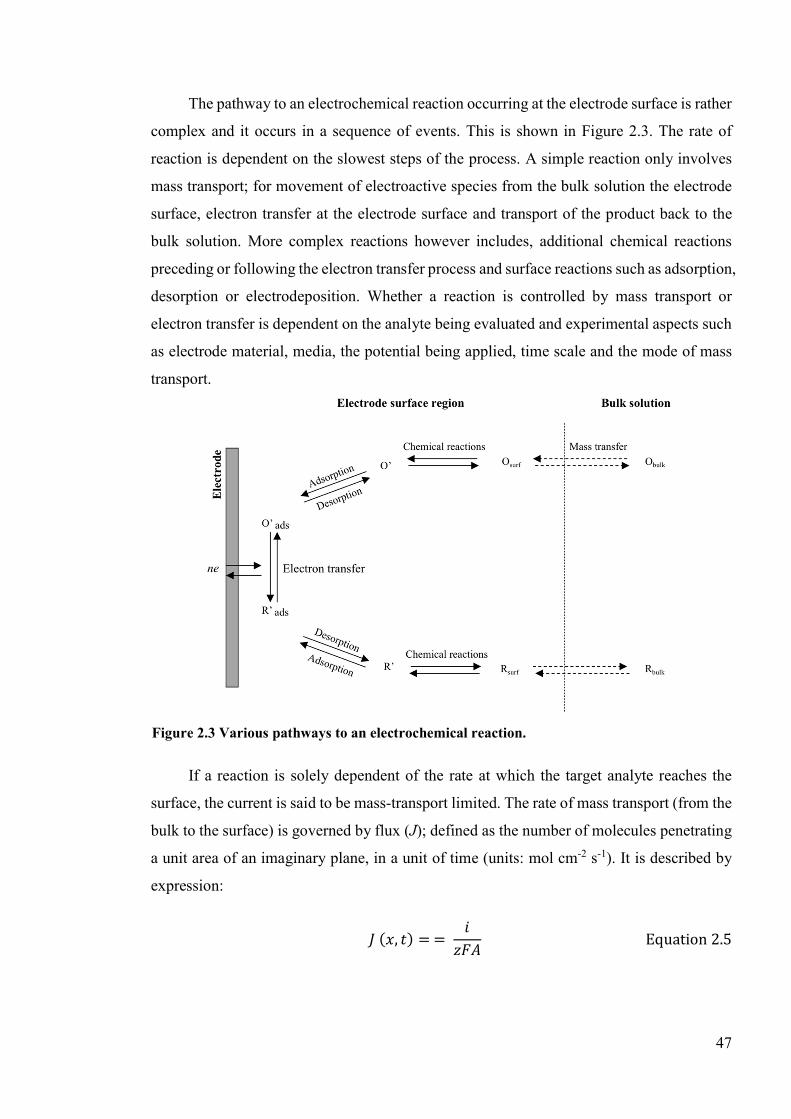
47
The pathway to an electrochemical reaction occurring at the electrode surface is rather
complex and it occurs in a sequence of events. This is shown in Figure 2.3. The rate of
reaction is dependent on the slowest steps of the process. A simple reaction only involves
mass transport; for movement of electroactive species from the bulk solution the electrode
surface, electron transfer at the electrode surface and transport of the product back to the
bulk solution. More complex reactions however includes, additional chemical reactions
preceding or following the electron transfer process and surface reactions such as adsorption,
desorption or electrodeposition. Whether a reaction is controlled by mass transport or
electron transfer is dependent on the analyte being evaluated and experimental aspects such
as electrode material, media, the potential being applied, time scale and the mode of mass
transport.
If a reaction is solely dependent of the rate at which the target analyte reaches the
surface, the current is said to be mass-transport limited. The rate of mass transport (from the
bulk to the surface) is governed by flux (J); defined as the number of molecules penetrating
a unit area of an imaginary plane, in a unit of time (units: mol cm-2 s-1). It is described by
expression:
𝐽 (𝑥, 𝑡) = = 𝑖
𝑧𝐹𝐴 Equation 2.5
Figure 2.3 Various pathways to an electrochemical reaction.
48
where J (x, t) refers to the flux of the species, i is current in ampere (A), z is the number
of electrons involved in the reaction, F as before is the Faraday’s constant and A indicates
the area of the electrode in cm2.
Mass transport occurs in three different modes: (1) diffusion, (2) convection and (3)
migration. Diffusion occurs when there is concentration gradient (from regions of high to
low concentrations) and it acts to minimise the concentration gradient. Convection indicates
transport by gross physical movement to the electrode surface. It can occur naturally through
thermal or density gradient and artificially by inducing flow by means of stirring or using a
rotating disc. Finally, migration accounts for movement of particles along an electrical field.
In other words, this is an electrostatic effect arising from the application of voltage to the
electrodes. The interface as results becomes charged and any charged species near the
interface will either be attracted or repelled by electrostatic forces. By taking these factors
into account, the rate of mass transport can be re-written as follows (Nernst-Planck
Equation);
𝐽 (𝑥, 𝑡) = −𝐷 ( , )
− ∅ ( , )
+ 𝐶(𝑥, 𝑡) 𝑉(𝑥, 𝑡) Equation 2.6
where D is the diffusion co-efficient (cm-2 s-1), ∂C (x, t)/∂x is the concentration
gradient (at distance x and time t), ∂∅ (x, t)/∂x is the potential gradient (z refers to the charge
and C indicates the concentration gradient; of the electroactive species) and V (x, t) indicates
the hydrodynamic velocity of the solution. The flux measured is proportional to the current
(i) according to the equation below:
𝑖 = −𝑛𝐹𝐴𝐽 Equation 2.7
As indicated through Equation 2.6, it is very difficult to calculate flux when all three
processes are involved. Therefore, the situation is often simplified in electroanalysis by
suppressing migration and convection by adding a strong background analyte, which is
usually an inert salt (e.g. KCl) and thus the movement of electroactive species becomes
limited by diffusion alone. As a concentration gradient is established adjacent to the surface
of the electrode, resultant of the reactions occurring at the surface, a diffusional flux is set-
up. This can be expressed as Fick’s law, which indicates that the rate of diffusion is
Diffusion Migration Convection
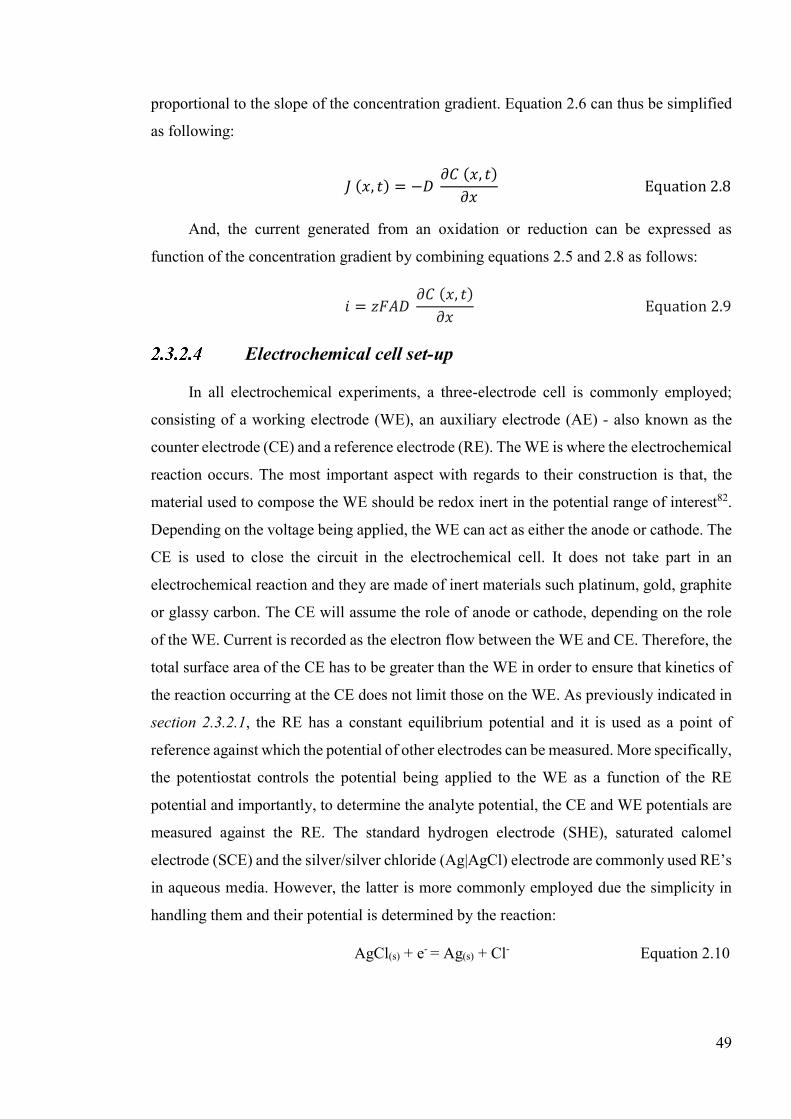
49
proportional to the slope of the concentration gradient. Equation 2.6 can thus be simplified
as following:
𝐽 (𝑥, 𝑡) = −𝐷 𝜕𝐶 (𝑥, 𝑡)
𝜕𝑥 Equation 2.8
And, the current generated from an oxidation or reduction can be expressed as
function of the concentration gradient by combining equations 2.5 and 2.8 as follows:
𝑖 = 𝑧𝐹𝐴𝐷 𝜕𝐶 (𝑥, 𝑡)
𝜕𝑥 Equation 2.9
Electrochemical cell set-up
In all electrochemical experiments, a three-electrode cell is commonly employed;
consisting of a working electrode (WE), an auxiliary electrode (AE) - also known as the
counter electrode (CE) and a reference electrode (RE). The WE is where the electrochemical
reaction occurs. The most important aspect with regards to their construction is that, the
material used to compose the WE should be redox inert in the potential range of interest82.
Depending on the voltage being applied, the WE can act as either the anode or cathode. The
CE is used to close the circuit in the electrochemical cell. It does not take part in an
electrochemical reaction and they are made of inert materials such platinum, gold, graphite
or glassy carbon. The CE will assume the role of anode or cathode, depending on the role
of the WE. Current is recorded as the electron flow between the WE and CE. Therefore, the
total surface area of the CE has to be greater than the WE in order to ensure that kinetics of
the reaction occurring at the CE does not limit those on the WE. As previously indicated in
section 2.3.2.1, the RE has a constant equilibrium potential and it is used as a point of
reference against which the potential of other electrodes can be measured. More specifically,
the potentiostat controls the potential being applied to the WE as a function of the RE
potential and importantly, to determine the analyte potential, the CE and WE potentials are
measured against the RE. The standard hydrogen electrode (SHE), saturated calomel
electrode (SCE) and the silver/silver chloride (Ag|AgCl) electrode are commonly used RE’s
in aqueous media. However, the latter is more commonly employed due the simplicity in
handling them and their potential is determined by the reaction:
AgCl(s) + e- = Ag(s) + Cl- Equation 2.10
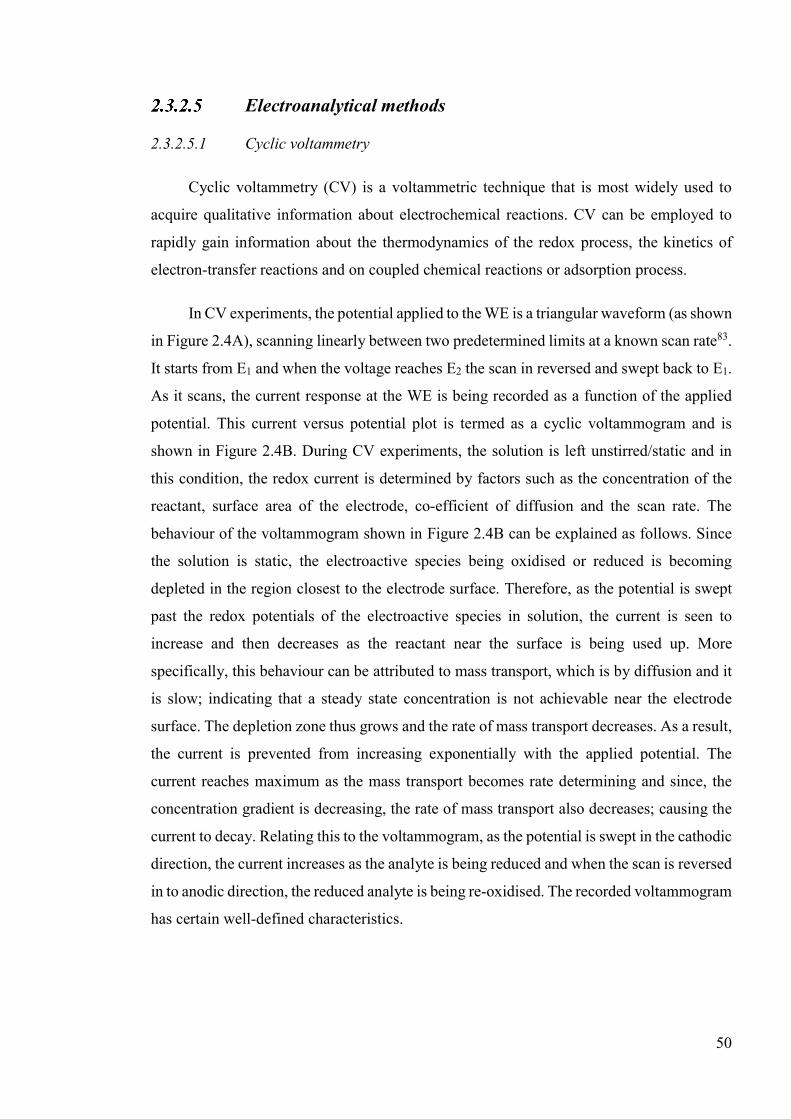
50
Electroanalytical methods
2.3.2.5.1 Cyclic voltammetry
Cyclic voltammetry (CV) is a voltammetric technique that is most widely used to
acquire qualitative information about electrochemical reactions. CV can be employed to
rapidly gain information about the thermodynamics of the redox process, the kinetics of
electron-transfer reactions and on coupled chemical reactions or adsorption process.
In CV experiments, the potential applied to the WE is a triangular waveform (as shown
in Figure 2.4A), scanning linearly between two predetermined limits at a known scan rate83.
It starts from E1 and when the voltage reaches E2 the scan in reversed and swept back to E1.
As it scans, the current response at the WE is being recorded as a function of the applied
potential. This current versus potential plot is termed as a cyclic voltammogram and is
shown in Figure 2.4B. During CV experiments, the solution is left unstirred/static and in
this condition, the redox current is determined by factors such as the concentration of the
reactant, surface area of the electrode, co-efficient of diffusion and the scan rate. The
behaviour of the voltammogram shown in Figure 2.4B can be explained as follows. Since
the solution is static, the electroactive species being oxidised or reduced is becoming
depleted in the region closest to the electrode surface. Therefore, as the potential is swept
past the redox potentials of the electroactive species in solution, the current is seen to
increase and then decreases as the reactant near the surface is being used up. More
specifically, this behaviour can be attributed to mass transport, which is by diffusion and it
is slow; indicating that a steady state concentration is not achievable near the electrode
surface. The depletion zone thus grows and the rate of mass transport decreases. As a result,
the current is prevented from increasing exponentially with the applied potential. The
current reaches maximum as the mass transport becomes rate determining and since, the
concentration gradient is decreasing, the rate of mass transport also decreases; causing the
current to decay. Relating this to the voltammogram, as the potential is swept in the cathodic
direction, the current increases as the analyte is being reduced and when the scan is reversed
in to anodic direction, the reduced analyte is being re-oxidised. The recorded voltammogram
has certain well-defined characteristics.
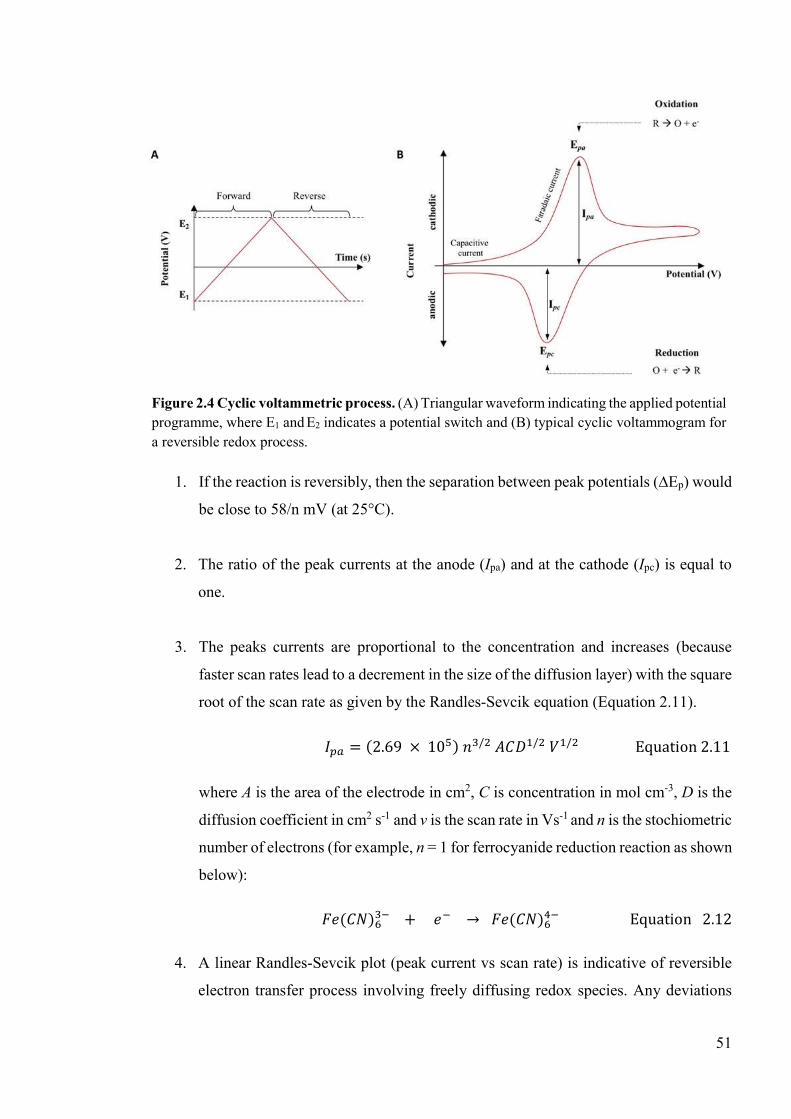
51
1. If the reaction is reversibly, then the separation between peak potentials (∆Ep) would
be close to 58/n mV (at 25°C).
2. The ratio of the peak currents at the anode (Ipa) and at the cathode (Ipc) is equal to
one.
3. The peaks currents are proportional to the concentration and increases (because
faster scan rates lead to a decrement in the size of the diffusion layer) with the square
root of the scan rate as given by the Randles-Sevcik equation (Equation 2.11).
𝐼 = (2.69 × 10 ) 𝑛 / 𝐴𝐶𝐷 / 𝑉 / Equation 2.11
where A is the area of the electrode in cm2, C is concentration in mol cm-3, D is the
diffusion coefficient in cm2 s-1 and v is the scan rate in Vs-1 and n is the stochiometric
number of electrons (for example, n = 1 for ferrocyanide reduction reaction as shown
below):
𝐹𝑒(𝐶𝑁) + 𝑒 → 𝐹𝑒(𝐶𝑁) Equation 2.12
4. A linear Randles-Sevcik plot (peak current vs scan rate) is indicative of reversible
electron transfer process involving freely diffusing redox species. Any deviations
Figure 2.4 Cyclic voltammetric process. (A) Triangular waveform indicating the applied potential programme, where E1 and E2 indicates a potential switch and (B) typical cyclic voltammogram for a reversible redox process.
52
from the linearity indicates electron transfer occurring via surface absorbed
electroactive species.
5. The formal potential of the redox process for a reversible couple is centred between
Epa and Epc, as shown by the expression below:
𝐸 = 𝐸 + 𝐸
2 Equation 2.13
6. An irreversible electron transfer reaction shows considerably different behaviour on
the recorded voltammogram i.e. individual peaks are reduced in size and widely
separated; peak potential shifts with the scan rate and there will be a large separation
between the peak potentials.
2.3.2.5.2 Differential pulse voltammetry
DPV is one of the most widely utilised pulse techniques84,85. The pulse implies a
potential step and it is used to increase the ratio between faradaic and non-faradaic (or
charging) currents, which consequently improves quantitation of the detection limits of an
analyte up to 10-8 M concentrations. In DPV, the pulses of fixed amplitude (10 – 100 mv)
are superimposed on a linear potential ramp and applied to the working electrode (Figure
2.5). Each potential step has a duration of about 50 ms. The current is then measured at two
points i.e. the first, just before the application of the pulse (at point a) and the second, at the
end of pulse (at point b, after ~40 ms). This way of sampling ensures that the charging
current measured is negligible because it decays exponentially after the potential step, while
the faradaic current decays more slowly. Therefore, by sampling late in the pulse life, mainly
the faradaic current is measured. The difference between the first and second current
measurement is determined for each pulse and plotted against the applied potential. This
gives a voltammogram consisting of peak(s). The height of the peak is directly proportional
to the concentration of the analyte, while peak potential can be used to identify the
electroactive species. Moreover, the width of the peak indicates electron stoichiometry.
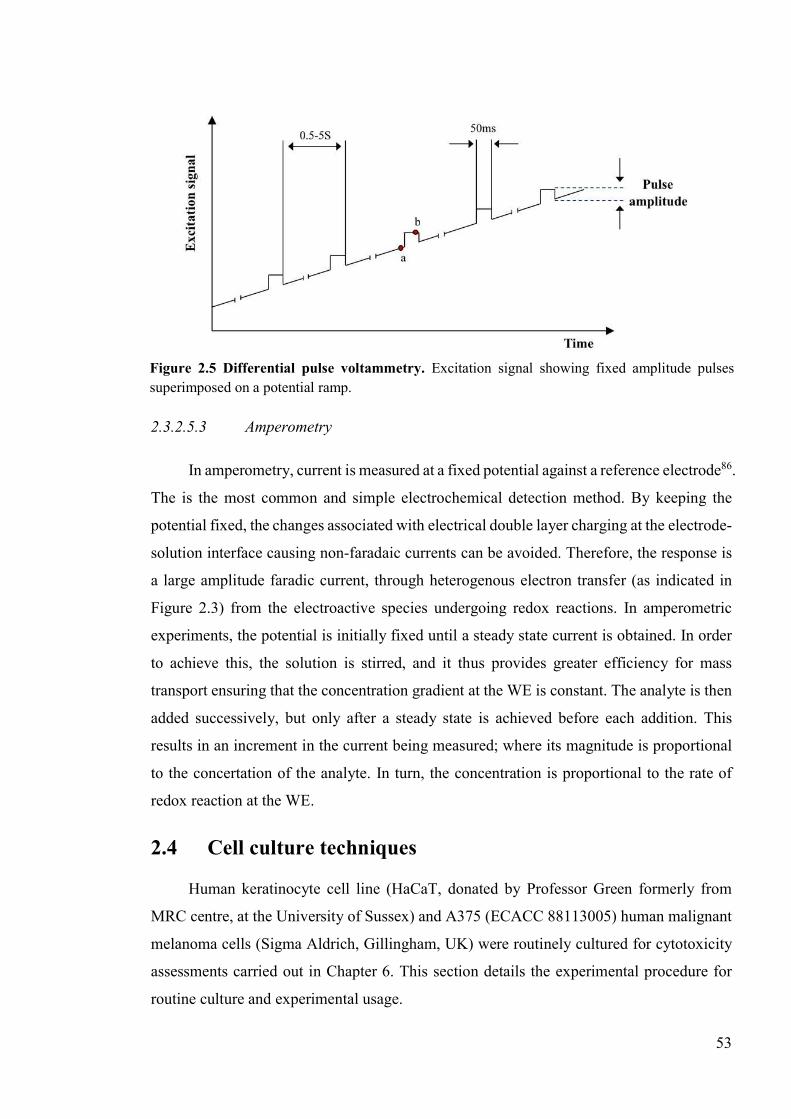
53
2.3.2.5.3 Amperometry
In amperometry, current is measured at a fixed potential against a reference electrode86.
The is the most common and simple electrochemical detection method. By keeping the
potential fixed, the changes associated with electrical double layer charging at the electrode-
solution interface causing non-faradaic currents can be avoided. Therefore, the response is
a large amplitude faradic current, through heterogenous electron transfer (as indicated in
Figure 2.3) from the electroactive species undergoing redox reactions. In amperometric
experiments, the potential is initially fixed until a steady state current is obtained. In order
to achieve this, the solution is stirred, and it thus provides greater efficiency for mass
transport ensuring that the concentration gradient at the WE is constant. The analyte is then
added successively, but only after a steady state is achieved before each addition. This
results in an increment in the current being measured; where its magnitude is proportional
to the concertation of the analyte. In turn, the concentration is proportional to the rate of
redox reaction at the WE.
2.4 Cell culture techniques
Human keratinocyte cell line (HaCaT, donated by Professor Green formerly from
MRC centre, at the University of Sussex) and A375 (ECACC 88113005) human malignant
melanoma cells (Sigma Aldrich, Gillingham, UK) were routinely cultured for cytotoxicity
assessments carried out in Chapter 6. This section details the experimental procedure for
routine culture and experimental usage.
Figure 2.5 Differential pulse voltammetry. Excitation signal showing fixed amplitude pulses superimposed on a potential ramp.
54
2.4.1 Thawing, culture, subculture and storage
Both cells were received cryopreserved in 95% media and 5% DMSO. For culturing,
the cells were thawed rapidly in a water bath at 37°C and then transferred into T75 flasks
containing 15 mL of pre-warmed, complete, Dulbecco’s modified Eagle medium (DMEM,
with a high glucose content of 4.5 g/L and supplemented with foetal bovine serum (FBS) at
10% and 15%, respectively for HaCaT and A375 cell culture). The flasks were then
incubated under standard conditions (i.e. 37°C under 5% CO2 - 95% air) for 24 hrs in order
to allow the cells to attach. The media was then aspirated, and the attached cells were washed
with PBS before replacing with fresh media. The cells were then allowed to grow (with
media changes every 2 - 3 days) until they reached 75 – 80% confluency, at which point
they were subcultured/passaged. This involved, detachment of the cells by incubating with
5 mL of pre-warmed trypsin-EDTA for 5 – 8 mins at 37°C; neutralisation of trypsin by
adding 10 mL of complete media; gentle mixing, followed by centrifugation at 500 xg for 5
mins to form pellets; re-suspension of the pellet in 1 mL of pre-warmed complete mediate
and redistribution into new sterile T75 flasks. HaCaT cells were routinely seeded in a ratio
of 1:5 to 1:10; whereas for the A375 cells, the ratios were 1:3 to 1:10. Alternatively, for
storage purposes, after trypsinisation and centrifugation, the cells were re-suspended in 1
mL of complete mediate containing 10% (v/v) dimethyl sulfoxide (DMSO). This suspension
was transferred to cryogenic tubes, frozen at -80°C for 48h in a freezing pot and then
transferred to liquid nitrogen vapour (-130°C) for long-term storage.
2.4.2 Quantification of cell number using a haemocytometer
To determine the seeding density, the re-suspended cells were diluted 1:10 in complete
media. A 10 µL aliquot of this suspension was then loaded onto the chambers of a Neubauer
haemocytometer. Cell counts were made manually in at least the four outer counting squares
of the haemocytometer using an inverted light microscope (20x magnification). A total cell
count was calculated using the following equation:
𝑇𝑜𝑡𝑎𝑙 𝑛𝑢𝑚𝑏𝑒𝑟 𝑜𝑓𝑐𝑒𝑙𝑙𝑠 𝑚𝐿⁄
=𝑡𝑜𝑡𝑎𝑙 𝑐𝑒𝑙𝑙 𝑐𝑜𝑢𝑛𝑡 × 𝑑𝑖𝑙𝑢𝑡𝑖𝑜𝑛 𝑓𝑎𝑐𝑡𝑜𝑟 × (1 × 10 𝑐𝑒𝑙𝑙𝑠 𝑚𝑙)⁄
𝑛𝑢𝑚𝑏𝑒𝑟 𝑜𝑓 𝑠𝑞𝑢𝑎𝑟𝑒𝑠 Equation 2.14
Once a total cell count was obtained, the volume of the cell suspension required to
seed the desired number of cells per flask was calculated by dividing the required number
of cells by the total number of cells/mL.
55
2.5 Statistical analysis
Mechanical forces were measured and recorded using Exponent Lite software (version
6.1.9.0; Stable Microsystems Ltd, Surrey, UK). Similarly, CHI760 (version 14.02; CH
Instruments, Inc, Austin, TX, USA) was used to measure DPV traces, with respect to their
peak potential and total peak area. GraphPad Prizm 6 (GraphPad Software, La Jolla, CA,
USA) was used to analyse the data. Where appropriate, statistical differences between
groups were assessed using two-sided Student’s t-test, repeated measures, one- or two-way
analysis of variance (ANOVA). Differences were considered statistically significant where
p < 0.05. All data are expressed as mean ± standard deviation.
56
Chapter 3. Investigating the potential for developing Epoxy/Carbon Nanotube composites
based MNA electrodes
3.1 Introduction
Epoxy is the most widely utilised matrix for manufacturing advanced composites for
applications in aircraft/aerospace engineering, electronics, electromagnetic interference
(EMI) shielding, sensors and biomedical devices87. Epoxy resin is a thermosetting, cross-
linked, low-molecular-weight polymer that provides attractive material properties such as
high specific strength, stiffness, adhesivity to a range of substrates, good thermal and
chemical resistance and low shrinkage during curing88. For structural applications, the major
drawback of epoxy is attributed to their inherent brittleness87. As such, over the past two
decades extensive research efforts have gone into their reinforcement with the addition of
CNT’s and this dates back to the time when the first ever polymer nanocomposite was
produced, in 1994 by Ajayan et al.89. Interestingly, the first ever CNT-based nanocomposite
for electrochemical sensing was also produced using epoxy as a matrix, in 2005 by Pumera
et al.; due to their simplicity in processing via add-mixing90. In this primary study, crucial
comparisons were made with differing length and diameters of CNT’s (i.e. length: 0.5 –
200 µm, outer diameter: 30 – 50 nm and length 0.5 – 2 µm, outer diameter: 20 – 30 nm);
where they found enhanced electrochemical activity for the long-carbon nanotube
composites towards ferricyanide, nicotinamide adenine dinucleotide (NADH) and hydrogen
peroxide (H2O2). Since this initial study, there have been an increasing number of reports
demonstrating excellent electrochemical behaviour of CNT-epoxy based composites.
Examples include: glucose biosensors made by mixing CNT’s with GOx enzyme and
homogenised into epoxy resin91; tyrosinase enzyme incorporated CNT-epoxy biocomposite
for detection of catechol92; highly compressed MWCNT-epoxy composites providing
excellent anti-fouling properties for highly sensitive detection of serotonin71 and hybrid
composites of MWCNT-Prussian blue (PB)/epoxy, showing enhanced stability and
sensitivity towards the detection of glutathione70. In concert with these results and the
inherent advantage of using nanocomposite formulations i.e. offering a wide range of design
possibilities; MNA fabrication via epoxy nanocomposite processing offers a unique
opportunity to develop simple, low-cost and highly sensitive electrochemical biosensors.
57
However, the above studies have all incorporated a very high percentage of CNT in to their
composites (>15%, w/w), which poses a significant challenge to the design of MNA’s due
to the increased viscosity of the composites; making dispersions harder and the resultant
clustering of CNT’s impacting on both the fabrication and the mechanical strength of the
microneedles. Therefore, effective dispersions at lower concentrations are ideal.
In the sections below a brief introduction is given to CNT’s first and foremost, with
respect to their fabrication, material properties and electrochemical behaviour. Following
which a detailed account is given on the processing of epoxies, methods of developing
epoxy-based nanocomposites and finally, the influence of CNT’s in improving mechanical
and electrical properties.
3.1.1 Carbon Nanotubes
CNT’s are allotropes of carbon, with a cylindrical structure composed of hexagonal
graphitic sheets of sp2 hybridised carbon-carbon chemical bonds93. The existence of these
cylindrical graphitic structures was reported and studied from the early 1950’s by several
researchers, however Iijima’s detailed analysis of the helical arrangement of carbon atoms
on seamless co-axial cylinders published in 1991 is considered to be first discovery
report94,95. Since then, CNT’s have attracted significant research interests with potential
applications as nanoelectronics and photovoltaics devices, superconductors,
electrochemical capacitors, sensors, nanowires and advanced nanocomposite materials96.
With respect to the sp2 arrangement, each carbon atom is covalently bonded to three
neighbouring carbon atoms via sp2 orbitals. The strength on this sp2 carbon-carbon bonds
accounts for the extraordinary mechanical strength displayed by the CNT’s. In addition, the
fourth valence electrons remain free in each unit and they are delocalised over the entire
system; thus, it accounts for the ultrahigh electronic properties displayed. Typical values
reported include an ultra-high elastic module of ~1 Tpa, superior tensile strength between
11 – 63 Gpa (up to 50 times higher than steel) whilst having a density as low as 1.3 g/cm3
(1/6th to that of stainless steel) and conductivities higher than copper97–100. In terms of
dimensions, CNT’s are several hundred micrometres in length, with diameters in the
nanometre scale. Typical length-to-diameter ratio often exceeds 1000; thus, indicating the
presence of an extremely high aspect ratio93. Due to their high aspect ratio, CNT’s are
considered nearly one-dimensional structures.
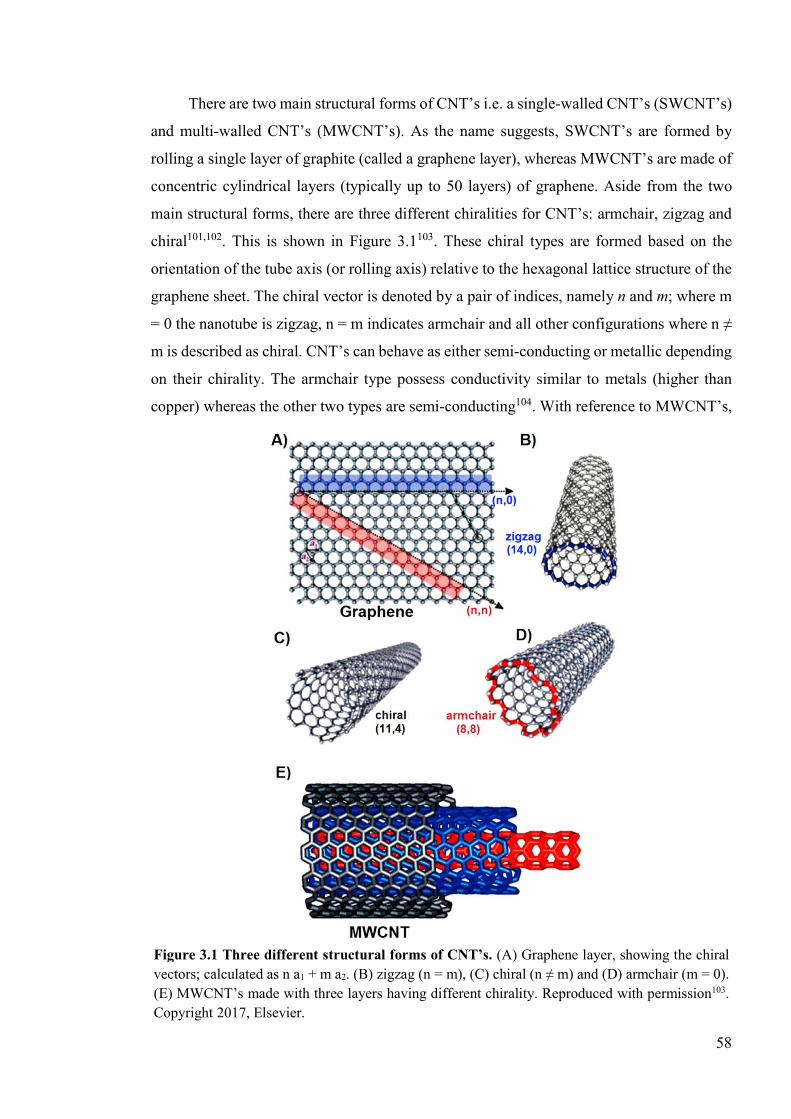
58
There are two main structural forms of CNT’s i.e. a single-walled CNT’s (SWCNT’s)
and multi-walled CNT’s (MWCNT’s). As the name suggests, SWCNT’s are formed by
rolling a single layer of graphite (called a graphene layer), whereas MWCNT’s are made of
concentric cylindrical layers (typically up to 50 layers) of graphene. Aside from the two
main structural forms, there are three different chiralities for CNT’s: armchair, zigzag and
chiral101,102. This is shown in Figure 3.1103. These chiral types are formed based on the
orientation of the tube axis (or rolling axis) relative to the hexagonal lattice structure of the
graphene sheet. The chiral vector is denoted by a pair of indices, namely n and m; where m
= 0 the nanotube is zigzag, n = m indicates armchair and all other configurations where n ≠
m is described as chiral. CNT’s can behave as either semi-conducting or metallic depending
on their chirality. The armchair type possess conductivity similar to metals (higher than
copper) whereas the other two types are semi-conducting104. With reference to MWCNT’s,
Figure 3.1 Three different structural forms of CNT’s. (A) Graphene layer, showing the chiral vectors; calculated as n a1 + m a2. (B) zigzag (n = m), (C) chiral (n ≠ m) and (D) armchair (m = 0). (E) MWCNT’s made with three layers having different chirality. Reproduced with permission103. Copyright 2017, Elsevier.
59
each graphene layer can have different chirality. Consequently, they possess a high surface
area, unique physical properties, chemical stability and high electrical conductivity. For
applications in nanoelectronics, SWCNT’s are commonly utilised because they can offer
scatter free ballistic transport105. MWCNT’s on the other hand, have been found to be fairly
diffusive or quasi-ballistic106. For applications as electrochemical sensors, which is the
intended objective for this thesis, MWCNT’s are preferred over SWCNT’s. A detailed
explanation for this is given in section 3.1.1.1.
Arc discharge, laser ablation, high pressure carbon monoxide (HIPCO) and catalytic
chemical vapour deposition (CCVD) are common methods employed to synthesise CNT’s94.
Due to a high degree of control and its scalability, the latter is primarily used for CNT
synthesis14,93. However, the growth mechanisms are ill defined for all methods of fabrication.
For example, in CCVD, the control of structure, semiconducting/metallic ratio and the
nature and density of the defects are poorly understood107. SWCNT’s remain to be very
expensive to produce due to the extensive post-purification methods required to obtain
specific chiralities and diameters, which ultimately defines their applications108.
CNT’s usually aggregate forming bundles and ropes due to strong Van der Waals
interactions between the tubes. Consequently, they are extremely difficult disperse and align
in any polymeric matrices. To overcome this issue, several strategies have been developed96.
These includes: (1) mechanical dispersion via ultrasonication, ball milling, calendaring and
extrusion (melt compounding). (2) Covalent functionalisation; whereby acid treatments are
used to create functional groups (commonly hydroxyl, carboxy and amino) in an attempt to
improve interfacial interaction with the matrix involved. However, covalent
functionalisation disrupts the translational symmetry of CNT’s by changing some of the sp2
carbon atoms into sp3 carbon atoms; thus, negatively impacting electronic and transport
properties. (3) Non-covalent functionalisation strategies have therefore been used as an
effective alternative to covalent functionalisation. This involves adsorption of surfactant or
biomacromolecules to CNT surfaces and they prevent agglomeration by causing
electrostatic repulsion between the nanotubes. This process in turn preserves all intrinsic
properties of the CNT’s. However, translation of non-covalent strategies to nanocomposites
are challenging because they could influence the functional properties either positively or
negatively. Typically, a combinatorial approach is commonly employed to realise the full
potential of CNT’s in nanocomposites.
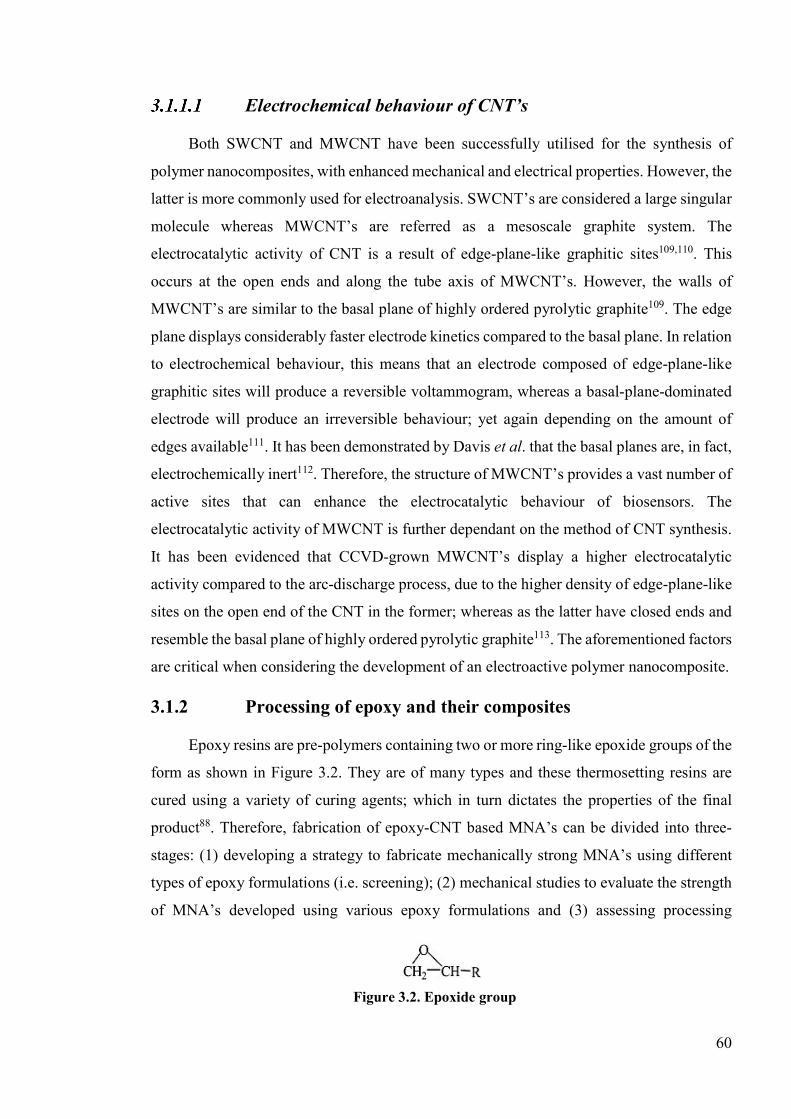
60
Electrochemical behaviour of CNT’s
Both SWCNT and MWCNT have been successfully utilised for the synthesis of
polymer nanocomposites, with enhanced mechanical and electrical properties. However, the
latter is more commonly used for electroanalysis. SWCNT’s are considered a large singular
molecule whereas MWCNT’s are referred as a mesoscale graphite system. The
electrocatalytic activity of CNT is a result of edge-plane-like graphitic sites109,110. This
occurs at the open ends and along the tube axis of MWCNT’s. However, the walls of
MWCNT’s are similar to the basal plane of highly ordered pyrolytic graphite109. The edge
plane displays considerably faster electrode kinetics compared to the basal plane. In relation
to electrochemical behaviour, this means that an electrode composed of edge-plane-like
graphitic sites will produce a reversible voltammogram, whereas a basal-plane-dominated
electrode will produce an irreversible behaviour; yet again depending on the amount of
edges available111. It has been demonstrated by Davis et al. that the basal planes are, in fact,
electrochemically inert112. Therefore, the structure of MWCNT’s provides a vast number of
active sites that can enhance the electrocatalytic behaviour of biosensors. The
electrocatalytic activity of MWCNT is further dependant on the method of CNT synthesis.
It has been evidenced that CCVD-grown MWCNT’s display a higher electrocatalytic
activity compared to the arc-discharge process, due to the higher density of edge-plane-like
sites on the open end of the CNT in the former; whereas as the latter have closed ends and
resemble the basal plane of highly ordered pyrolytic graphite113. The aforementioned factors
are critical when considering the development of an electroactive polymer nanocomposite.
3.1.2 Processing of epoxy and their composites
Epoxy resins are pre-polymers containing two or more ring-like epoxide groups of the
form as shown in Figure 3.2. They are of many types and these thermosetting resins are
cured using a variety of curing agents; which in turn dictates the properties of the final
product88. Therefore, fabrication of epoxy-CNT based MNA’s can be divided into three-
stages: (1) developing a strategy to fabricate mechanically strong MNA’s using different
types of epoxy formulations (i.e. screening); (2) mechanical studies to evaluate the strength
of MNA’s developed using various epoxy formulations and (3) assessing processing
Figure 3.2. Epoxide group
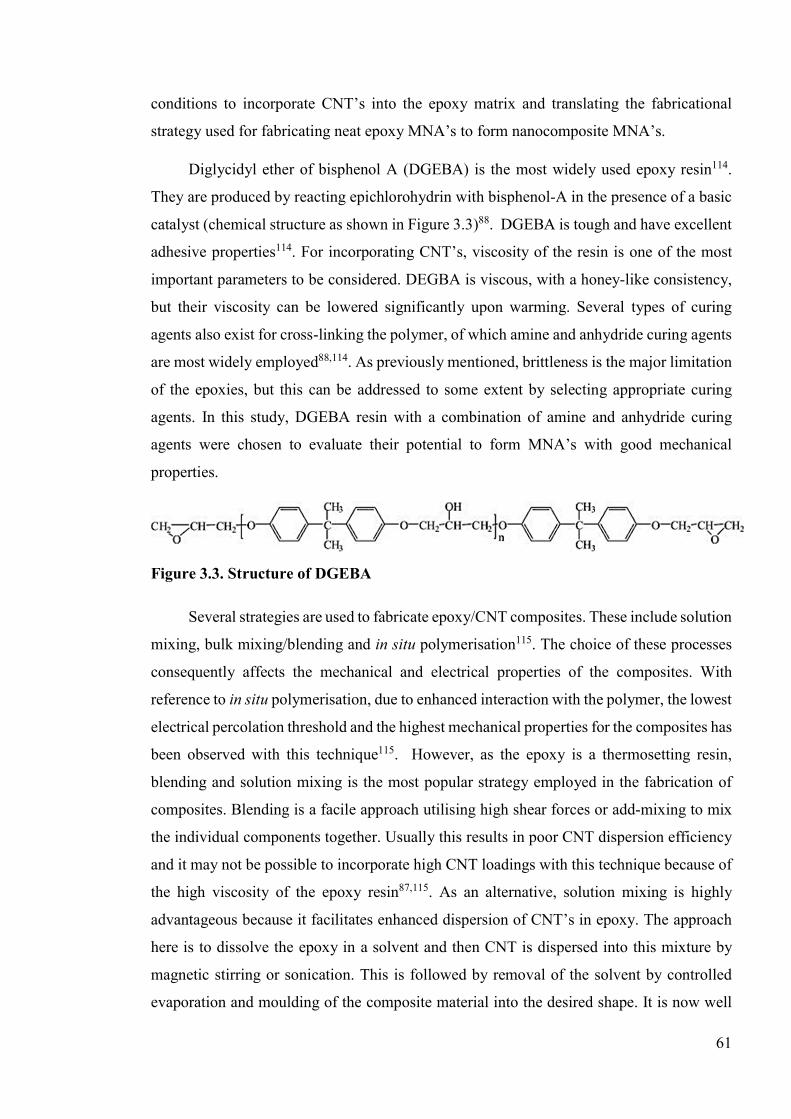
61
conditions to incorporate CNT’s into the epoxy matrix and translating the fabricational
strategy used for fabricating neat epoxy MNA’s to form nanocomposite MNA’s.
Diglycidyl ether of bisphenol A (DGEBA) is the most widely used epoxy resin114.
They are produced by reacting epichlorohydrin with bisphenol-A in the presence of a basic
catalyst (chemical structure as shown in Figure 3.3)88. DGEBA is tough and have excellent
adhesive properties114. For incorporating CNT’s, viscosity of the resin is one of the most
important parameters to be considered. DEGBA is viscous, with a honey-like consistency,
but their viscosity can be lowered significantly upon warming. Several types of curing
agents also exist for cross-linking the polymer, of which amine and anhydride curing agents
are most widely employed88,114. As previously mentioned, brittleness is the major limitation
of the epoxies, but this can be addressed to some extent by selecting appropriate curing
agents. In this study, DGEBA resin with a combination of amine and anhydride curing
agents were chosen to evaluate their potential to form MNA’s with good mechanical
properties.
Figure 3.3. Structure of DGEBA
Several strategies are used to fabricate epoxy/CNT composites. These include solution
mixing, bulk mixing/blending and in situ polymerisation115. The choice of these processes
consequently affects the mechanical and electrical properties of the composites. With
reference to in situ polymerisation, due to enhanced interaction with the polymer, the lowest
electrical percolation threshold and the highest mechanical properties for the composites has
been observed with this technique115. However, as the epoxy is a thermosetting resin,
blending and solution mixing is the most popular strategy employed in the fabrication of
composites. Blending is a facile approach utilising high shear forces or add-mixing to mix
the individual components together. Usually this results in poor CNT dispersion efficiency
and it may not be possible to incorporate high CNT loadings with this technique because of
the high viscosity of the epoxy resin87,115. As an alternative, solution mixing is highly
advantageous because it facilitates enhanced dispersion of CNT’s in epoxy. The approach
here is to dissolve the epoxy in a solvent and then CNT is dispersed into this mixture by
magnetic stirring or sonication. This is followed by removal of the solvent by controlled
evaporation and moulding of the composite material into the desired shape. It is now well
62
established that the addition of CNT can significantly influence the curing kinetics of the
epoxy resin; of which there are two important steps: gelation and vitrification116. Vega et
al., found that the time for gelation and vitrification was decreased slightly with the addition
of 0.2 wt% of CNT; whilst pointing out that a higher CNT concentration would have a more
significant effect on the curing kinetics117.
The changes in mechanical and electrical properties with the addition of CNT’s into
epoxy matrices have been extensively documented. However, as the aim is to develop a
facile strategy for fabricating MNA-based electrochemical sensors, blending and solution
mixing processes were particularly attractive due their simplicity. With reference to this, a
brief discussion on mechanical and electrical properties is given below.
Mechanical properties
The poor dispersibility and weak interfacial interactions of CNT’s with the epoxy
matrix is well known. To overcome these issues CNT’s are typically modified covalently or
with chemical functional groups. However, comparisons are difficult to establish between
studies, due to the use of different combinations of epoxies and hardeners as well as
variations in processing conditions within the solution mixing and blending processes. The
use of different CNT types, geometries and functional chemistries further adds to the
difficulty in drawing comparative analysis with regards to mechanical properties.
Nevertheless, some of the important results are highlighted below.
With reference to pristine MWCNT’s, incorporation of high amounts of MWCNT’s
(< 1 wt%) with manual homogenisation did not yield significantly enhanced mechanical
properties118. At 1 wt% of CNT loading, the percentage improvement in tensile strength
(TS) and Young’s modulus (YM) was 20% and 100% respectively. These results hardly
improved, when 4 wt% of MWCNT was incorporated into the epoxy matrix. The TS
obtained was identical to 1 wt% at 20%, whereas the YM increased marginally by 15%.
This is because, the homogenisation process became difficult at higher CNT loadings due
to high sample viscosity and resulted in highly aggregated nanocomposites118. When
solution mixing was employed however, the mechanical properties were seen to improve
with the increment in CNT loading; producing an improved TS of 50% and YM of 100% at
a CNT loading of 3 wt%119. When oxidised MWCNT’s are used in combination with high
powered ultrasonication, an even higher loading of CNT’s (i.e. 8 wt%) could be
incorporated in the epoxy matrix; producing a TS and YM that are ~27% and ~65% higher,
63
respectively, when compared to neat epoxy120. This increase in TS and YM are not
comparatively higher to those found in the aforementioned studies, but when considering
the fact that electrochemical sensors are often constructed with a high concentration of CNT;
these results are encouraging. Instead of oxidised MWCNT, amino-functionalised
MWCNT’s are popular within epoxy composites as they can form covalent bonds with the
epoxy resin. For example, at just 0.1 wt% CNT loading, the enhancement in TS was found
to be 12% and YM at 56% for non-solution mixed composites121. Collectively, these results
provide a good scope for fabricating epoxy-based nanocomposite MNA’s by blending or
solution mixing processes, without compromising on the need for incorporating high CNT
loadings; necessary to achieve good electrochemical properties.
Electrical properties
With reference to the electronic conductivity of nanocomposites, the traditional view
has been that, electrical conductivity can be increased through enhanced dispersion of the
CNT’s or by reducing the overall size of the aggregates122. The reasoning behind this, as
demonstrated by Grossiord et al.123 and Xu et al.124. was that, a good dispersion can increase
the number of complete conductive paths in the nanocomposite. Better dispersion has been
shown to reduce the probability for nanomaterials to re-aggregate into clusters, such that
more of the conductive pathways are built up by binary conductive materials in the system125.
An enhanced dispersion can also help lower the percolation threshold significantly such that,
excessive amount of the nanomaterial will not be required to develop highly conductive
nanocomposites126. As opposed to the traditional view, numerous studies have demonstrated
that aggregation is actually beneficial to bring about good bulk conductivity in
nanocomposites127–131. The major argument presented in these studies, in favour of the
alternate view, is associated with the fact that, nanoparticles can become isolated with layers
of the matrix surrounding it if the suspension in highly stable. This would decrease the
likelihood for nanoparticulates coming into contact with one another, thus inhibiting the
formation of a conductive network and therefore, the overall conductivity would decrease.
With regards to the fabrication of MNA’s from epoxy/CNT-based nanocomposites,
processing is the most critical step and the following factors must be accounted for as they
amount to have a synergistic effect on the final functional properties of the nanocomposite
device. Firstly, due to the finite structure of the microneedles, efforts must be undertaken to
reduce the size of CNT aggregates, as they can act as localised stress points that would
64
initiate mechanical failure during the process of microneedle insertion and removal.
Therefore, although a high loading of CNT can help achieve better conductivities and
electrochemical properties, it may not be favourable as microneedles are required to have
sufficient mechanical strength for penetrating the human skin effectively. Secondly,
reducing the size of the CNT agglomerates through enhanced dispersion will have a knock-
on effect on the electrical percolation threshold; helping to achieve high electrical
conductivities at a low percolation threshold. This is highly beneficial, because the critical
concentration of the filler required can be minimised, which in turn helps to avoid any
determinantal effects resulting from the formation of large aggregates. Most importantly, an
excellent interfacial interaction is required between the CNT and the epoxy matrix to allow
for efficient processing; which consequently helps realise the benefits as described above.
A very broad range of percolation thresholds has been reported for CNT-epoxy
composites from 0.012 wt% to over 4 wt%122. Špitalský et al. reported that a percolation
threshold as low as 0.012 wt% can be achieved for solution-mixed oxidised MWCNT-epoxy
composites; reaching a maximum conductivity of 10-2 S/m at a low CNT concentration of 1
wt%132. The authors suggested that, a mild oxidation treatment would reduce damage to the
CNT’s electronic structure and therefore provide better electrical conductivity. In an attempt
to improve interfacial interaction, Liu et al. compared polyethylenimine-functionalised-
MWCNT’s (covalently or non-covalently) with pristine MWCNT-epoxy composites133.
They found that both covalent and non-covalent functionalisation significantly reduced the
conductivity of the composites, however non-covalently functionalised CNT provided
conductivity that was 3-fold higher at 10-6 S/m. However, this was considerably worse than
pristine MWCNT’s, which achieved10-2 S/m at 1 wt% loading. In contrast, palmitic acid-
modification of MWCNT’s not only aided better dispersion of the nanomaterial, but also
helped improve electrical conductivity depending on the ratio of CNT to palmitic acid. At
the optimal ratio (1:1, CNT to palmitic acid), the percolation threshold was found to be
between 0.03 to 0.06 wt% and the maximum conductivity reported was 10-3 S/m at a CNT
concentration of 0.8 wt%134. Alternatively, dos Santos et al. showed that an initial de-
bundling process with an anionic surfactant; sodium dodecyl sulphate (SDS), followed by
surfactant removal and dispersion into solubilised epoxy, can help improve conductivity by
5 orders of magnitude (from 10-12 S/m to 10-7 S/m) at a low concentration of 0.5 wt%135.
Recent studies have further reported that CNT’s of high aspect ratios136 and low-viscosity
65
epoxy resin137 can help lower the percolation threshold and improve the conductivity of the
composites.
A general consensus is difficult to obtain from the studies described above. Broadly,
this can be attributed to the range of processing conditions employed, variation in the
geometries of CNT being used and different epoxy formulations. However, in an attempt to
produce high quality suspensions with individualised CNT’s, the studies described above
have commonly adopted a multifactorial approach. This involved, various CNT surface
modification strategies to allow efficient interfacial interaction and dispersion; which is
enhanced through the use of high powered sonication in solubilised epoxy.
66
3.2 Aims and objectives
The aim of this chapter is to fabricate MNA’s from epoxy-CNT composites which can
be developed into biosensors.
The objectives of this chapter are to:
1. Develop and optimise fabrication of MNA’s from neat epoxy.
2. Mechanically characterise the epoxy MNA’s by skin insertion tests, whilst also
validating physical characterisation by using Texture analyser.
3. Investigate the potential for developing composite MNA’s by blending and
solution mixing processes.
67
3.3 Materials and methods
The porcine ear skin used in this study were obtained from animals euthanized for
unrelated work and used freshly. Hairs were removed using an electric trimmer. Sylgard®
184 silicone elastomer was purchased from Dow Corning (Midland, MI, USA). Polylactic
acid (PLA) filaments was from Makerbot (Germany). Standard 2-part epoxy resin
(RX771/C) and its amine hardener (HY3100) was purchased from Robnor Resins Ltd
(Swindon, Wilshire, UK). Electron Microscopy (EM) grade Agar 100 resin was purchased
from Agar Scientific (Stanstead, Essex, UK). This is a four-part mix with the resin and two
anhydride hardeners (DDSA: dodecenylsuccinic anhydride; MNA: methyl nadic anhydride)
as well as an accelerator (BDMA: benzyldimethlyamine). Microneedle templates (Derma
stamps) were obtained from Amazon UK (https://www.amazon.co.uk). Ethanol (AR-grade)
was purchased from Sigma Aldrich (Gillingham, UK).
3.3.1 Fabrication of PLA and Epoxy MNA’s
MNA’s were fabricated using a micromoulding approach. Negatives of the template
MNA’s stamps were made using a two-part silicon elastomer kit, mixed in a 10:1 mass ratio
and degassed under a vacuum pressure of ~10 mbar (Fistreem digital vacuum oven,
Loughborough, UK) for 2 – 3 hours. The template MNA stamps were then set in this
elastomer and heat cured at 90˚C for 2 – 3 hours to produce the micromoulds. The length of
the microneedles in the template array was 1 mm. PLA MNA’s were fabricated by melting
fragmented filaments in the micromould at 180˚C under a vacuum pressure of ~20 mbar for
~4 hours. Upon cooling, the MNA’s were manually ejected from the micromould.
To fabricate epoxy-based MNA’s, different grades of the resin was used. This
included a commonly used 2 part-epoxy resin, RX771/C (referred to as standard epoxy) and
an EM grade Agar 100 resin, from which medium and hard epoxy formulations could be
developed by varying the ratio of epoxy to hardeners. As a micromoulding approach is
employed, it was hypothesised that the resin might not be able to percolate into microneedle
imprints in the micromould without the application of external pressure. However, the resin
manufacturers had suggested that, usage of a very low vacuum (i.e. approaching 0 mbar –
absolute vacuum) whilst thermally curing the epoxy samples can exaggerate air bubbles,
that are formed in situ duration the cure reaction. Entrapped air bubbles within the finished
epoxy is detrimental to their mechanical integrity. Taking this into consideration, the
varying pressure conditions were investigated in separate experiments (after mixing all the
68
components together), to determine the conditions under which a complete MNA can be
successfully developed using all epoxy formulations. The vacuum pressure variations
applied before thermal curing of all epoxies in separate experiments were: (1) 980 mbar for
10 mins (recommended by the manufactures to remove air bubbles incorporated when
mixing the different constituents; and hence used as control); (2) 600 mbar for 45 mins; (3)
200 mbar for 45 mins and (4) 20 mbar (near full vacuum) for 45 mins.
Briefly, for producing the standard epoxy MNA’s, the RX771/C epoxy resin and its
harder was warmed to 60˚C, before mixing at a mass ratio of 10:1 (resin:hardener). The
epoxy formulation was then poured into the micromoulds and cured at 80˚C overnight, after
the application of vacuum pressure variations as detailed above, in separate experiments.
Similarly, EM grade medium and hard epoxy formulations were prepared according to the
manufacturer guidelines; poured into micromould and cured at 60˚C overnight, once again
after the pressure variations had been applied in separate experiments. The MNA’s formed
were manually ejected from the micromoulds.
3.3.2 Fabrication of nanocomposite MNA’s
Carboxylic functionalised‒MWCNT’s (i.e. f-MWCNT’s, length: 10 – 30µm, outer
diameter: 20 – 30nm) were used to develop the nanocomposite MNA’s by blending and a
solution mixing process. A loading of 5 wt% of CNT was investigated here. Nanocomposite
MNA fabrication was initially investigated by blending the CNT’s into the warmed epoxy
(at 60°C, in order to lower the viscosity) by hand. This was later optimised by the addition
of a sonication step using an ultrasonic bath (operation at 37 kHz) for 20 mins. The
respective hardeners and accelerators were then warmed to 60°C and add-mixed to the
homogenised nanocomposite suspension. In order to develop the nanocomposite MNA’s,
the epoxy/f-MWCNT suspension was poured into the micromoulds and thermally cured
under the optimised conditions found for developing neat epoxy MNA’s. To develop
solution-mixed nanocomposites, the epoxies were initially dissolved in ethanol (30%, v/v).
Appropriate amounts of f-MWCNT’s was then added into this media, homogenised
mechanically and de-bundled by bath sonication for 45 mins. According to Ventura et al.
the solvent was then allowed to evaporate over 2 hours at 80°C138. Hardeners and
accelerators (both warmed to 60°C) specific to each epoxy was then added and mixed
thoroughly by hand. Finally, the solution-mixed nanocomposite was poured into the
micromoulds and cured under the optimised conditions found for developing the neat epoxy
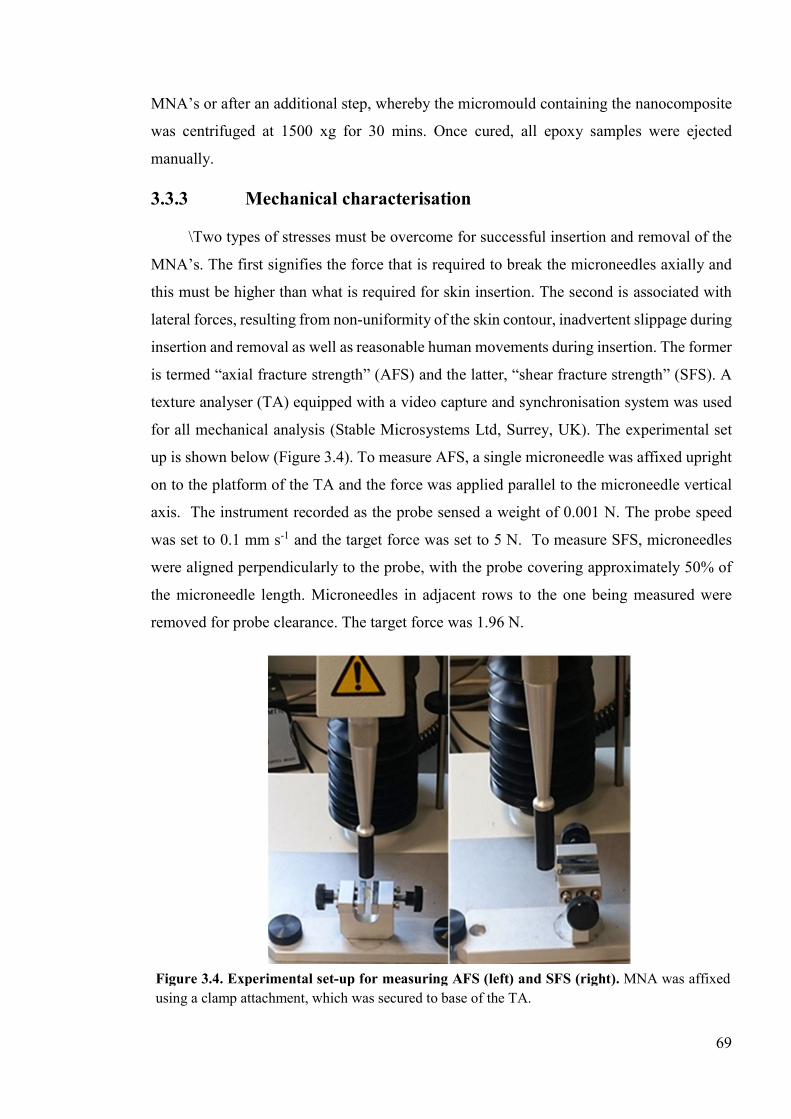
69
MNA’s or after an additional step, whereby the micromould containing the nanocomposite
was centrifuged at 1500 xg for 30 mins. Once cured, all epoxy samples were ejected
manually.
3.3.3 Mechanical characterisation
\Two types of stresses must be overcome for successful insertion and removal of the
MNA’s. The first signifies the force that is required to break the microneedles axially and
this must be higher than what is required for skin insertion. The second is associated with
lateral forces, resulting from non-uniformity of the skin contour, inadvertent slippage during
insertion and removal as well as reasonable human movements during insertion. The former
is termed “axial fracture strength” (AFS) and the latter, “shear fracture strength” (SFS). A
texture analyser (TA) equipped with a video capture and synchronisation system was used
for all mechanical analysis (Stable Microsystems Ltd, Surrey, UK). The experimental set
up is shown below (Figure 3.4). To measure AFS, a single microneedle was affixed upright
on to the platform of the TA and the force was applied parallel to the microneedle vertical
axis. The instrument recorded as the probe sensed a weight of 0.001 N. The probe speed
was set to 0.1 mm s-1 and the target force was set to 5 N. To measure SFS, microneedles
were aligned perpendicularly to the probe, with the probe covering approximately 50% of
the microneedle length. Microneedles in adjacent rows to the one being measured were
removed for probe clearance. The target force was 1.96 N.
Figure 3.4. Experimental set-up for measuring AFS (left) and SFS (right). MNA was affixed using a clamp attachment, which was secured to base of the TA.
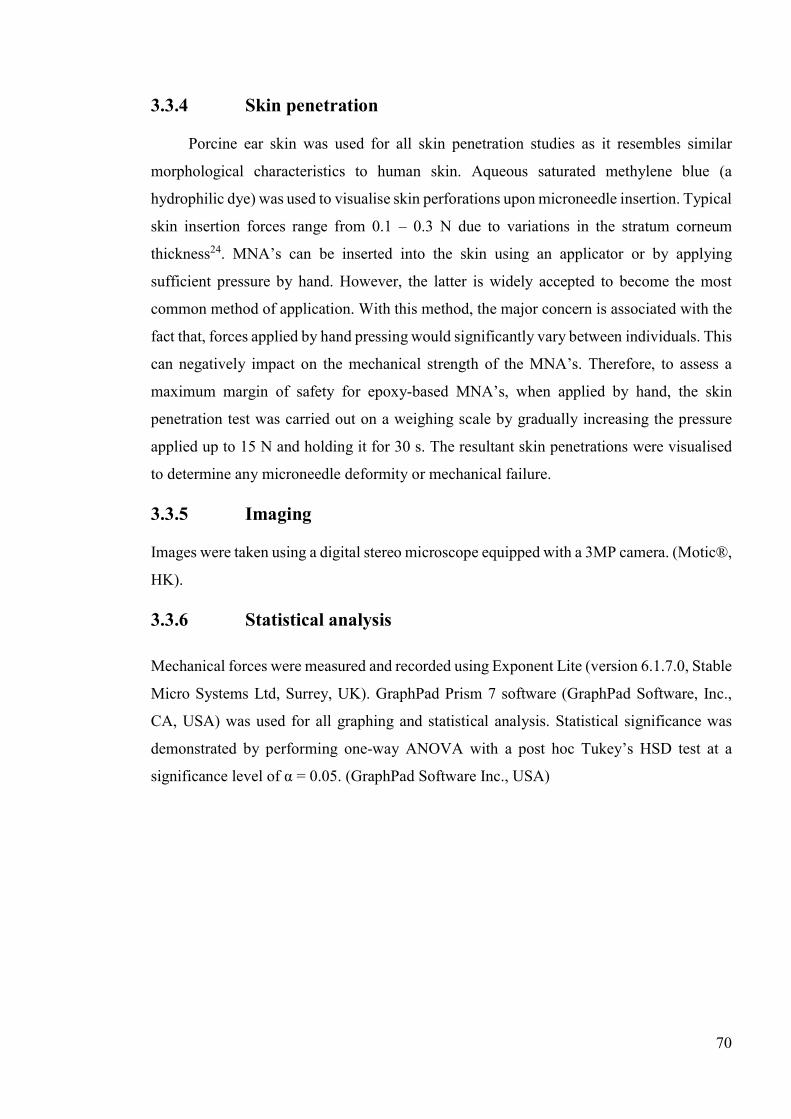
70
3.3.4 Skin penetration
Porcine ear skin was used for all skin penetration studies as it resembles similar
morphological characteristics to human skin. Aqueous saturated methylene blue (a
hydrophilic dye) was used to visualise skin perforations upon microneedle insertion. Typical
skin insertion forces range from 0.1 – 0.3 N due to variations in the stratum corneum
thickness24. MNA’s can be inserted into the skin using an applicator or by applying
sufficient pressure by hand. However, the latter is widely accepted to become the most
common method of application. With this method, the major concern is associated with the
fact that, forces applied by hand pressing would significantly vary between individuals. This
can negatively impact on the mechanical strength of the MNA’s. Therefore, to assess a
maximum margin of safety for epoxy-based MNA’s, when applied by hand, the skin
penetration test was carried out on a weighing scale by gradually increasing the pressure
applied up to 15 N and holding it for 30 s. The resultant skin penetrations were visualised
to determine any microneedle deformity or mechanical failure.
3.3.5 Imaging
Images were taken using a digital stereo microscope equipped with a 3MP camera. (Motic®,
HK).
3.3.6 Statistical analysis
Mechanical forces were measured and recorded using Exponent Lite (version 6.1.7.0, Stable
Micro Systems Ltd, Surrey, UK). GraphPad Prism 7 software (GraphPad Software, Inc.,
CA, USA) was used for all graphing and statistical analysis. Statistical significance was
demonstrated by performing one-way ANOVA with a post hoc Tukey’s HSD test at a
significance level of α = 0.05. (GraphPad Software Inc., USA)
71
3.4 Results
3.4.1 Fabrication of Epoxy MN’s
Microbubble or nanobubble formation is a continuous process that may result from the
curing reaction of the epoxy. When curing under a low vacuum pressure, these microbubbles
can expand and become more exaggerated. This is shown in Panel A, Figure 3.5; where all
epoxy samples showed an extensive amount of air bubbles entrapped within the finished
Figure 3.5. Optimisation of fabrication conditions for epoxy MNA’s. Panel A shows air bubbles entrapped in cured samples when a low vacuum pressure of 20 mbar was applied prior to thermal curing overnight; (A) RX771C – standard epoxy (B) medium epoxy and (C) hard epoxy. Panel B shows optimal processing conditions by using hard epoxy as a representative example: (D) small stubs were formed under 980 mbar vacuum pressure, which elongated the pressure was reduced to 600 mbar (E) and (F) a complete MNA formed after reducing the pressure to 200 mbar. Scale bar represents 0.3 mm.
72
product, when a full vacuum pressure (i.e. 20 mbar) was applied for 45 mins prior to thermal
curing. Hence, the optimum conditions under which epoxy-MNA’s can be developed was
investigated first and foremost. As per manufacturer guidelines, initially a high vacuum
pressure of 980 mbar was applied for 10 mins. This was recommended as adequate to
remove air bubbles incorporated during mechanical mixing. But, it was not known whether
the high pressure was enough to form microneedles. In separate experiments, the vacuum
pressure was then reduced to 600 mbar and 200 mbar with an application time of 45 minutes
under each setting, for all epoxy samples. The results from these studies are shown using
representative images of the hard epoxy samples, in Panel B, Figure 3.5. Under the
manufacturer-recommended conditions, only small stubs were formed (d). On increasing
the pressure to 600 mbar the stubs appeared more elongated (e), however a full MNA only
formed when a low pressure of 200 mbar was applied. This was consistent across all the
epoxy samples studied.
3.4.2 Skin Penetration
Skin penetrations tests were done by hand using all epoxy MNA’s and the penetrations
were visualised by methylene blue staining. MNA’s were applied onto the skin by applying
a maximum force of 15 N. Figure 3.6 shows a series of images taken before and after the
skin penetration tests. In all cases, i.e. for standard, medium and hard epoxy, all of the
microneedles in an array penetrated the skin, as visualised by methylene blue staining of the
perforations caused by microneedle insertions (Figure 3.6 A.3, B3, and C.3). Standard epoxy
MNA’s rarely bent, however one of the needles appeared to have fractured near the base
(Figure 3.6 A.2). Medium epoxy MNA’s showed multiple needles with their tips bent
following skin insertion (Figure 3.6, B.2), but none was seen to fracture. With the hard
epoxy MNA’s, the degree of tip bending appeared lower compared to that of medium epoxy
(Figure 3.6, C.2), and again none of the microneedles was seen to fracture. Collectively,
these results indicate that the hard epoxy formulation is least likely to be affected by skin
insertion and removal.
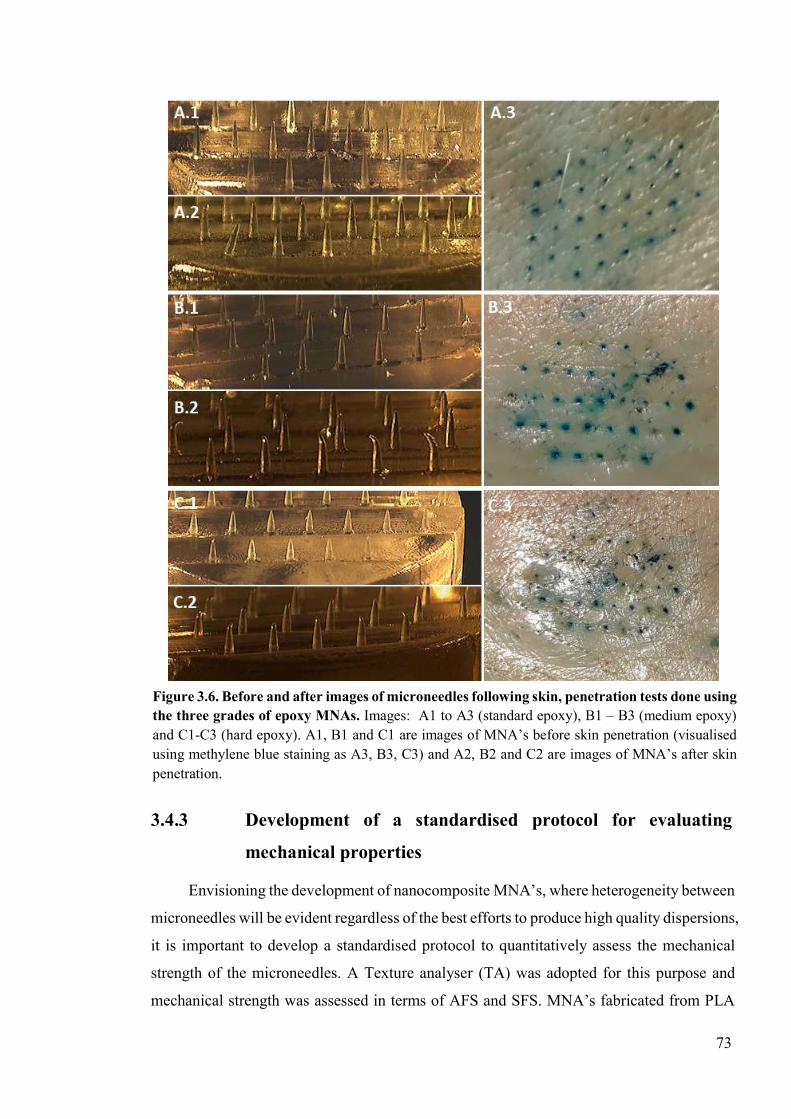
73
3.4.3 Development of a standardised protocol for evaluating
mechanical properties
Envisioning the development of nanocomposite MNA’s, where heterogeneity between
microneedles will be evident regardless of the best efforts to produce high quality dispersions,
it is important to develop a standardised protocol to quantitatively assess the mechanical
strength of the microneedles. A Texture analyser (TA) was adopted for this purpose and
mechanical strength was assessed in terms of AFS and SFS. MNA’s fabricated from PLA
Figure 3.6. Before and after images of microneedles following skin, penetration tests done using the three grades of epoxy MNAs. Images: A1 to A3 (standard epoxy), B1 – B3 (medium epoxy) and C1-C3 (hard epoxy). A1, B1 and C1 are images of MNA’s before skin penetration (visualised using methylene blue staining as A3, B3, C3) and A2, B2 and C2 are images of MNA’s after skin penetration.
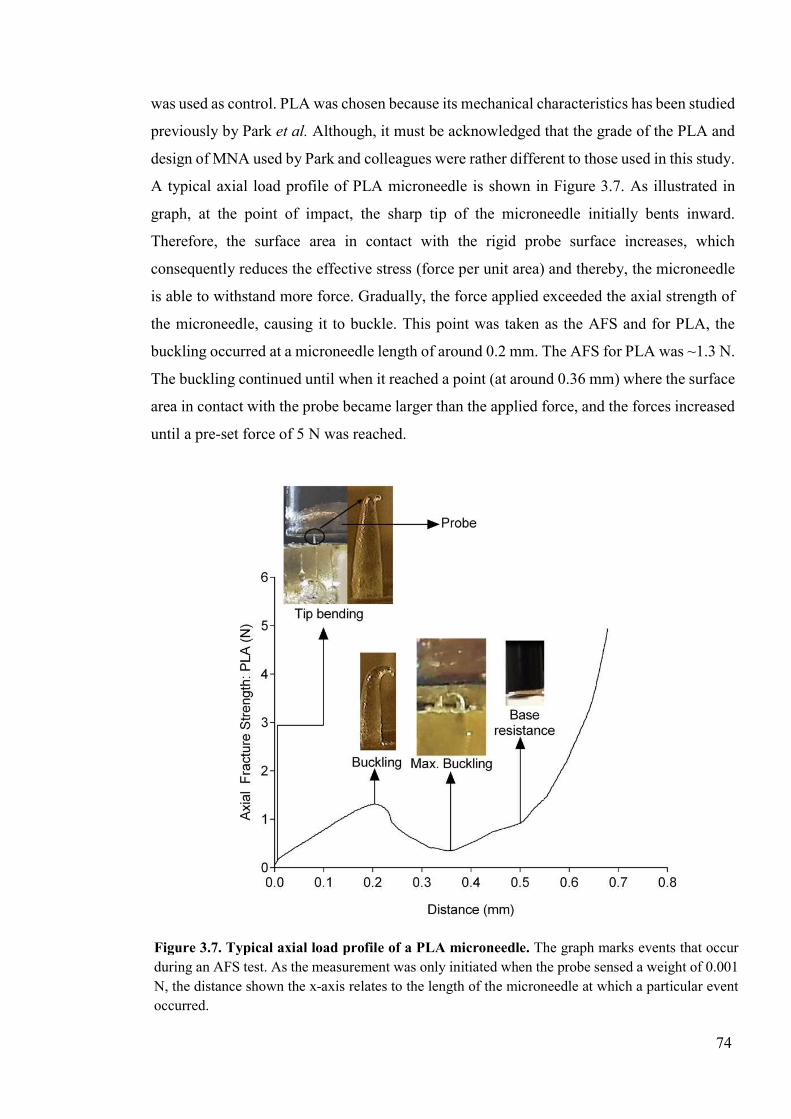
74
was used as control. PLA was chosen because its mechanical characteristics has been studied
previously by Park et al. Although, it must be acknowledged that the grade of the PLA and
design of MNA used by Park and colleagues were rather different to those used in this study.
A typical axial load profile of PLA microneedle is shown in Figure 3.7. As illustrated in
graph, at the point of impact, the sharp tip of the microneedle initially bents inward.
Therefore, the surface area in contact with the rigid probe surface increases, which
consequently reduces the effective stress (force per unit area) and thereby, the microneedle
is able to withstand more force. Gradually, the force applied exceeded the axial strength of
the microneedle, causing it to buckle. This point was taken as the AFS and for PLA, the
buckling occurred at a microneedle length of around 0.2 mm. The AFS for PLA was ~1.3 N.
The buckling continued until when it reached a point (at around 0.36 mm) where the surface
area in contact with the probe became larger than the applied force, and the forces increased
until a pre-set force of 5 N was reached.
Figure 3.7. Typical axial load profile of a PLA microneedle. The graph marks events that occur during an AFS test. As the measurement was only initiated when the probe sensed a weight of 0.001 N, the distance shown the x-axis relates to the length of the microneedle at which a particular event occurred.
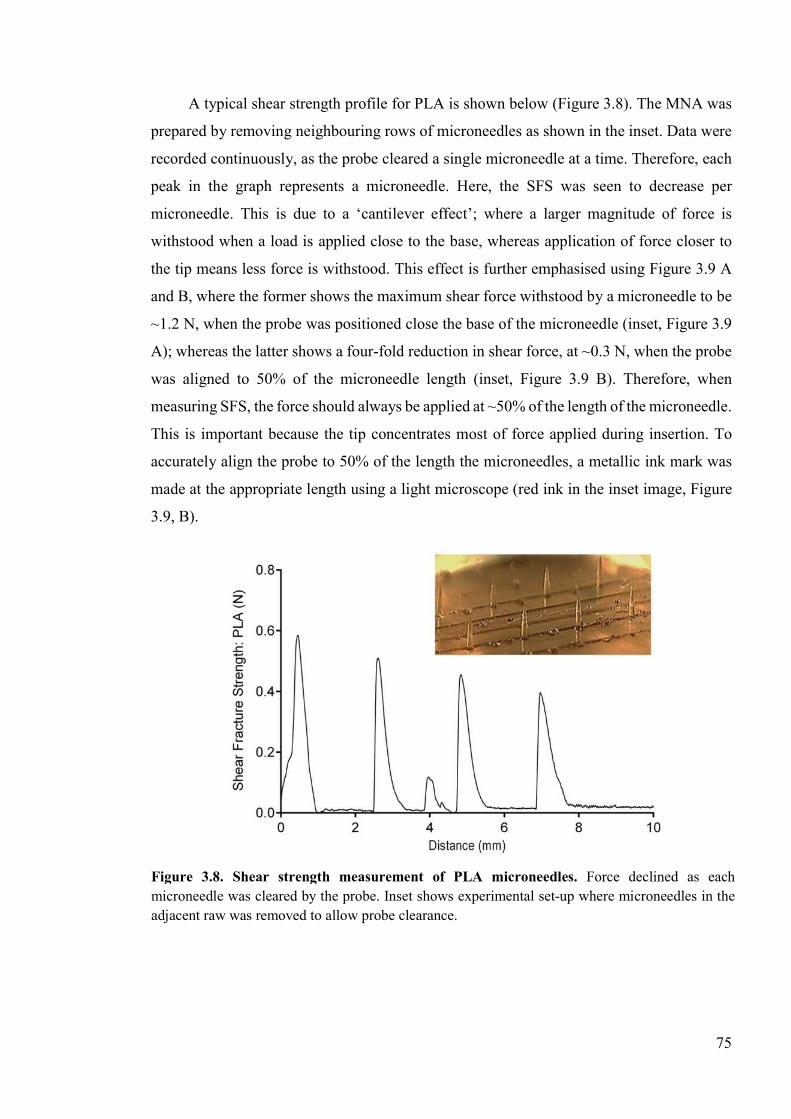
75
A typical shear strength profile for PLA is shown below (Figure 3.8). The MNA was
prepared by removing neighbouring rows of microneedles as shown in the inset. Data were
recorded continuously, as the probe cleared a single microneedle at a time. Therefore, each
peak in the graph represents a microneedle. Here, the SFS was seen to decrease per
microneedle. This is due to a ‘cantilever effect’; where a larger magnitude of force is
withstood when a load is applied close to the base, whereas application of force closer to
the tip means less force is withstood. This effect is further emphasised using Figure 3.9 A
and B, where the former shows the maximum shear force withstood by a microneedle to be
~1.2 N, when the probe was positioned close the base of the microneedle (inset, Figure 3.9
A); whereas the latter shows a four-fold reduction in shear force, at ~0.3 N, when the probe
was aligned to 50% of the microneedle length (inset, Figure 3.9 B). Therefore, when
measuring SFS, the force should always be applied at ~50% of the length of the microneedle.
This is important because the tip concentrates most of force applied during insertion. To
accurately align the probe to 50% of the length the microneedles, a metallic ink mark was
made at the appropriate length using a light microscope (red ink in the inset image, Figure
3.9, B).
Figure 3.8. Shear strength measurement of PLA microneedles. Force declined as each microneedle was cleared by the probe. Inset shows experimental set-up where microneedles in the adjacent raw was removed to allow probe clearance.
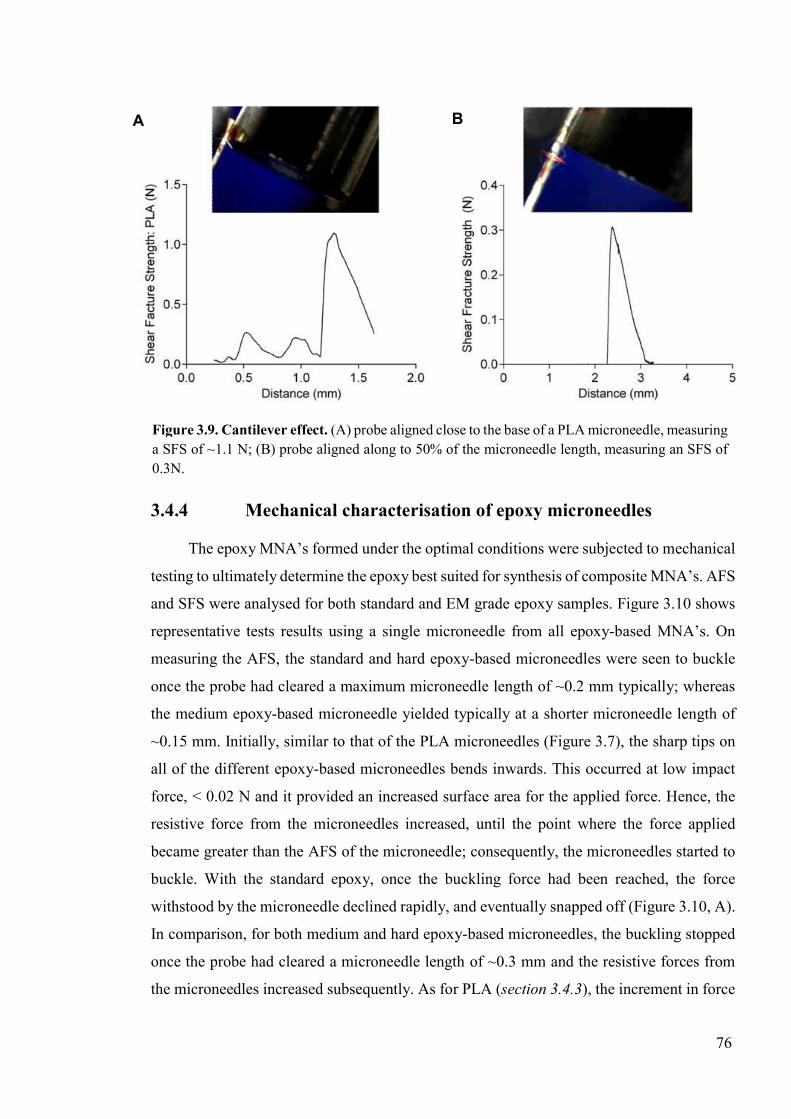
76
3.4.4 Mechanical characterisation of epoxy microneedles
The epoxy MNA’s formed under the optimal conditions were subjected to mechanical
testing to ultimately determine the epoxy best suited for synthesis of composite MNA’s. AFS
and SFS were analysed for both standard and EM grade epoxy samples. Figure 3.10 shows
representative tests results using a single microneedle from all epoxy-based MNA’s. On
measuring the AFS, the standard and hard epoxy-based microneedles were seen to buckle
once the probe had cleared a maximum microneedle length of ~0.2 mm typically; whereas
the medium epoxy-based microneedle yielded typically at a shorter microneedle length of
~0.15 mm. Initially, similar to that of the PLA microneedles (Figure 3.7), the sharp tips on
all of the different epoxy-based microneedles bends inwards. This occurred at low impact
force, < 0.02 N and it provided an increased surface area for the applied force. Hence, the
resistive force from the microneedles increased, until the point where the force applied
became greater than the AFS of the microneedle; consequently, the microneedles started to
buckle. With the standard epoxy, once the buckling force had been reached, the force
withstood by the microneedle declined rapidly, and eventually snapped off (Figure 3.10, A).
In comparison, for both medium and hard epoxy-based microneedles, the buckling stopped
once the probe had cleared a microneedle length of ~0.3 mm and the resistive forces from
the microneedles increased subsequently. As for PLA (section 3.4.3), the increment in force
Figure 3.9. Cantilever effect. (A) probe aligned close to the base of a PLA microneedle, measuring a SFS of ~1.1 N; (B) probe aligned along to 50% of the microneedle length, measuring an SFS of 0.3N.
A B
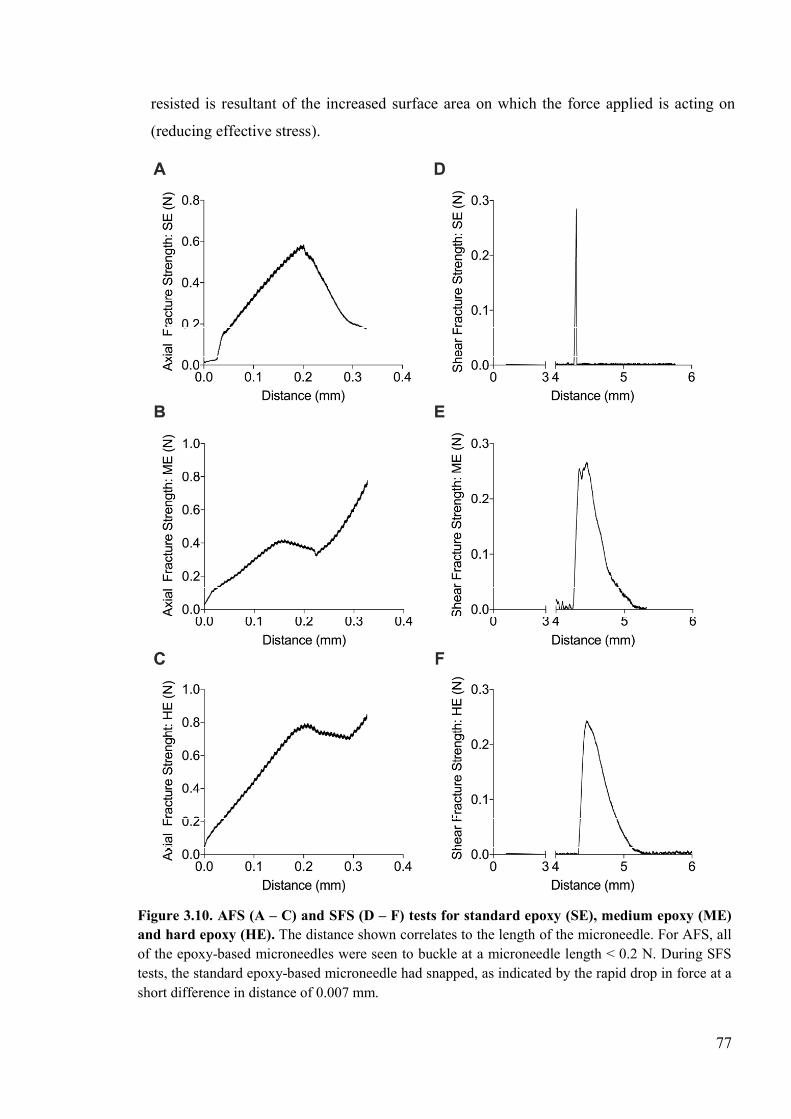
77
resisted is resultant of the increased surface area on which the force applied is acting on
(reducing effective stress).
Figure 3.10. AFS (A – C) and SFS (D – F) tests for standard epoxy (SE), medium epoxy (ME) and hard epoxy (HE). The distance shown correlates to the length of the microneedle. For AFS, all of the epoxy-based microneedles were seen to buckle at a microneedle length < 0.2 N. During SFS tests, the standard epoxy-based microneedle had snapped, as indicated by the rapid drop in force at a short difference in distance of 0.007 mm.
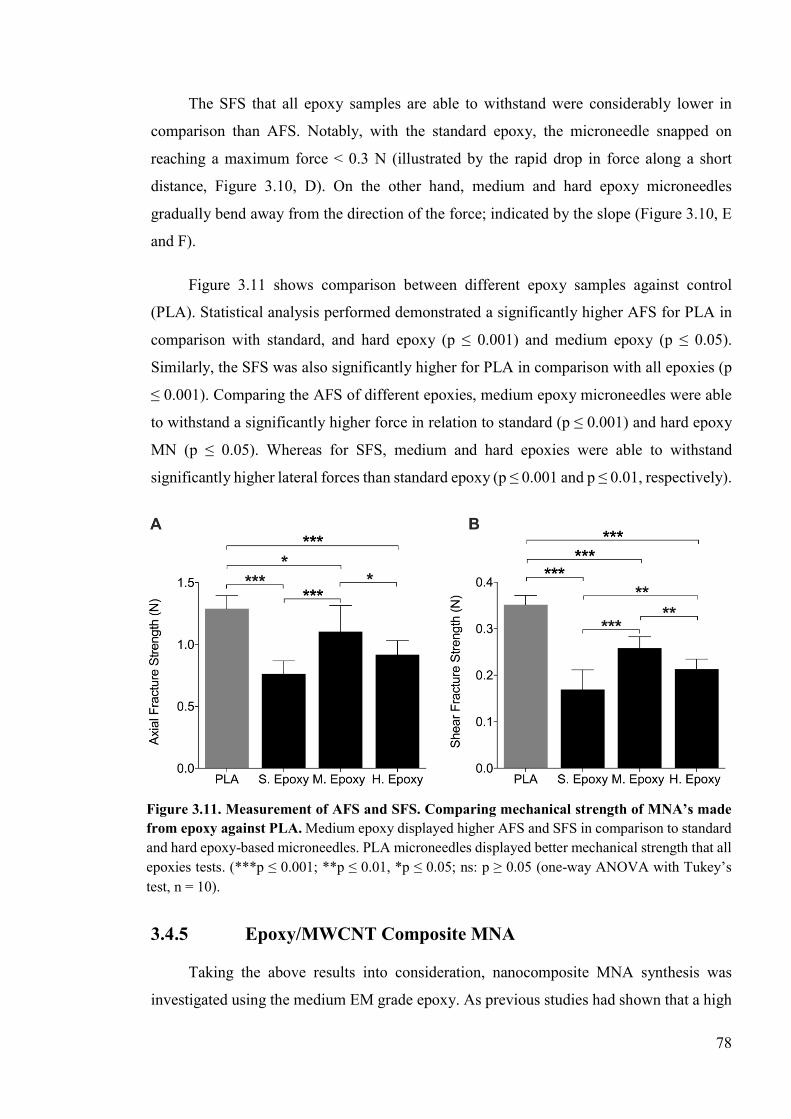
78
The SFS that all epoxy samples are able to withstand were considerably lower in
comparison than AFS. Notably, with the standard epoxy, the microneedle snapped on
reaching a maximum force < 0.3 N (illustrated by the rapid drop in force along a short
distance, Figure 3.10, D). On the other hand, medium and hard epoxy microneedles
gradually bend away from the direction of the force; indicated by the slope (Figure 3.10, E
and F).
Figure 3.11 shows comparison between different epoxy samples against control
(PLA). Statistical analysis performed demonstrated a significantly higher AFS for PLA in
comparison with standard, and hard epoxy (p ≤ 0.001) and medium epoxy (p ≤ 0.05).
Similarly, the SFS was also significantly higher for PLA in comparison with all epoxies (p
≤ 0.001). Comparing the AFS of different epoxies, medium epoxy microneedles were able
to withstand a significantly higher force in relation to standard (p ≤ 0.001) and hard epoxy
MN (p ≤ 0.05). Whereas for SFS, medium and hard epoxies were able to withstand
significantly higher lateral forces than standard epoxy (p ≤ 0.001 and p ≤ 0.01, respectively).
3.4.5 Epoxy/MWCNT Composite MNA
Taking the above results into consideration, nanocomposite MNA synthesis was
investigated using the medium EM grade epoxy. As previous studies had shown that a high
Figure 3.11. Measurement of AFS and SFS. Comparing mechanical strength of MNA’s made from epoxy against PLA. Medium epoxy displayed higher AFS and SFS in comparison to standard and hard epoxy-based microneedles. PLA microneedles displayed better mechanical strength that all epoxies tests. (***p ≤ 0.001; **p ≤ 0.01, *p ≤ 0.05; ns: p ≥ 0.05 (one-way ANOVA with Tukey’s test, n = 10).
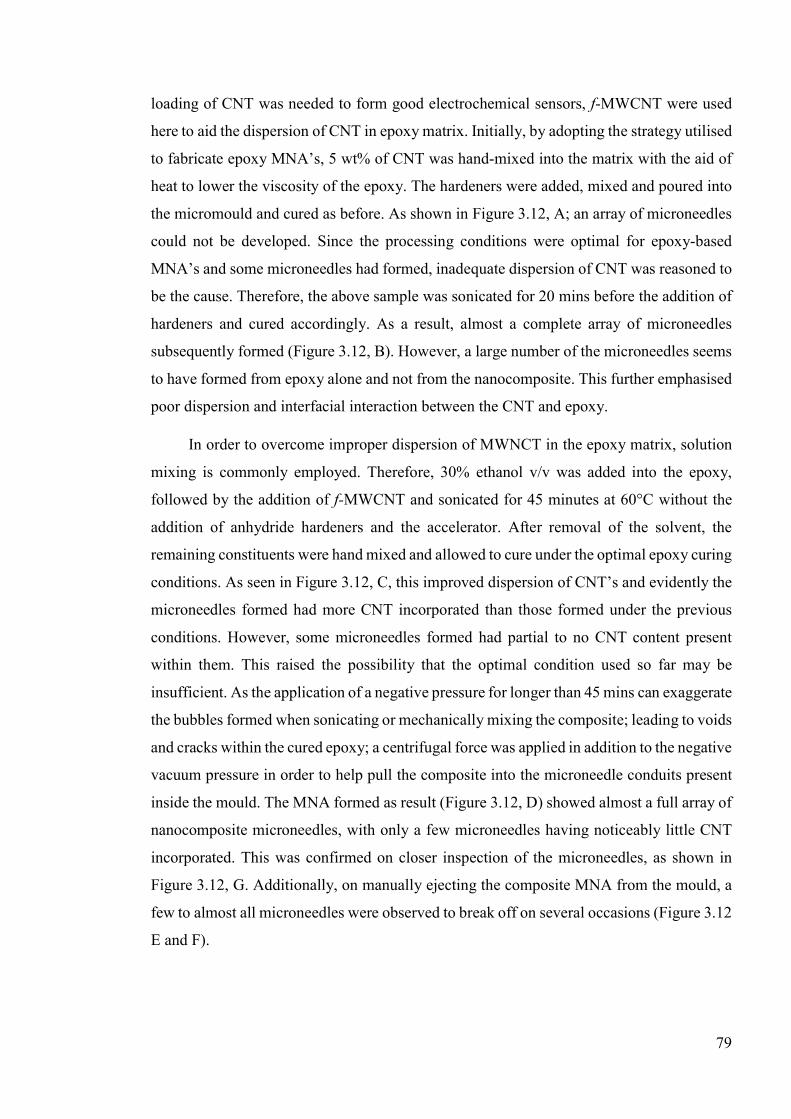
79
loading of CNT was needed to form good electrochemical sensors, f-MWCNT were used
here to aid the dispersion of CNT in epoxy matrix. Initially, by adopting the strategy utilised
to fabricate epoxy MNA’s, 5 wt% of CNT was hand-mixed into the matrix with the aid of
heat to lower the viscosity of the epoxy. The hardeners were added, mixed and poured into
the micromould and cured as before. As shown in Figure 3.12, A; an array of microneedles
could not be developed. Since the processing conditions were optimal for epoxy-based
MNA’s and some microneedles had formed, inadequate dispersion of CNT was reasoned to
be the cause. Therefore, the above sample was sonicated for 20 mins before the addition of
hardeners and cured accordingly. As a result, almost a complete array of microneedles
subsequently formed (Figure 3.12, B). However, a large number of the microneedles seems
to have formed from epoxy alone and not from the nanocomposite. This further emphasised
poor dispersion and interfacial interaction between the CNT and epoxy.
In order to overcome improper dispersion of MWNCT in the epoxy matrix, solution
mixing is commonly employed. Therefore, 30% ethanol v/v was added into the epoxy,
followed by the addition of f-MWCNT and sonicated for 45 minutes at 60°C without the
addition of anhydride hardeners and the accelerator. After removal of the solvent, the
remaining constituents were hand mixed and allowed to cure under the optimal epoxy curing
conditions. As seen in Figure 3.12, C, this improved dispersion of CNT’s and evidently the
microneedles formed had more CNT incorporated than those formed under the previous
conditions. However, some microneedles formed had partial to no CNT content present
within them. This raised the possibility that the optimal condition used so far may be
insufficient. As the application of a negative pressure for longer than 45 mins can exaggerate
the bubbles formed when sonicating or mechanically mixing the composite; leading to voids
and cracks within the cured epoxy; a centrifugal force was applied in addition to the negative
vacuum pressure in order to help pull the composite into the microneedle conduits present
inside the mould. The MNA formed as result (Figure 3.12, D) showed almost a full array of
nanocomposite microneedles, with only a few microneedles having noticeably little CNT
incorporated. This was confirmed on closer inspection of the microneedles, as shown in
Figure 3.12, G. Additionally, on manually ejecting the composite MNA from the mould, a
few to almost all microneedles were observed to break off on several occasions (Figure 3.12
E and F).
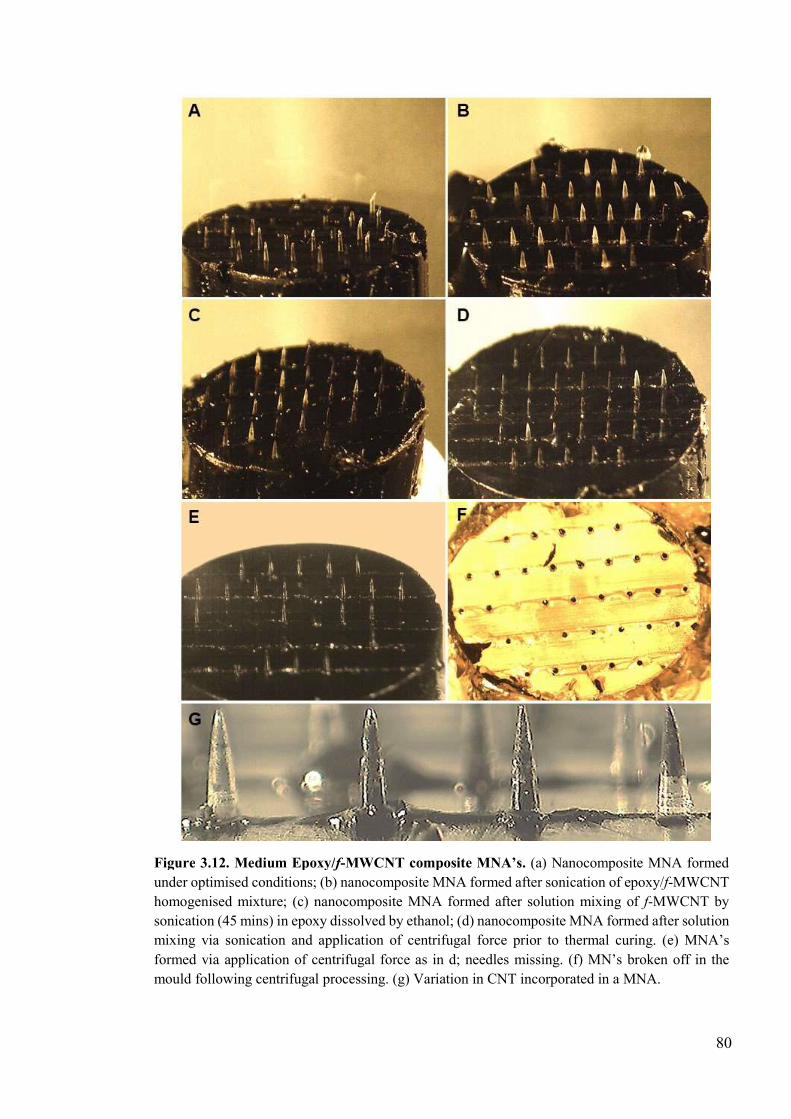
80
Figure 3.12. Medium Epoxy/f-MWCNT composite MNA’s. (a) Nanocomposite MNA formed under optimised conditions; (b) nanocomposite MNA formed after sonication of epoxy/f-MWCNT homogenised mixture; (c) nanocomposite MNA formed after solution mixing of f-MWCNT by sonication (45 mins) in epoxy dissolved by ethanol; (d) nanocomposite MNA formed after solution mixing via sonication and application of centrifugal force prior to thermal curing. (e) MNA’s formed via application of centrifugal force as in d; needles missing. (f) MN’s broken off in the mould following centrifugal processing. (g) Variation in CNT incorporated in a MNA.
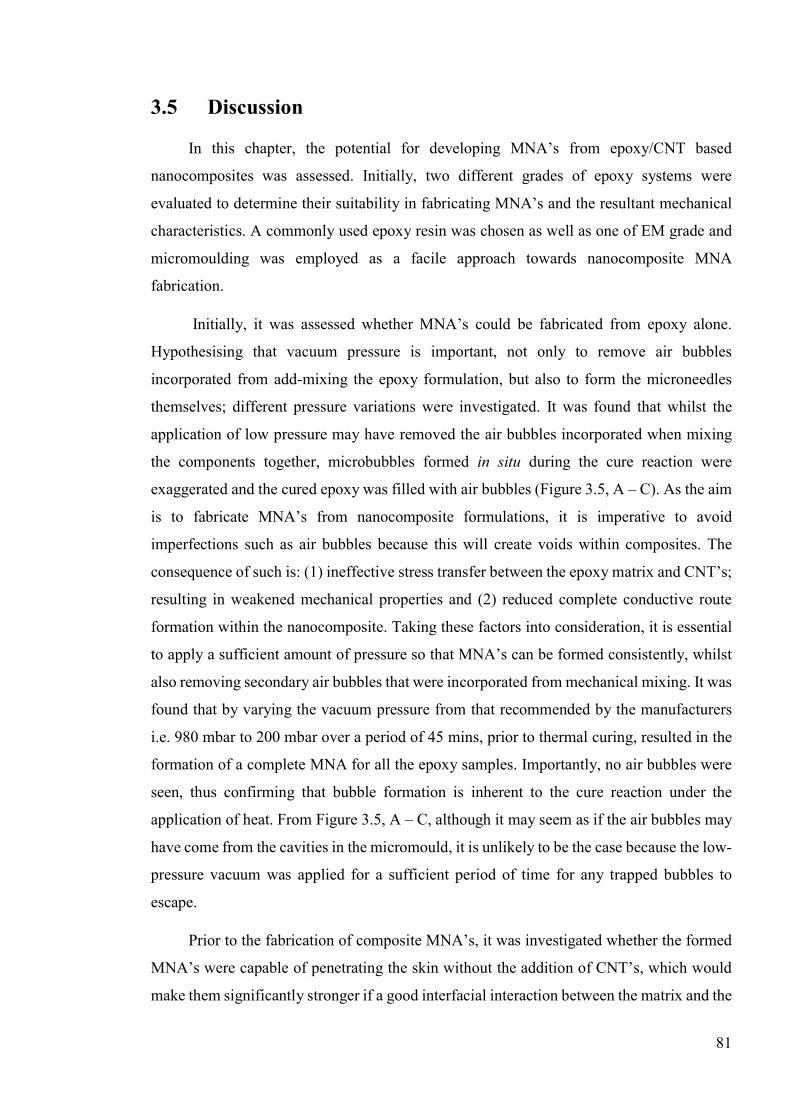
81
3.5 Discussion
In this chapter, the potential for developing MNA’s from epoxy/CNT based
nanocomposites was assessed. Initially, two different grades of epoxy systems were
evaluated to determine their suitability in fabricating MNA’s and the resultant mechanical
characteristics. A commonly used epoxy resin was chosen as well as one of EM grade and
micromoulding was employed as a facile approach towards nanocomposite MNA
fabrication.
Initially, it was assessed whether MNA’s could be fabricated from epoxy alone.
Hypothesising that vacuum pressure is important, not only to remove air bubbles
incorporated from add-mixing the epoxy formulation, but also to form the microneedles
themselves; different pressure variations were investigated. It was found that whilst the
application of low pressure may have removed the air bubbles incorporated when mixing
the components together, microbubbles formed in situ during the cure reaction were
exaggerated and the cured epoxy was filled with air bubbles (Figure 3.5, A – C). As the aim
is to fabricate MNA’s from nanocomposite formulations, it is imperative to avoid
imperfections such as air bubbles because this will create voids within composites. The
consequence of such is: (1) ineffective stress transfer between the epoxy matrix and CNT’s;
resulting in weakened mechanical properties and (2) reduced complete conductive route
formation within the nanocomposite. Taking these factors into consideration, it is essential
to apply a sufficient amount of pressure so that MNA’s can be formed consistently, whilst
also removing secondary air bubbles that were incorporated from mechanical mixing. It was
found that by varying the vacuum pressure from that recommended by the manufacturers
i.e. 980 mbar to 200 mbar over a period of 45 mins, prior to thermal curing, resulted in the
formation of a complete MNA for all the epoxy samples. Importantly, no air bubbles were
seen, thus confirming that bubble formation is inherent to the cure reaction under the
application of heat. From Figure 3.5, A – C, although it may seem as if the air bubbles may
have come from the cavities in the micromould, it is unlikely to be the case because the low-
pressure vacuum was applied for a sufficient period of time for any trapped bubbles to
escape.
Prior to the fabrication of composite MNA’s, it was investigated whether the formed
MNA’s were capable of penetrating the skin without the addition of CNT’s, which would
make them significantly stronger if a good interfacial interaction between the matrix and the
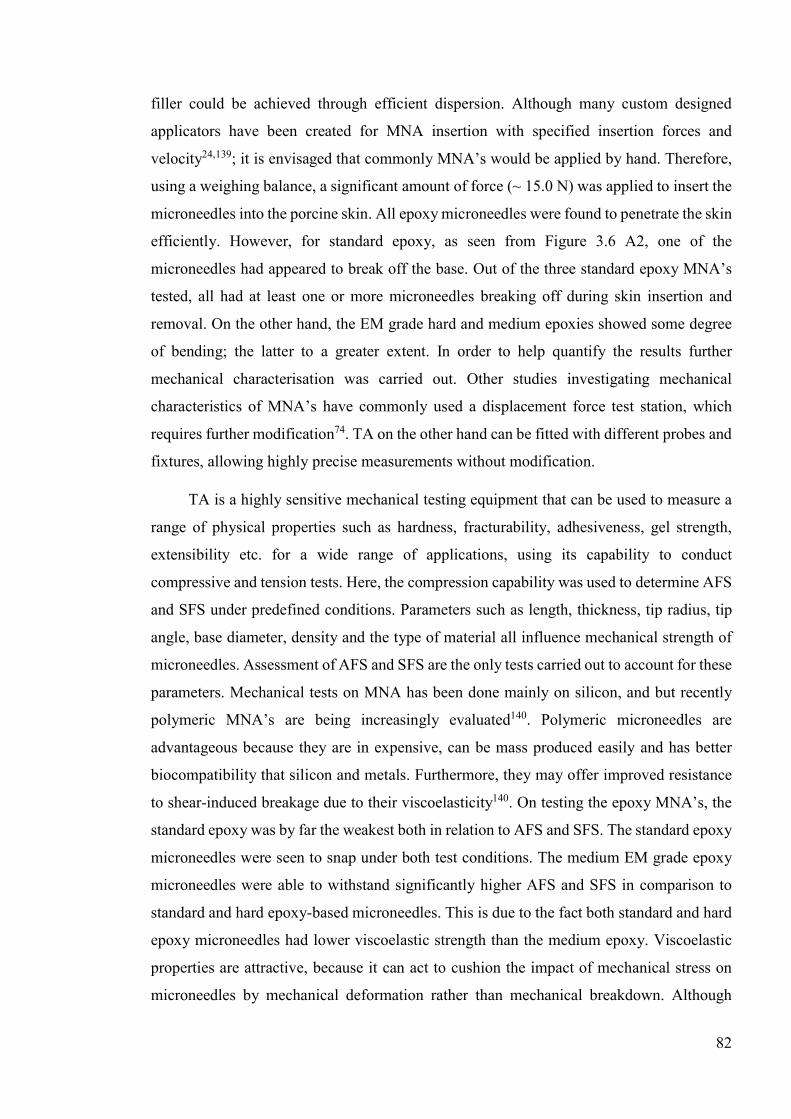
82
filler could be achieved through efficient dispersion. Although many custom designed
applicators have been created for MNA insertion with specified insertion forces and
velocity24,139; it is envisaged that commonly MNA’s would be applied by hand. Therefore,
using a weighing balance, a significant amount of force (~ 15.0 N) was applied to insert the
microneedles into the porcine skin. All epoxy microneedles were found to penetrate the skin
efficiently. However, for standard epoxy, as seen from Figure 3.6 A2, one of the
microneedles had appeared to break off the base. Out of the three standard epoxy MNA’s
tested, all had at least one or more microneedles breaking off during skin insertion and
removal. On the other hand, the EM grade hard and medium epoxies showed some degree
of bending; the latter to a greater extent. In order to help quantify the results further
mechanical characterisation was carried out. Other studies investigating mechanical
characteristics of MNA’s have commonly used a displacement force test station, which
requires further modification74. TA on the other hand can be fitted with different probes and
fixtures, allowing highly precise measurements without modification.
TA is a highly sensitive mechanical testing equipment that can be used to measure a
range of physical properties such as hardness, fracturability, adhesiveness, gel strength,
extensibility etc. for a wide range of applications, using its capability to conduct
compressive and tension tests. Here, the compression capability was used to determine AFS
and SFS under predefined conditions. Parameters such as length, thickness, tip radius, tip
angle, base diameter, density and the type of material all influence mechanical strength of
microneedles. Assessment of AFS and SFS are the only tests carried out to account for these
parameters. Mechanical tests on MNA has been done mainly on silicon, and but recently
polymeric MNA’s are being increasingly evaluated140. Polymeric microneedles are
advantageous because they are in expensive, can be mass produced easily and has better
biocompatibility that silicon and metals. Furthermore, they may offer improved resistance
to shear-induced breakage due to their viscoelasticity140. On testing the epoxy MNA’s, the
standard epoxy was by far the weakest both in relation to AFS and SFS. The standard epoxy
microneedles were seen to snap under both test conditions. The medium EM grade epoxy
microneedles were able to withstand significantly higher AFS and SFS in comparison to
standard and hard epoxy-based microneedles. This is due to the fact both standard and hard
epoxy microneedles had lower viscoelastic strength than the medium epoxy. Viscoelastic
properties are attractive, because it can act to cushion the impact of mechanical stress on
microneedles by mechanical deformation rather than mechanical breakdown. Although
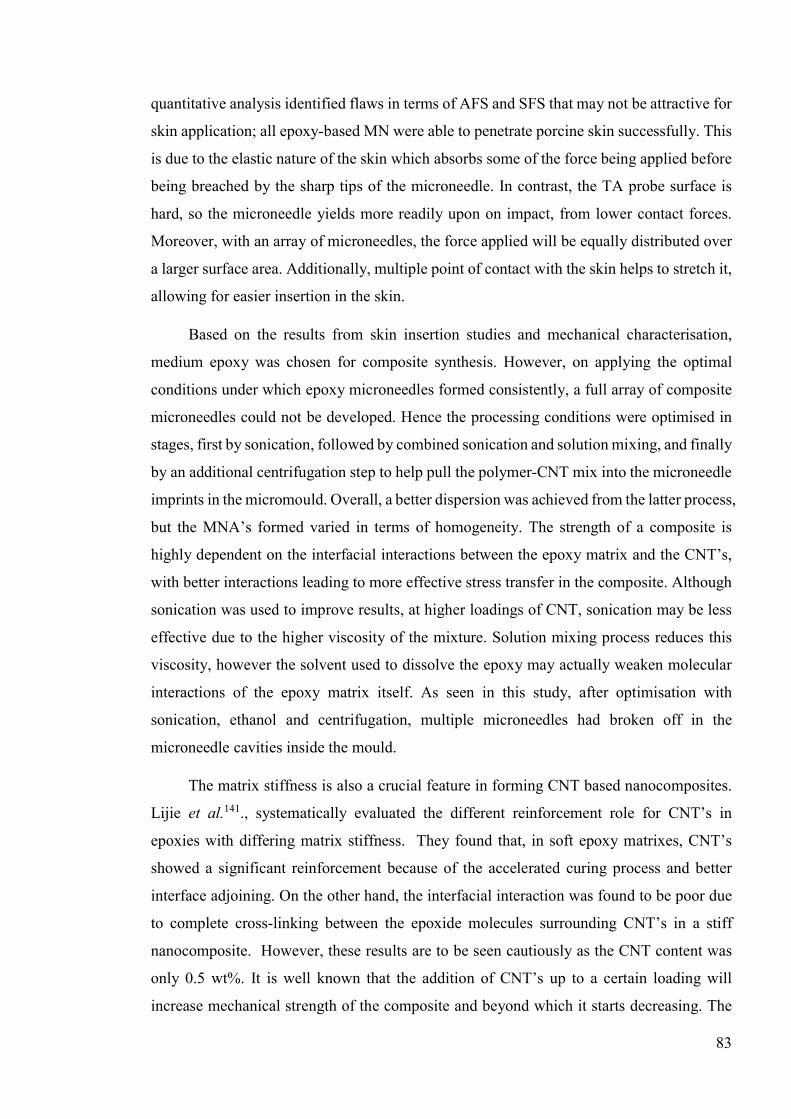
83
quantitative analysis identified flaws in terms of AFS and SFS that may not be attractive for
skin application; all epoxy-based MN were able to penetrate porcine skin successfully. This
is due to the elastic nature of the skin which absorbs some of the force being applied before
being breached by the sharp tips of the microneedle. In contrast, the TA probe surface is
hard, so the microneedle yields more readily upon on impact, from lower contact forces.
Moreover, with an array of microneedles, the force applied will be equally distributed over
a larger surface area. Additionally, multiple point of contact with the skin helps to stretch it,
allowing for easier insertion in the skin.
Based on the results from skin insertion studies and mechanical characterisation,
medium epoxy was chosen for composite synthesis. However, on applying the optimal
conditions under which epoxy microneedles formed consistently, a full array of composite
microneedles could not be developed. Hence the processing conditions were optimised in
stages, first by sonication, followed by combined sonication and solution mixing, and finally
by an additional centrifugation step to help pull the polymer-CNT mix into the microneedle
imprints in the micromould. Overall, a better dispersion was achieved from the latter process,
but the MNA’s formed varied in terms of homogeneity. The strength of a composite is
highly dependent on the interfacial interactions between the epoxy matrix and the CNT’s,
with better interactions leading to more effective stress transfer in the composite. Although
sonication was used to improve results, at higher loadings of CNT, sonication may be less
effective due to the higher viscosity of the mixture. Solution mixing process reduces this
viscosity, however the solvent used to dissolve the epoxy may actually weaken molecular
interactions of the epoxy matrix itself. As seen in this study, after optimisation with
sonication, ethanol and centrifugation, multiple microneedles had broken off in the
microneedle cavities inside the mould.
The matrix stiffness is also a crucial feature in forming CNT based nanocomposites.
Lijie et al.141., systematically evaluated the different reinforcement role for CNT’s in
epoxies with differing matrix stiffness. They found that, in soft epoxy matrixes, CNT’s
showed a significant reinforcement because of the accelerated curing process and better
interface adjoining. On the other hand, the interfacial interaction was found to be poor due
to complete cross-linking between the epoxide molecules surrounding CNT’s in a stiff
nanocomposite. However, these results are to be seen cautiously as the CNT content was
only 0.5 wt%. It is well known that the addition of CNT’s up to a certain loading will
increase mechanical strength of the composite and beyond which it starts decreasing. The
84
decrement in mechanical strength is associated with the fact that, at high loadings (> 10
wt%), some surfaces of CNT’s are not completely covered by the matrix due to the large
specific surface area of CNT’s142. For this reason, the majority of studies into
nanocomposite processing have used a small weight fraction of CNT’s, between 0.1 – 8
wt%. Only a few studies have investigated higher CNT loadings (up to 39 wt%) and shown
that they resulted in improved mechanical features, and these were achieved by shear
processing143 and melt mixing144. Functionalisation of CNT’s can certainly improve
dispersion, but to create nanocomposites with greater mechanical strengths, amine
functionalisation may be a better alternative as it may form covalent bonds with the epoxy
matrix as opposed to hydrogen bonds when using carboxylic functionalised MWCNT.
85
3.6 Conclusions
Overall, this chapter demonstrated that efficient dispersion of CNT’s into epoxy is
challenging, even when even when f-MWCNT’s are used. As predicted, the inhomogeneity
resultant of poor dispersion was translated into the finite structure of microneedles. A major
consideration regarding the poor dispersion concerns the choice of epoxy used for
synthesising nanocomposites with CNT’s as a filler. Results seen here are in agreement with
the notion that epoxy matrices that are less stiff may prove better for CNT incorporation.
Nevertheless, this chapter showcases a cost-effective and highly scalable fabrication
strategy to produce mechanically strong solid MNA’s using epoxy.
86
3.7 Future work
Although, this chapter shows successful fabrication of MNA’s from epoxies,
nanocomposite MNA’s could not be successfully fabricated. This is due to the poor
interfacial interaction between the CNT’s and the epoxy matrix, even when f-MWCNT’s
was utilised. This raises concerns regarding the suitability of epoxy as a matrix. Considering
the finding that interfacial interaction may actually benefit from using a matrix that is less
stiff, a “softer” blend could be prepared from the EM grade epoxy by varying the ratio of
epoxy to hardeners and the accelerator and, analysed in terms of mechanical strength and
nanocomposite MNA synthesis. Shear mixing maybe an alternative to sonication, as it can
be used to incorporate higher loadings of CNT’s; which is necessary to the function of
nanocomposite MNA’s as an electrochemical sensor. Critically, the PLA microneedles
analysed here had better mechanical strength than all epoxies tested. Therefore, it may be a
suitable alternative towards the fabrication of nanocomposite MNA’s.
87
Chapter 4. Synthesis and characterisation of poly (lactic acid)/f-MWCNT composite MNA’s
4.1 Introduction
Excellent interfacial interaction between the polymer and CNT is crucial to the
formation of conductive MNA’s with good mechanical properties. Aside from epoxy, more
than 30 polymeric matrices have been investigated for mechanical re-enforcement upon the
addition of CNT67. However, polymer–CNT composites used for electroanalysis have been
primarily derived from conductive polymers (CP) and used mainly as modifiers of
electrodes. CP’s are attractive because they can exhibit electrical properties similar to metals
and semiconductors, and can be easily synthesised as with conventional polymers145.
Polyaniline, polypyrrole, polythiophene and their derivatives such as poly(3,4–
ethylenedioxythiophene), are a group of CP compounds that has been widely investigated
for electrochemical applications146. They are inherently conductive because of the
delocalised electrons in the conjugated double bonds along their backbone which can move
around the entire system as carriers of charge147. These conjugated systems are however
unstable, because of the energy gap created in the electronic spectrum with respect to the -
bond alterations and therefore do not possess high conductivity145,147. Consequently, they
are doped with both p- and n-type dopants, which transfer charge to the polymer chain by
redox processes and induces the formation of charge carriers, which are delocalised along
the polymer chain145,147. This facilitates metallic conductivity in the CP’s. However, there
are limitations. In particular to biosensing capabilities, they suffer from low sensitivity and
poor selectivity148. CNT’s are often incorporated within the CP’s to improve sensitivity,
selectivity, stability and reproducibility, as well as impart resistance to fouling and reduce
the overpotential of oxidative chemical reactions148. Composites of this nature are being
extensively investigated to produce ultrasensitive sensors for electrochemical detection of a
range of analytes, proteins, small molecules, biomarkers and DNA148,149. However, CP’s are
difficult to process once synthesised, i.e. whereas some CP’s lack sufficient mechanical
strength, others are rigid, insoluble, non-biodegradable and may even be cytotoxic145.
Mechanical properties of CP’s can be improved by blending with other insulating polymers,
however the insulating molecules may interfere with the conjugated system of CP’s150.
Considering these difficulties, utilising a non-conjugated or an insulating polymer maybe
88
be more advantageous in terms of processability and enhanced mechanical properties as
required for microneedles.
CNT’s can be incorporated into insulating polymeric matrices using versatile and
scalable strategies to make them conductive. In general, the conductivity of the polymer
depends on the concentration on filler being incorporated. High conductivities can be
achieved, albeit at the expense of mechanical properties. A major challenge when producing
nanocomposite MNA’s is therefore to achieve high conductivity and mechanical strength at
the same time. The field of study concerning insulating polymer–CNT composites for
electrochemical sensing (referred to as polymer nanocomposites) is however in its infancy,
as research has emphasised the fundamentals of synthesis more than their applications.
4.1.1 Polymer nanocomposites
Mechanical and electrical properties of polymer nanocomposites are dependent on a
number of factors, i.e. methods of nanocomposite synthesis, functionalisation of nanotubes
and different functional groups, choice of polymer, aspect ratio, dispersion and interfacial
interaction67. A brief description of these aspects in relation to polymer nanocomposites is
given below.
4.1.2 Fabrication of nanocomposites
An important consideration regarding polymer nanocomposite synthesis relates to the
choice of polymer and the eventual application. Polymers with a Young’s modulus greater
than 3 GPa have been recommended for developing MNA’s151. Biocompatibility is also
highly desired since a dermal application is intended. Therefore, synthetic polymers such as
poly(lactic acid) (PLA), polyglycolic acid (PGA), poly(lactic-co-glycolic acid) (PLGA),
polycarbonate (PC), polystyrene (PS), polycaprolactone (PCL), polymethylmethacrylate
(PMMA), and natural polymers such as silk, chitin and chitosan are being widely employed
to make polymeric MNA’s for drug delivery, biosensing and diagnostic applications64.
Strategies commonly employed for producing these MNA’s involve micromoulding,
solvent/solution casting, droplet-borne air blowing (DAB) and photolithographic
processes64. In relation to MNA biosensors, current fabrication techniques are of high cost
and require multi-step processing, based on conventional micromachining technology,
including photolithographic processes. Several reports have recently illustrated simpler
fabrication of MNA biosensors using micromoulding49,56. However, multi-step processes,
89
higher costs of raw materials and specialised post-processing equipment negates this
advantage. Therefore, incorporating conductive fillers such as MWCNT directly into
polymeric matrices using a facile fabrication strategy such as solvent casting, in situ
polymerisation and melt-mixing may be highly advantageous for scaling up the production
of electrochemical MNA’s. These processing techniques can however significantly
influence the final properties of the polymer composites. For example, low reinforcement
and poor electrical properties have been observed for melt-processed composites, while
solvent casting and in situ polymerisation can produce high strength composites through
intermolecular bond formation and provide high conductivities; more so for the latter due
to better homogenisation and strong interactions between the polymer and nanotube during
the growth stage rather than when mixing the components together67,142. However, due to
the ease of processing, solvent casting is commonly adopted to produce polymer
nanocomposites. Three main steps are involved in this approach: (1) CNT is dispersed into
a solvent by mechanical stirring or by ultrasonication, (2) the polymer is then dissolved into
this mixture at room temperature or elevated temperatures, and (3) finally the solvent is
evaporated off to produce a thin composite film. The aforementioned synthetic polymers
are all amenable to be utilised in this manner as they all melt at high temperatures and are
dissolvable using organic solvents. Similarly, natural polymers can also be dissolved in
aqueous solutions or organic solvents.
Dispersion
MWCNT’s are often functionalised covalently because they have limited
dispersibility in organic solvents and polymeric matrices otherwise. Although, the cost of
such functionalisation is defective electronic and transport properties in CNT’s; some
studies have shown that carboxylated nanotubes still retain good electrochemical
activity152,153. The solvent used in itself also affects the dispersity of CNT’s. A comparative
analysis of CNT dispersion in various solvents with their Hansen solubility parameter found
that, the state of dispersion is related to the dispersive component rather than the total
solubility parameter of the solvent154. Solvents with a low polar (<14 MPa) and hydrogen
(<12 MPa) component produced a stable and dispersed solution. This included N, N’-
dimethylformamide, chloroform and 1-methyl-2- polypropylene. Those above the
corresponding polar and hydrogen component values led to precipitation of the CNT (e.g.
acetone, hexane, ethanol, dichloromethane, etc.)154. When the nanotubes are functionalised
with –COOH and –OH groups on their end caps and sidewalls; they impart high solubility
90
in polar solvents as well155. However, even with functionalisation, simple mechanical
stirring is inadequate to disperse the CNT’s effectively. Bath sonication is commonly
employed to assist dispersion. The sonication parameters vary depending on the type of
CNT, mode of CNT synthesis, aspect ratio, functionalisation and solvents156. By using
simple bath sonication, it has been shown that high-performance nanocomposites can be
developed using –COOH functionalised MWCNT incorporated into various polymers such
as PLA, PS and polyurethane (PU)157–162 (refer to tables 4.1 and 4.2). The functionalisation
of MWCNT’s further acts to improve interfacial interaction between the polymer and the
nanotubes via non-covalent links.
Mechanical properties
MNA’s developed from polymer nanocomposites are highly attractive because of the
ease of the processing, low cost, scalable fabrication methods and the wide range of
polymers available offering tuneable mechanical properties. Table 4.1 shows examples of
polymeric nanocomposites developed by solution mixing and solvent casting that may be
relevant to the formation of MNA’s with sufficient mechanical strength. It demonstrates a
large spread in the mechanical performance of the nanocomposites. It must be
acknowledged that processing conditions significantly influence the mechanical properties
of the nanocomposites. Since efficient dispersion is key to all performance aspects of the
final composites, among the processing conditions, sonication parameters play a crucial role.
However, sonication parameters largely varied between the studies, based on the type of
sonicator (i.e. bath vs horn), power, time and temperature. Therefore, generalised
correlations and dependencies are difficult to establish. The collection of data presented in
the Table 4.1 should be sufficient however, to guide research into the development of
nanocomposite MNA’s.
From a close inspection of the data presented in table 4.1, the following conclusions
can be made. For all solution-based nanocomposites, the addition of CNT generally
improves the mechanical strength. Mechanical reinforcement occurs until a critical value is
reached for the filler content. Above this value, the nanocomposites deteriorate in
mechanical strength due to aggregation of the CNT and therefore may become inferior to
the matrix alone. Nanocomposites developed from covalently functionalised nanotubes
display enhanced mechanical properties when compared to raw nanotubes in all cases. This
is resultant of better interfacial interaction with the polymeric matrix. When comparing
91
nanocomposites developed from raw MWCNT’s with –COOH and –NH2 functionalised
MWCNT’s, an interesting relationship was found whereby, at low loadings –NH2
functionalised MWCNT’s had improved tensile strength compared to –COOH
functionalised MWCNT’s. At higher loadings however, this relationship was reversed163.
Two possible reasons were reported for this: (1) the long alkyl chain provides greater
repulsion between the nanotubes, increasing the available surface area of –NH2
functionalised MWCNT’s in comparison to acid functionalised MWCNT’s. Therefore, the
amount of polymer available is insufficient for proper wetting of the large volume of the
MWCNT surface. This leads to the formation of voids in the final composites. (2) The
amine functional groups on the nanotube may interfere with the imidization process of
polyamic acid to polyimide, resulting in unreacted polyamic acids that may act as stress
points for mechanical failure. Although covalent functionalisation of MWCNT’s helps to
improve mechanical properties, nanocomposites prepared from CNT’s grafted with
polymeric chains display enhanced mechanical properties at lower loadings. This is because
polymer grafting helps to maximise CNT dispersion; resulting in effective load transfer to
the matrix. In relation to the CNT’s themselves, improvements in mechanical strength can
also be achieved by using longer CNT’s, but only after adjusting for the time required to
reach optimal dispersion. Longer CNT’s require longer sonication times to be dispersed
efficiently. As a final remark, comparisons between different polymers are difficult to
establish because of the differences in processing conditions and in general, in line with our
previous results, mechanical reinforcement is higher for a ductile matrix than for a rigid
matrix.
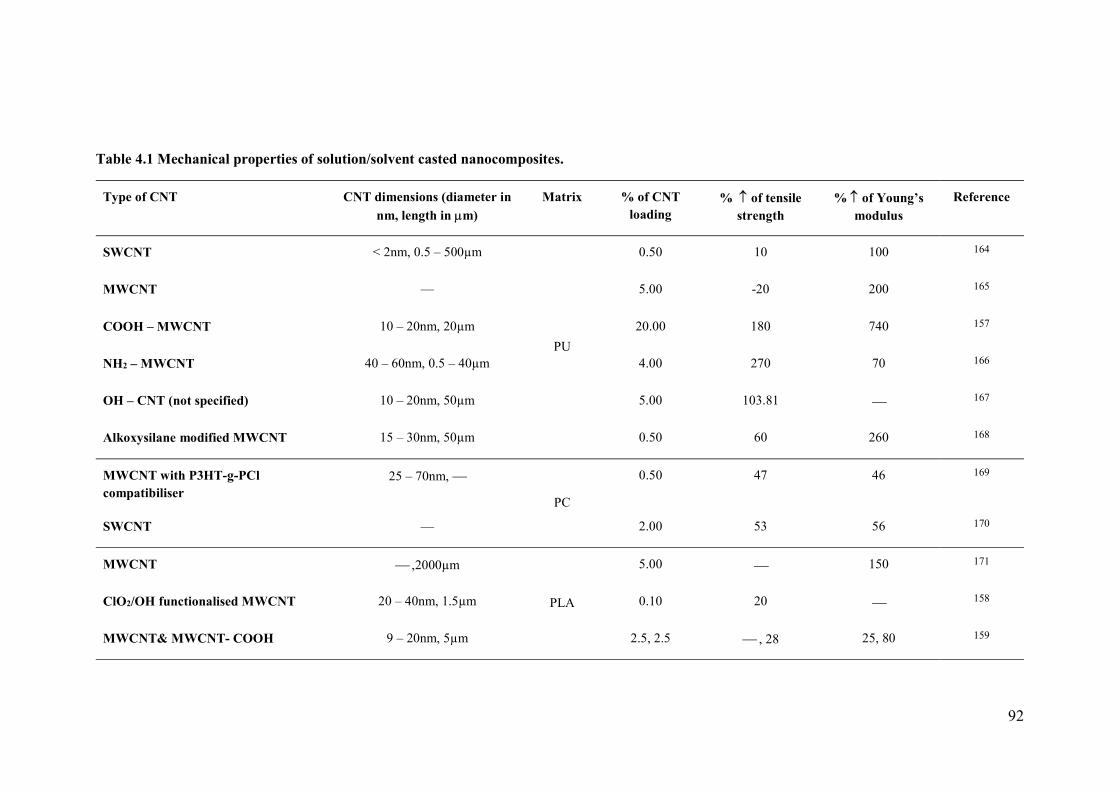
92
Table 4.1 Mechanical properties of solution/solvent casted nanocomposites.
Type of CNT CNT dimensions (diameter in
nm, length in m)
Matrix % of CNT loading
% of tensile strength
% of Young’s modulus
Reference
SWCNT < 2nm, 0.5 – 500µm
PU
0.50 10 100 164
MWCNT — 5.00 -20 200 165
COOH – MWCNT 10 – 20nm, 20µm 20.00 180 740 157
NH2 – MWCNT 40 – 60nm, 0.5 – 40µm 4.00 270 70 166
OH – CNT (not specified) 10 – 20nm, 50µm 5.00 103.81 167
Alkoxysilane modified MWCNT 15 – 30nm, 50µm 0.50 60 260 168
MWCNT with P3HT-g-PCl compatibiliser
25 – 70nm,
PC
0.50 47 46 169
SWCNT — 2.00 53 56 170
MWCNT ,2000µm
PLA
5.00 150 171
ClO2/OH functionalised MWCNT 20 – 40nm, 1.5µm 0.10 20 158
MWCNT& MWCNT- COOH 9 – 20nm, 5µm 2.5, 2.5 , 28 25, 80 159
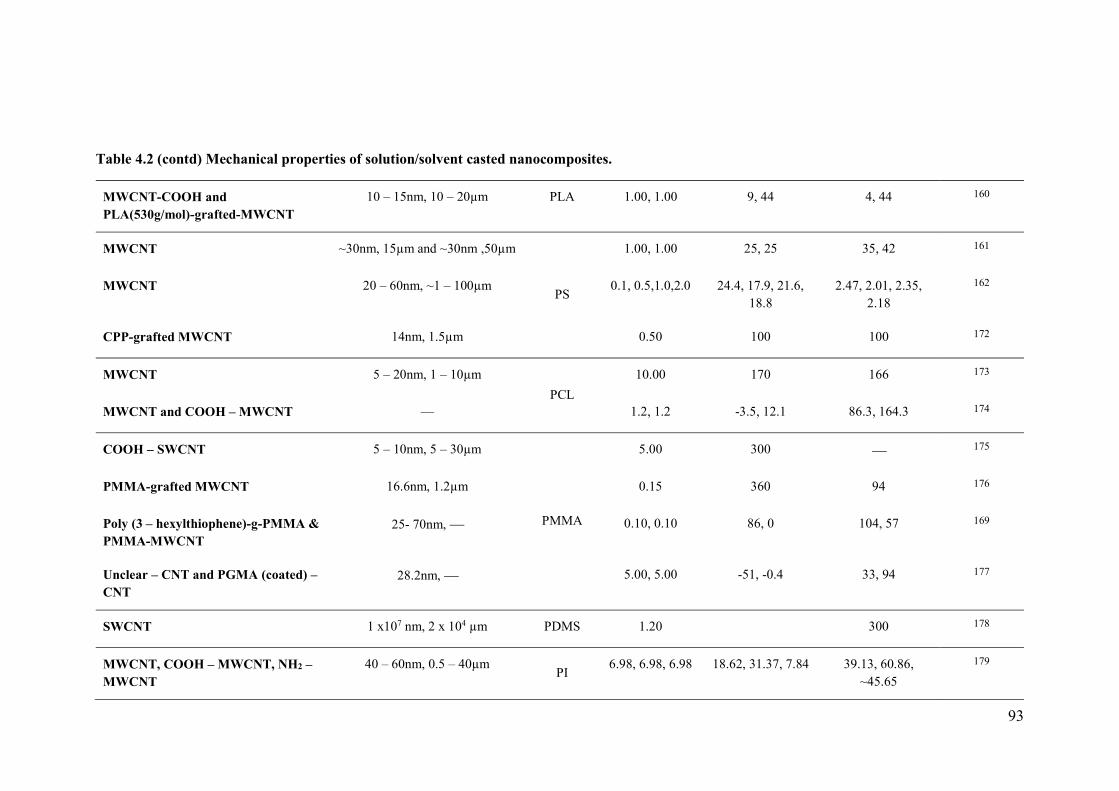
93
Table 4.2 (contd) Mechanical properties of solution/solvent casted nanocomposites.
MWCNT-COOH and PLA(530g/mol)-grafted-MWCNT
10 – 15nm, 10 – 20µm PLA 1.00, 1.00 9, 44 4, 44 160
MWCNT ~30nm, 15µm and ~30nm ,50µm
PS
1.00, 1.00 25, 25 35, 42 161
MWCNT 20 – 60nm, ~1 – 100µm 0.1, 0.5,1.0,2.0 24.4, 17.9, 21.6, 18.8
2.47, 2.01, 2.35, 2.18
162
CPP-grafted MWCNT 14nm, 1.5µm 0.50 100 100 172
MWCNT 5 – 20nm, 1 – 10µm
PCL
10.00 170 166 173
MWCNT and COOH – MWCNT — 1.2, 1.2 -3.5, 12.1 86.3, 164.3 174
COOH – SWCNT 5 – 10nm, 5 – 30µm
PMMA
5.00 300 175
PMMA-grafted MWCNT 16.6nm, 1.2µm 0.15 360 94 176
Poly (3 – hexylthiophene)-g-PMMA & PMMA-MWCNT
25- 70nm, 0.10, 0.10 86, 0 104, 57 169
Unclear – CNT and PGMA (coated) – CNT
28.2nm, 5.00, 5.00 -51, -0.4 33, 94 177
SWCNT 1 x10⁷ nm, 2 x 104 µm PDMS 1.20 300 178
MWCNT, COOH – MWCNT, NH2 – MWCNT
40 – 60nm, 0.5 – 40µm PI
6.98, 6.98, 6.98 18.62, 31.37, 7.84 39.13, 60.86, ~45.65
179
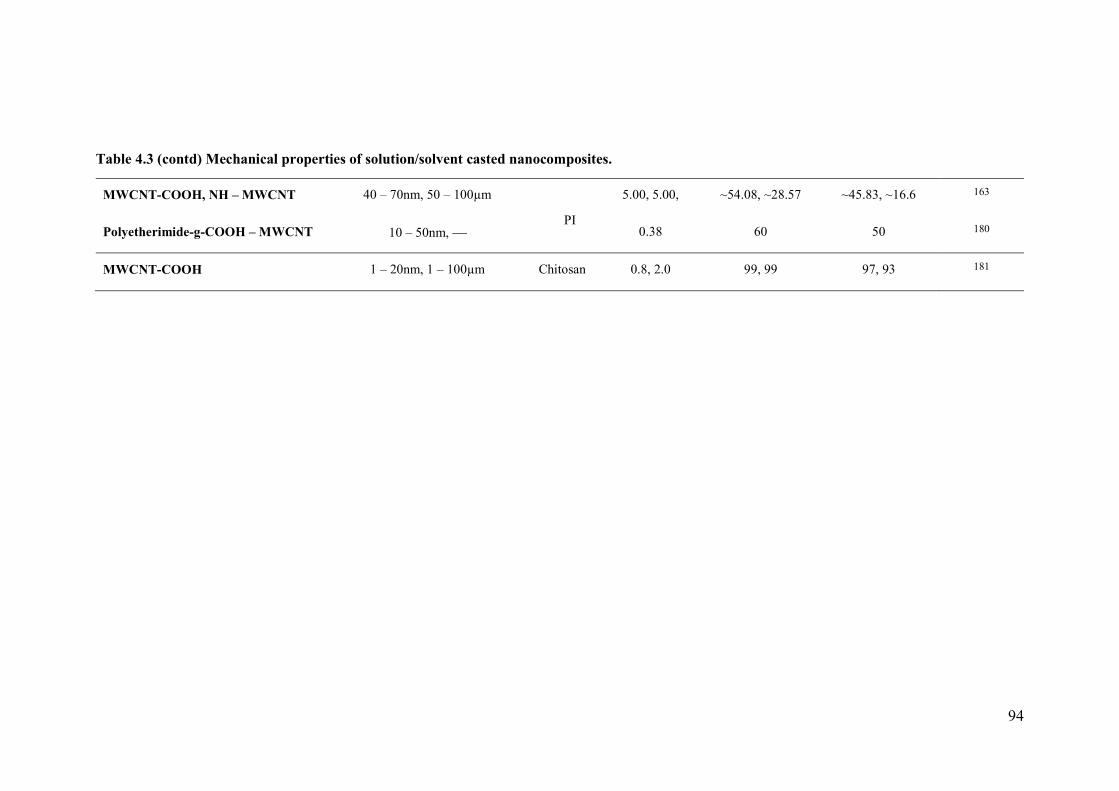
94
Table 4.3 (contd) Mechanical properties of solution/solvent casted nanocomposites.
MWCNT-COOH, NH – MWCNT 40 – 70nm, 50 – 100µm
PI
5.00, 5.00, ~54.08, ~28.57 ~45.83, ~16.6 163
Polyetherimide-g-COOH – MWCNT 10 – 50nm, 0.38 60 50 180
MWCNT-COOH 1 – 20nm, 1 – 100µm Chitosan 0.8, 2.0 99, 99 97, 93 181
95
Electrical properties
Polymeric nanocomposites exhibit a percolating behaviour, whereby the formation of
an interconnected network of nanotubes dramatically increases the conductivity of the
polymer. A critical weight/volume fraction of CNT is required to reach the percolation
threshold in an insulating polymer, at which point the composites turn electrically
conductive. At the percolation threshold, conductivity between adjacent nanotubes maybe
achieved by electron hopping, however at higher concentrations a conductive network is
established throughout the composite. Over the last decade, a wide range of values for
conductivity and percolation threshold have been reported in the literature. These values
have been shown to be strongly dependant on the polymer type, composite processing
methods, dispersion, degree of functionalisation, alignment, aspect ratio and the type of
CNT. As with the mechanical properties, correlations and dependencies between the
aforementioned parameters are difficult to establish. Therefore, a focused survey of the
available literature on polymer nanocomposites developed by solution mixing/solvent
casting is shown in the Table 4.2.
It is generally well accepted that chemical functionalisation disrupts the extended -
conjugation of CNT’s and thereby reduces electrical conductivity. However,
functionalisation of CNT’s is often necessary to produce multifunctional composites. Some
investigators have therefore studied the effect of functionalised CNT’s on the electronic
properties of composites. For example, Tamburri et al. found that functionalising SWCNT’s
with –COOH and –OH groups enhances the conductivity of the composites by a factor of
7.5 in comparison to untreated SWCNT’s182. The matrix used in this study was that of a
conjugated polymer. Therefore, when incorporating functionalised SWCNT’s, effective
bridges are formed between the conductive domains of the polymer. This is a result of better
interfacial interaction with the polymer, as when measuring pure SWCNTs, no differences
in conductivity were found between the treated and untreated. Kim et al. found similar
results with nanocomposites developed from MWCNT-COOH and PCL, inferring that
better dispersion within the polymer may take precedence over damages caused by chemical
functionalisation of CNT’s169. The effect of different functional groups on CNT based
composites has also been studied. It has been found that NH2 – MWCNT/PI nanocomposites
provide higher conductivities than COOH – MWCNT/PI nanocomposites, especially at
lower loadings of CNT’s179. This is because NH2 – MWCNT’s were more homogenously
dispersed compared to COOH – MWCNT’s in PI. Furthermore, in contrast to the
96
aforementioned studies, it was found here that unmodified nanotubes provided better
electrical conductivity in composites regardless of the poor dispersion. These differences
can somewhat be attributed to the degree of functionalisation and therefore the extent of
damage to the electronic structure of CNT’s.
Lau et al. investigated whether there are differences in the intrinsic conductivity of
MWCNT’s after functionalisation153. They compared various functionalisation techniques
such as acid reflux, thermal and dry UV-ozonolysis and found that, the conductivity
increased by 12, 80 and 330-fold respectively. The large increase in conductivity for dry
UV-ozonolysis is mainly due the fact it caused the least structural damage to CNT’s.
Furthermore, they were able to attribute the increasing conductivity after functionalisation
to an increasing concentration of oxygenated groups; promoting electron transfer between
the carbon atoms. As a final remark on the impact of various functionalisation strategies,
covalent grafting of polymers to CNT’s can significantly improve mechanical properties at
low loadings. Yoon et al. investigated the influence of grafting polymers on the electrical
properties of PLA/MWCNT-g-PLA nanocomposites160. They found that PLA-g-
PLA/MWCNT nanocomposites reduced the electrical conductivity and became very
resistive upon increasing the PLA chain length that was grafted onto MWCNT’s.
Overall, the literature data gathered here presents a wide range of values for electrical
conductivity and percolation threshold. Other than those factors mentioned above, a high
aspect ratio, processing conditions, polymeric matrix and nanotube type can all influence
the electrical conductivity of final composites. Nevertheless, the ease of fabrication and the
excellent electrical conductivities reported for nanocomposites incorporating CNT’s offer
much promise in the effort to produce an electrochemical MNA from nanocomposites for
biosensing applications.
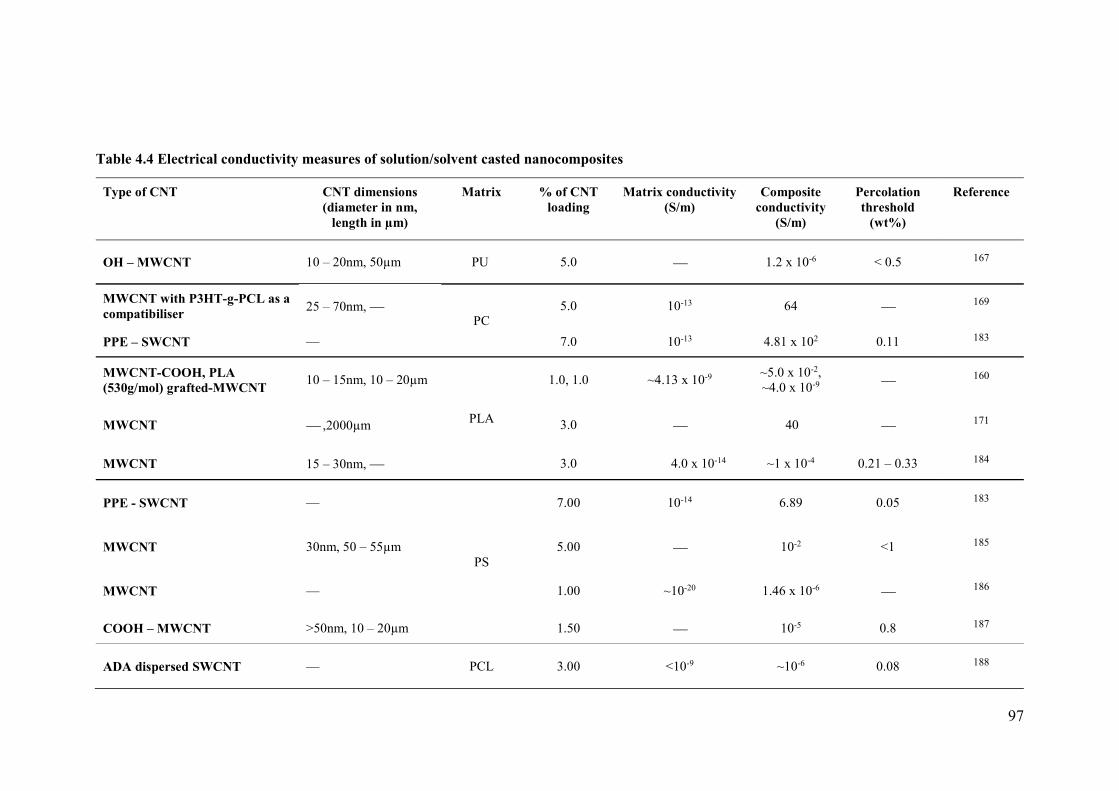
97
Table 4.4 Electrical conductivity measures of solution/solvent casted nanocomposites
Type of CNT CNT dimensions (diameter in nm,
length in µm)
Matrix % of CNT loading
Matrix conductivity
(S/m) Composite
conductivity (S/m)
Percolation threshold
(wt%)
Reference
OH – MWCNT 10 – 20nm, 50µm PU 5.0 1.2 x 10⁻⁶ < 0.5 167
MWCNT with P3HT-g-PCL as a compatibiliser
25 – 70nm, PC
5.0 10-13 64 169
PPE – SWCNT — 7.0 10-13 4.81 x 10² 0.11 183
MWCNT-COOH, PLA (530g/mol) grafted-MWCNT
10 – 15nm, 10 – 20µm
PLA
1.0, 1.0 ~4.13 x 10⁻⁹ ~5.0 x 10⁻², ~4.0 x 10⁻⁹ 160
MWCNT ,2000µm 3.0 40 171
MWCNT 15 – 30nm, 3.0 4.0 x 10⁻¹⁴ ~1 x 10⁻⁴ 0.21 – 0.33 184
PPE - SWCNT —
PS
7.00 10-14 6.89 0.05 183
MWCNT 30nm, 50 – 55µm 5.00 10-2 <1 185
MWCNT — 1.00 ~10-20 1.46 x 10⁻⁶ 186
COOH – MWCNT >50nm, 10 – 20µm 1.50 10-5 0.8 187
ADA dispersed SWCNT — PCL 3.00 <10-9 ~10-6 0.08 188
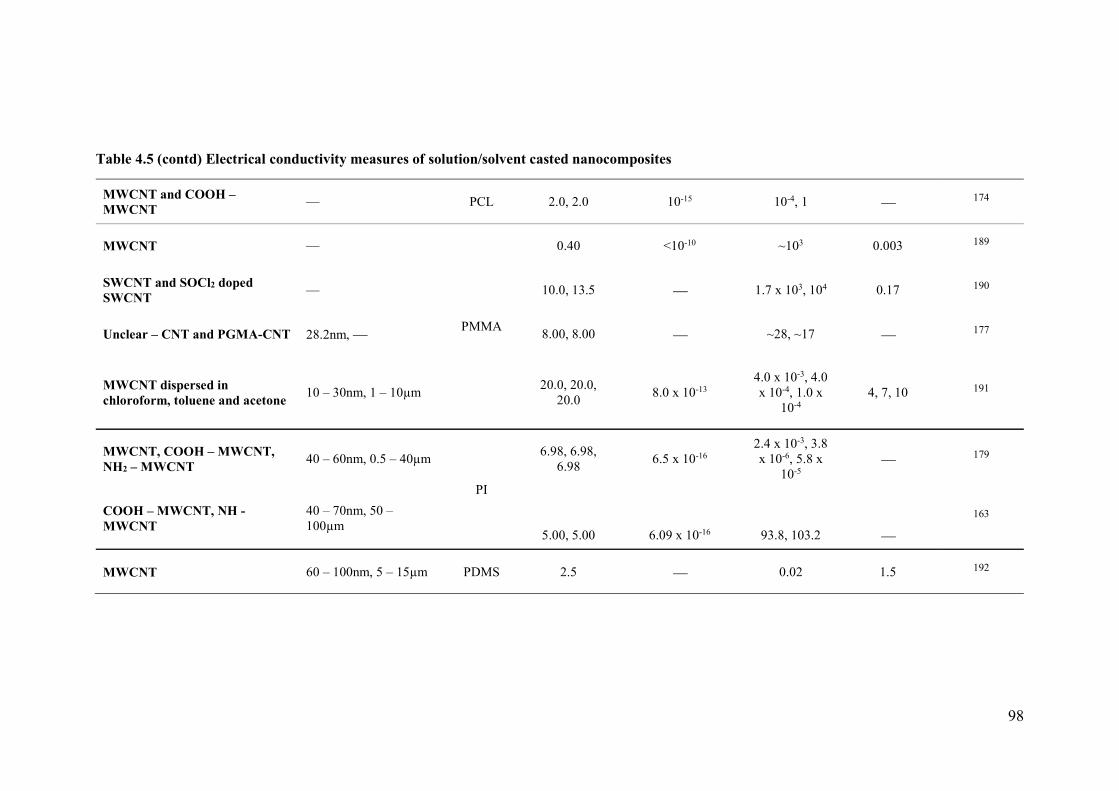
98
Table 4.5 (contd) Electrical conductivity measures of solution/solvent casted nanocomposites
MWCNT and COOH – MWCNT
— PCL 2.0, 2.0 10-15 10-4, 1 174
MWCNT —
PMMA
0.40 <10-10 ~103 0.003 189
SWCNT and SOCl2 doped SWCNT
— 10.0, 13.5 1.7 x 10³, 104 0.17 190
Unclear – CNT and PGMA-CNT 28.2nm, 8.00, 8.00 ~28, ~17 177
MWCNT dispersed in chloroform, toluene and acetone
10 – 30nm, 1 – 10µm 20.0, 20.0,
20.0 8.0 x 10⁻¹³
4.0 x 10⁻³, 4.0 x 10⁻⁴, 1.0 x
10-4 4, 7, 10 191
MWCNT, COOH – MWCNT, NH2 – MWCNT
40 – 60nm, 0.5 – 40µm
PI
6.98, 6.98, 6.98
6.5 x 10⁻¹⁶ 2.4 x 10⁻³, 3.8 x 10⁻⁶, 5.8 x
10-5 179
COOH – MWCNT, NH - MWCNT
40 – 70nm, 50 – 100µm
5.00, 5.00
6.09 x 10⁻¹⁶
93.8, 103.2
163
MWCNT 60 – 100nm, 5 – 15µm PDMS 2.5 0.02 1.5 192
99
Considerations for the choice of polymer
In relation to the fabrication of MNA based sensors, polymeric nanocomposites can
be used as effectively as their matrix material alone in order to fabricate MNA’s easily and
on a large scale. Several candidate polymers have been used to fabricate mechanically robust
MNA’s for applications across the board in microneedle research. However, concerning the
evolving field of MNA based transdermal sensors, solid and hollow polymeric MNA’s have
only been utilised as a penetrative structural support and not as active components
themselves. Examples include PCL and epoxy for solid sensors49,65, while Miller et al., used
an acrylate based photopolymer under the trade name of E-Shell for rapid prototyping of
hollow MNA’s57,58. Metallisation is a popular strategy used to convert the solid MNA’s into
biosensors, whereas hollow MNA’s can be used to conceal modified carbon fibres and pastes
for selective and multiplexed detection of a range of analytes. On comparison, solid MNA
sensors are far more advantageous because their 3D surface provides a larger electroactive
surface area for biomolecular detection60. Therefore, their overall current response is greater
alongside an improved signal to noise ratio.
The addition of CNT’s can certainly improve the mechanical and electrical properties
of a wide range of polymers as shown in Tables 4.1 and 4. 2. Notably, this range also includes
those polymers that have been typically used to develop MNA’s. As stated previously, a
number of techniques have been developed to enable rapid prototyping of polymeric MNA’s,
however micromoulding is commonly used due to its cost-effectiveness, excellent
reproducibility of the master structures and high scalability. It is important to note that
processability using this technique is highly dependent on the fact most of these polymers
are either dissolvable in organic solvents and or can be melted at high temperatures64. The
development of polymeric nanocomposite MNA’s was envisioned to encompass a two-step
process in a broad sense: (1) preparation of polymeric nanocomposite material/film from a
homogenous suspension of CNT’s embedded in a polymeric matrix and (2) fabrication of
MNA’s from the nanocomposites by micromoulding. A key challenge to these steps is
processability and this can be made favourable by lowering the concentration of fillers
(CNT) being used, which subsequently makes processing simpler by lowering viscosities for
sample and melt processing. From table 4.2, it can be seen that polymeric hosts such as PU,
PC, PLA, PS, PCL, PMMA and PI, all exhibit very low percolation thresholds.
100
Nanocomposites developed from these polymers also show the potential to achieve very high
conductivities. For example, Kim et al. reported a maximum conductivity value of ~3000
S/m for PMMA/MWCNT composites with a CNT loading of only 0.4 wt%189. This is
however an exception with many others reporting a relatively high CNT loading (> 5 wt%)
being used to achieve high conductivities in different polymeric matrices. Concerning these
host polymers, nanocomposites developed from PLA, PCL and PI in particular show
significant improvements in conductivity with lower loadings of CNT (< 5 wt%).
Micromoulding is an efficient fabrication strategy to produce MNA’s out of both PLA
and PCL. Previous researches have shown that MNA’s developed from these materials can
penetrate the skin easily and without any mechanical damage2,63. However, in terms of
mechanical properties of the polymers, PLA is stronger than PCL. In comparison to these
polymers, PI is difficult to process by solvent dissolution or melting because of the presence
of rigid aromatic moieties in their structure. Nanocomposites produced from this host
polymer have only been processed from its precursor polyamic acid (PAA). A high
temperature (250 – 300C) is also required for the imidization process193. Therefore, taking
these considerations into account, PLA may represent an ideal host matrix for the fabrication
of nanocomposite MNA’s.
PLA is a thermoplastic aliphatic polyester derived by various methods of
polymerisation of naturally occurring carbohydrates194. This polymer has attracted a great
deal of interest because of specific characteristics that are lacking in other polymers, such as
renewability, biodegradability, biocompatibility, mechanical strength and importantly cost-
effective processability194. In terms of the biomedical applications of PLA, extensive
research is being carried out on drug delivery systems, tissue engineering and as
biodegradable matrix for surgical implants66,194. In order to extend its applications,
enhancement of mechanical strength is deemed necessary for PLA because of their low
impact toughness. A popular approach to achieve this is by incorporation of nanofillers such
as CNT’s, which can impart excellent mechanical and electrical properties to the matrix.
Incorporation of CNT’s within PLA is readily achievable as the polymer can be melted at
moderately high temperatures and is soluble in organic solvents of low boiling points. As
with many of the polymers, research into PLA/CNT based composites is still in its infancy,
with research focused more so on synthesis than its applications. Biosensors based on

101
PLA/CNT composites have only been reported as modifiers of electrodes in a few recent
studies195,196.
102
4.2 Aims and objectives
The aim of this chapter is to demonstrate a convenient route of fabrication for
developing electrochemical MNA’s from composites of PLA and carboxyl functionalised
MWCNT’s (f-MWCNT). Once developed, these MNA’s will be characterised for
mechanical strength and electrochemical performance.
The objectives of this chapter are to:
1. Investigate nanocomposites film synthesis with different loadings of f-MWCNT
embedded homogenously in PLA.
2. Develop a method to fabricate nanocomposite MNA’s using the nanocomposite
films and assess the limit of fabrication.
3. Evaluate the mechanical strength of the nanocomposite MNA’s with different
loadings of f-MWCNT.
4. Design and optimise MNA’s for assessment of electrochemical behaviour
5. In vitro electrochemical characterisation of nanocomposite MNA’s
6. In situ electrochemical characterisation of nanocomposite MNA’s using freshly
excised porcine ear skin.
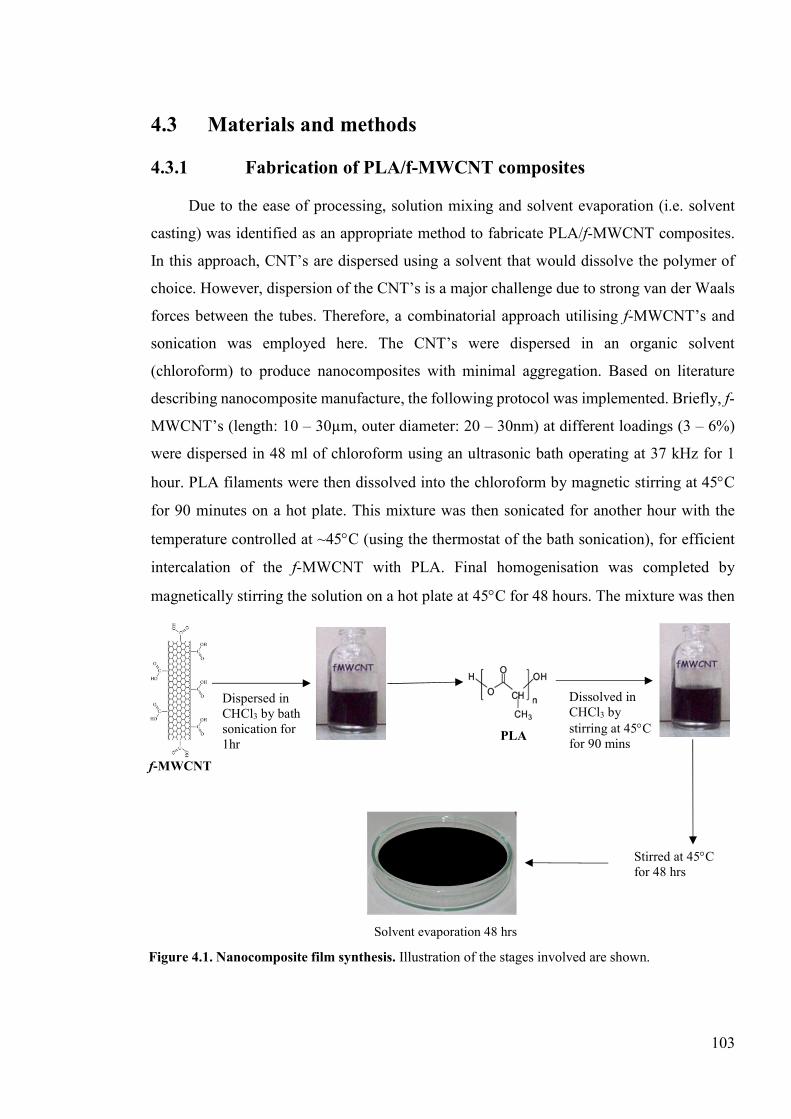
103
4.3 Materials and methods
4.3.1 Fabrication of PLA/f-MWCNT composites
Due to the ease of processing, solution mixing and solvent evaporation (i.e. solvent
casting) was identified as an appropriate method to fabricate PLA/f-MWCNT composites.
In this approach, CNT’s are dispersed using a solvent that would dissolve the polymer of
choice. However, dispersion of the CNT’s is a major challenge due to strong van der Waals
forces between the tubes. Therefore, a combinatorial approach utilising f-MWCNT’s and
sonication was employed here. The CNT’s were dispersed in an organic solvent
(chloroform) to produce nanocomposites with minimal aggregation. Based on literature
describing nanocomposite manufacture, the following protocol was implemented. Briefly, f-
MWCNT’s (length: 10 – 30µm, outer diameter: 20 – 30nm) at different loadings (3 – 6%)
were dispersed in 48 ml of chloroform using an ultrasonic bath operating at 37 kHz for 1
hour. PLA filaments were then dissolved into the chloroform by magnetic stirring at 45C
for 90 minutes on a hot plate. This mixture was then sonicated for another hour with the
temperature controlled at ~45C (using the thermostat of the bath sonication), for efficient
intercalation of the f-MWCNT with PLA. Final homogenisation was completed by
magnetically stirring the solution on a hot plate at 45C for 48 hours. The mixture was then
Dispersed in CHCl3 by bath sonication for 1hr
Dissolved in CHCl3 by stirring at 45C for 90 mins
Stirred at 45C for 48 hrs
PLA
Solvent evaporation 48 hrs
f-MWCNT
Figure 4.1. Nanocomposite film synthesis. Illustration of the stages involved are shown.
104
poured into a glass petri dish and the solvent was evaporated at room temperature (RT) for
48 hours. The resultant composite film was then dried further in a thermal oven at 60C
overnight to remove any residual chloroform. A schematic illustration of the process of
fabrication nanocomposite films is shown in Figure 4.1 above.
4.3.2 Micromoulding
MNA’s were produced by adapting a micromoulding approach developed by
McAllister et al.9. Initially, a PDMS micromould (negative template) was produced from the
Sylgard 184 elastomer kit (Dow Corning, Midland, MI, USA) against a commercial
template MNA (Derma Stamp, amazon.co.uk, ASIN: B007ATO20I). To fabricate the
nanocomposite MNA’s, the film of PLA/f-MWCNT was cut into small pieces (~1 x 1cm)
and filled into a micromould at a specified weight of 0.175 grams (optimisation of weight
described in section 4.3.4). The nanocomposite filled micromould was then heated in a
thermal oven at 200C for 2 hours. This caused the nanocomposite material inside the
micromould to become pliable, upon which, it was manually compressed into the
microcavities of the micromould to form the microneedles. Manual compression was
repeated three times at 30 min intervals to ensure MNA formation in the mould. The
micromould was then removed from the thermal oven and the nanocomposite material was
allowed to cool at RT for 30 mins. Micromoulds were then filled with PCL pellets and melted
on top of the nanocomposite material at 100C for 2 hours to form a thick base. After further
cooling at RT, the MNA’s were manually ejected from the mould. PLA MNA’s were made
similarly, but with vacuum assisted micromoulding at 180°C for 4 hours.
4.3.3 Mechanical characterisations
A TA.TX Plus texture analyser (Stable Microsystems Ltd, Surrey, UK) was used to
assess the microneedle AFS and SFS as previously described in Chapter 3 (section 3.3.3).
4.3.4 Electrochemical characterisation
Electrochemical measurements and data acquisition was carried out using a CHI 630B
pontentiostat (CH Instruments, Austin, TX) controlled using the manufacturer’s own
software (version 10.18). A three-electrode system was employed consisting of an Ag|AgCl
(3M KCl) reference electrode, a platinum wire auxiliary electrode and the nanocomposite
105
MNA’s as the working electrode. The initial characterisation and optimisation of the device
was carried out by analysing the cyclic voltammetric (CV) response of the nanocomposite
MNA’s towards 1mM potassium ferricyanide in 1M KCl, across a potential window of 0 –
1V. The electrochemical response was analysed in terms of conductance (at a scan rate of:
0.01 Vs-1) and capacitance (at a scan rate of: 0.1 Vs-1) of the MNA electrode.
In terms of optimisation, the initial work involved designing an electrical contact to
measure the electrochemical response. Three main strategies were investigated: (1) affixing
an electrical wire across the centre of the supporting base of a MNA using conductive epoxy,
(2) electrical wire fixed to the side wall of the micromould before fabricating the MNA and
(3) after ensuring the MNA’s formed by compressing the nanocomposite material inside the
mould, a coiled wire covering ~85% of the nanocomposite surface was affixed by minimal
compression to the supporting base while the material was pliable. The designs are illustrated
in Figure 4.2. In all cases, after a period of cooling (or curing in terms of conductive silver
epoxy) to ensure a firm connection with the composite material, the electrical contact was
sealed with PCL by melting it (at 100°C) over the surface, forming an insulating layer. Upon
further cooling at RT, the MNA was manually ejected from the mould.
Second optimisation involved isolation of the electrochemical response generated by
the MNA’s to the microneedles alone. As the MNA is moulded completely from the
nanocomposite material, contact of an analyte to the base will alter the electrochemical
response significantly. Therefore, the microneedles of each test array were pierced through
a layer of Parafilm® and sealed around the nanocomposite by application of heat at 40°C
for 2 minutes. Comparisons were made between sealed and unsealed MNA. Finally, the
height of the supporting base structure was optimised by using a specific weight (0.175g) of
the polymer nanocomposite material to provide the lowest path of resistance. The specified
weight also helped minimise conductive variation between MNA’s of the same CNT loading
and of different loadings studied in this work.
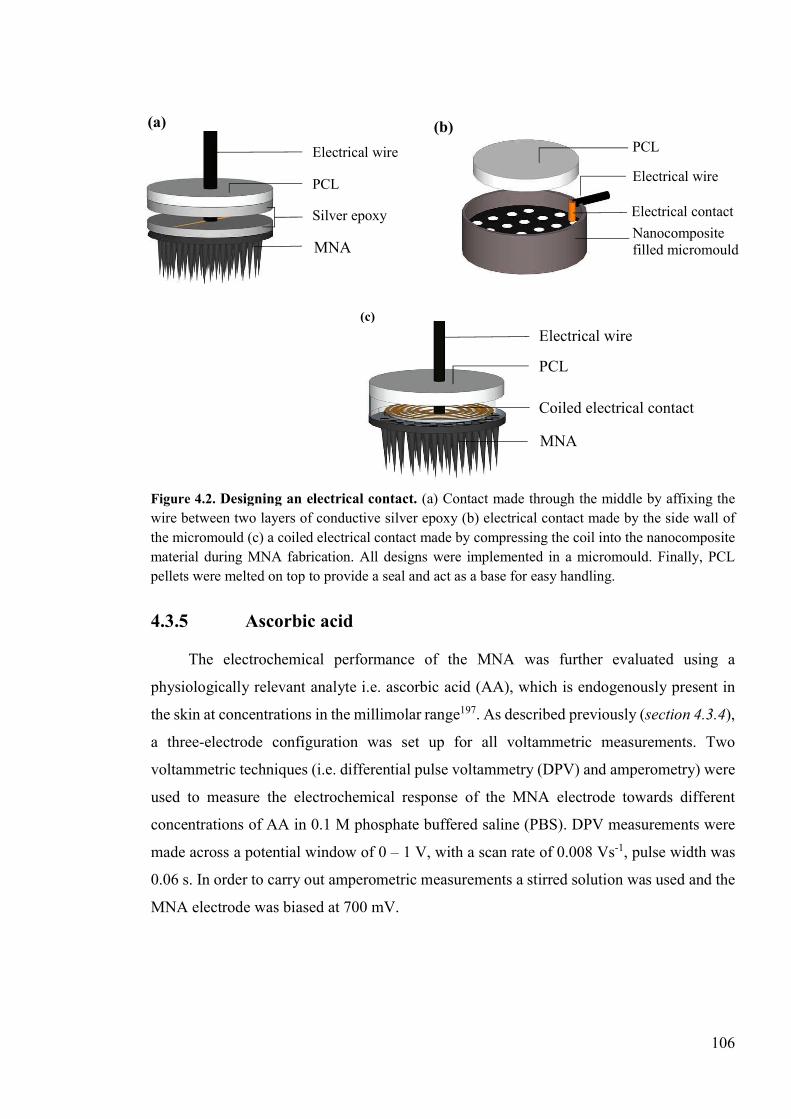
106
4.3.5 Ascorbic acid
The electrochemical performance of the MNA was further evaluated using a
physiologically relevant analyte i.e. ascorbic acid (AA), which is endogenously present in
the skin at concentrations in the millimolar range197. As described previously (section 4.3.4),
a three-electrode configuration was set up for all voltammetric measurements. Two
voltammetric techniques (i.e. differential pulse voltammetry (DPV) and amperometry) were
used to measure the electrochemical response of the MNA electrode towards different
concentrations of AA in 0.1 M phosphate buffered saline (PBS). DPV measurements were
made across a potential window of 0 – 1 V, with a scan rate of 0.008 Vs-1, pulse width was
0.06 s. In order to carry out amperometric measurements a stirred solution was used and the
MNA electrode was biased at 700 mV.
Figure 4.2. Designing an electrical contact. (a) Contact made through the middle by affixing the wire between two layers of conductive silver epoxy (b) electrical contact made by the side wall of the micromould (c) a coiled electrical contact made by compressing the coil into the nanocomposite material during MNA fabrication. All designs were implemented in a micromould. Finally, PCL pellets were melted on top to provide a seal and act as a base for easy handling.
(a)
(b)
(c) (c)
Electrical wire PCL Silver epoxy MNA
Electrical wire
PCL
Electrical contact Nanocomposite filled micromould
Electrical wire
PCL
Coiled electrical contact
MNA
107
4.3.6 In situ electrochemical characterisation
Measuring in the skin
Full-thickness skin was removed from freshly excised porcine ears by blunt dissection
(harvested from euthanised animals from unrelated studies, donated by Dr. Ryan Waters,
Pirbright Institute, UK). To evaluate the performance of the MNA as a penetrable biosensor,
a skin diffusion experiment was set up in a Franz diffusion cell (Figure 4.9A). Briefly, one
end of the skin was pinched and clamped between the donor and receptor chambers. The
clamped skin was then pierced with a hypodermic needle to equalise the pressure and allow
direct fluid flow between the two chambers. Both chambers were then filled with PBS. The
reference and the auxiliary electrodes were placed inside the donor chamber, while the MNA
was used to penetrate the skin which in turn securely held the MNA in place for the duration
of the experiment. Measurements were taken at time intervals over 160 mins across a
potential window of 0 – 1 V using DPV. Control measurements were taken without the
diffusion cell set-up. Ear skin samples from five animals were used to account for inter-
sample variability.
Evaluation of a burn would model
Once the skin had been allowed to equilibrate for 160 mins with PBS in the diffusion
cell, controlled burn wounds were induced in the skin using the flat end of a stainless-steel
rod (12mm in diameter) heated to 100°C (in a thermal oven) and kept in contact with the
skin for two minutes. Throughout this procedure, the skin was maintained in the Franz
diffusion cell setup above. After the burn was induced, the PBS was allowed to re-diffuse
in to the skin for another 160 mins. Electrochemical measurements were taken before and
after the burn using DPV across a potential window of 0 – 1V.
To evaluate the diagnostic potential of the electrochemical signature of the skin, the
influence of the burn was measured at specified distances from the edge of a burn site. Using
the MNA’s DPV responses were measured again at the site of the burn, 1 mm away and 10
mm away. As before the measurements were taken after PBS was allowed to re-diffuse into
the skin. Responses were measured from five ear skin samples.
108
4.3.7 Imaging
Microneedle topology and dimensions were analysed using field emission gun
scanning electron microscopy (FEG-SEM; Carl Zeiss SIGMA, Germany). Topological and
cross-sectional imaging of the microneedle was carried out after sputter coating the samples
with a 4 nm layer of gold. MNA perforations in the skin was visualised by methylene blue
staining and acquired using a stereo digital microscope equipped with a 3-megapixel camera
(SMZ-168, Motic, HK). Photographs of MNA’s were taken using a digital camera.
4.3.8 Statistical analysis
Data were processed in Microsoft Office Excel 2016, analysed using GraphPad Prism
7 (GraphPad Software Inc., USA) and expressed as mean ± standard deviation. Graphing of
electrochemical data was performed using Igor Pro, version 6.0 (WaveMetrics Inc, USA).
Where appropriate, statistical differences between groups were assessed using the two-sided
Student’s t-test, repeated measures and one- or two-way ANOVA with Tukey’s post-hoc test
for pair-wise comparison. Differences were considered statistically significant where P <
0.05.
109
4.4 Results
4.4.1 Fabrication of nanocomposite films
Nanocomposite films of f-MWCNT/PLA were made successfully at CNT loadings greater
than 3 wt%. With an hour of sonication, f-MWCNT were adequately dispersed into
suspension without any evidence of sedimentation (as seen from the images shown in the
schematic, Figure 4.1). The nanocomposite films produced were smooth and even with
average thickness of ~800 µm. Different loadings were produced to determine the threshold
at which MNA’s form consistently. As discussed before the percentage of CNT added to the
composite significantly influences the mechanical and electrical properties of the composite.
Significant increases in Young’s modulus and tensile strength for MWCNT/PLA composites
have been reported between 0.25 – 5 wt%171. For carboxylic acid-functionalised MWCNT’s,
a CNT loading of 2.5 wt% was required to achieve optimum mechanical strength159. In
contrast, conductivity increases with the incorporation of higher percentages of CNT. For
MWCNT/PLA composites prepared via solvent casting, at least 3 wt% of CNT was required
to initiate conductivity and the best conductivity has been reported at 10 wt%171. With higher
loadings, it was anticipated that processing will become more difficult because of the higher
viscosities. Therefore, the fabrication limit of the MNA was assessed with the increment in
CNT loading.
4.4.2 Fabrication of nanocomposite MNA’s
Preliminary work here determined the fabrication limit when employing a micromoulding
approach. In order to produce nanocomposite MNA’s, the micromoulds were filled
completely with ~1 x 1 cm pieces of the nanocomposite films incorporating different
loadings of f-MWCNT and heated to 200C with the aim of melting it to form the MNA’s.
The following observations were made from this work: (1) Even at the lowest loading used
here i.e. 3 wt%, the nanocomposite film did not melt, but rather became malleable with the
application of heat. (2) Therefore, minimal to moderate manual compression was applied
(with the increment in CNT loading) to the malleable nanocomposite films to determine if
MNA’s would form consistently and with sufficient mechanical strength, that it may be
ejected from the micromould with the microneedles intact after a period of cooling. (3)
Nanocomposite MNA’s could be formed efficiently from 3 – 6 wt% of CNT loaded
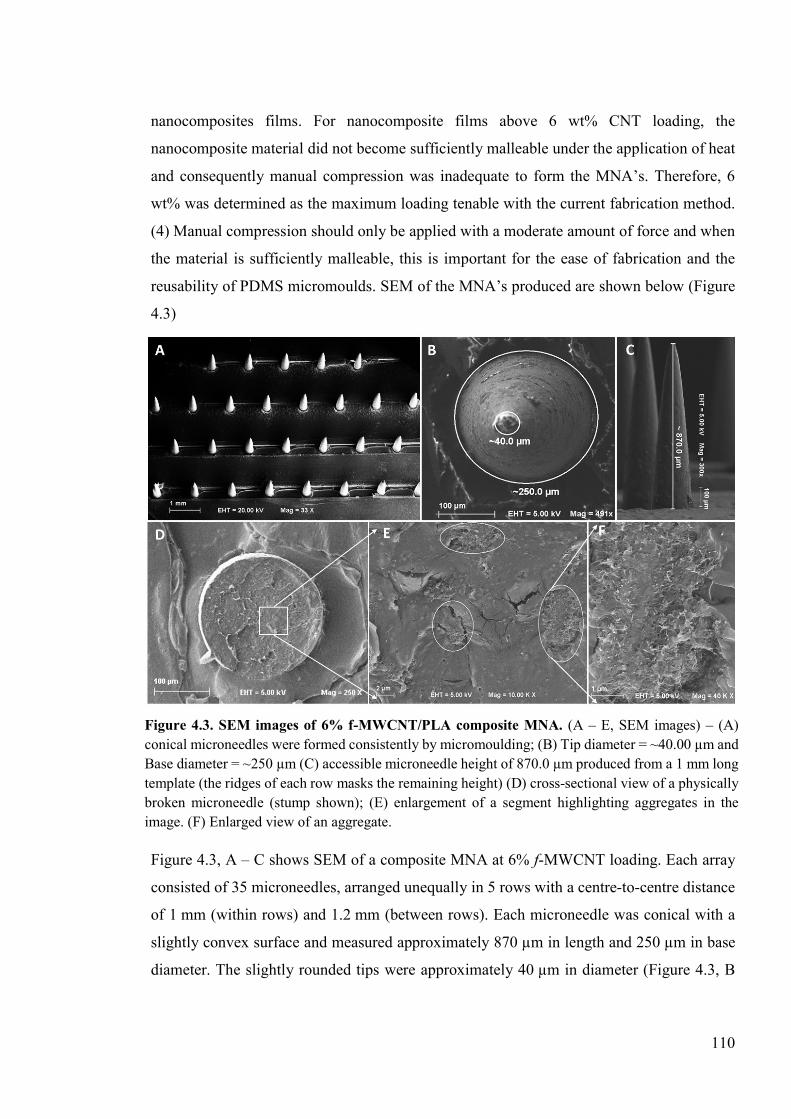
110
nanocomposites films. For nanocomposite films above 6 wt% CNT loading, the
nanocomposite material did not become sufficiently malleable under the application of heat
and consequently manual compression was inadequate to form the MNA’s. Therefore, 6
wt% was determined as the maximum loading tenable with the current fabrication method.
(4) Manual compression should only be applied with a moderate amount of force and when
the material is sufficiently malleable, this is important for the ease of fabrication and the
reusability of PDMS micromoulds. SEM of the MNA’s produced are shown below (Figure
4.3)
Figure 4.3, A – C shows SEM of a composite MNA at 6% f-MWCNT loading. Each array
consisted of 35 microneedles, arranged unequally in 5 rows with a centre-to-centre distance
of 1 mm (within rows) and 1.2 mm (between rows). Each microneedle was conical with a
slightly convex surface and measured approximately 870 µm in length and 250 µm in base
diameter. The slightly rounded tips were approximately 40 µm in diameter (Figure 4.3, B
Figure 4.3. SEM images of 6% f-MWCNT/PLA composite MNA. (A – E, SEM images) – (A) conical microneedles were formed consistently by micromoulding; (B) Tip diameter = ~40.00 µm and Base diameter = ~250 µm (C) accessible microneedle height of 870.0 µm produced from a 1 mm long template (the ridges of each row masks the remaining height) (D) cross-sectional view of a physically broken microneedle (stump shown); (E) enlargement of a segment highlighting aggregates in the image. (F) Enlarged view of an aggregate.
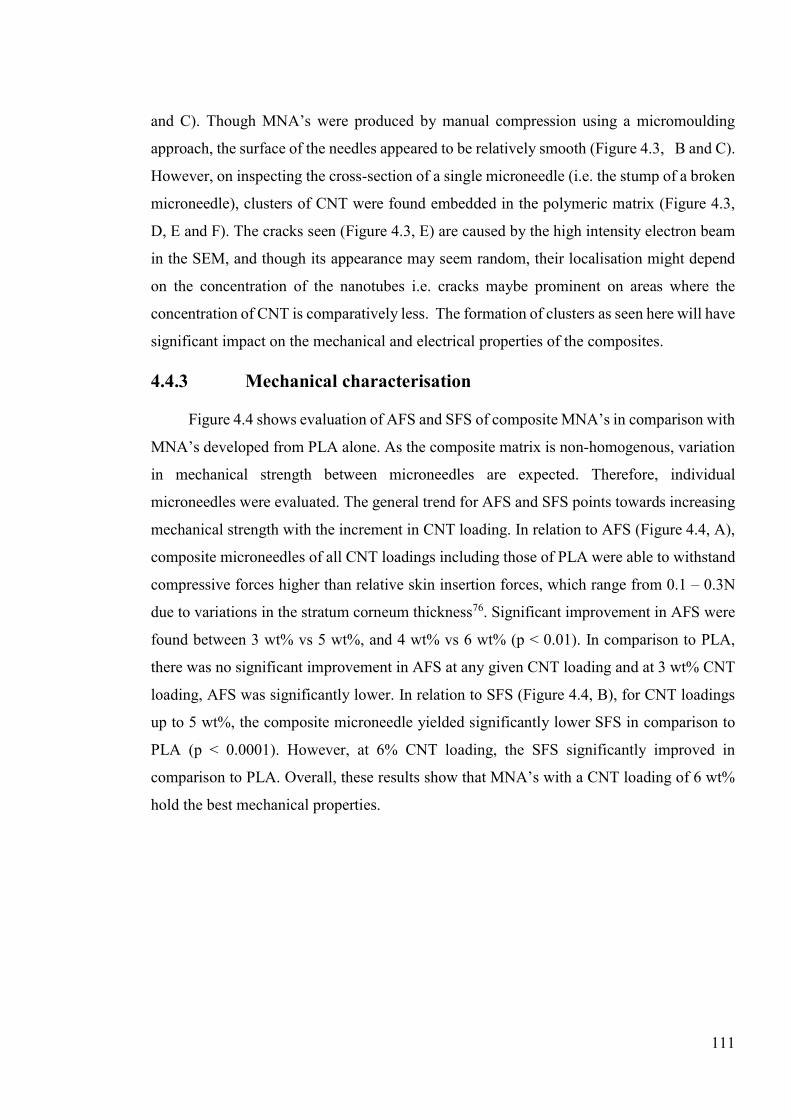
111
and C). Though MNA’s were produced by manual compression using a micromoulding
approach, the surface of the needles appeared to be relatively smooth (Figure 4.3, B and C).
However, on inspecting the cross-section of a single microneedle (i.e. the stump of a broken
microneedle), clusters of CNT were found embedded in the polymeric matrix (Figure 4.3,
D, E and F). The cracks seen (Figure 4.3, E) are caused by the high intensity electron beam
in the SEM, and though its appearance may seem random, their localisation might depend
on the concentration of the nanotubes i.e. cracks maybe prominent on areas where the
concentration of CNT is comparatively less. The formation of clusters as seen here will have
significant impact on the mechanical and electrical properties of the composites.
4.4.3 Mechanical characterisation
Figure 4.4 shows evaluation of AFS and SFS of composite MNA’s in comparison with
MNA’s developed from PLA alone. As the composite matrix is non-homogenous, variation
in mechanical strength between microneedles are expected. Therefore, individual
microneedles were evaluated. The general trend for AFS and SFS points towards increasing
mechanical strength with the increment in CNT loading. In relation to AFS (Figure 4.4, A),
composite microneedles of all CNT loadings including those of PLA were able to withstand
compressive forces higher than relative skin insertion forces, which range from 0.1 – 0.3N
due to variations in the stratum corneum thickness76. Significant improvement in AFS were
found between 3 wt% vs 5 wt%, and 4 wt% vs 6 wt% (p < 0.01). In comparison to PLA,
there was no significant improvement in AFS at any given CNT loading and at 3 wt% CNT
loading, AFS was significantly lower. In relation to SFS (Figure 4.4, B), for CNT loadings
up to 5 wt%, the composite microneedle yielded significantly lower SFS in comparison to
PLA (p < 0.0001). However, at 6% CNT loading, the SFS significantly improved in
comparison to PLA. Overall, these results show that MNA’s with a CNT loading of 6 wt%
hold the best mechanical properties.
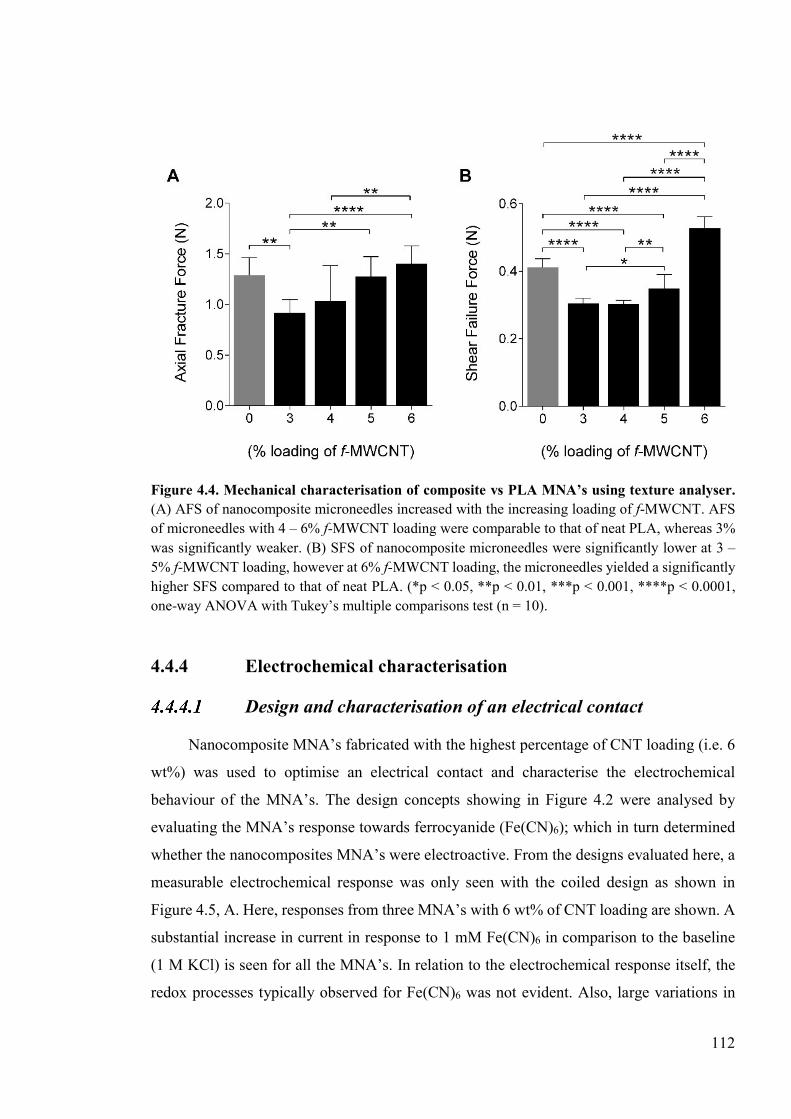
112
4.4.4 Electrochemical characterisation
Design and characterisation of an electrical contact
Nanocomposite MNA’s fabricated with the highest percentage of CNT loading (i.e. 6
wt%) was used to optimise an electrical contact and characterise the electrochemical
behaviour of the MNA’s. The design concepts showing in Figure 4.2 were analysed by
evaluating the MNA’s response towards ferrocyanide (Fe(CN)6); which in turn determined
whether the nanocomposites MNA’s were electroactive. From the designs evaluated here, a
measurable electrochemical response was only seen with the coiled design as shown in
Figure 4.5, A. Here, responses from three MNA’s with 6 wt% of CNT loading are shown. A
substantial increase in current in response to 1 mM Fe(CN)6 in comparison to the baseline
(1 M KCl) is seen for all the MNA’s. In relation to the electrochemical response itself, the
redox processes typically observed for Fe(CN)6 was not evident. Also, large variations in
Figure 4.4. Mechanical characterisation of composite vs PLA MNA’s using texture analyser. (A) AFS of nanocomposite microneedles increased with the increasing loading of f-MWCNT. AFS of microneedles with 4 – 6% f-MWCNT loading were comparable to that of neat PLA, whereas 3% was significantly weaker. (B) SFS of nanocomposite microneedles were significantly lower at 3 – 5% f-MWCNT loading, however at 6% f-MWCNT loading, the microneedles yielded a significantly higher SFS compared to that of neat PLA. (*p < 0.05, **p < 0.01, ***p < 0.001, ****p < 0.0001, one-way ANOVA with Tukey’s multiple comparisons test (n = 10).
113
current generated between the three MNA’s were apparent. Nevertheless, this result implies
that the nanocomposite MNA’s were electroactive. However, it does not indicate whether
the microneedles alone were sufficient to produce an electrochemical response. The
responses seen in Figure 4.5, A were generated from the microneedles as well as its
supporting base, composed entirely of the nanocomposite material, immersed in the analyte
solution.
The base of the MNA’s were therefore concealed with Parafilm® as detailed in section
4.3.4 (see Figure 4.10, D) and the measurements were repeated. The responses generated as
Figure 4.5. Electrochemical response of MNA’s towards 1mM Fe(CN)6. (a) Response from a coiled electrical contact recorded for three MNA’s with 6 wt% CNT loading (b) lower response recorded after sealing the supporting base of the MNA’s with Parafilm® (c) evaluating the MNA response at 1 V for unsealed and Parafilm® sealed MNA’s. (d) representative CV traces showing non-linear responses from MNA’s incorporating different loadings of CNT. (**p < 0.01, one-way ANOVA with Tukey’s multiple comparisons test (n = 3).
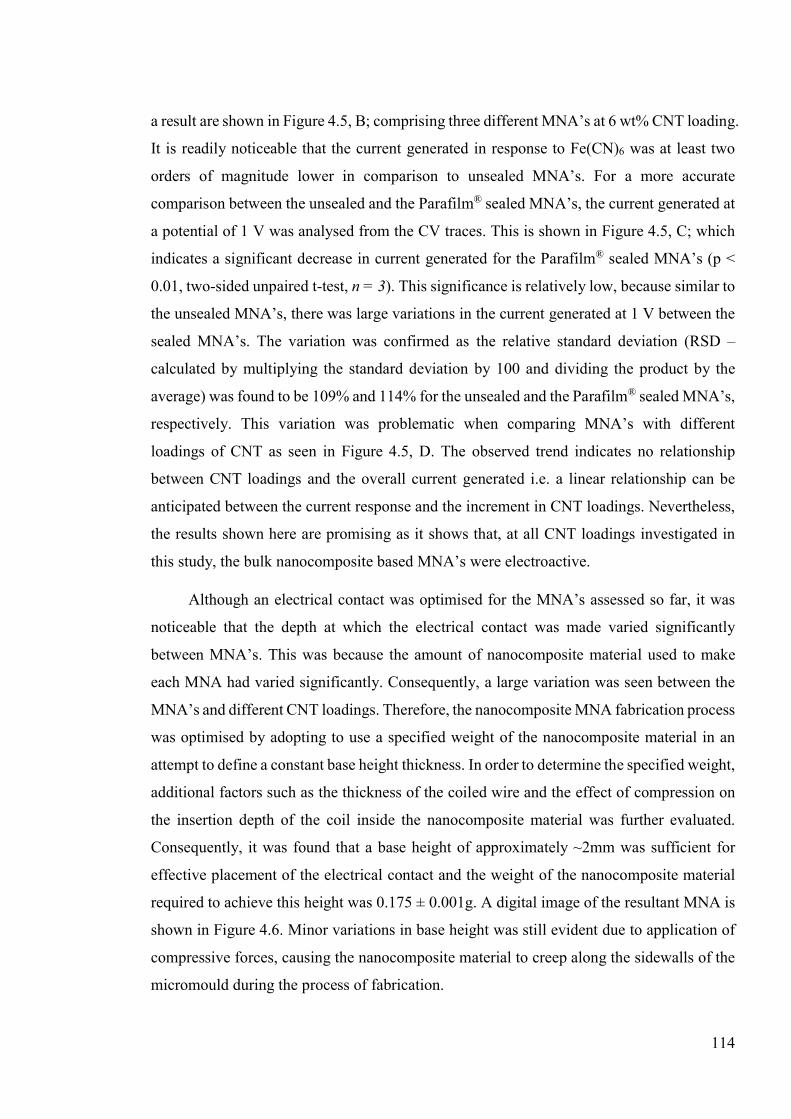
114
a result are shown in Figure 4.5, B; comprising three different MNA’s at 6 wt% CNT loading.
It is readily noticeable that the current generated in response to Fe(CN)6 was at least two
orders of magnitude lower in comparison to unsealed MNA’s. For a more accurate
comparison between the unsealed and the Parafilm® sealed MNA’s, the current generated at
a potential of 1 V was analysed from the CV traces. This is shown in Figure 4.5, C; which
indicates a significant decrease in current generated for the Parafilm® sealed MNA’s (p <
0.01, two-sided unpaired t-test, n = 3). This significance is relatively low, because similar to
the unsealed MNA’s, there was large variations in the current generated at 1 V between the
sealed MNA’s. The variation was confirmed as the relative standard deviation (RSD –
calculated by multiplying the standard deviation by 100 and dividing the product by the
average) was found to be 109% and 114% for the unsealed and the Parafilm® sealed MNA’s,
respectively. This variation was problematic when comparing MNA’s with different
loadings of CNT as seen in Figure 4.5, D. The observed trend indicates no relationship
between CNT loadings and the overall current generated i.e. a linear relationship can be
anticipated between the current response and the increment in CNT loadings. Nevertheless,
the results shown here are promising as it shows that, at all CNT loadings investigated in
this study, the bulk nanocomposite based MNA’s were electroactive.
Although an electrical contact was optimised for the MNA’s assessed so far, it was
noticeable that the depth at which the electrical contact was made varied significantly
between MNA’s. This was because the amount of nanocomposite material used to make
each MNA had varied significantly. Consequently, a large variation was seen between the
MNA’s and different CNT loadings. Therefore, the nanocomposite MNA fabrication process
was optimised by adopting to use a specified weight of the nanocomposite material in an
attempt to define a constant base height thickness. In order to determine the specified weight,
additional factors such as the thickness of the coiled wire and the effect of compression on
the insertion depth of the coil inside the nanocomposite material was further evaluated.
Consequently, it was found that a base height of approximately ~2mm was sufficient for
effective placement of the electrical contact and the weight of the nanocomposite material
required to achieve this height was 0.175 ± 0.001g. A digital image of the resultant MNA is
shown in Figure 4.6. Minor variations in base height was still evident due to application of
compressive forces, causing the nanocomposite material to creep along the sidewalls of the
micromould during the process of fabrication.
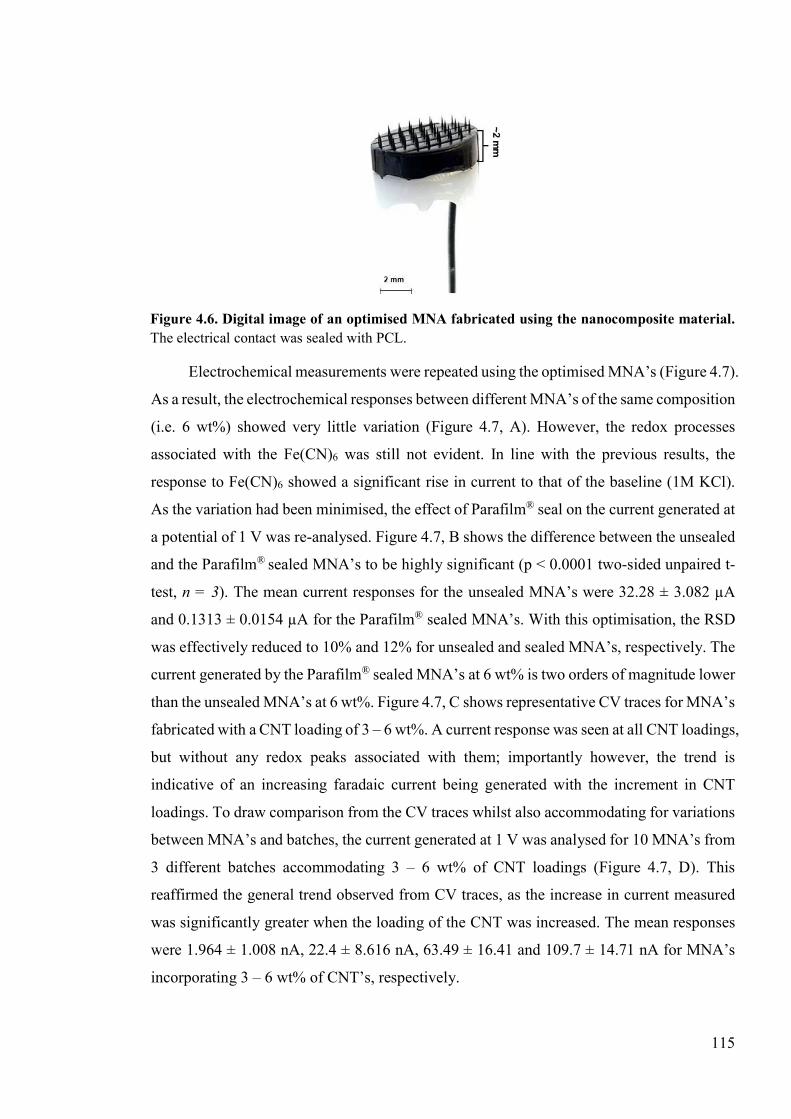
115
Electrochemical measurements were repeated using the optimised MNA’s (Figure 4.7).
As a result, the electrochemical responses between different MNA’s of the same composition
(i.e. 6 wt%) showed very little variation (Figure 4.7, A). However, the redox processes
associated with the Fe(CN)6 was still not evident. In line with the previous results, the
response to Fe(CN)6 showed a significant rise in current to that of the baseline (1M KCl).
As the variation had been minimised, the effect of Parafilm® seal on the current generated at
a potential of 1 V was re-analysed. Figure 4.7, B shows the difference between the unsealed
and the Parafilm® sealed MNA’s to be highly significant (p < 0.0001 two-sided unpaired t-
test, n = 3). The mean current responses for the unsealed MNA’s were 32.28 ± 3.082 µA
and 0.1313 ± 0.0154 µA for the Parafilm® sealed MNA’s. With this optimisation, the RSD
was effectively reduced to 10% and 12% for unsealed and sealed MNA’s, respectively. The
current generated by the Parafilm® sealed MNA’s at 6 wt% is two orders of magnitude lower
than the unsealed MNA’s at 6 wt%. Figure 4.7, C shows representative CV traces for MNA’s
fabricated with a CNT loading of 3 – 6 wt%. A current response was seen at all CNT loadings,
but without any redox peaks associated with them; importantly however, the trend is
indicative of an increasing faradaic current being generated with the increment in CNT
loadings. To draw comparison from the CV traces whilst also accommodating for variations
between MNA’s and batches, the current generated at 1 V was analysed for 10 MNA’s from
3 different batches accommodating 3 – 6 wt% of CNT loadings (Figure 4.7, D). This
reaffirmed the general trend observed from CV traces, as the increase in current measured
was significantly greater when the loading of the CNT was increased. The mean responses
were 1.964 ± 1.008 nA, 22.4 ± 8.616 nA, 63.49 ± 16.41 and 109.7 ± 14.71 nA for MNA’s
incorporating 3 – 6 wt% of CNT’s, respectively.
Figure 4.6. Digital image of an optimised MNA fabricated using the nanocomposite material. The electrical contact was sealed with PCL.
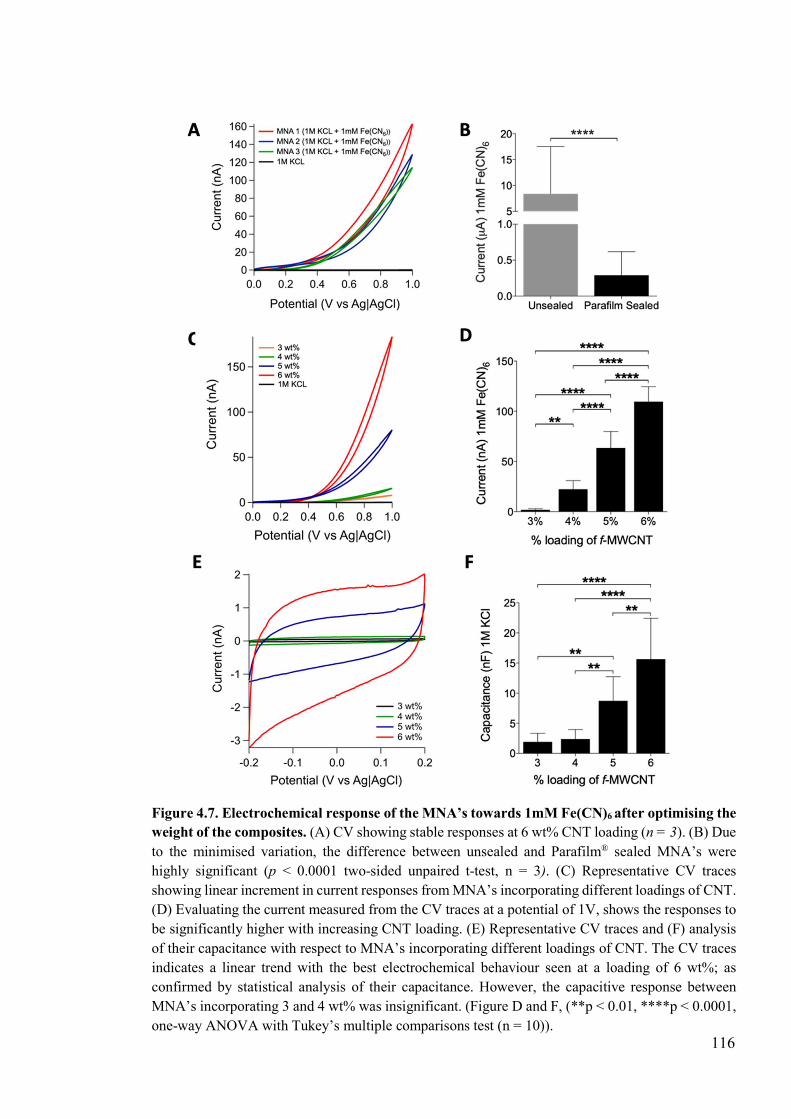
116
Figure 4.7. Electrochemical response of the MNA’s towards 1mM Fe(CN)6 after optimising the weight of the composites. (A) CV showing stable responses at 6 wt% CNT loading (n = 3). (B) Due to the minimised variation, the difference between unsealed and Parafilm® sealed MNA’s were highly significant (p < 0.0001 two-sided unpaired t-test, n = 3). (C) Representative CV traces showing linear increment in current responses from MNA’s incorporating different loadings of CNT. (D) Evaluating the current measured from the CV traces at a potential of 1V, shows the responses to be significantly higher with increasing CNT loading. (E) Representative CV traces and (F) analysis of their capacitance with respect to MNA’s incorporating different loadings of CNT. The CV traces indicates a linear trend with the best electrochemical behaviour seen at a loading of 6 wt%; as confirmed by statistical analysis of their capacitance. However, the capacitive response between MNA’s incorporating 3 and 4 wt% was insignificant. (Figure D and F, (**p < 0.01, ****p < 0.0001, one-way ANOVA with Tukey’s multiple comparisons test (n = 10)).
117
From evaluating their RSD’s, (i.e. 47%, 36%, 25% and 13%, for 3 – 6 wt%,
respectively) it was found that the variations were lower as the % loading of CNT increased.
As such, MNA’s incorporating 6 wt% of CNT produced the best results. For further
characterisation, the capacitive behaviour of the MNA electrodes was evaluated using CV.
Figure 4.7, E shows representative traces at a potential window of -0.2 to 0.2 V. A quasi-
rectangular shape without any redox peaks is evident at all loadings; indicative of a good
capacitive behaviour. The current densities scaled with the loading of CNT’s, and the
MNA’s incorporating 5 and 6 wt% showed a higher integrated area, which points towards
their superior electrochemical performance over the other loadings investigated. The
capacitive current at each loading was evaluated by measuring the difference in current at 0
V over the scan rate; shown in Figure 4.7, F. With the increment in the CNT loadings, the
capacitive current was seen to increase significantly, except from 3 wt% and 4 wt%. The
highest capacitive current of 15.65 nF was measured at 6 wt% CNT loading. Variability
among the different loadings was relatively high, though it was inversely proportional to
increment in CNT loadings. At 6 wt%, the capacitive variability was found to be 23.41%
(RSD). Overall, as the best electrochemical behaviour was seen at a CNT loading of 6 wt%,
further analysis was based on this composition only.
4.4.5 Ascorbic acid analysis
DPV and amperometry were used for quantitative determination of AA using the
MNA’s incorporating a CNT loading of 6 wt%. AA is the most abundant electroactive
biological compound that is known for its reductive properties and extensively investigated
for their rapid determination, as they play a crucial role in various biochemical processes
and industrial applications197. For DPV measurements, the response towards AA was
determined from 200 µM to 1 mM using three devices and their representative DPV
voltammograms are shown in Figure 4.8, A. This shows an asymmetric anodic peak for all
concentrations analysed, at a low potential of 0.320 ± 0.02 V. Calibration data acquired by
analysing the peak area for the oxidative responses at each concentration averaged from three
MNA devices are shown in Figure 4.8, B. This indicates a linear relationship between the
concentration of AA and the current measured (r2 = 0.9282). The limit of detection (LOD),
determined as 3 times the standard deviation at the lowest concentration over the slope of
the calibration line was 164.38 µM, with a sensitivity of 1.113 nC µM-1. RSD
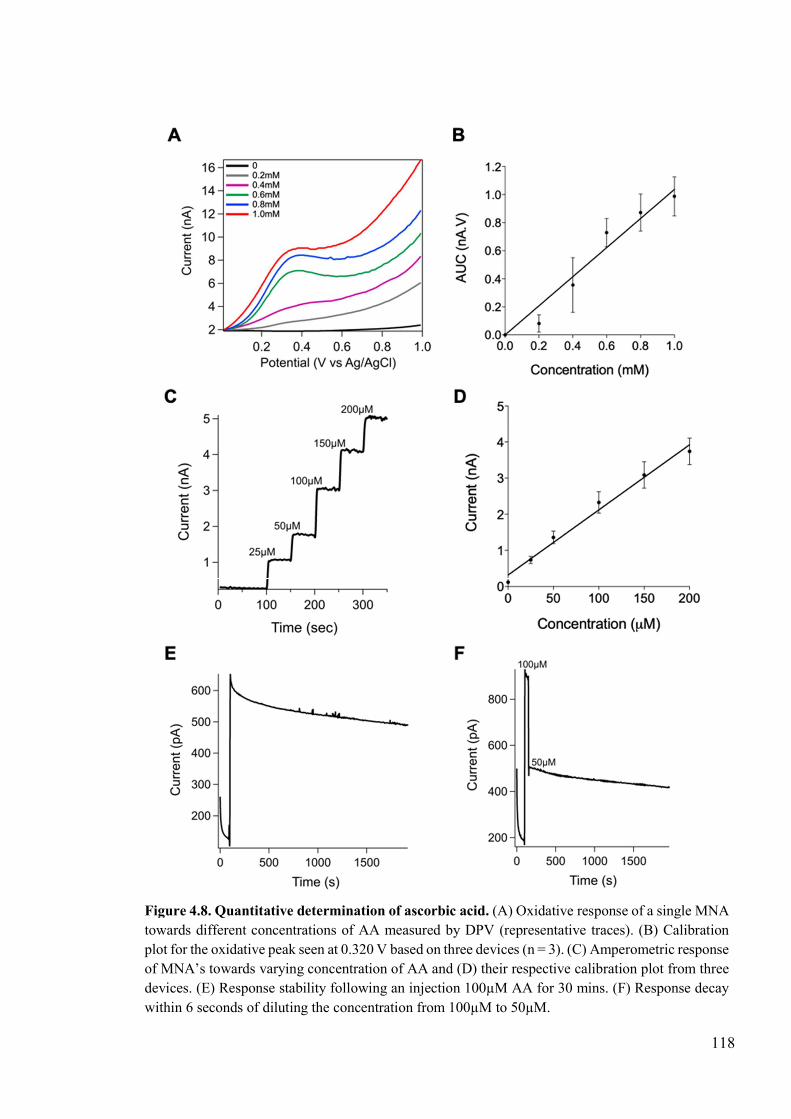
118
Figure 4.8. Quantitative determination of ascorbic acid. (A) Oxidative response of a single MNA towards different concentrations of AA measured by DPV (representative traces). (B) Calibration plot for the oxidative peak seen at 0.320 V based on three devices (n = 3). (C) Amperometric response of MNA’s towards varying concentration of AA and (D) their respective calibration plot from three devices. (E) Response stability following an injection 100µM AA for 30 mins. (F) Response decay within 6 seconds of diluting the concentration from 100µM to 50µM.
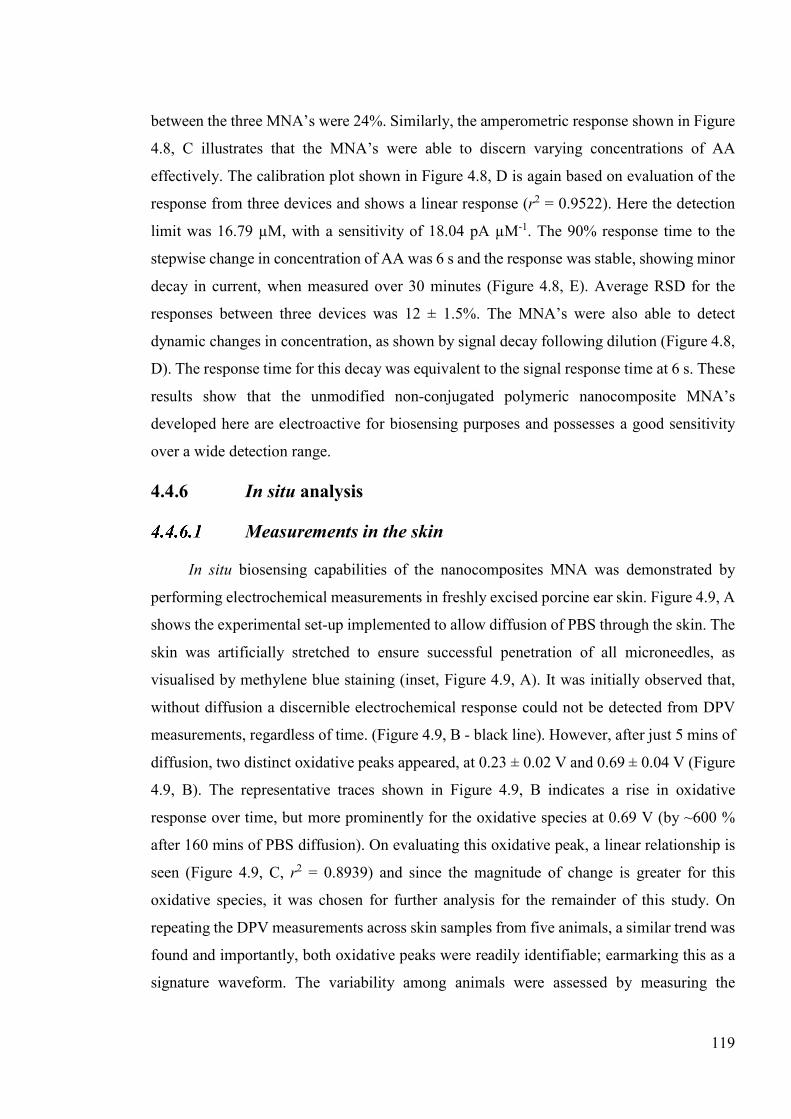
119
between the three MNA’s were 24%. Similarly, the amperometric response shown in Figure
4.8, C illustrates that the MNA’s were able to discern varying concentrations of AA
effectively. The calibration plot shown in Figure 4.8, D is again based on evaluation of the
response from three devices and shows a linear response (r2 = 0.9522). Here the detection
limit was 16.79 µM, with a sensitivity of 18.04 pA µM-1. The 90% response time to the
stepwise change in concentration of AA was 6 s and the response was stable, showing minor
decay in current, when measured over 30 minutes (Figure 4.8, E). Average RSD for the
responses between three devices was 12 ± 1.5%. The MNA’s were also able to detect
dynamic changes in concentration, as shown by signal decay following dilution (Figure 4.8,
D). The response time for this decay was equivalent to the signal response time at 6 s. These
results show that the unmodified non-conjugated polymeric nanocomposite MNA’s
developed here are electroactive for biosensing purposes and possesses a good sensitivity
over a wide detection range.
4.4.6 In situ analysis
Measurements in the skin
In situ biosensing capabilities of the nanocomposites MNA was demonstrated by
performing electrochemical measurements in freshly excised porcine ear skin. Figure 4.9, A
shows the experimental set-up implemented to allow diffusion of PBS through the skin. The
skin was artificially stretched to ensure successful penetration of all microneedles, as
visualised by methylene blue staining (inset, Figure 4.9, A). It was initially observed that,
without diffusion a discernible electrochemical response could not be detected from DPV
measurements, regardless of time. (Figure 4.9, B - black line). However, after just 5 mins of
diffusion, two distinct oxidative peaks appeared, at 0.23 ± 0.02 V and 0.69 ± 0.04 V (Figure
4.9, B). The representative traces shown in Figure 4.9, B indicates a rise in oxidative
response over time, but more prominently for the oxidative species at 0.69 V (by ~600 %
after 160 mins of PBS diffusion). On evaluating this oxidative peak, a linear relationship is
seen (Figure 4.9, C, r2 = 0.8939) and since the magnitude of change is greater for this
oxidative species, it was chosen for further analysis for the remainder of this study. On
repeating the DPV measurements across skin samples from five animals, a similar trend was
found and importantly, both oxidative peaks were readily identifiable; earmarking this as a
signature waveform. The variability among animals were assessed by measuring the
120
oxidative response at 0.69 V after 160 mins of PBS diffusion. This indicated a significant
variation between animals (one-way ANOVA, p = 0.001)) and the mean response was 0.687
± 0.367 nC across all samples (Figure 4.9, D). However, the variation was only significant
when comparing responses from all samples with that of skin 2, where the mean response
was 1.282 ± 0.618 nC.
Burn wound model
The utility of the signature waveform as found here and hence the ability of our MNA’s
to monitor dynamic changes in the microenvironment of the skin was assessed by inducing
Figure 4.9. In situ bioanalysis. (A) Experimental set-up using a Franz diffusion cell for transdermal electrochemical measurements of the skin. Inset showing successful penetration of the microneedles visualised by methylene blue staining. (B) DPV traces after diffusion of PBS – two distinct oxidative peaks were seen within 5 mins of PBS diffusion, at a potential of 0.23 V and 0.69 V. (C) Linear plot of AUC against time for the biggest change seen at a potential of 0.7 V. (D) Variation of the oxidative peak at 0.7 V across five skin samples (*p < 0.05, **p < 0.01, ***p < 0.001, ****p < 0.0001, one-way ANOVA with Tukey’s multiple comparisons test, n = 5 animals).
121
artificial burn wounds. Two experimental conditions were investigated: (1) before and after
burn measurements on the same skin site and (2) comparing the burnt skin site to an adjacent
control (non-burnt) site. As detatiled previously (in section 4.3.6.2), measurements after the
burn were taken once the PBS was allowed to re-diffuse in to the skin. Under both conditions,
attenuation of the oxidative peak at 0.69 V was clear from the representative DPV traces
shown in Figure 4.10, A and B. This was found to be significant, as the oxidative response
was suppressed by, 0.4137 nC on the same skin site and 0.6915 nC on burnt skin site to an
adjacent control site (p = 0.0070 and p = 0.0048, respectively; two-tailed paired t-test, Figure
4.10, C). This difference is unlikely to be due to diffusive or evaporative water loss caused
by the application of heat, since this was accounted for by allowing PBS to re-diffuse into
the burnt site for 160 min. Neither is the difference likely to be due to the creation of
microconduits in the skin by successive applications of MNAs, because in the second
experimental condition only a post-burn measurement was taken. The impact of any
mechanical failure can also be excluded as there was no evidence of damage to the MNA
after six repetitive insertions and removals (Figure 4.10, D). Although not evaluated at
present, the oxidative peak with the lower magnitude, evident at 0.23 V also seems to be
supressed following the burn (Figure 4.10, A and B).
To determine whether an electrochemical waveform as found here, would hold a
diagnostic value, the impact of the burn on the skin was measured at progressive distances
away from the burnt skin site. The representative DPV traces shown in Figure 4.10, E
indicates a trend where, as expected the oxidative response at 0.69 V was severely attenuated
at the burnt skin site (red line). Interestingly, the effect of the burn was still evident at a non-
burnt site that was 1 mm distant to the burn skin site (blue line). However, measurements
taken at a site 10 mm distant to the burnt skin site revealed an oxidative response comparable
to that of the non-burnt skin (black line). On analysis of the peak area, there was no
significant difference between the burnt and 1 mm distant skin sites (p = 0.0692); whereas
the 10 mm site produced significantly higher responses (p < 0.05) compared to that of the
burnt skin site and the 1 mm distant site, with a mean difference of 3.245 nC and 2.746 nC,
respectively (Figure 4.10, F). The mean responses at the 10 mm distant site was further
~270 % higher, because in these experiments PBS was allowed to diffuse into the skin for a
longer period of time (i.e. both before and after the burn was induced). This further validates
the claim for burn induced suppression of the oxidative response at 0.69 V and, further
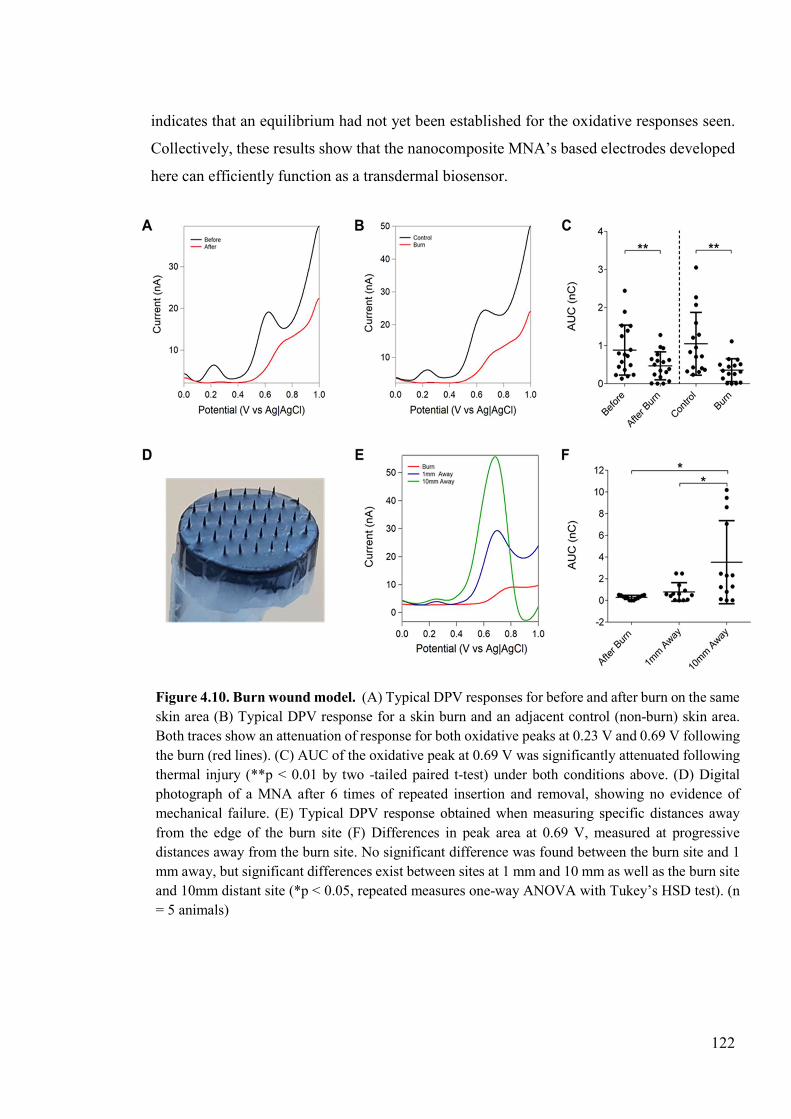
122
indicates that an equilibrium had not yet been established for the oxidative responses seen.
Collectively, these results show that the nanocomposite MNA’s based electrodes developed
here can efficiently function as a transdermal biosensor.
Figure 4.10. Burn wound model. (A) Typical DPV responses for before and after burn on the same skin area (B) Typical DPV response for a skin burn and an adjacent control (non-burn) skin area. Both traces show an attenuation of response for both oxidative peaks at 0.23 V and 0.69 V following the burn (red lines). (C) AUC of the oxidative peak at 0.69 V was significantly attenuated following thermal injury (**p < 0.01 by two -tailed paired t-test) under both conditions above. (D) Digital photograph of a MNA after 6 times of repeated insertion and removal, showing no evidence of mechanical failure. (E) Typical DPV response obtained when measuring specific distances away from the edge of the burn site (F) Differences in peak area at 0.69 V, measured at progressive distances away from the burn site. No significant difference was found between the burn site and 1 mm away, but significant differences exist between sites at 1 mm and 10 mm as well as the burn site and 10mm distant site (*p < 0.05, repeated measures one-way ANOVA with Tukey’s HSD test). (n = 5 animals)
123
4.5 Discussion
By adopting a facile fabrication strategy for both composite processing (i.e. solvent
casting) and MNA fabrication (micromoulding), novel electrochemical MNA based
electrodes have been successfully developed from PLA/f-MWCNT composites. These
nanocomposite MNA electrodes were directly connected to an electrochemical analyser for
the first time as bulk electrodes, without any surface modifications and evaluated for their
potential as a transdermal biosensor. Initially, on analysing the efficiency of the fabrication
strategy by SEM, it was found that MNA’s could be formed consistently with a high
structural fidelity. However, on close inspection of the morphology of the nanocomposites
MNA’s (SEM, Figure 4.3, E-F), numerous clusters were evident. The formation of these
clusters can be attributed to localised aggregation of CNT’s during the solvent evaporation
process198,199; which in turn, may also give rise to some CNT-free regions depending on the
loading199. Such morphologies have a significant impact on the electrical and mechanical
properties of the composites. In relation to solvent casting, this is due to a strong localised
interaction between the CNT’s and therefore the effective volume fraction of CNT is higher
compared to that of a homogenous network199. The high CNT loading as used here typically
produces a vastly agglomerated network. However, this may have a positive impact on
conductivity, as contacts between CNT’s can be improved once the percolation network has
been formed. Additionally, the use of compressive forces to form the MNA’s can also be
advantageous in improving the conductivity of the MNA’s; as evidence suggests that
application of compressive forces can impart a certain degree of mobility to the CNT’s in a
composite, thereby improving conductivity by enhancing the interaction and contacts
between the CNT’s199,201,202. In contrast, it is generally accepted that agglomerates will act
as stress concentrators of mechanical failure under physical stress, i.e. they prevent effective
load transfer between the polymer and CNT’s203. This may not always be the case, however,
as a recent study has found that a mixture of particles of different sizes could help occupy
spaces better within the polymer, resulting in a stronger network with better mechanical
properties204. Usage of f-MWCNT’s and compressing moulding to form the composite
MNA’s are two further processes that can enhance mechanical properties201.
Analysis of the mechanical properties of the nanocomposite MNA’s revealed that, at
all loadings they could withstand the compressive forces (i.e. AFF) required for skin
124
penetration. The insertion forces required for a single microneedle is highly dependent on
the interfacial area at the tip. Davis et al. reported that, for a single microneedle of 25µm tip
diameter, the expected insertion force is 0.058N regardless of the microneedle height73. Our
composite microneedles with a slightly larger tip diameter, at all CNT loadings withstood
forces at least 15-fold higher (24-fold higher for 6% composite MNA’s). However, there
was no significant improvement in AFS for the nanocomposite MNA’s at any given loading
when compared to that of MNA’s fabricated from PLA alone. It is possible that
intermolecular forces were weakened when dissolving the polymer. The PLA MNA’s used
here for comparative purposes were developed from non-solvent casted PLA, as these have
been shown to penetrate the skin effectively. In agreement with the literature, the SFS of
composite microneedles were considerably lower than AFS140. This suggests that MNA’s
are more susceptible to failure from shear forces than axial forces76. Concerning the specific
microneedle geometry, the SFS of the nanocomposite and PLA MNA’s were higher by
~120% and ~70%, respectively; when compared with MNA’s developed from another
biodegradable polymer polyglycolic acid (PGA) with a similar height and base diameter140.
However, only MNA’s with a CNT loading of 6 wt% produced higher SFS forces with
reference to PLA. This further supports the notion that dissolution of the polymer may have
weakened intermolecular forces. The higher AFS and SFS for MNA’s incorporating a CNT
loading of 6 wt% are most probably a result of enhanced matrix stiffness and better
interfacial interaction provided by the increased f-MWCNT loading, since the carboxyl
groups can interact via hydrogen bonding with carbonyl groups in the PLA chains205,206.
Developing an appropriate electrical contact is not only essential to maximise the
electrochemical signal transduction but also to enable scalable fabrication of MNA’s. Wire
bonding onto support structures using conductive epoxy is a commonly employed approach
for establishing an electrical contact49. Hence, such a strategy was investigated alongside
others, as shown in Figure 4.2. It was found that an electrochemical response could only be
detected by a coiled-type contact, because it maximised the surface area for capturing charge
transferred from the electrocatalytic reactions. As the MNA’s were entirely fabricated from
the nanocomposite material, it was important to isolate the electrochemical response to the
MNA’s alone. This was achieved by concealing the supporting base of the MNA’s by
piercing the microneedles through a layer of Parafilm® and sealing it with the application of
heat. Albeit being two orders of magnitude lower, due to the reduced surface area available
125
for electrocatalytic reactions, an electrochemical response could still be detected from the
microneedles alone; indicative of the biosensing potential of the nanocomposite MNA’s. In
fact, an electrochemical response could be detected from microneedles alone, for all CNT
loadings investigated here. However, initial characterisation showed large variations in the
electrochemical response between MNA’s incorporating the same and different loadings of
CNT (Figure 4.5 A and D). This was attributed to a combination of factors, i.e. variation in
the amount of the nanocomposite material used to fabricate the MNA’s and the
corresponding variation in insertion depth of the electrical contact. Therefore, as an effective
optimisation step, the amount of the nanocomposite material used to make each MNA was
fixed at 0.175g, which consequently achieved a base height of ~2mm, at which point the
electrical contact was made. This optimisation resulted in an increase in current towards 1
mM Fe(CN)6, proportional to the loading of CNT’s and showed minimal variation between
different MNA’s. Importantly, on re-analysing the effectiveness of the Parafilm® seal, it was
found that the RSD was only slightly lower for unsealed MNA’s (10%) in comparison to
those that were sealed (12%). This confirms that the seal was effective, however the higher
RSD between MNA’s could be a result of larger microtears in the Parafilm® caused by the
penetration of microneedles or an uneven coverage of the seal along the length of
microneedles/base of the MNA even with the application of heat. It was also found that, for
some MNA’s incorporating 3 wt% of CNT, a measurable electrochemical response could
not be detected. This is in line with the previous literature indicating that at least 3 wt% of
CNT was required to initiate conductivity in solvent casted CNT/PLA nanocomposites171. A
major finding derived from evaluating the current response at 1V and the capacitive current
between different loadings, is that the RSD between MNA’s progressively decreased as
the % loading of CNT increased. This can be explained on the basis that past the percolation
threshold of PLA (reportedly at values > 3 wt%), there is enhanced interaction between the
CNT’s in the composite171,184. As a result, the effect of heterogeneity (causing
electrochemical signal variation) maybe be overcome at a higher loading.
As the characterisation results collectively point towards the better electrochemical
performance of MNA’s incorporating 6 wt% of CNT’s, they were used for electrochemical
quantification of AA. DPV showed an asymmetric anodic peak; indicative of irreversible
oxidation of AA at a low potential of ~0.320 V, with a LOD of 164.38 µM. The oxidation
of AA is reversible producing dehydroascorbic acid; but, this is unstable and rapidly
126
undergoes a salvation reaction producing non-electroactive 2,3-diketogulonic acid197. Hence,
the overall reaction is described as irreversible. Moreover, the final product of this reaction
can readily absorb onto the electrode surface; resulting in fouling197. As CNT’s are effective
in reducing the overvoltage for electrochemical reactions, the oxidative peak observed here
was at lower potential that those reported previously by researchers using unmodified
platinum (Pt) and carbon paste working electrodes; (at 0.530 V and 0.470 V, respectively)207.
Although their LOD was lower, at 87 µM for the Pt and 20 µM for CP electrodes, the LOD
achieved by nanocomposite MNA’s were remarkable (164.38 µM); considering that bulk
composite-based electrodes in a MNA format have been connected to an electrochemical
analyser for the first time. In comparison, quantification of AA by amperometry using the
MNA’s produced a more stable step wise increase in current based on the concentration
analysed with a lower LOD at 16.79 µM. The RSD between MNA’s were also lower at 12%
for amperometry in comparison to 24% by DPV and importantly, comparable to the variation
observed during their characterisation. Hence, it is possible to normalise the response from
the MNA’s. Nevertheless, these results show that the nanocomposite MNA’s are fit for
biosensing purposes.
Electrochemical measurements made in the skin validated our MNA’s for transdermal
biosensing purposes. With the diffusion of PBS, the nanocomposite MNA’s were able to
detect distinct oxidative species in the skin at specified potentials of ~0.23 and ~0.69 V. The
voltammograms recorded over a period of time showed that the concentration of these
oxidative species increases over time. This is because, the lateral diffusion of PBS into the
skin helps establish a concentration gradient, that allows passive movement of intra or
extracellular oxidative species, on to the electrode surface, that are then oxidised at a
specified voltage. As shown in Figure 4.9, B; the rise in concentration was prominent for the
oxidative species detected at a potential of 0.69 V. Analysis of this peak, revealed a linear
relationship, though it can be assumed that a steady state equilibrium will be established over
time. However, further recordings did not ensue at this time, as the skin was maintained to
represent conditions in vivo for further experimentation. Importantly, this electrochemical
signature comprising both oxidative species were readily identifiable across all samples
measured. But there existed significant variation between the animals. The implication of
such variation is that, it may be difficult to assign a threshold value that could help
differentiate between normal and pathological conditions.
127
The established signature waveform may hold potential diagnostic value in addressing
skin-related wounds and injuries. For example, early recognition of burn wounds that may
not heal and scar will inform a definitive decision on surgical intervention, improving final
functional and cosmetic outcome. Using the MNA developed here, it was initially assessed
whether an artificial burn can induce changes to the signature waveform. This showed
significant suppression of the oxidative peak at ~0.69 V that was unbiased by experimental
conditions (Figure 4.10). However, tissue damage, denaturing and cross-linking of proteins
are factors that might contribute to the attenuation of the response at 0.69 V. The diagnostic
potential of the signature waveform was further validated, as the effect of the burn could be
measured at progressive distances away from the burnt skin site. These results collectively
indicate that the nanocomposite MNA’s can effectively discern dynamic changes in the skin.
Thus, it proves the excellent potential of these MNA’s to be turned in transdermal biosensors.
128
4.6 Conclusions
In this chapter, the utility of nanocomposites produced from PLA/f-MWCNT’s via
simple solvent casting process to be turned into electrochemical MNA’s were investigated.
Micromoulding coupled with manual compression was found to be effective in forming with
MNA’s consistently with high structural fidelity. The fabrication steps discussed here are
simple and easy to scale up, with further adaptation possible using compression moulding or
hot embossing technique allowing rapid prototyping capabilities. A maximum loading of 6
wt% was found tenable with the current fabrication method. Mechanical strength and
electrochemical behaviour of the MNA’s were evaluated with reference to MNA’s
incorporating different loadings of f-MWCNT’s and both properties were found to be
optimal at the highest loading i.e. 6 wt%. Consequently, these MNA’s were used for
electrochemical quantification of AA by DPV and amperometry. The nanocomposite
MNA’s were able to distinguish varying concentration of AA using both techniques;
achieving detection limits of 164.38 µM for DPV and 16.79 µM for amperometry. In situ
measurements in the skin, followed by evaluation of a burn wound model showed that the
MNA’s can dynamically monitor electrochemical changes within the skin
microenvironment and therefore can function effectively as a transdermal biosensor.
Interestingly, an electrochemical signature comprising two distinct oxidative species were
identified from freshly excised porcine ear skin. Characterisation of the oxidative species
may be necessary as they may not only relate to skin pathologies (as shown with the thermal
injuries) but can also provide crucial information on electrochemical interferants for
biosensing applications.
129
4.7 Further work
The nanocomposite fabricated MNA’s discussed in the work are effective at a CNT
loading of 6 wt%, however further optimisation is needed to improve their electrochemical
behaviour to reduce the resistive behaviour as seen with their CV; thus, improving the
sensitivity of these electrodes further. This is crucial as quantitation of clinically relevant
analytes and biomarkers maybe challenging due the their sub-micromolar physiological
concentrations.
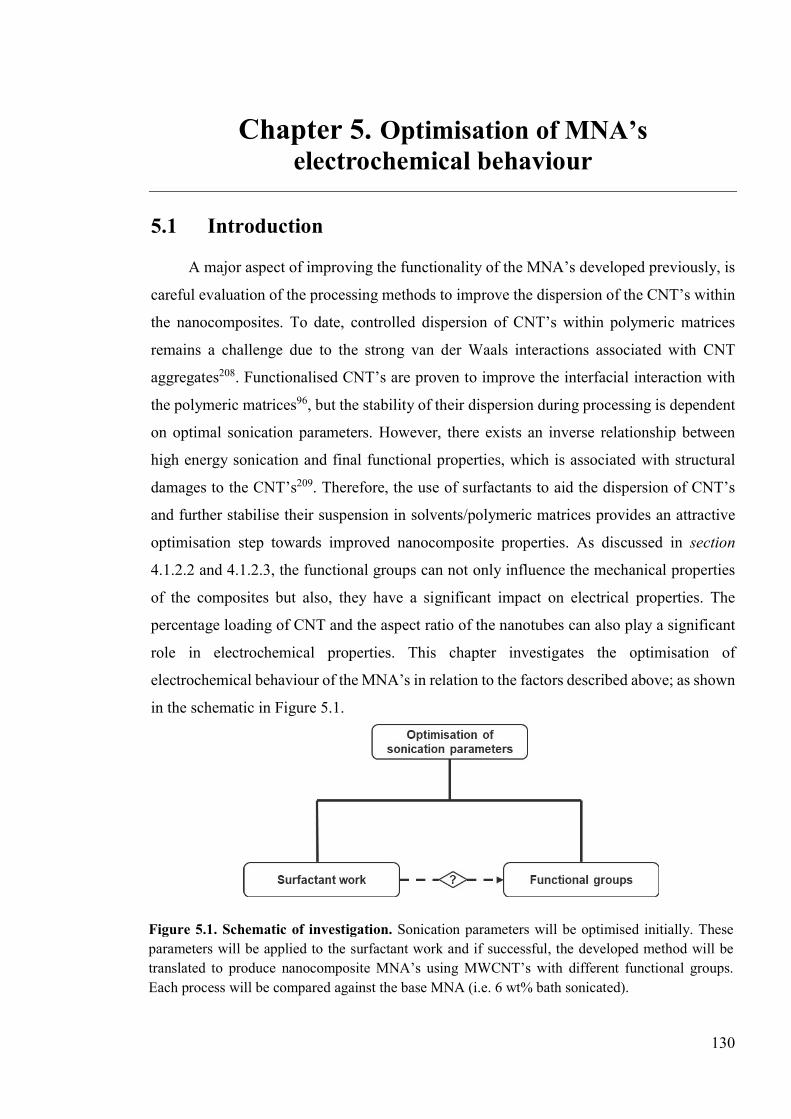
130
Chapter 5. Optimisation of MNA’s electrochemical behaviour
5.1 Introduction
A major aspect of improving the functionality of the MNA’s developed previously, is
careful evaluation of the processing methods to improve the dispersion of the CNT’s within
the nanocomposites. To date, controlled dispersion of CNT’s within polymeric matrices
remains a challenge due to the strong van der Waals interactions associated with CNT
aggregates208. Functionalised CNT’s are proven to improve the interfacial interaction with
the polymeric matrices96, but the stability of their dispersion during processing is dependent
on optimal sonication parameters. However, there exists an inverse relationship between
high energy sonication and final functional properties, which is associated with structural
damages to the CNT’s209. Therefore, the use of surfactants to aid the dispersion of CNT’s
and further stabilise their suspension in solvents/polymeric matrices provides an attractive
optimisation step towards improved nanocomposite properties. As discussed in section
4.1.2.2 and 4.1.2.3, the functional groups can not only influence the mechanical properties
of the composites but also, they have a significant impact on electrical properties. The
percentage loading of CNT and the aspect ratio of the nanotubes can also play a significant
role in electrochemical properties. This chapter investigates the optimisation of
electrochemical behaviour of the MNA’s in relation to the factors described above; as shown
in the schematic in Figure 5.1.
Figure 5.1. Schematic of investigation. Sonication parameters will be optimised initially. These parameters will be applied to the surfactant work and if successful, the developed method will be translated to produce nanocomposite MNA’s using MWCNT’s with different functional groups. Each process will be compared against the base MNA (i.e. 6 wt% bath sonicated).
131
A brief discussion concerning the specifics of each these aspects is given in the following
subsections.
5.1.1 Optimisation of sonication parameters
Although nanocomposites are extensively researched, evaluation of their final
properties have given results far off the theoretical predictions210. Central to this issue is
effective dispersion of the CNT’s in the nanocomposites. This is often achieved through high
energy sonication, however a consensus on the parameters used has not been reached. This
is largely due to the fact that, the sonication parameter needs to be optimised for the type
and aspect ratio of the CNT, and most of the studies claiming effective dispersions are based
on qualitative observation through SEM and TEM211,212. Composite processing requires
careful monitoring of the CNT dispersion during the fabrication process and this is often met
with challenges due to the limitations associated with appropriate instrumentations and the
reliability of existing methods213. Consequently, the sonication parameters applied by the
researchers have varied significantly.
Effective dispersion of CNT is dependent on the following conditions: (1) the energy
supplied to impart shear stress via the medium used (i.e. solvent) must be greater than the
binding energy holding the aggregates together and (2) the supplied energy must be lower
than that required to break the CNT’s, therefore retaining their structure156. Though bath
sonicators can be used adequately to produce good dispersion as seen in the previous chapter,
they are inefficient for industrial applications due to the long processing times and the
uneven spread of ultrasonic energy throughout the sonic bath. The energy required varies,
depending on the type of the nanotubes (SWCNT > MWCNT), the diameter of the nanotubes
(larger diameters requiring less energy) and the functional groups present (reduces the
energy required)214. With the aid of surfactants, the energy required can be as high as 50,400
J.ml-1 if SWCNT’s with low diameters are used, whereas for MWCNT’s it can be as high as
8,228 J.ml-1; with a sonication time of 120 mins in both cases215,216. Standard lab based
sonicators operate at 20 – 37 kHz with a power output up to 280 W208. In comparison,
commercial probe sonicators has a variable amplitude setting from 1 – 100% and the power
adjusts between 100 – 1500 W217. By design, the probes are attached to a base unit which
propagates energy down to a tapered tip, with a base dimeter ranging from 1.6 – 25.4 mm,
depending on the volume to be processed. Consequently, the energy dissipates at high
132
intensity from the tip of the probe. However, the probe sonicators can generate heat rapidly,
so there is a need for the sample to be kept cold. Recent research using probe type sonicators
have shown that the time required for dispersion can be reduced to as little as 8 mins
depending on the amplitude settings218.
5.1.2 Surfactants
Surfactants are amphiphilic molecules (containing both polar and non-polar groups),
that adsorb at the interface between bulk immiscible phases, (i.e. solution and particles in
this case) to reduce the surface tension219. The polar head group constitutes the hydrophilic
component, while the tail groups are the hydrophobic regions. They are classified as anionic,
cationic or non-ionic based on the charge on their head groups. The two characteristics
behind their utilisation as stabilising agents for colloidal dispersions is associated with
adsorption at the interface and self-accumulation into supramolecular structures220. This in
turn is governed by the characteristics of the particles, the surfactant molecules and the
solvent220. For ionic surfactants, their adsorption is based on coulombic interactions between
the charges on the head group and the solid surface. Non-ionic surfactants on the other hand,
adsorbs via strong hydrophobic interactions between the solid surface and the hydrophobic
tail. Ultimately, the non-covalent interaction with surfactants allows preservation of the
dispersion state for a long period of time.
Stabilisation mechanism
In a typical process, the high local shear forces created by ultrasonication begins to the
exfoliate the CNT bundles; creating gaps and spaces for the adsorption of surfactant
molecules which ultimately propagates along the length of the CNT’s and separates them
into individual tubes in an unzipping mechanism221. These dispersions are stabilised by
electrostatic or steric repulsion for ionic and non-ionic surfactants, respectively. The
surfactants can adsorb on the surfaces of the CNT’s in a number of ways, with their head
down or tail down and as a monolayer or a multilayer222. Once the surfactant is adsorbed on
to the CNT surface, they can self-organise to form micelles at concentrations above the
critical micelle concentration (CMC)220,222. This self-organisation on the CNT surface can
be in a specific format i.e. perpendicular orientation, parallel or perpendicular half cylinder
orientation along the tube axis and could also be completely random223. Despite the
intensified research in this area, a definitive mechanism of surfactant arrangement around
133
the nanotubes have not been identified. One of the critical factors that can influence the
mechanism and therefore the dispersion of CNT’s in aqueous media is the concentration of
the surfactants. In general, the surfactant concentration needs to be above the CMC as well
the CNT concentration224,225. When dispersing CNT’s, the CMC is thought to be higher than
in neat surfactants, because a certain amount of surfactants will ready adsorb on to
nanotubes226. However, recent studies have suggested that, the surfactant concentration used
should be just sufficient to coat the surface of the CNT’s, as any excess amount can in fact
decrease the dispersion of the CNT’s227,228. This is because at high concentrations, the
surfactants form micelles that grow in size, forming multilayers on the CNT surface as the
concentration of the surfactant is increased for the same CNT concentration. This is resultant
of the interaction between groups of the same polarity. Consequently, the part of the
surfactant molecules extending into the liquid phase from the large multilayers can interact
with that of the neighbouring CNT’s227. This form of bridging causes flocculation of CNT’s
and it been found to occur at concentrations typically 10 times higher than the CMC218. Aside
from surfactant concentration, the characteristic structure of each surfactant dictates the
dispersion efficiency. For example, surfactants with separated aromatic ring structures as in
sodium dodecylbenzenesulfonate (SDBS) increases the hydrophobicity and promotes π-π
interactions with the CNT surface; resulting in stronger binding and higher dispersion
efficiency. Similarly, as the alkyl chain length increases, so does their hydrophobicity and
resultantly, the surfactant tendency to adsorb onto CNT surfaces220,222. This increases
dispersion efficiency. Generally, when the aromatic ring factor and the alkyl chain length
factor compete, the surfactants with the former dominates227. There are exceptions, however.
For example, although cetylpyridinium chloride (CPyCl) has an aromatic ring, it is less
efficient than SDBS because of its polar head group possessing a cationic charge218.
Although research into surfactant aided dispersion and stabilisation is well established
for water-soluble systems as above; more work is being increasingly carried out for
dispersions in organic solvents, having recognised the potential for easily processed
multifunctional polymeric nanocomposites. Organic solvent-based systems are different to
water-based systems in the sense that, CNT’s are wetted by the solvents and are less likely
to self-assemble into aggregates220,222. However, as seen in the results from the previous
chapter (section 4.4.2), a combined approach that had involved sonication in an organic
solvent still produced an aggregated sample. The dispersion maybe improved to a certain
134
extent by moving from a bath type sonicator to that of a sonic probe, but it may still be
inadequate. This is highlighted by the fact that in aqueous surfactant solutions, the maximum
CNT loading that can be dispersed effectively is only 1.4 wt%229 and the developed
nanocomposite MNA’s have a CNT loading of 6 wt%. Therefore, by implementing an
approach that involves f-MWCNT’s being dispersed in an organic solvent (chloroform) that
contains a high efficiency surfactant might help disperse a higher volume fraction of CNT.
The choice of the surfactant must not only be concerned with dispersion efficiency but
should also not limit the final functional properties of the nanocomposites. Most of the
studies of the sort are directed towards improvement in thermo-mechanical properties of the
composites222. With regards to the development of polymeric nanocomposites by solvent
processing, typically non-ionic surfactants are used (i.e. Titron X-100, Tergitol NP-7,
Polyoxyethlene lauryl, Span 85 (sorbitan trioleate) because of their excellent dispersive
properties and in all cases improved mechanical properties have been reported at low CNT
loadings230–233. Some promising results have also been reported in these studies for
conductivity. However, at high concentration of the surfactant, the percolation threshold had
increased, and a poor conductivity have been observed. This is resultant of the long
hydrophilic tail and the bulky character of the non-ionic surfactant, that increases the
distance between tubes, resulting in a lack of contact222. Sun et al., employed a gemini
surfactant, 6,6-(butane-1,4-diylbis(oxy))bis(3-nonylbenzenesulfonic acid) to disperse
MWCNT’s in toluene and subsequently develop nanocomposites with polystyrene (PS)
matrices224. They showed that, with the addition of this surfactant, conductivity can be
increased up to 800 times when compared to neat PS/MWCNT matrix. Conventional anionic
and cationic surfactants have also been utilised to produce nanocomposites, however similar
to that of the non-ionic surfactants it is not obvious whether a composite with perfectly
dispersed CNT’s will reduce the percolation threshold, resulting in enhanced
conductivity222,234. As described before, the characteristics of the surfactants will play a
crucial role alongside their respective concentrations. It has been postulated that a dynamic
equilibrium exists between adsorbed and free surfactants in the dispersions that is sensitive
to the surfactant concentration235. The excess surfactants are difficult to remove and once
processed it severely impairs the performance of the composites/devices. Considering this
issue, a key factor that can be manipulated is the Krafft temperature (TK), the minimum
temperature at which surfactant forms micelles. Using the cationic surfactant
135
cetyltrimethylammonium bromide (CTAB – a cationic surfactant) as an example, it has been
recently shown that when processing the surfactant solution below its TK, micelle formation
can be supressed completely and only a fraction of the surfactant can remain in the solution
below the CMC228. The excess can be precipitated out as crystalline needles by
centrifugation or standing the solution at temperatures less than TK. This critically solves the
issue of finding an optimal surfactant to CNT ratio, as irrespective of the concentration of
surfactant used, no additional surfactant remains in solution than what is required for
dispersing and stabilising the suspension. Aside from this, the study also pointed to better
exfoliation of the nanotubes below their TK. This offers an attractive strategy for processing
nanocomposites, without the negative impact of the surfactants.
Characterisation of CNT dispersion
Analysing the quality of dispersion whilst processing plays a significant role in the
optimisation process. Commonly, researchers have employed a combination of methods to
assess various aspects of dispersion. This involves particle or CNT cluster size analysis, Zeta
potential (ζ) measurements and UV-Vis absorbance readings. Characterisation of CNT
suspension by particle size analysis based on dynamic light scattering (DLS) techniques have
been used extensively in the literature. However, they assume the particles as spherical in
shape, and report an average value based on hydrodynamic diameter that are in the
micrometre range213. However, without proper dispersion and stabilisation (resulting in
particle sedimentation); it is difficult to estimate the particle size in a dispersion with
accuracy. ζ potential is the potential difference between the mobile dispersion medium and
the stationary layer of dispersion media attached to the particle236. Cationic surfactants will
have a positive potential, whilst a negative potential can be found for anionic surfactants. In
principle, a large ζ potential is an indicator of the binding strength of surfactants, and
particles coated with surfactants with a magnitude of change > 30 mV reflects long-term
kinetic stabilisation218. As ζ potential scales with the amount of surfactant adsorbed on to the
dispersed particles, it is a useful way of analysing the effect of different concentrations222.
Another measure of assessing dispersion quality is by UV-Vis-NIR spectroscopy. Unlike
bundled CNT’s, dispersed nanotubes are highly active in the 200 – 1200 nm wavelength
region due to 1D van Hove singularities and hence UV-Vis can be applied to detect
individual particles by relating the specificity of absorption at a given wavelength to that of
136
the concentration of the nanotubes213. Studies employing this approach have evaluated
multiple positions on the spectra, however the absorption spectra for MWCNT with
individualised CNT’s exhibit a specific peak between 250 – 265 nm, which has been
successfully utilised in many studies to quantitatively assess the amount of dispersed
CNT’s237–239.
Electrochemical behaviour
Several authors have reported the benefits of using surfactants in electrochemical
reactions. Hoyer et al., reported that the addition of cationic surfactants cetyl trimethyl
ammonium chloride (CTAC) and cetyl pyridinium chloride (CPyCl) into the electrolyte
solution forming micellar media can significantly reduce electrode fouling during the
voltammetric detection of serotonin by preventing the adsorption of its oxidation products
on to the electrode surface through electrostatic repulsion240. This effect can indeed be
translated to surfactant modified electrodes. Carmen et al., showed that carbon paste
electrodes (CPE’s) modified by anionic surfactants at the submicellar concentrations can
increase redox behaviour and the reversibility of the electrode processes towards epinephrine
and norepinephrine241. Whereas, CTAC modified electrodes could effectively stabilise
electrochemical reaction intermediates for homovanillic acid, which proved to be an
excellent strategy for studying their reaction mechanisms241. More recent research has shown
that CTAB-modified GCE’s increase the rate of oxidation and reversibility of the
electrochemical process for routine monitoring of a therapeutic drug, 6-Mercaptopurine for
the treatment of acute lymphocytic leukaemia; whilst it also enhanced stability, sensitivity
and selectivity towards the determination of a toxic drug 4-aminoantipyrine242,243. These
results ultimately signify the utility of surfactants from an application perspective.
5.1.3 MWCNT functional and structural evaluations
The effect of different functional groups was briefly summarised before under
appropriate sections (4.1.2.2 and 4.1.2.3). In this chapter, -COOH, -NH2 and -N2 functional
groups on the MWCNT were compared for their mechanical properties and electrochemical
behaviour. Functionalisation of MWCNT’s with –N2 induces pyridinic and pyrrolic
functionalities, which increase the specific capacitance of the electrodes, while the
quaternary nitrogen and pyridinic-N-oxide improve the electron transfer processes
associated with the reversibility of redox processes at the electrode surface244. Hence, N2-
137
functionalised MWCNT’s may possess superior electrochemical properties when compared
with the other surface functional groups. Alongside these investigations, the influence of
varying length and diameters of MWCNT’s on MNA fabrication, mechanical and
electrochemical properties were further investigated.
138
5.2 Aims and objectives
This chapter aims to investigate multiple aspects associated with optimising the
electrochemical behaviour of MNA electrodes. These include optimising the dispersion of
f-MWCNT’s by improving the sonication conditions and by the incorporating of surfactants.
These optimisations were carried out using the developed composition for MNA’s, i.e. 6
wt% f-MWCNT. Additionally, the influence of different functional groups, alongside
varying dimensional parameters of MWCNT’s were addressed in terms of MNA fabrication,
mechanical and electrochemical properties.
The objectives of this chapter are to:
1. Quantitatively determine an optimal time of sonication for dispersing the
nanotubes and investigate the improvements in mechanical and electrochemical
properties.
2. Using the optimised sonication parameter, analyse the influence of two cationic
surfactants: (1) CTAB and (2) CPyCl on mechanical and electrochemical
properties of the MNA.
a) Analyse CNT dispersion above and below the TK of the surfactants.
b) Evaluate different concentrations of the surfactants
3. In relation to differing dimensional parameters and functional groups on MWCNT:
a. Assess the limit of fabrication using –N2, ‒NH2, ‒COOH functional
groups with differing dimensional parameters. For ease of comparison,
existing ‒COOH functionalised MWCNT’s with a length (l) of 10 –
30 µm and outer diameter (O.D) of 20 – 30nm, was compared against
all other functional groups with a l of 1 – 12 µm and O.D < 20 nm
(including a shorter version of ‒COOH functionalised MWCNT’s)
b. Optimise the processing conditions to address the fabrication limit.
c. Compare mechanical and electrochemical behaviour.
139
5.3 Materials and methods
5.3.1 Optimisation of dispersion by sonic probe
In this chapter, the bath sonicator was substituted for an advanced probe type sonicator
(model: Q705, Fisherbrand™, Loughborough, UK) using a solid 12.7 mm diameter probe,
operating at a power output up to 700 W and a frequency of 20 kHz. Optimisation of the
sonication assisted dispersion was carried out using the previously established composition,
i.e. 6 wt% f-MWCNT/PLA (referred to as base MNA’s here in). In order to keep the sample
cold whilst sonicating, an ice bath prepared from dry ice and acetonitrile was used. The sonic
probe was inserted half way to ensure even circulation of the sonication energy, with its
intensity set at 100% amplitude. The sonication energy was delivered in pulses of 20 sec
with a 30 sec rest period in between to further prevent overheating. Different sonication
times was applied ranging from 2 – 20 mins and the dispersion efficiency was monitored
immediately using a UV-Vis spectrometer (Lambda 45, Perkin Elmer, UK) and laser
diffraction particle size analyser (Mastersizer 3000, Malvern Instruments, Ltd, UK)
equipped with a dispersion unit. For UV-Vis analysis, the original samples were diluted by
a factor of 2000 in ice cold chloroform and a wavelength scan performed in triplicates
between 240 – 700 nm at 240 nm/s for three independent samples. For particle size analysis,
the parameters inputted into the software were: refractive index of 2.5, absorptive value was
0.99 and a density of 2.6 g.cm-3. To carry out the measurements, a 20 µl aliquot was added
to the dispersion unit, which was set at 1500 rpm, containing 50 ml of chloroform. The
dispersion unit kept the sample suspended and homogenised, that is, continually circulated
around the measurement zone. This gave reliable measurements of particle size, as the
dispersion had not been stabilised by surfactants at this stage. The measurements were
completed in triplicates using three independent samples. Nanocomposite MNA’s were
fabricated using the composites prepared with different sonication times (i.e. 2, 4, 8, 12, 16
and 20 mins) and evaluated for their mechanical strength (section 5.3.4) and electrochemical
behaviour (section 5.3.5). Thus, correlating the characterisation results with physical data.
5.3.2 Surfactant assisted dispersion
Using the optimal sonication time (i.e. 3 mins), the dispersion efficiency of two
cationic surfactants, CTAB and CPyCl; was analysed. They were chosen based on their
140
dispersive character and electrochemical behaviour. Initially, the effect of TK on the
dispersion of ‒COOH functionalised MWCNT was analysed. The TK of both surfactants
were 25°C. The aforementioned dry ice bath (section 5.3.1) was sufficient to keep the
temperature between below 5°C. To maintain the temperature between 25 – 30°C, a standard
ice bath was utilised, and the pulse period was shortened to 10 sec, with a longer rest period
of 1 min. For analysis, UV-Vis was utilised as before (section 5.3.1), whilst particle size
analysis and measurement of ζ potential were completed using dynamic light scattering
(DLS, Zetasizer Nano, S90, Malvern Instruments, Ltd, UK); as the solution was now
stabilised with surfactants. For particle size analysis and ζ potential measurements the
inputted software parameters were the same as for the Mastersizer (section 5.3.1), however,
the temperature was adjusted to 5°C and 25°C for measurements above and below the TK.
A 12 mm O.D. glass cell was used for particle size analysis and for ζ potential measurements
a gold-plated-electrode capillary cell (DTS1070, Malvern Instruments, Ltd, UK) was
inserted into the aforementioned glass cell. Here, the samples were diluted as described
previously for UV-Vis analysis (section 5.3.1). The concentration of both surfactants used
here was 10 mM.
Following the determination of temperature effects on CNT exfoliation and
stabilisation, the influence of different concentrations was analysed (i.e. 1, 5, 10 and 15mM)
at the optimum temperature (0 – 5°C) to determine an optimal amount of surfactant for
effective dispersion of CNT’s. Analysis of dispersion efficiency for each surfactant
concentration was analysed as before using UV-Vis, particle size and ζ potential
measurements. Nanocomposites were then prepared using the different surfactant
concentrations and assessed for their mechanical and electrochemical behaviour.
5.3.3 Evaluating length and functional groups
In addition to the long (l = 10 – 30 µm, O.D = 20 – 30 nm) ‒COOH functionalised
MWCNT’s used to fabricate the base MNA’s, shorter versions of the nanotubes (l = 1 – 12
µm and O.D < 20 nm) with same and different functional groups (i.e. –COOH, –N2, ‒NH2),
were used to analyse the influence of MWCNT dimensions and functional groups on the
mechanical strength and electrochemical behaviour of the nanocomposite MNA’s. As initial
characterisation, the limit of fabrication was assessed by determining the maximum CNT
loading that can be incorporated with the optimised sonication parameters to produce
141
nanocomposite MNA’s using the shorter nanotubes with different functional groups (i.e.–
N2, ‒NH2, ‒COOH). From this characterisation, it was obvious that ‒NH2- and ‒N2-
functionalised MWCNT’s required a larger volume of chloroform to promote their
dispersion. Therefore, the effect of lowering the concentration from 0.5 wt% to 0.1 wt% and
0.05 wt% on the dispersibility of CNT’s was investigated for all compositions including the
long ‒COOH functionalised MWCNT’s at equivalent loadings. The dispersion efficiency
was quantified in terms of particle size analysis and UV absorbance as detailed in section
5.3.1. Using the optimal concentration (i.e.0.05 wt%), the fabrication limit was re-evaluated
and the MNA’s thus developed were assessed for their mechanical properties and
electrochemical behaviour (section 5.3.4 and 5.3.5).
5.3.4 Mechanical characterisation
The AFS and SFS of the MNA’s were evaluated for mechanical characterisation as
previously described (section 3.3.3) using a Texture analyser (TA).
5.3.5 Electrochemical characterisation
Using the three-electrode set-up as described in section 4.3.4, initial characterisation
was carried out by analysing the cyclic voltammetric (CV) response of the nanocomposite
MNA’s towards 1mM potassium ferrocyanide (Fe(CN)6) in 1M potassium chloride (KCl),
across a potential window of 0 – 1V. The electrochemical response was analysed in terms of
conductance (at a scan rate of 0.01 vs-1), unless otherwise stated. The electrochemical
behaviour for all MNA devices fabricated here was evaluated by amperometry as described
previously (section 4.3.5), using AA as a model analyte to allow effective comparisons.
5.3.6 Statistical analysis
Data were processed in Microsoft Office Excel 2016, analysed using GraphPad Prism
7 (GraphPad Software Inc., USA) and expressed as mean ± standard deviation. Graphing of
electrochemical data was performed using Igor Pro, version 6.0 (WaveMetrics Inc, USA).
Where appropriate, statistical differences between groups were assessed using the two-sided
Student’s t-test, repeated measures and one- or two-way ANOVA with Tukey’s post-hoc test
for pair-wise comparison. Differences were considered statistically significant where P <
0.05.
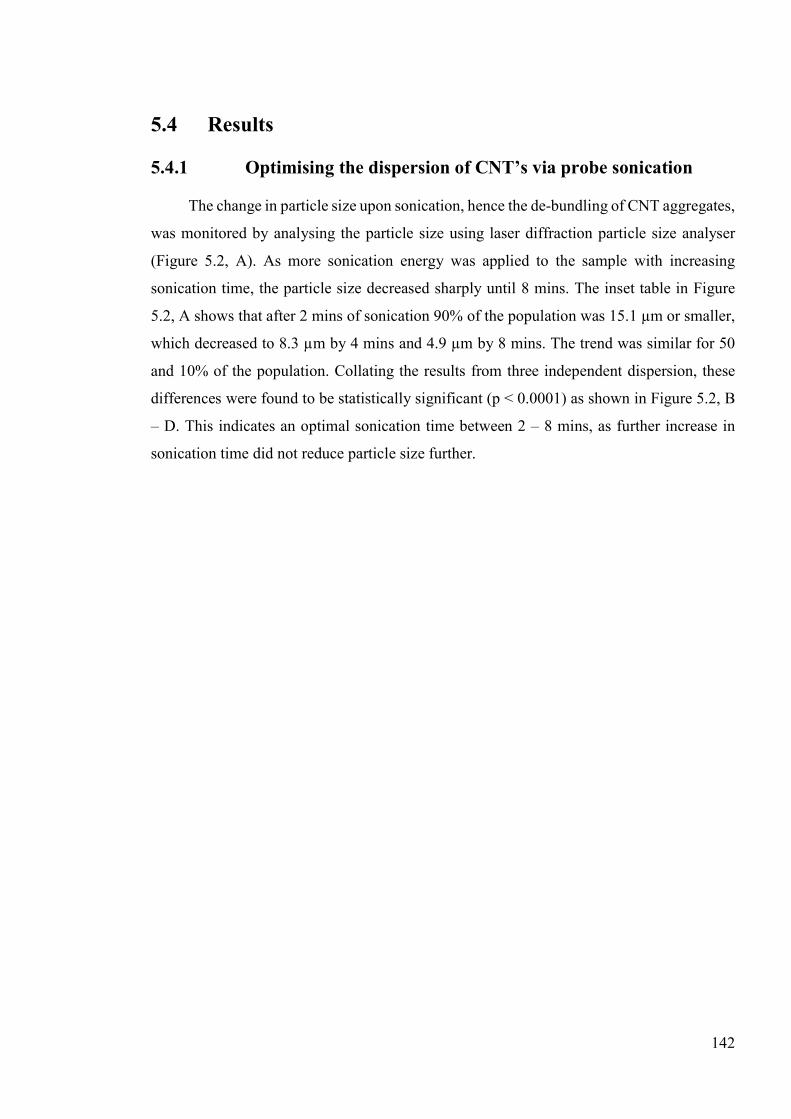
142
5.4 Results
5.4.1 Optimising the dispersion of CNT’s via probe sonication
The change in particle size upon sonication, hence the de-bundling of CNT aggregates,
was monitored by analysing the particle size using laser diffraction particle size analyser
(Figure 5.2, A). As more sonication energy was applied to the sample with increasing
sonication time, the particle size decreased sharply until 8 mins. The inset table in Figure
5.2, A shows that after 2 mins of sonication 90% of the population was 15.1 µm or smaller,
which decreased to 8.3 µm by 4 mins and 4.9 µm by 8 mins. The trend was similar for 50
and 10% of the population. Collating the results from three independent dispersion, these
differences were found to be statistically significant (p < 0.0001) as shown in Figure 5.2, B
– D. This indicates an optimal sonication time between 2 – 8 mins, as further increase in
sonication time did not reduce particle size further.
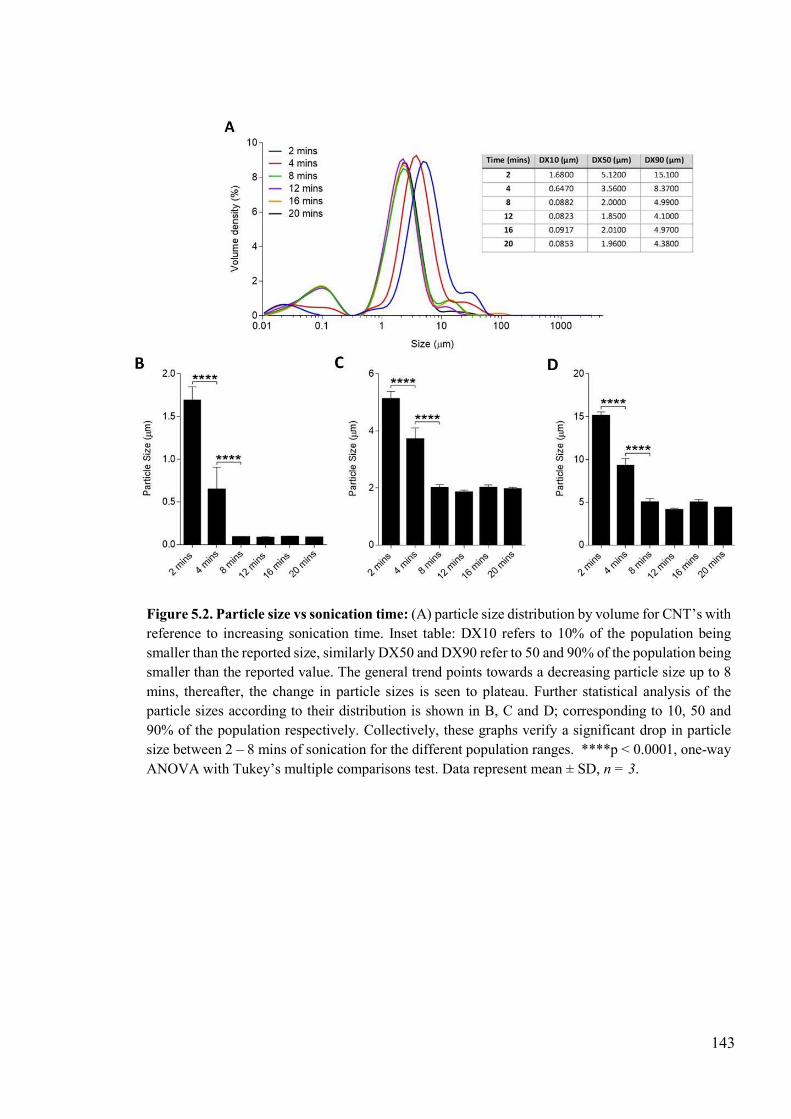
143
Figure 5.2. Particle size vs sonication time: (A) particle size distribution by volume for CNT’s with reference to increasing sonication time. Inset table: DX10 refers to 10% of the population being smaller than the reported size, similarly DX50 and DX90 refer to 50 and 90% of the population being smaller than the reported value. The general trend points towards a decreasing particle size up to 8 mins, thereafter, the change in particle sizes is seen to plateau. Further statistical analysis of the particle sizes according to their distribution is shown in B, C and D; corresponding to 10, 50 and 90% of the population respectively. Collectively, these graphs verify a significant drop in particle size between 2 – 8 mins of sonication for the different population ranges. ****p < 0.0001, one-way ANOVA with Tukey’s multiple comparisons test. Data represent mean ± SD, n = 3.
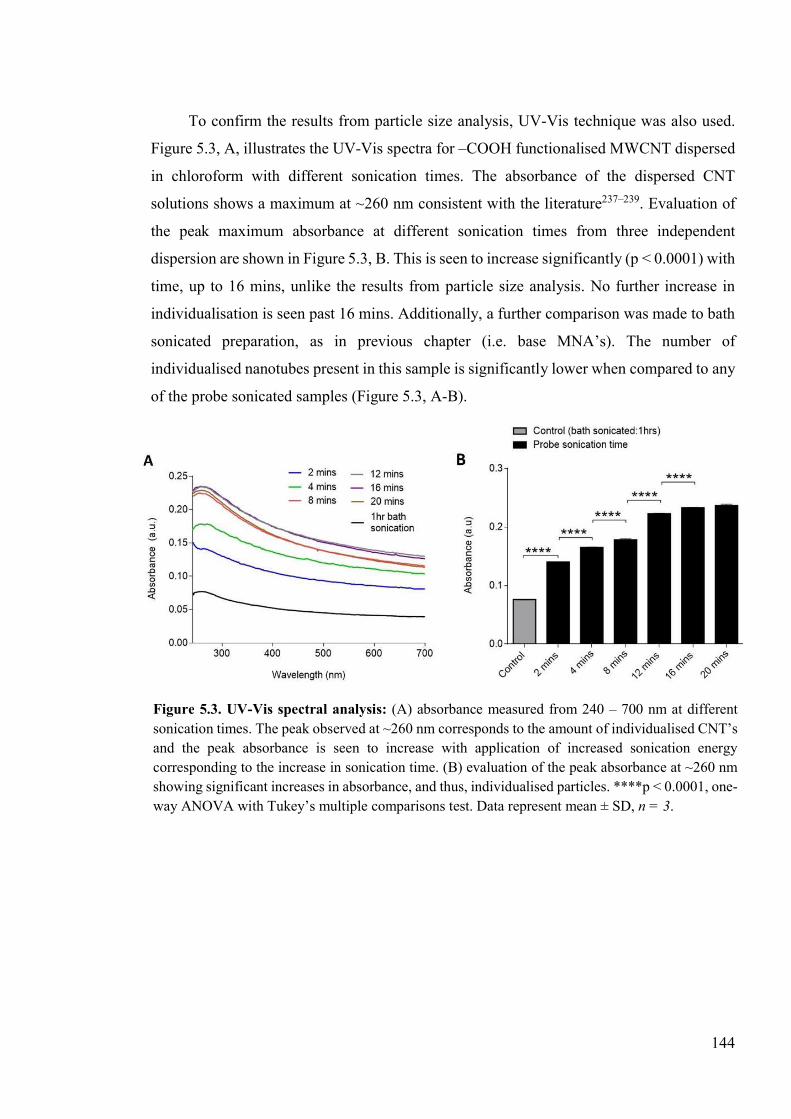
144
To confirm the results from particle size analysis, UV-Vis technique was also used.
Figure 5.3, A, illustrates the UV-Vis spectra for ‒COOH functionalised MWCNT dispersed
in chloroform with different sonication times. The absorbance of the dispersed CNT
solutions shows a maximum at ~260 nm consistent with the literature237–239. Evaluation of
the peak maximum absorbance at different sonication times from three independent
dispersion are shown in Figure 5.3, B. This is seen to increase significantly (p < 0.0001) with
time, up to 16 mins, unlike the results from particle size analysis. No further increase in
individualisation is seen past 16 mins. Additionally, a further comparison was made to bath
sonicated preparation, as in previous chapter (i.e. base MNA’s). The number of
individualised nanotubes present in this sample is significantly lower when compared to any
of the probe sonicated samples (Figure 5.3, A-B).
Figure 5.3. UV-Vis spectral analysis: (A) absorbance measured from 240 – 700 nm at different sonication times. The peak observed at ~260 nm corresponds to the amount of individualised CNT’s and the peak absorbance is seen to increase with application of increased sonication energy corresponding to the increase in sonication time. (B) evaluation of the peak absorbance at ~260 nm showing significant increases in absorbance, and thus, individualised particles. ****p < 0.0001, one-way ANOVA with Tukey’s multiple comparisons test. Data represent mean ± SD, n = 3.
145
To corroborate the dispersion characterisation data with physical electrochemical
measurements from the MNA’s, their response towards 1 mM Fe(CN)6 was evaluated from
the respective CV traces at a potential of 1 V (Figure 5.4). The CV traces are not shown here,
because they are not different to those seen in the previous chapter (section 4.4.4, Figure
4.7); with no redox processes. However, compared to the base MNA, there is a significant
rise in current from 3 to 12 mins. Thereafter (i.e. 16 – 20 mins), the current measured
plateaued. With probe sonication, in comparison to 2 mins, there was a significant rise in
current after 3 and 4 mins of sonication (p < 0.001, p < 0.05; respectively). Interestingly,
there was no significant rise in current between 3 and 4 mins, and nor was there a significant
difference between 4 and 8 mins, in comparison with the results seen from particle size and
UV-Vis analysis. Following the sharp increase in current at 3 mins, the current gradually
decreased with increasing sonication times from 12 to 20 mins (p < 0.05). Notably, the MNA
Figure 5.4. Electrochemical response of the MNA’s towards 1mM Fe(CN)6 after sonication optimisation: shows the current measured at a potential of 1 V from CV traces (not shown). The general trend shows a rise in current with increasing probe sonication time up to 3/4 mins and followed by gradual decline, stabilising until 20 mins. Compared to the base MNA, a significant increase in current can be seen from 3 mins to 12 mins. A significant rise in current is seen between 2 to 3 mins and 2 to 4 mins, but with no difference between 3 and 4 mins. Post 3 minutes, there is a significant drop in current from 12 to 20 mins. *p < 0.05, **p < 0.01, ***p < 0.001, ****p < 0.0001, one-way ANOVA with Tukey’s multiple comparisons test. Data represent mean ± SD, n = 3.
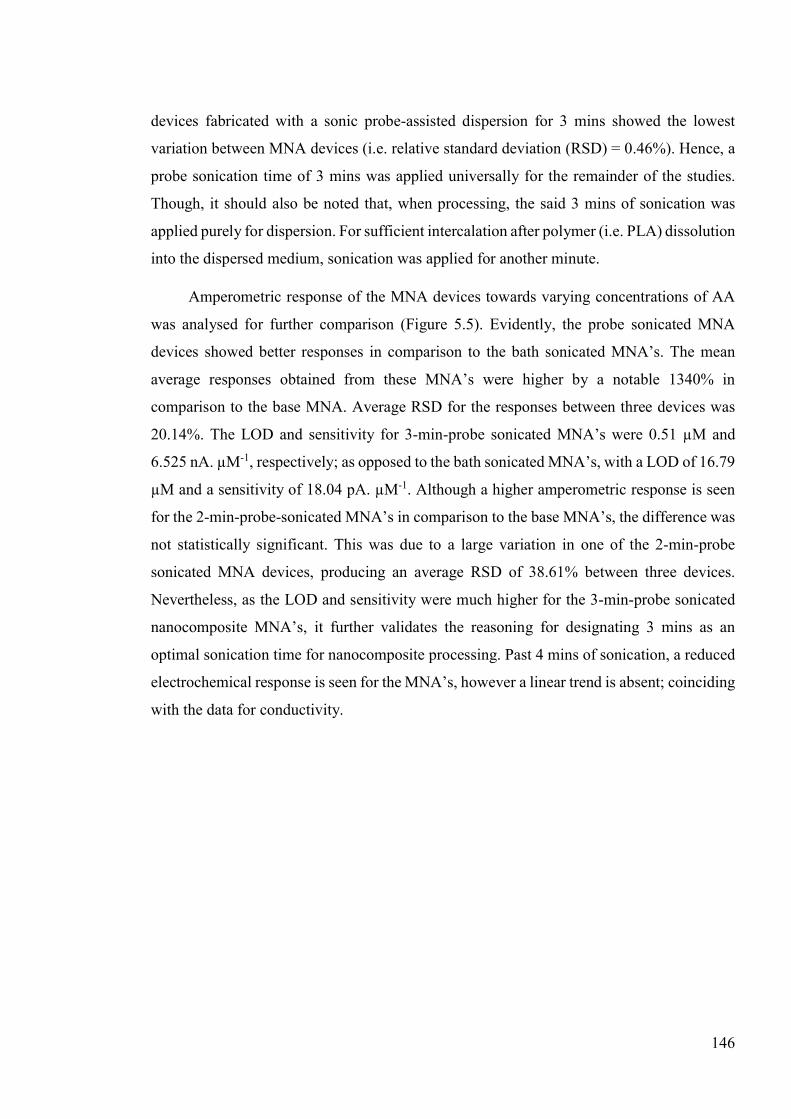
146
devices fabricated with a sonic probe-assisted dispersion for 3 mins showed the lowest
variation between MNA devices (i.e. relative standard deviation (RSD) = 0.46%). Hence, a
probe sonication time of 3 mins was applied universally for the remainder of the studies.
Though, it should also be noted that, when processing, the said 3 mins of sonication was
applied purely for dispersion. For sufficient intercalation after polymer (i.e. PLA) dissolution
into the dispersed medium, sonication was applied for another minute.
Amperometric response of the MNA devices towards varying concentrations of AA
was analysed for further comparison (Figure 5.5). Evidently, the probe sonicated MNA
devices showed better responses in comparison to the bath sonicated MNA’s. The mean
average responses obtained from these MNA’s were higher by a notable 1340% in
comparison to the base MNA. Average RSD for the responses between three devices was
20.14%. The LOD and sensitivity for 3-min-probe sonicated MNA’s were 0.51 µM and
6.525 nA. µM-1, respectively; as opposed to the bath sonicated MNA’s, with a LOD of 16.79
µM and a sensitivity of 18.04 pA. µM-1. Although a higher amperometric response is seen
for the 2-min-probe-sonicated MNA’s in comparison to the base MNA’s, the difference was
not statistically significant. This was due to a large variation in one of the 2-min-probe
sonicated MNA devices, producing an average RSD of 38.61% between three devices.
Nevertheless, as the LOD and sensitivity were much higher for the 3-min-probe sonicated
nanocomposite MNA’s, it further validates the reasoning for designating 3 mins as an
optimal sonication time for nanocomposite processing. Past 4 mins of sonication, a reduced
electrochemical response is seen for the MNA’s, however a linear trend is absent; coinciding
with the data for conductivity.
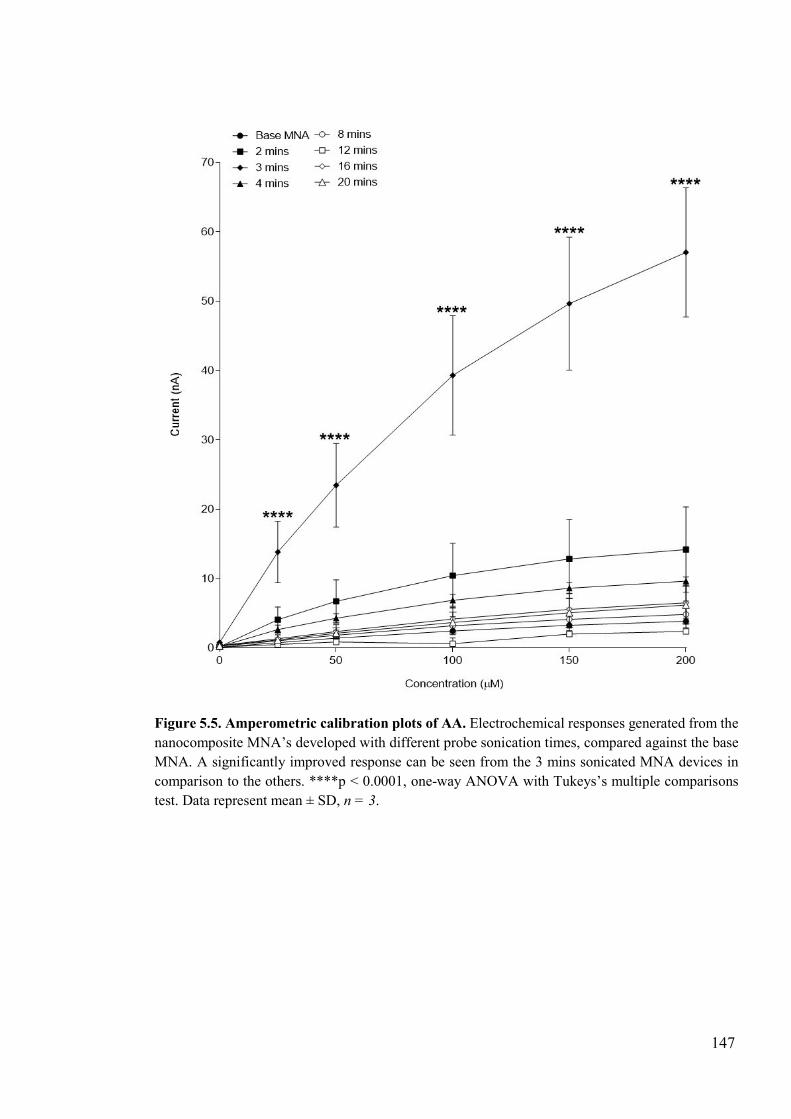
147
Figure 5.5. Amperometric calibration plots of AA. Electrochemical responses generated from the nanocomposite MNA’s developed with different probe sonication times, compared against the base MNA. A significantly improved response can be seen from the 3 mins sonicated MNA devices in comparison to the others. ****p < 0.0001, one-way ANOVA with Tukeys’s multiple comparisons test. Data represent mean ± SD, n = 3.
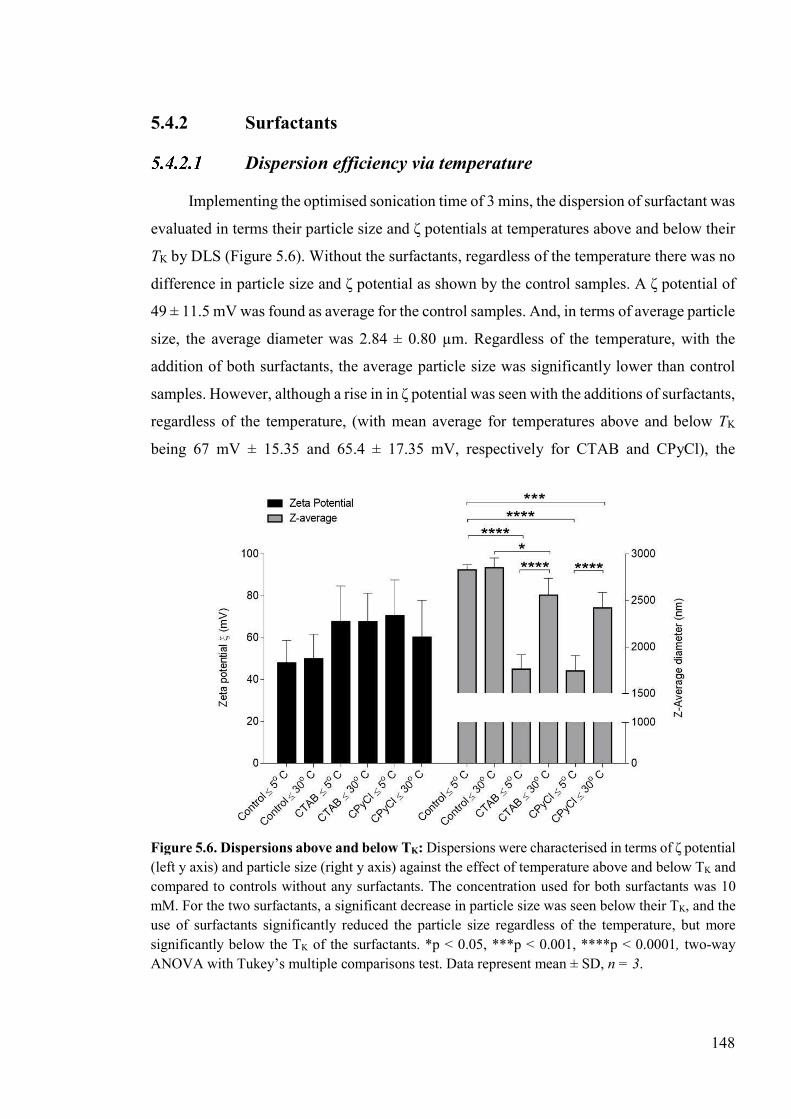
148
5.4.2 Surfactants
Dispersion efficiency via temperature
Implementing the optimised sonication time of 3 mins, the dispersion of surfactant was
evaluated in terms their particle size and ζ potentials at temperatures above and below their
TK by DLS (Figure 5.6). Without the surfactants, regardless of the temperature there was no
difference in particle size and ζ potential as shown by the control samples. A ζ potential of
49 ± 11.5 mV was found as average for the control samples. And, in terms of average particle
size, the average diameter was 2.84 ± 0.80 µm. Regardless of the temperature, with the
addition of both surfactants, the average particle size was significantly lower than control
samples. However, although a rise in in ζ potential was seen with the additions of surfactants,
regardless of the temperature, (with mean average for temperatures above and below TK
being 67 mV ± 15.35 and 65.4 ± 17.35 mV, respectively for CTAB and CPyCl), the
Figure 5.6. Dispersions above and below TK: Dispersions were characterised in terms of ζ potential (left y axis) and particle size (right y axis) against the effect of temperature above and below TK and compared to controls without any surfactants. The concentration used for both surfactants was 10 mM. For the two surfactants, a significant decrease in particle size was seen below their TK, and the use of surfactants significantly reduced the particle size regardless of the temperature, but more significantly below the TK of the surfactants. *p < 0.05, ***p < 0.001, ****p < 0.0001, two-way ANOVA with Tukey’s multiple comparisons test. Data represent mean ± SD, n = 3.
149
difference was not statistically significant when compared to the control samples for both
surfactants. With reference to the temperature, a significant decrease in particle size can be
seen when sonicating below the TK, for both surfactants. The mean difference in particle
sizes were ~795 µm for CTAB and ~677 µm for CPyCl. Between the two surfactants, at a
given temperature there was no significant difference in the particle size of the CNTs. These
results suggest that, sonicating at a temperature below the surfactant TK aids better
exfoliation of CNT’s.
Figure 5.7 reports the polydispersity index (PDI), where values ≤ 0.5 are considered
mono-disperses and ≥ 0.5 are poly-dispersed samples (ISO 22412:2017). Here, the control
samples at both temperatures, as well the surfactants CTAB and CPyCl at 30°C displayed a
PDI of > 0.80, indicative of a wide particle size distribution. However, when the temperature
was below the TK for both surfactants, the PDI was found to be significantly lower at ~0.625
(P < 0.0001), suggesting that the particle size distribution is narrower. These results further
evidence a strong effect of surfactant TK on CNT exfoliation.
UV-Vis absorbance for the surfactant dispersed samples and controls (i.e. without
surfactants) were also measured to further validate the results above (Figure 5.8). From
Figure 5.7. PDI of surfactants at different temperatures against control (i.e. no surfactant): An improved PDI is seen for both surfactants exfoliated below their TK. **p < 0.01, ****p < 0.0001, two-way ANOVA with Tukey’s multiple comparisons test. Data represent mean ± SD, n = 3.
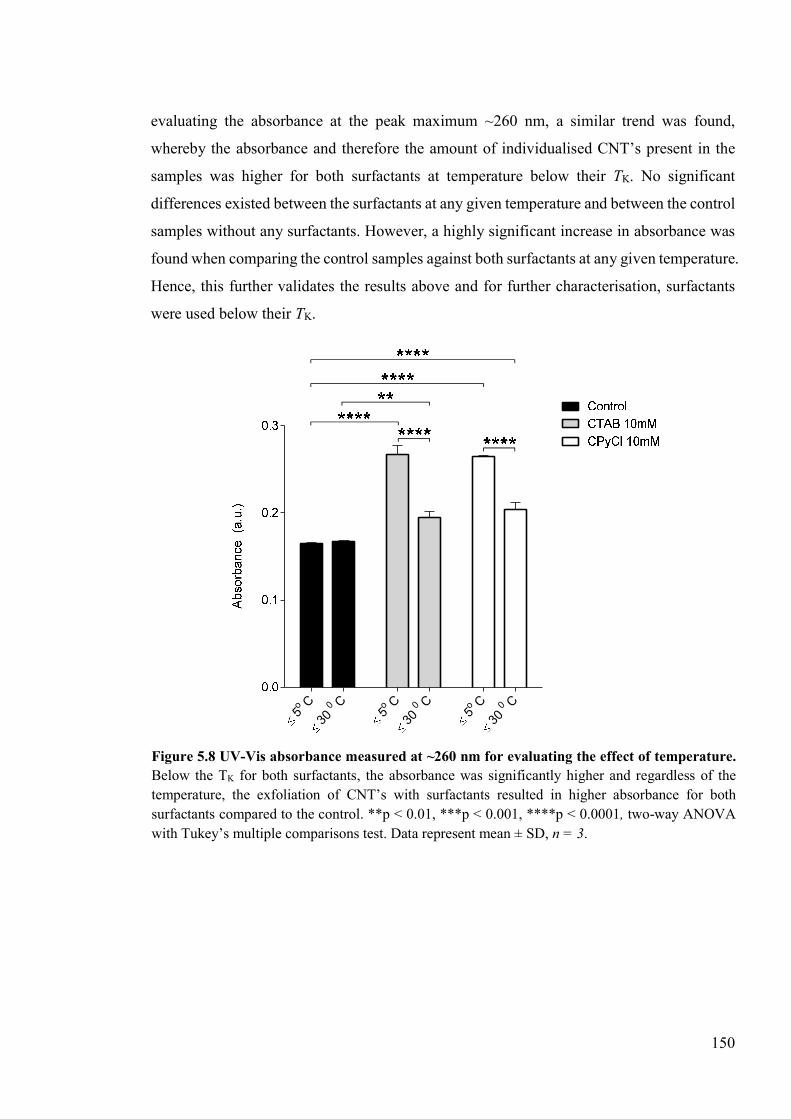
150
evaluating the absorbance at the peak maximum ~260 nm, a similar trend was found,
whereby the absorbance and therefore the amount of individualised CNT’s present in the
samples was higher for both surfactants at temperature below their TK. No significant
differences existed between the surfactants at any given temperature and between the control
samples without any surfactants. However, a highly significant increase in absorbance was
found when comparing the control samples against both surfactants at any given temperature.
Hence, this further validates the results above and for further characterisation, surfactants
were used below their TK.
5o C
30 0 C
5o C
30 0 C
5o C
30 0 C
Figure 5.8 UV-Vis absorbance measured at ~260 nm for evaluating the effect of temperature. Below the TK for both surfactants, the absorbance was significantly higher and regardless of the temperature, the exfoliation of CNT’s with surfactants resulted in higher absorbance for both surfactants compared to the control. **p < 0.01, ***p < 0.001, ****p < 0.0001, two-way ANOVA with Tukey’s multiple comparisons test. Data represent mean ± SD, n = 3.
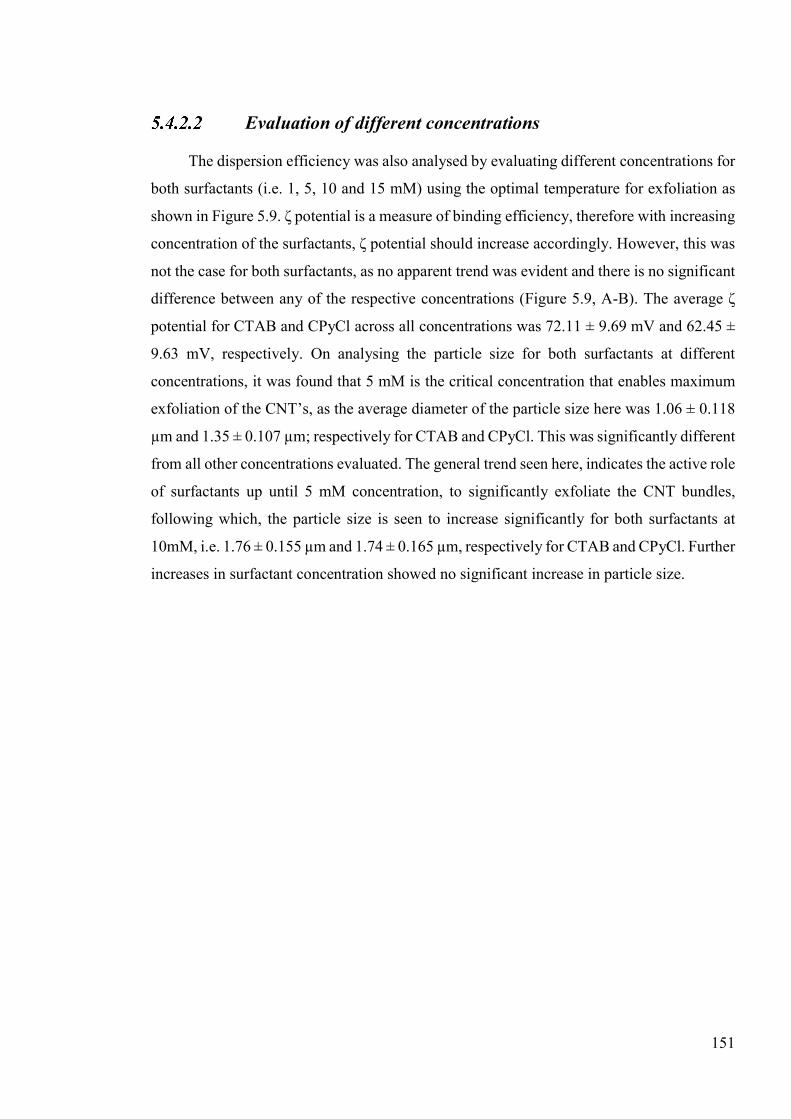
151
Evaluation of different concentrations
The dispersion efficiency was also analysed by evaluating different concentrations for
both surfactants (i.e. 1, 5, 10 and 15 mM) using the optimal temperature for exfoliation as
shown in Figure 5.9. ζ potential is a measure of binding efficiency, therefore with increasing
concentration of the surfactants, ζ potential should increase accordingly. However, this was
not the case for both surfactants, as no apparent trend was evident and there is no significant
difference between any of the respective concentrations (Figure 5.9, A-B). The average ζ
potential for CTAB and CPyCl across all concentrations was 72.11 ± 9.69 mV and 62.45 ±
9.63 mV, respectively. On analysing the particle size for both surfactants at different
concentrations, it was found that 5 mM is the critical concentration that enables maximum
exfoliation of the CNT’s, as the average diameter of the particle size here was 1.06 ± 0.118
µm and 1.35 ± 0.107 µm; respectively for CTAB and CPyCl. This was significantly different
from all other concentrations evaluated. The general trend seen here, indicates the active role
of surfactants up until 5 mM concentration, to significantly exfoliate the CNT bundles,
following which, the particle size is seen to increase significantly for both surfactants at
10mM, i.e. 1.76 ± 0.155 µm and 1.74 ± 0.165 µm, respectively for CTAB and CPyCl. Further
increases in surfactant concentration showed no significant increase in particle size.

152
Figure 5.9. Evaluating different concentrations of surfactants: Dispersions characterised in terms of ζ potential (left y axis) and particle size (right y axis). (A) CTAB at different concentrations, no significant increase in ζ potential was found with the rise in concentration, however for particle size, there is a significant decrease in particle size at a concentration of 5 mM. (B) CPyCl shows a similar trend, with a significant decrease in particle size at 5mM. *p < 0.05, **p < 0.01, ***p < 0.001, ****p < 0.0001, two-way ANOVA with Tukey’s multiple comparisons test. Data represent mean ± SD, n = 3.
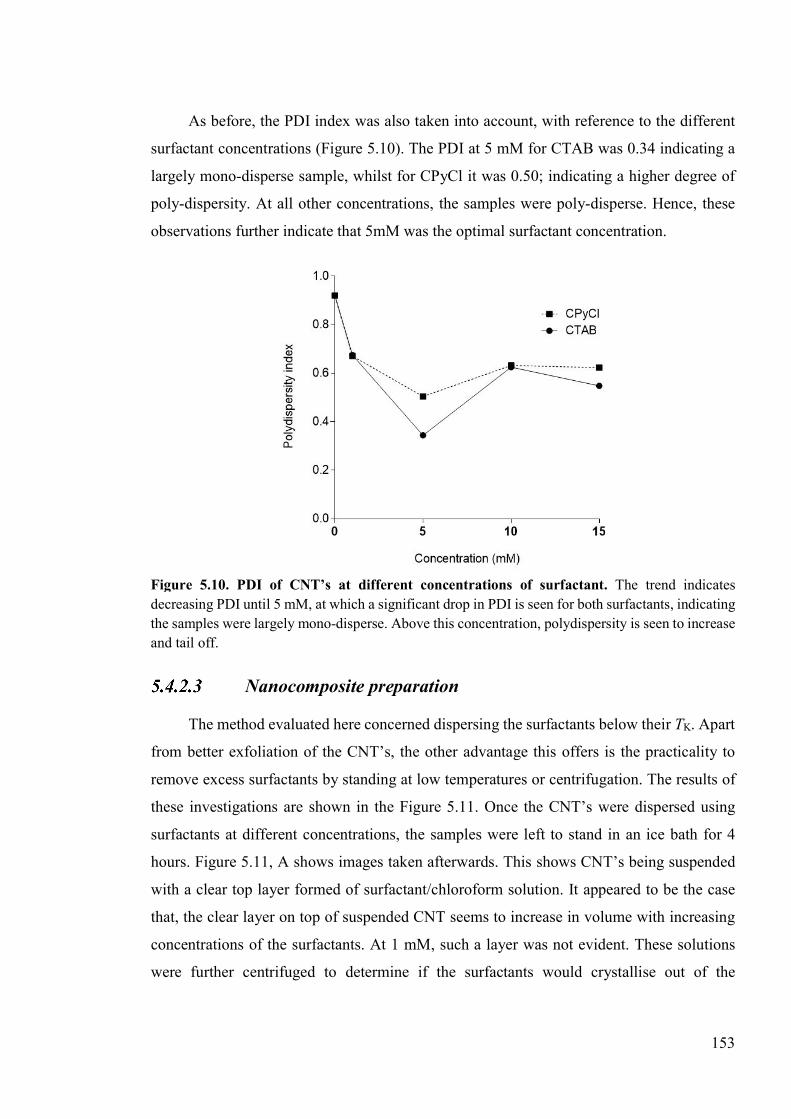
153
As before, the PDI index was also taken into account, with reference to the different
surfactant concentrations (Figure 5.10). The PDI at 5 mM for CTAB was 0.34 indicating a
largely mono-disperse sample, whilst for CPyCl it was 0.50; indicating a higher degree of
poly-dispersity. At all other concentrations, the samples were poly-disperse. Hence, these
observations further indicate that 5mM was the optimal surfactant concentration.
Nanocomposite preparation
The method evaluated here concerned dispersing the surfactants below their TK. Apart
from better exfoliation of the CNT’s, the other advantage this offers is the practicality to
remove excess surfactants by standing at low temperatures or centrifugation. The results of
these investigations are shown in the Figure 5.11. Once the CNT’s were dispersed using
surfactants at different concentrations, the samples were left to stand in an ice bath for 4
hours. Figure 5.11, A shows images taken afterwards. This shows CNT’s being suspended
with a clear top layer formed of surfactant/chloroform solution. It appeared to be the case
that, the clear layer on top of suspended CNT seems to increase in volume with increasing
concentrations of the surfactants. At 1 mM, such a layer was not evident. These solutions
were further centrifuged to determine if the surfactants would crystallise out of the
Figure 5.10. PDI of CNT’s at different concentrations of surfactant. The trend indicates decreasing PDI until 5 mM, at which a significant drop in PDI is seen for both surfactants, indicating the samples were largely mono-disperse. Above this concentration, polydispersity is seen to increase and tail off.
154
suspension and settle to the bottom of the container. However, as shown in Figure 5.11, B,
the CNT’s themselves sedimented after centrifugation and this occurred regardless of
whether the dispersion was carried out above or below the TK.
Despite these results, nanocomposites were processed at 6 wt% CNT loading at all
concentrations from both surfactants. However, whilst attempting to develop MNA’s by
manual compression moulding, only the composites made with 1 mM concentration for both
surfactants could be fabricated into MNA’s. At the remaining concentrations, MNA’s
formed were found to be brittle; as they could not be ejected from the micromould with the
microneedles intact. Therefore, the MNA’s incorporating 1 mM concentration of the
surfactant was used for characterisation of their mechanical and electrochemical properties.
Figure 5.12 shows evaluation of the AFS and SFS for the surfactant incorporated
microneedles, compared against the sonic-probe-optimised MNA and the base MNA. The
AFS and SFS measured for the probe-optimised MNA’s showed no significant improvement
in comparison to the base MNA (Figure 5.12, A-B). The mean axial forces were 1.40 ± 0.18
N for the base MNA and 1.30 ± 0.16 N for the probe-optimised MNA. When compared with
1 mM surfactant incorporated MNA’s, there was no significant difference in AFS for CTAB
with respect to the base or probe-optimised MNA; whereas for CPyCl, the corresponding
AFS was significantly lower compared to the base and the probe-optimised MNA’s (Figure
5.12 A). In addition, the AFS was significantly lower for CPyCl in comparison to CTAB
(mean AFS were 1.31 ± 0.23 N and 1.08 ± 0.13, for CTAB and CPyCl respectively). In
Figure 5.11. Digital photographs of nanocomposite suspensions. (A) Dispersions left to stand below the surfactant TK for 4 hours, showing a clear layer of chloroform/surfactant solution formed on top at higher volumes for increasing surfactant concentrations. (B) When centrifuged, the CNT’s were seen to pellet regardless of the temperature or the surfactant being used.
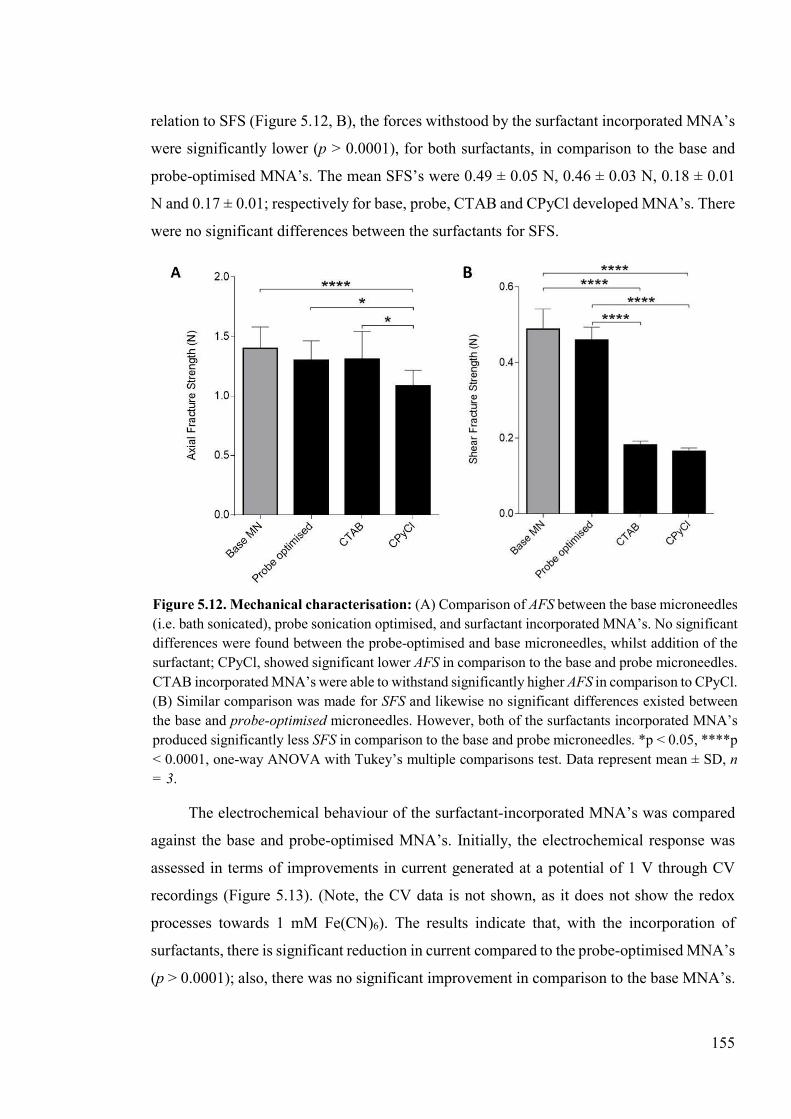
155
relation to SFS (Figure 5.12, B), the forces withstood by the surfactant incorporated MNA’s
were significantly lower (p > 0.0001), for both surfactants, in comparison to the base and
probe-optimised MNA’s. The mean SFS’s were 0.49 ± 0.05 N, 0.46 ± 0.03 N, 0.18 ± 0.01
N and 0.17 ± 0.01; respectively for base, probe, CTAB and CPyCl developed MNA’s. There
were no significant differences between the surfactants for SFS.
The electrochemical behaviour of the surfactant-incorporated MNA’s was compared
against the base and probe-optimised MNA’s. Initially, the electrochemical response was
assessed in terms of improvements in current generated at a potential of 1 V through CV
recordings (Figure 5.13). (Note, the CV data is not shown, as it does not show the redox
processes towards 1 mM Fe(CN)6). The results indicate that, with the incorporation of
surfactants, there is significant reduction in current compared to the probe-optimised MNA’s
(p > 0.0001); also, there was no significant improvement in comparison to the base MNA’s.
Figure 5.12. Mechanical characterisation: (A) Comparison of AFS between the base microneedles (i.e. bath sonicated), probe sonication optimised, and surfactant incorporated MNA’s. No significant differences were found between the probe-optimised and base microneedles, whilst addition of the surfactant; CPyCl, showed significant lower AFS in comparison to the base and probe microneedles. CTAB incorporated MNA’s were able to withstand significantly higher AFS in comparison to CPyCl. (B) Similar comparison was made for SFS and likewise no significant differences existed between the base and probe-optimised microneedles. However, both of the surfactants incorporated MNA’s produced significantly less SFS in comparison to the base and probe microneedles. *p < 0.05, ****p < 0.0001, one-way ANOVA with Tukey’s multiple comparisons test. Data represent mean ± SD, n = 3.
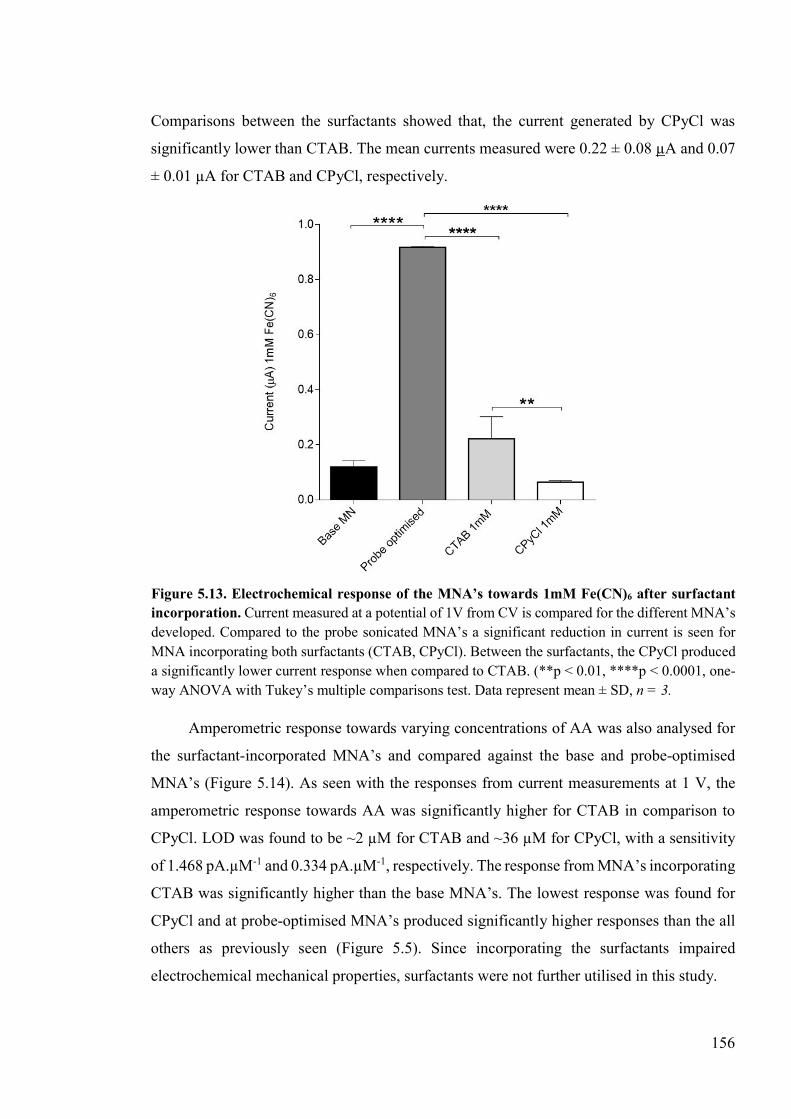
156
Comparisons between the surfactants showed that, the current generated by CPyCl was
significantly lower than CTAB. The mean currents measured were 0.22 ± 0.08 µA and 0.07
± 0.01 µA for CTAB and CPyCl, respectively.
Amperometric response towards varying concentrations of AA was also analysed for
the surfactant-incorporated MNA’s and compared against the base and probe-optimised
MNA’s (Figure 5.14). As seen with the responses from current measurements at 1 V, the
amperometric response towards AA was significantly higher for CTAB in comparison to
CPyCl. LOD was found to be ~2 µM for CTAB and ~36 µM for CPyCl, with a sensitivity
of 1.468 pA.µM-1 and 0.334 pA.µM-1, respectively. The response from MNA’s incorporating
CTAB was significantly higher than the base MNA’s. The lowest response was found for
CPyCl and at probe-optimised MNA’s produced significantly higher responses than the all
others as previously seen (Figure 5.5). Since incorporating the surfactants impaired
electrochemical mechanical properties, surfactants were not further utilised in this study.
Figure 5.13. Electrochemical response of the MNA’s towards 1mM Fe(CN)6 after surfactant incorporation. Current measured at a potential of 1V from CV is compared for the different MNA’s developed. Compared to the probe sonicated MNA’s a significant reduction in current is seen for MNA incorporating both surfactants (CTAB, CPyCl). Between the surfactants, the CPyCl produced a significantly lower current response when compared to CTAB. (**p < 0.01, ****p < 0.0001, one-way ANOVA with Tukey’s multiple comparisons test. Data represent mean ± SD, n = 3.
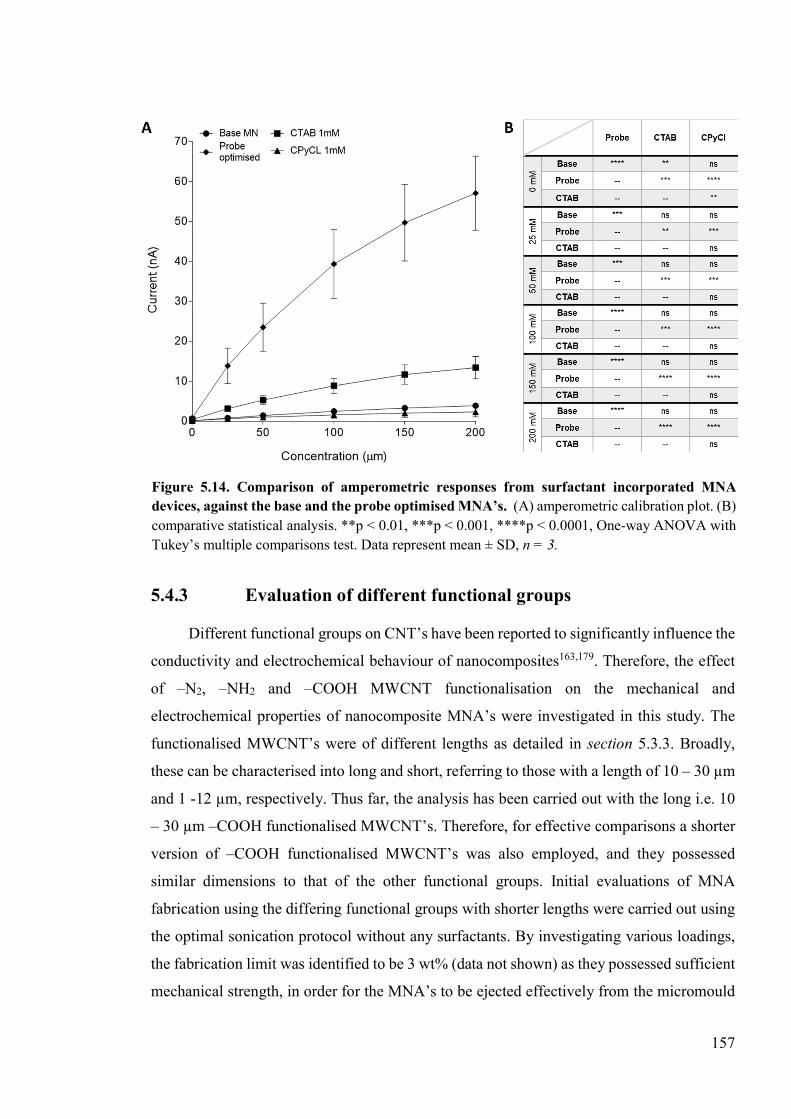
157
5.4.3 Evaluation of different functional groups
Different functional groups on CNT’s have been reported to significantly influence the
conductivity and electrochemical behaviour of nanocomposites163,179. Therefore, the effect
of –N2, ‒NH2 and ‒COOH MWCNT functionalisation on the mechanical and
electrochemical properties of nanocomposite MNA’s were investigated in this study. The
functionalised MWCNT’s were of different lengths as detailed in section 5.3.3. Broadly,
these can be characterised into long and short, referring to those with a length of 10 – 30 µm
and 1 -12 µm, respectively. Thus far, the analysis has been carried out with the long i.e. 10
– 30 µm ‒COOH functionalised MWCNT’s. Therefore, for effective comparisons a shorter
version of –COOH functionalised MWCNT’s was also employed, and they possessed
similar dimensions to that of the other functional groups. Initial evaluations of MNA
fabrication using the differing functional groups with shorter lengths were carried out using
the optimal sonication protocol without any surfactants. By investigating various loadings,
the fabrication limit was identified to be 3 wt% (data not shown) as they possessed sufficient
mechanical strength, in order for the MNA’s to be ejected effectively from the micromould
Figure 5.14. Comparison of amperometric responses from surfactant incorporated MNA devices, against the base and the probe optimised MNA’s. (A) amperometric calibration plot. (B) comparative statistical analysis. **p < 0.01, ***p < 0.001, ****p < 0.0001, One-way ANOVA with Tukey’s multiple comparisons test. Data represent mean ± SD, n = 3.
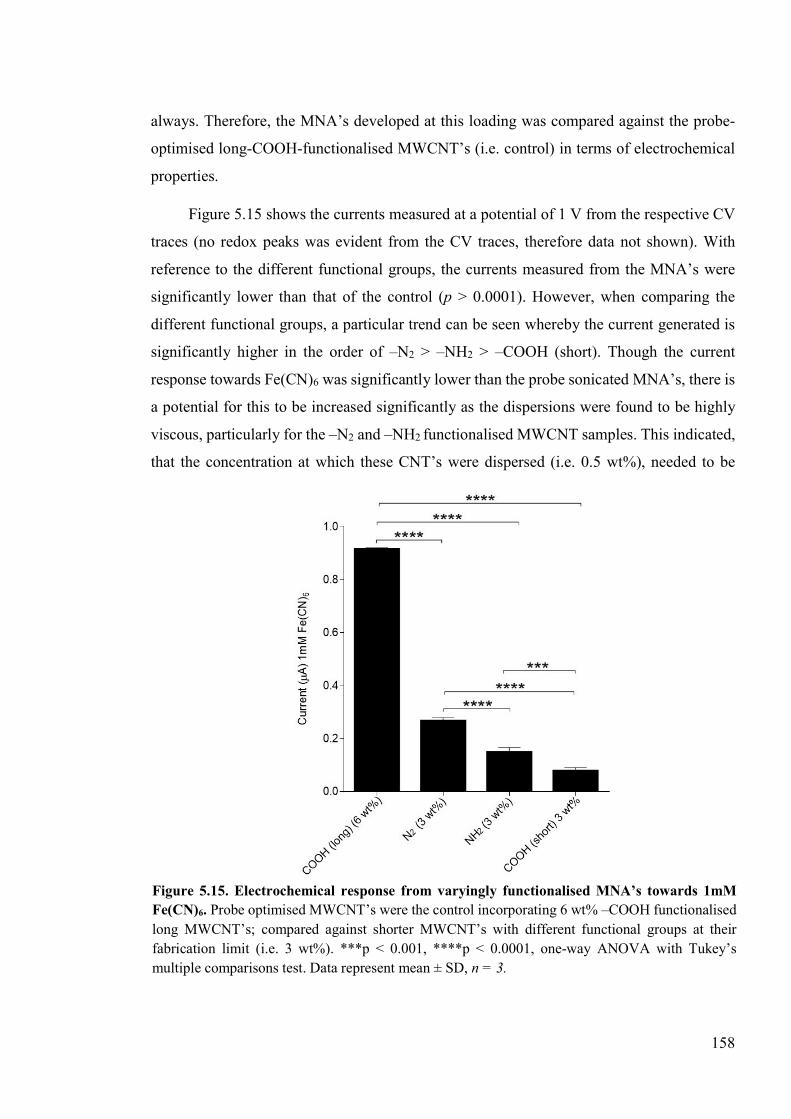
158
always. Therefore, the MNA’s developed at this loading was compared against the probe-
optimised long-COOH-functionalised MWCNT’s (i.e. control) in terms of electrochemical
properties.
Figure 5.15 shows the currents measured at a potential of 1 V from the respective CV
traces (no redox peaks was evident from the CV traces, therefore data not shown). With
reference to the different functional groups, the currents measured from the MNA’s were
significantly lower than that of the control (p > 0.0001). However, when comparing the
different functional groups, a particular trend can be seen whereby the current generated is
significantly higher in the order of ‒N2 > ‒NH2 > ‒COOH (short). Though the current
response towards Fe(CN)6 was significantly lower than the probe sonicated MNA’s, there is
a potential for this to be increased significantly as the dispersions were found to be highly
viscous, particularly for the ‒N2 and ‒NH2 functionalised MWCNT samples. This indicated,
that the concentration at which these CNT’s were dispersed (i.e. 0.5 wt%), needed to be
Figure 5.15. Electrochemical response from varyingly functionalised MNA’s towards 1mM Fe(CN)6. Probe optimised MWCNT’s were the control incorporating 6 wt% ‒COOH functionalised long MWCNT’s; compared against shorter MWCNT’s with different functional groups at their fabrication limit (i.e. 3 wt%). ***p < 0.001, ****p < 0.0001, one-way ANOVA with Tukey’s multiple comparisons test. Data represent mean ± SD, n = 3.
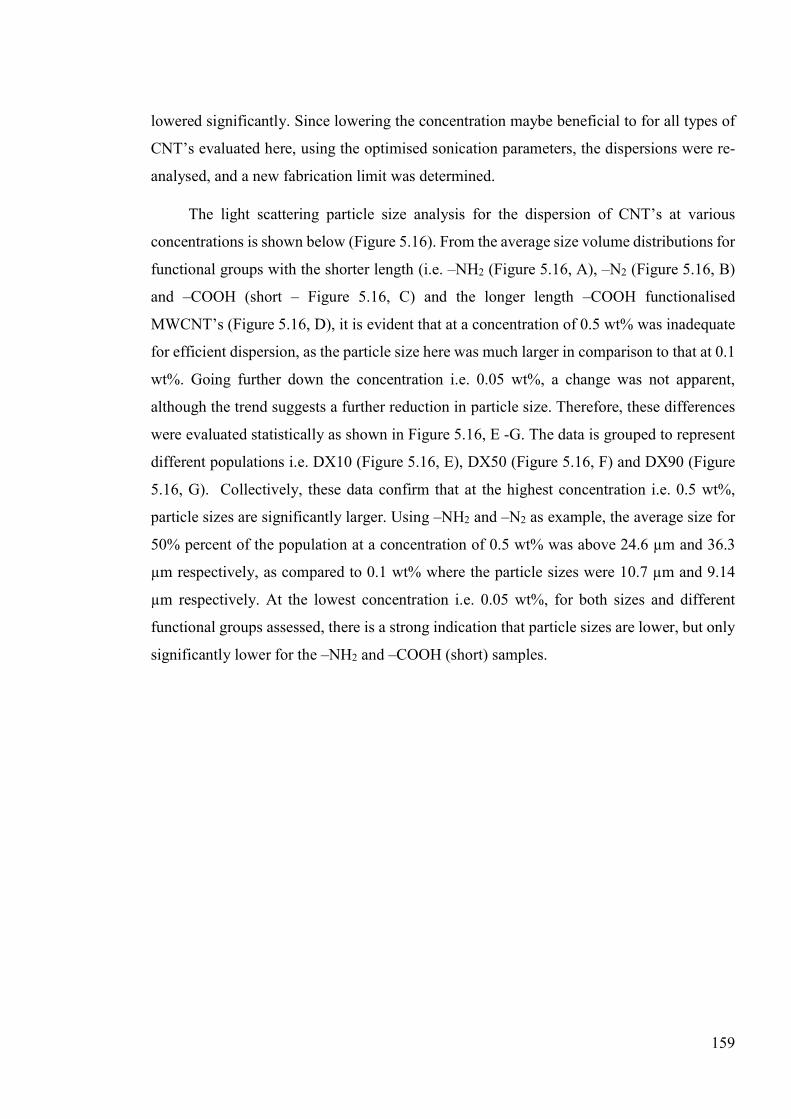
159
lowered significantly. Since lowering the concentration maybe beneficial to for all types of
CNT’s evaluated here, using the optimised sonication parameters, the dispersions were re-
analysed, and a new fabrication limit was determined.
The light scattering particle size analysis for the dispersion of CNT’s at various
concentrations is shown below (Figure 5.16). From the average size volume distributions for
functional groups with the shorter length (i.e. ‒NH2 (Figure 5.16, A), ‒N2 (Figure 5.16, B)
and ‒COOH (short – Figure 5.16, C) and the longer length ‒COOH functionalised
MWCNT’s (Figure 5.16, D), it is evident that at a concentration of 0.5 wt% was inadequate
for efficient dispersion, as the particle size here was much larger in comparison to that at 0.1
wt%. Going further down the concentration i.e. 0.05 wt%, a change was not apparent,
although the trend suggests a further reduction in particle size. Therefore, these differences
were evaluated statistically as shown in Figure 5.16, E -G. The data is grouped to represent
different populations i.e. DX10 (Figure 5.16, E), DX50 (Figure 5.16, F) and DX90 (Figure
5.16, G). Collectively, these data confirm that at the highest concentration i.e. 0.5 wt%,
particle sizes are significantly larger. Using ‒NH2 and ‒N2 as example, the average size for
50% percent of the population at a concentration of 0.5 wt% was above 24.6 µm and 36.3
µm respectively, as compared to 0.1 wt% where the particle sizes were 10.7 µm and 9.14
µm respectively. At the lowest concentration i.e. 0.05 wt%, for both sizes and different
functional groups assessed, there is a strong indication that particle sizes are lower, but only
significantly lower for the ‒NH2 and ‒COOH (short) samples.
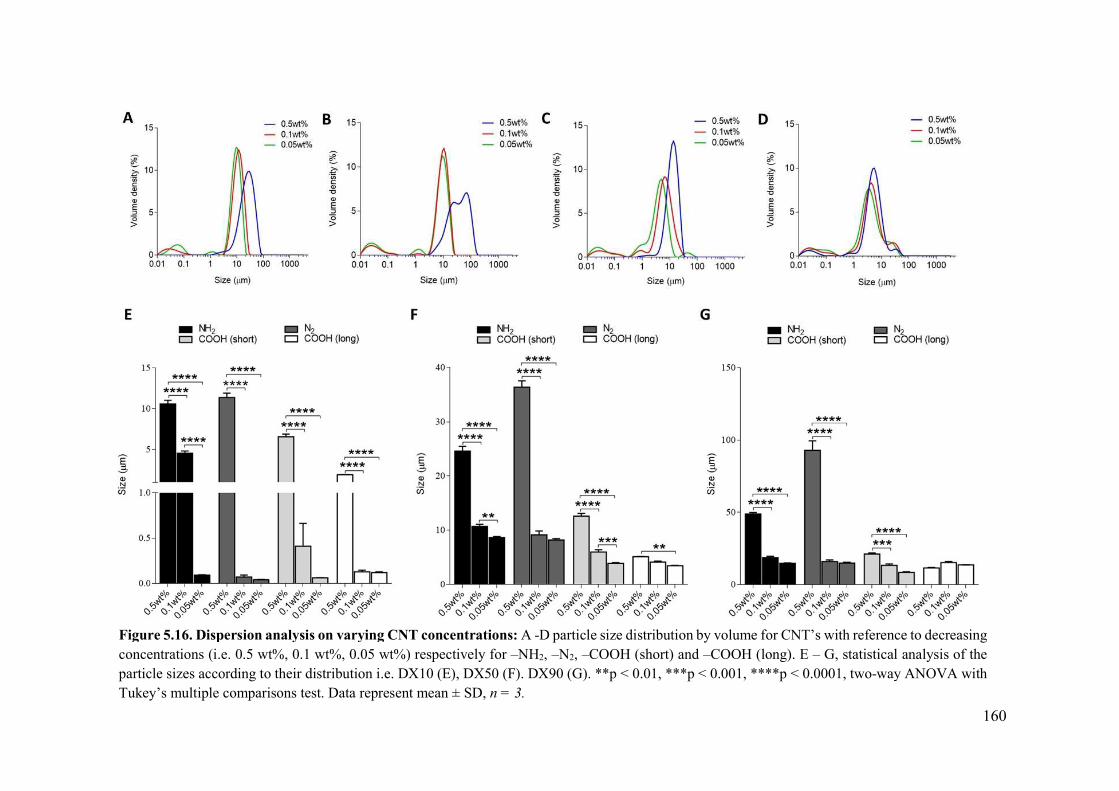
160
Figure 5.16. Dispersion analysis on varying CNT concentrations: A -D particle size distribution by volume for CNT’s with reference to decreasing concentrations (i.e. 0.5 wt%, 0.1 wt%, 0.05 wt%) respectively for ‒NH2, ‒N2, ‒COOH (short) and ‒COOH (long). E – G, statistical analysis of the particle sizes according to their distribution i.e. DX10 (E), DX50 (F). DX90 (G). **p < 0.01, ***p < 0.001, ****p < 0.0001, two-way ANOVA with Tukey’s multiple comparisons test. Data represent mean ± SD, n = 3.
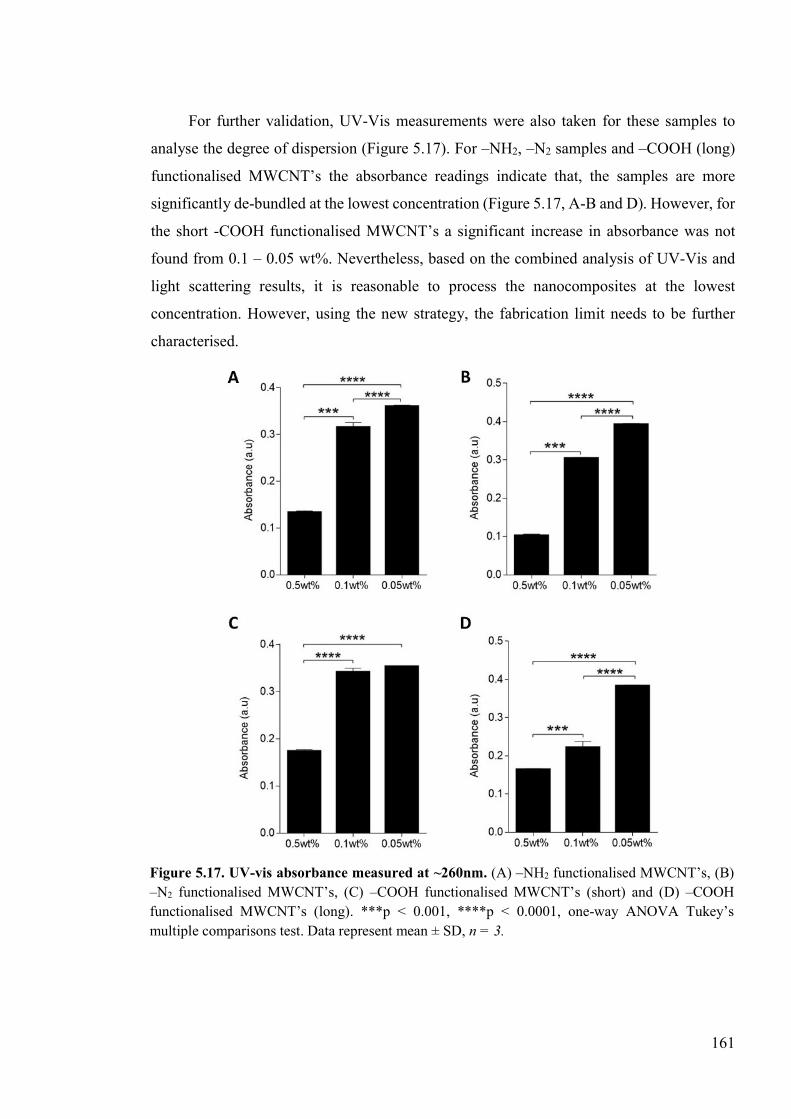
161
For further validation, UV-Vis measurements were also taken for these samples to
analyse the degree of dispersion (Figure 5.17). For ‒NH2, ‒N2 samples and ‒COOH (long)
functionalised MWCNT’s the absorbance readings indicate that, the samples are more
significantly de-bundled at the lowest concentration (Figure 5.17, A-B and D). However, for
the short -COOH functionalised MWCNT’s a significant increase in absorbance was not
found from 0.1 – 0.05 wt%. Nevertheless, based on the combined analysis of UV-Vis and
light scattering results, it is reasonable to process the nanocomposites at the lowest
concentration. However, using the new strategy, the fabrication limit needs to be further
characterised.
Figure 5.17. UV-vis absorbance measured at ~260nm. (A) ‒NH2 functionalised MWCNT’s, (B) ‒N2 functionalised MWCNT’s, (C) ‒COOH functionalised MWCNT’s (short) and (D) ‒COOH functionalised MWCNT’s (long). ***p < 0.001, ****p < 0.0001, one-way ANOVA Tukey’s multiple comparisons test. Data represent mean ± SD, n = 3.
162
At a concentration of 0.05 wt%, the maximum loading of CNT at which MNA’s
formed consistently was determined for the different dimensionalities and the functional
groups of/on MWCNT’s. It was found that a complete MNA’s could only be developed at 1
wt% of CNT loading for the MWCNT’s with shorter dimensions, whereas for long ‒COOH
functionalised MWCNT’s, MNA’s could still be fabricated with a maximum loading of 6
wt%. Figure 5.18, A shows digital images of MNA’s fabricated with 6 wt% MWCNT
loading (i.e. ‒COOH(long)), whereas Figure 5.18, B‒D show weak MNA’s formed at 2 wt%
MWCNT loading using the shorter nanotubes. The composite film shown in Figure 5.18, F,
shows large aggregates present when fabricating with composites with a high loading of 6
wt% (‒ COOH long).
Using the nanocomposite MNA’s developed at 1 wt% CNT loading, their AFS and
SFS was compared against the probe-sonicated MNA’s fabricated with 6 wt% ̶ COOH
functionalised MWCNT’s (i.e. control, Figure 5.19). The AFS (Figure 5.19, A) showed that,
MNA’s fabricated at a concentration of 0.05 wt% with a maximum CNT loading of 1 wt%
could withstand axial forces as high as the probe-optimised MNA’s fabricated at a
concentration of 0.5 wt%, with a maximum CNT loading of 6 wt%, without any significant
differences. On comparing the different functional groups, the AFS was significantly higher
for the MNA’s fabricated with ‒NH2 functionalised MWCNT’s as opposed to the MNA’s
fabricated with ‒N2 functionalised MWCNT’s (P < 0.05). Their mean AFS was, 1.46 ± 0.20
N and 1.15 ± 0.19 N, respectively. In terms of SFS, the MNA’s fabricated from ‒N2 and ‒
COOH (short) functionalised MWCNT’s showed comparable mechanical strength to the 6
wt% probe-sonicated MNA’s, whereas the long ‒COOH and ‒NH2 functional groups had
significantly lower SFS in comparison. Between the MNA’s developed from the newly
Figure 5.18. Characterising fabricational limits: Digital images shown for complete MNA’s at 6 wt% CNT loading for the long ‒COOH MWCNT’s (A) and their composite film with large aggregates (F). Fabricational limit at 2 wt% for shorter nanotubes with different functionalities.
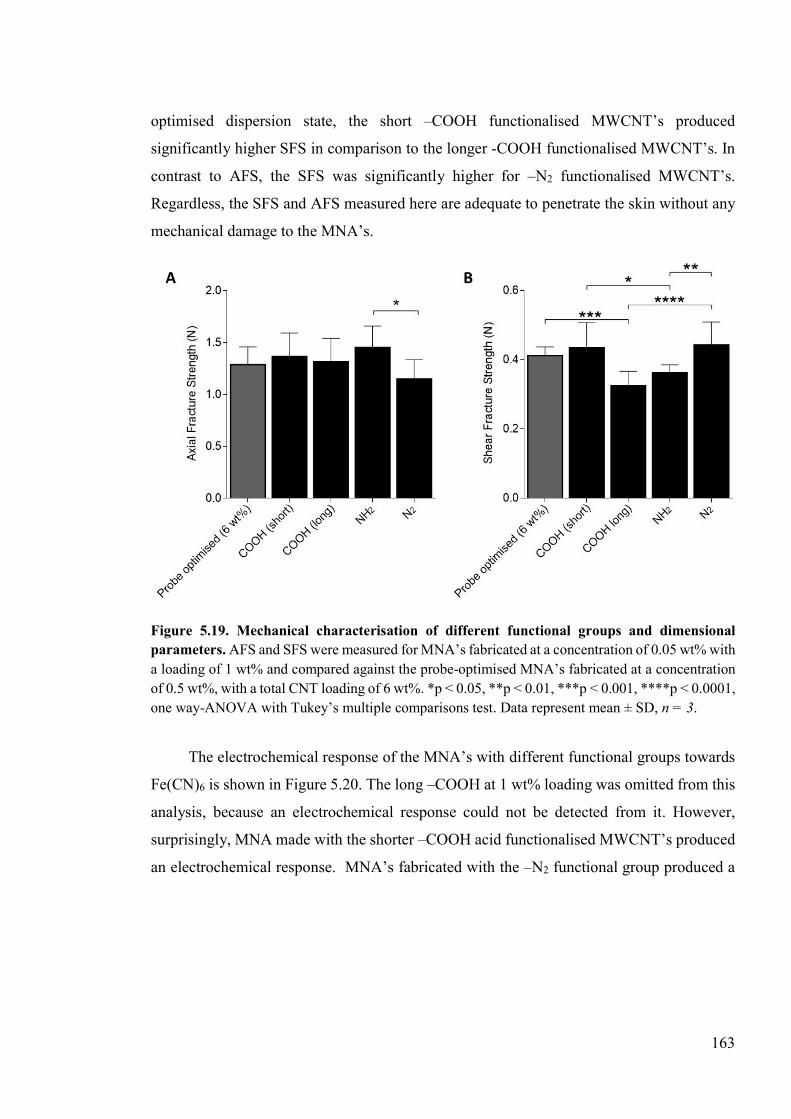
163
optimised dispersion state, the short ‒COOH functionalised MWCNT’s produced
significantly higher SFS in comparison to the longer -COOH functionalised MWCNT’s. In
contrast to AFS, the SFS was significantly higher for ‒N2 functionalised MWCNT’s.
Regardless, the SFS and AFS measured here are adequate to penetrate the skin without any
mechanical damage to the MNA’s.
The electrochemical response of the MNA’s with different functional groups towards
Fe(CN)6 is shown in Figure 5.20. The long ‒COOH at 1 wt% loading was omitted from this
analysis, because an electrochemical response could not be detected from it. However,
surprisingly, MNA made with the shorter ‒COOH acid functionalised MWCNT’s produced
an electrochemical response. MNA’s fabricated with the ‒N2 functional group produced a
Figure 5.19. Mechanical characterisation of different functional groups and dimensional parameters. AFS and SFS were measured for MNA’s fabricated at a concentration of 0.05 wt% with a loading of 1 wt% and compared against the probe-optimised MNA’s fabricated at a concentration of 0.5 wt%, with a total CNT loading of 6 wt%. *p < 0.05, **p < 0.01, ***p < 0.001, ****p < 0.0001, one way-ANOVA with Tukey’s multiple comparisons test. Data represent mean ± SD, n = 3.
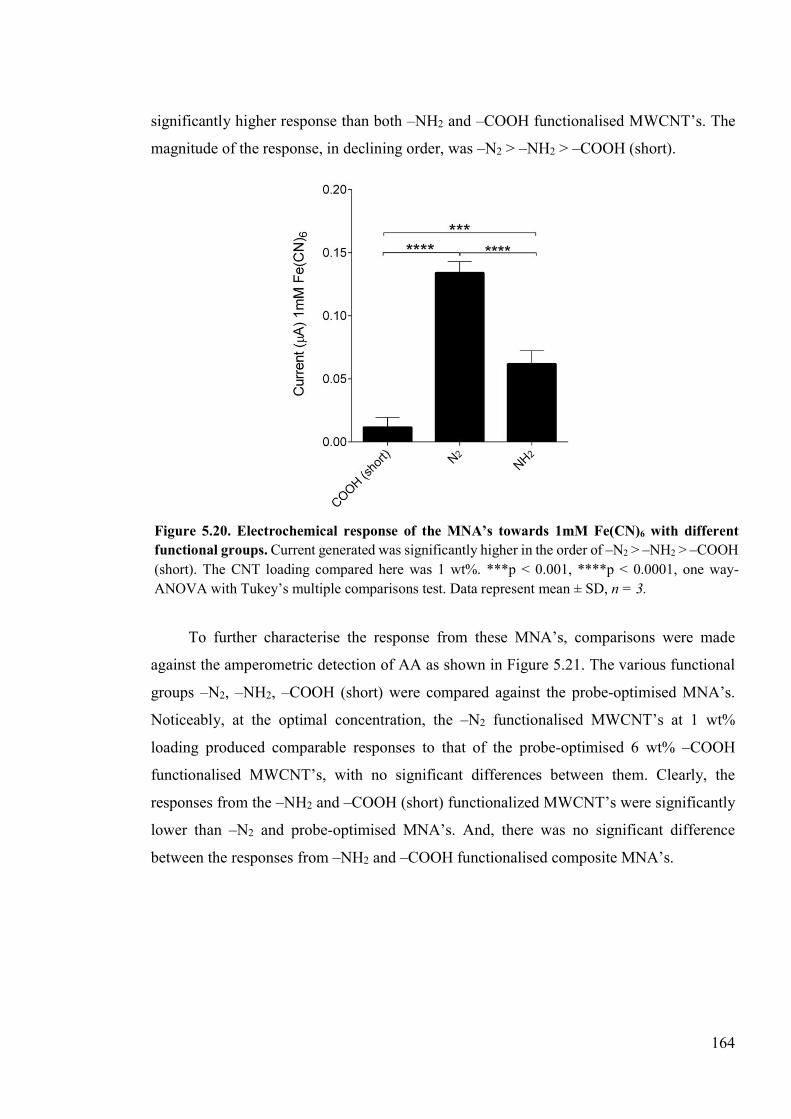
164
significantly higher response than both ‒NH2 and ‒COOH functionalised MWCNT’s. The
magnitude of the response, in declining order, was ‒N2 > ‒NH2 > ‒COOH (short).
To further characterise the response from these MNA’s, comparisons were made
against the amperometric detection of AA as shown in Figure 5.21. The various functional
groups ‒N2, ‒NH2, ‒COOH (short) were compared against the probe-optimised MNA’s.
Noticeably, at the optimal concentration, the ‒N2 functionalised MWCNT’s at 1 wt%
loading produced comparable responses to that of the probe-optimised 6 wt% ‒COOH
functionalised MWCNT’s, with no significant differences between them. Clearly, the
responses from the ‒NH2 and ‒COOH (short) functionalized MWCNT’s were significantly
lower than ‒N2 and probe-optimised MNA’s. And, there was no significant difference
between the responses from ‒NH2 and ‒COOH functionalised composite MNA’s.
Figure 5.20. Electrochemical response of the MNA’s towards 1mM Fe(CN)6 with different functional groups. Current generated was significantly higher in the order of ‒N2 > ‒NH2 > ‒COOH (short). The CNT loading compared here was 1 wt%. ***p < 0.001, ****p < 0.0001, one way-ANOVA with Tukey’s multiple comparisons test. Data represent mean ± SD, n = 3.
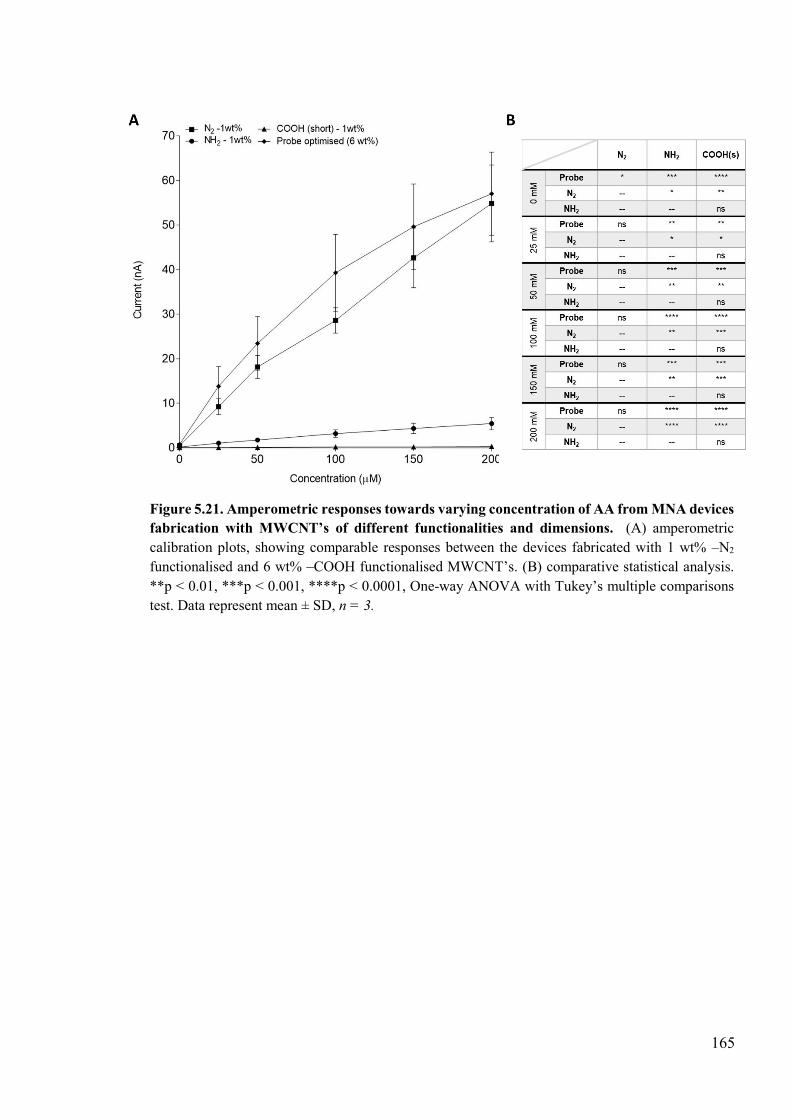
165
Figure 5.21. Amperometric responses towards varying concentration of AA from MNA devices fabrication with MWCNT’s of different functionalities and dimensions. (A) amperometric calibration plots, showing comparable responses between the devices fabricated with 1 wt% ‒N2 functionalised and 6 wt% ‒COOH functionalised MWCNT’s. (B) comparative statistical analysis. **p < 0.01, ***p < 0.001, ****p < 0.0001, One-way ANOVA with Tukey’s multiple comparisons test. Data represent mean ± SD, n = 3.
166
5.5 Discussion
In this chapter, various strategies were attempted to optimise the electrochemical
behaviour of the existing MNA’s and assess their LOD and sensitivity towards AA. CNT
dispersion is the major hurdle in composite manufacturing, in order to achieve optimal
mechanical and electrical properties. One of the most efficient ways to achieve this is by
evaluating the sonication parameters involved. The sonication energy supplied must
overcome the Van der Waals cohesive binding energy by which the CNT’s are held together
and at the same time should not exceed the scission pressure156. These two parameters are
theoretically estimated to be around 0.1 MPa and 0.5 MPa for MWCNT, respectively218. The
sonication energy supplied induces shear forces from cavitation, resulting in a sequence of
events i.e. bubble formation, growth and collapse. The efficiency of cavitation is, however,
dependent on solvent parameters (viscosity, vapour pressure and surface tension) as well the
sonication parameter i.e. frequency, time and intensity156. In this chapter, the dispersion was
evaluated as a function of sonication time using both laser diffraction particle size and UV-
Vis spectral analysis; and corroborated with the resultant mechanical and electrochemical
properties. Using the former, the particle size was found to decrease significantly up until 8
mins of sonication. The ‒COOH functionalised MWCNT’s used here are of 20 – 30 nm in
diameter and a length of 10 – 30 µm. When cross-referencing this to the obtained particle
size data, it is difficult to establish whether the sizes correspond to the length or the diameter
of the nanotubes; therefore, it is not possible to interpret the sizes in terms of damages to
CNT’s with the extent of sonication. This is in agreement with the literature213. Therefore,
the sizes measured are interpreted as that related to the size of the irregular aggregate. The
different classes of sizes observed correspond to the de-bundling process, where progressive
de-bundling starts from the outermost layer208. The probe sonicator used here outputs an
energy of ~12,300 and ~24,800 J of energy after a sonication time of 2 mins and 4 mins,
respectively. During sonication, the level of energy density supplied is equivalent to the
shear stress achieved156. Therefore, this equates to ~2.58 x 10² and 5.16 x 10² MPA (i.e. the
total energy density/J.mL-1), respectively; which is significantly higher than what is need for
de-bundling. This is comparable to that used by Fernandez et al., however they applied a
sonication time of 8.5 mins at 30% amplitude (equating to 5.3 x 10² MPA)218. It is possible
that the high intensity sonication (at 100% amplitude) used here might inflict structural
damages to the CNT’s; especially when the sonication time was increased. UV-Vis analysis
167
was further carried to corroborate all data from particle size analysis in this chapter.
Commonly, the absorbance measured at a specific wavelength is related to the degree to
which CNT’s are dispersed. Here, a peak maximum was identified at ~260nm and
consequently evaluated. This is consistent with the literature, indicating that well-dispersed
MCNT’s have an absorbance maximum between 200 – 300 nm213. Also, consistent with the
literature is the trend observed from UV-vis, where after a critical amount of sonication (i.e.
16 mins) the absorbance profile showed very little change229.
Because an ideal sonication time is more likely to be between 2 and 4 mins of
sonication; an additional nanocomposite was processed at 3 mins. This was important, as
sonication was not only applied for CNT dispersion, but also for efficient intercalation with
the polymer after its dissolution in the CNT dispersed solvent. The composite MNA’s
produced using the different sonication times were evaluated by CV using Fe(CN)6 and
amperometric detection of AA. On evaluating the current measured by the MNA’s, the
observed trend, whereby the current is seen to increasing initially and then decrease with
prolonged sonication time confirms that the electronic properties of the MWCNT’s are
impaired from extended periods of sonication, causing structural defects by breaking the
CNT’s into smaller lengths. At 3 mins however, the dispersion is optimal without breakage
of the nanotubes. Thus, the current response from MNA’s prepared at the optimal sonication
time was significantly higher by 735.53% when compared to the base MNA’s. In agreement
with these results, amperometric evaluation using AA also demonstrated an improved LOD
and sensitivity for the sonication optimised MNA’s, at 0.51 µM and 6.525 nA.µM-1,
respectively, as opposed to the based MNA’s with a LOD of 16 µM and sensitivity of 18.04
pA.µM-1.
Using the optimised sonication conditions, the effect of the surfactants, CTAB and
CPyCl, on the dispersion and hence the electro-mechanical properties of the MNA’s was
investigated. These surfactants were chosen based on their dispersive character, a high CMC
(i.e. ~1mM), high TK (> 25°C), compatibility with solvents and electrochemical behaviour.
When manufacturing a nanocomposite, it is widely accepted that excess surfactants that
remain can severely weaken the mechanical properties and reduce the conductivity of the
composites as the surfactants at high concentrations will reduce contact between the
CNT’s218,227,228. Therefore, in this chapter, the utility of dispersing above and below the
surfactants’ TK was investigated. This was based on a recent report illustrating that, below
168
the TK, any free surfactants not adsorbed on the surfaces of CNT’s will crystallise out of the
suspension and sediment to the bottom of the container228. To establish a baseline, the
MWCNT’s were dispersed with probe sonication in chloroform without the addition of
surfactants for 3 mins at temperatures ≤ 5°C and ≤ 25°C. This showed no differences in
particle size, with an average diameter of 2.85 ± 0.105 µm. However, this contradicts a recent
report that temperature significantly influenced the aggregative behaviour of CNT in
solvents. That report found that sonication of CNT’s in propan-2-ol at –17° C helped
improve dispersibility and stability of the suspension when compared to higher temperatures
as evaluated by particle size and UV-Vis analysis245. These improvements were reasoned to
be the effect of several factors, including a reduced Van der Waals energy between CNT’s
at lower temperatures, reduced Brownian motion in solution so that collision between
neighbouring particles are limited, increased viscosity and removal of air bubbles
incorporated into the suspension by sonication. With reference to these factors, as the
prepared dry-ice bath could cool the sample down to approximately ‒40°C, the benefits of
lowering the temperature as above, could have been assimilated in this study. However, the
sharp rise in temperature from utilising a probe-type sonicator could mean that sample
temperature could not have been sufficiently low throughout the sonication procedure.
By dispersing the CNT’s at temperatures lower than the surfactant TK, a better
exfoliation of the aggregates, alongside better stabilisation was found. In agreement with the
literature, the surfactants showed no significant differences between their dispersive
power218. CPyCl has an aromatic pyridinium ring in its structure, which would usually be
expected to increase the hydrophobicity and promotes π ‒ π interactions with the CNT
surface. However, in this case, the aromatic ring is part of the polar head group with the
cationic charge. This negates the positive effect of the aromatic ring218. Therefore, the
dispersive power for CPyCl is similar to CTAB as both possess the same alkyl chain length
(C17).
Typically, the concentration of surfactants, or the optimal CNT: surfactant ratio,
defined by many researchers have exceeded the CNT concentration in suspension by several
hundred folds. Different concentrations were analysed here as the CNT loading is high (at 6
wt%) and therefore having an optimal amount of surfactant would mean that the excess to
be removed will be minimal and if the surfactant is not crystallising out of the suspension,
the negative impact of excess surfactants can be minimised. Here, 5 mM was identified as
169
the optimal concentration, at which maximum dispersibility and stability was found for both
surfactants; which again showed no significant differences between them. At higher
concentrations, the particle sizes were found to be significantly larger and was more
polydisperse. This could be the result of multiple layers of surfactants attaching to the CNT
surface, which could even cause flocculation of the CNT’s227. When using organic solvents,
the orientation of the surfactant are different i.e. the hydrophilic groups form the core, while
the hydrophobic chains form the outer layer in a configuration known as the reverse
micelle246–248. However, very recent studies have argued that such micelles form due to the
presence of a small number of polar molecules (i.e. water)249. The implication here is that,
the extent to which the polar molecular are present alone can in fact give rise to large
polydispersity; as there exists a linear relationship between the size of the polar core and size
of the micelles. However, since micelle formation is suppressed by sonicating below the
surfactant TK, the particle size measurements here were unlikely to be influenced by water-
surfactant reverse micelle formation.
Unlike the water-based dispersion of CNT below the surfactants TK, excess
surfactants did not crystallise out of the suspension in solvent based dispersions. In fact, the
excess surfactants formed a separated layer that grew in volume proportionally to the
concentration of the surfactants. Attempts to remove non-adsorbed surfactants by
centrifugation had also failed. Hence, the dispersions, as prepared, were made into
nanocomposites and their mechanical characteristics were first investigated. Only the
nanocomposites prepared with 1 mM surfactant concentration could be fabricated into
MNA’s. Mechanically, the only significant difference between the surfactant-incorporated
MNA’s was in AFS, with CTAB withstanding more compressive force than CPyCl.
Comparison of AFS between the optimised probe sonicated MNA’s and the preceding base
MNA’s showed CPyCl incorporated MNA’s to be significantly weaker. However, on
evaluating the SFS, both surfactant-incorporated MNA’s were found to be significantly
weaker in comparison to the base and the probe-optimised MNA’s. Although the dispersive
power for both surfactants are quite similar, the results evaluated thus far evidences slightly
better performance for CTAB. This could be associated with the fact the bulky polar head
group on CPyCl, though ineffective for dispersion, may still create higher intra- and inter-
layer gap between MWCNT’s, hence weakening the interfacial interaction. This was in fact
more apparent from the measurement of current response to Fe(CN)6, where the CPyCl-
170
incorporated MNA’s showed a significant reduction in comparison to CTAB. For both
surfactants, the current generated was significantly lower than probe-optimised MNA’s. This
is because of the surfactant molecules interfering with the conductive pathways, resulting in
lack of contact between the nanotubes222,234. Therefore, the benefits observed from better
exfoliation of the nanotubes did not translate into better electrical properties. Comparably,
the amperometric response towards AA for the surfactant-incorporated MNA’s showed
significantly higher responses for CTAB than for CPyCl. Amperometric responses from
CPyCl was comparable to that of the base MNA’s. At present, these results collectively show
that, incorporation of the two cationic surfactants have detrimental effects on the functional
properties of MNA’s, more so on the mechanical properties than their electrochemical
properties. Hence, they were not adopted for the remainder of this work.
The intrinsic properties of the CNT’s (i.e. optimal dimensions and functionalities)
were also evaluated in order to develop a highly sensitive nanocomposite MNA. Dispersing
with the optimised sonication strategy, it was initially observed that, for the ‒N2 and ‒NH2
functionalised MWCNT’s samples, the concentration at which the CNT’s were dispersed
(i.e. ~ 0.5 wt%) was too high, resulting in a highly viscous sample, with a significant amount
of sedimentation immediately after sonication. This is because the long alkyl chain provides
greater repulsion between the nanotubes, increasing the available surface area of –NH2/‒N2
functionalised MWCNT’s in comparison to acid functionalised MWCNT’s. Therefore, the
volume of chloroform available becomes insufficient for proper wetting of the large volume
of the MWCNT surface. Nevertheless, MNA’s could be developed from their composites,
but at a low CNT loading of 3 wt%, these showed no significant improvement in comparison
to the probe-optimised MNA’s in terms of their electrochemical response.
The degree of dispersion can be controlled initially by varying the sonication times.
However, the quality of this dispersion will deteriorate over time because of re-
agglomeration and sedimentation of MWCNT’s, which will consequently impinge on the
final properties of the polymer composites. Addition of surfactants can certainly aid the
dispersion and stability of the composites, but as seen this chapter, they impair the
performance of the composites. Hence, recent studies have critically assessed the effect of
CNT concentration on the time stability and hence the agglomeration rate of MWCNT’s
dispersed in chloroform250,251. These studies collectively reported that MWCNT dispersions
in chloroform are stable for up to 20 days at 0.005 wt%. This points towards the utilisation
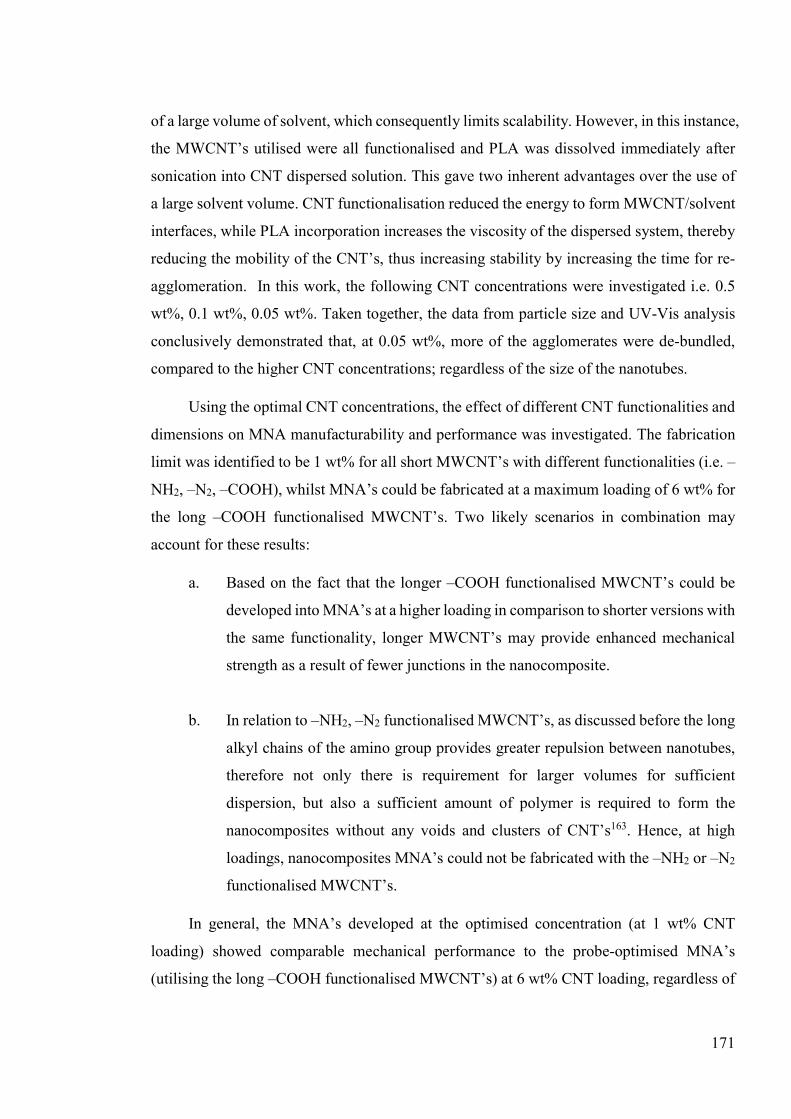
171
of a large volume of solvent, which consequently limits scalability. However, in this instance,
the MWCNT’s utilised were all functionalised and PLA was dissolved immediately after
sonication into CNT dispersed solution. This gave two inherent advantages over the use of
a large solvent volume. CNT functionalisation reduced the energy to form MWCNT/solvent
interfaces, while PLA incorporation increases the viscosity of the dispersed system, thereby
reducing the mobility of the CNT’s, thus increasing stability by increasing the time for re-
agglomeration. In this work, the following CNT concentrations were investigated i.e. 0.5
wt%, 0.1 wt%, 0.05 wt%. Taken together, the data from particle size and UV-Vis analysis
conclusively demonstrated that, at 0.05 wt%, more of the agglomerates were de-bundled,
compared to the higher CNT concentrations; regardless of the size of the nanotubes.
Using the optimal CNT concentrations, the effect of different CNT functionalities and
dimensions on MNA manufacturability and performance was investigated. The fabrication
limit was identified to be 1 wt% for all short MWCNT’s with different functionalities (i.e. ‒
NH2, ‒N2, ‒COOH), whilst MNA’s could be fabricated at a maximum loading of 6 wt% for
the long ‒COOH functionalised MWCNT’s. Two likely scenarios in combination may
account for these results:
a. Based on the fact that the longer –COOH functionalised MWCNT’s could be
developed into MNA’s at a higher loading in comparison to shorter versions with
the same functionality, longer MWCNT’s may provide enhanced mechanical
strength as a result of fewer junctions in the nanocomposite.
b. In relation to ‒NH2, ‒N2 functionalised MWCNT’s, as discussed before the long
alkyl chains of the amino group provides greater repulsion between nanotubes,
therefore not only there is requirement for larger volumes for sufficient
dispersion, but also a sufficient amount of polymer is required to form the
nanocomposites without any voids and clusters of CNT’s163. Hence, at high
loadings, nanocomposites MNA’s could not be fabricated with the ‒NH2 or ‒N2
functionalised MWCNT’s.
In general, the MNA’s developed at the optimised concentration (at 1 wt% CNT
loading) showed comparable mechanical performance to the probe-optimised MNA’s
(utilising the long ‒COOH functionalised MWCNT’s) at 6 wt% CNT loading, regardless of
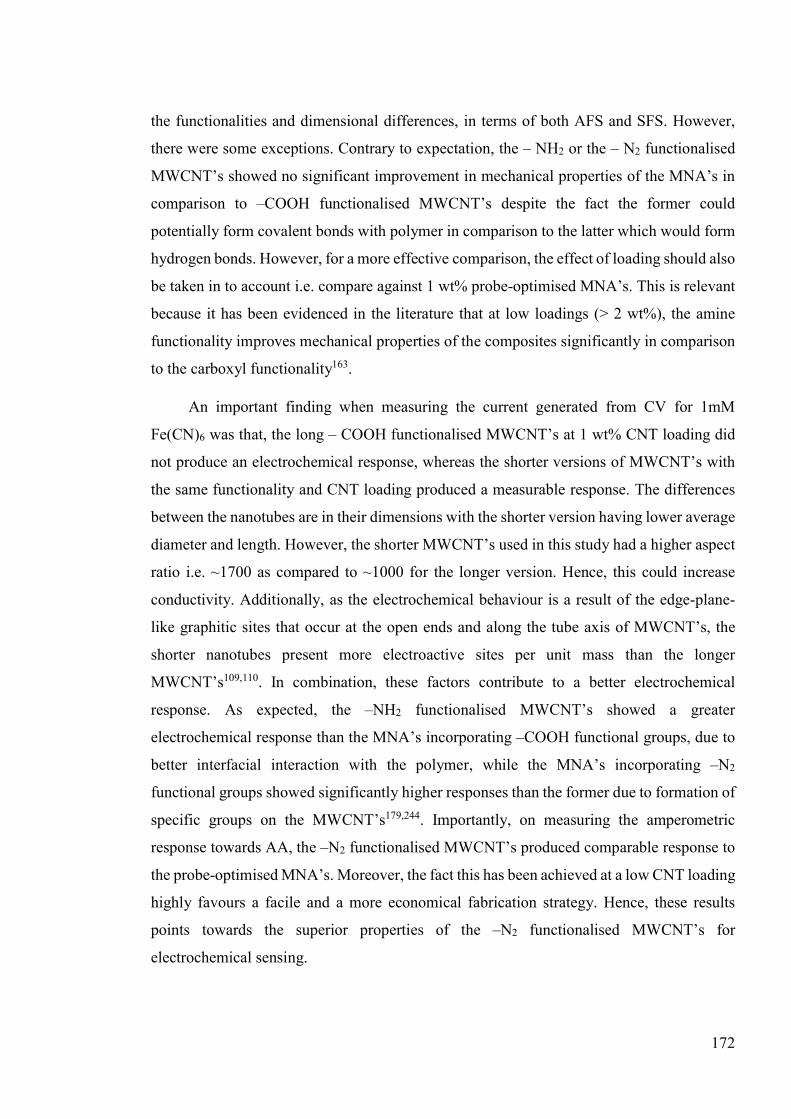
172
the functionalities and dimensional differences, in terms of both AFS and SFS. However,
there were some exceptions. Contrary to expectation, the – NH2 or the – N2 functionalised
MWCNT’s showed no significant improvement in mechanical properties of the MNA’s in
comparison to –COOH functionalised MWCNT’s despite the fact the former could
potentially form covalent bonds with polymer in comparison to the latter which would form
hydrogen bonds. However, for a more effective comparison, the effect of loading should also
be taken in to account i.e. compare against 1 wt% probe-optimised MNA’s. This is relevant
because it has been evidenced in the literature that at low loadings (> 2 wt%), the amine
functionality improves mechanical properties of the composites significantly in comparison
to the carboxyl functionality163.
An important finding when measuring the current generated from CV for 1mM
Fe(CN)6 was that, the long – COOH functionalised MWCNT’s at 1 wt% CNT loading did
not produce an electrochemical response, whereas the shorter versions of MWCNT’s with
the same functionality and CNT loading produced a measurable response. The differences
between the nanotubes are in their dimensions with the shorter version having lower average
diameter and length. However, the shorter MWCNT’s used in this study had a higher aspect
ratio i.e. ~1700 as compared to ~1000 for the longer version. Hence, this could increase
conductivity. Additionally, as the electrochemical behaviour is a result of the edge-plane-
like graphitic sites that occur at the open ends and along the tube axis of MWCNT’s, the
shorter nanotubes present more electroactive sites per unit mass than the longer
MWCNT’s109,110. In combination, these factors contribute to a better electrochemical
response. As expected, the ‒NH2 functionalised MWCNT’s showed a greater
electrochemical response than the MNA’s incorporating ‒COOH functional groups, due to
better interfacial interaction with the polymer, while the MNA’s incorporating ‒N2
functional groups showed significantly higher responses than the former due to formation of
specific groups on the MWCNT’s179,244. Importantly, on measuring the amperometric
response towards AA, the ‒N2 functionalised MWCNT’s produced comparable response to
the probe-optimised MNA’s. Moreover, the fact this has been achieved at a low CNT loading
highly favours a facile and a more economical fabrication strategy. Hence, these results
points towards the superior properties of the ‒N2 functionalised MWCNT’s for
electrochemical sensing.
173
5.6 Conclusions
In this chapter, various strategies towards the optimisation of the electrochemical
response of the MNA’s were investigated. Initially, the sonication parameters were
optimised and a sonication time of 3 mins was found to be optimal, under which the
nanocomposites MNA’s produced an enhanced current response for Fe(CN)6 and
significantly higher amperometric response towards different concentrations of AA as
compared to the base MNA. The effect of two cationic surfactants, i.e. CTAB and CPyCl
were investigated for their dispersive power. Both surfactants were found be highly effective
in dispersing the CNT’s below their TK and at a specific concentration of 5 mM. Although
excessive surfactants could be removed in aqueous solutions by dispersing under the TK, in
organic solvents this was not found to be the case. As a result, the MNA’s could not be
fabricated successfully by incorporating the optimal surfactant concentration. It was found
that MNA’s could only be developed at 1 mM surfactant concentration, which did not
improve the final functional properties of the MNA’s. Finally, the effect of having different
functional groups and dimensional parameters were investigated on MNA fabrication. It was
found that, in order to process MNA’s with high CNT loadings, length was an important
parameter; as the longer MWCNT’s with –COOH functional groups could be incorporated
at 6 wt% loading as compared to their shorter versions. In contrast, it was also found that the
shorter MWCNT’s, regardless of their functionalities (i.e. ‒NH2, ‒N2, ‒COOH), showed
enhanced electrochemical behaviour at lower loadings. This can be attributed to their higher
aspect ratio and or the presence of more electroactive sites per unit mass. The MNA’s
incorporating ‒N2 functionalised MWCNT’s showed an enhanced electrochemical response
at 1 wt% loading, comparable to that of ‒COOH functionalised MWCNT’s at a higher
loading of 6 wt%.
174
Chapter 6. Toxicity evaluations of MNA’s
6.1 Introduction
MNA’s pierce the stratum corneum barrier of the skin, leaving the microneedle tips
directly in contact with the viable tissue. Therefore, biocompatible materials are mandatory
for fabricating these devices. PLA, utilised successfully as the matrix component for
incorporating CNT as nanofillers is considered biocompatible, as they are derived from
renewable sources (such as corn and sugar); and its degradation products (i.e. lactic and
glycolic acid) are non-toxic66,193. As such, PLA has been validated for several bio-
applications including surgical implants, tissue engineering, dental materials and
importantly as drug delivery systems66,193,252. Most nanomaterials, when used in its isolated
form above a certain concentration threshold, can lead to toxicity in comparison to those that
are embedded in a polymeric matrix193,253. Regardless, when used as biomaterials for
fabricating in situ medical devices (as in this case), biocompatibility of the devices should
be addressed in terms of both intrinsic and extrinsic factors. Intrinsic factors include size,
shape, roughness, design, composition, surface chemistry, porosity, sterility, duration of
contact and degradation products, whereas extrinsic factors are concerned with the host, site
of implantation and the microenvironment254,255. Evaluation of these factors involve a
complex body of work, that incorporates both in vivo and in vitro assessments directed
towards cytotoxicity, inflammation, allergic and irritant responses and both acute and
chronic toxicity. The International Organization of Standardization (ISO) has defined a set
of standards (10993) for evaluating the biocompatibility of medical devices.
Due to the brittleness, slow crystallisation rate and low thermal resistance of PLA,
incorporation of carbon-based nanomaterials is an innovative approach utilised by many
researchers to improve their applicability, in particular for hard and soft tissue engineering
applications252. Hence, numerous studies have evaluated the biocompatibility of CNT-based
nanocomposites and have presented some promising results. Results from these studies
suggest: (1) as various fabrication processes have been adopted to develop PLA based
nanocomposites (i.e. solvent casting, spin coating, melt blending, electrospinning or doctor
blading), a general consensus is that, the mode of fabrication does not affect cell metabolic
activity and (2) the nanocomposites (films or nanofibers) do not decrease the metabolic
175
activity of numerous cell types in vitro and, as found on many instances, they may actually
increase the metabolic activity193. A summary of important studies concerning these
statements are given below.
Electrospun scaffolds developed with MWCNT for bone tissue engineering showed
that cells can remain viable in a 3D matrix for up to 14 days, and in comparison to unfilled
PLA, the CNT-filled nanocomposites showed increased cell density/metabolic activity and
even alignment along the longitudinal axis after 7 days256. Application of direct current (d.c.)
electrical stimulation to randomly orientated PLA/MWCNT nanocomposite scaffolds at 100
µA showed enhanced proliferation, adhesion and elongation of cells over 7 days. However,
application of a higher magnitude of current i.e. 200 µA, was proven to be detrimental to
cell survival257. To note, the current was applied for 4 hrs on each day. Better
hemocompatibility, less clotting and resistance to platelet adhesion was found for
PLA/MWCNT nanocomposites at 5 wt% when compared to the neat PLA and orientation
of the nanocomposites was found to further enhance the aforementioned properties258. A
recent study evaluating biocompatibility, both in vitro and in vivo (implanted subcutaneously
for 2 weeks in C57B1/6 mice) for PLA/GNP (graphene nanoplatelets, at 2 wt%) and
PLA/CNT-COOH (0.3 and 0.7 wt%) found no adverse effects. However, longer assays are
needed to study the effect of material degradation and nanofiller release in time-dependant
toxicity evaluations259. This is important when developing CNT nanocomposite-based
MNA’s, as any mechanical failure during insertion and removal can leave debris in the
dermal tissue which will be degraded over time260. Although the results described above are
promising, generalisability is poor due to the diversity in raw materials, their fabrication,
surface chemistry and differing amounts of nanofiller incorporated.
The influence of electrical stimulation and or electrochemical processes directly on
cells and or their microenvironment is an important area of research concerning metallic
implants, potential therapeutics for various forms of cancer and even as novel therapy for
human immunodeficiency virus 261–265. These studies fall under a generalised category
referred to as electrical stimulation of cells and has been studied since the 1970’s261,266.
Electrical stimulation induced effects based on the application of MNA-based
electrochemical sensors can be classified into electrolytic, dielectric and cell/electrode
interactive effects267. Electrolytic effects can be defined as those brought about by the redox
reactions of electroactive components at the electrode surface in solution phase or the

176
constituents of the cells themselves. For example, an irreversible redox process involving
physiological components of the cell membrane or the formation of reactive oxygen species
from electrochemical processes may lead to cell death261. Dielectric effects refer to
electroporation and electrofusion of cells, where application of high voltage pulses may
breakdown the cell membrane, in addition to the formation of pores or fusion of the cell
membranes268,269. Finally, cell/electrode interactive effects have been shown to modulate cell
viability, proliferation, gene expression, protein synthesis, morphological and cytoskeletal
organisation; at a low potential loading267,270–272. In relation to cytotoxic effects, several
authors have employed a three-electrode system connected to a potentiostat (as used for
electrochemical measurements), to apply a d.c. potential to the working electrode and
monitor the effect of electrochemical stimulation on cells. For example, a potential of 1.0 V
applied for 3 mins resulted in inhibition of HIV infection by 90%264; studies investigating
corrosion assisted electrochemical voltage shifts in metallic implants have shown that
application of voltage outside a viability range of 500 mV of anodic current can lead to cell
death via necrosis263. Hence, these results illustrate the utility of studying voltage induced
toxicity upon the application of MNA-based electrochemical sensors.
Mechanical safety of the devices is determined by evaluating the AFS and SFS of the
MNA’s; which for the nanocomposite MNA’s developed here, have been proven to be
significantly higher than skin insertion forces. A long-term study evaluating, inflammation
and nanocomposite degradation associated toxicity in vivo is important, but is beyond the
scope of this chapter and comes secondary to primary cytotoxicity evaluations. As our
MNA-based electrochemical sensor is currently aimed at rapid diagnosis and monitoring
purposes, the time required for these devices to be in contact with the viable tissue is rather
limited. Therefore, two important aspects were investigated; the toxicity associated with (1)
short term exposure to MNA’s, and (2) time-dependant exposure to voltage during
electrochemical measurements.
177
6.2 Aims and objectives
An extensive evaluation based on all three types of cytotoxicity tests described in part
5 of the ISO-10993 (which includes, evaluation by extracts, direct contact and indirect
contact of medical devices) is beyond the scope of this chapter. Therefore, here the
investigations were limited to evaluating the effects of MNA-based device extracts, using
both the –N2 and –COOH functionalised MWCNT/PLA nanocomposite MNA’s. Moreover,
their effects were evaluated using two cell lines: (1) human keratinocytes (HaCaT) and (2)
human malignant melanoma cell line, A375. In addition to the standardised cytotoxicity
evaluations, this chapter further examined the immediate effects of application of voltage to
cells when performing electrochemical measurements. Overall, these investigations will
help to further characterise the devices in terms of their biocompatibility and applicability
towards the development of an electrochemical biosensor.
The objectives of this chapter are to:
1. Investigate both short and long-term toxicity to cells using extracts from the
two devices
2. Investigate immediate toxicity associated with electrochemical measurements
via DPV and amperometry
178
6.3 Materials and Methods
6.3.1 Cell lines and culture conditions
The human keratinocyte cell line (HaCaT) was kindly donated by Professor Green
formerly from MRC centre, at the University of Sussex. This is a spontaneously transformed
human epithelial cell line from adult skin. The A375 (ECACC 88113005) human malignant
melanoma cells, which had been isolated from a 54-year-old female with malignant
melanoma, was purchased from Sigma Aldrich, Gillingham, UK. These cell lines were used
between passages 12 and 21. Both cell lines were cultured in Dulbecco’s modified Eagle
medium, with high glucose (DMEM, glucose 4.5 g/L) and supplemented with 10% and 15%
foetal bovine serum (FBS) for HaCaT and A375, respectively. These medium compositions
are hereafter referred to as the ‘complete media’ for each cell line, respectively. The cell
culture media (Gibco) and plastics, including tissue culture flasks and multi-well plates were
purchased from Fisher Scientific, Loughborough, UK. Typical cell culture conditions
(referred to as standard conditions) were applied, i.e. 37°C under 5% CO2 (95% air), with
the media being replaced every 2 days and passaged upon reaching 75 – 80% confluency.
6.3.2 Toxicity evaluation using MNA extracts
Preparation of extracts
MNA devices fabricated from nanocomposite material alone (i.e. CNT-PLA without
the PCL base and the electrical wire, which will not encounter viable tissue in the intended
use case) were used to prepare device extracts. For effective sterilisation of the devices, the
MNA’s were left in the mould and sterilised by dry heat, under vacuum, at 160°C for 2 hours
using the thermal oven that was initially used to prepare the MNA’s. Once the dry-heat
sterilisation process was complete, the MNA’s were ejected from the mould in the laminar
flow cabinet and washed x3 with PBS. The devices were then dried inside the laminar flow
cabinet, for 1 hour with the UV irradiation. Following which each microneedle was weighed
whilst maintaining sterile conditions. The extracts were prepared at a concentration of 0.2
g.ml-1 using complete media as the extraction vehicle, accounting for both cell lines. The
different extract times and exposure times utilised are summarised below in Table 1. Briefly,
two main extractions were made by incubating the device in the media for 4 hrs and 24 hrs.
These 100% extracts were then diluted into 6.25%, 12.5%, 25% and 50% using the
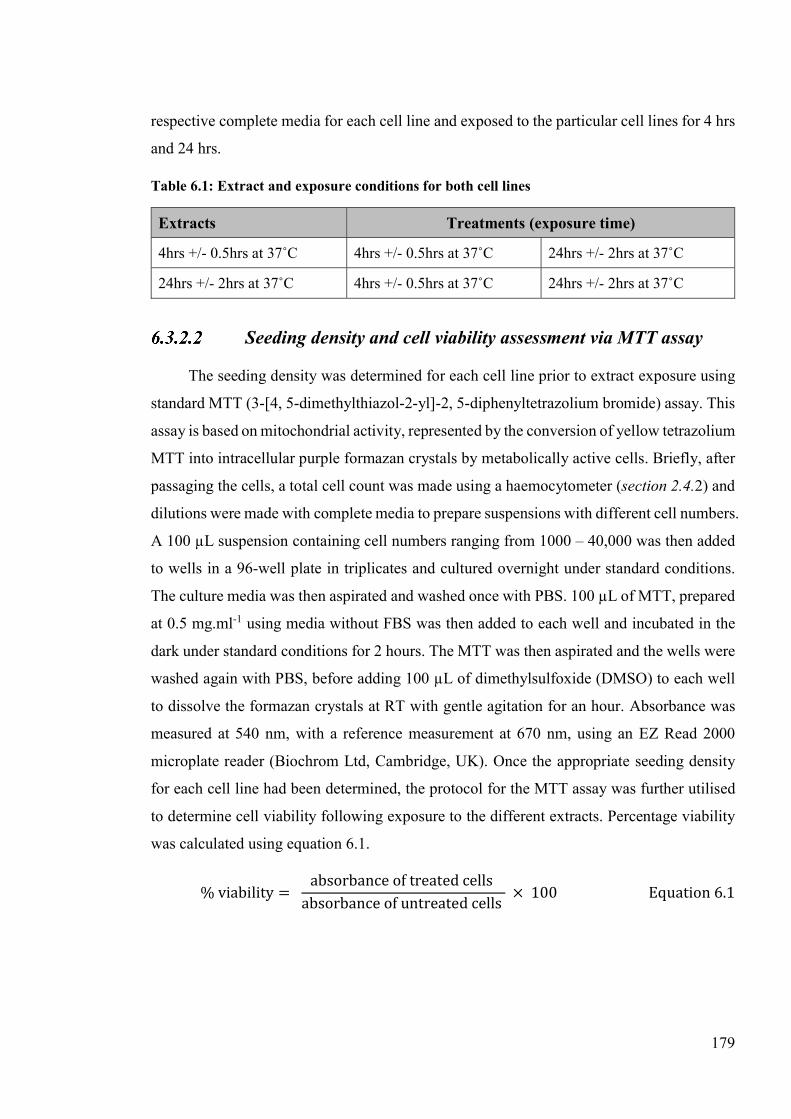
179
respective complete media for each cell line and exposed to the particular cell lines for 4 hrs
and 24 hrs.
Table 6.1: Extract and exposure conditions for both cell lines
Extracts Treatments (exposure time)
4hrs +/- 0.5hrs at 37˚C 4hrs +/- 0.5hrs at 37˚C 24hrs +/- 2hrs at 37˚C
24hrs +/- 2hrs at 37˚C 4hrs +/- 0.5hrs at 37˚C 24hrs +/- 2hrs at 37˚C
Seeding density and cell viability assessment via MTT assay
The seeding density was determined for each cell line prior to extract exposure using
standard MTT (3-[4, 5-dimethylthiazol-2-yl]-2, 5-diphenyltetrazolium bromide) assay. This
assay is based on mitochondrial activity, represented by the conversion of yellow tetrazolium
MTT into intracellular purple formazan crystals by metabolically active cells. Briefly, after
passaging the cells, a total cell count was made using a haemocytometer (section 2.4.2) and
dilutions were made with complete media to prepare suspensions with different cell numbers.
A 100 µL suspension containing cell numbers ranging from 1000 – 40,000 was then added
to wells in a 96-well plate in triplicates and cultured overnight under standard conditions.
The culture media was then aspirated and washed once with PBS. 100 µL of MTT, prepared
at 0.5 mg.ml-1 using media without FBS was then added to each well and incubated in the
dark under standard conditions for 2 hours. The MTT was then aspirated and the wells were
washed again with PBS, before adding 100 µL of dimethylsulfoxide (DMSO) to each well
to dissolve the formazan crystals at RT with gentle agitation for an hour. Absorbance was
measured at 540 nm, with a reference measurement at 670 nm, using an EZ Read 2000
microplate reader (Biochrom Ltd, Cambridge, UK). Once the appropriate seeding density
for each cell line had been determined, the protocol for the MTT assay was further utilised
to determine cell viability following exposure to the different extracts. Percentage viability
was calculated using equation 6.1.
% viability = absorbance of treated cells
absorbance of untreated cells × 100 Equation 6.1
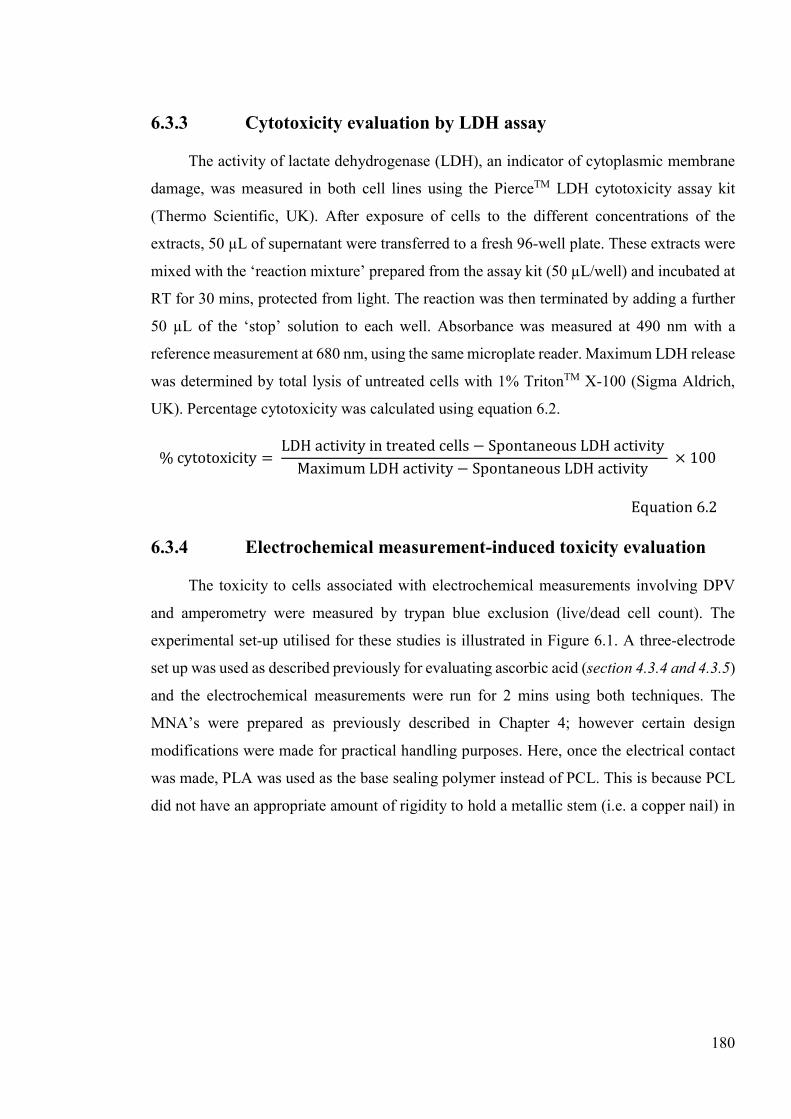
180
6.3.3 Cytotoxicity evaluation by LDH assay
The activity of lactate dehydrogenase (LDH), an indicator of cytoplasmic membrane
damage, was measured in both cell lines using the PierceTM LDH cytotoxicity assay kit
(Thermo Scientific, UK). After exposure of cells to the different concentrations of the
extracts, 50 µL of supernatant were transferred to a fresh 96-well plate. These extracts were
mixed with the ‘reaction mixture’ prepared from the assay kit (50 µL/well) and incubated at
RT for 30 mins, protected from light. The reaction was then terminated by adding a further
50 µL of the ‘stop’ solution to each well. Absorbance was measured at 490 nm with a
reference measurement at 680 nm, using the same microplate reader. Maximum LDH release
was determined by total lysis of untreated cells with 1% TritonTM X-100 (Sigma Aldrich,
UK). Percentage cytotoxicity was calculated using equation 6.2.
% cytotoxicity = LDH activity in treated cells − Spontaneous LDH activity
Maximum LDH activity − Spontaneous LDH activity × 100
Equation 6.2
6.3.4 Electrochemical measurement-induced toxicity evaluation
The toxicity to cells associated with electrochemical measurements involving DPV
and amperometry were measured by trypan blue exclusion (live/dead cell count). The
experimental set-up utilised for these studies is illustrated in Figure 6.1. A three-electrode
set up was used as described previously for evaluating ascorbic acid (section 4.3.4 and 4.3.5)
and the electrochemical measurements were run for 2 mins using both techniques. The
MNA’s were prepared as previously described in Chapter 4; however certain design
modifications were made for practical handling purposes. Here, once the electrical contact
was made, PLA was used as the base sealing polymer instead of PCL. This is because PCL
did not have an appropriate amount of rigidity to hold a metallic stem (i.e. a copper nail) in
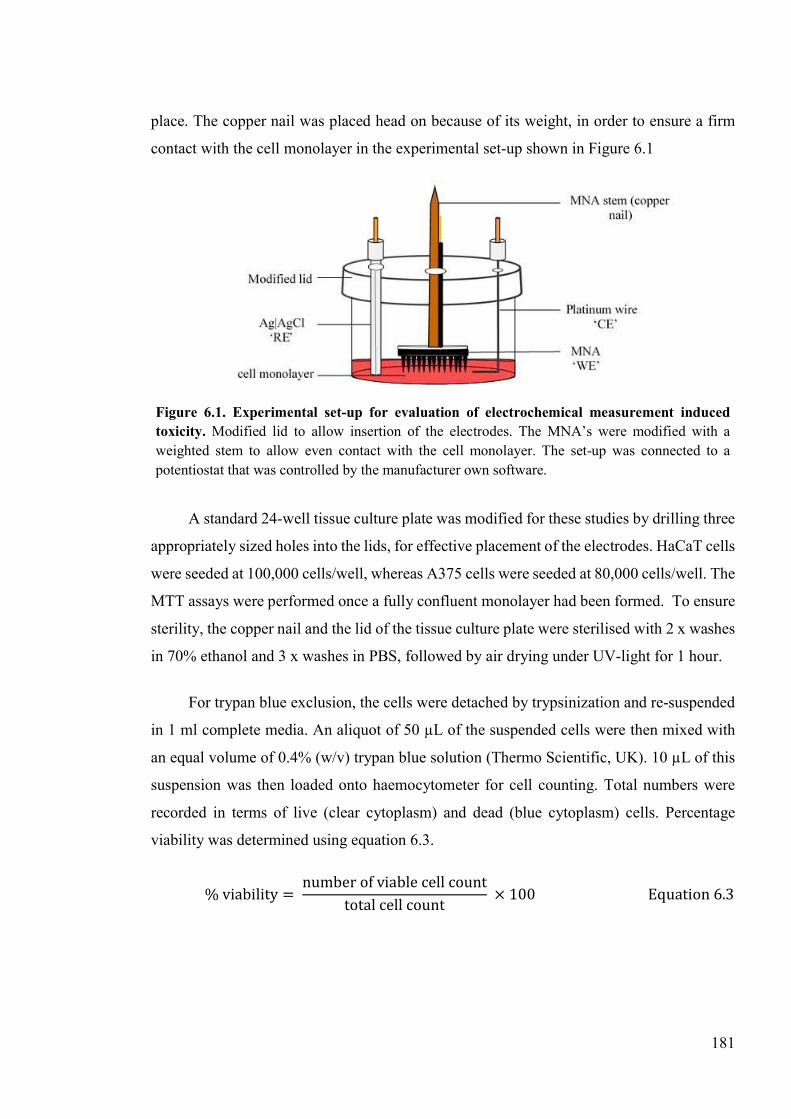
181
place. The copper nail was placed head on because of its weight, in order to ensure a firm
contact with the cell monolayer in the experimental set-up shown in Figure 6.1
A standard 24-well tissue culture plate was modified for these studies by drilling three
appropriately sized holes into the lids, for effective placement of the electrodes. HaCaT cells
were seeded at 100,000 cells/well, whereas A375 cells were seeded at 80,000 cells/well. The
MTT assays were performed once a fully confluent monolayer had been formed. To ensure
sterility, the copper nail and the lid of the tissue culture plate were sterilised with 2 x washes
in 70% ethanol and 3 x washes in PBS, followed by air drying under UV-light for 1 hour.
For trypan blue exclusion, the cells were detached by trypsinization and re-suspended
in 1 ml complete media. An aliquot of 50 µL of the suspended cells were then mixed with
an equal volume of 0.4% (w/v) trypan blue solution (Thermo Scientific, UK). 10 µL of this
suspension was then loaded onto haemocytometer for cell counting. Total numbers were
recorded in terms of live (clear cytoplasm) and dead (blue cytoplasm) cells. Percentage
viability was determined using equation 6.3.
% viability = number of viable cell count
total cell count × 100 Equation 6.3
Figure 6.1. Experimental set-up for evaluation of electrochemical measurement induced toxicity. Modified lid to allow insertion of the electrodes. The MNA’s were modified with a weighted stem to allow even contact with the cell monolayer. The set-up was connected to a potentiostat that was controlled by the manufacturer own software.
182
6.3.5 Microscopic imaging of the cell monolayer
Visualisations of the cell monolayer was obtained using a digital stereo microscope
equipped with a 3MP camera (Motic®, HK), using a 10x objective. Representative images
are shown after scanning three samples and three different areas per sample.
6.3.6 Statistical analysis
Data were processed in Microsoft Office Excel 2016, analysed using GraphPad Prism
7 (GraphPad Software Inc., USA) and all data are expressed as mean ± standard deviation
(SD). Where appropriate, statistical difference between groups was assessed using one- or
two-way analysis of variance (ANOVA) with Sidak’s multiple comparison test. Differences
were considered statistically significant where P < 0.05.
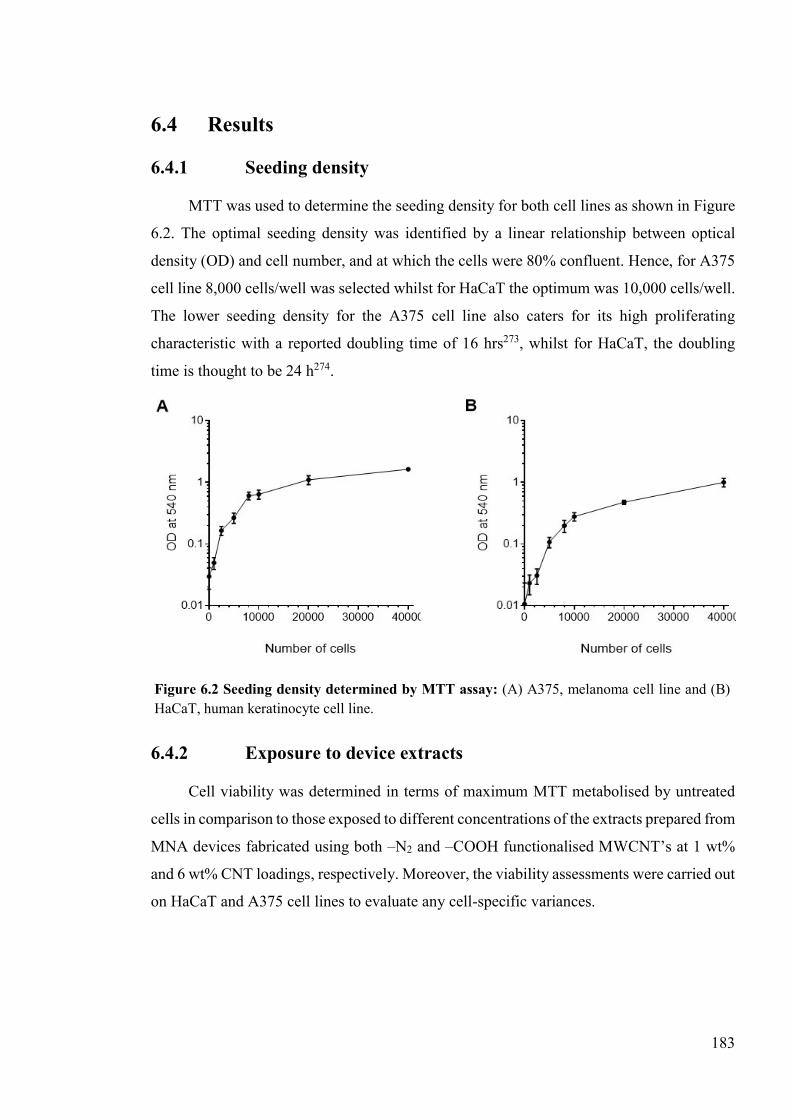
183
6.4 Results
6.4.1 Seeding density
MTT was used to determine the seeding density for both cell lines as shown in Figure
6.2. The optimal seeding density was identified by a linear relationship between optical
density (OD) and cell number, and at which the cells were 80% confluent. Hence, for A375
cell line 8,000 cells/well was selected whilst for HaCaT the optimum was 10,000 cells/well.
The lower seeding density for the A375 cell line also caters for its high proliferating
characteristic with a reported doubling time of 16 hrs273, whilst for HaCaT, the doubling
time is thought to be 24 h274.
6.4.2 Exposure to device extracts
Cell viability was determined in terms of maximum MTT metabolised by untreated
cells in comparison to those exposed to different concentrations of the extracts prepared from
MNA devices fabricated using both –N2 and –COOH functionalised MWCNT’s at 1 wt%
and 6 wt% CNT loadings, respectively. Moreover, the viability assessments were carried out
on HaCaT and A375 cell lines to evaluate any cell-specific variances.
Figure 6.2 Seeding density determined by MTT assay: (A) A375, melanoma cell line and (B) HaCaT, human keratinocyte cell line.
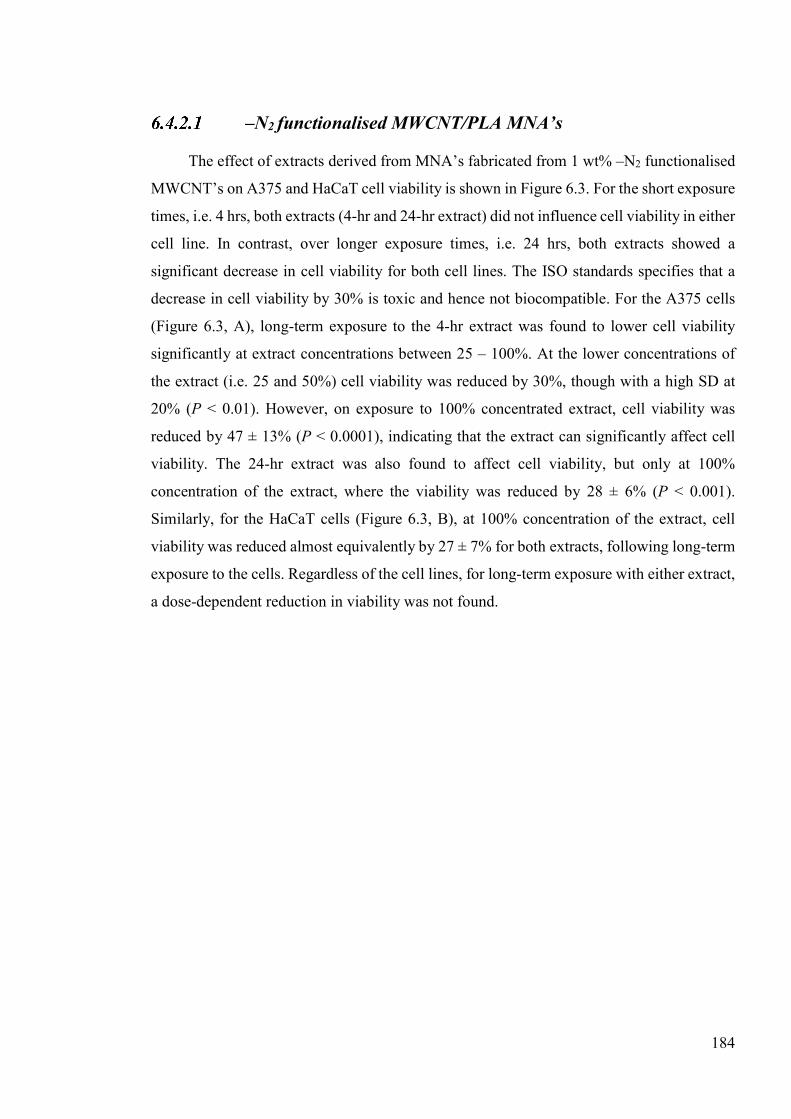
184
–N2 functionalised MWCNT/PLA MNA’s
The effect of extracts derived from MNA’s fabricated from 1 wt% –N2 functionalised
MWCNT’s on A375 and HaCaT cell viability is shown in Figure 6.3. For the short exposure
times, i.e. 4 hrs, both extracts (4-hr and 24-hr extract) did not influence cell viability in either
cell line. In contrast, over longer exposure times, i.e. 24 hrs, both extracts showed a
significant decrease in cell viability for both cell lines. The ISO standards specifies that a
decrease in cell viability by 30% is toxic and hence not biocompatible. For the A375 cells
(Figure 6.3, A), long-term exposure to the 4-hr extract was found to lower cell viability
significantly at extract concentrations between 25 – 100%. At the lower concentrations of
the extract (i.e. 25 and 50%) cell viability was reduced by 30%, though with a high SD at
20% (P < 0.01). However, on exposure to 100% concentrated extract, cell viability was
reduced by 47 ± 13% (P < 0.0001), indicating that the extract can significantly affect cell
viability. The 24-hr extract was also found to affect cell viability, but only at 100%
concentration of the extract, where the viability was reduced by 28 ± 6% (P < 0.001).
Similarly, for the HaCaT cells (Figure 6.3, B), at 100% concentration of the extract, cell
viability was reduced almost equivalently by 27 ± 7% for both extracts, following long-term
exposure to the cells. Regardless of the cell lines, for long-term exposure with either extract,
a dose-dependent reduction in viability was not found.
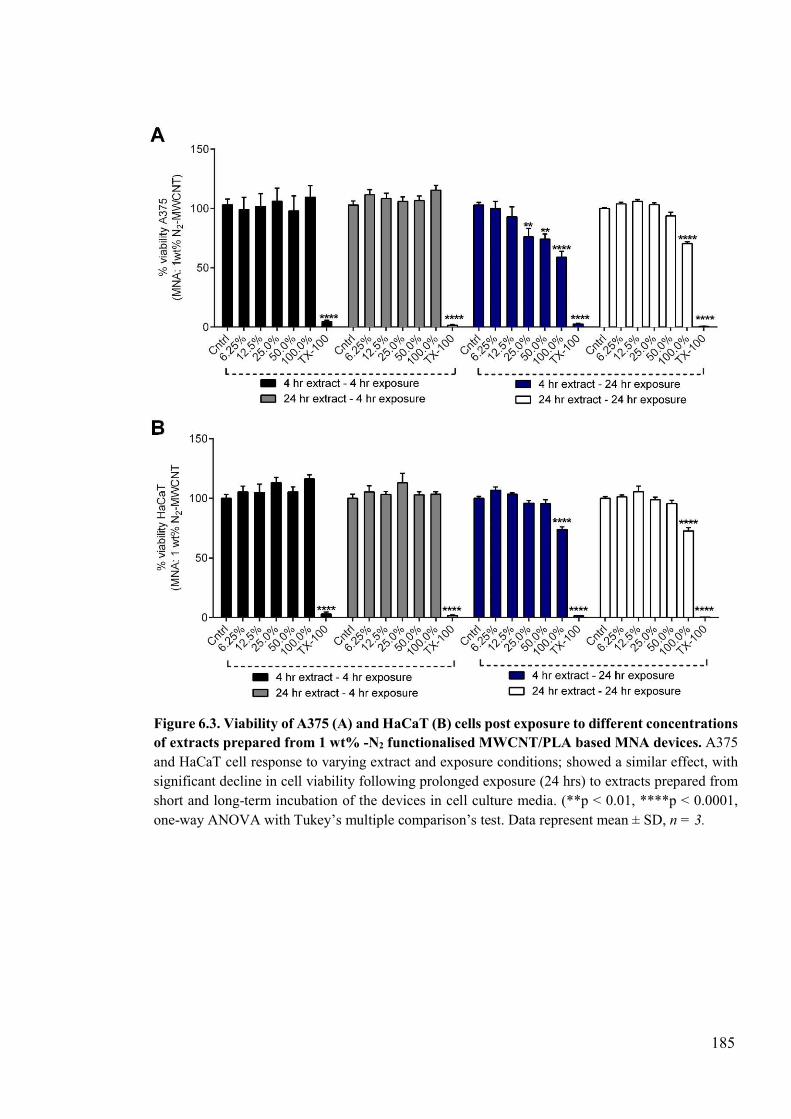
185
Figure 6.3. Viability of A375 (A) and HaCaT (B) cells post exposure to different concentrations of extracts prepared from 1 wt% -N2 functionalised MWCNT/PLA based MNA devices. A375 and HaCaT cell response to varying extract and exposure conditions; showed a similar effect, with significant decline in cell viability following prolonged exposure (24 hrs) to extracts prepared from short and long-term incubation of the devices in cell culture media. (**p < 0.01, ****p < 0.0001, one-way ANOVA with Tukey’s multiple comparison’s test. Data represent mean ± SD, n = 3.
186
–COOH functionalised MWCNT/PLA MNA’s
On evaluating cell viability upon exposure to extracts derived from 6 wt% ‒COOH
functionalised MWCNT’s (Figure 6.4), comparable results were found as previously
described. Regardless of the extract, short-term exposure showed no adverse effects on cell
viability for both cell lines. From long-term exposure to the 4-hr extract, the A375 cells
showed significant reduction in cell viability from 12.5 – 100% (Figure 6.4, A). However, a
30% reduction in cell viability was only found at the highest concentration i.e. 100% where
cell viability was found to be 62 ± 7%. Long-term exposure with the 24-hr extract also
decreased cell viability by 30 ± 9 %, but only at 100% extract concentration. With respect
to the HaCaT cells (Figure 6.4, B), long-term exposure to the 4-hr extract did not influence
the viability of the cells. However, on exposure to the 24-hr extract, HaCaT cell viability
was found significantly reduced by 16 ± 9 % (P < 0.0001); a reduction in cell viability less
than 30%. Collectively, the results indicate that 24-hr extracts on long-term exposure have
had a higher impact on A375 cell viability in comparison to the HaCaT cells.
187
Figure 6.4. Viability of A375 (A) and HaCaT (B) cells post exposure to different concentrations of extracts prepared from 6 wt% -COOH functionalised MWCNT/PLA based MNA devices. A375 and HaCaT cell responses to varying extract and exposure conditions showed a similar effect, with significant decline in cell viability following prolonged exposure (24 hrs) to extracts prepared from short and long-term incubation of the devices in cell culture media. As an exception, the HaCaT cells showed no reduction in cell viability following long-term exposure to the 4-hr extract. (**p < 0.01, ****p < 0.0001, one-way ANOVA with Tukey’s multiple comparison’s test. Data represent mean ± SD, n = 3.
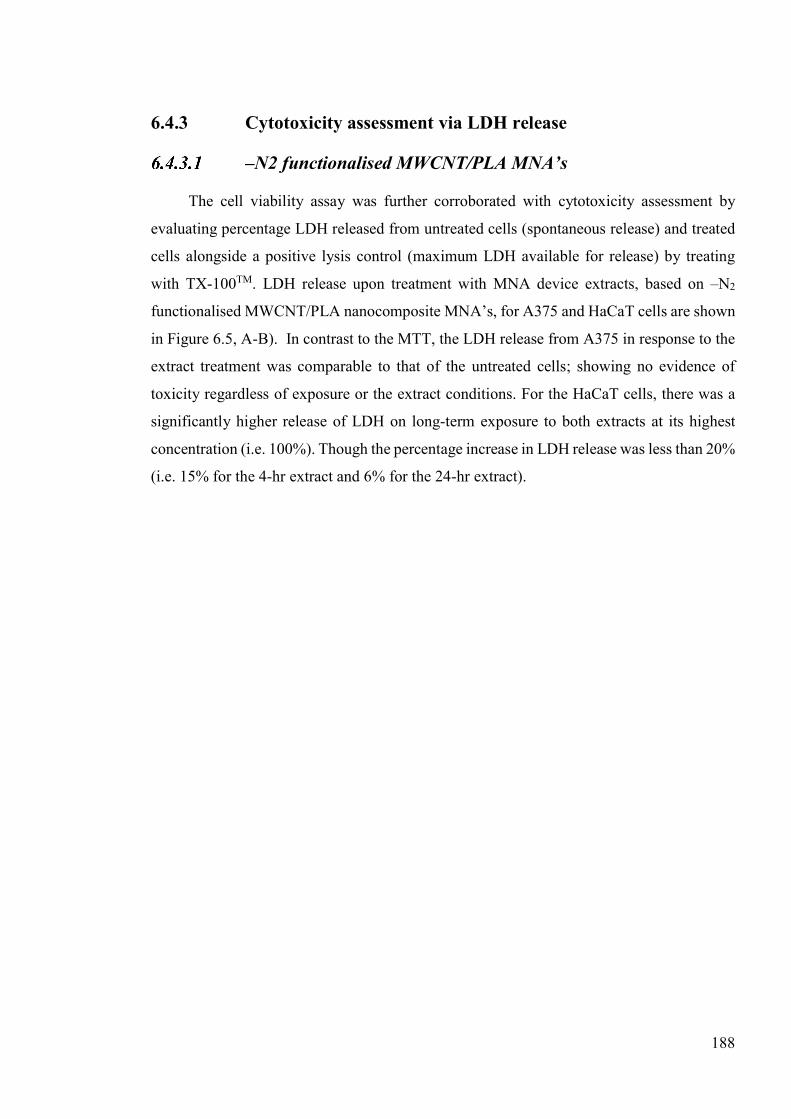
188
6.4.3 Cytotoxicity assessment via LDH release
‒N2 functionalised MWCNT/PLA MNA’s
The cell viability assay was further corroborated with cytotoxicity assessment by
evaluating percentage LDH released from untreated cells (spontaneous release) and treated
cells alongside a positive lysis control (maximum LDH available for release) by treating
with TX-100TM. LDH release upon treatment with MNA device extracts, based on –N2
functionalised MWCNT/PLA nanocomposite MNA’s, for A375 and HaCaT cells are shown
in Figure 6.5, A-B). In contrast to the MTT, the LDH release from A375 in response to the
extract treatment was comparable to that of the untreated cells; showing no evidence of
toxicity regardless of exposure or the extract conditions. For the HaCaT cells, there was a
significantly higher release of LDH on long-term exposure to both extracts at its highest
concentration (i.e. 100%). Though the percentage increase in LDH release was less than 20%
(i.e. 15% for the 4-hr extract and 6% for the 24-hr extract).
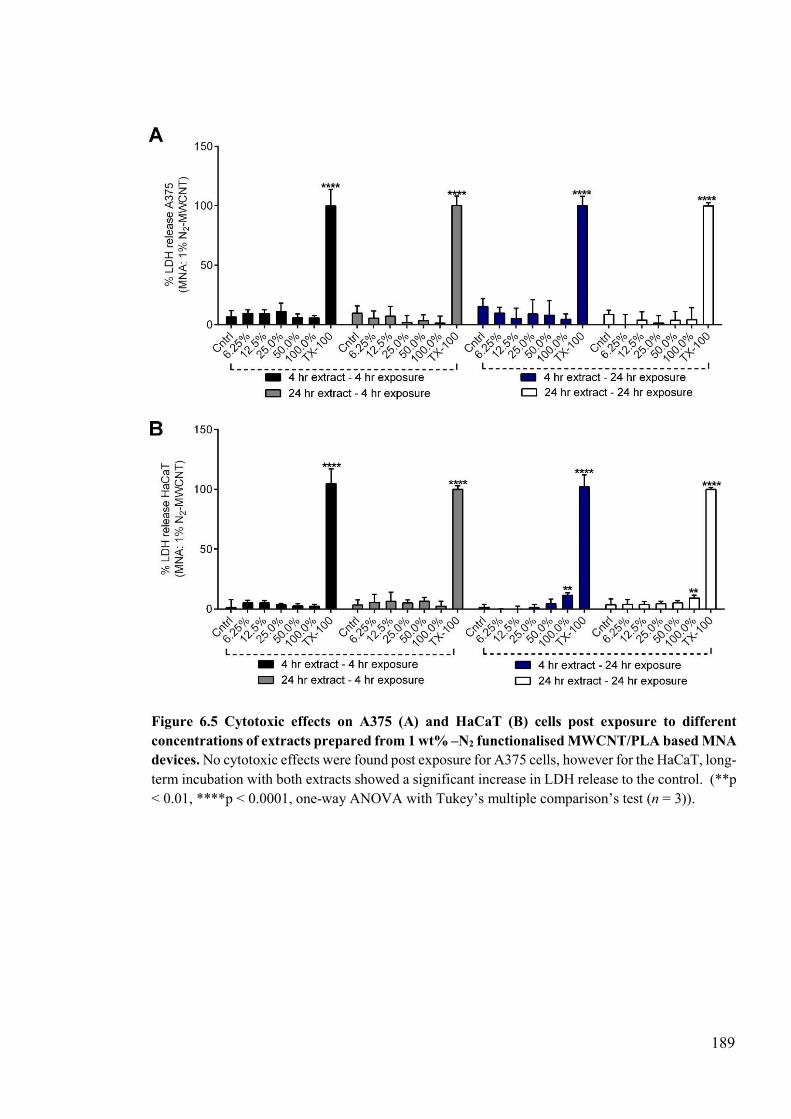
189
Figure 6.5 Cytotoxic effects on A375 (A) and HaCaT (B) cells post exposure to different concentrations of extracts prepared from 1 wt% –N2 functionalised MWCNT/PLA based MNA devices. No cytotoxic effects were found post exposure for A375 cells, however for the HaCaT, long-term incubation with both extracts showed a significant increase in LDH release to the control. (**p < 0.01, ****p < 0.0001, one-way ANOVA with Tukey’s multiple comparison’s test (n = 3)).
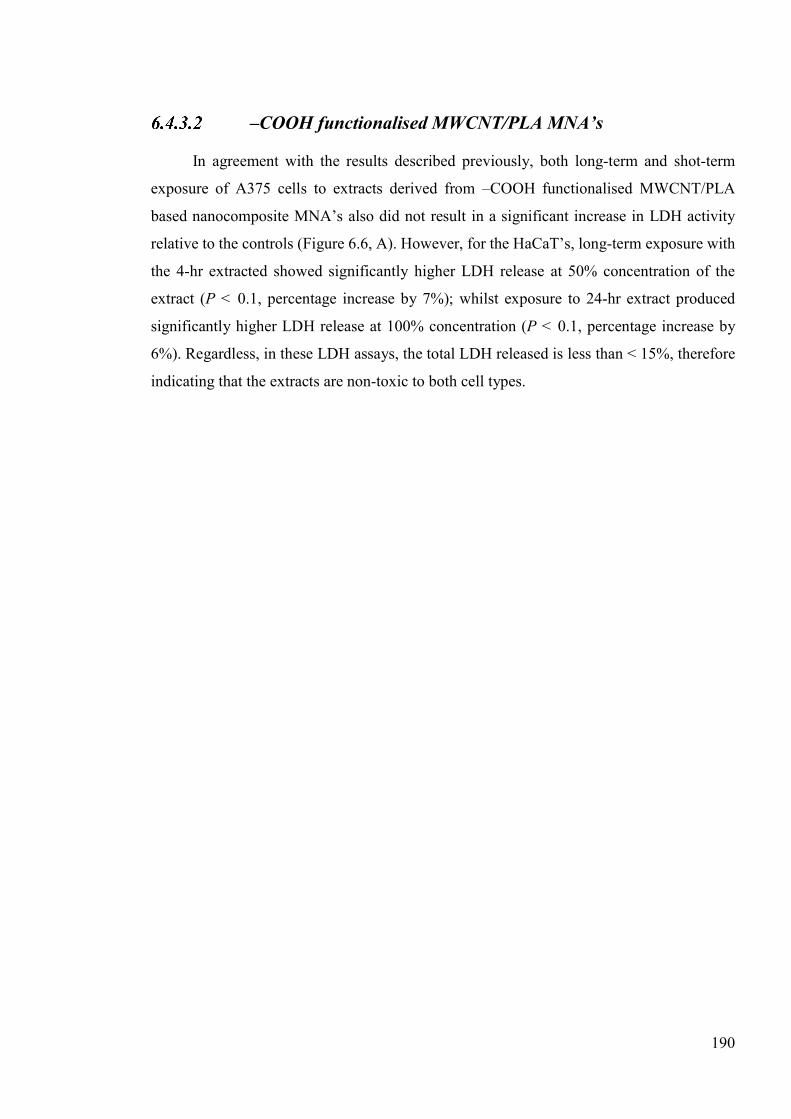
190
–COOH functionalised MWCNT/PLA MNA’s
In agreement with the results described previously, both long-term and shot-term
exposure of A375 cells to extracts derived from –COOH functionalised MWCNT/PLA
based nanocomposite MNA’s also did not result in a significant increase in LDH activity
relative to the controls (Figure 6.6, A). However, for the HaCaT’s, long-term exposure with
the 4-hr extracted showed significantly higher LDH release at 50% concentration of the
extract (P < 0.1, percentage increase by 7%); whilst exposure to 24-hr extract produced
significantly higher LDH release at 100% concentration (P < 0.1, percentage increase by
6%). Regardless, in these LDH assays, the total LDH released is less than < 15%, therefore
indicating that the extracts are non-toxic to both cell types.
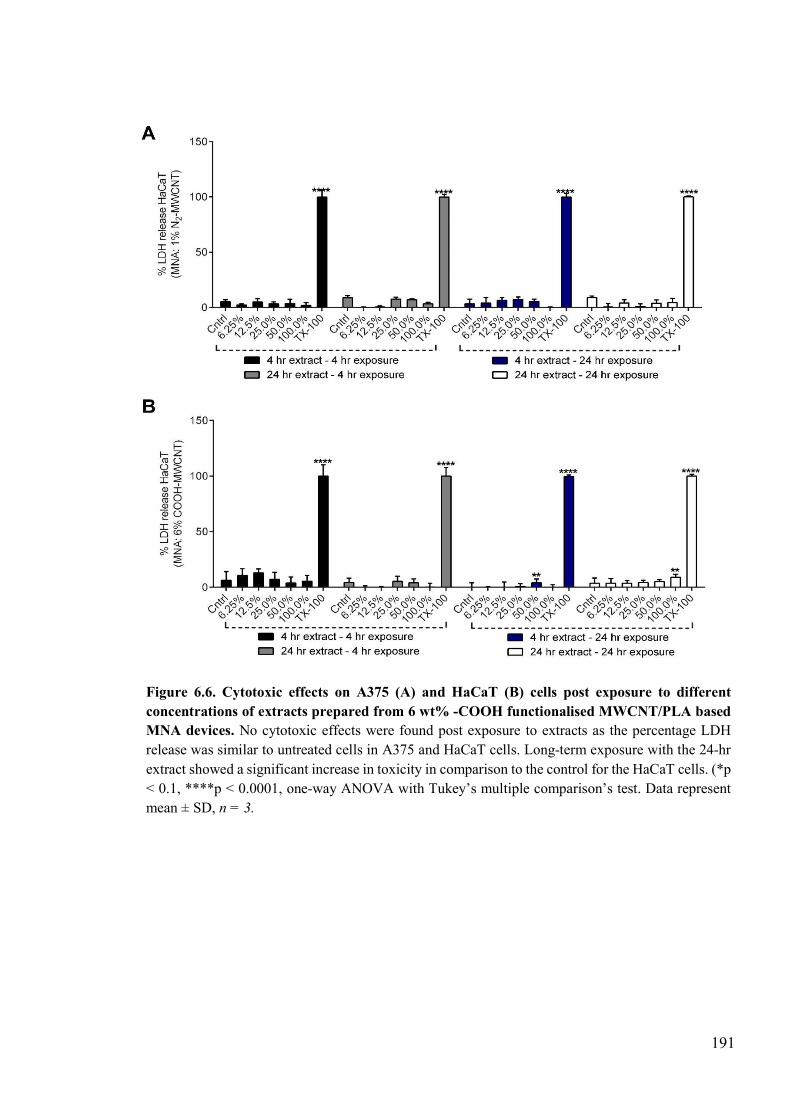
191
Figure 6.6. Cytotoxic effects on A375 (A) and HaCaT (B) cells post exposure to different concentrations of extracts prepared from 6 wt% -COOH functionalised MWCNT/PLA based MNA devices. No cytotoxic effects were found post exposure to extracts as the percentage LDH release was similar to untreated cells in A375 and HaCaT cells. Long-term exposure with the 24-hr extract showed a significant increase in toxicity in comparison to the control for the HaCaT cells. (*p < 0.1, ****p < 0.0001, one-way ANOVA with Tukey’s multiple comparison’s test. Data represent mean ± SD, n = 3.
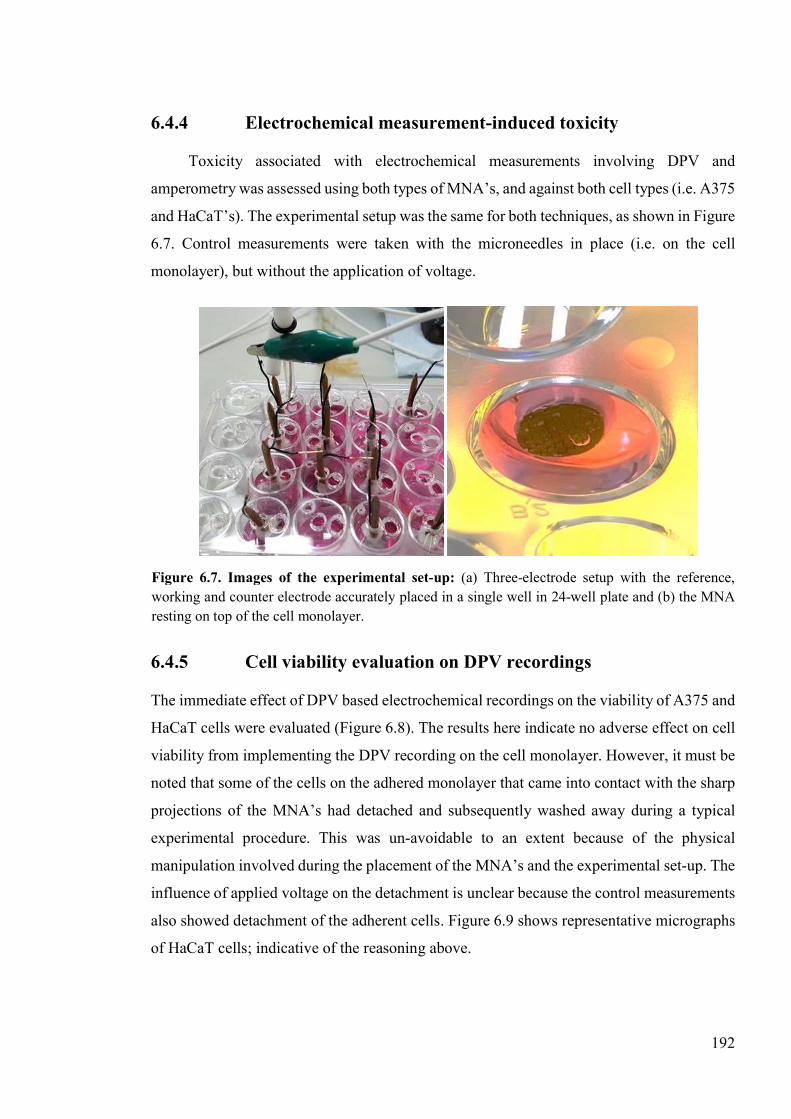
192
6.4.4 Electrochemical measurement-induced toxicity
Toxicity associated with electrochemical measurements involving DPV and
amperometry was assessed using both types of MNA’s, and against both cell types (i.e. A375
and HaCaT’s). The experimental setup was the same for both techniques, as shown in Figure
6.7. Control measurements were taken with the microneedles in place (i.e. on the cell
monolayer), but without the application of voltage.
6.4.5 Cell viability evaluation on DPV recordings
The immediate effect of DPV based electrochemical recordings on the viability of A375 and
HaCaT cells were evaluated (Figure 6.8). The results here indicate no adverse effect on cell
viability from implementing the DPV recording on the cell monolayer. However, it must be
noted that some of the cells on the adhered monolayer that came into contact with the sharp
projections of the MNA’s had detached and subsequently washed away during a typical
experimental procedure. This was un-avoidable to an extent because of the physical
manipulation involved during the placement of the MNA’s and the experimental set-up. The
influence of applied voltage on the detachment is unclear because the control measurements
also showed detachment of the adherent cells. Figure 6.9 shows representative micrographs
of HaCaT cells; indicative of the reasoning above.
Figure 6.7. Images of the experimental set-up: (a) Three-electrode setup with the reference, working and counter electrode accurately placed in a single well in 24-well plate and (b) the MNA resting on top of the cell monolayer.
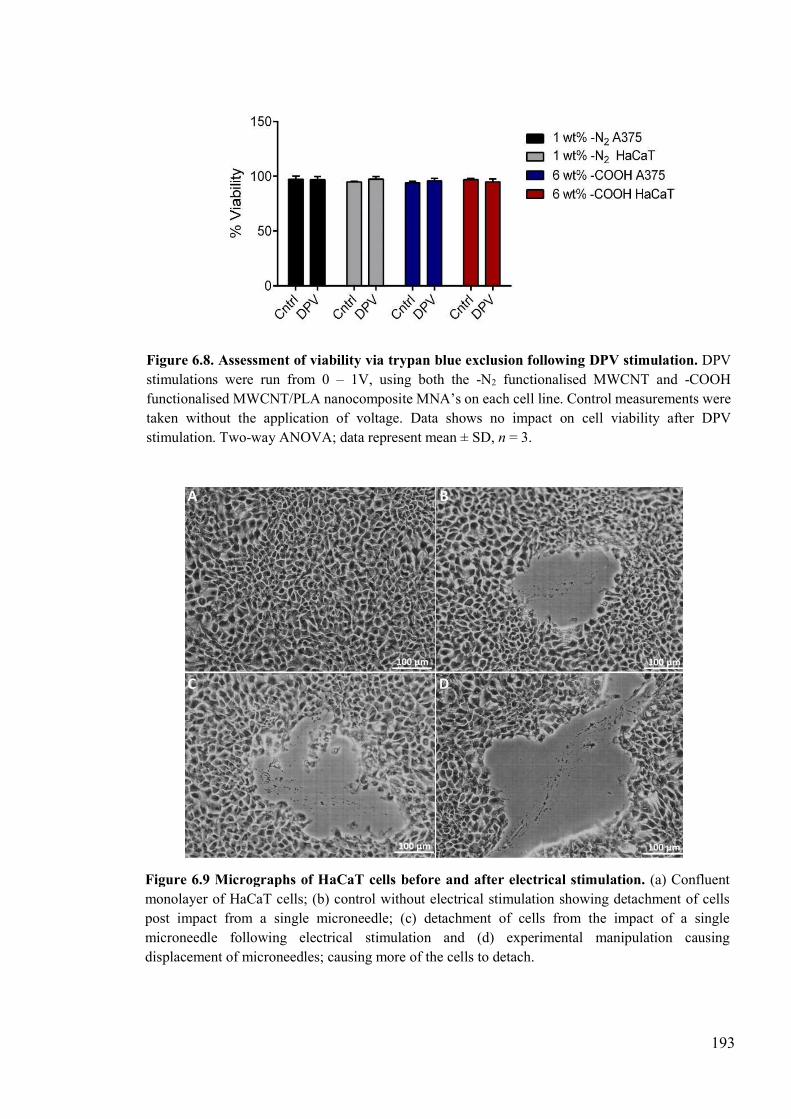
193
Figure 6.8. Assessment of viability via trypan blue exclusion following DPV stimulation. DPV stimulations were run from 0 – 1V, using both the -N2 functionalised MWCNT and -COOH functionalised MWCNT/PLA nanocomposite MNA’s on each cell line. Control measurements were taken without the application of voltage. Data shows no impact on cell viability after DPV stimulation. Two-way ANOVA; data represent mean ± SD, n = 3.
Figure 6.9 Micrographs of HaCaT cells before and after electrical stimulation. (a) Confluent monolayer of HaCaT cells; (b) control without electrical stimulation showing detachment of cells post impact from a single microneedle; (c) detachment of cells from the impact of a single microneedle following electrical stimulation and (d) experimental manipulation causing displacement of microneedles; causing more of the cells to detach.
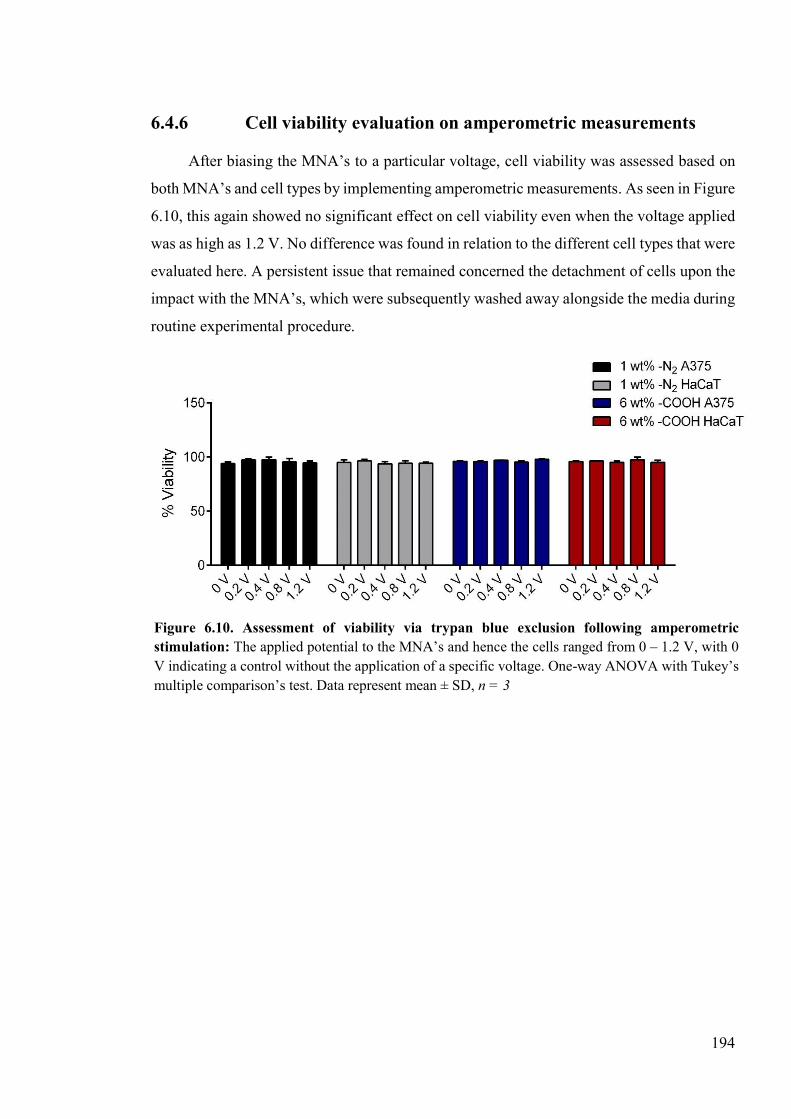
194
6.4.6 Cell viability evaluation on amperometric measurements
After biasing the MNA’s to a particular voltage, cell viability was assessed based on
both MNA’s and cell types by implementing amperometric measurements. As seen in Figure
6.10, this again showed no significant effect on cell viability even when the voltage applied
was as high as 1.2 V. No difference was found in relation to the different cell types that were
evaluated here. A persistent issue that remained concerned the detachment of cells upon the
impact with the MNA’s, which were subsequently washed away alongside the media during
routine experimental procedure.
Figure 6.10. Assessment of viability via trypan blue exclusion following amperometric stimulation: The applied potential to the MNA’s and hence the cells ranged from 0 – 1.2 V, with 0 V indicating a control without the application of a specific voltage. One-way ANOVA with Tukey’s multiple comparison’s test. Data represent mean ± SD, n = 3
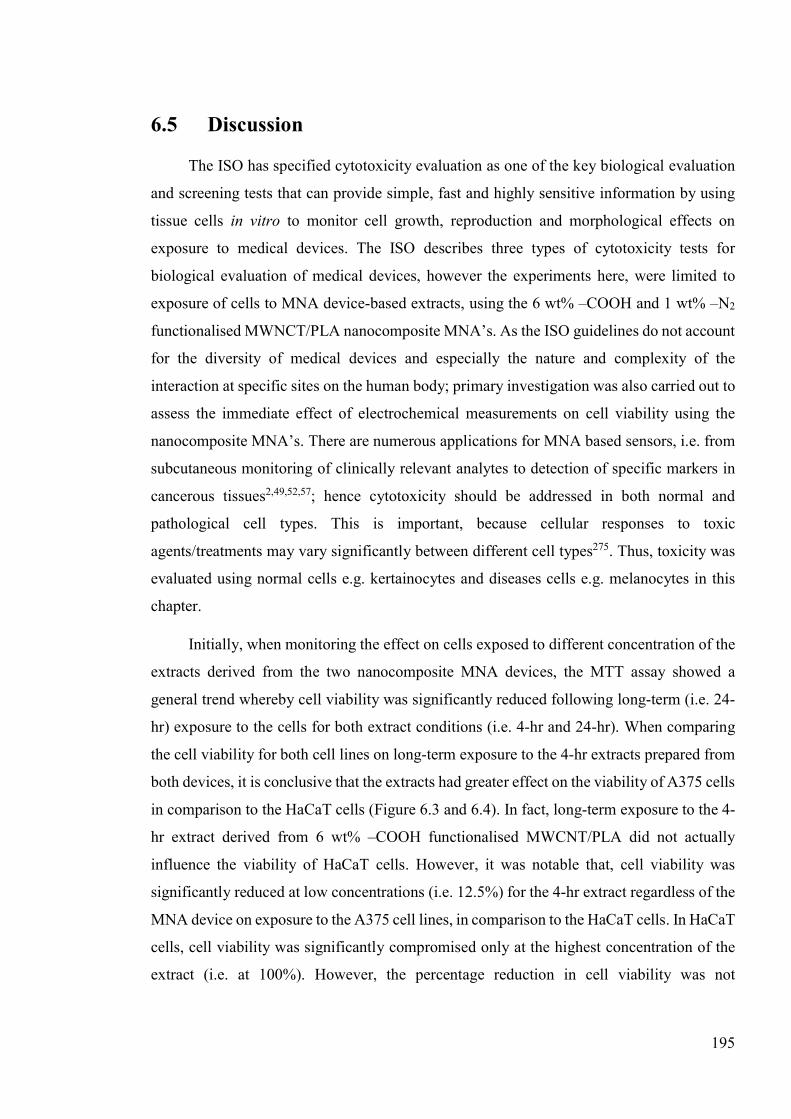
195
6.5 Discussion
The ISO has specified cytotoxicity evaluation as one of the key biological evaluation
and screening tests that can provide simple, fast and highly sensitive information by using
tissue cells in vitro to monitor cell growth, reproduction and morphological effects on
exposure to medical devices. The ISO describes three types of cytotoxicity tests for
biological evaluation of medical devices, however the experiments here, were limited to
exposure of cells to MNA device-based extracts, using the 6 wt% ‒COOH and 1 wt% ‒N2
functionalised MWNCT/PLA nanocomposite MNA’s. As the ISO guidelines do not account
for the diversity of medical devices and especially the nature and complexity of the
interaction at specific sites on the human body; primary investigation was also carried out to
assess the immediate effect of electrochemical measurements on cell viability using the
nanocomposite MNA’s. There are numerous applications for MNA based sensors, i.e. from
subcutaneous monitoring of clinically relevant analytes to detection of specific markers in
cancerous tissues2,49,52,57; hence cytotoxicity should be addressed in both normal and
pathological cell types. This is important, because cellular responses to toxic
agents/treatments may vary significantly between different cell types275. Thus, toxicity was
evaluated using normal cells e.g. kertainocytes and diseases cells e.g. melanocytes in this
chapter.
Initially, when monitoring the effect on cells exposed to different concentration of the
extracts derived from the two nanocomposite MNA devices, the MTT assay showed a
general trend whereby cell viability was significantly reduced following long-term (i.e. 24-
hr) exposure to the cells for both extract conditions (i.e. 4-hr and 24-hr). When comparing
the cell viability for both cell lines on long-term exposure to the 4-hr extracts prepared from
both devices, it is conclusive that the extracts had greater effect on the viability of A375 cells
in comparison to the HaCaT cells (Figure 6.3 and 6.4). In fact, long-term exposure to the 4-
hr extract derived from 6 wt% ‒COOH functionalised MWCNT/PLA did not actually
influence the viability of HaCaT cells. However, it was notable that, cell viability was
significantly reduced at low concentrations (i.e. 12.5%) for the 4-hr extract regardless of the
MNA device on exposure to the A375 cell lines, in comparison to the HaCaT cells. In HaCaT
cells, cell viability was significantly compromised only at the highest concentration of the
extract (i.e. at 100%). However, the percentage reduction in cell viability was not
196
proportional to the concentration of the extract for the A375 cells. This non-proportionality
is reported as a challenge associated with the MTT assay itself and have been reported by
several authors in unrelated studies; as reviewed in Li et al.276. Most probable experimental
causes involve variances in cell density and most importantly time. It has been suggested
that, a dose-related toxicity can be obtained from an MTT assay, but only after significant
optimisation concerning the influence of time when testing medical devices276. In relation to
the A375 cells, the most notable difference between the 4-hr and 24-hr extract on long-term
exposure was that, the 24-hr extract only reduced viability at its maximum concentration.
This is contrary to expectations, as the extract prepared over 24 hrs should contain more of
the leached components that is responsible for reducing cell viability as opposed to the 4-hr
extract. As the components leaching into the media during incubation of the MNA device
has not yet been identified, it is difficult to ascertain a possible cause. The reduction in cell
viability is unlikely due to the release of nanoparticles from the nanocomposite MNA’s
themselves as the MWCNT’s are embedded in the PLA matrix. However, in a scenario
where nanoparticles are indeed released into the media, over longer incubation times, as in
the case for the 24-hr extract, components of the media (i.e. mainly proteins) can adsorb on
to the surface of nanoparticles forming a protein corona277. The nanoparticles may relate to
the MWCNT’s themselves, catalyst contaminants incorporated during CNT fabrication and
other components from the uncharacterised PLA. Nevertheless, since the interaction
between nanoparticles and the cells is mediated by the outermost layer of the nanoparticles,
protein corona formation may lower the effect of nanoparticles on cell viability278. Such a
phenomenon can therefore explain why reduction in cell viability was only associated with
the maximum extract concentration for the 24-hr extract, where there may be some uncoated
nanoparticles present.
In terms of differences between the MNA devices, the A375 cells shows no
conceivable difference in cell viability from long-term exposure to the device extracts.
However, the viability of HaCaT cells on exposure to the extracts derived from –N2
functionalised MWCNT/PLA nanocomposites showed a greater reduction in comparison to
the –COOH functionalised MWCNT/PLA devices (Figure 6.3 and 6.4). Between the two
devices, the MWCNT’s used were different not only in terms of the functional groups
present, but also their structural characteristics. The –N2 functionalised MWCNT’s used
were shorter in length, smaller in diameter and had a higher surface area in comparison to
197
the –COOH functionalised MWCNT’s. These factors have all been shown to influence
toxicity when CNT’s are in their isolated form. The extent to which each factor is influential
in determining cytotoxicity is yet to be established. However, a recent study has indicated
that the diameter is inversely proportional to cell viability (toxic below 40 nm in diameter),
while functionalisation with –COOH groups was shown to mitigate the effect on cell
viability as compared to pristine MWCNT’s254. This mitigating effect was reasoned to be
effect of sedimentation in cell culture media, which in turn is influenced by the adsorption
of the proteins from the cell culture media. The aforementioned study also reported that –
COOH functionalised MWCNT’s can attract distinct types of proteins to different extents.
Therefore, the type and amount of proteins adsorbed onto the –N2 functionalised MWCNT’s
may differ to some extent, depending on the type of interactions formed254. Hence, if indeed
MWCNT-based nanoparticles have leached out of the nanocomposite MNA’s, it is important
to determine the toxicity associated with the type of nanotubes to fully comprehend the
results from cytotoxicity evaluations. Overall, the MTT results indicate no cytotoxicity over
short-term exposure (i.e. 4 hrs) from either device regardless of the extraction conditions. In
contrast, long-term exposure showed a significant reduction in cell viability, more so for the
A375 cells and for the extract prepared over 4 hrs. In terms of application, the nanocomposite
MNA-based electrochemical sensors have only been evaluated for one-off measurements
thus far and they were carried out in real-time. Hence the MNA’s, only remain in contact
with the viable tissue for a short-period of time (i.e. a few minutes), which consequently
limits the possibility for constituents to leach out of the MNA’s. However, in the case that
constituents of the MNA’s have been leached and they remain within the tissue, it may affect
the viability of the cells.
Cytotoxicity was further evaluated using LDH assay, a marker of cytoplasmic damage.
However, the results obtained in this study contradicted that of the MTT assay; as regardless
of the extract or exposure conditions, the level of LDH activity measured indicated no
cytotoxicity. Assuming that, the toxicity is caused by leached nanoparticulates from the
nanocomposite MNA’s; this result indicates the possibility of interference from the
nanoparticles to the LDH assay. In fact, it has been recently reported in the literature that
nanoparticles in general can interfere with both MTT and LDH assays279. For MTT, (1) the
absorbance from the particles can add to the MTT absorbance, (2) particles can adsorb the
formazan compound thus reducing the absorbance from the MTT assay and (3) the formazan
198
compound can be produced by the particles themselves hence adding to the assay absorbance.
In terms of the LDH assay, (1) the particles can adsorb the LDH, thereby preventing the
LDH from being measured or (2) the particles can inactivate the LDH enzyme non-
specifically by generating free radicals on the surface preventing LDH from being measured.
If the interference from the nanoparticles is to be factored in, an alternative explanation can
be given to the MTT results as well. With reference to CNT’s, Wörle-knirsch et al. reported
that SWCNT exposure can give false-positive MTT results, as they interact with the MTT-
formazan crystals formed after the reduction of MTT; resulting in stabilisation of their
chemical structure280. As a result, the MTT-formazan crystals cannot be solubilised. Other
factors involve the adsorption of proteins from the media causing in-direct toxicity281.
However, since this only occurs at high concentrations of CNT (0.4 – 0.8 mg/ml), an amount
unlikely to be released from the nanocomposite MNA’s, the influence of indirect toxicity
can be ruled out. In comparison to the MTT, fewer studies have reported interference to LDH
assay with reference to CNT’s. Importantly, the results obtained are also conflicting. In terms
of SWCNT, Wörle-knirsch et al. initially reported that LDH activity is not influenced by
SWCNT280, however, Wang et al. showed that both oxidised and pristine SWCNT’s can
reduce the absorbance of formazan282. Moreover, since CNT’s may not be the only type of
nanoparticle present in the extract, others may adsorb/inactive LDH to different extents,
depending on their type and characteristics279. When considering these arguments, although
there were differences between the MTT and LDH assay, the toxicity was only observed at
low levels and only on prolonged exposure. Thus, it gives more confidence to the use of
nanocomposite MNA’s for rapid bioanalysis. Further analysis is however imperative,
especially in identifying the leached components present in the extract.
Other than the cytotoxicity induced by contact or leached components from the
nanocomposites materials, electrochemical measurements also play a crucial role in
mediating cytotoxicity. In this study, the immediate effect of electrochemical measurements
on cells were investigated. It was found that regardless of the MNA device or the cell line,
DPV or amperometric measurements on cell monolayers did not lead to cytotoxicity.
However, the results shown here may not be representative due to an experimental limitation,
that resulted in cells close to the vicinity of the MNA’s to be detached from the impact of
the microneedles and subsequently washed away during routine experimental procedure. As
the duration of the experiment was limited to 2 mins for both electrochemical measurements,
199
any detrimental effects to cells is likely to have occurred for those around the vicinity of
individual microneedles. Gabi et al. showed that at current densities higher than 0.5 A m-2,
myoblasts cultured directly on top of a microelectrode can undergo cell death, within 2 mins
of exposure283. It may also be case that, the duration until which the test measurements were
run was insufficient to induce any cytotoxicity. Tominaga et al. showed that a noticeable
difference in cellular morphology could only be identified when a potential of 1 V was
applied for over 10 mins284. In contrast, Kumagai et al. showed that the same potential
applied for a shorter period (i.e. 5 mins) decreased the proliferation rate of cells when
cultured over 3 days by ~75%266. Overall, further optimisation to the experimental set-up is
required to accurately assess the impact of electrochemical measurements on cells and
thereby assess cytotoxicity.
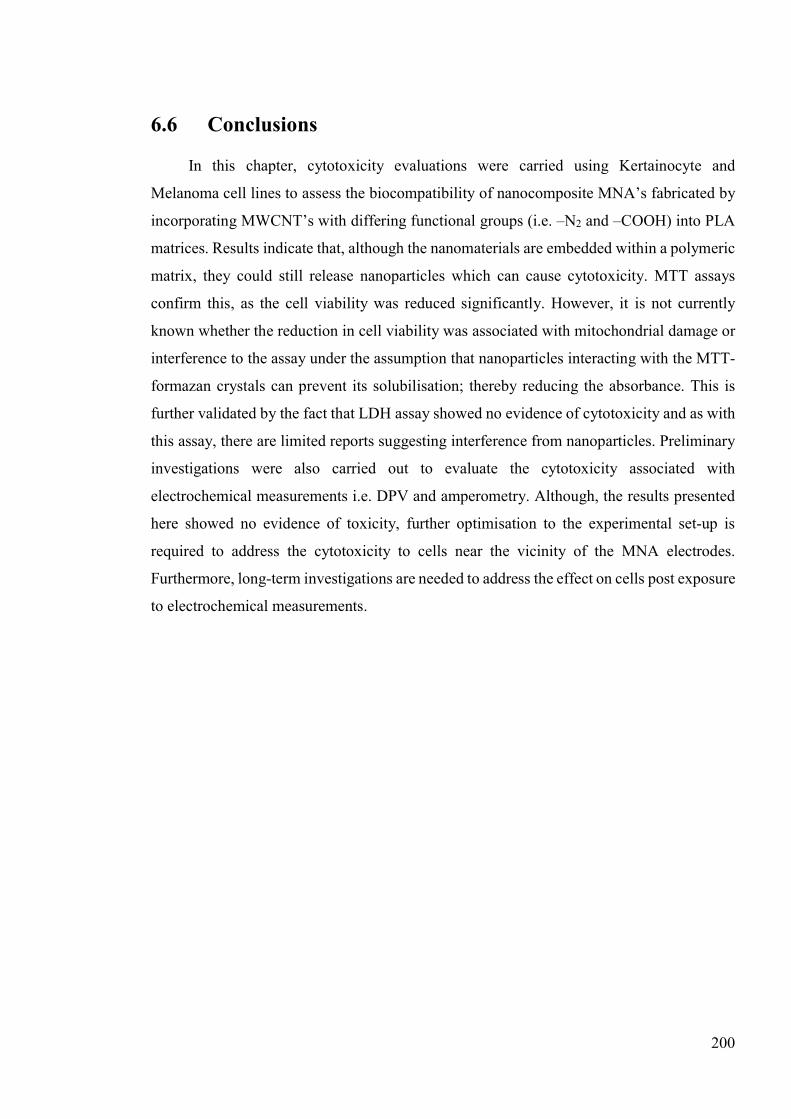
200
6.6 Conclusions
In this chapter, cytotoxicity evaluations were carried using Kertainocyte and
Melanoma cell lines to assess the biocompatibility of nanocomposite MNA’s fabricated by
incorporating MWCNT’s with differing functional groups (i.e. –N2 and –COOH) into PLA
matrices. Results indicate that, although the nanomaterials are embedded within a polymeric
matrix, they could still release nanoparticles which can cause cytotoxicity. MTT assays
confirm this, as the cell viability was reduced significantly. However, it is not currently
known whether the reduction in cell viability was associated with mitochondrial damage or
interference to the assay under the assumption that nanoparticles interacting with the MTT-
formazan crystals can prevent its solubilisation; thereby reducing the absorbance. This is
further validated by the fact that LDH assay showed no evidence of cytotoxicity and as with
this assay, there are limited reports suggesting interference from nanoparticles. Preliminary
investigations were also carried out to evaluate the cytotoxicity associated with
electrochemical measurements i.e. DPV and amperometry. Although, the results presented
here showed no evidence of toxicity, further optimisation to the experimental set-up is
required to address the cytotoxicity to cells near the vicinity of the MNA electrodes.
Furthermore, long-term investigations are needed to address the effect on cells post exposure
to electrochemical measurements.
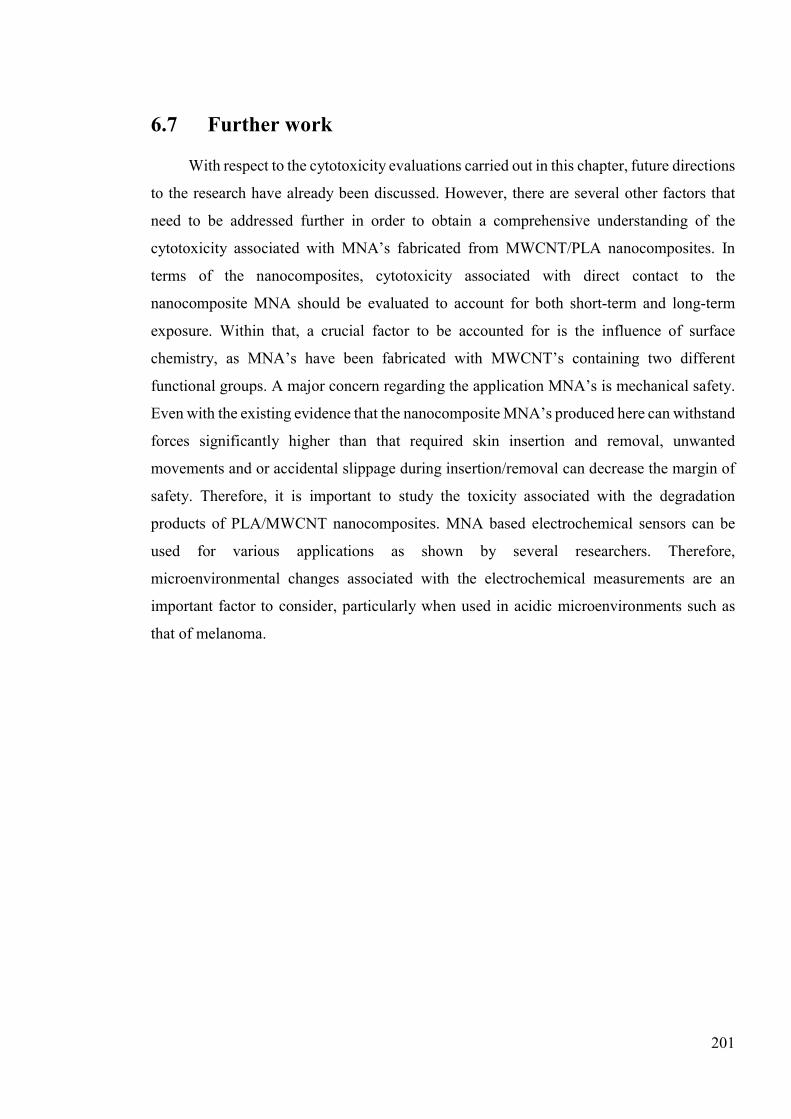
201
6.7 Further work
With respect to the cytotoxicity evaluations carried out in this chapter, future directions
to the research have already been discussed. However, there are several other factors that
need to be addressed further in order to obtain a comprehensive understanding of the
cytotoxicity associated with MNA’s fabricated from MWCNT/PLA nanocomposites. In
terms of the nanocomposites, cytotoxicity associated with direct contact to the
nanocomposite MNA should be evaluated to account for both short-term and long-term
exposure. Within that, a crucial factor to be accounted for is the influence of surface
chemistry, as MNA’s have been fabricated with MWCNT’s containing two different
functional groups. A major concern regarding the application MNA’s is mechanical safety.
Even with the existing evidence that the nanocomposite MNA’s produced here can withstand
forces significantly higher than that required skin insertion and removal, unwanted
movements and or accidental slippage during insertion/removal can decrease the margin of
safety. Therefore, it is important to study the toxicity associated with the degradation
products of PLA/MWCNT nanocomposites. MNA based electrochemical sensors can be
used for various applications as shown by several researchers. Therefore,
microenvironmental changes associated with the electrochemical measurements are an
important factor to consider, particularly when used in acidic microenvironments such as
that of melanoma.
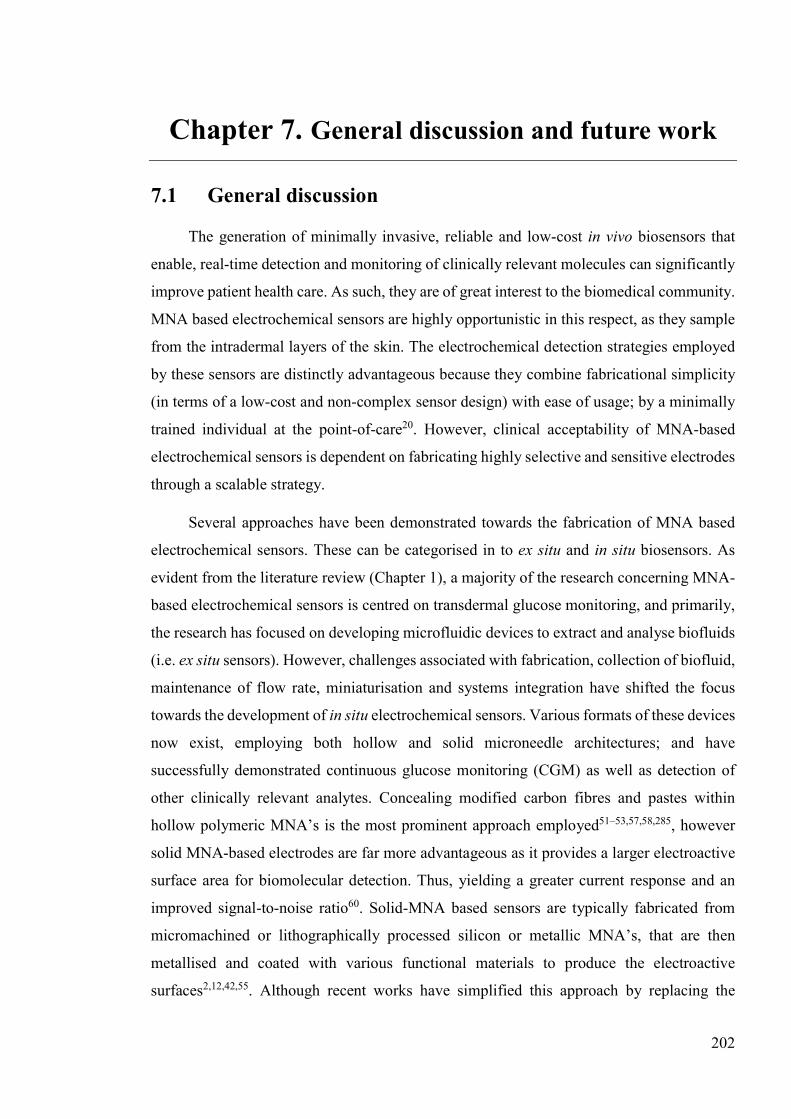
202
Chapter 7. General discussion and future work
7.1 General discussion
The generation of minimally invasive, reliable and low-cost in vivo biosensors that
enable, real-time detection and monitoring of clinically relevant molecules can significantly
improve patient health care. As such, they are of great interest to the biomedical community.
MNA based electrochemical sensors are highly opportunistic in this respect, as they sample
from the intradermal layers of the skin. The electrochemical detection strategies employed
by these sensors are distinctly advantageous because they combine fabricational simplicity
(in terms of a low-cost and non-complex sensor design) with ease of usage; by a minimally
trained individual at the point-of-care20. However, clinical acceptability of MNA-based
electrochemical sensors is dependent on fabricating highly selective and sensitive electrodes
through a scalable strategy.
Several approaches have been demonstrated towards the fabrication of MNA based
electrochemical sensors. These can be categorised in to ex situ and in situ biosensors. As
evident from the literature review (Chapter 1), a majority of the research concerning MNA-
based electrochemical sensors is centred on transdermal glucose monitoring, and primarily,
the research has focused on developing microfluidic devices to extract and analyse biofluids
(i.e. ex situ sensors). However, challenges associated with fabrication, collection of biofluid,
maintenance of flow rate, miniaturisation and systems integration have shifted the focus
towards the development of in situ electrochemical sensors. Various formats of these devices
now exist, employing both hollow and solid microneedle architectures; and have
successfully demonstrated continuous glucose monitoring (CGM) as well as detection of
other clinically relevant analytes. Concealing modified carbon fibres and pastes within
hollow polymeric MNA’s is the most prominent approach employed51–53,57,58,285, however
solid MNA-based electrodes are far more advantageous as it provides a larger electroactive
surface area for biomolecular detection. Thus, yielding a greater current response and an
improved signal-to-noise ratio60. Solid-MNA based sensors are typically fabricated from
micromachined or lithographically processed silicon or metallic MNA’s, that are then
metallised and coated with various functional materials to produce the electroactive
surfaces2,12,42,55. Although recent works have simplified this approach by replacing the
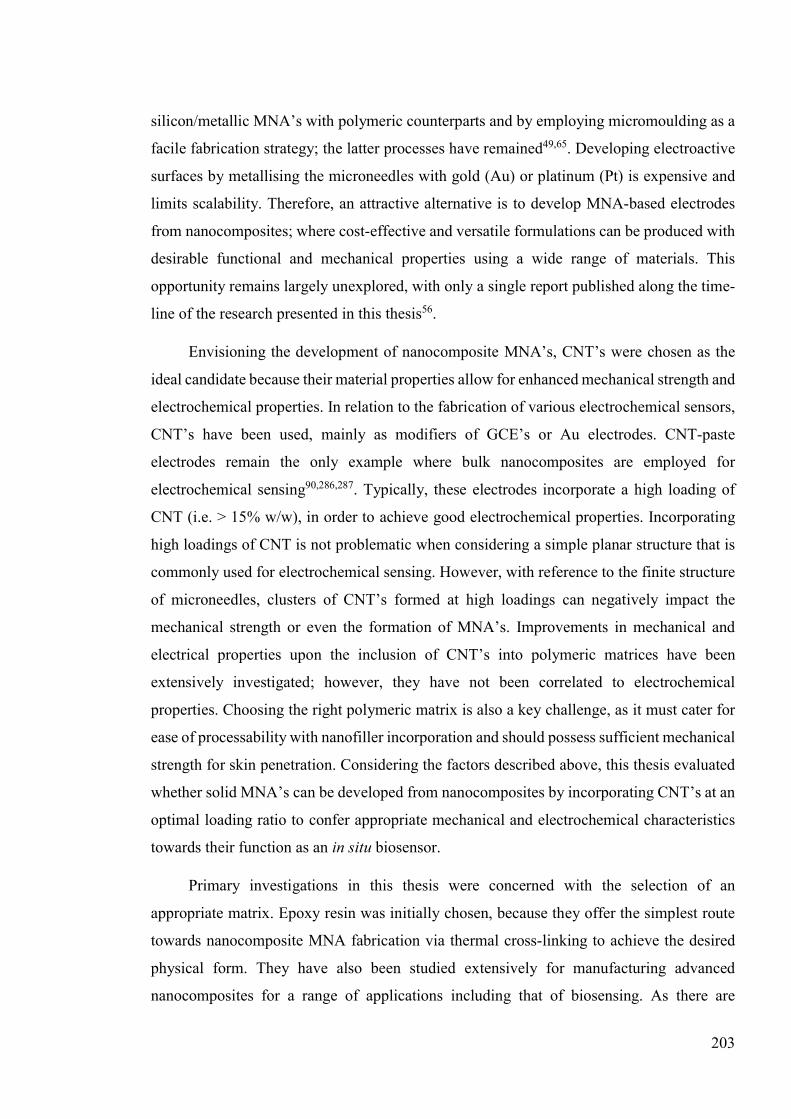
203
silicon/metallic MNA’s with polymeric counterparts and by employing micromoulding as a
facile fabrication strategy; the latter processes have remained49,65. Developing electroactive
surfaces by metallising the microneedles with gold (Au) or platinum (Pt) is expensive and
limits scalability. Therefore, an attractive alternative is to develop MNA-based electrodes
from nanocomposites; where cost-effective and versatile formulations can be produced with
desirable functional and mechanical properties using a wide range of materials. This
opportunity remains largely unexplored, with only a single report published along the time-
line of the research presented in this thesis56.
Envisioning the development of nanocomposite MNA’s, CNT’s were chosen as the
ideal candidate because their material properties allow for enhanced mechanical strength and
electrochemical properties. In relation to the fabrication of various electrochemical sensors,
CNT’s have been used, mainly as modifiers of GCE’s or Au electrodes. CNT-paste
electrodes remain the only example where bulk nanocomposites are employed for
electrochemical sensing90,286,287. Typically, these electrodes incorporate a high loading of
CNT (i.e. > 15% w/w), in order to achieve good electrochemical properties. Incorporating
high loadings of CNT is not problematic when considering a simple planar structure that is
commonly used for electrochemical sensing. However, with reference to the finite structure
of microneedles, clusters of CNT’s formed at high loadings can negatively impact the
mechanical strength or even the formation of MNA’s. Improvements in mechanical and
electrical properties upon the inclusion of CNT’s into polymeric matrices have been
extensively investigated; however, they have not been correlated to electrochemical
properties. Choosing the right polymeric matrix is also a key challenge, as it must cater for
ease of processability with nanofiller incorporation and should possess sufficient mechanical
strength for skin penetration. Considering the factors described above, this thesis evaluated
whether solid MNA’s can be developed from nanocomposites by incorporating CNT’s at an
optimal loading ratio to confer appropriate mechanical and electrochemical characteristics
towards their function as an in situ biosensor.
Primary investigations in this thesis were concerned with the selection of an
appropriate matrix. Epoxy resin was initially chosen, because they offer the simplest route
towards nanocomposite MNA fabrication via thermal cross-linking to achieve the desired
physical form. They have also been studied extensively for manufacturing advanced
nanocomposites for a range of applications including that of biosensing. As there are
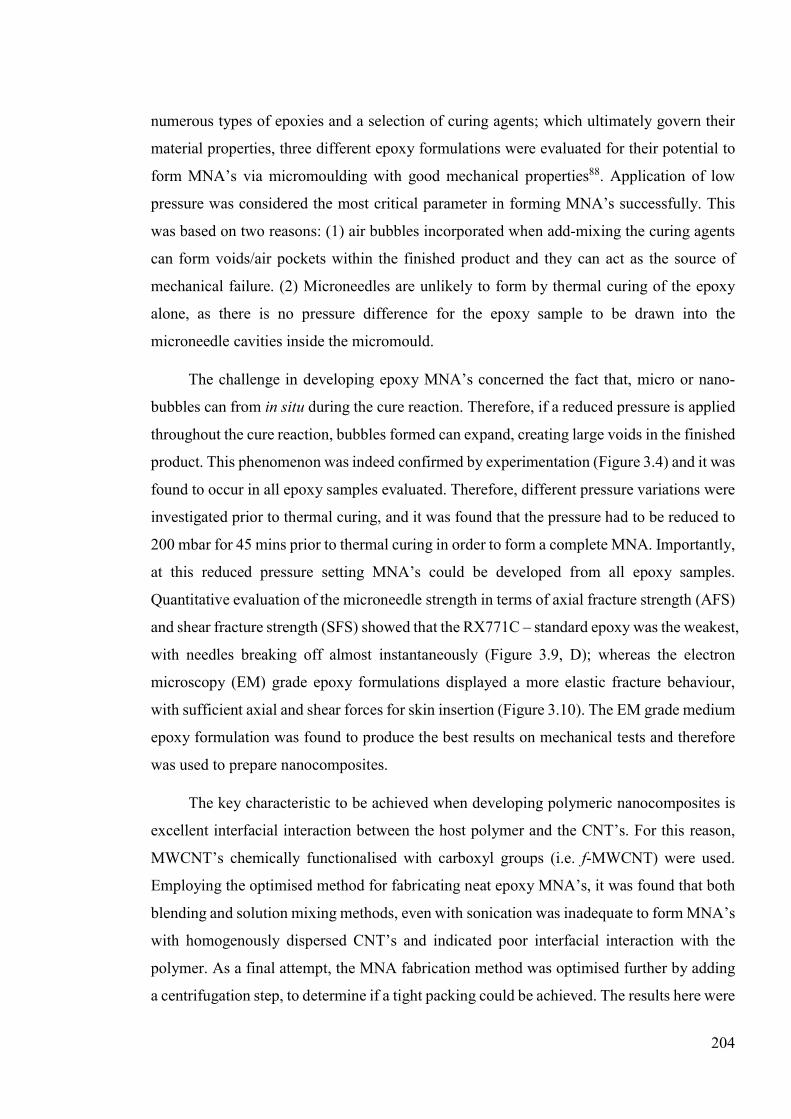
204
numerous types of epoxies and a selection of curing agents; which ultimately govern their
material properties, three different epoxy formulations were evaluated for their potential to
form MNA’s via micromoulding with good mechanical properties88. Application of low
pressure was considered the most critical parameter in forming MNA’s successfully. This
was based on two reasons: (1) air bubbles incorporated when add-mixing the curing agents
can form voids/air pockets within the finished product and they can act as the source of
mechanical failure. (2) Microneedles are unlikely to form by thermal curing of the epoxy
alone, as there is no pressure difference for the epoxy sample to be drawn into the
microneedle cavities inside the micromould.
The challenge in developing epoxy MNA’s concerned the fact that, micro or nano-
bubbles can from in situ during the cure reaction. Therefore, if a reduced pressure is applied
throughout the cure reaction, bubbles formed can expand, creating large voids in the finished
product. This phenomenon was indeed confirmed by experimentation (Figure 3.4) and it was
found to occur in all epoxy samples evaluated. Therefore, different pressure variations were
investigated prior to thermal curing, and it was found that the pressure had to be reduced to
200 mbar for 45 mins prior to thermal curing in order to form a complete MNA. Importantly,
at this reduced pressure setting MNA’s could be developed from all epoxy samples.
Quantitative evaluation of the microneedle strength in terms of axial fracture strength (AFS)
and shear fracture strength (SFS) showed that the RX771C – standard epoxy was the weakest,
with needles breaking off almost instantaneously (Figure 3.9, D); whereas the electron
microscopy (EM) grade epoxy formulations displayed a more elastic fracture behaviour,
with sufficient axial and shear forces for skin insertion (Figure 3.10). The EM grade medium
epoxy formulation was found to produce the best results on mechanical tests and therefore
was used to prepare nanocomposites.
The key characteristic to be achieved when developing polymeric nanocomposites is
excellent interfacial interaction between the host polymer and the CNT’s. For this reason,
MWCNT’s chemically functionalised with carboxyl groups (i.e. f-MWCNT) were used.
Employing the optimised method for fabricating neat epoxy MNA’s, it was found that both
blending and solution mixing methods, even with sonication was inadequate to form MNA’s
with homogenously dispersed CNT’s and indicated poor interfacial interaction with the
polymer. As a final attempt, the MNA fabrication method was optimised further by adding
a centrifugation step, to determine if a tight packing could be achieved. The results here were
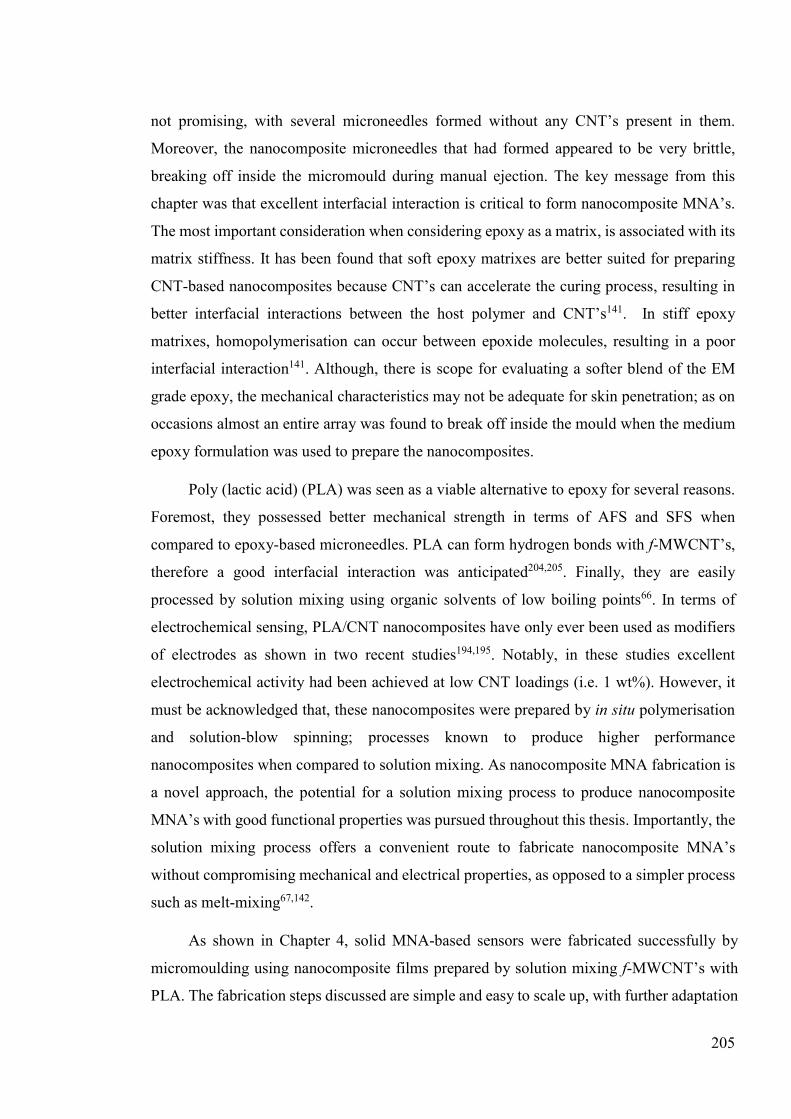
205
not promising, with several microneedles formed without any CNT’s present in them.
Moreover, the nanocomposite microneedles that had formed appeared to be very brittle,
breaking off inside the micromould during manual ejection. The key message from this
chapter was that excellent interfacial interaction is critical to form nanocomposite MNA’s.
The most important consideration when considering epoxy as a matrix, is associated with its
matrix stiffness. It has been found that soft epoxy matrixes are better suited for preparing
CNT-based nanocomposites because CNT’s can accelerate the curing process, resulting in
better interfacial interactions between the host polymer and CNT’s141. In stiff epoxy
matrixes, homopolymerisation can occur between epoxide molecules, resulting in a poor
interfacial interaction141. Although, there is scope for evaluating a softer blend of the EM
grade epoxy, the mechanical characteristics may not be adequate for skin penetration; as on
occasions almost an entire array was found to break off inside the mould when the medium
epoxy formulation was used to prepare the nanocomposites.
Poly (lactic acid) (PLA) was seen as a viable alternative to epoxy for several reasons.
Foremost, they possessed better mechanical strength in terms of AFS and SFS when
compared to epoxy-based microneedles. PLA can form hydrogen bonds with f-MWCNT’s,
therefore a good interfacial interaction was anticipated204,205. Finally, they are easily
processed by solution mixing using organic solvents of low boiling points66. In terms of
electrochemical sensing, PLA/CNT nanocomposites have only ever been used as modifiers
of electrodes as shown in two recent studies194,195. Notably, in these studies excellent
electrochemical activity had been achieved at low CNT loadings (i.e. 1 wt%). However, it
must be acknowledged that, these nanocomposites were prepared by in situ polymerisation
and solution-blow spinning; processes known to produce higher performance
nanocomposites when compared to solution mixing. As nanocomposite MNA fabrication is
a novel approach, the potential for a solution mixing process to produce nanocomposite
MNA’s with good functional properties was pursued throughout this thesis. Importantly, the
solution mixing process offers a convenient route to fabricate nanocomposite MNA’s
without compromising mechanical and electrical properties, as opposed to a simpler process
such as melt-mixing67,142.
As shown in Chapter 4, solid MNA-based sensors were fabricated successfully by
micromoulding using nanocomposite films prepared by solution mixing f-MWCNT’s with
PLA. The fabrication steps discussed are simple and easy to scale up, with further adaptation
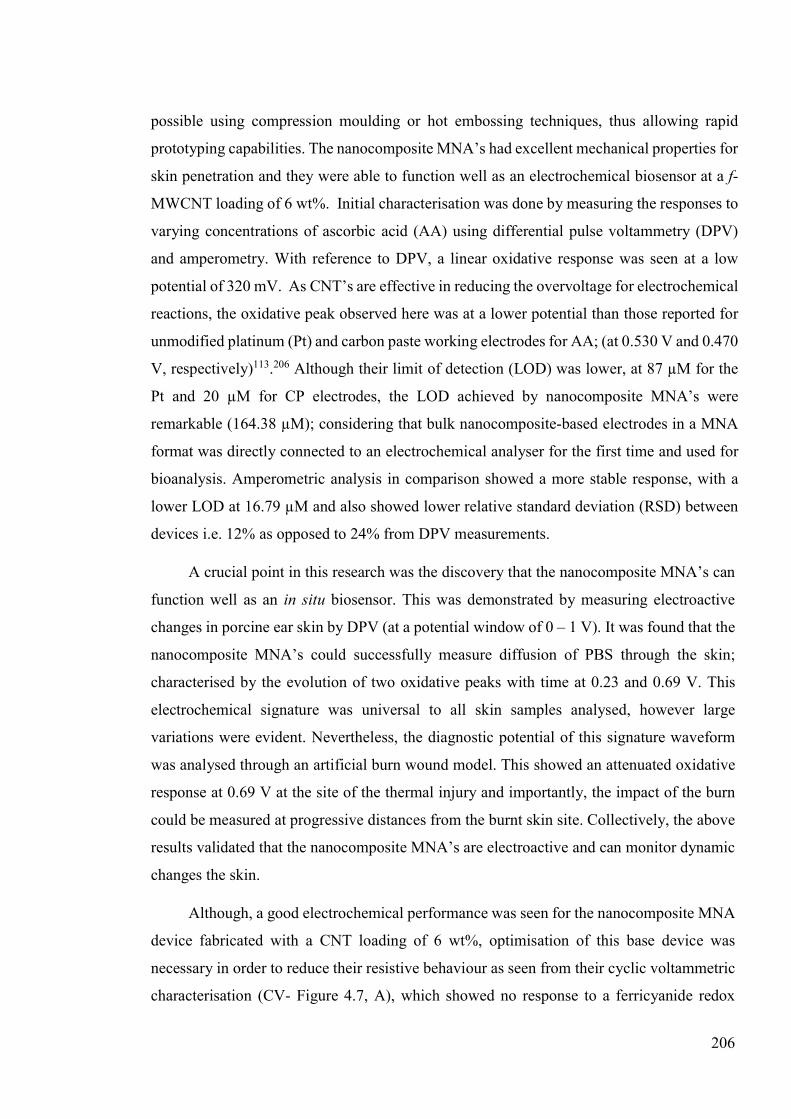
206
possible using compression moulding or hot embossing techniques, thus allowing rapid
prototyping capabilities. The nanocomposite MNA’s had excellent mechanical properties for
skin penetration and they were able to function well as an electrochemical biosensor at a f-
MWCNT loading of 6 wt%. Initial characterisation was done by measuring the responses to
varying concentrations of ascorbic acid (AA) using differential pulse voltammetry (DPV)
and amperometry. With reference to DPV, a linear oxidative response was seen at a low
potential of 320 mV. As CNT’s are effective in reducing the overvoltage for electrochemical
reactions, the oxidative peak observed here was at a lower potential than those reported for
unmodified platinum (Pt) and carbon paste working electrodes for AA; (at 0.530 V and 0.470
V, respectively)113.206 Although their limit of detection (LOD) was lower, at 87 µM for the
Pt and 20 µM for CP electrodes, the LOD achieved by nanocomposite MNA’s were
remarkable (164.38 µM); considering that bulk nanocomposite-based electrodes in a MNA
format was directly connected to an electrochemical analyser for the first time and used for
bioanalysis. Amperometric analysis in comparison showed a more stable response, with a
lower LOD at 16.79 µM and also showed lower relative standard deviation (RSD) between
devices i.e. 12% as opposed to 24% from DPV measurements.
A crucial point in this research was the discovery that the nanocomposite MNA’s can
function well as an in situ biosensor. This was demonstrated by measuring electroactive
changes in porcine ear skin by DPV (at a potential window of 0 – 1 V). It was found that the
nanocomposite MNA’s could successfully measure diffusion of PBS through the skin;
characterised by the evolution of two oxidative peaks with time at 0.23 and 0.69 V. This
electrochemical signature was universal to all skin samples analysed, however large
variations were evident. Nevertheless, the diagnostic potential of this signature waveform
was analysed through an artificial burn wound model. This showed an attenuated oxidative
response at 0.69 V at the site of the thermal injury and importantly, the impact of the burn
could be measured at progressive distances from the burnt skin site. Collectively, the above
results validated that the nanocomposite MNA’s are electroactive and can monitor dynamic
changes the skin.
Although, a good electrochemical performance was seen for the nanocomposite MNA
device fabricated with a CNT loading of 6 wt%, optimisation of this base device was
necessary in order to reduce their resistive behaviour as seen from their cyclic voltammetric
characterisation (CV- Figure 4.7, A), which showed no response to a ferricyanide redox
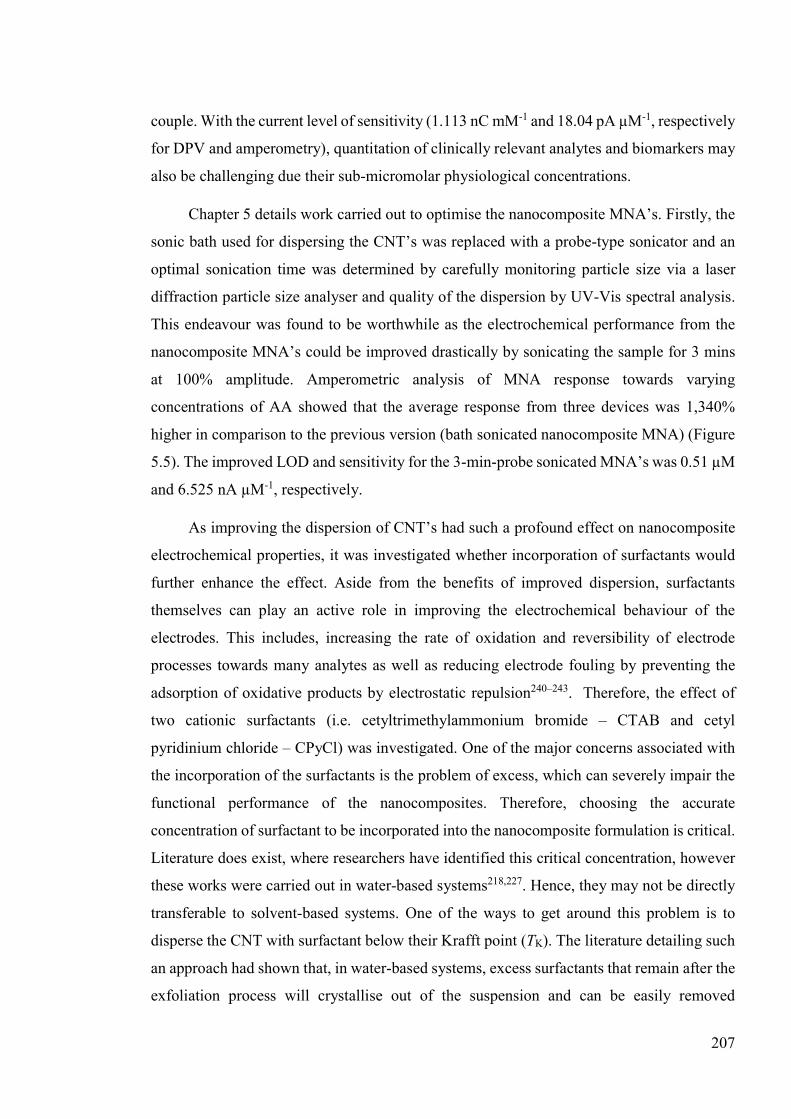
207
couple. With the current level of sensitivity (1.113 nC mM-1 and 18.04 pA µM-1, respectively
for DPV and amperometry), quantitation of clinically relevant analytes and biomarkers may
also be challenging due their sub-micromolar physiological concentrations.
Chapter 5 details work carried out to optimise the nanocomposite MNA’s. Firstly, the
sonic bath used for dispersing the CNT’s was replaced with a probe-type sonicator and an
optimal sonication time was determined by carefully monitoring particle size via a laser
diffraction particle size analyser and quality of the dispersion by UV-Vis spectral analysis.
This endeavour was found to be worthwhile as the electrochemical performance from the
nanocomposite MNA’s could be improved drastically by sonicating the sample for 3 mins
at 100% amplitude. Amperometric analysis of MNA response towards varying
concentrations of AA showed that the average response from three devices was 1,340%
higher in comparison to the previous version (bath sonicated nanocomposite MNA) (Figure
5.5). The improved LOD and sensitivity for the 3-min-probe sonicated MNA’s was 0.51 µM
and 6.525 nA µM-1, respectively.
As improving the dispersion of CNT’s had such a profound effect on nanocomposite
electrochemical properties, it was investigated whether incorporation of surfactants would
further enhance the effect. Aside from the benefits of improved dispersion, surfactants
themselves can play an active role in improving the electrochemical behaviour of the
electrodes. This includes, increasing the rate of oxidation and reversibility of electrode
processes towards many analytes as well as reducing electrode fouling by preventing the
adsorption of oxidative products by electrostatic repulsion240–243. Therefore, the effect of
two cationic surfactants (i.e. cetyltrimethylammonium bromide – CTAB and cetyl
pyridinium chloride – CPyCl) was investigated. One of the major concerns associated with
the incorporation of the surfactants is the problem of excess, which can severely impair the
functional performance of the nanocomposites. Therefore, choosing the accurate
concentration of surfactant to be incorporated into the nanocomposite formulation is critical.
Literature does exist, where researchers have identified this critical concentration, however
these works were carried out in water-based systems218,227. Hence, they may not be directly
transferable to solvent-based systems. One of the ways to get around this problem is to
disperse the CNT with surfactant below their Krafft point (TK). The literature detailing such
an approach had shown that, in water-based systems, excess surfactants that remain after the
exfoliation process will crystallise out of the suspension and can be easily removed
208
regardless of the concentration being used228. Taking these results cautiously, the effect of
surfactant TK on dispersibility of CNT’s was initially investigated. Results were in agreement
with the literature, as it was found that CNT’s were exfoliated better at temperatures below
the surfactant TK for both surfactants. As a next step, the effect of different concentrations
for both surfactants were also analysed (1 – 15 mM) as it was not known what an excess
amount would be. Dispersing below the surfactant TK, an appropriate concentration for both
surfactant was found to be 5 mM, above which the particle sizes were seen to increase,
possibly due to multiple layers of surfactant wrapping around the nanotubes. Unlike the
results obtained in water-based systems, the excess surfactant at any given concentration did
not crystallise out of suspension in these experiments. Rather, a clear layer of CNT free
region formed on top of the suspension and it appeared to be increasing in volume with
increasing surfactant concentration (Figure 5.11, A). In an attempt to remove all of the excess
surfactants, the suspension was centrifuged. However, this resulted in complete
sedimentation of the CNT’s from suspension (Figure 5.11, B). Nevertheless,
nanocomposites MNA’s were fabricated with the excess surfactant at all concentrations to
determine if any improvements had been made with the incorporation of surfactants. From
a fabricational point of view, the nanocomposites were mechanically weak as MNA’s could
only be developed from those incorporating a concentration of 1 mM, for both surfactants.
As expected, CV and amperometric characterisation showed poor electrochemical response
from the MNA’s. Further optimisation work with surfactants was not pursued in this thesis.
The final optimisation step addressed the influence of different dimensionalities and
functional groups on MWCNT’s, on the electrochemical behaviour of the nanocomposite
MNA’s. The f-MWCNT’s used up until this point were 20 – 30 nm in outer diameter and 10
– 30 µm in length. For assessing the effect of dimensionalities MWCNT’s with the same
functional group (i.e. –COOH) was purchased with a smaller length (i.e. 1 – 12 µm) and
outer diameter (i.e. < 20 nm). With reference to the different length parameters, the former
was referred to as ‘long’ and the latter as ‘short’ MWCNT’s. In addition, short MWCNT’s
functionalised with –N2 and –NH2 groups were also used to assess the influence of different
functional groups. First and foremost, the research reported here determined the limit of
fabrication when employing the shorter nanotubes with different functional groups. Two key
observations were made: Firstly, for the shorter nanotubes, regardless of the functional
groups present the maximum loading at which nanocomposite MNA’s could be fabricated
209
with the sonication-optimised method was 3 wt%. Secondly, the concentration at which the
CNT’s were dispersed (0.5 wt%) was inadequate for effective dispersion of the –N2 and –
NH2 functionalised MWCNT’s in particular. This is because the longer alkyl chain provides
greater repulsion between the nanotubes, which consequently yields an increased surface
area that is being inadequately wetted by the available volume of the solvent163. The
difference in maximum loading meant that an effective comparison in terms of
electrochemical behaviour could not be obtained between the long and short MWCNT’s with
same and different functional groups. However, at 3 wt% CNT loading an interesting pattern
was observed whereby the current generated was significantly higher in the order of ‒N2 >
‒NH2 > ‒COOH functionalised MWCNT’s (short).
It was hypothesised that reducing the concentration at which the MWCNT’s are being
dispersed (i.e. 0.5 wt%) would enhance the electrochemical behaviour and mechanical
strength of the MNA’s. Therefore, different concentrations were evaluated, and the data
obtained from particle size and dispersion analysis helped identify that 0.05 wt% is the ideal
concentration at which CNT’s are maximally dispersed at their lowest particle size. Using
this concentration, the fabrication limit was re-assessed. Interestingly, it was found that,
whilst MNA’s could be fabricated from long carboxyl functionalised MWCNT/PLA
nanocomposites at a CNT loading of 6 wt%, regardless of the functional groups present,
MNA’s could only be fabricated at a maximum CNT loading of 1 wt% from nanocomposites
developed with the shorter version of MWCNT’s. This result highlighted length as an import
factor with reference to long and short carboxyl functionalised MWCNT’s and as for the ‒
N2 and ‒NH2 functionalised MWCNT’s, insufficient amount of polymer to properly wet the
increased surface area obtained from greater repulsion between the nanotubes could be an
additional factor163. However, in order to determine the resultant effect from using
MWCNT’s with varying functional groups and dimensionalities, the mechanical and
electrochemical properties of the nanocomposite MNA’s were characterised.
With reference to the mechanical properties, it was seen that the MNA’s developed at
the optimised concentration with 1 wt% CNT loading produced comparable mechanical
performance to that of the probe optimised MNA’s composed of the long –COOH
functionalised MWCNT’s at 6 wt% CNT loading. However, there were no notable
differences when comparing the different functionalities or dimensions. In terms of the
current generated, at 1 wt% CNT loading, microneedles incorporating the long –COOH
210
functionalised MWCNT’s did not generate a response. Interestingly, at the same loading, the
shorter carboxyl functionalised MWCNT’s was able to generate a response. A plausible
explanation maybe be attributed to the higher aspect ratio for the shorter carboxyl
functionalised MWCNT’s and more importantly, as the electrochemical activity is
dependent on edge-plane-like graphitic sites that occur at the open ends and along the tube
axis of MWCNT’s, the shorter nanotubes may present more electroactive sites per unit mass
when compared to the longer MWCNT’s109,110. Comparison between the different functional
groups with the same dimensions yielded the same pattern as before, with the current
generated being significantly higher in the order of ‒N2 > ‒NH2 > ‒COOH functionalised
MWCNT’s. In contrast, the amperometric measurements of AA showed that MNA’s
incorporating just 1 wt% of ‒N2 functionalised MWCNT’s can produce comparable
responses to that of 6 wt% probe-optimised MNA’s. This is resultant of the enhanced
electron transfer process, aided by the formation of quaternary nitrogen and pyridinic-N-
oxide groups on –N2 functionalised MWCNT’s. In addition, this result also points towards
the efficiency of the current fabrication method, resulting in enhanced dispersions. As such,
a good electrochemical response was achieved from solution mixed nanocomposites at such
a low CNT loading; which is otherwise only seen when nanocomposites are developed by
in situ polymerisation. Consequently, the lower loadings also make the fabrication more
economical.
In terms of performance, as two comparable nanocomposite MNA-based devices have
now been fabricated, it was essential to start assessing their biocompatibility. This was
pursued in Chapter 6, where cytotoxicity evaluations were carried out using human
keratinocyte cell line (HaCaT) and A375 human malignant melanoma cells (A375) in order
to evaluate device and cell specific toxicity based on exposure to both MNA device extracts
and uniquely, electrochemical measurements (i.e. DPV and amperometry). With regards to
MNA device-based extracts, an interesting finding was that, MTT and LDH assays produced
different results. With MTT, regardless of the extract prepared (i.e. 4 hrs or 24 hrs) or the
device, long-term (i.e. 24 hrs) exposure was seen to reduce the viability of the cells; more so
for the A375 cells in comparison to the HaCaT cells for extract concentration as low as
12.5 %. In contrast, the LDH activity measured did not actually indicate any cytotoxicity. A
possible explanation for this disparity was given assuming a scenario that nanoparticles are
released from the MNA based devices. Indeed, the constituent that is released from the
211
nanocomposite MNA’s have not yet been identified. However, if nanoparticles are released,
the literature details that both MTT and LDH assays can yield false-positive results279.
However, this problem has been more commonly reported with the MTT assay. Here,
nanoparticles can interact with the MTT-formazan crystals and prevent its solubilisation;
resulting in reduced absorbance280. Electrochemical measurement induced cytotoxicity was
further assessed. DPV and amperometric stimulations showed no evidence of voltage
mediated cell toxicity. However, optimisations are necessary in order to address the
methodological limitation whereby cells near the vicinity of the microneedles were seen to
wash off due to abrasions caused by the sharp projections and from experimental
manipulations.
Overall, this body of work shows that solid MNA-based electrochemical sensors can
be fabricated successfully from nanocomposites of PLA and CNT, with sufficient
mechanical strength for skin penetration and good electrochemical properties for rapid
intradermal bioanalysis. An optimal strategy for developing nanocomposite MNA’s have
been demonstrated through optimisation of the processing conditions. Alongside this,
specific details on how CNT characteristics (i.e. dimensions and functional groups) can
influence the processing conditions and the resultant functional properties have also been
demonstrated. Fabrication of only the working electrode is demonstrated here at present, but
it is envisaged that reference and counter electrodes can be fabricated using a similar
approach. MNA sensors produced from CNT based composites could serve as a template for
a range of sensors, due to the variety of modification strategies employable.
7.2 Future directions
A number of research avenues can be explored to further optimise the nanocomposites
MNA’s developed in this body of work, with the aim of directing them towards practical
applications.
In terms of the design, bringing the electrical contact closer to the base or even the
microneedle surface can drastically improve the electrochemical behaviour of the
microneedles. This is based on the fact electrochemical reaction occur along the
surface of the nanocomposite microneedles. Therefore, by placing an electrical
contact close to the surface, a path of least resistance is facilitated. In polymeric
212
nanocomposites, the longer the conductive path the higher the resistance. This is
because, the resistivity of the polymer is several orders higher than that of CNT’s.
Partially removing the layer of the polymer that forms the smooth surface of the
nanocomposite MNA’s by plasma etching could make the MNA’s more electroactive.
Electrochemical behaviour improves because the number of sites available for
electrocatalysis increases. Moreover, this could be an efficient method to attach
biomolecules directly to the active components (i.e. CNT’s). Consequently, the
MNA-based electrodes can be made highly selective with improved sensitivity.
In this body of work, the MWCNT’s used were all functionalised with different
chemical groups. This was to overcome the poor dispersibility of pristine MWCNT’s
and to improve interfacial interaction with the polymer. Recent research has
highlighted that by using probe sonication, pristine MWCNT’s can be dispersed
effectively in specific organic solvents including chloroform, without the addition of
surfactants. Hence, this opens up another avenue to explore the impact of CNT
characteristics on the functional performance of the nanocomposite MNA’s.
Alternatively, if it is not possible to achieve a good dispersion of pristine MWCNT’s,
exploring the use of PEDOT: PSS as conductive surfactants maybe a worthwhile
endeavour.
Alternative approaches to nanocomposite fabrication can be explored, especially that
of in situ polymerisation because it is known to produce nanocomposites with a lower
percolation threshold.
As detailed in Chapter 6, future studies are required to identify the constituents that
are released from the nanocomposite MNA’s and correlate them to toxicity or false-
positive results from the cytotoxicity assays. Moreover, the existing methodology
should be adapted in order to address toxicity to cells near the vicinity of the
microneedle-based electrodes induced by electrochemical measurements.
213
REFERENCES
1. Kim, Y. C., Edelhauser, H. F. & Prausnitz, M. R. Targeted delivery of antiglaucoma drugs to the supraciliary space using microneedles. Investig. Opthalmology Vis. Sci. 55, 7387 (2014).
2. Keum, D. H., Jung, H. S., Wang, T., Shin, M. H., Kim, Y.-E., Kim, K. H., Ahn, G.-O. & Hahn, S. K. Microneedle biosensor for real-time electrical detection of nitric oxide for in situ cancer diagnosis during endomicroscopy. Adv. Healthc. Mater. 4, 1153–1158 (2015).
3. Roy, R. S. Vaccination appliance. (1952). 4. Roy, R. S. Injection device. (1965). 5. Gerstel, M. S. & Place, V. A. Drug delivery device. (1976). 6. Kim, Y. C., Park, J. H. & Prausnitz, M. R. Microneedles for drug and vaccine delivery.
Adv. Drug Deliv. Rev. 64, 1547–1568 (2012). 7. Henry, S., McAllister, D. V., Allen, M. G. & Prausnitz, M. R. Microfabricated
microneedles: a novel approach to transdermal drug delivery. J. Pharm. Sci. 87, 922–925 (1998).
8. Mikszta, J. A., Alarcon, J. B., Brittingham, J. M., Sutter, D. E., Pettis, R. J. & Harvey, N. G. Improved genetic immunization via micromechanical disruption of skin-barrier function and targeted epidermal delivery. Nat. Med. 8, 415–419 (2002).
9. McAllister, D. V., Wang, P. M., Davis, S. P., Park, J.-H., Canatella, P. J., Allen, M. G. & Prausnitz, M. R. Microfabricated needles for transdermal delivery of macromolecules and nanoparticles: fabrication methods and transport studies. Proc. Natl. Acad. Sci. U. S. A. 100, 13755–13760 (2003).
10. Wang, P. M., Cornwell, M. & Prausnitz, M. R. Minimally invasive extraction of dermal interstitial fluid for glucose monitoring using microneedles. Diabetes Technol. Ther. 7, 131–141 (2005).
11. Windmiller, J. R., Valdés-Ramírez, G., Zhou, N., Zhou, M., Miller, P. R., Jin, C., Brozik, S. M., Polsky, R., Katz, E., Narayan, R. & Wang, J. Bicomponent microneedle array biosensor for minimally-invasive glutamate monitoring. Electroanalysis 23, 2302–2309 (2011).
12. Moniz, A. R. B., Michelakis, K., Trzebinski, J., Sharma, S., Johnston, D. G., Oliver, N. & Cass, A. Minimally invasive enzyme microprobes: an alternative approach for continuous glucose monitoring. J. Diabetes Sci. Technol. 6, 479–480 (2012).
13. Corrie, S. R., Fernando, G. J. P., Crichton, M. L., Brunck, M. E. G., Anderson, C. D. & Kendall, M. A. F. Surface-modified microprojection arrays for intradermal biomarker capture, with low non-specific protein binding. Lab. Chip 10, 2655 (2010).
14. Indermun, S., Luttge, R., Choonara, Y. E., Kumar, P., du Toit, L. C., Modi, G. & Pillay, V. Current advances in the fabrication of microneedles for transdermal delivery. J. Controlled Release 185, 130–138 (2014).
15. Tuan-Mahmood, T. M., McCrudden, M. T. C., Torrisi, B. M., McAlister, E., Garland, M. J., Singh, T. R. R. & Donnelly, R. F. Microneedles for intradermal and transdermal drug delivery. Eur. J. Pharm. Sci. Off. J. Eur. Fed. Pharm. Sci. 50, 623–637 (2013).
16. Akhtar, N. Microneedles: an innovative approach to transdermal delivery- A review. Int. J. Pharm. Pharm. Sci.6, 18-25 (2014).
17. Paliwal, S., Hwang, B. H., Tsai, K. Y. & Mitragotri, S. Diagnostic opportunities based on skin biomarkers. Eur. J. Pharm. Sci. 50, 546–556 (2013).
214
18. Shoo, B. A., Sagebiel, R. W. & Kashani-Sabet, M. Discordance in the histopathologic diagnosis of melanoma at a melanoma referral center. J. Am. Acad. Dermatol. 62, 751–756 (2010).
19. Inamadar, A. & Palit, A. Immunohistochemistry: relevance in dermatology. Indian J. Dermatol. 56, 629 (2011).
20. Ventrelli, L., Marsilio Strambini, L. & Barillaro, G. Microneedles for transdermal biosensing: current picture and future direction. Adv. Healthc. Mater. 4, 2606–2640 (2015).
21. Davidson, M. B. Starting insulin therapy in type 2 diabetic patients: does it really matter how? Diabetes Care 28, 494–495 (2005).
22. Blonde, L. Easing the transition to insulin therapy in people with type 2 diabetes. Diabetes Educ. 33, 232S-240S (2007).
23. Khanna, P., Strom, J. A., Malone, J. I. & Bhansali, S. Microneedle-based automated therapy for diabetes mellitus. J. Diabetes Sci. Technol. Online 2, 1122–1129 (2008).
24. El-Laboudi, A., Oliver, N. S., Cass, A. & Johnston, D. Use of microneedle array devices for continuous glucose monitoring: a review. Diabetes Technol. Ther. 15, 101–115 (2013).
25. Zimmermann, S., Fienbork, D., Stoeber, B., Flounders, A. W. & Liepmann, D. A microneedle-based glucose monitor: fabricated on a wafer-level using in-device enzyme immobilization. IEEE 1, 99–102 (2003).
26. Mastrototaro, J. The minimed continuous glucose monitoring system (CGMS). J. Pediatr. Endocrinol. Metab. JPEM 12, 751–758 (1999).
27. Cass, A. E. G. & Sharma, S. in Methods Enzymol. (eds. Thompson, R. B. & Fierke, C. A.) 589, 413–427 (Academic Press, 2017).
28. Stout, P. J., Peled, N., Erickson, B. J., Hilgers, M. E., Racchini, J. R. & Hoegh, T. B. Comparison of glucose levels in dermal interstitial fluid and finger capillary blood. Diabetes Technol. Ther. 3, 81–90 (2001).
29. Boyne, M. S., Silver, D. M., Kaplan, J. & Saudek, C. D. Timing of changes in interstitial and venous blood glucose measured with a continuous subcutaneous glucose sensor. Diabetes 52, 2790–2794 (2003).
30. Battelino, T., Phillip, M., Bratina, N., Nimri, R., Oskarsson, P. & Bolinder, J. Effect of continuous glucose monitoring on hypoglycemia in type 1 diabetes. Diabetes Care 34, 795–800 (2011).
31. Hermanides, J., Phillip, M. & DeVries, J. H. Current application of continuous glucose monitoring in the treatment of diabetes: Pros and cons. Diabetes Care 34, S197–S201 (2011).
32. Voskerician, G. & Anderson, J. M. in Wiley Encycl. Biomed. Eng. (ed. Akay, M.) (John Wiley & Sons, Inc., 2006).
33. Ferri, S., Kojima, K. & Sode, K. Review of glucose oxidases and glucose dehydrogenases: a bird’s eye view of glucose sensing enzymes. J. Diabetes Sci. Technol. 5, 1068–1076 (2011).
34. Smart, W. H. & Subramanian, K. The use of silicon microfabrication technology in painless blood glucose monitoring. Diabetes Technol. Ther. 2, 549–559 (2000).
35. Kobayashi, K. & Suzuki, H. A sampling mechanism employing the phase transition of a gel and its application to a micro analysis system imitating a mosquito. Sens. Actuators B Chem. 80, 1–8 (2001).
215
36. Suzuki, H., Tokuda, T. & Kobayashi, K. A disposable “intelligent mosquito” with a reversible sampling mechanism using the volume-phase transition of a gel. Sens. Actuators B Chem. 83, 53–59 (2002).
37. Suzuki, H., Tokuda, T., Miyagishi, T., Yoshida, H. & Honda, N. A disposable on-line microsystem for continuous sampling and monitoring of glucose. Sens. Actuators B Chem. 97, 90–97 (2004).
38. Tsuchiya, K., Nakanishi, N., Uetsuji, Y. & Nakamachi, E. Development of blood extraction system for health monitoring system. Biomed. Microdevices 7, 347–353 (2005).
39. Li, C. G., Lee, K., Lee, C. Y., Dangol, M. & Jung, H. A minimally invasive blood-extraction system: elastic self-recovery actuator integrated with an ultrahigh- aspect-ratio microneedle. Adv. Mater. Deerfield Beach Fla 24, 4583–4586 (2012).
40. Li, C. G., Lee, C. Y., Lee, K. & Jung, H. An optimized hollow microneedle for minimally invasive blood extraction. Biomed. Microdevices 15, 17–25 (2013).
41. Invernale, M. A., Tang, B. C., York, R. L., Le, L., Hou, D. Y. & Anderson, D. G. Microneedle electrodes toward an amperometric glucose-sensing smart patch. Adv. Healthc. Mater. 3, 338–342 (2014).
42. Yoon, Y., Lee, G., Yoo, K. & Lee, J. B. Fabrication of a microneedle/CNT hierarchical micro/nano surface electrochemical sensor and its in-vitro glucose sensing characterization. Sensors 13, 16672–16681 (2013).
43. Mukerjee, E. V., Issseroff, R. R., Collins, S. D. & Smith, R. L. Microneedle array with integrated microchannels for transdermal sample extraction and in situ analysis. IEEE 2, 1439–1441 (2003).
44. Chua, B., Desai, S. P., Tierney, M. J., Tamada, J. A. & Jina, A. N. Effect of microneedles shape on skin penetration and minimally invasive continuous glucose monitoring in vivo. Sens. Actuators Phys. 203, 373–381 (2013).
45. Jina, A., Tierney, M. J., Tamada, J. A., McGill, S., Desai, S., Chua, B., Chang, A. & Christiansen, M. Design, development, and evaluation of a novel microneedle array-based continuous glucose monitor. J. Diabetes Sci. Technol. 8, 483–487 (2014).
46. Strambini, L. M., Longo, A., Scarano, S., Prescimone, T., Palchetti, I., Minunni, M., Giannessi, D. & Barillaro, G. Self-powered microneedle-based biosensors for pain-free high-accuracy measurement of glycaemia in interstitial fluid. Biosens. Bioelectron. 66, 162–168 (2015).
47. Hwa, K. Y., Subramani, B., Chang, P. W., Chien, M. & Huang, J. T. Transdermal microneedle array-based sensor for real time continuous glucose monitoring. Int J Electrochem Sci 10, 2455–2466 (2015).
48. Valdés-Ramírez, G., Li, Y. C., Kim, J., Jia, W., Bandodkar, A. J., Nuñez-Flores, R., Miller, P. R., Wu, S. Y., Narayan, R., Windmiller, J. R., Polsky, R. & Wang, J. Microneedle-based self-powered glucose sensor. Electrochem. Commun. 47, 58–62 (2014).
49. Sharma, S., Huang, Z., Rogers, M., Boutelle, M. & Cass, A. E. G. Evaluation of a minimally invasive glucose biosensor for continuous tissue monitoring. Anal. Bioanal. Chem. 408, 8427–8435 (2016).
50. Sharma, S., El-Laboudi, A., Reddy, M., Jugnee, N., Sivasubramaniyam, S., Sharkawy, M. E., Georgiou, P., Johnston, D., Oliver, N. & G. Cass, A. E. A pilot study in humans of microneedle sensor arrays for continuous glucose monitoring. Anal. Methods 10, 2088–2095 (2018).
216
51. Windmiller, J. R., Zhou, N., Chuang, M.-C., Valdés-Ramírez, G., Santhosh, P., Miller, P. R., Narayan, R. & Wang, J. Microneedle array-based carbon paste amperometric sensors and biosensors. The Analyst 136, 1846–1851 (2011).
52. Mohan, A. M. V., Windmiller, J. R., Mishra, R. K. & Wang, J. Continuous minimally-invasive alcohol monitoring using microneedle sensor arrays. Biosens. Bioelectron. 91, 574–579 (2017).
53. Mishra, R. K., Vinu Mohan, A. M., Soto, F., Chrostowski, R. & Wang, J. A microneedle biosensor for minimally-invasive transdermal detection of nerve agents. The Analyst 142, 918–924 (2017).
54. Miller, P. R., Xiao, X., Brener, I., Burckel, D. B., Narayan, R. & Polsky, R. Microneedle-based transdermal sensor for on-chip potentiometric determination of K+. Adv. Healthc. Mater. 3, 876–881 (2014).
55. Skoog, S. A., Miller, P. R., Boehm, R. D., Sumant, A. V., Polsky, R. & Narayan, R. J. Nitrogen-incorporated ultrananocrystalline diamond microneedle arrays for electrochemical biosensing. Diam. Relat. Mater. 54, 39–46 (2015).
56. McConville, A. & Davis, J. Transdermal microneedle sensor arrays based on palladium: Polymer composites. Electrochem. Commun. 72, 162–165 (2016).
57. Miller, P. R., Gittard, S. D., Edwards, T. L., Lopez, D. M., Xiao, X., Wheeler, D. R., Monteiro-Riviere, N. A., Brozik, S. M., Polsky, R. & Narayan, R. J. Integrated carbon fiber electrodes within hollow polymer microneedles for transdermal electrochemical sensing. Biomicrofluidics 5, 013415 (2011).
58. Miller, P. R., Skoog, S. A., Edwards, T. L., Lopez, D. M., Wheeler, D. R., Arango, D. C., Xiao, X., Brozik, S. M., Wang, J., Polsky, R. & Narayan, R. J. Multiplexed microneedle-based biosensor array for characterization of metabolic acidosis. Talanta 88, 739–742 (2012).
59. Global report on diabetes. (World Health Organization, 2016). 60. Trzebinski, J., Sharma, S., Radomska-Botelho Moniz, A., Michelakis, K., Zhang, Y. &
Cass, A. E. G. Microfluidic device to investigate factors affecting performance in biosensors designed for transdermal applications. Lab Chip 12, 348–352 (2012).
61. Muller, D. A., Corrie, S. R., Coffey, J., Young, P. R. & Kendall, M. A. Surface modified microprojection arrays for the selective extraction of the dengue virus ns1 protein as a marker for disease. Anal. Chem. 84, 3262–3268 (2012).
62. Bhargav, A., Muller, D. A., Kendall, M. A. F. & Corrie, S. R. Surface modifications of microprojection arrays for improved biomarker capture in the skin of live mice. ACS Appl. Mater. Interfaces 4, 2483–2489 (2012).
63. Ng, K. W., Lau, W. M. & Williams, A. C. Towards pain-free diagnosis of skin diseases through multiplexed microneedles: biomarker extraction and detection using a highly sensitive blotting method. Drug Deliv. Transl. Res. 5, 387–396 (2015).
64. Wang, M., Hu, L. & Xu, C. Recent advances in the design of polymeric microneedles for transdermal drug delivery and biosensing. Lab Chip 17, 1373–1387 (2017).
65. Sharma, S., Saeed, A., Johnson, C., Gadegaard, N. & Cass, A. E. Rapid, low cost prototyping of transdermal devices for personal healthcare monitoring. Sens. Bio-Sens. Res. 13, 104–108 (2017).
66. Kaseem, M., Hamad, K., Deri, F. & Ko, Y. G. A review on recent researches on polylactic acid/carbon nanotube composites. Polym. Bull. 74, 2921–2937 (2017).
67. Spitalsky, Z., Tasis, D., Papagelis, K. & Galiotis, C. Carbon nanotube–polymer composites: Chemistry, processing, mechanical and electrical properties. Prog. Polym. Sci. 35, 357–401 (2010).
217
68. Yáñez-Sedeño, P., Pingarrón, J. M., Riu, J. & Rius, F. X. Electrochemical sensing based on carbon nanotubes. TrAC Trends Anal. Chem. 29, 939–953 (2010).
69. Ahammad, A. J. S., Lee, J. J. & Rahman, M. A. Electrochemical Sensors Based on Carbon Nanotubes. Sensors 9, 2289–2319 (2009).
70. Fagan-Murphy, A., Allen, M. C. & Patel, B. A. Chemically modified multiwall carbon nanotube composite electrodes: An assessment of fabrication strategies. Electrochimica Acta 152, 249–254 (2015).
71. Fagan-Murphy, A. & Patel, B. A. Compressed multiwall carbon nanotube composite electrodes provide enhanced electroanalytical performance for determination of serotonin. Electrochimica Acta 138, 392–399 (2014).
72. Lutton, R. E. M., Moore, J., Larrañeta, E., Ligett, S., Woolfson, A. D. & Donnelly, R. F. Microneedle characterisation: the need for universal acceptance criteria and GMP specifications when moving towards commercialisation. Drug Deliv. Transl. Res. 5, 313–331 (2015).
73. Davis, S. P., Landis, B. J., Adams, Z. H., Allen, M. G. & Prausnitz, M. R. Insertion of microneedles into skin: measurement and prediction of insertion force and needle fracture force. J. Biomech. 37, 1155–1163 (2004).
74. Khanna, P., Luongo, K., Strom, J. A. & Bhansali, S. Axial and shear fracture strength evaluation of silicon microneedles. Microsyst. Technol. 16, 973–978 (2010).
75. Donnelly, R. F., Majithiya, R., Singh, T. R. R., Morrow, D. I. J., Garland, M. J., Demir, Y. K., Migalska, K., Ryan, E., Gillen, D., Scott, C. J. & Woolfson, A. D. Design, optimization and characterisation of polymeric microneedle arrays prepared by a novel laser-based micromoulding technique. Pharm. Res. 28, 41–57 (2011).
76. Khann, P., Silv, H. & Bhansali, S. Variation in microneedle geometry to increase shear strength. Procedia Eng. 5, 977–980 (2010).
77. Wang, J. Analytical electrochemistry. (Wiley-VCH, 2000). 78. Wang, J. Analytical Electrochemistry: Wang/Analytical Electrochemistry, Third
Edition. (John Wiley & Sons, Inc., 2006). 79. Bagot︠ s︡kiĭ, V. S. Fundamentals of electrochemistry. (Wiley-Interscience, 2006). 80. Bard, A. J. & Faulkner, L. R. Electrochemical methods: fundamentals and applications.
(Wiley, 2001). 81. Leite, F. L., Bueno, C. C., Da Róz, A. L., Ziemath, E. C. & Oliveira, O. N. Theoretical
models for surface forces and adhesion and their measurement using atomic force microscopy. Int. J. Mol. Sci. 13, 12773–12856 (2012).
82. Elgrishi, N., Rountree, K. J., McCarthy, B. D., Rountree, E. S., Eisenhart, T. T. & Dempsey, J. L. A practical beginner’s guide to cyclic voltammetry. J. Chem. Educ. 95, 197–206 (2018).
83. Mabbott, G. A. An introduction to cyclic voltammetry. J. Chem. Educ. 60, 697 (1983). 84. Stojek, Z. in Electroanal. Methods (eds. Scholz, F., Bond, A. M., Compton, R. G.,
Fiedler, D. A., Inzelt, G., Kahlert, H., Komorsky-Lovrić, š., Lohse, H., Lovrić, M., Marken, F., Neudeck, A., Retter, U., Scholz, F. & Stojek, Z.) 107–119 (Springer Berlin Heidelberg, 2010).
85. Scholz, F. Voltammetric techniques of analysis: the essentials. ChemTexts 1, (2015). 86. Haddad, P. & Jackson, P. In J. Chromatogr. Libr. 46, 291–321 (Elsevier, 1990). 87. Kausar, A., Rafique, I. & Muhammad, B. Review of applications of polymer/carbon
nanotubes and epoxy/CNT composites. Polym.-Plast. Technol. Eng. 55, 1167–1191 (2016).
218
88. Jin, F.-L., Li, X. & Park, S. J. Synthesis and application of epoxy resins: A review. J. Ind. Eng. Chem. 29, 1–11 (2015).
89. Ajayan, P. M., Stephan, O., Colliex, C. & Trauth, D. Aligned carbon nanotube arrays formed by cutting a polymer resin--nanotube composite. Science 265, 1212–1214 (1994).
90. Pumera, M., Merkoçi, A. & Alegret, S. Carbon nanotube-epoxy composites for electrochemical sensing. Sens. Actuators B Chem. 113, 617–622 (2006).
91. Pérez, B., Pumera, M., del Valle, M., Merkoçi, A. & Alegret, S. Glucose biosensor based on carbon nanotube epoxy composites. J. Nanosci. Nanotechnol. 5, 1694–1698 (2005).
92. López, B. P. & Merkoçi, A. Improvement of the electrochemical detection of catechol by the use of a carbon nanotube based biosensor. Analyst 134, 60–64 (2008).
93. Aqel, A., El-Nour, K. M. M. A., Ammar, R. A. A. & Al-Warthan, A. Carbon nanotubes, science and technology part (I) structure, synthesis and characterisation. Arab. J. Chem. 5, 1–23 (2012).
94. Kumar, M. & Ando, Y. Chemical vapor deposition of carbon nanotubes: a review on growth mechanism and mass production. J. Nanosci. Nanotechnol. 10, 3739–3758 (2010).
95. Iijima, S. Helical microtubules of graphitic carbon. Nature 354, 56–58 (1991). 96. Sahoo, N. G., Rana, S., Cho, J. W., Li, L. & Chan, S. H. Polymer nanocomposites based
on functionalized carbon nanotubes. Prog. Polym. Sci. 35, 837–867 (2010). 97. Yu, M. F., Files, B. S., Arepalli, S. & Ruoff, R. S. Tensile Loading of Ropes of Single
Wall Carbon Nanotubes and their Mechanical Properties. Phys. Rev. Lett. 84, 5552–5555 (2000).
98. Xie, S., Li, W., Pan, Z., Chang, B. & Sun, L. Mechanical and physical properties on carbon nanotube. J. Phys. Chem. Solids 61, 1153–1158 (2000).
99. Ibrahim, K. S. Carbon nanotubes-properties and applications: a review. Carbon Lett. 14, 131–144 (2013).
100. Eatemadi, A., Daraee, H., Karimkhanloo, H., Kouhi, M., Zarghami, N., Akbarzadeh, A., Abasi, M., Hanifehpour, Y. & Joo, S. Carbon nanotubes: properties, synthesis, purification, and medical applications. Nanoscale Res. Lett. 9, 393 (2014).
101. Dresselhaus, M. S., Dresselhaus, G. & Jorio, A. Unusual properties and structure of carbon nanotubes. Annu. Rev. Mater. Res. 34, 247–278 (2004).
102. Zhang, M. & Li, J. Carbon nanotube in different shapes. Mater. Today 12, 12–18 (2009). 103. Ansari, S. Combination of molecularly imprinted polymers and carbon nanomaterials
as a versatile biosensing tool in sample analysis: Recent applications and challenges. TrAC Trends Anal. Chem. 93, 134–151 (2017).
104. He, H., Pham-Huy, L. A., Dramou, P., Xiao, D., Zuo, P. & Pham-Huy, C. Carbon nanotubes: applications in pharmacy and medicine. BioMed Res. Int. 2013, 1–12 (2013).
105. Tans, S. J., Devoret, M. H., Dai, H., Thess, A., Smalley, R. E., Geerligs, L. J. & Dekker, C. Individual single-wall carbon nanotubes as quantum wires. Nature 386, 474–477 (1997).
106. Delaney, P., Di Ventra, M. & Pantelides, S. T. Quantized conductance of multiwalled carbon nanotubes. Appl. Phys. Lett. 75, 3787–3789 (1999).
107. Jourdain, V. & Bichara, C. Current understanding of the growth of carbon nanotubes in catalytic chemical vapour deposition. Carbon 58, 2–39 (2013).
108. Hedman, D., Reza Barzegar, H., Rosén, A., Wågberg, T. & Andreas Larsson, J. On the stability and abundance of single walled carbon nanotubes. Sci. Rep. 5, (2015).
219
109. Agüí, L., Yáñez-Sedeño, P. & Pingarrón, J. M. Role of carbon nanotubes in electroanalytical chemistry. Anal. Chim. Acta 622, 11–47 (2008).
110. Liu, G., Riechers, S. L., Mellen, M. C. & Lin, Y. Sensitive electrochemical detection of enzymatically generated thiocholine at carbon nanotube modified glassy carbon electrode. Electrochem. Commun. 7, 1163–1169 (2005).
111. Banks, C. E. & Compton, R. G. New electrodes for old: from carbon nanotubes to edge plane pyrolytic graphite. The Analyst 131, 15–21 (2006).
112. Davies, T. J., Hyde, M. E. & Compton, R. G. Nanotrench arrays reveal insight into graphite electrochemistry. Angew. Chem. Int. Ed. 44, 5121–5126 (2005).
113. Musameh, M., Lawrence, N. S. & Wang, J. Electrochemical activation of carbon nanotubes. Electrochem. Commun. 7, 14–18 (2005).
114. Gibson, G. in Brydsons Plast. Mater. 773–797 (Elsevier, 2017). 115. Gantayat, S., Rout, D. & Swain, S. K. Carbon nanomaterial–reinforced epoxy
composites: a review. Polym. Plast. Technol. Eng. 57, 1–16 (2018). 116. Rahaman, A. & Mohanty, A. Effect of carbon nanotubes on the curing and
thermomechanical behavior of epoxy/carbon nanotubes composites. Polym. Compos. 35, 441–449 (2014).
117. de la Vega, A., Kovacs, J. Z., Bauhofer, W. & Schulte, K. Combined Raman and dielectric spectroscopy on the curing behaviour and stress build up of carbon nanotube–epoxy composites. Compos. Sci. Technol. 69, 1540–1546 (2009).
118. Bai, J. B. & Allaoui, A. Effect of the length and the aggregate size of MWNTs on the improvement efficiency of the mechanical and electrical properties of nanocomposites-experimental investigation. Compos. Part Appl. Sci. Manuf. 34, 689–694 (2003).
119. Park, J. M., Kim, D. S., Lee, J. R. & Kim, T. W. Nondestructive damage sensitivity and reinforcing effect of carbon nanotube/epoxy composites using electro-micromechanical technique. Mater. Sci. Eng. C 23, 971–975 (2003).
120. Guo, P., Chen, X., Gao, X., Song, H. & Shen, H. Fabrication and mechanical properties of well-dispersed multiwalled carbon nanotubes/epoxy composites. Compos. Sci. Technol. 67, 3331–3337 (2007).
121. Valentini, L., Puglia, D., Carniato, F., Boccaleri, E., Marchese, L. & Kenny, J. M. Use of plasma fluorinated single-walled carbon nanotubes for the preparation of nanocomposites with epoxy matrix. Compos. Sci. Technol. 68, 1008–1014 (2008).
122. Min, C., Shen, X., Shi, Z., Chen, L. & Xu, Z. The electrical properties and conducting mechanisms of carbon nanotube/polymer nanocomposites: a review. Polym.-Plast. Technol. Eng. 49, 1172–1181 (2010).
123. Grossiord, N., Loos, J., Regev, O. & Koning, C. E. Toolbox for dispersing carbon nanotubes into polymers to get conductive nanocomposites. Chem. Mater. 18, 1089–1099 (2006).
124. Xu, Y., Higgins, B. & Brittain, W. J. Bottom-up synthesis of PS–CNF nanocomposites. Polymer 46, 799–810 (2005).
125. Mazinani, S., Ajji, A. & Dubois, C. Morphology, structure and properties of conductive PS/CNT nanocomposite electrospun mat. Polymer 50, 3329–3342 (2009).
126. Li, J., Ma, P. C., Chow, W. S., To, C. K., Tang, B. Z. & Kim, J.-K. Correlations between percolation threshold, dispersion state, and aspect ratio of carbon nanotubes. Adv. Funct. Mater. 17, 3207–3215 (2007).
127. Bryning, M. B., Islam, M. F., Kikkawa, J. M. & Yodh, A. G. Very low conductivity threshold in bulk isotropic single-walled carbon nanotube-epoxy composites. Adv. Mater. 17, 1186–1191 (2005).
220
128. Martin, C. A., Sandler, J. K. W., Shaffer, M. S. P., Schwarz, M.-K., Bauhofer, W., Schulte, K. & Windle, A. H. Formation of percolating networks in multi-wall carbon-nanotube–epoxy composites. Compos. Sci. Technol. 64, 2309–2316 (2004).
129. Hu, G., Zhao, C., Zhang, S., Yang, M. & Wang, Z. Low percolation thresholds of electrical conductivity and rheology in poly(ethylene terephthalate) through the networks of multi-walled carbon nanotubes. Polymer 47, 480–488 (2006).
130. Gojny, F. H., Wichmann, M. H. G., Fiedler, B., Kinloch, I. A., Bauhofer, W., Windle, A. H. & Schulte, K. Evaluation and identification of electrical and thermal conduction mechanisms in carbon nanotube/epoxy composites. Polymer 47, 2036–2045 (2006).
131. Delozier, D. M., Watson, K. A., Smith, J. G., Clancy, T. C. & Connell, J. W. Investigation of aromatic/aliphatic polyimides as dispersants for single wall carbon nanotubes. Macromolecules 39, 1731–1739 (2006).
132. Špitalský, Z., Krontiras, C. A., Georga, S. N. & Galiotis, C. Effect of oxidation treatment of multiwalled carbon nanotubes on the mechanical and electrical properties of their epoxy composites. Compos. Part Appl. Sci. Manuf. 40, 778–783 (2009).
133. Liu, L., Etika, K. C., Liao, K.-S., Hess, L. A., Bergbreiter, D. E. & Grunlan, J. C. Comparison of covalently and noncovalently functionalized carbon nanotubes in epoxy. Macromol. Rapid Commun. 30, 627–632 (2009).
134. Barrau, S., Demont, P., Perez, E., Peigney, A., Laurent, C. & Lacabanne, C. Effect of Palmitic Acid on the Electrical Conductivity of Carbon Nanotubes−Epoxy Resin Composites. Macromolecules 36, 9678–9680 (2003).
135. dos Santos, A. S., Leite, T. de O. N., Furtado, C. A., Welter, C., Pardini, L. C. & Silva, G. G. Morphology, thermal expansion, and electrical conductivity of multiwalled carbon nanotube/epoxy composites. J. Appl. Polym. Sci. 108, 979–986 (2008).
136. Inam, F., Reece, M. J. & Peijs, T. Shortened carbon nanotubes and their influence on the electrical properties of polymer nanocomposites. J. Compos. Mater. 46, 1313–1322 (2012).
137. Pereira, C. M. C., Nóvoa, P., Martins, M., Forero, S., Hepp, F. & Pambaguian, L. Characterization of carbon nanotube 3D-structures infused with low viscosity epoxy resin system. Compos. Struct. 92, 2252–2257 (2010).
138. Ventura, I. A., Rahaman, A. & Lubineau, G. The thermal properties of a carbon nanotube-enriched epoxy: Thermal conductivity, curing, and degradation kinetics. J. Appl. Polym. Sci. 130, 2722–2733 (2013).
139. van der Maaden, K., Jiskoot, W. & Bouwstra, J. Microneedle technologies for (trans)dermal drug and vaccine delivery. J. Controlled Release 161, 645–655 (2012).
140. Park, J.-H., Allen, M. G. & Prausnitz, M. R. Biodegradable polymer microneedles: Fabrication, mechanics and transdermal drug delivery. J. Controlled Release 104, 51–66 (2005).
141. Ci, L. & Bai, J. The reinforcement role of carbon nanotubes in epoxy composites with different matrix stiffness. Compos. Sci. Technol. 66, 599–603 (2006).
142. Choudhary, V., Singh, B. P. & Mathur, R. B. in Synth. Appl. Carbon Nanotub. Their Compos. (ed. Suzuki, S.) (InTech, 2013).
143. Bradford, P. D., Wang, X., Zhao, H., Maria, J. P., Jia, Q. & Zhu, Y. T. A novel approach to fabricate high volume fraction nanocomposites with long aligned carbon nanotubes. Compos. Sci. Technol. 70, 1980–1985 (2010).
144. Ogasawara, T., Moon, S.-Y., Inoue, Y. & Shimamura, Y. Mechanical properties of aligned multi-walled carbon nanotube/epoxy composites processed using a hot-melt prepreg method. Compos. Sci. Technol. 71, 1826–1833 (2011).
221
145. Kaur, G., Adhikari, R., Cass, P., Bown, M. & Gunatillake, P. Electrically conductive polymers and composites for biomedical applications. RSC Adv. 5, 37553–37567 (2015).
146. Kumar, R. Conducting Polymers: Synthesis, Properties and Applications. 2, (2015). 147. Le, T. H., Kim, Y. & Yoon, H. Electrical and electrochemical properties of conducting
polymers. Polymers 9, 150 (2017). 148. Shrivastava, S., Jadon, N. & Jain, R. Next-generation polymer nanocomposite-based
electrochemical sensors and biosensors: A review. TrAC Trends Anal. Chem. 82, 55–67 (2016).
149. Karabiberoglu, S. U., Koçak, Ç. C. & Dursun, Z. in Carbon Nanotub. - Curr. Prog. Their Polym. Compos. (eds. Berber, M. R. & Hafez, I. H.) (InTech, 2016).
150. Guimard, N. K., Gomez, N. & Schmidt, C. E. Conducting polymers in biomedical engineering. Prog. Polym. Sci. 32, 876–921 (2007).
151. Park, J. H. & Prausnitz, M. R. Analysis of mechanical failure of polymer microneedles by axial force. J. Korean Phys. Soc. 56, 1223–1227 (2010).
152. Choudhary, V., Singh, B. P. & Mathur, R. B. Carbon nanotubes and their composites. in Syntheses and applications of carbon nanotubes and their composites (ed Suzuki, S.; InTech, 2013).
153. Lau, C. H., Cervini, R., Clarke, S. R., Markovic, M. G., Matisons, J. G., Hawkins, S. C., Huynh, C. P. & Simon, G. P. The effect of functionalization on structure and electrical conductivity of multi-walled carbon nanotubes. J. Nanoparticle Res. 10, 77–88 (2008).
154. Ham, H. T., Choi, Y. S. & Chung, I. J. An explanation of dispersion states of single-walled carbon nanotubes in solvents and aqueous surfactant solutions using solubility parameters. J. Colloid Interface Sci. 286, 216–223 (2005).
155. Lee, J., Kim, M., Hong, C. K. & Shim, S. E. Measurement of the dispersion stability of pristine and surface-modified multiwalled carbon nanotubes in various nonpolar and polar solvents. Meas. Sci. Technol. 18, 3707–3712 (2007).
156. Huang, Y. Y. & Terentjev, E. M. Dispersion of carbon nanotubes: mixing, sonication, stabilization, and composite properties. Polymers 4, 275–295 (2012).
157. Sahoo, N. G., Jung, Y. C., Yoo, H. J. & Cho, J. W. Effect of functionalized carbon nanotubes on molecular interaction and properties of polyurethane composites. Macromol. Chem. Phys. 207, 1773–1780 (2006).
158. Seligra, P. G., Lamanna, M. & Famá, L. Promising PLA-functionalized MWCNT composites to use in nanotechnology. Polym. Compos. 37, 3066–3072 (2016).
159. Chrissafis, K., Paraskevopoulos, K. M., Jannakoudakis, A., Beslikas, T. & Bikiaris, D. Oxidized multiwalled carbon nanotubes as effective reinforcement and thermal stability agents of poly(lactic acid) ligaments. J. Appl. Polym. Sci. 118, 2712–2721 (2010).
160. Yoon, J. T., Lee, S. C. & Jeong, Y. G. Effects of grafted chain length on mechanical and electrical properties of nanocomposites containing polylactide-grafted carbon nanotubes. Compos. Sci. Technol. 70, 776–782 (2010).
161. Qian, D., Dickey, E. C., Andrews, R. & Rantell, T. Load transfer and deformation mechanisms in carbon nanotube-polystyrene composites. Appl. Phys. Lett. 76, 2868–2870 (2000).
162. Wong, M., Paramsothy, M., Xu, X. J., Ren, Y., Li, S. & Liao, K. Physical interactions at carbon nanotube-polymer interface. Polymer 44, 7757–7764 (2003).
222
163. Singh, B. P., Singh, D., Mathur, R. B. & Dhami, T. L. Influence of surface modified mwcnts on the mechanical, electrical and thermal properties of polyimide nanocomposites. Nanoscale Res. Lett. 3, 444 (2008).
164. Chen, W. & Tao, X. Self-organizing alignment of carbon nanotubes in thermoplastic polyurethane. Macromol. Rapid Commun. 26, 1763–1767 (2005).
165. Koerner, H., Liu, W., Alexander, M., Mirau, P., Dowty, H. & Vaia, R. A. Deformation–morphology correlations in electrically conductive carbon nanotube—thermoplastic polyurethane nanocomposites. Polymer 46, 4405–4420 (2005).
166. Kuan, H. C., Ma, C. C. M., Chang, W. P., Yuen, S. M., Wu, H. H. & Lee, T. M. Synthesis, thermal, mechanical and rheological properties of multiwall carbon nanotube/waterborne polyurethane nanocomposite. Compos. Sci. Technol. 65, 1703–1710 (2005).
167. Wang, J., Xu, H., Yang, D. & Wu, Y. Preparation and properties of alkaline functionalized carbon nanotubes reinforced polyurethane composites. Fibers Polym. 14, 571–577 (2013).
168. Xu, M., Zhang, T., Gu, B., Wu, J. & Chen, Q. Synthesis and properties of novel polyurethane−urea/multiwalled carbon nanotube composites. Macromolecules 39, 3540–3545 (2006).
169. Kim, K. H. & Jo, W. H. A strategy for enhancement of mechanical and electrical properties of polycarbonate/multi-walled carbon nanotube composites. Carbon 47, 1126–1134 (2009).
170. Khan, F., Rafi Ahmad, S. & A. Syed, A. Nanotube Composites Produced from Single-Walled Carbon Nanotubes and Polycarbonate. JOAM 1, 344-347 (2007).
171. Moon, S. I., Jin, F., Lee, C., Tsutsumi, S. & Hyon, S. H. Novel carbon nanotube/poly(L-lactic acid) nanocomposites; their modulus, thermal stability, and electrical conductivity. Macromol. Symp. 224, 287–296 (2005).
172. Blake, R., Coleman, J. N., Byrne, M. T., McCarthy, J. E., Perova, T. S., Blau, W. J., Fonseca, A., Nagy, J. B. & Gun’ko, Y. K. Reinforcement of poly(vinyl chloride) and polystyrene using chlorinated polypropylene grafted carbon nanotubes. J. Mater. Chem. 16, 4206–4213 (2006).
173. Sanchez-Garcia, M. D., Lagaron, J. M. & Hoa, S. V. Effect of addition of carbon nanofibers and carbon nanotubes on properties of thermoplastic biopolymers. Compos. Sci. Technol. 70, 1095–1105 (2010).
174. Kim, H. S., Chae, Y. S., Choi, J. H., Yoon, J. S. & Jin, H. J. Thermal Properties of Poly(ε-Caprolactone)/Multiwalled Carbon Nanotubes Composites. Adv. Compos. Mater. 17, 157–166 (2008).
175. Kalakonda, P. & Banne, S. Thermomechanical properties of PMMA and modified SWCNT composites. Nanotechnol. Sci. Appl. 10, 45–52 (2017).
176. Blond, D., Barron, V., Ruether, M., Ryan, K. P., Nicolosi, V., Blau, W. J. & Coleman, J. N. Enhancement of modulus, strength, and toughness in poly(methyl methacrylate)-based composites by the incorporation of poly(methyl methacrylate)-functionalized nanotubes. Adv. Funct. Mater. 16, 1608–1614 (2006).
177. Koysuren, O., Karaman, M. & Ozyurt, D. Effect of noncovalent chemical modification on the electrical conductivity and tensile properties of poly(methyl methacrylate)/carbon nanotube composites. J. Appl. Polym. Sci. 127, 4557–4563 (2013).
223
178. Worsley, M. A., Kucheyev, S. O., Kuntz, J. D., Hamza, A. V., Joe H. Satcher, J. & Baumann, T. F. Stiff and electrically conductive composites of carbon nanotube aerogels and polymers. J. Mater. Chem. 19, 3370–3372 (2009).
179. Yuen, S. M., Ma, C. C. M., Lin, Y. Y. & Kuan, H. C. Preparation, morphology and properties of acid and amine modified multiwalled carbon nanotube/polyimide composite. Compos. Sci. Technol. 67, 2564–2573 (2007).
180. Ge, J. J., Zhang, D., Li, Q., Hou, H., Graham, M. J., Dai, L., Harris, F. W. & Cheng, S. Z. D. Multiwalled carbon nanotubes with chemically grafted polyetherimides. J. Am. Chem. Soc. 127, 9984–9985 (2005).
181. Wang, S. F., Shen, L., Zhang, W. D. & Tong Y. J. Preparation and mechanical properties of chitosan/carbon nanotubes composites. Biomacromolecules 6, 3067-3072 (2005).
182. Tamburri, E., Orlanducci, S., Terranova, M. L., Valentini, F., Palleschi, G., Curulli, A., Brunetti, F., Passeri, D., Alippi, A. & Rossi, M. Modulation of electrical properties in single-walled carbon nanotube/conducting polymer composites. Carbon 43, 1213–1221 (2005).
183. Ramasubramaniam, R., Chen, J. & Liu, H. Homogeneous carbon nanotube/polymer composites for electrical applications. Appl. Phys. Lett. 83, 2928 (2003).
184. Lizundia, E., Sarasua, J. R., D’Angelo, F., Orlacchio, A., Martino, S., Kenny, J. M. & Armentano, I. Biocompatible poly(L-lactide)/MWCNT nanocomposites: morphological characterization, electrical properties, and stem cell interaction. Macromol. Biosci. 12, 870–881 (2012).
185. Safadi, B., Andrews, R. & Grulke, E. A. Multiwalled carbon nanotube polymer composites: Synthesis and characterization of thin films. J. Appl. Polym. Sci. 84, 2660–2669 (2002).
186. Velasco-Santos, C., Martínez-Hernández, A. L., Fisher, F. T., Ruoff, R. & Castaño, V. M. Improvement of Thermal and Mechanical Properties of Carbon Nanotube Composites through Chemical Functionalization. Chem. Mater. 15, 4470–4475 (2003).
187. Ayman S Ayesh, Sobhy S Ibrahim & Abdullah A Aljaafari. Electrical, optical, and rheological properties of ozone-treated multiwalled carbon nanotubes–polystyrene nanocomposites. J. Reinf. Plast. Compos. 32, 359–370 (2013).
188. Mitchell, C. A. & Krishnamoorti, R. Dispersion of single-walled carbon nanotubes in Poly(ε-caprolactone). Macromolecules 40, 1538–1545 (2007).
189. Kim, H. M., Kim, K., Lee, C. Y., Joo, J., Cho, S. J., Yoon, H. S., Pejaković, D. A., Yoo, J. W. & Epstein, A. J. Electrical conductivity and electromagnetic interference shielding of multiwalled carbon nanotube composites containing Fe catalyst. Appl. Phys. Lett. 84, 589–591 (2004).
190. Skákalová, V., Dettlaff-Weglikowska, U. & Roth, S. Electrical and mechanical properties of nanocomposites of single wall carbon nanotubes with PMMA. Synth. Met. 152, 349–352 (2005).
191. Slobodian, P., Lengálová, A., Sáha, P. & Šlouf, M. Poly(methyl methacrylate)/Multi-wall carbon nanotubes composites prepared by solvent cast technique: Composites electrical percolation threshold. J. Reinf. Plast. Compos. 26, 1705–1712 (2007).
192. Khosla, A. & Gray, B. L. Preparation, characterization and micromolding of multi-walled carbon nanotube polydimethylsiloxane conducting nanocomposite polymer. Mater. Lett. 63, 1203–1206 (2009).
224
193. Tang, Q. Y., Chen, J., Chan, Y. C. & Chung, C. Y. Effect of carbon nanotubes and their dispersion on thermal curing of polyimide precursors. Polym. Degrad. Stab. 95, 1672–1678 (2010).
194. Gonçalves, C., Gonçalves, I. C., Magalhães, F. D. & Pinto, A. M. Poly(lactic acid) composites containing carbon-based nanomaterials: a review. Polymers 9, 269 (2017).
195. Oliveira, J. E., Mattoso, L. H. C., Medeiros, E. S. & Zucolotto, V. Poly(lactic acid)/carbon nanotube fibers as novel platforms for glucose biosensors. Biosensors 2, 70–82 (2012).
196. Han, H. S., You, J. M., Jeong, H. & Jeon, S. Electrochemical sensing of H2O2 by the modified electrode with pd nanoparticles on multi-walled carbon nanotubes-g-Poly(Lactic Acid). J. Nanosci. Nanotechnol. 14, 4050–4057 (2014).
197. Pisoschi, A. M., Pop, A., Serban, A. I. & Fafaneata, C. Electrochemical methods for ascorbic acid determination. Electrochimica Acta 121, 443–460 (2014).
198. Liu, C. X. & Choi, J. W. Improved dispersion of carbon nanotubes in polymers at high concentrations. Nanomaterials 2, 329–347 (2012).
199. Gnanasekaran, K., de With, G. & Friedrich, H. Quantitative analysis of connectivity and conductivity in mesoscale multiwalled carbon nanotube networks in polymer composites. J. Phys. Chem. C 120, 27618–27627 (2016).
200. Aguilar, J. O., Bautista-Quijano, J. R. & Aviles, F. Influence of carbon nanotube clustering on the electrical conductivity of polymer composite films. Express Polym. Lett. 4, 292–299 (2010).
201. Mathur, R. B., Pande, S., Singh, B. P. & Dhami, T. L. Electrical and mechanical properties of multi-walled carbon nanotubes reinforced PMMA and PS composites. Polym. Compos. 29, 717–727 (2008).
202. Ghislandi, M., Tkalya, E., Schillinger, S., Koning, C. E & de With, G. High performance graphene- and MWCNTs-based PS/PPO composites obtained via organic solvent dispersion. Compos. Sci. Technol. 80, 16-22 (2013).
203. Atif, R. & Inam, F. Reasons and remedies for the agglomeration of multilayered graphene and carbon nanotubes in polymers. Beilstein J. Nanotechnol. 7, 1174–1196 (2016).
204. Atif, R., Wei, J., Shyha, I. & Inam, F. Use of morphological features of carbonaceous materials for improved mechanical properties of epoxy nanocomposites. RSC Adv 6, 1351–1359 (2016).
205. Wu, D., Wu, L., Zhang, M. & Zhao, Y. Viscoelasticity and thermal stability of polylactide composites with various functionalized carbon nanotubes. Polym. Degrad. Stab. 93, 1577–1584 (2008).
206. Sobkowicz, M. J., Sosa, R. & Dorgan, J. R. Supramolecular bionanocomposites, part 2: Effects of carbon nanoparticle surface functionality on polylactide crystallization. J. Appl. Polym. Sci. 121, 2029–2038 (2011).
207. Pisoschi, A. M., Pop, A., Negulescu, G. P. & Pisoschi, A. Determination of ascorbic acid content of some fruit juices and wine by voltammetry performed at pt and carbon paste electrodes. Molecules 16, 1349–1365 (2011).
208. Ma, P. C., Siddiqui, N. A., Marom, G. & Kim, J. K. Dispersion and functionalization of carbon nanotubes for polymer-based nanocomposites: a review. Compos. Part Appl. Sci. Manuf. 41, 1345–1367 (2010).
209. Lu, K. L. Mechanical damage of carbon nanotubes by ultrasound. Carbon 34, 814–816 (1996).
225
210. Thostenson, E. T., Ren, Z. & Chou, T. W. Advances in the science and technology of carbon nanotubes and their composites: a review. Compos. Sci. Technol. 61, 1899–1912 (2001).
211. Hilding, J., Grulke, E. A., Zhang, Z. G. & Lockwood, F. dispersion of carbon nanotubes in liquids. J. Dispers. Sci. Technol. 24, 1–41 (2003).
212. Cheng, Q., Debnath, S., Gregan, E. & Byrne, H. J. Ultrasound-assisted SWNTs dispersion: effects of sonication parameters and solvent properties. J. Phys. Chem. C 114, 8821–8827 (2010).
213. Njuguna, J., Vanli, O. A. & Liang, R. A review of spectral methods for dispersion characterization of carbon nanotubes in aqueous suspensions. J. Spectrosc. 2015, 1–11 (2015).
214. Yang, K., Yi, Z., Jing, Q., Yue, R., Jiang, W. & Lin, D. Sonication-assisted dispersion of carbon nanotubes in aqueous solutions of the anionic surfactant SDBS: the role of sonication energy. Chin. Sci. Bull. 58, 2082–2090 (2013).
215. Tan, Y. & Resasco, D. E. Dispersion of single-walled carbon nanotubes of narrow diameter distribution. J. Phys. Chem. B 109, 14454–14460 (2005).
216. Correlation of carbon nanotube dispersability in aqueous surfactant solutions and polymers. Carbon 47, 602–612 (2009).
217. Qsonica (2009), Sonicators: 'Ultrasonic Processing Equipment' [online] Available at www.sonicator.com/20-sonicators [Accessed on 11 March 2018].
218. Fernandes, R. M. F., Abreu, B., Claro, B., Buzaglo, M., Regev, O., Furó, I. & Marques, E. F. Dispersing carbon nanotubes with ionic surfactants under controlled conditions: comparisons and insight. Langmuir 31, 10955–10965 (2015).
219. Pletnev, M. Y. Chemistry of surfactants in Stud. Interface Sci. 13, 1–97 (Elsevier, 2001). 220. Vaisman, L., Wagner, H. D. & Marom, G. The role of surfactants in dispersion of
carbon nanotubes. Adv. Colloid Interface Sci. 128–130, 37–46 (2006). 221. Strano, M. S., Moore, V. C., Miller, M. K., Allen, M. J., Haroz, E. H., Kittrell, C.,
Hauge, R. H. & Smalley, R. E. The role of surfactant adsorption during ultrasonication in the dispersion of single-walled carbon nanotubes. J. Nanosci. Nanotechnol. 3, 81–86 (2003).
222. Tkalya, E. E., Ghislandi, M., de With, G. & Koning, C. E. The use of surfactants for dispersing carbon nanotubes and graphene to make conductive nanocomposites. Curr. Opin. Colloid Interface Sci. 17, 225–232 (2012).
223. Richard, C. Supramolecular self-assembly of lipid derivatives on carbon nanotubes. Science 300, 775–778 (2003).
224. Sun, Z., Nicolosi, V., Rickard, D., Bergin, S. D., Aherne, D. & Coleman, J. N. Quantitative evaluation of surfactant-stabilized single-walled carbon nanotubes: dispersion quality and its correlation with zeta potential. J. Phys. Chem. C 112, 10692–10699 (2008).
225. Grossiord, N., Kivit, P. J. J., Loos, J., Meuldijk, J., Kyrylyuk, A. V., van der Schoot, P. & Koning, C. E. On the influence of the processing conditions on the performance of electrically conductive carbon nanotube/polymer nanocomposites. Polymer 49, 2866–2872 (2008).
226. Sa, V. & Kornev, K. G. Analysis of stability of nanotube dispersions using surface tension isotherms. Langmuir 27, 13451–13460 (2011).
227. Rastogi, R., Kaushal, R., Tripathi, S. K., Sharma, A. L., Kaur, I. & Bharadwaj, L. M. Comparative study of carbon nanotube dispersion using surfactants. J. Colloid Interface Sci. 328, 421–428 (2008).
226
228. Dölle, S., Lechner, B. D., Park, J. H., Schymura, S., Lagerwall, J. P. F. & Scalia, G. Utilizing the krafft phenomenon to generate ideal micelle-free surfactant-stabilized nanoparticle suspensions. Angew. Chem. Int. Ed. 51, 3254–3257 (2012).
229. Yu, J., Grossiord, N., Koning, C. E. & Loos, J. Controlling the dispersion of multi-wall carbon nanotubes in aqueous surfactant solution. Carbon 45, 618–623 (2007).
230. Gong, X., Liu, J., Baskaran, S., Voise, R. D. & Young, J. S. Surfactant-assisted processing of carbon nanotube/polymer composites. Chem. Mater. 12, 1049–1052 (2000).
231. Cai, N., Gong, Y., Chian, K. S., Chan, V. & Liao, K. Adhesion dynamics of porcine esophageal fibroblasts on extracellular matrix protein-functionalized poly(lactic acid). Biomed. Mater. 3, 015014 (2008).
232. Velasco-Santos, C., Mart nez-Hern ndez, A. L., Fisher, F., Ruoff, R. & Casta o, V. M. Dynamical–mechanical and thermal analysis of carbon nanotube–methyl-ethyl methacrylate nanocomposites. J. Phys. Appl. Phys. 36, 1423–1428 (2003).
233. Vaisman, L., Marom, G. & Wagner, H. D. Dispersions of surface-modified carbon nanotubes in water-soluble and water-insoluble polymers. Adv. Funct. Mater. 16, 357–363 (2006).
234. Vilčáková, J., Moučka, R., Svoboda, P., Ilčíková, M., Kazantseva, N., Hřibová, M., Mičušík, M. & Omastová, M. Effect of surfactants and manufacturing methods on the electrical and thermal conductivity of carbon nanotube/silicone composites. Molecules 17, 13157–13174 (2012).
235. Zhong, W. & Claverie, J. P. Probing the carbon nanotube-surfactant interaction for the preparation of composites. Carbon 51, 72–84 (2013).
236. Lu, G. W. & Gao, P. in Handb. Non-Invasive Drug Deliv. Syst. 59–94 (Elsevier, 2010). 237. Jiang, L., Gao, L. & Sun, J. Production of aqueous colloidal dispersions of carbon
nanotubes. J. Colloid Interface Sci. 260, 89–94 (2003). 238. Pircheraghi, G., Foudazi, R. & Manas-Zloczower, I. Characterization of carbon
nanotube dispersion and filler network formation in melted polyol for nanocomposite materials. Powder Technol. 276, 222–231 (2015).
239. Kim, S., Lee, Y. I., Kim, D. H., Lee, K. J., Kim, B. S., Hussain, M. & Choa, Y. H. Estimation of dispersion stability of UV/ozone treated multi-walled carbon nanotubes and their electrical properties. Carbon 51, 346–354 (2013).
240. Hoyer, B. & Jensen, N. Stabilization of the voltammetric serotonin signal by surfactants. Electrochem. Commun. 8, 323–328 (2006).
241. Blanco-López, M. C., Lobo-Castañón, M. J., Ordieres, A. J. M. & Tuñón-Blanco, P. Electrochemical behavior of catecholamines and related compounds at in situ surfactant modified carbon paste electrodes. Electroanalysis 19, 207–213 (2007).
242. Gowda, J. I., Buddanavar, A. T. & Nandibewoor, S. T. Fabrication of multiwalled carbon nanotube-surfactant modified sensor for the direct determination of toxic drug 4-aminoantipyrine. J. Pharm. Anal. 5, 231–238 (2015).
243. Gowda, J. I., M., M. & Nandibewoor, S. T. CTAB functionalized multiwalled carbon nanotube composite modified electrode for the determination of 6-mercaptopurine. Sens. Bio-Sens. Res. 12, 1–7 (2017).
244. Hussain, S., Amade, R., Jover, E. & Bertran, E. Nitrogen plasma functionalization of carbon nanotubes for supercapacitor applications. J. Mater. Sci. 48, 7620–7628 (2013).
245. Dumée, L., Sears, K., Schütz, J., Finn, N., Duke, M. & Gray, S. Influence of the sonication temperature on the debundling kinetics of carbon nanotubes in propan-2-ol. Nanomaterials 3, 70–85 (2013).
227
246. Dhar, S., Rana, D. K., Sarkar, A., Mandal, T. K., Ghosh, S. & Bhattacharya, S. C. Physicochemical characterization of reverse micelles of Triton X using 1-anthracene sulphonate as fluorescent probe: A spectroscopic study. Colloids Surf. Physicochem. Eng. Asp. 349, 117–124 (2009).
247. Desando, M. A., Lahajnar, G. & Sepe, A. Proton magnetic relaxation and the aggregation of n-octylammonium n-octadecanoate surfactant in deuterochloroform solution. J. Colloid Interface Sci. 345, 338–345 (2010).
248. Anand, U., Jash, C. & Mukherjee, S. Spectroscopic determination of Critical Micelle Concentration in aqueous and non-aqueous media using a non-invasive method. J. Colloid Interface Sci. 364, 400–406 (2011).
249. Klíčová, L., Šebej, P., Štacko, P., Filippov, S. K., Bogomolova, A., Padilla, M. & Klán, P. CTAB/water/chloroform reverse micelles: a closed or open association model? Langmuir 28, 15185–15192 (2012).
250. Kolesnikova, A. A., Eremin, Y. S. & Grekhov, A. M. Time-stability dispersion of carbon nanotubes in chloroform. Phys. Procedia 72, 51–55 (2015).
251. Eremin, Y. S., Kolesnikova, A. A. & Grekhov, A. M. Agglomeration and sedimentation of MWCNTS in chloroform. Phys. Procedia 72, 56–61 (2015).
252. Pinto, V., Costa-Almeida, R., Rodrigues, I., Guardão, L., Soares, R. & Guedes, R. Biocompatibility study of PLA/GNP and PLA/CNT-COOH biodegradable nanocomposites. Conference paper in MRS (2015).
253. Magrez, A., Kasas, S., Salicio, V., Pasquier, N., Seo, J. W., Celio, M., Catsicas, S., Schwaller, B. & Forró, L. Cellular toxicity of carbon-based nanomaterials. Nano Lett. 6, 1121–1125 (2006).
254. Allegri, M., Perivoliotis, D. K., Bianchi, M. G., Chiu, M., Pagliaro, A., Koklioti, M. A., Trompeta, A.-F. A., Bergamaschi, E., Bussolati, O. & Charitidis, C. A. Toxicity determinants of multi-walled carbon nanotubes: The relationship between functionalization and agglomeration. Toxicol. Rep. 3, 230–243 (2016).
255. Liu, Y., Zhao, Y., Sun, B. & Chen, C. Understanding the toxicity of carbon nanotubes. Acc. Chem. Res. 46, 702–713 (2013).
256. McCullen, S. D., Stevens, D. R., Roberts, W. A., Clarke, L. I., Bernacki, S. H., Gorga, R. E. & Loboa, E. G. Characterization of electrospun nanocomposite scaffolds and biocompatibility with adipose-derived human mesenchymal stem cells. Int. J. Nanomedicine 2, 253–263 (2007).
257. Shao, S., Zhou, S., Li, L., Li, J., Luo, C., Wang, J., Li, X. & Weng, J. Osteoblast function on electrically conductive electrospun PLA/MWCNTs nanofibers. Biomaterials 32, 2821–2833 (2011).
258. Li, Z., Zhao, X., Ye, L., Coates, P., Caton-Rose, F. & Martyn, M. Structure and blood compatibility of highly oriented PLA/MWNTs composites produced by solid hot drawing. J. Biomater. Appl. 28, 978–989 (2014).
259. Correia Pinto, V., Costa-Almeida, R., Rodrigues, I., Guardão, L., Soares, R. & Miranda Guedes, R. Exploring the in vitro and in vivo compatibility of PLA, PLA/GNP and PLA/CNT-COOH biodegradable nanocomposites: Prospects for tendon and ligament applications. J. Biomed. Mater. Res. A 105, 2182–2190 (2017).
260. Jeong, H. R., Lee, H. S., Choi, I. J. & Park, J. H. Considerations in the use of microneedles: pain, convenience, anxiety and safety. J. Drug Target. 25, 29–40 (2017).
261. Haeri, M., Goldberg, S. & Gilbert, J. L. The voltage-dependent electrochemical impedance spectroscopy of CoCrMo medical alloy using time-domain techniques:
228
Generalized Cauchy–Lorentz, and KWW–Randles functions describing non-ideal interfacial behaviour. Corros. Sci. 53, 582–588 (2011).
262. Haeri, M. & Gilbert, J. L. Study of cellular dynamics on polarized CoCrMo alloy using time-lapse live-cell imaging. Acta Biomater. 9, 9220–9228 (2013).
263. Haeri M., Wollert, T., Langford, G. M. & Gilbert, J. L. Electrochemical control of cell death by reduction-induced intrinsic apoptosis and oxidation-induced necrosis on CoCrMo alloy in vitro. Biomaterials 33, 6295–6304 (2012).
264. Tominaga M., Kumagai, E. & Harada, S. Effect of electrical stimulation on HIV-1-infected HeLa cells cultured on an electrode surface. App. Microbiol. Biotechnol. 61, 447-450 (2003).
265. Veiga, V. F., Nimrichter, L., Teixeira, C. A., Morales, M. M., Alviano, C. S., Rodrigues, M. L. & Holandino, C. Exposure of human leukemic cells to direct electric current. Cell Biochem. Biophys. 42, 61–74 (2005).
266. Kumagai, E., Tominaga, M. & Harada, S. Sensitivity to electrical stimulation of human immunodeficiency virus type 1 and MAGIC-5 cells. AMB Express 1, 23 (2011).
267. Aizawa, M., Koyama, S., Kimura, K., Haruyama, T., Yanagida, Y. & Kobatake, E. Electrically stimulated modulation of cellular function in proliferation, differentiation, and gene expression. Electrochemistry 67, 118–125 (1999).
268. Kinosita Jr, K. & Tsong, T. Y. Formation and resealing of pores of controlled sizes in human erythrocyte membrane. Nature 268, 438–441 (1977).
269. Tsong, T. Y. Electroporation of cell membranes. Biophys. J. 60, 297–306 (1991). 270. Tandon, N., Marsano, A., Maidhof, R., Numata, K., Montouri-Sorrentino, C.,
Cannizzaro, C., Voldman, J. & Vunjak-Novakovic, G. Surface-patterned electrode bioreactor for electrical stimulation. Lab. Chip 10, 692–700 (2010).
271. Koyama, S., Haruyama, T., Kobatake, E. & Aizawa, M. Electrically induced NGF production by astroglial cells. Nat. Biotechnol. 15, 164–166 (1997).
272. Yaoita, M., Shinohara, H., Aizawa, M., Hayakawa, Y., Yamashita, T. & Ikariyama, Y. Potential-controlled morphological change and lysis of HeLa cells cultured on an electrode surface. J. Electroanal. Chem. Interfacial Electrochem. 254, 169–177 (1988).
273. Ragone, C., Minopoli, M., Ingangi, V., Botti, G., Fratangelo, F., Pessi, A., Stoppelli, M. P., Ascierto, P. A., Ciliberto, G., Motti, M. L. & Carriero, M. V. Targeting the cross-talk between Urokinase receptor and Formyl peptide receptor type 1 to prevent invasion and trans-endothelial migration of melanoma cells. J. Exp. Clin. Cancer Res. 36, (2017).
274. Scheitza, S., Bonifas, J. & Blömeke, B. Variable NAT1 Enzyme Activity in Long-Term Cultured Human HaCaT Keratinocytes. J. Toxicol. Environ. Health A 75, 471–477 (2012).
275. Kumar, V., Sharma, N. & Maitra, S. S. In vitro and in vivo toxicity assessment of nanoparticles. Int. Nano Lett. 7, 243–256 (2017).
276. Li, W., Zhou, J. & Xu, Y. Study of the in vitro cytotoxicity testing of medical devices. Biomed. Rep. 3, 617–620 (2015).
277. Strojan, K., Leonardi, A., Bregar, V. B., Križaj, I., Svete, J. & Pavlin, M. Dispersion of nanoparticles in different media importantly determines the composition of their protein corona. PLOS ONE 12, e0169552 (2017).
278. Zanganeh, S., Spitler, R., Erfanzadeh, M., Alkilany, A. M. & Mahmoudi, M. Protein corona: opportunities and challenges. Int. J. Biochem. Cell Biol. 75, 143–147 (2016).
279. Holder, A. L., Goth-Goldstein, R., Lucas, D. & Koshland, C. P. Particle-Induced Artifacts in the MTT and LDH Viability Assays. Chem. Res. Toxicol. 25, 1885–1892 (2012).
229
280. Wörle-Knirsch, J. M., Pulskamp, K. & Krug, H. F. Oops they did it again! Carbon nanotubes hoax scientists in viability assays. Nano Lett. 6, 1261–1268 (2006).
281. Casey, A., Herzog, E., Lyng, F. M., Byrne, H. J., Chambers, G. & Davoren, M. Single walled carbon nanotubes induce indirect cytotoxicity by medium depletion in A549 lung cells. Toxicol. Lett. 179, 78–84 (2008).
282. Wang, G., Zhang, J., Dewilde, A. H., Pal, A. K., Bello, D., Therrien, J. M., Braunhut, S. J. & Marx, K. A. Understanding and correcting for carbon nanotube interferences with a commercial LDH cytotoxicity assay. Toxicology 299, 99–111 (2012).
283. Gabi, M., Sannomiya, T., Larmagnac, A., Puttaswamy, M. & Vörös, J. Influence of applied currents on the viability of cells close to microelectrodes. Integr Biol 1, 108–115 (2009).
284. Tominaga, M., Kumagai, E. & Harada, S. Effect of electrical stimulation on HIV-1-infected HeLa cells cultured on an electrode surface. Appl. Microbiol. Biotechnol. 61, 447–450 (2003).
285. Miller, P. R., Skoog, S. A., Edwards, T. L., Wheeler, D. R., Xiao, X., Brozik, S. M., Polsky, R. & Narayan, R. J. Hollow microneedle-based sensor for multiplexed transdermal electrochemical sensing. J. Vis. Exp. (2012). doi:10.3791/4067
286. Fagan-Murphy, A. & Patel, B. A. Compressed multiwall carbon nanotube composite electrodes provide enhanced electroanalytical performance for determination of serotonin. Electrochimica Acta 138, 392–399 (2014).
287. Fagan-Murphy, A., Kataria, S. & Patel, B. A. Electrochemical performance of multi-walled carbon nanotube composite electrodes is enhanced with larger diameters and reduced specific surface area. J. Solid State Electrochem. 20, 785–792 (2016).


