Embed Size (px)
Citation preview
Development and Characterization of Solid and PorousPolylactide-Multiwall Carbon Nanotube Composites
Reza Rizvi,1 Omer Khan,2 Hani E. Naguib1,2
1 Department of Materials Science and Engineering, University of Toronto, Toronto, Canada
2 Department of Mechanical and Industrial Engineering, University of Toronto, Toronto, Canada
This article describes the fabrication of solid and po-rous polylactide (PLA)-multiwall carbon nanotube(MWNT) composites prepared using melt blending andsubsequent batch processing of porous structures.The morphology and thermal, rheological and electricalproperties of the PLA-MWNT composites prepared withMWNT concentrations of 0, 0.5, 1, 2, and 5 wt% werecharacterized. The composite structure consisted ofidentifiable regions of MWNT aggregation and MWNTdispersion. Increasing MWNT content was found toincrease the thermal stability and crystallizationkinetics of PLA. The addition of MWNT to PLA signifi-cantly increased the melt viscosity and electrical con-ductivity of the composites. Based on rheological andelectrical measurements, a continuous MWNT networkstructure in PLA was found to form when the concen-tration of MWNT is increased from 0.5 wt% (0.33 vol%)to 1 wt% (0.66 vol%). As many current day applicationsof polymers and polymer composites require light-weight and low-density materials, porous PLA-MWNTcomposites were fabricated from a batch porous struc-ture processing technique. Porous PLA-MWNT compo-sites containing 2 and 5 wt% MWNT had lower relativedensities, which is attributed to the higher viscosity ofthe composites suppressing collapse of the porousstructure during processing. POLYM. ENG. SCI., 51:43–53,2011. ª 2010 Society of Plastics Engineers
INTRODUCTION
Among the many applications of carbon nanotubes
(CNT) is the possibility of forming composite materials
with a polymer filler/matrix. Advantages such as electri-
cally conductive polymers with a low electrical percolation
threshold (e.g., 0.7 wt% multiwall carbon nanotube
(MWNT) in polycarbonate [1]) and mechanical enhance-
ments such as 10 times modulus increase (20 wt% MWNT
in situ polymerized Poly(methyl methacrylate) [2] have al-
ready been realized. Most CNT-polymer composites are
prepared by solvent mixing and casting or by melt-mixing
[3]. Dispersability including exfoliation of CNT in the
polymer matrix can be improved with the addition of com-
patibilizing agents, attaching functional groups on CNT or
by in situ polymerization in the presence of CNTs [4]. The
most pressing concern regarding the applicability of CNTs
is their cost which is directly related to their purity level
and fabrication technique [3, 5].
Polylactide (PLA) is one of the more widely used bio-
degradable polymers. Produced from renewable resources,
usually starch-rich products like corn, it may be used to
fabricate porous structures for biomedical, food, and pack-
aging applications. PLA possesses properties that lie
between those of polystyrene (PS) and polyethylene ter-
ephthalate (PET) [6], and as a biodegradable alternative it
is expected to replace these commodity polymers. The
PLA-CNT combination for nanocomposites has garnered
significant interest as is revealed by the number of articles
on this subject. With PLA being biodegradable this com-
bination has naturally drawn interest from the tissue-engi-
neering community as an electrically conductive scaffold
material. Supronowicz et al. [7] created PLA-CNT com-
posite substrates and then investigated osteoblast prolifer-
ation using an alternating current stimulation. Similarly
Zhang et al. [8] and Moon et al. [9] fabricated PLA-
MWNT solvent cast films and investigated their biocom-
patibility and mechanical properties respectively. Lynam
et al. [10] employed fiber spinning to produce hydroxya-
pitite-PLA-CNT composite biofibers and McCullen et al.
[11] used electro-spinning to construct a fibrous PLA-
CNT scaffold for tissue engineering purposes.
Recent studies have focused on melt blending PLA
and CNT. For example, Villmow et al. [12], have used a
corotating extruder to fabricate PLA-MWNT master-
batches which were then further diluted to create opti-
mized composites with volume resistivity on the order of
102 O cm and a percolation threshold of only 0.5 wt%.
The optimization was done by selecting the process pa-
rameters which yielded the highest dispersion index and
the lowest aggregate amount measured using light micros-
copy. Dispersion index is the ratio between the polymer
Correspondence to: Hani E. Naguib; e-mail: [email protected]
DOI 10.1002/pen.21792
Published online in Wiley Online Library (wileyonlinelibrary.com).
VVC 2010 Society of Plastics Engineers
POLYMER ENGINEERING AND SCIENCE—-2011
volume fraction and the total polymer and aggregate vol-
ume fraction. The low resistivity of the composites was
exploited by Kobashi et al. [13] to demonstrate the liquid
sensing capabilities of the melt blended composites. Dif-
ferent polar and non-polar solvents were detected by the
melt blended composite sensor as each solvent, depending
upon its solubility with PLA, will disrupt the percolated
MWNT network and cause a change the composite film’s
measured resistance.
A few studies have focused on the functionalization and
surface modification of CNTs in order to improve their dis-
persion in PLA. Kim et al. [14] used carboxyl and acyl chlo-
ride functionalized MWNT for solution cast films with PLA.
Chen et al. covalently attached PLA of various molecular
weights to acyl chloride functionalized MWNTs in a
‘‘grafting-to’’ approach [15]. They followed this by another
study where a ‘‘grafting-from’’ approach was used to ring-
open polymerize lactide monomers in the presence of
hydroxyl functionalized MWNTs [16]. The resulting solution
processed composite films offered better dispersion and exfo-
liation when the MWNTs were surface modified with PLA
compared to no surface modification. Song et al. [17] used a
direct in situ polycondensation reaction of lactic acid in the
presence of carboxylic acid functionalized MWNTs to coat
the MWNT with PLA. They also reported much better dis-
persion and exfoliation of MWNTs in PLA after the surface
modification. Wu and Liao [18] reaction melt blended acrylic
acid grafted PLA and hydroxyl functionalized MWNT to cre-
ate ester cross-linkages between the two components. How-
ever they found that MWNT concentrations greater than 1
wt% MWNT caused aggregation of MWNTs in PLA.
Key strategies for increasing the application potential
for CNT-polymer composites lie in reducing the produc-
tion costs as well as improving the physical and mechani-
cal characteristics, such as strength-to-weight ratio, insu-
lating properties and impact-resistance characteristics.
Most of these advances can be attained by inducing a po-
rous morphology in the pure polymer with the aid of a
compatible solvent. Inducing a porous structure in plastics
can dramatically alter their physical properties, where the
degree of change is influenced by the quality of the pore
structure. This can result in light weight materials with
high specific properties, which contribute to material sav-
ings and ultimately cost savings.
Processing methods to fabricate porous structures include
continuous extrusion, injection molding and batch processes,
which are detailed elsewhere [19]. In short, most fabrication
processes consist of (i) forming a single phase polymer-sol-
vent solution, (ii) formation of a large thermodynamic insta-
bility resulting in polymer and solvent phase separation, and
(iii) the growth of the solvent second phase, through diffu-
sion, in the polymer matrix resulting in a porous morphol-
ogy. The extent to which the second phase nucleates and
grows depends on several system parameters such as solvent
diffusivity, polymer surface tension, crystalline content, vis-
cosity and system temperature [19]. Incorporating nanomet-
ric sized features in a polymer can prove beneficial for fabri-
cating porous structures. Finely dispersed nanometric fea-
tures can act as heterogeneous nucleation sites where gas
pores can be nucleated and grown resulting in high pore den-
sities. A high pore density is advantageous for mechanical
integrity [20]. Marrazzo et al. [21] used CNTs in conjunction
with other nano-scale nucleating agents for fabricating
porous melt blended Poly(e-caprolactone) composites.
Although no comment on CNT dispersion was given, the
authors found that CNTs affect the crystallization kinetics
and increase the crystallinity during the gas saturation pro-
cess. This increase in crystallinity results in a stiffer polymer
matrix which prevented pore growth.
The pore nucleation efficiency of carbon nanofibres
(CNF) in batch processing of porous Polystyrene (PS) com-
posites was studied in great detail by Shen et al. [22]. They
linked the increase in nucleation efficiency which is defined
as the pore density/nucleant site density, to the dispersion
and the contact angle between the CNF and the PS matrix.
In another study by the same group [23], porous polysty-
rene-CNF were produced by continuous extrusion process.
High resolution SEM images revealed the alignment of
CNF along the pore wall as well as evidence of absorbed
polymer layers on the fibers. Compression testing results
indicated that the high pore density PS-CNF composites are
excellent candidates to serve as lightweight structural mate-
rials. Yang et al. [24, 25] demonstrated that porous PS-
MWNT composites fabricated using a chemical blowing
agent, azobisobutyronitrile, had pore sizes ranging from 40
to 170 lm and were conductive at high MWNT concentra-
tions (greater than 7 wt% MWNT). Such a material combi-
nation has potential to serve as lightweight electro-mag-
netic interference (EMI) shielded packaging.
Finally, Pilla et al. [26] investigated microporous PLA-
MWNT nanocomposites produced by microcellular injec-
tion molding. The authors found that incorporation of
MWNTs in the composites yielded a much finer porous
structure than PLA by itself because of two reasons; (1)
MWNTs acted as nucleating agents causing more pores to
nucleate and (2) MWNTs increased the melt viscosity,
inducing a strain hardening effect and preventing pore
growth. The authors also found evidence of better MWNT
dispersion when the porous composites were prepared
with super-critical nitrogen because of the plasticization
effect dissolved nitrogen has on PLA.
As shown in the beginning of this section, most PLA-
CNT composite fabrication is done using solvent and po-
lymerization based techniques. Relatively few studies
have examined the thermal, rheological, and electrical
properties of melt blended PLA-MWNT composites. In
addition, it is not clear what role MWNT play during the
fabrication of porous polymer-MWNT composites. This
article details the synthesis and characterization of PLA-
MWNT melt blended composites and porous composites.
Morphological, thermal, rheological, and electrical proper-
ties of the composites are presented. The morphology and
the expansion behavior of the porous composites and the
role of rheology during fabrication are also discussed.
44 POLYMER ENGINEERING AND SCIENCE—-2011 DOI 10.1002/pen
MATERIALS AND METHODS
Materials
Semi-crystalline PLA 3001D was provided by Jamplast
(Ellisville, MO) and was manufactured by NatureWorks
LLC. It was reported to have a density of 1.24 g/cm3 and
a melt flow index of 10–30 g/10 min. Thin CVD grown
MWNTs (grade 3101) with carbon purity of 95 þ% were
purchased from Nanocyl (Belgium). The MWNTs were
functionalized with less than 4% carboxylic acid and were
reported to have an average diameter of 10 nm and lengths
ranging from 0.1 to 10 lm. The solvent used to generate
the porous composites was commercial purity ([99%) car-
bon-dioxide obtained from Linde Gases (Toronto, Canada).
PLA-MWNT Composite Preparation
PLA-MWNT composites were prepared by melt blend-
ing PLA with as received MWNT. MWNT powder and
PLA were dry blended in compositions of 0, 0.5, 1, 2,
and 5 wt% MWNT in PLA. The dry blend was fed into a
corotating twin screw compounder (Haake MiniLab) at a
temperature of 1658C, screw rotation speed of 200 rpm
and a mixing time of 6 min. The extrudate obtained was
pelletized and compression molded on a Carver hydraulic
press into disc shaped samples (12.5 mm dia, 1.5 mm
thick) at a temperature of 1808C, a melt time of 5 min
and a press force of 2 metric tons for 5 min.
Porous Composite Preparation
A temperature soak batch processing technique was used
to fabricate porous PLA-MWNT composites using carbon-
dioxide as the solvent. This offers advantages over other
techniques such as solvent casting, particulate leaching,
fiber weaving, and phase inversion, which are used to pro-
duce porous structures, especially for biomedical applica-
tions. Carbon-dioxide is an inexpensive and relatively be-
nign solvent compared to other organic solvents and any re-
sidual carbon-dioxide remaining in the porous structure
generally has no detrimental effect for various applications.
PLA-MWNT composites were sealed in high pressure
chambers (schematized in Fig. 1) and saturated with car-
bon-dioxide at a pressure of 2.76 MPa at room tempera-
ture for 24 hours. Based on mass uptake measurements,
24 hours was determined to be sufficient time for satura-
tion of 1.5 mm thick samples. After 24 hours, the gas
pressure was released and the samples were transferred to
a hot water bath and soaked at a temperature of 958C for
20 seconds to induce the porous morphology before being
ice quenched to prevent any further pore growth.
Characterization
The morphology and the thermal, rheological, and
electrical properties of the PLA-MWNT composites were
characterized. The state of MWNT dispersion in the com-
posites was characterized by a scanning electron micro-
scope (SEM) (JEOL JSM 6060). Sample cross-sections
were obtained by cooling the composites in liquid nitro-
gen for a sufficient time and then fracturing them.
The thermal characteristics were determined using differ-
ential scanning calorimetry (DSC Q2000, TA Instruments) in
a heat-cool-heat cycle between 0 and 2008C with a heating
and cooling rate of 108C/min, which is a very common rate
for observing nonequilibrium thermal events. The glass tran-
sition point, melting temperature, cold crystallization temper-
ature, and degree of crystallinity were determined from the
DSC scans. Thermo-gravimetric analysis of the PLA-MWNT
composites was performed on a thermo-gravimetric analyzer
(TGA Q50, TA Instruments) by heating the sample in nitro-
gen to 6508C using a heating rate of 208C/min. Dynamic os-
cillatory rheological measurements were performed on an
ARES parallel plate rheometer (TA Instruments) at a melt
temperature of 1808C. Alternating Current (AC) electrical
properties of the composites were measured on a dielectric
impedance spectrometer (model Alpha, Novacontrol Tech-
nologies). Frequency sweeps were conducted from 1021 to
105 Hz at a root-mean-square (rms) voltage of 1V.
RESULTS AND DISCUSSIONS
MWNT and PLA-MWNT Composite Morphology
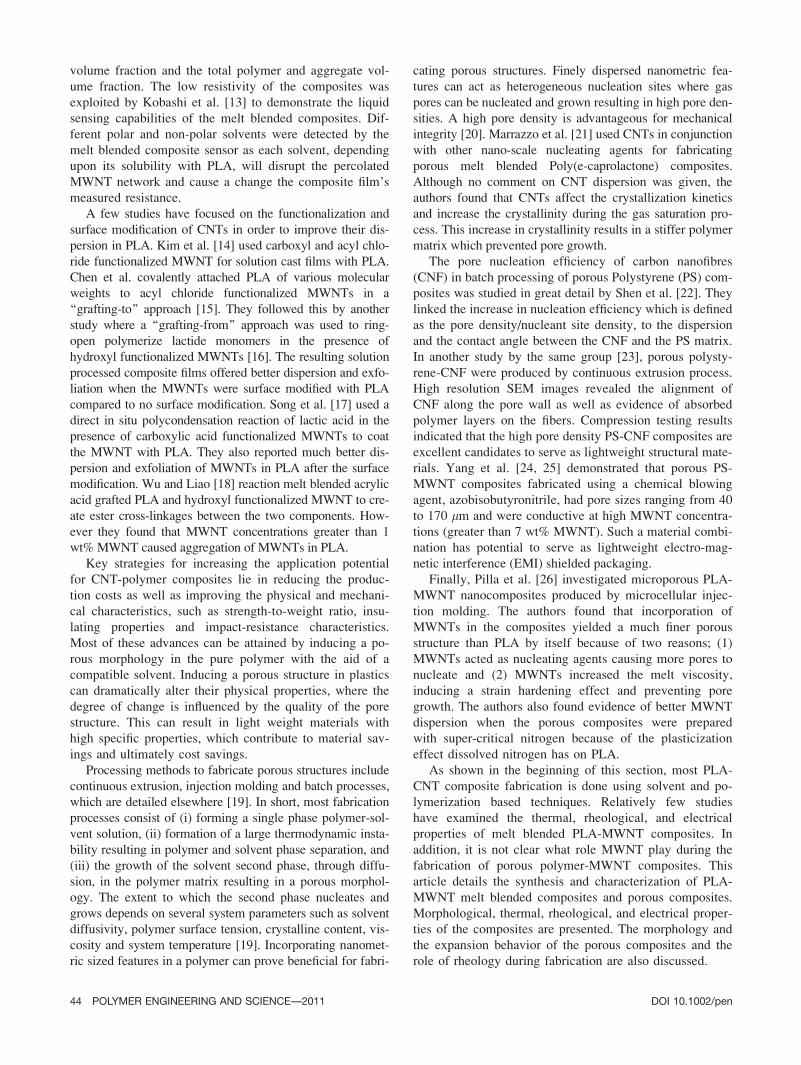
Figure 2a–c shows low magnification SEM images of melt
blended PLA-MWNT containing 0 (neat PLA), 0.5 and 5
wt% MWNT respectively. At a low MWNT content of 0.5
wt% the fracture surface is rough and only a few aggregates
are distinguishable with sizes less than 20 lm. The amount
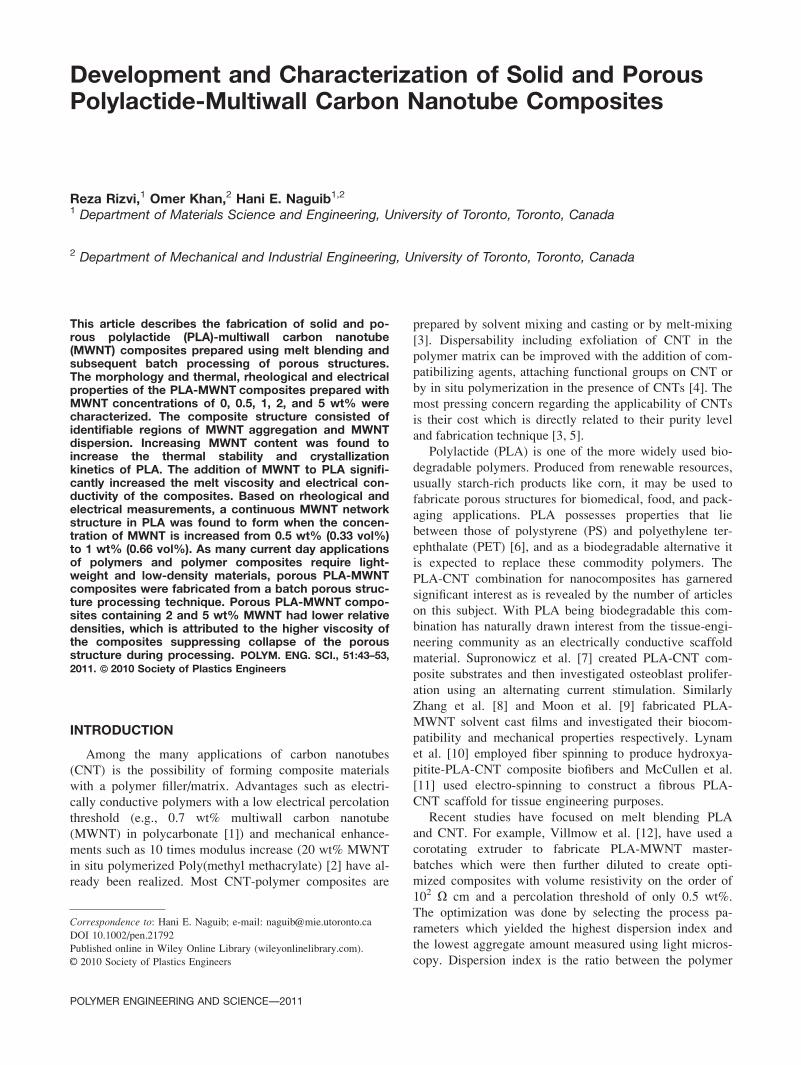
FIG. 1. Manufacturing process and parameters used for fabricating porous PLA-MWNT composites. Melt
blending performed at 1658C with a screw speed of 200 rpm for 6 min. Compression molding performed at
1808C with a force of 4.4 kN for a heat and press time of 10 min. Two stage batch foaming performed by
saturating under a pressure of 2.76 MPa for 24 hr and foaming at 958C for 20 seconds.
DOI 10.1002/pen POLYMER ENGINEERING AND SCIENCE—-2011 45
and size of visible MWNT aggregates increases as MWNT
concentration is increased by a factor of 10 (5 wt%). It can be
seen that the 5 wt% MWNT composite contains aggregates as
large as 100 lm (Fig. 2c). At a low concentration of 0.5 wt%
MWNT (Fig. 2b), the boundary between the aggregate and
the PLA matrix is indistinguishable. However at a higher con-
centration of 5 wt% (Fig. 2c) the interfaces between the aggre-
gates and PLA are more distinguishable and fracture cracks
and gaps emanating and transmitting through the agglomer-
ates become observable at low magnifications.
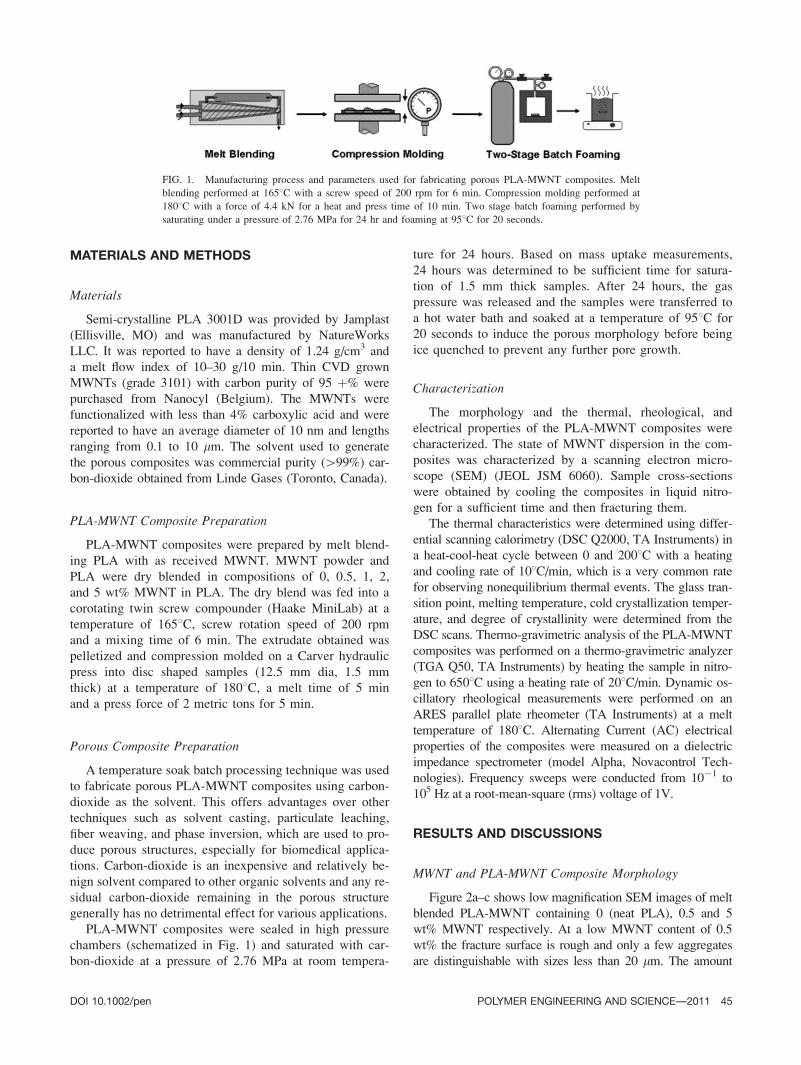
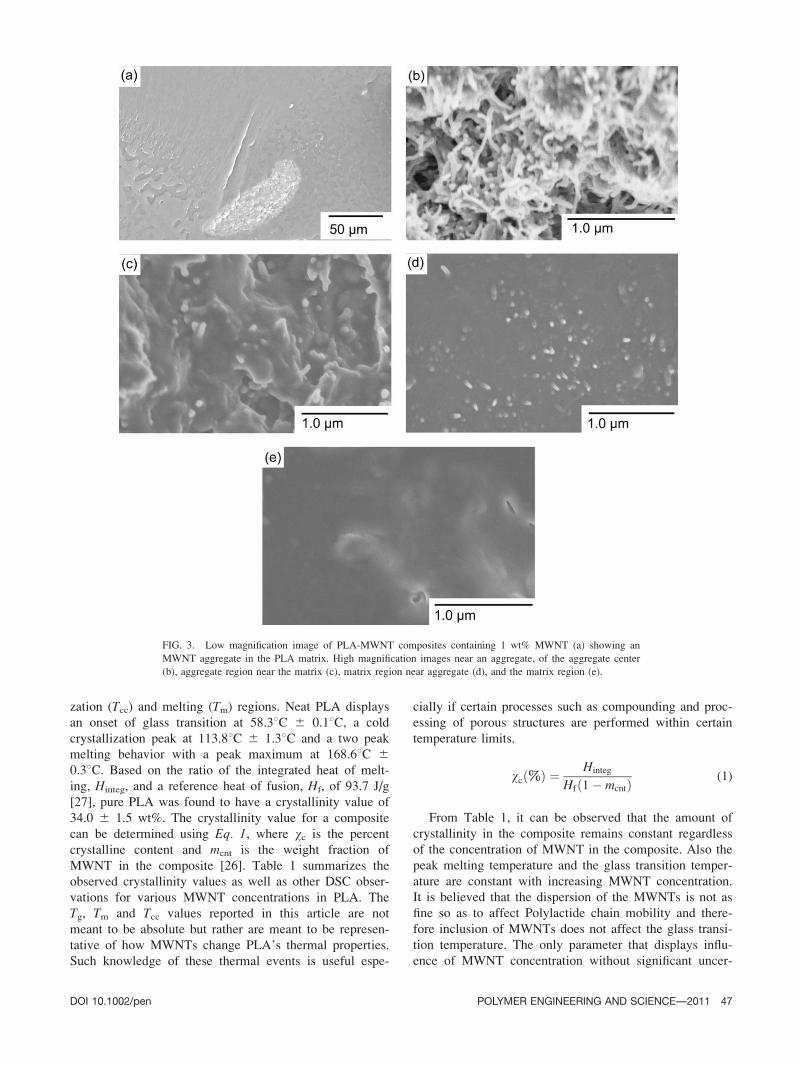
Figure 3b–e are high magnification SEM images at dif-
ferent regions in the PLA-1 wt% MWNT composite shown
in Fig. 3a. Individual MWNT entanglements can be
observed at the center region of the aggregate (Fig. 3b).
Regions bordering the PLA matrix were observed as having
a rough fracture surface with an increased density of fibrous
features, similar in dimension to MWNTs (Fig. 3c). These
regions had higher concentration of MWNTs dispersed in
the PLA matrix. Low concentrations of fibrous features,
were observed in the PLA matrix region near the aggregates
(Fig. 3d). The PLA matrix region further away from the
aggregates consists of a smooth surface morphology which
contains no fibrous features (Fig. 3e). This concentration
gradient originating from the aggregate to the matrix sug-
gests that the dispersion of MWNT in PLA is limited by the
break down of the larger aggregates.
Thermal Properties
Thermal analysis of the PLA-MWNT composites was
performed using thermal gravimetric analysis (TGA) and
differential scanning calorimetry (DSC) in order to under-
stand the effect of MWNT addition on the polymer’s ther-
mal characteristics and how this would affect processing
of the composites and porous composites. Figure 4 details
the results of the thermal gravimetric analysis (TGA) per-
formed after melt blending various amount of MWNT
with PLA. The onset of thermal decomposition was deter-
mined using the tangent method and the temperature of
thermal decomposition was determined by recording when
the rate of weight change was maximum. Also measured
was the residue remaining at 6008C which would indicate
the MWNT content if the MWNT are assumed to be sta-
ble at that temperature. It can be interpreted from Fig. 4
that the residue remaining corresponds well with the con-
centration of MWNT in the composites. PLA-MWNT
composites containing supposed MWNT concentrations of
0.5, 1, 2, and 5 wt% had actual MWNT concentrations of
0.35 6 0.39, 1.07 6 0.24, 2.16 6 0.14, 4.92 6 0.35
wt%. Also from Fig. 4, we can incur that adding MWNTs
to PLA results in a slight improvement to the onset and
decomposition temperatures of the composites. The onset
and decomposition temperatures for PLA-2 wt% MWNT
increase to 377 and 4148C, respectively, versus 371 and
4048C for neat PLA. No monotonic increase in decompo-
sition behavior is observed when the MWNT concentra-
tion is increased to 5 wt% MWNT. This is because of the
similar levels of dispersion of MWNTs in the composites
at 2 and 5 wt% MWNT. Based on the morphological
observations from Figs. 2 and 3, it is believed that most
of the additional MWNTs that are added at 5 wt%
MWNT exist mainly in aggregates and not dispersed in
the polymer matrix thereby not displaying a further
increase in the decomposition temperature.
Differential scanning calorimetry (DSC) was performed
on PLA-MWNT composites in a heat-cool-heat procedure
at a heating/cooling rate of 108C/min. Figure 5 is the heat
flow thermogram of the second heating run for the com-
posites with various MWNT concentrations. At 108C/min
all of the curves show glass transition (Tg), cold crystalli-
FIG. 2. Fracture surface of PLA (a) and PLA-MWNT composites with
MWNT content of 0.5 wt% (b) and 5 wt% (c).
46 POLYMER ENGINEERING AND SCIENCE—-2011 DOI 10.1002/pen
zation (Tcc) and melting (Tm) regions. Neat PLA displays
an onset of glass transition at 58.38C 6 0.18C, a cold
crystallization peak at 113.88C 6 1.38C and a two peak
melting behavior with a peak maximum at 168.68C 60.38C. Based on the ratio of the integrated heat of melt-
ing, Hinteg, and a reference heat of fusion, Hf, of 93.7 J/g
[27], pure PLA was found to have a crystallinity value of
34.0 6 1.5 wt%. The crystallinity value for a composite
can be determined using Eq. 1, where vc is the percent
crystalline content and mcnt is the weight fraction of
MWNT in the composite [26]. Table 1 summarizes the
observed crystallinity values as well as other DSC obser-
vations for various MWNT concentrations in PLA. The
Tg, Tm and Tcc values reported in this article are not
meant to be absolute but rather are meant to be represen-
tative of how MWNTs change PLA’s thermal properties.
Such knowledge of these thermal events is useful espe-
cially if certain processes such as compounding and proc-
essing of porous structures are performed within certain
temperature limits.
wcð%Þ ¼ Hinteg
Hfð1� mcntÞ (1)
From Table 1, it can be observed that the amount of
crystallinity in the composite remains constant regardless
of the concentration of MWNT in the composite. Also the
peak melting temperature and the glass transition temper-
ature are constant with increasing MWNT concentration.
It is believed that the dispersion of the MWNTs is not as
fine so as to affect Polylactide chain mobility and there-
fore inclusion of MWNTs does not affect the glass transi-
tion temperature. The only parameter that displays influ-
ence of MWNT concentration without significant uncer-
FIG. 3. Low magnification image of PLA-MWNT composites containing 1 wt% MWNT (a) showing an
MWNT aggregate in the PLA matrix. High magnification images near an aggregate, of the aggregate center
(b), aggregate region near the matrix (c), matrix region near aggregate (d), and the matrix region (e).
DOI 10.1002/pen POLYMER ENGINEERING AND SCIENCE—-2011 47
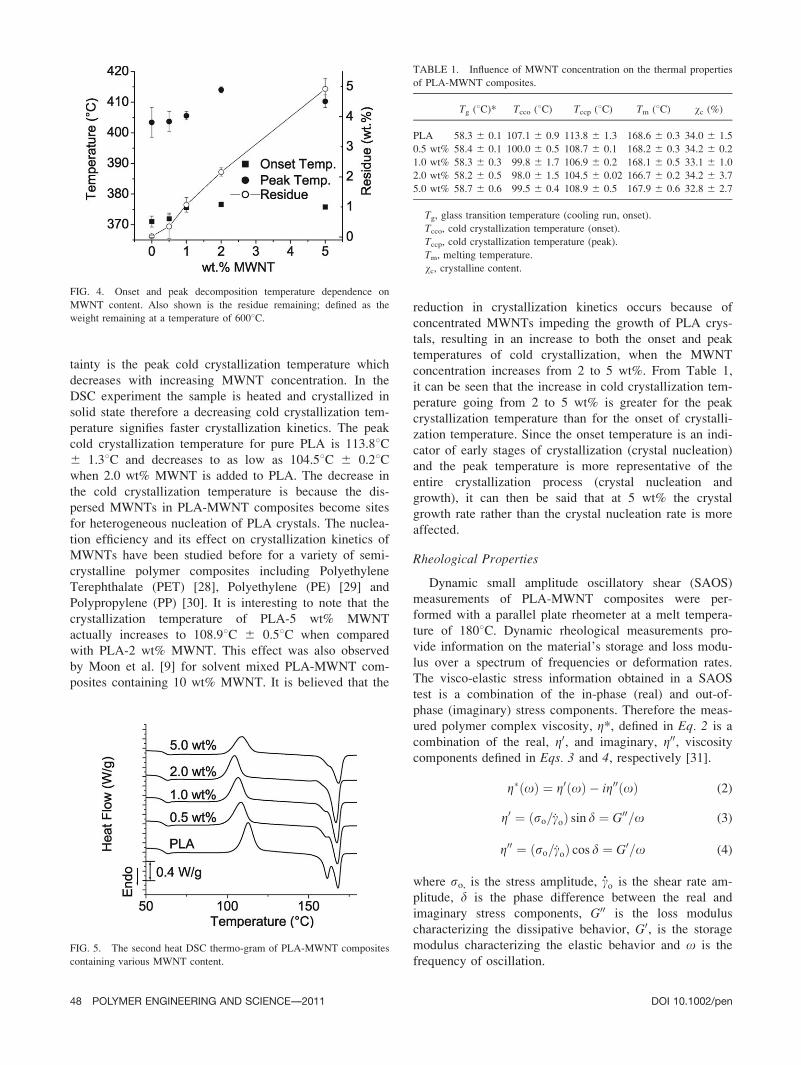
tainty is the peak cold crystallization temperature which
decreases with increasing MWNT concentration. In the
DSC experiment the sample is heated and crystallized in
solid state therefore a decreasing cold crystallization tem-
perature signifies faster crystallization kinetics. The peak
cold crystallization temperature for pure PLA is 113.88C6 1.38C and decreases to as low as 104.58C 6 0.28Cwhen 2.0 wt% MWNT is added to PLA. The decrease in
the cold crystallization temperature is because the dis-
persed MWNTs in PLA-MWNT composites become sites
for heterogeneous nucleation of PLA crystals. The nuclea-
tion efficiency and its effect on crystallization kinetics of
MWNTs have been studied before for a variety of semi-
crystalline polymer composites including Polyethylene
Terephthalate (PET) [28], Polyethylene (PE) [29] and
Polypropylene (PP) [30]. It is interesting to note that the
crystallization temperature of PLA-5 wt% MWNT
actually increases to 108.98C 6 0.58C when compared
with PLA-2 wt% MWNT. This effect was also observed
by Moon et al. [9] for solvent mixed PLA-MWNT com-
posites containing 10 wt% MWNT. It is believed that the
reduction in crystallization kinetics occurs because of
concentrated MWNTs impeding the growth of PLA crys-
tals, resulting in an increase to both the onset and peak
temperatures of cold crystallization, when the MWNT
concentration increases from 2 to 5 wt%. From Table 1,
it can be seen that the increase in cold crystallization tem-
perature going from 2 to 5 wt% is greater for the peak
crystallization temperature than for the onset of crystalli-
zation temperature. Since the onset temperature is an indi-
cator of early stages of crystallization (crystal nucleation)
and the peak temperature is more representative of the
entire crystallization process (crystal nucleation and
growth), it can then be said that at 5 wt% the crystal
growth rate rather than the crystal nucleation rate is more
affected.
Rheological Properties
Dynamic small amplitude oscillatory shear (SAOS)
measurements of PLA-MWNT composites were per-
formed with a parallel plate rheometer at a melt tempera-
ture of 1808C. Dynamic rheological measurements pro-
vide information on the material’s storage and loss modu-
lus over a spectrum of frequencies or deformation rates.
The visco-elastic stress information obtained in a SAOS
test is a combination of the in-phase (real) and out-of-
phase (imaginary) stress components. Therefore the meas-
ured polymer complex viscosity, g*, defined in Eq. 2 is a
combination of the real, g0, and imaginary, g00, viscositycomponents defined in Eqs. 3 and 4, respectively [31].
Z�ðoÞ ¼ Z0ðoÞ � iZ00ðoÞ (2)
Z0 ¼ ðso=goÞ sin d ¼ G00=o (3)
Z00 ¼ ðso=goÞ cos d ¼ G0=o (4)
where so, is the stress amplitude, _co is the shear rate am-
plitude, d is the phase difference between the real and
imaginary stress components, G00 is the loss modulus
characterizing the dissipative behavior, G0, is the storage
modulus characterizing the elastic behavior and x is the
frequency of oscillation.FIG. 5. The second heat DSC thermo-gram of PLA-MWNT composites
containing various MWNT content.
TABLE 1. Influence of MWNT concentration on the thermal properties
of PLA-MWNT composites.
Tg (8C)* Tcco (8C) Tccp (8C) Tm (8C) vc (%)
PLA 58.3 6 0.1 107.1 6 0.9 113.8 6 1.3 168.6 6 0.3 34.0 6 1.5
0.5 wt% 58.4 6 0.1 100.0 6 0.5 108.7 6 0.1 168.2 6 0.3 34.2 6 0.2
1.0 wt% 58.3 6 0.3 99.8 6 1.7 106.9 6 0.2 168.1 6 0.5 33.1 6 1.0
2.0 wt% 58.2 6 0.5 98.0 6 1.5 104.5 6 0.02 166.7 6 0.2 34.2 6 3.7
5.0 wt% 58.7 6 0.6 99.5 6 0.4 108.9 6 0.5 167.9 6 0.6 32.8 6 2.7
Tg, glass transition temperature (cooling run, onset).
Tcco, cold crystallization temperature (onset).
Tccp, cold crystallization temperature (peak).
Tm, melting temperature.
vc, crystalline content.
FIG. 4. Onset and peak decomposition temperature dependence on
MWNT content. Also shown is the residue remaining; defined as the
weight remaining at a temperature of 6008C.
48 POLYMER ENGINEERING AND SCIENCE—-2011 DOI 10.1002/pen
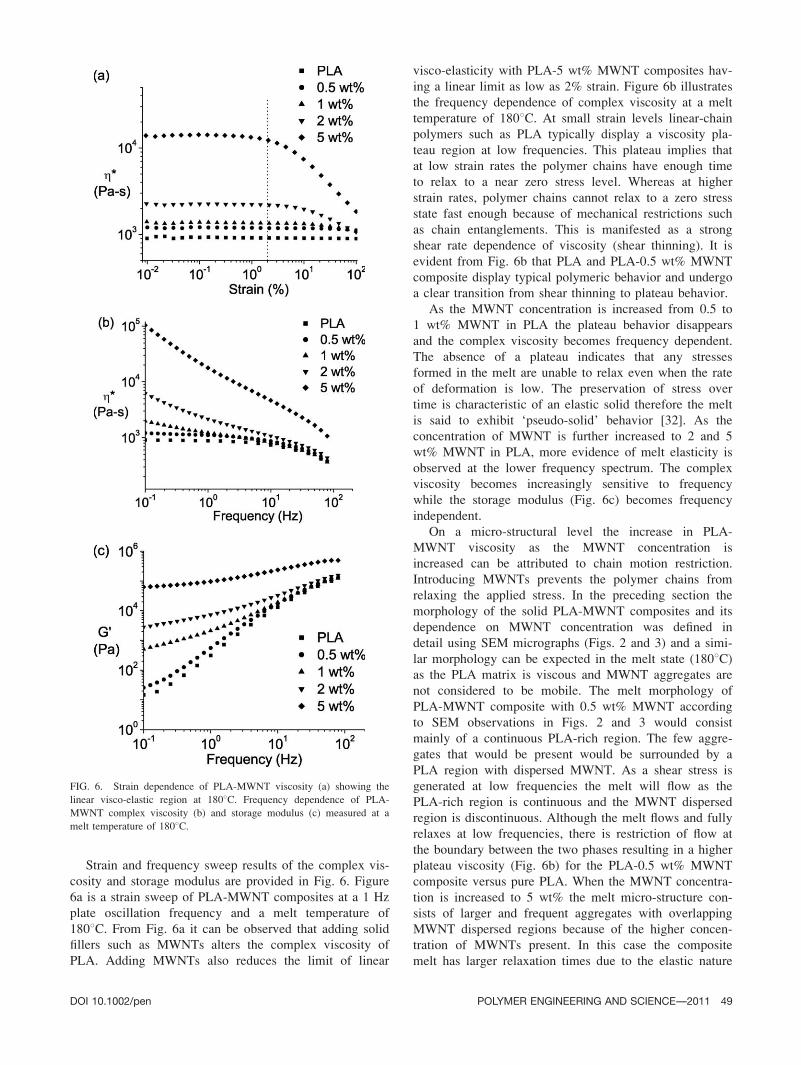
Strain and frequency sweep results of the complex vis-
cosity and storage modulus are provided in Fig. 6. Figure
6a is a strain sweep of PLA-MWNT composites at a 1 Hz
plate oscillation frequency and a melt temperature of
1808C. From Fig. 6a it can be observed that adding solid
fillers such as MWNTs alters the complex viscosity of
PLA. Adding MWNTs also reduces the limit of linear
visco-elasticity with PLA-5 wt% MWNT composites hav-
ing a linear limit as low as 2% strain. Figure 6b illustrates
the frequency dependence of complex viscosity at a melt
temperature of 1808C. At small strain levels linear-chain
polymers such as PLA typically display a viscosity pla-
teau region at low frequencies. This plateau implies that
at low strain rates the polymer chains have enough time
to relax to a near zero stress level. Whereas at higher
strain rates, polymer chains cannot relax to a zero stress
state fast enough because of mechanical restrictions such
as chain entanglements. This is manifested as a strong
shear rate dependence of viscosity (shear thinning). It is
evident from Fig. 6b that PLA and PLA-0.5 wt% MWNT
composite display typical polymeric behavior and undergo
a clear transition from shear thinning to plateau behavior.
As the MWNT concentration is increased from 0.5 to
1 wt% MWNT in PLA the plateau behavior disappears
and the complex viscosity becomes frequency dependent.
The absence of a plateau indicates that any stresses
formed in the melt are unable to relax even when the rate
of deformation is low. The preservation of stress over
time is characteristic of an elastic solid therefore the melt
is said to exhibit ‘pseudo-solid’ behavior [32]. As the
concentration of MWNT is further increased to 2 and 5
wt% MWNT in PLA, more evidence of melt elasticity is
observed at the lower frequency spectrum. The complex
viscosity becomes increasingly sensitive to frequency
while the storage modulus (Fig. 6c) becomes frequency
independent.
On a micro-structural level the increase in PLA-
MWNT viscosity as the MWNT concentration is
increased can be attributed to chain motion restriction.
Introducing MWNTs prevents the polymer chains from
relaxing the applied stress. In the preceding section the
morphology of the solid PLA-MWNT composites and its
dependence on MWNT concentration was defined in
detail using SEM micrographs (Figs. 2 and 3) and a simi-
lar morphology can be expected in the melt state (1808C)as the PLA matrix is viscous and MWNT aggregates are
not considered to be mobile. The melt morphology of
PLA-MWNT composite with 0.5 wt% MWNT according
to SEM observations in Figs. 2 and 3 would consist
mainly of a continuous PLA-rich region. The few aggre-
gates that would be present would be surrounded by a
PLA region with dispersed MWNT. As a shear stress is
generated at low frequencies the melt will flow as the
PLA-rich region is continuous and the MWNT dispersed
region is discontinuous. Although the melt flows and fully
relaxes at low frequencies, there is restriction of flow at
the boundary between the two phases resulting in a higher
plateau viscosity (Fig. 6b) for the PLA-0.5 wt% MWNT
composite versus pure PLA. When the MWNT concentra-
tion is increased to 5 wt% the melt micro-structure con-
sists of larger and frequent aggregates with overlapping
MWNT dispersed regions because of the higher concen-
tration of MWNTs present. In this case the composite
melt has larger relaxation times due to the elastic nature
FIG. 6. Strain dependence of PLA-MWNT viscosity (a) showing the
linear visco-elastic region at 1808C. Frequency dependence of PLA-
MWNT complex viscosity (b) and storage modulus (c) measured at a
melt temperature of 1808C.
DOI 10.1002/pen POLYMER ENGINEERING AND SCIENCE—-2011 49
of the MWNT aggregates and the MWNT dispersed
regions. The absence of a plateau in complex viscosity
and the formation of a plateau in storage modulus (Fig.
6c) leads to the observation that the continuous phase is
the MWNT dispersed region and the discontinuous phase
is the PLA-rich region. Such behavior is attributed to
MWNTs forming a rheological percolation network that
forms along continuous MWNT dispersed region.
Electrical Properties of PLA-MWNT Composites
Alternating current electrical conductivity of the PLA-
MWNT composites was measured on a dielectric imped-
ance spectrometer at a root-mean-square (rms) voltage of
1 V. Upon application of an oscillating voltage, V, at a
specific frequency, x, an oscillating current, I, is induced
which is measured by the instrument. The composite’s
complex conductivity, r*, is defined in Eq. 5 [33].
s� ¼ s0 � is00 ¼ ioe0e� ¼ ioe0ðe0 � ie00Þ (5)
where s0 is the in-phase component of conductivity, s00 isthe out-of-phase component of conductivity, e* is the
complex permittivity comprising of an in-phase compo-
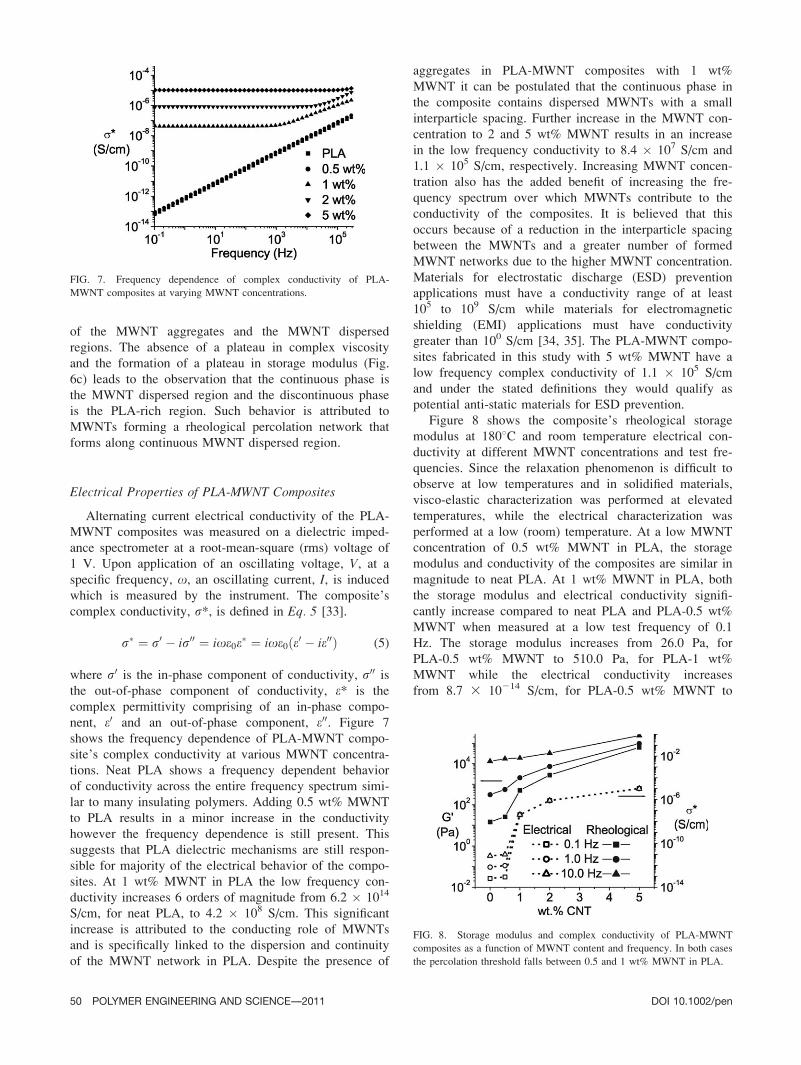
nent, e0 and an out-of-phase component, e00. Figure 7
shows the frequency dependence of PLA-MWNT compo-
site’s complex conductivity at various MWNT concentra-
tions. Neat PLA shows a frequency dependent behavior
of conductivity across the entire frequency spectrum simi-
lar to many insulating polymers. Adding 0.5 wt% MWNT
to PLA results in a minor increase in the conductivity
however the frequency dependence is still present. This
suggests that PLA dielectric mechanisms are still respon-
sible for majority of the electrical behavior of the compo-
sites. At 1 wt% MWNT in PLA the low frequency con-
ductivity increases 6 orders of magnitude from 6.2 � 1014
S/cm, for neat PLA, to 4.2 � 108 S/cm. This significant
increase is attributed to the conducting role of MWNTs
and is specifically linked to the dispersion and continuity
of the MWNT network in PLA. Despite the presence of
aggregates in PLA-MWNT composites with 1 wt%
MWNT it can be postulated that the continuous phase in
the composite contains dispersed MWNTs with a small
interparticle spacing. Further increase in the MWNT con-
centration to 2 and 5 wt% MWNT results in an increase
in the low frequency conductivity to 8.4 � 107 S/cm and
1.1 � 105 S/cm, respectively. Increasing MWNT concen-
tration also has the added benefit of increasing the fre-
quency spectrum over which MWNTs contribute to the
conductivity of the composites. It is believed that this
occurs because of a reduction in the interparticle spacing
between the MWNTs and a greater number of formed
MWNT networks due to the higher MWNT concentration.
Materials for electrostatic discharge (ESD) prevention
applications must have a conductivity range of at least
105 to 109 S/cm while materials for electromagnetic
shielding (EMI) applications must have conductivity
greater than 100 S/cm [34, 35]. The PLA-MWNT compo-
sites fabricated in this study with 5 wt% MWNT have a
low frequency complex conductivity of 1.1 � 105 S/cm
and under the stated definitions they would qualify as
potential anti-static materials for ESD prevention.
Figure 8 shows the composite’s rheological storage
modulus at 1808C and room temperature electrical con-
ductivity at different MWNT concentrations and test fre-
quencies. Since the relaxation phenomenon is difficult to
observe at low temperatures and in solidified materials,
visco-elastic characterization was performed at elevated
temperatures, while the electrical characterization was
performed at a low (room) temperature. At a low MWNT
concentration of 0.5 wt% MWNT in PLA, the storage
modulus and conductivity of the composites are similar in
magnitude to neat PLA. At 1 wt% MWNT in PLA, both
the storage modulus and electrical conductivity signifi-
cantly increase compared to neat PLA and PLA-0.5 wt%
MWNT when measured at a low test frequency of 0.1
Hz. The storage modulus increases from 26.0 Pa, for
PLA-0.5 wt% MWNT to 510.0 Pa, for PLA-1 wt%
MWNT while the electrical conductivity increases
from 8.7 3 10214 S/cm, for PLA-0.5 wt% MWNT to
FIG. 7. Frequency dependence of complex conductivity of PLA-
MWNT composites at varying MWNT concentrations.
FIG. 8. Storage modulus and complex conductivity of PLA-MWNT
composites as a function of MWNT content and frequency. In both cases
the percolation threshold falls between 0.5 and 1 wt% MWNT in PLA.
50 POLYMER ENGINEERING AND SCIENCE—-2011 DOI 10.1002/pen
4.2 3 1028 S/cm for PLA-1 wt% MWNT. Observing
from Fig. 8 it can be concluded that both the rheological
and electrical percolation thresholds associated with a for-
mation of a continuous MWNT network for PLA-MWNT
composites fabricated in this study lie between MWNT
concentrations of 0.5 wt% (0.33 vol%) and 1 wt% (0.66
vol%) MWNT in PLA.
Porous PLA-MWNT Composites
In order to achieve density reduction for applications
requiring lightweight materials, porous PLA-MWNT com-
posites were prepared using a batch processing technique.
Based on a previous study [36] for optimal density reduc-
tion of neat PLA, the saturation pressure, saturation time
and saturation temperature were fixed at 2.76 MPa, 24 hr
and room temperature, respectively. After saturation the
PLA-MWNT composites were transferred to a hot water
bath at 958C for 20 s to induce a porous structure. Lower-
ing the polymer viscosity by heating the PLA-MWNT
composites above PLA’s glass transition point is neces-
sary for allowing pore growth. Furthermore pore growth
is dependent upon the time that the composites are heated
for. If the composites are overexposed to heat then pore
walls can thin and pore collapse can occur. The pore
growth process can be ceased by increasing the composite
viscosity through lowering the temperature which can be
done by cold water quenching.
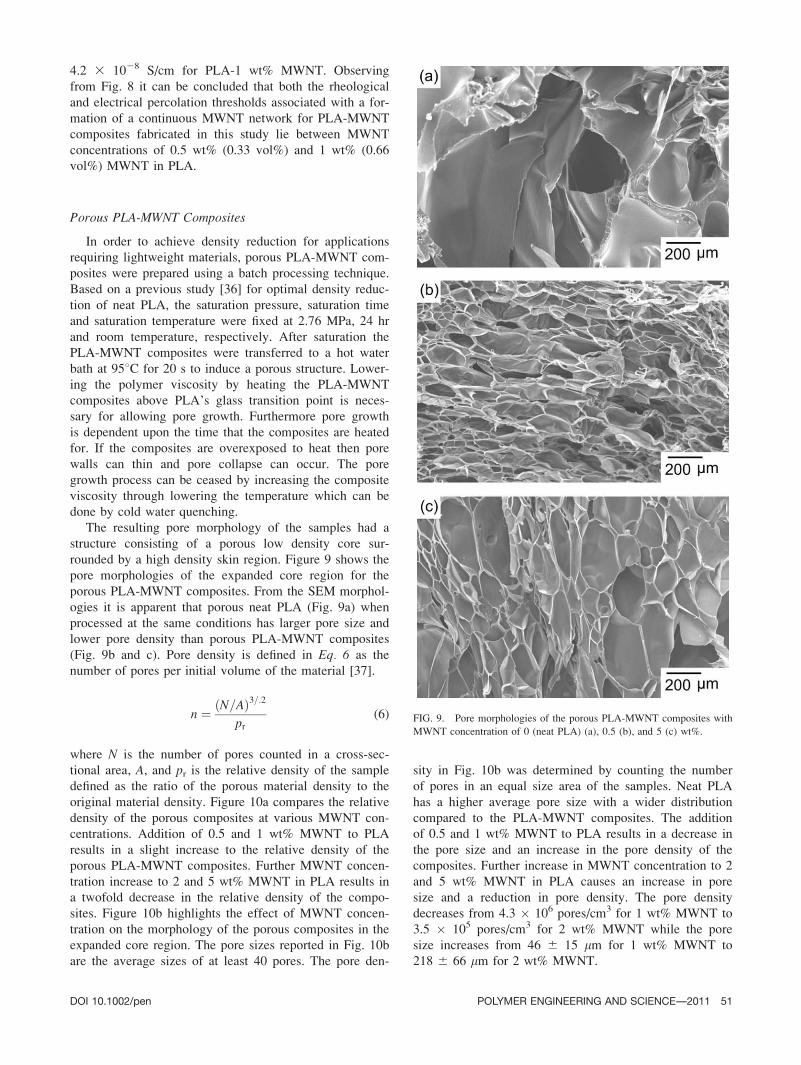
The resulting pore morphology of the samples had a
structure consisting of a porous low density core sur-
rounded by a high density skin region. Figure 9 shows the
pore morphologies of the expanded core region for the
porous PLA-MWNT composites. From the SEM morphol-
ogies it is apparent that porous neat PLA (Fig. 9a) when
processed at the same conditions has larger pore size and
lower pore density than porous PLA-MWNT composites
(Fig. 9b and c). Pore density is defined in Eq. 6 as the
number of pores per initial volume of the material [37].
n ¼ ðN=AÞ3=:2pr
(6)
where N is the number of pores counted in a cross-sec-
tional area, A, and pr is the relative density of the sample
defined as the ratio of the porous material density to the
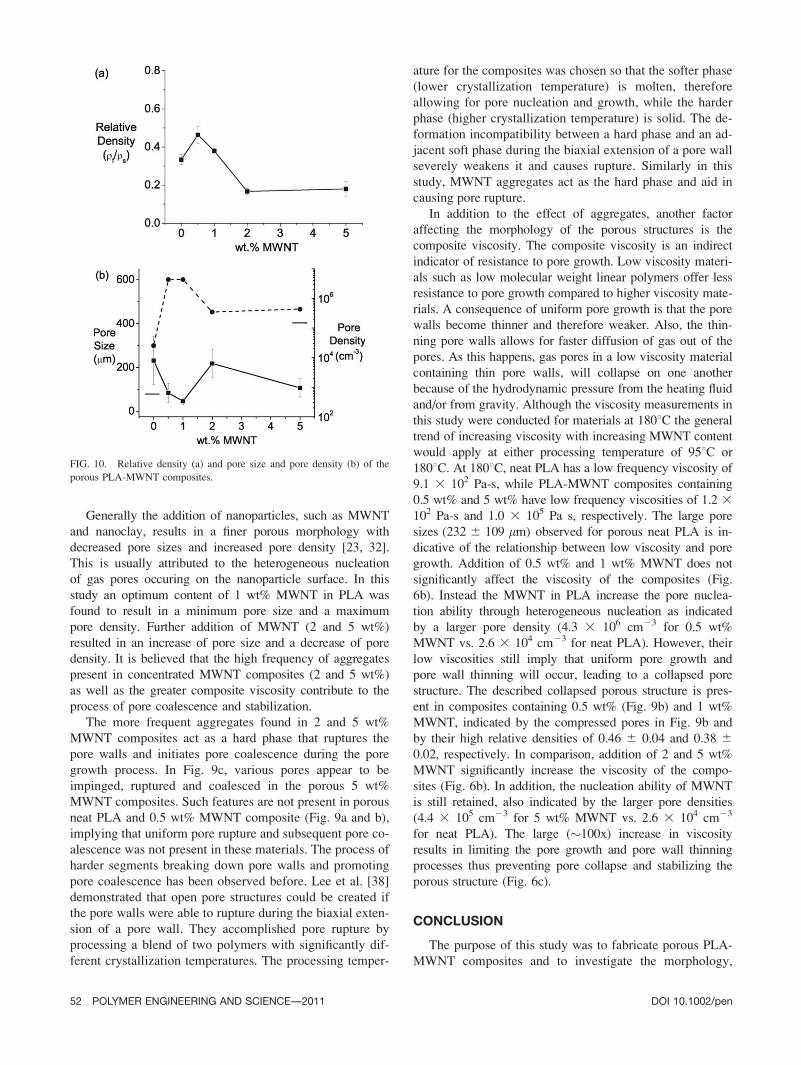
original material density. Figure 10a compares the relative
density of the porous composites at various MWNT con-
centrations. Addition of 0.5 and 1 wt% MWNT to PLA
results in a slight increase to the relative density of the
porous PLA-MWNT composites. Further MWNT concen-
tration increase to 2 and 5 wt% MWNT in PLA results in
a twofold decrease in the relative density of the compo-
sites. Figure 10b highlights the effect of MWNT concen-
tration on the morphology of the porous composites in the
expanded core region. The pore sizes reported in Fig. 10b
are the average sizes of at least 40 pores. The pore den-
sity in Fig. 10b was determined by counting the number
of pores in an equal size area of the samples. Neat PLA
has a higher average pore size with a wider distribution
compared to the PLA-MWNT composites. The addition
of 0.5 and 1 wt% MWNT to PLA results in a decrease in
the pore size and an increase in the pore density of the
composites. Further increase in MWNT concentration to 2
and 5 wt% MWNT in PLA causes an increase in pore
size and a reduction in pore density. The pore density
decreases from 4.3 � 106 pores/cm3 for 1 wt% MWNT to
3.5 � 105 pores/cm3 for 2 wt% MWNT while the pore
size increases from 46 6 15 mm for 1 wt% MWNT to
218 6 66 mm for 2 wt% MWNT.
FIG. 9. Pore morphologies of the porous PLA-MWNT composites with
MWNT concentration of 0 (neat PLA) (a), 0.5 (b), and 5 (c) wt%.
DOI 10.1002/pen POLYMER ENGINEERING AND SCIENCE—-2011 51
Generally the addition of nanoparticles, such as MWNT
and nanoclay, results in a finer porous morphology with
decreased pore sizes and increased pore density [23, 32].
This is usually attributed to the heterogeneous nucleation
of gas pores occuring on the nanoparticle surface. In this
study an optimum content of 1 wt% MWNT in PLA was
found to result in a minimum pore size and a maximum
pore density. Further addition of MWNT (2 and 5 wt%)
resulted in an increase of pore size and a decrease of pore
density. It is believed that the high frequency of aggregates
present in concentrated MWNT composites (2 and 5 wt%)
as well as the greater composite viscosity contribute to the
process of pore coalescence and stabilization.
The more frequent aggregates found in 2 and 5 wt%
MWNT composites act as a hard phase that ruptures the
pore walls and initiates pore coalescence during the pore
growth process. In Fig. 9c, various pores appear to be
impinged, ruptured and coalesced in the porous 5 wt%
MWNT composites. Such features are not present in porous
neat PLA and 0.5 wt% MWNT composite (Fig. 9a and b),
implying that uniform pore rupture and subsequent pore co-
alescence was not present in these materials. The process of
harder segments breaking down pore walls and promoting
pore coalescence has been observed before. Lee et al. [38]
demonstrated that open pore structures could be created if
the pore walls were able to rupture during the biaxial exten-
sion of a pore wall. They accomplished pore rupture by
processing a blend of two polymers with significantly dif-
ferent crystallization temperatures. The processing temper-
ature for the composites was chosen so that the softer phase
(lower crystallization temperature) is molten, therefore
allowing for pore nucleation and growth, while the harder
phase (higher crystallization temperature) is solid. The de-
formation incompatibility between a hard phase and an ad-
jacent soft phase during the biaxial extension of a pore wall
severely weakens it and causes rupture. Similarly in this
study, MWNT aggregates act as the hard phase and aid in
causing pore rupture.
In addition to the effect of aggregates, another factor
affecting the morphology of the porous structures is the
composite viscosity. The composite viscosity is an indirect
indicator of resistance to pore growth. Low viscosity materi-
als such as low molecular weight linear polymers offer less
resistance to pore growth compared to higher viscosity mate-
rials. A consequence of uniform pore growth is that the pore
walls become thinner and therefore weaker. Also, the thin-
ning pore walls allows for faster diffusion of gas out of the
pores. As this happens, gas pores in a low viscosity material
containing thin pore walls, will collapse on one another
because of the hydrodynamic pressure from the heating fluid
and/or from gravity. Although the viscosity measurements in
this study were conducted for materials at 1808C the general
trend of increasing viscosity with increasing MWNT content
would apply at either processing temperature of 958C or
1808C. At 1808C, neat PLA has a low frequency viscosity of
9.1 3 102 Pa-s, while PLA-MWNT composites containing
0.5 wt% and 5 wt% have low frequency viscosities of 1.2 3102 Pa-s and 1.0 3 105 Pa s, respectively. The large pore
sizes (232 6 109 lm) observed for porous neat PLA is in-
dicative of the relationship between low viscosity and pore
growth. Addition of 0.5 wt% and 1 wt% MWNT does not
significantly affect the viscosity of the composites (Fig.
6b). Instead the MWNT in PLA increase the pore nuclea-
tion ability through heterogeneous nucleation as indicated
by a larger pore density (4.3 3 106 cm23 for 0.5 wt%
MWNT vs. 2.6 3 104 cm23 for neat PLA). However, their
low viscosities still imply that uniform pore growth and
pore wall thinning will occur, leading to a collapsed pore
structure. The described collapsed porous structure is pres-
ent in composites containing 0.5 wt% (Fig. 9b) and 1 wt%
MWNT, indicated by the compressed pores in Fig. 9b and
by their high relative densities of 0.46 6 0.04 and 0.38 60.02, respectively. In comparison, addition of 2 and 5 wt%
MWNT significantly increase the viscosity of the compo-
sites (Fig. 6b). In addition, the nucleation ability of MWNT
is still retained, also indicated by the larger pore densities
(4.4 3 105 cm23 for 5 wt% MWNT vs. 2.6 3 104 cm23
for neat PLA). The large (�100x) increase in viscosity
results in limiting the pore growth and pore wall thinning
processes thus preventing pore collapse and stabilizing the
porous structure (Fig. 6c).
CONCLUSION
The purpose of this study was to fabricate porous PLA-
MWNT composites and to investigate the morphology,
FIG. 10. Relative density (a) and pore size and pore density (b) of the
porous PLA-MWNT composites.
52 POLYMER ENGINEERING AND SCIENCE—-2011 DOI 10.1002/pen
thermal and rheological properties of melt blended PLA-
MWNT composites. The morphology of the composites, as
observed on SEM, was characterized as containing MWNT
aggregates at high MWNT concentrations in PLA. A high
density of MWNTs in PLA regions adjacent to the aggre-
gates was observed on SEM while a low MWNT density
was observed in PLA regions far away from the aggregates.
Increasing the MWNT concentration resulted in a slight
increase in the decomposition temperature of the compo-
sites while the MWNT concentrations examined in this
study had a minimal effect on PLA’s glass transition, melt-
ing temperature and amount of crystallinity. However,
increasing MWNT concentration was found to decrease the
cold crystallization temperature suggesting that MWNT’s
are effective nucleation sites for PLA crystallization.
MWNTs were observed to have a considerable effect on
the visco-elastic properties of PLA, with slight additions
significantly increasing PLA’s melt viscosity. A rheological
and electrical percolation threshold was observed to lie
between 0.5 wt% (0.33 vol%) and 1 wt% (0.66 vol%)
MWNT in PLA. Porous articles were fabricated by the two
step batch processing technique. The porous morphology
consisted of a highly expanded core region and a denser
skin region. Furthermore, highly concentrated PLA-MWNT
composites had a higher degree of expansion than neat
PLA which was attributed to the MWNT aggregation and
greater viscosity of the composites.
REFERENCES
1. S. Pegel, P. Potschke, G. Petzold, I. Alig, S.M. Dudkin, and
D. Lellinger, Polymer, 49, 4 (2008).
2. G.L. Hwang, Y. Shieh, and K.C. Hwang, Adv. Funct.Mater., 14, 5 (2004).
3. J.N. Coleman, U. Khan, W.J. Blau, and Y.K. Gun’ko,
Carbon, 44, 9 (2006).
4. O. Breuer and U. Sundararaj, Polym. Compos., 25, 6 (2004).
5. P.J.F. Harris, Int. Mater. Rev., 49, 1 (2004).
6. C. Bastioli, Handbook of Biodegradable Polymers, Smithers
Rapra Technology, UK (2005).
7. P.R. Supronowicz, P.M. Ajayan, K.R. Ullmann, B.P.
Arulanandam, D.W. Metzger, and R. Bizios, J. Biomed.Mater. Res., 59, 3 (2002).
8. D. Zhang, M.A. Kandadai, J. Cech, S. Roth, and S.A.
Curran, J. Phys. Chem. B, 110, 26 (2006).
9. S. Moon, F. Jin, C. Lee, S. Tsutsumi, and S. Hyon, Macro-mol. Symposia, 224, 287 (2005).
10. C. Lynam, S.E. Moulton, and G.G. Wallace, Adv. Mater.,19, 9 (2007).
11. S.D. McCullen, K.L. Stano, D.R. Stevens, W.A. Roberts, N.
Monteiro-Riviere, L.I. Clarke, and R.E. Gorga, J. Appl.Polym. Sci., 105, 3 (2007).
12. T. Villmow, P. Potschke, S. Pegel, L. Haussler, and B.
Kretzschmar, Polymer, 49, 16 (2008).
13. K. Kobashi, T. Villmow, T. Andres, and P. Potschke, Sens.Actuators B: Chem., 134, 2 (2008).
14. H. Kim, B. Park, J. Yoon, and H. Jin, Key Eng. Mat., 326–328(Part 2), 1785 (2006).
15. G. Chen, H. Kim, B.H. Park, and J. Yoon, J. Phys. Chem.B, 109, 47 (2005).
16. G. Chen, H. Kim, B.H. Park, and J. Yoon, Macromol.Chem. Phys., 208, 4 (2007).
17. W. Song, Z. Zheng, W. Tang, and X. Wang, Polymer, 48,13 (2007).
18. C. Wu and H. Liao, Polymer, 48, 15 (2007).
19. D. Klempner and K.C. Frisch, Handbook of PolymericFoams and Foam Technology, Oxford University Press,
New York (1991).
20. C.B. Park, D.F. Baldwin, and N.P. Suh, Polym. Eng. Sci.,35, 5 (1995).
21. C. Marrazzo, E. Di Maio, and S. Iannace, Polym. Eng. Sci.,48, 2 (2008).
22. J. Shen, C. Zeng, and L.J. Lee, Polymer, 46, 14 (2005).
23. J. Shen, X. Han, and L.J. Lee, J. Cell. Plast., 42, 2 (2006).
24. Y. Yang, M.C. Gupta, K.L. Dudley, and R.W. Lawrence,
Adv. Mater., 17, 16 (2005).
25. Y. Yang, M.C. Gupta, K.L. Dudley, and R.W. Lawrence,
Nano. Lett., 5, 11 (2005).
26. S. Pilla, A. Kramschuster, S. Gong, A. Chandra, and L.
Turng, Int. Polym. Process., 22, 5 (2007).
27. D. Garlotta, J. Polym. Environ., 9, 2 (2001).
28. J.Y. Kim, H.S. Park, and S.H. Kim, J. Appl. Polym. Sci.,103, 3 (2007).
29. T. McNally, P. Potschke, P. Halley, M. Murphy, D. Martin,
S.E.J. Bell, G.P. Brennan, D. Bein, P. Lemoine, and J.P.
Quinn, Polymer, 46, 19 (2005).
30. A.R. Bhattacharyya, T.V. Sreekumar, T. Liu, S. Kumar,
L.M. Ericson, R.H. Hauge, and R.E. Smalley, Polymer, 44,8 (2003).
31. J.M. Dealy and K.F. Wissbrun, Melt Rheology and its Rolein Plastics Processing, Van Nostrand Reinhold, New York
(1990).
32. S.S. Ray and M. Okamoto, Macromol. Mater. Eng., 288, 12(2003).
33. P. Zhihua, P. Jingcui, P. Yanfeng, O. Yangyu, and N.
Yantao, Phys. Lett. A, 372, 20 (2008).
34. A. Pud, N. Ogurtsov, A. Korzhenko, and G. Shapoval, Prog.Polym. Sci. (Oxford), 28, 12 (2003).
35. O.T. Ikkala, J. Laakso, K. Vakiparta, E. Virtanen, H.
Ruohonen, H. Jarvinen, T. Taka, P. Passiniemi, and J.
Osterholm, Synth. Met., 69, 1 (1995).
36. E. Richards, R. Rizvi, A. Chow, and H. Naguib, J. Polym.Environ., 16, 4 (2008).
37. H.E. Naguib, C.B. Park, N. Reichelt, and U. Panzer, Polym.Eng. Sci., 42, 7 (2002).
38. P.C. Lee, J. Wang, and C.B. Park, Ind. Eng. Chem. Res., 45,1 (2006).
DOI 10.1002/pen POLYMER ENGINEERING AND SCIENCE—-2011 53


