Embed Size (px)
Citation preview

3D polylactide-based scaffolds for studying human hepatocarcinoma processes in vitro
This article has been downloaded from IOPscience. Please scroll down to see the full text article.
2012 Sci. Technol. Adv. Mater. 13 045003
(http://iopscience.iop.org/1468-6996/13/4/045003)
Download details:
IP Address: 147.163.17.177
The article was downloaded on 24/07/2012 at 10:36
Please note that terms and conditions apply.
View the table of contents for this issue, or go to the journal homepage for more
Home Search Collections Journals About Contact us My IOPscience
IOP PUBLISHING SCIENCE AND TECHNOLOGY OF ADVANCED MATERIALS
Sci. Technol. Adv. Mater. 13 (2012) 045003 (12pp) doi:10.1088/1468-6996/13/4/045003
3D polylactide-based scaffolds forstudying human hepatocarcinomaprocesses in vitroRoberto Scaffaro1, Giada Lo Re1,3, Salvatrice Rigogliuso2
and Giulio Ghersi2
1 Department of Civil, Environmental, Aerospace and Materials Engineering University of Palermo,Viale delle Scienze, ed. 6, 90128 Palermo, Italy2 Department of Molecular and Biomolecular Science and Technology, University of Palermo,Viale delle Scienze, ed. 16, 90128 Palermo, Italy
E-mail: [email protected]
Received 4 April 2012Accepted for publication 25 May 2012Published 23 July 2012Online at stacks.iop.org/STAM/13/045003
AbstractWe evaluated the combination of leaching techniques and melt blending of polymers andparticles for the preparation of highly interconnected three-dimensional polymeric porousscaffolds for in vitro studies of human hepatocarcinoma processes. More specifically, sodiumchloride and poly(ethylene glycol) (PEG) were used as water-soluble porogens to form porousand solvent-free poly(L,D-lactide) (PLA)-based scaffolds. Several characterization techniques,including porosimetry, image analysis and thermogravimetry, were combined to improve thereliability of measurements and mapping of the size, distribution and microarchitecture ofpores. We also investigated the effect of processing, in PLA-based blends, on the simultaneousbulk/surface modifications and pore architectures in the scaffolds, and assessed the effects onhuman hepatocarcinoma viability and cell adhesion. The influence of PEG molecular weighton the scaffold morphology and cell viability and adhesion were also investigated.Morphological studies indicated that it was possible to obtain scaffolds withwell-interconnected pores of assorted sizes. The analysis confirmed that SK-Hep1 cellsadhered well to the polymeric support and emitted surface protrusions necessary to grow anddifferentiate three-dimensional systems. PEGs with higher molecular weight showed the bestresults in terms of cell adhesion and viability.
Keywords: biomimetic scaffolds, 3D structures, poly(lactide), poly(ethylene glycol), leaching,hepatocarcinoma
S Online supplementary data available from stacks.iop.org/STAM/13/045003/mmedia
1. Introduction
Three-dimensional (3D) scaffolds are more suitable thantraditional two-dimensional (2D) substrates for realistic andeffective investigations of pathological and physiologicalprocesses, such as tumors, inflammatory processes and
3 Current address: UMONS—Universite de Mons, Place du Parc, 23, B-7000Mons, Belgium.
fibrosis ([1] and references herein). Cancer cells culturedin three dimensions have several features that differentiatethem from monolayer cultures. For instance, before effectivevascularization, the tumor growth appears to be closelyreproduced in 3D culture systems, and the proliferation oftumor cells is typically slower and hence more indicativeof physiological growth than that in monolayer cultures. Tobridge the gap between 2D studies and in vivo animal models,
1468-6996/12/045003+12$33.00 1 © 2012 National Institute for Materials Science Printed in the UK

Sci. Technol. Adv. Mater. 13 (2012) 045003 R Scaffaro et al
the 3D culture of cancer cells in vitro has been presented inseveral recent studies [2–7].
Good candidate materials to prepare porous scaffoldsfor cell culture and proliferation are supposed to (i) allowcell growth and adhesion; (ii) produce degradation productsthat are not toxic or inflammatory; (iii) have adequatepore dimensions and distribution, to stimulate cell viabilityand nourishment/metabolites exchange; (iv) exhibit tunablebiodegradation, to allow adequate cellular growth both in vitroand in vivo; (v) have surface chemical and physical propertiesthat promote cell adhesion and proliferation and (vi) possessmechanical properties mimicking those of the real biologicaltissue to be replaced [8–22]. Among the different materials,synthetic polymers satisfy all the above criteria and they havebeen widely used to prepare substrates for cell proliferationboth in vitro and in vivo [23–27].
Although the pore architecture plays a vital role inscaffold functionality, the scientific literature is unclear onthe optimal size and distribution of pores. Excessively smallpores inhibit cell migration and may obstruct the diffusionof nourishment and metabolites owing to the formation ofa compact biofilm [28–30]. On the other hand, overly largepores, may severely inhibit cell adhesion owing to a reducedinterfacial area. Therefore, an assortment of small and largepores might be adequate for the optimization of cell growthand proliferation [31–33].
The morphological evaluation of a polymeric 3Dstructure is a difficult task, and there is no establishedcharacterization method of pore dimensions and distribution,of the available interfacial area and of the interconnectivity.Nonetheless, useful information can be obtained by imageanalysis coupled with porosimetry [33–37].
Owing to their biocompatibility and modular kineticsof degradation, polylactides (PLAs) are being studied forthe production of 3D structures in tissue engineering [28].Blends of PLAs with polyethylene glycol (PEG) wereextensively used to improve the biocompatibility, minimizethe adsorption of proteins via steric repulsion, tune thedegradation rate, improve the hydrophilicity, and enhancethe flexibility, resilience and melt processability of PLAs([38, 39] and references therein). Ever since the recognitionof the antithrombogenic action of PEG, the design of mostPEG-derivatized surfaces has sought to eliminate the adhesionof cells and proteins using a high surface concentration ofPEG. On the other hand, lower-density PEG interactionsallow protein adsorption and cell adhesion on biomaterials.Thus, the biological and regulatory behaviors of PEG-bearingsurfaces are not clearly understood, particularly at low andintermediate concentrations of PEG on the surface, whereconformational changes in adsorbed proteins may sensitivelyregulate cell adhesion processes [40, 41].
One of the most common techniques to prepareporous scaffolds is the particulate leaching method, whichinvolves the selective leaching of a mineral or organicporogen [42–44]. Porogen is a template material that canbe removed to generate pores. This method allows thecontrol of the porosity and pore size by changing theamount and/or size of leachable particles even if it is more
difficult to achieve good interconnectivity of pores. In thepast, to overcome this deficiency, high porosity levels andinterconnectivity were achieved by combining leaching withgas foaming [45], solvent casting [46, 47], freeze drying[48, 49] or immersion precipitation [50, 51]. More recently,melt blending of two immiscible polymers has emerged asa new method of fabricating porous scaffolds for tissueengineering, particularly by creating co-continuous blendmorphologies [52, 53]. From a manufacturing view point,melt processing techniques are an economic way to prepareporous scaffolds even with complex geometries. However,the complete extraction of one of the polymer phases, usingselective solvents, is possible only in the concentration rangeclose to the phase inversion point, with a maximum porosityof 40–60% [54]. In this work, we combined polymer andparticulate leaching techniques to obtain a 3D porous scaffoldcontaining highly interconnected small and large pores. Inparticular, we used a partially miscible polymer system,PLA/PEG, melt-blended with NaCl, in which the salt and PEGwere water-leachable porogens. Moreover, we correlated thepore architecture with the preparation conditions by changingthe molecular weight of the PEG component.
Image analysis based on scanning electron microscopydetecting backscattered secondary electrons (SEM-BSEs)[55, 56] was coupled with other methods to characterizethe pores in the scaffolds. The morphological results werecorrelated with in vitro adhesion, proliferation and viabilitytests critical for the further migration/differentiation in 3Dstructures on human SK-Hep1 hepatocarcinoma cells [57].
2. Materials and methods
2.1. Fabrication of porous 3D structures
PLA/PEG blends were prepared with or without NaClcrystals, using a batch mixer (Brabender PLE-330 T =
190 ◦C, t = 10 min, 64 rpm) and the following reagents.PLA: Natureworks 2002D, density d = 1.24 g cm−3, meltflow index MFI210 ◦C/2.16 kg = 6 g per 10 min;PEG: PEG1 (molecular weight Mw = 380–420 Da), PEG2(Mw = 2000 Da), PEG3 (Mw = 4600 Da, Sigma Aldrich)NaCl: ACS Reagent, > 99.0%, d = 2.17 g cm−3, SigmaAldrich, sieved to a size in the range of 500–1000 µm.
The composition was 80/20 wt% for PLA/PEGs blendsand 20/5/75 for PLA/PEGs/NaCl blends. The blends wereleached in boiling demineralized water for 3 h to obtain porous3D structures.
2.2. Morphological characterization
SEM (SEM-FEI QUANTA 200F) was used to image crosssections of the scaffolds broken under liquid nitrogen. Thesamples were mounted on an aluminum stub using anadhesive carbon tab and sputter coated with gold (SputteringScancoat Six, Edwards) for 40 s under argon atmospherebefore imaging. SEM images were exported as 24-bit imagefiles using the tagged image file format (tiff) for furtheranalysis.
2
Sci. Technol. Adv. Mater. 13 (2012) 045003 R Scaffaro et al
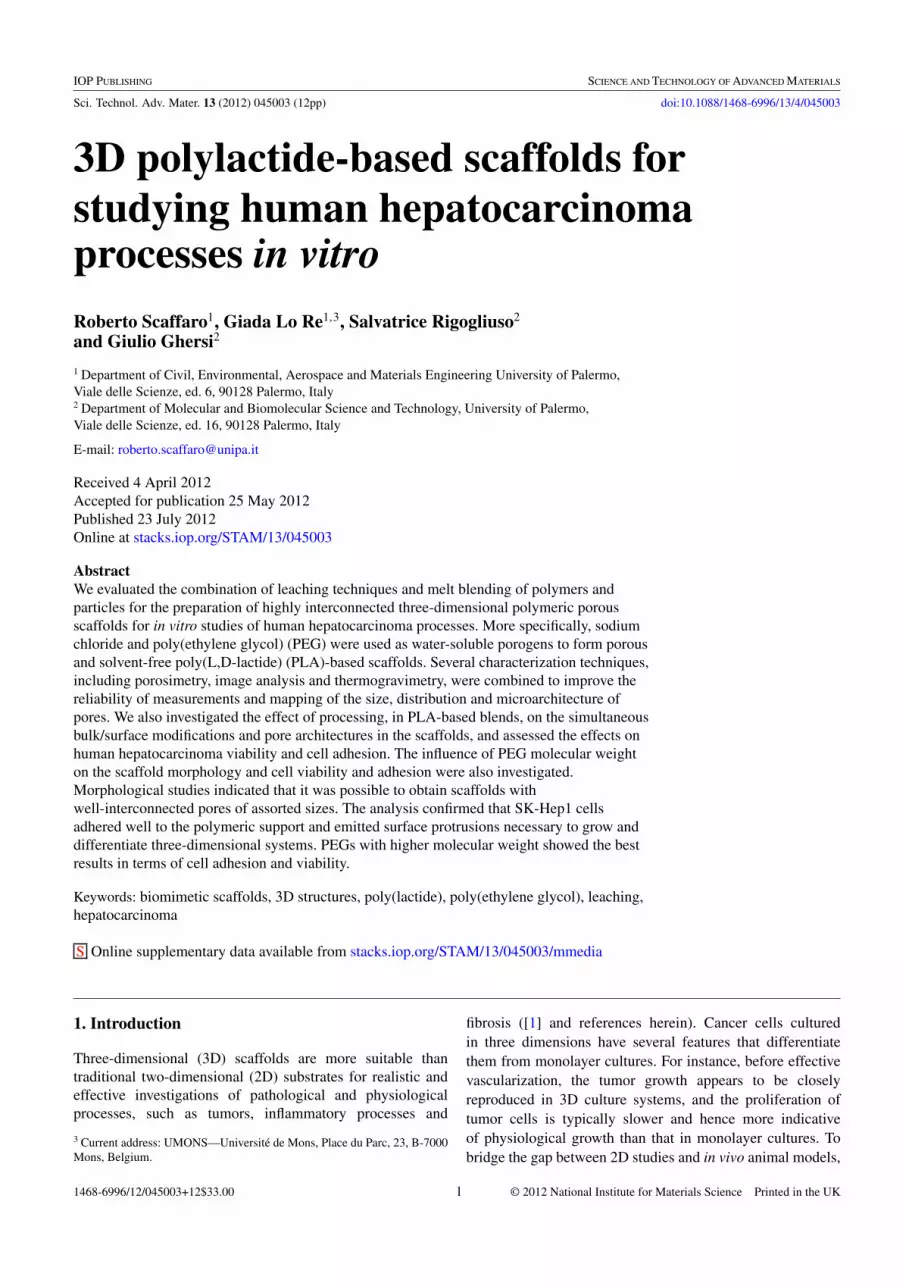
Scheme 1. Schematic of image processing for a ternary blend PLA/PEG3/NaCl: (a) original SEM image, (b) local gradient of intensity,(c) image obtained by overlapping the gradient and intensity information and (d) binary image.
2.3. Gravimetric and thermogravimetric measurements
Gravimetric measurements were performed using a 5-digitSartorius balance on ten specimens of each type of binaryand ternary blends, which were dried overnight in a vacuumoven at 55 ◦C to keep the moisture content constant.Thermogravimetric tests were carried out under nitrogen flow,using a Hi-Res TGA TA 2950 system.
2.4. XPS analysis of surface composition
To confirm the presence of PEG on the surface of thepores after leaching, the surface composition of the sampleswas investigated by X-ray photoelectron spectroscopy (XPS).The analyses were performed using an ESCALAB 220iXLspectrometer and non-monochromatized Al-Kα radiation(1486.6 eV). The working pressure was <5 · 10–8 Pa. Thespectrometer was calibrated by assuming the binding energy(BE) of the Au 4f7/2 line at 83.9 eV with respect to the Fermilevel. The standard deviation for the BE values was 0.15 eV.The reported BEs were corrected for the charging effects,assigning a value of 284.8 eV to the C1s line of adventitiouscarbon. Survey scans were obtained in the 0–1200 eVrange, and high-resolution scans were recorded for theC1s region. The analysis involved Shirley-type backgroundsubtraction, nonlinear least-squares curve fitting, adoptingGaussian–Lorentzian peak shapes, and peak integration.
2.5. Determination of porosity and architecture of pores
One of the focuses of the present work is the applicationof the principles of scaffold characterization outlined in theASTM F 2450-09 standard. Accordingly, the average size,pore distribution and surface area were evaluated by mercuryporosimetry (Pascal Porosimeter 140 and 240) and by animage-based method assisted by MATLAB software.
2.5.1. Mercury porosimetry: determination of averagediameter, distribution and specific surface area of pores. Tomeasure the pore sizes, we used the mercury penetrationtechnique outlined in the ASTM International D4404and D2873 guidelines, which is based on the behavior of‘nonwetting’ liquids in a capillary. Ten samples for each typeof scaffold were cut at different distances from the outersurface, after breaking the scaffolds in liquid nitrogen tohave a random distribution of the surface types. Assuming
cylindrical pores, the relationship between the pore sizeand applied pressure is expressed using the Washburnequation [58]:
Pr = −2γ cos θ, (1)
where P is applied pressure, r is pore radius, χ is mercurysurface tension and θ is contact angle. Considering a mercurysurface tension of 480 mN m−1 (average value between 25and 50 ◦C) and an average value of mercury contact angle of141.3◦, and assuming that all pores are cylindrical, equation(1) yields:
r =7500
P. (2)
2.5.2. MATLAB image processing method. The porosity wasevaluated by processing the images obtained by SEM-BSEwith MATLAB software (Mathworks Inc). Images werecropped to the scaffold area and then segmented, based on asingle grayscale threshold. The porosity was calculated fromthe ratio of pixels assigned to the porous phase to the totalnumber of image pixels (see scheme 1). This process wasrepeated by stepping the grayscale threshold over the fullrange of the image grayscale, to study the effect of thresholdvalue on porosity calculations.
2.6. Biological tests
2.6.1. Cell culture. Human SK-Hep1 hepatocarcinoma cellswere grown in Dulbecco’s modified Eagle’s medium(DMEM) supplemented with 10% fetal calf serum (FCS;Euroclone, Celbio), 1% antibiotic and 1% glutamine(Euroclone, Celbio).
2.6.2. SK-Hep1 cell viability. SK-Hep1 cells wereenzymatically detached from the culture plate wherethey were grown with/without scaffolds after 48/72 h, usinga solution of Trypsin-EDTA 1X (Sigma), centrifuged at 800gfor 5 min and added to phosphate-buffered saline (PBS) ata concentration of 5 × 10⁵ cells ml−1. A solution to test cellviability was prepared by mixing 0.5 ml of 0.4% trypan bluewith 0.3 ml of PBS and 0.2 ml of cell solution. Samples wereincubated for 10 min at room temperature and counted ina Burker’s chamber. Trypan blue—a dye that discriminatesbetween viable and dead cells—was absorbed only from deadcells.
3
Sci. Technol. Adv. Mater. 13 (2012) 045003 R Scaffaro et al
2.6.3. Apoptotic assay by acridine orange-ethidium bromidestaining. SK-Hep1 cells were plated on scaffolds pretreatedwith type I collagen (Sigma, 50 µg ml−1) in 0.02 N aceticacid, neutralized to physiologic pH, and grown in DMEM.To evaluate the presence of apoptotic cells and, therefore,the possible effects of cytotoxicity of the scaffolds, thecells were stained with a 100 µg ml−1 solution of acridineorange-ethidium bromide (EtBr) in PBS for 10 s. The cellswere observed using a confocal microscope (Olympus 1X70)equipped with two Melles Griot lasers.
2.6.4. SK-Hep1 cell extraction. Sk-Hep1 cells were seededat high density on a six-well plate in the presence of thescaffolds as previously described, then they were grownfor 72 h in complete medium. Subsequently, the cells wereenzymatically detached from the culture plate using asolution of Trypsin-EDTA 1X (Sigma) and centrifuged at800g for 5 min; the pelletted cells were added to 70 µlof PBS containing 1% Triton X-100, then incubated for10 min at room temperature; the suspensions were centrifugedat 10 600g for 10 min to extract cell proteins. The pelletcontaining the cellular nonprotein portion was removed,and the amount of extracted proteins contained in thesupernatant was evaluated using the Bradford microassaymethod (Bio-Rad, Segrate, Milan, Italy) with bovine serumalbumin (Sigma-Aldrich) as a standard.
2.6.5. Caspase 3 enzymatic assay on synthetic fluorescentsubstrate. SK-Hep1 cells were grown for 72 h in thepresence of scaffolds having PEG conjugates of differentmolecular weights; the cells were extracted as describedabove, and 20 µg of each extract was used to detect thepresence of caspase 3 in different samples. We used SK-Hep1cells treated with doxorubicin (an apoptosis inducer), 10 µMfor 4 h, as a positive control, and SK-Hep1 cells grown in theabsence of scaffolds as a negative control.
Caspase 3 activity was evaluated using theAc.Asp-Glu-Val-Asp-MCA (PeptaNova, Peptide Institute,Inc) peptide, a specific substrate for active caspase 3,which has its cutting site conjugated to a fluorophorethat emits fluorescence when cut by the enzyme. Theseexperiments were performed in a 96-well plate with 75 µl(8 µM) of substrate. Enzymatic activity was evaluated byspectrofluorimetry. The measurements were performed usinga Spectra Max Gemini EM-500 system (Molecular Devices)and processed using Soft Max Pro 5.2 software.
2.6.6. Cell adhesion within scaffolds. Some scaffoldsprepared with PEGs of different molecular weights werepretreated with type I collagen (Sigma, 50 µg m−1) in 0.02 Nacetic acid for 2 h at 37 ◦C, neutralized by adding completemedium, and then used in cell adhesion experiments.
SK-Hep1 cells were seeded on each scaffold and grownin complete medium for 48 h. To evaluate the cell adhesion,scaffolds were fixed in 4% formaldehyde and then stainedwith phalloidin-FITC (1 : 500), a specific marker for actincytoskeleton structures (from Amanita phalloides (Sigma)
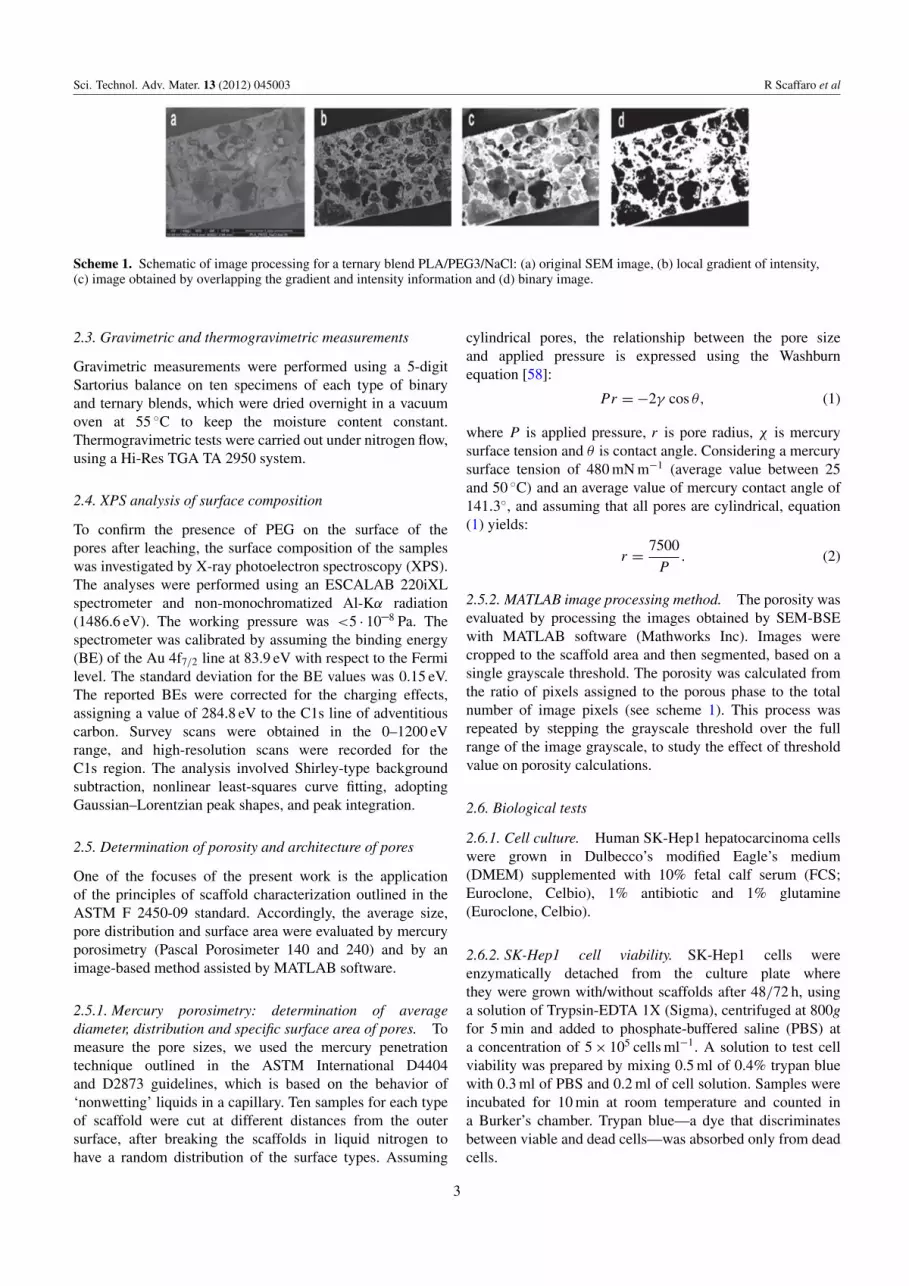
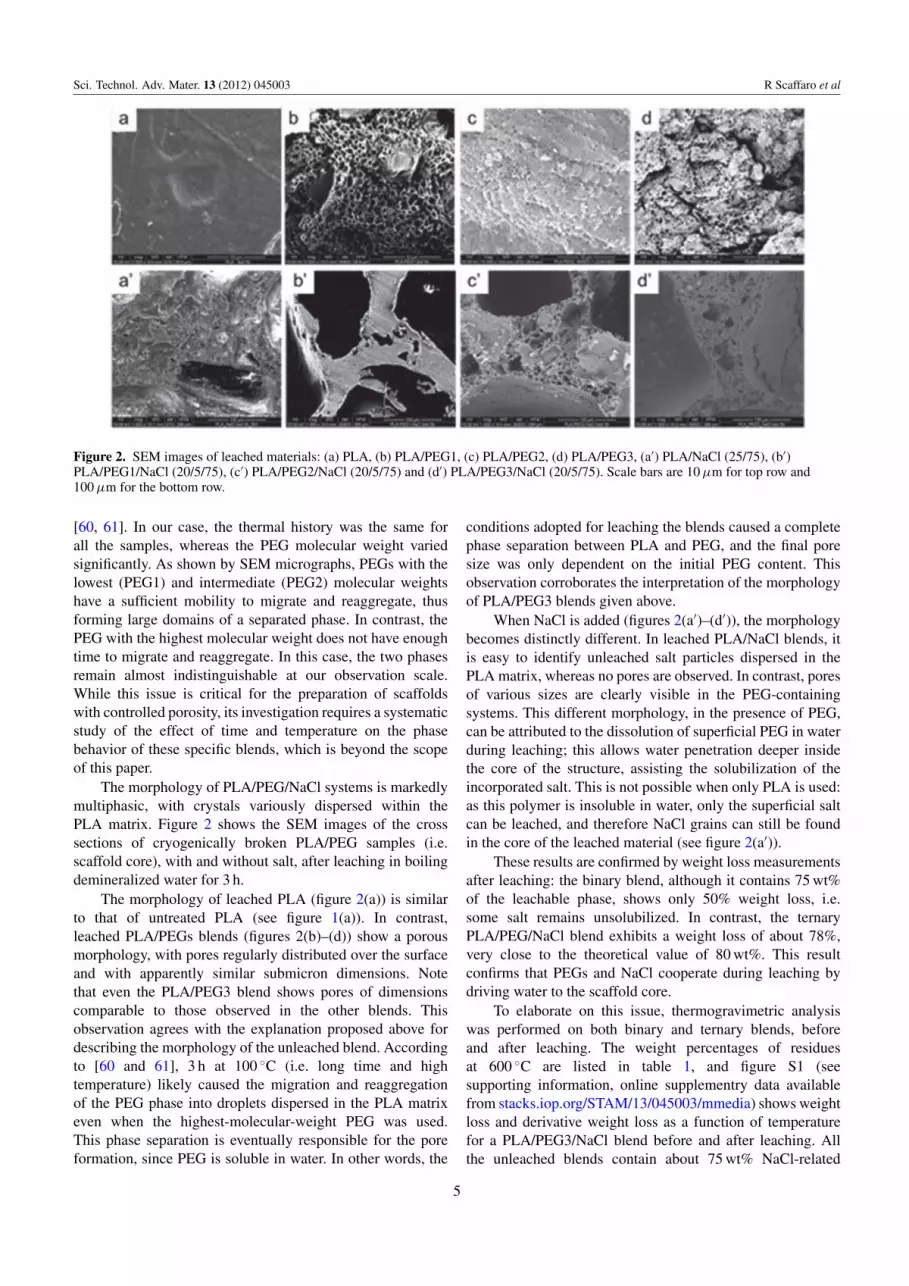
Figure 1. SEM images of (a) PLA and of the 80/20 blends of (b)PLA/PEG1, (c) PLA/PEG2 and (d) PLA/PEG3.
for 15 min). The nuclei were stained with ethidium bromide(EtBr, a DNA-intercalating molecule) (1 : 1000; Sigma) for5 min. Observations were carried out by confocal microscopy.
2.6.7. Morphological analysis. SK-Hep1 cells werecultured as described in section 2.6.1 to assess theirmorphology when adhering to scaffolds. They were fixedin 4% formaldehyde, labeled with the primary antibodyanti-β1-integrin (a rat monoclonal C27 antibody 1 : 300)for 24 h and eventually revealed by a secondary antibody(Anti-RAT-FITC, 1 : 320, Sigma) [59]. Cells were observedby confocal microscopy at 60× magnification.
3. Results and discussion
3.1. Scaffold preparation and characterization
Figure 1 shows a selection of SEM images of the studiedsystems. The morphology of the PLA (figure 1(a)) isconsistent with that of a brittle fractured material. WhenPEG1 is added to PLA (figure 1(b)), the morphology becomestypical of binary immiscible polymer blends, with two distinctphases and large domains of PEG dispersed in the PLAmatrix.
Note, however, that the adhesion between the two phasesis good as no voids at the interface and no PEG pulloutcould be detected, at least at this magnification. The samemorphology is observed when PEG2 is used (figure 1(c)),whereas when PEG3 is added (figure 1(d)), the system ismonophasic. This unusual behavior was already observed andstudied by other authors [32, 33]. PLA and PEG are misciblein particular ranges of concentration and temperature. Out ofthis miscibility range, the aggregation and phase separationfollow a kinetic that depends on the thermal history andmolecular weight of PEG. In particular, lower molecularweight and higher temperatures promote reaggregation
4
Sci. Technol. Adv. Mater. 13 (2012) 045003 R Scaffaro et al
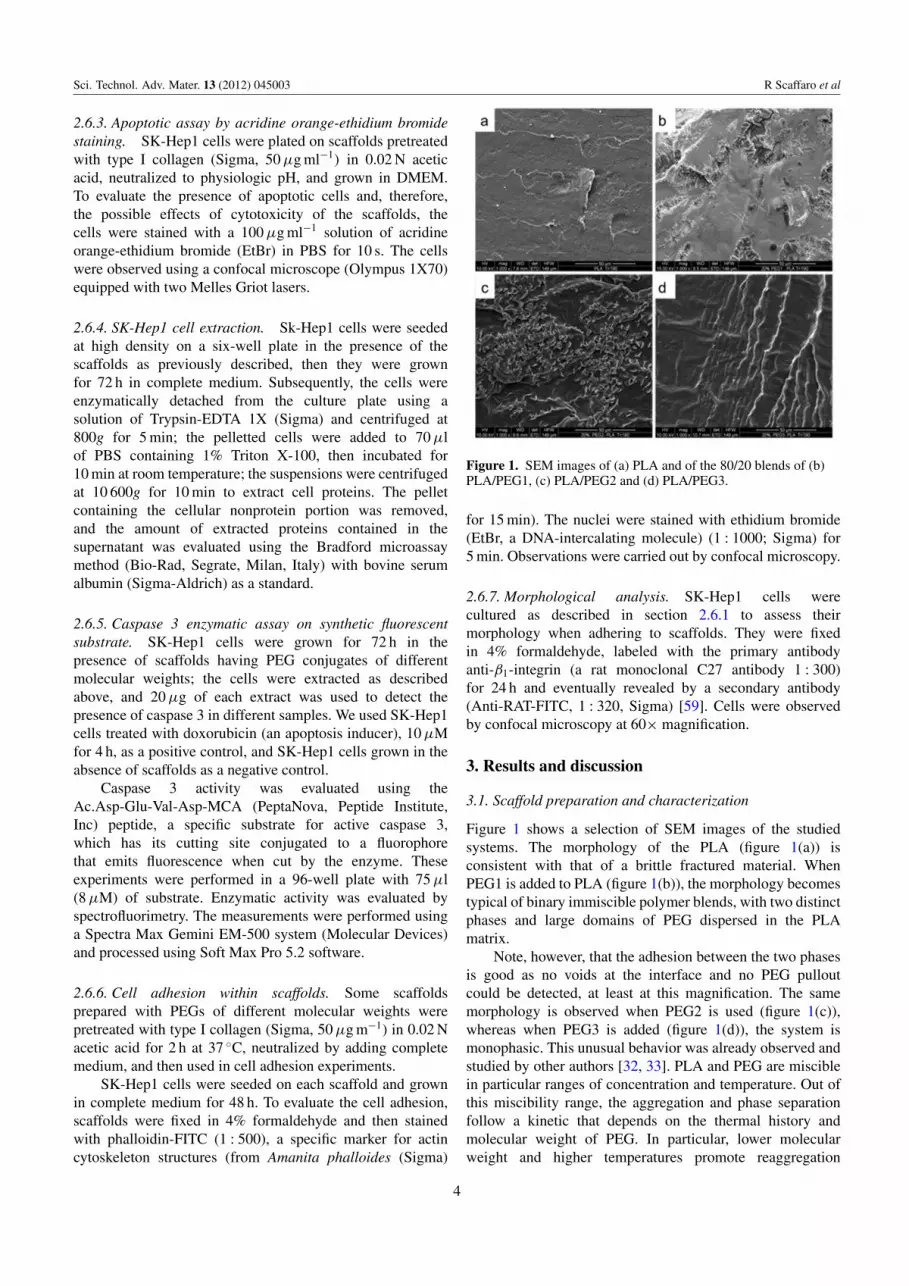
Figure 2. SEM images of leached materials: (a) PLA, (b) PLA/PEG1, (c) PLA/PEG2, (d) PLA/PEG3, (a′) PLA/NaCl (25/75), (b′)PLA/PEG1/NaCl (20/5/75), (c′) PLA/PEG2/NaCl (20/5/75) and (d′) PLA/PEG3/NaCl (20/5/75). Scale bars are 10 µm for top row and100 µm for the bottom row.
[60, 61]. In our case, the thermal history was the same forall the samples, whereas the PEG molecular weight variedsignificantly. As shown by SEM micrographs, PEGs with thelowest (PEG1) and intermediate (PEG2) molecular weightshave a sufficient mobility to migrate and reaggregate, thusforming large domains of a separated phase. In contrast, thePEG with the highest molecular weight does not have enoughtime to migrate and reaggregate. In this case, the two phasesremain almost indistinguishable at our observation scale.While this issue is critical for the preparation of scaffoldswith controlled porosity, its investigation requires a systematicstudy of the effect of time and temperature on the phasebehavior of these specific blends, which is beyond the scopeof this paper.
The morphology of PLA/PEG/NaCl systems is markedlymultiphasic, with crystals variously dispersed within thePLA matrix. Figure 2 shows the SEM images of the crosssections of cryogenically broken PLA/PEG samples (i.e.scaffold core), with and without salt, after leaching in boilingdemineralized water for 3 h.
The morphology of leached PLA (figure 2(a)) is similarto that of untreated PLA (see figure 1(a)). In contrast,leached PLA/PEGs blends (figures 2(b)–(d)) show a porousmorphology, with pores regularly distributed over the surfaceand with apparently similar submicron dimensions. Notethat even the PLA/PEG3 blend shows pores of dimensionscomparable to those observed in the other blends. Thisobservation agrees with the explanation proposed above fordescribing the morphology of the unleached blend. Accordingto [60 and 61], 3 h at 100 ◦C (i.e. long time and hightemperature) likely caused the migration and reaggregationof the PEG phase into droplets dispersed in the PLA matrixeven when the highest-molecular-weight PEG was used.This phase separation is eventually responsible for the poreformation, since PEG is soluble in water. In other words, the
conditions adopted for leaching the blends caused a completephase separation between PLA and PEG, and the final poresize was only dependent on the initial PEG content. Thisobservation corroborates the interpretation of the morphologyof PLA/PEG3 blends given above.
When NaCl is added (figures 2(a′)–(d′)), the morphologybecomes distinctly different. In leached PLA/NaCl blends, itis easy to identify unleached salt particles dispersed in thePLA matrix, whereas no pores are observed. In contrast, poresof various sizes are clearly visible in the PEG-containingsystems. This different morphology, in the presence of PEG,can be attributed to the dissolution of superficial PEG in waterduring leaching; this allows water penetration deeper insidethe core of the structure, assisting the solubilization of theincorporated salt. This is not possible when only PLA is used:as this polymer is insoluble in water, only the superficial saltcan be leached, and therefore NaCl grains can still be foundin the core of the leached material (see figure 2(a′)).
These results are confirmed by weight loss measurementsafter leaching: the binary blend, although it contains 75 wt%of the leachable phase, shows only 50% weight loss, i.e.some salt remains unsolubilized. In contrast, the ternaryPLA/PEG/NaCl blend exhibits a weight loss of about 78%,very close to the theoretical value of 80 wt%. This resultconfirms that PEGs and NaCl cooperate during leaching bydriving water to the scaffold core.
To elaborate on this issue, thermogravimetric analysiswas performed on both binary and ternary blends, beforeand after leaching. The weight percentages of residuesat 600 ◦C are listed in table 1, and figure S1 (seesupporting information, online supplementry data availablefrom stacks.iop.org/STAM/13/045003/mmedia) shows weightloss and derivative weight loss as a function of temperaturefor a PLA/PEG3/NaCl blend before and after leaching. Allthe unleached blends contain about 75 wt% NaCl-related
5

Sci. Technol. Adv. Mater. 13 (2012) 045003 R Scaffaro et al
Table 1. Residues at 600 ◦C of binary and ternary blends before andafter leaching for 3 h.
Sample Residues (%)
Before PLA/NaCl 75.3 ± 0.3After (25 : 75) 26 ± 5Before PLA/PEG1/NaCl 75.0 ± 0.5After (20 : 5 : 75) 1.0 ± 0.2Before PLA/PEG2/NaCl 74.9 ± 0.3After (20 : 5 : 75) 1.4 ± 0.2Before PLA/PEG3/NaCl 75.2 ± 0.2After (20 : 5 : 75) 1.1 ± 0.1
residues, demonstrating that a good dispersion of the salt wasachieved during processing. After leaching, the residues of theternary blends are all ∼1%, confirming that almost all the saltwas effectively removed during the treatment.
Considering that the PLA/PEG systems had residues ofabout 0.2–0.3% (data not discussed here for brevity), it canbe concluded that only about 0.6–0.7% of salt remains inthe scaffold. The situation is different for the binary blend.In this case, the residue after leaching is about 25% andthe scattering of data is the highest. Both features confirmthe previous observations, namely that in PLA/NaCl blends,only the surface salt can be leached. As the pores are formedonly by the progressive and sequential solubilization of NaCl,depending on the structure and depth of the percolatednetwork formed by NaCl crystals, a larger or smaller amountof salt is leached. This explanation can also account for thelarge amount of residue and high data scattering for thisblend. Note that all these data agree well with the weight lossmeasurements reported above.
The three different PEG-containing systems showdifferent pore morphologies, suggesting that, by changingthe molecular weight of PEG, it is possible to control thepore size and distribution in the final leached structure. Thevariety of pore sizes can be explained as follows: oncesolubilized, PEG yields small pores whereas the large ones arederived from the large NaCl crystals present in the structure(see, for instance, figure 2(b′)). To describe the architectureof the porous structures, it is necessary to evaluate boththe size and interconnection of the pores. As mentioned inthe introduction, both properties are essential for a materialappropriate for growing cells. However, their measurement isdifficult and requires different methodologies.
Table 2 summarizes results obtained by mercuryporosimetry for the leached PLA/NaCl and ternary blends.The PLA/NaCl blend has the lowest total porosity, inagreement with the SEM analysis. In this case, the saltis hardly leached and only a few superficial pores can beformed. The blend containing PEG1 broke during testing,and thus, the results are not shown. Note that, consideringthe total salt leaching, the maximum theoretical porosity isabout 63.2 vol.% (calculated taking densities as 1.24 g cm−3
for PLA and 2.17 g cm−3 for NaCl, see Materials and methodssection), whereas the measured values are slightly lower. Theaverage pore diameter is very low for PLA/NaCl, confirmingthat only small superficial NaCl inclusions were leached.The pore diameter is, in contrast, higher for PEG2- andPEG3-containing blends.
Table 2. Porosimetry results for NaCl-containing scaffolds.
Cumulative AveragePorosity volume pore diameter
Scaffold (%) (mm3 g−1) (µm)
PLA/NaCl (25 : 75) 48 ± 9 487 ± 115 5.0 ± 1.5PLA/PEG2/NaCl (20 : 5 : 75) 50 ± 6 701 ± 80 94 ± 10PLA/PEG3/NaCl (20 : 5 : 75) 53 ± 5 1401 ± 100 10 ± 1
Scheme 2. Penetration of mercury into pores during theporosimetry test: (a) correct and (b) incorrect pore size measurementthat underestimates the pore size. During depressurization, mercuryremains entrapped in the pore P4, generating hysteresis.
Mercury porosimetry can estimate the average pore sizeand total porosity, and its limitations are intrinsic to themeasurement procedure, as described below. The sample isplaced in the dilatometer, which was calibrated with a knownvolume of mercury, and the sample volume is calculated byimmersion in mercury. From the weight, it is then possible tocalculate the apparent density and total porosity. By applyingincreasing pressure, it is possible to determine the fraction ofpores with a certain diameter using equation (2), whereas thetotal cumulative volume of pores is calculated from the totalvolume of mercury penetrated into the sample. Whereas themeasurement of the total porosity is reasonably reliable (itcan be slightly underestimated owing to superficial pores orcavities present on the sample), the pore diameter and totalcumulative volume of pores can be affected by significanterrors. A correct pore size measurement would imply thatlarger pores are connected only with smaller ones fromthe outside to the inside of the specimen, so that mercurygradually penetrates into the structure (see scheme 2(a)).
In reality, large and small pores are randomly distributedin the specimen. For instance, inner large pores connectedwith outer small pores will be detected only at high pressures,i.e. they will be counted as small pores when they arenot (scheme 2(b)). This can be checked by depressurizingthe sample and observing the recovery of the mercuryvolume. In our case, all the samples exhibited a pronouncedhysteresis, thus suggesting that the average diameter of poreswas underestimated. Additional error originates from theassumption of cylindrical pores in the Washburn equation.
6
Sci. Technol. Adv. Mater. 13 (2012) 045003 R Scaffaro et al
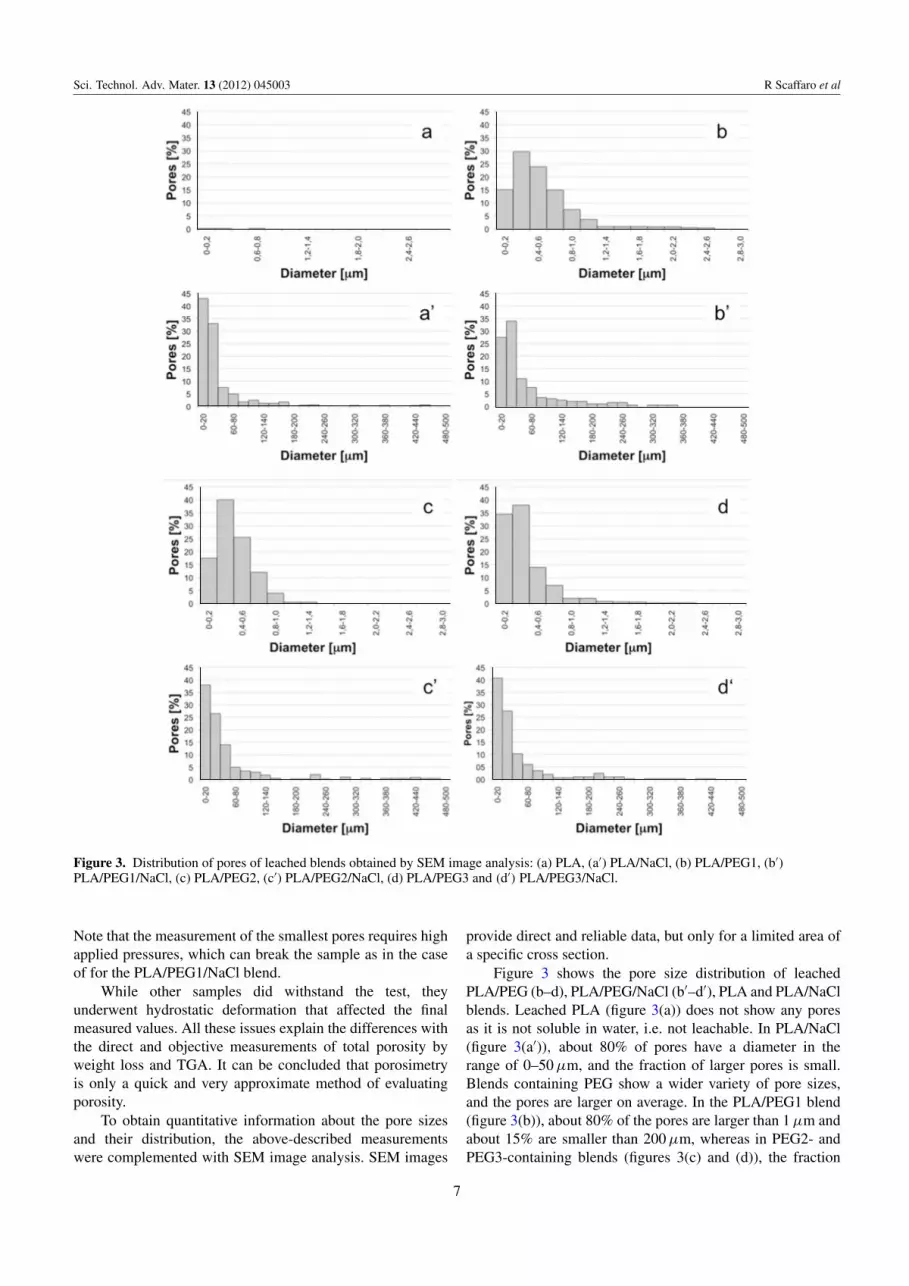
Figure 3. Distribution of pores of leached blends obtained by SEM image analysis: (a) PLA, (a′) PLA/NaCl, (b) PLA/PEG1, (b′)PLA/PEG1/NaCl, (c) PLA/PEG2, (c′) PLA/PEG2/NaCl, (d) PLA/PEG3 and (d′) PLA/PEG3/NaCl.
Note that the measurement of the smallest pores requires highapplied pressures, which can break the sample as in the caseof for the PLA/PEG1/NaCl blend.
While other samples did withstand the test, theyunderwent hydrostatic deformation that affected the finalmeasured values. All these issues explain the differences withthe direct and objective measurements of total porosity byweight loss and TGA. It can be concluded that porosimetryis only a quick and very approximate method of evaluatingporosity.
To obtain quantitative information about the pore sizesand their distribution, the above-described measurementswere complemented with SEM image analysis. SEM images
provide direct and reliable data, but only for a limited area ofa specific cross section.
Figure 3 shows the pore size distribution of leachedPLA/PEG (b–d), PLA/PEG/NaCl (b′–d′), PLA and PLA/NaClblends. Leached PLA (figure 3(a)) does not show any poresas it is not soluble in water, i.e. not leachable. In PLA/NaCl(figure 3(a′)), about 80% of pores have a diameter in therange of 0–50 µm, and the fraction of larger pores is small.Blends containing PEG show a wider variety of pore sizes,and the pores are larger on average. In the PLA/PEG1 blend(figure 3(b)), about 80% of the pores are larger than 1 µm andabout 15% are smaller than 200 µm, whereas in PEG2- andPEG3-containing blends (figures 3(c) and (d)), the fraction
7
Sci. Technol. Adv. Mater. 13 (2012) 045003 R Scaffaro et al
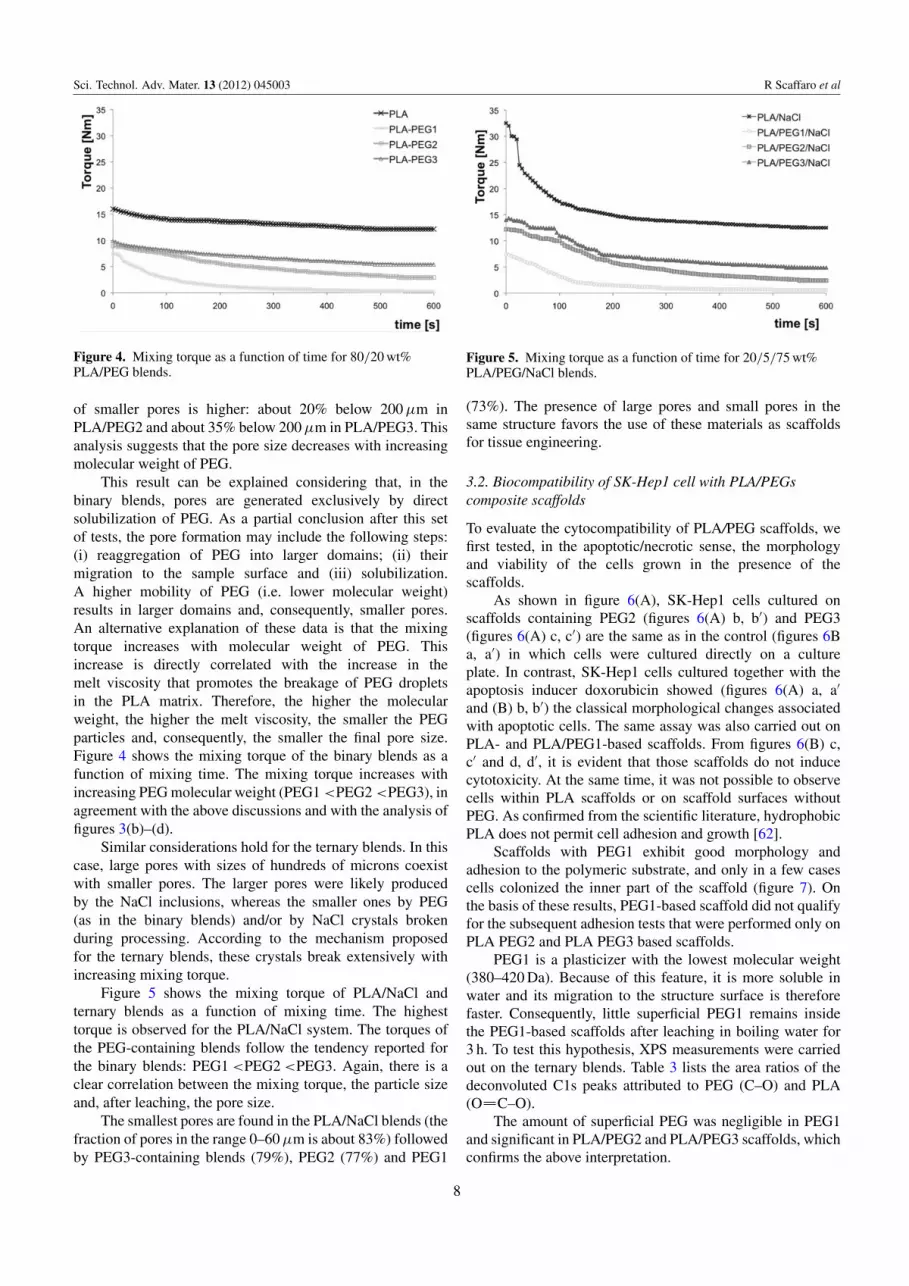
Figure 4. Mixing torque as a function of time for 80/20 wt%PLA/PEG blends.
of smaller pores is higher: about 20% below 200 µm inPLA/PEG2 and about 35% below 200 µm in PLA/PEG3. Thisanalysis suggests that the pore size decreases with increasingmolecular weight of PEG.
This result can be explained considering that, in thebinary blends, pores are generated exclusively by directsolubilization of PEG. As a partial conclusion after this setof tests, the pore formation may include the following steps:(i) reaggregation of PEG into larger domains; (ii) theirmigration to the sample surface and (iii) solubilization.A higher mobility of PEG (i.e. lower molecular weight)results in larger domains and, consequently, smaller pores.An alternative explanation of these data is that the mixingtorque increases with molecular weight of PEG. Thisincrease is directly correlated with the increase in themelt viscosity that promotes the breakage of PEG dropletsin the PLA matrix. Therefore, the higher the molecularweight, the higher the melt viscosity, the smaller the PEGparticles and, consequently, the smaller the final pore size.Figure 4 shows the mixing torque of the binary blends as afunction of mixing time. The mixing torque increases withincreasing PEG molecular weight (PEG1 <PEG2 <PEG3), inagreement with the above discussions and with the analysis offigures 3(b)–(d).
Similar considerations hold for the ternary blends. In thiscase, large pores with sizes of hundreds of microns coexistwith smaller pores. The larger pores were likely producedby the NaCl inclusions, whereas the smaller ones by PEG(as in the binary blends) and/or by NaCl crystals brokenduring processing. According to the mechanism proposedfor the ternary blends, these crystals break extensively withincreasing mixing torque.
Figure 5 shows the mixing torque of PLA/NaCl andternary blends as a function of mixing time. The highesttorque is observed for the PLA/NaCl system. The torques ofthe PEG-containing blends follow the tendency reported forthe binary blends: PEG1 <PEG2 <PEG3. Again, there is aclear correlation between the mixing torque, the particle sizeand, after leaching, the pore size.
The smallest pores are found in the PLA/NaCl blends (thefraction of pores in the range 0–60 µm is about 83%) followedby PEG3-containing blends (79%), PEG2 (77%) and PEG1
Figure 5. Mixing torque as a function of time for 20/5/75 wt%PLA/PEG/NaCl blends.
(73%). The presence of large pores and small pores in thesame structure favors the use of these materials as scaffoldsfor tissue engineering.
3.2. Biocompatibility of SK-Hep1 cell with PLA/PEGscomposite scaffolds
To evaluate the cytocompatibility of PLA/PEG scaffolds, wefirst tested, in the apoptotic/necrotic sense, the morphologyand viability of the cells grown in the presence of thescaffolds.
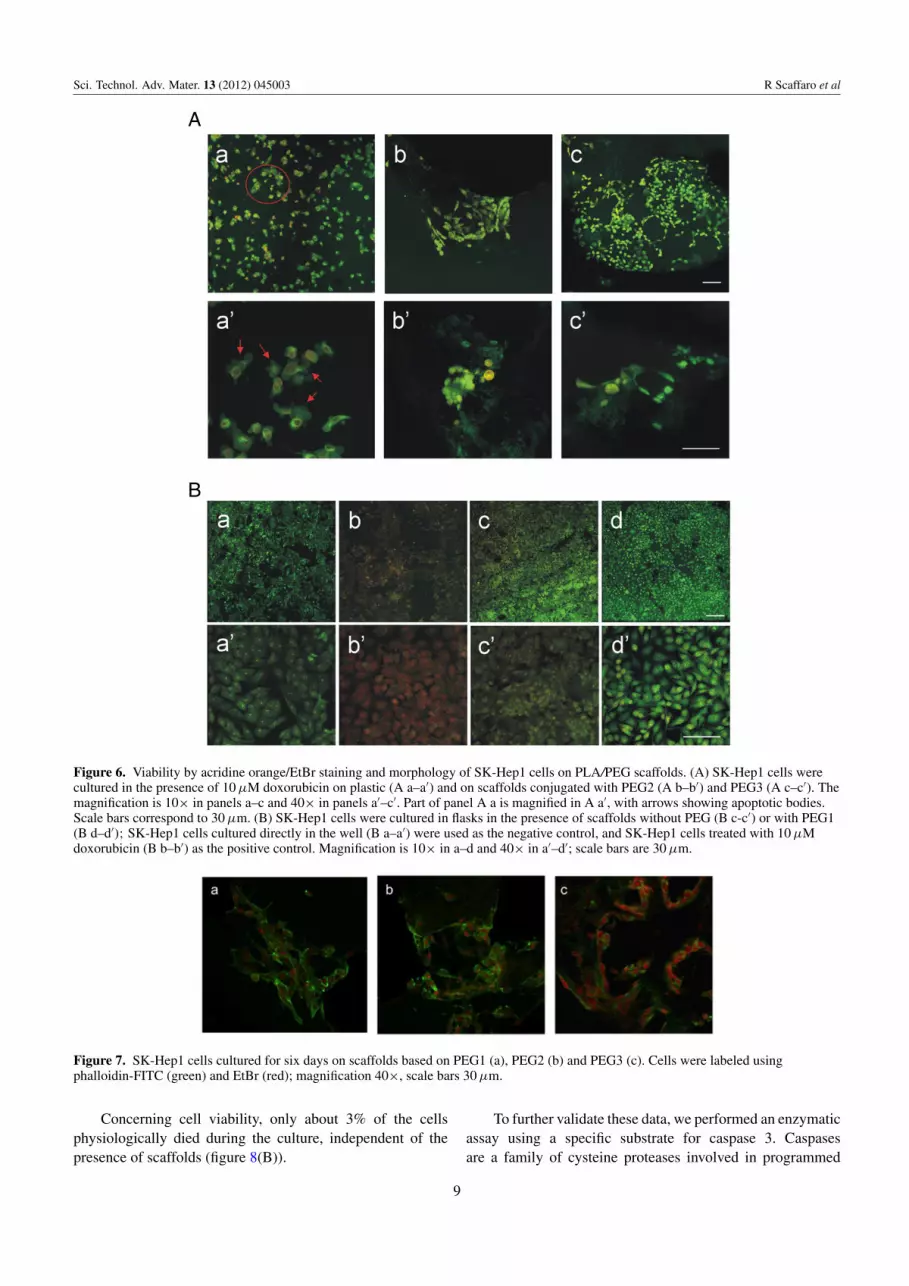
As shown in figure 6(A), SK-Hep1 cells cultured onscaffolds containing PEG2 (figures 6(A) b, b′) and PEG3(figures 6(A) c, c′) are the same as in the control (figures 6Ba, a′) in which cells were cultured directly on a cultureplate. In contrast, SK-Hep1 cells cultured together with theapoptosis inducer doxorubicin showed (figures 6(A) a, a′
and (B) b, b′) the classical morphological changes associatedwith apoptotic cells. The same assay was also carried out onPLA- and PLA/PEG1-based scaffolds. From figures 6(B) c,c′ and d, d′, it is evident that those scaffolds do not inducecytotoxicity. At the same time, it was not possible to observecells within PLA scaffolds or on scaffold surfaces withoutPEG. As confirmed from the scientific literature, hydrophobicPLA does not permit cell adhesion and growth [62].
Scaffolds with PEG1 exhibit good morphology andadhesion to the polymeric substrate, and only in a few casescells colonized the inner part of the scaffold (figure 7). Onthe basis of these results, PEG1-based scaffold did not qualifyfor the subsequent adhesion tests that were performed only onPLA PEG2 and PLA PEG3 based scaffolds.
PEG1 is a plasticizer with the lowest molecular weight(380–420 Da). Because of this feature, it is more soluble inwater and its migration to the structure surface is thereforefaster. Consequently, little superficial PEG1 remains insidethe PEG1-based scaffolds after leaching in boiling water for3 h. To test this hypothesis, XPS measurements were carriedout on the ternary blends. Table 3 lists the area ratios of thedeconvoluted C1s peaks attributed to PEG (C–O) and PLA(O C–O).
The amount of superficial PEG was negligible in PEG1and significant in PLA/PEG2 and PLA/PEG3 scaffolds, whichconfirms the above interpretation.
8
Sci. Technol. Adv. Mater. 13 (2012) 045003 R Scaffaro et al
A
B
Figure 6. Viability by acridine orange/EtBr staining and morphology of SK-Hep1 cells on PLA/PEG scaffolds. (A) SK-Hep1 cells werecultured in the presence of 10 µM doxorubicin on plastic (A a–a′) and on scaffolds conjugated with PEG2 (A b–b′) and PEG3 (A c–c′). Themagnification is 10× in panels a–c and 40× in panels a′–c′. Part of panel A a is magnified in A a′, with arrows showing apoptotic bodies.Scale bars correspond to 30 µm. (B) SK-Hep1 cells were cultured in flasks in the presence of scaffolds without PEG (B c-c′) or with PEG1(B d–d′); SK-Hep1 cells cultured directly in the well (B a–a′) were used as the negative control, and SK-Hep1 cells treated with 10 µMdoxorubicin (B b–b′) as the positive control. Magnification is 10× in a–d and 40× in a′–d′; scale bars are 30 µm.
Figure 7. SK-Hep1 cells cultured for six days on scaffolds based on PEG1 (a), PEG2 (b) and PEG3 (c). Cells were labeled usingphalloidin-FITC (green) and EtBr (red); magnification 40×, scale bars 30 µm.
Concerning cell viability, only about 3% of the cellsphysiologically died during the culture, independent of thepresence of scaffolds (figure 8(B)).
To further validate these data, we performed an enzymaticassay using a specific substrate for caspase 3. Caspasesare a family of cysteine proteases involved in programmed
9
Sci. Technol. Adv. Mater. 13 (2012) 045003 R Scaffaro et al
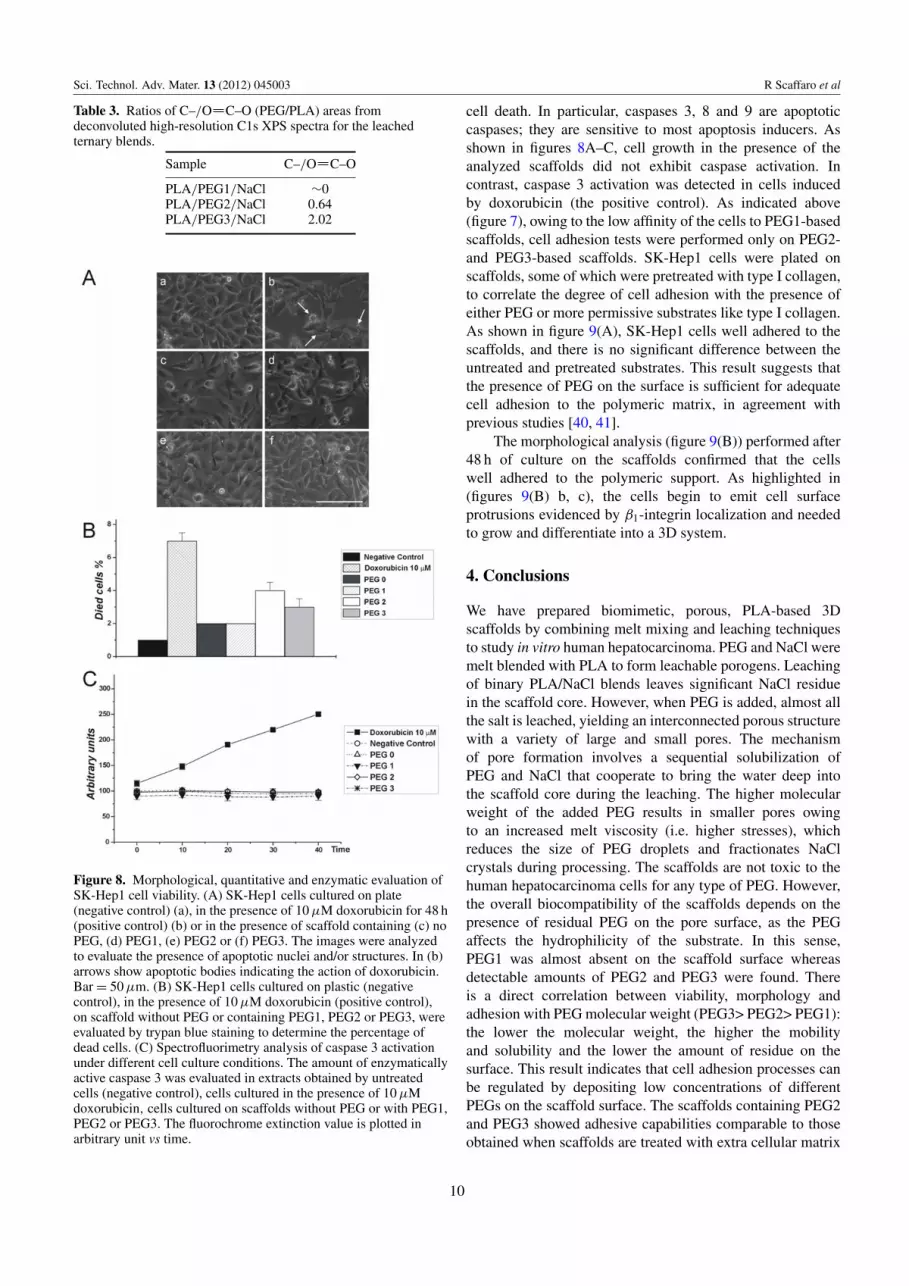
Table 3. Ratios of C–/O C–O (PEG/PLA) areas fromdeconvoluted high-resolution C1s XPS spectra for the leachedternary blends.
Sample C–/O C–O
PLA/PEG1/NaCl ∼0PLA/PEG2/NaCl 0.64PLA/PEG3/NaCl 2.02
Figure 8. Morphological, quantitative and enzymatic evaluation ofSK-Hep1 cell viability. (A) SK-Hep1 cells cultured on plate(negative control) (a), in the presence of 10 µM doxorubicin for 48 h(positive control) (b) or in the presence of scaffold containing (c) noPEG, (d) PEG1, (e) PEG2 or (f) PEG3. The images were analyzedto evaluate the presence of apoptotic nuclei and/or structures. In (b)arrows show apoptotic bodies indicating the action of doxorubicin.Bar = 50 µm. (B) SK-Hep1 cells cultured on plastic (negativecontrol), in the presence of 10 µM doxorubicin (positive control),on scaffold without PEG or containing PEG1, PEG2 or PEG3, wereevaluated by trypan blue staining to determine the percentage ofdead cells. (C) Spectrofluorimetry analysis of caspase 3 activationunder different cell culture conditions. The amount of enzymaticallyactive caspase 3 was evaluated in extracts obtained by untreatedcells (negative control), cells cultured in the presence of 10 µMdoxorubicin, cells cultured on scaffolds without PEG or with PEG1,PEG2 or PEG3. The fluorochrome extinction value is plotted inarbitrary unit vs time.
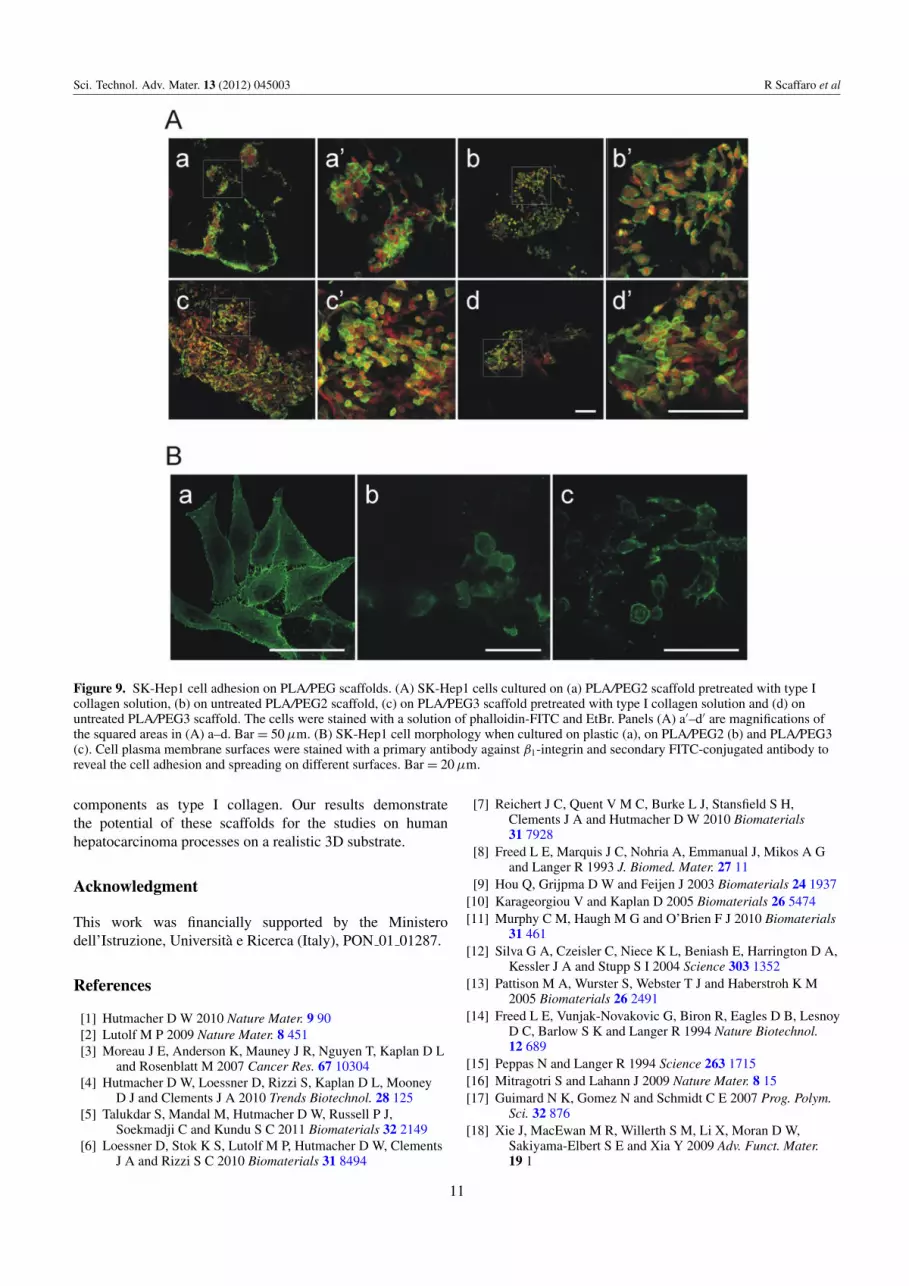
cell death. In particular, caspases 3, 8 and 9 are apoptoticcaspases; they are sensitive to most apoptosis inducers. Asshown in figures 8A–C, cell growth in the presence of theanalyzed scaffolds did not exhibit caspase activation. Incontrast, caspase 3 activation was detected in cells inducedby doxorubicin (the positive control). As indicated above(figure 7), owing to the low affinity of the cells to PEG1-basedscaffolds, cell adhesion tests were performed only on PEG2-and PEG3-based scaffolds. SK-Hep1 cells were plated onscaffolds, some of which were pretreated with type I collagen,to correlate the degree of cell adhesion with the presence ofeither PEG or more permissive substrates like type I collagen.As shown in figure 9(A), SK-Hep1 cells well adhered to thescaffolds, and there is no significant difference between theuntreated and pretreated substrates. This result suggests thatthe presence of PEG on the surface is sufficient for adequatecell adhesion to the polymeric matrix, in agreement withprevious studies [40, 41].
The morphological analysis (figure 9(B)) performed after48 h of culture on the scaffolds confirmed that the cellswell adhered to the polymeric support. As highlighted in(figures 9(B) b, c), the cells begin to emit cell surfaceprotrusions evidenced by β1-integrin localization and neededto grow and differentiate into a 3D system.
4. Conclusions
We have prepared biomimetic, porous, PLA-based 3Dscaffolds by combining melt mixing and leaching techniquesto study in vitro human hepatocarcinoma. PEG and NaCl weremelt blended with PLA to form leachable porogens. Leachingof binary PLA/NaCl blends leaves significant NaCl residuein the scaffold core. However, when PEG is added, almost allthe salt is leached, yielding an interconnected porous structurewith a variety of large and small pores. The mechanismof pore formation involves a sequential solubilization ofPEG and NaCl that cooperate to bring the water deep intothe scaffold core during the leaching. The higher molecularweight of the added PEG results in smaller pores owingto an increased melt viscosity (i.e. higher stresses), whichreduces the size of PEG droplets and fractionates NaClcrystals during processing. The scaffolds are not toxic to thehuman hepatocarcinoma cells for any type of PEG. However,the overall biocompatibility of the scaffolds depends on thepresence of residual PEG on the pore surface, as the PEGaffects the hydrophilicity of the substrate. In this sense,PEG1 was almost absent on the scaffold surface whereasdetectable amounts of PEG2 and PEG3 were found. Thereis a direct correlation between viability, morphology andadhesion with PEG molecular weight (PEG3> PEG2> PEG1):the lower the molecular weight, the higher the mobilityand solubility and the lower the amount of residue on thesurface. This result indicates that cell adhesion processes canbe regulated by depositing low concentrations of differentPEGs on the scaffold surface. The scaffolds containing PEG2and PEG3 showed adhesive capabilities comparable to thoseobtained when scaffolds are treated with extra cellular matrix
10
Sci. Technol. Adv. Mater. 13 (2012) 045003 R Scaffaro et al
Figure 9. SK-Hep1 cell adhesion on PLA/PEG scaffolds. (A) SK-Hep1 cells cultured on (a) PLA/PEG2 scaffold pretreated with type Icollagen solution, (b) on untreated PLA/PEG2 scaffold, (c) on PLA/PEG3 scaffold pretreated with type I collagen solution and (d) onuntreated PLA/PEG3 scaffold. The cells were stained with a solution of phalloidin-FITC and EtBr. Panels (A) a′–d′ are magnifications ofthe squared areas in (A) a–d. Bar = 50 µm. (B) SK-Hep1 cell morphology when cultured on plastic (a), on PLA/PEG2 (b) and PLA/PEG3(c). Cell plasma membrane surfaces were stained with a primary antibody against β1-integrin and secondary FITC-conjugated antibody toreveal the cell adhesion and spreading on different surfaces. Bar = 20 µm.
components as type I collagen. Our results demonstratethe potential of these scaffolds for the studies on humanhepatocarcinoma processes on a realistic 3D substrate.
Acknowledgment
This work was financially supported by the Ministerodell’Istruzione, Universita e Ricerca (Italy), PON 01 01287.
References
[1] Hutmacher D W 2010 Nature Mater. 9 90[2] Lutolf M P 2009 Nature Mater. 8 451[3] Moreau J E, Anderson K, Mauney J R, Nguyen T, Kaplan D L
and Rosenblatt M 2007 Cancer Res. 67 10304[4] Hutmacher D W, Loessner D, Rizzi S, Kaplan D L, Mooney
D J and Clements J A 2010 Trends Biotechnol. 28 125[5] Talukdar S, Mandal M, Hutmacher D W, Russell P J,
Soekmadji C and Kundu S C 2011 Biomaterials 32 2149[6] Loessner D, Stok K S, Lutolf M P, Hutmacher D W, Clements
J A and Rizzi S C 2010 Biomaterials 31 8494
[7] Reichert J C, Quent V M C, Burke L J, Stansfield S H,Clements J A and Hutmacher D W 2010 Biomaterials31 7928
[8] Freed L E, Marquis J C, Nohria A, Emmanual J, Mikos A Gand Langer R 1993 J. Biomed. Mater. 27 11
[9] Hou Q, Grijpma D W and Feijen J 2003 Biomaterials 24 1937[10] Karageorgiou V and Kaplan D 2005 Biomaterials 26 5474[11] Murphy C M, Haugh M G and O’Brien F J 2010 Biomaterials
31 461[12] Silva G A, Czeisler C, Niece K L, Beniash E, Harrington D A,
Kessler J A and Stupp S I 2004 Science 303 1352[13] Pattison M A, Wurster S, Webster T J and Haberstroh K M
2005 Biomaterials 26 2491[14] Freed L E, Vunjak-Novakovic G, Biron R, Eagles D B, Lesnoy
D C, Barlow S K and Langer R 1994 Nature Biotechnol.12 689
[15] Peppas N and Langer R 1994 Science 263 1715[16] Mitragotri S and Lahann J 2009 Nature Mater. 8 15[17] Guimard N K, Gomez N and Schmidt C E 2007 Prog. Polym.
Sci. 32 876[18] Xie J, MacEwan M R, Willerth S M, Li X, Moran D W,
Sakiyama-Elbert S E and Xia Y 2009 Adv. Funct. Mater.19 1
11

Sci. Technol. Adv. Mater. 13 (2012) 045003 R Scaffaro et al
[19] Bettinger C J, Bruggeman J P, Misra A, Borenstein J T andLanger R 2009 Biomaterials 30 3050
[20] Burdick J A and Vunjak-Novakovic G 2009 Tissue Eng. A15 205
[21] Mastro A M and Vogler E A 2009 Cancer Res. 69 4097[22] Martin I, Smith T and Wendt D 2009 Trends Biotechnol.
27 495[23] Hollister S J 2005 Nature Mater. 4 518[24] Lutolf M P and Hebbell J A 2005 Nature Biotechnol. 23 47[25] Stevens M M and George J H 2005 Science 310 1135[26] Hutmacher D W 2000 Biomaterials 21 2529[27] Yannas I V 2005 Adv. Biochem. Eng. Biothecnol. 41 141[28] Shoichet M S 2010 Macromolecules 4 581[29] O’Brien F J, Harley B A, Yannas I V and Gibson L J 2005
Biomaterials 26 433[30] Harley B A C, Kim H-D, Zaman M H, Yannas I V,
Lauffenburger D A and Gibson L J 2008 Biophys. J. 95 4013[31] Karageorgiou V and Kaplan D 2005 Biomaterials 26 5474[32] Murphy C A, Haugh M G and O’Brien F J 2010 Biomaterials
31 461[33] Peroglio M, Gremillard L, Gauthier C, Chazeau L, Verrier S,
Alibi M and Chevalier J 2010 Acta Biomater. 6 4369[34] Mather M L, Morgan S P, White L J, Tai H, Kockenberger W,
Howdle S M, Shakesheff K M and Crowe J A 2008 Biomed.Mater. 3 1
[35] Melissa L, Mather M L, Crowe J A, Morgan S P, White L J,Kalashnikov A N, Ivchenko V G, Howdle S M andShakesheff K M 2008 J. Mater. Sci. Mater. Med. 19 3071
[36] Yang Z, Peng X F, Lee D J and Chen M Y 2009 Environ. Sci.Technol. 43 3248
[37] Torres-Sanchez C and Corney J R 2009 Smart Mater. Struct.18 1
[38] Jeon S I, Lee J H, Andrade J D and de Gennes P G 1991J. Colloid Interface Sci. 142 149
[39] Rasal R M, Janorkar A V and Douglas E H 2010 Prog. Polym.Sci. 35 338
[40] Tziampazis E, Kohn J and Moghe P V 2000 Biomaterials21 511
[41] Chen H, Yuan L, Song W, Wu Z and Li D 2008 Prog. Polym.Sci. 33 1059
[42] Thomson R C, Yaszemski M J, Powers J M and Mikos A G1995 J. Biomater. Sci. Polym. Ed. 7 23
[43] Hou Q, Grijpma D W and Feijen J 2003 Biomaterials 24 1937[44] Mikos A G, Thorsen A J, Czerwonka L A, Bao Y, Langer R,
Winslow D N and Vacanti J P 1994 Polymer 35 1068[45] Nam Y S, Yoon J J and Park T G 2000 J. Biomed. Mater. Res.
53 1[46] Lam K H, Nieuwenhuis P, Molenaar I, Esselbrugge H, Feijen
J, Dijkstra P J and Schakenraad J M 1994 J. Mater. Sci.Mater. Med. 5 181
[47] Mikos A G, Sarakinos G, Leite S M, Vacanti J P and Langer R1993 Biomaterials 14 323
[48] De Groot J H, Nijenhuis A J, Bruin P, Pennings A J, VethR P H, Klompmaker J and Jansen H W B 1990 ColloidPolym. Sci. 268 1073
[49] Spaans C J, de Groot J H, Belgraver V W and Pennings A J1998 J. Mater. Sci.: Mater Med. 9 675
[50] Pego A P, Poot A A, Grijpma D W and Feijen J 2001J. Biomater. Sci.: Polym. Ed. 12 35
[51] Holy C E, Shoichet M S and Davies J E 1999 PCT WO PatentNo. 99/25391
[52] Virgilio N, Sarazin P and Favis B D 2010 Biomaterials31 5719
[53] Reignier J and Hunneault M A 2006 Polymer 47 4703[54] Chaput S, Carrot C, Castro M and Prochazka F 2004
Rheol. Acta 43 417[55] Gauthier O, Bouler J-M, Aguado E, Pilet P and Daculsi G
1998 Biomaterials 19 133[56] Kaczmarek D 2001 Vacuum 62 303[57] Harley B A, Kim H D, Zaman M H, Yannas I V, Lauffenburger
D A and Gibson L J 2008 Biophys. J. 95 4013[58] Washburn E W 1921 Proc. Natl Acad. Sci. USA 7 115[59] Monsky W L, Lin C-Y, Aoyama A, Kelly T, Akiyama S K,
Mueller S C and Chen W-T 1994 Cancer Res. 54 5702[60] Hu Y, Rogunova M, Topolkaraev V, Hiltner A and Baer E 2003
Polymer 44 5701[61] Hu Y, Hu Y S, Topolkaraev V, Hiltner A and Baer E 2003
Polymer 44 5711[62] Steuer H, Fadale R, Muller E, Muller H-W, Planck H and
Schlosshauer B 1999 Neurosci. Lett. 277 165
12


