Embed Size (px)
Citation preview
Hitit ZY et al. JOTCSB. 2022; 5(2): 111-126. RESEARCH ARTICLE
Determination of Reactor Operational Mode for Concentrated FungicideProduction
Zeynep Yilmazer Hitit1* , Pinar Aygener1 , Seda Teymur1 , Beyza Akiska1 ,
Kemal Kesenci2 , Suna Ertunc1 , and Bulent Akay1
1Ankara University, Department of Chemical Engineering, 06100, Ankara, Turkey.2Safa Tarim AS, Konya, Turkey.
Abstract: An aqueous solution of phosphorous acid (H3PO3) and potassium hydroxide (KOH) is an exampleof a phosphonic acid neutralization reaction where potassium salts are formed. This study aimed to designthe reactor and the process, which is a problem encountered in the industry, arising from the need todevelop a safe and efficient production process. It was found that the production process carried out underexothermic conditions should be in a temperature-controlled reactor at optimum acid/base initialconcentration ratios and feed flow rates as 1/1.5, 22800 mL/min, respectively. Due to the thermal safetyand risk accidents at the batch reactor, a tubular flow reactor (TFR) has been designed to increase thecontrollability and the yield of the products produced in the batch reactor having some advantages as tofeeding, sampling, and measuring from different points at different times.
Keywords: Fungicide production; phosphorous acid potassium salts; tubular flow reactor; neutralizationreaction; mono and dipotassium phosphite.
Submitted: June 24, 2022. Accepted: September 23, 2022 .
Cite this: Hitit ZY, Aygener P, Teymur S, Akiska B, Kesenci K, Ertunc S, et al. Determination of ReactorOperational Mode for Concentrated Fungicide Production. JOTCSB. 2022;5(2):110–26.
*Corresponding author. E-mail: [email protected]
INTRODUCTION
Fungal microorganisms are the structures that causeplant diseases and need to be kept under control.The most effective method to keep these structuresunder control is the application of fungicides to theplant (1). Phosphite compounds in the HPO3
structure are widely used in agriculture as fertilizeror fungicide. For an accurate hazard identificationand risk assessment, it is crucial to recognize thetoxic effects of fungicides and increase the benefitsof fungicides while reducing toxic effects (2).Fungicides are used in the treatment of fungi thatare formed or likely to occur in plants. Additionally,phosphite salts are pH-neutral chemical compoundsand can show healing properties like fungicides inplants.
Although phosphite (PO33-) and phosphate (PO4
3-)compounds have similar chemical structures, theyhave different effects on plants and fungi.Phosphorous acid (H3PO3) and its salt (phosphite)contain higher P concentrations (39%) than
conventional phosphate-based (H3PO4) fertilizer(32% P) (3). It is used as a fungicide in theagricultural sector. It also has fertilizer propertiesand is used to strengthen the immune system ofplants and overcome various infections. In addition,it has various uses such as having a directantifungal effect on plant pathogens, controllingroot-borne diseases, increasing yields, and organicfarming. The mono-potassium and di-potassiumsalts of phosphorous acid, the active ingredient,have direct toxic effects on plant pathogens. Theyalso activate the natural defense mechanisms ofplants through disease suppression or eradication.Thus, they provide a double effect mode. However,as in the case of all commercial chemicals andespecially environmentally friendly chemicals suchas fungicides, a much more improved effect with asmall amount is aimed, so improved performance isalways required at the same dose. Thus, potassiumphosphite will be particularly useful as it will providepotassium as a second precious nutrient besides theother two critical plant nutrients. Moreover, a
111
Hitit ZY et al. JOTCSB. 2022; 5(2): 111-126. RESEARCH ARTICLE
polyphosphite is expected to provide the knownslow-release advantages of polyphosphate.Currently available commercial methods for thepreparation of fertilizer grade potassium phosphite(KH2PO3 and K2HPO3) include a stirred tank (usuallya batch reactor) equipped with a stirrer and coolingjacket, using an aqueous solution of potassiumhydroxide as seen in Equations 1 and 2.
H 3PO3+KO H→K H 2PO3+H 2O (Eq. 1)
K H 2PO3+K O H→K2H PO3+H2O (Eq. 2)
Batch reactors are widely used and preferred inindustry and their type is frequently preferred in thepharmaceutical industry. The performance of abatch reactor can be determined through mass andenergy balances. At the beginning of the reaction,the inputs (substrates) are fed into the reactor andthere is no material feeding and/or dischargingduring the reaction. Temperatures andconcentrations are observed over time by thedifferential equations created with the help of massand energy balances. In a batch reactor system, itmay not be possible in all cases to maximize theproduct yield, as well as determining the reactionrate, which determines the variation of theconcentration over time (4). Since the suddenfeeding of the inputs to the reactor changes thetemperature and reaction rate abruptly, the batchmode is not often preferred for exothermicneutralization reactions. Fed-batch reactors arecommonly used for strongly exothermic reactions(5). As the heat of the reaction can be balanced bythe existing cooling of the reactor (6). In fed-batchoperating modes, some of the inputs are fed to thereactor before the reaction starts, while the rest isfed to the reactor during the reaction (7). In general,the performance of a batch reactor subjected to anindustrial-scale volume change is affected by twoimportant factors, kinetics, and dilution (8).
Despite many years of research and experimentalresults obtained by chemical engineers in the fieldof reactor safety, it is known that thermal runawayemergencies still occur in chemical reactors today.In the design and operation of batch and semi-batchreactors, it is necessary to determine the correctand optimum operating conditions and to adaptearly warning detection systems to prevent thermalrunaways and develop a reliable production process.In the case of homogeneous reactions, a thermalrunaway problem may rise faster than forheterogeneous ones due to the lack of interfacialmass transfer resistances (9). A reactor design thatprovides temperature control is extremely importantfor such reaction systems. For this reason, tubular(plug) flow reactors (PFR) are recommended. ThePFR is characterized by the regularity of the fluidflow in it, without any mixing of the fluid with anyother element. In fact, there may be radial mixing offluid in a PFR; however, there should be no mixing ordiffusion along the axial flow. A necessary andsufficient condition for PFR flow is that the residence
time in the reactor is the same for all elements ofthe liquid (10). The inputs enter the reactor and areconsumed while flowing axially and the reactionconversion increases along the length of the reactor(11). This also increases the yield of the product.
In fungicides with fertilizer properties, it should benoted that the final product concentration valueshould be between 6.2 and 6.7 in the production ofmonopotassium phosphite (KH2PO3) and dipotassiumphosphite (K2HPO3) in order not to harm the soil andthe plant as well as showing a nutritive feature (12).Since the pH value of phosphorous acid, the activeingredient in the reaction, is approximately 1.5, itcannot directly contact the plant, in order to preventit from harming the plant (13). The active substance(H3PO3) reacts with potassium hydroxide (KOH), astrong potassium-containing base, to produceKH2PO3 and K2HPO3 in the form of SL (soluble liquid)with fungicidal properties. The pH values of thepotassium phosphite salts obtained areapproximately 6.5 (3).
Mono and dipotassium phosphide compounds aregenerally produced by reaction with phosphonic acid(H3PO3) by charging an aqueous solution ofpotassium hydroxide (KOH) in a batch reactor.Potassium hydroxide (KOH) releases heat during thedissolution process (14), while phosphorous acid(H3PO3) absorbs heat. The neutralization reaction ofa weak acid and a strong base is an exothermicreaction that still has unsolved problems in theproduction, storage, and analysis results. Acid-basefoaming, boiling, explosion, and splashes are highlylikely to occur in the reaction during the production.Even when the rate of the reaction is slowed, thereaction reaches 94 °C. Phosphine gas(monophosphan, PH3), is formed at temperatures of65 °C and above and has an odor reminiscent ofgarlic and has an extremely toxic feature forhumans, plants, and the environment (15). Unlessthe formation of phosphine gas is prevented orremoved from the product, this gas causes seriouspoisoning as well as reducing the productionefficiency rapidly (16). This situation poses a greatrisk for not only human health but also for theenvironment and economy. Occupational accidentsresulting in many injuries in production withneutralization are recorded: causes temporary orpermanent bodily damage, acid-base burns andsplashes, environmental residues, and economicdamage (17). In order to control splashes andexplosions, a reduction in all these risks by adjustingpH values and maintaining acid-base balance isaimed (18).
An economical and safe way for reactor operationand optimization is inevitably required for theproduction of a potassium polyphosphitecomposition with enhanced efficacy as anagricultural fungicide (19–21). This study is anexperimental study carried out to determine theoptimum experimental conditions and the mostappropriate operating mode of the neutralizationreaction to produce monopotassium phosphite and
112
Hitit ZY et al. JOTCSB. 2022; 5(2): 111-126. RESEARCH ARTICLE
dipotassium phosphite salts. For a concentratedfungicide production stoichiometric ratio, operatingmode, feed rate, and reactor type are optimized byexamining the effects of different operating types(batch, fed-batch and tubular flow operation) on theproduction process and product yield.
MATERIALS AND METHODS
The effect of feed order and feed amount on productyield is extremely important in acid-baseneutralization reactions. As well as product yield, thefeeding sequence ensures a safe productionprocess. For this reason, repeated experiments werecarried out in order to determine the optimum inputconditions and safe production process of thisproduction reaction, which has significant risks. Inthe neutralization reaction of a weak acid and strongbase, acid was fed to the base. The reaction wasobserved by recording temperature, pH, andconductivity data at frequent intervals throughoutthe feeding and product formation.
Determination of the Optimum InputConcentration in the Batch ReactorRepeated experiments were carried out with a batchsystem to develop a safe and sustainable productionprocess of potassium salts of phosphorous acid. Theacid/base inlet concentration (mol/L, M) ratios ofmono and dipotassium phosphite salts produced inthe batch system were determined as 1/1, 1/1.5,1/2, 1/3, and 1/4. The pH, temperature, andconductivity data of the salts produced withdifferent input concentrations were recorded atregular intervals before feeding, during the reaction,and in the final product. The effects of the inputconcentration ratio on the reaction conditions andproduct yield were observed.
Determination of the Optimum Input Concentration in the Fed-Batch ReactorIn the fed-batch system, repeated experiments werecarried out with an acid/base input concentration(M) ratio of 1/1.5. As a result of an exothermicreaction, toxic gas formation is observed due to hightemperatures. Phosphine gas (PH3), which is likely tocause permanent damage to human health,environment, and equipment safety, is an exampleof these gases. Therefore, it is necessary to keepthe temperature under control in order to design asafe production process. Temperature control wasachieved by cooling the reactor in a cold-water bath.The initial conditions for pH, water bath, and reactortemperature data for the pilot-scale experiments areshown in Table 1. The production process, whichwas controlled by a pilot scale, was repeated at theindustrial scale and the initial conditions are given inTable 2.
Table 1: Initial conditions of the titrationexperiment performed by adding base to acid in anice bath in a fed-batch system Vacid= 50 mL, Vbase=
100 mL
pHacid pHbaseTacid
°CTbase
°C
Experiment 1 1.05 15.4 18.3 25.1
Experiment 2 1.2 15.4 15.2 23.5
Experiment 3 1.1 15.5 16.2 22.5
Table 2: Initial conditions of the titrationexperiment performed by adding base to acid in an
ice bath in a fed-batch system in industrial scalemolarities.
Property Acid BaseMolarity, mol/L 7.31 10.96pH 0.01 15.8T, °C 20.8 23Base, mL 50 100
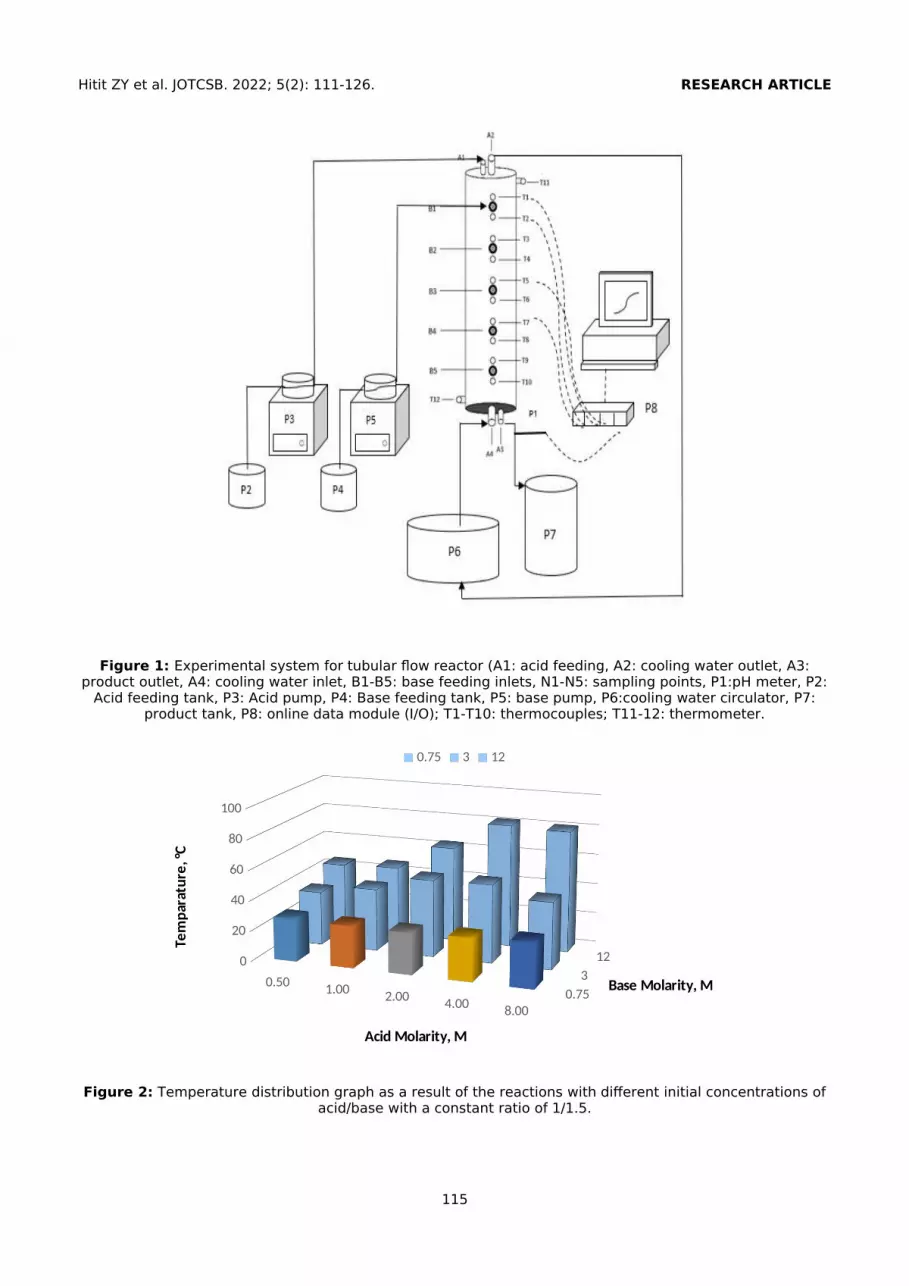
Determination of the Optimum InputConcentration in the Plug Flow ReactorIt has been observed that the experiments carriedout in the fed-batch reactor as an alternative to thebatch reactor do not create a safe and sustainableproduction process according to the temperatureincrease. Therefore, once the optimum inputconcentration ratio of 1/1.5 M (A/B) has beendetermined, an optimum generation system andreactor design are required as the reactionconversion is completed in a short time and thereaction carries significant risks. For a chemicalkinetics study, a system should be designed inwhich samples can be analyzed at certain timeintervals. A 12 m long tubular flow reactor with a 10mm inner and 12 mm outer radii is designed torealize uninterrupted production. There are 5 basesand 1 acid feeding point on the system. Samplingpoints were made parallel to the feeding pointsalong the reactor. A jacket with a diameter of 14 cmand a length of 120 cm was used to control the hightemperature resulting from the reaction around thedesigned tubular reactor. There is a cooling waterinlet at the bottom of the system and a coolingwater outlet at the top. The schematic view of theexperimental system for tubular flow reactor isgiven in Figure 1.
The pilot-scale experiments were carried outrepetitively with the TFR, which was designed on anindustrial scale. As a result of the pilot-scaleexperiments, the industrial-scale repeatedexperiments were carried out, as the condition forthe sustainability of the system was ensured. In thefirst stage, 82 g/L acid and base liquid solutionswere stored in 5 L volume acid and base tanks forthe pilot-scale experiments. Considering themolecular weights of the inputs, it can be calculatedthat the prepared solutions have 1/1.5 (A/B) molarconcentrations. As a result of the flow ratecalibration experiments, the optimum flow rate wasdetermined, and the system was expected to come
113
Hitit ZY et al. JOTCSB. 2022; 5(2): 111-126. RESEARCH ARTICLE
to a steady state for the first feeding. Acid was fedto the TFR at a flow rate of 370 mL/min. About 12minutes after the acid was fed, the base was fedfrom point B1 of the reactor. While the base is fed,the volumetric flow rate of the product, which isformed simultaneously, is recorded and after thefeeding, the base flow rate was increasedperiodically at the 4th, 7th, and 10th minutes. Afterabout 30 minutes, the acid feeding was completed,and the pH data of the product were recordedsimultaneously. Industrial-scale experiments weredesigned, because the experiments completedrepeatedly with a pilot scale. 400 g/L acid and basesolutions were stored in the 10 L volume acid andbase storage tanks. The reactant concentrationswere 4.9:7.1 M. In this system, where the optimuminput concentration ratio (1/1.5) was provided,repeated experiments were carried out. The basewas fed to the designed tubular reactor from pointB1 at a flow rate of 150 mL/min and simultaneouslyfrom point B2 at a flow rate of 250 mL/min. The acidwas fed from point A1 at a flow rate of 400 mL/min.5 minutes after the system became stable, the basefeeding was continued from B1, B2, and B3 points.After 12 minutes, two samples were taken at 15-second intervals, and temperature and pHmeasurements were made. To control the reactiontemperature, cooling water was sent at a flow rateof 17400 mL/min for approximately 18 minutes.After 3 minutes, the volumetric flow rate of thecooling water was set to 22800 mL/min. The basefed from the B3 point at the 22nd minute ofproduction continued to be fed from the B4 pointuntil the almost 31st minute. The base feeding wascompleted, and the product pH value was recorded.
Phosphorus AnalysisPhosphorus analyses were carried out repeatedly toanalyze the chemical kinetics and determine theproduct yield. A calibration graph was created at awavelength of 460 nm with the reaction inputphosphorous acid standard solution, and then thephosphorous acid concentration of the product wasdetermined through the spectrometric method. Inthe analysis method, nitric acid (29% HNO3)solution, 0.25% ammonium vanadate (NH4VO3)solution, and 5% ammonium molybdate solution((NH4)6Mo7O24.H2O) chemicals were used. UV-Vismeasurements were obtained with a Shimadzu -UV160 and manual Spectrometer using 1 cm plasticcuvettes (22).
RESULTS AND DISCUSSION
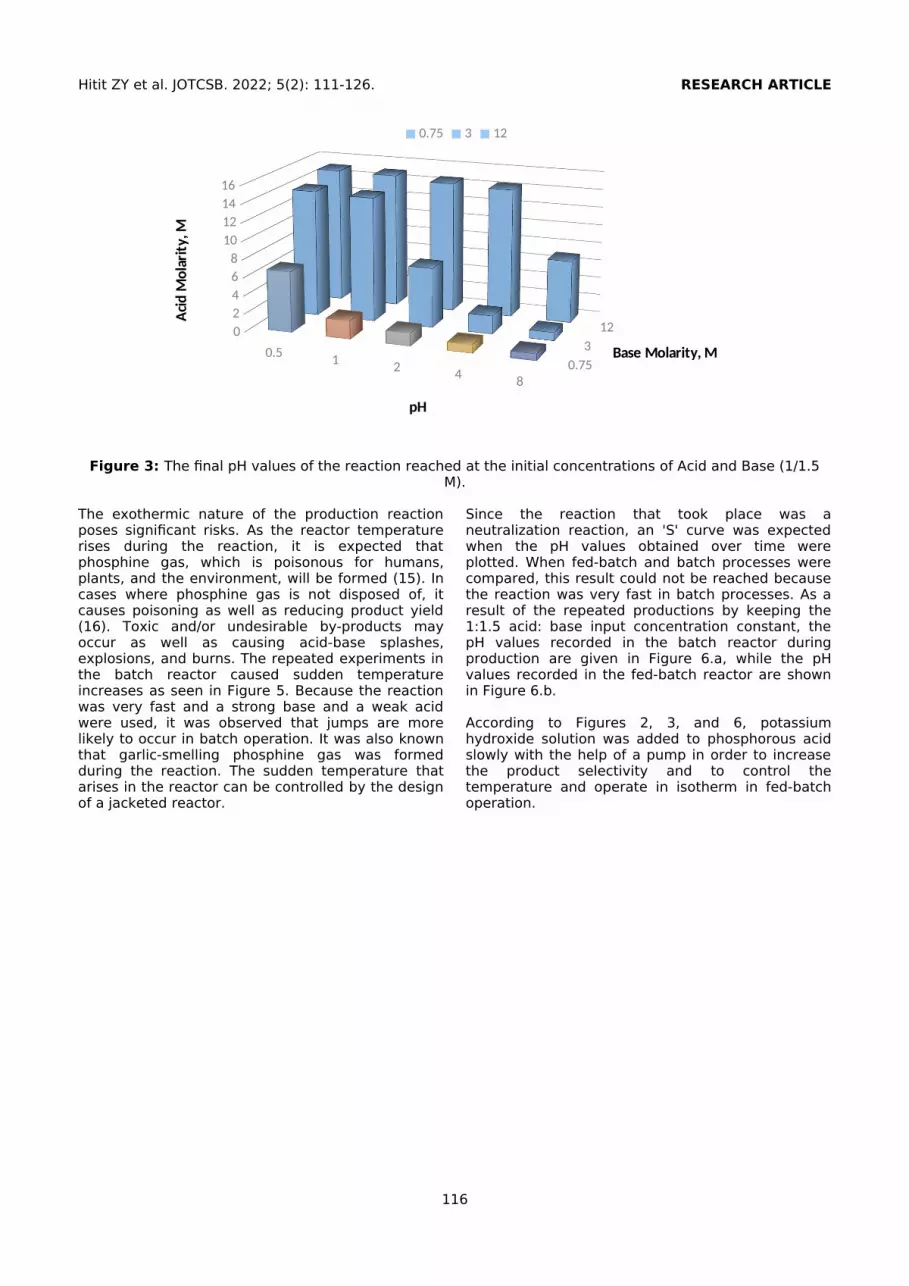
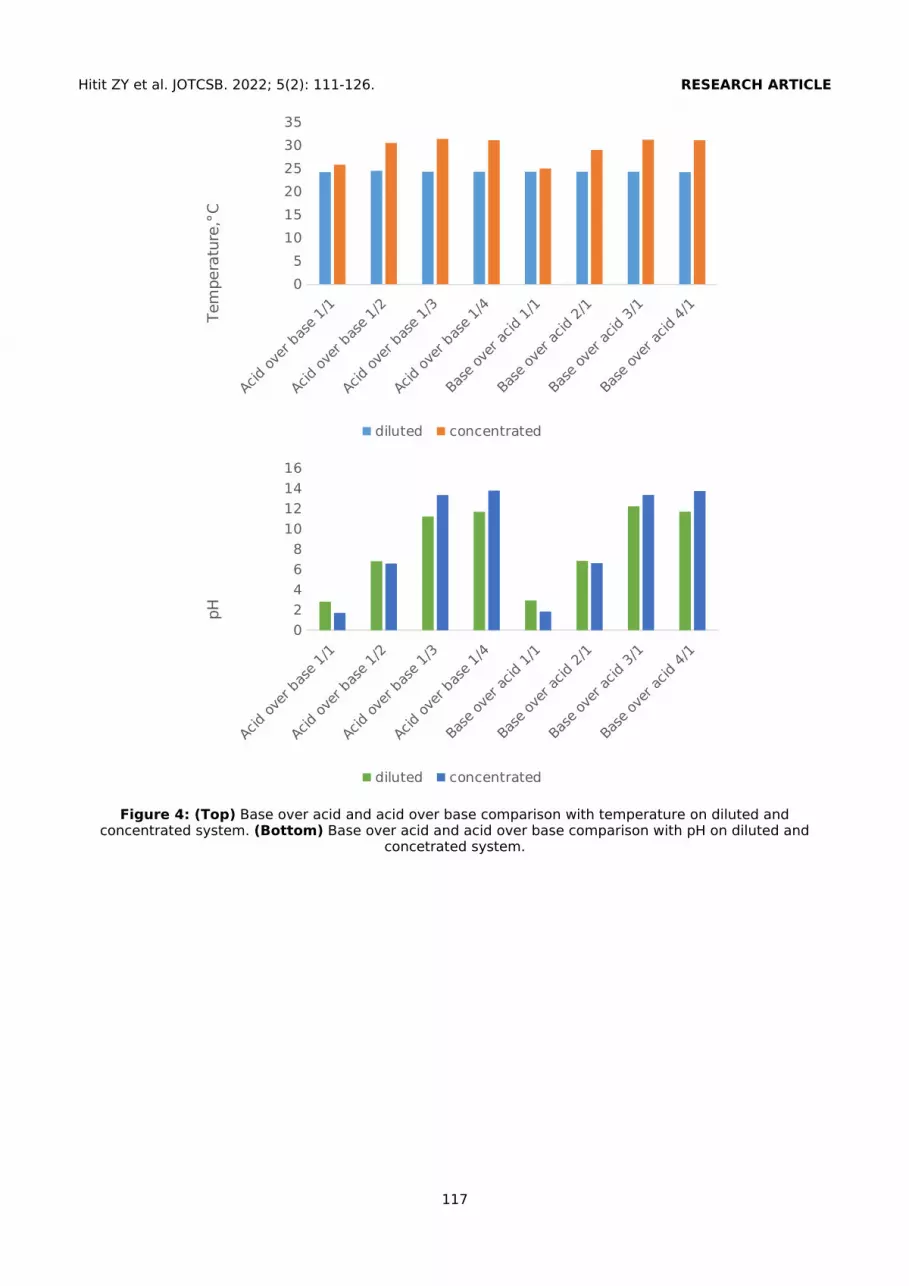
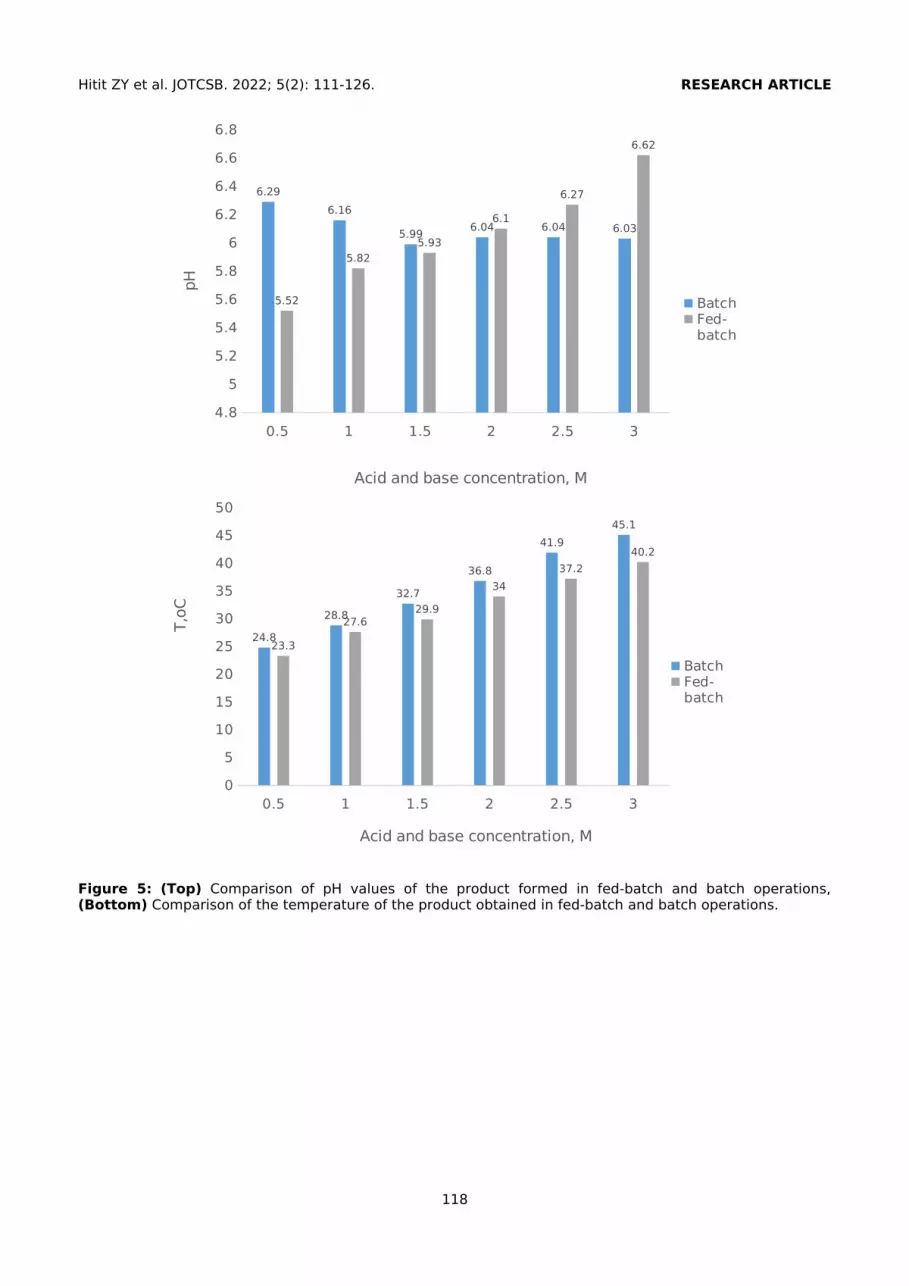
Determination of optimum input concentrationratio and reactant feed orderIt is known that the pH values of phosphorous acid,potassium hydroxide, and neutralized phosphorousacid (NPA) water solution at different concentrationsare ranging from 1.85 to 2.34, 11.98 to 12.88, and6.26 to 6.96, respectively (12). The repeatedexperiments on a pilot scale showed that thereaction proceeded efficiently when the reactantswere at an equal mass flow rate. It is seen in Figure2 that the temperature increase reacheduncontrollable values as a result of the gradualincrease in the acid and base concentrations. It isessential to prevent the formation of toxicphosphine gas and therefore to control thetemperature for both product yield and safe processoperation. In this case, regardless of the type ofproduction, the optimum input concentration ratiowas determined as 1/1.5 (A/ B). When this ratio wasmaintained, it is seen in Figure 3 that the pH valueof the product was recorded in the range of 6.5-7.This value is the common feature of pesticides thathave a nutritive effect when applied to the plants.The effects of feed order to the reactor ontemperature and pH on diluted and concentratedsystems are given in Figure 4. The test results withthe pilot scale obtained proved that feeding thereactor at a low flow rate by keeping the inputconcentration ratio constant would be effective bothin terms of occupational health and safety andproduct yield. When the input conditions for theeffective product were provided, it was observedthat the acid-base feeding sequence to the reactordid not have a significant effect on the product andthe production process.
Determination of the Type of Reactor andProductionThe experiments carried out on a pilot scale andthen repeated at an industrial scale, showing thatthe optimum input concentration ratio should be1/1.5 for an effective and productive product. Afterdetermining the input concentration ratio, the mostsuitable, reliable, and sustainable reactor typeshould be determined by considering the productionconditions, production time, and product quality ofthe product. Since the production process ofpotassium phosphite salts formed by the reaction ofa strong base and a weak acid caused acid-basesplashes on the pilot scale, it can cause reactorexplosion in industrial production. For this reason,errors that might arise were kept under control byconducting repeated experiments with a pilot-scalebefore designing a safe production process at anindustrial scale.
114
Hitit ZY et al. JOTCSB. 2022; 5(2): 111-126. RESEARCH ARTICLE
Figure 1: Experimental system for tubular flow reactor (A1: acid feeding, A2: cooling water outlet, A3:product outlet, A4: cooling water inlet, B1-B5: base feeding inlets, N1-N5: sampling points, P1:pH meter, P2:
Acid feeding tank, P3: Acid pump, P4: Base feeding tank, P5: base pump, P6:cooling water circulator, P7:product tank, P8: online data module (I/O); T1-T10: thermocouples; T11-12: thermometer.
0.50 1.00
2.00 4.00
8.00
0
20
40
60
80
100
0.75
3
12
0.75 3 12
Acid Molarity, M
Tem
par
atu
re, °
C
Base Molarity, M
Figure 2: Temperature distribution graph as a result of the reactions with different initial concentrations ofacid/base with a constant ratio of 1/1.5.
115
Hitit ZY et al. JOTCSB. 2022; 5(2): 111-126. RESEARCH ARTICLE
0.51
24
8
0
2
4
6
8
10
12
14
16
0.75
3
12
0.75 3 12
pH
Aci
d M
ola
rity
, M
Base Molarity, M
Figure 3: The final pH values of the reaction reached at the initial concentrations of Acid and Base (1/1.5M).
The exothermic nature of the production reactionposes significant risks. As the reactor temperaturerises during the reaction, it is expected thatphosphine gas, which is poisonous for humans,plants, and the environment, will be formed (15). Incases where phosphine gas is not disposed of, itcauses poisoning as well as reducing product yield(16). Toxic and/or undesirable by-products mayoccur as well as causing acid-base splashes,explosions, and burns. The repeated experiments inthe batch reactor caused sudden temperatureincreases as seen in Figure 5. Because the reactionwas very fast and a strong base and a weak acidwere used, it was observed that jumps are morelikely to occur in batch operation. It was also knownthat garlic-smelling phosphine gas was formedduring the reaction. The sudden temperature thatarises in the reactor can be controlled by the designof a jacketed reactor.
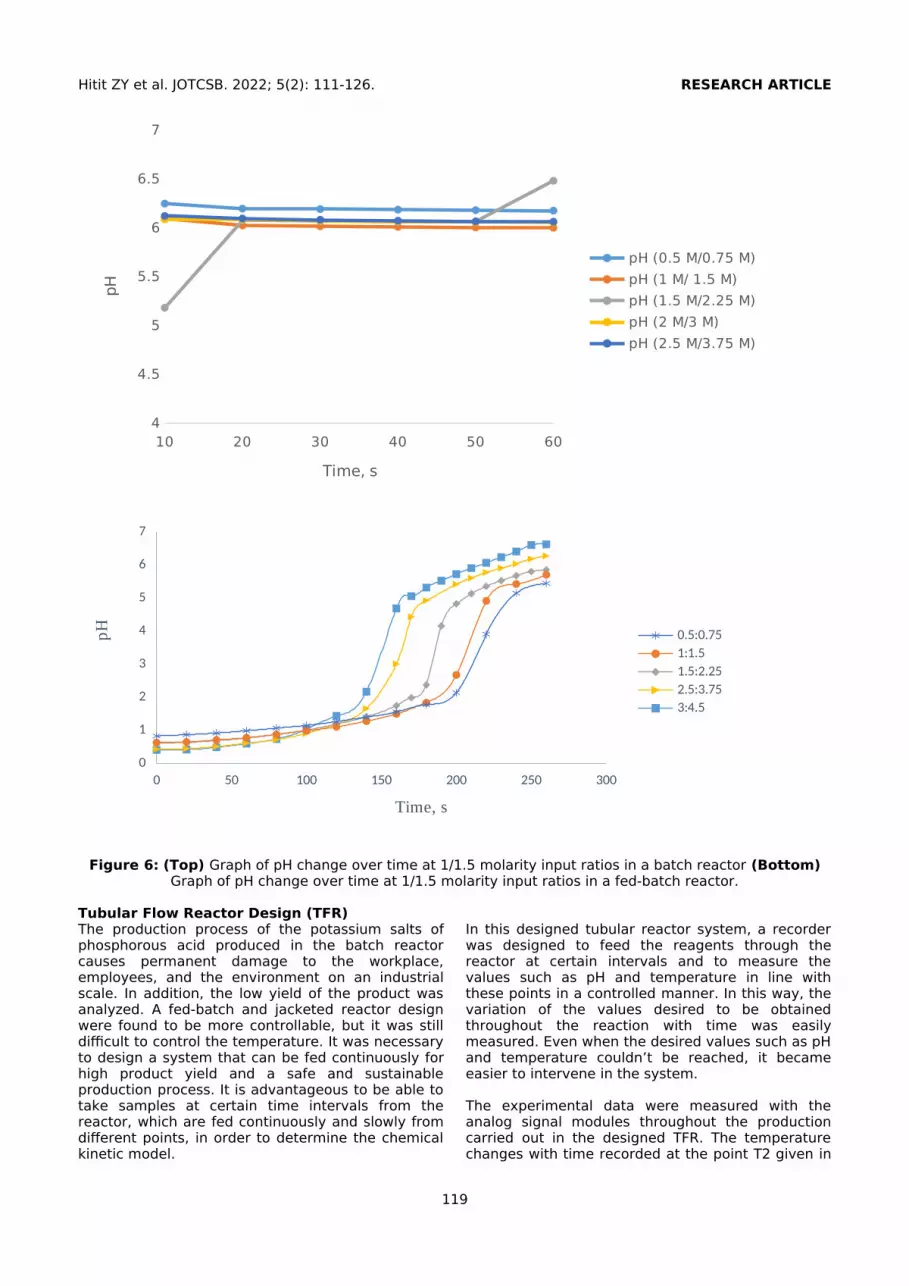
Since the reaction that took place was aneutralization reaction, an 'S' curve was expectedwhen the pH values obtained over time wereplotted. When fed-batch and batch processes werecompared, this result could not be reached becausethe reaction was very fast in batch processes. As aresult of the repeated productions by keeping the1:1.5 acid: base input concentration constant, thepH values recorded in the batch reactor duringproduction are given in Figure 6.a, while the pHvalues recorded in the fed-batch reactor are shownin Figure 6.b.
According to Figures 2, 3, and 6, potassiumhydroxide solution was added to phosphorous acidslowly with the help of a pump in order to increasethe product selectivity and to control thetemperature and operate in isotherm in fed-batchoperation.
116
Hitit ZY et al. JOTCSB. 2022; 5(2): 111-126. RESEARCH ARTICLE
Acid
ove
r bas
e 1/1
Acid
ove
r bas
e 1/
2
Acid
ove
r bas
e 1/3
Acid
ove
r bas
e 1/
4
Base
ove
r acid
1/1
Base
ove
r acid
2/1
Base
ove
r acid
3/1
Base
ove
r acid
4/1
0
5
10
15
20
25
30
35
diluted concentrated
Tem
pera
ture
,°C
Acid
ove
r bas
e 1/1
Acid
ove
r bas
e 1/
2
Acid
ove
r bas
e 1/3
Acid
ove
r bas
e 1/4
Base
ove
r acid
1/1
Base
ove
r acid
2/1
Base
ove
r acid
3/1
Base
ove
r acid
4/1
0
2
4
6
8
10
12
14
16
diluted concentrated
pH
Figure 4: (Top) Base over acid and acid over base comparison with temperature on diluted andconcentrated system. (Bottom) Base over acid and acid over base comparison with pH on diluted and
concetrated system.
117
Hitit ZY et al. JOTCSB. 2022; 5(2): 111-126. RESEARCH ARTICLE
0.5 1 1.5 2 2.5 34.8
5
5.2
5.4
5.6
5.8
6
6.2
6.4
6.6
6.8
6.29
6.16
5.996.04 6.04 6.03
5.52
5.825.93
6.1
6.27
6.62
BatchFed-batch
Acid and base concentration, M
pH
0.5 1 1.5 2 2.5 30
5
10
15
20
25
30
35
40
45
50
24.8
28.8
32.7
36.8
41.9
45.1
23.3
27.629.9
34
37.2
40.2
BatchFed-batch
Acid and base concentration, M
T,o
C
Figure 5: (Top) Comparison of pH values of the product formed in fed-batch and batch operations,(Bottom) Comparison of the temperature of the product obtained in fed-batch and batch operations.
118
Hitit ZY et al. JOTCSB. 2022; 5(2): 111-126. RESEARCH ARTICLE
10 20 30 40 50 604
4.5
5
5.5
6
6.5
7
pH (0.5 M/0.75 M)
pH (1 M/ 1.5 M)
pH (1.5 M/2.25 M)
pH (2 M/3 M)
pH (2.5 M/3.75 M)
Time, s
pH
0 50 100 150 200 250 300
0
1
2
3
4
5
6
7
0.5:0.75
1:1.5
1.5:2.25
2.5:3.75
3:4.5
Time, s
pH
Figure 6: (Top) Graph of pH change over time at 1/1.5 molarity input ratios in a batch reactor (Bottom)Graph of pH change over time at 1/1.5 molarity input ratios in a fed-batch reactor.
Tubular Flow Reactor Design (TFR)The production process of the potassium salts ofphosphorous acid produced in the batch reactorcauses permanent damage to the workplace,employees, and the environment on an industrialscale. In addition, the low yield of the product wasanalyzed. A fed-batch and jacketed reactor designwere found to be more controllable, but it was stilldifficult to control the temperature. It was necessaryto design a system that can be fed continuously forhigh product yield and a safe and sustainableproduction process. It is advantageous to be able totake samples at certain time intervals from thereactor, which are fed continuously and slowly fromdifferent points, in order to determine the chemicalkinetic model.
In this designed tubular reactor system, a recorderwas designed to feed the reagents through thereactor at certain intervals and to measure thevalues such as pH and temperature in line withthese points in a controlled manner. In this way, thevariation of the values desired to be obtainedthroughout the reaction with time was easilymeasured. Even when the desired values such as pHand temperature couldn’t be reached, it becameeasier to intervene in the system.
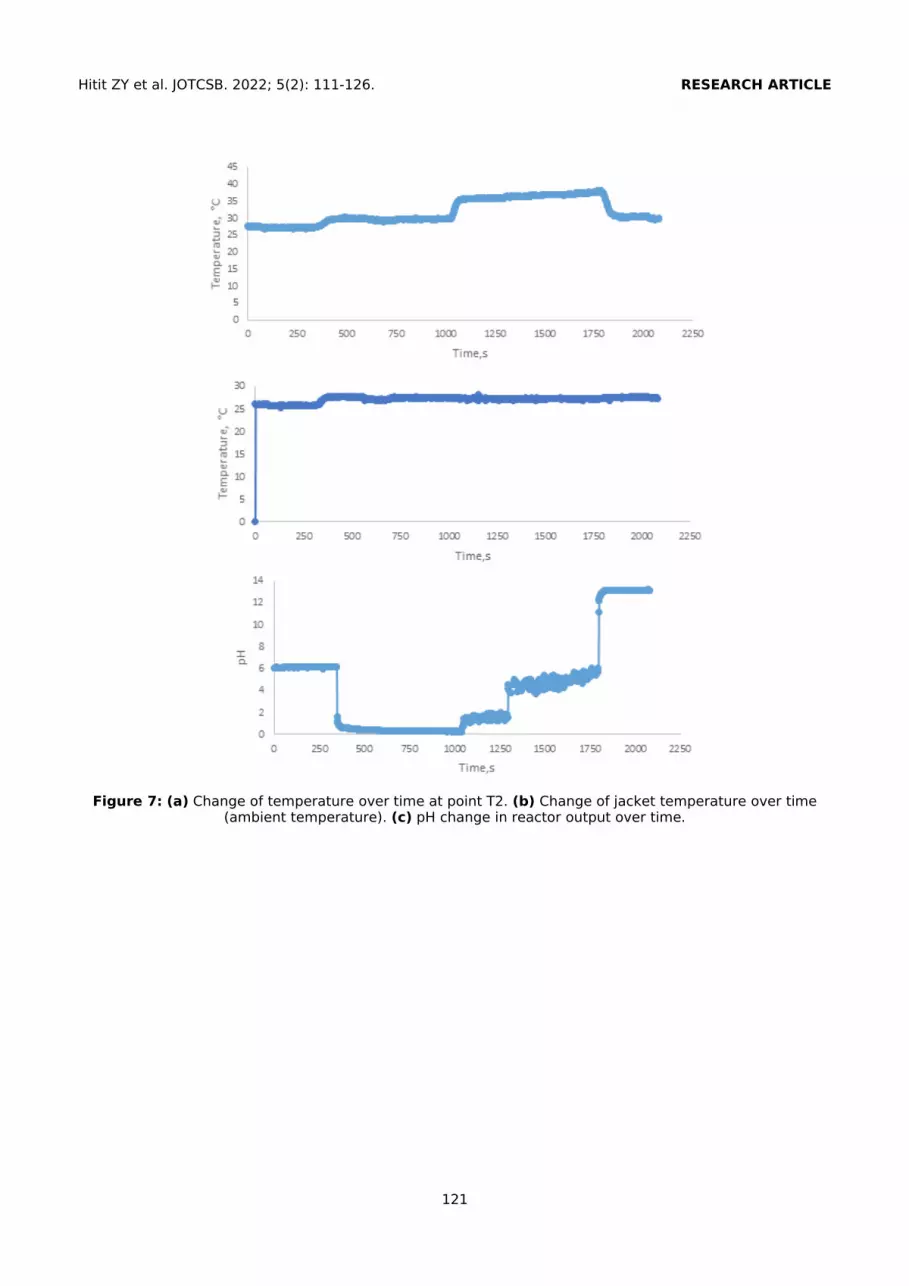
The experimental data were measured with theanalog signal modules throughout the productioncarried out in the designed TFR. The temperaturechanges with time recorded at the point T2 given in
119
Hitit ZY et al. JOTCSB. 2022; 5(2): 111-126. RESEARCH ARTICLE
Figure 7, the change in the empty jackettemperature with time in Figure 7.b, and the pHchange at the reactor outlet over time is given inFigure 7.c.
As seen in Figure 7.a, an instantaneous temperaturechange occurred when the base was sent to thesystem; that is, the reaction started quickly, and thetemperature increased quickly. As seen in Figure7.b, no temperature change was observed since nocooling water was sent to the jacket.
When Figure 7.c is examined, it is observed that thepH decreased considerably with the acid being sentto the system at the 380th second. With the additionof the base at 1010 seconds, the pH increased overtime, and neutralization was observed. It wasobserved that the base flow rate should beincreased when the pH could not reach the desiredrange. Thus, it was observed that the flow rate wasimportant and therefore the base flow rate wasincreased until the desired product pH was reached.When the acid stock finished, the pH value wasmeasured as 5.9. With the end of the acid that wasbeing sent to the system, the pH quickly increasedto 13 because only the base remained in theenvironment, as the base feeding continued. Theexperimental data were measured with analogsignal modules throughout the production carriedout in the designed TFR. The temperature changeswith time recorded at the point T2 is given in Figure7, the change in the empty jacket temperature withtime in Figure 7.b, and the pH change at the reactoroutlet over time is given in Figure 7.c.
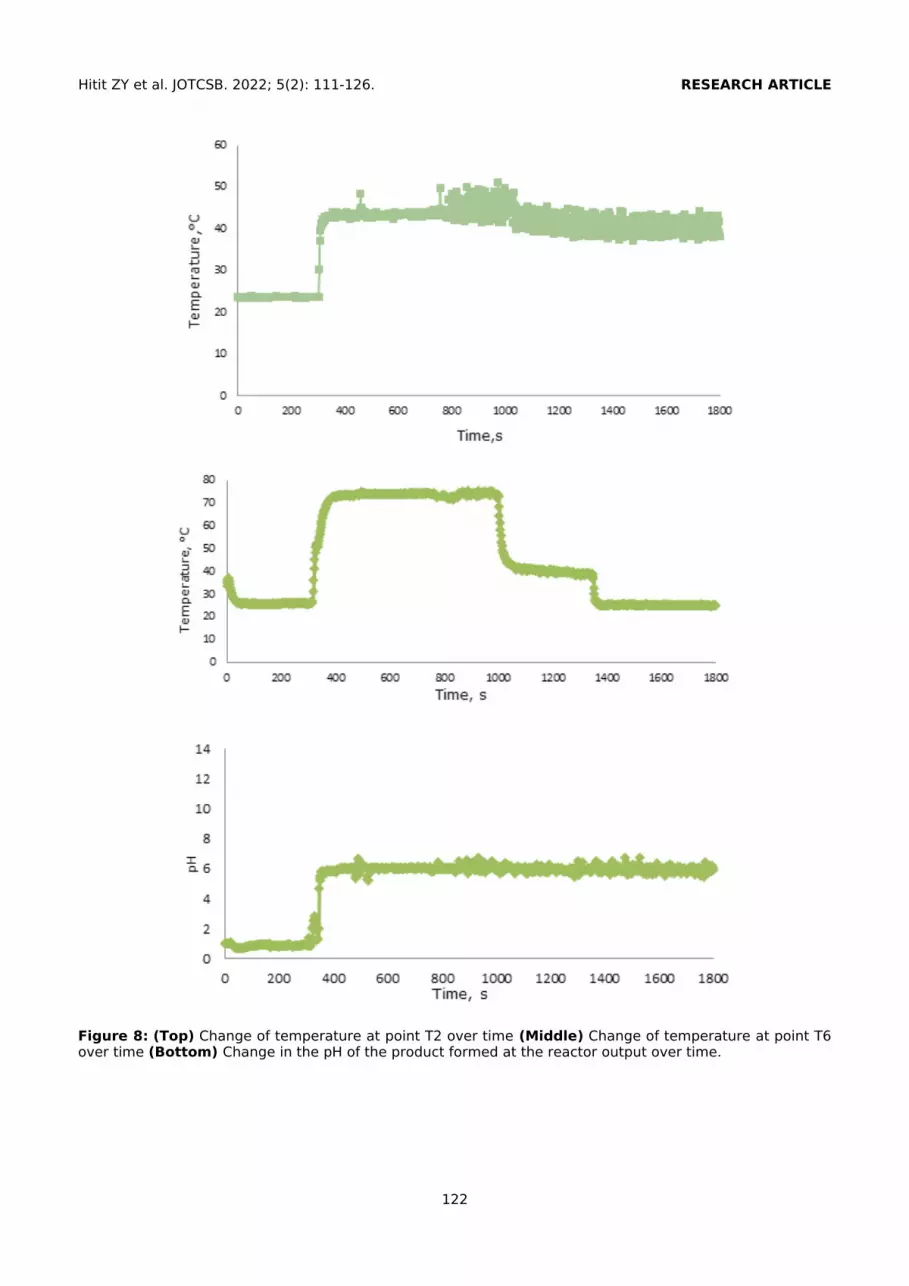
In the production reaction, the system was expectedto reach steady state after about 12 minutes, the pHvalue of the samples was measured as 6.5 and thetemperature values were measured asapproximately 55 °C. At the 30th minute ofproduction, sample pH was recorded as 6.6, andsample temperature was recorded as 26 °C.Approximately 1 minute after this measurement, thebase feed was completed, and the pH of the finalproduct was measured as 6.7. In Figure 8, thechange in the temperature of the samples taken atthe point T2 over time (Figure 8.a), the temperaturechanges in the jacket over time (Figure 8.b), and thepH change of the product over time (Figure 8.c) aregiven. The pH is acidic because there is no base
feeding until the 300th second. As the reactionstarted to take place with the feeding, the pH valuestarted to increase. During the reaction, acid feedand base feed from two different points continued.When the reaction was completed, it was observedthat the pH value of the desired product wasreached. The TFR design was proven to besuccessfully implemented.
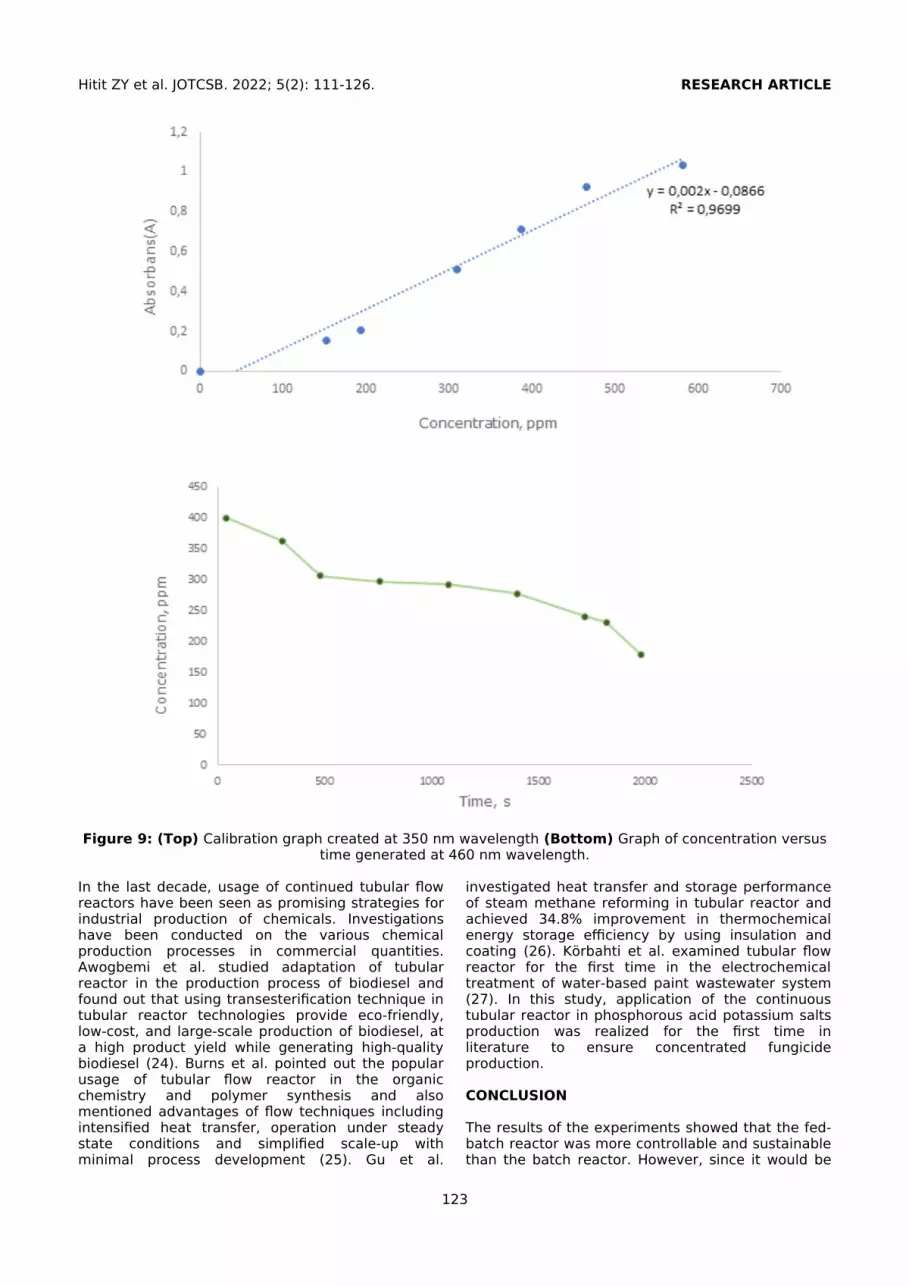
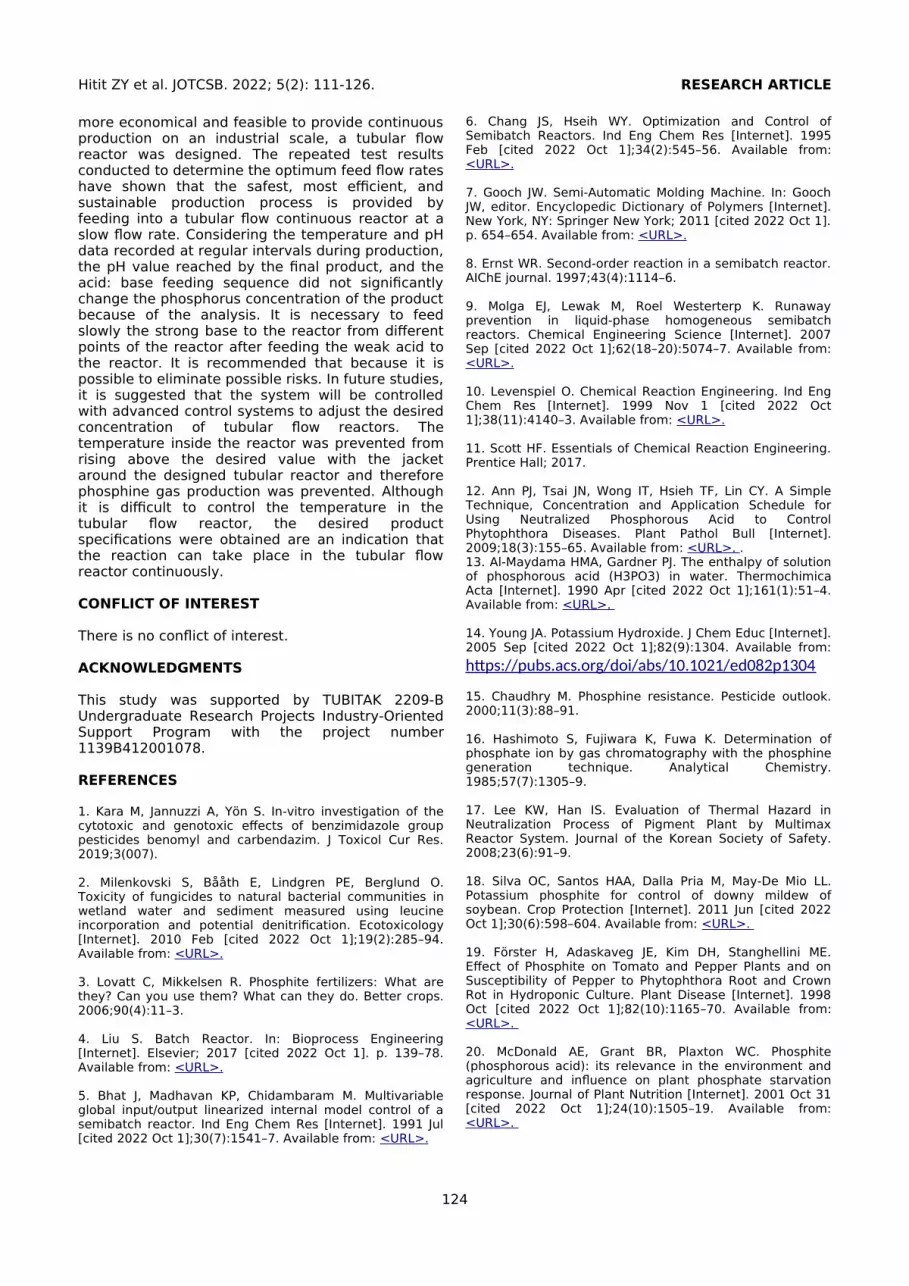
Results of Phosphorus Acid Analysis The stock solutions prepared at differentconcentrations in the range of 0-500 ppm wereprepared for analysis with Shimadzu - UV160 and amanual spectrophotometer to form the calibrationline of the amount of phosphorous acid contained inthe product. It was observed that the maximum pickvalues of the spectra were read at a wavelength of350 nm. Separate absorbance values of the solutionat each concentration were recorded for thewavelength of 460 nm and the wavelength of 350nm given in the literature (23). In Figure 9.a, thecalibration graph created at a wavelength of 350nm, and in Figure 9. b, the calibration graph createdat a wavelength of 460 nm is given.
The phosphorus acid concentrations of the productsobtained in different reactors were analyzed and thepercentages of phosphorus content in the productswere determined. The conclusive analysis resultswith the theoretical values with an acceptablemargin of error prove the applicability of theanalysis method and the high product yield. Whenthe base is fed to the reactor, it is expected that thevolume will double and thus the phosphorous acidconcentration will be halved. The product analysisresults are consistent with the expected theoreticalvalues.
However, in order for the obtained data to be usedin determining the chemical kinetic model, it wasexpected that the amount of 400 g/L H3PO3 in themedium was expected to be completely depleted intime, and when the reaction was completed, the 200g/L H3PO3 concentration was calculated in themedium, and it was concluded that the analysisperformed not only measured the phosphorus (P%)in the H3PO3 but also the total phosphorus amount inthe medium. For this reason, it was concluded thatthe results of the phosphorus analysis could not beused in kinetic analysis calculations.
120
Hitit ZY et al. JOTCSB. 2022; 5(2): 111-126. RESEARCH ARTICLE
Figure 7: (a) Change of temperature over time at point T2. (b) Change of jacket temperature over time(ambient temperature). (c) pH change in reactor output over time.
121
Hitit ZY et al. JOTCSB. 2022; 5(2): 111-126. RESEARCH ARTICLE
Figure 8: (Top) Change of temperature at point T2 over time (Middle) Change of temperature at point T6over time (Bottom) Change in the pH of the product formed at the reactor output over time.
122
Hitit ZY et al. JOTCSB. 2022; 5(2): 111-126. RESEARCH ARTICLE
Figure 9: (Top) Calibration graph created at 350 nm wavelength (Bottom) Graph of concentration versustime generated at 460 nm wavelength.
In the last decade, usage of continued tubular flowreactors have been seen as promising strategies forindustrial production of chemicals. Investigationshave been conducted on the various chemicalproduction processes in commercial quantities.Awogbemi et al. studied adaptation of tubularreactor in the production process of biodiesel andfound out that using transesterification technique intubular reactor technologies provide eco-friendly,low-cost, and large-scale production of biodiesel, ata high product yield while generating high-qualitybiodiesel (24). Burns et al. pointed out the popularusage of tubular flow reactor in the organicchemistry and polymer synthesis and alsomentioned advantages of flow techniques includingintensified heat transfer, operation under steadystate conditions and simplified scale-up withminimal process development (25). Gu et al.
investigated heat transfer and storage performanceof steam methane reforming in tubular reactor andachieved 34.8% improvement in thermochemicalenergy storage efficiency by using insulation andcoating (26). Körbahti et al. examined tubular flowreactor for the first time in the electrochemicaltreatment of water-based paint wastewater system(27). In this study, application of the continuoustubular reactor in phosphorous acid potassium saltsproduction was realized for the first time inliterature to ensure concentrated fungicideproduction.
CONCLUSION
The results of the experiments showed that the fed-batch reactor was more controllable and sustainablethan the batch reactor. However, since it would be
123
Hitit ZY et al. JOTCSB. 2022; 5(2): 111-126. RESEARCH ARTICLE
more economical and feasible to provide continuousproduction on an industrial scale, a tubular flowreactor was designed. The repeated test resultsconducted to determine the optimum feed flow rateshave shown that the safest, most efficient, andsustainable production process is provided byfeeding into a tubular flow continuous reactor at aslow flow rate. Considering the temperature and pHdata recorded at regular intervals during production,the pH value reached by the final product, and theacid: base feeding sequence did not significantlychange the phosphorus concentration of the productbecause of the analysis. It is necessary to feedslowly the strong base to the reactor from differentpoints of the reactor after feeding the weak acid tothe reactor. It is recommended that because it ispossible to eliminate possible risks. In future studies,it is suggested that the system will be controlledwith advanced control systems to adjust the desiredconcentration of tubular flow reactors. Thetemperature inside the reactor was prevented fromrising above the desired value with the jacketaround the designed tubular reactor and thereforephosphine gas production was prevented. Althoughit is difficult to control the temperature in thetubular flow reactor, the desired productspecifications were obtained are an indication thatthe reaction can take place in the tubular flowreactor continuously.
CONFLICT OF INTEREST
There is no conflict of interest.
ACKNOWLEDGMENTS
This study was supported by TUBITAK 2209-BUndergraduate Research Projects Industry-OrientedSupport Program with the project number1139B412001078.
REFERENCES
1. Kara M, Jannuzzi A, Yön S. In-vitro investigation of thecytotoxic and genotoxic effects of benzimidazole grouppesticides benomyl and carbendazim. J Toxicol Cur Res.2019;3(007).
2. Milenkovski S, Bååth E, Lindgren PE, Berglund O.Toxicity of fungicides to natural bacterial communities inwetland water and sediment measured using leucineincorporation and potential denitrification. Ecotoxicology[Internet]. 2010 Feb [cited 2022 Oct 1];19(2):285–94.Available from: <URL>.
3. Lovatt C, Mikkelsen R. Phosphite fertilizers: What arethey? Can you use them? What can they do. Better crops.2006;90(4):11–3.
4. Liu S. Batch Reactor. In: Bioprocess Engineering[Internet]. Elsevier; 2017 [cited 2022 Oct 1]. p. 139–78.Available from: <URL>.
5. Bhat J, Madhavan KP, Chidambaram M. Multivariableglobal input/output linearized internal model control of asemibatch reactor. Ind Eng Chem Res [Internet]. 1991 Jul[cited 2022 Oct 1];30(7):1541–7. Available from: <URL>.
6. Chang JS, Hseih WY. Optimization and Control ofSemibatch Reactors. Ind Eng Chem Res [Internet]. 1995Feb [cited 2022 Oct 1];34(2):545–56. Available from:<URL>.
7. Gooch JW. Semi-Automatic Molding Machine. In: GoochJW, editor. Encyclopedic Dictionary of Polymers [Internet].New York, NY: Springer New York; 2011 [cited 2022 Oct 1].p. 654–654. Available from: <URL>.
8. Ernst WR. Second‐order reaction in a semibatch reactor.AIChE journal. 1997;43(4):1114–6.
9. Molga EJ, Lewak M, Roel Westerterp K. Runawayprevention in liquid-phase homogeneous semibatchreactors. Chemical Engineering Science [Internet]. 2007Sep [cited 2022 Oct 1];62(18–20):5074–7. Available from:<URL>.
10. Levenspiel O. Chemical Reaction Engineering. Ind EngChem Res [Internet]. 1999 Nov 1 [cited 2022 Oct1];38(11):4140–3. Available from: <URL>.
11. Scott HF. Essentials of Chemical Reaction Engineering.Prentice Hall; 2017.
12. Ann PJ, Tsai JN, Wong IT, Hsieh TF, Lin CY. A SimpleTechnique, Concentration and Application Schedule forUsing Neutralized Phosphorous Acid to ControlPhytophthora Diseases. Plant Pathol Bull [Internet].2009;18(3):155–65. Available from: <URL>. . 13. Al-Maydama HMA, Gardner PJ. The enthalpy of solutionof phosphorous acid (H3PO3) in water. ThermochimicaActa [Internet]. 1990 Apr [cited 2022 Oct 1];161(1):51–4.Available from: <URL>.
14. Young JA. Potassium Hydroxide. J Chem Educ [Internet].2005 Sep [cited 2022 Oct 1];82(9):1304. Available from:
https://pubs.acs.org/doi/abs/10.1021/ed082p1304
15. Chaudhry M. Phosphine resistance. Pesticide outlook.2000;11(3):88–91.
16. Hashimoto S, Fujiwara K, Fuwa K. Determination ofphosphate ion by gas chromatography with the phosphinegeneration technique. Analytical Chemistry.1985;57(7):1305–9.
17. Lee KW, Han IS. Evaluation of Thermal Hazard inNeutralization Process of Pigment Plant by MultimaxReactor System. Journal of the Korean Society of Safety.2008;23(6):91–9.
18. Silva OC, Santos HAA, Dalla Pria M, May-De Mio LL.Potassium phosphite for control of downy mildew ofsoybean. Crop Protection [Internet]. 2011 Jun [cited 2022Oct 1];30(6):598–604. Available from: <URL>.
19. Förster H, Adaskaveg JE, Kim DH, Stanghellini ME.Effect of Phosphite on Tomato and Pepper Plants and onSusceptibility of Pepper to Phytophthora Root and CrownRot in Hydroponic Culture. Plant Disease [Internet]. 1998Oct [cited 2022 Oct 1];82(10):1165–70. Available from:<URL>.
20. McDonald AE, Grant BR, Plaxton WC. Phosphite(phosphorous acid): its relevance in the environment andagriculture and influence on plant phosphate starvationresponse. Journal of Plant Nutrition [Internet]. 2001 Oct 31[cited 2022 Oct 1];24(10):1505–19. Available from:<URL>.
124
Hitit ZY et al. JOTCSB. 2022; 5(2): 111-126. RESEARCH ARTICLE
21. Achary VMM, Ram B, Manna M, Datta D, Bhatt A, ReddyMK, et al. Phosphite: a novel P fertilizer for weedmanagement and pathogen control. Plant Biotechnol J[Internet]. 2017 Dec [cited 2022 Oct 1];15(12):1493–508.Available from: <URL>.
22. Gübre analizleri yapma-2 [Internet]. Milli EğitimBakanliği; 2014. Available from: <URL>.
23. Perrin FX, Phan TA, Nguyen DL. Synthesis andcharacterization of polyaniline nanoparticles in phosphonicacid amphiphile aqueous micellar solutions for waterbornecorrosion protection coatings. J Polym Sci Part A: PolymChem [Internet]. 2015 Jul 1 [cited 2022 Oct1];53(13):1606–16. Available from: <URL>.
24. Awogbemi O, Kallon DVV. Application of TubularReactor Technologies for the Acceleration of BiodieselProduction. Bioengineering [Internet]. 2022 Jul 27 [cited2022 Oct 1];9(8):347. Available from: <URL>.
25. Burns JA, Houben C, Anastasaki A, Waldron C, LapkinAA, Haddleton DM. Poly(acrylates) via SET-LRP in acontinuous tubular reactor. Polym Chem [Internet]. 2013[cited 2022 Oct 1];4(17):4809. Available from: <URL>.
26. Gu R, Ding J, Wang Y, Yuan Q, Wang W, Lu J. Heattransfer and storage performance of steam methanereforming in tubular reactor with focused solar simulator.Applied Energy [Internet]. 2019 Jan [cited 2022 Oct 1];233–234:789–801. Available from: <URL>.
27. Körbahti BK, Tanyolaç A. Electrochemical treatment ofsimulated industrial paint wastewater in a continuoustubular reactor. Chemical Engineering Journal [Internet].2009 May 15 [cited 2022 Oct 1];148(2–3):444–51.Available from: <URL>.
125

Hitit ZY et al. JOTCSB. 2022; 5(2): 111-126. RESEARCH ARTICLE
126