Embed Size (px)
Citation preview
1
VISCOSITY OF CONCENTRATED SUSPENSIONS: INFLUENCE OF
CLUSTER FORMATION
V.Starov1ƒ, V.Zhdanov1, M.Meireles2, C.Molle2
1 Department of Chemical Engineering, Loughborough University, Loughborough,
Leicestershire, LE11 3TU, UK, [email protected] 2Laboratoire de Génie Chimique, Université P.Sabatier, Toulouse, France,
ABSTRACT Dispersed particles can form clusters even at sufficiently low concentrations. Colloidal
and hydrodynamic forces are responsible for this phenomenon and these forces determine
both structure and size of clusters. We assume that viscosity of concentrated suspension is
completely determined by cluster size distribution, no matter if clusters form under the action
of colloidal, hydrodynamic interactions or shear rates. Based on this assumption an equation,
which describes dependency of viscosity on a concentration of dispersed particles taking into
account cluster formation, is deduced. Under special restrictions the deduced dependency
coincides with the well-known Douherty-Krieger’s equation except for a clear physical
meaning of entering parameters. Our consideration shows that Douherty-Krieger’s equation
has deeper physical background than it has been supposed earlier. Experimental verification
of the suggested model shows a good agreement with the theory predictions and proves a
presence of clusters even at low concentrations of dispersed particles.
Key words: cluster size distribution, viscosity, concentrated suspensions.
ƒ To whom correspondence should be addressed
hal-0
0323
082,
ver
sion
1 -
19 S
ep 2
008
Author manuscript, published in "Advances in Colloid and Interface Science 96, 1-3 (2002) 279-293"
2
INTRODUCTION There is no need to describe an importance of concentrated suspensions for industrial
applications as well as a number of theoretical approaches used for description of viscosity
dependence on concentration of dispersed particles [1]. Colloidal and hydrodynamic
interactions between particles result in a formation of doublets, triplets and higher clusters
[1]. Aggregation of particles is accompanied by destruction of aggregates caused by finite
depth of potential well and/or shear stress applied. As a result a distribution of cluster sizes is
formed in the suspension. Presence of clusters influences drastically viscosity of concentrated
suspensions. Computer simulation is a useful tool for exploring the relationship between
interparticle interactions and suspension rheological properties. Clustering and restructuring
of colloidal systems under shear is observed in a number of computer simulations [2-6].
However, computer simulations can not substitute analytical modeling and interactions
between these two types of modeling can provide a new insight. Here we present a new
analytical method, which allows deducing a dependency of viscosity on particle concentration
taking into account cluster formation. Differential method, a modified version of which is
used in the present paper, has not been frequently used in this area. That is why differential
method is briefly reviewed below.
Differential method is adjusted for determination of effective properties of non-
homogenous media. For the first time differential method has been suggested in ref. [7] and
then it has been applied for determination of viscosity of concentrated suspensions without
cluster formation [8,9]. Elastic properties of solid non-homogeneous materials have been
investigated [10,11] with the help of the same method. Below a modified version of
differential method is used for calculation of viscosity dependence on concentration in the
case when clusters form in a suspension.
THEORY Let us consider a suspension of volume V, which contains N single particles.
Volume fraction of particles, γ, is
VNνγ = , (1)
where aa ,3
4 3πν = are the volume of a single particle and particle radius, respectively. Let
,...3,2,1, =ini be a number of clusters of corresponding size in the volume V and
hal-0
0323
082,
ver
sion
1 -
19 S
ep 2
008

3
,...3,2,1,max, =iiγ be an averaged packing density of single particles inside clusters. n1 is a
number density of “clusters of size 1”, that is, single particles, hence, γ1,max=1.
Volume fraction of clusters containing i particles can be written as
,...3,2,1,,max,
=== iivn
VVV
i
ii
ii γ
γ (2)
which satisfy the following mass conservation condition
∑∞
=
=1
max,i
ii γγγ (3)
It is assumed below that the viscosity of the suspension is completely determined by
cluster size distribution, that is, can be described by the following dependency
( ) ,...],,,[, 32100 γγγηγηη Ψ= , (4)
where 0η is the viscosity of the pure liquid.
When all cluster concentrations, iγ , are zero, the suspension consists only of the pure
liquid and Eq (4) gives
,...)0,0,0,( 00 ηη Ψ= , (5)
which is used below.
When particle density, γ, is small then all iγ are also small and Eq (4) can be written
in accordance with Einstein’s relation as
ii
iγηηγγγη ∑∞
=
+Ψ=Ψ1
003210 5.2,...]0,0,0,[,...],,,[ A (6)
where coefficients ,...3,2,1, =iAi are deviations of friction coefficient of clusters with i
particles from the corresponding value for solid particles. Obviously A1=1. Coefficients
,...3,2,1, =iAi are referred to below as friction coefficients for abbreviation. A meaning of
friction coefficients can be understood using the following example. Let two spherical
particles with the same diameter be considered: the first one is a solid particle, the second one
is a particle composed of i smaller particles (a model of a cluster). A friction force exerted to
each of two particles under consideration will be different if both particles are placed in a
liquid flow. Let iA be a ratio of the friction force in the case of the composed particle
(cluster) to the corresponding force exerted to the solid particle. The friction force is changed
in the case of the composed particle because of two reasons: (a) a solid surface exposed to the
liquid flow is smaller than in the case of the solid particle, (b) the liquid flow partially
hal-0
0323
082,
ver
sion
1 -
19 S
ep 2
008
4
penetrates inside the composed particle. Two mentioned trends, (a) and (b), change
,...3,2, =iAi values in different ways: because of the reason (a) these values decrease and
increase because of the reason (b). That is, a complex interplay determines ,...3,2, =iAi
values. Friction coefficients can be calculated based on theory developed in [12].
Deviation of cluster shapes from spherical is an additional cause of change of friction
coefficient values [13].
It is obvious that parameters ,...3,2,max, =iAiiγ are functions of both colloidal,
hydrodynamic interactions and applied shear rates. These dependencies are left undetermined
in the present consideration.
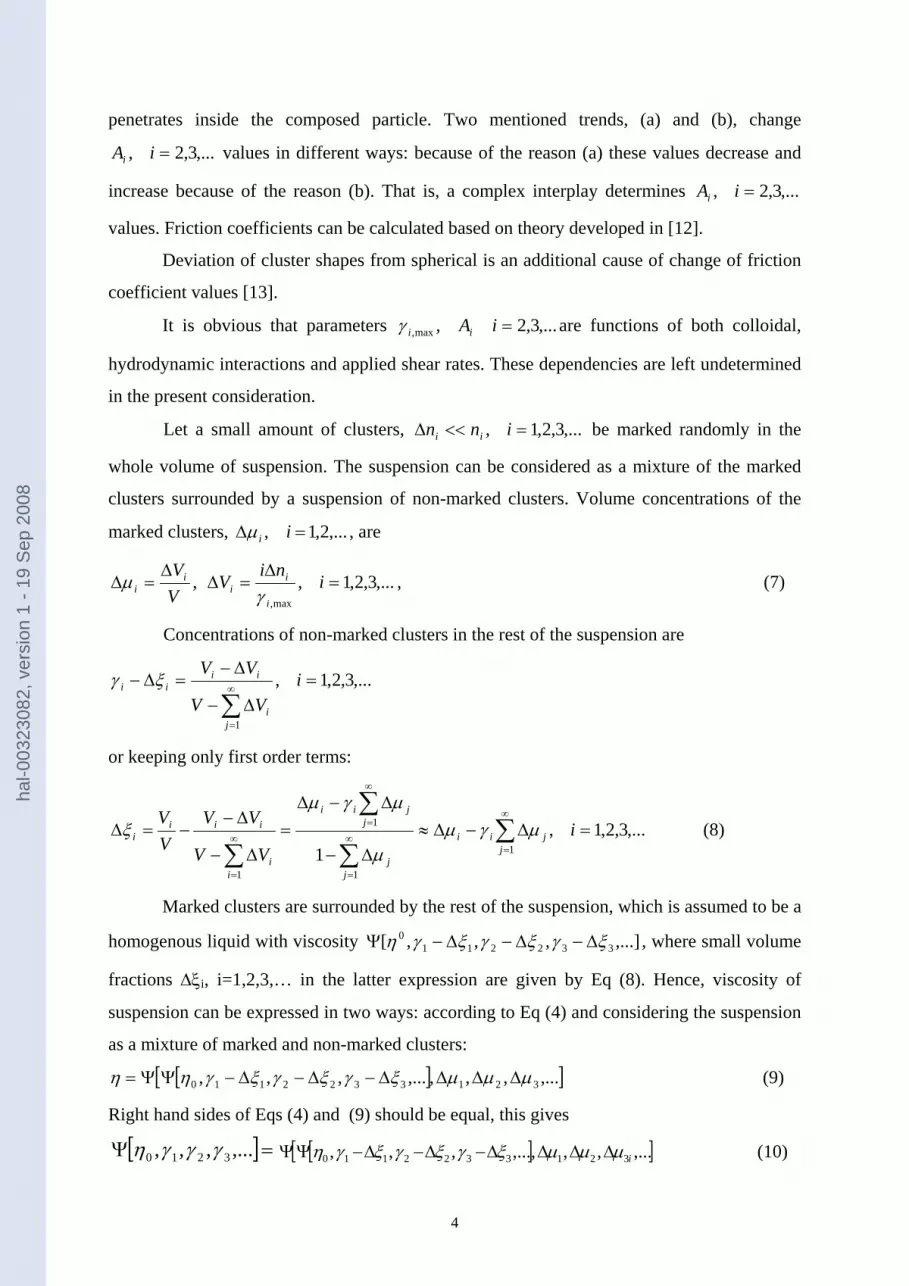
Let a small amount of clusters, ,...3,2,1, =<<Δ inn ii be marked randomly in the
whole volume of suspension. The suspension can be considered as a mixture of the marked
clusters surrounded by a suspension of non-marked clusters. Volume concentrations of the
marked clusters, ,...2,1, =Δ iiμ , are
,...3,2,1,,max,
=Δ
=ΔΔ
=Δ ini
VVV
i
ii
ii γ
μ , (7)
Concentrations of non-marked clusters in the rest of the suspension are
,...3,2,1,
1
=Δ−
Δ−=Δ−
∑∞
=
iVV
VV
ji
iiii ξγ
or keeping only first order terms:
,...3,2,1,1 1
1
1
1
=Δ−Δ≈Δ−
Δ−Δ=
Δ−
Δ−−=Δ ∑
∑
∑
∑
∞
=∞
=
∞
=∞
=
iVV
VVVV
jjii
jj
jjii
ii
iiii μγμ
μ
μγμξ (8)
Marked clusters are surrounded by the rest of the suspension, which is assumed to be a
homogenous liquid with viscosity ,...],,,[ 3322110 ξγξγξγη Δ−Δ−Δ−Ψ , where small volume
fractions Δξi, i=1,2,3,… in the latter expression are given by Eq (8). Hence, viscosity of
suspension can be expressed in two ways: according to Eq (4) and considering the suspension
as a mixture of marked and non-marked clusters:
[ ][ ],...,,,,...,,, 3213322110 μμμξγξγξγηη ΔΔΔΔ−Δ−Δ−ΨΨ= (9)
Right hand sides of Eqs (4) and (9) should be equal, this gives
[ ]=Ψ ,...,,, 3210 γγγη [ ][ ],...,,,,...,,, 3213322110 iμμμξγξγξγη ΔΔΔΔ−Δ−Δ−ΨΨ (10)
hal-0
0323
082,
ver
sion
1 -
19 S
ep 2
008
5
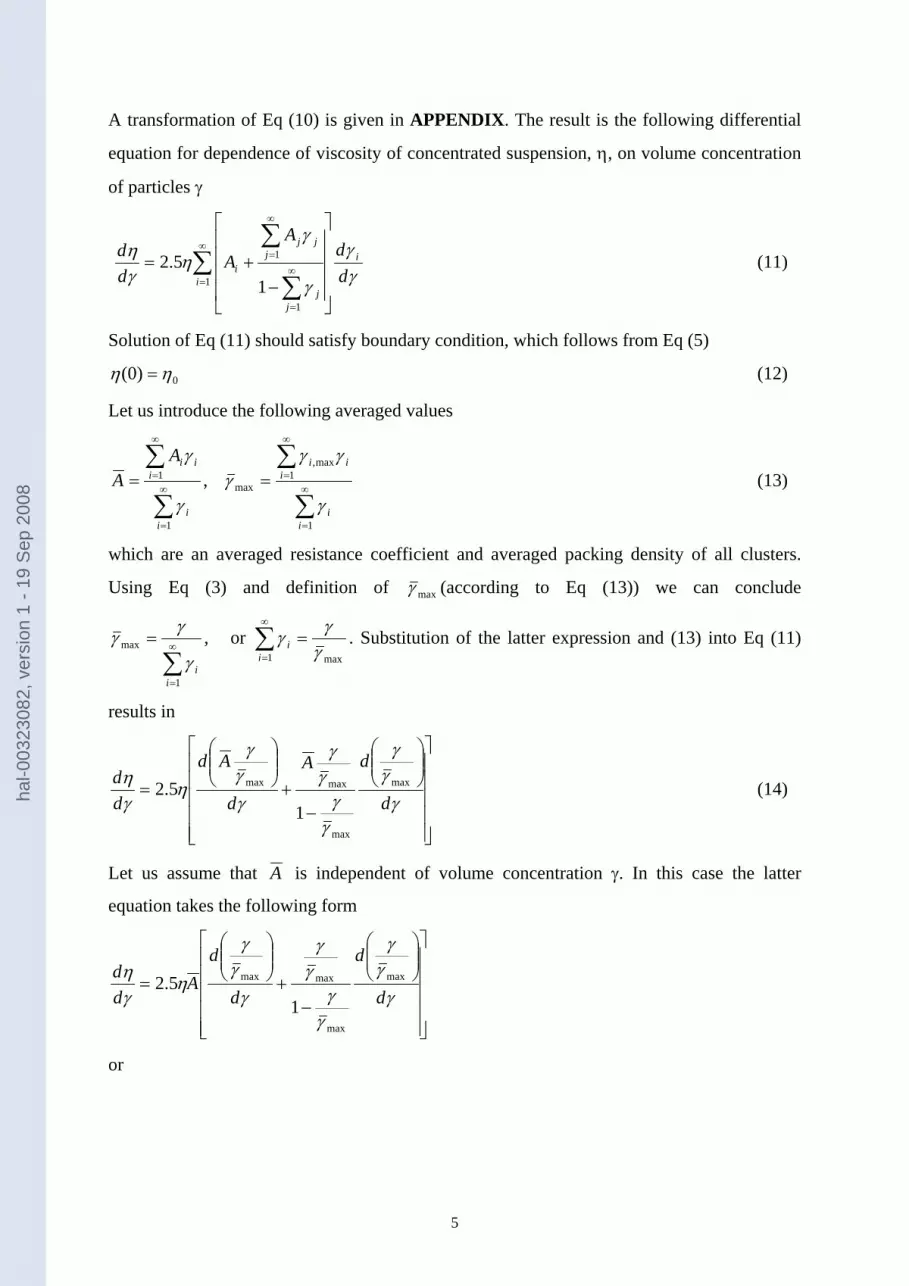
A transformation of Eq (10) is given in APPENDIX. The result is the following differential
equation for dependence of viscosity of concentrated suspension, η, on volume concentration
of particles γ
γγ
γ
γη
γη
dd
AA
dd i
i
jj
jjj
i∑∑
∑∞
=∞
=
∞
=
⎥⎥⎥⎥
⎦
⎤
⎢⎢⎢⎢
⎣
⎡
−+=
1
1
1
15.2 (11)
Solution of Eq (11) should satisfy boundary condition, which follows from Eq (5)
0)0( ηη = (12)
Let us introduce the following averaged values
∑
∑
∑
∑∞
=
∞
=∞
=
∞
= ==
1
1max,
max
1
1 ,
ii
iii
ii
iiiA
Aγ
γγγ
γ
γ (13)
which are an averaged resistance coefficient and averaged packing density of all clusters.
Using Eq (3) and definition of maxγ (according to Eq (13)) we can conclude
,
1
max
∑∞
=
=
iiγ
γγ or max1 γγγ =∑
∞
=ii . Substitution of the latter expression and (13) into Eq (11)
results in
⎥⎥⎥⎥⎥
⎦
⎤
⎢⎢⎢⎢⎢
⎣
⎡⎟⎟⎠
⎞⎜⎜⎝
⎛
−+
⎟⎟⎠
⎞⎜⎜⎝
⎛
=γγγ
γγ
γγ
γγγ
ηγη
d
dA
d
Ad
dd max
max
maxmax
15.2 (14)
Let us assume that A is independent of volume concentration γ. In this case the latter
equation takes the following form
⎥⎥⎥⎥⎥
⎦
⎤
⎢⎢⎢⎢⎢
⎣
⎡⎟⎟⎠
⎞⎜⎜⎝
⎛
−+
⎟⎟⎠
⎞⎜⎜⎝
⎛
=γγγ
γγ
γγ
γγγ
ηγη
d
d
d
dA
dd max
max
maxmax
15.2
or
hal-0
0323
082,
ver
sion
1 -
19 S
ep 2
008
6
γγγ
γγη
γη
d
dA
dd ⎟⎟
⎠
⎞⎜⎜⎝
⎛
−= max
max
1
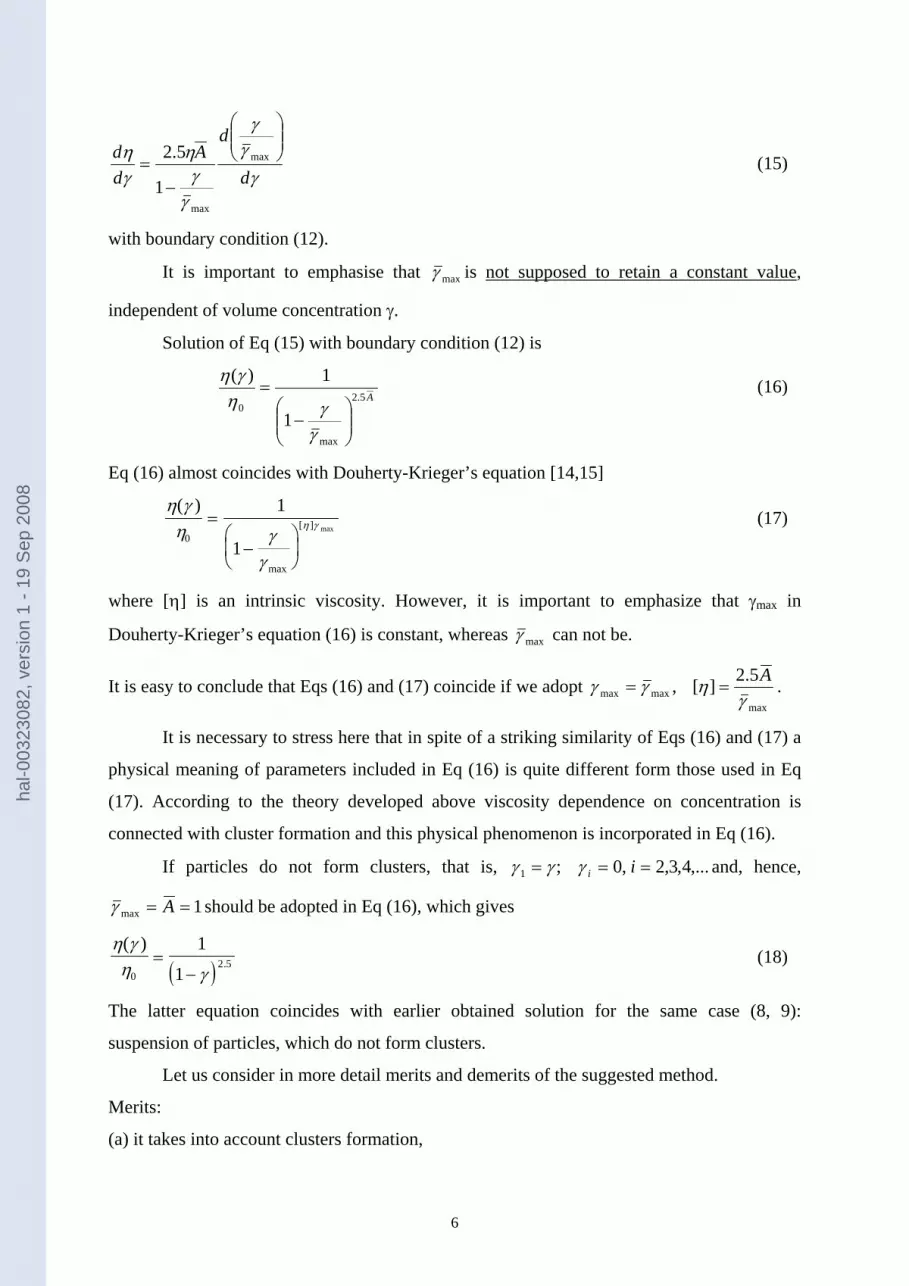
5.2 (15)
with boundary condition (12).
It is important to emphasise that maxγ is not supposed to retain a constant value,
independent of volume concentration γ.
Solution of Eq (15) with boundary condition (12) is
A5.2
max
01
1)(
⎟⎟⎠
⎞⎜⎜⎝
⎛−
=
γγη
γη (16)
Eq (16) almost coincides with Douherty-Krieger’s equation [14,15]
η γη γ
γ
η γ
( )
max
[ ] max0
1
1
=
−⎛
⎝⎜
⎞
⎠⎟
(17)
where [η] is an intrinsic viscosity. However, it is important to emphasize that γmax in
Douherty-Krieger’s equation (16) is constant, whereas maxγ can not be.
It is easy to conclude that Eqs (16) and (17) coincide if we adopt max
maxmax5.2][,
γηγγ A
== .
It is necessary to stress here that in spite of a striking similarity of Eqs (16) and (17) a
physical meaning of parameters included in Eq (16) is quite different form those used in Eq
(17). According to the theory developed above viscosity dependence on concentration is
connected with cluster formation and this physical phenomenon is incorporated in Eq (16).
If particles do not form clusters, that is, ,...4,3,2,0;1 === iiγγγ and, hence,
1max == Aγ should be adopted in Eq (16), which gives
( )η γη γ
( ).
02 5
1
1=
− (18)
The latter equation coincides with earlier obtained solution for the same case (8, 9):
suspension of particles, which do not form clusters.
Let us consider in more detail merits and demerits of the suggested method.
Merits:
(a) it takes into account clusters formation,
hal-0
0323
082,
ver
sion
1 -
19 S
ep 2
008

7
(b) it takes into account a simplest particle-particle interaction, that is, hard core interaction;
(c) it gives a clear physical meaning of parameters, which are present in Eq(11);
(d) a striking simplicity of this method.
Demerits:
the main demerit of this method is a hypothesis that suspension of non-marked particles can
be considered as a homogeneous liquid (mean field approximation). Marked particles (the
same as «non-marked ones»!) feel «non-marked particles» as a continuous medium.
However, a reasonable agreement of ions’ diffusion coefficients calculated according to the
Einstein’s relation can be considered as a justification of this hypothesis.
COMPARISON WITH KNOWN EXPERIMENTAL DATA
A comprehensive review of experimental data on viscosity of concentrated
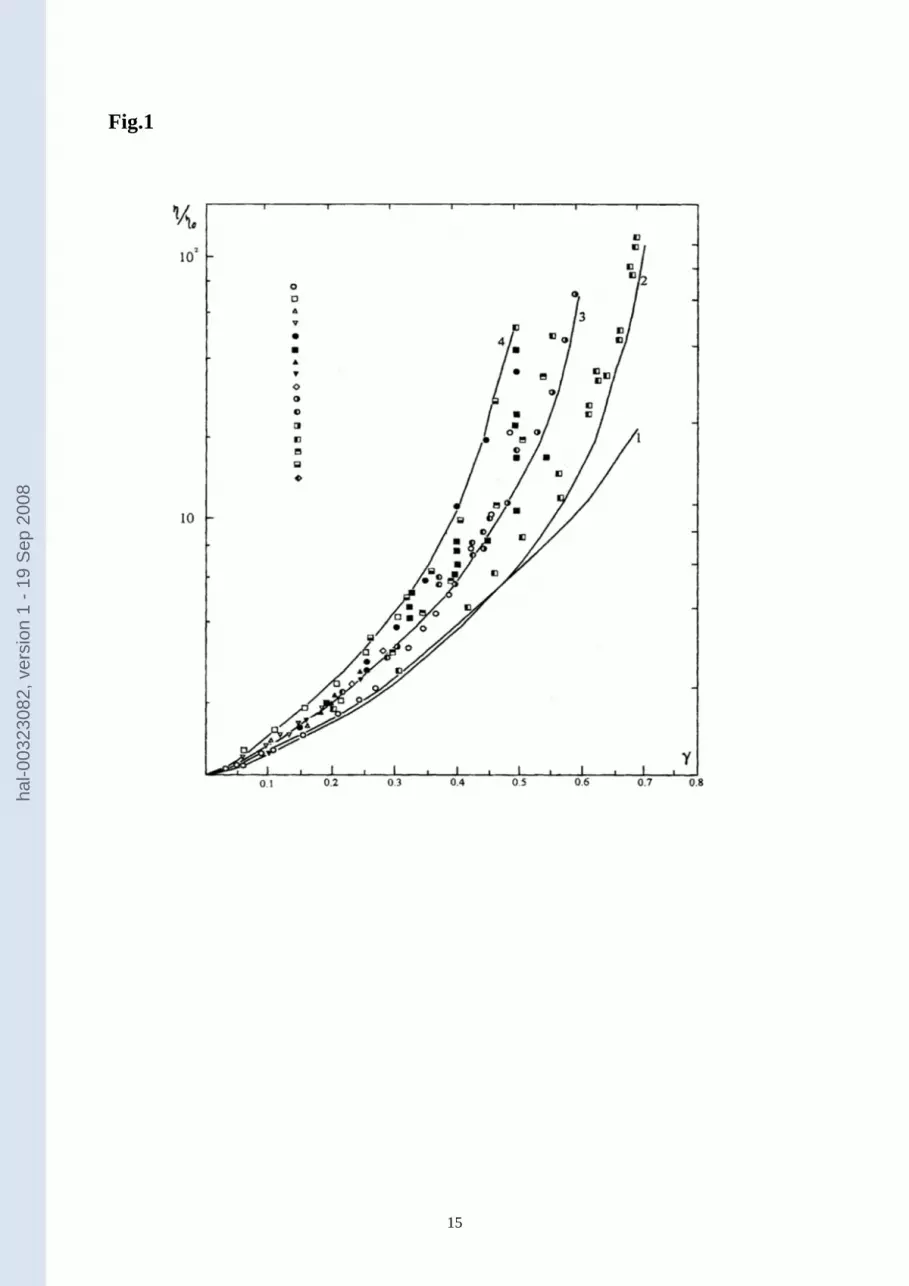
suspensions is presented in [16]. In Fig.1 comparison of experimental data with predictions
according to Eq (18) (curve 1), and Eq (16) (curves 2-4) is presented. Experimental points
used in Fig. 1 are specified in ref. [16]. Fig.1 shows that the whole array of experimental data
can be described using Eq (16) at different but reasonable parameters maxγ and A : curve 4
( maxγ =0.56, close to a simple cubic packing density; A = 0.72); curve 3 ( maxγ = 0.65, close to
a cubic centered packing density; A =0.67), curve 2 ( maxγ = 0.73, close to hexagonal packing
density; A = 0.61).
EXPERIMENTAL METHOD
This part presents results of rheological experiments and comparison with theoretical
predictions. Yeast suspensions at different cell concentrations are used.
Suspension
The suspension under investigation was made of active dry baker’s yeast
Saccharomyces Cerevisiae (Lesaffre, France) suspended in physiological solution (8 g/l
NaCl). Yeast particles are of 5 µm average diameter. The particle density is 1.13 g/cm3.
Volume fraction of the suspension is used below.
Volume fraction determination
Since yeast cells allow water transfer through the cell's membrane, the determination
of the volume fraction is not straightforward. The conversion of a dry weight into the volume
fraction has been a source of errors in literature on the concentration dependence of yeast
hal-0
0323
082,
ver
sion
1 -
19 S
ep 2
008
8
viscosity [17]. A particular attention is given here to the determination of the volume fraction,
γ, of yeast suspensions. Reuss et al. [17] proposed a dye dilution technique to determine a
volume fraction as a function of a dry weight at several osmotic pressures: a fixed quantity of
a dye (Naphtol green B) solution is mixed with the yeast suspension. External water is then
determined by measuring the dilution effect.
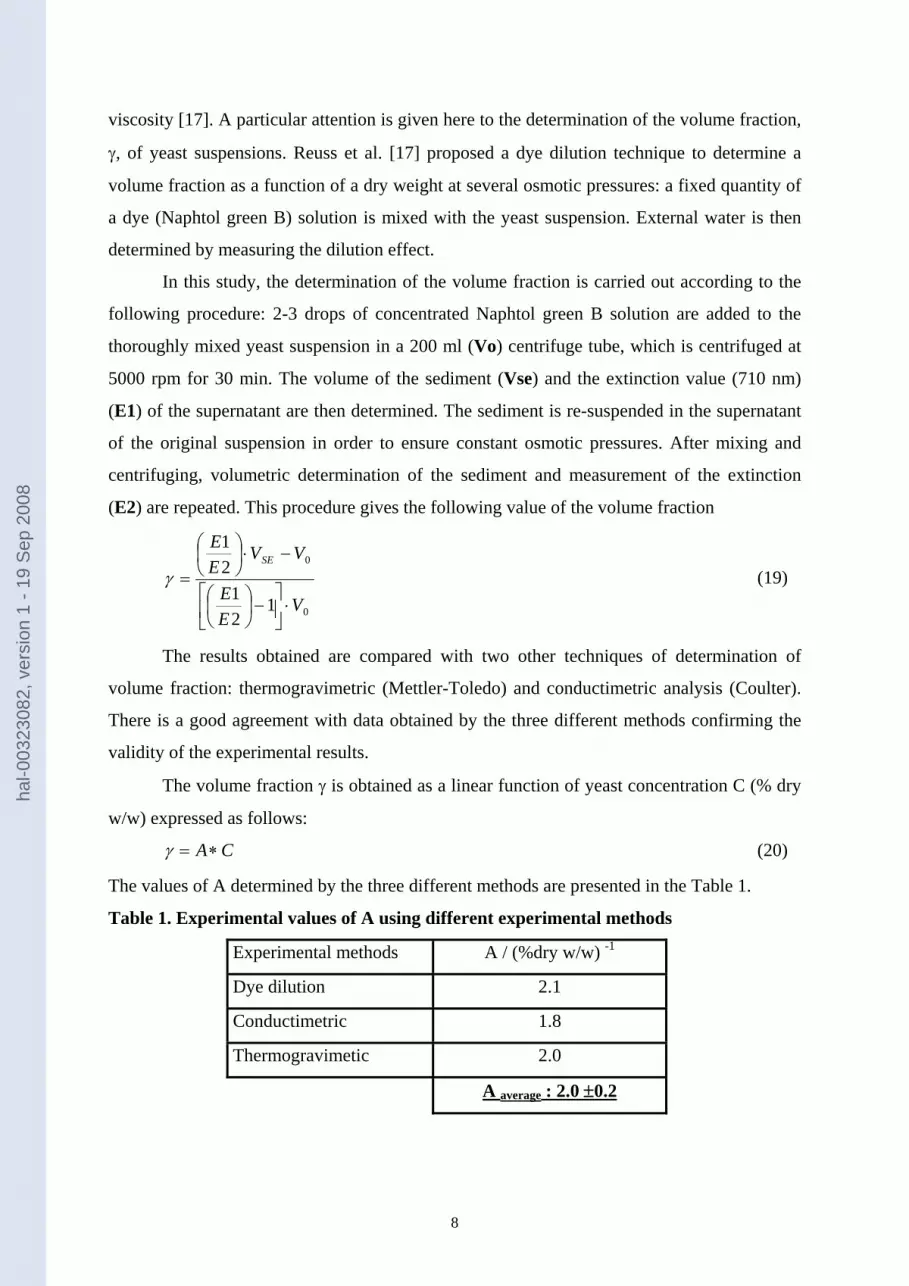
In this study, the determination of the volume fraction is carried out according to the
following procedure: 2-3 drops of concentrated Naphtol green B solution are added to the
thoroughly mixed yeast suspension in a 200 ml (Vo) centrifuge tube, which is centrifuged at
5000 rpm for 30 min. The volume of the sediment (Vse) and the extinction value (710 nm)
(E1) of the supernatant are then determined. The sediment is re-suspended in the supernatant
of the original suspension in order to ensure constant osmotic pressures. After mixing and
centrifuging, volumetric determination of the sediment and measurement of the extinction
(E2) are repeated. This procedure gives the following value of the volume fraction
0
0
121
21
VEE
VVEE
SE
⋅⎥⎦
⎤⎢⎣
⎡−⎟
⎠⎞
⎜⎝⎛
−⋅⎟⎠⎞
⎜⎝⎛
=γ (19)
The results obtained are compared with two other techniques of determination of
volume fraction: thermogravimetric (Mettler-Toledo) and conductimetric analysis (Coulter).
There is a good agreement with data obtained by the three different methods confirming the
validity of the experimental results.
The volume fraction γ is obtained as a linear function of yeast concentration C (% dry
w/w) expressed as follows:
CA∗=γ (20)
The values of A determined by the three different methods are presented in the Table 1.
Table 1. Experimental values of A using different experimental methods
Experimental methods A / (%dry w/w) -1
Dye dilution 2.1
Conductimetric 1.8
Thermogravimetic 2.0
A average : 2.0 ±0.2
hal-0
0323
082,
ver
sion
1 -
19 S
ep 2
008
9
Rheological measurements and observation of cluster formation
Rheological measurements utilized a controlled strain rate rheometer (Rheomat 115 –
Contraves) with concentric cylinder geometry. Temperature of the suspension in the
rheometer was maintained and controlled at 20 °C in all measurements.
Determination of physical parameters describing the rheological properties of the
suspension requires steady state conditions. Experiment shows that at volume fractions higher
than 0.3 the rheological behavior becomes non-Newtonian because viscosity value depends
on the shear rate.
A linear increasing-decreasing shear rates sequences 10-1000-10 s-1 are performed
during 2000s including a step at 1000 s-1 for 200 s to reach a steady state.
For a direct determination of cluster formation a drop of yeast suspension is placed on
the support of the sample and is observed by optical microscope (Zeiss). The number of single
particles (N1), clusters (N2), triplets (N3), four and more particle clusters (N4&+) are
calculated.
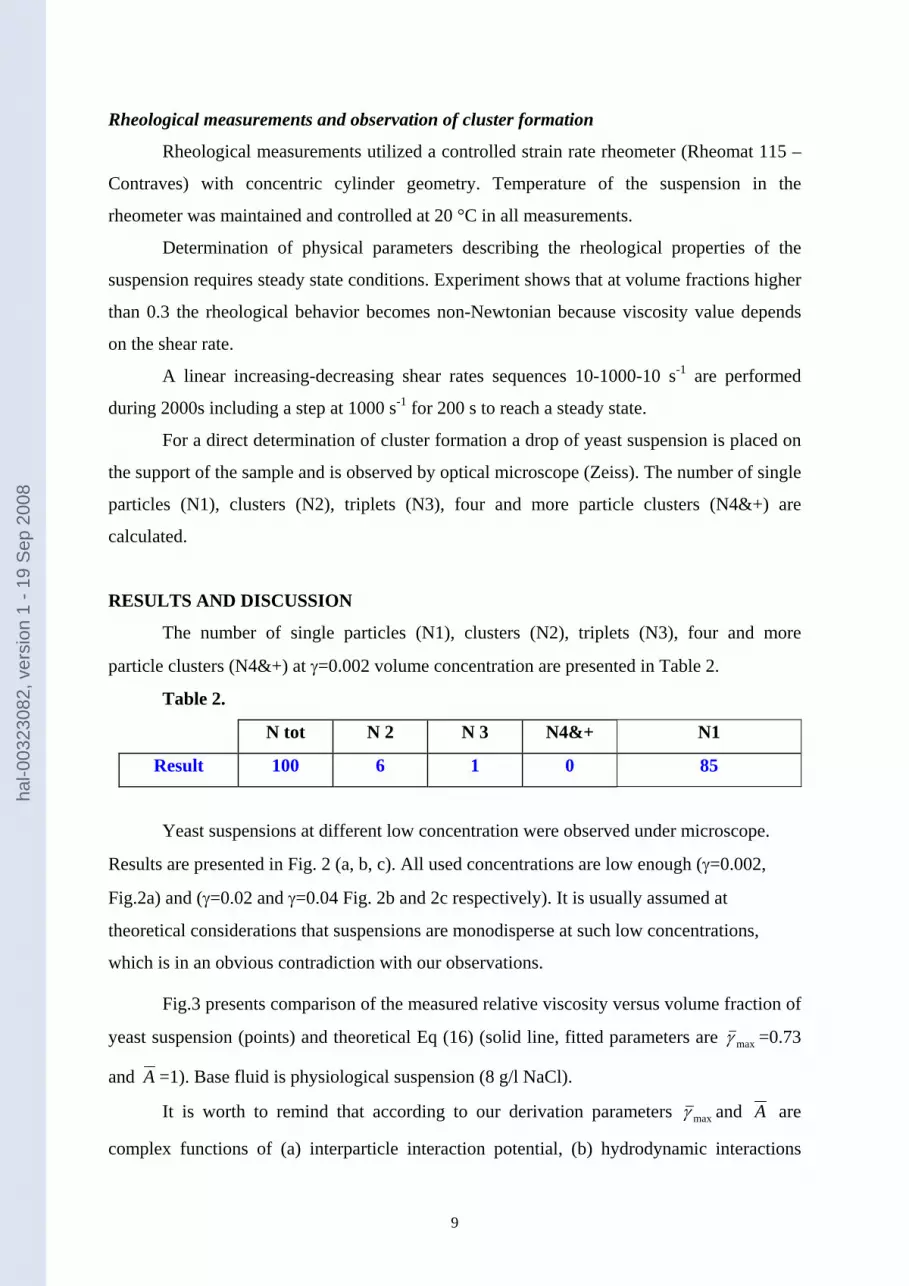
RESULTS AND DISCUSSION
The number of single particles (N1), clusters (N2), triplets (N3), four and more
particle clusters (N4&+) at γ=0.002 volume concentration are presented in Table 2.
Table 2.
N tot N 2 N 3 N4&+ N1
Result 100 6 1 0 85
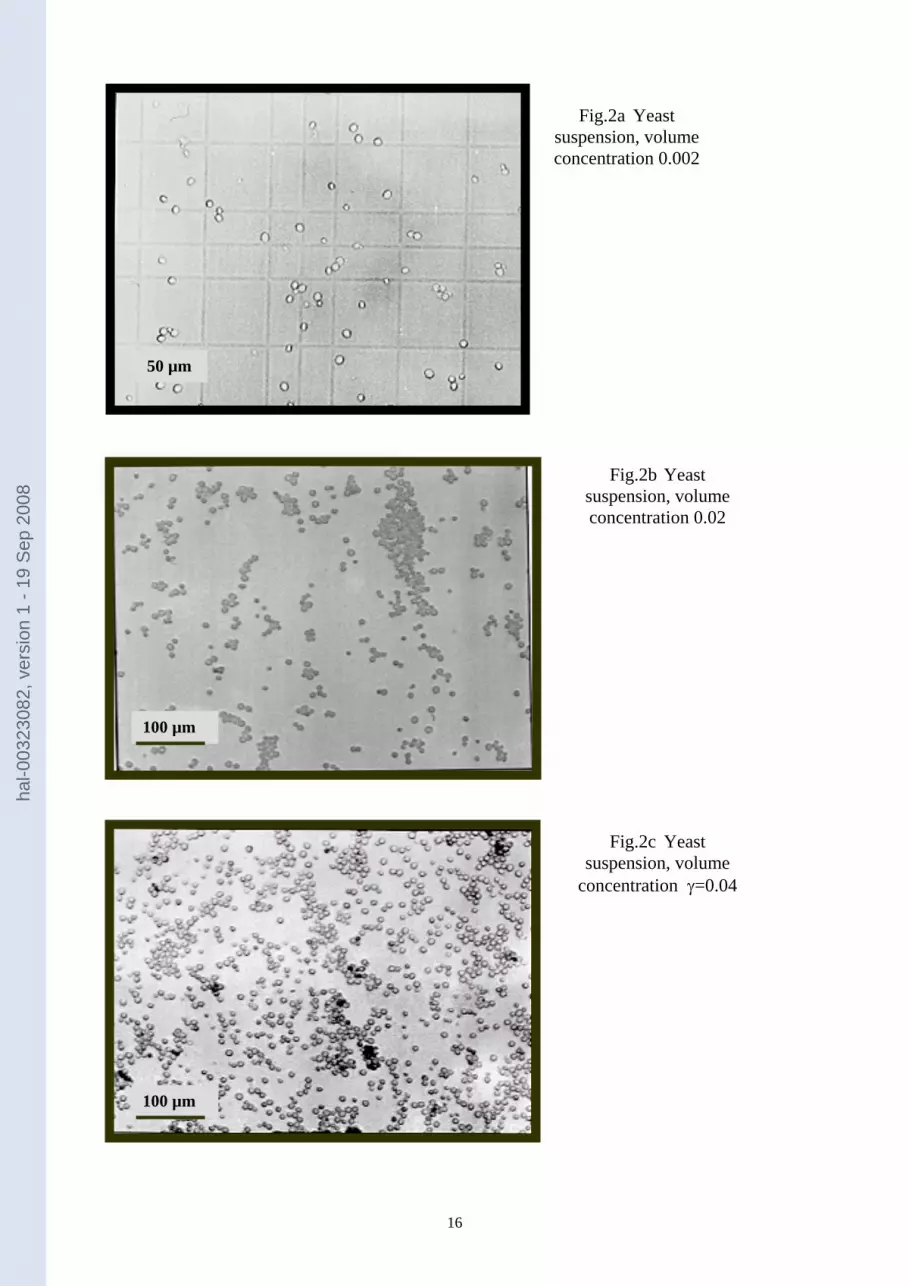
Yeast suspensions at different low concentration were observed under microscope.
Results are presented in Fig. 2 (a, b, c). All used concentrations are low enough (γ=0.002,
Fig.2a) and (γ=0.02 and γ=0.04 Fig. 2b and 2c respectively). It is usually assumed at
theoretical considerations that suspensions are monodisperse at such low concentrations,
which is in an obvious contradiction with our observations.
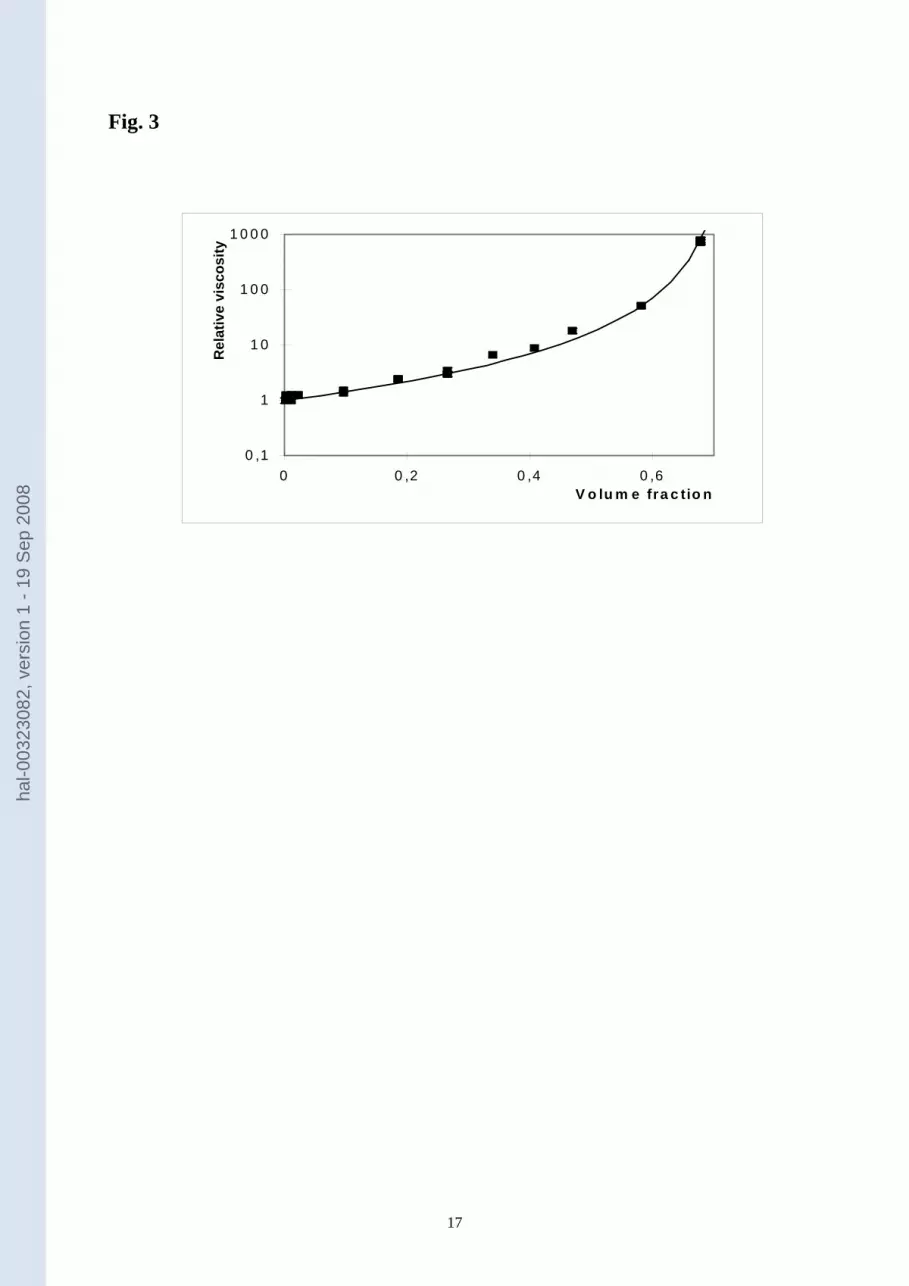
Fig.3 presents comparison of the measured relative viscosity versus volume fraction of
yeast suspension (points) and theoretical Eq (16) (solid line, fitted parameters are maxγ =0.73
and A =1). Base fluid is physiological suspension (8 g/l NaCl).
It is worth to remind that according to our derivation parameters maxγ and A are
complex functions of (a) interparticle interaction potential, (b) hydrodynamic interactions
hal-0
0323
082,
ver
sion
1 -
19 S
ep 2
008
10
between clusters. Both interactions are unknown in the case of yeast suspensions. In spite of
this a reasonable agreement with experimental data are achieved using fitting procedure with
these two parameters.
CONCLUSIONS
A new method is suggested for derivation of viscosity dependence on a concentration
of dispersed particles taking into account cluster formation. We assume that viscosity of
concentrated suspension is completely determined by cluster size distribution, no matter if
clusters form under the action of colloidal, hydrodynamic interactions or shear rates. Based on
this assumption an equation, which describes dependency of viscosity on a concentration of
dispersed particles taking into account cluster formation, is deduced. Under special
restrictions the deduced dependency coincides with the well-known Douherty-Krieger’s
equation except for a clear physical meaning of entering parameters. Our consideration shows
that Douherty-Krieger’s equation has deeper physical background than it has been supposed
earlier. Observations of yeast suspensions prove a presence of clusters even at low
concentrations of dispersed particles. Viscosity dependency of yeast suspension on
concentration is in a good agreement with the deduced theoretical equation and gives
reasonable value of parameters.
ACKNOLEDGEMENT
V.Starov and V.Zhdanov would like to express their gratitude to the Royal Society for
support (grant ESEP/JP/JEB/11159).
hal-0
0323
082,
ver
sion
1 -
19 S
ep 2
008
11
APPENDIX
Everywhere below only first order terms are kept in the consideration. Using Eq (6) the right
hand side of Eq (10) can be transformed as
[ ][ ]
[ ][ ]
[ ][ ]
[ ] [ ]
[ ] [ ] ii
i
ii
i
ii
i
i
A
A
A
μγγγηξγξγξγη
μξγξγξγηξγξγξγη
μξγξγξγη
ξγξγξγη
μμμξγξγξγη
ΔΨ+Δ−Δ−Δ−Ψ=
=ΔΔ−Δ−Δ−Ψ+Δ−Δ−Δ−Ψ=
=ΔΔ−Δ−Δ−ΨΨ+
+Δ−Δ−Δ−ΨΨ=
=ΔΔΔΔ−Δ−Δ−ΨΨ
∑
∑
∑
∞
=
∞
=
∞
=
132103322110
133221103322110
13322110
3322110
3213322110
,...,,,5.2,...,,,
,...,,,5.2,...,,,
,...0,0,0,,...,,,5.2
,...0,0,0,,...,,,
,...,,,,...,,,
(A1) Further transformation of right hand side of Eq (A1) keeping only first order terms gives
[ ]=Δ−Δ−Δ−Ψ ,...,,, 3322110 ξγξγξγη ii i
ξγ
γγγη Δ∂Ψ∂
−Ψ= ∑∞
=13210 ,...),,,( (A2)
Using Eqs (A1) and (A2) Eq (10) transforms into
[ ] 0,...,,,5.211
210 =Δ∂Ψ∂
−ΔΨ ∑∑∞
=
∞
=i
i ii
iiiA ξ
γμγγγη
Substitution of expressions for Δξi from Eq (8) into the latter equation and collecting all
terms proportional to iμΔ gives
,...3,2,1,05.21
==Ψ+∂Ψ∂−∑
∞
= ∂Ψ∂ iiA
ijj j γ
γγ
(A3)
Let Eq (A3) be multiplied by jγ and summarised over j=1,2,3… this gives
∑
∑=∑
∞
= ∂Ψ∂
∞
=
∞
=
−1
1
1
5.2
1j
j
jjjA
jj j γ
γηγ
γ
hal-0
0323
082,
ver
sion
1 -
19 S
ep 2
008
12
Substitution of the latter expression for jj jγ
γ∑∞
= ∂Ψ∂
1into Eq (A3) gives
∑
∑∞
=
∞
=
−+=
∂Ψ∂
1
1
1
5.25.2
jj
jjj
ii
AA
γ
γηη
γ (A4)
It is obvious that
∑∞
= ∂Ψ∂
=1i
i
i dd
dd
γγ
γγη ,
where γ is the volume fracture of particles. After multiplying of Eq (A4) by γγ
dd i and
summation over i=1,2,3… Eq (A4) becomes
γγ
γ
γη
γη
dd
AA
dd i
i
jj
jjj
i∑∑
∑∞
=∞
=
∞
=
⎥⎥⎥⎥
⎦
⎤
⎢⎢⎢⎢
⎣
⎡
−+=
1
1
1
1
5.25.25.2 (A5)
hal-0
0323
082,
ver
sion
1 -
19 S
ep 2
008
13
REFERENCES
1. Russel, W.B., Saville, D.A., Schowalter, W.R. Colloidal dispersions. 1989, London,
Cambridge University Press, 525 pp.
2. Bosis J., Brady J.F., J. Chem. Phys., 80, 5141 (1984).
3. Heyes, D.M., Melrose, J.R., J. Non-Newtonian Fluid mech., 46, 1 (1993).
4. Lodge J.F.M., Heyes D.M., Phys. Chem. Chem. Phys., 1, 2119 (1999).
5. Heyes D.M., Branka A.C., Molec. Phys., 96(12), 1757 (1999)
6. Dickinson E, J. Col. Int. Sci., 225, 2 (2000).
7. Bruggemann, D.A., Ann. Phys., 24, 636 (1935).
8. Brinkman, H.C., J. Chem. Phys. 20, 571 (1952).
9. Roscoe R. British J. Appl. Phys. 3, 267 (1952).
10. Cristensen, R.M. J. Mech. And Phys. Solids. 38, 379, (1990).
11. McLaughlin, A. Intern. J. Engin. Sci. 15, 237 (1977).
12. Perepelkim, P.V., Starov, V.M., Filippov, A.N. Colloid J. of the Russian Academy of
Sciences (English Translation), 54 (2), 257 (1992).
13. Happel, J., Brenner, H. Low Reynolds Number Hydrodynamics. Martinus Nijhoff
Publishers, Prentice-Hall, 1965.
14. Krieger, I.M., Dougherty, T.J. Trans. Soc. Rheology, III, 137 (1952).
15. Krieger, I.M. Adv. Colloid Interface Sci, 3, 111 (1972).
16. Thomas, D.G. J. Colloid Sci. 20, 267 (1965).
17. Reuss, M., Josic, D.,Ppovic, M., Bronn, W.K. European J. Appl. Microbiol. Biotechnol.
8,167, (1979). hal-0
0323
082,
ver
sion
1 -
19 S
ep 2
008

14
FIGURE LEGENDS
Fig. 1 Relative viscosity as a function of volume concentration of dispersed particles.
Experimental points from review [16], solid lines according to Eq(16) with different values of
maxγ and A
curve 1 maxγ =1, A =1 (particles do not form clusters)
curve 2 maxγ =0.73 (close to hexagonal packing of particles inside clusters), A =0.61
curve 3 maxγ =0.65 (close to cubic centered packing of particles inside clusters),
A =0.67
curve 4 maxγ =0.56 (close to simple cubic packing of particles inside clusters), A =0.72
Fig. 2 Photographs of yeast suspensions at different concentrations
a γ=0.002
b γ = 0.02
c γ = 0.04
Fig. 3 Comparison of measured and predicted relative viscosity on concentration of yeast
suspension. Solid curve according to Eq(16). Fitted parameters are maxγ =0.73 and A =1.
hal-0
0323
082,
ver
sion
1 -
19 S
ep 2
008
15
Fig.1
hal-0
0323
082,
ver
sion
1 -
19 S
ep 2
008
16
50 µm
Fig.2a Yeast suspension, volume concentration 0.002
100 µm
Fig.2b Yeast suspension, volume concentration 0.02
100 µm
Fig.2c Yeast suspension, volume
concentration γ=0.04
hal-0
0323
082,
ver
sion
1 -
19 S
ep 2
008
17
Fig. 3
0 ,1
1
1 0
1 0 0
1 0 0 0
0 0 ,2 0 ,4 0 ,6V o lu m e fra c tio n
Rel
ativ
e vi
scos
ity
hal-0
0323
082,
ver
sion
1 -
19 S
ep 2
008


