Embed Size (px)
Citation preview
Kidney Support
Determination of Cardiovascular Mechanics Evolution in thePresence of the Arteriovenous Fistula
GIUSTINA CASAGRANDE,* ETTORE LANZARONE,* FERRUCCIO MIGLIETTA,* ANDREA REMUZZI,†‡ ROBERTO FUMERO,*AND MARIA LAURA COSTANTINO*
Uremic patients are prone to heart damage as a consequenceof arteriovenous fistula (AVF) presence and hemodialysistreatment. Arteriovenous fistula induces hand ischemic syn-drome and cardiac work increase, thus determining cardiacinsufficiency in the medium to long term. This work investi-gates the cardiovascular mechanics evolution induced by thefistula presence. Twenty patients were enrolled; blood pres-sure, heart rate (HR), cardiac dimensions, and fistula flowwere measured at scheduled intervals. A mathematical modelof the cardiocirculatory system was implemented to simulatecardiovascular evolution. Input parameters were heart andvessel features; output of the model were cardiac perfor-mances indicators, partly reproducing measurable data andpartly quantifiable only by using the model. Input and outputvariability and their long-term variations were analyzed.Blood pressure and peripheral resistance were found to behigher in uremic than in healthy subjects. Fistula tailoringshowed increased cardiac fiber contractility and decreasedperipheral resistances. Moreover, between 10 days and 3months, an increased blood flow at the vascular access de-termined an increment in fiber contractility. In the sameperiod, the 85% of the patients showed an increase in cardiacfiber stiffness. Similar but less pronounced trends were ob-served between 3 months and 1 year. The developed modelreproduces the cardiovascular system in physiologic andpathologic conditions and allows description of the cardio-vascular evolution for a uremic patient. ASAIO Journal 2009;55:484–493.
Patients with end-stage renal disease (ESRD) are prone tocardiac alterations, and cardiac disease alone accounts for40% of deaths among these patients.1–3 Factors affecting car-diac function in dialysis patients include hypertension, ane-mia, intravascular volume, and arteriovenous fistula (AVF)
placement. Between two subsequent treatments, patients ac-cumulate fluids that can only be removed during the dialysissession; the consequent interdialysis hypervolemia, combinedwith water and sodium retention, promotes the onset of hy-pertension and long-term cardiac pathologies, which are en-hanced by the cardiac overload because of the presence of theAVF. A large number of studies performed on hemodialysispatients suggested that the increase in venous return, strokevolume (SV), and heart rate (HR), sustained by a circuit of lowvascular resistance (e.g., AVF), causes, in the long term, car-diomegaly and heart failure.4–7
As a matter of fact, AVF may induce hand ischemic syndromeand increase cardiac work, leading, in the medium to long term,to left ventricular hypertrophy (LVH) and cardiac insufficiency.
The influence of the AVF on cardiac performances alterationhas been studied since 1970s using different methods,5–10 includ-ing electromagnetic flow rate evaluation,5 catheterization withindicator dilution,11–13 Swan-Ganz pulmonary artery catheteriza-tion,13,14 and echocardiography.15,16 These studies pointed outthat the prevalence of LVH, among patients with ESRD, is close to70%, and this hypertrophy is more severe when compared withthe patients suffering from essential hypertension.17,18 However,all these studies considered patients who were already on dialy-sis. Ori et al. and Iwashima et al.4,19,20 first investigated therelationship between cardiac performance and AV access tailor-ing enrolling the patients before the fistula placement and begin-ning of hemodialysis, studying the short-term evolution in cardiacperformances, based on clinical data as ultrasound investigationsand hormonal response. An increase in SV, ejection fraction (EF),cardiac output (CO), and left ventricular end-diastolic diameterwas found, whereas left ventricular end-systolic diameter, leftatrium, and septum diameters did not significantly vary. Thesechanges occurred without any alteration in other parameters,which can influence blood pressure, HR, or hematocrit (Ht).4
Based on these considerations, the investigation of cardiovascularalterations induced by the presence of the AVF seems to becrucial.
Indeed, clinical monitoring can be useful to study cardiacmorphological alterations and radial artery flow variationsover time, but mathematical modeling of the cardiovascularsystem would be needed to study the alterations of thoseparameters that are not directly measurable, such as cardiacfiber contractility and stiffness, peripheral resistances, and ven-tricular work and power.
A number of either lumped or distributed parameter modelscan be found in the literature separately describing the heart
From the *Department of Structural Engineering, Laboratory of Bi-ological Structure Mechanics (LaBS), Politecnico di Milano, Milan,Italy; †Department of Industrial Engineering, University of Bergamo,Bergamo, Italy; and ‡Department of Biomedical Engineering, MarioNegri Institute, Bergamo, Italy.
Submitted for consideration July 2008; accepted for publication inrevised form April 2009.
Reprint Requests: Giustina Casagrande, Ph.D., Department of Struc-tural Engineering, Laboratory of Biological Structure Mechanics(LaBS), Politecnico di Milano, Piazza Leonardo da Vinci, 32, Milano20133, Italy. Email: [email protected].
DOI: 10.1097/MAT.0b013e3181ab55fb
ASAIO Journal 2009
484
and the vascular system21–28 (open-loop models), whereas thefew available closed-loop models are about physiologic con-ditions.29–32 Moreover, models developed with the specificaim to study medium to long-term AVF placement effects havenot been found in the literature.
The aim of this study is to investigate the alterations inducedby the presence of the AVF both in the short and the medium-long period on the cardiovascular mechanics. To do so, an adhoc customized structural model of the left ventricle describ-ing either physiologic or pathologic conditions was developedand coupled to a lumped parameter model of the remainingpart of the cardiovascular system (right and left atria, rightventricle, and vascular system).23
Materials and Methods
Patients and Data Collection
Twenty patients were enrolled at Mario Negri Institute, VillaCamozzi, Bergamo, Italy. All the patients suffered from ESRDand were candidates for chronic hemodialysis treatment. All ofthem were on a waiting list for the creation of the AVF access.
A protocol was defined to acquire from the patients systolicblood pressure (SBP), diastolic blood pressure (DBP), HR, car-diac, and AVF ultrasound data at scheduled times, beforefistula tailoring and 10 days, 3 months, and 1 year after theprocedure (Table 1). The measurements performed after put-ting the patients on dialysis were taken on the day after the midweek dialysis session to ensure comparable interindividualand intraindividual hydration conditions. Ultrasound imageswere obtained by an HDI 5000 unit (Advanced TechnologyLaboratory, Bothell, WA); 3.5 MHz and 5 MHz probes wereused for the heart and the upper limbs, respectively.
The Closed-Loop Cardiovascular Model
Given the need of a mathematical model of the cardiovas-cular system to study the alterations of not directly measurableparameters, a structural model of the left ventricle was coupledto a lumped parameter model of the remaining part of the
cardiovascular system so as to obtain a closed-loop model ableto describe both physiologic and pathologic conditions.
Left Ventricle Model. Given the existence of left ventricularalterations induced by the dialysis treatment, the left ventriclewas modeled in detail starting from the mechanical descriptionof the cardiac sarcomeres organized in a 10-layer cylindricalstructure24 and then imposing the equilibrium equations of thecontinuum mechanics at the ventricular wall.
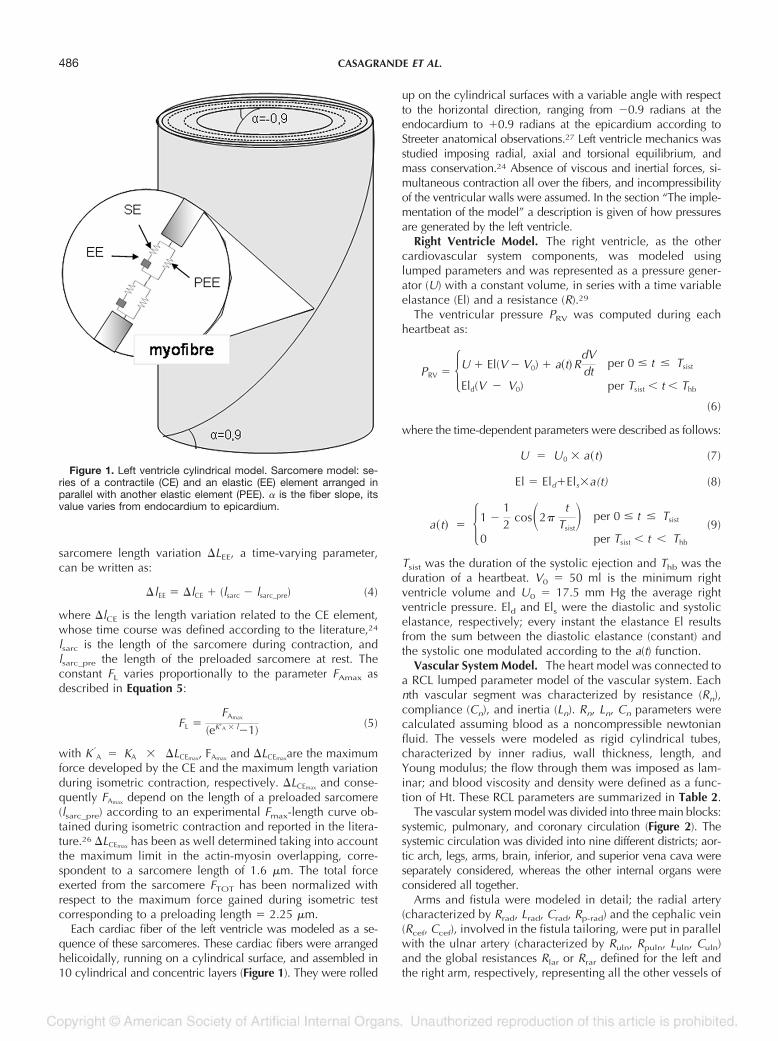
In detail, each sarcomere was described according to theMaxwell variant of the Hill’s model,21,22 characterized by aseries of a contractile element (CE), representing the activesarcomere contraction, and an elastic element (EE) represent-ing the elasticity of myosin and elastin. These two elementswere arranged in parallel with another elastic element (PEE)representing the elasticity of connective tissue and cellularmembrane (Figure 1). Each sarcomere can develop a passiveforce and active contraction. The total developed force is thesum of the passive (FP) and the active force (FA):
FTOT � FP � FA (1)
FP � F0 � q � �eKP � �LPEE � 1) (2)
FA � FL � cc � (eKA � �lEE � 1) (3)
The parameter q represents the cardiac fibers stiffness or ratherthe resistance offered by the sarcomeres to stretching; cc is thecontractility or rather the ability of the cardiac fiber, whenstimulated, to contract and develop tension against resistance.These two parameters were ad hoc introduced in this study todescribe both physiologic and pathologic cardiac behavior.The assumed physiologic values of q and cc were 0.316 and 1,respectively.
FP is a function of two experimental constants derived fromthe literature25: Kp � 6.2254 (�m�1) and F0 � 0.0317 (dimen-sionless). The sarcomere length variation �LPEE was defined aslsarc � l0, where l0 � 1.85 �m is the sarcomere rest length,26
and lsarc is the length of the sarcomere during the cardiaccycle.
In the same way, FA depends on two experimentally deter-mined constants: KA � 0.15 � 10�4 (�m�1) and FL.25 The
Table 1. Averaged Data of Enrolled Patients at the Different Time Steps
Measurements Acquisition Method Basal Value 10 (d) 3 (mo) 1 (yr)
No. of patients — 20 20 13 5Man/woman — 13/7 13/7 7/6 1/4Age (yr) — 60.00 � 13.10 60.00 � 13.10 65.23 � 13.18 57.80 � 14.13Weight (kg) Measured 68.10 � 16.00 68.10 � 16.00 72.02 � 18.20 65.40 � 4.03SBP (mm Hg) Measured 155.00 � 16.30 141.46 � 14.86 139.00 � 12.66 144.40 � 13.90DBP (mm Hg) Measured 90.03 � 12.80 84.23 � 7.50 82.77 � 8.42 88.60 � 11.67HR (beats/min) Measured 80.00 � 9.89 73.89 � 14.83 75.03 � 13.63 82.41 � 11.20Stroke volume (ml) From ultrasound measurements 76.68 � 9.27 40.74 � 15.06 42.34 � 14.58 35.52 � 15.18Cardiac output (l/min) Measured 5.80 � 0.86 3.08 � 0.87 3.41 � 1.30 2.81 � 1.15Ejection fraction (%) From ultrasound measurements 62.30 � 11.15 39.10 � 8.98 42.92 � 7.53 36.20 � 12.53LV radius (cm) From ultrasound measurements 1.84 � 0.28 2.13 � 0.34 2.04 � 0.31 2.05 � 0.37LV height (cm) From ultrasound measurements 7.51 � 1.10 7.20 � 1.08 7.40 � 1.26 7.47 � 1.08End-diastolic volume (ml) From ultrasound measurements 127.31 � 11.67 104.17 � 32.26 99.94 � 33.48 102.38 � 33.36End-systolic volume (ml) From ultrasound measurements 51.77 � 9.53 63.37 � 22.95 57.60 � 22.08 66.85 � 27.15AVF diameter (cm) From ultrasound measurements — 0.40 � 0.10 0.45 � 0.17 0.47 � 0.12AVF blood flow (L/min) From ultrasound measurements — 0.36 � 0.16 0.53 � 0.30 0.53 � 0.21Haematocrit (Ht) Measured 30.00 � 5.86 33.90 � 4.56 36.21 � 4.36 34.95 � 6.06
SBP, systolic blood pressure; DBP, diastolic blood pressure; HR, heart rate; LV, left ventricular; AVF, arteriovenous fistula.
485CARDIOVASCULAR EVOLUTION IN DIALYSIS
sarcomere length variation �LEE, a time-varying parameter,can be written as:
�lEE � �lCE � (lsarc � lsarc_pre) (4)
where �lCE is the length variation related to the CE element,whose time course was defined according to the literature,24
lsarc is the length of the sarcomere during contraction, andlsarc_pre the length of the preloaded sarcomere at rest. Theconstant FL varies proportionally to the parameter FAmax asdescribed in Equation 5:
FL �FAmax
(eK�A � l�1)(5)
with K �A � KA � �LCEmax, FAmax and �LCEmaxare the maximum
force developed by the CE and the maximum length variationduring isometric contraction, respectively. �LCEmax and conse-quently FAmax depend on the length of a preloaded sarcomere(lsarc_pre) according to an experimental Fmax-length curve ob-tained during isometric contraction and reported in the litera-ture.26 �LCEmax has been as well determined taking into accountthe maximum limit in the actin-myosin overlapping, corre-spondent to a sarcomere length of 1.6 �m. The total forceexerted from the sarcomere FTOT has been normalized withrespect to the maximum force gained during isometric testcorresponding to a preloading length � 2.25 �m.
Each cardiac fiber of the left ventricle was modeled as a se-quence of these sarcomeres. These cardiac fibers were arrangedhelicoidally, running on a cylindrical surface, and assembled in10 cylindrical and concentric layers (Figure 1). They were rolled
up on the cylindrical surfaces with a variable angle with respectto the horizontal direction, ranging from �0.9 radians at theendocardium to �0.9 radians at the epicardium according toStreeter anatomical observations.27 Left ventricle mechanics wasstudied imposing radial, axial and torsional equilibrium, andmass conservation.24 Absence of viscous and inertial forces, si-multaneous contraction all over the fibers, and incompressibilityof the ventricular walls were assumed. In the section “The imple-mentation of the model” a description is given of how pressuresare generated by the left ventricle.
Right Ventricle Model. The right ventricle, as the othercardiovascular system components, was modeled usinglumped parameters and was represented as a pressure gener-ator (U) with a constant volume, in series with a time variableelastance (El) and a resistance (R).29
The ventricular pressure PRV was computed during eachheartbeat as:
PRV � �U � El(V � V0) � a�tRdVdt
per 0 � t � Tsist
Eld(V � V0) per Tsist t Thb
(6)
where the time-dependent parameters were described as follows:
U � U0 � a�t (7)
El � Eld�Els�a(t) (8)
a�t � �1 �12
cos�2�t
Tsist� per 0 � t � Tsist
0 per Tsist t � Thb
(9)
Tsist was the duration of the systolic ejection and Thb was theduration of a heartbeat. V0 � 50 ml is the minimum rightventricle volume and U0 � 17.5 mm Hg the average rightventricle pressure. Eld and Els were the diastolic and systolicelastance, respectively; every instant the elastance El resultsfrom the sum between the diastolic elastance (constant) andthe systolic one modulated according to the a(t) function.
Vascular System Model. The heart model was connected toa RCL lumped parameter model of the vascular system. Eachnth vascular segment was characterized by resistance (Rn),compliance (Cn), and inertia (Ln). Rn, Ln, Cn parameters werecalculated assuming blood as a noncompressible newtonianfluid. The vessels were modeled as rigid cylindrical tubes,characterized by inner radius, wall thickness, length, andYoung modulus; the flow through them was imposed as lam-inar; and blood viscosity and density were defined as a func-tion of Ht. These RCL parameters are summarized in Table 2.
The vascular system model was divided into three main blocks:systemic, pulmonary, and coronary circulation (Figure 2). Thesystemic circulation was divided into nine different districts; aor-tic arch, legs, arms, brain, inferior, and superior vena cava wereseparately considered, whereas the other internal organs wereconsidered all together.
Arms and fistula were modeled in detail; the radial artery(characterized by Rrad, Lrad, Crad, Rp-rad) and the cephalic vein(Rcef, Ccef), involved in the fistula tailoring, were put in parallelwith the ulnar artery (characterized by Ruln, Rpuln, Luln, Culn)and the global resistances Rlar or Rrar defined for the left andthe right arm, respectively, representing all the other vessels of
Figure 1. Left ventricle cylindrical model. Sarcomere model: se-ries of a contractile (CE) and an elastic (EE) element arranged inparallel with another elastic element (PEE). � is the fiber slope, itsvalue varies from endocardium to epicardium.
486 CASAGRANDE ET AL.
the arm. Fistula resistance was calculated based on blood flowechocardiographic measurements. All the fistulas of the en-rolled patients are tailored by connecting the radial artery withthe cephalic vein (terminoterminal anastomosis). In the simu-lations concerning patients after fistula placement, the parameterRp-rad (peripheral radial circulation resistance) was substi-tuted by the fistula resistance Rfis. Assuming blood flowingthrough the fistula as in a rigid pipe, the local pressure drop isdue to the abrupt change in direction, thus the fistula equiva-lent resistance can be calculated as:
Rfis � K �
2�
Qfis
A2 (10)
where Qfis is the average blood flow in the fistula, A the sectionof the fistula, K the pressure drop coefficient (3.57 for the localpressure drop consequent to an abrupt change in direction), ‚
the blood density defined as a function of Ht (from 1,035kg/m3 if Ht � 0% to 1,090 kg/m3 if Ht � 100%). Qfis and Awere obtained from the ultrasound unit outputs.
Pulmonary Circulation. The pulmonary circulation was de-scribed as a series of vascular elements placed between twovalves (Table 2). Arteries were described by the parametersCp1, Rp2, Lp2, and Cp2 and veins and capillaries by Rp3, Lp3,and Cp3. The left atrium was modeled by means of Rla, Lla, and
Cla. Pulmonary and mitral valves were described by two di-odes (Dpv and Dmv) and two resistances (Rpv and Rmv).
Coronary Circulation. Coronary arteries were modelled ac-cording to Beyar and Sideman studies.34 The 10-layer model ofthe heart being taken into account, coronaries were considereddistributed in the myocardium, and the flow-dynamics in eachvessel was assumed to be a non-linear function of the intra-myocardial pressure that varies during a cardiac cycle. The pres-sure is calculated in each layer when left ventricle mechanicsequations (radial, axial, torsional equilibrium, and mass conser-vation) were solved. In the model, blood can perfuse the singlecoronary only if the pressure drop across this vessel exceeds acritical pressure threshold (Pcr,i) whose value depends on theposition of the i-layer containing the vessel. The occlusive behav-ior of the vessels was simulated by a Zener diode. The flow (fc,i)through the single coronary can thus be written as:
fc,i � �(xc � Pcr,i � Pim,i)Rt,i
if xc � Pcr,i � Pim,i
0 if xc � Pcr,i � Pim,i
(11)
where Pim,i is the intramyocardial pressure, Rt,i the resistanceof a single coronary vessel, and xc the tension corresponding tothe main coronary artery compliance (Cep).
Table 2. Vascular System Parameters28–33
R (Pa � m�3 � s) L (Pa � m�3 � s2) C (Pa�1 � m3)
Systemic circulationAorta arch C0 � 8.34 � 10�10
R1 � 4.87 � 103 L1 � 4.53 � 104 C1 � 2.09 � 10�10
R2 � 6.94 � 103 L2 � 3.81 � 104 C2 � 2.96 � 10�10
Brain R3 � 6.35 � 107 L3 � 3.80 � 105 C3 � 1.50 � 10�9
R4tot � 1.07 � 109 L4 � 7.69 � 105 C4 � 6.80 � 10�11
Internal organs Rio1 � 8.69 � 106 Lio1 � 1.13 � 103 Cio1 � 1.42 � 10�8
Rio-art � 1.39 � 108 Lio2 � 6.96 � 104
Rio-cap � 7.82 � 107
Rio-ven � 2.88 � 107
Legs Rlg-1 � 4.75 � 107 Llg1 � 9.49 � 104 Clg1 � 2.00 � 10�10
Rlg-art � 1.03 � 109 Llg2 � 1.68 � 105 Clg2 � 1.14 � 10�7
Rlg-cap � 5.00 � 108
Rlg-ven � 1.94 � 108
Arms Rart � 2.42 � 108 Lart � 9.49 � 106 Cart � 2.00 � 10�10
Rrad � 3.46 � 108 Lrad � 9.49 � 107 Crad � 2.00 � 10�11
Ruln � 2.27 � 108 Luln � 9.49 � 107 Culn � 2.00 � 10�10
Rcef � 1.88 � 108 Ccef � 2.00 � 10�9
Rven � 8.59 � 107 Cven � 2.00 � 10�8
Rp-rad � 3.00 � 1010
Rp-uln � 1.99 � 1010
Rlar � 3.77 � 109
Rrar � 3.77 � 109
Inferior and superior vena cava Rvcd � 1.16 � 104 Lvcd � 1.70 � 107 Cvcd � 1.01 � 10�7
Rvcsup � 1.90 � 104 Lvcsup � 2.50 � 105 Cvc � 6.67 � 10�8
Rvcinf � 9.55 � 102 Lvcinf � 3.13 � 106
Right atrium R5 � 2.57 � 106 L5 � 2.04 � 103 C5 � 2.84 � 10�8
Rout-v � 4.48 � 105
Rin-v � 1.40 � 106
Pulmonary circulation Rp2 � 3.22 � 106 Lp2 � 1.02 � 105 Cp2 � 2.00 � 10�8
Rp3 � 7.84 � 106 Lp3 � 4.20 � 105 Cp3 � 4.62 � 10�7
Rla � 2.95 � 106 Lla � 2.04 � 104 Cla � 3.75 � 10�8
Rpv � 5.60 � 105 Cp1 � 6.75 � 10�10
Rmv � 1.40 � 106
Coronary circulation Rca � 4.03 � 107 Lca � 4.10 � 106 Cep � 1.13 � 10�9
Rmin,0 � 8.33 � 1011 Cmin,0 � 5.62 � 10�10
Rmin,9 � 3.33 � 1011 Cmin,9 � 1.13 � 10�9
Rmax,0 � 4.17 � 1012
Rmax,9 � 1.67 � 1012
487CARDIOVASCULAR EVOLUTION IN DIALYSIS
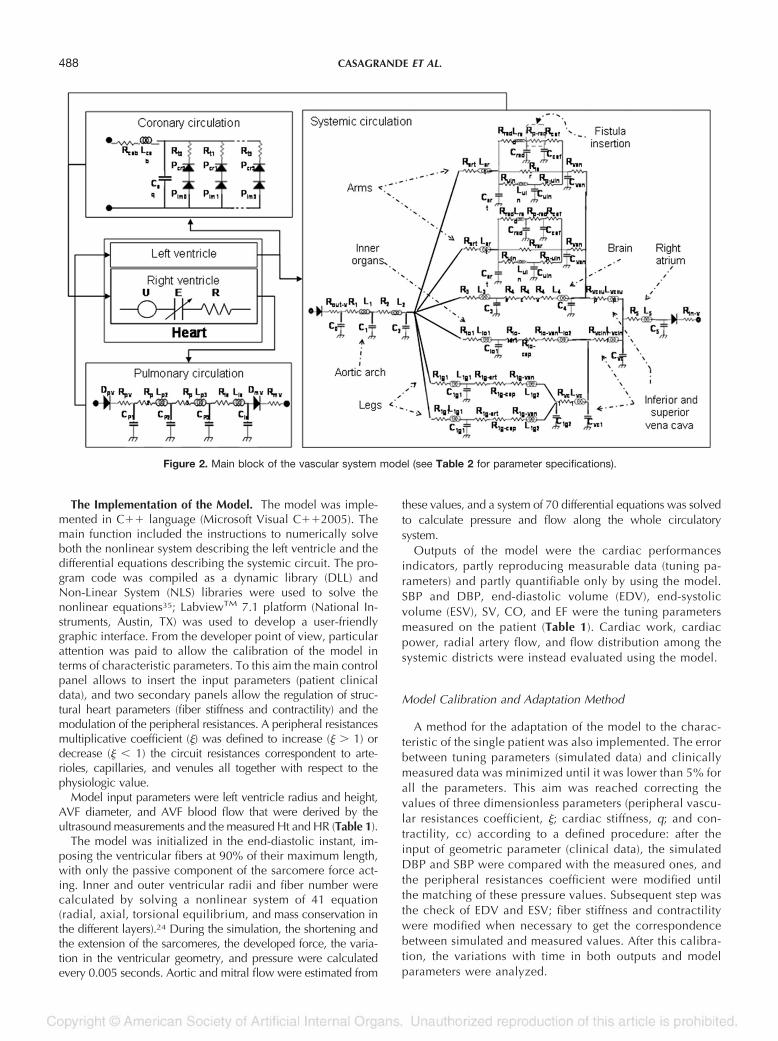
The Implementation of the Model. The model was imple-mented in C�� language (Microsoft Visual C��2005). Themain function included the instructions to numerically solveboth the nonlinear system describing the left ventricle and thedifferential equations describing the systemic circuit. The pro-gram code was compiled as a dynamic library (DLL) andNon-Linear System (NLS) libraries were used to solve thenonlinear equations35; LabviewTM 7.1 platform (National In-struments, Austin, TX) was used to develop a user-friendlygraphic interface. From the developer point of view, particularattention was paid to allow the calibration of the model interms of characteristic parameters. To this aim the main controlpanel allows to insert the input parameters (patient clinicaldata), and two secondary panels allow the regulation of struc-tural heart parameters (fiber stiffness and contractility) and themodulation of the peripheral resistances. A peripheral resistancesmultiplicative coefficient () was defined to increase ( � 1) ordecrease ( 1) the circuit resistances correspondent to arte-rioles, capillaries, and venules all together with respect to thephysiologic value.
Model input parameters were left ventricle radius and height,AVF diameter, and AVF blood flow that were derived by theultrasound measurements and the measured Ht and HR (Table 1).
The model was initialized in the end-diastolic instant, im-posing the ventricular fibers at 90% of their maximum length,with only the passive component of the sarcomere force act-ing. Inner and outer ventricular radii and fiber number werecalculated by solving a nonlinear system of 41 equation(radial, axial, torsional equilibrium, and mass conservation inthe different layers).24 During the simulation, the shortening andthe extension of the sarcomeres, the developed force, the varia-tion in the ventricular geometry, and pressure were calculatedevery 0.005 seconds. Aortic and mitral flow were estimated from
these values, and a system of 70 differential equations was solvedto calculate pressure and flow along the whole circulatorysystem.
Outputs of the model were the cardiac performancesindicators, partly reproducing measurable data (tuning pa-rameters) and partly quantifiable only by using the model.SBP and DBP, end-diastolic volume (EDV), end-systolicvolume (ESV), SV, CO, and EF were the tuning parametersmeasured on the patient (Table 1). Cardiac work, cardiacpower, radial artery flow, and flow distribution among thesystemic districts were instead evaluated using the model.
Model Calibration and Adaptation Method
A method for the adaptation of the model to the charac-teristic of the single patient was also implemented. The errorbetween tuning parameters (simulated data) and clinicallymeasured data was minimized until it was lower than 5% forall the parameters. This aim was reached correcting thevalues of three dimensionless parameters (peripheral vascu-lar resistances coefficient, ; cardiac stiffness, q; and con-tractility, cc) according to a defined procedure: after theinput of geometric parameter (clinical data), the simulatedDBP and SBP were compared with the measured ones, andthe peripheral resistances coefficient were modified untilthe matching of these pressure values. Subsequent step wasthe check of EDV and ESV; fiber stiffness and contractilitywere modified when necessary to get the correspondencebetween simulated and measured values. After this calibra-tion, the variations with time in both outputs and modelparameters were analyzed.
Figure 2. Main block of the vascular system model (see Table 2 for parameter specifications).
488 CASAGRANDE ET AL.
Validation of the Model With Reference to a StandardHealthy Subject
Model parameters were initially chosen to represent ahealthy subject whose characteristics were set according to theliterature.36 Cardiac diastolic diameter was set equal to 5 cm,and physiologic HR was assumed equal to 76 beats/min. Theaverage physiologic blood flow in the radial artery was 0.34ml/s, and Ht was imposed equal to 41%.37
Simulated values obtained from the model included bloodpressure varying between 120 (systolic) and 80 mm Hg (dia-stolic); SV 67 ml, CO 5.2 l/min, and EF 58%. The resultingcardiac volume varies between 49 ml (end systolic) and 116ml (end diastolic); ulnar artery flow was 0.50 ml/s.
Sensitivity Analysis
A sensitivity analysis was performed both to test the modelreliability, verifying that changes in inputs parameters pro-duced output variation in accordance with physiology, andmainly to evaluate the contribution on the outputs of eachmodel parameter variation height.
The range of variation of the variables (inputs and modelparameters) was chosen to include both physiologic andpathologic conditions. The varied inputs were HR, ventric-ular radius, and height; the effects of their variations onventricular volume, SV, CO, ventricular power, SBP, andDBP (SBP � DPB) were evaluated. The varied model pa-rameters were contractility (cc) and fiber stiffness (q); theeffects of their variations on SBP and DBP, SV, CO, ventric-ular power, ventricular volume, EF, number of sarcomeres,and sarcomere force were evaluated. All these simulationswere run keeping unchanged the electrical net describingthe patient. The parameter range and step of variation andthe results of the sensitivity analysis are reported in Table 3.The fiber stiffness seemed to play the most determinant role,even allowing to differentiate the performances of two ven-tricles with the same geometric features. A variation (from
0.2 to 0.5) of this parameter imply in fact a not negligiblevariation all over the outputs, implying an increase of 22.6% inthe pick value of sarcomere force, and of 30% and 8.6% in theend-systolic and end-diastolic volumes, respectively. Thesame variation induces a decrease of 26%, 40%, and 60% inSV, EF, and number of sarcomeres, respectively.
Application of the Model With Reference to an AverageUremic Patient and to the Studied Population
The model was then adapted to a generic uremic patientwhose characteristic parameters were identified averaging thedata related to the basal measurements collected at the MarioNegri Institute (Table 1, basal values). The average age of theuremic patient was 60 years, with a weight of 68 kg. SBPand DBP were 155 mm Hg and 90 mm Hg, respectively, HR80 beats/min, and Ht 30%. Left ventricle end-diastolic di-ameter was 5 cm, EDV 127 ml, SV 77 ml, and CO 5.8 l/min;the EF was 62%.
In the third and the last phase, the model was applied tosimulate each enrolled patient at each scheduled control(basal, 10 days, 3 months, and 1 year after fistula tailoring), tostudy the cardiovascular evolution.
Results
Characterization of a Healthy Individual
The initialization of the model with data referred to a healthysubject allowed to determine the physiologic values of thecardiac parameters and the flow distribution among the differ-ent vascular net districts. The set cardiac contractility was 1;cardiac stiffness, 0.316; and peripheral resistances coefficient,1. The physiologic cardiac work was 0.99 J and cardiac power3.6 W. In this situation, 56% of the CO resulted directed to theinternal organs, 13% to the brain, 16% to the lower limbs, 4%to each arm, and 7% to the coronary circulation.
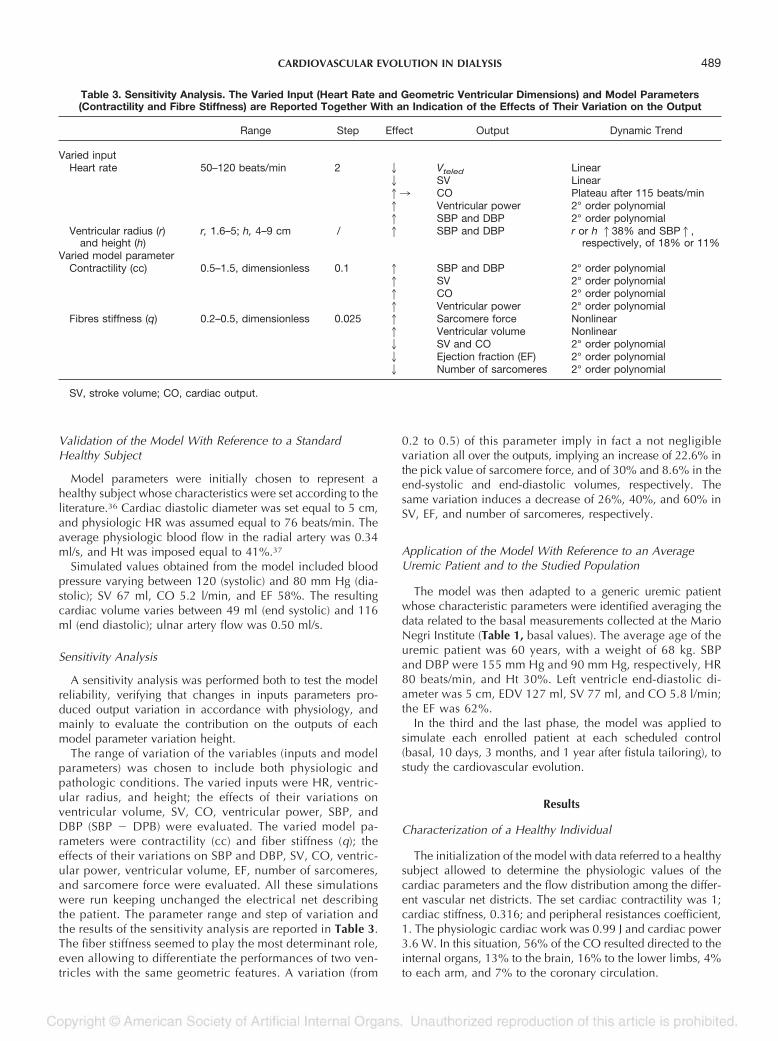
Table 3. Sensitivity Analysis. The Varied Input (Heart Rate and Geometric Ventricular Dimensions) and Model Parameters(Contractility and Fibre Stiffness) are Reported Together With an Indication of the Effects of Their Variation on the Output
Range Step Effect Output Dynamic Trend
Varied inputHeart rate 50–120 beats/min 2 2 Vteled Linear
2 SV Linear13 CO Plateau after 115 beats/min1 Ventricular power 2° order polynomial1 SBP and DBP 2° order polynomial
Ventricular radius (r)and height (h)
r, 1.6–5; h, 4–9 cm / 1 SBP and DBP r or h 138% and SBP1,respectively, of 18% or 11%
Varied model parameterContractility (cc) 0.5–1.5, dimensionless 0.1 1 SBP and DBP 2° order polynomial
1 SV 2° order polynomial1 CO 2° order polynomial1 Ventricular power 2° order polynomial
Fibres stiffness (q) 0.2–0.5, dimensionless 0.025 1 Sarcomere force Nonlinear1 Ventricular volume Nonlinear2 SV and CO 2° order polynomial2 Ejection fraction (EF) 2° order polynomial2 Number of sarcomeres 2° order polynomial
SV, stroke volume; CO, cardiac output.
489CARDIOVASCULAR EVOLUTION IN DIALYSIS
Comparison Between a Healthy Subject and a UremicPatient
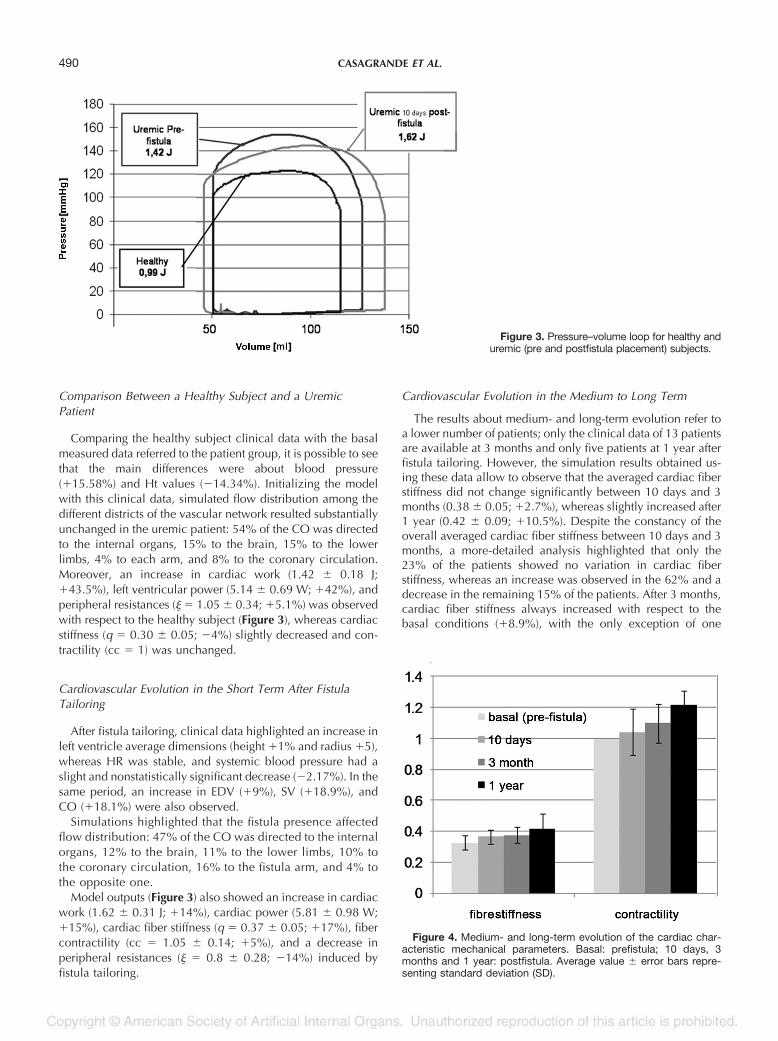
Comparing the healthy subject clinical data with the basalmeasured data referred to the patient group, it is possible to seethat the main differences were about blood pressure(�15.58%) and Ht values (�14.34%). Initializing the modelwith this clinical data, simulated flow distribution among thedifferent districts of the vascular network resulted substantiallyunchanged in the uremic patient: 54% of the CO was directedto the internal organs, 15% to the brain, 15% to the lowerlimbs, 4% to each arm, and 8% to the coronary circulation.Moreover, an increase in cardiac work (1.42 � 0.18 J;�43.5%), left ventricular power (5.14 � 0.69 W; �42%), andperipheral resistances ( � 1.05 � 0.34; �5.1%) was observedwith respect to the healthy subject (Figure 3), whereas cardiacstiffness (q � 0.30 � 0.05; �4%) slightly decreased and con-tractility (cc � 1) was unchanged.
Cardiovascular Evolution in the Short Term After FistulaTailoring
After fistula tailoring, clinical data highlighted an increase inleft ventricle average dimensions (height �1% and radius �5),whereas HR was stable, and systemic blood pressure had aslight and nonstatistically significant decrease (�2.17%). In thesame period, an increase in EDV (�9%), SV (�18.9%), andCO (�18.1%) were also observed.
Simulations highlighted that the fistula presence affectedflow distribution: 47% of the CO was directed to the internalorgans, 12% to the brain, 11% to the lower limbs, 10% tothe coronary circulation, 16% to the fistula arm, and 4% tothe opposite one.
Model outputs (Figure 3) also showed an increase in cardiacwork (1.62 � 0.31 J; �14%), cardiac power (5.81 � 0.98 W;�15%), cardiac fiber stiffness (q � 0.37 � 0.05; �17%), fibercontractility (cc � 1.05 � 0.14; �5%), and a decrease inperipheral resistances ( � 0.8 � 0.28; �14%) induced byfistula tailoring.
Cardiovascular Evolution in the Medium to Long Term
The results about medium- and long-term evolution refer toa lower number of patients; only the clinical data of 13 patientsare available at 3 months and only five patients at 1 year afterfistula tailoring. However, the simulation results obtained us-ing these data allow to observe that the averaged cardiac fiberstiffness did not change significantly between 10 days and 3months (0.38 � 0.05; �2.7%), whereas slightly increased after1 year (0.42 � 0.09; �10.5%). Despite the constancy of theoverall averaged cardiac fiber stiffness between 10 days and 3months, a more-detailed analysis highlighted that only the23% of the patients showed no variation in cardiac fiberstiffness, whereas an increase was observed in the 62% and adecrease in the remaining 15% of the patients. After 3 months,cardiac fiber stiffness always increased with respect to thebasal conditions (�8.9%), with the only exception of one
Figure 4. Medium- and long-term evolution of the cardiac char-acteristic mechanical parameters. Basal: prefistula; 10 days, 3months and 1 year: postfistula. Average value � error bars repre-senting standard deviation (SD).
Figure 3. Pressure–volume loop for healthy anduremic (pre and postfistula placement) subjects.
490 CASAGRANDE ET AL.
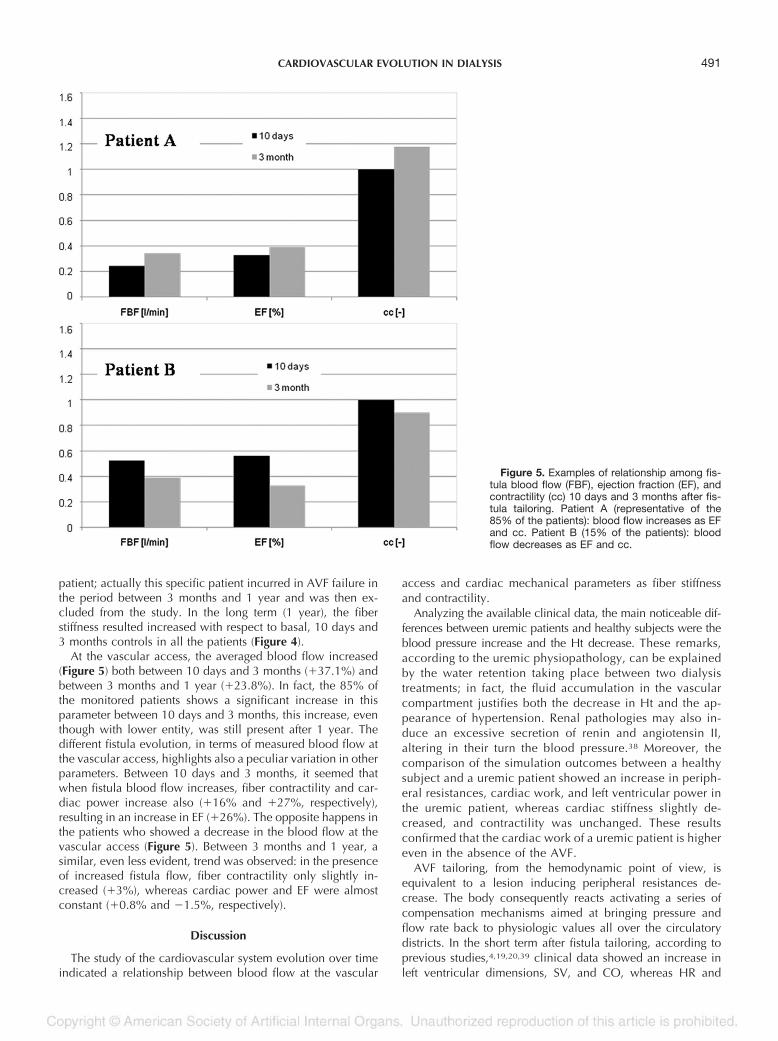
patient; actually this specific patient incurred in AVF failure inthe period between 3 months and 1 year and was then ex-cluded from the study. In the long term (1 year), the fiberstiffness resulted increased with respect to basal, 10 days and3 months controls in all the patients (Figure 4).
At the vascular access, the averaged blood flow increased(Figure 5) both between 10 days and 3 months (�37.1%) andbetween 3 months and 1 year (�23.8%). In fact, the 85% ofthe monitored patients shows a significant increase in thisparameter between 10 days and 3 months, this increase, eventhough with lower entity, was still present after 1 year. Thedifferent fistula evolution, in terms of measured blood flow atthe vascular access, highlights also a peculiar variation in otherparameters. Between 10 days and 3 months, it seemed thatwhen fistula blood flow increases, fiber contractility and car-diac power increase also (�16% and �27%, respectively),resulting in an increase in EF (�26%). The opposite happens inthe patients who showed a decrease in the blood flow at thevascular access (Figure 5). Between 3 months and 1 year, asimilar, even less evident, trend was observed: in the presenceof increased fistula flow, fiber contractility only slightly in-creased (�3%), whereas cardiac power and EF were almostconstant (�0.8% and �1.5%, respectively).
Discussion
The study of the cardiovascular system evolution over timeindicated a relationship between blood flow at the vascular
access and cardiac mechanical parameters as fiber stiffnessand contractility.
Analyzing the available clinical data, the main noticeable dif-ferences between uremic patients and healthy subjects were theblood pressure increase and the Ht decrease. These remarks,according to the uremic physiopathology, can be explainedby the water retention taking place between two dialysistreatments; in fact, the fluid accumulation in the vascularcompartment justifies both the decrease in Ht and the ap-pearance of hypertension. Renal pathologies may also in-duce an excessive secretion of renin and angiotensin II,altering in their turn the blood pressure.38 Moreover, thecomparison of the simulation outcomes between a healthysubject and a uremic patient showed an increase in periph-eral resistances, cardiac work, and left ventricular power inthe uremic patient, whereas cardiac stiffness slightly de-creased, and contractility was unchanged. These resultsconfirmed that the cardiac work of a uremic patient is highereven in the absence of the AVF.
AVF tailoring, from the hemodynamic point of view, isequivalent to a lesion inducing peripheral resistances de-crease. The body consequently reacts activating a series ofcompensation mechanisms aimed at bringing pressure andflow rate back to physiologic values all over the circulatorydistricts. In the short term after fistula tailoring, according toprevious studies,4,19,20,39 clinical data showed an increase inleft ventricular dimensions, SV, and CO, whereas HR and
Figure 5. Examples of relationship among fis-tula blood flow (FBF), ejection fraction (EF), andcontractility (cc) 10 days and 3 months after fis-tula tailoring. Patient A (representative of the85% of the patients): blood flow increases as EFand cc. Patient B (15% of the patients): bloodflow decreases as EF and cc.
491CARDIOVASCULAR EVOLUTION IN DIALYSIS
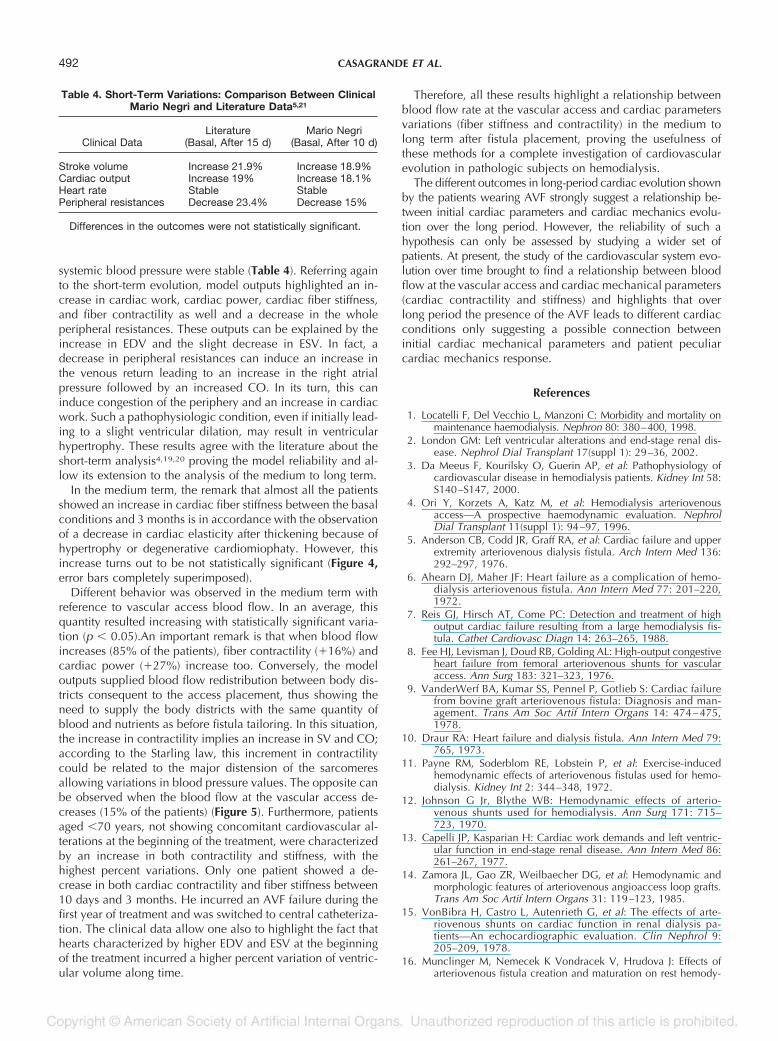
systemic blood pressure were stable (Table 4). Referring againto the short-term evolution, model outputs highlighted an in-crease in cardiac work, cardiac power, cardiac fiber stiffness,and fiber contractility as well and a decrease in the wholeperipheral resistances. These outputs can be explained by theincrease in EDV and the slight decrease in ESV. In fact, adecrease in peripheral resistances can induce an increase inthe venous return leading to an increase in the right atrialpressure followed by an increased CO. In its turn, this caninduce congestion of the periphery and an increase in cardiacwork. Such a pathophysiologic condition, even if initially lead-ing to a slight ventricular dilation, may result in ventricularhypertrophy. These results agree with the literature about theshort-term analysis4,19,20 proving the model reliability and al-low its extension to the analysis of the medium to long term.
In the medium term, the remark that almost all the patientsshowed an increase in cardiac fiber stiffness between the basalconditions and 3 months is in accordance with the observationof a decrease in cardiac elasticity after thickening because ofhypertrophy or degenerative cardiomiophaty. However, thisincrease turns out to be not statistically significant (Figure 4,error bars completely superimposed).
Different behavior was observed in the medium term withreference to vascular access blood flow. In an average, thisquantity resulted increasing with statistically significant varia-tion (p 0.05).An important remark is that when blood flowincreases (85% of the patients), fiber contractility (�16%) andcardiac power (�27%) increase too. Conversely, the modeloutputs supplied blood flow redistribution between body dis-tricts consequent to the access placement, thus showing theneed to supply the body districts with the same quantity ofblood and nutrients as before fistula tailoring. In this situation,the increase in contractility implies an increase in SV and CO;according to the Starling law, this increment in contractilitycould be related to the major distension of the sarcomeresallowing variations in blood pressure values. The opposite canbe observed when the blood flow at the vascular access de-creases (15% of the patients) (Figure 5). Furthermore, patientsaged 70 years, not showing concomitant cardiovascular al-terations at the beginning of the treatment, were characterizedby an increase in both contractility and stiffness, with thehighest percent variations. Only one patient showed a de-crease in both cardiac contractility and fiber stiffness between10 days and 3 months. He incurred an AVF failure during thefirst year of treatment and was switched to central catheteriza-tion. The clinical data allow one also to highlight the fact thathearts characterized by higher EDV and ESV at the beginningof the treatment incurred a higher percent variation of ventric-ular volume along time.
Therefore, all these results highlight a relationship betweenblood flow rate at the vascular access and cardiac parametersvariations (fiber stiffness and contractility) in the medium tolong term after fistula placement, proving the usefulness ofthese methods for a complete investigation of cardiovascularevolution in pathologic subjects on hemodialysis.
The different outcomes in long-period cardiac evolution shownby the patients wearing AVF strongly suggest a relationship be-tween initial cardiac parameters and cardiac mechanics evolu-tion over the long period. However, the reliability of such ahypothesis can only be assessed by studying a wider set ofpatients. At present, the study of the cardiovascular system evo-lution over time brought to find a relationship between bloodflow at the vascular access and cardiac mechanical parameters(cardiac contractility and stiffness) and highlights that overlong period the presence of the AVF leads to different cardiacconditions only suggesting a possible connection betweeninitial cardiac mechanical parameters and patient peculiarcardiac mechanics response.
References
1. Locatelli F, Del Vecchio L, Manzoni C: Morbidity and mortality onmaintenance haemodialysis. Nephron 80: 380–400, 1998.
2. London GM: Left ventricular alterations and end-stage renal dis-ease. Nephrol Dial Transplant 17(suppl 1): 29–36, 2002.
3. Da Meeus F, Kourilsky O, Guerin AP, et al: Pathophysiology ofcardiovascular disease in hemodialysis patients. Kidney Int 58:S140–S147, 2000.
4. Ori Y, Korzets A, Katz M, et al: Hemodialysis arteriovenousaccess—A prospective haemodynamic evaluation. NephrolDial Transplant 11(suppl 1): 94–97, 1996.
5. Anderson CB, Codd JR, Graff RA, et al: Cardiac failure and upperextremity arteriovenous dialysis fistula. Arch Intern Med 136:292–297, 1976.
6. Ahearn DJ, Maher JF: Heart failure as a complication of hemo-dialysis arteriovenous fistula. Ann Intern Med 77: 201–220,1972.
7. Reis GJ, Hirsch AT, Come PC: Detection and treatment of highoutput cardiac failure resulting from a large hemodialysis fis-tula. Cathet Cardiovasc Diagn 14: 263–265, 1988.
8. Fee HJ, Levisman J, Doud RB, Golding AL: High-output congestiveheart failure from femoral arteriovenous shunts for vascularaccess. Ann Surg 183: 321–323, 1976.
9. VanderWerf BA, Kumar SS, Pennel P, Gotlieb S: Cardiac failurefrom bovine graft arteriovenous fistula: Diagnosis and man-agement. Trans Am Soc Artif Intern Organs 14: 474 – 475,1978.
10. Draur RA: Heart failure and dialysis fistula. Ann Intern Med 79:765, 1973.
11. Payne RM, Soderblom RE, Lobstein P, et al: Exercise-inducedhemodynamic effects of arteriovenous fistulas used for hemo-dialysis. Kidney Int 2: 344–348, 1972.
12. Johnson G Jr, Blythe WB: Hemodynamic effects of arterio-venous shunts used for hemodialysis. Ann Surg 171: 715–723, 1970.
13. Capelli JP, Kasparian H: Cardiac work demands and left ventric-ular function in end-stage renal disease. Ann Intern Med 86:261–267, 1977.
14. Zamora JL, Gao ZR, Weilbaecher DG, et al: Hemodynamic andmorphologic features of arteriovenous angioaccess loop grafts.Trans Am Soc Artif Intern Organs 31: 119–123, 1985.
15. VonBibra H, Castro L, Autenrieth G, et al: The effects of arte-riovenous shunts on cardiac function in renal dialysis pa-tients—An echocardiographic evaluation. Clin Nephrol 9:205–209, 1978.
16. Munclinger M, Nemecek K Vondracek V, Hrudova J: Effects ofarteriovenous fistula creation and maturation on rest hemody-
Table 4. Short-Term Variations: Comparison Between ClinicalMario Negri and Literature Data5,21
Clinical DataLiterature
(Basal, After 15 d)Mario Negri
(Basal, After 10 d)
Stroke volume Increase 21.9% Increase 18.9%Cardiac output Increase 19% Increase 18.1%Heart rate Stable StablePeripheral resistances Decrease 23.4% Decrease 15%
Differences in the outcomes were not statistically significant.
492 CASAGRANDE ET AL.
namics in patients with end-stage renal disease. Nephron 46:105–106, 1987.
17. Middleton RJ, Parfrey PS, Foley RN: Left ventricular hypertrophyin the renal patient. J Am Soc Nephrol 12: 1079, 2001.
18. Foley RN, Parfrey PS, Kent GM, et al: Long-term evolution ofcardiomyopathy in dialysis patients. Kidney Int 54: 1720–1725,1998.
19. Ori Y, Korzets A, Katz M, et al: The contribution of an arterio-venous access for hemodialysis to left ventricular hypertrophy.Am J Kidney Dis 40: 745–752, 2002.
20. Iwashima Y, Horio T, Takami Y, et al: Effects of the creation ofarteriovenous fistula for hemodialysis on cardiac function andnatriuretic peptide levels in CRF. Am J Kidney Dis 40: 974–982,2002.
21. Pollack GH, Huntsman LL, Verdugo P: Cardiac muscle models—Anoverextension of series elasticity? Circ Res 31: 569–579, 1972.
22. Hill AV, Weber HH, Astbury WT, et al: A discussion on muscularcontraction and relaxation: Their physical and chemical basis.Proc R Soc Lond B Biol Sci 137: 40–87, 1950.
23. Gerbeau JF, Chapelle D: Simulation numerique du systeme car-diovasculaire. Medecine/Science 21: 530–534, 2005.
24. Pietrabissa R, Redaelli A: A structural model of the left ventricleincluding fibres and coronary vessel: Mechanical behaviour innormal condition. Meccanica 32: 53–70, 1997.
25. Wong AYK: Mechanics of cardiac muscle, based on huxley’smodel: Mathematical simulation of isometric contraction. J Bio-mech 4: 529–540, 1971.
26. Sonnenblick EH, Ross J Jr, Cowell JW, et al: The ultrastructureof the heart in systole and diastole. Circ Res 21: 423– 431,1967.
27. Streeter DD Jr: Gross morphology and fiber geometry of the heart,in Berne RM (ed), Handbook of Physiology, Vol. I. BethesdaMD, American Physiological Society, 1979, pp. 61–112.
28. Avolio AP: Multi branched model of the human arterial system.Med Bio Eng Comput 18: 709–718, 1980.
29. Rideout VC: Mathematical and Computer Modeling of Physio-logical Systems. Madison, WI, Medical Physics Publishing,1991.
30. Palladino JL, Ribeiro LC, Noordergraaf A: Human circulatorysystem model based on Frank’s mechanism, in MathematicalModeling in Medicine. The Netherland, IOS Press, 2000.
31. Ferrari G, Kozarski M, De Lazzari C, et al: A hybrid (numerical-physical) model of the left ventricle. Int J Artif Organs 24:456–462, 2001.
32. Ottesen JT, Danielsen M: Modeling ventricular contraction withheart rate changes. J Theor Biol 222: 337–346, 2003.
33. Burattini R, Gnudi G: Computer identification of models for thearterial tree input impedance: Comparison between two newsimple models and first experimental results. Med Biol EngComput 20: 134–144, 1982.
34. Beyar R, Sideman S: Time dependent coronary blood flow distri-bution. Am J Physiol 252: 417–433, 1987.
35. Buzzi-Ferraris G: Metodi Numerici e Software in C��. Milano,Addinson-Wesley, 1998.
36. Duncan AM, Francis DP, Henein MY, Gibson DG: Limitation ofcardiac output by total isovolumic time during pharmacologicstress in patients with dilated cardiomyopathy: Activation-mediated effects of left bundle branch block and coronaryartery disease. Am Coll Cardiol 41: 121–128, 2003.
37. Guyton AC, Hall JE: Textbook of Medical Physiology, 10th ed.Philadelphia, Saunders, 2000.
38. Maldonado MM: Hypertension in end-stage renal disease. KidneyInt 54: S67–S72, 1998.
39. Sandhu JS, Wander GS, Gupta ML, et al: Hemodynamic effects ofarteriovenous fistula in end-stage renal failure. Ren Fail 26:695–701, 2004.
493CARDIOVASCULAR EVOLUTION IN DIALYSIS


![[Pancreatic fistula following duodenocephalopancreatectomy with Wirsung occlusion]](https://img.dokumen.tips/doc/110x75/63527b8430053fbe620bfb86/pancreatic-fistula-following-duodenocephalopancreatectomy-with-wirsung-occlusion.jpg)


