Embed Size (px)
Citation preview

Accid. Anal. & Prw. Vol. 24, No. 2. pp. 117-131. 1992 wo1-1575192 ss.M)+ .oo Printed in Great Britain. @ 1992 Pergamon Press Ltd.
DETERMINANTS OF INTENTION TO COMMIT DRIVING VIOLATIONS*
DIANNE PARKER, ANTONY S. R. MANSTEAD, STEPHEN G. STRADLING, and JAMES T. REASON
Department of Psychology, University of Manchester, Manchester Ml3 9PL, United Kingdom
(Received 23 July 1990; in revised form 24 December 1990)
Abstract-Ajzen’s theory of planned behaviour was used to measure the attitudes and intentions of a large stratified sample of drivers (Iv = 881) towards four driving violations. Measures were taken of respondents’ attitudes to four imaginary scenarios depicting their commission of the four violations concerned. Demographic subgroups of drivers within the sample were differen- tiated on the basis of their beliefs about and evaluations of their commission of the violations. We were able to identify attitude items differentiating the younger, statistically more “accident liable” drivers in the sampIe from their older, and statistically safer counterparts. The implications of using this approach to inform future road safety campaigns are discussed.
INTRODUCTION
In 1988, there were 246,994 road traffic accidents (RTAs) in Great Britain, resulting in 5,052 fatalities and 63,491 serious injuries. The total cost of RTAs in Great Britain in 1988 was estimated to be &5,50Om (approx. $lOm), and the average cost per accident f17,760 (approx. $34,000) (Department of Transport 1989). Much of the loss and suf- fering that lie behind these figures may be attributed to “human error.” Driver and pedestrian error and impairment were concluded to be the main contributory factors in 95% of the 2,041 accidents considered in a four-year study of accident causation in Great Britain (Sabey and Taylor 1980). The aberrant driver behaviours that potentially cause RTAs may be divided into two main types: errors, which have been defined as “slips and mistakes in the highest risk category,” and violations, which are “deliberate . . . [and] . . . involving a definite risk to others” (Reason et al. 1990). In a recent study, drivers’ self-reported propensity to commit driving violations was shown to be related to accident involvement, whereas there was no systematic relationship between the frequency with which driving errors are made and accident involvement (Reason et al., in preparation). In the same study, an above average tendency to commit violations was also associated with being male, young, and having a higher than average annual mileage. There is ample evidence that young drivers are at greater risk of accident involvement than older drivers, partly as a result of their propensity to take risks while driving (see Jonah 1986, for a review). Clearly, the motivational factors that prompt the behaviour of the (typically young, male, high mileage, accident-involved) violation-prone driver warrant further study. Such an investigation would accord with the recent call for a shift of emphasis in research to the attitudinal and motivational aspects of aberrant driving behaviour (Quimby and Drake 1989).
Assessing the motivational factors involved in the commission of driving violations would allow us to uncover any systematic differences between the attitudes of various subgroups of drivers toward these behaviours. Fishbein and Ajzen’s (1975) Theory of Reasoned Action (TRA) and its successor, the Theory of Planned Behaviour (TPB) (Ajzen 1985, 1988), are ideal vehicles for investigating this issue. The TRA is a social psychological theory providing a framework for understanding attitudes and behaviour with reference to a small number of concepts linked together in a model. It has been used successfully to predict behaviour in a wide variety of applied research settings, including drug and alcohol use (Budd 1986), dental health behaviour (Beale and Man-
*This research was funded by the U.K. Transport and Road Research Laboratory.
117
118 D. PARKER etal.
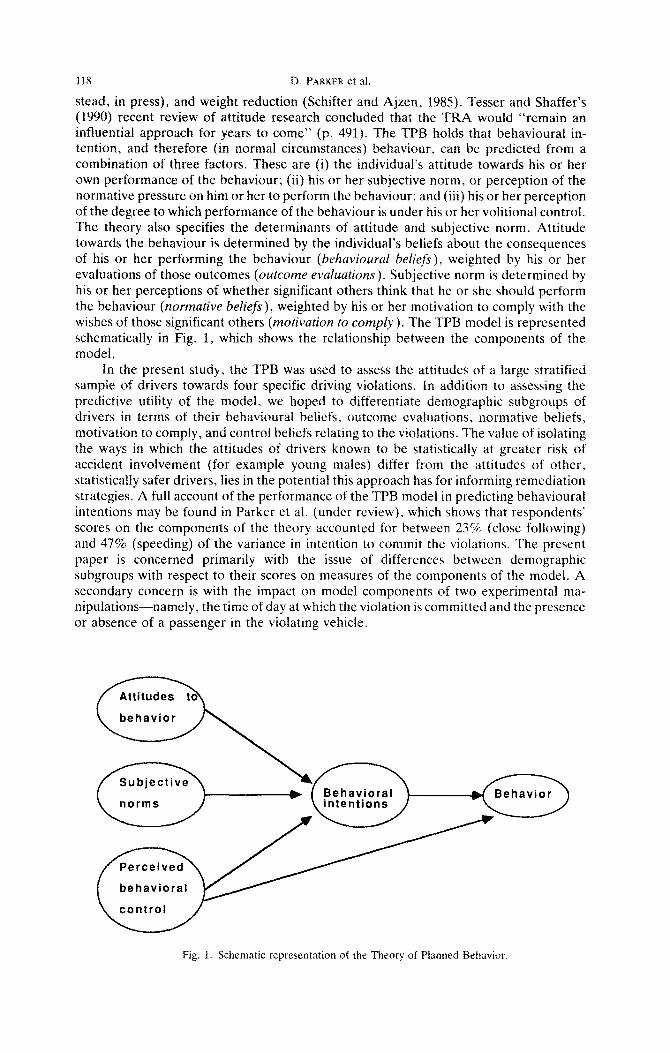
stead, in press), and weight reduction (Schifter and Ajzen, 1985). Tesser and Shaffer’s (1990) recent review of attitude research concluded that the TRA would “remain an in~uential approach for years to come” (p. 491). The TPB holds that behavioural in- tention, and therefore (in normal circumstances) behavi~~ur, can be predicted from a combination of three factors. These are (i) the individual’s attitude towards his or her own performance of the behaviour; (ii) his or her subjective norm, or perception of the normative pressure on him or her to perform the behaviour; and (iii) his or her perception of the degree to which performance of the behaviour is under his or her volitional control. The theory also specifies the determinants of attitude and subjective norm. Attitude towards the behaviour is determined by the individual’s beliefs about the consequences of his or her performing the behaviour (behawioural beliefs), weighted by his or her evaluations of those outcomes (outcome evaluations). Subjective norm is determined by his or her perceptions of whether significant others think that he or she should perform the behaviour (normative beliefs), weighted by his or her motivation to comply with the wishes of those significant others (motivation to comply). The TPB model is represented schematically in Fig. 1, which shows the relationship between the components of the model.
In the present study, the TPB was used to assess the attitudes of a large stratified sample of drivers towards four specific driving violations. In addition to assessing the predictive utility of the model, we hoped to differentiate demographic subgroups of drivers in terms of their behavioural beliefs. outcome evaluations. normative beliefs, motivation to comply, and control beliefs relating to the violations. The value of isolating the ways in which the attitudes of drivers known to be statistically at greater risk of accident involvement (for example young males) differ from the attitudes of other, statistically safer drivers, lies in the potential this approach has for informing remediation strategies. A full account of the performance of the TPB model in predicting behavioural intentions may be found in Parker et al. (under review), which shows that respondents’ scores on the components of the theory accounted for between 23% (close following) and 47% (speeding) of the variance in intention to commit the violations. The present paper is concerned primarily with the issue of differences between demographic subgroups with respect to their scores on measures of the components of the model. A secondary concern is with the impact on model components of two experimental ma- nipulations-namely, the time of day at which the violation is committed and the presence or absence of a passenger in the violating vehicle.
Fig. 1. Schematic representation of the Theory of Planned Behavior.

Intention to commit driving violations
METHOD
119
The TPB was applied to four specified driving violatians utilising an interview schedule in which respondents were asked to make judgcments in relation to four stan- dardised, hypothetical scenarios. These depicted drink-driving, speeding, close following, and dangerous overtaking. The descriptions of these scenarios were as follows:
1. Drink-driving You have driven to a pub alone one afternoon. You have been caught up in the mood of the occasion, and when you leave three hours later, you think that you may be over the legal blood-alcohol limit for driving. You nevertheless decide to drive home, alone, at 4 o’clock on a fine and dry afternoon.
2. Speeding Your are driving alone down a residential street with cars parked down both sides. It is 4 o’clock on a fine and dry afternoon. The road has a 45 kph (30 mph) speed limit. However, you are driving at 65 kilometres per hour (40 mph),
3. Close following You are driving alone on a three-lane motorway. It is 4 o’clock on a fine and dry afternoon. On a busy stretch of the road, traffic in the middle lane is travelling at 100 kph (6.5 mph). You want to go faster, so you move into the fast lane. Here you find yourself stuck behind a car doing just on 110 kph (70 mph). You close up until you are a couple of yards behind the other car.
4. Dangerous overtaking You are driving alone on an A-class rural road with a 90 kph (60 mph) speed limit. It is 4 o’clock on a fine and dry afternoon. On this section of the road there is a series of bends, which means that you cannot see very far ahead. In front of you is a large lorry, which is being driven at 45 kph (30 mph). You have been stuck behind it for a while. Although your view of the road ahead is restricted, you pull out to overtake.
Each scenario was written in the second person singular, with a view to encouraging the respondent to imagine him- or herself in the situation described. The aim was to use simpIe, unambiguous language to evoke a mental picture with sufficient detail to give respondents a ciear image of the scene. Each of the written descriptions was accompanied by a line drawing of the physical context in which the violation took place, in order to reinforce the verbal descriptions and to ensure a degree of comparability in each re- spondent’s visualisation of the scene in question.
In order to assess the effect of situational factors on attitude towards performance of the violations, certain contextual features of the scenarios were systematically ma- nipulated. Four versions of each scenario were produced, corresponding in contextual detail to the following four experimental conditions:
1. Daytime (4 P.M.) driving alone (i.e. as in the description cited above); 2. Daytime (4 P.M.) driving with “a passenger of the same age and sex as yourself”‘; 3. Nighttime (11 P.M.) driving alone; 4. Nighttime (11 P.M.) driving with “a passenger of the same age and sex as
yourself.”
The written descriptions together with the line drawings formed the stimulus ma- terials that served to elicit respondents’ beliefs, attitudes, and intentions relating to the driving violations of interest.
A pilot study involving 240 drivers, stratified by age and sex, was carried out in order to identify salient behavioural beliefs and referents with respect to each of the four violations. After determination that they were drivers, persons approached were asked to imagine one of the four violation scenarios and then asked if they could think
120 D. PARKER et al.
of any reasons why they might be driving in the way indicated, or why they might refrain from doing so, and whether they could think of anyone who would approve or disapprove of their driving in that way. All responses were noted and taken to represent the salient beliefs and referents of those approached. A list of six behavioural beliefs in relation to each of the violations was compiled, including the three most commonly mentioned positive and the three most commonly mentioned negative beliefs. Similarly, a list of the six most frequently mentioned referents was generated, including three approvers and three disapprovers.
The six behavioural beliefs and salient referents generated by the pilot study were used in the main questionnaire. Respondents were asked to rate each of the six modal salient belief statements on a semantic differential scale anchored by endpoints labelled “likely” and “unlikely.” Outcome evaluations were measured by six items, corresponding to the six behavioural belief statements: which respondents were required to locate on a rating scale with endpoints labelled “good” and “bad.” The police, the respondent’s spouse or partner, other drivers on the road at the time, the respondent’s immediate family, the “typical young male driver,” and respondent’s friends had emerged as the salient referents for each of the four violations. Normative beliefs were measured by six items that asked respondents to rate how likely or unlikely it was that each of the six salient referents would approve of their driving in the manner indicated. Motivation to comply was assessed by asking respondents the extent to which they agreed or disagreed with six statements to the effect that they generally liked to drive in a way that would meet with the approval of the referent in question.
In a final section of the questionnaire, respondents were asked about their age, sex, social class, marital status, length of driving experience, annual mileage, and their driving offence and accident histories over the previous three years.
A total of 800 drivers were to be interviewed. They were sampled from one of four geographical areas, chosen on the basis of population size (89,000 t 4%), location (two in the North and two in the South of England), and proximity to (near, far) the motorway system. Two hundred respondents were to be sampled from each of these areas. The respondents were stratified by age (five age bands of 17-25, 26-35, 36-45, 46-55, and over 55) and sex. The four within-scenario contextual treatments were distributed equahy within and between cells of the sampling frame. Each respondent was exposed to all four violation scenarios; order of presentation was counterbalanced in order to control for the possible effects of boredom, fatigue, and practice. The sampling strategy adopted ensured that the total number of respondents included 400 each of males and females, 160 from each of the five age groups specified, 200 from each sampling area, and 200 who were given each of the four contextual manipulations.
It was felt that an in-home interview in the presence of a trained interviewer was the most appropriate method for the administration of such a long and complex ques- tionnaire. The interviews were conducted by Gallup plc. Respondents were given the written scenarios and the accompanying line drawings to study. The interviewer read out the violation frame scenarios in order to ensure that the respondent fully understood them. The semantic differential scales used were printed on separate show-cards for the respondents to hold as the interviewer worked through the schedule.
RESULTS
The specified quota was exceeded in some of the sampling areas, with the result that the final number of respondents was 881. Stratification by age, sex, sampling point, and within-scenario contextual manipulation was successful.
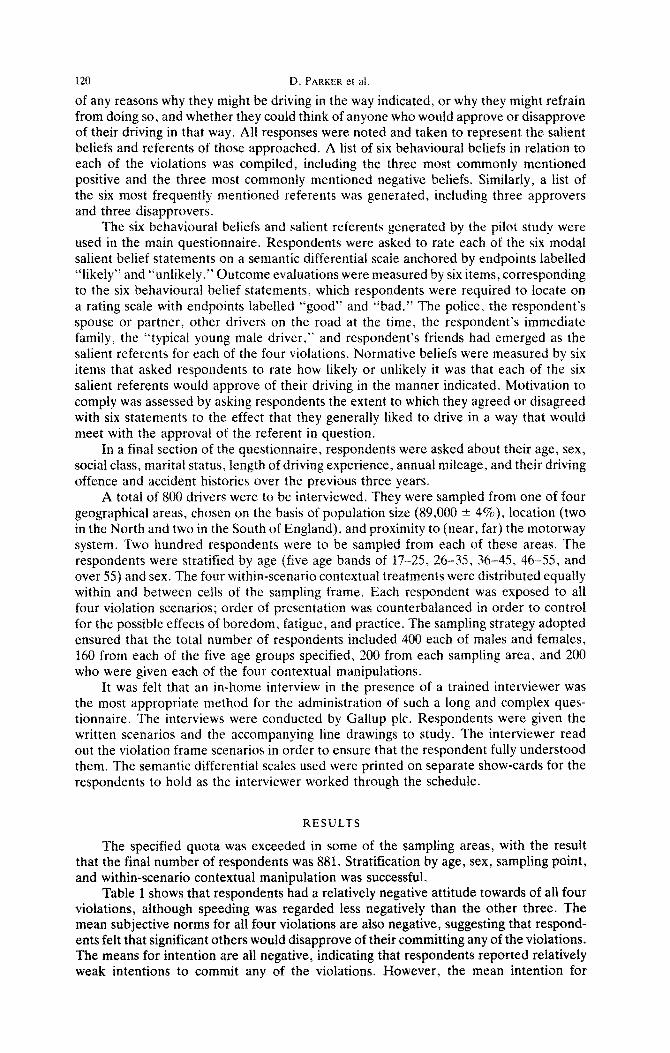
Table 1 shows that respondents had a relatively negative attitude towards of all four violations, although speeding was regarded less negatively than the other three. The mean subjective norms for all four violations are also negative, suggesting that respond- ents felt that significant others would disapprove of their committing any of the violations. The means for intention are all negative, indicating that respondents reported relatively weak intentions to commit any of the violations. However, the mean intention for
Intention to commit driving violations
Table 1. Components of the theory of planned behaviour: mean values
Subjective Control Behavioural Attitude norm belief intention
121
Drink-driving SD
Speeding SD
Close following SD
Dangerous ove~aking SD
-12.1 -48.0 -2.2 ‘-‘;.y (33.7) (1.5)
(148) - 33.0 -0.2 (34.4)
-14.1 -49.9 $) ‘;.;)
(14.4) (32.5) (L6) - 11.6 -44.8
‘;;)
(2:o) -1.6
(15.1) (33.6) (1.8)
Note: Higher positive means reflect attitudes, subjective norms, and intentions that are more pro the commission of the violation. For control beliefs and motivations to comply, higher means indicate perceptions of greater control and stronger motivation to comply, respectively.
speeding (-0.2) was less negative than for the other three violations. The control belief means shows that respondents felt that they would find refraining from drink-driving (1.9) and close following (1.4) relatively easy, although overtaking a slow-moving lorry (0.7) and speeding (0.9) were seen as more difficult to resist.
The use of self-report scales in relation to behaviours that are self-evidently socially undesirable raises questions about the possibility of response bias. Considering the issue of inaccuracy in self-reports of errors, Groeger (1990) concluded that “The fact that self- assessments are inaccurate, argues not for their abandonment as a measure (since they may still, even if inaccurate, influence behaviour) but that self-assessments, without the corroboration of a behaviour index, are insufficient to answer some types of question” (p. 1427). Elsewhere, we have demonstrated a positive correlation between self-reported frequency of commission of violations and accident involvement (Reason et al., in prep- aration). Because there are no grounds for thinking that individuals would inflate (or avoid reducing) self-reported frequency of accidents, this positive association enhances confidence in the accuracy of self-reports of violations.
The mean ratings for each of the behavioural beliefs, and corresponding outcome evaluations are shown in Table 2a. Overall, the negative behavioural beliefs were much more strongly endorsed than the positive ones, indicating that respondents thought that the commission of each of the violations would entail more disadvantages than advan- tages. As would be expected, the negative outcomes were also negatively evaluated, i.e., their consequences were judged to be relatively bad in all cases. In relation to close following and dangerous overtaking, even the positive behavioural beliefs attracted mean ratings that fell below the scale midpoint, indicating that respondents did not feel that saving time, or getting round or past obstructions by committing these violations would have particularly beneficial consequences. All four violations were believed to put lives in danger, although this belief was weaker in relation to speeding than the other three violations. Close following was seen as the most inherently dangerous of the four vio- lations, in that the three negative behavioural belief items were endorsed more strongly than the equivalent items for the other violations. Responses to the normative belief items, shown in Table 2b, revealed that respondents thought that almost all of their significant others would be unlikely to approve of their committing the violations in question. The only exception to this was the “typical young male driver” who was judged, on average, to be “neither likely nor unlikely” to approve of the respondent’s violation in three of the cases, and “slightly likely” to approve of their speeding. Responses to the questions assessing respondents’ motivations to comply with these referents indicated that motivation was strongest to comply with the wishes of the police (5.80) and weakest in the case of the “typical young male driver” (2.27).
Multivariate analyses of variance were performed for each of the violations sepa- rately, using seven dependent variables: behavioural beliefs, normative beliefs, outcome evaluations, motivations to comply, control beliefs, intentions, and directly measured

122 D. PARKER et al
Table 2a. Salient behavioural beliefs and the corresponding outcome evaluations
BB* OEt
Drink-driving My driving home from the pub would
get me home faster than public transport 0.30 0.14 avoid the inconvenience of using other forms of transport 1.06 0.00 mean that I did not incur the expense of a taxi 1.44 0.33
put the lives of others at risk 2.10 -2.70 lead to my being banned from driving 1.84 -2.71 risk causing an accident 2.0 -2.74
Speeding My driving down this street at 40 mph would . .
get me to my destination more quickly 0.46 0.38 feel more comfartabte than driving at 30 mph -0.80 -0.20 help me to keep up with the flow of the traffic 0.01 0.25
lead to my being stopped and fined for speeding 1.13 -2.39 put the lives of pedestrians at risk I so -2.66 increase the chances of my having an accident 1.62 -2.20
Close fotlowing Driving a couple of yards behind the other car would I .
get me to my destination more quickly help me to drive as fast as I would like to make the driver in front move over so that I could get past
- 1.58 -1.55 -0.09
-0.22 -1.00 -0.85
limit the view of the motorway ahead 2.32 - 2.60 not give me enough time if the driver in front braked suddenly 2.13 -2.83 put lives in danger 2.33 -2.85
Dangerous overtaking Overtaking in this situation would
allow me to express my impatience - 0.48 - 1.70 get me to my destination more quickly -0.37 -0.25 get me past the obstruction I had been held up by 0.84 -0.06
increase the risk of causing an accident 2.43 -2.44 put lives in danger 2.41 -2.66 annoy other drivers on the road at the same time 1.63 - 1.99
*BB = behavioural beliefs tOE = Outcome evaluations NB: For behavioural beliefs, higher values indicate stronger beliefs.
For outcome evaluations, higher values indicate positive evaluations.
Table 2b. Salient normative beliefs and corresponding motivations to comply
Drink- Close Dangerous Motivation Referent driving speeding follow overtaking to comply
Same-sex friends - 1.37 -0.74 -1.79 - 1.46 3.49 Police -2.73 - 2.53 -2.71 -2.68 5.80 Close family -2.44 - 1.77 -2.38 -2.32 4.48 Partner -2.26 - 1.60 -2.30 -2.10 4.34 Other drivers - 1.56 -0.51 -1.65 - 1.25 4.37 Typical young male 0.09 1.01 0.10 0.57 2.21
NB: For normative beliefs, higher values indicate more perceived pressure to violate For motivations to comply, higher values indicate stronger motivation
Intention to commit driving violations 123
attitude. There were two between-subjects factors, namely, sex and age (17-25,26-35, 36-45, 46-55, 55-t) of the respondent, and two within-subjects factors, namely, pas- senger (present or absent), and time of day (4 P.M. or 11 P.M.) as specified in the scenario. Univariate effects were only examined where the relevant multivariate effect was significant.
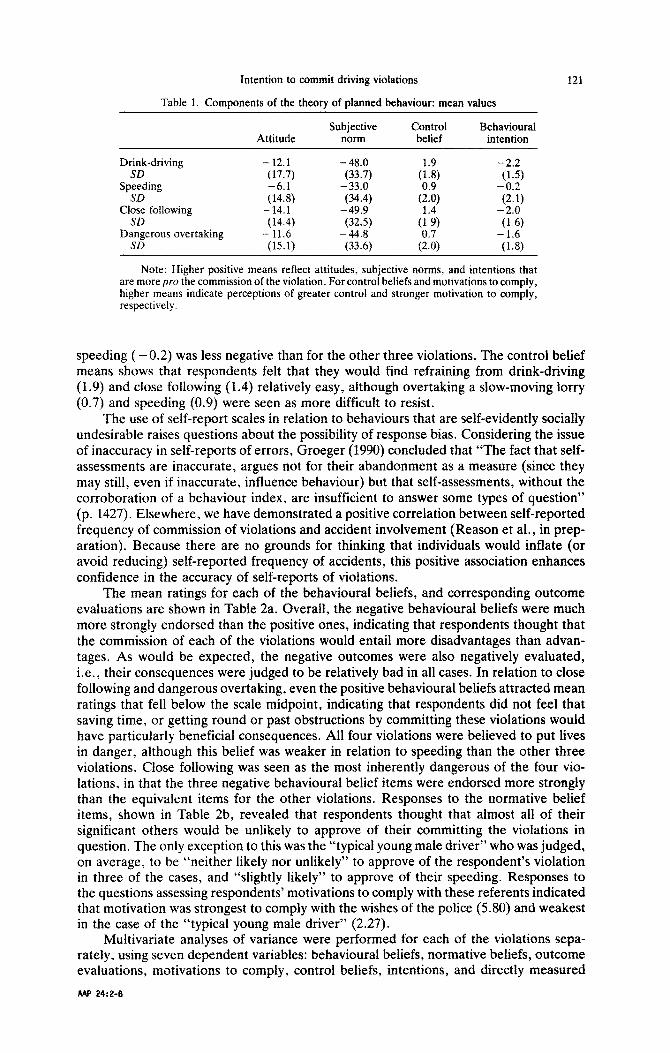
Table 3 shows the significant univariate effects due to age, together with the as- sociated F values. It can be seen that age had a significant effect on all components of the model. Younger people’s behavioural beliefs concerning drink-driving, close follow- ing, and dangerous overtaking were stronger than those of older people. Younger re- spondents’ outcome evaluations were less negative than those of older people, and this applied to all four violations. With regard to normative beliefs, younger respondents perceived more approval from salient referents for their speeding, close following, and
Table 3. Age effects
Drink-driving Speeding ClOStZ follow
Dangerous overtaking
Behavioura~ beliefs {range -3 to +3) F ratios 4.34”
<25 1.56 26-35 1.59 36-45 1.47 46-55 1.49 >56 1.18
Outcome evaluations F ratios 2.58” 3.18” 6.78h 16.6Y
<25 -1.13 -0.97 -1.48 -1.06 26-35 - 1.21 - 1.05 -1.62 -1.41 36-45 -1.28 -1.17 - 1.85 -1.60 46-55 - 1.35 -1.20 -1.76 -1.61 >56 -1.42 -1.29 -1.91 -1.89
Normative beliefs F ratios
<25 -0.60 -1.56 -1.16 26-35 -0.86 - 1.76 -1.44 36-45 -1.15 - 1.91 -1.59 46-55 -1.19 - 1.80 -1.60 >56 - 1.27 -1.86 -1.84
Control beliefs F ratios 12.33” 3.73h 7.81’
<25 0.16 1.04 0.26 26-35 0.47 1.22 0.59 36-45 1.06 1.33 0.47 46-55 1.27 1.59 1.15 >56 1.49 1.78 1.14
Intention F ratios
~25 26-35 36-45 46-55 >56
3.94”
-2.14 -2.16 - 1.95 -2.29 -2.56
8.58b
21.35h 10.2oh 10.32’
0.70 - 1.44 - 1.08 0.34 - 1.72 -1.30
- 0.27 -2.00 - 1.55 -0.67 -2.30 - 1.87 - 1.06 - 2.34 -2.14
3.53h 13.12
0.70 1.44 0.70 1.12 0.57 1.02 0.56 1.11 0.44 0.73
3.39” 7.39’
Note: “df = 4,813 “df = 4,822 ‘df = 4,827
124 D. PARKER et al.
Table 4. Sex effects
Close Dangerous Drink-driving Speeding following overtaking
Outcome evaluations F ratios
MaIf? Female
Normative beliefs F ratios
Male Female
Control beliefs F ratios
Male Female
Intention F ratios
Male Female
4.35”
- 1.21 - 1.35
4.19”
.- 1.63 - 1.78
30.04”
I.53 2.20
16.21”
-_ 2.01 -. 2.43
4.X3h
- 1.06 -1.21
4.3Ob 4.55h
0.77 1.53 1.02 1.26
1o.w 17.37” 22.15’
0.01 - 1.74 -- 1.31 - 0.40 -2.18 -1.86
Note: “df = 1,813 hdf = 1.823 'df = 1,827
risky overtaking than older subjects did. The effects of age on control beliefs show that the oider respondents felt it was easier to refrain from speeding, close following, and risky overtaking than did the younger respondents, but there was no significant effect of age in relation to perceived control over drink-driving. Finally, the mean intention scores show that younger respondents generally felt it was more likely that they would commit all four violations than did older respondents, although the respondents with the weakest intentions to refrain from drink-driving were the 36-45 year-olds.
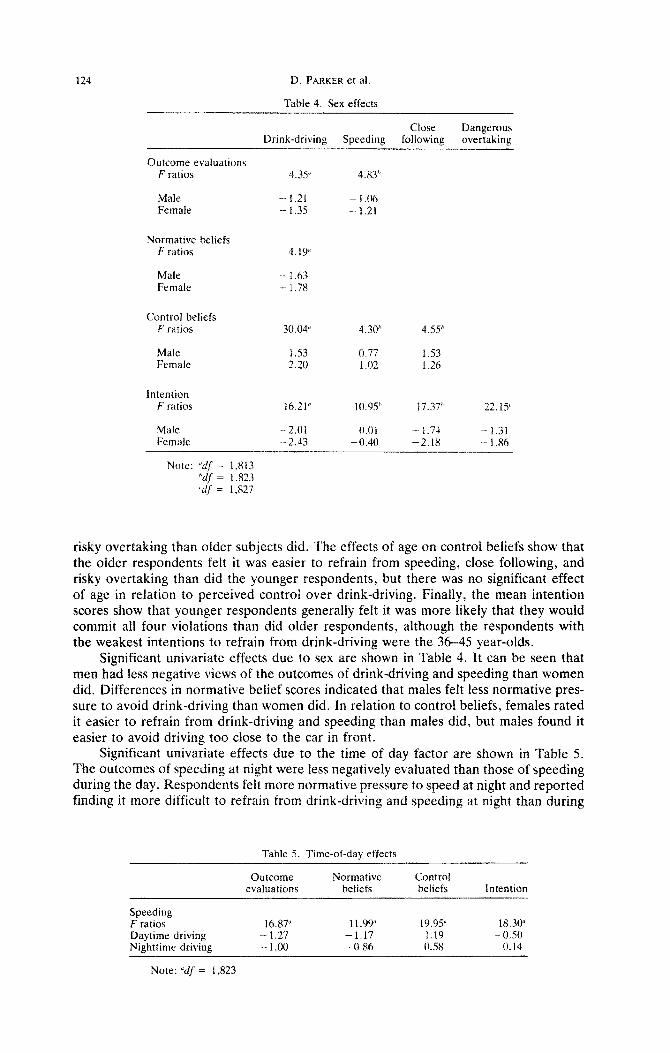
Significant univariate effects due to sex are shown in Table 4. It can be seen that men had less negative views of the outcomes of drink-driving and speeding than women did. Differences in normative belief scores indicated that males felt less normative pres- sure to avoid drink-driving than women did. In relation to control beliefs, females rated it easier to refrain from drink-driving and speeding than males did, but males found it easier to avoid driving too close to the car in front.
Significant univariate effects due to the time of day factor are shown in Table 5. The outcomes of speeding at night were less negatively evaluated than those of speeding during the day. Respondents felt more normative pressure to speed at night and reported finding it more difficult to refrain from drink-driving and speeding at night than during
Table 5. Time-of-dav effects
Outcome Normative Control evaluations beliefs beliefs Intention
Speeding F ratios 16.87” 11.99” 19.95” 18.30” Daytime driving - 1.27 -1.17 1.19 - 0.50 Nighttime driving - 1.00 -0.86 0.58 0.14
Note: "df = 1,823
Intention to commit driving violations 125
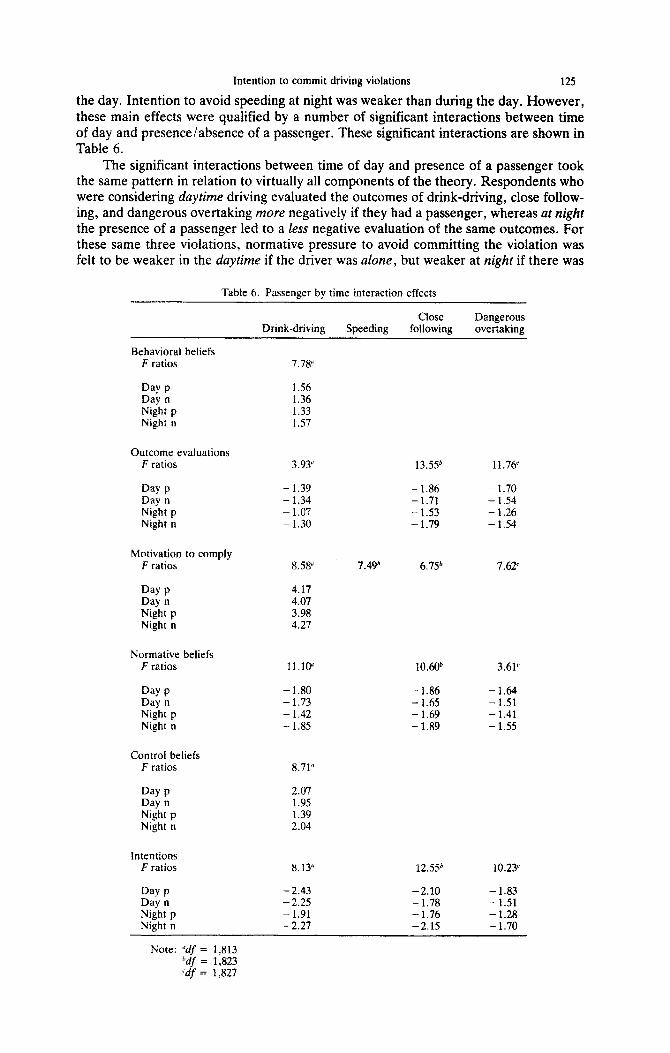
the day. Intention to avoid speeding at night was weaker than during the day. However, these main effects were qualified by a number of significant interactions between time of day and presence/absence of a passenger. These signi~cant interactions are shown in Table 6.
The significant interactions between time of day and presence of a passenger took the same pattern in relation to virtually all components of the theory. Respondents who were considering daytime driving evaluated the outcomes of drink-driving, close foliow- ing, and dangerous overtaking more negatively if they had a passenger, whereas nt nig&t the presence of a passenger led to a less negative evaluation of the same outcomes. For these same three violations, normative pressure to avoid committing the violation was felt to be weaker in the daytime if the driver was alone, but weaker at night if there was
Table 6, Passenger by time interaction effects
Drink-driving Speeding Close Dangerous
following overtaking
Behavioral beliefs F ratios
Day P Day n Night p Night n
Outcome evaluations F ratios
Day P Day n Night p Night n
Motivation to comply F ratios
Day P Day n Night p Night n
Normative beliefs F ratios
Day P Day n Night p Night n
Control beliefs F ratios
Day P Day n Night p Night n
Intentions F ratios
Day P Day n Night p Night n
7.78”
I.56 1.36 1.33 1.57
3.93” 13SY 11.76’
- 1.39 - 1.86 -1.70 - 1.34 - 1.71 -1.54 - 1.07 - 1.53 -1.26 -1.30 - 1.79 -1.54
8.58” 7.49b 6.7Y 7.62’
4.17 4.07 3.98 4.27
11.10” lOA@ 3.61’
-1.80 -1.86 -1.64 - 1.73 - 1.65 - 1.51 - 1.42 - 1.69 -1.41 - 1.85 - 1.89 - 1.55
8.71”
2.07 1.95 1.39 2.04
8.13” 12.5Y 10.23’
- 2.43 -2.10 - 1.83 -2.25 - 1.78 - 1.51 - 1.91 - 1.76 - 1.28 -2.27 -2.15 -1.70
Note: “df = 1,813 hdf = 1,823 ‘df = 1,827
126 D. PARKER etal.
a passenger. Similarly, respondents’ motivations to comply with the perceived wishes of their salient referents were stronger when a passenger was present during daytime driving, but stronger when the driver was alone during nighttime driving. It was felt to be easier to refrain from drink-driving during the day if a passenger was present, but easier at night when the driver was alone. In relation to their intentions to drink-drive, close follow, and overtake in risky circumstances, respondents felt that they were less unlikely to commit the violation during the day if they were ufone, but less unlikely to do so at night if a passenger was present.
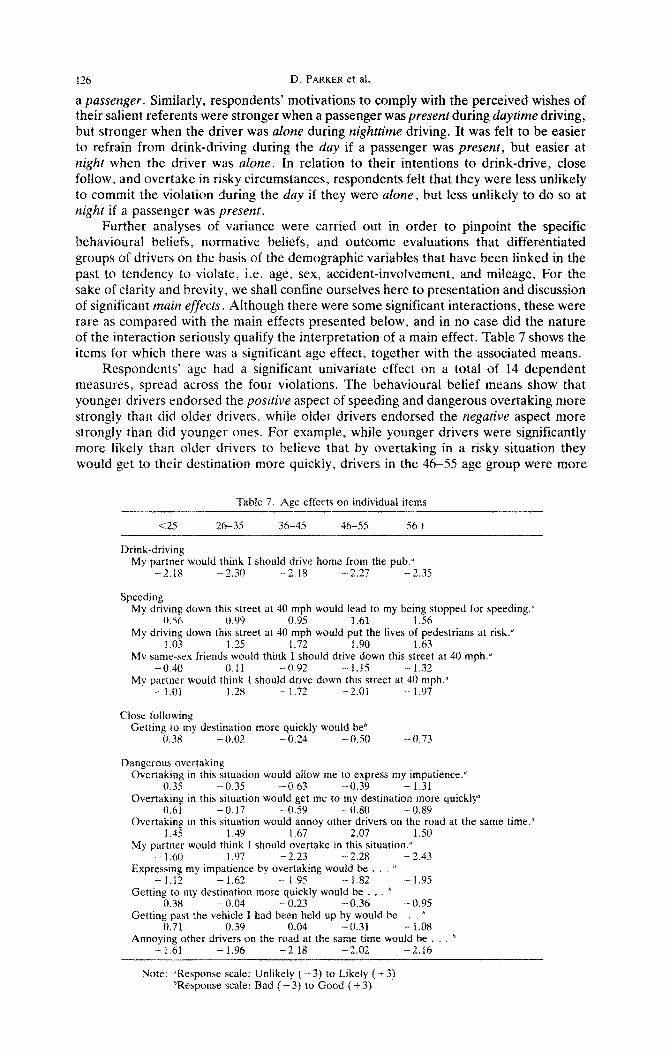
Further analyses of variance were carried out in order to pinpoint the specific behavioural beliefs, normative beliefs, and outcome evaluations that differentiated groups of drivers on the basis of the demographic variables that have been linked in the past to tendency to violate, i.e. age, sex, accident-involvement, and mileage. For the sake of clarity and brevity, we shall confine ourselves here to presentation and discussion of significant main $fecrs. Ahhough there were some significant interactions, these were rare as compared with the main effects presented below, and in no case did the nature of the interaction seriously qualify the interpretation of a main effect. Table 7 shows the items for which there was a significant age effect, together with the associated means.
Respondents’ age had a significant univariate effect on a total of 14 dependent measures, spread across the four violations. The behavioural belief means show that younger drivers endorsed the positive aspect of speeding and dangerous overtaking more strongly than did older drivers, whiie older drivers endorsed the negative aspect more strongly than did younger ones. For example, while younger drivers were significantly more likely than older drivers to believe that by overtaking in a risky situation they would get to their destination more quickly, drivers in the 46-55 age group were more
Table 7. Age effects on individual items
<25 2635 36-45 46-55 56+
Drink”drivin~ My partner would think I should drive home from the pub.*
-2.18 ~ 2.30 -2.18 -2.27 -2.35
Speeding My driving down this street at 40 mph would lead to my being stopped for speeding.”
0.56 0.99 0.95 1.61 1.56 My driving down this street at 40 mph would put the lives of pedestrians at risk.”
f .03 1.25 1.72 1.90 1.63 My same-sex friends would think I should drive down this street at 40 mph:’
- 0.4fl O.il - 0.92 - 1.15 - 1.32 My partner would think I should drive down this street at 40 mph.”
- I.01 ~ 1.28 - 1.72 - 2.01 - 1.97
Close foilowin~ Getting to my destination more quickly would beh
(I.38 - 0.02 - 0.24 -0.5O -0.73
Dangerous overtaking Overtaking in this situation would allow me to express my impatience.”
0.35 - 0.35 -0.63 -0.39 - 1.31 Overtaking in this situation would get me to my destination more quickly”
(1.61 -0.17 -0.59 -0.80 -0.89 Overtaking in this situation would annoy other drivers on the road at the same time.”
1.45 1.49 1.67 2.07 1.50 My partner would think I should overtake in this situation.”
- l.t% - 1.97 - 2.23 _I 2.28 - 2.43 Expressing my impatience by overtaking would be ”
- 1.12 - 1.62 -- 1.95 - 1.82 -1.95 Getting to my destination more quickly would be . . . ”
0.38 - 0.04 -- 0.23 -0.36 -0.95 Getting past the vehicle I had been held up by would be . ’
0.71 0.39 0.04 - 0.31 - 1.08 Annoying other drivers on the road at the same time would be . . , ’
- 1.61 - 1.96 -2.18 -2.02 -2.16
Note: “Response scale: UnlikeIy ( - 3) to Likely f f 3) “Response scale: Bad ( - 3) to Good ( + 3)
Intention to commit driving violations
Table 8. Sex effects in individual items
127
Speeding Male Female
My driving down this street at 40 mph would lead to my being stopped and fined for speeding.” 0.84 1.41
My driving down this street at 40 mph would increase the chances of my having an accident.” 1.47 I.77
My same-sex friends would think I should drive down this street at 40 mph.” - 0.43 -1.05
Putting the lives of pedestrians at risk (by speeding) would be . . * -2.59 -2.74
Close following My family would think I should drive a couple of yards behind the car in front.”
-2.43 -2.32
Note: “Response scale: Unlikely (-3) to Likely (+3) hResponse scale: Bad ( -3) to Good (i-3)
likely than younger drivers to believe that by doing so they would annoy other drivers on the road. The normative belief items that were SignificantIy affected by age ail revealed young drivers reporting more social pressure to commit the violations than older drivers did, from their same-sex friends (speeding) and their partners (drink-driving, speeding, and dangerous overtaking), although this trend is less pronounced in the case of drink- driving. Younger drivers evaluated the outcome of “getting to my destination more quickly” more positively than older drivers did in the context of close following. Four of the dangerous overtaking outcomes were more positively (or less negatively) evaluated by younger drivers than by older ones.
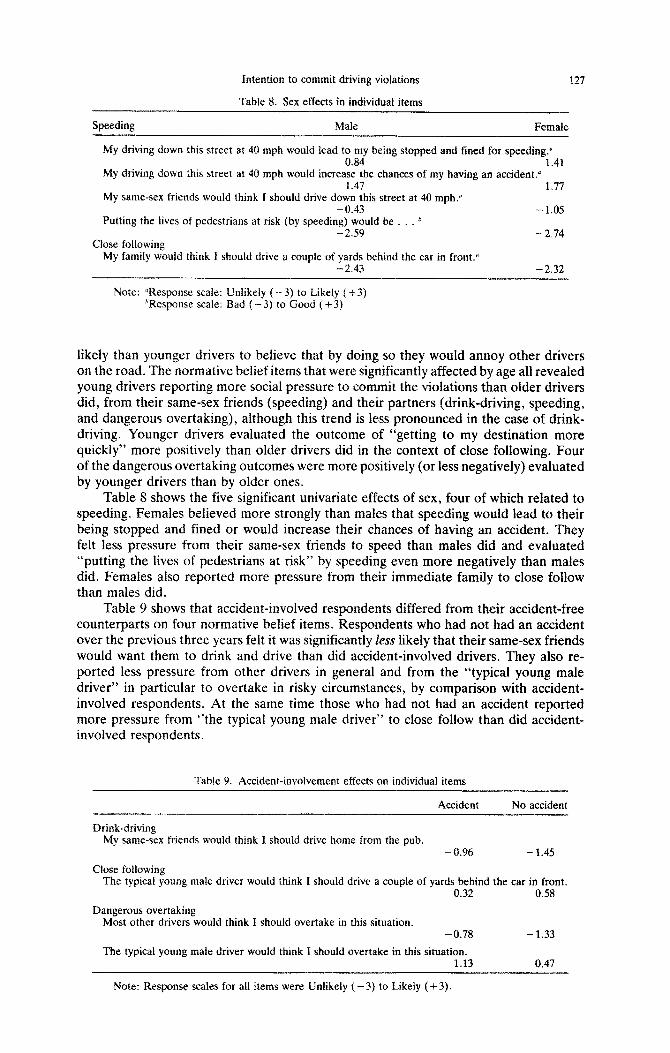
Table 8 shows the five significant univariate effects of sex, four of which related to speeding. Females believed more strongly than maies that speeding would lead to their being stopped and fined or would increase their chances of having an accident. They felt fess pressure from their same-sex friends to speed than males did and evaluated “putting the lives of pedestrians at risk” by speeding even more negatively than males did. Females also reported more pressure from their immediate family to close follow than males did.
Table 9 shows that accident-involved respondents differed from their accident-free counterparts on four normative belief items. Respondents who had not had an accident over the previous three years felt it was significantly less likely that their same-sex friends would want them to drink and drive than did accident-involved drivers. They also re- ported less pressure from other drivers in general and from the “typical young male driver” in particular to overtake in risky circumstances, by comparison with accident- involved respondents. At the same time those who had not had an accident reported more pressure from “the typical young male driver” to close follow than did accident- involved respondents.
Table 9. Accident-involvement effects on individual items
Accident No accident
Drink-driving My same-sex friends woutd think I should drive home from the pub.
-0.96 -1.45
Close following The typical young male driver would think I should drive a couple of yards behind the car in front.
0.32 0.58
Dangerous overtaking Most other drivers would think I should overtake in this situation.
- 0.78
The typical young male driver would think I should overtake in this situation. 1.13
- I.33
0.47
Note: Response scales for all items were Unlikely ( -3) to Likely (+3).
128 D. PARKER et al.
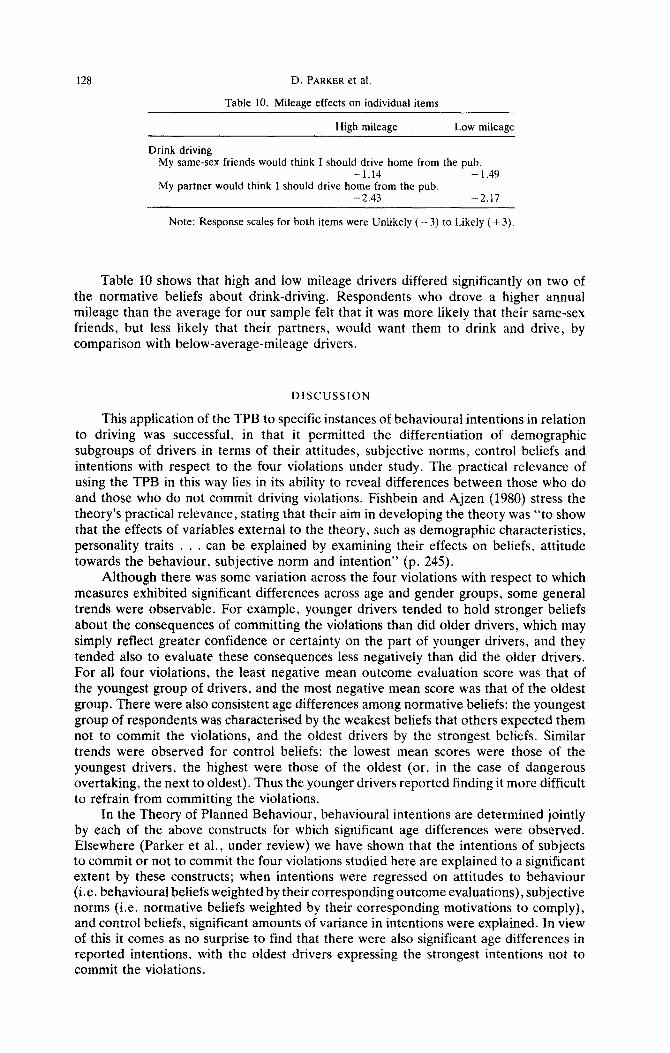
Table 10. Mileage effects on individual items
High mileage Low mileage
Drink driving My same-sex friends would think I should drive home from the pub.
- 1.14 - 1.49 My partner would think I should drive home from the pub.
- 2.43 -2.17
Note: Response scales for both items were Unlikely ( - 3) to Likely ( + 3)
Table 10 shows that high and low mileage drivers differed significantly on two of the normative beliefs about drink-driving. Respondents who drove a higher annual mileage than the average for our sample felt that it was more likely that their same-sex friends, but less likely that their partners, would want them to drink and drive, by comparison with below-average-mileage drivers.
DISCUSSION
This application of the TPB to specific instances of behavioural intentions in relation to driving was successful, in that it permitted the differentiation of demographic subgroups of drivers in terms of their attitudes, subjective norms, control beliefs and intentions with respect to the four violations under study. The practical relevance of using the TPB in this way lies in its ability to reveal differences between those who do and those who do not commit driving violations. Fishbein and Ajzen (1980) stress the theory’s practical relevance, stating that their aim in developing the theory was “to show that the effects of variables external to the theory, such as demographic characteristics, personality traits . . . can be explained by examining their effects on beliefs, attitude towards the behaviour, subjective norm and intention” (p. 245).
Although there was some variation across the four violations with respect to which measures exhibited significant differences across age and gender groups, some general trends were observable. For example, younger drivers tended to hold stronger beliefs about the consequences of committing the violations than did older drivers, which may simply reflect greater confidence or certainty on the part of younger drivers, and they tended also to evaluate these consequences less negatively than did the older drivers. For all four violations, the least negative mean outcome evaluation score was that of the youngest group of drivers, and the most negative mean score was that of the oldest group. There were also consistent age differences among normative beliefs: the youngest group of respondents was ~hara~terised by the weakest beliefs that others expected them not to commit the violations, and the oldest drivers by the strongest beliefs. Similar trends were observed for control beliefs: the lowest mean scores were those of the youngest drivers, the highest were those of the oldest (or, in the case of dangerous overtaking, the next to oldest). Thus the younger drivers reported finding it more difficult to refrain from committing the violations.
In the Theory of Planned Behaviour, behavioural intentions are determined jointly by each of the above constructs for which significant age differences were observed. Elsewhere (Parker et al., under review) we have shown that the intentions of subjects to commit or not to commit the four violations studied here are explained to a significant extent by these constructs; when intentions were regressed on attitudes to behaviour (i.e. behavioural beliefs weighted by their corresponding outcome evaluations), subjective norms (i.e. normative beliefs weighted by their corresponding motivations to comply), and control beliefs, significant amounts of variance in intentions were explained. In view of this it comes as no surprise to find that there were also significant age differences in reported intentions, with the oldest drivers expressing the strongest intentions not to commit the violations.
Intention to commit driving violations 129
Examining age differences at the level of individual measures throws further light on the way in which younger and older drivers’ perceptions varied. Despite the fact that younger drivers held more extreme beliefs, overall, than did older drivers, the latter were more certain, on average, in their beliefs about outcomes that could reasonably be described as negative (e.g. that speeding would lead to being stopped or would endanger the lives of pedestrians); younger drivers, by contrast, regarded as more likely than did older drivers some outcomes that could be described as positive (e.g. that overtaking in risky circumstances would get them to their destination more quickly or allow them to express their impatience). Furthemore, younger drivers evaluated certain positive outcomes (e.g. getting to their destination more quickly) more positively than did older drivers, who in turn evaluated certain negative outcomes (e.g. annoying other drivers) more negatively than did younger drivers. When it comes to perception of how others expect them to behave, younger drivers see their partners and same-sex friends as having weaker negative expectations with regard to speeding and their partners as having weaker negative expectations with regard to drink-driving, by comparison with older drivers. The genera1 picture that emerges is that the younger drivers are less aware of or concerned with the negative outcomes (for themselves or others) of violations; are more attuned to the potentially positive outcomes, as compared to older drivers; see their friends and intimates as less likely to expect them not to commit violations; and find it difficult to resist commiting the violations.
Turning to sex differences, although there is rather less consistency across the vi- olations, there was a general trend for males to evaluate the outcomes of the violations less negatively than females did, to report that they had less control over committing the violations (especially drink-driving) than females did, and to have significantly weaker intentions not to commit the violations. At the level of individual measures, males tended to see negative outcomes (being stopped and fined; having an accident) as less likely to ensue from speeding than did females, to evaluate putting the lives of pedestrians at risk through speeding less negatively than did females, and to see male friends as having weaker negative expectations regarding speeding than females’ perceptions of their fe- male friends’ expectations. Thus, the general pattern for males is a weaker echo of the pattern for younger drivers: less awareness of or concern with the negative outcomes of violations, especially speeding, and greater difficulty in resisting commission of the vi- olations.
The effects of the time of day and presence/absence of passenger manipulations are interesting, especially the interactions between these two factors. For speeding, responses indicated a consistently more “permissive” orientation to speeding at night than during the day, but for the other three violations, time of day affected responses only in conjunction with the passenger factor. Across a variety of measures, the presence of a passenger was found to result in a less permissive orientation to the violations during the day, but a more permissive orientation at night. This cannot be explained in terms of respondents having different kinds of passenger in mind during daytime and nighttime driving, because the passenger was consistently specified as being a person of the same age and sex as the respondent. It would seem, then, that these interaction effects have to be accounted for in terms of factors such as the “social” nature of nighttime driving with a passenger, which might be seen as encouraging a more carefree and less responsible approach to driving than the more “business” nature of daytime driving. Another factor might simply be the greater visibility of violations committed during the day than at night, although it is difficult to see why this should interact with passenger presence, since the violations would be as visible to a passenger at night as during the day. Further research is needed to examine the combined effects of time of day and passenger presence on beliefs and attitudes relating to intention to perform risky driving behaviours.
The last group of findings that warrant some discussion are those relating to dif- ferences between respondents who were accident-involved during the previous three years versus those who were accident-free over that period. Accident-involved drivers differed from their accident-free counte~a~s on only four measures, but these were all measures of normative beliefs, and three of the four differences reflected the fact that
AiV 24:2-C

130 D. PARKER et al.
accident-free drivers believed that significant others would be less likely to expect them to commit the violations, by comparison with the equivalent beliefs of the accident- involved drivers. The exception to this general trend concerned beliefs about the ex- pectations of the “typical young male driver” with regard to close following, where the accident-free drivers were more! likely than the accident-involved to see this referent as expecting them to drive close to the car in front. It is not clear why this particular normative belief deviated from the general pattern, especially in view of the fact that the “typical young male driver” was seen as less likely by the accident-free than by the accident-involved to expect them to overtake in dangerous circumstances. Nevertheless, the findings suggest that those who are accident-involved may see others as having less negative expectations with respect to the commission of violations, and this is a possibility that could be examined more closely in future research.
The final issue we wish to address concerns the practical implications of these findings. in view of the increased accident liability of younger drivers, the age differences in normative beliefs are of particular interest, These show that younger drivers perceive less pressure from others to avoid committing these violations by comparison with older drivers. The relevant motivation to comply means across the five age groups are 4.00, 4.00. 4.17, 4.04 and 4.40, respectively. Analysis at the level of individual normative belief items illustrates the importance of the peer group and of the respondent’s partner for the formation of young drivers’ normative beliefs. This establishes the potential usefulness of highlighting the disapproval of peers and partners in publicity campaigns targeted at younger drivers.
Furthermore. given the finding that young drivers differed from their older coun- terparts in terms of certain behavioural beliefs and outcome evaluations, with respect to how srrongl~~ certain negative beliefs were held or how negatively certain outcomes were evaluated, there is scope for educational materials and programmes that would help to make negative consequences of risky driving behaviour more salient to younger drivers and at the same time remind them that positive consequences are either much less likely than they believe them to be or are insignificant by comparison with the potential negative outcomes. Young drivers should also benefit from persuasive com- munications that emphasise the fact that whether or not one commits driving violations is something over which cun exert some control, for they differ significantly from other drivers in terms of the degree to which they perceive the commission of the violations as being under their volitional control.
Quimby and Drake (1989) point out that information both on the attitudes of road users and on cost-effective ways of influencing those attitudes must be available if road safety issues are to be successfully approached from a social perspective. Policy-makers have acknowledged that “we do not know anything like enough about public attitudes to road safety. or about the means of influencing these attitudes’” (Department of Trans- port 1987). We suggest that the Theory of Planned Behaviour offers a potentially useful tool for the exploration of those attitudes and for pinpointing the particular aspects of an overall “poor” attitude that would be amenable to change through persuasive com- munication. Unpopular and expensive enforcement strategies have not thus far had noticeable success in reducing the amount of aberrant driving behaviour evident on the roads (see Hornet 1988, for a review on the effectiveness of deterrence on drink-driving). Moreover, the North Report (Department of Transport 1988) suggested that “Road safety education attempts to influence road users in their formative years, but recent studies have shown it to be patchy in its application and often unsatisfactory in its execution” (p. 17). A thorough understanding of the attitudes of drivers who indulge in such behaviour is the first step towards using education and/or publicity as an alter- native route to road safety, through the modification of drivers’ antisocial behaviours.
Campaigns emphasising the potential costs and benefits of committing driving vi- olations shouid prove effective for drivers in the younger age group. Previous research has asked I&O are the drivers who commit driving violations and has shown that they tend to be young males who drive a high annual mileage. The results of the present study go some way towards answering the question why such drivers decide to attempt
Intention to commit driving violations 131
such potentially dangerous manoeuvres. The findings could be used to assist those in- volved in the development of road safety campaigns aimed at curbing the risk-taking behaviour of accident-viable drivers, and thereby help the Department of Transport in its current stated aim of reducing the toll of road accidents in Great Britain by 30% before the year 2000.
REFERENCES
Ajzen, I. From intentions to actions: A theory of planned behaviour. In: Kuhl, J.; Beckmann, J., eds. Action control: From cognition to behaviour. Berlin: Springer-Verlag; 1985.
Ajzen, I. Attitudes, personality and behaviour. Milton Keynes: Open University Press; 1988. Beale, D. A.; Manstead, A. S. R. Predicting mothers’ intentions to limit frequency of infants’ sugar intake:
Testing the theory of planned behaviour. J Appl. Sot. Psychol. (in press). Budd. R. J. Predicting cigarette use: The need to incorporate measures of salience in the theory of reasoned
action. J. Appl. Sot. Psvchol. 16:109-117: 1986. Department of Transport. Road safety: the next steps-report by the DTp. London: HMSO; 1987. Denartment of Transnort. Road Traffic Law Review Report. London: HMSO: 1988. Department of Transport. Road accidents Great Britain’l988: The casualty report. London: HMSO; 1989. Fishbein, M.; Ajzen. I. Belief. attitude, intention, and behaviour: An introduction to theory and research.
Reading, MA: Addison-Wesley: 1975. Fishbein, M.; Ajzen, I. Understanding attitudes and predicting social behaviour. Englewood Cliffs, NJ:
Prentice-Hall; 1980. Groeger, J. A. Errors in, and out of, context. Ergonomics 33:1423-1429; 1990. Homel, R. Policing and punishing the drinking driver: A study of general and specific deterrence. New York:
Springer-Verlag; 1988. Jonah, B. A. Accident risk and risk-taking behaviour among young drivers. Accid. Anal. Prev. 18255-271;
1986. Parker, D.; Manstead, A. S. R.; Stradling, S. G.; Reason. J. T.; Baxter, J. S. Intention to commit driving
violations: An application of the theory of planned behaviour (Under review). Quimby, A.; Drake, S. A follow-up to the UK’s IDBRA driver attitude survey. TRRL Research Report
RR216. Crowthorne, U.K.: Transport and Road Research Laboratory; 1989.- Reason, J. T.; Manstead. A. S. R.; Stradlina, S. G.; Baxter. J. S.: Camnbell. K. A. Errors and violations on
the road: A real distinction. Ergonomics-33: 1315-1333; 1990. ’ Reason, J. T.; Manstead, A. S. R.; Stradling, S. G.; Baxter, J. S.: Parker, D.; Kelemen, D. A. The Driver
Behaviour Questionnaire and its correlates (In preparation). Sabey. B. E.; Taylor, H. The known risks we run: The highway. TRRL Supplementary Report 567. Crow-
thorne, U.K.: Transport and Road Research Laboratory; 1980. Schifter. D. E.; Ajzen, I. Intention, perceived control. and weight loss: An application of the theory of planned
behaviour. 3. Pers. Sot. Psychol. 49:843-851; 1985. Tesser, A; Shaffer, D. R. Attitudes and attitude change. Annu. Rev. Psychol. 41:479-523; 1990.


