Embed Size (px)
Citation preview

IEEE TRANSACTIONS ON IMAGE PROCESSING, VOL. 17, NO. 12, DECEMBER 2008 2465
Detection and Segmentation of ConcealedObjects in Terahertz Images
Xilin Shen, Student Member, IEEE, Charles R. Dietlein, Member, IEEE, Erich Grossman,Zoya Popovic, Fellow, IEEE, and François G. Meyer, Senior Member, IEEE
Abstract—Terahertz imaging makes it possible to acquire im-ages of objects concealed underneath clothing by measuring theradiometric temperatures of different objects on a human sub-ject. The goal of this work is to automatically detect and segmentconcealed objects in broadband 0.1–1 THz images. Due to the in-herent physical properties of passive terahertz imaging and associ-ated hardware, images have poor contrast and low signal to noiseratio. Standard segmentation algorithms are unable to segment ordetect concealed objects. Our approach relies on two stages. First,we remove the noise from the image using the anisotropic diffu-sion algorithm. We then detect the boundaries of the concealed ob-jects. We use a mixture of Gaussian densities to model the distri-bution of the temperature inside the image. We then evolve curvesalong the isocontours of the image to identify the concealed ob-jects. We have compared our approach with two state-of-the-artsegmentation methods. Both methods fail to identify the concealedobjects, while our method accurately detected the objects. In ad-dition, our approach was more accurate than a state-of-the-art su-pervised image segmentation algorithm that required that the con-cealed objects be already identified. Our approach is completelyunsupervised and could work in real-time on dedicated hardware.
Index Terms—Object detection, segmentation, terahertzimaging.
I. INTRODUCTION
A T room temperature, the peak of black body radiation isin the infra-red (IR) region of the spectrum. However, de-
tectable power levels are emitted from objects in the terahertzand millimeter wave frequency range. The different emissivitiesof different materials in this frequency range enable applicationsuch as concealed weapon detection under clothing, guidancein adverse weather conditions, etc. [1]–[5]. However, passiveradiometry implies very low signal levels and low SNR, as wellas low contrast images. Detectors have limited sensitivity, and
Manuscript received December 13, 2007; revised August 04, 2008. Currentversion published November 12, 2008. This work was supported by the NationalScience Foundation, project ECS-0501578. NIST is an agency of the U.S. gov-ernment; therefore, this work is not subject to copyright. The associate editorcoordinating the review of this manuscript and approving it for publication wasDr. Ercan E. Kuruoglu.
X. Shen is with the Department of Radiology, Yale University, New Haven,CT 06519 USA.
C. R. Dietlein, Z. Popovic, and F. G. Meyer are with the Department ofElectrical Engineering, University of Colorado, Boulder, CO 80309-0425 USA(e-mail: [email protected]).
E. Grossman is with the Optoelectronics Division, NIST, Boulder, CO 80305USA.
Color versions of one or more of the figures in this paper are available onlineat http://ieeexplore.ieee.org.
Digital Object Identifier 10.1109/TIP.2008.2006662
images are typically obtained by scanning, resulting in a smallnumber of pixels. In fact, we show in our experiments that stateof the art image segmentation algorithms fail with radiometricthermal images. In this work, we address the problem of de-tecting from terahertz images the contours of objects that areconcealed under clothing.
In previous research, millimeter wave (MMW) imaging hasbeen combined with infra-red imaging [6]–[8]. Although theIR images provide no useful information about the concealedobjects, they help locate the human subject. Image restorationtechniques have been applied simultaneously to MMW and IRimages to improve their quality. Restoration techniques includeLorentzian and Wiener filtering [9], wavelet based methods[10], neural network based methods [11], [12], super-resolu-tion algorithms [13]–[16], and others [17], [18]. After imagerestoration, the same regions of interest are extracted from bothmodalities (terahertz and IR) and the sub-images are alignedand fused. Several segmentation methods have been proposedfor the fused images, e.g. in [19], the authors used Otsu’sthresholding [20] method to separate concealed weapons fromthe rest of the images. The method is solely based on thehistogram of the image, and the single value thresholdingoffers no guarantee to find the concealed objects. The SlamaniMapping Procedure (SMP) [21], [22] quantizes and decom-poses the fused image into several homogeneous regions.Shape parameters such as circularity, Fourier descriptors andmoments were used to analyze each region for recognitionpurpose [23]. The underlying assumption of SMP is that aconcealed object can be represented by a single region. How-ever, a low signal-to-noise ratio greatly affects the accuracyof the decomposition. It is likely that a concealed object isdecomposed into two or more regions, which makes it difficultto recognize. More recently, video sequences obtained usingmillimeter wave imaging technology have been studied [24]. Inorder to segment the human body from each frame of the videosequence, an image-histogram-based segmentation approachand a model-based segmentation approach were implementedand compared, but segmentation of concealed objects was notaddressed. In summary, existing methods for concealed objectdetection depend on the information from an IR/visible imagewhich helps restrict the analysis to a small region on a humansubject. In this paper, we show that the terahertz images aloneprovide sufficient information for concealed object detectionand segmentation.
Because terahertz images usually have low SNR, it is advan-tageous to remove noise to improve the image quality. There area number of sophisticated image denoising algorithms that can
1057-7149/$25.00 © 2008 IEEE
Authorized licensed use limited to: NIST Research Library. Downloaded on September 24, 2009 at 15:29 from IEEE Xplore. Restrictions apply.
2466 IEEE TRANSACTIONS ON IMAGE PROCESSING, VOL. 17, NO. 12, DECEMBER 2008
be used for terahertz images. The algorithms include Gaussianfiltering [25], Wiener local filter [26], anisotropic diffusion [27],total variation model [28], translation invariant wavelet thresh-olding [29], Yaroslavsky neighborhood filters [26], and nonlocalmeans (NL-means) algorithm [30]. Terahertz images are piece-wise smooth with no significant texture; thus, the anisotropicdiffusion algorithm is appropriate for denoising the images. Inour experiments, we compare the anisotropic diffusion algo-rithm with the NL-means algorithm. It has been proved in [30]that the NL-means algorithm is asymptotically optimal under ageneric statistical image model, and, therefore, the results ob-tained by the NL-means algorithm should be close to the bestthat one can achieve.
We have explained above that existing methods to segmentconcealed objects in millimeter wave images suffer from signif-icant limitations and require the use of IR images. Thus, thesemethods cannot be applied directly to terahertz images. Theemergence of terahertz imaging systems for the detection ofconcealed nonmetallic weapons creates a need for fast algo-rithms that can remove the noise and segment images to ex-tract the hidden objects. Such systems should be fully automatedin order to be useful in environments such as airports. In thispaper, we propose a fully automated method called MultilevelThresholding, which combines a mixture model for the imagehistogram and a geometry analysis of the intensity isocontours.We compare our approach to three state-of-the-art segmenta-tion algorithms: the level set approach of Chan and Vese [31],the Normalized Cut algorithm of Shi and Malik [32], and therandom walk segmentation algorithm of Grady [33]. In [31],the authors propose the so-called “active contours without edgesapproach” to detect objects in a given image. By restricting thesegmented image to be piecewise constant, they re-formulatethe Mumford-Shah [34] minimization problem using level setfunctions. The outline of the objects is given by the zero-levelsets. The piecewise constant model is appropriate for terahertzimages, but the output of the segmentation algorithm is not ac-curate due to the low contrast across object boundaries. Overthe last couple of years, graph-based image segmentation ap-proaches [32], [33] have been developed and shown promisingresults. In [32], an image is represented by a graph, where eachpixel becomes a node in the graph and the nodes are connectedand edges are weighed. The segmentation problem then turnsinto a graph partition problem. In [33], the author solves the seg-mentation problem using an algorithm based on random walks.By prelabeling a small number of pixels, one finds the probabil-ities that a random walker first reaches the labeled pixels fromeach unlabeled pixel. We apply the two graph-based algorithmsto terahertz images. We have found that the algorithm describedin [32] does not work well due to the low contrast. Althoughthe random walk algorithm produces reasonable segmentationof the concealed objects, its interactive mode of operation re-quires a significant amount of human interaction, and, thus, doesnot satisfy the requirement of automatic processing.
The paper is organized as follows. In Section II, the acqui-sition of passive terahertz images and the physical propertiesof the data are discussed. The anisotropic diffusion algorithmand the NL-means denoising method are presented in Sec-tion III, followed by a description of the proposed Multilevel
Thresholding method in Section IV. We show the resultsof our approach in Section V and compare them with threestate-of-the-art image segmentation algorithms.
II. IMAGE ACQUISITION
A passive superconducting , vacuum-bridge,antenna-coupled Nb microbolometer, described in [35], isutilized for terahertz detection. As explained in [35], the imagesare acquired by single-pixel, row-based raster scanning of theuncontrolled scene. Readout of the radiometric temperatureis performed by electronics discussed in [36]. The imagesare broadband, where the bandwidth is nominally 0.1–1 THz.This bandwidth is governed by the logarithmic spiral antennabandwidth and the low-pass filters installed in the optical path;the mean imaging frequency for purposes of spatial resolutionand edge sharpness is approximately 450 GHz, as mentionedin [37]. The primary aperture of the imaging system is 30 cmin diameter, with a focal length of 25 cm. The subject inthe images is approximately 1 m from the primary aperture.The human subject is fully clothed with concealed objectsunderneath clothing. In the terahertz frequency range, clothinghas very different emissivity than the body and the concealedobjects, and it appears transparent in the images. The concealedobjects include a kitchen knife, a small metallic handgun,and a rectangular piece of standard RF anechoic material.
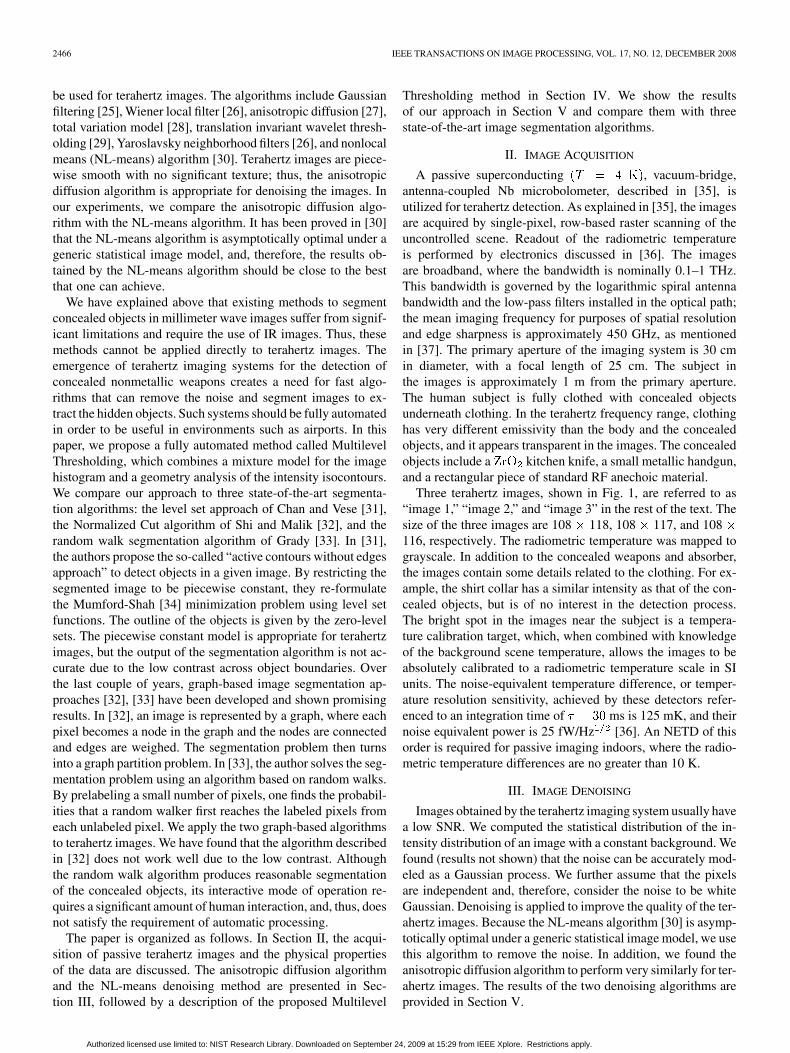
Three terahertz images, shown in Fig. 1, are referred to as“image 1,” “image 2,” and “image 3” in the rest of the text. Thesize of the three images are 108 118, 108 117, and 108116, respectively. The radiometric temperature was mapped tograyscale. In addition to the concealed weapons and absorber,the images contain some details related to the clothing. For ex-ample, the shirt collar has a similar intensity as that of the con-cealed objects, but is of no interest in the detection process.The bright spot in the images near the subject is a tempera-ture calibration target, which, when combined with knowledgeof the background scene temperature, allows the images to beabsolutely calibrated to a radiometric temperature scale in SIunits. The noise-equivalent temperature difference, or temper-ature resolution sensitivity, achieved by these detectors refer-enced to an integration time of ms is 125 mK, and theirnoise equivalent power is 25 fW/Hz [36]. An NETD of thisorder is required for passive imaging indoors, where the radio-metric temperature differences are no greater than 10 K.
III. IMAGE DENOISING
Images obtained by the terahertz imaging system usually havea low SNR. We computed the statistical distribution of the in-tensity distribution of an image with a constant background. Wefound (results not shown) that the noise can be accurately mod-eled as a Gaussian process. We further assume that the pixelsare independent and, therefore, consider the noise to be whiteGaussian. Denoising is applied to improve the quality of the ter-ahertz images. Because the NL-means algorithm [30] is asymp-totically optimal under a generic statistical image model, we usethis algorithm to remove the noise. In addition, we found theanisotropic diffusion algorithm to perform very similarly for ter-ahertz images. The results of the two denoising algorithms areprovided in Section V.
Authorized licensed use limited to: NIST Research Library. Downloaded on September 24, 2009 at 15:29 from IEEE Xplore. Restrictions apply.
SHEN et al.: DETECTION AND SEGMENTATION OF CONCEALED OBJECTS IN TERAHERTZ IMAGES 2467
Fig. 1. Image 1 (left), � � �������� ����. A ceramic knife and a handgun are concealed under the clothing. Image 2 (center), � � ������� ����. A handgun anda rectangular piece of standard RF anechoic material are concealed under the clothing. Image 3 (right), � � ������������. A ceramic knife is concealed underthe clothing. The radiometric temperature � is mapped to grayscale intensity.
A. NL-Means Image Denoising Algorithm
The NL-means algorithm [30] takes advantage of the high de-gree of redundancy that exists in natural images. Given a smallneighborhood in a natural image, one can find many other neigh-borhoods where the intensity function is locally the same. Theintensity in all these neighborhoods can thus be averaged forremoving the incoherent noise. Let denote a noisy image. Wedefine the similarity between pixel and pixel to be a weighted
distance between the intensities around the two pixels
(1)
where is a Gaussian kernel with standard deviation . TheGaussian kernel controls the size of the windows around pixels
and within which the intensity is compared. The NL-meansalgorithm [30] is then defined by
(2)
where is a normalization factor given by. The parameter controls the amount of
averaging. The algorithm is nonlocal since the estimated valueat pixel is a weighted average of all pixels in the
image. In practice, the computation is restricted within a searchwindow to reduce the complexity of the algorithm.
B. Anisotropic Diffusion Algorithm
Convolving an image with a Gaussian kernel is equivalent tosolving the heat equation with the image as the initial condition.Inspired by this equivalence, Perona and Malik [27] introducedan anisotropic diffusion equation to denoise images
(3)
where . The initial conditionis given by the noisy image, . The time pa-rameter controls the amount of smoothing. The functiondetermines the diffusion coefficient. Because
, (3) encourages diffusion in smooth regions where issmall and stops diffusion at discontinuities where is large.
We can write (3) as a weighted sum in the normal direction andin the tangential direction [38]
where . The diffusion in the tangentialdirection is controlled by , and the diffusion in the normaldirection is controlled by . Since we choose for all, the equation results in smoothing in the tangential direction.
However, in the normal direction, the sign of determineswhether an edge is blurred or sharpened. The evolution equa-tion (3) can also be interpreted in terms of a gradient descentmethod to minimize an energy functional. Geman and Gemanproposed in [39] nonconvex potentials that require more com-plex minimization methods.
There are several possible choices for the function . Inour implementation of the anisotropic diffusion algorithm, weused the Tukey’s biweight function, because it generates the bestresult. The Tukey’s biweight function, given by
ifotherwise
(4)
was suggested by Black et al. [40] because of its connection tothe robust error norm in robust statistics. The function is givenby
ifotherwise.
(5)
Clearly, when , when ,and when , thus the edge enhancing stops at .
IV. MULTILEVEL THRESHOLDING
A. Analysis of the Histogram
Terahertz imaging measures the radiometric temperature ofthe scene. In general, the background has a lower temperature,the human body has a higher temperature (clothing is trans-parent), and the concealed objects (knives or hand guns) have a
Authorized licensed use limited to: NIST Research Library. Downloaded on September 24, 2009 at 15:29 from IEEE Xplore. Restrictions apply.

2468 IEEE TRANSACTIONS ON IMAGE PROCESSING, VOL. 17, NO. 12, DECEMBER 2008
Fig. 2. Left: histogram of the intensity of denoised image 1. Right: the mixture model and the thresholds � and � .
radiometric temperature that is higher than the background butlower than the human body (Fig. 1).
Fig. 2 shows the histogram of the denoised “image 1.” Weinterpret the histogram as the sum of four regions. Region one,denoted by “ ,” approximately ranging from 286 K to 296 K,has the lowest temperature and corresponds to the radiometrictemperature of the background region. Region two, denoted by“ ,” ranging from 296 K to 303 K is the transition region be-tween and , and corresponds to the radiometric temper-ature of the concealed objects. Region three, denoted by “ ,”ranging from 303 to 308 K, has relatively high temperature andcorresponds to the radiometric temperature of the human body.Region four, denoted by “ ,” has the highest temperature andcorresponds to the radiometric temperature of the heat sourcefor calibration. is the region which we are interested in.We model the probability density function of the image inten-sity (radiometric temperature of the scene) using a mixture ofGaussian densities
(6)
where is the weight of each component and isthe Gaussian density with mean and standard deviation .We specify the number of components of the mixture to be 3,representing the background, the human body and the concealedobjects respectively. Similar mixture models have been used in[41] and [42] with Laplacian-Rayleigh densities and 2 compo-nents. Because there are only very few pixels corresponding tothe heat source, we do not assign an individual component forit. The parameters ( , and ) of the mixture model can beestimated using the expectation-maximization algorithm [43].The estimate of the Gaussian densities for image 1 are shown inFig. 2.
Given the estimation of the Gaussian mixture density, we canassign to each pixel a label that corresponds to themost likely component of the mixture that gave rise to the tem-perature at that pixel. The maximum a posteriori estimationof the label is given by
(7)
Fig. 3. Pixels � such that ���� is in given range. Left: ����� � � � � .Center: ����� � � � �� � . Right: ����� � � � � � �. Wehave � � � ���� �, � � ������ �, and � � � �.
is the posterior probability on the basis of the observa-tion , which can be re-written according to the Bayes’ theoremas
(8)
The distribution of the image intensity (see Fig. 2) is guaranteedto have the first and the third components of the Gaussian mix-ture well separated from each other. Therefore, for any giventemperature , we only need to make two comparisons to de-termine the component label according to (7). In fact, it is suf-ficient to compute two thresholds, for separating the firstand second components and for separating the second andthird components. and are defined as
(9)
Both and are marked in Fig. 2. The two thresholdsare the lower and upper bounds of the transition region .
Fig. 3 is the binary image showing the segmentation. Pixelswith intensity values in the range are shown inwhite. White pixels not only come from the concealed objectsbut also from the boundary of the human subject. Becausethe imaging system is not able to produce images with sharpedges, the terahertz image shows a smooth transition fromthe human body to the background. Therefore, pixels locatedat the boundary of the human body also have temperature in
. It should be clear that pixels at the boundary are included
Authorized licensed use limited to: NIST Research Library. Downloaded on September 24, 2009 at 15:29 from IEEE Xplore. Restrictions apply.

SHEN et al.: DETECTION AND SEGMENTATION OF CONCEALED OBJECTS IN TERAHERTZ IMAGES 2469
in the segmentation not because of the inaccuracy of the twothresholds and . This is illustrated by Fig. 3-left. Thebinary image in Fig. 3-center is obtained using and
, and the binary image Fig. 3-right is obtained usingand . Increasing the lower threshold by reducesthe number of pixels from the boundary. However, some of thepixels from the concealed object (the handgun) are missing, aswell. On the other hand, lowering the higher threshold causesthe shape of the knife to be inexact. Therefore, both thresholdsshould remain as they are. Here, we denote the set of pixels thathave intensity value between and by
(10)
We need to partition into two sets: that contains pixelsthat belong to the concealed objects, and that contains pixelslocated at the boundary of the human body
(11)
B. Multilevel Thresholding
We describe here a new method, called Multilevel Thresh-olding, to partition into and . The method takesadvantage of the smooth transition of the temperature from thebackground to the human body. We note that by continuouslyincreasing the lower threshold , the boundary of the humanbody shrinks inward continuously. The Multilevel Thresh-olding method is designed to keep track of this evolution of thisboundary. The general idea is as follows.
We partition the set into a union of level sets
(12)
where, goes from to and is the coordinate ofeach pixel in the level set. All ’s are disjoint and .Now, each can be further partitioned into two disjoint subsets
and , where is the subset of pixels that belong to theboundary of the human body and is the subset of pixels thatbelong to the concealed objects
(13)
The Multilevel Thresholding first finds an initial boundary setand then recursively identifies the subset in each .
By eliminating the s from , we are able to recover the setthat corresponds to the concealed objects. Fig. 4 is a car-
toon example that shows how the level sets s are spatiallylocated and the relationship among the sets s, s and s.Note that (13) does not provide a way to find or , sincewe do not have access to either or . The s are actuallyidentified based on the observation that the radiometric tempera-ture changes smoothly from the background to the human body;therefore, in successive s, the pixels are spatially connected.One can start from an initial set that defines the boundaryof the human subject, and search in for all pixels that arespatially connected to . These pixels must form the subsets
, which will serve as the reference set for finding . We
Fig. 4. Left: pixels in various shades of red have intensity between � and� . The boundary of the region � is shown in blue. The outline of the con-cealed object � is drawn in green. Pixels colored with the same shade of redbelong to the same level set� . Right: each� can be partitioned into two dis-joint sets� and� , where� contains pixels from the boundary region, and� contains pixels from the concealed object. Successive � ’s are spatiallyconnected. � is the starting set.
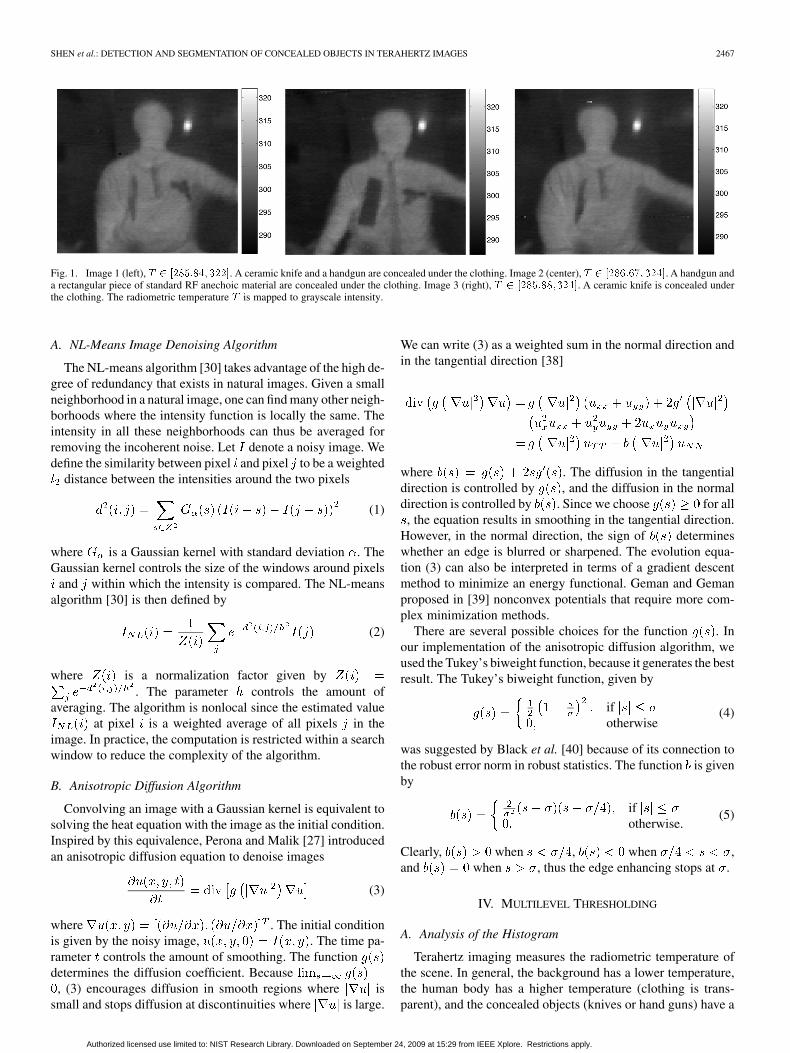
illustrate in Fig. 5 the Multilevel Thresholding using a 1-D ex-ample. First, a line segment is extracted from a denoised ter-ahertz image (see Fig. 5). Starting from the left, points alongthe segment are in the background, in the human body, acrossthe handgun and the collar, and finally are again in the back-ground. The transition of the intensity between the different re-gions is shown in the top-right plot in Fig. 5. We mark the firstfew level sets and the initial boundary set on thebottom-left plot. In , all pixels are spatially connected to ,so . Similarly in , all pixels are spatially connectedto ; therefore, . In , part of the pixels are spa-tially connected to . These pixels are classified to be in ,while the rest of the pixels form the set . Recursively, we canrecover all subsets ’s, as described in the algorithm given inFig. 9. The union of the s gives and the complement setof is . The sets and are shown in Fig. 7. The Multi-level Thresholding algorithm is given in Fig. 9. The step sizebetween the level sets should be sufficiently small to guaranteethat the consecutive ’s remains connected. In other words, ifwe define that a pixel is spatially connected to its 8-neighbors,then pixels in must be one of the 8-neighbors of pixels in
. If is too large, then some pixels in may not be di-rectly connected to pixels in . In this case, these pixels willby mistake be identified to belong to the set . Fig. 6 showshow the choice of affects the construction of ’s. In our ex-periments, we choose to be .
V. EXPERIMENTS
We generate noisy images by adding white Gaussian noiseof increasing strength ( 0.5, 1.0, 1.5 , and 2.0 K) to thethree images shown in Fig. 1. For each noise level, we create tenrealizations of the noisy images. Note that the original terahertzimages on which we add noise are already noisy.
A. Image Denoising
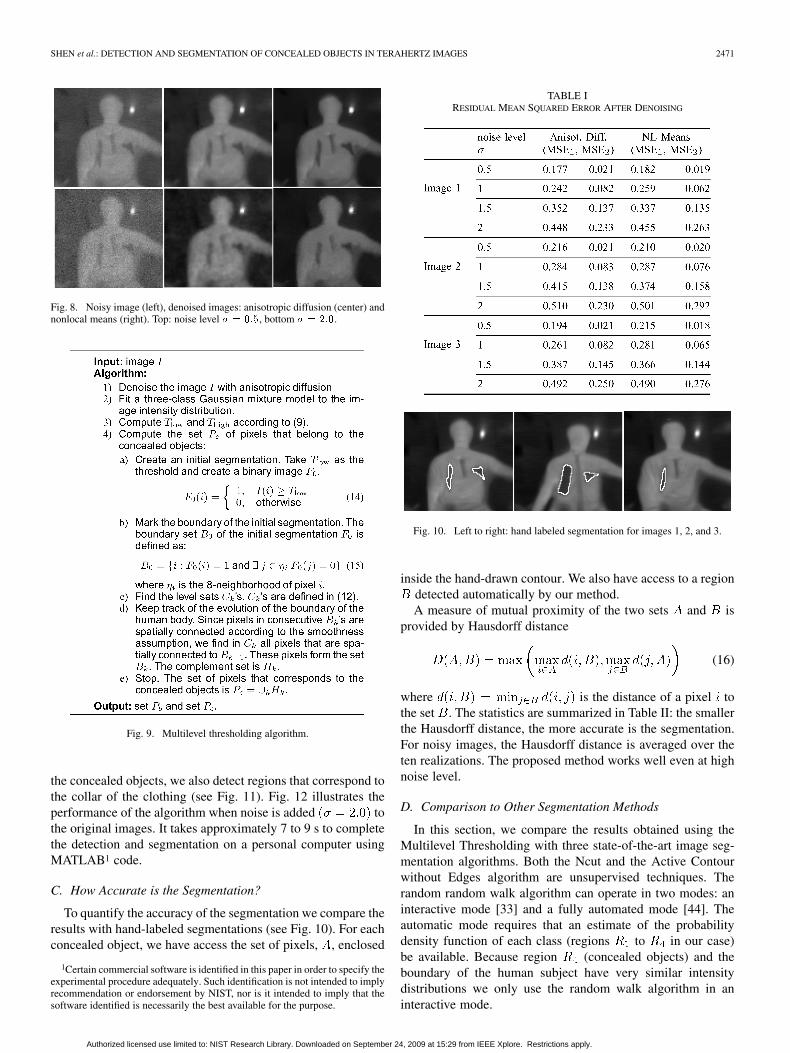
In Fig. 8, we show the images denoised using the anisotropicdiffusion and the NL-means algorithm. Both algorithms workequally well in terms of mean squared error (MSE). The de-noised images using the NL-means are visually more pleasant.However, the NL-means method is much slower than theanisotropic diffusion algorithm. On a personal computer, it
Authorized licensed use limited to: NIST Research Library. Downloaded on September 24, 2009 at 15:29 from IEEE Xplore. Restrictions apply.
2470 IEEE TRANSACTIONS ON IMAGE PROCESSING, VOL. 17, NO. 12, DECEMBER 2008
Fig. 5. Intensity along a segment from denoised image 1 (top left) is plotted against the arc length (top right). Bottom left: the level sets � �� �� and initialboundary set � . Bottom right: the subsets � �� �� that contain pixels located at the boundary of the human body, and the set � that contains pixels corre-sponding to the concealed objects.
Fig. 6. Left: dark blue pixels are from � . Light blue pixels are from the levelset � ; if classified correctly, these pixels should all belong to the set ofboundary pixels � . Right: because � is too large, some of the light blue pixelsare not in the 8-neighbors of the dark blue pixels. According to the spatial con-nectivity constraint, only part of the light blue pixels are classified as in � ,while the rest of them, which are painted in red, are by mistake classified as in� .
takes about 0.8 to 1.0 s to denoise an image using the anisotropicdiffusion, while it takes about 90 to 94 s for the NL-meansalgorithm. Therefore, we only use the anisotropic diffusionalgorithm in the remaining of the paper. We now confirm ourvisual impression with a quantitative comparison. Let bethe denoised image for the noise level , and let be theoriginal terahertz image. The mean squared error is given by
.Because the denoising will remove some of the noise of the
original image, may not be a good indicator of the per-formance of the denoising. To address this issue, we comparethe denoised image to a “cleaned” original image, , which is
Fig. 7. Set of pixels with intensity in �� � � � is partitioned into � and� . Pixels in � (shown in red) are located at the boundary of the human body.Pixels in � (shown in white) belong to the concealed objects.
obtained by a light denoising with the anisotropic diffusion. Wedefine a second mean squared error
The statistics in Table I confirm that anisotropic diffusion andNL-means perform similarly for terahertz images. This result isspecific to terahertz images and, therefore, does not contradictthe results obtained in [30] for the class of natural images.
B. Concealed Object Detection and Segmentation
Fig. 11 (right column) shows the contours of the concealedobjects detected by our algorithm. While we accurately segment
Authorized licensed use limited to: NIST Research Library. Downloaded on September 24, 2009 at 15:29 from IEEE Xplore. Restrictions apply.
SHEN et al.: DETECTION AND SEGMENTATION OF CONCEALED OBJECTS IN TERAHERTZ IMAGES 2471
Fig. 8. Noisy image (left), denoised images: anisotropic diffusion (center) andnonlocal means (right). Top: noise level � � ���, bottom � � ���.
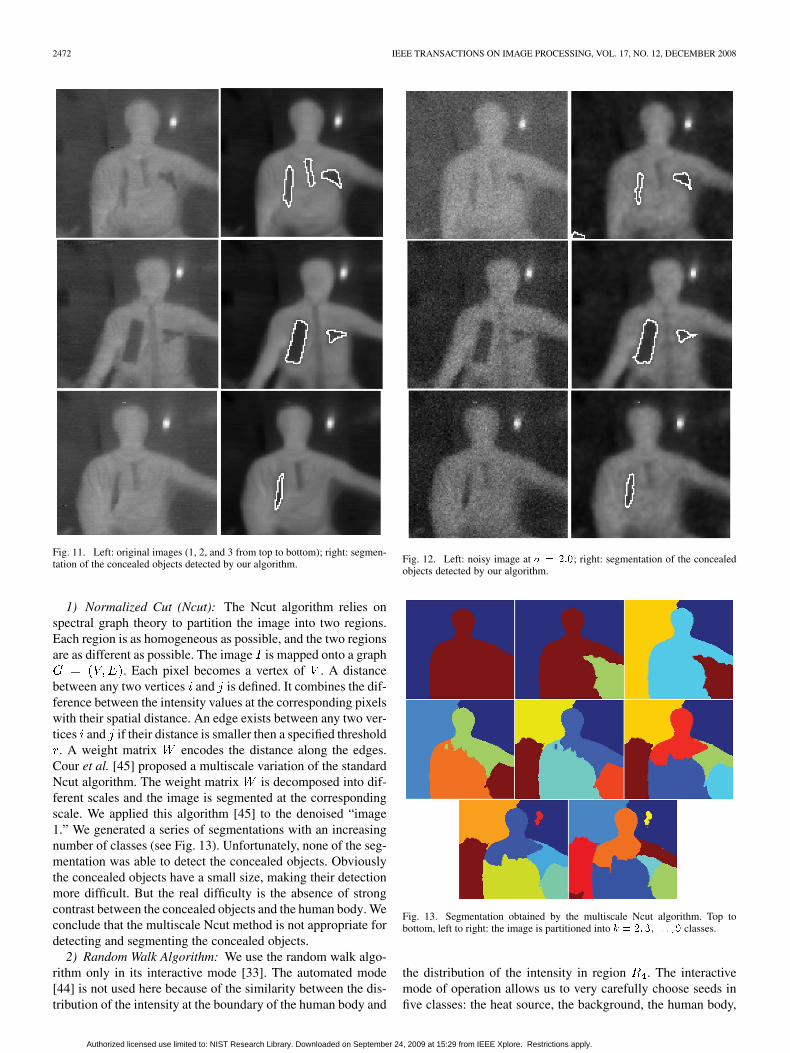
Fig. 9. Multilevel thresholding algorithm.
the concealed objects, we also detect regions that correspond tothe collar of the clothing (see Fig. 11). Fig. 12 illustrates theperformance of the algorithm when noise is added tothe original images. It takes approximately 7 to 9 s to completethe detection and segmentation on a personal computer usingMATLAB1 code.
C. How Accurate is the Segmentation?
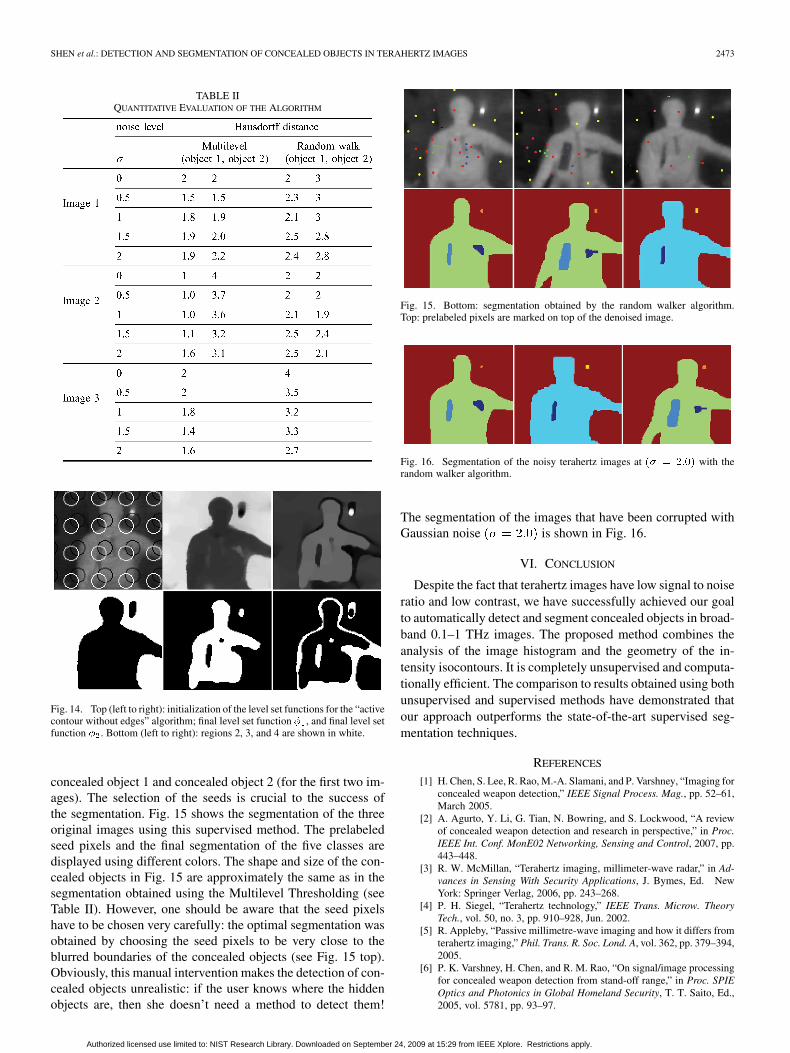
To quantify the accuracy of the segmentation we compare theresults with hand-labeled segmentations (see Fig. 10). For eachconcealed object, we have access the set of pixels, , enclosed
1Certain commercial software is identified in this paper in order to specify theexperimental procedure adequately. Such identification is not intended to implyrecommendation or endorsement by NIST, nor is it intended to imply that thesoftware identified is necessarily the best available for the purpose.
TABLE IRESIDUAL MEAN SQUARED ERROR AFTER DENOISING
Fig. 10. Left to right: hand labeled segmentation for images 1, 2, and 3.
inside the hand-drawn contour. We also have access to a regiondetected automatically by our method.A measure of mutual proximity of the two sets and is
provided by Hausdorff distance
(16)
where is the distance of a pixel tothe set . The statistics are summarized in Table II: the smallerthe Hausdorff distance, the more accurate is the segmentation.For noisy images, the Hausdorff distance is averaged over theten realizations. The proposed method works well even at highnoise level.
D. Comparison to Other Segmentation Methods
In this section, we compare the results obtained using theMultilevel Thresholding with three state-of-the-art image seg-mentation algorithms. Both the Ncut and the Active Contourwithout Edges algorithm are unsupervised techniques. Therandom random walk algorithm can operate in two modes: aninteractive mode [33] and a fully automated mode [44]. Theautomatic mode requires that an estimate of the probabilitydensity function of each class (regions to in our case)be available. Because region (concealed objects) and theboundary of the human subject have very similar intensitydistributions we only use the random walk algorithm in aninteractive mode.
Authorized licensed use limited to: NIST Research Library. Downloaded on September 24, 2009 at 15:29 from IEEE Xplore. Restrictions apply.
2472 IEEE TRANSACTIONS ON IMAGE PROCESSING, VOL. 17, NO. 12, DECEMBER 2008
Fig. 11. Left: original images (1, 2, and 3 from top to bottom); right: segmen-tation of the concealed objects detected by our algorithm.
1) Normalized Cut (Ncut): The Ncut algorithm relies onspectral graph theory to partition the image into two regions.Each region is as homogeneous as possible, and the two regionsare as different as possible. The image is mapped onto a graph
. Each pixel becomes a vertex of . A distancebetween any two vertices and is defined. It combines the dif-ference between the intensity values at the corresponding pixelswith their spatial distance. An edge exists between any two ver-tices and if their distance is smaller then a specified threshold. A weight matrix encodes the distance along the edges.
Cour et al. [45] proposed a multiscale variation of the standardNcut algorithm. The weight matrix is decomposed into dif-ferent scales and the image is segmented at the correspondingscale. We applied this algorithm [45] to the denoised “image1.” We generated a series of segmentations with an increasingnumber of classes (see Fig. 13). Unfortunately, none of the seg-mentation was able to detect the concealed objects. Obviouslythe concealed objects have a small size, making their detectionmore difficult. But the real difficulty is the absence of strongcontrast between the concealed objects and the human body. Weconclude that the multiscale Ncut method is not appropriate fordetecting and segmenting the concealed objects.
2) Random Walk Algorithm: We use the random walk algo-rithm only in its interactive mode [33]. The automated mode[44] is not used here because of the similarity between the dis-tribution of the intensity at the boundary of the human body and
Fig. 12. Left: noisy image at � � ���; right: segmentation of the concealedobjects detected by our algorithm.
Fig. 13. Segmentation obtained by the multiscale Ncut algorithm. Top tobottom, left to right: the image is partitioned into � � �� �� � � � � � classes.
the distribution of the intensity in region . The interactivemode of operation allows us to very carefully choose seeds infive classes: the heat source, the background, the human body,
Authorized licensed use limited to: NIST Research Library. Downloaded on September 24, 2009 at 15:29 from IEEE Xplore. Restrictions apply.
SHEN et al.: DETECTION AND SEGMENTATION OF CONCEALED OBJECTS IN TERAHERTZ IMAGES 2473
TABLE IIQUANTITATIVE EVALUATION OF THE ALGORITHM
Fig. 14. Top (left to right): initialization of the level set functions for the “activecontour without edges” algorithm; final level set function � , and final level setfunction � . Bottom (left to right): regions 2, 3, and 4 are shown in white.
concealed object 1 and concealed object 2 (for the first two im-ages). The selection of the seeds is crucial to the success ofthe segmentation. Fig. 15 shows the segmentation of the threeoriginal images using this supervised method. The prelabeledseed pixels and the final segmentation of the five classes aredisplayed using different colors. The shape and size of the con-cealed objects in Fig. 15 are approximately the same as in thesegmentation obtained using the Multilevel Thresholding (seeTable II). However, one should be aware that the seed pixelshave to be chosen very carefully: the optimal segmentation wasobtained by choosing the seed pixels to be very close to theblurred boundaries of the concealed objects (see Fig. 15 top).Obviously, this manual intervention makes the detection of con-cealed objects unrealistic: if the user knows where the hiddenobjects are, then she doesn’t need a method to detect them!
Fig. 15. Bottom: segmentation obtained by the random walker algorithm.Top: prelabeled pixels are marked on top of the denoised image.
Fig. 16. Segmentation of the noisy terahertz images at �� � ���� with therandom walker algorithm.
The segmentation of the images that have been corrupted withGaussian noise is shown in Fig. 16.
VI. CONCLUSION
Despite the fact that terahertz images have low signal to noiseratio and low contrast, we have successfully achieved our goalto automatically detect and segment concealed objects in broad-band 0.1–1 THz images. The proposed method combines theanalysis of the image histogram and the geometry of the in-tensity isocontours. It is completely unsupervised and computa-tionally efficient. The comparison to results obtained using bothunsupervised and supervised methods have demonstrated thatour approach outperforms the state-of-the-art supervised seg-mentation techniques.
REFERENCES
[1] H. Chen, S. Lee, R. Rao, M.-A. Slamani, and P. Varshney, “Imaging forconcealed weapon detection,” IEEE Signal Process. Mag., pp. 52–61,March 2005.
[2] A. Agurto, Y. Li, G. Tian, N. Bowring, and S. Lockwood, “A reviewof concealed weapon detection and research in perspective,” in Proc.IEEE Int. Conf. MonE02 Networking, Sensing and Control, 2007, pp.443–448.
[3] R. W. McMillan, “Terahertz imaging, millimeter-wave radar,” in Ad-vances in Sensing With Security Applications, J. Bymes, Ed. NewYork: Springer Verlag, 2006, pp. 243–268.
[4] P. H. Siegel, “Terahertz technology,” IEEE Trans. Microw. TheoryTech., vol. 50, no. 3, pp. 910–928, Jun. 2002.
[5] R. Appleby, “Passive millimetre-wave imaging and how it differs fromterahertz imaging,” Phil. Trans. R. Soc. Lond. A, vol. 362, pp. 379–394,2005.
[6] P. K. Varshney, H. Chen, and R. M. Rao, “On signal/image processingfor concealed weapon detection from stand-off range,” in Proc. SPIEOptics and Photonics in Global Homeland Security, T. T. Saito, Ed.,2005, vol. 5781, pp. 93–97.
Authorized licensed use limited to: NIST Research Library. Downloaded on September 24, 2009 at 15:29 from IEEE Xplore. Restrictions apply.
2474 IEEE TRANSACTIONS ON IMAGE PROCESSING, VOL. 17, NO. 12, DECEMBER 2008
[7] M.-A. Slamani, P. K. Varshney, and D. D. Ferris, “Survey of imageprocessing techniques applied to the enhancement and detectionof weapons in mmw data,” in Proc. SPIE Infrared and PassiveMillimeter-Wave Imaging Systems: Design, Analysis, Modeling, andTesting, D. A. W. R. Appleby and G. C. Holst, Eds., 2002, vol.4719, pp. 296–305.
[8] H. M. Chen and P. K. Varshney, “Automatic two-stage IR and MMWimage registration algorithm for concealed weapons detection,” Proc.IEE, Vis., Image, Signal Process., vol. 148, pp. 209–216, 2001.
[9] A. H. Lettington, M. R. Yallop, and S. Tzimopoulou, “Restoration tech-niques for millimeter-wave images,” in Proc. SPIE Passive Millimeter-Wave Imaging Technology V, R. A. R. M. Smith, Ed., 2001, vol. 4373,pp. 94–104.
[10] H. Park, S.-H. Kim, and M. K. Singh et al., “Performance analysis ofwavelet based restoration for passive millimeter-wave images,” in Proc.SPIE Passive Millimeter-Wave Imaging Technology VIII, R. Appleby,Ed., 2005, vol. 5789, pp. 157–166.
[11] K. Shimizu, K. Yamada, and K. Watabe et al., “Image restoration formillimeter wave images by feedforward neural network,” in Proc. 4thEur. Congr. Intelligent Techniques and Soft Computing, 1996, vol. 1,pp. 334–338.
[12] K. Yuasa, H. Sawai, and K. Watabe et al., “Image restoration for mil-limeter wave images by Hopfield neural network,” in Proc. 3rd Work-shop on Image and Signal Processing on the Theme of Advances inComputational Intelligence, 1996, pp. 321–324.
[13] H.-Y. Pang, M. K. Sundareshan, and S. Amphay, “Superresolutionof millimeter-wave images by iterative blind maximum-likelihoodrestoration,” in Proc. Int. Soc. Optical Engineering, 1997, vol. 3064,pp. 227–238.
[14] A. H. Lettington, D. Dunn, and M. P. Rollason et al., “Use of con-straints in the superresolution of passive millimeter-wave images,”in Proc. SPIE Int. Soc. Optical Engineering, 2003, vol. 5077, pp.100–109.
[15] M. K. Sundareshan and S. Bhattacharjee, “Superresolution of passivemillimeter-wave images using a combined maximum-likelihood opti-mization and projection-onto-convex-sets approach,” in Proc. SPIE Int.Soc. Optical Engineering, 2001, vol. 4373, pp. 105–116.
[16] A. H. Lettington, M. R. Yallop, and D. Dunn, “Review of super-reso-lution techniques for passive millimeter-wave imaging,” in Proc. SPIEInt. Soc. Optical Engineering, 2002, vol. 4719, pp. 230–239.
[17] S. Lee, R. Rao, and M.-A. Slamani, “Noise reduction and objectenhancement in passive millimeter wave concealed weapon detec-tion,” in Proc. IEEE Int. Conf. Image Processing, 2002, vol. 1, pp.509–512.
[18] B. R. Hunt and D. Dekruger, “Bayesian restoration of millimeter waveimagery,” in Proc. IEEE Int. Conf. Acoustics, Speech and Signal Pro-cessing, 1994, vol. 5, pp. 549–552.
[19] L. C. Ramac, M. K. Uner, and P. K. Varshney et al., “Morphologicalfilters and wavelet based image fusion for concealed weapons detec-tion,” in Proc. SPIE Int. Soc. Optical Engineering, 1998, vol. 3376, pp.110–119.
[20] N. Otsu, “A threshold selection method from gray-level histogram,”IEEE Trans. Syst., Man, and Cybern., vol. 8, no. 1, pp. 62–66, Jan.1978.
[21] M. A. Slamani, P. K. Varshney, and R. M. Rao et al., “An integratedplatform for the enhancement of concealed weapon detection sensors,”in Proc. SPIE Int. Symp. Enabling Technologies for Law Enforcementand Security, 1998, vol. 3575, pp. 68–78.
[22] M. A. Slamani, V. Vannicola, and D. D. Weiner, “An automated ap-proach to the partitioning and statistical characterization of a surveil-lance volume,” presented at the Int. Conf. Signal Processing Applica-tion and Technology, 1995.
[23] M. A. Slamani and D. D. Ferris, “Shape descriptors based detectionof concealed weapons in millimeter-wave data,” in Proc. SPIE OpticalPattern Recognition XII, 2001, vol. 4387, pp. 176–185.
[24] C. D. Haworth, B. G. Gonzalez, and M. Tomsin et al., “Image analysisfor object detection in millimeter-wave images,” in Proc. SPIE Int. Soc.Optical Engineering, 2004, vol. 5619, pp. 117–128.
[25] M. Lindenbaum, M. Fischer, and A. M. Bruchstein, “On Gabor con-tribution to image enhancement,” Pattern Recognit., vol. 27, pp. 1–8,1994.
[26] L. P. Yaroslavsky, Digital Picture Processing. An Introduc-tion. Berlin, Germany: Springer-Verlag, 1985.
[27] P. Perona and J. Malik, “Scale space and edge detection usinganisotropic diffusion,” IEEE Trans. Pattern Anal. Mach. Intell., vol.12, no. 7, pp. 629–639, Jul. 1990.
[28] L. Rudin, S. Osher, and E. Fatemi, “Nonlinear total variation basednoise removal algorithms,” Phys. D, vol. 60, pp. 259–268, 1992.
[29] R. R. Coifman and D. Donoho, Wavelets and Statistics. New York:Springer-Verlag, 1995.
[30] A. Buades, B. Coll, and J. M. Morel, “A review of image denoisingalgorithms, with a new one,” Multiscale Model. Simul., vol. 4, pp.490–530, 2005.
[31] T. T. Chan and L. A. Vese, “Active contours without edges,” IEEETrans. Image Process., vol. 10, no. 2, pp. 266–277, Feb. 2001.
[32] J. Shi and J. Malik, “Normalized cuts and image segmentation,” IEEETrans. Pattern Anal. Mach. Intell., vol. 22, pp. 888–905, 2000.
[33] L. Grady, “Random walks for image segmentation,” IEEE Trans. Pat-tern Anal. Mach. Intell., vol. 28, pp. 1–17, 2006.
[34] D. Mumford and J. Shah, “Optimal approximation by piecewisesmooth functions and associated variational problems,” Commun.Pure Appl. Math., vol. 42, pp. 577–685, 1989.
[35] A. Luukanen and J. P. Pekola, “A superconducting antenna-coupledhot-spot microbolometer,” Appl. Phys. Lett., vol. 82, pp. 3970–3972,2003.
[36] A. Luukanen, E. N. Grossman, A. J. Miller, P. Helisto, J. S. Pent-tila, H. Sipola, and H. Seppa, “An ultra-low noise superconductingantenna-coupled microbolometer with a room-temperature read-out,”IEEE Microw. Wireless Compon. Lett., vol. 16, no. 8, pp. 464–466,Aug. 2006.
[37] C. Dietlein, A. Luukanen, F. Meyer, Z. Popovic, and E. Grossman,“Phenomenology of passive broadband terahertz images,” presented atthe 4th ESA Workshop on Millimetre-Wave Technology and Applica-tions, Feb. 2006.
[38] G. Aubert and P. Kornprobst, Mathematical Problems in ImageProcessing: Partial Differential Equations and the Calculus of Varia-tions. New York: Springer-Verlag, 2002.
[39] S. Geman and D. Geman, “Stochastic relaxation, Gibbs distributionsand the bayesian restoration of images,” IEEE Trans. Pattern Anal.Mach. Intell., vol. 6, no. 6, pp. 721–741, Nov. 1984.
[40] M. J. Black, G. Sapiro, D. H. Marimont, and D. Heeger, “Robustanisotropic diffusion,” IEEE Trans. Image Process., vol. 7, no. 3, pp.421–43, Mar. 1998.
[41] C. D. Haworth, Y. Petillot, and E. Trucco, “Image processing tech-niques for metallic object detection with millimetre-wave images,” Pat-tern Recognit. Lett., vol. 27, pp. 1843–1851, 2006.
[42] C. D. Haworth, Y. de Saint-Pern, D. Clark, E. Trucco, and Y. Petillot,“Detection and tracking of multiple metallic objects in millimetre-waveimages,” Int. J. Comput. Vis., vol. 71, no. 2, pp. 183–196, 2007.
[43] G. Mclachlan and T. Krishnan, The EM Algorithm and Extensions.New York: Wiley, 1997.
[44] L. Grady, “Multilabel random walker image segmentation using priormodels,” in Proc. IEEE Computer Society Conf. Computer Vision andPattern Recognition, 2005, vol. 1, pp. 763–770.
[45] T. Cour, F. Benezit, and J. Shi, “Spectral segmentation with multiscalegraph decomposition,” presented at the IEEE Int. Conf. Computer Vi-sion and Pattern Recognition, 2005.
[46] L. A. Vese and T. F. Chan, “A multiphase level set framework for imagesegmentation using the mumford and shar model,” Int. J. Comput. Vis.,vol. 50, pp. 271–293, 2002.
Xilin Shen (S’99) received the B.S. degree inelectrical engineering, with honors from ZhejiangUniversity, China, in 2002, and the Ph.D. degreein electrical engineering from the University ofColorado, Boulder, in 2007.
Since May 2008, she has been a Postdoctoral As-sociate at the Magnetic Resonance Research Center,Yale University, New Haven, CT. Her researchinterests are fMRI analysis, data mining, and imageprocessing.
Authorized licensed use limited to: NIST Research Library. Downloaded on September 24, 2009 at 15:29 from IEEE Xplore. Restrictions apply.
SHEN et al.: DETECTION AND SEGMENTATION OF CONCEALED OBJECTS IN TERAHERTZ IMAGES 2475
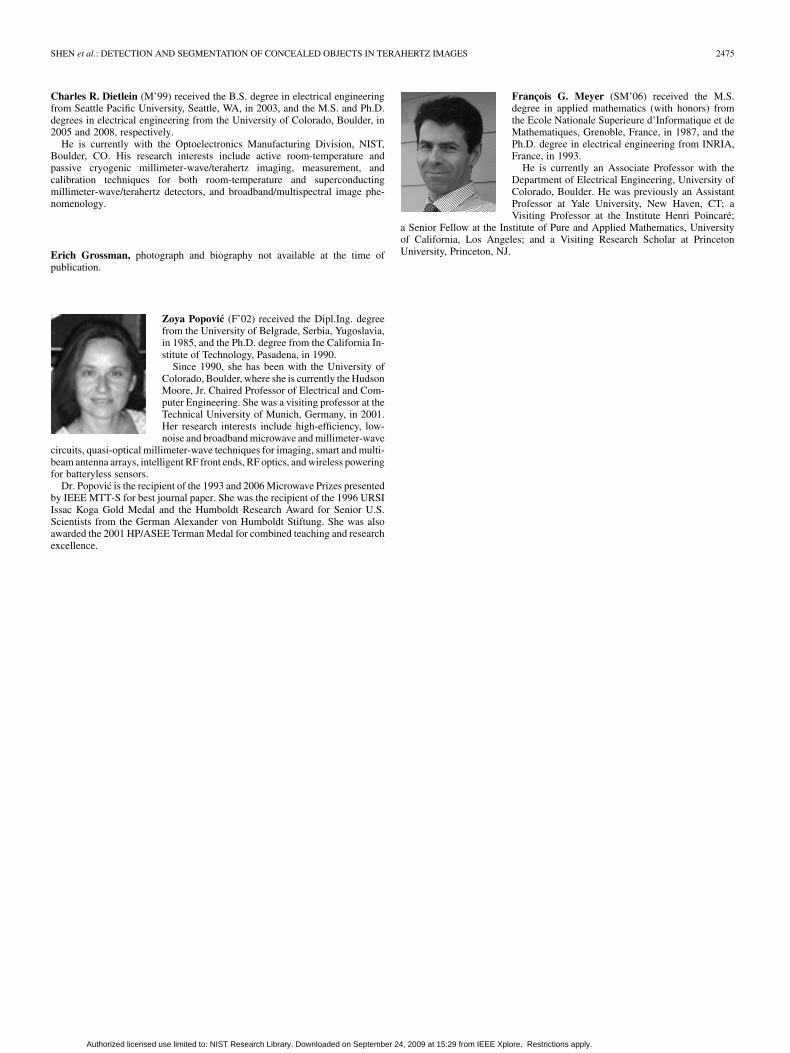
Charles R. Dietlein (M’99) received the B.S. degree in electrical engineeringfrom Seattle Pacific University, Seattle, WA, in 2003, and the M.S. and Ph.D.degrees in electrical engineering from the University of Colorado, Boulder, in2005 and 2008, respectively.
He is currently with the Optoelectronics Manufacturing Division, NIST,Boulder, CO. His research interests include active room-temperature andpassive cryogenic millimeter-wave/terahertz imaging, measurement, andcalibration techniques for both room-temperature and superconductingmillimeter-wave/terahertz detectors, and broadband/multispectral image phe-nomenology.
Erich Grossman, photograph and biography not available at the time ofpublication.
Zoya Popovic (F’02) received the Dipl.Ing. degreefrom the University of Belgrade, Serbia, Yugoslavia,in 1985, and the Ph.D. degree from the California In-stitute of Technology, Pasadena, in 1990.
Since 1990, she has been with the University ofColorado, Boulder, where she is currently the HudsonMoore, Jr. Chaired Professor of Electrical and Com-puter Engineering. She was a visiting professor at theTechnical University of Munich, Germany, in 2001.Her research interests include high-efficiency, low-noise and broadband microwave and millimeter-wave
circuits, quasi-optical millimeter-wave techniques for imaging, smart and multi-beam antenna arrays, intelligent RF front ends, RF optics, and wireless poweringfor batteryless sensors.
Dr. Popovic is the recipient of the 1993 and 2006 Microwave Prizes presentedby IEEE MTT-S for best journal paper. She was the recipient of the 1996 URSIIssac Koga Gold Medal and the Humboldt Research Award for Senior U.S.Scientists from the German Alexander von Humboldt Stiftung. She was alsoawarded the 2001 HP/ASEE Terman Medal for combined teaching and researchexcellence.
François G. Meyer (SM’06) received the M.S.degree in applied mathematics (with honors) fromthe Ecole Nationale Superieure d’Informatique et deMathematiques, Grenoble, France, in 1987, and thePh.D. degree in electrical engineering from INRIA,France, in 1993.
He is currently an Associate Professor with theDepartment of Electrical Engineering, University ofColorado, Boulder. He was previously an AssistantProfessor at Yale University, New Haven, CT; aVisiting Professor at the Institute Henri Poincaré;
a Senior Fellow at the Institute of Pure and Applied Mathematics, Universityof California, Los Angeles; and a Visiting Research Scholar at PrincetonUniversity, Princeton, NJ.
Authorized licensed use limited to: NIST Research Library. Downloaded on September 24, 2009 at 15:29 from IEEE Xplore. Restrictions apply.