Embed Size (px)
Citation preview

arX
iv:0
709.
3936
v1 [
cond
-mat
.sof
t] 2
5 Se
p 20
07
Depletion induced isotropic-isotropic phase separation in suspensions of rod-like
colloids
S. Jungblut,1 R. Tuinier,2 K. Binder,1 and T. Schilling1
1Institut fur Physik, Johannes Gutenberg-Universitat, D-55099 Mainz, Staudinger Weg 7, Germany2Forschungszentrum Julich, Institut fur Festkorperforschung, D-52425 Julich, Germany
(Dated: February 2, 2008)
When non-adsorbing polymers are added to an isotropic suspension of rod-like colloids, the col-loids effectively attract each other via depletion forces. We performed Monte Carlo simulations tostudy the phase diagram of such rod-polymer mixture. The colloidal rods were modelled as hardspherocylinders; the polymers were described as spheres of the same diameter as the rods. Thepolymers may overlap with no energy cost, while overlap of polymers and rods is forbidden.
Large amounts of depletant cause phase separation of the mixture. We estimated the phaseboundaries of isotropic-isotropic coexistence both, in the bulk and in confinement. To determinethe phase boundaries we applied the grand canonical ensemble using successive umbrella sampling[J. Chem. Phys. 120, 10925 (2004)], and we performed a finite-size scaling analysis to estimatethe location of the critical point. The results are compared with predictions of the free volumetheory developed by Lekkerkerker and Stroobants [Nuovo Cimento D 16, 949 (1994)]. We alsogive estimates for the interfacial tension between the coexisting isotropic phases and analyse itspower-law behaviour on approach of the critical point.
PACS numbers: 82.70.Dd, 64.70.Ja, 68.35.Rh, 05.10.Ln
I. INTRODUCTION
Non-adsorbing polymers are often added to colloidalsuspensions in order to modify the effective interactionsbetween the colloids. By this means phase transitionscan be driven, e. g., in order to facilitate the isolationof the colloids10. In particular, mixtures of viruses andpolymers are widely used in experiments on colloidal liq-uid crystals (see, for instance, the recent review by Dogicand Fraden9).
As certain viruses, such as Tobacco Mosaic Virus andfd-virus, can to a first approximation be regarded as longcylinders, they are good model systems for liquid crystals.Currently there is much interest in the non-equilibriumbehaviour of these systems – in particular in the effectof shear11,12,15,16. In order to interpret the experimentalresults, detailed theoretical knowledge on the equilibriumphase diagram is needed. Therefore we present in this ar-ticle a computer simulation study of the phase behaviourof rods and spheres, both in the bulk and in confinement.
The Asakura-Oosawa-Vrij model19,29 is a useful modelfor mixtures of polymers and spherical colloids. Thepolymers are assumed to be freely interpenetrable withrespect to each other, while there is a hard-core repulsionbetween the colloids as well as between the colloids andthe polymers. As the interaction energy is then eitherzero or infinite, the phase behaviour is purely of entropicorigin.
In this article we discuss a similar model for mixturesof rod-like colloids and polymers: a mixture of hard sphe-rocylinders with length L and diameter D and freely in-terpenetrable spheres with the same diameter.
This system was studied with liquid-state integralequation theory5,6,8 and free volume theory14 as well aswith computer simulations4,17,20. In recent years vari-
ous regimes of size-ratios and concentrations have beendiscussed, e. g. the packing properties at very highconcentrations or the behaviour of small rods, whichact as a depletant on large spheres. Here we focus ondispersions of rods and spheres of similar diameters atlow concentrations. The phase diagram of this modelwas studied within free volume theory by Lekkerkerkerand Stroobants14. Details of this approach will be de-scribed in section II. Li and Ma recently computed theeffective interaction between two rods by Monte Carlosimulation17. Bolhuis and coworkers4 as well as Savenkoand Dijkstra20 determined the bulk rod-sphere phase di-agram by simulation (via thermodynamic integration).Both have given results for rods of aspect ratio L/D = 5and spheres of several diameter values. In order toavoid simulating the spheres explicitly, Savenko and Di-jkstra used an exact expression for the effective Hamilto-nian, which was numerically evaluated during the MonteCarlo simulation for each rod configuration. Bolhuis andcoworkers4 modelled the spheres explicitly in their GibbsEnsemble Monte Carlo simulations to study fluid-fluidseparation, while for the other parts of the phase dia-gram they used an effective expression for the rod-rodinteraction.
Here we present results for the full rod-sphere sys-tem, which were obtained in the grand canonical en-semble. The successive umbrella sampling method28 wasemployed to determine the grand potential hypersurfaceof the system. This allowed us to predict the phaseboundaries of isotropic-isotropic coexistence with muchhigher accuracy than the studies mentioned above, whichused thermodynamic integration. In particular, we deter-mined the critical point by a finite-size scaling analysis.We also studied the influence of confinement on the phasebehaviour. This is relevant for experiments under shear.

2
In section II we briefly review free volume theory forthe rod-sphere mixture. In section III the simulationmethod is introduced. In section IV we show resultsfor phase diagrams and interfacial tensions and comparethem to the theoretical predictions. Section V containsa summary and a discussion.
II. FREE VOLUME THEORY
We briefly review the theoretical approach to rod-sphere mixtures which was introduced by Lekkerkerkerand Stroobants14 in 1994. The starting point is the ther-modynamic potential in the semi-grand canonical ensem-ble, where the number of rods is fixed, while the num-ber of “penetrable hard” spheres is set by the chemi-cal potential of spheres in a hypothetical reservoir thatis held in equilibrium with the system. The potentialΩsemi(Nr, V, T, µs) of such a mixture can be written as:
Ωsemi = F (Nr, V, T ) +
∫ µR
s
−∞
∂Ω(Nr, V, T, µ′Rs )
∂µ′Rs
dµ′Rs
= F (Nr, V, T ) −∫ µR
s
−∞
Ns(µ′Rs )dµ
′Rs , (1)
where F (Nr, V, T ) is the free energy of Nr rods in a vol-ume V at temperature T , and the second term accountsfor the perturbation due to the addition of Ns spheresfrom a reservoir, where the chemical potential is kept atµR
s . Osmotic equilibrium requires the chemical poten-tials of the system and the reservoir to be equal. Thechemical potential of an ideal gas of spheres is connectedto the density ρs via
ρs = exp
(
µs
kBT
)
. (2)
Thus, the number of spheres in the system depends onµR
s . The only influence the rods have on the spheres isthe reduction of the free volume:
Ns = ρRs Vfree, (3)
where Vfree is the volume accessible for spheres under theassumption that the rod configurations are undistortedupon adding spheres and ρR
s is the number density ofspheres in the reservoir. The free volume fraction α isdefined as:
α =Vfree
V(4)
and it can be calculated within scaled particle theory14.Hence, the expression for the semi-grand canonical po-tential is reduced to:
Ωsemi = F (Nr, V, T )− αV kBTρRs . (5)
The chemical potential as well as the osmotic pressureΠr of the rods in the mixture can be obtained from the
thermodynamic relationships:
µr =
(
∂Ωsemi
∂Nr
)
V
(6)
Πr = −(
∂Ωsemi
∂V
)
Nr
(7)
where vr = πD3(2 + 3L/D)/12 is the volume of a sphe-rocylinder of length L and diameter D.
The virial expansion of the free energy of a systemof hard spherocylinders can be calculated using scaledparticle theory7:
Fvr
kBTV=
y
y + 1
(
const + ln(y) + σ[f ] + Π2y +Π3
2y2
)
(8)with
y =ηr
1 − ηr, (9)
where ηr = ρrvr is the volume fraction of rods.
Π2 = 3 +3(τ − 1)2
3τ − 1ρ[f ]
Π3 =12τ(2τ − 1)
(3τ − 1)2+
12τ(τ − 1)2
(3τ − 1)2ρ[f ] , (10)
and τ is the overall length-to-diameter ratio of the sphe-rocylinders
τ =L + D
D. (11)
In eqs. 8 and 10, σ[f ] and ρ[f ] are functionals of theorientational distribution function f :
σ[f ] =
∫
f(u) ln[4πf(u)]du (12)
ρ[f ] =4
π
∫ ∫
sin[Φ(u,u′)]f(u)f(u′)dudu′ (13)
where u is the unit vector along a particle’s axis.The normalised orientational distribution function of
a single rod f is adapted to minimise the semi-grandcanonical potential. In the nematic case it can beobtained either numerically23 or from the Gaussianapproximation14, but here we are interested in theisotropic case, i. e., all orientations u are equally probableand the distribution is uniform:
f(u) =1
4π. (14)
Therefore, in our case, the functionals are reduced to:
σ[f ] = 0 (15)
ρ[f ] = 1 (16)
3
The expression for the free volume fraction calculatedwith scaled particle theory reads:
α =1
1 + ye−(Ay+By2+Cy3), (17)
where, in the isotropic case, for “penetrable hard”spheres with diameter D:
A =6τ
3τ − 1+
3(τ + 1)
3τ − 1+
2
3τ − 1
B =18τ2
(3τ − 1)2+
(
6
3τ − 1+
6(τ − 1)2
(3τ − 1)2
)
C =2
3τ − 1
(
12τ(2τ − 1)
(3τ − 1)2+
12τ(τ − 1)2
(3τ − 1)2
)
(18)
Thus, the chemical potential and the osmotic pressureof the rods in the mixture are functions of the rod vol-ume fraction and of the chemical potential of spheres inthe reservoir. At coexistence, they are equal. From thiscondition we have obtained the phase diagrams, whichare compared to our simulation results in section IV.
III. MODEL AND SIMULATION METHOD
In our Monte Carlo simulations we model the colloidsas hard spherocylinders of length L and diameter D. Thepolymers are approximated as spheres of the same diam-eter, which are hard with respect to the rods and freelyinterpenetrable among each other.
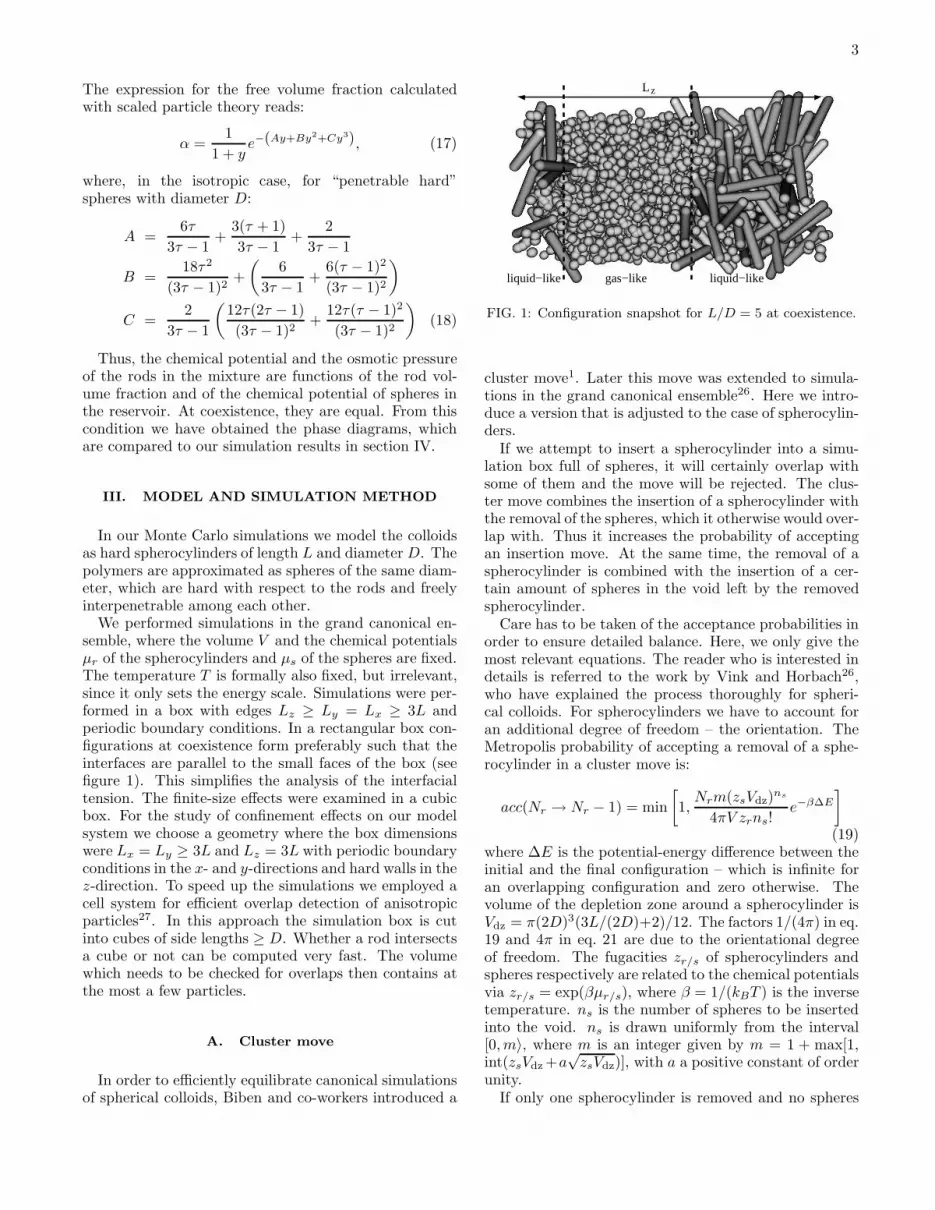
We performed simulations in the grand canonical en-semble, where the volume V and the chemical potentialsµr of the spherocylinders and µs of the spheres are fixed.The temperature T is formally also fixed, but irrelevant,since it only sets the energy scale. Simulations were per-formed in a box with edges Lz ≥ Ly = Lx ≥ 3L andperiodic boundary conditions. In a rectangular box con-figurations at coexistence form preferably such that theinterfaces are parallel to the small faces of the box (seefigure 1). This simplifies the analysis of the interfacialtension. The finite-size effects were examined in a cubicbox. For the study of confinement effects on our modelsystem we choose a geometry where the box dimensionswere Lx = Ly ≥ 3L and Lz = 3L with periodic boundaryconditions in the x- and y-directions and hard walls in thez-direction. To speed up the simulations we employed acell system for efficient overlap detection of anisotropicparticles27. In this approach the simulation box is cutinto cubes of side lengths ≥ D. Whether a rod intersectsa cube or not can be computed very fast. The volumewhich needs to be checked for overlaps then contains atthe most a few particles.
A. Cluster move
In order to efficiently equilibrate canonical simulationsof spherical colloids, Biben and co-workers introduced a
liquid−like liquid−likegas−like
L z
FIG. 1: Configuration snapshot for L/D = 5 at coexistence.
cluster move1. Later this move was extended to simula-tions in the grand canonical ensemble26. Here we intro-duce a version that is adjusted to the case of spherocylin-ders.
If we attempt to insert a spherocylinder into a simu-lation box full of spheres, it will certainly overlap withsome of them and the move will be rejected. The clus-ter move combines the insertion of a spherocylinder withthe removal of the spheres, which it otherwise would over-lap with. Thus it increases the probability of acceptingan insertion move. At the same time, the removal of aspherocylinder is combined with the insertion of a cer-tain amount of spheres in the void left by the removedspherocylinder.
Care has to be taken of the acceptance probabilities inorder to ensure detailed balance. Here, we only give themost relevant equations. The reader who is interested indetails is referred to the work by Vink and Horbach26,who have explained the process thoroughly for spheri-cal colloids. For spherocylinders we have to account foran additional degree of freedom – the orientation. TheMetropolis probability of accepting a removal of a sphe-rocylinder in a cluster move is:
acc(Nr → Nr − 1) = min
[
1,Nrm(zsVdz)
ns
4πV zrns!e−β∆E
]
(19)where ∆E is the potential-energy difference between theinitial and the final configuration – which is infinite foran overlapping configuration and zero otherwise. Thevolume of the depletion zone around a spherocylinder isVdz = π(2D)3(3L/(2D)+2)/12. The factors 1/(4π) in eq.19 and 4π in eq. 21 are due to the orientational degreeof freedom. The fugacities zr/s of spherocylinders andspheres respectively are related to the chemical potentialsvia zr/s = exp(βµr/s), where β = 1/(kBT ) is the inversetemperature. ns is the number of spheres to be insertedinto the void. ns is drawn uniformly from the interval[0, m〉, where m is an integer given by m = 1 + max[1,int(zsVdz +a
√zsVdz)], with a a positive constant of order
unity.If only one spherocylinder is removed and no spheres

4
are inserted, the acceptance probability is reduced to:
acc(Nr → Nr − 1) = min
[
1,Nr
4πV zre−β∆E
]
(20)
The Metropolis probability of accepting an insertion ofa spherocylinder in a cluster move is:
acc(Nr → Nr + 1) = min
[
1,zrns!4πV e−β∆E
(Vdzzs)nsm(Nr + 1)
]
,
(21)if ns < m and 0 otherwise. Here ns is the number ofspheres which need to be removed to produce a void, inwhich the spherocylinder can be inserted. If only onespherocylinder is inserted and no spheres are removed,the acceptance probability is reduced to:
acc(Nr → Nr + 1) = min
[
1,zr4πV
Nr + 1e−β∆E
]
(22)
B. Phase boundaries from grand-canonical
simulations
We determined the phase boundaries from the prob-ability distribution P (Nr), which is the probability toobserve Nr rods in the mixture for given chemical po-tentials µr and µs. For a given value of µs, we searchedfor the value of µr at which the distribution is bimodal.However, the simulations need not be performed rightat the coexistence chemical potential (which is usuallynot known beforehand). In fact, the chemical potentialcan be set to any value µsim
r and then renormalised tocoexistence via
ln[Pµr(Nr)] = ln[Pµsim
r(Nr)] + (µr − µsim
r )Nr (23)
such that the areas under the two peaks in P (Nr) areequal13. We used the successive umbrella samplingmethod28 to determine P (Nr). This technique allowedus to sample regions between the two bulk phases whereP (Nr) is very low.
Figure 2 shows the logarithm of the probability dis-tribution P (ηr) as a function of the rod volume fractionηr = Nrvr/V with vr = πD3(2 + 3L/D)/12, which – upto an additive constant – is equal to the grand potentialof the system. The locations of the maxima of the peaksare the bulk volume fractions of rods at coexistence. Fora large fugacity zs (squares), and hence a large concen-tration of spheres, there are two clearly separated peaksindicating a phase transition which is strongly of firstorder. With decreasing concentration of spheres (starsand crosses) the effective attraction between the rods be-comes weaker. Hence the peaks broaden and move closeruntil eventually the critical point is reached.
Figure 1 shows a typical configuration at coexistence.Due to the periodic boundaries two slabs separated bytwo interfaces have formed.
In figure 2 one can also clearly see that an advancedbiasing scheme such as successive umbrella sampling is
-30
-20
-10
0
10
20
30
0 0.05 0.1 0.15 0.2 0.25 0.3 0.35 0.4
ln[P
(η)]
= -
Ω/k
BT
+ c
onst
ηr
∆ Ω
FIG. 2: Grand potential ln[P (ηr)] for spherocylinders of as-pect ratio L/D = 5 at sphere fugacities zs = 1.0125 (crosses),1.0625 (stars) and 1.175 (squares). ∆Ω indicates the heightof the grand potential barrier between the coexisting phases.
necessary to bridge the huge differences in probabilitiesbetween the pure bulk states and the states in the two-phase coexistence region (which show up via a horizontalpart of the Ω vs. ηr curve, since a change of ηr justamounts to a change of the sizes of the gas-like and liquid-like domains, without changing the areas of the interfacesbetween them).
IV. RESULTS
A. Bulk
1. Phase diagram
The phase diagram is presented choosing the fugacityof the spheres and the rod volume fraction as variables.The fugacity zs is related to the sphere reservoir volumefraction via ηR
s = zsvs, where vs = πD3/6 is the volumeof a sphere. Explicit implementation of the spheres allowsan easy transformation into the frame of (ηs, ηr), whereηs is the sphere volume fraction in the system. In freevolume theory the actual concentration of spheres followsas ηs = αηR
s , with α from eq. 17.Figures 3 and 4 show phase diagrams for mixtures of
rods with aspect ratios L/D = 3 and 5 and spheres. Thesolid lines are free volume theory predictions. The sin-gle phase, the isotropic mixture of rods and spheres, ismarked “I”. The region of the phase diagram, where thegas-like and liquid-like isotropic phases coexist is named“I+I”. The two almost vertical lines are theoretical pre-dictions for the phase boundaries of the isotropic-nematictransition22.
Since free volume theory is based upon a mean-fieldapproximation, and fluctuations, which are especially rel-evant near the critical point, are ignored, we expect itspredictions to deviate from the simulation results there.

5
0
0.2
0.4
0.6
0.8
1
1.2
0 0.05 0.1 0.15 0.2 0.25 0.3 0.35 0.4 0.45 0.5
η s
ηr
I
I+I 0 0.4 0.8 1.2 1.6
2 2.4
0 0.1 0.2 0.3 0.4 0.5
z s=
η sR
/vs
I
I+I
FIG. 3: Bulk phase diagram for a mixture of spherocylinderswith aspect ratio L/D = 3 and spheres of diameter D. Thesolid lines are predictions of the free volume theory. The filledsquare marks the critical point. The inset shows the phasediagram in the (zs, ηr)-plane. The almost vertical lines in theinset indicate the coexistence region of the isotropic-nematictransition.
0
0.1
0.2
0.3
0.4
0.5
0.6
0.7
0 0.05 0.1 0.15 0.2 0.25 0.3 0.35 0.4
η s
ηr
I
I+I
0.6
0.8
1
1.2
1.4
0 0.1 0.2 0.3 0.4
z s=
η sR
/vs
I
I+I
FIG. 4: Bulk phase diagram for a mixture of spherocylinderswith aspect ratio L/D = 5 and spheres of diameter D. Thesolid lines are predictions of the free volume theory. The filledsquare marks the critical point. The inset shows the phasediagram in the (zs, ηr)-plane.The almost vertical lines in theinset indicate the coexistence region of the isotropic-nematictransition.
Away from the critical point the predictions of the freevolume theory approach the simulation results. As anti-cipated, the theory underestimates the volume fraction ofspheres in the liquid phase considerably. This is due tothe fact that the depletion forces change the local struc-ture of the fluid21 – an effect which is not included inthe calculations of the free volume accessible to spheres.On the gas-branch of the coexistence region, where theamount of rods is negligible, the theoretical predictionsagree well with the simulation results.
Figure 5 shows a comparison of our results with thedata obtained in previous computer simulations on the
0.6
0.8
1
1.2
1.4
0 0.05 0.1 0.15 0.2 0.25 0.3 0.35 0.4
z s=
η sR
/vs
ηr
I
I+I
FIG. 5: Comparison of the bulk phase diagram for a mixtureof spherocylinders with aspect ratio L/D = 5 and spheresof diameter D to previous work. The open triangles are theresults of the present work, the filled square marks the criticalpoint. The open squares are the data obtained by Bolhuis andcoworkers4. The solid lines are predictions of the free volumetheory.
fluid-fluid separation by Bolhuis and coworkers4 (opensquares). The errorbars of their data are ∆ηr ∼ 0.02.Thus, the results do not coincide within the errorbars.We attribute the difference to the small system sizeswhich were accessible at that time (1997). No estimatefor the critical point could be obtained from their work4.The data from Savenko and Dijkstra20 does not lie withinthe range of this graph. Presumably there is an error inreference [15]30. Therefore we cannot compare to thiswork in detail.
The results presented here are of high accuracy: the er-rorbars are smaller than the symbols. The main sourcesof error are finite-size effects and insufficient sampling ofthe grand potential hypersurface perpendicular to the re-action coordinate (i. e., the packing fraction of rods). Inorder to check for the quality of sampling, we repeatedour simulations for several different chemical potentialsand different values of accuracy thresholds in the succes-sive umbrella sampling. From this we estimate the erroron the coexistence volume fractions to be ∆ηr = ±0.002.
Finite-size effects enter in two ways: 1) At coexistencethe system forms slab configurations with two interfaces(due to the periodic boundaries). If Lz is too small, theinterfaces interact. Away from the critical point, we ruledout this contribution by increasing Lz such that a plateauappeared between the peaks in P (ηr). 2) P (ηr) dependson the lateral box size, because the spectrum of capillarywaves on the interfaces is cut off for wavelengths largerthan the box. This effect is negligible far away from thecritical point, too, because the interfacial tension thereis large and the effects of capillary waves are very weak.However, close to the critical point a finite-size scalinganalysis becomes necessary. In fact, the two effects arethen just two aspects of the same property, the diverg-ing correlation length. We discuss this issue further in

6
0.4
0.6
0.8
1
1.08 1.12 1.16 1.2 1.24 1.28
U4
zs
0.4
0.6
0.8
1
1.09 1.1 1.11 1.12 1.13
FIG. 6: Cumulant ratio U4 as a function of the sphere fugacityclose to the critical point for box lengths Lx = 9D (crosses),12D (stars), 14D (squares) and 18D (triangles). Spherocylin-ders aspect ratio is L/D = 3. The inset shows a magnifiedplot of the region near the intersection point.
subsection IVA2.Close to the isotropic-nematic transition, the simula-
tions cannot be equilibrated properly with the methodsused here. For accurate grand-canonical simulations ofthe IN transition more advanced biasing techniques arenecessary24. A study of this part of the phase diagramis beyond the scope of the present work, however.
2. Finite-size scaling
As explained above, P (ηr) depends on system size.This is, however, not a drawback but an advantage, be-cause the finite-size effects can be used in order to locatethe critical point of isotropic-isotropic demixing. Onecan construct quantities which are independent of sys-tem size at the critical point. One possible choice2,13 ofsuch a quantity is the cumulant ratio U4 = 〈m4〉/〈m2〉2with m = ηr − 〈ηr〉. When U4 is plotted versus zs closeto the critical point for different system sizes, the inter-section point marks the critical point. Figure 6 showsthat the critical sphere fugacity for spherocylinders withaspect ratio L/D = 3 is zc
s = 1.109 ± 0.001.Figure 7 shows the difference in packing fraction ηl
r−ηgr
versus the “relative distance from the critical point”zs/zc
s − 1 (circles for L/D = 3 and diamonds for L/D =5). The upper line in the graph is proportional to(zs/zc
s −1)βIsing, where βIsing = 0.326 is the critical expo-nent of the order parameter in the Ising model. Clearly,the critical point is of the Ising universality class.
3. Interfacial tension
In the transition region where the gas phase transformsinto the liquid phase and vice-versa, a grand potential
Order parameter
Interfacial tension
ss
FIG. 7: Order parameter (ηlr − ηg
r ) (circles and diamonds)and interfacial tension γ (triangles and squares) versus “rela-tive distance from the critical point” zs/zc
s − 1. Spherocylin-ders aspect ratios are L/D = 3 (triangles and circles) and 5(squares and diamonds). The solid lines correspond to theIsing power-law-behaviour with exponents βIsing = 0.326 and2νIsing = 1.26.
barrier ∆Ω needs to be crossed (indicated in figure 2).∆Ω is related to the interfacial tension via
γ ≡ limLx→∞
∆Ω
2L2x
(24)
where L2x is the area of the interface and the factor 1/2
accounts for the two interfaces, which are present due tothe periodic boundary conditions3. Figure 7 shows valuesof the interfacial tension as a function of the “relativedistance from the critical point” zs/zc
s − 1 (triangles forL/D = 3 and squares for L/D = 5). The lower line inthe graph indicates (zs/zc
s−1)2νIsing , where 2νIsing = 1.26is the critical exponent for the interfacial tension in the3d Ising model.
B. Confinement
1. Phase diagram
Now we consider the behaviour of the mixture confinedbetween two hard walls at distance d. Figures 8 and 9show the phase diagrams for rod aspect ratios L/D = 3and 5. The distance between the walls is d/D = 3L/D.Demixing in confinement occurs at larger sphere fugac-ities than in the bulk. Also the chemical potential ofthe rods at coexistence is higher than in the bulk. Thegas-like phase is shifted to larger rod volume fractions.The amount of spheres in the system is smaller than inthe bulk at the same fugacity. The large increase of theconcentration of rods in the gas–like phase distinguishesthis system clearly from the behaviour of the Asakura-Oosawa-Vrij model in confinement.
We also performed a finite size scaling analysis in con-finement to see how the critical point is shifted. Table I

7
0
0.2
0.4
0.6
0.8
1
0 0.05 0.1 0.15 0.2 0.25 0.3 0.35 0.4
η s
ηr
1
1.2
1.4
1.6
0 0.1 0.2 0.3 0.4
z s=
η sR
/vs
FIG. 8: Phase diagram for a mixture of spherocylinders withaspect ratio L/D = 3 and spheres of diameter D betweentwo hard walls at distance d/D = 3L/D (squares) comparedto the bulk values (triangles). The filled symbols mark thecritical points. The inset shows the phase diagram in the(zs, ηr)-plane. The symbols show “raw data” for one boxdimension Lx = 12D only, and thus the curves marking thepeaks of P (ηr) do not join at the critical points (“finite sizetails”13).
0
0.1
0.2
0.3
0.4
0.5
0.6
0 0.05 0.1 0.15 0.2 0.25 0.3 0.35
η s
ηr
I
0.9
1
1.1
1.2
1.3
0 0.1 0.2 0.3 0.4
z s=
η sR
/vs
I
I+I
FIG. 9: Phase diagram for a mixture of spherocylinders withaspect ratio L/D = 5 and spheres of diameter D between twohard wall at distance d/D = 3L/D (squares) compared to thebulk values (triangles). The filled symbols mark the criticalpoints. The inset shows the phase diagram in the (zs, ηr)-plane. The symbols show “raw data” for one box dimensionLx = 20D only, and thus the curves marking the peaks ofP (ηr) do not join at the critical points (“finite size tails”13).
lists the results in comparison to the bulk results.
The relative shift in ηcr, which we observe for rods with
aspect ratio L/D = 5, is larger than the one of rods withaspect ratio L/D = 3, though the relative shift in zc
s
behaves the other way around. The second effect is dueto the ordering of the spheres close to the walls. Thus,its relative decrease on increase of the rods’ aspect ratiois plausible, since, in terms of the sphere diameter, thedistance between the walls increases.
L/D zcs,conf ηc
r,conf zcs,bulk ηc
r,bulk
3 1.26 ± 0.01 0.168 ± 0.002 1.109 ± 0.001 0.131 ± 0.002
5 1.05 ± 0.01 0.172 ± 0.002 0.981 ± 0.001 0.124 ± 0.002
TABLE I: Critical point in the bulk and in confinement toslit-pore of width d/D = 3L/D.
0.4
0.6
0.8
1
1.2 1.3 1.4 1.5 1.6
U4
zs
0.4
0.6
0.8
1
1.2 1.24 1.28
FIG. 10: Cumulant ratio U4 as a function of the sphere fu-gacity close to the critical point for box lengths Lx = 12D(crosses), 15D (stars), 18D (squares) and 21D (triangles) be-tween two hard walls at distance d/D = 3L/D. Aspect ratioL/D = 3. The inset shows a magnified plot of the region nearthe intersection point.
The shift in ηcr is caused by the wall-induced layer-
ing of the rods. Because of orientational ordering, thiseffect is much stronger than e. g. the shift in the Asakura-Oosawa-Vrij model, which is due to positional ordering25.Close to the wall the rods are preferably oriented paral-lel to the wall (“parallel anchoring”). Therefore, theirconcentration is much higher than in the isotropic bulk.
Obviously, it would be very interesting to investigatehow the critical point depends on the wall separation d.This is unfortunately currently too demanding computa-tionally. One week of CPU time on a Pentium 4, 2.60GHzwas needed to compute one density distribution in the(3L× 3L× 3L)-box, and one month of CPU time for the(5L × 5L × 5L)-box. Hence, a systematic study of thecrossover from 3d to 2d in this system would require verylarge computational effort.
2. Order parameter profiles
The walls change the structural properties of the gas-and liquid-like phase of rods. Here we show data fromsimulations in the NV T -ensemble, where the volume ofthe system as well as the numbers of rods and spheresare fixed. The number of particles was chosen to matchthe coexistence values determined in the grand canonicalensemble. Although in principle finite size effects are dif-ferent in the canonical and grand canonical ensemble13,

8
0
2
4
6
8
10
-6 -4 -2 0 2 4 6
z/D
FIG. 11: Density distribution of rods (triangles) and spheres(squares) normalised by their overall densities in the gas-likephase between two hard walls at distance d/D = 3L/D.Aspect ratio L/D = 5. Corresponding sphere fugacity iszs = 1.1.
0
1
2
3
4
-6 -4 -2 0 2 4 6
z/D
FIG. 12: Density distribution of rods (triangles) and spheres(squares) normalised by their overall densities in the liquid-like phase between two hard walls at distance d/D = 3L/D.Aspect ratio L/D = 5. Corresponding sphere fugacity is zs =1.1.
far enough away from the critical point this differencecan safely be neglected.
To study the anchoring effects of the walls, we definethe nematic order parameter S and the biaxiality pa-rameter ξ. S is the largest absolute eigenvalue18 of thematrix
Q =1
2Nr
Nr∑
i=0
(
3uiui − I)
, (25)
where ui is a unit vector in the direction of the orien-tation of the rod i and I is the identity matrix. Wedivide the space between the walls into thin slices, soNr is the number of rods in such a slice at the distancez/D from the middle of the simulation box. (Note thatmany authors use the largest eigenvalue instead of the
-0.5
-0.4
-0.3
-0.2
-0.1
0
0.1
0.2
-6 -4 -2 0 2 4 6
z/D
FIG. 13: Nematic order S (triangles) and biaxiality ξ(squares) parameter distributions in the gas-like phase be-tween two hard walls at distance d/D = 3L/D. Aspect ratioL/D = 5. Corresponding sphere fugacity is zs = 1.1.
-0.5
-0.4
-0.3
-0.2
-0.1
0
0.1
-6 -4 -2 0 2 4 6
z/D
FIG. 14: Nematic order S (triangles) and biaxiality ξ(squares) parameter distributions in the liquid-like phase be-tween two hard walls at distance d/D = 3L/D. Aspect ratioL/D = 5. Corresponding sphere fugacity is zs = 1.1.
eigenvalue with the largest absolute value, which leadsto different results in the case of uniaxial surface order-ing!) S indicates if there is a preferred direction in thesystem and how strongly the rods are oriented with re-spect to it. The eigenvector to this eigenvalue is calleddirector. If S is zero, the phase is completely isotropic. IfS is unity, all rods are aligned parallel to the director. IfS is negative, they lie perpendicular to the director. Thebiaxiality measure ξ is half of the difference of the othertwo eigenvalues of the matrix Q. It shows whether thereis another preferred direction in the plane perpendicularto the director.
Figures 11 and 12 show the density distributions ofrods with aspect ratio L/D = 5 and spheres betweenwalls at a distance d/D = 3L/D. Figure 11 showsthe gas-like phase, figure 12 the corresponding liquid-likephase at coexistence. The overall densities are approxi-
9
mately the positions of the peaks of the probability dis-tribution P (ηr) from the grand canonical simulation atsphere fugacity zs = 1.1.
Figures 13 and 14 show the corresponding profiles ofthe nematic order parameter S and of the biaxiality pa-rameter ξ in the gas- and liquid-like phases respectively.
The positional as well as the orientational order of rodsare clearly visible in the liquid- as well as in the gas-likephase. The range of the induced effects is of the orderof the rod length, which is short in comparison to thechosen distance between the walls. In the middle of thesystem the order parameters reach their bulk values. Thespheres are pushed away from the walls. This effect isalso of the order of the rod length in both phases.
V. DISCUSSION AND SUMMARY
We have presented simulation results on the phase di-agram of mixtures of hard spherocylinders and “penetra-ble hard” spheres in the bulk and in confinement. Wehope that these results are useful for experimental inves-tigations with suspensions of viruses and polymers.
We have studied isotropic-isotropic demixing by sim-ulations in the grand canonical ensemble. In order toaccess states of high free energy we used the successiveumbrella sampling method. The resulting phase bound-aries were compared to free volume theory. We extractedthe critical point from an analysis of the cumulants of the
order parameter distribution. Free volume theory workswell far away from the critical point, but, as expected,underestimates the concentrations at the critical point.
In the bulk the system is very similar to the Asakura-Oosawa-Vrij-model. In particular, we showed that itsbehaviour on approach to the critical point falls into theIsing universality class. In confinement, however, the ori-entational degrees of freedom play a role. As the rodsanchor parallel to the wall, the gas-like branch of thecoexistence region moves to higher colloid (rod) volumefractions than in the Asakura-Oosawa-Vrij model. Andthe walls induce a much larger shift in the critical colloid(rod) volume fraction than they do for spherical colloids.
Acknowledgments
We would like to thank Jurgen Horbach, Richard Vinkand Peter Virnau for helpful suggestions. This work waspart of the priority program SFB Tr6 (project D5) ofthe German Research Association (DFG). It was par-tially funded by the DFG Emmy-Noether-Program, theMWFZ Mainz. It has also been supported by the Eu-ropean Comission under the 6th Framework Programthrough integrating and strengthening the European Re-search Area. Contract: SoftComp VP-06/109. Wethank the Forschungszentrum Julich for CPU time onthe JUMP.
1 T. Biben, P. Bladon, and D. Frenkel. Depletion effectsin binary hard-sphere fluids. J. Phys.: Condens. Matter,8:10799, 1996.
2 K. Binder. Finite size scaling analysis of ising model blockdistribution funktions. Z. Phys. B - Condensed Matter,43:119, 1981.
3 K. Binder. Monte carlo calculation of the surface tensionfor two- and three-dimensional lattice-gas models. Phys.
Rev. A, 25:1699, 1982.4 P. G. Bolhuis, A. Stroobants, D. Frenkel, and H. N. W.
Lekkerkerker. Numerical study of the phase behaviourof rodlike colloids with attractive interactions. J. Chem.
Phys., 107:1551, 1997.5 Y. L. Chen and K. S. Schweizer. Depletion interaction in
suspensions of spheres and rod-polymers. J. Chem. Phys.,117:1351, 2002.
6 Y. L. Chen and K. S. Schweizer. Liquid-state theory ofstructure, thermodynamics, and phase separation in sus-pensions of rod polymers and hard spheres. J. Phys. Chem.
B, 108:6687, 2004.7 M.A. Cotter. Hard spherocylinders in an anisotropic mean
field: A simple model for a nematic liquid crystal. J. Chem.
Phys., 66:1098, 1977.8 A. Cuetos, B. Martinez-Haya, S. Lago, and L.F. Rull. Use
of parsons-lee and onsager theories to predict nematic anddemixing behaviour in binary mixtures of hard rods andhard spheres. Phys. Rev. E, 75:061701, 2007.
9 Z. Dogic and S. Fraden. Ordered phases of filamentousviruses. Current Opinion in Colloid and Interface Sciences,11:47, 2006.
10 T. T. Hebert. Phytopathology, 53:362, 1963.11 J. K. G.Dhont, M. P. Lettinga, Z. Dogic, T. A. J. Lenstra,
H. Wang, S. Rathgeber, P. Carletto, L. Willner, H. Friel-inghaus, and P. Lindner. Shear-banding and microstruc-ture of colloids in shear flow. Faraday Discussions, 123:157,2003.
12 K. G. Kang, M. P. Lettinga, Z. Dogic, and J. K. G.Dhont.Vorticity banding in rodlike virus suspensions. Phys. Rev.
E, 74:026307, 2006.13 D. P. Landau and K. Binder. A Guide to Monte Carlo
Simulations in Statistical Physics. Cambridge UniversityPress, Cambridge, 2000.
14 H. N. W. Lekkerkerker and A. Stroobants. Phase behaviourof rod-like colloid + flexible polymer mixtures. Nuovo Ci-
mento D, 16:949, 1994.15 T. A. J. Lenstra, Z. Dogic, and J. K. G. Dhont. Shear-
induced displacement of isotropic-nematic spinodals. J.
Chem. Phys., 114:10151, 2001.16 M. P. Lettinga and J. K. G. Dhont. Non-equilibrium phase
behaviour of rod-like viruses under shear flow. J. Phys.
Cond. Matter, 16:S3929, 2004.17 W. Li and H. R. Ma. Depletion interactions between two
spherocylinders. Eur. Phys. J. E., 16:225, 2005.18 R. J. Low. Measuring order and biaxiality. Eur. J. Phys.,

10
23:111, 2002.19 F. Oosawa and S. Asakura. J. Chem. Phys., 22:1255, 1954.20 S. V. Savenko and M. Dijkstra. Phase behavior of a sus-
pension of colloidal hard rods and nonadsorbing polymer.J. Chem. Phys., 124:234902, 2006.
21 T. Schilling, S. Jungblut, and Mark A. Miller. Depletion-induced percolation in networks of nanorods. Phys. Rev.
Lett., 98:108303, 2007.22 R. Tuinier, T. Taniguchi, and H. H. Wensink. Phase be-
havior of a suspension of hard spherocylinders plus idealpolymer chains. Phys. Rev. E, page in press, 2007.
23 R. van Roij. The isotropic and nematic liquid crystal phaseof colloidal rods. Eur. J. Phys., 26:S57, 2005.
24 R. Vink, S. Wolfsheimer, and T. Schilling. Isotropic-nematic interfacial tension of hard and soft rods: appli-cation of advanced grand canonical biased sampling tech-niques. J. Chem. Phys., 123:074901, 2005.
25 R. L. C. Vink, K. Binder, and J. Horbach. Critical behavior
of a colloid-polymer mixture confined between walls. Phys.
Rev E, 73:056118, 2006.26 R. L. C. Vink and J. Horbach. The fluid-fluid interface
in a model colloid-polymer mixture: Application of grandcanonical monte carlo to asymmetric binary mixtures. J.
Chem. Phys., 121:3253, 2004.27 R. L. C. Vink and T. Schilling. Interfacial tension of the
isotropic-nematic interface in suspensions of soft sphero-cylinders. Phys. Rev. E, 71:051716, 2005.
28 P. Virnau and M. Muller. Calculation of free energythrough successive umbrella sampling. J. Chem. Phys.,120:10925, 2004.
29 A. Vrij. Pure Appl. Chem., 48:471, 1976. doendnoteend-note30Dr. S. Savenko, private communication to Dr. R.Vink.
30 Dr. S. Savenko, private communication to Dr. R. Vink.


