Embed Size (px)
Citation preview
Denham Townsite CHRMAP
Final Report
Shire of Shark Bay
31 March 2020
Shire of Shark Bay | 31 March 2020 Final Report Page 1
5652_01_R
09v02.d
ocx
Document Status
Version Doc type Reviewed by Approved by Date issued
V01 FINAL Joanna Garcia-Webb Astrid Stuer 10/03/2020
V02 FINAL Joanna Garcia-Webb Astrid Stuer 31/03/2020
Project Details
Project Name Final Report
Client Shire of Shark Bay
Client Project Manager Paul Anderson
Water Technology Project Manager Joanna Garcia-Webb
Water Technology Project Director Gildas Colleter
Authors William Edge, Joanna Garcia-Webb
Document Number 5652_01_R09v02.docx
COPYRIGHT
Water Technology Pty Ltd has produced this document in accordance with instructions from Shire of Shark Bay for their
use only. The concepts and information contained in this document are the copyright of Water Technology Pty Ltd. Use or
copying of this document in whole or in part without written permission of Water Technology Pty Ltd constitutes an
infringement of copyright.
Water Technology Pty Ltd does not warrant this document is definitive nor free from error and does not accept liability for
any loss caused, or arising from, reliance upon the information provided herein.
Ground Floor Head Office:
430 Roberts Road 15 Business Park Drive
Subiaco WA 6904 Notting Hill VIC 3168
Telephone 08 6555 0105
ACN 093 377 283
ABN 60 093 377 283
Shire of Shark Bay | 31 March 2020 Final Report Page 2
5652_01_R
09v02.d
ocx
31 March 2020
Paul Anderson Chief Executive Officer Shire of Shark Bay 65 Knight Terrace Denham WA 6537 Via email [email protected] Dear Paul
Final Report
We are pleased to present the Denham Townsite Coastal Hazard Risk Management and Adaptation Plan Final
Report. If you have any queries, please do not hesitate to contact me on (08) 6555 0105.
Yours sincerely
Joanna Garcia-Webb Principal Coastal Engineer | National Practice Lead – Coasts & Environment
WATER TECHNOLOGY PTY LTD
Shire of Shark Bay | 31 March 2020 Final Report Page 3
5652_01_R
09v02.d
ocx
EXECUTIVE SUMMARY
It is internationally recognised that increasing sea levels will intensify coastal hazards such as coastal
inundation (temporary coastal flooding), storm erosion and long-term shoreline recession (IPCC 2014).
Consequently, State governments across Australia have introduced obligations that require local governments
to consider and plan for the effects of these hazards on current and future development. In Western Australia
(WA), the governing policy is the Western Australian Planning Commission’s State Coastal Planning Policy
2.6 (WAPC, 2013, herein referred to as “SPP2.6”). SPP2.6 recommends management authorities develop a
Coastal Hazard Risk Management and Adaptation Plan (CHRMAP) for the next 100 years. Specific guidelines
have been developed to assist in this process (WAPC, 2019).
One of the key objectives of SPP2.6 is to establish coastal foreshore reserves which include allowances for
the protection, conservation and enhancement of coastal values across the state. Risk assessment processes
are then utilised to identify risks that are intolerable to the community and other stakeholders, such as the
Shire of Shark Bay, indigenous and cultural interests, and private enterprise. Adaptation measures are then
developed according to the preferential adaptation hierarchy outlined in SPP2.6.
The overall CHRMAP purpose is as follows:
◼ To identify vulnerable assets (public and private) and the risk posed to them by coastal hazards.
◼ To preserve community values for present and future generations.
◼ To develop a plan that will allow the Shire to respond to identified risks through adaptation planning
activities.
◼ To recommend monitoring plans to ensure the risk management and adaptation plan activities are working
into the future as expected.
◼ For the Shire of Shark Bay to manage their coastline at Denham. It is not intended to be used by others
to replace their own CHRMAP requirements (e.g. specific new coastal developments)
For the purposes of the assessment, the study area was divided into 5 distinct coastal compartments based
on natural and built features; these are displayed in Figure 2-2. This study considers a 100-year planning
timeframe (to 2118). Interim epochs also considered are the present day, 2030 and 2050.
In the process of developing a holistic adaptation plan, suitable options were to be identified and assessed. A
core principle of SPP2.6 is the adaptation planning hierarchy which specifies that coastal management options
should be preferred in the following order (most to least):
◼ Avoid development in all previously undeveloped coastal areas seaward of the 2118 hazard line;
◼ Planned or Managed Retreat, i.e. maintaining a foreshore reserve through public acquisition of private
property; or,
◼ Accommodate at-risk developments over the short term while new development is appropriately
designed and located; or
◼ Protect, i.e. preventing the shoreline from receding beyond private property boundaries by stabilising the
current shoreline position using various protection measures (e.g. rock groynes, offshore breakwaters).
Other important considerations when assessing adaption options are as follows:
◼ Adaptation options should minimise coastal process interference and legacy issues
◼ The adaptation hierarchy is presented in Figure 2-5.
◼ Coastal development must be sustainable in the long term, and must balance the community,
economic, environmental and cultural needs

Shire of Shark Bay | 31 March 2020 Final Report Page 4
5652_01_R
09v02.d
ocx
◼ Local Governments are responsible for managing risks to public assets and any assets they
manage. They should also:
◼ Develop local policies and regulations consistent with state legislation and policy
◼ Facilitate building resilience and adaptive capacity within the local community
◼ Work in partnership with community to identity and manage risks / impacts
◼ Management strategies that preserve the natural coastline and move development away from the
active coastal zone in an orderly manner are considered ideal.
◼ Of relevance to the CHRMAP process is the user pays principle, whereby those who benefit most
from protection must provide the greatest financial contribution.
◼ Adaptation options should maintain future flexibility, in order to build resilient coastal communities.
◼ A key adaptation option is the use of planning instruments, including managed retreat
Success criteria were developed for this study to represent the community and stakeholders’ overarching goals
and define the Town’s tolerance to identified coastal hazards. The adopted success criteria based on
community consultation and surveys are as follows:
◼ Protection of the environmental assets of the study area / planning to retain environmental integrity
◼ Protection of the recreational value of the coastline
◼ Protection of the cultural values of the coastline & town centre
◼ Maintenance of a level of public recreational assets
◼ Development controls not to inhibit the landscape
Coastal processes allowances were calculated as per the guidelines in SPP2.6 for inundation and erosion
over the full 100-year planning timeframe. Key policy objectives of SPP2.6 are to include an allowance for
predicted sea level rise and a provision for a coastal foreshore reserve. The coastal foreshore reserve is
essentially a publicly owned ‘space’ between the ocean and coastal development. The erosion and inundation
allowance are not predictors of future shoreline position or sea level respectively, they are indicators of the
area of potential vulnerability over the planning timeframe.
The final inundation allowance (and recommended finished floor level) was calculated to be 4.2 m AHD. This
value includes tidal, surge and wave set-up components. Given the paucity of local field data the final finished
floor level was considered to be very conservative and as such, wave run-up was not included. The final
erosion allowance is the sum of storm erosion, persistent erosion trends, and an estimate of the erosion due
to sea level rise. The final inundation and erosion allowances for coastal processes are available to view online
overlaying the study area. An explanation as to how to interpret the maps is provided when first visiting this
link.
To further understand the Town’s exposure to coastal hazards and its adaptive capacity at present, assets in
the coastal zone were identified. Each asset was colour coded based on its classification (commercial, public,
tourism related and residential) and these are also viewable in the online database.
Now that the study area’s coastal environmental context was well established and the community’s goals were
defined, adaptation options were identified and assessed. Each option was first assessed using a multi-criteria
(MCA) framework by scoring six different categories; (expected) effectiveness, environmental impact, social
impact, aesthetic impact, future adaptability, and cost. Adaptation options that passed the MCA were then
assessed through a cost-benefit analysis (CBA) to determine if there was a strong economic argument to
pursue the option. Through these analyses, final adaptation options to be included in the CHRMAP were
identified.
Shire of Shark Bay | 31 March 2020 Final Report Page 5
5652_01_R
09v02.d
ocx
The identified options were developed into an implementation plan; the short-term plan is summarised in the
table overleaf, with the full table and long-term plan presented in Section 8. In addition to the implementation
plan, specific trigger-based adaptation criteria were recommended as follows:
◼ Proximity trigger: Where the most landward part of the Horizontal Shoreline Datum (HSD) is within 40
metres of the most seaward point of a development / structure / foreshore reserve area.
◼ Due to the high value placed on the foreshore coastal reserve, the recreational area would itself be
considered the asset in this case
◼ Access trigger: Where a public road is considered no longer available or able to provide legal access to
the property
◼ This may occur for Knight Terrace, particularly to the east of Denham Hamelin Road. The Shire may
choose to investigate access options from the landward side of these properties.
◼ Utilities trigger: When water, sewage or electricity to the lot is no longer available as they have been
removed/decommissioned by the relevant authority due to coastal hazards.
◼ Damage trigger: Any property within the hazard zone and Special Control Area (SCA) that is damaged
by a coastal hazard from an extreme weather event shall require Shire approval before being repaired.
The review process should involve:
◼ Re-fit of minor or moderately damaged assets to better accommodate coastal hazards in the future
◼ OR
◼ Removal and redevelopment outside the hazard zone for assets that suffer major damage
Finally, potential long-term adaptation strategies were discussed and recommendations for a monitoring plan
for filling present knowledge gaps were also included in Section 8.
Shire of Shark Bay | 31 March 2020 Final Report Page 6
5652_01_R
09v02.d
ocx
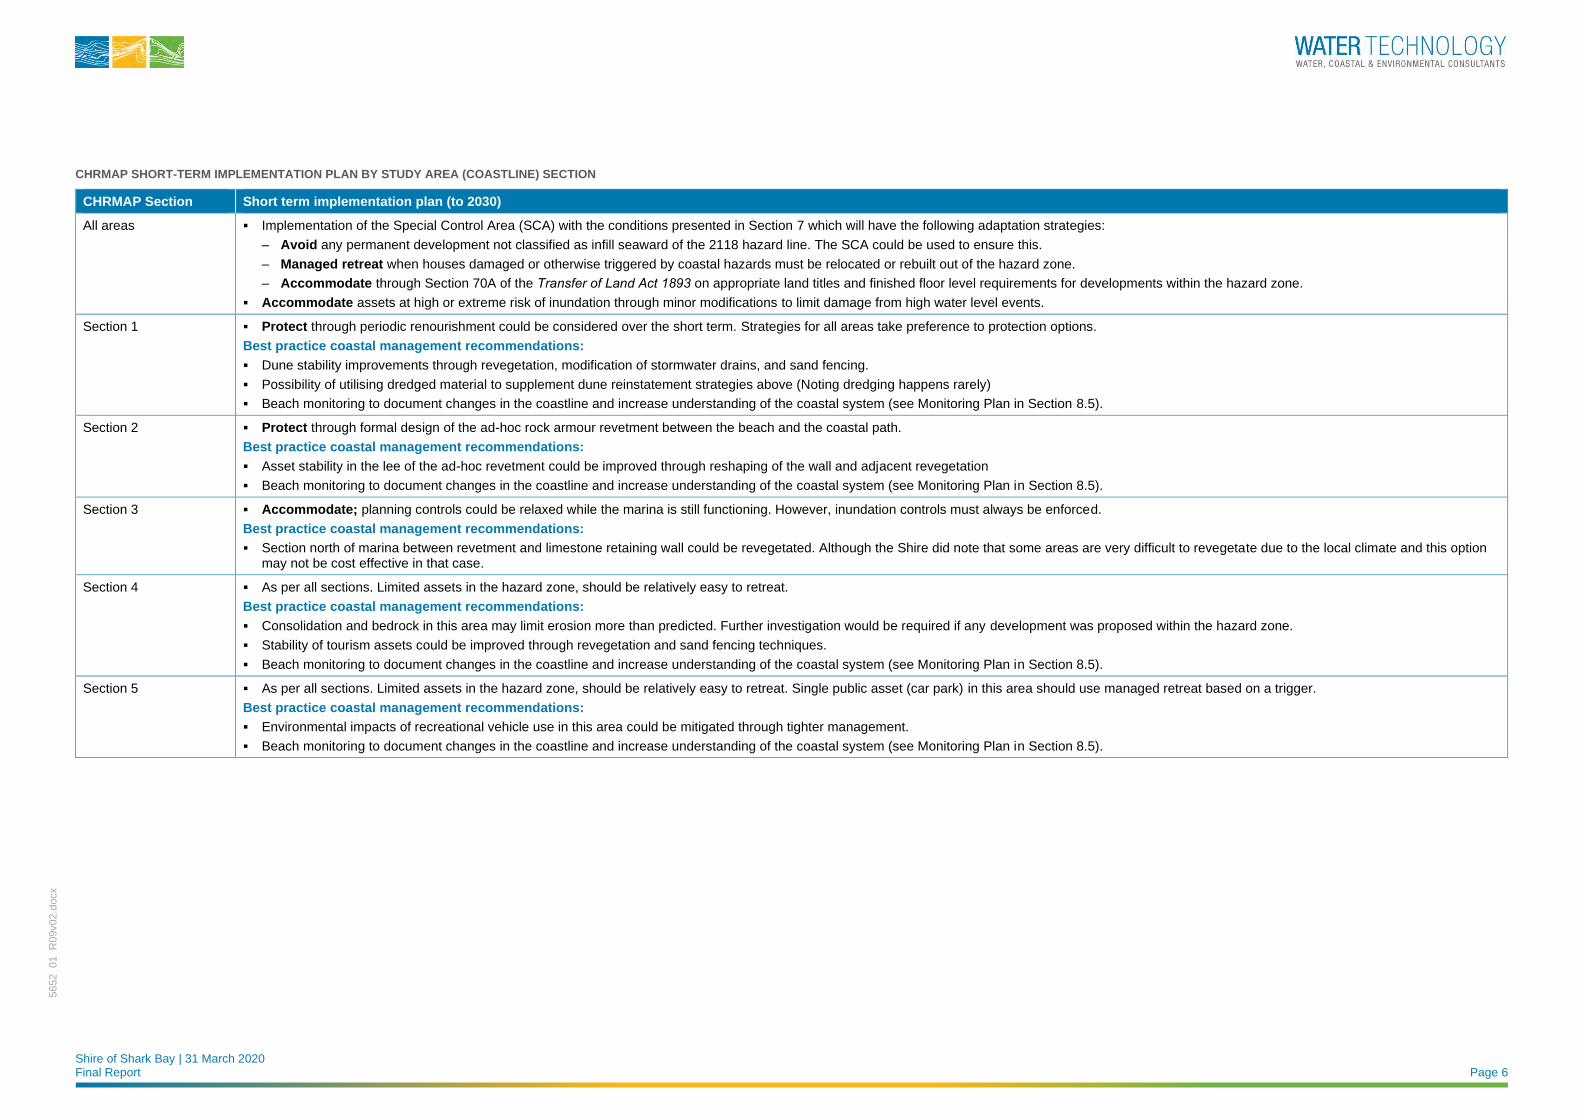
CHRMAP SHORT-TERM IMPLEMENTATION PLAN BY STUDY AREA (COASTLINE) SECTION
CHRMAP Section Short term implementation plan (to 2030)
All areas ▪ Implementation of the Special Control Area (SCA) with the conditions presented in Section 7 which will have the following adaptation strategies:
– Avoid any permanent development not classified as infill seaward of the 2118 hazard line. The SCA could be used to ensure this.
– Managed retreat when houses damaged or otherwise triggered by coastal hazards must be relocated or rebuilt out of the hazard zone.
– Accommodate through Section 70A of the Transfer of Land Act 1893 on appropriate land titles and finished floor level requirements for developments within the hazard zone.
▪ Accommodate assets at high or extreme risk of inundation through minor modifications to limit damage from high water level events.
Section 1 ▪ Protect through periodic renourishment could be considered over the short term. Strategies for all areas take preference to protection options.
Best practice coastal management recommendations:
▪ Dune stability improvements through revegetation, modification of stormwater drains, and sand fencing.
▪ Possibility of utilising dredged material to supplement dune reinstatement strategies above (Noting dredging happens rarely)
▪ Beach monitoring to document changes in the coastline and increase understanding of the coastal system (see Monitoring Plan in Section 8.5).
Section 2 ▪ Protect through formal design of the ad-hoc rock armour revetment between the beach and the coastal path.
Best practice coastal management recommendations:
▪ Asset stability in the lee of the ad-hoc revetment could be improved through reshaping of the wall and adjacent revegetation
▪ Beach monitoring to document changes in the coastline and increase understanding of the coastal system (see Monitoring Plan in Section 8.5).
Section 3 ▪ Accommodate; planning controls could be relaxed while the marina is still functioning. However, inundation controls must always be enforced.
Best practice coastal management recommendations:
▪ Section north of marina between revetment and limestone retaining wall could be revegetated. Although the Shire did note that some areas are very difficult to revegetate due to the local climate and this option may not be cost effective in that case.
Section 4 ▪ As per all sections. Limited assets in the hazard zone, should be relatively easy to retreat.
Best practice coastal management recommendations:
▪ Consolidation and bedrock in this area may limit erosion more than predicted. Further investigation would be required if any development was proposed within the hazard zone.
▪ Stability of tourism assets could be improved through revegetation and sand fencing techniques.
▪ Beach monitoring to document changes in the coastline and increase understanding of the coastal system (see Monitoring Plan in Section 8.5).
Section 5 ▪ As per all sections. Limited assets in the hazard zone, should be relatively easy to retreat. Single public asset (car park) in this area should use managed retreat based on a trigger.
Best practice coastal management recommendations:
▪ Environmental impacts of recreational vehicle use in this area could be mitigated through tighter management.
▪ Beach monitoring to document changes in the coastline and increase understanding of the coastal system (see Monitoring Plan in Section 8.5).
Shire of Shark Bay | 31 March 2020 Final Report Page 7
5652_01_R
09v02.d
ocx
CONTENTS
1 INTRODUCTION 10
2 ESTABLISH THE CONTEXT 13
2.1 CHRMAP Purpose & Objectives 13
2.2 Planning Timeframes 13
2.3 Site Description 13
2.4 Existing Planning Controls 16
2.5 Risk Management & Adaptation Hierarchy 19
2.6 Summary for Decision Makers 19
3 COMMUNITY ENGAGEMENT 21
3.1 Engagement Process 21
3.2 Success Criteria 21
4 COASTAL HAZARD IDENTIFICATION 22
4.1 Hazard Assessment Approach 22
4.1.1 Coastal Foreshore Reserve 22
4.1.2 Sea Level Rise 22
4.1.3 Inundation Allowance 22
4.1.4 Allowance for Coastal Erosion 22
4.2 Coastal Inundation Assessment 23
4.3 Coastal Erosion Allowance 23
4.4 Coastal Hazard Identification Limitations 24
5 RISK ASSESSMENT 26
5.1 Risk Assessment Process 26
5.2 Assets at Risk 27
6 ADAPTATION OPTION IDENTIFICATION 30
6.1 Adaptation Options - General 30
6.2 Adaptation Options - Planning 31
6.2.1 Summary for Decision Makers – Identified Planning Instruments 32
6.3 Adaptation Options – Inundation 32
6.3.1 Present Day 32
6.3.2 2030 32
6.3.3 2050 33
6.3.4 2118 33
6.4 Adaptation Options - Coastal Erosion 33
6.4.1 Adaptation Triggers (all timeframes) 33
6.4.2 Present Day 34
6.4.3 2030 34
6.4.4 2050 34
6.4.5 2118 35
Shire of Shark Bay | 31 March 2020 Final Report Page 8
5652_01_R
09v02.d
ocx
7 ADAPTATION OPTIONS ASSESSMENT 36
8 IMPLEMENTATION 38
8.1 Short Term Implementation Plan 38
8.1.1 Trigger-based Adaptation 38
8.2 Long-Term Adaptation Strategies 40
8.3 Challenges 41
8.4 Funding and Responsibilities 42
8.5 Monitoring Plan 44
8.6 Knowledge Gaps & Recommendations 44
9 SUMMARY 46
10 REFERENCES 47
APPENDICES
Appendix A Stakeholder and Community Engagement Plan
Appendix B Chapter Report: Establish the Context
Appendix C Chapter Report: Coastal Hazard & Vulnerability Assessment
Appendix D Chapter Report: Risk Assessment
Appendix E Chapter Report: Identification of Adaptation Options
Appendix F Chapter Report: Assessment of Adaptation Options
Appendix G Public Consultation Summary
LIST OF FIGURES
Figure 1-1 Extent of CHRMAP 11
Figure 1-2 CHRMAP methodology flow chart (adapted from WAPC CHRMAP Guidelines) 12
Figure 2-1 Location of the study site with within Shark Bay 15
Figure 2-2 Study area sections 16
Figure 2-3 State planning framework for Western Australia 16
Figure 2-4 Site-specific planning instruments 17
Figure 2-5 Coastal hazard risk management and adaptation planning hierarchy (adapted from WAPC, 2013) 19
Figure 5-1 Risk assessment process 26
Figure 8-1 Primary long-term adaptation pathways available for the Shire (managed retreat recommended) 40
LIST OF TABLES
CHRMAP short-term implementation plan by study area (coastline) section 6
Table 2-1 Existing Planning Controls – key messages (extracted from full table: Table 2-1 in Appendix E) 18
Table 2-2 Adaptation consideration summary 20
Table 3-1 Adopted success criteria 21
Shire of Shark Bay | 31 March 2020 Final Report Page 9
5652_01_R
09v02.d
ocx
Table 4-1 Proposed sea level rise scenarios 22
Table 4-2 Design water levels for the town of Denham (m AHD); numbers in bold are the allowance for Inundation 23
Table 4-3 Coastal Processes allowance - 2030 24
Table 4-4 Coastal Processes allowance - 2050 24
Table 4-5 Coastal Processes allowance - 2118 24
Table 5-1 Risk assessment matrix 27
Table 5-2 Risk profile definition 27
Table 5-3 Prioritised assets - inundation risks 28
Table 5-4 Prioritised assets - erosion risks 29
Table 6-1 Available Adaptation Options (Appendix E, Table 3-3; adapted from WAPC, 2019) 30
Table 7-1 Summary of adaptation options assessment (*points below) 36
Table 7-2 Assets Exposed to Erosion Under Managed Retreat Predictions 37
Table 8-1 CHRMAP short-term implementation plan by study area (coastline) section (Applies to whole section unless stated otherwise) 39
Table 8-2 Proposed long-term adaptation pathway for a managed retreat strategy 41
Table 8-3 Proposed long-term adaptation pathway for an accommodate and protect strategy 41
Table 8-4 Strategy responsibility summary: short & long-term implementation plans 43
Table G-1 Submission 1 63
Table G-1 Extract of Concern 1 from Submission 2 63
Table G-1 Extract of Concern 2 from Submission 2 66
Table G-1 Extract of Concern 3 from Submission 2 67
Shire of Shark Bay | 31 March 2020 Final Report Page 10
5652_01_R
09v02.d
ocx
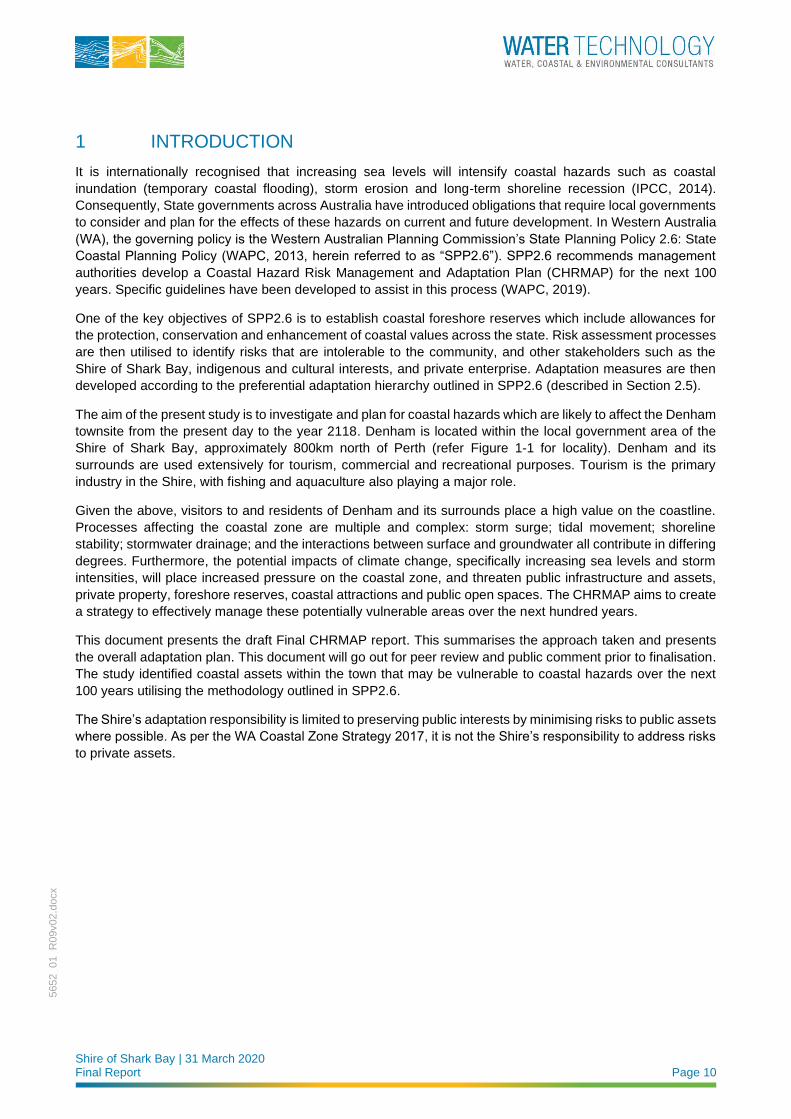
1 INTRODUCTION
It is internationally recognised that increasing sea levels will intensify coastal hazards such as coastal
inundation (temporary coastal flooding), storm erosion and long-term shoreline recession (IPCC, 2014).
Consequently, State governments across Australia have introduced obligations that require local governments
to consider and plan for the effects of these hazards on current and future development. In Western Australia
(WA), the governing policy is the Western Australian Planning Commission’s State Planning Policy 2.6: State
Coastal Planning Policy (WAPC, 2013, herein referred to as “SPP2.6”). SPP2.6 recommends management
authorities develop a Coastal Hazard Risk Management and Adaptation Plan (CHRMAP) for the next 100
years. Specific guidelines have been developed to assist in this process (WAPC, 2019).
One of the key objectives of SPP2.6 is to establish coastal foreshore reserves which include allowances for
the protection, conservation and enhancement of coastal values across the state. Risk assessment processes
are then utilised to identify risks that are intolerable to the community, and other stakeholders such as the
Shire of Shark Bay, indigenous and cultural interests, and private enterprise. Adaptation measures are then
developed according to the preferential adaptation hierarchy outlined in SPP2.6 (described in Section 2.5).
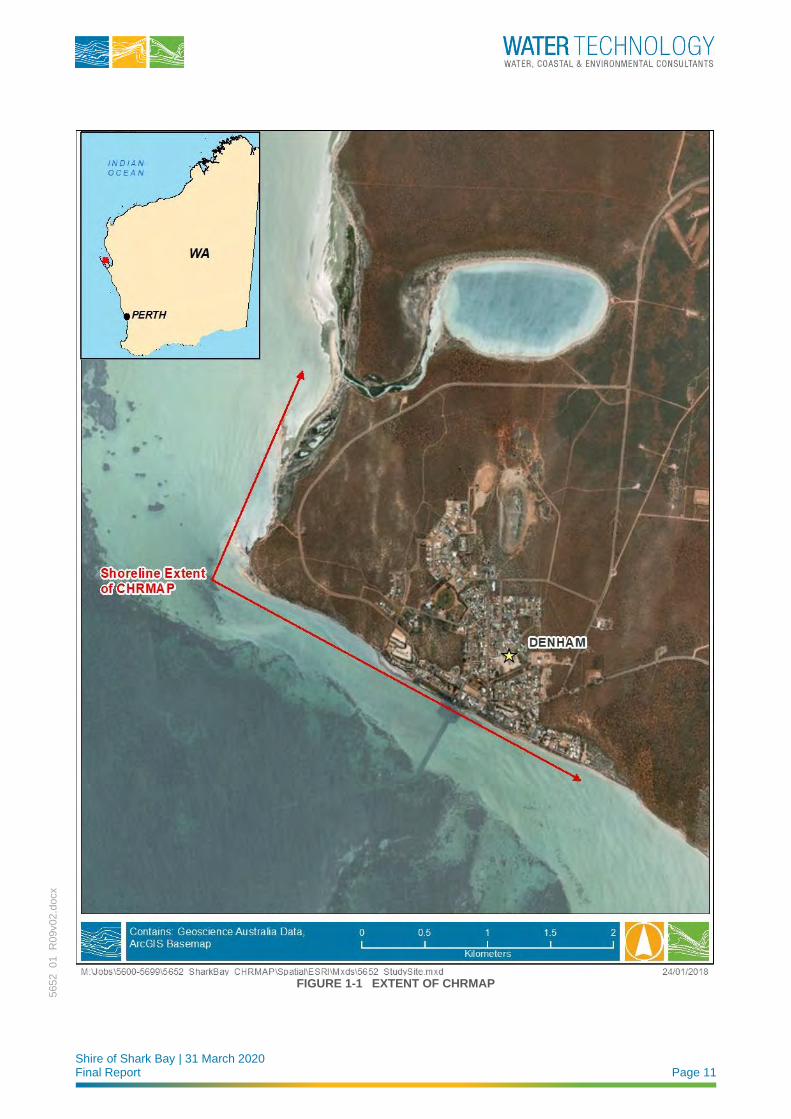
The aim of the present study is to investigate and plan for coastal hazards which are likely to affect the Denham
townsite from the present day to the year 2118. Denham is located within the local government area of the
Shire of Shark Bay, approximately 800km north of Perth (refer Figure 1-1 for locality). Denham and its
surrounds are used extensively for tourism, commercial and recreational purposes. Tourism is the primary
industry in the Shire, with fishing and aquaculture also playing a major role.
Given the above, visitors to and residents of Denham and its surrounds place a high value on the coastline.
Processes affecting the coastal zone are multiple and complex: storm surge; tidal movement; shoreline
stability; stormwater drainage; and the interactions between surface and groundwater all contribute in differing
degrees. Furthermore, the potential impacts of climate change, specifically increasing sea levels and storm
intensities, will place increased pressure on the coastal zone, and threaten public infrastructure and assets,
private property, foreshore reserves, coastal attractions and public open spaces. The CHRMAP aims to create
a strategy to effectively manage these potentially vulnerable areas over the next hundred years.
This document presents the draft Final CHRMAP report. This summarises the approach taken and presents
the overall adaptation plan. This document will go out for peer review and public comment prior to finalisation.
The study identified coastal assets within the town that may be vulnerable to coastal hazards over the next
100 years utilising the methodology outlined in SPP2.6.
The Shire’s adaptation responsibility is limited to preserving public interests by minimising risks to public assets
where possible. As per the WA Coastal Zone Strategy 2017, it is not the Shire’s responsibility to address risks
to private assets.
Shire of Shark Bay | 31 March 2020 Final Report Page 11
5652_01_R
09v02.d
ocx
FIGURE 1-1 EXTENT OF CHRMAP
Shire of Shark Bay | 31 March 2020 Final Report Page 12
5652_01_R
09v02.d
ocx
ESTABLISHING THE CONTEXT
Project Inception Meeting
• Held via teleconference. Finalised project scope, deliverables, timing, data gap actions and identify key stakeholders
Stakeholder and Community Engagement Plan
• Preparation of Community Information Sheet 1
Literature Review and Issues Paper
• Historical reports reviewed, state and local coastal policy, planning schemes & instruments considered.
Site Investigations / Community Workshop 1 (Workshop 1 undertaken on the same trip as the site visit.)
• CIS1 was posted online / displayed immediately prior to Workshop 1; focus group interviews were available outside
Workshop
• Community Values Assessment was completed (community and cultural values identified).
• Site visit allowed for finalisation of the Identification of Coastal Assets task and fill gaps noted in Issues Paper.
• Site visit to also aid in coastal processes understanding.
CO
MM
UN
ICA
TIO
N A
ND
CO
NS
UL
TA
TIO
N:
SH
IRE
OF
SH
AR
K B
AY
, S
TA
KE
HO
LD
ER
S, C
OM
MU
NIT
Y W
RO
KS
HO
PS
& S
UR
VE
Y
MO
NIT
OR
ING
AN
D R
EV
IEW
Final CHRMAP and Interim Deliverables
ADAPTATION PLANNING
COASTAL HAZARD RISK IDENTIFICATION
Hazard Assessment – to understand coastal processes & hazards & identify areas at risk
• Review of available information and knowledge summary
o Water Level / inundation information
o Hydrographic surveys
o Aerial photography analysis
o Previous coastal hazard reporting
• Coastal Hazard Assessment on key coastal processes – coastal inundation, long-term and short-term erosion
o Updated previous assessments with most recent aerial photographs / historical where necessary; analyse
accordingly
o Inundation scenarios included - Present day, 2030, 2050, 2118 conditions, with Average Recurrence
Interval of 20, 50, 100, 500 years
o Erosion scenarios assessed as per SPP2.6, with SBEACH modelling at key points in the study area o Determine trigger events & responses
• Coastal Hazard Mapping
o 3D surface mapping of all coastal inundation and erosion scenarios.
o Split into sectors, as required, at the stipulated scales & generate maps
o Online mapping provided for all maps, all information within GIS system
RISK ANALYSIS AND EVALUATION
Prepare Likelihood and Consequence Scales
• Risk assessment of each vulnerable asset: likelihood, consequence, vulnerability & risk rating for each scenario
Risk Evaluation
• Identified actions & priorities for management until 2118
• Analysed Community Values / Success Criteria--> established community priorities for Vulnerable Assets
Identify Existing Controls
• Identified existing mitigation measures: physical & planning schemes to mitigate the above risks
o Update risks accordingly; identify prioritised risk action list based on Success Criteria & existing controls
Identification of Adaptation Options – following SPP2.6 hierarchy
• Develop long-term pathway for full planning timeframe, and epochs present day, 2030, 2050, 2118
• Adaptation options for highly valued assets - built & natural; short & long-term management
• Land use planning instruments considered: proposed wording & implementation; decision making processes
Vulnerability Assessment
• Identified vulnerable assets, grouped by specified categories; implications on land use
• Identified function, services & values of each vulnerable asset
• Assessed vulnerability of each asset (exposure, sensitivity and adaptive capacity)
o Assets grouped with rationale; Sensitivity scaling considered
o Results tabularised
• Online mapping of vulnerability, all information within GIS system
ENGAGEMENT • Community Information Sheet
• Community Workshop
• Definition of values / success criteria
Assessment of Adaptation Options For each vulnerable asset:
• For each Mitigation / Adaptation measure:
o Multi-Criteria Analysis (MCA). If +ve, proceed to CBA
o Timeframes / triggers to be considered
• Trade-offs between option selection & asset value
Implementation For each vulnerable asset:
• For each Mitigation / Adaptation measure:
o Identify long-term pathways, considering trigger points and previous assessments
o Short-term implementation plan to produce a clear action plan to 2030
o Monitoring plan, detailing any monitoring or review that may be required
ENGAGEMENT • Obtain additional feedback on success
criteria & presented adaptation options:
o Community Information Sheet
o Community Workshop
o Online Survey
ENGAGEMENT • Public advertisement of Final Draft
CHRMAP
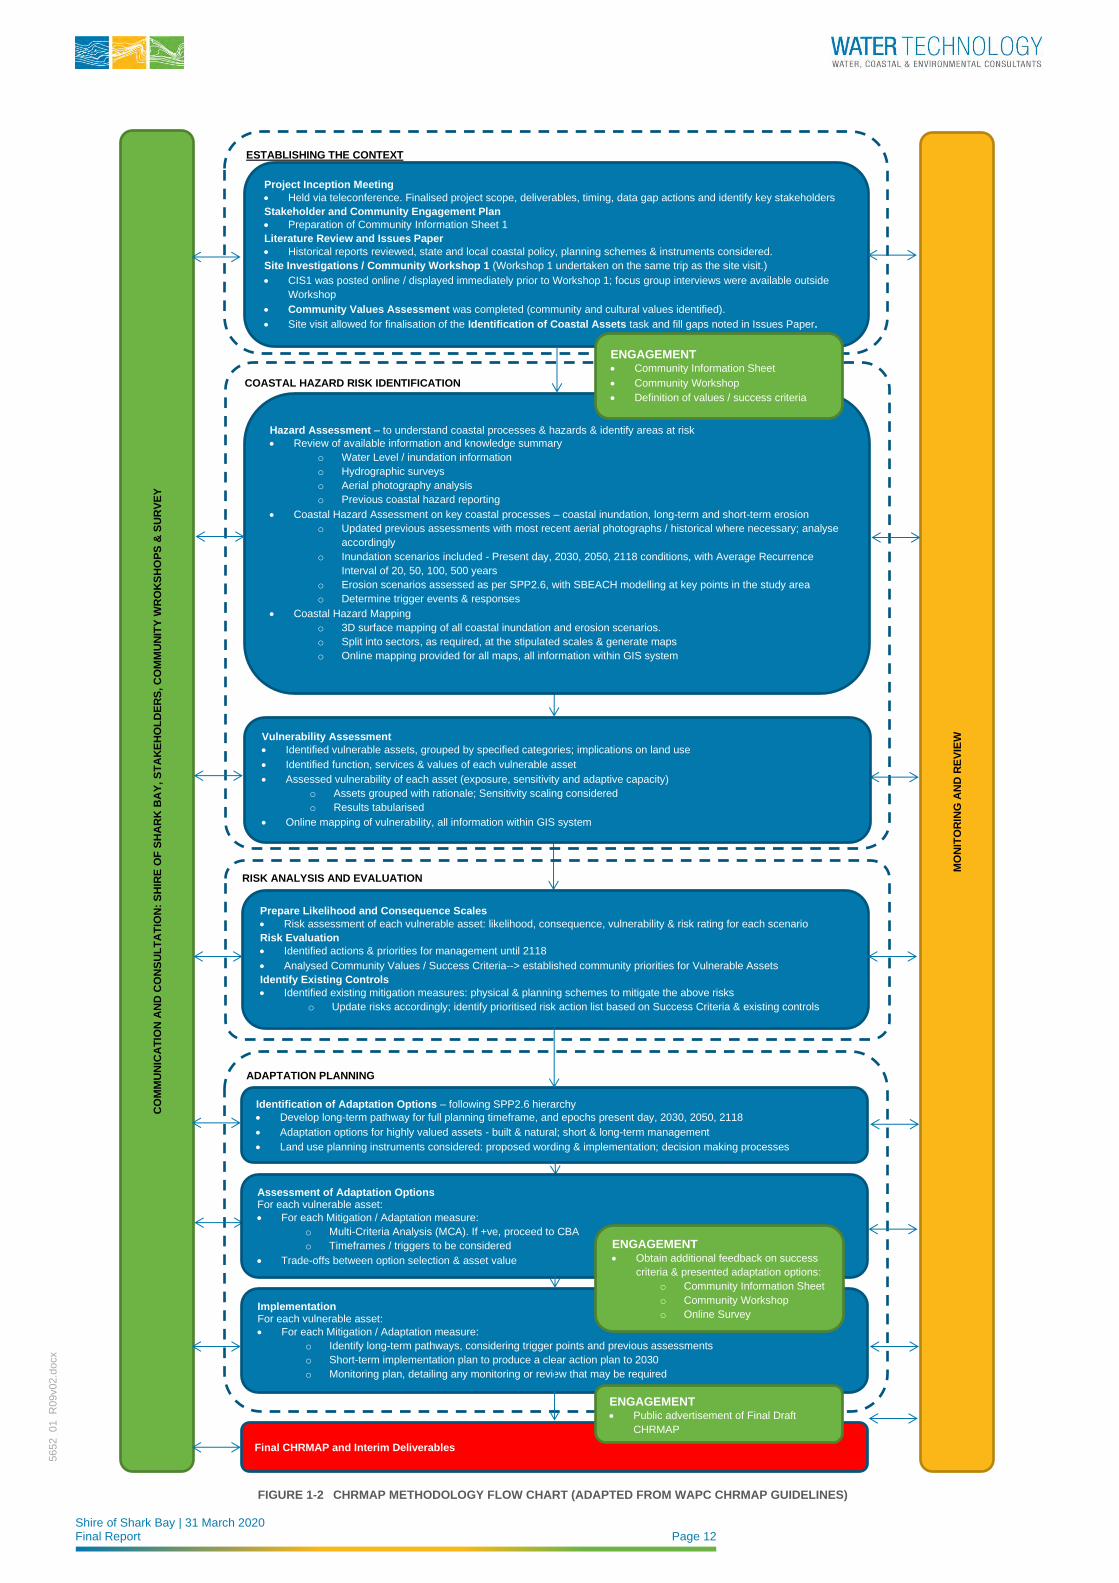
FIGURE 1-2 CHRMAP METHODOLOGY FLOW CHART (ADAPTED FROM WAPC CHRMAP GUIDELINES)
Shire of Shark Bay | 31 March 2020 Final Report Page 13
5652_01_R
09v02.d
ocx
2 ESTABLISH THE CONTEXT
2.1 CHRMAP Purpose & Objectives
As discussed in Section 1, the CHRMAP is a legislative recommendation from the state government.
The Denham CHRMAP aims to investigate and provide the blueprint for adapting and addressing coastal
hazards which are likely to affect the Denham townsite over various planning timeframes. The CHRMAP will
provide strategic guidance for coordinated, integrated and sustainable decision making by the Shire of Shark
Bay in terms of future land use planning and management within the project area. The project will generate
information on climate change and its impacts in the coastal zone within the Denham Townsite. This will enable
the Shire to optimise its use of the coastal foreshore reserve in present day, and plan for how this may change
in the future.
The overall CHRMAP purpose is as follows:
◼ To identify vulnerable assets (public and private) and the risk posed to them by coastal hazards.
◼ To preserve community values for present and future generations.
◼ To develop a plan that will allow the Shire to respond to identified risks through adaptation planning
activities.
◼ To recommend monitoring plans to ensure the risk management and adaptation plan activities are working
into the future as expected.
◼ For the Shire of Shark Bay to manage their coastline at Denham. It is not intended to be used by others
to replace their own CHRMAP requirements (e.g. specific new coastal developments)
2.2 Planning Timeframes
This study considers a 100-year planning timeframe (to 2118). Interim epochs also considered are the present
day, 2030 and 2050. The predicted erosion and inundation extents for these epochs were defined in the
Coastal Hazard & Vulnerability Assessment Chapter Report (Appendix C). These extents are utilised to
develop corresponding adaptation options. However, planning and adaptation actions should be undertaken
and reviewed more frequently than these epochs.
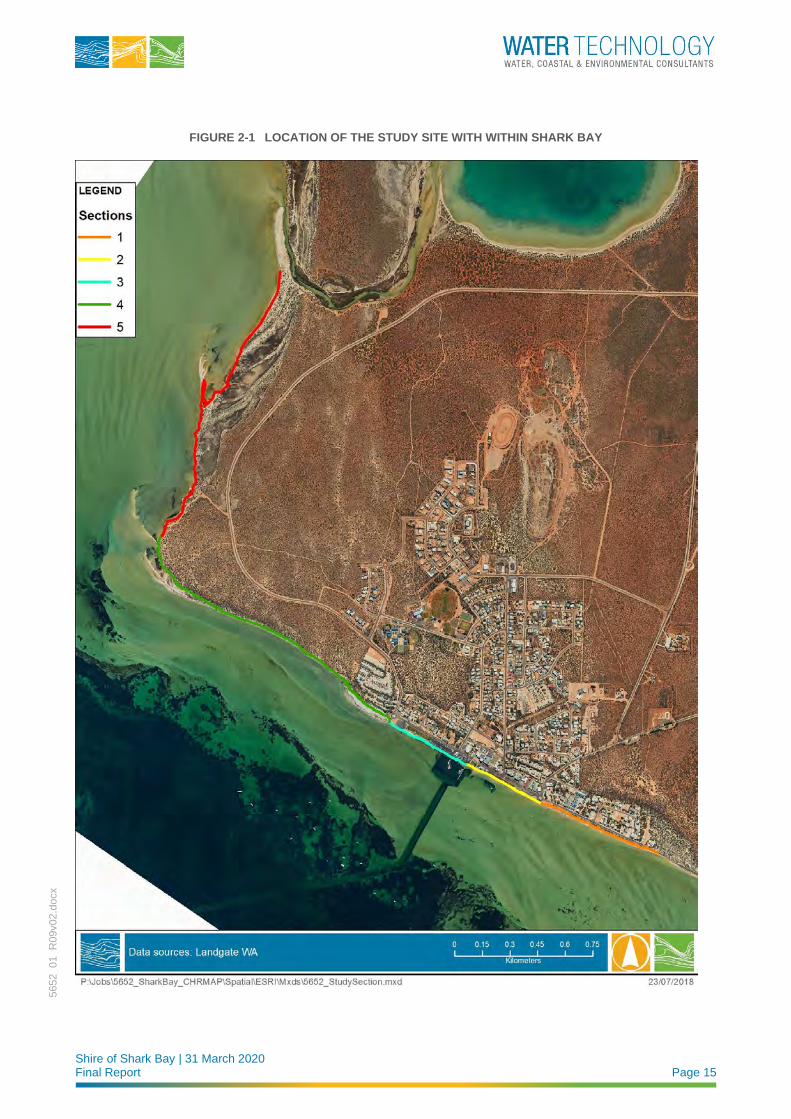
2.3 Site Description
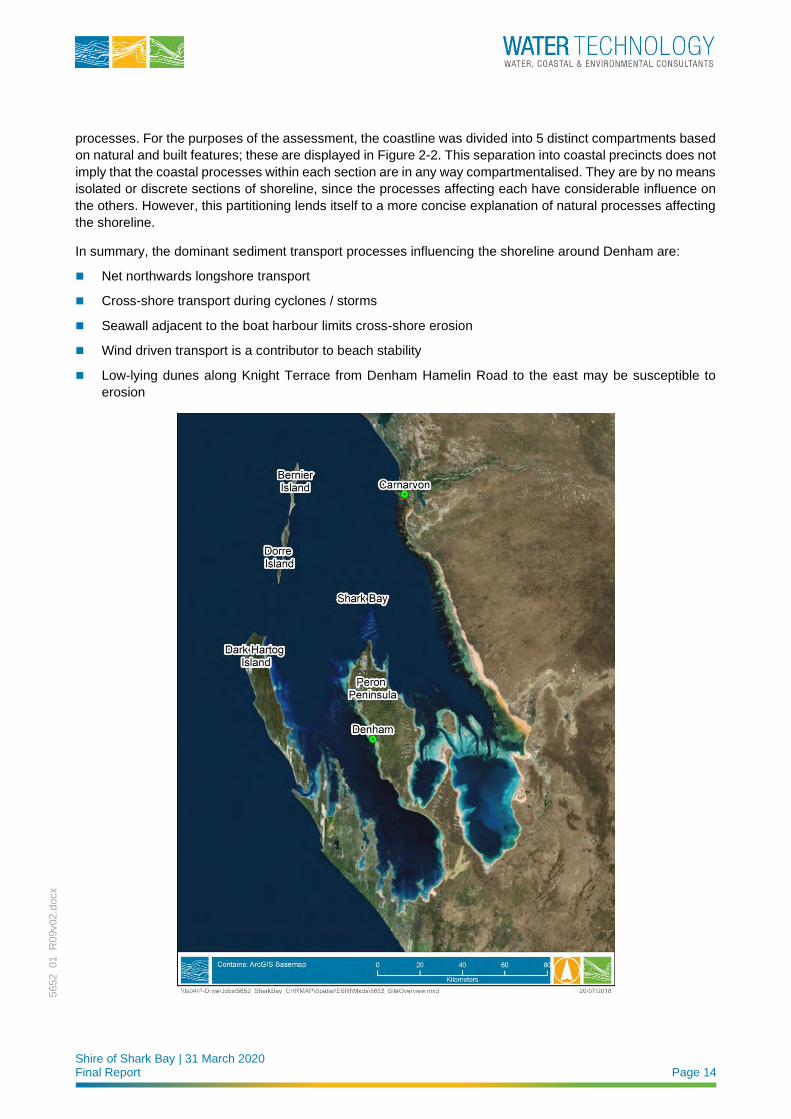
The Denham townsite is located approximately 800 km north of Perth in the Shire of Shark Bay on Western
Australia’s Gascoyne Coast. The town’s unique location (refer Figure 2-1) on the western flank of the Peron
Peninsula, in the lee of Dirk Hartog Island, provides it with some protection from open ocean conditions. With
the exception of the dredged channel, the nearshore bathymetry adjacent to the town remains within -3m AHD
up to a distance 2km offshore, with significant portions of this area becoming exposed under regular tidal
action.
The townsite itself is centred around the foreshore area and accompanying main street (Knight Terrace), which
comprises new and old developments primarily under 5 m AHD. The low-lying foreshore area is part of a storm
ridge and tidal flat system and is reported to be the original settlement location (Eliot et al. 2012). This area
has experienced some seaward advancement due to reclamation works, the presence of built structures and
periodic renourishment from dredged materials. The foreshore is bounded on the landward side by a scarp up
to 25 m AHD, upon which much of the town’s later development has occurred.
A detailed description of the oceanographic conditions, geomorphological setting and the existing shoreline
along the study area is provided in Section 3 of Appendix C, as well as the sediment transport and coastal
Shire of Shark Bay | 31 March 2020 Final Report Page 14
5652_01_R
09v02.d
ocx
processes. For the purposes of the assessment, the coastline was divided into 5 distinct compartments based
on natural and built features; these are displayed in Figure 2-2. This separation into coastal precincts does not
imply that the coastal processes within each section are in any way compartmentalised. They are by no means
isolated or discrete sections of shoreline, since the processes affecting each have considerable influence on
the others. However, this partitioning lends itself to a more concise explanation of natural processes affecting
the shoreline.
In summary, the dominant sediment transport processes influencing the shoreline around Denham are:
◼ Net northwards longshore transport
◼ Cross-shore transport during cyclones / storms
◼ Seawall adjacent to the boat harbour limits cross-shore erosion
◼ Wind driven transport is a contributor to beach stability
◼ Low-lying dunes along Knight Terrace from Denham Hamelin Road to the east may be susceptible to
erosion
Shire of Shark Bay | 31 March 2020 Final Report Page 15
5652_01_R
09v02.d
ocx
FIGURE 2-1 LOCATION OF THE STUDY SITE WITH WITHIN SHARK BAY
Shire of Shark Bay | 31 March 2020 Final Report Page 16
5652_01_R
09v02.d
ocx
FIGURE 2-2 STUDY AREA SECTIONS
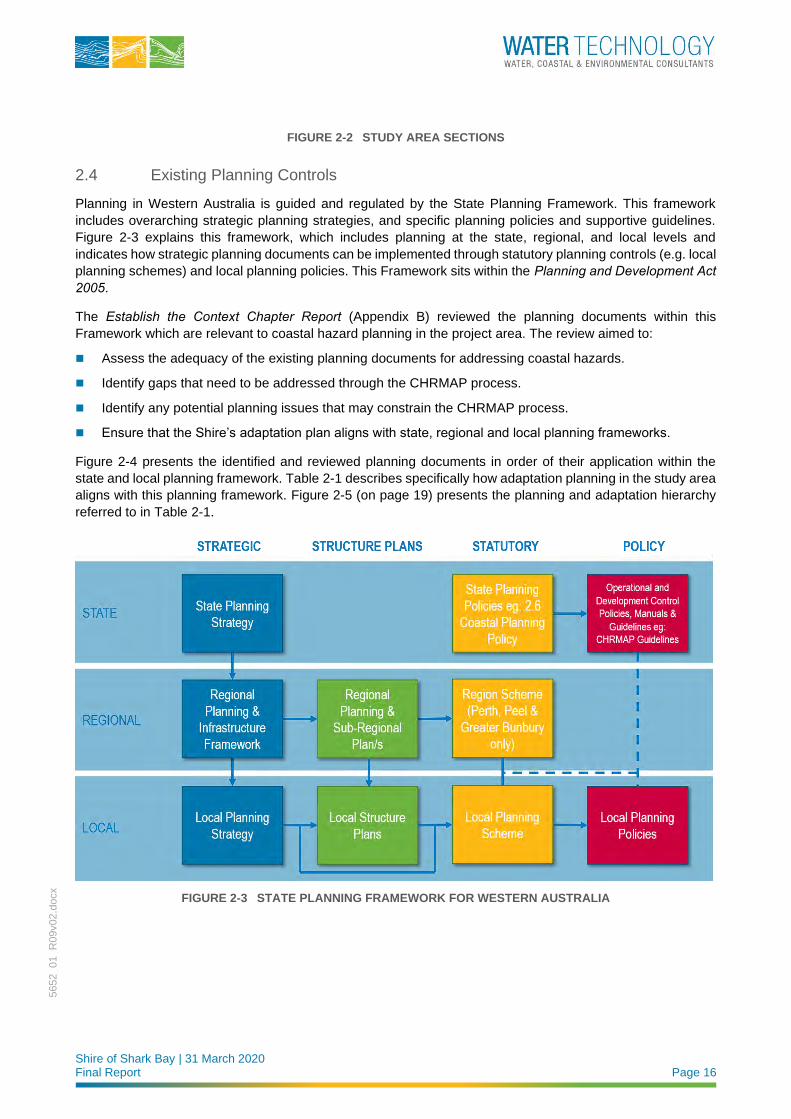
2.4 Existing Planning Controls
Planning in Western Australia is guided and regulated by the State Planning Framework. This framework
includes overarching strategic planning strategies, and specific planning policies and supportive guidelines.
Figure 2-3 explains this framework, which includes planning at the state, regional, and local levels and
indicates how strategic planning documents can be implemented through statutory planning controls (e.g. local
planning schemes) and local planning policies. This Framework sits within the Planning and Development Act 2005.
The Establish the Context Chapter Report (Appendix B) reviewed the planning documents within this
Framework which are relevant to coastal hazard planning in the project area. The review aimed to:
◼ Assess the adequacy of the existing planning documents for addressing coastal hazards.
◼ Identify gaps that need to be addressed through the CHRMAP process.
◼ Identify any potential planning issues that may constrain the CHRMAP process.
◼ Ensure that the Shire’s adaptation plan aligns with state, regional and local planning frameworks.
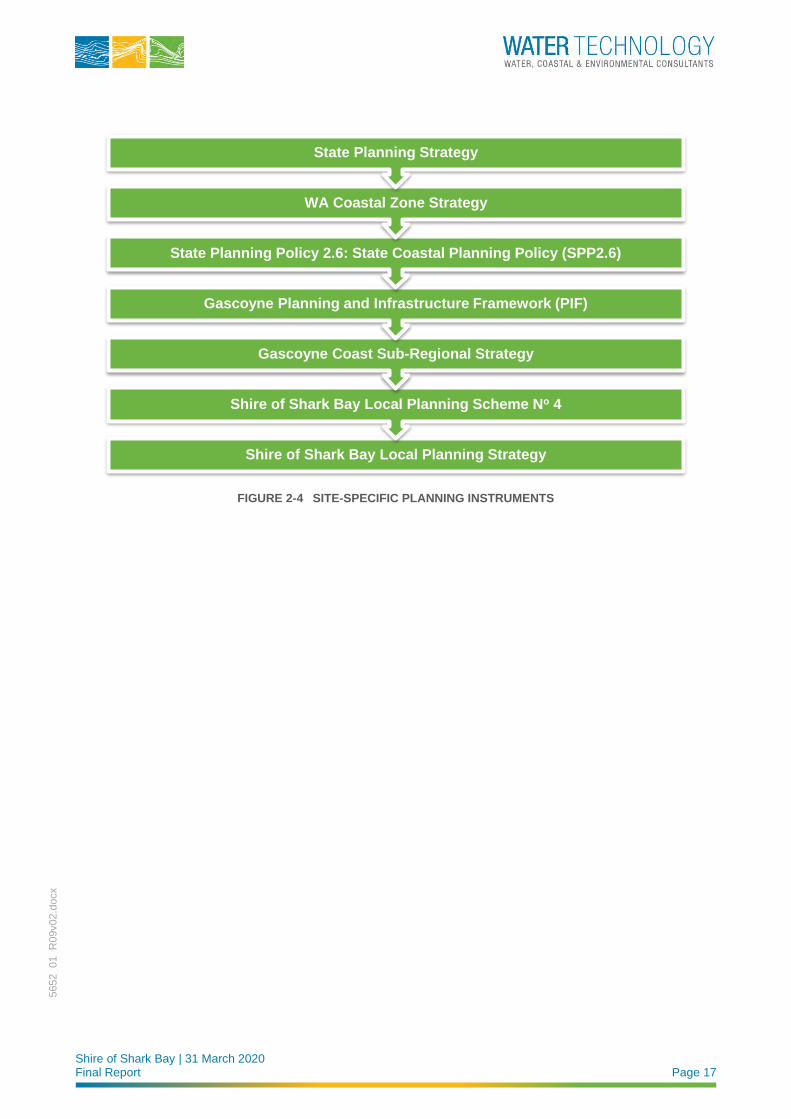
Figure 2-4 presents the identified and reviewed planning documents in order of their application within the
state and local planning framework. Table 2-1 describes specifically how adaptation planning in the study area
aligns with this planning framework. Figure 2-5 (on page 19) presents the planning and adaptation hierarchy
referred to in Table 2-1.
FIGURE 2-3 STATE PLANNING FRAMEWORK FOR WESTERN AUSTRALIA
Shire of Shark Bay | 31 March 2020 Final Report Page 17
5652_01_R
09v02.d
ocx
FIGURE 2-4 SITE-SPECIFIC PLANNING INSTRUMENTS
Shire of Shark Bay Local Planning Strategy
Shire of Shark Bay Local Planning Scheme No 4
Gascoyne Coast Sub-Regional Strategy
Gascoyne Planning and Infrastructure Framework (PIF)
State Planning Policy 2.6: State Coastal Planning Policy (SPP2.6)
WA Coastal Zone Strategy
State Planning Strategy
Shire of Shark Bay | 31 March 2020 Final Report Page 18
5652_01_R
09v02.d
ocx
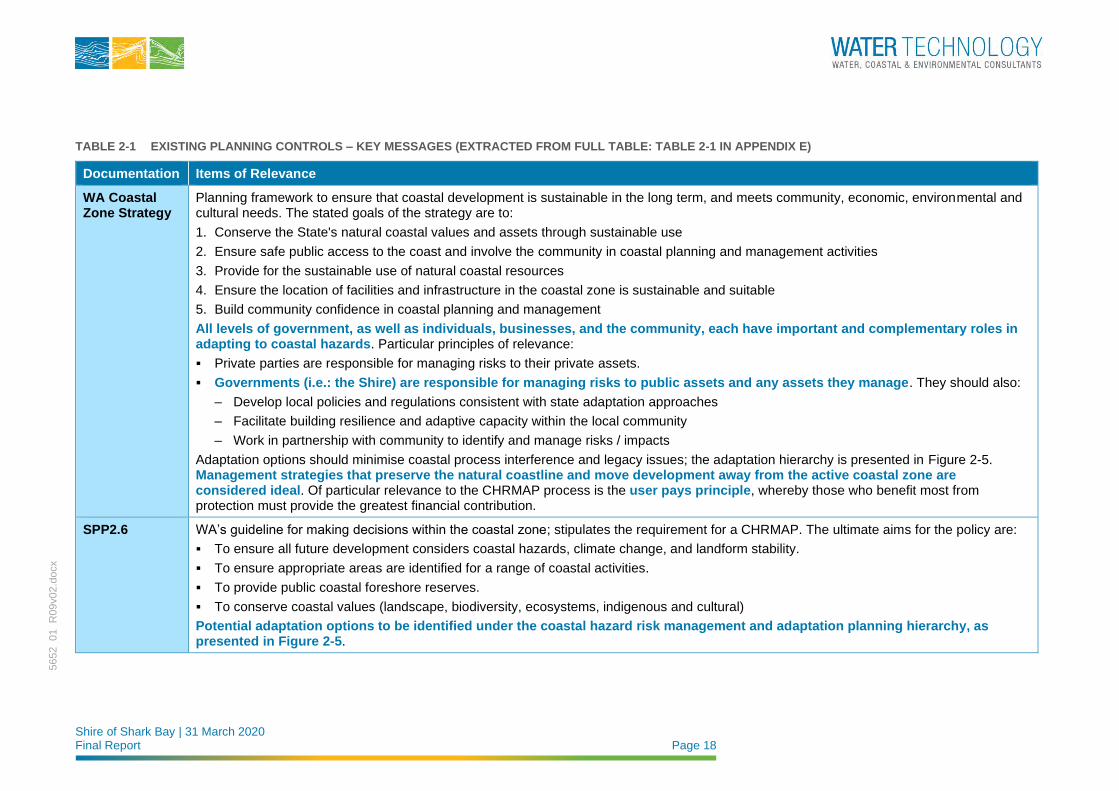
TABLE 2-1 EXISTING PLANNING CONTROLS – KEY MESSAGES (EXTRACTED FROM FULL TABLE: TABLE 2-1 IN APPENDIX E)
Documentation Items of Relevance
WA Coastal Zone Strategy
Planning framework to ensure that coastal development is sustainable in the long term, and meets community, economic, environmental and cultural needs. The stated goals of the strategy are to:
1. Conserve the State's natural coastal values and assets through sustainable use
2. Ensure safe public access to the coast and involve the community in coastal planning and management activities
3. Provide for the sustainable use of natural coastal resources
4. Ensure the location of facilities and infrastructure in the coastal zone is sustainable and suitable
5. Build community confidence in coastal planning and management
All levels of government, as well as individuals, businesses, and the community, each have important and complementary roles in adapting to coastal hazards. Particular principles of relevance:
▪ Private parties are responsible for managing risks to their private assets.
▪ Governments (i.e.: the Shire) are responsible for managing risks to public assets and any assets they manage. They should also:
– Develop local policies and regulations consistent with state adaptation approaches
– Facilitate building resilience and adaptive capacity within the local community
– Work in partnership with community to identify and manage risks / impacts
Adaptation options should minimise coastal process interference and legacy issues; the adaptation hierarchy is presented in Figure 2-5. Management strategies that preserve the natural coastline and move development away from the active coastal zone are considered ideal. Of particular relevance to the CHRMAP process is the user pays principle, whereby those who benefit most from protection must provide the greatest financial contribution.
SPP2.6 WA’s guideline for making decisions within the coastal zone; stipulates the requirement for a CHRMAP. The ultimate aims for the policy are:
▪ To ensure all future development considers coastal hazards, climate change, and landform stability.
▪ To ensure appropriate areas are identified for a range of coastal activities.
▪ To provide public coastal foreshore reserves.
▪ To conserve coastal values (landscape, biodiversity, ecosystems, indigenous and cultural)
Potential adaptation options to be identified under the coastal hazard risk management and adaptation planning hierarchy, as presented in Figure 2-5.
Shire of Shark Bay | 31 March 2020 Final Report Page 19
5652_01_R
09v02.d
ocx
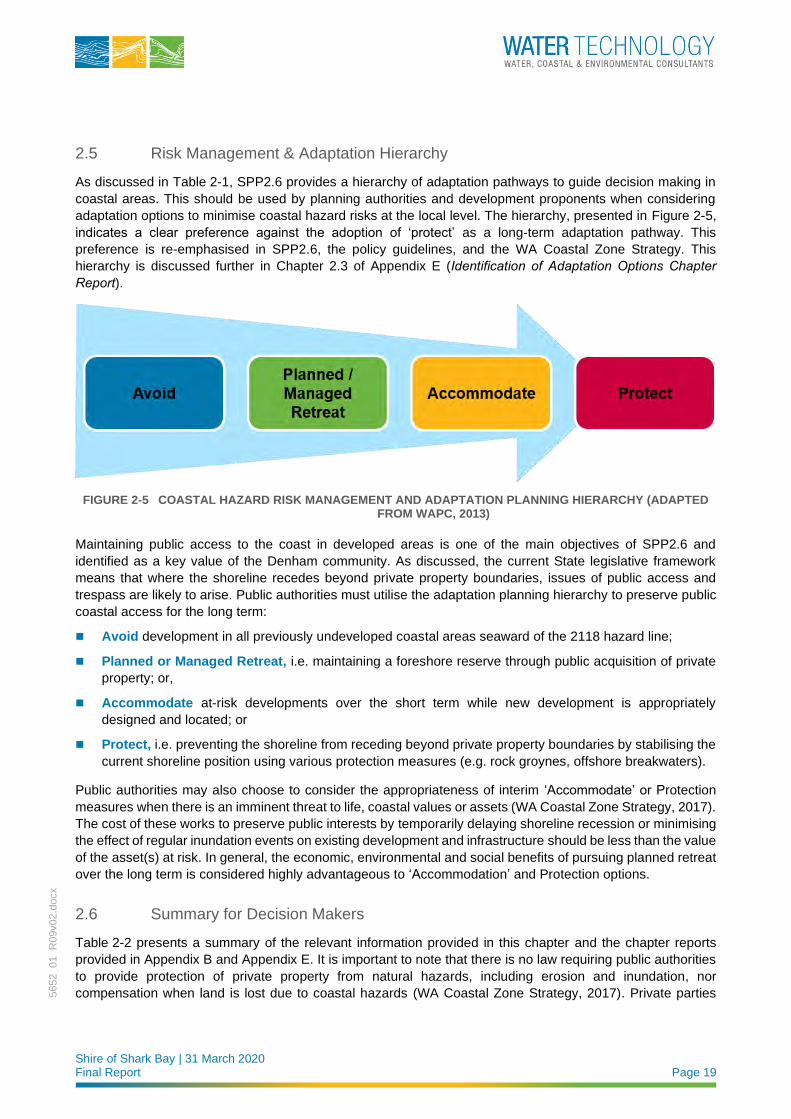
2.5 Risk Management & Adaptation Hierarchy
As discussed in Table 2-1, SPP2.6 provides a hierarchy of adaptation pathways to guide decision making in
coastal areas. This should be used by planning authorities and development proponents when considering
adaptation options to minimise coastal hazard risks at the local level. The hierarchy, presented in Figure 2-5,
indicates a clear preference against the adoption of ‘protect’ as a long-term adaptation pathway. This
preference is re-emphasised in SPP2.6, the policy guidelines, and the WA Coastal Zone Strategy. This
hierarchy is discussed further in Chapter 2.3 of Appendix E (Identification of Adaptation Options Chapter Report).
FIGURE 2-5 COASTAL HAZARD RISK MANAGEMENT AND ADAPTATION PLANNING HIERARCHY (ADAPTED FROM WAPC, 2013)
Maintaining public access to the coast in developed areas is one of the main objectives of SPP2.6 and
identified as a key value of the Denham community. As discussed, the current State legislative framework
means that where the shoreline recedes beyond private property boundaries, issues of public access and
trespass are likely to arise. Public authorities must utilise the adaptation planning hierarchy to preserve public
coastal access for the long term:
◼ Avoid development in all previously undeveloped coastal areas seaward of the 2118 hazard line;
◼ Planned or Managed Retreat, i.e. maintaining a foreshore reserve through public acquisition of private
property; or,
◼ Accommodate at-risk developments over the short term while new development is appropriately
designed and located; or
◼ Protect, i.e. preventing the shoreline from receding beyond private property boundaries by stabilising the
current shoreline position using various protection measures (e.g. rock groynes, offshore breakwaters).
Public authorities may also choose to consider the appropriateness of interim ‘Accommodate’ or Protection
measures when there is an imminent threat to life, coastal values or assets (WA Coastal Zone Strategy, 2017).
The cost of these works to preserve public interests by temporarily delaying shoreline recession or minimising
the effect of regular inundation events on existing development and infrastructure should be less than the value
of the asset(s) at risk. In general, the economic, environmental and social benefits of pursuing planned retreat
over the long term is considered highly advantageous to ‘Accommodation’ and Protection options.
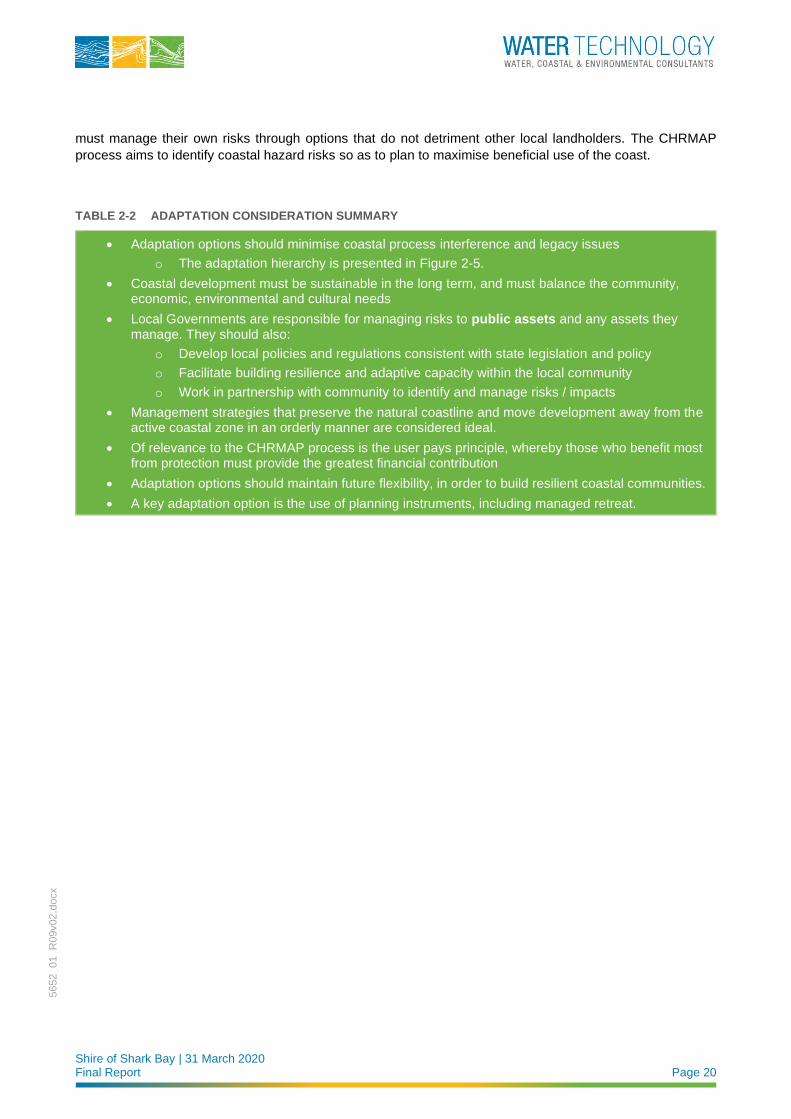
2.6 Summary for Decision Makers
Table 2-2 presents a summary of the relevant information provided in this chapter and the chapter reports
provided in Appendix B and Appendix E. It is important to note that there is no law requiring public authorities
to provide protection of private property from natural hazards, including erosion and inundation, nor
compensation when land is lost due to coastal hazards (WA Coastal Zone Strategy, 2017). Private parties
Shire of Shark Bay | 31 March 2020 Final Report Page 20
5652_01_R
09v02.d
ocx
must manage their own risks through options that do not detriment other local landholders. The CHRMAP
process aims to identify coastal hazard risks so as to plan to maximise beneficial use of the coast.
TABLE 2-2 ADAPTATION CONSIDERATION SUMMARY
• Adaptation options should minimise coastal process interference and legacy issues
o The adaptation hierarchy is presented in Figure 2-5.
• Coastal development must be sustainable in the long term, and must balance the community, economic, environmental and cultural needs
• Local Governments are responsible for managing risks to public assets and any assets they manage. They should also:
o Develop local policies and regulations consistent with state legislation and policy
o Facilitate building resilience and adaptive capacity within the local community
o Work in partnership with community to identify and manage risks / impacts
• Management strategies that preserve the natural coastline and move development away from the active coastal zone in an orderly manner are considered ideal.
• Of relevance to the CHRMAP process is the user pays principle, whereby those who benefit most from protection must provide the greatest financial contribution
• Adaptation options should maintain future flexibility, in order to build resilient coastal communities.
• A key adaptation option is the use of planning instruments, including managed retreat.
Shire of Shark Bay | 31 March 2020 Final Report Page 21
5652_01_R
09v02.d
ocx
3 COMMUNITY ENGAGEMENT
3.1 Engagement Process
The Stakeholder and Community Engagement Plan (Appendix A) aimed to engage all relevant stakeholders
to provide them with ownership of the CHRMAP and acceptance of its outcomes. The objectives of the strategy
were as follows:
◼ Consult with stakeholders and the community on climate change and its impacts in the coastal zone within
the Denham Townsite:
◼ What does this mean for the community?
◼ How can we adapt?
◼ Generate the success criteria for the risk assessment component of the CHRMAP. Success criteria
represent stakeholders’ tolerance and acceptability of the impact to assets from the identified coastal
hazards.
◼ Aid in the selection of site-specific adaptation measures. Stakeholders on the ground are likely to have a
knowledge of the site developed over years of interaction. This provides invaluable information that can
be applied to generate innovative adaptation measures.
The success criteria were developed as part of the community values assessment workshop, described in the
Establish the Context Chapter Report (Appendix B). The finalised success criteria are presented in Table 3-1.
These criteria were used to guide the identification of adaptation options. To assist with a review of the
adaptation options identification and assessment process, the engagement strategy (Appendix A) utilised a
second community workshop and an online survey. Community views on the initial outcomes of the adaptation
planning as well as comments on the implementation plan direction were collated.
The final component of community and stakeholder engagement for this CHRMAP was the release and
advertisement of this final report in its draft version. The Shire uploaded the Draft Final CHRMAP to the Shire’s
website on December 9th, 2019. Submissions from the public were welcomed from then until the 5th February
inclusive. Submissions received during this time are summarised and responded to in Appendix G.
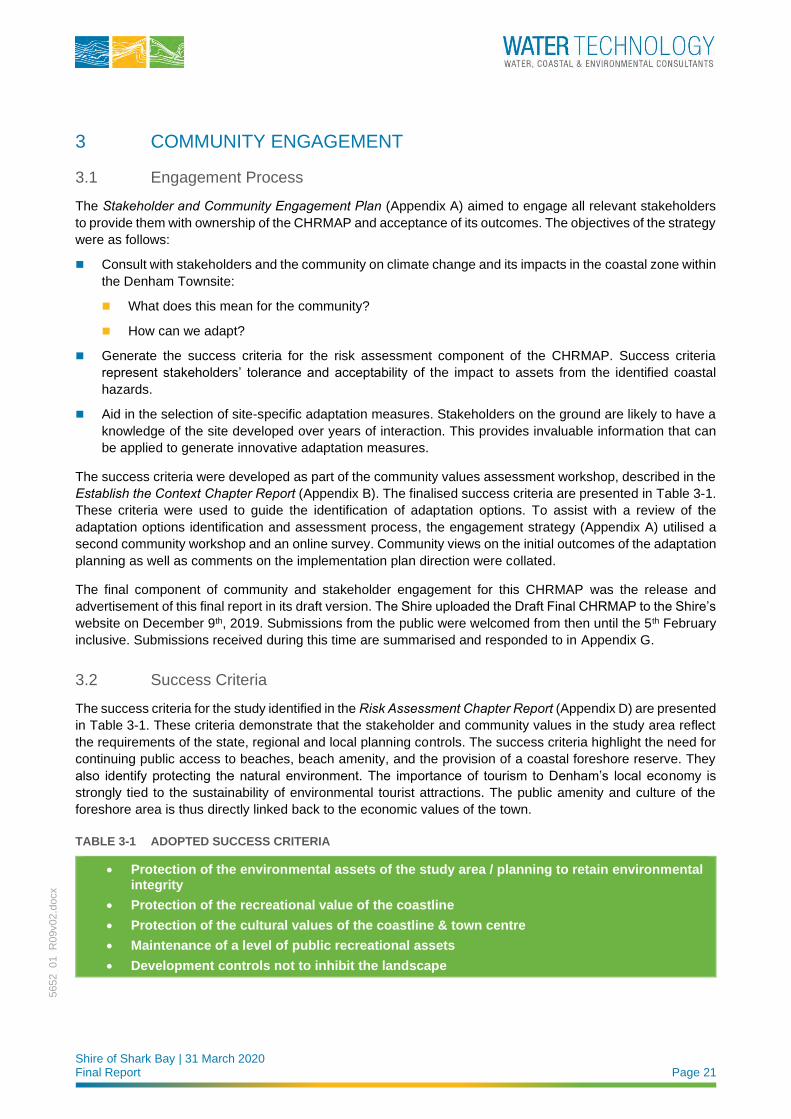
3.2 Success Criteria
The success criteria for the study identified in the Risk Assessment Chapter Report (Appendix D) are presented
in Table 3-1. These criteria demonstrate that the stakeholder and community values in the study area reflect
the requirements of the state, regional and local planning controls. The success criteria highlight the need for
continuing public access to beaches, beach amenity, and the provision of a coastal foreshore reserve. They
also identify protecting the natural environment. The importance of tourism to Denham’s local economy is
strongly tied to the sustainability of environmental tourist attractions. The public amenity and culture of the
foreshore area is thus directly linked back to the economic values of the town.
TABLE 3-1 ADOPTED SUCCESS CRITERIA
• Protection of the environmental assets of the study area / planning to retain environmental integrity
• Protection of the recreational value of the coastline
• Protection of the cultural values of the coastline & town centre
• Maintenance of a level of public recreational assets
• Development controls not to inhibit the landscape
Shire of Shark Bay | 31 March 2020 Final Report Page 22
5652_01_R
09v02.d
ocx
4 COASTAL HAZARD IDENTIFICATION
4.1 Hazard Assessment Approach
4.1.1 Coastal Foreshore Reserve
SPP2.6 provides guidance on the planning principles and guidelines required for coastal development in
Western Australia. A key policy objective of SPP2.6 is the provision of a coastal foreshore reserve. The coastal
foreshore reserve is essentially a public ‘space’ between the ocean and coastal development. It
accommodates a range of functions and values such as geomorphological integrity, biodiversity, heritage,
public ownership and access.
Schedule One of SPP2.6 provides guidance for calculating the extent of the coastal foreshore reserve in terms
of the physical processes alone. This reserve allows for coastal processes including present day erosion,
historical shoreline movement, sea-level rise and storm surge inundation. However, as per the above, the
coastal foreshore reserve should be determined on a case by case basis and include allowance for additional
functions provided by the coastal foreshore associated with environmental, social and indigenous values. The
primary aim of establishing coastal foreshore reserves is to ensure the values, functions and uses prescribed
for coastal foreshore reserves will be available at the end of the 100-year planning timeframe.
The component of the coastal foreshore reserve to allow for coastal processes should be sufficient to mitigate
the risks of coastal hazards by allowing for landform stability, natural variability and climate change. The
coastal foreshore reserve is a critical input into the coastal hazard risk management and adaptation planning
framework outlined in SPP2.6. The assessment considers allowances for coastal erosion and storm surge
inundation in parallel. It should be emphasised that this reserve is a designated area that may be vulnerable
to coastal processes over the next 100 years, not a prediction of the future shoreline.
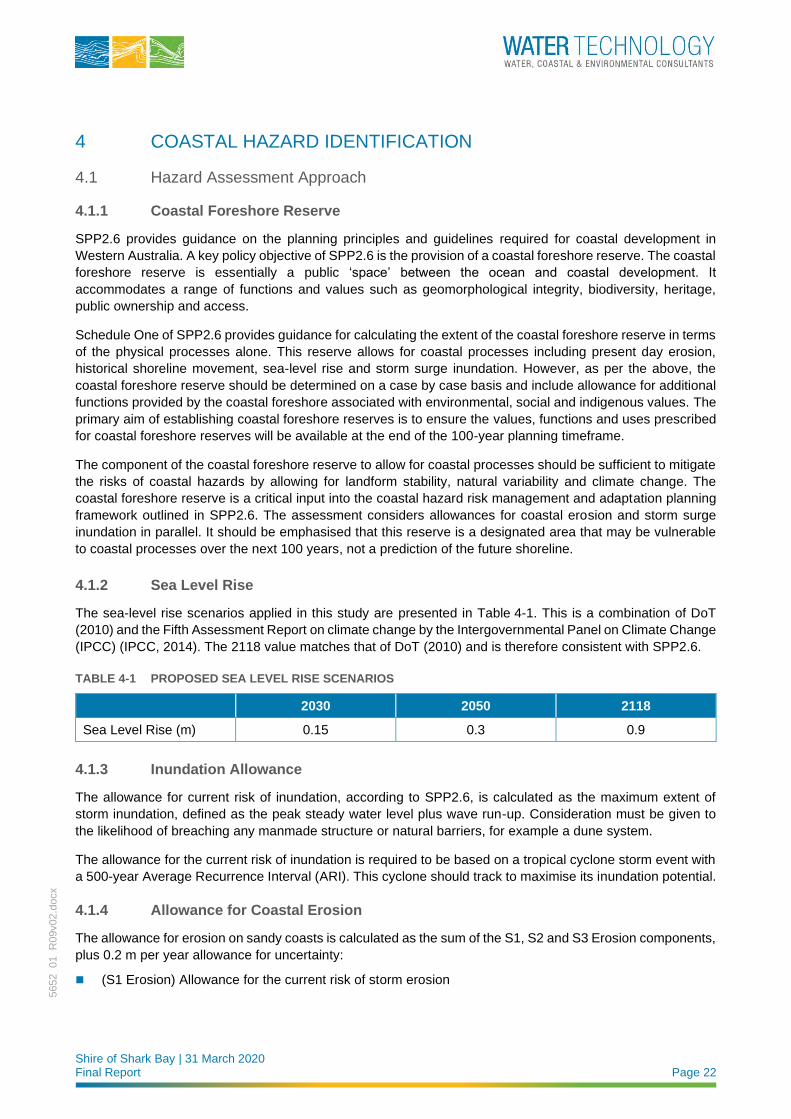
4.1.2 Sea Level Rise
The sea-level rise scenarios applied in this study are presented in Table 4-1. This is a combination of DoT
(2010) and the Fifth Assessment Report on climate change by the Intergovernmental Panel on Climate Change
(IPCC) (IPCC, 2014). The 2118 value matches that of DoT (2010) and is therefore consistent with SPP2.6.
TABLE 4-1 PROPOSED SEA LEVEL RISE SCENARIOS
2030 2050 2118
Sea Level Rise (m) 0.15 0.3 0.9
4.1.3 Inundation Allowance
The allowance for current risk of inundation, according to SPP2.6, is calculated as the maximum extent of
storm inundation, defined as the peak steady water level plus wave run-up. Consideration must be given to
the likelihood of breaching any manmade structure or natural barriers, for example a dune system.
The allowance for the current risk of inundation is required to be based on a tropical cyclone storm event with
a 500-year Average Recurrence Interval (ARI). This cyclone should track to maximise its inundation potential.
4.1.4 Allowance for Coastal Erosion
The allowance for erosion on sandy coasts is calculated as the sum of the S1, S2 and S3 Erosion components,
plus 0.2 m per year allowance for uncertainty:
◼ (S1 Erosion) Allowance for the current risk of storm erosion
Shire of Shark Bay | 31 March 2020 Final Report Page 23
5652_01_R
09v02.d
ocx
◼ (S2 Erosion) Allowance for historic shoreline movement trends
◼ (S3 Erosion) Allowance for erosion caused by future sea level rise
The coastal processes allowance is applied from a horizontal shoreline datum (HSD), defined as the active
limit of the shoreline under storm activity. The Denham townsite is located in an area prone to tropical cyclones.
SPP2.6 stipulates that a cyclone event corresponding to the 100-year ARI event should be selected to assess
the erosion due to an extreme storm event, tracking to maximise its erosion and inundation potential.
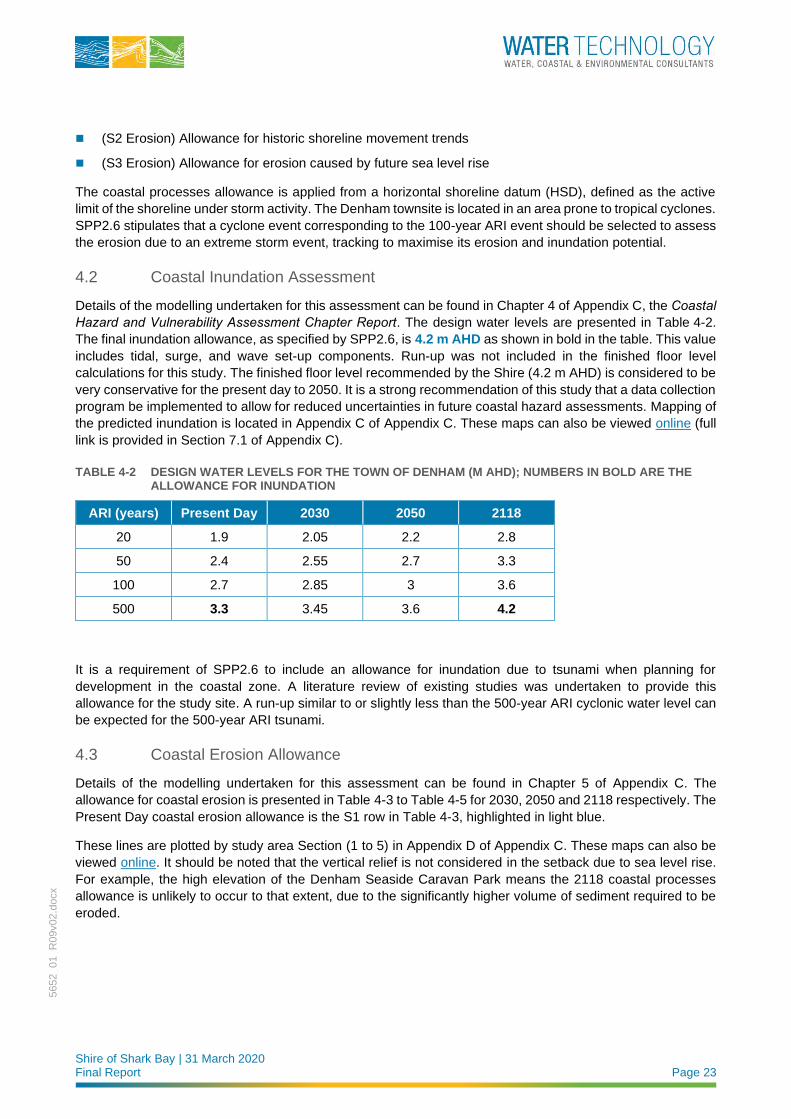
4.2 Coastal Inundation Assessment
Details of the modelling undertaken for this assessment can be found in Chapter 4 of Appendix C, the Coastal Hazard and Vulnerability Assessment Chapter Report. The design water levels are presented in Table 4-2.
The final inundation allowance, as specified by SPP2.6, is 4.2 m AHD as shown in bold in the table. This value
includes tidal, surge, and wave set-up components. Run-up was not included in the finished floor level
calculations for this study. The finished floor level recommended by the Shire (4.2 m AHD) is considered to be
very conservative for the present day to 2050. It is a strong recommendation of this study that a data collection
program be implemented to allow for reduced uncertainties in future coastal hazard assessments. Mapping of
the predicted inundation is located in Appendix C of Appendix C. These maps can also be viewed online (full
link is provided in Section 7.1 of Appendix C).
TABLE 4-2 DESIGN WATER LEVELS FOR THE TOWN OF DENHAM (M AHD); NUMBERS IN BOLD ARE THE ALLOWANCE FOR INUNDATION
ARI (years) Present Day 2030 2050 2118
20 1.9 2.05 2.2 2.8
50 2.4 2.55 2.7 3.3
100 2.7 2.85 3 3.6
500 3.3 3.45 3.6 4.2
It is a requirement of SPP2.6 to include an allowance for inundation due to tsunami when planning for
development in the coastal zone. A literature review of existing studies was undertaken to provide this
allowance for the study site. A run-up similar to or slightly less than the 500-year ARI cyclonic water level can
be expected for the 500-year ARI tsunami.
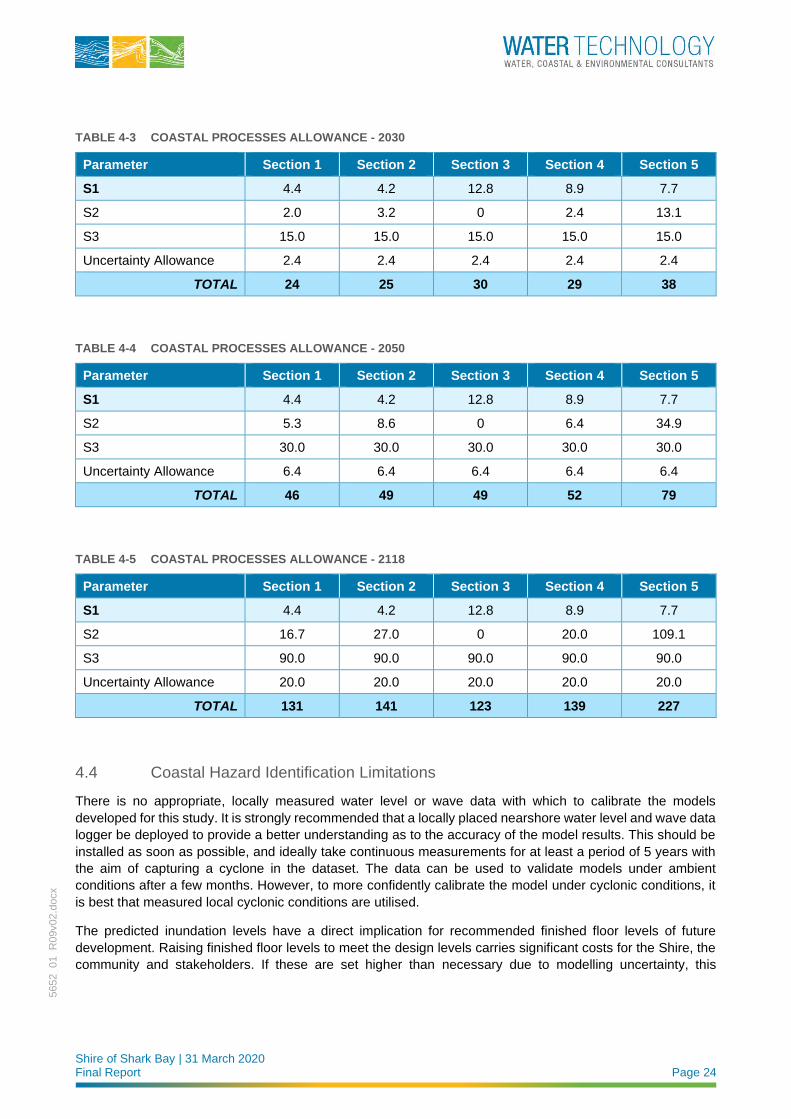
4.3 Coastal Erosion Allowance
Details of the modelling undertaken for this assessment can be found in Chapter 5 of Appendix C. The
allowance for coastal erosion is presented in Table 4-3 to Table 4-5 for 2030, 2050 and 2118 respectively. The
Present Day coastal erosion allowance is the S1 row in Table 4-3, highlighted in light blue.
These lines are plotted by study area Section (1 to 5) in Appendix D of Appendix C. These maps can also be
viewed online. It should be noted that the vertical relief is not considered in the setback due to sea level rise.
For example, the high elevation of the Denham Seaside Caravan Park means the 2118 coastal processes
allowance is unlikely to occur to that extent, due to the significantly higher volume of sediment required to be
eroded.
Shire of Shark Bay | 31 March 2020 Final Report Page 24
5652_01_R
09v02.d
ocx
TABLE 4-3 COASTAL PROCESSES ALLOWANCE - 2030
Parameter Section 1 Section 2 Section 3 Section 4 Section 5
S1 4.4 4.2 12.8 8.9 7.7
S2 2.0 3.2 0 2.4 13.1
S3 15.0 15.0 15.0 15.0 15.0
Uncertainty Allowance 2.4 2.4 2.4 2.4 2.4
TOTAL 24 25 30 29 38
TABLE 4-4 COASTAL PROCESSES ALLOWANCE - 2050
Parameter Section 1 Section 2 Section 3 Section 4 Section 5
S1 4.4 4.2 12.8 8.9 7.7
S2 5.3 8.6 0 6.4 34.9
S3 30.0 30.0 30.0 30.0 30.0
Uncertainty Allowance 6.4 6.4 6.4 6.4 6.4
TOTAL 46 49 49 52 79
TABLE 4-5 COASTAL PROCESSES ALLOWANCE - 2118
Parameter Section 1 Section 2 Section 3 Section 4 Section 5
S1 4.4 4.2 12.8 8.9 7.7
S2 16.7 27.0 0 20.0 109.1
S3 90.0 90.0 90.0 90.0 90.0
Uncertainty Allowance 20.0 20.0 20.0 20.0 20.0
TOTAL 131 141 123 139 227
4.4 Coastal Hazard Identification Limitations
There is no appropriate, locally measured water level or wave data with which to calibrate the models
developed for this study. It is strongly recommended that a locally placed nearshore water level and wave data
logger be deployed to provide a better understanding as to the accuracy of the model results. This should be
installed as soon as possible, and ideally take continuous measurements for at least a period of 5 years with
the aim of capturing a cyclone in the dataset. The data can be used to validate models under ambient
conditions after a few months. However, to more confidently calibrate the model under cyclonic conditions, it
is best that measured local cyclonic conditions are utilised.
The predicted inundation levels have a direct implication for recommended finished floor levels of future
development. Raising finished floor levels to meet the design levels carries significant costs for the Shire, the
community and stakeholders. If these are set higher than necessary due to modelling uncertainty, this
Shire of Shark Bay | 31 March 2020 Final Report Page 25
5652_01_R
09v02.d
ocx
represents costs the Shire and community could be spending elsewhere. Similarly, if these levels are set too
low, this poses a significant risk to housing and infrastructure.
It is understood discussions regarding the instalment of such a device are already underway between the Shire
and DoT.
This limitation, as well as others pertaining to inaccuracies in the coastal processes allowance are addressed
in the recommended adaptation implementation and monitoring actions in Section 8 of this report.
Shire of Shark Bay | 31 March 2020 Final Report Page 26
5652_01_R
09v02.d
ocx
5 RISK ASSESSMENT
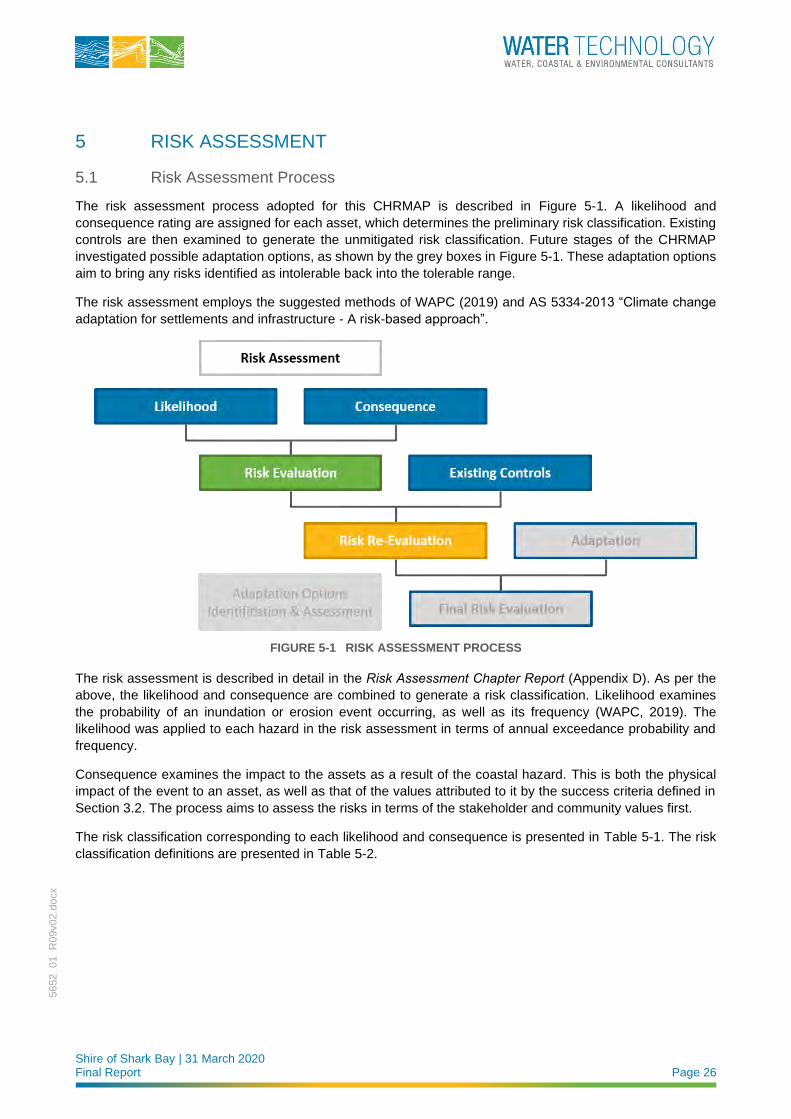
5.1 Risk Assessment Process
The risk assessment process adopted for this CHRMAP is described in Figure 5-1. A likelihood and
consequence rating are assigned for each asset, which determines the preliminary risk classification. Existing
controls are then examined to generate the unmitigated risk classification. Future stages of the CHRMAP
investigated possible adaptation options, as shown by the grey boxes in Figure 5-1. These adaptation options
aim to bring any risks identified as intolerable back into the tolerable range.
The risk assessment employs the suggested methods of WAPC (2019) and AS 5334-2013 “Climate change
adaptation for settlements and infrastructure - A risk-based approach”.
FIGURE 5-1 RISK ASSESSMENT PROCESS
The risk assessment is described in detail in the Risk Assessment Chapter Report (Appendix D). As per the
above, the likelihood and consequence are combined to generate a risk classification. Likelihood examines
the probability of an inundation or erosion event occurring, as well as its frequency (WAPC, 2019). The
likelihood was applied to each hazard in the risk assessment in terms of annual exceedance probability and
frequency.
Consequence examines the impact to the assets as a result of the coastal hazard. This is both the physical
impact of the event to an asset, as well as that of the values attributed to it by the success criteria defined in
Section 3.2. The process aims to assess the risks in terms of the stakeholder and community values first.
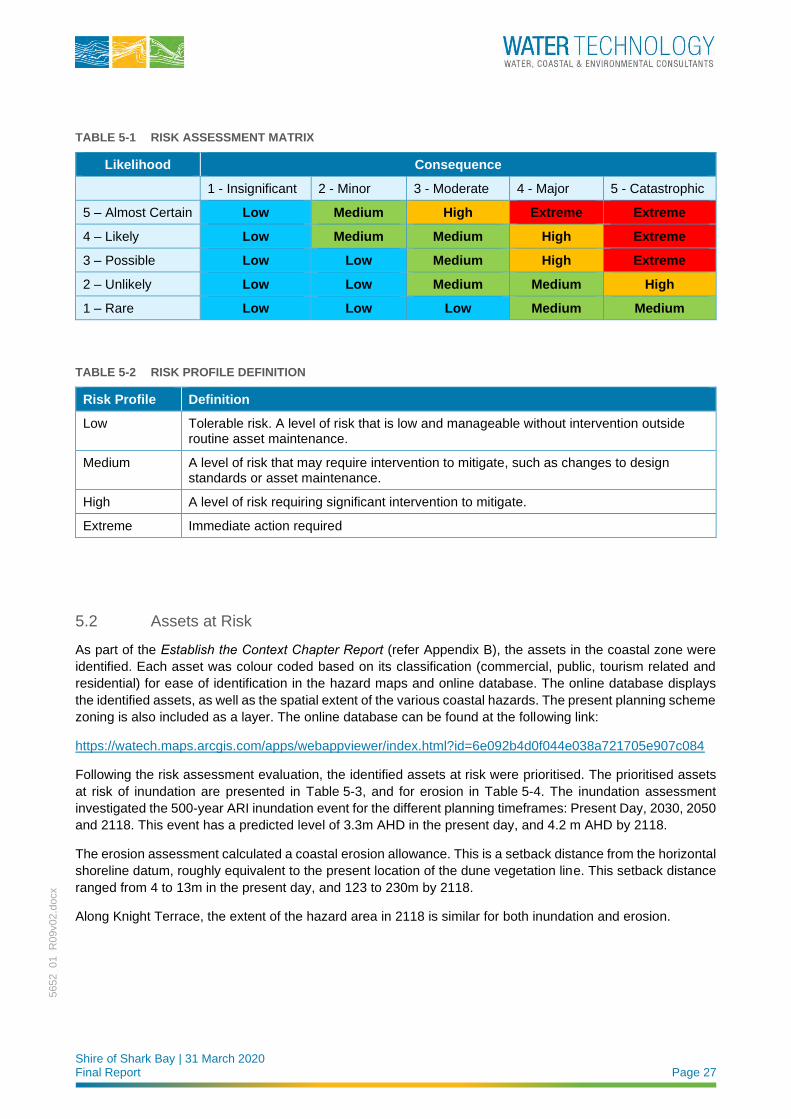
The risk classification corresponding to each likelihood and consequence is presented in Table 5-1. The risk
classification definitions are presented in Table 5-2.
Shire of Shark Bay | 31 March 2020 Final Report Page 27
5652_01_R
09v02.d
ocx
TABLE 5-1 RISK ASSESSMENT MATRIX
Likelihood Consequence
1 - Insignificant 2 - Minor 3 - Moderate 4 - Major 5 - Catastrophic
5 – Almost Certain Low Medium High Extreme Extreme
4 – Likely Low Medium Medium High Extreme
3 – Possible Low Low Medium High Extreme
2 – Unlikely Low Low Medium Medium High
1 – Rare Low Low Low Medium Medium
TABLE 5-2 RISK PROFILE DEFINITION
Risk Profile Definition
Low Tolerable risk. A level of risk that is low and manageable without intervention outside routine asset maintenance.
Medium A level of risk that may require intervention to mitigate, such as changes to design standards or asset maintenance.
High A level of risk requiring significant intervention to mitigate.
Extreme Immediate action required
5.2 Assets at Risk
As part of the Establish the Context Chapter Report (refer Appendix B), the assets in the coastal zone were
identified. Each asset was colour coded based on its classification (commercial, public, tourism related and
residential) for ease of identification in the hazard maps and online database. The online database displays
the identified assets, as well as the spatial extent of the various coastal hazards. The present planning scheme
zoning is also included as a layer. The online database can be found at the following link:
https://watech.maps.arcgis.com/apps/webappviewer/index.html?id=6e092b4d0f044e038a721705e907c084
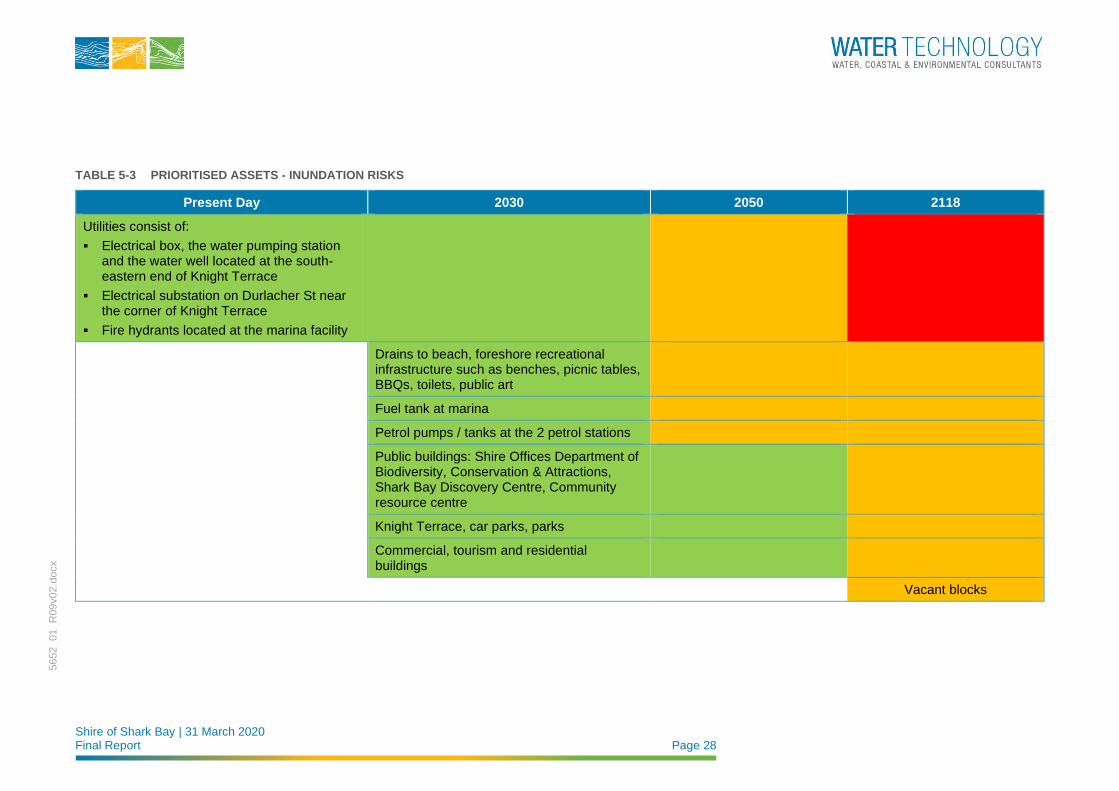
Following the risk assessment evaluation, the identified assets at risk were prioritised. The prioritised assets
at risk of inundation are presented in Table 5-3, and for erosion in Table 5-4. The inundation assessment
investigated the 500-year ARI inundation event for the different planning timeframes: Present Day, 2030, 2050
and 2118. This event has a predicted level of 3.3m AHD in the present day, and 4.2 m AHD by 2118.
The erosion assessment calculated a coastal erosion allowance. This is a setback distance from the horizontal
shoreline datum, roughly equivalent to the present location of the dune vegetation line. This setback distance
ranged from 4 to 13m in the present day, and 123 to 230m by 2118.
Along Knight Terrace, the extent of the hazard area in 2118 is similar for both inundation and erosion.
Shire of Shark Bay | 31 March 2020 Final Report Page 28
5652_01_R
09v02.d
ocx
TABLE 5-3 PRIORITISED ASSETS - INUNDATION RISKS
Present Day 2030 2050 2118
Utilities consist of:
▪ Electrical box, the water pumping station and the water well located at the south-eastern end of Knight Terrace
▪ Electrical substation on Durlacher St near the corner of Knight Terrace
▪ Fire hydrants located at the marina facility
Drains to beach, foreshore recreational infrastructure such as benches, picnic tables, BBQs, toilets, public art
Fuel tank at marina
Petrol pumps / tanks at the 2 petrol stations
Public buildings: Shire Offices Department of Biodiversity, Conservation & Attractions, Shark Bay Discovery Centre, Community resource centre
Knight Terrace, car parks, parks
Commercial, tourism and residential buildings
Vacant blocks

Shire of Shark Bay | 31 March 2020 Final Report Page 29
5652_01_R
09v02.d
ocx
TABLE 5-4 PRIORITISED ASSETS - EROSION RISKS
Present Day 2030 2050 2118
Adhoc seawall
Utilities:
▪ Fire hydrants located at the marina facility
Utilities:
▪ Electrical box and water pumping station located at south-eastern end of Knight Terrace
▪ Fire hydrants located at the marina facility
Utilities:
▪ Electrical box and water pumping station located at south-eastern end of Knight Terrace
▪ Fire hydrants located at the marina facility
▪ Electrical substation on Durlacher St near the corner of Knight Terrace
Foreshore recreational infrastructure: BBQs, toilets, fish cleaning station
Foreshore recreational infrastructure: BBQs, public toilets
Foreshore recreational infrastructure: BBQs, public toilets, fish cleaning station
Knight Terrace Knight Terrace & Stella Rowley Drive
Fuel tank at marina
Public buildings: Shire Offices Public buildings: Shire Offices, Department of Biodiversity, Conservation & Attractions, Shark Bay Discovery Centre, Community resource centre
Commercial, tourism and residential buildings
Petrol pumps / tanks at the 2 petrol stations
Vacant blocks
Foreshore recreational infrastructure: foreshore path, limestone retaining wall, playground, parks, car parks, drain to beach, public art, public bench, pergola
Marine infrastructure: Engineered seawall, FRP sheet-pile groyne, jetty, boat ramp, beach access
Shire of Shark Bay | 31 March 2020 Final Report Page 30
5652_01_R
09v02.d
ocx
6 ADAPTATION OPTION IDENTIFICATION
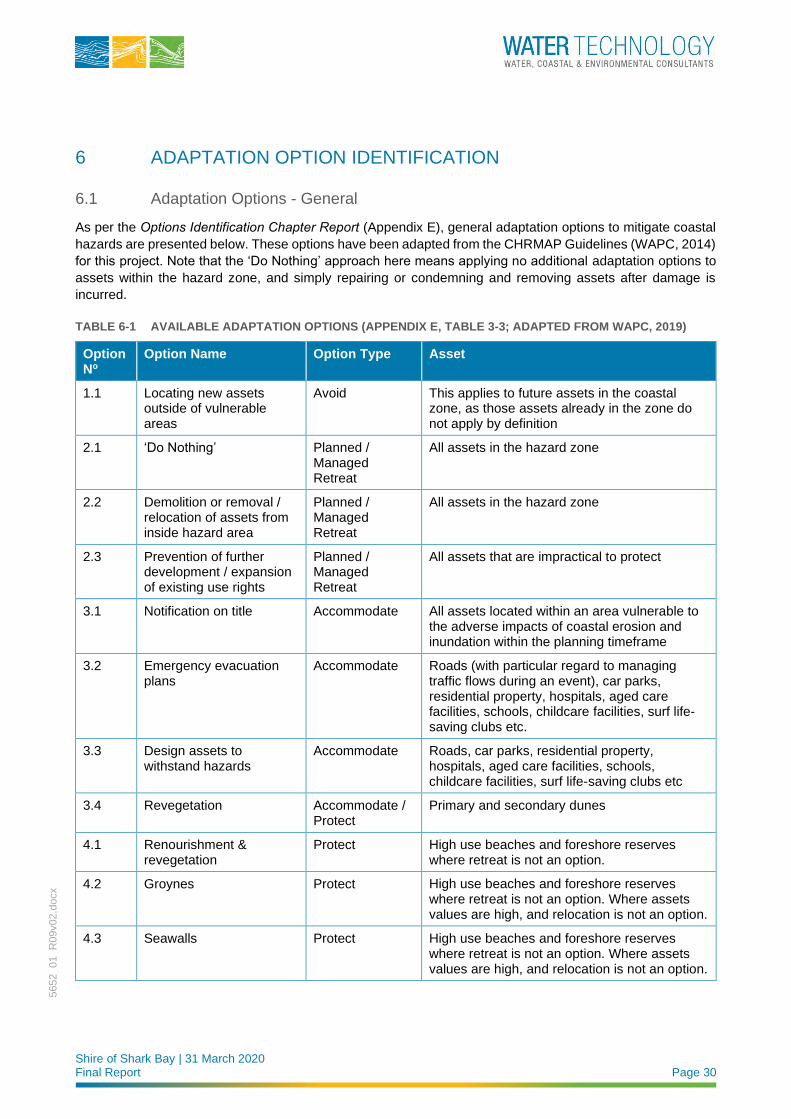
6.1 Adaptation Options - General
As per the Options Identification Chapter Report (Appendix E), general adaptation options to mitigate coastal
hazards are presented below. These options have been adapted from the CHRMAP Guidelines (WAPC, 2014)
for this project. Note that the ‘Do Nothing’ approach here means applying no additional adaptation options to
assets within the hazard zone, and simply repairing or condemning and removing assets after damage is
incurred.
TABLE 6-1 AVAILABLE ADAPTATION OPTIONS (APPENDIX E, TABLE 3-3; ADAPTED FROM WAPC, 2019)
Option No
Option Name Option Type Asset
1.1 Locating new assets outside of vulnerable areas
Avoid This applies to future assets in the coastal zone, as those assets already in the zone do not apply by definition
2.1 ‘Do Nothing’ Planned / Managed Retreat
All assets in the hazard zone
2.2 Demolition or removal / relocation of assets from inside hazard area
Planned / Managed Retreat
All assets in the hazard zone
2.3 Prevention of further development / expansion of existing use rights
Planned / Managed Retreat
All assets that are impractical to protect
3.1 Notification on title Accommodate All assets located within an area vulnerable to the adverse impacts of coastal erosion and inundation within the planning timeframe
3.2 Emergency evacuation plans
Accommodate Roads (with particular regard to managing traffic flows during an event), car parks, residential property, hospitals, aged care facilities, schools, childcare facilities, surf life-saving clubs etc.
3.3 Design assets to withstand hazards
Accommodate Roads, car parks, residential property, hospitals, aged care facilities, schools, childcare facilities, surf life-saving clubs etc
3.4 Revegetation Accommodate / Protect
Primary and secondary dunes
4.1 Renourishment & revegetation
Protect High use beaches and foreshore reserves where retreat is not an option.
4.2 Groynes Protect High use beaches and foreshore reserves where retreat is not an option. Where assets values are high, and relocation is not an option.
4.3 Seawalls Protect High use beaches and foreshore reserves where retreat is not an option. Where assets values are high, and relocation is not an option.
Shire of Shark Bay | 31 March 2020 Final Report Page 31
5652_01_R
09v02.d
ocx
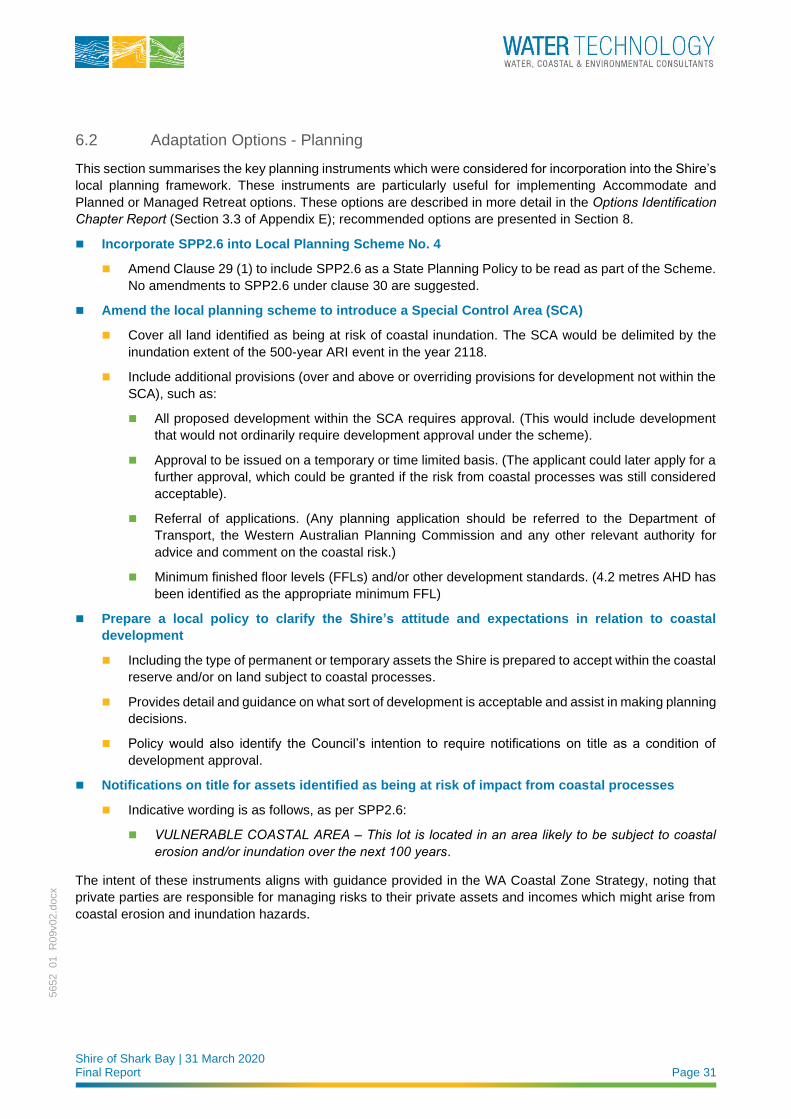
6.2 Adaptation Options - Planning
This section summarises the key planning instruments which were considered for incorporation into the Shire’s
local planning framework. These instruments are particularly useful for implementing Accommodate and
Planned or Managed Retreat options. These options are described in more detail in the Options Identification Chapter Report (Section 3.3 of Appendix E); recommended options are presented in Section 8.
◼ Incorporate SPP2.6 into Local Planning Scheme No. 4
◼ Amend Clause 29 (1) to include SPP2.6 as a State Planning Policy to be read as part of the Scheme.
No amendments to SPP2.6 under clause 30 are suggested.
◼ Amend the local planning scheme to introduce a Special Control Area (SCA)
◼ Cover all land identified as being at risk of coastal inundation. The SCA would be delimited by the
inundation extent of the 500-year ARI event in the year 2118.
◼ Include additional provisions (over and above or overriding provisions for development not within the
SCA), such as:
◼ All proposed development within the SCA requires approval. (This would include development
that would not ordinarily require development approval under the scheme).
◼ Approval to be issued on a temporary or time limited basis. (The applicant could later apply for a
further approval, which could be granted if the risk from coastal processes was still considered
acceptable).
◼ Referral of applications. (Any planning application should be referred to the Department of
Transport, the Western Australian Planning Commission and any other relevant authority for
advice and comment on the coastal risk.)
◼ Minimum finished floor levels (FFLs) and/or other development standards. (4.2 metres AHD has
been identified as the appropriate minimum FFL)
◼ Prepare a local policy to clarify the Shire’s attitude and expectations in relation to coastal
development
◼ Including the type of permanent or temporary assets the Shire is prepared to accept within the coastal
reserve and/or on land subject to coastal processes.
◼ Provides detail and guidance on what sort of development is acceptable and assist in making planning
decisions.
◼ Policy would also identify the Council’s intention to require notifications on title as a condition of
development approval.
◼ Notifications on title for assets identified as being at risk of impact from coastal processes
◼ Indicative wording is as follows, as per SPP2.6:
◼ VULNERABLE COASTAL AREA – This lot is located in an area likely to be subject to coastal erosion and/or inundation over the next 100 years.
The intent of these instruments aligns with guidance provided in the WA Coastal Zone Strategy, noting that
private parties are responsible for managing risks to their private assets and incomes which might arise from
coastal erosion and inundation hazards.
Shire of Shark Bay | 31 March 2020 Final Report Page 32
5652_01_R
09v02.d
ocx
6.2.1 Summary for Decision Makers – Identified Planning Instruments
• Amend Local Planning Scheme No. 4 Clause 29 (1) to include SPP2.6 as a State Planning Policy to be read as part of the Scheme.
• Amend the local planning scheme to introduce a Special Control Area (SCA) over all land identified as being at risk of coastal inundation.
• Prepare a local policy to clarify the Shire’s attitude and expectations in relation to coastal development including the type of permanent or temporary assets it is prepared to accept within the coastal reserve.
• All freehold land identified as being at risk of impact from coastal processes should have a notification placed on its certificate of title/s.
6.3 Adaptation Options – Inundation
As per the planning instruments, numerous adaptation options to mitigate the risks of inundation were identified
as part of the Options Identification Chapter Report (Appendix E). Options were identified over the different
planning epochs to address the changing risks. A summary of the identified options to mitigate inundation risks
is presented below. Options presented for future epochs are in addition to or add to those discussed for the
Present Day.
Economically, relocation or managed retreat options may be triggered by the physical costs of repair exceeding
the relocation costs. As per the success criteria and adaptation hierarchy, consideration should be given to the
continued allowance for a recreational reserve. This may mean relocating buildings ahead of their risk rating
in order to continue to allow this space.
6.3.1 Present Day
◼ Prevention of further development / limiting existing use rights
◼ Introduce ‘Special Control Area - Coastal Hazard’ with a requirement for new development to achieve
a minimum finished floor level of 4.2m AHD for habitable areas of buildings. Depending on the nature
of development proposed, approval may be time limited or require structures to be removed by a
specified date or when a specified trigger is reached.
◼ Introduce a local planning policy outlining the Shire’s requirements for building construction, land fill,
and other relevant matters within the Special Control Area.
◼ Incorporate SPP2.6 into Local Planning Scheme
◼ Any new assets should avoid the coastal zone.
◼ If they must be located within the coastal zone, they should be designed to withstand the inundation
hazard. For example, new buildings to be constructed with permeable lower levels (e.g. a stilt
arrangement), and services located above the flood level. This avoids the need to use fill to raise the
FFL. Fill is expensive, and also alters the flood flow, which could lead to increased hazards.
◼ Emergency evacuation plans for the affected areas
◼ It is noted that access to the town is not predicted to be blocked in the event of a hazard.
◼ Commence investigations to determine options for appropriate longer-term relocation of affected parts of
the town.
6.3.2 2030
◼ Services moved to be located above the recommended FFL
Shire of Shark Bay | 31 March 2020 Final Report Page 33
5652_01_R
09v02.d
ocx
◼ Commercial stock or important possessions stored above the flood level
◼ Installation of false (raised) floors
◼ Use of materials that are water resistant
◼ Floorplate / wall arrangements to allow flow of water (and therefore minimise damage)
◼ Building evacuation requirements
6.3.3 2050
◼ Utilities and foreshore recreational infrastructure may require significant repair. Relocation may be a viable
option by this timeframe.
◼ At this time, the drains and drainage system to the beach may need to be modified to continue to function.
The drains rely on gravity flow from the streets down to the ocean. Under increased sea levels and storm
frequency, the ability of the drains to function will be reduced as they may be more frequently inundated
from the ocean side, such that there is nowhere for the landward-side water to go.
◼ Public, commercial, tourism and residential buildings should consider mechanisms for minimising the
impact of flood damage, as per the recommendations in 2030 above.
◼ There may be some flood related damage to Knight Terrace, car parks, and grassed foreshore area
leading to increased maintenance requirements.
◼ Structure plans for relocation areas should have been completed and the Scheme Map amended as
necessary.
6.3.4 2118
◼ Utilities, foreshore recreational infrastructure, Knight Terrace, Stella Rowley Drive and the adjacent car
parking areas and drains may require significant repair or relocation.
◼ Under the 2118 predicted sea level rise, the drains may be completely inundated during a tidal cycle,
leading to the inability to drain rainwater at high tide.
◼ Public, commercial, tourism and residential buildings may need significant repairs or relocation.
◼ Flood related damage to public open space, beach access, boat ramps and marine infrastructure may
require significant repairs.
6.4 Adaptation Options - Coastal Erosion
Adaptation options with the specific aim of mitigating risks from coastal erosion were also identified for
assessment (assessed in Section 7 of this report). The identified options over all planning epochs are
presented in this section. Significantly more detail on the process of options identification is contained within
the Options Identification Chapter Report (Appendix E).
6.4.1 Adaptation Triggers (all timeframes)
These options signify when to abandon or relocate an asset.
◼ Trigger 1: Where the most landward part of the Horizontal Shoreline Datum (HSD) is within 40 metres of
the most seaward point of a development / structure / foreshore reserve area.
◼ Due to the high value placed on the foreshore coastal reserve, the recreational area would itself be
considered the asset in this case
◼ Trigger 2: Where a public road is no longer available or able to provide legal access to the property
Shire of Shark Bay | 31 March 2020 Final Report Page 34
5652_01_R
09v02.d
ocx
◼ This may occur for Knight Terrace, particularly to the east of Denham Hamelin Road. The Shire may
choose to investigate access options from the landward side of these properties.
◼ Trigger 3: When water, sewage or electricity to the lot is no longer available as they have been
removed/decommissioned by the relevant authority due to coastal hazards.
6.4.2 Present Day
◼ Formal design and construction of the adhoc seawall in Section 2 of the study area.
◼ Revegetation in the adhoc seawall’s lee with some minor renourishment to stabilise the profile, in addition
to an initial re-placement of the existing rocks into a more stable shape.
◼ Groynes were initially identified as an option but were not considered to be suitable at the site unless
multiple groynes are in place, together with significant renourishment and bypassing works. This would
require ongoing maintenance in the long term and thus constitute a ‘legacy’ adaptation option. Groynes
can also lead to unintended consequences.
◼ As per the inundation adaptation options, planning mechanisms are recommended. These are as follows:
◼ Introduce Special Control Area - Coastal Hazard with a requirement for new development to achieve
a minimum finished floor level of 4.2m AHD for habitable areas of buildings. Depending on the nature
of development proposed, approval may be time limited or require structures to be removed by a
specified date or when a specified trigger is reached.
◼ Require Notification on Title for all land located seaward of the 100-year hazard line for coastal
erosion within the next planning epoch. That is, at present, this applied to all land located seaward
of the 2030 line. This should be made a condition of any approval for development or
subdivision/amalgamation of land. The Shire should also negotiate with landholders whose land is
not subject to an application for planning approval to place such a notification on the title with their
consent.
◼ Introduce a local planning policy outlining the Shire’s requirements for building construction, land fill,
and other relevant matters within the Special Control Area.
◼ Commence investigations to determine options for appropriate longer-term relocation of affected parts of
the town.
6.4.3 2030
◼ Amend the provisions (and boundaries, if necessary) of the Special Control Area to limit development in
locations at risk of erosion.
◼ Continue to require notification on Title as a condition of planning approval and/or on a voluntary basis.
◼ Ensure that appropriately zoned land is available for relocation of the town as necessary. Structure
planning of the land may be required.
◼ Utility connected foreshore infrastructure, marina fuel tank, utilities and Knight Terrace may require
additional maintenance / repair by this timeframe.
6.4.4 2050
◼ Utilities, marina fuel tank, petrol pumps and utility connected foreshore infrastructure may require
significant repairs.
◼ Public, commercial, tourism and residential buildings may sustain damage.
◼ Knight Terrace, Stella Rowley Drive and foreshore recreational infrastructure may require additional
maintenance.
Shire of Shark Bay | 31 March 2020 Final Report Page 35
5652_01_R
09v02.d
ocx
◼ Structure plans for relocation areas should have been completed and the Scheme Map amended as
necessary.
6.4.5 2118
◼ Utilities, marina fuel tank, petrol pumps, utility connected foreshore infrastructure, public, commercial,
tourism and residential buildings, Knight Terrace and a section of Stella Rowley Drive may require
relocation.
◼ Foreshore recreational infrastructure may require significant repair or relocation.
◼ Beach access, boat ramps and marine infrastructure may require significant repairs.
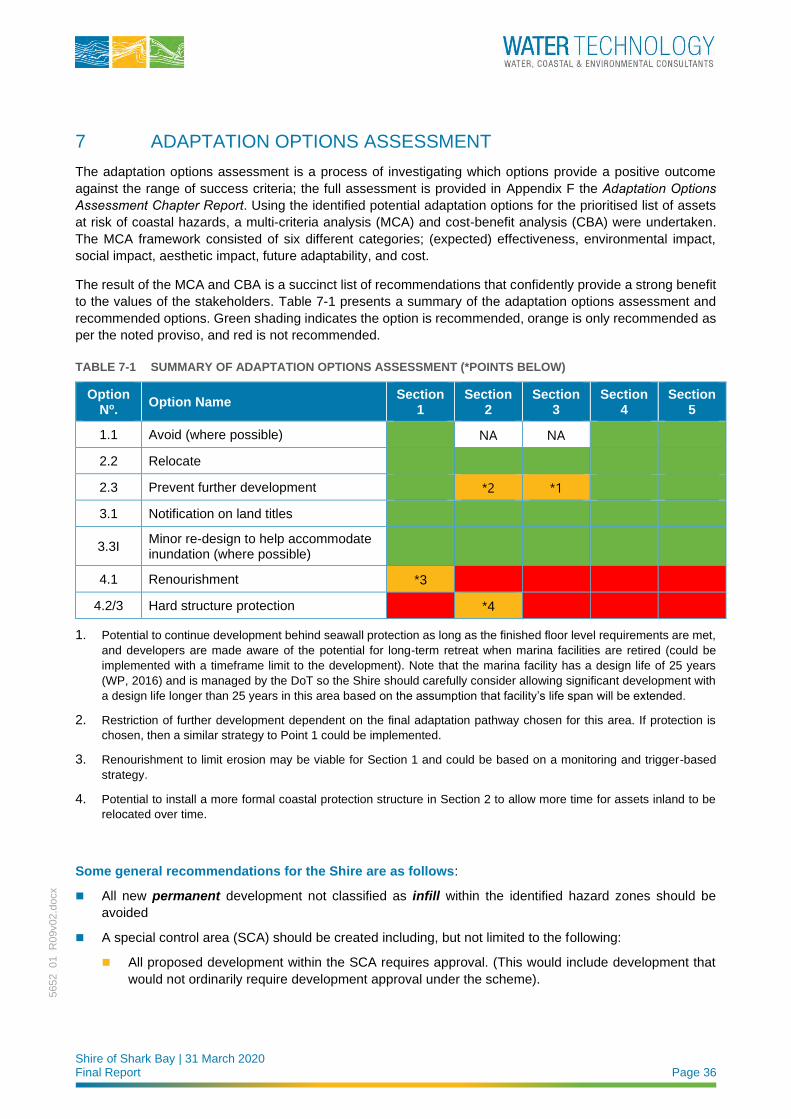
Shire of Shark Bay | 31 March 2020 Final Report Page 36
5652_01_R
09v02.d
ocx
7 ADAPTATION OPTIONS ASSESSMENT
The adaptation options assessment is a process of investigating which options provide a positive outcome
against the range of success criteria; the full assessment is provided in Appendix F the Adaptation Options Assessment Chapter Report. Using the identified potential adaptation options for the prioritised list of assets
at risk of coastal hazards, a multi-criteria analysis (MCA) and cost-benefit analysis (CBA) were undertaken.
The MCA framework consisted of six different categories; (expected) effectiveness, environmental impact,
social impact, aesthetic impact, future adaptability, and cost.
The result of the MCA and CBA is a succinct list of recommendations that confidently provide a strong benefit
to the values of the stakeholders. Table 7-1 presents a summary of the adaptation options assessment and
recommended options. Green shading indicates the option is recommended, orange is only recommended as
per the noted proviso, and red is not recommended.
TABLE 7-1 SUMMARY OF ADAPTATION OPTIONS ASSESSMENT (*POINTS BELOW)
Option No.
Option Name Section
1 Section
2 Section
3 Section
4 Section
5
1.1 Avoid (where possible) NA NA
2.2 Relocate
2.3 Prevent further development *2 *1
3.1 Notification on land titles
3.3I Minor re-design to help accommodate inundation (where possible)
4.1 Renourishment *3
4.2/3 Hard structure protection *4
1. Potential to continue development behind seawall protection as long as the finished floor level requirements are met,
and developers are made aware of the potential for long-term retreat when marina facilities are retired (could be
implemented with a timeframe limit to the development). Note that the marina facility has a design life of 25 years
(WP, 2016) and is managed by the DoT so the Shire should carefully consider allowing significant development with
a design life longer than 25 years in this area based on the assumption that facility’s life span will be extended.
2. Restriction of further development dependent on the final adaptation pathway chosen for this area. If protection is
chosen, then a similar strategy to Point 1 could be implemented.
3. Renourishment to limit erosion may be viable for Section 1 and could be based on a monitoring and trigger-based
strategy.
4. Potential to install a more formal coastal protection structure in Section 2 to allow more time for assets inland to be
relocated over time.
Some general recommendations for the Shire are as follows:
◼ All new permanent development not classified as infill within the identified hazard zones should be
avoided
◼ A special control area (SCA) should be created including, but not limited to the following:
◼ All proposed development within the SCA requires approval. (This would include development that
would not ordinarily require development approval under the scheme).
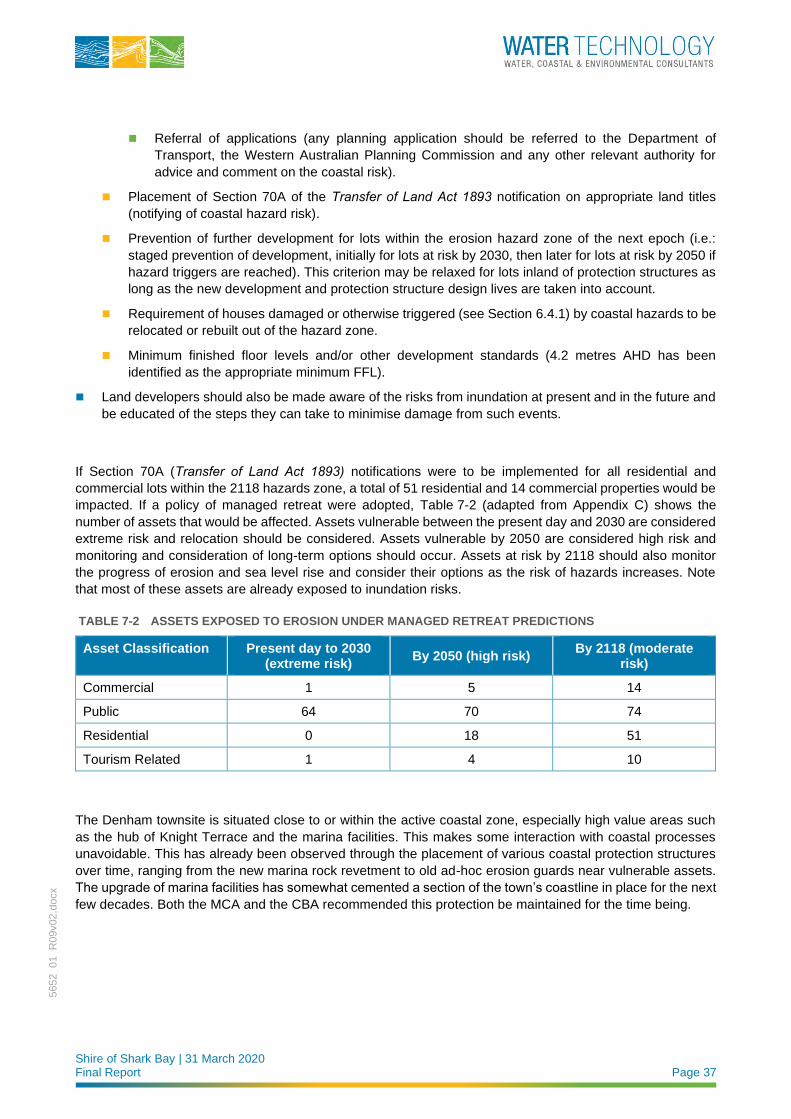
Shire of Shark Bay | 31 March 2020 Final Report Page 37
5652_01_R
09v02.d
ocx
◼ Referral of applications (any planning application should be referred to the Department of
Transport, the Western Australian Planning Commission and any other relevant authority for
advice and comment on the coastal risk).
◼ Placement of Section 70A of the Transfer of Land Act 1893 notification on appropriate land titles
(notifying of coastal hazard risk).
◼ Prevention of further development for lots within the erosion hazard zone of the next epoch (i.e.:
staged prevention of development, initially for lots at risk by 2030, then later for lots at risk by 2050 if
hazard triggers are reached). This criterion may be relaxed for lots inland of protection structures as
long as the new development and protection structure design lives are taken into account.
◼ Requirement of houses damaged or otherwise triggered (see Section 6.4.1) by coastal hazards to be
relocated or rebuilt out of the hazard zone.
◼ Minimum finished floor levels and/or other development standards (4.2 metres AHD has been
identified as the appropriate minimum FFL).
◼ Land developers should also be made aware of the risks from inundation at present and in the future and
be educated of the steps they can take to minimise damage from such events.
If Section 70A (Transfer of Land Act 1893) notifications were to be implemented for all residential and
commercial lots within the 2118 hazards zone, a total of 51 residential and 14 commercial properties would be
impacted. If a policy of managed retreat were adopted, Table 7-2 (adapted from Appendix C) shows the
number of assets that would be affected. Assets vulnerable between the present day and 2030 are considered
extreme risk and relocation should be considered. Assets vulnerable by 2050 are considered high risk and
monitoring and consideration of long-term options should occur. Assets at risk by 2118 should also monitor
the progress of erosion and sea level rise and consider their options as the risk of hazards increases. Note
that most of these assets are already exposed to inundation risks.
TABLE 7-2 ASSETS EXPOSED TO EROSION UNDER MANAGED RETREAT PREDICTIONS
Asset Classification Present day to 2030 (extreme risk)
By 2050 (high risk) By 2118 (moderate
risk)
Commercial 1 5 14
Public 64 70 74
Residential 0 18 51
Tourism Related 1 4 10
The Denham townsite is situated close to or within the active coastal zone, especially high value areas such
as the hub of Knight Terrace and the marina facilities. This makes some interaction with coastal processes
unavoidable. This has already been observed through the placement of various coastal protection structures
over time, ranging from the new marina rock revetment to old ad-hoc erosion guards near vulnerable assets.
The upgrade of marina facilities has somewhat cemented a section of the town’s coastline in place for the next
few decades. Both the MCA and the CBA recommended this protection be maintained for the time being.
Shire of Shark Bay | 31 March 2020 Final Report Page 38
5652_01_R
09v02.d
ocx
8 IMPLEMENTATION
This section summarises the recommended adaptation approaches for all sections of the study area for the
Town of Denham. The implementation plan is divided into a relatively well-defined short-term plan (to 2030)
and trigger-based strategy, as well as a long-term plan that is designed to prompt local decision makers into
long term thinking strategies.
8.1 Short Term Implementation Plan
The short-term implementation plan is divided into the five coastal sections defined during the project.
Table 8-1 outlines the preferred adaptation approach as well as some best practice coastal management
recommendations that should be implemented as an overall Foreshore Management Plan to increase the
resilience of the coastline. All recommendations in the short-term plan should be considered now unless a
trigger-based initiation is preferred by the Shire.
8.1.1 Trigger-based Adaptation
The following triggers are listed in cascading order. That is, proximity trigger is considered first, and damage
last (if the first three are enacted, the damage trigger would have lower likelihood of occurrence). For example,
the utilities would be planned to be removed by a proximity trigger. This would then require landholders to
relocate as the utilities trigger would have been reached.
◼ Proximity trigger: Where the most landward part of the Horizontal Shoreline Datum (HSD) is within 40
metres of the most seaward point of a development / structure / foreshore reserve area.
◼ Due to the high value placed on the foreshore coastal reserve, the recreational area would itself be
considered the asset in this case
◼ Access trigger: Where a public road is considered no longer available or able to provide legal access to
the property
◼ This may occur for Knight Terrace, particularly to the east of Denham Hamelin Road. The Shire may
choose to investigate access options from the landward side of these properties.
◼ Utilities trigger: When water, sewage or electricity to the lot is no longer available as they have been
removed/decommissioned by the relevant authority due to coastal hazards.
◼ Damage trigger: Any property within the hazard zone and SCA that is damaged by a coastal hazard from
an extreme weather event shall require Shire approval before being repaired. The review process should
involve:
◼ Re-fit of minor or moderately damaged assets to better accommodate coastal hazards in the future
◼ OR
◼ Removal and redevelopment outside the hazard zone for assets that suffer major damage.
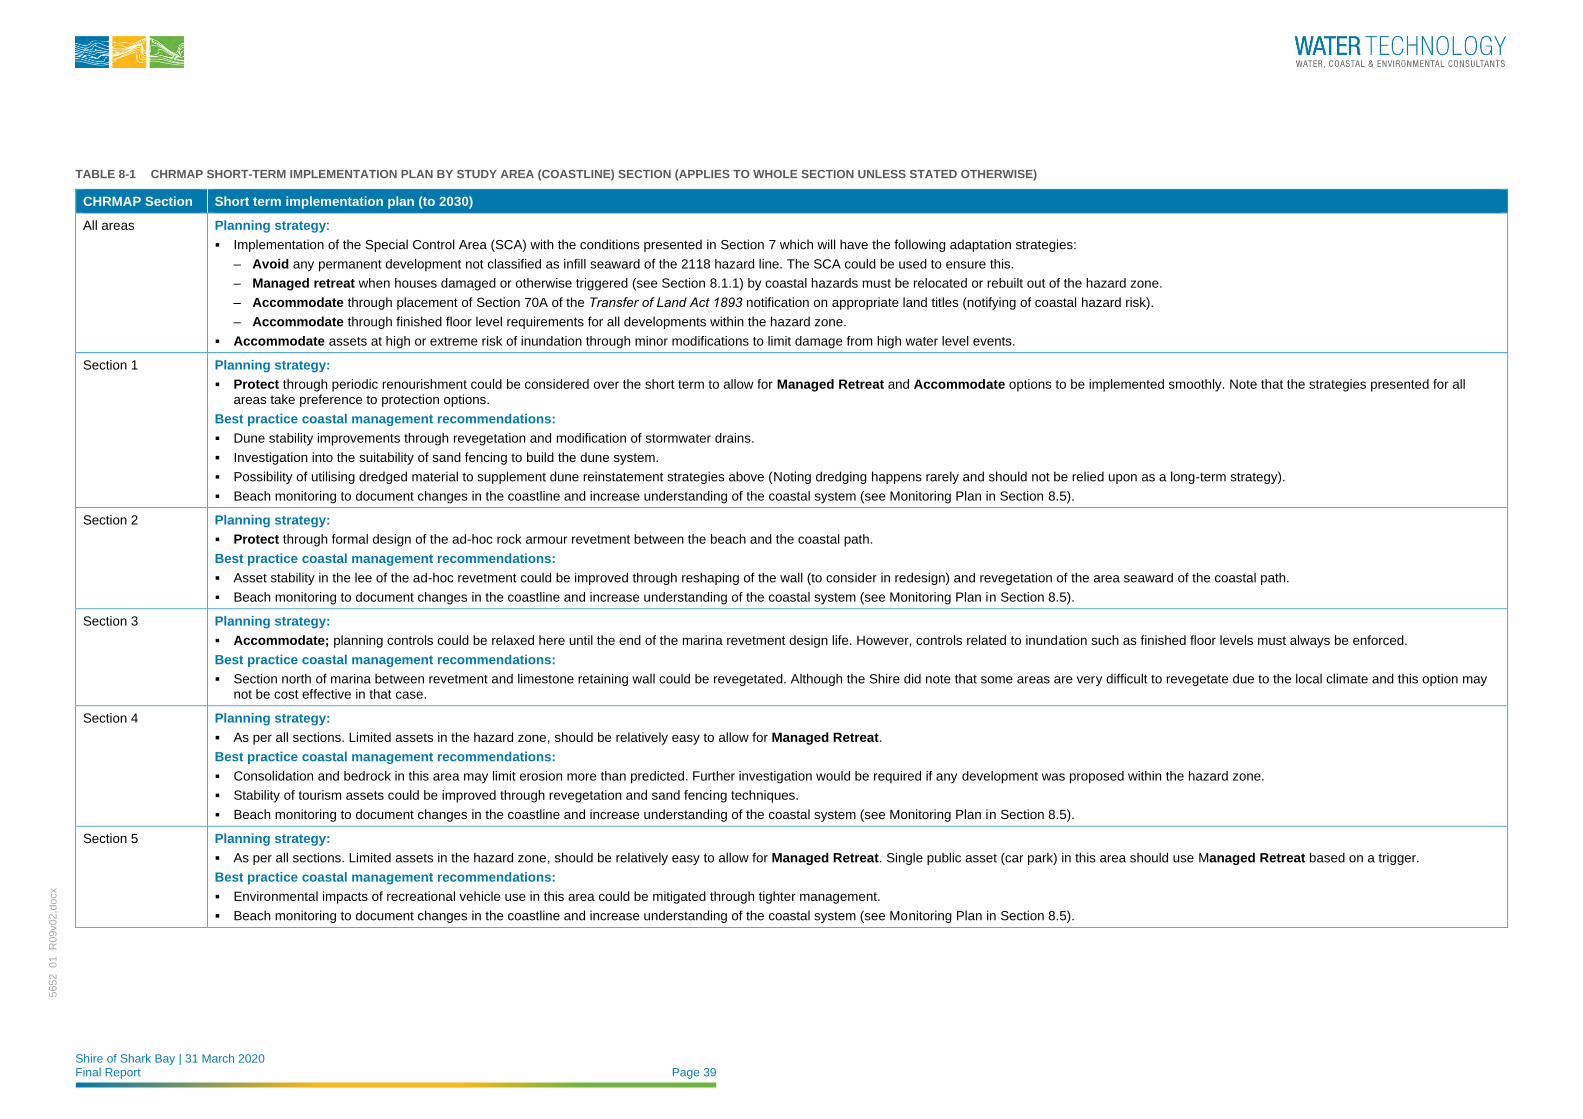
Shire of Shark Bay | 31 March 2020 Final Report Page 39
5652_01_R
09v02.d
ocx
TABLE 8-1 CHRMAP SHORT-TERM IMPLEMENTATION PLAN BY STUDY AREA (COASTLINE) SECTION (APPLIES TO WHOLE SECTION UNLESS STATED OTHERWISE)
CHRMAP Section Short term implementation plan (to 2030)
All areas Planning strategy:
▪ Implementation of the Special Control Area (SCA) with the conditions presented in Section 7 which will have the following adaptation strategies:
– Avoid any permanent development not classified as infill seaward of the 2118 hazard line. The SCA could be used to ensure this.
– Managed retreat when houses damaged or otherwise triggered (see Section 8.1.1) by coastal hazards must be relocated or rebuilt out of the hazard zone.
– Accommodate through placement of Section 70A of the Transfer of Land Act 1893 notification on appropriate land titles (notifying of coastal hazard risk).
– Accommodate through finished floor level requirements for all developments within the hazard zone.
▪ Accommodate assets at high or extreme risk of inundation through minor modifications to limit damage from high water level events.
Section 1 Planning strategy:
▪ Protect through periodic renourishment could be considered over the short term to allow for Managed Retreat and Accommodate options to be implemented smoothly. Note that the strategies presented for all areas take preference to protection options.
Best practice coastal management recommendations:
▪ Dune stability improvements through revegetation and modification of stormwater drains.
▪ Investigation into the suitability of sand fencing to build the dune system.
▪ Possibility of utilising dredged material to supplement dune reinstatement strategies above (Noting dredging happens rarely and should not be relied upon as a long-term strategy).
▪ Beach monitoring to document changes in the coastline and increase understanding of the coastal system (see Monitoring Plan in Section 8.5).
Section 2 Planning strategy:
▪ Protect through formal design of the ad-hoc rock armour revetment between the beach and the coastal path.
Best practice coastal management recommendations:
▪ Asset stability in the lee of the ad-hoc revetment could be improved through reshaping of the wall (to consider in redesign) and revegetation of the area seaward of the coastal path.
▪ Beach monitoring to document changes in the coastline and increase understanding of the coastal system (see Monitoring Plan in Section 8.5).
Section 3 Planning strategy:
▪ Accommodate; planning controls could be relaxed here until the end of the marina revetment design life. However, controls related to inundation such as finished floor levels must always be enforced.
Best practice coastal management recommendations:
▪ Section north of marina between revetment and limestone retaining wall could be revegetated. Although the Shire did note that some areas are very difficult to revegetate due to the local climate and this option may not be cost effective in that case.
Section 4 Planning strategy:
▪ As per all sections. Limited assets in the hazard zone, should be relatively easy to allow for Managed Retreat.
Best practice coastal management recommendations:
▪ Consolidation and bedrock in this area may limit erosion more than predicted. Further investigation would be required if any development was proposed within the hazard zone.
▪ Stability of tourism assets could be improved through revegetation and sand fencing techniques.
▪ Beach monitoring to document changes in the coastline and increase understanding of the coastal system (see Monitoring Plan in Section 8.5).
Section 5 Planning strategy:
▪ As per all sections. Limited assets in the hazard zone, should be relatively easy to allow for Managed Retreat. Single public asset (car park) in this area should use Managed Retreat based on a trigger.
Best practice coastal management recommendations:
▪ Environmental impacts of recreational vehicle use in this area could be mitigated through tighter management.
▪ Beach monitoring to document changes in the coastline and increase understanding of the coastal system (see Monitoring Plan in Section 8.5).
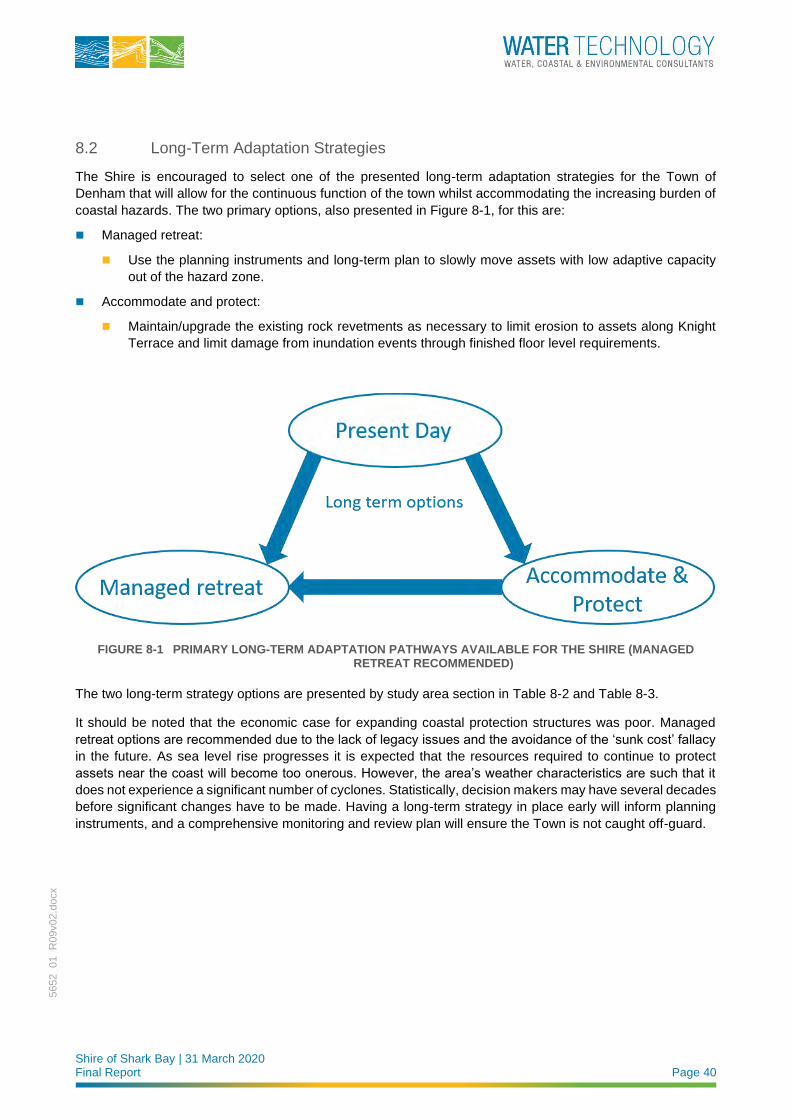
Shire of Shark Bay | 31 March 2020 Final Report Page 40
5652_01_R
09v02.d
ocx
8.2 Long-Term Adaptation Strategies
The Shire is encouraged to select one of the presented long-term adaptation strategies for the Town of
Denham that will allow for the continuous function of the town whilst accommodating the increasing burden of
coastal hazards. The two primary options, also presented in Figure 8-1, for this are:
◼ Managed retreat:
◼ Use the planning instruments and long-term plan to slowly move assets with low adaptive capacity
out of the hazard zone.
◼ Accommodate and protect:
◼ Maintain/upgrade the existing rock revetments as necessary to limit erosion to assets along Knight
Terrace and limit damage from inundation events through finished floor level requirements.
FIGURE 8-1 PRIMARY LONG-TERM ADAPTATION PATHWAYS AVAILABLE FOR THE SHIRE (MANAGED RETREAT RECOMMENDED)
The two long-term strategy options are presented by study area section in Table 8-2 and Table 8-3.
It should be noted that the economic case for expanding coastal protection structures was poor. Managed
retreat options are recommended due to the lack of legacy issues and the avoidance of the ‘sunk cost’ fallacy
in the future. As sea level rise progresses it is expected that the resources required to continue to protect
assets near the coast will become too onerous. However, the area’s weather characteristics are such that it
does not experience a significant number of cyclones. Statistically, decision makers may have several decades
before significant changes have to be made. Having a long-term strategy in place early will inform planning
instruments, and a comprehensive monitoring and review plan will ensure the Town is not caught off-guard.
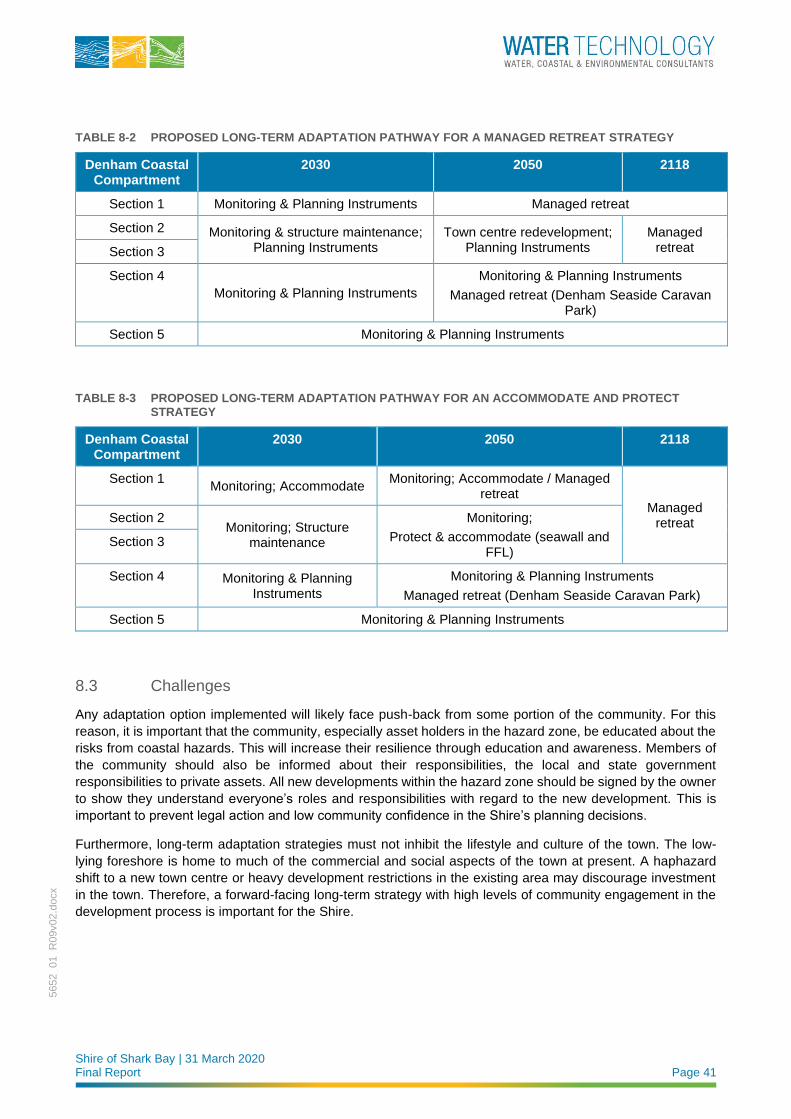
Shire of Shark Bay | 31 March 2020 Final Report Page 41
5652_01_R
09v02.d
ocx
TABLE 8-2 PROPOSED LONG-TERM ADAPTATION PATHWAY FOR A MANAGED RETREAT STRATEGY
Denham Coastal Compartment
2030 2050 2118
Section 1 Monitoring & Planning Instruments Managed retreat
Section 2 Monitoring & structure maintenance; Planning Instruments
Town centre redevelopment; Planning Instruments
Managed retreat Section 3
Section 4
Monitoring & Planning Instruments
Monitoring & Planning Instruments
Managed retreat (Denham Seaside Caravan Park)
Section 5 Monitoring & Planning Instruments
TABLE 8-3 PROPOSED LONG-TERM ADAPTATION PATHWAY FOR AN ACCOMMODATE AND PROTECT STRATEGY
Denham Coastal Compartment
2030 2050 2118
Section 1 Monitoring; Accommodate
Monitoring; Accommodate / Managed retreat
Managed retreat Section 2
Monitoring; Structure maintenance
Monitoring;
Protect & accommodate (seawall and FFL)
Section 3
Section 4 Monitoring & Planning Instruments
Monitoring & Planning Instruments
Managed retreat (Denham Seaside Caravan Park)
Section 5 Monitoring & Planning Instruments
8.3 Challenges
Any adaptation option implemented will likely face push-back from some portion of the community. For this
reason, it is important that the community, especially asset holders in the hazard zone, be educated about the
risks from coastal hazards. This will increase their resilience through education and awareness. Members of
the community should also be informed about their responsibilities, the local and state government
responsibilities to private assets. All new developments within the hazard zone should be signed by the owner
to show they understand everyone’s roles and responsibilities with regard to the new development. This is
important to prevent legal action and low community confidence in the Shire’s planning decisions.
Furthermore, long-term adaptation strategies must not inhibit the lifestyle and culture of the town. The low-
lying foreshore is home to much of the commercial and social aspects of the town at present. A haphazard
shift to a new town centre or heavy development restrictions in the existing area may discourage investment
in the town. Therefore, a forward-facing long-term strategy with high levels of community engagement in the
development process is important for the Shire.
Shire of Shark Bay | 31 March 2020 Final Report Page 42
5652_01_R
09v02.d
ocx
8.4 Funding and Responsibilities
Managing the CHRMAP implementation will be the responsibility of the Shire. The Shire should seek
assistance from relevant local and state organisations as required. A monitoring plan is briefly outlined in this
report to assist with decision making and future updates to the Town’s CHRMAP, which should be undertaken
every 5-years, and at a maximum of every ten years.
In the short-term we recommend investigating funding avenues based on the town’s high tourism value, and
the World Heritage listing. Maintaining the culture and recreational value of the Denham townsite is strongly
linked to the continuation of both tourism and environmental protection of the region.
In the long-term, effective use of planning instruments will ideally ensure that adaptation of assets in the town
happens organically with low resource burden to the Shire. Long-term adaptation strategies should ensure that
Shire assets such as utilities are relocated at the end of their useful life without significant additional cost over
what would normally be required.
It is recommended that a specific Coastal Adaptation Fund is created to fund coastal adaptation for the long-
term. The following funding sources should be considered to contribute to this fund. These are in line with the
user pays principle:
◼ Percentage increase in all rates – the full Shire community benefits from the coast
◼ Special Area Rates – for those landholders that are directly affected by coastal hazards, and will therefore
directly benefit from adaptation measures
◼ Existing state government grants:
◼ Coastal Adaptation and Protection (CAP) Grants implemented by the Department of Transport
◼ Coastwest Grants implemented by DPLH
◼ Coastal Management Plan Assistance Program grants administered by DPLH
◼ Royalties for Regions funding administered by the Regional Development Commission
◼ Continuing advocacy for further funding from the state and introduction of federal government funding
◼ The recently released Coastal Erosion Hot Spots report (general information provided here; released
by Department of Transport) aims to assist with gaining traction with federal government.
◼ Mechanisms for visitors to the town, i.e. Users of the coastline, to contribute. This could be in the form of
a levy applied to their accommodation, or paid parking at key tourist sites.
◼ Developer contributions where specific developments benefit from their coastal location
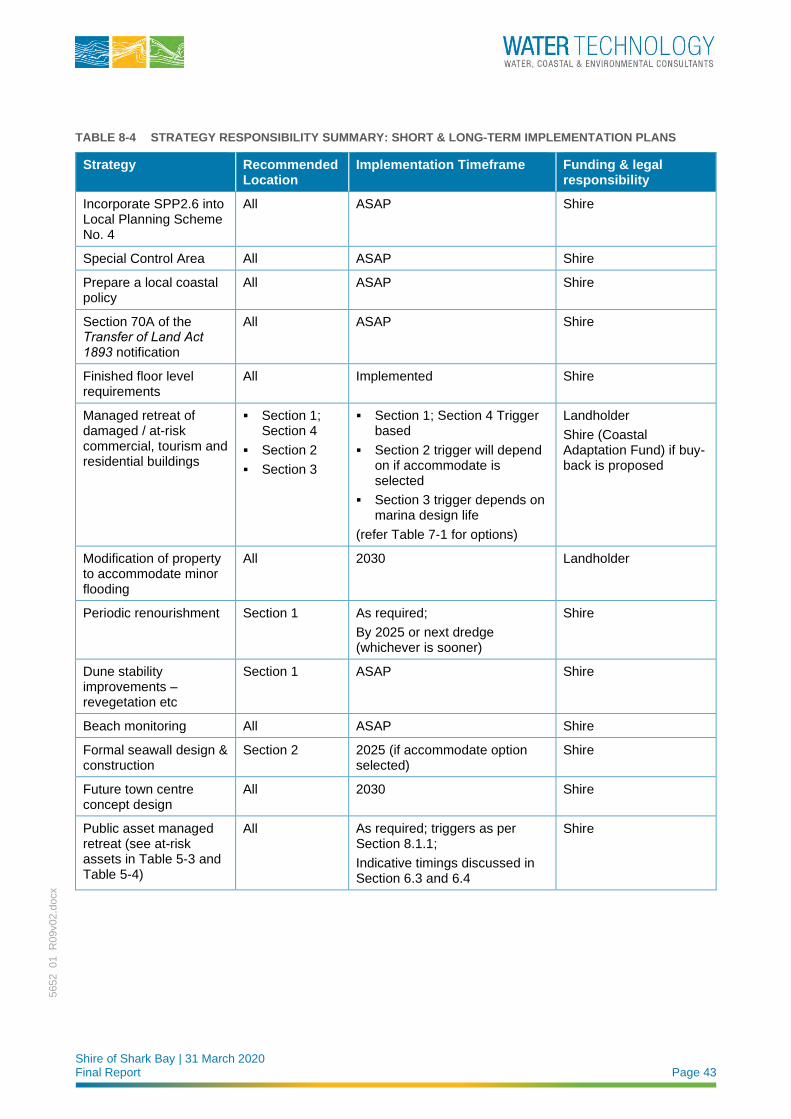
Shire of Shark Bay | 31 March 2020 Final Report Page 43
5652_01_R
09v02.d
ocx
TABLE 8-4 STRATEGY RESPONSIBILITY SUMMARY: SHORT & LONG-TERM IMPLEMENTATION PLANS
Strategy Recommended Location
Implementation Timeframe Funding & legal responsibility
Incorporate SPP2.6 into Local Planning Scheme No. 4
All ASAP Shire
Special Control Area All ASAP Shire
Prepare a local coastal policy
All ASAP Shire
Section 70A of the Transfer of Land Act 1893 notification
All ASAP Shire
Finished floor level requirements
All Implemented Shire
Managed retreat of damaged / at-risk commercial, tourism and residential buildings
▪ Section 1; Section 4
▪ Section 2
▪ Section 3
▪ Section 1; Section 4 Trigger based
▪ Section 2 trigger will depend on if accommodate is selected
▪ Section 3 trigger depends on marina design life
(refer Table 7-1 for options)
Landholder
Shire (Coastal Adaptation Fund) if buy-back is proposed
Modification of property to accommodate minor flooding
All 2030 Landholder
Periodic renourishment Section 1 As required;
By 2025 or next dredge (whichever is sooner)
Shire
Dune stability improvements – revegetation etc
Section 1 ASAP Shire
Beach monitoring All ASAP Shire
Formal seawall design & construction
Section 2 2025 (if accommodate option selected)
Shire
Future town centre concept design
All 2030 Shire
Public asset managed retreat (see at-risk assets in Table 5-3 and Table 5-4)
All As required; triggers as per Section 8.1.1;
Indicative timings discussed in Section 6.3 and 6.4
Shire
Shire of Shark Bay | 31 March 2020 Final Report Page 44
5652_01_R
09v02.d
ocx
8.5 Monitoring Plan
A comprehensive monitoring and data collection plan will increase the confidence of future coastal hazard
studies and resulting design requirements. It is recommended that the Shire perform seasonal / annual
photographic monitoring of the coastline to assist in identifying long-term changes. It is also recommended
that the CHRMAP be updated every 5-10 years (for now) with re-analysis of new data including:
◼ Review of the photographic monitoring;
◼ Review of any new survey data;
◼ Shoreline vegetation movement analysis from the last report to present;
◼ Analysis of any severe inundation or erosion events;
◼ Discussion with the Shire on the status of both short and long-term adaptation strategy progress; including
◼ Assessment of the present strategy’s performance and review of any new strategies identified;
◼ Assessment of whether modelling of the study area should be updated given any recent data collection,
planning change or sea level rise prediction updates.
The final management options will include the continued revision of the CHRMAP and update of the
recommended options at regular intervals (i.e. every five to ten years). This is due to corresponding future
updates in climate change science, coastal engineering methodology, changes to the town’s success criteria,
triggers reached, and so on.
8.6 Knowledge Gaps & Recommendations
At present there are several challenges to undertaking a CHRMAP for the town. Primarily this is a lack of local
oceanographic data which can limit confidence in the results of analysis / modelling and, in some cases, result
in unnecessary economic burden to asset holders near the coast through overly conservative design
requirements.
When dealing with coastal adaptation, whilst it is important to understand the level of accuracy of the modelling
as it informs the risk and vulnerability ratings, we believe the most effective approach is to use the proposed
modelling to identify triggers and their corresponding coastal management action. An indicative likelihood and
timeframe can be provided for guidance, but the ultimate adaptive action is driven by the triggers.
To assist in filling the knowledge gaps, the following ongoing data collection is recommended. These are listed
in order of priority. Except where indicated, the benefit of the data will not be gained during the present study,
but in the application of the resulting coastal management plan:
◼ Locally placed nearshore water level and wave data logger. This will enable calibration of wave models,
especially if a storm / cyclone is captured during the deployment. Following the completion of the
CHRMAP, the data can be used to get a better understanding of event probabilities, rather than just
triggers.
◼ Ideally, this instrument would be deployed before the commencement of the next cyclone season.
◼ Regular photographic beach monitoring is a useful tool in analysing beach behaviour. This can be
conducted at 6-monthly intervals at the end of the summer and winter. Photos should also be taken
immediately following severe storms. They should be undertaken from a set vantage point to allow
accurate comparisons between images. The images can be used to supplement available data when
undertaking adaptation option design. These images can also be used to support adaptation option
funding applications, and in educating the community about natural fluctuations in beach shape.
Shire of Shark Bay | 31 March 2020 Final Report Page 45
5652_01_R
09v02.d
ocx
◼ These can be commenced immediately. Water Technology have proformas for these which allow
Shire staff to undertake the inspections, once initial guidance is provided. Coastal specialists should
review the data every couple of years, or if erosion is causing an issue.
◼ This data can also be used to identify if a trigger has been reached.
◼ Beach surveys, ideally every 6-months following the summer and winter periods. If possible, immediately
following cyclones. Corresponding monitoring photos should be taken at the same time.
◼ Regular monitoring of the marine structures / assets – e.g. seawall, jetties. These should be undertaken
with consistent proformas to allow comparison between inspections
◼ These can be commenced immediately. Water Technology have proformas for these which allow
Shire staff to undertake the inspections, once initial guidance is provided. Coastal / marine
specialists should review the data every couple of years, or if there is an issue with an asset.
◼ Geotechnical investigations to determine the presence of bedrock. If located relatively near the surface,
bedrock can act as a natural protection structure, and negate the need for other mitigation works.
However, in low lying areas the presence of bedrock may not alter the level of risk to coastal hazards. If
the area is inundated the hard surface will not provide the expected protection to erosion.
◼ A foreshore management plan for the Town could boost the protective capacity of the natural dune system.
The local Foreshore Management Plans should consider broader issues such as biodiversity and
environmental impacts.
Shire of Shark Bay | 31 March 2020 Final Report Page 46
5652_01_R
09v02.d
ocx
9 SUMMARY
The adaptation options presented within this report have followed the coastal hazard risk management
hierarchy, as per SPP2.6. The aim of the CHRMAP is to provide a planning framework that the Shire can follow
that allows sustainable development, but also allows the continued use of the land until the risk is realised.
Three primary adaptation pathways for the next 50 years are presented below. These options were discussed
with stakeholders and feedback was implemented into the final recommended adaptation pathways.
Stakeholders should note that while the assessment indicated that certain protection options may be viable,
they do not include all the potential costs. For example, implementation of a protection strategy may encourage
developers to commit to areas at risk of inundation or erosion and may increase difficulty of a successful
managed retreat in the future.
The key summary of the implementation plan pathways is as follows:
1. Managed retreat for all areas except coastline Section 3
2. Construction of more formal seawall in coastline Section 2; managed retreat for all other areas
except Section 3.
3. Possibility of renourishment for protection of Section 1 (trigger-based); independent of whether
Option 1 or 2 is selected, managed retreat for all other areas except Section 3.
Whilst erosion may be locally restricted in the near future if a protection strategy is pursued, it is clear from
inundation hazard mapping that as sea level rise progresses, the feasibility of development in low lying areas
will decline. The Shire should select and optimise one of the long-term adaptation pathways (refer Section 8),
which may potentially involve managed retreat of significant parts of the town, mainly Knight Terrace and
associated lots, over the next 30-100 years. While the above options under the Managed Retreat and
Accommodate groupings aim to make this process easier in the long run, such a significant shift will require
a clear and collaborative vision for Denham’s future. It is recommended that the Shire investigate potential
town structure plans that can achieve this goal over the next decade. Staged infill to raise low lying parts of
the town between new and old developments may be expensive and require coastal protection indefinitely,
which may be appropriate for private landholders but could be difficult to justify for public assets given the
alternatives.
Shire of Shark Bay | 31 March 2020 Final Report Page 47
5652_01_R
09v02.d
ocx
10 REFERENCES
Cooper, J. A. G., and O. H. Pilkey. (2004). “Sea-level rise and shoreline retreat: Time to abandon the Bruun
Rule”, Global and Planetary Change, 43: 157-71.
Eliot I, Gozzard JR, Eliot M, Stul T and McCormack G. (2012). The Coast of the Shires of Shark Bay to Exmouth, Gascoyne, Western Australia: Geology, Geomorphology & Vulnerability, prepared by Damara WA
Pty Ltd and Geological Survey of Western Australia for the Department of Planning and the Department of
Transport
FitzGerald, D., Fenster, M., Agrow, B., Buynevich, I. (2008). “Coastal impacts due to sea-level rise”, Annu. Rev. Earth Planet. Sci 2008. 36:601-47.
Gutierrez, B. T., Plant, N. G., and Thieler, E. R. (2011), “A Bayesian network to predict coastal vulnerability to
sea level rise”, J. Geophys. Res., 116, F02009, doi:10.1029/2010JF001891.
Hetzel, Y., Pattiaratchi, C., Lowe, R., Hofmeister, R., (2015). “Wind and tidal mixing controls on stratification
and dense water outflows in a large hypersaline bay”. J. Geophys. Res. Oceans 120 (9), 6034–6056.
Intergovernmental Panel on Climate Change (IPCC, 2014). Climate Change 2014: Synthesis Report, Contribution of Working Groups I, II and III to the Fifth Assessment Report of the Intergovernmental Panel on Climate Change. Geneva, Switzerland, Core Writing Team, R.K. Pachauri and L.A. Meyer (eds.)], IPCC,
Geneva, Switzerland, 151 pp.
McInnes, K., White, C., Haigh, I., Hemer, M., Hoeke, R., Holbrook, N., Kiem, A., Oliver, E., Ranasinghe, R.,
Walsh, K., Westra, S., Cox, R. (2016). “Natural hazards in Australia: sea level and coastal extremes”, Climatic Change, 139:69:83.
Nahas, E.L., Pattiaratchi, C.B., Ivey, G.N., (2005). “Processes controlling the position of frontal systems in
Shark Bay, Western Australia”. Estuarine, Coastal and Shelf Science. 65 (3), 463–474.
Ranasinghe, R., Callaghan, D. & Stive, M.J.F (2012). “Estimating coastal recession due to sea level rise:
beyond the Bruun rule”. Climatic Change 110, 561–574 (2012). https://doi.org/10.1007/s10584-011-0107-8.
Short, A. D. (2005). Beaches of the Western Australian Coast: Eucla to Roebuck Bay: A guide to their nature, characteristics, surf and safety, Sydney University Press.
Woodroffe C, Cowell P, Callaghan D, Ranasinghe R, Jongejan R, Wainwright D, Barry S, Rogers K, Dougherty
A. (2012). Approaches to risk assessment on Australian coasts: a model framework for assessing risk and adaptation to climate change on Australian coasts, National Climate Change Adaptation Research Facility,
Gold Coast, 205 pp.
Western Australian Planning Commission (WAPC, 2013). State Planning Policy No. 2.6 – State Coastal Planning Policy, prepared under the Planning and Development Act 2005.
Western Australian Planning Commission (WAPC, 2019). Coastal Hazard Risk Management and Adaptation Planning Guidelines.
Western Australian Planning Commission (WAPC, 2017). WA Coastal Zone Strategy, Department of Planning,
Lands and Heritage.
WorleyParsons (WP, 2016). Denham Foreshore Revitalisation Stage 1A: Design Report, Report No 301012-
02233 – GE-REP-002, prepared for Department of Transport
Shire of Shark Bay | 31 March 2020 Final Report
5652_01_R
09v02.d
ocx
APPENDIX A STAKEHOLDER AND COMMUNITY ENGAGEMENT PLAN
Denham Townsite CHRMAP
Stakeholder and Community Engagement Plan
Shire of Shark Bay
17 April 2018
Shire of Shark Bay | 17 April 2018 Stakeholder and Community Engagement Plan Page 1
5652_01_R
01v02.d
ocx
Document Status
Version Doc type Reviewed by Approved by Date issued
V01 DRAFT Christine Arrowsmith Christine Arrowsmith 17/04/2018
Project Details
Project Name Stakeholder and Community Engagement Plan
Client Shire of Shark Bay
Client Project Manager Paul Anderson
Water Technology Project Manager Joanna Garcia-Webb
Water Technology Project Director Christine Lachlan Arrowsmith
Authors Joanna Garcia-Webb
Document Number 5652_01_R01v01.docx
COPYRIGHT
Water Technology Pty Ltd has produced this document in accordance with instructions from Shire of Shark Bay for their
use only. The concepts and information contained in this document are the copyright of Water Technology Pty Ltd. Use or
copying of this document in whole or in part without written permission of Water Technology Pty Ltd constitutes an
infringement of copyright.
Water Technology Pty Ltd does not warrant this document is definitive nor free from error and does not accept liability for
any loss caused, or arising from, reliance upon the information provided herein.
Ground Floor, 430 Roberts Rd
Subiaco WA 6008
Telephone 08 6555 0105
ACN 093 377 283
ABN 60 093 377 283
Shire of Shark Bay | 17 April 2018 Stakeholder and Community Engagement Plan Page 2
5652_01_R
01v02.d
ocx
17 April 2018
Paul Anderson Chief Executive Officer Shire of Shark Bay 65 Knight Terrace Denham WA 6537 Via email [email protected] Dear Paul
Stakeholder and Community Engagement Plan
We are pleased to present our Stakeholder and Community Engagement Plan. If you have any queries, please
do not hesitate to contact me on (03) 8526 0830.
Yours sincerely
Joanna Garcia-Webb Senior Coastal Engineer
WATER TECHNOLOGY PTY LTD
Shire of Shark Bay | 17 April 2018 Stakeholder and Community Engagement Plan Page 3
5652_01_R
01v02.d
ocx
CONTENTS
1 INTRODUCTION 4
2 STAKEHOLDER IDENTIFICATION 7
2.1 Internal Stakeholders 7
2.2 External Stakeholders 7
3 CONSULTATION APPROACH 9
3.1 Objectives of Strategy 9
3.2 Level of Consultation 9
3.3 Strategy Messaging 9
4 ENGAGEMENT PLAN 11
4.1 Implementation Plan 11
4.2 Values Assessment 11
4.3 Adaptation Assessment 12
4.4 Draft CHRMAP Advertising 12
5 MONITORING & EVALUATION 14
6 REFERENCES 15
LIST OF FIGURES Figure 1-1 Extent of CHRMAP 5
Figure 1-2 Proposed CHRMAP methodology flow chart (adapted from WAPC CHRMAP Guidelines) 6
LIST OF TABLES Table 4-1 Proposed Engagement Activities 12
Table 4-2 Proposed Engagement Activities 13
Table 4-3 Proposed Engagement Activities 13
Shire of Shark Bay | 17 April 2018 Stakeholder and Community Engagement Plan Page 4
5652_01_R
01v02.d
ocx
1 INTRODUCTION It is internationally recognised that the increasing sea levels and storm intensities associated with climate
change will intensify coastal hazards such as coastal inundation (temporary coastal flooding), storm erosion
and long-term shoreline recession. Consequently, State governments across Australia have introduced
obligations that require local governments to consider and plan for the effects of these hazards over various
planning timeframes. In Western Australia (WA), the governing policy is the Western Australian Planning
Commission’s State Coastal Planning Policy 2.6 (WAPC, 2013, herein referred to as “SPP2.6”). SPP2.6
recommends management authorities develop a Coastal Hazard Risk Management and Adaptation Plan
(CHRMAP). Specific guidelines have been developed to assist in this process (WAPC, 2014).
One of the key objectives of SPP2.6 is to establish coastal foreshore reserves which include allowances for
the protection, conservation and enhancement of coastal values across the state. Risk assessment processes
are then utilised to identify risks that are intolerable to stakeholders. Adaptation measures are then developed
according to the preferential adaptation hierarchy outlined in SPP2.6.
The aim of the present study is to investigate and plan for coastal hazards which are likely to affect the Denham
townsite. Denham is located within the local government area of the Shire of Shark Bay, located approximately
800km north of Perth (refer Figure 1-1 for locality). Denham and its surrounds are used extensively for tourism,
commercial and recreational purposes. Tourism is the primary industry in the Shire, with fishing and
aquaculture also playing a major role.
Given the above, visitors to and residents of Denham and its surrounds place a high value on the coastline.
Processes affecting the coastal zone are multiple and complex: storm surge; tidal movement; shoreline
stability; stormwater drainage; and the interactions between surface and groundwater all contribute in differing
degrees. Furthermore, the potential impacts of climate change, specifically increasing sea levels and storm
intensities, will place increased pressure on the coastal zone, and threaten public infrastructure and assets,
private property, foreshore reserves, coastal attractions and public open spaces.
The WA CHRMAP Guidelines (WAPC, 2014) recommend that community and stakeholder values and
knowledge inform each step of the CHRMAP process. A clear Stakeholder and Community Engagement Plan
is therefore required to be developed at the commencement of the project. This document presents the
proposed engagement activities for the study; their relative timings with respect to the overall project are
displayed in Figure 1-2.
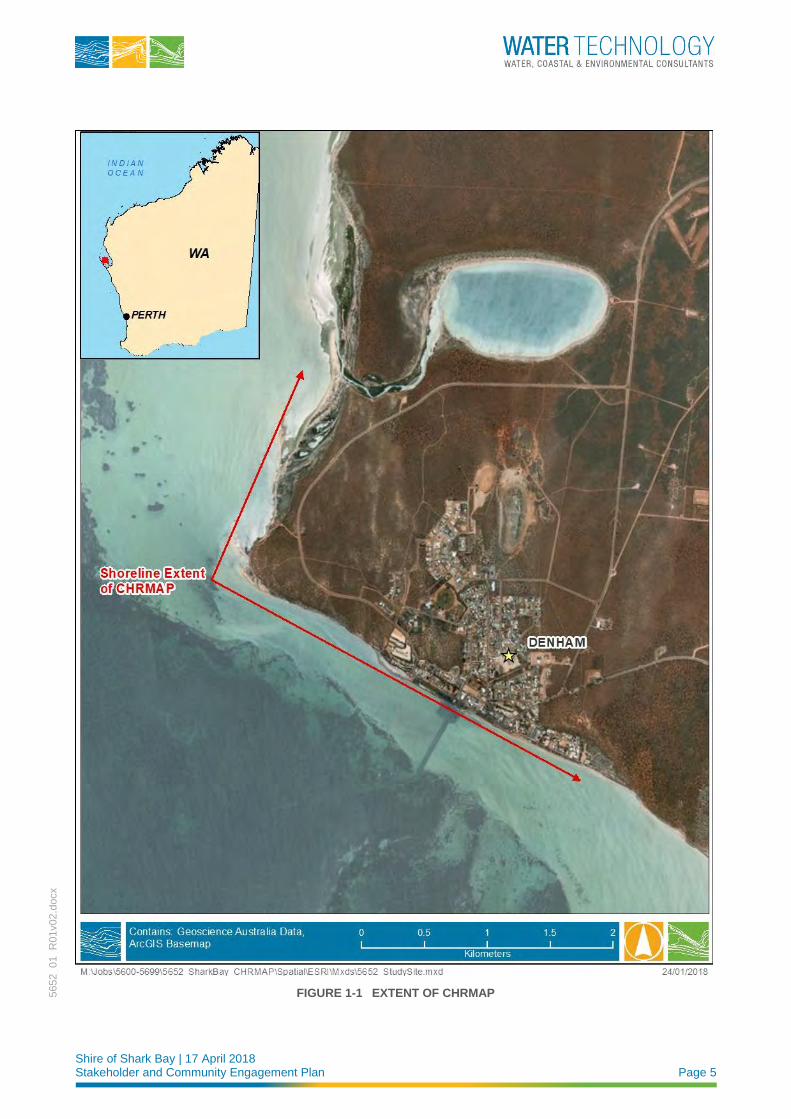
Shire of Shark Bay | 17 April 2018 Stakeholder and Community Engagement Plan Page 5
5652_01_R
01v02.d
ocx
FIGURE 1-1 EXTENT OF CHRMAP
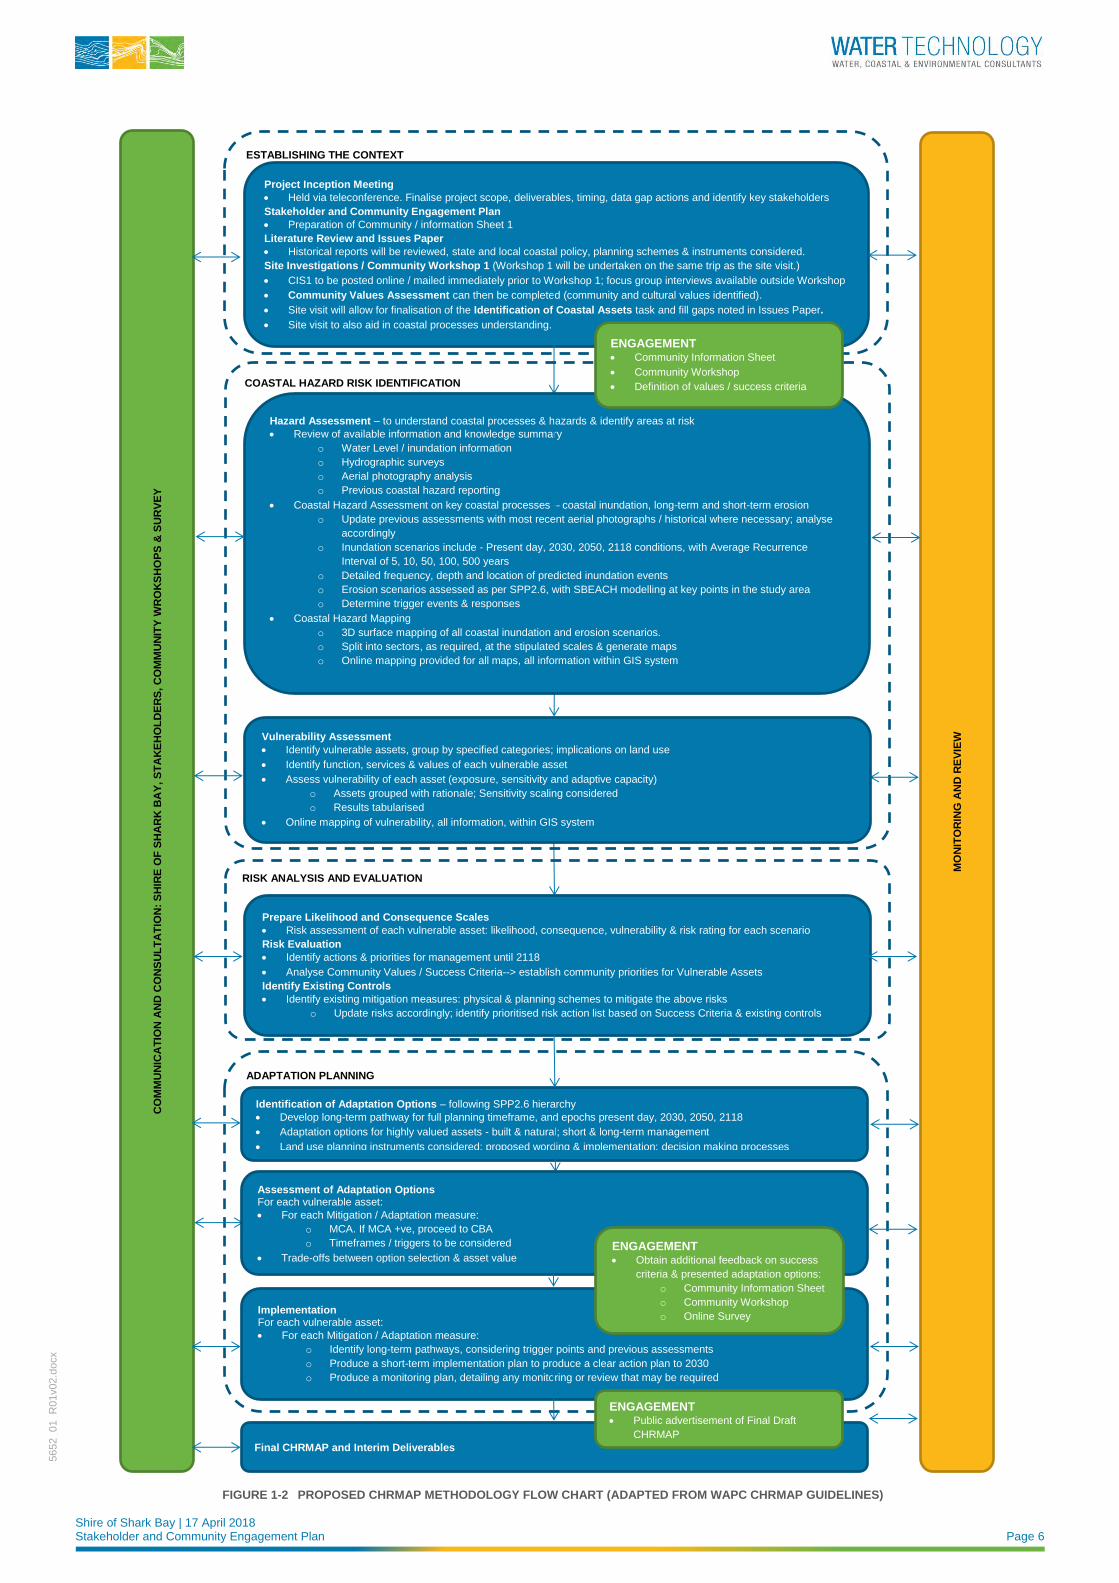
Shire of Shark Bay | 17 April 2018 Stakeholder and Community Engagement Plan Page 6
5652_01_R
01v02.d
ocx
ESTABLISHING THE CONTEXT
Project Inception Meeting
• Held via teleconference. Finalise project scope, deliverables, timing, data gap actions and identify key stakeholders
Stakeholder and Community Engagement Plan
• Preparation of Community / information Sheet 1
Literature Review and Issues Paper
• Historical reports will be reviewed, state and local coastal policy, planning schemes & instruments considered.
Site Investigations / Community Workshop 1 (Workshop 1 will be undertaken on the same trip as the site visit.)
• CIS1 to be posted online / mailed immediately prior to Workshop 1; focus group interviews available outside Workshop
• Community Values Assessment can then be completed (community and cultural values identified).
• Site visit will allow for finalisation of the Identification of Coastal Assets task and fill gaps noted in Issues Paper.
• Site visit to also aid in coastal processes understanding.
CO
MM
UN
ICA
TIO
N A
ND
CO
NS
UL
TA
TIO
N:
SH
IRE
OF
SH
AR
K B
AY
, S
TA
KE
HO
LD
ER
S, C
OM
MU
NIT
Y W
RO
KS
HO
PS
& S
UR
VE
Y
MO
NIT
OR
ING
AN
D R
EV
IEW
Final CHRMAP and Interim Deliverables
ADAPTATION PLANNING
COASTAL HAZARD RISK IDENTIFICATION
Hazard Assessment – to understand coastal processes & hazards & identify areas at risk
• Review of available information and knowledge summary
o Water Level / inundation information
o Hydrographic surveys
o Aerial photography analysis
o Previous coastal hazard reporting
• Coastal Hazard Assessment on key coastal processes – coastal inundation, long-term and short-term erosion
o Update previous assessments with most recent aerial photographs / historical where necessary; analyse
accordingly
o Inundation scenarios include - Present day, 2030, 2050, 2118 conditions, with Average Recurrence
Interval of 5, 10, 50, 100, 500 years
o Detailed frequency, depth and location of predicted inundation events
o Erosion scenarios assessed as per SPP2.6, with SBEACH modelling at key points in the study area o Determine trigger events & responses
• Coastal Hazard Mapping
o 3D surface mapping of all coastal inundation and erosion scenarios.
o Split into sectors, as required, at the stipulated scales & generate maps
o Online mapping provided for all maps, all information within GIS system
RISK ANALYSIS AND EVALUATION
Prepare Likelihood and Consequence Scales
• Risk assessment of each vulnerable asset: likelihood, consequence, vulnerability & risk rating for each scenario
Risk Evaluation
• Identify actions & priorities for management until 2118
• Analyse Community Values / Success Criteria--> establish community priorities for Vulnerable Assets
Identify Existing Controls
• Identify existing mitigation measures: physical & planning schemes to mitigate the above risks
o Update risks accordingly; identify prioritised risk action list based on Success Criteria & existing controls
Identification of Adaptation Options – following SPP2.6 hierarchy
• Develop long-term pathway for full planning timeframe, and epochs present day, 2030, 2050, 2118
• Adaptation options for highly valued assets - built & natural; short & long-term management
• Land use planning instruments considered: proposed wording & implementation; decision making processes
Vulnerability Assessment
• Identify vulnerable assets, group by specified categories; implications on land use
• Identify function, services & values of each vulnerable asset
• Assess vulnerability of each asset (exposure, sensitivity and adaptive capacity)
o Assets grouped with rationale; Sensitivity scaling considered
o Results tabularised
• Online mapping of vulnerability, all information, within GIS system
ENGAGEMENT • Community Information Sheet
• Community Workshop
• Definition of values / success criteria
Assessment of Adaptation Options For each vulnerable asset:
• For each Mitigation / Adaptation measure:
o MCA. If MCA +ve, proceed to CBA
o Timeframes / triggers to be considered
• Trade-offs between option selection & asset value
Implementation For each vulnerable asset:
• For each Mitigation / Adaptation measure:
o Identify long-term pathways, considering trigger points and previous assessments
o Produce a short-term implementation plan to produce a clear action plan to 2030
o Produce a monitoring plan, detailing any monitoring or review that may be required
ENGAGEMENT • Obtain additional feedback on success
criteria & presented adaptation options:
o Community Information Sheet
o Community Workshop
o Online Survey
ENGAGEMENT • Public advertisement of Final Draft
CHRMAP
FIGURE 1-2 PROPOSED CHRMAP METHODOLOGY FLOW CHART (ADAPTED FROM WAPC CHRMAP GUIDELINES)
Shire of Shark Bay | 17 April 2018 Stakeholder and Community Engagement Plan Page 7
5652_01_R
01v02.d
ocx
2 STAKEHOLDER IDENTIFICATION
2.1 Internal Stakeholders
Internal stakeholders are those part of the decision-making team. Predominantly, these will be Shire of Shark
Bay Councillors and staff, although state government will also play a role. A Steering Committee has been
established to oversee preparation and completion of the CHRMAP, including review of project deliverables.
The Steering Committee plays an advisory role in the project and consists of representatives from:
◼ Shire of Shark Bay
◼ Gascoyne Development Commission
◼ Department of Transport
◼ Department of Biodiversity, Conservation and Attractions
◼ Department of Planning, Lands and Heritage.
Members of the Steering Committee are invited to take part in all engagement activities. Practically, it may be
that a subset of members is involved in each, and this is reported back to the group during the Steering
Committee meetings. Outcomes and summaries of each engagement activity would be incorporated into the
overall project deliverables and included in the fortnightly progress updates to the Shire’s project manager.
Engagement internally within the Shire, during and after the completion of the CHRMAP, will be paramount to
the ultimate success and implementation of the CHRMAP.
2.2 External Stakeholders
External stakeholders are those that are not decision-makers, but who are affected by the project. They might
live near the coast, use an asset or resource located in the coastal zone, or simply have an interest in the
coastal foreshore reserve. Some external stakeholders have been identified below; each engagement activity
will be publicly advertised to ensure those not captured below still have an opportunity to attend.
◼ Department of Fisheries
◼ Community members
◼ Recreational & Community groups
◼ http://www.sharkbay.wa.gov.au/community/community/community-directory.aspx
◼ Businesses based in Denham and surrounds
◼ Shark Bay Tourism Association
◼ World Heritage Discovery Visitor Centre
◼ Representatives from Yamatji Marlpa Aboriginal Corporation
◼ Emergency Management Agencies / Services Organisations
◼ Denham Volunteer Fire Brigade
◼ Shark Bay State Emergency Service
◼ Volunteer Marine Rescue (Shark Bay)
◼ Infrastructure Providers / Utilities
Shire of Shark Bay | 17 April 2018 Stakeholder and Community Engagement Plan Page 8
5652_01_R
01v02.d
ocx
◼ Horizon Power
◼ Water Corporation
◼ Telstra
Shire of Shark Bay | 17 April 2018 Stakeholder and Community Engagement Plan Page 9
5652_01_R
01v02.d
ocx
3 CONSULTATION APPROACH
3.1 Objectives of Strategy
This strategy aims to engage all relevant stakeholders to provide them with ownership of the CHRMAP and
acceptance of its outcomes. The objectives of the strategy are as follows:
◼ Consult with stakeholders and the community on climate change and its impacts in the coastal zone within
the Denham Townsite:
◼ What does this mean for the community?
◼ How can we adapt?
◼ Generate the success criteria for the risk assessment component of the CHRMAP. Success criteria
represent stakeholders’ tolerance and acceptability of the impact to assets from the identified coastal
hazards.
◼ Aid in the selection of site-specific adaptation measures. Stakeholders on the ground are likely to have a
knowledge of the site developed over years of interaction. This provides invaluable information that can
be applied to generate innovative adaptation measures.
3.2 Level of Consultation
As per the Shire’s consultant scope of work, levels of engagement have been defined as the following:
◼ Inform stakeholders about the outcomes of the hazard assessment and the risks identified through the
project.
◼ Collaborate with stakeholders to determine the level of risk tolerance, community values attributed to
coastal assets and to identify potential adaptation options.
◼ Involve stakeholders in assessing the adaptation options presented.
◼ Consult with stakeholders on the draft CHRMAP.
Each phase of consultation is assigned a level of consultation, allowing the consultation activity to be scoped
appropriately. At the commencement of each activity, the level of influence their contribution will have on the
overall outcome should be clearly defined. Managing stakeholder expectations regarding their involvement will
assist with ownership and acceptance of the CHRMAP.
3.3 Strategy Messaging
A consistent, central information source will be helpful in managing the consultation process. The Shire may
like to prepare a webpage of information related to the project as a central repository for the community. This
would include a brief description of the project, upcoming steps for the community to be involved in, and links
to materials such as SPP2.6, the State Coastal Zone Strategy, and CoastAdapt.
All queries should be directed through a member of the Steering Committee. At this time, we have identified
the Shire’s project representative: Shire of Shark Bay –Chief Executive Officer. The range of activities
planned in the strategy (refer Section 4) should minimise the CEO’s requirement as a key information source.
A set of key messages of the Stakeholder and Community Engagement Plan can be used in response to
queries (these can also be available on the webpage):
Shire of Shark Bay | 17 April 2018 Stakeholder and Community Engagement Plan Page 10
5652_01_R
01v02.d
ocx
◼ The project is initiated by the Shire of Shark Bay. The project is funded jointly through the Shire,
Department of Planning, Lands and Heritage, and the Department of Transport.
◼ The consultants carrying out the project are Water Technology, with support from sub-consultants.
◼ A Steering Committee has been established to oversee preparation and completion of the CHRMAP,
including review of project deliverables. The Steering Committee plays an advisory role in the project and
consists of representatives from: the Shire; Gascoyne Development Commission; Department of
Transport; Department of Biodiversity, Conservation and Attractions; and, the Department of Planning,
Lands and Heritage.
◼ The CHRMAP will provide strategic guidance for coordinated, integrated and sustainable decision making
by the Shire in terms of future land use planning and management within the project area. It will also be
used to guide necessary changes to the Shire’s Local Planning Strategy, Local Planning Scheme and
other relevant strategies or planning documents.
◼ The project will generate information on climate change and its impacts in the coastal zone within the
Denham Townsite. This will enable the Shire to optimise its use of the coastal foreshore reserve in present
day, and plan for how this may change in the future.
◼ Unless otherwise stated, information gathered from stakeholders during the project will only be applied to
the project and will remain confidential.
Shire of Shark Bay | 17 April 2018 Stakeholder and Community Engagement Plan Page 11
5652_01_R
01v02.d
ocx
4 ENGAGEMENT PLAN
4.1 Implementation Plan
Water Technology propose three main phases to the engagement process as follows:
◼ Values Assessment
◼ Adaptation Assessment
◼ Draft CHRMAP Advertising
4.2 Values Assessment
We propose a workshop to collate the community’s values. The community values workshop will be an
interactive process. Aerial imagery / maps will be presented, and community members allowed the opportunity
to identify areas and assets of high social, environment and cultural value.
Values may be grouped during or after the workshop, as appropriate. Our experience in values assessment
suggests that the following groupings may be appropriate:
◼ Recreational
◼ Commercial
◼ Environmental
◼ Historic / heritage
◼ Physical infrastructure
◼ Aboriginal
As per Table 4-1, a Community Information Sheet will be developed to advertise the first workshop. This will
also allow workshop attendees to be informed as to the purpose of the session. Additional focus groups / semi
structured interviews will be held as required during the site visit to ensure that all stakeholder groups’ views
are captured.
The outputs from the community values assessment will be used to generate the success criteria for the risk
assessment component of the CHRMAP. These will be key to the whole CHRMAP as it is these that will
ultimately drive the selection of adaptation options. It is important that a comprehensive approach be applied
at this stage of the project, in order to provide a CHRMAP applicable to the Shire and stakeholders.

Shire of Shark Bay | 17 April 2018 Stakeholder and Community Engagement Plan Page 12
5652_01_R
01v02.d
ocx
TABLE 4-1 PROPOSED ENGAGEMENT ACTIVITIES
Engagement Activity
Engagement Level
Description
Community Information Sheet 1 (CIS1)
Inform A summary sheet that describes the CHRMAP process, and advertises the upcoming Community Workshop 1
Community Workshop 1
Collaborate This will be an interactive workshop where the community has the opportunity to identify areas of value. Values will be categorised to aid the identification process.
Focus groups / semi structured interviews
Collaborate Some stakeholder groups may not respond well to workshops and surveys. The Steering Committee can identify such groups; they can then be consulted in a more focussed, one-on-one approach in order to ensure their needs are met and views heard
4.3 Adaptation Assessment
Following the generation of the coastal hazard maps, the risk assessment and the draft adaptation options, a
second workshop will be held. This workshop will explore the tolerance and acceptability of risks. The success
criteria defined from the outcomes of Community Workshop 1 will be reviewed, and the community can see
how the criteria have been applied.
The community will have a chance to view the hazard maps, increase their understanding of the CHRMAP
process, preview draft adaptation options and discuss any comments they may have in-person with coastal
specialists, Shire staff and potentially, elected representatives. Table 4-2 describes the workshop and survey
suggested for this assessment. Feedback received from this round of consultation will be included in the draft
CHRMAP document.
As part of the advertising process for the workshop, it is recommended the Shire send a mail out to landholders
that are likely to be affected by coastal hazards. The mail out would contain a letter from the Shire, an FAQ
sheet and links to the online hazard maps; basically, a targeted distribution of Community Information Sheet
2. This allows absorption of the information prior to the workshop.
4.4 Draft CHRMAP Advertising
The Draft CHRMAP will first be submitted to the Steering Committee for a peer review. Comments will be
responded to in table format. The completed draft CHRMAP document will then be advertised publicly for
comment, as per Table 4-3. Following the feedback process, comments will be collated, addressed and
included as a summary spreadsheet in the final CHRMAP.
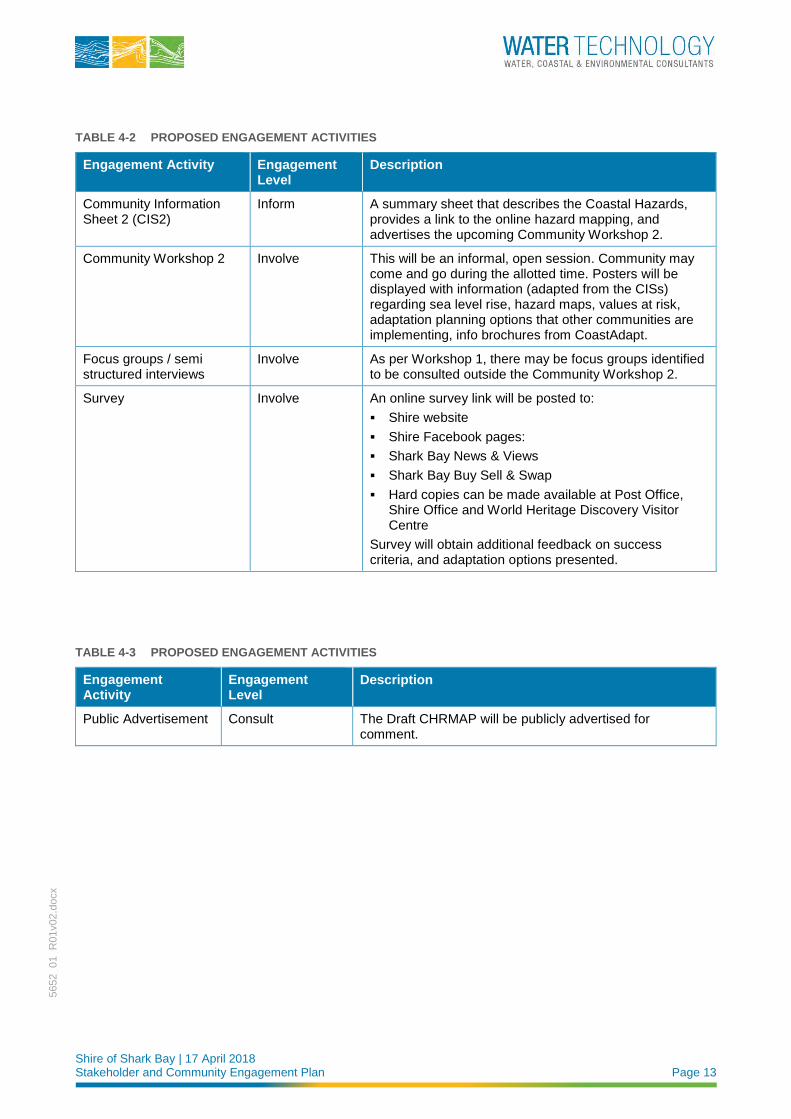
Shire of Shark Bay | 17 April 2018 Stakeholder and Community Engagement Plan Page 13
5652_01_R
01v02.d
ocx
TABLE 4-2 PROPOSED ENGAGEMENT ACTIVITIES
Engagement Activity Engagement Level
Description
Community Information Sheet 2 (CIS2)
Inform A summary sheet that describes the Coastal Hazards, provides a link to the online hazard mapping, and advertises the upcoming Community Workshop 2.
Community Workshop 2 Involve This will be an informal, open session. Community may come and go during the allotted time. Posters will be displayed with information (adapted from the CISs) regarding sea level rise, hazard maps, values at risk, adaptation planning options that other communities are implementing, info brochures from CoastAdapt.
Focus groups / semi structured interviews
Involve As per Workshop 1, there may be focus groups identified to be consulted outside the Community Workshop 2.
Survey
Involve An online survey link will be posted to:
▪ Shire website
▪ Shire Facebook pages:
▪ Shark Bay News & Views
▪ Shark Bay Buy Sell & Swap
▪ Hard copies can be made available at Post Office, Shire Office and World Heritage Discovery Visitor Centre
Survey will obtain additional feedback on success criteria, and adaptation options presented.
TABLE 4-3 PROPOSED ENGAGEMENT ACTIVITIES
Engagement Activity
Engagement Level
Description
Public Advertisement Consult The Draft CHRMAP will be publicly advertised for comment.
Shire of Shark Bay | 17 April 2018 Stakeholder and Community Engagement Plan Page 14
5652_01_R
01v02.d
ocx
5 MONITORING & EVALUATION Following initial engagement, each subsequent engagement activity will clearly include how previous
engagement has been applied. This builds community trust, as stakeholders can see they have been listened
to and views were recorded. In addition, transparency of the CHRMAP process will aid community acceptance.
Additional feedback mechanisms are as follows:
◼ Each workshop will issue a post-workshop evaluation survey.
◼ The survey itself will include a feedback component
◼ Feedback sought from the Steering Committee at each deliverable submission.
◼ A summary of the engagement process will be included in the Final CHRMAP.
Shire of Shark Bay | 17 April 2018 Stakeholder and Community Engagement Plan Page 15
5652_01_R
01v02.d
ocx
6 REFERENCES West Australian Planning Commission (WAPC, 2013). State Planning Policy No. 2.6 – State Coastal Planning Policy, prepared under the Planning and Development Act 2005.
Western Australian Planning Commission (WAPC, 2014). Coastal Hazard Risk Management and Adaptation Planning Guidelines
Western Australian Planning Commission (WAPC, 2017). Draft Planned or Managed Retreat Guidelines,
published by WAPC, Department of Planning, Lands and Heritage
Shire of Shark Bay | 31 March 2020 Final Report
5652_01_R
09v02.d
ocx
APPENDIX B CHAPTER REPORT: ESTABLISH THE CONTEXT
Denham Townsite CHRMAP
Chapter Report: Establish the Context
Shire of Shark Bay
12 July 2018
Shire of Shark Bay | 12 July 2018 Chapter Report: Establish the Context Page 1
5652_01_R
03v02.d
ocx
Document Status
Version Doc type Reviewed by Approved by Date issued
V01 DRAFT Christine Arrowsmith Christine Arrowsmith 25/05/2018
V02 FINAL Christine Arrowsmith Christine Arrowsmith 12/07/2018
Project Details
Project Name Chapter Report: Establish the Context
Client Shire of Shark Bay
Client Project Manager Paul Anderson
Water Technology Project Manager Joanna Garcia-Webb
Water Technology Project Director Christine Lauchlan Arrowsmith
Authors Joanna Garcia-Webb
Document Number 5652_01_R03v02.docx
COPYRIGHT
Water Technology Pty Ltd has produced this document in accordance with instructions from Shire of Shark Bay for their
use only. The concepts and information contained in this document are the copyright of Water Technology Pty Ltd. Use or
copying of this document in whole or in part without written permission of Water Technology Pty Ltd constitutes an
infringement of copyright.
Water Technology Pty Ltd does not warrant this document is definitive nor free from error and does not accept liability for
any loss caused, or arising from, reliance upon the information provided herein.
Ground Floor, 430 Roberts Rd
Subiaco WA 6008
Telephone (08) 6555 0105
ACN 093 377 283
ABN 60 093 377 283
Shire of Shark Bay | 12 July 2018 Chapter Report: Establish the Context Page 2
5652_01_R
03v02.d
ocx
12 July 2018
Paul Anderson Chief Executive Officer Shire of Shark Bay 65 Knight Terrace Denham WA 6537 Via email [email protected] Dear Paul
Chapter Report: Establish the Context
We are pleased to present the Denham Townsite Coastal Hazard Risk Management and Adaptation Plan
Chapter Report: Establish the Context. If you have any queries, please do not hesitate to contact me on (03)
8526 0830.
Yours sincerely
Joanna Garcia-Webb Senior Coastal Engineer
WATER TECHNOLOGY PTY LTD
Shire of Shark Bay | 12 July 2018 Chapter Report: Establish the Context Page 3
5652_01_R
03v02.d
ocx
EXECUTIVE SUMMARY It is internationally recognised that increasing sea levels and storm intensities will intensify coastal hazards
such as coastal inundation (temporary coastal flooding), storm erosion and long-term shoreline recession
(IPCC 2014). Consequently, State governments across Australia have introduced obligations that require local
governments to consider and plan for the effects of these hazards over various planning timeframes. In
Western Australia (WA), the governing policy is the Western Australian Planning Commission’s State Coastal
Planning Policy 2.6 (WAPC, 2013, herein referred to as “SPP2.6”). SPP2.6 recommends management
authorities develop a Coastal Hazard Risk Management and Adaptation Plan (CHRMAP). Specific guidelines
have been developed to assist in this process (WAPC, 2014).
One of the key objectives of SPP2.6 is to establish coastal foreshore reserves which include allowances for
the protection, conservation and enhancement of coastal values across the state. Risk assessment processes
are then utilised to identify risks that are intolerable to the community, and other stakeholders such as the
Shire of Shark Bay, indigenous and cultural interests, and private enterprise. Adaptation measures are then
developed according to the preferential adaptation hierarchy outlined in SPP2.6.
The Denham CHRMAP aims to investigate and provide the blueprint for adapting and addressing coastal
hazards which are likely to affect the Denham townsite over various planning timeframes. The CHRMAP will
provide strategic guidance for coordinated, integrated and sustainable decision making by the Shire of Shark
Bay in terms of future land use planning and management within the project area. The project will generate
information on climate change and its impacts in the coastal zone within the Denham Townsite. This will enable
the Shire to optimise its use of the coastal foreshore reserve in present day, and plan for how this may change
in the future.
The overall CHRMAP purpose is as follows:
◼ To identify vulnerable assets (public and private) and the risk posed to them by coastal hazards.
◼ To preserve community values for present and future generations.
◼ To develop a plan that will allow the Shire to respond to identified risks through adaptation planning
activities.
◼ To recommend monitoring plans to ensure the risk management and adaptation plan activities are working
into the future as expected.
This document outlines the key management and adaptation issues that need to be considered in the
CHRMAP, as well as identifying the coastal assets and success criteria (community values). It is the
‘Establishing the Context’ component of the CHRMAP process, as described in the top bubble of the flow chart
displayed in Figure 1-2, also replicated below. The Stakeholder and Community Engagement Plan, Community
Information Sheet 1 and the Issues Paper have been prepared separately in earlier documents. A summary
of these is included within this report.
Project Inception Meeting
• Held via teleconference. Finalise project scope, deliverables, timing, data gap actions and identify key stakeholders
Stakeholder and Community Engagement Plan
• Preparation of Community Information Sheet 1
Literature Review and Issues Paper
• Historical reports will be reviewed, state and local coastal policy, planning schemes & instruments considered.
Site Investigations / Community Workshop 1 (Workshop 1 will be undertaken on the same trip as the site visit.)
• CIS1 to be posted online / mailed immediately prior to Workshop 1; focus group interviews available outside Workshop
• Community Values Assessment can then be completed (community and cultural values identified).
• Site visit will allow for finalisation of the Identification of Coastal Assets task and fill gaps noted in Issues Paper.
• Site visit to also aid in coastal processes understanding.
Shire of Shark Bay | 12 July 2018 Chapter Report: Establish the Context Page 4
5652_01_R
03v02.d
ocx
The following sections summarise the key items of note identified in this report.
Coastal Hazards Summary
To identify coastal hazards, analysis and investigation is required. The full assessment of coastal hazards will
be undertaken in the next phase of the project. This report presents a literature review of work undertaken to
date in order to establish the context for the study, as summarised below:
◼ When dealing with coastal adaptation, it is important to understand the level of accuracy of the modelling,
as it informs the risk and vulnerability ratings. However, we believe the most effective approach is to use
the modelling to identify triggers, and their corresponding coastal management action. An indicative
likelihood and timeframe can be provided for guidance, but the ultimate adaptive action is driven by the
triggers.
◼ Modelling will be undertaken using the available data to quantify the coastal erosion and inundation
hazards. Present data gaps mean assumptions will be made that limit the accuracy of the results.
◼ To assist in filling the knowledge gaps, the following ongoing data collection is recommended. These are
listed in order of priority. Except where indicated, the benefit of the data will not be gained during the
present study, but in the application of the resulting coastal management plan:
◼ Locally placed nearshore water level and wave data logger. This will enable calibration of wave
models, especially if a storm / cyclone is captured during the deployment. Following the completion
of the CHRMAP, the data can be used to get a better understanding of event probabilities, rather than
just triggers.
◼ Ideally, this instrument would be deployed before the commencement of the next cyclone season.
If the data is to be used in the present study, the instrument would need to be deployed within
the next few months.
◼ Regular photographic beach monitoring is a useful tool in analysing beach behaviour. This can be
conducted at 6-monthly intervals at the end of the summer and winter. Photos should also be taken
immediately following severe storms. They should be undertaken from a set vantage point to allow
accurate comparisons between images. The images can be used to supplement available data when
undertaking adaptation option design. These images can also be used to support adaptation option
funding applications, and in educating the community about natural fluctuations in beach shape.
◼ These can be commenced immediately. Water Technology have proformas for these which allow
Shire staff to undertake the inspections, once initial guidance is provided. Coastal specialists
should review the data every couple of years, or if erosion is causing an issue.
◼ This data can also be used to identify if a trigger has been reached.
◼ Beach surveys, ideally every 6-months following the summer and winter periods. If possible,
immediately following cyclones. Corresponding monitoring photos should be taken at the same time.
◼ Regular monitoring of the marine structures / assets – e.g. seawall, jetties. These should be
undertaken with consistent proformas to allow comparison between inspections.
◼ These can be commenced immediately. Water Technology have proformas for these which allow
Shire staff to undertake the inspections, once initial guidance is provided. Coastal / marine
specialists should review the data every couple of years, or if there is an issue with an asset.
◼ Geotechnical investigations to determine the presence of bedrock. If located relatively near the
surface, bedrock can act as a natural protection structure, and negate the need for other mitigation
works. However, in low lying areas the presence of bedrock may not alter the level of risk to coastal
Shire of Shark Bay | 12 July 2018 Chapter Report: Establish the Context Page 5
5652_01_R
03v02.d
ocx
hazards. If the area is inundated the hard surface will not provide the expected protection to erosion.
The benefits of such an investigation will be explored in future stages of the CHRMAP.
Planning Items / Controls Summary
When managing the coastal zone and its hazards, a number of planning instruments may be relevant. For
example, there may be existing coastal hazard risk mitigation measures in the planning policies, schemes,
strategies and plans for the Denham townsite and surrounds. Adaptation plans may include the
recommendation of additional plans / clauses to address the coastal hazard risk. A literature review of the
relevant planning documentation was carried out; this is summarised below:
◼ SPP2.6 aims to avoid future development within areas identified to be at risk within the planning timeframe
of 100-years. For areas at risk, all potential adaptation options will be identified under the risk management
categories of avoid, managed retreat, accommodate and protect to manage the unacceptable risks.
◼ The ultimate aims of the policy are to ensure all future development takes into account coastal hazards,
climate change, and landform stability. Coastal values (landscape, biodiversity, ecosystems, indigenous
and cultural) are to be conserved.
◼ The WA Coastal Zone Strategy is a critical planning guide for any coastal community. It outlines the State
Government’s aims for sustainable coastal development into the future. The State Government
emphasises the preference of public interests over private and industry interests, and reinforces the
presumption of landholder responsibility. The State Government also reiterates protection should be used
only in the most exceptional circumstances. Ultimately, the Shire will be responsible for determining how
local landholders address risk, possibly by writing an LPP under the guidance of this strategy.
◼ This CHRMAP may identify developed land that will be at risk to coastal hazards, that, for various reasons
have not yet been formally identified. The current draft of LPS 4 does not outline how such areas are to
be managed. Guidance may be required to address these risks.
◼ The risks will be identified in Chapter Reports:
◼ Coastal Hazard & Vulnerability Assessment
◼ Risk Assessment.
◼ Presently there are limited development controls relating to the impacts of coastal hazards for land use
and development. At present, only the risk of inundation is addressed. Finished floor levels in these areas
are addressed in LPS 4 but there is no guidance for managing the impact that increased floor levels will
have on the interface between buildings and the adjacent public realm. This will be a challenge especially
within the Town Centre, where the highest concentration of retail premises and pedestrians requires easily
negotiated thresholds. It also creates a challenge in integrating new development with existing
development, especially along Knight Terrace.
◼ This will be addressed in the Chapter Report: Identification of Adaptation Options
◼ Absence of a local planning policy to provide guidance for developers and decision makers on the form
and nature of acceptable development on land exposed to coastal processes. For example, whilst
increasing finished floor levels for habitable buildings may succeed in minimising damage to the affected
property, the manner in which the increase is achieved can have implications for how quickly water can
recede as well as impact on other development.
◼ This will be addressed in:
◼ Chapter Report Assessment of Adaptation Options
◼ Draft CHRMAP (includes Implementation Plan).
Shire of Shark Bay | 12 July 2018 Chapter Report: Establish the Context Page 6
5652_01_R
03v02.d
ocx
Identification of Coastal Assets
All the assets in the coastal foreshore reserve were collected as defined by the literature review. A total of 144
assets were identified, photographed, georeferenced and classified into the categories of Commercial, Public,
Residential and Tourism Related. Risks to these assets will be considered by applying the success criteria in
the Risk Analysis and Evaluation phase of the project (refer Figure 1-2 for project phases).
Each asset was colour coded based on its classification for ease of identification in the mapping. The online
database can be found at the following link:
https://watech.maps.arcgis.com/apps/webappviewer/index.html?id=6e092b4d0f044e038a721705e907c084
Within the database are brief descriptions of each asset, together with a photograph. All assets are
georeferenced.
Community Values Assessment
Community and stakeholder involvement is a critical component of the CHRMAP process, as it defines what
and how much value is placed on assets within the study area. This will inform the adaptation planning process
and ensure all needs are considered. As such, the project contains a high level of community and stakeholder
engagement. This provides ownership of the CHRMAP with those that it affects, and acceptance of its
outcomes. The engagement is discussed further in Section 6.
The community values workshop identified the following success criteria from which to assess the coastal
hazard risks:
◼ Protection of the environmental assets of the study area / planning to retain environmental integrity
◼ Protection of the recreational value of the coastline
◼ Protection of the cultural values of the coastline
◼ Maintenance of the culture of the Denham Town Centre
◼ Maintenance of a level of public infrastructure
◼ Development controls not to inhibit the landscape
The aim of this stage of the engagement process is to engage with both internal and external stakeholders.
As only internal stakeholders were present at the workshop, there is the option of bringing the proposed online
survey (Water Technology, 2018) forward. The development of the success criteria could be further enhanced
by the addition of external stakeholder input in the form of an online survey.
Next Steps
The next phases of the study are to identify the coastal hazard risks and undertake a vulnerability assessment.
That is, examine the impacts of coastal erosion and storm surge inundation on the assets and their
corresponding values.
Shire of Shark Bay | 12 July 2018 Chapter Report: Establish the Context Page 7
5652_01_R
03v02.d
ocx
CONTENTS
1 INTRODUCTION 9
2 CHRMAP PURPOSE & OBJECTIVES 12
3 PREVIOUS COASTAL INVESTIGATIONS 13
3.1 Available Data 13
3.2 Knowledge Gaps & Recommendations 13
3.2.1 Coastal Erosion 13
3.2.2 Coastal Inundation 15
3.3 Summary for Decision Makers and Community 16
4 EXISTING PLANNING CONTROLS 18
4.1 State Planning Documentation 18
4.1.1 State Planning Strategy 18
4.1.2 WA Coastal Zone Strategy 19
4.1.3 State Planning Policy 2.6: State Coastal Planning Policy (SPP2.6) 21
4.1.4 Other Relevant State Documents 21
4.2 Local Planning Documents 22
4.2.1 Shire of Shark Bay Local Planning Strategy 22
4.2.2 Denham Townsite Plan 23
4.2.3 Local Planning Scheme 23
4.3 Summary for Decision Makers and Community 25
5 IDENTIFICATION OF COASTAL ASSETS 26
5.1 Collection Methodology 26
5.2 Asset Classifications 26
5.3 Asset Data 26
6 COMMUNITY VALUES ASSESSMENT 30
6.1 Engagement Process 30
6.2 Stakeholders 30
6.3 Community Values Workshop Summary 30
6.3.1 Anecdotal Observations 34
6.3.2 Workshop Close 34
6.4 Success Criteria 34
6.4.1 Engagement 35
7 CONCLUSIONS & RECOMMENDATIONS 36
7.1 Coastal Hazards Summary 36
7.2 Planning Items / Controls Summary 37
7.3 Identification of Coastal Assets 38
7.4 Community Values Assessment: 38
7.5 Next Steps 38
Shire of Shark Bay | 12 July 2018 Chapter Report: Establish the Context Page 8
5652_01_R
03v02.d
ocx
8 REFERENCES 39
APPENDICES Appendix A Supporting Planning Controls / Information
Appendix B Review of Historical Coastal Investigations
Appendix C Storm Surge Modelling Report Review
Appendix D Community Information Sheet
Appendix E Asset & Community Values Maps
LIST OF FIGURES Figure 1-1 Extent of CHRMAP 10
Figure 1-2 Proposed CHRMAP methodology flow chart (adapted from WAPC CHRMAP Guidelines) 11
Figure 4-1 State planning framework for Western Australia 18
Figure 4-2 Policy Relationships 19
Figure 5-1 Identified assets in Denham townsite 28
Figure 5-2 Identified assets in study area 29
Figure 6-1 Identified community values in Denham townsite 32
Figure 6-2 Identified community values in study area 33
LIST OF TABLES Table 3-1 Summary of available data 14
Table 3-2 Summary for decision makers and community – coastal hazards 17
Table 4-1 Local planning strategy objectives - coastal areas 23
Table 4-2 Summary for decision makers and community – planning controls 25
Table 5-1 Asset summary 27
Table 6-1 Values ‘Key’ 31
Table 6-2 Success criteria 35
Table B-1 MRA (2014) Design storm surge inundation levels for Denham 46
Table B-2 Seashore Engineering (2018) Design storm surge inundation levels for Denham 46
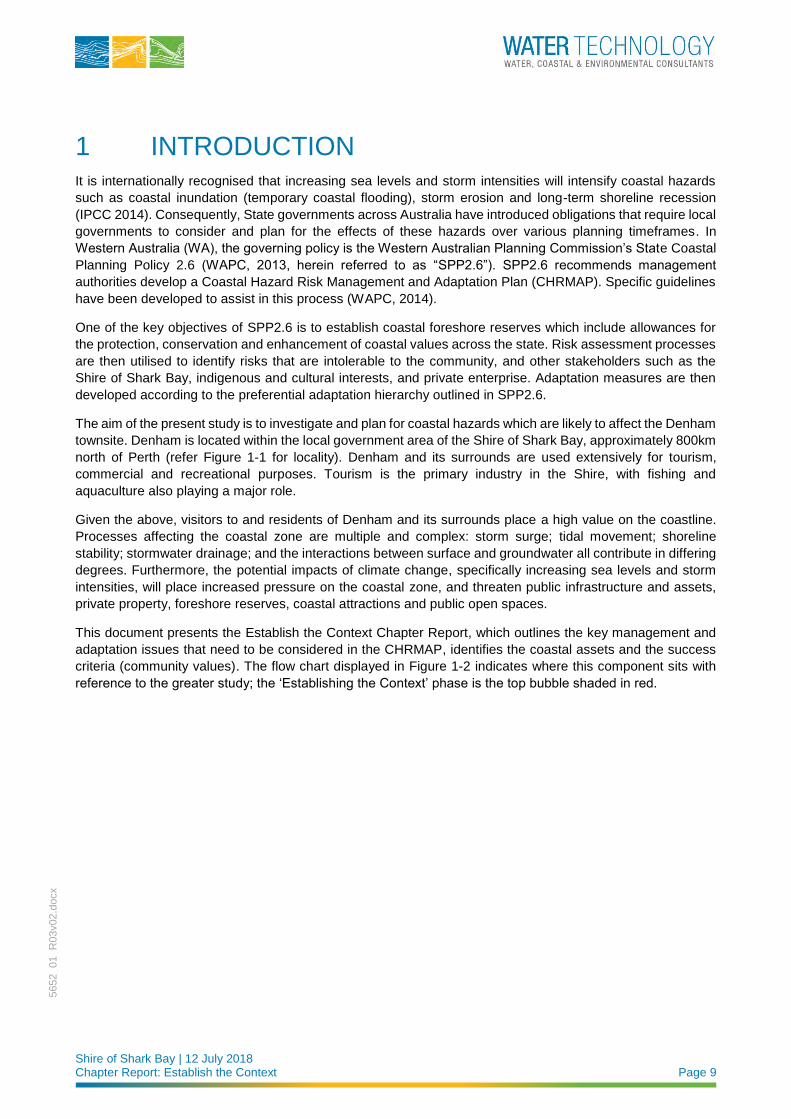
Shire of Shark Bay | 12 July 2018 Chapter Report: Establish the Context Page 9
5652_01_R
03v02.d
ocx
1 INTRODUCTION It is internationally recognised that increasing sea levels and storm intensities will intensify coastal hazards
such as coastal inundation (temporary coastal flooding), storm erosion and long-term shoreline recession
(IPCC 2014). Consequently, State governments across Australia have introduced obligations that require local
governments to consider and plan for the effects of these hazards over various planning timeframes. In
Western Australia (WA), the governing policy is the Western Australian Planning Commission’s State Coastal
Planning Policy 2.6 (WAPC, 2013, herein referred to as “SPP2.6”). SPP2.6 recommends management
authorities develop a Coastal Hazard Risk Management and Adaptation Plan (CHRMAP). Specific guidelines
have been developed to assist in this process (WAPC, 2014).
One of the key objectives of SPP2.6 is to establish coastal foreshore reserves which include allowances for
the protection, conservation and enhancement of coastal values across the state. Risk assessment processes
are then utilised to identify risks that are intolerable to the community, and other stakeholders such as the
Shire of Shark Bay, indigenous and cultural interests, and private enterprise. Adaptation measures are then
developed according to the preferential adaptation hierarchy outlined in SPP2.6.
The aim of the present study is to investigate and plan for coastal hazards which are likely to affect the Denham
townsite. Denham is located within the local government area of the Shire of Shark Bay, approximately 800km
north of Perth (refer Figure 1-1 for locality). Denham and its surrounds are used extensively for tourism,
commercial and recreational purposes. Tourism is the primary industry in the Shire, with fishing and
aquaculture also playing a major role.
Given the above, visitors to and residents of Denham and its surrounds place a high value on the coastline.
Processes affecting the coastal zone are multiple and complex: storm surge; tidal movement; shoreline
stability; stormwater drainage; and the interactions between surface and groundwater all contribute in differing
degrees. Furthermore, the potential impacts of climate change, specifically increasing sea levels and storm
intensities, will place increased pressure on the coastal zone, and threaten public infrastructure and assets,
private property, foreshore reserves, coastal attractions and public open spaces.
This document presents the Establish the Context Chapter Report, which outlines the key management and
adaptation issues that need to be considered in the CHRMAP, identifies the coastal assets and the success
criteria (community values). The flow chart displayed in Figure 1-2 indicates where this component sits with
reference to the greater study; the ‘Establishing the Context’ phase is the top bubble shaded in red.

Shire of Shark Bay | 12 July 2018 Chapter Report: Establish the Context Page 10
5652_01_R
03v02.d
ocx
Figure 1-1 Extent of CHRMAP
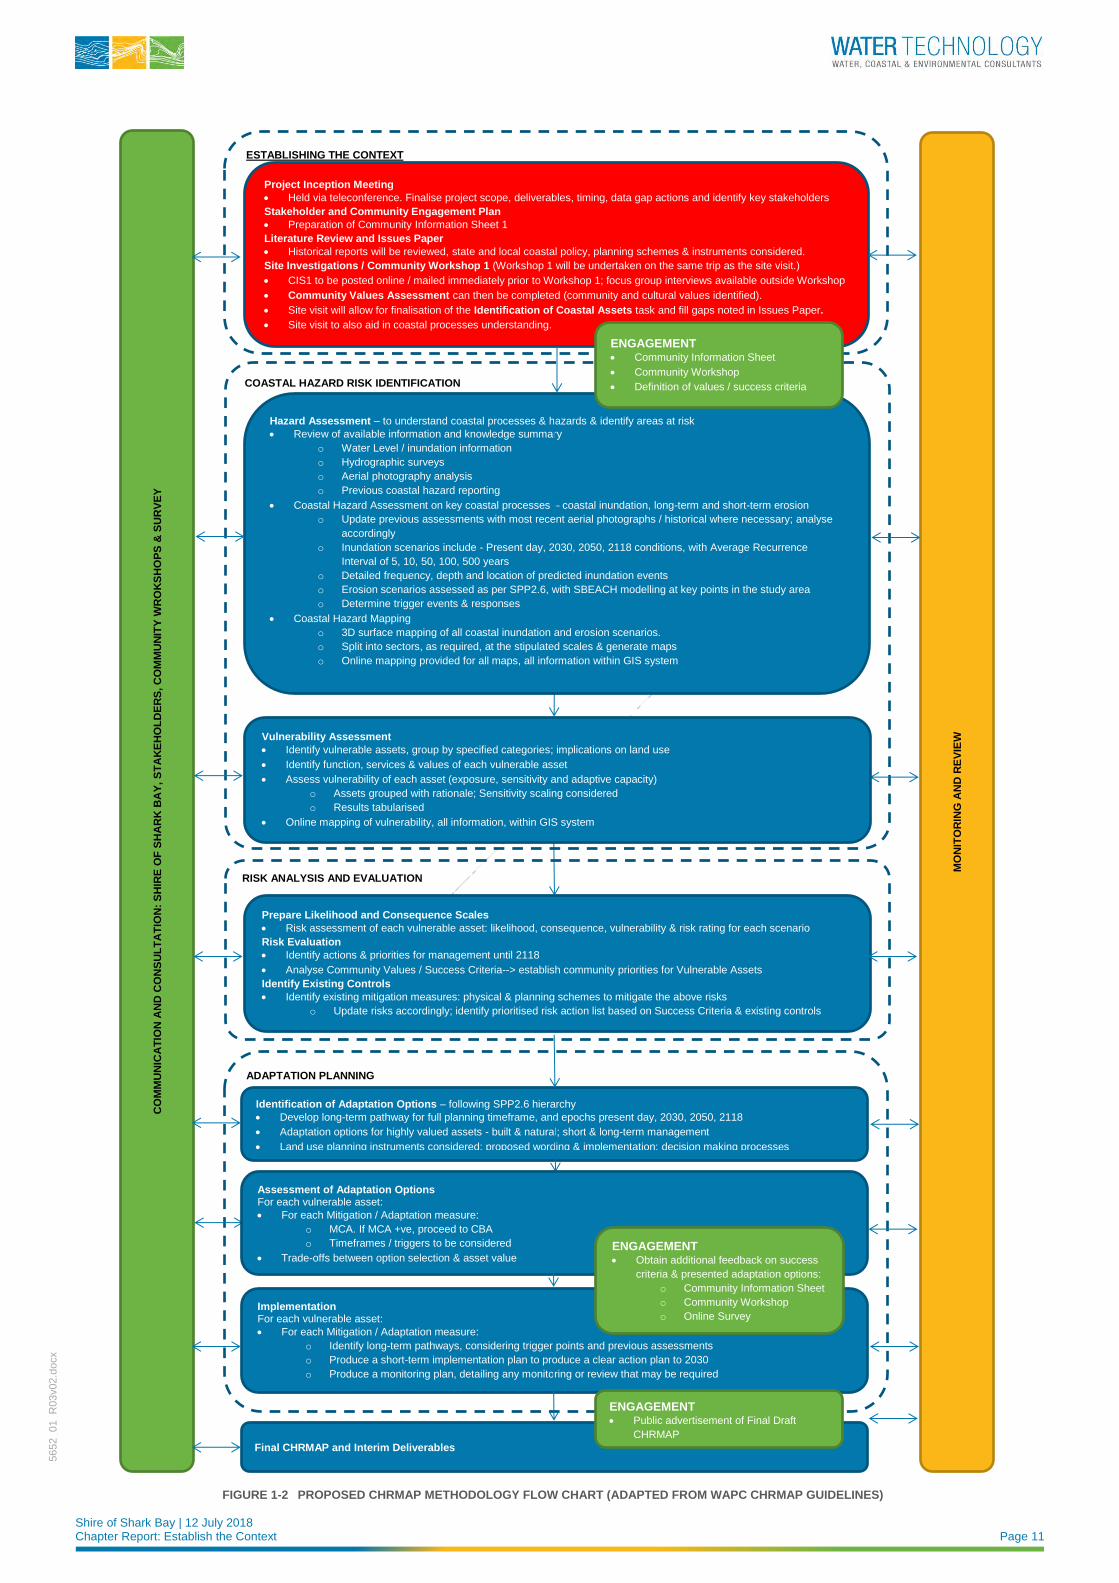
Shire of Shark Bay | 12 July 2018 Chapter Report: Establish the Context Page 11
5652_01_R
03v02.d
ocx
ESTABLISHING THE CONTEXT
Project Inception Meeting
• Held via teleconference. Finalise project scope, deliverables, timing, data gap actions and identify key stakeholders
Stakeholder and Community Engagement Plan
• Preparation of Community Information Sheet 1
Literature Review and Issues Paper
• Historical reports will be reviewed, state and local coastal policy, planning schemes & instruments considered.
Site Investigations / Community Workshop 1 (Workshop 1 will be undertaken on the same trip as the site visit.)
• CIS1 to be posted online / mailed immediately prior to Workshop 1; focus group interviews available outside Workshop
• Community Values Assessment can then be completed (community and cultural values identified).
• Site visit will allow for finalisation of the Identification of Coastal Assets task and fill gaps noted in Issues Paper.
• Site visit to also aid in coastal processes understanding.
CO
MM
UN
ICA
TIO
N A
ND
CO
NS
UL
TA
TIO
N:
SH
IRE
OF
SH
AR
K B
AY
, S
TA
KE
HO
LD
ER
S, C
OM
MU
NIT
Y W
RO
KS
HO
PS
& S
UR
VE
Y
MO
NIT
OR
ING
AN
D R
EV
IEW
Final CHRMAP and Interim Deliverables
ADAPTATION PLANNING
COASTAL HAZARD RISK IDENTIFICATION
Hazard Assessment – to understand coastal processes & hazards & identify areas at risk
• Review of available information and knowledge summary
o Water Level / inundation information
o Hydrographic surveys
o Aerial photography analysis
o Previous coastal hazard reporting
• Coastal Hazard Assessment on key coastal processes – coastal inundation, long-term and short-term erosion
o Update previous assessments with most recent aerial photographs / historical where necessary; analyse
accordingly
o Inundation scenarios include - Present day, 2030, 2050, 2118 conditions, with Average Recurrence
Interval of 5, 10, 50, 100, 500 years
o Detailed frequency, depth and location of predicted inundation events
o Erosion scenarios assessed as per SPP2.6, with SBEACH modelling at key points in the study area o Determine trigger events & responses
• Coastal Hazard Mapping
o 3D surface mapping of all coastal inundation and erosion scenarios.
o Split into sectors, as required, at the stipulated scales & generate maps
o Online mapping provided for all maps, all information within GIS system
RISK ANALYSIS AND EVALUATION
Prepare Likelihood and Consequence Scales
• Risk assessment of each vulnerable asset: likelihood, consequence, vulnerability & risk rating for each scenario
Risk Evaluation
• Identify actions & priorities for management until 2118
• Analyse Community Values / Success Criteria--> establish community priorities for Vulnerable Assets
Identify Existing Controls
• Identify existing mitigation measures: physical & planning schemes to mitigate the above risks
o Update risks accordingly; identify prioritised risk action list based on Success Criteria & existing controls
Identification of Adaptation Options – following SPP2.6 hierarchy
• Develop long-term pathway for full planning timeframe, and epochs present day, 2030, 2050, 2118
• Adaptation options for highly valued assets - built & natural; short & long-term management
• Land use planning instruments considered: proposed wording & implementation; decision making processes
Vulnerability Assessment
• Identify vulnerable assets, group by specified categories; implications on land use
• Identify function, services & values of each vulnerable asset
• Assess vulnerability of each asset (exposure, sensitivity and adaptive capacity)
o Assets grouped with rationale; Sensitivity scaling considered
o Results tabularised
• Online mapping of vulnerability, all information, within GIS system
ENGAGEMENT • Community Information Sheet
• Community Workshop
• Definition of values / success criteria
Assessment of Adaptation Options For each vulnerable asset:
• For each Mitigation / Adaptation measure:
o MCA. If MCA +ve, proceed to CBA
o Timeframes / triggers to be considered
• Trade-offs between option selection & asset value
Implementation For each vulnerable asset:
• For each Mitigation / Adaptation measure:
o Identify long-term pathways, considering trigger points and previous assessments
o Produce a short-term implementation plan to produce a clear action plan to 2030
o Produce a monitoring plan, detailing any monitoring or review that may be required
ENGAGEMENT • Obtain additional feedback on success
criteria & presented adaptation options:
o Community Information Sheet
o Community Workshop
o Online Survey
ENGAGEMENT • Public advertisement of Final Draft
CHRMAP
FIGURE 1-2 PROPOSED CHRMAP METHODOLOGY FLOW CHART (ADAPTED FROM WAPC CHRMAP GUIDELINES)
Shire of Shark Bay | 12 July 2018 Chapter Report: Establish the Context Page 12
5652_01_R
03v02.d
ocx
2 CHRMAP PURPOSE & OBJECTIVES As discussed in Section 1, the CHRMAP is a legislative recommendation from the state government.
The Denham CHRMAP aims to investigate and provide the blueprint for adapting and addressing coastal
hazards which are likely to affect the Denham townsite over various planning timeframes. The CHRMAP will
provide strategic guidance for coordinated, integrated and sustainable decision making by the Shire of Shark
Bay in terms of future land use planning and management within the project area. The project will generate
information on climate change and its impacts in the coastal zone within the Denham Townsite. This will enable
the Shire to optimise its use of the coastal foreshore reserve in present day, and plan for how this may change
in the future.
The overall CHRMAP purpose is as follows:
◼ To identify vulnerable assets (public and private) and the risk posed to them by coastal hazards.
◼ To preserve community values for present and future generations.
◼ To develop a plan that will allow the Shire to respond to identified risks through adaptation planning
activities.
◼ To recommend monitoring plans to ensure the risk management and adaptation plan activities are working
into the future as expected.
Analysis and investigation is required to identify the coastal hazards. The full assessment of coastal hazard
will be undertaken in the next phase of the project. This report presents a literature review of work undertaken
to date in order to establish the context for the study – refer Section 3.
When managing the coastal zone and its hazards, a number of planning instruments may be relevant. For
example, there may be existing coastal hazard risk mitigation measures in the planning policies, schemes,
strategies and plans for the Denham townsite and surrounds. A literature review of the relevant planning
documentation is carried out in Section 4. Adaptation plans may include the recommendation of additional
plans / clauses to address the coastal hazard risk.
All the assets in the coastal foreshore reserve, as defined by the literature review presented in Section 3, were
collected and described in Section 5.
Community and stakeholder involvement is a critical component of the CHRMAP process, as it defines what
and how much value is placed on assets within the study area. This will inform the adaptation planning process
and ensure all needs are considered. As such, the project contains a high level of community and stakeholder
engagement. This provides ownership of the CHRMAP with those that it affects, and acceptance of its
outcomes. The engagement is discussed further in Section 6.
Shire of Shark Bay | 12 July 2018 Chapter Report: Establish the Context Page 13
5652_01_R
03v02.d
ocx
3 PREVIOUS COASTAL INVESTIGATIONS The Shire of Shark Bay has undertaken several studies in recent years relating to coastal hazards for the
Denham townsite. These studies form the basis of the coastal knowledge for the CHRMAP initiation and have
been reviewed to identify critical information that will assist in the analysis of coastal hazards. The methodology
of relevant studies has also been considered to provide insight into the level of confidence to be drawn from
the previous conclusions. These reviews are presented in Appendix B. Gaps in the present knowledge
regarding coastal hazards affecting Denham have been considered to ensure that the CHRMAP process can
be wholly and satisfactorily completed. A summary of these data gaps and recommendations required to fill
these gaps are provided within this section.
3.1 Available Data
There is limited measured data available for the study site. A summary of the available data is provided in
Table 3-1 below. The applicability of the data to the present study is included in the final column.
A key gap is long-term water level data within Shark Bay, specifically in the proximity of Denham, as well as
wave data. The lack of data makes it difficult to calibrate numerical models for the area.
Whilst the Digital Elevation Model covers the full study area, it is data converted from aerial imagery. Levels
derived from this source can have errors due to the presence of vegetation and other features. It is considered
good practice to ground truth this data with survey data. For example, if the Shire has surveys of road levels,
this can be used to test the accuracy of the dataset.
3.2 Knowledge Gaps & Recommendations
3.2.1 Coastal Erosion
The erosion assessments undertaken to date will be expanded on in the present study in order to meet the
planning policy requirements. The present paucity of measured data means triggered management responses
will be important for the Shire in coming years. That is, adaptation will be driven by events and their impacts,
rather than a set predicted timeframe.
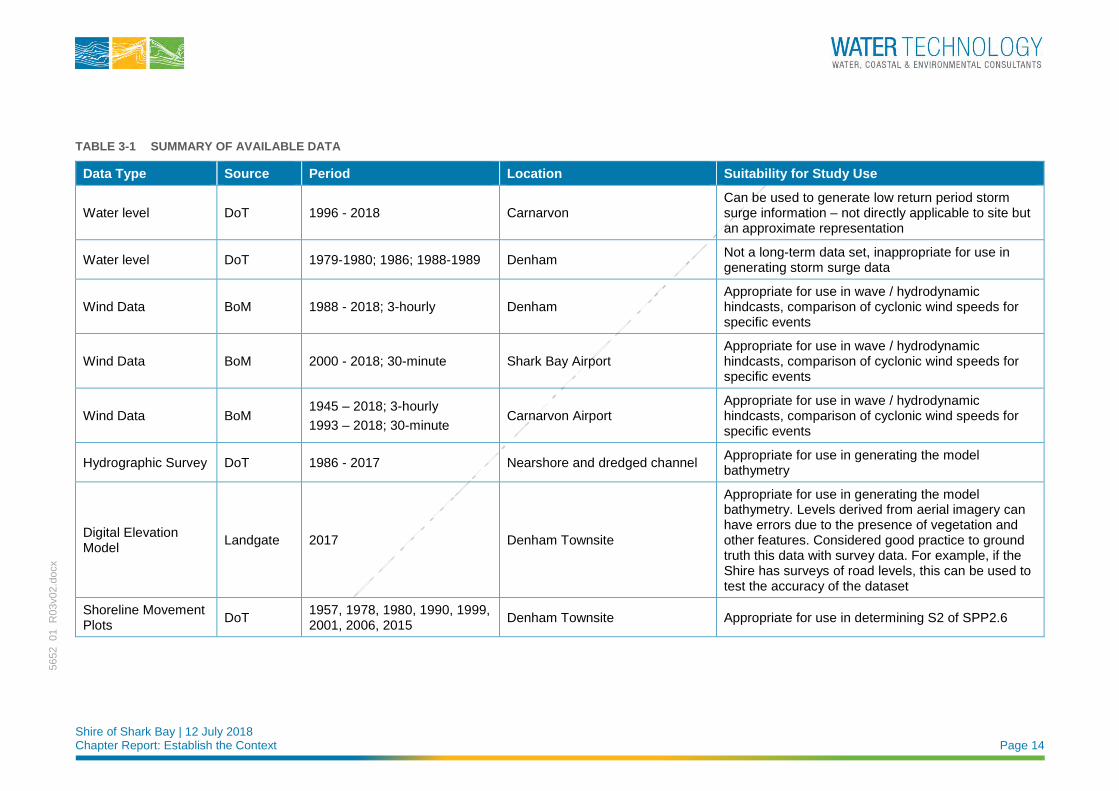
Shire of Shark Bay | 12 July 2018 Chapter Report: Establish the Context Page 14
5652_01_R
03v02.d
ocx
TABLE 3-1 SUMMARY OF AVAILABLE DATA
Data Type Source Period Location Suitability for Study Use
Water level DoT 1996 - 2018 Carnarvon Can be used to generate low return period storm surge information – not directly applicable to site but an approximate representation
Water level DoT 1979-1980; 1986; 1988-1989 Denham Not a long-term data set, inappropriate for use in generating storm surge data
Wind Data BoM 1988 - 2018; 3-hourly Denham Appropriate for use in wave / hydrodynamic hindcasts, comparison of cyclonic wind speeds for specific events
Wind Data BoM 2000 - 2018; 30-minute Shark Bay Airport Appropriate for use in wave / hydrodynamic hindcasts, comparison of cyclonic wind speeds for specific events
Wind Data BoM 1945 – 2018; 3-hourly
1993 – 2018; 30-minute Carnarvon Airport
Appropriate for use in wave / hydrodynamic hindcasts, comparison of cyclonic wind speeds for specific events
Hydrographic Survey DoT 1986 - 2017 Nearshore and dredged channel Appropriate for use in generating the model bathymetry
Digital Elevation Model
Landgate 2017 Denham Townsite
Appropriate for use in generating the model bathymetry. Levels derived from aerial imagery can have errors due to the presence of vegetation and other features. Considered good practice to ground truth this data with survey data. For example, if the Shire has surveys of road levels, this can be used to test the accuracy of the dataset
Shoreline Movement Plots
DoT 1957, 1978, 1980, 1990, 1999, 2001, 2006, 2015
Denham Townsite Appropriate for use in determining S2 of SPP2.6
Shire of Shark Bay | 12 July 2018 Chapter Report: Establish the Context Page 15
5652_01_R
03v02.d
ocx
3.2.1.1 Gap-Filling Recommendations
To assist in filling the knowledge gaps, the following ongoing data collection is recommended:
◼ Regular photographic beach and structure monitoring is a useful tool in analysing beach behaviour. This
can be conducted at 6-monthly intervals at the end of the summer and winter. Photos should also be taken
immediately following severe storms. They should be undertaken from a set vantage point to allow
accurate comparisons between images. The images can be used to supplement available data when
undertaking adaptation option design. These images can also be used to support adaptation option
funding applications, and in educating the community about natural fluctuations in beach shape.
◼ Beach surveys, ideally every 6-months following the summer and winter periods. If possible, immediately
following cyclones. Corresponding monitoring photos should be taken at the same time.
◼ Regular monitoring of the marine structures / assets – e.g. seawall, jetties. These should be undertaken
with consistent proformas to allow comparison between inspections.
◼ Geotechnical investigations to determine the presence of bedrock. If located relatively near the surface,
bedrock can act as a natural protection structure, and negate the need for other mitigation works.
However, in low lying areas the presence of bedrock may not alter the level of risk to coastal hazards. If
the area is inundated the hard surface will not provide the expected protection to erosion. The benefits of
such an investigation will be explored in future stages of the CHRMAP.
3.2.2 Coastal Inundation
Water Technology included cyclone modelling specialist Dr Bruce Harper, of Systems Engineering Australia
Pty Ltd (SEA), in the project team. Bruce has over 40-years of specialist experience in cyclone modelling. He
has conducted a peer review of the methodology employed in the MRA (2014) report and will subsequently
undertake a review of Water Technology’s application of this work. The aim is to provide an assessment
regarding the accuracy of the assumptions, and correspondingly greater certainty of the error margins, and
thus likelihood of occurrence of the various simulated events.
The full memorandum of the MRA report review is included in Appendix C. Key knowledge gaps identified in
the review are as follows:
◼ While the overall study approach is supported, there is a lack of detail around the many essential steps
needed to fulfil the benefits of the methodology. This does not allow a ready endorsement of the results.
◼ It would have been more compelling to see the comparisons of measured and modelled wind speeds and
pressures for each modelled event (e.g. using winds at Carnarvon) to provide confidence in the
hydrodynamic model results, noting that the BoM parameters in conjunction with a Holland (1980) model
often do not match these well.
◼ To further demonstrate that the model has predictive skill for this region the long-term winds for (say)
Carnarvon could be generated and compared with the measured winds (e.g. Harper and Mason 2016).
Unfortunately, this is not done and so the reliability of the whole analysis remains unknown.
◼ The method ignores the potential contribution of wave setup at Denham, which although not likely to be
critical given the exposure and the shallow margins, is also not likely to be insignificant at higher ARI.
Given the proximity of assets to the shoreline, wave setup and runup are likely important components of
any tropical cyclone storm tide impact and should be estimated as part of the CHRMAP.
◼ There is no validation of the Monte Carlo storm climatology against regional data. Given that storm tide is
a complex function of wind-field scale, magnitude, speed of movement, frequency and track, the synthetic
storms should be demonstrated to produce a similar statistical distribution to regionally-measured winds
where they are available (Harper, 2001). The need for this is compounded by the adoption of the US-
Shire of Shark Bay | 12 July 2018 Chapter Report: Establish the Context Page 16
5652_01_R
03v02.d
ocx
based Emanuel approach combined with the lack of parameter information in the BoM dataset and the
assumptions made in the WES model, which together leave a wide range of interpretation. Finally, there
is a lack of disclosure of how the final 154 event extrapolation was performed and what likely range of
uncertainty exists with that.
◼ It is difficult to conclude the reliability of the final MRA (2014) Table 5.1 “Tide plus Surge”
recommendations. The various uncertainties in the methodology mean it may be ± 0.5 m at the 500 y ARI.
Wave setup allowances will add to the upper limit of this uncertainty by potentially another 0.5 m at the
500 y ARI. In contrast, the estimated 20 y ARI level of 1.9 m AHD seems relatively high given that HAT is
only around 0.9 m AHD.
3.2.2.1 Gap-Filling Recommendations
Whilst the review highlights some gaps in the modelling reported in MRA (2014), the project scope and
budgetary constraints may have restricted the detail of the study. When dealing with coastal adaptation, it is
important to understand the level of accuracy of the modelling, as it informs the risk and vulnerability ratings.
However, we believe the most effective approach is to use the modelling to identify triggers, and their
corresponding coastal management action. An indicative likelihood and timeframe can be provided for
guidance, but the ultimate adaptive action is driven by the triggers.
As part of the present study, the cyclone tracks applied in the MRA (2014) will be utilised in the regional model
of the study area to be developed in the next phase. We will use the Danish Hydraulic Institute’s (DHI) Mike21
HD/SW (Hydrodynamic / Spectral Wave) model. This allows the interaction of the water levels and currents to
be included in the wave calculations. It also allows for wave setup. Wave runup will be included in the SBEACH
model. This then allows for wave setup and runup to be considered in the inundation and erosion hazards.
The potential impact from a tsunami will be investigated via a literature review as part of the coastal hazard
assessment. This will predominantly make use of the offshore tsunami hazard information provided by
Geoscience Australia. The offshore risk of tsunami at the study site is moderate in comparison to the area to
the north, for example Onslow and the Exmouth Gulf. However, the shape of Shark Bay is such that funnelling
effects may exacerbate the wave amplitude and subsequent inundation. Conversely, the presence of Dirk,
Dorre and Bernier Islands will limit the extreme long wave energy associated with tsunamis from penetrating
into the bay.
In addition to the present study, the following ongoing data collection is recommended:
◼ Locally placed nearshore water level and wave data logger. This will enable calibration of wave models,
especially if a storm / cyclone is captured during the deployment. It is not anticipated that this data
collection can be applied during the present study, as it would involve extending the project duration by at
least 6-months whilst the data is being collected. However, following completion of the CHRMAP, the data
can be used to get a better understanding of event probabilities, rather than just triggers.
3.3 Summary for Decision Makers and Community
From the analysis of previous coastal investigations, the key take-home messages and data gaps requiring
attention in the future are displayed in Table 3-2.
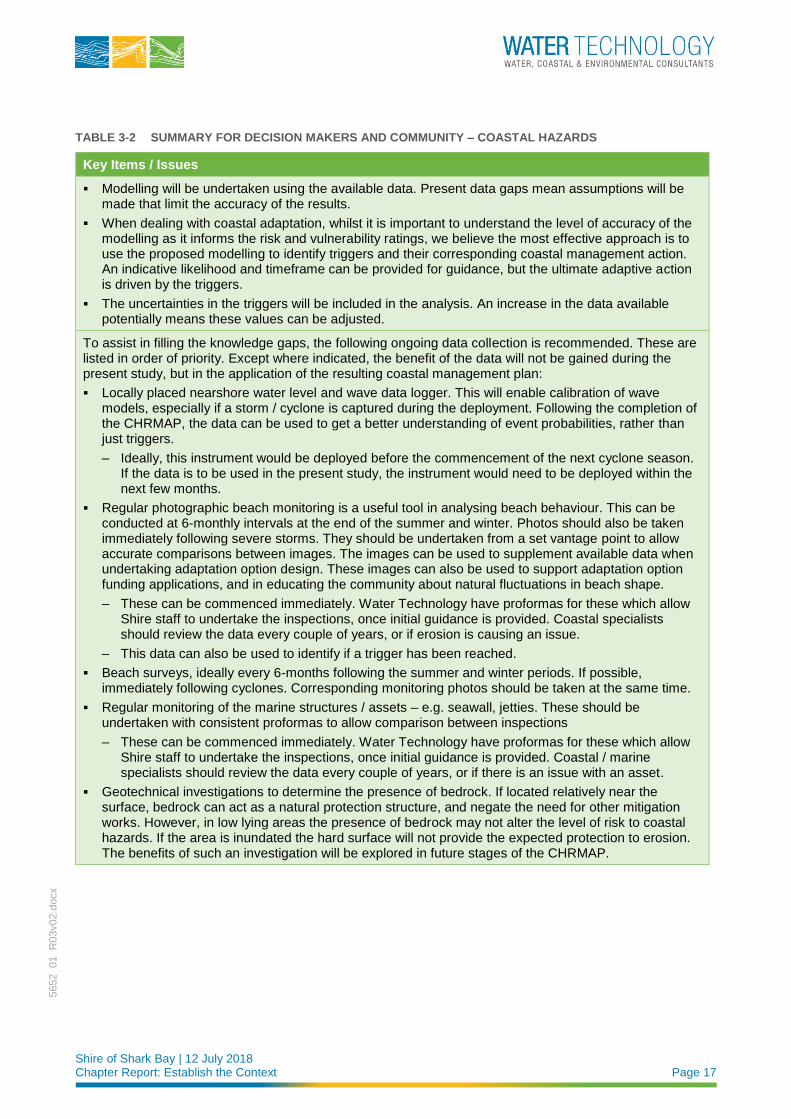
Shire of Shark Bay | 12 July 2018 Chapter Report: Establish the Context Page 17
5652_01_R
03v02.d
ocx
TABLE 3-2 SUMMARY FOR DECISION MAKERS AND COMMUNITY – COASTAL HAZARDS
Key Items / Issues
▪ Modelling will be undertaken using the available data. Present data gaps mean assumptions will be made that limit the accuracy of the results.
▪ When dealing with coastal adaptation, whilst it is important to understand the level of accuracy of the modelling as it informs the risk and vulnerability ratings, we believe the most effective approach is to use the proposed modelling to identify triggers and their corresponding coastal management action. An indicative likelihood and timeframe can be provided for guidance, but the ultimate adaptive action is driven by the triggers.
▪ The uncertainties in the triggers will be included in the analysis. An increase in the data available potentially means these values can be adjusted.
To assist in filling the knowledge gaps, the following ongoing data collection is recommended. These are listed in order of priority. Except where indicated, the benefit of the data will not be gained during the present study, but in the application of the resulting coastal management plan:
▪ Locally placed nearshore water level and wave data logger. This will enable calibration of wave models, especially if a storm / cyclone is captured during the deployment. Following the completion of the CHRMAP, the data can be used to get a better understanding of event probabilities, rather than just triggers.
– Ideally, this instrument would be deployed before the commencement of the next cyclone season. If the data is to be used in the present study, the instrument would need to be deployed within the next few months.
▪ Regular photographic beach monitoring is a useful tool in analysing beach behaviour. This can be conducted at 6-monthly intervals at the end of the summer and winter. Photos should also be taken immediately following severe storms. They should be undertaken from a set vantage point to allow accurate comparisons between images. The images can be used to supplement available data when undertaking adaptation option design. These images can also be used to support adaptation option funding applications, and in educating the community about natural fluctuations in beach shape.
– These can be commenced immediately. Water Technology have proformas for these which allow Shire staff to undertake the inspections, once initial guidance is provided. Coastal specialists should review the data every couple of years, or if erosion is causing an issue.
– This data can also be used to identify if a trigger has been reached.
▪ Beach surveys, ideally every 6-months following the summer and winter periods. If possible, immediately following cyclones. Corresponding monitoring photos should be taken at the same time.
▪ Regular monitoring of the marine structures / assets – e.g. seawall, jetties. These should be undertaken with consistent proformas to allow comparison between inspections
– These can be commenced immediately. Water Technology have proformas for these which allow Shire staff to undertake the inspections, once initial guidance is provided. Coastal / marine specialists should review the data every couple of years, or if there is an issue with an asset.
▪ Geotechnical investigations to determine the presence of bedrock. If located relatively near the surface, bedrock can act as a natural protection structure, and negate the need for other mitigation works. However, in low lying areas the presence of bedrock may not alter the level of risk to coastal hazards. If the area is inundated the hard surface will not provide the expected protection to erosion. The benefits of such an investigation will be explored in future stages of the CHRMAP.
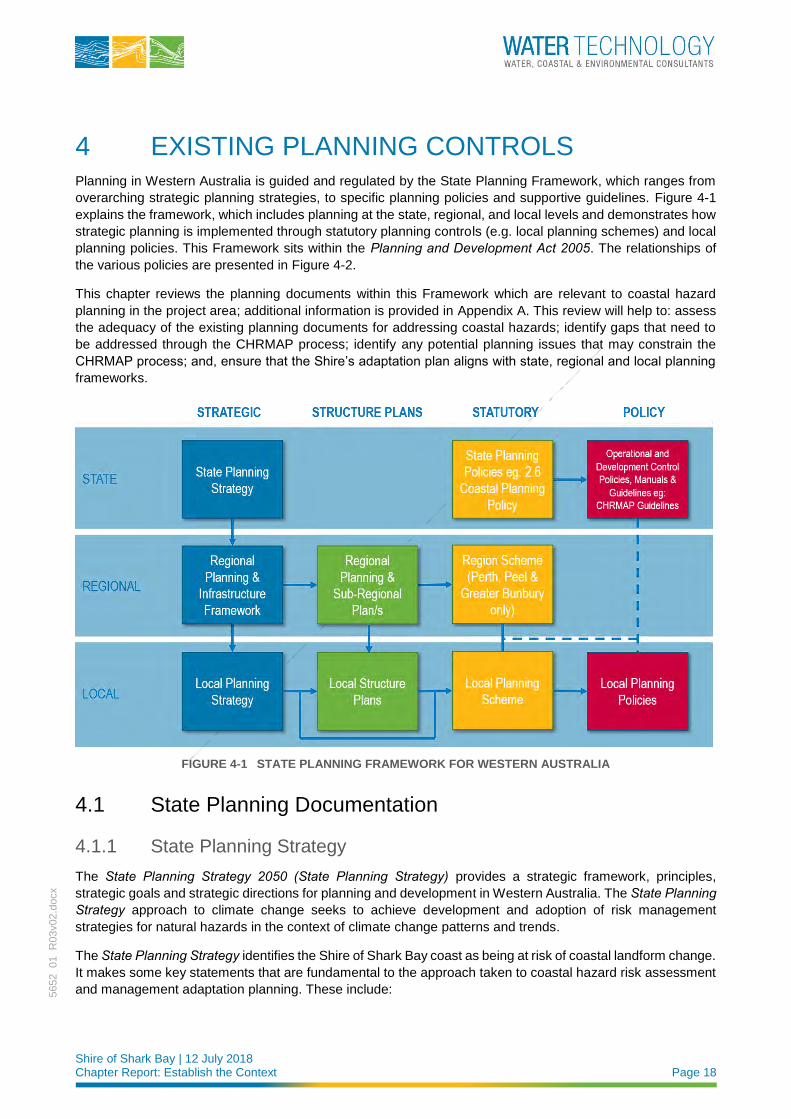
Shire of Shark Bay | 12 July 2018 Chapter Report: Establish the Context Page 18
5652_01_R
03v02.d
ocx
4 EXISTING PLANNING CONTROLS Planning in Western Australia is guided and regulated by the State Planning Framework, which ranges from
overarching strategic planning strategies, to specific planning policies and supportive guidelines. Figure 4-1
explains the framework, which includes planning at the state, regional, and local levels and demonstrates how
strategic planning is implemented through statutory planning controls (e.g. local planning schemes) and local
planning policies. This Framework sits within the Planning and Development Act 2005. The relationships of
the various policies are presented in Figure 4-2.
This chapter reviews the planning documents within this Framework which are relevant to coastal hazard
planning in the project area; additional information is provided in Appendix A. This review will help to: assess
the adequacy of the existing planning documents for addressing coastal hazards; identify gaps that need to
be addressed through the CHRMAP process; identify any potential planning issues that may constrain the
CHRMAP process; and, ensure that the Shire’s adaptation plan aligns with state, regional and local planning
frameworks.
FIGURE 4-1 STATE PLANNING FRAMEWORK FOR WESTERN AUSTRALIA
4.1 State Planning Documentation
4.1.1 State Planning Strategy
The State Planning Strategy 2050 (State Planning Strategy) provides a strategic framework, principles,
strategic goals and strategic directions for planning and development in Western Australia. The State Planning Strategy approach to climate change seeks to achieve development and adoption of risk management
strategies for natural hazards in the context of climate change patterns and trends.
The State Planning Strategy identifies the Shire of Shark Bay coast as being at risk of coastal landform change.
It makes some key statements that are fundamental to the approach taken to coastal hazard risk assessment
and management adaptation planning. These include:
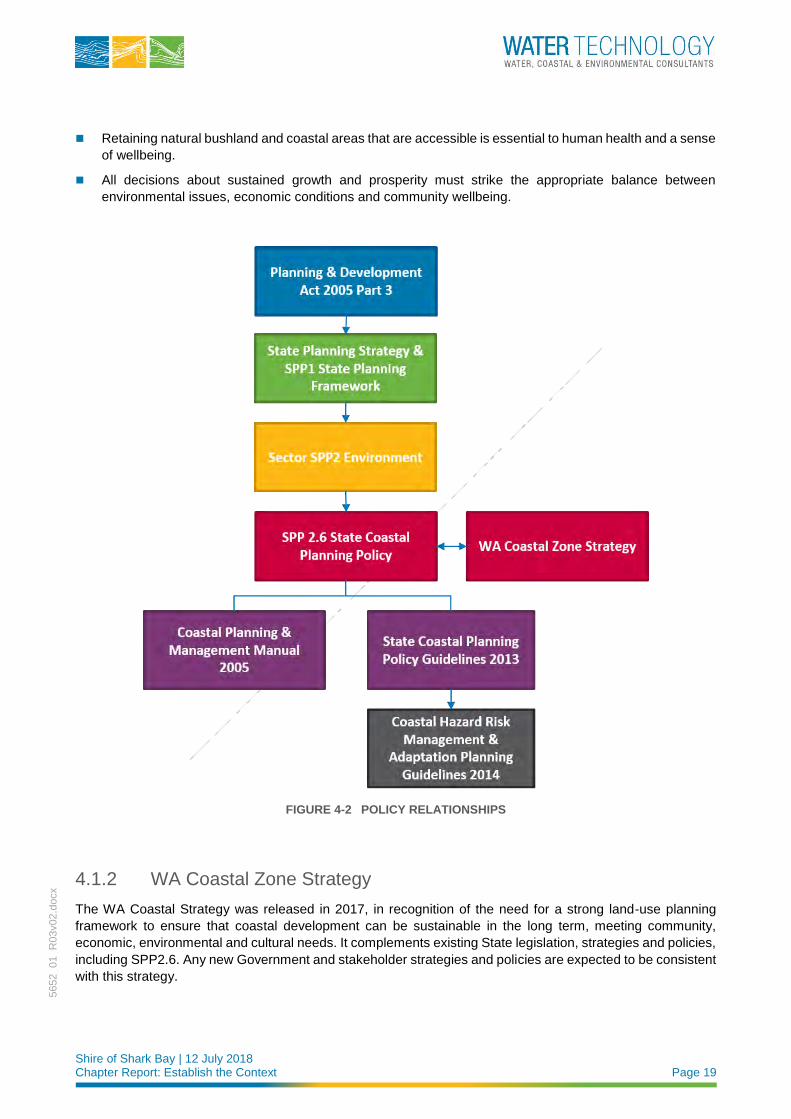
Shire of Shark Bay | 12 July 2018 Chapter Report: Establish the Context Page 19
5652_01_R
03v02.d
ocx
◼ Retaining natural bushland and coastal areas that are accessible is essential to human health and a sense
of wellbeing.
◼ All decisions about sustained growth and prosperity must strike the appropriate balance between
environmental issues, economic conditions and community wellbeing.
FIGURE 4-2 POLICY RELATIONSHIPS
4.1.2 WA Coastal Zone Strategy
The WA Coastal Strategy was released in 2017, in recognition of the need for a strong land-use planning
framework to ensure that coastal development can be sustainable in the long term, meeting community,
economic, environmental and cultural needs. It complements existing State legislation, strategies and policies,
including SPP2.6. Any new Government and stakeholder strategies and policies are expected to be consistent
with this strategy.
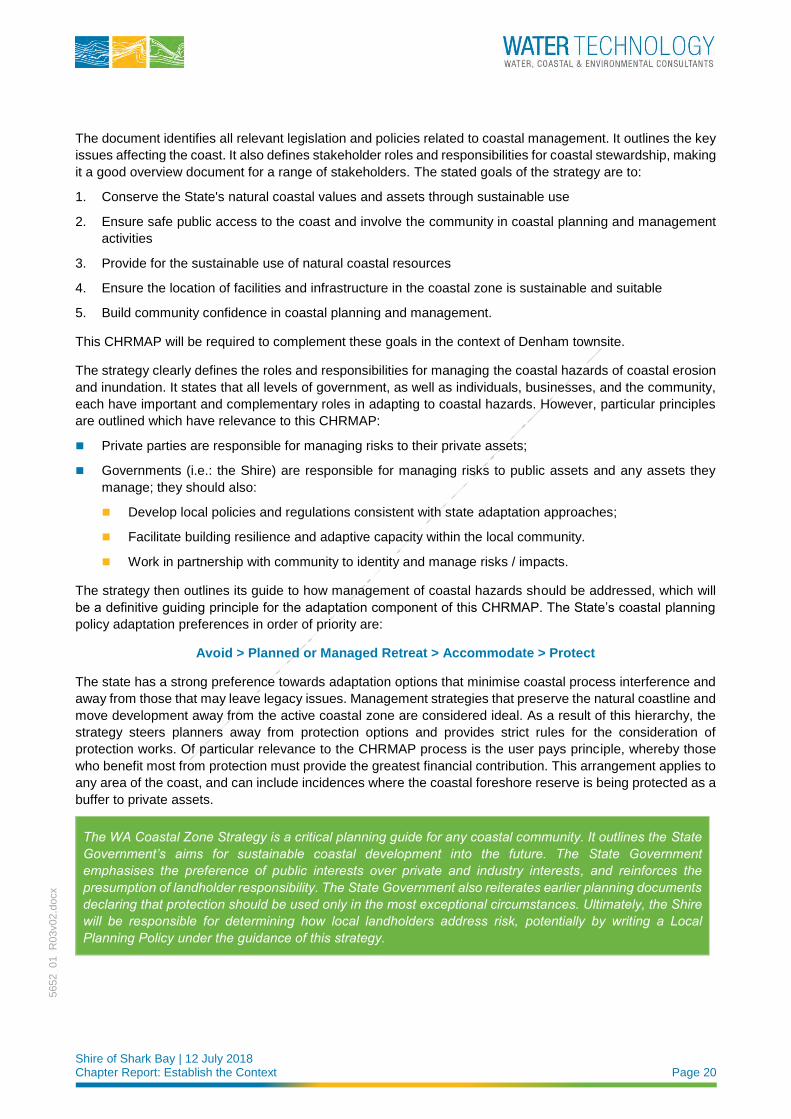
Shire of Shark Bay | 12 July 2018 Chapter Report: Establish the Context Page 20
5652_01_R
03v02.d
ocx
The document identifies all relevant legislation and policies related to coastal management. It outlines the key
issues affecting the coast. It also defines stakeholder roles and responsibilities for coastal stewardship, making
it a good overview document for a range of stakeholders. The stated goals of the strategy are to:
1. Conserve the State's natural coastal values and assets through sustainable use
2. Ensure safe public access to the coast and involve the community in coastal planning and management
activities
3. Provide for the sustainable use of natural coastal resources
4. Ensure the location of facilities and infrastructure in the coastal zone is sustainable and suitable
5. Build community confidence in coastal planning and management.
This CHRMAP will be required to complement these goals in the context of Denham townsite.
The strategy clearly defines the roles and responsibilities for managing the coastal hazards of coastal erosion
and inundation. It states that all levels of government, as well as individuals, businesses, and the community,
each have important and complementary roles in adapting to coastal hazards. However, particular principles
are outlined which have relevance to this CHRMAP:
◼ Private parties are responsible for managing risks to their private assets;
◼ Governments (i.e.: the Shire) are responsible for managing risks to public assets and any assets they
manage; they should also:
◼ Develop local policies and regulations consistent with state adaptation approaches;
◼ Facilitate building resilience and adaptive capacity within the local community.
◼ Work in partnership with community to identity and manage risks / impacts.
The strategy then outlines its guide to how management of coastal hazards should be addressed, which will
be a definitive guiding principle for the adaptation component of this CHRMAP. The State’s coastal planning
policy adaptation preferences in order of priority are:
Avoid > Planned or Managed Retreat > Accommodate > Protect
The state has a strong preference towards adaptation options that minimise coastal process interference and
away from those that may leave legacy issues. Management strategies that preserve the natural coastline and
move development away from the active coastal zone are considered ideal. As a result of this hierarchy, the
strategy steers planners away from protection options and provides strict rules for the consideration of
protection works. Of particular relevance to the CHRMAP process is the user pays principle, whereby those
who benefit most from protection must provide the greatest financial contribution. This arrangement applies to
any area of the coast, and can include incidences where the coastal foreshore reserve is being protected as a
buffer to private assets.
The WA Coastal Zone Strategy is a critical planning guide for any coastal community. It outlines the State Government’s aims for sustainable coastal development into the future. The State Government emphasises the preference of public interests over private and industry interests, and reinforces the presumption of landholder responsibility. The State Government also reiterates earlier planning documents declaring that protection should be used only in the most exceptional circumstances. Ultimately, the Shire will be responsible for determining how local landholders address risk, potentially by writing a Local Planning Policy under the guidance of this strategy.
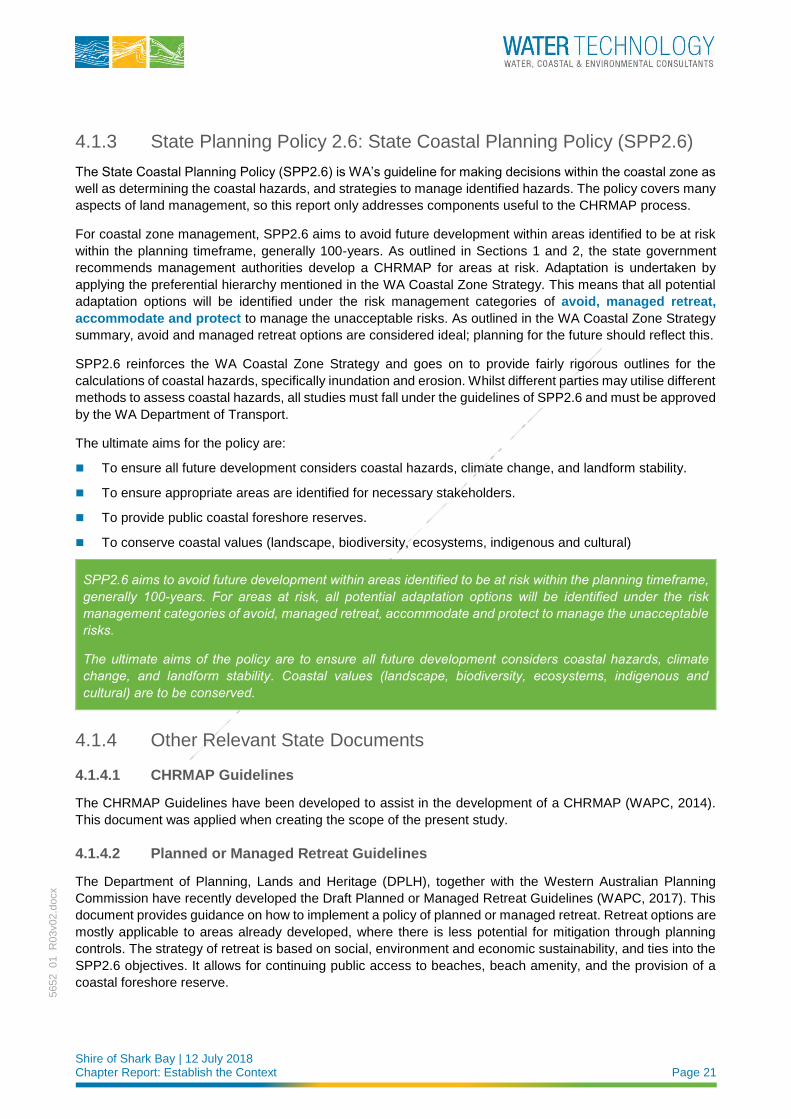
Shire of Shark Bay | 12 July 2018 Chapter Report: Establish the Context Page 21
5652_01_R
03v02.d
ocx
4.1.3 State Planning Policy 2.6: State Coastal Planning Policy (SPP2.6)
The State Coastal Planning Policy (SPP2.6) is WA’s guideline for making decisions within the coastal zone as
well as determining the coastal hazards, and strategies to manage identified hazards. The policy covers many
aspects of land management, so this report only addresses components useful to the CHRMAP process.
For coastal zone management, SPP2.6 aims to avoid future development within areas identified to be at risk
within the planning timeframe, generally 100-years. As outlined in Sections 1 and 2, the state government
recommends management authorities develop a CHRMAP for areas at risk. Adaptation is undertaken by
applying the preferential hierarchy mentioned in the WA Coastal Zone Strategy. This means that all potential
adaptation options will be identified under the risk management categories of avoid, managed retreat,
accommodate and protect to manage the unacceptable risks. As outlined in the WA Coastal Zone Strategy
summary, avoid and managed retreat options are considered ideal; planning for the future should reflect this.
SPP2.6 reinforces the WA Coastal Zone Strategy and goes on to provide fairly rigorous outlines for the
calculations of coastal hazards, specifically inundation and erosion. Whilst different parties may utilise different
methods to assess coastal hazards, all studies must fall under the guidelines of SPP2.6 and must be approved
by the WA Department of Transport.
The ultimate aims for the policy are:
◼ To ensure all future development considers coastal hazards, climate change, and landform stability.
◼ To ensure appropriate areas are identified for necessary stakeholders.
◼ To provide public coastal foreshore reserves.
◼ To conserve coastal values (landscape, biodiversity, ecosystems, indigenous and cultural)
SPP2.6 aims to avoid future development within areas identified to be at risk within the planning timeframe, generally 100-years. For areas at risk, all potential adaptation options will be identified under the risk management categories of avoid, managed retreat, accommodate and protect to manage the unacceptable risks.
The ultimate aims of the policy are to ensure all future development considers coastal hazards, climate change, and landform stability. Coastal values (landscape, biodiversity, ecosystems, indigenous and cultural) are to be conserved.
4.1.4 Other Relevant State Documents
4.1.4.1 CHRMAP Guidelines
The CHRMAP Guidelines have been developed to assist in the development of a CHRMAP (WAPC, 2014).
This document was applied when creating the scope of the present study.
4.1.4.2 Planned or Managed Retreat Guidelines
The Department of Planning, Lands and Heritage (DPLH), together with the Western Australian Planning
Commission have recently developed the Draft Planned or Managed Retreat Guidelines (WAPC, 2017). This
document provides guidance on how to implement a policy of planned or managed retreat. Retreat options are
mostly applicable to areas already developed, where there is less potential for mitigation through planning
controls. The strategy of retreat is based on social, environment and economic sustainability, and ties into the
SPP2.6 objectives. It allows for continuing public access to beaches, beach amenity, and the provision of a
coastal foreshore reserve.
Shire of Shark Bay | 12 July 2018 Chapter Report: Establish the Context Page 22
5652_01_R
03v02.d
ocx
Existing land uses would continue until the coastal hazard risk becomes unacceptable. This trigger is to be
defined during the CHRMAP process.
This adaptation option will be considered, where appropriate, as part of the present study in the Chapter
Reports Identification of Adaptation Options and Assessment of Adaptation Options.
4.2 Local Planning Documents
4.2.1 Shire of Shark Bay Local Planning Strategy
The Shire of Shark Bay Local Planning Strategy 2013 (Local Planning Strategy), is generally in alignment with
the Gascoyne PIF strategy direction (refer Section A-2-1 of Appendix A for a description of this strategy). A
local planning strategy outlines the local government’s intentions and objectives for development of the district
over a timeframe of around 15 years. It informs the content of the local planning scheme to provide the statutory
controls and guidance to direct development towards achieving these longer-term objectives. The local
planning strategy is an important guiding document for the exercise of discretion in determining planning
applications within the district as it provides context and enunciates the intentions behind various planning
strategies, scheme provisions and local planning policies.
The local planning strategy has several stated objectives that are directly or indirectly related to planning for
coastal areas. These objectives are reproduced in Table 4-1, with remarks as to the relevance to coastal
planning.
The strategy acknowledges that there are key constraints of cyclonic storm and coastal processes. It identifies
the following physical constraint challenges relevant to coastal processes:
◼ The proximity of development to the coast and lack of coastal setbacks. Coastal risks are a planning
implication and constraints can be associated with storm surge, coastal processes and setbacks.
◼ Flooding in the Town Centre resulting from major and intense storm events and the need to implement
minimum floor levels, which causes streetscape and design challenges for interaction between existing
and new development.
The Shire’s objective is to prepare strategies that will minimise the risk of damage to the Denham Town Centre
caused by flooding, inundation and stormwater damage. In December 2014, MP Rogers and Associates Pty
Ltd prepared the Denham Inundation Levels Storm Surge Modelling Report, which provided information about
inundation that had not been available when the local planning strategy was prepared in 2013. The findings
resulted in a recommendation to increase the minimum floor level to 4.2m AHD from the 3.2m AHD currently
required in the Shire’s Local Planning Scheme No. 3 (refer Section 4.2.3).
This constraint is recognised in the existing Scheme and is addressed by implementing minimum floor levels
for development. The Shire implements the recommendations of the Shark Bay—Denham Foreshore
Topography and Storm Surge levels map which is used to inform Finished Floor Levels (FFL) for new
development.
The Local Planning Strategy suggests that increased flexibility could be examined to allow lower levels for
detached non-habitable buildings such as outbuildings. This is in recognition that increased floor levels applied
to new development will represent a challenge in dealing with streetscape and interfaces between existing
buildings and new development of Knight Terrace, the main street. This is difficult when the visual impact of
development on land adjacent to the coast is also an important consideration.
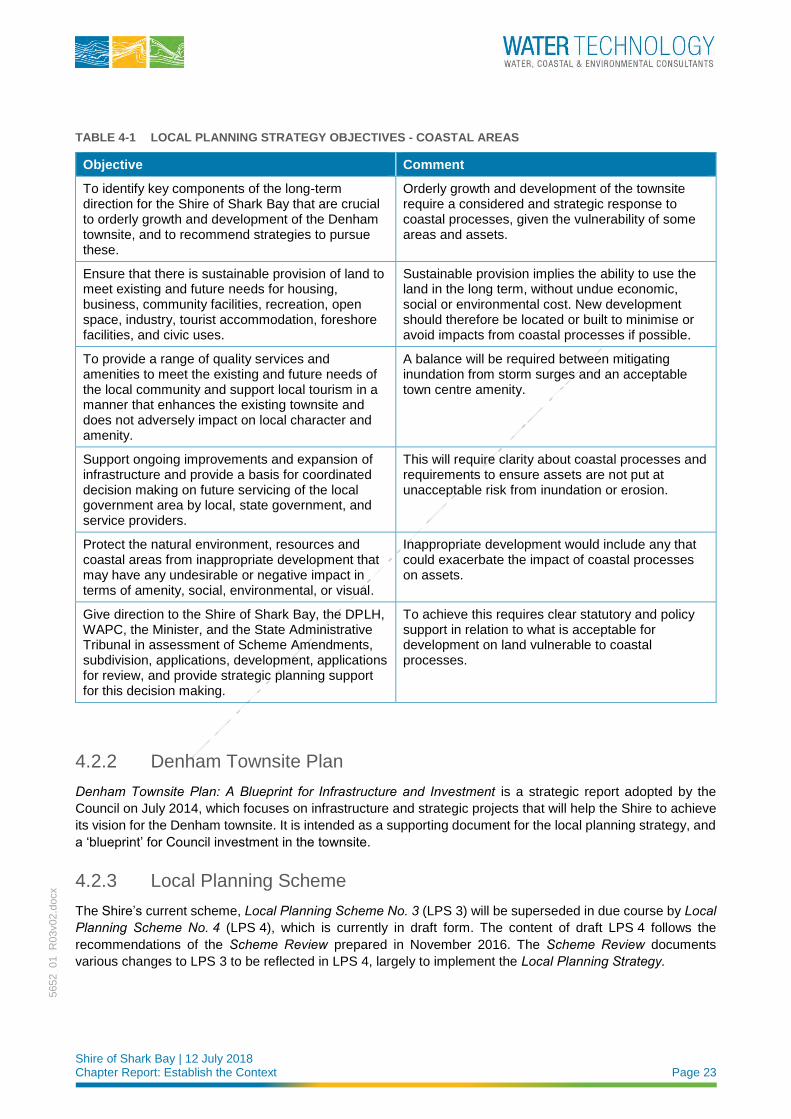
Shire of Shark Bay | 12 July 2018 Chapter Report: Establish the Context Page 23
5652_01_R
03v02.d
ocx
TABLE 4-1 LOCAL PLANNING STRATEGY OBJECTIVES - COASTAL AREAS
Objective Comment
To identify key components of the long-term direction for the Shire of Shark Bay that are crucial to orderly growth and development of the Denham townsite, and to recommend strategies to pursue these.
Orderly growth and development of the townsite require a considered and strategic response to coastal processes, given the vulnerability of some areas and assets.
Ensure that there is sustainable provision of land to meet existing and future needs for housing, business, community facilities, recreation, open space, industry, tourist accommodation, foreshore facilities, and civic uses.
Sustainable provision implies the ability to use the land in the long term, without undue economic, social or environmental cost. New development should therefore be located or built to minimise or avoid impacts from coastal processes if possible.
To provide a range of quality services and amenities to meet the existing and future needs of the local community and support local tourism in a manner that enhances the existing townsite and does not adversely impact on local character and amenity.
A balance will be required between mitigating inundation from storm surges and an acceptable town centre amenity.
Support ongoing improvements and expansion of infrastructure and provide a basis for coordinated decision making on future servicing of the local government area by local, state government, and service providers.
This will require clarity about coastal processes and requirements to ensure assets are not put at unacceptable risk from inundation or erosion.
Protect the natural environment, resources and coastal areas from inappropriate development that may have any undesirable or negative impact in terms of amenity, social, environmental, or visual.
Inappropriate development would include any that could exacerbate the impact of coastal processes on assets.
Give direction to the Shire of Shark Bay, the DPLH, WAPC, the Minister, and the State Administrative Tribunal in assessment of Scheme Amendments, subdivision, applications, development, applications for review, and provide strategic planning support for this decision making.
To achieve this requires clear statutory and policy support in relation to what is acceptable for development on land vulnerable to coastal processes.
4.2.2 Denham Townsite Plan
Denham Townsite Plan: A Blueprint for Infrastructure and Investment is a strategic report adopted by the
Council on July 2014, which focuses on infrastructure and strategic projects that will help the Shire to achieve
its vision for the Denham townsite. It is intended as a supporting document for the local planning strategy, and
a ‘blueprint’ for Council investment in the townsite.
4.2.3 Local Planning Scheme
The Shire’s current scheme, Local Planning Scheme No. 3 (LPS 3) will be superseded in due course by Local Planning Scheme No. 4 (LPS 4), which is currently in draft form. The content of draft LPS 4 follows the
recommendations of the Scheme Review prepared in November 2016. The Scheme Review documents
various changes to LPS 3 to be reflected in LPS 4, largely to implement the Local Planning Strategy.

Shire of Shark Bay | 12 July 2018 Chapter Report: Establish the Context Page 24
5652_01_R
03v02.d
ocx
One of the stated aims of draft LPS 4 is to impose special conditions for development of land within Denham
to mitigate the adverse effects of land subject to inundation and other physical constraints.
Clause 29 of the Model Scheme Text provides local government the option to give statutory effect to any
relevant State Planning Policy (SPP) in whole or in part, in a similar way as the R-Codes are linked to a
Scheme. The Shire has not elected to do this with SPP 2.6 State Coastal Policy. Instead, it is proposed to
include provisions relating to requirements for development approval and minimum floor levels in areas
identified as being vulnerable to coastal storm surge inundation.
As at April 2018 draft LPS 4 contains the following clause of relevance to land subject to inundation from
coastal processes.
31.1 Land Subject to Inundation
a. No development shall be constructed upon any land within an area considered by the local government as being vulnerable to coastal storm surge inundation unless granted specific planning approval by the local government.
b. The local government shall require any new development within an area as being vulnerable to coastal storm surge inundation to comply with a minimum finished floor level not less than RL 4.2 metres AHD.
c. Notwithstanding Clause 32.1(b), Council has discretion to consider a minimum finished floor level less than RL 4.2 metres AHD for non-habitable development that is detached from any single house or dwelling unit on the same lot in the Denham townsite and / or any minor non-habitable development that is ancillary to existing tourist development in the Scheme Area.
d. In considering applications for development in areas vulnerable to coastal storm surge inundation, the local government may have regard to any Local Planning Policy or any site specific coastal storm surge inundation report acceptable to the local government.
e. Notwithstanding Clause 32.1(b), the local government has discretion to consider and require alternative minimum finished floor levels where:
i. The proponent provides a site specific coastal storm surge inundation report by a suitably qualified professional coastal engineer that is acceptable to the local government and clearly identifies appropriate alternative minimum finished floor levels and / or;
ii. Approval of the development is consistent with variations allowable under the relevant State Coastal Planning Policy; and /or
iii. the proposed development only involves refurbishment of or a minor extension to an existing development.
It is noted that this clause relates only to vulnerability to coastal storm surge inundation. Other potential impacts
of increases to sea level rise and storm intensities, such as storm erosion and shoreline recession, are not
addressed.
Some proposed zones make reference to the requirement for preparation of foreshore management plans and
to have regard to SPP 2.6.
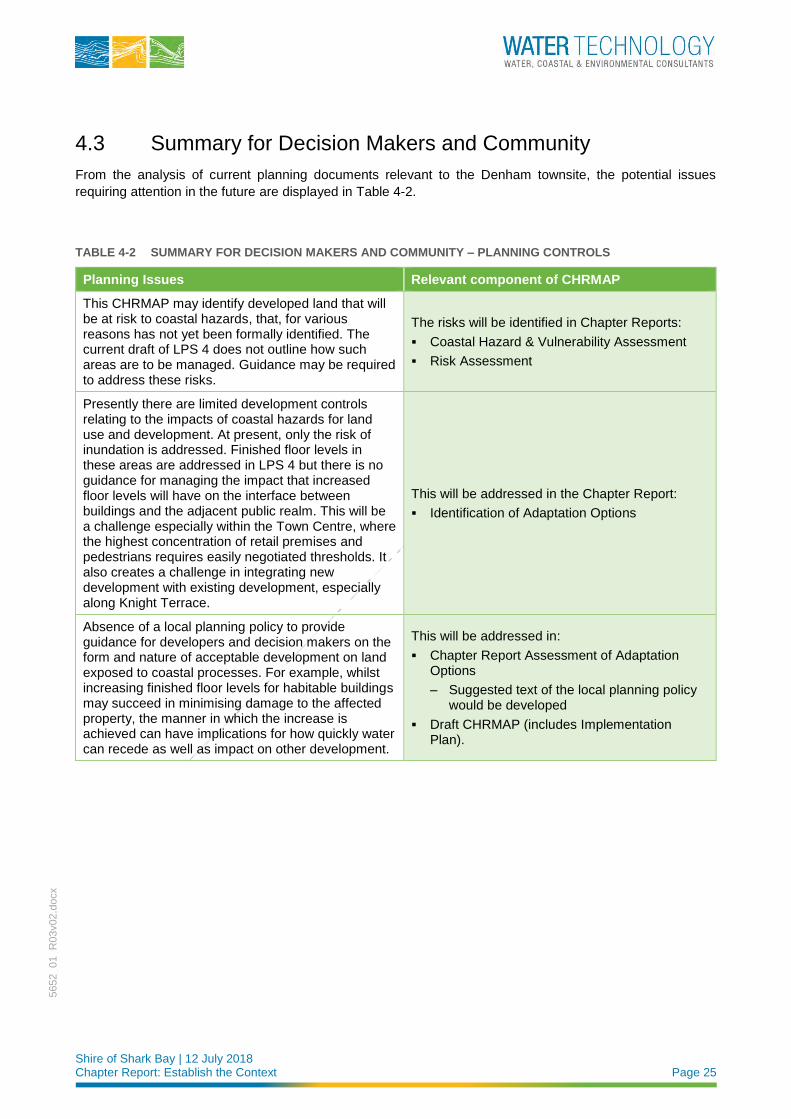
Shire of Shark Bay | 12 July 2018 Chapter Report: Establish the Context Page 25
5652_01_R
03v02.d
ocx
4.3 Summary for Decision Makers and Community
From the analysis of current planning documents relevant to the Denham townsite, the potential issues
requiring attention in the future are displayed in Table 4-2.
TABLE 4-2 SUMMARY FOR DECISION MAKERS AND COMMUNITY – PLANNING CONTROLS
Planning Issues Relevant component of CHRMAP
This CHRMAP may identify developed land that will be at risk to coastal hazards, that, for various reasons has not yet been formally identified. The current draft of LPS 4 does not outline how such areas are to be managed. Guidance may be required to address these risks.
The risks will be identified in Chapter Reports:
▪ Coastal Hazard & Vulnerability Assessment
▪ Risk Assessment
Presently there are limited development controls relating to the impacts of coastal hazards for land use and development. At present, only the risk of inundation is addressed. Finished floor levels in these areas are addressed in LPS 4 but there is no guidance for managing the impact that increased floor levels will have on the interface between buildings and the adjacent public realm. This will be a challenge especially within the Town Centre, where the highest concentration of retail premises and pedestrians requires easily negotiated thresholds. It also creates a challenge in integrating new development with existing development, especially along Knight Terrace.
This will be addressed in the Chapter Report:
▪ Identification of Adaptation Options
Absence of a local planning policy to provide guidance for developers and decision makers on the form and nature of acceptable development on land exposed to coastal processes. For example, whilst increasing finished floor levels for habitable buildings may succeed in minimising damage to the affected property, the manner in which the increase is achieved can have implications for how quickly water can recede as well as impact on other development.
This will be addressed in:
▪ Chapter Report Assessment of Adaptation Options
– Suggested text of the local planning policy would be developed
▪ Draft CHRMAP (includes Implementation Plan).
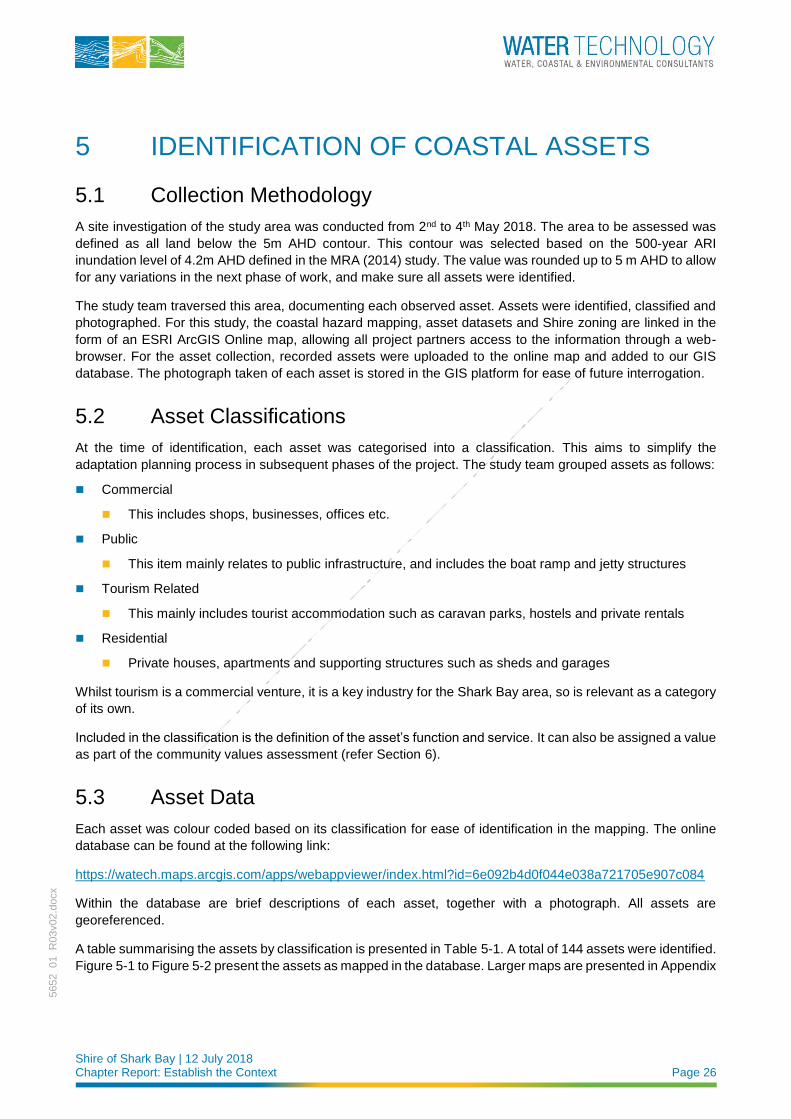
Shire of Shark Bay | 12 July 2018 Chapter Report: Establish the Context Page 26
5652_01_R
03v02.d
ocx
5 IDENTIFICATION OF COASTAL ASSETS
5.1 Collection Methodology
A site investigation of the study area was conducted from 2nd to 4th May 2018. The area to be assessed was
defined as all land below the 5m AHD contour. This contour was selected based on the 500-year ARI
inundation level of 4.2m AHD defined in the MRA (2014) study. The value was rounded up to 5 m AHD to allow
for any variations in the next phase of work, and make sure all assets were identified.
The study team traversed this area, documenting each observed asset. Assets were identified, classified and
photographed. For this study, the coastal hazard mapping, asset datasets and Shire zoning are linked in the
form of an ESRI ArcGIS Online map, allowing all project partners access to the information through a web-
browser. For the asset collection, recorded assets were uploaded to the online map and added to our GIS
database. The photograph taken of each asset is stored in the GIS platform for ease of future interrogation.
5.2 Asset Classifications
At the time of identification, each asset was categorised into a classification. This aims to simplify the
adaptation planning process in subsequent phases of the project. The study team grouped assets as follows:
◼ Commercial
◼ This includes shops, businesses, offices etc.
◼ Public
◼ This item mainly relates to public infrastructure, and includes the boat ramp and jetty structures
◼ Tourism Related
◼ This mainly includes tourist accommodation such as caravan parks, hostels and private rentals
◼ Residential
◼ Private houses, apartments and supporting structures such as sheds and garages
Whilst tourism is a commercial venture, it is a key industry for the Shark Bay area, so is relevant as a category
of its own.
Included in the classification is the definition of the asset’s function and service. It can also be assigned a value
as part of the community values assessment (refer Section 6).
5.3 Asset Data
Each asset was colour coded based on its classification for ease of identification in the mapping. The online
database can be found at the following link:
https://watech.maps.arcgis.com/apps/webappviewer/index.html?id=6e092b4d0f044e038a721705e907c084
Within the database are brief descriptions of each asset, together with a photograph. All assets are
georeferenced.
A table summarising the assets by classification is presented in Table 5-1. A total of 144 assets were identified.
Figure 5-1 to Figure 5-2 present the assets as mapped in the database. Larger maps are presented in Appendix
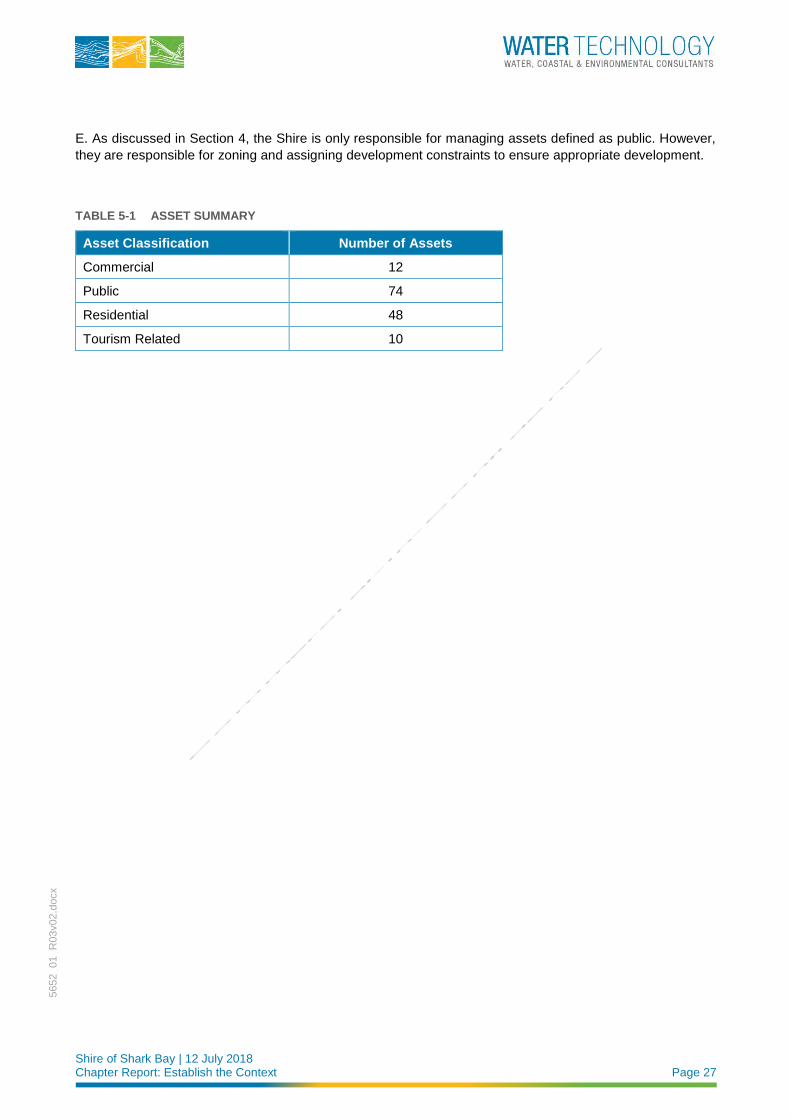
Shire of Shark Bay | 12 July 2018 Chapter Report: Establish the Context Page 27
5652_01_R
03v02.d
ocx
E. As discussed in Section 4, the Shire is only responsible for managing assets defined as public. However,
they are responsible for zoning and assigning development constraints to ensure appropriate development.
TABLE 5-1 ASSET SUMMARY
Asset Classification Number of Assets
Commercial 12
Public 74
Residential 48
Tourism Related 10
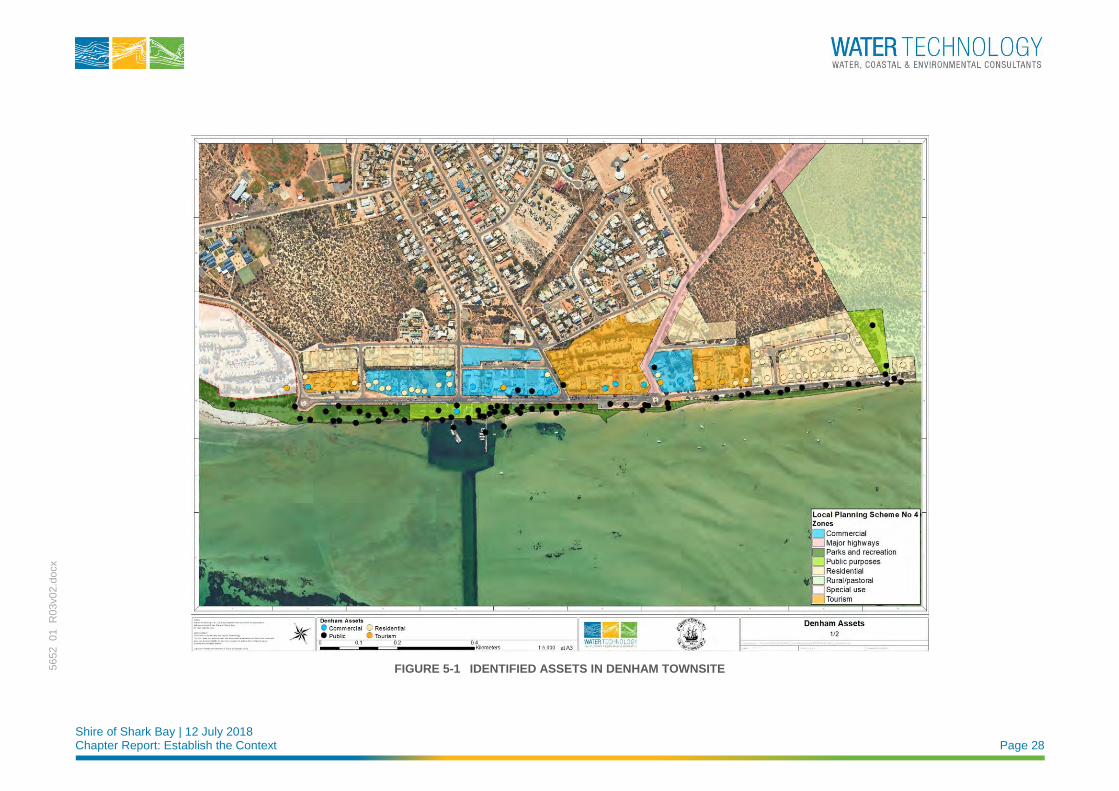
Shire of Shark Bay | 12 July 2018 Chapter Report: Establish the Context Page 28
5652_01_R
03v02.d
ocx
FIGURE 5-1 IDENTIFIED ASSETS IN DENHAM TOWNSITE
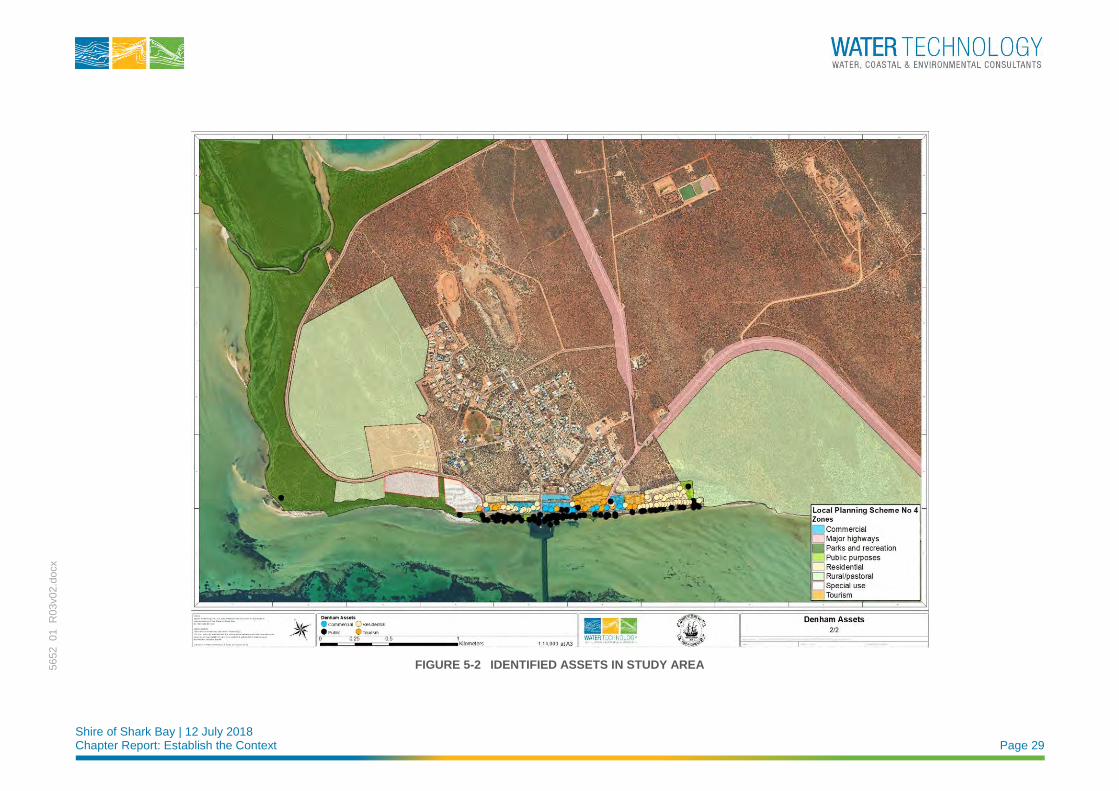
Shire of Shark Bay | 12 July 2018 Chapter Report: Establish the Context Page 29
5652_01_R
03v02.d
ocx
FIGURE 5-2 IDENTIFIED ASSETS IN STUDY AREA
Shire of Shark Bay | 12 July 2018 Chapter Report: Establish the Context Page 30
5652_01_R
03v02.d
ocx
6 COMMUNITY VALUES ASSESSMENT
6.1 Engagement Process
The Stakeholder and Community Engagement Plan (Water Technology, 2018) aims to engage all relevant
stakeholders to provide them with ownership of the CHRMAP and acceptance of its outcomes. The objectives
of the strategy are as follows:
◼ Consult with stakeholders and the community on climate change and its impacts in the coastal zone within
the Denham Townsite:
◼ What does this mean for the community?
◼ How can we adapt?
◼ Generate the success criteria for the risk assessment component of the CHRMAP. Success criteria
represent stakeholders’ tolerance and acceptability of the impact to assets from the identified coastal
hazards.
◼ Aid in the selection of site-specific adaptation measures. Stakeholders on the ground are likely to have a
knowledge of the site developed over years of interaction. This provides invaluable information that can
be applied to generate innovative adaptation measures.
The Community Values Assessment represents the collaborate component of the consultation: to determine
the community values attributed to coastal assets and the corresponding level of risk tolerance.
The engagement strategy (Water Technology, 2018) identified a workshop to collate the stakeholder and
community’s values.
6.2 Stakeholders
As defined in Water Technology (2018), stakeholders for the project can be split into two categories:
◼ Internal Stakeholders:
◼ Part of the decision-making team. Predominantly, these will be Shire of Shark Bay Councillors and
staff, although state government will also play a role. A Steering Committee has been established to
oversee preparation and completion of the CHRMAP, including review of project deliverables. This
includes representatives from state government.
◼ External Stakeholders:
◼ Not decision-makers but are affected by the project outcomes. They might live near the coast, use an
asset or resource located in the coastal zone, or simply have an interest in the coastal foreshore
reserve.
The aim of the Community Values Assessment was to engage both internal and external stakeholders. To this
end, a Community Information Sheet was developed to advertise the workshop and its purpose (refer Appendix
D).
6.3 Community Values Workshop Summary
The workshop was held at 5:30pm on Thursday 3rd May. There were 7 attendees in addition to Water
Technology staff – 4 Shire of Shark Bay Councillors, and 3 Shire of Shark Bay staff. That is, only internal
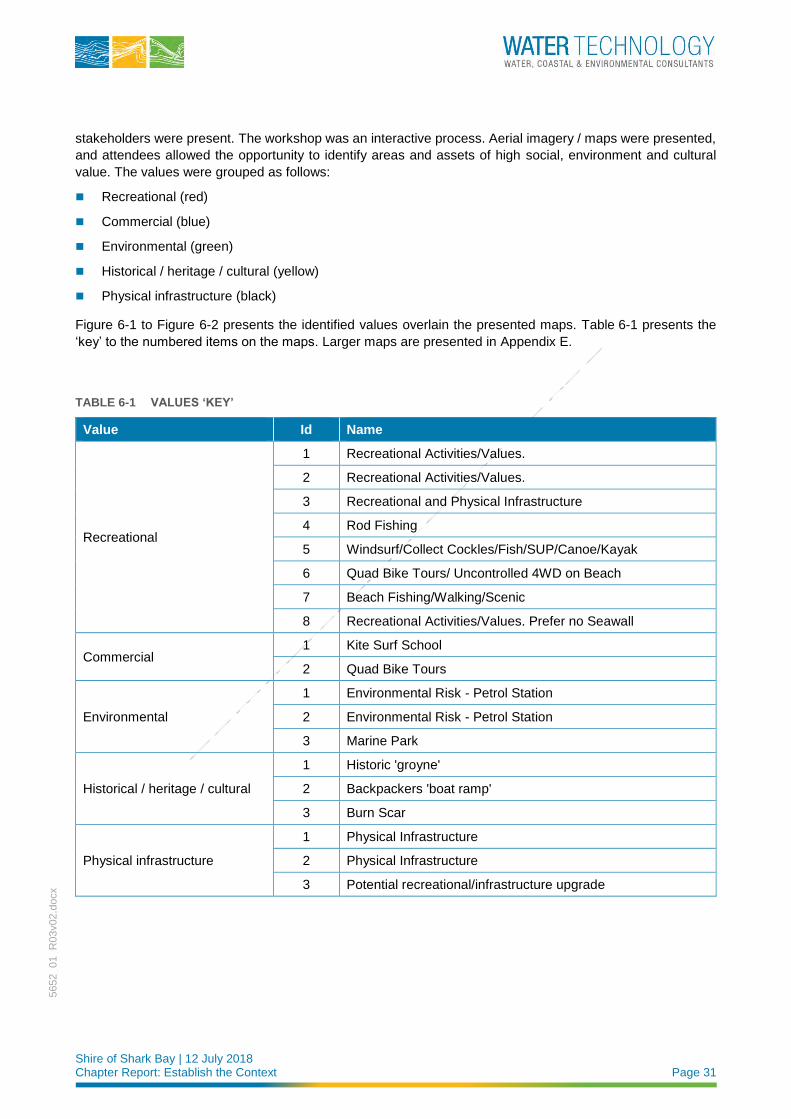
Shire of Shark Bay | 12 July 2018 Chapter Report: Establish the Context Page 31
5652_01_R
03v02.d
ocx
stakeholders were present. The workshop was an interactive process. Aerial imagery / maps were presented,
and attendees allowed the opportunity to identify areas and assets of high social, environment and cultural
value. The values were grouped as follows:
◼ Recreational (red)
◼ Commercial (blue)
◼ Environmental (green)
◼ Historical / heritage / cultural (yellow)
◼ Physical infrastructure (black)
Figure 6-1 to Figure 6-2 presents the identified values overlain the presented maps. Table 6-1 presents the
‘key’ to the numbered items on the maps. Larger maps are presented in Appendix E.
TABLE 6-1 VALUES ‘KEY’
Value Id Name
Recreational
1 Recreational Activities/Values.
2 Recreational Activities/Values.
3 Recreational and Physical Infrastructure
4 Rod Fishing
5 Windsurf/Collect Cockles/Fish/SUP/Canoe/Kayak
6 Quad Bike Tours/ Uncontrolled 4WD on Beach
7 Beach Fishing/Walking/Scenic
8 Recreational Activities/Values. Prefer no Seawall
Commercial 1 Kite Surf School
2 Quad Bike Tours
Environmental
1 Environmental Risk - Petrol Station
2 Environmental Risk - Petrol Station
3 Marine Park
Historical / heritage / cultural
1 Historic 'groyne'
2 Backpackers 'boat ramp'
3 Burn Scar
Physical infrastructure
1 Physical Infrastructure
2 Physical Infrastructure
3 Potential recreational/infrastructure upgrade
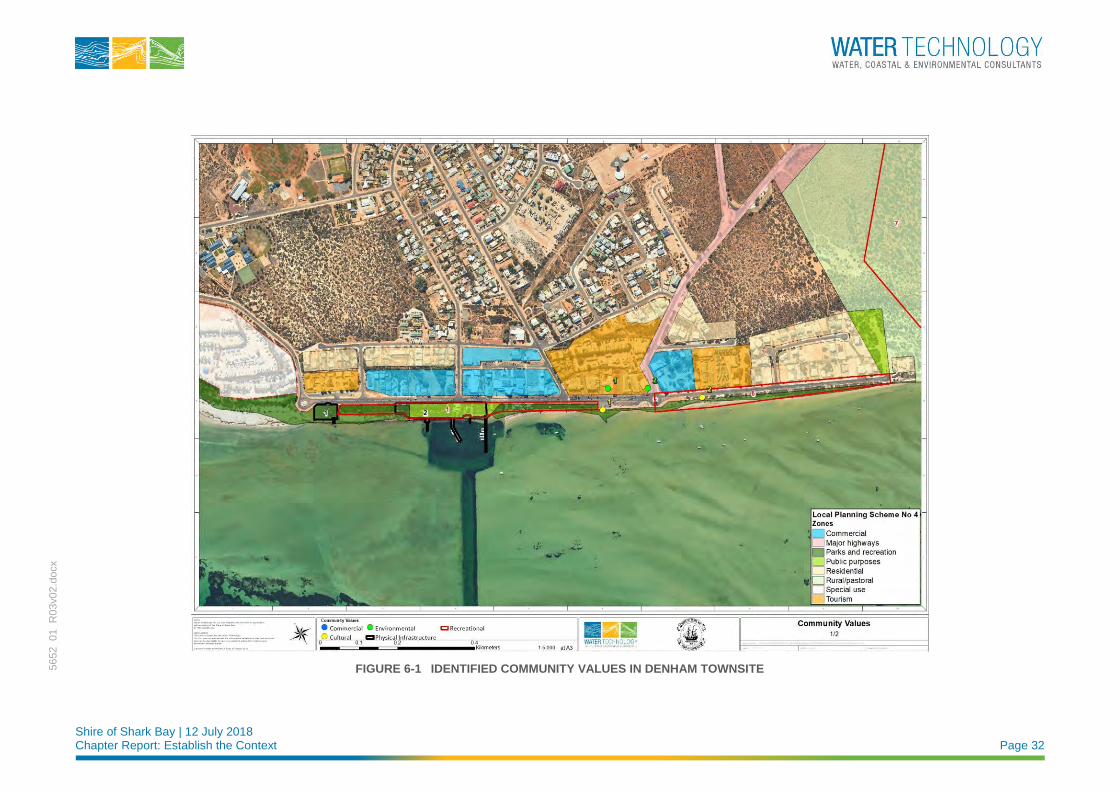
Shire of Shark Bay | 12 July 2018 Chapter Report: Establish the Context Page 32
5652_01_R
03v02.d
ocx
FIGURE 6-1 IDENTIFIED COMMUNITY VALUES IN DENHAM TOWNSITE
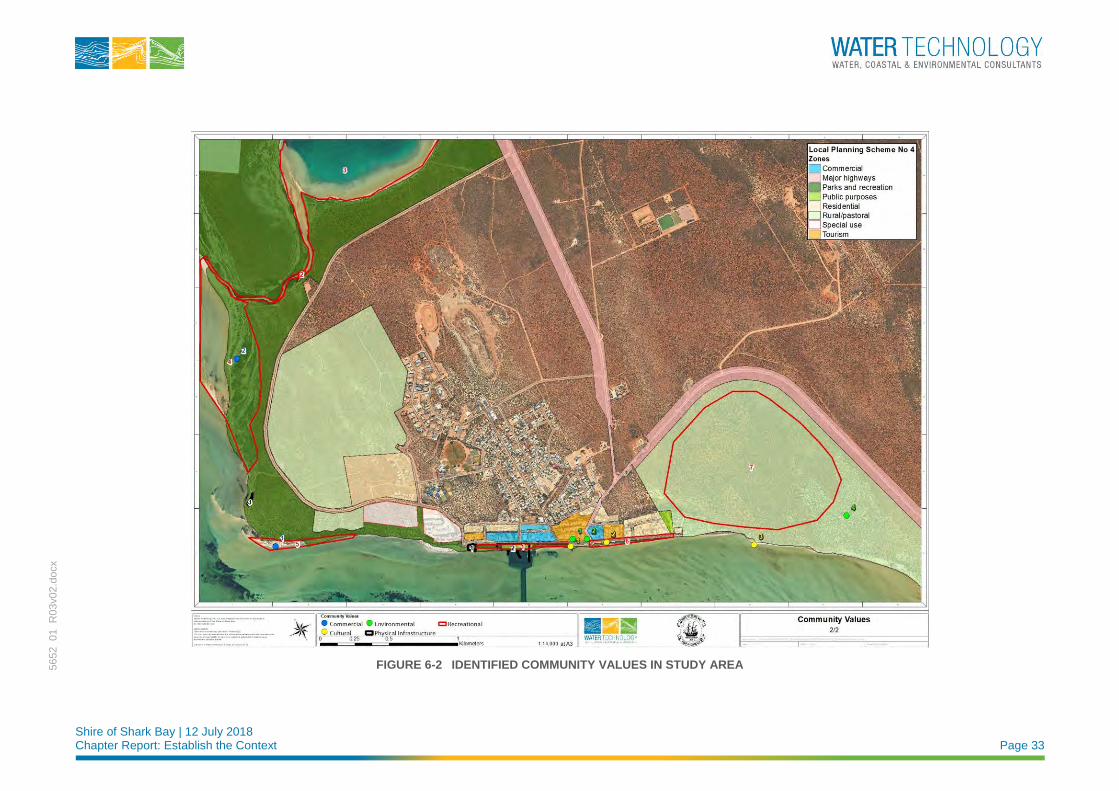
Shire of Shark Bay | 12 July 2018 Chapter Report: Establish the Context Page 33
5652_01_R
03v02.d
ocx
FIGURE 6-2 IDENTIFIED COMMUNITY VALUES IN STUDY AREA
Shire of Shark Bay | 12 July 2018 Chapter Report: Establish the Context Page 34
5652_01_R
03v02.d
ocx
6.3.1 Anecdotal Observations
During the workshop, attendees provided anecdotal observations of historical events and thoughts on the
study area:
◼ 2015 cyclone (not identified, however most likely Olwyn from the cyclone track information) crossed the
townsite during low tide. The leading edge was to the southeast and damage / impacts were minimal.
◼ It was thought that in general, erosion during a cyclone was minimal due to the high inundation levels.
That is, wave attack would almost occur on the roads rather than the beach face itself.
◼ This will be investigated during the coastal hazard assessment.
◼ The southern end of town appears to be more resilient to erosion, including cyclonic erosion.
◼ Decision-makers are unwilling to interfere with the more ‘natural’ coastline at the southern end of town,
due to its high recreational value and impacts from previous works.
◼ A ‘groyne’ located between Durlacher Street and Denham Road led to detrimental impacts.
◼ Historically, horse racing was held along the foreshore during the 1950’s.
◼ The beach is accreting at the backpacker ‘boat ramp’.
◼ The nearshore sandbanks are dynamic. Historically (i.e. 1980’s / 1990’s) seagrass was present.
◼ In 2010 there was a heatwave, and it was suggested that this was the cause of a noticeable reduction
in seagrass within much of the western inlet of Shark Bay. Seagrass disappearance offshore from the
eastern coastline of Dirk Hartog Island was linked to erosion in the area. Seagrass disappearance
offshore from Denham was noticed but not attributed directly to erosion.
◼ Concerned about the impacts to water quality and recreation of if the lagoon entrance were to close.
◼ Concerned about the uncontrolled 4WD beach driving / quad bike riding and their impact on the
environment.
◼ Human degradation considered to be a coastal hazard.
◼ There is a potential upgrade scheduled for the recreational infrastructure at the recreational node off Stella
Rowley Drive.
◼ Tidal action appears to reduce further south within the bay.
◼ There are identified indigenous sites to the east of town.
◼ Significant reclamation works over the years has made it difficult to ascertain shoreline movements.
6.3.2 Workshop Close
All attendees were provided with a feedback form at the end of the session to provide anonymous (if desired)
feedback. All attendees completed the form; feedback suggested the session was of value.
6.4 Success Criteria
The values collated from the workshop have been used to generate the success criteria for the risk assessment
component of the CHRMAP. These will be key to the whole CHRMAP as it is these that will ultimately drive
the selection of adaptation options. It is important that a comprehensive approach be applied at this stage of
the project, in order to provide a CHRMAP applicable to the Shire and stakeholders.
The success criteria are defined in Table 6-2.
Shire of Shark Bay | 12 July 2018 Chapter Report: Establish the Context Page 35
5652_01_R
03v02.d
ocx
TABLE 6-2 SUCCESS CRITERIA
• Protection of the environmental assets of the study area / planning to retain environmental integrity
• Protection of the recreational value of the coastline
• Protection of the cultural values of the coastline
• Maintenance of the culture of the Denham Town Centre
• Maintenance of a level of public infrastructure
• Development controls not to inhibit the landscape
6.4.1 Engagement
The aim of this stage of the engagement process is to engage with both internal and external stakeholders.
As only internal stakeholders were present at the workshop, there is the option of bringing the proposed online
survey (Water Technology, 2018) forward. This survey was originally aimed at advertising the project and the
proposed adaptation options. However, as there will be an Adaptation Assessment Workshop, and the draft
CHRMAP open for public comment, the second half of the study will be covered with suitable engagement.
The development of the success criteria could be further enhanced by the addition of external stakeholder
input in the form of an online survey. The Success Criteria developed from the Community Values Workshop
can be supplied for comment, and the opportunity to put forward additional values provided.
The survey link can be posted to:
◼ Shire website
◼ Shire Facebook pages:
◼ Shark Bay News & Views
◼ Shark Bay Buy Sell & Swap
◼ Hard copies can be made available at Post Office, Shire Office and World Heritage Discovery Visitor
Centre
Shire of Shark Bay | 12 July 2018 Chapter Report: Establish the Context Page 36
5652_01_R
03v02.d
ocx
7 CONCLUSIONS & RECOMMENDATIONS This document outlines the key management and adaptation issues that need to be considered in the
CHRMAP, as well as identifying the coastal assets and success criteria (community values). It is the
‘Establishing the Context’ component of the CHRMAP process, as described in the top bubble of the flow chart
displayed in Figure 1-2. To establish the context of the study, state and local coastal policy, planning schemes
and instruments were reviewed, as well as historical reports detailing physical phenomena affecting the
coastline.
The following sections summarise the key items of note identified in this report:
7.1 Coastal Hazards Summary
◼ Modelling will be undertaken using the available data. Present data gaps mean assumptions will be made
that limit the accuracy of the results.
◼ When dealing with coastal adaptation, it is important to understand the level of accuracy of the modelling,
as it informs the risk and vulnerability ratings. However, we believe the most effective approach is to use
the modelling to identify triggers, and their corresponding coastal management action. An indicative
likelihood and timeframe can be provided for guidance, but the ultimate adaptive action is driven by the
triggers
◼ To assist in filling the knowledge gaps, the following ongoing data collection is recommended. These are
listed in order of priority. Except where indicated, the benefit of the data will not be gained during the
present study, but in the application of the resulting coastal management plan:
◼ Locally placed nearshore water level and wave data logger. This will enable calibration of wave
models, especially if a storm / cyclone is captured during the deployment. Following the completion
of the CHRMAP, the data can be used to get a better understanding of event probabilities, rather than
just triggers.
◼ Ideally, this instrument would be deployed before the commencement of the next cyclone season.
If the data is to be used in the present study, the instrument would need to be deployed within
the next few months.
◼ Regular photographic beach monitoring is a useful tool in analysing beach behaviour. This can be
conducted at 6-monthly intervals at the end of the summer and winter. Photos should also be taken
immediately following severe storms. They should be undertaken from a set vantage point to allow
accurate comparisons between images. The images can be used to supplement available data when
undertaking adaptation option design. These images can also be used to support adaptation option
funding applications, and in educating the community about natural fluctuations in beach shape.
◼ These can be commenced immediately. Water Technology have proformas for these which allow
Shire staff to undertake the inspections, once initial guidance is provided. Coastal specialists
should review the data every couple of years, or if erosion is causing an issue.
◼ This data can also be used to identify if a trigger has been reached.
◼ Beach surveys, ideally every 6-months following the summer and winter periods. If possible,
immediately following cyclones. Corresponding monitoring photos should be taken at the same time.
◼ Regular monitoring of the marine structures / assets – e.g. seawall, jetties. These should be
undertaken with consistent proformas to allow comparison between inspections.

Shire of Shark Bay | 12 July 2018 Chapter Report: Establish the Context Page 37
5652_01_R
03v02.d
ocx
◼ These can be commenced immediately. Water Technology have proformas for these which allow
Shire staff to undertake the inspections, once initial guidance is provided. Coastal / marine
specialists should review the data every couple of years, or if there is an issue with an asset.
◼ Geotechnical investigations to determine the presence of bedrock. If located relatively near the
surface, bedrock can act as a natural protection structure, and negate the need for other mitigation
works. However, in low lying areas the presence of bedrock may not alter the level of risk to coastal
hazards. If the area is inundated the hard surface will not provide the expected protection to erosion.
The benefits of such an investigation will be explored in future stages of the CHRMAP.
7.2 Planning Items / Controls Summary
◼ SPP2.6 aims to avoid future development within areas identified to be at risk within the planning timeframe
of 100-years. For areas at risk, all potential adaptation options will be identified under the risk management
categories of avoid, managed retreat, accommodate and protect to manage the unacceptable risks.
◼ The ultimate aims of the policy are to ensure all future development takes into account coastal hazards,
climate change, and landform stability. Coastal values (landscape, biodiversity, ecosystems, indigenous
and cultural) are to be conserved.
◼ The WA Coastal Zone Strategy is a critical planning guide for any coastal community. It outlines the State
Government’s aims for sustainable coastal development into the future. The State Government
emphasises the preference of public interests over private and industry interests, and reinforces the
presumption of landholder responsibility. The State Government also reiterates protection should be used
only in the most exceptional circumstances. Ultimately, the Shire will be responsible for determining how
local landholders address risk, possibly by writing an LPP under the guidance of this strategy.
◼ This CHRMAP may identify developed land that will be at risk to coastal hazards, that, for various reasons
have not yet been formally identified. The current draft of LPS 4 does not outline how such areas are to
be managed. Guidance may be required to address these risks.
◼ The risks will be identified in Chapter Reports:
◼ Coastal Hazard & Vulnerability Assessment
◼ Risk Assessment.
◼ Presently there are limited development controls relating to the impacts of coastal hazards for land use
and development. At present, only the risk of inundation is addressed. Finished floor levels in these areas
are addressed in LPS 4 but there is no guidance for managing the impact that increased floor levels will
have on the interface between buildings and the adjacent public realm. This will be a challenge especially
within the Town Centre, where the highest concentration of retail premises and pedestrians requires easily
negotiated thresholds. It also creates a challenge in integrating new development with existing
development, especially along Knight Terrace.
◼ This will be addressed in the Chapter Report: Identification of Adaptation Options
◼ Absence of a local planning policy to provide guidance for developers and decision makers on the form
and nature of acceptable development on land exposed to coastal processes. For example, whilst
increasing finished floor levels for habitable buildings may succeed in minimising damage to the affected
property, the manner in which the increase is achieved can have implications for how quickly water can
recede as well as impact on other development.
◼ This will be addressed in:
◼ Chapter Report Assessment of Adaptation Options
◼ Draft CHRMAP (includes Implementation Plan).
Shire of Shark Bay | 12 July 2018 Chapter Report: Establish the Context Page 38
5652_01_R
03v02.d
ocx
7.3 Identification of Coastal Assets
A total of 144 assets were identified, photographed, georeferenced and classified into the categories of
Commercial, Public, Residential and Tourism Related. Risks to these assets will be considered by applying
the success criteria in the Risk Analysis and Evaluation phase of the project (refer Figure 1-2 for project
phases).
Each asset was colour coded based on its classification for ease of identification in the mapping. The online
database can be found at the following link:
https://watech.maps.arcgis.com/apps/webappviewer/index.html?id=6e092b4d0f044e038a721705e907c084
Within the database are brief descriptions of each asset, together with a photograph. All assets are
georeferenced.
7.4 Community Values Assessment:
The community values workshop identified the following success criteria from which to assess the coastal
hazard risks:
◼ Protection of the environmental assets of the study area / planning to retain environmental integrity
◼ Protection of the recreational value of the coastline
◼ Protection of the cultural values of the coastline
◼ Maintenance of the culture of the Denham Town Centre
◼ Maintenance of a level of public infrastructure
◼ Development controls not to inhibit the landscape
The aim of this stage of the engagement process is to engage with both internal and external stakeholders.
As only internal stakeholders were present at the workshop, there is the option of bringing the proposed online
survey (Water Technology, 2018) forward. The development of the success criteria could be further enhanced
by the addition of external stakeholder input in the form of an online survey.
7.5 Next Steps
The next phases of the study are to identify the coastal hazard risks and undertake a vulnerability assessment.
That is, examine the impacts of coastal erosion and storm surge inundation on the assets and their
corresponding values.
Shire of Shark Bay | 12 July 2018 Chapter Report: Establish the Context Page 39
5652_01_R
03v02.d
ocx
8 REFERENCES Bureau of Meteorology (BoM, 2014). Tropical Cyclone Hazel, [ONLINE] Available at:
http://www.bom.gov.au/cyclone/history/hazel.shtml, [Accessed 18th April 2018]
Eliot I, Gozzard JR, Eliot M, Stul T and McCormack G. (2012). The Coast of the Shires of Shark Bay to Exmouth, Gascoyne, Western Australia: Geology, Geomorphology & Vulnerability, Prepared by Damara WA
Pty Ltd and Geological Survey of Western Australia for the Department of Planning and the Department of
Transport
Harper B.A. (ed.), (2001). Queensland Climate Change and community vulnerability to tropical cyclones - ocean hazards assessment - stage 1, Report prepared by Systems Engineering Australia Pty Ltd in association
with James Cook University Marine Modelling Unit, Queensland Government, March, 375pp. [available from:
http://www.longpaddock.qld.gov.au/about/publications/pdf/climatechange/vulnerabilitytotropicalcyclones/stag
e1/FullReportLowRes.pdf ]
Harper B.A., Stroud S.A., McCormack M. and West S. (2008). ‘A review of historical tropical cyclone intensity
in north-western Australia and implications for climate change trend analysis’. Australian Meteorological Magazine, Vol. 57, No. 2, June, 121-141. [Available online at:
http://www.bom.gov.au/amoj/docs/2008/harper.pdf ]
Harper B.A. and Mason L.B. (2016) A tropical cyclone wind event data set for Australia. Proc. 18th Australasian
Wind Engineering Society Workshop, 6-8 July, McClaren Vale, SA.
Intergovernmental Panel on Climate Change (IPCC, 2014). Climate Change 2014: Synthesis Report, Contribution of Working Groups I, II and III to the Fifth Assessment Report of the Intergovernmental Panel on
Climate Change. Geneva, Switzerland, Core Writing Team, R.K. Pachauri and L.A. Meyer (eds.)], IPCC,
Geneva, Switzerland, 151 pp.
MRA (2014). Denham Inundation Levels Storm Surge Modelling Report, report to the Shire of Shark Bay
Seashore Engineering (2017). Shire of Shark Bay - Final Draft Hotspots Snapshots, Report No SE052,
prepared for Department of Planning
Water Technology (2018). Denham Townsite CHRMAP: Stakeholder and Community Engagement Plan,
Report No 5562-01 R01v01, prepared for Shire of Shark Bay
Western Australian Planning Commission (WAPC, 2013). State Planning Policy No. 2.6 – State Coastal Planning Policy, prepared under the Planning and Development Act 2005.
Western Australian Planning Commission (WAPC, 2014). Coastal Hazard Risk Management and Adaptation Planning Guidelines
Western Australian Planning Commission (WAPC, 2017). Draft Planned or Managed Retreat Guidelines,
published by WAPC, Department of Planning, Lands and Heritage
Worley Parsons (WP, 2016). Denham Foreshore Revitalisation Stage 1A: Design Report, Report No 301012-
02233 – GE-REP-002, prepared for Department of Transport

[Client Name] | [Publish Date] [Project Name]
5652_01_R
03v02.d
ocx
APPENDIX A SUPPORTING PLANNING CONTROLS / INFORMATION
[Client Name] | [Publish Date] [Project Name]
5652_01_R
03v02.d
ocx
A-1 State Planning Documentation
A-1-1 State Planning Policies
State Planning Policies (SPPs) provide the highest level of planning policy control and guidance in Western
Australia and are prepared under Part 3 of the Planning and Development Act 2005. The Coastal Planning Policy (SPP 2.6) is an environmental sector policy consistent with the higher order SPP 2 Environmental and Natural Resources Policy. This relationship is illustrated in Figure 4-2, which also shows how the CHRMAP
process fits into the hierarchy. The CHRMAP is a local level policy document (refer to Figure 4-2), though not
a local planning policy unless the Shire adopts it as such via the processes of the local planning scheme.
A-1-2 State Planning Policy 3.4: Natural Hazards and Disasters
This document aims to include natural disaster planning in town planning schemes and local planning
strategies so as to minimise the adverse impacts of natural disasters on communities, both in terms of the
economy and environment. Natural disasters in the context of the present study include (land) flood, cyclones,
storm surge, and bushfires. Bushfires can have an impact in the coastal zone in terms of dune vegetation
integrity, and therefore erosion susceptibility.
The cost of recovery following a natural disaster is significant. The most effective strategy is to integrate
mitigation activities into land use planning.
The contents of this planning policy are directly in line with the advice provided in SPP2.6.
A-1-3 Other Relevant State Documents
8.1.1.1 Coastal Adaptation and Protection (CAP) Grants
These are grants implemented by the Department of Transport (DoT) to assist WA local coastal managers
with coastal management. These grants are available for monitoring, investigation, asset management,
adaptation and maintenance in the coastal zone. In 2017, $750,000 was available across the state; in 2018
this was increased to $1.057 million. The grant process adheres to the CHRMAP principles and aims to ensure
coastal managers adapt sustainably to coastal hazards for the benefit of the public. Adaptation options are to
preserve and enhance coastal values, and assets to benefit the community. New coastal protection works are
not permitted under the grant scheme unless they can be adequately justified in the context of the CHRMAP
process.
It is important to bear the above in mind when developing adaptation options, as funding will only be available
if the principles are followed. Some useful weblinks for these grants are included below:
◼ Main page:
◼ https://www.transport.wa.gov.au/imarine/coastal-adaptation-and-protection-cap-grants.asp
◼ Frequently Asked Questions:
◼ https://www.transport.wa.gov.au/mediaFiles/marine/MAC_P_CAP_2018_19_Grant_FAQ.pdf
◼ Detailed Grant Information
◼ https://www.transport.wa.gov.au/mediaFiles/marine/MAC_P_CAP_2018_19_Grant_InfoApps.pdf
[Client Name] | [Publish Date] [Project Name]
5652_01_R
03v02.d
ocx
A-2 Regional Planning Documents
A-2-1 Gascoyne Planning and Infrastructure Framework
After the State Planning Strategy, the key regional strategic planning document is the Gascoyne Planning and Infrastructure Framework 2015 (Gascoyne PIF). The Gascoyne PIF takes into consideration the
recommendations of the Shark Bay Regional Strategy 1998, which was itself a review of the 1988 Shark Bay Region Plan, the primary purpose of which related to guidance for planning and management to protect and
enhance the Shark Bay World Heritage values. The Gascoyne PIF provides an overall strategic regional
context for land-use planning within the region and identifies several priority initiatives required to facilitate
comprehensive regional planning and guide local planning processes.
A-2-2 Gascoyne Coast Sub-Regional Strategy
A Gascoyne Coast Sub-Regional Strategy is in preparation and the draft was advertised for public comment
early in 2017. The draft strategy aims to guide local planning processes, including the preparation of and
amendments to local planning schemes and strategies. It identifies coastal processes and hazards as an issue
and recognises that these may compromise the suitability of proximate areas for development, noting that
coastal foreshore reserves are generally required. Also noted is the fact that development may be subject to
specific construction requirements as per the Building Code of Australia as a result of the region being prone
to cyclonic activity. Coastal processes are not mentioned specifically in relation to the ongoing development
and expansion of the Denham townsite; however, the importance of tourism to the local economy is strongly
tied to the sustainability of environmental tourist attractions and the tourism services provided within Denham.
A-3 Local Planning Documents
A-3-1 Local Planning Policies
Local planning policies can be made to support local planning scheme provisions. Currently, the Shire has no
published Local Planning Policies which address coastal hazards.
A-3-2 Structure Plans
Structure Plans can provide guidance for the future subdivision and development of land. A structure plan is
not a statutory document, but decision makers for applications for development or subdivision approval within
a structure plan area must have regard to its content when deciding the application. Decision makers are not
bound by the structure plan, but it would require compelling alternative considerations to ignore its intent.
The Shire of Shark Bay has no approved structure plans relevant to the Denham townsite; however, the
Denham Townsite Plan (refer to section 4.2.2) is referred to by the Shire as a structure plan.
[Client Name] | [Publish Date] [Project Name]
5652_01_R
03v02.d
ocx
APPENDIX B REVIEW OF HISTORICAL COASTAL INVESTIGATIONS
[Client Name] | [Publish Date] [Project Name]
5652_01_R
03v02.d
ocx
B-1 Coastal Hazard Assessments
B-1-1 Historical Cyclones
Whilst numerous cyclones have affected Denham in the last 60 years, there is a lack of climatic and
oceanographic data for the Town of Denham and its surrounds that captures the passage of Tropical Cyclones
(TC’s) within a significant distance. This means that examination of many historical TC’s may be rudimentary
and discussion of their impacts may be provided by circumstantial evidence and second-hand observations.
Details of observed erosion or inundation effects and previous modelling relating to cyclones have been
reviewed in Sections B-1-2 and B-1-3.
Eliot et al (2012) analysed tropical cyclone data for the Pilbara and Gascoyne coasts. The report states that
direct impact of cyclones for the Gascoyne coastline are less frequent than further north, occurring on average
once every two to three years. The report references Hubbert et al. (1991) which reported that TC Hazel
developed a high storm surge due to the path of the cyclone parallel to the coast, compared with an equivalent
theoretical system approaching the coast at a perpendicular angle.
MRA (2014) investigated cyclones that passed within 250 km of the Denham townsite, noting that 29 named
and 4 unnamed cyclones fit such criteria between the 1960’s and 2014. MRA selected three TC’s (Elaine,
Hazel, and Narelle) due to the availability of water level data at Denham or nearby. MRA noted that the cyclone
track information for the selected storms was available from the BoM, however details of specific
characteristics or impacts observed at Denham could not be found either in the MRA report or other literature.
BoM (2014) summarised the meteorological description and observed impacts of TC Hazel from March 1979.
This report refers to Denham as one of the towns damaged by cyclonic activity, specifically that there were
reports of inundated buildings as a result of a storm surge. The report also mentions that people were
evacuated and local jetties damaged.
The BoM report states that the lowest pressure recorded by an on-the-ground monitoring station was 977.3
hPa at Kalbarri and Geraldton. However, the cyclone track information estimates that TC Hazel reached a
maximum low pressure of 938 hPa just 20 km south of Denham. Track information from the BoM also indicates
that the eye of the storm passed directly over the townsite.
B-1-2 Coastal Erosion
Under the guidance of the planning controls mentioned in Section 2 (WAPC, 2013), the allowance for erosion
on sandy coasts is calculated as the sum of the S1, S2 and S3 Erosion components, plus 0.2 m per year
allowance for uncertainty, and should be measured from the horizontal shoreline datum (HSD):
◼ S1 Erosion: Allowance for the present risk of storm erosion
◼ S2 Erosion: Allowance for the historic shoreline movement trends
◼ S3 Erosion: Allowance for erosion caused by future sea level rise.
As stated above, these allowances form the coastal foreshore reserve for coastal erosion required by the
WAPC when applied from a horizontal shoreline datum (HSD), a fixed line that is defined on the basis of the
type of coastline being assessed. The HSD defines the active limit of the shoreline under storm activity and
should be determined against the physical and biological features of the coast. In most cases it should be
defined as the seaward shoreline contour representing the peak steady water level under storm activity.
Investigations into the historic, present, and future erosion estimates have not yet been undertaken for the
study area.
[Client Name] | [Publish Date] [Project Name]
5652_01_R
03v02.d
ocx
Seashore Engineering (2017) investigated erosion at the Denham townsite identifying two ‘erosion hotspots’
at the western and eastern extents of Knight Terrace corresponding with each end of the ad-hoc revetment’s
transition to beachfront. The report provides a summary of erosion and associated problems, a brief register
of public and private assets potentially exposed to erosion, as well as anticipated management options for the
immediate future and their triggers.
The report outlines that the area of Denham foreshore at risk is mainly reclaimed land that is managed by the
revetment and ongoing renourishment. The report also states that the western hotspot is more susceptible to
erosion (than the east) due to the interruption of sediment transport by the dredged channel. The report agrees
that no quantitative or otherwise significant hazard assessment regarding erosion has been done at this
location.
As summarised in Section 3.2 and 3.2.2.1, this study aims to fill some of the identified knowledge gaps and
recommend measures to fill the remaining gaps.
B-1-3 Coastal Inundation
The allowance for the current risk of inundation, according to SPP2.6, is calculated as the maximum extent of
storm inundation, defined as the peak steady water level plus wave run-up. Consideration must be given to
the likelihood of breaching any manmade structure, e.g. the seawall fronting the Denham town site, or natural
barriers, for example a dune system.
As Denham is located in an area subject to tropical cyclones, the allowance for the present risk of inundation
must consider tropical cyclonic storm events. The design event must have a 0.2% Annual Exceedance
Probability (AEP), which corresponds to a 500-year Average Recurrence Interval (ARI). Planning guidelines
state that this cyclone should track to maximise its inundation potential. Planning guidelines also indicate that
0.9 m of sea level rise must be added to design water levels to determine the final inundation levels for 2110.
The inundation allowance should also include an allowance for the current risk of inundation from a tsunami.
MRA (2014) provides the most comprehensive summation of historically observed water levels for the study
area, as well as the only detailed investigation into the design water levels required by the planning controls
outlined in Section 2. Notable water levels observed at Denham are:
◼ TC Hazel (1979) reached a maximum water level of 1.9 m AHD. MRA references the SoSB Cyclone
Contingency Plan from 2009 however it is unclear in what way this original observation was recorded.
This document has now been superseded with the 2017/18 Cyclone Season Community Information
Sheet.
◼ TC Herbie (1988) reached a maximum water level of 2.1 m AHD. This observation was also referenced
from the SoSB Cyclone Contingency Plan from 2009 and its origin is not stated.
The report states that no cyclonic event was captured during the brief water level records at Denham (refer
Table 3-1 for Denham water level data record).
MRA (2014) used limited available data to set up and calibrate a Delft3D cyclone hydrodynamic model for the
town of Denham. Modelling of historical cyclones was used to create a first order storm surge approximation.
Following this, a Monte Carlo model was used to generate and simulate 1,000 years of synthetic cyclone tracks
to determine extreme water levels for Denham. The results of this methodology are shown in Table B-1.
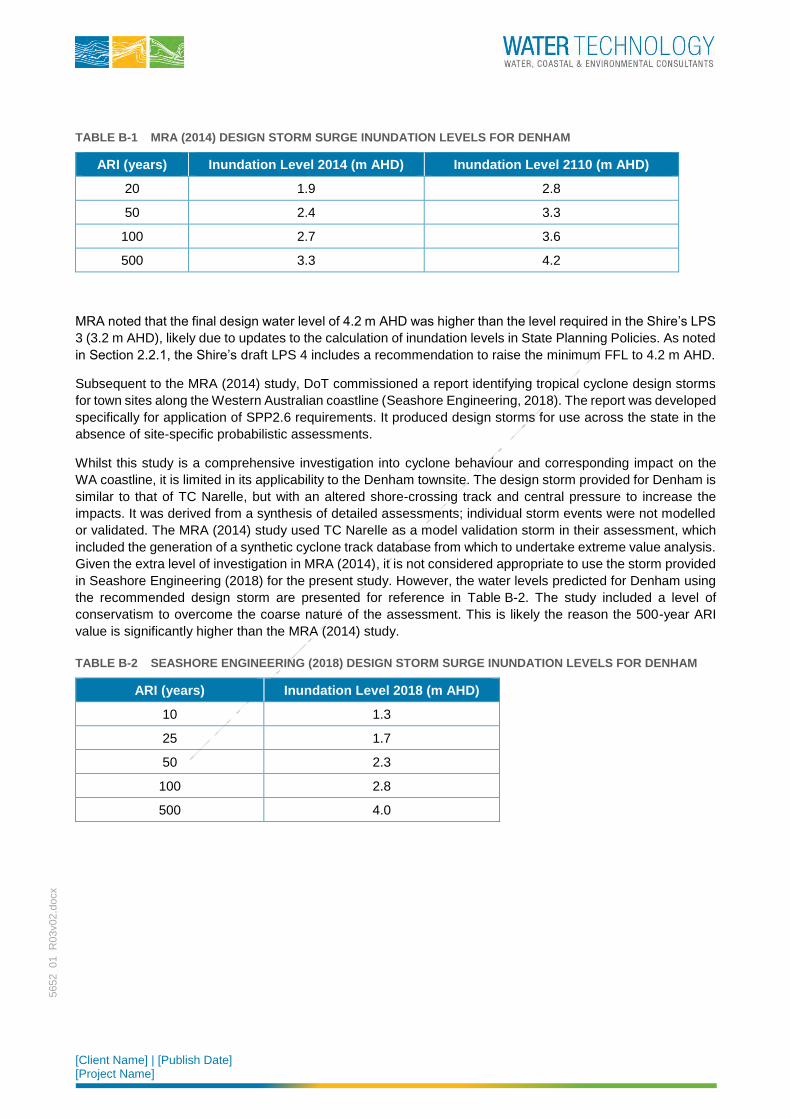
[Client Name] | [Publish Date] [Project Name]
5652_01_R
03v02.d
ocx
TABLE B-1 MRA (2014) DESIGN STORM SURGE INUNDATION LEVELS FOR DENHAM
ARI (years) Inundation Level 2014 (m AHD) Inundation Level 2110 (m AHD)
20 1.9 2.8
50 2.4 3.3
100 2.7 3.6
500 3.3 4.2
MRA noted that the final design water level of 4.2 m AHD was higher than the level required in the Shire’s LPS
3 (3.2 m AHD), likely due to updates to the calculation of inundation levels in State Planning Policies. As noted
in Section 2.2.1, the Shire’s draft LPS 4 includes a recommendation to raise the minimum FFL to 4.2 m AHD.
Subsequent to the MRA (2014) study, DoT commissioned a report identifying tropical cyclone design storms
for town sites along the Western Australian coastline (Seashore Engineering, 2018). The report was developed
specifically for application of SPP2.6 requirements. It produced design storms for use across the state in the
absence of site-specific probabilistic assessments.
Whilst this study is a comprehensive investigation into cyclone behaviour and corresponding impact on the
WA coastline, it is limited in its applicability to the Denham townsite. The design storm provided for Denham is
similar to that of TC Narelle, but with an altered shore-crossing track and central pressure to increase the
impacts. It was derived from a synthesis of detailed assessments; individual storm events were not modelled
or validated. The MRA (2014) study used TC Narelle as a model validation storm in their assessment, which
included the generation of a synthetic cyclone track database from which to undertake extreme value analysis.
Given the extra level of investigation in MRA (2014), it is not considered appropriate to use the storm provided
in Seashore Engineering (2018) for the present study. However, the water levels predicted for Denham using
the recommended design storm are presented for reference in Table B-2. The study included a level of
conservatism to overcome the coarse nature of the assessment. This is likely the reason the 500-year ARI
value is significantly higher than the MRA (2014) study.
TABLE B-2 SEASHORE ENGINEERING (2018) DESIGN STORM SURGE INUNDATION LEVELS FOR DENHAM
ARI (years) Inundation Level 2018 (m AHD)
10 1.3
25 1.7
50 2.3
100 2.8
500 4.0
[Client Name] | [Publish Date] [Project Name]
5652_01_R
03v02.d
ocx
B-2 Coastal Adaptation Assessments
Worley Parsons (WP, 2016) undertook the design of the Denham Foreshore Revitalisation project which
encompassed a review and recommended upgrade of the town’s existing revetment. WP noted that the design
was completed by desktop analysis without inclusion of any modelling services. WP states that, in order to
satisfy the overtopping requirement standards they follow, the crest of the upgraded revetment would have to
exceed 5.2 m AHD. A brief assessment of this option considered it unrealistic due to cost, aesthetics, and
functionality. The final recommended revetment design has a recommended crest level of 3.4 m AHD with a
width of three armour stones at the crest to minimise damage due to overtopping. This level is 1.1 m above
the existing revetment crest level. It is not stated how the recommended crest level was obtained.
Seashore Engineering (2017) undertook a preliminary assessment of adaptation options due to the anticipated
further erosion at the two identified erosion hotspots described in Section B-1-2. This assessment only
considered the next 5-years and, in both cases, it was deemed necessary to protect, rather than avoid, retreat,
or accommodate. For the western hotspot, renourishment with dredged material was recommended. For the
eastern hotspot, minor embankment repairs and revegetation efforts were recommended.
[Client Name] | [Publish Date] [Project Name]
5652_01_R
03v02.d
ocx
APPENDIX C STORM SURGE MODELLING REPORT REVIEW
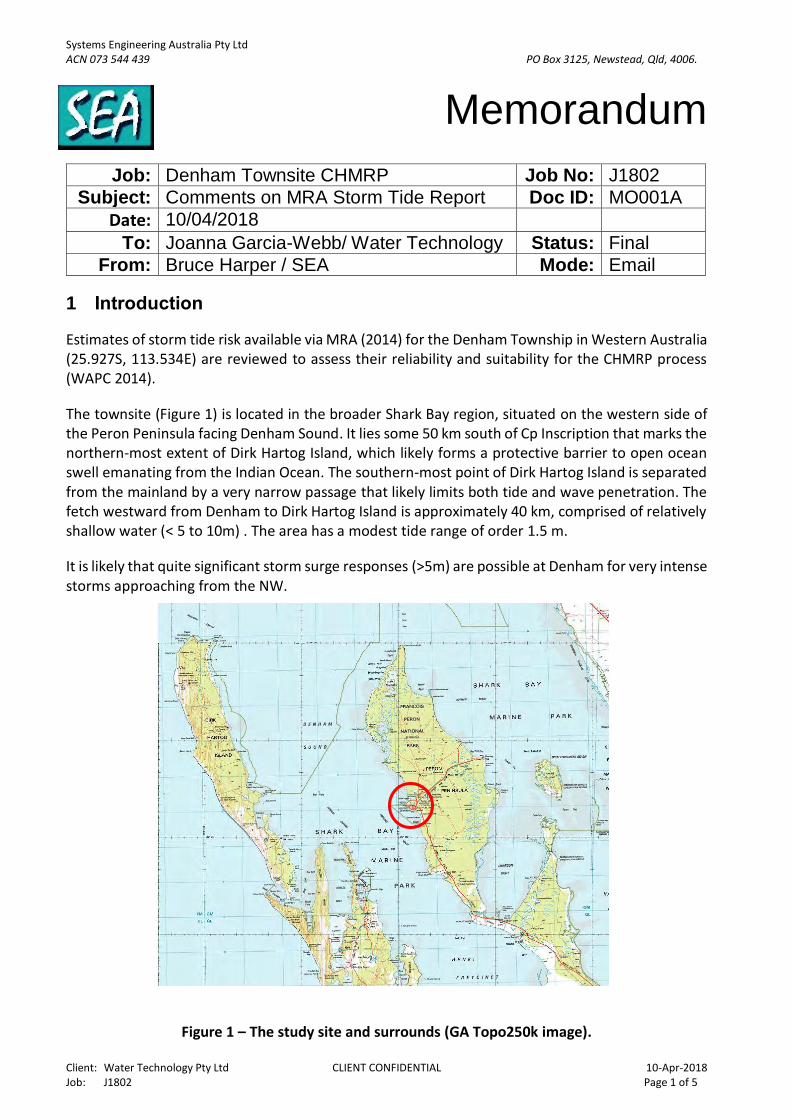
Systems Engineering Australia Pty Ltd ACN 073 544 439 PO Box 3125, Newstead, Qld, 4006.
Client: Water Technology Pty Ltd CLIENT CONFIDENTIAL 10-Apr-2018 Job: J1802 Page 1 of 5
Memorandum
Job: Denham Townsite CHMRP Job No: J1802
Subject: Comments on MRA Storm Tide Report Doc ID: MO001A
Date: 10/04/2018
To: Joanna Garcia-Webb/ Water Technology Status: Final
From: Bruce Harper / SEA Mode: Email
1 Introduction
Estimates of storm tide risk available via MRA (2014) for the Denham Township in Western Australia (25.927S, 113.534E) are reviewed to assess their reliability and suitability for the CHMRP process (WAPC 2014).
The townsite (Figure 1) is located in the broader Shark Bay region, situated on the western side of the Peron Peninsula facing Denham Sound. It lies some 50 km south of Cp Inscription that marks the northern-most extent of Dirk Hartog Island, which likely forms a protective barrier to open ocean swell emanating from the Indian Ocean. The southern-most point of Dirk Hartog Island is separated from the mainland by a very narrow passage that likely limits both tide and wave penetration. The fetch westward from Denham to Dirk Hartog Island is approximately 40 km, comprised of relatively shallow water (< 5 to 10m) . The area has a modest tide range of order 1.5 m.
It is likely that quite significant storm surge responses (>5m) are possible at Denham for very intense storms approaching from the NW.
Figure 1 – The study site and surrounds (GA Topo250k image).
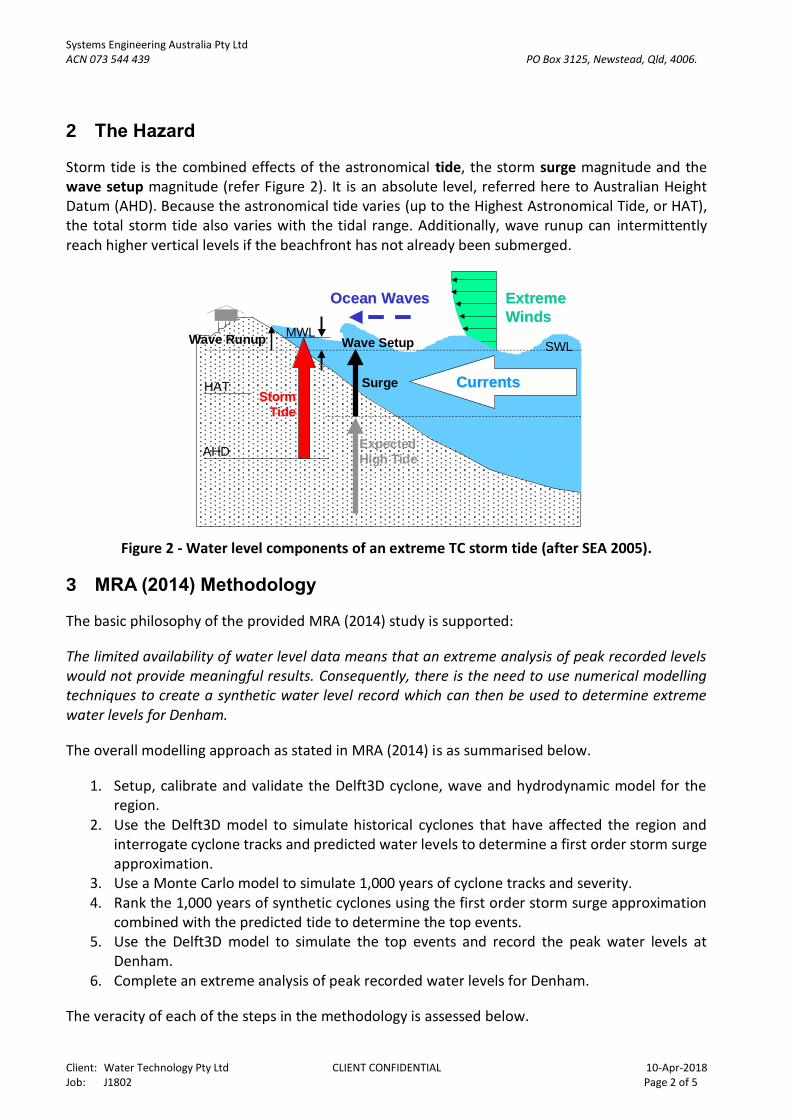
Systems Engineering Australia Pty Ltd ACN 073 544 439 PO Box 3125, Newstead, Qld, 4006.
Client: Water Technology Pty Ltd CLIENT CONFIDENTIAL 10-Apr-2018 Job: J1802 Page 2 of 5
2 The Hazard
Storm tide is the combined effects of the astronomical tide, the storm surge magnitude and the wave setup magnitude (refer Figure 2). It is an absolute level, referred here to Australian Height Datum (AHD). Because the astronomical tide varies (up to the Highest Astronomical Tide, or HAT), the total storm tide also varies with the tidal range. Additionally, wave runup can intermittently reach higher vertical levels if the beachfront has not already been submerged.
Figure 2 - Water level components of an extreme TC storm tide (after SEA 2005).
3 MRA (2014) Methodology
The basic philosophy of the provided MRA (2014) study is supported:
The limited availability of water level data means that an extreme analysis of peak recorded levels would not provide meaningful results. Consequently, there is the need to use numerical modelling techniques to create a synthetic water level record which can then be used to determine extreme water levels for Denham.
The overall modelling approach as stated in MRA (2014) is as summarised below.
1. Setup, calibrate and validate the Delft3D cyclone, wave and hydrodynamic model for the region.
2. Use the Delft3D model to simulate historical cyclones that have affected the region and interrogate cyclone tracks and predicted water levels to determine a first order storm surge approximation.
3. Use a Monte Carlo model to simulate 1,000 years of cyclone tracks and severity. 4. Rank the 1,000 years of synthetic cyclones using the first order storm surge approximation
combined with the predicted tide to determine the top events. 5. Use the Delft3D model to simulate the top events and record the peak water levels at
Denham. 6. Complete an extreme analysis of peak recorded water levels for Denham.
The veracity of each of the steps in the methodology is assessed below.
Ocean WavesOcean Waves
Wave SetupWave RunupSWL
MWL
HAT
AHD
ExtremeExtreme
WindsWinds
Expected
High Tide
CurrentsCurrentsSurgeStormStorm
TideTide
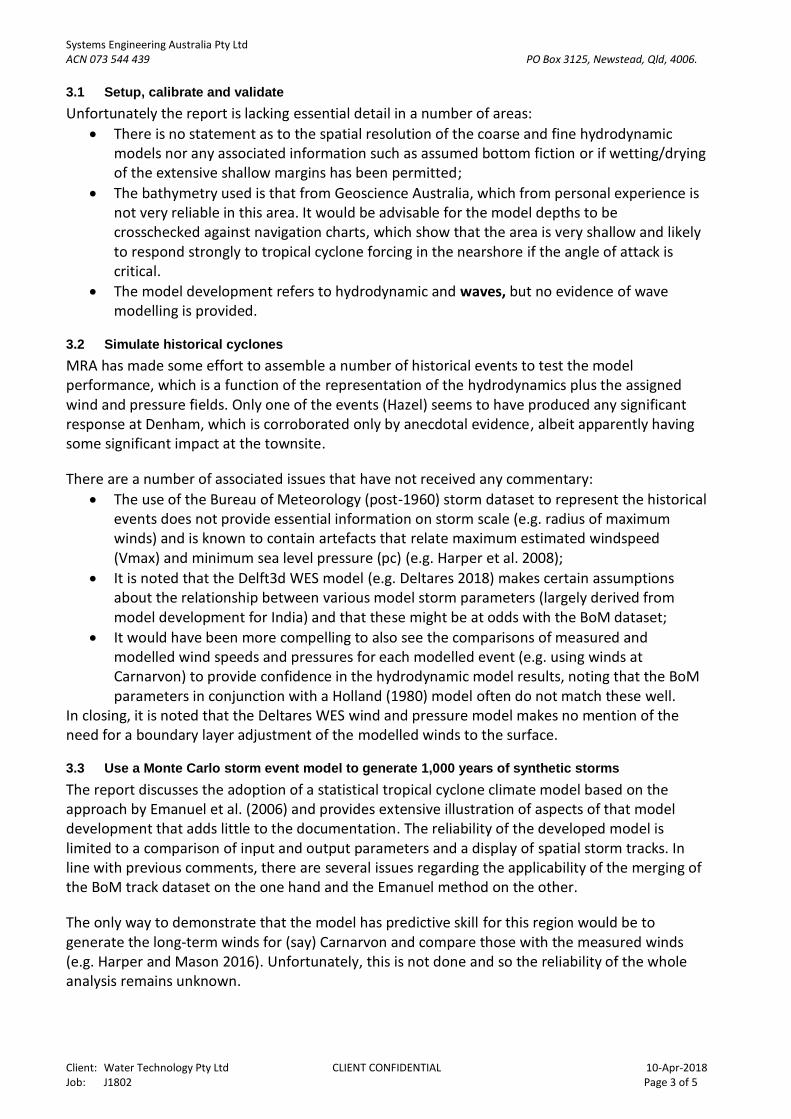
Systems Engineering Australia Pty Ltd ACN 073 544 439 PO Box 3125, Newstead, Qld, 4006.
Client: Water Technology Pty Ltd CLIENT CONFIDENTIAL 10-Apr-2018 Job: J1802 Page 3 of 5
3.1 Setup, calibrate and validate
Unfortunately the report is lacking essential detail in a number of areas:
• There is no statement as to the spatial resolution of the coarse and fine hydrodynamic models nor any associated information such as assumed bottom fiction or if wetting/drying of the extensive shallow margins has been permitted;
• The bathymetry used is that from Geoscience Australia, which from personal experience is not very reliable in this area. It would be advisable for the model depths to be crosschecked against navigation charts, which show that the area is very shallow and likely to respond strongly to tropical cyclone forcing in the nearshore if the angle of attack is critical.
• The model development refers to hydrodynamic and waves, but no evidence of wave modelling is provided.
3.2 Simulate historical cyclones
MRA has made some effort to assemble a number of historical events to test the model performance, which is a function of the representation of the hydrodynamics plus the assigned wind and pressure fields. Only one of the events (Hazel) seems to have produced any significant response at Denham, which is corroborated only by anecdotal evidence, albeit apparently having some significant impact at the townsite.
There are a number of associated issues that have not received any commentary:
• The use of the Bureau of Meteorology (post-1960) storm dataset to represent the historical events does not provide essential information on storm scale (e.g. radius of maximum winds) and is known to contain artefacts that relate maximum estimated windspeed (Vmax) and minimum sea level pressure (pc) (e.g. Harper et al. 2008);
• It is noted that the Delft3d WES model (e.g. Deltares 2018) makes certain assumptions about the relationship between various model storm parameters (largely derived from model development for India) and that these might be at odds with the BoM dataset;
• It would have been more compelling to also see the comparisons of measured and modelled wind speeds and pressures for each modelled event (e.g. using winds at Carnarvon) to provide confidence in the hydrodynamic model results, noting that the BoM parameters in conjunction with a Holland (1980) model often do not match these well.
In closing, it is noted that the Deltares WES wind and pressure model makes no mention of the need for a boundary layer adjustment of the modelled winds to the surface.
3.3 Use a Monte Carlo storm event model to generate 1,000 years of synthetic storms
The report discusses the adoption of a statistical tropical cyclone climate model based on the approach by Emanuel et al. (2006) and provides extensive illustration of aspects of that model development that adds little to the documentation. The reliability of the developed model is limited to a comparison of input and output parameters and a display of spatial storm tracks. In line with previous comments, there are several issues regarding the applicability of the merging of the BoM track dataset on the one hand and the Emanuel method on the other.
The only way to demonstrate that the model has predictive skill for this region would be to generate the long-term winds for (say) Carnarvon and compare those with the measured winds (e.g. Harper and Mason 2016). Unfortunately, this is not done and so the reliability of the whole analysis remains unknown.
Systems Engineering Australia Pty Ltd ACN 073 544 439 PO Box 3125, Newstead, Qld, 4006.
Client: Water Technology Pty Ltd CLIENT CONFIDENTIAL 10-Apr-2018 Job: J1802 Page 4 of 5
3.4 Rank the 1,000 years of synthetic cyclones
Section 4.4 also introduces the so-called “first order” or parametric storm tide model that is used to rank the 1,000-year event track set to reduce it to the “top 154” decided upon to be modelled through the hydrodynamic models. There is no way to assess the veracity of this model because there are no specific details provided, other than describing its principal parameters and the fact that it is combined with a simple harmonic tide generator. It is noted that a 150 km radius is also used to include any potentially significant events, which is supported.
3.5 Use the Delft3D model to simulate the top events
The “top 154” events (why this number was adopted is not stated but must be related to the Poisson inter-arrival frequency to achieve a lowest ARI of 20 y) are then modelled in detail. Whether this is done with tidal boundaries in a coupled-mode or simply retaining the associated parametric model astronomical tide sequence, which itself lacks specifically-localised tidal nuances, is not stated. It would have been instructive to show a comparison between the parametric and hydrodynamic storm tide response to gauge the effectiveness of the parametric model used in the initial ranking to select the 154 runs.
It is noted that the 154 storm’s storm tide levels were then subject to an Extreme Value Analysis following Petrauskas & Aagaard (1971) but, given that P&A offer a wide range of possible EVAs with sometimes disparate outcomes, it would have been useful to show how well the modelled data points have been fitted and then subsequently extrapolated. P&A also enables confidence limits to be estimated for such extrapolation, but these are not provided.
4 Conclusions and Recommendations
While the overall study approach is supported, the lack of detail around the many essential steps needed to fulfil the benefits of the methodology is disappointing and does not allow a ready endorsement of the results.
Firstly, the method ignores the potential contribution of wave setup at Denham, which although not likely to be critical given the exposure and the shallow margins, is also not likely to be insignificant at higher ARI. Given the proximity of assets to the shoreline, wave setup and runup are likely important components of any tropical cyclone storm tide impact and should be estimated as part of the CHMRP.
Next, there is no validation of the Monte Carlo storm climatology against regional data. Given that storm tide is a complex function of wind-field scale, magnitude, speed of movement, frequency and track, the synthetic storms should be demonstrated to produce a similar statistical distribution to regionally-measured winds where they are available (Harper 2001). The need for this is compounded by the adoption of the US-based Emanuel approach combined with the lack of parameter information in the BoM dataset and the assumptions made in the WES model, which together leave a wide range of interpretation. Finally, there is a lack of disclosure of how the final 154 event extrapolation was performed and what likely range of uncertainty exists with that.
It is difficult to conclude the reliability of the final MRA Table 5.1 “Tide plus Surge” recommendations and so I can only point to the various uncertainties in the methodology to speculate that it may be no better than ± 0.5 m at the 500 y ARI. Wave setup allowances will add to the upper limit of this uncertainty by potentially another 0.5 m at the 500 y ARI. In contrast, the estimated 20 y ARI level of 1.9 m AHD seems relatively high given that HAT is only around 0.9 m AHD.
Systems Engineering Australia Pty Ltd ACN 073 544 439 PO Box 3125, Newstead, Qld, 4006.
Client: Water Technology Pty Ltd CLIENT CONFIDENTIAL 10-Apr-2018 Job: J1802 Page 5 of 5
5 References
Harper B.A. (ed.), (2001) Queensland climate change and community vulnerability to tropical cyclones - ocean hazards assessment - stage 1, Report prepared by Systems Engineering Australia Pty Ltd in association with James Cook University Marine Modelling Unit, Queensland Government, March, 375pp. [available from: http://www.longpaddock.qld.gov.au/about/publications/pdf/climatechange/vulnerabilitytotropicalcyclones/stage1/FullReportLowRes.pdf ]
Harper B.A., Stroud S.A., McCormack M. and West S. (2008) A review of historical tropical cyclone intensity in north-western Australia and implications for climate change trend analysis. Australian Meteorological Magazine, Vol. 57, No. 2, June, 121-141. [Available online at: http://www.bom.gov.au/amoj/docs/2008/harper.pdf ]
Harper B.A. and Mason L.B. (2016) A tropical cyclone wind event data set for Australia. Proc. 18th Australasian Wind Engineering Society Workshop, 6-8 July, McClaren Vale, SA.
Holland G.J. (1980) An analytic model of the wind and pressure profiles in hurricanes. Mon. Wea. Rev., 108, 1212-1218.
Deltares (2018) WES - Wind Enhance Scheme for cyclone modelling, User Manual, Version: 3.01. SVN Revision: 52614, April, 56pp.
Emanuel K. A., Ravela S., Vivant E., and Risi C. (2006) A statistical deterministic approach to hurricane risk assessment. Bull. Amer. Meteor. Soc., 87, 299–314.
MRA (2014) Denham Inundation Levels -Storm Surge Modelling Report. Prepared by M.P. Rogers and Associates Pty Ltd for Shire of Shark Bay. R558 Rev 0, Dec, 35pp.
Petrauskas C. & Aagaard P. M. (1971) Extrapolation of Historical Storm Data for Estimating Design Wave Heights. American Institute of Mining, Metallurgical and Petroleum Engineers Inc.
WT (2018) Subcontractor agreement 5652_SC03V01. March.
WAPC (2014) Coastal hazard risk management and adaptation planning guidelines. Western Australian Planning Commission, Government of Western Australia, 38pp.
Bruce Harper
BE PhD FIEAust CPEng NER RPEQ Managing Director Systems Engineering Australia Pty Ltd Tel: (07) 3254 0782 PO Box 3125, Newstead, QLD, 4006. Email:
[email protected] ABN 65 075 544 439 WWW:
http://www.systemsengineeringaustralia.com.au

[Client Name] | [Publish Date] [Project Name]
5652_01_R
03v02.d
ocx
APPENDIX D COMMUNITY INFORMATION SHEET
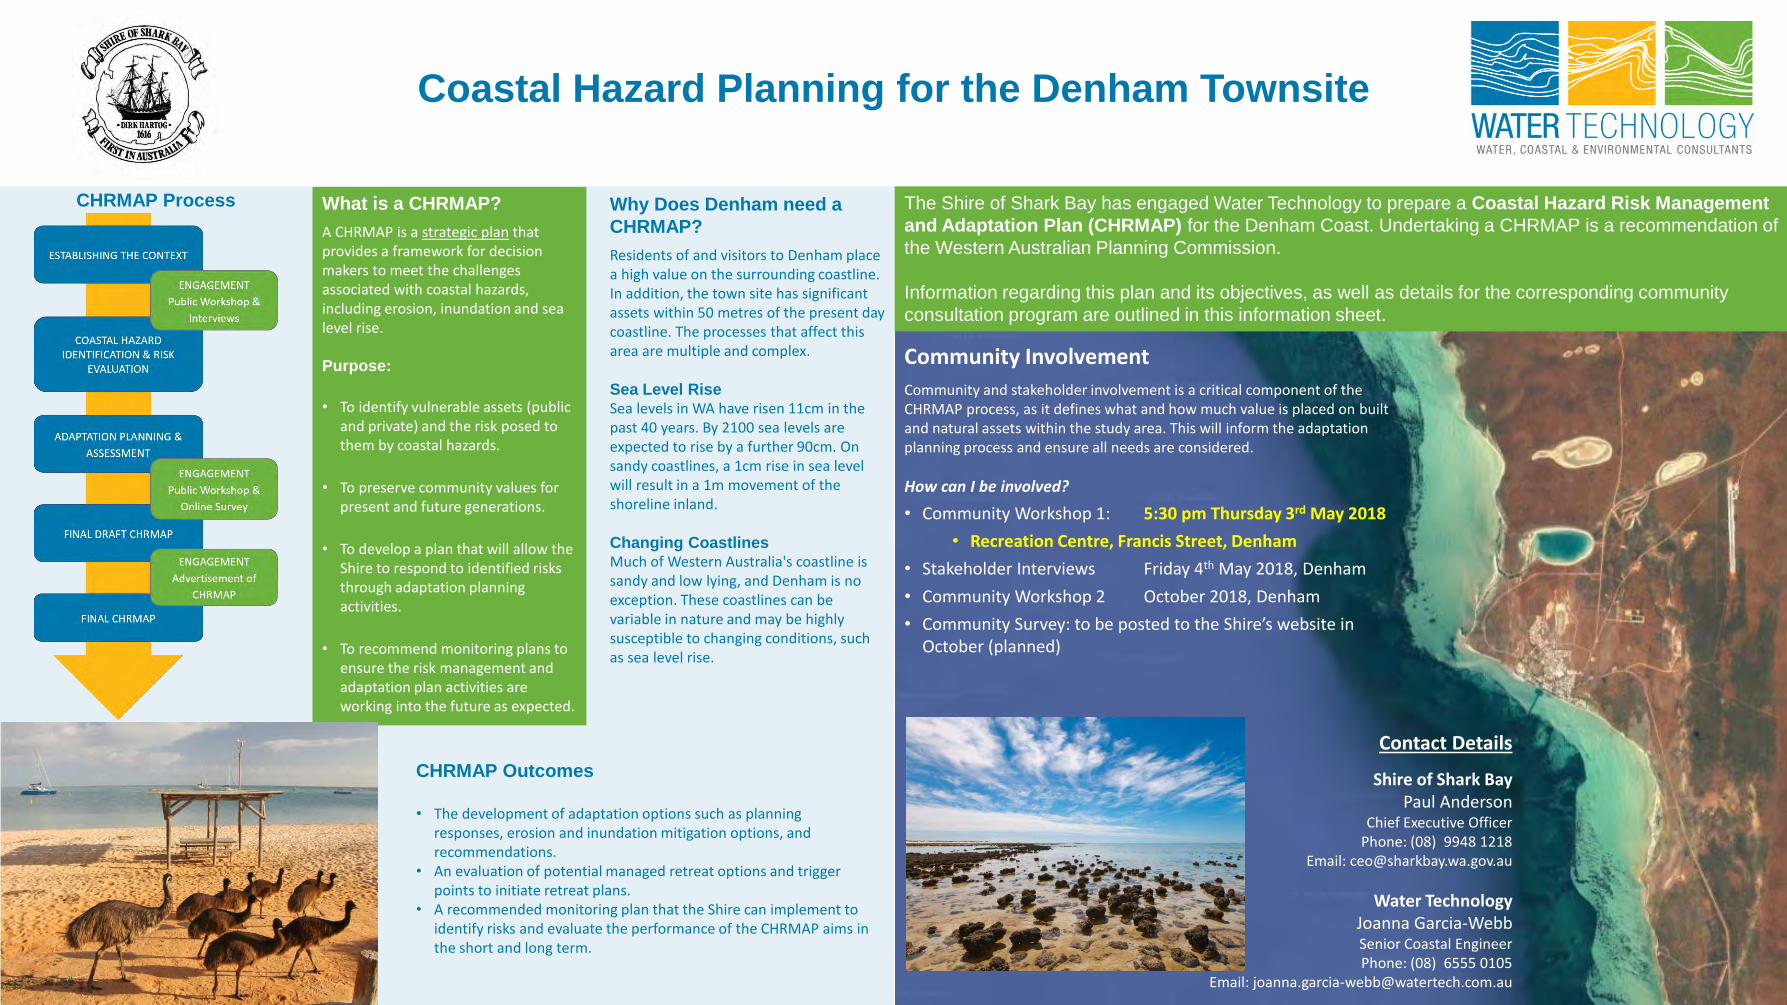
Coastal Hazard Planning for the Denham Townsite
What is a CHRMAP?
A CHRMAP is a strategic plan that provides a framework for decision makers to meet the challenges associated with coastal hazards, including erosion, inundation and sea level rise.
Purpose:
• To identify vulnerable assets (public and private) and the risk posed to them by coastal hazards.
• To preserve community values for present and future generations.
• To develop a plan that will allow the Shire to respond to identified risks through adaptation planning activities.
• To recommend monitoring plans to ensure the risk management and adaptation plan activities are working into the future as expected.
Why Does Denham need a
CHRMAP?
Residents of and visitors to Denham place a high value on the surrounding coastline. In addition, the town site has significant assets within 50 metres of the present day coastline. The processes that affect this area are multiple and complex.
Sea Level RiseSea levels in WA have risen 11cm in the past 40 years. By 2100 sea levels are expected to rise by a further 90cm. On sandy coastlines, a 1cm rise in sea level will result in a 1m movement of the shoreline inland.
Changing CoastlinesMuch of Western Australia's coastline is sandy and low lying, and Denham is no exception. These coastlines can be variable in nature and may be highly susceptible to changing conditions, such as sea level rise.
Community Involvement
Community and stakeholder involvement is a critical component of the CHRMAP process, as it defines what and how much value is placed on built and natural assets within the study area. This will inform the adaptation planning process and ensure all needs are considered.
How can I be involved?
• Community Workshop 1: 5:30 pm Thursday 3rd May 2018
• Recreation Centre, Francis Street, Denham
• Stakeholder Interviews Friday 4th May 2018, Denham
• Community Workshop 2 October 2018, Denham
• Community Survey: to be posted to the Shire’s website in October (planned)
The Shire of Shark Bay has engaged Water Technology to prepare a Coastal Hazard Risk Management
and Adaptation Plan (CHRMAP) for the Denham Coast. Undertaking a CHRMAP is a recommendation of
the Western Australian Planning Commission.
Information regarding this plan and its objectives, as well as details for the corresponding community
consultation program are outlined in this information sheet.
CHRMAP Process
CHRMAP Outcomes
• The development of adaptation options such as planning responses, erosion and inundation mitigation options, and recommendations.
• An evaluation of potential managed retreat options and trigger points to initiate retreat plans.
• A recommended monitoring plan that the Shire can implement to identify risks and evaluate the performance of the CHRMAP aims in the short and long term.
Contact Details
Shire of Shark BayPaul Anderson
Chief Executive OfficerPhone: (08) 9948 1218
Email: [email protected]
Water TechnologyJoanna Garcia-WebbSenior Coastal EngineerPhone: (08) 6555 0105
Email: [email protected]

[Client Name] | [Publish Date] [Project Name]
5652_01_R
03v02.d
ocx
APPENDIX E ASSET & COMMUNITY VALUES MAPS
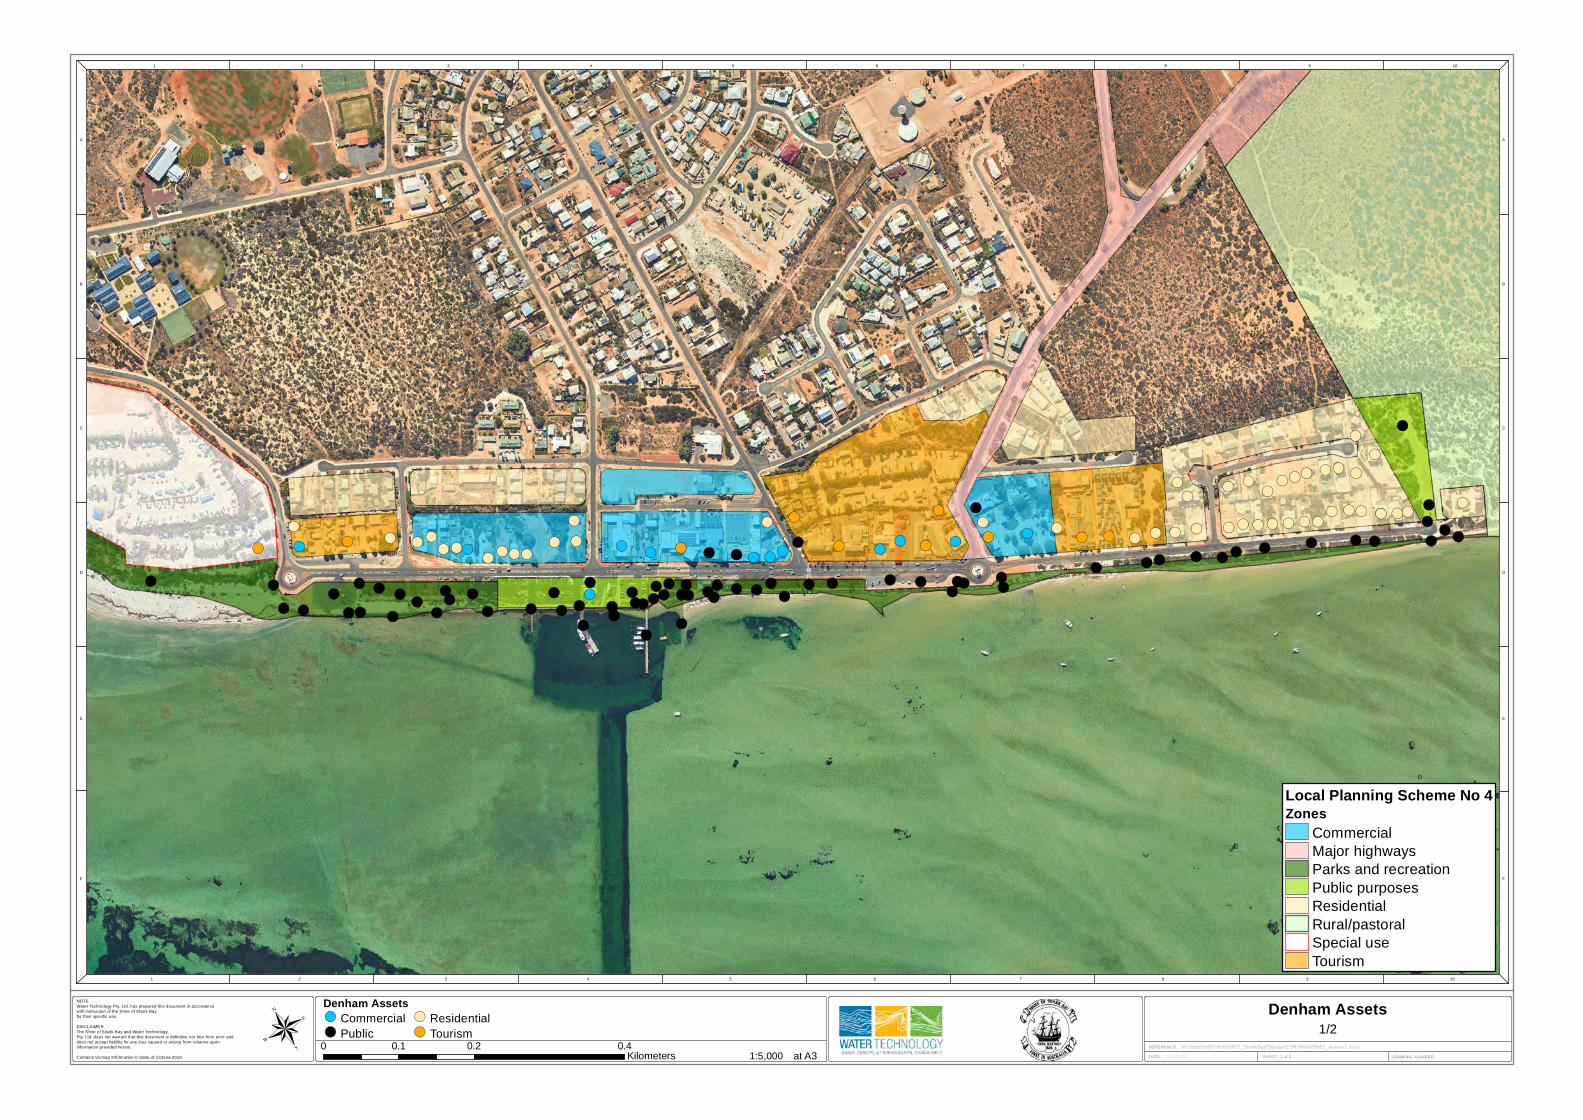
1 2 3 4 5 6 7 8 9 10
1 2 3 4 5 6 7 8 9 10
A
B
C
D
E
F
A
B
C
D
E
F
NOTE
Water Technology Pty. Ltd. has prepared this document in accordance
with instruction of the Shire of Shark Bay
for their specific use.
DISCLAIMER
The Shire of Shark Bay and Water Technology
Pty. Ltd. does not warrant that this document is definitive nor free from error and
does not accept liability for any loss caused or arising from reliance upon
information provided herein.
Contains Vicmap Information © State of Victoria 2018 DATE:
!(
!(
!(
!(!(
!(
!(!(!(!(
!(!(
!(!(!(!(!(!(
!(!(
!(!(!(
!(
!(
!(!(
!(!(!(!(!(!(
!(
!(
!(!(
!(
!(
!(!(!(!(!(!(!(
!(!(!(
!(
!(
!(!(!(!(
!(!(!(!(!(!(!(!(!(!(!(
!(
!(
!(
!(!(
!(
!(!(
!(!(
!( !(
!(
!(!(!(!(!(
!(!(
!(
!(!(!(!(
!( !( !(
!( !(
!(!(
!(!(!(!(
!(
!(
!( !( !( !(
!( !(!(!(!(
!( !(!(!(!(!(
!(!(!(!(!(!(!(!(
!(!(!(!(!(
!(
!(
!(
!(
!(!(
!(
!(!(
!(!(
SHEET: 2 of 2
REFERENCE:
DRAWING NUMBER: 1:5,000
Denham Assets
at A30 0.2 0.40.1
Kilometers® 1/2
Denham Assets!( Commercial
!( Public
!( Residential
!( TourismM:\Jobs\5600-5699\5652_SharkBay\Spatial\ESRI\Mxds\5652_Assets1.mxd
17/05/2018
Local Planning Scheme No 4Zones
Commercial
Major highways
Parks and recreation
Public purposes
Residential
Rural/pastoral
Special use
Tourism
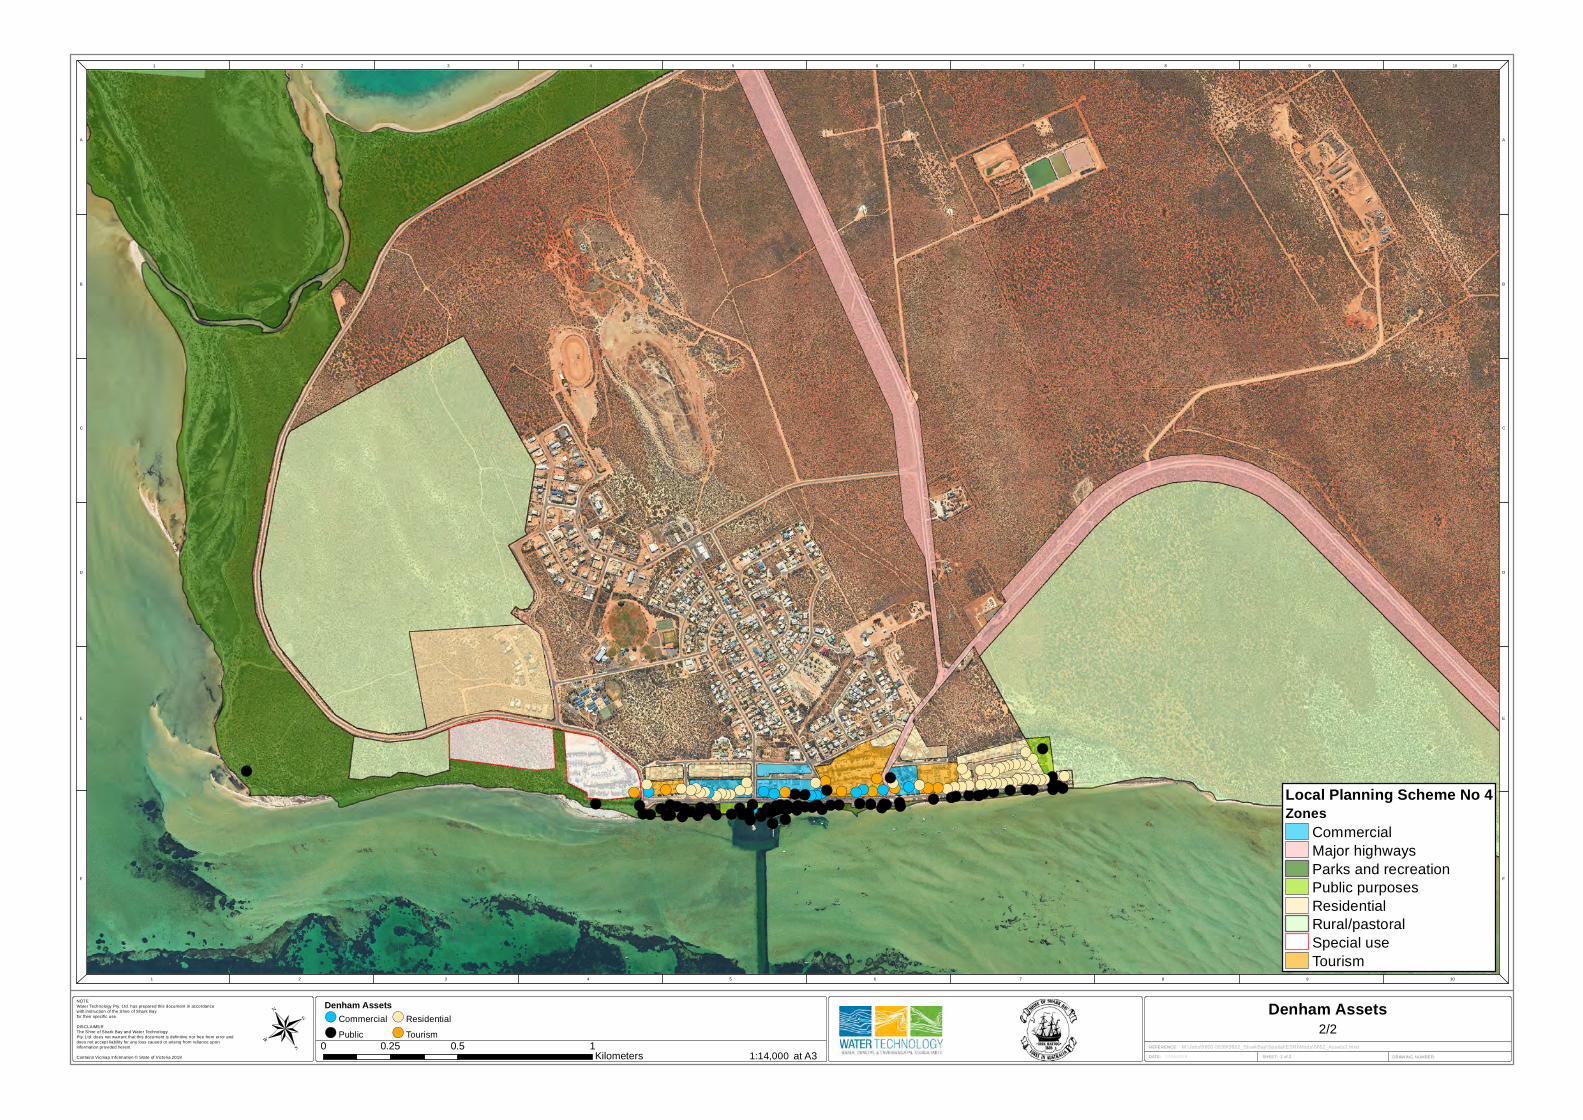
1 2 3 4 5 6 7 8 9 10
1 2 3 4 5 6 7 8 9 10
A
B
C
D
E
F
A
B
C
D
E
F
NOTE
Water Technology Pty. Ltd. has prepared this document in accordance
with instruction of the Shire of Shark Bay
for their specific use.
DISCLAIMER
The Shire of Shark Bay and Water Technology
Pty. Ltd. does not warrant that this document is definitive nor free from error and
does not accept liability for any loss caused or arising from reliance upon
information provided herein.
Contains Vicmap Information © State of Victoria 2018 DATE:
!(!(!(
!(!(!(!(!(!(!(
!(!(!(!(!(!(!(!(
!(!(!(!(!(
!(!(!(!(
!(!(!(!(!(!(!(
!(!(!(
!(
!(
!(!(!(!(!(!(!(!(!(!(!(
!(
!(!(!(!(!(!(!(!(!(!(!(!(!(!(!(
!(!(!(
!(!(
!(!(!(!(!(!( !(
!(
!(!(!(!(!(!(!(!(!(!(!(!(
!(!(!(!( !(!(!(!(!(!(!(
!(
!(!(!( !( !(
!( !(!(!(!(!(!(!(!(!(!(!(!(!(!(!(!(!(!(!(!(!(!(!(!(!(
!(
!(
!(!(!(
!( !(
!(!(
!(
SHEET: 2 of 2
REFERENCE:
DRAWING NUMBER: 1:14,000
Denham Assets
at A30 0.5 10.25
Kilometers® 2/2
Denham Assets!( Commercial
!( Public
!( Residential
!( Tourism
M:\Jobs\5600-5699\5652_SharkBay\Spatial\ESRI\Mxds\5652_Assets2.mxd
17/05/2018
Local Planning Scheme No 4Zones
Commercial
Major highways
Parks and recreation
Public purposes
Residential
Rural/pastoral
Special use
Tourism

1 2 3 4 5 6 7 8 9 10
1 2 3 4 5 6 7 8 9 10
A
B
C
D
E
F
A
B
C
D
E
F
NOTE
Water Technology Pty. Ltd. has prepared this document in accordance
with instruction of the Shire of Shark Bay
for their specific use.
DISCLAIMER
The Shire of Shark Bay and Water Technology
Pty. Ltd. does not warrant that this document is definitive nor free from error and
does not accept liability for any loss caused or arising from reliance upon
information provided herein.
Contains Vicmap Information © State of Victoria 2018 DATE:
!( !(
!(
!(
7
6121
212
1
SHEET: 2 of 2
REFERENCE:
DRAWING NUMBER: 1:5,000
Community Values
at A30 0.2 0.40.1
Kilometers® 1/2
Community Values!( Commercial!( Cultural
!( EnvironmentalPhysical Infrastructure
RecreationalM:\Jobs\5600-5699\5652_SharkBay\Spatial\ESRI\Mxds\5652_CommunityValues1.mxd
17/05/2018
Local Planning Scheme No 4Zones
Commercial
Major highways
Parks and recreation
Public purposes
Residential
Rural/pastoral
Special use
Tourism

1 2 3 4 5 6 7 8 9 10
1 2 3 4 5 6 7 8 9 10
A
B
C
D
E
F
A
B
C
D
E
F
NOTE
Water Technology Pty. Ltd. has prepared this document in accordance
with instruction of the Shire of Shark Bay
for their specific use.
DISCLAIMER
The Shire of Shark Bay and Water Technology
Pty. Ltd. does not warrant that this document is definitive nor free from error and
does not accept liability for any loss caused or arising from reliance upon
information provided herein.
Contains Vicmap Information © State of Victoria 2018 DATE:
!( !(
!(
!(
!(!( !(!(
!(
7
3
4
5 61
2
21
3 4
21 321
2
1
SHEET: 2 of 2
REFERENCE:
DRAWING NUMBER: 1:14,000
Community Values
at A30 0.5 10.25
Kilometers® 2/2
Community Values!( Commercial!( Cultural
!( EnvironmentalPhysical Infrastructure
RecreationalM:\Jobs\5600-5699\5652_SharkBay\Spatial\ESRI\Mxds\5652_CommunityValues2.mxd
17/05/2018
Local Planning Scheme No 4Zones
Commercial
Major highways
Parks and recreation
Public purposes
Residential
Rural/pastoral
Special use
Tourism

Shire of Shark Bay | 31 March 2020 Final Report
5652_01_R
09v02.d
ocx
APPENDIX C CHAPTER REPORT: COASTAL HAZARD & VULNERABILITY ASSESSMENT

Denham Townsite CHRMAP
Chapter Report: Coastal Hazard & Vulnerability Assessment
Shire of Shark Bay
16 August 2019
Shire of Shark Bay | 16 August 2019 Chapter Report: Coastal Hazard & Vulnerability Assessment Page 1
5652_01_R
04v03.d
ocx
Document Status
Version Doc type Reviewed by Approved by Date issued
V01 DRAFT Christine Arrowsmith Christine Arrowsmith 27/07/2018
V02 FINAL Paul O’Brien Paul O’Brien 17/01/2019
V03 FINAL Joanna Garcia-Webb Joanna Garcia-Webb 16/08/2019
Project Details
Project Name Chapter Report: Coastal Hazard & Vulnerability Assessment
Client Shire of Shark Bay
Client Project Manager Paul Anderson
Water Technology Project Manager Joanna Garcia-Webb
Water Technology Project Director Christine Lauchlan Arrowsmith
Authors William Edge, Joanna Garcia-Webb
Document Number 5652_01_R04v03.docx
COPYRIGHT
Water Technology Pty Ltd has produced this document in accordance with instructions from Shire of Shark Bay for their
use only. The concepts and information contained in this document are the copyright of Water Technology Pty Ltd. Use or
copying of this document in whole or in part without written permission of Water Technology Pty Ltd constitutes an
infringement of copyright.
Water Technology Pty Ltd does not warrant this document is definitive nor free from error and does not accept liability for
any loss caused, or arising from, reliance upon the information provided herein.
Ground Floor, 430 Roberts Rd
Subiaco WA 6008
Telephone (08) 6555 0105
ACN 093 377 283
ABN 60 093 377 283
Shire of Shark Bay | 16 August 2019 Chapter Report: Coastal Hazard & Vulnerability Assessment Page 2
5652_01_R
04v03.d
ocx
16 August 2019
Paul Anderson Chief Executive Officer Shire of Shark Bay 65 Knight Terrace Denham WA 6537 Via email [email protected] Dear Paul
Chapter Report: Coastal Hazard & Vulnerability Assessment
We are pleased to present the Denham Townsite Coastal Hazard Risk Management and Adaptation Plan
Chapter Report: Coastal Hazard & Vulnerability Assessment. If you have any queries, please do not hesitate
to contact me on (03) 8526 0830.
Yours sincerely
Joanna Garcia-Webb Principal Coastal Engineer | National Practice Lead – Coasts & Environment
WATER TECHNOLOGY PTY LTD
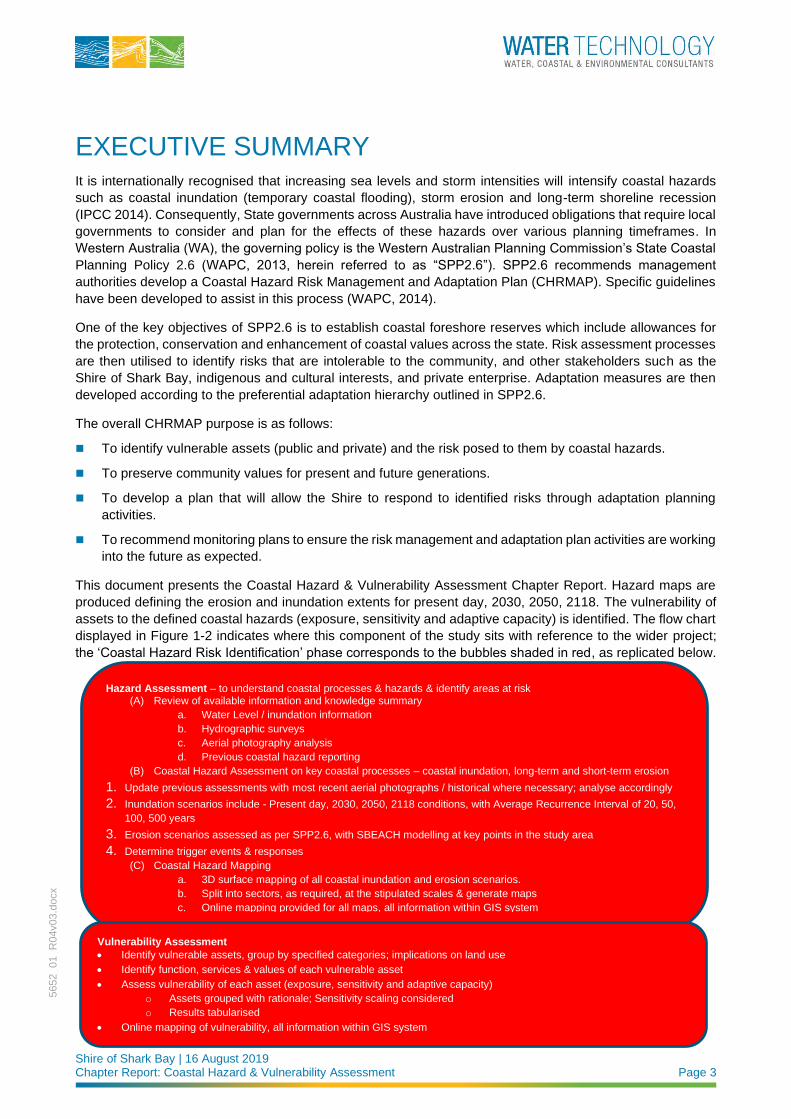
Shire of Shark Bay | 16 August 2019 Chapter Report: Coastal Hazard & Vulnerability Assessment Page 3
5652_01_R
04v03.d
ocx
EXECUTIVE SUMMARY It is internationally recognised that increasing sea levels and storm intensities will intensify coastal hazards
such as coastal inundation (temporary coastal flooding), storm erosion and long-term shoreline recession
(IPCC 2014). Consequently, State governments across Australia have introduced obligations that require local
governments to consider and plan for the effects of these hazards over various planning timeframes. In
Western Australia (WA), the governing policy is the Western Australian Planning Commission’s State Coastal
Planning Policy 2.6 (WAPC, 2013, herein referred to as “SPP2.6”). SPP2.6 recommends management
authorities develop a Coastal Hazard Risk Management and Adaptation Plan (CHRMAP). Specific guidelines
have been developed to assist in this process (WAPC, 2014).
One of the key objectives of SPP2.6 is to establish coastal foreshore reserves which include allowances for
the protection, conservation and enhancement of coastal values across the state. Risk assessment processes
are then utilised to identify risks that are intolerable to the community, and other stakeholders such as the
Shire of Shark Bay, indigenous and cultural interests, and private enterprise. Adaptation measures are then
developed according to the preferential adaptation hierarchy outlined in SPP2.6.
The overall CHRMAP purpose is as follows:
◼ To identify vulnerable assets (public and private) and the risk posed to them by coastal hazards.
◼ To preserve community values for present and future generations.
◼ To develop a plan that will allow the Shire to respond to identified risks through adaptation planning
activities.
◼ To recommend monitoring plans to ensure the risk management and adaptation plan activities are working
into the future as expected.
This document presents the Coastal Hazard & Vulnerability Assessment Chapter Report. Hazard maps are
produced defining the erosion and inundation extents for present day, 2030, 2050, 2118. The vulnerability of
assets to the defined coastal hazards (exposure, sensitivity and adaptive capacity) is identified. The flow chart
displayed in Figure 1-2 indicates where this component of the study sits with reference to the wider project;
the ‘Coastal Hazard Risk Identification’ phase corresponds to the bubbles shaded in red, as replicated below.
Hazard Assessment – to understand coastal processes & hazards & identify areas at risk (A) Review of available information and knowledge summary
a. Water Level / inundation information
b. Hydrographic surveys
c. Aerial photography analysis
d. Previous coastal hazard reporting
(B) Coastal Hazard Assessment on key coastal processes – coastal inundation, long-term and short-term erosion
1. Update previous assessments with most recent aerial photographs / historical where necessary; analyse accordingly
2. Inundation scenarios include - Present day, 2030, 2050, 2118 conditions, with Average Recurrence Interval of 20, 50,
100, 500 years
3. Erosion scenarios assessed as per SPP2.6, with SBEACH modelling at key points in the study area 4. Determine trigger events & responses
(C) Coastal Hazard Mapping
a. 3D surface mapping of all coastal inundation and erosion scenarios.
b. Split into sectors, as required, at the stipulated scales & generate maps
c. Online mapping provided for all maps, all information within GIS system
Vulnerability Assessment
• Identify vulnerable assets, group by specified categories; implications on land use
• Identify function, services & values of each vulnerable asset
• Assess vulnerability of each asset (exposure, sensitivity and adaptive capacity)
o Assets grouped with rationale; Sensitivity scaling considered
o Results tabularised
• Online mapping of vulnerability, all information within GIS system
Shire of Shark Bay | 16 August 2019 Chapter Report: Coastal Hazard & Vulnerability Assessment Page 4
5652_01_R
04v03.d
ocx
A summary of the findings of the hazard and vulnerability assessment is presented below:
◼ The hazard maps for the coastal inundation assessment are presented in Appendix C. These display the
extent of the predicted inundation for present day, 2030, 2050 and 2118. The data is overlaid the 2017
aerial photograph; the identified assets are also displayed.
◼ The coastal processes allowance hazard maps are presented in and Appendix D. Similarly, these display
the calculated erosion extent for the planning timeframes.
◼ Note this is not necessarily the predicted extent of erosion, rather the area at risk of erosion following
the methodology of SPP2.6.
◼ All hazards and assets are included in the online database:
◼ https://watech.maps.arcgis.com/apps/webappviewer/index.html?id=6e092b4d0f044e038a721705e9
07c084
◼ A vulnerability assessment was undertaken for assets predicted to be exposed to inundation and erosion.
The full vulnerability assessment is provided in Appendix E and Appendix F for inundation and erosion
respectively. Table 0-1 and Table 0-2 below present the number of assets predicted to be vulnerable to
coastal hazards.
◼ The vulnerability assessment considers the physical impact of the hazard, and to some extent assumes
the hazard will definitely occur. The next phase of the study involves carrying out a risk assessment for all
assets predicted to be exposed to coastal hazards. This will include applying the likelihood of the hazard
occurring. The risk assessment will also consider the social, cultural and environmental impacts in the
form of the success criteria already developed in previous phases of the study.
◼ Inundation vulnerability summary:
◼ The number of assets exposed to inundation is almost the same for all planning timeframes. However,
the exposure increases due to the relative increase in water depth.
◼ All buildings (commercial, residential and tourism related) and utilities are given a high vulnerability
rating, due to both their sensitivity and low adaptive capacity.
◼ Public recreational items are considered to be less vulnerable, especially those that can easily moved
◼ Assets that are connected to utilities (e.g. toilets, BBQs) are given a higher vulnerability
◼ Erosion vulnerability summary:
◼ In the present day, only public recreational items are vulnerable,
◼ The exception is the utility: marina fire hydrant. As this is located at the crest of the engineered
seawall, it is unlikely to be compromised in a present-day erosion event.
◼ No buildings are threatened until the 2050 timeframe
◼ Utilities begin to be threatened by 2030
◼ All buildings (commercial, residential and tourism related) and utilities are given a high vulnerability
rating, due to both their sensitivity and low adaptive capacity.
◼ Public recreational items are considered to be less vulnerable
◼ Assets that are connected to utilities (e.g. toilets, BBQs) are given a higher vulnerability
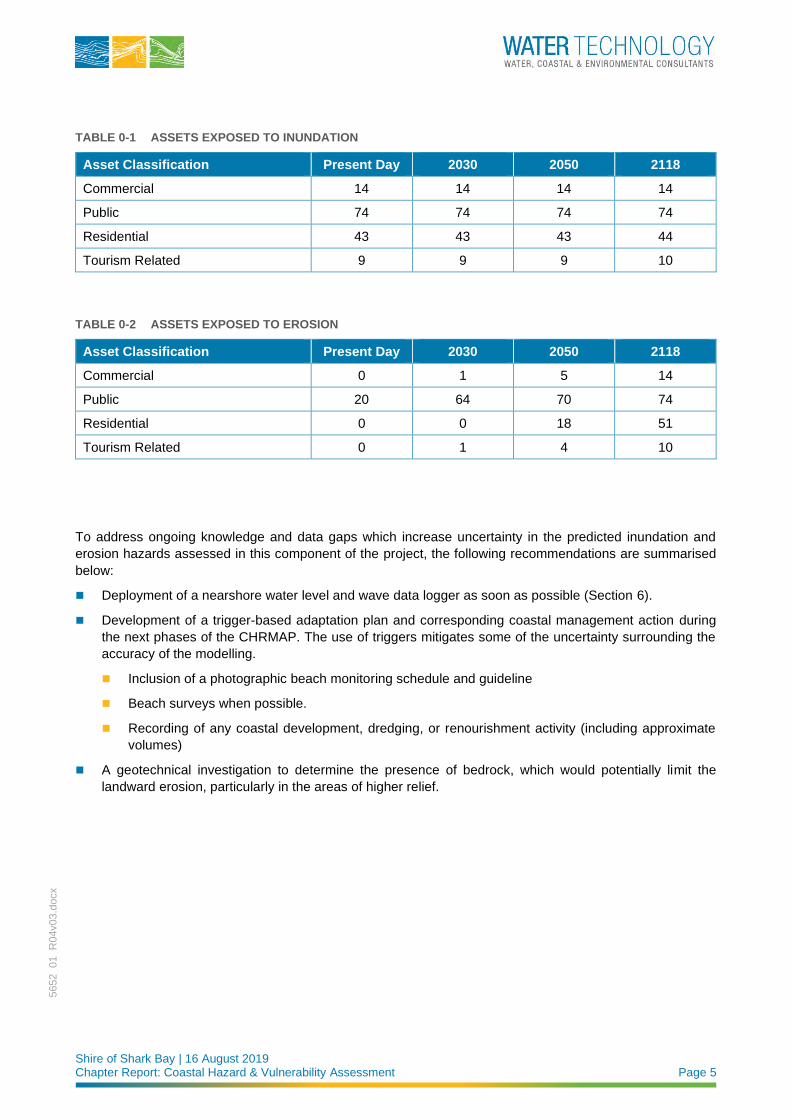
Shire of Shark Bay | 16 August 2019 Chapter Report: Coastal Hazard & Vulnerability Assessment Page 5
5652_01_R
04v03.d
ocx
TABLE 0-1 ASSETS EXPOSED TO INUNDATION
Asset Classification Present Day 2030 2050 2118
Commercial 14 14 14 14
Public 74 74 74 74
Residential 43 43 43 44
Tourism Related 9 9 9 10
TABLE 0-2 ASSETS EXPOSED TO EROSION
Asset Classification Present Day 2030 2050 2118
Commercial 0 1 5 14
Public 20 64 70 74
Residential 0 0 18 51
Tourism Related 0 1 4 10
To address ongoing knowledge and data gaps which increase uncertainty in the predicted inundation and
erosion hazards assessed in this component of the project, the following recommendations are summarised
below:
◼ Deployment of a nearshore water level and wave data logger as soon as possible (Section 6).
◼ Development of a trigger-based adaptation plan and corresponding coastal management action during
the next phases of the CHRMAP. The use of triggers mitigates some of the uncertainty surrounding the
accuracy of the modelling.
◼ Inclusion of a photographic beach monitoring schedule and guideline
◼ Beach surveys when possible.
◼ Recording of any coastal development, dredging, or renourishment activity (including approximate
volumes)
◼ A geotechnical investigation to determine the presence of bedrock, which would potentially limit the
landward erosion, particularly in the areas of higher relief.
Shire of Shark Bay | 16 August 2019 Chapter Report: Coastal Hazard & Vulnerability Assessment Page 6
5652_01_R
04v03.d
ocx
CONTENTS
1 INTRODUCTION 11
2 STUDY APPROACH 14
2.1 CHRMAP Objectives 14
2.2 Coastal Foreshore Reserve 14
2.2.1 Allowance for Coastal Erosion 14
2.2.2 Inundation Allowance 15
2.2.3 Sea Level Rise 15
3 SITE DESCRIPTION 16
3.1 Oceanographic Conditions 17
3.1.1 Climate & Wind 17
3.1.2 Water Levels 17
3.1.3 Waves 18
3.1.4 Currents 18
3.2 Geomorphological Setting 18
3.3 Shoreline Description 19
3.3.1 Section 1 20
3.3.2 Section 2 21
3.3.3 Section 3 23
3.3.4 Section 4 24
3.3.5 Section 5 25
3.4 Sediment Transport 26
3.4.1 Coastal Processes 27
4 COASTAL INUNDATION ASSESSMENT 28
4.1 Modelling Overview 28
4.2 Modelling Scenarios 28
4.3 Model Bathymetry 29
4.4 Tidal Boundary Conditions 29
4.5 Wind Forcing 32
4.6 Simulation Period 37
4.7 Model Setup 37
4.7.1 HD Model Parameters 37
4.7.2 Spectral Wave Model Parameters 38
4.8 Model Validation 38
4.8.1 Water Levels 38
4.8.2 Waves 39
4.8.3 Wind 40
4.8.4 Summary for Decision Makers 40
4.9 Water Level Design Criteria 40
4.9.1 Coastal Inundation Assessment Summary 40
Shire of Shark Bay | 16 August 2019 Chapter Report: Coastal Hazard & Vulnerability Assessment Page 7
5652_01_R
04v03.d
ocx
4.9.2 Wave Runup Allowance 41
4.10 Tsunami Allowance 41
5 COASTAL EROSION ASSESSMENT 43
5.1 S1: Current Risk by Storm Erosion 43
5.1.1 Determination of Storm Events 43
5.1.2 SBEACH Set-up 43
5.1.3 SBEACH Results & Storm Erosion Allowance 45
5.2 S2: Historical Shoreline Evolution 47
5.2.1 Policy Requirements 47
5.2.2 Historical Shoreline Change Calculations 47
5.3 S3: Erosion Due to Sea Level Rise 52
5.4 Summary of Coastal Erosion Allowance 52
6 STUDY LIMITATIONS 54
7 VULNERABILITY ASSESSMENT - ASSETS 55
7.1 Asset Identification 55
7.2 Vulnerability Assessment Approach 55
7.3 Inundation Vulnerability 57
7.3.1 Commercial Assets 57
7.3.2 Public Assets 58
7.3.3 Residential Assets 59
7.3.4 Tourism Related Assets 59
7.4 Erosion Vulnerability 59
7.4.1 Commercial Assets 60
7.4.2 Public Assets 60
7.4.3 Residential Assets 61
7.4.4 Tourism Related Assets 62
7.5 Vulnerability Assessment Summary 62
8 CONCLUSIONS & RECOMMENDATIONS 63
9 REFERENCES 65
APPENDICES Appendix A Cyclone Track Parameters
Appendix B Historical Shoreline Movement
Appendix C Inundation Hazard Maps
Appendix D Coastal Processes Hazard Maps
Appendix E Inundation Vulnerability Assessment Tables
Appendix F Coastal Erosion Vulnerability Tables
Shire of Shark Bay | 16 August 2019 Chapter Report: Coastal Hazard & Vulnerability Assessment Page 8
5652_01_R
04v03.d
ocx
LIST OF FIGURES Figure 1-1 Extent of CHRMAP 12
Figure 1-2 Proposed CHRMAP methodology flow chart (adapted from WAPC CHRMAP Guidelines) 13
Figure 3-1 Location of the study site with within Shark Bay 16
Figure 3-2 Shark Bay airport wind rose: 2000 to 2018 (10-minute mean) 17
Figure 3-3 Figure of study area sections and SBEACH transects 20
Figure 3-4 Rock seawall with variable armour sizing protecting Knight Terrace turnaround (LEFT); Typical beach profile in Section 1 (RIGHT) 21
Figure 3-5 Road to beach drainage interface on Knight Terrace (LEFT); Beach face showing evidence of aeolian sediment transport 21
Figure 3-6 Typical section of beach and rock armour structure (LEFT); Gap between two structures causing locally increased erosion (RIGHT) 22
Figure 3-7 Wide beach and improved armour structure immediately adjacent to FRP Groyne (LEFT); Landward end of FRP Groyne and small beach section up to (RIGHT) 22
Figure 3-8 Typical section of rock armour revetment along Section 3 (LEFT); Commercial boat launching ramp with some seagrass wrack accumulation (RIGHT) 23
Figure 3-9 Northern half of section with lower crested seawall and sparsely vegetated beach 23
Figure 3-10 Southern extent of Section 4 viewed from the revetment tie-in. Recent renourishment and pre-nourishment shoreline visible (LEFT); Section of exposed scarp representative of the 1956 shoreline location (RIGHT) 24
Figure 3-11 The north-eastern extent of Section 4 as viewed from the north-eastern extent of the caravan park 25
Figure 3-12 Southern half of Section 5 showing coastal access track and a transient sediment feature at the midpoint of the section 26
Figure 3-13 Low lying coastal foreshore in Section 5 with intertidal marsh areas visible 26
Figure 4-1 Model extent overview 30
Figure 4-2 Model mesh – Denham area 31
Figure 4-3 Model tidal boundary conditions (midway along the northern boundary) 32
Figure 4-4 Non-linear fit on radius to maximum winds versus central pressure for cyclones passing within 500km of Denham 34
Figure 4-5 Wind field: 500-year ARI cyclone event 35
Figure 4-6 Cyclone tracks for the selected events 36
Figure 4-7 Time series of predicted and modelled water levels for a tide only simulation at Denham & Carnarvon 39
Figure 4-8 Predicted tsunami wave amplitude at 100m depth contour for 500-year ARI (Geoscience Australia, 2009) 42
Figure 4-9 Predicted tsunami wave amplitude at 50m depth contour for 500-year ARI (Burbidge et al, 2008) 42
Figure 5-1 Time series of design water level and waves applied in SBEACH (storm 1 of 3) 44
Figure 5-2 SBEACH results for each Transect, representing each coastal section 46
Figure 5-3 Section 1 shoreline movement: 1957, 1990, 2006 and 2017 49
Figure 5-4 Section 2 shoreline movement: 1957, 1990, 2006 and 2017 49
Figure 5-5 Section 3 shoreline movement: 1957, 1990, 2006 and 2017 50
Figure 5-6 Section 4 shoreline movement: 1957, 1990, 2006 and 2017 50
Figure 5-7 Section 5 shoreline movement: 1957, 1990, 2006 and 2017 51
Figure 7-1 Vulnerability assessment components (reproduced from Allen Consulting, 2005) 55
Figure 7-2 Vulnerability relationship 56
Shire of Shark Bay | 16 August 2019 Chapter Report: Coastal Hazard & Vulnerability Assessment Page 9
5652_01_R
04v03.d
ocx
LIST OF TABLES Table 0-1 Assets exposed to inundation 5
Table 0-2 Assets exposed to erosion 5
Table 2-1 Proposed sea level rise scenarios 15
Table 3-1 Tidal planes at Denham 18
Table 4-1 Scenario matrix 28
Table 4-2 Monthly averages of atmospheric pressure from Shark Bay Airport 33
Table 4-3 Wind friction varying with wind speed 37
Table 4-4 SW model parameters 38
Table 4-5 Model validation summary 40
Table 4-6 Design water levels for the town of Denham (m AHD); numbers in bold are the allowance for Inundation 40
Table 5-1 Allowance for current risk of storm erosion , S1 (m) 45
Table 5-2 Historical shoreline change 48
Table 5-3 historical shoreline movement allowance, S2 (m) 48
Table 5-4 Erosion due to sea level rise, S3 (m) 52
Table 5-5 Coastal Processes allowance - 2030 52
Table 5-6 Coastal Processes allowance - 2050 53
Table 5-7 Coastal Processes allowance - 2118 53
Table 7-1 Vulnerability assessment ratings: sensitivity, exposure & adaptive capacity 56
Table 7-2 Vulnerability assessment ratings: Potential impact & vulnerability 57
Table 7-3 Commercial assets Inundation vulnerability 57
Table 7-4 Public assets Inundation vulnerability 58
Table 7-5 Residential assets Inundation vulnerability 59
Table 7-6 Tourism related assets Inundation vulnerability 59
Table 7-7 Assets exposed to erosion 59
Table 7-8 Commercial assets erosion vulnerability 60
Table 7-9 Public assets erosion vulnerability 61
Table 7-10 Residential assets erosion vulnerability 61
Table 7-11 Tourism related assets erosion vulnerability 62
Table 8-1 Assets exposed to inundation 63
Table 8-2 Assets exposed to erosion 63
Table A-1 Cyclone track parameters for the 20-year ARI event 68
Table A-2 Cyclone track parameters for the 50-year ARI event 69
Table A-3 Cyclone track parameters for the 100-year ARI event 70
Table A-4 Cyclone track parameters for the 500-year ARI event 71
Table E-1 Inundation vulnerability – Present Day 79
Table E-2 Inundation vulnerability - 2030 80
Table E-3 Inundation vulnerability - 2050 81
Table E-4 Inundation vulnerability - 2118 82
Table F-1 Erosion vulnerability – Present Day 85
Table F-2 Erosion vulnerability – 2030 86
Shire of Shark Bay | 16 August 2019 Chapter Report: Coastal Hazard & Vulnerability Assessment Page 10
5652_01_R
04v03.d
ocx
Table F-3 Erosion vulnerability – 2050 87
Table F-4 Erosion vulnerability – 2118 88
Shire of Shark Bay | 16 August 2019 Chapter Report: Coastal Hazard & Vulnerability Assessment Page 11
5652_01_R
04v03.d
ocx
1 INTRODUCTION It is internationally recognised that increasing sea levels and storm intensities will intensify coastal hazards
such as coastal inundation (temporary coastal flooding), storm erosion and long-term shoreline recession
(IPCC 2014). Consequently, State governments across Australia have introduced obligations that require local
governments to consider and plan for the effects of these hazards over various planning timeframes. In
Western Australia (WA), the governing policy is the Western Australian Planning Commission’s State Coastal
Planning Policy 2.6 (WAPC, 2013, herein referred to as “SPP2.6”). SPP2.6 recommends management
authorities develop a Coastal Hazard Risk Management and Adaptation Plan (CHRMAP). Specific guidelines
have been developed to assist in this process (WAPC, 2014).
One of the key objectives of SPP2.6 is to establish coastal foreshore reserves which include allowances for
the protection, conservation and enhancement of coastal values across the state. Risk assessment processes
are then utilised to identify risks that are intolerable to the community, and other stakeholders such as the
Shire of Shark Bay, indigenous and cultural interests, and private enterprise. Adaptation measures are then
developed according to the preferential adaptation hierarchy outlined in SPP2.6.
The aim of the present study is to investigate and plan for coastal hazards which are likely to affect the Denham
townsite. Denham is located within the local government area of the Shire of Shark Bay, approximately 800km
north of Perth (refer Figure 1-1 for locality). Denham and its surrounds are used extensively for tourism,
commercial and recreational purposes. Tourism is the primary industry in the Shire, with fishing and
aquaculture also playing a major role.
Given the above, visitors to and residents of Denham and its surrounds place a high value on the coastline.
Processes affecting the coastal zone are multiple and complex: storm surge; tidal movement; shoreline
stability; stormwater drainage; and the interactions between surface and groundwater all contribute in differing
degrees. Furthermore, the potential impacts of climate change, specifically increasing sea levels and storm
intensities, will place increased pressure on the coastal zone, and threaten public infrastructure and assets,
private property, foreshore reserves, coastal attractions and public open spaces.
This document presents the Coastal Hazard & Vulnerability Assessment Chapter Report. Hazard maps are
produced defining the erosion and inundation extents for present day, 2030, 2050, 2118. Vulnerability of assets
to the defined coastal hazards (exposure, sensitivity and adaptive capacity) is identified. The flow chart
displayed in Figure 1-2 indicates where this component of the study sits with reference to the wider study; the
‘Coastal Hazard Risk Identification’ phase corresponds to the bubbles shaded in red.

Shire of Shark Bay | 16 August 2019 Chapter Report: Coastal Hazard & Vulnerability Assessment Page 12
5652_01_R
04v03.d
ocx
FIGURE 1-1 EXTENT OF CHRMAP

Shire of Shark Bay | 16 August 2019 Chapter Report: Coastal Hazard & Vulnerability Assessment Page 13
5652_01_R
04v03.d
ocx
ESTABLISHING THE CONTEXT
Project Inception Meeting
• Held via teleconference. Finalise project scope, deliverables, timing, data gap actions and identify key stakeholders
Stakeholder and Community Engagement Plan
• Preparation of Community Information Sheet 1
Literature Review and Issues Paper
• Historical reports will be reviewed, state and local coastal policy, planning schemes & instruments considered.
Site Investigations / Community Workshop 1 (Workshop 1 will be undertaken on the same trip as the site visit.)
• CIS1 to be posted online / mailed immediately prior to Workshop 1; focus group interviews available outside Workshop
• Community Values Assessment can then be completed (community and cultural values identified).
• Site visit will allow for finalisation of the Identification of Coastal Assets task and fill gaps noted in Issues Paper.
• Site visit to also aid in coastal processes understanding.
CO
MM
UN
ICA
TIO
N A
ND
CO
NS
UL
TA
TIO
N:
SH
IRE
OF
SH
AR
K B
AY
, S
TA
KE
HO
LD
ER
S, C
OM
MU
NIT
Y W
RO
KS
HO
PS
& S
UR
VE
Y
MO
NIT
OR
ING
AN
D R
EV
IEW
Final CHRMAP and Interim Deliverables
ADAPTATION PLANNING
COASTAL HAZARD RISK IDENTIFICATION
Hazard Assessment – to understand coastal processes & hazards & identify areas at risk
• Review of available information and knowledge summary
o Water Level / inundation information
o Hydrographic surveys
o Aerial photography analysis
o Previous coastal hazard reporting
• Coastal Hazard Assessment on key coastal processes – coastal inundation, long-term and short-term erosion
o Update previous assessments with most recent aerial photographs / historical where necessary; analyse
accordingly
o Inundation scenarios include - Present day, 2030, 2050, 2118 conditions, with Average Recurrence
Interval of 20, 50, 100, 500 years
o Erosion scenarios assessed as per SPP2.6, with SBEACH modelling at key points in the study area o Determine trigger events & responses
• Coastal Hazard Mapping
o 3D surface mapping of all coastal inundation and erosion scenarios.
o Split into sectors, as required, at the stipulated scales & generate maps
o Online mapping provided for all maps, all information within GIS system
RISK ANALYSIS AND EVALUATION
Prepare Likelihood and Consequence Scales
• Risk assessment of each vulnerable asset: likelihood, consequence, vulnerability & risk rating for each scenario
Risk Evaluation
• Identify actions & priorities for management until 2118
• Analyse Community Values / Success Criteria--> establish community priorities for Vulnerable Assets
Identify Existing Controls
• Identify existing mitigation measures: physical & planning schemes to mitigate the above risks
o Update risks accordingly; identify prioritised risk action list based on Success Criteria & existing controls
Identification of Adaptation Options – following SPP2.6 hierarchy
• Develop long-term pathway for full planning timeframe, and epochs present day, 2030, 2050, 2118
• Adaptation options for highly valued assets - built & natural; short & long-term management
• Land use planning instruments considered: proposed wording & implementation; decision making processes
Vulnerability Assessment
• Identify vulnerable assets, group by specified categories; implications on land use
• Identify function, services & values of each vulnerable asset
• Assess vulnerability of each asset (exposure, sensitivity and adaptive capacity)
o Assets grouped with rationale; Sensitivity scaling considered
o Results tabularised
• Online mapping of vulnerability, all information within GIS system
ENGAGEMENT • Community Information Sheet
• Community Workshop
• Online Survey
• Definition of values / success criteria
Assessment of Adaptation Options For each vulnerable asset:
• For each Mitigation / Adaptation measure:
o MCA. If MCA +ve, proceed to CBA
o Timeframes / triggers to be considered
• Trade-offs between option selection & asset value
Implementation For each vulnerable asset:
• For each Mitigation / Adaptation measure:
o Identify long-term pathways, considering trigger points and previous assessments
o Produce a short-term implementation plan to produce a clear action plan to 2030
o Produce a monitoring plan, detailing any monitoring or review that may be required
ENGAGEMENT • Obtain additional feedback on success
criteria & presented adaptation options:
o Community Information Sheet
o Community Workshop
o Online Survey
ENGAGEMENT • Public advertisement of Final Draft
CHRMAP
FIGURE 1-2 PROPOSED CHRMAP METHODOLOGY FLOW CHART (ADAPTED FROM WAPC CHRMAP GUIDELINES)
Shire of Shark Bay | 16 August 2019 Chapter Report: Coastal Hazard & Vulnerability Assessment Page 14
5652_01_R
04v03.d
ocx
2 STUDY APPROACH
2.1 CHRMAP Objectives
As discussed in Chapter 1, the CHRMAP is a legislative recommendation from the state government.
The Denham CHRMAP aims to investigate and provide the blueprint for adapting and addressing coastal
hazards which are likely to affect the Denham townsite over various planning timeframes. The CHRMAP will
provide strategic guidance for coordinated, integrated and sustainable decision making by the Shire of Shark
Bay in terms of future land use planning and management within the project area. The project will generate
information on climate change and its impacts in the coastal zone within the Denham Townsite. This will enable
the Shire to optimise its use of the coastal foreshore reserve in present day, and plan for how this may change
in the future.
The overall CHRMAP purpose is as follows:
◼ To identify vulnerable assets (public and private) and the risk posed to them by coastal hazards.
◼ To preserve community values for present and future generations.
◼ To develop a plan that will allow the Shire to respond to identified risks through adaptation planning
activities.
◼ To recommend monitoring plans to ensure the risk management and adaptation plan activities are working
into the future as expected.
2.2 Coastal Foreshore Reserve
SPP2.6 provides guidance on the planning principles and guidelines required for coastal development in
Western Australia. A key policy objective of SPP2.6 is the provision of a coastal foreshore reserve. The coastal
foreshore reserve is essentially a ‘space’ between the ocean and coastal development. It accommodates a
range of functions and values such as geomorphological integrity, biodiversity, heritage, public ownership and
access.
Schedule One of SPP2.6 provides guidance for calculating the extent of the coastal foreshore reserve in terms
of the physical processes alone. This reserve allows for coastal processes including present day erosion,
historical shoreline movement, sea-level rise and storm surge inundation. However, as per the above, the
coastal foreshore reserve should be determined on a case by case basis and include allowance for additional
functions provided by the coastal foreshore associated with environmental, social and indigenous values.
The component of the coastal foreshore reserve to allow for coastal processes should be sufficient to mitigate
the risks of coastal hazards by allowing for landform stability, natural variability and climate change. The
coastal foreshore reserve is a critical input into the coastal hazard risk management and adaption planning
framework outlined in SPP2.6. The assessment considers allowances for coastal erosion and storm surge
inundation in parallel.
2.2.1 Allowance for Coastal Erosion
The allowance for erosion on sandy coasts is calculated as the sum of the S1, S2 and S3 Erosion components,
plus 0.2 m per year allowance for uncertainty:
◼ (S1 Erosion) Allowance for the current risk of storm erosion
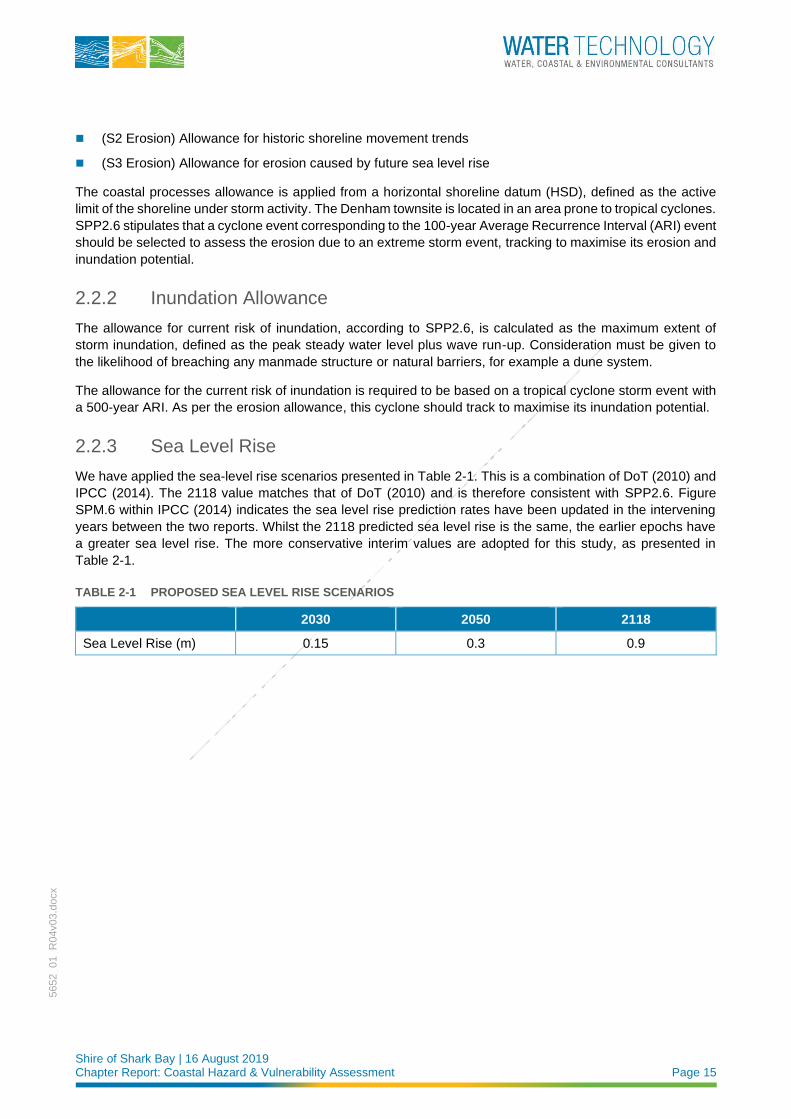
Shire of Shark Bay | 16 August 2019 Chapter Report: Coastal Hazard & Vulnerability Assessment Page 15
5652_01_R
04v03.d
ocx
◼ (S2 Erosion) Allowance for historic shoreline movement trends
◼ (S3 Erosion) Allowance for erosion caused by future sea level rise
The coastal processes allowance is applied from a horizontal shoreline datum (HSD), defined as the active
limit of the shoreline under storm activity. The Denham townsite is located in an area prone to tropical cyclones.
SPP2.6 stipulates that a cyclone event corresponding to the 100-year Average Recurrence Interval (ARI) event
should be selected to assess the erosion due to an extreme storm event, tracking to maximise its erosion and
inundation potential.
2.2.2 Inundation Allowance
The allowance for current risk of inundation, according to SPP2.6, is calculated as the maximum extent of
storm inundation, defined as the peak steady water level plus wave run-up. Consideration must be given to
the likelihood of breaching any manmade structure or natural barriers, for example a dune system.
The allowance for the current risk of inundation is required to be based on a tropical cyclone storm event with
a 500-year ARI. As per the erosion allowance, this cyclone should track to maximise its inundation potential.
2.2.3 Sea Level Rise
We have applied the sea-level rise scenarios presented in Table 2-1. This is a combination of DoT (2010) and
IPCC (2014). The 2118 value matches that of DoT (2010) and is therefore consistent with SPP2.6. Figure
SPM.6 within IPCC (2014) indicates the sea level rise prediction rates have been updated in the intervening
years between the two reports. Whilst the 2118 predicted sea level rise is the same, the earlier epochs have
a greater sea level rise. The more conservative interim values are adopted for this study, as presented in
Table 2-1.
TABLE 2-1 PROPOSED SEA LEVEL RISE SCENARIOS
2030 2050 2118
Sea Level Rise (m) 0.15 0.3 0.9
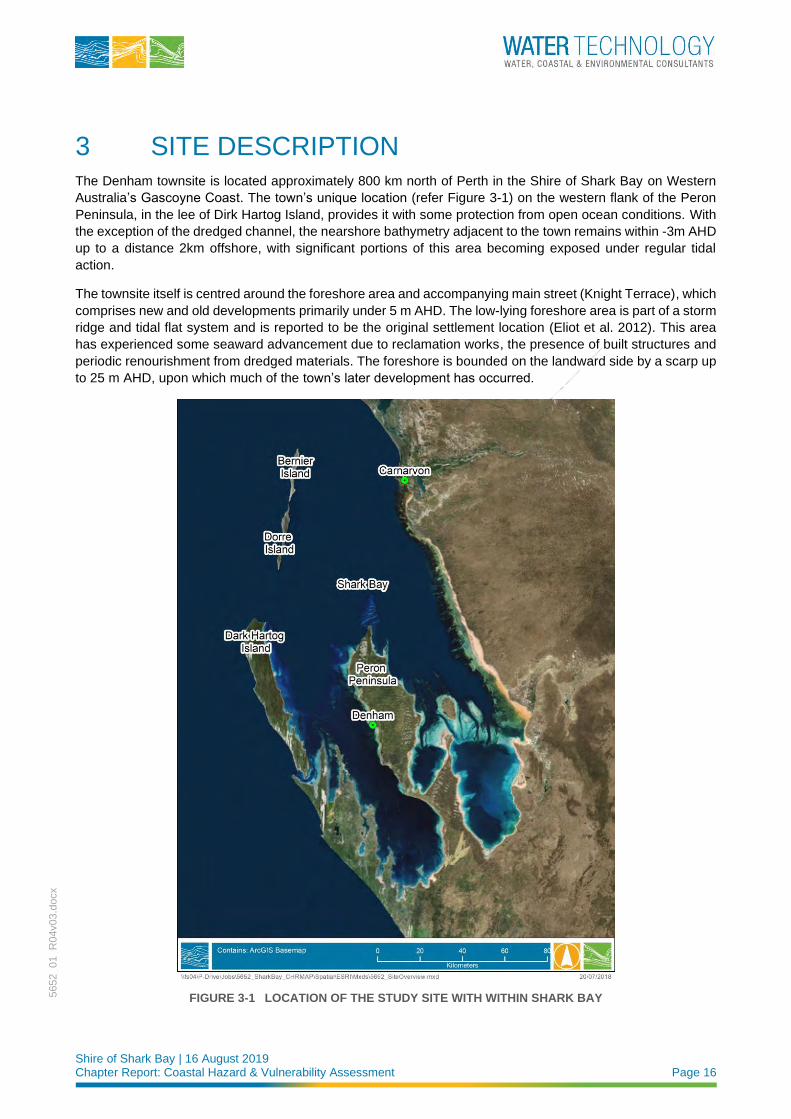
Shire of Shark Bay | 16 August 2019 Chapter Report: Coastal Hazard & Vulnerability Assessment Page 16
5652_01_R
04v03.d
ocx
3 SITE DESCRIPTION The Denham townsite is located approximately 800 km north of Perth in the Shire of Shark Bay on Western
Australia’s Gascoyne Coast. The town’s unique location (refer Figure 3-1) on the western flank of the Peron
Peninsula, in the lee of Dirk Hartog Island, provides it with some protection from open ocean conditions. With
the exception of the dredged channel, the nearshore bathymetry adjacent to the town remains within -3m AHD
up to a distance 2km offshore, with significant portions of this area becoming exposed under regular tidal
action.
The townsite itself is centred around the foreshore area and accompanying main street (Knight Terrace), which
comprises new and old developments primarily under 5 m AHD. The low-lying foreshore area is part of a storm
ridge and tidal flat system and is reported to be the original settlement location (Eliot et al. 2012). This area
has experienced some seaward advancement due to reclamation works, the presence of built structures and
periodic renourishment from dredged materials. The foreshore is bounded on the landward side by a scarp up
to 25 m AHD, upon which much of the town’s later development has occurred.
FIGURE 3-1 LOCATION OF THE STUDY SITE WITH WITHIN SHARK BAY
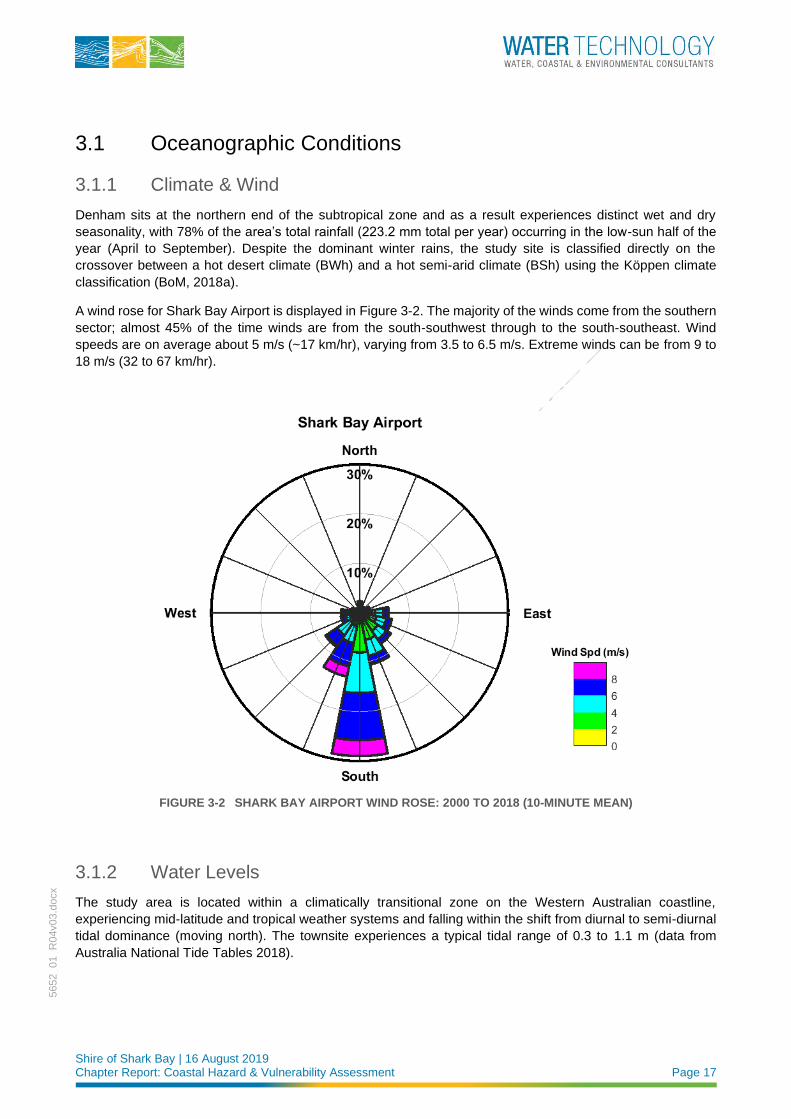
Shire of Shark Bay | 16 August 2019 Chapter Report: Coastal Hazard & Vulnerability Assessment Page 17
5652_01_R
04v03.d
ocx
3.1 Oceanographic Conditions
3.1.1 Climate & Wind
Denham sits at the northern end of the subtropical zone and as a result experiences distinct wet and dry
seasonality, with 78% of the area’s total rainfall (223.2 mm total per year) occurring in the low-sun half of the
year (April to September). Despite the dominant winter rains, the study site is classified directly on the
crossover between a hot desert climate (BWh) and a hot semi-arid climate (BSh) using the Köppen climate
classification (BoM, 2018a).
A wind rose for Shark Bay Airport is displayed in Figure 3-2. The majority of the winds come from the southern
sector; almost 45% of the time winds are from the south-southwest through to the south-southeast. Wind
speeds are on average about 5 m/s (~17 km/hr), varying from 3.5 to 6.5 m/s. Extreme winds can be from 9 to
18 m/s (32 to 67 km/hr).
FIGURE 3-2 SHARK BAY AIRPORT WIND ROSE: 2000 TO 2018 (10-MINUTE MEAN)
3.1.2 Water Levels
The study area is located within a climatically transitional zone on the Western Australian coastline,
experiencing mid-latitude and tropical weather systems and falling within the shift from diurnal to semi-diurnal
tidal dominance (moving north). The townsite experiences a typical tidal range of 0.3 to 1.1 m (data from
Australia National Tide Tables 2018).
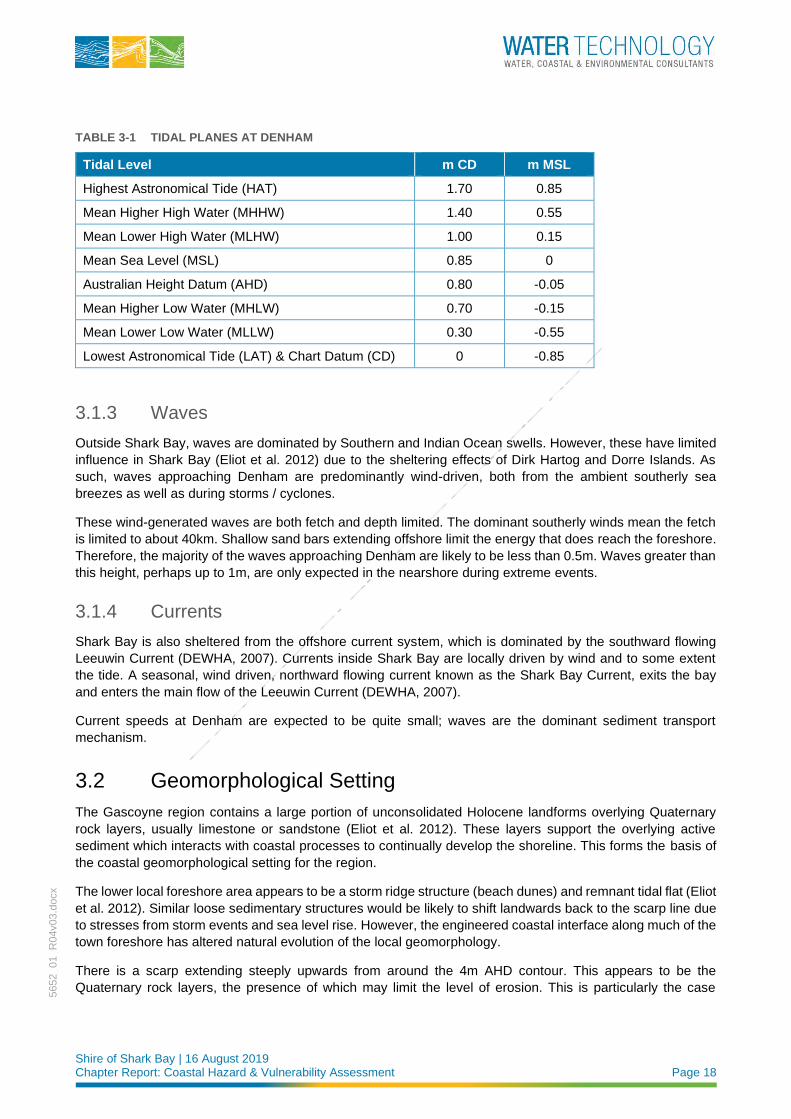
Shire of Shark Bay | 16 August 2019 Chapter Report: Coastal Hazard & Vulnerability Assessment Page 18
5652_01_R
04v03.d
ocx
TABLE 3-1 TIDAL PLANES AT DENHAM
Tidal Level m CD m MSL
Highest Astronomical Tide (HAT) 1.70 0.85
Mean Higher High Water (MHHW) 1.40 0.55
Mean Lower High Water (MLHW) 1.00 0.15
Mean Sea Level (MSL) 0.85 0
Australian Height Datum (AHD) 0.80 -0.05
Mean Higher Low Water (MHLW) 0.70 -0.15
Mean Lower Low Water (MLLW) 0.30 -0.55
Lowest Astronomical Tide (LAT) & Chart Datum (CD) 0 -0.85
3.1.3 Waves
Outside Shark Bay, waves are dominated by Southern and Indian Ocean swells. However, these have limited
influence in Shark Bay (Eliot et al. 2012) due to the sheltering effects of Dirk Hartog and Dorre Islands. As
such, waves approaching Denham are predominantly wind-driven, both from the ambient southerly sea
breezes as well as during storms / cyclones.
These wind-generated waves are both fetch and depth limited. The dominant southerly winds mean the fetch
is limited to about 40km. Shallow sand bars extending offshore limit the energy that does reach the foreshore.
Therefore, the majority of the waves approaching Denham are likely to be less than 0.5m. Waves greater than
this height, perhaps up to 1m, are only expected in the nearshore during extreme events.
3.1.4 Currents
Shark Bay is also sheltered from the offshore current system, which is dominated by the southward flowing
Leeuwin Current (DEWHA, 2007). Currents inside Shark Bay are locally driven by wind and to some extent
the tide. A seasonal, wind driven, northward flowing current known as the Shark Bay Current, exits the bay
and enters the main flow of the Leeuwin Current (DEWHA, 2007).
Current speeds at Denham are expected to be quite small; waves are the dominant sediment transport
mechanism.
3.2 Geomorphological Setting
The Gascoyne region contains a large portion of unconsolidated Holocene landforms overlying Quaternary
rock layers, usually limestone or sandstone (Eliot et al. 2012). These layers support the overlying active
sediment which interacts with coastal processes to continually develop the shoreline. This forms the basis of
the coastal geomorphological setting for the region.
The lower local foreshore area appears to be a storm ridge structure (beach dunes) and remnant tidal flat (Eliot
et al. 2012). Similar loose sedimentary structures would be likely to shift landwards back to the scarp line due
to stresses from storm events and sea level rise. However, the engineered coastal interface along much of the
town foreshore has altered natural evolution of the local geomorphology.
There is a scarp extending steeply upwards from around the 4m AHD contour. This appears to be the
Quaternary rock layers, the presence of which may limit the level of erosion. This is particularly the case
Shire of Shark Bay | 16 August 2019 Chapter Report: Coastal Hazard & Vulnerability Assessment Page 19
5652_01_R
04v03.d
ocx
seaward of the Denham Seaside Caravan Park, and to the west around to the public lookout, where the scarp
line is quite close to the existing shoreline.
3.3 Shoreline Description
Water Technology performed a site inspection of the townsite and greater study area on the 3rd of May 2018.
A major aim of this visit was to document, photograph, and characterise the entire coastline to assist in the
compartmentalisation and analysis of the area. For the purposes of the assessment, the coastline was divided
into 5 distinct compartments based on natural and built features; these are displayed in Figure 3-3.
This separation into coastal precincts does not imply that the coastal processes within each section are in any
way compartmentalised. They are by no means isolated or discrete sections of shoreline, since the processes
affecting each have considerable influence on the others. However, this partitioning lends itself to a more
concise explanation of natural processes affecting the shoreline.
Descriptions of each section, the features of note, and representative photographs have been included in the
following chapters. Historical shoreline position data has been analysed and presented in Chapter 5.2 for all
sections.
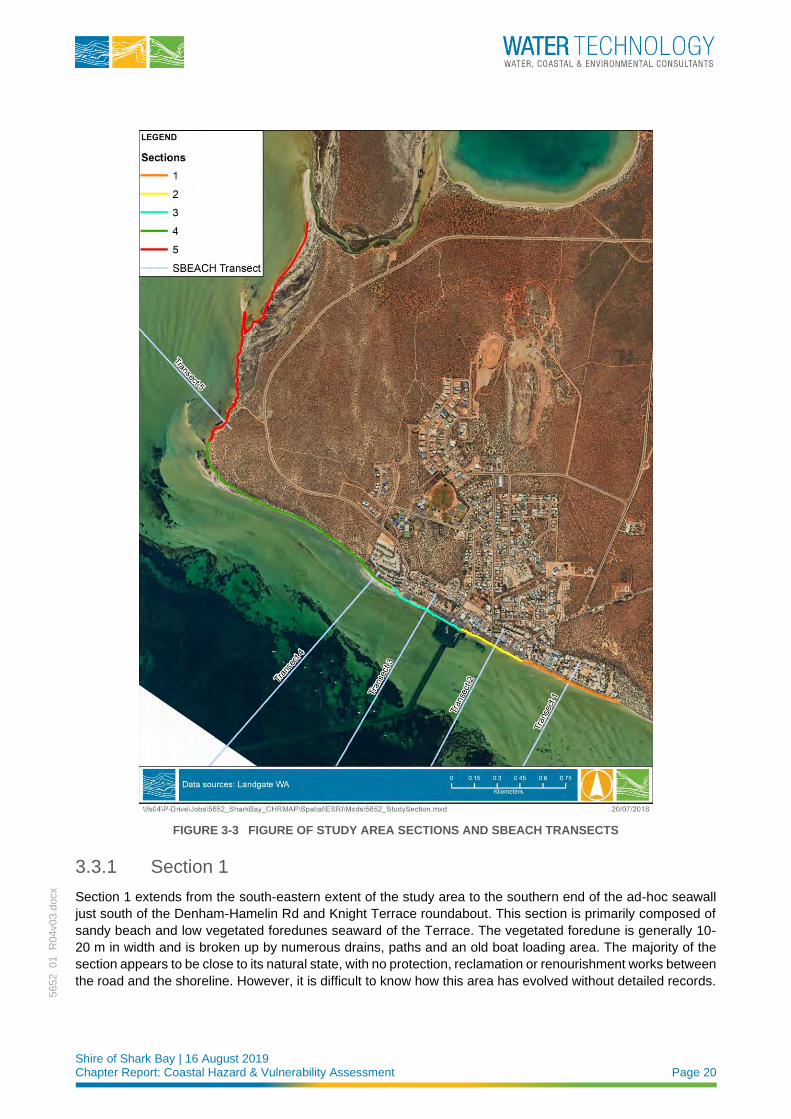
Shire of Shark Bay | 16 August 2019 Chapter Report: Coastal Hazard & Vulnerability Assessment Page 20
5652_01_R
04v03.d
ocx
FIGURE 3-3 FIGURE OF STUDY AREA SECTIONS AND SBEACH TRANSECTS
3.3.1 Section 1
Section 1 extends from the south-eastern extent of the study area to the southern end of the ad-hoc seawall
just south of the Denham-Hamelin Rd and Knight Terrace roundabout. This section is primarily composed of
sandy beach and low vegetated foredunes seaward of the Terrace. The vegetated foredune is generally 10-
20 m in width and is broken up by numerous drains, paths and an old boat loading area. The majority of the
section appears to be close to its natural state, with no protection, reclamation or renourishment works between
the road and the shoreline. However, it is difficult to know how this area has evolved without detailed records.
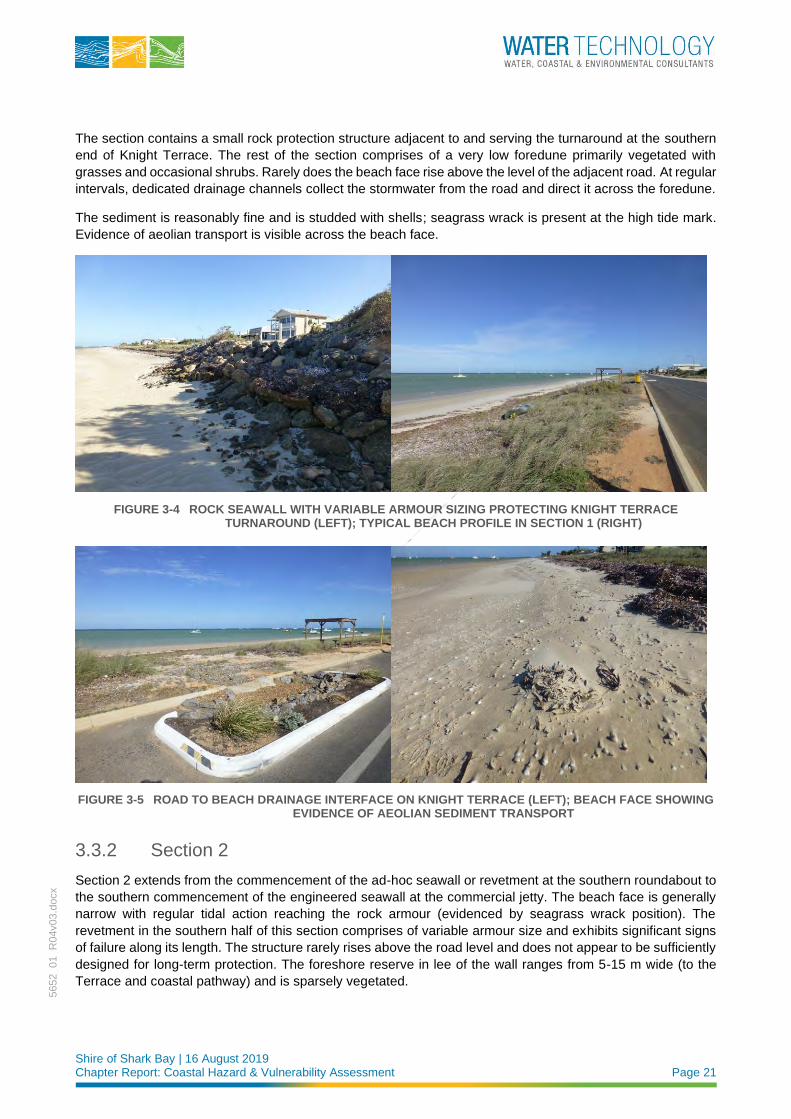
Shire of Shark Bay | 16 August 2019 Chapter Report: Coastal Hazard & Vulnerability Assessment Page 21
5652_01_R
04v03.d
ocx
The section contains a small rock protection structure adjacent to and serving the turnaround at the southern
end of Knight Terrace. The rest of the section comprises of a very low foredune primarily vegetated with
grasses and occasional shrubs. Rarely does the beach face rise above the level of the adjacent road. At regular
intervals, dedicated drainage channels collect the stormwater from the road and direct it across the foredune.
The sediment is reasonably fine and is studded with shells; seagrass wrack is present at the high tide mark.
Evidence of aeolian transport is visible across the beach face.
FIGURE 3-4 ROCK SEAWALL WITH VARIABLE ARMOUR SIZING PROTECTING KNIGHT TERRACE TURNAROUND (LEFT); TYPICAL BEACH PROFILE IN SECTION 1 (RIGHT)
FIGURE 3-5 ROAD TO BEACH DRAINAGE INTERFACE ON KNIGHT TERRACE (LEFT); BEACH FACE SHOWING EVIDENCE OF AEOLIAN SEDIMENT TRANSPORT
3.3.2 Section 2
Section 2 extends from the commencement of the ad-hoc seawall or revetment at the southern roundabout to
the southern commencement of the engineered seawall at the commercial jetty. The beach face is generally
narrow with regular tidal action reaching the rock armour (evidenced by seagrass wrack position). The
revetment in the southern half of this section comprises of variable armour size and exhibits significant signs
of failure along its length. The structure rarely rises above the road level and does not appear to be sufficiently
designed for long-term protection. The foreshore reserve in lee of the wall ranges from 5-15 m wide (to the
Terrace and coastal pathway) and is sparsely vegetated.
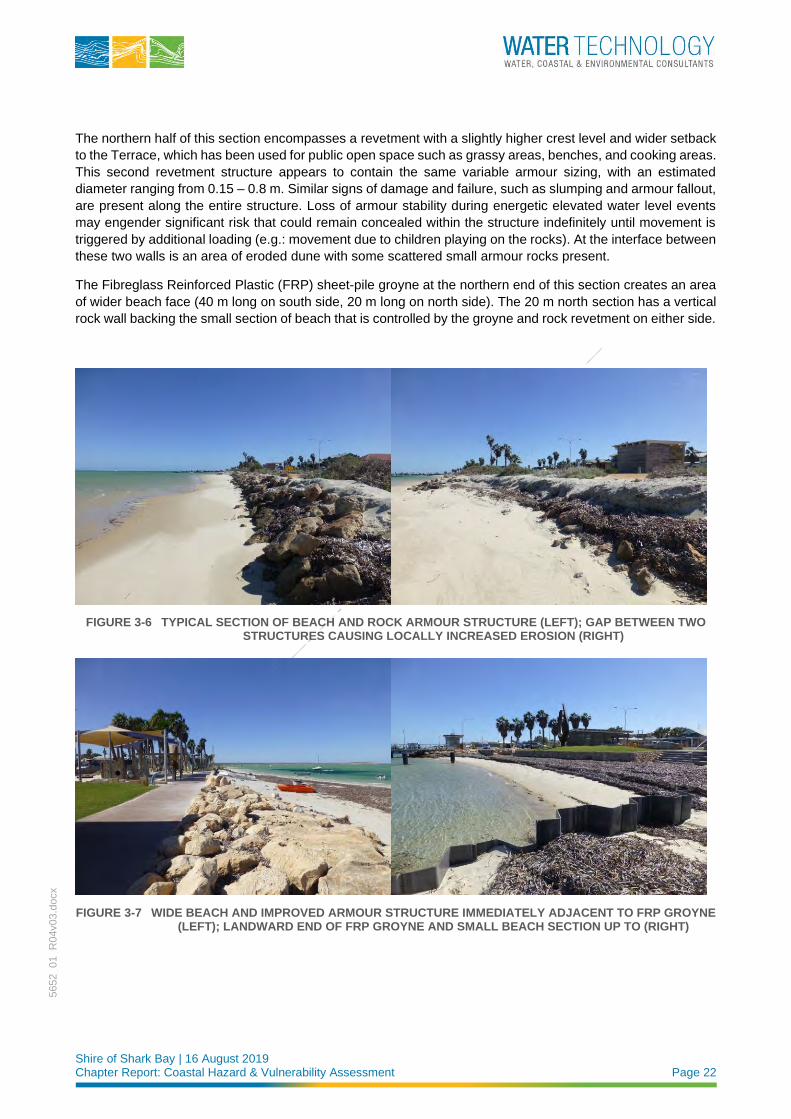
Shire of Shark Bay | 16 August 2019 Chapter Report: Coastal Hazard & Vulnerability Assessment Page 22
5652_01_R
04v03.d
ocx
The northern half of this section encompasses a revetment with a slightly higher crest level and wider setback
to the Terrace, which has been used for public open space such as grassy areas, benches, and cooking areas.
This second revetment structure appears to contain the same variable armour sizing, with an estimated
diameter ranging from 0.15 – 0.8 m. Similar signs of damage and failure, such as slumping and armour fallout,
are present along the entire structure. Loss of armour stability during energetic elevated water level events
may engender significant risk that could remain concealed within the structure indefinitely until movement is
triggered by additional loading (e.g.: movement due to children playing on the rocks). At the interface between
these two walls is an area of eroded dune with some scattered small armour rocks present.
The Fibreglass Reinforced Plastic (FRP) sheet-pile groyne at the northern end of this section creates an area
of wider beach face (40 m long on south side, 20 m long on north side). The 20 m north section has a vertical
rock wall backing the small section of beach that is controlled by the groyne and rock revetment on either side.
FIGURE 3-6 TYPICAL SECTION OF BEACH AND ROCK ARMOUR STRUCTURE (LEFT); GAP BETWEEN TWO STRUCTURES CAUSING LOCALLY INCREASED EROSION (RIGHT)
FIGURE 3-7 WIDE BEACH AND IMPROVED ARMOUR STRUCTURE IMMEDIATELY ADJACENT TO FRP GROYNE (LEFT); LANDWARD END OF FRP GROYNE AND SMALL BEACH SECTION UP TO (RIGHT)
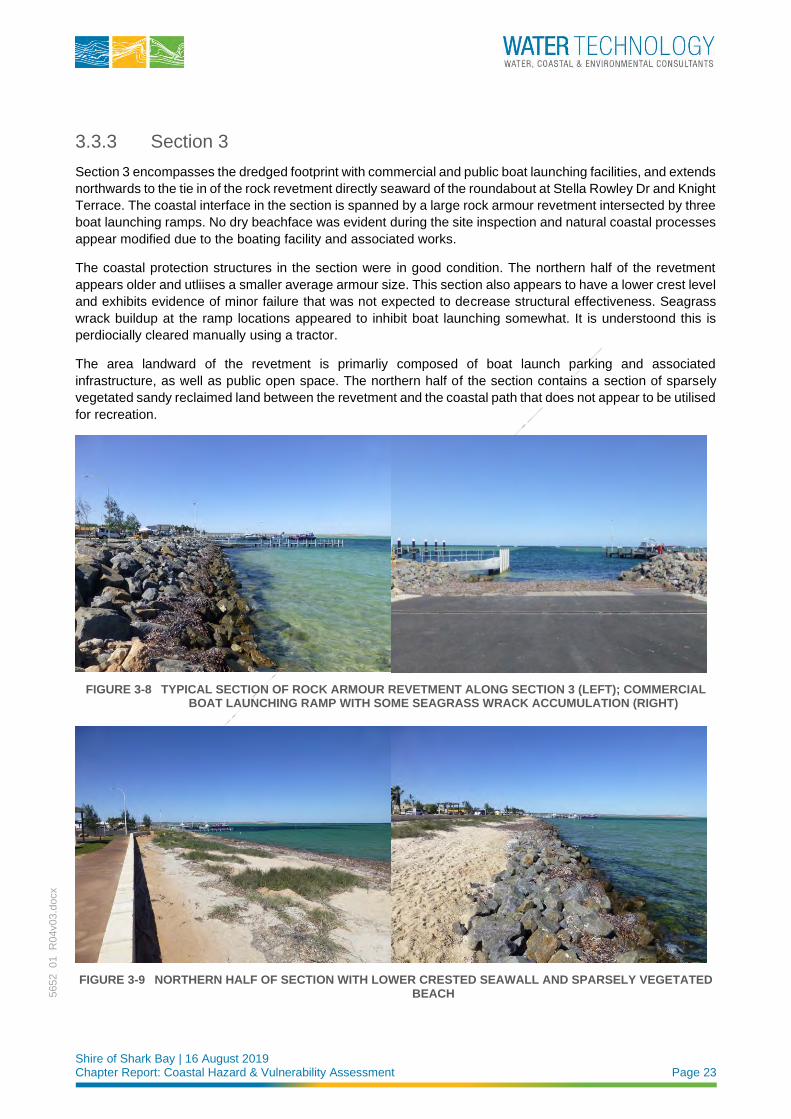
Shire of Shark Bay | 16 August 2019 Chapter Report: Coastal Hazard & Vulnerability Assessment Page 23
5652_01_R
04v03.d
ocx
3.3.3 Section 3
Section 3 encompasses the dredged footprint with commercial and public boat launching facilities, and extends
northwards to the tie in of the rock revetment directly seaward of the roundabout at Stella Rowley Dr and Knight
Terrace. The coastal interface in the section is spanned by a large rock armour revetment intersected by three
boat launching ramps. No dry beachface was evident during the site inspection and natural coastal processes
appear modified due to the boating facility and associated works.
The coastal protection structures in the section were in good condition. The northern half of the revetment
appears older and utliises a smaller average armour size. This section also appears to have a lower crest level
and exhibits evidence of minor failure that was not expected to decrease structural effectiveness. Seagrass
wrack buildup at the ramp locations appeared to inhibit boat launching somewhat. It is understoond this is
perdiocially cleared manually using a tractor.
The area landward of the revetment is primarliy composed of boat launch parking and associated
infrastructure, as well as public open space. The northern half of the section contains a section of sparsely
vegetated sandy reclaimed land between the revetment and the coastal path that does not appear to be utilised
for recreation.
FIGURE 3-8 TYPICAL SECTION OF ROCK ARMOUR REVETMENT ALONG SECTION 3 (LEFT); COMMERCIAL BOAT LAUNCHING RAMP WITH SOME SEAGRASS WRACK ACCUMULATION (RIGHT)
FIGURE 3-9 NORTHERN HALF OF SECTION WITH LOWER CRESTED SEAWALL AND SPARSELY VEGETATED BEACH
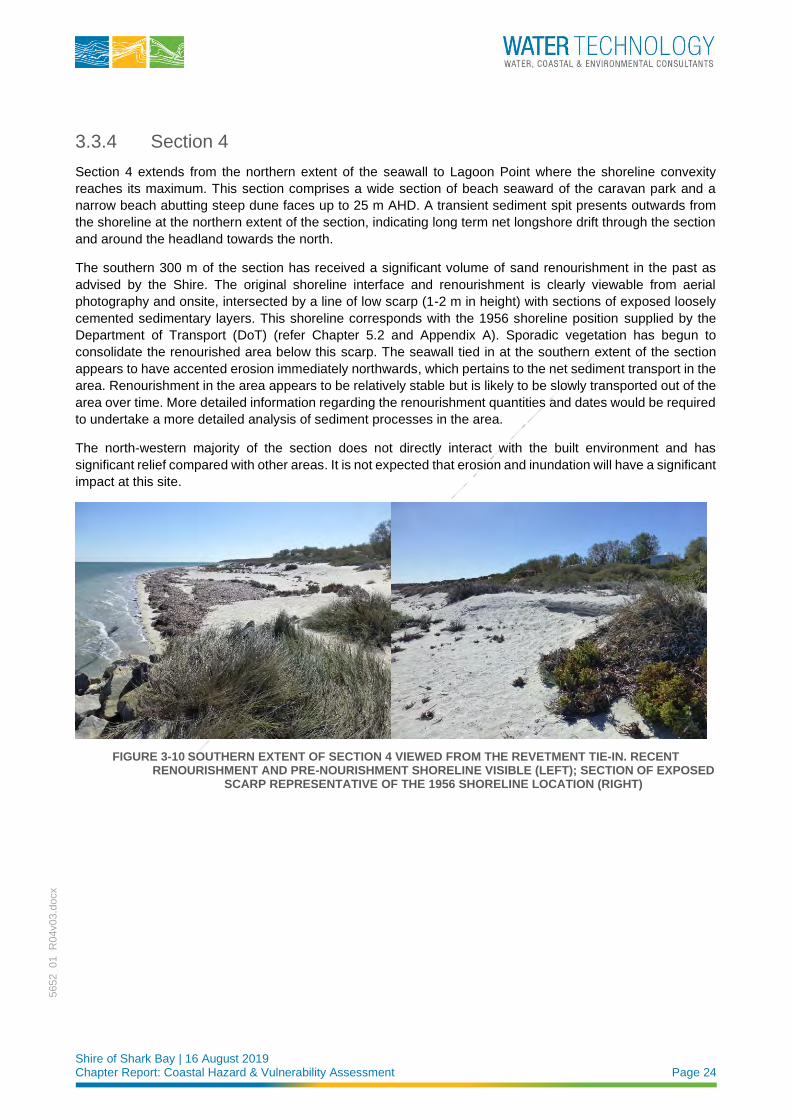
Shire of Shark Bay | 16 August 2019 Chapter Report: Coastal Hazard & Vulnerability Assessment Page 24
5652_01_R
04v03.d
ocx
3.3.4 Section 4
Section 4 extends from the northern extent of the seawall to Lagoon Point where the shoreline convexity
reaches its maximum. This section comprises a wide section of beach seaward of the caravan park and a
narrow beach abutting steep dune faces up to 25 m AHD. A transient sediment spit presents outwards from
the shoreline at the northern extent of the section, indicating long term net longshore drift through the section
and around the headland towards the north.
The southern 300 m of the section has received a significant volume of sand renourishment in the past as
advised by the Shire. The original shoreline interface and renourishment is clearly viewable from aerial
photography and onsite, intersected by a line of low scarp (1-2 m in height) with sections of exposed loosely
cemented sedimentary layers. This shoreline corresponds with the 1956 shoreline position supplied by the
Department of Transport (DoT) (refer Chapter 5.2 and Appendix A). Sporadic vegetation has begun to
consolidate the renourished area below this scarp. The seawall tied in at the southern extent of the section
appears to have accented erosion immediately northwards, which pertains to the net sediment transport in the
area. Renourishment in the area appears to be relatively stable but is likely to be slowly transported out of the
area over time. More detailed information regarding the renourishment quantities and dates would be required
to undertake a more detailed analysis of sediment processes in the area.
The north-western majority of the section does not directly interact with the built environment and has
significant relief compared with other areas. It is not expected that erosion and inundation will have a significant
impact at this site.
FIGURE 3-10 SOUTHERN EXTENT OF SECTION 4 VIEWED FROM THE REVETMENT TIE-IN. RECENT RENOURISHMENT AND PRE-NOURISHMENT SHORELINE VISIBLE (LEFT); SECTION OF EXPOSED
SCARP REPRESENTATIVE OF THE 1956 SHORELINE LOCATION (RIGHT)
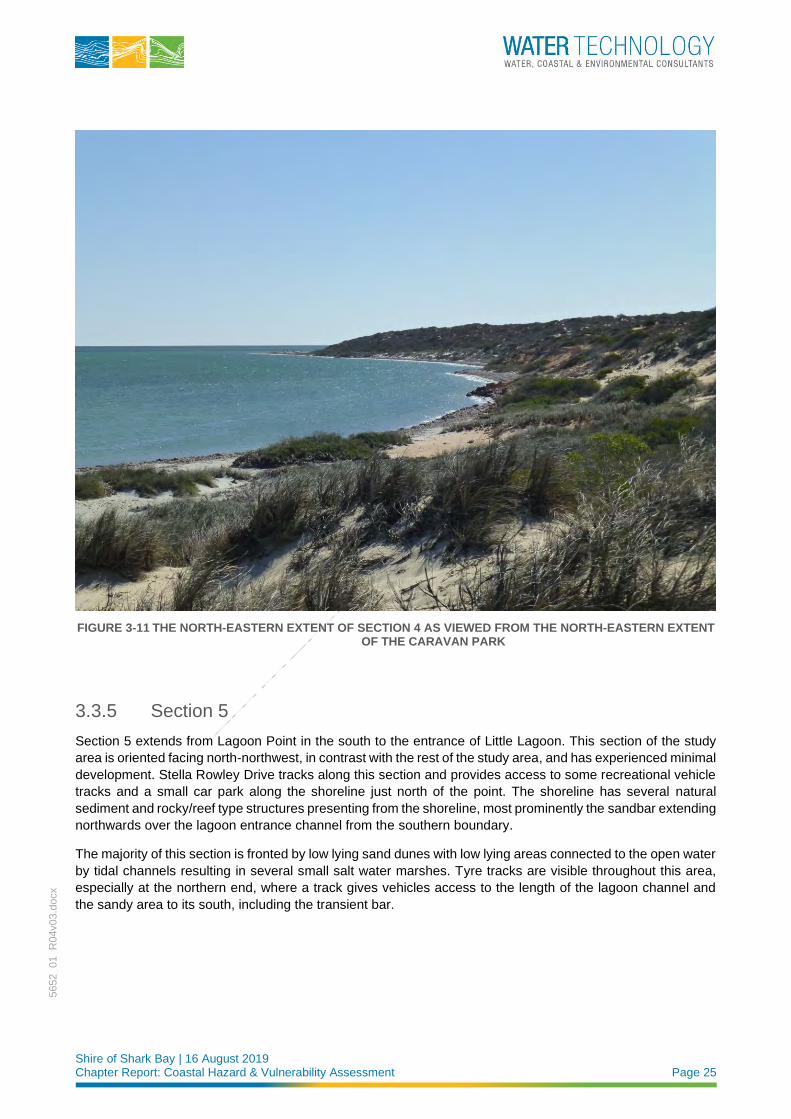
Shire of Shark Bay | 16 August 2019 Chapter Report: Coastal Hazard & Vulnerability Assessment Page 25
5652_01_R
04v03.d
ocx
FIGURE 3-11 THE NORTH-EASTERN EXTENT OF SECTION 4 AS VIEWED FROM THE NORTH-EASTERN EXTENT OF THE CARAVAN PARK
3.3.5 Section 5
Section 5 extends from Lagoon Point in the south to the entrance of Little Lagoon. This section of the study
area is oriented facing north-northwest, in contrast with the rest of the study area, and has experienced minimal
development. Stella Rowley Drive tracks along this section and provides access to some recreational vehicle
tracks and a small car park along the shoreline just north of the point. The shoreline has several natural
sediment and rocky/reef type structures presenting from the shoreline, most prominently the sandbar extending
northwards over the lagoon entrance channel from the southern boundary.
The majority of this section is fronted by low lying sand dunes with low lying areas connected to the open water
by tidal channels resulting in several small salt water marshes. Tyre tracks are visible throughout this area,
especially at the northern end, where a track gives vehicles access to the length of the lagoon channel and
the sandy area to its south, including the transient bar.
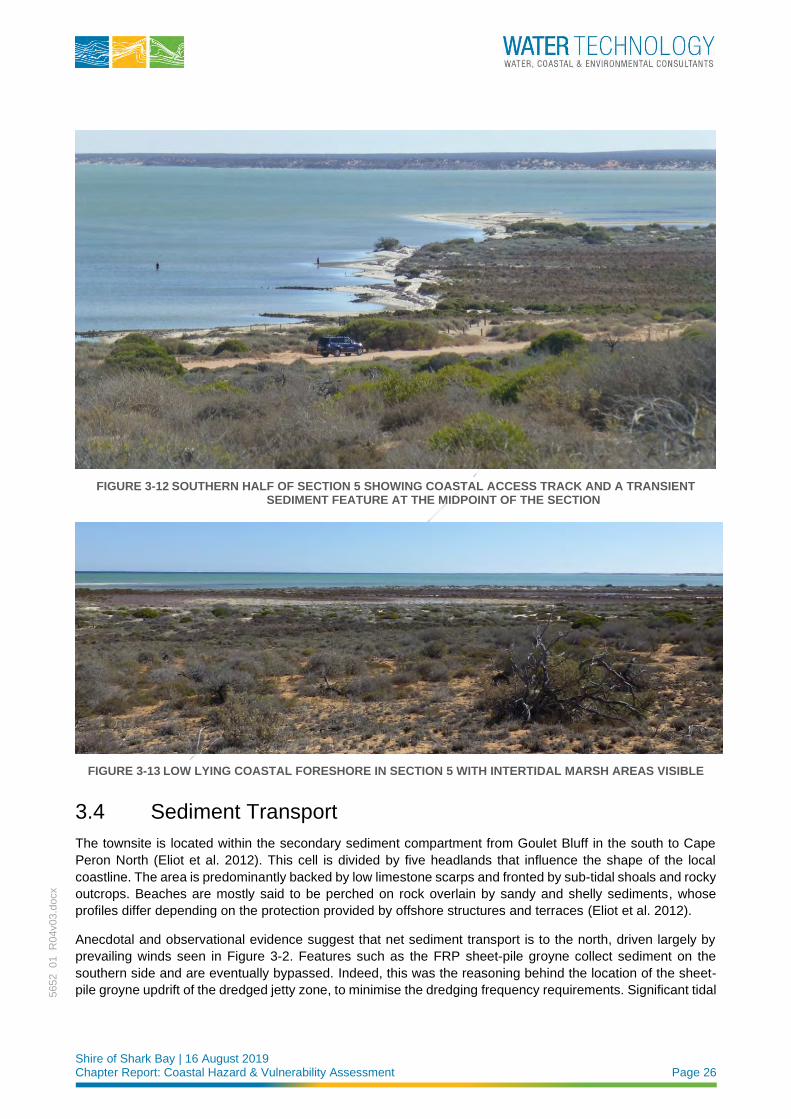
Shire of Shark Bay | 16 August 2019 Chapter Report: Coastal Hazard & Vulnerability Assessment Page 26
5652_01_R
04v03.d
ocx
FIGURE 3-12 SOUTHERN HALF OF SECTION 5 SHOWING COASTAL ACCESS TRACK AND A TRANSIENT SEDIMENT FEATURE AT THE MIDPOINT OF THE SECTION
FIGURE 3-13 LOW LYING COASTAL FORESHORE IN SECTION 5 WITH INTERTIDAL MARSH AREAS VISIBLE
3.4 Sediment Transport
The townsite is located within the secondary sediment compartment from Goulet Bluff in the south to Cape
Peron North (Eliot et al. 2012). This cell is divided by five headlands that influence the shape of the local
coastline. The area is predominantly backed by low limestone scarps and fronted by sub-tidal shoals and rocky
outcrops. Beaches are mostly said to be perched on rock overlain by sandy and shelly sediments, whose
profiles differ depending on the protection provided by offshore structures and terraces (Eliot et al. 2012).
Anecdotal and observational evidence suggest that net sediment transport is to the north, driven largely by
prevailing winds seen in Figure 3-2. Features such as the FRP sheet-pile groyne collect sediment on the
southern side and are eventually bypassed. Indeed, this was the reasoning behind the location of the sheet-
pile groyne updrift of the dredged jetty zone, to minimise the dredging frequency requirements. Significant tidal
Shire of Shark Bay | 16 August 2019 Chapter Report: Coastal Hazard & Vulnerability Assessment Page 27
5652_01_R
04v03.d
ocx
flats offshore and south of the Denham townsite likely provide sediment to the area. This agrees with the
anecdotal evidence that Section 1 remains relatively wide and unsusceptible to energetic storm events.
The active coastal zone along the town’s foreshore inhibits longshore sediment transport to the north. As a
result, sediment supply to Section 4 is expected to be net negative (without renourishment) potentially causing
erosion observed in the area. Town officials noted that infrequently maintenance dredge spoil has been utilised
to satisfy the sediment deficit in this location, with acceptable success in recent years.
Aeolian sediment transport was witnessed during Water Technology’s site visit in May 2018. The amount of
wind-blown sediment transport depends on the sediment grain size as well as the wind speed. The D50 for the
study site is estimated to be approximately 0.17 to 0.25 mm, based on observations at the site. Using the
equations for initiation of motion of sediment in Hsu & Weggel (2002), the threshold wind speed at a height of
2 m above the beach is 4.3 to 5.5 ms-1. To estimate the period of time this wind speed is exceeded at the study
site, the threshold wind speed was converted to the wind record at Shark Bay Airport by applying both a height
and wind-over-water factor as per CERC (1984). From this it was calculated that approximately 60-70% of the
time sand can be transported by wind; a significant period of time. Dune vegetation would likely improve the
sediment trapping function of the beach significantly.
3.4.1 Coastal Processes
The dominant sediment transport processes influencing the shoreline around Denham are:
◼ Net northwards longshore transport
◼ Cross-shore transport during cyclones / storms
◼ Seawall adjacent to the boat harbour limits cross-shore erosion
◼ Wind driven transport is a contributor to beach stability
◼ Low-lying dunes in Section 1 may be susceptible to erosion
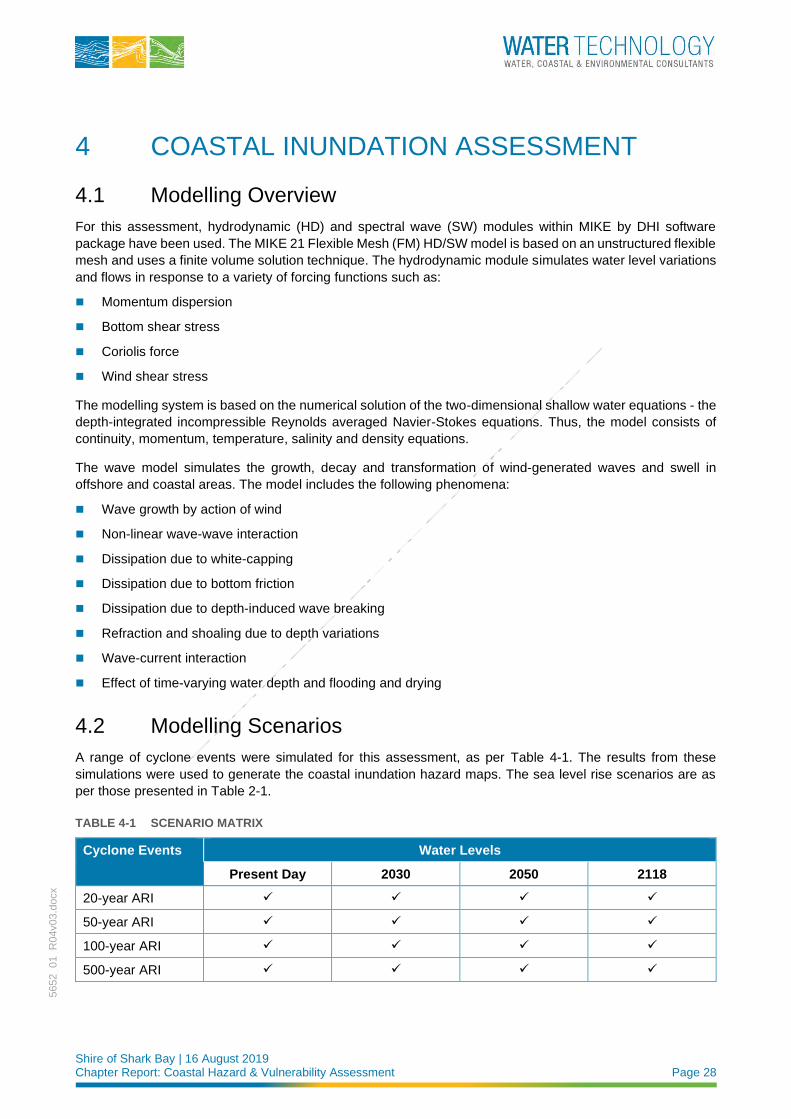
Shire of Shark Bay | 16 August 2019 Chapter Report: Coastal Hazard & Vulnerability Assessment Page 28
5652_01_R
04v03.d
ocx
4 COASTAL INUNDATION ASSESSMENT
4.1 Modelling Overview
For this assessment, hydrodynamic (HD) and spectral wave (SW) modules within MIKE by DHI software
package have been used. The MIKE 21 Flexible Mesh (FM) HD/SW model is based on an unstructured flexible
mesh and uses a finite volume solution technique. The hydrodynamic module simulates water level variations
and flows in response to a variety of forcing functions such as:
◼ Momentum dispersion
◼ Bottom shear stress
◼ Coriolis force
◼ Wind shear stress
The modelling system is based on the numerical solution of the two-dimensional shallow water equations - the
depth-integrated incompressible Reynolds averaged Navier-Stokes equations. Thus, the model consists of
continuity, momentum, temperature, salinity and density equations.
The wave model simulates the growth, decay and transformation of wind-generated waves and swell in
offshore and coastal areas. The model includes the following phenomena:
◼ Wave growth by action of wind
◼ Non-linear wave-wave interaction
◼ Dissipation due to white-capping
◼ Dissipation due to bottom friction
◼ Dissipation due to depth-induced wave breaking
◼ Refraction and shoaling due to depth variations
◼ Wave-current interaction
◼ Effect of time-varying water depth and flooding and drying
4.2 Modelling Scenarios
A range of cyclone events were simulated for this assessment, as per Table 4-1. The results from these
simulations were used to generate the coastal inundation hazard maps. The sea level rise scenarios are as
per those presented in Table 2-1.
TABLE 4-1 SCENARIO MATRIX
Cyclone Events Water Levels
Present Day 2030 2050 2118
20-year ARI ✓ ✓ ✓ ✓
50-year ARI ✓ ✓ ✓ ✓
100-year ARI ✓ ✓ ✓ ✓
500-year ARI ✓ ✓ ✓ ✓
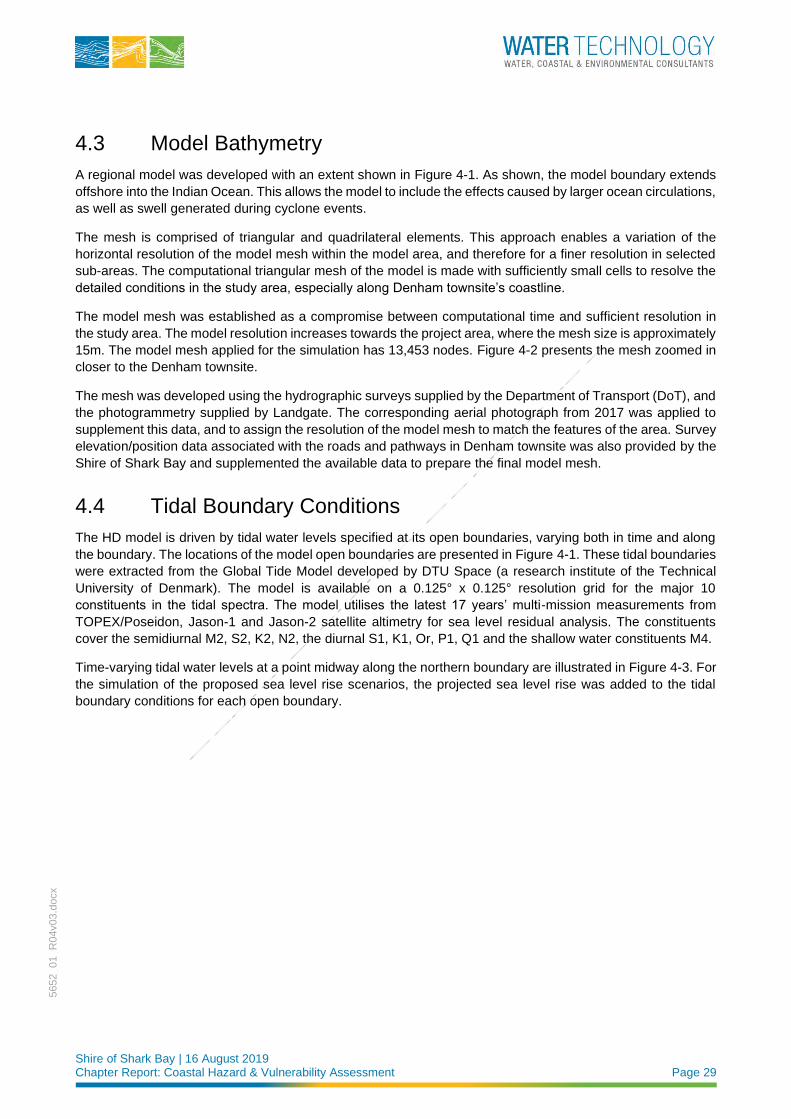
Shire of Shark Bay | 16 August 2019 Chapter Report: Coastal Hazard & Vulnerability Assessment Page 29
5652_01_R
04v03.d
ocx
4.3 Model Bathymetry
A regional model was developed with an extent shown in Figure 4-1. As shown, the model boundary extends
offshore into the Indian Ocean. This allows the model to include the effects caused by larger ocean circulations,
as well as swell generated during cyclone events.
The mesh is comprised of triangular and quadrilateral elements. This approach enables a variation of the
horizontal resolution of the model mesh within the model area, and therefore for a finer resolution in selected
sub-areas. The computational triangular mesh of the model is made with sufficiently small cells to resolve the
detailed conditions in the study area, especially along Denham townsite’s coastline.
The model mesh was established as a compromise between computational time and sufficient resolution in
the study area. The model resolution increases towards the project area, where the mesh size is approximately
15m. The model mesh applied for the simulation has 13,453 nodes. Figure 4-2 presents the mesh zoomed in
closer to the Denham townsite.
The mesh was developed using the hydrographic surveys supplied by the Department of Transport (DoT), and
the photogrammetry supplied by Landgate. The corresponding aerial photograph from 2017 was applied to
supplement this data, and to assign the resolution of the model mesh to match the features of the area. Survey
elevation/position data associated with the roads and pathways in Denham townsite was also provided by the
Shire of Shark Bay and supplemented the available data to prepare the final model mesh.
4.4 Tidal Boundary Conditions
The HD model is driven by tidal water levels specified at its open boundaries, varying both in time and along
the boundary. The locations of the model open boundaries are presented in Figure 4-1. These tidal boundaries
were extracted from the Global Tide Model developed by DTU Space (a research institute of the Technical
University of Denmark). The model is available on a 0.125° x 0.125° resolution grid for the major 10
constituents in the tidal spectra. The model utilises the latest 17 years’ multi-mission measurements from
TOPEX/Poseidon, Jason-1 and Jason-2 satellite altimetry for sea level residual analysis. The constituents
cover the semidiurnal M2, S2, K2, N2, the diurnal S1, K1, Or, P1, Q1 and the shallow water constituents M4.
Time-varying tidal water levels at a point midway along the northern boundary are illustrated in Figure 4-3. For
the simulation of the proposed sea level rise scenarios, the projected sea level rise was added to the tidal
boundary conditions for each open boundary.
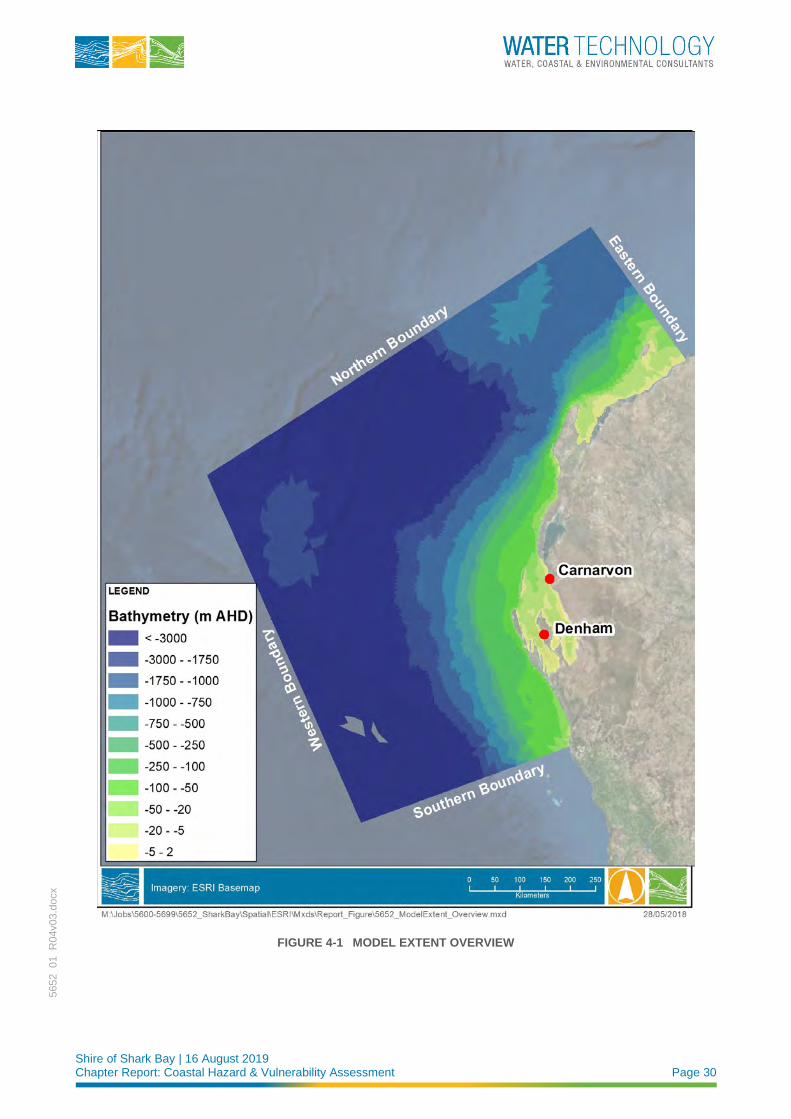
Shire of Shark Bay | 16 August 2019 Chapter Report: Coastal Hazard & Vulnerability Assessment Page 30
5652_01_R
04v03.d
ocx
FIGURE 4-1 MODEL EXTENT OVERVIEW
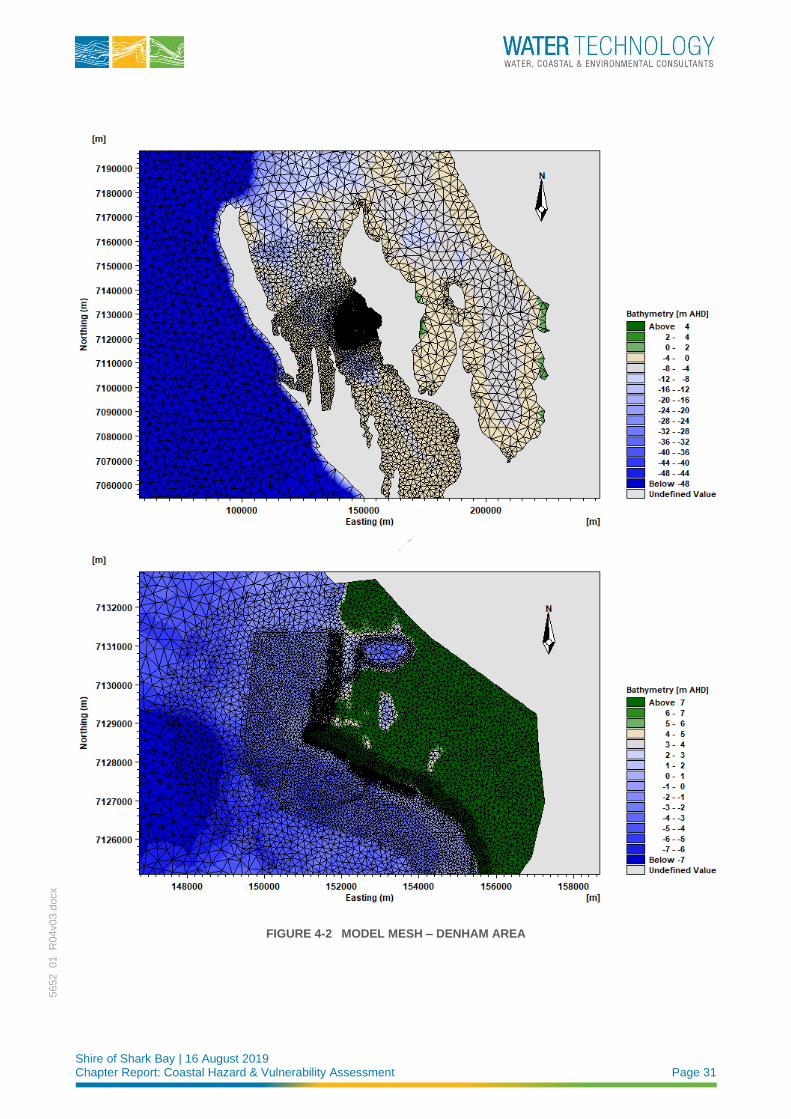
Shire of Shark Bay | 16 August 2019 Chapter Report: Coastal Hazard & Vulnerability Assessment Page 31
5652_01_R
04v03.d
ocx
FIGURE 4-2 MODEL MESH – DENHAM AREA
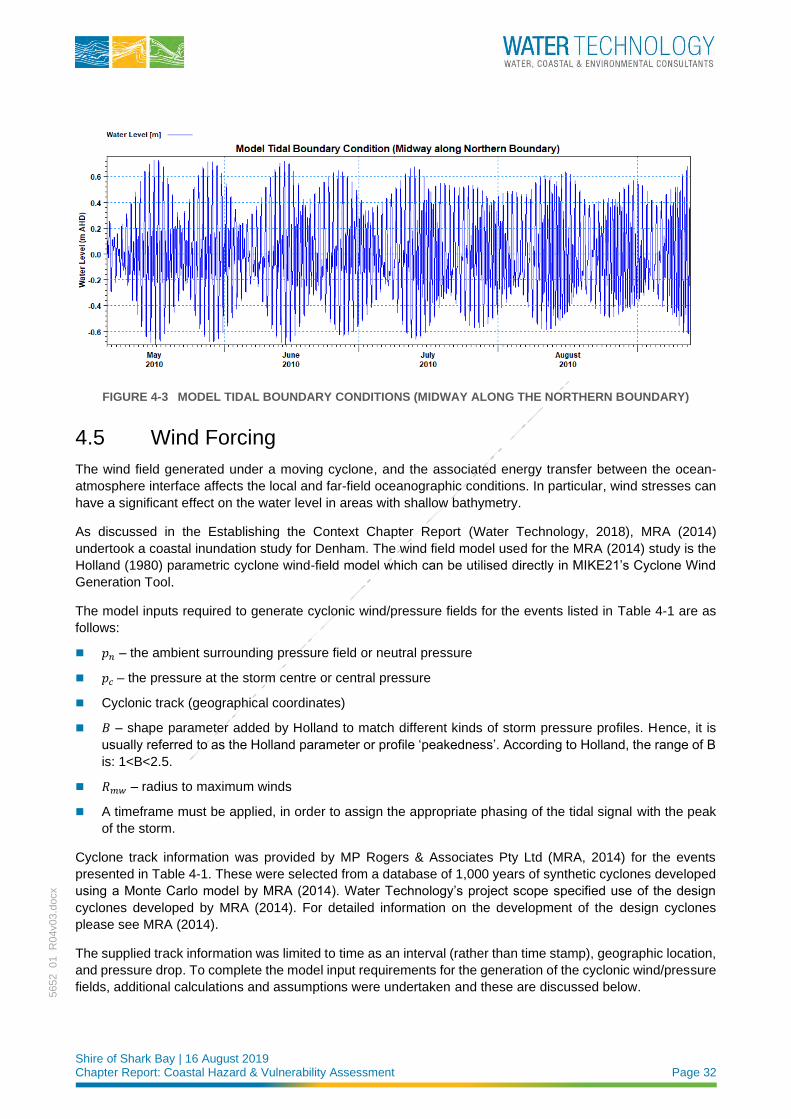
Shire of Shark Bay | 16 August 2019 Chapter Report: Coastal Hazard & Vulnerability Assessment Page 32
5652_01_R
04v03.d
ocx
FIGURE 4-3 MODEL TIDAL BOUNDARY CONDITIONS (MIDWAY ALONG THE NORTHERN BOUNDARY)
4.5 Wind Forcing
The wind field generated under a moving cyclone, and the associated energy transfer between the ocean-
atmosphere interface affects the local and far-field oceanographic conditions. In particular, wind stresses can
have a significant effect on the water level in areas with shallow bathymetry.
As discussed in the Establishing the Context Chapter Report (Water Technology, 2018), MRA (2014)
undertook a coastal inundation study for Denham. The wind field model used for the MRA (2014) study is the
Holland (1980) parametric cyclone wind-field model which can be utilised directly in MIKE21’s Cyclone Wind
Generation Tool.
The model inputs required to generate cyclonic wind/pressure fields for the events listed in Table 4-1 are as
follows:
◼ 𝑝𝑛 – the ambient surrounding pressure field or neutral pressure
◼ 𝑝𝑐 – the pressure at the storm centre or central pressure
◼ Cyclonic track (geographical coordinates)
◼ 𝐵 – shape parameter added by Holland to match different kinds of storm pressure profiles. Hence, it is
usually referred to as the Holland parameter or profile ‘peakedness’. According to Holland, the range of B
is: 1<B<2.5.
◼ 𝑅𝑚𝑤 – radius to maximum winds
◼ A timeframe must be applied, in order to assign the appropriate phasing of the tidal signal with the peak
of the storm.
Cyclone track information was provided by MP Rogers & Associates Pty Ltd (MRA, 2014) for the events
presented in Table 4-1. These were selected from a database of 1,000 years of synthetic cyclones developed
using a Monte Carlo model by MRA (2014). Water Technology’s project scope specified use of the design
cyclones developed by MRA (2014). For detailed information on the development of the design cyclones
please see MRA (2014).
The supplied track information was limited to time as an interval (rather than time stamp), geographic location,
and pressure drop. To complete the model input requirements for the generation of the cyclonic wind/pressure
fields, additional calculations and assumptions were undertaken and these are discussed below.
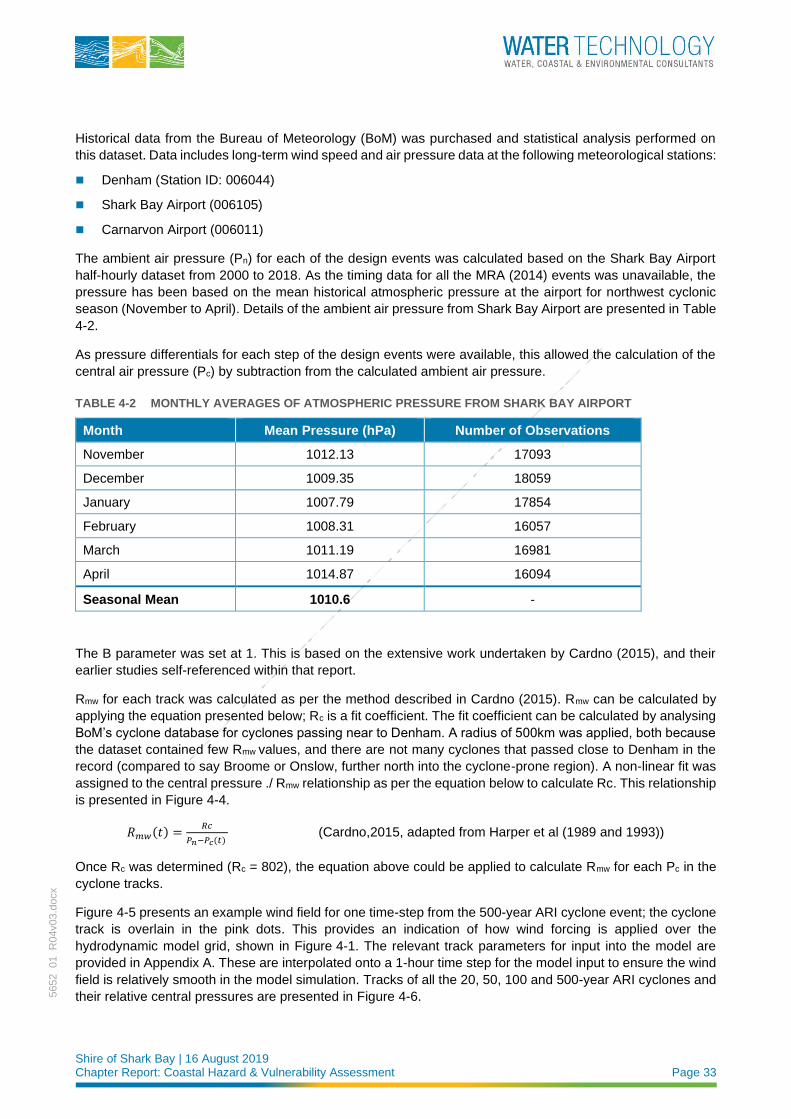
Shire of Shark Bay | 16 August 2019 Chapter Report: Coastal Hazard & Vulnerability Assessment Page 33
5652_01_R
04v03.d
ocx
Historical data from the Bureau of Meteorology (BoM) was purchased and statistical analysis performed on
this dataset. Data includes long-term wind speed and air pressure data at the following meteorological stations:
◼ Denham (Station ID: 006044)
◼ Shark Bay Airport (006105)
◼ Carnarvon Airport (006011)
The ambient air pressure (Pn) for each of the design events was calculated based on the Shark Bay Airport
half-hourly dataset from 2000 to 2018. As the timing data for all the MRA (2014) events was unavailable, the
pressure has been based on the mean historical atmospheric pressure at the airport for northwest cyclonic
season (November to April). Details of the ambient air pressure from Shark Bay Airport are presented in Table
4-2.
As pressure differentials for each step of the design events were available, this allowed the calculation of the
central air pressure (Pc) by subtraction from the calculated ambient air pressure.
TABLE 4-2 MONTHLY AVERAGES OF ATMOSPHERIC PRESSURE FROM SHARK BAY AIRPORT
Month Mean Pressure (hPa) Number of Observations
November 1012.13 17093
December 1009.35 18059
January 1007.79 17854
February 1008.31 16057
March 1011.19 16981
April 1014.87 16094
Seasonal Mean 1010.6 -
The B parameter was set at 1. This is based on the extensive work undertaken by Cardno (2015), and their
earlier studies self-referenced within that report.
Rmw for each track was calculated as per the method described in Cardno (2015). Rmw can be calculated by
applying the equation presented below; Rc is a fit coefficient. The fit coefficient can be calculated by analysing
BoM’s cyclone database for cyclones passing near to Denham. A radius of 500km was applied, both because
the dataset contained few Rmw values, and there are not many cyclones that passed close to Denham in the
record (compared to say Broome or Onslow, further north into the cyclone-prone region). A non-linear fit was
assigned to the central pressure ./ Rmw relationship as per the equation below to calculate Rc. This relationship
is presented in Figure 4-4.
𝑅𝑚𝑤(𝑡) =𝑅𝑐
𝑃𝑛−𝑃𝑐(𝑡) (Cardno,2015, adapted from Harper et al (1989 and 1993))
Once Rc was determined (Rc = 802), the equation above could be applied to calculate Rmw for each Pc in the
cyclone tracks.
Figure 4-5 presents an example wind field for one time-step from the 500-year ARI cyclone event; the cyclone
track is overlain in the pink dots. This provides an indication of how wind forcing is applied over the
hydrodynamic model grid, shown in Figure 4-1. The relevant track parameters for input into the model are
provided in Appendix A. These are interpolated onto a 1-hour time step for the model input to ensure the wind
field is relatively smooth in the model simulation. Tracks of all the 20, 50, 100 and 500-year ARI cyclones and
their relative central pressures are presented in Figure 4-6.
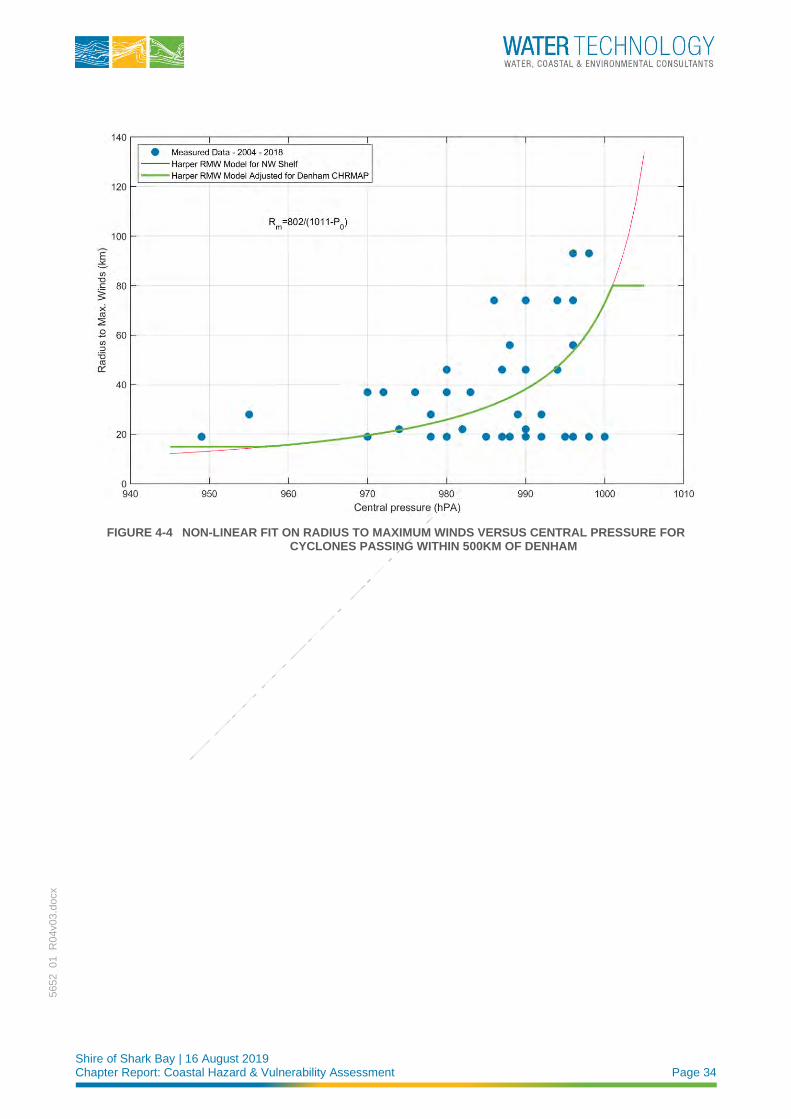
Shire of Shark Bay | 16 August 2019 Chapter Report: Coastal Hazard & Vulnerability Assessment Page 34
5652_01_R
04v03.d
ocx
FIGURE 4-4 NON-LINEAR FIT ON RADIUS TO MAXIMUM WINDS VERSUS CENTRAL PRESSURE FOR CYCLONES PASSING WITHIN 500KM OF DENHAM
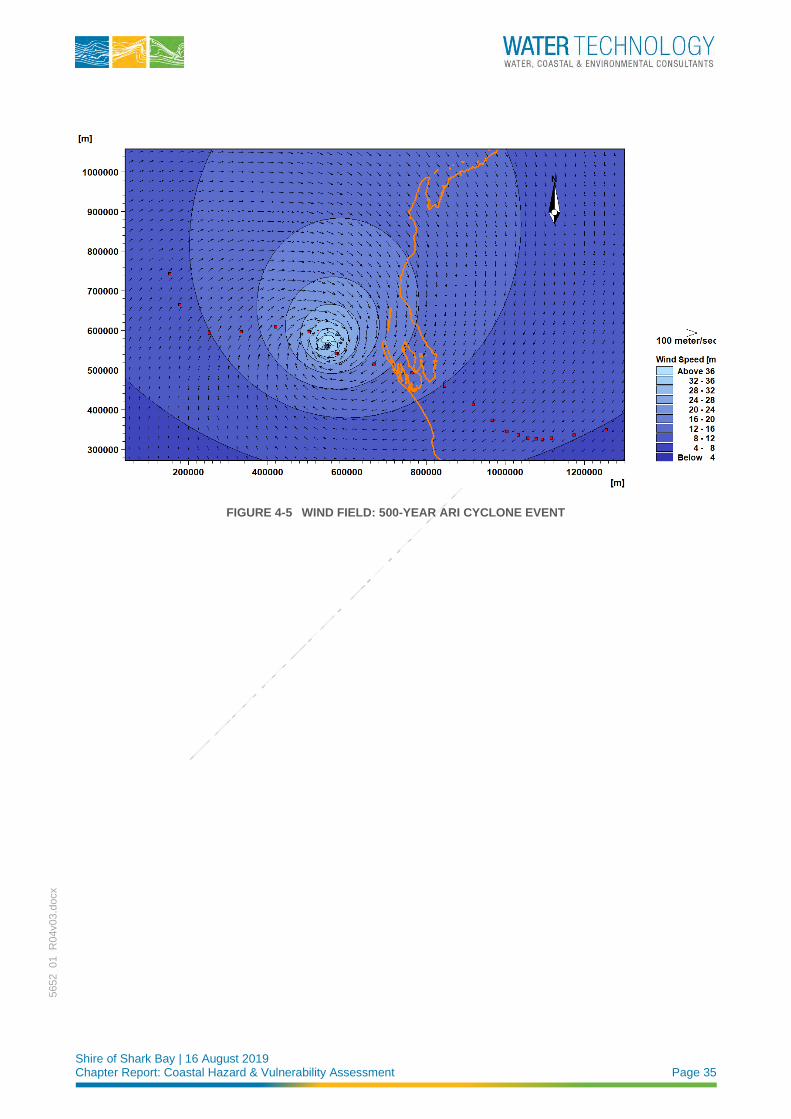
Shire of Shark Bay | 16 August 2019 Chapter Report: Coastal Hazard & Vulnerability Assessment Page 35
5652_01_R
04v03.d
ocx
FIGURE 4-5 WIND FIELD: 500-YEAR ARI CYCLONE EVENT
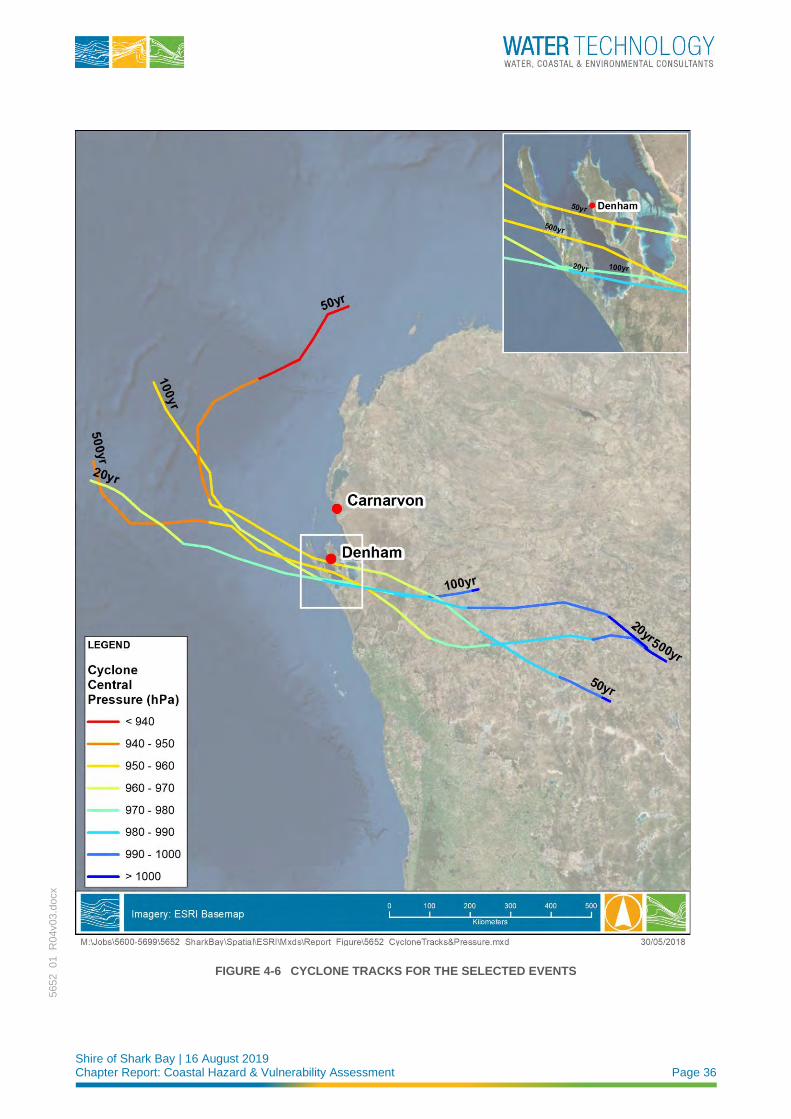
Shire of Shark Bay | 16 August 2019 Chapter Report: Coastal Hazard & Vulnerability Assessment Page 36
5652_01_R
04v03.d
ocx
FIGURE 4-6 CYCLONE TRACKS FOR THE SELECTED EVENTS
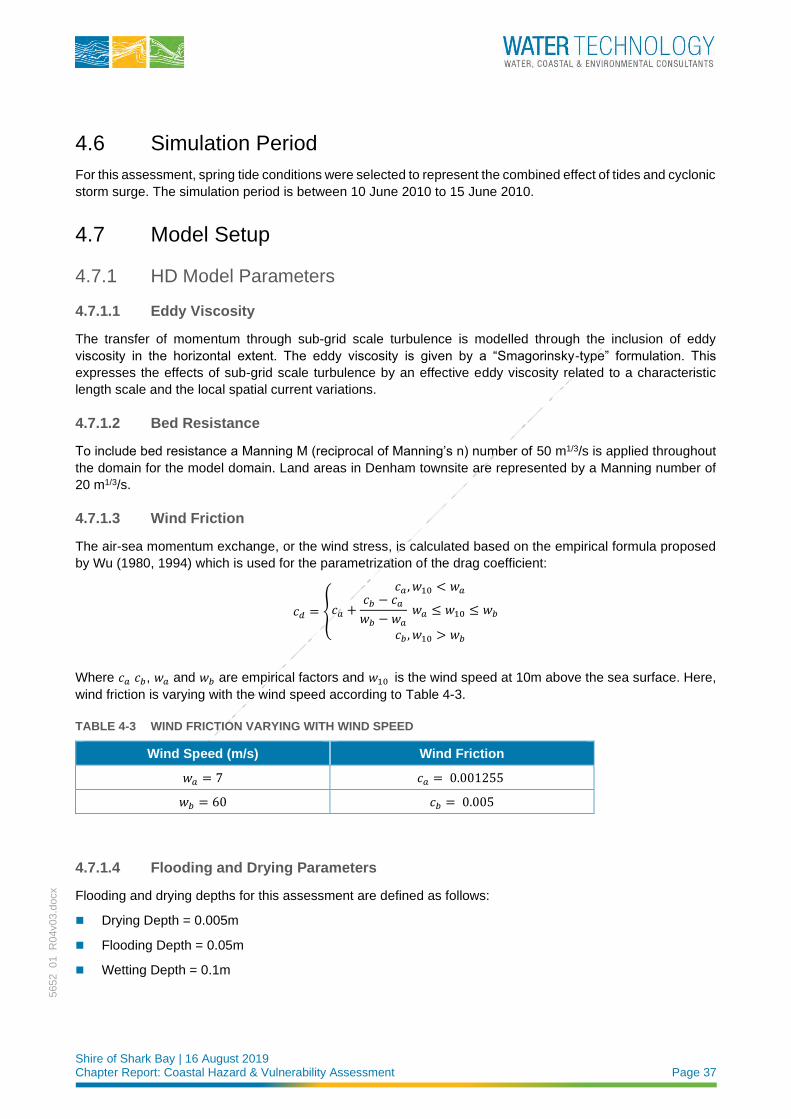
Shire of Shark Bay | 16 August 2019 Chapter Report: Coastal Hazard & Vulnerability Assessment Page 37
5652_01_R
04v03.d
ocx
4.6 Simulation Period
For this assessment, spring tide conditions were selected to represent the combined effect of tides and cyclonic
storm surge. The simulation period is between 10 June 2010 to 15 June 2010.
4.7 Model Setup
4.7.1 HD Model Parameters
4.7.1.1 Eddy Viscosity
The transfer of momentum through sub-grid scale turbulence is modelled through the inclusion of eddy
viscosity in the horizontal extent. The eddy viscosity is given by a “Smagorinsky-type” formulation. This
expresses the effects of sub-grid scale turbulence by an effective eddy viscosity related to a characteristic
length scale and the local spatial current variations.
4.7.1.2 Bed Resistance
To include bed resistance a Manning M (reciprocal of Manning’s n) number of 50 m1/3/s is applied throughout
the domain for the model domain. Land areas in Denham townsite are represented by a Manning number of
20 m1/3/s.
4.7.1.3 Wind Friction
The air-sea momentum exchange, or the wind stress, is calculated based on the empirical formula proposed
by Wu (1980, 1994) which is used for the parametrization of the drag coefficient:
𝑐𝑑 = {
𝑐𝑎 , 𝑤10 < 𝑤𝑎
𝑐𝑎 +𝑐𝑏 − 𝑐𝑎
𝑤𝑏 − 𝑤𝑎
𝑤𝑎 ≤ 𝑤10 ≤ 𝑤𝑏
𝑐𝑏 , 𝑤10 > 𝑤𝑏
Where 𝑐𝑎 𝑐𝑏, 𝑤𝑎 and 𝑤𝑏 are empirical factors and 𝑤10 is the wind speed at 10m above the sea surface. Here,
wind friction is varying with the wind speed according to Table 4-3.
TABLE 4-3 WIND FRICTION VARYING WITH WIND SPEED
Wind Speed (m/s) Wind Friction
𝑤𝑎 = 7 𝑐𝑎 = 0.001255
𝑤𝑏 = 60 𝑐𝑏 = 0.005
4.7.1.4 Flooding and Drying Parameters
Flooding and drying depths for this assessment are defined as follows:
◼ Drying Depth = 0.005m
◼ Flooding Depth = 0.05m
◼ Wetting Depth = 0.1m
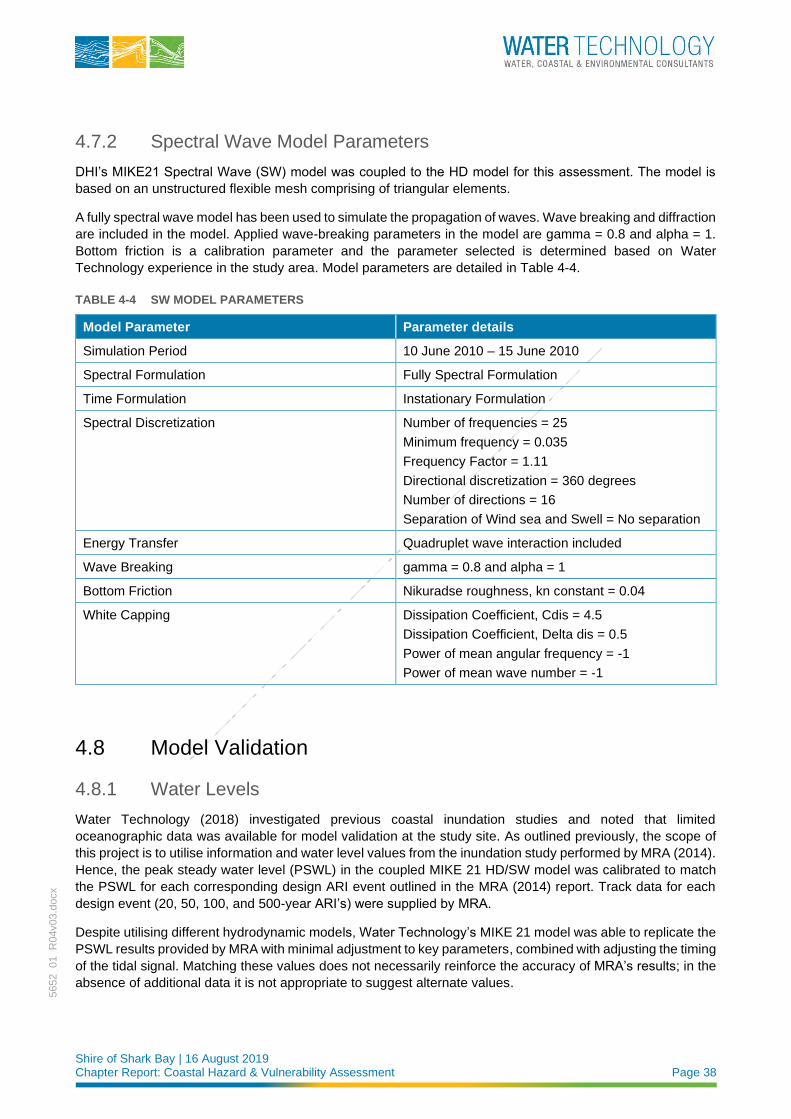
Shire of Shark Bay | 16 August 2019 Chapter Report: Coastal Hazard & Vulnerability Assessment Page 38
5652_01_R
04v03.d
ocx
4.7.2 Spectral Wave Model Parameters
DHI’s MIKE21 Spectral Wave (SW) model was coupled to the HD model for this assessment. The model is
based on an unstructured flexible mesh comprising of triangular elements.
A fully spectral wave model has been used to simulate the propagation of waves. Wave breaking and diffraction
are included in the model. Applied wave-breaking parameters in the model are gamma = 0.8 and alpha = 1.
Bottom friction is a calibration parameter and the parameter selected is determined based on Water
Technology experience in the study area. Model parameters are detailed in Table 4-4.
TABLE 4-4 SW MODEL PARAMETERS
Model Parameter Parameter details
Simulation Period 10 June 2010 – 15 June 2010
Spectral Formulation Fully Spectral Formulation
Time Formulation Instationary Formulation
Spectral Discretization Number of frequencies = 25
Minimum frequency = 0.035
Frequency Factor = 1.11
Directional discretization = 360 degrees
Number of directions = 16
Separation of Wind sea and Swell = No separation
Energy Transfer Quadruplet wave interaction included
Wave Breaking gamma = 0.8 and alpha = 1
Bottom Friction Nikuradse roughness, kn constant = 0.04
White Capping Dissipation Coefficient, Cdis = 4.5
Dissipation Coefficient, Delta dis = 0.5
Power of mean angular frequency = -1
Power of mean wave number = -1
4.8 Model Validation
4.8.1 Water Levels
Water Technology (2018) investigated previous coastal inundation studies and noted that limited
oceanographic data was available for model validation at the study site. As outlined previously, the scope of
this project is to utilise information and water level values from the inundation study performed by MRA (2014).
Hence, the peak steady water level (PSWL) in the coupled MIKE 21 HD/SW model was calibrated to match
the PSWL for each corresponding design ARI event outlined in the MRA (2014) report. Track data for each
design event (20, 50, 100, and 500-year ARI’s) were supplied by MRA.
Despite utilising different hydrodynamic models, Water Technology’s MIKE 21 model was able to replicate the
PSWL results provided by MRA with minimal adjustment to key parameters, combined with adjusting the timing
of the tidal signal. Matching these values does not necessarily reinforce the accuracy of MRA’s results; in the
absence of additional data it is not appropriate to suggest alternate values.
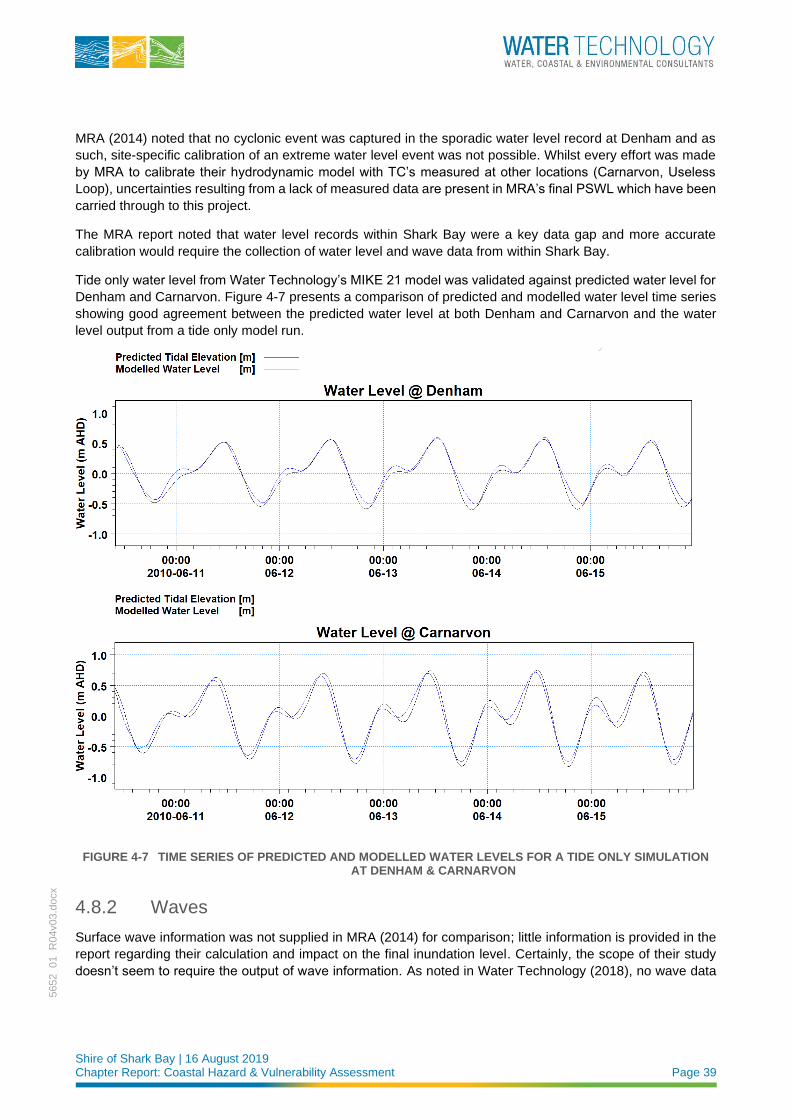
Shire of Shark Bay | 16 August 2019 Chapter Report: Coastal Hazard & Vulnerability Assessment Page 39
5652_01_R
04v03.d
ocx
MRA (2014) noted that no cyclonic event was captured in the sporadic water level record at Denham and as
such, site-specific calibration of an extreme water level event was not possible. Whilst every effort was made
by MRA to calibrate their hydrodynamic model with TC’s measured at other locations (Carnarvon, Useless
Loop), uncertainties resulting from a lack of measured data are present in MRA’s final PSWL which have been
carried through to this project.
The MRA report noted that water level records within Shark Bay were a key data gap and more accurate
calibration would require the collection of water level and wave data from within Shark Bay.
Tide only water level from Water Technology’s MIKE 21 model was validated against predicted water level for
Denham and Carnarvon. Figure 4-7 presents a comparison of predicted and modelled water level time series
showing good agreement between the predicted water level at both Denham and Carnarvon and the water
level output from a tide only model run.
FIGURE 4-7 TIME SERIES OF PREDICTED AND MODELLED WATER LEVELS FOR A TIDE ONLY SIMULATION AT DENHAM & CARNARVON
4.8.2 Waves
Surface wave information was not supplied in MRA (2014) for comparison; little information is provided in the
report regarding their calculation and impact on the final inundation level. Certainly, the scope of their study
doesn’t seem to require the output of wave information. As noted in Water Technology (2018), no wave data
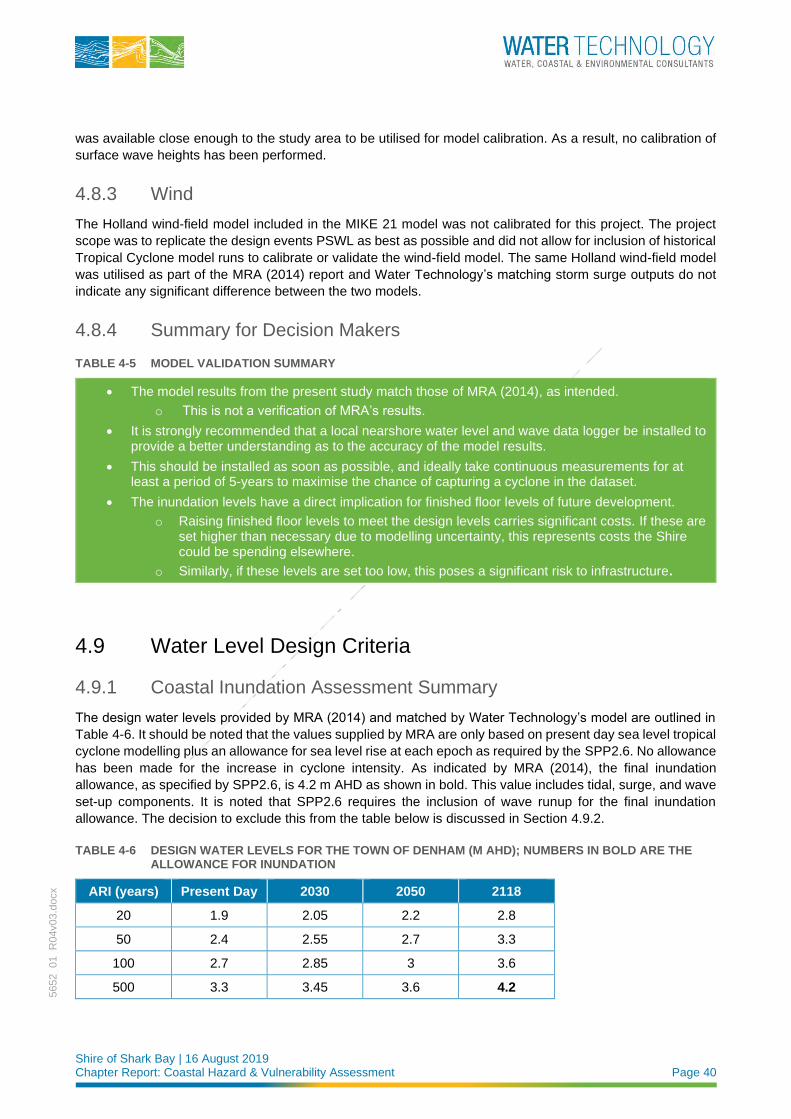
Shire of Shark Bay | 16 August 2019 Chapter Report: Coastal Hazard & Vulnerability Assessment Page 40
5652_01_R
04v03.d
ocx
was available close enough to the study area to be utilised for model calibration. As a result, no calibration of
surface wave heights has been performed.
4.8.3 Wind
The Holland wind-field model included in the MIKE 21 model was not calibrated for this project. The project
scope was to replicate the design events PSWL as best as possible and did not allow for inclusion of historical
Tropical Cyclone model runs to calibrate or validate the wind-field model. The same Holland wind-field model
was utilised as part of the MRA (2014) report and Water Technology’s matching storm surge outputs do not
indicate any significant difference between the two models.
4.8.4 Summary for Decision Makers
TABLE 4-5 MODEL VALIDATION SUMMARY
• The model results from the present study match those of MRA (2014), as intended.
o This is not a verification of MRA’s results.
• It is strongly recommended that a local nearshore water level and wave data logger be installed to provide a better understanding as to the accuracy of the model results.
• This should be installed as soon as possible, and ideally take continuous measurements for at least a period of 5-years to maximise the chance of capturing a cyclone in the dataset.
• The inundation levels have a direct implication for finished floor levels of future development.
o Raising finished floor levels to meet the design levels carries significant costs. If these are set higher than necessary due to modelling uncertainty, this represents costs the Shire could be spending elsewhere.
o Similarly, if these levels are set too low, this poses a significant risk to infrastructure.
4.9 Water Level Design Criteria
4.9.1 Coastal Inundation Assessment Summary
The design water levels provided by MRA (2014) and matched by Water Technology’s model are outlined in
Table 4-6. It should be noted that the values supplied by MRA are only based on present day sea level tropical
cyclone modelling plus an allowance for sea level rise at each epoch as required by the SPP2.6. No allowance
has been made for the increase in cyclone intensity. As indicated by MRA (2014), the final inundation
allowance, as specified by SPP2.6, is 4.2 m AHD as shown in bold. This value includes tidal, surge, and wave
set-up components. It is noted that SPP2.6 requires the inclusion of wave runup for the final inundation
allowance. The decision to exclude this from the table below is discussed in Section 4.9.2.
TABLE 4-6 DESIGN WATER LEVELS FOR THE TOWN OF DENHAM (M AHD); NUMBERS IN BOLD ARE THE ALLOWANCE FOR INUNDATION
ARI (years) Present Day 2030 2050 2118
20 1.9 2.05 2.2 2.8
50 2.4 2.55 2.7 3.3
100 2.7 2.85 3 3.6
500 3.3 3.45 3.6 4.2
Shire of Shark Bay | 16 August 2019 Chapter Report: Coastal Hazard & Vulnerability Assessment Page 41
5652_01_R
04v03.d
ocx
4.9.2 Wave Runup Allowance
SPP2.6 requires an allowance for wave run-up to be included in the definition of the design water levels, as
indicated previously. Wave runup is the maximum elevation of wave uprush above still-water level (Smith,
2003). This is the combination of wave setup and swash, which is the fluctuation of the water level about the
mean setup value. Wave set-up is the increase in steady water level near a coastline due to wave breaking
and the conservation of the resultant momentum flux (Smith, 2003). This increase can be significant during
extreme weather events due to the large waves generated.
Wave set-up was included in the coupled MIKE 21 HD/SW model, and the MRA (2014) modelling. For the
purpose of this study wave runup was calculated using the SBEACH model utilised for the coastal erosion
assessment. The model results from the SBEACH simulations (refer Chapter 5) indicate a runup of 0.3 m
should be allowed for a 500-year ARI design event for all sections of the study area.
To match the design water level values provided in MRA (2014), some scaling up of the results was required.
Given the uncertainties in the modelling output, it is not recommended to add 0.3m to the 500-year ARI design
event, the requirement of SPP2.6. Instead, as discussed in Section 6, a locally placed nearshore water level
and wave data logger should be deployed to provide a better understanding as to the accuracy of the model
results and thus accurately define the PSWL and wave runup allowance.
Once improved model calibration is achieved, the value can be updated with run-up included. Given the
inundation level refers to the 500-year ARI in 2118, there is relatively low risk for this value to be updated over
the next 5-years. It is recommended the specified Finished Floor Level in the Shire’s Local Planning Scheme
remain at 4.2m AHD until the relevant data has been obtained.
4.10 Tsunami Allowance
It is a requirement of SPP2.6, WAPC (2013), to include an allowance for inundation due to tsunami when
planning for development in the coastal zone. We have undertaken a literature review of existing studies to
provide this allowance for the study site.
Geoscience Australia has mapped the tsunami hazard at the 100m depth contour across the Australian
coastline (Geoscience Australia, 2009). Figure 4-8 presents the predicted wave amplitude offshore from the
study site for the 500-year ARI tsunami hazard. These hazard maps, and the corresponding probabilistic
tsunami hazard assessment by Burbidge et al (2008), identify the coastline from Shark Bay to Dampier as the
region with the highest level of hazard in Australia. This present study is south of the peak hazard at Exmouth;
the hazard offshore from Shark Bay has an amplitude of approximately 0.7m at the 100m depth contour, and
approximately 0.4m at the 50m depth contour (Figure 4-9). The maximum run-up ever recorded in Australia
occurred at Steep Point (Shark Bay) in 2006, with a value of 9m.
The entrance to Shark Bay is approximately 27km wide between Dirk Hartog Island and Dorre Island, and
37km between Bernier Island and the mainland. Tsunami wavelengths typically would range from 10km to
500km (BoM, 2018b). It is therefore unlikely a high energy (wavelength) tsunami would be able to penetrate
into Shark Bay.
Geoscience Australia (2006) undertook tsunami modelling to assess the vulnerability of the nearshore Onslow
coastline from earthquake generated tsunamis originating on the Sunda Arc Subduction Zone. The simulation
was run for an approximately 500-year ARI event at Highest Astronomical Tide (HAT), Lowest Astronomical
Tide and Mean Sea Level. Local bathymetry played a large role in the measured tsunami water level in the
nearshore. The resultant inundation levels varied from 0.5 to 5 m AHD.
Given the tsunami hazard at Denham is lower than at Onslow, a run-up similar to or slightly less than the 500-
year ARI cyclonic water level can be expected for the 500-year ARI tsunami.
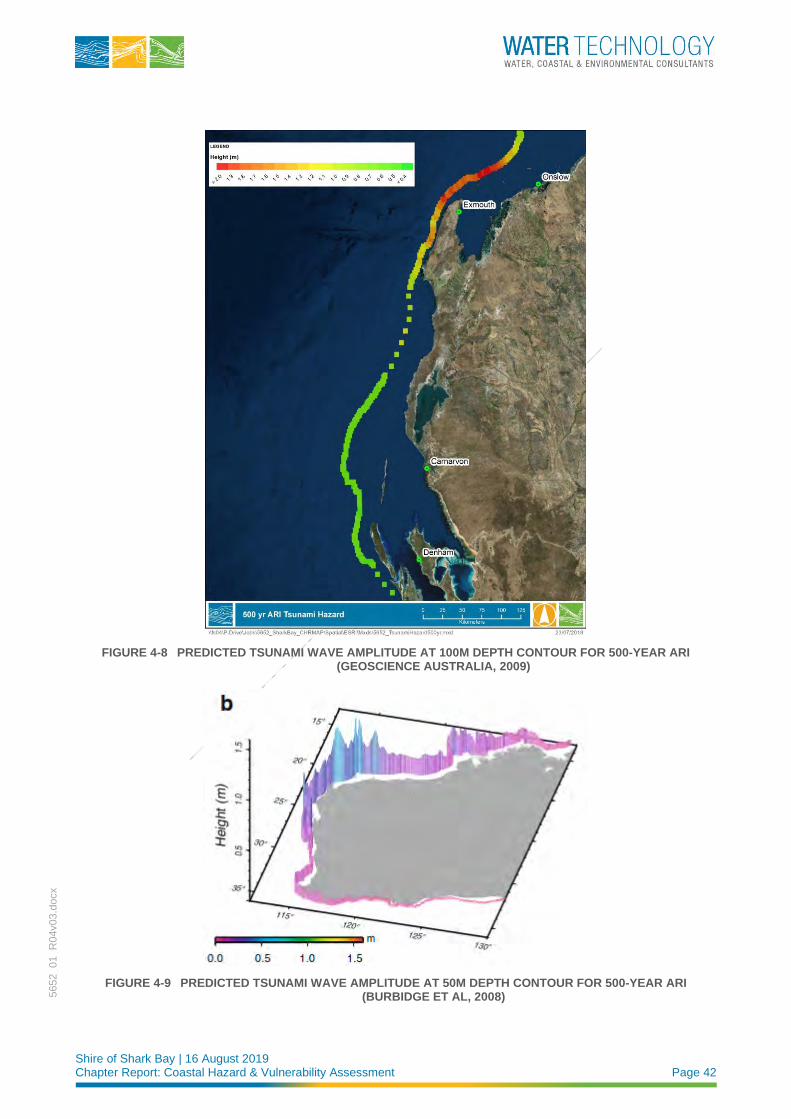
Shire of Shark Bay | 16 August 2019 Chapter Report: Coastal Hazard & Vulnerability Assessment Page 42
5652_01_R
04v03.d
ocx
FIGURE 4-8 PREDICTED TSUNAMI WAVE AMPLITUDE AT 100M DEPTH CONTOUR FOR 500-YEAR ARI (GEOSCIENCE AUSTRALIA, 2009)
FIGURE 4-9 PREDICTED TSUNAMI WAVE AMPLITUDE AT 50M DEPTH CONTOUR FOR 500-YEAR ARI (BURBIDGE ET AL, 2008)
Shire of Shark Bay | 16 August 2019 Chapter Report: Coastal Hazard & Vulnerability Assessment Page 43
5652_01_R
04v03.d
ocx
5 COASTAL EROSION ASSESSMENT The assessment of coastal processes affecting the study site has been undertaken based on available data
and utilising the methodology specified in SPP2.6, as per the description in Chapter 2.2.1. This chapter details
the calculation of the total erosive potential over the 100-year planning time frame to define the width of the
coastal foreshore reserve that allows for coastal erosion processes.
Due to the limitations of this study it is assumed that the subsurface of the shoreline within the study site is of
a uniform uncemented sandy constituency. However, the actual study area is likely to encompass a spatially
variable and complex three-dimensional geologic support system that may make use of the Bruun Rule
unnecessary (Eliot et all, 2012). Consideration of more complex geological features is beyond the scope of
this report.
5.1 S1: Current Risk by Storm Erosion
5.1.1 Determination of Storm Events
The 100-year ARI cyclone track provided by MRA was utilised as the selected storm to model acute storm
erosion. This design storm track moves past the study area to the west generating significant wave energy
offshore that impacts the town site and meets SPP2.6 requirements. The wave field generated by the cyclone
approaches shore normal for Sections 1 to 4 at approximately the same time as the peak water level is
reached, maximising erosive potential of the storm. Section 5 has a different coastline orientation, so the storm
approach is slightly different. However, significant wave energy is still directed towards the shoreline, and the
cyclone is considered appropriate to use in the assessment.
5.1.2 SBEACH Set-up
The potential for storm-induced acute erosion was assessed using the SBEACH numerical model as
recommended by SPP2.6. This model was developed to calculate idealised sediment dynamics under short
term wave action (Wise et al, 1995) and has been utilised in a range of studies including shoreline stability
assessments in the northwest of Western Australia (Cardno, 2015). It is recommended in SPP2.6 for use in
calculating this component of the shoreline change.
A representative beach profile was determined for each of the five study sections extending from -5 m to 5 m
AHD across the beach face (profile locations shown in Figure 3-3). The bathymetry used for the hydrodynamic
model was used to generate nearshore seabed levels and beach face elevations for each transect. Data was
then extracted from the hydrodynamic model at the offshore terminus of each profile to force the SBEACH
model. The storm data for Transect 1 is displayed in Figure 5-1 as an example; data did not vary significantly
between transects.
Critical input utilised for each profile included:
◼ Digital elevation data from +5 m AHD down to -5 m AHD offshore (from model bathymetry, see Chapter
4.3)
◼ Time-series of water level from the design cyclone (tide plus surge)
◼ Time-series of significant wave height (Hs) which encompasses the tide and cyclone-induced surge
◼ Peak wave period (Tp)
◼ Wave direction (Wdir)
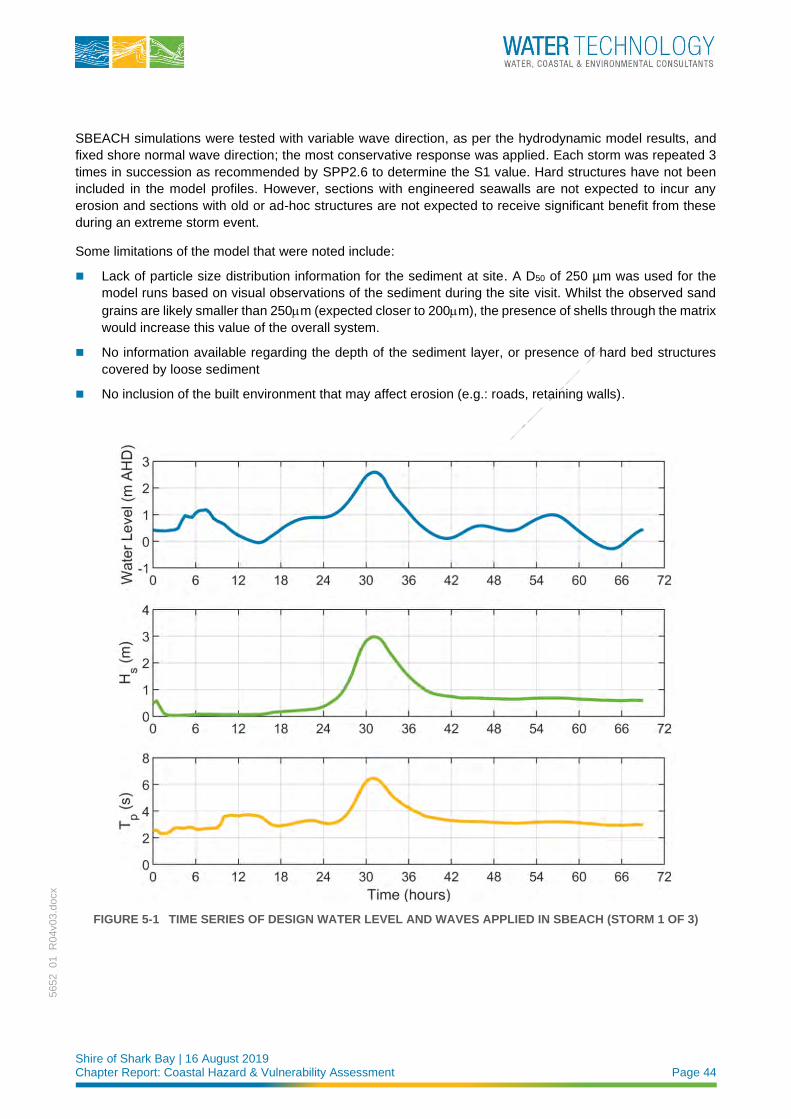
Shire of Shark Bay | 16 August 2019 Chapter Report: Coastal Hazard & Vulnerability Assessment Page 44
5652_01_R
04v03.d
ocx
SBEACH simulations were tested with variable wave direction, as per the hydrodynamic model results, and
fixed shore normal wave direction; the most conservative response was applied. Each storm was repeated 3
times in succession as recommended by SPP2.6 to determine the S1 value. Hard structures have not been
included in the model profiles. However, sections with engineered seawalls are not expected to incur any
erosion and sections with old or ad-hoc structures are not expected to receive significant benefit from these
during an extreme storm event.
Some limitations of the model that were noted include:
◼ Lack of particle size distribution information for the sediment at site. A D50 of 250 µm was used for the
model runs based on visual observations of the sediment during the site visit. Whilst the observed sand
grains are likely smaller than 250m (expected closer to 200m), the presence of shells through the matrix
would increase this value of the overall system.
◼ No information available regarding the depth of the sediment layer, or presence of hard bed structures
covered by loose sediment
◼ No inclusion of the built environment that may affect erosion (e.g.: roads, retaining walls).
FIGURE 5-1 TIME SERIES OF DESIGN WATER LEVEL AND WAVES APPLIED IN SBEACH (STORM 1 OF 3)
Shire of Shark Bay | 16 August 2019 Chapter Report: Coastal Hazard & Vulnerability Assessment Page 45
5652_01_R
04v03.d
ocx
5.1.3 SBEACH Results & Storm Erosion Allowance
The S1 horizontal erosion distance is calculated as the maximum horizontal recession of the Horizontal
Shoreline Datum HSD contour, as discussed in Chapter 2.2.1. The value for the HSD is 2.92m AHD. This
corresponds to the 100-year ARI peak steady water level (PSWL) calculated for the design storm in SBEACH
itself, which includes tidal, storm surge and wave set-up actions. The 2.9m AHD contour is located 70 to 100m
landward of the dune / beach interface in Sections 1 to 3. The terrain at that location consists of roads and
buildings; this is not appropriate to be modelled in SBEACH as storm-induced erosion. To conduct a more
realistic assessment of the acute erosion due to storms, the aim behind S1 in SPP2.6, the HSD has been
defined as follows:
◼ Section 1 to 3:
◼ The maximum recession in the vicinity of the vegetation line. This is considered to represent the
erosive effects during the event that would impact the study area. For example, in most areas, the
retreat of the vegetation line by about 10m would lead to potential damage to Knight Terrace.
◼ Section 3 and 4:
◼ HSD value of 2.92 m AHD, as per SPP2.6. This corresponds well with the vegetation and dune system
in these beach sections.
The shoreline response to the storm events is displayed in Figure 5-2 for all transects. The HSD value of 2.9m
AHD is shown on all transects, as is the location of the vegetation line. The shoreline recession S1 value is
presented in Table 5-1. Whilst Section 3 contains the engineered seawall, it is still anticipated that some
erosion could occur in the area to the west of the harbour, due to the low crest level in this location. The value
calculated to the west of the harbour is applied across the whole section.
TABLE 5-1 ALLOWANCE FOR CURRENT RISK OF STORM EROSION , S1 (M)
Section 1 Section 2 Section 3 Section 4 Section 5
4.4 4.2 12.8 8.9 7.7
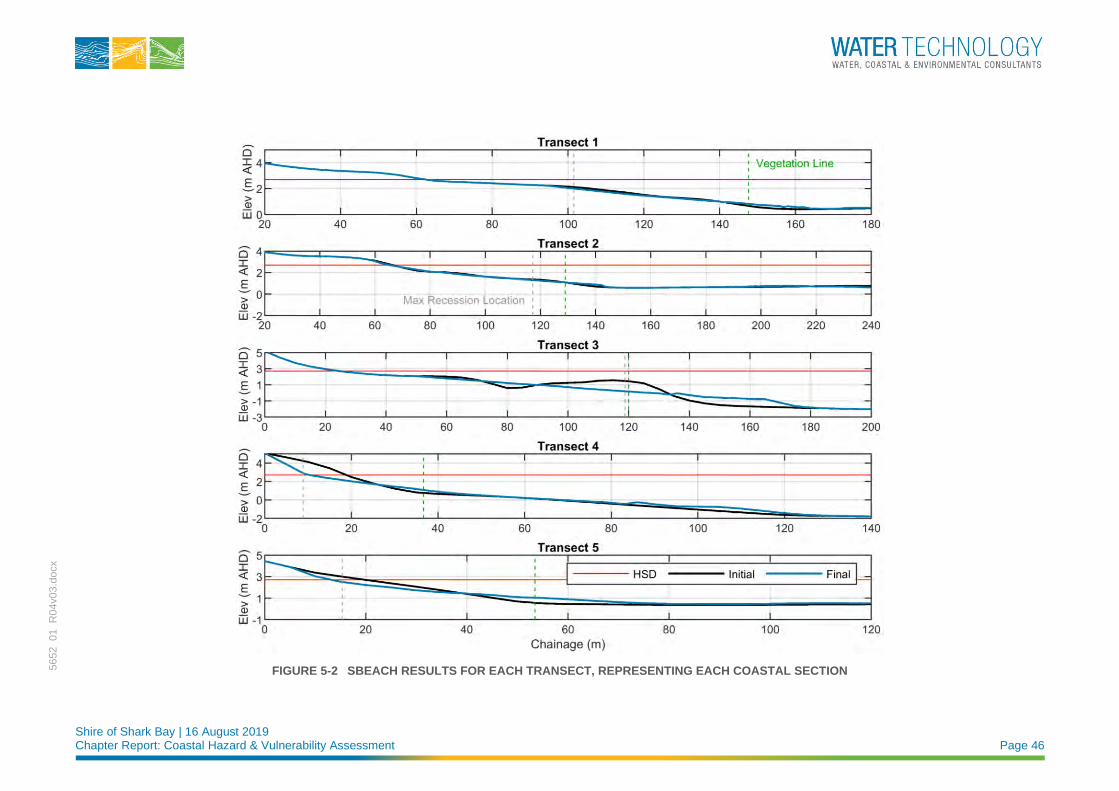
Shire of Shark Bay | 16 August 2019 Chapter Report: Coastal Hazard & Vulnerability Assessment Page 46
5652_01_R
04v03.d
ocx
FIGURE 5-2 SBEACH RESULTS FOR EACH TRANSECT, REPRESENTING EACH COASTAL SECTION
Shire of Shark Bay | 16 August 2019 Chapter Report: Coastal Hazard & Vulnerability Assessment Page 47
5652_01_R
04v03.d
ocx
5.2 S2: Historical Shoreline Evolution
5.2.1 Policy Requirements
The guidance provided in SPP2.6 for the calculation of shoreline evolution is based on historical shoreline
trends. The policy recommends that a review of available shoreline records be conducted and that “trends should be derived from shoreline movement timeseries and may include continuous erosion or accretion; erosion followed by accretion or vice versa; longshore evolution of features; or shoreline rotation. The allowance for historic shoreline movement trends should generally be calculated as 100 times the historic annual rate of erosion… Where the historic annual rate of shoreline movement is accretion less than 0.2 metres per year the allowance for historic shoreline movement trends should be zero.”
5.2.2 Historical Shoreline Change Calculations
Shoreline change for the study area at Denham has been calculated based on historical shoreline movement
data and aerial imagery provided by the Department of Transport (DoT) and Landgate respectively. Data was
available from 1957 to 2015 with an additional aerial for 2017 included by tracing the vegetation line.
Comparison with the digital elevation model compiled for this project indicates that the vegetation line was
generally at about 2.5 to 3 m AHD when the built environment did not significantly affect vegetation locations.
Recession per year was calculated as the average recession over the discrete section of coastline divided by
the appropriate time period as discussed in Table 5-2 below. Care has been taken to remove reclamation and
renourishment influences from the calculation of S2 where possible as it may result in legacy issues. Sections
of coastline that have artificially accreted and been consolidated by designed seawalls will be given an S2
value of 0 m/year. This primarily applies to S3 and legacy issues due to this should be noted.
Section 4 appears to experience significant variability in the vegetation lines, however further analysis indicates
that the majority of this movement is a result of changes to unstable low-lying sediment features that evolve
over time. Sporadic vegetation of these features distorts a simple calculation of meaningful historical trends. It
appears from aerial imagery that little significant changes occur to the high relief dunes fronting the coast here,
although more spatial data is needed to increase confidence. It is recommended that an historical erosion rate
of 0.2 m/year be applied to this section to ensure that any development close to the crest of the dunes in this
area comes under the scrutiny of the active coastal zone requirements.
The eastern portion of Section 4 is significantly affected by renourishment from dredging works that occurred
in 1997 and 2004. This obfuscation of natural historic trends is compounded by significant development and
reclamation in the adjacent Section 3. It can be reasonably expected that sporadic renourishment will occur
over the lifetime of the Denham port. However, it is recommended that the historic rate of 0.2 m/year applied
to the rest of the section be applied here, due to low confidence in natural trends and to reduce liability of
legacy issues.
Figure 5-3 to Figure 5-7 show the shoreline location overlain on the 2017 aerial photograph for 1957, 1990,
2006 and 2017 for Sections 1 to 5 respectively. All 9 sets of shoreline data are displayed in Appendix A.
Table 5-3 presents the allowance due to historical shoreline movement for each section.
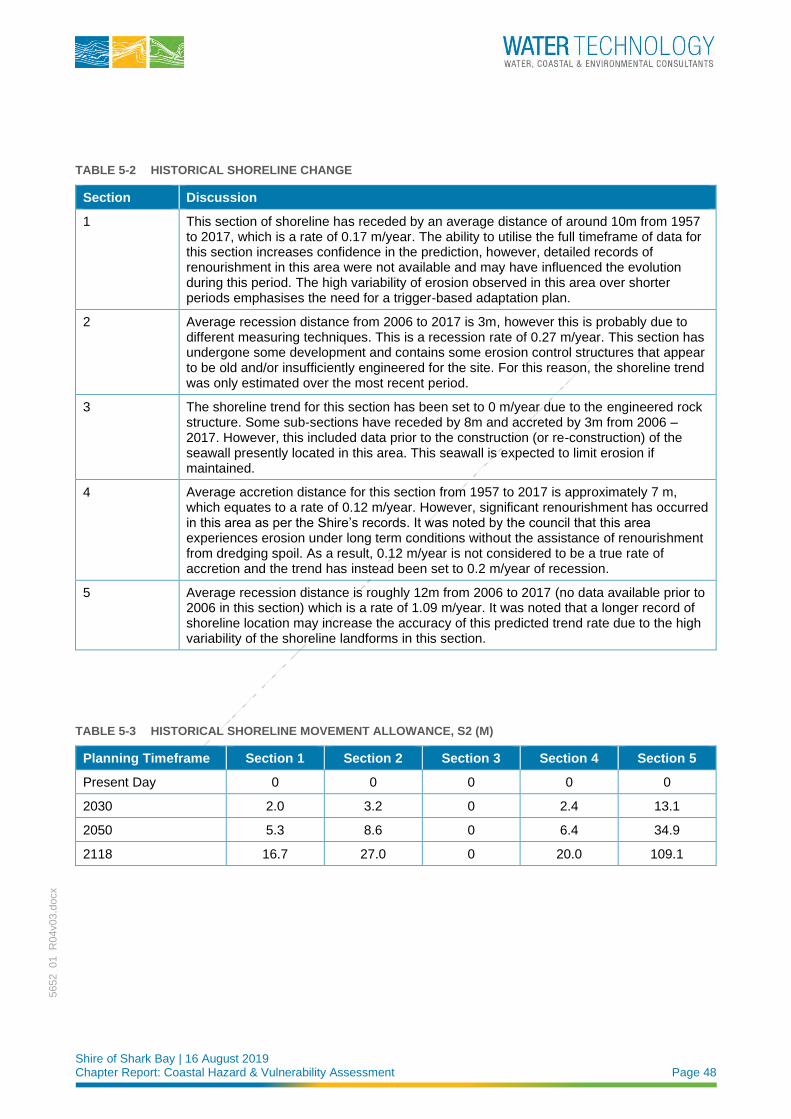
Shire of Shark Bay | 16 August 2019 Chapter Report: Coastal Hazard & Vulnerability Assessment Page 48
5652_01_R
04v03.d
ocx
TABLE 5-2 HISTORICAL SHORELINE CHANGE
Section Discussion
1 This section of shoreline has receded by an average distance of around 10m from 1957 to 2017, which is a rate of 0.17 m/year. The ability to utilise the full timeframe of data for this section increases confidence in the prediction, however, detailed records of renourishment in this area were not available and may have influenced the evolution during this period. The high variability of erosion observed in this area over shorter periods emphasises the need for a trigger-based adaptation plan.
2 Average recession distance from 2006 to 2017 is 3m, however this is probably due to different measuring techniques. This is a recession rate of 0.27 m/year. This section has undergone some development and contains some erosion control structures that appear to be old and/or insufficiently engineered for the site. For this reason, the shoreline trend was only estimated over the most recent period.
3 The shoreline trend for this section has been set to 0 m/year due to the engineered rock structure. Some sub-sections have receded by 8m and accreted by 3m from 2006 – 2017. However, this included data prior to the construction (or re-construction) of the seawall presently located in this area. This seawall is expected to limit erosion if maintained.
4 Average accretion distance for this section from 1957 to 2017 is approximately 7 m, which equates to a rate of 0.12 m/year. However, significant renourishment has occurred in this area as per the Shire’s records. It was noted by the council that this area experiences erosion under long term conditions without the assistance of renourishment from dredging spoil. As a result, 0.12 m/year is not considered to be a true rate of accretion and the trend has instead been set to 0.2 m/year of recession.
5 Average recession distance is roughly 12m from 2006 to 2017 (no data available prior to 2006 in this section) which is a rate of 1.09 m/year. It was noted that a longer record of shoreline location may increase the accuracy of this predicted trend rate due to the high variability of the shoreline landforms in this section.
TABLE 5-3 HISTORICAL SHORELINE MOVEMENT ALLOWANCE, S2 (M)
Planning Timeframe Section 1 Section 2 Section 3 Section 4 Section 5
Present Day 0 0 0 0 0
2030 2.0 3.2 0 2.4 13.1
2050 5.3 8.6 0 6.4 34.9
2118 16.7 27.0 0 20.0 109.1
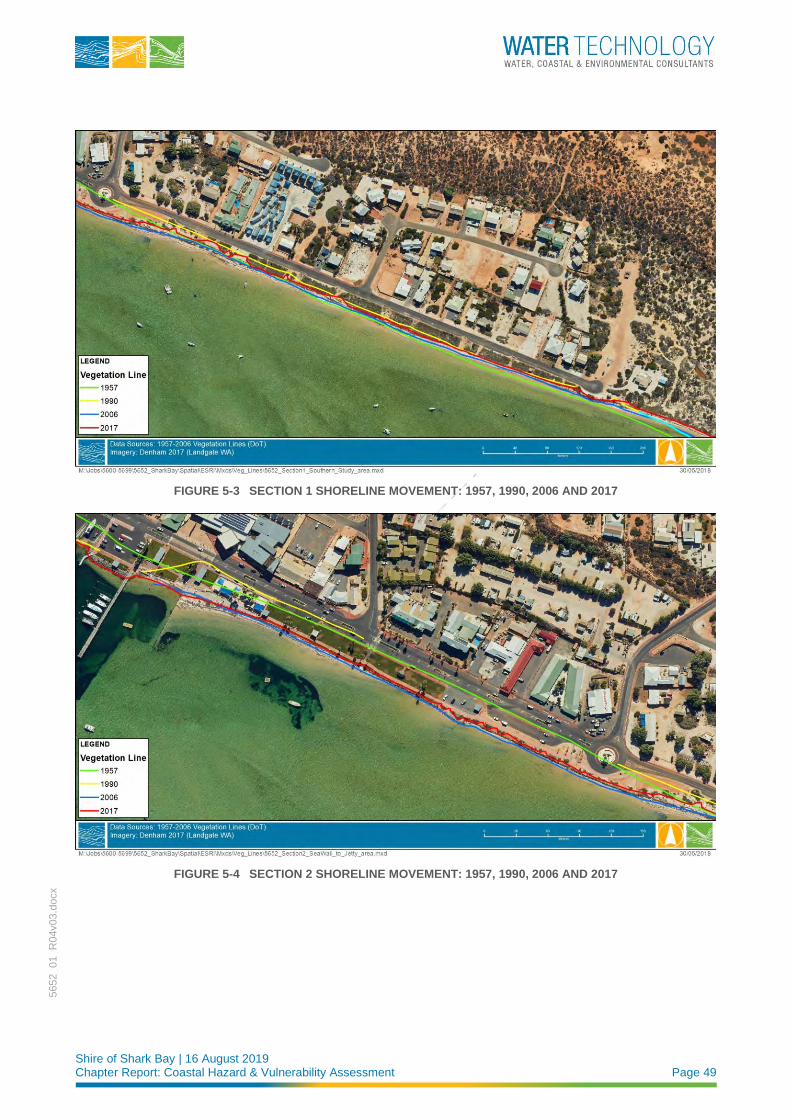
Shire of Shark Bay | 16 August 2019 Chapter Report: Coastal Hazard & Vulnerability Assessment Page 49
5652_01_R
04v03.d
ocx
FIGURE 5-3 SECTION 1 SHORELINE MOVEMENT: 1957, 1990, 2006 AND 2017
FIGURE 5-4 SECTION 2 SHORELINE MOVEMENT: 1957, 1990, 2006 AND 2017
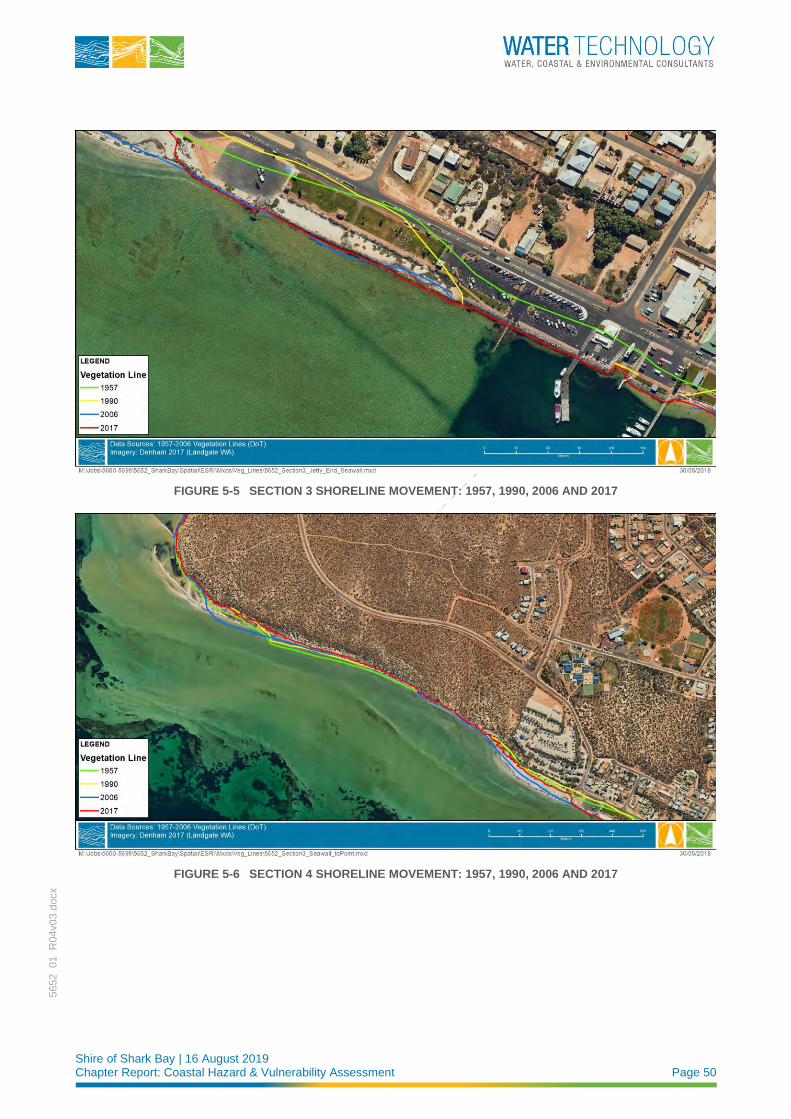
Shire of Shark Bay | 16 August 2019 Chapter Report: Coastal Hazard & Vulnerability Assessment Page 50
5652_01_R
04v03.d
ocx
FIGURE 5-5 SECTION 3 SHORELINE MOVEMENT: 1957, 1990, 2006 AND 2017
FIGURE 5-6 SECTION 4 SHORELINE MOVEMENT: 1957, 1990, 2006 AND 2017
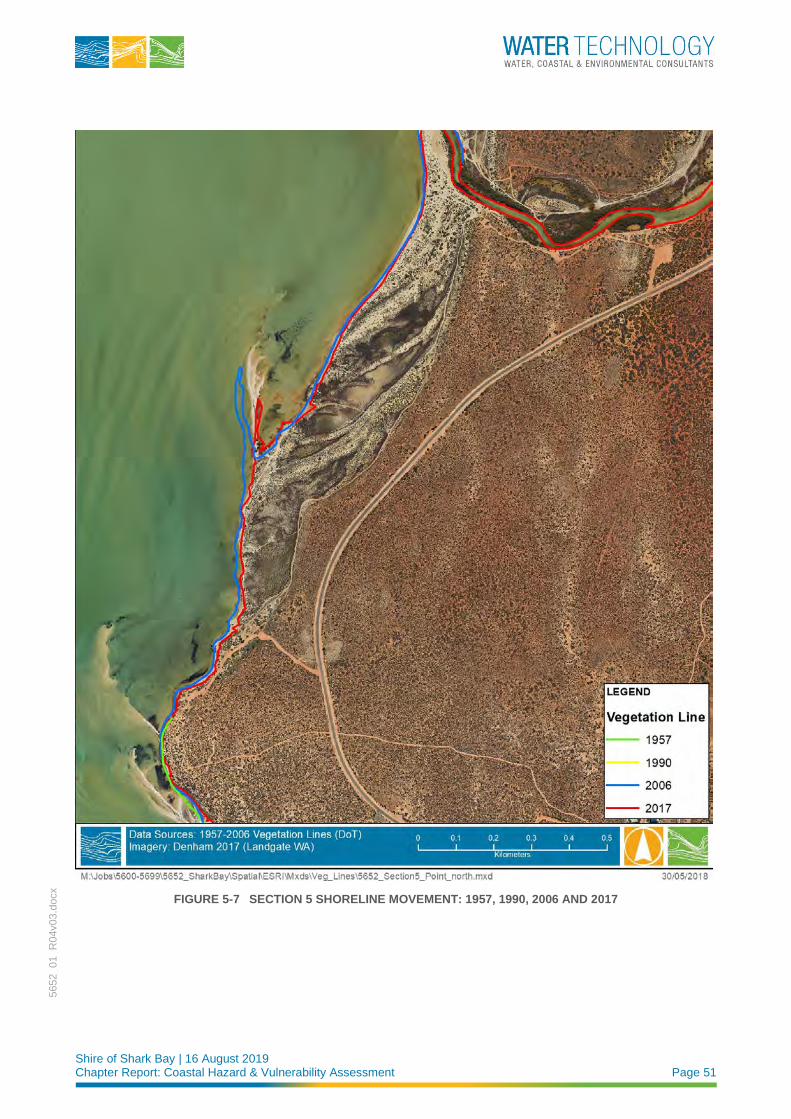
Shire of Shark Bay | 16 August 2019 Chapter Report: Coastal Hazard & Vulnerability Assessment Page 51
5652_01_R
04v03.d
ocx
FIGURE 5-7 SECTION 5 SHORELINE MOVEMENT: 1957, 1990, 2006 AND 2017
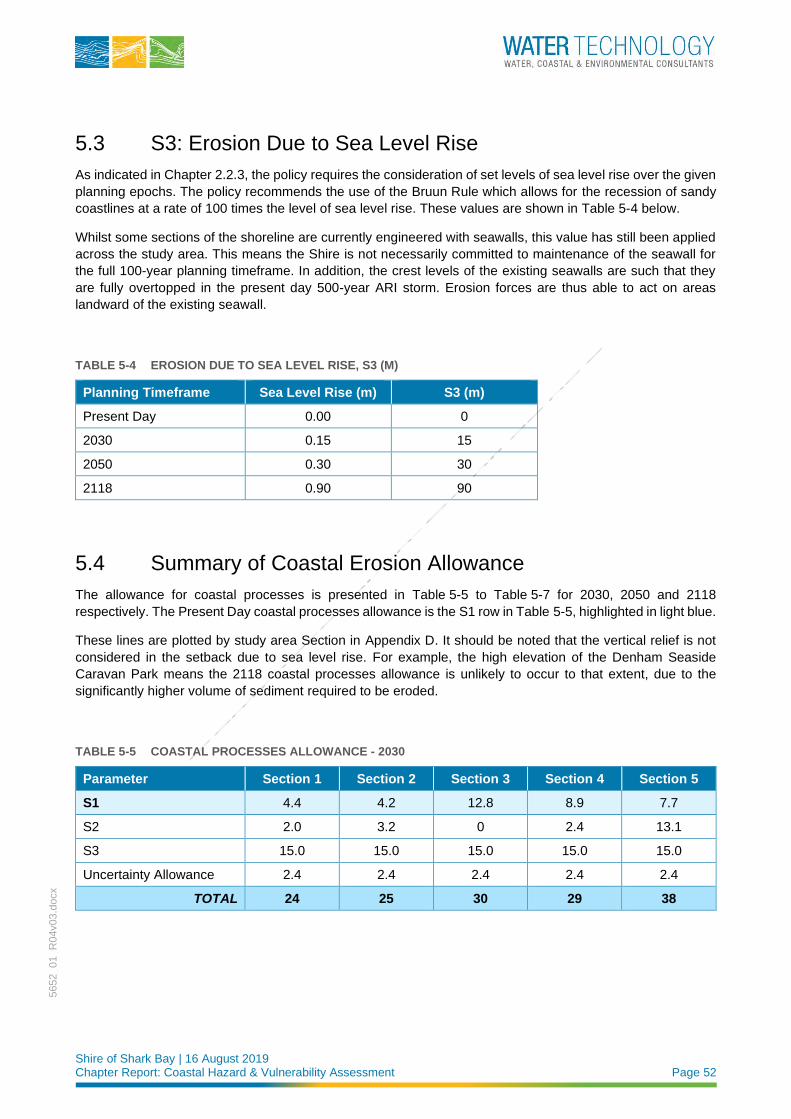
Shire of Shark Bay | 16 August 2019 Chapter Report: Coastal Hazard & Vulnerability Assessment Page 52
5652_01_R
04v03.d
ocx
5.3 S3: Erosion Due to Sea Level Rise
As indicated in Chapter 2.2.3, the policy requires the consideration of set levels of sea level rise over the given
planning epochs. The policy recommends the use of the Bruun Rule which allows for the recession of sandy
coastlines at a rate of 100 times the level of sea level rise. These values are shown in Table 5-4 below.
Whilst some sections of the shoreline are currently engineered with seawalls, this value has still been applied
across the study area. This means the Shire is not necessarily committed to maintenance of the seawall for
the full 100-year planning timeframe. In addition, the crest levels of the existing seawalls are such that they
are fully overtopped in the present day 500-year ARI storm. Erosion forces are thus able to act on areas
landward of the existing seawall.
TABLE 5-4 EROSION DUE TO SEA LEVEL RISE, S3 (M)
Planning Timeframe Sea Level Rise (m) S3 (m)
Present Day 0.00 0
2030 0.15 15
2050 0.30 30
2118 0.90 90
5.4 Summary of Coastal Erosion Allowance
The allowance for coastal processes is presented in Table 5-5 to Table 5-7 for 2030, 2050 and 2118
respectively. The Present Day coastal processes allowance is the S1 row in Table 5-5, highlighted in light blue.
These lines are plotted by study area Section in Appendix D. It should be noted that the vertical relief is not
considered in the setback due to sea level rise. For example, the high elevation of the Denham Seaside
Caravan Park means the 2118 coastal processes allowance is unlikely to occur to that extent, due to the
significantly higher volume of sediment required to be eroded.
TABLE 5-5 COASTAL PROCESSES ALLOWANCE - 2030
Parameter Section 1 Section 2 Section 3 Section 4 Section 5
S1 4.4 4.2 12.8 8.9 7.7
S2 2.0 3.2 0 2.4 13.1
S3 15.0 15.0 15.0 15.0 15.0
Uncertainty Allowance 2.4 2.4 2.4 2.4 2.4
TOTAL 24 25 30 29 38
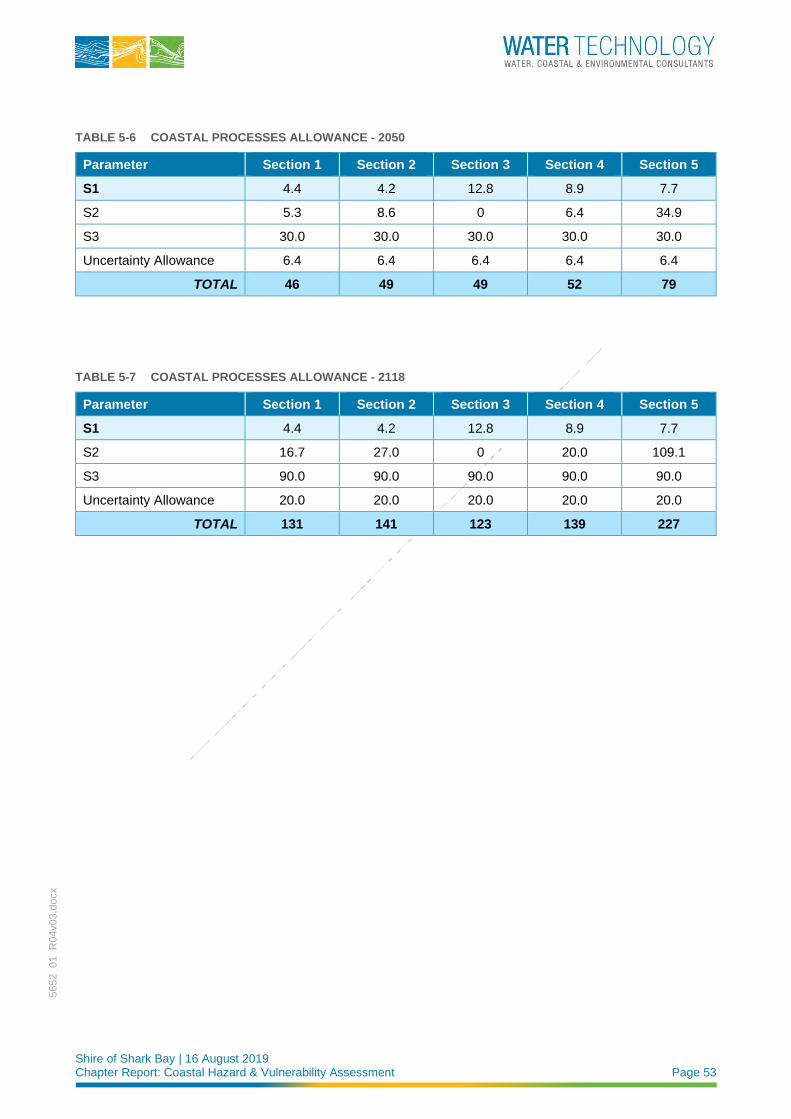
Shire of Shark Bay | 16 August 2019 Chapter Report: Coastal Hazard & Vulnerability Assessment Page 53
5652_01_R
04v03.d
ocx
TABLE 5-6 COASTAL PROCESSES ALLOWANCE - 2050
Parameter Section 1 Section 2 Section 3 Section 4 Section 5
S1 4.4 4.2 12.8 8.9 7.7
S2 5.3 8.6 0 6.4 34.9
S3 30.0 30.0 30.0 30.0 30.0
Uncertainty Allowance 6.4 6.4 6.4 6.4 6.4
TOTAL 46 49 49 52 79
TABLE 5-7 COASTAL PROCESSES ALLOWANCE - 2118
Parameter Section 1 Section 2 Section 3 Section 4 Section 5
S1 4.4 4.2 12.8 8.9 7.7
S2 16.7 27.0 0 20.0 109.1
S3 90.0 90.0 90.0 90.0 90.0
Uncertainty Allowance 20.0 20.0 20.0 20.0 20.0
TOTAL 131 141 123 139 227
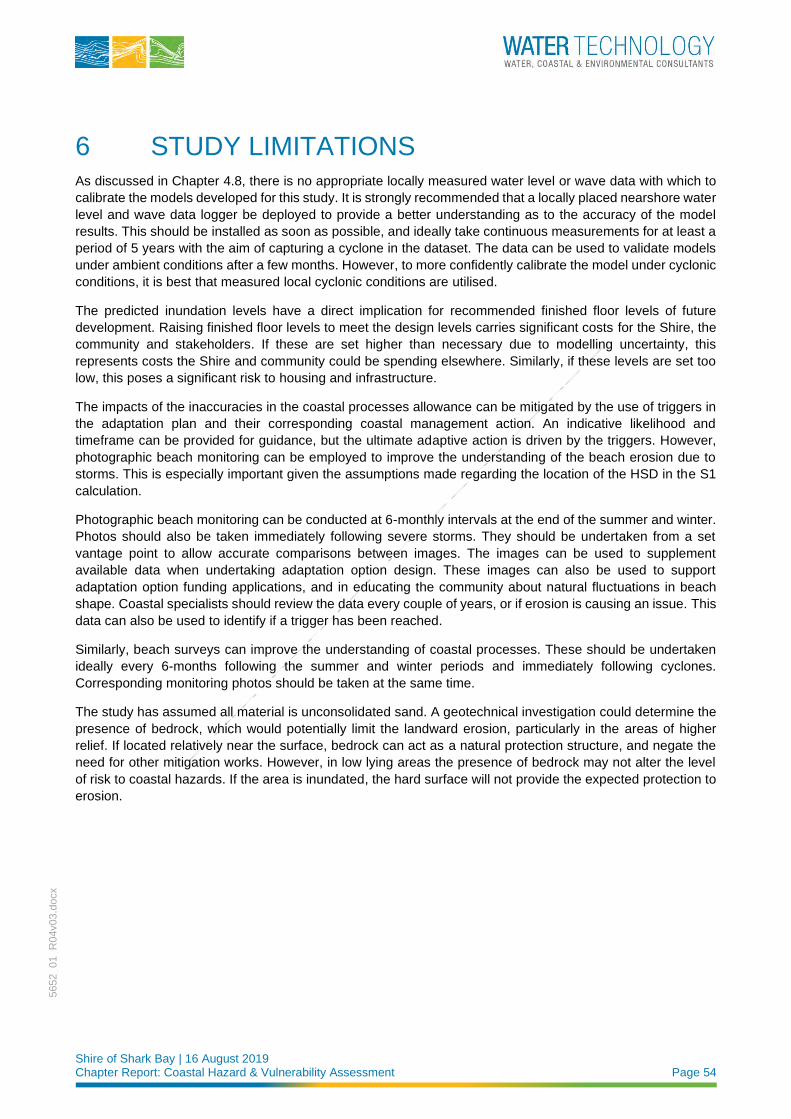
Shire of Shark Bay | 16 August 2019 Chapter Report: Coastal Hazard & Vulnerability Assessment Page 54
5652_01_R
04v03.d
ocx
6 STUDY LIMITATIONS As discussed in Chapter 4.8, there is no appropriate locally measured water level or wave data with which to
calibrate the models developed for this study. It is strongly recommended that a locally placed nearshore water
level and wave data logger be deployed to provide a better understanding as to the accuracy of the model
results. This should be installed as soon as possible, and ideally take continuous measurements for at least a
period of 5 years with the aim of capturing a cyclone in the dataset. The data can be used to validate models
under ambient conditions after a few months. However, to more confidently calibrate the model under cyclonic
conditions, it is best that measured local cyclonic conditions are utilised.
The predicted inundation levels have a direct implication for recommended finished floor levels of future
development. Raising finished floor levels to meet the design levels carries significant costs for the Shire, the
community and stakeholders. If these are set higher than necessary due to modelling uncertainty, this
represents costs the Shire and community could be spending elsewhere. Similarly, if these levels are set too
low, this poses a significant risk to housing and infrastructure.
The impacts of the inaccuracies in the coastal processes allowance can be mitigated by the use of triggers in
the adaptation plan and their corresponding coastal management action. An indicative likelihood and
timeframe can be provided for guidance, but the ultimate adaptive action is driven by the triggers. However,
photographic beach monitoring can be employed to improve the understanding of the beach erosion due to
storms. This is especially important given the assumptions made regarding the location of the HSD in the S1
calculation.
Photographic beach monitoring can be conducted at 6-monthly intervals at the end of the summer and winter.
Photos should also be taken immediately following severe storms. They should be undertaken from a set
vantage point to allow accurate comparisons between images. The images can be used to supplement
available data when undertaking adaptation option design. These images can also be used to support
adaptation option funding applications, and in educating the community about natural fluctuations in beach
shape. Coastal specialists should review the data every couple of years, or if erosion is causing an issue. This
data can also be used to identify if a trigger has been reached.
Similarly, beach surveys can improve the understanding of coastal processes. These should be undertaken
ideally every 6-months following the summer and winter periods and immediately following cyclones.
Corresponding monitoring photos should be taken at the same time.
The study has assumed all material is unconsolidated sand. A geotechnical investigation could determine the
presence of bedrock, which would potentially limit the landward erosion, particularly in the areas of higher
relief. If located relatively near the surface, bedrock can act as a natural protection structure, and negate the
need for other mitigation works. However, in low lying areas the presence of bedrock may not alter the level
of risk to coastal hazards. If the area is inundated, the hard surface will not provide the expected protection to
erosion.
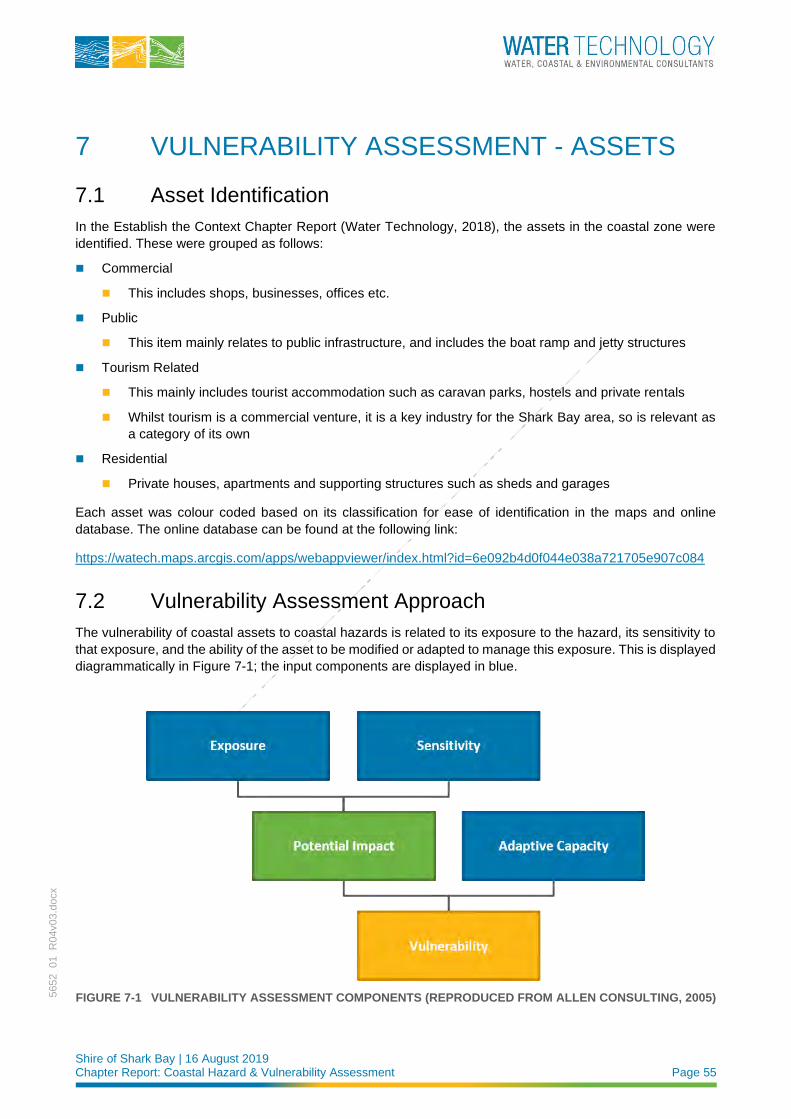
Shire of Shark Bay | 16 August 2019 Chapter Report: Coastal Hazard & Vulnerability Assessment Page 55
5652_01_R
04v03.d
ocx
7 VULNERABILITY ASSESSMENT - ASSETS
7.1 Asset Identification
In the Establish the Context Chapter Report (Water Technology, 2018), the assets in the coastal zone were
identified. These were grouped as follows:
◼ Commercial
◼ This includes shops, businesses, offices etc.
◼ Public
◼ This item mainly relates to public infrastructure, and includes the boat ramp and jetty structures
◼ Tourism Related
◼ This mainly includes tourist accommodation such as caravan parks, hostels and private rentals
◼ Whilst tourism is a commercial venture, it is a key industry for the Shark Bay area, so is relevant as
a category of its own
◼ Residential
◼ Private houses, apartments and supporting structures such as sheds and garages
Each asset was colour coded based on its classification for ease of identification in the maps and online
database. The online database can be found at the following link:
https://watech.maps.arcgis.com/apps/webappviewer/index.html?id=6e092b4d0f044e038a721705e907c084
7.2 Vulnerability Assessment Approach
The vulnerability of coastal assets to coastal hazards is related to its exposure to the hazard, its sensitivity to
that exposure, and the ability of the asset to be modified or adapted to manage this exposure. This is displayed
diagrammatically in Figure 7-1; the input components are displayed in blue.
FIGURE 7-1 VULNERABILITY ASSESSMENT COMPONENTS (REPRODUCED FROM ALLEN CONSULTING, 2005)

Shire of Shark Bay | 16 August 2019 Chapter Report: Coastal Hazard & Vulnerability Assessment Page 56
5652_01_R
04v03.d
ocx
The exposure of identified assets to the inundation and erosion hazards are displayed in the hazard maps
presented in Appendix C and Appendix D respectively, as well as the online database. In addition to the
predicted 500-year ARI inundation extent that is displayed in Appendix C, the 20, 50 and 100-year ARI
inundation extents are also included within the online database.
The sensitivity of an asset is its responsiveness to the coastal hazard. This could be a gradual response or a
stepped change in response to discrete events (WAPC, 2014). The sensitivity can be applied to the asset
itself, or to the asset’s function and the criticality of the service it provides (CoastAdapt, 2017). For example,
the inundation of the road leading into town would be highly sensitive as this would cut off access to the town.
At this stage of the project, the sensitivity is limited to the physical response or impact to the asset. The social,
cultural or environmental impacts are to be dealt with as part of the CHRMAP risk assessment (the next stage
of the project), once the success criteria are incorporated. That is, they will be considered as part of the
assessment of the tolerability of the physical risk to the asset, as defined by the community and stakeholders.
The potential impact is the product of the exposure and sensitivity. The adaptive capacity is the asset’s
ability to adjust / adapt to the identified hazard. Vulnerability is the product of potential impact and the
adaptive capacity, as presented in Figure 7-2. Traditionally, a rating is assigned to the three inputs: exposure,
sensitivity and adaptive capacity, and then the calculations carried out to determine the relative vulnerability.
The ratings for all components of the vulnerability assessment, together with their definitions, are presented in
Table 7-1 and Table 7-2. For the purposes of the vulnerability assessment, the exposure is considered to be
a relative assessment of the magnitude of the hazard. All assets have a minimum exposure rating of ‘Moderate’
because these assets are identified as being located within the hazard zone for that specific event. The
probability or likelihood of the event occurring will be considered in the risk assessment component of the
CHRMAP.
In the sub-chapters below, the asset ratings to the hazards are discussed and a vulnerability rating assigned.
Inundation and erosion hazards are considered separately. Assets are also grouped according to classification
for ease of interpretation. Ratings were discussed with the Steering Committee to ensure they are reflective of
stakeholder knowledge.
FIGURE 7-2 VULNERABILITY RELATIONSHIP
TABLE 7-1 VULNERABILITY ASSESSMENT RATINGS: SENSITIVITY, EXPOSURE & ADAPTIVE CAPACITY
Sensitivity / Exposure Adaptive Capacity
Rating Description Rating Description
1 Very Low 1 No adaptation required
2 Low 2 Very High
3 Moderate 3 High
4 High 4 Moderate
5 Very High 5 Low
Exposure SensitvityPotential Impact
Adaptive Capacity
Vulnerability
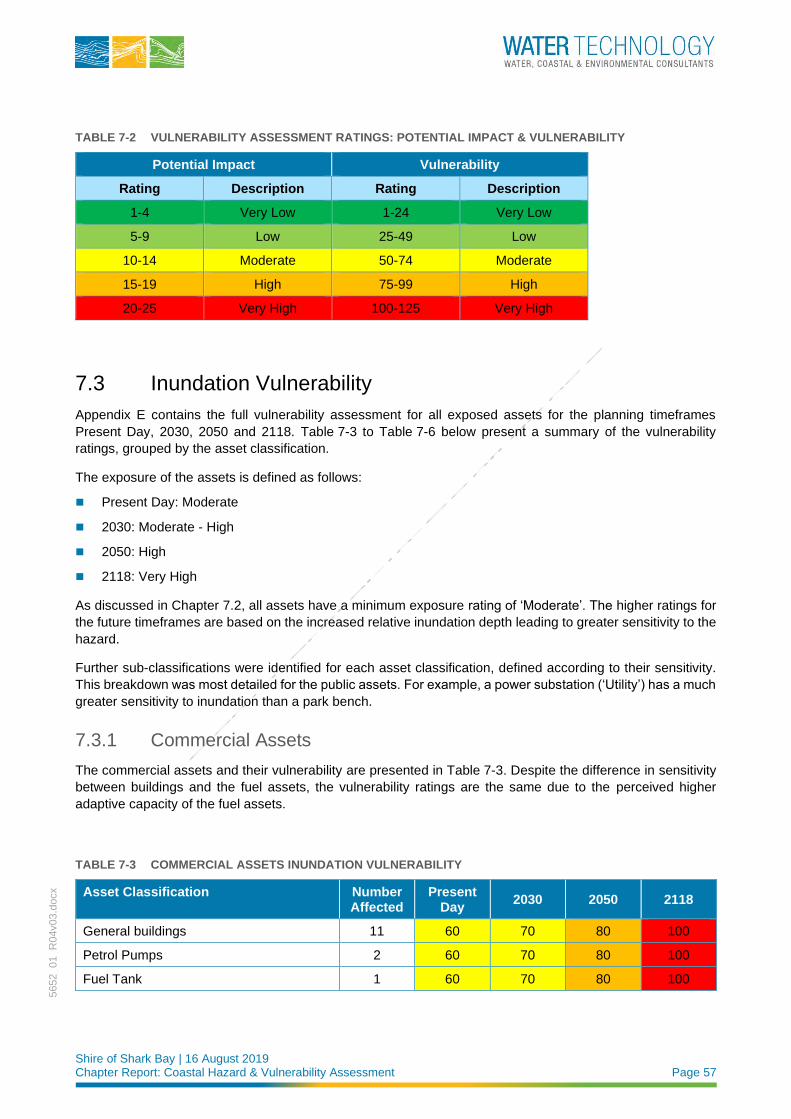
Shire of Shark Bay | 16 August 2019 Chapter Report: Coastal Hazard & Vulnerability Assessment Page 57
5652_01_R
04v03.d
ocx
TABLE 7-2 VULNERABILITY ASSESSMENT RATINGS: POTENTIAL IMPACT & VULNERABILITY
Potential Impact Vulnerability
Rating Description Rating Description
1-4 Very Low 1-24 Very Low
5-9 Low 25-49 Low
10-14 Moderate 50-74 Moderate
15-19 High 75-99 High
20-25 Very High 100-125 Very High
7.3 Inundation Vulnerability
Appendix E contains the full vulnerability assessment for all exposed assets for the planning timeframes
Present Day, 2030, 2050 and 2118. Table 7-3 to Table 7-6 below present a summary of the vulnerability
ratings, grouped by the asset classification.
The exposure of the assets is defined as follows:
◼ Present Day: Moderate
◼ 2030: Moderate - High
◼ 2050: High
◼ 2118: Very High
As discussed in Chapter 7.2, all assets have a minimum exposure rating of ‘Moderate’. The higher ratings for
the future timeframes are based on the increased relative inundation depth leading to greater sensitivity to the
hazard.
Further sub-classifications were identified for each asset classification, defined according to their sensitivity.
This breakdown was most detailed for the public assets. For example, a power substation (‘Utility’) has a much
greater sensitivity to inundation than a park bench.
7.3.1 Commercial Assets
The commercial assets and their vulnerability are presented in Table 7-3. Despite the difference in sensitivity
between buildings and the fuel assets, the vulnerability ratings are the same due to the perceived higher
adaptive capacity of the fuel assets.
TABLE 7-3 COMMERCIAL ASSETS INUNDATION VULNERABILITY
Asset Classification Number Affected
Present Day
2030 2050 2118
General buildings 11 60 70 80 100
Petrol Pumps 2 60 70 80 100
Fuel Tank 1 60 70 80 100
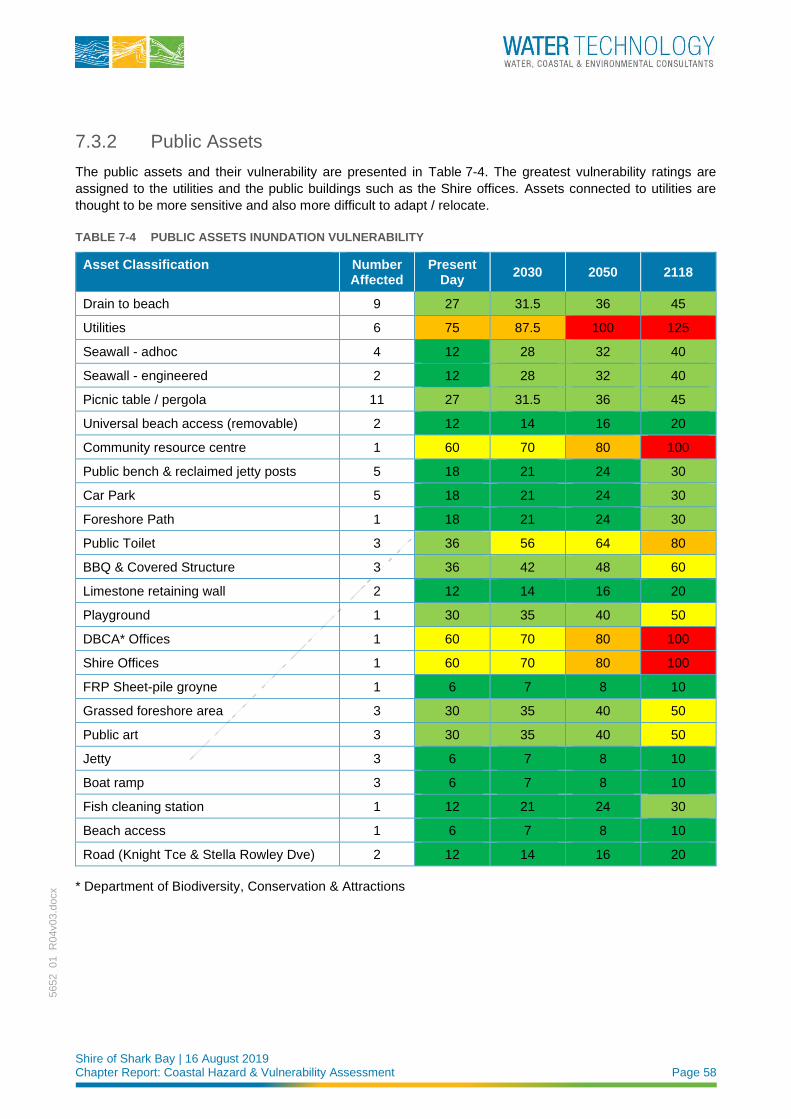
Shire of Shark Bay | 16 August 2019 Chapter Report: Coastal Hazard & Vulnerability Assessment Page 58
5652_01_R
04v03.d
ocx
7.3.2 Public Assets
The public assets and their vulnerability are presented in Table 7-4. The greatest vulnerability ratings are
assigned to the utilities and the public buildings such as the Shire offices. Assets connected to utilities are
thought to be more sensitive and also more difficult to adapt / relocate.
TABLE 7-4 PUBLIC ASSETS INUNDATION VULNERABILITY
Asset Classification Number Affected
Present Day
2030 2050 2118
Drain to beach 9 27 31.5 36 45
Utilities 6 75 87.5 100 125
Seawall - adhoc 4 12 28 32 40
Seawall - engineered 2 12 28 32 40
Picnic table / pergola 11 27 31.5 36 45
Universal beach access (removable) 2 12 14 16 20
Community resource centre 1 60 70 80 100
Public bench & reclaimed jetty posts 5 18 21 24 30
Car Park 5 18 21 24 30
Foreshore Path 1 18 21 24 30
Public Toilet 3 36 56 64 80
BBQ & Covered Structure 3 36 42 48 60
Limestone retaining wall 2 12 14 16 20
Playground 1 30 35 40 50
DBCA* Offices 1 60 70 80 100
Shire Offices 1 60 70 80 100
FRP Sheet-pile groyne 1 6 7 8 10
Grassed foreshore area 3 30 35 40 50
Public art 3 30 35 40 50
Jetty 3 6 7 8 10
Boat ramp 3 6 7 8 10
Fish cleaning station 1 12 21 24 30
Beach access 1 6 7 8 10
Road (Knight Tce & Stella Rowley Dve) 2 12 14 16 20
* Department of Biodiversity, Conservation & Attractions
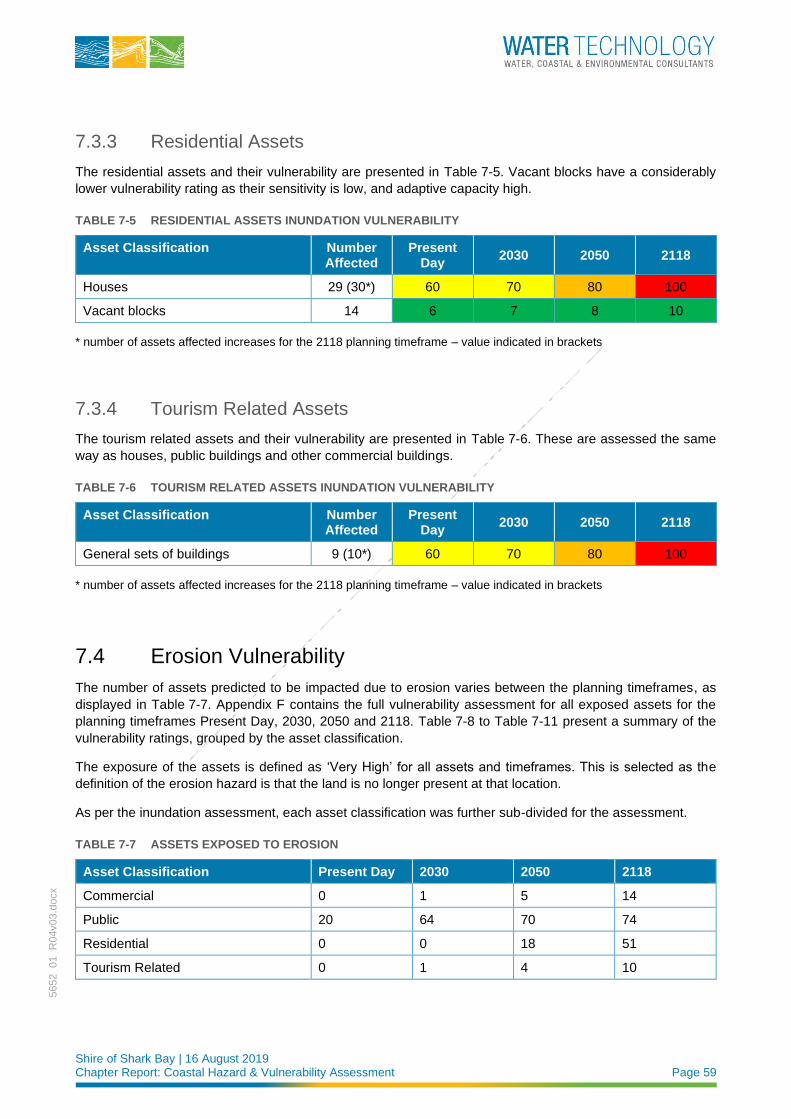
Shire of Shark Bay | 16 August 2019 Chapter Report: Coastal Hazard & Vulnerability Assessment Page 59
5652_01_R
04v03.d
ocx
7.3.3 Residential Assets
The residential assets and their vulnerability are presented in Table 7-5. Vacant blocks have a considerably
lower vulnerability rating as their sensitivity is low, and adaptive capacity high.
TABLE 7-5 RESIDENTIAL ASSETS INUNDATION VULNERABILITY
Asset Classification Number Affected
Present Day
2030 2050 2118
Houses 29 (30*) 60 70 80 100
Vacant blocks 14 6 7 8 10
* number of assets affected increases for the 2118 planning timeframe – value indicated in brackets
7.3.4 Tourism Related Assets
The tourism related assets and their vulnerability are presented in Table 7-6. These are assessed the same
way as houses, public buildings and other commercial buildings.
TABLE 7-6 TOURISM RELATED ASSETS INUNDATION VULNERABILITY
Asset Classification Number Affected
Present Day
2030 2050 2118
General sets of buildings 9 (10*) 60 70 80 100
* number of assets affected increases for the 2118 planning timeframe – value indicated in brackets
7.4 Erosion Vulnerability
The number of assets predicted to be impacted due to erosion varies between the planning timeframes, as
displayed in Table 7-7. Appendix F contains the full vulnerability assessment for all exposed assets for the
planning timeframes Present Day, 2030, 2050 and 2118. Table 7-8 to Table 7-11 present a summary of the
vulnerability ratings, grouped by the asset classification.
The exposure of the assets is defined as ‘Very High’ for all assets and timeframes. This is selected as the
definition of the erosion hazard is that the land is no longer present at that location.
As per the inundation assessment, each asset classification was further sub-divided for the assessment.
TABLE 7-7 ASSETS EXPOSED TO EROSION
Asset Classification Present Day 2030 2050 2118
Commercial 0 1 5 14
Public 20 64 70 74
Residential 0 0 18 51
Tourism Related 0 1 4 10
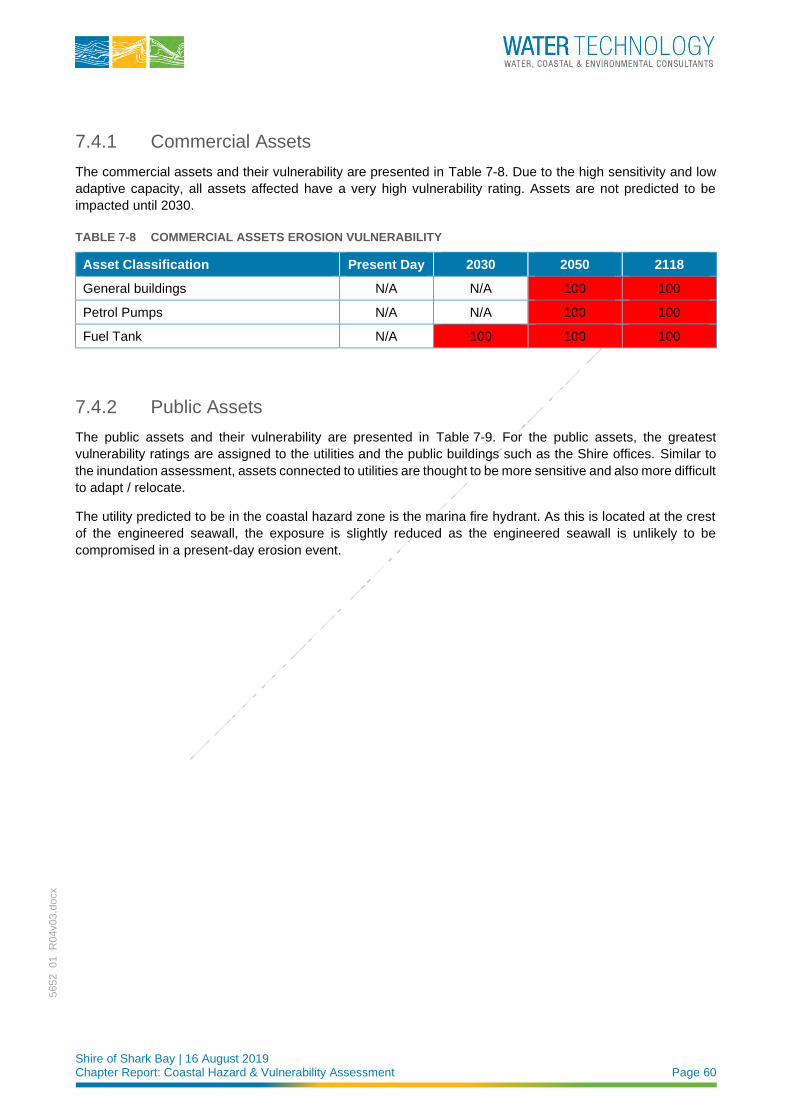
Shire of Shark Bay | 16 August 2019 Chapter Report: Coastal Hazard & Vulnerability Assessment Page 60
5652_01_R
04v03.d
ocx
7.4.1 Commercial Assets
The commercial assets and their vulnerability are presented in Table 7-8. Due to the high sensitivity and low
adaptive capacity, all assets affected have a very high vulnerability rating. Assets are not predicted to be
impacted until 2030.
TABLE 7-8 COMMERCIAL ASSETS EROSION VULNERABILITY
Asset Classification Present Day 2030 2050 2118
General buildings N/A N/A 100 100
Petrol Pumps N/A N/A 100 100
Fuel Tank N/A 100 100 100
7.4.2 Public Assets
The public assets and their vulnerability are presented in Table 7-9. For the public assets, the greatest
vulnerability ratings are assigned to the utilities and the public buildings such as the Shire offices. Similar to
the inundation assessment, assets connected to utilities are thought to be more sensitive and also more difficult
to adapt / relocate.
The utility predicted to be in the coastal hazard zone is the marina fire hydrant. As this is located at the crest
of the engineered seawall, the exposure is slightly reduced as the engineered seawall is unlikely to be
compromised in a present-day erosion event.
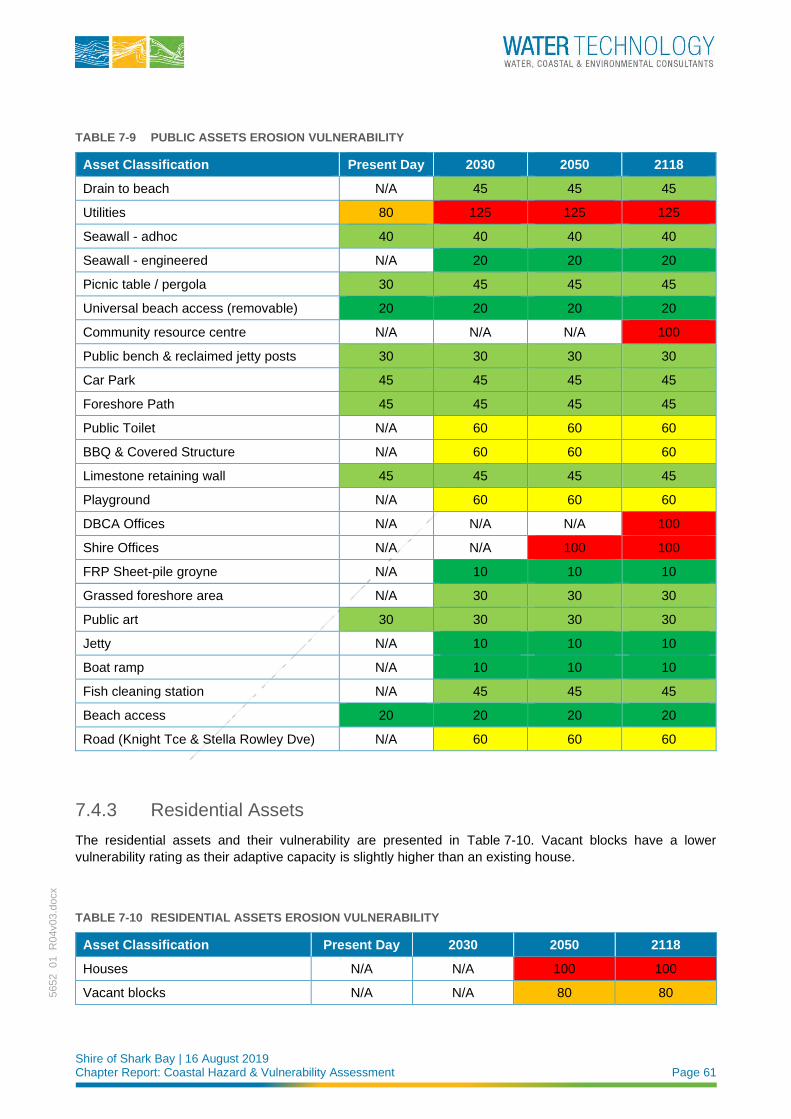
Shire of Shark Bay | 16 August 2019 Chapter Report: Coastal Hazard & Vulnerability Assessment Page 61
5652_01_R
04v03.d
ocx
TABLE 7-9 PUBLIC ASSETS EROSION VULNERABILITY
Asset Classification Present Day 2030 2050 2118
Drain to beach N/A 45 45 45
Utilities 80 125 125 125
Seawall - adhoc 40 40 40 40
Seawall - engineered N/A 20 20 20
Picnic table / pergola 30 45 45 45
Universal beach access (removable) 20 20 20 20
Community resource centre N/A N/A N/A 100
Public bench & reclaimed jetty posts 30 30 30 30
Car Park 45 45 45 45
Foreshore Path 45 45 45 45
Public Toilet N/A 60 60 60
BBQ & Covered Structure N/A 60 60 60
Limestone retaining wall 45 45 45 45
Playground N/A 60 60 60
DBCA Offices N/A N/A N/A 100
Shire Offices N/A N/A 100 100
FRP Sheet-pile groyne N/A 10 10 10
Grassed foreshore area N/A 30 30 30
Public art 30 30 30 30
Jetty N/A 10 10 10
Boat ramp N/A 10 10 10
Fish cleaning station N/A 45 45 45
Beach access 20 20 20 20
Road (Knight Tce & Stella Rowley Dve) N/A 60 60 60
7.4.3 Residential Assets
The residential assets and their vulnerability are presented in Table 7-10. Vacant blocks have a lower
vulnerability rating as their adaptive capacity is slightly higher than an existing house.
TABLE 7-10 RESIDENTIAL ASSETS EROSION VULNERABILITY
Asset Classification Present Day 2030 2050 2118
Houses N/A N/A 100 100
Vacant blocks N/A N/A 80 80
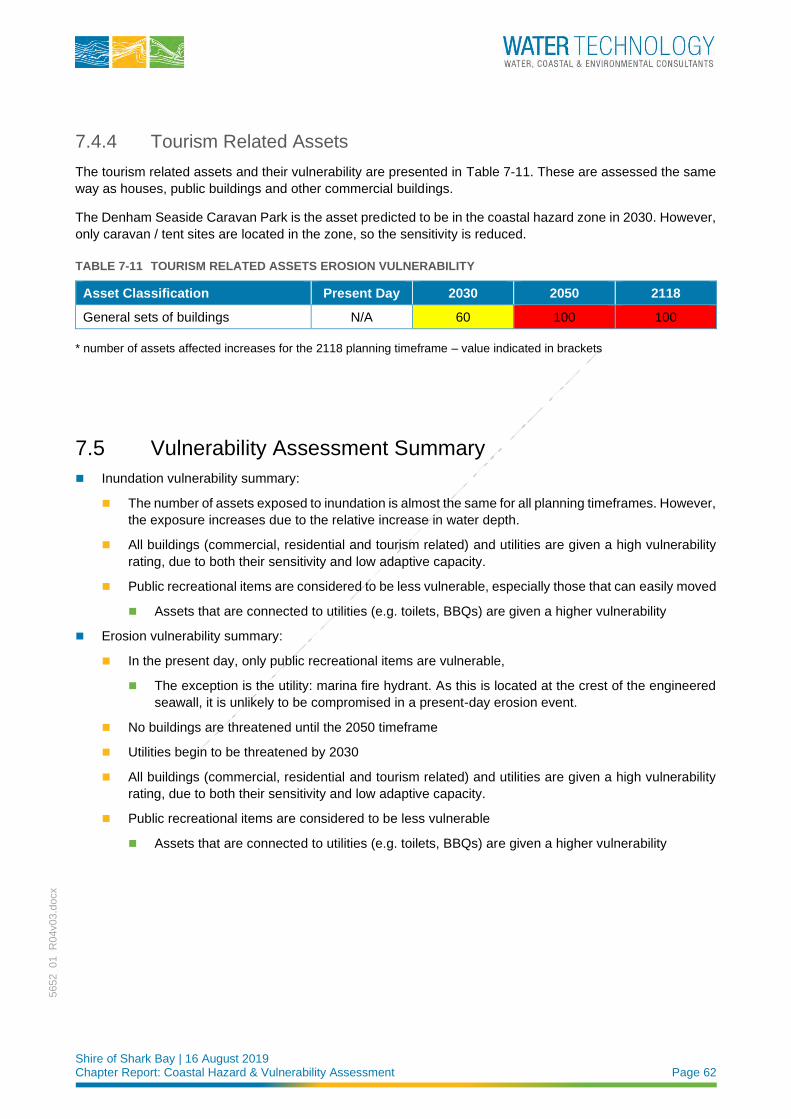
Shire of Shark Bay | 16 August 2019 Chapter Report: Coastal Hazard & Vulnerability Assessment Page 62
5652_01_R
04v03.d
ocx
7.4.4 Tourism Related Assets
The tourism related assets and their vulnerability are presented in Table 7-11. These are assessed the same
way as houses, public buildings and other commercial buildings.
The Denham Seaside Caravan Park is the asset predicted to be in the coastal hazard zone in 2030. However,
only caravan / tent sites are located in the zone, so the sensitivity is reduced.
TABLE 7-11 TOURISM RELATED ASSETS EROSION VULNERABILITY
Asset Classification Present Day 2030 2050 2118
General sets of buildings N/A 60 100 100
* number of assets affected increases for the 2118 planning timeframe – value indicated in brackets
7.5 Vulnerability Assessment Summary
◼ Inundation vulnerability summary:
◼ The number of assets exposed to inundation is almost the same for all planning timeframes. However,
the exposure increases due to the relative increase in water depth.
◼ All buildings (commercial, residential and tourism related) and utilities are given a high vulnerability
rating, due to both their sensitivity and low adaptive capacity.
◼ Public recreational items are considered to be less vulnerable, especially those that can easily moved
◼ Assets that are connected to utilities (e.g. toilets, BBQs) are given a higher vulnerability
◼ Erosion vulnerability summary:
◼ In the present day, only public recreational items are vulnerable,
◼ The exception is the utility: marina fire hydrant. As this is located at the crest of the engineered
seawall, it is unlikely to be compromised in a present-day erosion event.
◼ No buildings are threatened until the 2050 timeframe
◼ Utilities begin to be threatened by 2030
◼ All buildings (commercial, residential and tourism related) and utilities are given a high vulnerability
rating, due to both their sensitivity and low adaptive capacity.
◼ Public recreational items are considered to be less vulnerable
◼ Assets that are connected to utilities (e.g. toilets, BBQs) are given a higher vulnerability
Shire of Shark Bay | 16 August 2019 Chapter Report: Coastal Hazard & Vulnerability Assessment Page 63
5652_01_R
04v03.d
ocx
8 CONCLUSIONS & RECOMMENDATIONS A summary of the findings of this component of the CHRMAP is presented below:
◼ The hazard maps for the coastal inundation assessment are presented in Appendix C. These display the
extent of the predicted inundation for present day, 2030, 2050 and 2118. The data is overlaid on the 2017
aerial photograph; the identified assets are also displayed.
◼ The coastal processes allowance hazard maps are presented in Appendix D. Similarly, these display the
calculated erosion extent for the planning timeframes.
◼ Note this is not necessarily the predicted extent of erosion, rather the area at risk of erosion following
the methodology of SPP2.6.
◼ All hazards and assets are included in the online database:
◼ https://watech.maps.arcgis.com/apps/webappviewer/index.html?id=6e092b4d0f044e038a721705e9
07c084
◼ A vulnerability assessment was undertaken for assets predicted to be exposed to inundation and erosion.
The full vulnerability assessment is provided in Appendix E and Appendix F for inundation and erosion
respectively. Table 8-1 and Table 8-2 below present the number of assets predicted to be vulnerable to
coastal hazards.
◼ The vulnerability assessment considers the physical impact of the hazard, and to some extent assumes
the hazard will definitely occur. The next phase of the study involves carrying out a risk assessment for all
assets predicted to be exposed to coastal hazards. This will include applying the likelihood of the hazard
occurring. The risk assessment will also consider the social, cultural and environmental impacts in the
form of the success criteria already developed in previous phases of the study.
TABLE 8-1 ASSETS EXPOSED TO INUNDATION
Asset Classification Present Day 2030 2050 2118
Commercial 14 14 14 14
Public 74 74 74 74
Residential 43 43 43 44
Tourism Related 9 9 9 10
TABLE 8-2 ASSETS EXPOSED TO EROSION
Asset Classification Present Day 2030 2050 2118
Commercial 0 1 5 14
Public 20 64 70 74
Residential 0 0 18 51
Tourism Related 0 1 4 10
Shire of Shark Bay | 16 August 2019 Chapter Report: Coastal Hazard & Vulnerability Assessment Page 64
5652_01_R
04v03.d
ocx
A summary of the recommendations presented within this component of the CHRMAP is presented below:
◼ Deployment of a nearshore water level and wave data logger as soon as possible (Section 6).
◼ Development of a trigger-based adaptation plan and corresponding coastal management action during
the next phases of the CHRMAP. The use of triggers mitigates some of the uncertainty surrounding the
accuracy of the modelling.
◼ Inclusion of a photographic beach monitoring schedule and guideline
◼ Beach surveys when possible.
◼ Recording of any coastal development, dredging, or renourishment activity (including approximate
volumes)
◼ A geotechnical investigation to determine the presence of bedrock, which would potentially limit the
landward erosion, particularly in the areas of higher relief.
Shire of Shark Bay | 16 August 2019 Chapter Report: Coastal Hazard & Vulnerability Assessment Page 65
5652_01_R
04v03.d
ocx
9 REFERENCES Allen Consulting, (2005). Climate Change Risk and Vulnerability: Promoting an efficient adaptation response in Australia, Australian Greenhouse Office, March 2005, 159pp
Bureau of Meteorology (BoM, 2018a). Climate Statistics for Australian Locations, accessed 26th June 2018,
[http://www.bom.gov.au/climate/averages/tables/cw_006044.shtml]
Bureau of Meteorology (BoM, 2018b). Tsunami Facts and Information, accessed 20th July 2018,
[http://www.bom.gov.au/tsunami/info/]
Cardno (2015). Broome Coastal Vulnerability Study: Final Report, report No 59914800, prepared for the
Shire of Broome, available online: [http://www.broome.wa.gov.au/files/assets/public/building/major-
projects/59914800_r04_rev2.pdf ], accessed 21/05/2018
CoastAdapt (2017). How to conduct a climate change risk assessment, accessed 17th July 2018,
[https://coastadapt.com.au/how-to-pages/how-to-conduct-a-climate-change-risk-assessment], developed by
National Climate Change Adaptation Research Facility with funding from Department of the Environment and
Energy
Coastal Engineering Research Center (1984). Shore Protection Manual Volume I, US Army Corps of
Engineers
DEWHA (2007). ‘A characterisation of the marine environment of the north-west marine region’, summary of an expert workshop convened in Perth, Western Australia, 5-6 September, Department of the Environment,
Water, Heritage and the Arts. Commonwealth of Australia, Barton.
(http://www.environment.gov.au/resource/characterisation-marine-environment-north-west-marine-region)
Department of Transport (2010). Sea Level Change in Western Australia: Application to Coastal Planning,
Coastal Infrastructure, Coastal Engineering Group
Eliot I, Gozzard JR, Eliot M, Stul T and McCormack G. (2012). The Coast of the Shires of Shark Bay to Exmouth, Gascoyne, Western Australia: Geology, Geomorphology & Vulnerability, prepared by Damara WA
Pty Ltd and Geological Survey of Western Australia for the Department of Planning and the Department of
Transport
Geoscience Australia. (2006). Tsunami impact modelling for the North West Shelf: Onslow.
Geoscience Australia (2009). Offshore Tsunami Hazard for Australia, website & downloadable files
[http://www.ga.gov.au/scientific-topics/hazards/tsunami/australia], accessed 17th July 2018
Harper, B.A., Lovell, K.F., Chandler, B.D. and Todd D.J. (1989). ‘The Derivation of Environmental Design
Criteria for Goodwyn ‘A’ Platform’, Proceedings of the 9th Australian Conference on Coastal and Ocean Engineering, Institution of Engineers, Australia, Adelaide, December 1989.
Harper B.A., Mason L.B. and Bode L., (1993). ‘Tropical Cyclone Orson - A Severe Test for Modelling’,
Proceedings of the 11th Australian Conference on Coastal and Ocean Engineering, Institution of Engineers,
Australia, Townsville, August 1993
Holland, G. J. (1980). ‘An Analytical Model for the Wind and Pressure Profiles in Hurricanes’, Monthly Weather Review, 108, pp 1212-1218
Hsu, S.A., and Weggel, J.R. (2002). Coastal Engineering Manual: Chapter III-4 Wind-Blown Sediment Transport, US Army Corp of Engineers, Report No: EM 1110-2-1100 (Part III)
Shire of Shark Bay | 16 August 2019 Chapter Report: Coastal Hazard & Vulnerability Assessment Page 66
5652_01_R
04v03.d
ocx
Intergovernmental Panel on Climate Change (IPCC, 2014). Climate Change 2014: Synthesis Report, Contribution of Working Groups I, II and III to the Fifth Assessment Report of the Intergovernmental Panel on
Climate Change. Geneva, Switzerland, Core Writing Team, R.K. Pachauri and L.A. Meyer (eds.)], IPCC,
Geneva, Switzerland, 151 pp.
MRA (2014). Denham Inundation Levels Storm Surge Modelling Report, report to the Shire of Shark Bay
Seashore Engineering Pty Ltd (2018). Design Storms for Western Australian Coastal Planning: Tropical Cyclones, report prepared for Department of Transport, report No SE015-01-RevB
Smith, J.M., (2003). Coastal Engineering Manual: Chapter II-4 Surf Zone Hydrodynamics, US Army Corps of
Engineers, Report No. EM 1110-2-1100 (Part II)
Water Technology (2018). Denham Townsite CHRMAP - Chapter Report: Establish the Context, Report No
5562-01 R03v02, prepared for Shire of Shark Bay
Western Australian Planning Commission (WAPC, 2013). State Planning Policy No. 2.6 – State Coastal Planning Policy, prepared under the Planning and Development Act 2005.
Western Australian Planning Commission (WAPC, 2014). Coastal Hazard Risk Management and Adaptation Planning Guidelines
Wise, R. A., Smith, S. J., and Larson, M. (1995). ‘SBEACH: Numerical Model for Simulating Storm-Induced
Beach Change. Report 4. Cross-Shore Transport Under Random Waves and Model Validation with
SUPERTANK and Field Data’, Technical Report CERC-95, U.S. Army Engineer Waterways Experiment
Station, Coastal Engineering Research Center, Vicksburg, MS
Wu, Jin (1994). ‘The sea surface is aerodynamically rough even under light winds’, Boundary Layer Meteorology, 69, 149-158
Wu, Jin (1980). ‘Wind-stress Coefficients over sea surface and near neutral conditions - A revisit’, Journal of Physical Oceanography, 10, 727-740

Shire of Shark Bay | 16 August 2019 Chapter Report: Coastal Hazard & Vulnerability Assessment Page 67
5652_01_R
04v03.d
ocx
APPENDIX A CYCLONE TRACK PARAMETERS
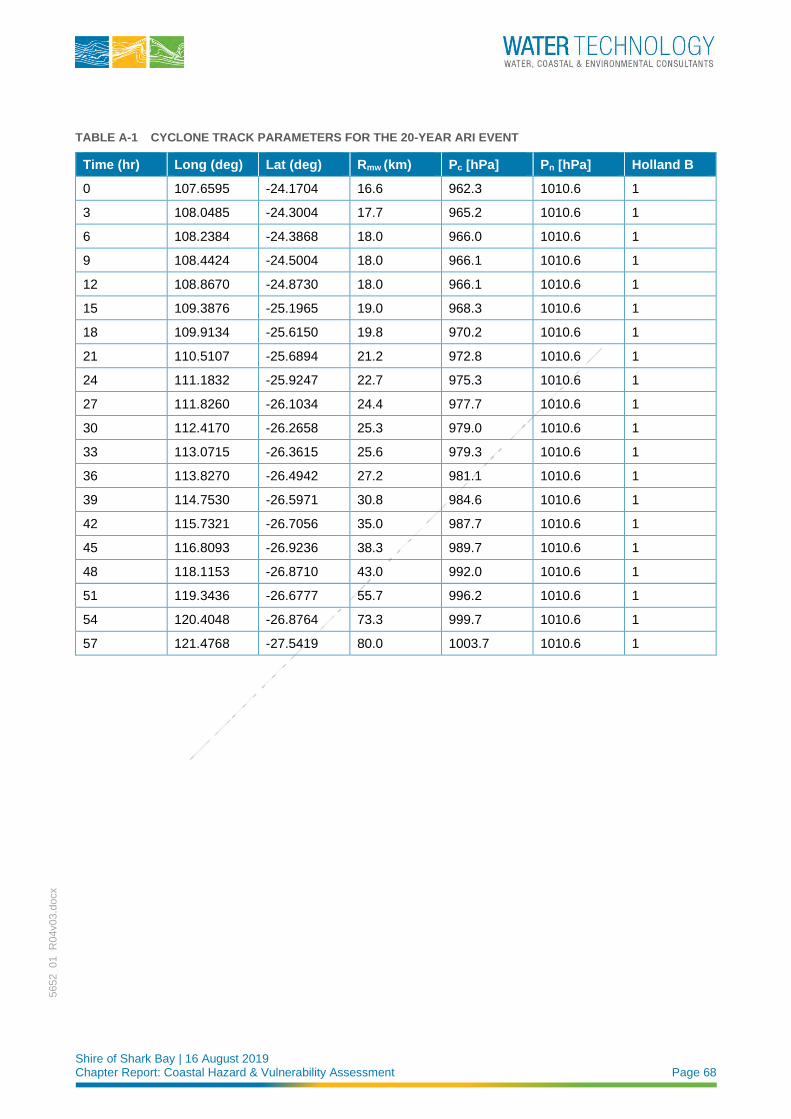
Shire of Shark Bay | 16 August 2019 Chapter Report: Coastal Hazard & Vulnerability Assessment Page 68
5652_01_R
04v03.d
ocx
TABLE A-1 CYCLONE TRACK PARAMETERS FOR THE 20-YEAR ARI EVENT
Time (hr) Long (deg) Lat (deg) Rmw (km) Pc [hPa] Pn [hPa] Holland B
0 107.6595 -24.1704 16.6 962.3 1010.6 1
3 108.0485 -24.3004 17.7 965.2 1010.6 1
6 108.2384 -24.3868 18.0 966.0 1010.6 1
9 108.4424 -24.5004 18.0 966.1 1010.6 1
12 108.8670 -24.8730 18.0 966.1 1010.6 1
15 109.3876 -25.1965 19.0 968.3 1010.6 1
18 109.9134 -25.6150 19.8 970.2 1010.6 1
21 110.5107 -25.6894 21.2 972.8 1010.6 1
24 111.1832 -25.9247 22.7 975.3 1010.6 1
27 111.8260 -26.1034 24.4 977.7 1010.6 1
30 112.4170 -26.2658 25.3 979.0 1010.6 1
33 113.0715 -26.3615 25.6 979.3 1010.6 1
36 113.8270 -26.4942 27.2 981.1 1010.6 1
39 114.7530 -26.5971 30.8 984.6 1010.6 1
42 115.7321 -26.7056 35.0 987.7 1010.6 1
45 116.8093 -26.9236 38.3 989.7 1010.6 1
48 118.1153 -26.8710 43.0 992.0 1010.6 1
51 119.3436 -26.6777 55.7 996.2 1010.6 1
54 120.4048 -26.8764 73.3 999.7 1010.6 1
57 121.4768 -27.5419 80.0 1003.7 1010.6 1
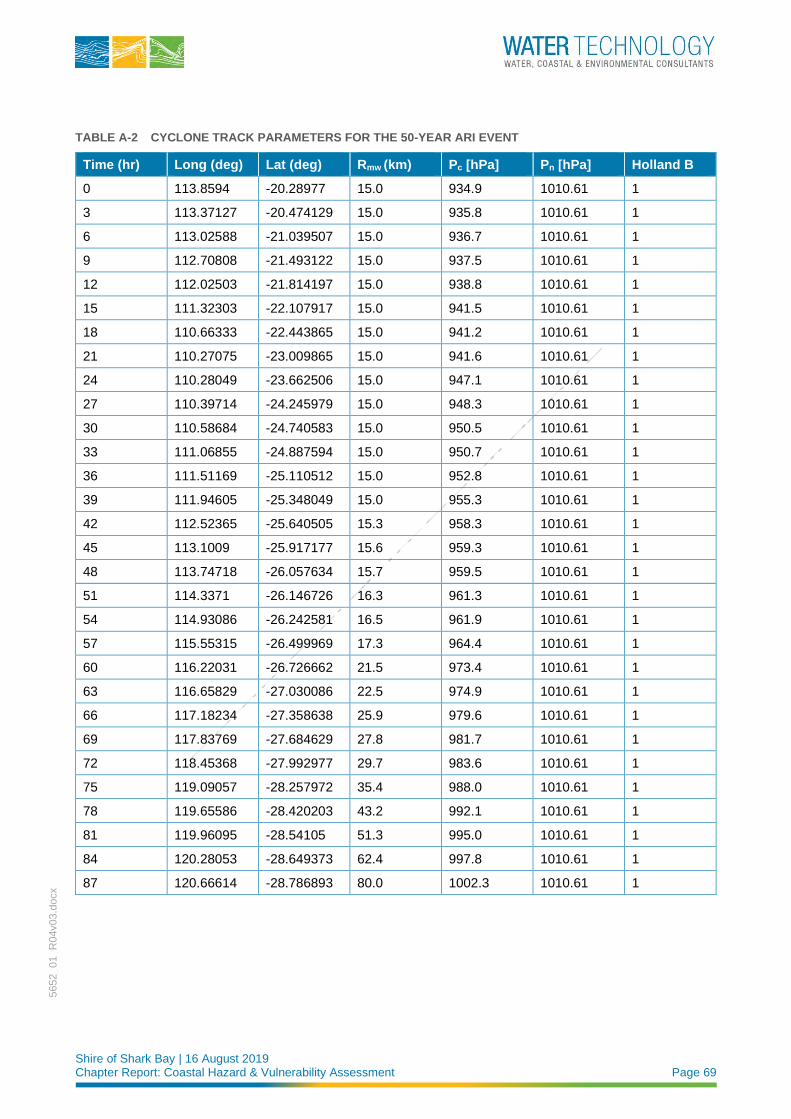
Shire of Shark Bay | 16 August 2019 Chapter Report: Coastal Hazard & Vulnerability Assessment Page 69
5652_01_R
04v03.d
ocx
TABLE A-2 CYCLONE TRACK PARAMETERS FOR THE 50-YEAR ARI EVENT
Time (hr) Long (deg) Lat (deg) Rmw (km) Pc [hPa] Pn [hPa] Holland B
0 113.8594 -20.28977 15.0 934.9 1010.61 1
3 113.37127 -20.474129 15.0 935.8 1010.61 1
6 113.02588 -21.039507 15.0 936.7 1010.61 1
9 112.70808 -21.493122 15.0 937.5 1010.61 1
12 112.02503 -21.814197 15.0 938.8 1010.61 1
15 111.32303 -22.107917 15.0 941.5 1010.61 1
18 110.66333 -22.443865 15.0 941.2 1010.61 1
21 110.27075 -23.009865 15.0 941.6 1010.61 1
24 110.28049 -23.662506 15.0 947.1 1010.61 1
27 110.39714 -24.245979 15.0 948.3 1010.61 1
30 110.58684 -24.740583 15.0 950.5 1010.61 1
33 111.06855 -24.887594 15.0 950.7 1010.61 1
36 111.51169 -25.110512 15.0 952.8 1010.61 1
39 111.94605 -25.348049 15.0 955.3 1010.61 1
42 112.52365 -25.640505 15.3 958.3 1010.61 1
45 113.1009 -25.917177 15.6 959.3 1010.61 1
48 113.74718 -26.057634 15.7 959.5 1010.61 1
51 114.3371 -26.146726 16.3 961.3 1010.61 1
54 114.93086 -26.242581 16.5 961.9 1010.61 1
57 115.55315 -26.499969 17.3 964.4 1010.61 1
60 116.22031 -26.726662 21.5 973.4 1010.61 1
63 116.65829 -27.030086 22.5 974.9 1010.61 1
66 117.18234 -27.358638 25.9 979.6 1010.61 1
69 117.83769 -27.684629 27.8 981.7 1010.61 1
72 118.45368 -27.992977 29.7 983.6 1010.61 1
75 119.09057 -28.257972 35.4 988.0 1010.61 1
78 119.65586 -28.420203 43.2 992.1 1010.61 1
81 119.96095 -28.54105 51.3 995.0 1010.61 1
84 120.28053 -28.649373 62.4 997.8 1010.61 1
87 120.66614 -28.786893 80.0 1002.3 1010.61 1
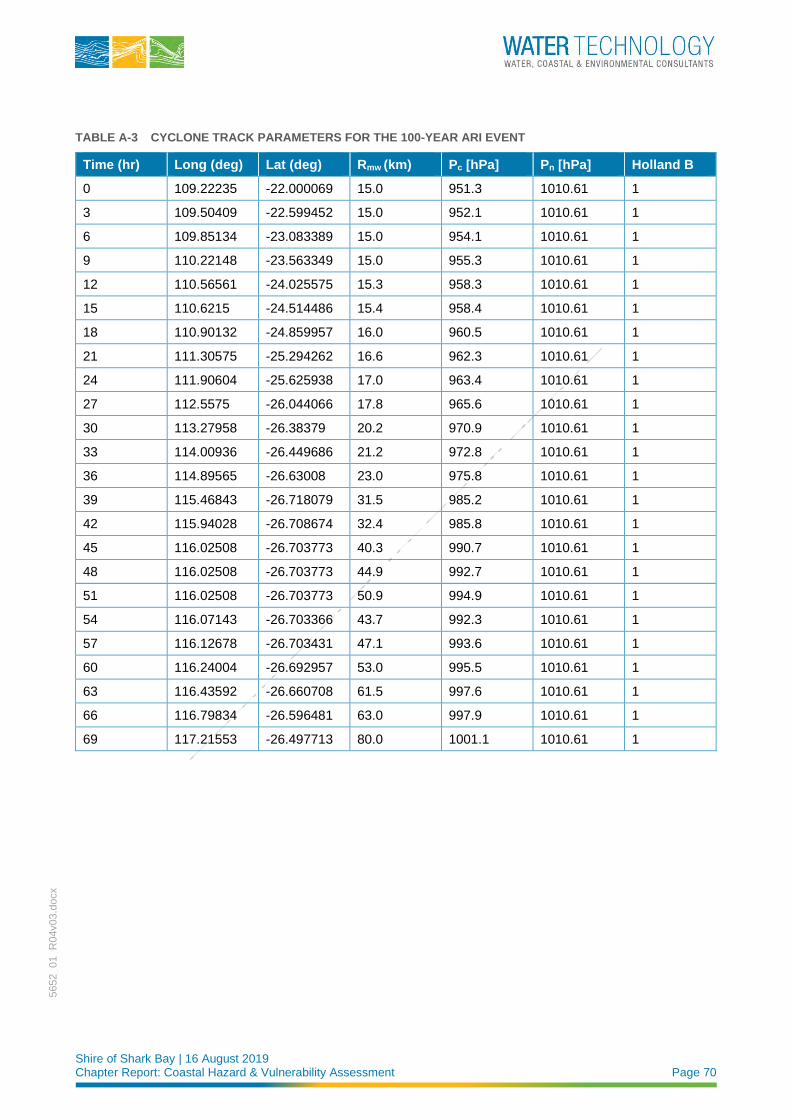
Shire of Shark Bay | 16 August 2019 Chapter Report: Coastal Hazard & Vulnerability Assessment Page 70
5652_01_R
04v03.d
ocx
TABLE A-3 CYCLONE TRACK PARAMETERS FOR THE 100-YEAR ARI EVENT
Time (hr) Long (deg) Lat (deg) Rmw (km) Pc [hPa] Pn [hPa] Holland B
0 109.22235 -22.000069 15.0 951.3 1010.61 1
3 109.50409 -22.599452 15.0 952.1 1010.61 1
6 109.85134 -23.083389 15.0 954.1 1010.61 1
9 110.22148 -23.563349 15.0 955.3 1010.61 1
12 110.56561 -24.025575 15.3 958.3 1010.61 1
15 110.6215 -24.514486 15.4 958.4 1010.61 1
18 110.90132 -24.859957 16.0 960.5 1010.61 1
21 111.30575 -25.294262 16.6 962.3 1010.61 1
24 111.90604 -25.625938 17.0 963.4 1010.61 1
27 112.5575 -26.044066 17.8 965.6 1010.61 1
30 113.27958 -26.38379 20.2 970.9 1010.61 1
33 114.00936 -26.449686 21.2 972.8 1010.61 1
36 114.89565 -26.63008 23.0 975.8 1010.61 1
39 115.46843 -26.718079 31.5 985.2 1010.61 1
42 115.94028 -26.708674 32.4 985.8 1010.61 1
45 116.02508 -26.703773 40.3 990.7 1010.61 1
48 116.02508 -26.703773 44.9 992.7 1010.61 1
51 116.02508 -26.703773 50.9 994.9 1010.61 1
54 116.07143 -26.703366 43.7 992.3 1010.61 1
57 116.12678 -26.703431 47.1 993.6 1010.61 1
60 116.24004 -26.692957 53.0 995.5 1010.61 1
63 116.43592 -26.660708 61.5 997.6 1010.61 1
66 116.79834 -26.596481 63.0 997.9 1010.61 1
69 117.21553 -26.497713 80.0 1001.1 1010.61 1
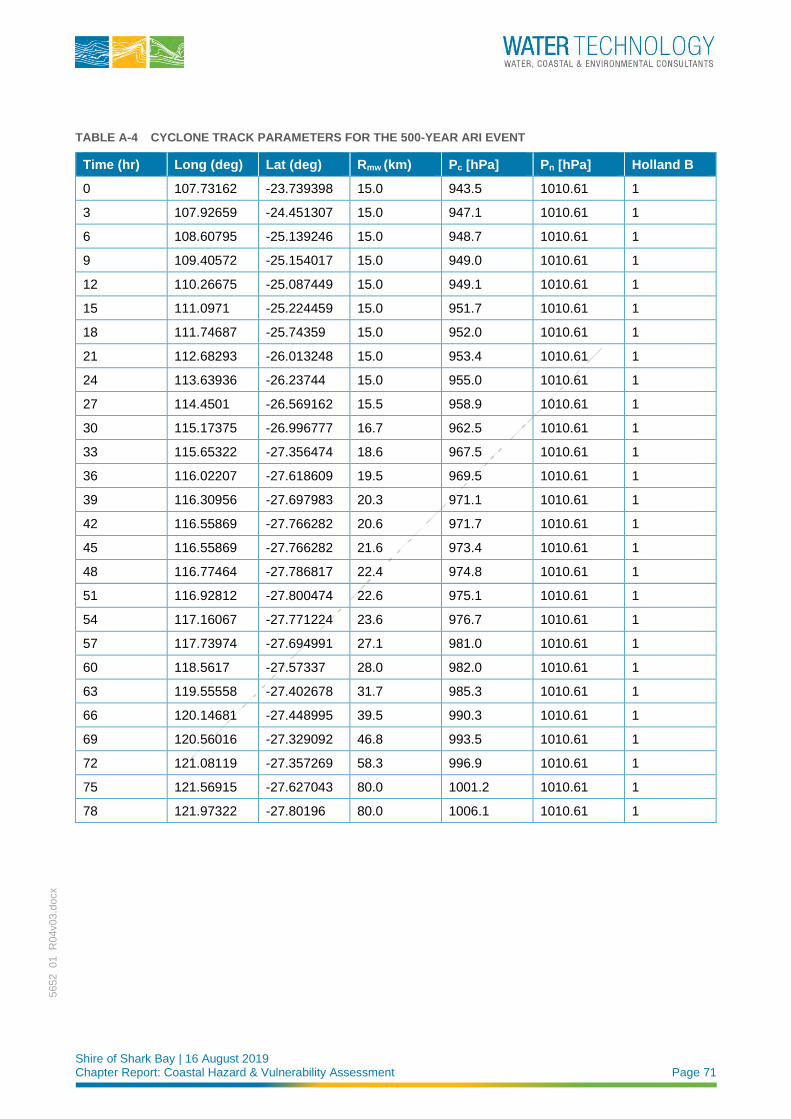
Shire of Shark Bay | 16 August 2019 Chapter Report: Coastal Hazard & Vulnerability Assessment Page 71
5652_01_R
04v03.d
ocx
TABLE A-4 CYCLONE TRACK PARAMETERS FOR THE 500-YEAR ARI EVENT
Time (hr) Long (deg) Lat (deg) Rmw (km) Pc [hPa] Pn [hPa] Holland B
0 107.73162 -23.739398 15.0 943.5 1010.61 1
3 107.92659 -24.451307 15.0 947.1 1010.61 1
6 108.60795 -25.139246 15.0 948.7 1010.61 1
9 109.40572 -25.154017 15.0 949.0 1010.61 1
12 110.26675 -25.087449 15.0 949.1 1010.61 1
15 111.0971 -25.224459 15.0 951.7 1010.61 1
18 111.74687 -25.74359 15.0 952.0 1010.61 1
21 112.68293 -26.013248 15.0 953.4 1010.61 1
24 113.63936 -26.23744 15.0 955.0 1010.61 1
27 114.4501 -26.569162 15.5 958.9 1010.61 1
30 115.17375 -26.996777 16.7 962.5 1010.61 1
33 115.65322 -27.356474 18.6 967.5 1010.61 1
36 116.02207 -27.618609 19.5 969.5 1010.61 1
39 116.30956 -27.697983 20.3 971.1 1010.61 1
42 116.55869 -27.766282 20.6 971.7 1010.61 1
45 116.55869 -27.766282 21.6 973.4 1010.61 1
48 116.77464 -27.786817 22.4 974.8 1010.61 1
51 116.92812 -27.800474 22.6 975.1 1010.61 1
54 117.16067 -27.771224 23.6 976.7 1010.61 1
57 117.73974 -27.694991 27.1 981.0 1010.61 1
60 118.5617 -27.57337 28.0 982.0 1010.61 1
63 119.55558 -27.402678 31.7 985.3 1010.61 1
66 120.14681 -27.448995 39.5 990.3 1010.61 1
69 120.56016 -27.329092 46.8 993.5 1010.61 1
72 121.08119 -27.357269 58.3 996.9 1010.61 1
75 121.56915 -27.627043 80.0 1001.2 1010.61 1
78 121.97322 -27.80196 80.0 1006.1 1010.61 1

Shire of Shark Bay | 16 August 2019 Chapter Report: Coastal Hazard & Vulnerability Assessment Page 72
5652_01_R
04v03.d
ocx
APPENDIX B HISTORICAL SHORELINE MOVEMENT
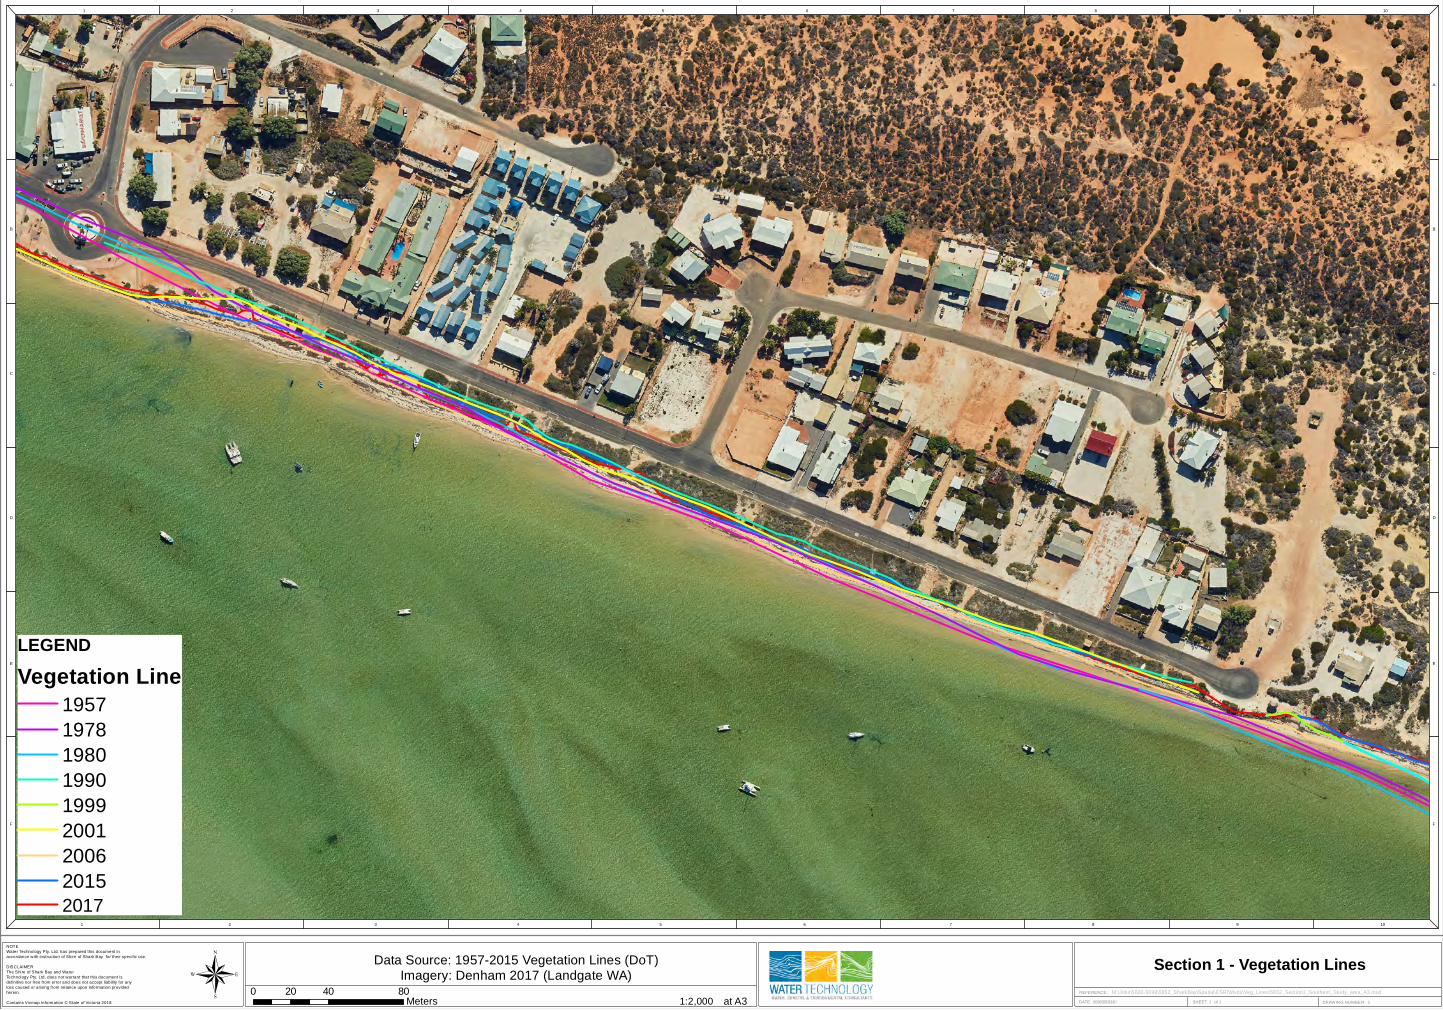
1 2 3 4 5 6 7 8 9 10
1 2 3 4 5 6 7 8 9 10
A
B
C
D
E
F
A
B
C
D
E
F
NOTE
Water Technology Pty. Ltd. has prepared this document in
accordance w ith instruction of Shire of Shark Bay for their specific use.
DISCLAIMER
The Shire of Shark Bay and Water
Technology Pty. Ltd. does not warrant that this document is
definitive nor free from error and does not accept liability for any
loss caused or arising from rel iance upon information provided
herein.
Contains Vicmap Information © State of Victoria 2018 DATE: 30/05/2018 SHEET: 1 of 1
REFERENCE:
DRAWING NUMBER: 11:2,000
Section 1 - Vegetation Linesat A3
0 40 8020Meters
®
LEGENDVegetation Line
1957
1978
1980
1990
1999
2001
2006
2015
2017
M:\Jobs\5600-5699\5652_SharkBay\Spatial\ESRI\Mxds\Veg_Lines\5652_Section1_Southern_Study_area_A3.mxd
30/05/2018
Data Source: 1957-2015 Vegetation Lines (DoT)Imagery: Denham 2017 (Landgate WA)
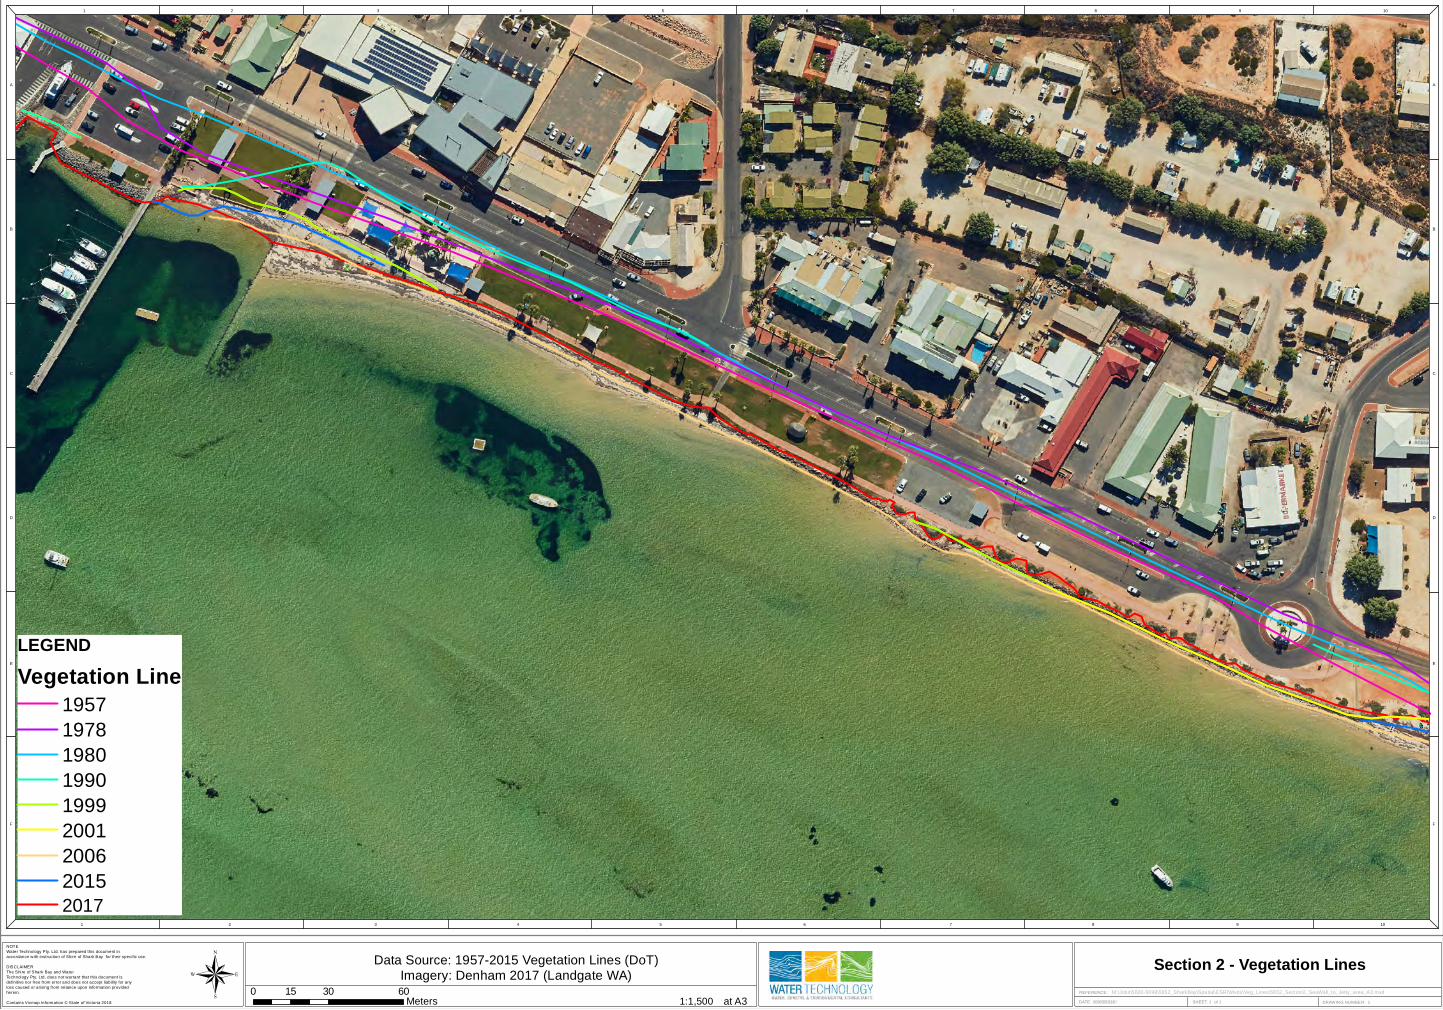
1 2 3 4 5 6 7 8 9 10
1 2 3 4 5 6 7 8 9 10
A
B
C
D
E
F
A
B
C
D
E
F
NOTE
Water Technology Pty. Ltd. has prepared this document in
accordance w ith instruction of Shire of Shark Bay for their specific use.
DISCLAIMER
The Shire of Shark Bay and Water
Technology Pty. Ltd. does not warrant that this document is
definitive nor free from error and does not accept liability for any
loss caused or arising from rel iance upon information provided
herein.
Contains Vicmap Information © State of Victoria 2018 DATE: 30/05/2018 SHEET: 1 of 1
REFERENCE:
DRAWING NUMBER: 11:1,500
Section 2 - Vegetation Linesat A3
0 30 6015Meters
®
LEGENDVegetation Line
1957
1978
1980
1990
1999
2001
2006
2015
2017
M:\Jobs\5600-5699\5652_SharkBay\Spatial\ESRI\Mxds\Veg_Lines\5652_Section2_SeaWall_to_Jetty_area_A3.mxd
30/05/2018
Data Source: 1957-2015 Vegetation Lines (DoT)Imagery: Denham 2017 (Landgate WA)
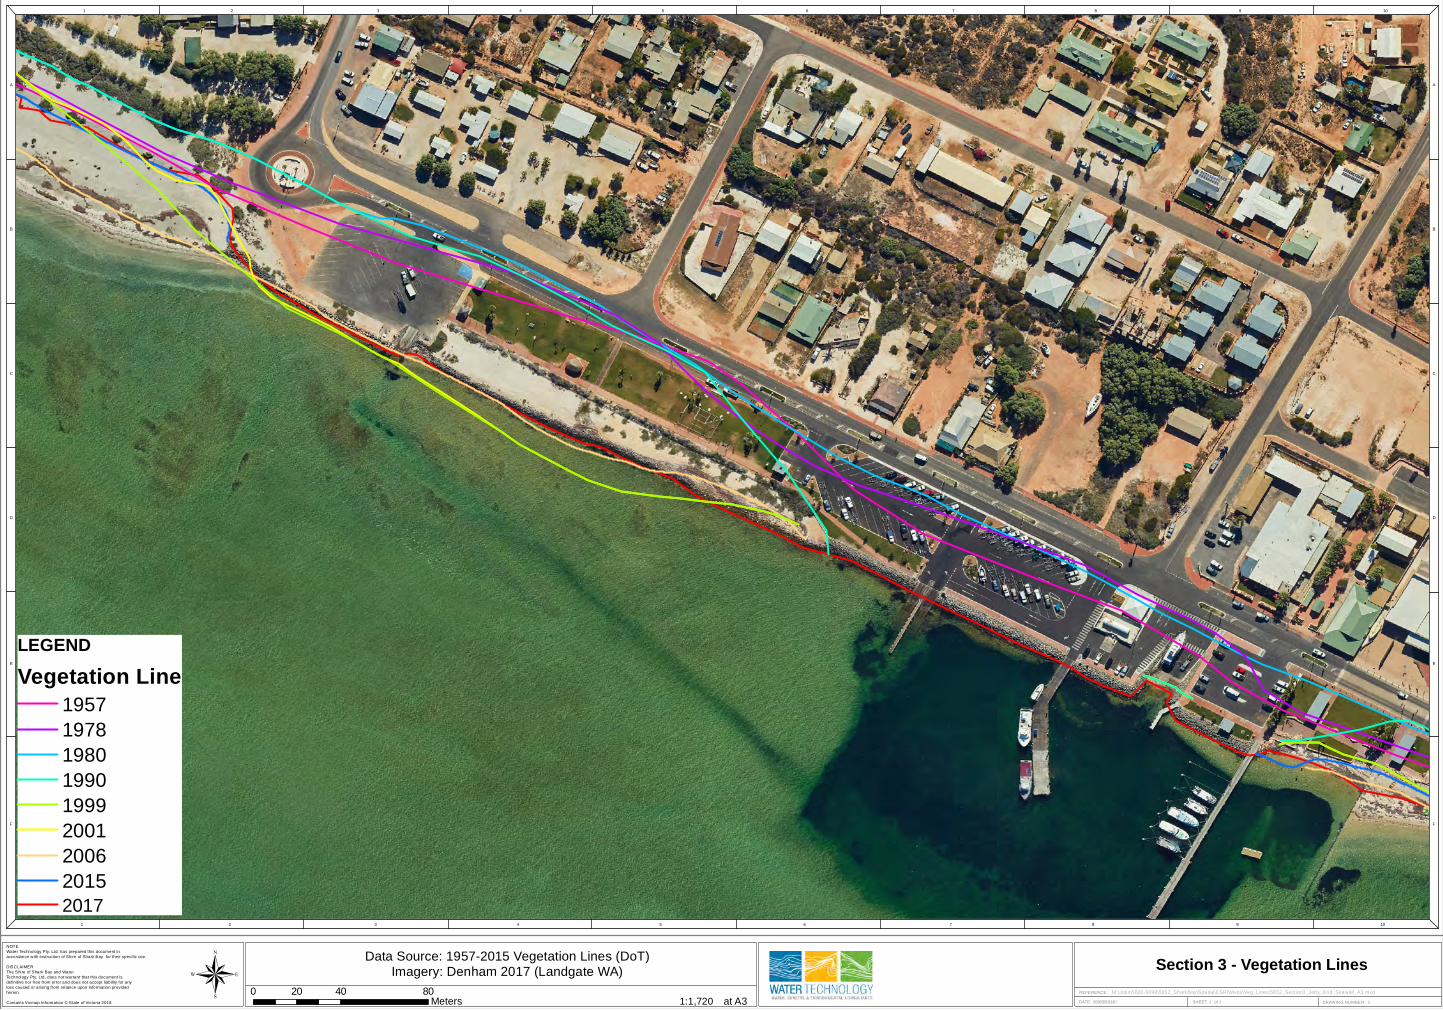
1 2 3 4 5 6 7 8 9 10
1 2 3 4 5 6 7 8 9 10
A
B
C
D
E
F
A
B
C
D
E
F
NOTE
Water Technology Pty. Ltd. has prepared this document in
accordance w ith instruction of Shire of Shark Bay for their specific use.
DISCLAIMER
The Shire of Shark Bay and Water
Technology Pty. Ltd. does not warrant that this document is
definitive nor free from error and does not accept liability for any
loss caused or arising from rel iance upon information provided
herein.
Contains Vicmap Information © State of Victoria 2018 DATE: 30/05/2018 SHEET: 1 of 1
REFERENCE:
DRAWING NUMBER: 11:1,720
Section 3 - Vegetation Linesat A3
0 40 8020Meters
®
LEGENDVegetation Line
1957
1978
1980
1990
1999
2001
2006
2015
2017
M:\Jobs\5600-5699\5652_SharkBay\Spatial\ESRI\Mxds\Veg_Lines\5652_Section3_Jetty_End_Seawall_A3.mxd
30/05/2018
Data Source: 1957-2015 Vegetation Lines (DoT)Imagery: Denham 2017 (Landgate WA)
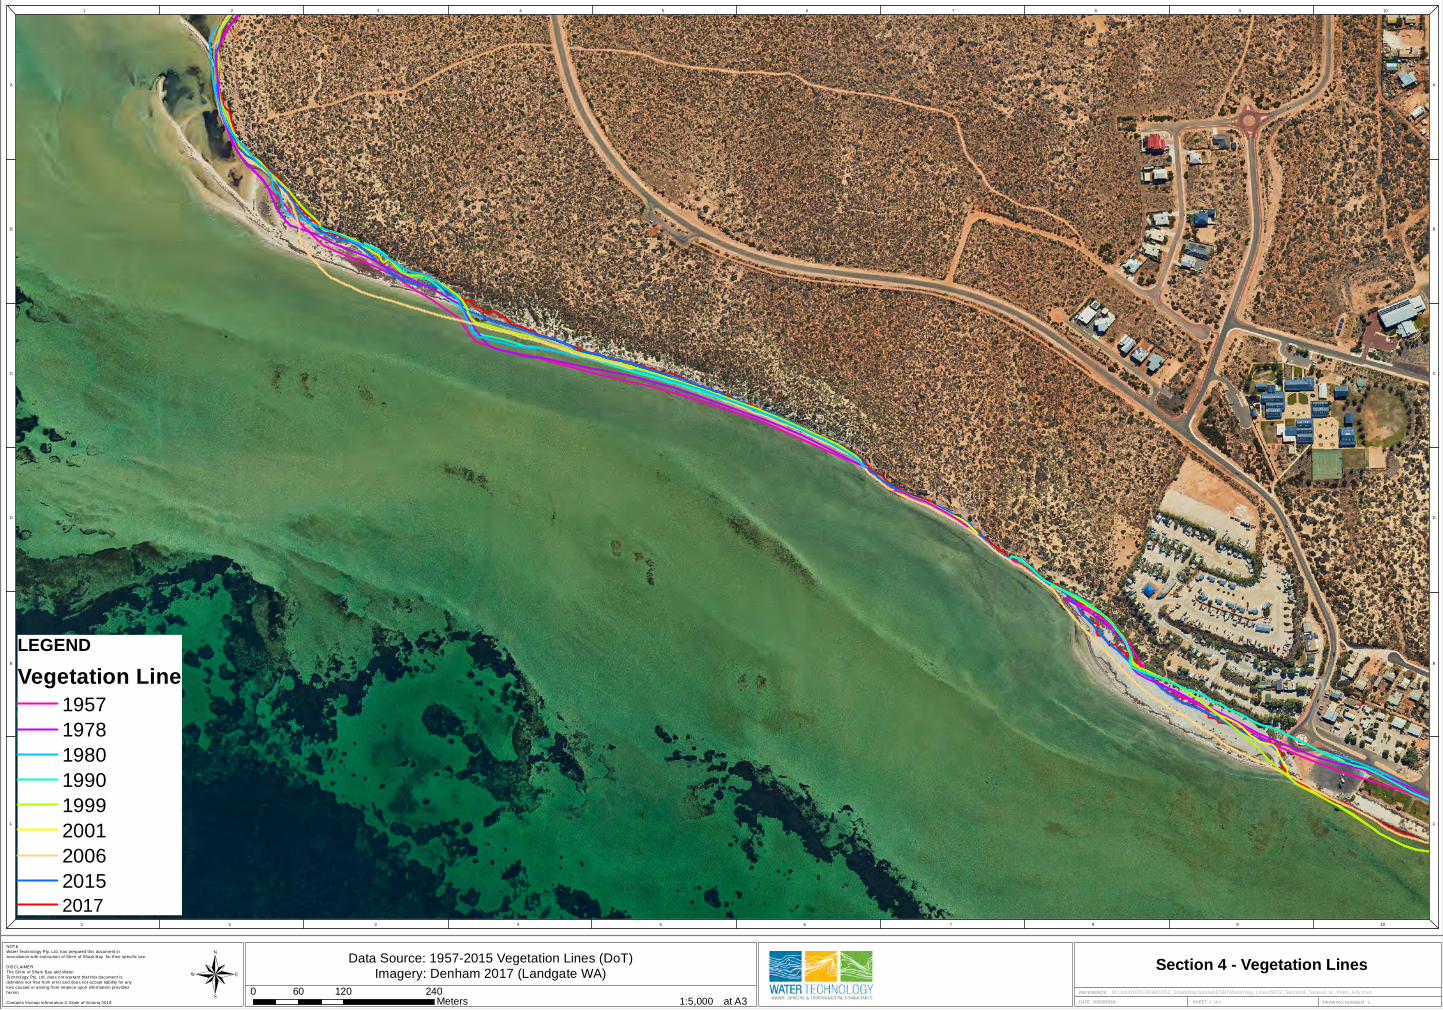
1 2 3 4 5 6 7 8 9 10
1 2 3 4 5 6 7 8 9 10
A
B
C
D
E
F
A
B
C
D
E
F
NOTE
Water Technology Pty. Ltd. has prepared this document in
accordance w ith instruction of Shire of Shark Bay for their specific use.
DISCLAIMER
The Shire of Shark Bay and Water
Technology Pty. Ltd. does not warrant that this document is
definitive nor free from error and does not accept liability for any
loss caused or arising from rel iance upon information provided
herein.
Contains Vicmap Information © State of Victoria 2018 DATE: 30/05/2018 SHEET: 1 of 1
REFERENCE:
DRAWING NUMBER: 11:5,000
Section 4 - Vegetation Linesat A3
0 120 24060Meters
®
LEGENDVegetation Line
1957
1978
1980
1990
1999
2001
2006
2015
2017
M:\Jobs\5600-5699\5652_SharkBay\Spatial\ESRI\Mxds\Veg_Lines\5652_Section4_Seawal_to_Point_A3y.mxd
30/05/2018
Data Source: 1957-2015 Vegetation Lines (DoT)Imagery: Denham 2017 (Landgate WA)
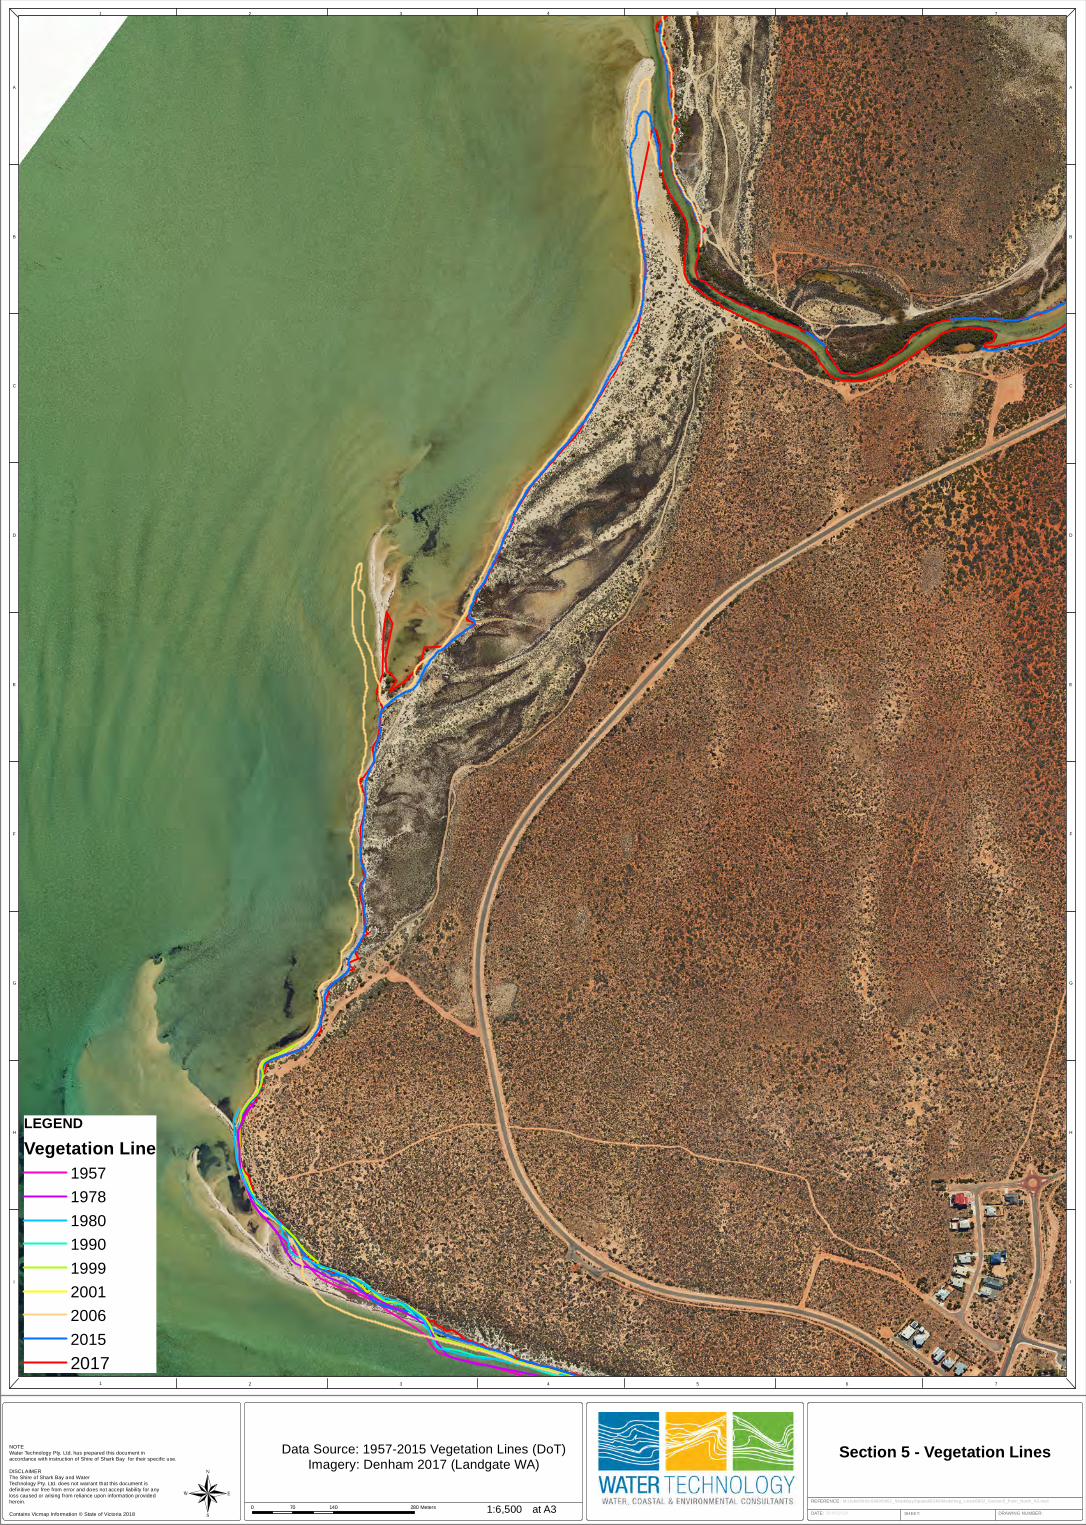
I
A
B
C
D
E
F
G
H
A
B
C
D
E
F
G
H
I
1 2 3 4 5 6 7
1 2 3 4 5 6 7
Section 5 - Vegetation Lines
REFERENCE:
DATE: SHEET: DRAWING NUMBER:
Data Source: 1957-2015 Vegetation Lines (DoT)Imagery: Denham 2017 (Landgate WA)
30/05/2018
M:\Jobs\5600-5699\5652_SharkBay\Spatial\ESRI\Mxds\Veg_Lines\5652_Section5_Point_North_A3.mxd
NOTE
Water Technology Pty. Ltd. has prepared this document in
accordance with instruction of Shire of Shark Bay for their specific use.
DISCLAIMER
The Shire of Shark Bay and Water
Technology Pty. Ltd. does not warrant that this document is
definitive nor free from error and does not accept liability for any
loss caused or arising from reliance upon information provided
herein.
Contains Vicmap Information © State of Victoria 2018 ®
LEGENDVegetation Line
1957
1978
1980
1990
1999
2001
2006
2015
2017
0 140 28070 Meters 1:6,500 at A3
Shire of Shark Bay | 16 August 2019 Chapter Report: Coastal Hazard & Vulnerability Assessment Page 74
5652_01_R
04v03.d
ocx
APPENDIX C INUNDATION HAZARD MAPS

1 2 3 4 5 6 7 8 9 10
1 2 3 4 5 6 7 8 9 10
A
B
C
D
E
F
A
B
C
D
E
F
NOTE
Water Technology Pty. Ltd. has prepared this document in
accordance with instruction of Shire of Shark Bay for their specific use.
DISCLAIMER
The Shire of Shark Bay and Water
Technology Pty. Ltd. does not warrant that this document is
definitive nor free from error and does not accept liability for any
loss caused or arising from rel iance upon information provided
herein.DATE: 30/05/2018
STELLA ROWLEY DR
SPAVEN WY
BROC
KMAN
ST ED
WARD
ST
HARTOGCR
VLAM
INGH
CR
FRANCIS RD
DIRK PL
CAPEWELL DR
HUGHES ST
BATES RD
BAUDIN ST
LEEDS CT
PAGE
T ST
FREY
CINE
T DR
OLDKNIGHTTCE
HOULT ST
SUNTER PL
MONK
EY M
IA R
D
MAINLAND ST
MEADST
BARNARD STDENHAM RD
LOGU
ERD
FRY CT
KNIGHT TCE
DAMPIER RD
DUMP
RD
SHARK BAY RD
NEW TIP RD
COMM
ON RD
1
2
3
4A
4B
5A
5B
SHEET: 1 of 1
REFERENCE:
DRAWING NUMBER: 11:15,000 at A30 410 820205
Metres® \\FS04\P-Drive\Jobs\5652_SharkBay_CHRMAP\Spatial\ESRI\Mxds\Inundation\5652_500yrARI_PresentDay_all_A3.mxd
28/06/2018
Denham Townsite CHRMAPImagery: Denham 2017 (Landgate WA)
Map Location Key
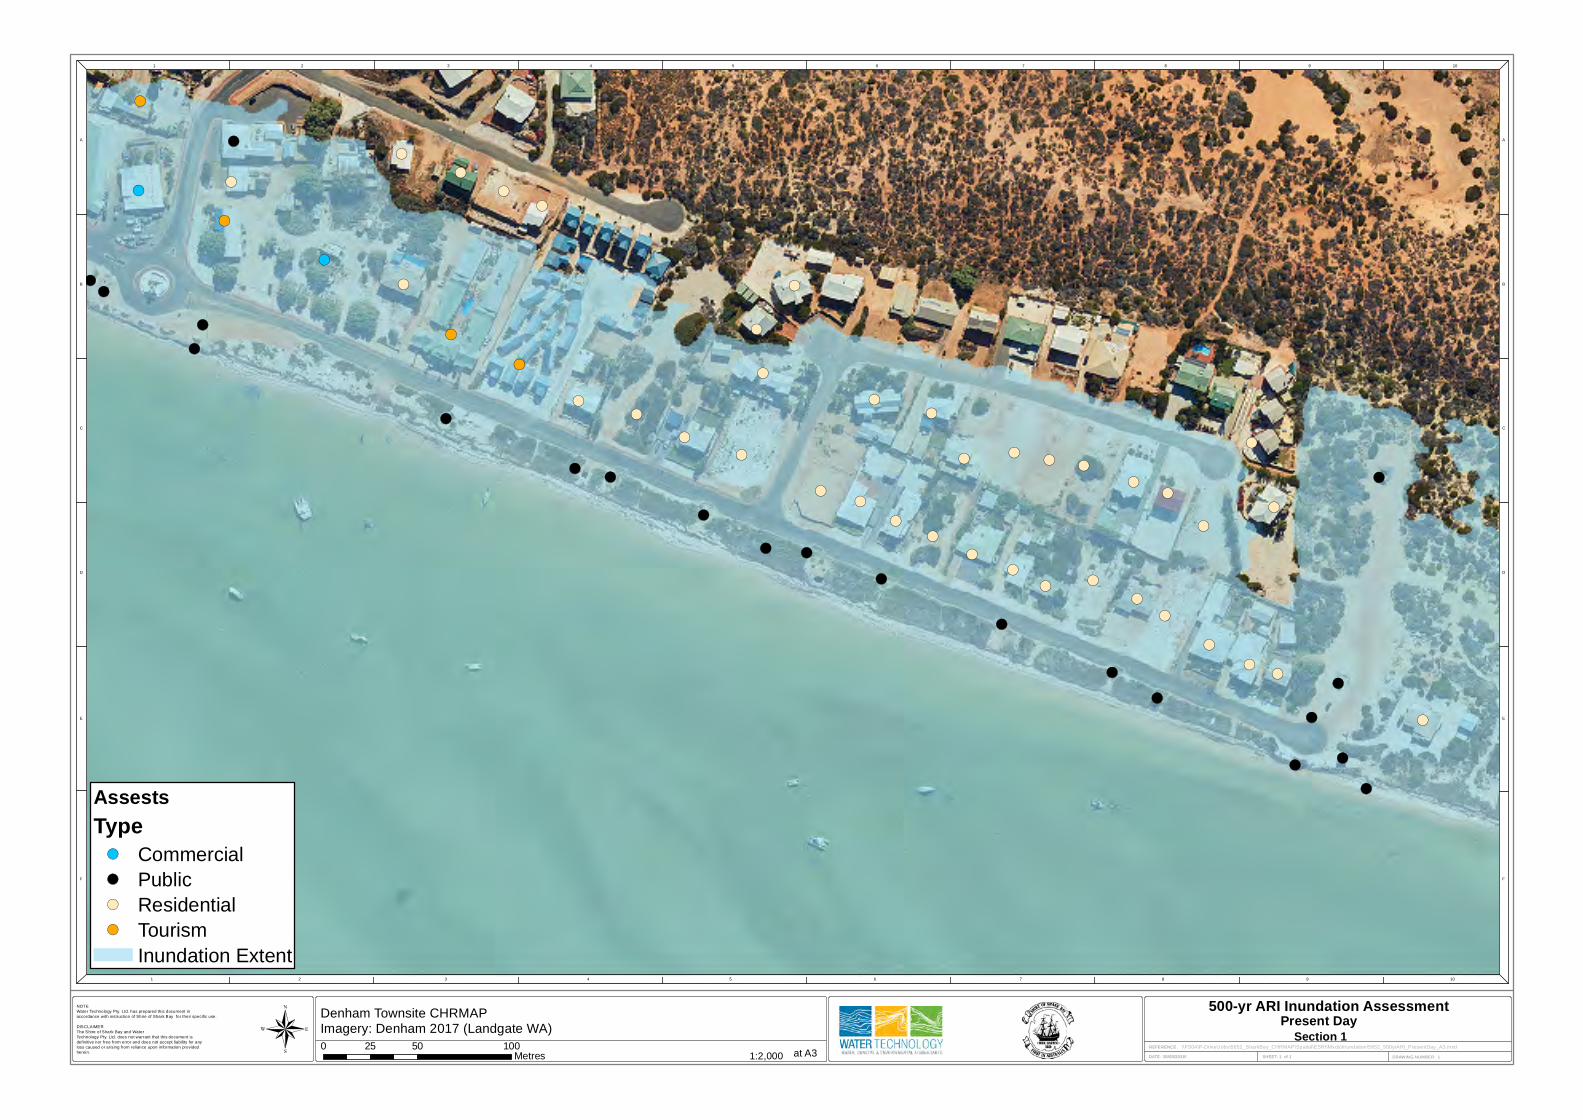
1 2 3 4 5 6 7 8 9 10
1 2 3 4 5 6 7 8 9 10
A
B
C
D
E
F
A
B
C
D
E
F
NOTE
Water Technology Pty. Ltd. has prepared this document in
accordance with instruction of Shire of Shark Bay for their specific use.
DISCLAIMER
The Shire of Shark Bay and Water
Technology Pty. Ltd. does not warrant that this document is
definitive nor free from error and does not accept liability for any
loss caused or arising from rel iance upon information provided
herein.DATE: 30/05/2018
!(
!(
!(!(
!(
!(
!(!(
!(
!(
!(
!(
!(
!(!(
!(!(
!(
!(
!(!(
!(
!(
!(
!(
!(
!(
!(
!(!(
!(
!(
!(
!(
!(
!(
!(
!(
!(
!(!(
!(!(!(!(
!(!(
!(
!(
!(
!(
!(
!(
!(
!(
!(
!(
!(!(!(
!(
!(
!(
!(
!(!(
!(
SHEET: 1 of 1
REFERENCE:
DRAWING NUMBER: 11:2,000
500-yr ARI Inundation Assessment
at A30 50 10025
Metres®
AssestsType!( Commercial
!( Public
!( Residential
!( Tourism
Inundation Extent
\\FS04\P-Drive\Jobs\5652_SharkBay_CHRMAP\Spatial\ESRI\Mxds\Inundation\5652_500yrARI_PresentDay_A3.mxd
25/07/2018
Denham Townsite CHRMAPImagery: Denham 2017 (Landgate WA) Section 1
Present Day
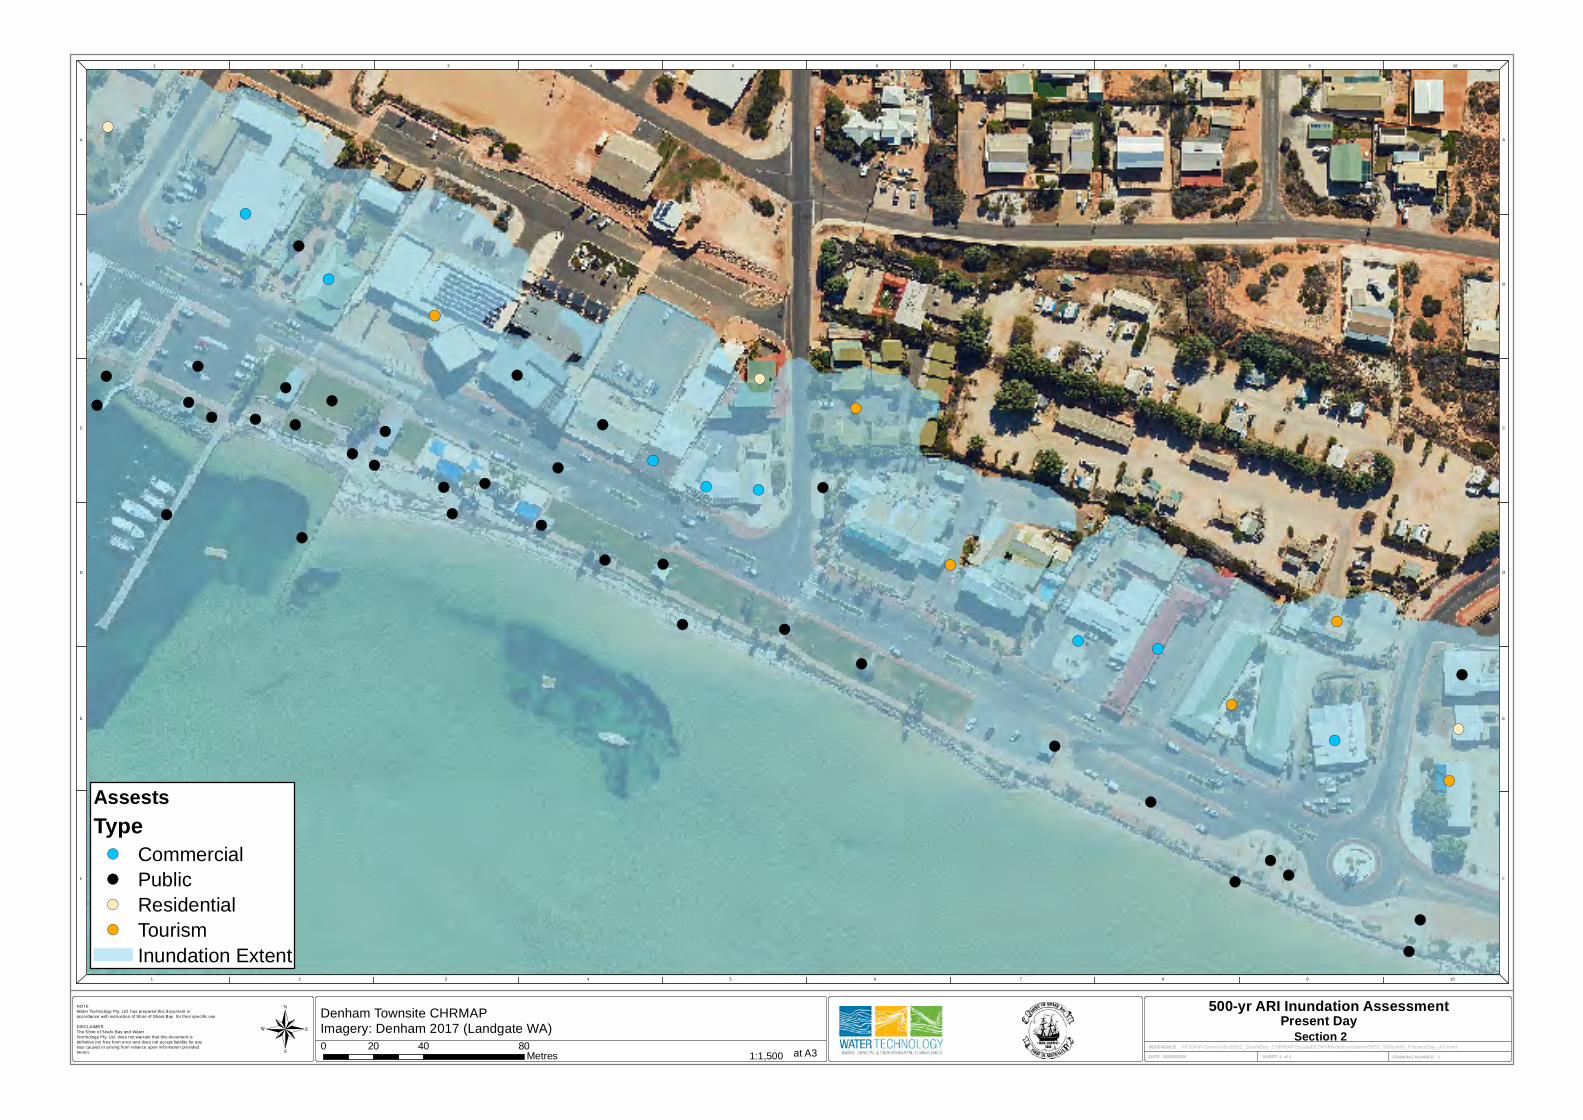
1 2 3 4 5 6 7 8 9 10
1 2 3 4 5 6 7 8 9 10
A
B
C
D
E
F
A
B
C
D
E
F
NOTE
Water Technology Pty. Ltd. has prepared this document in
accordance with instruction of Shire of Shark Bay for their specific use.
DISCLAIMER
The Shire of Shark Bay and Water
Technology Pty. Ltd. does not warrant that this document is
definitive nor free from error and does not accept liability for any
loss caused or arising from rel iance upon information provided
herein.DATE: 30/05/2018
!(
!(
!(
!(
!(
!(
!(
!(!(
!(
!(!(
!(
!(
!(
!(
!(
!(
!(
!(
!(
!(
!(
!(
!(
!(
!(
!(
!(!(!(
!(
!(
!(
!(
!(
!(
!(
!(
!(
!(!(
!(
!(!(
!(!(!(!(!(
!(
!(
!(
!(
!(
!(
!(
SHEET: 1 of 1
REFERENCE:
DRAWING NUMBER: 11:1,500
500-yr ARI Inundation Assessment
at A30 40 8020
Metres®
AssestsType!( Commercial
!( Public
!( Residential
!( Tourism
Inundation Extent
\\FS04\P-Drive\Jobs\5652_SharkBay_CHRMAP\Spatial\ESRI\Mxds\Inundation\5652_500yrARI_PresentDay_A3.mxd
25/07/2018
Denham Townsite CHRMAPImagery: Denham 2017 (Landgate WA) Section 2
Present Day
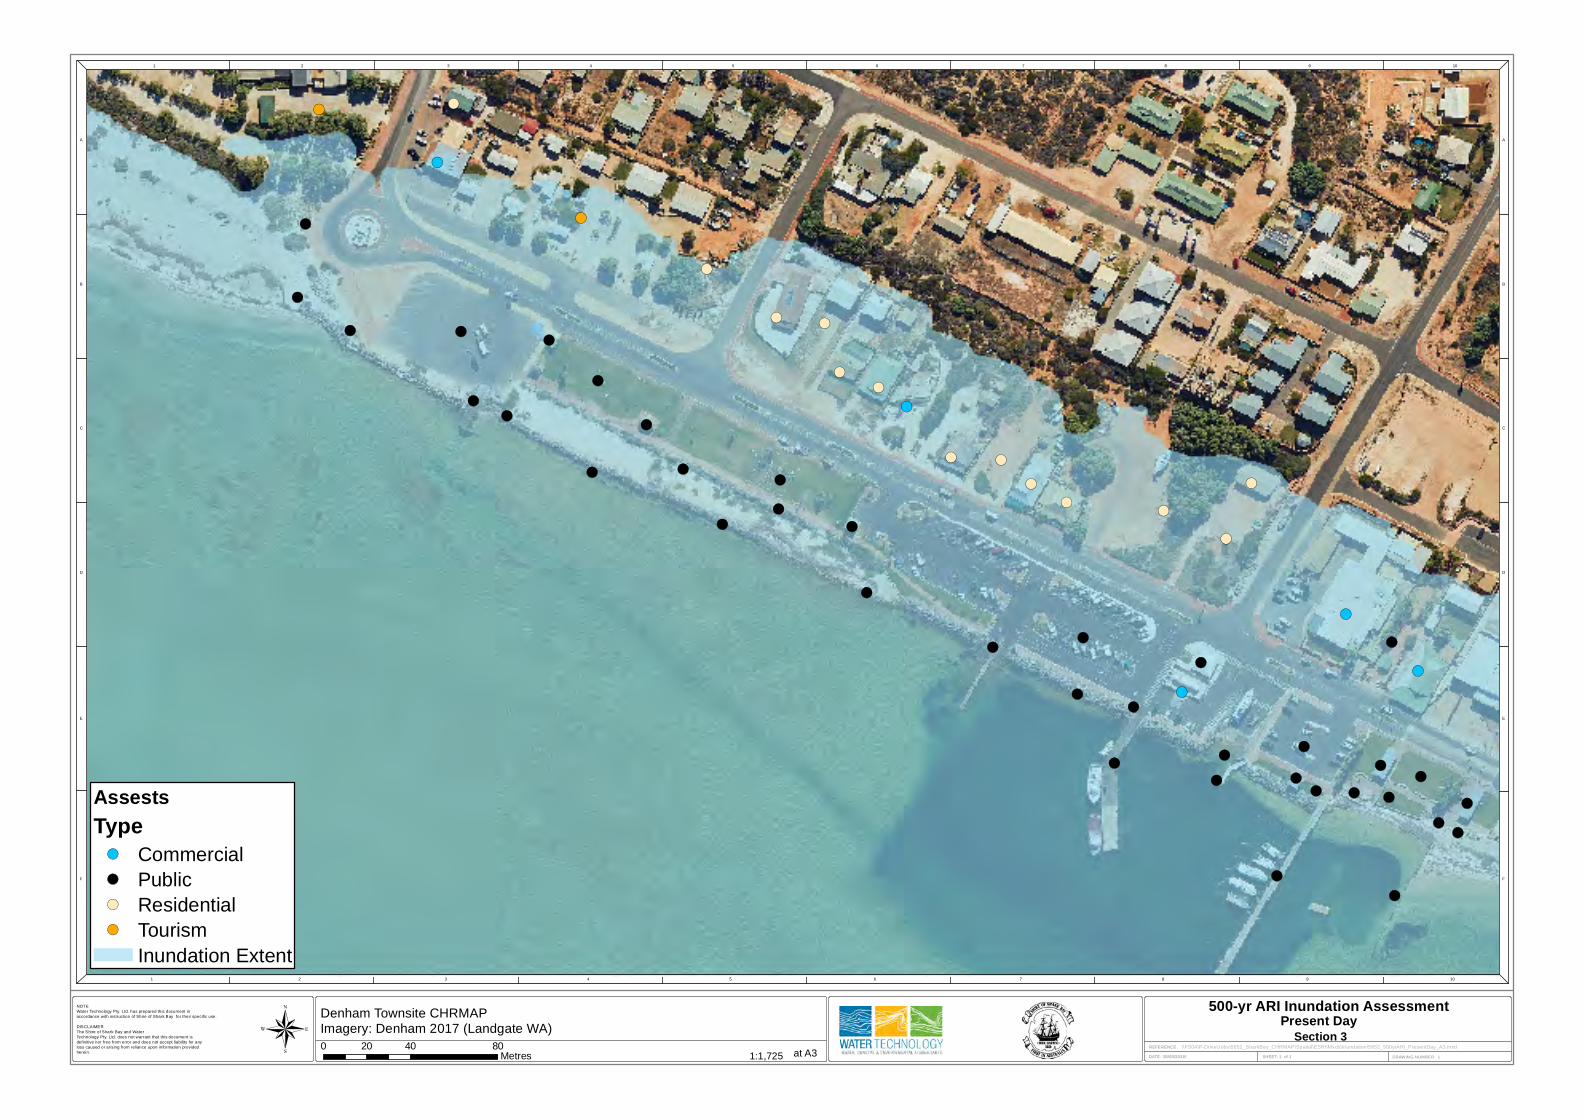
1 2 3 4 5 6 7 8 9 10
1 2 3 4 5 6 7 8 9 10
A
B
C
D
E
F
A
B
C
D
E
F
NOTE
Water Technology Pty. Ltd. has prepared this document in
accordance with instruction of Shire of Shark Bay for their specific use.
DISCLAIMER
The Shire of Shark Bay and Water
Technology Pty. Ltd. does not warrant that this document is
definitive nor free from error and does not accept liability for any
loss caused or arising from rel iance upon information provided
herein.DATE: 30/05/2018
!(
!(
!(
!(
!(
!(
!(!(
!( !(
!(!(
!(
!(
!(
!(!(
!(
!(!(
!(
!(
!(!(
!(!(
!(
!(
!(!(
!(
!(
!(
!(
!(
!(
!( !(
!(
!(
!(
!(
!(
!(
!(!(
!(
!(!(
!(!(!(!(!(
!(
!(
!(
!(!(
!(
!(
SHEET: 1 of 1
REFERENCE:
DRAWING NUMBER: 11:1,725
500-yr ARI Inundation Assessment
at A30 40 8020
Metres®
AssestsType!( Commercial
!( Public
!( Residential
!( Tourism
Inundation Extent
\\FS04\P-Drive\Jobs\5652_SharkBay_CHRMAP\Spatial\ESRI\Mxds\Inundation\5652_500yrARI_PresentDay_A3.mxd
25/07/2018
Denham Townsite CHRMAPImagery: Denham 2017 (Landgate WA) Section 3
Present Day
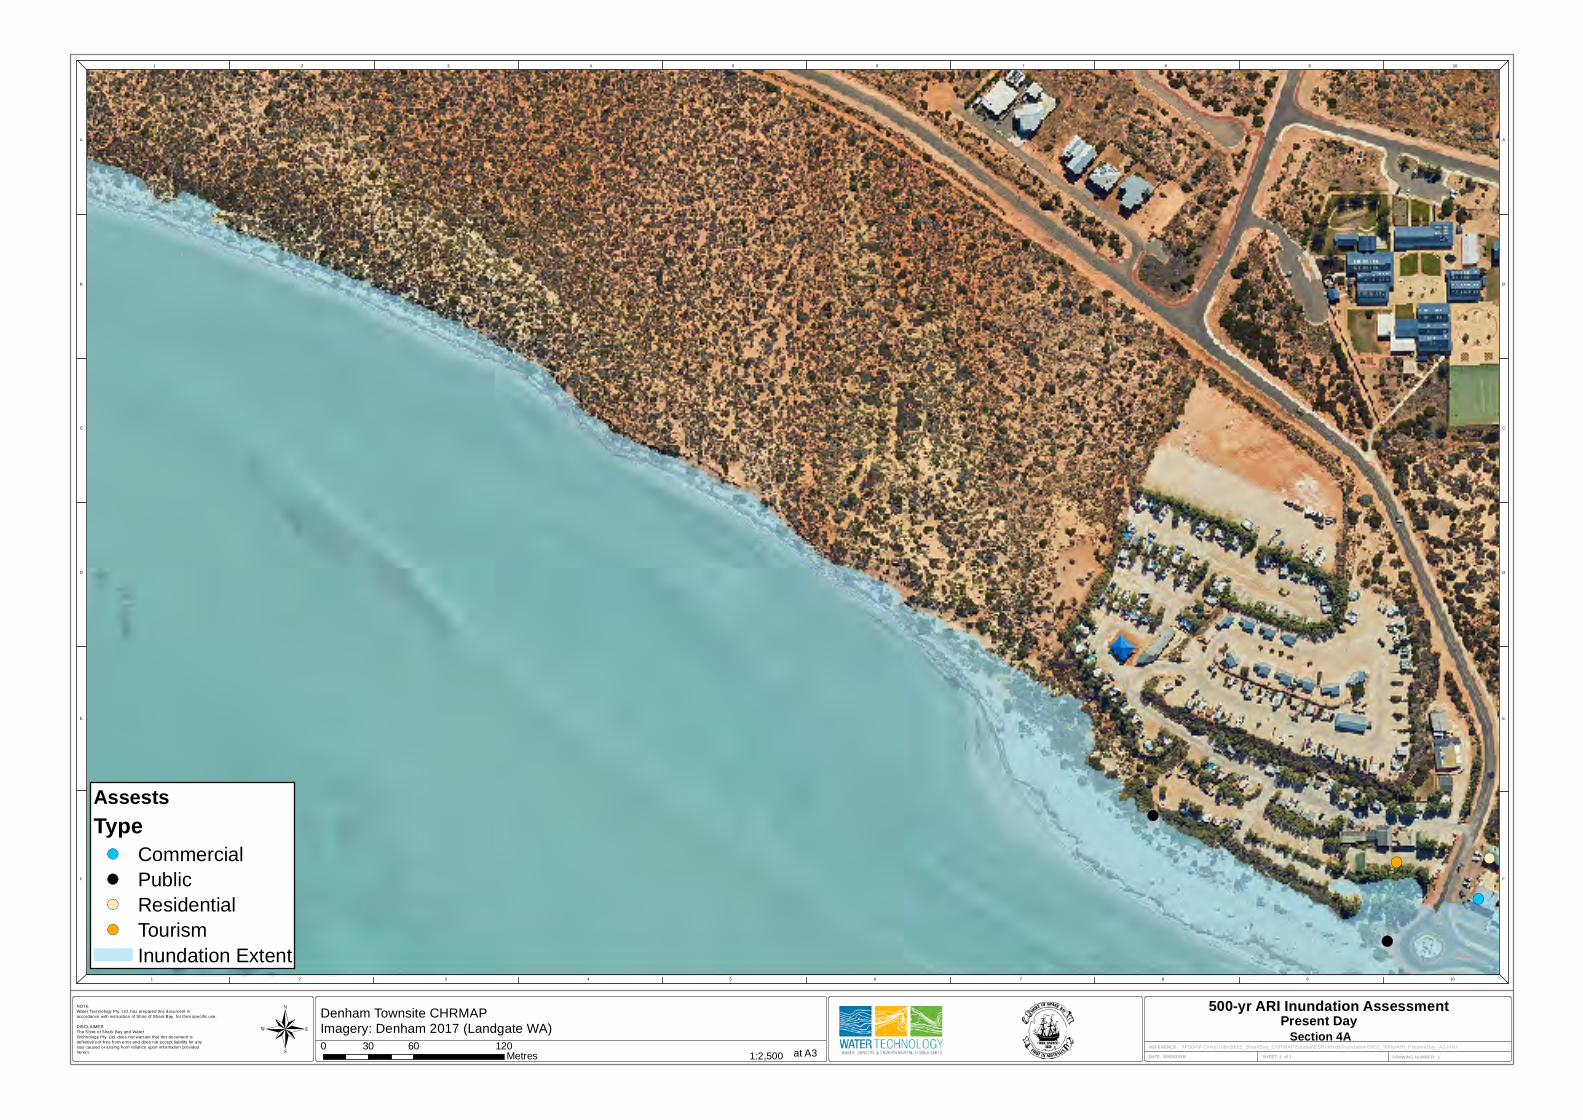
1 2 3 4 5 6 7 8 9 10
1 2 3 4 5 6 7 8 9 10
A
B
C
D
E
F
A
B
C
D
E
F
NOTE
Water Technology Pty. Ltd. has prepared this document in
accordance with instruction of Shire of Shark Bay for their specific use.
DISCLAIMER
The Shire of Shark Bay and Water
Technology Pty. Ltd. does not warrant that this document is
definitive nor free from error and does not accept liability for any
loss caused or arising from rel iance upon information provided
herein.DATE: 30/05/2018
!(
!( !(
!(
!(
!(
SHEET: 1 of 1
REFERENCE:
DRAWING NUMBER: 11:2,500
500-yr ARI Inundation Assessment
at A30 60 12030
Metres®
AssestsType!( Commercial
!( Public
!( Residential
!( Tourism
Inundation Extent
\\FS04\P-Drive\Jobs\5652_SharkBay_CHRMAP\Spatial\ESRI\Mxds\Inundation\5652_500yrARI_PresentDay_A3.mxd
25/07/2018
Denham Townsite CHRMAPImagery: Denham 2017 (Landgate WA) Section 4A
Present Day

1 2 3 4 5 6 7 8 9 10
1 2 3 4 5 6 7 8 9 10
A
B
C
D
E
F
A
B
C
D
E
F
NOTE
Water Technology Pty. Ltd. has prepared this document in
accordance with instruction of Shire of Shark Bay for their specific use.
DISCLAIMER
The Shire of Shark Bay and Water
Technology Pty. Ltd. does not warrant that this document is
definitive nor free from error and does not accept liability for any
loss caused or arising from rel iance upon information provided
herein.DATE: 30/05/2018
!(
SHEET: 1 of 1
REFERENCE:
DRAWING NUMBER: 11:2,500
500-yr ARI Inundation Assessment
at A30 60 12030
Metres®
AssestsType!( Commercial
!( Public
!( Residential
!( Tourism
Inundation Extent
\\FS04\P-Drive\Jobs\5652_SharkBay_CHRMAP\Spatial\ESRI\Mxds\Inundation\5652_500yrARI_PresentDay_A3.mxd
25/07/2018
Denham Townsite CHRMAPImagery: Denham 2017 (Landgate WA) Section 4B
Present Day
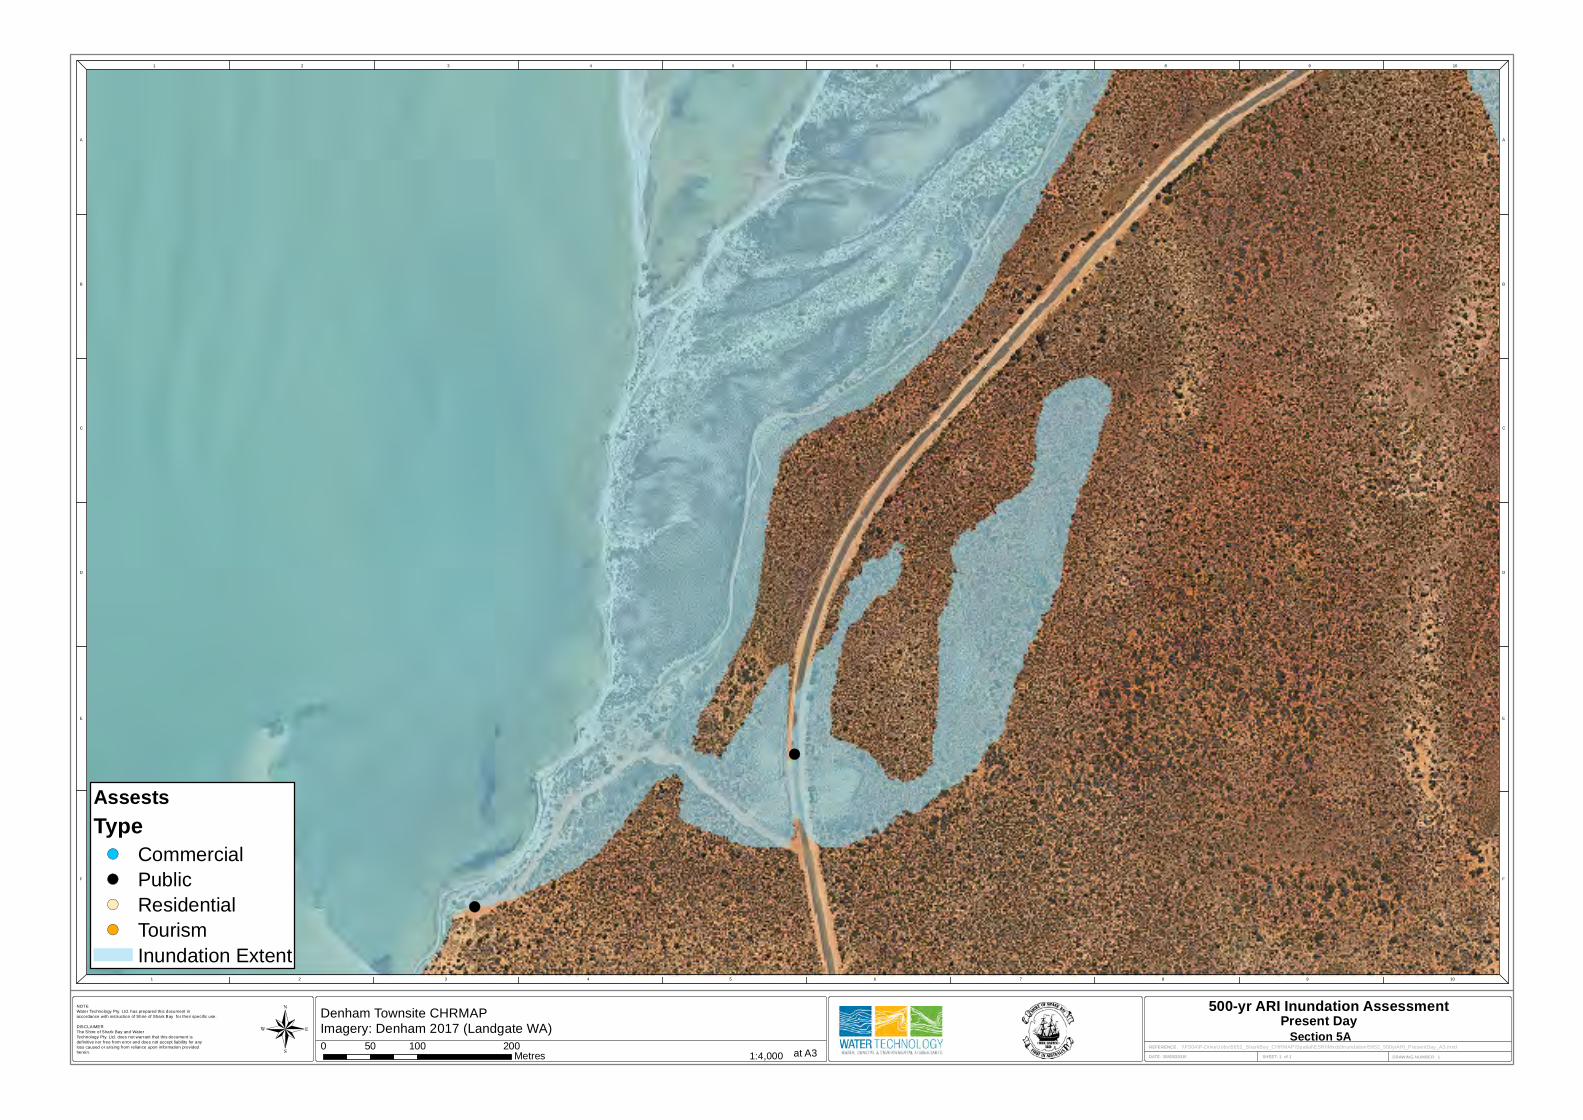
1 2 3 4 5 6 7 8 9 10
1 2 3 4 5 6 7 8 9 10
A
B
C
D
E
F
A
B
C
D
E
F
NOTE
Water Technology Pty. Ltd. has prepared this document in
accordance with instruction of Shire of Shark Bay for their specific use.
DISCLAIMER
The Shire of Shark Bay and Water
Technology Pty. Ltd. does not warrant that this document is
definitive nor free from error and does not accept liability for any
loss caused or arising from rel iance upon information provided
herein.DATE: 30/05/2018
!(
!(
SHEET: 1 of 1
REFERENCE:
DRAWING NUMBER: 11:4,000
500-yr ARI Inundation Assessment
at A30 100 20050
Metres®
AssestsType!( Commercial
!( Public
!( Residential
!( Tourism
Inundation Extent
\\FS04\P-Drive\Jobs\5652_SharkBay_CHRMAP\Spatial\ESRI\Mxds\Inundation\5652_500yrARI_PresentDay_A3.mxd
25/07/2018
Denham Townsite CHRMAPImagery: Denham 2017 (Landgate WA) Section 5A
Present Day
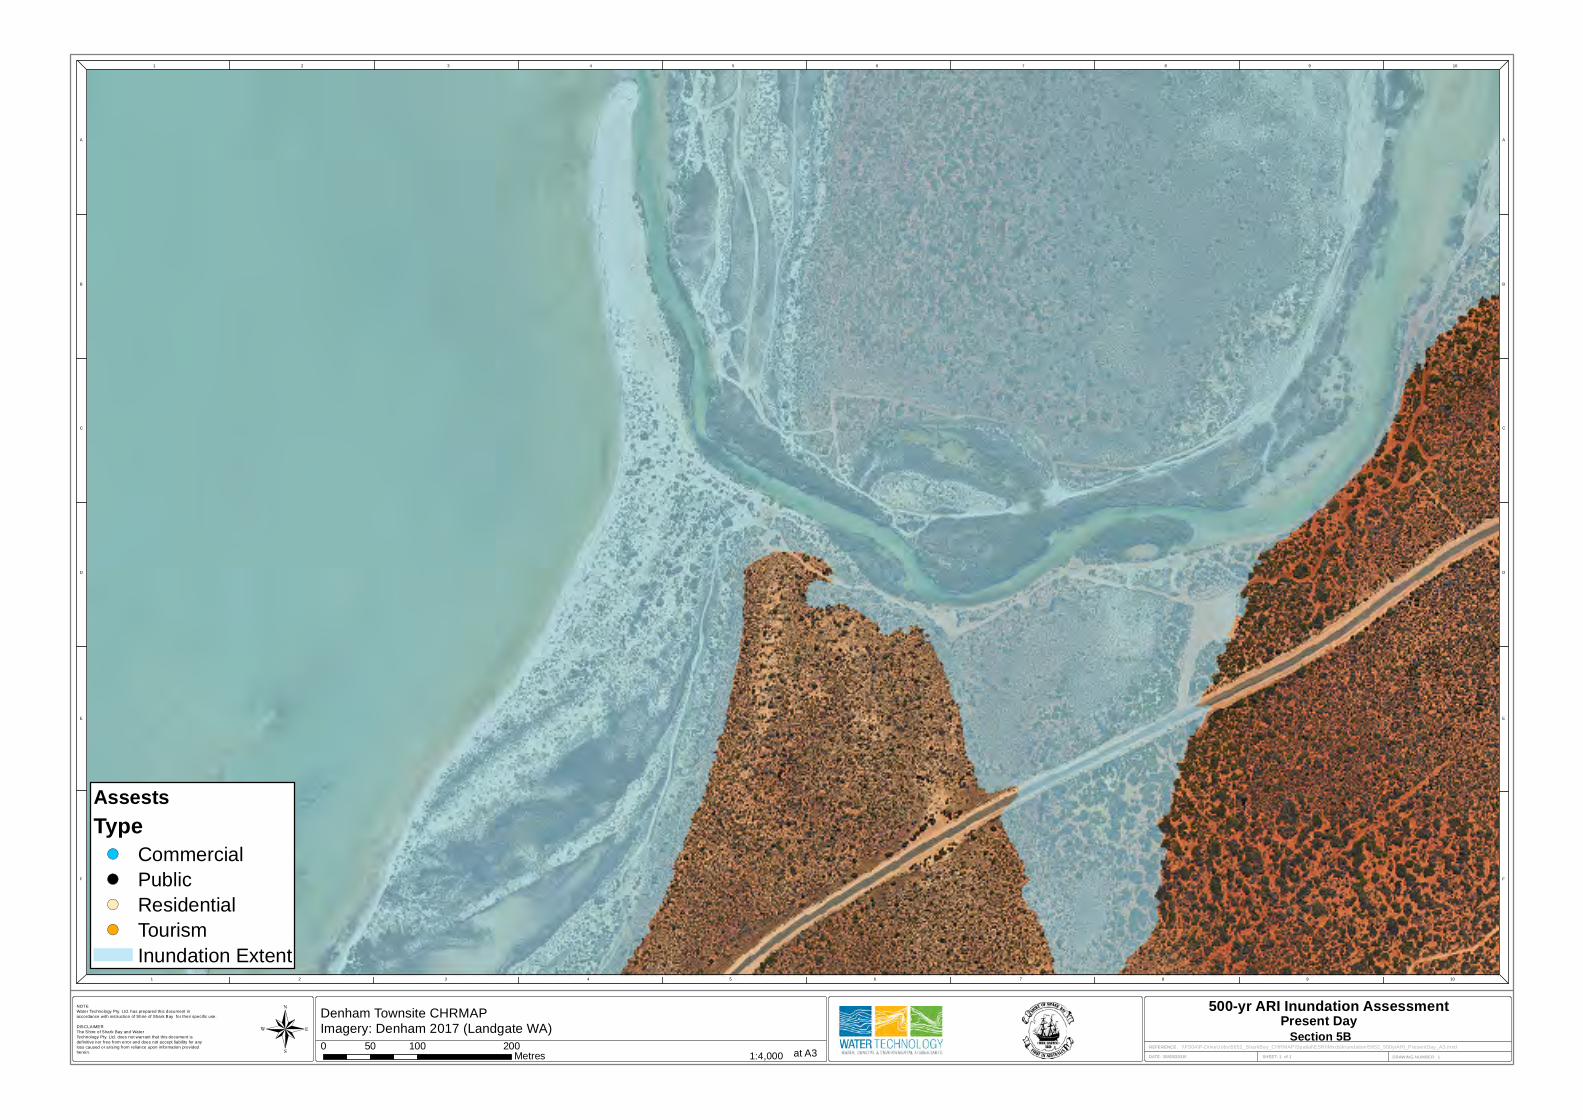
1 2 3 4 5 6 7 8 9 10
1 2 3 4 5 6 7 8 9 10
A
B
C
D
E
F
A
B
C
D
E
F
NOTE
Water Technology Pty. Ltd. has prepared this document in
accordance with instruction of Shire of Shark Bay for their specific use.
DISCLAIMER
The Shire of Shark Bay and Water
Technology Pty. Ltd. does not warrant that this document is
definitive nor free from error and does not accept liability for any
loss caused or arising from rel iance upon information provided
herein.DATE: 30/05/2018 SHEET: 1 of 1
REFERENCE:
DRAWING NUMBER: 11:4,000
500-yr ARI Inundation Assessment
at A30 100 20050
Metres®
AssestsType!( Commercial
!( Public
!( Residential
!( Tourism
Inundation Extent
\\FS04\P-Drive\Jobs\5652_SharkBay_CHRMAP\Spatial\ESRI\Mxds\Inundation\5652_500yrARI_PresentDay_A3.mxd
25/07/2018
Denham Townsite CHRMAPImagery: Denham 2017 (Landgate WA) Section 5B
Present Day

1 2 3 4 5 6 7 8 9 10
1 2 3 4 5 6 7 8 9 10
A
B
C
D
E
F
A
B
C
D
E
F
NOTE
Water Technology Pty. Ltd. has prepared this document in
accordance with instruction of Shire of Shark Bay for their specific use.
DISCLAIMER
The Shire of Shark Bay and Water
Technology Pty. Ltd. does not warrant that this document is
definitive nor free from error and does not accept liability for any
loss caused or arising from rel iance upon information provided
herein.DATE: 30/05/2018
!(
!(
!(!(
!(
!(
!(!(
!(
!(
!(
!(
!(
!(!(
!(!(
!(
!(
!(!(
!(
!(
!(
!(
!(
!(
!(
!(!(
!(
!(
!(
!(
!(
!(
!(
!(
!(
!(!(
!(!(!(!(
!(!(
!(
!(
!(
!(
!(
!(
!(
!(
!(
!(
!(!(!(
!(
!(
!(
!(
!(!(
!(
SHEET: 1 of 1
REFERENCE:
DRAWING NUMBER: 11:2,000
500-yr ARI Inundation Assessment
at A30 50 10025
Metres®
AssestsType!( Commercial
!( Public
!( Residential
!( Tourism
Inundation Extent
\\FS04\P-Drive\Jobs\5652_SharkBay_CHRMAP\Spatial\ESRI\Mxds\Inundation\5652_500yrARI_2030_A3.mxd
25/07/2018
Denham Townsite CHRMAPImagery: Denham 2017 (Landgate WA) Section 1
2030
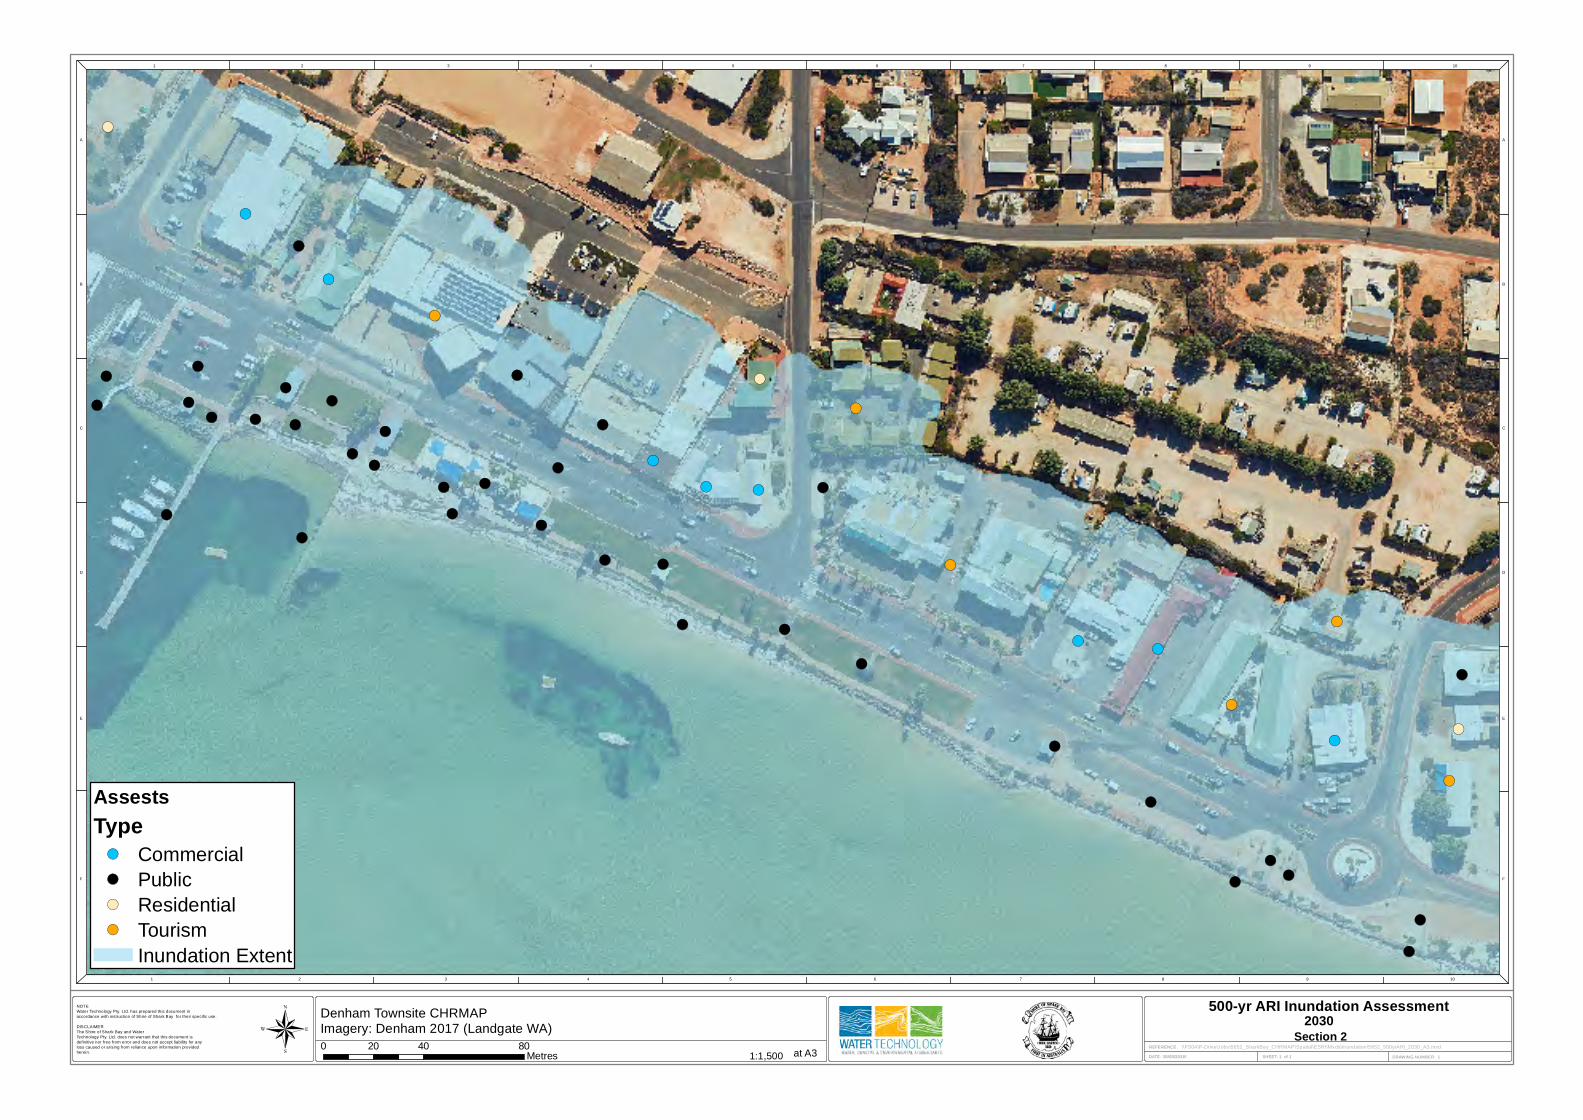
1 2 3 4 5 6 7 8 9 10
1 2 3 4 5 6 7 8 9 10
A
B
C
D
E
F
A
B
C
D
E
F
NOTE
Water Technology Pty. Ltd. has prepared this document in
accordance with instruction of Shire of Shark Bay for their specific use.
DISCLAIMER
The Shire of Shark Bay and Water
Technology Pty. Ltd. does not warrant that this document is
definitive nor free from error and does not accept liability for any
loss caused or arising from rel iance upon information provided
herein.DATE: 30/05/2018
!(
!(
!(
!(
!(
!(
!(
!(!(
!(
!(!(
!(
!(
!(
!(
!(
!(
!(
!(
!(
!(
!(
!(
!(
!(
!(
!(
!(!(!(
!(
!(
!(
!(
!(
!(
!(
!(
!(
!(!(
!(
!(!(
!(!(!(!(!(
!(
!(
!(
!(
!(
!(
!(
SHEET: 1 of 1
REFERENCE:
DRAWING NUMBER: 11:1,500
500-yr ARI Inundation Assessment
at A30 40 8020
Metres®
AssestsType!( Commercial
!( Public
!( Residential
!( Tourism
Inundation Extent
\\FS04\P-Drive\Jobs\5652_SharkBay_CHRMAP\Spatial\ESRI\Mxds\Inundation\5652_500yrARI_2030_A3.mxd
25/07/2018
Denham Townsite CHRMAPImagery: Denham 2017 (Landgate WA) Section 2
2030
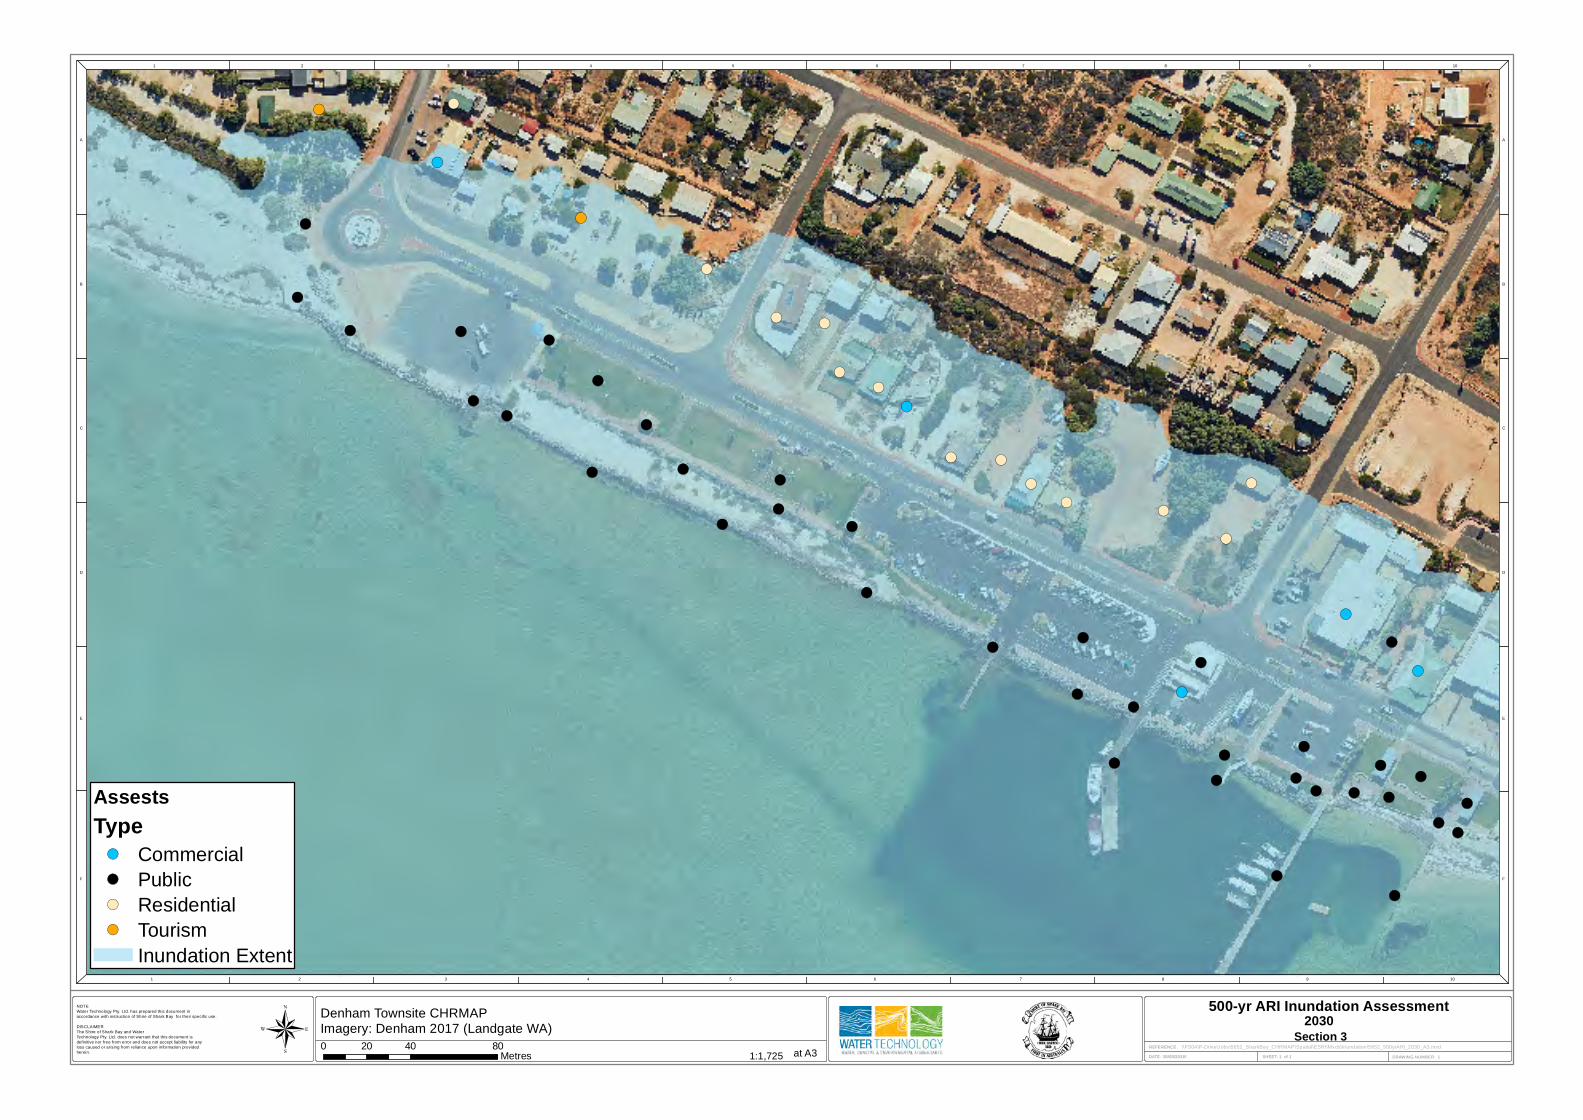
1 2 3 4 5 6 7 8 9 10
1 2 3 4 5 6 7 8 9 10
A
B
C
D
E
F
A
B
C
D
E
F
NOTE
Water Technology Pty. Ltd. has prepared this document in
accordance with instruction of Shire of Shark Bay for their specific use.
DISCLAIMER
The Shire of Shark Bay and Water
Technology Pty. Ltd. does not warrant that this document is
definitive nor free from error and does not accept liability for any
loss caused or arising from rel iance upon information provided
herein.DATE: 30/05/2018
!(
!(
!(
!(
!(
!(
!(!(
!( !(
!(!(
!(
!(
!(
!(!(
!(
!(!(
!(
!(
!(!(
!(!(
!(
!(
!(!(
!(
!(
!(
!(
!(
!(
!( !(
!(
!(
!(
!(
!(
!(
!(!(
!(
!(!(
!(!(!(!(!(
!(
!(
!(
!(!(
!(
!(
SHEET: 1 of 1
REFERENCE:
DRAWING NUMBER: 11:1,725
500-yr ARI Inundation Assessment
at A30 40 8020
Metres®
AssestsType!( Commercial
!( Public
!( Residential
!( Tourism
Inundation Extent
\\FS04\P-Drive\Jobs\5652_SharkBay_CHRMAP\Spatial\ESRI\Mxds\Inundation\5652_500yrARI_2030_A3.mxd
25/07/2018
Denham Townsite CHRMAPImagery: Denham 2017 (Landgate WA) Section 3
2030

1 2 3 4 5 6 7 8 9 10
1 2 3 4 5 6 7 8 9 10
A
B
C
D
E
F
A
B
C
D
E
F
NOTE
Water Technology Pty. Ltd. has prepared this document in
accordance with instruction of Shire of Shark Bay for their specific use.
DISCLAIMER
The Shire of Shark Bay and Water
Technology Pty. Ltd. does not warrant that this document is
definitive nor free from error and does not accept liability for any
loss caused or arising from rel iance upon information provided
herein.DATE: 30/05/2018
!(
!( !(
!(
!(
!(
SHEET: 1 of 1
REFERENCE:
DRAWING NUMBER: 11:2,500
500-yr ARI Inundation Assessment
at A30 60 12030
Metres®
AssestsType!( Commercial
!( Public
!( Residential
!( Tourism
Inundation Extent
\\FS04\P-Drive\Jobs\5652_SharkBay_CHRMAP\Spatial\ESRI\Mxds\Inundation\5652_500yrARI_2030_A3.mxd
25/07/2018
Denham Townsite CHRMAPImagery: Denham 2017 (Landgate WA) Section 4A
2030
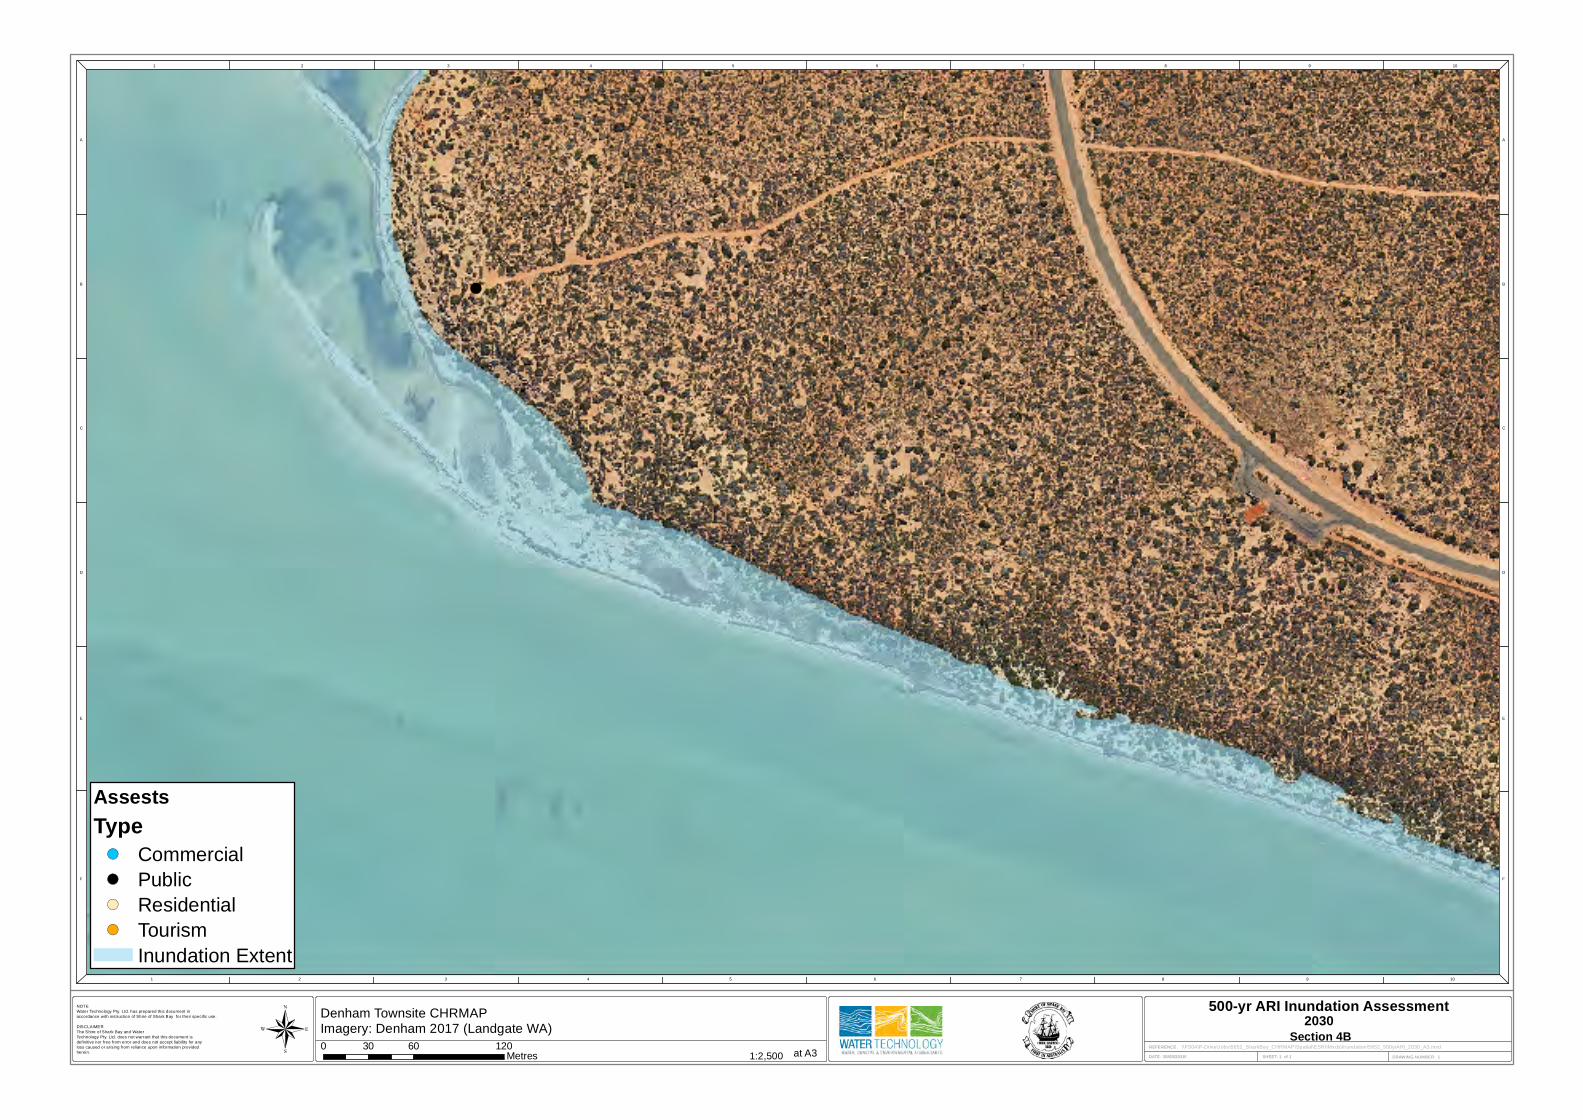
1 2 3 4 5 6 7 8 9 10
1 2 3 4 5 6 7 8 9 10
A
B
C
D
E
F
A
B
C
D
E
F
NOTE
Water Technology Pty. Ltd. has prepared this document in
accordance with instruction of Shire of Shark Bay for their specific use.
DISCLAIMER
The Shire of Shark Bay and Water
Technology Pty. Ltd. does not warrant that this document is
definitive nor free from error and does not accept liability for any
loss caused or arising from rel iance upon information provided
herein.DATE: 30/05/2018
!(
SHEET: 1 of 1
REFERENCE:
DRAWING NUMBER: 11:2,500
500-yr ARI Inundation Assessment
at A30 60 12030
Metres®
AssestsType!( Commercial
!( Public
!( Residential
!( Tourism
Inundation Extent
\\FS04\P-Drive\Jobs\5652_SharkBay_CHRMAP\Spatial\ESRI\Mxds\Inundation\5652_500yrARI_2030_A3.mxd
25/07/2018
Denham Townsite CHRMAPImagery: Denham 2017 (Landgate WA) Section 4B
2030
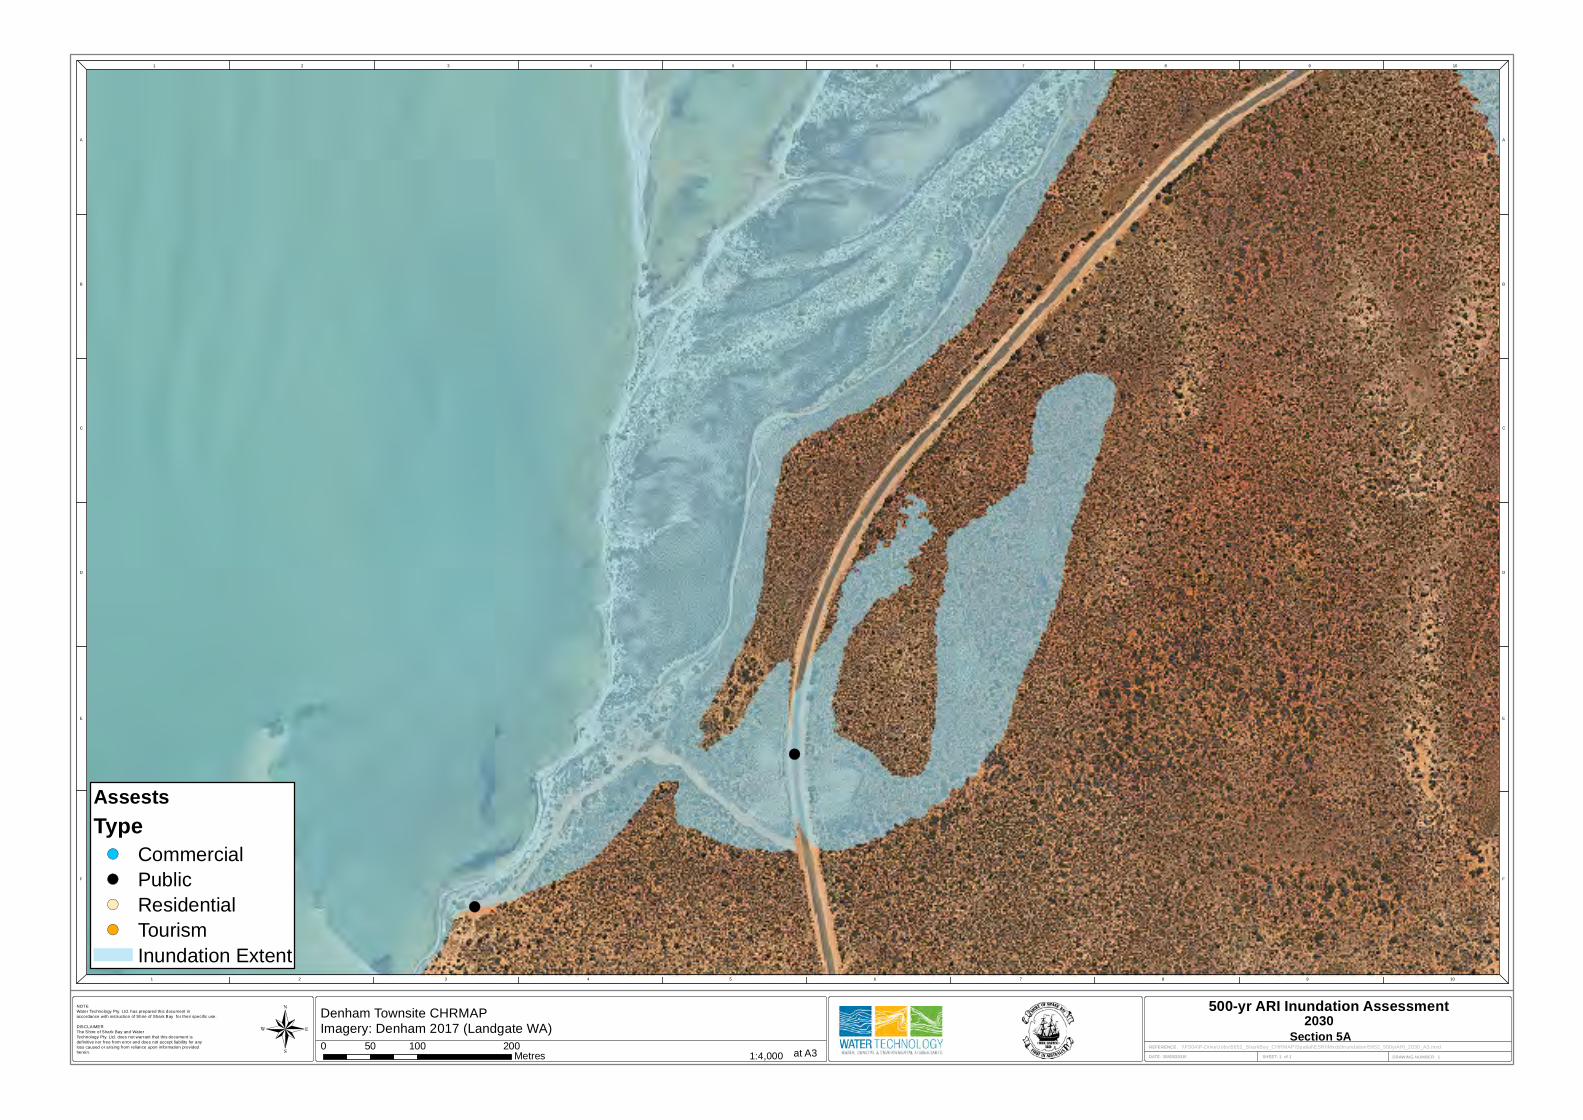
1 2 3 4 5 6 7 8 9 10
1 2 3 4 5 6 7 8 9 10
A
B
C
D
E
F
A
B
C
D
E
F
NOTE
Water Technology Pty. Ltd. has prepared this document in
accordance with instruction of Shire of Shark Bay for their specific use.
DISCLAIMER
The Shire of Shark Bay and Water
Technology Pty. Ltd. does not warrant that this document is
definitive nor free from error and does not accept liability for any
loss caused or arising from rel iance upon information provided
herein.DATE: 30/05/2018
!(
!(
SHEET: 1 of 1
REFERENCE:
DRAWING NUMBER: 11:4,000
500-yr ARI Inundation Assessment
at A30 100 20050
Metres®
AssestsType!( Commercial
!( Public
!( Residential
!( Tourism
Inundation Extent
\\FS04\P-Drive\Jobs\5652_SharkBay_CHRMAP\Spatial\ESRI\Mxds\Inundation\5652_500yrARI_2030_A3.mxd
25/07/2018
Denham Townsite CHRMAPImagery: Denham 2017 (Landgate WA) Section 5A
2030

1 2 3 4 5 6 7 8 9 10
1 2 3 4 5 6 7 8 9 10
A
B
C
D
E
F
A
B
C
D
E
F
NOTE
Water Technology Pty. Ltd. has prepared this document in
accordance with instruction of Shire of Shark Bay for their specific use.
DISCLAIMER
The Shire of Shark Bay and Water
Technology Pty. Ltd. does not warrant that this document is
definitive nor free from error and does not accept liability for any
loss caused or arising from rel iance upon information provided
herein.DATE: 30/05/2018 SHEET: 1 of 1
REFERENCE:
DRAWING NUMBER: 11:4,000
500-yr ARI Inundation Assessment
at A30 100 20050
Metres®
AssestsType!( Commercial
!( Public
!( Residential
!( Tourism
Inundation Extent
\\FS04\P-Drive\Jobs\5652_SharkBay_CHRMAP\Spatial\ESRI\Mxds\Inundation\5652_500yrARI_2030_A3.mxd
25/07/2018
Denham Townsite CHRMAPImagery: Denham 2017 (Landgate WA) Section 5B
2030

1 2 3 4 5 6 7 8 9 10
1 2 3 4 5 6 7 8 9 10
A
B
C
D
E
F
A
B
C
D
E
F
NOTE
Water Technology Pty. Ltd. has prepared this document in
accordance with instruction of Shire of Shark Bay for their specific use.
DISCLAIMER
The Shire of Shark Bay and Water
Technology Pty. Ltd. does not warrant that this document is
definitive nor free from error and does not accept liability for any
loss caused or arising from rel iance upon information provided
herein.DATE: 30/05/2018
!(
!(
!(!(
!(
!(
!(!(
!(
!(
!(
!(
!(
!(!(
!(!(
!(
!(
!(!(
!(
!(
!(
!(
!(
!(
!(
!(!(
!(
!(
!(
!(
!(
!(
!(
!(
!(
!(!(
!(!(!(!(
!(!(
!(
!(
!(
!(
!(
!(
!(
!(
!(
!(
!(!(!(
!(
!(
!(
!(
!(!(
!(
SHEET: 1 of 1
REFERENCE:
DRAWING NUMBER: 11:2,000
500-yr ARI Inundation Assessment
at A30 50 10025
Metres®
AssestsType!( Commercial
!( Public
!( Residential
!( Tourism
Inundation Extent
\\FS04\P-Drive\Jobs\5652_SharkBay_CHRMAP\Spatial\ESRI\Mxds\Inundation\5652_500yrARI_2050_A3.mxd
25/07/2018
Denham Townsite CHRMAPImagery: Denham 2017 (Landgate WA) Section 1
2050

1 2 3 4 5 6 7 8 9 10
1 2 3 4 5 6 7 8 9 10
A
B
C
D
E
F
A
B
C
D
E
F
NOTE
Water Technology Pty. Ltd. has prepared this document in
accordance with instruction of Shire of Shark Bay for their specific use.
DISCLAIMER
The Shire of Shark Bay and Water
Technology Pty. Ltd. does not warrant that this document is
definitive nor free from error and does not accept liability for any
loss caused or arising from rel iance upon information provided
herein.DATE: 30/05/2018
!(
!(
!(
!(
!(
!(
!(
!(!(
!(
!(!(
!(
!(
!(
!(
!(
!(
!(
!(
!(
!(
!(
!(
!(
!(
!(
!(
!(!(!(
!(
!(
!(
!(
!(
!(
!(
!(
!(
!(!(
!(
!(!(
!(!(!(!(!(
!(
!(
!(
!(
!(
!(
!(
SHEET: 1 of 1
REFERENCE:
DRAWING NUMBER: 11:1,500
500-yr ARI Inundation Assessment
at A30 40 8020
Metres®
AssestsType!( Commercial
!( Public
!( Residential
!( Tourism
Inundation Extent
\\FS04\P-Drive\Jobs\5652_SharkBay_CHRMAP\Spatial\ESRI\Mxds\Inundation\5652_500yrARI_2050_A3.mxd
25/07/2018
Denham Townsite CHRMAPImagery: Denham 2017 (Landgate WA) Section 2
2050

1 2 3 4 5 6 7 8 9 10
1 2 3 4 5 6 7 8 9 10
A
B
C
D
E
F
A
B
C
D
E
F
NOTE
Water Technology Pty. Ltd. has prepared this document in
accordance with instruction of Shire of Shark Bay for their specific use.
DISCLAIMER
The Shire of Shark Bay and Water
Technology Pty. Ltd. does not warrant that this document is
definitive nor free from error and does not accept liability for any
loss caused or arising from rel iance upon information provided
herein.DATE: 30/05/2018
!(
!(
!(
!(
!(
!(
!(!(
!( !(
!(!(
!(
!(
!(
!(!(
!(
!(!(
!(
!(
!(!(
!(!(
!(
!(
!(!(
!(
!(
!(
!(
!(
!(
!( !(
!(
!(
!(
!(
!(
!(
!(!(
!(
!(!(
!(!(!(!(!(
!(
!(
!(
!(!(
!(
!(
SHEET: 1 of 1
REFERENCE:
DRAWING NUMBER: 11:1,725
500-yr ARI Inundation Assessment
at A30 40 8020
Metres®
AssestsType!( Commercial
!( Public
!( Residential
!( Tourism
Inundation Extent
\\FS04\P-Drive\Jobs\5652_SharkBay_CHRMAP\Spatial\ESRI\Mxds\Inundation\5652_500yrARI_2050_A3.mxd
25/07/2018
Denham Townsite CHRMAPImagery: Denham 2017 (Landgate WA) Section 3
2050

1 2 3 4 5 6 7 8 9 10
1 2 3 4 5 6 7 8 9 10
A
B
C
D
E
F
A
B
C
D
E
F
NOTE
Water Technology Pty. Ltd. has prepared this document in
accordance with instruction of Shire of Shark Bay for their specific use.
DISCLAIMER
The Shire of Shark Bay and Water
Technology Pty. Ltd. does not warrant that this document is
definitive nor free from error and does not accept liability for any
loss caused or arising from rel iance upon information provided
herein.DATE: 30/05/2018
!(
!( !(
!(
!(
!(
SHEET: 1 of 1
REFERENCE:
DRAWING NUMBER: 11:2,500
500-yr ARI Inundation Assessment
at A30 60 12030
Metres®
AssestsType!( Commercial
!( Public
!( Residential
!( Tourism
Inundation Extent
\\FS04\P-Drive\Jobs\5652_SharkBay_CHRMAP\Spatial\ESRI\Mxds\Inundation\5652_500yrARI_2050_A3.mxd
25/07/2018
Denham Townsite CHRMAPImagery: Denham 2017 (Landgate WA) Section 4A
2050

1 2 3 4 5 6 7 8 9 10
1 2 3 4 5 6 7 8 9 10
A
B
C
D
E
F
A
B
C
D
E
F
NOTE
Water Technology Pty. Ltd. has prepared this document in
accordance with instruction of Shire of Shark Bay for their specific use.
DISCLAIMER
The Shire of Shark Bay and Water
Technology Pty. Ltd. does not warrant that this document is
definitive nor free from error and does not accept liability for any
loss caused or arising from rel iance upon information provided
herein.DATE: 30/05/2018
!(
SHEET: 1 of 1
REFERENCE:
DRAWING NUMBER: 11:2,500
500-yr ARI Inundation Assessment
at A30 60 12030
Metres®
AssestsType!( Commercial
!( Public
!( Residential
!( Tourism
Inundation Extent
\\FS04\P-Drive\Jobs\5652_SharkBay_CHRMAP\Spatial\ESRI\Mxds\Inundation\5652_500yrARI_2050_A3.mxd
25/07/2018
Denham Townsite CHRMAPImagery: Denham 2017 (Landgate WA) Section 4B
2050
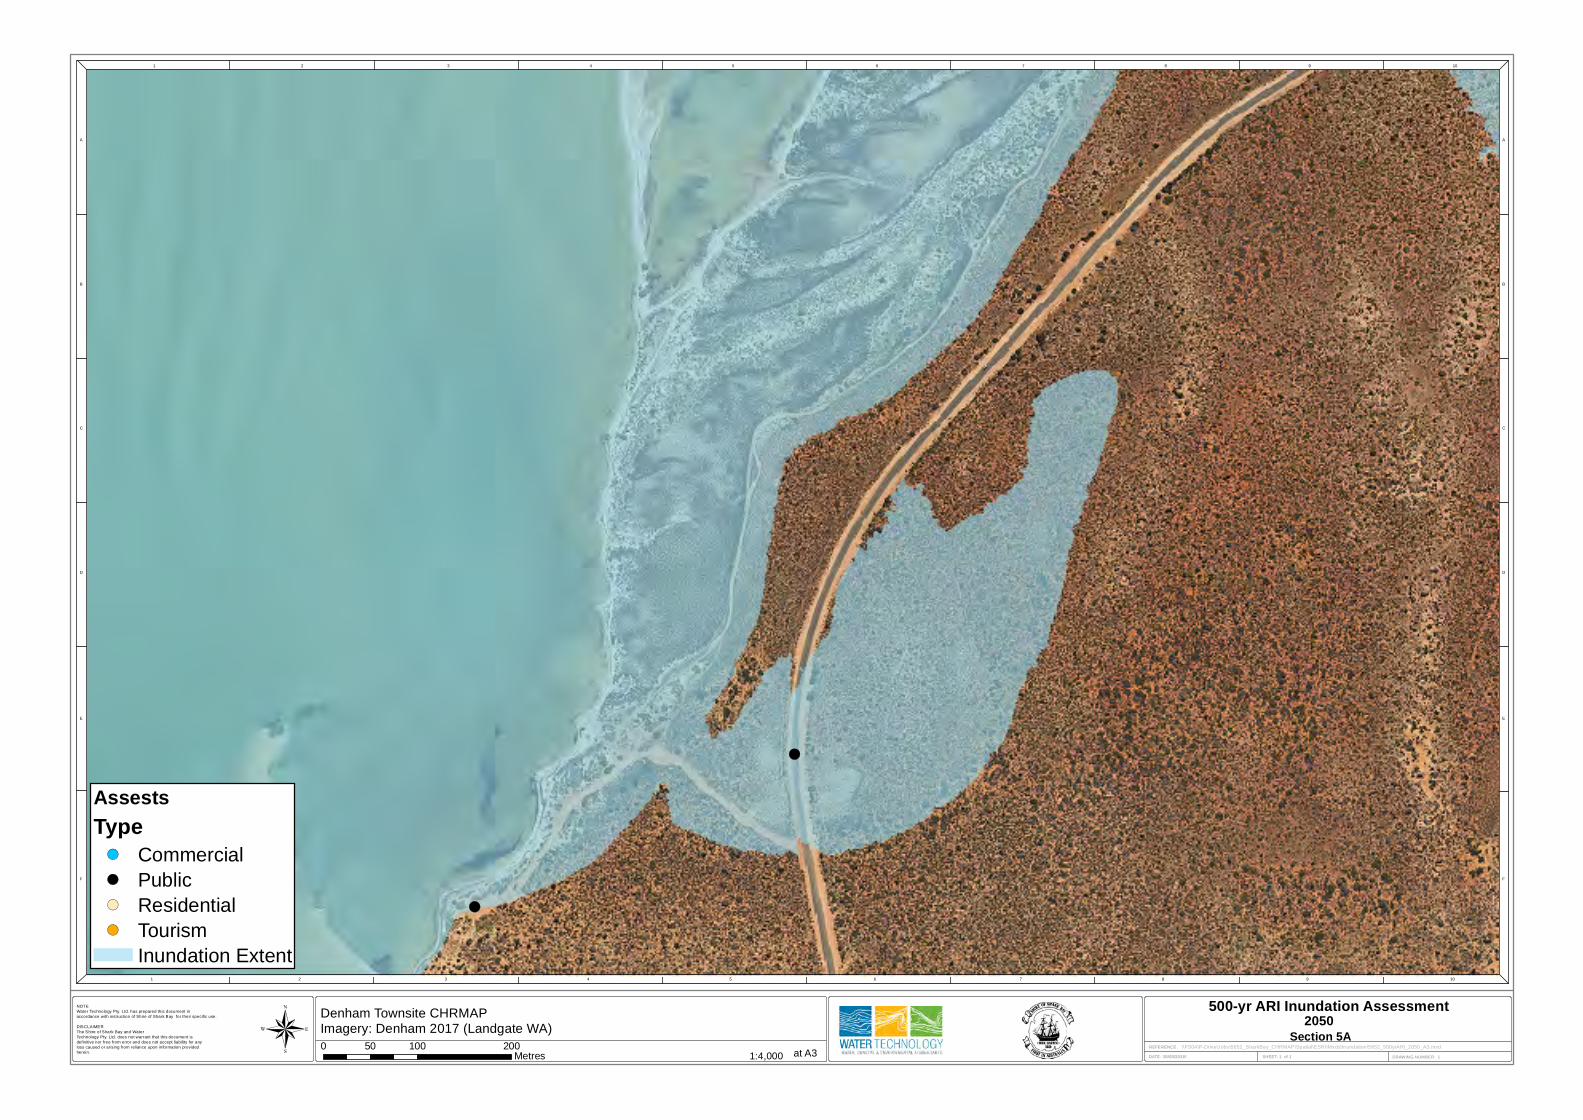
1 2 3 4 5 6 7 8 9 10
1 2 3 4 5 6 7 8 9 10
A
B
C
D
E
F
A
B
C
D
E
F
NOTE
Water Technology Pty. Ltd. has prepared this document in
accordance with instruction of Shire of Shark Bay for their specific use.
DISCLAIMER
The Shire of Shark Bay and Water
Technology Pty. Ltd. does not warrant that this document is
definitive nor free from error and does not accept liability for any
loss caused or arising from rel iance upon information provided
herein.DATE: 30/05/2018
!(
!(
SHEET: 1 of 1
REFERENCE:
DRAWING NUMBER: 11:4,000
500-yr ARI Inundation Assessment
at A30 100 20050
Metres®
AssestsType!( Commercial
!( Public
!( Residential
!( Tourism
Inundation Extent
\\FS04\P-Drive\Jobs\5652_SharkBay_CHRMAP\Spatial\ESRI\Mxds\Inundation\5652_500yrARI_2050_A3.mxd
25/07/2018
Denham Townsite CHRMAPImagery: Denham 2017 (Landgate WA) Section 5A
2050

1 2 3 4 5 6 7 8 9 10
1 2 3 4 5 6 7 8 9 10
A
B
C
D
E
F
A
B
C
D
E
F
NOTE
Water Technology Pty. Ltd. has prepared this document in
accordance with instruction of Shire of Shark Bay for their specific use.
DISCLAIMER
The Shire of Shark Bay and Water
Technology Pty. Ltd. does not warrant that this document is
definitive nor free from error and does not accept liability for any
loss caused or arising from rel iance upon information provided
herein.DATE: 30/05/2018 SHEET: 1 of 1
REFERENCE:
DRAWING NUMBER: 11:4,000
500-yr ARI Inundation Assessment
at A30 100 20050
Metres®
AssestsType!( Commercial
!( Public
!( Residential
!( Tourism
Inundation Extent
\\FS04\P-Drive\Jobs\5652_SharkBay_CHRMAP\Spatial\ESRI\Mxds\Inundation\5652_500yrARI_2050_A3.mxd
25/07/2018
Denham Townsite CHRMAPImagery: Denham 2017 (Landgate WA) Section 5B
2050
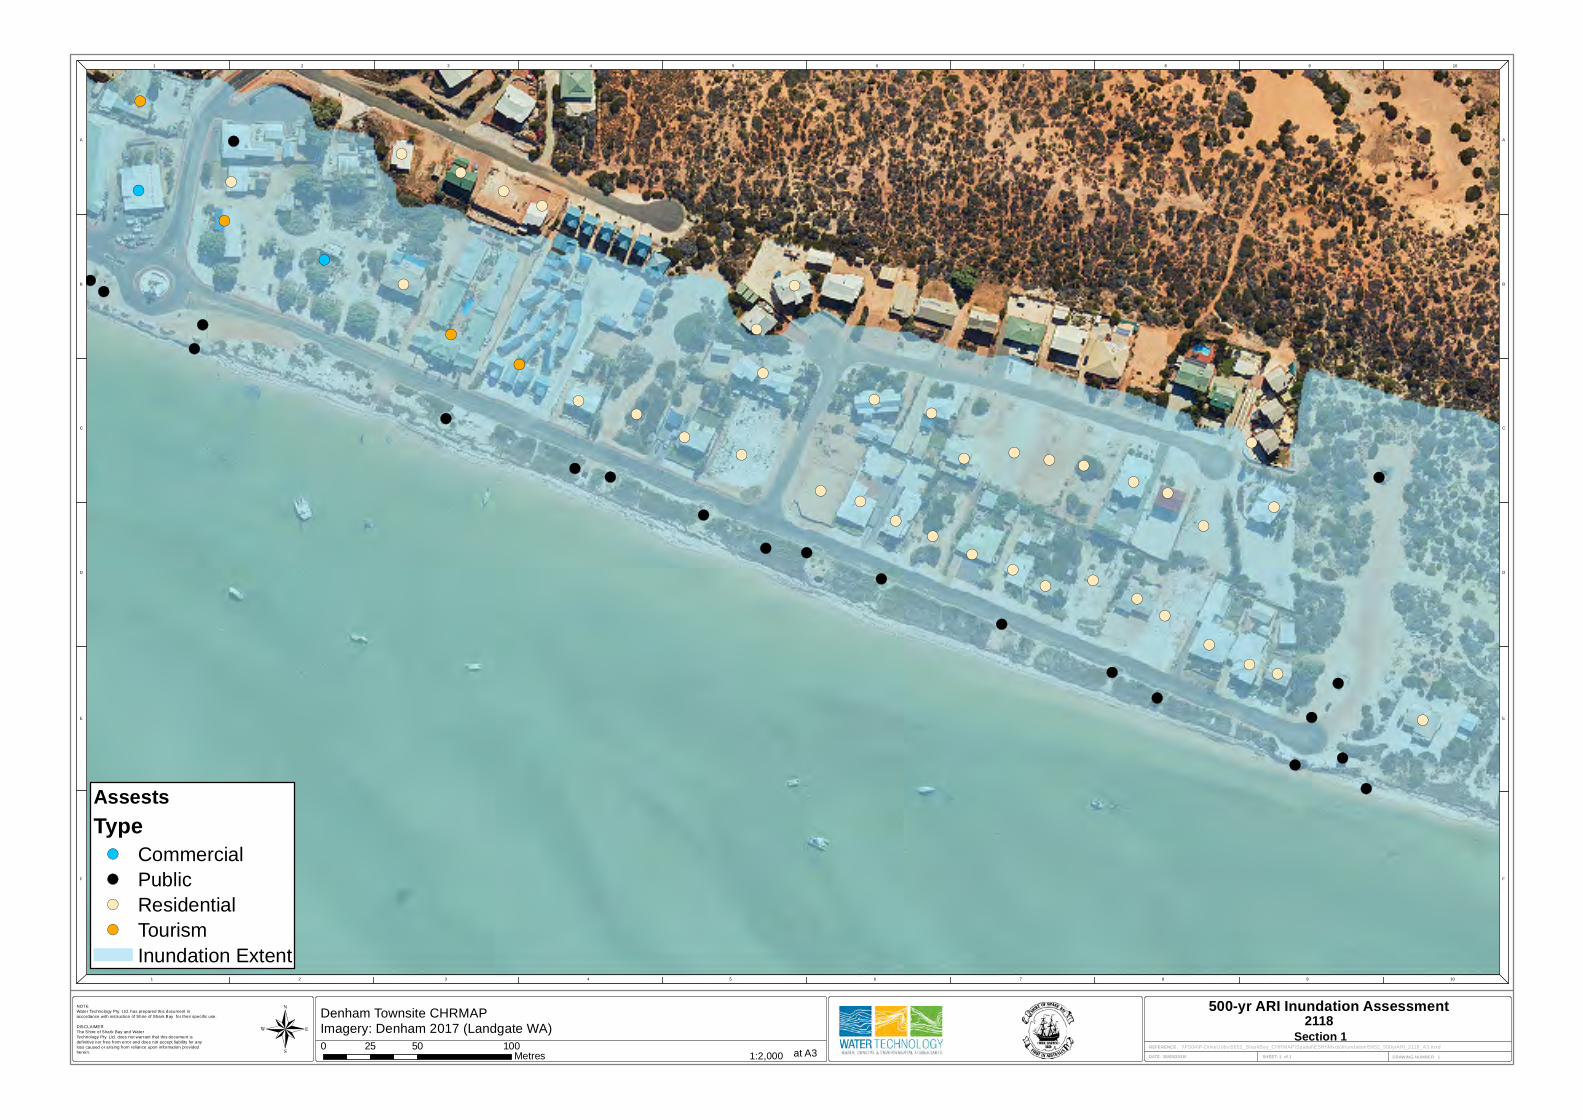
1 2 3 4 5 6 7 8 9 10
1 2 3 4 5 6 7 8 9 10
A
B
C
D
E
F
A
B
C
D
E
F
NOTE
Water Technology Pty. Ltd. has prepared this document in
accordance with instruction of Shire of Shark Bay for their specific use.
DISCLAIMER
The Shire of Shark Bay and Water
Technology Pty. Ltd. does not warrant that this document is
definitive nor free from error and does not accept liability for any
loss caused or arising from rel iance upon information provided
herein.DATE: 30/05/2018
!(
!(
!(!(
!(
!(
!(!(
!(
!(
!(
!(
!(
!(!(
!(!(
!(
!(
!(!(
!(
!(
!(
!(
!(
!(
!(
!(!(
!(
!(
!(
!(
!(
!(
!(
!(
!(
!(!(
!(!(!(!(
!(!(
!(
!(
!(
!(
!(
!(
!(
!(
!(
!(
!(!(!(
!(
!(
!(
!(
!(!(
!(
SHEET: 1 of 1
REFERENCE:
DRAWING NUMBER: 11:2,000
500-yr ARI Inundation Assessment
at A30 50 10025
Metres®
AssestsType!( Commercial
!( Public
!( Residential
!( Tourism
Inundation Extent
\\FS04\P-Drive\Jobs\5652_SharkBay_CHRMAP\Spatial\ESRI\Mxds\Inundation\5652_500yrARI_2118_A3.mxd
25/07/2018
Denham Townsite CHRMAPImagery: Denham 2017 (Landgate WA) Section 1
2118
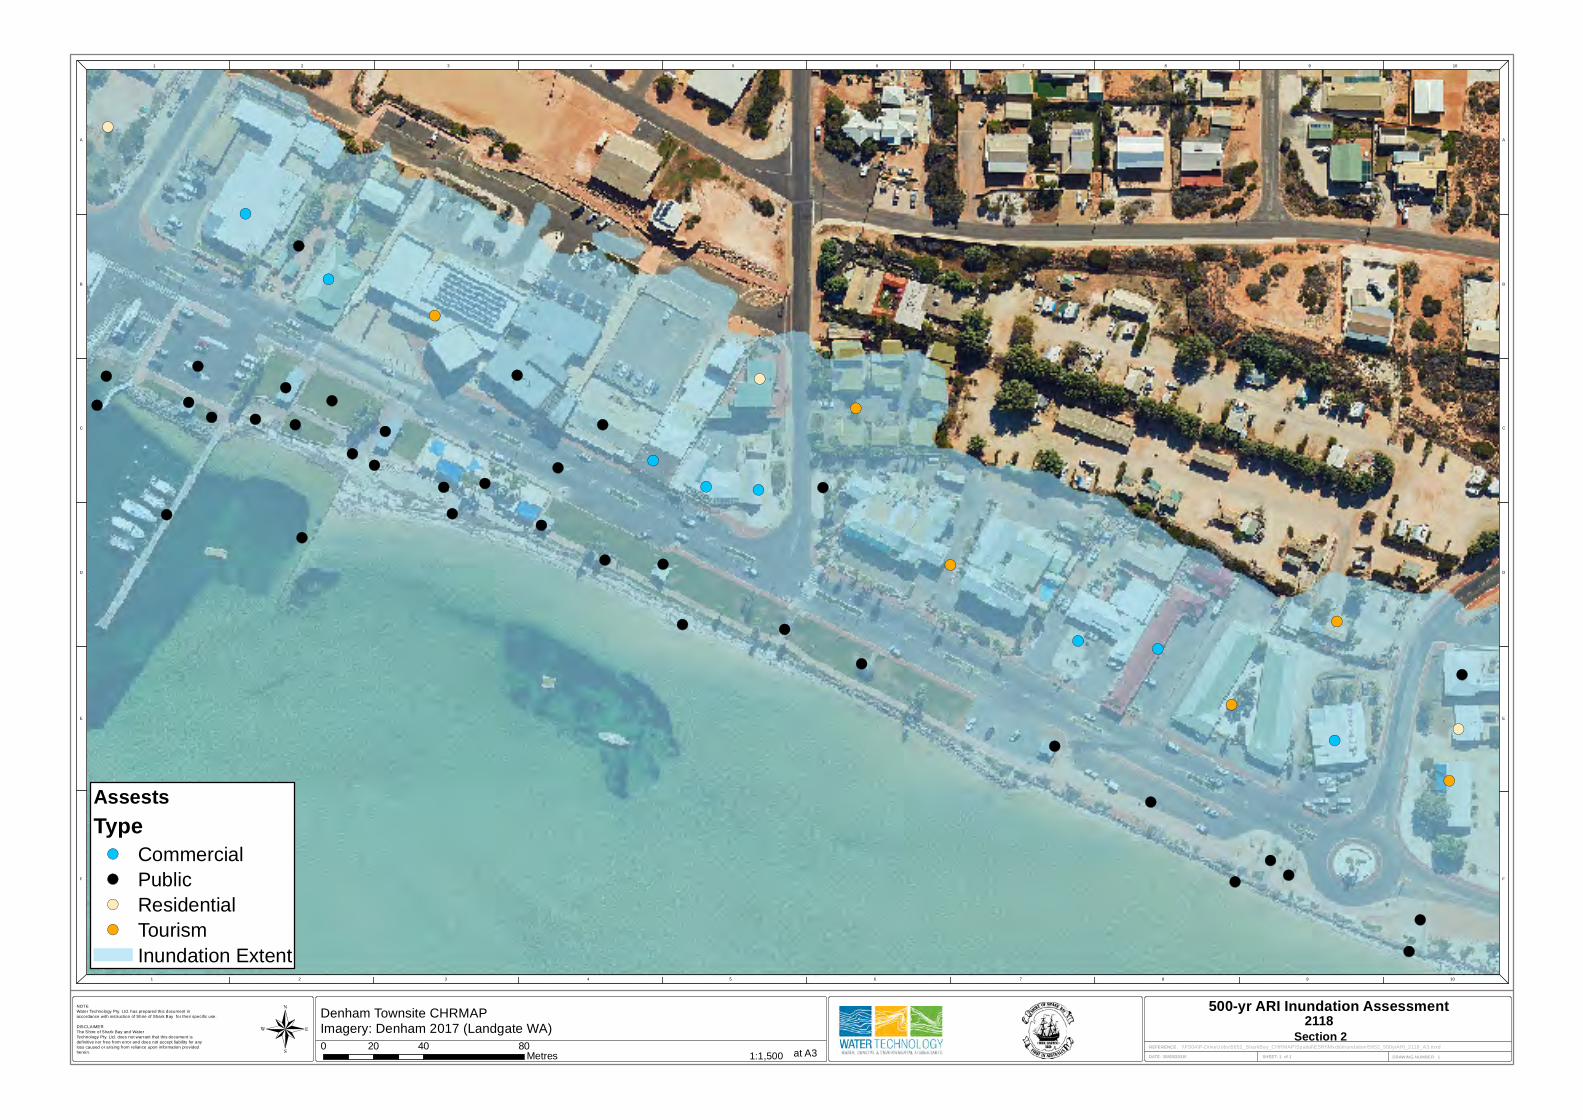
1 2 3 4 5 6 7 8 9 10
1 2 3 4 5 6 7 8 9 10
A
B
C
D
E
F
A
B
C
D
E
F
NOTE
Water Technology Pty. Ltd. has prepared this document in
accordance with instruction of Shire of Shark Bay for their specific use.
DISCLAIMER
The Shire of Shark Bay and Water
Technology Pty. Ltd. does not warrant that this document is
definitive nor free from error and does not accept liability for any
loss caused or arising from rel iance upon information provided
herein.DATE: 30/05/2018
!(
!(
!(
!(
!(
!(
!(
!(!(
!(
!(!(
!(
!(
!(
!(
!(
!(
!(
!(
!(
!(
!(
!(
!(
!(
!(
!(
!(!(!(
!(
!(
!(
!(
!(
!(
!(
!(
!(
!(!(
!(
!(!(
!(!(!(!(!(
!(
!(
!(
!(
!(
!(
!(
SHEET: 1 of 1
REFERENCE:
DRAWING NUMBER: 11:1,500
500-yr ARI Inundation Assessment
at A30 40 8020
Metres®
AssestsType!( Commercial
!( Public
!( Residential
!( Tourism
Inundation Extent
\\FS04\P-Drive\Jobs\5652_SharkBay_CHRMAP\Spatial\ESRI\Mxds\Inundation\5652_500yrARI_2118_A3.mxd
25/07/2018
Denham Townsite CHRMAPImagery: Denham 2017 (Landgate WA) Section 2
2118

1 2 3 4 5 6 7 8 9 10
1 2 3 4 5 6 7 8 9 10
A
B
C
D
E
F
A
B
C
D
E
F
NOTE
Water Technology Pty. Ltd. has prepared this document in
accordance with instruction of Shire of Shark Bay for their specific use.
DISCLAIMER
The Shire of Shark Bay and Water
Technology Pty. Ltd. does not warrant that this document is
definitive nor free from error and does not accept liability for any
loss caused or arising from rel iance upon information provided
herein.DATE: 30/05/2018
!(
!(
!(
!(
!(
!(
!(!(
!( !(
!(!(
!(
!(
!(
!(!(
!(
!(!(
!(
!(
!(!(
!(!(
!(
!(
!(!(
!(
!(
!(
!(
!(
!(
!( !(
!(
!(
!(
!(
!(
!(
!(!(
!(
!(!(
!(!(!(!(!(
!(
!(
!(
!(!(
!(
!(
SHEET: 1 of 1
REFERENCE:
DRAWING NUMBER: 11:1,725
500-yr ARI Inundation Assessment
at A30 40 8020
Metres®
AssestsType!( Commercial
!( Public
!( Residential
!( Tourism
Inundation Extent
\\FS04\P-Drive\Jobs\5652_SharkBay_CHRMAP\Spatial\ESRI\Mxds\Inundation\5652_500yrARI_2118_A3.mxd
25/07/2018
Denham Townsite CHRMAPImagery: Denham 2017 (Landgate WA) Section 3
2118
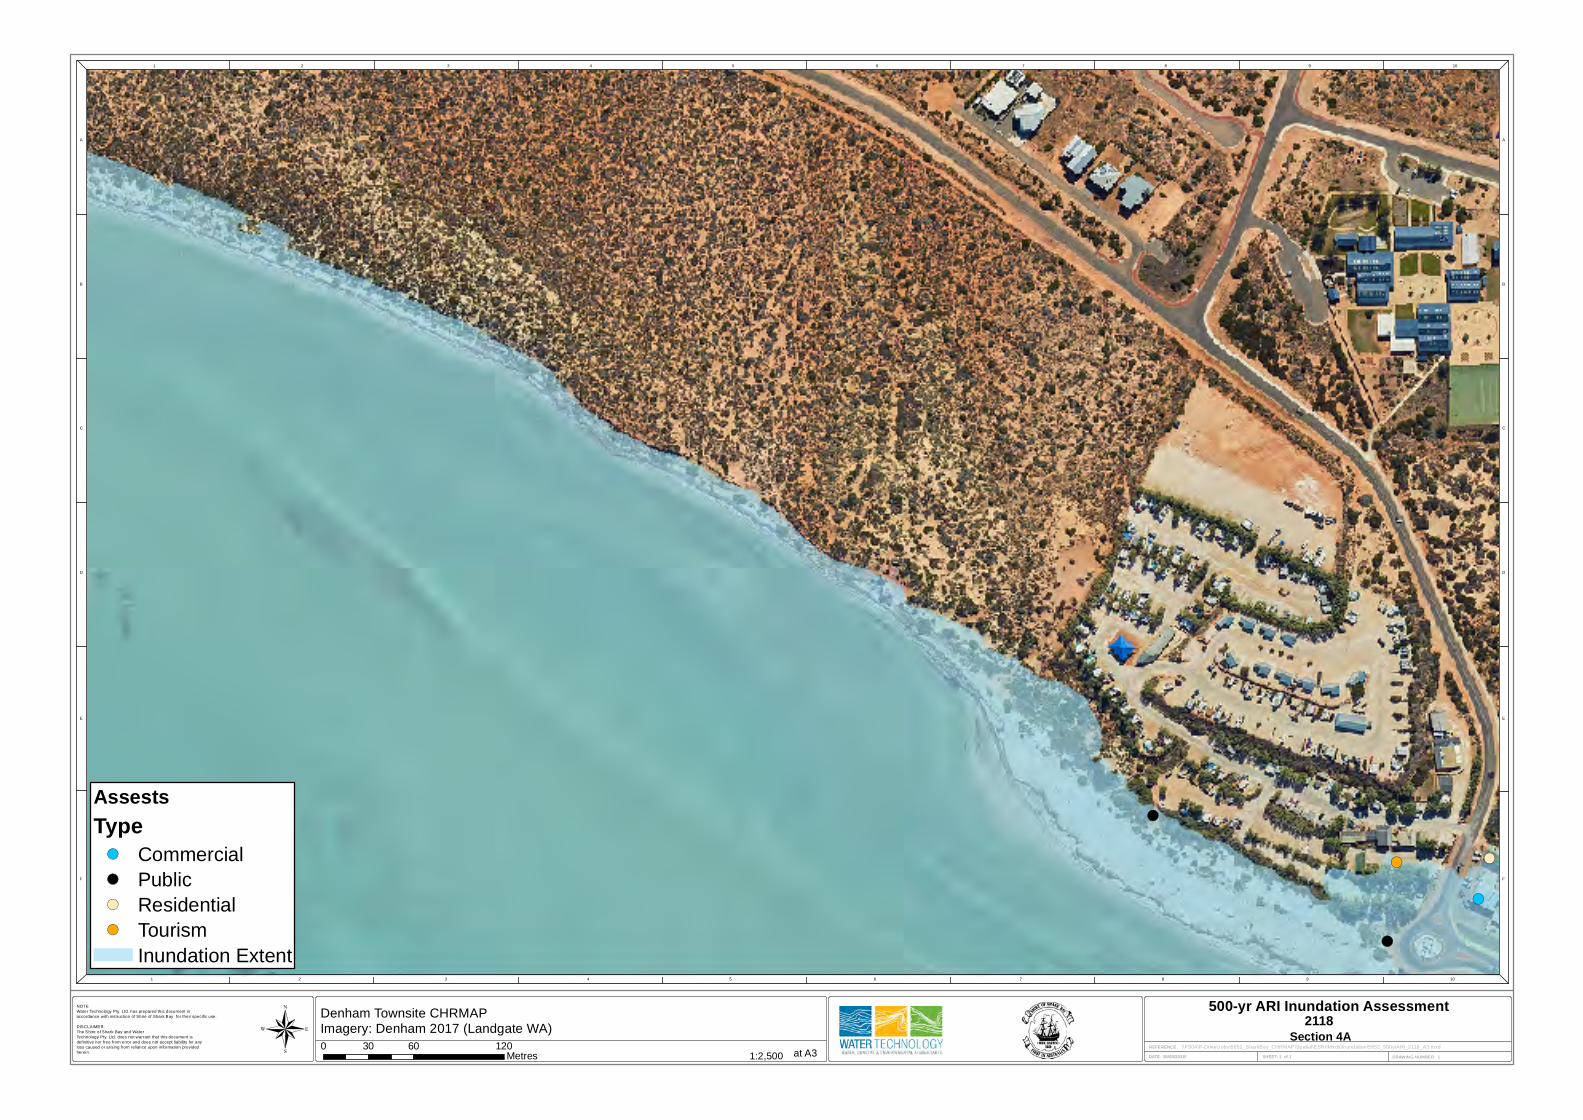
1 2 3 4 5 6 7 8 9 10
1 2 3 4 5 6 7 8 9 10
A
B
C
D
E
F
A
B
C
D
E
F
NOTE
Water Technology Pty. Ltd. has prepared this document in
accordance with instruction of Shire of Shark Bay for their specific use.
DISCLAIMER
The Shire of Shark Bay and Water
Technology Pty. Ltd. does not warrant that this document is
definitive nor free from error and does not accept liability for any
loss caused or arising from rel iance upon information provided
herein.DATE: 30/05/2018
!(
!( !(
!(
!(
!(
SHEET: 1 of 1
REFERENCE:
DRAWING NUMBER: 11:2,500
500-yr ARI Inundation Assessment
at A30 60 12030
Metres®
AssestsType!( Commercial
!( Public
!( Residential
!( Tourism
Inundation Extent
\\FS04\P-Drive\Jobs\5652_SharkBay_CHRMAP\Spatial\ESRI\Mxds\Inundation\5652_500yrARI_2118_A3.mxd
25/07/2018
Denham Townsite CHRMAPImagery: Denham 2017 (Landgate WA) Section 4A
2118

1 2 3 4 5 6 7 8 9 10
1 2 3 4 5 6 7 8 9 10
A
B
C
D
E
F
A
B
C
D
E
F
NOTE
Water Technology Pty. Ltd. has prepared this document in
accordance with instruction of Shire of Shark Bay for their specific use.
DISCLAIMER
The Shire of Shark Bay and Water
Technology Pty. Ltd. does not warrant that this document is
definitive nor free from error and does not accept liability for any
loss caused or arising from rel iance upon information provided
herein.DATE: 30/05/2018
!(
SHEET: 1 of 1
REFERENCE:
DRAWING NUMBER: 11:2,500
500-yr ARI Inundation Assessment
at A30 60 12030
Metres®
AssestsType!( Commercial
!( Public
!( Residential
!( Tourism
Inundation Extent
\\FS04\P-Drive\Jobs\5652_SharkBay_CHRMAP\Spatial\ESRI\Mxds\Inundation\5652_500yrARI_2118_A3.mxd
25/07/2018
Denham Townsite CHRMAPImagery: Denham 2017 (Landgate WA) Section 4B
2118
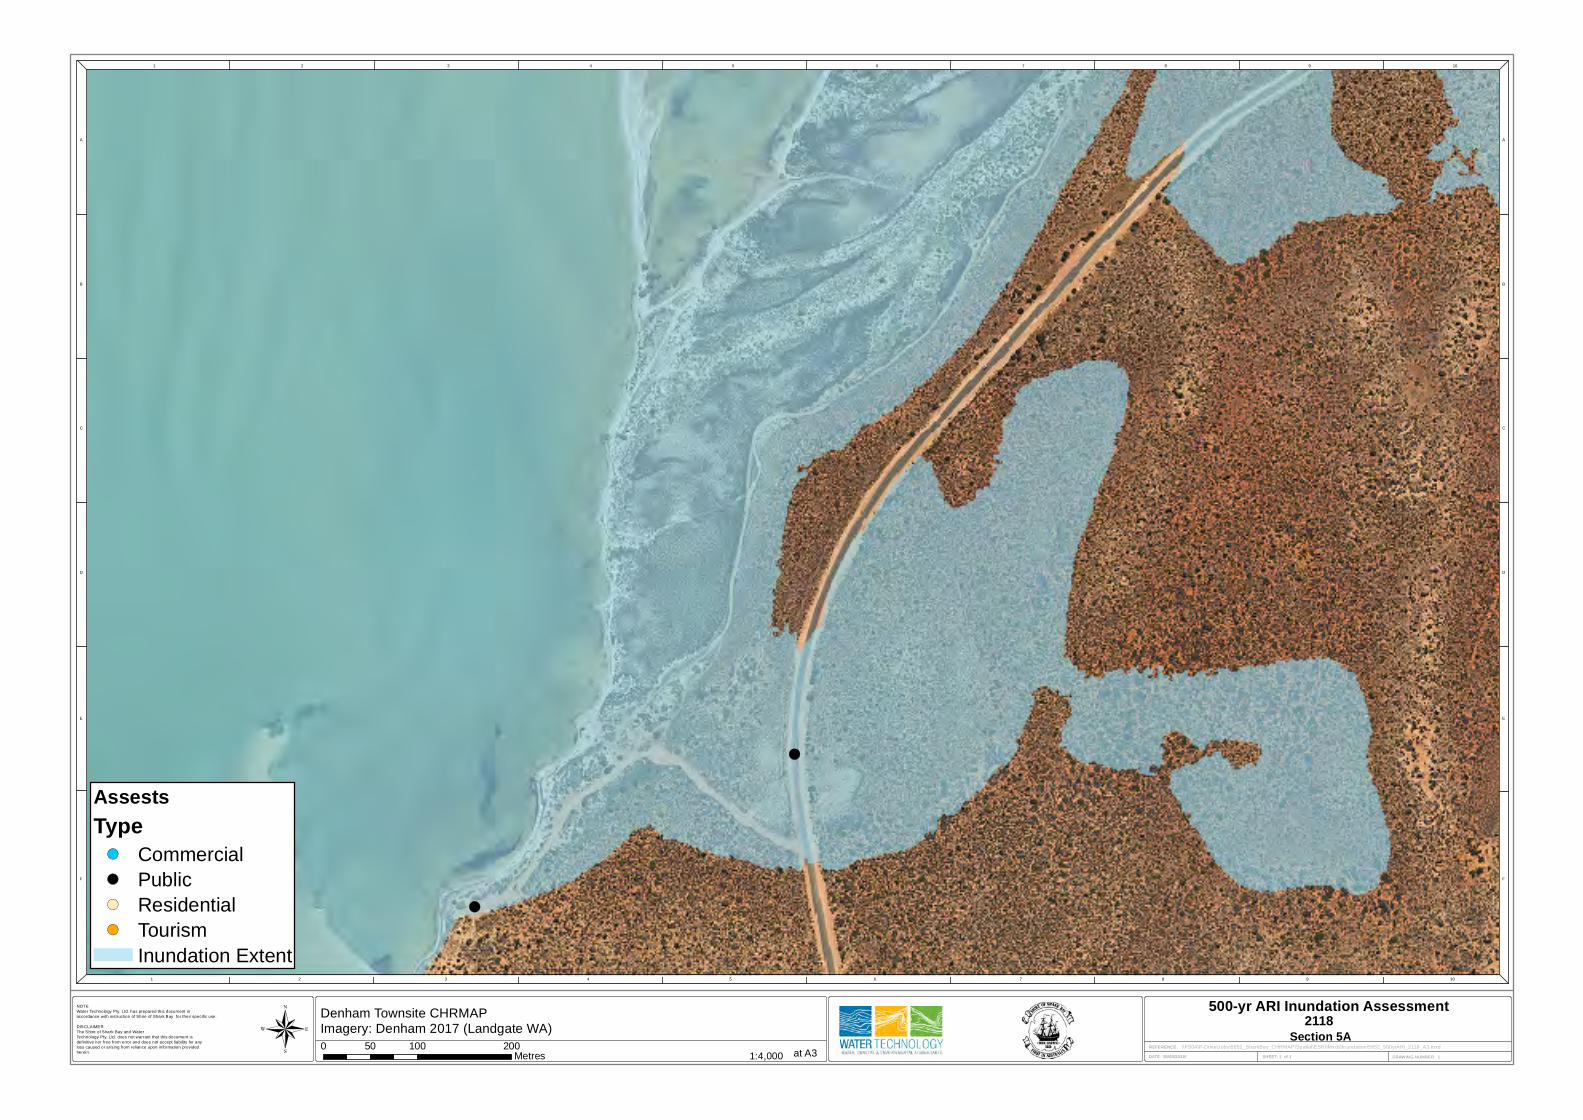
1 2 3 4 5 6 7 8 9 10
1 2 3 4 5 6 7 8 9 10
A
B
C
D
E
F
A
B
C
D
E
F
NOTE
Water Technology Pty. Ltd. has prepared this document in
accordance with instruction of Shire of Shark Bay for their specific use.
DISCLAIMER
The Shire of Shark Bay and Water
Technology Pty. Ltd. does not warrant that this document is
definitive nor free from error and does not accept liability for any
loss caused or arising from rel iance upon information provided
herein.DATE: 30/05/2018
!(
!(
SHEET: 1 of 1
REFERENCE:
DRAWING NUMBER: 11:4,000
500-yr ARI Inundation Assessment
at A30 100 20050
Metres®
AssestsType!( Commercial
!( Public
!( Residential
!( Tourism
Inundation Extent
\\FS04\P-Drive\Jobs\5652_SharkBay_CHRMAP\Spatial\ESRI\Mxds\Inundation\5652_500yrARI_2118_A3.mxd
25/07/2018
Denham Townsite CHRMAPImagery: Denham 2017 (Landgate WA) Section 5A
2118
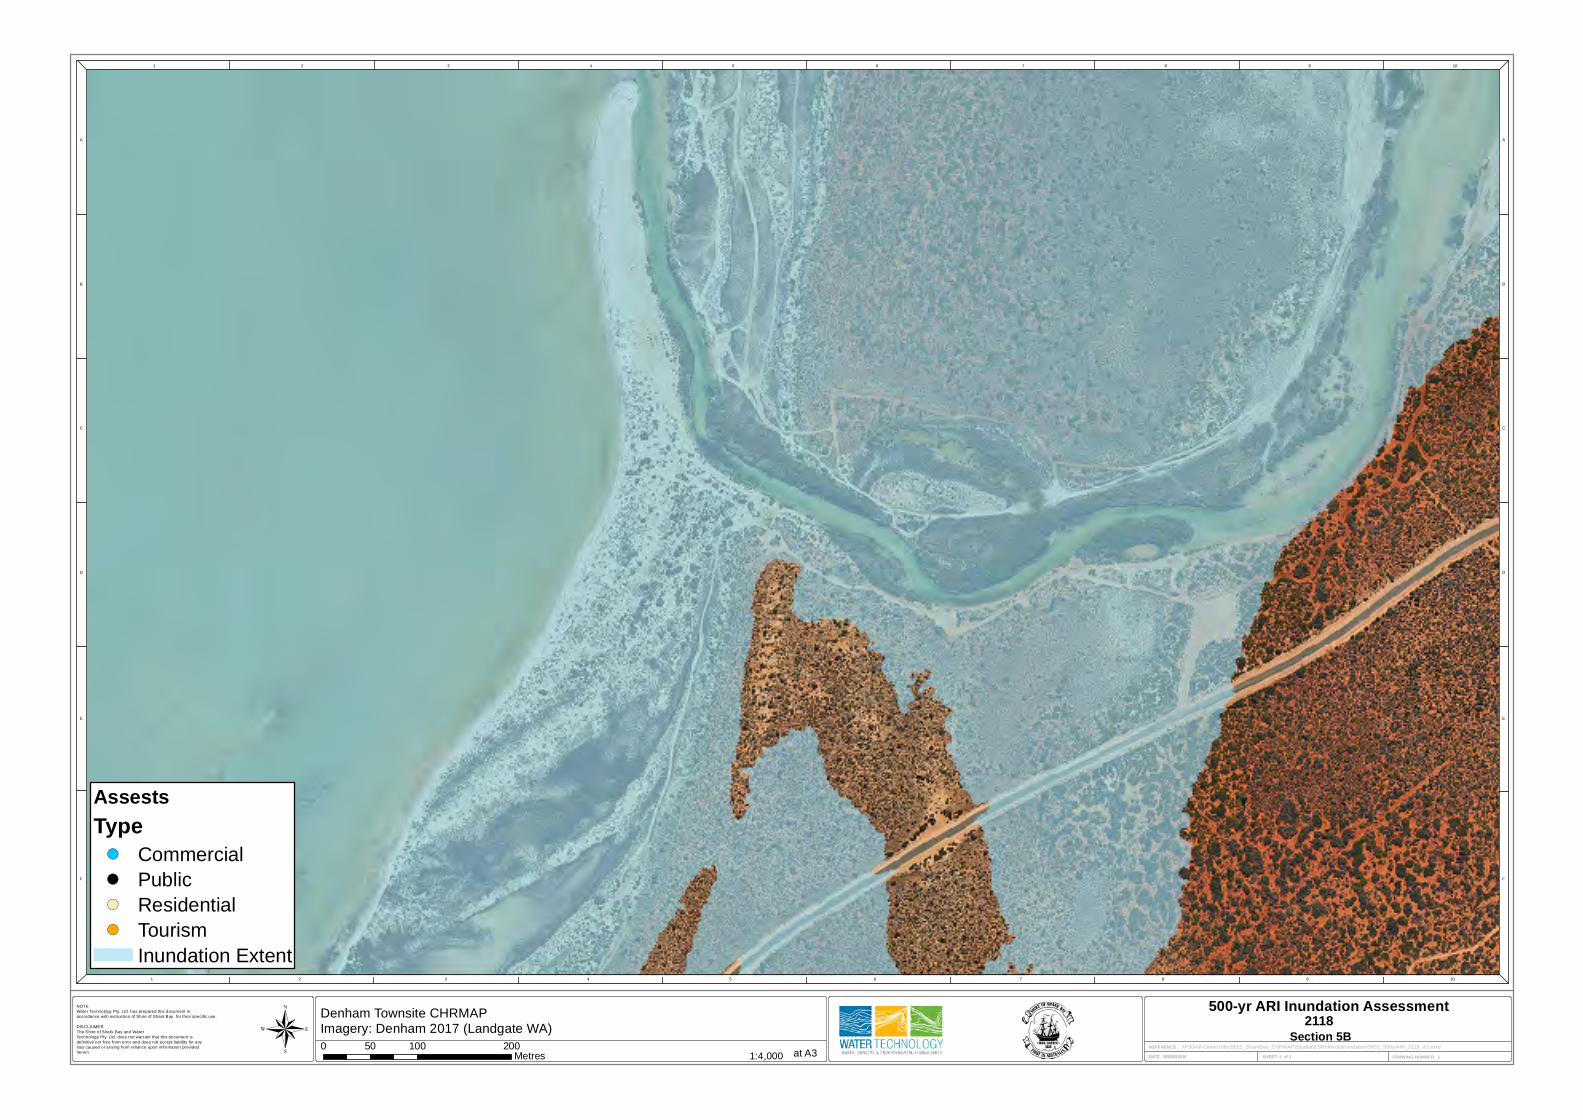
1 2 3 4 5 6 7 8 9 10
1 2 3 4 5 6 7 8 9 10
A
B
C
D
E
F
A
B
C
D
E
F
NOTE
Water Technology Pty. Ltd. has prepared this document in
accordance with instruction of Shire of Shark Bay for their specific use.
DISCLAIMER
The Shire of Shark Bay and Water
Technology Pty. Ltd. does not warrant that this document is
definitive nor free from error and does not accept liability for any
loss caused or arising from rel iance upon information provided
herein.DATE: 30/05/2018 SHEET: 1 of 1
REFERENCE:
DRAWING NUMBER: 11:4,000
500-yr ARI Inundation Assessment
at A30 100 20050
Metres®
AssestsType!( Commercial
!( Public
!( Residential
!( Tourism
Inundation Extent
\\FS04\P-Drive\Jobs\5652_SharkBay_CHRMAP\Spatial\ESRI\Mxds\Inundation\5652_500yrARI_2118_A3.mxd
25/07/2018
Denham Townsite CHRMAPImagery: Denham 2017 (Landgate WA) Section 5B
2118

Shire of Shark Bay | 16 August 2019 Chapter Report: Coastal Hazard & Vulnerability Assessment Page 75
5652_01_R
04v03.d
ocx
APPENDIX D COASTAL PROCESSES HAZARD MAPS
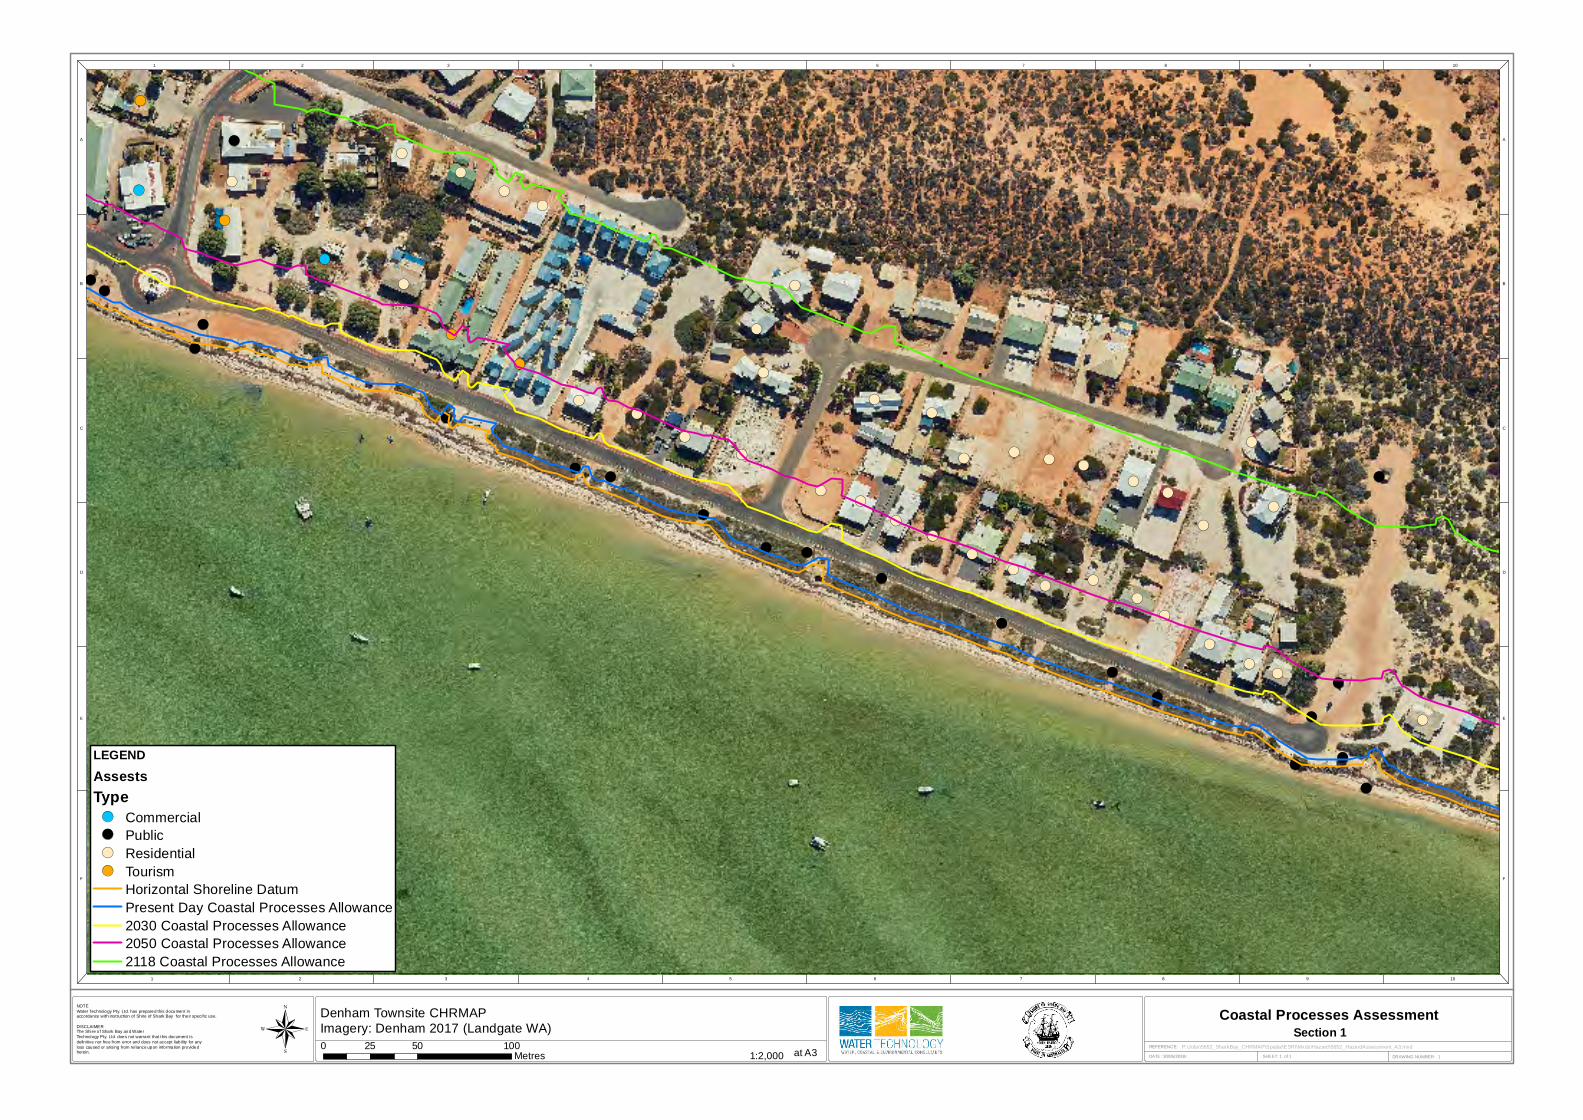
1 2 3 4 5 6 7 8 9 10
1 2 3 4 5 6 7 8 9 10
A
B
C
D
E
F
A
B
C
D
E
F
NOTE
Water Technology Pty. Ltd. has prepared this document inaccordance with instruction of Shire of Shark Bay for the ir specific use.
DISCLAIMER The Shi re of Shark Bay and Water
Technology Pty. Ltd. does not warrant that this document is
defin itive nor free from error and does not accept liab ility for any
loss caused or arising from rel iance upon information provided herein.
DATE: 30/05/2018
!(
!(
!(!(
!(
!(
!(!(
!(
!(
!(
!(
!(
!(!(
!(!(
!(
!(
!(!(
!(
!(
!(
!(
!(
!(
!(
!(!(
!(
!(
!(
!(
!(
!(
!(
!(
!(
!(!(
!(!(
!(!(
!(!(
!(
!(
!(
!(
!(
!(
!(
!(
!(
!(
!(!(!(
!(
!(
!(
!(
!(!(
!(
SHEET: 1 of 1
REFERENCE:
DRAWING NUMBER: 11:2,000
Coastal Processes Assessment
at A30 50 10025
Metres®
LEGENDAssestsType!( Commercial
!( Public
!( Residential
!( Tourism
Horizontal Shoreline Datum
Present Day Coastal Processes Allowance
2030 Coastal Processes Allowance
2050 Coastal Processes Allowance
2118 Coastal Processes Allowance
P:\Jobs\5652_SharkBay_CHRMAP\Spatial\ESRI\Mxds\Hazard\5652_HazardAssessment_A3.mxd
24/10/2018
Denham Townsite CHRMAP
Imagery: Denham 2017 (Landgate WA) Section 1
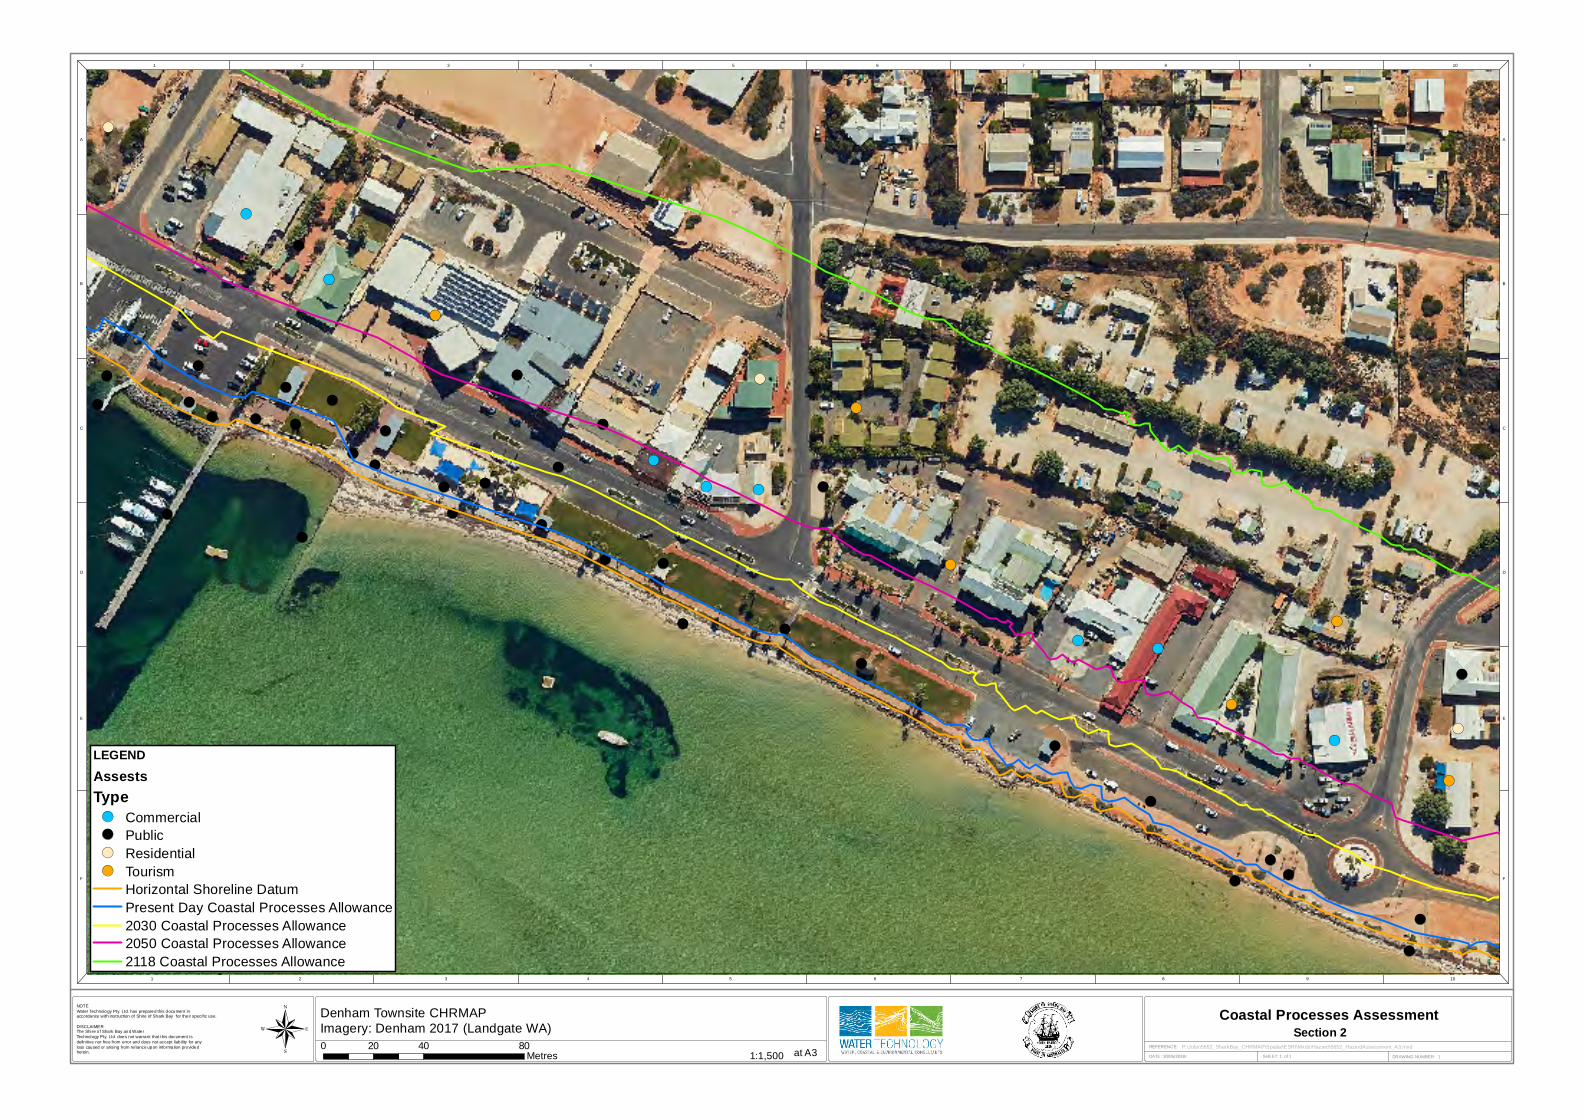
1 2 3 4 5 6 7 8 9 10
1 2 3 4 5 6 7 8 9 10
A
B
C
D
E
F
A
B
C
D
E
F
NOTE
Water Technology Pty. Ltd. has prepared this document inaccordance with instruction of Shire of Shark Bay for the ir specific use.
DISCLAIMER The Shi re of Shark Bay and Water
Technology Pty. Ltd. does not warrant that this document is
defin itive nor free from error and does not accept liab ility for any
loss caused or arising from rel iance upon information provided herein.
DATE: 30/05/2018
!(
!(
!(
!(
!(
!(
!(
!(!(
!(
!(!(
!(
!(
!(
!(
!(
!(
!(
!(
!(
!(
!(
!(
!(
!(
!(
!(
!(!(!(
!(
!(
!(
!(
!(
!(
!(
!(
!(
!(!(
!(
!(!(
!(!(!(!(!(
!(
!(
!(
!(
!(
!(
!(
SHEET: 1 of 1
REFERENCE:
DRAWING NUMBER: 11:1,500
Coastal Processes Assessment
at A30 40 8020
Metres®
LEGENDAssestsType!( Commercial
!( Public
!( Residential
!( Tourism
Horizontal Shoreline Datum
Present Day Coastal Processes Allowance
2030 Coastal Processes Allowance
2050 Coastal Processes Allowance
2118 Coastal Processes Allowance
P:\Jobs\5652_SharkBay_CHRMAP\Spatial\ESRI\Mxds\Hazard\5652_HazardAssessment_A3.mxd
24/10/2018
Denham Townsite CHRMAP
Imagery: Denham 2017 (Landgate WA) Section 2
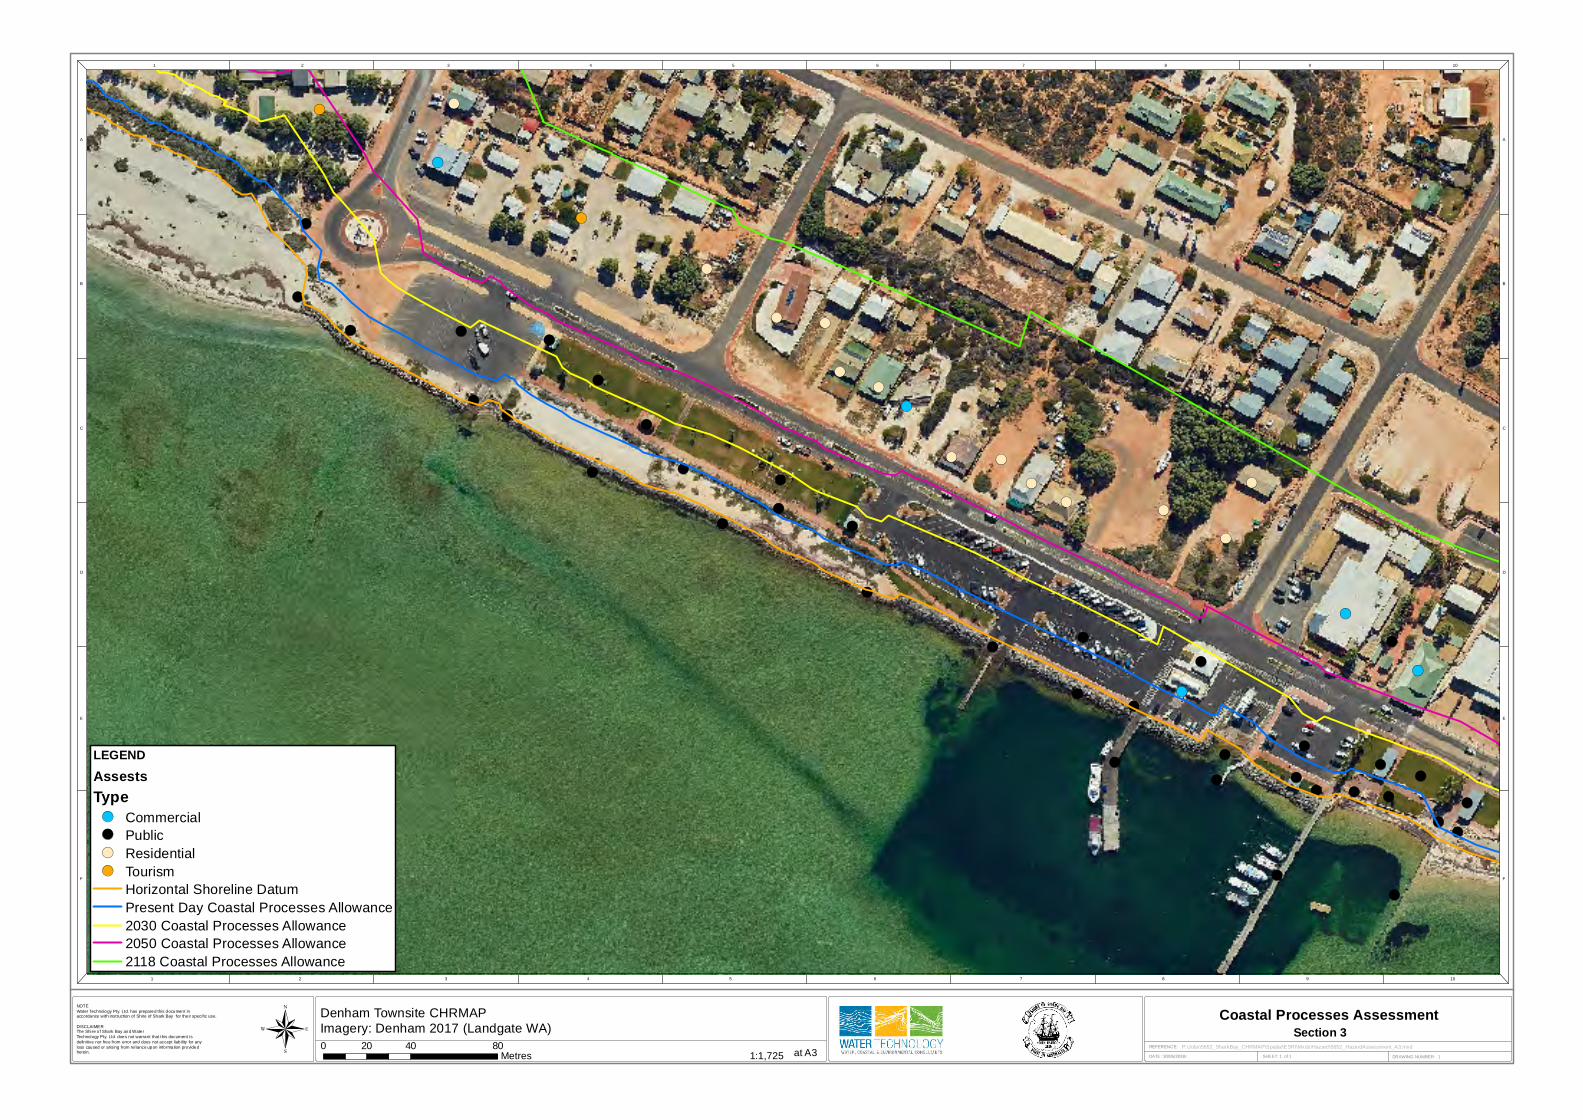
1 2 3 4 5 6 7 8 9 10
1 2 3 4 5 6 7 8 9 10
A
B
C
D
E
F
A
B
C
D
E
F
NOTE
Water Technology Pty. Ltd. has prepared this document inaccordance with instruction of Shire of Shark Bay for the ir specific use.
DISCLAIMER The Shi re of Shark Bay and Water
Technology Pty. Ltd. does not warrant that this document is
defin itive nor free from error and does not accept liab ility for any
loss caused or arising from rel iance upon information provided herein.
DATE: 30/05/2018
!(
!(
!(
!(
!(
!(
!(!(
!( !(
!(!(
!(
!(
!(
!(!(
!(
!(!(
!(
!(
!(!(
!(!(
!(
!(
!(!(
!(
!(
!(
!(
!(
!(
!( !(
!(
!(
!(
!(
!(
!(
!(!(
!(
!(!(
!(!(!(!(!(
!(
!(
!(
!(!(
!(
!(
SHEET: 1 of 1
REFERENCE:
DRAWING NUMBER: 11:1,725
Coastal Processes Assessment
at A30 40 8020
Metres®
LEGENDAssestsType!( Commercial
!( Public
!( Residential
!( Tourism
Horizontal Shoreline Datum
Present Day Coastal Processes Allowance
2030 Coastal Processes Allowance
2050 Coastal Processes Allowance
2118 Coastal Processes Allowance
P:\Jobs\5652_SharkBay_CHRMAP\Spatial\ESRI\Mxds\Hazard\5652_HazardAssessment_A3.mxd
24/10/2018
Denham Townsite CHRMAP
Imagery: Denham 2017 (Landgate WA) Section 3
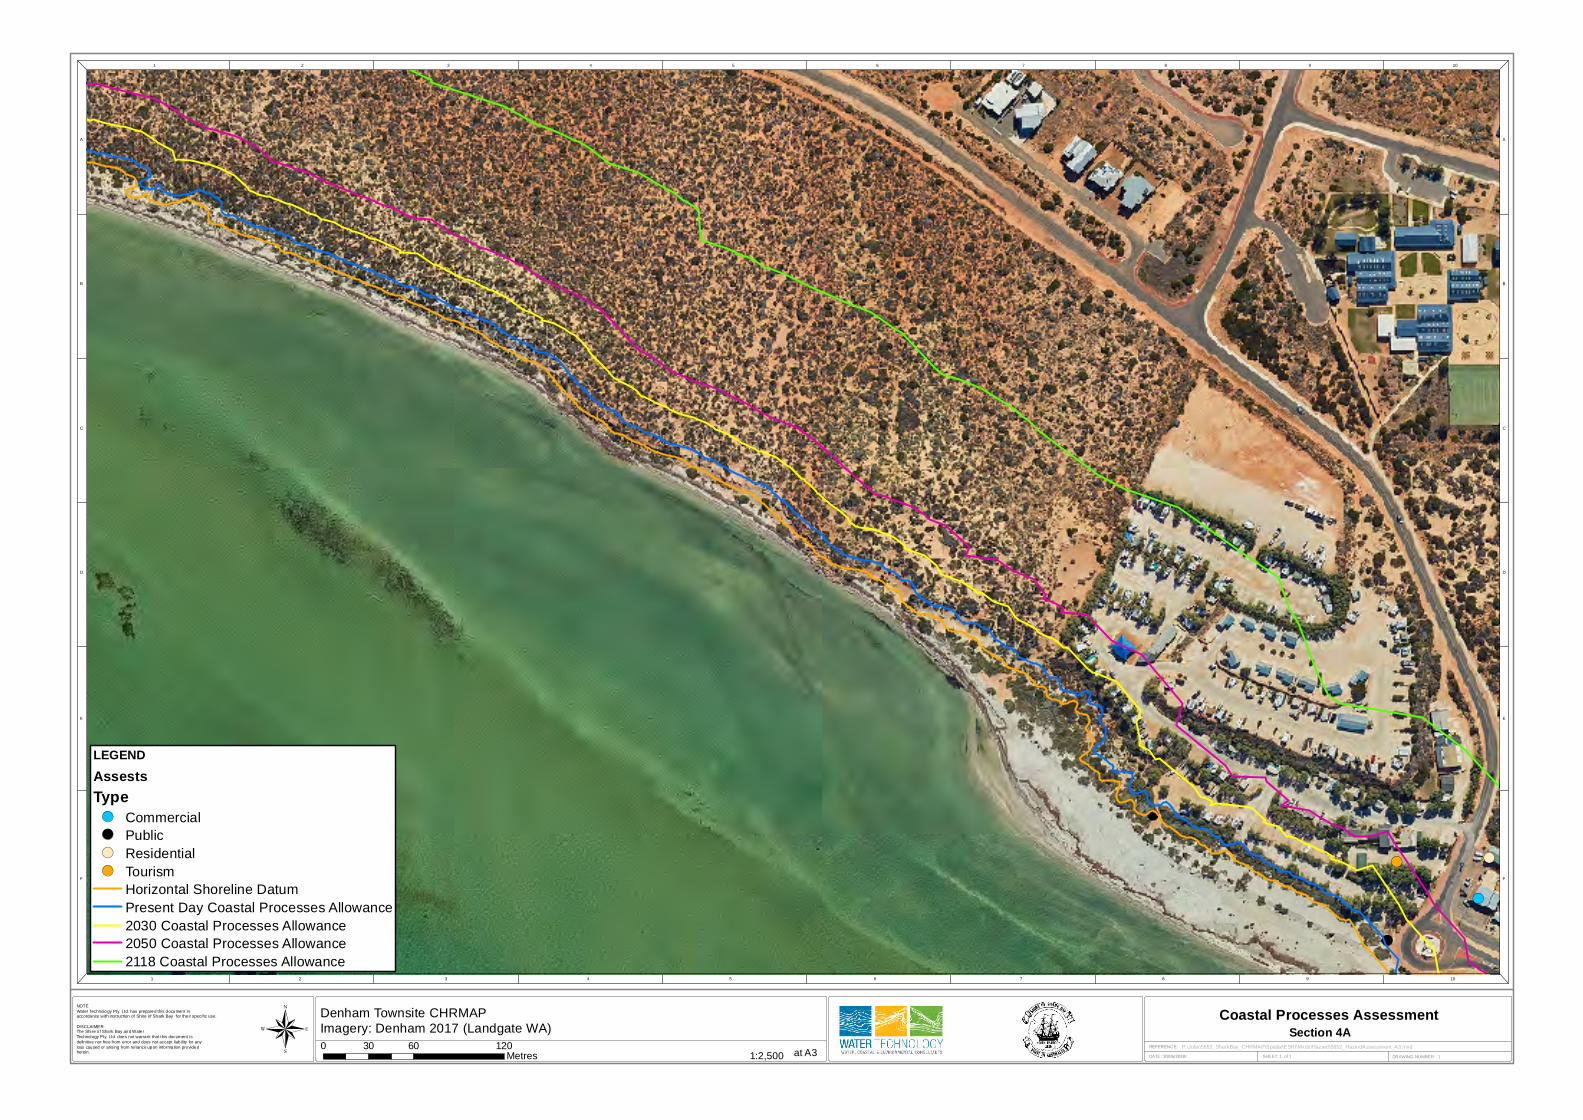
1 2 3 4 5 6 7 8 9 10
1 2 3 4 5 6 7 8 9 10
A
B
C
D
E
F
A
B
C
D
E
F
NOTE
Water Technology Pty. Ltd. has prepared this document inaccordance with instruction of Shire of Shark Bay for the ir specific use.
DISCLAIMER The Shi re of Shark Bay and Water
Technology Pty. Ltd. does not warrant that this document is
defin itive nor free from error and does not accept liab ility for any
loss caused or arising from rel iance upon information provided herein.
DATE: 30/05/2018
!(
!( !(
!(
!(
!(
SHEET: 1 of 1
REFERENCE:
DRAWING NUMBER: 11:2,500
Coastal Processes Assessment
at A30 60 12030
Metres®
LEGENDAssestsType!( Commercial
!( Public
!( Residential
!( Tourism
Horizontal Shoreline Datum
Present Day Coastal Processes Allowance
2030 Coastal Processes Allowance
2050 Coastal Processes Allowance
2118 Coastal Processes Allowance
P:\Jobs\5652_SharkBay_CHRMAP\Spatial\ESRI\Mxds\Hazard\5652_HazardAssessment_A3.mxd
24/10/2018
Denham Townsite CHRMAP
Imagery: Denham 2017 (Landgate WA) Section 4A
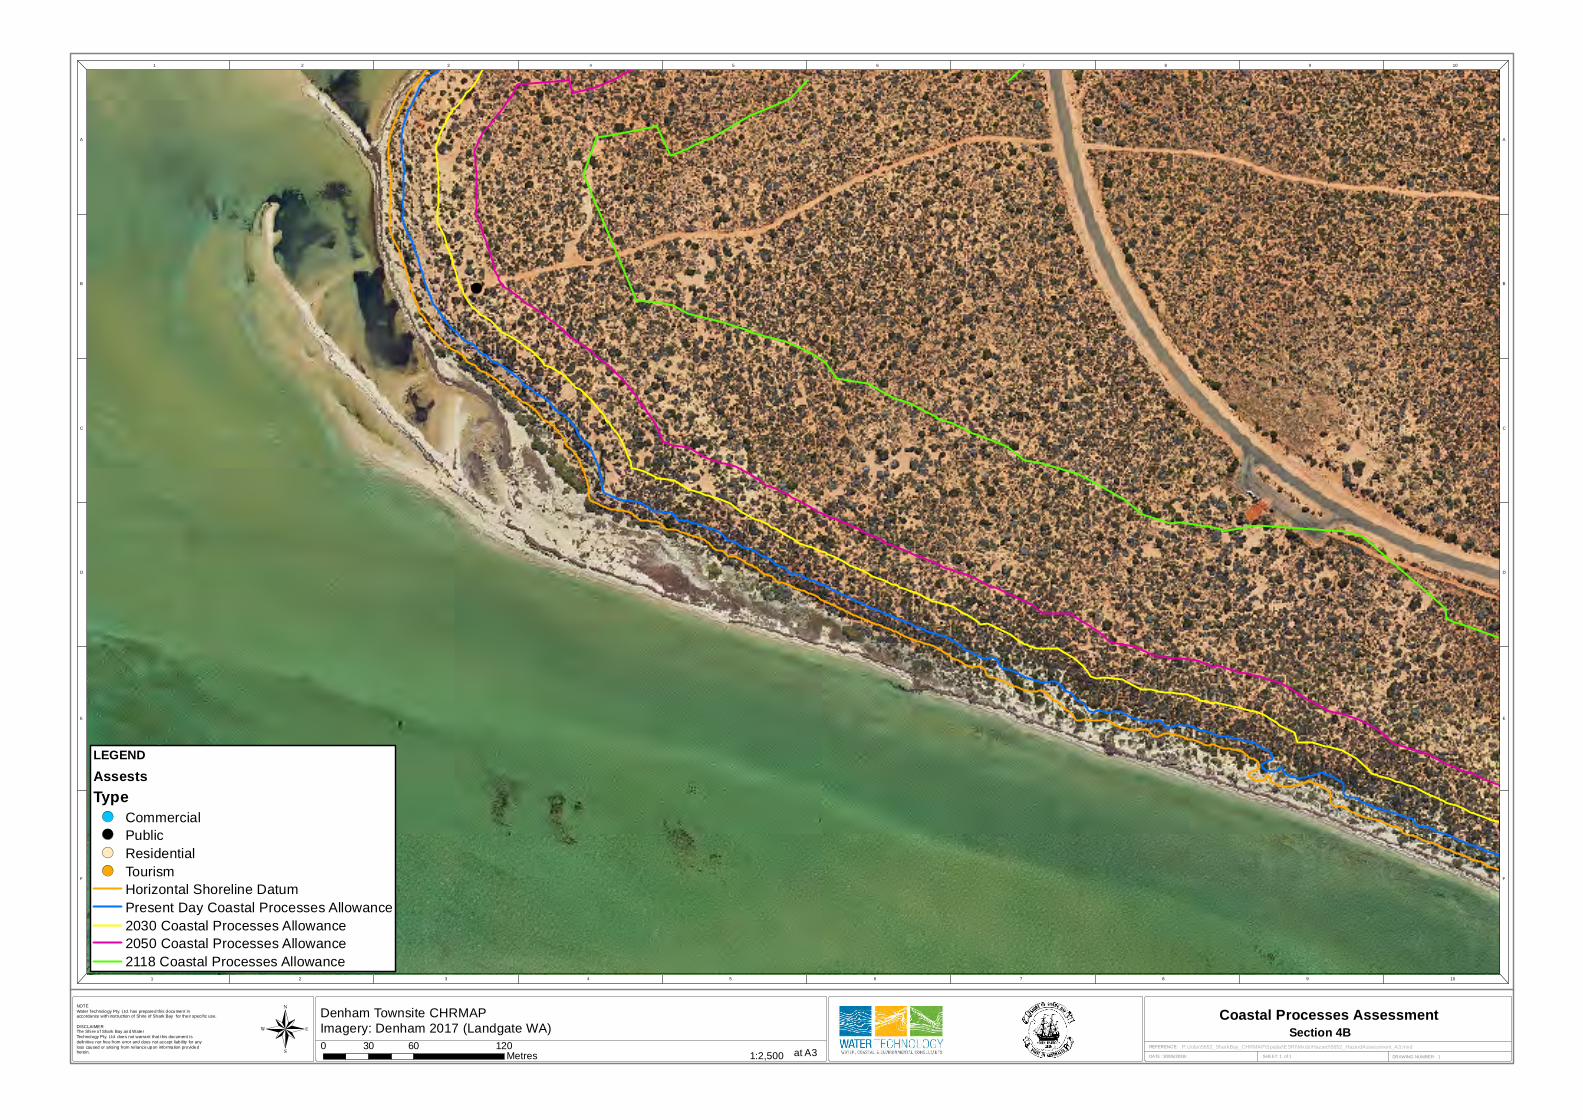
1 2 3 4 5 6 7 8 9 10
1 2 3 4 5 6 7 8 9 10
A
B
C
D
E
F
A
B
C
D
E
F
NOTE
Water Technology Pty. Ltd. has prepared this document inaccordance with instruction of Shire of Shark Bay for the ir specific use.
DISCLAIMER The Shi re of Shark Bay and Water
Technology Pty. Ltd. does not warrant that this document is
defin itive nor free from error and does not accept liab ility for any
loss caused or arising from rel iance upon information provided herein.
DATE: 30/05/2018
!(
SHEET: 1 of 1
REFERENCE:
DRAWING NUMBER: 11:2,500
Coastal Processes Assessment
at A30 60 12030
Metres®
LEGENDAssestsType!( Commercial
!( Public
!( Residential
!( Tourism
Horizontal Shoreline Datum
Present Day Coastal Processes Allowance
2030 Coastal Processes Allowance
2050 Coastal Processes Allowance
2118 Coastal Processes Allowance
P:\Jobs\5652_SharkBay_CHRMAP\Spatial\ESRI\Mxds\Hazard\5652_HazardAssessment_A3.mxd
24/10/2018
Denham Townsite CHRMAP
Imagery: Denham 2017 (Landgate WA) Section 4B
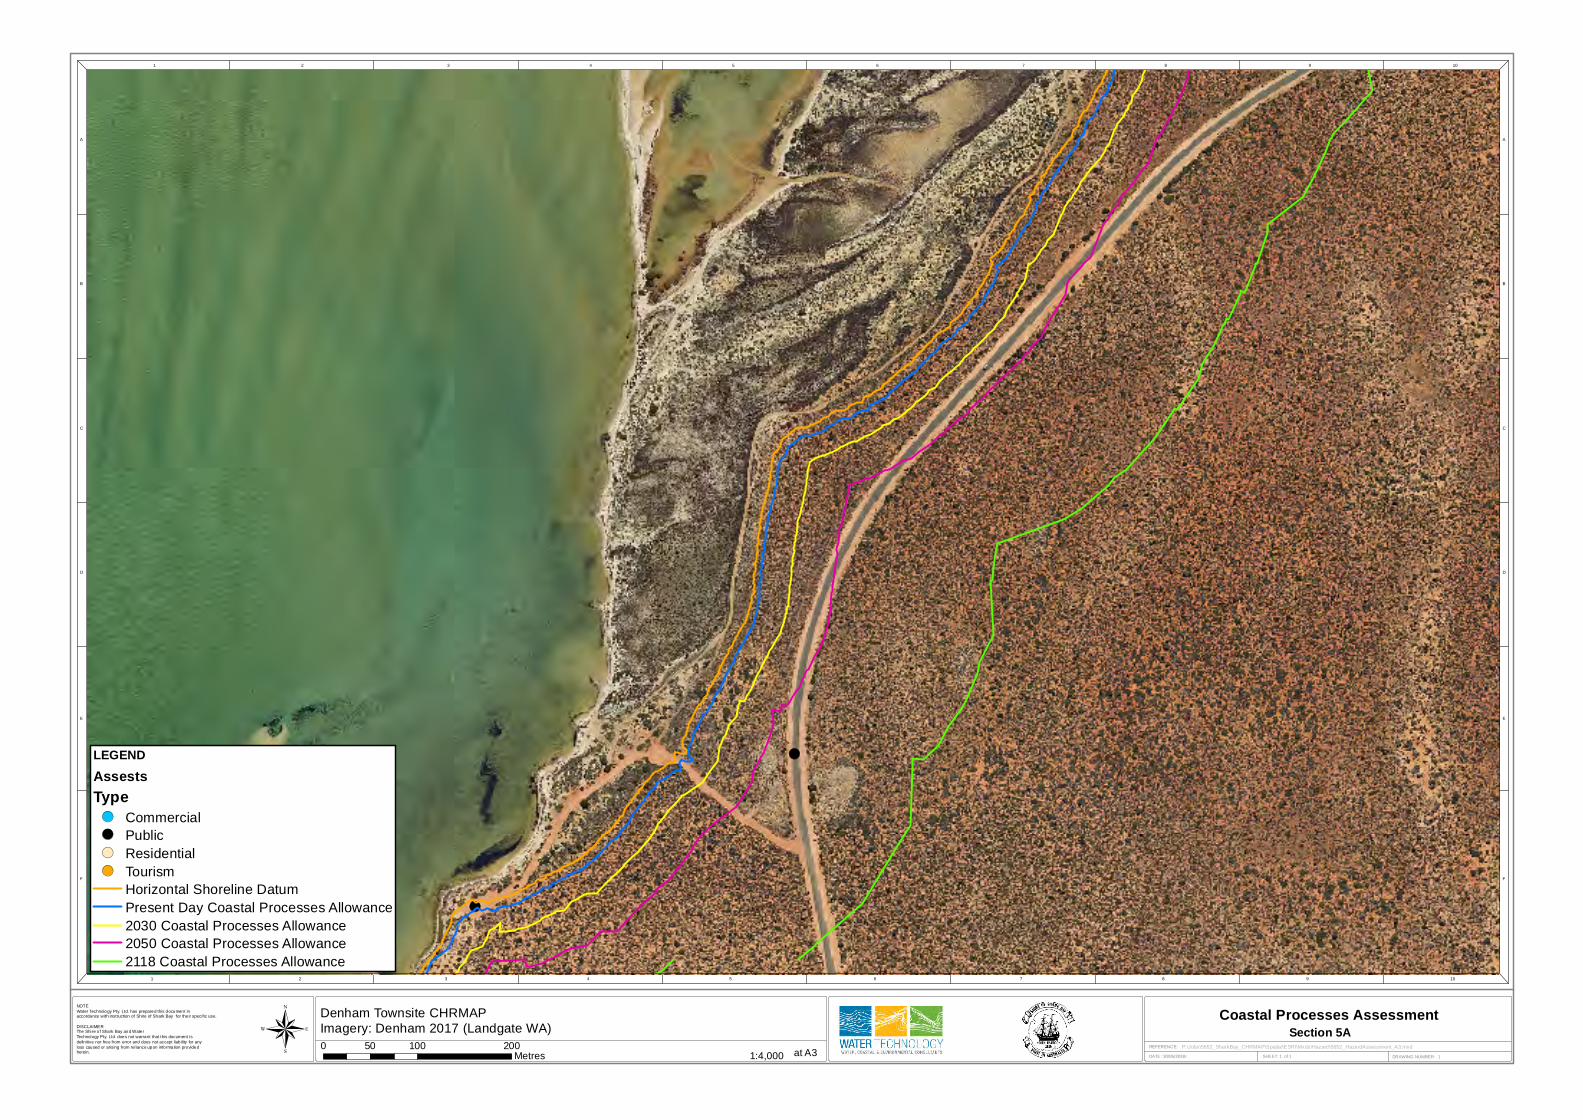
1 2 3 4 5 6 7 8 9 10
1 2 3 4 5 6 7 8 9 10
A
B
C
D
E
F
A
B
C
D
E
F
NOTE
Water Technology Pty. Ltd. has prepared this document inaccordance with instruction of Shire of Shark Bay for the ir specific use.
DISCLAIMER The Shi re of Shark Bay and Water
Technology Pty. Ltd. does not warrant that this document is
defin itive nor free from error and does not accept liab ility for any
loss caused or arising from rel iance upon information provided herein.
DATE: 30/05/2018
!(
!(
SHEET: 1 of 1
REFERENCE:
DRAWING NUMBER: 11:4,000
Coastal Processes Assessment
at A30 100 20050
Metres®
LEGENDAssestsType!( Commercial
!( Public
!( Residential
!( Tourism
Horizontal Shoreline Datum
Present Day Coastal Processes Allowance
2030 Coastal Processes Allowance
2050 Coastal Processes Allowance
2118 Coastal Processes Allowance
P:\Jobs\5652_SharkBay_CHRMAP\Spatial\ESRI\Mxds\Hazard\5652_HazardAssessment_A3.mxd
24/10/2018
Denham Townsite CHRMAP
Imagery: Denham 2017 (Landgate WA) Section 5A
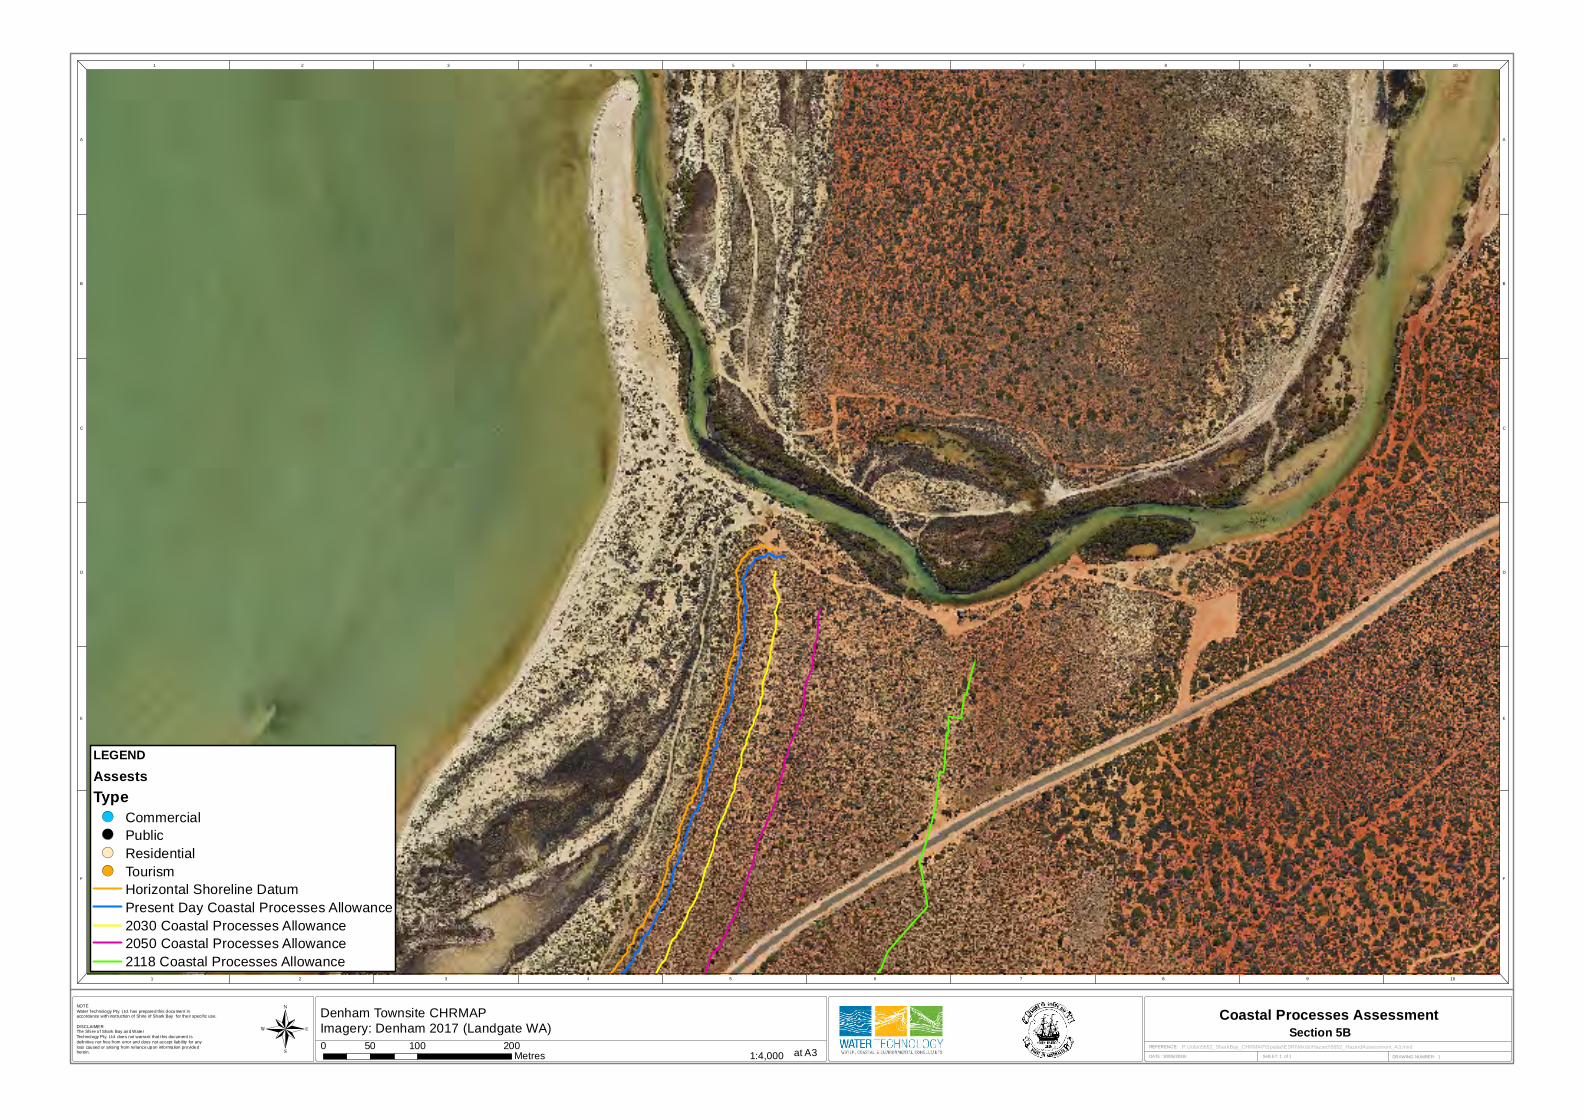
1 2 3 4 5 6 7 8 9 10
1 2 3 4 5 6 7 8 9 10
A
B
C
D
E
F
A
B
C
D
E
F
NOTE
Water Technology Pty. Ltd. has prepared this document inaccordance with instruction of Shire of Shark Bay for the ir specific use.
DISCLAIMER The Shi re of Shark Bay and Water
Technology Pty. Ltd. does not warrant that this document is
defin itive nor free from error and does not accept liab ility for any
loss caused or arising from rel iance upon information provided herein.
DATE: 30/05/2018 SHEET: 1 of 1
REFERENCE:
DRAWING NUMBER: 11:4,000
Coastal Processes Assessment
at A30 100 20050
Metres®
LEGENDAssestsType!( Commercial
!( Public
!( Residential
!( Tourism
Horizontal Shoreline Datum
Present Day Coastal Processes Allowance
2030 Coastal Processes Allowance
2050 Coastal Processes Allowance
2118 Coastal Processes Allowance
P:\Jobs\5652_SharkBay_CHRMAP\Spatial\ESRI\Mxds\Hazard\5652_HazardAssessment_A3.mxd
24/10/2018
Denham Townsite CHRMAP
Imagery: Denham 2017 (Landgate WA) Section 5B
Shire of Shark Bay | 16 August 2019 Chapter Report: Coastal Hazard & Vulnerability Assessment Page 77
5652_01_R
04v03.d
ocx
APPENDIX E INUNDATION VULNERABILITY ASSESSMENT TABLES
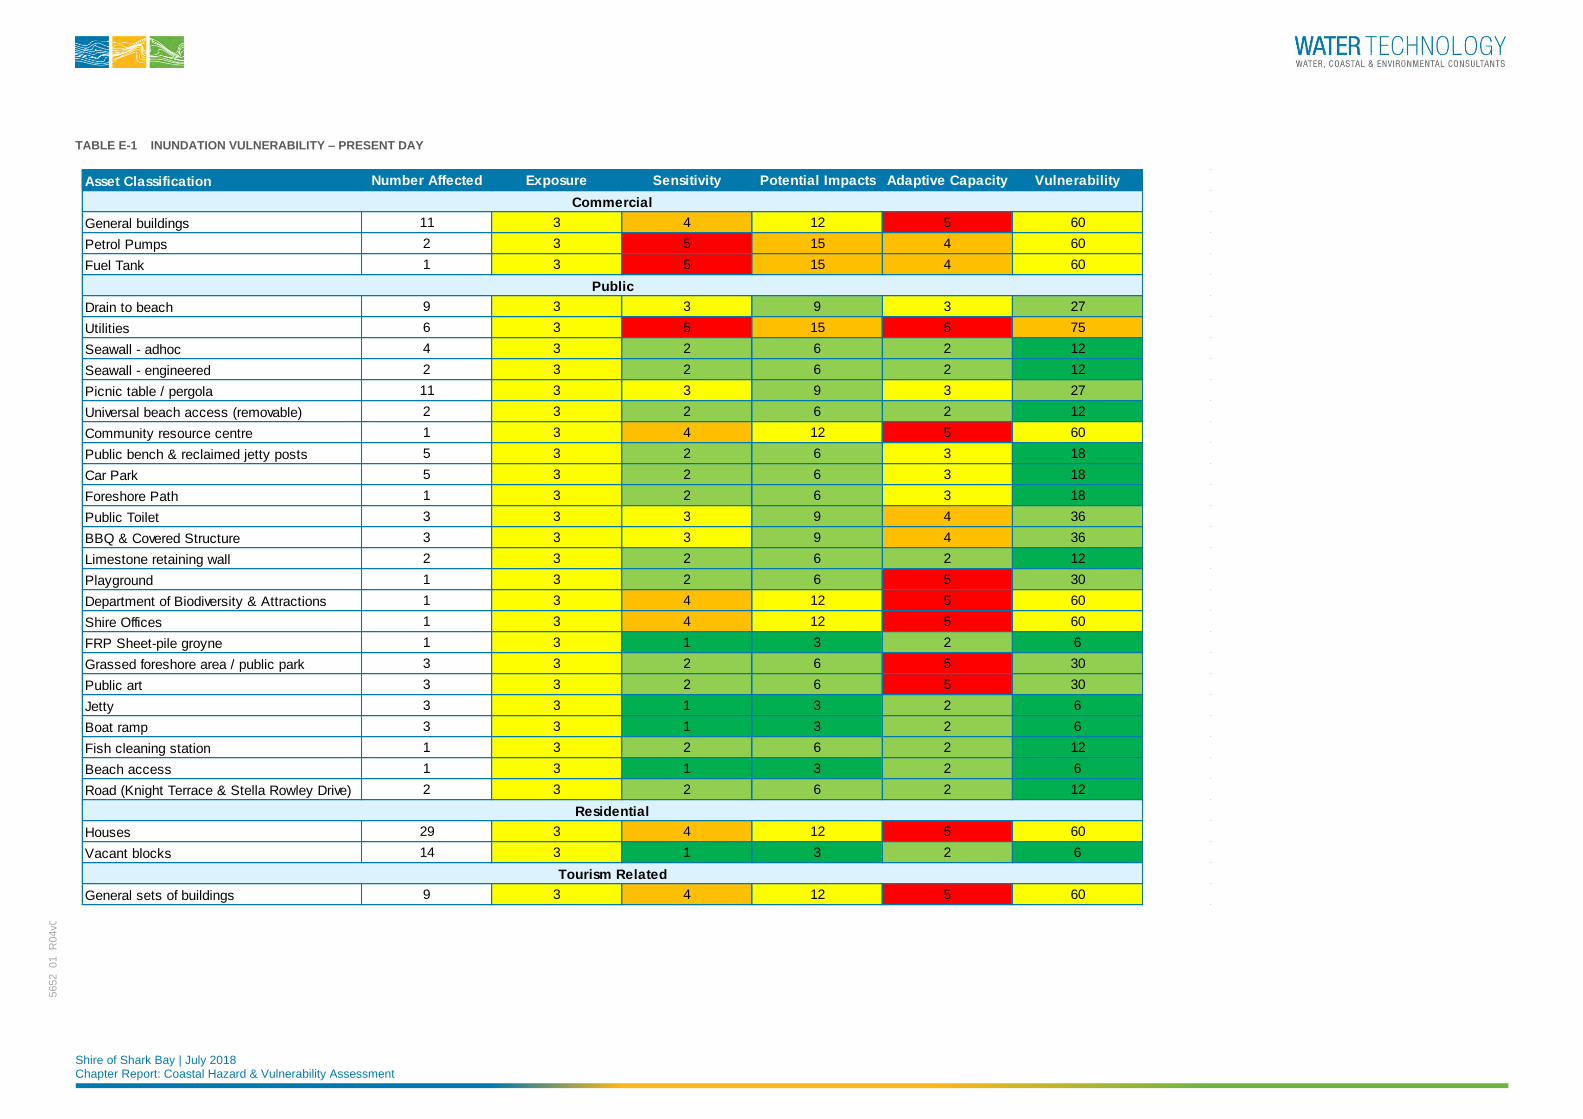
Shire of Shark Bay | July 2018 Chapter Report: Coastal Hazard & Vulnerability Assessment
5652_01_R
04v03.d
ocx
TABLE E-1 INUNDATION VULNERABILITY – PRESENT DAY
Asset Classification Number Affected Exposure Sensitivity Potential Impacts Adaptive Capacity Vulnerability
General buildings 11 3 4 12 5 60
Petrol Pumps 2 3 5 15 4 60
Fuel Tank 1 3 5 15 4 60
Drain to beach 9 3 3 9 3 27
Utilities 6 3 5 15 5 75
Seawall - adhoc 4 3 2 6 2 12
Seawall - engineered 2 3 2 6 2 12
Picnic table / pergola 11 3 3 9 3 27
Universal beach access (removable) 2 3 2 6 2 12
Community resource centre 1 3 4 12 5 60
Public bench & reclaimed jetty posts 5 3 2 6 3 18
Car Park 5 3 2 6 3 18
Foreshore Path 1 3 2 6 3 18
Public Toilet 3 3 3 9 4 36
BBQ & Covered Structure 3 3 3 9 4 36
Limestone retaining wall 2 3 2 6 2 12
Playground 1 3 2 6 5 30
Department of Biodiversity & Attractions 1 3 4 12 5 60
Shire Offices 1 3 4 12 5 60
FRP Sheet-pile groyne 1 3 1 3 2 6
Grassed foreshore area / public park 3 3 2 6 5 30
Public art 3 3 2 6 5 30
Jetty 3 3 1 3 2 6
Boat ramp 3 3 1 3 2 6
Fish cleaning station 1 3 2 6 2 12
Beach access 1 3 1 3 2 6
Road (Knight Terrace & Stella Rowley Drive) 2 3 2 6 2 12
Houses 29 3 4 12 5 60
Vacant blocks 14 3 1 3 2 6
General sets of buildings 9 3 4 12 5 60
Tourism Related
Public
Commercial
Residential

Shire of Shark Bay | July 2018 Chapter Report: Coastal Hazard & Vulnerability Assessment
5652_01_R
04v03.d
ocx
TABLE E-2 INUNDATION VULNERABILITY - 2030
Asset Classification Number Affected Exposure Sensitivity Potential Impacts Adaptive Capacity Vulnerability
General buildings 11 3.5 4 14 5 70
Petrol Pumps 2 3.5 5 17.5 4 70
Fuel Tank 1 3.5 5 17.5 4 70
Drain to beach 9 3.5 3 10.5 3 31.5
Utilities 6 3.5 5 17.5 5 87.5
Seawall - adhoc 4 3.5 4 14 2 28
Seawall - engineered 2 3.5 4 14 2 28
Picnic table / pergola 11 3.5 3 10.5 3 31.5
Universal beach access (removable) 2 3.5 2 7 2 14
Community resource centre 1 3.5 4 14 5 70
Public bench & reclaimed jetty posts 5 3.5 2 7 3 21
Car Park 5 3.5 2 7 3 21
Foreshore Path 1 3.5 2 7 3 21
Public Toilet 3 3.5 4 14 4 56
BBQ & Covered Structure 3 3.5 3 10.5 4 42
Limestone retaining wall 2 3.5 2 7 2 14
Playground 1 3.5 2 7 5 35
Department of Biodiversity & Attractions 1 3.5 4 14 5 70
Shire Offices 1 3.5 4 14 5 70
FRP Sheet-pile groyne 1 3.5 1 3.5 2 7
Grassed foreshore area 3 3.5 2 7 5 35
Public art 3 3.5 2 7 5 35
Jetty 3 3.5 1 3.5 2 7
Boat ramp 3 3.5 1 3.5 2 7
Fish cleaning station 1 3.5 3 10.5 2 21
Beach access 1 3.5 1 3.5 2 7
Road (Knight Terrace & Stella Rowley Dve) 2 3.5 2 7 2 14
Houses 29 3.5 4 14 5 70
Vacant blocks 14 3.5 1 3.5 2 7
General sets of buildings 9 3.5 4 14 5 70
Commercial
Public
Residential
Tourism Related
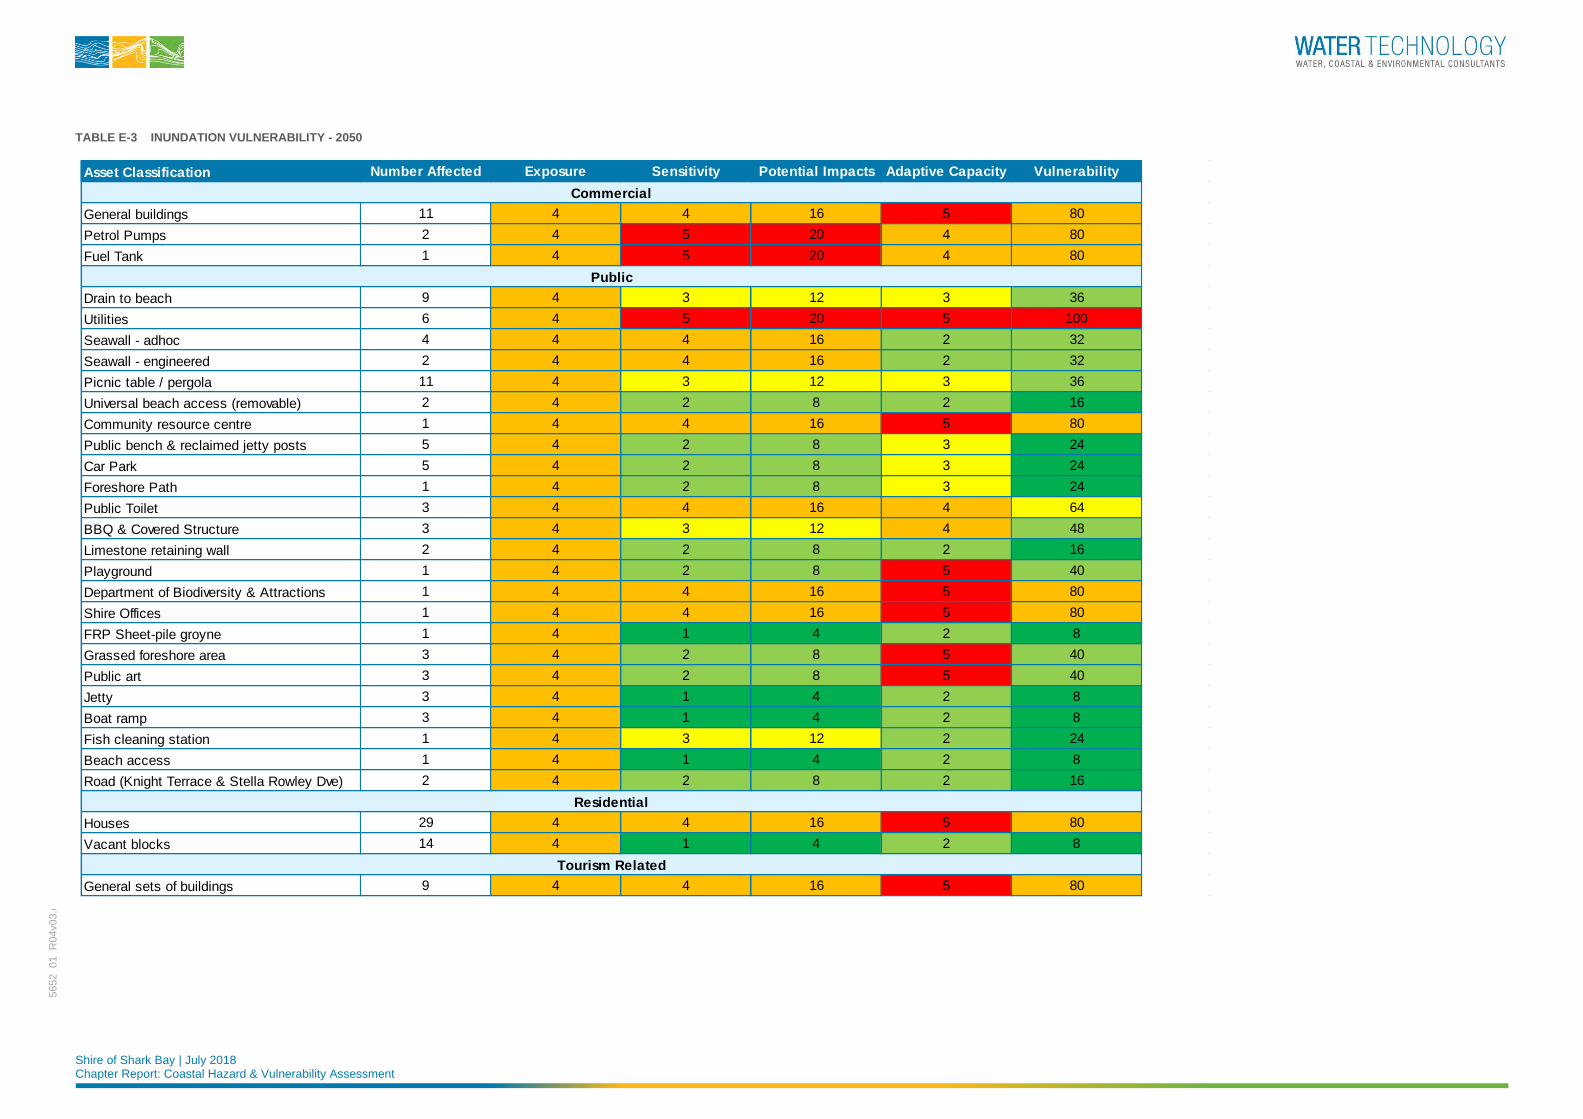
Shire of Shark Bay | July 2018 Chapter Report: Coastal Hazard & Vulnerability Assessment
5652_01_R
04v03.d
ocx
TABLE E-3 INUNDATION VULNERABILITY - 2050
Asset Classification Number Affected Exposure Sensitivity Potential Impacts Adaptive Capacity Vulnerability
General buildings 11 4 4 16 5 80
Petrol Pumps 2 4 5 20 4 80
Fuel Tank 1 4 5 20 4 80
Drain to beach 9 4 3 12 3 36
Utilities 6 4 5 20 5 100
Seawall - adhoc 4 4 4 16 2 32
Seawall - engineered 2 4 4 16 2 32
Picnic table / pergola 11 4 3 12 3 36
Universal beach access (removable) 2 4 2 8 2 16
Community resource centre 1 4 4 16 5 80
Public bench & reclaimed jetty posts 5 4 2 8 3 24
Car Park 5 4 2 8 3 24
Foreshore Path 1 4 2 8 3 24
Public Toilet 3 4 4 16 4 64
BBQ & Covered Structure 3 4 3 12 4 48
Limestone retaining wall 2 4 2 8 2 16
Playground 1 4 2 8 5 40
Department of Biodiversity & Attractions 1 4 4 16 5 80
Shire Offices 1 4 4 16 5 80
FRP Sheet-pile groyne 1 4 1 4 2 8
Grassed foreshore area 3 4 2 8 5 40
Public art 3 4 2 8 5 40
Jetty 3 4 1 4 2 8
Boat ramp 3 4 1 4 2 8
Fish cleaning station 1 4 3 12 2 24
Beach access 1 4 1 4 2 8
Road (Knight Terrace & Stella Rowley Dve) 2 4 2 8 2 16
Houses 29 4 4 16 5 80
Vacant blocks 14 4 1 4 2 8
General sets of buildings 9 4 4 16 5 80
Commercial
Public
Residential
Tourism Related
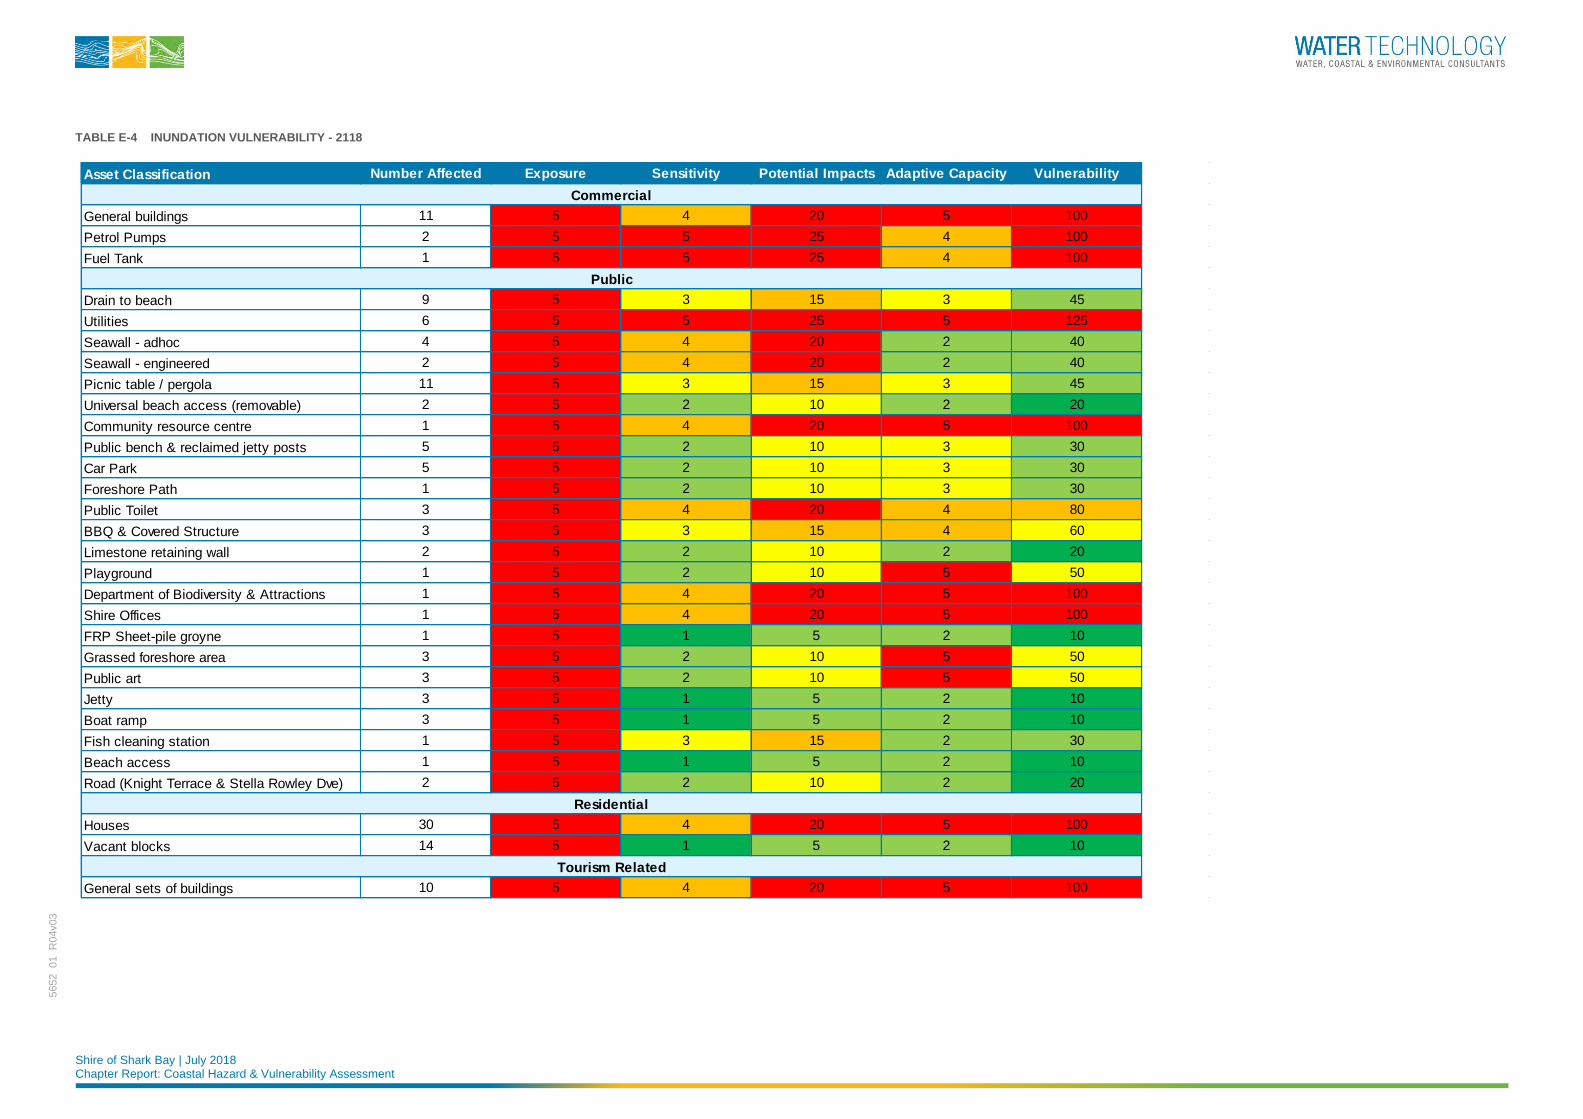
Shire of Shark Bay | July 2018 Chapter Report: Coastal Hazard & Vulnerability Assessment
5652_01_R
04v03.d
ocx
TABLE E-4 INUNDATION VULNERABILITY - 2118
Asset Classification Number Affected Exposure Sensitivity Potential Impacts Adaptive Capacity Vulnerability
General buildings 11 5 4 20 5 100
Petrol Pumps 2 5 5 25 4 100
Fuel Tank 1 5 5 25 4 100
Drain to beach 9 5 3 15 3 45
Utilities 6 5 5 25 5 125
Seawall - adhoc 4 5 4 20 2 40
Seawall - engineered 2 5 4 20 2 40
Picnic table / pergola 11 5 3 15 3 45
Universal beach access (removable) 2 5 2 10 2 20
Community resource centre 1 5 4 20 5 100
Public bench & reclaimed jetty posts 5 5 2 10 3 30
Car Park 5 5 2 10 3 30
Foreshore Path 1 5 2 10 3 30
Public Toilet 3 5 4 20 4 80
BBQ & Covered Structure 3 5 3 15 4 60
Limestone retaining wall 2 5 2 10 2 20
Playground 1 5 2 10 5 50
Department of Biodiversity & Attractions 1 5 4 20 5 100
Shire Offices 1 5 4 20 5 100
FRP Sheet-pile groyne 1 5 1 5 2 10
Grassed foreshore area 3 5 2 10 5 50
Public art 3 5 2 10 5 50
Jetty 3 5 1 5 2 10
Boat ramp 3 5 1 5 2 10
Fish cleaning station 1 5 3 15 2 30
Beach access 1 5 1 5 2 10
Road (Knight Terrace & Stella Rowley Dve) 2 5 2 10 2 20
Houses 30 5 4 20 5 100
Vacant blocks 14 5 1 5 2 10
General sets of buildings 10 5 4 20 5 100
Commercial
Public
Residential
Tourism Related

Shire of Shark Bay | July 2018 Chapter Report: Coastal Hazard & Vulnerability Assessment
5652_01_R
04v03.d
ocx
APPENDIX F COASTAL EROSION VULNERABILITY TABLES
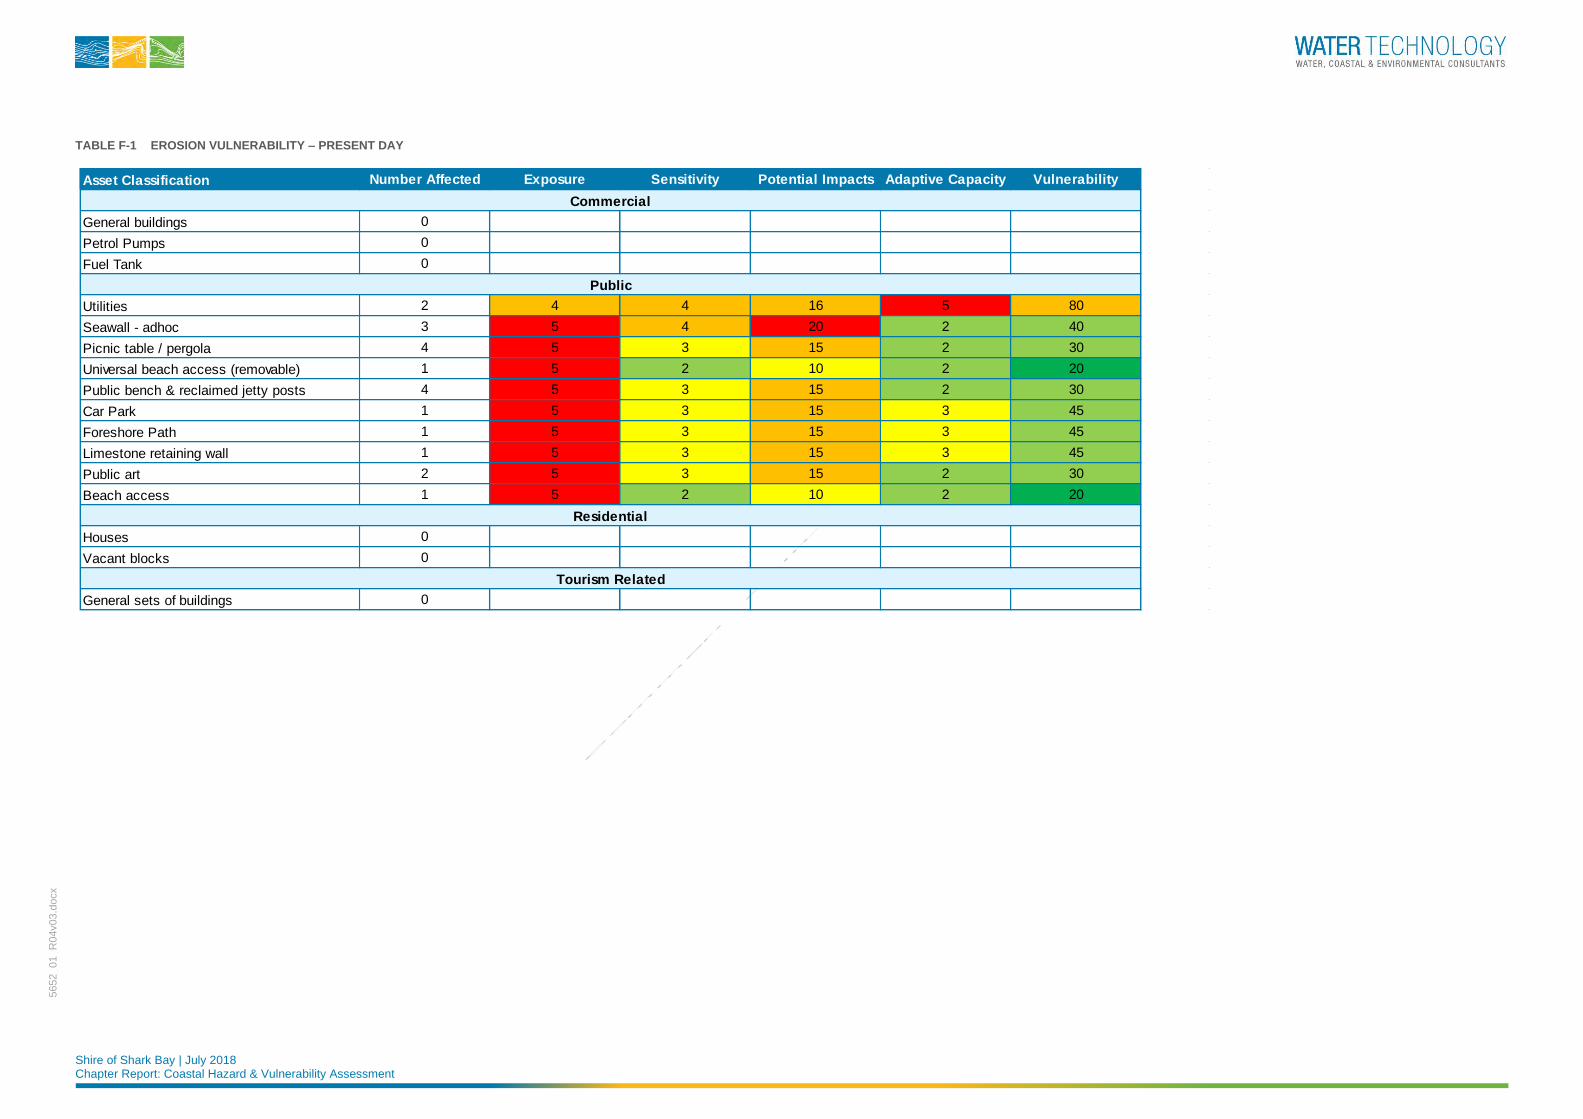
Shire of Shark Bay | July 2018 Chapter Report: Coastal Hazard & Vulnerability Assessment
5652_01_R
04v03.d
ocx
TABLE F-1 EROSION VULNERABILITY – PRESENT DAY
Asset Classification Number Affected Exposure Sensitivity Potential Impacts Adaptive Capacity Vulnerability
General buildings 0
Petrol Pumps 0
Fuel Tank 0
Utilities 2 4 4 16 5 80
Seawall - adhoc 3 5 4 20 2 40
Picnic table / pergola 4 5 3 15 2 30
Universal beach access (removable) 1 5 2 10 2 20
Public bench & reclaimed jetty posts 4 5 3 15 2 30
Car Park 1 5 3 15 3 45
Foreshore Path 1 5 3 15 3 45
Limestone retaining wall 1 5 3 15 3 45
Public art 2 5 3 15 2 30
Beach access 1 5 2 10 2 20
Houses 0
Vacant blocks 0
General sets of buildings 0
Tourism Related
Public
Commercial
Residential
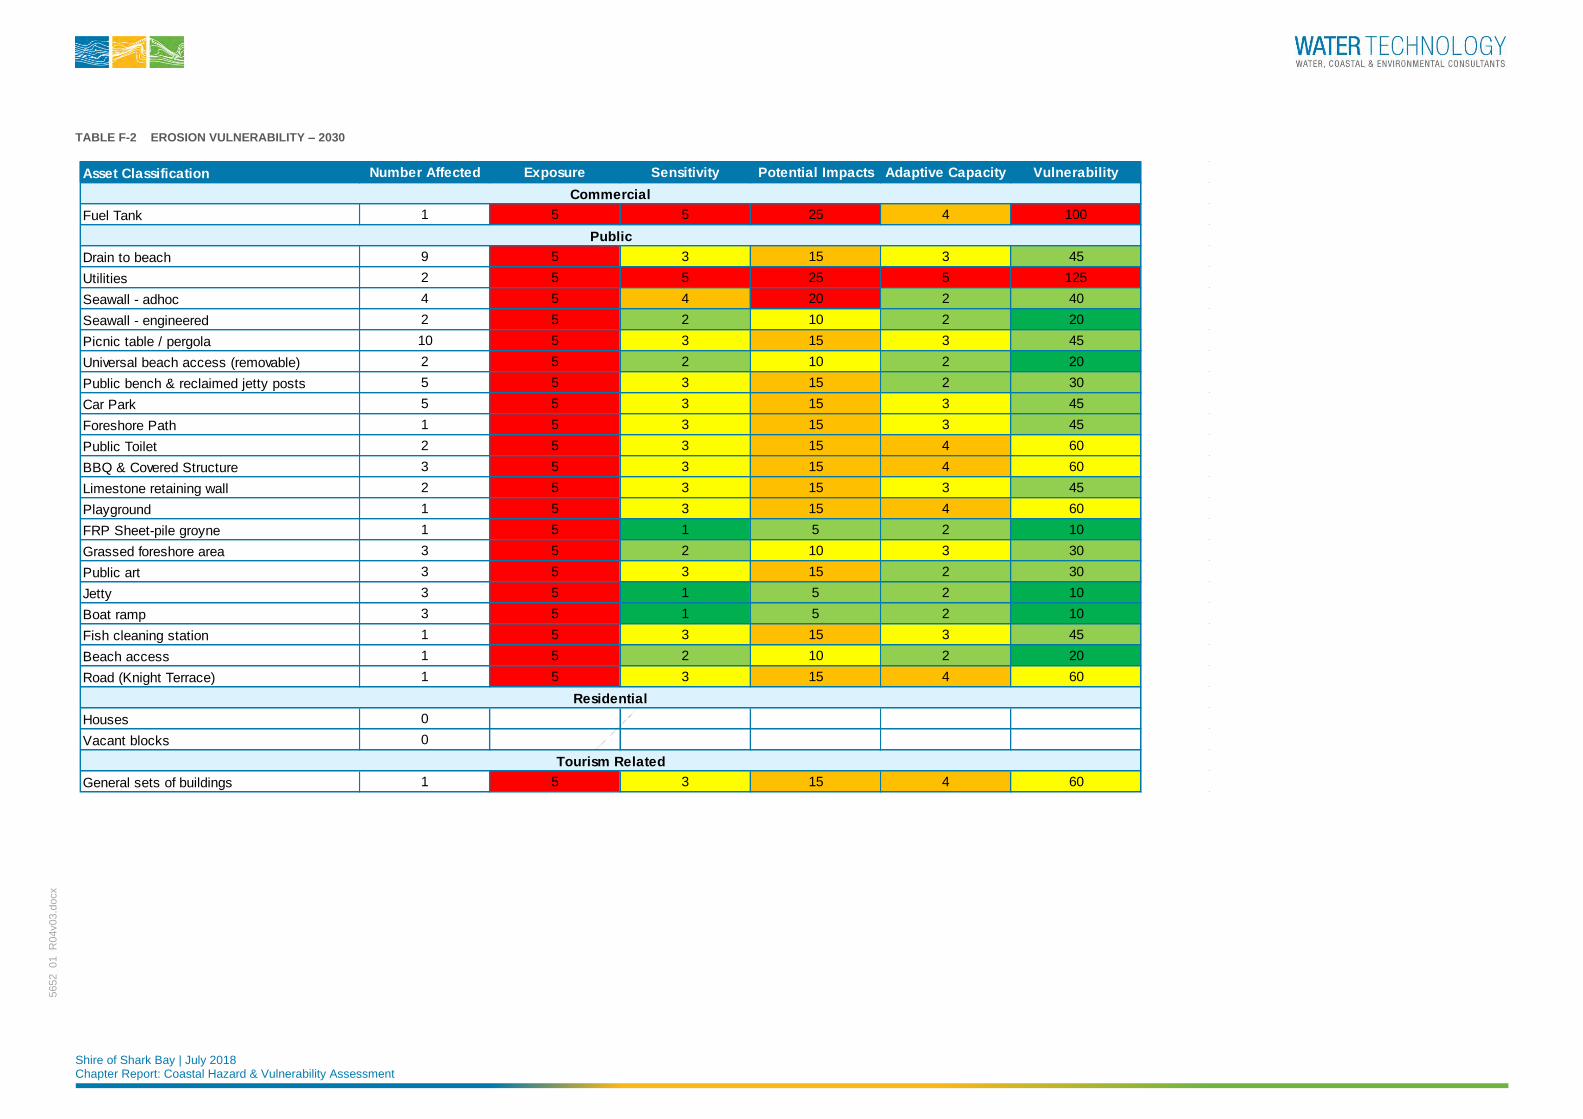
Shire of Shark Bay | July 2018 Chapter Report: Coastal Hazard & Vulnerability Assessment
5652_01_R
04v03.d
ocx
TABLE F-2 EROSION VULNERABILITY – 2030
Asset Classification Number Affected Exposure Sensitivity Potential Impacts Adaptive Capacity Vulnerability
Fuel Tank 1 5 5 25 4 100
Drain to beach 9 5 3 15 3 45
Utilities 2 5 5 25 5 125
Seawall - adhoc 4 5 4 20 2 40
Seawall - engineered 2 5 2 10 2 20
Picnic table / pergola 10 5 3 15 3 45
Universal beach access (removable) 2 5 2 10 2 20
Public bench & reclaimed jetty posts 5 5 3 15 2 30
Car Park 5 5 3 15 3 45
Foreshore Path 1 5 3 15 3 45
Public Toilet 2 5 3 15 4 60
BBQ & Covered Structure 3 5 3 15 4 60
Limestone retaining wall 2 5 3 15 3 45
Playground 1 5 3 15 4 60
FRP Sheet-pile groyne 1 5 1 5 2 10
Grassed foreshore area 3 5 2 10 3 30
Public art 3 5 3 15 2 30
Jetty 3 5 1 5 2 10
Boat ramp 3 5 1 5 2 10
Fish cleaning station 1 5 3 15 3 45
Beach access 1 5 2 10 2 20
Road (Knight Terrace) 1 5 3 15 4 60
Houses 0
Vacant blocks 0
General sets of buildings 1 5 3 15 4 60
Commercial
Public
Residential
Tourism Related
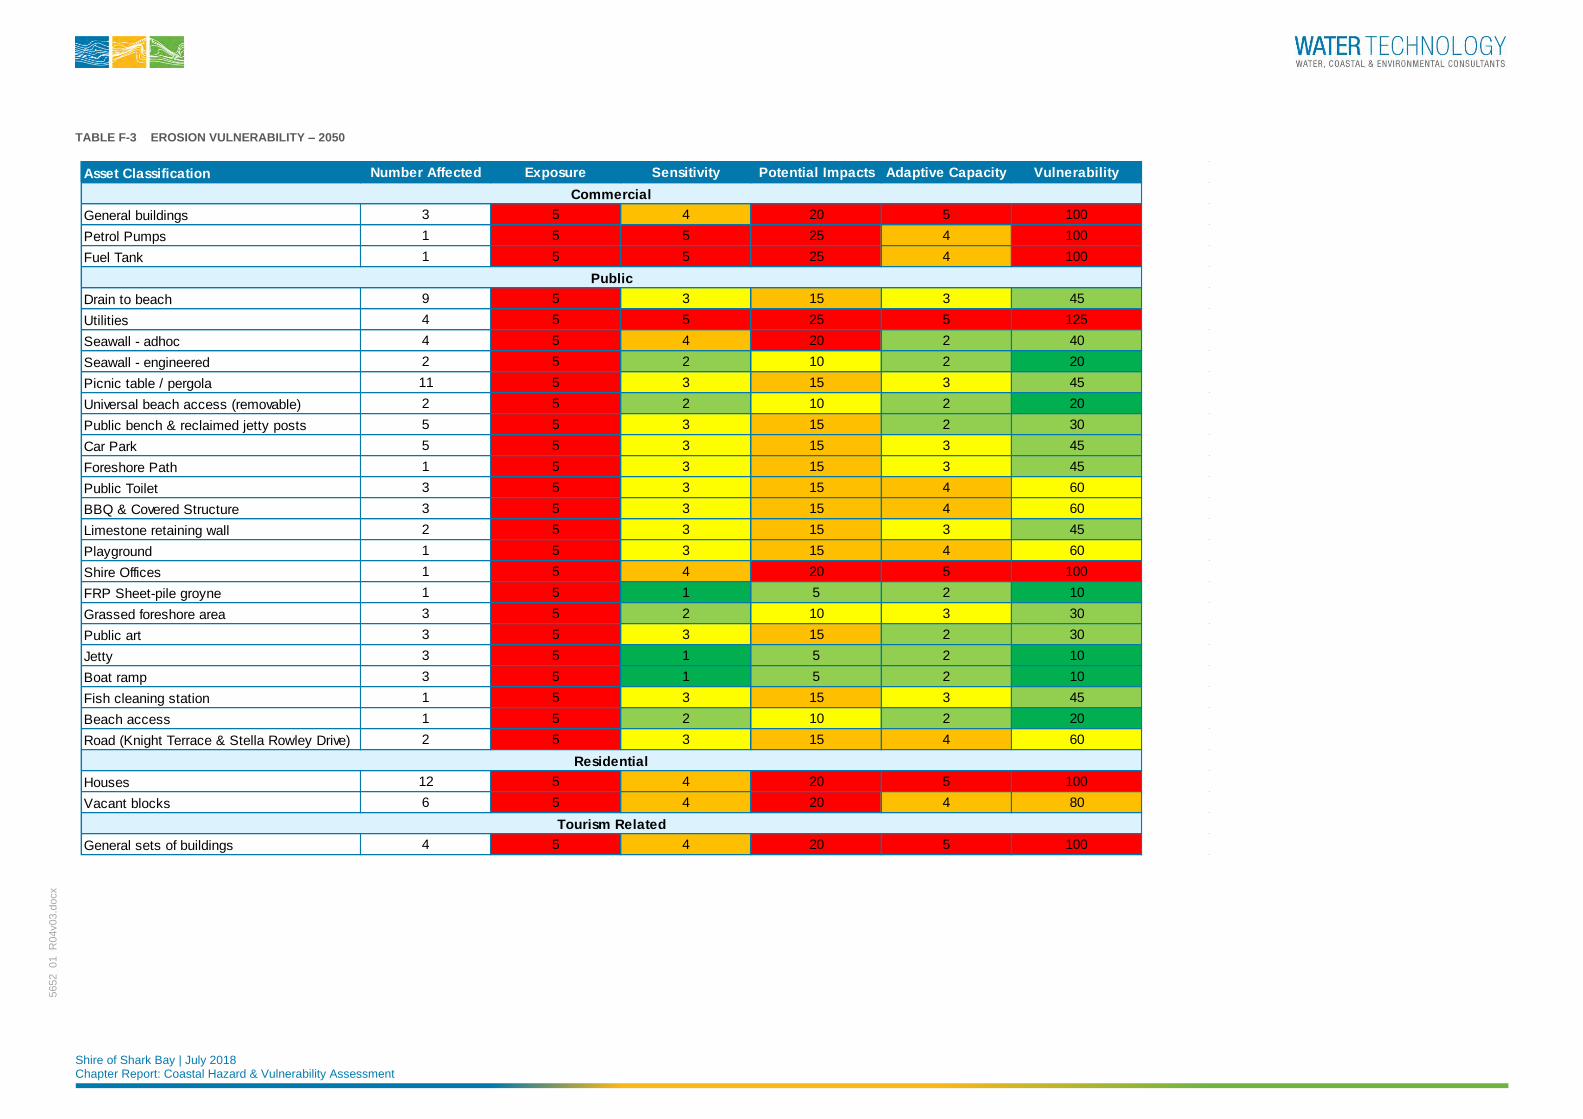
Shire of Shark Bay | July 2018 Chapter Report: Coastal Hazard & Vulnerability Assessment
5652_01_R
04v03.d
ocx
TABLE F-3 EROSION VULNERABILITY – 2050
Asset Classification Number Affected Exposure Sensitivity Potential Impacts Adaptive Capacity Vulnerability
General buildings 3 5 4 20 5 100
Petrol Pumps 1 5 5 25 4 100
Fuel Tank 1 5 5 25 4 100
Drain to beach 9 5 3 15 3 45
Utilities 4 5 5 25 5 125
Seawall - adhoc 4 5 4 20 2 40
Seawall - engineered 2 5 2 10 2 20
Picnic table / pergola 11 5 3 15 3 45
Universal beach access (removable) 2 5 2 10 2 20
Public bench & reclaimed jetty posts 5 5 3 15 2 30
Car Park 5 5 3 15 3 45
Foreshore Path 1 5 3 15 3 45
Public Toilet 3 5 3 15 4 60
BBQ & Covered Structure 3 5 3 15 4 60
Limestone retaining wall 2 5 3 15 3 45
Playground 1 5 3 15 4 60
Shire Offices 1 5 4 20 5 100
FRP Sheet-pile groyne 1 5 1 5 2 10
Grassed foreshore area 3 5 2 10 3 30
Public art 3 5 3 15 2 30
Jetty 3 5 1 5 2 10
Boat ramp 3 5 1 5 2 10
Fish cleaning station 1 5 3 15 3 45
Beach access 1 5 2 10 2 20
Road (Knight Terrace & Stella Rowley Drive) 2 5 3 15 4 60
Houses 12 5 4 20 5 100
Vacant blocks 6 5 4 20 4 80
General sets of buildings 4 5 4 20 5 100
Commercial
Public
Residential
Tourism Related
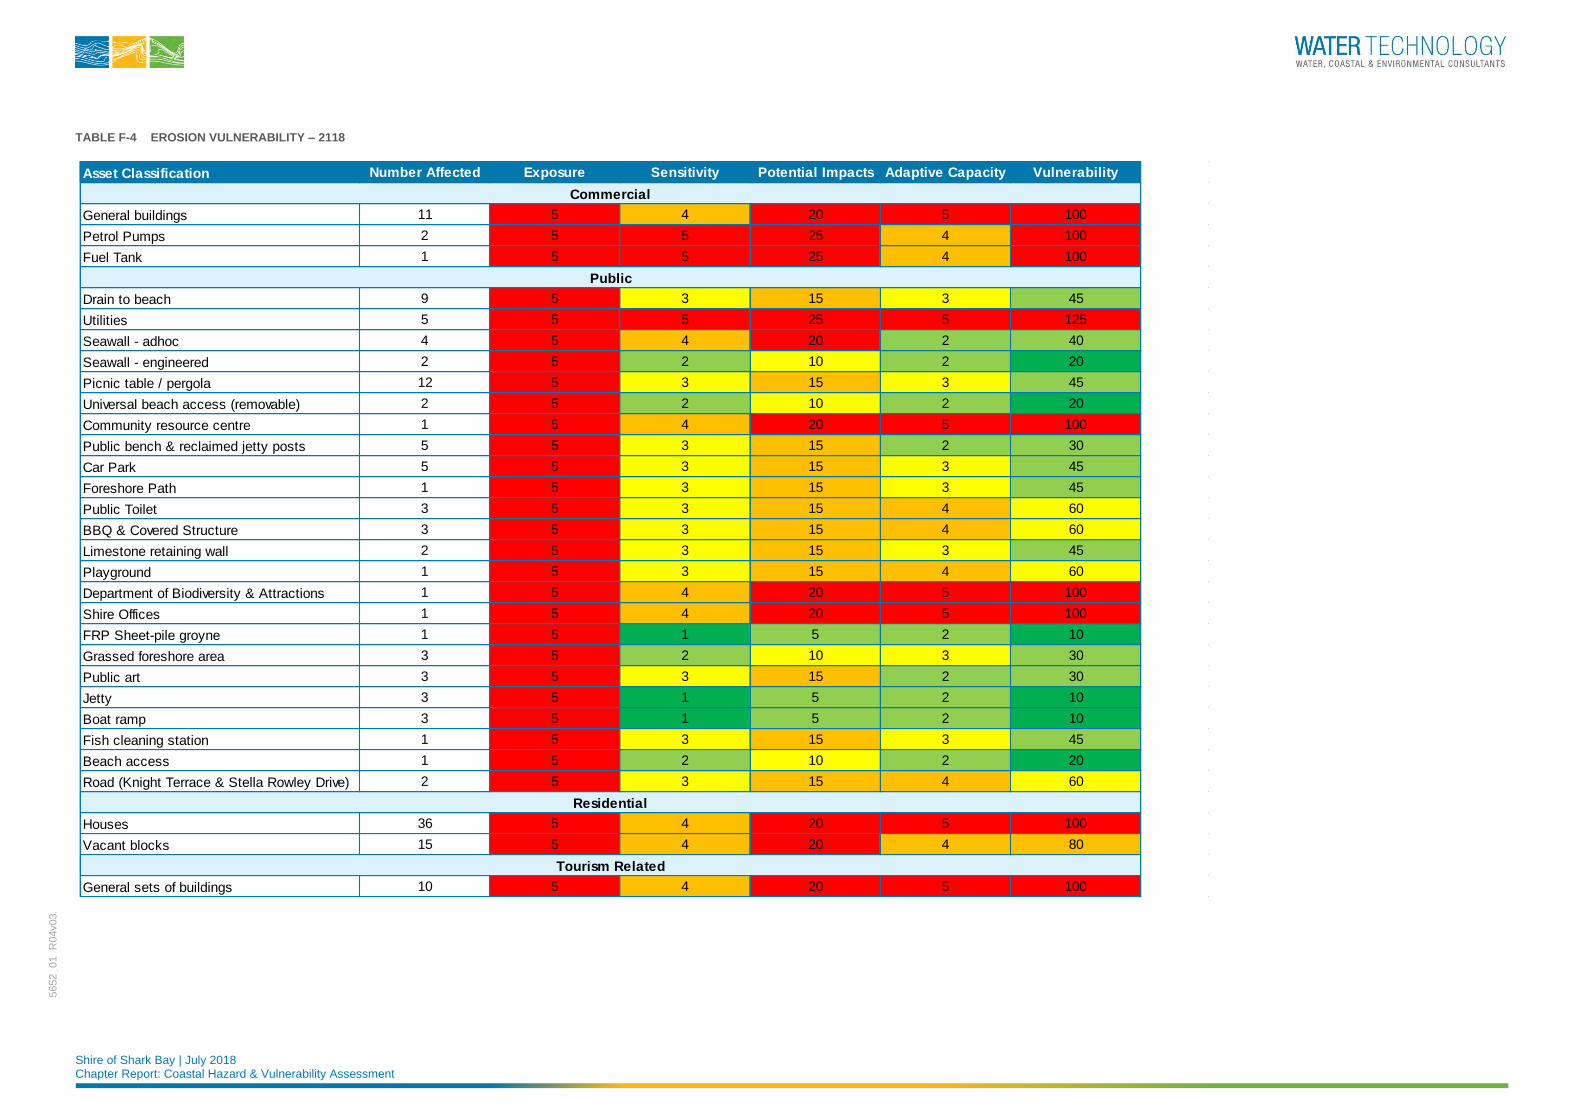
Shire of Shark Bay | July 2018 Chapter Report: Coastal Hazard & Vulnerability Assessment
5652_01_R
04v03.d
ocx
TABLE F-4 EROSION VULNERABILITY – 2118
Asset Classification Number Affected Exposure Sensitivity Potential Impacts Adaptive Capacity Vulnerability
General buildings 11 5 4 20 5 100
Petrol Pumps 2 5 5 25 4 100
Fuel Tank 1 5 5 25 4 100
Drain to beach 9 5 3 15 3 45
Utilities 5 5 5 25 5 125
Seawall - adhoc 4 5 4 20 2 40
Seawall - engineered 2 5 2 10 2 20
Picnic table / pergola 12 5 3 15 3 45
Universal beach access (removable) 2 5 2 10 2 20
Community resource centre 1 5 4 20 5 100
Public bench & reclaimed jetty posts 5 5 3 15 2 30
Car Park 5 5 3 15 3 45
Foreshore Path 1 5 3 15 3 45
Public Toilet 3 5 3 15 4 60
BBQ & Covered Structure 3 5 3 15 4 60
Limestone retaining wall 2 5 3 15 3 45
Playground 1 5 3 15 4 60
Department of Biodiversity & Attractions 1 5 4 20 5 100
Shire Offices 1 5 4 20 5 100
FRP Sheet-pile groyne 1 5 1 5 2 10
Grassed foreshore area 3 5 2 10 3 30
Public art 3 5 3 15 2 30
Jetty 3 5 1 5 2 10
Boat ramp 3 5 1 5 2 10
Fish cleaning station 1 5 3 15 3 45
Beach access 1 5 2 10 2 20
Road (Knight Terrace & Stella Rowley Drive) 2 5 3 15 4 60
Houses 36 5 4 20 5 100
Vacant blocks 15 5 4 20 4 80
General sets of buildings 10 5 4 20 5 100
Commercial
Public
Residential
Tourism Related
Shire of Shark Bay | 31 March 2020 Final Report
5652_01_R
09v02.d
ocx
APPENDIX D CHAPTER REPORT: RISK ASSESSMENT
Denham Townsite CHRMAP
Chapter Report: Risk Assessment
Shire of Shark Bay
06 March 2019
Shire of Shark Bay | 06 March 2019 Chapter Report: Risk Assessment Page 1
5652_01_R
05v03.d
ocx
Document Status
Version Doc type Reviewed by Approved by Date issued
V01 DRAFT Christine Arrowsmith Christine Arrowsmith 30/08/2018
V02 FINAL Paul O’Brien Paul O’Brien 01/03/2019
V03 FINAL Paul O’Brien Paul O’Brien 06/03/2019
Project Details
Project Name Chapter Report: Risk Assessment
Client Shire of Shark Bay
Client Project Manager Paul Anderson
Water Technology Project Manager Joanna Garcia-Webb
Water Technology Project Director Christine Lauchlan Arrowsmith
Authors Joanna Garcia-Webb
Document Number 5652_01_R05v03.docx
COPYRIGHT
Water Technology Pty Ltd has produced this document in accordance with instructions from Shire of Shark Bay for their
use only. The concepts and information contained in this document are the copyright of Water Technology Pty Ltd. Use or
copying of this document in whole or in part without written permission of Water Technology Pty Ltd constitutes an
infringement of copyright.
Water Technology Pty Ltd does not warrant this document is definitive nor free from error and does not accept liability for
any loss caused, or arising from, reliance upon the information provided herein.
Ground Floor, 430 Roberts Rd
Subiaco WA 6008
Telephone (08) 6555 0105
ACN 093 377 283
ABN 60 093 377 283
Shire of Shark Bay | 06 March 2019 Chapter Report: Risk Assessment Page 2
5652_01_R
05v03.d
ocx
06 March 2019
Paul Anderson Chief Executive Officer Shire of Shark Bay 65 Knight Terrace Denham WA 6537 Via email [email protected] Dear Paul
Chapter Report: Risk Assessment
We are pleased to present the Denham Townsite Coastal Hazard Risk Management and Adaptation Plan
Chapter Report: Risk Assessment. If you have any queries, please do not hesitate to contact me on (03) 8526
0830.
Yours sincerely
Joanna Garcia-Webb Senior Coastal Engineer
WATER TECHNOLOGY PTY LTD
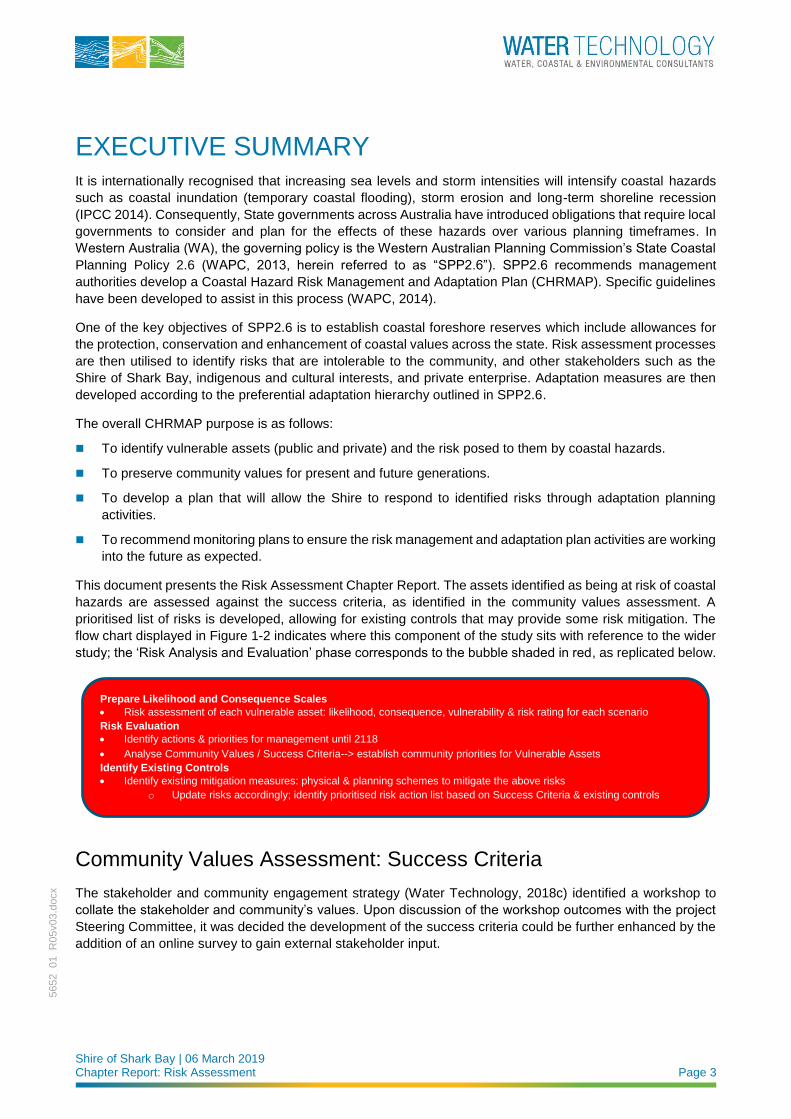
Shire of Shark Bay | 06 March 2019 Chapter Report: Risk Assessment Page 3
5652_01_R
05v03.d
ocx
EXECUTIVE SUMMARY It is internationally recognised that increasing sea levels and storm intensities will intensify coastal hazards
such as coastal inundation (temporary coastal flooding), storm erosion and long-term shoreline recession
(IPCC 2014). Consequently, State governments across Australia have introduced obligations that require local
governments to consider and plan for the effects of these hazards over various planning timeframes. In
Western Australia (WA), the governing policy is the Western Australian Planning Commission’s State Coastal
Planning Policy 2.6 (WAPC, 2013, herein referred to as “SPP2.6”). SPP2.6 recommends management
authorities develop a Coastal Hazard Risk Management and Adaptation Plan (CHRMAP). Specific guidelines
have been developed to assist in this process (WAPC, 2014).
One of the key objectives of SPP2.6 is to establish coastal foreshore reserves which include allowances for
the protection, conservation and enhancement of coastal values across the state. Risk assessment processes
are then utilised to identify risks that are intolerable to the community, and other stakeholders such as the
Shire of Shark Bay, indigenous and cultural interests, and private enterprise. Adaptation measures are then
developed according to the preferential adaptation hierarchy outlined in SPP2.6.
The overall CHRMAP purpose is as follows:
◼ To identify vulnerable assets (public and private) and the risk posed to them by coastal hazards.
◼ To preserve community values for present and future generations.
◼ To develop a plan that will allow the Shire to respond to identified risks through adaptation planning
activities.
◼ To recommend monitoring plans to ensure the risk management and adaptation plan activities are working
into the future as expected.
This document presents the Risk Assessment Chapter Report. The assets identified as being at risk of coastal
hazards are assessed against the success criteria, as identified in the community values assessment. A
prioritised list of risks is developed, allowing for existing controls that may provide some risk mitigation. The
flow chart displayed in Figure 1-2 indicates where this component of the study sits with reference to the wider
study; the ‘Risk Analysis and Evaluation’ phase corresponds to the bubble shaded in red, as replicated below.
Community Values Assessment: Success Criteria
The stakeholder and community engagement strategy (Water Technology, 2018c) identified a workshop to
collate the stakeholder and community’s values. Upon discussion of the workshop outcomes with the project
Steering Committee, it was decided the development of the success criteria could be further enhanced by the
addition of an online survey to gain external stakeholder input.
Prepare Likelihood and Consequence Scales
• Risk assessment of each vulnerable asset: likelihood, consequence, vulnerability & risk rating for each scenario
Risk Evaluation
• Identify actions & priorities for management until 2118
• Analyse Community Values / Success Criteria--> establish community priorities for Vulnerable Assets
Identify Existing Controls
• Identify existing mitigation measures: physical & planning schemes to mitigate the above risks
o Update risks accordingly; identify prioritised risk action list based on Success Criteria & existing controls
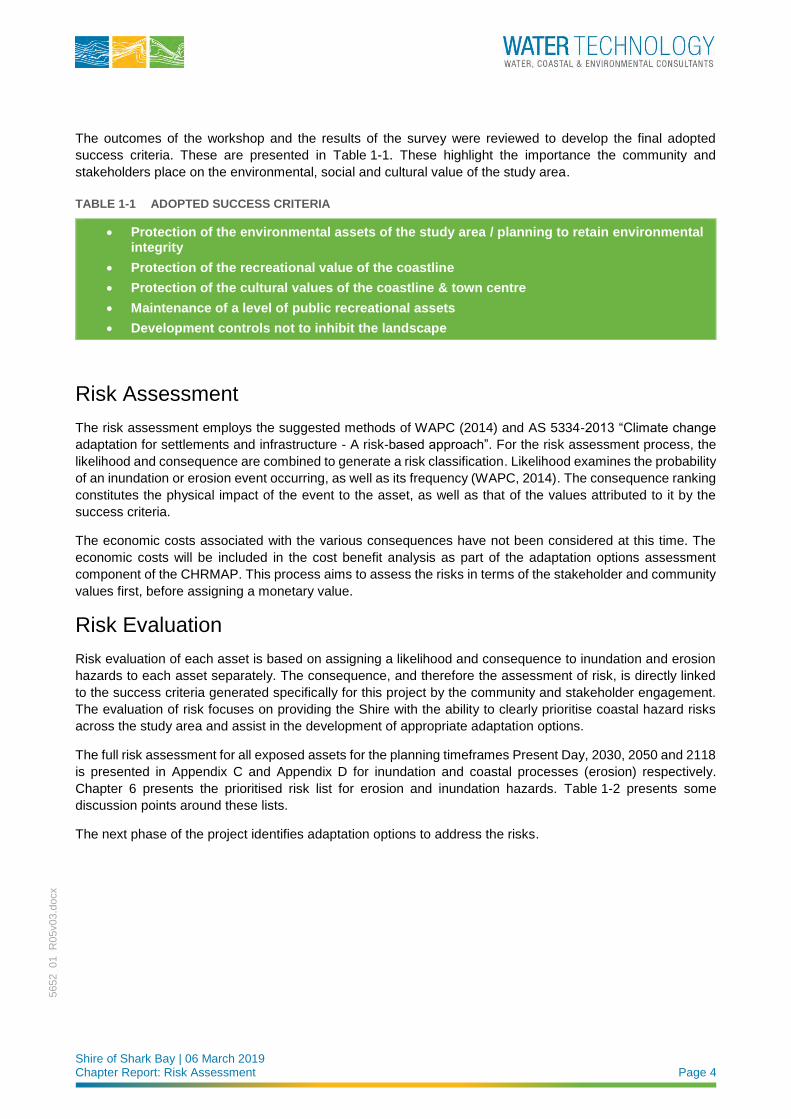
Shire of Shark Bay | 06 March 2019 Chapter Report: Risk Assessment Page 4
5652_01_R
05v03.d
ocx
The outcomes of the workshop and the results of the survey were reviewed to develop the final adopted
success criteria. These are presented in Table 1-1. These highlight the importance the community and
stakeholders place on the environmental, social and cultural value of the study area.
TABLE 1-1 ADOPTED SUCCESS CRITERIA
• Protection of the environmental assets of the study area / planning to retain environmental integrity
• Protection of the recreational value of the coastline
• Protection of the cultural values of the coastline & town centre
• Maintenance of a level of public recreational assets
• Development controls not to inhibit the landscape
Risk Assessment
The risk assessment employs the suggested methods of WAPC (2014) and AS 5334-2013 “Climate change
adaptation for settlements and infrastructure - A risk-based approach”. For the risk assessment process, the
likelihood and consequence are combined to generate a risk classification. Likelihood examines the probability
of an inundation or erosion event occurring, as well as its frequency (WAPC, 2014). The consequence ranking
constitutes the physical impact of the event to the asset, as well as that of the values attributed to it by the
success criteria.
The economic costs associated with the various consequences have not been considered at this time. The
economic costs will be included in the cost benefit analysis as part of the adaptation options assessment
component of the CHRMAP. This process aims to assess the risks in terms of the stakeholder and community
values first, before assigning a monetary value.
Risk Evaluation
Risk evaluation of each asset is based on assigning a likelihood and consequence to inundation and erosion
hazards to each asset separately. The consequence, and therefore the assessment of risk, is directly linked
to the success criteria generated specifically for this project by the community and stakeholder engagement.
The evaluation of risk focuses on providing the Shire with the ability to clearly prioritise coastal hazard risks
across the study area and assist in the development of appropriate adaptation options.
The full risk assessment for all exposed assets for the planning timeframes Present Day, 2030, 2050 and 2118
is presented in Appendix C and Appendix D for inundation and coastal processes (erosion) respectively.
Chapter 6 presents the prioritised risk list for erosion and inundation hazards. Table 1-2 presents some
discussion points around these lists.
The next phase of the project identifies adaptation options to address the risks.
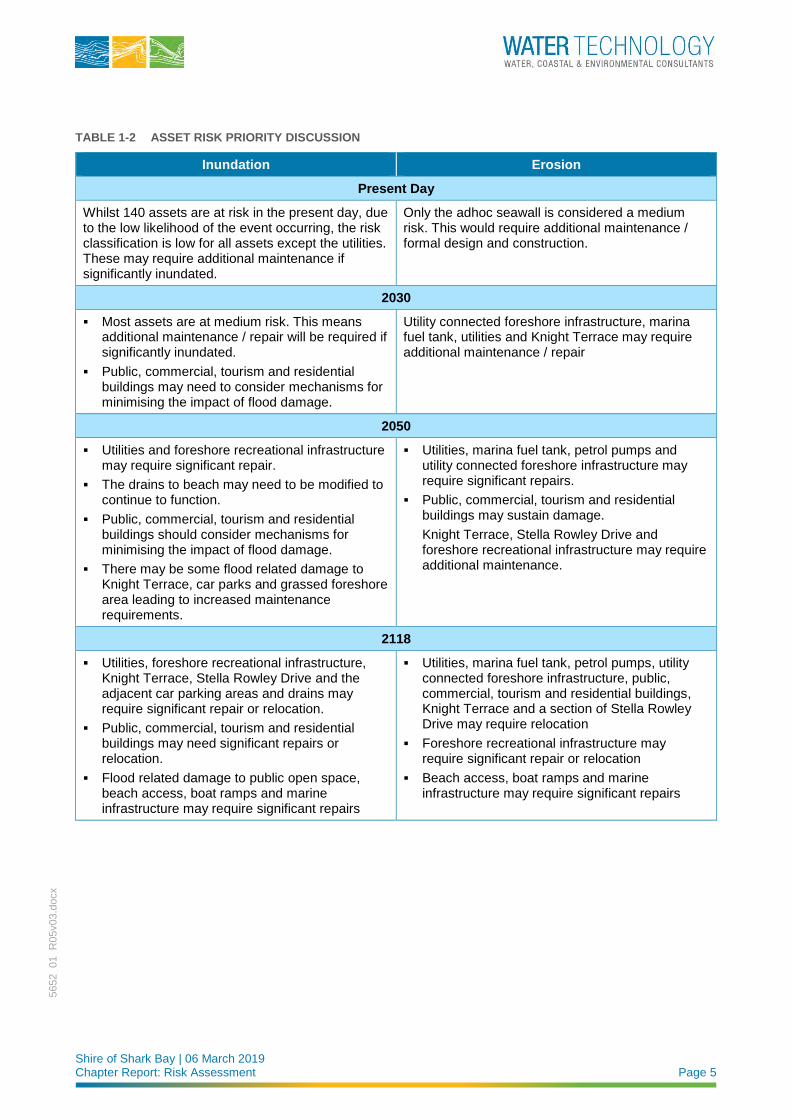
Shire of Shark Bay | 06 March 2019 Chapter Report: Risk Assessment Page 5
5652_01_R
05v03.d
ocx
TABLE 1-2 ASSET RISK PRIORITY DISCUSSION
Inundation Erosion
Present Day
Whilst 140 assets are at risk in the present day, due to the low likelihood of the event occurring, the risk classification is low for all assets except the utilities. These may require additional maintenance if significantly inundated.
Only the adhoc seawall is considered a medium risk. This would require additional maintenance / formal design and construction.
2030
▪ Most assets are at medium risk. This means additional maintenance / repair will be required if significantly inundated.
▪ Public, commercial, tourism and residential buildings may need to consider mechanisms for minimising the impact of flood damage.
Utility connected foreshore infrastructure, marina fuel tank, utilities and Knight Terrace may require additional maintenance / repair
2050
▪ Utilities and foreshore recreational infrastructure may require significant repair.
▪ The drains to beach may need to be modified to continue to function.
▪ Public, commercial, tourism and residential buildings should consider mechanisms for minimising the impact of flood damage.
▪ There may be some flood related damage to Knight Terrace, car parks and grassed foreshore area leading to increased maintenance requirements.
▪ Utilities, marina fuel tank, petrol pumps and utility connected foreshore infrastructure may require significant repairs.
▪ Public, commercial, tourism and residential buildings may sustain damage.
Knight Terrace, Stella Rowley Drive and foreshore recreational infrastructure may require additional maintenance.
2118
▪ Utilities, foreshore recreational infrastructure, Knight Terrace, Stella Rowley Drive and the adjacent car parking areas and drains may require significant repair or relocation.
▪ Public, commercial, tourism and residential buildings may need significant repairs or relocation.
▪ Flood related damage to public open space, beach access, boat ramps and marine infrastructure may require significant repairs
▪ Utilities, marina fuel tank, petrol pumps, utility connected foreshore infrastructure, public, commercial, tourism and residential buildings, Knight Terrace and a section of Stella Rowley Drive may require relocation
▪ Foreshore recreational infrastructure may require significant repair or relocation
▪ Beach access, boat ramps and marine infrastructure may require significant repairs
Shire of Shark Bay | 06 March 2019 Chapter Report: Risk Assessment Page 6
5652_01_R
05v03.d
ocx
CONTENTS
1 INTRODUCTION 9
2 SUCCESS CRITERIA 12
2.1 Community Workshop Values 12
2.2 Community Values Survey 13
2.3 Adopted Success Criteria 14
3 RISK ASSESSMENT PROCESS 15
3.1 Likelihood & Consequence Scales 15
3.1.1 Likelihood Ranking 15
3.1.2 Consequence Ranking 17
3.2 Risk Classification 19
4 RISK EVALUATION 20
4.1 Asset Identification 20
4.2 Inundation Risk Evaluation 20
4.2.1 Commercial Assets 21
4.2.2 Public Assets 21
4.2.3 Residential Assets 21
4.2.4 Tourism Related Assets 23
4.3 Erosion Risk Evaluation 23
4.3.1 Commercial Assets 24
4.3.2 Public Assets 24
4.3.3 Residential Assets 24
4.3.4 Tourism Related Assets 26
5 EXISTING CONTROL IDENTIFICATION 27
5.1 Planning Controls 27
5.1.1 Shire of Shark Bay Local Planning Strategy 27
5.1.2 Local Planning Scheme 29
5.2 Structural Controls 31
6 RISK RE-EVALUATION 33
6.1 Inundation Risk Re-Evaluation 33
6.2 Erosion Risk Re-Evaluation 33
6.3 Risk Priority List 34
7 SUMMARY 38
8 REFERENCES 40
Shire of Shark Bay | 06 March 2019 Chapter Report: Risk Assessment Page 7
5652_01_R
05v03.d
ocx
APPENDICES Appendix A Community Values Survey Questions
Appendix B Community Value Survey Results
Appendix C Inundation Risk Evaluation
Appendix D Coastal Processes Risk Evaluation
LIST OF FIGURES Figure 1-1 Extent of CHRMAP 10
Figure 1-2 Proposed CHRMAP methodology flow chart (adapted from WAPC CHRMAP Guidelines) 11
Figure 3-1 Risk assessment process 15
Figure 3-2 Flood hazard curve (Smith et al, 2014) 18
Figure 5-1 State planning framework for Western Australia 27
Figure 5-2 Engineered seawall along foreshore 31
Figure 5-3 Extent of engineered seawall – Section 3 32
LIST OF TABLES Table 1-1 Adopted success criteria 4
Table 1-2 Asset risk priority discussion 5
Table 2-1 Preliminary success criteria 12
Table 2-2 Adopted success criteria 14
Table 3-1 Likelihood ranking definition 16
Table 3-2 Event probabilities over planning timframes 16
Table 3-3 Consequence ranking 17
Table 3-4 Risk assessment matrix 19
Table 3-5 Risk profile definition 19
Table 4-1 Commercial assets inundation risk 21
Table 4-2 Public assets Inundation risk 22
Table 4-3 Residential assets inundation risk 22
Table 4-4 Tourism related assets Inundation vulnerability 23
Table 4-5 Assets exposed to erosion 23
Table 4-6 Commercial assets erosion risk 24
Table 4-7 Public assets erosion risk 25
Table 4-8 Residential assets erosion risk 25
Table 4-9 Tourism related assets erosion risk 26
Table 5-1 Local planning strategy objectives - coastal areas 28
Table 6-1 Prioritised assets - inundation risks 35
Table 6-2 Prioritised assets - erosion risks 36
Table 6-3 Asset risk priority discussion 37
Table 7-1 Adopted success criteria 38
Shire of Shark Bay | 06 March 2019 Chapter Report: Risk Assessment Page 8
5652_01_R
05v03.d
ocx
Table A-1 Community values survey questions 42
Table C-1 Inundation Risk Evaluation – Present Day. Re-evaluation considering existing controls shown in last 3 columns 47
Table C-2 Inundation Risk Evaluation - 2030. Re-evaluation considering existing controls shown in last 3 columns 48
Table C-3 Inundation Risk Evaluation - 2050. Re-evaluation considering existing controls shown in last 3 columns 49
Table C-4 Inundation Risk Evaluation - 2118. Re-evaluation considering existing controls shown in last 3 columns 50
Table D-1 Coastal Processes Risk Evaluation - Present Day. Re-evaluation considering existing controls shown in last 3 columns 54
Table D-2 Coastal Processes Risk Evaluation - 2030. Re-evaluation considering existing controls shown in last 3 columns 55
Table D-3 Coastal Processes Risk Evaluation - 2050. Re-evaluation considering existing controls shown in last 3 columns 56
Table D-4 Coastal Processes Risk Evaluation - 2118. Re-evaluation considering existing controls shown in last 3 columns 57
Shire of Shark Bay | 06 March 2019 Chapter Report: Risk Assessment Page 9
5652_01_R
05v03.d
ocx
1 INTRODUCTION It is internationally recognised that increasing sea levels and storm intensities will intensify coastal hazards
such as coastal inundation (temporary coastal flooding), storm erosion and long-term shoreline recession
(IPCC 2014). Consequently, State governments across Australia have introduced obligations that require local
governments to consider and plan for the effects of these hazards over various planning timeframes. In
Western Australia (WA), the governing policy is the Western Australian Planning Commission’s State Coastal
Planning Policy 2.6 (WAPC, 2013, herein referred to as “SPP2.6”). SPP2.6 recommends management
authorities develop a Coastal Hazard Risk Management and Adaptation Plan (CHRMAP). Specific guidelines
have been developed to assist in this process (WAPC, 2014).
One of the key objectives of SPP2.6 is to establish coastal foreshore reserves which include allowances for
the protection, conservation and enhancement of coastal values across the state. Risk assessment processes
are then utilised to identify risks that are intolerable to the community, and other stakeholders such as the
Shire of Shark Bay, indigenous and cultural interests, and private enterprise. Adaptation measures are then
developed according to the preferential adaptation hierarchy outlined in SPP2.6.
The aim of the present study is to investigate and plan for coastal hazards which are likely to affect the Denham
townsite. Denham is located within the local government area of the Shire of Shark Bay, approximately 800km
north of Perth (refer Figure 1-1 for locality). Denham and its surrounds are used extensively for tourism,
commercial and recreational purposes. Tourism is the primary industry in the Shire, with fishing and
aquaculture also playing a major role.
Given the above, visitors to and residents of Denham and its surrounds place a high value on the coastline.
Processes affecting the coastal zone are multiple and complex: storm surge; tidal movement; shoreline
stability; stormwater drainage; and the interactions between surface and groundwater all contribute in differing
degrees. Furthermore, the potential impacts of climate change, specifically increasing sea levels and storm
intensities, will place increased pressure on the coastal zone, and threaten public infrastructure and assets,
private property, foreshore reserves, coastal attractions and public open spaces.
This document presents the Risk Assessment Chapter Report. The assets identified as being at risk of coastal
hazards will be assessed against the success criteria, as identified in the community values assessment. A
prioritised list of risks is developed, allowing for existing controls that may provide some risk mitigation. The
flow chart displayed in Figure 1-2 indicates where this component of the study sits with reference to the wider
study; the ‘Risk Analysis and Evaluation’ phase corresponds to the bubble shaded in red.

Shire of Shark Bay | 06 March 2019 Chapter Report: Risk Assessment Page 10
5652_01_R
05v03.d
ocx
FIGURE 1-1 EXTENT OF CHRMAP
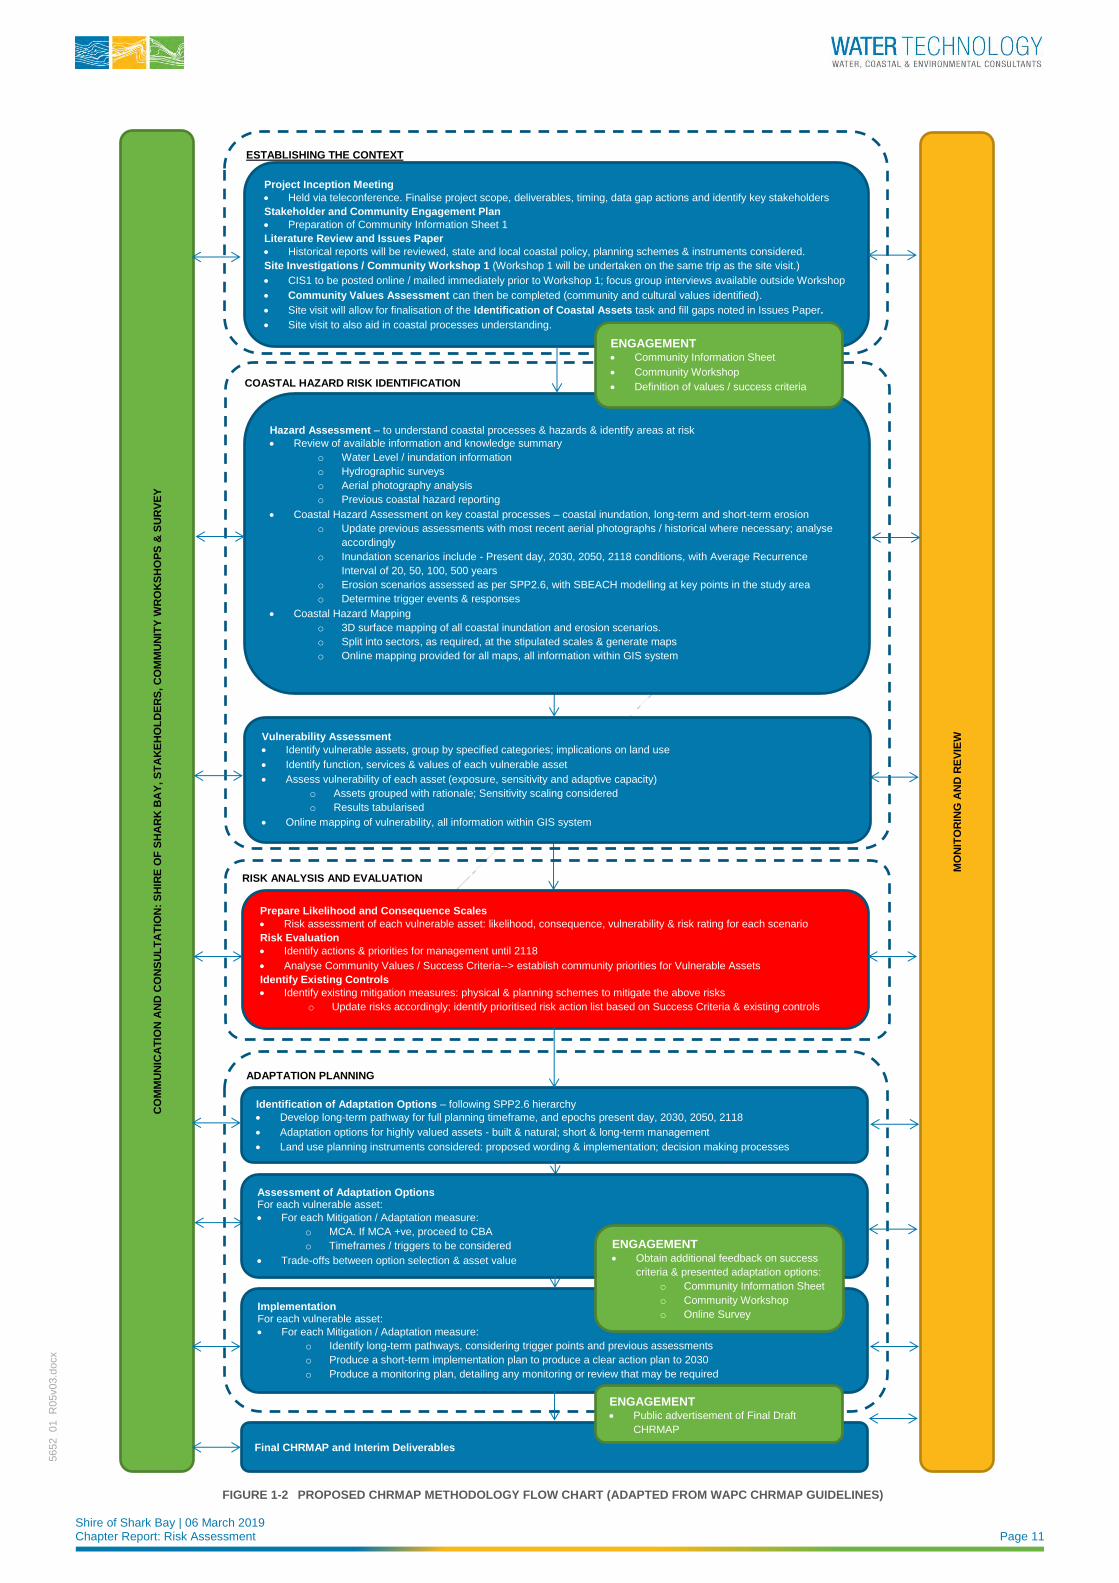
Shire of Shark Bay | 06 March 2019 Chapter Report: Risk Assessment Page 11
5652_01_R
05v03.d
ocx
ESTABLISHING THE CONTEXT
Project Inception Meeting
• Held via teleconference. Finalise project scope, deliverables, timing, data gap actions and identify key stakeholders
Stakeholder and Community Engagement Plan
• Preparation of Community Information Sheet 1
Literature Review and Issues Paper
• Historical reports will be reviewed, state and local coastal policy, planning schemes & instruments considered.
Site Investigations / Community Workshop 1 (Workshop 1 will be undertaken on the same trip as the site visit.)
• CIS1 to be posted online / mailed immediately prior to Workshop 1; focus group interviews available outside Workshop
• Community Values Assessment can then be completed (community and cultural values identified).
• Site visit will allow for finalisation of the Identification of Coastal Assets task and fill gaps noted in Issues Paper.
• Site visit to also aid in coastal processes understanding.
CO
MM
UN
ICA
TIO
N A
ND
CO
NS
UL
TA
TIO
N:
SH
IRE
OF
SH
AR
K B
AY
, S
TA
KE
HO
LD
ER
S, C
OM
MU
NIT
Y W
RO
KS
HO
PS
& S
UR
VE
Y
MO
NIT
OR
ING
AN
D R
EV
IEW
Final CHRMAP and Interim Deliverables
ADAPTATION PLANNING
COASTAL HAZARD RISK IDENTIFICATION
Hazard Assessment – to understand coastal processes & hazards & identify areas at risk
• Review of available information and knowledge summary
o Water Level / inundation information
o Hydrographic surveys
o Aerial photography analysis
o Previous coastal hazard reporting
• Coastal Hazard Assessment on key coastal processes – coastal inundation, long-term and short-term erosion
o Update previous assessments with most recent aerial photographs / historical where necessary; analyse
accordingly
o Inundation scenarios include - Present day, 2030, 2050, 2118 conditions, with Average Recurrence
Interval of 20, 50, 100, 500 years
o Erosion scenarios assessed as per SPP2.6, with SBEACH modelling at key points in the study area o Determine trigger events & responses
• Coastal Hazard Mapping
o 3D surface mapping of all coastal inundation and erosion scenarios.
o Split into sectors, as required, at the stipulated scales & generate maps
o Online mapping provided for all maps, all information within GIS system
RISK ANALYSIS AND EVALUATION
Prepare Likelihood and Consequence Scales
• Risk assessment of each vulnerable asset: likelihood, consequence, vulnerability & risk rating for each scenario
Risk Evaluation
• Identify actions & priorities for management until 2118
• Analyse Community Values / Success Criteria--> establish community priorities for Vulnerable Assets
Identify Existing Controls
• Identify existing mitigation measures: physical & planning schemes to mitigate the above risks
o Update risks accordingly; identify prioritised risk action list based on Success Criteria & existing controls
Identification of Adaptation Options – following SPP2.6 hierarchy
• Develop long-term pathway for full planning timeframe, and epochs present day, 2030, 2050, 2118
• Adaptation options for highly valued assets - built & natural; short & long-term management
• Land use planning instruments considered: proposed wording & implementation; decision making processes
Vulnerability Assessment
• Identify vulnerable assets, group by specified categories; implications on land use
• Identify function, services & values of each vulnerable asset
• Assess vulnerability of each asset (exposure, sensitivity and adaptive capacity)
o Assets grouped with rationale; Sensitivity scaling considered
o Results tabularised
• Online mapping of vulnerability, all information within GIS system
ENGAGEMENT • Community Information Sheet
• Community Workshop
• Definition of values / success criteria
Assessment of Adaptation Options For each vulnerable asset:
• For each Mitigation / Adaptation measure:
o MCA. If MCA +ve, proceed to CBA
o Timeframes / triggers to be considered
• Trade-offs between option selection & asset value
Implementation For each vulnerable asset:
• For each Mitigation / Adaptation measure:
o Identify long-term pathways, considering trigger points and previous assessments
o Produce a short-term implementation plan to produce a clear action plan to 2030
o Produce a monitoring plan, detailing any monitoring or review that may be required
ENGAGEMENT • Obtain additional feedback on success
criteria & presented adaptation options:
o Community Information Sheet
o Community Workshop
o Online Survey
ENGAGEMENT • Public advertisement of Final Draft
CHRMAP
FIGURE 1-2 PROPOSED CHRMAP METHODOLOGY FLOW CHART (ADAPTED FROM WAPC CHRMAP GUIDELINES)
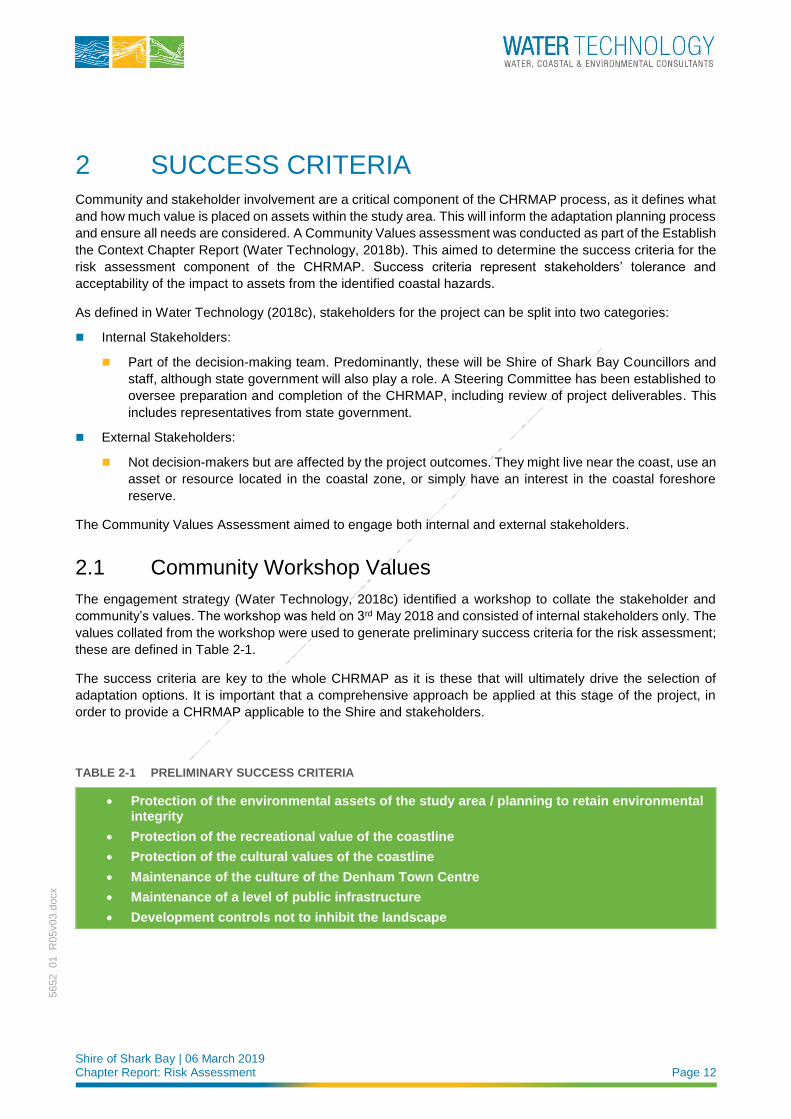
Shire of Shark Bay | 06 March 2019 Chapter Report: Risk Assessment Page 12
5652_01_R
05v03.d
ocx
2 SUCCESS CRITERIA Community and stakeholder involvement are a critical component of the CHRMAP process, as it defines what
and how much value is placed on assets within the study area. This will inform the adaptation planning process
and ensure all needs are considered. A Community Values assessment was conducted as part of the Establish
the Context Chapter Report (Water Technology, 2018b). This aimed to determine the success criteria for the
risk assessment component of the CHRMAP. Success criteria represent stakeholders’ tolerance and
acceptability of the impact to assets from the identified coastal hazards.
As defined in Water Technology (2018c), stakeholders for the project can be split into two categories:
◼ Internal Stakeholders:
◼ Part of the decision-making team. Predominantly, these will be Shire of Shark Bay Councillors and
staff, although state government will also play a role. A Steering Committee has been established to
oversee preparation and completion of the CHRMAP, including review of project deliverables. This
includes representatives from state government.
◼ External Stakeholders:
◼ Not decision-makers but are affected by the project outcomes. They might live near the coast, use an
asset or resource located in the coastal zone, or simply have an interest in the coastal foreshore
reserve.
The Community Values Assessment aimed to engage both internal and external stakeholders.
2.1 Community Workshop Values
The engagement strategy (Water Technology, 2018c) identified a workshop to collate the stakeholder and
community’s values. The workshop was held on 3rd May 2018 and consisted of internal stakeholders only. The
values collated from the workshop were used to generate preliminary success criteria for the risk assessment;
these are defined in Table 2-1.
The success criteria are key to the whole CHRMAP as it is these that will ultimately drive the selection of
adaptation options. It is important that a comprehensive approach be applied at this stage of the project, in
order to provide a CHRMAP applicable to the Shire and stakeholders.
TABLE 2-1 PRELIMINARY SUCCESS CRITERIA
• Protection of the environmental assets of the study area / planning to retain environmental integrity
• Protection of the recreational value of the coastline
• Protection of the cultural values of the coastline
• Maintenance of the culture of the Denham Town Centre
• Maintenance of a level of public infrastructure
• Development controls not to inhibit the landscape
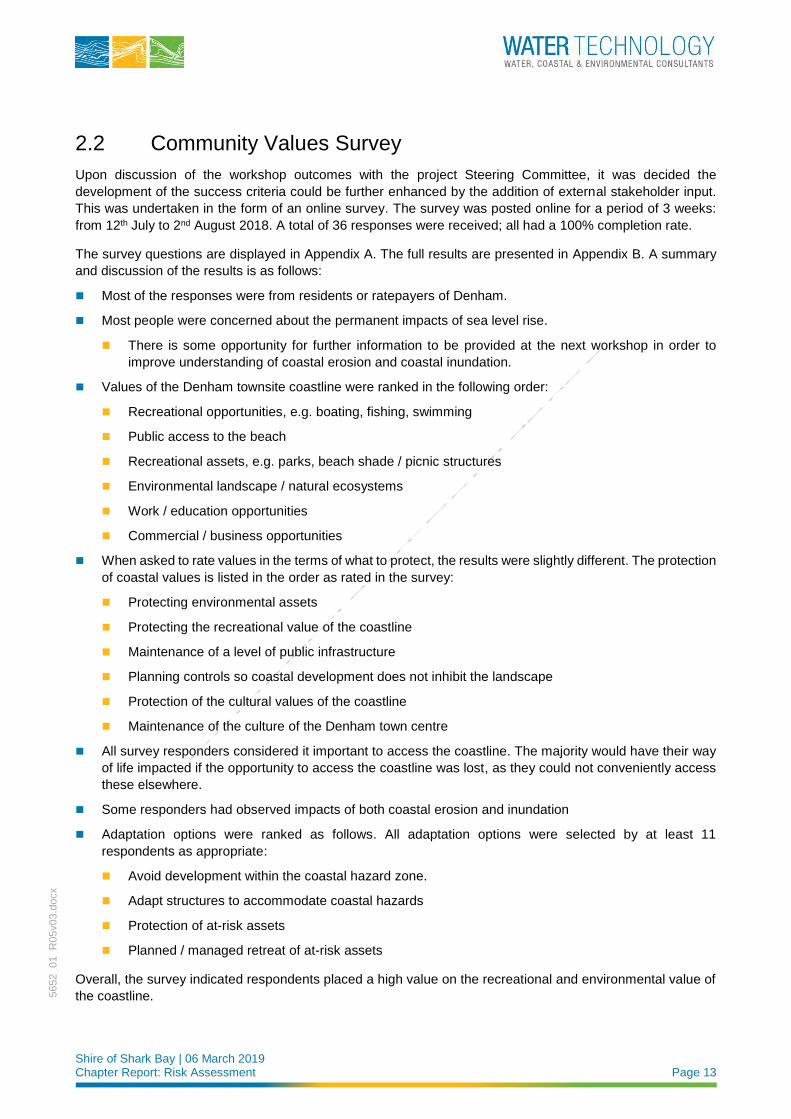
Shire of Shark Bay | 06 March 2019 Chapter Report: Risk Assessment Page 13
5652_01_R
05v03.d
ocx
2.2 Community Values Survey
Upon discussion of the workshop outcomes with the project Steering Committee, it was decided the
development of the success criteria could be further enhanced by the addition of external stakeholder input.
This was undertaken in the form of an online survey. The survey was posted online for a period of 3 weeks:
from 12th July to 2nd August 2018. A total of 36 responses were received; all had a 100% completion rate.
The survey questions are displayed in Appendix A. The full results are presented in Appendix B. A summary
and discussion of the results is as follows:
◼ Most of the responses were from residents or ratepayers of Denham.
◼ Most people were concerned about the permanent impacts of sea level rise.
◼ There is some opportunity for further information to be provided at the next workshop in order to
improve understanding of coastal erosion and coastal inundation.
◼ Values of the Denham townsite coastline were ranked in the following order:
◼ Recreational opportunities, e.g. boating, fishing, swimming
◼ Public access to the beach
◼ Recreational assets, e.g. parks, beach shade / picnic structures
◼ Environmental landscape / natural ecosystems
◼ Work / education opportunities
◼ Commercial / business opportunities
◼ When asked to rate values in the terms of what to protect, the results were slightly different. The protection
of coastal values is listed in the order as rated in the survey:
◼ Protecting environmental assets
◼ Protecting the recreational value of the coastline
◼ Maintenance of a level of public infrastructure
◼ Planning controls so coastal development does not inhibit the landscape
◼ Protection of the cultural values of the coastline
◼ Maintenance of the culture of the Denham town centre
◼ All survey responders considered it important to access the coastline. The majority would have their way
of life impacted if the opportunity to access the coastline was lost, as they could not conveniently access
these elsewhere.
◼ Some responders had observed impacts of both coastal erosion and inundation
◼ Adaptation options were ranked as follows. All adaptation options were selected by at least 11
respondents as appropriate:
◼ Avoid development within the coastal hazard zone.
◼ Adapt structures to accommodate coastal hazards
◼ Protection of at-risk assets
◼ Planned / managed retreat of at-risk assets
Overall, the survey indicated respondents placed a high value on the recreational and environmental value of
the coastline.
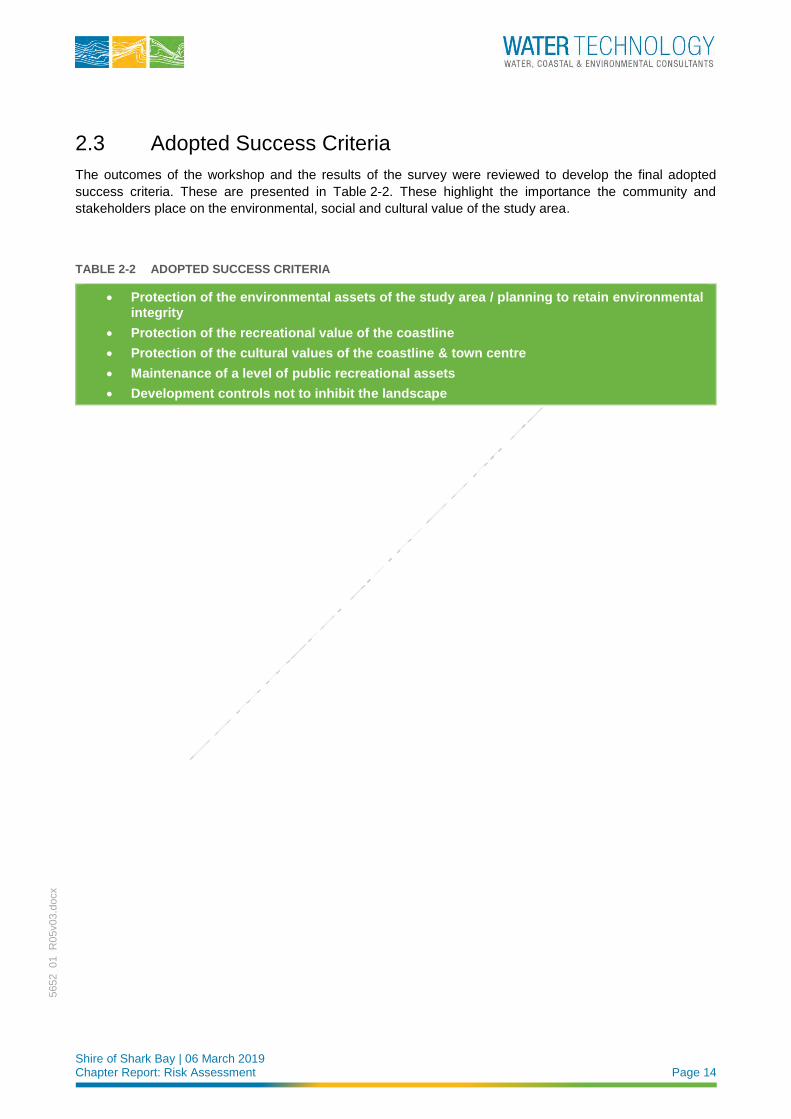
Shire of Shark Bay | 06 March 2019 Chapter Report: Risk Assessment Page 14
5652_01_R
05v03.d
ocx
2.3 Adopted Success Criteria
The outcomes of the workshop and the results of the survey were reviewed to develop the final adopted
success criteria. These are presented in Table 2-2. These highlight the importance the community and
stakeholders place on the environmental, social and cultural value of the study area.
TABLE 2-2 ADOPTED SUCCESS CRITERIA
• Protection of the environmental assets of the study area / planning to retain environmental integrity
• Protection of the recreational value of the coastline
• Protection of the cultural values of the coastline & town centre
• Maintenance of a level of public recreational assets
• Development controls not to inhibit the landscape
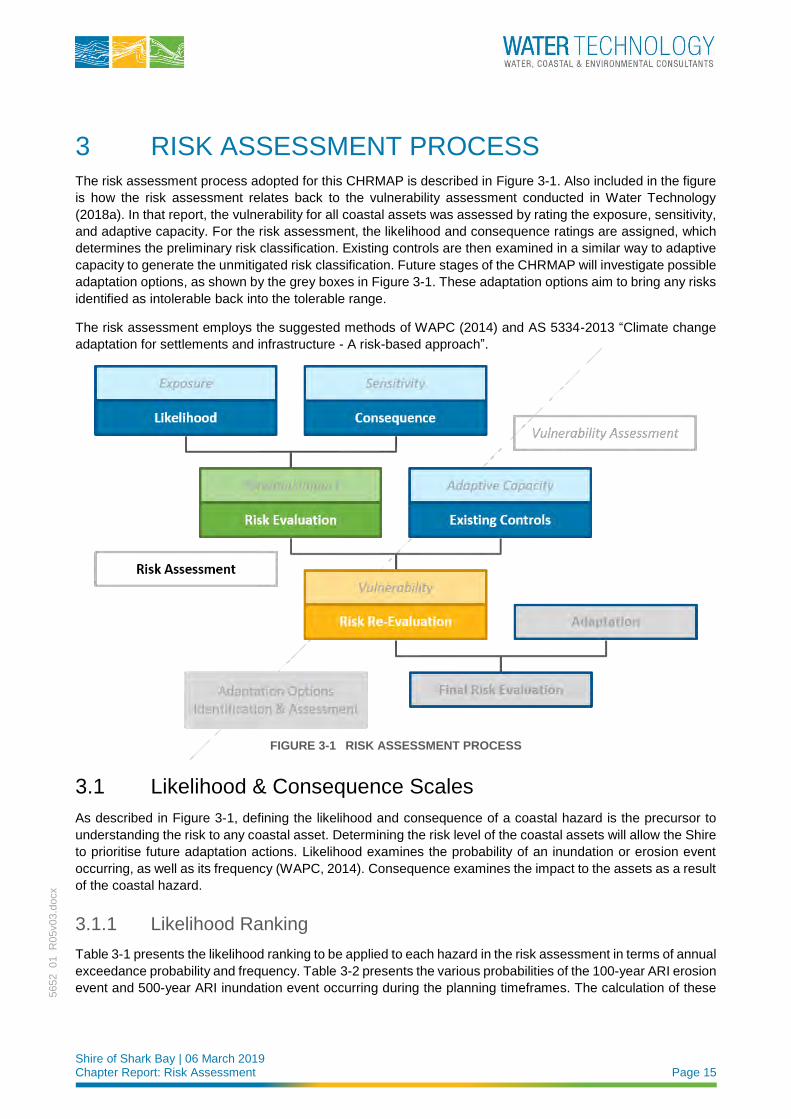
Shire of Shark Bay | 06 March 2019 Chapter Report: Risk Assessment Page 15
5652_01_R
05v03.d
ocx
3 RISK ASSESSMENT PROCESS The risk assessment process adopted for this CHRMAP is described in Figure 3-1. Also included in the figure
is how the risk assessment relates back to the vulnerability assessment conducted in Water Technology
(2018a). In that report, the vulnerability for all coastal assets was assessed by rating the exposure, sensitivity,
and adaptive capacity. For the risk assessment, the likelihood and consequence ratings are assigned, which
determines the preliminary risk classification. Existing controls are then examined in a similar way to adaptive
capacity to generate the unmitigated risk classification. Future stages of the CHRMAP will investigate possible
adaptation options, as shown by the grey boxes in Figure 3-1. These adaptation options aim to bring any risks
identified as intolerable back into the tolerable range.
The risk assessment employs the suggested methods of WAPC (2014) and AS 5334-2013 “Climate change
adaptation for settlements and infrastructure - A risk-based approach”.
FIGURE 3-1 RISK ASSESSMENT PROCESS
3.1 Likelihood & Consequence Scales
As described in Figure 3-1, defining the likelihood and consequence of a coastal hazard is the precursor to
understanding the risk to any coastal asset. Determining the risk level of the coastal assets will allow the Shire
to prioritise future adaptation actions. Likelihood examines the probability of an inundation or erosion event
occurring, as well as its frequency (WAPC, 2014). Consequence examines the impact to the assets as a result
of the coastal hazard.
3.1.1 Likelihood Ranking
Table 3-1 presents the likelihood ranking to be applied to each hazard in the risk assessment in terms of annual
exceedance probability and frequency. Table 3-2 presents the various probabilities of the 100-year ARI erosion
event and 500-year ARI inundation event occurring during the planning timeframes. The calculation of these
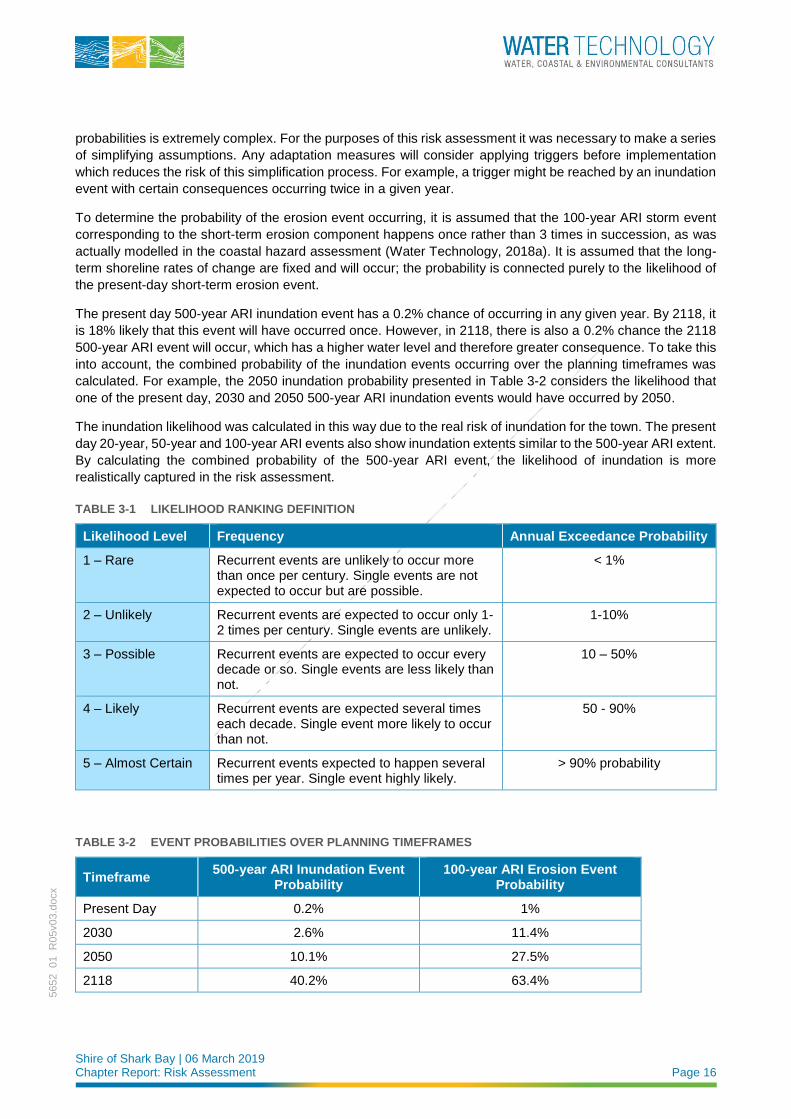
Shire of Shark Bay | 06 March 2019 Chapter Report: Risk Assessment Page 16
5652_01_R
05v03.d
ocx
probabilities is extremely complex. For the purposes of this risk assessment it was necessary to make a series
of simplifying assumptions. Any adaptation measures will consider applying triggers before implementation
which reduces the risk of this simplification process. For example, a trigger might be reached by an inundation
event with certain consequences occurring twice in a given year.
To determine the probability of the erosion event occurring, it is assumed that the 100-year ARI storm event
corresponding to the short-term erosion component happens once rather than 3 times in succession, as was
actually modelled in the coastal hazard assessment (Water Technology, 2018a). It is assumed that the long-
term shoreline rates of change are fixed and will occur; the probability is connected purely to the likelihood of
the present-day short-term erosion event.
The present day 500-year ARI inundation event has a 0.2% chance of occurring in any given year. By 2118, it
is 18% likely that this event will have occurred once. However, in 2118, there is also a 0.2% chance the 2118
500-year ARI event will occur, which has a higher water level and therefore greater consequence. To take this
into account, the combined probability of the inundation events occurring over the planning timeframes was
calculated. For example, the 2050 inundation probability presented in Table 3-2 considers the likelihood that
one of the present day, 2030 and 2050 500-year ARI inundation events would have occurred by 2050.
The inundation likelihood was calculated in this way due to the real risk of inundation for the town. The present
day 20-year, 50-year and 100-year ARI events also show inundation extents similar to the 500-year ARI extent.
By calculating the combined probability of the 500-year ARI event, the likelihood of inundation is more
realistically captured in the risk assessment.
TABLE 3-1 LIKELIHOOD RANKING DEFINITION
Likelihood Level Frequency Annual Exceedance Probability
1 – Rare Recurrent events are unlikely to occur more than once per century. Single events are not expected to occur but are possible.
< 1%
2 – Unlikely Recurrent events are expected to occur only 1-2 times per century. Single events are unlikely.
1-10%
3 – Possible Recurrent events are expected to occur every decade or so. Single events are less likely than not.
10 – 50%
4 – Likely Recurrent events are expected several times each decade. Single event more likely to occur than not.
50 - 90%
5 – Almost Certain Recurrent events expected to happen several times per year. Single event highly likely.
> 90% probability
TABLE 3-2 EVENT PROBABILITIES OVER PLANNING TIMEFRAMES
Timeframe 500-year ARI Inundation Event
Probability 100-year ARI Erosion Event
Probability
Present Day 0.2% 1%
2030 2.6% 11.4%
2050 10.1% 27.5%
2118 40.2% 63.4%
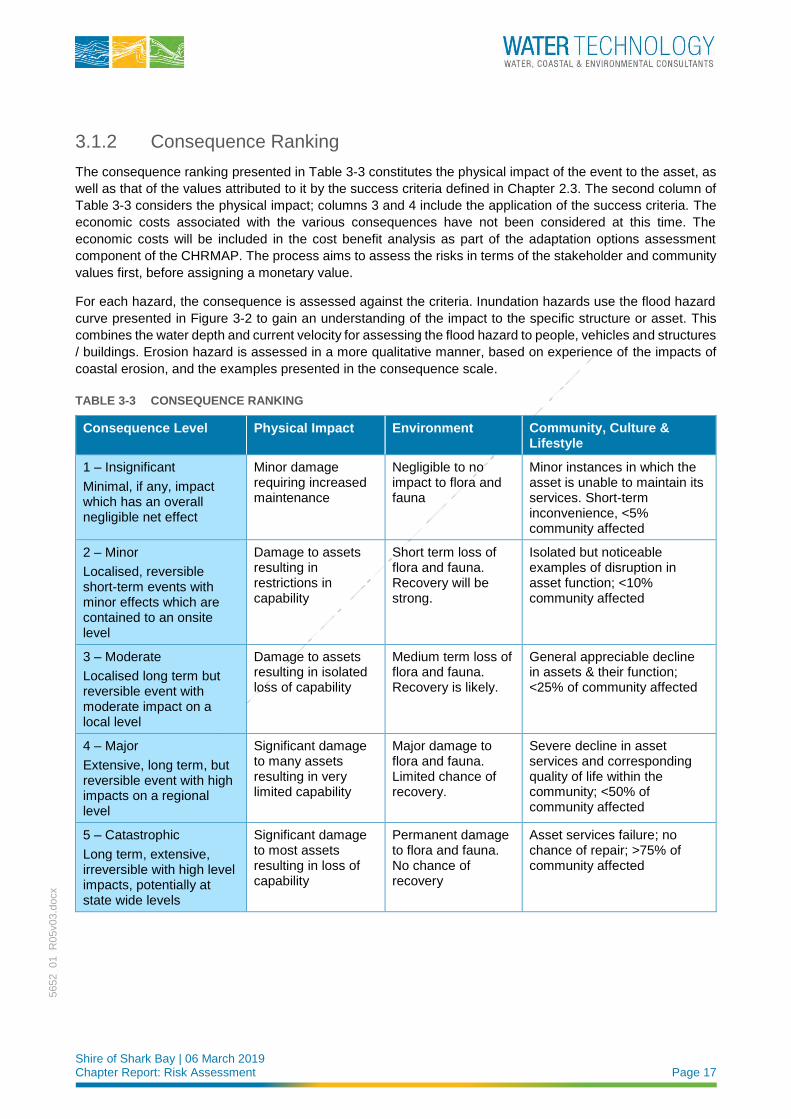
Shire of Shark Bay | 06 March 2019 Chapter Report: Risk Assessment Page 17
5652_01_R
05v03.d
ocx
3.1.2 Consequence Ranking
The consequence ranking presented in Table 3-3 constitutes the physical impact of the event to the asset, as
well as that of the values attributed to it by the success criteria defined in Chapter 2.3. The second column of
Table 3-3 considers the physical impact; columns 3 and 4 include the application of the success criteria. The
economic costs associated with the various consequences have not been considered at this time. The
economic costs will be included in the cost benefit analysis as part of the adaptation options assessment
component of the CHRMAP. The process aims to assess the risks in terms of the stakeholder and community
values first, before assigning a monetary value.
For each hazard, the consequence is assessed against the criteria. Inundation hazards use the flood hazard
curve presented in Figure 3-2 to gain an understanding of the impact to the specific structure or asset. This
combines the water depth and current velocity for assessing the flood hazard to people, vehicles and structures
/ buildings. Erosion hazard is assessed in a more qualitative manner, based on experience of the impacts of
coastal erosion, and the examples presented in the consequence scale.
TABLE 3-3 CONSEQUENCE RANKING
Consequence Level Physical Impact Environment Community, Culture & Lifestyle
1 – Insignificant
Minimal, if any, impact which has an overall negligible net effect
Minor damage requiring increased maintenance
Negligible to no impact to flora and fauna
Minor instances in which the asset is unable to maintain its services. Short-term inconvenience, <5% community affected
2 – Minor
Localised, reversible short-term events with minor effects which are contained to an onsite level
Damage to assets resulting in restrictions in capability
Short term loss of flora and fauna. Recovery will be strong.
Isolated but noticeable examples of disruption in asset function; <10% community affected
3 – Moderate
Localised long term but reversible event with moderate impact on a local level
Damage to assets resulting in isolated loss of capability
Medium term loss of flora and fauna. Recovery is likely.
General appreciable decline in assets & their function; <25% of community affected
4 – Major
Extensive, long term, but reversible event with high impacts on a regional level
Significant damage to many assets resulting in very limited capability
Major damage to flora and fauna. Limited chance of recovery.
Severe decline in asset services and corresponding quality of life within the community; <50% of community affected
5 – Catastrophic
Long term, extensive, irreversible with high level impacts, potentially at state wide levels
Significant damage to most assets resulting in loss of capability
Permanent damage to flora and fauna. No chance of recovery
Asset services failure; no chance of repair; >75% of community affected
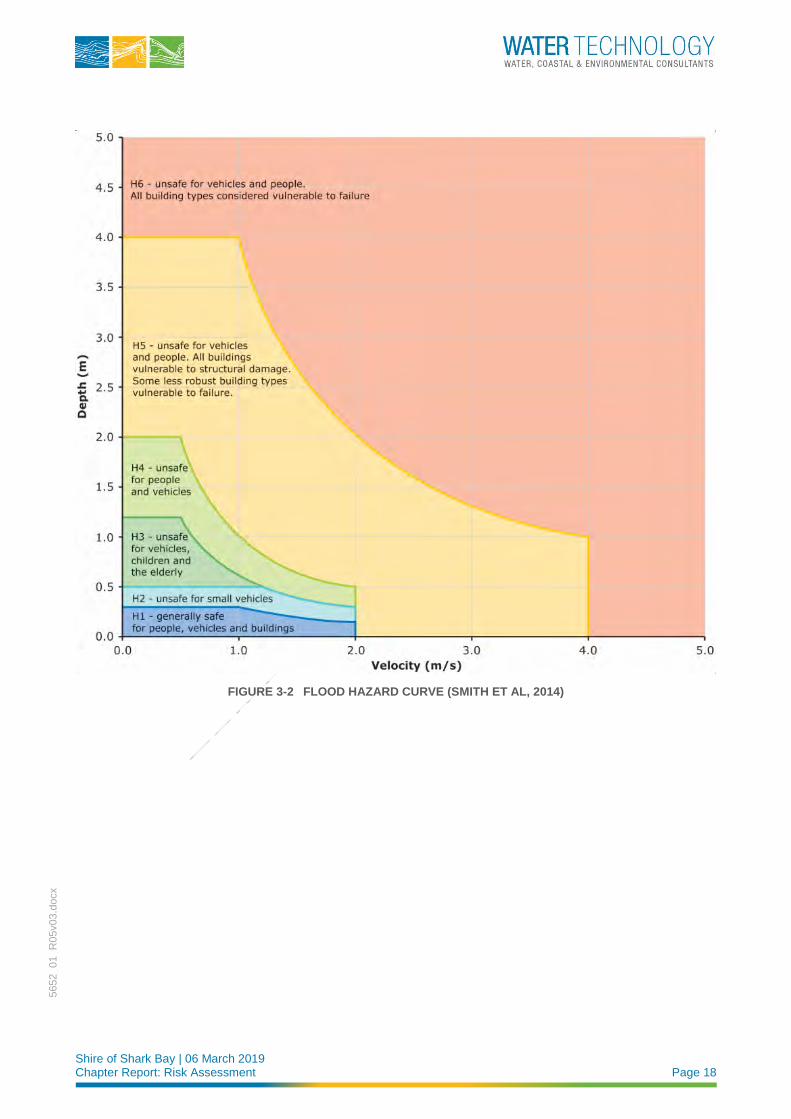
Shire of Shark Bay | 06 March 2019 Chapter Report: Risk Assessment Page 18
5652_01_R
05v03.d
ocx
FIGURE 3-2 FLOOD HAZARD CURVE (SMITH ET AL, 2014)
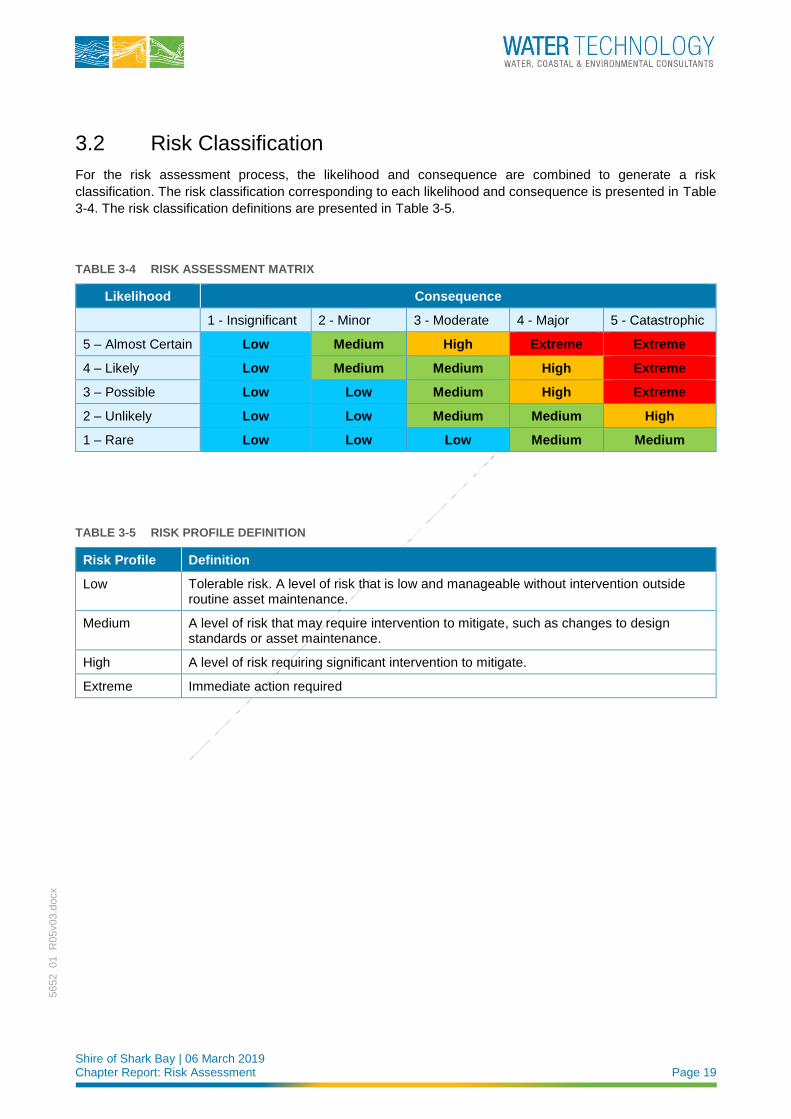
Shire of Shark Bay | 06 March 2019 Chapter Report: Risk Assessment Page 19
5652_01_R
05v03.d
ocx
3.2 Risk Classification
For the risk assessment process, the likelihood and consequence are combined to generate a risk
classification. The risk classification corresponding to each likelihood and consequence is presented in Table
3-4. The risk classification definitions are presented in Table 3-5.
TABLE 3-4 RISK ASSESSMENT MATRIX
Likelihood Consequence
1 - Insignificant 2 - Minor 3 - Moderate 4 - Major 5 - Catastrophic
5 – Almost Certain Low Medium High Extreme Extreme
4 – Likely Low Medium Medium High Extreme
3 – Possible Low Low Medium High Extreme
2 – Unlikely Low Low Medium Medium High
1 – Rare Low Low Low Medium Medium
TABLE 3-5 RISK PROFILE DEFINITION
Risk Profile Definition
Low Tolerable risk. A level of risk that is low and manageable without intervention outside routine asset maintenance.
Medium A level of risk that may require intervention to mitigate, such as changes to design standards or asset maintenance.
High A level of risk requiring significant intervention to mitigate.
Extreme Immediate action required
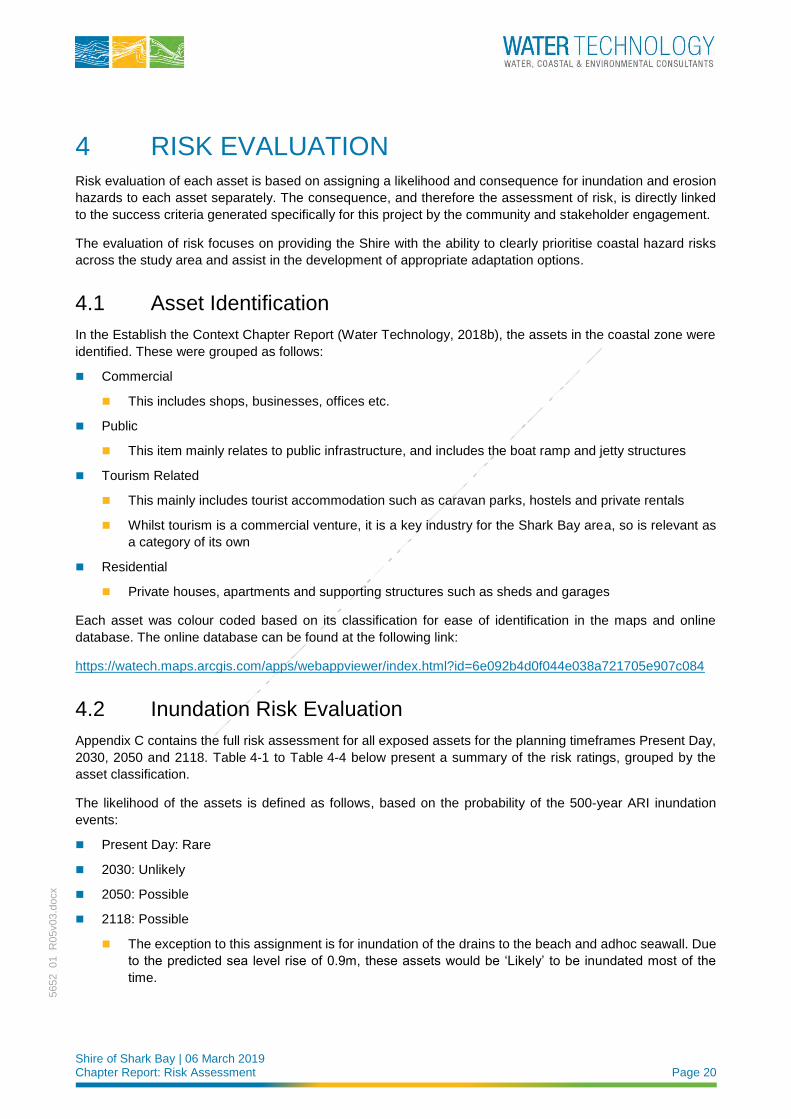
Shire of Shark Bay | 06 March 2019 Chapter Report: Risk Assessment Page 20
5652_01_R
05v03.d
ocx
4 RISK EVALUATION Risk evaluation of each asset is based on assigning a likelihood and consequence for inundation and erosion
hazards to each asset separately. The consequence, and therefore the assessment of risk, is directly linked
to the success criteria generated specifically for this project by the community and stakeholder engagement.
The evaluation of risk focuses on providing the Shire with the ability to clearly prioritise coastal hazard risks
across the study area and assist in the development of appropriate adaptation options.
4.1 Asset Identification
In the Establish the Context Chapter Report (Water Technology, 2018b), the assets in the coastal zone were
identified. These were grouped as follows:
◼ Commercial
◼ This includes shops, businesses, offices etc.
◼ Public
◼ This item mainly relates to public infrastructure, and includes the boat ramp and jetty structures
◼ Tourism Related
◼ This mainly includes tourist accommodation such as caravan parks, hostels and private rentals
◼ Whilst tourism is a commercial venture, it is a key industry for the Shark Bay area, so is relevant as
a category of its own
◼ Residential
◼ Private houses, apartments and supporting structures such as sheds and garages
Each asset was colour coded based on its classification for ease of identification in the maps and online
database. The online database can be found at the following link:
https://watech.maps.arcgis.com/apps/webappviewer/index.html?id=6e092b4d0f044e038a721705e907c084
4.2 Inundation Risk Evaluation
Appendix C contains the full risk assessment for all exposed assets for the planning timeframes Present Day,
2030, 2050 and 2118. Table 4-1 to Table 4-4 below present a summary of the risk ratings, grouped by the
asset classification.
The likelihood of the assets is defined as follows, based on the probability of the 500-year ARI inundation
events:
◼ Present Day: Rare
◼ 2030: Unlikely
◼ 2050: Possible
◼ 2118: Possible
◼ The exception to this assignment is for inundation of the drains to the beach and adhoc seawall. Due
to the predicted sea level rise of 0.9m, these assets would be ‘Likely’ to be inundated most of the
time.
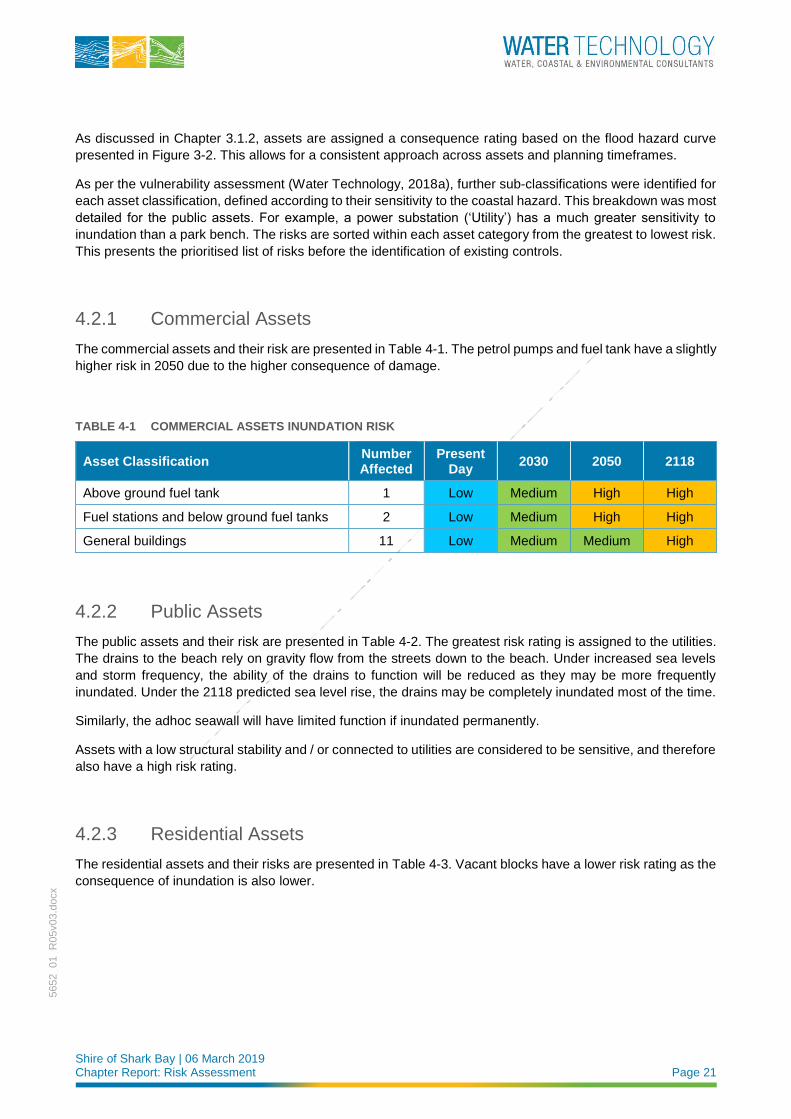
Shire of Shark Bay | 06 March 2019 Chapter Report: Risk Assessment Page 21
5652_01_R
05v03.d
ocx
As discussed in Chapter 3.1.2, assets are assigned a consequence rating based on the flood hazard curve
presented in Figure 3-2. This allows for a consistent approach across assets and planning timeframes.
As per the vulnerability assessment (Water Technology, 2018a), further sub-classifications were identified for
each asset classification, defined according to their sensitivity to the coastal hazard. This breakdown was most
detailed for the public assets. For example, a power substation (‘Utility’) has a much greater sensitivity to
inundation than a park bench. The risks are sorted within each asset category from the greatest to lowest risk.
This presents the prioritised list of risks before the identification of existing controls.
4.2.1 Commercial Assets
The commercial assets and their risk are presented in Table 4-1. The petrol pumps and fuel tank have a slightly
higher risk in 2050 due to the higher consequence of damage.
TABLE 4-1 COMMERCIAL ASSETS INUNDATION RISK
Asset Classification Number Affected
Present Day
2030 2050 2118
Above ground fuel tank 1 Low Medium High High
Fuel stations and below ground fuel tanks 2 Low Medium High High
General buildings 11 Low Medium Medium High
4.2.2 Public Assets
The public assets and their risk are presented in Table 4-2. The greatest risk rating is assigned to the utilities.
The drains to the beach rely on gravity flow from the streets down to the beach. Under increased sea levels
and storm frequency, the ability of the drains to function will be reduced as they may be more frequently
inundated. Under the 2118 predicted sea level rise, the drains may be completely inundated most of the time.
Similarly, the adhoc seawall will have limited function if inundated permanently.
Assets with a low structural stability and / or connected to utilities are considered to be sensitive, and therefore
also have a high risk rating.
4.2.3 Residential Assets
The residential assets and their risks are presented in Table 4-3. Vacant blocks have a lower risk rating as the
consequence of inundation is also lower.
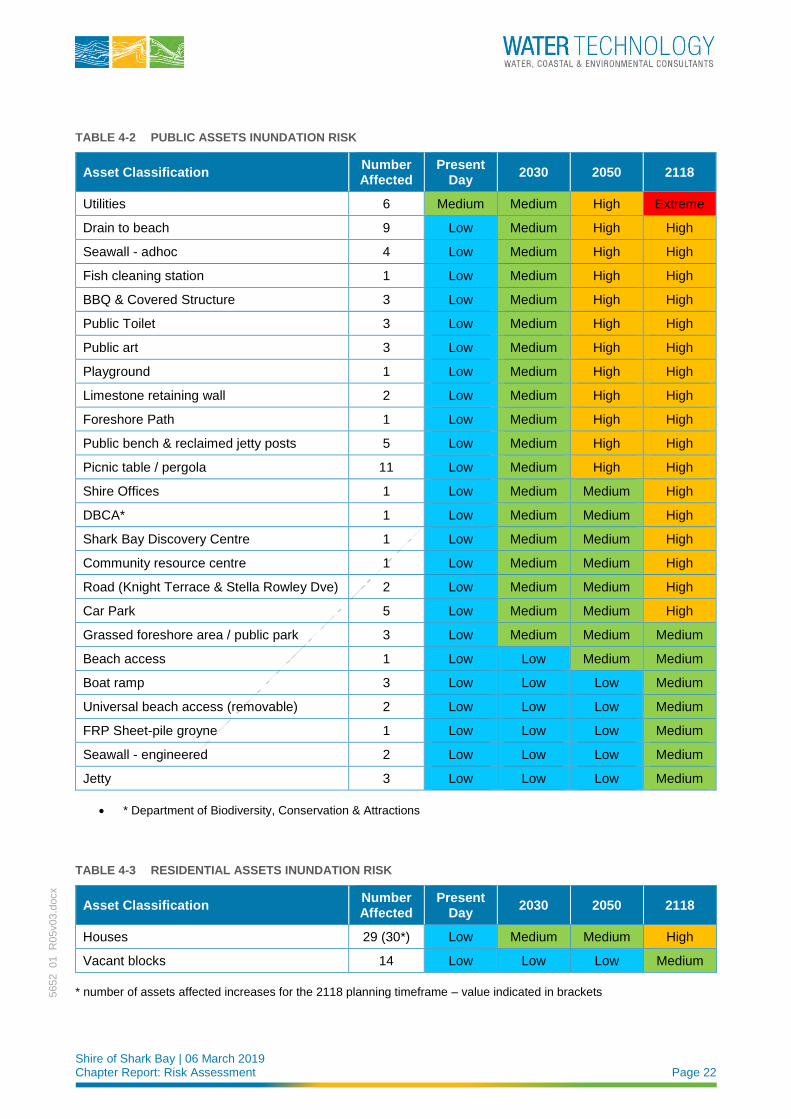
Shire of Shark Bay | 06 March 2019 Chapter Report: Risk Assessment Page 22
5652_01_R
05v03.d
ocx
TABLE 4-2 PUBLIC ASSETS INUNDATION RISK
Asset Classification Number Affected
Present Day
2030 2050 2118
Utilities 6 Medium Medium High Extreme
Drain to beach 9 Low Medium High High
Seawall - adhoc 4 Low Medium High High
Fish cleaning station 1 Low Medium High High
BBQ & Covered Structure 3 Low Medium High High
Public Toilet 3 Low Medium High High
Public art 3 Low Medium High High
Playground 1 Low Medium High High
Limestone retaining wall 2 Low Medium High High
Foreshore Path 1 Low Medium High High
Public bench & reclaimed jetty posts 5 Low Medium High High
Picnic table / pergola 11 Low Medium High High
Shire Offices 1 Low Medium Medium High
DBCA* 1 Low Medium Medium High
Shark Bay Discovery Centre 1 Low Medium Medium High
Community resource centre 1 Low Medium Medium High
Road (Knight Terrace & Stella Rowley Dve) 2 Low Medium Medium High
Car Park 5 Low Medium Medium High
Grassed foreshore area / public park 3 Low Medium Medium Medium
Beach access 1 Low Low Medium Medium
Boat ramp 3 Low Low Low Medium
Universal beach access (removable) 2 Low Low Low Medium
FRP Sheet-pile groyne 1 Low Low Low Medium
Seawall - engineered 2 Low Low Low Medium
Jetty 3 Low Low Low Medium
• * Department of Biodiversity, Conservation & Attractions
TABLE 4-3 RESIDENTIAL ASSETS INUNDATION RISK
Asset Classification Number Affected
Present Day
2030 2050 2118
Houses 29 (30*) Low Medium Medium High
Vacant blocks 14 Low Low Low Medium
* number of assets affected increases for the 2118 planning timeframe – value indicated in brackets
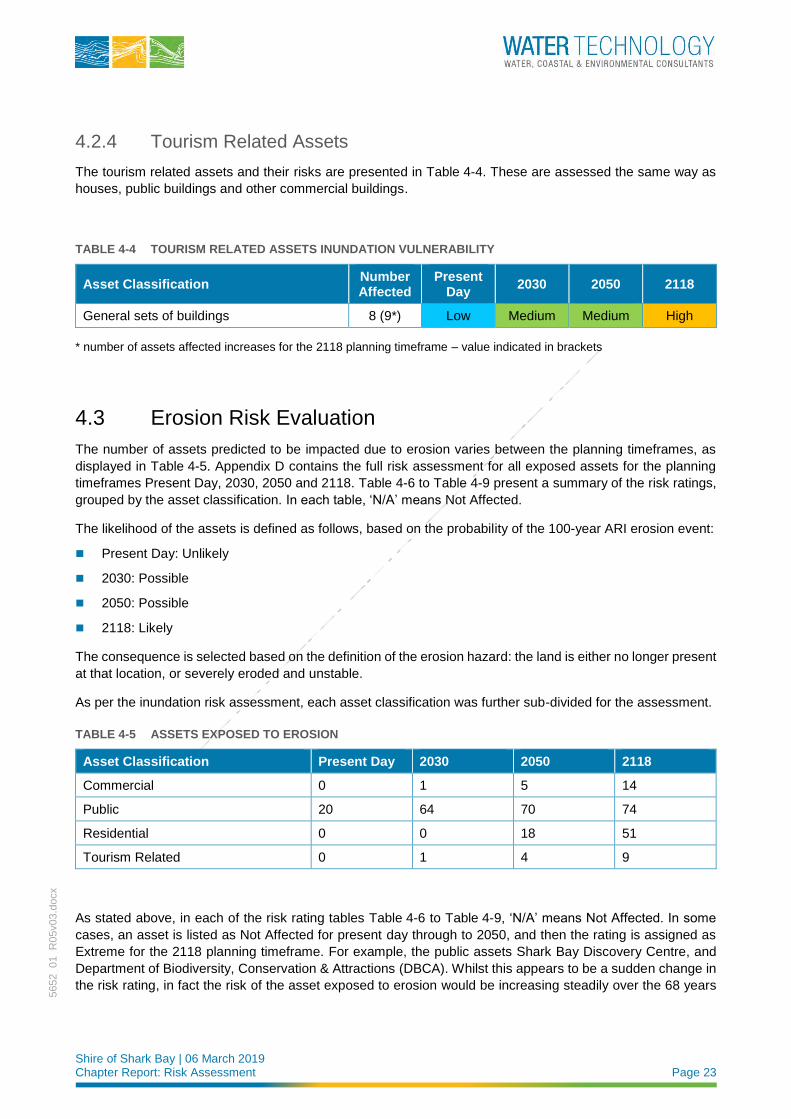
Shire of Shark Bay | 06 March 2019 Chapter Report: Risk Assessment Page 23
5652_01_R
05v03.d
ocx
4.2.4 Tourism Related Assets
The tourism related assets and their risks are presented in Table 4-4. These are assessed the same way as
houses, public buildings and other commercial buildings.
TABLE 4-4 TOURISM RELATED ASSETS INUNDATION VULNERABILITY
Asset Classification Number Affected
Present Day
2030 2050 2118
General sets of buildings 8 (9*) Low Medium Medium High
* number of assets affected increases for the 2118 planning timeframe – value indicated in brackets
4.3 Erosion Risk Evaluation
The number of assets predicted to be impacted due to erosion varies between the planning timeframes, as
displayed in Table 4-5. Appendix D contains the full risk assessment for all exposed assets for the planning
timeframes Present Day, 2030, 2050 and 2118. Table 4-6 to Table 4-9 present a summary of the risk ratings,
grouped by the asset classification. In each table, ‘N/A’ means Not Affected.
The likelihood of the assets is defined as follows, based on the probability of the 100-year ARI erosion event:
◼ Present Day: Unlikely
◼ 2030: Possible
◼ 2050: Possible
◼ 2118: Likely
The consequence is selected based on the definition of the erosion hazard: the land is either no longer present
at that location, or severely eroded and unstable.
As per the inundation risk assessment, each asset classification was further sub-divided for the assessment.
TABLE 4-5 ASSETS EXPOSED TO EROSION
Asset Classification Present Day 2030 2050 2118
Commercial 0 1 5 14
Public 20 64 70 74
Residential 0 0 18 51
Tourism Related 0 1 4 9
As stated above, in each of the risk rating tables Table 4-6 to Table 4-9, ‘N/A’ means Not Affected. In some
cases, an asset is listed as Not Affected for present day through to 2050, and then the rating is assigned as
Extreme for the 2118 planning timeframe. For example, the public assets Shark Bay Discovery Centre, and
Department of Biodiversity, Conservation & Attractions (DBCA). Whilst this appears to be a sudden change in
the risk rating, in fact the risk of the asset exposed to erosion would be increasing steadily over the 68 years
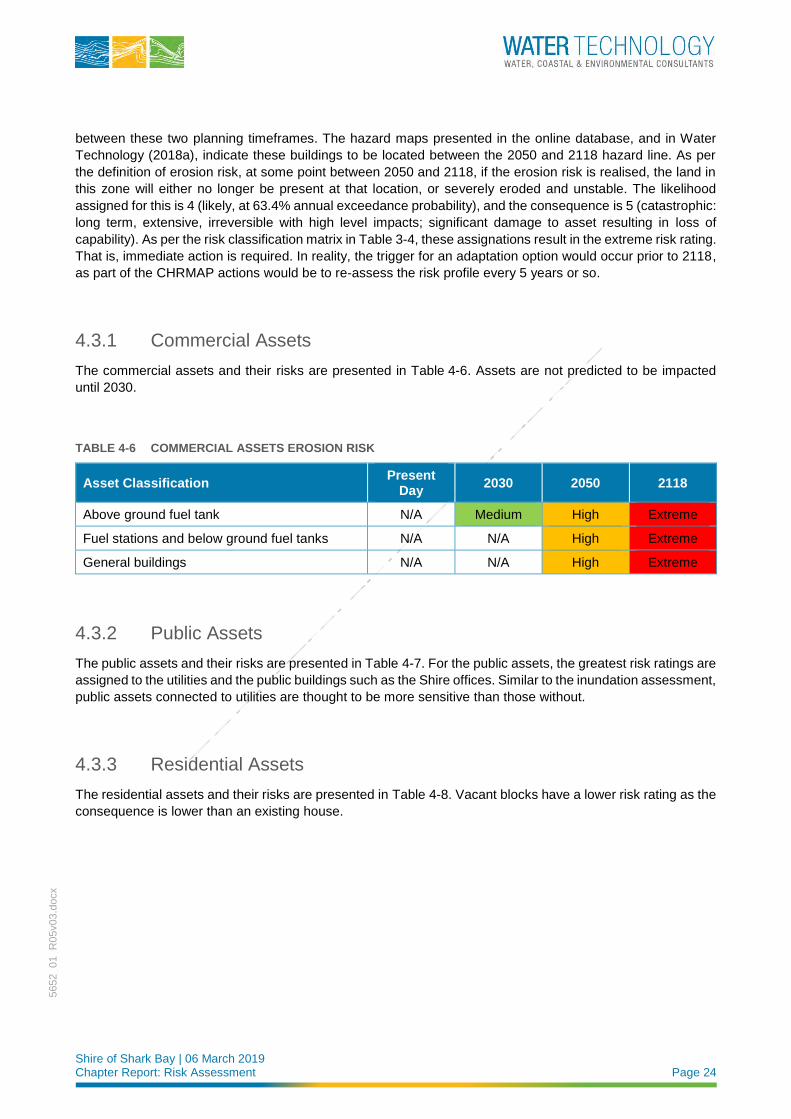
Shire of Shark Bay | 06 March 2019 Chapter Report: Risk Assessment Page 24
5652_01_R
05v03.d
ocx
between these two planning timeframes. The hazard maps presented in the online database, and in Water
Technology (2018a), indicate these buildings to be located between the 2050 and 2118 hazard line. As per
the definition of erosion risk, at some point between 2050 and 2118, if the erosion risk is realised, the land in
this zone will either no longer be present at that location, or severely eroded and unstable. The likelihood
assigned for this is 4 (likely, at 63.4% annual exceedance probability), and the consequence is 5 (catastrophic:
long term, extensive, irreversible with high level impacts; significant damage to asset resulting in loss of
capability). As per the risk classification matrix in Table 3-4, these assignations result in the extreme risk rating.
That is, immediate action is required. In reality, the trigger for an adaptation option would occur prior to 2118,
as part of the CHRMAP actions would be to re-assess the risk profile every 5 years or so.
4.3.1 Commercial Assets
The commercial assets and their risks are presented in Table 4-6. Assets are not predicted to be impacted
until 2030.
TABLE 4-6 COMMERCIAL ASSETS EROSION RISK
Asset Classification Present
Day 2030 2050 2118
Above ground fuel tank N/A Medium High Extreme
Fuel stations and below ground fuel tanks N/A N/A High Extreme
General buildings N/A N/A High Extreme
4.3.2 Public Assets
The public assets and their risks are presented in Table 4-7. For the public assets, the greatest risk ratings are
assigned to the utilities and the public buildings such as the Shire offices. Similar to the inundation assessment,
public assets connected to utilities are thought to be more sensitive than those without.
4.3.3 Residential Assets
The residential assets and their risks are presented in Table 4-8. Vacant blocks have a lower risk rating as the
consequence is lower than an existing house.
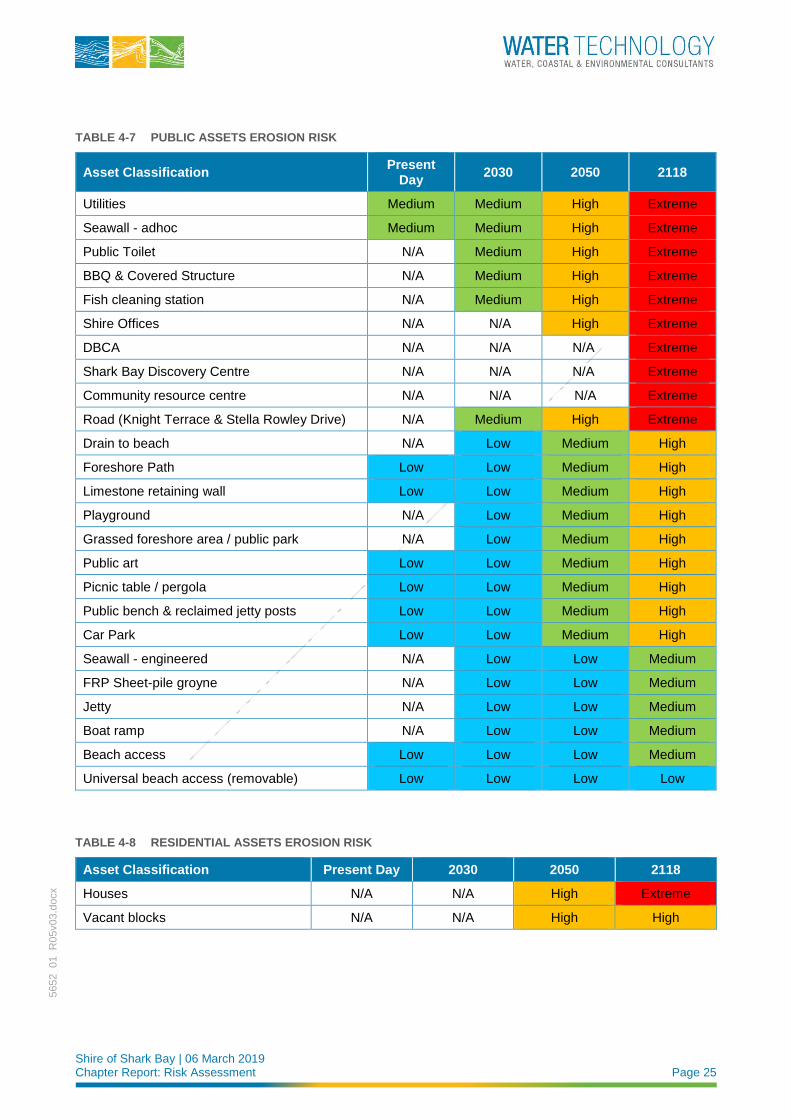
Shire of Shark Bay | 06 March 2019 Chapter Report: Risk Assessment Page 25
5652_01_R
05v03.d
ocx
TABLE 4-7 PUBLIC ASSETS EROSION RISK
Asset Classification Present
Day 2030 2050 2118
Utilities Medium Medium High Extreme
Seawall - adhoc Medium Medium High Extreme
Public Toilet N/A Medium High Extreme
BBQ & Covered Structure N/A Medium High Extreme
Fish cleaning station N/A Medium High Extreme
Shire Offices N/A N/A High Extreme
DBCA N/A N/A N/A Extreme
Shark Bay Discovery Centre N/A N/A N/A Extreme
Community resource centre N/A N/A N/A Extreme
Road (Knight Terrace & Stella Rowley Drive) N/A Medium High Extreme
Drain to beach N/A Low Medium High
Foreshore Path Low Low Medium High
Limestone retaining wall Low Low Medium High
Playground N/A Low Medium High
Grassed foreshore area / public park N/A Low Medium High
Public art Low Low Medium High
Picnic table / pergola Low Low Medium High
Public bench & reclaimed jetty posts Low Low Medium High
Car Park Low Low Medium High
Seawall - engineered N/A Low Low Medium
FRP Sheet-pile groyne N/A Low Low Medium
Jetty N/A Low Low Medium
Boat ramp N/A Low Low Medium
Beach access Low Low Low Medium
Universal beach access (removable) Low Low Low Low
TABLE 4-8 RESIDENTIAL ASSETS EROSION RISK
Asset Classification Present Day 2030 2050 2118
Houses N/A N/A High Extreme
Vacant blocks N/A N/A High High

Shire of Shark Bay | 06 March 2019 Chapter Report: Risk Assessment Page 26
5652_01_R
05v03.d
ocx
4.3.4 Tourism Related Assets
The tourism related assets and their risks are presented in Table 4-9. These are assessed the same way as
houses, public buildings and other commercial buildings.
The Denham Seaside Caravan Park is the asset predicted to be in the coastal hazard zone in 2030. However,
only caravan / tent sites are located in the zone, so the consequence is reduced.
TABLE 4-9 TOURISM RELATED ASSETS EROSION RISK
Asset Classification Present Day 2030 2050 2118
General sets of buildings N/A Low High Extreme
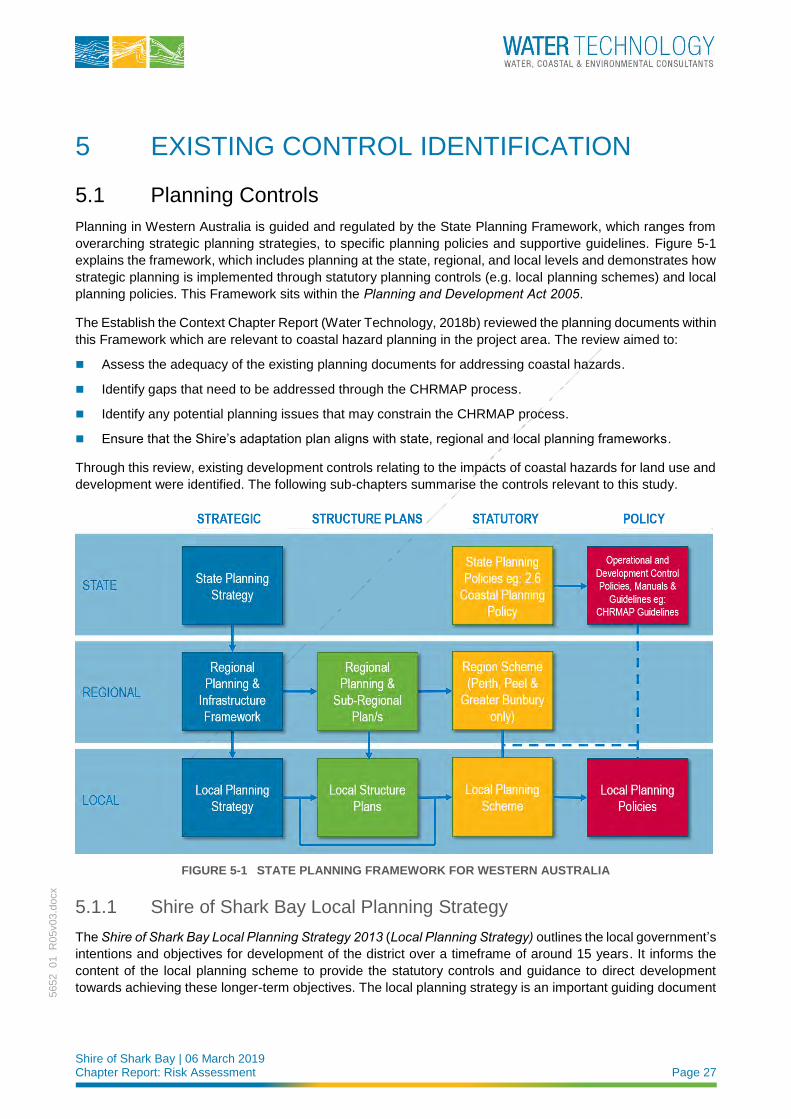
Shire of Shark Bay | 06 March 2019 Chapter Report: Risk Assessment Page 27
5652_01_R
05v03.d
ocx
5 EXISTING CONTROL IDENTIFICATION
5.1 Planning Controls
Planning in Western Australia is guided and regulated by the State Planning Framework, which ranges from
overarching strategic planning strategies, to specific planning policies and supportive guidelines. Figure 5-1
explains the framework, which includes planning at the state, regional, and local levels and demonstrates how
strategic planning is implemented through statutory planning controls (e.g. local planning schemes) and local
planning policies. This Framework sits within the Planning and Development Act 2005.
The Establish the Context Chapter Report (Water Technology, 2018b) reviewed the planning documents within
this Framework which are relevant to coastal hazard planning in the project area. The review aimed to:
◼ Assess the adequacy of the existing planning documents for addressing coastal hazards.
◼ Identify gaps that need to be addressed through the CHRMAP process.
◼ Identify any potential planning issues that may constrain the CHRMAP process.
◼ Ensure that the Shire’s adaptation plan aligns with state, regional and local planning frameworks.
Through this review, existing development controls relating to the impacts of coastal hazards for land use and
development were identified. The following sub-chapters summarise the controls relevant to this study.
FIGURE 5-1 STATE PLANNING FRAMEWORK FOR WESTERN AUSTRALIA
5.1.1 Shire of Shark Bay Local Planning Strategy
The Shire of Shark Bay Local Planning Strategy 2013 (Local Planning Strategy) outlines the local government’s
intentions and objectives for development of the district over a timeframe of around 15 years. It informs the
content of the local planning scheme to provide the statutory controls and guidance to direct development
towards achieving these longer-term objectives. The local planning strategy is an important guiding document
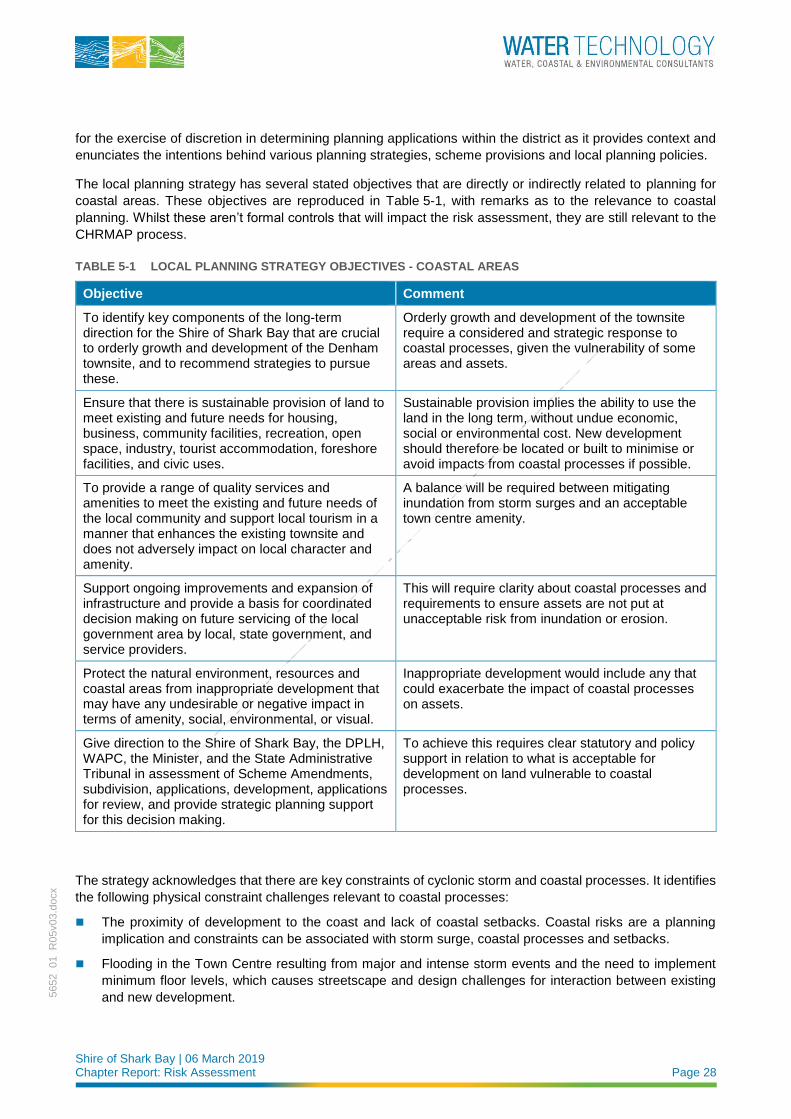
Shire of Shark Bay | 06 March 2019 Chapter Report: Risk Assessment Page 28
5652_01_R
05v03.d
ocx
for the exercise of discretion in determining planning applications within the district as it provides context and
enunciates the intentions behind various planning strategies, scheme provisions and local planning policies.
The local planning strategy has several stated objectives that are directly or indirectly related to planning for
coastal areas. These objectives are reproduced in Table 5-1, with remarks as to the relevance to coastal
planning. Whilst these aren’t formal controls that will impact the risk assessment, they are still relevant to the
CHRMAP process.
TABLE 5-1 LOCAL PLANNING STRATEGY OBJECTIVES - COASTAL AREAS
Objective Comment
To identify key components of the long-term direction for the Shire of Shark Bay that are crucial to orderly growth and development of the Denham townsite, and to recommend strategies to pursue these.
Orderly growth and development of the townsite require a considered and strategic response to coastal processes, given the vulnerability of some areas and assets.
Ensure that there is sustainable provision of land to meet existing and future needs for housing, business, community facilities, recreation, open space, industry, tourist accommodation, foreshore facilities, and civic uses.
Sustainable provision implies the ability to use the land in the long term, without undue economic, social or environmental cost. New development should therefore be located or built to minimise or avoid impacts from coastal processes if possible.
To provide a range of quality services and amenities to meet the existing and future needs of the local community and support local tourism in a manner that enhances the existing townsite and does not adversely impact on local character and amenity.
A balance will be required between mitigating inundation from storm surges and an acceptable town centre amenity.
Support ongoing improvements and expansion of infrastructure and provide a basis for coordinated decision making on future servicing of the local government area by local, state government, and service providers.
This will require clarity about coastal processes and requirements to ensure assets are not put at unacceptable risk from inundation or erosion.
Protect the natural environment, resources and coastal areas from inappropriate development that may have any undesirable or negative impact in terms of amenity, social, environmental, or visual.
Inappropriate development would include any that could exacerbate the impact of coastal processes on assets.
Give direction to the Shire of Shark Bay, the DPLH, WAPC, the Minister, and the State Administrative Tribunal in assessment of Scheme Amendments, subdivision, applications, development, applications for review, and provide strategic planning support for this decision making.
To achieve this requires clear statutory and policy support in relation to what is acceptable for development on land vulnerable to coastal processes.
The strategy acknowledges that there are key constraints of cyclonic storm and coastal processes. It identifies
the following physical constraint challenges relevant to coastal processes:
◼ The proximity of development to the coast and lack of coastal setbacks. Coastal risks are a planning
implication and constraints can be associated with storm surge, coastal processes and setbacks.
◼ Flooding in the Town Centre resulting from major and intense storm events and the need to implement
minimum floor levels, which causes streetscape and design challenges for interaction between existing
and new development.
Shire of Shark Bay | 06 March 2019 Chapter Report: Risk Assessment Page 29
5652_01_R
05v03.d
ocx
The Local Planning Strategy suggests that increased flexibility could be examined to allow lower levels for
detached non-habitable buildings such as outbuildings. This is in recognition that increased floor levels applied
to new development will represent a challenge in dealing with streetscape and interfaces between existing
buildings and new development of Knight Terrace, the main street. This is difficult when the visual impact of
development on land adjacent to the coast is also an important consideration.
5.1.2 Local Planning Scheme
The Shire’s current scheme, Local Planning Scheme No. 3 (LPS 3) will be superseded in due course by Local Planning Scheme No. 4 (LPS 4), which is currently in draft form. The content of draft LPS 4 follows the
recommendations of the Scheme Review prepared in November 2016. The Scheme Review documents
various changes to LPS 3 to be reflected in LPS 4, largely to implement the Local Planning Strategy.
One of the stated aims of draft LPS 4 is to impose special conditions for development of land within Denham
to mitigate the adverse effects of land subject to inundation and other physical constraints.
Clause 29 of the Model Scheme Text provides local government the option to give statutory effect to any
relevant State Planning Policy (SPP) in whole or in part, in a similar way as the R-Codes are linked to a
Scheme. The Shire has not elected to do this with SPP 2.6 State Coastal Policy, although some proposed
zones do make reference to the requirement for preparation of foreshore management plans and to have
regard to SPP 2.6. Mostly, it is proposed to include provisions relating to requirements for development
approval and minimum floor levels in areas identified as being vulnerable to coastal storm surge inundation.
As at April 2018 draft LPS 4 contains the following clause of relevance to land subject to inundation from
coastal processes.
31.1 Land Subject to Inundation
a. No development shall be constructed upon any land within an area considered by the local government as being vulnerable to coastal storm surge inundation unless granted specific planning approval by the local government.
a. The local government shall require any new development within an area as being vulnerable to coastal storm surge inundation to comply with a minimum finished floor level not less than RL 4.2 metres AHD.
b. Notwithstanding Clause 32.1(b), Council has discretion to consider a minimum finished floor level less than RL 4.2 metres AHD for non-habitable development that is detached from any single house or dwelling unit on the same lot in the Denham townsite and / or any minor non-habitable development that is ancillary to existing tourist development in the Scheme Area.
c. In considering applications for development in areas vulnerable to coastal storm surge inundation, the local government may have regard to any Local Planning Policy, or any site-specific coastal storm surge inundation report acceptable to the local government.
d. Notwithstanding Clause 32.1(b), the local government has discretion to consider and require alternative minimum finished floor levels where:
i. The proponent provides a site-specific coastal storm surge inundation report by a suitably qualified professional coastal engineer that is acceptable to the local government and clearly identifies appropriate alternative minimum finished floor levels and / or;
ii. Approval of the development is consistent with variations allowable under the relevant State Coastal Planning Policy; and /or
iii. the proposed development only involves refurbishment of or a minor extension to an existing development.
Shire of Shark Bay | 06 March 2019 Chapter Report: Risk Assessment Page 30
5652_01_R
05v03.d
ocx
It is noted that this clause relates only to vulnerability to coastal storm surge inundation. Other potential impacts
such as erosion are not addressed in the Scheme. This is an important distinction because whilst infrastructure
may recover from temporary inundation, erosion can be much more devastating. It is further noted that there
is no Local Planning Policy relating to development on land vulnerable to coastal processes which could
provide guidance as to appropriate ways of addressing the risk from coastal processes.
Application of the recommended FFL of 4.2m AHD will be recommended as an adaptation option in the next
phase of the CHRMAP. However, the Scheme at present does not give consideration to the method of
achieving the elevated FFL. That is, landfill, or raised buildings that allow water to flow beneath them and how
this will impact other sites.
There are a number of planning zones located in the coastal foreshore reserve defined in Water Technology
(2018a). One such zone is the Special Control Area (SCA) which is described in more detail below in Chapter
5.1.2.1.
Although some special use zones require coastal processes to be addressed in development applications,
these controls do not apply universally to land identified as being impacted by coastal processes to 2118.
5.1.2.1 Special Control Area
An SCA is an overlay that applies in addition to the underlying classification of the land and specifies special
controls in addition to any other requirements relevant to the underlying zone. An SCA could be applied to
relate specifically to land subject to coastal processes, as recommended in WAPC (2017): Draft Planned or Managed Retreat Guidelines. This will be analysed in the Adaptation Options Chapter report, the next phase
of the CHRMAP.
There is just one proposed SCA located in the study area, the Shark Bay World Heritage Property. However,
this is located in the nearshore waters to the north of Nicholson Point, so not directly applicable to the study.
For land-based development applications in these areas:
35.1 Application Requirements
a. The local government may require applicants to provide a professional coastal report by a suitably qualified coastal engineer to determine appropriate coastal setbacks, minimum floor areas, and address coastal hazard risk management adaption planning to comply with relevant state planning coastal policy and guidelines.
35.2 Relevant Considerations
In considering any proposal including and not limited to a development application, structure plan, local development plan, scheme amendment, strata or subdivision the local government will have regard to:
a. Requirements for referral of proposals to the Environmental Protection Authority (EPA) under Part IV of the Environmental Protection act 1986.
b. Relevant State Planning Policies including and not limited to state Coastal Planning
c. Any recommendations and advice provided by relevant government agencies.
d. Recommendations and advice by the Shark Bay World Heritage Advisory Committee or any replacement of that Committee.
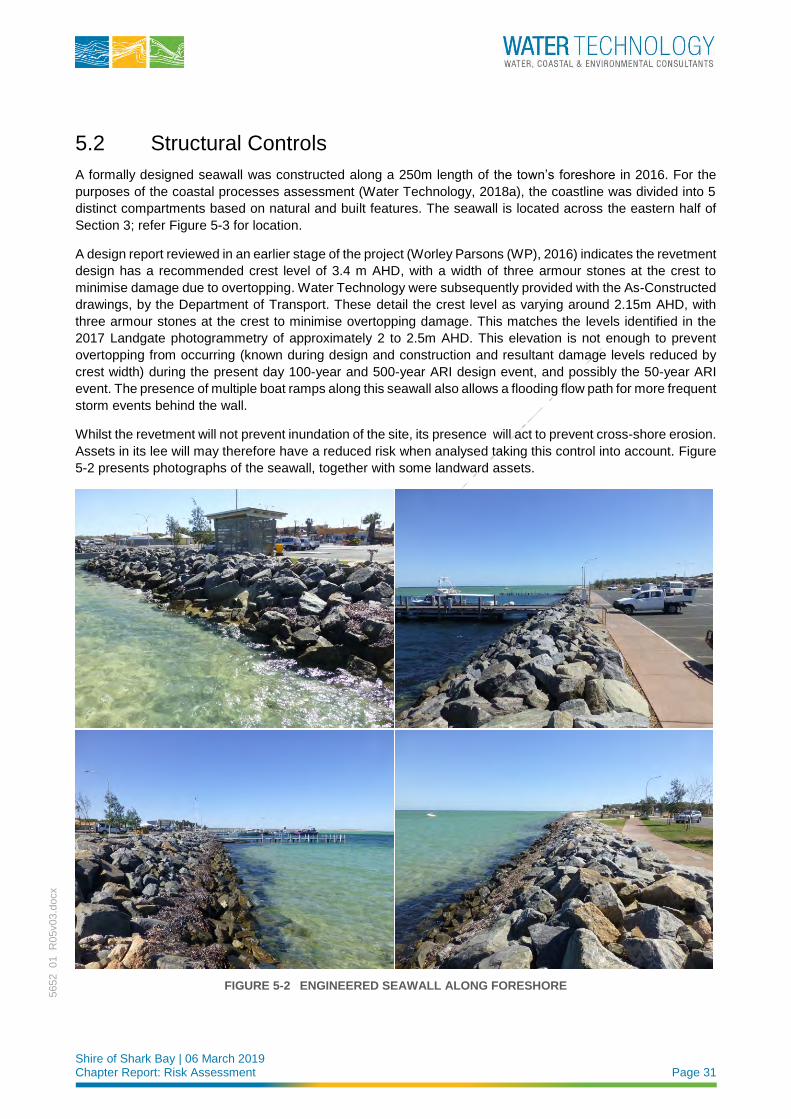
Shire of Shark Bay | 06 March 2019 Chapter Report: Risk Assessment Page 31
5652_01_R
05v03.d
ocx
5.2 Structural Controls
A formally designed seawall was constructed along a 250m length of the town’s foreshore in 2016. For the
purposes of the coastal processes assessment (Water Technology, 2018a), the coastline was divided into 5
distinct compartments based on natural and built features. The seawall is located across the eastern half of
Section 3; refer Figure 5-3 for location.
A design report reviewed in an earlier stage of the project (Worley Parsons (WP), 2016) indicates the revetment
design has a recommended crest level of 3.4 m AHD, with a width of three armour stones at the crest to
minimise damage due to overtopping. Water Technology were subsequently provided with the As-Constructed
drawings, by the Department of Transport. These detail the crest level as varying around 2.15m AHD, with
three armour stones at the crest to minimise overtopping damage. This matches the levels identified in the
2017 Landgate photogrammetry of approximately 2 to 2.5m AHD. This elevation is not enough to prevent
overtopping from occurring (known during design and construction and resultant damage levels reduced by
crest width) during the present day 100-year and 500-year ARI design event, and possibly the 50-year ARI
event. The presence of multiple boat ramps along this seawall also allows a flooding flow path for more frequent
storm events behind the wall.
Whilst the revetment will not prevent inundation of the site, its presence will act to prevent cross-shore erosion.
Assets in its lee will may therefore have a reduced risk when analysed taking this control into account. Figure
5-2 presents photographs of the seawall, together with some landward assets.
FIGURE 5-2 ENGINEERED SEAWALL ALONG FORESHORE
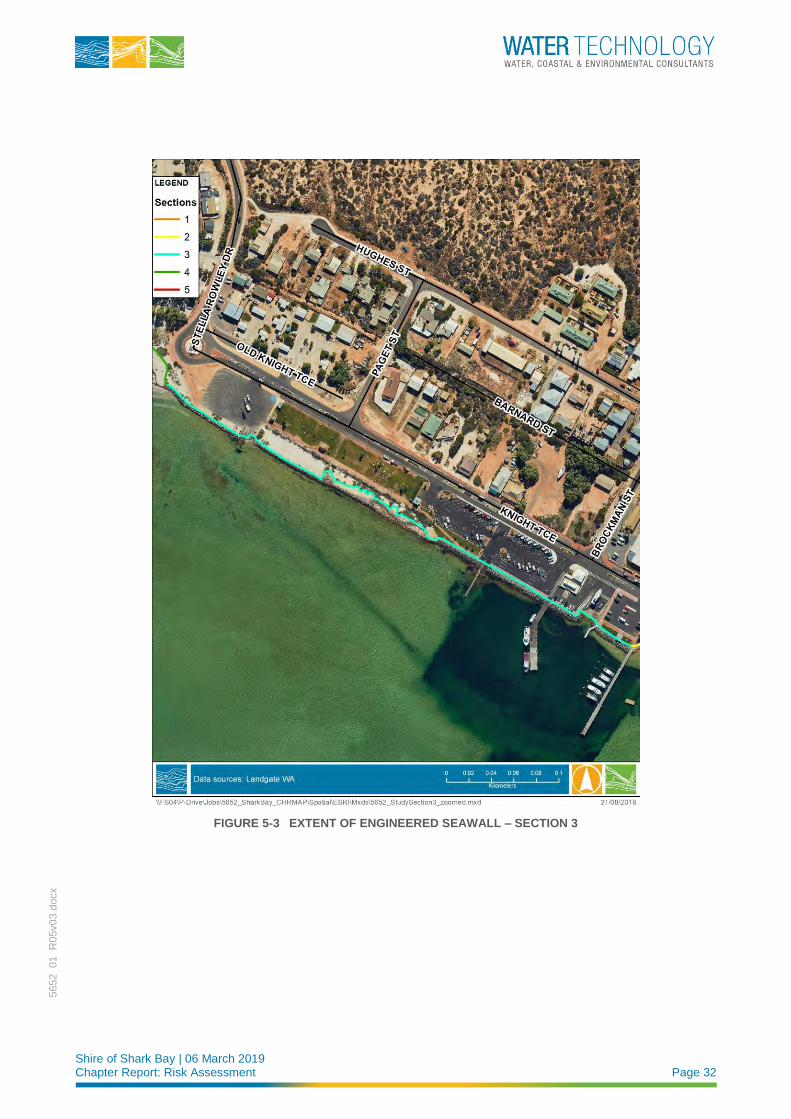
Shire of Shark Bay | 06 March 2019 Chapter Report: Risk Assessment Page 32
5652_01_R
05v03.d
ocx
FIGURE 5-3 EXTENT OF ENGINEERED SEAWALL – SECTION 3
Shire of Shark Bay | 06 March 2019 Chapter Report: Risk Assessment Page 33
5652_01_R
05v03.d
ocx
6 RISK RE-EVALUATION As discussed in Chapter 5, the existing risk management controls and measures are as follows:
◼ New development is required to have a finished floor level (FFL) of 3.2m AHD
◼ Draft Local Planning Scheme No. 4 includes a requirement for FFL of 4.2m AHD, however this has
not yet come into effect.
◼ A formal seawall is in place across the eastern half of Section 3. This limits the level of erosion that will
occur at the site.
The sub-chapters below discuss the implications of applying these controls to the risk evaluation. Appendix C
and Appendix D present the full risk assessment for all assets.
6.1 Inundation Risk Re-Evaluation
Local Planning Scheme No. 3 (LPS 3) was gazetted in 2008. The clause regarding land subject to inundation
was modified in 2012. It is not clear from the document’s quality control panel if the land subject to inundation
clause was added in 2012, or if it was already in place at document gazettal. Similarly, it is not known if the
Local Planning Scheme pre-2008 also had a clause regarding finished floor levels. If it is new to LPS 3,
buildings older than 6-10 years may not have an FFL of 3.2m AHD. As such, reassessing all buildings
assuming this control is in place may lead to lower than actual risks.
For a conservative approach, the risk assessment has been left as assessed in Chapter 4. Appendix C does
contain additional columns indicating the revised risk rating if buildings do have an FFL of 3.2m AHD. If applied,
the risk level of all buildings drops from ‘High’ to ‘Medium’ by 2118. However, the adaptation planning will be
determined from the higher risk rating.
6.2 Erosion Risk Re-Evaluation
For the risk assessment, the assets are grouped by type such that there are multiples of the same asset type
along the foreshore. For example, toilet blocks, foreshore path and limestone retaining walls occur throughout
the foreshore area. It is unsuitable to revise the risk rating for individual instances of these assets that happen
to be located landward of the engineered seawall without also revising those that are not protected. Therefore,
only the likelihood for assets singularly located in the protected area have been adjusted. The assets with a
reduced risk due to the presence of the seawall are as follows:
◼ Utilities: marina and dock fire hydrants reduced to ‘Low’ for the present day and a lower ‘Medium’ by 2030.
◼ Fuel tank at the marina reduced within the ‘Medium’ category in 2030.
◼ Boat ramp and jetty scores are reduced, but this does not change their risk rating within each planning
timeframe.
◼ Fish cleaning station has a reduced risk rating that changes the risk rating in 2050 from ‘High’ to ‘Medium’.
This risk is still considered ‘Extreme’ by 2118.
It is noted that individual asset management plans may take the specific location into account and thus the
individual asset’s risk, however the adaptation plans developed in the next phase of the CHRMAP will consider
each group as a whole.
Shire of Shark Bay | 06 March 2019 Chapter Report: Risk Assessment Page 34
5652_01_R
05v03.d
ocx
6.3 Risk Priority List
The risk assessment has allowed the identification of a set of risks that require action, specifically targeting
assets that are highly valued by the community. This involves consideration of the success criteria presented
in Table 2-2 (Chapter 2.3).
The main area at risk for the town is the length of Knight Terrace. Moving from there to the west along the
study area, the remaining at-risk assets include the lookout at Nicholson Point, the car park to the north of
Nicholson Point, and a section of Stella Rowley Drive at that location.
Table 6-1 and Table 6-2 present the coastal hazard risks in order of priority for each planning timeframe, due
to inundation and coastal erosion respectively. Each asset’s risk is presented along each row; risk classification
is indicated by colour, as defined in Table 3-4 (Chapter 3.2). Only risks from medium and above are presented;
low risks are considered manageable without intervention, as per the risk profile definition.
Some discussion on the risk priority lists are discussed below in Table 6-3.
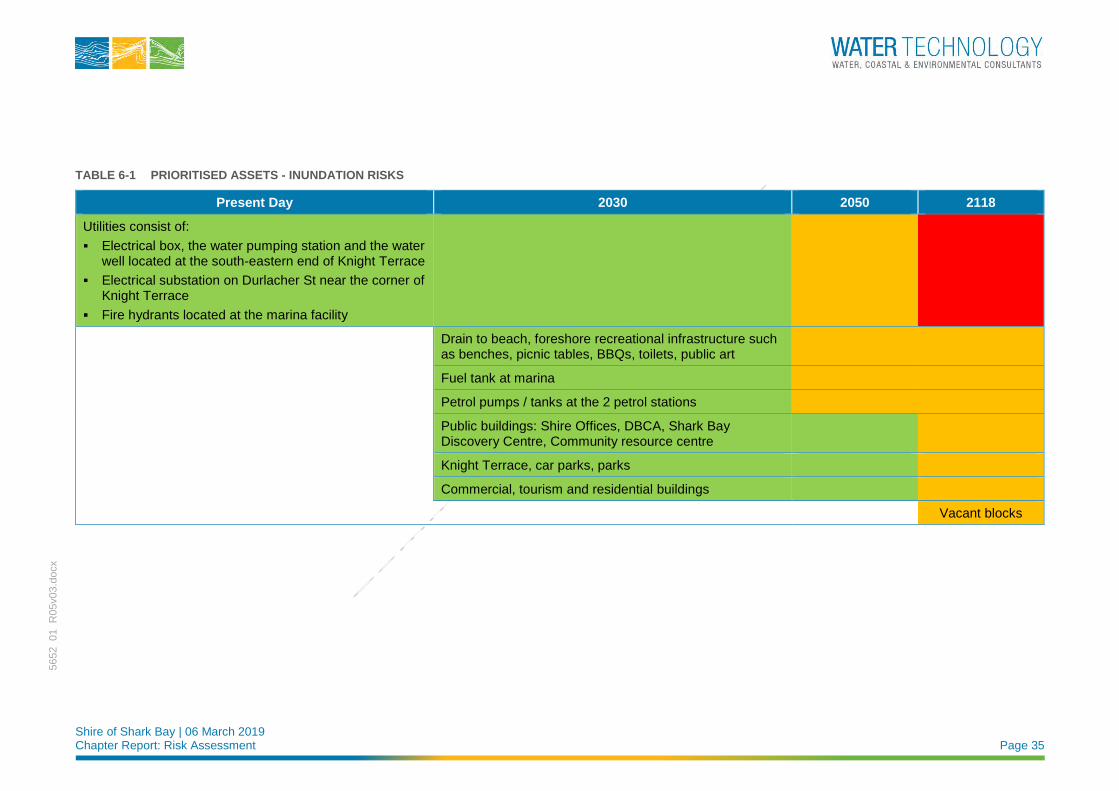
Shire of Shark Bay | 06 March 2019 Chapter Report: Risk Assessment Page 35
5652_01_R
05v03.d
ocx
TABLE 6-1 PRIORITISED ASSETS - INUNDATION RISKS
Present Day 2030 2050 2118
Utilities consist of:
▪ Electrical box, the water pumping station and the water well located at the south-eastern end of Knight Terrace
▪ Electrical substation on Durlacher St near the corner of Knight Terrace
▪ Fire hydrants located at the marina facility
Drain to beach, foreshore recreational infrastructure such as benches, picnic tables, BBQs, toilets, public art
Fuel tank at marina
Petrol pumps / tanks at the 2 petrol stations
Public buildings: Shire Offices, DBCA, Shark Bay Discovery Centre, Community resource centre
Knight Terrace, car parks, parks
Commercial, tourism and residential buildings
Vacant blocks

Shire of Shark Bay | 06 March 2019 Chapter Report: Risk Assessment Page 36
5652_01_R
05v03.d
ocx
TABLE 6-2 PRIORITISED ASSETS - EROSION RISKS
Present Day 2030 2050 2118
Adhoc seawall
Utilities:
▪ Fire hydrants located at the marina facility
Utilities:
▪ Electrical box and water pumping station located at south-eastern end of Knight Terrace
▪ Fire hydrants located at the marina facility
Utilities:
▪ Electrical box and water pumping station located at south-eastern end of Knight Terrace
▪ Fire hydrants located at the marina facility
▪ Electrical substation on Durlacher St near the corner of Knight Terrace
Foreshore recreational infrastructure: BBQs, toilets, fish cleaning station
Foreshore recreational infrastructure: BBQs, public toilets
Foreshore recreational infrastructure: BBQs, public toilets, fish cleaning station
Knight Terrace Knight Terrace & Stella Rowley Drive
Fuel tank at marina
Public buildings: Shire Offices Public buildings: Shire Offices, DBCA, Shark Bay Discovery Centre, Community resource centre
Commercial, tourism and residential buildings
Petrol pumps / tanks at the 2 petrol stations
Vacant blocks
Foreshore recreational infrastructure: foreshore path, limestone retaining wall, playground, parks, car parks, drain to beach, public art, public bench, pergola
Marine infrastructure: Engineered seawall, FRP sheet-pile groyne, jetty, boat ramp, beach access
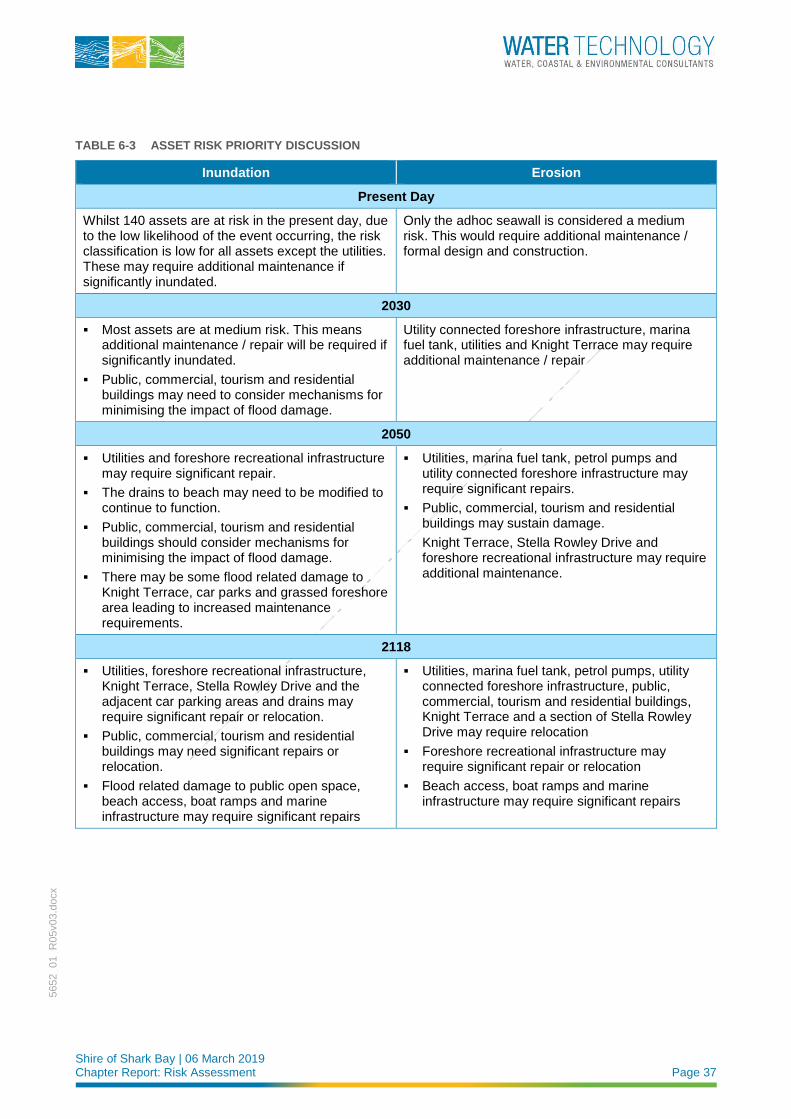
Shire of Shark Bay | 06 March 2019 Chapter Report: Risk Assessment Page 37
5652_01_R
05v03.d
ocx
TABLE 6-3 ASSET RISK PRIORITY DISCUSSION
Inundation Erosion
Present Day
Whilst 140 assets are at risk in the present day, due to the low likelihood of the event occurring, the risk classification is low for all assets except the utilities. These may require additional maintenance if significantly inundated.
Only the adhoc seawall is considered a medium risk. This would require additional maintenance / formal design and construction.
2030
▪ Most assets are at medium risk. This means additional maintenance / repair will be required if significantly inundated.
▪ Public, commercial, tourism and residential buildings may need to consider mechanisms for minimising the impact of flood damage.
Utility connected foreshore infrastructure, marina fuel tank, utilities and Knight Terrace may require additional maintenance / repair
2050
▪ Utilities and foreshore recreational infrastructure may require significant repair.
▪ The drains to beach may need to be modified to continue to function.
▪ Public, commercial, tourism and residential buildings should consider mechanisms for minimising the impact of flood damage.
▪ There may be some flood related damage to Knight Terrace, car parks and grassed foreshore area leading to increased maintenance requirements.
▪ Utilities, marina fuel tank, petrol pumps and utility connected foreshore infrastructure may require significant repairs.
▪ Public, commercial, tourism and residential buildings may sustain damage.
Knight Terrace, Stella Rowley Drive and foreshore recreational infrastructure may require additional maintenance.
2118
▪ Utilities, foreshore recreational infrastructure, Knight Terrace, Stella Rowley Drive and the adjacent car parking areas and drains may require significant repair or relocation.
▪ Public, commercial, tourism and residential buildings may need significant repairs or relocation.
▪ Flood related damage to public open space, beach access, boat ramps and marine infrastructure may require significant repairs
▪ Utilities, marina fuel tank, petrol pumps, utility connected foreshore infrastructure, public, commercial, tourism and residential buildings, Knight Terrace and a section of Stella Rowley Drive may require relocation
▪ Foreshore recreational infrastructure may require significant repair or relocation
▪ Beach access, boat ramps and marine infrastructure may require significant repairs
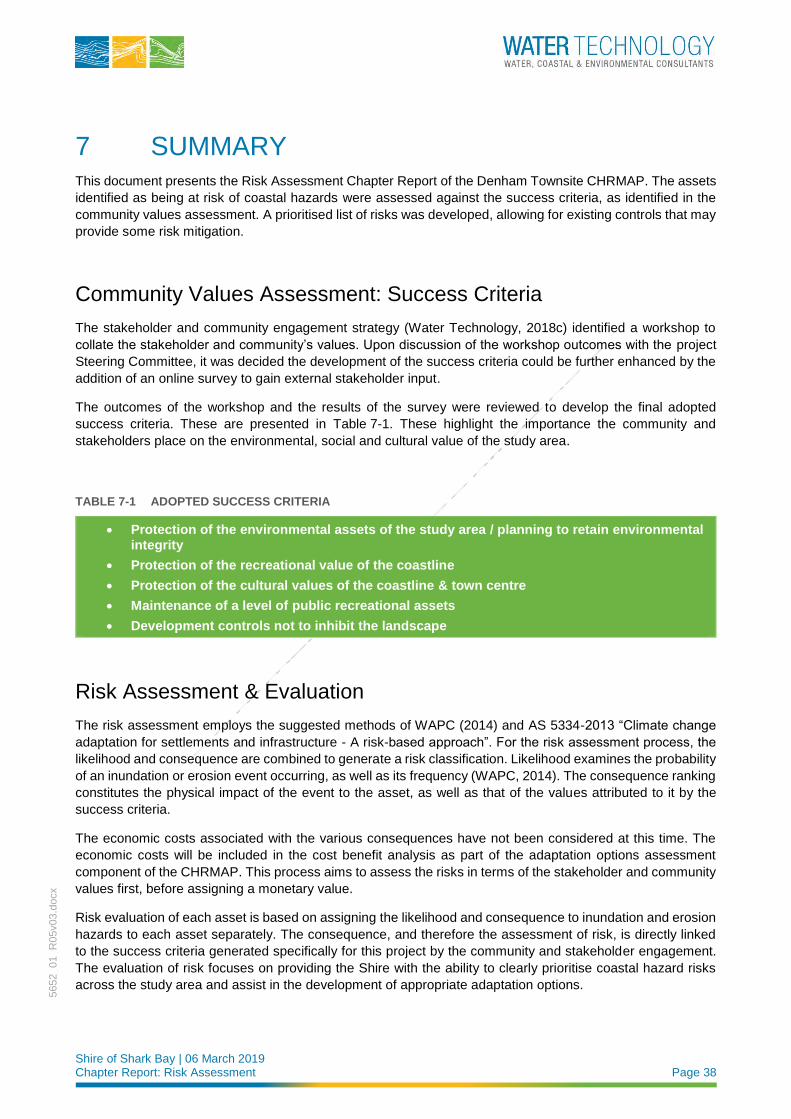
Shire of Shark Bay | 06 March 2019 Chapter Report: Risk Assessment Page 38
5652_01_R
05v03.d
ocx
7 SUMMARY This document presents the Risk Assessment Chapter Report of the Denham Townsite CHRMAP. The assets
identified as being at risk of coastal hazards were assessed against the success criteria, as identified in the
community values assessment. A prioritised list of risks was developed, allowing for existing controls that may
provide some risk mitigation.
Community Values Assessment: Success Criteria
The stakeholder and community engagement strategy (Water Technology, 2018c) identified a workshop to
collate the stakeholder and community’s values. Upon discussion of the workshop outcomes with the project
Steering Committee, it was decided the development of the success criteria could be further enhanced by the
addition of an online survey to gain external stakeholder input.
The outcomes of the workshop and the results of the survey were reviewed to develop the final adopted
success criteria. These are presented in Table 7-1. These highlight the importance the community and
stakeholders place on the environmental, social and cultural value of the study area.
TABLE 7-1 ADOPTED SUCCESS CRITERIA
• Protection of the environmental assets of the study area / planning to retain environmental integrity
• Protection of the recreational value of the coastline
• Protection of the cultural values of the coastline & town centre
• Maintenance of a level of public recreational assets
• Development controls not to inhibit the landscape
Risk Assessment & Evaluation
The risk assessment employs the suggested methods of WAPC (2014) and AS 5334-2013 “Climate change
adaptation for settlements and infrastructure - A risk-based approach”. For the risk assessment process, the
likelihood and consequence are combined to generate a risk classification. Likelihood examines the probability
of an inundation or erosion event occurring, as well as its frequency (WAPC, 2014). The consequence ranking
constitutes the physical impact of the event to the asset, as well as that of the values attributed to it by the
success criteria.
The economic costs associated with the various consequences have not been considered at this time. The
economic costs will be included in the cost benefit analysis as part of the adaptation options assessment
component of the CHRMAP. This process aims to assess the risks in terms of the stakeholder and community
values first, before assigning a monetary value.
Risk evaluation of each asset is based on assigning the likelihood and consequence to inundation and erosion
hazards to each asset separately. The consequence, and therefore the assessment of risk, is directly linked
to the success criteria generated specifically for this project by the community and stakeholder engagement.
The evaluation of risk focuses on providing the Shire with the ability to clearly prioritise coastal hazard risks
across the study area and assist in the development of appropriate adaptation options.
Shire of Shark Bay | 06 March 2019 Chapter Report: Risk Assessment Page 39
5652_01_R
05v03.d
ocx
The full risk assessment for all exposed assets for the planning timeframes Present Day, 2030, 2050 and 2118
is presented in Appendix C and Appendix D for inundation and coastal processes (erosion) respectively.
Chapter 6 presents the prioritised risk list for erosion and inundation hazards separately. Table 6-3 presents
some discussion points around these lists. The next phase of the project identifies adaptation options to
address the risks
Shire of Shark Bay | 06 March 2019 Chapter Report: Risk Assessment Page 40
5652_01_R
05v03.d
ocx
8 REFERENCES Intergovernmental Panel on Climate Change (IPCC, 2014). Climate Change 2014: Synthesis Report, Contribution of Working Groups I, II and III to the Fifth Assessment Report of the Intergovernmental Panel on
Climate Change. Geneva, Switzerland, Core Writing Team, R.K. Pachauri and L.A. Meyer (eds.)], IPCC,
Geneva, Switzerland, 151 pp.
Standards Australia (2013). Australian Standard: Climate change adaptation for settlements and infrastructure - A risk-based approach, AS 5334-2013, published by Standards Australia, Australia
Smith G P, Davey E K, and Cox R J (2014). Flood Hazard, UNSW Australia Water Research Laboratory
Technical Report 2014/07, 30 September 2014
Water Technology (2018a). Denham Townsite CHRMAP Chapter Report: Coastal Hazard & Vulnerability Assessment, Report No 5652-01 R04v01, prepared for Shire of Shark Bay
Water Technology (2018b). Denham Townsite CHRMAP Chapter Report: Establish the Context, Report No
5652-01 R03v02, prepared for Shire of Shark Bay
Water Technology (2018c). Denham Townsite CHRMAP: Stakeholder and Community Engagement Plan,
Report No 5562-01 R01v01, prepared for Shire of Shark Bay
Western Australian Planning Commission (WAPC, 2013). State Planning Policy No. 2.6 – State Coastal
Planning Policy, prepared under the Planning and Development Act 2005.
Western Australian Planning Commission (WAPC, 2014). Coastal Hazard Risk Management and Adaptation
Planning Guidelines
Western Australian Planning Commission (WAPC, 2017). Draft Planned or Managed Retreat Guidelines,
published by WAPC, Department of Planning, Lands and Heritage
Worley Parsons (WP, 2016). Denham Foreshore Revitalisation Stage 1A: Design Report, Report No 301012-
02233 – GE-REP-002, prepared for Department of Transport
Shire of Shark Bay | March 2019 Chapter Report: Risk Assessment
5652_01_R
05v03.d
ocx
APPENDIX A COMMUNITY VALUES SURVEY QUESTIONS
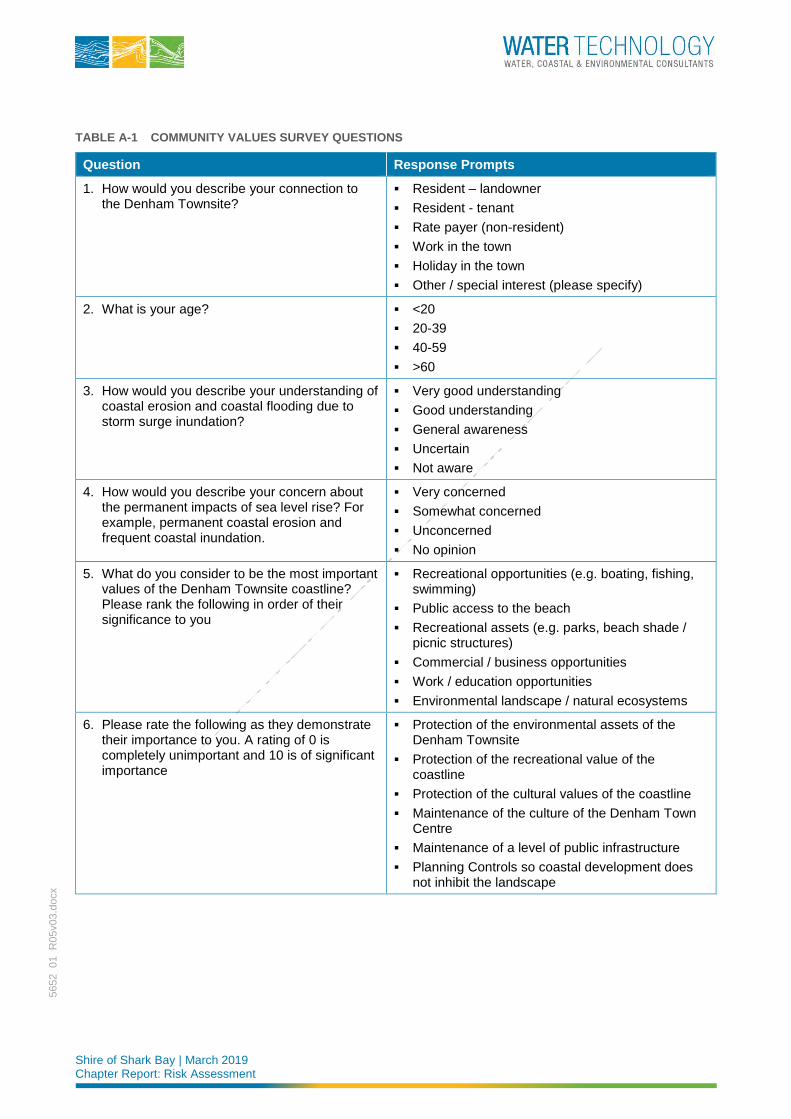
Shire of Shark Bay | March 2019 Chapter Report: Risk Assessment
5652_01_R
05v03.d
ocx
TABLE A-1 COMMUNITY VALUES SURVEY QUESTIONS
Question Response Prompts
1. How would you describe your connection to the Denham Townsite?
▪ Resident – landowner
▪ Resident - tenant
▪ Rate payer (non-resident)
▪ Work in the town
▪ Holiday in the town
▪ Other / special interest (please specify)
2. What is your age? ▪ <20
▪ 20-39
▪ 40-59
▪ >60
3. How would you describe your understanding of coastal erosion and coastal flooding due to storm surge inundation?
▪ Very good understanding
▪ Good understanding
▪ General awareness
▪ Uncertain
▪ Not aware
4. How would you describe your concern about the permanent impacts of sea level rise? For example, permanent coastal erosion and frequent coastal inundation.
▪ Very concerned
▪ Somewhat concerned
▪ Unconcerned
▪ No opinion
5. What do you consider to be the most important values of the Denham Townsite coastline? Please rank the following in order of their significance to you
▪ Recreational opportunities (e.g. boating, fishing, swimming)
▪ Public access to the beach
▪ Recreational assets (e.g. parks, beach shade / picnic structures)
▪ Commercial / business opportunities
▪ Work / education opportunities
▪ Environmental landscape / natural ecosystems
6. Please rate the following as they demonstrate their importance to you. A rating of 0 is completely unimportant and 10 is of significant importance
▪ Protection of the environmental assets of the Denham Townsite
▪ Protection of the recreational value of the coastline
▪ Protection of the cultural values of the coastline
▪ Maintenance of the culture of the Denham Town Centre
▪ Maintenance of a level of public infrastructure
▪ Planning Controls so coastal development does not inhibit the landscape
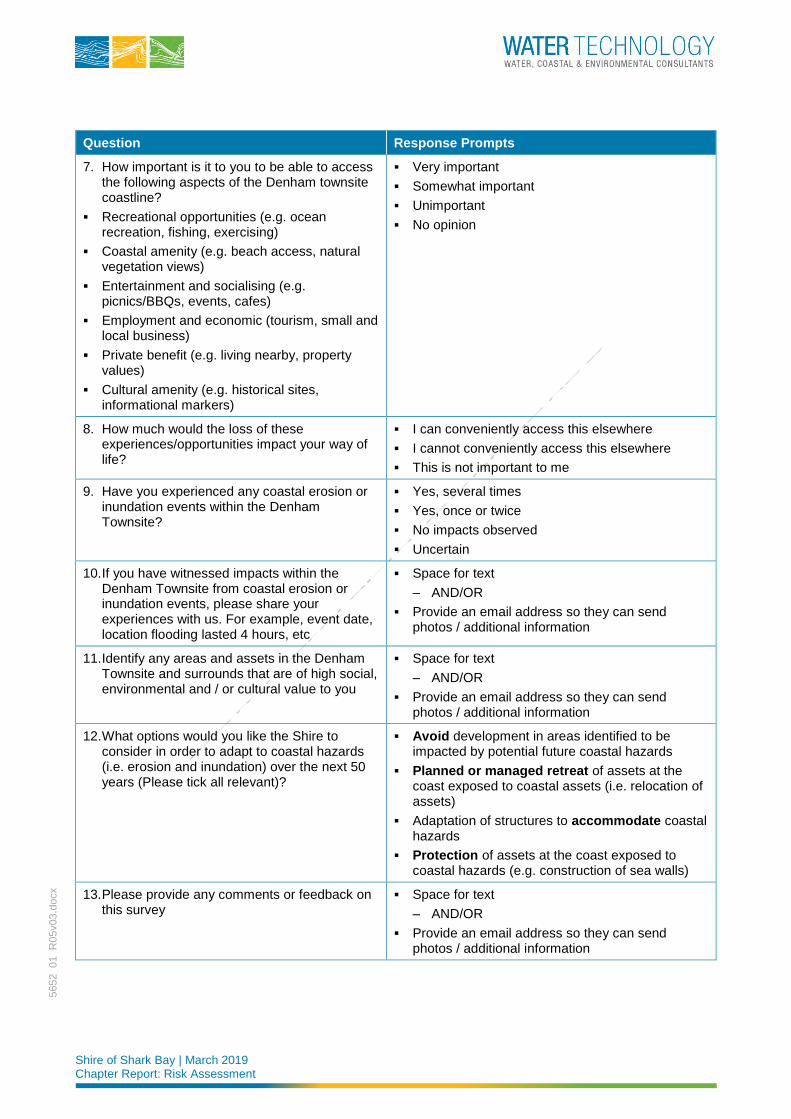
Shire of Shark Bay | March 2019 Chapter Report: Risk Assessment
5652_01_R
05v03.d
ocx
Question Response Prompts
7. How important is it to you to be able to access the following aspects of the Denham townsite coastline?
▪ Recreational opportunities (e.g. ocean recreation, fishing, exercising)
▪ Coastal amenity (e.g. beach access, natural vegetation views)
▪ Entertainment and socialising (e.g. picnics/BBQs, events, cafes)
▪ Employment and economic (tourism, small and local business)
▪ Private benefit (e.g. living nearby, property values)
▪ Cultural amenity (e.g. historical sites, informational markers)
▪ Very important
▪ Somewhat important
▪ Unimportant
▪ No opinion
8. How much would the loss of these experiences/opportunities impact your way of life?
▪ I can conveniently access this elsewhere
▪ I cannot conveniently access this elsewhere
▪ This is not important to me
9. Have you experienced any coastal erosion or inundation events within the Denham Townsite?
▪ Yes, several times
▪ Yes, once or twice
▪ No impacts observed
▪ Uncertain
10. If you have witnessed impacts within the Denham Townsite from coastal erosion or inundation events, please share your experiences with us. For example, event date, location flooding lasted 4 hours, etc
▪ Space for text
– AND/OR
▪ Provide an email address so they can send photos / additional information
11. Identify any areas and assets in the Denham Townsite and surrounds that are of high social, environmental and / or cultural value to you
▪ Space for text
– AND/OR
▪ Provide an email address so they can send photos / additional information
12. What options would you like the Shire to consider in order to adapt to coastal hazards (i.e. erosion and inundation) over the next 50 years (Please tick all relevant)?
▪ Avoid development in areas identified to be impacted by potential future coastal hazards
▪ Planned or managed retreat of assets at the coast exposed to coastal assets (i.e. relocation of assets)
▪ Adaptation of structures to accommodate coastal hazards
▪ Protection of assets at the coast exposed to coastal hazards (e.g. construction of sea walls)
13. Please provide any comments or feedback on this survey
▪ Space for text
– AND/OR
▪ Provide an email address so they can send photos / additional information
Shire of Shark Bay | March 2019 Chapter Report: Risk Assessment
5652_01_R
05v03.d
ocx
APPENDIX B COMMUNITY VALUE SURVEY RESULTS
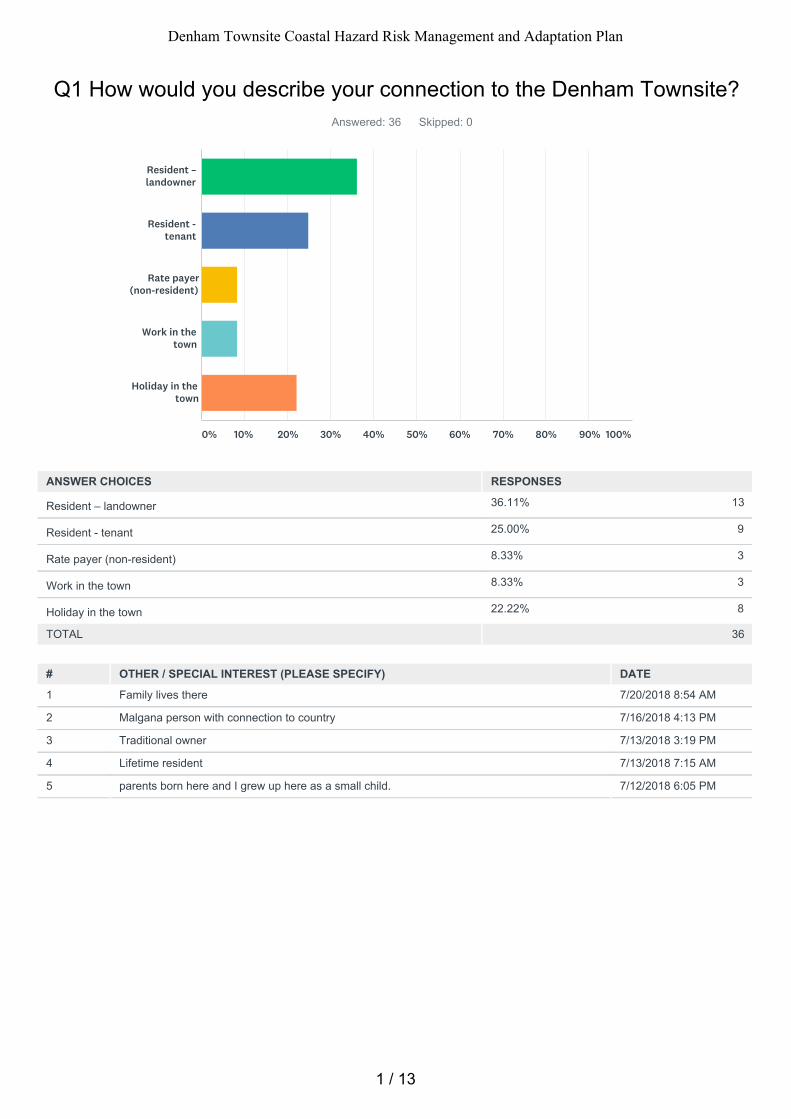
36.11% 13
25.00% 9
8.33% 3
8.33% 3
22.22% 8
Q1 How would you describe your connection to the Denham Townsite?Answered: 36 Skipped: 0
TOTAL 36
# OTHER / SPECIAL INTEREST (PLEASE SPECIFY) DATE
1 Family lives there 7/20/2018 8:54 AM
2 Malgana person with connection to country 7/16/2018 4:13 PM
3 Traditional owner 7/13/2018 3:19 PM
4 Lifetime resident 7/13/2018 7:15 AM
5 parents born here and I grew up here as a small child. 7/12/2018 6:05 PM
Resident –landowner
Resident -tenant
Rate payer(non-resident)
Work in thetown
Holiday in thetown
0% 10% 20% 30% 40% 50% 60% 70% 80% 90% 100%
ANSWER CHOICES RESPONSES
Resident – landowner
Resident - tenant
Rate payer (non-resident)
Work in the town
Holiday in the town
1 / 13
Denham Townsite Coastal Hazard Risk Management and Adaptation Plan
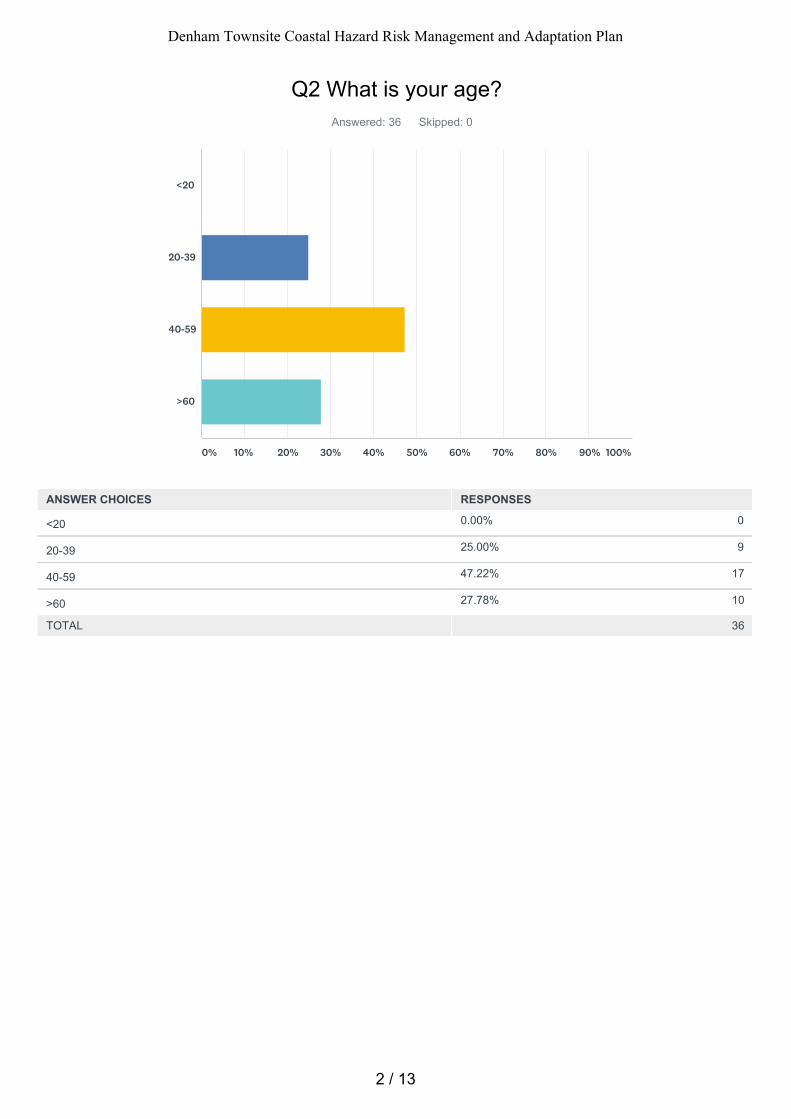
0.00% 0
25.00% 9
47.22% 17
27.78% 10
Q2 What is your age?Answered: 36 Skipped: 0
TOTAL 36
<20
20-39
40-59
>60
0% 10% 20% 30% 40% 50% 60% 70% 80% 90% 100%
ANSWER CHOICES RESPONSES
<20
20-39
40-59
>60
2 / 13
Denham Townsite Coastal Hazard Risk Management and Adaptation Plan
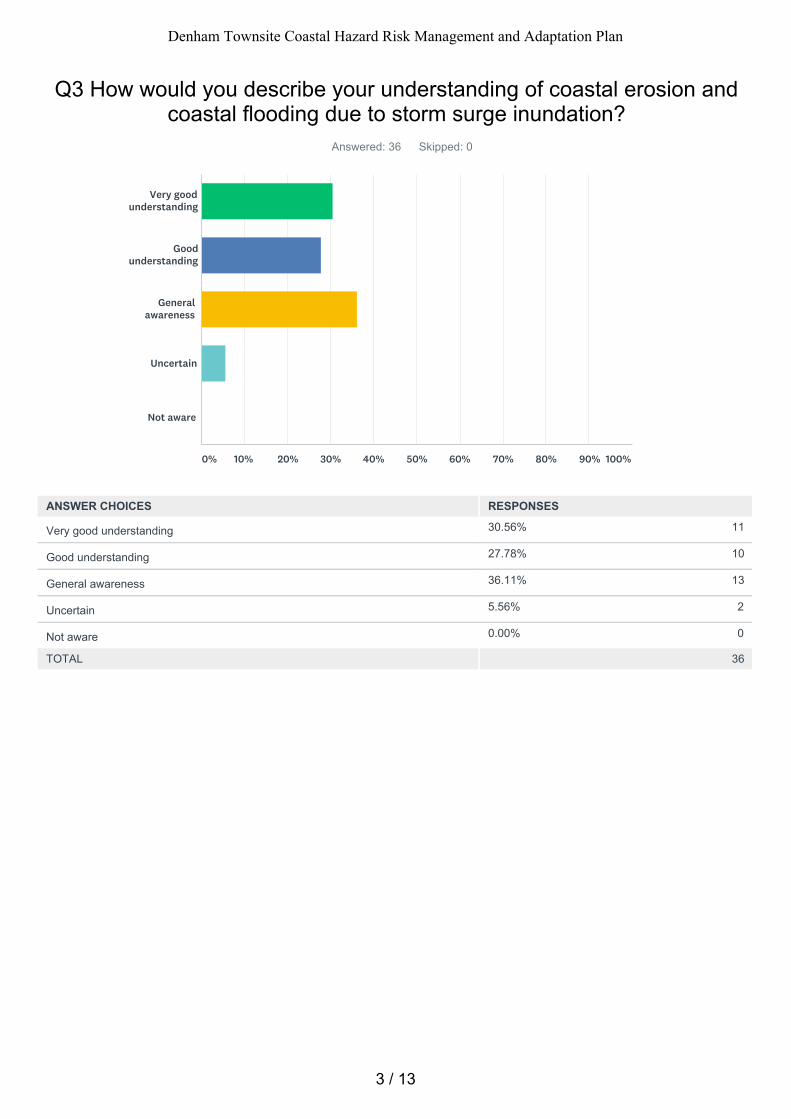
30.56% 11
27.78% 10
36.11% 13
5.56% 2
0.00% 0
Q3 How would you describe your understanding of coastal erosion andcoastal flooding due to storm surge inundation?
Answered: 36 Skipped: 0
TOTAL 36
Very goodunderstanding
Goodunderstanding
Generalawareness
Uncertain
Not aware
0% 10% 20% 30% 40% 50% 60% 70% 80% 90% 100%
ANSWER CHOICES RESPONSES
Very good understanding
Good understanding
General awareness
Uncertain
Not aware
3 / 13
Denham Townsite Coastal Hazard Risk Management and Adaptation Plan
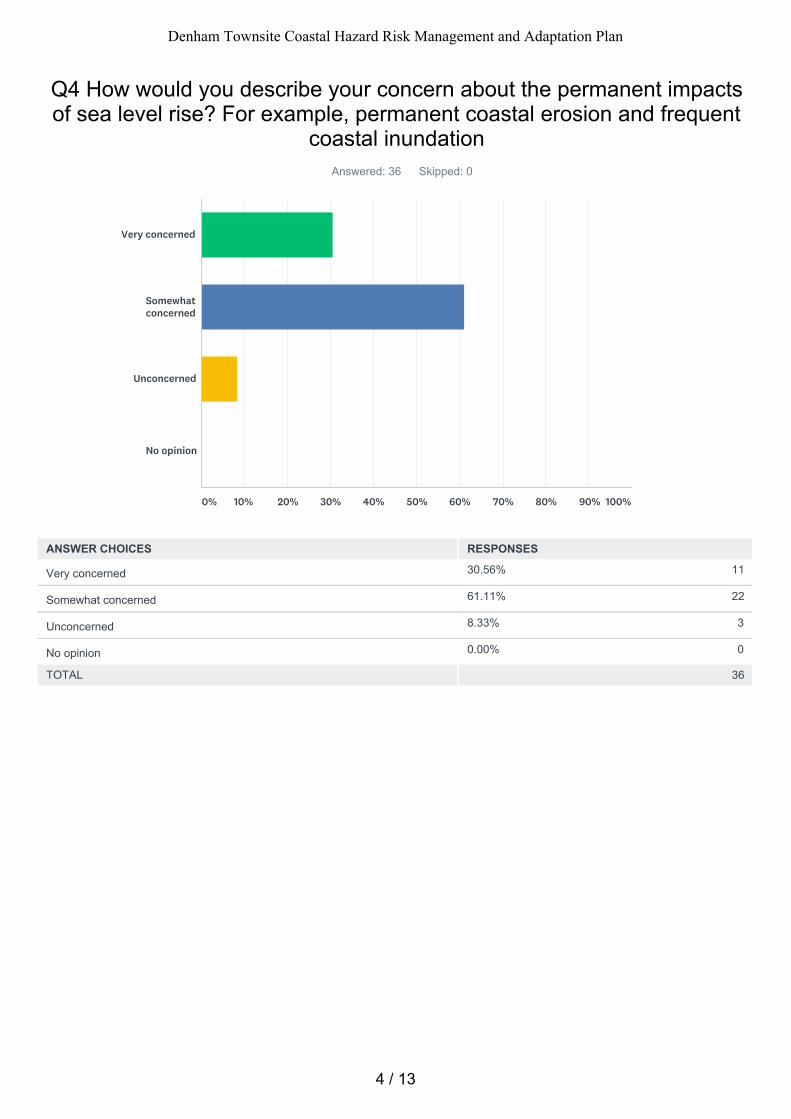
30.56% 11
61.11% 22
8.33% 3
0.00% 0
Q4 How would you describe your concern about the permanent impactsof sea level rise? For example, permanent coastal erosion and frequent
coastal inundationAnswered: 36 Skipped: 0
TOTAL 36
Very concerned
Somewhatconcerned
Unconcerned
No opinion
0% 10% 20% 30% 40% 50% 60% 70% 80% 90% 100%
ANSWER CHOICES RESPONSES
Very concerned
Somewhat concerned
Unconcerned
No opinion
4 / 13
Denham Townsite Coastal Hazard Risk Management and Adaptation Plan
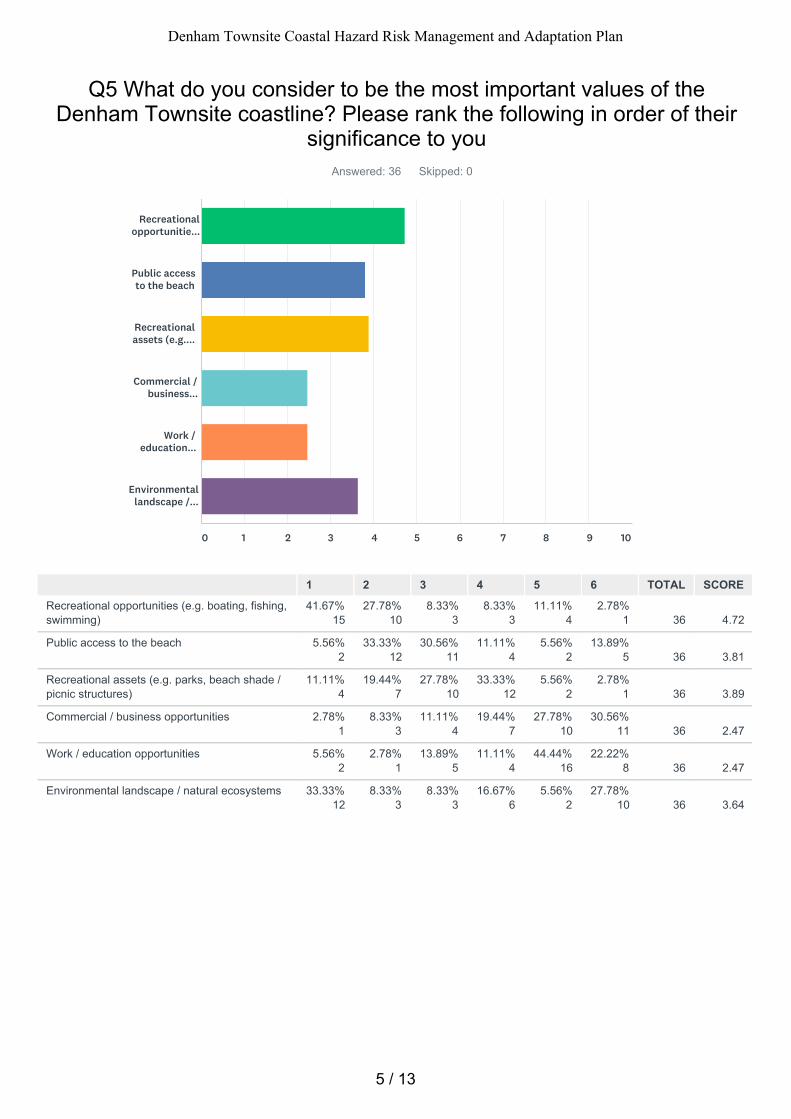
Q5 What do you consider to be the most important values of theDenham Townsite coastline? Please rank the following in order of their
significance to youAnswered: 36 Skipped: 0
41.67%15
27.78%10
8.33%3
8.33%3
11.11%4
2.78%1
36
4.72
5.56%2
33.33%12
30.56%11
11.11%4
5.56%2
13.89%5
36
3.81
11.11%4
19.44%7
27.78%10
33.33%12
5.56%2
2.78%1
36
3.89
2.78%1
8.33%3
11.11%4
19.44%7
27.78%10
30.56%11
36
2.47
5.56%2
2.78%1
13.89%5
11.11%4
44.44%16
22.22%8
36
2.47
33.33%12
8.33%3
8.33%3
16.67%6
5.56%2
27.78%10
36
3.64
Recreationalopportunitie...
Public accessto the beach
Recreationalassets (e.g....
Commercial /business...
Work /education...
Environmentallandscape /...
0 1 2 3 4 5 6 7 8 9 10
1 2 3 4 5 6 TOTAL SCORE
Recreational opportunities (e.g. boating, fishing,swimming)
Public access to the beach
Recreational assets (e.g. parks, beach shade /picnic structures)
Commercial / business opportunities
Work / education opportunities
Environmental landscape / natural ecosystems
5 / 13
Denham Townsite Coastal Hazard Risk Management and Adaptation Plan
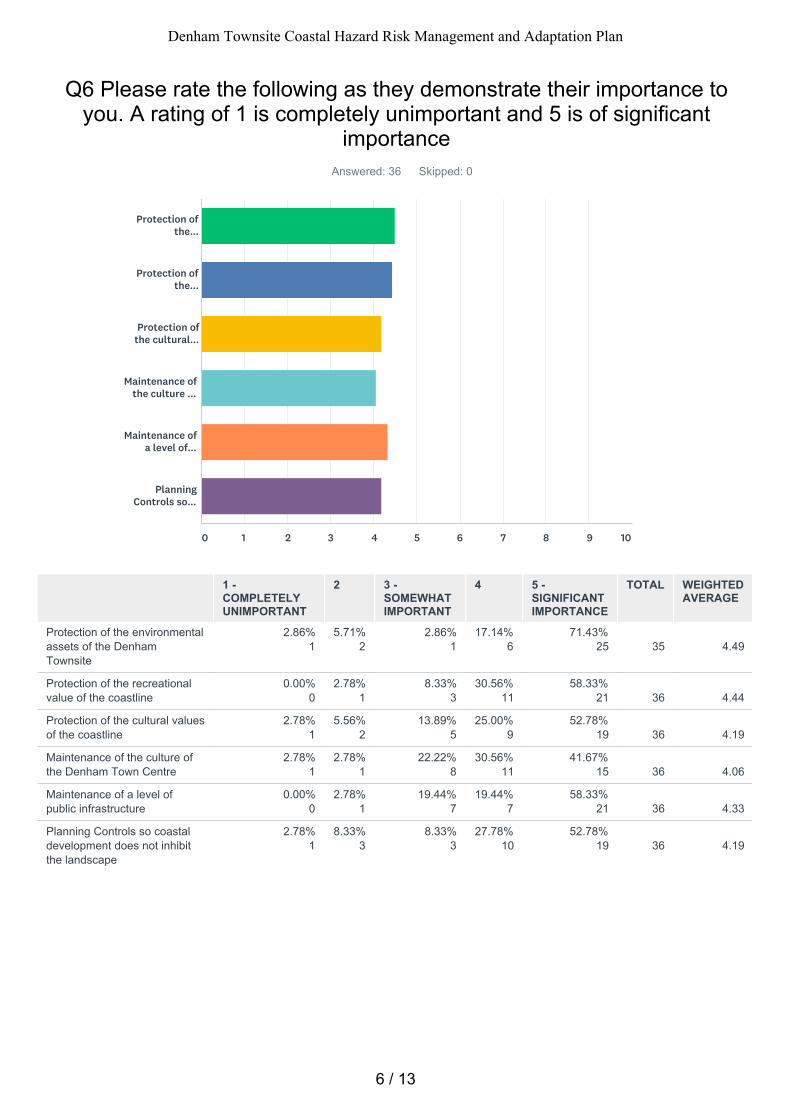
Q6 Please rate the following as they demonstrate their importance toyou. A rating of 1 is completely unimportant and 5 is of significant
importanceAnswered: 36 Skipped: 0
2.86%1
5.71%2
2.86%1
17.14%6
71.43%25
35
4.49
0.00%0
2.78%1
8.33%3
30.56%11
58.33%21
36
4.44
2.78%1
5.56%2
13.89%5
25.00%9
52.78%19
36
4.19
2.78%1
2.78%1
22.22%8
30.56%11
41.67%15
36
4.06
0.00%0
2.78%1
19.44%7
19.44%7
58.33%21
36
4.33
2.78%1
8.33%3
8.33%3
27.78%10
52.78%19
36
4.19
Protection ofthe...
Protection ofthe...
Protection ofthe cultural...
Maintenance ofthe culture ...
Maintenance ofa level of...
PlanningControls so...
0 1 2 3 4 5 6 7 8 9 10
1 -COMPLETELYUNIMPORTANT
2 3 -SOMEWHATIMPORTANT
4 5 -SIGNIFICANTIMPORTANCE
TOTAL WEIGHTEDAVERAGE
Protection of the environmentalassets of the DenhamTownsite
Protection of the recreationalvalue of the coastline
Protection of the cultural valuesof the coastline
Maintenance of the culture ofthe Denham Town Centre
Maintenance of a level ofpublic infrastructure
Planning Controls so coastaldevelopment does not inhibitthe landscape
6 / 13
Denham Townsite Coastal Hazard Risk Management and Adaptation Plan
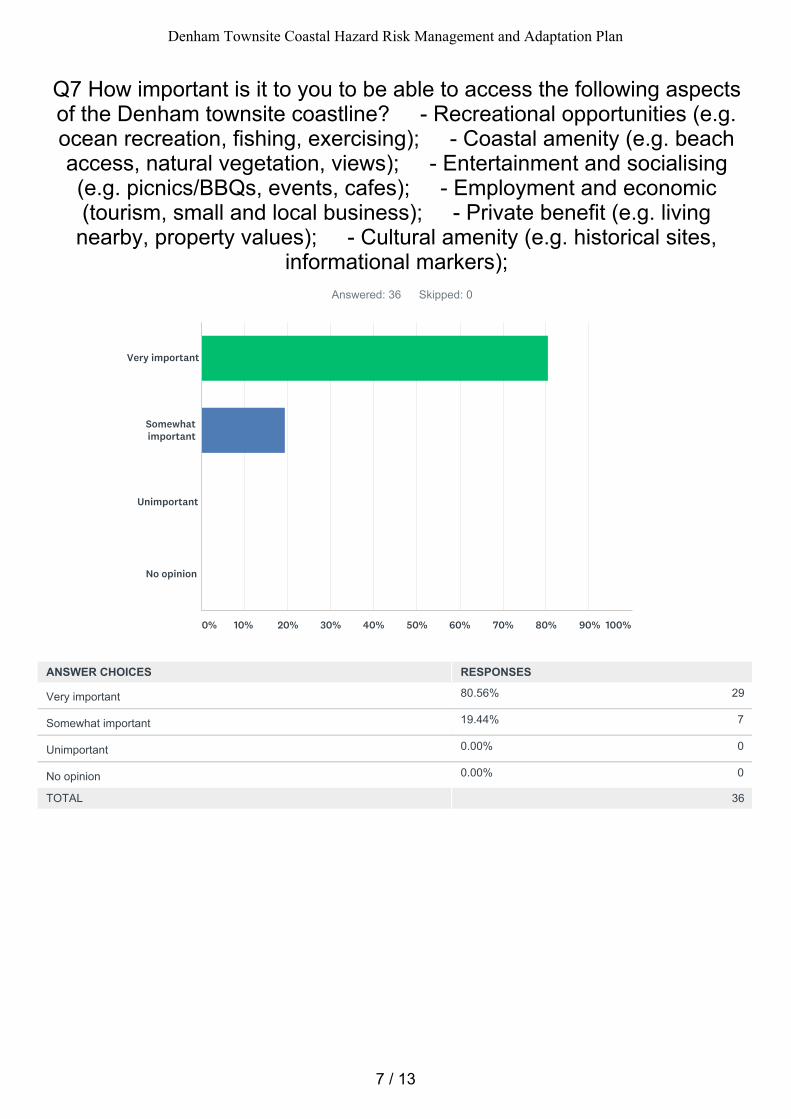
80.56% 29
19.44% 7
0.00% 0
0.00% 0
Q7 How important is it to you to be able to access the following aspectsof the Denham townsite coastline? - Recreational opportunities (e.g.ocean recreation, fishing, exercising); - Coastal amenity (e.g. beachaccess, natural vegetation, views); - Entertainment and socialising(e.g. picnics/BBQs, events, cafes); - Employment and economic(tourism, small and local business); - Private benefit (e.g. living
nearby, property values); - Cultural amenity (e.g. historical sites,informational markers);
Answered: 36 Skipped: 0
TOTAL 36
Very important
Somewhatimportant
Unimportant
No opinion
0% 10% 20% 30% 40% 50% 60% 70% 80% 90% 100%
ANSWER CHOICES RESPONSES
Very important
Somewhat important
Unimportant
No opinion
7 / 13
Denham Townsite Coastal Hazard Risk Management and Adaptation Plan
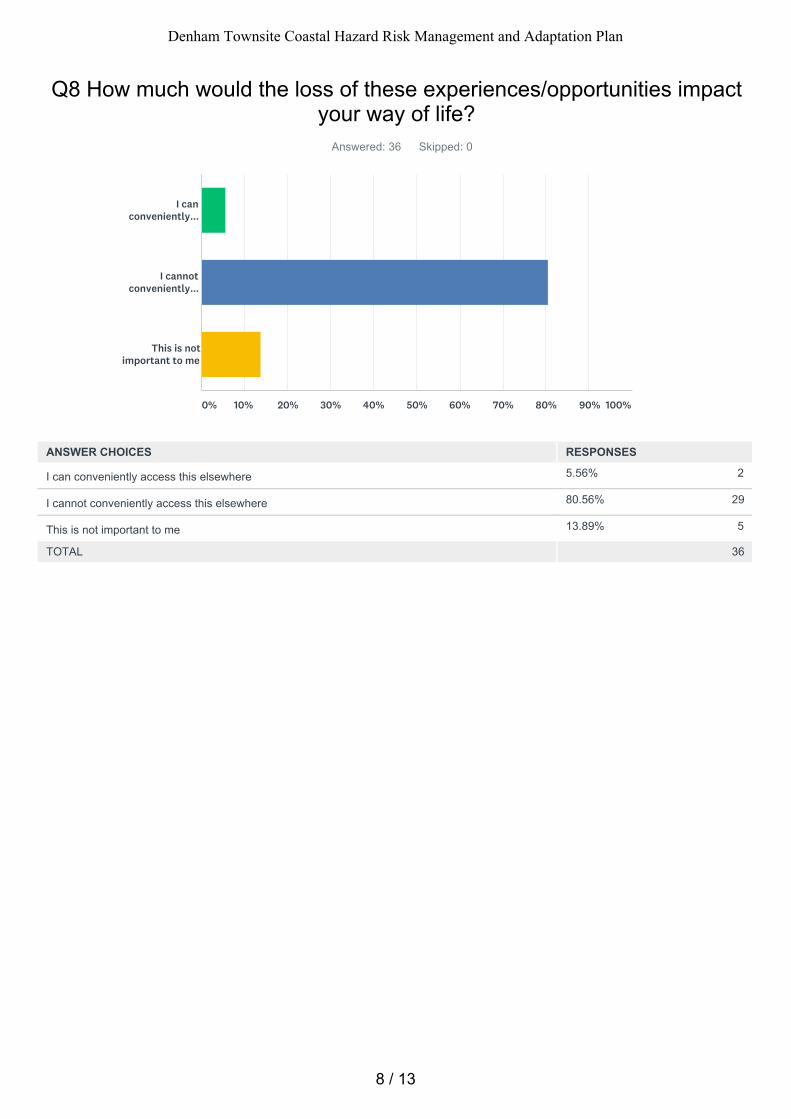
5.56% 2
80.56% 29
13.89% 5
Q8 How much would the loss of these experiences/opportunities impactyour way of life?
Answered: 36 Skipped: 0
TOTAL 36
I canconveniently...
I cannotconveniently...
This is notimportant to me
0% 10% 20% 30% 40% 50% 60% 70% 80% 90% 100%
ANSWER CHOICES RESPONSES
I can conveniently access this elsewhere
I cannot conveniently access this elsewhere
This is not important to me
8 / 13
Denham Townsite Coastal Hazard Risk Management and Adaptation Plan
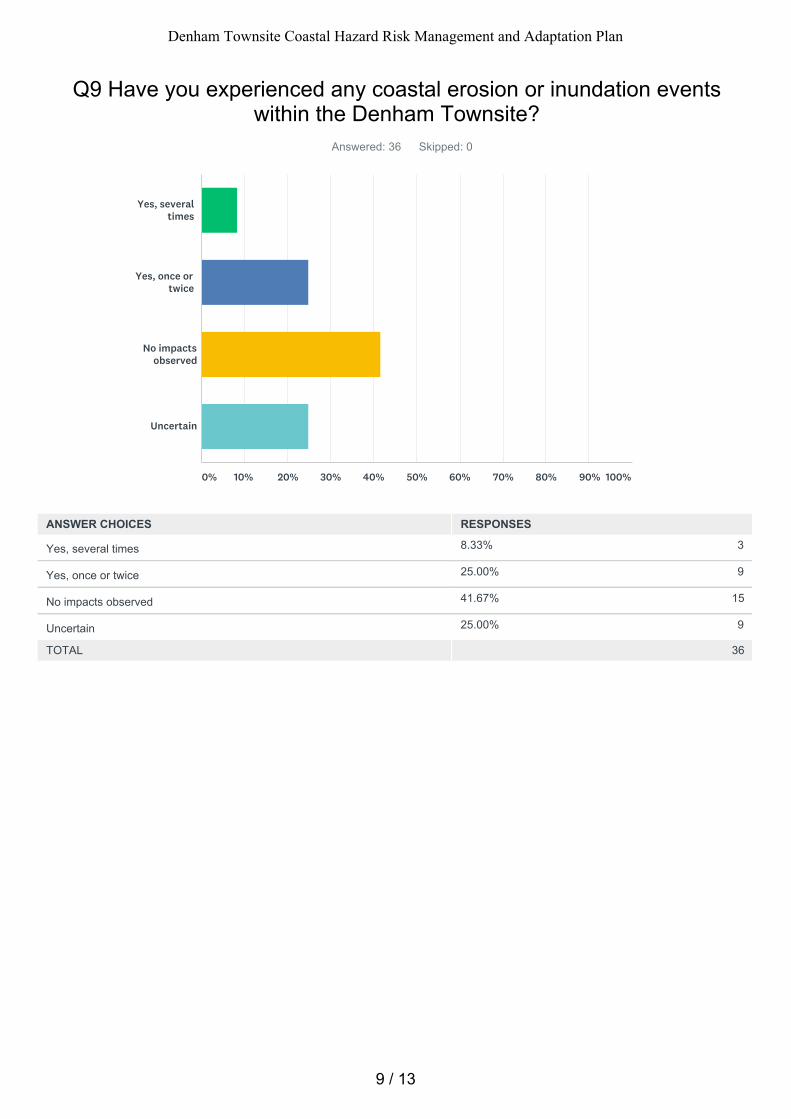
8.33% 3
25.00% 9
41.67% 15
25.00% 9
Q9 Have you experienced any coastal erosion or inundation eventswithin the Denham Townsite?
Answered: 36 Skipped: 0
TOTAL 36
Yes, severaltimes
Yes, once ortwice
No impactsobserved
Uncertain
0% 10% 20% 30% 40% 50% 60% 70% 80% 90% 100%
ANSWER CHOICES RESPONSES
Yes, several times
Yes, once or twice
No impacts observed
Uncertain
9 / 13
Denham Townsite Coastal Hazard Risk Management and Adaptation Plan
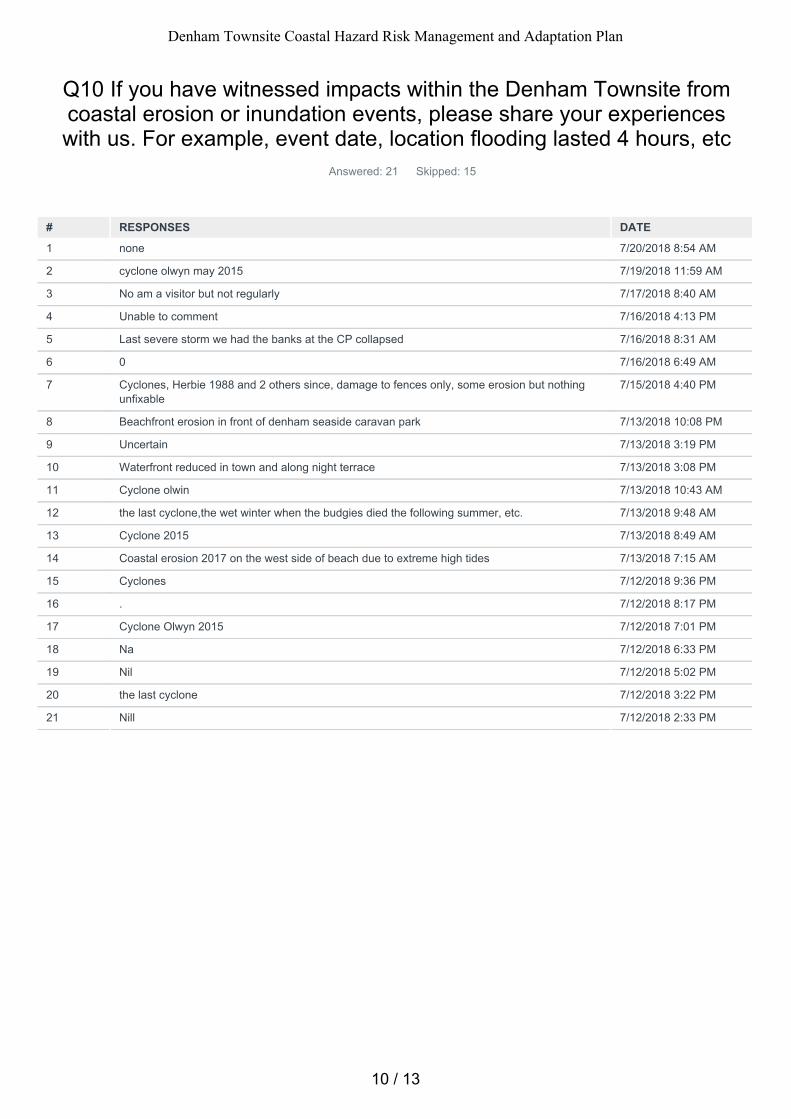
Q10 If you have witnessed impacts within the Denham Townsite fromcoastal erosion or inundation events, please share your experienceswith us. For example, event date, location flooding lasted 4 hours, etc
Answered: 21 Skipped: 15
# RESPONSES DATE
1 none 7/20/2018 8:54 AM
2 cyclone olwyn may 2015 7/19/2018 11:59 AM
3 No am a visitor but not regularly 7/17/2018 8:40 AM
4 Unable to comment 7/16/2018 4:13 PM
5 Last severe storm we had the banks at the CP collapsed 7/16/2018 8:31 AM
6 0 7/16/2018 6:49 AM
7 Cyclones, Herbie 1988 and 2 others since, damage to fences only, some erosion but nothingunfixable
7/15/2018 4:40 PM
8 Beachfront erosion in front of denham seaside caravan park 7/13/2018 10:08 PM
9 Uncertain 7/13/2018 3:19 PM
10 Waterfront reduced in town and along night terrace 7/13/2018 3:08 PM
11 Cyclone olwin 7/13/2018 10:43 AM
12 the last cyclone,the wet winter when the budgies died the following summer, etc. 7/13/2018 9:48 AM
13 Cyclone 2015 7/13/2018 8:49 AM
14 Coastal erosion 2017 on the west side of beach due to extreme high tides 7/13/2018 7:15 AM
15 Cyclones 7/12/2018 9:36 PM
16 . 7/12/2018 8:17 PM
17 Cyclone Olwyn 2015 7/12/2018 7:01 PM
18 Na 7/12/2018 6:33 PM
19 Nil 7/12/2018 5:02 PM
20 the last cyclone 7/12/2018 3:22 PM
21 Nill 7/12/2018 2:33 PM
10 / 13
Denham Townsite Coastal Hazard Risk Management and Adaptation Plan
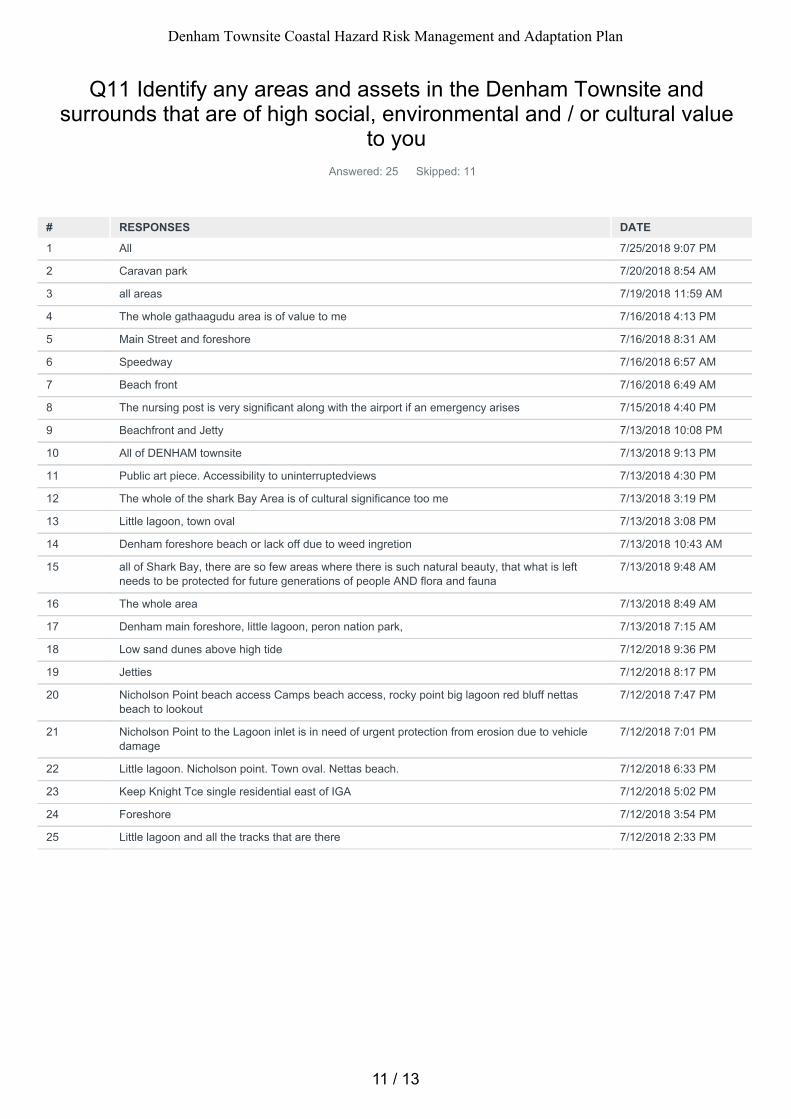
Q11 Identify any areas and assets in the Denham Townsite andsurrounds that are of high social, environmental and / or cultural value
to youAnswered: 25 Skipped: 11
# RESPONSES DATE
1 All 7/25/2018 9:07 PM
2 Caravan park 7/20/2018 8:54 AM
3 all areas 7/19/2018 11:59 AM
4 The whole gathaagudu area is of value to me 7/16/2018 4:13 PM
5 Main Street and foreshore 7/16/2018 8:31 AM
6 Speedway 7/16/2018 6:57 AM
7 Beach front 7/16/2018 6:49 AM
8 The nursing post is very significant along with the airport if an emergency arises 7/15/2018 4:40 PM
9 Beachfront and Jetty 7/13/2018 10:08 PM
10 All of DENHAM townsite 7/13/2018 9:13 PM
11 Public art piece. Accessibility to uninterruptedviews 7/13/2018 4:30 PM
12 The whole of the shark Bay Area is of cultural significance too me 7/13/2018 3:19 PM
13 Little lagoon, town oval 7/13/2018 3:08 PM
14 Denham foreshore beach or lack off due to weed ingretion 7/13/2018 10:43 AM
15 all of Shark Bay, there are so few areas where there is such natural beauty, that what is leftneeds to be protected for future generations of people AND flora and fauna
7/13/2018 9:48 AM
16 The whole area 7/13/2018 8:49 AM
17 Denham main foreshore, little lagoon, peron nation park, 7/13/2018 7:15 AM
18 Low sand dunes above high tide 7/12/2018 9:36 PM
19 Jetties 7/12/2018 8:17 PM
20 Nicholson Point beach access Camps beach access, rocky point big lagoon red bluff nettasbeach to lookout
7/12/2018 7:47 PM
21 Nicholson Point to the Lagoon inlet is in need of urgent protection from erosion due to vehicledamage
7/12/2018 7:01 PM
22 Little lagoon. Nicholson point. Town oval. Nettas beach. 7/12/2018 6:33 PM
23 Keep Knight Tce single residential east of IGA 7/12/2018 5:02 PM
24 Foreshore 7/12/2018 3:54 PM
25 Little lagoon and all the tracks that are there 7/12/2018 2:33 PM
11 / 13
Denham Townsite Coastal Hazard Risk Management and Adaptation Plan
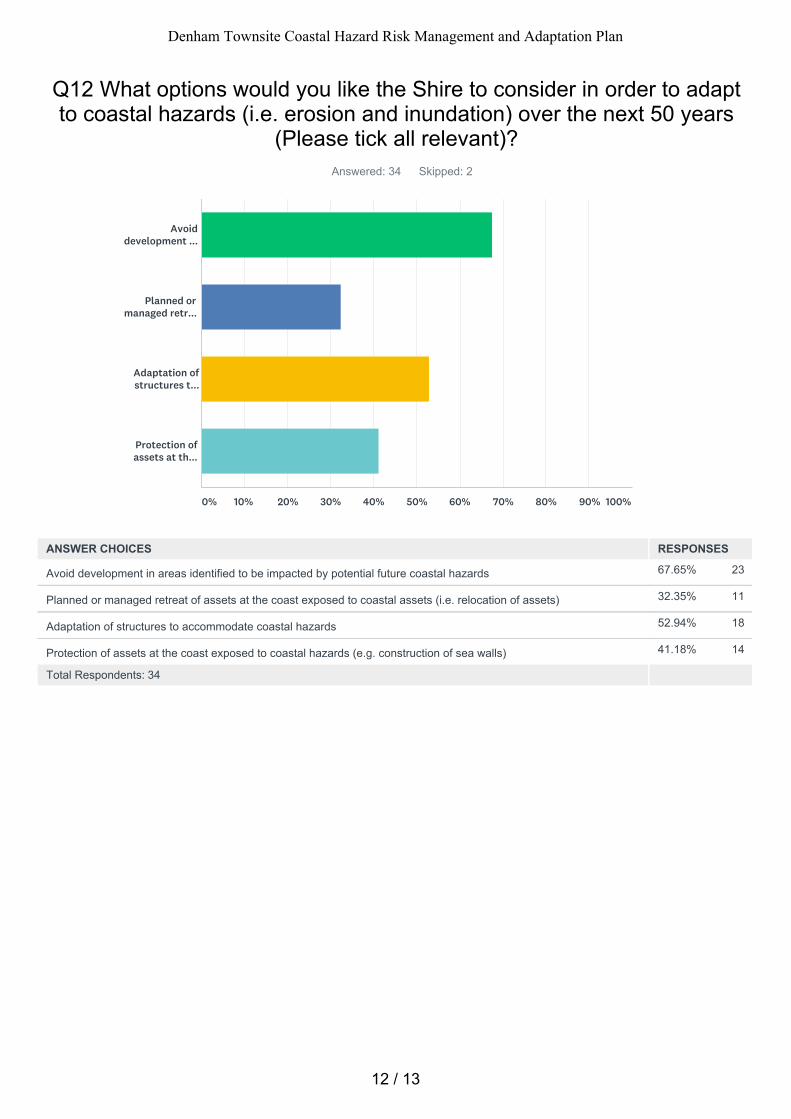
67.65% 23
32.35% 11
52.94% 18
41.18% 14
Q12 What options would you like the Shire to consider in order to adaptto coastal hazards (i.e. erosion and inundation) over the next 50 years
(Please tick all relevant)?Answered: 34 Skipped: 2
Total Respondents: 34
Avoiddevelopment ...
Planned ormanaged retr...
Adaptation ofstructures t...
Protection ofassets at th...
0% 10% 20% 30% 40% 50% 60% 70% 80% 90% 100%
ANSWER CHOICES RESPONSES
Avoid development in areas identified to be impacted by potential future coastal hazards
Planned or managed retreat of assets at the coast exposed to coastal assets (i.e. relocation of assets)
Adaptation of structures to accommodate coastal hazards
Protection of assets at the coast exposed to coastal hazards (e.g. construction of sea walls)
12 / 13
Denham Townsite Coastal Hazard Risk Management and Adaptation Plan
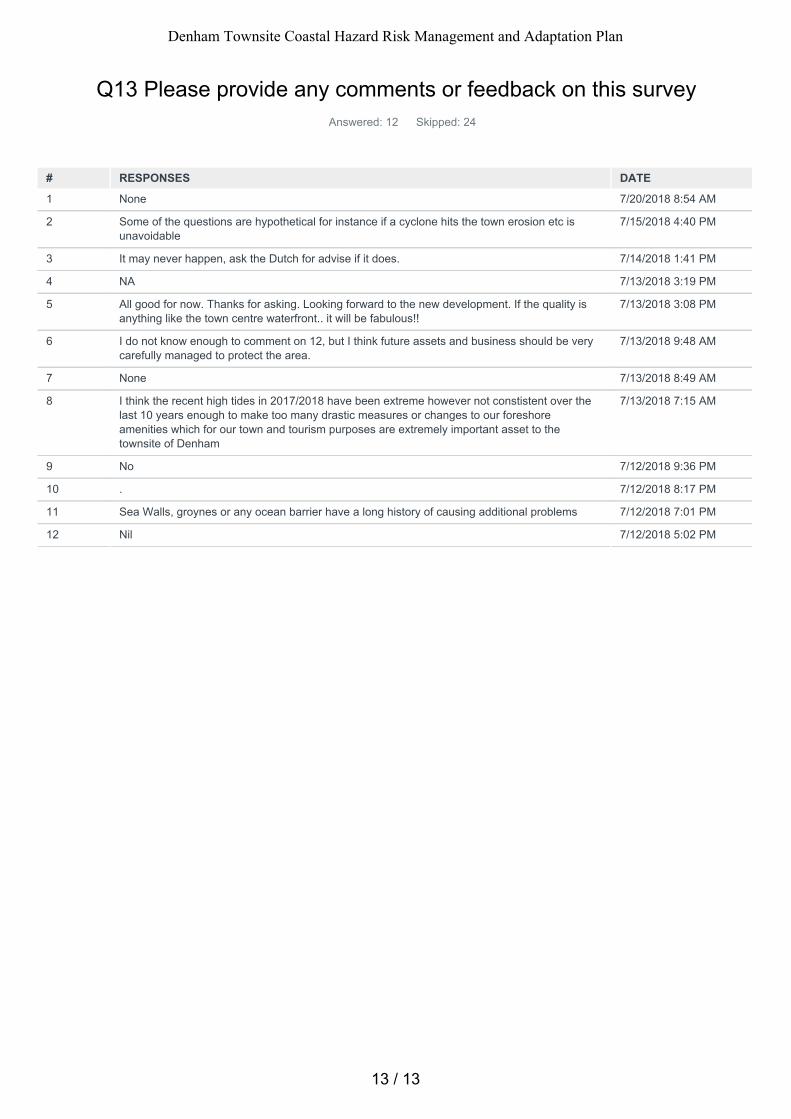
Q13 Please provide any comments or feedback on this surveyAnswered: 12 Skipped: 24
# RESPONSES DATE
1 None 7/20/2018 8:54 AM
2 Some of the questions are hypothetical for instance if a cyclone hits the town erosion etc isunavoidable
7/15/2018 4:40 PM
3 It may never happen, ask the Dutch for advise if it does. 7/14/2018 1:41 PM
4 NA 7/13/2018 3:19 PM
5 All good for now. Thanks for asking. Looking forward to the new development. If the quality isanything like the town centre waterfront.. it will be fabulous!!
7/13/2018 3:08 PM
6 I do not know enough to comment on 12, but I think future assets and business should be verycarefully managed to protect the area.
7/13/2018 9:48 AM
7 None 7/13/2018 8:49 AM
8 I think the recent high tides in 2017/2018 have been extreme however not constistent over thelast 10 years enough to make too many drastic measures or changes to our foreshoreamenities which for our town and tourism purposes are extremely important asset to thetownsite of Denham
7/13/2018 7:15 AM
9 No 7/12/2018 9:36 PM
10 . 7/12/2018 8:17 PM
11 Sea Walls, groynes or any ocean barrier have a long history of causing additional problems 7/12/2018 7:01 PM
12 Nil 7/12/2018 5:02 PM
13 / 13
Denham Townsite Coastal Hazard Risk Management and Adaptation Plan
Shire of Shark Bay | March 2019 Chapter Report: Risk Assessment
5652_01_R
05v03.d
ocx
APPENDIX C INUNDATION RISK EVALUATION
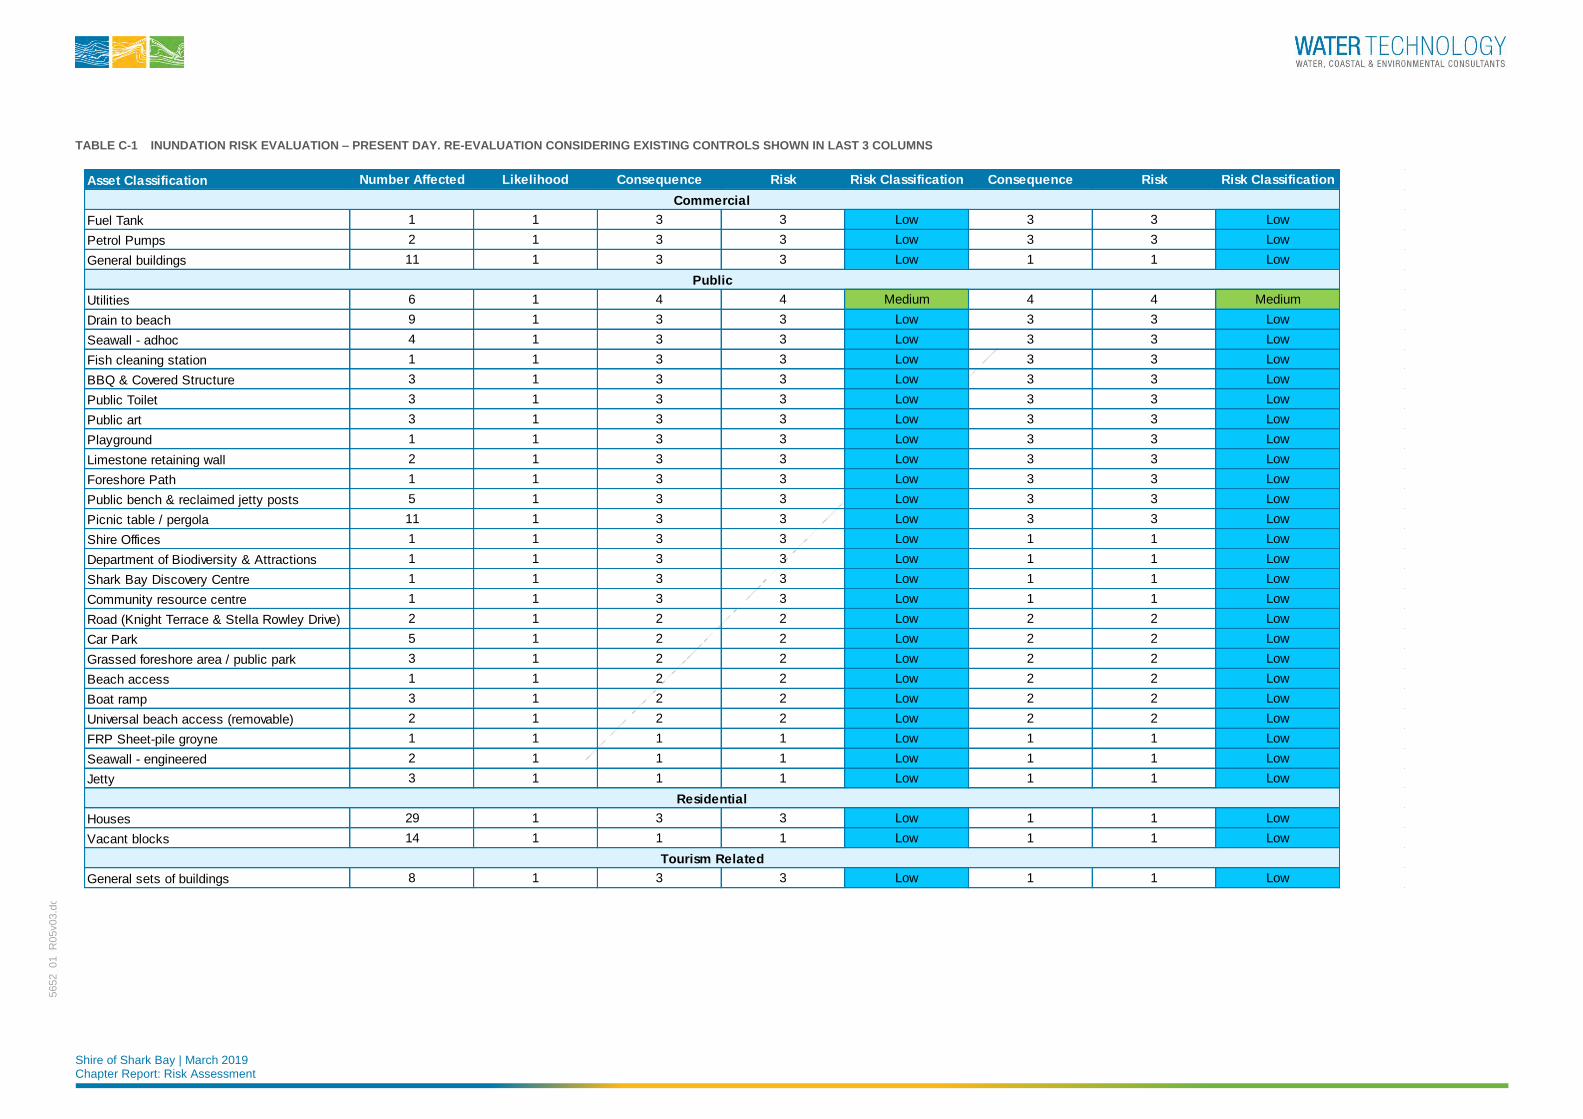
Shire of Shark Bay | March 2019 Chapter Report: Risk Assessment
5652_01_R
05v03.d
ocx
TABLE C-1 INUNDATION RISK EVALUATION – PRESENT DAY. RE-EVALUATION CONSIDERING EXISTING CONTROLS SHOWN IN LAST 3 COLUMNS
Asset Classification Number Affected Likelihood Consequence Risk Risk Classification Consequence Risk Risk Classification
Fuel Tank 1 1 3 3 Low 3 3 Low
Petrol Pumps 2 1 3 3 Low 3 3 Low
General buildings 11 1 3 3 Low 1 1 Low
Utilities 6 1 4 4 Medium 4 4 Medium
Drain to beach 9 1 3 3 Low 3 3 Low
Seawall - adhoc 4 1 3 3 Low 3 3 Low
Fish cleaning station 1 1 3 3 Low 3 3 Low
BBQ & Covered Structure 3 1 3 3 Low 3 3 Low
Public Toilet 3 1 3 3 Low 3 3 Low
Public art 3 1 3 3 Low 3 3 Low
Playground 1 1 3 3 Low 3 3 Low
Limestone retaining wall 2 1 3 3 Low 3 3 Low
Foreshore Path 1 1 3 3 Low 3 3 Low
Public bench & reclaimed jetty posts 5 1 3 3 Low 3 3 Low
Picnic table / pergola 11 1 3 3 Low 3 3 Low
Shire Offices 1 1 3 3 Low 1 1 Low
Department of Biodiversity & Attractions 1 1 3 3 Low 1 1 Low
Shark Bay Discovery Centre 1 1 3 3 Low 1 1 Low
Community resource centre 1 1 3 3 Low 1 1 Low
Road (Knight Terrace & Stella Rowley Drive) 2 1 2 2 Low 2 2 Low
Car Park 5 1 2 2 Low 2 2 Low
Grassed foreshore area / public park 3 1 2 2 Low 2 2 Low
Beach access 1 1 2 2 Low 2 2 Low
Boat ramp 3 1 2 2 Low 2 2 Low
Universal beach access (removable) 2 1 2 2 Low 2 2 Low
FRP Sheet-pile groyne 1 1 1 1 Low 1 1 Low
Seawall - engineered 2 1 1 1 Low 1 1 Low
Jetty 3 1 1 1 Low 1 1 Low
Houses 29 1 3 3 Low 1 1 Low
Vacant blocks 14 1 1 1 Low 1 1 Low
General sets of buildings 8 1 3 3 Low 1 1 Low
Commercial
Public
Residential
Tourism Related
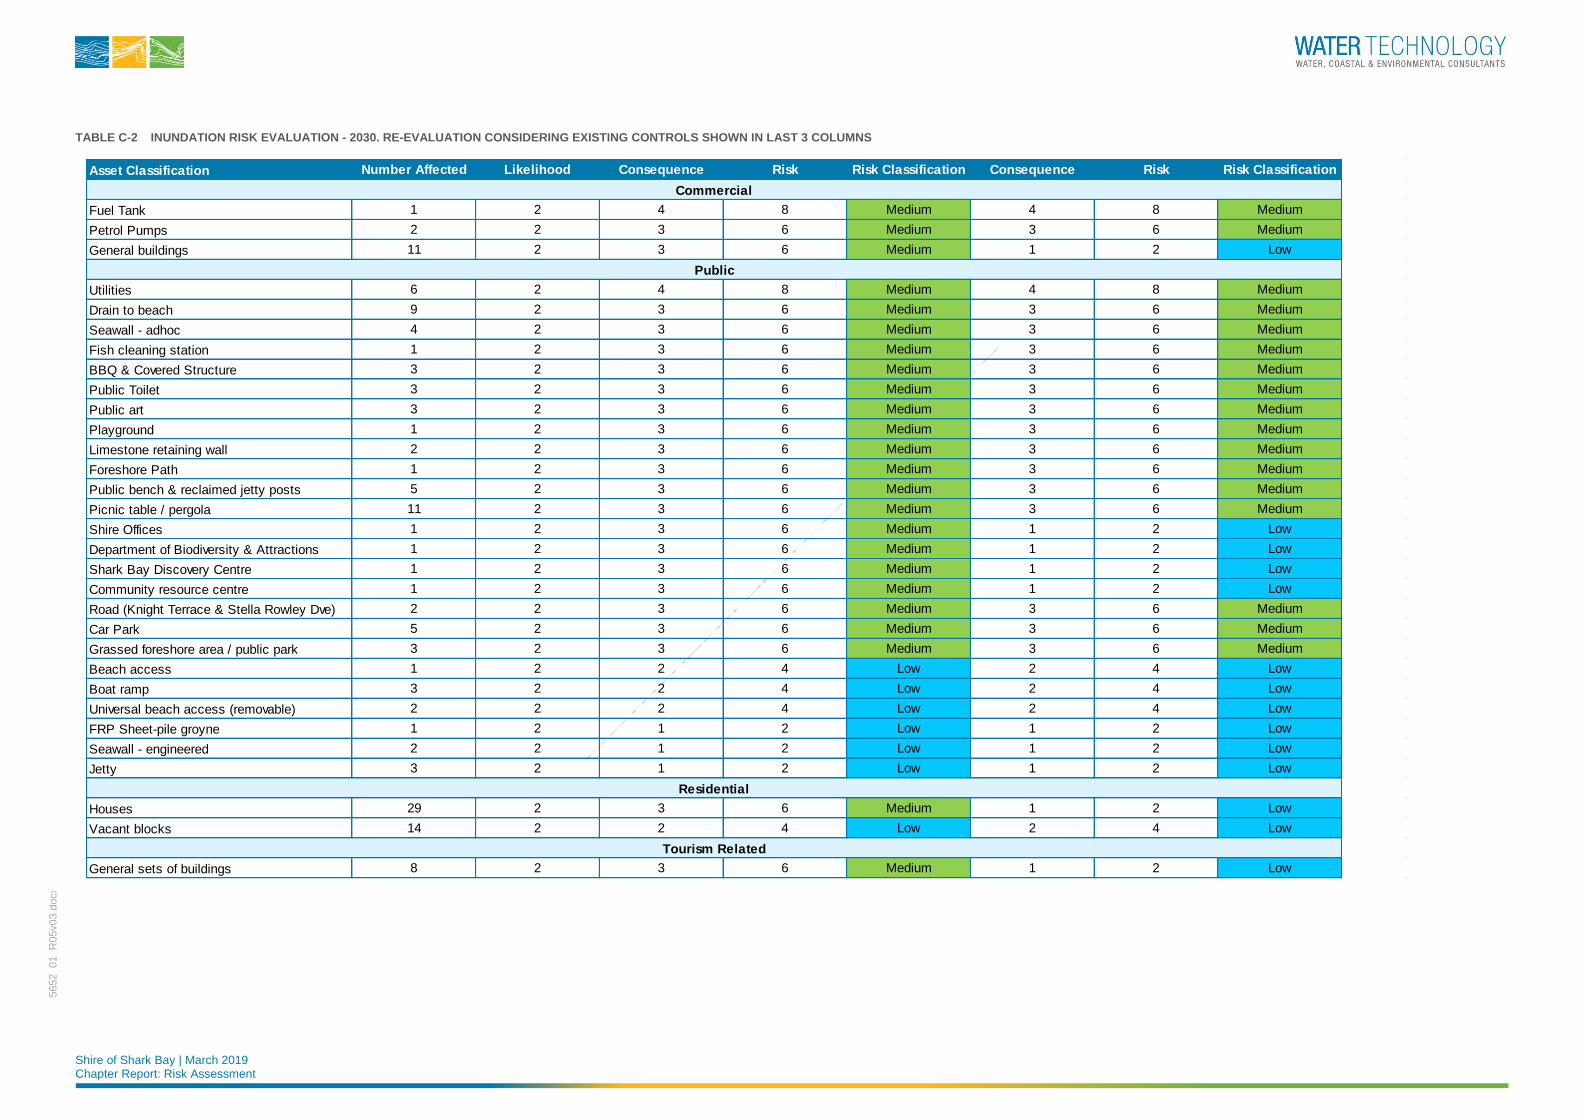
Shire of Shark Bay | March 2019 Chapter Report: Risk Assessment
5652_01_R
05v03.d
ocx
TABLE C-2 INUNDATION RISK EVALUATION - 2030. RE-EVALUATION CONSIDERING EXISTING CONTROLS SHOWN IN LAST 3 COLUMNS
Asset Classification Number Affected Likelihood Consequence Risk Risk Classification Consequence Risk Risk Classification
Fuel Tank 1 2 4 8 Medium 4 8 Medium
Petrol Pumps 2 2 3 6 Medium 3 6 Medium
General buildings 11 2 3 6 Medium 1 2 Low
Utilities 6 2 4 8 Medium 4 8 Medium
Drain to beach 9 2 3 6 Medium 3 6 Medium
Seawall - adhoc 4 2 3 6 Medium 3 6 Medium
Fish cleaning station 1 2 3 6 Medium 3 6 Medium
BBQ & Covered Structure 3 2 3 6 Medium 3 6 Medium
Public Toilet 3 2 3 6 Medium 3 6 Medium
Public art 3 2 3 6 Medium 3 6 Medium
Playground 1 2 3 6 Medium 3 6 Medium
Limestone retaining wall 2 2 3 6 Medium 3 6 Medium
Foreshore Path 1 2 3 6 Medium 3 6 Medium
Public bench & reclaimed jetty posts 5 2 3 6 Medium 3 6 Medium
Picnic table / pergola 11 2 3 6 Medium 3 6 Medium
Shire Offices 1 2 3 6 Medium 1 2 Low
Department of Biodiversity & Attractions 1 2 3 6 Medium 1 2 Low
Shark Bay Discovery Centre 1 2 3 6 Medium 1 2 Low
Community resource centre 1 2 3 6 Medium 1 2 Low
Road (Knight Terrace & Stella Rowley Dve) 2 2 3 6 Medium 3 6 Medium
Car Park 5 2 3 6 Medium 3 6 Medium
Grassed foreshore area / public park 3 2 3 6 Medium 3 6 Medium
Beach access 1 2 2 4 Low 2 4 Low
Boat ramp 3 2 2 4 Low 2 4 Low
Universal beach access (removable) 2 2 2 4 Low 2 4 Low
FRP Sheet-pile groyne 1 2 1 2 Low 1 2 Low
Seawall - engineered 2 2 1 2 Low 1 2 Low
Jetty 3 2 1 2 Low 1 2 Low
Houses 29 2 3 6 Medium 1 2 Low
Vacant blocks 14 2 2 4 Low 2 4 Low
General sets of buildings 8 2 3 6 Medium 1 2 Low
Commercial
Public
Residential
Tourism Related
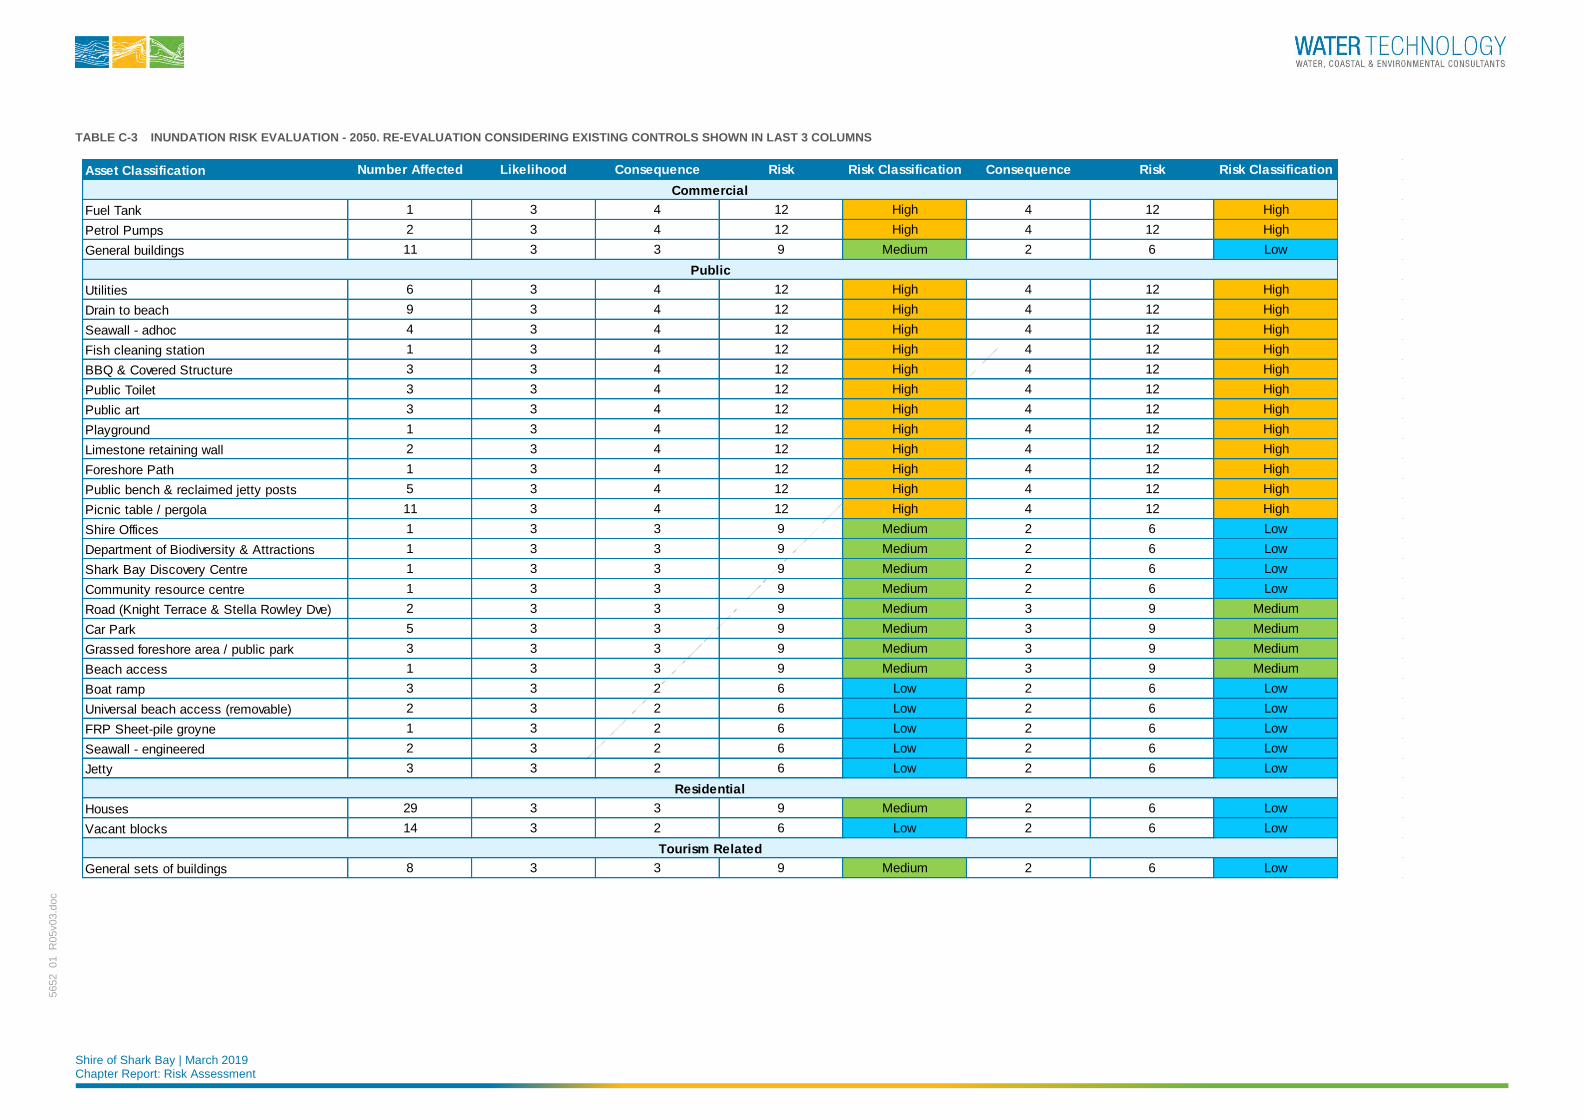
Shire of Shark Bay | March 2019 Chapter Report: Risk Assessment
5652_01_R
05v03.d
ocx
TABLE C-3 INUNDATION RISK EVALUATION - 2050. RE-EVALUATION CONSIDERING EXISTING CONTROLS SHOWN IN LAST 3 COLUMNS
Asset Classification Number Affected Likelihood Consequence Risk Risk Classification Consequence Risk Risk Classification
Fuel Tank 1 3 4 12 High 4 12 High
Petrol Pumps 2 3 4 12 High 4 12 High
General buildings 11 3 3 9 Medium 2 6 Low
Utilities 6 3 4 12 High 4 12 High
Drain to beach 9 3 4 12 High 4 12 High
Seawall - adhoc 4 3 4 12 High 4 12 High
Fish cleaning station 1 3 4 12 High 4 12 High
BBQ & Covered Structure 3 3 4 12 High 4 12 High
Public Toilet 3 3 4 12 High 4 12 High
Public art 3 3 4 12 High 4 12 High
Playground 1 3 4 12 High 4 12 High
Limestone retaining wall 2 3 4 12 High 4 12 High
Foreshore Path 1 3 4 12 High 4 12 High
Public bench & reclaimed jetty posts 5 3 4 12 High 4 12 High
Picnic table / pergola 11 3 4 12 High 4 12 High
Shire Offices 1 3 3 9 Medium 2 6 Low
Department of Biodiversity & Attractions 1 3 3 9 Medium 2 6 Low
Shark Bay Discovery Centre 1 3 3 9 Medium 2 6 Low
Community resource centre 1 3 3 9 Medium 2 6 Low
Road (Knight Terrace & Stella Rowley Dve) 2 3 3 9 Medium 3 9 Medium
Car Park 5 3 3 9 Medium 3 9 Medium
Grassed foreshore area / public park 3 3 3 9 Medium 3 9 Medium
Beach access 1 3 3 9 Medium 3 9 Medium
Boat ramp 3 3 2 6 Low 2 6 Low
Universal beach access (removable) 2 3 2 6 Low 2 6 Low
FRP Sheet-pile groyne 1 3 2 6 Low 2 6 Low
Seawall - engineered 2 3 2 6 Low 2 6 Low
Jetty 3 3 2 6 Low 2 6 Low
Houses 29 3 3 9 Medium 2 6 Low
Vacant blocks 14 3 2 6 Low 2 6 Low
General sets of buildings 8 3 3 9 Medium 2 6 Low
Commercial
Public
Residential
Tourism Related
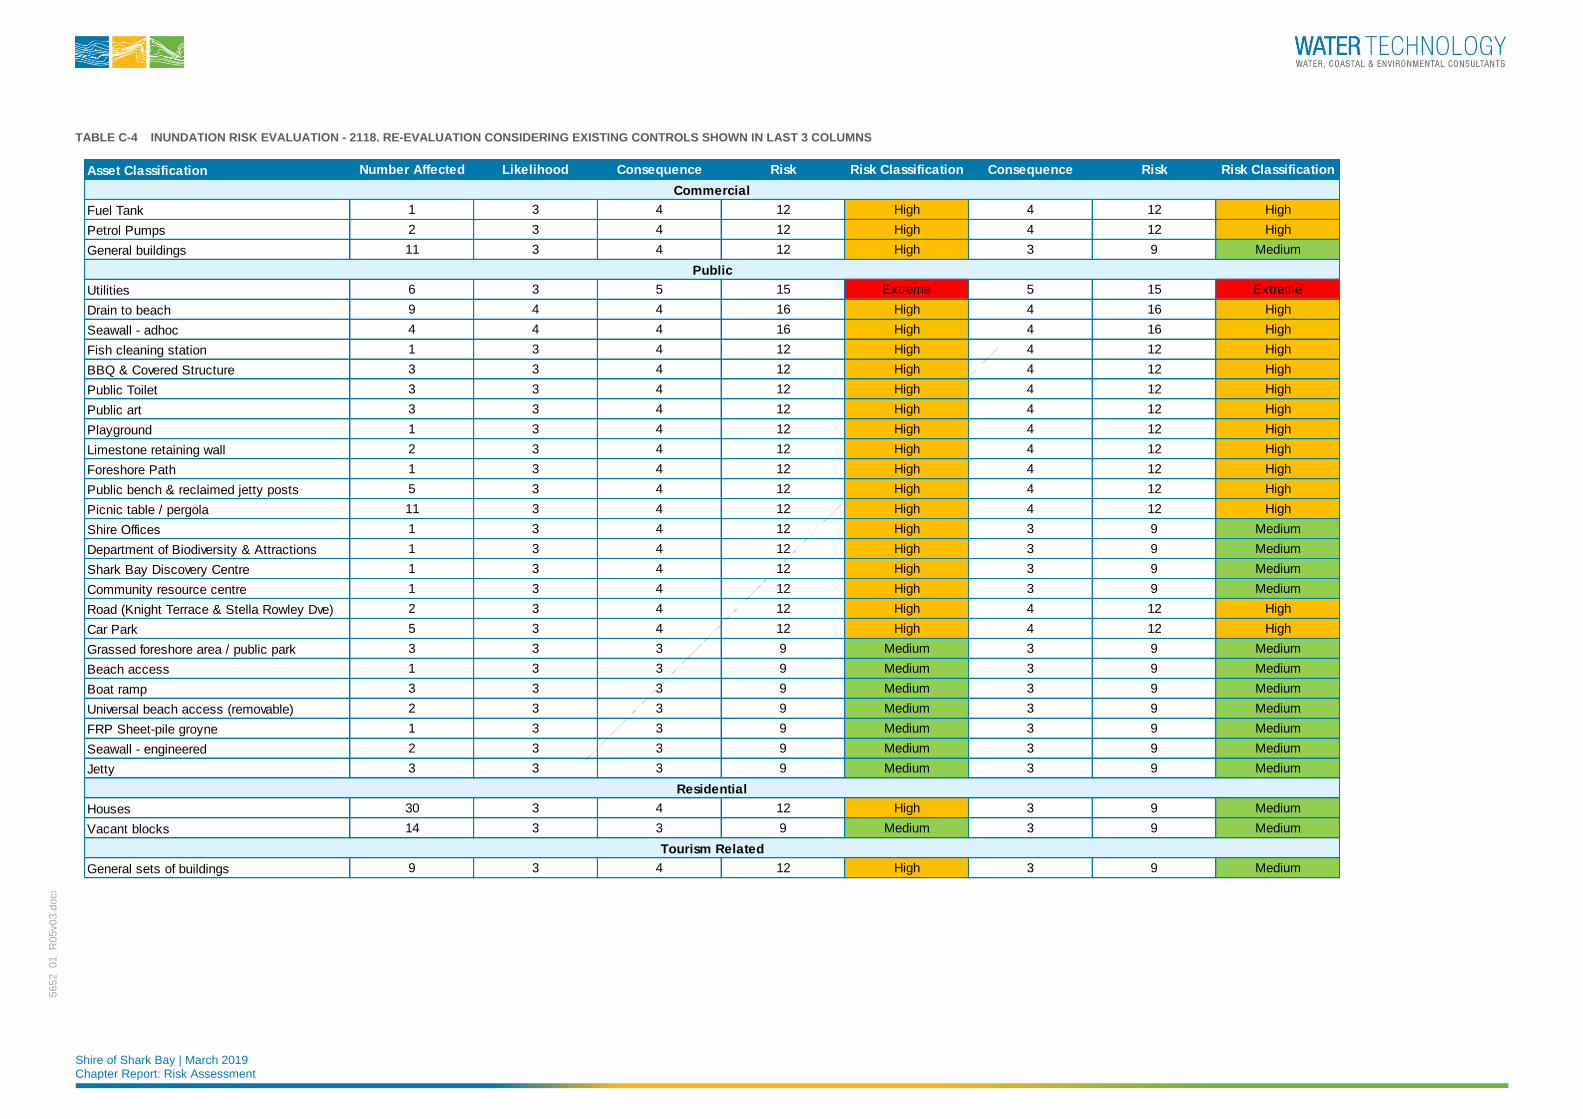
Shire of Shark Bay | March 2019 Chapter Report: Risk Assessment
5652_01_R
05v03.d
ocx
TABLE C-4 INUNDATION RISK EVALUATION - 2118. RE-EVALUATION CONSIDERING EXISTING CONTROLS SHOWN IN LAST 3 COLUMNS
Asset Classification Number Affected Likelihood Consequence Risk Risk Classification Consequence Risk Risk Classification
Fuel Tank 1 3 4 12 High 4 12 High
Petrol Pumps 2 3 4 12 High 4 12 High
General buildings 11 3 4 12 High 3 9 Medium
Utilities 6 3 5 15 Extreme 5 15 Extreme
Drain to beach 9 4 4 16 High 4 16 High
Seawall - adhoc 4 4 4 16 High 4 16 High
Fish cleaning station 1 3 4 12 High 4 12 High
BBQ & Covered Structure 3 3 4 12 High 4 12 High
Public Toilet 3 3 4 12 High 4 12 High
Public art 3 3 4 12 High 4 12 High
Playground 1 3 4 12 High 4 12 High
Limestone retaining wall 2 3 4 12 High 4 12 High
Foreshore Path 1 3 4 12 High 4 12 High
Public bench & reclaimed jetty posts 5 3 4 12 High 4 12 High
Picnic table / pergola 11 3 4 12 High 4 12 High
Shire Offices 1 3 4 12 High 3 9 Medium
Department of Biodiversity & Attractions 1 3 4 12 High 3 9 Medium
Shark Bay Discovery Centre 1 3 4 12 High 3 9 Medium
Community resource centre 1 3 4 12 High 3 9 Medium
Road (Knight Terrace & Stella Rowley Dve) 2 3 4 12 High 4 12 High
Car Park 5 3 4 12 High 4 12 High
Grassed foreshore area / public park 3 3 3 9 Medium 3 9 Medium
Beach access 1 3 3 9 Medium 3 9 Medium
Boat ramp 3 3 3 9 Medium 3 9 Medium
Universal beach access (removable) 2 3 3 9 Medium 3 9 Medium
FRP Sheet-pile groyne 1 3 3 9 Medium 3 9 Medium
Seawall - engineered 2 3 3 9 Medium 3 9 Medium
Jetty 3 3 3 9 Medium 3 9 Medium
Houses 30 3 4 12 High 3 9 Medium
Vacant blocks 14 3 3 9 Medium 3 9 Medium
General sets of buildings 9 3 4 12 High 3 9 Medium
Commercial
Public
Residential
Tourism Related
Shire of Shark Bay | March 2019 Chapter Report: Risk Assessment
5652_01_R
05v03.d
ocx
APPENDIX D COASTAL PROCESSES RISK EVALUATION
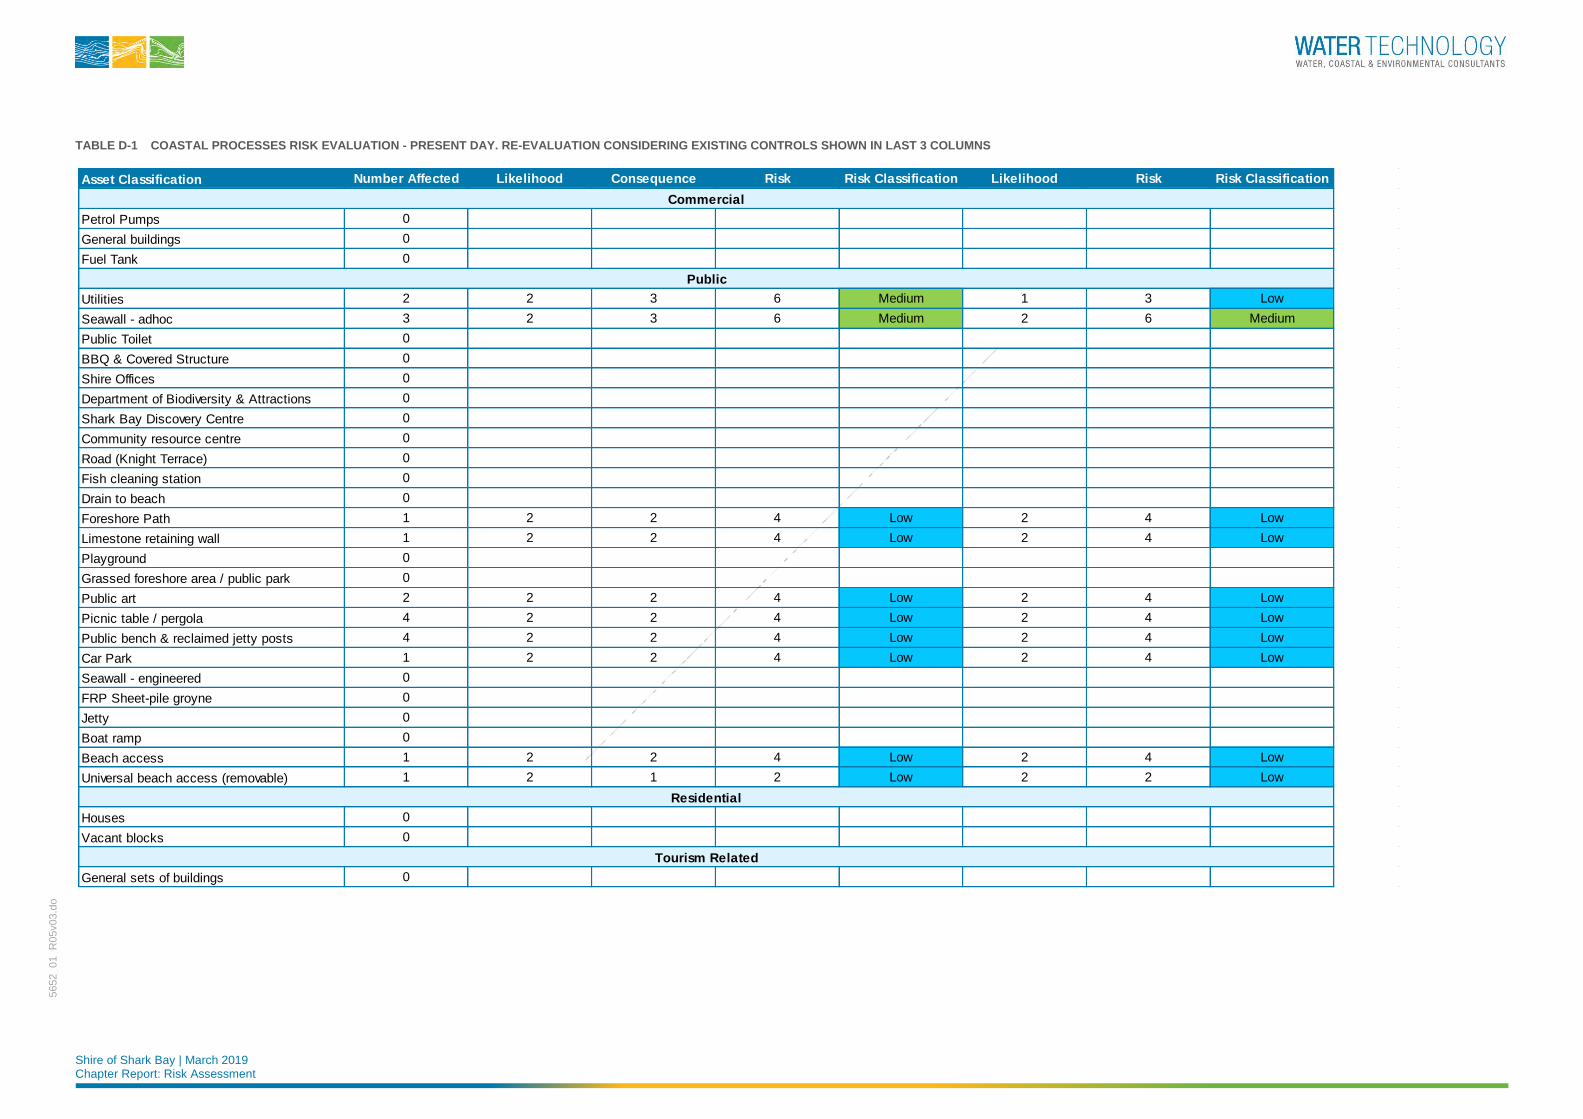
Shire of Shark Bay | March 2019 Chapter Report: Risk Assessment
5652_01_R
05v03.d
ocx
TABLE D-1 COASTAL PROCESSES RISK EVALUATION - PRESENT DAY. RE-EVALUATION CONSIDERING EXISTING CONTROLS SHOWN IN LAST 3 COLUMNS
Asset Classification Number Affected Likelihood Consequence Risk Risk Classification Likelihood Risk Risk Classification
Petrol Pumps 0
General buildings 0
Fuel Tank 0
Utilities 2 2 3 6 Medium 1 3 Low
Seawall - adhoc 3 2 3 6 Medium 2 6 Medium
Public Toilet 0
BBQ & Covered Structure 0
Shire Offices 0
Department of Biodiversity & Attractions 0
Shark Bay Discovery Centre 0
Community resource centre 0
Road (Knight Terrace) 0
Fish cleaning station 0
Drain to beach 0
Foreshore Path 1 2 2 4 Low 2 4 Low
Limestone retaining wall 1 2 2 4 Low 2 4 Low
Playground 0
Grassed foreshore area / public park 0
Public art 2 2 2 4 Low 2 4 Low
Picnic table / pergola 4 2 2 4 Low 2 4 Low
Public bench & reclaimed jetty posts 4 2 2 4 Low 2 4 Low
Car Park 1 2 2 4 Low 2 4 Low
Seawall - engineered 0
FRP Sheet-pile groyne 0
Jetty 0
Boat ramp 0
Beach access 1 2 2 4 Low 2 4 Low
Universal beach access (removable) 1 2 1 2 Low 2 2 Low
Houses 0
Vacant blocks 0
General sets of buildings 0
Commercial
Public
Residential
Tourism Related
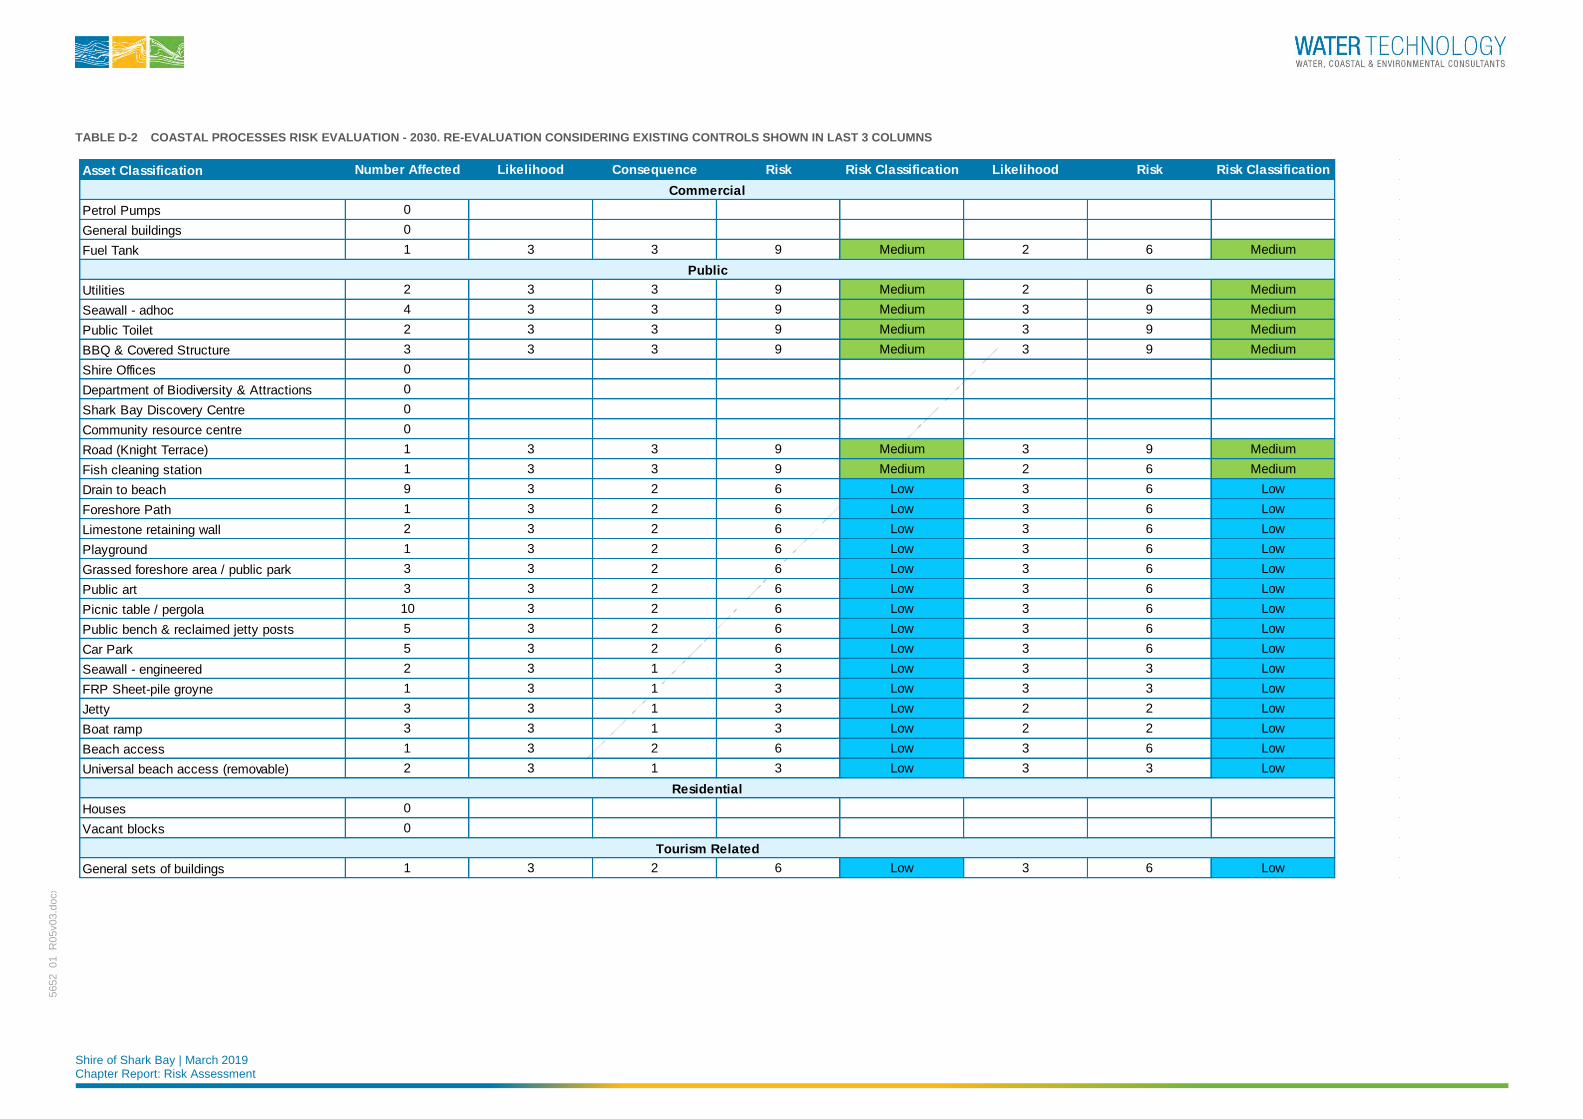
Shire of Shark Bay | March 2019 Chapter Report: Risk Assessment
5652_01_R
05v03.d
ocx
TABLE D-2 COASTAL PROCESSES RISK EVALUATION - 2030. RE-EVALUATION CONSIDERING EXISTING CONTROLS SHOWN IN LAST 3 COLUMNS
Asset Classification Number Affected Likelihood Consequence Risk Risk Classification Likelihood Risk Risk Classification
Petrol Pumps 0
General buildings 0
Fuel Tank 1 3 3 9 Medium 2 6 Medium
Utilities 2 3 3 9 Medium 2 6 Medium
Seawall - adhoc 4 3 3 9 Medium 3 9 Medium
Public Toilet 2 3 3 9 Medium 3 9 Medium
BBQ & Covered Structure 3 3 3 9 Medium 3 9 Medium
Shire Offices 0
Department of Biodiversity & Attractions 0
Shark Bay Discovery Centre 0
Community resource centre 0
Road (Knight Terrace) 1 3 3 9 Medium 3 9 Medium
Fish cleaning station 1 3 3 9 Medium 2 6 Medium
Drain to beach 9 3 2 6 Low 3 6 Low
Foreshore Path 1 3 2 6 Low 3 6 Low
Limestone retaining wall 2 3 2 6 Low 3 6 Low
Playground 1 3 2 6 Low 3 6 Low
Grassed foreshore area / public park 3 3 2 6 Low 3 6 Low
Public art 3 3 2 6 Low 3 6 Low
Picnic table / pergola 10 3 2 6 Low 3 6 Low
Public bench & reclaimed jetty posts 5 3 2 6 Low 3 6 Low
Car Park 5 3 2 6 Low 3 6 Low
Seawall - engineered 2 3 1 3 Low 3 3 Low
FRP Sheet-pile groyne 1 3 1 3 Low 3 3 Low
Jetty 3 3 1 3 Low 2 2 Low
Boat ramp 3 3 1 3 Low 2 2 Low
Beach access 1 3 2 6 Low 3 6 Low
Universal beach access (removable) 2 3 1 3 Low 3 3 Low
Houses 0
Vacant blocks 0
General sets of buildings 1 3 2 6 Low 3 6 Low
Commercial
Public
Residential
Tourism Related
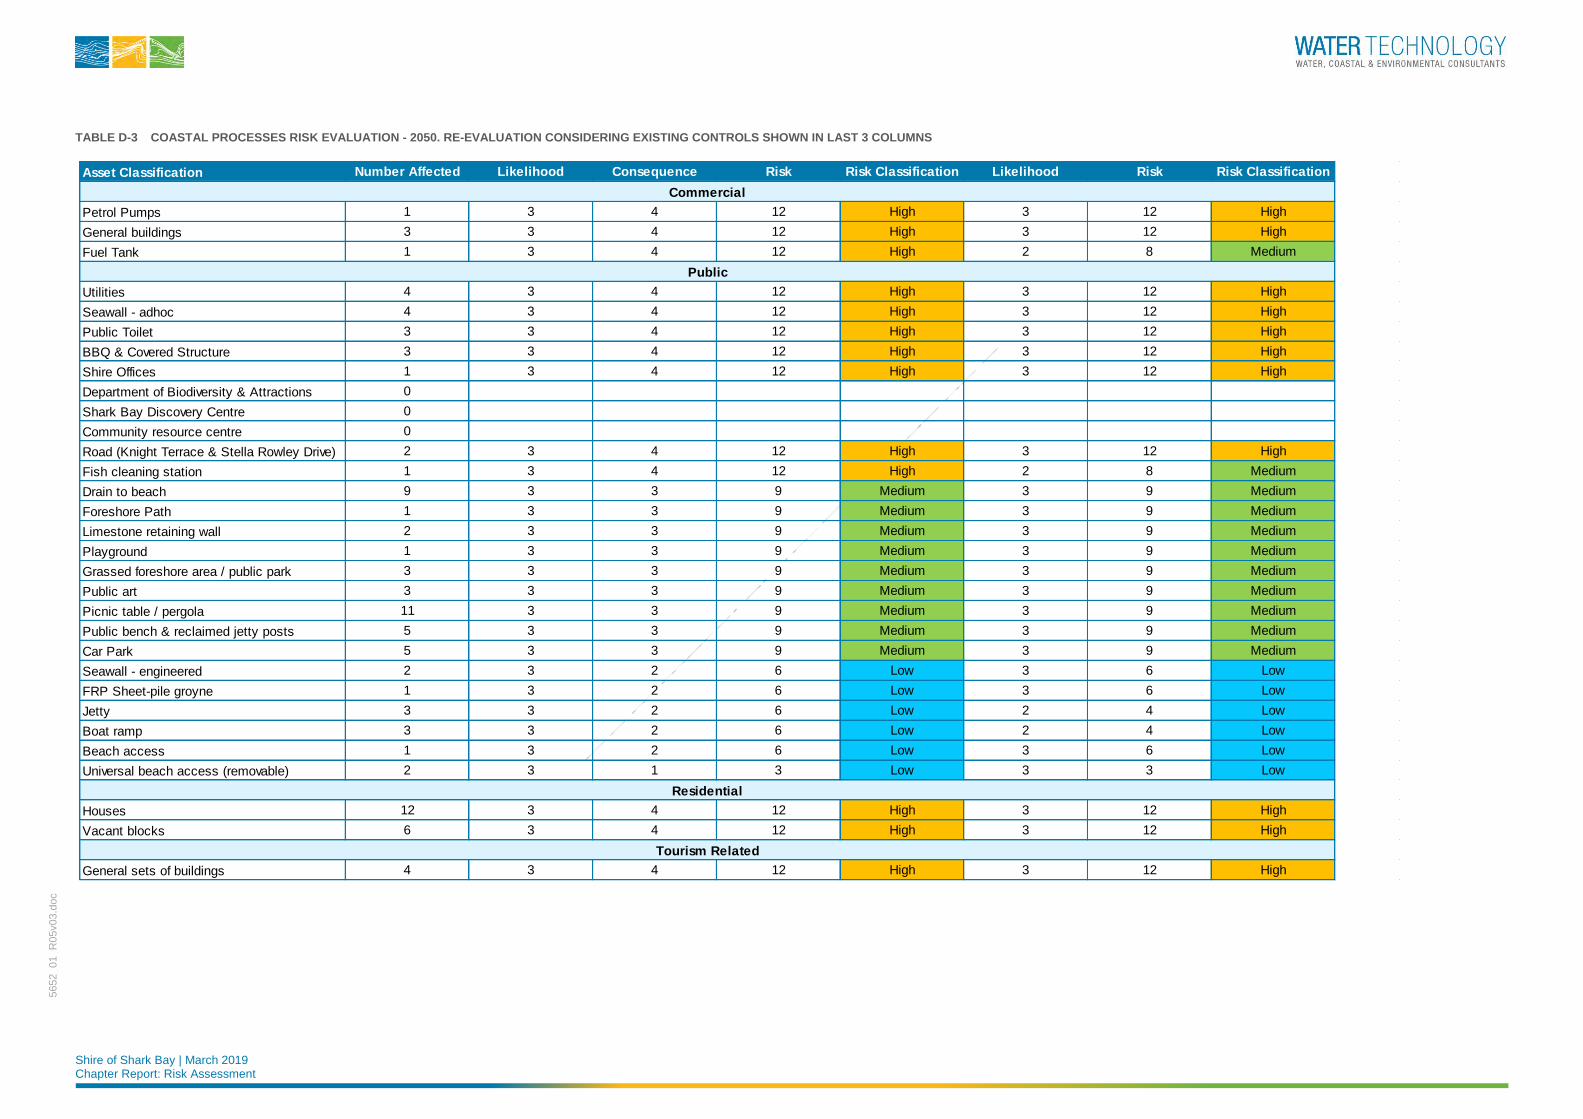
Shire of Shark Bay | March 2019 Chapter Report: Risk Assessment
5652_01_R
05v03.d
ocx
TABLE D-3 COASTAL PROCESSES RISK EVALUATION - 2050. RE-EVALUATION CONSIDERING EXISTING CONTROLS SHOWN IN LAST 3 COLUMNS
Asset Classification Number Affected Likelihood Consequence Risk Risk Classification Likelihood Risk Risk Classification
Petrol Pumps 1 3 4 12 High 3 12 High
General buildings 3 3 4 12 High 3 12 High
Fuel Tank 1 3 4 12 High 2 8 Medium
Utilities 4 3 4 12 High 3 12 High
Seawall - adhoc 4 3 4 12 High 3 12 High
Public Toilet 3 3 4 12 High 3 12 High
BBQ & Covered Structure 3 3 4 12 High 3 12 High
Shire Offices 1 3 4 12 High 3 12 High
Department of Biodiversity & Attractions 0
Shark Bay Discovery Centre 0
Community resource centre 0
Road (Knight Terrace & Stella Rowley Drive) 2 3 4 12 High 3 12 High
Fish cleaning station 1 3 4 12 High 2 8 Medium
Drain to beach 9 3 3 9 Medium 3 9 Medium
Foreshore Path 1 3 3 9 Medium 3 9 Medium
Limestone retaining wall 2 3 3 9 Medium 3 9 Medium
Playground 1 3 3 9 Medium 3 9 Medium
Grassed foreshore area / public park 3 3 3 9 Medium 3 9 Medium
Public art 3 3 3 9 Medium 3 9 Medium
Picnic table / pergola 11 3 3 9 Medium 3 9 Medium
Public bench & reclaimed jetty posts 5 3 3 9 Medium 3 9 Medium
Car Park 5 3 3 9 Medium 3 9 Medium
Seawall - engineered 2 3 2 6 Low 3 6 Low
FRP Sheet-pile groyne 1 3 2 6 Low 3 6 Low
Jetty 3 3 2 6 Low 2 4 Low
Boat ramp 3 3 2 6 Low 2 4 Low
Beach access 1 3 2 6 Low 3 6 Low
Universal beach access (removable) 2 3 1 3 Low 3 3 Low
Houses 12 3 4 12 High 3 12 High
Vacant blocks 6 3 4 12 High 3 12 High
General sets of buildings 4 3 4 12 High 3 12 High
Commercial
Public
Residential
Tourism Related

Shire of Shark Bay | March 2019 Chapter Report: Risk Assessment
5652_01_R
05v03.d
ocx
TABLE D-4 COASTAL PROCESSES RISK EVALUATION - 2118. RE-EVALUATION CONSIDERING EXISTING CONTROLS SHOWN IN LAST 3 COLUMNS
Asset Classification Number Affected Likelihood Consequence Risk Risk Classification Likelihood Risk Risk Classification
Petrol Pumps 2 4 5 20 Extreme 4 20 Extreme
General buildings 11 4 5 20 Extreme 4 20 Extreme
Fuel Tank 1 4 5 20 Extreme 3 15 Extreme
Utilities 5 4 5 20 Extreme 4 20 Extreme
Seawall - adhoc 4 4 5 20 Extreme 4 20 Extreme
Public Toilet 3 4 5 20 Extreme 4 20 Extreme
BBQ & Covered Structure 3 4 5 20 Extreme 4 20 Extreme
Shire Offices 1 4 5 20 Extreme 4 20 Extreme
Department of Biodiversity & Attractions 1 4 5 20 Extreme 4 20 Extreme
Shark Bay Discovery Centre 1 4 5 20 Extreme 4 20 Extreme
Community resource centre 1 4 5 20 Extreme 4 20 Extreme
Road (Knight Terrace & Stella Rowley Drive) 2 4 5 20 Extreme 4 20 Extreme
Fish cleaning station 1 4 5 20 Extreme 3 15 Extreme
Drain to beach 9 4 4 16 High 4 16 High
Foreshore Path 1 4 4 16 High 4 16 High
Limestone retaining wall 2 4 4 16 High 4 16 High
Playground 1 4 4 16 High 4 16 High
Grassed foreshore area / public park 3 4 4 16 High 4 16 High
Public art 3 4 4 16 High 4 16 High
Picnic table / pergola 12 4 4 16 High 4 16 High
Public bench & reclaimed jetty posts 5 4 4 16 High 4 16 High
Car Park 5 4 4 16 High 4 16 High
Seawall - engineered 2 4 3 12 Medium 4 12 Medium
FRP Sheet-pile groyne 1 4 3 12 Medium 4 12 Medium
Jetty 3 4 3 12 Medium 3 9 Medium
Boat ramp 3 4 3 12 Medium 3 9 Medium
Beach access 1 4 3 12 Medium 4 12 Medium
Universal beach access (removable) 2 4 1 4 Low 4 4 Low
Houses 36 4 5 20 Extreme 4 20 Extreme
Vacant blocks 15 4 4 16 High 4 16 High
General sets of buildings 9 4 5 20 Extreme 4 20 Extreme
Commercial
Public
Residential
Tourism Related

Shire of Shark Bay | 31 March 2020 Final Report
5652_01_R
09v02.d
ocx
APPENDIX E CHAPTER REPORT: IDENTIFICATION OF ADAPTATION OPTIONS
Denham Townsite CHRMAP
Chapter Report: Adaptation Option Identification
Shire of Shark Bay
12 March 2019
Shire of Shark Bay | 12 March 2019 Chapter Report: Adaptation Option Identification Page 1
5652_01_R
06v03.d
ocx
Document Status
Version Doc type Reviewed by Approved by Date issued
V01 DRAFT Christine Arrowsmith Christine Arrowsmith 05/10/2018
V02 FINAL Paul O’Brien Paul O’Brien 01/03/2019
V03 FINAL Paul O’Brien Paul O’Brien 12/03/2019
Project Details
Project Name Chapter Report: Adaptation Option Identification
Client Shire of Shark Bay
Client Project Manager Paul Anderson
Water Technology Project Manager Joanna Garcia- Webb
Water Technology Project Director Christine Lauchlan Arrowsmith
Authors Joanna Garcia-Webb
Document Number 5652_01_R06v03.docx
COPYRIGHT
Water Technology Pty Ltd has produced this document in accordance with instructions from Shire of Shark Bay for their
use only. The concepts and information contained in this document are the copyright of Water Technology Pty Ltd. Use or
copying of this document in whole or in part without written permission of Water Technology Pty Ltd constitutes an
infringement of copyright.
Water Technology Pty Ltd does not warrant this document is definitive nor free from error and does not accept liability for
any loss caused, or arising from, reliance upon the information provided herein.
430 Roberts Rd
Subiaco WA 6008
Telephone (08) 6555 0105
ACN 093 377 283
ABN 60 093 377 283
Shire of Shark Bay | 12 March 2019 Chapter Report: Adaptation Option Identification Page 2
5652_01_R
06v03.d
ocx
12 March 2019
Paul Anderson Chief Executive Officer Shire of Shark Bay 65 Knight Terrace Denham WA 6537 Via email [email protected] Dear Paul
Chapter Report: Adaptation Option Identification
We are pleased to present the Denham Townsite Coastal Hazard Risk Management and Adaptation Plan
Chapter Report: Adaptation Option Identification. If you have any queries, please do not hesitate to contact
me on (03) 8526 0830.
Yours sincerely
Joanna Garcia- Webb Principal Coastal Engineer | National Practice Lead – Coasts & Environment
WATER TECHNOLOGY PTY LTD
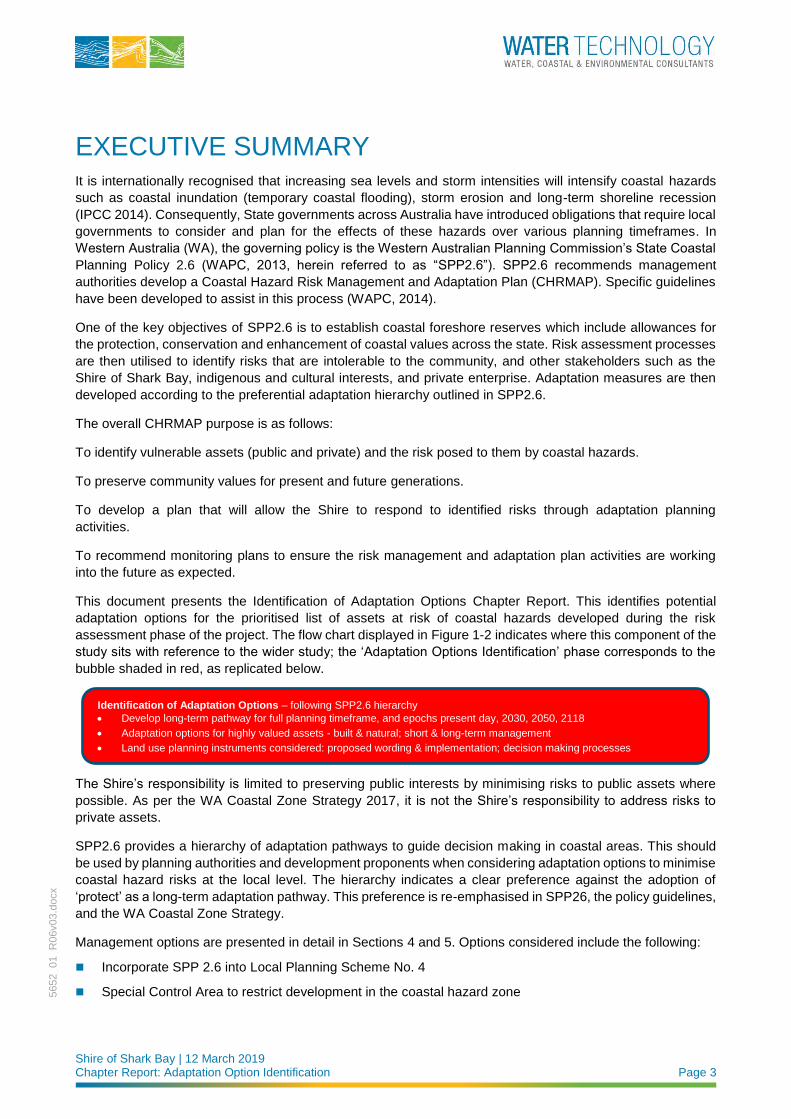
Shire of Shark Bay | 12 March 2019 Chapter Report: Adaptation Option Identification Page 3
5652_01_R
06v03.d
ocx
EXECUTIVE SUMMARY It is internationally recognised that increasing sea levels and storm intensities will intensify coastal hazards
such as coastal inundation (temporary coastal flooding), storm erosion and long-term shoreline recession
(IPCC 2014). Consequently, State governments across Australia have introduced obligations that require local
governments to consider and plan for the effects of these hazards over various planning timeframes. In
Western Australia (WA), the governing policy is the Western Australian Planning Commission’s State Coastal
Planning Policy 2.6 (WAPC, 2013, herein referred to as “SPP2.6”). SPP2.6 recommends management
authorities develop a Coastal Hazard Risk Management and Adaptation Plan (CHRMAP). Specific guidelines
have been developed to assist in this process (WAPC, 2014).
One of the key objectives of SPP2.6 is to establish coastal foreshore reserves which include allowances for
the protection, conservation and enhancement of coastal values across the state. Risk assessment processes
are then utilised to identify risks that are intolerable to the community, and other stakeholders such as the
Shire of Shark Bay, indigenous and cultural interests, and private enterprise. Adaptation measures are then
developed according to the preferential adaptation hierarchy outlined in SPP2.6.
The overall CHRMAP purpose is as follows:
To identify vulnerable assets (public and private) and the risk posed to them by coastal hazards.
To preserve community values for present and future generations.
To develop a plan that will allow the Shire to respond to identified risks through adaptation planning
activities.
To recommend monitoring plans to ensure the risk management and adaptation plan activities are working
into the future as expected.
This document presents the Identification of Adaptation Options Chapter Report. This identifies potential
adaptation options for the prioritised list of assets at risk of coastal hazards developed during the risk
assessment phase of the project. The flow chart displayed in Figure 1-2 indicates where this component of the
study sits with reference to the wider study; the ‘Adaptation Options Identification’ phase corresponds to the
bubble shaded in red, as replicated below.
The Shire’s responsibility is limited to preserving public interests by minimising risks to public assets where
possible. As per the WA Coastal Zone Strategy 2017, it is not the Shire’s responsibility to address risks to
private assets.
SPP2.6 provides a hierarchy of adaptation pathways to guide decision making in coastal areas. This should
be used by planning authorities and development proponents when considering adaptation options to minimise
coastal hazard risks at the local level. The hierarchy indicates a clear preference against the adoption of
‘protect’ as a long-term adaptation pathway. This preference is re-emphasised in SPP26, the policy guidelines,
and the WA Coastal Zone Strategy.
Management options are presented in detail in Sections 4 and 5. Options considered include the following:
◼ Incorporate SPP 2.6 into Local Planning Scheme No. 4
◼ Special Control Area to restrict development in the coastal hazard zone
Identification of Adaptation Options – following SPP2.6 hierarchy
• Develop long-term pathway for full planning timeframe, and epochs present day, 2030, 2050, 2118
• Adaptation options for highly valued assets - built & natural; short & long-term management
• Land use planning instruments considered: proposed wording & implementation; decision making processes
Shire of Shark Bay | 12 March 2019 Chapter Report: Adaptation Option Identification Page 4
5652_01_R
06v03.d
ocx
◼ Develop a Local Planning Policy that provides guidance on coastal development
◼ Notifications on Title
◼ Revegetation / sand fencing of dune
◼ Renourishment with dredged material
◼ Monitoring of beach and seawalls
◼ Manage 4WD and quad bike activities
The adaptation options presented within this report have followed the coastal hazard risk management
hierarchy, as per SPP2.6. The aim of the adaptation is to provide a planning framework that the Shire can
follow that allows sustainable development, but also allows the continued use of the land until the risk is
realised, and there is a plan on what to do if it is.
The final management options will include the continued revision of the CHRMAP and update of the
recommended options at regular intervals (i.e. every five to ten years). This is due to corresponding future
updates in climate change science, coastal engineering methodology, changes to the town’s success criteria,
triggers reached, and so on.
The next stage of the project will assess the adaptation options discussed within this report with a multi-criteria
analysis. Options receiving a positive score from this will be assessed in a cost benefit analysis. All adaptation
options come with a financial cost. We recommend investigating funding avenues based on the town’s high
tourism value, and the World Heritage listing. Maintaining the culture and recreational value of the Denham
townsite is strongly linked to the continuation of both tourism and environmental protection of the region.
In addition to the recommendations of the CHRMAP, local foreshore management plans should consider
broader issues such as biodiversity and environmental impacts.
The identification and assessment of the adaptation options will be reviewed by the community and
stakeholders, as recommended in WAPC (2014). Similarly, the community and stakeholders may have
suggestions for alternate adaptation options. The Stakeholder and Community Engagement Strategy (Water
Technology, 2018d) identified a review period that included a workshop and online survey to complete this
process.
Shire of Shark Bay | 12 March 2019 Chapter Report: Adaptation Option Identification Page 5
5652_01_R
06v03.d
ocx
CONTENTS
1 INTRODUCTION 7
2 ADAPTATION: THE CONTEXT 10
2.1 Planning Timeframes 10
2.2 Planning Controls 10
2.3 Risk Management & Adaptation Hierarchy 13
2.3.1 Avoid 13
2.3.2 Planned or Managed Retreat 13
2.3.3 Accommodate 14
2.3.4 Protect 15
2.3.5 Hierarchy Summary 15
2.4 Site Constraints 16
2.5 Summary for Decision Makers 16
3 ADAPTATION OPTIONS 17
3.1 Assets at Risk 17
3.2 General Options 17
3.3 Planning Options 21
3.3.1 Incorporate SPP 2.6 into Local Planning Scheme No. 4 21
3.3.2 Special Control Area 21
3.3.3 Coastal Development Local Planning Policy 22
3.3.4 Notifications on Title 22
3.3.5 Other Instruments 23
4 INUNDATION ADAPTATION OPTIONS 24
4.1 Present Day 24
4.2 Future Timeframes 24
4.2.1 2030 25
4.2.2 2050 25
4.2.3 2118 26
5 COASTAL EROSION ADAPTATION OPTIONS 27
5.1 Present Day 27
5.2 Future Timeframes 30
5.2.1 2030 30
5.2.2 2050 31
5.2.3 2118 31
Shire of Shark Bay | 12 March 2019 Chapter Report: Adaptation Option Identification Page 6
5652_01_R
06v03.d
ocx
6 CONCLUSIONS 32
7 REFERENCES 33
LIST OF FIGURES Figure 1-1 Extent of CHRMAP 8
Figure 1-2 Proposed CHRMAP methodology flow chart (adapted from WAPC CHRMAP Guidelines) 9
Figure 2-1 State planning framework for Western Australia 10
Figure 2-2 Site-specific planning instruments in order of priority 11
Figure 2-3 Coastal hazard risk management and adaptation planning hierarchy (adapted from WAPC, 2013) 13
Figure 5-1 Study area sections 29
LIST OF TABLES Table 2-1 Existing Planning Controls 12
Table 2-2 Adopted success criteria 16
Table 2-3 Adaptation consideration summary 16
Table 3-1 Prioritised assets - inundation risks 18
Table 3-2 Prioritised assets - erosion risks 19
Table 3-3 Available adaptation options (adapted from WAPC, 2014) 20
Table 5-1 Present day conditions 28
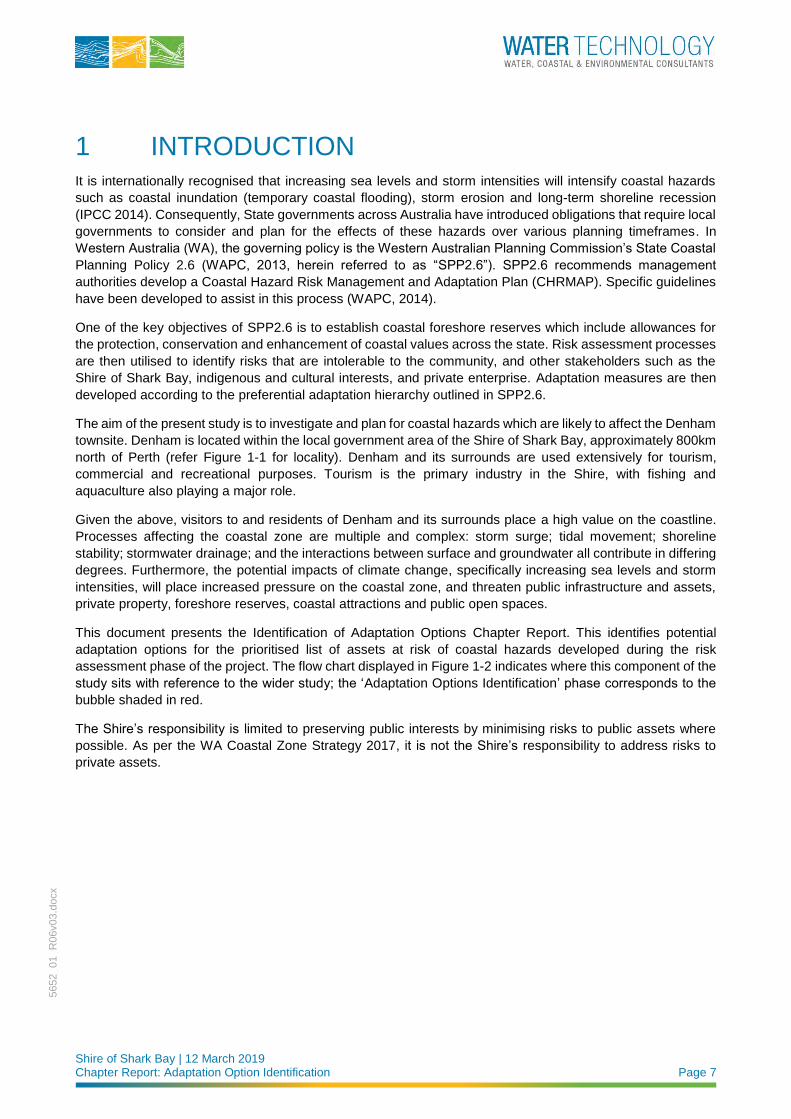
Shire of Shark Bay | 12 March 2019 Chapter Report: Adaptation Option Identification Page 7
5652_01_R
06v03.d
ocx
1 INTRODUCTION It is internationally recognised that increasing sea levels and storm intensities will intensify coastal hazards
such as coastal inundation (temporary coastal flooding), storm erosion and long-term shoreline recession
(IPCC 2014). Consequently, State governments across Australia have introduced obligations that require local
governments to consider and plan for the effects of these hazards over various planning timeframes. In
Western Australia (WA), the governing policy is the Western Australian Planning Commission’s State Coastal
Planning Policy 2.6 (WAPC, 2013, herein referred to as “SPP2.6”). SPP2.6 recommends management
authorities develop a Coastal Hazard Risk Management and Adaptation Plan (CHRMAP). Specific guidelines
have been developed to assist in this process (WAPC, 2014).
One of the key objectives of SPP2.6 is to establish coastal foreshore reserves which include allowances for
the protection, conservation and enhancement of coastal values across the state. Risk assessment processes
are then utilised to identify risks that are intolerable to the community, and other stakeholders such as the
Shire of Shark Bay, indigenous and cultural interests, and private enterprise. Adaptation measures are then
developed according to the preferential adaptation hierarchy outlined in SPP2.6.
The aim of the present study is to investigate and plan for coastal hazards which are likely to affect the Denham
townsite. Denham is located within the local government area of the Shire of Shark Bay, approximately 800km
north of Perth (refer Figure 1-1 for locality). Denham and its surrounds are used extensively for tourism,
commercial and recreational purposes. Tourism is the primary industry in the Shire, with fishing and
aquaculture also playing a major role.
Given the above, visitors to and residents of Denham and its surrounds place a high value on the coastline.
Processes affecting the coastal zone are multiple and complex: storm surge; tidal movement; shoreline
stability; stormwater drainage; and the interactions between surface and groundwater all contribute in differing
degrees. Furthermore, the potential impacts of climate change, specifically increasing sea levels and storm
intensities, will place increased pressure on the coastal zone, and threaten public infrastructure and assets,
private property, foreshore reserves, coastal attractions and public open spaces.
This document presents the Identification of Adaptation Options Chapter Report. This identifies potential
adaptation options for the prioritised list of assets at risk of coastal hazards developed during the risk
assessment phase of the project. The flow chart displayed in Figure 1-2 indicates where this component of the
study sits with reference to the wider study; the ‘Adaptation Options Identification’ phase corresponds to the
bubble shaded in red.
The Shire’s responsibility is limited to preserving public interests by minimising risks to public assets where
possible. As per the WA Coastal Zone Strategy 2017, it is not the Shire’s responsibility to address risks to
private assets.
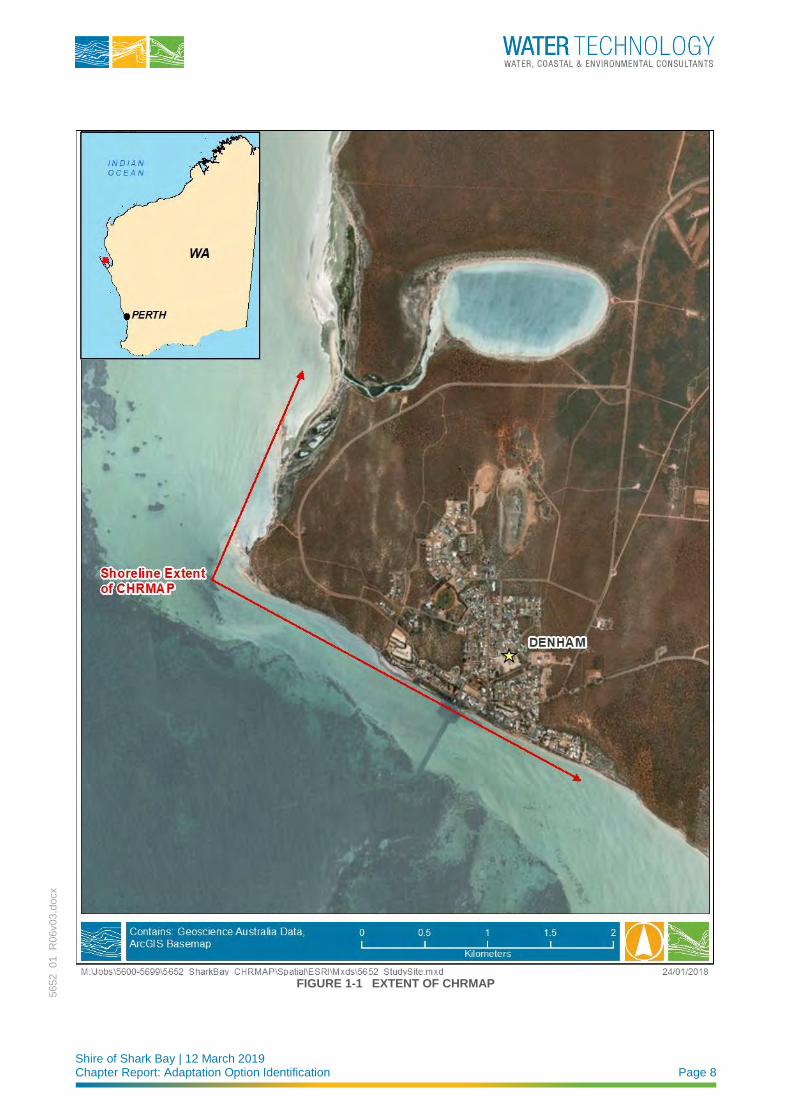
Shire of Shark Bay | 12 March 2019 Chapter Report: Adaptation Option Identification Page 8
5652_01_R
06v03.d
ocx
FIGURE 1-1 EXTENT OF CHRMAP

Shire of Shark Bay | 12 March 2019 Chapter Report: Adaptation Option Identification Page 9
5652_01_R
06v03.d
ocx
ESTABLISHING THE CONTEXT
Project Inception Meeting
• Held via teleconference. Finalise project scope, deliverables, timing, data gap actions and identify key stakeholders
Stakeholder and Community Engagement Plan
• Preparation of Community Information Sheet 1
Literature Review and Issues Paper
• Historical reports will be reviewed, state and local coastal policy, planning schemes & instruments considered.
Site Investigations / Community Workshop 1 (Workshop 1 will be undertaken on the same trip as the site visit.)
• CIS1 to be posted online / mailed immediately prior to Workshop 1; focus group interviews available outside Workshop
• Community Values Assessment can then be completed (community and cultural values identified).
• Site visit will allow for finalisation of the Identification of Coastal Assets task and fill gaps noted in Issues Paper.
• Site visit to also aid in coastal processes understanding.
CO
MM
UN
ICA
TIO
N A
ND
CO
NS
UL
TA
TIO
N:
SH
IRE
OF
SH
AR
K B
AY
, S
TA
KE
HO
LD
ER
S, C
OM
MU
NIT
Y W
RO
KS
HO
PS
& S
UR
VE
Y
MO
NIT
OR
ING
AN
D R
EV
IEW
Final CHRMAP and Interim Deliverables
ADAPTATION PLANNING
COASTAL HAZARD RISK IDENTIFICATION
Hazard Assessment – to understand coastal processes & hazards & identify areas at risk
• Review of available information and knowledge summary
o Water Level / inundation information
o Hydrographic surveys
o Aerial photography analysis
o Previous coastal hazard reporting
• Coastal Hazard Assessment on key coastal processes – coastal inundation, long-term and short-term erosion
o Update previous assessments with most recent aerial photographs / historical where necessary; analyse
accordingly
o Inundation scenarios include - Present day, 2030, 2050, 2118 conditions, with Average Recurrence
Interval of 20, 50, 100, 500 years
o Erosion scenarios assessed as per SPP2.6, with SBEACH modelling at key points in the study area o Determine trigger events & responses
• Coastal Hazard Mapping
o 3D surface mapping of all coastal inundation and erosion scenarios.
o Split into sectors, as required, at the stipulated scales & generate maps
o Online mapping provided for all maps, all information within GIS system
RISK ANALYSIS AND EVALUATION
Prepare Likelihood and Consequence Scales
• Risk assessment of each vulnerable asset: likelihood, consequence, vulnerability & risk rating for each scenario
Risk Evaluation
• Identify actions & priorities for management until 2118
• Analyse Community Values / Success Criteria--> establish community priorities for Vulnerable Assets
Identify Existing Controls
• Identify existing mitigation measures: physical & planning schemes to mitigate the above risks
o Update risks accordingly; identify prioritised risk action list based on Success Criteria & existing controls
Identification of Adaptation Options – following SPP2.6 hierarchy
• Develop long-term pathway for full planning timeframe, and epochs present day, 2030, 2050, 2118
• Adaptation options for highly valued assets - built & natural; short & long-term management
• Land use planning instruments considered: proposed wording & implementation; decision making processes
Vulnerability Assessment
• Identify vulnerable assets, group by specified categories; implications on land use
• Identify function, services & values of each vulnerable asset
• Assess vulnerability of each asset (exposure, sensitivity and adaptive capacity)
o Assets grouped with rationale; Sensitivity scaling considered
o Results tabularised
• Online mapping of vulnerability, all information within GIS system
ENGAGEMENT • Community Information Sheet
• Community Workshop
• Definition of values / success criteria
Assessment of Adaptation Options For each vulnerable asset:
• For each Mitigation / Adaptation measure:
o MCA. If MCA +ve, proceed to CBA
o Timeframes / triggers to be considered
• Trade-offs between option selection & asset value
Implementation For each vulnerable asset:
• For each Mitigation / Adaptation measure:
o Identify long-term pathways, considering trigger points and previous assessments
o Produce a short-term implementation plan to produce a clear action plan to 2030
o Produce a monitoring plan, detailing any monitoring or review that may be required
ENGAGEMENT • Obtain additional feedback on success
criteria & presented adaptation options:
o Community Information Sheet
o Community Workshop
o Online Survey
ENGAGEMENT • Public advertisement of Final Draft
CHRMAP
FIGURE 1-2 PROPOSED CHRMAP METHODOLOGY FLOW CHART (ADAPTED FROM WAPC CHRMAP GUIDELINES)
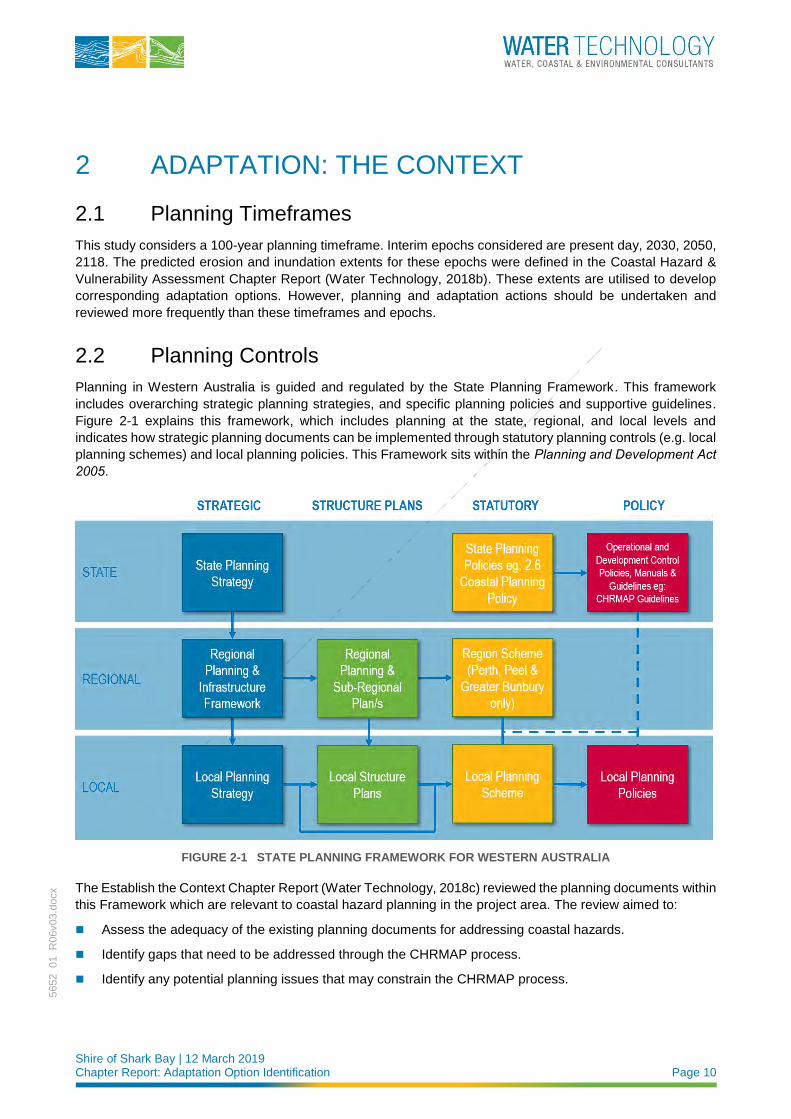
Shire of Shark Bay | 12 March 2019 Chapter Report: Adaptation Option Identification Page 10
5652_01_R
06v03.d
ocx
2 ADAPTATION: THE CONTEXT
2.1 Planning Timeframes
This study considers a 100-year planning timeframe. Interim epochs considered are present day, 2030, 2050,
2118. The predicted erosion and inundation extents for these epochs were defined in the Coastal Hazard &
Vulnerability Assessment Chapter Report (Water Technology, 2018b). These extents are utilised to develop
corresponding adaptation options. However, planning and adaptation actions should be undertaken and
reviewed more frequently than these timeframes and epochs.
2.2 Planning Controls
Planning in Western Australia is guided and regulated by the State Planning Framework. This framework
includes overarching strategic planning strategies, and specific planning policies and supportive guidelines.
Figure 2-1 explains this framework, which includes planning at the state, regional, and local levels and
indicates how strategic planning documents can be implemented through statutory planning controls (e.g. local
planning schemes) and local planning policies. This Framework sits within the Planning and Development Act 2005.
FIGURE 2-1 STATE PLANNING FRAMEWORK FOR WESTERN AUSTRALIA
The Establish the Context Chapter Report (Water Technology, 2018c) reviewed the planning documents within
this Framework which are relevant to coastal hazard planning in the project area. The review aimed to:
◼ Assess the adequacy of the existing planning documents for addressing coastal hazards.
◼ Identify gaps that need to be addressed through the CHRMAP process.
◼ Identify any potential planning issues that may constrain the CHRMAP process.
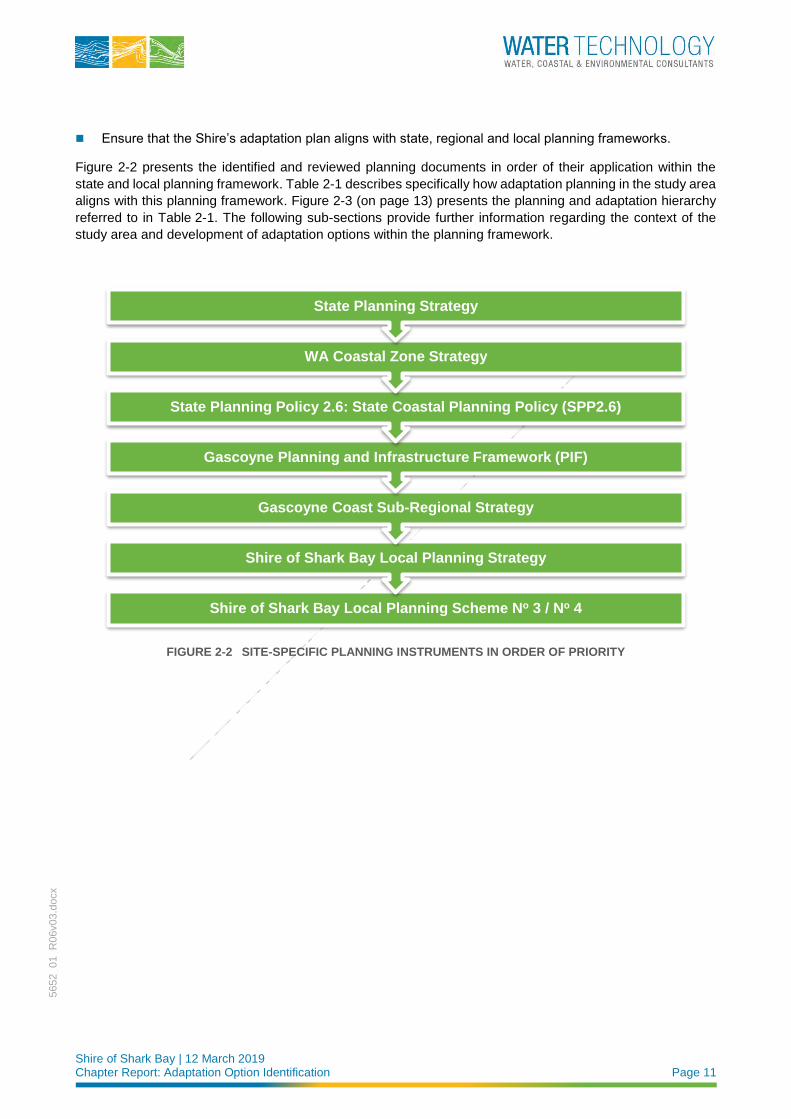
Shire of Shark Bay | 12 March 2019 Chapter Report: Adaptation Option Identification Page 11
5652_01_R
06v03.d
ocx
◼ Ensure that the Shire’s adaptation plan aligns with state, regional and local planning frameworks.
Figure 2-2 presents the identified and reviewed planning documents in order of their application within the
state and local planning framework. Table 2-1 describes specifically how adaptation planning in the study area
aligns with this planning framework. Figure 2-3 (on page 13) presents the planning and adaptation hierarchy
referred to in Table 2-1. The following sub-sections provide further information regarding the context of the
study area and development of adaptation options within the planning framework.
FIGURE 2-2 SITE-SPECIFIC PLANNING INSTRUMENTS IN ORDER OF PRIORITY
Shire of Shark Bay Local Planning Scheme No 3 / No 4
Shire of Shark Bay Local Planning Strategy
Gascoyne Coast Sub-Regional Strategy
Gascoyne Planning and Infrastructure Framework (PIF)
State Planning Policy 2.6: State Coastal Planning Policy (SPP2.6)
WA Coastal Zone Strategy
State Planning Strategy
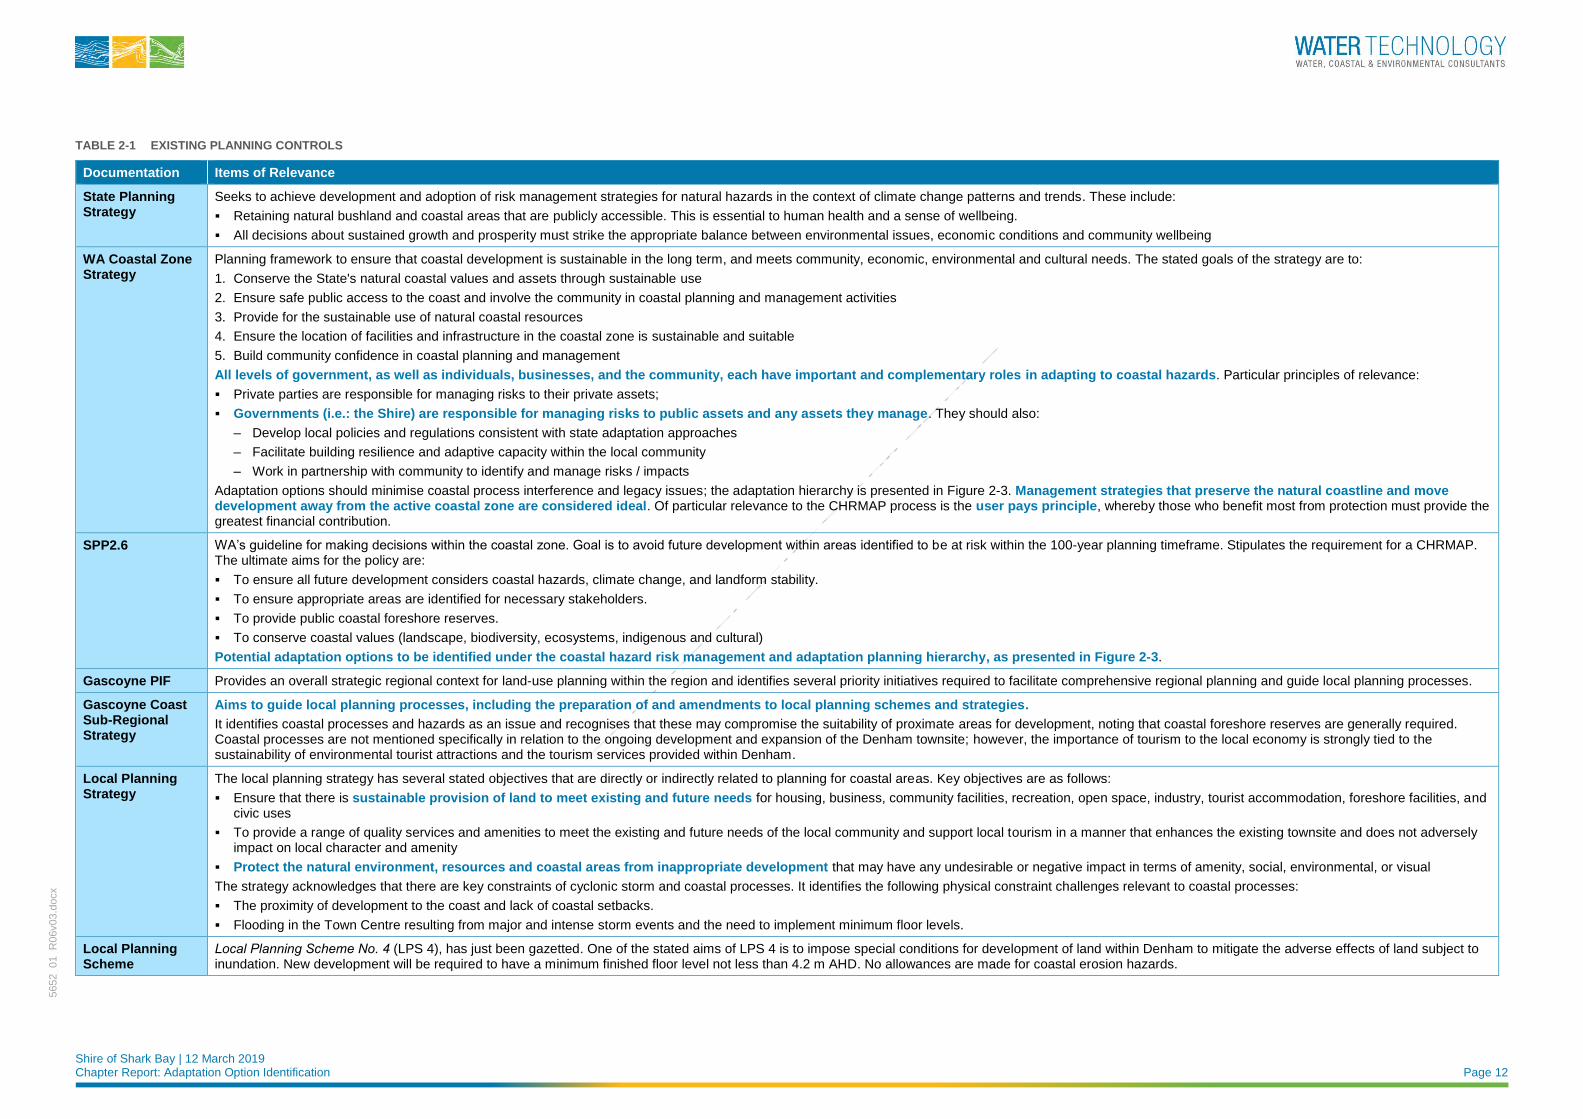
Shire of Shark Bay | 12 March 2019 Chapter Report: Adaptation Option Identification Page 12
5652_01_R
06v03.d
ocx
TABLE 2-1 EXISTING PLANNING CONTROLS
Documentation Items of Relevance
State Planning Strategy
Seeks to achieve development and adoption of risk management strategies for natural hazards in the context of climate change patterns and trends. These include:
▪ Retaining natural bushland and coastal areas that are publicly accessible. This is essential to human health and a sense of wellbeing.
▪ All decisions about sustained growth and prosperity must strike the appropriate balance between environmental issues, economic conditions and community wellbeing
WA Coastal Zone Strategy
Planning framework to ensure that coastal development is sustainable in the long term, and meets community, economic, environmental and cultural needs. The stated goals of the strategy are to:
1. Conserve the State's natural coastal values and assets through sustainable use
2. Ensure safe public access to the coast and involve the community in coastal planning and management activities
3. Provide for the sustainable use of natural coastal resources
4. Ensure the location of facilities and infrastructure in the coastal zone is sustainable and suitable
5. Build community confidence in coastal planning and management
All levels of government, as well as individuals, businesses, and the community, each have important and complementary roles in adapting to coastal hazards. Particular principles of relevance:
▪ Private parties are responsible for managing risks to their private assets;
▪ Governments (i.e.: the Shire) are responsible for managing risks to public assets and any assets they manage. They should also:
– Develop local policies and regulations consistent with state adaptation approaches
– Facilitate building resilience and adaptive capacity within the local community
– Work in partnership with community to identify and manage risks / impacts
Adaptation options should minimise coastal process interference and legacy issues; the adaptation hierarchy is presented in Figure 2-3. Management strategies that preserve the natural coastline and move development away from the active coastal zone are considered ideal. Of particular relevance to the CHRMAP process is the user pays principle, whereby those who benefit most from protection must provide the greatest financial contribution.
SPP2.6 WA’s guideline for making decisions within the coastal zone. Goal is to avoid future development within areas identified to be at risk within the 100-year planning timeframe. Stipulates the requirement for a CHRMAP. The ultimate aims for the policy are:
▪ To ensure all future development considers coastal hazards, climate change, and landform stability.
▪ To ensure appropriate areas are identified for necessary stakeholders.
▪ To provide public coastal foreshore reserves.
▪ To conserve coastal values (landscape, biodiversity, ecosystems, indigenous and cultural)
Potential adaptation options to be identified under the coastal hazard risk management and adaptation planning hierarchy, as presented in Figure 2-3.
Gascoyne PIF Provides an overall strategic regional context for land-use planning within the region and identifies several priority initiatives required to facilitate comprehensive regional planning and guide local planning processes.
Gascoyne Coast Sub-Regional Strategy
Aims to guide local planning processes, including the preparation of and amendments to local planning schemes and strategies.
It identifies coastal processes and hazards as an issue and recognises that these may compromise the suitability of proximate areas for development, noting that coastal foreshore reserves are generally required. Coastal processes are not mentioned specifically in relation to the ongoing development and expansion of the Denham townsite; however, the importance of tourism to the local economy is strongly tied to the sustainability of environmental tourist attractions and the tourism services provided within Denham.
Local Planning Strategy
The local planning strategy has several stated objectives that are directly or indirectly related to planning for coastal areas. Key objectives are as follows:
▪ Ensure that there is sustainable provision of land to meet existing and future needs for housing, business, community facilities, recreation, open space, industry, tourist accommodation, foreshore facilities, and civic uses
▪ To provide a range of quality services and amenities to meet the existing and future needs of the local community and support local tourism in a manner that enhances the existing townsite and does not adversely impact on local character and amenity
▪ Protect the natural environment, resources and coastal areas from inappropriate development that may have any undesirable or negative impact in terms of amenity, social, environmental, or visual
The strategy acknowledges that there are key constraints of cyclonic storm and coastal processes. It identifies the following physical constraint challenges relevant to coastal processes:
▪ The proximity of development to the coast and lack of coastal setbacks.
▪ Flooding in the Town Centre resulting from major and intense storm events and the need to implement minimum floor levels.
Local Planning Scheme
Local Planning Scheme No. 4 (LPS 4), has just been gazetted. One of the stated aims of LPS 4 is to impose special conditions for development of land within Denham to mitigate the adverse effects of land subject to inundation. New development will be required to have a minimum finished floor level not less than 4.2 m AHD. No allowances are made for coastal erosion hazards.
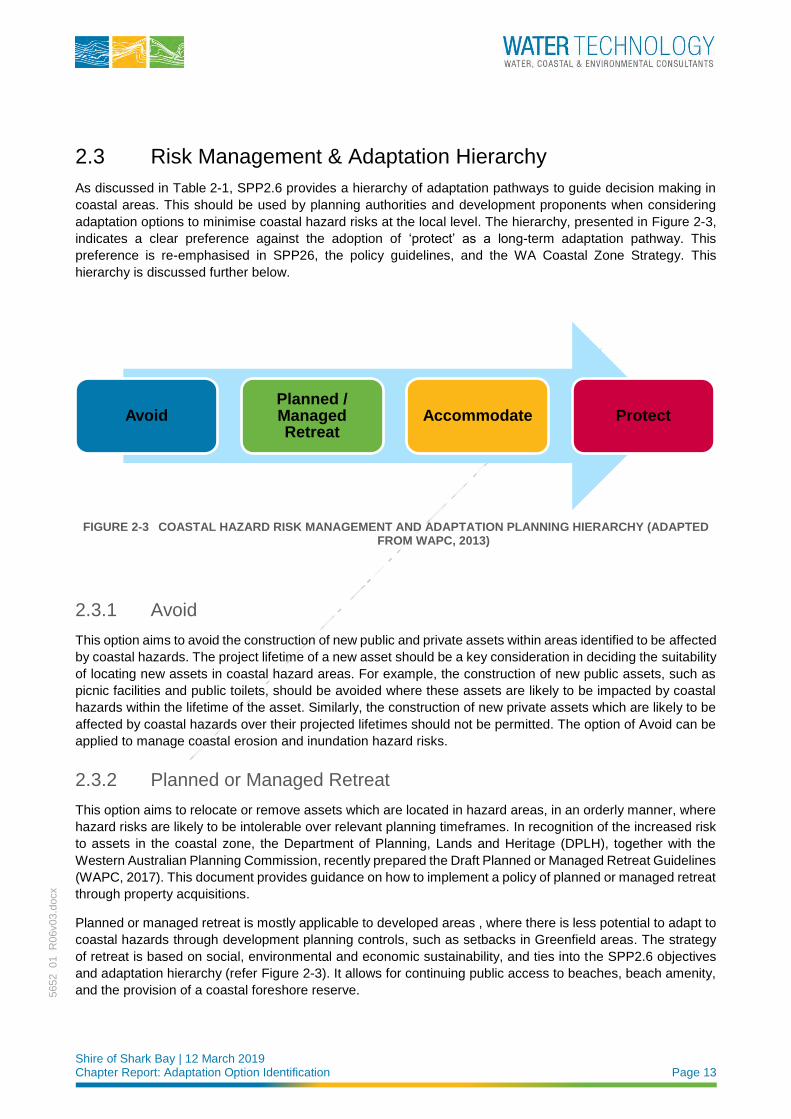
Shire of Shark Bay | 12 March 2019 Chapter Report: Adaptation Option Identification Page 13
5652_01_R
06v03.d
ocx
2.3 Risk Management & Adaptation Hierarchy
As discussed in Table 2-1, SPP2.6 provides a hierarchy of adaptation pathways to guide decision making in
coastal areas. This should be used by planning authorities and development proponents when considering
adaptation options to minimise coastal hazard risks at the local level. The hierarchy, presented in Figure 2-3,
indicates a clear preference against the adoption of ‘protect’ as a long-term adaptation pathway. This
preference is re-emphasised in SPP26, the policy guidelines, and the WA Coastal Zone Strategy. This
hierarchy is discussed further below.
FIGURE 2-3 COASTAL HAZARD RISK MANAGEMENT AND ADAPTATION PLANNING HIERARCHY (ADAPTED FROM WAPC, 2013)
2.3.1 Avoid
This option aims to avoid the construction of new public and private assets within areas identified to be affected
by coastal hazards. The project lifetime of a new asset should be a key consideration in deciding the suitability
of locating new assets in coastal hazard areas. For example, the construction of new public assets, such as
picnic facilities and public toilets, should be avoided where these assets are likely to be impacted by coastal
hazards within the lifetime of the asset. Similarly, the construction of new private assets which are likely to be
affected by coastal hazards over their projected lifetimes should not be permitted. The option of Avoid can be
applied to manage coastal erosion and inundation hazard risks.
2.3.2 Planned or Managed Retreat
This option aims to relocate or remove assets which are located in hazard areas, in an orderly manner, where
hazard risks are likely to be intolerable over relevant planning timeframes. In recognition of the increased risk
to assets in the coastal zone, the Department of Planning, Lands and Heritage (DPLH), together with the
Western Australian Planning Commission, recently prepared the Draft Planned or Managed Retreat Guidelines
(WAPC, 2017). This document provides guidance on how to implement a policy of planned or managed retreat
through property acquisitions.
Planned or managed retreat is mostly applicable to developed areas , where there is less potential to adapt to
coastal hazards through development planning controls, such as setbacks in Greenfield areas. The strategy
of retreat is based on social, environmental and economic sustainability, and ties into the SPP2.6 objectives
and adaptation hierarchy (refer Figure 2-3). It allows for continuing public access to beaches, beach amenity,
and the provision of a coastal foreshore reserve.
AvoidPlanned / Managed Retreat
Accommodate Protect
Shire of Shark Bay | 12 March 2019 Chapter Report: Adaptation Option Identification Page 14
5652_01_R
06v03.d
ocx
The Guidelines suggest a range of mechanisms for achieving managed retreat in developed areas, using
compulsory or voluntary acquisition provisions outlined in state legislation. Alternatively, planned or managed
Retreat can be achieved through the early acquisition and leaseback of private property. This alternative can
help to reduce overall implementation costs.
Planned or managed retreat is an option that can be applied to manage coastal erosion and inundation
hazards; however, this option requires a significant investment of public resources to fund acquisitions. From
a practical perspective, implementation of managed retreat may require the State or Commonwealth to provide
the majority of funding to acquire property. Funding programs offered at the State level do not currently provide
amounts which facilitate property acquisitions, and there has been no indication to date that this situation will
change in the near future. Therefore, landholders and the broader public should be aware of the risks in any
decisions they make about purchasing or developing lands in coastal areas.
Given the values of the Denham townsite presented in the form of the success criteria (refer Section 2.4),
together with the existing asset locations in proximity to the coastal hazard extents, a managed retreat option
may be the most appropriate for the foreshore area. A planned or managed retreat option would allow for the
continued public amenity of the foreshore and meet tourism sector needs. It is important to note that existing
land uses would continue until the coastal hazard risk becomes unacceptable. The trigger for retreat is to be
defined during the CHRMAP process. It is further discussed in Chapters 3.3 and 5.
The suitability and extent of the managed retreat option will be fully assessed in the next chapter report:
Assessment of Adaptation Options. It is noted the above discussion focuses on potential acquisition of freehold
land. Planned/managed retreat may also be applied to other type of assets; the level of investment depends
on the type of assets to retreat. For example, removing / relocating a public bench or pergola / picnic table
represents a much lower investment than the relocation of a residential property.
2.3.3 Accommodate
This option aims to utilise design and management strategies which render the risks from identified coastal
hazards as acceptable. Design and management strategies include: minimum finished floor levels and
elevated electrical circuitry, to minimise inundation risks; or, relocatable structures which can be moved to a
different location on- or off-site, as shorelines recede, or regular inundation events make the provision of critical
services unviable. In this way, the ‘Accommodate’ option allows landholders to continue to use land until
hazard risks become intolerable, while minimising the current and future risk of legal and financial liability for
Council.
Accommodate design and management strategies can be facilitated through modifications to local planning
frameworks. These modified planning frameworks need to provide clear direction for planning authorities when
assessing applications for new development and for affected landholders. Planning frameworks might include
the introduction or modification of the following instruments:
◼ Special control areas, to ensure planning discretion over new development
◼ Clear development assessment criteria, to ensure that new development gives due regard to coastal
processes
◼ Notifications on title, to inform current and future property owners of hazard risks
◼ Time or event limited planning permits, to allow the continued use of land until hazards become intolerable
Accommodate is an option that can be applied to help minimise the effect of coastal erosion and inundation
hazards on new development and infrastructure. A key concern with the accommodate option, particularly in
regard to managing coastal erosion, is that the current State legislative framework means that permanently
inundated private land does not become Crown land, unlike in other Australian states (Robb et al 2017, Robb
et all 2018). Therefore, where the shoreline is allowed to recede beyond private property boundaries, issues
Shire of Shark Bay | 12 March 2019 Chapter Report: Adaptation Option Identification Page 15
5652_01_R
06v03.d
ocx
of public access and trespass may arise. This should be a key consideration when assessing the
appropriateness of the Accommodate option.
2.3.4 Protect
This option aims to stabilise the position of the shoreline using hard or soft coastal protection measures such
as seawalls, groynes, offshore breakwaters, geotextile sand-containers, sand renourishment and levee banks.
Protection is an option that can be applied to manage coastal erosion and inundation hazards.
The adaptation hierarchy considers the construction of new protection measures as the least preferred option
of all potential options listed in the hierarchy. Protection measures, particularly hard measures such as rock
groynes and seawalls, interfere with local coastal processes and can have detrimental effects on local
ecological systems. Protection measures can also inflate property values in hazard areas, create expectations
that protection measures will be maintained into the future, and may limit the capacity of future decision makers
to change strategies as situations change.
Over the short to medium term, public authorities may need to consider the appropriateness of using interim
protection measures to delay shoreline recession. This might be achieved through measures such as
geotextile sand containers which can be less costly to remove than rock structures, regular sand
renourishment, and revegetating coastal dunes. Where public and private assets are proposed to be
constructed inland of interim protection measures, the design life of the protection measure should be a key
factor in determining the appropriateness of the proposed asset or development.
2.3.5 Hierarchy Summary
Maintaining public access to the coast in developed areas is one of the main objectives of SPP2.6 and
identified as a key value of the Denham community. As discussed, the current State legislative framework
means that where the shoreline recedes beyond private property boundaries, issues of public access and
trespass are likely to arise. . This situation means that public authorities have two main adaptation options
available to them for preserving public coastal access:
◼ Planned or Managed Retreat i.e. maintaining a foreshore reserve through public acquisition of private
property; or,
◼ Protect i.e. preventing the shoreline from receding beyond private property boundaries by stabilising the
current shoreline position using various protection measures (e.g. rock groynes, offshore breakwaters).
Where public authorities cannot commit to either of these options over the long term, it is likely that public
authorities will need to Accommodate, by modifying local planning frameworks to help ensure that new
development is appropriately designed and located. Public authorities in this situation may also choose to
consider the appropriateness of interim Protection measures to preserve public interests by delaying shoreline
recession and minimising the effect of regular nuisance inundation events on existing development and
infrastructure.
A modified local planning framework, to facilitate the Accommodate and interim Protection options is discussed
in Section 3.3.
Shire of Shark Bay | 12 March 2019 Chapter Report: Adaptation Option Identification Page 16
5652_01_R
06v03.d
ocx
2.4 Site Constraints
The success criteria for the study identified in the Risk Assessment Chapter Report (Water Technology, 2018a)
are presented in Table 2-2. These criteria demonstrate that the stakeholder and community values in the study
area reflect the requirements of the state, regional and local planning controls. The success criteria highlight
the need for continuing public access to beaches, beach amenity, and the provision of a coastal foreshore
reserve. They also identify protecting the natural environment. The importance of tourism to Denham’s local
economy is strongly tied to the sustainability of environmental tourist attractions. The public amenity and
culture of the foreshore area is thus directly linked back to the economic values of the town.
TABLE 2-2 ADOPTED SUCCESS CRITERIA
• Protection of the environmental assets of the study area / planning to retain environmental integrity
• Protection of the recreational value of the coastline
• Protection of the cultural values of the coastline & town centre
• Maintenance of a level of public recreational assets
• Development controls not to inhibit the landscape
2.5 Summary for Decision Makers
Table 2-3 presents a summary of the relevant information provided in this chapter. It is important to note that
there is no law requiring public authorities to provide protection of private property from natural hazards, nor
compensation when land is lost due to coastal hazards. The CHRMAP process aims to minimise coastal
hazard risks and maximise beneficial use of the coast.
TABLE 2-3 ADAPTATION CONSIDERATION SUMMARY
• Adaptation options should minimise coastal process interference and legacy issues
o The adaptation hierarchy is presented in Figure 2-3.
• Coastal development must be sustainable in the long term, and must balance the community, economic, environmental and cultural needs
• Local Governments are responsible for managing risks to public assets and any assets they manage. They should also:
o Develop local policies and regulations consistent with state legislation and policy
o Facilitate building resilience and adaptive capacity within the local community
o Work in partnership with community to identity and manage risks / impacts
• Management strategies that preserve the natural coastline and move development away from the active coastal zone in an orderly manner are considered ideal. Of particular relevance to the CHRMAP process is the user pays principle, whereby those who benefit most from protection must provide the greatest financial contribution
• Adaptation options should maintain future flexibility, in order to build resilient coastal communities.
• A key adaptation option will be the use of planning instruments, including managed retreat.
Shire of Shark Bay | 12 March 2019 Chapter Report: Adaptation Option Identification Page 17
5652_01_R
06v03.d
ocx
3 ADAPTATION OPTIONS
3.1 Assets at Risk
In the Establish the Context Chapter Report (Water Technology, 2018c), the assets in the coastal zone were
identified. Each asset was colour coded based on its classification (commercial, public, tourism related and
residential) for ease of identification in the hazard maps and online database. The online database displays
the identified assets, as well as the spatial extent of the various coastal hazards. The present planning scheme
zoning is also included as a layer. The online database can be found at the following link:
https://watech.maps.arcgis.com/apps/webappviewer/index.html?id=6e092b4d0f044e038a721705e907c084
The prioritised assets at risk of inundation are presented in Table 3-1, and for erosion in Table 3-2. These are
as per the analysis undertaken in Water Technology (2018a). The inundation assessment investigated the
500-year ARI inundation event for the different planning timeframes: Present Day, 2030, 2050 and 2118. This
event has a predicted level of 3.3m AHD in the present day, and 4.2 m AHD by 2118.
The erosion assessment calculated a coastal processes allowance. This is a setback distance from the
horizontal shoreline datum, roughly equivalent to the present location of the dune vegetation line. This setback
distance ranged from 4 to 13m in the present day, and 123 to 230m by 2118.
Along Knight Terrace, the extent of the hazard area in 2118 is similar for both inundation and erosion.
3.2 General Options
Table 3-3 below presents a list of generally available adaptation options suitable for most coastal sites. These
relate to both short term and long-term adaptation to coastal hazards in general, not just in relation to planning
for climate change impacts. The column on the right-hand side provides some discussion as to the possibility
of its application in Denham. Chapters 3.3 and 5 provide some discussion and selection of these options over
the planning timeframe for inundation and erosion respectively.
Whilst the risks and their corresponding adaptation options are assessed separately, triggers to adapt can
occur at any time from either erosion or inundation.
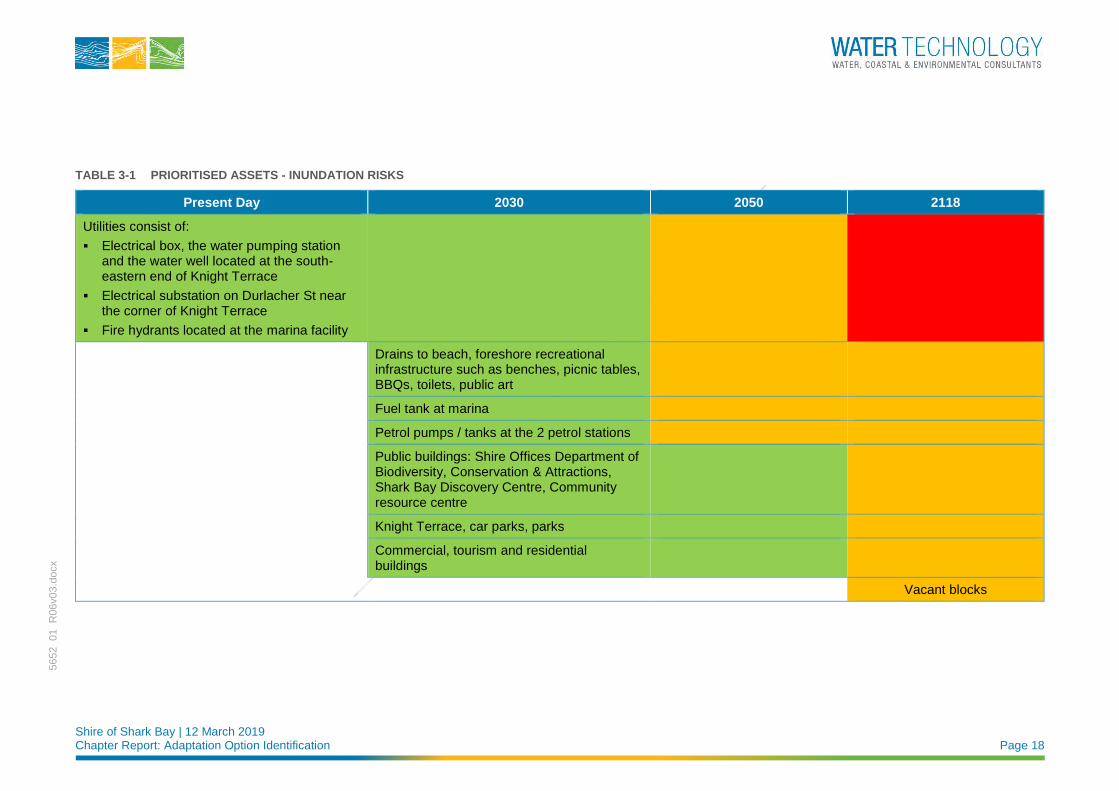
Shire of Shark Bay | 12 March 2019 Chapter Report: Adaptation Option Identification Page 18
5652_01_R
06v03.d
ocx
TABLE 3-1 PRIORITISED ASSETS - INUNDATION RISKS
Present Day 2030 2050 2118
Utilities consist of:
▪ Electrical box, the water pumping station and the water well located at the south-eastern end of Knight Terrace
▪ Electrical substation on Durlacher St near the corner of Knight Terrace
▪ Fire hydrants located at the marina facility
Drains to beach, foreshore recreational infrastructure such as benches, picnic tables, BBQs, toilets, public art
Fuel tank at marina
Petrol pumps / tanks at the 2 petrol stations
Public buildings: Shire Offices Department of Biodiversity, Conservation & Attractions, Shark Bay Discovery Centre, Community resource centre
Knight Terrace, car parks, parks
Commercial, tourism and residential buildings
Vacant blocks
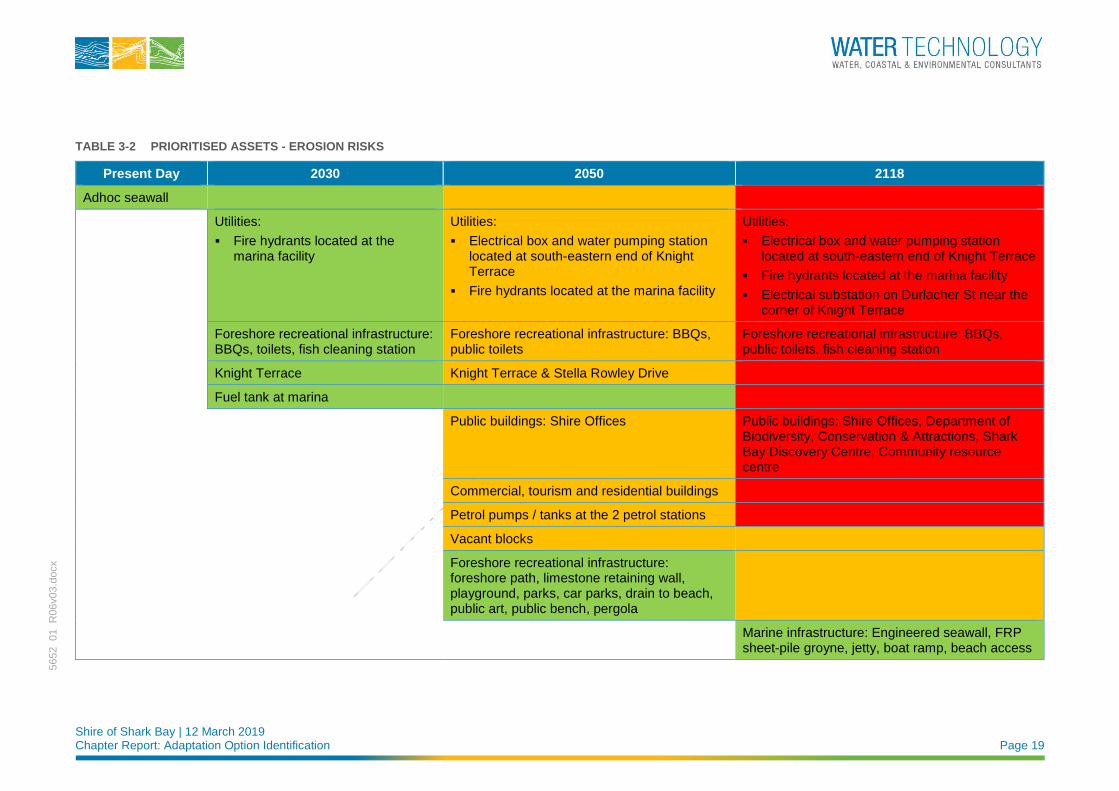
Shire of Shark Bay | 12 March 2019 Chapter Report: Adaptation Option Identification Page 19
5652_01_R
06v03.d
ocx
TABLE 3-2 PRIORITISED ASSETS - EROSION RISKS
Present Day 2030 2050 2118
Adhoc seawall
Utilities:
▪ Fire hydrants located at the marina facility
Utilities:
▪ Electrical box and water pumping station located at south-eastern end of Knight Terrace
▪ Fire hydrants located at the marina facility
Utilities:
▪ Electrical box and water pumping station located at south-eastern end of Knight Terrace
▪ Fire hydrants located at the marina facility
▪ Electrical substation on Durlacher St near the corner of Knight Terrace
Foreshore recreational infrastructure: BBQs, toilets, fish cleaning station
Foreshore recreational infrastructure: BBQs, public toilets
Foreshore recreational infrastructure: BBQs, public toilets, fish cleaning station
Knight Terrace Knight Terrace & Stella Rowley Drive
Fuel tank at marina
Public buildings: Shire Offices Public buildings: Shire Offices, Department of Biodiversity, Conservation & Attractions, Shark Bay Discovery Centre, Community resource centre
Commercial, tourism and residential buildings
Petrol pumps / tanks at the 2 petrol stations
Vacant blocks
Foreshore recreational infrastructure: foreshore path, limestone retaining wall, playground, parks, car parks, drain to beach, public art, public bench, pergola
Marine infrastructure: Engineered seawall, FRP sheet-pile groyne, jetty, boat ramp, beach access
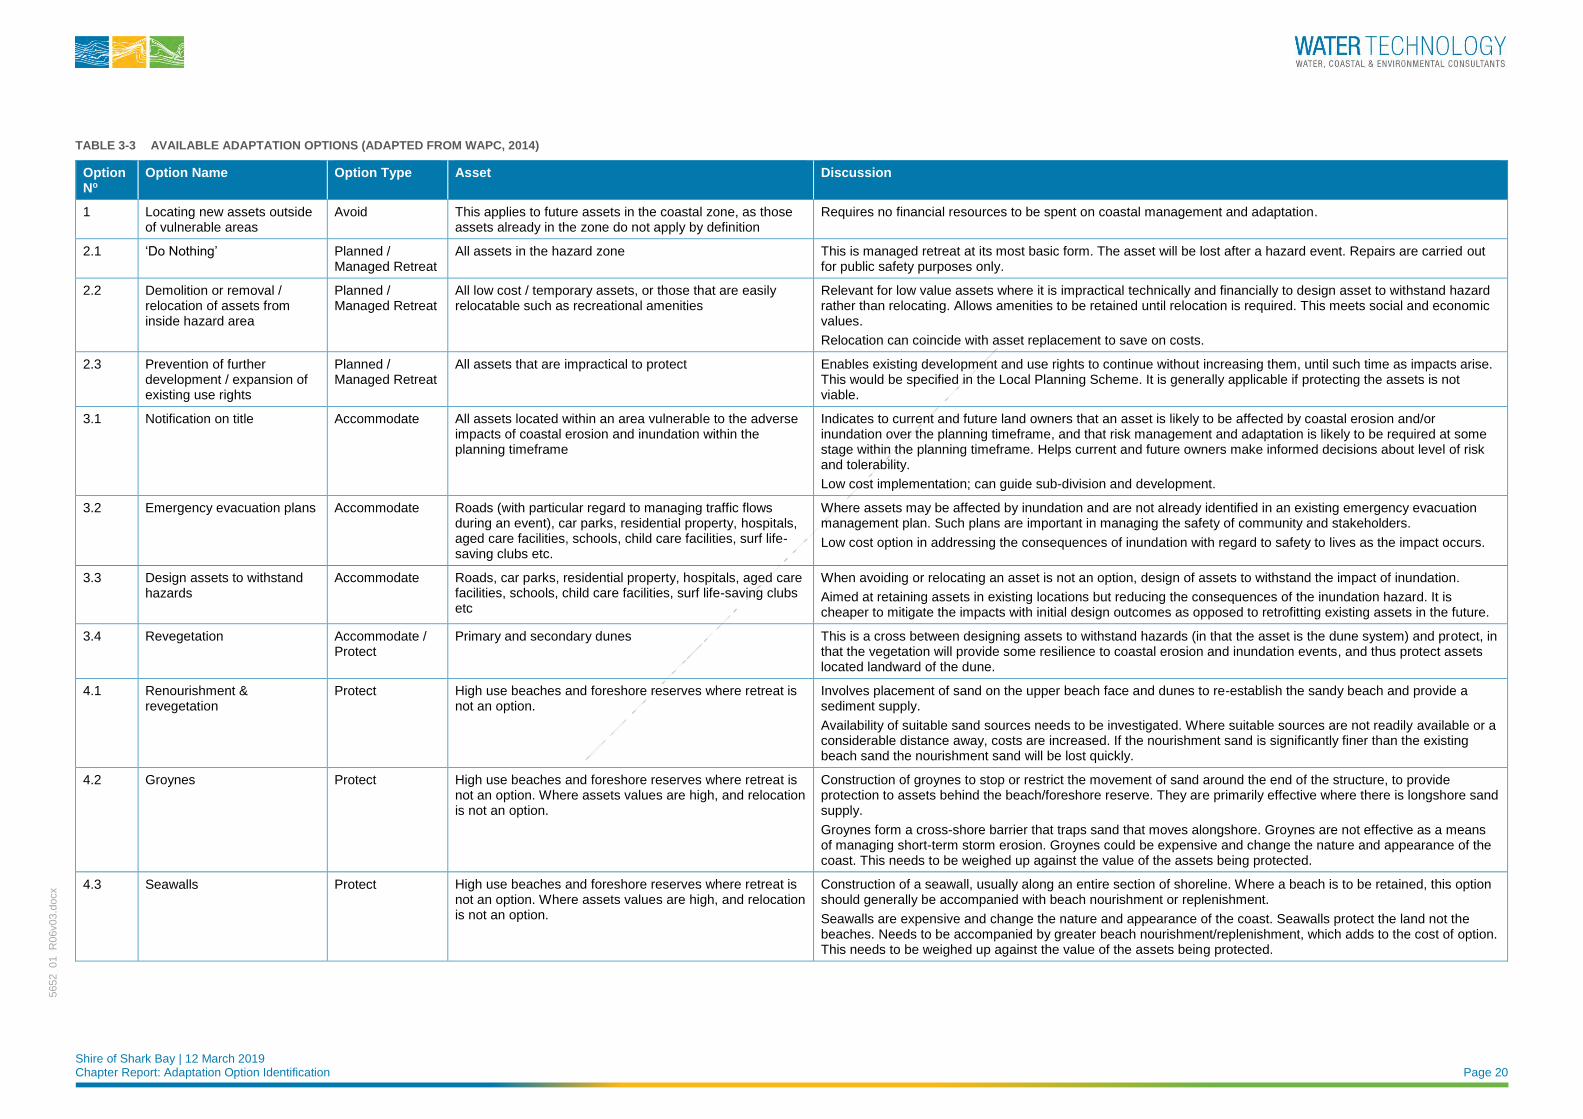
Shire of Shark Bay | 12 March 2019 Chapter Report: Adaptation Option Identification Page 20
5652_01_R
06v03.d
ocx
TABLE 3-3 AVAILABLE ADAPTATION OPTIONS (ADAPTED FROM WAPC, 2014)
Option No
Option Name Option Type Asset Discussion
1 Locating new assets outside of vulnerable areas
Avoid This applies to future assets in the coastal zone, as those assets already in the zone do not apply by definition
Requires no financial resources to be spent on coastal management and adaptation.
2.1 ‘Do Nothing’ Planned / Managed Retreat
All assets in the hazard zone This is managed retreat at its most basic form. The asset will be lost after a hazard event. Repairs are carried out for public safety purposes only.
2.2 Demolition or removal / relocation of assets from inside hazard area
Planned / Managed Retreat
All low cost / temporary assets, or those that are easily relocatable such as recreational amenities
Relevant for low value assets where it is impractical technically and financially to design asset to withstand hazard rather than relocating. Allows amenities to be retained until relocation is required. This meets social and economic values.
Relocation can coincide with asset replacement to save on costs.
2.3 Prevention of further development / expansion of existing use rights
Planned / Managed Retreat
All assets that are impractical to protect Enables existing development and use rights to continue without increasing them, until such time as impacts arise. This would be specified in the Local Planning Scheme. It is generally applicable if protecting the assets is not viable.
3.1 Notification on title Accommodate All assets located within an area vulnerable to the adverse impacts of coastal erosion and inundation within the planning timeframe
Indicates to current and future land owners that an asset is likely to be affected by coastal erosion and/or inundation over the planning timeframe, and that risk management and adaptation is likely to be required at some stage within the planning timeframe. Helps current and future owners make informed decisions about level of risk and tolerability.
Low cost implementation; can guide sub-division and development.
3.2 Emergency evacuation plans Accommodate Roads (with particular regard to managing traffic flows during an event), car parks, residential property, hospitals, aged care facilities, schools, child care facilities, surf life-saving clubs etc.
Where assets may be affected by inundation and are not already identified in an existing emergency evacuation management plan. Such plans are important in managing the safety of community and stakeholders.
Low cost option in addressing the consequences of inundation with regard to safety to lives as the impact occurs.
3.3 Design assets to withstand hazards
Accommodate Roads, car parks, residential property, hospitals, aged care facilities, schools, child care facilities, surf life-saving clubs etc
When avoiding or relocating an asset is not an option, design of assets to withstand the impact of inundation.
Aimed at retaining assets in existing locations but reducing the consequences of the inundation hazard. It is cheaper to mitigate the impacts with initial design outcomes as opposed to retrofitting existing assets in the future.
3.4 Revegetation Accommodate / Protect
Primary and secondary dunes This is a cross between designing assets to withstand hazards (in that the asset is the dune system) and protect, in that the vegetation will provide some resilience to coastal erosion and inundation events, and thus protect assets located landward of the dune.
4.1 Renourishment & revegetation
Protect High use beaches and foreshore reserves where retreat is not an option.
Involves placement of sand on the upper beach face and dunes to re-establish the sandy beach and provide a sediment supply.
Availability of suitable sand sources needs to be investigated. Where suitable sources are not readily available or a considerable distance away, costs are increased. If the nourishment sand is significantly finer than the existing beach sand the nourishment sand will be lost quickly.
4.2 Groynes Protect High use beaches and foreshore reserves where retreat is not an option. Where assets values are high, and relocation is not an option.
Construction of groynes to stop or restrict the movement of sand around the end of the structure, to provide protection to assets behind the beach/foreshore reserve. They are primarily effective where there is longshore sand supply.
Groynes form a cross-shore barrier that traps sand that moves alongshore. Groynes are not effective as a means of managing short-term storm erosion. Groynes could be expensive and change the nature and appearance of the coast. This needs to be weighed up against the value of the assets being protected.
4.3 Seawalls Protect High use beaches and foreshore reserves where retreat is not an option. Where assets values are high, and relocation is not an option.
Construction of a seawall, usually along an entire section of shoreline. Where a beach is to be retained, this option should generally be accompanied with beach nourishment or replenishment.
Seawalls are expensive and change the nature and appearance of the coast. Seawalls protect the land not the beaches. Needs to be accompanied by greater beach nourishment/replenishment, which adds to the cost of option. This needs to be weighed up against the value of the assets being protected.
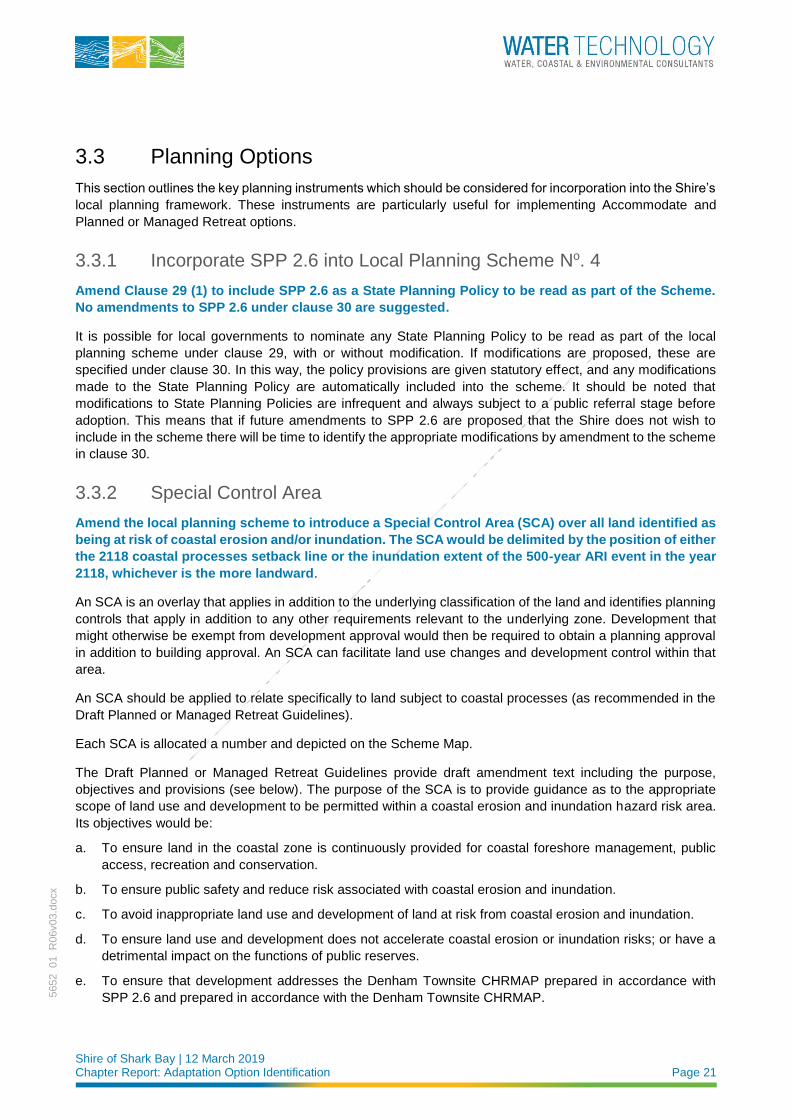
Shire of Shark Bay | 12 March 2019 Chapter Report: Adaptation Option Identification Page 21
5652_01_R
06v03.d
ocx
3.3 Planning Options
This section outlines the key planning instruments which should be considered for incorporation into the Shire’s
local planning framework. These instruments are particularly useful for implementing Accommodate and
Planned or Managed Retreat options.
3.3.1 Incorporate SPP 2.6 into Local Planning Scheme No. 4
Amend Clause 29 (1) to include SPP 2.6 as a State Planning Policy to be read as part of the Scheme.
No amendments to SPP 2.6 under clause 30 are suggested.
It is possible for local governments to nominate any State Planning Policy to be read as part of the local
planning scheme under clause 29, with or without modification. If modifications are proposed, these are
specified under clause 30. In this way, the policy provisions are given statutory effect, and any modifications
made to the State Planning Policy are automatically included into the scheme. It should be noted that
modifications to State Planning Policies are infrequent and always subject to a public referral stage before
adoption. This means that if future amendments to SPP 2.6 are proposed that the Shire does not wish to
include in the scheme there will be time to identify the appropriate modifications by amendment to the scheme
in clause 30.
3.3.2 Special Control Area
Amend the local planning scheme to introduce a Special Control Area (SCA) over all land identified as
being at risk of coastal erosion and/or inundation. The SCA would be delimited by the position of either
the 2118 coastal processes setback line or the inundation extent of the 500-year ARI event in the year
2118, whichever is the more landward.
An SCA is an overlay that applies in addition to the underlying classification of the land and identifies planning
controls that apply in addition to any other requirements relevant to the underlying zone. Development that
might otherwise be exempt from development approval would then be required to obtain a planning approval
in addition to building approval. An SCA can facilitate land use changes and development control within that
area.
An SCA should be applied to relate specifically to land subject to coastal processes (as recommended in the
Draft Planned or Managed Retreat Guidelines).
Each SCA is allocated a number and depicted on the Scheme Map.
The Draft Planned or Managed Retreat Guidelines provide draft amendment text including the purpose,
objectives and provisions (see below). The purpose of the SCA is to provide guidance as to the appropriate
scope of land use and development to be permitted within a coastal erosion and inundation hazard risk area.
Its objectives would be:
a. To ensure land in the coastal zone is continuously provided for coastal foreshore management, public
access, recreation and conservation.
b. To ensure public safety and reduce risk associated with coastal erosion and inundation.
c. To avoid inappropriate land use and development of land at risk from coastal erosion and inundation.
d. To ensure land use and development does not accelerate coastal erosion or inundation risks; or have a
detrimental impact on the functions of public reserves.
e. To ensure that development addresses the Denham Townsite CHRMAP prepared in accordance with
SPP 2.6 and prepared in accordance with the Denham Townsite CHRMAP.
Shire of Shark Bay | 12 March 2019 Chapter Report: Adaptation Option Identification Page 22
5652_01_R
06v03.d
ocx
The SCA would include additional provisions (over and above or overriding provisions for development not
within the SCA), such as:
a. All proposed development within the SCA requires approval. (This would include development that would
not ordinarily require development approval under the scheme).
b. Approval to be issued on a temporary or time limited basis. (The applicant could later apply for a further
approval, which could be granted if the risk from coastal processes was still considered acceptable).
c. Referral of applications. (Any planning application should be referred to the Department of Transport, the
Western Australian Planning Commission and any other relevant authority for advice and comment on the
coastal risk.)
d. Minimum finished floor levels and/or other development standards. (4.2 metres AHD has been identified
as the appropriate minimum FFL).
3.3.3 Coastal Development Local Planning Policy
Prepare a local policy to clarify its attitude and expectations in relation to coastal development
including the type of permanent or temporary assets it is prepared to accept within the coastal reserve
and/or on land subject to coastal processes.
Local Planning Policies (LPP) are prepared and adopted according to the provisions Division 2 of Part 2 of the
Deemed Provisions of LPS 4. The Deemed Provisions comprise Schedule 2 of the Planning and Development
(Local Planning Schemes) Guidelines 2015.
A Coastal Development LPP can provide more detail and guidance on what sort of development would be
acceptable and will also assist the Council in making planning decisions on coastal development requiring the
exercise of discretion. For example, on land at risk of erosion within the life of a proposed development the
LPP may encourage use of structures that can be disassembled and/or transported should erosion come within
a specified distance of the structure. The policy would also identify the Council’s intention to require
notifications on title as a condition of development approval.
3.3.4 Notifications on Title
All freehold land identified as being at risk of impact from coastal processes should have a notification
placed on its certificate of title/s to make the owner and future landholders aware of the potential for
the land to be impacted.
Section 70A of the Transfer of Land Act 1893 and Section 165 of the Planning and Development Act 2005
enables a local government or public authority to cause a notification to be placed on the certificate of title of
land to make owners and future owners of land aware of a factor that may affect the use and enjoyment of the
land. The process requires the written consent of the landholder and payment of a fee, so it is usual for the
requirement for placement of a notification to be a condition of development or subdivision approval. However,
placement of a notification on the title does not have to be tied to an application and could take place at any
time with owner consent.
Indicative wording is as follows, as per SPP2.6:
VULNERABLE COASTAL AREA – This lot is located in an area likely to be subject to coastal erosion and/or inundation over the next 100 years.
Shire of Shark Bay | 12 March 2019 Chapter Report: Adaptation Option Identification Page 23
5652_01_R
06v03.d
ocx
3.3.5 Other Instruments
Other instruments may be useful for implementing adaptation options. These include:
◼ Restrictive Covenants, which can be used to restrict present and future landholders from constructing
protection structures and, to internalise the risk of building in inherently hazardous locations.
◼ Special Area Rates, which can be used to ensure that the costs associated with protection options are
equitably distributed across beneficiaries.
◼ The requirement for a structure plan could be considered, setting out development provisions and planning
controls consistent with SPP2.6 for vulnerable areas with new development/subdivision proposed.
◼ Update of Shire of Shark Bay Local Planning Strategy to be considered as part of amendments to other
planning instruments.
The intent of these instruments aligns with guidance provided in the WA Coastal Zone Strategy, noting that
private parties are responsible for managing risks to their private assets and incomes which might arise from
coastal erosion and inundation hazards.
Shire of Shark Bay | 12 March 2019 Chapter Report: Adaptation Option Identification Page 24
5652_01_R
06v03.d
ocx
4 INUNDATION ADAPTATION OPTIONS This section discusses adaptation options identified to respond to inundation hazards.
4.1 Present Day
Whilst 140 identified assets are at some level of risk in the present day, due to the low likelihood of the 500-
year ARI inundation event occurring (0.2%), the resulting risk classification is low for all assets except the
critical utilities. These utilities may require additional maintenance if significantly inundated. Depending on their
specific construction details, the Shire and responsible authorities may consider planning for the relocation of
these assets in the present day, or adapting designs to ensure inundation does not cause asset failure. This
may apply to the electrical box, the water pumping station and the water well located at the south-eastern end
of Knight Terrace, as well as the electrical substation on Durlacher St near the corner of Knight Terrace.
Due to the number of assets already at risk in the present day, there are additional options that will facilitate
flexible adaptation in the future:
◼ Prevention of further development / limiting existing use rights
◼ Introduce ‘Special Control Area - Coastal Hazard’ with a requirement for new development to achieve
a minimum finished floor level of 4.2m AHD for habitable areas of buildings. Depending on the nature
of development proposed, approval may be time limited or require structures to be removed by a
specified date or when a specified trigger is reached.
◼ Introduce a local planning policy outlining the Shire’s requirements for building construction, land fill,
and other relevant matters within the Special Control Area.
◼ Incorporate SPP 2.6 into Local Planning Scheme
◼ Any new assets should avoid the coastal zone.
◼ If they must be located within the coastal zone, they should be designed to withstand the inundation
hazard. For example, new buildings to be constructed with permeable lower levels (e.g. a stilt
arrangement), and services located above the flood level. This avoids the need to use fill to raise the
(FFL). Fill is expensive, and also alters the flood flow, which could lead to increased hazards.
◼ Emergency evacuation plans for the affected areas
◼ It is noted that access to the town is not predicted to be blocked in the event of a hazard.
◼ Commence investigations to determine options for appropriate longer-term relocation of affected parts of
the town
4.2 Future Timeframes
The adaptation options discussed below are in addition to or add to those discussed for the Present Day above.
Economically, relocation or managed retreat options may be triggered by the physical costs of repair exceeding
the relocation costs. As per the success criteria and adaptation hierarchy, consideration should be given to the
continued allowance for a recreational reserve. This may mean relocating buildings ahead of their risk rating
in order to continue to allow this space.
Shire of Shark Bay | 12 March 2019 Chapter Report: Adaptation Option Identification Page 25
5652_01_R
06v03.d
ocx
4.2.1 2030
The modelling has indicated that by 2030, inundation places most assets at medium risk. This means additional
maintenance or repair will be required if significantly inundated. The multi-criteria analysis (MCA) / cost benefit
analysis (CBA) to be conducted in the next chapter report: Assessment of Adaptation Options should
investigate the timeframe when (if) relocating the foreshore recreational infrastructure is the most appropriate.
Public, commercial, tourism and residential buildings may need to consider mechanisms for minimising the
impact of flood damage. The Shire is not responsible for preventing damage to private assets. Therefore,
where relevant, landholders might consider the following measures in their own responses to minimise coastal
hazard risk:
◼ Services moved so as to be located above the recommended FFL
◼ Commercial stock or important possessions stored above the flood level
◼ Installation of false (raised) floors
◼ Use of materials that are water resistant
◼ Floorplate / wall arrangements to allow flow of water (and therefore minimise damage)
◼ Building evacuation requirements
The fuel tank at the marina, and the petrol tanks / pumps at the two petrol stations should be investigated as
to their resilience under an inundation event. Potentially adaptation of the waterproofing / footings could be
carried out to ensure spills do not occur.
The following planning mechanisms are also recommended:
◼ Ensure that appropriately zoned land is available for relocation of the town as necessary. Structure
planning of the land may be required.
◼ Amend the provisions (and boundaries, if necessary) of the Special Control Area to manage development
in locations at risk of permanent inundation.
4.2.2 2050
Utilities and foreshore recreational infrastructure may require significant repair. Relocation may be a viable
option by this timeframe. As per the 2030 timeframe, the CBA will provide a clearer understanding of the
actions in this timeframe.
At this time, the drains and drainage system to the beach may need to be modified to continue to function. The
drains rely on gravity flow from the streets down to the ocean. Under increased sea levels and storm frequency,
the ability of the drains to function will be reduced as they may be more frequently inundated from the ocean
side, such that there is nowhere for the landward-side water to go.
Public, commercial, tourism and residential buildings should consider mechanisms for minimising the impact
of flood damage, as per the recommendations in 2030 above.
There may be some flood related damage to Knight Terrace, car parks, and grassed foreshore area leading
to increased maintenance requirements.
Structure plans for relocation areas should have been completed and the Scheme Map amended as
necessary.
Shire of Shark Bay | 12 March 2019 Chapter Report: Adaptation Option Identification Page 26
5652_01_R
06v03.d
ocx
4.2.3 2118
Utilities, foreshore recreational infrastructure, Knight Terrace, Stella Rowley Drive and the adjacent car parking
areas and drains may require significant repair or relocation.
Under the 2118 predicted sea level rise, the drains may be completely inundated during a tidal cycle, leading
to the inability to drain rainwater at high tide.
Public, commercial, tourism and residential buildings may need significant repairs or relocation.
Flood related damage to public open space, beach access, boat ramps and marine infrastructure may require
significant repairs.
Shire of Shark Bay | 12 March 2019 Chapter Report: Adaptation Option Identification Page 27
5652_01_R
06v03.d
ocx
5 COASTAL EROSION ADAPTATION OPTIONS
5.1 Present Day
The evolution of the Denham townsite is such that much of the recreational infrastructure, and Knight Terrace
itself, is located where the primary dune would have been historically. The foreshore from the Denham Seaside
Tourist Village on Stella Rowley Drive, to the intersection of Denham Hamelin Road, is on reclaimed land. In
an unmodified, undeveloped beach system, the primary dune acts as a natural buffer for erosion events. During
storm events the dune face is eroded, and over time, is built back up again naturally. In the study area, as the
dune has been converted to recreational and infrastructure space, erosion events will have a greater impact
as the system has little tolerance to the erosion / accretion cycle. In addition to storm events, human foot traffic
and stormwater run-off can also be significant contributors to erosion.
As indicated by the history of reclamation, the shoreline plan has changed significantly since European
settlement. A 1987 aerial photograph displayed in the Shire’s office shows some early reclamation works at
the present-day marina site. The 2001 image available to view on the Landgate website shows the extension
of this reclamation either side of the marina to the west and east. In this image, the beach area to the west of
the marina extends some 16 m seaward of the beach location in the 2017 aerial image, noting the present-
day beach is held in place by a low seawall. This movement is reflected in the historical shoreline movement
chapter within Water Technology (2018b).
The 2017 planform (that is, the present-day planform) is likely more stable in shape than that of 1987 and
2001, due to its smoother profile. Unless rock is present, the shoreline will generally evolve to be parallel to
the incoming wave crests. Sharp changes in beach planform shape due to reclamation works would be
reworked to an equilibrium shape. It is expected that is what has happened along the Denham foreshore.
The present condition of the foreshore is summarised in Table 5-1, split by the study area sections defined in
the Coastal Hazard & Vulnerability Assessment Chapter Report (Water Technology, 2018b, refer Figure 5-1).
Also included in the table are each section’s vulnerability to erosion, and potential coastal management actions
that could improve stability in the present day.
In the present day, only the adhoc seawall is considered a medium risk according to the risk assessment
(Water Technology, 2018a). To mitigate this risk fully would require formal design and construction. However,
the upgrade of a seawall constitutes a protect option, which is not preferred under the adaptation hierarchy. It
is also contrary to the feedback received during the project that has formed the success criteria. The presence
of a formal seawall would significantly reduce the public amenity of the beaches from the marina to the eastern
end of Knight Terrace. We note this could simply extend from the marina to the intersection of Denham Hamelin
Road.
Revegetation in the adhoc seawall’s lee with some minor renourishment to stabilise the profile may be an
alternative, in addition to an initial re-placement of the existing rocks into a more stable shape. Maintenance
of this vegetation will provide a natural resilience to the narrow ‘dune’ between the beach and recreational
infrastructure.
Groynes are not a suitable option at the site unless multiple groynes are in place, together with significant
renourishment and bypassing works. This would require ongoing maintenance in the long term and thus
constitute a ‘legacy’ adaptation option. Groynes can also lead to unintended consequences.
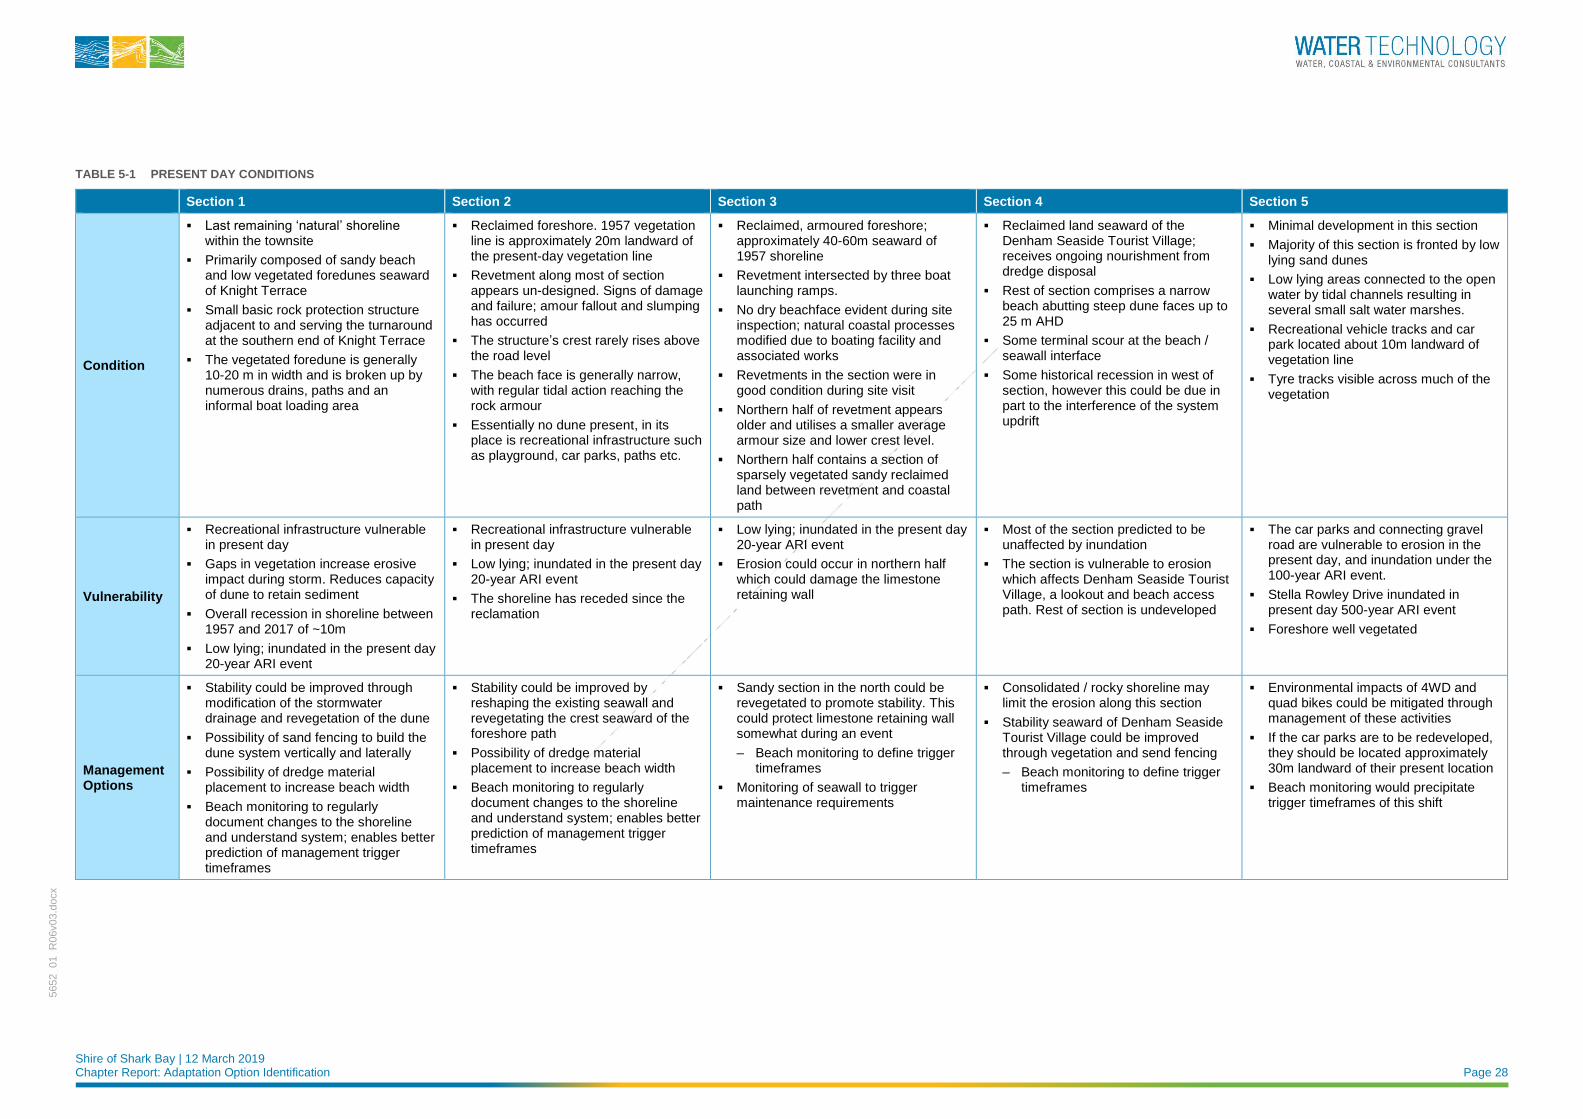
Shire of Shark Bay | 12 March 2019 Chapter Report: Adaptation Option Identification Page 28
5652_01_R
06v03.d
ocx
TABLE 5-1 PRESENT DAY CONDITIONS
Section 1 Section 2 Section 3 Section 4 Section 5
Condition
▪ Last remaining ‘natural’ shoreline within the townsite
▪ Primarily composed of sandy beach and low vegetated foredunes seaward of Knight Terrace
▪ Small basic rock protection structure adjacent to and serving the turnaround at the southern end of Knight Terrace
▪ The vegetated foredune is generally 10-20 m in width and is broken up by numerous drains, paths and an informal boat loading area
▪ Reclaimed foreshore. 1957 vegetation line is approximately 20m landward of the present-day vegetation line
▪ Revetment along most of section appears un-designed. Signs of damage and failure; amour fallout and slumping has occurred
▪ The structure’s crest rarely rises above the road level
▪ The beach face is generally narrow, with regular tidal action reaching the rock armour
▪ Essentially no dune present, in its place is recreational infrastructure such as playground, car parks, paths etc.
▪ Reclaimed, armoured foreshore; approximately 40-60m seaward of 1957 shoreline
▪ Revetment intersected by three boat launching ramps.
▪ No dry beachface evident during site inspection; natural coastal processes modified due to boating facility and associated works
▪ Revetments in the section were in good condition during site visit
▪ Northern half of revetment appears older and utilises a smaller average armour size and lower crest level.
▪ Northern half contains a section of sparsely vegetated sandy reclaimed land between revetment and coastal path
▪ Reclaimed land seaward of the Denham Seaside Tourist Village; receives ongoing nourishment from dredge disposal
▪ Rest of section comprises a narrow beach abutting steep dune faces up to 25 m AHD
▪ Some terminal scour at the beach / seawall interface
▪ Some historical recession in west of section, however this could be due in part to the interference of the system updrift
▪ Minimal development in this section
▪ Majority of this section is fronted by low lying sand dunes
▪ Low lying areas connected to the open water by tidal channels resulting in several small salt water marshes.
▪ Recreational vehicle tracks and car park located about 10m landward of vegetation line
▪ Tyre tracks visible across much of the vegetation
Vulnerability
▪ Recreational infrastructure vulnerable in present day
▪ Gaps in vegetation increase erosive impact during storm. Reduces capacity of dune to retain sediment
▪ Overall recession in shoreline between 1957 and 2017 of ~10m
▪ Low lying; inundated in the present day 20-year ARI event
▪ Recreational infrastructure vulnerable in present day
▪ Low lying; inundated in the present day 20-year ARI event
▪ The shoreline has receded since the reclamation
▪ Low lying; inundated in the present day 20-year ARI event
▪ Erosion could occur in northern half which could damage the limestone retaining wall
▪ Most of the section predicted to be unaffected by inundation
▪ The section is vulnerable to erosion which affects Denham Seaside Tourist Village, a lookout and beach access path. Rest of section is undeveloped
▪ The car parks and connecting gravel road are vulnerable to erosion in the present day, and inundation under the 100-year ARI event.
▪ Stella Rowley Drive inundated in present day 500-year ARI event
▪ Foreshore well vegetated
Management Options
▪ Stability could be improved through modification of the stormwater drainage and revegetation of the dune
▪ Possibility of sand fencing to build the dune system vertically and laterally
▪ Possibility of dredge material placement to increase beach width
▪ Beach monitoring to regularly document changes to the shoreline and understand system; enables better prediction of management trigger timeframes
▪ Stability could be improved by reshaping the existing seawall and revegetating the crest seaward of the foreshore path
▪ Possibility of dredge material placement to increase beach width
▪ Beach monitoring to regularly document changes to the shoreline and understand system; enables better prediction of management trigger timeframes
▪ Sandy section in the north could be revegetated to promote stability. This could protect limestone retaining wall somewhat during an event
– Beach monitoring to define trigger timeframes
▪ Monitoring of seawall to trigger maintenance requirements
▪ Consolidated / rocky shoreline may limit the erosion along this section
▪ Stability seaward of Denham Seaside Tourist Village could be improved through vegetation and send fencing
– Beach monitoring to define trigger timeframes
▪ Environmental impacts of 4WD and quad bikes could be mitigated through management of these activities
▪ If the car parks are to be redeveloped, they should be located approximately 30m landward of their present location
▪ Beach monitoring would precipitate trigger timeframes of this shift
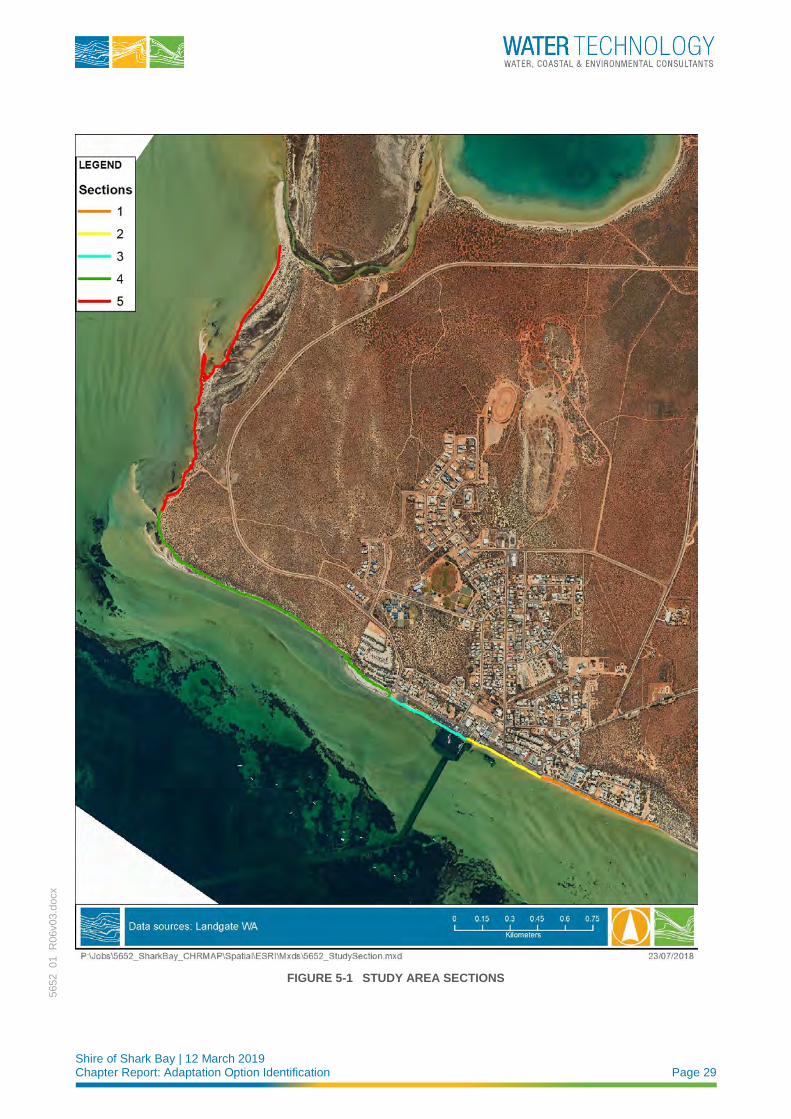
Shire of Shark Bay | 12 March 2019 Chapter Report: Adaptation Option Identification Page 29
5652_01_R
06v03.d
ocx
FIGURE 5-1 STUDY AREA SECTIONS
Shire of Shark Bay | 12 March 2019 Chapter Report: Adaptation Option Identification Page 30
5652_01_R
06v03.d
ocx
As per the inundation adaptation options, planning mechanisms are recommended. These are as follows:
◼ Introduce Special Control Area - Coastal Hazard with a requirement for new development to achieve a
minimum finished floor level of 4.2m AHD (in line with the present Scheme revisions) for habitable areas
of buildings. Depending on the nature of development proposed, approval may be time limited or require
structures to be removed by a specified date or when a specified trigger is reached.
◼ Require notification on Title for all land located seaward of the 100-year hazard line for coastal erosion.
This should be made a condition of any approval for development or subdivision/amalgamation of land.
The Shire should also negotiate with landholders whose land is not subject to an application for planning
approval to place such a notification on the title with their consent.
◼ Introduce a local planning policy outlining the Shire’s requirements for building construction, land fill, and
other relevant matters within the Special Control Area.
◼ Commence investigations to determine options for appropriate longer-term relocation of affected parts of
the town.
5.2 Future Timeframes
The modelling has provided an indicative timeframe as to when adaptation will be required. However, it is
recommended to employ the use of triggers for adaptation, including for relocation or managed retreat
purposes. These are as per those of WAPC (2017).
◼ Trigger 1: Where the most landward part of the Horizontal Shoreline Datum (HSD) is within 40 metres of
the most seaward point of a development / structure / foreshore reserve area.
◼ Due to the high value placed on the foreshore coastal reserve, the recreational area would itself be
considered the asset in this case
◼ Trigger 2: Where a public road is no longer available or able to provide legal access to the property
◼ This may occur for Knight Terrace, particularly to the east of Denham Hamelin Road. The Shire may
choose to investigate access options from the landward side of these properties.
◼ Trigger 3: When water, sewage or electricity to the lot is no longer available as they have been
removed/decommissioned by the relevant authority due to coastal hazards.
As per the inundation discussion, the management measures discussed in Table 5-1 and Chapter 5.1 above
apply in the addition to those discussed below.
5.2.1 2030
Amend the provisions (and boundaries, if necessary) of the Special Control Area to limit development in
locations at risk of erosion.
Continue to require notification on title as a condition of planning approval and/or on a voluntary basis.
Ensure that appropriately zoned land is available for relocation of the town as necessary. Structure planning
of the land may be required.
Utility connected foreshore infrastructure, marina fuel tank, utilities and Knight Terrace may require additional
maintenance / repair by this timeframe.

Shire of Shark Bay | 12 March 2019 Chapter Report: Adaptation Option Identification Page 31
5652_01_R
06v03.d
ocx
5.2.2 2050
Utilities, marina fuel tank, petrol pumps and utility connected foreshore infrastructure may require significant
repairs.
Public, commercial, tourism and residential buildings may sustain damage.
Knight Terrace, Stella Rowley Drive and foreshore recreational infrastructure may require additional
maintenance.
Structure plans for relocation areas should have been completed and the Scheme Map amended as
necessary.
5.2.3 2118
Utilities, marina fuel tank, petrol pumps, utility connected foreshore infrastructure, public, commercial, tourism
and residential buildings, Knight Terrace and a section of Stella Rowley Drive may require relocation.
Foreshore recreational infrastructure may require significant repair or relocation.
Beach access, boat ramps and marine infrastructure may require significant repairs.
Shire of Shark Bay | 12 March 2019 Chapter Report: Adaptation Option Identification Page 32
5652_01_R
06v03.d
ocx
6 CONCLUSIONS The adaptation options presented within this report have followed the coastal hazard risk management
hierarchy, as per SPP2.6. The aim of the adaptation is to provide a planning framework that the Shire can
follow that allows sustainable development, but also allows the continued use of the land until the risk is
realised, and there is a plan on what to do if it is.
The final management options will include the continued revision of the CHRMAP and update of the
recommended options at regular intervals (i.e. every five to ten years). This is due to corresponding future
updates in climate change science, coastal engineering methodology, changes to the town’s success criteria,
triggers reached, and so on.
The next stage of the project will assess the adaptation options discussed within this report with a multi-criteria
analysis. Options receiving a positive score from this will be assessed in a cost benefit analysis. All adaptation
options come with a financial cost. We recommend investigating funding avenues based on the town’s high
tourism value, and the World Heritage listing. Maintaining the culture and recreational value of the Denham
townsite is strongly linked to the continuation of both tourism and environmental protection of the region.
In addition to the recommendations of the CHRMAP, local foreshore management plans should consider
broader issues such as biodiversity and environmental impacts.
The identification and assessment of the adaptation options will be reviewed by the community and
stakeholders, as recommended in WAPC (2014). Similarly, the community and stakeholders may have
suggestions for alternate adaptation options. The Stakeholder and Community Engagement Strategy (Water
Technology, 2018d) identified a review period that included a workshop and online survey to complete this
process.
Shire of Shark Bay | 12 March 2019 Chapter Report: Adaptation Option Identification Page 33
5652_01_R
06v03.d
ocx
7 REFERENCES Intergovernmental Panel on Climate Change (IPCC, 2014). Climate Change 2014: Synthesis Report, Contribution of Working Groups I, II and III to the Fifth Assessment Report of the Intergovernmental Panel on
Climate Change. Geneva, Switzerland, Core Writing Team, R.K. Pachauri and L.A. Meyer (eds.)], IPCC,
Geneva, Switzerland, 151 pp.
Robb, A., Stocker, L., Payne M., & Middle, G., (2017). ‘Planning for coastal erosion and inundation in Western
Australia: Practices and perceptions from the local level’, Environmental and Planning Law Journal, Volume
34
Robb, A., Payne, M., Stocker, L., Middle G. & Trosic, A. (2018). ‘Development Control And Vulnerable Coastal
Lands: Examples Of Australian Practice’, Urban Policy and Research, DOI: 10.1080/08111146.2018.1489791
Water Technology (2018a). Denham Townsite CHRMAP Chapter Report: Risk Assessment, Report No 5652-
01 R05v01, prepared for Shire of Shark Bay
Water Technology (2018b). Denham Townsite CHRMAP Chapter Report: Coastal Hazard & Vulnerability Assessment, Report No 5652-01 R04v01, prepared for Shire of Shark Bay
Water Technology (2018c). Denham Townsite CHRMAP Chapter Report: Establish the Context, Report No
5652-01 R03v02, prepared for Shire of Shark Bay
Water Technology (2018d). Denham Townsite CHRMAP: Stakeholder and Community Engagement Plan,
Report No 5562-01 R01v01, prepared for Shire of Shark Bay
Western Australian Planning Commission (WAPC, 2013). State Planning Policy No. 2.6 – State Coastal
Planning Policy, prepared under the Planning and Development Act 2005.
Western Australian Planning Commission (WAPC, 2014). Coastal Hazard Risk Management and Adaptation
Planning Guidelines
Western Australian Planning Commission (WAPC, 2017). Draft Planned or Managed Retreat Guidelines,
published by WAPC, Department of Planning, Lands and Heritage
Shire of Shark Bay | 31 March 2020 Final Report
5652_01_R
09v02.d
ocx
APPENDIX F CHAPTER REPORT: ASSESSMENT OF ADAPTATION OPTIONS
Denham Townsite CHRMAP
Chapter Report: Adaptation Option Assessment
Shire of Shark Bay
02 April 2019
Shire of Shark Bay | 02 April 2019 Chapter Report: Adaptation Option Assessment Page 1
5652_01_R
07v03.d
ocx
Document Status
Version Doc type Reviewed by Approved by Date issued
V01 DRAFT Richard Connell Richard Connell 31/10/2018
V02 FINAL Paul O’Brien Paul O’Brien 21/03/2019
V03 FINAL Paul O’Brien Paul O’Brien 02/04/2019
Project Details
Project Name Chapter Report: Adaptation Option Assessment
Client Shire of Shark Bay
Client Project Manager Paul Anderson
Water Technology Project Manager Joanna Garcia-Webb
Water Technology Project Director Paul O’Brien
Authors Joanna Garcia-Webb
Document Number 5652_01_R07v03.docx
COPYRIGHT
Water Technology Pty Ltd has produced this document in accordance with instructions from Shire of Shark Bay for their
use only. The concepts and information contained in this document are the copyright of Water Technology Pty Ltd. Use or
copying of this document in whole or in part without written permission of Water Technology Pty Ltd constitutes an
infringement of copyright.
Water Technology Pty Ltd does not warrant this document is definitive nor free from error and does not accept liability for
any loss caused, or arising from, reliance upon the information provided herein.
Ground Floor Head Office:
430 Roberts Road 15 Business Park Drive
Subiaco WA 6904 Notting Hill VIC 3168
Telephone 08 6555 0105
ACN 093 377 283
ABN 60 093 377 283
Shire of Shark Bay | 02 April 2019 Chapter Report: Adaptation Option Assessment Page 2
5652_01_R
07v03.d
ocx
02 April 2019
Paul Anderson Chief Executive Officer Shire of Shark Bay 65 Knight Terrace Denham WA 6537 Via email [email protected] Dear Paul
Chapter Report: Adaptation Option Assessment
We are pleased to present the Denham Townsite Coastal Hazard Risk Management and Adaptation Plan
Chapter Report: Adaptation Option Assessment. If you have any queries, please do not hesitate to contact me
on (08) 6555 0105.
Yours sincerely
Joanna Garcia-Webb Principal Coastal Engineer – National Practice Lead – Coasts & Environment
WATER TECHNOLOGY PTY LTD
Shire of Shark Bay | 02 April 2019 Chapter Report: Adaptation Option Assessment Page 3
5652_01_R
07v03.d
ocx
EXECUTIVE SUMMARY
It is internationally recognised that increasing sea levels and storm intensities will intensify coastal hazards
such as coastal inundation (temporary coastal flooding), storm erosion and long-term shoreline recession
(IPCC 2014). Consequently, State governments across Australia have introduced obligations that require local
governments to consider and plan for the effects of these hazards over various planning timeframes. In
Western Australia (WA), the governing policy is the Western Australian Planning Commission’s State Coastal
Planning Policy 2.6 (WAPC, 2013, herein referred to as “SPP2.6”). SPP2.6 recommends management
authorities develop a Coastal Hazard Risk Management and Adaptation Plan (CHRMAP). Specific guidelines
have been developed to assist in this process (WAPC, 2014).
One of the key objectives of SPP2.6 is to establish coastal foreshore reserves which include allowances for
the protection, conservation and enhancement of coastal values across the state. Risk assessment processes
are then utilised to identify risks that are intolerable to the community, and other stakeholders such as the
Shire of Shark Bay, indigenous and cultural interests, and private enterprise. Adaptation measures are then
developed according to the preferential adaptation hierarchy outlined in SPP2.6.
The overall CHRMAP purpose is as follows:
◼ To identify vulnerable assets (public and private) and the risk posed to them by coastal hazards.
◼ To preserve community values for present and future generations.
◼ To develop a plan that will allow the Shire to respond to identified risks through adaptation planning
activities.
◼ To recommend monitoring plans to ensure the risk management and adaptation plan activities are working
into the future as expected.
This document presents the Assessment of Adaptation Options Chapter Report. This assesses the identified
potential adaptation options for the prioritised list of assets at risk of coastal hazards developed during the
previous project phases. The flow chart displayed in Figure 1-2 indicates where this component of the study
sits with reference to the wider study; the ‘Adaptation Options Assessment’ phase corresponds to the bubble
shaded in red, as replicated below.
The Shire’s responsibility is limited to preserving public interests by minimising risks to public assets where
possible. As per the WA Coastal Zone Strategy 2017, it is not the Shire’s responsibility to address risks to
private assets.
This assessment has further defined the hazard mitigation options identified in the options identification report
(Water Technology, 2018a) and applied them to the coastal hazards faced within the Denham townsite and
surrounds. As discussed in the Water Technology (2018a), WAPC (2014) strongly recommend a tiered
preference system geared towards managed retreat for existing assets, then accommodation and finally
protection when no other strategy is plausible.
This report adheres to those guidelines, recommending avoid, managed retreat and some accommodation
options in all areas. Through a multi-criteria assessment and a cost-benefit analysis, various adaptation options
Assessment of Adaptation Options For each vulnerable asset:
• For each Mitigation / Adaptation measure:
o Multi-Criteria Analysis (MCA). If +ve, proceed to CBA
o Timeframes / triggers to be considered
• Trade-offs between option selection & asset value
Shire of Shark Bay | 02 April 2019 Chapter Report: Adaptation Option Assessment Page 4
5652_01_R
07v03.d
ocx
were scored and compared to the alternative of doing nothing. A summary of the final recommended options
from this report are presented in Table 1-1.
From this table some recommendations for the Shire are as follows:
◼ All new non-infill permanent development within the identified hazard zones should be avoided
◼ A special control area (SCA) should be created including, but not limited to the following:
◼ All proposed development within the SCA requires approval. (This would include development that
would not ordinarily require development approval under the scheme).
◼ Referral of applications (any planning application should be referred to the Department of
Transport, the Western Australian Planning Commission and any other relevant authority for
advice and comment on the coastal risk).
◼ Placement of Section 70A notification on appropriate land titles (notifying of coastal hazard risk)
◼ Prevention of further development for lots within the erosion hazard zone of the next epoch (i.e.:
staged prevention of development, initially for lots at risk by 2030, then later for lots at risk by 2050 if
hazard triggers are reached). This criterion may be relaxed for lots inland of protection structures as
long as the new development and protection structure design lives are taken into account.
◼ Requirement of houses damaged or otherwise triggered (see Section 2.2) by coastal hazards to be
relocated or rebuilt out of the hazard zone.
◼ Minimum finished floor levels and/or other development standards (4.2 metres AHD has been
identified as the appropriate minimum FFL).
◼ Land developers should also be made aware of the risks from inundation at present and in the future and
be educated of the steps they can take to minimise damage from such events.
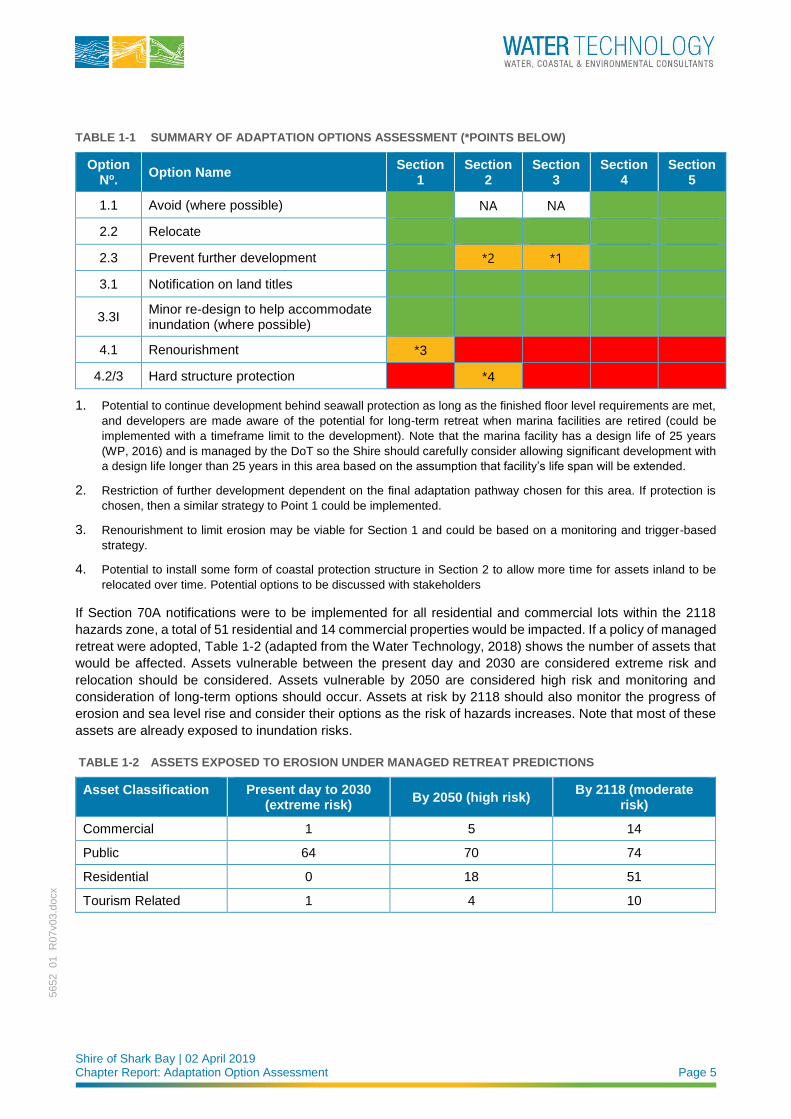
Shire of Shark Bay | 02 April 2019 Chapter Report: Adaptation Option Assessment Page 5
5652_01_R
07v03.d
ocx
TABLE 1-1 SUMMARY OF ADAPTATION OPTIONS ASSESSMENT (*POINTS BELOW)
Option No.
Option Name Section
1 Section
2 Section
3 Section
4 Section
5
1.1 Avoid (where possible) NA NA
2.2 Relocate
2.3 Prevent further development *2 *1
3.1 Notification on land titles
3.3I Minor re-design to help accommodate inundation (where possible)
4.1 Renourishment *3
4.2/3 Hard structure protection *4
1. Potential to continue development behind seawall protection as long as the finished floor level requirements are met,
and developers are made aware of the potential for long-term retreat when marina facilities are retired (could be
implemented with a timeframe limit to the development). Note that the marina facility has a design life of 25 years
(WP, 2016) and is managed by the DoT so the Shire should carefully consider allowing significant development with
a design life longer than 25 years in this area based on the assumption that facility’s life span will be extended.
2. Restriction of further development dependent on the final adaptation pathway chosen for this area. If protection is
chosen, then a similar strategy to Point 1 could be implemented.
3. Renourishment to limit erosion may be viable for Section 1 and could be based on a monitoring and trigger-based
strategy.
4. Potential to install some form of coastal protection structure in Section 2 to allow more time for assets inland to be
relocated over time. Potential options to be discussed with stakeholders
If Section 70A notifications were to be implemented for all residential and commercial lots within the 2118
hazards zone, a total of 51 residential and 14 commercial properties would be impacted. If a policy of managed
retreat were adopted, Table 1-2 (adapted from the Water Technology, 2018) shows the number of assets that
would be affected. Assets vulnerable between the present day and 2030 are considered extreme risk and
relocation should be considered. Assets vulnerable by 2050 are considered high risk and monitoring and
consideration of long-term options should occur. Assets at risk by 2118 should also monitor the progress of
erosion and sea level rise and consider their options as the risk of hazards increases. Note that most of these
assets are already exposed to inundation risks.
TABLE 1-2 ASSETS EXPOSED TO EROSION UNDER MANAGED RETREAT PREDICTIONS
Asset Classification Present day to 2030 (extreme risk)
By 2050 (high risk) By 2118 (moderate
risk)
Commercial 1 5 14
Public 64 70 74
Residential 0 18 51
Tourism Related 1 4 10
Shire of Shark Bay | 02 April 2019 Chapter Report: Adaptation Option Assessment Page 6
5652_01_R
07v03.d
ocx
The Denham townsite is situated close to or within the active coastal zone, especially high value areas such
as the hub of Knight Terrace and the marina facilities. This makes some interaction with coastal processes
unavoidable. This has already been observed through the placement of various coastal protection structures
over time, ranging from the new marina rock revetment to old ad-hoc erosion guards near vulnerable assets.
The upgrade of marina facilities has somewhat cemented a section of the town’s coastline in place for the next
few decades. Both the MCA and the CBA recommended this protection be maintained for the time being.
Given the results of the assessment, three primary adaptation pathways for the next 50-years are presented
below. These options were discussed with stakeholders with feedback implemented into the final
recommended adaptation pathways. Stakeholders should note that while the assessment indicated that certain
protection options may be viable, they do not include all the potential costs. Implementation of a protection
strategy may encourage developers to commit to areas at risk of inundation and may increase difficulty of a
successful managed retreat in the future.
1. Managed retreat for all areas except Section 3
2. Construction of more formal seawall in Section 2; managed retreat for all other areas except
Section 3.
3. Renourishment for protection of Section 1; independent of whether Option 1 or 2 is selected,
managed retreat for all other areas except Section 3.
Whilst erosion may be locally restricted in the near future if a protection strategy is pursued, it is clear from
inundation hazard mapping that as sea level rise progresses, the feasibility of development in low lying areas
will decline. The Shire should begin to prepare for long-term adaptation pathways that potentially involve
managed retreat of significant parts of the town, mainly Knight Terrace and associated lots. While the above
options under the managed retreat and accommodation groupings aim to make this process easier in the long
run, such a significant shift will require a clear and collaborative vision for Denham’s future. It is recommended
that the Shire investigate potential town structure plans that can achieve this goal over the next decade. Staged
infill to raise low lying parts of the town between new and old developments may be expensive and require
coastal protection indefinitely, which will be very difficult to justify.
The next stage of the project considers implementation of the selected options. An implementation plan will be
prepared for each vulnerable group of assets, identifying long-term pathways, considering trigger points and
all components of the CHRMAP to date. A short-term implementation plan to produce a clear action plan to
2030 will be developed, as well as a monitoring plan, detailing any monitoring or review that may be required
over the full 100-year planning timeframe.
Shire of Shark Bay | 02 April 2019 Chapter Report: Adaptation Option Assessment Page 7
5652_01_R
07v03.d
ocx
CONTENTS
1 INTRODUCTION 9
2 POTENTIAL ADAPTATION OPTIONS 12
2.1 Do Nothing 13
2.2 Planned or Managed Retreat 13
2.2.1 Development Restrictions – Planning Instruments 13
2.3 Renourishment 14
2.4 Protection Structures 14
3 MULTI-CRITERIA ASSESSMENT APPROACH 15
3.1 Assessment Framework 16
4 MULTI-CRITERIA ASSESSMENT RESULTS 19
4.1 Section 1 20
4.2 Section 2 21
4.3 Section 3 22
4.4 Section 4 23
4.5 Section 5 24
5 COST BENEFIT ANALYSIS 25
5.1 Analysis Approach 25
5.2 Adaptation Options Assessed 25
5.3 Erosion and Inundation 26
5.4 Asset Valuation 27
5.5 Options Costing 27
5.6 Assumptions 28
5.7 Results 28
6 ADAPTATION PLANNING – COMMUNITY ENGAGEMENT 30
6.1 Engagement Process 30
6.2 Stakeholders 30
6.3 Adaptation Options Workshop Summary 30
6.4 Adaptation Options Survey 31
6.5 Engagement Summary 32
7 SUMMARY 33
8 REFERENCES 36
APPENDICES
Asset Values
Appendix B Community Information Sheet
Appendix C Adaptation Options Survey Questions

Shire of Shark Bay | 02 April 2019 Chapter Report: Adaptation Option Assessment Page 8
5652_01_R
07v03.d
ocx
Appendix D Adaptation Options Survey Results
LIST OF FIGURES
Figure 1-1 Extent of CHRMAP 10
Figure 1-2 Proposed CHRMAP methodology flow chart (adapted from WAPC CHRMAP Guidelines) 11
Figure 3-1 Coastal hazard risk management and adaptation planning hierarchy (adapted from WAPC, 2013) 16
Figure 3-2 Study area sections 17
LIST OF TABLES
Table 1-1 Summary of Adaptation Options Assessment (*Points below) 5
Table 1-2 Assets Exposed to Erosion Under Managed Retreat Predictions 5
Table 2-1 Available Adaptation Options (Water Technology 2018a, Table 3-3; adapted from WAPC, 2014) 12
Table 3-1 Multi-criteria assessment framework for Denham 18
Table 4-1 MCA for Section 1 20
Table 4-2 MCA for Section 2 21
Table 4-3 MCA for Section 3 22
Table 4-4 MCA for Section 4 23
Table 4-5 MCA for Section 5 24
Table 5-1 Outline of options assessed in the CBA 26
Table 5-2 CBA Results 29
Table 6-1 Summary of Adaptation Options Assessment (*Points below) 34
Table 6-2 Assets Exposed to Erosion Under Managed Retreat Predictions 34
Table A-1 CBA asset valuations 39
Table C-1 Proposed adaptation options survey questions 45
Shire of Shark Bay | 02 April 2019 Chapter Report: Adaptation Option Assessment Page 9
5652_01_R
07v03.d
ocx
1 INTRODUCTION
It is internationally recognised that increasing sea levels and storm intensities will intensify coastal hazards
such as coastal inundation (temporary coastal flooding), storm erosion and long-term shoreline recession
(IPCC 2014). Consequently, State governments across Australia have introduced obligations that require local
governments to consider and plan for the effects of these hazards over various planning timeframes. In
Western Australia (WA), the governing policy is the Western Australian Planning Commission’s State Coastal
Planning Policy 2.6 (WAPC, 2013, herein referred to as “SPP2.6”). SPP2.6 recommends management
authorities develop a Coastal Hazard Risk Management and Adaptation Plan (CHRMAP). Specific guidelines
have been developed to assist in this process (WAPC, 2014).
One of the key objectives of SPP2.6 is to establish coastal foreshore reserves which include allowances for
the protection, conservation and enhancement of coastal values across the state. Risk assessment processes
are then utilised to identify risks that are intolerable to the community, and other stakeholders such as the
Shire of Shark Bay, indigenous and cultural interests, and private enterprise. Adaptation measures are then
developed according to the preferential adaptation hierarchy outlined in SPP2.6.
The aim of the present study is to investigate and plan for coastal hazards which are likely to affect the Denham
townsite. Denham is located within the local government area of the Shire of Shark Bay, approximately 800km
north of Perth (refer Figure 1-1 for locality). Denham and its surrounds are used extensively for tourism,
commercial and recreational purposes. Tourism is the primary industry in the Shire, with fishing and
aquaculture also playing a major role.
Given the above, visitors to and residents of Denham and its surrounds place a high value on the coastline.
Processes affecting the coastal zone are multiple and complex: storm surge; tidal movement; shoreline
stability; stormwater drainage; and the interactions between surface and groundwater all contribute in differing
degrees. Furthermore, the potential impacts of climate change, specifically increasing sea levels and storm
intensities, will place increased pressure on the coastal zone, and threaten public infrastructure and assets,
private property, foreshore reserves, coastal attractions and public open spaces.
This document presents the Assessment of Adaptation Options Chapter Report. This assesses the identified
potential adaptation options for the prioritised list of assets at risk of coastal hazards developed during the
previous project phases. The flow chart displayed in Figure 1-2 indicates where this component of the study
sits with reference to the wider study; the ‘Adaptation Options Assessment’ phase corresponds to the bubble
shaded in red.
The Shire’s responsibility is limited to preserving public interests by minimising risks to public assets where
possible. As per the WA Coastal Zone Strategy 2017, it is not the Shire’s responsibility to address risks to
private assets.
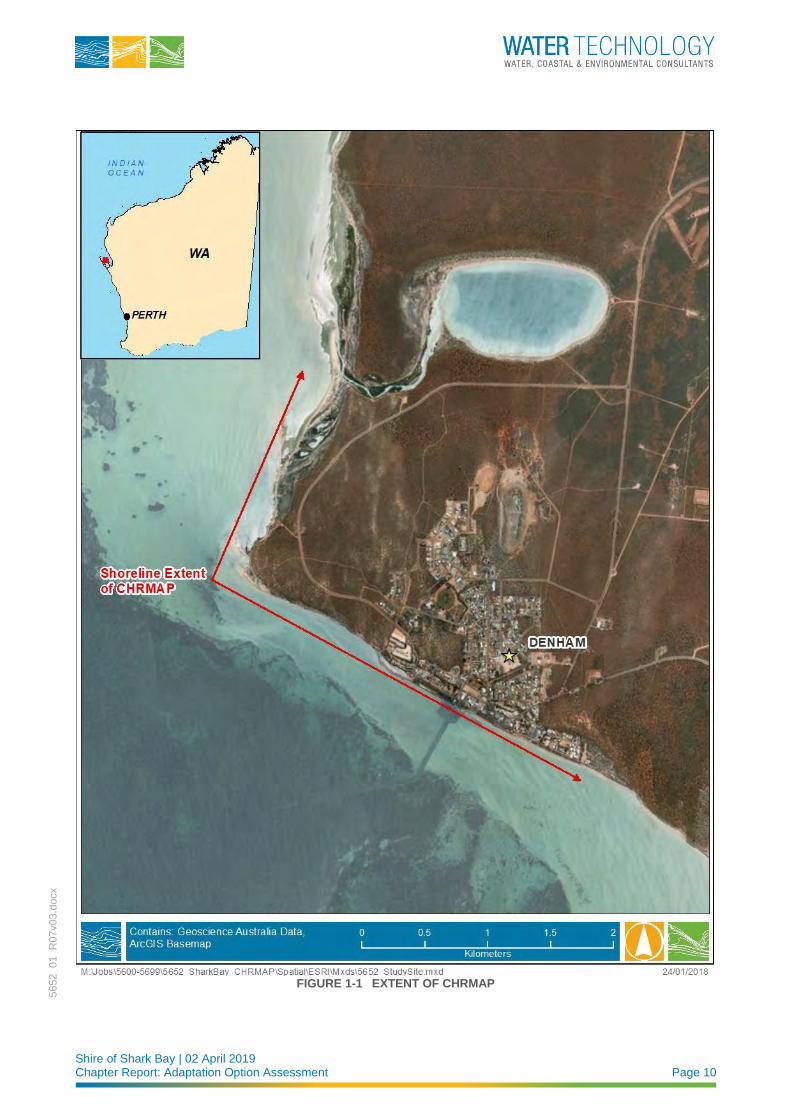
Shire of Shark Bay | 02 April 2019 Chapter Report: Adaptation Option Assessment Page 10
5652_01_R
07v03.d
ocx
FIGURE 1-1 EXTENT OF CHRMAP
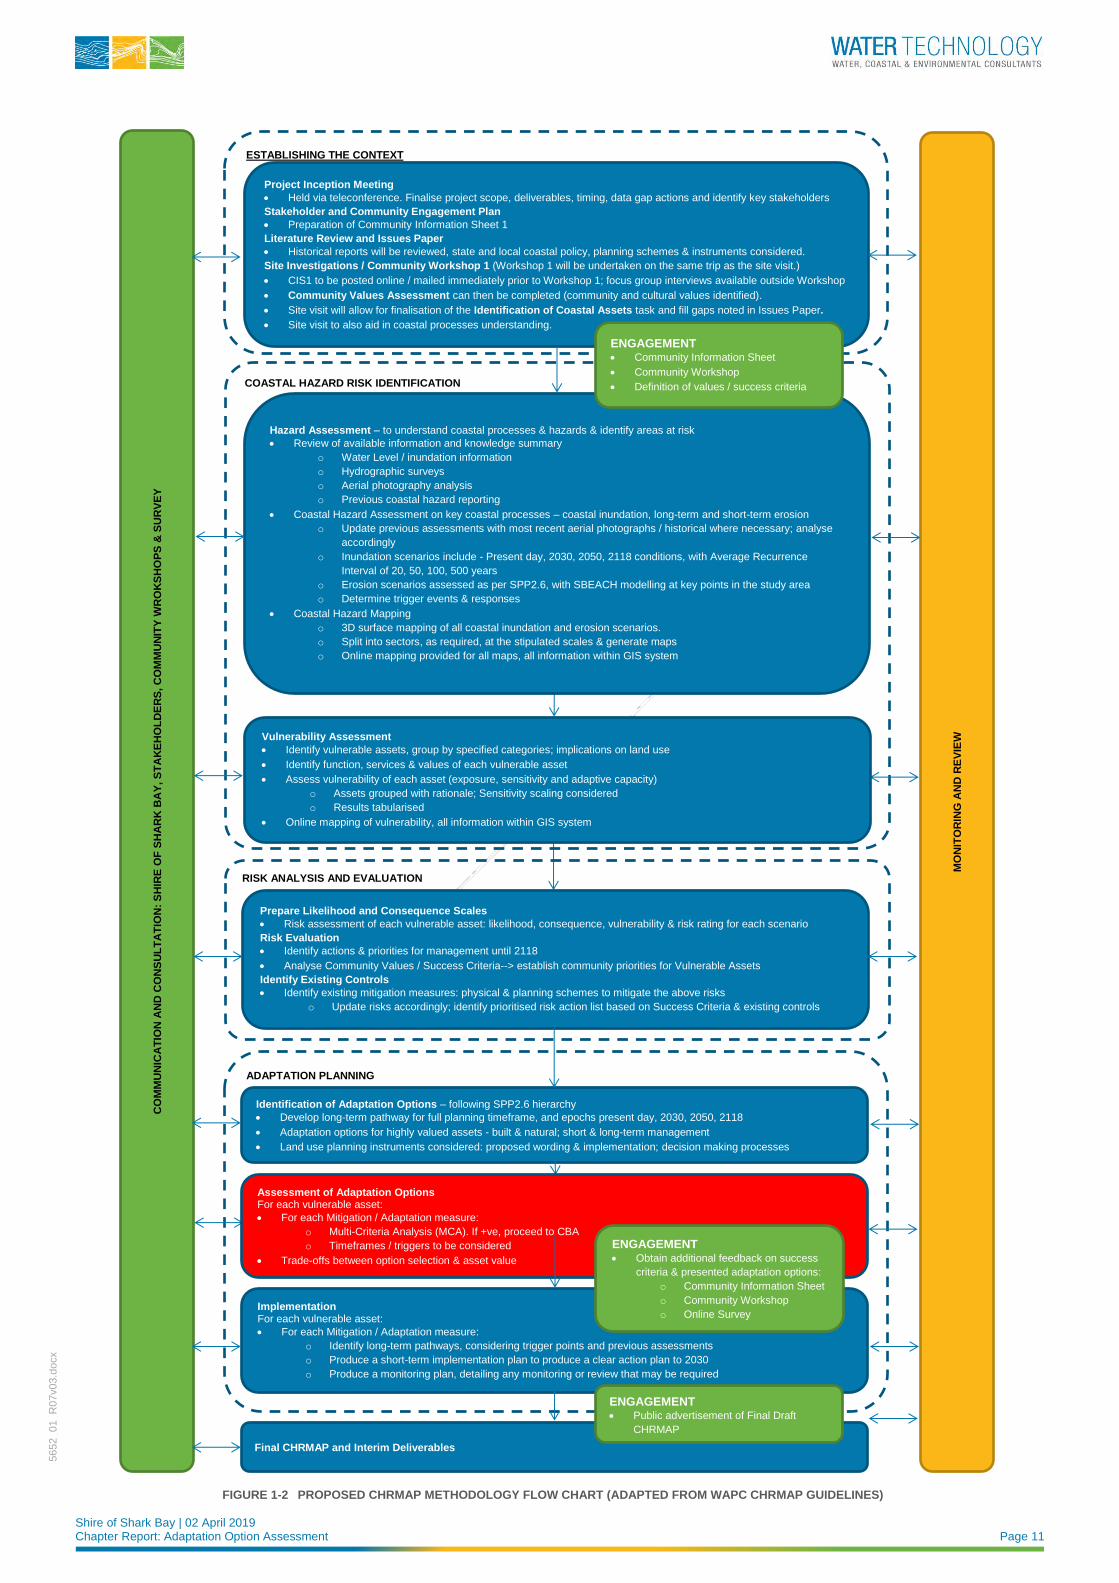
Shire of Shark Bay | 02 April 2019 Chapter Report: Adaptation Option Assessment Page 11
5652_01_R
07v03.d
ocx
ESTABLISHING THE CONTEXT
Project Inception Meeting
• Held via teleconference. Finalise project scope, deliverables, timing, data gap actions and identify key stakeholders
Stakeholder and Community Engagement Plan
• Preparation of Community Information Sheet 1
Literature Review and Issues Paper
• Historical reports will be reviewed, state and local coastal policy, planning schemes & instruments considered.
Site Investigations / Community Workshop 1 (Workshop 1 will be undertaken on the same trip as the site visit.)
• CIS1 to be posted online / mailed immediately prior to Workshop 1; focus group interviews available outside Workshop
• Community Values Assessment can then be completed (community and cultural values identified).
• Site visit will allow for finalisation of the Identification of Coastal Assets task and fill gaps noted in Issues Paper.
• Site visit to also aid in coastal processes understanding.
CO
MM
UN
ICA
TIO
N A
ND
CO
NS
UL
TA
TIO
N:
SH
IRE
OF
SH
AR
K B
AY
, S
TA
KE
HO
LD
ER
S, C
OM
MU
NIT
Y W
RO
KS
HO
PS
& S
UR
VE
Y
MO
NIT
OR
ING
AN
D R
EV
IEW
Final CHRMAP and Interim Deliverables
ADAPTATION PLANNING
COASTAL HAZARD RISK IDENTIFICATION
Hazard Assessment – to understand coastal processes & hazards & identify areas at risk
• Review of available information and knowledge summary
o Water Level / inundation information
o Hydrographic surveys
o Aerial photography analysis
o Previous coastal hazard reporting
• Coastal Hazard Assessment on key coastal processes – coastal inundation, long-term and short-term erosion
o Update previous assessments with most recent aerial photographs / historical where necessary; analyse
accordingly
o Inundation scenarios include - Present day, 2030, 2050, 2118 conditions, with Average Recurrence
Interval of 20, 50, 100, 500 years
o Erosion scenarios assessed as per SPP2.6, with SBEACH modelling at key points in the study area o Determine trigger events & responses
• Coastal Hazard Mapping
o 3D surface mapping of all coastal inundation and erosion scenarios.
o Split into sectors, as required, at the stipulated scales & generate maps
o Online mapping provided for all maps, all information within GIS system
RISK ANALYSIS AND EVALUATION
Prepare Likelihood and Consequence Scales
• Risk assessment of each vulnerable asset: likelihood, consequence, vulnerability & risk rating for each scenario
Risk Evaluation
• Identify actions & priorities for management until 2118
• Analyse Community Values / Success Criteria--> establish community priorities for Vulnerable Assets
Identify Existing Controls
• Identify existing mitigation measures: physical & planning schemes to mitigate the above risks
o Update risks accordingly; identify prioritised risk action list based on Success Criteria & existing controls
Identification of Adaptation Options – following SPP2.6 hierarchy
• Develop long-term pathway for full planning timeframe, and epochs present day, 2030, 2050, 2118
• Adaptation options for highly valued assets - built & natural; short & long-term management
• Land use planning instruments considered: proposed wording & implementation; decision making processes
Vulnerability Assessment
• Identify vulnerable assets, group by specified categories; implications on land use
• Identify function, services & values of each vulnerable asset
• Assess vulnerability of each asset (exposure, sensitivity and adaptive capacity)
o Assets grouped with rationale; Sensitivity scaling considered
o Results tabularised
• Online mapping of vulnerability, all information within GIS system
ENGAGEMENT • Community Information Sheet
• Community Workshop
• Definition of values / success criteria
Assessment of Adaptation Options For each vulnerable asset:
• For each Mitigation / Adaptation measure:
o Multi-Criteria Analysis (MCA). If +ve, proceed to CBA
o Timeframes / triggers to be considered
• Trade-offs between option selection & asset value
Implementation For each vulnerable asset:
• For each Mitigation / Adaptation measure:
o Identify long-term pathways, considering trigger points and previous assessments
o Produce a short-term implementation plan to produce a clear action plan to 2030
o Produce a monitoring plan, detailing any monitoring or review that may be required
ENGAGEMENT • Obtain additional feedback on success
criteria & presented adaptation options:
o Community Information Sheet
o Community Workshop
o Online Survey
ENGAGEMENT • Public advertisement of Final Draft
CHRMAP
FIGURE 1-2 PROPOSED CHRMAP METHODOLOGY FLOW CHART (ADAPTED FROM WAPC CHRMAP GUIDELINES)
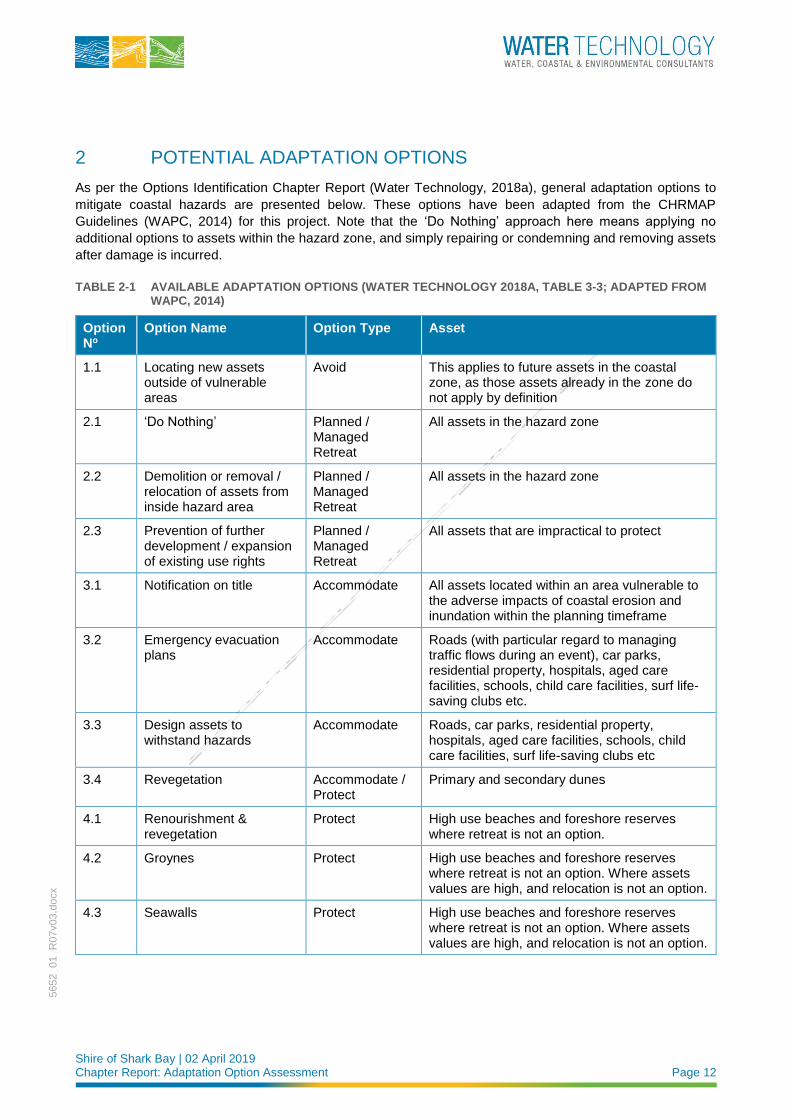
Shire of Shark Bay | 02 April 2019 Chapter Report: Adaptation Option Assessment Page 12
5652_01_R
07v03.d
ocx
2 POTENTIAL ADAPTATION OPTIONS
As per the Options Identification Chapter Report (Water Technology, 2018a), general adaptation options to
mitigate coastal hazards are presented below. These options have been adapted from the CHRMAP
Guidelines (WAPC, 2014) for this project. Note that the ‘Do Nothing’ approach here means applying no
additional options to assets within the hazard zone, and simply repairing or condemning and removing assets
after damage is incurred.
TABLE 2-1 AVAILABLE ADAPTATION OPTIONS (WATER TECHNOLOGY 2018A, TABLE 3-3; ADAPTED FROM WAPC, 2014)
Option No
Option Name Option Type Asset
1.1 Locating new assets outside of vulnerable areas
Avoid This applies to future assets in the coastal zone, as those assets already in the zone do not apply by definition
2.1 ‘Do Nothing’ Planned / Managed Retreat
All assets in the hazard zone
2.2 Demolition or removal / relocation of assets from inside hazard area
Planned / Managed Retreat
All assets in the hazard zone
2.3 Prevention of further development / expansion of existing use rights
Planned / Managed Retreat
All assets that are impractical to protect
3.1 Notification on title Accommodate All assets located within an area vulnerable to the adverse impacts of coastal erosion and inundation within the planning timeframe
3.2 Emergency evacuation plans
Accommodate Roads (with particular regard to managing traffic flows during an event), car parks, residential property, hospitals, aged care facilities, schools, child care facilities, surf life-saving clubs etc.
3.3 Design assets to withstand hazards
Accommodate Roads, car parks, residential property, hospitals, aged care facilities, schools, child care facilities, surf life-saving clubs etc
3.4 Revegetation Accommodate / Protect
Primary and secondary dunes
4.1 Renourishment & revegetation
Protect High use beaches and foreshore reserves where retreat is not an option.
4.2 Groynes Protect High use beaches and foreshore reserves where retreat is not an option. Where assets values are high, and relocation is not an option.
4.3 Seawalls Protect High use beaches and foreshore reserves where retreat is not an option. Where assets values are high, and relocation is not an option.
Shire of Shark Bay | 02 April 2019 Chapter Report: Adaptation Option Assessment Page 13
5652_01_R
07v03.d
ocx
2.1 Do Nothing
Implementation of a ‘Do Nothing’ approach means the Shire allows coastal processes to occur unhindered. If
and when these processes impact a private property, the Shire will seek to reclaim the lot by way of
condemning the property on the grounds of safety (Health Act 1911). The lot would then become assimilated
into the public foreshore reserve and provide protection to assets further inland.
Publicly owned assets would undergo a similar lifecycle, with relocation of each asset only required when
damaged or absolutely necessary. Protection structures such as seawalls shall be left in place but not
significantly maintained (public safety only) until they too are condemned and removed.
For this option the cost is the complete value of each asset as it is removed.
2.2 Planned or Managed Retreat
The ‘Planned Retreat’ option is very similar to ‘Do Nothing’ except assets are relocated or removed prior to the
occurrence of irreparable damage and returned to public foreshore reserve. Under this option the Shire would
purchase privately owned properties when a set trigger is reached.
Triggers recommended for this study are as per those of WAPC (2017):
◼ Trigger 1: Where the most landward part of the Horizontal Shoreline Datum (HSD, defined as the active
limit of the shoreline under storm activity) is within 40 metres of the most seaward point of a development
/ structure / foreshore reserve area.
◼ Due to the high value placed on the foreshore coastal reserve, the recreational area would itself be
considered the asset in this case
◼ Trigger 2: Where a public road is no longer available or able to provide legal access to the property
◼ This may occur for Knight Terrace, particularly to the east of Denham Hamelin Road. The Shire may
choose to investigate access options from the landward side of these properties.
◼ Trigger 3: When water, sewerage or electricity to the lot is no longer available as they have been
removed/decommissioned by the relevant authority due to coastal hazards.
Under the WA Planning Framework, a land parcel may be recovered by voluntary or compulsory acquisition
based on the value of its land and improvements. Public property would utilise the same trigger-based
relocation strategy.
Costs for this option are the same as ‘Do Nothing’, however the burden of cost for private assets is passed
from the asset holder to the Shire.
2.2.1 Development Restrictions – Planning Instruments
The use of planning instruments to restrict development in the coastal hazard zone was discussed in Water
Technology (2018a). These include the following:
◼ Incorporate SPP2.6 into Local Planning Scheme
◼ Special Control Area
◼ Coastal Development Local Planning Policy
◼ Notifications on Title
◼ Structure Plan
◼ Restrictive Covenants
Shire of Shark Bay | 02 April 2019 Chapter Report: Adaptation Option Assessment Page 14
5652_01_R
07v03.d
ocx
◼ Special Area Rates
These options facilitate planned / managed retreat. These are considered as part of the ‘Prevent further
development’ option in the Multi-Criteria analysis (MCA).
2.3 Renourishment
To protect against the increased erosive pressure forecast to occur as sea level rises, some beach areas could
be renourished with sediment on a regular basis. This is a ‘soft’ protection option that allows for continued
utility of the beach for stakeholders and aims to slow the landward movement of the HSD. This option can be
expensive and sediment requirements can increase over time. Also, without supplemental design structures
holding the renourishment in place, the shoreline will naturally return to its equilibrium position and
renourishment may be transported away from the area faster than desired. This option does not reduce the
risk of inundation to properties inland.
Whilst this option could initiate some legacy issues by requiring future spending to provide continued
protection, it could also be used to delay the onset of erosion until structures at risk have been relocated.
2.4 Protection Structures
Construction of a seawall is likely to result in the loss of the beach seaward of its toe. It will therefore score
poorly in certain MCA criteria, given the high value of beach area for stakeholders.
The construction of a groyne or multiple groynes on the town’s foreshore is a protection option that seeks to
limit erosion risk and maintain beach amenity. There are several different options that could meet these aims
(groynes, offshore breakwaters), all of which are generally expensive and will convey legacy issues to future
generations. The ‘groyne’ option included in the MCA is representative of the general costs and benefits that
such an option would result in, and further pursuit of this kind of strategy would require detailed design and
careful consideration beyond the scope of this study. Strategies of this kind can result in significant and
unforeseen detrimental impacts to the local coastline, even after detailed design in locations of reasonable
data availability.
Shire of Shark Bay | 02 April 2019 Chapter Report: Adaptation Option Assessment Page 15
5652_01_R
07v03.d
ocx
3 MULTI-CRITERIA ASSESSMENT APPROACH
Successful risk management and adaptation planning requires identification and diligent assessment of
suitable options to ensure selection of the best strategy. The chosen option should mitigate risk to an
acceptable level whilst maximising the values important to the stakeholders. For the Shire of Shark Bay’s
CHRMAP the key assessment criteria are:
◼ Effectiveness
◼ Ability for the option to mitigate the coastal hazard risk
◼ Environmental
◼ Impact on existing native vegetation / dunes / coastal processes
◼ Includes consideration of:
◼ Any construction / clearing impacts
◼ Impact of maintenance on the environment
◼ Social: this considers stakeholder and community impacts
◼ Aesthetic impacts
◼ The visual appeal of the option
◼ Consideration of option aesthetics tying into the wider town vision
◼ Future adaptability
◼ Whether the option is easily adaptable in future
◼ If the option limits the availability of other options in future
◼ Cost
◼ Upfront capital costs
◼ Ongoing maintenance costs
In general, consideration shall be given to any option that may have detrimental impacts on indigenous or
historical values, through a lowering of the social score along with supplementary notes to indicate the negative
interaction. For this CHRMAP several aboriginal sites with heritage value were identified through the AHIS
(DPLH, 2018), both to the south of Section 1 and clustered around Lagoon Point in Section 4 and 5. These
sites were located within the hazard zones but not significantly close to existing development. An historic
building was also identified on Knight Terrace. The aboriginal and historical heritage consequences from the
MCA are summarised in Section 4. Information provided by stakeholders is included in the assessment of each
value as required. Options are assessed using the multi-criteria assessment (MCA) matrix shown in Table 3-1,
which indicates the rating given to each criterion for a given option and provides the recommendation for
pursuing the option.
Potential options have been identified as part of the Options Identification Chapter Report (Water Technology,
2018a). These were identified by applying the risk management and adaptation hierarchy specified in SPP2.6
and the CHRMAP guidelines (Figure 3-1). This hierarchy mandates that management options are to be
considered in the order: avoid, managed retreat, accommodate, protect. For example, if a managed retreat
and a protect option score equal in the MCA, the managed retreat option must always be preferred to a
protection option that achieves the same outcome. SPP2.6 states that protection may only be considered when
“sufficient justification can be provided for not avoiding the use or development of land that is at risk from coastal hazards and accommodation measures alone cannot adequately address the risks from coastal hazards”.
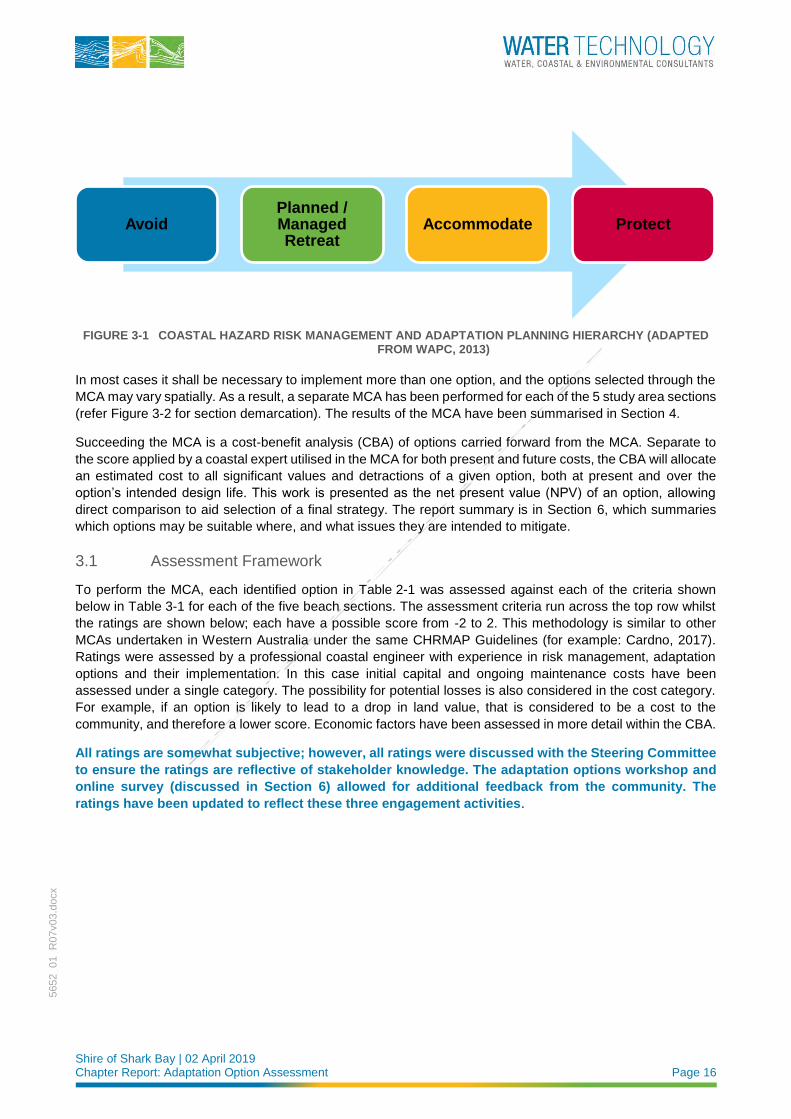
Shire of Shark Bay | 02 April 2019 Chapter Report: Adaptation Option Assessment Page 16
5652_01_R
07v03.d
ocx
FIGURE 3-1 COASTAL HAZARD RISK MANAGEMENT AND ADAPTATION PLANNING HIERARCHY (ADAPTED FROM WAPC, 2013)
In most cases it shall be necessary to implement more than one option, and the options selected through the
MCA may vary spatially. As a result, a separate MCA has been performed for each of the 5 study area sections
(refer Figure 3-2 for section demarcation). The results of the MCA have been summarised in Section 4.
Succeeding the MCA is a cost-benefit analysis (CBA) of options carried forward from the MCA. Separate to
the score applied by a coastal expert utilised in the MCA for both present and future costs, the CBA will allocate
an estimated cost to all significant values and detractions of a given option, both at present and over the
option’s intended design life. This work is presented as the net present value (NPV) of an option, allowing
direct comparison to aid selection of a final strategy. The report summary is in Section 6, which summaries
which options may be suitable where, and what issues they are intended to mitigate.
3.1 Assessment Framework
To perform the MCA, each identified option in Table 2-1 was assessed against each of the criteria shown
below in Table 3-1 for each of the five beach sections. The assessment criteria run across the top row whilst
the ratings are shown below; each have a possible score from -2 to 2. This methodology is similar to other
MCAs undertaken in Western Australia under the same CHRMAP Guidelines (for example: Cardno, 2017).
Ratings were assessed by a professional coastal engineer with experience in risk management, adaptation
options and their implementation. In this case initial capital and ongoing maintenance costs have been
assessed under a single category. The possibility for potential losses is also considered in the cost category.
For example, if an option is likely to lead to a drop in land value, that is considered to be a cost to the
community, and therefore a lower score. Economic factors have been assessed in more detail within the CBA.
All ratings are somewhat subjective; however, all ratings were discussed with the Steering Committee
to ensure the ratings are reflective of stakeholder knowledge. The adaptation options workshop and
online survey (discussed in Section 6) allowed for additional feedback from the community. The
ratings have been updated to reflect these three engagement activities.
AvoidPlanned / Managed Retreat
Accommodate Protect
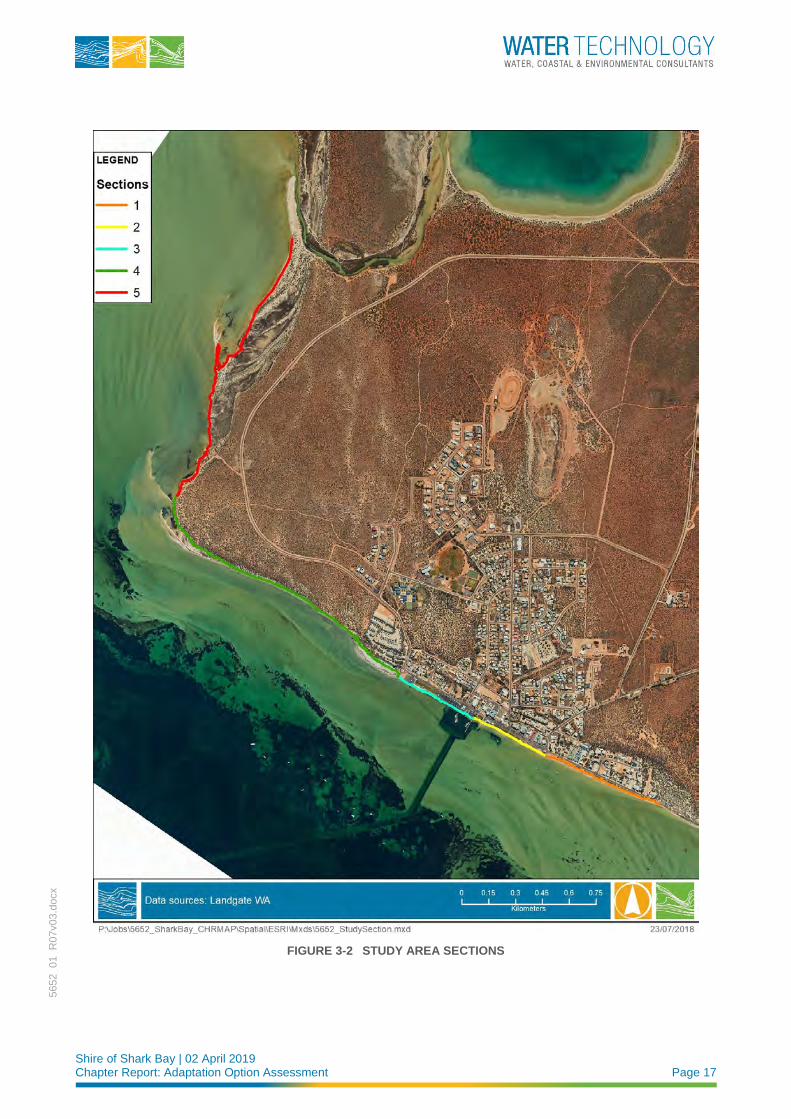
Shire of Shark Bay | 02 April 2019 Chapter Report: Adaptation Option Assessment Page 17
5652_01_R
07v03.d
ocx
FIGURE 3-2 STUDY AREA SECTIONS

Shire of Shark Bay | 02 April 2019 Chapter Report: Adaptation Option Assessment Page 18
5652_01_R
07v03.d
ocx
TABLE 3-1 MULTI-CRITERIA ASSESSMENT FRAMEWORK FOR DENHAM
Rati
ng
; S
co
re
Eff
ecti
ven
ess
En
vir
on
men
tal
Imp
act
So
cia
l Im
pa
ct
Aesth
eti
c I
mp
act
Co
st
(Cap
ital &
On
go
ing
)
Fu
ture
Ad
ap
tab
ilit
y
Fin
al
Reco
mm
en
dati
on
Positive; +1 or +2 Expected to be effective
Positive impact; return to more natural coastline
Positive social impact; encourages community development
Positive aesthetics
Low or reasonable costs
Adaptable, not likely to leave legacy issues
Further Investigation Recommended; Score > 0
Neutral; 0
May or may not be effective, possibly unable to predict
No (or unclear) environmental impact
No discernible social impact; indeterminate net impact
Neutral aesthetic Moderate costs May leave legacy issues
Suitability unclear; Score = 0
Negative; -1 or -2 Likely to be ineffective in the short or long term
Potential significant negative impacts
Negative social impact. May discourage new or existing people from the area
Negative aesthetic
High initial or ongoing costs
Will create legacy issues
Not recommended; Score < 0
Shire of Shark Bay | 02 April 2019 Chapter Report: Adaptation Option Assessment Page 19
5652_01_R
07v03.d
ocx
4 MULTI-CRITERIA ASSESSMENT RESULTS
A full MCA was conducted for each of the five beach sections, with the results presented below in Table 4-1
to Table 4-5; discussion points are included below each table. Note that if the Shire elects to choose certain
options this may affect the recommendation rating for other options. For example, where previously a managed
retreat option was best suited, this may be switched to accommodate for most assets if the Shire elects to
implement a protection strategy for that area (e.g.: retreat may not be required if the Shire builds a seawall in
front of a house). If two options are recommended that cannot both be selected or are illogical to combine, the
CBA and the strength of the MCA recommendation has been used to determine the optimal course of action.
For Accommodation Option 3.3, re-design for hazards, the scoring has been split into re-design for inundation
(3.3I) and re-design for erosion (3.3E). This is because the options to mitigate either hazard can vary
significantly for all of the assessed categories. For the purpose of this MCA, re-design options to mitigate
inundation risk are generally considered small and easy to implement. These include minor electrical works to
move services higher, removal of valuables from the ground floor (or placement on shelves prior to flooding
events), or installation of an emergency pump in the case of low-lying areas or basements. Erosion mitigation
options that can be employed on an individual asset basis are generally very expensive and intrusive. These
include construction of a retaining wall adjacent to the structure, buried concrete skirting around the foundation,
or other buried structures. For this reason, it is rare to see erosion protection for a specific low-medium value
asset (e.g.: one house).
Aboriginal heritage sites within or adjacent to the study area were not expected to be significantly impacted by
any of the recommended options as part of this analysis. Only options that significantly impeded sediment
transport to the north may impact sites at Lagoon Point and would require some infrequent monitoring.
However, this is not expected from the options carried forward to the cost-benefit analysis.
The logic behind some of the scores are presented in the comments section of each table. If the reasoning is
consistent with an earlier section no comment has been included. Further details may be provided in the next
stakeholder engagement session as required.
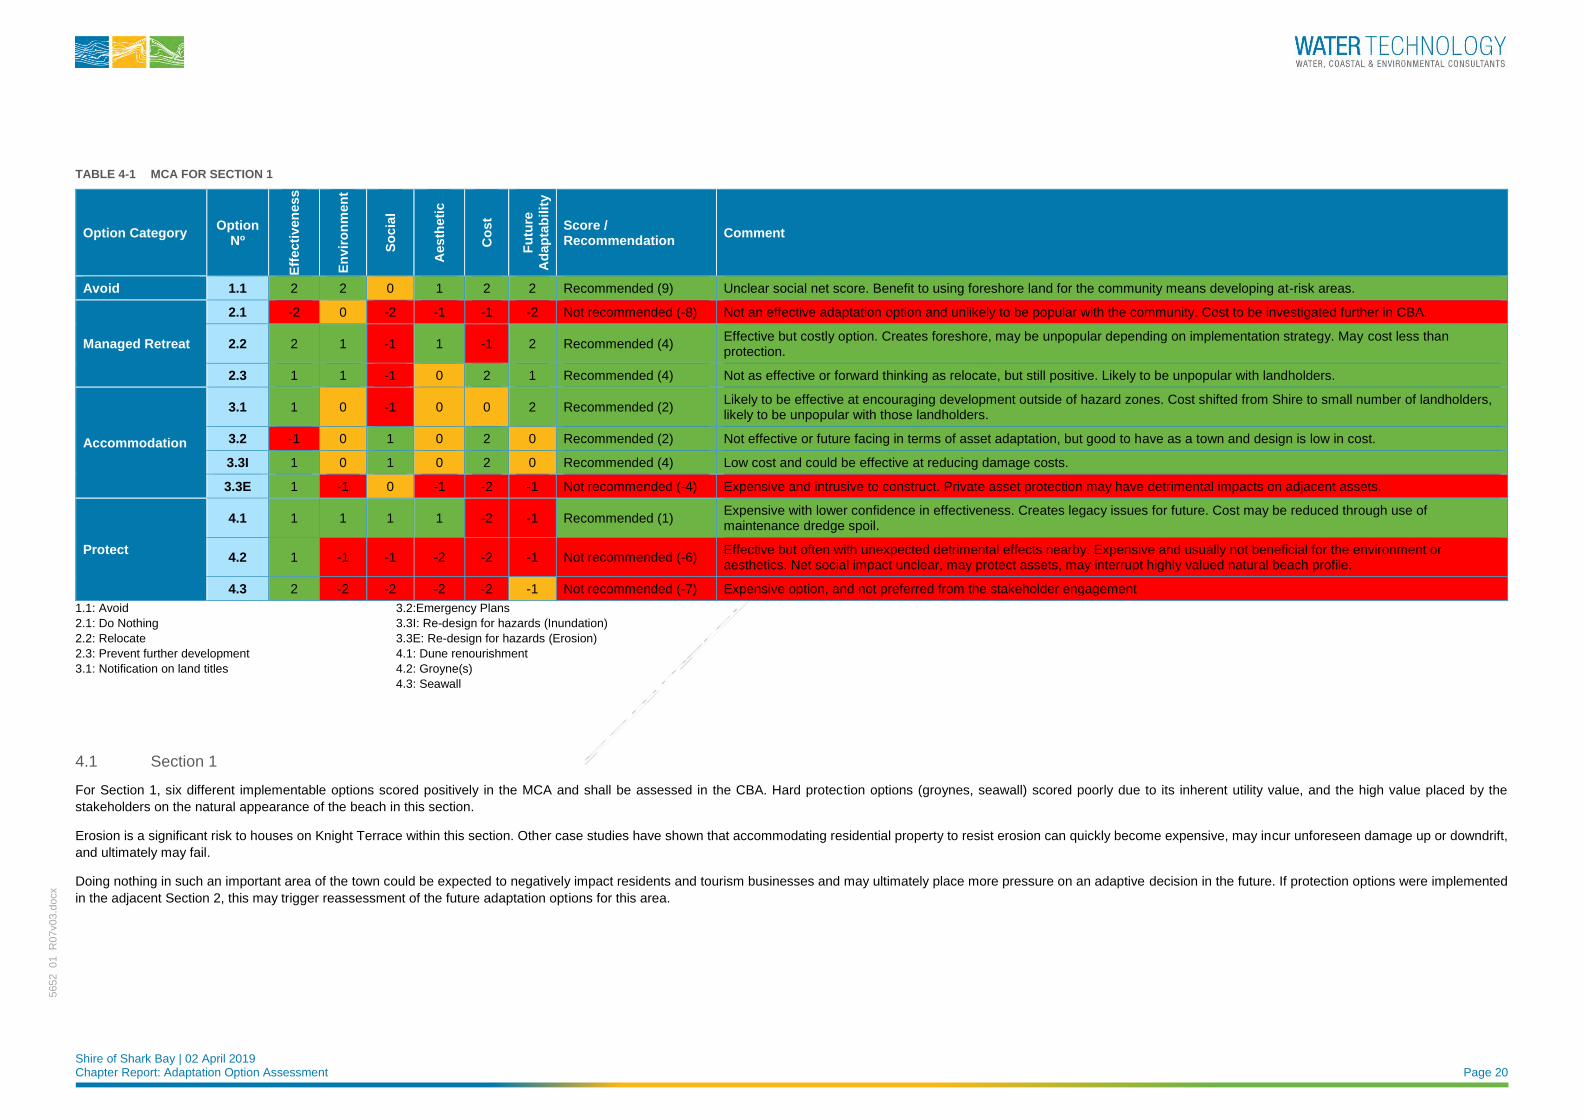
Shire of Shark Bay | 02 April 2019 Chapter Report: Adaptation Option Assessment Page 20
5652_01_R
07v03.d
ocx
TABLE 4-1 MCA FOR SECTION 1
Option Category Option
No
Eff
ecti
ven
ess
En
vir
on
men
t
So
cia
l
Aesth
eti
c
Co
st
Fu
ture
Ad
ap
tab
ilit
y
Score / Recommendation
Comment
Avoid 1.1 2 2 0 1 2 2 Recommended (9) Unclear social net score. Benefit to using foreshore land for the community means developing at-risk areas.
Managed Retreat
2.1 -2 0 -2 -1 -1 -2 Not recommended (-8) Not an effective adaptation option and unlikely to be popular with the community. Cost to be investigated further in CBA.
2.2 2 1 -1 1 -1 2 Recommended (4) Effective but costly option. Creates foreshore, may be unpopular depending on implementation strategy. May cost less than protection.
2.3 1 1 -1 0 2 1 Recommended (4) Not as effective or forward thinking as relocate, but still positive. Likely to be unpopular with landholders.
Accommodation
3.1 1 0 -1 0 0 2 Recommended (2) Likely to be effective at encouraging development outside of hazard zones. Cost shifted from Shire to small number of landholders, likely to be unpopular with those landholders.
3.2 -1 0 1 0 2 0 Recommended (2) Not effective or future facing in terms of asset adaptation, but good to have as a town and design is low in cost.
3.3I 1 0 1 0 2 0 Recommended (4) Low cost and could be effective at reducing damage costs.
3.3E 1 -1 0 -1 -2 -1 Not recommended (-4) Expensive and intrusive to construct. Private asset protection may have detrimental impacts on adjacent assets.
Protect
4.1 1 1 1 1 -2 -1 Recommended (1) Expensive with lower confidence in effectiveness. Creates legacy issues for future. Cost may be reduced through use of maintenance dredge spoil.
4.2 1 -1 -1 -2 -2 -1 Not recommended (-6) Effective but often with unexpected detrimental effects nearby. Expensive and usually not beneficial for the environment or aesthetics. Net social impact unclear, may protect assets, may interrupt highly valued natural beach profile.
4.3 2 -2 -2 -2 -2 -1 Not recommended (-7) Expensive option, and not preferred from the stakeholder engagement
1.1: Avoid
2.1: Do Nothing
2.2: Relocate
2.3: Prevent further development
3.1: Notification on land titles
3.2:Emergency Plans
3.3I: Re-design for hazards (Inundation)
3.3E: Re-design for hazards (Erosion)
4.1: Dune renourishment
4.2: Groyne(s)
4.3: Seawall
4.1 Section 1
For Section 1, six different implementable options scored positively in the MCA and shall be assessed in the CBA. Hard protection options (groynes, seawall) scored poorly due to its inherent utility value, and the high value placed by the
stakeholders on the natural appearance of the beach in this section.
Erosion is a significant risk to houses on Knight Terrace within this section. Other case studies have shown that accommodating residential property to resist erosion can quickly become expensive, may incur unforeseen damage up or downdrift,
and ultimately may fail.
Doing nothing in such an important area of the town could be expected to negatively impact residents and tourism businesses and may ultimately place more pressure on an adaptive decision in the future. If protection options were implemented
in the adjacent Section 2, this may trigger reassessment of the future adaptation options for this area.

Shire of Shark Bay | 02 April 2019 Chapter Report: Adaptation Option Assessment Page 21
5652_01_R
07v03.d
ocx
TABLE 4-2 MCA FOR SECTION 2
Option Category Option
No
Eff
ecti
ven
ess
En
vir
on
men
t
So
cia
l
Aesth
eti
c
Co
st
Fu
ture
Ad
ap
tab
ilit
y
Score / Recommendation
Comment
Avoid 1.1 2 2 0 1 2 2 Recommended (9) Same as Section 1
Managed Retreat
2.1 -2 -1 -2 -2 -1 -2 Not recommended (-10) Damage to commercial assets may place environment at risk (e.g.: fuel). Erosion of main street (Knight Terrace) not conducive to attracting visitors to the town.
2.2 1 1 -1 -1 -1 2 Recommended (1) Staged relocation back through main street with commercial access may be difficult, unpopular, and visually unappealing.
2.3 1 1 -1 0 2 1 Recommended (4) Same as Section 1
Accommodation
3.1 1 0 -1 0 0 2 Recommended (2) Same as Section 1
3.2 -1 0 1 0 2 0 Recommended (2) Same as Section 1
3.3I 1 0 1 0 2 0 Recommended (4) Same as Section 1
3.3E 1 -1 0 -1 -2 -1 Not recommended (-4) Same as Section 1
Protect
4.1 -2 1 1 1 -2 -1 Not recommended (-2) Sediment likely to be removed quickly by coastal processes, no beach to renourish.
4.2 1 0 0 0 -2 -1 Not recommended (-2) Increased in most scores compared to Section 1 as area is already developed and beach condition is comparatively poor.
4.3 2 -1 2 0 -2 -1 Neutral (0) Increased in most scores compared to Section 1 as area is already developed, beach condition is comparatively poor and a temporary structure already in place.
1.1: Avoid
2.1: Do Nothing
2.2: Relocate
2.3: Prevent further development
3.1: Notification on land titles
3.2: Emergency Plans
3.3I: Re-design for hazards (Inundation)
3.3E: Re-design for hazards (Erosion)
4.1: Dune renourishment
4.2: Groyne(s)
4.3: Seawall
4.2 Section 2
Section 2 has five recommended options and one split option, where accommodation by redesign is recommended for inundation but not for erosion. In this section the only significant protection work that appears logical is to formalise the ad-hoc
seawall already in place. However, this option is not necessarily preferable to other options higher up the adaptation hierarchy and further investigation is required.
Minor accommodation to existing structures landward of Knight Terrace to accommodate coastal inundation could extend the usable life of these structures. If protection is not adopted, retreat of the commercial properties should be triggered by
removal of Knight Terrace if and when required.
If a protection option is selected many of the analyses for this section would look more like Section 3, with development not restrained for erosion impacts, and consideration of relocation delayed. This section contains a building with historic
heritage value, the current location of the restaurant “The Pearler”. More specific determination of its value with regards to coastal hazard protection will be discussed at the second stakeholder engagement meeting.
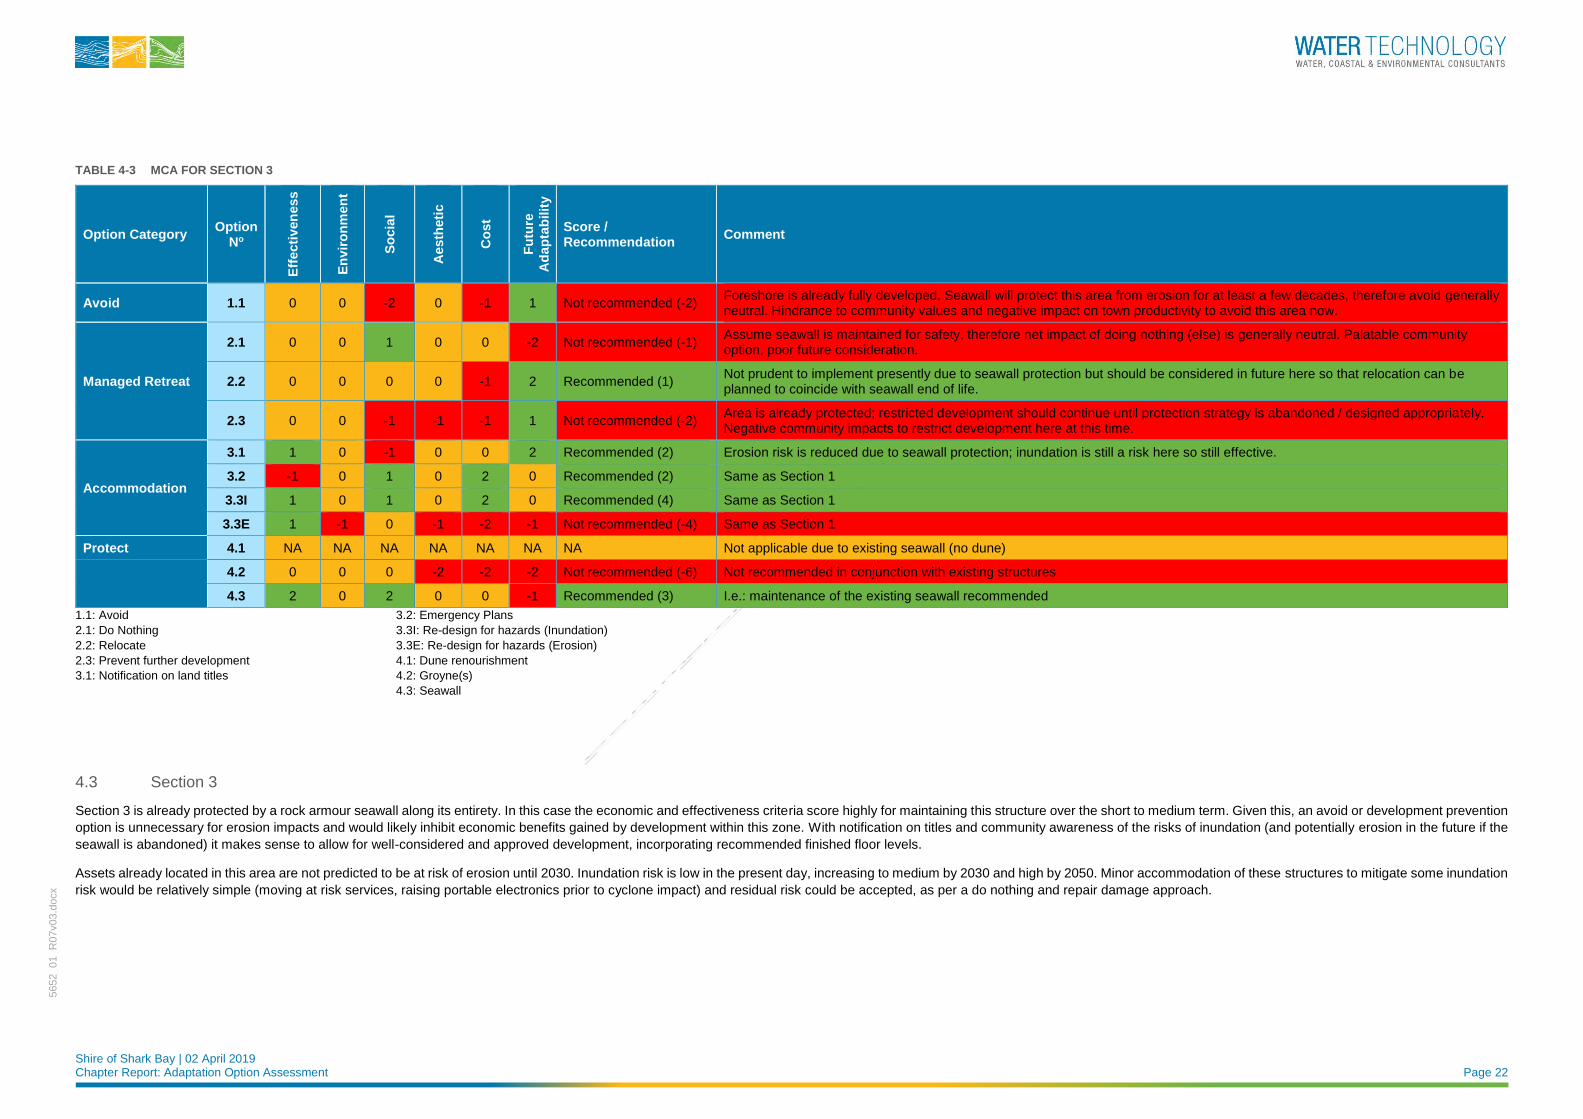
Shire of Shark Bay | 02 April 2019 Chapter Report: Adaptation Option Assessment Page 22
5652_01_R
07v03.d
ocx
TABLE 4-3 MCA FOR SECTION 3
Option Category Option
No
Eff
ecti
ven
ess
En
vir
on
men
t
So
cia
l
Aesth
eti
c
Co
st
Fu
ture
Ad
ap
tab
ilit
y
Score / Recommendation
Comment
Avoid 1.1 0 0 -2 0 -1 1 Not recommended (-2) Foreshore is already fully developed. Seawall will protect this area from erosion for at least a few decades, therefore avoid generally neutral. Hindrance to community values and negative impact on town productivity to avoid this area now.
Managed Retreat
2.1 0 0 1 0 0 -2 Not recommended (-1) Assume seawall is maintained for safety, therefore net impact of doing nothing (else) is generally neutral. Palatable community option, poor future consideration.
2.2 0 0 0 0 -1 2 Recommended (1) Not prudent to implement presently due to seawall protection but should be considered in future here so that relocation can be planned to coincide with seawall end of life.
2.3 0 0 -1 -1 -1 1 Not recommended (-2) Area is already protected; restricted development should continue until protection strategy is abandoned / designed appropriately. Negative community impacts to restrict development here at this time.
Accommodation
3.1 1 0 -1 0 0 2 Recommended (2) Erosion risk is reduced due to seawall protection; inundation is still a risk here so still effective.
3.2 -1 0 1 0 2 0 Recommended (2) Same as Section 1
3.3I 1 0 1 0 2 0 Recommended (4) Same as Section 1
3.3E 1 -1 0 -1 -2 -1 Not recommended (-4) Same as Section 1
Protect 4.1 NA NA NA NA NA NA NA Not applicable due to existing seawall (no dune)
4.2 0 0 0 -2 -2 -2 Not recommended (-6) Not recommended in conjunction with existing structures
4.3 2 0 2 0 0 -1 Recommended (3) I.e.: maintenance of the existing seawall recommended
1.1: Avoid
2.1: Do Nothing
2.2: Relocate
2.3: Prevent further development
3.1: Notification on land titles
3.2: Emergency Plans
3.3I: Re-design for hazards (Inundation)
3.3E: Re-design for hazards (Erosion)
4.1: Dune renourishment
4.2: Groyne(s)
4.3: Seawall
4.3 Section 3
Section 3 is already protected by a rock armour seawall along its entirety. In this case the economic and effectiveness criteria score highly for maintaining this structure over the short to medium term. Given this, an avoid or development prevention
option is unnecessary for erosion impacts and would likely inhibit economic benefits gained by development within this zone. With notification on titles and community awareness of the risks of inundation (and potentially erosion in the future if the
seawall is abandoned) it makes sense to allow for well-considered and approved development, incorporating recommended finished floor levels.
Assets already located in this area are not predicted to be at risk of erosion until 2030. Inundation risk is low in the present day, increasing to medium by 2030 and high by 2050. Minor accommodation of these structures to mitigate some inundation
risk would be relatively simple (moving at risk services, raising portable electronics prior to cyclone impact) and residual risk could be accepted, as per a do nothing and repair damage approach.
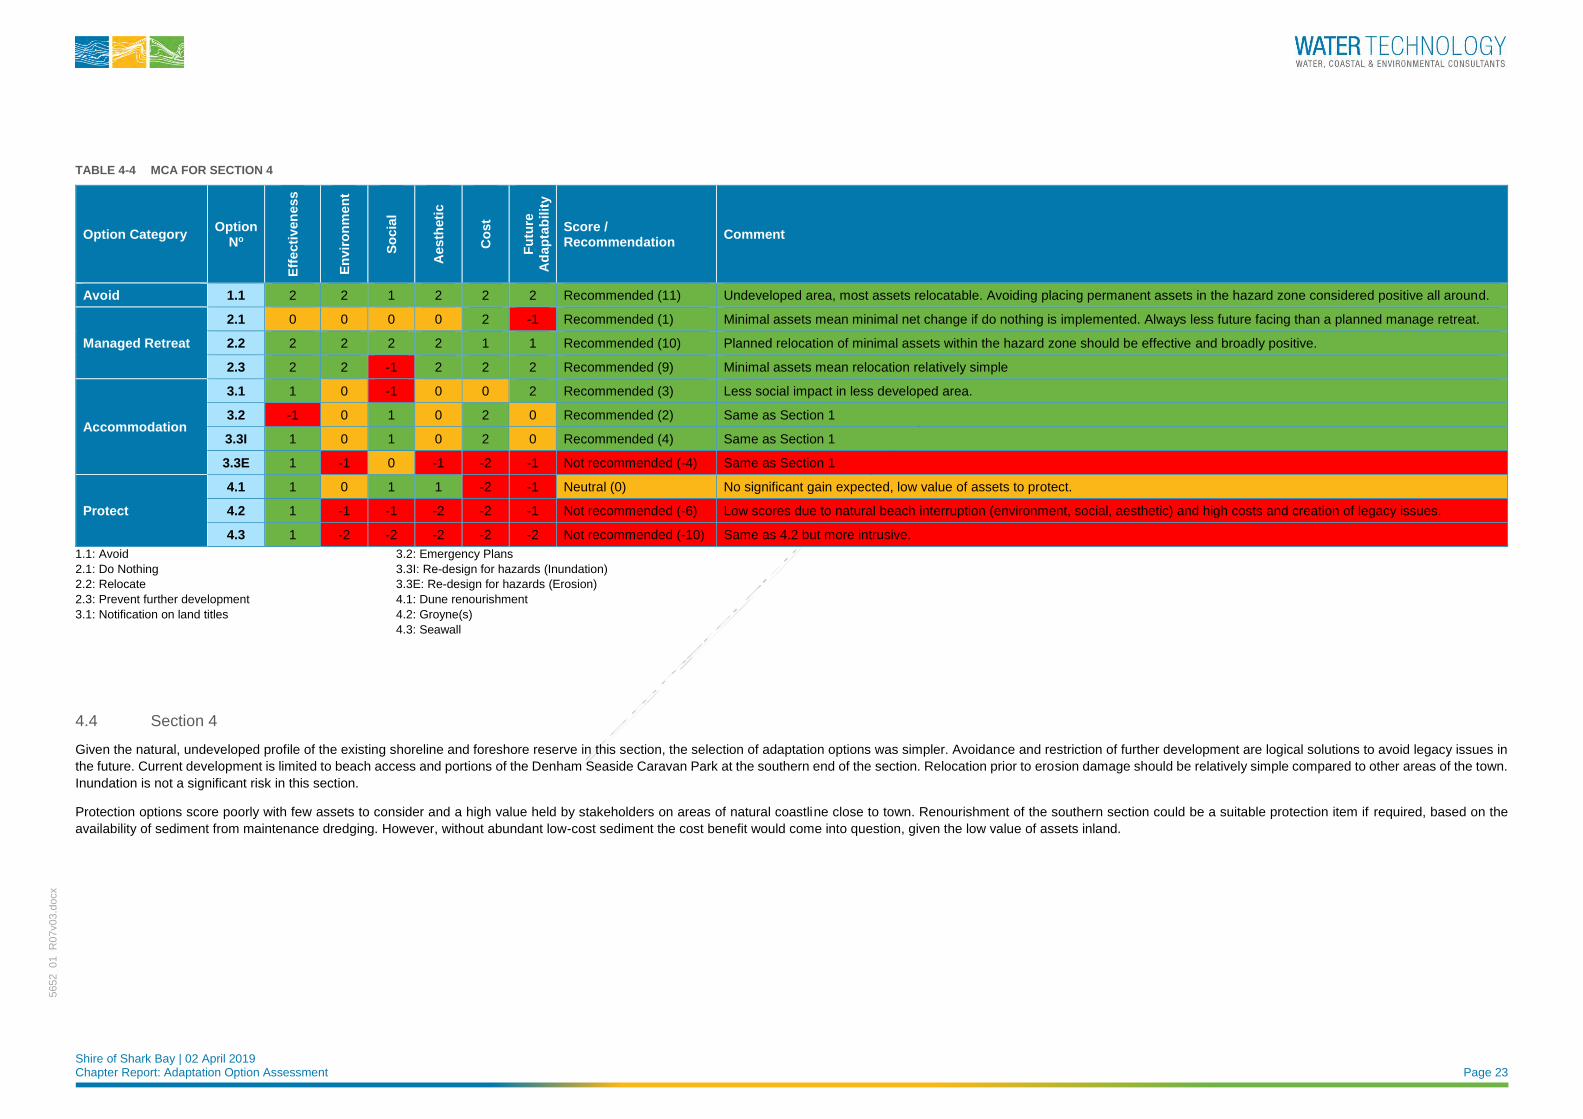
Shire of Shark Bay | 02 April 2019 Chapter Report: Adaptation Option Assessment Page 23
5652_01_R
07v03.d
ocx
TABLE 4-4 MCA FOR SECTION 4
Option Category Option
No
Eff
ecti
ven
ess
En
vir
on
men
t
So
cia
l
Aesth
eti
c
Co
st
Fu
ture
Ad
ap
tab
ilit
y
Score / Recommendation
Comment
Avoid 1.1 2 2 1 2 2 2 Recommended (11) Undeveloped area, most assets relocatable. Avoiding placing permanent assets in the hazard zone considered positive all around.
Managed Retreat
2.1 0 0 0 0 2 -1 Recommended (1) Minimal assets mean minimal net change if do nothing is implemented. Always less future facing than a planned manage retreat.
2.2 2 2 2 2 1 1 Recommended (10) Planned relocation of minimal assets within the hazard zone should be effective and broadly positive.
2.3 2 2 -1 2 2 2 Recommended (9) Minimal assets mean relocation relatively simple
Accommodation
3.1 1 0 -1 0 0 2 Recommended (3) Less social impact in less developed area.
3.2 -1 0 1 0 2 0 Recommended (2) Same as Section 1
3.3I 1 0 1 0 2 0 Recommended (4) Same as Section 1
3.3E 1 -1 0 -1 -2 -1 Not recommended (-4) Same as Section 1
Protect
4.1 1 0 1 1 -2 -1 Neutral (0) No significant gain expected, low value of assets to protect.
4.2 1 -1 -1 -2 -2 -1 Not recommended (-6) Low scores due to natural beach interruption (environment, social, aesthetic) and high costs and creation of legacy issues.
4.3 1 -2 -2 -2 -2 -2 Not recommended (-10) Same as 4.2 but more intrusive.
1.1: Avoid
2.1: Do Nothing
2.2: Relocate
2.3: Prevent further development
3.1: Notification on land titles
3.2: Emergency Plans
3.3I: Re-design for hazards (Inundation)
3.3E: Re-design for hazards (Erosion)
4.1: Dune renourishment
4.2: Groyne(s)
4.3: Seawall
4.4 Section 4
Given the natural, undeveloped profile of the existing shoreline and foreshore reserve in this section, the selection of adaptation options was simpler. Avoidance and restriction of further development are logical solutions to avoid legacy issues in
the future. Current development is limited to beach access and portions of the Denham Seaside Caravan Park at the southern end of the section. Relocation prior to erosion damage should be relatively simple compared to other areas of the town.
Inundation is not a significant risk in this section.
Protection options score poorly with few assets to consider and a high value held by stakeholders on areas of natural coastline close to town. Renourishment of the southern section could be a suitable protection item if required, based on the
availability of sediment from maintenance dredging. However, without abundant low-cost sediment the cost benefit would come into question, given the low value of assets inland.
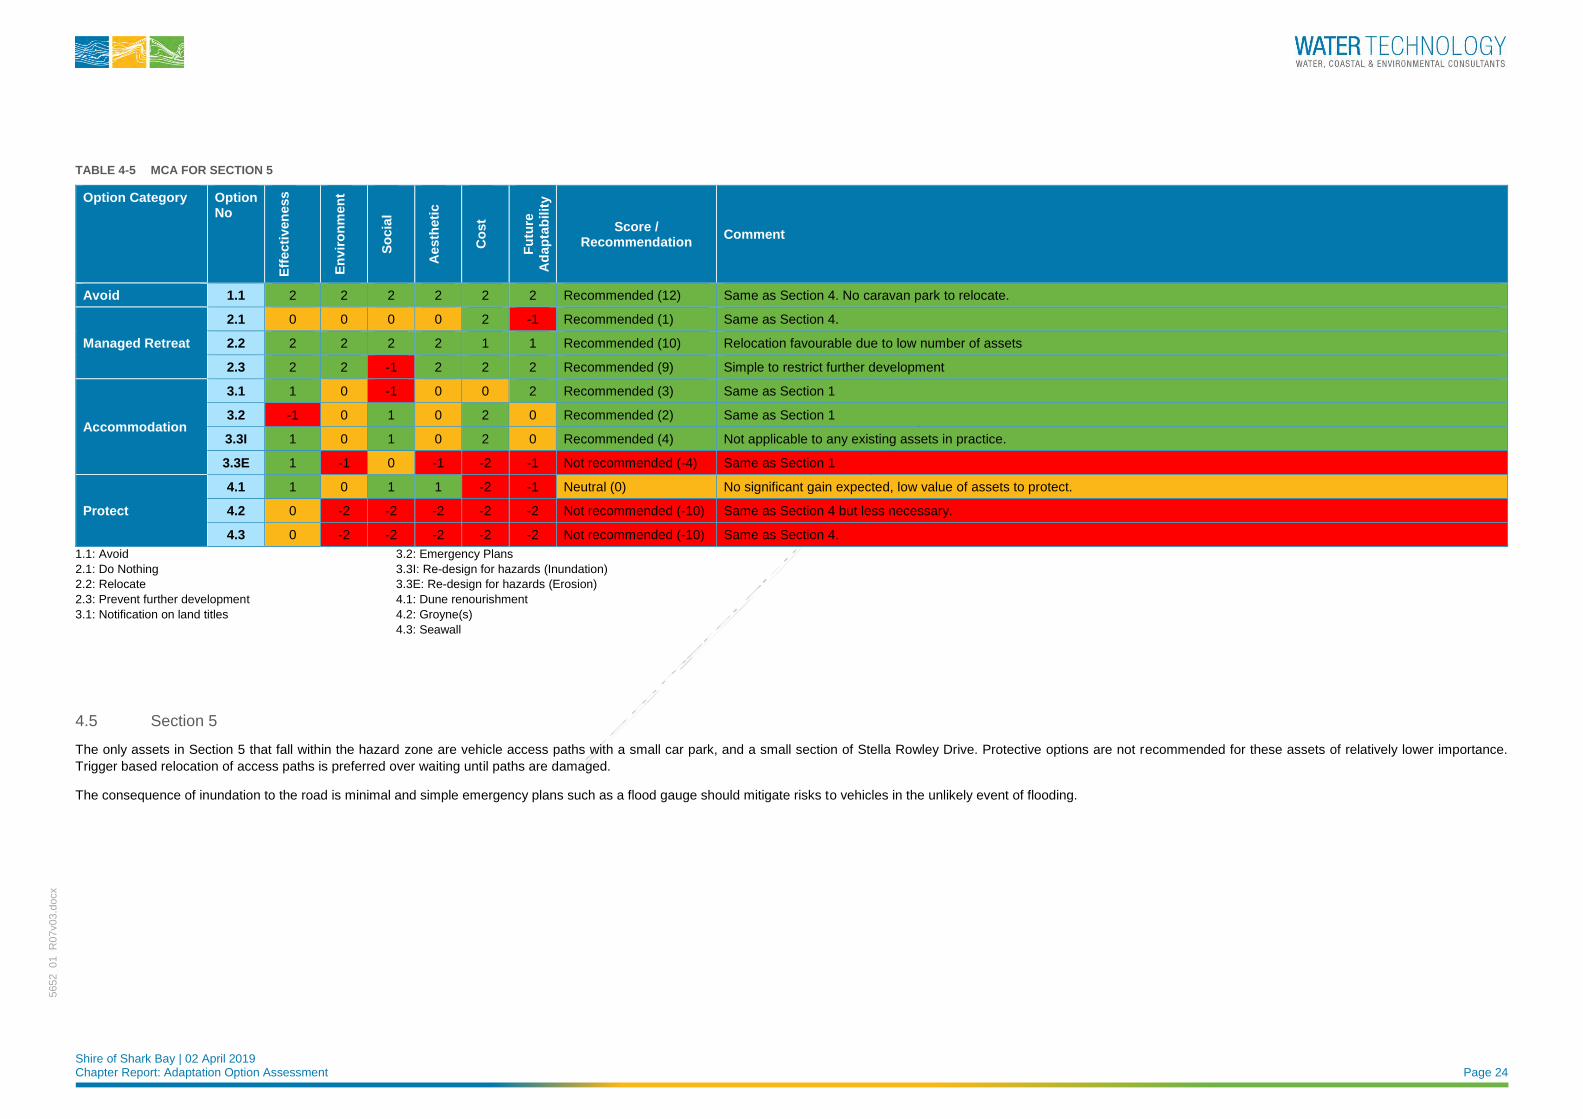
Shire of Shark Bay | 02 April 2019 Chapter Report: Adaptation Option Assessment Page 24
5652_01_R
07v03.d
ocx
TABLE 4-5 MCA FOR SECTION 5
Option Category Option No
Eff
ecti
ven
ess
En
vir
on
men
t
So
cia
l
Aesth
eti
c
Co
st
Fu
ture
Ad
ap
tab
ilit
y
Score / Recommendation
Comment
Avoid 1.1 2 2 2 2 2 2 Recommended (12) Same as Section 4. No caravan park to relocate.
Managed Retreat
2.1 0 0 0 0 2 -1 Recommended (1) Same as Section 4.
2.2 2 2 2 2 1 1 Recommended (10) Relocation favourable due to low number of assets
2.3 2 2 -1 2 2 2 Recommended (9) Simple to restrict further development
Accommodation
3.1 1 0 -1 0 0 2 Recommended (3) Same as Section 1
3.2 -1 0 1 0 2 0 Recommended (2) Same as Section 1
3.3I 1 0 1 0 2 0 Recommended (4) Not applicable to any existing assets in practice.
3.3E 1 -1 0 -1 -2 -1 Not recommended (-4) Same as Section 1
Protect
4.1 1 0 1 1 -2 -1 Neutral (0) No significant gain expected, low value of assets to protect.
4.2 0 -2 -2 -2 -2 -2 Not recommended (-10) Same as Section 4 but less necessary.
4.3 0 -2 -2 -2 -2 -2 Not recommended (-10) Same as Section 4.
1.1: Avoid
2.1: Do Nothing
2.2: Relocate
2.3: Prevent further development
3.1: Notification on land titles
3.2: Emergency Plans
3.3I: Re-design for hazards (Inundation)
3.3E: Re-design for hazards (Erosion)
4.1: Dune renourishment
4.2: Groyne(s)
4.3: Seawall
4.5 Section 5
The only assets in Section 5 that fall within the hazard zone are vehicle access paths with a small car park, and a small section of Stella Rowley Drive. Protective options are not recommended for these assets of relatively lower importance.
Trigger based relocation of access paths is preferred over waiting until paths are damaged.
The consequence of inundation to the road is minimal and simple emergency plans such as a flood gauge should mitigate risks to vehicles in the unlikely event of flooding.
Shire of Shark Bay | 02 April 2019 Chapter Report: Adaptation Option Assessment Page 25
5652_01_R
07v03.d
ocx
5 COST BENEFIT ANALYSIS
5.1 Analysis Approach
The purpose of the Cost-Benefit Analysis (CBA) as part of this CHRMAP is to elucidate the selection of
adaptation options through economic analysis. In the previous section, potential adaptation options have been
assessed against a range of criteria, including expected lifetime cost (score only). Options with significant
investment that scored positively in the MCA have been included in this CBA. The idea is that a more rigorous
assessment of costs and benefits for an option will assist with preferential selection and potentially uncover
any inaccurate costing assumptions previously made in the MCA. This analysis also ensures that selected
adaptation options are economically defendable.
The cost-benefit of each option is presented in net present value (NPV) terms. NPV is a standard economic
analysis for options with costs and benefits that vary across a given timeframe and allows for discounting of
all future economic considerations to present day dollars for a more direct comparison. This relates to the time-
value of money as planned expenses in the future are, in a sense, cheaper than equivalent costs today,
because the money required for that future expense could be invested elsewhere today to provide value to the
community over time. Whereas if that expense occurred today the money could not be invested and would be
spent.
The discount rate chosen for this project was 7% based on similar assessments (Baird, 2018). The discount
rate essentially converts all future costs and benefits back to today’s dollar value for comparison (in the NPV).
For example, a project with a cost of $1 million per year for 10 years would discount to an NPV of roughly $7.5
million, whereas a project that only has a single outlay of $10 million in 10 years’ time would have an NPV of
roughly $5.4 million, both discounted at 7%. A project that cost $10 million today would have an NPV of $10
million. This example shows the importance of when a cost is realised.
The CBA has been performed over a 50-year period, designed to match the expected lifespan of the proposed
adaptation options. This means that the costs and benefits are only applied up to 2070, i.e.: assets not affected
by this point are not included. Beyond this timeframe, any consideration of costs contains significant
uncertainty and therefore has minimal bearing on analysis. Also, errors in data and errors arising from
assumptions would likely be significant and multiple rounds of adaptation would have to be considered. Long-
term adaptation pathways should always be monitored and updated over time. Whilst this analysis considers
only the next 50 years, the overall CHRMAP considers planning over a 100-year timeframe and will include
recommendations to re-assess adaptation strategies in the future.
5.2 Adaptation Options Assessed
The options considered here were determined in the MCA. The ‘avoid’ strategy was not assessed here as its
implementation is logical and recommended for any case where non-infill development would be considered
within the hazard zone. Other low-cost options such as planning instruments (prevent / restrict further
development, notification on land title), emergency plans and accommodation for inundation at
existing structures only require assessment at the MCA level. Options scoring positively in the MCA
are recommended for implementation in the CHRMAP.
Despite its poor score in the MCA, the construction of groynes in Section 1 was considered as well as Section
2 due to the large amount of residential assets in the area. Note that a viable economic assessment does not
address issues raised in other categories of the MCA.
The ’managed retreat’ option does not distinguish who shall bear the cost of retreat. This will depend on the
adaptation strategy chosen as well as the policies of the local and state government. For this portion of the
analysis there is no cost distinction between a ‘do nothing’ managed retreat and a ‘relocate’ managed retreat,
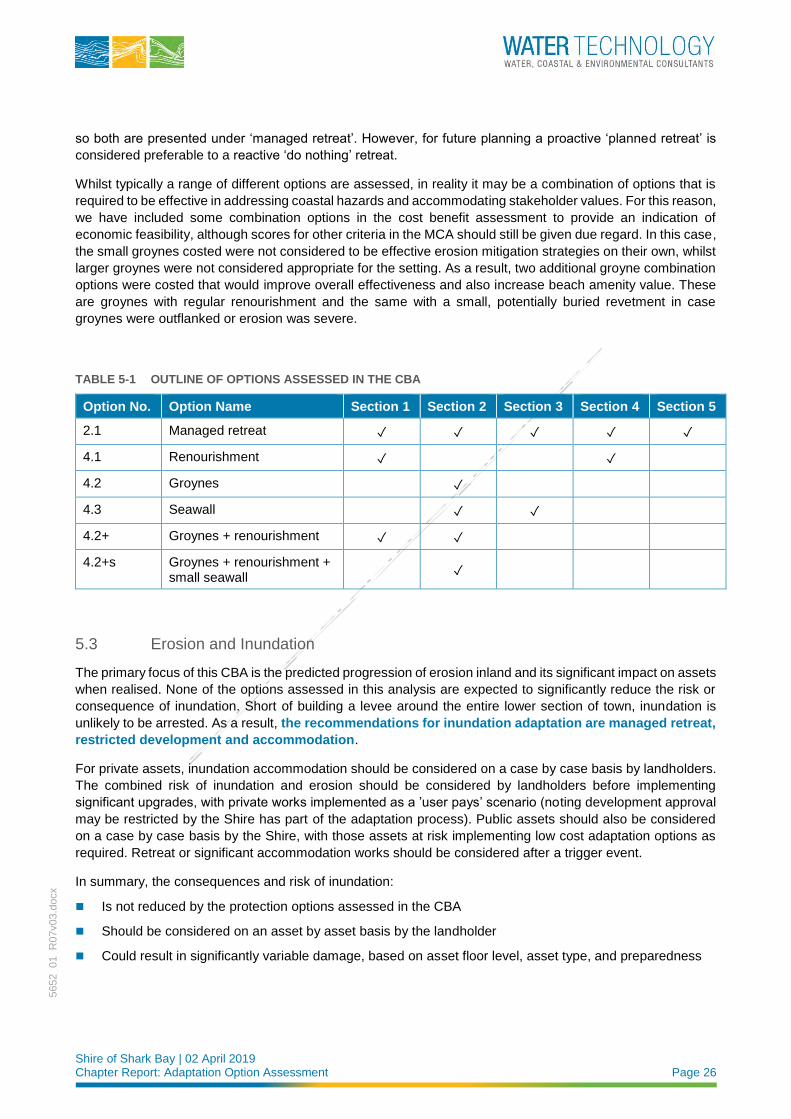
Shire of Shark Bay | 02 April 2019 Chapter Report: Adaptation Option Assessment Page 26
5652_01_R
07v03.d
ocx
so both are presented under ‘managed retreat’. However, for future planning a proactive ‘planned retreat’ is
considered preferable to a reactive ‘do nothing’ retreat.
Whilst typically a range of different options are assessed, in reality it may be a combination of options that is
required to be effective in addressing coastal hazards and accommodating stakeholder values. For this reason,
we have included some combination options in the cost benefit assessment to provide an indication of
economic feasibility, although scores for other criteria in the MCA should still be given due regard. In this case,
the small groynes costed were not considered to be effective erosion mitigation strategies on their own, whilst
larger groynes were not considered appropriate for the setting. As a result, two additional groyne combination
options were costed that would improve overall effectiveness and also increase beach amenity value. These
are groynes with regular renourishment and the same with a small, potentially buried revetment in case
groynes were outflanked or erosion was severe.
TABLE 5-1 OUTLINE OF OPTIONS ASSESSED IN THE CBA
Option No. Option Name Section 1 Section 2 Section 3 Section 4 Section 5
2.1 Managed retreat ✓ ✓ ✓ ✓ ✓
4.1 Renourishment ✓ ✓
4.2 Groynes ✓
4.3 Seawall ✓ ✓
4.2+ Groynes + renourishment ✓ ✓
4.2+s Groynes + renourishment + small seawall
✓
5.3 Erosion and Inundation
The primary focus of this CBA is the predicted progression of erosion inland and its significant impact on assets
when realised. None of the options assessed in this analysis are expected to significantly reduce the risk or
consequence of inundation. Short of building a levee around the entire lower section of town, inundation is
unlikely to be arrested. As a result, the recommendations for inundation adaptation are managed retreat,
restricted development and accommodation.
For private assets, inundation accommodation should be considered on a case by case basis by landholders.
The combined risk of inundation and erosion should be considered by landholders before implementing
significant upgrades, with private works implemented as a ’user pays’ scenario (noting development approval
may be restricted by the Shire has part of the adaptation process). Public assets should also be considered
on a case by case basis by the Shire, with those assets at risk implementing low cost adaptation options as
required. Retreat or significant accommodation works should be considered after a trigger event.
In summary, the consequences and risk of inundation:
◼ Is not reduced by the protection options assessed in the CBA
◼ Should be considered on an asset by asset basis by the landholder
◼ Could result in significantly variable damage, based on asset floor level, asset type, and preparedness
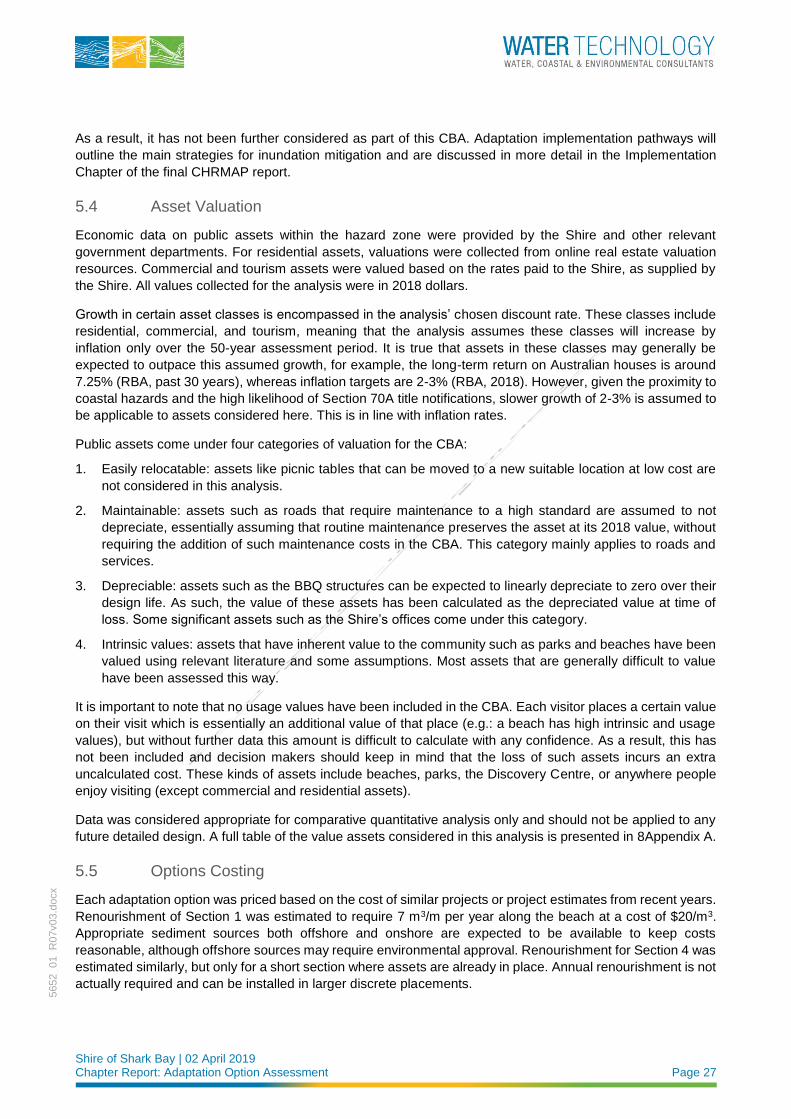
Shire of Shark Bay | 02 April 2019 Chapter Report: Adaptation Option Assessment Page 27
5652_01_R
07v03.d
ocx
As a result, it has not been further considered as part of this CBA. Adaptation implementation pathways will
outline the main strategies for inundation mitigation and are discussed in more detail in the Implementation
Chapter of the final CHRMAP report.
5.4 Asset Valuation
Economic data on public assets within the hazard zone were provided by the Shire and other relevant
government departments. For residential assets, valuations were collected from online real estate valuation
resources. Commercial and tourism assets were valued based on the rates paid to the Shire, as supplied by
the Shire. All values collected for the analysis were in 2018 dollars.
Growth in certain asset classes is encompassed in the analysis’ chosen discount rate. These classes include
residential, commercial, and tourism, meaning that the analysis assumes these classes will increase by
inflation only over the 50-year assessment period. It is true that assets in these classes may generally be
expected to outpace this assumed growth, for example, the long-term return on Australian houses is around
7.25% (RBA, past 30 years), whereas inflation targets are 2-3% (RBA, 2018). However, given the proximity to
coastal hazards and the high likelihood of Section 70A title notifications, slower growth of 2-3% is assumed to
be applicable to assets considered here. This is in line with inflation rates.
Public assets come under four categories of valuation for the CBA:
1. Easily relocatable: assets like picnic tables that can be moved to a new suitable location at low cost are
not considered in this analysis.
2. Maintainable: assets such as roads that require maintenance to a high standard are assumed to not
depreciate, essentially assuming that routine maintenance preserves the asset at its 2018 value, without
requiring the addition of such maintenance costs in the CBA. This category mainly applies to roads and
services.
3. Depreciable: assets such as the BBQ structures can be expected to linearly depreciate to zero over their
design life. As such, the value of these assets has been calculated as the depreciated value at time of
loss. Some significant assets such as the Shire’s offices come under this category.
4. Intrinsic values: assets that have inherent value to the community such as parks and beaches have been
valued using relevant literature and some assumptions. Most assets that are generally difficult to value
have been assessed this way.
It is important to note that no usage values have been included in the CBA. Each visitor places a certain value
on their visit which is essentially an additional value of that place (e.g.: a beach has high intrinsic and usage
values), but without further data this amount is difficult to calculate with any confidence. As a result, this has
not been included and decision makers should keep in mind that the loss of such assets incurs an extra
uncalculated cost. These kinds of assets include beaches, parks, the Discovery Centre, or anywhere people
enjoy visiting (except commercial and residential assets).
Data was considered appropriate for comparative quantitative analysis only and should not be applied to any
future detailed design. A full table of the value assets considered in this analysis is presented in 8Appendix A.
5.5 Options Costing
Each adaptation option was priced based on the cost of similar projects or project estimates from recent years.
Renourishment of Section 1 was estimated to require 7 m3/m per year along the beach at a cost of $20/m3.
Appropriate sediment sources both offshore and onshore are expected to be available to keep costs
reasonable, although offshore sources may require environmental approval. Renourishment for Section 4 was
estimated similarly, but only for a short section where assets are already in place. Annual renourishment is not
actually required and can be installed in larger discrete placements.
Shire of Shark Bay | 02 April 2019 Chapter Report: Adaptation Option Assessment Page 28
5652_01_R
07v03.d
ocx
The cost of groynes used was $400,000 per groyne, with two included per section. This is in line with the cost
of the FRP sheet pile groyne ($430,000) and a recent estimate for geotextile sand bag groynes at Geraldton
($360,000 per groyne). Significant rock armour structures that are designed to not be outflanked or overtopped
in any conditions are not considered to be the most appropriate structures here, due to the limited setback and
requirement of rising much higher than the surrounding land. Where groynes and renourishment have been
recommended, the renourishment requirement has been reduced (compared to renourish only). This cost was
the same for both Section 1 and 2; two groynes with an initial renourishment of 8,000 m3 and 1,000 m3 total
per year.
Seawalls were based on the cost of constructing a significant rock armour structure similar to the revetment in
Section 3. The cost of this was estimated at $7,000 per m with a 2% annual maintenance cost. For the final
option that includes a smaller revetment for the groynes to tieback to the estimated cost was $3,500 per m
with the same renourishment as the groyne plus renourishment option and the same maintenance estimate
(2%).
5.6 Assumptions
The assumptions required to perform this analysis are listed below:
◼ Assume linear depreciation of public assets over effective lifespan. E.g.: a seawall designed for 50 years
will at the end of its life have no value.
◼ Assume commercial and tourism assets increase in value in-line with long-term inflation. This assumption
is based on the fact that these properties could be expected to be kept fit-for-purpose over the analysis
through minor improvements. Business trademark value does not require inclusion.
◼ An asset is considered lost when the first structure on the structure footprint is estimated to be impacted
by erosion.
◼ 171 and 179 Knight Terrace (undeveloped land parcels to the south-east of the end of Knight Terrace)
have been excluded from the CBA. These are stipulated as ‘unrateable’ in the Shire’s provided cost
information.
◼ ‘Easily’ relocatable assets are moved before erosion damage; applies to assets such as picnic tables, art,
reclaimed wood displays, historic / tourism displays. Relocation costs are not included in the CBA.
◼ DoT seafront assets (jetty, ramp) are included as a benefit to maintaining the seawall that already exists,
as not doing so may jeopardize these assets’ integrity.
5.7 Results
The results of the complete cost benefit analysis are presented in Table 5-2 below. All costs are compared
against the ‘managed retreat’ approach. Options that are significantly cheaper than retreat are highlighted
green, while options that are significantly more expensive are highlighted red. Options that fall within ±25% of
the expected cost of retreat are highlighted in orange and may be suitable. However, careful consideration of
the other potential costs and benefits not included in this analysis come into play (such as those considered in
the MCA). The primary costs not considered in this analysis are the costs of inundation and the usage benefits
of the foreshore and beach amenities.
Shire of Shark Bay | 02 April 2019 Chapter Report: Adaptation Option Assessment Page 29
5652_01_R
07v03.d
ocx
TABLE 5-2 CBA RESULTS
Option No. Option Name
Costs (thousands of dollars)
Section 1 Section 2 Section 3 Section 4 Section 5
2.1 Managed retreat 2,960 4,020 6,090 550 120
4.1 Renourishment 1,320 840
4.2 Groynes 1,060
4.3 Seawall 3,700 4,870
4.2+ Groynes + renourishment 2,440 1,300
4.2+s Groynes + renourishment + small seawall
4,000 3,090
Section 1 recommends renourishment or groynes with renourishment as viable adaptation options. However,
given the uncertainty regarding the effectiveness of only groynes to fully arrest erosion it may not be the most
suitable option. Furthermore, installation of groynes may signal to landholders and developers not to adopt a
retreat policy when possible, leaving the area exposed to greater risk of inundation in the future. Given the
option is only recommended marginally here and scored poorly in the MCA, it is not recommended at this time.
Section 2 contains significant assets within the hazard zone and as a result some significant protection options
may be viable. Results from Section 3 indicate the existing seawall infrastructure should be maintained and in
Section 4 renourishment was considered a potentially viable option.
Whilst the economic viability of some of the adaptation options assessed here appears positive, there are
many more factors that need to be taken into account to implement a successful long-term CHRMAP. The
summary in the following section considers the results of the MCA and the CBA together with the potential
impacts of inundation, and the potential issues of actually implementing each of options.
Shire of Shark Bay | 02 April 2019 Chapter Report: Adaptation Option Assessment Page 30
5652_01_R
07v03.d
ocx
6 ADAPTATION PLANNING – COMMUNITY ENGAGEMENT
6.1 Engagement Process
The Stakeholder and Community Engagement Plan (Water Technology, 2018e) aimed to engage all relevant
stakeholders to provide them with ownership of the CHRMAP and acceptance of its outcomes. The objectives
of the strategy are as follows:
◼ Consult with stakeholders and the community on climate change and its impacts in the coastal zone within
the Denham Townsite:
◼ What does this mean for the community?
◼ How can we adapt?
◼ Generate the success criteria for the risk assessment component of the CHRMAP. Success criteria
represent stakeholders’ tolerance and acceptability of the impact to assets from the identified coastal
hazards.
◼ Aid in the selection of site-specific adaptation measures. Stakeholders on the ground are likely to have a
knowledge of the site developed over years of interaction. This provides invaluable information that can
be applied to generate innovative adaptation measures.
As part of the Adaptation Options Assessment, the engagement strategy (Water Technology, 2018e) identified
a workshop and an online survey to collate the stakeholder and community’s views on different adaptation
options.
6.2 Stakeholders
As defined in Water Technology (2018e), stakeholders for the project can be split into two categories:
◼ Internal Stakeholders:
◼ Part of the decision-making team. Predominantly, these will be Shire of Shark Bay Councillors and
staff, although state government will also play a role. A Steering Committee was established to
oversee preparation and completion of the CHRMAP, including review of project deliverables. This
includes representatives from state government.
◼ External Stakeholders:
◼ Not decision-makers but are affected by the project outcomes. They might live near the coast, use an
asset or resource located in the coastal zone, or simply have an interest in the coastal foreshore
reserve.
The aim of the Adaptation Options Assessment engagement was to engage both internal and external
stakeholders. To this end, a Community Information Sheet was developed to advertise the workshop and its
purpose (refer Appendix B).
6.3 Adaptation Options Workshop Summary
The workshop was held on 11th December 2018. There were around 10 attendees and information was
presented by Water Technology representatives interactively with attendees. Brief post workshop surveys
indicated that the sessions were beneficial and generally well received.
A primary goal of the second workshop was to inform attendees about the adaptation planning phase of the
CHRMAP process and to receive feedback on the recently undertaken assessment of adaptation options.
Short (up to 2050) and long-term (up to 2119) options identified as part of the project were presented and
discussed. This was followed by an outline of the assessment process and a more detailed discussion of the
Shire of Shark Bay | 02 April 2019 Chapter Report: Adaptation Option Assessment Page 31
5652_01_R
07v03.d
ocx
results. Attendees were encouraged to suggest alternative scores for the MCA, where appropriate, and several
minor alterations were discussed. Overall the adaptation options assessment was well received. Some of the
most important discussion points from the meeting were as follows:
◼ Consensus on upgrading of the protection to Section 2, similar to Section 3 and Section 4;
◼ No desire to begin seriously considering relocation of Knight Terrace assets and town ‘hub’ in the short-
term while risk of inundation is still relatively low;
◼ Shire staff and Councillors already thinking about redevelopment of Shire’s offices due to particularly
low-lying FFL;
◼ Limited money available for private asset protection or relocation;
◼ Seawalls in Section 2, Section 3, and Section 4, along with irregular renourishment of Section 1 as
required considered to be the best short-term strategies;
◼ Funding options such as tourist levies or increased council rates for coastal adaptation considered a
difficult subject, unlikely to get majority support from council or residents;
◼ User pays principle generally well received but implementation considered difficult as well;
◼ Uncertainties in long-term predictions and real-world implications generally result in a ‘wait and see’
consensus for long-term planning.
6.4 Adaptation Options Survey
The online adaptation options survey aimed to enhance the results of the adaptation options workshop results,
as well as generate information for implementation of the CHRMAP. The survey was posted online for a period
of approximately 2 months: from 21st December 2018 to 1st March 2019. This extended period was selected
to allow for the Christmas break and January school holiday period. A total of 35 responses were received; all
had a 100% completion rate.
The survey questions are displayed in Appendix A. The full results are presented in Appendix B. A summary
and discussion of the results is as follows:
◼ Most of the responses were residents of Denham;
◼ The majority of those were landowners.
◼ Only 1 respondent also attended a workshop.
◼ Just over half of the respondents viewed the online hazard mapping database prior to completing the
survey. Of these, 7 respondents would benefit from additional explanation on the CHRMAP process.
◼ Most people were at least somewhat concerned about the permanent impacts of sea level rise.
◼ There is a need for further information to be provided in order to improve understanding of coastal erosion
and coastal inundation.
◼ Only 5 respondents knew they owned an asset that may be at risk of inundation or erosion.
◼ A large majority of respondents supported some form of coastal hazard warning on land (e.g.: notification
on title).
◼ Managed retreat was preferred to protection structures.
◼ A persistent minority were willing to pay higher rates for coastal adaptation and/or foreshore improvement
works.
Shire of Shark Bay | 02 April 2019 Chapter Report: Adaptation Option Assessment Page 32
5652_01_R
07v03.d
ocx
◼ An overwhelming majority did not believe that those who benefit more from an adaptation option should
be required to pay more to fund that option (NOTE this is in direct opposition to the State Coastal
Strategy and SPP2.6).
◼ It is likely that more work is needed to educate the community on the ‘user pays’ principle.
◼ The majority of respondents agreed with the workshop consensus that plans to move the town hub could
be discussed in future. About a third preferred to remain in place and increase protection as required.
◼ Most respondents believed the owner should pay for the loss of their private property due to coastal
hazards. There was no clear consensus on when a property should be removed.
◼ In terms of future foreshore developments, leaving the coast as it is now or increasing recreational and
community facilities were strongly preferred options for all areas of coastline.
6.5 Engagement Summary
To date the community engagement strategy has included two workshops, two online surveys, and the
publishing of the online coastal hazards database. Earlier engagement focused on the community’s success
criteria for the project while later engagement focused on optimising the selection of possible adaptation
options.
Overall the community engagement was helpful in guiding the project and the work was generally well
received. However, more education on the CHRMAP process and on coastal management in general may
result in higher local participation in the engagement process. Survey results indicate that more awareness of
the online database and its contents may also improve community awareness, with a significant number of
survey respondents not having viewed the CHRMAP hazard lines.
The community placed a high value on the recreational and environmental value of the coastline which guided
the options assessment processes.
Shire of Shark Bay | 02 April 2019 Chapter Report: Adaptation Option Assessment Page 33
5652_01_R
07v03.d
ocx
7 SUMMARY
The adaptation options assessment has further defined the hazard mitigation options identified in the options
identification report (Water Technology, 2018a) and applied them to the coastal hazards faced within the
Denham townsite and surrounds. As discussed in the Water Technology (2018a), WAPC (2014) strongly
recommend a tiered preference system geared towards managed retreat for existing assets, then
accommodation and finally protection when no other strategy is plausible.
This report adheres to those guidelines, recommending avoid, managed retreat and some accommodation
options in all areas. Through a multi-criteria assessment and a cost-benefit analysis, various adaptation options
were scored and compared to the alternative of retreat. A summary of the final recommended options from
this report are presented in Table 7-1.
From this table some recommendations for the Shire are as follows:
◼ All new non-infill permanent development within the identified hazard zones should be avoided
◼ A special control area (SCA) should be created including, but not limited to the following:
◼ All proposed development within the SCA requires approval. (This would include development that
would not ordinarily require development approval under the scheme).
◼ Referral of applications (any planning application should be referred to the Department of
Transport, the Western Australian Planning Commission and any other relevant authority for
advice and comment on the coastal risk).
◼ Placement of Section 70A notification on appropriate land titles (notifying of coastal hazard risk)
◼ Prevention of further development for lots within the erosion hazard zone of the next epoch (i.e.:
staged prevention of development, initially for lots at risk by 2030, then later for lots at risk by 2050 if
hazard triggers are reached). This criterion may be relaxed for lots inland of protection structures.
◼ Requirement of houses damaged or otherwise triggered (see Section 2.2) by coastal hazards to be
relocated or rebuilt out of the hazard zone.
◼ Minimum finished floor levels and/or other development standards (4.2 metres AHD has been
identified as the appropriate minimum FFL).
◼ Land developers should also be made aware of the risks from inundation at present and in the future and
be educated of the steps they can take to minimise damage from such events.

Shire of Shark Bay | 02 April 2019 Chapter Report: Adaptation Option Assessment Page 34
5652_01_R
07v03.d
ocx
TABLE 7-1 SUMMARY OF ADAPTATION OPTIONS ASSESSMENT (*POINTS BELOW)
Option No.
Option Name Section
1 Section
2 Section
3 Section
4 Section
5
1.1 Avoid (where possible) NA NA
2.2 Relocate
2.3 Prevent further development *2 *1
3.1 Notification on land titles
3.3I Minor re-design to help accommodate inundation (where possible)
4.1 Renourishment *3
4.2/3 Hard structure protection *4
1. Potential to continue development behind seawall protection as long as the finished floor level requirements are met,
and developers are made aware of the potential for long-term retreat when marina facilities are retired (could be
implemented with a timeframe limit to the development).
2. Restriction of further development dependent on the final adaptation pathway chosen for this area. If protection is
chosen, then a similar strategy to Point 1 could be implemented.
3. Renourishment to limit erosion may be viable for Section 1 and could be based on a monitoring and trigger-based
strategy.
4. Potential to install some form of coastal protection structure in Section 2 to allow more time for assets inland to be
relocated over time. Potential options to be discussed with stakeholders
If Section 70A notifications were to be implemented for all residential and commercial lots within the 2118
hazards zone, a total of 51 residential and 14 commercial properties would be impacted. If a policy of managed
retreat were adopted, Table 7-2 (adapted from the Water Technology, 2018c) shows the number of assets that
would be affected. Assets vulnerable between the present day and 2030 are considered at extreme risk and
relocation should be considered. Assets vulnerable by 2050 are considered high risk and monitoring and
consideration of long-term options should occur. Assets at risk by 2118 should also monitor the progress of
erosion and sea level rise and consider their options as the risk of hazards increases. Note that most of these
assets are already exposed to inundation risks.
TABLE 7-2 ASSETS EXPOSED TO EROSION UNDER MANAGED RETREAT PREDICTIONS
Asset Classification Present day to 2030 (extreme risk)
By 2050 (high risk) By 2118 (moderate
risk)
Commercial 1 5 14
Public 64 70 74
Residential 0 18 51
Tourism Related 1 4 10

Shire of Shark Bay | 02 April 2019 Chapter Report: Adaptation Option Assessment Page 35
5652_01_R
07v03.d
ocx
The Denham townsite is situated close to or within the active coastal zone, especially high value areas such
as the hub of Knight Terrace and the marina facilities. This makes some interaction with coastal processes
unavoidable. This has already been observed through the placement of various coastal protection structures
over time, ranging from the new marina rock revetment to old ad-hoc erosion guards near vulnerable assets.
The upgrade of marina facilities has somewhat cemented a section of the town’s coastline in place for the next
few decades. Both the MCA and the CBA recommended this protection be maintained for the time being.
Given the results of the assessment, three primary adaptation pathways for the next 50-years are presented
below. These options were discussed with stakeholders with feedback implemented into the final
recommended adaptation pathways. Stakeholders should note that while the assessment indicated that certain
protection options may be viable, they do not include all the potential costs. Implementation of a protection
strategy may encourage developers to commit to areas at risk of inundation and may increase difficulty of a
successful managed retreat in the future.
1. Managed retreat for all areas except Section 3
2. Construction of more formal seawall in Section 2; managed retreat for all other areas except
Section 3.
3. Renourishment for protection of Section 1; independent of whether Option 1 or 2 is selected,
managed retreat for all other areas except Section 3.
Whilst erosion may be locally restricted in the near future if a protection strategy is pursued, it is clear from
inundation hazard mapping that as sea level rise progresses, the feasibility of development in low lying areas
will decline. The Shire should begin to prepare for long-term adaptation pathways that potentially involve
managed retreat of significant parts of the town, mainly Knight Terrace and associated lots. While the above
options under the managed retreat and accommodation groupings aim to make this process easier in the long
run, such a significant shift will require a clear and collaborative vision for Denham’s future. It is recommended
that the Shire investigate potential town structure plans that can achieve this goal over the next decade. Staged
infill to raise low lying parts of the town between new and old developments may be expensive and require
coastal protection indefinitely, which will be very difficult to justify.
The next stage of the project considers implementation of the selected options. An implementation plan will be
prepared for each vulnerable group of assets, identifying long-term pathways, considering trigger points and
all components of the CHRMAP to date. A short-term implementation plan to produce a clear action plan to
2030 will be developed, as well as a monitoring plan, detailing any monitoring or review that may be required
over the full 100-year planning timeframe.
Shire of Shark Bay | 02 April 2019 Chapter Report: Adaptation Option Assessment Page 36
5652_01_R
07v03.d
ocx
8 REFERENCES
Baird (2018). Geraldton Coastal Hazard Risk Management and Adaption Planning Project, Report No
12693.101.R2.RevB, prepared for the City of Greater Geraldton.
Cardno (2017). Coastal Hazard Risk Management and Adaption Plan: CHRMAP For the Onslow Coast, Report
No 59916801 R06 Rev0, prepared for the Shire of Ashburton.
Department of Planning, Lands and Heritage (2018). Aboriginal Heritage Inquiry System, viewed 13th
November, 2018, <https://maps.daa.wa.gov.au/AHIS/>.
Intergovernmental Panel on Climate Change (IPCC, 2014). Climate Change 2014: Synthesis Report, Contribution of Working Groups I, II and III to the Fifth Assessment Report of the Intergovernmental Panel on
Climate Change. Geneva, Switzerland, Core Writing Team, R.K. Pachauri and L.A. Meyer (eds.)], IPCC,
Geneva, Switzerland, 151 pp.
Kohler, M., and van der Merwe, M. (2015). Long-run Trends in Housing Price Growth, prepared for Reserve
Bank of Australia Bulletin September Quarter 2015.
Pascoe, S., Doshi, A., Kovac, M., Austin, A., (2017). What’s my beach worth? Economic values of NSW coastal assets, prepared by CSIRO and NSW Office of Environment and Heritage.
Reserve Bank of Australia 2018, Inflation Target, viewed 1st October 2018,
<https://www.rba.gov.au/inflation/inflation-target.html>.
Water Technology (2018a). Denham Townsite CHRMAP Chapter Report: Adaptation Options Identification,
Report No 5652-01 R06v01, prepared for Shire of Shark Bay.
Water Technology (2018b). Denham Townsite CHRMAP Chapter Report: Risk Assessment, Report No 5652-
01 R05v01, prepared for Shire of Shark Bay.
Water Technology (2018c). Denham Townsite CHRMAP Chapter Report: Coastal Hazard & Vulnerability Assessment, Report No 5652-01 R04v01, prepared for Shire of Shark Bay.
Water Technology (2018d). Denham Townsite CHRMAP Chapter Report: Establish the Context, Report No
5652-01 R03v02, prepared for Shire of Shark Bay.
Water Technology (2018e). Denham Townsite CHRMAP: Stakeholder and Community Engagement Plan,
Report No 5562-01 R01v01, prepared for Shire of Shark Bay.
Western Australian Planning Commission (WAPC, 2013). State Planning Policy No. 2.6 – State Coastal
Planning Policy, prepared under the Planning and Development Act 2005.
Western Australian Planning Commission (WAPC, 2014). Coastal Hazard Risk Management and Adaptation
Planning Guidelines.
Western Australian Planning Commission (WAPC, 2017). Draft Planned or Managed Retreat Guidelines,
published by WAPC, Department of Planning, Lands and Heritage.
WorleyParsons (WP, 2016). Denham Foreshore Revitalisation Stage 1A: Design Report, Report No 301012-
02233 – GE-REP-002, prepared for Department of Transport
Shire of Shark Bay | 02 April 2019 Chapter Report: Adaptation Option Assessment Page 38
5652_01_R
07v03.d
ocx
ASSET VALUES
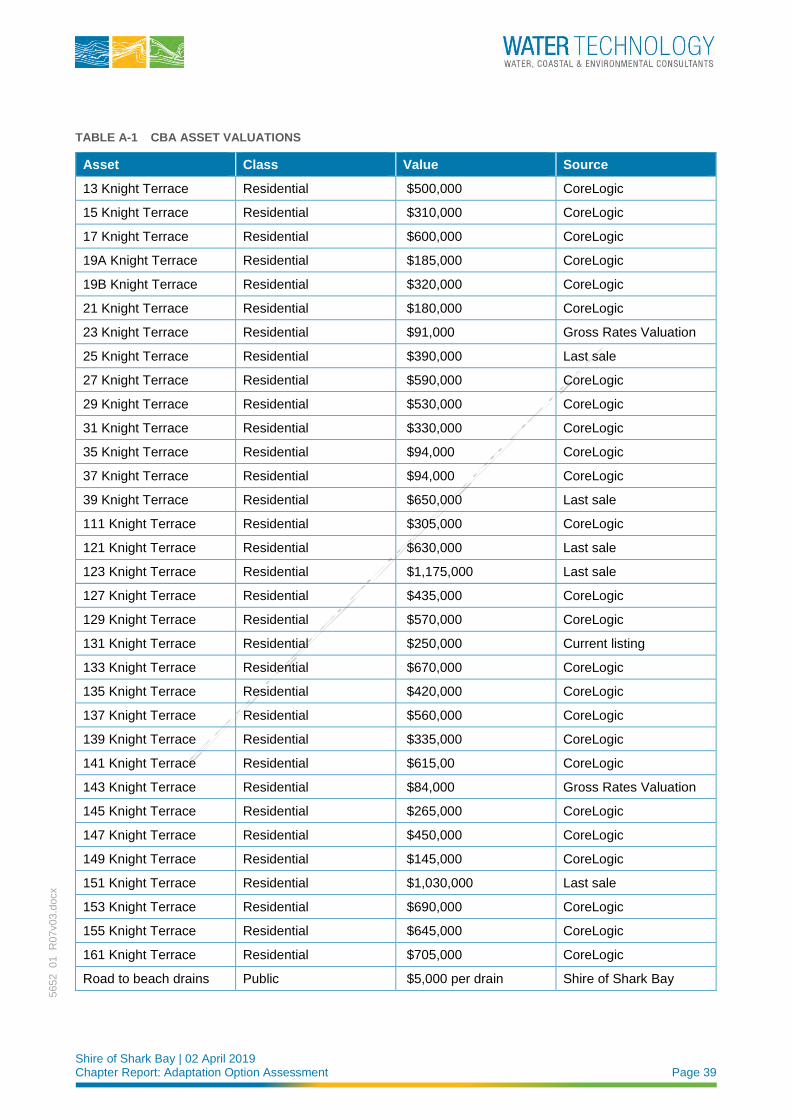
Shire of Shark Bay | 02 April 2019 Chapter Report: Adaptation Option Assessment Page 39
5652_01_R
07v03.d
ocx
TABLE A-1 CBA ASSET VALUATIONS
Asset Class Value Source
13 Knight Terrace Residential $500,000 CoreLogic
15 Knight Terrace Residential $310,000 CoreLogic
17 Knight Terrace Residential $600,000 CoreLogic
19A Knight Terrace Residential $185,000 CoreLogic
19B Knight Terrace Residential $320,000 CoreLogic
21 Knight Terrace Residential $180,000 CoreLogic
23 Knight Terrace Residential $91,000 Gross Rates Valuation
25 Knight Terrace Residential $390,000 Last sale
27 Knight Terrace Residential $590,000 CoreLogic
29 Knight Terrace Residential $530,000 CoreLogic
31 Knight Terrace Residential $330,000 CoreLogic
35 Knight Terrace Residential $94,000 CoreLogic
37 Knight Terrace Residential $94,000 CoreLogic
39 Knight Terrace Residential $650,000 Last sale
111 Knight Terrace Residential $305,000 CoreLogic
121 Knight Terrace Residential $630,000 Last sale
123 Knight Terrace Residential $1,175,000 Last sale
127 Knight Terrace Residential $435,000 CoreLogic
129 Knight Terrace Residential $570,000 CoreLogic
131 Knight Terrace Residential $250,000 Current listing
133 Knight Terrace Residential $670,000 CoreLogic
135 Knight Terrace Residential $420,000 CoreLogic
137 Knight Terrace Residential $560,000 CoreLogic
139 Knight Terrace Residential $335,000 CoreLogic
141 Knight Terrace Residential $615,00 CoreLogic
143 Knight Terrace Residential $84,000 Gross Rates Valuation
145 Knight Terrace Residential $265,000 CoreLogic
147 Knight Terrace Residential $450,000 CoreLogic
149 Knight Terrace Residential $145,000 CoreLogic
151 Knight Terrace Residential $1,030,000 Last sale
153 Knight Terrace Residential $690,000 CoreLogic
155 Knight Terrace Residential $645,000 CoreLogic
161 Knight Terrace Residential $705,000 CoreLogic
Road to beach drains Public $5,000 per drain Shire of Shark Bay
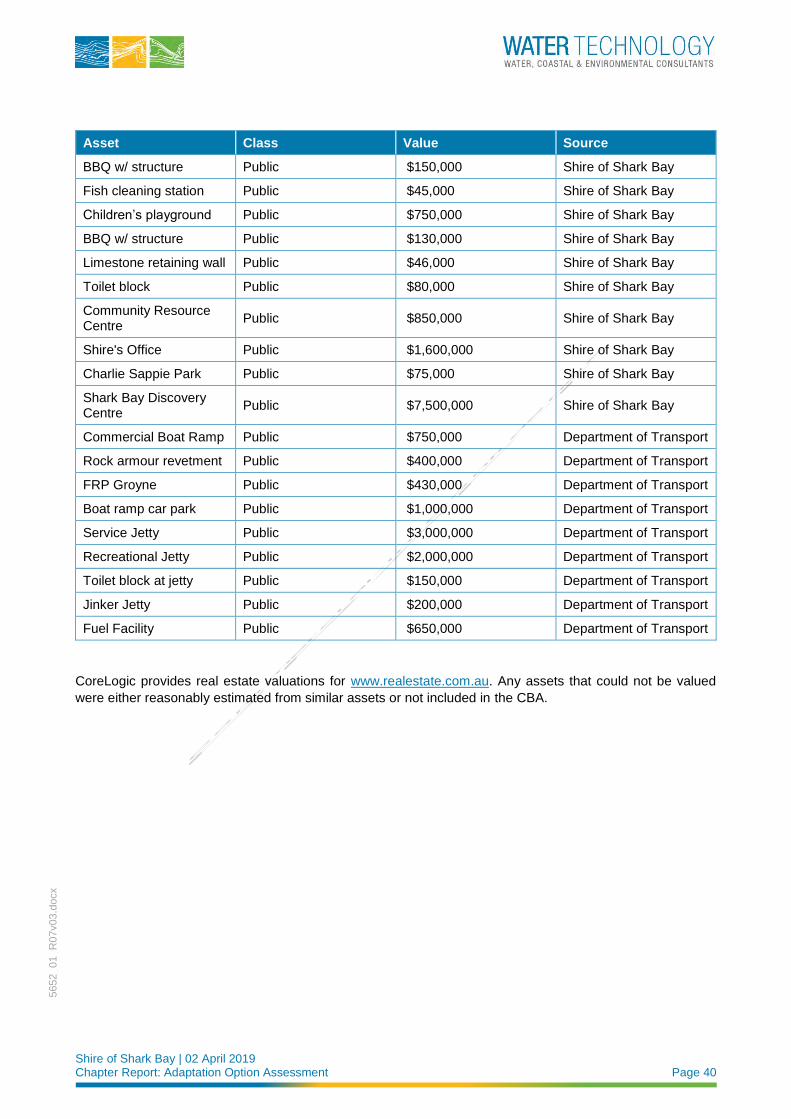
Shire of Shark Bay | 02 April 2019 Chapter Report: Adaptation Option Assessment Page 40
5652_01_R
07v03.d
ocx
Asset Class Value Source
BBQ w/ structure Public $150,000 Shire of Shark Bay
Fish cleaning station Public $45,000 Shire of Shark Bay
Children’s playground Public $750,000 Shire of Shark Bay
BBQ w/ structure Public $130,000 Shire of Shark Bay
Limestone retaining wall Public $46,000 Shire of Shark Bay
Toilet block Public $80,000 Shire of Shark Bay
Community Resource Centre
Public $850,000 Shire of Shark Bay
Shire's Office Public $1,600,000 Shire of Shark Bay
Charlie Sappie Park Public $75,000 Shire of Shark Bay
Shark Bay Discovery Centre
Public $7,500,000 Shire of Shark Bay
Commercial Boat Ramp Public $750,000 Department of Transport
Rock armour revetment Public $400,000 Department of Transport
FRP Groyne Public $430,000 Department of Transport
Boat ramp car park Public $1,000,000 Department of Transport
Service Jetty Public $3,000,000 Department of Transport
Recreational Jetty Public $2,000,000 Department of Transport
Toilet block at jetty Public $150,000 Department of Transport
Jinker Jetty Public $200,000 Department of Transport
Fuel Facility Public $650,000 Department of Transport
CoreLogic provides real estate valuations for www.realestate.com.au. Any assets that could not be valued
were either reasonably estimated from similar assets or not included in the CBA.

Shire of Shark Bay | 02 April 2019 Chapter Report: Adaptation Option Assessment Page 41
5652_01_R
07v03.d
ocx
APPENDIX B COMMUNITY INFORMATION SHEET
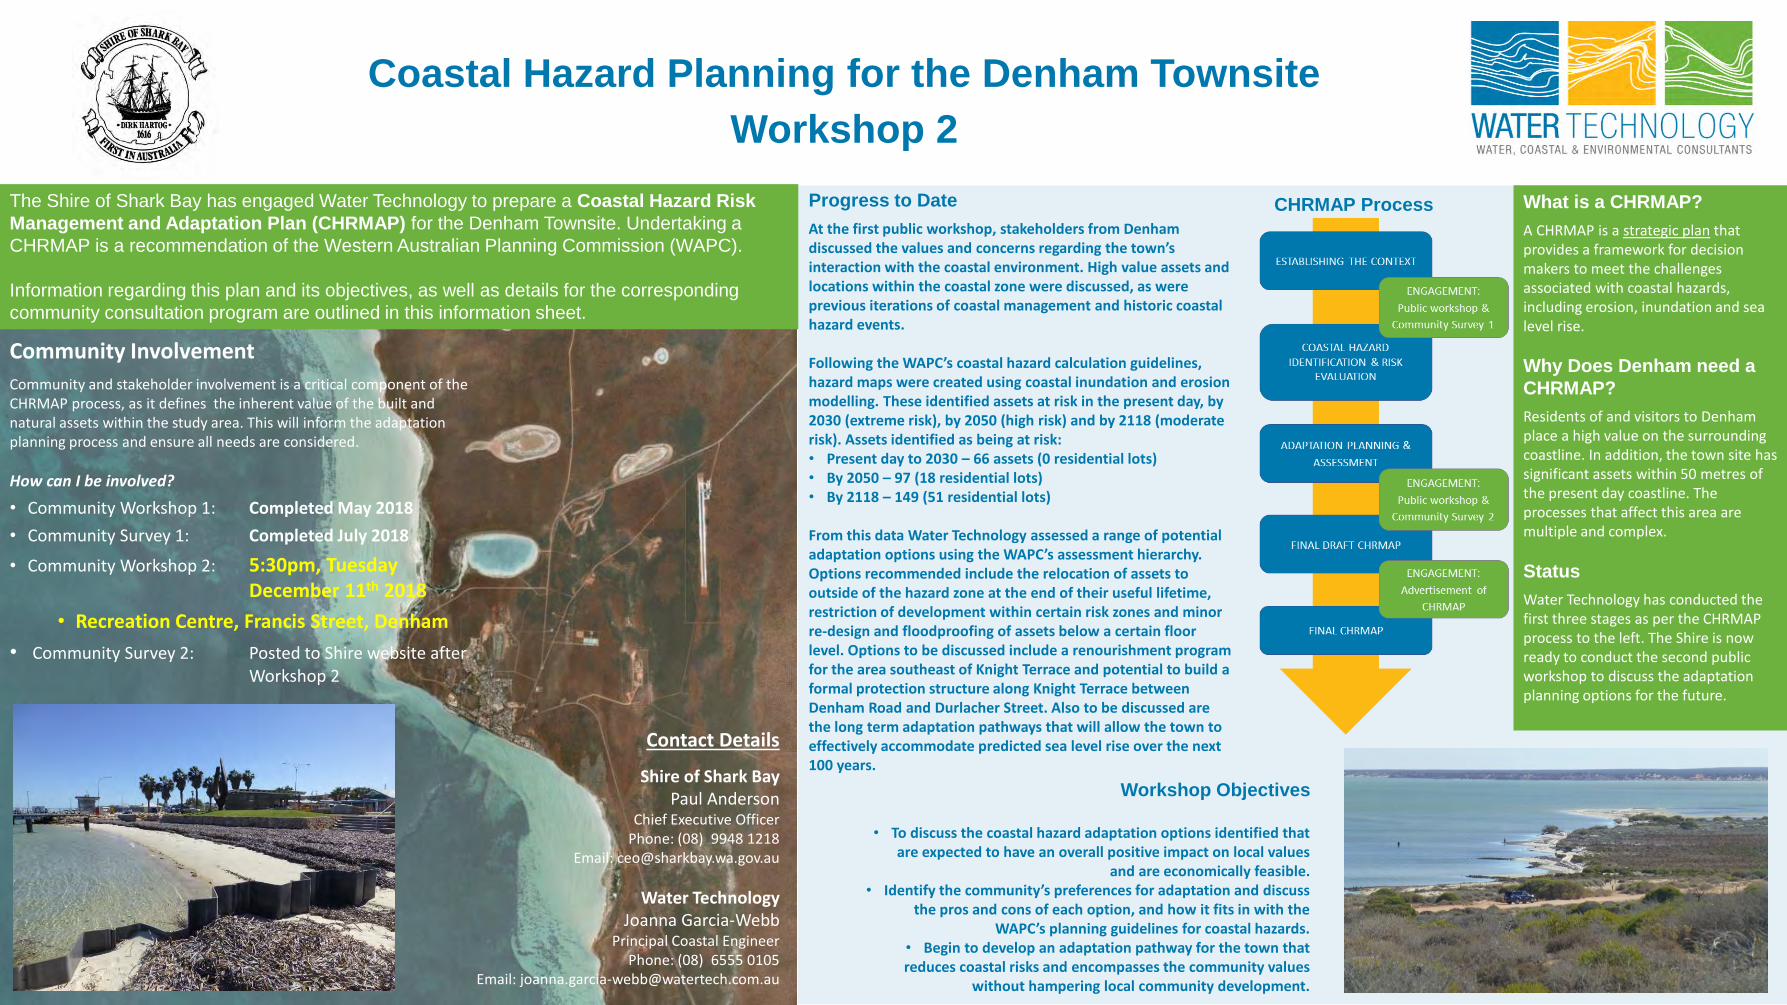
The Shire of Shark Bay has engaged Water Technology to prepare a Coastal Hazard Risk
Management and Adaptation Plan (CHRMAP) for the Denham Townsite. Undertaking a
CHRMAP is a recommendation of the Western Australian Planning Commission (WAPC).
Information regarding this plan and its objectives, as well as details for the corresponding
community consultation program are outlined in this information sheet.
Coastal Hazard Planning for the Denham Townsite
Workshop 2
What is a CHRMAP?
A CHRMAP is a strategic plan that provides a framework for decision makers to meet the challenges associated with coastal hazards, including erosion, inundation and sea level rise.
Why Does Denham need a
CHRMAP?
Residents of and visitors to Denham place a high value on the surrounding coastline. In addition, the town site has significant assets within 50 metres of the present day coastline. The processes that affect this area are multiple and complex.
Status
Water Technology has conducted the first three stages as per the CHRMAP process to the left. The Shire is now ready to conduct the second public workshop to discuss the adaptation planning options for the future.
Progress to Date
At the first public workshop, stakeholders from Denham discussed the values and concerns regarding the town’s interaction with the coastal environment. High value assets and locations within the coastal zone were discussed, as were previous iterations of coastal management and historic coastal hazard events.
Following the WAPC’s coastal hazard calculation guidelines, hazard maps were created using coastal inundation and erosion modelling. These identified assets at risk in the present day, by 2030 (extreme risk), by 2050 (high risk) and by 2118 (moderate risk). Assets identified as being at risk:• Present day to 2030 – 66 assets (0 residential lots)• By 2050 – 97 (18 residential lots)• By 2118 – 149 (51 residential lots)
From this data Water Technology assessed a range of potential adaptation options using the WAPC’s assessment hierarchy. Options recommended include the relocation of assets to outside of the hazard zone at the end of their useful lifetime, restriction of development within certain risk zones and minor re-design and floodproofing of assets below a certain floor level. Options to be discussed include a renourishment program for the area southeast of Knight Terrace and potential to build a formal protection structure along Knight Terrace between Denham Road and Durlacher Street. Also to be discussed are the long term adaptation pathways that will allow the town to effectively accommodate predicted sea level rise over the next 100 years.
Community Involvement
Community and stakeholder involvement is a critical component of the CHRMAP process, as it defines the inherent value of the built and natural assets within the study area. This will inform the adaptation planning process and ensure all needs are considered.
How can I be involved?
• Community Workshop 1: Completed May 2018
• Community Survey 1: Completed July 2018
• Community Workshop 2: 5:30pm, Tuesday December 11th 2018
• Recreation Centre, Francis Street, Denham
• Community Survey 2: Posted to Shire website after Workshop 2
CHRMAP Process
Workshop Objectives
• To discuss the coastal hazard adaptation options identified that are expected to have an overall positive impact on local values
and are economically feasible. • Identify the community’s preferences for adaptation and discuss
the pros and cons of each option, and how it fits in with the WAPC’s planning guidelines for coastal hazards.
• Begin to develop an adaptation pathway for the town that reduces coastal risks and encompasses the community values
without hampering local community development.
Contact Details
Shire of Shark BayPaul Anderson
Chief Executive OfficerPhone: (08) 9948 1218
Email: [email protected]
Water TechnologyJoanna Garcia-Webb
Principal Coastal EngineerPhone: (08) 6555 0105
Email: [email protected]
Shire of Shark Bay | 02 April 2019 Chapter Report: Adaptation Option Assessment Page 43
5652_01_R
07v03.d
ocx
APPENDIX C ADAPTATION OPTIONS SURVEY QUESTIONS
Shire of Shark Bay | 02 April 2019 Chapter Report: Adaptation Option Assessment Page 44
5652_01_R
07v03.d
ocx
Thank you for taking the time to complete the Shire of Shark Bay's adaptation options survey. This survey is
part of the Coastal Hazard Risk Management and Adaptation Plan (CHRMAP) for the town of Denham to
address the risks of coastal hazards both now and over the next 100 years. Undertaking a CHRMAP is a
recommendation of the Western Australian Planning Commission’s (WAPC) State Planning Policy 2.6
(SPP2.6).
As part of this project the Shire of Shark Bay (Shire) has identified all assets within the town that may be
subject to coastal inundation or erosion over the next 100 years. WAPC provides guidelines for the calculation
of these hazard zones and mandates the inclusion of 0.9 m sea level rise (SLR) over the coming century as
predicted by studies from the Intergovernmental Panel on Climate Change (IPCC).
The results of the asset survey and coastal hazard study can be found on the online database here:
It is recommended that you read the database notice and view the calculated erosion and inundation hazard
lines before taking the survey. Please keep in mind that these allowances are not a prediction of the future
shoreline but rather a planning tool for decision makers.
Using the information from the asset database the Shire is developing a risk management and adaptation plan
to help the town of Denham adapt to hazards over both the short and long term. When developing an
adaptation plan the WAPC requires that planners follow the adaptation hierarchy:
Avoid > Planned / Managed Retreat > Accommodate > Protect
This hierarchy shows, for example, that it is preferred to move assets away from coastal hazard zones rather
than protect them. The WAPC’s planning policy and guidelines also state that the user pays principle should
be adopted. This principle simply states that those who benefit most from coastal adaptation works should
contribute the most towards the project. It should also be noted that the State and Local Government are
not legally obliged to protect private assets or fund coastal adaptation works or strategies. These core
points: the adaptation hierarchy, the user pays principle, and the Government’s obligations, are not considered
well known amongst communities, but should be noted by anyone thinking about coastal planning and
adaptation.
On the 11th of December 2018, the Shire held a community workshop to discuss the recommendations from
the CHRMAP and the potential adaptation options identified for the future. This survey is to provide further
insight into the community’s preferences for the future of Denham and also into the community’s understanding
and satisfaction with the project process so far.
This survey can be completed by any member of the community regardless of whether they have attended
any of the CHRMAP workshops or not. It should only take you 5-10 minutes to complete the survey.
If you would like to share observations or thoughts on coastal adaptation, or if you have any questions
regarding the CHRMAP process, please email us at:
OR

Shire of Shark Bay | 02 April 2019 Chapter Report: Adaptation Option Assessment Page 45
5652_01_R
07v03.d
ocx
TABLE C-1 PROPOSED ADAPTATION OPTIONS SURVEY QUESTIONS
Question Response Prompts
1. How would you describe your connection to the Denham Townsite?
▪ Resident – landowner
▪ Resident - tenant
▪ Rate payer (non-resident)
▪ Work in the town
▪ Holiday in the town
▪ Other / special interest (please specify)
2. What is your age? ▪ <20
▪ 20-39
▪ 40-59
▪ >60
3. What is your residential address? (optional)
4. Did you attend either of the Denham CHRMAP community workshops?
▪ Workshop 1 (3rd May 2018)
▪ Workshop 2 (11th December 2018)
▪ Both
▪ Neither
5. Have you viewed the online hazard mapping database for the Town of Denham? If so, how would you describe your understanding of the hazard mapping?
▪ Yes… very easy to understand
▪ Yes… easy to understand
▪ Yes… difficult to understand
▪ Yes… very difficult to understand
▪ I have not viewed it
6. How would you describe your understanding of coastal erosion and coastal flooding due to storm surge inundation?
▪ Very good understanding
▪ Good understanding
▪ General awareness
▪ Uncertain
▪ Not aware
7. How would you describe your concern about the permanent impacts of sea level rise? For example, permanent coastal erosion and frequent coastal inundation.
▪ Very concerned
▪ Somewhat concerned
▪ Unconcerned
▪ No opinion
8. To your knowledge, do you own any vulnerable assets (residential or otherwise) that may be at risk to coastal erosion and/or coastal inundation due to storm surge?
▪ Yes
▪ No
▪ Not sure
9. Landholders should be informed about the risks of coastal erosion and inundation before purchasing or developing in hazardous areas
▪ Strongly agree
▪ Somewhat agree
▪ Neutral
▪ Strongly disagree
▪ Somewhat disagree
▪ Not sure
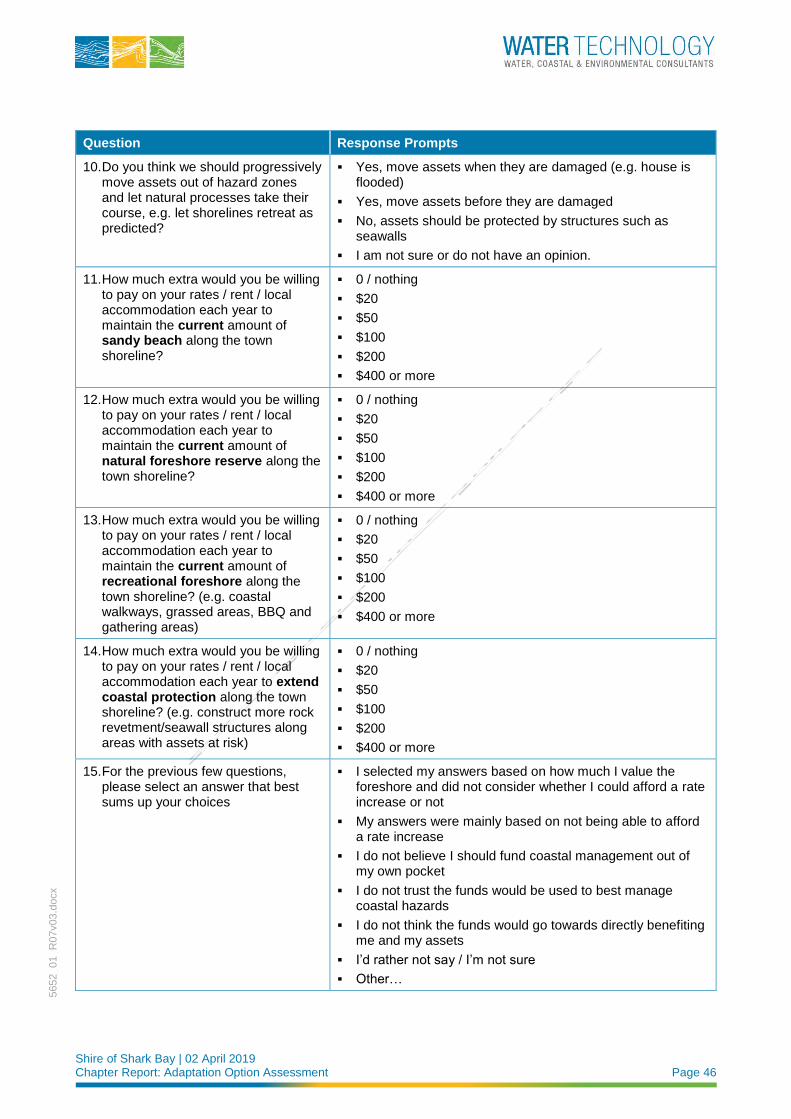
Shire of Shark Bay | 02 April 2019 Chapter Report: Adaptation Option Assessment Page 46
5652_01_R
07v03.d
ocx
Question Response Prompts
10. Do you think we should progressively move assets out of hazard zones and let natural processes take their course, e.g. let shorelines retreat as predicted?
▪ Yes, move assets when they are damaged (e.g. house is flooded)
▪ Yes, move assets before they are damaged
▪ No, assets should be protected by structures such as seawalls
▪ I am not sure or do not have an opinion.
11. How much extra would you be willing to pay on your rates / rent / local accommodation each year to maintain the current amount of sandy beach along the town shoreline?
▪ 0 / nothing
▪ $20
▪ $50
▪ $100
▪ $200
▪ $400 or more
12. How much extra would you be willing to pay on your rates / rent / local accommodation each year to maintain the current amount of natural foreshore reserve along the town shoreline?
▪ 0 / nothing
▪ $20
▪ $50
▪ $100
▪ $200
▪ $400 or more
13. How much extra would you be willing to pay on your rates / rent / local accommodation each year to maintain the current amount of recreational foreshore along the town shoreline? (e.g. coastal walkways, grassed areas, BBQ and gathering areas)
▪ 0 / nothing
▪ $20
▪ $50
▪ $100
▪ $200
▪ $400 or more
14. How much extra would you be willing to pay on your rates / rent / local accommodation each year to extend coastal protection along the town shoreline? (e.g. construct more rock revetment/seawall structures along areas with assets at risk)
▪ 0 / nothing
▪ $20
▪ $50
▪ $100
▪ $200
▪ $400 or more
15. For the previous few questions, please select an answer that best sums up your choices
▪ I selected my answers based on how much I value the foreshore and did not consider whether I could afford a rate increase or not
▪ My answers were mainly based on not being able to afford a rate increase
▪ I do not believe I should fund coastal management out of my own pocket
▪ I do not trust the funds would be used to best manage coastal hazards
▪ I do not think the funds would go towards directly benefiting me and my assets
▪ I’d rather not say / I’m not sure
▪ Other…
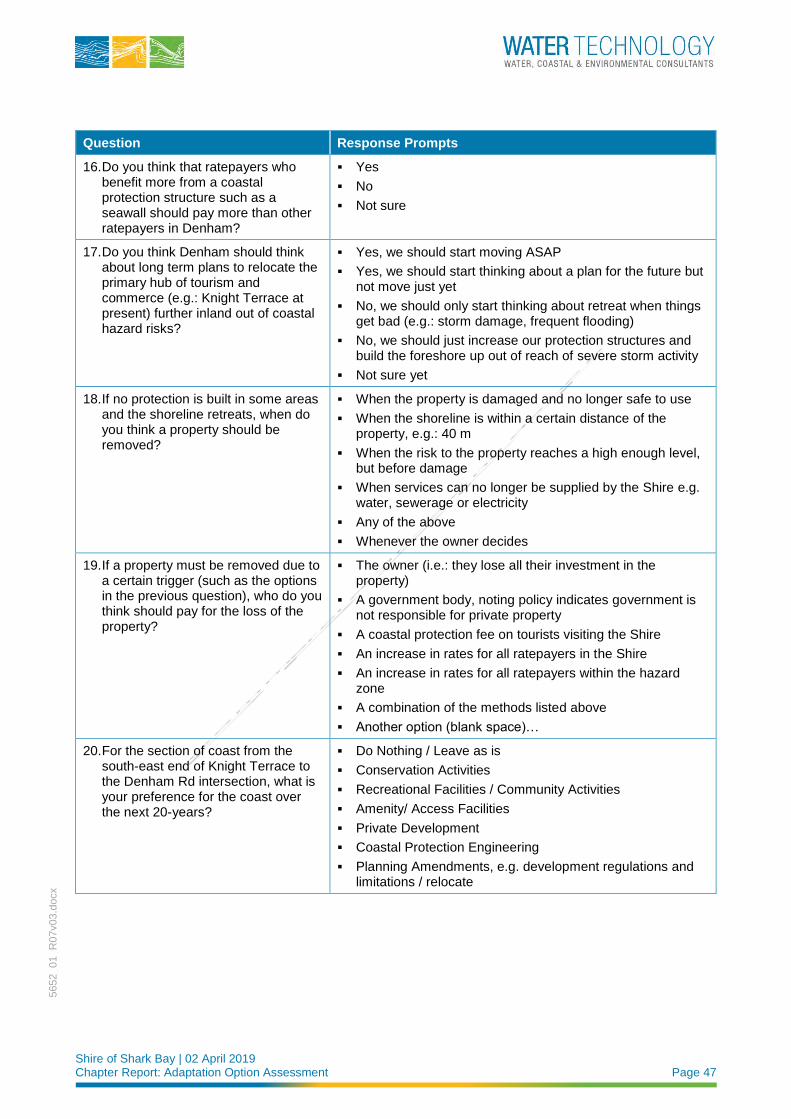
Shire of Shark Bay | 02 April 2019 Chapter Report: Adaptation Option Assessment Page 47
5652_01_R
07v03.d
ocx
Question Response Prompts
16. Do you think that ratepayers who benefit more from a coastal protection structure such as a seawall should pay more than other ratepayers in Denham?
▪ Yes
▪ No
▪ Not sure
17. Do you think Denham should think about long term plans to relocate the primary hub of tourism and commerce (e.g.: Knight Terrace at present) further inland out of coastal hazard risks?
▪ Yes, we should start moving ASAP
▪ Yes, we should start thinking about a plan for the future but not move just yet
▪ No, we should only start thinking about retreat when things get bad (e.g.: storm damage, frequent flooding)
▪ No, we should just increase our protection structures and build the foreshore up out of reach of severe storm activity
▪ Not sure yet
18. If no protection is built in some areas and the shoreline retreats, when do you think a property should be removed?
▪ When the property is damaged and no longer safe to use
▪ When the shoreline is within a certain distance of the property, e.g.: 40 m
▪ When the risk to the property reaches a high enough level, but before damage
▪ When services can no longer be supplied by the Shire e.g. water, sewerage or electricity
▪ Any of the above
▪ Whenever the owner decides
19. If a property must be removed due to a certain trigger (such as the options in the previous question), who do you think should pay for the loss of the property?
▪ The owner (i.e.: they lose all their investment in the property)
▪ A government body, noting policy indicates government is not responsible for private property
▪ A coastal protection fee on tourists visiting the Shire
▪ An increase in rates for all ratepayers in the Shire
▪ An increase in rates for all ratepayers within the hazard zone
▪ A combination of the methods listed above
▪ Another option (blank space)…
20. For the section of coast from the south-east end of Knight Terrace to the Denham Rd intersection, what is your preference for the coast over the next 20-years?
▪ Do Nothing / Leave as is
▪ Conservation Activities
▪ Recreational Facilities / Community Activities
▪ Amenity/ Access Facilities
▪ Private Development
▪ Coastal Protection Engineering
▪ Planning Amendments, e.g. development regulations and limitations / relocate
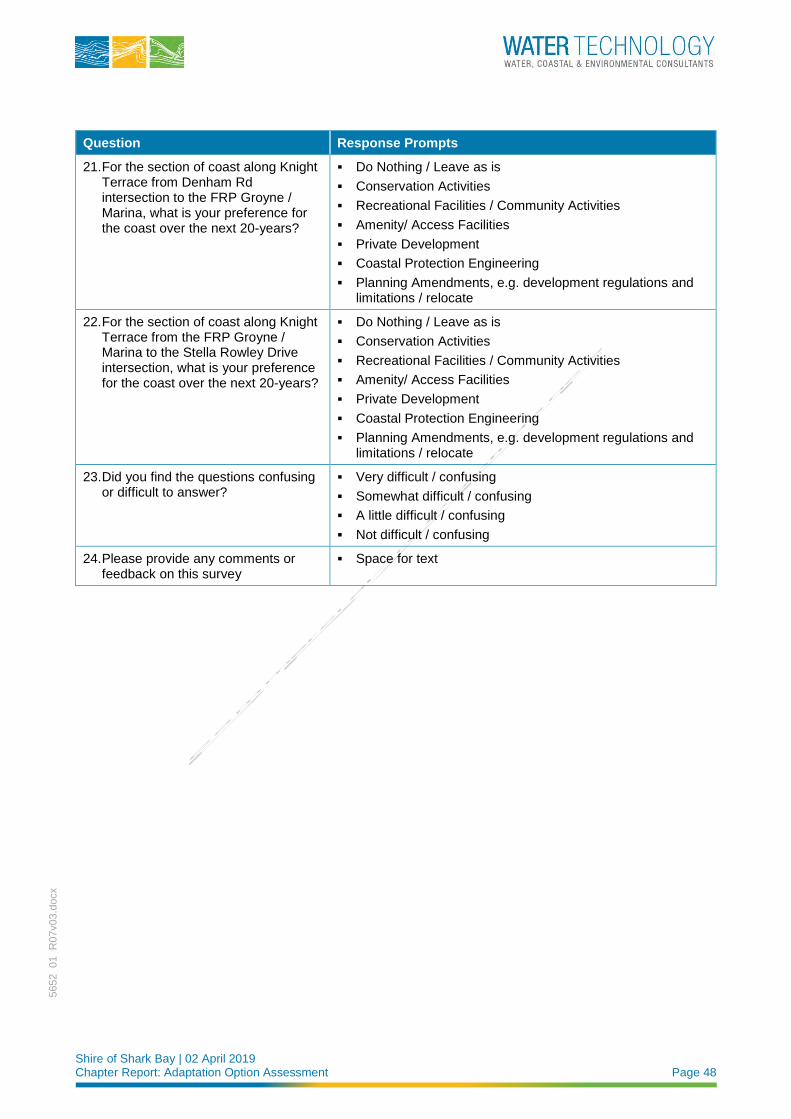
Shire of Shark Bay | 02 April 2019 Chapter Report: Adaptation Option Assessment Page 48
5652_01_R
07v03.d
ocx
Question Response Prompts
21. For the section of coast along Knight Terrace from Denham Rd intersection to the FRP Groyne / Marina, what is your preference for the coast over the next 20-years?
▪ Do Nothing / Leave as is
▪ Conservation Activities
▪ Recreational Facilities / Community Activities
▪ Amenity/ Access Facilities
▪ Private Development
▪ Coastal Protection Engineering
▪ Planning Amendments, e.g. development regulations and limitations / relocate
22. For the section of coast along Knight Terrace from the FRP Groyne / Marina to the Stella Rowley Drive intersection, what is your preference for the coast over the next 20-years?
▪ Do Nothing / Leave as is
▪ Conservation Activities
▪ Recreational Facilities / Community Activities
▪ Amenity/ Access Facilities
▪ Private Development
▪ Coastal Protection Engineering
▪ Planning Amendments, e.g. development regulations and limitations / relocate
23. Did you find the questions confusing or difficult to answer?
▪ Very difficult / confusing
▪ Somewhat difficult / confusing
▪ A little difficult / confusing
▪ Not difficult / confusing
24. Please provide any comments or feedback on this survey
▪ Space for text

Shire of Shark Bay | 02 April 2019 Chapter Report: Adaptation Option Assessment Page 49
5652_01_R
07v03.d
ocx
APPENDIX D ADAPTATION OPTIONS SURVEY RESULTS
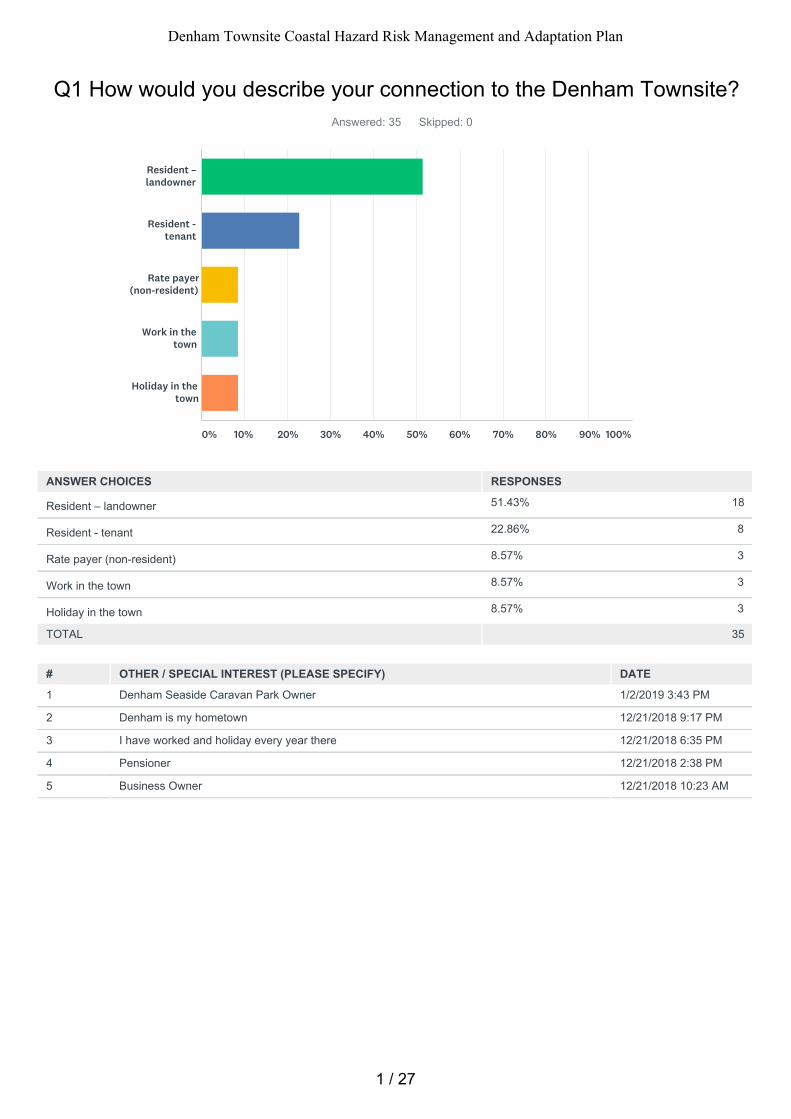
51.43% 18
22.86% 8
8.57% 3
8.57% 3
8.57% 3
Q1 How would you describe your connection to the Denham Townsite?Answered: 35 Skipped: 0
TOTAL 35
# OTHER / SPECIAL INTEREST (PLEASE SPECIFY) DATE
1 Denham Seaside Caravan Park Owner 1/2/2019 3:43 PM
2 Denham is my hometown 12/21/2018 9:17 PM
3 I have worked and holiday every year there 12/21/2018 6:35 PM
4 Pensioner 12/21/2018 2:38 PM
5 Business Owner 12/21/2018 10:23 AM
Resident –landowner
Resident -tenant
Rate payer(non-resident)
Work in thetown
Holiday in thetown
0% 10% 20% 30% 40% 50% 60% 70% 80% 90% 100%
ANSWER CHOICES RESPONSES
Resident – landowner
Resident - tenant
Rate payer (non-resident)
Work in the town
Holiday in the town
1 / 27
Denham Townsite Coastal Hazard Risk Management and Adaptation Plan
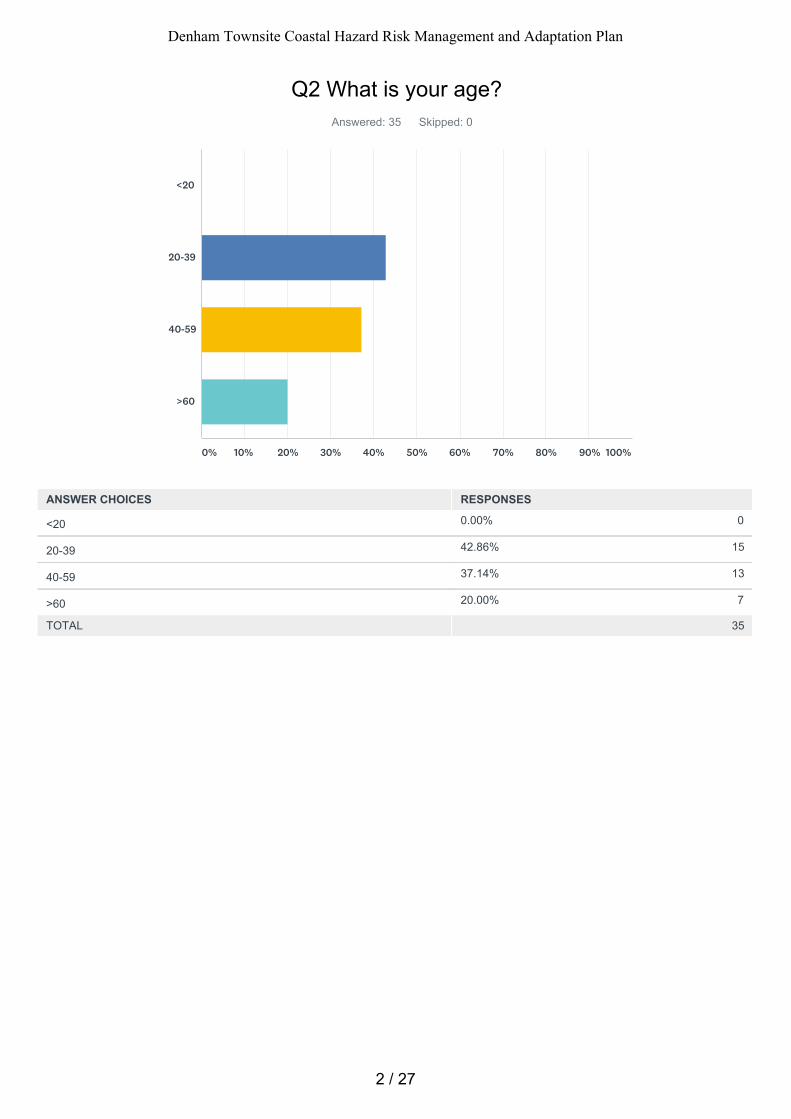
0.00% 0
42.86% 15
37.14% 13
20.00% 7
Q2 What is your age?Answered: 35 Skipped: 0
TOTAL 35
<20
20-39
40-59
>60
0% 10% 20% 30% 40% 50% 60% 70% 80% 90% 100%
ANSWER CHOICES RESPONSES
<20
20-39
40-59
>60
2 / 27
Denham Townsite Coastal Hazard Risk Management and Adaptation Plan
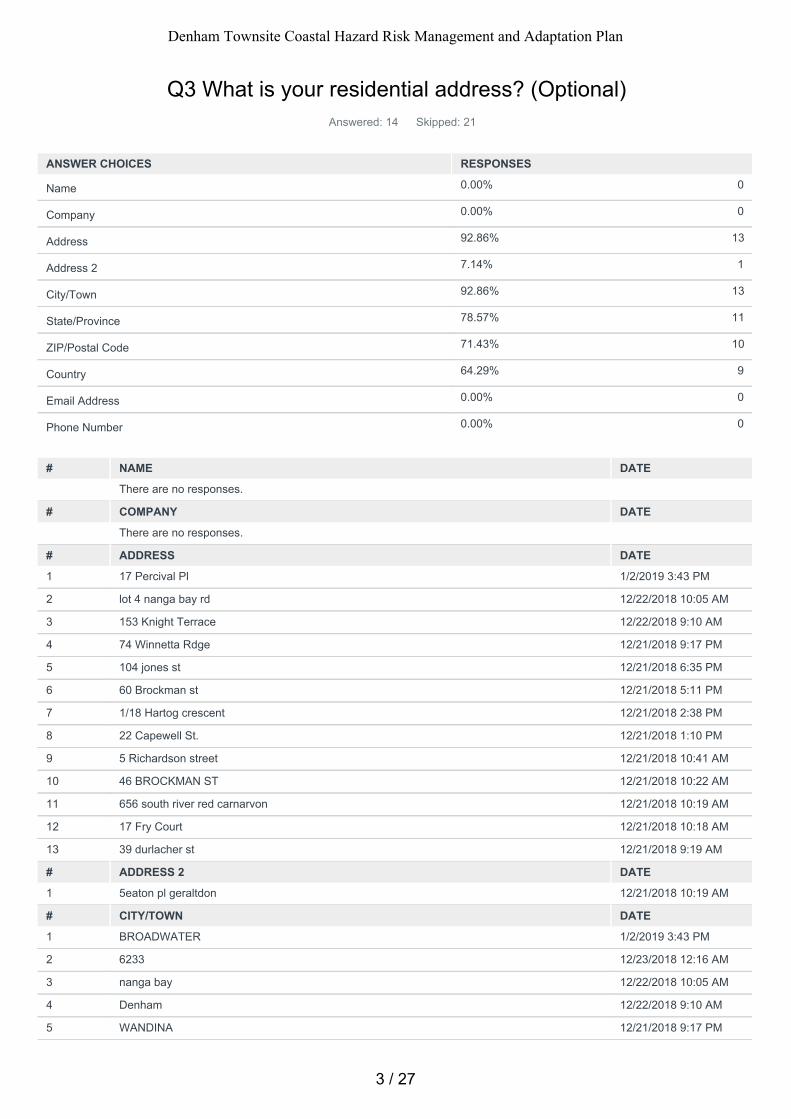
0.00% 0
0.00% 0
92.86% 13
7.14% 1
92.86% 13
78.57% 11
71.43% 10
64.29% 9
0.00% 0
0.00% 0
Q3 What is your residential address? (Optional)Answered: 14 Skipped: 21
# NAME DATE
There are no responses.
# COMPANY DATE
There are no responses.
# ADDRESS DATE
1 17 Percival Pl 1/2/2019 3:43 PM
2 lot 4 nanga bay rd 12/22/2018 10:05 AM
3 153 Knight Terrace 12/22/2018 9:10 AM
4 74 Winnetta Rdge 12/21/2018 9:17 PM
5 104 jones st 12/21/2018 6:35 PM
6 60 Brockman st 12/21/2018 5:11 PM
7 1/18 Hartog crescent 12/21/2018 2:38 PM
8 22 Capewell St. 12/21/2018 1:10 PM
9 5 Richardson street 12/21/2018 10:41 AM
10 46 BROCKMAN ST 12/21/2018 10:22 AM
11 656 south river red carnarvon 12/21/2018 10:19 AM
12 17 Fry Court 12/21/2018 10:18 AM
13 39 durlacher st 12/21/2018 9:19 AM
# ADDRESS 2 DATE
1 5eaton pl geraltdon 12/21/2018 10:19 AM
# CITY/TOWN DATE
1 BROADWATER 1/2/2019 3:43 PM
2 6233 12/23/2018 12:16 AM
3 nanga bay 12/22/2018 10:05 AM
4 Denham 12/22/2018 9:10 AM
5 WANDINA 12/21/2018 9:17 PM
ANSWER CHOICES RESPONSES
Name
Company
Address
Address 2
City/Town
State/Province
ZIP/Postal Code
Country
Email Address
Phone Number
3 / 27
Denham Townsite Coastal Hazard Risk Management and Adaptation Plan
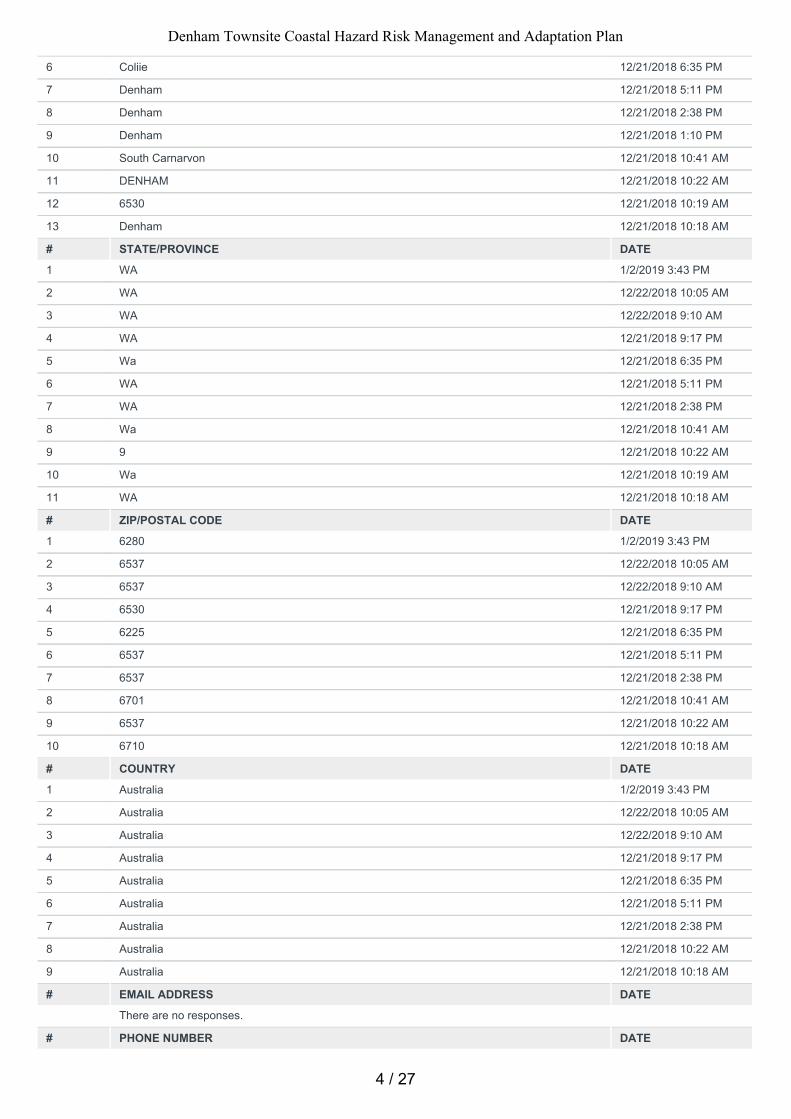
6 Coliie 12/21/2018 6:35 PM
7 Denham 12/21/2018 5:11 PM
8 Denham 12/21/2018 2:38 PM
9 Denham 12/21/2018 1:10 PM
10 South Carnarvon 12/21/2018 10:41 AM
11 DENHAM 12/21/2018 10:22 AM
12 6530 12/21/2018 10:19 AM
13 Denham 12/21/2018 10:18 AM
# STATE/PROVINCE DATE
1 WA 1/2/2019 3:43 PM
2 WA 12/22/2018 10:05 AM
3 WA 12/22/2018 9:10 AM
4 WA 12/21/2018 9:17 PM
5 Wa 12/21/2018 6:35 PM
6 WA 12/21/2018 5:11 PM
7 WA 12/21/2018 2:38 PM
8 Wa 12/21/2018 10:41 AM
9 9 12/21/2018 10:22 AM
10 Wa 12/21/2018 10:19 AM
11 WA 12/21/2018 10:18 AM
# ZIP/POSTAL CODE DATE
1 6280 1/2/2019 3:43 PM
2 6537 12/22/2018 10:05 AM
3 6537 12/22/2018 9:10 AM
4 6530 12/21/2018 9:17 PM
5 6225 12/21/2018 6:35 PM
6 6537 12/21/2018 5:11 PM
7 6537 12/21/2018 2:38 PM
8 6701 12/21/2018 10:41 AM
9 6537 12/21/2018 10:22 AM
10 6710 12/21/2018 10:18 AM
# COUNTRY DATE
1 Australia 1/2/2019 3:43 PM
2 Australia 12/22/2018 10:05 AM
3 Australia 12/22/2018 9:10 AM
4 Australia 12/21/2018 9:17 PM
5 Australia 12/21/2018 6:35 PM
6 Australia 12/21/2018 5:11 PM
7 Australia 12/21/2018 2:38 PM
8 Australia 12/21/2018 10:22 AM
9 Australia 12/21/2018 10:18 AM
# EMAIL ADDRESS DATE
There are no responses.
# PHONE NUMBER DATE
4 / 27
Denham Townsite Coastal Hazard Risk Management and Adaptation Plan
There are no responses.
5 / 27
Denham Townsite Coastal Hazard Risk Management and Adaptation Plan
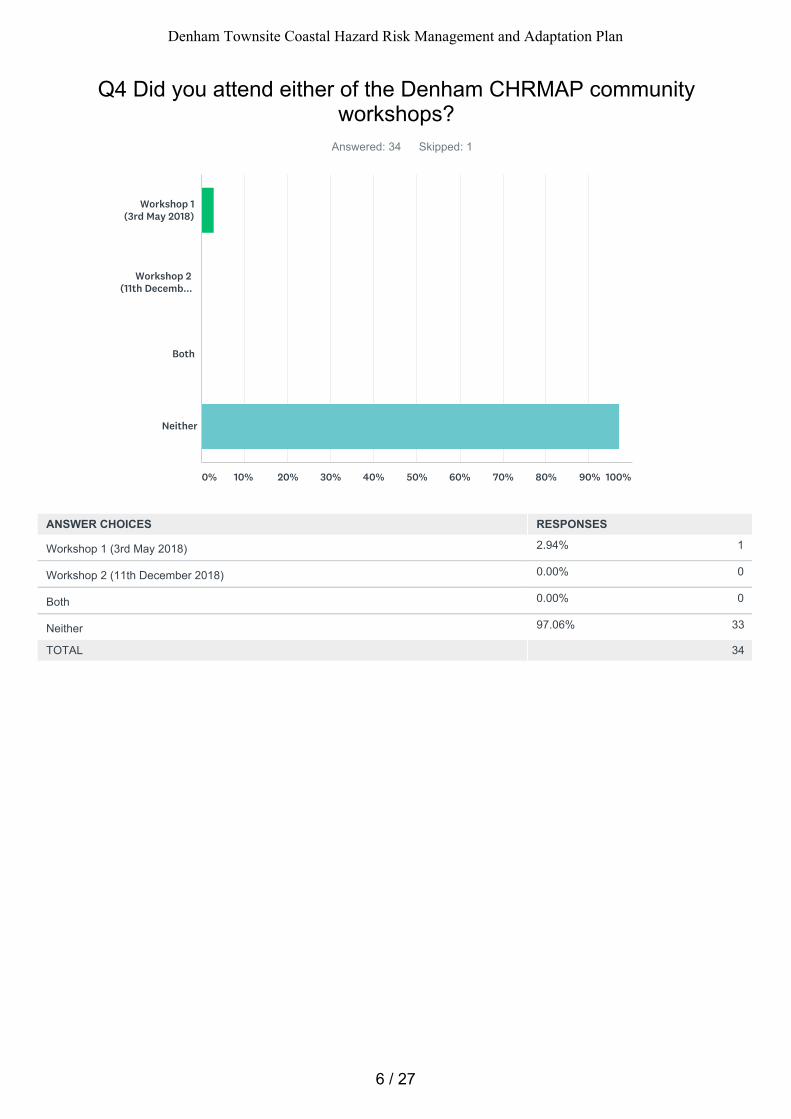
2.94% 1
0.00% 0
0.00% 0
97.06% 33
Q4 Did you attend either of the Denham CHRMAP communityworkshops?
Answered: 34 Skipped: 1
TOTAL 34
Workshop 1(3rd May 2018)
Workshop 2(11th Decemb...
Both
Neither
0% 10% 20% 30% 40% 50% 60% 70% 80% 90% 100%
ANSWER CHOICES RESPONSES
Workshop 1 (3rd May 2018)
Workshop 2 (11th December 2018)
Both
Neither
6 / 27
Denham Townsite Coastal Hazard Risk Management and Adaptation Plan
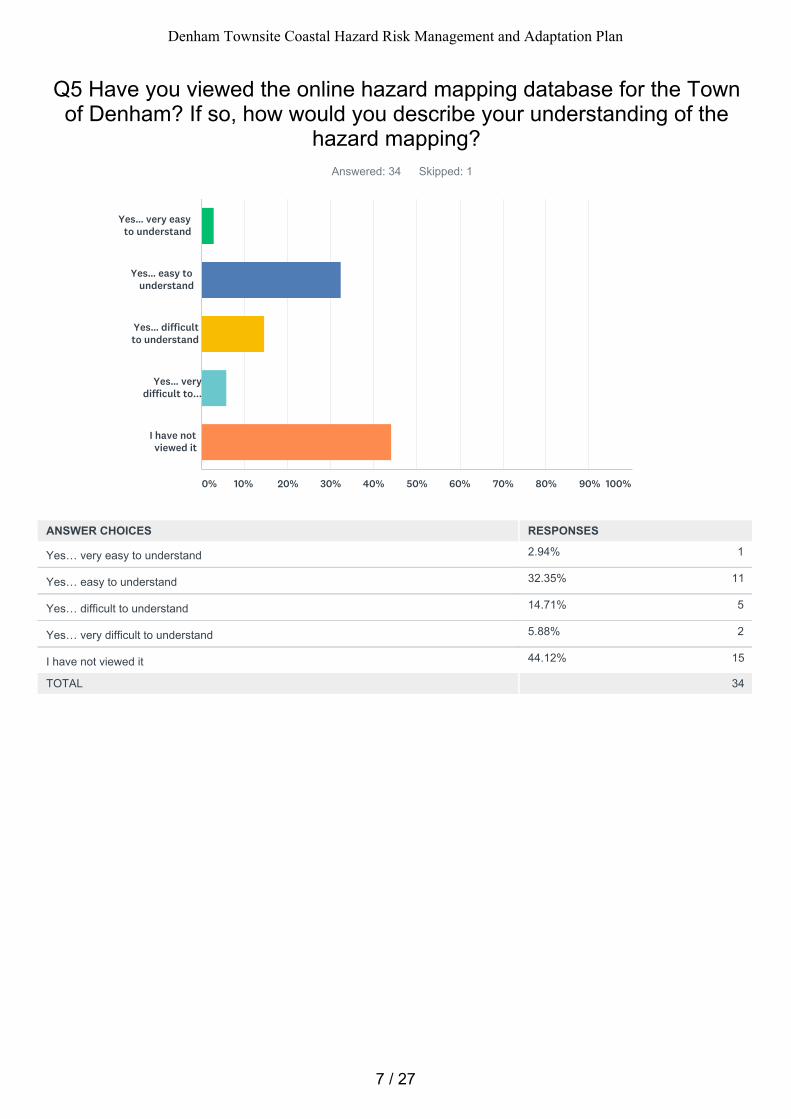
2.94% 1
32.35% 11
14.71% 5
5.88% 2
44.12% 15
Q5 Have you viewed the online hazard mapping database for the Townof Denham? If so, how would you describe your understanding of the
hazard mapping?Answered: 34 Skipped: 1
TOTAL 34
Yes… very easyto understand
Yes… easy tounderstand
Yes… difficultto understand
Yes… verydifficult to...
I have notviewed it
0% 10% 20% 30% 40% 50% 60% 70% 80% 90% 100%
ANSWER CHOICES RESPONSES
Yes… very easy to understand
Yes… easy to understand
Yes… difficult to understand
Yes… very difficult to understand
I have not viewed it
7 / 27
Denham Townsite Coastal Hazard Risk Management and Adaptation Plan
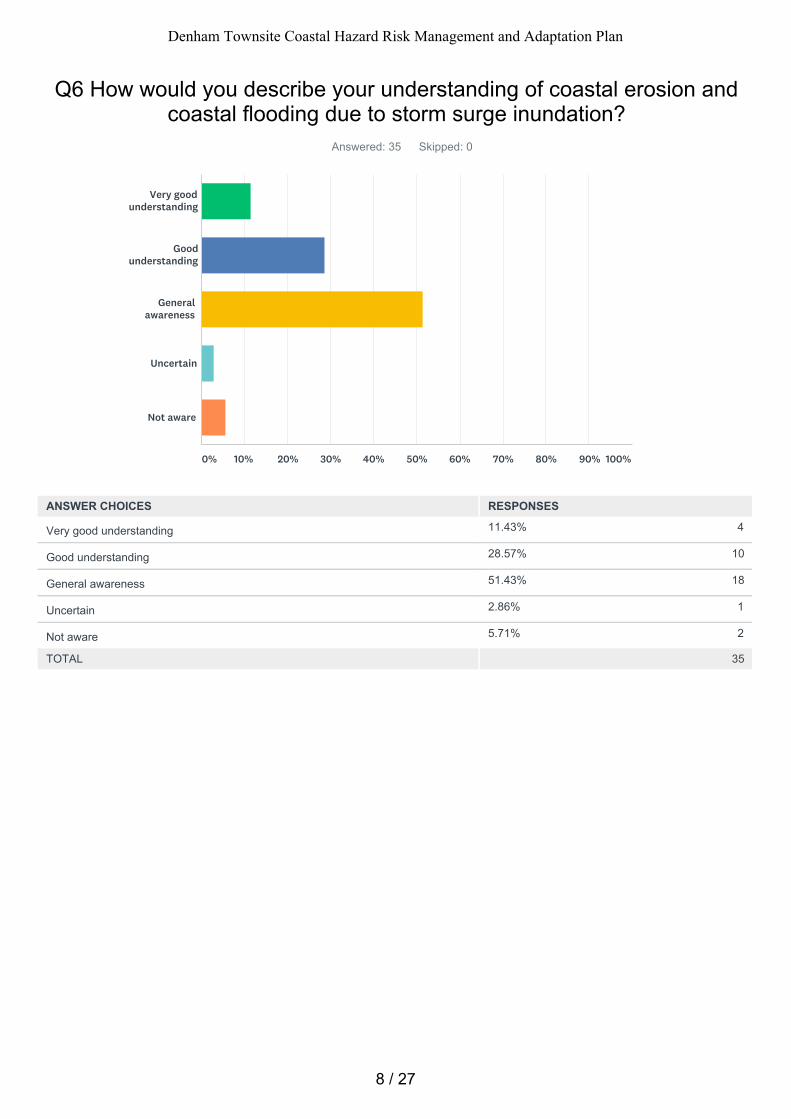
11.43% 4
28.57% 10
51.43% 18
2.86% 1
5.71% 2
Q6 How would you describe your understanding of coastal erosion andcoastal flooding due to storm surge inundation?
Answered: 35 Skipped: 0
TOTAL 35
Very goodunderstanding
Goodunderstanding
Generalawareness
Uncertain
Not aware
0% 10% 20% 30% 40% 50% 60% 70% 80% 90% 100%
ANSWER CHOICES RESPONSES
Very good understanding
Good understanding
General awareness
Uncertain
Not aware
8 / 27
Denham Townsite Coastal Hazard Risk Management and Adaptation Plan
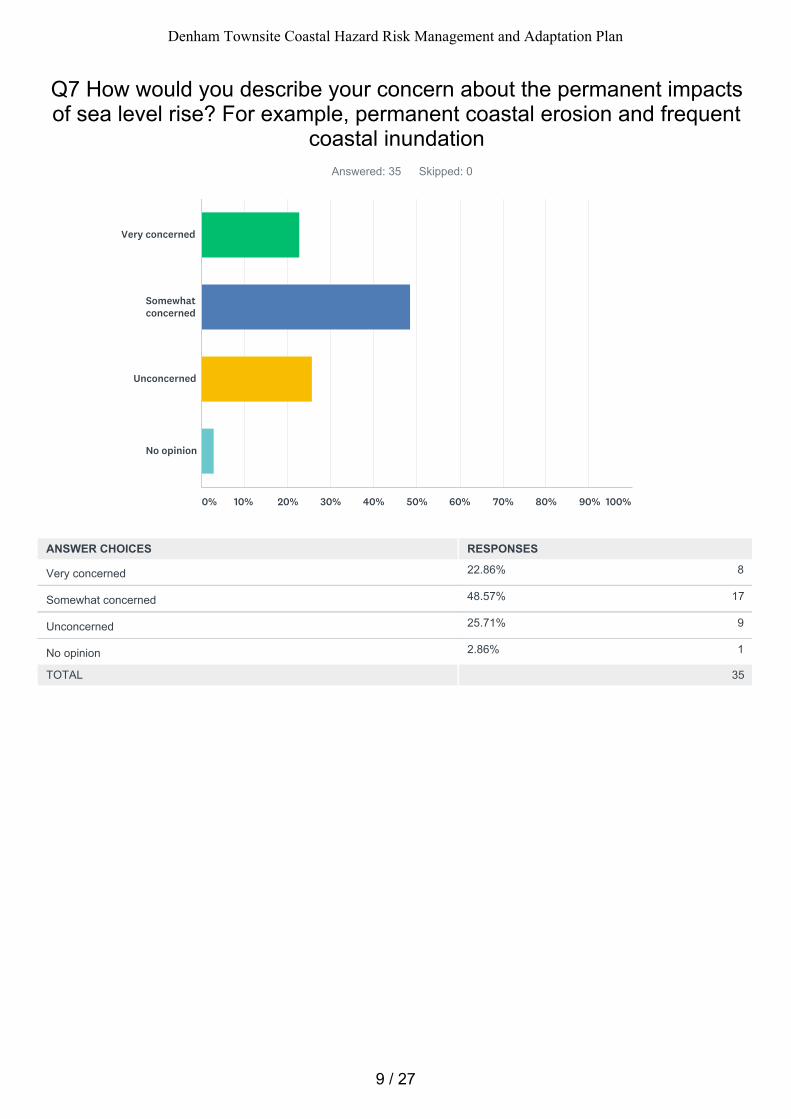
22.86% 8
48.57% 17
25.71% 9
2.86% 1
Q7 How would you describe your concern about the permanent impactsof sea level rise? For example, permanent coastal erosion and frequent
coastal inundationAnswered: 35 Skipped: 0
TOTAL 35
Very concerned
Somewhatconcerned
Unconcerned
No opinion
0% 10% 20% 30% 40% 50% 60% 70% 80% 90% 100%
ANSWER CHOICES RESPONSES
Very concerned
Somewhat concerned
Unconcerned
No opinion
9 / 27
Denham Townsite Coastal Hazard Risk Management and Adaptation Plan
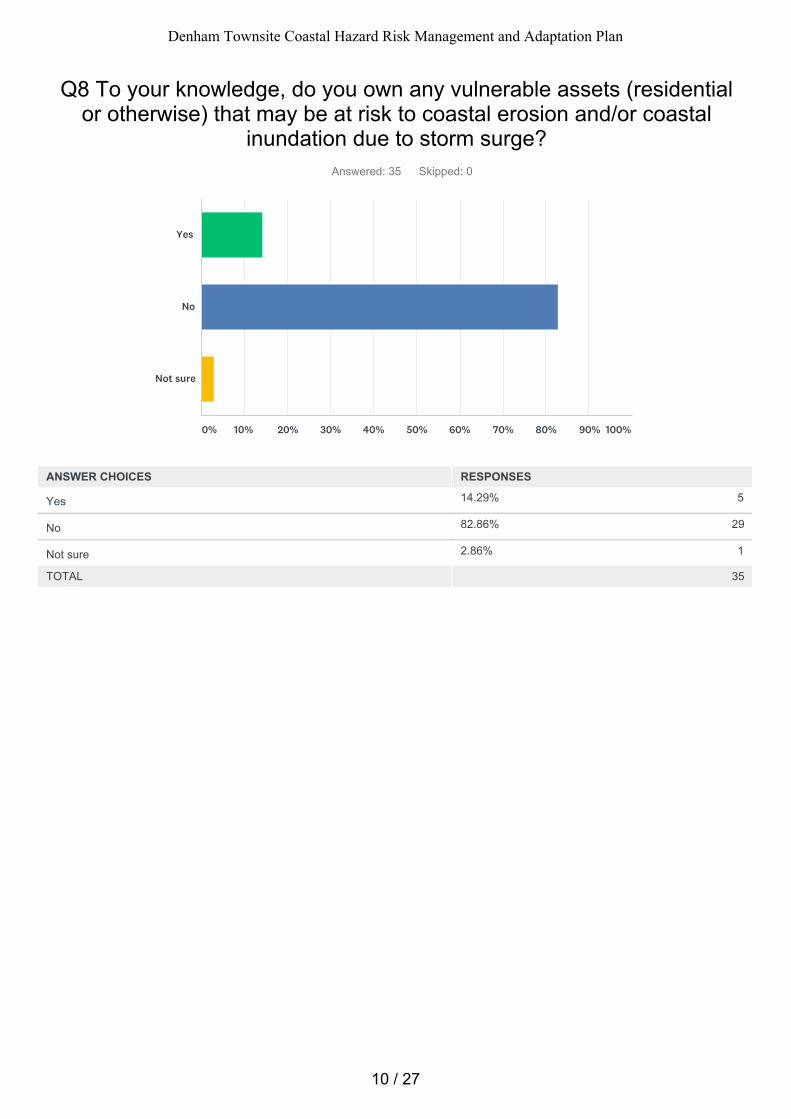
14.29% 5
82.86% 29
2.86% 1
Q8 To your knowledge, do you own any vulnerable assets (residentialor otherwise) that may be at risk to coastal erosion and/or coastal
inundation due to storm surge?Answered: 35 Skipped: 0
TOTAL 35
Yes
No
Not sure
0% 10% 20% 30% 40% 50% 60% 70% 80% 90% 100%
ANSWER CHOICES RESPONSES
Yes
No
Not sure
10 / 27
Denham Townsite Coastal Hazard Risk Management and Adaptation Plan

60.00% 21
22.86% 8
11.43% 4
2.86% 1
0.00% 0
2.86% 1
Q9 Landholders should be informed about the risks of coastal erosionand inundation before purchasing or developing in hazardous areas
Answered: 35 Skipped: 0
TOTAL 35
Strongly agree
Somewhat agree
Neutral
Stronglydisagree
Somewhatdisagree
Not sure
0% 10% 20% 30% 40% 50% 60% 70% 80% 90% 100%
ANSWER CHOICES RESPONSES
Strongly agree
Somewhat agree
Neutral
Strongly disagree
Somewhat disagree
Not sure
11 / 27
Denham Townsite Coastal Hazard Risk Management and Adaptation Plan
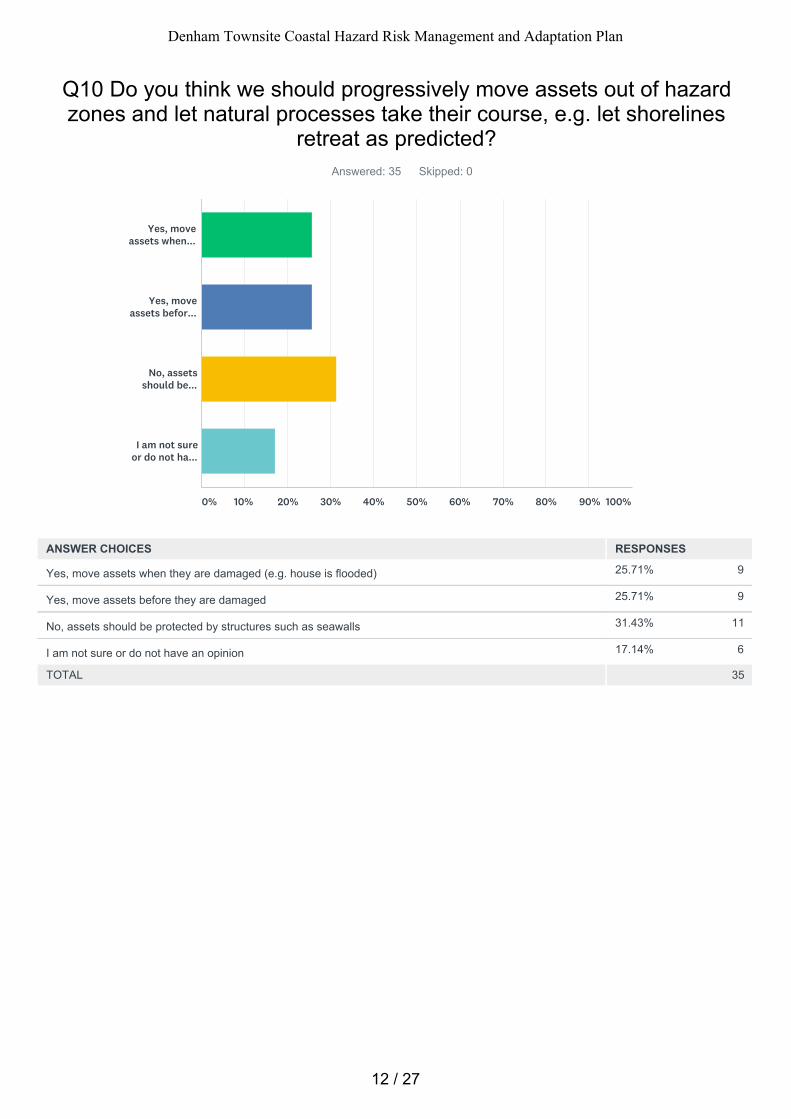
25.71% 9
25.71% 9
31.43% 11
17.14% 6
Q10 Do you think we should progressively move assets out of hazardzones and let natural processes take their course, e.g. let shorelines
retreat as predicted?Answered: 35 Skipped: 0
TOTAL 35
Yes, moveassets when...
Yes, moveassets befor...
No, assetsshould be...
I am not sureor do not ha...
0% 10% 20% 30% 40% 50% 60% 70% 80% 90% 100%
ANSWER CHOICES RESPONSES
Yes, move assets when they are damaged (e.g. house is flooded)
Yes, move assets before they are damaged
No, assets should be protected by structures such as seawalls
I am not sure or do not have an opinion
12 / 27
Denham Townsite Coastal Hazard Risk Management and Adaptation Plan
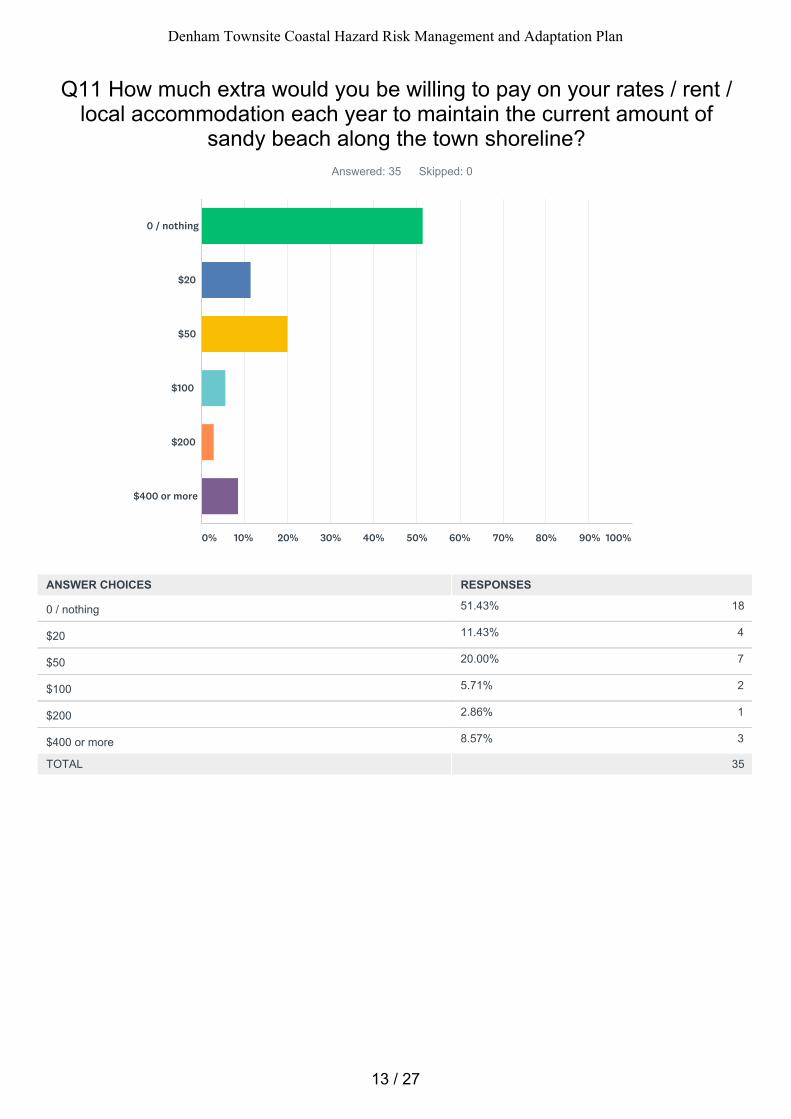
51.43% 18
11.43% 4
20.00% 7
5.71% 2
2.86% 1
8.57% 3
Q11 How much extra would you be willing to pay on your rates / rent /local accommodation each year to maintain the current amount of
sandy beach along the town shoreline?Answered: 35 Skipped: 0
TOTAL 35
0 / nothing
$20
$50
$100
$200
$400 or more
0% 10% 20% 30% 40% 50% 60% 70% 80% 90% 100%
ANSWER CHOICES RESPONSES
0 / nothing
$20
$50
$100
$200
$400 or more
13 / 27
Denham Townsite Coastal Hazard Risk Management and Adaptation Plan

57.14% 20
14.29% 5
11.43% 4
5.71% 2
2.86% 1
8.57% 3
Q12 How much extra would you be willing to pay on your rates / rent /local accommodation each year to maintain the current amount of
natural foreshore reserve along the town shoreline?Answered: 35 Skipped: 0
TOTAL 35
0 / nothing
$20
$50
$100
$200
$400 or more
0% 10% 20% 30% 40% 50% 60% 70% 80% 90% 100%
ANSWER CHOICES RESPONSES
0 / nothing
$20
$50
$100
$200
$400 or more
14 / 27
Denham Townsite Coastal Hazard Risk Management and Adaptation Plan
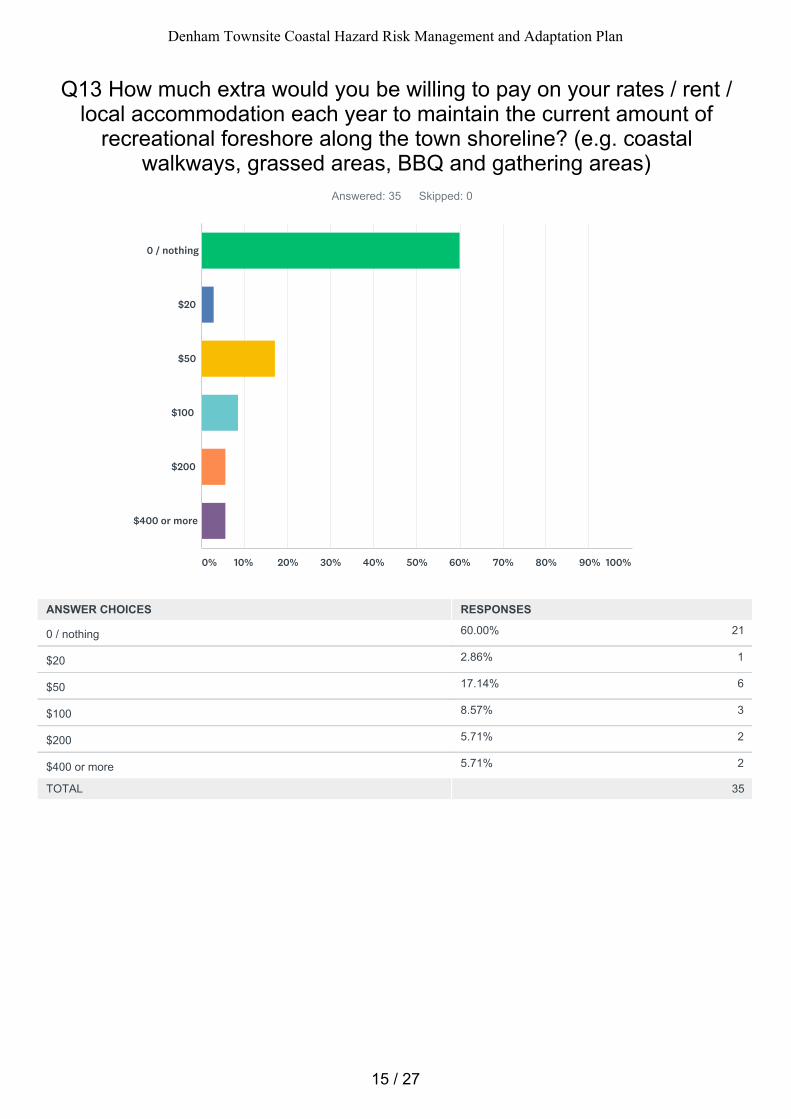
60.00% 21
2.86% 1
17.14% 6
8.57% 3
5.71% 2
5.71% 2
Q13 How much extra would you be willing to pay on your rates / rent /local accommodation each year to maintain the current amount of
recreational foreshore along the town shoreline? (e.g. coastalwalkways, grassed areas, BBQ and gathering areas)
Answered: 35 Skipped: 0
TOTAL 35
0 / nothing
$20
$50
$100
$200
$400 or more
0% 10% 20% 30% 40% 50% 60% 70% 80% 90% 100%
ANSWER CHOICES RESPONSES
0 / nothing
$20
$50
$100
$200
$400 or more
15 / 27
Denham Townsite Coastal Hazard Risk Management and Adaptation Plan
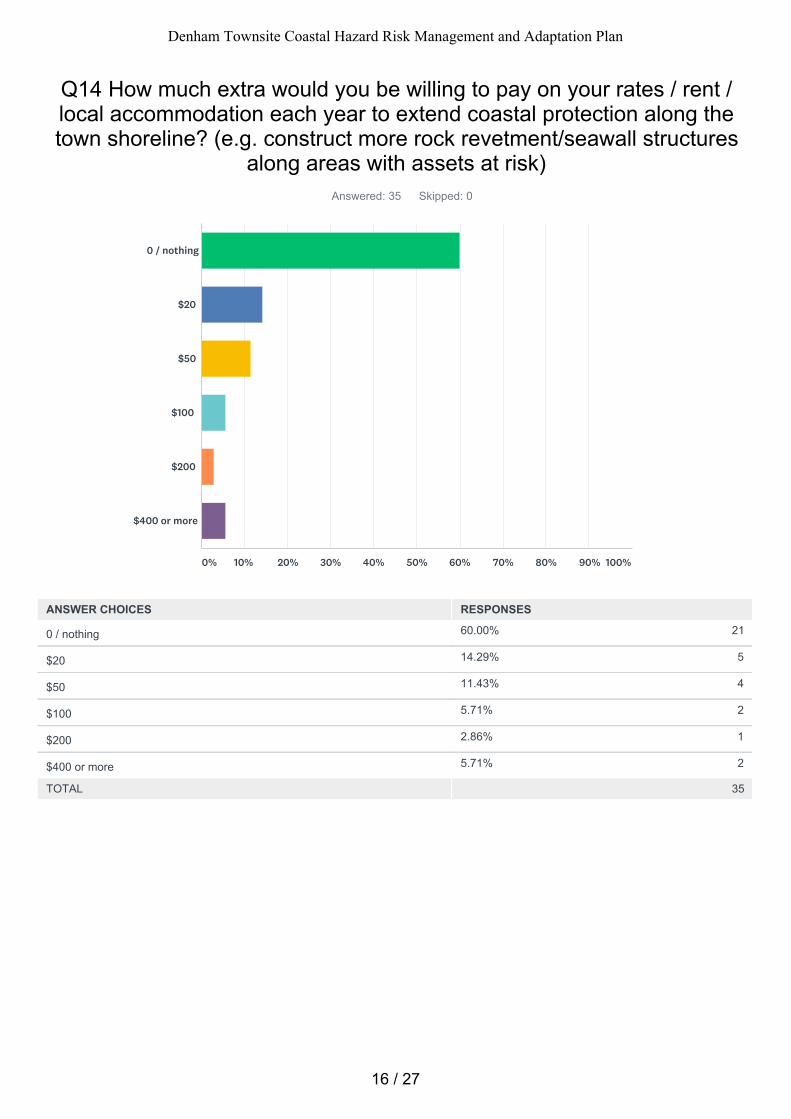
60.00% 21
14.29% 5
11.43% 4
5.71% 2
2.86% 1
5.71% 2
Q14 How much extra would you be willing to pay on your rates / rent /local accommodation each year to extend coastal protection along thetown shoreline? (e.g. construct more rock revetment/seawall structures
along areas with assets at risk)Answered: 35 Skipped: 0
TOTAL 35
0 / nothing
$20
$50
$100
$200
$400 or more
0% 10% 20% 30% 40% 50% 60% 70% 80% 90% 100%
ANSWER CHOICES RESPONSES
0 / nothing
$20
$50
$100
$200
$400 or more
16 / 27
Denham Townsite Coastal Hazard Risk Management and Adaptation Plan
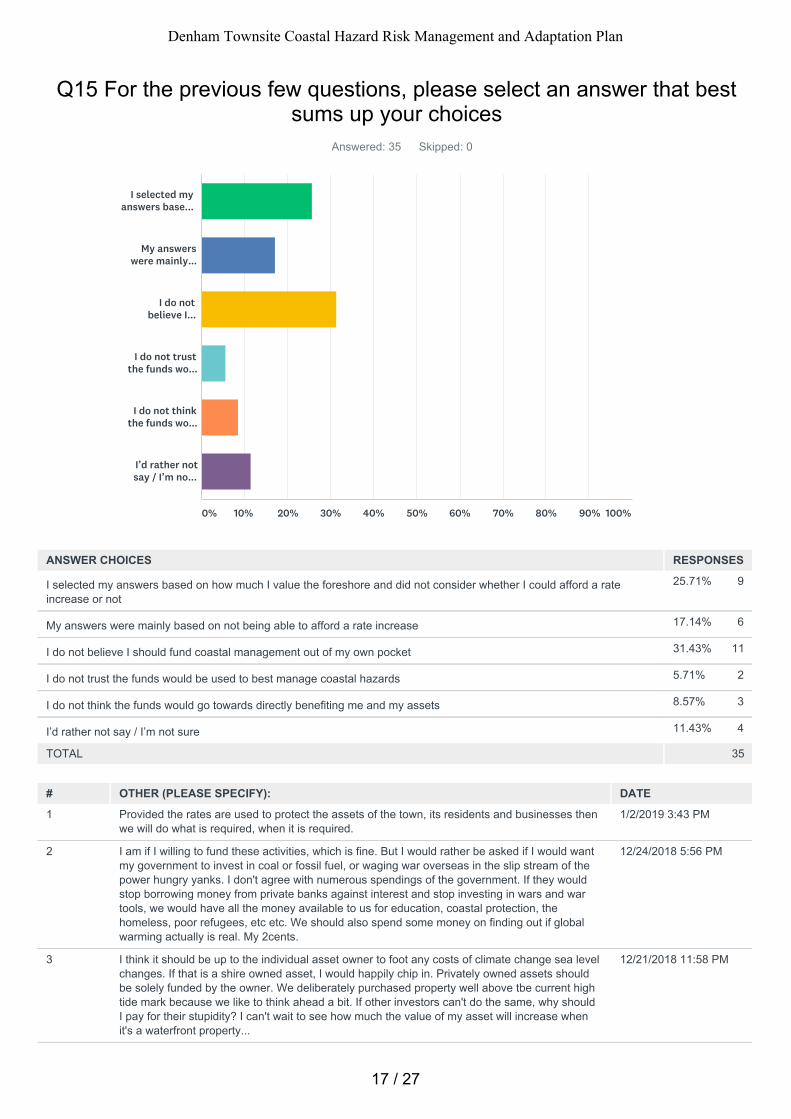
25.71% 9
17.14% 6
31.43% 11
5.71% 2
8.57% 3
11.43% 4
Q15 For the previous few questions, please select an answer that bestsums up your choices
Answered: 35 Skipped: 0
TOTAL 35
# OTHER (PLEASE SPECIFY): DATE
1 Provided the rates are used to protect the assets of the town, its residents and businesses thenwe will do what is required, when it is required.
1/2/2019 3:43 PM
2 I am if I willing to fund these activities, which is fine. But I would rather be asked if I would wantmy government to invest in coal or fossil fuel, or waging war overseas in the slip stream of thepower hungry yanks. I don't agree with numerous spendings of the government. If they wouldstop borrowing money from private banks against interest and stop investing in wars and wartools, we would have all the money available to us for education, coastal protection, thehomeless, poor refugees, etc etc. We should also spend some money on finding out if globalwarming actually is real. My 2cents.
12/24/2018 5:56 PM
3 I think it should be up to the individual asset owner to foot any costs of climate change sea levelchanges. If that is a shire owned asset, I would happily chip in. Privately owned assets shouldbe solely funded by the owner. We deliberately purchased property well above tbe current hightide mark because we like to think ahead a bit. If other investors can't do the same, why shouldI pay for their stupidity? I can't wait to see how much the value of my asset will increase whenit's a waterfront property...
12/21/2018 11:58 PM
I selected myanswers base...
My answerswere mainly...
I do notbelieve I...
I do not trustthe funds wo...
I do not thinkthe funds wo...
I’d rather notsay / I’m no...
0% 10% 20% 30% 40% 50% 60% 70% 80% 90% 100%
ANSWER CHOICES RESPONSES
I selected my answers based on how much I value the foreshore and did not consider whether I could afford a rateincrease or not
My answers were mainly based on not being able to afford a rate increase
I do not believe I should fund coastal management out of my own pocket
I do not trust the funds would be used to best manage coastal hazards
I do not think the funds would go towards directly benefiting me and my assets
I’d rather not say / I’m not sure
17 / 27
Denham Townsite Coastal Hazard Risk Management and Adaptation Plan
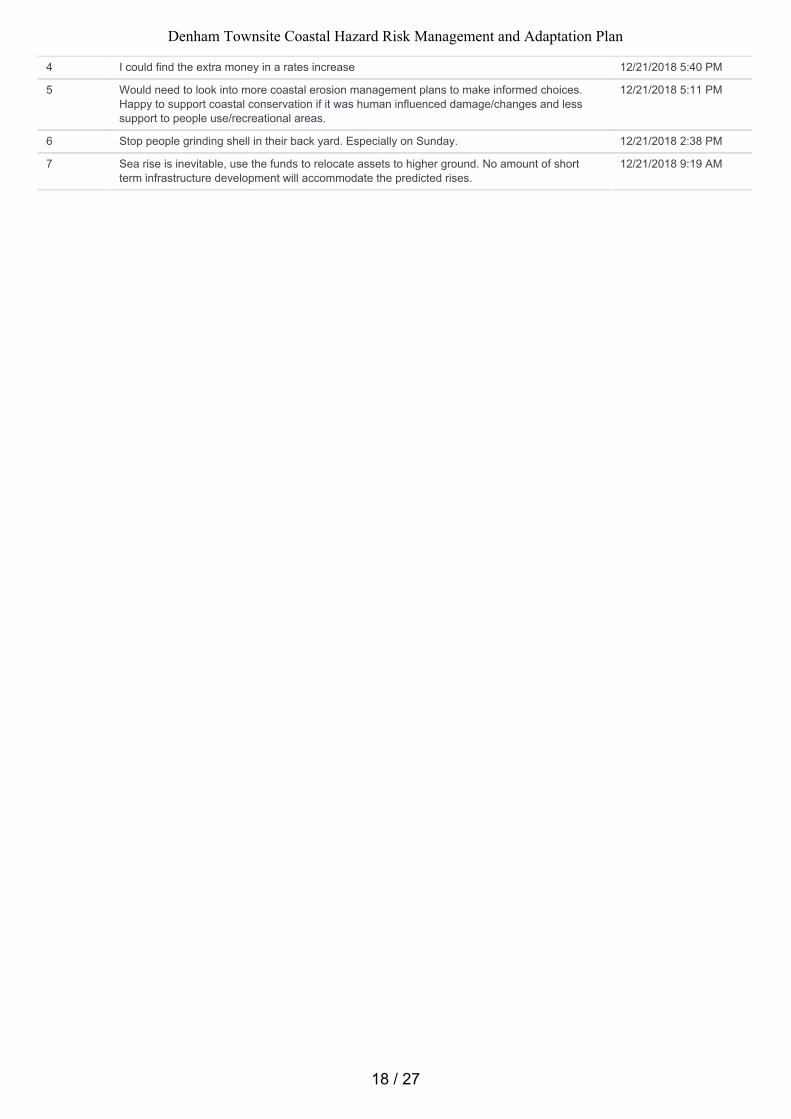
4 I could find the extra money in a rates increase 12/21/2018 5:40 PM
5 Would need to look into more coastal erosion management plans to make informed choices.Happy to support coastal conservation if it was human influenced damage/changes and lesssupport to people use/recreational areas.
12/21/2018 5:11 PM
6 Stop people grinding shell in their back yard. Especially on Sunday. 12/21/2018 2:38 PM
7 Sea rise is inevitable, use the funds to relocate assets to higher ground. No amount of shortterm infrastructure development will accommodate the predicted rises.
12/21/2018 9:19 AM
18 / 27
Denham Townsite Coastal Hazard Risk Management and Adaptation Plan
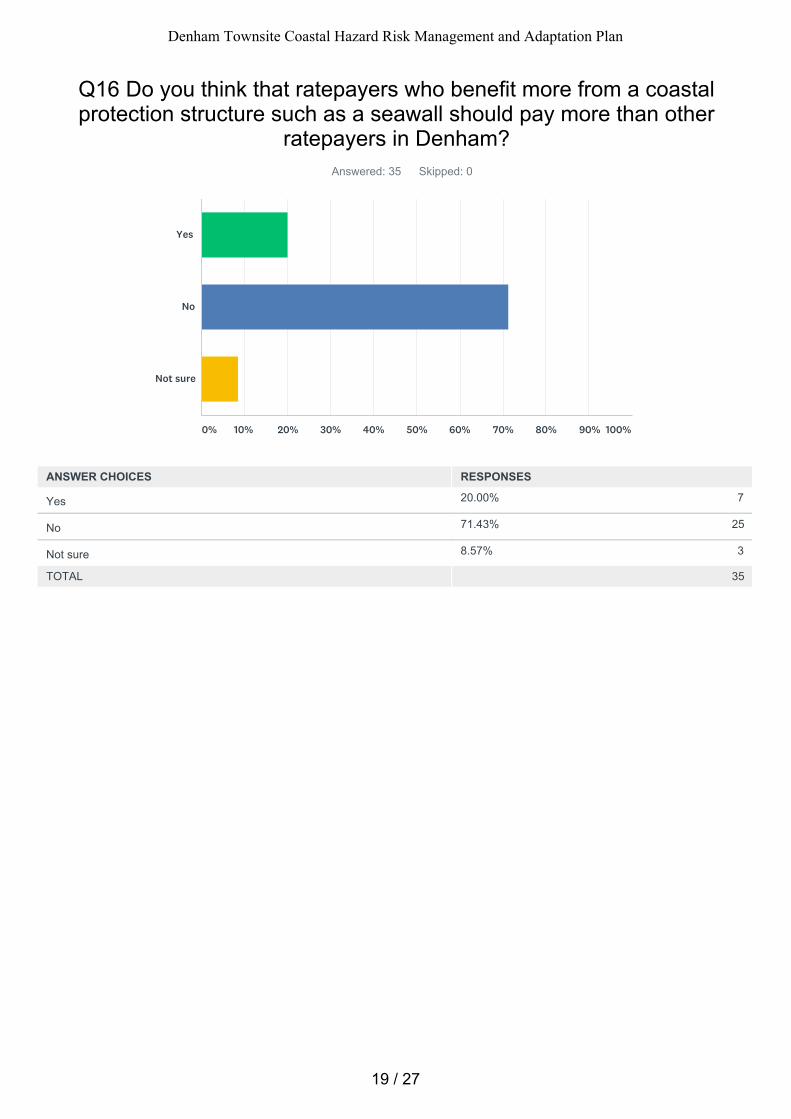
20.00% 7
71.43% 25
8.57% 3
Q16 Do you think that ratepayers who benefit more from a coastalprotection structure such as a seawall should pay more than other
ratepayers in Denham?Answered: 35 Skipped: 0
TOTAL 35
Yes
No
Not sure
0% 10% 20% 30% 40% 50% 60% 70% 80% 90% 100%
ANSWER CHOICES RESPONSES
Yes
No
Not sure
19 / 27
Denham Townsite Coastal Hazard Risk Management and Adaptation Plan
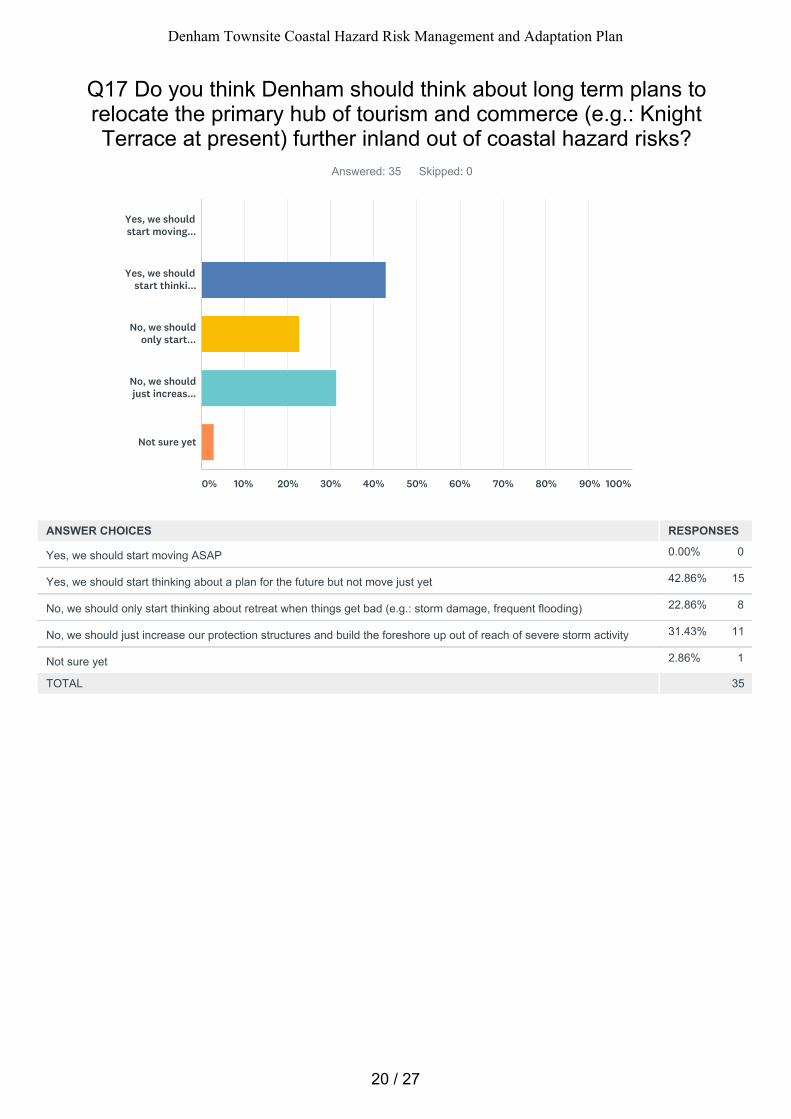
0.00% 0
42.86% 15
22.86% 8
31.43% 11
2.86% 1
Q17 Do you think Denham should think about long term plans torelocate the primary hub of tourism and commerce (e.g.: KnightTerrace at present) further inland out of coastal hazard risks?
Answered: 35 Skipped: 0
TOTAL 35
Yes, we shouldstart moving...
Yes, we shouldstart thinki...
No, we shouldonly start...
No, we shouldjust increas...
Not sure yet
0% 10% 20% 30% 40% 50% 60% 70% 80% 90% 100%
ANSWER CHOICES RESPONSES
Yes, we should start moving ASAP
Yes, we should start thinking about a plan for the future but not move just yet
No, we should only start thinking about retreat when things get bad (e.g.: storm damage, frequent flooding)
No, we should just increase our protection structures and build the foreshore up out of reach of severe storm activity
Not sure yet
20 / 27
Denham Townsite Coastal Hazard Risk Management and Adaptation Plan
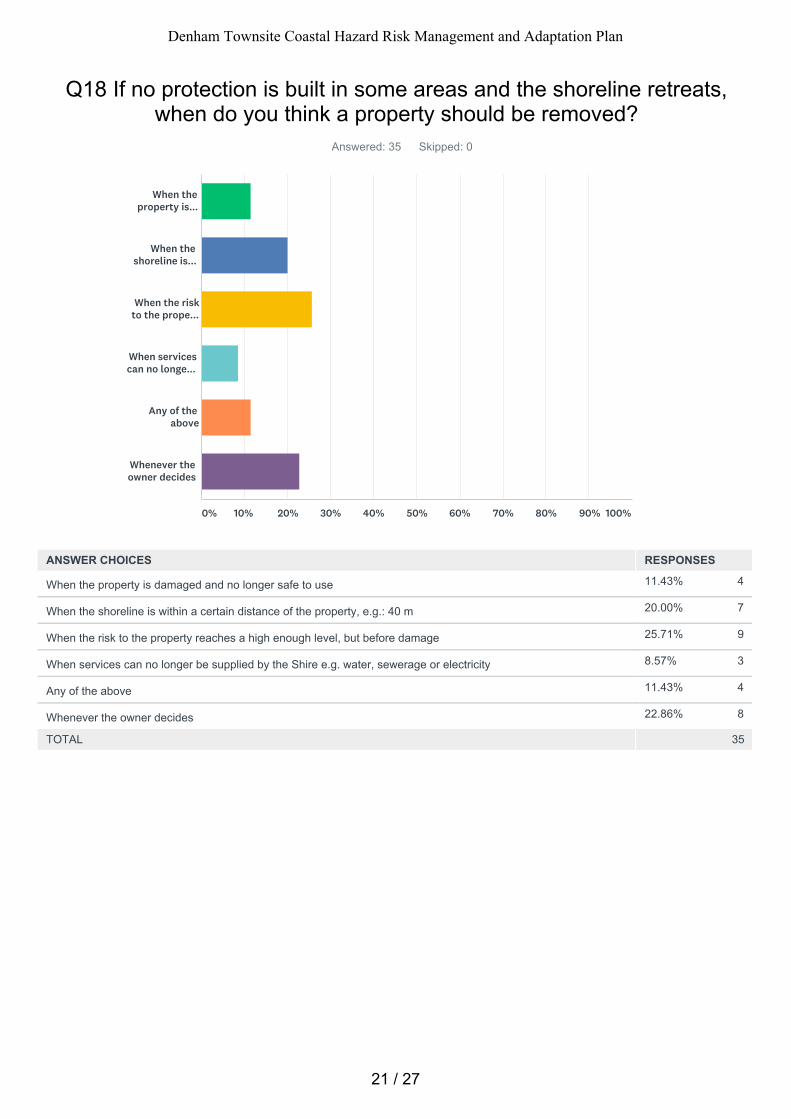
11.43% 4
20.00% 7
25.71% 9
8.57% 3
11.43% 4
22.86% 8
Q18 If no protection is built in some areas and the shoreline retreats,when do you think a property should be removed?
Answered: 35 Skipped: 0
TOTAL 35
When theproperty is...
When theshoreline is...
When the riskto the prope...
When servicescan no longe...
Any of theabove
Whenever theowner decides
0% 10% 20% 30% 40% 50% 60% 70% 80% 90% 100%
ANSWER CHOICES RESPONSES
When the property is damaged and no longer safe to use
When the shoreline is within a certain distance of the property, e.g.: 40 m
When the risk to the property reaches a high enough level, but before damage
When services can no longer be supplied by the Shire e.g. water, sewerage or electricity
Any of the above
Whenever the owner decides
21 / 27
Denham Townsite Coastal Hazard Risk Management and Adaptation Plan
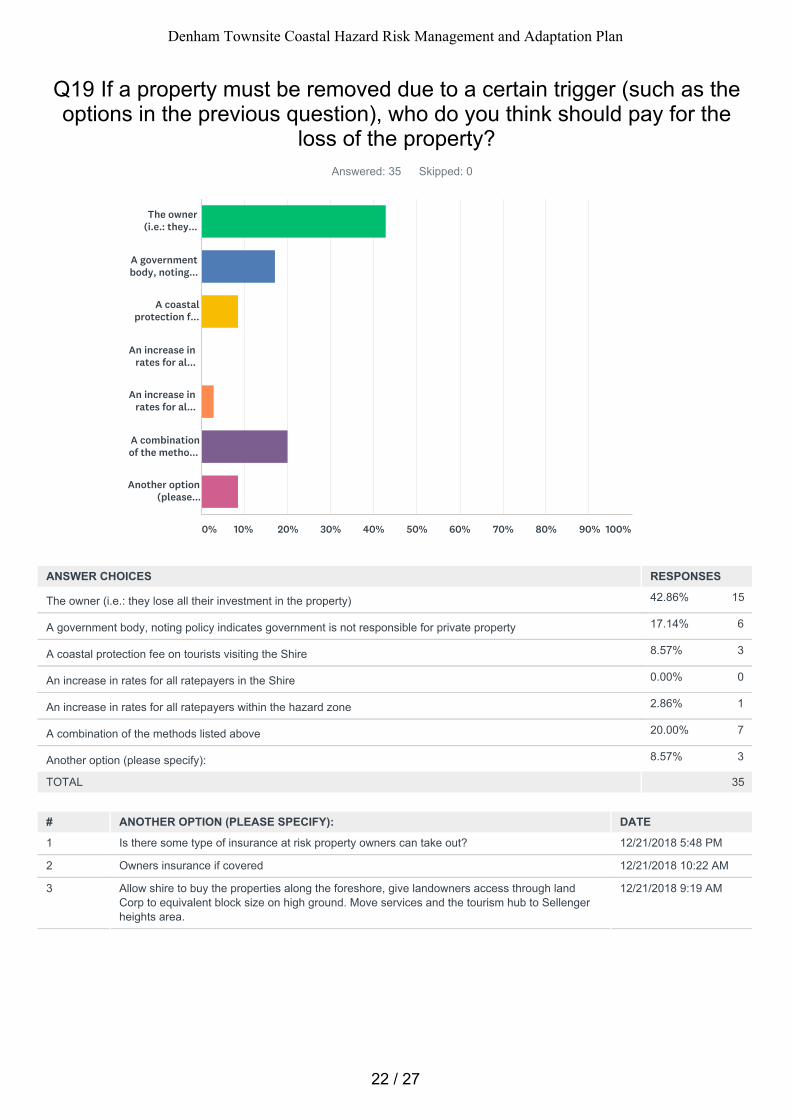
42.86% 15
17.14% 6
8.57% 3
0.00% 0
2.86% 1
20.00% 7
8.57% 3
Q19 If a property must be removed due to a certain trigger (such as theoptions in the previous question), who do you think should pay for the
loss of the property?Answered: 35 Skipped: 0
TOTAL 35
# ANOTHER OPTION (PLEASE SPECIFY): DATE
1 Is there some type of insurance at risk property owners can take out? 12/21/2018 5:48 PM
2 Owners insurance if covered 12/21/2018 10:22 AM
3 Allow shire to buy the properties along the foreshore, give landowners access through landCorp to equivalent block size on high ground. Move services and the tourism hub to Sellengerheights area.
12/21/2018 9:19 AM
The owner(i.e.: they...
A governmentbody, noting...
A coastalprotection f...
An increase inrates for al...
An increase inrates for al...
A combinationof the metho...
Another option(please...
0% 10% 20% 30% 40% 50% 60% 70% 80% 90% 100%
ANSWER CHOICES RESPONSES
The owner (i.e.: they lose all their investment in the property)
A government body, noting policy indicates government is not responsible for private property
A coastal protection fee on tourists visiting the Shire
An increase in rates for all ratepayers in the Shire
An increase in rates for all ratepayers within the hazard zone
A combination of the methods listed above
Another option (please specify):
22 / 27
Denham Townsite Coastal Hazard Risk Management and Adaptation Plan
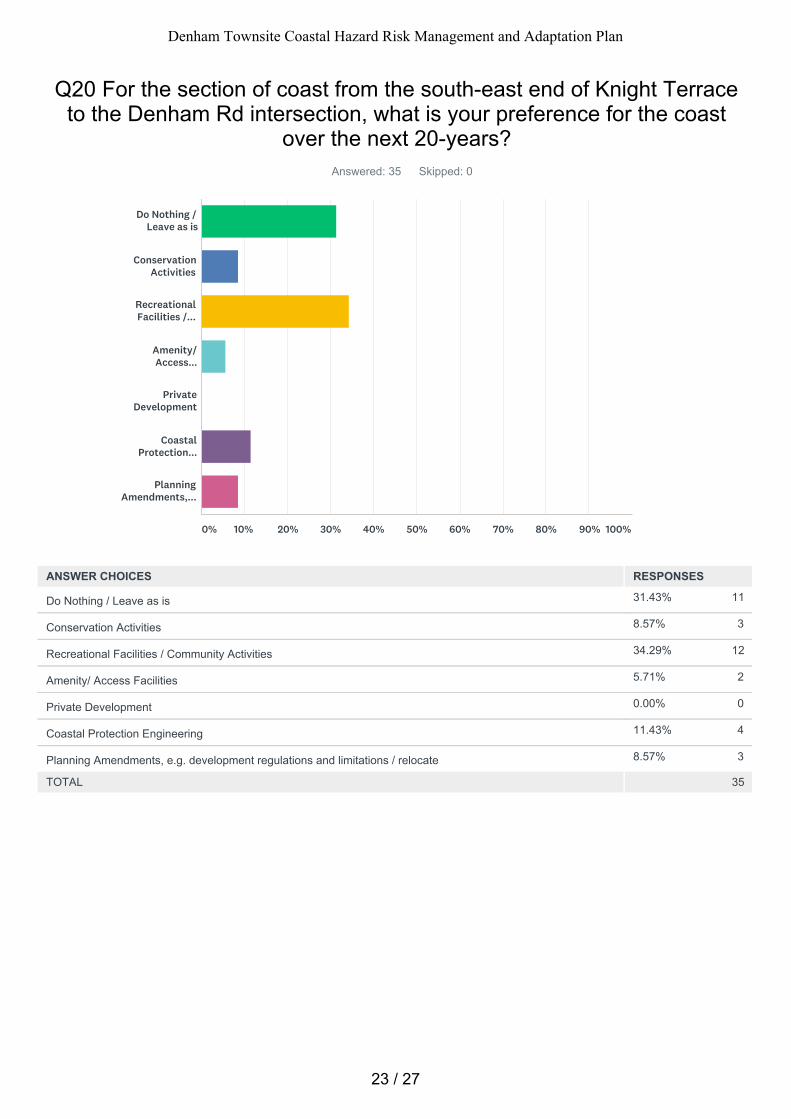
31.43% 11
8.57% 3
34.29% 12
5.71% 2
0.00% 0
11.43% 4
8.57% 3
Q20 For the section of coast from the south-east end of Knight Terraceto the Denham Rd intersection, what is your preference for the coast
over the next 20-years?Answered: 35 Skipped: 0
TOTAL 35
Do Nothing /Leave as is
ConservationActivities
RecreationalFacilities /...
Amenity/Access...
PrivateDevelopment
CoastalProtection...
PlanningAmendments,...
0% 10% 20% 30% 40% 50% 60% 70% 80% 90% 100%
ANSWER CHOICES RESPONSES
Do Nothing / Leave as is
Conservation Activities
Recreational Facilities / Community Activities
Amenity/ Access Facilities
Private Development
Coastal Protection Engineering
Planning Amendments, e.g. development regulations and limitations / relocate
23 / 27
Denham Townsite Coastal Hazard Risk Management and Adaptation Plan
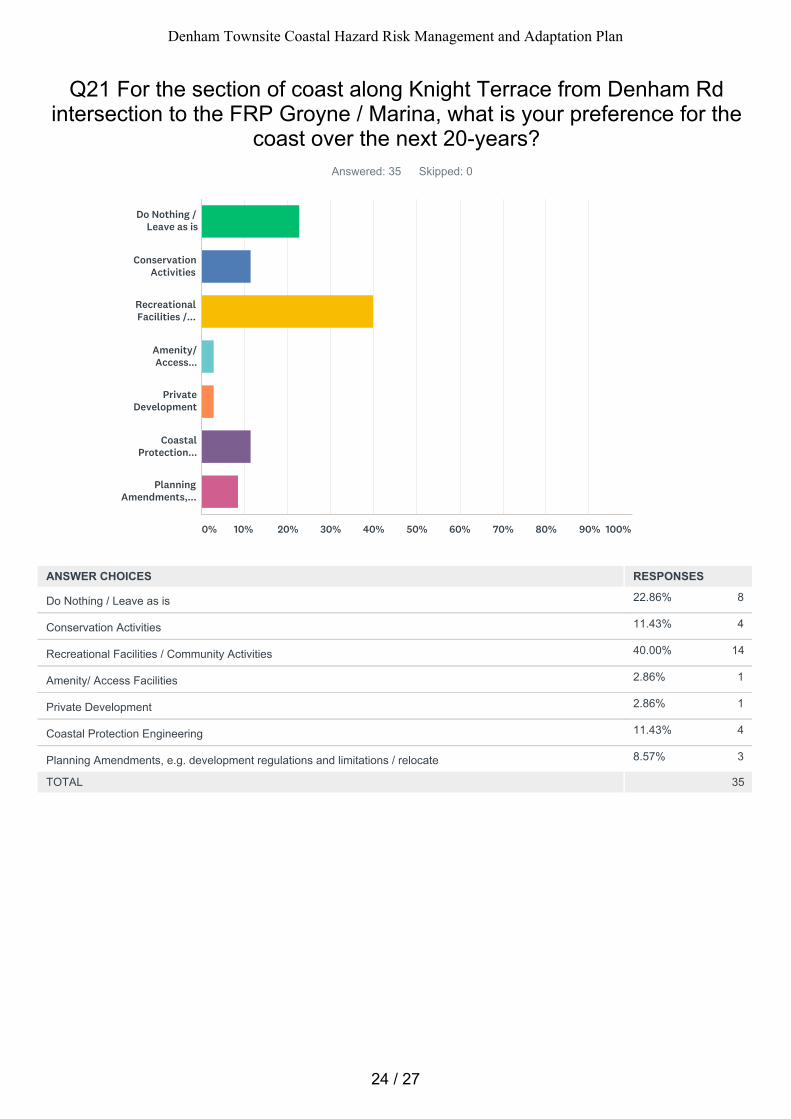
22.86% 8
11.43% 4
40.00% 14
2.86% 1
2.86% 1
11.43% 4
8.57% 3
Q21 For the section of coast along Knight Terrace from Denham Rdintersection to the FRP Groyne / Marina, what is your preference for the
coast over the next 20-years?Answered: 35 Skipped: 0
TOTAL 35
Do Nothing /Leave as is
ConservationActivities
RecreationalFacilities /...
Amenity/Access...
PrivateDevelopment
CoastalProtection...
PlanningAmendments,...
0% 10% 20% 30% 40% 50% 60% 70% 80% 90% 100%
ANSWER CHOICES RESPONSES
Do Nothing / Leave as is
Conservation Activities
Recreational Facilities / Community Activities
Amenity/ Access Facilities
Private Development
Coastal Protection Engineering
Planning Amendments, e.g. development regulations and limitations / relocate
24 / 27
Denham Townsite Coastal Hazard Risk Management and Adaptation Plan
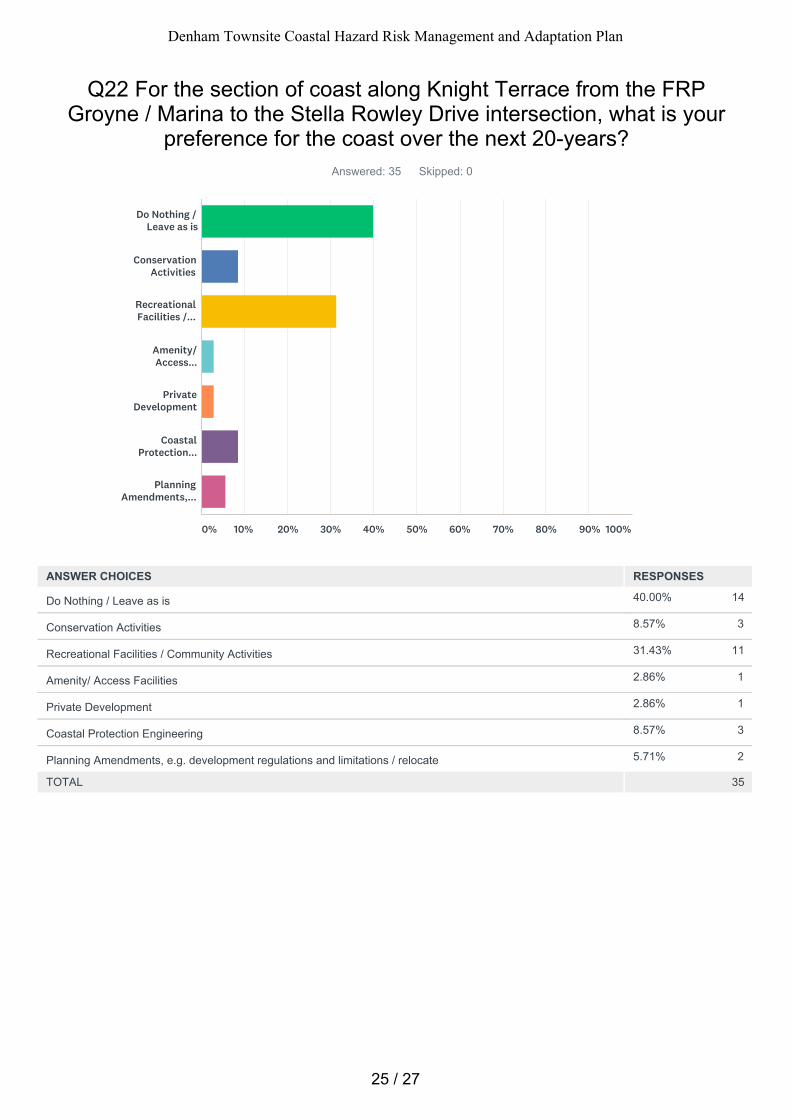
40.00% 14
8.57% 3
31.43% 11
2.86% 1
2.86% 1
8.57% 3
5.71% 2
Q22 For the section of coast along Knight Terrace from the FRPGroyne / Marina to the Stella Rowley Drive intersection, what is your
preference for the coast over the next 20-years?Answered: 35 Skipped: 0
TOTAL 35
Do Nothing /Leave as is
ConservationActivities
RecreationalFacilities /...
Amenity/Access...
PrivateDevelopment
CoastalProtection...
PlanningAmendments,...
0% 10% 20% 30% 40% 50% 60% 70% 80% 90% 100%
ANSWER CHOICES RESPONSES
Do Nothing / Leave as is
Conservation Activities
Recreational Facilities / Community Activities
Amenity/ Access Facilities
Private Development
Coastal Protection Engineering
Planning Amendments, e.g. development regulations and limitations / relocate
25 / 27
Denham Townsite Coastal Hazard Risk Management and Adaptation Plan
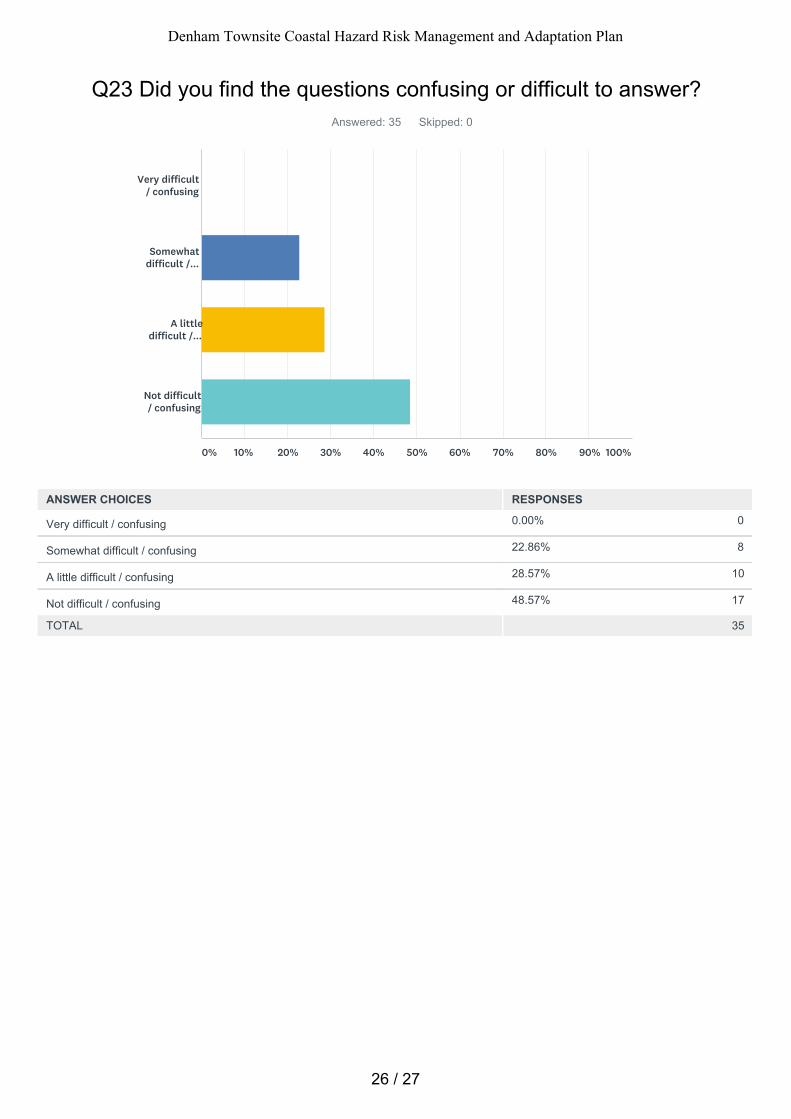
0.00% 0
22.86% 8
28.57% 10
48.57% 17
Q23 Did you find the questions confusing or difficult to answer?Answered: 35 Skipped: 0
TOTAL 35
Very difficult/ confusing
Somewhatdifficult /...
A littledifficult /...
Not difficult/ confusing
0% 10% 20% 30% 40% 50% 60% 70% 80% 90% 100%
ANSWER CHOICES RESPONSES
Very difficult / confusing
Somewhat difficult / confusing
A little difficult / confusing
Not difficult / confusing
26 / 27
Denham Townsite Coastal Hazard Risk Management and Adaptation Plan
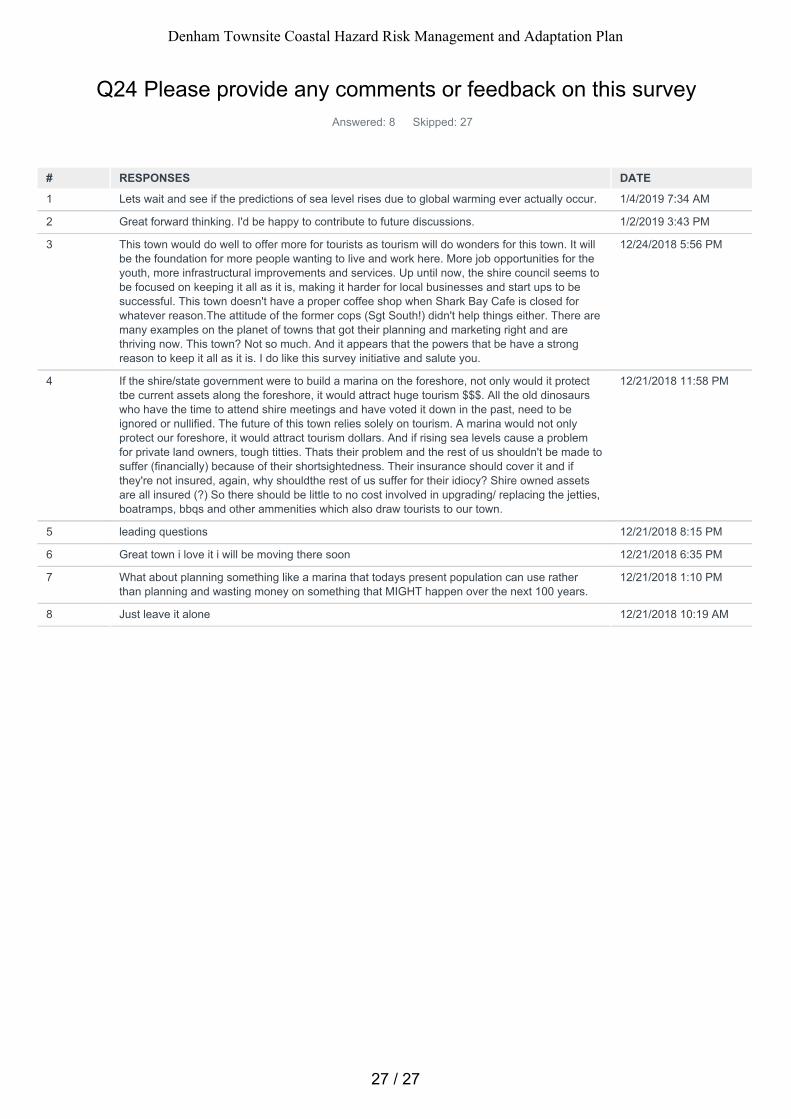
Q24 Please provide any comments or feedback on this surveyAnswered: 8 Skipped: 27
# RESPONSES DATE
1 Lets wait and see if the predictions of sea level rises due to global warming ever actually occur. 1/4/2019 7:34 AM
2 Great forward thinking. I'd be happy to contribute to future discussions. 1/2/2019 3:43 PM
3 This town would do well to offer more for tourists as tourism will do wonders for this town. It willbe the foundation for more people wanting to live and work here. More job opportunities for theyouth, more infrastructural improvements and services. Up until now, the shire council seems tobe focused on keeping it all as it is, making it harder for local businesses and start ups to besuccessful. This town doesn't have a proper coffee shop when Shark Bay Cafe is closed forwhatever reason.The attitude of the former cops (Sgt South!) didn't help things either. There aremany examples on the planet of towns that got their planning and marketing right and arethriving now. This town? Not so much. And it appears that the powers that be have a strongreason to keep it all as it is. I do like this survey initiative and salute you.
12/24/2018 5:56 PM
4 If the shire/state government were to build a marina on the foreshore, not only would it protecttbe current assets along the foreshore, it would attract huge tourism $$$. All the old dinosaurswho have the time to attend shire meetings and have voted it down in the past, need to beignored or nullified. The future of this town relies solely on tourism. A marina would not onlyprotect our foreshore, it would attract tourism dollars. And if rising sea levels cause a problemfor private land owners, tough titties. Thats their problem and the rest of us shouldn't be made tosuffer (financially) because of their shortsightedness. Their insurance should cover it and ifthey're not insured, again, why shouldthe rest of us suffer for their idiocy? Shire owned assetsare all insured (?) So there should be little to no cost involved in upgrading/ replacing the jetties,boatramps, bbqs and other ammenities which also draw tourists to our town.
12/21/2018 11:58 PM
5 leading questions 12/21/2018 8:15 PM
6 Great town i love it i will be moving there soon 12/21/2018 6:35 PM
7 What about planning something like a marina that todays present population can use ratherthan planning and wasting money on something that MIGHT happen over the next 100 years.
12/21/2018 1:10 PM
8 Just leave it alone 12/21/2018 10:19 AM
27 / 27
Denham Townsite Coastal Hazard Risk Management and Adaptation Plan
Shire of Shark Bay | 31 March 2020 Final Report
5652_01_R
09v02.d
ocx
APPENDIX G PUBLIC CONSULTATION SUMMARY
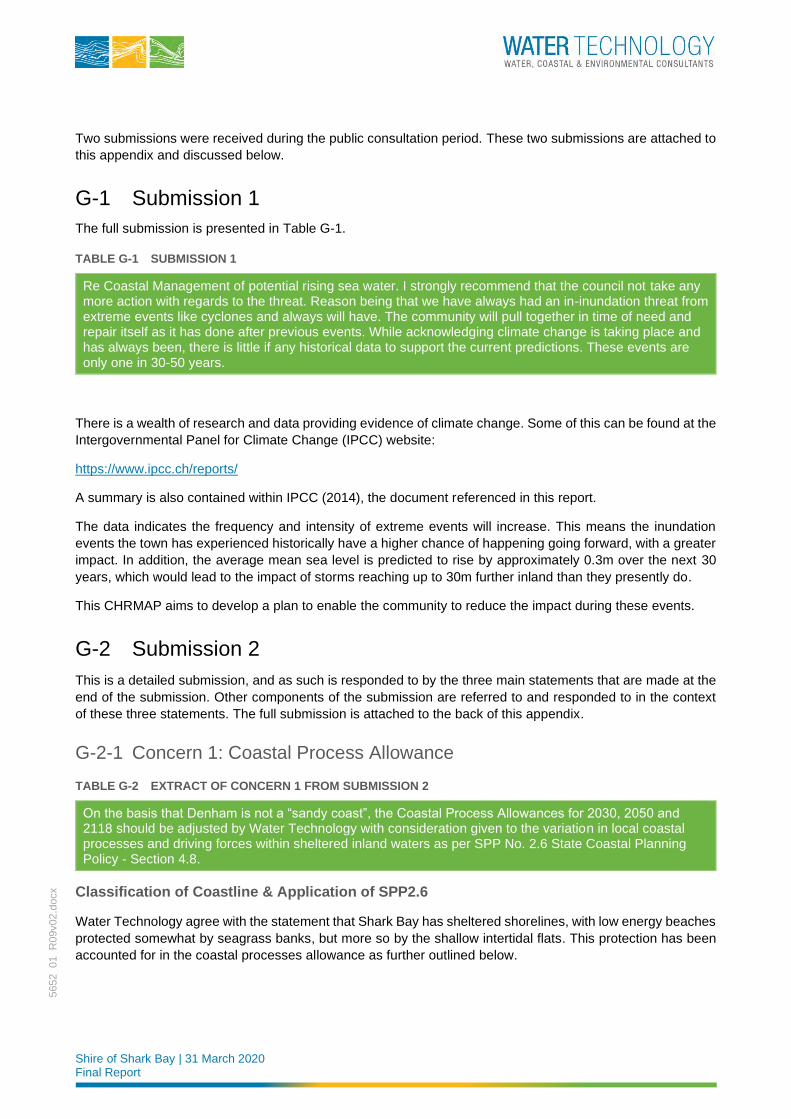
Shire of Shark Bay | 31 March 2020 Final Report
5652_01_R
09v02.d
ocx
Two submissions were received during the public consultation period. These two submissions are attached to
this appendix and discussed below.
G-1 Submission 1
The full submission is presented in Table G-1.
TABLE G-1 SUBMISSION 1
Re Coastal Management of potential rising sea water. I strongly recommend that the council not take any more action with regards to the threat. Reason being that we have always had an in-inundation threat from extreme events like cyclones and always will have. The community will pull together in time of need and repair itself as it has done after previous events. While acknowledging climate change is taking place and has always been, there is little if any historical data to support the current predictions. These events are only one in 30-50 years.
There is a wealth of research and data providing evidence of climate change. Some of this can be found at the
Intergovernmental Panel for Climate Change (IPCC) website:
https://www.ipcc.ch/reports/
A summary is also contained within IPCC (2014), the document referenced in this report.
The data indicates the frequency and intensity of extreme events will increase. This means the inundation
events the town has experienced historically have a higher chance of happening going forward, with a greater
impact. In addition, the average mean sea level is predicted to rise by approximately 0.3m over the next 30
years, which would lead to the impact of storms reaching up to 30m further inland than they presently do.
This CHRMAP aims to develop a plan to enable the community to reduce the impact during these events.
G-2 Submission 2
This is a detailed submission, and as such is responded to by the three main statements that are made at the
end of the submission. Other components of the submission are referred to and responded to in the context
of these three statements. The full submission is attached to the back of this appendix.
G-2-1 Concern 1: Coastal Process Allowance
TABLE G-2 EXTRACT OF CONCERN 1 FROM SUBMISSION 2
On the basis that Denham is not a “sandy coast”, the Coastal Process Allowances for 2030, 2050 and 2118 should be adjusted by Water Technology with consideration given to the variation in local coastal processes and driving forces within sheltered inland waters as per SPP No. 2.6 State Coastal Planning Policy - Section 4.8.
Classification of Coastline & Application of SPP2.6
Water Technology agree with the statement that Shark Bay has sheltered shorelines, with low energy beaches
protected somewhat by seagrass banks, but more so by the shallow intertidal flats. This protection has been
accounted for in the coastal processes allowance as further outlined below.
Shire of Shark Bay | 31 March 2020 Final Report
5652_01_R
09v02.d
ocx
The bay, whilst sheltered, can still receive wave energy propagating through the gaps between Dirk Hartog
and Dorre Island (approximately 25km wide), and, to a lesser extent, Bernier Island and the mainland coast
(approximately 40km for the purpose of wave penetration). To the south of Denham, local, wind generated
waves can form with a fetch of 35-40km; the dominant wind direction at Denham is from the south. The 100-
year ARI synthetic cyclone used in the SBEACH modelling to calculate S1 (the response due to storm erosion)
generated waves approximately 2.5-3 m in height in 5m of water offshore from Denham. This was then brought
into shore over the tidal flats using the SBEACH model.
It should be noted that significant wave height (Hs) represents the mean wave height (trough to crest) of the
highest third of the waves during a given time period. The maximum wave height (Hmax) experienced during a
storm would be higher. The ratio of Hmax/Hs is typically in the range 1.6 to 2.2.
As such, it isn’t appropriate to classify the Denham coast as “tidally affected inland waters”. Tidally affected
inland waters are considerably more sheltered. For example, the Swan River Estuary, the Princess Royal
Harbour (Albany) and the Peel-Harvey Estuary where wave energy is substantially restricted.
The model created for this study does take the unique properties of Shark Bay into account. The full bay is
included in the model, as is the entire northwest shelf (Figure 4-1 of Coastal Hazard & Vulnerability Assessment
(Appendix C of this document). This includes the shoals and tidal flats in the nearshore at Denham. As such,
the protection afforded to Denham from wave energy is represented by the significantly lower 100-year ARI
wave height compared with typical open ocean conditions on the west coast of Australia.
Seagrass does have a wave mitigation effect, however with sea level rise this will reduce. Deeper water means
the waves “feel” the seabed less and therefor the energy reduction is also less. For the purpose of assessing
the coastal erosion hazard, DoT recommends modelling the storm response assuming marine vegetation such
as seagrass beds and mangroves aren’t present, as there is no guarantee it will remain between storms or
under future conditions, thus removing the wave attenuation properties.
The submission references papers by Nahas et al. (2005) and Hetzel et al. (2015) that discuss the mixing
phenomena in Shark Bay due to tides, wind and evaporation. They contain no mention of extreme water level
or coastal geomorphology processes. Whilst Shark Bay exhibits some highly unusual mixing characteristics,
these processes are not inherently related to extreme inundation or erosion events.
In summary, Denham should still be classified as ‘sandy coast’ rather than ‘tidally affected inland
waters’ due to the potential for wave energy exposure in a cyclone.
Geological Setting & Susceptibility
The coastline at Denham does appear to have underlying rock. However, the horizontal and vertical spatial
extent is not currently known. According to the definitions provided in SPP2.6, the Denham coastline could be
characterised as “Mixed sandy and rocky coasts”, most likely “discontinuous rocky coast”. However, SPP2.6
also states:
“The allowance for the current and future risk of erosion should be based on a geotechnical assessment of the shoreline stability. The geotechnical assessment should include consideration of: slope elevation, slope angle, durability of material, consistency of material, angle of bedding layers and thickness of bedding layers.”
For this reason, Water Technology have recommended that a geotechnical assessment be carried out to
determine the extent of the rock layers, and their likelihood to contribute to protection at Denham. This is noted
in both our Establish the Context Chapter Report (Appendix B), our Coastal Hazard & Vulnerability Assessment
Chapter Report (Appendix C), and our Knowledge Gaps and Recommendations section of this report, Section
8.6.
For steep slopes, SPP2.6 notes that “coasts may also be subject to coastal recession as a result of slope failure.” Given the unknown geological setting of this area, no reduction in the erosion allowance was included
Shire of Shark Bay | 31 March 2020 Final Report
5652_01_R
09v02.d
ocx
in this assessment. However, it is acknowledged that the presence of bedrock may have an impact on the
level of erosion in the vicinity of and to the west of the Seaside Denham Seaside Caravan Park. It is for this
reason that we recommended the geotechnical assessment.
For the low-lying areas along Knight Terrace, the presence of bedrock will not have the limiting impact on
erosion, as during a storm these areas will be inundated.
Eliot et al. (2012) prepared a report for the Department of Planning (now Department of Planning, Lands and
Heritage) and the Department of Transport to determine the vulnerability of landforms on the Gascoyne coast
to changing environmental conditions, including predicted sea level rise. This document was referenced in the
submission. Careful review of this report highlights the risk of applying broadscale geological and
geomorphological classifications to highly localised studies. Whilst the area including Denham was rated low
susceptibility, their assessment of the Denham townsite area is shown below:
The cell has low susceptibility and low instability. Across the cell, there is a low vulnerability with risks including inundation and foredune plain retreat caused by alteration to sediment supply likely to provide low constraints to coastal management.
However, there are landforms within the cell that are more unstable and hence are likely to provide greater coastal planning constraint, such as the storm ridge and tidal flat on which the original townsite was constructed, including the reclaimed foreshore of Knight Terrace. This low-lying area will be prone to increased inundation and consequently shore retreat due to projected sea level rise. Without adequate adaptation, a rise in sea level and associated rise in groundwater levels may progress the landforms to a tidal flat similar to the coast north of the Oceanarium (Figure G-4; Figure 6-7).
In the absence of adequate engineered structures the storm ridge would migrate landwards during inundation events, with increased frequency due to higher sea levels. The rate of retreat is affected by the underlying rock structures, with low elevation or discontinuous rock features potentially enhancing rates of erosion. The subtidal terrace is also likely to rise and narrow in response to rising sea level with potentially altered rates of sand and shell supply from the adjacent seagrass beds and nett northerly sediment transport rates along the terrace and beachface (bar migration).
In summary, the following knowledge gap recommendation was made in our CHRMAP, in line with the
request of the submission: Collection of geotechnical data to confirm the risk of erosion in coastline
Section 4. This is in line with our initial recommendations. It is noted that the presence of bedrock in
coastline Sections 1 to 3 will not significantly alter the risk profile. These low-lying areas will still be
inundated under extreme events, and the coastline will recede correspondingly.
The classifications and current assessments are in line with the local coastal processes, SPP2.6, and
state government requirements.
Calculation of S3 – Erosion due to Sea Level Rise (Use of the Bruun Rule)
The referenced paper by Cooper and Pilkey (2004) presents an analysis on the shortcomings of the Bruun
Rule and its application to shoreline evolution. Following this paper, further research has been done to
investigate potential shoreline evolution, summarised in review papers by Fitzgerald et al. (2008) and McInnes
et al. (2016). Localised physical models (e.g.: Woodroffe et al., 2012) and probabilistic models (e.g.: Gutierrez
et al., 2011, Ranasinghe et al., 2012) have been put forward as alternative methods to the Bruun rule, with
results suggesting the Bruun rule may be conservative in those instances. However, the use of such methods
was not suggested by Water Technology in the present study for two main reasons:
1. Deriving defensible results from such methods with reasonable levels of uncertainty would require more
site-specific data then available at present.
Shire of Shark Bay | 31 March 2020 Final Report
5652_01_R
09v02.d
ocx
2. The WAPC’s SPP2.6 specifies the use of the Bruun rule for sandy coasts; “The allowance for erosion caused by future sea level rise on sandy coasts should be calculated as 100 times the adopted sea level rise value of 0.9m over a 100-year timeframe or 90 metres. Consideration should be given to increasing the allowance where the impact of obstacles (natural or manmade) may influence future trends by reducing updrift longshore sediment transport”. This same allowance would also be required for Denham
if given a classification of discontinuous rocky coast or tidal reaches of inland waters; “The allowance for erosion on tidal reaches of inland waters should generally be determined using the methods specified for sandy, rocky, and mixed sandy and rocky coasts”. With the data available at present, reclassification of
the coastline to mixed sandy or rocky coasts, or inland waters would result in no change to the final
erosion assessment. In this case, no sufficient evidence could be found to not use the SPP2.6
recommendation for sandy coastline under SPP2.6.
In summary, the Bruun rule has been used here due to the requirements of the SPP2.6 and the paucity
of local field observations (a primary limitation of this study). Water Technology acknowledges that
the Bruun rule is an empirical formula used to indicate potential areas of risk (and not future coastline
position) and has been found to be conservative in recent scientific studies. The CHRMAP could be
considered the first step towards a more rigorous study that could be implemented to provide
sufficient evidence to the WAPC and DoT to override the use of SPP2.6 for the case of Denham. The
Shire should consider the impact of the present recommendations and the cost of future work before
proceeding with future studies.
G-2-2 Concern 2: Calculation of S4
TABLE G-3 EXTRACT OF CONCERN 2 FROM SUBMISSION 2
The 500-year inundation storm surge model should be recalibrated by Water Technology to include the only TC cyclone (TC Hazel) that impacted Denham and is also recorded in the Carnarvon water levels.
Cyclone Hazel was one of the events used in the model calibration by MRA (2014). This applied the anecdotal
water levels observed in Denham during the event, that is, a peak level of 1.9m AHD. If data at Carnarvon was
obtained for this cyclone, the model could be re-simulated and compared to this dataset. However, the focus
of the study is at Denham and therefore it is most important that the water levels are replicated there – as they
were in the MRA (2014) model calibration.
Calibrating a model to a dataset some 115km away is not best practice. The only instance this would be carried
out is if there was no data locally, as it does provide an indication of general model performance.
The modelling undertaken by Water Technology utilised the cyclone tracks generated by MRA (2014), and
hence the model applied in the CHRMAP has already been calibrated including the effects of TC Hazel.
A more valuable exercise would be to recalibrate the model upon collection of local data at Denham under
future cyclones. This is the aim of the recommendation made in the CHRMAP to collect local wave and water
level data at Denham. During the recalibration process, the other pertinent recommendations made by Bruce
Harper in his Peer Review can also be applied.
SPP2.6 states: The values given for each factor should be based upon the best available data and be a conservative estimate of that factor and include allowance for uncertainty.
The present uncertainties cannot be resolved without additional data recorded at Denham – as per our
recommendation. The existing level of 4.2m AHD represents the level based upon the best available data, and
is a conservative estimate that includes an allowance for uncertainty.
Shire of Shark Bay | 31 March 2020 Final Report
5652_01_R
09v02.d
ocx
G-2-3 Concern 3: Calculation of S2 (Historical Shoreline Movement)
TABLE G-4 EXTRACT OF CONCERN 3 FROM SUBMISSION 2
The Historic Shoreline movement trends need to be adjusted to take historic sediment pulses into account.
For this assessment, we examined long-term changes to the vegetation line using the supplied aerial images
from DoT and Landgate, as described in Section 5.2 of the Coastal Hazard & Vulnerability Assessment
Chapter Report (Appendix C of this document). This does take into account natural, large scale sediment
pulses that have a duration long enough for vegetation to form (and thus are considered stable). A detailed
description of the methodology can be found in Section 5.2.2 “Historical Shoreline Change Calculations”.
This analysis was undertaken in consultation with Department of Transport coastal engineers. The advice
provided was to remove the influence of the dredge spoil placement in Coastline Section 4 as this cannot be
guaranteed to continue in the future. As per SPP2.6, planning for a CHRMAP should not lead to legacy issues.
Assuming that the dredge spoil renourishment will continue for the next 100-years is an inappropriate
assumption, especially as there is presently no formal arrangement for this to occur.
G-2-4 General: Implementation of Special Control Area & Notification on Title
Implementation of Special Control Area (SCA)
Please refer to Section 6.2 of this document for a description of the planning adaptation options. The
Adaptation Option Identification Chapter Report provides a further description of the purpose of the SCA
(Section 3.3.2 of Appendix E). An extract is provided below:
The purpose of the SCA is to provide guidance as to the appropriate scope of land use and development to
be permitted within a coastal erosion and inundation hazard risk area. Its objectives would be:
a. To ensure land in the coastal zone is continuously provided for coastal foreshore management, public
access, recreation and conservation.
b. To ensure public safety and reduce risk associated with coastal erosion and inundation.
c. To avoid inappropriate land use and development of land at risk from coastal erosion and inundation.
d. To ensure land use and development does not accelerate coastal erosion or inundation risks; or have a
detrimental impact on the functions of public reserves.
e. To ensure that development addresses the Denham Townsite CHRMAP prepared in accordance with
SPP2.6 and prepared in accordance with the Denham Townsite CHRMAP.
The SCA would include additional provisions (over and above or overriding provisions for development not
within the SCA), such as:
a. All proposed development within the SCA requires approval. (This would include development that would
not ordinarily require development approval under the scheme).
b. Approval to be issued on a temporary or time limited basis. (The applicant could later apply for a further
approval, which could be granted if the risk from coastal processes was still considered acceptable).
c. Referral of applications. (Any planning application should be referred to the Department of Transport, the
Western Australian Planning Commission and any other relevant authority for advice and comment on the
coastal risk.)
d. Minimum finished floor levels (FFLs) and/or other development standards. (4.2 metres AHD has been
identified as the appropriate minimum FFL).
Shire of Shark Bay | 31 March 2020 Final Report
5652_01_R
09v02.d
ocx
The Draft CHRMAP put out for public comment defined the extent of the SCA as “delimited by the position of
either the 2118 coastal processes setback line or the inundation extent of the 500-year ARI event in the year
2118, whichever is the more landward”. To better acknowledge the limitations of the erosion hazard line, this
should be defined by simply the 500-year ARI inundation event in the year 2118. The erosion hazard can then
be separately assigned to properties at risk within the next planning epoch, as per the recommendations in
Section 7 of this document:
◼ Prevention of further development for lots within the erosion hazard zone of the next epoch (i.e.: staged
prevention of development, initially for lots at risk by 2030, then later for lots at risk by 2050 if hazard
triggers are reached). This criterion may be relaxed for lots inland of protection structures as long as the
new development and protection structure design lives are taken into account.
◼ Requirement of houses damaged or otherwise triggered (see Section 6.4.1) by coastal hazards to be
relocated or rebuilt out of the hazard zone.
In this way, the erosion risk adaptation is staged so that only assets located within the hazard line of the next
epoch are affected, and adaptation actions are based on triggers. Currently, there are no residential assets
located in the predicted 2030 hazard zone. Any uncertainties associated with the definition of the hazard zone
are allowed for, as long as the hazard zones are redefined regularly, as new data and climate science
information comes to hand.
The requirements under the SCA for inundation are the same as that already defined in the current Shire
Planning Scheme, i.e.: no change to the FFL has been recommended in this study.
Notifications on Title
Please refer to Section 6.2 of this document for a description of the planning adaptation options. The
Adaptation Option Identification Chapter Report provides a further description of Notifications on Title (Section
3.3.4 of Appendix E). An extract is provided below:
“Section 70A of the Transfer of Land Act 1893 and Section 165 of the Planning and Development Act 2005
enables a local government or public authority to cause a notification to be placed on the certificate of title of
land to make landholders and future landholders aware of a factor that may affect the use and enjoyment of
the land. The process requires the written consent of the landholder and payment of a fee, so it is usual for the
requirement for placement of a notification to be a condition of development or subdivision approval. However,
placement of a notification on the title does not have to be tied to an application and could take place at any
time with owner consent.”
This indicates that there is no immediate impact on the majority of current landholders with respect to this
action.
G-2-5 State Government Response
As part of the review process of this document, both the Department of Transport (DoT) and Department of
Planning, Lands and Heritage (DPLH) were provided the public submission and Water Technology’s draft
response. DPLH comments were included in this final report version across the relevant sections of the
document; DoT’s response is included below:
Thank you for forwarding DoT the Denham CHRMAP’s public submissions and sharing Water Technology response.
The Coastal Hazard Assessment component of this CHRMAP project was funded through DoT’s Coastal Adaptation and Protection (CAP) Grant scheme 2017/2018 round. We have been working closely with Water
Shire of Shark Bay | 31 March 2020 Final Report
5652_01_R
09v02.d
ocx
Technology and the Shire of Shark Bay on this component of the CHRMAP since DoT co-funded this project with the Shire. We have also been involved with the subsequent components of the CHRMAP project as we were requested to be a part of the Steering Committee for the project.
We note that there have been some concerns on the methodology, the hazard maps and what it means for the Denham community in terms of implementation. This is understandable. This is the reason why public consultation is a key component of any CHRMAP project so that issues can be identified and hopefully by working together, sustainable and workable solutions can be planned for and the Shire and the community are prepared for future changes.
We would like to point out that the methodology prescribed by SPP2.6 is used to come up with a conservative allowance for coastal hazards so it can be used to identify risks and plan for them. This method is not intended to come up with the best estimate of shoreline position at a given timeframe. SPP2.6 (Section 4) states that “The values given for each factor should be based upon the best available data and be a conservative estimate of that factor and include allowance for uncertainty. As knowledge improves, the WAPC in consultation with and agreement of the Department of Planning will update the values and methods”. In order to refine the allowances for coastal hazard, the CHRMAP data collection recommendations can be implemented and after sufficient period of data collection, the data can be reviewed and potentially used to update the CHRMAP.
On the specific concerns:
◼ The study area doesn’t seem to have visible rock outcrop/platform. Without further geotechnical investigation as evidence, the assessment of the project site should be treated as sandy coast as per SPP2.6. Further details are outlined in Water Technology’s response.
◼ As discussed in Water Technology’s response, this area is not considered as tidal reaches of inland waters under SPP2.6.
◼ S3 allowance methodology. Water Technology’s response have detailed the reasons behind the methodology used for S3 allowance. It is acknowledged the methodology has limitations. However due to lack of alternative defensible methodology presented by the scientific community, the conservative factor of 100 was specified by SPP2.6.
◼ S2 allowance. As per Water Technology’s response, DoT’s dredging operation in the area is very infrequent and should not be relied upon for future planning. Since the facility was built, there were only four significant (dredging volume more than 30,000 m3) dredging campaigns completed at the site.
◼ Inundation level. As discussed in Water Technology’s response there are limitations in using available datasets, which led to the CHRMAP recommendation to collect local data. The Shire and DoT is currently discussing installation of water level measurement at Denham, which may assist with refining this in the future.
In summary, we are satisfied that the CHRMAP has been completed using best currently available information. The purpose of the project is to identify a conservative allowance for coastal hazards to allow risk identification and future planning/risk management to happen. The intent of the assessment was not to give a best estimate of shoreline position at a given timeframe. The CHRMAP recommendations regarding data collection/monitoring hopefully can be implemented as soon as possible, pending the Shire’s decision and resource availability. Other implementation actions seem to be trigger based, which the recently commenced coastal monitoring can assist with.
Shire of Shark Bay | 31 March 2020 Final Report
5652_01_R
09v02.d
ocx
G-2-6 Summary
The adaptation options recommended within this CHRMAP aim to minimise the impact of coastal hazards to
the community as a whole, as well as retaining the coastal values of the town. As per SPP2.6: Successful
coastal zone planning today will ensure that current and future generations of Western Australians can benefit
from the opportunities presented by the values and resources of the Western Australian coast.
As noted earlier, if the Shire chooses not to adopt the recommended adaptation measures, the impact on the
community could be significantly greater than that if a planned approach is taken. Inaction in planning for long-
term coastal hazards are likely to result in far greater economic losses, community discontent, safety issues
and potential legal action.
The study presented for Denham represents a best practice approach that adheres to the relevant policies,
and takes into account the site-specific conditions at Denham using the available data. It has been peer
reviewed by Department of Planning, Lands & Heritage, and the coastal engineers at Department of Transport.
Key points for this submission are as follows:
◼ It is noted that the Finished Floor Level (FFL) in the Shire’s Planning Scheme is not recommended to be
changed. This was put in place before the outcomes of the study were determined. Without any additional
water level data with which to calibrate the models, this cannot be reduced or changed.
◼ Use of the Bruun rule is specified by SPP2.6.
◼ Denham should still be classified as ‘sandy coast’ rather than ‘tidally affected inland waters’ due to the
potential for wave energy exposure in a cyclone. In fact, at present, reclassification of the coast type would
result in no change to the erosion assessment methodology and results.
◼ Previous assessments agree that the low-lying areas of Denham are vulnerable to inundation and erosion
at present which will be exacerbated by sea level rise.
◼ Unknown geological features may enhance local rates of erosion.
◼ An SCA is recommended immediately to allow for additional consideration of any proposed development.
This is recommended to remain in place while a long-term adaptation strategy is selected by the Shire.
Selection of a long-term adaptation strategy should not be rushed and should involve the community.
◼ Trigger-based adaptation strategies have been developed to determine when to implement certain
strategies (e.g.: when to retreat/protect). In addition, the SCA allows for better development control within
the hazard zone.
We note your concerns regarding emotional and financial burden. These are valid concerns that have been
directed to the Shire. The final decision, including consideration of potential impacts to members of the
community, lies with the Shire.
In adapting to the impacts of climate change, it would be impossible to avoid any impact, financial or otherwise,
to the community. The main aim of planning for the future now is to reduce the burden through long term
adaptation that allows for community values to be upheld throughout the planning timeframe. This is the goal
of SPP2.6.
References are included in Section 10 – main references section for this document.
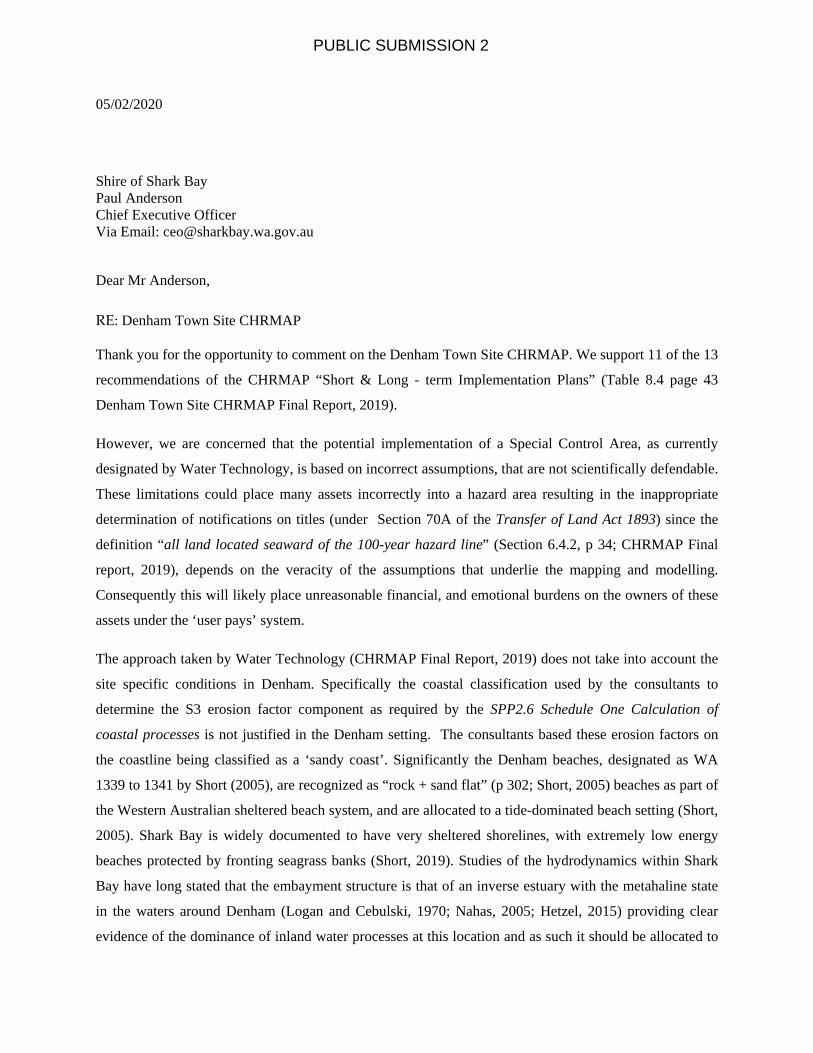
05/02/2020 Stephen and Thérèse Morris 13 Mainland St Denham WA
Shire of Shark Bay Paul Anderson Chief Executive Officer Via Email: [email protected]
Dear Mr Anderson,
RE: Denham Town Site CHRMAP
Thank you for the opportunity to comment on the Denham Town Site CHRMAP. We support 11 of the 13
recommendations of the CHRMAP “Short & Long - term Implementation Plans” (Table 8.4 page 43
Denham Town Site CHRMAP Final Report, 2019).
However, we are concerned that the potential implementation of a Special Control Area, as currently
designated by Water Technology, is based on incorrect assumptions, that are not scientifically defendable.
These limitations could place many assets incorrectly into a hazard area resulting in the inappropriate
determination of notifications on titles (under Section 70A of the Transfer of Land Act 1893) since the
definition “all land located seaward of the 100-year hazard line” (Section 6.4.2, p 34; CHRMAP Final
report, 2019), depends on the veracity of the assumptions that underlie the mapping and modelling.
Consequently this will likely place unreasonable financial, and emotional burdens on the owners of these
assets under the ‘user pays’ system.
The approach taken by Water Technology (CHRMAP Final Report, 2019) does not take into account the
site specific conditions in Denham. Specifically the coastal classification used by the consultants to
determine the S3 erosion factor component as required by the SPP2.6 Schedule One Calculation of
coastal processes is not justified in the Denham setting. The consultants based these erosion factors on
the coastline being classified as a ‘sandy coast’. Significantly the Denham beaches, designated as WA
1339 to 1341 by Short (2005), are recognized as “rock + sand flat” (p 302; Short, 2005) beaches as part of
the Western Australian sheltered beach system, and are allocated to a tide-dominated beach setting (Short,
2005). Shark Bay is widely documented to have very sheltered shorelines, with extremely low energy
beaches protected by fronting seagrass banks (Short, 2019). Studies of the hydrodynamics within Shark
Bay have long stated that the embayment structure is that of an inverse estuary with the metahaline state
in the waters around Denham (Logan and Cebulski, 1970; Nahas, 2005; Hetzel, 2015) providing clear
evidence of the dominance of inland water processes at this location and as such it should be allocated to
PUBLIC SUBMISSION 2
2
the SPP2.6 Schedule One Calculation of coastal processes coastal classification of ‘tidally effected inland
waters’. The consequence of ignoring these well documented and readily available studies of the
conditions around Denham (both circulation and beach state) is that the ‘sandy coast’ classification is an
open marine model with potential for significantly higher and likely unrealistic, erosion rates than will be
seen at the Denham Town Site.
The use of an open coast ‘sandy coast’ framework in this setting goes against the SPP2.6 guidelines
which state that the ‘sandy coast’ erosion rate, “ methods are principally derived for open ocean coasts
and case by case consideration should be given to variation in underlying coastal processes and diverse
forces within sheltered inland waters” (p16 SPP2.6). No case by case consideration is evident in the work
done by Water Technology.
Indeed the consultants have ubiquitously applied the Bruun rule (see discussion in Cooper and Pilkey
2004) to determine the position of the “2118 Coastal Processes Allowance” line on the map on the basis
that SPP2.6 recommended its application. However, this recommendation is suggested only in the case of
open “sandy coasts” with Schedule 1 of the policy placing a caveat on the case of estuaries such as
Denham Sound “ The allowance for erosion on tidal reaches of inland water should generally be
determined using the methods specified for sandy, rocky, and mixed sandy and rocky coasts. It is
however, acknowledged that these methods are principally derived for open ocean coast and case-by-case
consideration should be given to the variation in underlying coastal processes and driving forces within
sheltered inland waters.” (Section 4.8 p17, SPP2.6)
The use of the Bruun rule has allowed the “2118 Coastal Process Allowance” line to reach an
approximate elevation of at least 24 m AHD to the west of the caravan park, well above any likely extent
of coastal processes based on the modelled future projections under IPCC 2014 given the geology of the
setting. What’s more despite recognizing that a rocky scarp extends steeply upwards from around the 4m
AHD contour that “may limit the level of erosion” and that it is “particularly the case seaward of the
Denham Seaside Caravan Park, and to the west around to the public lookout, where the scarp line is
quite close to the existing shoreline.” (p 18, Appendix C; CHRMAP Final report, 2019) no sensible
adjustments to the position of the “2118 Coastal Process Allowance” line have been made.
Schedule 1 of the policy states that “Consideration should be given to the cause of shoreline movement
trends” (Section 4.4.1 p 15 SPP 2.6) when determining the S2 erosion component. It is clear that there
has been no credible allowance given for the processes that locally operate to make this setting unique.
For example the inclusion of shoreline movement by erosion /accretion waves that may be instigated by
3
storm or dredge spoil alterations at the beach face were not factored in to erosion estimates, and were
omitted from a list of coastal processes for the site. The lack of understanding of these local processes,
will result in inaccurate application of erosion rates across the different segments.
With regard to assessment of the ‘Allowance for the current risk of storm surge inundation (S4
Inundation)’ required under SPP2.6, it is of concern that Water Technology continues to use the MP
Rogers and Associates report (MRA 2014) as a basis for their inundation modelling despite the
limitations identified by the Systems Engineering Australia (SEA 2019) peer review. “Whilst every effort
was made by MRA to calibrate their hydrodynamic model with TC’s measured at other locations
(Carnarvon, Useless Loop), uncertainties resulting from a lack of measured data are present in MRA’s
final report which have been carried through to this project” (page 39 Appendix C CHRMAP Final
report, 2019) PSWL (Peak Steady Water Level).
Three cyclones were used to calibrate the MRA cyclone model, including a single anecdotal report of
maximum water elevation at Denham during the passage of TC Hazel (Tropical Cyclone), the other two
cyclones (TC Elaine, and TC Narelle) did not result in a measured storm surge in Denham. More detailed
data for TC Hazel was recorded at the Carnarvon Tide Gauge during 1979 and could have been
incorporated in the model calibration and validation, however, the MRA report failed to recognize it,
stating that water level data from Carnarvon is only available from April 1984 to present day. This was
despite their report noting that “As the focus of this study is on the storm surge levels at Denham, further
investigation was completed to try and find details of inundation levels within and around the Denham
townsite. Information from the BoM provides details regarding TC Hazel which occurred in March 1979.
BoM (2014b) notes the passage of TC Hazel resulted in a storm surge at Denham and along the coast
south of Carnarvon which lead to building being inundated and people being evacuated within the
Denham Townsite. SoSB (2009) states that the peak water level observed at Denham during the passage
of TC Hazel was 2.7 mCD (around 1.9 mAHD)” (p 5 – Denham Inundation Levels MRA 2015). Water
Technology also did not recognise that the water level data at Carnarvon had recorded the 1979 TC Hazel
storm surge, stating that the available water level data from DoT was from the period 1996 to 2018 (Table
3.1 Available data – Appendix B; CHRMAP Final report, 2019). It is unclear as to why both MRA and
Water Technology were unable to locate the full water level data from Carnarvon as these data are readily
available at the WADoT from 1965 to present day and are reported on in Fandry et al (1984), Hubbert et
al (1991) and Eliot (2012). While there are some gaps in the data set prior to July 1989, key to note is that
the maximum recorded water level ever recorded was observed on 13 March 1979 during the passage of
TC Hazel, and that this cyclone directly passed over Denham Sound and so its full bay wide, and
significant, record of impact should have been used to generate storm surge information.
4
While Water Technology acknowledges the issues with the MRA report they suggest that “the project
scope and budgetary constraints may have restricted the detail of the study” (p 16 -Appendix B,
CHRMAP Final report, 2019). Water Technology states that they “believe the most effective approach is
to use the modelling to identify triggers, and their corresponding coastal management action.” (p 16,
Appendix B; CHRMAP Final report, 2019). However, the final product of their modelling approach is
used to generate the 500-year ARI Inundation Assessment 2118, and this is used conjunction with the “
2118 Coastal Process Allowance” to determine the boundary of the Special Control Area’s (SCA).
“Cover all land identified as being at risk of coastal erosion and / or inundation. The SCA would be
delimited by the position of either the 2118 coastal erosion setback line or the inundation extent of the
500-year ARI event in the year 2118, whichever is the more landward.” (p 31, CHRMAP Final report
2019). Thus the use of their modelling clearly goes beyond simply trigger based decision making (see
Section 6.2 “Amend the local planning scheme to introduce a Special Control Area (SCA)” p 31,
CHRMAP Final report, 2019) and inaccuracies within it have financial and social consequences similar to
those generated by the inappropriate application of open water coastal classifications within an embayed
setting.
Water Technology recommends an Implementation Timeline of ‘ASAP’ to introduce a Special Control
Area with the funding and legal responsibility to borne by the Shire (page 43 Table 8.4 - CHRMAP Final
Report). However, we believe that before the Shire amends the local planning scheme to introduce a
Special Control Area that the coastal erosion setback lines need to be recalculated with the inundation
extents determined by a scientific valid evidence based approach rather than the simplistic approach that
Water Technology have inappropriately applied in this unique setting.
The Special Control Area as designated by Water Technology has likely incorrectly identified assets not
at risk due to coastal erosion and should not be used until the following issues are rectified;
1. On the basis that Denham is not a “sandy coast”, the Coastal Process Allowances for 2030, 2050 and 2118 should be adjusted by Water Technology with consideration given to the variation in local coastal processes and driving forces within sheltered inland waters as per SPP No. 2.6 State Coastal Planning Policy - Section 4.8
2. The 500-year inundation storm surge model should be recalibrated by Water Technology to include the only TC cyclone (TC Hazel) that impacted Denham and is also recorded in the Carnarvon water levels.
3. The Historic Shoreline movement trends need to be adjusted to take historic sediment pulses into account
5
While it is important to ensure that the Shire is compliant with state government obligations, rushing
amendments through without a scientifically defendable study will result in both an unreasonable
financial and emotional burden on those people effected. Moreover, in order to prevent legal action and
low community confidence in the Shire’s planning decisions future amendments must be based on robust
assessments.
Yours Sincerely Stephen and Thérèse Morris
References
Cooper, J. A. G., and O. H. Pilkey. 2004. 'Sea-level rise and shoreline retreat: Time to abandon the Bruun Rule', Global and Planetary Change, 43: 157-71 Eliot I., Gozzard J.R., Eliot M., Stul T. and McCormack G. (2012). The Coast of the Shires of Shark Bay to Exmouth, Gascoyne, Western Australia: Geology, Geomorphology & Vulnerability, Prepared by Damara WA Pty Ltd and Geological Survey of Western Australia for the Department of Planning and the Department of Transport Fandry, C.B, Leslie L.M., and Steedman R.K., 1984. Kelvin-type coastal surges generated by tropical cyclone', Journal of physical oceanography, 14: 582-93.
Hetzel, Y., Pattiaratchi, C., Lowe, R., Hofmeister, R., 2015. Wind and tidal mixing controls on stratification and dense water outflows in a large hypersaline bay. J. Geophys. Res. Oceans 120 (9), 6034–6056. Hubbert, G.D., Holland, G.J. Leslie, L.M. Manton, M.J., 1991 A Real-Time System for Forecasting Tropical Cyclone Storm Surges. Weather and Forecasting 6, 86-97 Logan, B.W. and Cebulski, D.E., 1970. Sedimentary environments of Shark Bay, Western Australia. MRA (2014). Denham Inundation Levels Storm Surge Modelling Report, report to the Shire of Shark Bay Nahas, E.L., Pattiaratchi, C.B., Ivey, G.N., 2005. Processes controlling the position of frontal systems in Shark Bay, Western Australia. Estuarine, Coastal and Shelf Science Estuar. Coast. Shelf Sci. 65 (3), 463–474. Short, A. D. 2005. Beaches of the Western Australian Coast: Eucla to Roebuck Bay: A guide to their nature, characteristics, surf and safety (Sydney University Press). Short, A. D. 2019. Australian Coastal Systems: Beaches, Barriers and Sediment Compartments (Springer Nature).

Shire of Shark Bay | 31 March 2020 Final Report
5652_01_R
09v02.d
ocx
Melbourne 15 Business Park Drive Notting Hill VIC 3168 Telephone (03) 8526 0800 Fax (03) 9558 9365
Brisbane Level 3, 43 Peel Street South Brisbane QLD 4101 Telephone (07) 3105 1460 Fax (07) 3846 5144
Adelaide 1/198 Greenhill Road Eastwood SA 5063 Telephone (08) 8378 8000 Fax (08) 8357 8988
Perth Ground Floor 430 Roberts Road Subiaco WA 6008 Telephone 08 6555 0105
Geelong PO Box 436 Geelong VIC 3220 Telephone 0458 015 664
Gippsland 154 Macleod Street Bairnsdale VIC 3875 Telephone (03) 5152 5833
Wangaratta First Floor, 40 Rowan Street Wangaratta VIC 3677 Telephone (03) 5721 2650
Wimmera PO Box 584 Stawell VIC 3380 Telephone 0438 510 240
www.watertech.com.au