Embed Size (px)
Citation preview
DELAWARE RIVER PORT AUTHORITY
BOARD MEETING
Wednesday, July 21, 20219:00 a.m.
One Port Center
Board Room/Zoom
Camden, NJJohn T. Hanson, Chief Executive Officer
1
1
DRPA BOARD
2
2
DELAWARE RIVER PORT AUTHORITY
BOARD MEETING
Wednesday, July 21, 2021 at 9:00 a.m. One Port Center 2 Riverside Drive
Camden, New Jersey
ORDER OF BUSINESS
1. Roll Call
2. Public Comment
3. Report of the CEO
4. Report of the CFO
5. Approval of June 16, 2021 Board Meeting Minutes
6. Monthly List of Previously Approved Payments – June 2021
7. Monthly List of Previously Approved Purchase Orders and Contracts – June 2021
8. Approval of Operations & Maintenance Committee Meeting Minutes – July 6, 2021
9. Adopt Resolutions Approved by Operations & Maintenance Committee – July 6, 2021
DRPA-21-044 Procurement & Delivery of 136# RE Head Hardened Rail.
DRPA-21-045 Capital Project Contract Modifications.
DRPA-21-046 Procurement & Installation of New Fare Collection Equipment for
Franklin Square Station.
DRPA-21-047 Procurement of Fifty (50) New Escalator Step Chains with Axles.
DRPA-21-048 FHW/NJ DOT Highway Infrastructure Program (HIP) Grant for
the BFB Interim Repairs and Improvement Program.
DRPA-21-049 Non-Hazardous Solid Waste Removal for DRPA Bridge Facilities.
DRPA-21-050 Northeast Work and Safety Boats.
10. Approval of Finance Committee Meeting Minutes – July 7, 2021
11. Adopt Resolutions Approved by Finance Committee – July 7, 2021
3
3
DRPA-21-042 Ciena 6500 Maintenance Agreement.
DRPA-21-043 Communications Consulting Services.
12. Citizens Advisory Report
13. Unfinished Business
14. New Business
DRPA-21-051 Consideration of Pending DRPA Contracts.
(Between $25,000 and $100,000)
DRPA-21-052 Right of Entry renewal for the United States of America (“United
States”).
15. Adjournment
4
4

CEO REPORT
5
5
July 21, 2021
Board of Commissioners
Delaware River Port Authority of Pennsylvania and New Jersey
One Port Center
2 Riverside Drive
Camden, New Jersey 08101-1949
To the Commissioners:
The following is a summary of recent DRPA activities. The appropriate reports are attached.
The Iconic Ben Franklin Bridge Turns 95
The Ben Franklin Bridge officially opened to traffic on July 1, 1926.
This month, 95 years later, more than 100,000 vehicles cross the
bridge daily, and the span plays a vital role in connecting the region.
For interesting facts about the bridge, visit www.drpa.org/bridges.
Report of the Chief Executive Officer
AROUND THE AUTHORITY
6
6
Congratulations to the Top May Walk4Wellness Walkers Who Submitted Logs
Four (4) registered participants who walked May 1 – 31, 2021, as
part of our 2021 remote Walk4Wellness Program and submitted their
miles were selected as the top walkers from their respective facilities.
We congratulate the following staff for this accomplishment:
• Anthony Bundi, PATCO
• William Anderson, OPC
• Tina Thomson, Commodore Barry Bridge
• Jackie Mullen, Ben Franklin Bridge
The four (4) received a $25 gift card from a healthy grocery store of their choice between Wegmans,
Sprouts Farmers Market, Whole Foods, and Trader Joe’s from 2021 AmeriHealth Wellness Funds.
We are proud to report of the 156 walkers who submitted May total miles walked logs, a total of
miles were walked collectively. We hope everyone on staff keeps walking for their
health and well-being throughout the year.
Ben Franklin Bridge Pedestrian Walkway
Allows E-Bikes and E-Scooters this
Summer as a Trial Run
This month, the DRPA launched a trial period to
allow electric bikes and scooters the same access as
traditional bikes on the Ben Franklin Bridge
Pedestrian South Walkway. The pilot program will
run from Monday, July 12, to Wednesday, August
25.
The 45-day trial period will allow the DRPA to monitor the activity of the e-bikes and e-scooters and
note any adverse effects to the bridge’s walkway and other walkway users.
The same rules of the walkway will apply to both e-bikes and traditional bicycles, with speed limits set
at 15 mph. In addition, cyclists must yield to pedestrians and use audible warnings. During the trial
STEWARDSHIP
7
7
period, Class 1, pedal-assist only bikes, and Class 2, throttle-assisted bikes, will be permitted. Class 3 e-
bikes, gas-powered motorized vehicles, skateboards, and hoverboards remain prohibited.
The Ben Franklin Bridge’s pedestrian walkway is open daily from 6 a.m. to 9 p.m. during the summer.
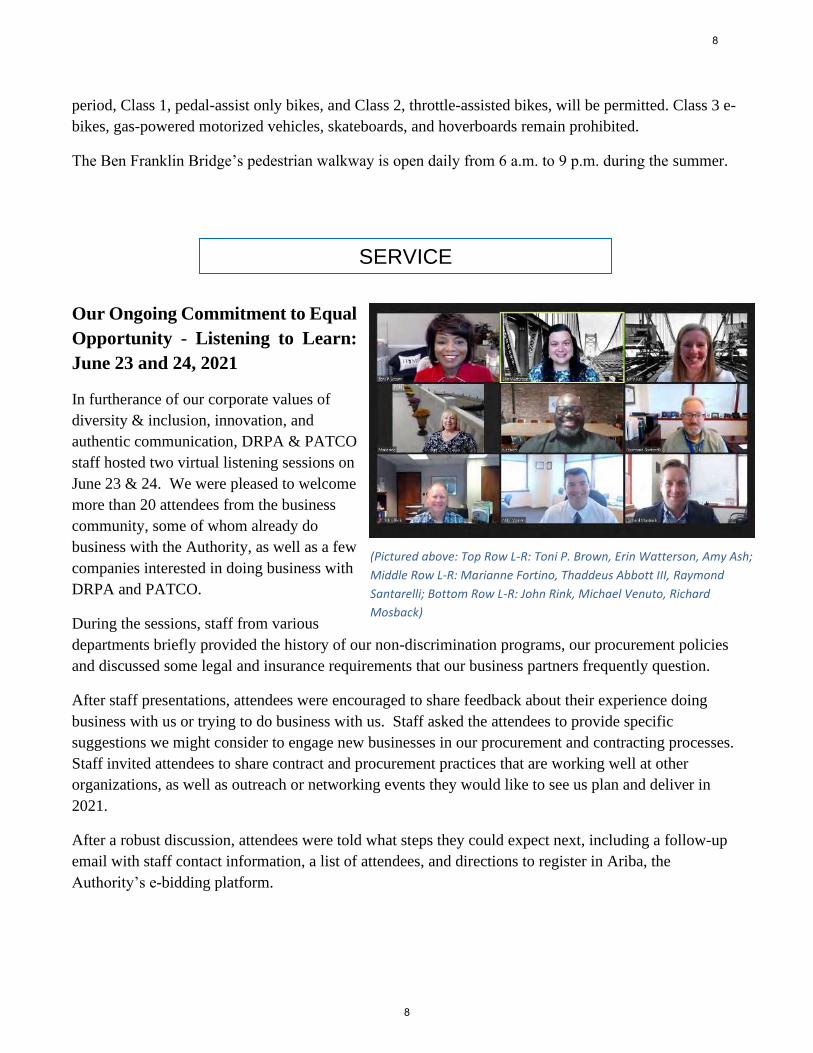
Our Ongoing Commitment to Equal
Opportunity - Listening to Learn:
June 23 and 24, 2021
In furtherance of our corporate values of
diversity & inclusion, innovation, and
authentic communication, DRPA & PATCO
staff hosted two virtual listening sessions on
June 23 & 24. We were pleased to welcome
more than 20 attendees from the business
community, some of whom already do
business with the Authority, as well as a few
companies interested in doing business with
DRPA and PATCO.
During the sessions, staff from various
departments briefly provided the history of our non-discrimination programs, our procurement policies
and discussed some legal and insurance requirements that our business partners frequently question.
After staff presentations, attendees were encouraged to share feedback about their experience doing
business with us or trying to do business with us. Staff asked the attendees to provide specific
suggestions we might consider to engage new businesses in our procurement and contracting processes.
Staff invited attendees to share contract and procurement practices that are working well at other
organizations, as well as outreach or networking events they would like to see us plan and deliver in
2021.
After a robust discussion, attendees were told what steps they could expect next, including a follow-up
email with staff contact information, a list of attendees, and directions to register in Ariba, the
Authority’s e-bidding platform.
SERVICE
(Pictured above: Top Row L-R: Toni P. Brown, Erin Watterson, Amy Ash;
Middle Row L-R: Marianne Fortino, Thaddeus Abbott III, Raymond
Santarelli; Bottom Row L-R: John Rink, Michael Venuto, Richard
Mosback)
8
8
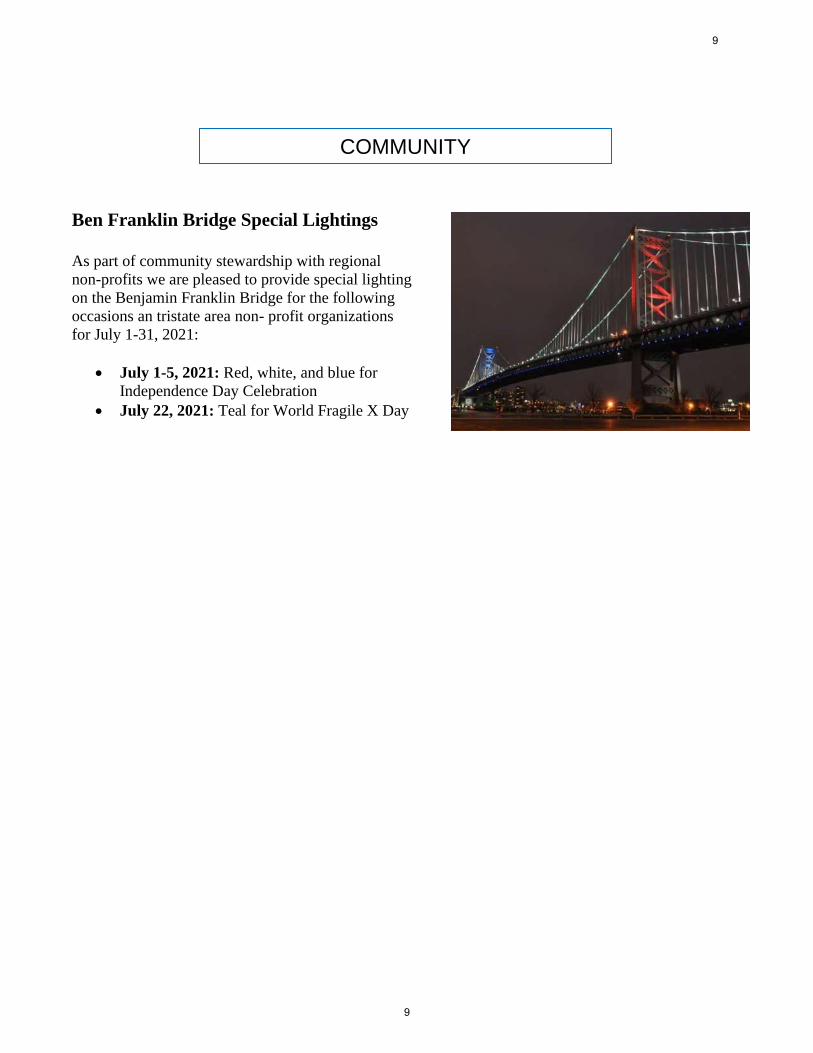
Ben Franklin Bridge Special Lightings
As part of community stewardship with regional
non-profits we are pleased to provide special lighting
on the Benjamin Franklin Bridge for the following
occasions an tristate area non- profit organizations
for July 1-31, 2021:
• July 1-5, 2021: Red, white, and blue for
Independence Day Celebration
• July 22, 2021: Teal for World Fragile X Day
COMMUNITY
9
9
____________________________________________________________
For a list of Bridge and Finance actions, see Attachment 1
For a list of Personnel Actions, see Attachment 2
For a list of Contracts and Purchases, see Attachment 3
For the Affirmative Action Report, see Attachment 4
For a list of Legal Statistics, see Attachment 5
____________________________________________________________
____________________________________________________________
For PATCO Ridership and Financial Information,
See the General Manager’s Report in the PATCO section
Attached are reports from the appropriate departments.
____________________________________________________________
Respectfully Submitted,
John T. Hanson
Chief Executive Officer
PATCO
10
10
REPORT OF THE CHIEF EXECUTIVE OFFICER
ATTACHMENT 1
BRIDGE AND FINANCE
11
11
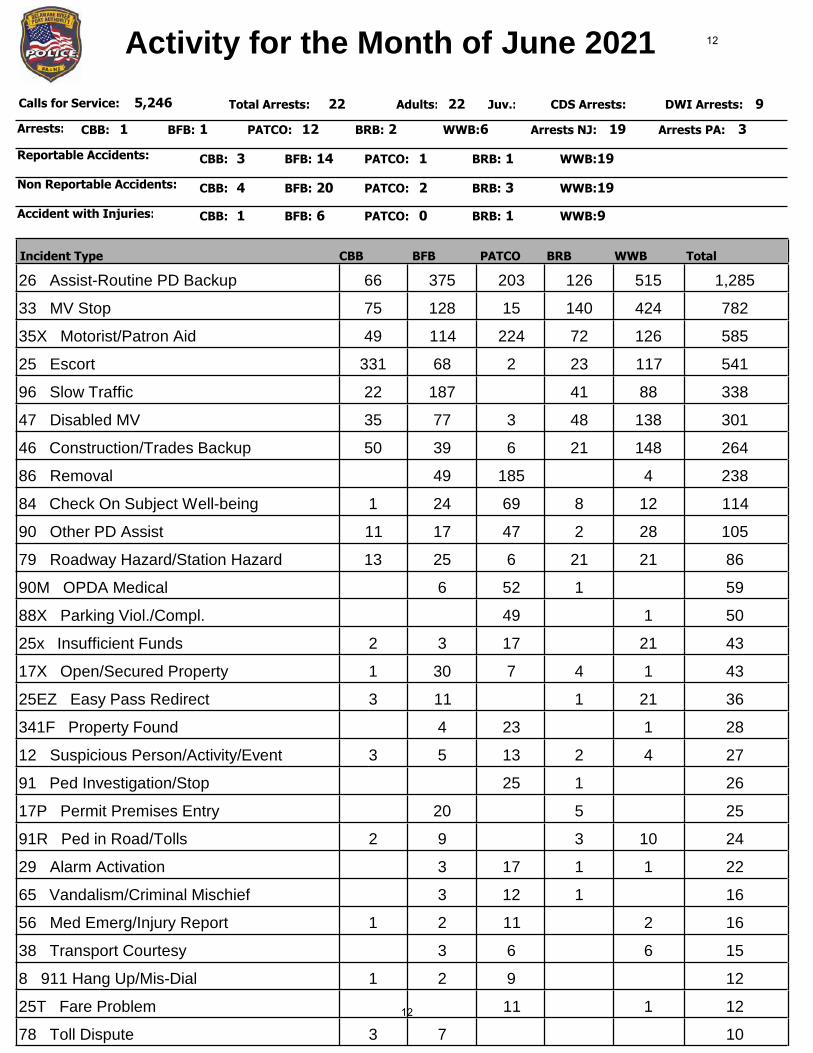
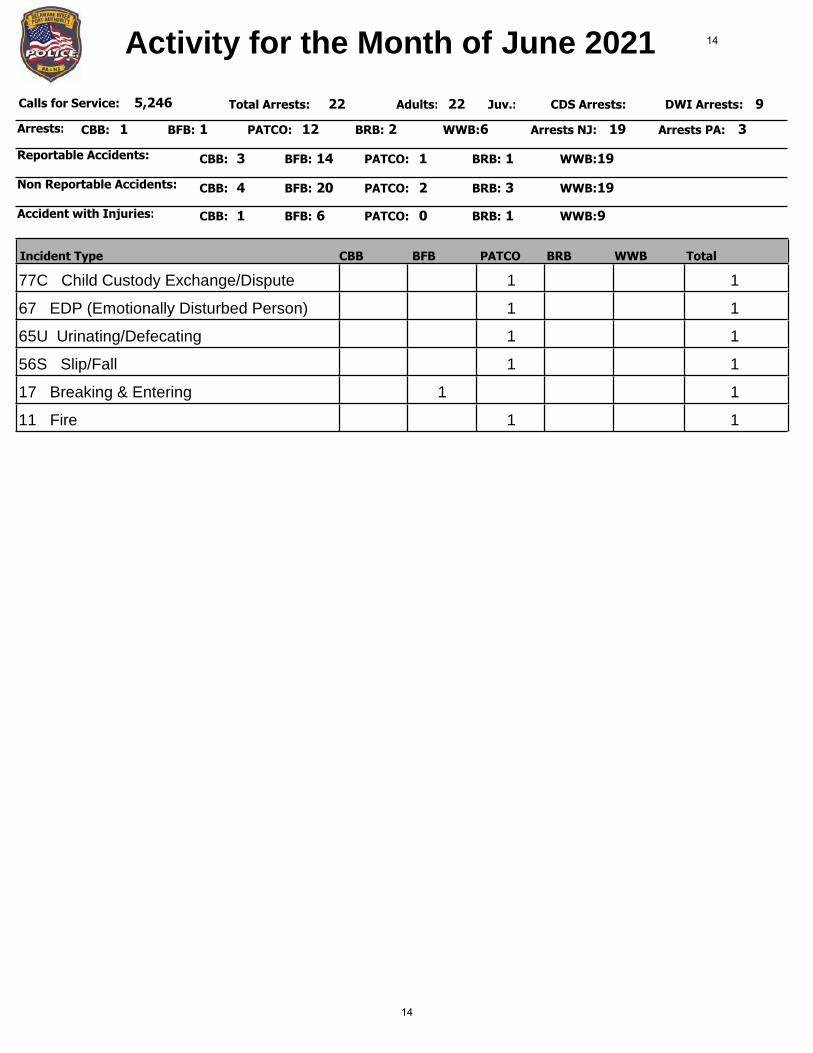
Activity for the Month of June 2021
22Adults: Juv.: CDS Arrests: 9DWI Arrests:5,246Calls for Service:
TotalCBB BFB PATCO BRB WWB
CBB: BFB: PATCO: BRB: WWB: Arrests NJ: Arrests PA:1 1 12 2 6 19 3
Total Arrests: 22
Incident Type
BFB: PATCO: BRB: WWB:3 14 1 1 19CBB:Reportable Accidents:
BFB: PATCO: BRB: WWB:CBB:Non Reportable Accidents:
BFB: PATCO: BRB: WWB:CBB:Accident with Injuries:
4 20 2 3 19
1 6 0 1 9
Arrests:
26 Assist-Routine PD Backup 1,28566 375 203 126 515
33 MV Stop 78275 128 15 140 424
35X Motorist/Patron Aid 58549 114 224 72 126
25 Escort 541331 68 2 23 117
96 Slow Traffic 33822 187 41 88
47 Disabled MV 30135 77 3 48 138
46 Construction/Trades Backup 26450 39 6 21 148
86 Removal 23849 185 4
84 Check On Subject Well-being 1141 24 69 8 12
90 Other PD Assist 10511 17 47 2 28
79 Roadway Hazard/Station Hazard 8613 25 6 21 21
90M OPDA Medical 596 52 1
88X Parking Viol./Compl. 5049 1
25x Insufficient Funds 432 3 17 21
17X Open/Secured Property 431 30 7 4 1
25EZ Easy Pass Redirect 363 11 1 21
341F Property Found 284 23 1
12 Suspicious Person/Activity/Event 273 5 13 2 4
91 Ped Investigation/Stop 2625 1
17P Permit Premises Entry 2520 5
91R Ped in Road/Tolls 242 9 3 10
29 Alarm Activation 223 17 1 1
65 Vandalism/Criminal Mischief 163 12 1
56 Med Emerg/Injury Report 161 2 11 2
38 Transport Courtesy 153 6 6
8 911 Hang Up/Mis-Dial 121 2 9
25T Fare Problem 1211 1
78 Toll Dispute 103 7
12
12
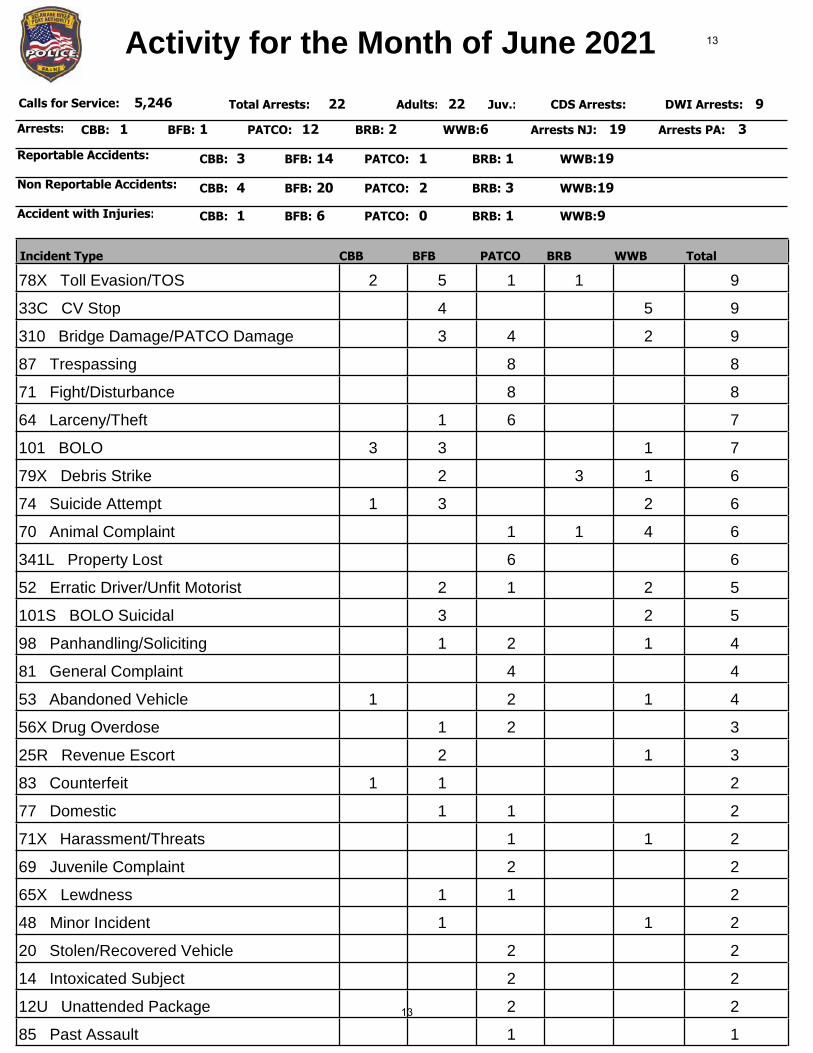
Activity for the Month of June 2021
22Adults: Juv.: CDS Arrests: 9DWI Arrests:5,246Calls for Service:
TotalCBB BFB PATCO BRB WWB
CBB: BFB: PATCO: BRB: WWB: Arrests NJ: Arrests PA:1 1 12 2 6 19 3
Total Arrests: 22
Incident Type
BFB: PATCO: BRB: WWB:3 14 1 1 19CBB:Reportable Accidents:
BFB: PATCO: BRB: WWB:CBB:Non Reportable Accidents:
BFB: PATCO: BRB: WWB:CBB:Accident with Injuries:
4 20 2 3 19
1 6 0 1 9
Arrests:
78X Toll Evasion/TOS 92 5 1 1
33C CV Stop 94 5
310 Bridge Damage/PATCO Damage 93 4 2
87 Trespassing 88
71 Fight/Disturbance 88
64 Larceny/Theft 71 6
101 BOLO 73 3 1
79X Debris Strike 62 3 1
74 Suicide Attempt 61 3 2
70 Animal Complaint 61 1 4
341L Property Lost 66
52 Erratic Driver/Unfit Motorist 52 1 2
101S BOLO Suicidal 53 2
98 Panhandling/Soliciting 41 2 1
81 General Complaint 44
53 Abandoned Vehicle 41 2 1
56X Drug Overdose 31 2
25R Revenue Escort 32 1
83 Counterfeit 21 1
77 Domestic 21 1
71X Harassment/Threats 21 1
69 Juvenile Complaint 22
65X Lewdness 21 1
48 Minor Incident 21 1
20 Stolen/Recovered Vehicle 22
14 Intoxicated Subject 22
12U Unattended Package 22
85 Past Assault 11
13
13
Activity for the Month of June 2021
22Adults: Juv.: CDS Arrests: 9DWI Arrests:5,246Calls for Service:
TotalCBB BFB PATCO BRB WWB
CBB: BFB: PATCO: BRB: WWB: Arrests NJ: Arrests PA:1 1 12 2 6 19 3
Total Arrests: 22
Incident Type
BFB: PATCO: BRB: WWB:3 14 1 1 19CBB:Reportable Accidents:
BFB: PATCO: BRB: WWB:CBB:Non Reportable Accidents:
BFB: PATCO: BRB: WWB:CBB:Accident with Injuries:
4 20 2 3 19
1 6 0 1 9
Arrests:
77C Child Custody Exchange/Dispute 11
67 EDP (Emotionally Disturbed Person) 11
65U Urinating/Defecating 11
56S Slip/Fall 11
17 Breaking & Entering 11
11 Fire 11
14
14

FINANCE
REVENUE AUDIT
Reported traffic and revenue for all four DRPA bridges for the month of April 2021:
2020 2021
Cash Revenue $0.00 $6,315,851.06
ETC Revenue $10,952,719.22 $18,437,550.47
Total Revenue $10,952,719.22 $24,753,401.53
Non ETC Traffic 0 1,173,794
ETC Traffic 1,321,476 2,580,852
Total Traffic 1,321,476 3,754,646
15
15
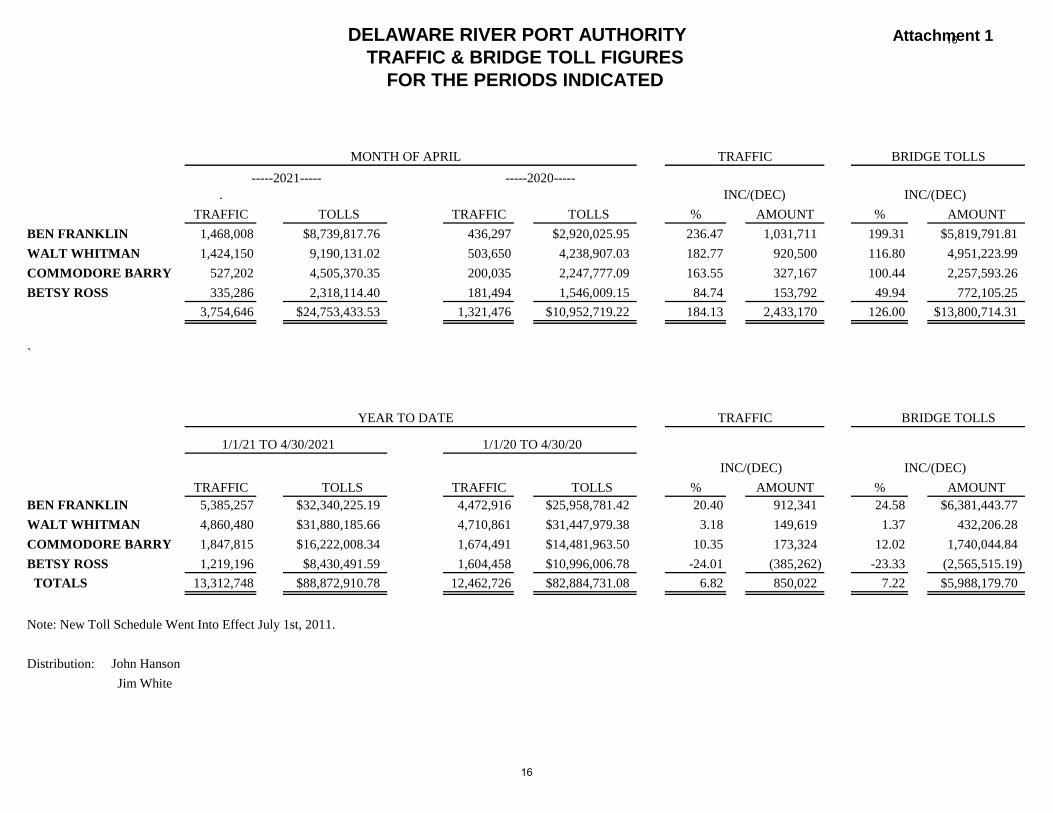
DELAWARE RIVER PORT AUTHORITY Attachment 1
TRAFFIC & BRIDGE TOLL FIGURESFOR THE PERIODS INDICATED
MONTH OF APRIL TRAFFIC BRIDGE TOLLS
-----2021----- -----2020-----
. INC/(DEC) INC/(DEC)
TRAFFIC TOLLS TRAFFIC TOLLS % AMOUNT % AMOUNT
BEN FRANKLIN 1,468,008 $8,739,817.76 436,297 $2,920,025.95 236.47 1,031,711 199.31 $5,819,791.81
WALT WHITMAN 1,424,150 9,190,131.02 503,650 4,238,907.03 182.77 920,500 116.80 4,951,223.99
COMMODORE BARRY 527,202 4,505,370.35 200,035 2,247,777.09 163.55 327,167 100.44 2,257,593.26
BETSY ROSS 335,286 2,318,114.40 181,494 1,546,009.15 84.74 153,792 49.94 772,105.25
3,754,646 $24,753,433.53 1,321,476 $10,952,719.22 184.13 2,433,170 126.00 $13,800,714.31
`
YEAR TO DATE TRAFFIC BRIDGE TOLLS
1/1/21 TO 4/30/2021 1/1/20 TO 4/30/20
INC/(DEC) INC/(DEC)
TRAFFIC TOLLS TRAFFIC TOLLS % AMOUNT % AMOUNT
BEN FRANKLIN 5,385,257 $32,340,225.19 4,472,916 $25,958,781.42 20.40 912,341 24.58 $6,381,443.77
WALT WHITMAN 4,860,480 $31,880,185.66 4,710,861 $31,447,979.38 3.18 149,619 1.37 432,206.28
COMMODORE BARRY 1,847,815 $16,222,008.34 1,674,491 $14,481,963.50 10.35 173,324 12.02 1,740,044.84
BETSY ROSS 1,219,196 $8,430,491.59 1,604,458 $10,996,006.78 -24.01 (385,262) -23.33 (2,565,515.19)
TOTALS 13,312,748 $88,872,910.78 12,462,726 $82,884,731.08 6.82 850,022 7.22 $5,988,179.70
Note: New Toll Schedule Went Into Effect July 1st, 2011.
Distribution: John Hanson
Jim White
16
16
REPORT OF THE CHIEF EXECUTIVE OFFICER
ATTACHMENT 2
PERSONNEL ACTIONS
17
17
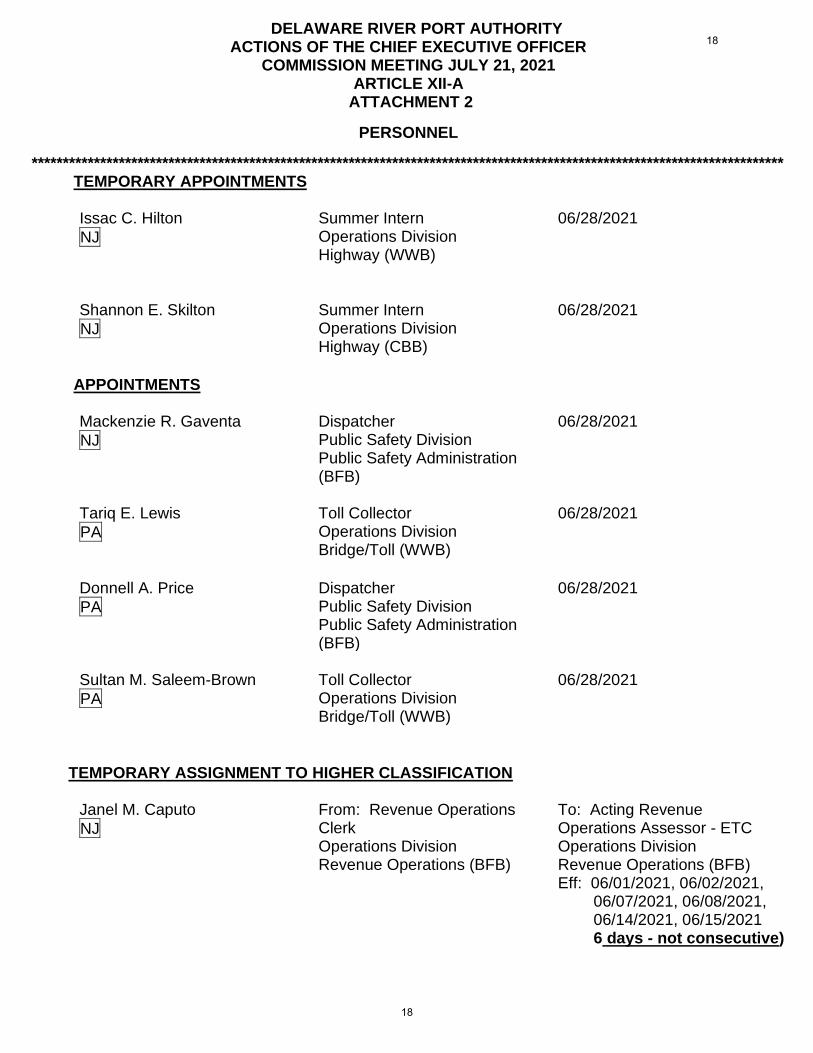
DELAWARE RIVER PORT AUTHORITY ACTIONS OF THE CHIEF EXECUTIVE OFFICER COMMISSION MEETING JULY 21, 2021 ARTICLE XII-A
ATTACHMENT 2
PERSONNEL
************************************************************************************************************************* TEMPORARY APPOINTMENTS Issac C. Hilton
NJ
Summer Intern Operations Division Highway (WWB)
06/28/2021
Shannon E. Skilton
NJ
Summer Intern Operations Division Highway (CBB)
06/28/2021
APPOINTMENTS Mackenzie R. Gaventa
NJ
Dispatcher Public Safety Division Public Safety Administration (BFB)
06/28/2021
Tariq E. Lewis
PA
Toll Collector Operations Division Bridge/Toll (WWB)
06/28/2021
Donnell A. Price
PA
Dispatcher Public Safety Division Public Safety Administration (BFB)
06/28/2021
Sultan M. Saleem-Brown
PA
Toll Collector Operations Division Bridge/Toll (WWB)
06/28/2021
TEMPORARY ASSIGNMENT TO HIGHER CLASSIFICATION Janel M. Caputo
NJ
From: Revenue Operations Clerk Operations Division Revenue Operations (BFB)
To: Acting Revenue Operations Assessor - ETC Operations Division Revenue Operations (BFB) Eff: 06/01/2021, 06/02/2021, 06/07/2021, 06/08/2021, 06/14/2021, 06/15/2021 6 days - not consecutive)
18
18
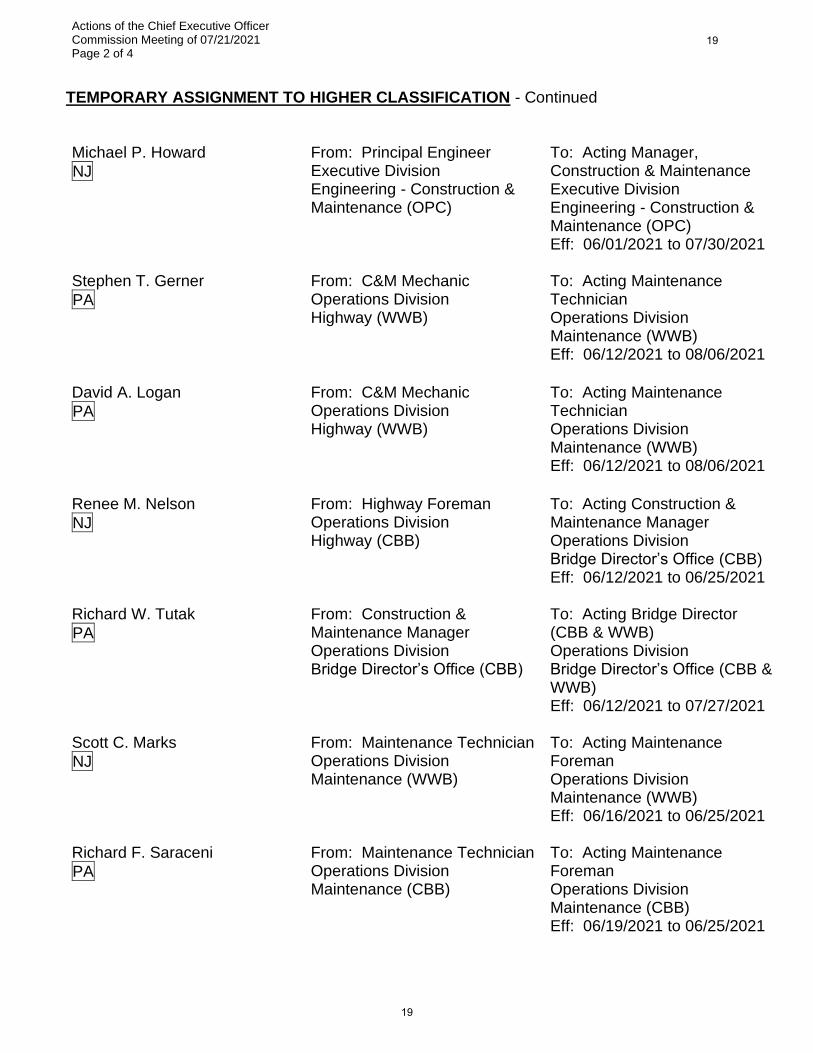
Actions of the Chief Executive Officer Commission Meeting of 07/21/2021 Page 2 of 4
TEMPORARY ASSIGNMENT TO HIGHER CLASSIFICATION - Continued Michael P. Howard
NJ
From: Principal Engineer Executive Division Engineering - Construction & Maintenance (OPC)
To: Acting Manager, Construction & Maintenance Executive Division Engineering - Construction & Maintenance (OPC) Eff: 06/01/2021 to 07/30/2021
Stephen T. Gerner
PA
From: C&M Mechanic Operations Division Highway (WWB)
To: Acting Maintenance Technician Operations Division Maintenance (WWB) Eff: 06/12/2021 to 08/06/2021
David A. Logan
PA
From: C&M Mechanic Operations Division Highway (WWB)
To: Acting Maintenance Technician Operations Division Maintenance (WWB) Eff: 06/12/2021 to 08/06/2021
Renee M. Nelson
NJ
From: Highway Foreman Operations Division Highway (CBB)
To: Acting Construction & Maintenance Manager Operations Division Bridge Director’s Office (CBB) Eff: 06/12/2021 to 06/25/2021
Richard W. Tutak
PA
From: Construction & Maintenance Manager Operations Division Bridge Director’s Office (CBB)
To: Acting Bridge Director (CBB & WWB) Operations Division Bridge Director’s Office (CBB & WWB) Eff: 06/12/2021 to 07/27/2021
Scott C. Marks
NJ
From: Maintenance Technician Operations Division Maintenance (WWB)
To: Acting Maintenance Foreman Operations Division Maintenance (WWB) Eff: 06/16/2021 to 06/25/2021
Richard F. Saraceni
PA
From: Maintenance Technician Operations Division Maintenance (CBB)
To: Acting Maintenance Foreman Operations Division Maintenance (CBB) Eff: 06/19/2021 to 06/25/2021
19
19
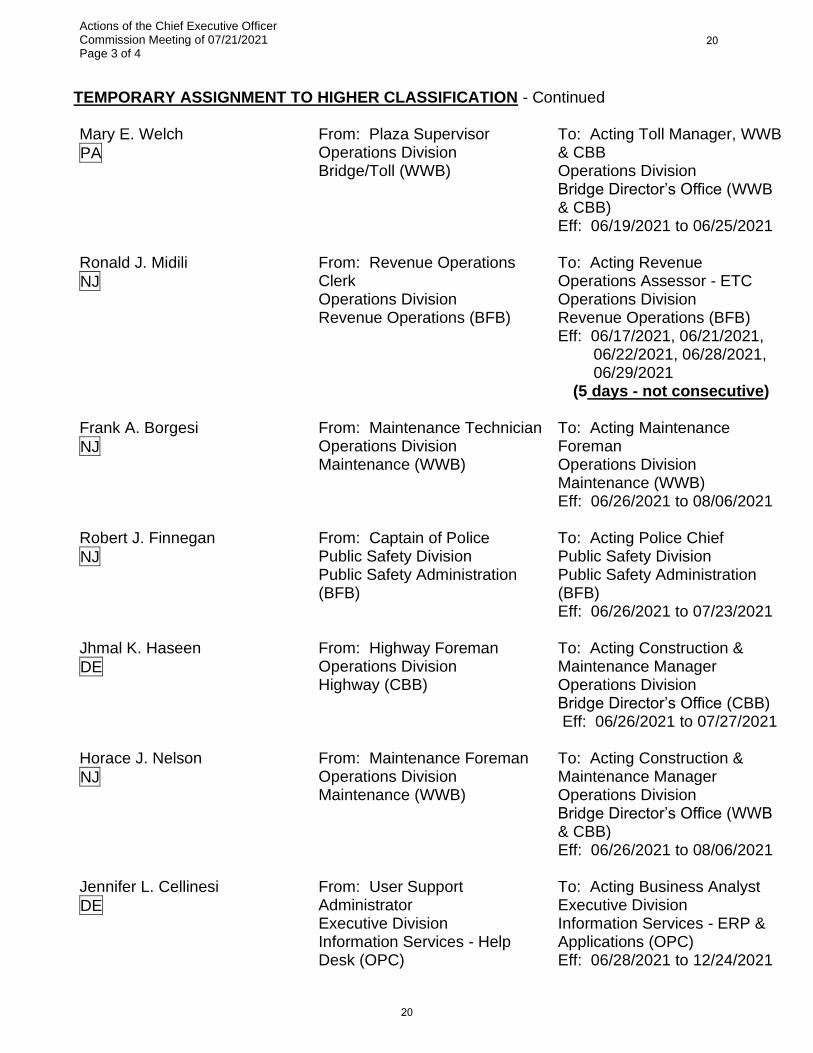
Actions of the Chief Executive Officer Commission Meeting of 07/21/2021 Page 3 of 4
TEMPORARY ASSIGNMENT TO HIGHER CLASSIFICATION - Continued Mary E. Welch
PA
From: Plaza Supervisor Operations Division Bridge/Toll (WWB)
To: Acting Toll Manager, WWB & CBB Operations Division Bridge Director’s Office (WWB & CBB) Eff: 06/19/2021 to 06/25/2021
Ronald J. Midili
NJ
From: Revenue Operations Clerk Operations Division Revenue Operations (BFB)
To: Acting Revenue Operations Assessor - ETC Operations Division Revenue Operations (BFB) Eff: 06/17/2021, 06/21/2021, 06/22/2021, 06/28/2021, 06/29/2021
(5 days - not consecutive)
Frank A. Borgesi
NJ
From: Maintenance Technician Operations Division Maintenance (WWB)
To: Acting Maintenance Foreman Operations Division Maintenance (WWB) Eff: 06/26/2021 to 08/06/2021
Robert J. Finnegan
NJ
From: Captain of Police Public Safety Division Public Safety Administration (BFB)
To: Acting Police Chief Public Safety Division Public Safety Administration (BFB) Eff: 06/26/2021 to 07/23/2021
Jhmal K. Haseen
DE
From: Highway Foreman Operations Division Highway (CBB)
To: Acting Construction & Maintenance Manager Operations Division Bridge Director’s Office (CBB) Eff: 06/26/2021 to 07/27/2021
Horace J. Nelson
NJ
From: Maintenance Foreman Operations Division Maintenance (WWB)
To: Acting Construction & Maintenance Manager Operations Division Bridge Director’s Office (WWB & CBB) Eff: 06/26/2021 to 08/06/2021
Jennifer L. Cellinesi
DE
From: User Support Administrator Executive Division Information Services - Help Desk (OPC)
To: Acting Business Analyst Executive Division Information Services - ERP & Applications (OPC) Eff: 06/28/2021 to 12/24/2021
20
20

Actions of the Chief Executive Officer Commission Meeting of 07/21/2021 Page 4 of 4
PROMOTIONS - None
INTERAGENCY PROMOTION to PATCO - from DRPA - None
TITLE CHANGES - None INTERAGENCY PROMOTION to DRPA - from PATCO - None
INTERAGENCY TRANSFERS to PATCO - from DRPA - None
INTERAGENCY TRANSFERS to DRPA - from PATCO – None
TRANSFERS - DEPARTMENTAL - None
RETIREMENTS - None
RESIGNATIONS - None
END OF TEMPORARY ASSIGNMENT - None
DECEASED - None
21
21
REPORT OF THE CHIEF EXECUTIVE OFFICER
ATTACHMENT 3
CONTRACTS AND PURCHASES
22
22
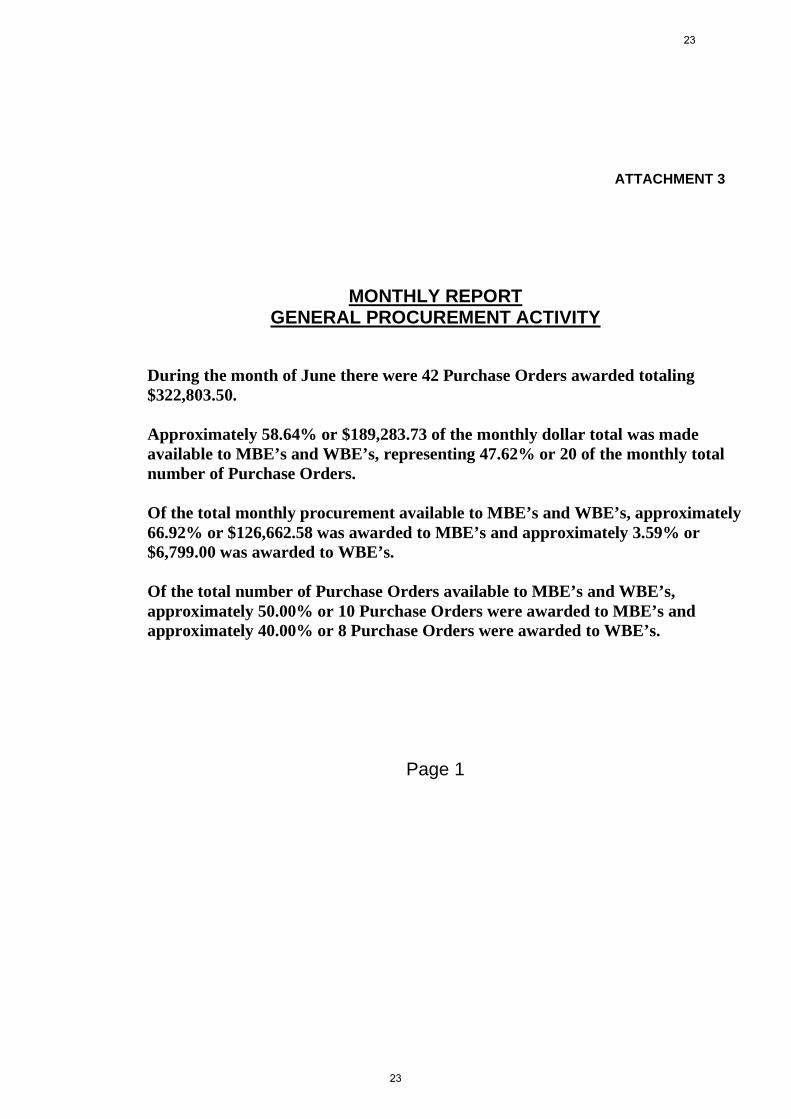
ATTACHMENT 3
MONTHLY REPORTGENERAL PROCUREMENT ACTIVITY
During the month of June there were 42 Purchase Orders awarded totaling$322,803.50.
Approximately 58.64% or $189,283.73 of the monthly dollar total was madeavailable to MBE’s and WBE’s, representing 47.62% or 20 of the monthly totalnumber of Purchase Orders.
Of the total monthly procurement available to MBE’s and WBE’s, approximately66.92% or $126,662.58 was awarded to MBE’s and approximately 3.59% or$6,799.00 was awarded to WBE’s.
Of the total number of Purchase Orders available to MBE’s and WBE’s,approximately 50.00% or 10 Purchase Orders were awarded to MBE’s andapproximately 40.00% or 8 Purchase Orders were awarded to WBE’s.
Page 1
23
23
July 21, 2021
1
ACTIONS OF THE CHIEF EXECUTIVE OFFICER
ARTICLE XII-C
ATTACHMENT 3
CONTRACTS AND PURCHASES
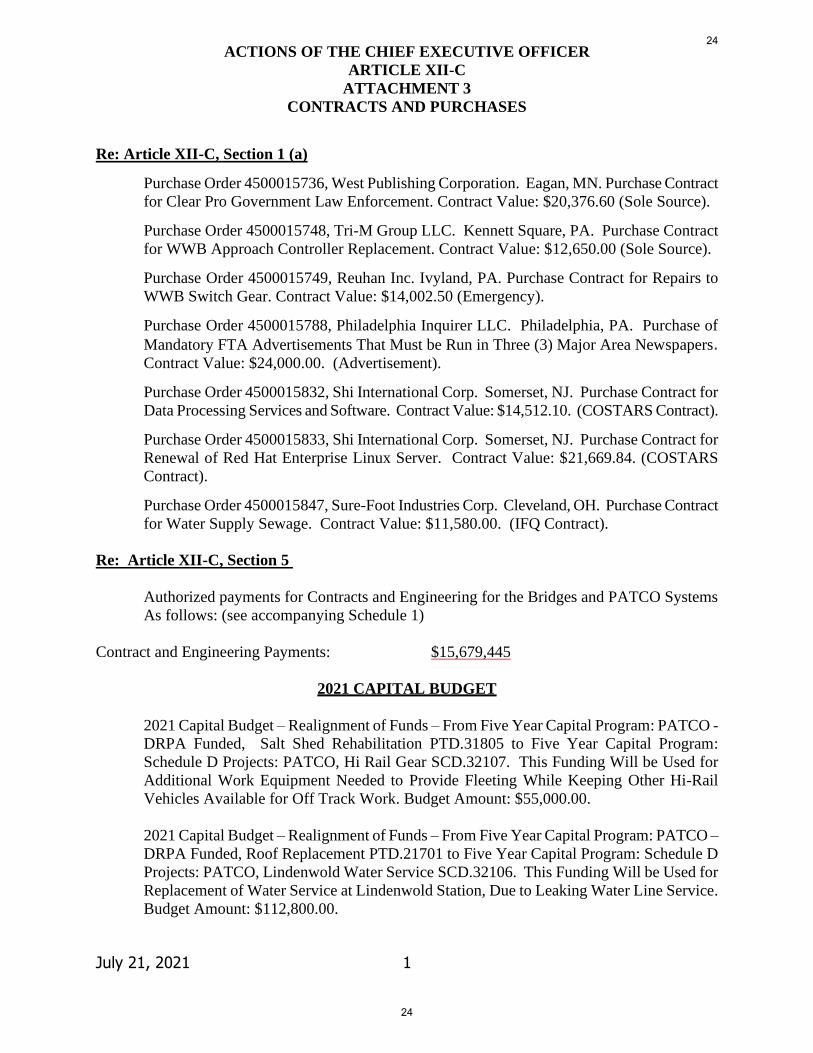
Re: Article XII-C, Section 1 (a)
Purchase Order 4500015736, West Publishing Corporation. Eagan, MN. Purchase Contract
for Clear Pro Government Law Enforcement. Contract Value: $20,376.60 (Sole Source).
Purchase Order 4500015748, Tri-M Group LLC. Kennett Square, PA. Purchase Contract
for WWB Approach Controller Replacement. Contract Value: $12,650.00 (Sole Source).
Purchase Order 4500015749, Reuhan Inc. Ivyland, PA. Purchase Contract for Repairs to
WWB Switch Gear. Contract Value: $14,002.50 (Emergency).
Purchase Order 4500015788, Philadelphia Inquirer LLC. Philadelphia, PA. Purchase of
Mandatory FTA Advertisements That Must be Run in Three (3) Major Area Newspapers. Contract Value: $24,000.00. (Advertisement).
Purchase Order 4500015832, Shi International Corp. Somerset, NJ. Purchase Contract for
Data Processing Services and Software. Contract Value: $14,512.10. (COSTARS Contract).
Purchase Order 4500015833, Shi International Corp. Somerset, NJ. Purchase Contract for
Renewal of Red Hat Enterprise Linux Server. Contract Value: $21,669.84. (COSTARS
Contract).
Purchase Order 4500015847, Sure-Foot Industries Corp. Cleveland, OH. Purchase Contract
for Water Supply Sewage. Contract Value: $11,580.00. (IFQ Contract).
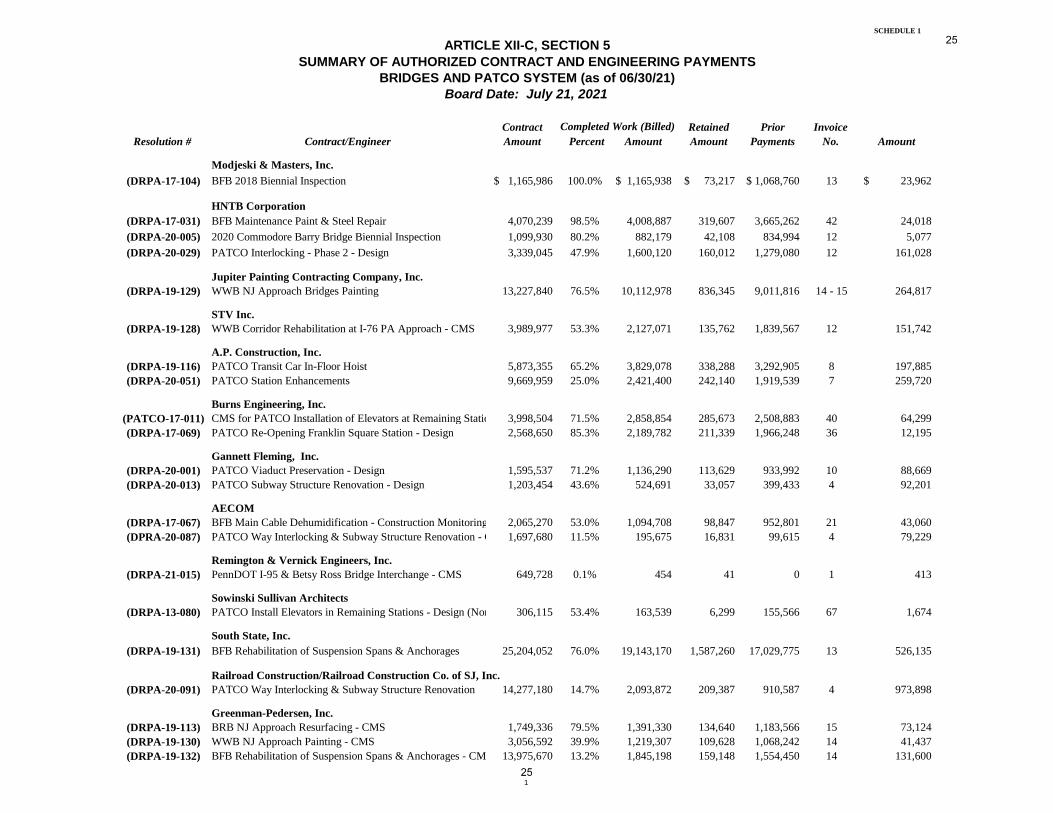
Re: Article XII-C, Section 5
Authorized payments for Contracts and Engineering for the Bridges and PATCO Systems
As follows: (see accompanying Schedule 1)
Contract and Engineering Payments: $15,679,445
2021 CAPITAL BUDGET
2021 Capital Budget – Realignment of Funds – From Five Year Capital Program: PATCO -
DRPA Funded, Salt Shed Rehabilitation PTD.31805 to Five Year Capital Program:
Schedule D Projects: PATCO, Hi Rail Gear SCD.32107. This Funding Will be Used for
Additional Work Equipment Needed to Provide Fleeting While Keeping Other Hi-Rail
Vehicles Available for Off Track Work. Budget Amount: $55,000.00.
2021 Capital Budget – Realignment of Funds – From Five Year Capital Program: PATCO –
DRPA Funded, Roof Replacement PTD.21701 to Five Year Capital Program: Schedule D
Projects: PATCO, Lindenwold Water Service SCD.32106. This Funding Will be Used for
Replacement of Water Service at Lindenwold Station, Due to Leaking Water Line Service.
Budget Amount: $112,800.00.
24
24
SCHEDULE 1
Contract Retained Prior Invoice
Resolution # Contract/Engineer Amount Percent Amount Amount Payments No. Amount
Modjeski & Masters, Inc.
(DRPA-17-104) BFB 2018 Biennial Inspection 1,165,986$ 100.0% 1,165,938$ 73,217$ 1,068,760$ 13 23,962$
HNTB Corporation
(DRPA-17-031) BFB Maintenance Paint & Steel Repair 4,070,239 98.5% 4,008,887 319,607 3,665,262 42 24,018
(DRPA-20-005) 2020 Commodore Barry Bridge Biennial Inspection 1,099,930 80.2% 882,179 42,108 834,994 12 5,077
(DRPA-20-029) PATCO Interlocking - Phase 2 - Design 3,339,045 47.9% 1,600,120 160,012 1,279,080 12 161,028
Jupiter Painting Contracting Company, Inc.
(DRPA-19-129) WWB NJ Approach Bridges Painting 13,227,840 76.5% 10,112,978 836,345 9,011,816 14 - 15 264,817
STV Inc.
(DRPA-19-128) WWB Corridor Rehabilitation at I-76 PA Approach - CMS 3,989,977 53.3% 2,127,071 135,762 1,839,567 12 151,742
A.P. Construction, Inc.
(DRPA-19-116) PATCO Transit Car In-Floor Hoist 5,873,355 65.2% 3,829,078 338,288 3,292,905 8 197,885
(DRPA-20-051) PATCO Station Enhancements 9,669,959 25.0% 2,421,400 242,140 1,919,539 7 259,720
Burns Engineering, Inc.
(PATCO-17-011) CMS for PATCO Installation of Elevators at Remaining Stations 3,998,504 71.5% 2,858,854 285,673 2,508,883 40 64,299
(DRPA-17-069) PATCO Re-Opening Franklin Square Station - Design 2,568,650 85.3% 2,189,782 211,339 1,966,248 36 12,195
Gannett Fleming, Inc.
(DRPA-20-001) PATCO Viaduct Preservation - Design 1,595,537 71.2% 1,136,290 113,629 933,992 10 88,669
(DRPA-20-013) PATCO Subway Structure Renovation - Design 1,203,454 43.6% 524,691 33,057 399,433 4 92,201
AECOM
(DRPA-17-067) BFB Main Cable Dehumidification - Construction Monitoring 2,065,270 53.0% 1,094,708 98,847 952,801 21 43,060
(DPRA-20-087) PATCO Way Interlocking & Subway Structure Renovation - CMS1,697,680 11.5% 195,675 16,831 99,615 4 79,229
Remington & Vernick Engineers, Inc.
(DRPA-21-015) PennDOT I-95 & Betsy Ross Bridge Interchange - CMS 649,728 0.1% 454 41 0 1 413
Sowinski Sullivan Architects
(DRPA-13-080) PATCO Install Elevators in Remaining Stations - Design (Non-FTA)306,115 53.4% 163,539 6,299 155,566 67 1,674
South State, Inc.
(DRPA-19-131) BFB Rehabilitation of Suspension Spans & Anchorages 25,204,052 76.0% 19,143,170 1,587,260 17,029,775 13 526,135
Railroad Construction/Railroad Construction Co. of SJ, Inc.
(DRPA-20-091) PATCO Way Interlocking & Subway Structure Renovation 14,277,180 14.7% 2,093,872 209,387 910,587 4 973,898
Greenman-Pedersen, Inc.
(DRPA-19-113) BRB NJ Approach Resurfacing - CMS 1,749,336 79.5% 1,391,330 134,640 1,183,566 15 73,124
(DRPA-19-130) WWB NJ Approach Painting - CMS 3,056,592 39.9% 1,219,307 109,628 1,068,242 14 41,437
(DRPA-19-132) BFB Rehabilitation of Suspension Spans & Anchorages - CMS 13,975,670 13.2% 1,845,198 159,148 1,554,450 14 131,600
Board Date: July 21, 2021
BRIDGES AND PATCO SYSTEM (as of 06/30/21)
SUMMARY OF AUTHORIZED CONTRACT AND ENGINEERING PAYMENTS
ARTICLE XII-C, SECTION 5
Completed Work (Billed)
1
25
25
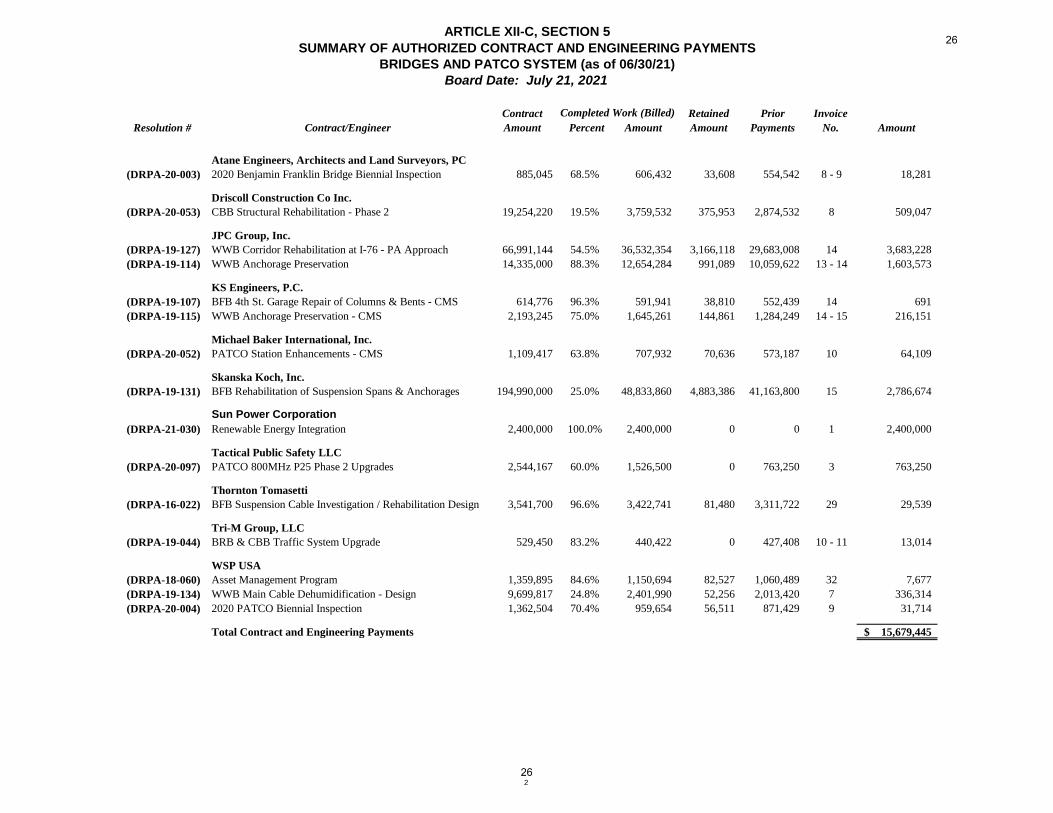
Contract Retained Prior Invoice
Resolution # Contract/Engineer Amount Percent Amount Amount Payments No. Amount
Board Date: July 21, 2021
BRIDGES AND PATCO SYSTEM (as of 06/30/21)
SUMMARY OF AUTHORIZED CONTRACT AND ENGINEERING PAYMENTS
ARTICLE XII-C, SECTION 5
Completed Work (Billed)
Atane Engineers, Architects and Land Surveyors, PC
(DRPA-20-003) 2020 Benjamin Franklin Bridge Biennial Inspection 885,045 68.5% 606,432 33,608 554,542 8 - 9 18,281
Driscoll Construction Co Inc.
(DRPA-20-053) CBB Structural Rehabilitation - Phase 2 19,254,220 19.5% 3,759,532 375,953 2,874,532 8 509,047
JPC Group, Inc.
(DRPA-19-127) WWB Corridor Rehabilitation at I-76 - PA Approach 66,991,144 54.5% 36,532,354 3,166,118 29,683,008 14 3,683,228
(DRPA-19-114) WWB Anchorage Preservation 14,335,000 88.3% 12,654,284 991,089 10,059,622 13 - 14 1,603,573
KS Engineers, P.C.
(DRPA-19-107) BFB 4th St. Garage Repair of Columns & Bents - CMS 614,776 96.3% 591,941 38,810 552,439 14 691
(DRPA-19-115) WWB Anchorage Preservation - CMS 2,193,245 75.0% 1,645,261 144,861 1,284,249 14 - 15 216,151
Michael Baker International, Inc.
(DRPA-20-052) PATCO Station Enhancements - CMS 1,109,417 63.8% 707,932 70,636 573,187 10 64,109
Skanska Koch, Inc.
(DRPA-19-131) BFB Rehabilitation of Suspension Spans & Anchorages 194,990,000 25.0% 48,833,860 4,883,386 41,163,800 15 2,786,674
Sun Power Corporation
(DRPA-21-030) Renewable Energy Integration 2,400,000 100.0% 2,400,000 0 0 1 2,400,000
Tactical Public Safety LLC
(DRPA-20-097) PATCO 800MHz P25 Phase 2 Upgrades 2,544,167 60.0% 1,526,500 0 763,250 3 763,250
Thornton Tomasetti
(DRPA-16-022) BFB Suspension Cable Investigation / Rehabilitation Design 3,541,700 96.6% 3,422,741 81,480 3,311,722 29 29,539
Tri-M Group, LLC
(DRPA-19-044) BRB & CBB Traffic System Upgrade 529,450 83.2% 440,422 0 427,408 10 - 11 13,014
WSP USA
(DRPA-18-060) Asset Management Program 1,359,895 84.6% 1,150,694 82,527 1,060,489 32 7,677
(DRPA-19-134) WWB Main Cable Dehumidification - Design 9,699,817 24.8% 2,401,990 52,256 2,013,420 7 336,314
(DRPA-20-004) 2020 PATCO Biennial Inspection 1,362,504 70.4% 959,654 56,511 871,429 9 31,714
Total Contract and Engineering Payments 15,679,445$
2
26
26

REPORT OF THE CHIEF EXECUTIVE OFFICER
ATTACHMENT 4
EEO REPORT
27
27
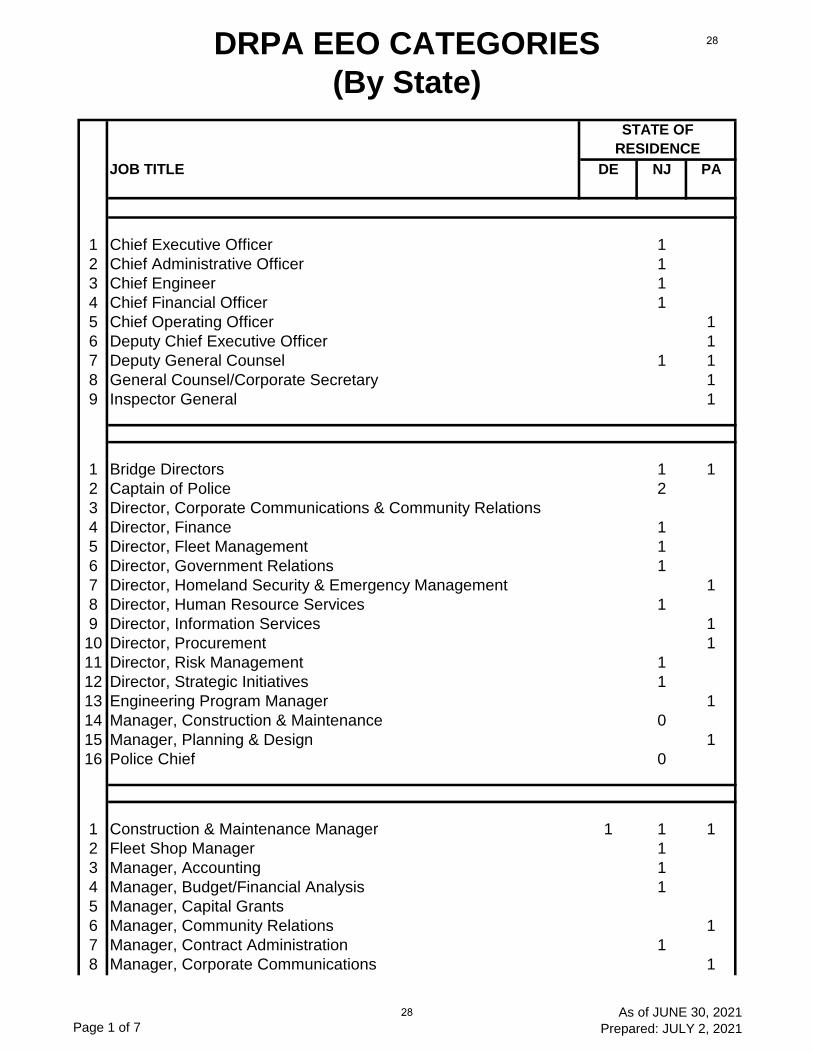
DRPA EEO CATEGORIES
(By State)
STATE OF
RESIDENCE
JOB TITLE DE NJ PA
1 Chief Executive Officer 1
2 Chief Administrative Officer 1
3 Chief Engineer 1
4 Chief Financial Officer 1
5 Chief Operating Officer 1
6 Deputy Chief Executive Officer 1
7 Deputy General Counsel 1 1
8 General Counsel/Corporate Secretary 1
9 Inspector General 1
1 Bridge Directors 1 1
2 Captain of Police 2
3 Director, Corporate Communications & Community Relations
4 Director, Finance 1
5 Director, Fleet Management 1
6 Director, Government Relations 1
7 Director, Homeland Security & Emergency Management 1
8 Director, Human Resource Services 1
9 Director, Information Services 1
10 Director, Procurement 1
11 Director, Risk Management 1
12 Director, Strategic Initiatives 1
13 Engineering Program Manager 1
14 Manager, Construction & Maintenance 0
15 Manager, Planning & Design 1
16 Police Chief 0
1 Construction & Maintenance Manager 1 1 1
2 Fleet Shop Manager 1
3 Manager, Accounting 1
4 Manager, Budget/Financial Analysis 1
5 Manager, Capital Grants
6 Manager, Community Relations 1
7 Manager, Contract Administration 1
8 Manager, Corporate Communications 1
Page 1 of 7As of JUNE 30, 2021
Prepared: JULY 2, 2021
28
28
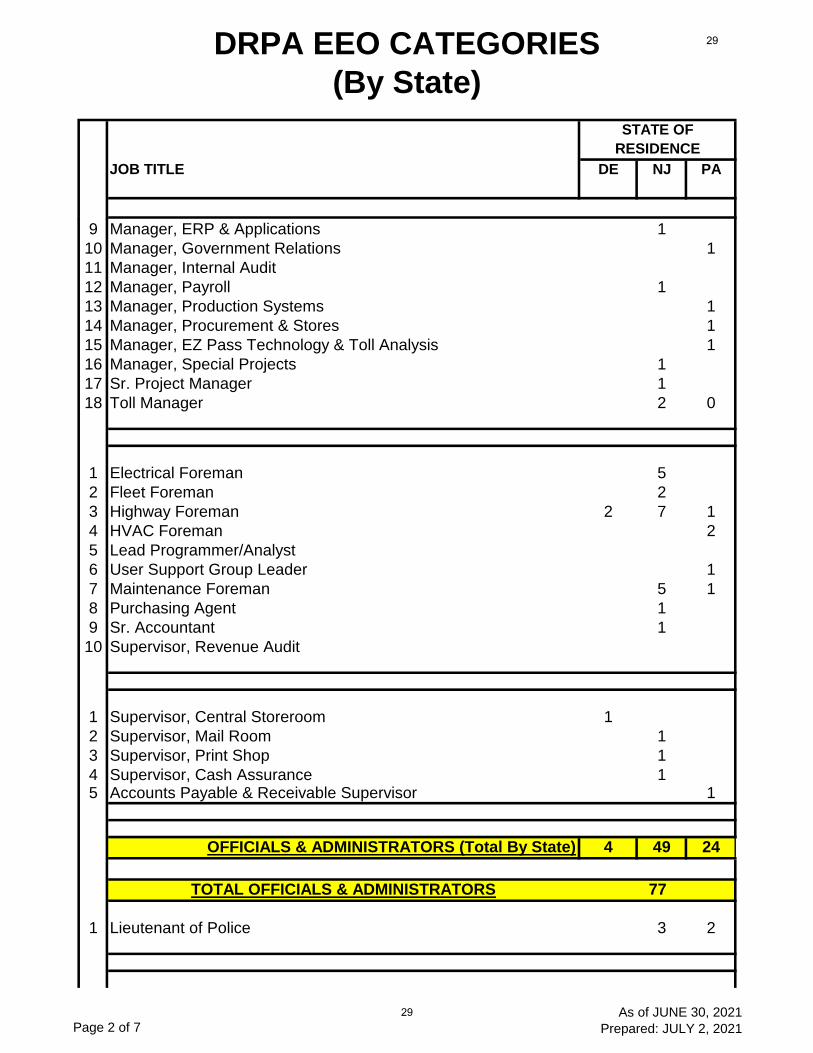
DRPA EEO CATEGORIES
(By State)
STATE OF
RESIDENCE
JOB TITLE DE NJ PA
9 Manager, ERP & Applications 1
10 Manager, Government Relations 1
11 Manager, Internal Audit
12 Manager, Payroll 1
13 Manager, Production Systems 1
14 Manager, Procurement & Stores 1
15 Manager, EZ Pass Technology & Toll Analysis 1
16 Manager, Special Projects 1
17 Sr. Project Manager 1
18 Toll Manager 2 0
1 Electrical Foreman 5
2 Fleet Foreman 2
3 Highway Foreman 2 7 1
4 HVAC Foreman 2
5 Lead Programmer/Analyst
6 User Support Group Leader 1
7 Maintenance Foreman 5 1
8 Purchasing Agent 1
9 Sr. Accountant 1
10 Supervisor, Revenue Audit
1 Supervisor, Central Storeroom 1
2 Supervisor, Mail Room 1
3 Supervisor, Print Shop 1
4 Supervisor, Cash Assurance 15 Accounts Payable & Receivable Supervisor 1
OFFICIALS & ADMINISTRATORS (Total By State) 4 49 24
TOTAL OFFICIALS & ADMINISTRATORS 77
1 Lieutenant of Police 3 2
Page 2 of 7As of JUNE 30, 2021
Prepared: JULY 2, 2021
29
29
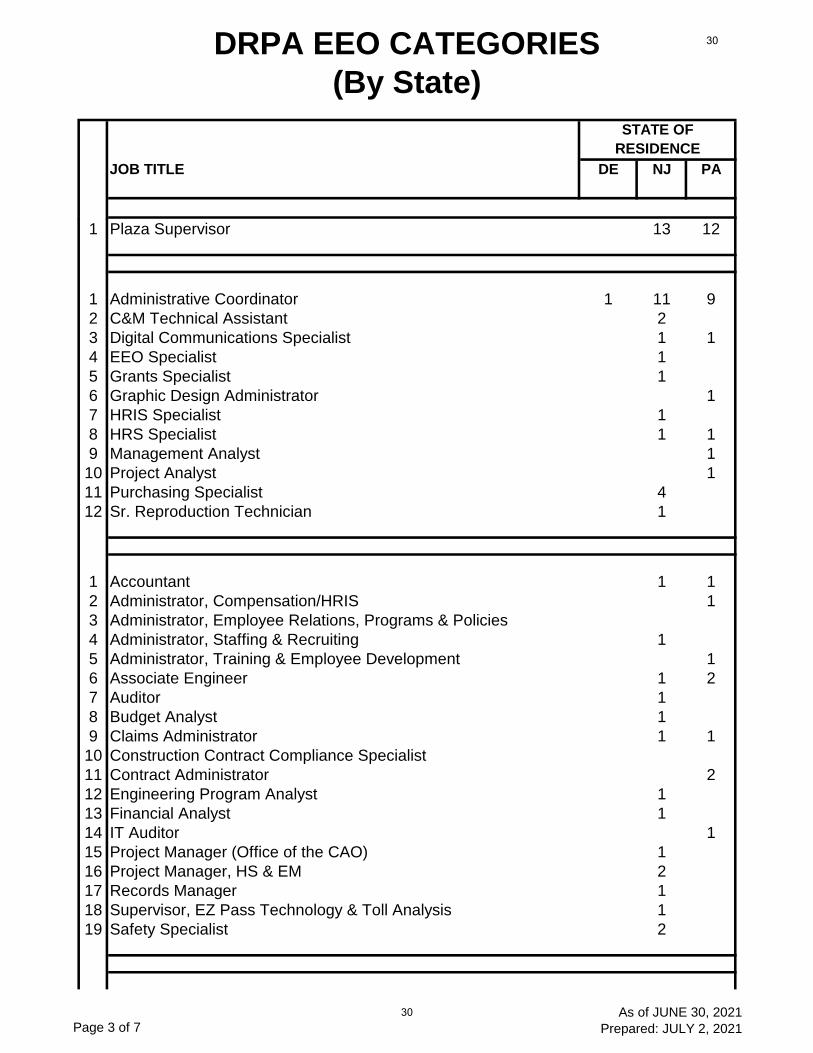
DRPA EEO CATEGORIES
(By State)
STATE OF
RESIDENCE
JOB TITLE DE NJ PA
1 Plaza Supervisor 13 12
1 Administrative Coordinator 1 11 9
2 C&M Technical Assistant 2
3 Digital Communications Specialist 1 1
4 EEO Specialist 1
5 Grants Specialist 1
6 Graphic Design Administrator 1
7 HRIS Specialist 1
8 HRS Specialist 1 1
9 Management Analyst 1
10 Project Analyst 1
11 Purchasing Specialist 4
12 Sr. Reproduction Technician 1
1 Accountant 1 1
2 Administrator, Compensation/HRIS 1
3 Administrator, Employee Relations, Programs & Policies
4 Administrator, Staffing & Recruiting 1
5 Administrator, Training & Employee Development 1
6 Associate Engineer 1 2
7 Auditor 1
8 Budget Analyst 1
9 Claims Administrator 1 1
10 Construction Contract Compliance Specialist
11 Contract Administrator 2
12 Engineering Program Analyst 1
13 Financial Analyst 1
14 IT Auditor 1
15 Project Manager (Office of the CAO) 1
16 Project Manager, HS & EM 2
17 Records Manager 1
18 Supervisor, EZ Pass Technology & Toll Analysis 1
19 Safety Specialist 2
Page 3 of 7As of JUNE 30, 2021
Prepared: JULY 2, 2021
30
30
DRPA EEO CATEGORIES
(By State)
STATE OF
RESIDENCE
JOB TITLE DE NJ PA
1 Assistant General Counsel 4 2
2 Electrical Engineer 1
3 Principal Engineer 2
4 Senior Engineer 4 1
PROFESSIONALS (Total By State) 1 65 40
TOTAL PROFESSIONALS 106
1 Police Officer 3 65 24
1 Corporal of Police 11 3
1 Sergeant of Police 18 6
PROTECTIVE SERVICE WORKERS (Total By State) 3 94 33
TOTAL PROTECTIVE SERVICE WORKERS 130
1 HVAC Technician 7 1
1 Auto Technician 1 12 2
1 Electrical Technician 19 4
1 Construction & Maintenance Mechanic 3 28 13
Page 4 of 7As of JUNE 30, 2021
Prepared: JULY 2, 2021
31
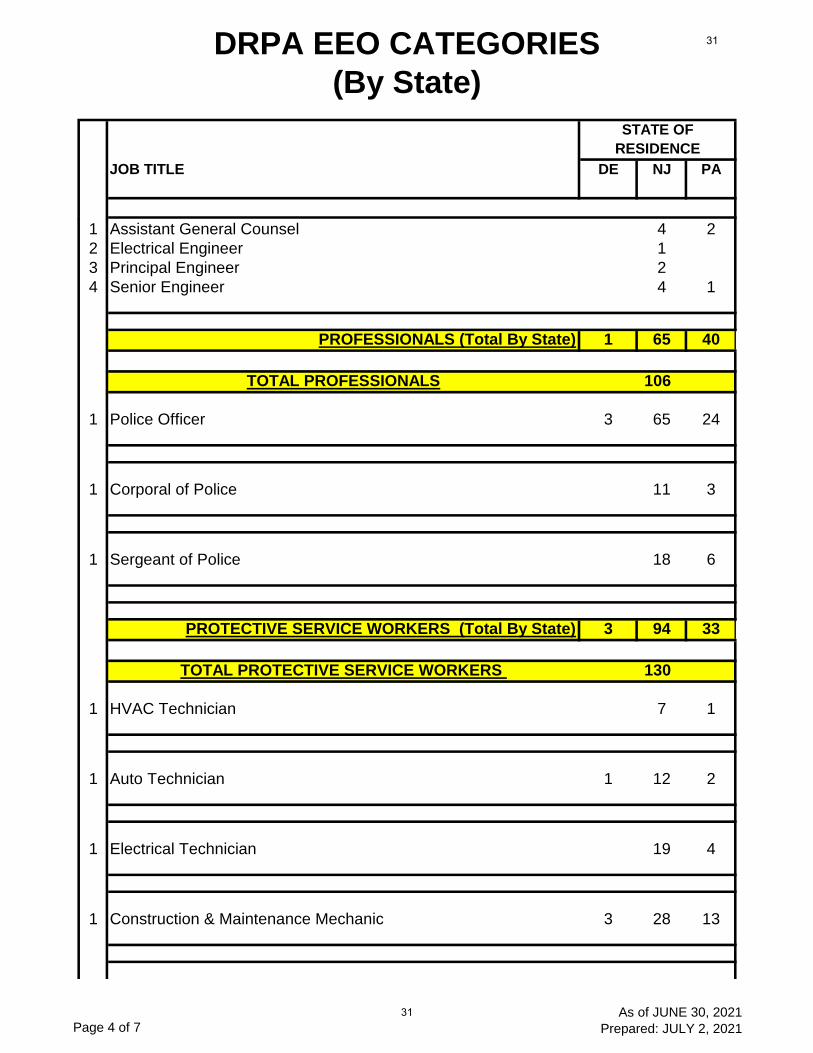
31
DRPA EEO CATEGORIES
(By State)
STATE OF
RESIDENCE
JOB TITLE DE NJ PA
1 Maintenance Technician 1 29 8
CRAFT WORKERS (SKILLED) (Total By State) 5 95 28
TOTAL CRAFT WORKERS (SKILLED) 128
1 Business Analyst 1
2 Data Base Administrator 1
3 Network Technician 3
4 Programmer/Analyst 1
5 Systems Administrator 8 2
6 User Support Administrator 1 1 1
TECHNICIANS (Total By State) 1 14 4
TOTAL TECHNICIANS 19
1 Customer Service Coordinator 1
2 Executive Assistant to the CEO 2
3 Executive Legal Secretary 0 0
4 Legal Assistant, Claims 1
5 Legal Secretary 1 2
1 Accounting Clerk 2
2 Administrative Clerk (Revenue Audit)
3 Building Services Clerk 3
4 Central Stores Clerk 1
5 Contracts Administration Clerk 1
6 Data Management Coordinator 2
7 Dispatcher 10 6
8 Lead Dispatcher 1
9 File Clerk 1 1
10 Media Specialist 1
11 Purchasing Clerk 1
12 Reproduction Technician 1
Page 5 of 7As of JUNE 30, 2021
Prepared: JULY 2, 2021
32
32
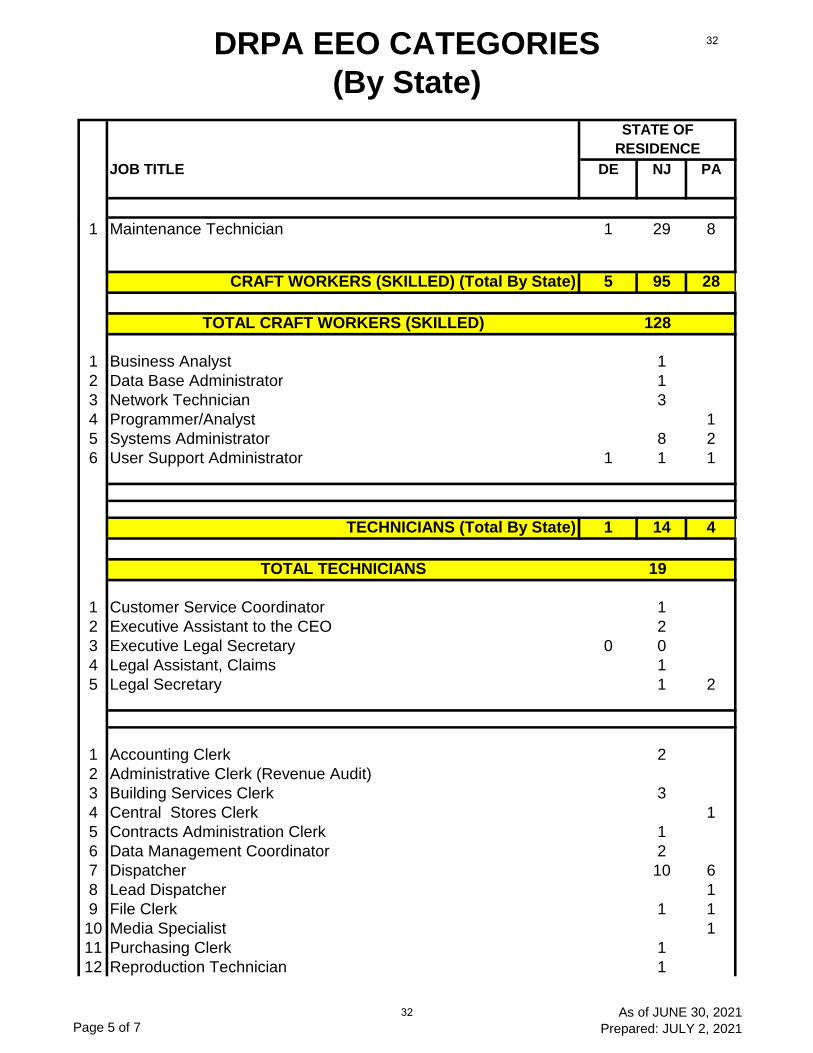
DRPA EEO CATEGORIES
(By State)
STATE OF
RESIDENCE
JOB TITLE DE NJ PA
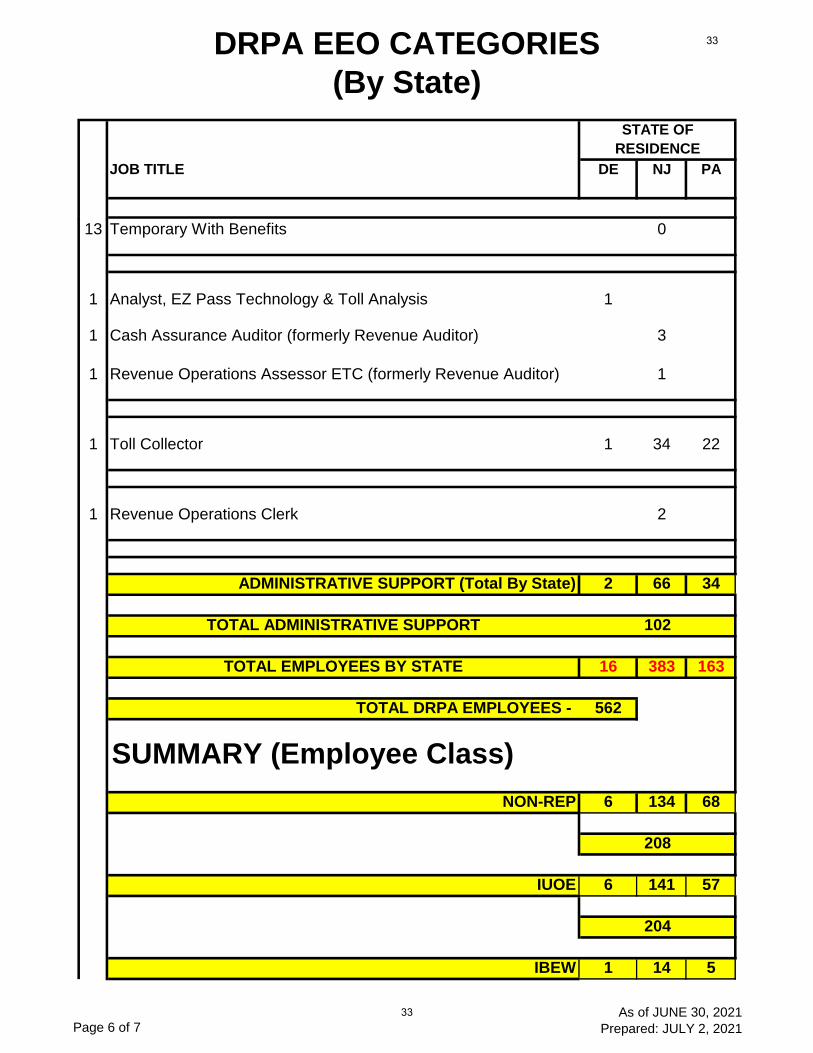
13 Temporary With Benefits 0
1 Analyst, EZ Pass Technology & Toll Analysis 1
1 Cash Assurance Auditor (formerly Revenue Auditor) 3
1 Revenue Operations Assessor ETC (formerly Revenue Auditor) 1
1 Toll Collector 1 34 22
1 Revenue Operations Clerk 2
ADMINISTRATIVE SUPPORT (Total By State) 2 66 34
TOTAL ADMINISTRATIVE SUPPORT 102
TOTAL EMPLOYEES BY STATE 16 383 163
TOTAL DRPA EMPLOYEES - 562
SUMMARY (Employee Class)
NON-REP 6 134 68
208
IUOE 6 141 57
204
IBEW 1 14 5
Page 6 of 7As of JUNE 30, 2021
Prepared: JULY 2, 2021
33
33
DRPA EEO CATEGORIES
(By State)
STATE OF
RESIDENCE
JOB TITLE DE NJ PA
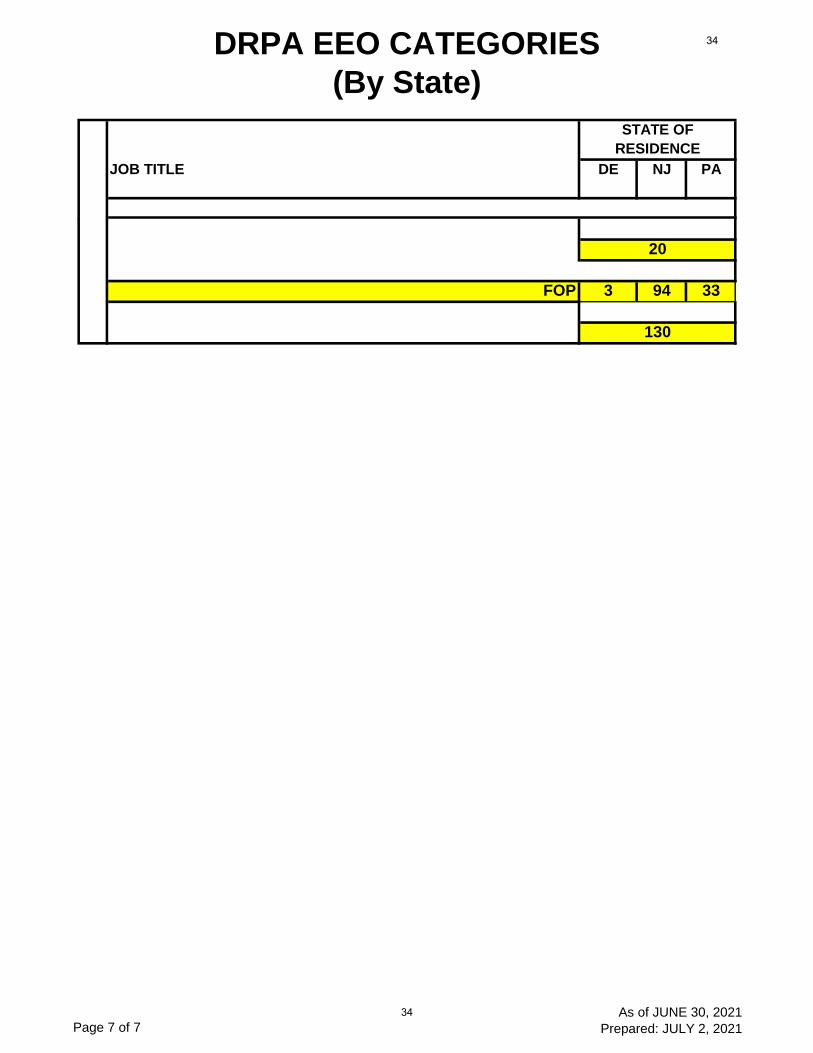
20
FOP 3 94 33
130
Page 7 of 7As of JUNE 30, 2021
Prepared: JULY 2, 2021
34
34
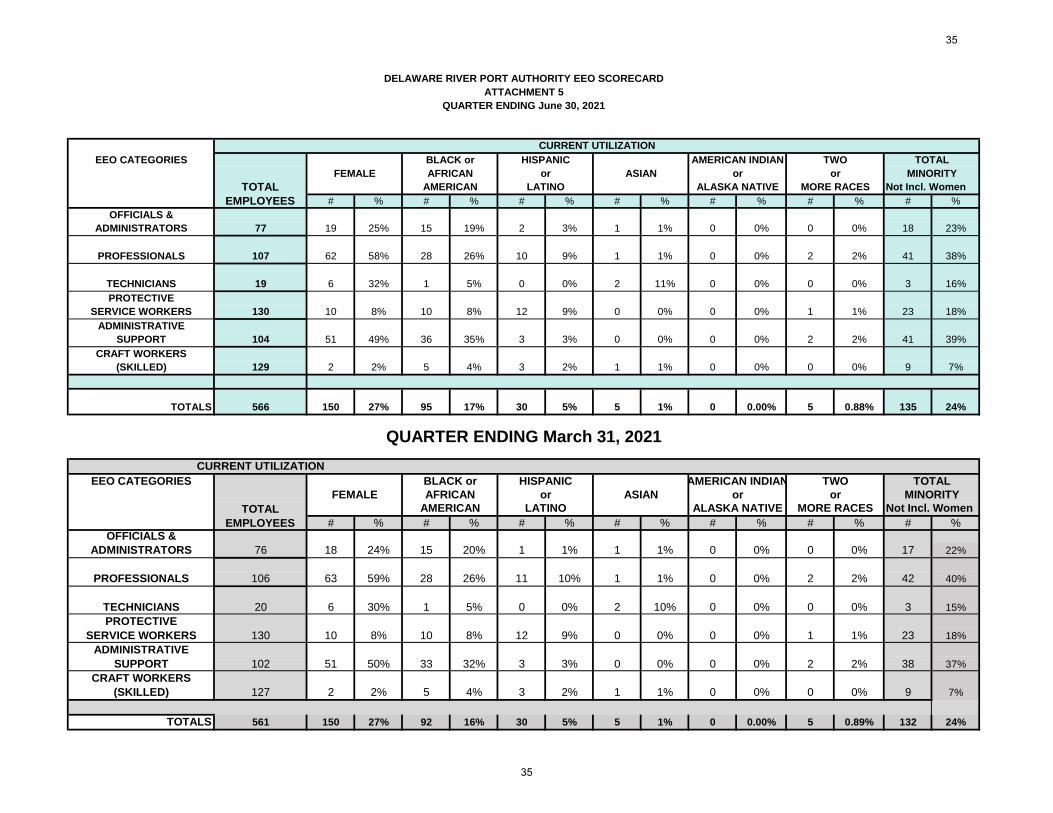
DELAWARE RIVER PORT AUTHORITY EEO SCORECARD
ATTACHMENT 5
QUARTER ENDING June 30, 2021
EEO CATEGORIES BLACK or HISPANIC AMERICAN INDIAN TWO TOTAL
FEMALE AFRICAN or ASIAN or or MINORITY
AMERICAN LATINO ALASKA NATIVE MORE RACES Not Incl. Women
# % # % # % # % # % # % # %
OFFICIALS &
ADMINISTRATORS 77 19 25% 15 19% 2 3% 1 1% 0 0% 0 0% 18 23%
PROFESSIONALS 107 62 58% 28 26% 10 9% 1 1% 0 0% 2 2% 41 38%
TECHNICIANS 19 6 32% 1 5% 0 0% 2 11% 0 0% 0 0% 3 16%
PROTECTIVE
SERVICE WORKERS 130 10 8% 10 8% 12 9% 0 0% 0 0% 1 1% 23 18%
ADMINISTRATIVE
SUPPORT 104 51 49% 36 35% 3 3% 0 0% 0 0% 2 2% 41 39%
CRAFT WORKERS
(SKILLED) 129 2 2% 5 4% 3 2% 1 1% 0 0% 0 0% 9 7%
TOTALS 566 150 27% 95 17% 30 5% 5 1% 0 0.00% 5 0.88% 135 24%
QUARTER ENDING March 31, 2021
CURRENT UTILIZATION
EEO CATEGORIES
Not Incl. Women
# % # % # % # % # % # % # %OFFICIALS &
ADMINISTRATORS 76 18 24% 15 20% 1 1% 1 1% 0 0% 0 0% 17 22%
PROFESSIONALS 106 63 59% 28 26% 11 10% 1 1% 0 0% 2 2% 42 40%
TECHNICIANS 20 6 30% 1 5% 0 0% 2 10% 0 0% 0 0% 3 15%
PROTECTIVE
SERVICE WORKERS 130 10 8% 10 8% 12 9% 0 0% 0 0% 1 1% 23 18%
ADMINISTRATIVE
SUPPORT 102 51 50% 33 32% 3 3% 0 0% 0 0% 2 2% 38 37%
CRAFT WORKERS
(SKILLED) 127 2 2% 5 4% 3 2% 1 1% 0 0% 0 0% 9 7%
TOTALS 561 150 27% 92 16% 30 5% 5 1% 0 0.00% 5 0.89% 132 24%
CURRENT UTILIZATION
TOTAL
EMPLOYEES
TOTAL
EMPLOYEES
BLACK or HISPANIC AMERICAN INDIAN TWO TOTAL
FEMALE AFRICAN or ASIAN or or MINORITY
AMERICAN LATINO ALASKA NATIVE MORE RACES
35
35
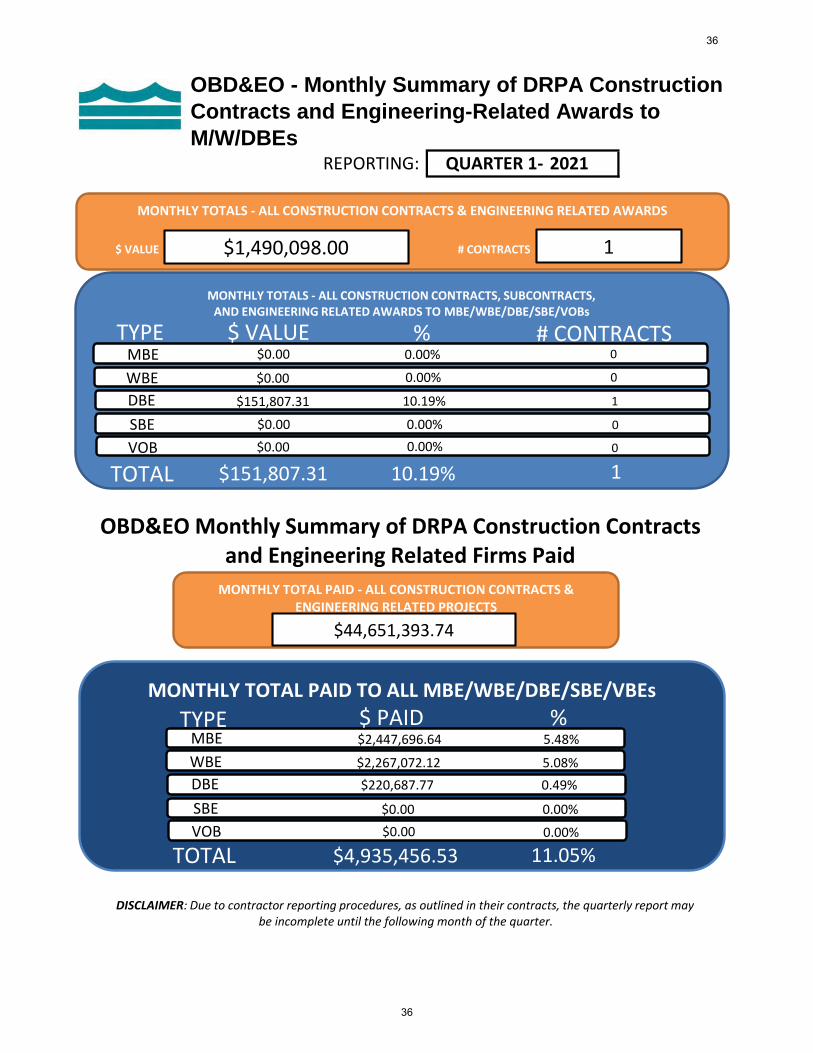
OBD&EO - Monthly Summary of DRPA Construction
Contracts and Engineering-Related Awards to
M/W/DBEs REPORTING: QUARTER 1- 2021
MONTHLY TOTALS - ALL CONSTRUCTION CONTRACTS, SUBCONTRACTS, AND ENGINEERING RELATED AWARDS TO MBE/WBE/DBE/SBE/VOBs
MONTHLY TOTALS - ALL CONSTRUCTION CONTRACTS & ENGINEERING RELATED AWARDS
$1,490,098.00
TYPE
1$ VALUE # CONTRACTS
$ VALUE % # CONTRACTSMBE
WBE
DBE
SBE
VOB
$0.00
$0.00
$151,807.31
$0.00
$0.00
0.00%
0.00%
10.19%
0.00%
0.00%
0
0
1
0
0
TOTAL $151,807.31 10.19% 1
OBD&EO Monthly Summary of DRPA Construction Contracts and Engineering Related Firms Paid
MONTHLY TOTAL PAID - ALL CONSTRUCTION CONTRACTS & ENGINEERING RELATED PROJECTS
$44,651,393.74
MONTHLY TOTAL PAID TO ALL MBE/WBE/DBE/SBE/VBEs
%TYPE $ PAIDMBE
WBE
DBE
SBE
VOB
$2,447,696.64
$2,267,072.12
$220,687.77
$0.00
$0.00
5.48%
5.08%
0.49%
0.00%
0.00%
TOTAL $4,935,456.53 11.05%
DISCLAIMER: Due to contractor reporting procedures, as outlined in their contracts, the quarterly report may be incomplete until the following month of the quarter.
36
36
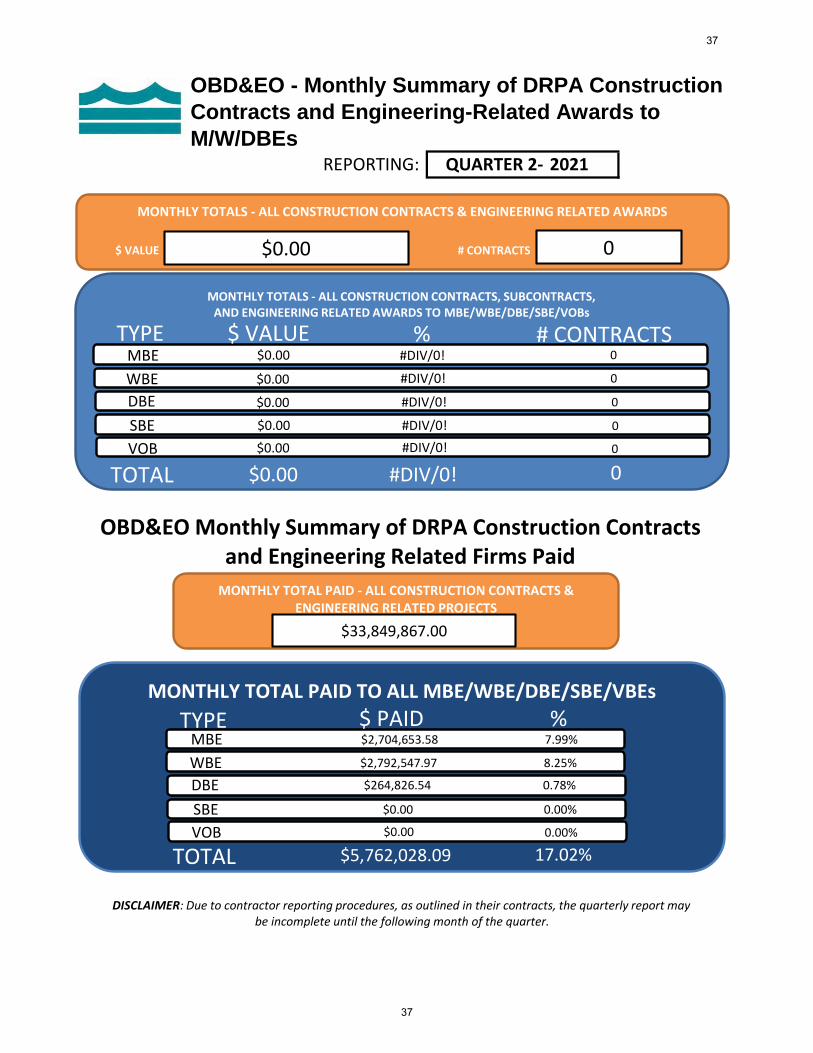
OBD&EO - Monthly Summary of DRPA Construction
Contracts and Engineering-Related Awards to
M/W/DBEs REPORTING: QUARTER 2- 2021
MONTHLY TOTALS - ALL CONSTRUCTION CONTRACTS, SUBCONTRACTS, AND ENGINEERING RELATED AWARDS TO MBE/WBE/DBE/SBE/VOBs
MONTHLY TOTALS - ALL CONSTRUCTION CONTRACTS & ENGINEERING RELATED AWARDS
$0.00
TYPE
0$ VALUE # CONTRACTS
$ VALUE % # CONTRACTSMBE
WBE
DBE
SBE
VOB
$0.00
$0.00
$0.00
$0.00
$0.00
#DIV/0!
#DIV/0!
#DIV/0!
#DIV/0!
#DIV/0!
0
0
0
0
0
TOTAL $0.00 #DIV/0! 0
OBD&EO Monthly Summary of DRPA Construction Contracts and Engineering Related Firms Paid
MONTHLY TOTAL PAID - ALL CONSTRUCTION CONTRACTS & ENGINEERING RELATED PROJECTS
$33,849,867.00
MONTHLY TOTAL PAID TO ALL MBE/WBE/DBE/SBE/VBEs
%TYPE $ PAIDMBE
WBE
DBE
SBE
VOB
$2,704,653.58
$2,792,547.97
$264,826.54
$0.00
$0.00
7.99%
8.25%
0.78%
0.00%
0.00%
TOTAL $5,762,028.09 17.02%
DISCLAIMER: Due to contractor reporting procedures, as outlined in their contracts, the quarterly report may be incomplete until the following month of the quarter.
37
37
REPORT OF THE CHIEF EXECUTIVE OFFICER
ATTACHMENT 5
LEGAL STATISTICS REPORT
38
38
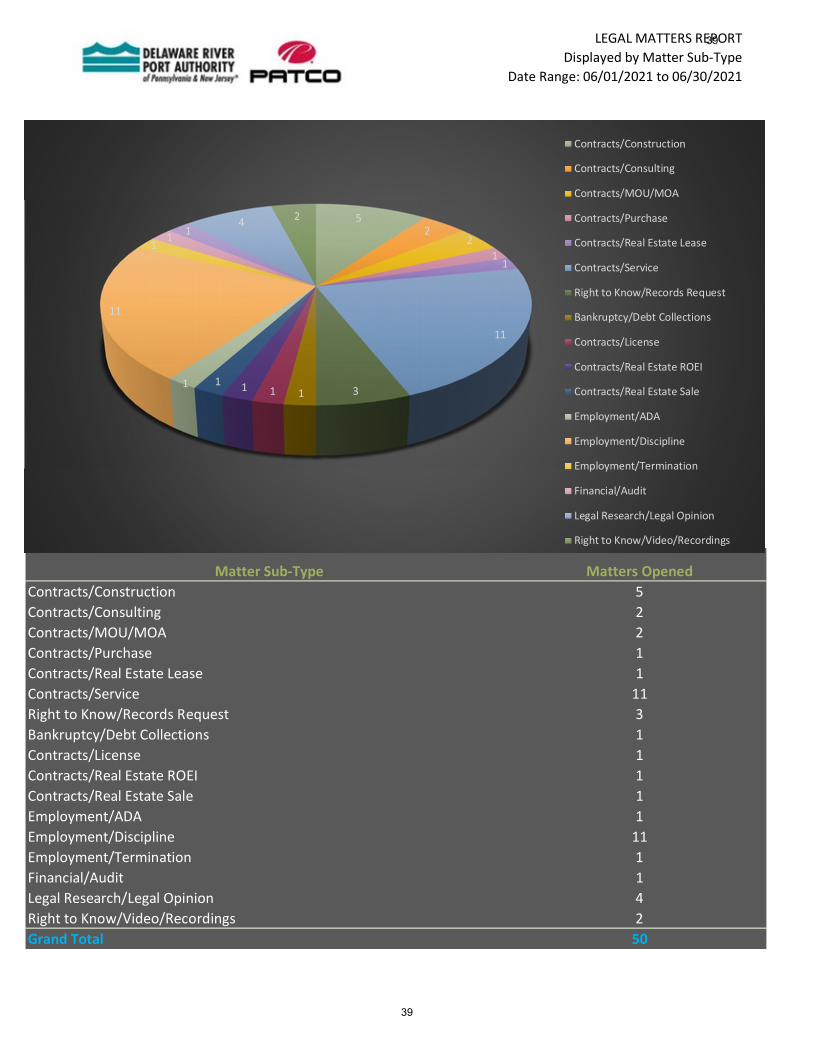
LEGAL MATTERS REPORT
Displayed by Matter Sub-Type
Date Range: 06/01/2021 to 06/30/2021
Matter Sub-Type Matters Opened
Contracts/Construction 5
Contracts/Consulting 2
Contracts/MOU/MOA 2
Contracts/Purchase 1
Contracts/Real Estate Lease 1
Contracts/Service 11
Right to Know/Records Request 3
Bankruptcy/Debt Collections 1
Contracts/License 1
Contracts/Real Estate ROEI 1
Contracts/Real Estate Sale 1
Employment/ADA 1
Employment/Discipline 11
Employment/Termination 1
Financial/Audit 1
Legal Research/Legal Opinion 4
Right to Know/Video/Recordings 2
Grand Total 50
52
2
11
11
311111
11
11
14
2
Contracts/Construction
Contracts/Consulting
Contracts/MOU/MOA
Contracts/Purchase
Contracts/Real Estate Lease
Contracts/Service
Right to Know/Records Request
Bankruptcy/Debt Collections
Contracts/License
Contracts/Real Estate ROEI
Contracts/Real Estate Sale
Employment/ADA
Employment/Discipline
Employment/Termination
Financial/Audit
Legal Research/Legal Opinion
Right to Know/Video/Recordings
39
39

CFO REPORT
40
40
1
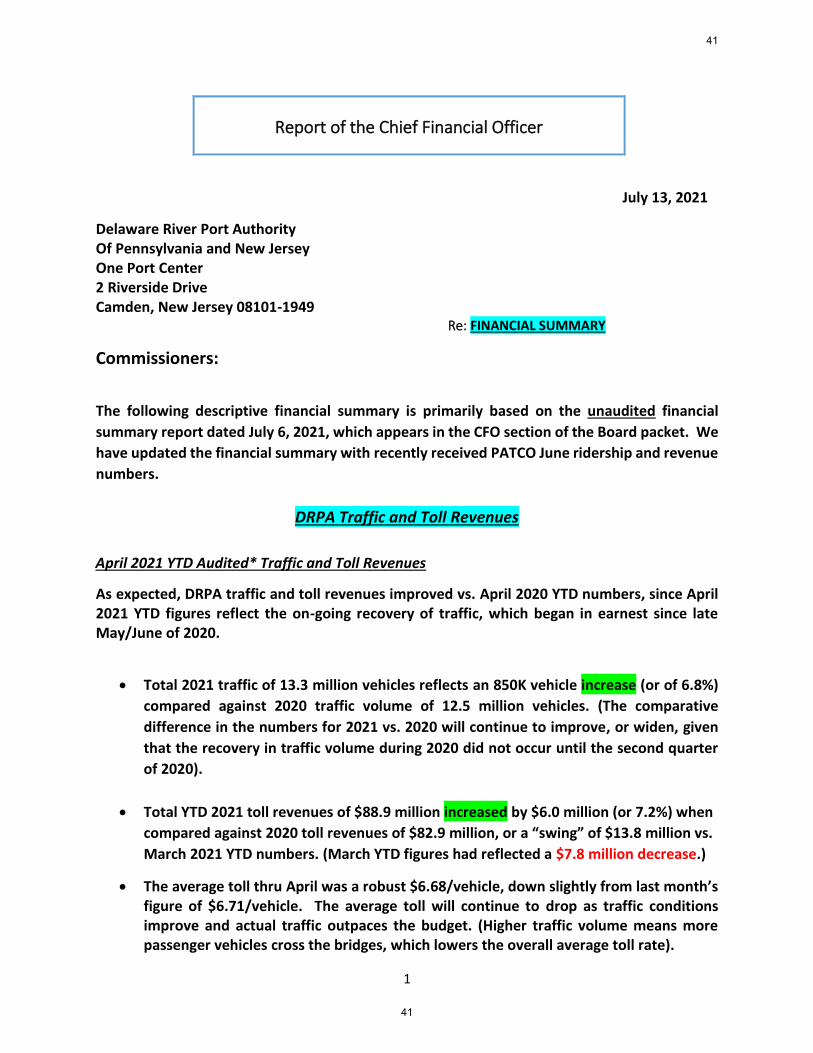
Report of the Chief Financial Officer
July 13, 2021
Delaware River Port Authority Of Pennsylvania and New Jersey One Port Center 2 Riverside Drive Camden, New Jersey 08101-1949
Re: FINANCIAL SUMMARY
Commissioners:
The following descriptive financial summary is primarily based on the unaudited financial
summary report dated July 6, 2021, which appears in the CFO section of the Board packet. We
have updated the financial summary with recently received PATCO June ridership and revenue
numbers.
DRPA Traffic and Toll Revenues
April 2021 YTD Audited* Traffic and Toll Revenues
As expected, DRPA traffic and toll revenues improved vs. April 2020 YTD numbers, since April 2021 YTD figures reflect the on-going recovery of traffic, which began in earnest since late May/June of 2020.
• Total 2021 traffic of 13.3 million vehicles reflects an 850K vehicle increase (or of 6.8%)
compared against 2020 traffic volume of 12.5 million vehicles. (The comparative
difference in the numbers for 2021 vs. 2020 will continue to improve, or widen, given
that the recovery in traffic volume during 2020 did not occur until the second quarter
of 2020).
• Total YTD 2021 toll revenues of $88.9 million increased by $6.0 million (or 7.2%) when
compared against 2020 toll revenues of $82.9 million, or a “swing” of $13.8 million vs.
March 2021 YTD numbers. (March YTD figures had reflected a $7.8 million decrease.)
• The average toll thru April was a robust $6.68/vehicle, down slightly from last month’s figure of $6.71/vehicle. The average toll will continue to drop as traffic conditions improve and actual traffic outpaces the budget. (Higher traffic volume means more passenger vehicles cross the bridges, which lowers the overall average toll rate).
41
41
2
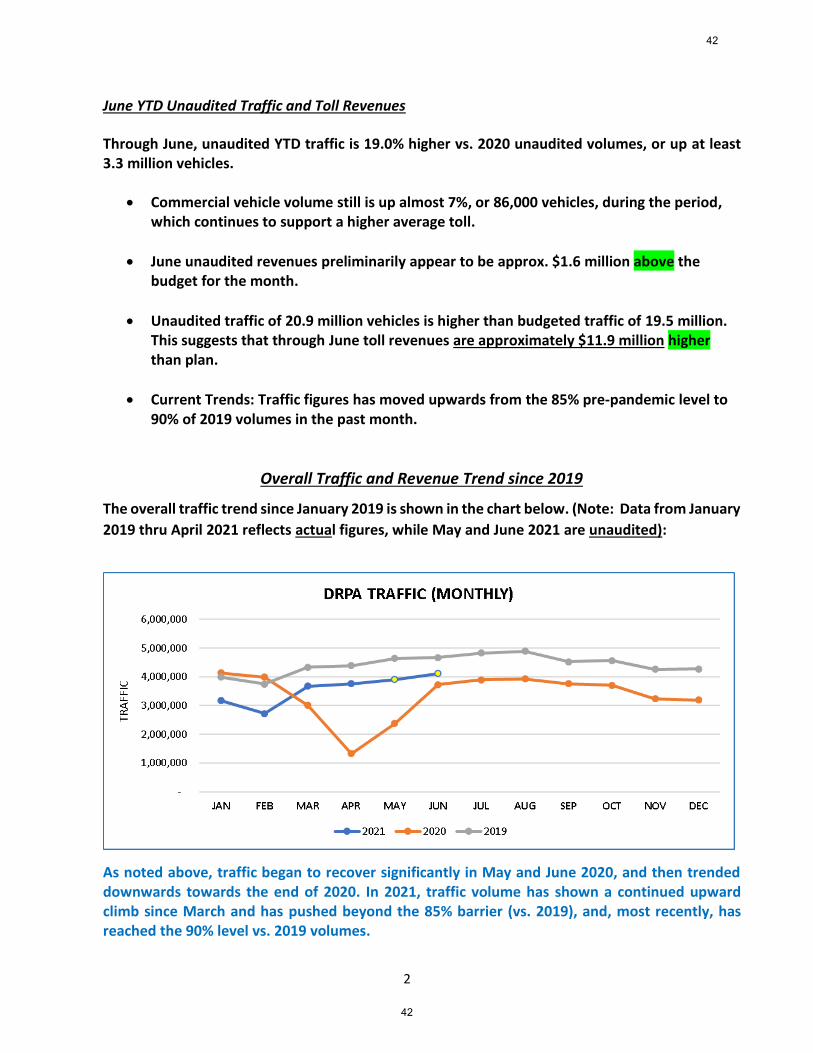
June YTD Unaudited Traffic and Toll Revenues
Through June, unaudited YTD traffic is 19.0% higher vs. 2020 unaudited volumes, or up at least 3.3 million vehicles.
• Commercial vehicle volume still is up almost 7%, or 86,000 vehicles, during the period, which continues to support a higher average toll.
• June unaudited revenues preliminarily appear to be approx. $1.6 million above the budget for the month.
• Unaudited traffic of 20.9 million vehicles is higher than budgeted traffic of 19.5 million. This suggests that through June toll revenues are approximately $11.9 million higher than plan.
• Current Trends: Traffic figures has moved upwards from the 85% pre-pandemic level to 90% of 2019 volumes in the past month.
Overall Traffic and Revenue Trend since 2019
The overall traffic trend since January 2019 is shown in the chart below. (Note: Data from January
2019 thru April 2021 reflects actual figures, while May and June 2021 are unaudited):
As noted above, traffic began to recover significantly in May and June 2020, and then trended downwards towards the end of 2020. In 2021, traffic volume has shown a continued upward climb since March and has pushed beyond the 85% barrier (vs. 2019), and, most recently, has reached the 90% level vs. 2019 volumes.
42
42

3
The Authority’s toll revenue experience from January 2019 through May 2021 is captured in
the above graph. As bridge traffic volume has increased since the depth of the pandemic, so
also have DRPA toll revenues. As mentioned in earlier reports, actual bridge tolls were down
$64 million in 2020 vs. 2019 toll revenues.
We expect bridge toll revenues in 2021 to be higher than 2020 volumes, assuming current
trends continue, but my expectation is that these revenues will still reflect a shortfall of approx.
$30 million below 2019 numbers. (Note: May & June figures are unaudited).
Actual Monthly Traffic and Revenues vs. Budget *
*May and June 2021 are unaudited
TRAFFIC JAN FEB MAR APR MAY JUN JUL AUG SEP OCT NOV DEC
2020 % of 2019 (act.) 103.9% 106.6% 69.4% 30.1% 51.3% 80.0% 80.6% 80.2% 83.1% 81.4% 75.9% 74.9%
2021 % of 2019 (act.) 79.5% 72.7% 84.6% 85.5% 84.2% * 88.2% *
2021 Budget % of 2019 (act.) 72.5% 72.5% 72.5% 75.0% 80.0% 80.0% 80.0% 85.0% 85.0% 85.0% 85.0% 85.0%
* Unaudited
43
43
4
April YTD actual traffic and toll revenues have exceeded 2020 YTD numbers, and actual DRPA
traffic and toll revenues have exceeded the 2021 budget, by 1.3 million vehicles and $10.0
million, respectively. Thus far, traffic and toll revenues are 10.5% and 12.7% respectively,
above budget.
During our annual budget planning in late 2020, given the late year spike in COVID-19 cases,
we assumed that actual traffic during January thru June 2021 would average about 75.4% of
2019 activity. As shown above, actual and unaudited traffic and revenues (through June) are
exceeding budgeted percentages. (Note: Each decrease, or increase, in traffic by 1.0% equates
to an approx. impact of $250,000).
44
44
5
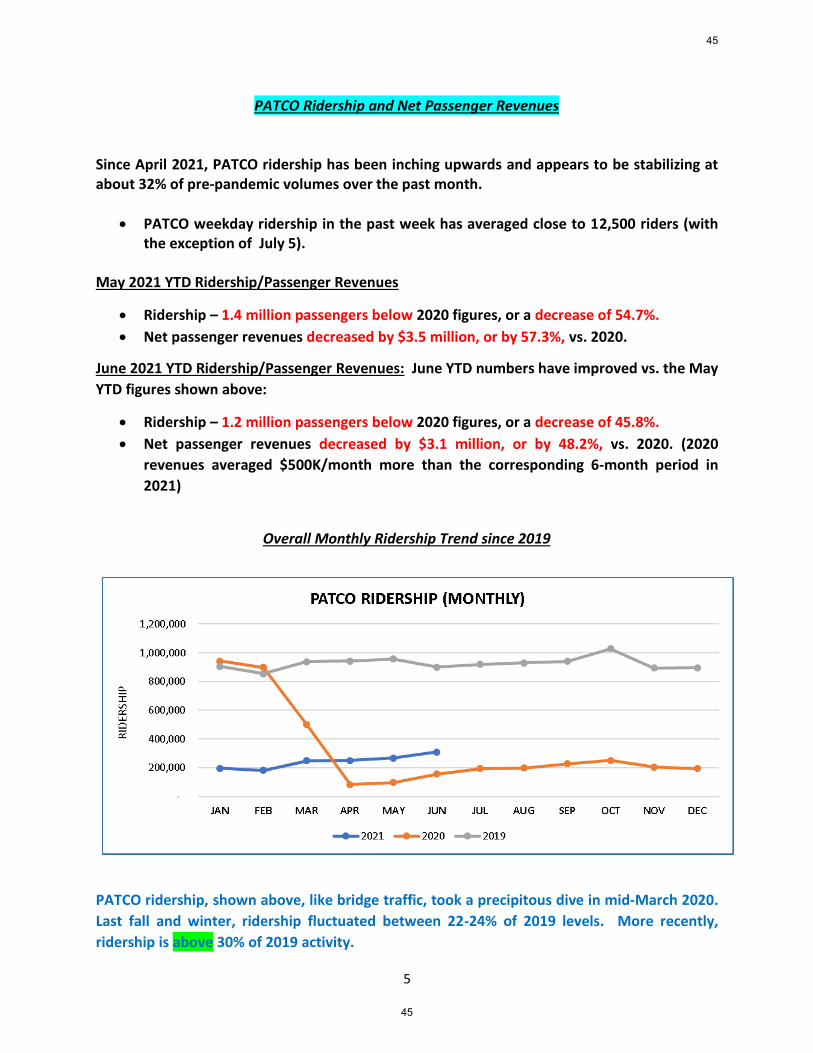
PATCO Ridership and Net Passenger Revenues
Since April 2021, PATCO ridership has been inching upwards and appears to be stabilizing at about 32% of pre-pandemic volumes over the past month.
• PATCO weekday ridership in the past week has averaged close to 12,500 riders (with the exception of July 5).
May 2021 YTD Ridership/Passenger Revenues
• Ridership – 1.4 million passengers below 2020 figures, or a decrease of 54.7%.
• Net passenger revenues decreased by $3.5 million, or by 57.3%, vs. 2020.
June 2021 YTD Ridership/Passenger Revenues: June YTD numbers have improved vs. the May
YTD figures shown above:
• Ridership – 1.2 million passengers below 2020 figures, or a decrease of 45.8%.
• Net passenger revenues decreased by $3.1 million, or by 48.2%, vs. 2020. (2020
revenues averaged $500K/month more than the corresponding 6-month period in
2021)
Overall Monthly Ridership Trend since 2019
PATCO ridership, shown above, like bridge traffic, took a precipitous dive in mid-March 2020.
Last fall and winter, ridership fluctuated between 22-24% of 2019 levels. More recently,
ridership is above 30% of 2019 activity.
45
45
6
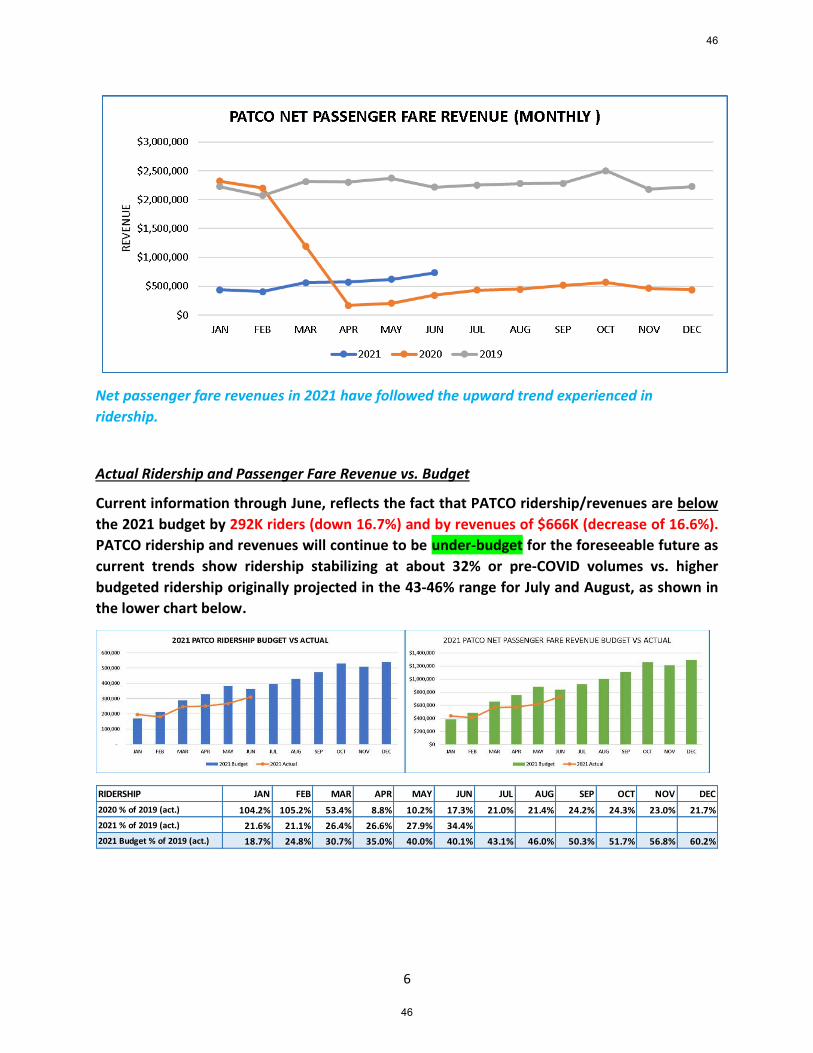
Net passenger fare revenues in 2021 have followed the upward trend experienced in
ridership.
Actual Ridership and Passenger Fare Revenue vs. Budget
Current information through June, reflects the fact that PATCO ridership/revenues are below
the 2021 budget by 292K riders (down 16.7%) and by revenues of $666K (decrease of 16.6%).
PATCO ridership and revenues will continue to be under-budget for the foreseeable future as
current trends show ridership stabilizing at about 32% or pre-COVID volumes vs. higher
budgeted ridership originally projected in the 43-46% range for July and August, as shown in
the lower chart below.
RIDERSHIP JAN FEB MAR APR MAY JUN JUL AUG SEP OCT NOV DEC
2020 % of 2019 (act.) 104.2% 105.2% 53.4% 8.8% 10.2% 17.3% 21.0% 21.4% 24.2% 24.3% 23.0% 21.7%
2021 % of 2019 (act.) 21.6% 21.1% 26.4% 26.6% 27.9% 34.4%
2021 Budget % of 2019 (act.) 18.7% 24.8% 30.7% 35.0% 40.0% 40.1% 43.1% 46.0% 50.3% 51.7% 56.8% 60.2%
46
46
7
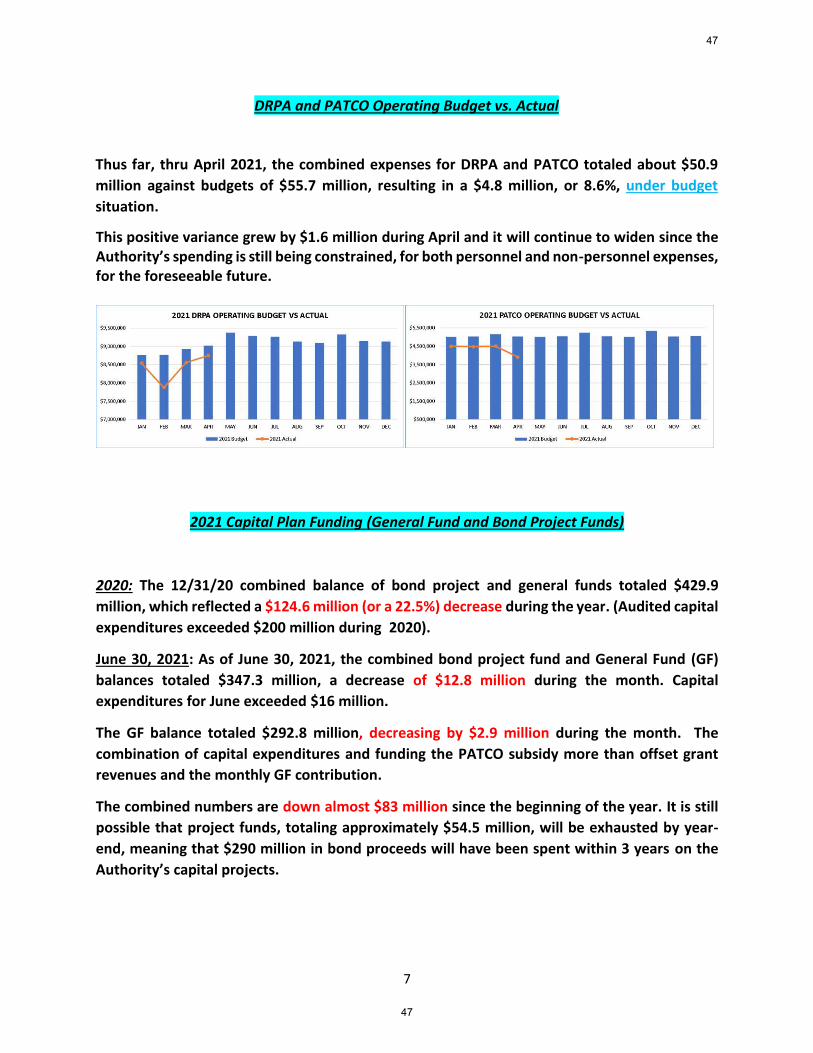
DRPA and PATCO Operating Budget vs. Actual
Thus far, thru April 2021, the combined expenses for DRPA and PATCO totaled about $50.9
million against budgets of $55.7 million, resulting in a $4.8 million, or 8.6%, under budget
situation.
This positive variance grew by $1.6 million during April and it will continue to widen since the Authority’s spending is still being constrained, for both personnel and non-personnel expenses, for the foreseeable future.
2021 Capital Plan Funding (General Fund and Bond Project Funds)
2020: The 12/31/20 combined balance of bond project and general funds totaled $429.9
million, which reflected a $124.6 million (or a 22.5%) decrease during the year. (Audited capital
expenditures exceeded $200 million during 2020).
June 30, 2021: As of June 30, 2021, the combined bond project fund and General Fund (GF)
balances totaled $347.3 million, a decrease of $12.8 million during the month. Capital
expenditures for June exceeded $16 million.
The GF balance totaled $292.8 million, decreasing by $2.9 million during the month. The
combination of capital expenditures and funding the PATCO subsidy more than offset grant
revenues and the monthly GF contribution.
The combined numbers are down almost $83 million since the beginning of the year. It is still
possible that project funds, totaling approximately $54.5 million, will be exhausted by year-
end, meaning that $290 million in bond proceeds will have been spent within 3 years on the
Authority’s capital projects.
47
47
8
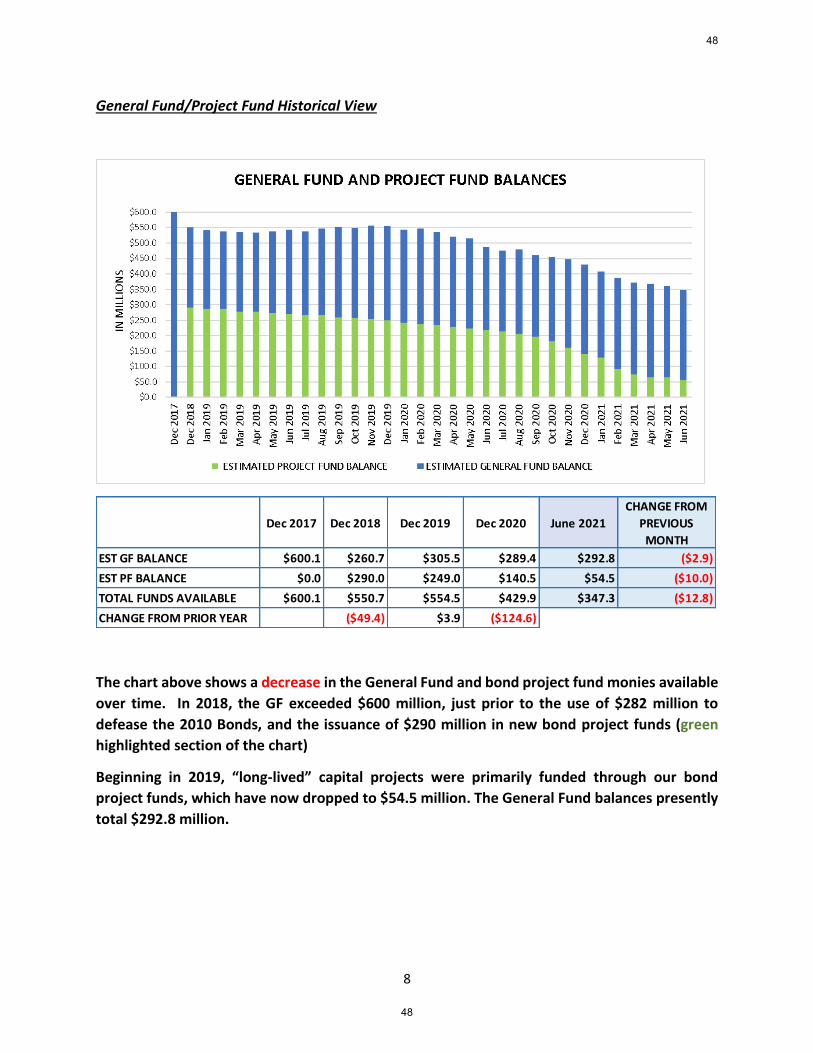
General Fund/Project Fund Historical View
The chart above shows a decrease in the General Fund and bond project fund monies available
over time. In 2018, the GF exceeded $600 million, just prior to the use of $282 million to
defease the 2010 Bonds, and the issuance of $290 million in new bond project funds (green
highlighted section of the chart)
Beginning in 2019, “long-lived” capital projects were primarily funded through our bond
project funds, which have now dropped to $54.5 million. The General Fund balances presently
total $292.8 million.
Dec 2017 Dec 2018 Dec 2019 Dec 2020 June 2021
CHANGE FROM
PREVIOUS
MONTH
EST GF BALANCE $600.1 $260.7 $305.5 $289.4 $292.8 ($2.9)
EST PF BALANCE $0.0 $290.0 $249.0 $140.5 $54.5 ($10.0)
TOTAL FUNDS AVAILABLE $600.1 $550.7 $554.5 $429.9 $347.3 ($12.8)
CHANGE FROM PRIOR YEAR ($49.4) $3.9 ($124.6)
48
48

9
CARES Act/CRRSAA Act (FTA Transit Grants)
2020 CARES Act Grant – The final $1.7 million remaining, from the $40.7 million transit grant
allocated to the Authority, has been drawn down for use in offsetting PATCO lost passenger
fare revenues and the operating subsidy.
2021 CRRSAA Act Grant - The Authority has been advised that it has been awarded $15.7
million from a new federal (FTA) transit grant. We expect to begin drawing down funds
against this grant within the next several weeks.
2021 American Rescue Plan Act - In addition, we have received notification that the Authority
will have access to another $27.9 million, in additional FTA funding, sometime later in the year,
once the application for the grant award and the FTA review are completed.
Annual Audit
The Authority filed its 2020 audited annual report, which has been included in the Board packet, with the Government Finance Officers Association (GFOA), by its June 30th deadline. We are hoping that this report will be the 29th consecutive year that the Authority has earned the “Financial Excellence” award.
The report will be filed with our bond trustee by July 29. (The filing of the annual report with the bond trustee is a Bond Indenture compliance item.)
Respectfully submitted,
James M. White, Jr.,
CFO/Treasurer
49
49
July 14, 2021 (Revised)
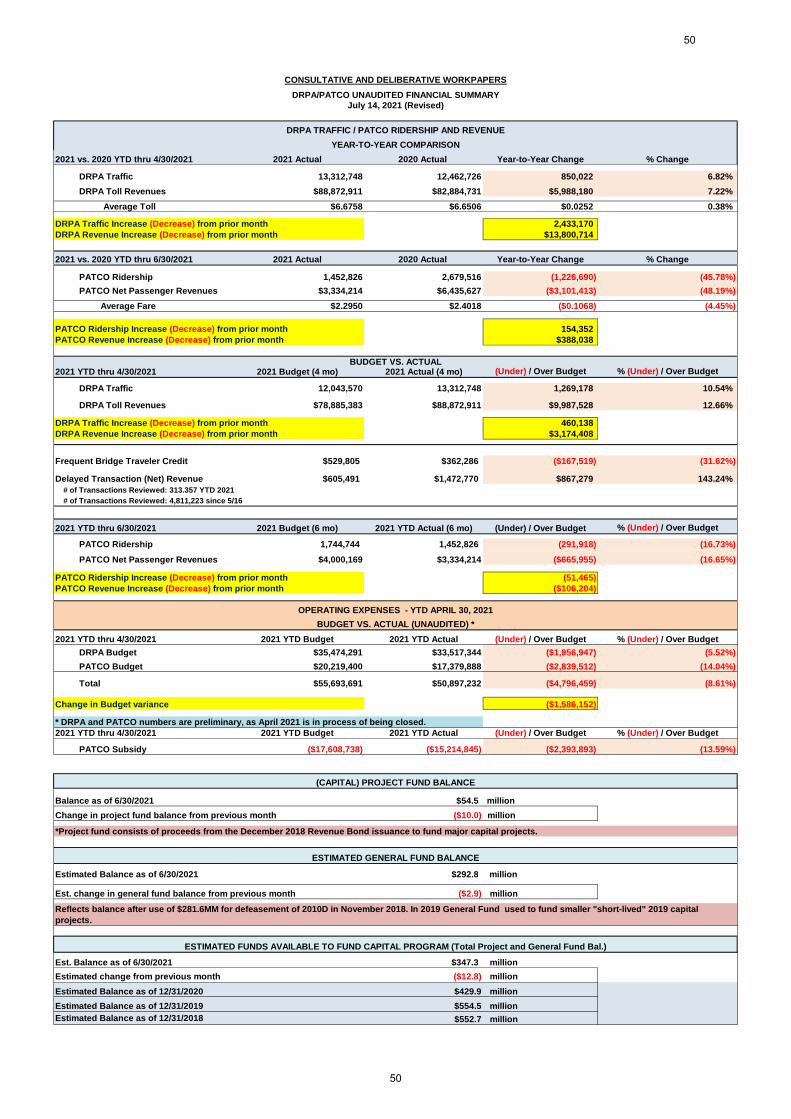
2021 vs. 2020 YTD thru 4/30/2021 2021 Actual 2020 Actual Year-to-Year Change % Change
DRPA Traffic 13,312,748 12,462,726 850,022 6.82%
DRPA Toll Revenues $88,872,911 $82,884,731 $5,988,180 7.22%
Average Toll $6.6758 $6.6506 $0.0252 0.38%Note: Snow impacted February 2016DRPA Traffic Increase (Decrease) from prior month 2,433,170DRPA Revenue Increase (Decrease) from prior month $13,800,714
2021 vs. 2020 YTD thru 6/30/2021 2021 Actual 2020 Actual Year-to-Year Change % Change
PATCO Ridership 1,452,826 2,679,516 (1,226,690) (45.78%)
PATCO Net Passenger Revenues $3,334,214 $6,435,627 ($3,101,413) (48.19%)
Average Fare $2.2950 $2.4018 ($0.1068) (4.45%)
PATCO Ridership Increase (Decrease) from prior month 154,352PATCO Revenue Increase (Decrease) from prior month $388,038
2021 YTD thru 4/30/2021 2021 Budget (4 mo) 2021 Actual (4 mo) (Under) / Over Budget % (Under) / Over Budget
DRPA Traffic 12,043,570 13,312,748 1,269,178 10.54%
DRPA Toll Revenues $78,885,383 $88,872,911 $9,987,528 12.66%
DRPA Traffic Increase (Decrease) from prior month 460,138DRPA Revenue Increase (Decrease) from prior month $3,174,408
Frequent Bridge Traveler Credit $529,805 $362,286 ($167,519) (31.62%)
Delayed Transaction (Net) Revenue $605,491 $1,472,770 $867,279 143.24%# of Transactions Reviewed: 313.357 YTD 2021
# of Transactions Reviewed: 4,811,223 since 5/16
2021 YTD thru 6/30/2021 2021 Budget (6 mo) 2021 YTD Actual (6 mo) (Under) / Over Budget % (Under) / Over Budget
PATCO Ridership 1,744,744 1,452,826 (291,918) (16.73%)
PATCO Net Passenger Revenues $4,000,169 $3,334,214 ($665,955) (16.65%)
PATCO Ridership Increase (Decrease) from prior month (51,465)PATCO Revenue Increase (Decrease) from prior month ($106,204)
2021 YTD thru 4/30/2021 2021 YTD Budget 2021 YTD Actual (Under) / Over Budget % (Under) / Over Budget
DRPA Budget $35,474,291 $33,517,344 ($1,956,947) (5.52%)
PATCO Budget $20,219,400 $17,379,888 ($2,839,512) (14.04%)
Total $55,693,691 $50,897,232 ($4,796,459) (8.61%)
Change in Budget variance ($1,586,152)
* DRPA and PATCO numbers are preliminary, as April 2021 is in process of being closed.2021 YTD thru 4/30/2021 2021 YTD Budget 2021 YTD Actual (Under) / Over Budget % (Under) / Over Budget
PATCO Subsidy ($17,608,738) ($15,214,845) ($2,393,893) (13.59%)
Balance as of 6/30/2021 $54.5 million
Change in project fund balance from previous month ($10.0) million
Estimated Balance as of 6/30/2021 $292.8 million
Est. change in general fund balance from previous month ($2.9) million
Est. Balance as of 6/30/2021 $347.3 million
Estimated change from previous month ($12.8) million
Estimated Balance as of 12/31/2020 $429.9 million
Estimated Balance as of 12/31/2019 $554.5 million
Estimated Balance as of 12/31/2018 $552.7 million
CONSULTATIVE AND DELIBERATIVE WORKPAPERS
DRPA/PATCO UNAUDITED FINANCIAL SUMMARY
BUDGET VS. ACTUAL
BUDGET VS. ACTUAL (UNAUDITED) *
YEAR-TO-YEAR COMPARISON
DRPA TRAFFIC / PATCO RIDERSHIP AND REVENUE
OPERATING EXPENSES - YTD APRIL 30, 2021
(CAPITAL) PROJECT FUND BALANCE
*Project fund consists of proceeds from the December 2018 Revenue Bond issuance to fund major capital projects.
ESTIMATED GENERAL FUND BALANCE
Reflects balance after use of $281.6MM for defeasement of 2010D in November 2018. In 2019 General Fund used to fund smaller "short-lived" 2019 capital
projects.
ESTIMATED FUNDS AVAILABLE TO FUND CAPITAL PROGRAM (Total Project and General Fund Bal.)
50
50
July 14, 2021 (Revised)
CONSULTATIVE AND DELIBERATIVE WORKPAPERS
DRPA/PATCO UNAUDITED FINANCIAL SUMMARY
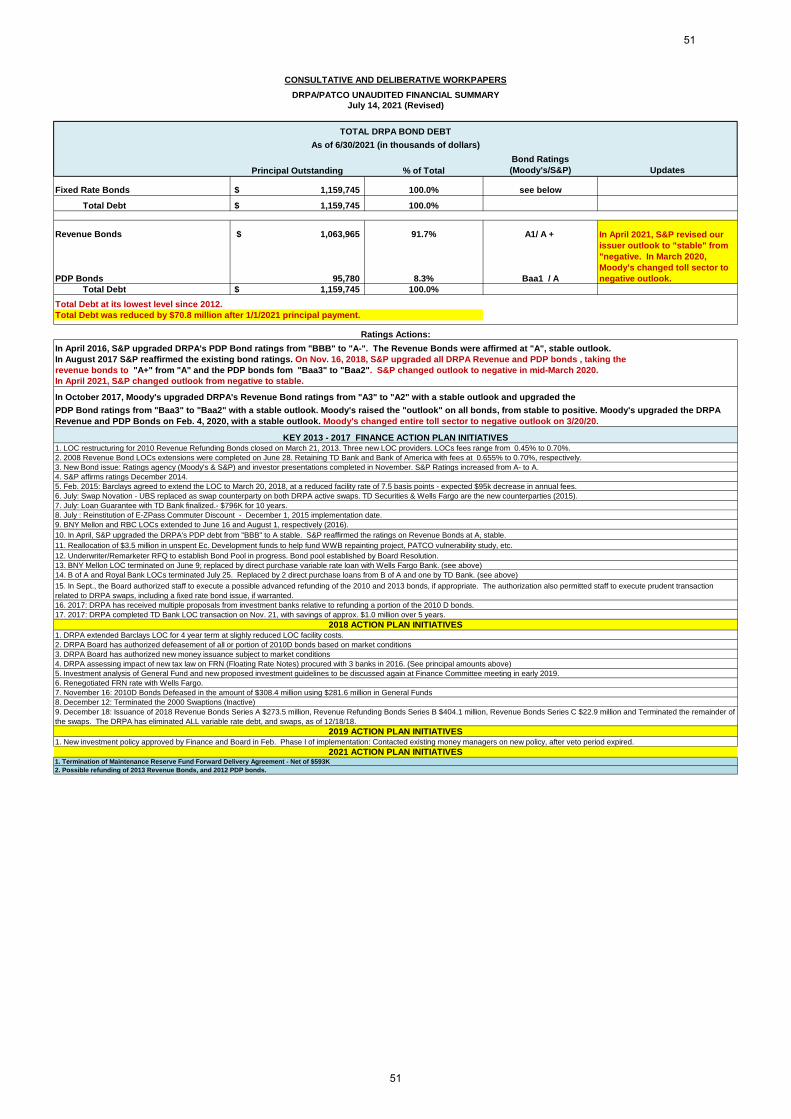
Principal Outstanding % of Total
Bond Ratings
(Moody's/S&P) Updates
Fixed Rate Bonds ###### 1,159,745$ 100.0% see below
Total Debt 1,159,745$ 100.0%
Revenue Bonds 1,063,965$ 91.7% A1/ A +
PDP Bonds 95,780 8.3% Baa1 / ATotal Debt 1,159,745$ 100.0%
Total Debt at its lowest level since 2012.Total Debt was reduced by $70.8 million after 1/1/2021 principal payment.
In April 2016, S&P upgraded DRPA's PDP Bond ratings from "BBB" to "A-". The Revenue Bonds were affirmed at "A", stable outlook.In August 2017 S&P reaffirmed the existing bond ratings. On Nov. 16, 2018, S&P upgraded all DRPA Revenue and PDP bonds , taking therevenue bonds to "A+" from "A" and the PDP bonds fom "Baa3" to "Baa2". S&P changed outlook to negative in mid-March 2020.In April 2021, S&P changed outlook from negative to stable.
In October 2017, Moody's upgraded DRPA's Revenue Bond ratings from "A3" to "A2" with a stable outlook and upgraded the
KEY 2013 - 2017 FINANCE ACTION PLAN INITIATIVES
3. New Bond issue: Ratings agency (Moody's & S&P) and investor presentations completed in November. S&P Ratings increased from A- to A.4. S&P affirms ratings December 2014.
5. Feb. 2015: Barclays agreed to extend the LOC to March 20, 2018, at a reduced facility rate of 7.5 basis points - expected $95k decrease in annual fees.
6. July: Swap Novation - UBS replaced as swap counterparty on both DRPA active swaps. TD Securities & Wells Fargo are the new counterparties (2015).
7. July: Loan Guarantee with TD Bank finalized.- $796K for 10 years.
8. July : Reinstitution of E-ZPass Commuter Discount - December 1, 2015 implementation date.
10. In April, S&P upgraded the DRPA's PDP debt from "BBB" to A stable. S&P reaffirmed the ratings on Revenue Bonds at A, stable.
11. Reallocation of $3.5 million in unspent Ec. Development funds to help fund WWB repainting project, PATCO vulnerability study, etc.
13. BNY Mellon LOC terminated on June 9; replaced by direct purchase variable rate loan with Wells Fargo Bank. (see above)
14. B of A and Royal Bank LOCs terminated July 25. Replaced by 2 direct purchase loans from B of A and one by TD Bank. (see above)
16. 2017: DRPA has received multiple proposals from investment banks relative to refunding a portion of the 2010 D bonds.
17. 2017: DRPA completed TD Bank LOC transaction on Nov. 21, with savings of approx. $1.0 million over 5 years.
1. DRPA extended Barclays LOC for 4 year term at slighly reduced LOC facility costs.
2. DRPA Board has authorized defeasement of all or portion of 2010D bonds based on market conditions3. DRPA Board has authorized new money issuance subject to market conditions
4. DRPA assessing impact of new tax law on FRN (Floating Rate Notes) procured with 3 banks in 2016. (See principal amounts above)
5. Investment analysis of General Fund and new proposed investment guidelines to be discussed again at Finance Committee meeting in early 2019.
6. Renegotiated FRN rate with Wells Fargo.
7. November 16: 2010D Bonds Defeased in the amount of $308.4 million using $281.6 million in General Funds
1. Termination of Maintenance Reserve Fund Forward Delivery Agreement - Net of $593K
2. Possible refunding of 2013 Revenue Bonds, and 2012 PDP bonds.
2021 ACTION PLAN INITIATIVES
PDP Bond ratings from "Baa3" to "Baa2" with a stable outlook. Moody's raised the "outlook" on all bonds, from stable to positive. Moody's upgraded the DRPA
Revenue and PDP Bonds on Feb. 4, 2020, with a stable outlook. Moody's changed entire toll sector to negative outlook on 3/20/20.
TOTAL DRPA BOND DEBT
As of 6/30/2021 (in thousands of dollars)
In April 2021, S&P revised our
issuer outlook to "stable" from
"negative. In March 2020,
Moody's changed toll sector to
negative outlook.
1. New investment policy approved by Finance and Board in Feb. Phase I of implementation: Contacted existing money managers on new policy, after veto period expired.
2019 ACTION PLAN INITIATIVES
Ratings Actions:
9. December 18: Issuance of 2018 Revenue Bonds Series A $273.5 million, Revenue Refunding Bonds Series B $404.1 million, Revenue Bonds Series C $22.9 million and Terminated the remainder of
the swaps. The DRPA has eliminated ALL variable rate debt, and swaps, as of 12/18/18.
8. December 12: Terminated the 2000 Swaptions (Inactive)
9. BNY Mellon and RBC LOCs extended to June 16 and August 1, respectively (2016).
1. LOC restructuring for 2010 Revenue Refunding Bonds closed on March 21, 2013. Three new LOC providers. LOCs fees range from 0.45% to 0.70%.
15. In Sept., the Board authorized staff to execute a possible advanced refunding of the 2010 and 2013 bonds, if appropriate. The authorization also permitted staff to execute prudent transactionrelated to DRPA swaps, including a fixed rate bond issue, if warranted.
12. Underwriter/Remarketer RFQ to establish Bond Pool in progress. Bond pool established by Board Resolution.
2018 ACTION PLAN INITIATIVES
2. 2008 Revenue Bond LOCs extensions were completed on June 28. Retaining TD Bank and Bank of America with fees at 0.655% to 0.70%, respectively.
51
51

Comprehensive Annual Financial Report for Years Ended December 31, 2020 and 2019
52
52

INTRODUCTORY SECTION
Stewardship.Stewardship.Service.Service.
Community.Community.
Our MissionOur MissionAs stewards of public assets, we provide forAs stewards of public assets, we provide for
the safe and efficient operation of transportation the safe and efficient operation of transportation services and facilities in a manner that services and facilities in a manner that creates value for the public we serve.creates value for the public we serve.
Our VisionOur VisionTogether we are world-class stewards ofTogether we are world-class stewards of
public transportation assets. Workingpublic transportation assets. Workingcollaboratively across all business units,collaboratively across all business units,
we operate, maintain, improve and protectwe operate, maintain, improve and protecttransportation infrastructure for the benefittransportation infrastructure for the benefit
of the citizens we serve throughout theof the citizens we serve throughout theGreater Philadelphia Region. We are committedGreater Philadelphia Region. We are committed
to building credibility, earning public trustto building credibility, earning public trustand creating public value.and creating public value.
53
53
DRPA 2020 COMPREHENSIVE ANNUAL FINANCIAL REPORT 3
INTRODUCTORY SECTION
Prepared by the Office of the Chief Financial Officer
FINANCIAL SECTION
INTRODUCTORY SECTION
Independent Auditor’s Report . . . . . . . . . . . . . . . . . . . . . . . . . . . . . . . . . . . . . . . . . . . . . . . . . . . . . . . . . . . . . . . . . . . . . . . . . . . . . . . . . . .
Required Supplementary Information - Part I Management’s Discussion and Analysis (Unaudited). . . . . . . . . . . . . . . . . . . . . . . . . . . . . . . . . . . . . . . . . . . . . . . . . . . . . .
Combined Financial Statements Combined Statements of Net Position. . . . . . .. . . . . . . . . . . . . . . . . . . . . . . . . . . . . . . . . . . . . . . . . . . . . . . . . . . . . . . . . . . . . . . . Combined Statements of Revenues, Expenses and Changes in Net Position . . . . . . . . . . . . . . . . . . . . . . . . . Combined Statements of Cash Flows .. . . . . . . . . . . . . . . . . . . . . . . . . . . . . . . . . . . . . . . . . . . . . . . . . . . . . . . . . . . . . . . . . . . . . . Other Postemployment Benefits Trust Combined Statements of Fiduciary Net Position. . . . . . . . . . . . . . . . . . . . . . . . . . . . . . . . . . . . . . . . . . . . . . . . . . . . . . . . . . . . . Combined Statements of Changes in Fiduciary Net Position. . . . . . . . . . . . . . . . . . . . . . . . . . . . . . . . . . . . . . . . . . . . . . . .
Notes to Combined Financial Statements. . . . . . . . . . . . . . . . . . . . . . . . . . . . . . . . . . . . . . . . . . . . ... . . . . . . . . . . . . . . . . . . .
Required Supplementary Information - Part IISchedules Related to Accounting and Reporting for Pensions (Unaudited): Schedule of the Authority's Proportionate Share of the Net Pension Liability Commonwealth of Pennsylvania - State Employees' Retirement System (SERS). . . . . . . . . . . . . . . . . Schedule of the Authority’s Contributions - Commonwealth of Pennsylvania - State Employees’ Retirement System (SERS). . . . . . . . . . . . . . . . . . . . . . . . . . . . . . . . . . . . . . . . . . . . . . . . . ... . . . . . . Schedule of the Authority's Proportionate Share of the Net Pension Liability State of New Jersey - Public Employees' Retirement System (PERS). . . . . . . . .. . . . . . . . . . . . . . . . . . . . . .
31
33
424446
4849
50
99
100
101
Table of Contents
Comprehensive Annual Financial Report For Years Ended December 31, 2020 and 2019
Chairwoman’s Letter. . . . . . . . . . . . . . . . . . . . . . . . . . . . . . . . . . . . . . . . . . . . . . . . . . . . . . . . . . . . . . . . . . . . . ... . . . . . . . . . . . . . . . . . . . . . . .Board of Commissioners. . . . . . . . . . . . . . . . . . . . . . . . . . . . . . . . . . . . . . . . . . . . . . . . . . . . . . . . . . . . . . . . . . . . . . . . . . . . . . . . . . . . . . . . . .Organizational Chart, Officers and Executive Staff . . . . . . . . . . . . . . . . . . . . . . . . . . . . . . . . . . . . . . . . . . . . . . . . . . . . . . . . . . .Facilities. . . . . . . . . . . . . . . . . . . . . . . . . . . . . . . . . . . . . . . . . . . . . . . . . . . . . . . . . . . . . . . . . . . . . . . . . . . . . . . . . . . . . . . . . . . . . . . . . . . . . . . . . . .Report of the Chief Executive Officer. . . . . . . . . . . . . . . . . . . . . . . . . . . . . . . . . . . . . . . . . . . . . . . . . . . . . . . . . . . . . . . . . . . . . . . . . . .Letter of Transmittal... . . . . . . . . . . . . . . . . . . . . . . . . . . . . . . . . . . . . . . . . . . . . . . . . . . . . . . . . . . . . . . . . . . . . . . . . . . . . . . . . . . . . . . . . . . . .
OF PENNSYLVANIA & NEW JERSEY
71012131519
54
54
4 DRPA 2020 COMPREHENSIVE ANNUAL FINANCIAL REPORT
INTRODUCTORY SECTION
Schedule of the Authority's Contributions State of New Jersey - Public Employees' Retirement System.. . Schedule of the Authority's Contributions Teamsters Pension Plan of Philadelphia and Vicinity. . . . . Notes to Required Supplementary Information - Part II. . . . . . . . . . . . . . . . . . . . . . . . . . . . . . . . . . . . . . . . . . . . . . . . . . .
Required Supplementary Information - Part IIISchedule Related to Other Postemployment Benefit Plans (Unaudited): Schedule of Changes in the Authority's Net OPEB Liability and Related Ratios . . . . . . . . . . . . . . . . . . . . . Schedule of Authority Contributions . . . . . . . . . . . . . . . . . . . . . . . . . . . . . . . . . . . . . . . . . . . . . . . . . . . . . . . . . . . . . . . . . . . . . . . .
Other Supplementary Information: Supplemental Schedules Combined Supplemental Schedule of Net Position Information by Fund .. . ..... . . . . . . . . . . . . . . . . . . . . . . . . Combined Supplemental Schedule of Changes in Fund Net Position Information by Fund. . . . . . . . . . . Supplemental Schedule of Net Position Information for Bond and Project Funds.. . . . . . . . . . . . . . . . . . . . . Supplemental Schedule of Changes in Net Position Information for Bond and Project Funds.. . . . . . .
102103104
105107
109110112113
FINANCIAL SECTION (CONT'D)
Financial Trend Data Net Position. . . . . . . . . . . . . . . . . . . . . . . . . . . . . . . . . . . . . . . . . . . . . . . . . . . . . . . . . . . . . . . . . . . . . . . . . . . . . . . . . . . . . . . . . . . . . . . . . . . . Changes in Net Position. . . . . . . . . . . . . . . . . . . . . . . . . . . . . . . . . . . . . . . . . . . . . . . . . . . . . . . . . . . . . . . . . . . . . . . . . . . . . . . . . . . . . .
Revenue Capacity Data Major Revenues by Source.. . . . . . . . . . . . . . . . . . . . . . . . . . . . . . . . . . . . . . . . . . . . . . . . . . . . . . . . . . . . . . . . . . . . . . . . . . . . . . . . . Toll Revenue by Bridge.. . . . . . . . . . . . . . . . . . . . . . . . . . . . . . . . . . . . . . . . . . . . . . . . . . . . . . . . . . . . . . . . . . . . . . . . . . . . . . . . . . . . . . Bridge Cash Toll Rates. . . . . . . . . . . . . . . . . . . . . . . . . . . . . . . . . . . . . . . . . . . . . . . . . . . . . . . . . . . . . . . . . . . . . . . . . . . . . . . . . . . . . . . Bridge Traffic by Vehicle Classification. . . . . . . . . . . . . . . . . . . . . . . . . . . . . . . . . . . . . . . . . . . . . . . . . . . . . . . . . . . . . . . . . . . . . Bridge Traffic By Bridge.. . . . . . . . . . . . . . . . . . . . . . . . . . . . . . . . . . . . . . . . . . . . . . . . . . . . . . . . . . . . . . . . . . . . . . . . . . . . . . . . . . . . . PATCO Operating Revenues.. . . . . . . . . . . . . . . . . . . . . . . . . . . . . . . . . . . . . . . . . . . . . . . . . . . . . . . . . . . . . . . . . . . . . . . . . . . . . . . PATCO Passenger Fares. . . . . . . . . . . . . . . . . . . . . . . . . . . . . . . . . . . . . . . . . . . . . . . . . . . . . . . . . . . . . . . . . . . . . . . . . . . . . . . . . . . . PATCO Transit System Ridership. . . . . . . . . . . . . . . . . . . . . . . . . . . . . . . . . . . . . . . . . . . . . . . . . . . . . . . . . . . . . . . . . . . . . . . . . . .
Debt Capacity Data Debt Service Coverage.. . . . . . . . . . . . . . . . . . . . . . . . . . . . . . . . . . . . . . . . . . . . . . . . . . . . . . . . . . . . . . . . . . . . . . . . . . . . . . . . . . . . . Funded Debt. . . . . . . . . . . . . . . . . . . . . . . . . . . . . . . . . . . . . . . . . . . . . . . . . . . . . . . . . . . . . . . . . . . . . . . . . . . . . . . . . . . . . . . . . . . . . . . . . . . Ratio of Debt per Customer. . . . . . . . . . . . . . . . . . . . . . . . . . . . . . . . . . . . . . . . . . . . . . . . . . . . . . . . . . . . . . . . . . . . . . . . . . . . . . . . . .
STATISTICAL SECTION (UNAUDITED)
117117
118118118119119119119119
120120120
55
55
DRPA 2020 COMPREHENSIVE ANNUAL FINANCIAL REPORT 5
INTRODUCTORY SECTION
Demographic and Economic DataPennsylvania Port District Economic Statistics. . . . . . . . . . . . . . . . . . . . . . . . . . . . . . . . . . . . . . . . . . . . . . . . . . . . . . . . . . . . . . .Pennsylvania Port District Top Ten Employers. . . . . . . . . . . . . . . . . . . . . . . . . . . . . . . . . . . . . . . . . . . . . . . . . . . . . . . . . . . . . . .New Jersey Port District Economic Statistics. . . . . . . . . . . . . . . . . . . . . . . . . . . . . . . . . . . . . . . . . . . . . . . . . . . . . . . . . . . . . . . . .New Jersey Port District Top Ten Employers. . . . . . . . . . . . . . . . . . . . . . . . . . . . . . . . . . . . . . . . . . . . . . . . . . . . . . . . . . . . . . . . . .Employment Shares by Sector: Greater Philadelphia Region 2019.. . . . . . . . . . . . . . . . . . . . . . . . . . . . . . . . . . . . . . . OPERATING INFORMATIONBridge Operating Revenues.. . . . . . . . . . . . . . . . . . . . . . . . . . . . . . . . . . . . . . . . . . . . . . . . . . . . . . . . . . . . . . . . . . . . . . . . . . . . . . . . . . . .General Expenses by Function. . . . . . . . . . . . . . . . . . . . . . . . . . . . . . . . . . . . . . . . . . . . . . . . . . . . . . . . . . . . . . . . . . . . . . . . . . . . . . . . .Operating Statistics. . . . . . . . . . . . . . . . . . . . . . . . . . . . . . . . . . . . . . . . . . . . . . . . . . . . . . . . . . . . . . . . . . . . . . . . . . . . . . . . . . . . . . . . . . . . . .Full-Time Authority Employees.. . . . . . . . . . . . . . . . . . . . . . . . . . . . . . . . . . . . . . . . . . . . . . . . . . . . . . . . . . . . . . . . . . . . . . . . . . . . . . . .Capital Expenditures. . . . . . . . . . . . . . . . . . . . . . . . . . . . . . . . . . . . . . . . . . . . . . . . . . . . . . . . . . . . . . . . . . . . . . . . . . . . . . . . . . . . . . . . . . . . .Capital Asset Statistics. . . . . . . . . . . . . . . . . . . . . . . . . . . . . . . . . . . . . . . . . . . . . . . . . . . . . . . . . . . . . . . . . . . . . . . . . . . . . . . . . . . . . . . . . .Bridge and PATCO Operations. . . . . . . . . . . . . . . . . . . . . . . . . . . . . . . . . . . . . . . . . . . . . . . . . . . . . . . . . . . . . . . . . . . . . . . . . . . . . . . . .
STATISTICAL SECTION (UNAUDITED) (CONT'D)
121121121121121
122122123123123123124
56
56
6 DRPA 2020 COMPREHENSIVE ANNUAL FINANCIAL REPORT
INTRODUCTORY SECTION
57
57
DRPA 2020 COMPREHENSIVE ANNUAL FINANCIAL REPORT 7
INTRODUCTORY SECTION
Chairwoman’s Letter
Cherelle L. ParkerChairwoman, DRPA
June 30, 2021
Greetings,
In February 2021, Pennsylvania Gov. Tom Wolf appointed me to serve on the Board of Commissioners for the Delaware River Port Authority (DRPA) and the Port Authority Transit Corporation (PATCO). I was pleased to accept the call to serve and was honored to be elected by my Board colleagues to serve as Chairwoman.
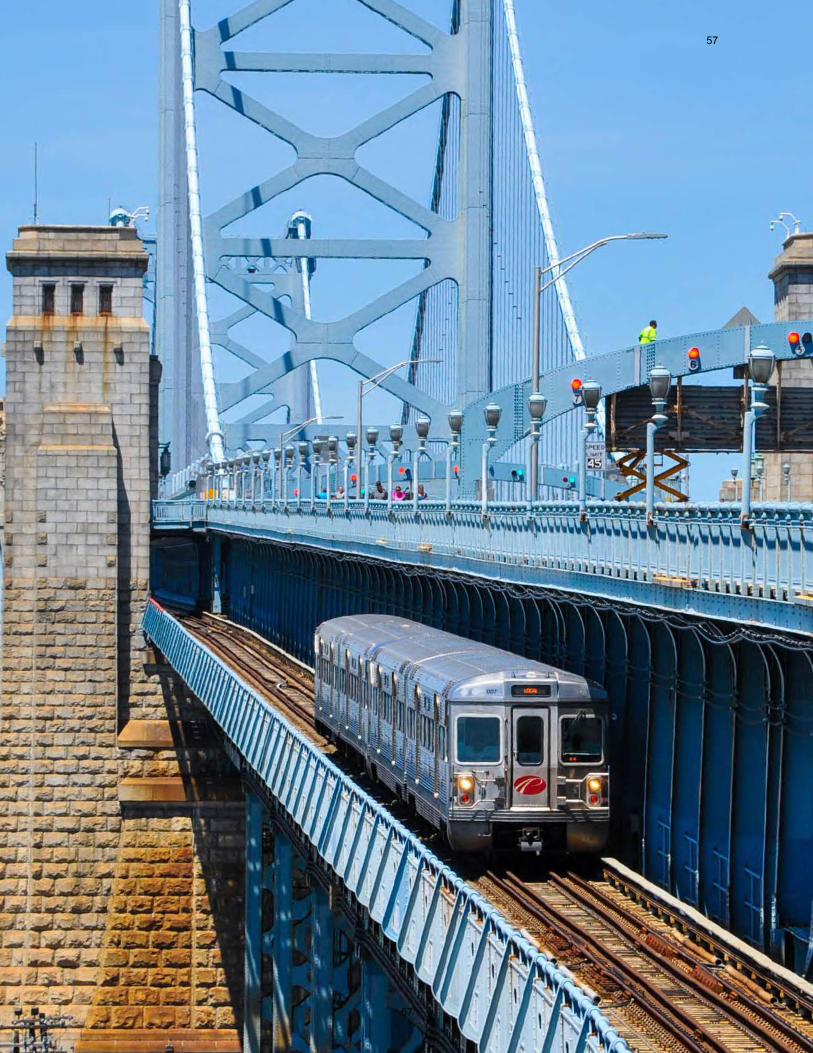
DRPA’s four bridges and PATCO’s 14.2-mile high speed transit line serve millions of commuters and local businesses. Like companies nationwide, our Board and the executive leadership team have had to grapple with challenges presented by the COVID-19 pandemic. Our executive leadership team rose to the challenge and created a comprehensive plan that focused on the health, safety, and overall well-being of our employees and customers. The plan, which was based on science and guidance from the CDC, federal and state sources, has proven to be very successful.
Throughout all phases of the pandemic, our team has remained committed to the Authority’s stewardship mission. We have focused on ensuring that all bridges, facilities, and PATCO trains are safe, secure and serviceable. We have controlled operating expenses and spending and have filled vacant positions strategically. As we emerge from the pandemic, I am pleased to report the following accomplishments:
• Bridge traffic is rebounding and is near 85% of pre-pandemic levels;
• PATCO ridership is improving. It has reached about 33% of the pre-pandemic ridership, with weekday ridership averaging more than 11,000 and continuing to grow;
• We are optimistic about our financial future.
• We invested a record $202.6 million in capital projects to upgrade and improve our bridge and PATCO assets. This represents an $84.3 million increase in total capital expenditures.
• We commenced work on the largest project in DRPA’s history- the $217 million Ben Franklin Bridge Suspension Span and Anchorage Rehabilitation Project. This '2021 Philadelphia Major Bridge Project’ award winner from the 28th Annual Transportation, Building & Construction Awards will provide for dehumidification of the main suspension cables, structural steel repairs, maintenance painting, pedestrian & bike walkway improvements and a state-of-the-art decorative bridge lighting system.
58
58
8 DRPA 2020 COMPREHENSIVE ANNUAL FINANCIAL REPORT
INTRODUCTORY SECTION
• In February 2020, we initiated the rehabilitation of the Walt Whitman Bridge Pennsylvania `I-76 Corridor. This $74 million project will improve the 2.5-mile roadway from our toll plaza to Passyunk Avenue. Work involves the rehabilitation of the existing roadway, overpasses, lighting, signage and roadway drainage.
• We continued our $32 million project to install elevators in every PATCO station. The project adds elevators to six stations and will make the PATCO line fully ADA-compliant. To date, four stations have been completed with the final two stations are expected to be finished in spring of 2022.
• As part of our stewardship commitment, in 2020, we added the use of drones to supplement our biennial inspections and we have developed a progressive asset management program. The asset management program, combined with our biennial inspections, allows us to
allocate resources more efficiently and extend the service life of existing assets.
From the start of my tenure, I have been clear about my commitment to innovation and continuous improvement. I have advocated policies, projects, and initiatives that will promote diversity, equity, inclusion and greater access for everyone, particularly those individuals without cars or other reliable means of transportation. Work on the following projects will continue in 2021. They demonstrate the Board’s continued commitment to provide efficient transportation services and facilities in a manner that creates value for the public we serve.
• The PATCO Franklin Square Station in Philadelphia has been closed since 1979. To restore access to the Chinatown and Northern Liberties sections of Philadelphia, we will undertake a $30 million revitalization of this station that will be ADA compliant. To date, we have secured $12.9 million through a BUILD Grant Agreement with the Federal Transit Administration.
• We are nearing completion of a 22-megawatt solar array installation at seven DRPA/PATCO locations (One Port Center, Commodore Barry Bridge, Betsy Ross Bridge, and PATCO stations at, Lindenwold, Ferry Avenue, Ashland, and Woodcrest). This new system will provide for more than 50% of the DRPA and PATCO’s power usage. This sustainability-led initiative was made possible through a power purchase agreement with a solar developer and will result in a substantial cost savings for the DRPA and PATCO over a 20-year period.
• The Environmental Impact Study for the Glassboro-Camden Line was completed in February 2021. In partnership with NJ Transit and South Jersey Transportation Authority,
we will continue to advance this important regional project that will provide better access to educational and employment opportunities, health care, and other regional activities.
59
59
DRPA 2020 COMPREHENSIVE ANNUAL FINANCIAL REPORT 9
INTRODUCTORY SECTION
The next phase includes the selection of a Program Management Office Consultant and a Preliminary Engineering Consultant.
As we move forward, together, Vice Chairman Jeffrey Nash, the Board of Commissioners, and I will be focused on strategies that will result in fiscal prudence and a strong overall financial standing for DRPA and PATCO. In addition, we will continue to make smart and innovative investments to maintain, upgrade, and improve the assets for which we are responsible.
Best regards,
Cherelle L. ParkerChairwoman
60
60

10 DRPA 2020 COMPREHENSIVE ANNUAL FINANCIAL REPORT
INTRODUCTORY SECTION
Donna POWELL Donna Powell, LLCFiduciary Services
PENNSYLVANIA
Joseph S. MARTZBoard Chairman & CEONHS Human Services
KatieMCGINTYVice President of Global Government Relations Johnson Controls
Hon. Timothy L. DEFOOR PA Auditor GeneralEx-Officio
Christopher A. LEWISAttorneyBlank Rome
Cherelle L. PARKERChairwoman City Council Majority Leader & 9th District CouncilwomanCity of Philadelphia
HonorableTom Wolf GovernorCommonwealth of Pennsylvania
BBOAROARD OF CD OF COMMISSIONERSOMMISSIONERSas of June 30, 2021
Angelina PERRYMAN Vice President of AdministrationPerryman Building &Construction Services
Hon. Stacy GARRITYPA State TreasurerEx-Officio
61
61

DRPA 2020 COMPREHENSIVE ANNUAL FINANCIAL REPORT 11
INTRODUCTORY SECTION
Jeffrey L. NASHVice ChairmanFreeholder Camden County Board of Chosen Freeholders
Sara LIPSETT CommissionerBoard of Fire Commissioners, Cherry Hill Township
Aaron T. NELSON Senior Vice President, Investment Advisor Evesham Capital Management
Daniel CHRISTYFreeholderGloucester County Senior Council Representative for Northeast Regional Council of Carpenters
NEW JERSEY
HonorablePhil MurphyGovernorState of New Jersey
Charles FENTRESS Retired Police Sergeant Delaware River Port Authority
Albert F. FRATTALI Co-Administrator Iron Workers District Council Philadelphia Benefit & Pension Fund
Bruce D.GARGANIO FreeholderBurlington CountySenior Council Representative for Northeast Regional Council of Carpenters
Richard SWEENEY Financial Secretary, Business RepresentativeIronworkers #399
62
62
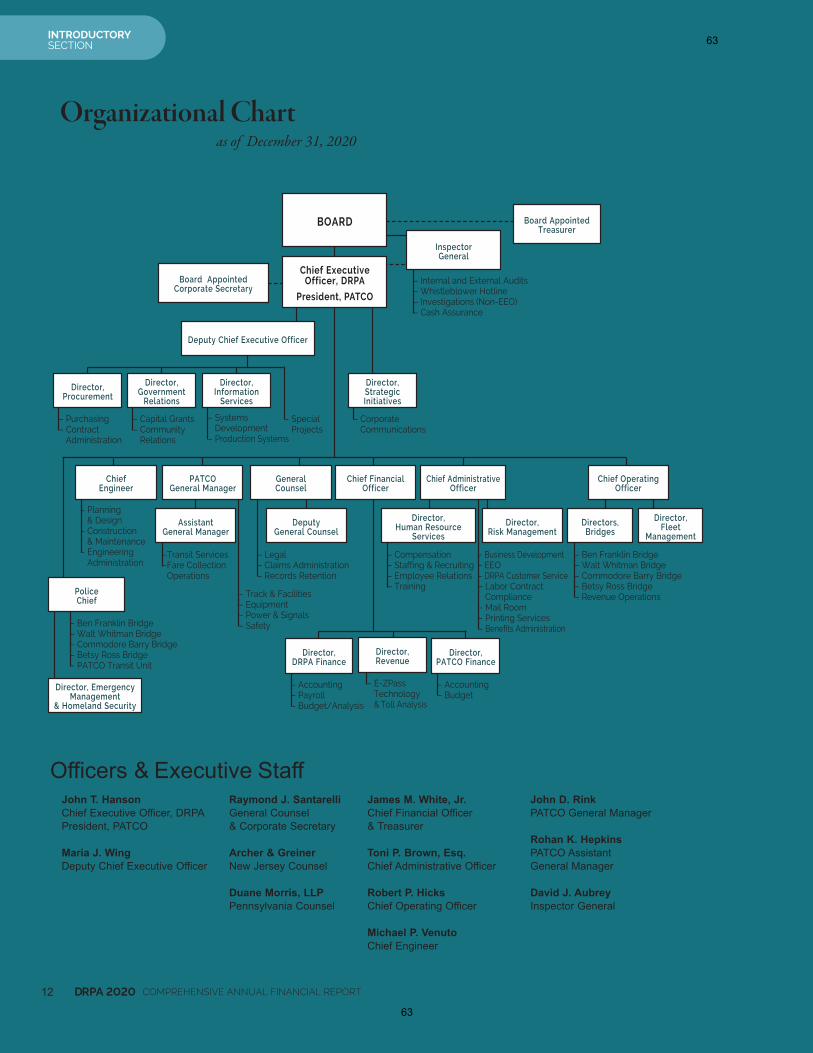
12 DRPA 2020 COMPREHENSIVE ANNUAL FINANCIAL REPORT
Organizational Chart
John T. HansonChief Executive Officer, DRPAPresident, PATCO
Maria J. Wing Deputy Chief Executive Officer
Raymond J. Santarelli General Counsel & Corporate Secretary
Archer & Greiner New Jersey Counsel
Duane Morris, LLP Pennsylvania Counsel
James M. White, Jr.Chief Financial Officer& Treasurer
Toni P. Brown, Esq.Chief Administrative Officer
Robert P. HicksChief Operating Officer
Michael P. VenutoChief Engineer
Officers & Executive StaffJohn D. Rink PATCO General Manager
Rohan K. Hepkins PATCO Assistant General Manager
David J. AubreyInspector General
as of December 31, 2020
INTRODUCTORY SECTION
– Capital Grants– Community Relations
– Legal – Claims Administration– Records Retention
– Ben Franklin Bridge– Walt Whitman Bridge– Commodore Barry Bridge– Betsy Ross Bridge– Revenue Operations
– Ben Franklin Bridge– Walt Whitman Bridge– Commodore Barry Bridge– Betsy Ross Bridge– PATCO Transit Unit
– Internal and External Audits– Whistleblower Hotline– Investigations (Non-EEO)– Cash Assurance
– Planning & Design– Construction
& Maintenance– Engineering
Administration
– Track & Facilities– Equipment– Power & Signals– Safety
BOARD
Chief ExecutiveOfficer, DRPA
President, PATCO
Deputy Chief Executive Officer
– Accounting– Budget
– Accounting– Payroll– Budget/Analysis
Director, DRPA Finance
Director, PATCO Finance
– Systems Development– Production Systems
Director, Information
Services
–Transit Services–Fare Collection Operations
– Business Development– EEO– DRPA Customer Service– Labor Contract Compliance– Mail Room– Printing Services– Benefits Administration
– Compensation– Staffing & Recruiting– Employee Relations– TrainingPolice
Chief
Director, Emergency Management
& Homeland Security
Board Appointed Treasurer
Inspector General
Board AppointedCorporate Secretary
Deputy General Counsel
Assistant General Manager
Director, Human Resource
Services
Director, Risk Management
Directors, Bridges
Director, Fleet
Management
General Counsel
Chief Administrative Officer
Chief Engineer
PATCOGeneral Manager
Chief FinancialOfficer
Chief OperatingOfficer
Director, Government
Relations
– Corporate Communications
Director, Strategic Initiatives
– Purchasing– Contract Administration
Director,Procurement
Director, Revenue
– Special Projects
– E-ZPass Technology & Toll Analysis
63
63
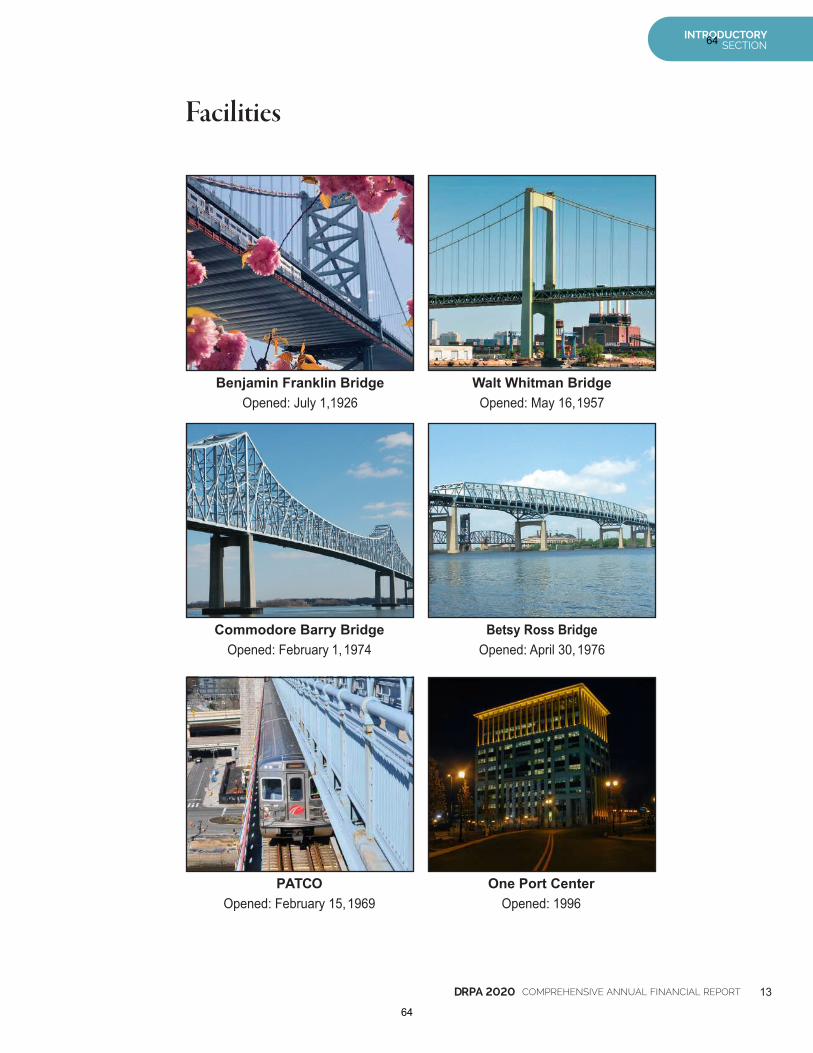
DRPA 2020 COMPREHENSIVE ANNUAL FINANCIAL REPORT 13
INTRODUCTORY SECTION
Benjamin Franklin BridgeOpened: July 1,1926
Walt Whitman Bridge Opened: May 16, 1957
Commodore Barry BridgeOpened: February 1, 1974
Betsy Ross BridgeOpened: April 30, 1976
PATCOOpened: February 15, 1969
Facilities
One Port CenterOpened: 1996
64
64
14 DRPA 2020 COMPREHENSIVE ANNUAL FINANCIAL REPORT
INTRODUCTORY SECTION
65
65
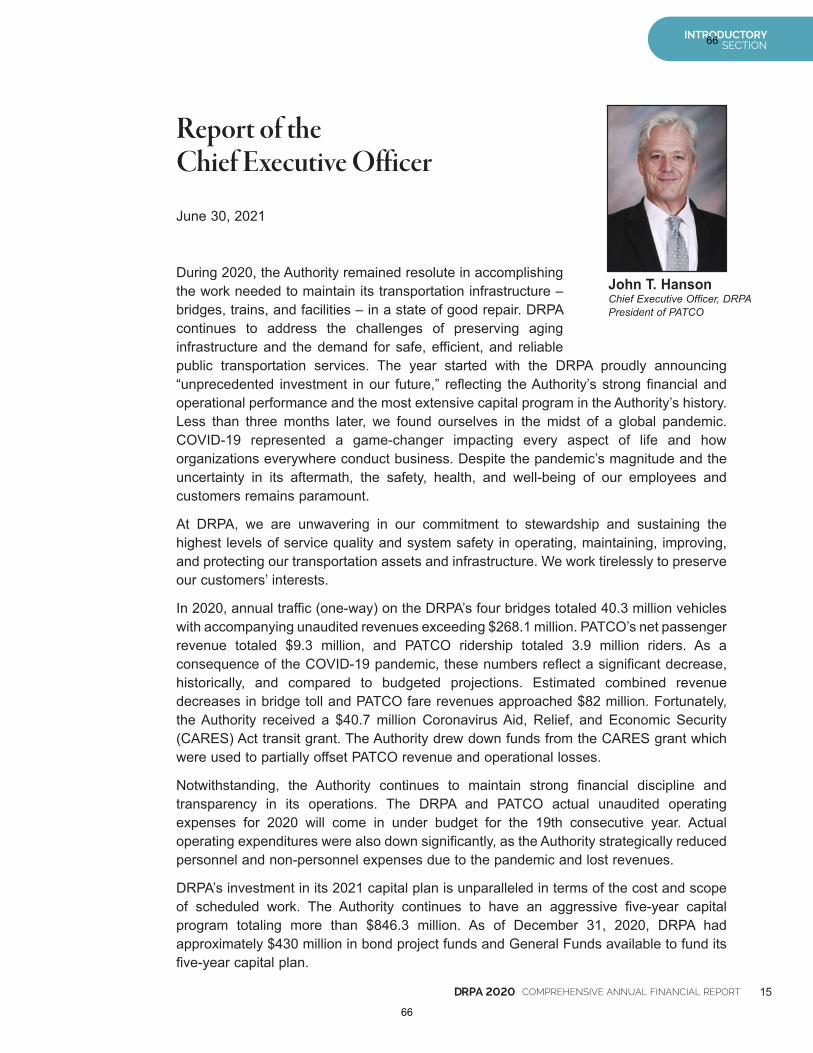
DRPA 2020 COMPREHENSIVE ANNUAL FINANCIAL REPORT 15
INTRODUCTORY SECTION
John T. Hanson Chief Executive Officer, DRPA President of PATCO
June 30, 2021
During 2020, the Authority remained resolute in accomplishing the work needed to maintain its transportation infrastructure – bridges, trains, and facilities – in a state of good repair. DRPA continues to address the challenges of preserving aging infrastructure and the demand for safe, efficient, and reliable public transportation services. The year started with the DRPA proudly announcing “unprecedented investment in our future,” reflecting the Authority’s strong financial and operational performance and the most extensive capital program in the Authority’s history. Less than three months later, we found ourselves in the midst of a global pandemic. COVID-19 represented a game-changer impacting every aspect of life and how organizations everywhere conduct business. Despite the pandemic’s magnitude and the uncertainty in its aftermath, the safety, health, and well-being of our employees and customers remains paramount.
At DRPA, we are unwavering in our commitment to stewardship and sustaining the highest levels of service quality and system safety in operating, maintaining, improving, and protecting our transportation assets and infrastructure. We work tirelessly to preserve our customers’ interests.
In 2020, annual traffic (one-way) on the DRPA’s four bridges totaled 40.3 million vehicles with accompanying unaudited revenues exceeding $268.1 million. PATCO’s net passenger revenue totaled $9.3 million, and PATCO ridership totaled 3.9 million riders. As a consequence of the COVID-19 pandemic, these numbers reflect a significant decrease, historically, and compared to budgeted projections. Estimated combined revenue decreases in bridge toll and PATCO fare revenues approached $82 million. Fortunately, the Authority received a $40.7 million Coronavirus Aid, Relief, and Economic Security (CARES) Act transit grant. The Authority drew down funds from the CARES grant which were used to partially offset PATCO revenue and operational losses.
Notwithstanding, the Authority continues to maintain strong financial discipline and transparency in its operations. The DRPA and PATCO actual unaudited operating expenses for 2020 will come in under budget for the 19th consecutive year. Actual operating expenditures were also down significantly, as the Authority strategically reduced personnel and non-personnel expenses due to the pandemic and lost revenues.
DRPA’s investment in its 2021 capital plan is unparalleled in terms of the cost and scope of scheduled work. The Authority continues to have an aggressive five-year capital program totaling more than $846.3 million. As of December 31, 2020, DRPA had approximately $430 million in bond project funds and General Funds available to fund its five-year capital plan.
Report of theChief Executive Officer
66
66
16 DRPA 2020 COMPREHENSIVE ANNUAL FINANCIAL REPORT
INTRODUCTORY SECTION
Employing the foundational elements of leadership, a highly skilled workforce, fiscal responsibility, and innovation, DRPA and PATCO are confronting the pandemic’s risks and devastating impacts. Our focus on these elements is not a reaction to COVID-19. It is a deliberate and proactive strategy that underpins the Authority’s strategic management framework. The core of this framework is the Authority’s Strategic Plan entitled “Strategic Plan: Roadmap to World-Class Stewardship 2018-2022”, which includes the mission, vision, shared values, strategic objectives, goals, and strategies to guide planning and project execution over the next several years. Despite the challenges presented by the pandemic, we continue to succeed in moving the Authority closer to realizing our vision of a world-class stewardship organization that consistently meets the highest standards of excellence in delivering its services.
We are proud of our 2020 achievements, and we look forward to facing our 2021 challenges with creativity, diligence, and an enduring commitment to STEWARDSHIP, SERVICE, and COMMUNITY.
Yours truly,
John T. Hanson Chief Executive Officer, Delaware River Port Authority President, Port Authority Transit Corporation
67
67
DRPA 2020 COMPREHENSIVE ANNUAL FINANCIAL REPORT 17
INTRODUCTORY SECTION
68
68
18 DRPA 2020 COMPREHENSIVE ANNUAL FINANCIAL REPORT
INTRODUCTORY SECTION
69
69
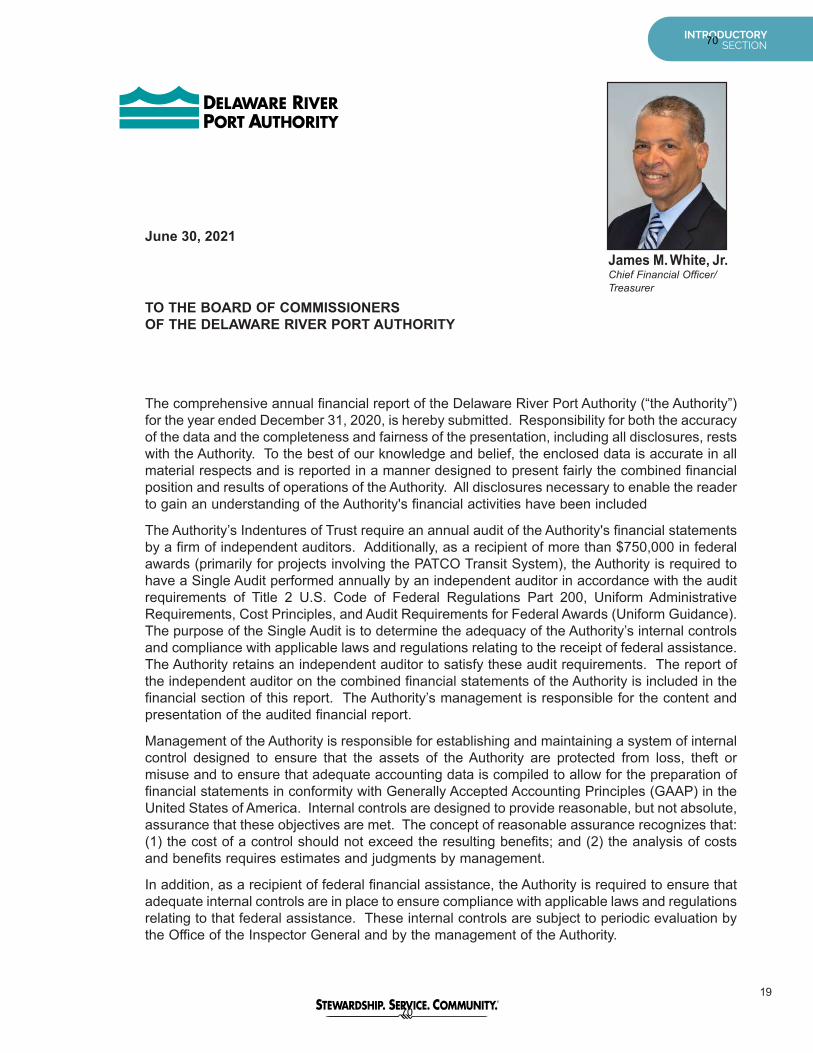
19
INTRODUCTORY SECTION
TO THE BOARD OF COMMISSIONERS OF THE DELAWARE RIVER PORT AUTHORITY
The comprehensive annual financial report of the Delaware River Port Authority (“the Authority”) for the year ended December 31, 2020, is hereby submitted. Responsibility for both the accuracy of the data and the completeness and fairness of the presentation, including all disclosures, rests with the Authority. To the best of our knowledge and belief, the enclosed data is accurate in all material respects and is reported in a manner designed to present fairly the combined financial position and results of operations of the Authority. All disclosures necessary to enable the reader to gain an understanding of the Authority's financial activities have been included
The Authority’s Indentures of Trust require an annual audit of the Authority's financial statements by a firm of independent auditors. Additionally, as a recipient of more than $750,000 in federal awards (primarily for projects involving the PATCO Transit System), the Authority is required to have a Single Audit performed annually by an independent auditor in accordance with the audit requirements of Title 2 U.S. Code of Federal Regulations Part 200, Uniform Administrative Requirements, Cost Principles, and Audit Requirements for Federal Awards (Uniform Guidance). The purpose of the Single Audit is to determine the adequacy of the Authority’s internal controls and compliance with applicable laws and regulations relating to the receipt of federal assistance. The Authority retains an independent auditor to satisfy these audit requirements. The report of the independent auditor on the combined financial statements of the Authority is included in the financial section of this report. The Authority’s management is responsible for the content and presentation of the audited financial report.
Management of the Authority is responsible for establishing and maintaining a system of internal control designed to ensure that the assets of the Authority are protected from loss, theft or misuse and to ensure that adequate accounting data is compiled to allow for the preparation of financial statements in conformity with Generally Accepted Accounting Principles (GAAP) in the United States of America. Internal controls are designed to provide reasonable, but not absolute, assurance that these objectives are met. The concept of reasonable assurance recognizes that: (1) the cost of a control should not exceed the resulting benefits; and (2) the analysis of costs and benefits requires estimates and judgments by management.
In addition, as a recipient of federal financial assistance, the Authority is required to ensure that adequate internal controls are in place to ensure compliance with applicable laws and regulations relating to that federal assistance. These internal controls are subject to periodic evaluation by the Office of the Inspector General and by the management of the Authority.
June 30, 2021James M. White, Jr. Chief Financial Officer/Treasurer
70
70
20 DRPA 2020 COMPREHENSIVE ANNUAL FINANCIAL REPORT
INTRODUCTORY SECTION
The combined financial statements of the Authority are prepared using the accrual method of accounting in accordance with GAAP. Management has provided a narrative introduction, overview, and analysis to accompany the combined financial statements in the Management’s Discussion and Analysis (MD&A). This letter of transmittal is designed to complement the MD&A and should be read in conjunction with it. The Delaware River Port Authority’s MD&A can be found immediately following the report of the independent auditors.
The Delaware River Port Authority is a public corporate instrumentality of the Commonwealth of Pennsylvania and the State of New Jersey created with the consent of Congress by compact legislation between the Commonwealth of Pennsylvania and the State of New Jersey. The Authority, which has no stockholders or equity holders, was created in 1952 as a successor to the Delaware River Joint Commission, which was created in 1931. The Authority is governed by a 16-member Board of Commissioners. The Governor of New Jersey appoints eight commissioners with the advice and consent of the Senate of New Jersey. The Governor of Pennsylvania appoints six commissioners, with the Auditor General and the State Treasurer of Pennsylvania serving as ex-officio commissioners for Pennsylvania. Commissioners serve five-year terms without compensation. The Board of Commissioners establishes policy and plans for the operations of the Authority. A Chief Executive Officer is appointed by the Board of Commissioners to implement policy and to manage the daily operations of the Authority.
The Board of Commissioners of the Delaware River Port Authority has established five (5) committees under the authority of its Bylaws. They are: the Operations and Maintenance Committee, the Projects Committee, the Executive Committee, the Finance Committee, and the Export Development and International Trade Committee. (The latter committee is now inactive). These committees adhere to the rules and leadership structure outlined in Article IX of the DRPA Bylaws. These Committees act pursuant to the power vested them under the Bylaws.
The Board of Commissioners of the Delaware River Port Authority has also established, under the authority of resolution DRPA-10-040, an Audit Committee that is chaired by the Auditor General of Pennsylvania. The Audit Committee is charged with overseeing an annual independent financial audit along with a biennial performance audit. The Authority’s Board also adopted an Audit Committee charter through resolution DRPA-10-141. This resolution specifies that the purpose of the Audit Committee is to assist the Board in fulfilling its oversight responsibility relating to: (1) the Authority’s internal and external audit process, the financial reporting process, and all risk assessment and internal controls over financial reporting; (2) compliance with applicable laws, policies, and accounting and auditing standards, and (3) communication between the Authority’s management, internal and external auditors, experts, other advisors, and the Board.
The Audit Committee adheres to the rules and leadership structure outlined in resolutions DRPA-10-040 and DRPA-10-141. The Audit Committee acts pursuant to the power vested it under these two resolutions. It is not vested with any power under the Bylaws.
71
71
DRPA 2020 COMPREHENSIVE ANNUAL FINANCIAL REPORT 21
INTRODUCTORY SECTION
In addition, to the aforementioned committees, the Board of Commissioners adopted resolutions DRPA 10-10-071 and DRPA 12-112, which established the Compensation and Labor Committees, respectively, to review the Authority’s compensation issues and current labor agreement(s), labor/employee relations and non-represented employee issues. These committees, similar to the Audit Committee, act pursuant to the power vested them under these two authorizing resolutions and are not vested with any power under the Bylaws.
The Authority is vested with the ownership, control, operation, and collection of tolls and revenues of certain bridges spanning the Delaware River; namely, the Benjamin Franklin, Walt Whitman, Commodore Barry and Betsy Ross bridges. The Authority has also constructed and owns a high-speed transit system, which is operated by its wholly owned subsidiary, the Port Authority Transit Corporation (PATCO). The transit system operates between Philadelphia, Pennsylvania and Lindenwold, New Jersey.
BUDGET PROCESS
The Authority prepares both operating and capital budgets annually. The annual operating budget is a financial planning tool for the associated fiscal year; it also sets the maximum spending limit for the Authority. The Authority's Chief Officers, Directors and staff contribute to the development of a preliminary operating budget based on the expected staffing and funding levels necessary to operate the Authority's facilities in an efficient and safe manner. After individual departmental proposed operating budgets are reviewed at budget hearings conducted by the Operating Budget Review Committee, (which consists of the Chief Executive Officer, Deputy Chief Executive Officer, Chief Financial Officer, Chief Operating Officer, General Counsel, the General Manager of PATCO and other senior staff), a proposed operating budget is presented by the Chief Executive Officer to the Finance Committee and ultimately to the Board of Commissioners for its review and approval. Any subsequent addition of funds to the total operating budget requires the approval of the Board of Commissioners.
A five-year capital budget, required by the Authority’s Compact, is also prepared through a similar process and submitted to the Finance Committee, and subsequently to the Board of Commissioners for approval. The capital budget is a planning document identifying the Authority's potential commitments. The approval of the capital budget does not in itself authorize any specific project. Specific approval by the Board of Commissioners is required before any capital project may commence. The foundation for the major capital budget projects (those projects greater than $200K) is the biennial inspection, which results in the inspection all four bridges and PATCO. This inspection is required by the 1998 Revenue Bond Indenture, and was last completed in October 2020, prior to finalization of the 2021 Capital Budget. Smaller capital projects, primarily projects under $200K, are identified by various operating and administrative departments.
Expenditures are monitored continuously throughout the year by the Finance Division to ensure that each department is following the approved operating and capital budgets and the established Policies and Bylaws of the Authority.
72
72
22 DRPA 2020 COMPREHENSIVE ANNUAL FINANCIAL REPORT
INTRODUCTORY SECTION
In accordance with the Authority’s governing Revenue and Port District Project Bond Indentures, the next year’s annual operating budget must be submitted to the bond trustee by December 31st of each year.
Pursuant to the Indentures, the Authority filed its 2020 operating budgets in late December 2019 with its bond trustees. The 2020 operating and capital budgets became effective on January 1, 2020. The Authority also filed its annual 2021 operating budgets (which include the debt service requirements) with its bond trustee in late December 2020 as required by the bond indentures. (The operating budgets became effective on January 1, 2021).
FACTORS AFFECTING FINANCIAL CONDITION
During the past several years, the Authority has taken significant strategic steps to strengthen its financial position through cost-containment of personnel and non-personnel expenditures, increasing its liquidity through growth in its General Fund, and restructuring its debt and swap portfolios. The latter strategy was primarily in response to: changing financial markets, the exercise of various swaptions (in 2006, 2008 and 2010), passage of a board resolution mandating the liquidation of the Authority’s swap portfolio in ”an orderly and strategic fashion,” the necessity of funding its various annual five-year Capital Programs, and the adoption of annual Finance Action plans by the Authority’s Board of Commissioners (which have been implemented during the period of 2012 through 2020).
Sustained traffic growth from 2014 through 2019, has been a major factor impacting the Authority’s financial condition. Total vehicular traffic in 2018 was 5.4 million vehicles annually, higher than 2014 traffic numbers, thereby increasing the annual bridge toll revenues to historically high levels during 2018. Annual toll revenues increased from $297.3 million in 2014, rising to a high of $335.6 million in 2018. Revenue growth outpaced expense growth during the period, with the net effect producing higher annual net income levels and a resultant strengthening of the Authority’s General Fund reserves. This strong cash flow increased the General Fund to approximately $548 million, (just prior to the use of $281.6 million to defease the 2010D bonds in the amount of $308.4 million) in November 2018, and helped create a higher net position (which increased to $779.8 million, up from $587.8 million in 2014). As mentioned elsewhere, the Authority then made the strategic decision to eliminate all variable rate debt and swaps from its debt portfolio in late December, significantly reducing exposure to its financial position.
In 2019, traffic trended slightly downwards, decreasing by 0.31%, which resulted in a $3.4 million decrease in toll revenues. However, 2019 was the still the second-highest year for toll revenues despite the dip in traffic. Total traffic and toll revenues dropped largely because of large construction projects on and around two (2) of the Authority’s bridges during the year.
While 2020 started out with increased traffic and bridge toll revenue growth, beginning in mid-March, due to the explosion of the COVID-19 pandemic and implementation of various government pronouncements, traffic and toll revenues dropped precipitously, with traffic volumes dropping to a low of 23% of 2019 traffic volumes in April. PATCO ridership dropped to a low of 9% on certain days in April, measured against 2019 volumes, with ridership falling to approximately 83K riders during the month.
73
73
DRPA 2020 COMPREHENSIVE ANNUAL FINANCIAL REPORT 23
INTRODUCTORY SECTION
Impact of COVID-19
In March 2020, with the expansion of the COVID-19 virus and with various emergency pronouncements by the federal government and states (including Pennsylvania and New Jersey), many industries were severely impacted due to the expansion of the COVID-19 virus throughout the country and specifically in the region. The Authority’s bridge toll revenues and PATCO passenger fare revenues were especially hit hard. At its lowest point, in April, the Authority’s traffic dropped by 3.1 million vehicles, or by 70%, with toll revenues decreasing by $16.7 million, or by over 60% vs. 2019 volumes. During the period June through October traffic recovered to approximately 80% of pre-COVID volumes. By year-end, traffic and bridge toll revenues decreased by 12.8 million vehicles and by $64.0 million, from 2019 totals.
PATCO ridership and revenues also were adversely impacted. At its lowest levels, early during the pandemic, PATCO ridership dropped by 90% of pre-COVID volumes. For the year, PATCO’s ridership and net passenger revenues were down by 7.1 million riders, or by 64%, and total net passenger revenues were down by approximately $18 million, respectively, from 2019 totals. Fortunately, the Authority was awarded a $40.7 million CARES Act FTA transit grant, which offset a large portion of PATCO’s lost revenues and expenses. The Authority drew down $28.7 million against the grant for year 2020.
In response to the lost revenues, the Authority constrained its operational spending, including a hiring freeze, etc. such that expenses were under budget for both entities. Given its strong pre-COVID financial position, the Authority was able to continue an aggressive capital spending plan and make all of its required debt service requirements on its bonds without problem.
Please refer to Note 19, Subsequent Events, for more information on the impact of the pandemic thus far in 2021.
DEBT MANAGEMENT
As mentioned previously, in the period of 2012 through 2020, the Authority, and its Board, approved comprehensive financial plans to: reduce the Authority’s debt, adopt a new swap strategy, renegotiate and replace various LOC agreements to reduce its annual LOC facility costs, and to finance its five-year capital programs. As described below, the Authority significantly restructured its overall debt and swap profiles by executing several large bond-related transactions during the fourth quarter of 2018, including the defeasement of its 2010 Revenue Bonds. The Authority’s $700.5 million bond deal eliminated all variable rate debt, supporting letters of credit and all swaps, such that the Authority’s bond portfolio consisted only of fixed rate debt as of December 31, 2018. At December 31, 2020, the Authority’s fixed rate debt accounted for $1.12 billion or roughly 91.1% of its total debt of $1.31 billion.
74
74
24 DRPA 2020 COMPREHENSIVE ANNUAL FINANCIAL REPORT
INTRODUCTORY SECTION
2018 Bond Transactions
As mentioned in the previous section, in mid-December 2018, the Authority issued new fixed-rate bond debt in the amount of $700.5 million. The 2018 Series B and C bonds, in the amounts of $404.1 million and $22.97 million, respectively, were issued to fully redeem all its variable rate debt (in the amount of $460.2 million) and to terminate the swaptions supporting this debt. As a result, the two remaining LOCs, and the four (4) direct purchase loans, were also terminated.
The Authority has reduced its debt service through 2040 by approximately $63 million, as a result of the aforementioned transactions
Total Debt
As mentioned, previously, one of the cornerstones of the Authority’s strategy has been to reduce debt exposure and the total amount of outstanding debt. During the past six (6) years, the Authority’s total funded debt which exceeded $1.65 billion at year-end 2013, has been reduced by almost $350 million, down to $1.31 billion.
The Authority’s total bonds outstanding decreased by $68.3 million in 2020 to total $1.23 billion at year-end, all of which is fixed rate debt. (An additional $70.8 million was paid down in January 2021). (Please see Note 12 for additional information).
Swap Management
In 2016, the Authority’s Board specifically authorized the Authority’s management “to the extent deemed economically advantageous and fiscally prudent for the Authority” the amendment, replacement and termination of any or all of the Authority’s outstanding Interest Rate Swap Agreements.” This authorization also provided for the issuance of fixed rate debt to refund all outstanding variable rate bonds.
With the issuance of the 2018 Revenue and Revenue Refunding Bonds in December 2018, specifically, Series B and C, the Authority cash-settled the 1995 and 1999 Revenue Bond swaptions in the amount of $63.8 million. (At the time of the termination, the notional amount was $460.2 million). Two smaller “inactive” swaptions were also cash-settled, thereby eliminating all swaps/swaptions.
At December 31, 2020, the Authority had no outstanding swaptions.
75
75
DRPA 2020 COMPREHENSIVE ANNUAL FINANCIAL REPORT 25
INTRODUCTORY SECTION
Bond Ratings
One of the key strategic goals of the Authority, in the past decade, has been to improve its bond ratings. The implementation of the aforementioned strategic initiatives including: on-going annual budget control, managing an affordable capital program, maintenance of strong debt coverage and liquidity, reduction of swap and variable rate exposures, and, improvement in annual traffic have been key factors cited by the ratings agencies to support recent upward movements of the Authority’s ratings, as shown below:
1. In October 2017, Moody’s Investors Service upgraded all of the Authority’s long term bond debt, increasing the ratings on the revenue bonds from “A3” to “A2,” while also raising the port district bonds ratings from “Baa3” to “Baa2”, all with a “stable” outlook.
2. In November 2018, prior to the issuance of the 2018 Revenue and Refunding Bonds, both S&P and Moody’s noted the Authority’s strong operational performance, upward trend in total annual traffic and the “expected elimination of all of the Authority variable rate debt and swap exposures” in their evaluation of the Authority’s debt. As a result, S&P, as it did in 2013, upgraded all of the Authority’s outstanding bond debt, raising the underlying rating on the revenue bonds to “A+” from “A” and also its ratings on the port district project bonds to “A” from “‘A-“, with a “stable” outlook.
Moody’s affirmed the ratings on the Authority’s revenue and port project bonds at ‘”A2” and “Baa2,” respectively, while changing the ratings outlook from “stable” to “positive”.
3. In February 2020, Moody’s raised the ratings on all of the Authority’s bonds. The revenue bonds were raised to “A1” from “A2”, while the Port District Project Bonds, were raised from “Baa2” to “Baa1”, all with a “stable” outlook.
These recent upward adjustments in the ratings for the revenue and revenue funding bonds and/or the subordinated port district project bonds, attest to the strength of the Authority’s overall financial condition, and its improvement over the past decade.
Shortly thereafter, in March 2020, as a result of the deteriorating operating environment, all toll road sector organizations were moved from “stable” to “negative” outlook by Moody’s and S&P. S&P took further action by moving the Authority’s outlook to negative.
(Please refer for additional information on ratings actions in early 2021 in Note 19, Subsequent Events).
76
76
26 DRPA 2020 COMPREHENSIVE ANNUAL FINANCIAL REPORT
INTRODUCTORY SECTION
LOCAL ECONOMY
2019 DataFrom the latest data available (through 2019), it appears that population growth has increased by 0.18% in the Pennsylvania (PA) counties and increased by 0.05% in the New Jersey (NJ) counties within the Port District versus 2018 totals. Population growth increased in PA and NJ by 7,251 and 1,174 people, respectively.
Employment growth has receded slightly in the Pennsylvania Port counties. In Pennsylvania counties, the unemployment rate increased from 4.21% in 2018 to 4.29% in 2019. The 2019 overall rate of 4.29% is down from a high of 8.63% in 2012.
Employment growth in New Jersey has shown continual improvement since 2012, when unemployment peaked at 10.82%. During 2019, the unemployment rate, in the New Jersey counties, dropped to 4.09% from the previous year total of 4.69%. The 2019 overall rate of 4.09% is down from a high of 10.82% in 2012.
2020 Data
While not all information on the local economy is available, at this writing, we have located information on employment/unemployment numbers for PA and NJ. Unemployment in the Port District appears to have increased dramatically in 2020, as a result of the severe contraction of the economy.
PA unemployment increased from the 4.29% to 9.43%, while NJ unemployment increased from a decade year low of 4.09% in 2019 to 10.43%.
Additional information can be found in the Statistical Section of this report.
LONG-TERM FINANCIAL PLANNING
An important component of the Authority’s long-term financial plan is ensuring that it has sufficient revenue to meet its operating and capital requirements. With assistance from its Financial Advisors, the Authority uses a long-term forecasting model, which creates a multi-year forecast of its revenues and expenses. The model incorporates numerous independent variables (including operating revenue and expense estimates, debt service coverage and capacity, etc.) and forecasts the estimated annual cash flows available to meet the Authority’s annual Indenture certification requirements. In addition, the model projects the annual General Fund contributions, which can be used to help fund the Authority’s five-year capital plan. Results from a traffic engineering study, completed in November 2018 (which contained projections for a ten-year period), were incorporated into this model for use in developing required forecasts necessary for the 2018 bond issuances. The Authority regularly updates this model based on changes in business conditions and its financial performance.
As mentioned in the “Budget Process” section of this document, each year, the Authority develops a five-year capital plan, which details the anticipated capital expenditures during this five-year period. (An annual 5-year Capital Plan is a requirement of the Authority’s
77
77

INTRODUCTORY SECTION
DRPA 2020 COMPREHENSIVE ANNUAL FINANCIAL REPORT 27
Compact). The Authority also performs a 5-year analysis of potential funding sources (including bond project funds, general fund monies, its annual operational surplus, and federal funding) to ensure funding of the program. The major capital programs originate in large part from the biennial inspections of all DRPA/PATCO facilities, which are conducted in every even-numbered year, by individual engineering firms. This is a requirement of our Bond Indentures. (In compliance with our bond indenture, the 2020 biennial inspection was completed by the October 1 deadline).
The 2020 Capital Plan, developed during the year 2019, and approved by the Board of Commissioners in November 2019, outlined numerous bridge, transit system, security and technology project expenditures of approximately $810.3 million (net of federal funding), for the five-year period commencing in 2020. The 2020 fiscal year budget for capital expenditures totaled $200.1 million, net of federal funding.
In December 2020, the Authority’s Board approved its 2021 Capital Budget in the amount of $196.7 million and a total 5-year capital plan with projected expenditures of $846.3 million, up almost $36 million from the total 2019 5-year capital plan. The Authority will continue to use both its General Fund reserves and bond project funds (resulting from the 2018 bond issuance) to fund these capital expenditures going forward. At year-end, roughly $430.7 million, in combined restricted and unrestricted funds, are available to fund a large portion of this 2021 Capital Plan.
BRIDGE TOLL AND PASSENGER FARE SCHEDULES
There have been no changes to the Authority’s bridge toll and passenger fare schedules since July 2011. However, as described below, the Authority’s Board did reinstitute a “frequent bridge traveler” credit program, which became effective in December of 2015.
Frequent Bridge Traveler Credit:
Under Board Resolution DRPA 15-090, the Authority reintroduced an $18 credit/18 trips per month for passenger vehicles in the NJ E-ZPass system. The new toll credit program became effective on December 1, 2015 with the first credit issued in January 2017 to eligible account holders.
The Authority paid out approximately $1.1 million during fiscal year 2020 related to this program, however this reduction in revenues was offset by an initiative established in 2016 (“delayed transaction processing”), which enabled the Authority to capture approximately $3.8 million in additional toll revenues in 2020.
(Please see Note 16 for the current toll and fare schedules).
78
78
AWARDS AND ACCOMPLISHMENTS
The Government Finance Officers Association of the United States and Canada (GFOA) awarded a Certificate of Achievement for Excellence in Financial Reporting to the Delaware River Port Authority for its comprehensive annual financial report for the fiscal year ended December 31, 2019. This was the twenty-eighth (28th) consecutive year that the Authority has achieved this prestigious award. In order to be awarded a Certificate of Achievement, a government must publish an easily readable and efficiently organized comprehensive annual financial report. This report must satisfy both generally accepted accounting principles and applicable legal requirements.
A Certificate of Achievement is valid for a period of one year only. We believe our current comprehensive annual financial report continues to meet the Certificate of Achievement Program’s requirements and we are submitting it to the GFOA to determine its eligibility for another certificate.
The preparation of this report would not have been possible without the dedication and effectiveness of the entire Finance Division staff, with support by the Government & Corporate Communications Department and Printing Services. I would especially like to express my appreciation to the members of these departments who contributed in the preparation of this report. Special thanks must also be given to the Chairman, Vice-Chairman, Chief Executive Officer, Deputy Chief Executive Officer and the Finance and Audit Committees of the Board for maintaining the highest standards in the management of the Delaware River Port Authority's finances. Special thanks also goes to DRPA’s David Aubrey, Inspector General, for his leadership in facilitating the annual financial audit.
Respectfully submitted,
James M. White, Jr. Chief Financial Officer/Treasurer
28 DRPA 2020 COMPREHENSIVE ANNUAL FINANCIAL REPORT
79
79

FinancialSection
80
80

FinancialSection
81
81
3131
INDEPENDENT AUDITOR'S REPORT
To the Board of CommissionersDelaware River Port Authority
Report on the Financial Statements
We have audited the accompanying combined financial statements of the Delaware River Port Authority and subsidiary (collectively referred to as the “Authority”), which comprise the combined statements of net position as of December 31, 2020 and 2019, and the related combined statements of revenues, expenses and changes in net position, and cash flows, for the years then ended, together with the combined statements of fiduciary net position as of December 31, 2020 and 2019, and the combined statements of changes in fiduciary net position for the years then ended, and the related notes to the combined financial statements, which collectively comprise the Authority’s basic financial statements as listed in the table of contents.
Management’s Responsibility for the Financial Statements
Management is responsible for the preparation and fair presentation of these financial statements in accordance with accounting principles generally accepted in the United States of America; this includes the design, implementation, and maintenance of internal control relevant to the preparation and fair presentation of financial statements that are free from material misstatement, whether due to fraud or error.
Auditor’s Responsibility
Our responsibility is to express opinions on these financial statements based on our audit. We conducted ouraudit in accordance with auditing standards generally accepted in the United States of America. Those standards require that we plan and perform the audit to obtain reasonable assurance about whether the financial statements are free from material misstatement.
An audit involves performing procedures to obtain audit evidence about the amounts and disclosures in the financial statements. The procedures selected depend on the auditor’s judgment, including the assessment of the risks of material misstatement of the financial statements, whether due to fraud or error. In making those risk assessments, the auditor considers internal control relevant to the entity’s preparation and fair presentation of the financial statements in order to design audit procedures that are appropriate in the circumstances, but not for the purpose of expressing an opinion on the effectiveness of the entity’s internal control. Accordingly, we express no such opinion. An audit also includes evaluating the appropriateness of accounting principles used and thereasonableness of significant accounting estimates made by management, as well as evaluating the overall presentation of the financial statements.
We believe that the audit evidence we have obtained is sufficient and appropriate to provide a basis for our audit opinions.
Opinions
In our opinion, the financial statements referred to above present fairly, in all material respects, the financial position of the Delaware River Port Authority and subsidiary as of December 31, 2020 and 2019, and its changes in financial position and cash flows thereof for the years then ended, in accordance with accounting principles generally accepted in the United States of America.
FINANCIALSECTION
DRPA 2020 COMPREHENSIVE ANNUAL FINANCIAL REPORT
82
82

32 DRPA 2020 COMPREHENSIVE ANNUAL FINANCIAL REPORT
FINANCIALSECTION
Emphasis of Matter
Subsequent Events
As discussed in note 19 to the combined financial statements, management of the Authority has evaluated the impact of the economic uncertainties caused by the COVID-19 coronavirus on its financial position subsequent to December 31, 2020. Our opinion is not modified with respect to this matter.
Other Matters
Required Supplementary Information
Accounting principles generally accepted in the United States of America require that the management’s discussion and analysis and the schedules listed under the heading Required Supplementary Information within the table of contents be presented to supplement the basic financial statements. Such information, although not a part of the basic financial statements, is required by the Governmental Accounting Standards Board who considers it to be an essential part of financial reporting for placing the basic financial statements in an appropriate operational, economic, or historical context. We have applied certain limited procedures to the required supplementary information in accordance with auditing standards generally accepted in the United States of America, which consisted of inquiries of management about the methods of preparing the information and comparing the information for consistency with management’s responses to our inquiries, the basic financial statements, and other knowledge we obtained during our audit of the basic financial statements. We do not express an opinion or provide any assurance on the information because the limited procedures do not provide us with sufficient evidence to express an opinion or provide any assurance.
Other Information
Our audit was conducted for the purpose of forming opinions on the combined financial statements that collectively comprise the Delaware River Port Authority and subsidiary’s basic financial statements. The accompanying supplemental schedules, as listed in the table of contents, and the introductory and statistical sections are presented for purposes of additional analysis and are not a required part of the basic financial statements.
The accompanying supplemental schedules are the responsibility of management and were derived from and relate directly to the underlying accounting and other records used to prepare the basic financial statements. Such information has been subjected to the auditing procedures applied in the audit of the basic financial statements and certain additional procedures, including comparing and reconciling such information directly to the underlying accounting and other records used to prepare the basic financial statements or to the basic financial statements themselves, and other additional procedures in accordance with auditing standards generally accepted in the United States of America. In our opinion, the accompanying supplemental schedules are fairly stated, in all material respects, in relation to the basic financial statements as a whole.
The introductory section and statistical section, as listed in the table of contents, have not been subjected to the auditing procedures applied in the audit of the basic financial statements, and accordingly, we do not express an opinion or provide any assurance on them.
Respectfully submitted,
BOWMAN & COMPANY LLPCertified Public Accountants& Consultants
Voorhees, New JerseyJune 30, 2021
83
83
DRPA 2020 COMPREHENSIVE ANNUAL FINANCIAL REPORT 33
FINANCIALSECTION
Management’s Discussion & Analysis (Unaudited)
As management of the Delaware River Port Authority (the “Authority”), we offer readers of our financial statementsthis narrative overview and analysis of the financial activities of the Authority for the years ended December 31, 2020and 2019. We encourage readers to consider the information presented here in conjunction with additionalinformation that we have furnished in our letter of transmittal. All amounts are expressed in thousands of dollarsunless otherwise indicated.
FINANCIAL OVERVIEW
Total operating revenues were $287.2 million in 2020. 2020 revenues decreased $81.0 million or by 22.0%vs. 2019 revenues. (Note 2019 revenues were the second highest level in DRPA history). The decrease wasprimarily related to the impact of the COVID-19 pandemic and the shutdown of the economy.
The $64.1 million net decrease in toll revenues (down 19.3%) during the year, was attributable to significantlylower automobile and commercial vehicle volume. The average toll, based on total vehicle volume, increasedfrom $6.26 to $6.65 in 2020, a function of commercial vehicles accounting for a higher percentage of traffic(or 8.2%) than in 2019.
Bridge traffic decreased by 12.8 million vehicles, or by 24.1% (during the period 2017-2019 traffic hadaveraged over 53 million vehicles), with 2018 and 2019 volumes being the highest totals in a decade.Passenger vehicles fell by 12.4 million (or by 25.5%.) Non-commercial traffic was stable at 3.3 millionvehicles. Traffic volume on the bridges resulted from large closures throughout the regional economy.
The Port Authority Transit Corporation (“PATCO”) is a wholly-owned subsidiary of the Delaware River PortAuthority (DRPA) and is subsidized by the DRPA. Total PATCO expenses exceeded total PATCO revenuesby $43.9 million in 2020 vs. $27.7 million in 2019. The operating loss increased by $16.2 million from 2019to 2020, an increase of 58.6%.
PATCO net passenger fare revenues decreased by $17.9 million (or by 65.9%) to $9.3 million from $27.1million in 2019. This decrease was primarily resultant from the impact of the pandemic, as total passengerridership of 3.9 million riders decreased by 7.2 million riders, (down 64.4%), down from 11.1 million riders in2019. Total PATCO revenues (inclusive of parking, advertising and other revenues) were down $19.0 millionoverall vs. 2019 totals. (2019 PATCO ridership, of 11.1 million passengers, was the highest level in the pasttwenty-five years).
Total “non-restricted” investments, specifically the General Fund investments, decreased by $19.1 million to$269.2 million, a decrease of 6.6%. The reduction is in part due to use of the General Fund to fund theaggressive capital program during 2020, the PATCO subsidy, and attributable to the reduced internal cashflows, especially related to the bridge toll revenues and investment income. The Authority executed cashdraw downs in CARES Act transit grant funds in 2020 which helped offset a large portion of the subsidy.
Restricted investments, including the monies held in the 2018 revenue bond project fund, decreased by$114.1 million to $381.7 million, down from a total of $495.8 million in 2019. At year-end, the bond projectfund (used for funding large capital projects) totaled $140.5 million, a decrease of $107.9 million (or 43.4%)from 2019’s year-end total of $248.4 million.
Total operating expenses decreased to $240.3 million, down $9.7 million, or by 3.9%, vs. 2019 expensestotaling $250.0 million. This decrease resulted from the Authority’s strategic plan to minimize expenses,including personnel costs, as the pandemic deepened throughout 2020. Key decreases occurred indepreciation expense, which dropped by $3.6 million, coupled with combined decreases in bridge andPATCO operating expenses totaling $5.8 million.
Total debt outstanding decreased by 6.0%, or by $83.0 million, to total $1.31 billion at year-end, down fromthe 2019 total of $1.39 billion. (Since year-end 2018, all of the Authority’s debt is fixed-rate debt. Prior toyear-end 2018, variable rate debt accounted for approx. 34% of the Authority’s total debt).
Capital expenditures totaled $202.6 million in 2020 vs. $118.3 million in 2019, a significant increase of $84.3million (or 71.2%). The 2020 total is the highest in DRPA history. Much of the increase is attributable toexpenditures of $128.3 million for seven (7) large capital projects, mentioned in the “Capital Assets” section,
The assets and deferred outflows of resources of the Authority exceeded its liabilities and deferred inflowsof resources at the close of 2020 resulting in a net position of $933.7 million, an increase of $54.3 millionfrom year-end 2019. Net income before capital contributions decreased to $32.3 million from $77.4 million, ayear-to-year decrease of $45.1 million, or (58.3%).
Debt service coverage for revenue bond debt (as calculated based on the 1998 Bond Indenture) decreasedto 1.50x from 2.04x in 2019, as 2020 net revenues available for debt service of $170.1 million decreased by$62.0 million or by 26.7%, This decrease resulted primarily from the significantly reduced toll revenues (down$64.1) million and interest income (down $6.6.million) during 2020.
84
84
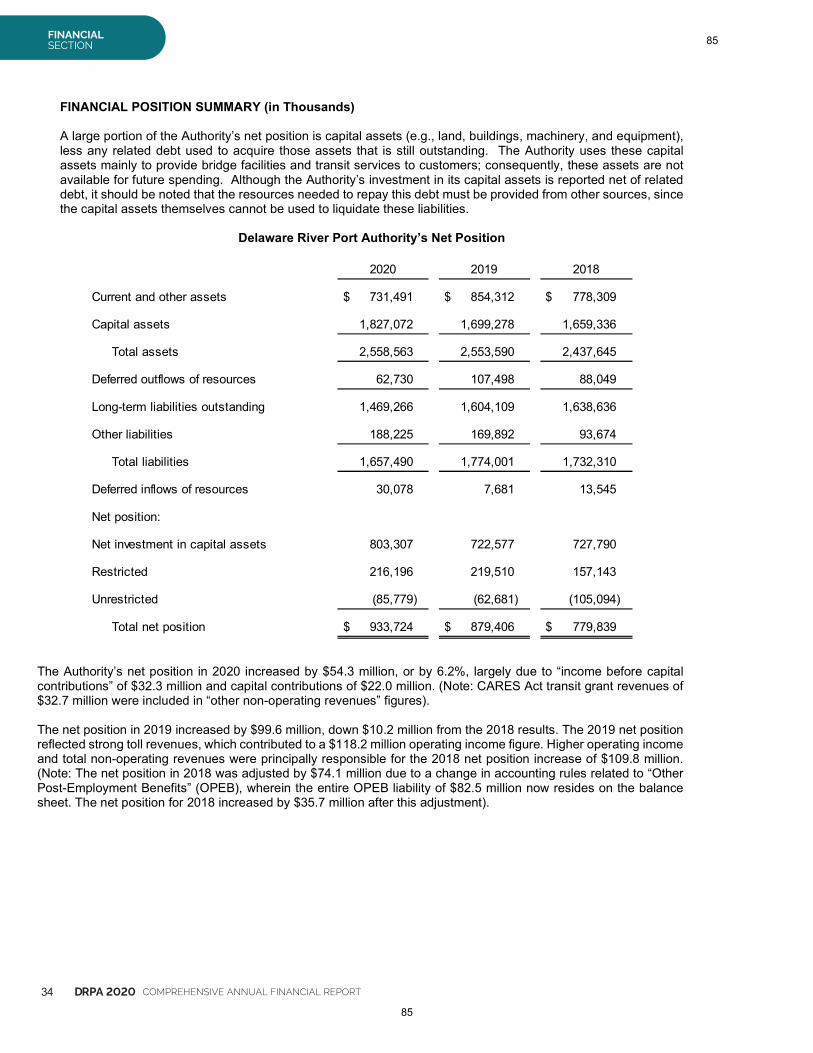
34 DRPA 2020 COMPREHENSIVE ANNUAL FINANCIAL REPORT
FINANCIALSECTION
FINANCIAL POSITION SUMMARY (in Thousands)
A large portion of the Authority’s net position is capital assets (e.g., land, buildings, machinery, and equipment),less any related debt used to acquire those assets that is still outstanding. The Authority uses these capitalassets mainly to provide bridge facilities and transit services to customers; consequently, these assets are notavailable for future spending. Although the Authority’s investment in its capital assets is reported net of relateddebt, it should be noted that the resources needed to repay this debt must be provided from other sources, sincethe capital assets themselves cannot be used to liquidate these liabilities.
Delaware River Port Authority’s Net Position
The Authority’s net position in 2020 increased by $54.3 million, or by 6.2%, largely due to “income before capitalcontributions” of $32.3 million and capital contributions of $22.0 million. (Note: CARES Act transit grant revenues of$32.7 million were included in “other non-operating revenues” figures).
The net position in 2019 increased by $99.6 million, down $10.2 million from the 2018 results. The 2019 net positionreflected strong toll revenues, which contributed to a $118.2 million operating income figure. Higher operating incomeand total non-operating revenues were principally responsible for the 2018 net position increase of $109.8 million.(Note: The net position in 2018 was adjusted by $74.1 million due to a change in accounting rules related to “OtherPost-Employment Benefits” (OPEB), wherein the entire OPEB liability of $82.5 million now resides on the balancesheet. The net position for 2018 increased by $35.7 million after this adjustment).
2020 2019 2018
Current and other assets 731,491$ 854,312$ 778,309$
Capital assets 1,827,072 1,699,278 1,659,336
Total assets 2,558,563 2,553,590 2,437,645
Deferred outflows of resources 62,730 107,498 88,049
Long-term liabilities outstanding 1,469,266 1,604,109 1,638,636
Other liabilities 188,225 169,892 93,674
Total liabilities 1,657,490 1,774,001 1,732,310
Deferred inflows of resources 30,078 7,681 13,545
Net position:
Net investment in capital assets 803,307 722,577 727,790
Restricted 216,196 219,510 157,143
Unrestricted (85,779) (62,681) (105,094)
Total net position 933,724$ 879,406$ 779,839$
85
85
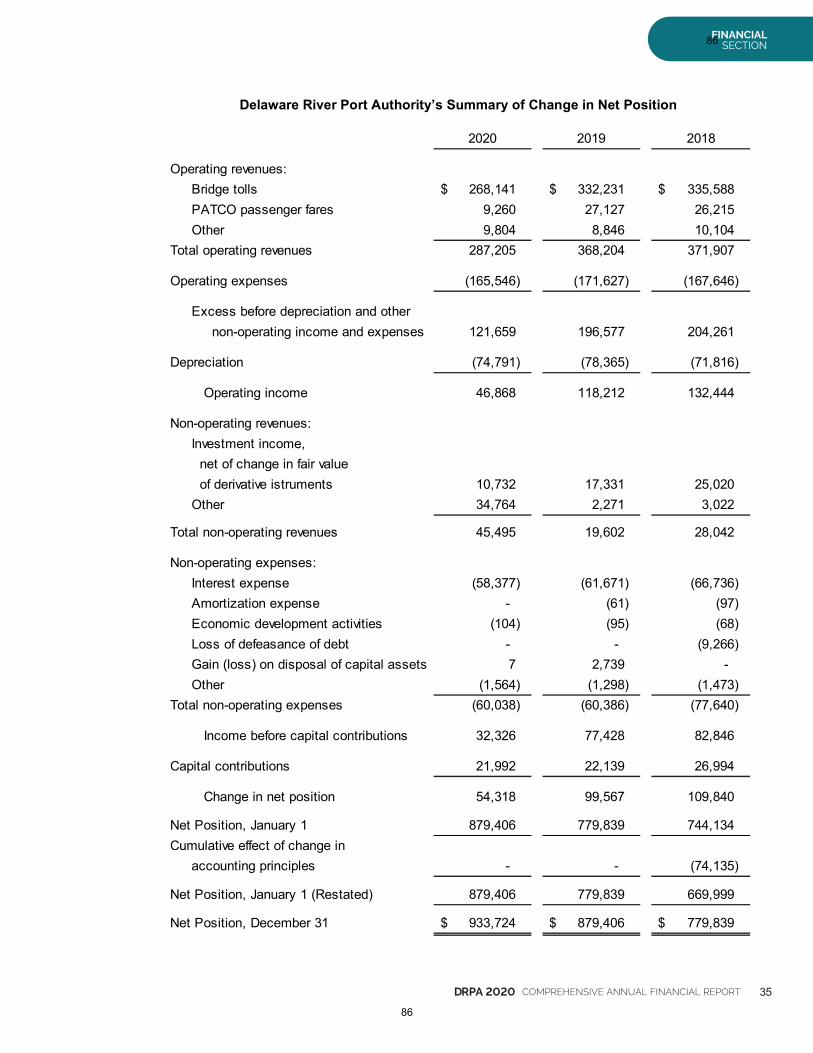
DRPA 2020 COMPREHENSIVE ANNUAL FINANCIAL REPORT 35
FINANCIALSECTION
Delaware River Port Authority’s Summary of Change in Net Position
2020 2019 2018
Operating revenues:Bridge tolls 268,141$ 332,231$ 335,588$PATCO passenger fares 9,260 27,127 26,215Other 9,804 8,846 10,104
Total operating revenues 287,205 368,204 371,907
Operating expenses (165,546) (171,627) (167,646)
Excess before depreciation and othernon-operating income and expenses 121,659 196,577 204,261
Depreciation (74,791) (78,365) (71,816)
Operating income 46,868 118,212 132,444
Non-operating revenues:Investment income,
net of change in fair valueof derivative istruments 10,732 17,331 25,020
Other 34,764 2,271 3,022
Total non-operating revenues 45,495 19,602 28,042
Non-operating expenses:Interest expense (58,377) (61,671) (66,736)Amortization expense - (61) (97)Economic development activities (104) (95) (68)Loss of defeasance of debt - - (9,266)Gain (loss) on disposal of capital assets 7 2,739 -Other (1,564) (1,298) (1,473)
Total non-operating expenses (60,038) (60,386) (77,640)
Income before capital contributions 32,326 77,428 82,846
Capital contributions 21,992 22,139 26,994
Change in net position 54,318 99,567 109,840
Net Position, January 1 879,406 779,839 744,134Cumulative effect of change in
accounting principles - - (74,135)
Net Position, January 1 (Restated) 879,406 779,839 669,999
Net Position, December 31 933,724$ 879,406$ 779,839$
86
86
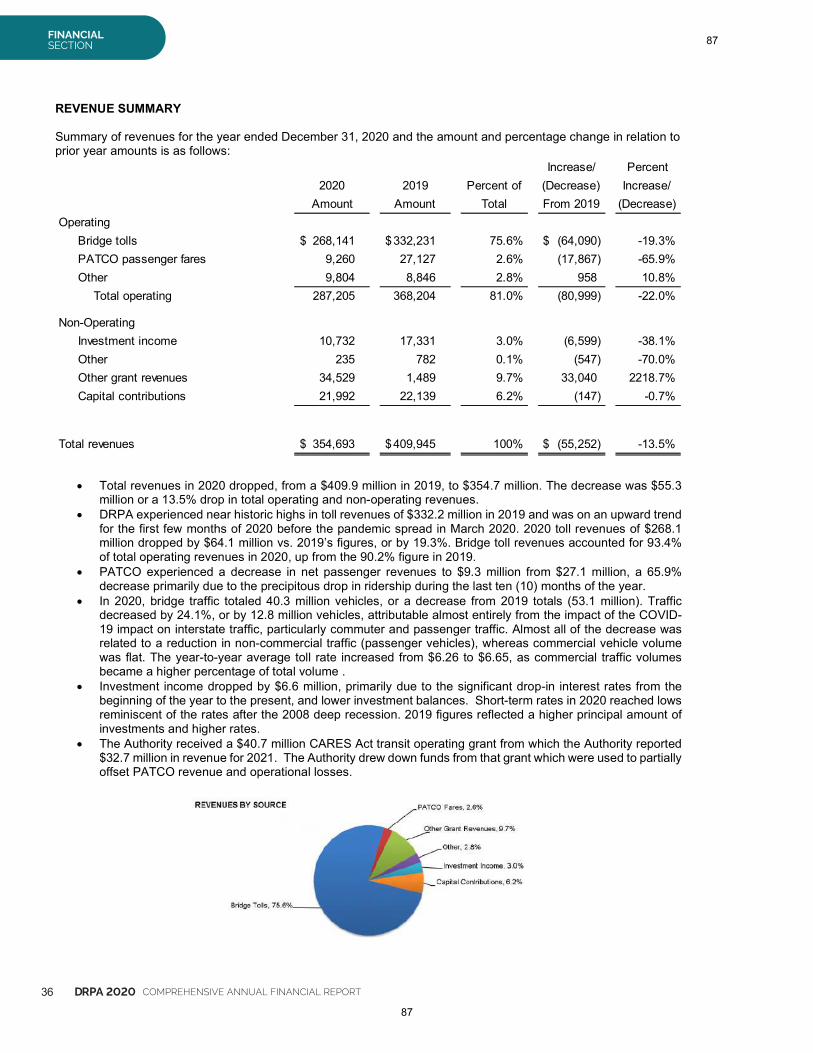
36 DRPA 2020 COMPREHENSIVE ANNUAL FINANCIAL REPORT
FINANCIALSECTION
REVENUE SUMMARY
Summary of revenues for the year ended December 31, 2020 and the amount and percentage change in relation toprior year amounts is as follows:
Total revenues in 2020 dropped, from a $409.9 million in 2019, to $354.7 million. The decrease was $55.3million or a 13.5% drop in total operating and non-operating revenues.
DRPA experienced near historic highs in toll revenues of $332.2 million in 2019 and was on an upward trendfor the first few months of 2020 before the pandemic spread in March 2020. 2020 toll revenues of $268.1million dropped by $64.1 million vs. 2019’s figures, or by 19.3%. Bridge toll revenues accounted for 93.4%of total operating revenues in 2020, up from the 90.2% figure in 2019.
PATCO experienced a decrease in net passenger revenues to $9.3 million from $27.1 million, a 65.9%decrease primarily due to the precipitous drop in ridership during the last ten (10) months of the year.
In 2020, bridge traffic totaled 40.3 million vehicles, or a decrease from 2019 totals (53.1 million). Trafficdecreased by 24.1%, or by 12.8 million vehicles, attributable almost entirely from the impact of the COVID-19 impact on interstate traffic, particularly commuter and passenger traffic. Almost all of the decrease wasrelated to a reduction in non-commercial traffic (passenger vehicles), whereas commercial vehicle volumewas flat. The year-to-year average toll rate increased from $6.26 to $6.65, as commercial traffic volumesbecame a higher percentage of total volume .
Investment income dropped by $6.6 million, primarily due to the significant drop-in interest rates from thebeginning of the year to the present, and lower investment balances. Short-term rates in 2020 reached lowsreminiscent of the rates after the 2008 deep recession. 2019 figures reflected a higher principal amount ofinvestments and higher rates.
The Authority received a $40.7 million CARES Act transit operating grant from which the Authority reported$32.7 million in revenue for 2021. The Authority drew down funds from that grant which were used to partiallyoffset PATCO revenue and operational losses.
Increase/ Percent2020 2019 Percent of (Decrease) Increase/
Amount Amount Total From 2019 (Decrease)Operating
Bridge tolls 268,141$ 332,231$ 75.6% (64,090)$ -19.3%PATCO passenger fares 9,260 27,127 2.6% (17,867) -65.9%Other 9,804 8,846 2.8% 958 10.8%
Total operating 287,205 368,204 81.0% (80,999) -22.0%
Non-OperatingInvestment income 10,732 17,331 3.0% (6,599) -38.1%Other 235 782 0.1% (547) -70.0%Other grant revenues 34,529 1,489 9.7% 33,040 2218.7%Capital contributions 21,992 22,139 6.2% (147) -0.7%
Total revenues 354,693$ 409,945$ 100% (55,252)$ -13.5%
87
87
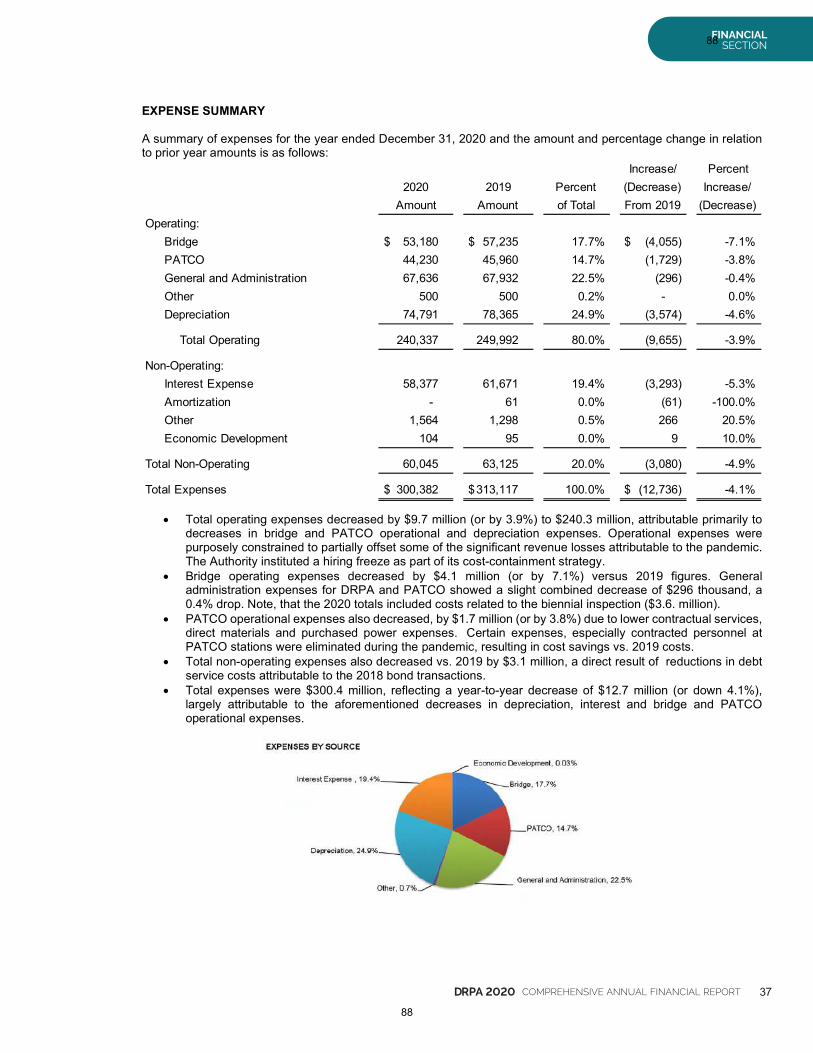
DRPA 2020 COMPREHENSIVE ANNUAL FINANCIAL REPORT 37
FINANCIALSECTION
EXPENSE SUMMARY
A summary of expenses for the year ended December 31, 2020 and the amount and percentage change in relationto prior year amounts is as follows:
Total operating expenses decreased by $9.7 million (or by 3.9%) to $240.3 million, attributable primarily todecreases in bridge and PATCO operational and depreciation expenses. Operational expenses werepurposely constrained to partially offset some of the significant revenue losses attributable to the pandemic.The Authority instituted a hiring freeze as part of its cost-containment strategy.
Bridge operating expenses decreased by $4.1 million (or by 7.1%) versus 2019 figures. Generaladministration expenses for DRPA and PATCO showed a slight combined decrease of $296 thousand, a0.4% drop. Note, that the 2020 totals included costs related to the biennial inspection ($3.6. million).
PATCO operational expenses also decreased, by $1.7 million (or by 3.8%) due to lower contractual services,direct materials and purchased power expenses. Certain expenses, especially contracted personnel atPATCO stations were eliminated during the pandemic, resulting in cost savings vs. 2019 costs.
Total non-operating expenses also decreased vs. 2019 by $3.1 million, a direct result of reductions in debtservice costs attributable to the 2018 bond transactions.
Total expenses were $300.4 million, reflecting a year-to-year decrease of $12.7 million (or down 4.1%),largely attributable to the aforementioned decreases in depreciation, interest and bridge and PATCOoperational expenses.
Increase/ Percent2020 2019 Percent (Decrease) Increase/
Amount Amount of Total From 2019 (Decrease)Operating:
Bridge 53,180$ 57,235$ 17.7% (4,055)$ -7.1%PATCO 44,230 45,960 14.7% (1,729) -3.8%General and Administration 67,636 67,932 22.5% (296) -0.4%Other 500 500 0.2% - 0.0%Depreciation 74,791 78,365 24.9% (3,574) -4.6%
Total Operating 240,337 249,992 80.0% (9,655) -3.9%
Non-Operating:Interest Expense 58,377 61,671 19.4% (3,293) -5.3%Amortization - 61 0.0% (61) -100.0%Other 1,564 1,298 0.5% 266 20.5%Economic Development 104 95 0.0% 9 10.0%
Total Non-Operating 60,045 63,125 20.0% (3,080) -4.9%
Total Expenses 300,382$ 313,117$ 100.0% (12,736)$ -4.1%
88
88
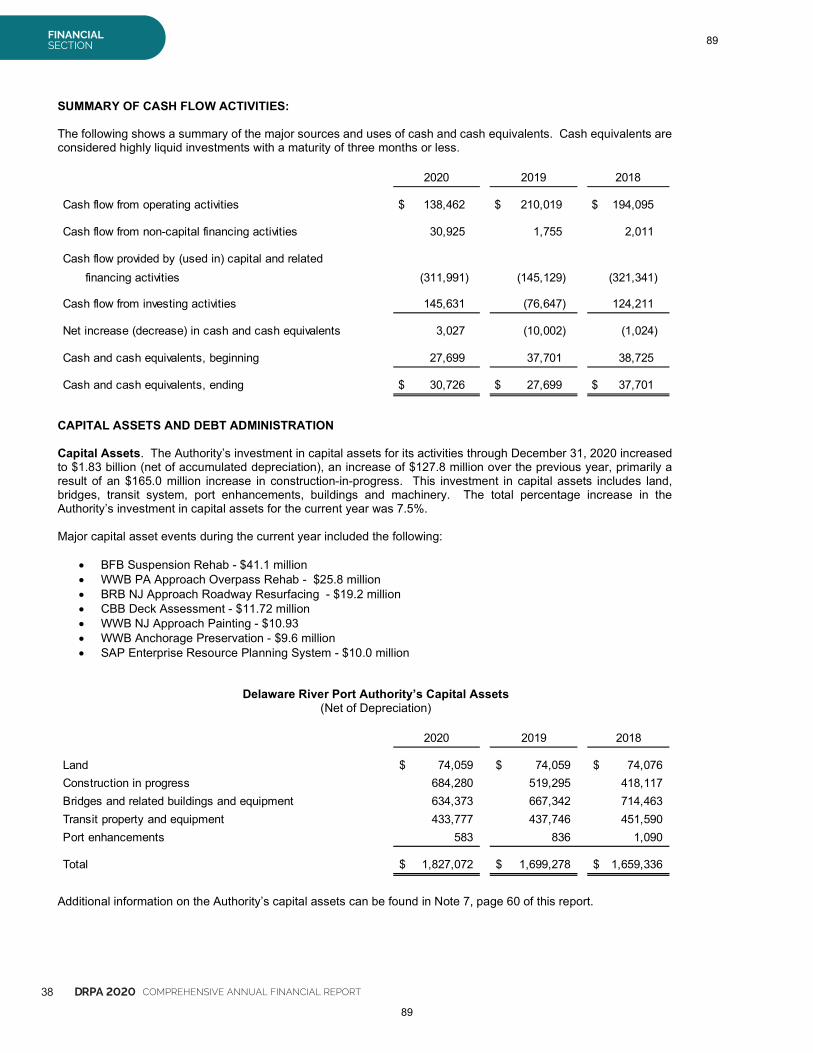
38 DRPA 2020 COMPREHENSIVE ANNUAL FINANCIAL REPORT
FINANCIALSECTION
SUMMARY OF CASH FLOW ACTIVITIES:
The following shows a summary of the major sources and uses of cash and cash equivalents. Cash equivalents areconsidered highly liquid investments with a maturity of three months or less.
CAPITAL ASSETS AND DEBT ADMINISTRATION
Capital Assets. The Authority’s investment in capital assets for its activities through December 31, 2020 increasedto $1.83 billion (net of accumulated depreciation), an increase of $127.8 million over the previous year, primarily aresult of an $165.0 million increase in construction-in-progress. This investment in capital assets includes land,bridges, transit system, port enhancements, buildings and machinery. The total percentage increase in theAuthority’s investment in capital assets for the current year was 7.5%.
Major capital asset events during the current year included the following:
BFB Suspension Rehab - $41.1 million WWB PA Approach Overpass Rehab - $25.8 million BRB NJ Approach Roadway Resurfacing - $19.2 million CBB Deck Assessment - $11.72 million WWB NJ Approach Painting - $10.93 WWB Anchorage Preservation - $9.6 million SAP Enterprise Resource Planning System - $10.0 million
Delaware River Port Authority’s Capital Assets(Net of Depreciation)
Additional information on the Authority’s capital assets can be found in Note 7, page 60 of this report.
2020 2019 2018
Cash flow from operating activities 138,462$ 210,019$ 194,095$
Cash flow from non-capital financing activities 30,925 1,755 2,011
Cash flow provided by (used in) capital and relatedfinancing activities (311,991) (145,129) (321,341)
Cash flow from investing activities 145,631 (76,647) 124,211
Net increase (decrease) in cash and cash equivalents 3,027 (10,002) (1,024)
Cash and cash equivalents, beginning 27,699 37,701 38,725
Cash and cash equivalents, ending 30,726$ 27,699$ 37,701$
2020 2019 2018
Land 74,059$ 74,059$ 74,076$Construction in progress 684,280 519,295 418,117Bridges and related buildings and equipment 634,373 667,342 714,463Transit property and equipment 433,777 437,746 451,590Port enhancements 583 836 1,090
Total 1,827,072$ 1,699,278$ 1,659,336$
89
89
DRPA 2020 COMPREHENSIVE ANNUAL FINANCIAL REPORT 39
FINANCIALSECTION
Long-term Debt. The Authority’s long-term debt structure changed dramatically as a result of several largetransactions executed in 2018: 1) the 2010D revenue bonds were defeased ($308.4 million outstanding), 2) $700.5million in fixed rate debt was issued in December. Proceeds of these bond issuances were used to establish a newbond project fund for capital projects ($290 million) and for the redemption and/or termination of all active swaptions,all variable rate debt (2008 and 2010 revenue refunding bonds) and all associated LOC and LIBOR-indexed bankpurchase loans associated with this variable rate debt.
In 2019, the Authority’s total bond debt decreased to $1.39 billion (shown below by issue), down from $1.42 billion atthe prior year-end, a decrease of $27.5 million. Of this amount, $1.26 billion (or 90.7% of total debt) representedrevenue bond debt, which is backed by toll revenues from the Authority’s bridges. The remaining debt of $123 millionrepresented subordinated obligations of the Authority.
In 2020, the Authority’s total bond debt decreased to $1.31 billion (shown below by issue), down from $1.39 billion atthe prior year-end, a decrease of $82.9 million. Of this amount, $1.19 billion (or 91.2% of total debt) representsrevenue bond debt, which is backed by toll revenues from the Authority’s bridges. The remaining debt of $114.7million represents subordinated obligations of the Authority. At year-end 2020, the Authority had no variable rate debtoutstanding.
Delaware River Port Authority’s Outstanding Debt(Revenue, Port District Project and Port District Project Refunding Bonds)
Additional information on the Authority’s outstanding debt can be found in the Letter of Transmittal on page 23 andin Note 12 which begins on page 77 of this report.
Bond Ratings
As also cited in the Letter of Transmittal, the Authority has experienced important positive changes to its bond ratingsduring the past few years.
In October 2017, Moody’s upgraded all of the Authority’s bond debt. The Authority’s underlying revenuebond ratings increased to “A2” from “A3” and the port district project bonds moved to “Baa2” from “Baa3”, allwith a “stable outlook”. This was the first upgrade of the Authority’s bond ratings by Moody’s in morethan a decade. Moody’s cited the “continued positive traffic momentum”, a “manageable” capital programrequiring no debt financing and solid liquidity reserves, as factors in the ratings upgrades.
In November 2018, just prior to the issuance of new revenue and revenue refunding bonds, S&P upgradedall of the Authority’s bond debt, increasing the revenue bond ratings from “‘A” to “‘A+”, and increasing theport district project bonds from ‘A-“ to ‘A’, all with a “stable outlook.” Moody’s reaffirmed the Authority’s existingratings, but raised the “outlook” on all revenue, refunding and port district project bonds from “stable” to“positive.”
In February 2020, Moody’s, for the second time in three years upgraded all of the Authority’s bond debt. Therevenue bonds were raised to “A1” from “A2”, while the Port District Project Bonds, were raised from “Baa2”to “Baa1”, all with a “stable” outlook.
In March 2020, shortly after the pandemic decimated traffic in general across the tolling sector, both Moody’s& S&P placed the toll sector agencies on “negative outlook”, with S&P also adjusting the Authority’s outlookto “negative.” No changes were made to the Authority’s underlying ratings.
2020 2019 2018
1999 Port District Project Bonds 1,035$ 6,330$ 11,250$2012 Port District Project Refunding Bonds 113,689 122,731 131,5462013 Revenue Bonds 484,389 484,956 485,5232018 Revenue Bonds 707,906 775,972 789,153
Total (net of amortizing premium and discount) 1,307,019$ 1,389,989$ 1,417,472$
90
90
40 DRPA 2020 COMPREHENSIVE ANNUAL FINANCIAL REPORT
FINANCIALSECTION
The underlying debt ratings on the Authority’s bond issues, as of December 31, 2020, are shown below:
* As a result of the COVID-19 pandemic, in March 2020, both Moody's and S&P changed the outlook for the entiretoll sector to "negative". S&P also changed the Authority's outlook from "stable" to "negative", however, Moody's didnot change the Authority's "stable" outlook.
Additional information related to the Authority’s bond ratings, can be found in the sub-section entitled “Bond Ratings”under Note 12, page 84 and Note 19, Subsequent Events, page 97 of this report.
ECONOMIC FACTORS AND NEXT YEAR’S BUDGETS
The following factors were considered in preparing the Authority's budget for the 2021 year:
Slight to moderate growth in the overall regional economy (subject to the pace of vaccinations and lifting ofCOVID-19 related restrictions).
No bridge toll or PATCO fare increases during 2021. Actual DRPA bridge toll revenues and PATCO passenger fare revenues were down significantly vs. the 2020
budget due to the impact of the pandemic. Operating expenses were also down considerably during theeconomic downturn. Expectation is that spending for 2021 will be constrained during at least the first half ofthe year.
Budgeted bridge traffic is expected to decrease by 10.5 million vehicles to 42.5 million vehicles, a 19.86%budget-to-budget decrease, based on modest expectations of changes in underlying economic factors andthe impact of bridge construction.
Bridge toll revenues are projected to approach $278.3 million, which represents a $53.8 million decrease (or16.21%) in budgeted toll revenues vs. 2020.
Decrease of 58.81% in projected total PATCO fares and other revenues versus the 2020 budget, decreasingfrom $28.3 million to $11.7 million or by $16.6 million. PATCO ridership is budgeted to decrease by roughly6.2 million passengers to total 4.6 million passengers vs. the 2020 budget.
Biennial inspection costs are estimated to be $2.3 million in 2021, a year-to year budget decrease of $0.7million or a 22.68%% decrease. (The biennial inspection of all DRPA/PATCO facilities last occurred in 2020).
The DRPA budgets project $109.2 million in spending. DRPA operating expenses are expected to increaseby nearly $0.8 million, or a 0.73 increase, primarily attributable to increased professional and contractualservice expenses) and E-ZPass Customer Service Center processing costs.
The PATCO operating budget, totaling $60.5 million in projected spending, increased by $0.4 million, or by0.74%, attributable primarily due to increases in purchased power, insurance and contractual services.
The combined DRPA and PATCO budgeted operating expenses are expected to increase from $168.9 millionto total $170.2 million, or a 0.73% increase over 2020.
Budgeted total debt service decreased by $2.6 million to a total of $129.5 million, down from the prior year’stotal ($132.2 million). 85.5% of the total debt service is attributable to the outstanding revenue bonds (seniordebt).
Capital budget expenditures for 2021 are budgeted at approximately $196.7 million, down $3.4 million fromthe $200.1 million budgeted for 2020. Large capital projects in 2021 include several significant projects, suchas: the Ben Franklin Bridge Suspension Span Rehab, Commodore Barry Deleading & Painting. the BetsyRoss NJ Approach Resurfacing, the Corridor Rehab-PA Approach, and the installation of elevators in theremaining PATCO stations. Together these listed projects are budgeted to exceed $77 million in totalexpenditures (prior to federal funding) in 2021.
Issue Moody's S&P
Revenue and Revenue Refunding Bonds A1 A+(2013 and 2018 bonds) Stable Negative *
Port District Project and Port District Project Baa1 ARefunding Bonds (1999 and 2012 bonds) Stable Negative *
FINANCIALSECTION
91
91
DRPA 2020 COMPREHENSIVE ANNUAL FINANCIAL REPORT 41
FINANCIALSECTION
FINANCIALSECTION
The Authority’s actual financial results could vary materially from management’s expectations because of changes inthe above factors, and other risks and uncertainties that adversely impact the Authority’s operations. This statement,as mentioned above, was the case during 2020, where revenues, including interest income, were significantlyimpacted by the COVID-19 pandemic.
REQUESTS FOR INFORMATION
This financial report is designed to provide a general overview of the Authority’s activities for all of those with aninterest in the Authority’s activities through December 31, 2020. Questions from interested parties concerning anyof the information provided in this report or requests for additional financial information should be addressed to theOffice of the Chief Financial Officer, Delaware River Port Authority, One Port Center, 2 Riverside Drive, P.O. Box1949, Camden, NJ 08101-1949.
92
92
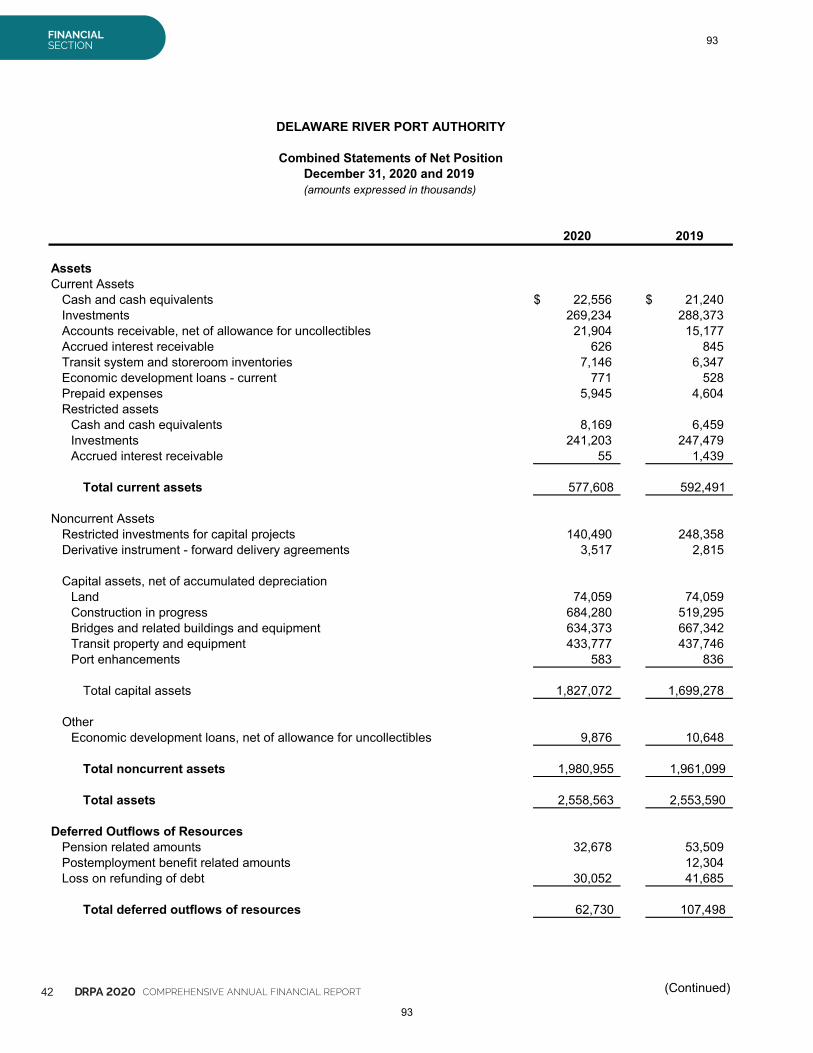
42 DRPA 2020 COMPREHENSIVE ANNUAL FINANCIAL REPORT
FINANCIALSECTION
DELAWARE RIVER PORT AUTHORITY
Combined Statements of Net PositionDecember 31, 2020 and 2019(amounts expressed in thousands)
2020 2019
AssetsCurrent Assets
Cash and cash equivalents 22,556$ 21,240$Investments 269,234 288,373Accounts receivable, net of allowance for uncollectibles 21,904 15,177Accrued interest receivable 626 845Transit system and storeroom inventories 7,146 6,347Economic development loans - current 771 528Prepaid expenses 5,945 4,604Restricted assets
Cash and cash equivalents 8,169 6,459Investments 241,203 247,479Accrued interest receivable 55 1,439
Total current assets 577,608 592,491
Noncurrent AssetsRestricted investments for capital projects 140,490 248,358Derivative instrument - forward delivery agreements 3,517 2,815
Capital assets, net of accumulated depreciationLand 74,059 74,059Construction in progress 684,280 519,295Bridges and related buildings and equipment 634,373 667,342Transit property and equipment 433,777 437,746Port enhancements 583 836
Total capital assets 1,827,072 1,699,278
OtherEconomic development loans, net of allowance for uncollectibles 9,876 10,648
Total noncurrent assets 1,980,955 1,961,099
Total assets 2,558,563 2,553,590
Deferred Outflows of ResourcesPension related amounts 32,678 53,509Postemployment benefit related amounts 12,304Loss on refunding of debt 30,052 41,685
Total deferred outflows of resources 62,730 107,498
(Continued)
93
93
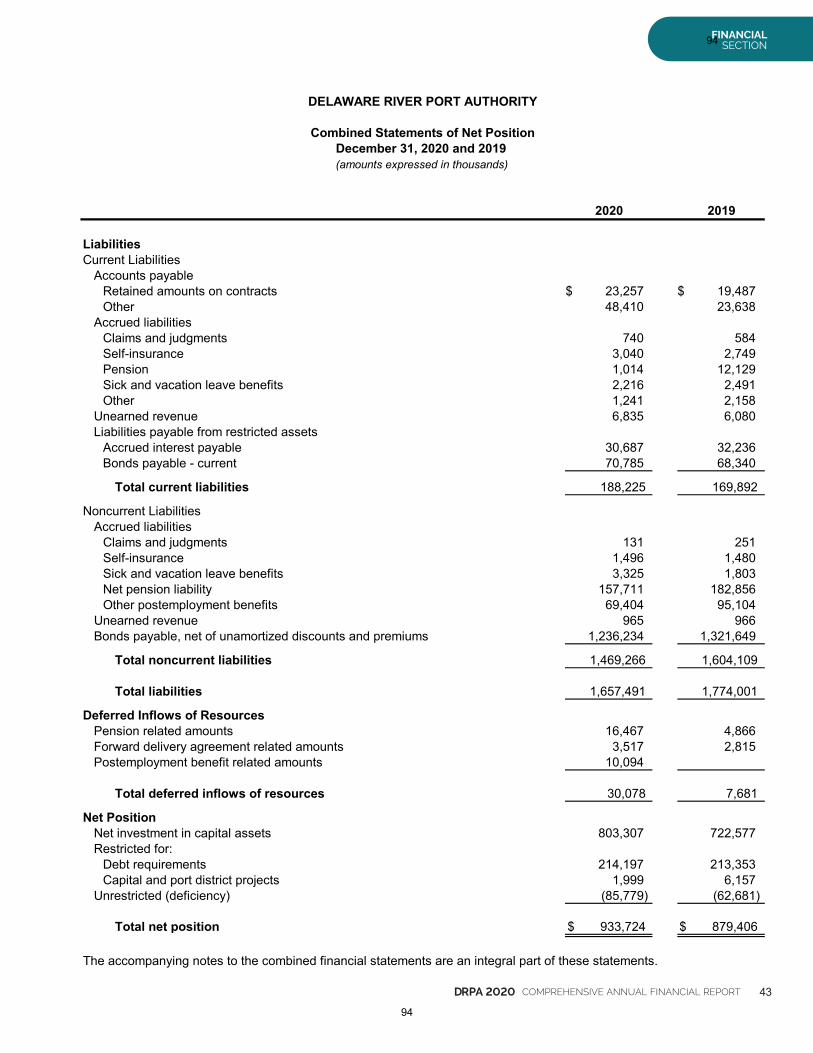
DRPA 2020 COMPREHENSIVE ANNUAL FINANCIAL REPORT 43
FINANCIALSECTION
DELAWARE RIVER PORT AUTHORITY
Combined Statements of Net PositionDecember 31, 2020 and 2019(amounts expressed in thousands)
2020 2019
LiabilitiesCurrent Liabilities
Accounts payableRetained amounts on contracts 23,257$ 19,487$Other 48,410 23,638
Accrued liabilitiesClaims and judgments 740 584Self-insurance 3,040 2,749Pension 1,014 12,129Sick and vacation leave benefits 2,216 2,491Other 1,241 2,158
Unearned revenue 6,835 6,080Liabilities payable from restricted assets
Accrued interest payable 30,687 32,236Bonds payable - current 70,785 68,340
Total current liabilities 188,225 169,892
Noncurrent LiabilitiesAccrued liabilities
Claims and judgments 131 251Self-insurance 1,496 1,480Sick and vacation leave benefits 3,325 1,803Net pension liability 157,711 182,856Other postemployment benefits 69,404 95,104
Unearned revenue 965 966Bonds payable, net of unamortized discounts and premiums 1,236,234 1,321,649
Total noncurrent liabilities 1,469,266 1,604,109
Total liabilities 1,657,491 1,774,001
Deferred Inflows of ResourcesPension related amounts 16,467 4,866Forward delivery agreement related amounts 3,517 2,815Postemployment benefit related amounts 10,094
Total deferred inflows of resources 30,078 7,681
Net PositionNet investment in capital assets 803,307 722,577Restricted for:
Debt requirements 214,197 213,353Capital and port district projects 1,999 6,157
Unrestricted (deficiency) (85,779) (62,681)
Total net position 933,724$ 879,406$
The accompanying notes to the combined financial statements are an integral part of these statements.
94
94
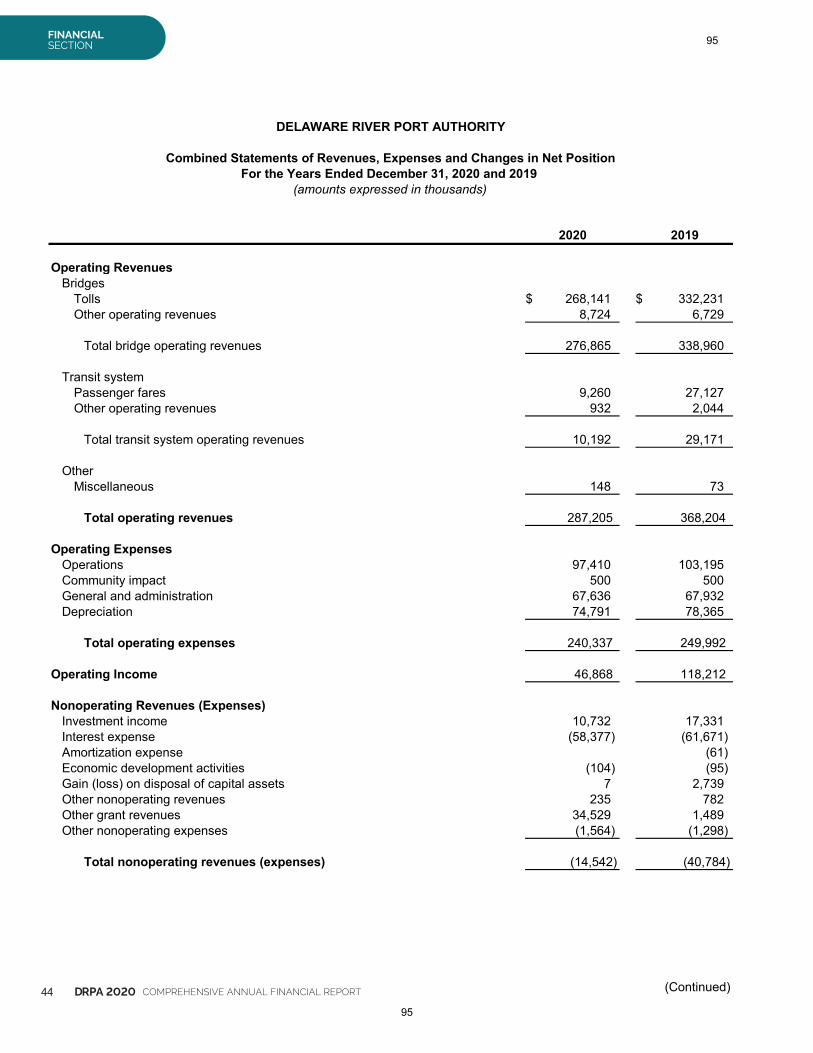
44 DRPA 2020 COMPREHENSIVE ANNUAL FINANCIAL REPORT
FINANCIALSECTION
DELAWARE RIVER PORT AUTHORITY
Combined Statements of Revenues, Expenses and Changes in Net PositionFor the Years Ended December 31, 2020 and 2019
(amounts expressed in thousands)
2020 2019
Operating RevenuesBridges
Tolls 268,141$ 332,231$Other operating revenues 8,724 6,729
Total bridge operating revenues 276,865 338,960
Transit systemPassenger fares 9,260 27,127Other operating revenues 932 2,044
Total transit system operating revenues 10,192 29,171
OtherMiscellaneous 148 73
Total operating revenues 287,205 368,204
Operating ExpensesOperations 97,410 103,195Community impact 500 500General and administration 67,636 67,932Depreciation 74,791 78,365
Total operating expenses 240,337 249,992
Operating Income 46,868 118,212
Nonoperating Revenues (Expenses)Investment income 10,732 17,331Interest expense (58,377) (61,671)Amortization expense (61)Economic development activities (104) (95)Gain (loss) on disposal of capital assets 7 2,739Other nonoperating revenues 235 782Other grant revenues 34,529 1,489Other nonoperating expenses (1,564) (1,298)
Total nonoperating revenues (expenses) (14,542) (40,784)
(Continued)
95
95
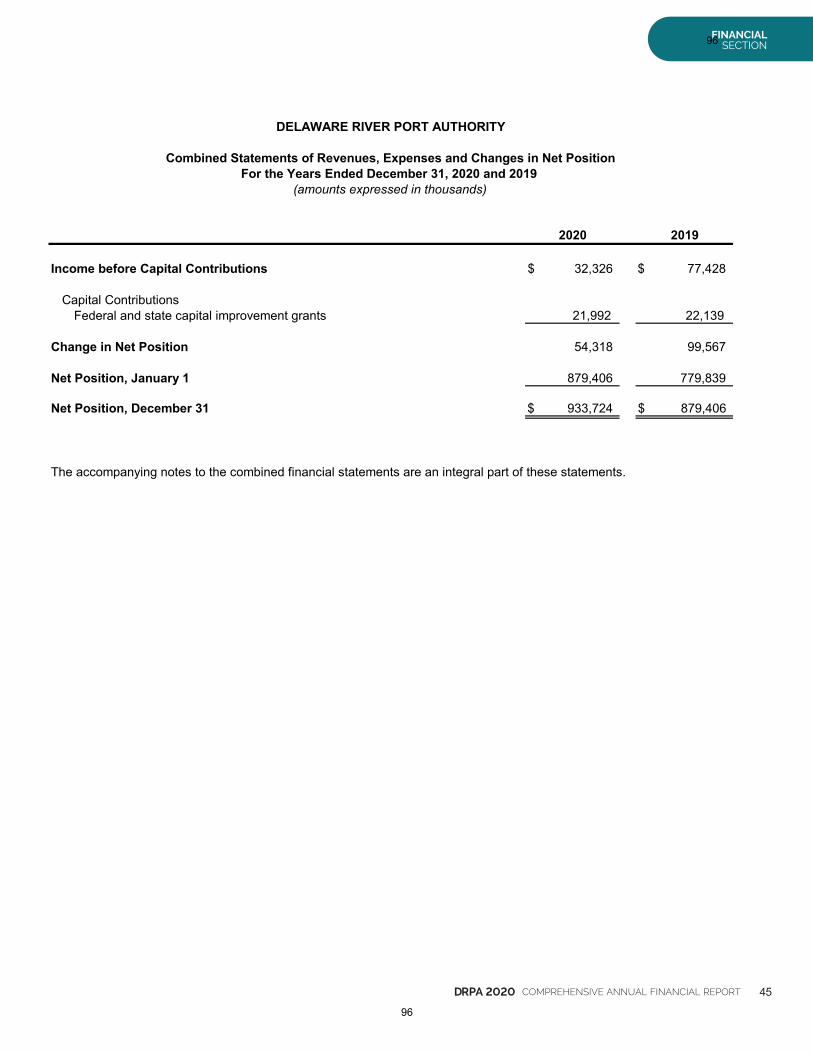
DRPA 2020 COMPREHENSIVE ANNUAL FINANCIAL REPORT 45
FINANCIALSECTION
DELAWARE RIVER PORT AUTHORITY
Combined Statements of Revenues, Expenses and Changes in Net PositionFor the Years Ended December 31, 2020 and 2019
(amounts expressed in thousands)
2020 2019
Income before Capital Contributions 32,326$ 77,428$
Capital ContributionsFederal and state capital improvement grants 21,992 22,139
Change in Net Position 54,318 99,567
Net Position, January 1 879,406 779,839
Net Position, December 31 933,724$ 879,406$
The accompanying notes to the combined financial statements are an integral part of these statements.
96
96
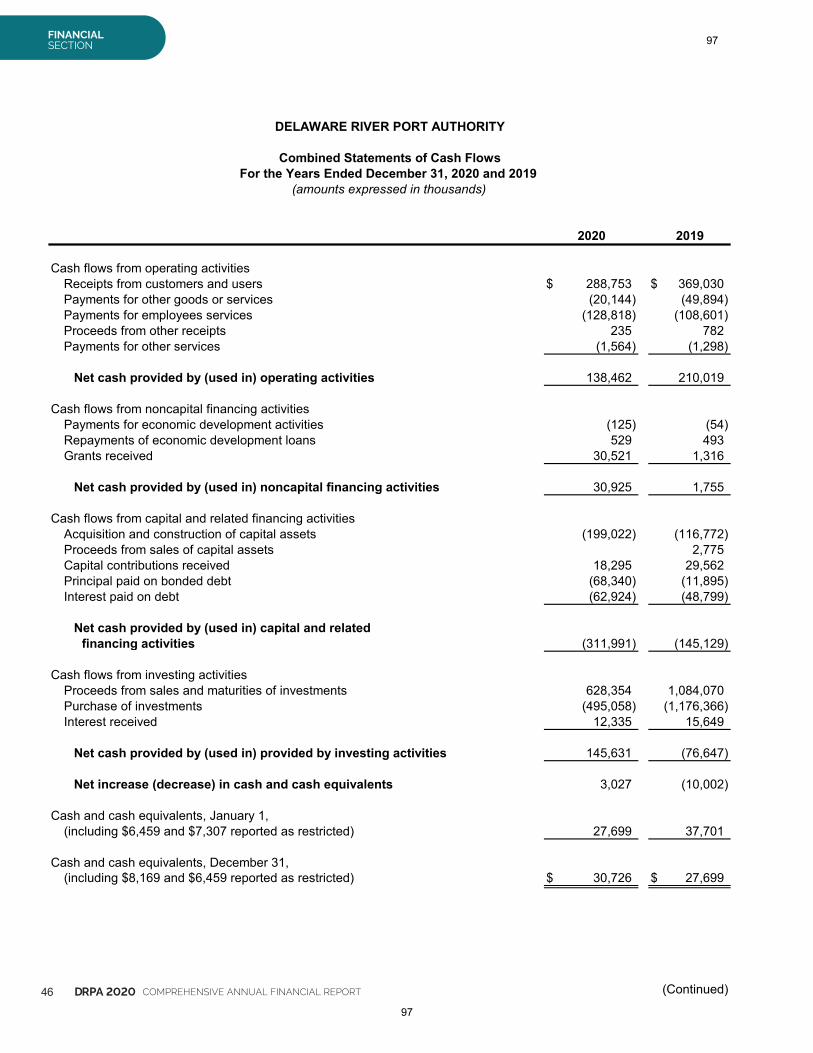
46 DRPA 2020 COMPREHENSIVE ANNUAL FINANCIAL REPORT
FINANCIALSECTION
DELAWARE RIVER PORT AUTHORITY
Combined Statements of Cash FlowsFor the Years Ended December 31, 2020 and 2019
(amounts expressed in thousands)
2020 2019
Cash flows from operating activitiesReceipts from customers and users 288,753$ 369,030$Payments for other goods or services (20,144) (49,894)Payments for employees services (128,818) (108,601)Proceeds from other receipts 235 782Payments for other services (1,564) (1,298)
Net cash provided by (used in) operating activities 138,462 210,019
Cash flows from noncapital financing activitiesPayments for economic development activities (125) (54)Repayments of economic development loans 529 493Grants received 30,521 1,316
financing activitiesNet cash provided by (used in) noncapital financing activities 30,925 1,755
Cash flows from capital and related financing activitiesAcquisition and construction of capital assets (199,022) (116,772)Proceeds from sales of capital assets 2,775Capital contributions received 18,295 29,562Principal paid on bonded debt (68,340) (11,895)Interest paid on debt (62,924) (48,799)
Net cash provided by (used in) capital and relatedfinancing activities (311,991) (145,129)
Cash flows from investing activitiesProceeds from sales and maturities of investments 628,354 1,084,070Purchase of investments (495,058) (1,176,366)Interest received 12,335 15,649
Net cash provided by (used in) provided by investing activities 145,631 (76,647)
Net increase (decrease) in cash and cash equivalents 3,027 (10,002)
Cash and cash equivalents, January 1,(including $6,459 and $7,307 reported as restricted) 27,699 37,701
Cash and cash equivalents, December 31,(including $8,169 and $6,459 reported as restricted) 30,726$ 27,699$
(Continued)
97
97
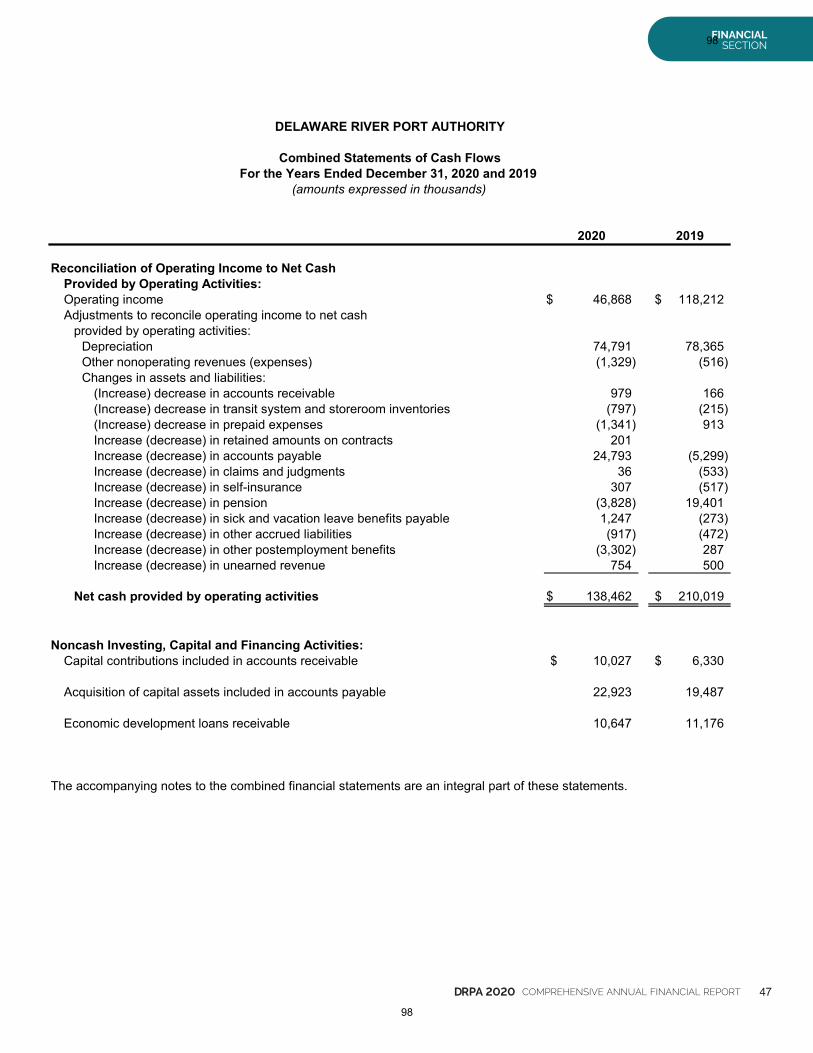
DRPA 2020 COMPREHENSIVE ANNUAL FINANCIAL REPORT 47
FINANCIALSECTION
DELAWARE RIVER PORT AUTHORITY
Combined Statements of Cash FlowsFor the Years Ended December 31, 2020 and 2019
(amounts expressed in thousands)
2020 2019
Reconciliation of Operating Income to Net CashProvided by Operating Activities:Operating income 46,868$ 118,212$Adjustments to reconcile operating income to net cash
provided by operating activities:Depreciation 74,791 78,365Other nonoperating revenues (expenses) (1,329) (516)Changes in assets and liabilities:
(Increase) decrease in accounts receivable 979 166(Increase) decrease in transit system and storeroom inventories (797) (215)(Increase) decrease in prepaid expenses (1,341) 913Increase (decrease) in retained amounts on contracts 201Increase (decrease) in accounts payable 24,793 (5,299)Increase (decrease) in claims and judgments 36 (533)Increase (decrease) in self-insurance 307 (517)Increase (decrease) in pension (3,828) 19,401Increase (decrease) in sick and vacation leave benefits payable 1,247 (273)Increase (decrease) in other accrued liabilities (917) (472)Increase (decrease) in other postemployment benefits (3,302) 287Increase (decrease) in unearned revenue 754 500
Net cash provided by operating activities 138,462$ 210,019$
Noncash Investing, Capital and Financing Activities:Capital contributions included in accounts receivable 10,027$ 6,330$
Acquisition of capital assets included in accounts payable 22,923 19,487
Economic development loans receivable 10,647 11,176
The accompanying notes to the combined financial statements are an integral part of these statements.
98
98
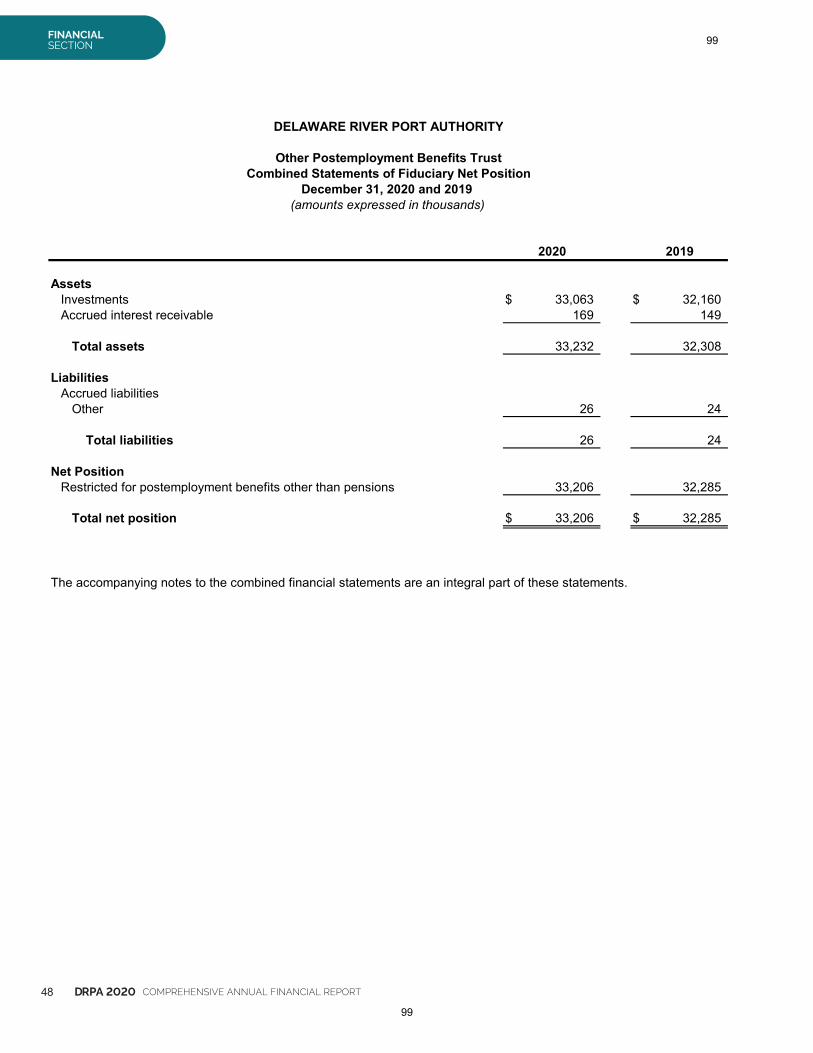
48 DRPA 2020 COMPREHENSIVE ANNUAL FINANCIAL REPORT
FINANCIALSECTION
DELAWARE RIVER PORT AUTHORITY
Other Postemployment Benefits TrustCombined Statements of Fiduciary Net Position
December 31, 2020 and 2019(amounts expressed in thousands)
2020 2019
AssetsInvestments 33,063$ 32,160$Accrued interest receivable 169 149
Total assets 33,232 32,308
LiabilitiesAccrued liabilities
Other 26 24
Total liabilities 26 24
Net PositionRestricted for postemployment benefits other than pensions 33,206 32,285
Total net position 33,206$ 32,285$
The accompanying notes to the combined financial statements are an integral part of these statements.
99
99

DRPA 2020 COMPREHENSIVE ANNUAL FINANCIAL REPORT 49
FINANCIALSECTION
DELAWARE RIVER PORT AUTHORITY
Other Postemployment Benefits TrustCombined Statements of Changes in Fiduciary Net Position
For the Years Ended December 31, 2020 and 2019(amounts expressed in thousands)
2020 2019
AdditionsEmployer contributions 5,416$ 5,012$Investment income (expenses) 1,022 1,298
Total additions 6,438 6,310
DeductionsBenefit payments 5,416 5,012Administrative expenses 101 96
Total deductions 5,517 5,108
Increase in Net Position 921 1,202
Net Position Restricted for PostemploymentBenefits other than Pensions
January 1 32,285 31,083
December 31 33,206$ 32,285$
The accompanying notes to the combined financial statements are an integral part of these statements.
100
100
50 DRPA 2020 COMPREHENSIVE ANNUAL FINANCIAL REPORT
FINANCIALSECTION
DELAWARE RIVER PORT AUTHORITYNotes to Combined Financial Statements
For the Years Ended December 31, 2020 and 2019(dollars expressed in thousands)
Note 1. Summary of Significant Accounting Policies
Description of Operations: The Delaware River Port Authority (the “Authority”) is a public corporateinstrumentality of the Commonwealth of Pennsylvania (the “Commonwealth”) and the State of New Jersey(the “State”), created with the consent of Congress by compact legislation between the Commonwealth andthe State. The Authority has no stockholders or equity holders. The Authority is vested with the ownership,control, operation, and collection of tolls and revenues of certain bridges spanning the Delaware River;namely, the Benjamin Franklin, Walt Whitman, Commodore Barry, and Betsy Ross bridges. The Authorityhas also constructed, and owns, a high-speed transit system that is operated by the Port Authority TransitCorporation (“PATCO”). The transit system operates between Philadelphia, Pennsylvania and Lindenwold,New Jersey.
The costs of providing facilities and services to the general public on a continuing basis are recoveredprimarily in the form of tolls and fares. The Authority is a member of the E-ZPass Interagency Group, thelargest interoperable electronic toll collection system in the world, comprised of thirty-three (33) agenciesin nineteen (19) states. Through December 31, 2020, customer participation in the E-ZPass electronic tollcollection process exceeded seventy-five percent (75.5%) of its toll collection activity during rush hourperiods. Toll revenues collected through E-ZPass are seventy-four percent (74.1%) of total toll revenues.
The Authority owns its One Port Center headquarters building and leases several floors to various tenants.The building is managed by a real estate management firm, which is overseen by Authority seniormanagement.
Basis of Presentation: The combined financial statements of the Authority have been prepared in conformitywith accounting principles generally accepted in the United States of America, as applied to governmentalunits. The Governmental Accounting Standards Board (“GASB”) is the accepted standard setting body forestablishing governmental accounting and financial reporting principles.
As part of the Authority’s combined financial statements, two funds are maintained: a proprietary fund(enterprise fund) and a fiduciary fund (other employee benefit trust fund). The focus of enterprise funds isthe measurement of economic resources, that is, the determination of operating income, changes in netposition (or cost recovery), financial position, and cash flows. The focus of fiduciary funds is also themeasurement of economic resources.
The enterprise fund is maintained on the accrual basis of accounting. Enterprise funds account for activities(i) that are financed with debt that is secured solely by a pledge of the net revenues from fees and chargesof the activity; or (ii) that are required by law or regulations that the activity’s cost of providing services,including capital cost (such as depreciation or debt service), be recovered with fees and charges, ratherthan with taxes or similar revenues; or (iii) that the pricing policies of the activity establish fees and chargesdesigned to recover its costs, including capital costs (such as depreciation or debt service). Under thismethod, revenues are recorded when earned and expenses are recorded when the related liability isincurred.
The fiduciary fund is also maintained on the accrual basis of accounting. The fiduciary fund accounts forthe recording and accumulation of other postemployment benefit resources, which are held in trust for theexclusive benefit of the Authority’s retirees. This fund is referred to as the “Other Postemployment Benefits(“OPEB”) Trust.
Cash and Cash Equivalents: The Authority considers all highly liquid investments with a maturity of threemonths or less when purchased to be cash equivalents (Note 2) for purposes of the combined statementsof cash flows. In addition, according to the various Indentures of Trust, which govern the flow andaccounting of the Authority’s financial resources, certain accounts are required to be maintained in order tocomply with the provisions of the Indentures of Trust. For the accounts that are restricted, the Authorityhas recorded the applicable cash and cash equivalents as restricted on the combined financial statements(Note 11).
101
101
DRPA 2020 COMPREHENSIVE ANNUAL FINANCIAL REPORT 51
FINANCIALSECTION
DELAWARE RIVER PORT AUTHORITYNotes to Combined Financial Statements
For the Years Ended December 31, 2020 and 2019(dollars expressed in thousands)
Note 1. Summary of Significant Accounting Policies (Continued)
Investment in Securities: Investments are stated at fair value, generally based on quoted market prices.Certain investments are maintained in connection with the Authority’s bonded debt (Notes 3 and 12) andthe OPEB Trust. Likewise, as with cash and cash equivalents, the accounts that are restricted as per thevarious Indentures of Trust have been recorded as restricted investments on the combined financialstatements (Note 11).
Accounts Receivable: The Authority establishes a provision for the estimated amount of uncollectibleaccounts based upon periodic analysis of collection history.
Transit System Inventory: Transit system inventory, consisting principally of spare parts for maintenance oftransit system facilities, is stated at the lower of cost (first-in, first-out method) or market.
Debt Insurance Costs, Bond Premiums, Bond Discounts, and Loss on Refunding: Insurance purchased aspart of the issuance of debt is amortized by the straight-line method from the issue date to maturity and isrecorded as a noncurrent asset on the combined statements of net position. Bond premiums and discountsare amortized by the effective interest method from the issue date to maturity, and are presented as anadjustment to the face amount of the bonds. Likewise, a loss on refunding arising from the issuance of therevenue bonds and port district project bonds is amortized by the effective interest method from the issuedate to maturity. The loss on refunding of debt, however, is classified as a deferred outflow of resourceson the combined statements of net position.
Investment in Facilities: Investment in facilities is stated at cost, which generally includes expenses for legalexpenses incurred during the construction period. Investment in facilities also includes the cost incurredfor port-related projects, and improvements, enlargements and betterments to the original facilities.Replacements of existing facilities (except for primarily police and certain other vehicles whose estimateduseful life is two years or less) are also recorded at cost. The related costs and accumulated depreciationof the property replaced are removed from the respective accounts, and any gain or loss on disposition iscredited or charged to non-operating revenues or expenses. Assets capitalizable generally have an originalcost of five thousand dollars or more and a useful life in excess of three years. Depreciation andamortization are provided using the straight-line method over the estimated useful lives of the relatedassets, including those financed by federal and state contributions (Notes 7 and 13).
Asset lives used in the calculation of depreciation are generally as follows:
Bridges, freeways and tunnels 100 yearsBuildings, stations and certain bridge components 35 - 50 yearsElectrification, signals and communications system 30 - 40 yearsTransit cars, machinery and equipment 10 - 25 yearsComputer equipment, automobiles and other equipment 3 - 10 years
Maintenance and Repairs: Maintenance and repair costs considered necessary to maintain bridge facilitiesin good operating condition are charged to operations as incurred.
Self-insurance: The Authority provides for the uninsured portion of potential public liability and workers’compensation claims through self-insurance programs and charges current operations for estimated claimsto be paid (Note 14).
102
102
52 DRPA 2020 COMPREHENSIVE ANNUAL FINANCIAL REPORT
FINANCIALSECTION
DELAWARE RIVER PORT AUTHORITYNotes to Combined Financial Statements
For the Years Ended December 31, 2020 and 2019(dollars expressed in thousands)
Note 1. Summary of Significant Accounting Policies (Continued)
Pensions: For purposes of measuring the net pension liability, deferred outflows of resources and deferredinflows of resources related to pensions, and pension expense, information about the fiduciary net positionof the Pennsylvania State Employees’ Retirement System (“SERS”) and the State of New Jersey PublicEmployees' Retirement System (“PERS”), and additions to/deductions from SERS and PERS fiduciary netposition, have been determined on the same basis as reported by the plans. For this purpose, benefitpayments (including refunds of employee contributions) are recognized when due and payable inaccordance with the benefit terms. Investments are reported at fair value.
Postemployment Benefits Other Than Pensions (“OPEB”): For purposes of measuring the net OPEBliability, deferred outflows of resources and deferred inflows of resources related to OPEB, and OPEBexpense, information about the fiduciary net position of the Authority’s OPEB Trust and additionsto/deductions from the OPEB Trust's fiduciary net position have been determined on the same basis asthey are reported by the OPEB Trust. For this purpose, the OPEB Trust recognizes benefit payments whendue and payable in accordance with the benefit terms. Investments are reported at fair value.
Economic Development Activities: The Authority establishes loan loss provisions for economicdevelopment loans receivable, based upon collection history and analysis of creditor’s ability to pay. TheAuthority has established a loss reserve in the amount of $1,345 as of December 31, 2020 and 2019 for itseconomic development loans outstanding.
Net Position: Net position is classified in the following three components:
Net Investment in Capital Assets: This component of net position consists of capital assets, net ofaccumulated depreciation, reduced by the outstanding balances of any bonds, notes or otherborrowings, and deferred outflows of resources and deferred inflows of resources that are attributableto the acquisition, construction, or improvement of those assets or related debt. If there are significantunspent related debt proceeds at year-end, the portion of the debt attributable to the unspent proceedsis not included in the calculation of net investment in capital assets. Rather, that portion of the debt isincluded in the same net position component as the unspent proceeds.
Restricted: This component of net position consists of external constraints imposed by creditors (suchas debt covenants), grantors, contributors, laws or regulations of other governments, or constraintsimposed by law through constitutional provisions or enabling legislation, that restricts the use of netposition.
Unrestricted: This component of net position consists of a net position that does not meet the definitionof “restricted” or “net investment in capital assets.” This component includes net position that may beallocated for specific purposes by the Board. A deficiency will require future funding.
Operating and Non-Operating Revenues and Expenses: Operating revenues include all revenues derivedfrom facility charges (i.e., toll revenues, which include E-ZPass revenues), PATCO operations (passengerfare, advertising and parking), and other revenue sources. Non-operating revenues principally consist ofinterest income earned on various interest-bearing accounts and on investments in debt securities.
Operating expenses include expenses associated with the operation, maintenance, and repair of thebridges, PATCO, and general administrative expenses. Non-operating expenses principally includeexpenses attributable to the Authority’s interest on funded debt and economic development activities.
When both restricted and unrestricted resources are available for use, it is the Authority’s policy to userestricted resources first, then unrestricted resources as they are needed.
103
103
DRPA 2020 COMPREHENSIVE ANNUAL FINANCIAL REPORT 53
FINANCIALSECTION
DELAWARE RIVER PORT AUTHORITYNotes to Combined Financial Statements
For the Years Ended December 31, 2020 and 2019(dollars expressed in thousands)
Note 1. Summary of Significant Accounting Policies (Continued)
Debt Management: Total outstanding bond debt reflected on the combined statements of net position is netof unamortized bond discounts and premiums (Note 12).
Derivative Instruments: The Authority was a party to two (2) forward delivery agreements during 2020 and2019; one related to its maintenance reserve and the other related to the debt service reserve the 1999Port District Project Bonds (Note 4). These forward delivery agreements allow the Authority to earn aguaranteed fixed rate of return over the life of the investments in both reserves.
Budget: In accordance with Section 5.15 of the 1998 Revenue Refunding Bonds Indenture of Trust and itsSupplemental Indentures and Section 5.07 of the 1999 and 2012 Port District Project (“PDP”) BondIndentures of Trust, the Authority must annually adopt an Annual Budget on or before December 31 for theensuing year. (Note: an Annual Budget for the 1999 PDP Bonds was not necessary in December 2020 asall remaining bonds matured on January 1, 2021.) For the Revenue Bonds, Section 5.15 of the 1998Revenue Refunding Bond Indenture of Trust requires that the Authority, on or before December 31, in eachyear, adopt a final budget for the ensuing year of (i) operational expenses, (ii) the PATCO Subsidy, (iii) theamount to be deposited to the credit of the Maintenance Reserve Fund, and (iv) the estimated amounts tobe deposited into the Debt Service Fund, the Debt Service Reserve Fund, and the Rebate Fund. EachAnnual Budget must also contain the Authority’s projections of revenues for the ensuing year demonstratingcompliance with the covenant as to facility charges as set forth in Section 5.09 of the Indentures of Trust.On or before December 31 in each year, the Authority must file a copy of the Annual Budget for the ensuingyear with the Trustee.
The Port District Project Bond Indentures require the following: the adopted budget must set forth, inter alia,the PATCO Subsidiary, the amount of any operating subsidy paid or payable by the Authority to or for theaccount of any other subsidiary of the Authority (including, without limitation, the Port of Philadelphia andCamden) and all other material operating expenses of the Authority payable from the General Fund (seeNote 11 for description of funds established under the Trust Indentures). The Authority must also includethe debt service payable on the bonds and any additional subordinated indebtedness during the ensuingyear and all amounts required to be paid by the Authority into the Debt Service Reserve Fund or the RebateFund or to any Reserve Fund Credit Facility issuer during the ensuing year. On or before December 31, ineach year, the Authority must file a copy of the Annual Budget for the ensuing year with the Trustees andCredit Facility Issuer.
The Authority filed the appropriate budgets for 2020 and 2021, as described above, to its bond trustees byDecember 31, 2019 and 2020, in compliance with the bond indentures. These budgets became effectiveon January 1, 2020 and January 1, 2021, respectively.
The Authority may at any time adopt an amended or supplemental Annual Budget for the remainder of thethen-current year, which shall be treated as the Annual Budget under the provisions of the Indentures ofTrust. A copy of any amended or supplemental Annual Budget must be promptly filed with the Trustees.
104
104
54 DRPA 2020 COMPREHENSIVE ANNUAL FINANCIAL REPORT
FINANCIALSECTION
DELAWARE RIVER PORT AUTHORITYNotes to Combined Financial Statements
For the Years Ended December 31, 2020 and 2019(dollars expressed in thousands)
Note 1. Summary of Significant Accounting Policies (Continued)
Interfunds: Interfund receivables/payables represent amounts that are owed, other than charges for goodsand services rendered, to/from a particular fund. These receivables/payables are eliminated during theaggregation process.
Use of Estimates: The preparation of financial statements in conformity with accounting principles generallyaccepted in the United States of America requires management to make estimates and assumptions thataffect the reported amounts of assets and liabilities and disclosure of contingent assets and liabilities at thedate of the combined financial statements and the reported amounts of revenues and expenses during thereporting period. Actual results could differ from those estimates.
Income Taxes: The Authority is a public corporate instrumentality of the State of New Jersey and theCommonwealth of Pennsylvania, and is described in its amended governing Compact, has been “deemedto be exercising an essential government function in effectuating such purposes,” and therefore is exemptfrom income taxes pursuant to the Internal Revenue Code (Section 115).
Note 2. Cash and Cash Equivalents
Custodial Credit Risk Related to Deposits: Custodial credit risk is the risk that, in the event of a bank failure,the Authority’s deposits might not be recovered. The Authority does not have a deposit policy for custodialcredit risk, however, the Authority has agreements with various banks where most of the deposits arecollateralized or secured by U.S. Treasury notes or through a Federal Home Loan Bank Letter of Credit.As of December 31, 2020 and 2019, the Authority’s bank balances of $111,197 and $62,317 (includingcertificates of deposit of $76,259 and $30,988 classified as investments in the combined statements of netposition), respectively, were exposed to custodial credit risk as follows:
2020 2019
Uninsured and uncollateralized 8,385$ 8,310$
Collateralized with securities held by thepledging financial institution in theAuthority's name 80,654$ 52,111$
Note 3. Investment in Securities
Excluding the investments of the OPEB Trust, the Authority’s investments in various securities aremaintained for specified funds in accordance with the provisions of the Indenture of Trust adopted as ofJuly 1, 1998 (revised in 2018) or the Authority’s General Fund investment policy (for unrestrictedinvestments), which was revised and became effective on March 15, 2019 (see reference below underInterest Rate Risk).
Custodial Credit Risk Related to Investments: For an investment, custodial credit risk is the risk that, in theevent of the failure of the counterparty, the Authority will not be able to recover the value of its investmentsor collateral securities that are in possession of an outside party. The Authority’s investments at December31, 2020 and 2019 totaled $650,927 and $784,210, respectively. These investments consisted of short-term investments, asset backed securities, commercial paper, corporate bonds and notes, U.S. federalagency notes and bonds, and U.S. government treasuries. All of the Authority’s investments are maintainedin the Authority’s name, by a third-party financial institution acting as the Authority’s agent.
105
105
DRPA 2020 COMPREHENSIVE ANNUAL FINANCIAL REPORT 55
FINANCIALSECTION
DELAWARE RIVER PORT AUTHORITYNotes to Combined Financial Statements
For the Years Ended December 31, 2020 and 2019(dollars expressed in thousands)
Note 3. Investment in Securities (Continued)
Custodial Credit Risk Related to Investments (Continued): As of December 31, 2020 and 2019, theAuthority had the following investments:
Maturities Fair Value(months Hierarchy
Investment average) Level * 2020 2019
Asset back securities 337.48 Level 1 87$ 80$Commercial Paper 6.67 Level 1 10,693 10,436Corporate bonds and notes 46.68 Level 1 45,468 48,735Short-term investments 20.37 Level 1 446,502 621,609U.S. federal agency notes and bonds 333.98 Level 1 285 2,142U.S. government treasuries 42.14 Level 1 71,633 70,220
574,668 753,222Certificates of deposits held at banks 76,259 30,988
Total 650,927$ 784,210$
* Level 1 inputs are quoted (unadjusted) prices in active markets for identical assets that thegovernment can access at the measurement date. Observable markets include exchange markets,dealer markets, brokered markets and principal-to-principal markets.Level 2 inputs are inputs other than quoted prices included within Level 1 that are observable for theasset, either directly or indirectly. These inputs are derived from or corroborated by observablemarket data through correlation.Level 3 inputs are unobservable inputs for the asset; they should be used only when the relevantLevel 1 and Level 2 inputs are unavailable.
The weighted average maturity of the Authority’s investment portfolio was 25.11 and 18.09 months as ofDecember 31, 2020 and 2019, respectively.
The short-term investments primarily consist of money market funds and certificates of deposits with amaturity of greater than one year. Since these funds are held by a third party financial institution, and it isthe policy of the Authority to re-invest these funds in investments with longer maturities, these amountshave been classified as investments, as opposed to cash and cash equivalents, in the combined statementsof net position.
Interest Rate Risk: The Authority’s General Fund investment policy (approved by the Board in February2019) limits investment maturities (on unrestricted investments) as a means of managing its exposure tofair value losses arising from increasing interest rates and is as follows: the average effective duration ofthe portfolio is not to exceed thirty-six (36) months, and the maximum effective duration of any individualsecurity is not to exceed seven (7) years, unless otherwise specified.
Credit Risk: Investments are purchased in accordance with the 1998 Indenture of Trust and itsSupplemental Indenture and General Fund investment parameters and generally include U.S. governmentobligations, money market funds, obligations of U.S. agencies or instrumentalities, and obligations of publicagencies or municipalities rated in either of the two highest rating categories by Standard & Poor’s Ratingsor Moody’s Investors Service. In accordance with the 1998 Indenture of Trust and its SupplementalIndentures and its General Fund investment guidelines, the Authority invests in corporate bonds andcommercial paper rated A-1 by Standard & Poor’s Corporation.
106
106
56 DRPA 2020 COMPREHENSIVE ANNUAL FINANCIAL REPORT
FINANCIALSECTION
DELAWARE RIVER PORT AUTHORITYNotes to Combined Financial Statements
For the Years Ended December 31, 2020 and 2019(dollars expressed in thousands)
Note 3. Investment in Securities (Continued)
Credit Risk (Continued): Guaranteed income contracts are collateralized by U.S. government and agencysecurities, and debt obligations having a rating in the highest rating category from Moody’s InvestorsService or Standard & Poor’s Rating Services. As of December 31, 2020, the following are the actualratings by Standard & Poor’s:
As of December 31, 2020, the following are the actual ratings by Moody’s:
Asset Corporate U.S. Federal U.S.Actual Backed Commercial Bonds Agency Notes GovernmentRating Securities Paper and Notes and Bonds Treasuries
Aaa 1,534$ 218$ 68,149$Aa1 2,368Aa2 4,190Aa3 7,752A1 9,487A2 1$ 11,510A3 6,348Baa1 800C 86Unrated 10,693$ 1,479 67 3,484
87$ 10,693$ 45,468$ 285$ 71,633$
Concentration of Credit Risk: The Authority’s investment policy on the concentration of credit risk for itsGeneral Fund investments states that no limitations exist on the purchase of investments in obligations ofthe U.S. government and U.S. federal agencies since they are fully guaranteed or backed by the U.S.government.
For the purchase of investments in obligations of all other issuers, total investments held from any oneissuer shall not exceed ten percent (10%) of the aggregate market value of the entire portfolio, except forrepurchase agreements, which, from any one issuer, shall not exceed twenty-five percent (25%) of theaggregate market value of the portfolio. As of December 31, 2020, more than 5% of the Authority’sinvestments are with Santander Bank commercial paper, much of which represents the forward deliveryagreement for the 2012 PDP bonds. This investment represents 18.91% of the Authority’s total investmentssubject to credit risk.
Asset Corporate U.S. Federal U.S.Actual Backed Commercial Bonds Agency Notes GovernmentRating Securities Paper and Notes and Bonds Treasuries
AAA 1,033$ 2,382$AA+ 2,428 218$ 57,098AA 1$ 1,541AA- 5,136A+ 8,269A- 11,778A 10,297BBB+ 4,107D 86Unrated 10,693$ 879 67 12,153$
87$ 10,693$ 45,468$ 285$ 71,633$
107
107
DRPA 2020 COMPREHENSIVE ANNUAL FINANCIAL REPORT 57
FINANCIALSECTION
DELAWARE RIVER PORT AUTHORITYNotes to Combined Financial Statements
For the Years Ended December 31, 2020 and 2019(dollars expressed in thousands)
Note 3. Investment in Securities (Continued)
OPEB Trust
As previously stated, the OPEB Trust accounts for the recording and accumulation of other postemploymentbenefit resources (Authority contributions), which are held in trust for the exclusive benefit of the Authority’sretirees. These contributions are invested by the Authority.
Custodial Credit Risk Related to Investments: The Authority’s investments at December 31, 2020 and 2019totaled $33,063 and $32,160, respectively. These investments consisted of money market funds, corporatebonds and notes, U.S. federal agency notes and bonds, and U.S. government treasuries. All of theAuthority’s investments are maintained in the Authority’s name, by a third-party financial institution actingas the Authority’s agent.
As of December 31, 2020 and 2019, the Authority had the following investments in the OPEB Trust:
Maturities Fair Value(months Hierarchy
Investment average) Level 2020 2019
Money market funds 0.03 Level 1 136$ 295$Corporate bonds and notes 35.00 Level 1 4,203 6,944U.S. federal agency notes and bonds 47.15 Level 1 927U.S. government treasuries 30.08 Level 1 27,797 24,921
Total 33,063$ 32,160$
The weighted average maturity of the Authority’s investment portfolio was 31.06 and 30.50 months as ofDecember 31, 2020 and 2019, respectively.
Interest Rate Risk: The Authority’s investment policy for the OPEB Trust calls for investments predominatelyin fixed income assets (corporate bonds, US treasury and agency paper, totaling approximately 99% of theportfolio), with the remainder held in high quality money market securities.
Credit Risk: As of December 31, 2020, the actual ratings by Moody’s for the OPEB Trust investments wereas follows:
Corporate U.S. Federal U.S.Actual Bonds Agency Notes GovernmentRating and Notes and Bonds Treasuries
Aaa 601$ 27,797$Aa1 519$Aa2 321Aa3 254A1 1,068A2 1,787A3 254Unrated 326
4,203$ 927$ 27,797$
Concentration of Credit Risk: As of December 31, 2020, more than 5% of the Authority’s investments werewith the following: Apple, Inc., Bank of America Corporation, Bank of Montreal, Exxon Mobile Corporation,Paccar Financial Corporation, and the Federal Home Loan Mortgage Corporation. These investmentsrepresent 5.11%, 5.27%, 5.86%, 5.01%, 5.15%, and 11.72%, respectively, of the Authority’s OPEB Trustinvestments subject to credit risk.
108
108
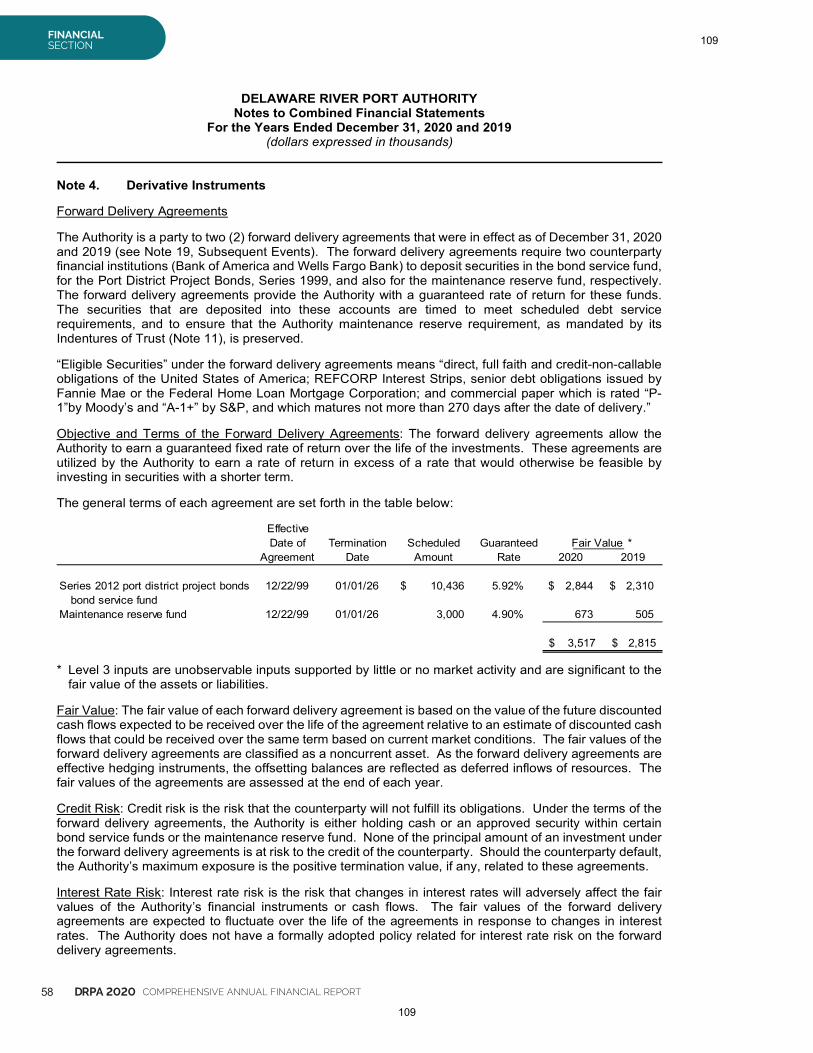
58 DRPA 2020 COMPREHENSIVE ANNUAL FINANCIAL REPORT
FINANCIALSECTION
DELAWARE RIVER PORT AUTHORITYNotes to Combined Financial Statements
For the Years Ended December 31, 2020 and 2019(dollars expressed in thousands)
Note 4. Derivative Instruments
Forward Delivery Agreements
The Authority is a party to two (2) forward delivery agreements that were in effect as of December 31, 2020and 2019 (see Note 19, Subsequent Events). The forward delivery agreements require two counterpartyfinancial institutions (Bank of America and Wells Fargo Bank) to deposit securities in the bond service fund,for the Port District Project Bonds, Series 1999, and also for the maintenance reserve fund, respectively.The forward delivery agreements provide the Authority with a guaranteed rate of return for these funds.The securities that are deposited into these accounts are timed to meet scheduled debt servicerequirements, and to ensure that the Authority maintenance reserve requirement, as mandated by itsIndentures of Trust (Note 11), is preserved.
“Eligible Securities” under the forward delivery agreements means “direct, full faith and credit-non-callableobligations of the United States of America; REFCORP Interest Strips, senior debt obligations issued byFannie Mae or the Federal Home Loan Mortgage Corporation; and commercial paper which is rated “P-1”by Moody’s and “A-1+” by S&P, and which matures not more than 270 days after the date of delivery.”
Objective and Terms of the Forward Delivery Agreements: The forward delivery agreements allow theAuthority to earn a guaranteed fixed rate of return over the life of the investments. These agreements areutilized by the Authority to earn a rate of return in excess of a rate that would otherwise be feasible byinvesting in securities with a shorter term.
The general terms of each agreement are set forth in the table below:
* Level 3 inputs are unobservable inputs supported by little or no market activity and are significant to thefair value of the assets or liabilities.
Fair Value: The fair value of each forward delivery agreement is based on the value of the future discountedcash flows expected to be received over the life of the agreement relative to an estimate of discounted cashflows that could be received over the same term based on current market conditions. The fair values of theforward delivery agreements are classified as a noncurrent asset. As the forward delivery agreements areeffective hedging instruments, the offsetting balances are reflected as deferred inflows of resources. Thefair values of the agreements are assessed at the end of each year.
Credit Risk: Credit risk is the risk that the counterparty will not fulfill its obligations. Under the terms of theforward delivery agreements, the Authority is either holding cash or an approved security within certainbond service funds or the maintenance reserve fund. None of the principal amount of an investment underthe forward delivery agreements is at risk to the credit of the counterparty. Should the counterparty default,the Authority’s maximum exposure is the positive termination value, if any, related to these agreements.
Interest Rate Risk: Interest rate risk is the risk that changes in interest rates will adversely affect the fairvalues of the Authority’s financial instruments or cash flows. The fair values of the forward deliveryagreements are expected to fluctuate over the life of the agreements in response to changes in interestrates. The Authority does not have a formally adopted policy related for interest rate risk on the forwarddelivery agreements.
EffectiveDate of Termination Scheduled Guaranteed Fair Value *
Agreement Date Amount Rate 2020 2019
Series 2012 port district project bonds 12/22/99 01/01/26 10,436$ 5.92% 2,844$ 2,310$bond service fund
Maintenance reserve fund 12/22/99 01/01/26 3,000 4.90% 673 505
3,517$ 2,815$
109
109
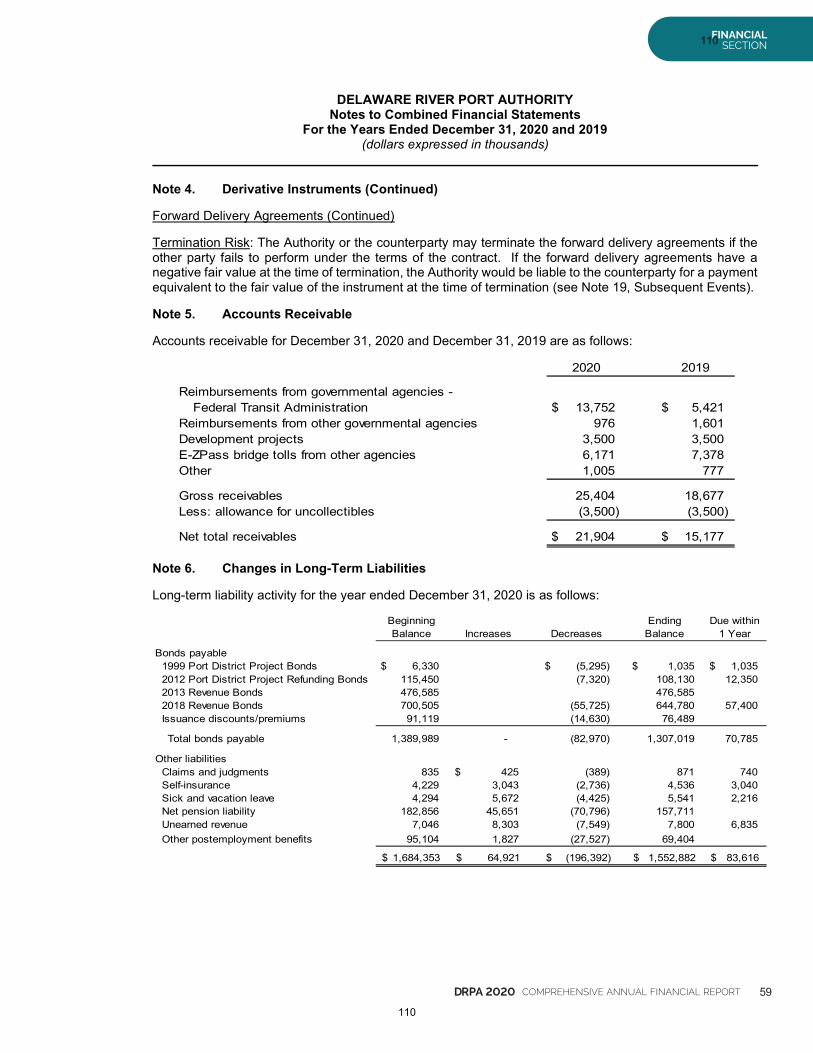
DRPA 2020 COMPREHENSIVE ANNUAL FINANCIAL REPORT 59
FINANCIALSECTION
DELAWARE RIVER PORT AUTHORITYNotes to Combined Financial Statements
For the Years Ended December 31, 2020 and 2019(dollars expressed in thousands)
Note 4. Derivative Instruments (Continued)
Forward Delivery Agreements (Continued)
Termination Risk: The Authority or the counterparty may terminate the forward delivery agreements if theother party fails to perform under the terms of the contract. If the forward delivery agreements have anegative fair value at the time of termination, the Authority would be liable to the counterparty for a paymentequivalent to the fair value of the instrument at the time of termination (see Note 19, Subsequent Events).
Note 5. Accounts Receivable
Accounts receivable for December 31, 2020 and December 31, 2019 are as follows:
2020 2019
Reimbursements from governmental agencies -Federal Transit Administration 13,752$ 5,421$
Reimbursements from other governmental agencies 976 1,601Development projects 3,500 3,500E-ZPass bridge tolls from other agencies 6,171 7,378Other 1,005 777
Gross receivables 25,404 18,677Less: allowance for uncollectibles (3,500) (3,500)
Net total receivables 21,904$ 15,177$
Note 6. Changes in Long-Term Liabilities
Long-term liability activity for the year ended December 31, 2020 is as follows:
Beginning Ending Due withinBalance Increases Decreases Balance 1 Year
Bonds payable1999 Port District Project Bonds 6,330$ (5,295)$ 1,035$ 1,035$2012 Port District Project Refunding Bonds 115,450 (7,320) 108,130 12,3502013 Revenue Bonds 476,585 476,5852018 Revenue Bonds 700,505 (55,725) 644,780 57,400Issuance discounts/premiums 91,119 (14,630) 76,489
Total bonds payable 1,389,989 - (82,970) 1,307,019 70,785
Other liabilitiesClaims and judgments 835 425$ (389) 871 740Self-insurance 4,229 3,043 (2,736) 4,536 3,040Sick and vacation leave 4,294 5,672 (4,425) 5,541 2,216Net pension liability 182,856 45,651 (70,796) 157,711Unearned revenue 7,046 8,303 (7,549) 7,800 6,835Other postemployment benefits 95,104 1,827 (27,527) 69,404
1,684,353$ 64,921$ (196,392)$ 1,552,882$ 83,616$
110
110
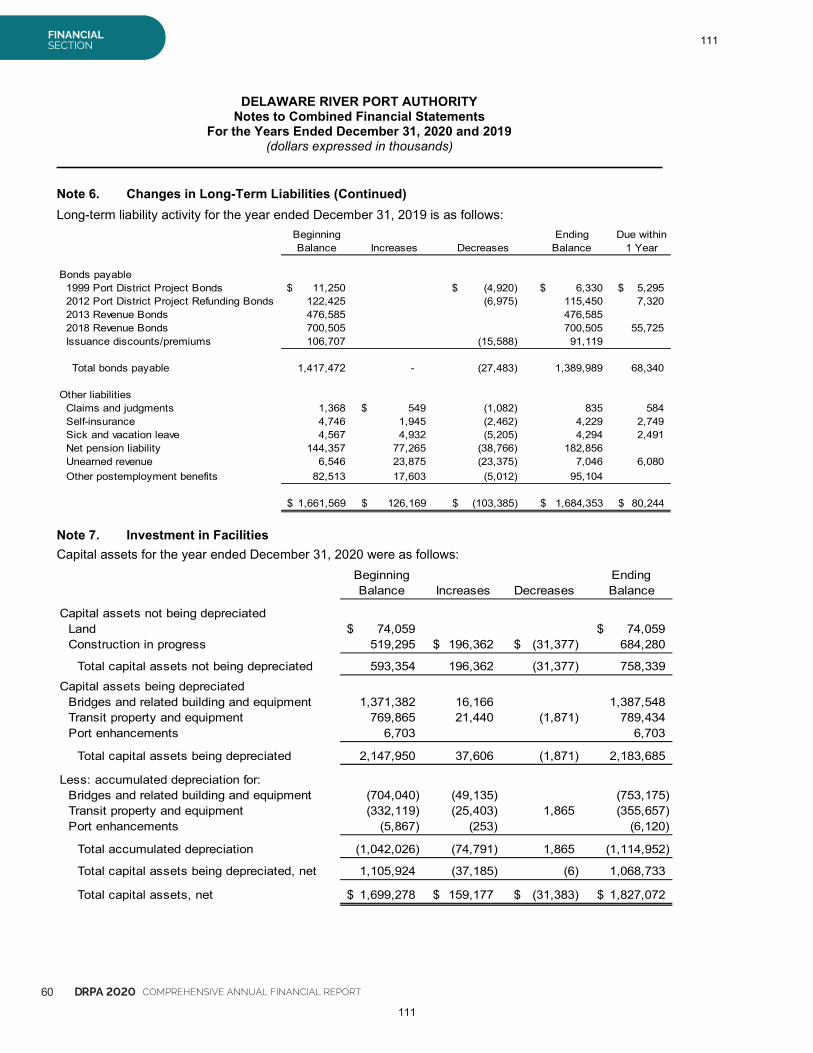
60 DRPA 2020 COMPREHENSIVE ANNUAL FINANCIAL REPORT
FINANCIALSECTION
DELAWARE RIVER PORT AUTHORITYNotes to Combined Financial Statements
For the Years Ended December 31, 2020 and 2019(dollars expressed in thousands)
Note 6. Changes in Long-Term Liabilities (Continued)Long-term liability activity for the year ended December 31, 2019 is as follows:
Beginning Ending Due withinBalance Increases Decreases Balance 1 Year
Bonds payable1999 Port District Project Bonds 11,250$ (4,920)$ 6,330$ 5,295$2012 Port District Project Refunding Bonds 122,425 (6,975) 115,450 7,3202013 Revenue Bonds 476,585 476,5852018 Revenue Bonds 700,505 700,505 55,725Issuance discounts/premiums 106,707 (15,588) 91,119
Total bonds payable 1,417,472 - (27,483) 1,389,989 68,340
Other liabilitiesClaims and judgments 1,368 549$ (1,082) 835 584Self-insurance 4,746 1,945 (2,462) 4,229 2,749Sick and vacation leave 4,567 4,932 (5,205) 4,294 2,491Net pension liability 144,357 77,265 (38,766) 182,856Unearned revenue 6,546 23,875 (23,375) 7,046 6,080Other postemployment benefits 82,513 17,603 (5,012) 95,104
1,661,569$ 126,169$ (103,385)$ 1,684,353$ 80,244$
Note 7. Investment in FacilitiesCapital assets for the year ended December 31, 2020 were as follows:
Beginning EndingBalance Increases Decreases Balance
Capital assets not being depreciatedLand 74,059$ 74,059$Construction in progress 519,295 196,362$ (31,377)$ 684,280
Total capital assets not being depreciated 593,354 196,362 (31,377) 758,339
Capital assets being depreciatedBridges and related building and equipment 1,371,382 16,166 1,387,548Transit property and equipment 769,865 21,440 (1,871) 789,434Port enhancements 6,703 6,703
Total capital assets being depreciated 2,147,950 37,606 (1,871) 2,183,685
Less: accumulated depreciation for:Bridges and related building and equipment (704,040) (49,135) (753,175)Transit property and equipment (332,119) (25,403) 1,865 (355,657)Port enhancements (5,867) (253) (6,120)
Total accumulated depreciation (1,042,026) (74,791) 1,865 (1,114,952)
Total capital assets being depreciated, net 1,105,924 (37,185) (6) 1,068,733
Total capital assets, net 1,699,278$ 159,177$ (31,383)$ 1,827,072$
111
111
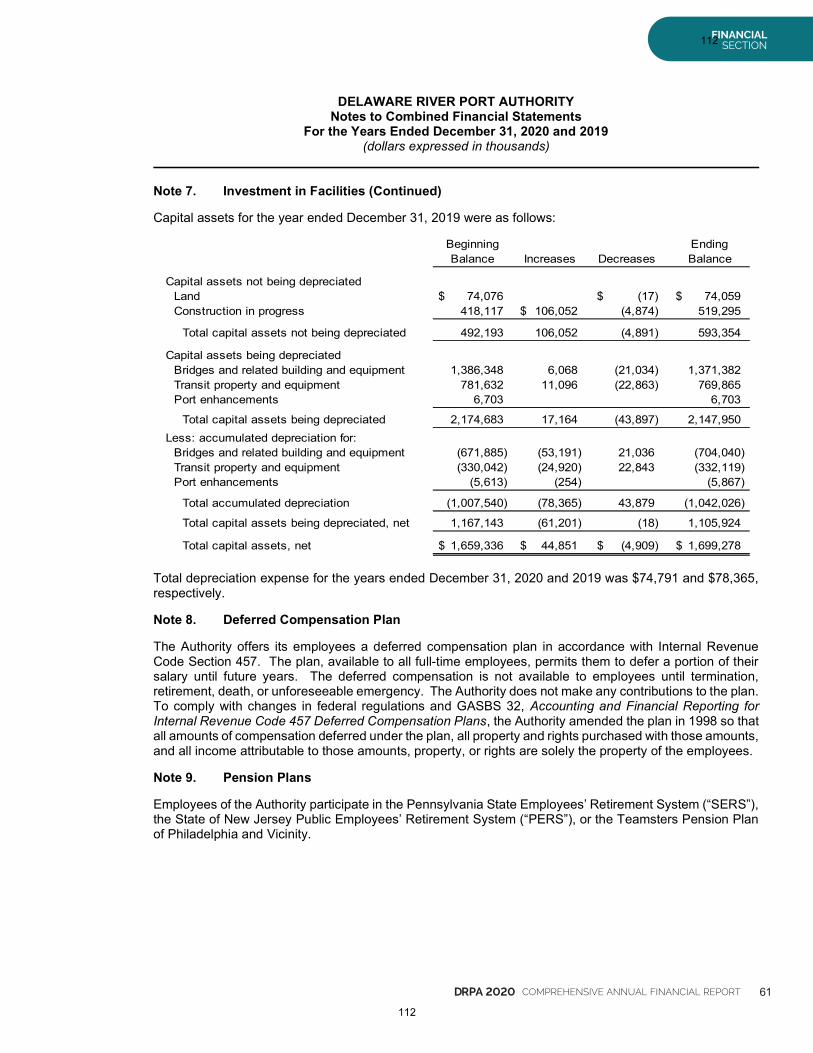
DRPA 2020 COMPREHENSIVE ANNUAL FINANCIAL REPORT 61
FINANCIALSECTION
DELAWARE RIVER PORT AUTHORITYNotes to Combined Financial Statements
For the Years Ended December 31, 2020 and 2019(dollars expressed in thousands)
Note 7. Investment in Facilities (Continued)
Capital assets for the year ended December 31, 2019 were as follows:
Beginning EndingBalance Increases Decreases Balance
Capital assets not being depreciatedLand 74,076$ (17)$ 74,059$Construction in progress 418,117 106,052$ (4,874) 519,295
Total capital assets not being depreciated 492,193 106,052 (4,891) 593,354
Capital assets being depreciatedBridges and related building and equipment 1,386,348 6,068 (21,034) 1,371,382Transit property and equipment 781,632 11,096 (22,863) 769,865Port enhancements 6,703 6,703
Total capital assets being depreciated 2,174,683 17,164 (43,897) 2,147,950Less: accumulated depreciation for:
Bridges and related building and equipment (671,885) (53,191) 21,036 (704,040)Transit property and equipment (330,042) (24,920) 22,843 (332,119)Port enhancements (5,613) (254) (5,867)
Total accumulated depreciation (1,007,540) (78,365) 43,879 (1,042,026)
Total capital assets being depreciated, net 1,167,143 (61,201) (18) 1,105,924
Total capital assets, net 1,659,336$ 44,851$ (4,909)$ 1,699,278$
Total depreciation expense for the years ended December 31, 2020 and 2019 was $74,791 and $78,365,respectively.
Note 8. Deferred Compensation Plan
The Authority offers its employees a deferred compensation plan in accordance with Internal RevenueCode Section 457. The plan, available to all full-time employees, permits them to defer a portion of theirsalary until future years. The deferred compensation is not available to employees until termination,retirement, death, or unforeseeable emergency. The Authority does not make any contributions to the plan.To comply with changes in federal regulations and GASBS 32, Accounting and Financial Reporting forInternal Revenue Code 457 Deferred Compensation Plans, the Authority amended the plan in 1998 so thatall amounts of compensation deferred under the plan, all property and rights purchased with those amounts,and all income attributable to those amounts, property, or rights are solely the property of the employees.
Note 9. Pension Plans
Employees of the Authority participate in the Pennsylvania State Employees’ Retirement System (“SERS”),the State of New Jersey Public Employees’ Retirement System (“PERS”), or the Teamsters Pension Planof Philadelphia and Vicinity.
112
112
62 DRPA 2020 COMPREHENSIVE ANNUAL FINANCIAL REPORT
FINANCIALSECTION
DELAWARE RIVER PORT AUTHORITYNotes to Combined Financial Statements
For the Years Ended December 31, 2020 and 2019(dollars expressed in thousands)
Note 9. Pension Plans (Continued)
General Information about the Plans
Plan Descriptions
Pennsylvania State Employees’ Retirement System: The Pennsylvania State Employees' RetirementSystem is the administrator of a cost-sharing multiple-employer defined benefit pension plan establishedby the Commonwealth of Pennsylvania (“Commonwealth”) to provide pension benefits for employees ofstate government and certain independent agencies. SERS is a component unit of the Commonwealth andis included in the Commonwealth's financial report as a pension trust fund. Membership in SERS ismandatory for most state employees. Members and employees of the General Assembly, certain electedor appointed officials in the executive branch, department heads, and certain employees in the field ofeducation are not required, but are given the option to participate.
SERS provides retirement, death, and disability benefits. Article II of the Commonwealth's constitutionassigns the authority to establish and amend the benefit provision of the plan to the General Assembly.Member retirement benefits are determined by taking years of credited service, multiplied by final averagesalary, multiplied by 2%, multiplied by class of service multiplier. According to the State Employees'Retirement Code, all obligations of SERS will be assumed by the Commonwealth should SERS terminate.
The Pennsylvania State Employees’ Retirement System issues a publicly available annual financial report,including financial statements, which may be obtained by writing to Pennsylvania State Employees’Retirement System, 30 North 3rd Street, Suite 150, Harrisburg, Pennsylvania 17101.
State of New Jersey Public Employees' Retirement System: The Public Employees' Retirement System(“PERS”) is the administrator of a cost-sharing multiple-employer defined benefit pension plan establishedby the State of New Jersey (“State”) which was established as of January 1, 1955 under the provisions ofN.J.S.A. 43:15A. The PERS’ designated purpose is to provide retirement, death, disability, and medicalbenefits to certain qualified members. Membership in the PERS is mandatory for some full-time employeesof the Authority, provided the employee is not required to be a member of another state-administeredretirement system or other state pensions fund or local jurisdiction’s pension fund. The PERS’ Board ofTrustees is primarily responsible for the administration of the PERS.
The State of New Jersey Public Employees’ Retirement System issues a publicly available annual financialreport, including financial statements, which may be obtained by writing to State of New Jersey, Division ofPensions and Benefits, P.O. Box 295, Trenton, New Jersey 08625-0295.
Teamsters Pension Plan of Philadelphia and Vicinity: The Teamsters Health and Welfare Fund ofPhiladelphia and Vicinity (the “Fund”) covers all eligible employees working for employers who have acollective bargaining agreement with a Teamsters local union which is party to the Fund and under whichthe employers have agreed to make contributions to the Fund on the employees' behalf in accordance withnegotiated hourly rates. The Fund is a cost-sharing multiple-employer defined benefit that was establishedunder the terms of collective bargaining agreements between the employers and Teamsters local unions(the local unions), located in central and northeast portions of Pennsylvania, along the eastern shore ofMaryland, Maine, New York and Ohio, and is not a state or local governmental pension plan. The Fund isgenerally non-contributory, but does provide for participant contributions under the Consolidated OmnibusBudget Reconciliation Act (COBRA). The Fund provides health and other benefits to eligible participantswho are covered under collective bargaining agreements, or other written agreements, with the local unions.The Fund is administered by a Board of Trustees (Trustees) with equal representation by the employersand the local unions and is subject to the provisions of the Employee Retirement Income Security Act of1974, as amended (ERISA). Benefit terms are established, and amended, by the Trustees. The Authorityis not subject to any provisions regarding withdrawal from the Fund.
113
113
DRPA 2020 COMPREHENSIVE ANNUAL FINANCIAL REPORT 63
FINANCIALSECTION
DELAWARE RIVER PORT AUTHORITYNotes to Combined Financial Statements
For the Years Ended December 31, 2020 and 2019(dollars expressed in thousands)
Note 9. Pension Plans (Continued)
General Information about the Plans (Continued)
Plan Descriptions (Continued)
Teamsters Pension Plan of Philadelphia and Vicinity (Continued): The Teamsters Pension Plan ofPhiladelphia and Vicinity issues a publicly available annual financial report, including financial statements,which may be obtained by writing to Teamsters Pension Plan of Philadelphia and Vicinity, Fourth andCherry Streets, Philadelphia, Pennsylvania 19106.
Vesting and Benefit Provisions
Pennsylvania State Employees’ Retirement System: A member may retire after completing three years ofservice and after reaching normal retirement age (the age of 60, except police officers at age 50, or the ageat which 35 years of service has been completed, whichever occurs first). Benefits vest after five years ofservice, or after 10 years of service for those hired on or after January 1, 2011. If an employee terminateshis or her employment after at least five years of service (10 years if hired on or after January 1, 2011) butbefore the normal retirement age, he or she may receive pension benefits immediately or defer pensionbenefits until reaching retirement age. Employees who retire after reaching the normal retirement age withat least three years of credited service who started on or prior to December 31, 2010 are entitled to receivepension benefits equal to 2.5% (2.0% for employees starting on or after January 1, 2011, unless they optto pay more to be eligible for the 2.5%) of their final average compensation (average of the three highestyears in earnings) times the number of years for which they were a participant in the plan. The pensionbenefits received by an employee who retires after five years of credited service but before normalretirement age are reduced for the number of years that person is under normal retirement age.
Pension provisions include death benefits, under which the surviving beneficiary may be entitled to receivethe employee’s accumulated contributions less the amount of pension payments that the employeereceived, the present value of the employees’ account at retirement less the amount of pension benefitsreceived by the employee, the same pension benefits formerly received by the employee, or one-half of themonthly pension payment formerly received by the employee. The maximum pension benefit to theemployee previously described may be reduced depending on the benefits elected for the survivingbeneficiary.
State of New Jersey Public Employees’ Retirement System: The vesting and benefit provisions are set byN.J.S.A. 43:15A. PERS provides retirement, death and disability benefits. All benefits vest after ten yearsof service, except for medical benefits, which vest after 25 years of service or under the disability provisionsof the PERS.
The following represents the membership tiers for PERS:
Tier Definition
1 Members who were enrolled prior to July 1, 20072 Members who were eligible to enroll on or after July 1, 2007 and prior to November 2, 20083 Members who were eligible to enroll on or after November 2, 2008 and prior to May 21, 20104 Members who were eligible to enroll after May 21, 2010 and prior to June 28, 20115 Members who were eligible to enroll on or after June 28, 2011
114
114
64 DRPA 2020 COMPREHENSIVE ANNUAL FINANCIAL REPORT
FINANCIALSECTION
DELAWARE RIVER PORT AUTHORITYNotes to Combined Financial Statements
For the Years Ended December 31, 2020 and 2019(dollars expressed in thousands)
Note 9. Pension Plans (Continued)
General Information about the Plans (Continued)
Vesting and Benefit Provisions (Continued)
State of New Jersey Public Employees’ Retirement System (Continued): Service retirement benefits of1/55th of final average salary for each year of service credit is available to tiers 1 and 2 members uponreaching age 60 and to tier 3 members upon reaching age 62. Service retirement benefits of 1/60th of finalaverage salary for each year of service credit is available to tier 4 members upon reaching age 62 and tier5 members upon reaching age 65. Early retirement benefits are available to tiers 1 and 2 members beforereaching age 60, tiers 3 and 4 with 25 years or more of service credit before age 62, and tier 5 with 30 ormore years of service credit before age 65. Benefits are reduced by a fraction of a percent for each monththat a member retires prior to the age at which a member can receive full early retirement benefits inaccordance with their respective tier. Tier 1 members can receive an unreduced benefit from age 55 toage 60 if they have at least 25 years of service. Deferred retirement is available to members who have atleast 10 years of service credit and have not reached the service retirement age for the respective tier.
Teamsters Pension Plan of Philadelphia and Vicinity: A member may retire at the later of (a) the date theemployee reaches 65 or (b) the tenth anniversary of the employee’s commencement of participation in theplan. Additionally, employees are eligible for early retirement after 10 years of participation in the plan and(a) completion of 30 years of vested service or (b) attainment of age 50 and completion of 10 years ofvested service. Benefits vest after 10 years of service. An employee who retires on or after his or hernormal retirement age is entitled to receive benefits based on his or her credited years of service multipliedby a monthly benefit rate, which is determined based on the employer’s daily contributions. The benefitsare subject to maximum rates that vary according to employer daily contribution rates. Members may alsoreceive benefits after early retirement at reduced rates, depending on age at retirement.
An employee who qualifies for disability retirement benefits (total and permanent disability with 10 years ofvested service and 5 years of continuous service with at least 300 covered days of contributions) is entitledto receive two hundred dollars per month until retirement age, when retirement benefits would commence.
Provisions include surviving spouse death benefits, under which the surviving spouse is entitled to a 50%survivor annuity in certain cases.
At December 31, 2020, 2019, and 2018, the Authority had 220, 203, and 218 employees, respectively,covered by the Fund.
Contributions
Pennsylvania State Employees’ Retirement System: The contribution requirements of plan members andthe Authority are established and amended by the Pennsylvania State Employees’ Retirement SystemBoard. As of January 1, 2011, employee’s contribution rates range from 5% to 9.3% of their gross earningsdepending on their plan selection.
Employer contribution rates are certified by the SERS Board annually, typically in April of each year tobecome effective the following fiscal year beginning in June. It is customary for rates to result from anindependent actuarial valuation of the pension fund. The employer contribution rate is set so that it canfund all retirement benefits earned by employees working during the year and pay toward any unfundedliability that may exist. In some cases, however, the actuarially calculated employer contribution rate hasbeen set or adjusted by Pennsylvania law.
115
115
DRPA 2020 COMPREHENSIVE ANNUAL FINANCIAL REPORT 65
FINANCIALSECTION
DELAWARE RIVER PORT AUTHORITYNotes to Combined Financial Statements
For the Years Ended December 31, 2020 and 2019(dollars expressed in thousands)
Note 9. Pension Plans (Continued)
General Information about the Plans (Continued)
Contributions (Continued)
Pennsylvania State Employees’ Retirement System (Continued): The Authority’s contractually requiredcontribution rate for the years ended December 31, 2020 and 2019 was 34.37% and 30.78%, respectively,of the Authority’s covered payroll, and the Authority’s contractually required quarterly contributions to thepension plan for 2020 and 2019 totaled $17,006 (includes $940 of accrued pension liability) and $16,663(includes $12,052 of accrued pension liability), respectively. Employee contributions to the plan during2020 and 2019 were $3,599 and $3,593, respectively.
State of New Jersey Public Employees’ Retirement System: The contribution policy is set by N.J.S.A.43:15A and requires contributions by active members and contributing employers. Pursuant to theprovisions of Chapter 78, P.L. 2011, the active member contribution rate increased from 5.5% of annualcompensation to 6.5% plus an additional 1% phased-in over 7 years beginning in July 2012. The membercontribution rate was 7.34% in State fiscal year 2018. The phase-in of the additional incremental membercontribution rate takes place in July of each subsequent State fiscal year. Employers' contribution arebased on an actuarially determined amount, which includes the normal cost and unfunded accrued liability.
The Authority’s contractually required contribution rate for the years ended December 31, 2020 and 2019was 15.72% and 12.37%, respectively, of the Authority’s covered payroll. This amount was actuariallydetermined as the amount that, when combined with employee contributions, is expected to finance thecosts of benefits earned by employees during the year, including an additional amount to finance anyunfunded accrued liability. The Authority’s contractually required contributions to the pension plan for theyears ended December 31, 2020 and 2019 were $132 and $106, which is and was due on April 1, 2021and April 1, 2020, respectively. Employee contributions to the plan during 2020 and 2019 were $63 and$66, respectively.
Teamsters Pension Plan of Philadelphia and Vicinity: The employer’s contribution requirements aredetermined under the terms of one Collective Bargaining Agreement (“CBA”) in force. The CBA betweenPort Authority Transit Corporation (“PATCO”) and Teamsters Local 676 (“Teamsters”) expired December31, 2017. PATCO and Teamsters subsequently entered into an Agreement executed by PATCO on July23, 2018. That Agreement extended the CBA without change and provided that PATCO will continue tomake contributions to the Teamsters Health and Welfare Fund of Philadelphia and Vicinity and theTeamsters Pension Trust Fund of Philadelphia and Vicinity in the same manner and method as set forth inthe CBA at the contribution rates established by the Trustees of the respective Funds, increasing effectiveJune 1, 2018 and August 1, 2018, respectively, subject to increases on a yearly basis, until such time as anew CBA is reached or either party terminates the Agreement. During 2020, the Authority was required toand did contribute thirty dollars and seventy cents ($30.70) per day from January 1 through July 31, andthirty-two dollars and twenty-four cents ($32.24) per day from August 1 through December 31 for eachPATCO participating employee. For the 2019 year, the Authority was required to and did contribute twenty-nine dollars and twenty-four cents ($29.24) per day from January 1 through June 30, and thirty dollars andseventy cents ($30.70) per day, from July 1 through December 31 for each PATCO participating employee.The Authority’s contributions totaled 10.02%, 9.27%, and 9.55% of covered payroll in 2020, 2019 and 2018,respectively.
The employees of the Authority do not contribute to the Fund. The Authority contributed $1,608, $1,474,and $1,378 in 2020, 2019 and 2018, respectively, which represented 100% of the required contributionsfor the aforementioned years.
116
116
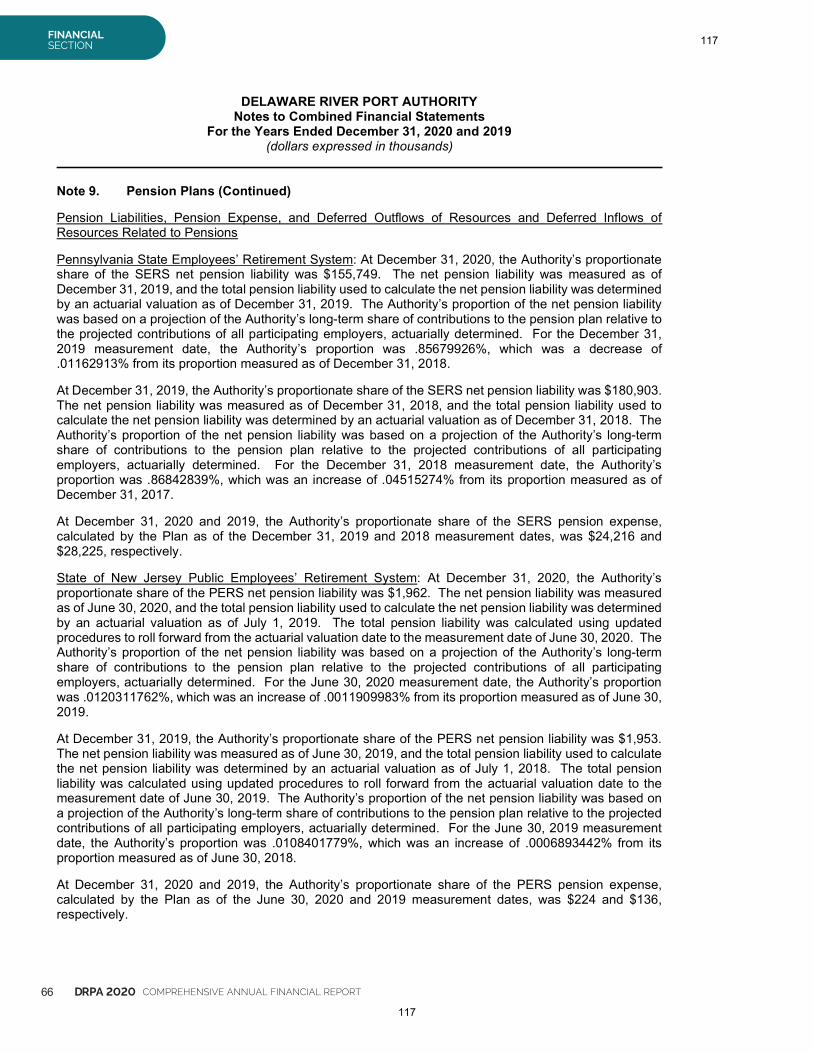
66 DRPA 2020 COMPREHENSIVE ANNUAL FINANCIAL REPORT
FINANCIALSECTION
DELAWARE RIVER PORT AUTHORITYNotes to Combined Financial Statements
For the Years Ended December 31, 2020 and 2019(dollars expressed in thousands)
Note 9. Pension Plans (Continued)
Pension Liabilities, Pension Expense, and Deferred Outflows of Resources and Deferred Inflows ofResources Related to Pensions
Pennsylvania State Employees’ Retirement System: At December 31, 2020, the Authority’s proportionateshare of the SERS net pension liability was $155,749. The net pension liability was measured as ofDecember 31, 2019, and the total pension liability used to calculate the net pension liability was determinedby an actuarial valuation as of December 31, 2019. The Authority’s proportion of the net pension liabilitywas based on a projection of the Authority’s long-term share of contributions to the pension plan relative tothe projected contributions of all participating employers, actuarially determined. For the December 31,2019 measurement date, the Authority’s proportion was .85679926%, which was a decrease of.01162913% from its proportion measured as of December 31, 2018.
At December 31, 2019, the Authority’s proportionate share of the SERS net pension liability was $180,903.The net pension liability was measured as of December 31, 2018, and the total pension liability used tocalculate the net pension liability was determined by an actuarial valuation as of December 31, 2018. TheAuthority’s proportion of the net pension liability was based on a projection of the Authority’s long-termshare of contributions to the pension plan relative to the projected contributions of all participatingemployers, actuarially determined. For the December 31, 2018 measurement date, the Authority’sproportion was .86842839%, which was an increase of .04515274% from its proportion measured as ofDecember 31, 2017.
At December 31, 2020 and 2019, the Authority’s proportionate share of the SERS pension expense,calculated by the Plan as of the December 31, 2019 and 2018 measurement dates, was $24,216 and$28,225, respectively.
State of New Jersey Public Employees’ Retirement System: At December 31, 2020, the Authority’sproportionate share of the PERS net pension liability was $1,962. The net pension liability was measuredas of June 30, 2020, and the total pension liability used to calculate the net pension liability was determinedby an actuarial valuation as of July 1, 2019. The total pension liability was calculated using updatedprocedures to roll forward from the actuarial valuation date to the measurement date of June 30, 2020. TheAuthority’s proportion of the net pension liability was based on a projection of the Authority’s long-termshare of contributions to the pension plan relative to the projected contributions of all participatingemployers, actuarially determined. For the June 30, 2020 measurement date, the Authority’s proportionwas .0120311762%, which was an increase of .0011909983% from its proportion measured as of June 30,2019.
At December 31, 2019, the Authority’s proportionate share of the PERS net pension liability was $1,953.The net pension liability was measured as of June 30, 2019, and the total pension liability used to calculatethe net pension liability was determined by an actuarial valuation as of July 1, 2018. The total pensionliability was calculated using updated procedures to roll forward from the actuarial valuation date to themeasurement date of June 30, 2019. The Authority’s proportion of the net pension liability was based ona projection of the Authority’s long-term share of contributions to the pension plan relative to the projectedcontributions of all participating employers, actuarially determined. For the June 30, 2019 measurementdate, the Authority’s proportion was .0108401779%, which was an increase of .0006893442% from itsproportion measured as of June 30, 2018.
At December 31, 2020 and 2019, the Authority’s proportionate share of the PERS pension expense,calculated by the Plan as of the June 30, 2020 and 2019 measurement dates, was $224 and $136,respectively.
117
117
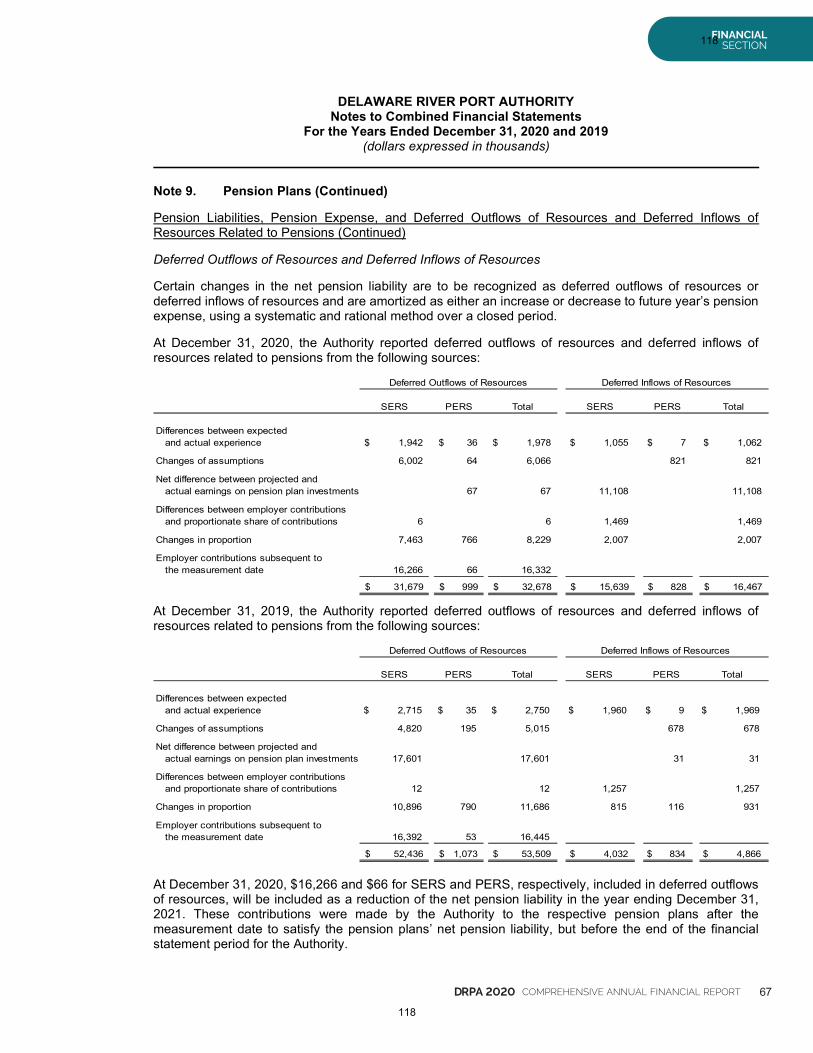
DRPA 2020 COMPREHENSIVE ANNUAL FINANCIAL REPORT 67
FINANCIALSECTION
DELAWARE RIVER PORT AUTHORITYNotes to Combined Financial Statements
For the Years Ended December 31, 2020 and 2019(dollars expressed in thousands)
Note 9. Pension Plans (Continued)
Pension Liabilities, Pension Expense, and Deferred Outflows of Resources and Deferred Inflows ofResources Related to Pensions (Continued)
Deferred Outflows of Resources and Deferred Inflows of Resources
Certain changes in the net pension liability are to be recognized as deferred outflows of resources ordeferred inflows of resources and are amortized as either an increase or decrease to future year’s pensionexpense, using a systematic and rational method over a closed period.
At December 31, 2020, the Authority reported deferred outflows of resources and deferred inflows ofresources related to pensions from the following sources:
SERS PERS Total SERS PERS Total
Differences between expectedand actual experience 1,942$ 36$ 1,978$ 1,055$ 7$ 1,062$
Changes of assumptions 6,002 64 6,066 821 821
Net difference between projected andactual earnings on pension plan investments 67 67 11,108 11,108
Differences between employer contributionsand proportionate share of contributions 6 6 1,469 1,469
Changes in proportion 7,463 766 8,229 2,007 2,007
Employer contributions subsequent tothe measurement date 16,266 66 16,332
31,679$ 999$ 32,678$ 15,639$ 828$ 16,467$
Deferred Outflows of Resources Deferred Inflows of Resources
At December 31, 2019, the Authority reported deferred outflows of resources and deferred inflows ofresources related to pensions from the following sources:
SERS PERS Total SERS PERS Total
Differences between expectedand actual experience 2,715$ 35$ 2,750$ 1,960$ 9$ 1,969$
Changes of assumptions 4,820 195 5,015 678 678
Net difference between projected andactual earnings on pension plan investments 17,601 17,601 31 31
Differences between employer contributionsand proportionate share of contributions 12 12 1,257 1,257
Changes in proportion 10,896 790 11,686 815 116 931
Employer contributions subsequent tothe measurement date 16,392 53 16,445
52,436$ 1,073$ 53,509$ 4,032$ 834$ 4,866$
Deferred Outflows of Resources Deferred Inflows of Resources
At December 31, 2020, $16,266 and $66 for SERS and PERS, respectively, included in deferred outflowsof resources, will be included as a reduction of the net pension liability in the year ending December 31,2021. These contributions were made by the Authority to the respective pension plans after themeasurement date to satisfy the pension plans’ net pension liability, but before the end of the financialstatement period for the Authority.
118
118
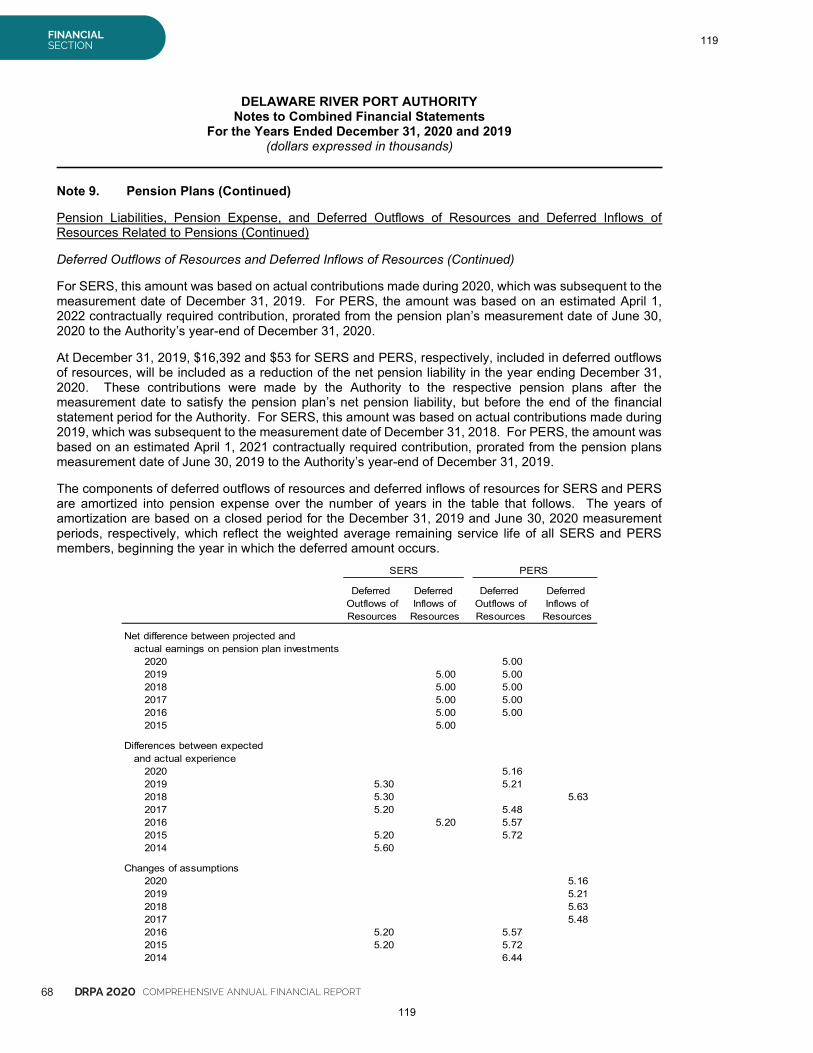
68 DRPA 2020 COMPREHENSIVE ANNUAL FINANCIAL REPORT
FINANCIALSECTION
DELAWARE RIVER PORT AUTHORITYNotes to Combined Financial Statements
For the Years Ended December 31, 2020 and 2019(dollars expressed in thousands)
Note 9. Pension Plans (Continued)
Pension Liabilities, Pension Expense, and Deferred Outflows of Resources and Deferred Inflows ofResources Related to Pensions (Continued)
Deferred Outflows of Resources and Deferred Inflows of Resources (Continued)
For SERS, this amount was based on actual contributions made during 2020, which was subsequent to themeasurement date of December 31, 2019. For PERS, the amount was based on an estimated April 1,2022 contractually required contribution, prorated from the pension plan’s measurement date of June 30,2020 to the Authority’s year-end of December 31, 2020.
At December 31, 2019, $16,392 and $53 for SERS and PERS, respectively, included in deferred outflowsof resources, will be included as a reduction of the net pension liability in the year ending December 31,2020. These contributions were made by the Authority to the respective pension plans after themeasurement date to satisfy the pension plan’s net pension liability, but before the end of the financialstatement period for the Authority. For SERS, this amount was based on actual contributions made during2019, which was subsequent to the measurement date of December 31, 2018. For PERS, the amount wasbased on an estimated April 1, 2021 contractually required contribution, prorated from the pension plansmeasurement date of June 30, 2019 to the Authority’s year-end of December 31, 2019.
The components of deferred outflows of resources and deferred inflows of resources for SERS and PERSare amortized into pension expense over the number of years in the table that follows. The years ofamortization are based on a closed period for the December 31, 2019 and June 30, 2020 measurementperiods, respectively, which reflect the weighted average remaining service life of all SERS and PERSmembers, beginning the year in which the deferred amount occurs.
SERS PERS
Deferred Deferred Deferred DeferredOutflows of Inflows of Outflows of Inflows ofResources Resources Resources Resources
Net difference between projected andactual earnings on pension plan investments
2020 5.002019 5.00 5.002018 5.00 5.002017 5.00 5.002016 5.00 5.002015 5.00
Differences between expectedand actual experience
2020 5.162019 5.30 5.212018 5.30 5.632017 5.20 5.482016 5.20 5.572015 5.20 5.722014 5.60
Changes of assumptions2020 5.162019 5.212018 5.632017 5.482016 5.20 5.572015 5.20 5.722014 6.44
119
119
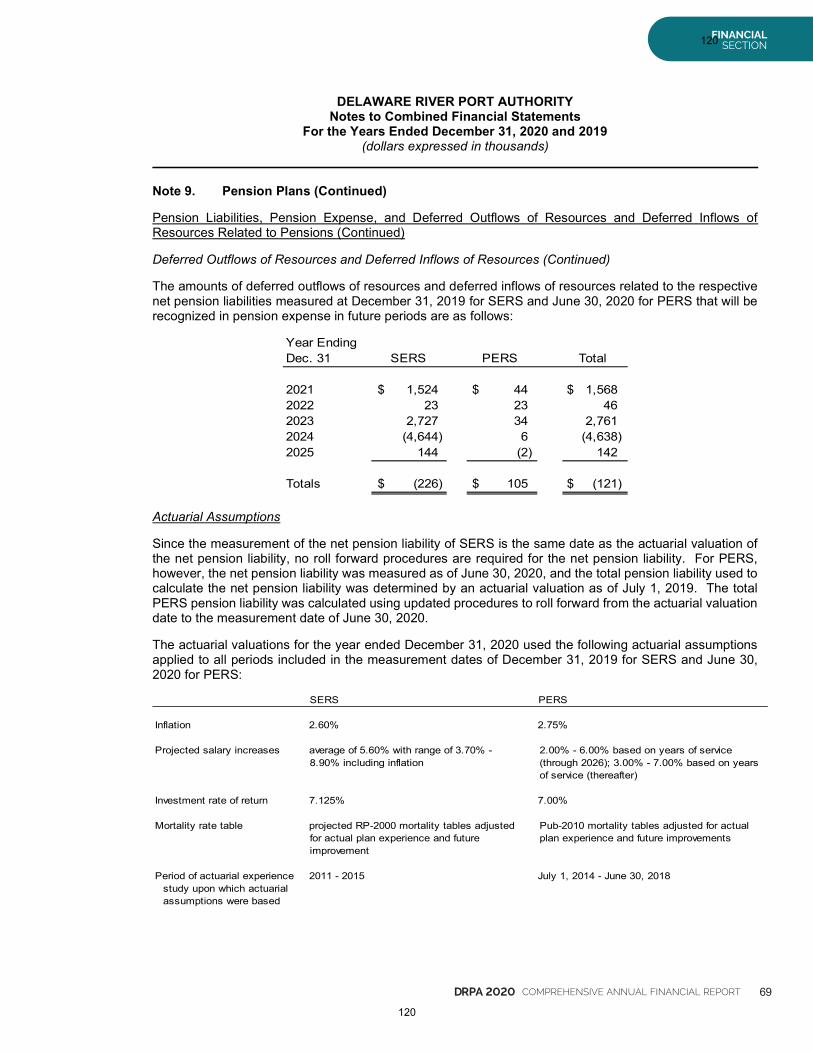
DRPA 2020 COMPREHENSIVE ANNUAL FINANCIAL REPORT 69
FINANCIALSECTION
DELAWARE RIVER PORT AUTHORITYNotes to Combined Financial Statements
For the Years Ended December 31, 2020 and 2019(dollars expressed in thousands)
Note 9. Pension Plans (Continued)
Pension Liabilities, Pension Expense, and Deferred Outflows of Resources and Deferred Inflows ofResources Related to Pensions (Continued)
Deferred Outflows of Resources and Deferred Inflows of Resources (Continued)
The amounts of deferred outflows of resources and deferred inflows of resources related to the respectivenet pension liabilities measured at December 31, 2019 for SERS and June 30, 2020 for PERS that will berecognized in pension expense in future periods are as follows:
Year EndingDec. 31 SERS PERS Total
2021 1,524$ 44$ 1,568$2022 23 23 462023 2,727 34 2,7612024 (4,644) 6 (4,638)2025 144 (2) 142
Totals (226)$ 105$ (121)$
Actuarial Assumptions
Since the measurement of the net pension liability of SERS is the same date as the actuarial valuation ofthe net pension liability, no roll forward procedures are required for the net pension liability. For PERS,however, the net pension liability was measured as of June 30, 2020, and the total pension liability used tocalculate the net pension liability was determined by an actuarial valuation as of July 1, 2019. The totalPERS pension liability was calculated using updated procedures to roll forward from the actuarial valuationdate to the measurement date of June 30, 2020.
The actuarial valuations for the year ended December 31, 2020 used the following actuarial assumptionsapplied to all periods included in the measurement dates of December 31, 2019 for SERS and June 30,2020 for PERS:
SERS PERS
Inflation 2.60% 2.75%
Projected salary increases average of 5.60% with range of 3.70% -8.90% including inflation
2.00% - 6.00% based on years of service(through 2026); 3.00% - 7.00% based on yearsof service (thereafter)
Investment rate of return 7.125% 7.00%
Mortality rate table projected RP-2000 mortality tables adjustedfor actual plan experience and futureimprovement
Pub-2010 mortality tables adjusted for actualplan experience and future improvements
Period of actuarial experience 2011 - 2015 July 1, 2014 - June 30, 2018study upon which actuarialassumptions were based
120
120
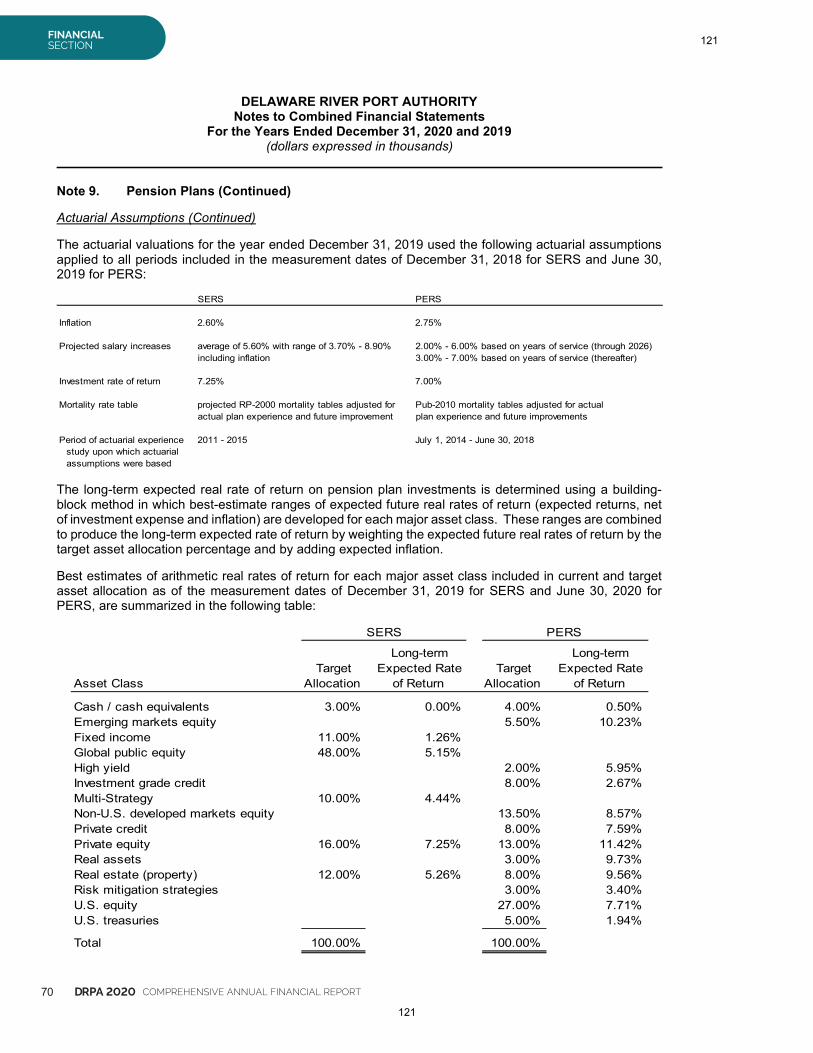
70 DRPA 2020 COMPREHENSIVE ANNUAL FINANCIAL REPORT
FINANCIALSECTION
DELAWARE RIVER PORT AUTHORITYNotes to Combined Financial Statements
For the Years Ended December 31, 2020 and 2019(dollars expressed in thousands)
Note 9. Pension Plans (Continued)
Actuarial Assumptions (Continued)
The actuarial valuations for the year ended December 31, 2019 used the following actuarial assumptionsapplied to all periods included in the measurement dates of December 31, 2018 for SERS and June 30,2019 for PERS:
SERS PERS
Inflation 2.60% 2.75%
Projected salary increases average of 5.60% with range of 3.70% - 8.90% 2.00% - 6.00% based on years of service (through 2026)including inflation 3.00% - 7.00% based on years of service (thereafter)
Investment rate of return 7.25% 7.00%
Mortality rate table projected RP-2000 mortality tables adjusted for Pub-2010 mortality tables adjusted for actualactual plan experience and future improvement plan experience and future improvements
Period of actuarial experience 2011 - 2015 July 1, 2014 - June 30, 2018study upon which actuarialassumptions were based
The long-term expected real rate of return on pension plan investments is determined using a building-block method in which best-estimate ranges of expected future real rates of return (expected returns, netof investment expense and inflation) are developed for each major asset class. These ranges are combinedto produce the long-term expected rate of return by weighting the expected future real rates of return by thetarget asset allocation percentage and by adding expected inflation.
Best estimates of arithmetic real rates of return for each major asset class included in current and targetasset allocation as of the measurement dates of December 31, 2019 for SERS and June 30, 2020 forPERS, are summarized in the following table:
SERS PERS
Long-term Long-termTarget Expected Rate Target Expected Rate
Asset Class Allocation of Return Allocation of Return
Cash / cash equivalents 3.00% 0.00% 4.00% 0.50%Emerging markets equity 5.50% 10.23%Fixed income 11.00% 1.26%Global public equity 48.00% 5.15%High yield 2.00% 5.95%Investment grade credit 8.00% 2.67%Multi-Strategy 10.00% 4.44%Non-U.S. developed markets equity 13.50% 8.57%Private credit 8.00% 7.59%Private equity 16.00% 7.25% 13.00% 11.42%Real assets 3.00% 9.73%Real estate (property) 12.00% 5.26% 8.00% 9.56%Risk mitigation strategies 3.00% 3.40%U.S. equity 27.00% 7.71%U.S. treasuries 5.00% 1.94%
Total 100.00% 100.00%
121
121
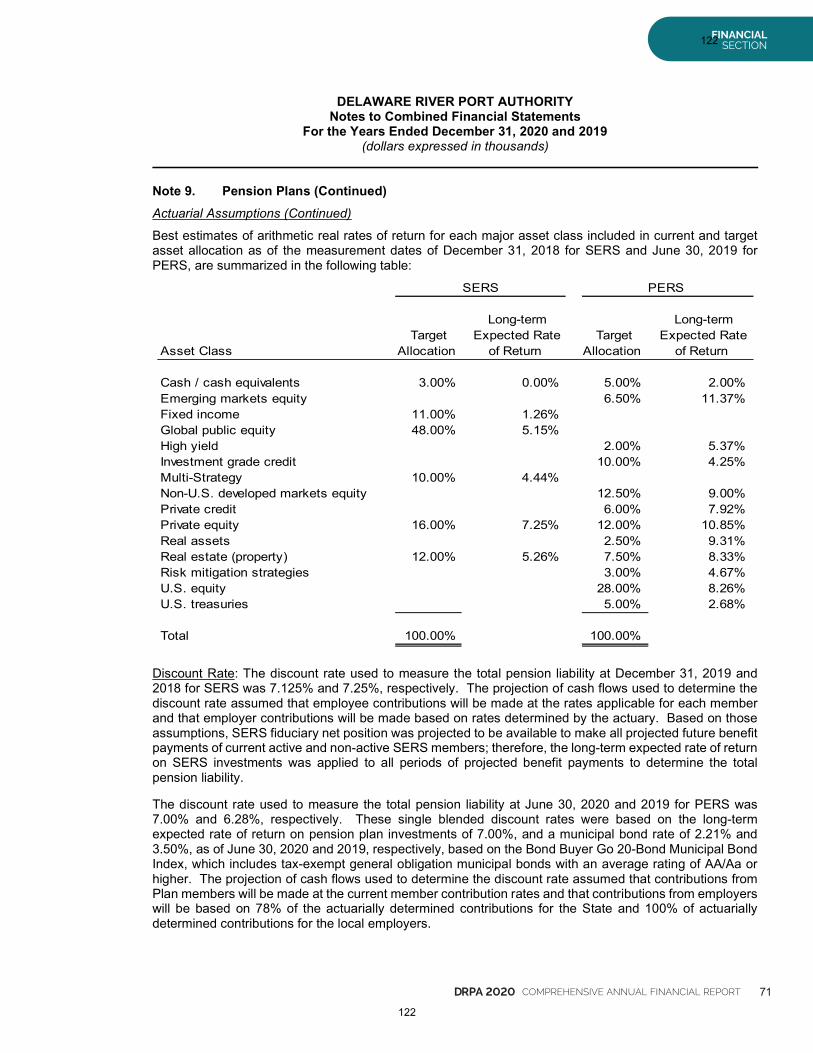
DRPA 2020 COMPREHENSIVE ANNUAL FINANCIAL REPORT 71
FINANCIALSECTION
DELAWARE RIVER PORT AUTHORITYNotes to Combined Financial Statements
For the Years Ended December 31, 2020 and 2019(dollars expressed in thousands)
Note 9. Pension Plans (Continued)
Actuarial Assumptions (Continued)
Best estimates of arithmetic real rates of return for each major asset class included in current and targetasset allocation as of the measurement dates of December 31, 2018 for SERS and June 30, 2019 forPERS, are summarized in the following table:
SERS PERS
Long-term Long-termTarget Expected Rate Target Expected Rate
Asset Class Allocation of Return Allocation of Return
Cash / cash equivalents 3.00% 0.00% 5.00% 2.00%Emerging markets equity 6.50% 11.37%Fixed income 11.00% 1.26%Global public equity 48.00% 5.15%High yield 2.00% 5.37%Investment grade credit 10.00% 4.25%Multi-Strategy 10.00% 4.44%Non-U.S. developed markets equity 12.50% 9.00%Private credit 6.00% 7.92%Private equity 16.00% 7.25% 12.00% 10.85%Real assets 2.50% 9.31%Real estate (property) 12.00% 5.26% 7.50% 8.33%Risk mitigation strategies 3.00% 4.67%U.S. equity 28.00% 8.26%U.S. treasuries 5.00% 2.68%
Total 100.00% 100.00%
Discount Rate: The discount rate used to measure the total pension liability at December 31, 2019 and2018 for SERS was 7.125% and 7.25%, respectively. The projection of cash flows used to determine thediscount rate assumed that employee contributions will be made at the rates applicable for each memberand that employer contributions will be made based on rates determined by the actuary. Based on thoseassumptions, SERS fiduciary net position was projected to be available to make all projected future benefitpayments of current active and non-active SERS members; therefore, the long-term expected rate of returnon SERS investments was applied to all periods of projected benefit payments to determine the totalpension liability.
The discount rate used to measure the total pension liability at June 30, 2020 and 2019 for PERS was7.00% and 6.28%, respectively. These single blended discount rates were based on the long-termexpected rate of return on pension plan investments of 7.00%, and a municipal bond rate of 2.21% and3.50%, as of June 30, 2020 and 2019, respectively, based on the Bond Buyer Go 20-Bond Municipal BondIndex, which includes tax-exempt general obligation municipal bonds with an average rating of AA/Aa orhigher. The projection of cash flows used to determine the discount rate assumed that contributions fromPlan members will be made at the current member contribution rates and that contributions from employerswill be based on 78% of the actuarially determined contributions for the State and 100% of actuariallydetermined contributions for the local employers.
122
122
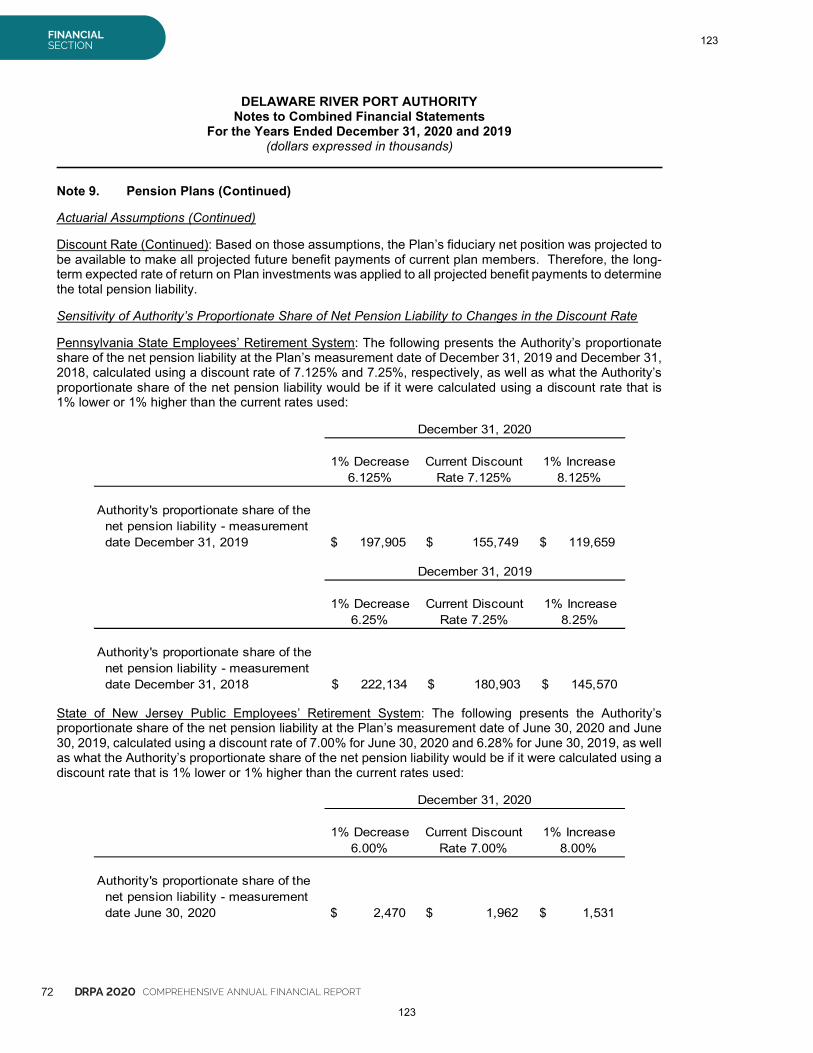
72 DRPA 2020 COMPREHENSIVE ANNUAL FINANCIAL REPORT
FINANCIALSECTION
DELAWARE RIVER PORT AUTHORITYNotes to Combined Financial Statements
For the Years Ended December 31, 2020 and 2019(dollars expressed in thousands)
Note 9. Pension Plans (Continued)
Actuarial Assumptions (Continued)
Discount Rate (Continued): Based on those assumptions, the Plan’s fiduciary net position was projected tobe available to make all projected future benefit payments of current plan members. Therefore, the long-term expected rate of return on Plan investments was applied to all projected benefit payments to determinethe total pension liability.
Sensitivity of Authority’s Proportionate Share of Net Pension Liability to Changes in the Discount Rate
Pennsylvania State Employees’ Retirement System: The following presents the Authority’s proportionateshare of the net pension liability at the Plan’s measurement date of December 31, 2019 and December 31,2018, calculated using a discount rate of 7.125% and 7.25%, respectively, as well as what the Authority’sproportionate share of the net pension liability would be if it were calculated using a discount rate that is1% lower or 1% higher than the current rates used:
December 31, 2020
1% Decrease Current Discount 1% Increase6.125% Rate 7.125% 8.125%
Authority's proportionate share of thenet pension liability - measurementdate December 31, 2019 197,905$ 155,749$ 119,659$
December 31, 2019
1% Decrease Current Discount 1% Increase6.25% Rate 7.25% 8.25%
Authority's proportionate share of thenet pension liability - measurementdate December 31, 2018 222,134$ 180,903$ 145,570$
State of New Jersey Public Employees’ Retirement System: The following presents the Authority’sproportionate share of the net pension liability at the Plan’s measurement date of June 30, 2020 and June30, 2019, calculated using a discount rate of 7.00% for June 30, 2020 and 6.28% for June 30, 2019, as wellas what the Authority’s proportionate share of the net pension liability would be if it were calculated using adiscount rate that is 1% lower or 1% higher than the current rates used:
December 31, 2020
1% Decrease Current Discount 1% Increase6.00% Rate 7.00% 8.00%
Authority's proportionate share of thenet pension liability - measurementdate June 30, 2020 2,470$ 1,962$ 1,531$
123
123
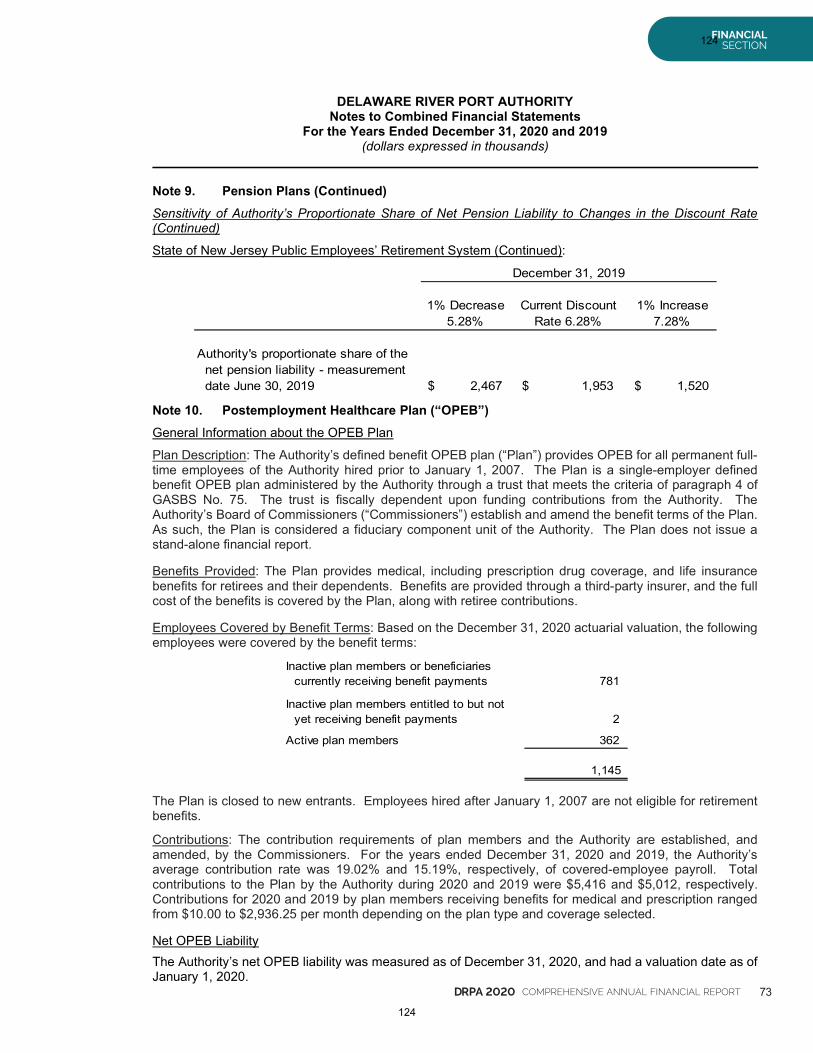
DRPA 2020 COMPREHENSIVE ANNUAL FINANCIAL REPORT 73
FINANCIALSECTION
DELAWARE RIVER PORT AUTHORITYNotes to Combined Financial Statements
For the Years Ended December 31, 2020 and 2019(dollars expressed in thousands)
Note 9. Pension Plans (Continued)
Sensitivity of Authority’s Proportionate Share of Net Pension Liability to Changes in the Discount Rate(Continued)
State of New Jersey Public Employees’ Retirement System (Continued):
December 31, 2019
1% Decrease Current Discount 1% Increase5.28% Rate 6.28% 7.28%
Authority's proportionate share of thenet pension liability - measurementdate June 30, 2019 2,467$ 1,953$ 1,520$
Note 10. Postemployment Healthcare Plan (“OPEB”)
General Information about the OPEB Plan
Plan Description: The Authority’s defined benefit OPEB plan (“Plan”) provides OPEB for all permanent full-time employees of the Authority hired prior to January 1, 2007. The Plan is a single-employer definedbenefit OPEB plan administered by the Authority through a trust that meets the criteria of paragraph 4 ofGASBS No. 75. The trust is fiscally dependent upon funding contributions from the Authority. TheAuthority’s Board of Commissioners (“Commissioners”) establish and amend the benefit terms of the Plan.As such, the Plan is considered a fiduciary component unit of the Authority. The Plan does not issue astand-alone financial report.
Benefits Provided: The Plan provides medical, including prescription drug coverage, and life insurancebenefits for retirees and their dependents. Benefits are provided through a third-party insurer, and the fullcost of the benefits is covered by the Plan, along with retiree contributions.
Employees Covered by Benefit Terms: Based on the December 31, 2020 actuarial valuation, the followingemployees were covered by the benefit terms:
Inactive plan members or beneficiariescurrently receiving benefit payments 781
Inactive plan members entitled to but notyet receiving benefit payments 2
Active plan members 362
1,145
The Plan is closed to new entrants. Employees hired after January 1, 2007 are not eligible for retirementbenefits.
Contributions: The contribution requirements of plan members and the Authority are established, andamended, by the Commissioners. For the years ended December 31, 2020 and 2019, the Authority’saverage contribution rate was 19.02% and 15.19%, respectively, of covered-employee payroll. Totalcontributions to the Plan by the Authority during 2020 and 2019 were $5,416 and $5,012, respectively.Contributions for 2020 and 2019 by plan members receiving benefits for medical and prescription rangedfrom $10.00 to $2,936.25 per month depending on the plan type and coverage selected.
Net OPEB LiabilityThe Authority’s net OPEB liability was measured as of December 31, 2020, and had a valuation date as ofJanuary 1, 2020.
124
124
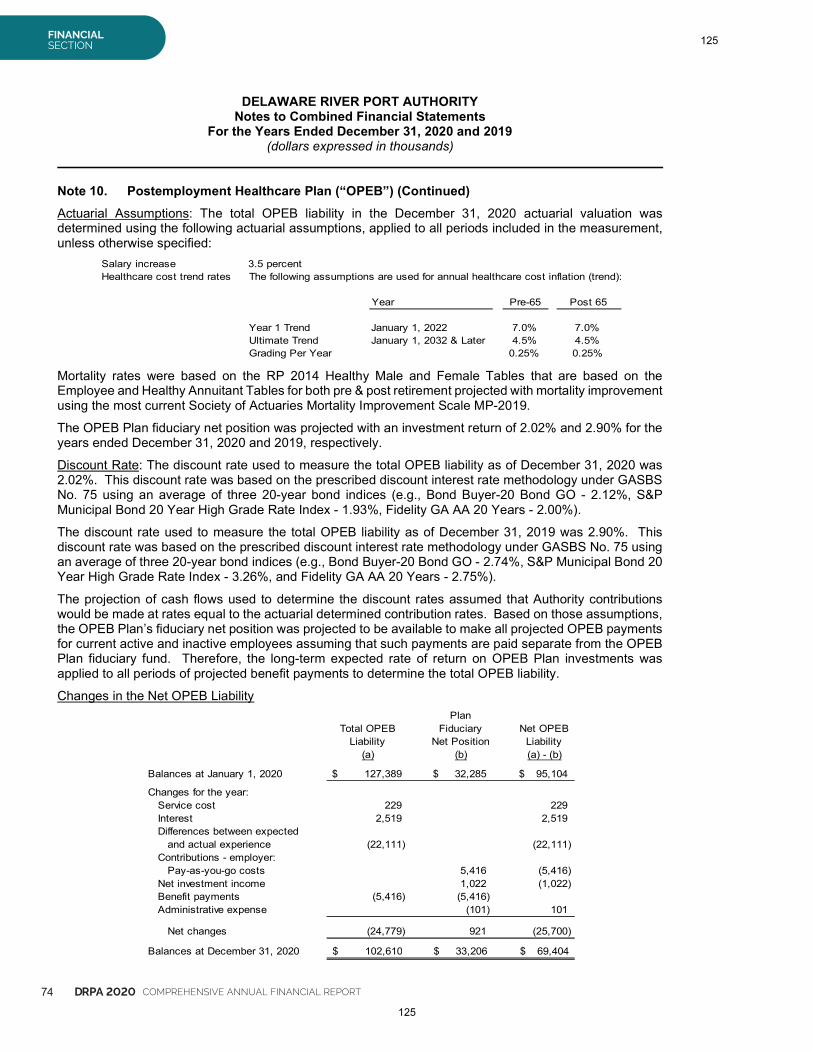
74 DRPA 2020 COMPREHENSIVE ANNUAL FINANCIAL REPORT
FINANCIALSECTION
DELAWARE RIVER PORT AUTHORITYNotes to Combined Financial Statements
For the Years Ended December 31, 2020 and 2019(dollars expressed in thousands)
Note 10. Postemployment Healthcare Plan (“OPEB”) (Continued)
Actuarial Assumptions: The total OPEB liability in the December 31, 2020 actuarial valuation wasdetermined using the following actuarial assumptions, applied to all periods included in the measurement,unless otherwise specified:
Salary increase 3.5 percentHealthcare cost trend rates The following assumptions are used for annual healthcare cost inflation (trend):
Year Pre-65 Post 65
Year 1 Trend January 1, 2022 7.0% 7.0%Ultimate Trend January 1, 2032 & Later 4.5% 4.5%Grading Per Year 0.25% 0.25%
Mortality rates were based on the RP 2014 Healthy Male and Female Tables that are based on theEmployee and Healthy Annuitant Tables for both pre & post retirement projected with mortality improvementusing the most current Society of Actuaries Mortality Improvement Scale MP-2019.
The OPEB Plan fiduciary net position was projected with an investment return of 2.02% and 2.90% for theyears ended December 31, 2020 and 2019, respectively.
Discount Rate: The discount rate used to measure the total OPEB liability as of December 31, 2020 was2.02%. This discount rate was based on the prescribed discount interest rate methodology under GASBSNo. 75 using an average of three 20-year bond indices (e.g., Bond Buyer-20 Bond GO - 2.12%, S&PMunicipal Bond 20 Year High Grade Rate Index - 1.93%, Fidelity GA AA 20 Years - 2.00%).
The discount rate used to measure the total OPEB liability as of December 31, 2019 was 2.90%. Thisdiscount rate was based on the prescribed discount interest rate methodology under GASBS No. 75 usingan average of three 20-year bond indices (e.g., Bond Buyer-20 Bond GO - 2.74%, S&P Municipal Bond 20Year High Grade Rate Index - 3.26%, and Fidelity GA AA 20 Years - 2.75%).
The projection of cash flows used to determine the discount rates assumed that Authority contributionswould be made at rates equal to the actuarial determined contribution rates. Based on those assumptions,the OPEB Plan’s fiduciary net position was projected to be available to make all projected OPEB paymentsfor current active and inactive employees assuming that such payments are paid separate from the OPEBPlan fiduciary fund. Therefore, the long-term expected rate of return on OPEB Plan investments wasapplied to all periods of projected benefit payments to determine the total OPEB liability.
Changes in the Net OPEB LiabilityPlan
Total OPEB Fiduciary Net OPEBLiability Net Position Liability
(a) (b) (a) - (b)
Balances at January 1, 2020 127,389$ 32,285$ 95,104$
Changes for the year:Service cost 229 229Interest 2,519 2,519Differences between expected
and actual experience (22,111) (22,111)Contributions - employer:
Pay-as-you-go costs 5,416 (5,416)Net investment income 1,022 (1,022)Benefit payments (5,416) (5,416)Administrative expense (101) 101
Net changes (24,779) 921 (25,700)
Balances at December 31, 2020 102,610$ 33,206$ 69,404$
125
125
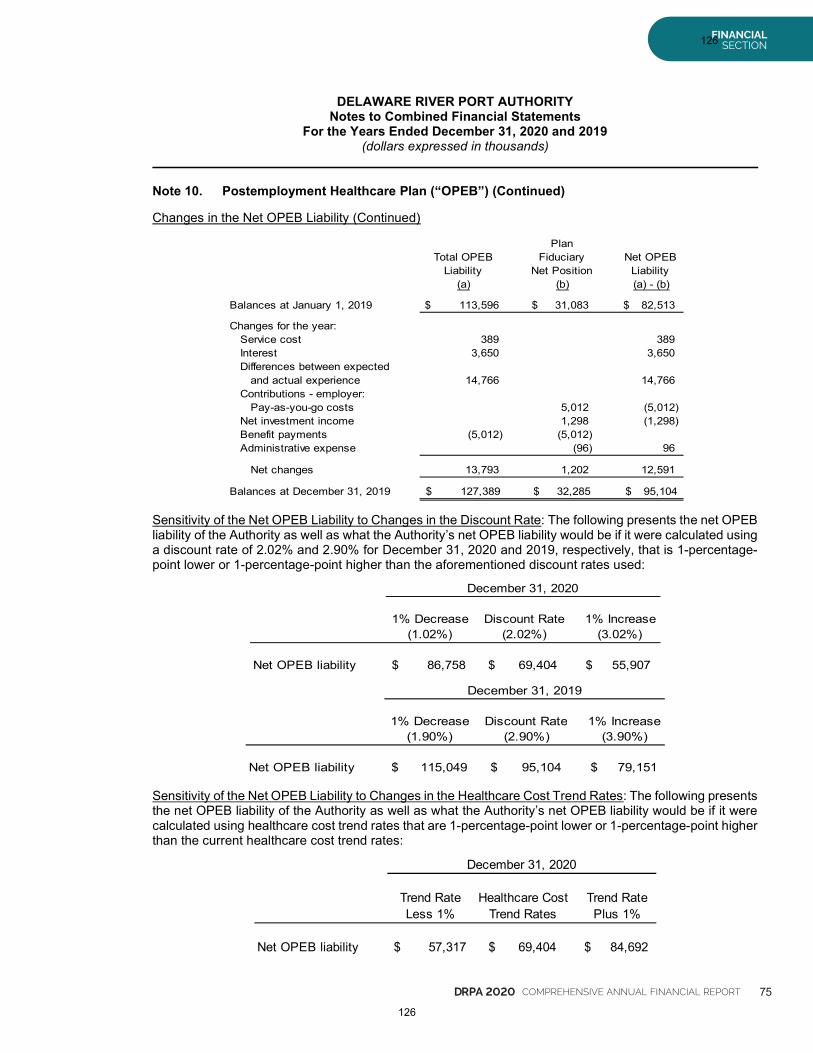
DRPA 2020 COMPREHENSIVE ANNUAL FINANCIAL REPORT 75
FINANCIALSECTION
DELAWARE RIVER PORT AUTHORITYNotes to Combined Financial Statements
For the Years Ended December 31, 2020 and 2019(dollars expressed in thousands)
Note 10. Postemployment Healthcare Plan (“OPEB”) (Continued)
Changes in the Net OPEB Liability (Continued)
PlanTotal OPEB Fiduciary Net OPEB
Liability Net Position Liability(a) (b) (a) - (b)
Balances at January 1, 2019 113,596$ 31,083$ 82,513$
Changes for the year:Service cost 389 389Interest 3,650 3,650Differences between expected
and actual experience 14,766 14,766Contributions - employer:
Pay-as-you-go costs 5,012 (5,012)Net investment income 1,298 (1,298)Benefit payments (5,012) (5,012)Administrative expense (96) 96
Net changes 13,793 1,202 12,591
Balances at December 31, 2019 127,389$ 32,285$ 95,104$
Sensitivity of the Net OPEB Liability to Changes in the Discount Rate: The following presents the net OPEBliability of the Authority as well as what the Authority’s net OPEB liability would be if it were calculated usinga discount rate of 2.02% and 2.90% for December 31, 2020 and 2019, respectively, that is 1-percentage-point lower or 1-percentage-point higher than the aforementioned discount rates used:
December 31, 2020
1% Decrease Discount Rate 1% Increase(1.02%) (2.02%) (3.02%)
Net OPEB liability 86,758$ 69,404$ 55,907$
December 31, 2019
1% Decrease Discount Rate 1% Increase(1.90%) (2.90%) (3.90%)
Net OPEB liability 115,049$ 95,104$ 79,151$
Sensitivity of the Net OPEB Liability to Changes in the Healthcare Cost Trend Rates: The following presentsthe net OPEB liability of the Authority as well as what the Authority’s net OPEB liability would be if it werecalculated using healthcare cost trend rates that are 1-percentage-point lower or 1-percentage-point higherthan the current healthcare cost trend rates:
December 31, 2020
Trend Rate Healthcare Cost Trend RateLess 1% Trend Rates Plus 1%
Net OPEB liability 57,317$ 69,404$ 84,692$
126
126
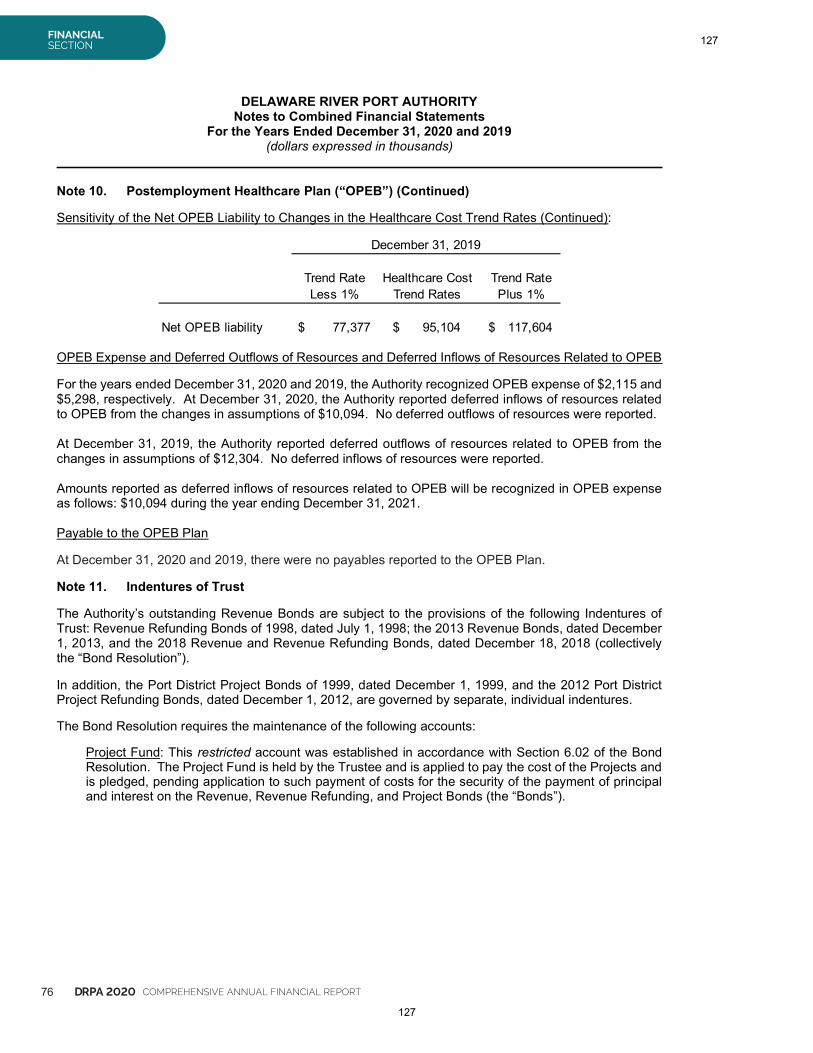
76 DRPA 2020 COMPREHENSIVE ANNUAL FINANCIAL REPORT
FINANCIALSECTION
DELAWARE RIVER PORT AUTHORITYNotes to Combined Financial Statements
For the Years Ended December 31, 2020 and 2019(dollars expressed in thousands)
Note 10. Postemployment Healthcare Plan (“OPEB”) (Continued)
Sensitivity of the Net OPEB Liability to Changes in the Healthcare Cost Trend Rates (Continued):
OPEB Expense and Deferred Outflows of Resources and Deferred Inflows of Resources Related to OPEB
For the years ended December 31, 2020 and 2019, the Authority recognized OPEB expense of $2,115 and$5,298, respectively. At December 31, 2020, the Authority reported deferred inflows of resources relatedto OPEB from the changes in assumptions of $10,094. No deferred outflows of resources were reported.
At December 31, 2019, the Authority reported deferred outflows of resources related to OPEB from thechanges in assumptions of $12,304. No deferred inflows of resources were reported.
Amounts reported as deferred inflows of resources related to OPEB will be recognized in OPEB expenseas follows: $10,094 during the year ending December 31, 2021.
Payable to the OPEB Plan
At December 31, 2020 and 2019, there were no payables reported to the OPEB Plan.
Note 11. Indentures of Trust
The Authority’s outstanding Revenue Bonds are subject to the provisions of the following Indentures ofTrust: Revenue Refunding Bonds of 1998, dated July 1, 1998; the 2013 Revenue Bonds, dated December1, 2013, and the 2018 Revenue and Revenue Refunding Bonds, dated December 18, 2018 (collectivelythe “Bond Resolution”).
In addition, the Port District Project Bonds of 1999, dated December 1, 1999, and the 2012 Port DistrictProject Refunding Bonds, dated December 1, 2012, are governed by separate, individual indentures.
The Bond Resolution requires the maintenance of the following accounts:
Project Fund: This restricted account was established in accordance with Section 6.02 of the BondResolution. The Project Fund is held by the Trustee and is applied to pay the cost of the Projects andis pledged, pending application to such payment of costs for the security of the payment of principaland interest on the Revenue, Revenue Refunding, and Project Bonds (the “Bonds”).
December 31, 2019
Trend Rate Healthcare Cost Trend RateLess 1% Trend Rates Plus 1%
Net OPEB liability 77,377$ 95,104$ 117,604$
127
127
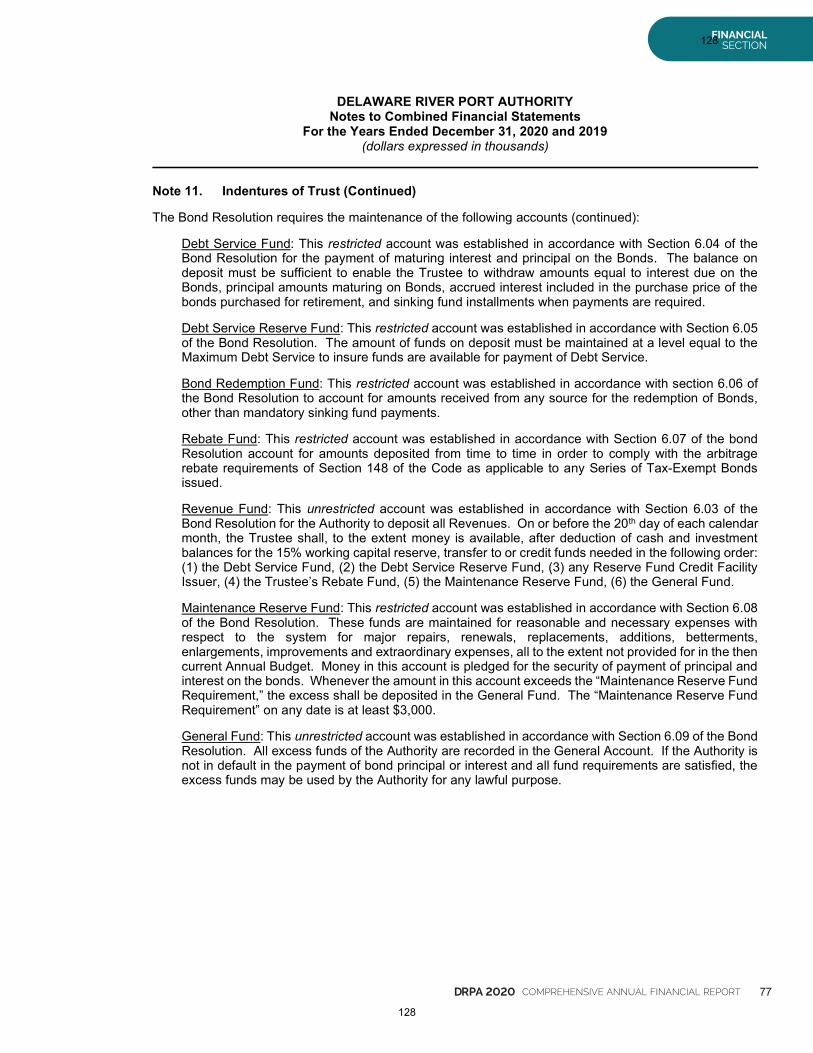
DRPA 2020 COMPREHENSIVE ANNUAL FINANCIAL REPORT 77
FINANCIALSECTION
DELAWARE RIVER PORT AUTHORITYNotes to Combined Financial Statements
For the Years Ended December 31, 2020 and 2019(dollars expressed in thousands)
Note 11. Indentures of Trust (Continued)
The Bond Resolution requires the maintenance of the following accounts (continued):
Debt Service Fund: This restricted account was established in accordance with Section 6.04 of theBond Resolution for the payment of maturing interest and principal on the Bonds. The balance ondeposit must be sufficient to enable the Trustee to withdraw amounts equal to interest due on theBonds, principal amounts maturing on Bonds, accrued interest included in the purchase price of thebonds purchased for retirement, and sinking fund installments when payments are required.
Debt Service Reserve Fund: This restricted account was established in accordance with Section 6.05of the Bond Resolution. The amount of funds on deposit must be maintained at a level equal to theMaximum Debt Service to insure funds are available for payment of Debt Service.
Bond Redemption Fund: This restricted account was established in accordance with section 6.06 ofthe Bond Resolution to account for amounts received from any source for the redemption of Bonds,other than mandatory sinking fund payments.
Rebate Fund: This restricted account was established in accordance with Section 6.07 of the bondResolution account for amounts deposited from time to time in order to comply with the arbitragerebate requirements of Section 148 of the Code as applicable to any Series of Tax-Exempt Bondsissued.
Revenue Fund: This unrestricted account was established in accordance with Section 6.03 of theBond Resolution for the Authority to deposit all Revenues. On or before the 20th day of each calendarmonth, the Trustee shall, to the extent money is available, after deduction of cash and investmentbalances for the 15% working capital reserve, transfer to or credit funds needed in the following order:(1) the Debt Service Fund, (2) the Debt Service Reserve Fund, (3) any Reserve Fund Credit FacilityIssuer, (4) the Trustee’s Rebate Fund, (5) the Maintenance Reserve Fund, (6) the General Fund.
Maintenance Reserve Fund: This restricted account was established in accordance with Section 6.08of the Bond Resolution. These funds are maintained for reasonable and necessary expenses withrespect to the system for major repairs, renewals, replacements, additions, betterments,enlargements, improvements and extraordinary expenses, all to the extent not provided for in the thencurrent Annual Budget. Money in this account is pledged for the security of payment of principal andinterest on the bonds. Whenever the amount in this account exceeds the “Maintenance Reserve FundRequirement,” the excess shall be deposited in the General Fund. The “Maintenance Reserve FundRequirement” on any date is at least $3,000.
General Fund: This unrestricted account was established in accordance with Section 6.09 of the BondResolution. All excess funds of the Authority are recorded in the General Account. If the Authority isnot in default in the payment of bond principal or interest and all fund requirements are satisfied, theexcess funds may be used by the Authority for any lawful purpose.
128
128
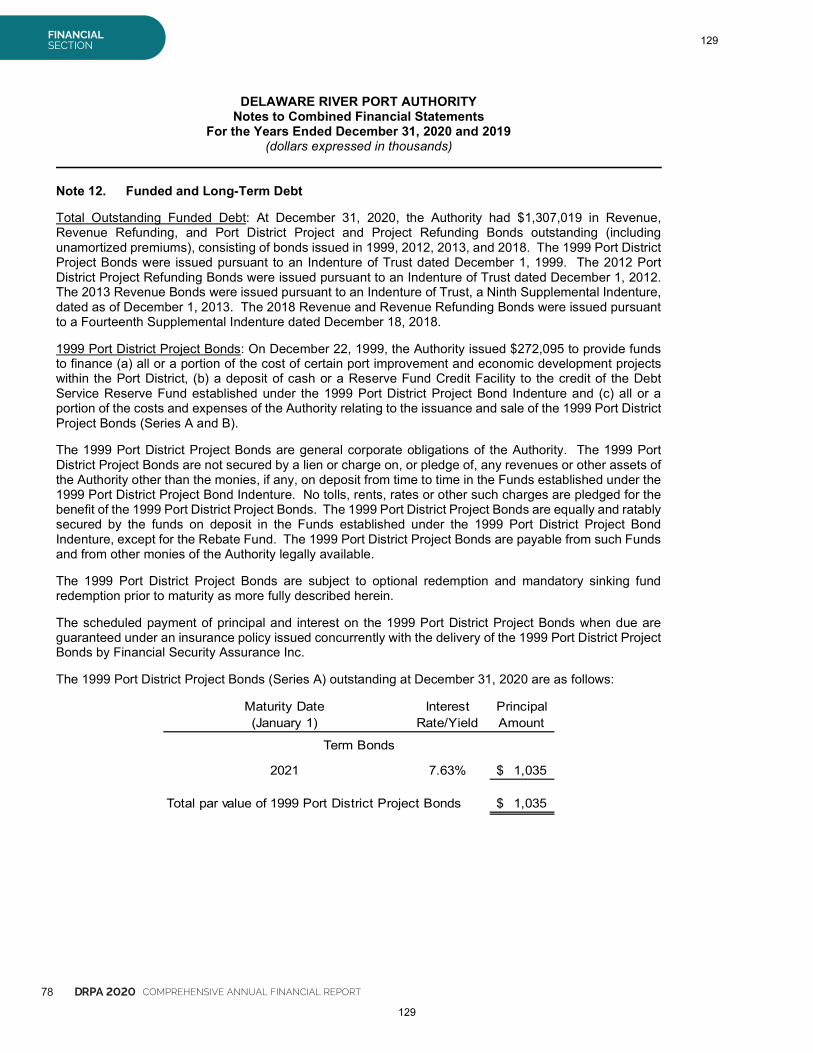
78 DRPA 2020 COMPREHENSIVE ANNUAL FINANCIAL REPORT
FINANCIALSECTION
DELAWARE RIVER PORT AUTHORITYNotes to Combined Financial Statements
For the Years Ended December 31, 2020 and 2019(dollars expressed in thousands)
Note 12. Funded and Long-Term Debt
Total Outstanding Funded Debt: At December 31, 2020, the Authority had $1,307,019 in Revenue,Revenue Refunding, and Port District Project and Project Refunding Bonds outstanding (includingunamortized premiums), consisting of bonds issued in 1999, 2012, 2013, and 2018. The 1999 Port DistrictProject Bonds were issued pursuant to an Indenture of Trust dated December 1, 1999. The 2012 PortDistrict Project Refunding Bonds were issued pursuant to an Indenture of Trust dated December 1, 2012.The 2013 Revenue Bonds were issued pursuant to an Indenture of Trust, a Ninth Supplemental Indenture,dated as of December 1, 2013. The 2018 Revenue and Revenue Refunding Bonds were issued pursuantto a Fourteenth Supplemental Indenture dated December 18, 2018.
1999 Port District Project Bonds: On December 22, 1999, the Authority issued $272,095 to provide fundsto finance (a) all or a portion of the cost of certain port improvement and economic development projectswithin the Port District, (b) a deposit of cash or a Reserve Fund Credit Facility to the credit of the DebtService Reserve Fund established under the 1999 Port District Project Bond Indenture and (c) all or aportion of the costs and expenses of the Authority relating to the issuance and sale of the 1999 Port DistrictProject Bonds (Series A and B).
The 1999 Port District Project Bonds are general corporate obligations of the Authority. The 1999 PortDistrict Project Bonds are not secured by a lien or charge on, or pledge of, any revenues or other assets ofthe Authority other than the monies, if any, on deposit from time to time in the Funds established under the1999 Port District Project Bond Indenture. No tolls, rents, rates or other such charges are pledged for thebenefit of the 1999 Port District Project Bonds. The 1999 Port District Project Bonds are equally and ratablysecured by the funds on deposit in the Funds established under the 1999 Port District Project BondIndenture, except for the Rebate Fund. The 1999 Port District Project Bonds are payable from such Fundsand from other monies of the Authority legally available.
The 1999 Port District Project Bonds are subject to optional redemption and mandatory sinking fundredemption prior to maturity as more fully described herein.
The scheduled payment of principal and interest on the 1999 Port District Project Bonds when due areguaranteed under an insurance policy issued concurrently with the delivery of the 1999 Port District ProjectBonds by Financial Security Assurance Inc.
The 1999 Port District Project Bonds (Series A) outstanding at December 31, 2020 are as follows:
Maturity Date Interest Principal(January 1) Rate/Yield Amount
Term Bonds
2021 7.63% 1,035$
Total par value of 1999 Port District Project Bonds 1,035$
129
129
DRPA 2020 COMPREHENSIVE ANNUAL FINANCIAL REPORT 79
FINANCIALSECTION
DELAWARE RIVER PORT AUTHORITYNotes to Combined Financial Statements
For the Years Ended December 31, 2020 and 2019(dollars expressed in thousands)
Note 12. Funded and Long-Term Debt (Continued)
1999 Port District Project Bonds (Continued):
Optional Redemption: The Series A Port District Project Bonds are redeemable by the Authority on anyinterest payment date in whole or in part, and if in part, in any order of maturity specified by the Authorityand in any principal amount within a maturity as specified by the Authority. Any such redemption shall bemade at a redemption price equal to accrued interest to the redemption date plus the greater of (i) theprincipal amount of the Series A Port District Project Bonds to be redeemed, and (ii) an amount equal tothe discounted remaining fixed amount payments applicable to the Series A Port District Project Bonds tobe redeemed. Allocation of the amounts of Series A Port District Project Bonds to be redeemed shall beproportionate nearly as reasonably possible having due regard for minimum authorized denominations ofthe 1999 Port District Project Bonds among the respective interest of the holders of the Series A Port DistrictProject Bonds to be redeemed at the time of selection of such Series A Port District Project Bonds forredemption regard for minimum authorized denominations of the 1999 Port District Project Bonds amongthe respective interest of the holders of the Series A Port District Project Bonds to be redeemed at the timeof selection of such Series A Port District Project Bonds for redemption.
2012 Port District Project Refunding Bonds: On December 20, 2012, the Authority issued $153,030 in PortDistrict Project Refunding Bonds, Series 2012. The Port District Project Refunding Bonds, Series 2012(the “2012 Bonds”) were issued pursuant to the Compact, the New Jersey Act, the Pennsylvania Act (assuch terms are defined herein) and an Indenture of Trust (the "Indenture") dated as of December 1, 2012,between the Authority and TD Bank, N.A., Cherry Hill, New Jersey, as trustee (the "Trustee").
The 2012 Bonds were issued to (i) refund and redeem all of the outstanding principal balance of and interestaccrued on the Authority's outstanding Port District Project Bonds, Series B of 1998, Port District ProjectBonds, Series B of 1999, and Port District Project Bonds, Series A of 2001.
The refunding resulted in a loss (difference between the reacquisition price and the net carrying amount ofthe old debt) of $7,000. This difference, reported in the accompanying combined financial statements as adeferred outflow of resources, is being charged to operations through the year 2025 using the effectiveinterest method.
The 2012 Bonds are general corporate obligations of the Authority. The 2012 Bonds are not secured by alien or charge on, or pledge of, any revenues or other assets of the Authority other than the moneys, if any,on deposit from time to time in the Funds established under the Indenture, except for the Rebate Fund. Notolls, rents, rates or other charges are pledged for the benefit of the 2012 Bonds. The 2012 Bonds areequally and ratably secured by the monies, if any, on deposit in the Funds established under Indenture,except for the Rebate Fund. The 2012 Bonds are payable from such Funds and from other monies of theAuthority legally available therefore.
Redemption Provisions:
Optional Redemption: The 2012 Bonds maturing on or after January 1, 2024 are subject to redemption priorto maturity at the option of the Authority on or after January 1, 2023, in whole at any time, or in part at anytime and from time to time, in any order of maturity specified by the Authority and within a maturity asselected by the Trustee as provided in the Indenture and as summarized below under the subheading“Redemption Provisions - Selection of 2012 Bonds to be Redeemed.” Any such redemption shall be madeat a redemption price equal to the principal amount of the Bonds to be redeemed, plus interest accrued tothe date fixed for redemption.
130
130

80 DRPA 2020 COMPREHENSIVE ANNUAL FINANCIAL REPORT
FINANCIALSECTION
DELAWARE RIVER PORT AUTHORITYNotes to Combined Financial Statements
For the Years Ended December 31, 2020 and 2019(dollars expressed in thousands)
Note 12. Funded and Long-Term Debt (Continued)
2012 Port District Project Refunding Bonds (Continued):
Redemption Provisions (Continued):
Payment of Redemption Price: Notice of redemption having been given in the manner provided in theIndenture, or written waivers of notice having been filed with the Trustee prior to the date set for redemption,the 2012 Bonds (or portions thereof) so called for redemption shall become due and payable on theredemption date so designated and interest on such 2012 Bonds (or portions thereof) shall cease to accruefrom the redemption date whether or not such Bonds shall be presented for payment. The principal amountof all 2012 Bonds so called for redemption, together with the redemption premium, if any, payable withrespect thereto and accrued and unpaid interest thereon to the date of redemption, shall be paid (uponpresentation and surrender of such 2012 Bonds) by the Paying Agent out of the appropriate Fund or otherfunds deposited for the purpose.
Selection of 2012 Bonds to be Redeemed: If less than all of the 2012 Bonds are to be redeemed and paidprior to maturity, 2012 Bonds registered in the name of the Authority shall be redeemed before other 2012Bonds are redeemed. Thereafter, the portion of 2012 Bonds to be redeemed shall be selected by theAuthority, or if no such selection is made, by lot by the Trustee from among all outstanding 2012 Bondseligible for redemption.
In the case of a partial redemption of 2012 Bonds when 2012 Bonds of denominations greater than theminimum Authorized Denomination are outstanding, then for all purposes in connection with suchredemption, each principal amount equal to the minimum authorized denomination shall be treated asthough it were a separate 2012 Bond for purposes of selecting the 2012 Bonds to be redeemed, providedthat no 2012 Bonds shall be redeemed in part if the principal amount to be outstanding following such partialredemption is not an authorized denomination.
The 2012 Port District Project Refunding Bonds outstanding at December 31, 2020 are as follows:
Maturity Date Interest Principal Maturity Date Interest Principal(January 1) Rate/Yield Amount (January 1) Rate/Yield Amount
2021 5.00% 12,350$ 2024 5.00% 15,520$2022 5.00% 14,085 2025 5.00% 16,3002023 3.00% 240 2026 5.00% 17,1152023 5.00% 14,545 2027 5.00% 17,975
Total par value of 2012 Port District Project Refunding Bonds 108,130Add: unamortized bond premium 5,559
Total 2012 Port District Project Refunding Bonds, net 113,689$
2013 Revenue Bonds: On December 18, 2013, the Delaware River Port Authority issued its RevenueBonds, Series of 2013 in the aggregate principal amount of $476,585. The 2013 Revenue Bonds wereissued by means of a book-entry-only system evidencing ownership and transfer of 2013 Revenue Bondson the records of The Depository Trust Company, New York, New York, and its participants. Interest onthe 2013 Revenue Bonds will be payable semi-annually on January 1 and July 1 of each year commencingJuly 1, 2014.
131
131
DRPA 2020 COMPREHENSIVE ANNUAL FINANCIAL REPORT 81
FINANCIALSECTION
DELAWARE RIVER PORT AUTHORITYNotes to Combined Financial Statements
For the Years Ended December 31, 2020 and 2019(dollars expressed in thousands)
Note 12. Funded and Long-Term Debt (Continued)
2013 Revenue Bonds (Continued): The 2013 Revenue Bonds were issued pursuant to the Compact, theNew Jersey Act, the Pennsylvania Act and an Indenture of Trust, dated as of July 1, 1998, by and betweenthe Authority and TD Bank, N.A., Cherry Hill, New Jersey, as successor to Commerce Bank, N.A., astrustee, as heretofore supplemented from time to time, including as supplemented by a Ninth SupplementalIndenture, dated as of December 1, 2013 (collectively, the “1998 Revenue Bond Indenture”). The 2013Revenue Bonds are being issued for the purpose of: (i) financing a portion of the costs of the Authority’sapproved capital improvement program; (ii) funding a deposit to the 1998 Debt Service Reserve Fundestablished under and as specifically defined in the 1998 Revenue Bond Indenture; and (iii) paying thecosts of issuance of the 2013 Revenue Bonds.
The 2013 Revenue Bonds are limited obligations of the Authority and are payable solely from the sourcesreferred to in the 2013 Revenue Bonds and the 1998 Revenue Bond Indenture. Neither the credit nor thetaxing power of the Commonwealth of Pennsylvania (the “Commonwealth”) or the State of New Jersey (the“State”) or of any county, city, borough, village, township or other municipality of the Commonwealth or theState is or shall be pledged for the payment of the principal, redemption premium, if any, or interest on the2013 Revenue Bonds. The 2013 Revenue Bonds are not and shall not be deemed to be a debt or liabilityof the Commonwealth or the State or of any such county, city, borough, village, township or othermunicipality, and neither the Commonwealth nor the State nor any such county, city, borough, village,township or other municipality is or shall be liable for the payment of such principal, redemption premium,or interest. The Authority has no taxing power.
The 2013 Revenue Bonds outstanding at December 31, 2020 are as follows:
Maturity Date Interest Principal Maturity Date Interest Principal(January 1) Rate/Yield Amount (January 1) Rate/Yield Amount
2027 5.000% 23,560$ 2034 4.625% 810$2027 4.125% 845 2035 5.000% 34,8702028 5.000% 25,615 2035 4.750% 1,0002029 5.000% 26,895 2036 5.000% 36,6602030 5.000% 28,070 2036 4.750% 1,0002030 4.500% 170 2037 5.000% 38,5402031 5.000% 29,650 2037 4.750% 1,0002032 4.500% 31,135 2038 5.000% 41,5152033 5.000% 32,535 2039 5.000% 43,5902034 5.000% 33,355 2040 5.000% 45,770
Total par value of 2013 Revenue Bonds 476,585Add: unamortized bond premium 7,804
Total 2013 Revenue Bonds, net 484,389$
Optional Redemption: The 2013 Revenue Bonds are subject to redemption at the option of the Authority,prior to maturity, in whole or in part (and if in part, in such order of maturity or within a maturity as theAuthority shall specify, or if the Authority shall fail to specify, by lot or by such other method as the PayingAgent determines to be fair and reasonable and in any principal amount in Authorized Denominations), atany time on or after January 1, 2024. Any such redemption shall be made at a redemption price equal to100% of the principal amount of the 2013 Revenue Bonds to be redeemed, plus accrued interest to theRedemption Date.
132
132
82 DRPA 2020 COMPREHENSIVE ANNUAL FINANCIAL REPORT
FINANCIALSECTION
DELAWARE RIVER PORT AUTHORITYNotes to Combined Financial Statements
For the Years Ended December 31, 2020 and 2019(dollars expressed in thousands)
Note 12. Funded and Long-Term Debt (Continued)
2018 Revenue Bonds: On December 18, 2018, the Delaware River Port Authority issued its RevenueBonds, Series of 2018, totaling $700,505, consisting of: its Revenue Bonds, Series A of 2018 in theaggregate principal amount of $273,475, its Revenue Refunding Bonds, Series B of 2018 (the “2018BRevenue Refunding Bonds”) in the aggregate principal amount of $404,060, and its Revenue Bonds, SeriesC of 2018 (Federally Taxable) (the “2018C Revenue Bonds) in the aggregate principal amount of $22,970,and together with the 2018A Revenue Bonds, the 2018B Revenue Refunding Bonds, and the 2018CRevenue Bonds collectively called the “2018 Revenue Bonds”. The 2018 Revenue Bonds were issued bymeans of a book-entry-only system evidencing ownership and transfer of 2018 Revenue Bonds on therecords of The Depository Trust Company, New York, New York, and its participants. Interest on the 2018Revenue Bonds is payable semi-annually on January 1 and July 1 of each year commencing July 1, 2019.
The 2018 Revenue Bonds were issued pursuant to the Compact, the New Jersey Act, the PennsylvaniaAct and an Indenture of Trust, dated as of July 1, 1998, by and between the Authority and TD Bank, N.A.,Cherry Hill, New Jersey, as successor to Commerce Bank, National Association, as trustee, as heretoforeamended and supplemented from time to time, including as amended and supplemented by a FourteenthSupplemental Indenture, dated as of December 18, 2018 (collectively, the “1998 Revenue BondIndenture”).
The 2018 Revenue Bonds, Series A, B and C, as more particularly specified within, were issued for thepurpose of: (i) financing a portion of the costs of the Authority’s approved capital improvement program; (ii)current refunding all of (1) $100,120 aggregate principal amount of the Authority’s Revenue RefundingBonds, Series A of 2008, (2) $111,240 aggregate principal amount of the Authority’s Revenue RefundingBonds, Series B of 2008, (3) $51,305 aggregate principal amount of the Authority’s Revenue RefundingBonds, Series A-1 of 2010, (4) $55,330 aggregate principal amount of the Authority’s Revenue RefundingBonds, Series A-2 of 2010, (5) $106,635 aggregate principal amount of the Authority’s Revenue RefundingBonds, Series B of 2010, and (6) $35,535 aggregate principal amount of the Authority’s Revenue RefundingBonds, Series C of 2010; (iii) financing a portion of the cash settlement cost to terminate all of the Authority’s1995 Revenue Bond Swaption and 1999 Revenue Bond Swaption; (iv) funding a deposit to the 1998 DebtService Reserve Fund established under and as specifically defined in the 1998 Revenue Bond Indenture;and (v) paying the costs of issuance of the 2018 Revenue Bonds.
The 2018 Revenue Bonds are limited obligations of the Authority and are payable solely from the sourcesreferred to in the 2018 Revenue Bonds and the 1998 Revenue Bond Indenture. Neither the credit nor thetaxing power of the Commonwealth of Pennsylvania (the “Commonwealth”) or the State of New Jersey (the“State”) or of any county, city, borough, village, township or other municipality of the Commonwealth or theState is or shall be pledged for the payment of the principal, redemption premium, if any, or interest on the2018 Revenue Bonds. The 2018 Revenue Bonds are not and shall not be deemed to be a debt or liabilityof the Commonwealth or the State or of any such county, city, borough, village, township or othermunicipality, and neither the Commonwealth nor the State nor any such county, city, borough, village,township or other municipality is or shall be liable for the payment of such principal, redemption premium,or interest. The Authority has no taxing power.
2018A Revenue Bonds: On December 18, 2018, the Authority issued new fixed rate bonds, in the amountof $273,475, at a premium of $43,893. As a result of this transaction (including payment of debt servicereserve and cost of issuance requirements), $290,000 was deposited into the 2018 new bond project fundaccount, to support the 2019 5-year Capital Plan.
133
133
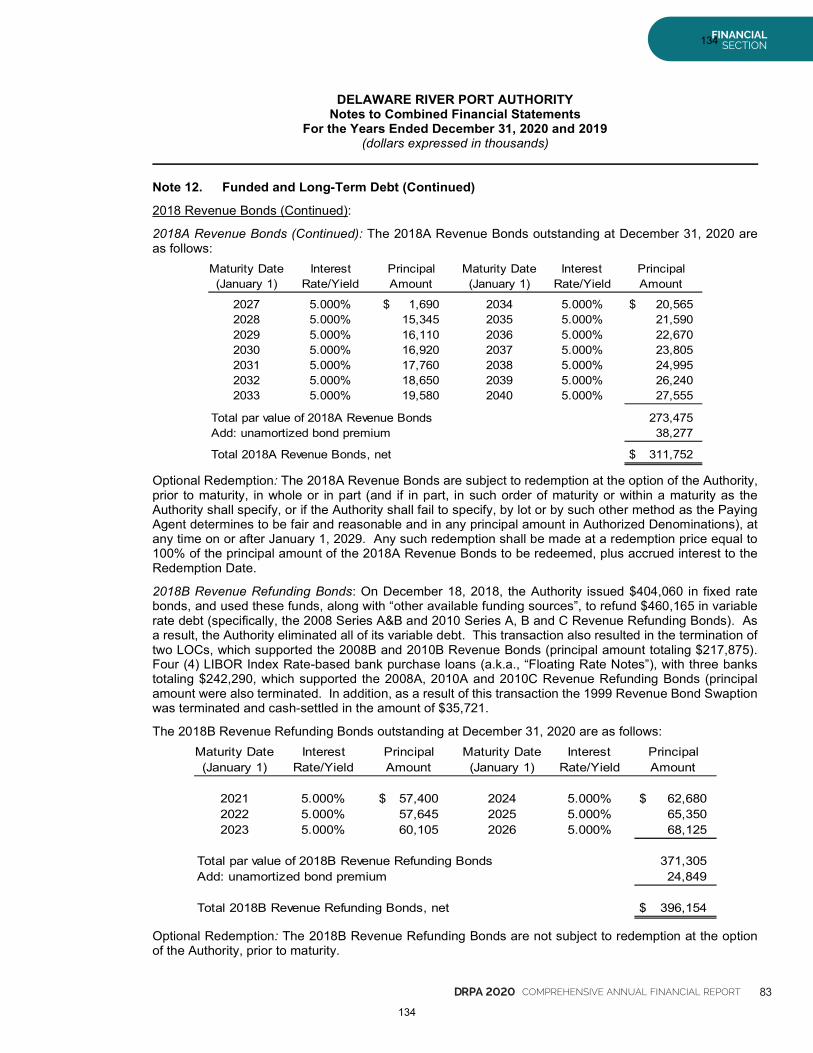
DRPA 2020 COMPREHENSIVE ANNUAL FINANCIAL REPORT 83
FINANCIALSECTION
DELAWARE RIVER PORT AUTHORITYNotes to Combined Financial Statements
For the Years Ended December 31, 2020 and 2019(dollars expressed in thousands)
Note 12. Funded and Long-Term Debt (Continued)
2018 Revenue Bonds (Continued):
2018A Revenue Bonds (Continued): The 2018A Revenue Bonds outstanding at December 31, 2020 areas follows:
Maturity Date Interest Principal Maturity Date Interest Principal(January 1) Rate/Yield Amount (January 1) Rate/Yield Amount
2027 5.000% 1,690$ 2034 5.000% 20,565$2028 5.000% 15,345 2035 5.000% 21,5902029 5.000% 16,110 2036 5.000% 22,6702030 5.000% 16,920 2037 5.000% 23,8052031 5.000% 17,760 2038 5.000% 24,9952032 5.000% 18,650 2039 5.000% 26,2402033 5.000% 19,580 2040 5.000% 27,555
Total par value of 2018A Revenue Bonds 273,475Add: unamortized bond premium 38,277
Total 2018A Revenue Bonds, net 311,752$
Optional Redemption: The 2018A Revenue Bonds are subject to redemption at the option of the Authority,prior to maturity, in whole or in part (and if in part, in such order of maturity or within a maturity as theAuthority shall specify, or if the Authority shall fail to specify, by lot or by such other method as the PayingAgent determines to be fair and reasonable and in any principal amount in Authorized Denominations), atany time on or after January 1, 2029. Any such redemption shall be made at a redemption price equal to100% of the principal amount of the 2018A Revenue Bonds to be redeemed, plus accrued interest to theRedemption Date.
2018B Revenue Refunding Bonds: On December 18, 2018, the Authority issued $404,060 in fixed ratebonds, and used these funds, along with “other available funding sources”, to refund $460,165 in variablerate debt (specifically, the 2008 Series A&B and 2010 Series A, B and C Revenue Refunding Bonds). Asa result, the Authority eliminated all of its variable debt. This transaction also resulted in the termination oftwo LOCs, which supported the 2008B and 2010B Revenue Bonds (principal amount totaling $217,875).Four (4) LIBOR Index Rate-based bank purchase loans (a.k.a., “Floating Rate Notes”), with three bankstotaling $242,290, which supported the 2008A, 2010A and 2010C Revenue Refunding Bonds (principalamount were also terminated. In addition, as a result of this transaction the 1999 Revenue Bond Swaptionwas terminated and cash-settled in the amount of $35,721.
The 2018B Revenue Refunding Bonds outstanding at December 31, 2020 are as follows:Maturity Date Interest Principal Maturity Date Interest Principal(January 1) Rate/Yield Amount (January 1) Rate/Yield Amount
2021 5.000% 57,400$ 2024 5.000% 62,680$2022 5.000% 57,645 2025 5.000% 65,3502023 5.000% 60,105 2026 5.000% 68,125
Total par value of 2018B Revenue Refunding Bonds 371,305Add: unamortized bond premium 24,849
Total 2018B Revenue Refunding Bonds, net 396,154$
Optional Redemption: The 2018B Revenue Refunding Bonds are not subject to redemption at the optionof the Authority, prior to maturity.
134
134
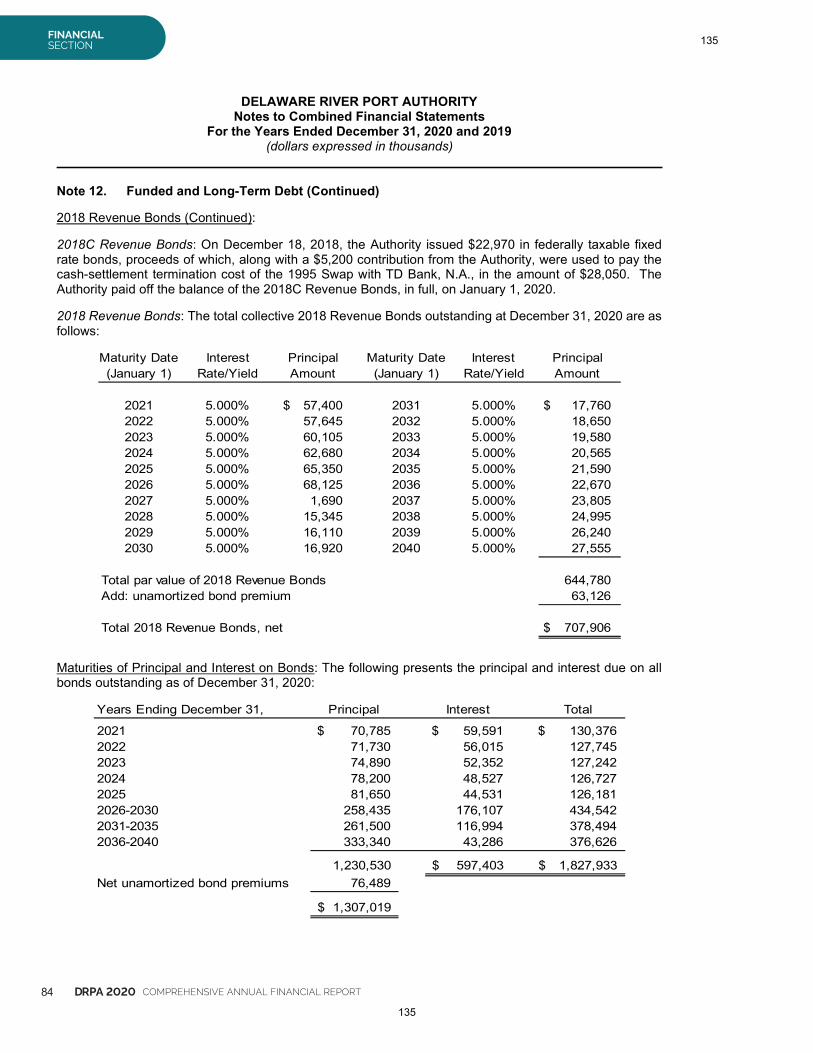
84 DRPA 2020 COMPREHENSIVE ANNUAL FINANCIAL REPORT
FINANCIALSECTION
DELAWARE RIVER PORT AUTHORITYNotes to Combined Financial Statements
For the Years Ended December 31, 2020 and 2019(dollars expressed in thousands)
Note 12. Funded and Long-Term Debt (Continued)
2018 Revenue Bonds (Continued):
2018C Revenue Bonds: On December 18, 2018, the Authority issued $22,970 in federally taxable fixedrate bonds, proceeds of which, along with a $5,200 contribution from the Authority, were used to pay thecash-settlement termination cost of the 1995 Swap with TD Bank, N.A., in the amount of $28,050. TheAuthority paid off the balance of the 2018C Revenue Bonds, in full, on January 1, 2020.
2018 Revenue Bonds: The total collective 2018 Revenue Bonds outstanding at December 31, 2020 are asfollows:
Maturity Date Interest Principal Maturity Date Interest Principal(January 1) Rate/Yield Amount (January 1) Rate/Yield Amount
2021 5.000% 57,400$ 2031 5.000% 17,760$2022 5.000% 57,645 2032 5.000% 18,6502023 5.000% 60,105 2033 5.000% 19,5802024 5.000% 62,680 2034 5.000% 20,5652025 5.000% 65,350 2035 5.000% 21,5902026 5.000% 68,125 2036 5.000% 22,6702027 5.000% 1,690 2037 5.000% 23,8052028 5.000% 15,345 2038 5.000% 24,9952029 5.000% 16,110 2039 5.000% 26,2402030 5.000% 16,920 2040 5.000% 27,555
Total par value of 2018 Revenue Bonds 644,780Add: unamortized bond premium 63,126
Total 2018 Revenue Bonds, net 707,906$
Maturities of Principal and Interest on Bonds: The following presents the principal and interest due on allbonds outstanding as of December 31, 2020:
Years Ending December 31, Principal Interest Total
2021 70,785$ 59,591$ 130,376$2022 71,730 56,015 127,7452023 74,890 52,352 127,2422024 78,200 48,527 126,7272025 81,650 44,531 126,1812026-2030 258,435 176,107 434,5422031-2035 261,500 116,994 378,4942036-2040 333,340 43,286 376,626
1,230,530 597,403$ 1,827,933$Net unamortized bond premiums 76,489
1,307,019$
135
135
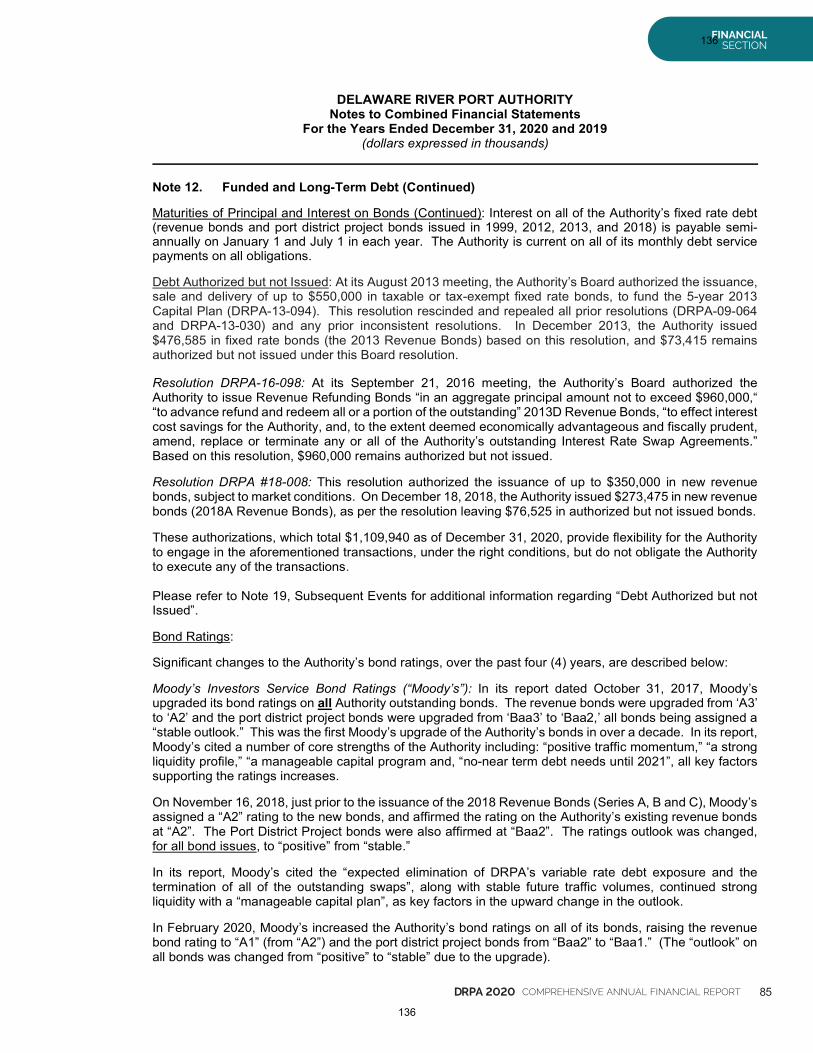
DRPA 2020 COMPREHENSIVE ANNUAL FINANCIAL REPORT 85
FINANCIALSECTION
DELAWARE RIVER PORT AUTHORITYNotes to Combined Financial Statements
For the Years Ended December 31, 2020 and 2019(dollars expressed in thousands)
Note 12. Funded and Long-Term Debt (Continued)
Maturities of Principal and Interest on Bonds (Continued): Interest on all of the Authority’s fixed rate debt(revenue bonds and port district project bonds issued in 1999, 2012, 2013, and 2018) is payable semi-annually on January 1 and July 1 in each year. The Authority is current on all of its monthly debt servicepayments on all obligations.
Debt Authorized but not Issued: At its August 2013 meeting, the Authority’s Board authorized the issuance,sale and delivery of up to $550,000 in taxable or tax-exempt fixed rate bonds, to fund the 5-year 2013Capital Plan (DRPA-13-094). This resolution rescinded and repealed all prior resolutions (DRPA-09-064and DRPA-13-030) and any prior inconsistent resolutions. In December 2013, the Authority issued$476,585 in fixed rate bonds (the 2013 Revenue Bonds) based on this resolution, and $73,415 remainsauthorized but not issued under this Board resolution.
Resolution DRPA-16-098: At its September 21, 2016 meeting, the Authority’s Board authorized theAuthority to issue Revenue Refunding Bonds “in an aggregate principal amount not to exceed $960,000,““to advance refund and redeem all or a portion of the outstanding” 2013D Revenue Bonds, “to effect interestcost savings for the Authority, and, to the extent deemed economically advantageous and fiscally prudent,amend, replace or terminate any or all of the Authority’s outstanding Interest Rate Swap Agreements.”Based on this resolution, $960,000 remains authorized but not issued.
Resolution DRPA #18-008: This resolution authorized the issuance of up to $350,000 in new revenuebonds, subject to market conditions. On December 18, 2018, the Authority issued $273,475 in new revenuebonds (2018A Revenue Bonds), as per the resolution leaving $76,525 in authorized but not issued bonds.
These authorizations, which total $1,109,940 as of December 31, 2020, provide flexibility for the Authorityto engage in the aforementioned transactions, under the right conditions, but do not obligate the Authorityto execute any of the transactions.
Please refer to Note 19, Subsequent Events for additional information regarding “Debt Authorized but notIssued”.
Bond Ratings:
Significant changes to the Authority’s bond ratings, over the past four (4) years, are described below:
Moody’s Investors Service Bond Ratings (“Moody’s”): In its report dated October 31, 2017, Moody’supgraded its bond ratings on all Authority outstanding bonds. The revenue bonds were upgraded from ‘A3’to ‘A2’ and the port district project bonds were upgraded from ‘Baa3’ to ‘Baa2,’ all bonds being assigned a“stable outlook.” This was the first Moody’s upgrade of the Authority’s bonds in over a decade. In its report,Moody’s cited a number of core strengths of the Authority including: “positive traffic momentum,” “a strongliquidity profile,” “a manageable capital program and, “no-near term debt needs until 2021”, all key factorssupporting the ratings increases.
On November 16, 2018, just prior to the issuance of the 2018 Revenue Bonds (Series A, B and C), Moody’sassigned a “A2” rating to the new bonds, and affirmed the rating on the Authority’s existing revenue bondsat “A2”. The Port District Project bonds were also affirmed at “Baa2”. The ratings outlook was changed,for all bond issues, to “positive” from “stable.”
In its report, Moody’s cited the “expected elimination of DRPA’s variable rate debt exposure and thetermination of all of the outstanding swaps”, along with stable future traffic volumes, continued strongliquidity with a “manageable capital plan”, as key factors in the upward change in the outlook.
In February 2020, Moody’s increased the Authority’s bond ratings on all of its bonds, raising the revenuebond rating to “A1” (from “A2”) and the port district project bonds from “Baa2” to “Baa1.” (The “outlook” onall bonds was changed from “positive” to “stable” due to the upgrade).
136
136
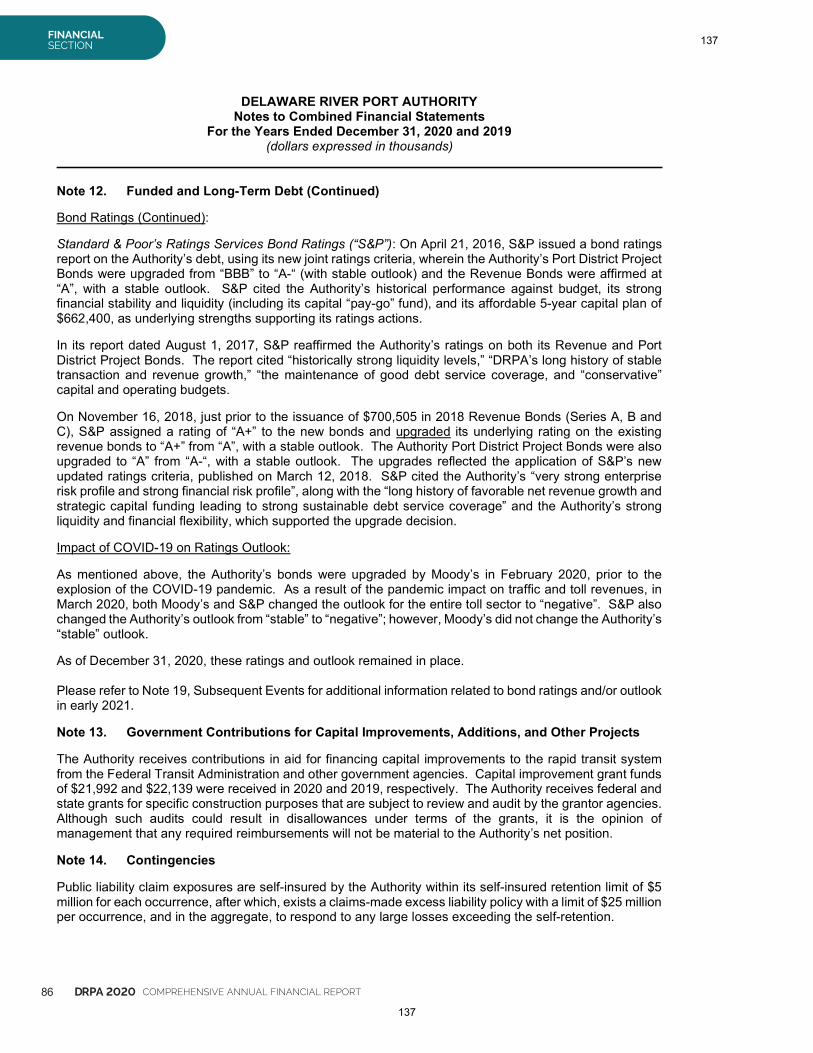
86 DRPA 2020 COMPREHENSIVE ANNUAL FINANCIAL REPORT
FINANCIALSECTION
DELAWARE RIVER PORT AUTHORITYNotes to Combined Financial Statements
For the Years Ended December 31, 2020 and 2019(dollars expressed in thousands)
Note 12. Funded and Long-Term Debt (Continued)
Bond Ratings (Continued):
Standard & Poor’s Ratings Services Bond Ratings (“S&P”): On April 21, 2016, S&P issued a bond ratingsreport on the Authority’s debt, using its new joint ratings criteria, wherein the Authority’s Port District ProjectBonds were upgraded from “BBB” to “A-“ (with stable outlook) and the Revenue Bonds were affirmed at“A”, with a stable outlook. S&P cited the Authority’s historical performance against budget, its strongfinancial stability and liquidity (including its capital “pay-go” fund), and its affordable 5-year capital plan of$662,400, as underlying strengths supporting its ratings actions.
In its report dated August 1, 2017, S&P reaffirmed the Authority’s ratings on both its Revenue and PortDistrict Project Bonds. The report cited “historically strong liquidity levels,” “DRPA’s long history of stabletransaction and revenue growth,” “the maintenance of good debt service coverage, and “conservative”capital and operating budgets.
On November 16, 2018, just prior to the issuance of $700,505 in 2018 Revenue Bonds (Series A, B andC), S&P assigned a rating of “A+” to the new bonds and upgraded its underlying rating on the existingrevenue bonds to “A+” from “A”, with a stable outlook. The Authority Port District Project Bonds were alsoupgraded to “A” from “A-“, with a stable outlook. The upgrades reflected the application of S&P’s newupdated ratings criteria, published on March 12, 2018. S&P cited the Authority’s “very strong enterpriserisk profile and strong financial risk profile”, along with the “long history of favorable net revenue growth andstrategic capital funding leading to strong sustainable debt service coverage” and the Authority’s strongliquidity and financial flexibility, which supported the upgrade decision.
Impact of COVID-19 on Ratings Outlook:
As mentioned above, the Authority’s bonds were upgraded by Moody’s in February 2020, prior to theexplosion of the COVID-19 pandemic. As a result of the pandemic impact on traffic and toll revenues, inMarch 2020, both Moody’s and S&P changed the outlook for the entire toll sector to “negative”. S&P alsochanged the Authority’s outlook from “stable” to “negative”; however, Moody’s did not change the Authority’s“stable” outlook.
As of December 31, 2020, these ratings and outlook remained in place.
Please refer to Note 19, Subsequent Events for additional information related to bond ratings and/or outlookin early 2021.
Note 13. Government Contributions for Capital Improvements, Additions, and Other Projects
The Authority receives contributions in aid for financing capital improvements to the rapid transit systemfrom the Federal Transit Administration and other government agencies. Capital improvement grant fundsof $21,992 and $22,139 were received in 2020 and 2019, respectively. The Authority receives federal andstate grants for specific construction purposes that are subject to review and audit by the grantor agencies.Although such audits could result in disallowances under terms of the grants, it is the opinion ofmanagement that any required reimbursements will not be material to the Authority’s net position.
Note 14. Contingencies
Public liability claim exposures are self-insured by the Authority within its self-insured retention limit of $5million for each occurrence, after which, exists a claims-made excess liability policy with a limit of $25 millionper occurrence, and in the aggregate, to respond to any large losses exceeding the self-retention.
137
137
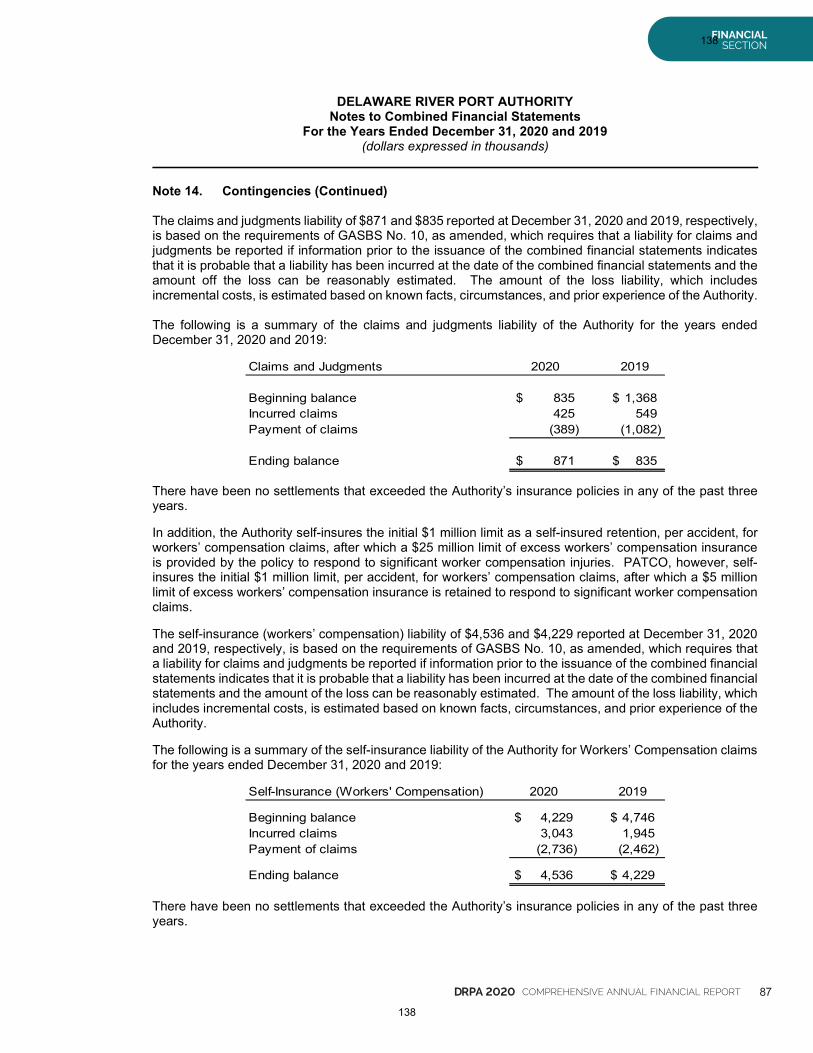
DRPA 2020 COMPREHENSIVE ANNUAL FINANCIAL REPORT 87
FINANCIALSECTION
DELAWARE RIVER PORT AUTHORITYNotes to Combined Financial Statements
For the Years Ended December 31, 2020 and 2019(dollars expressed in thousands)
Note 14. Contingencies (Continued)
The claims and judgments liability of $871 and $835 reported at December 31, 2020 and 2019, respectively,is based on the requirements of GASBS No. 10, as amended, which requires that a liability for claims andjudgments be reported if information prior to the issuance of the combined financial statements indicatesthat it is probable that a liability has been incurred at the date of the combined financial statements and theamount off the loss can be reasonably estimated. The amount of the loss liability, which includesincremental costs, is estimated based on known facts, circumstances, and prior experience of the Authority.
The following is a summary of the claims and judgments liability of the Authority for the years endedDecember 31, 2020 and 2019:
Claims and Judgments 2020 2019
Beginning balance 835$ 1,368$Incurred claims 425 549Payment of claims (389) (1,082)
Ending balance 871$ 835$
There have been no settlements that exceeded the Authority’s insurance policies in any of the past threeyears.
In addition, the Authority self-insures the initial $1 million limit as a self-insured retention, per accident, forworkers’ compensation claims, after which a $25 million limit of excess workers’ compensation insuranceis provided by the policy to respond to significant worker compensation injuries. PATCO, however, self-insures the initial $1 million limit, per accident, for workers’ compensation claims, after which a $5 millionlimit of excess workers’ compensation insurance is retained to respond to significant worker compensationclaims.
The self-insurance (workers’ compensation) liability of $4,536 and $4,229 reported at December 31, 2020and 2019, respectively, is based on the requirements of GASBS No. 10, as amended, which requires thata liability for claims and judgments be reported if information prior to the issuance of the combined financialstatements indicates that it is probable that a liability has been incurred at the date of the combined financialstatements and the amount of the loss can be reasonably estimated. The amount of the loss liability, whichincludes incremental costs, is estimated based on known facts, circumstances, and prior experience of theAuthority.
The following is a summary of the self-insurance liability of the Authority for Workers’ Compensation claimsfor the years ended December 31, 2020 and 2019:
Self-Insurance (Workers' Compensation) 2020 2019
Beginning balance 4,229$ 4,746$Incurred claims 3,043 1,945Payment of claims (2,736) (2,462)
Ending balance 4,536$ 4,229$
There have been no settlements that exceeded the Authority’s insurance policies in any of the past threeyears.
138
138
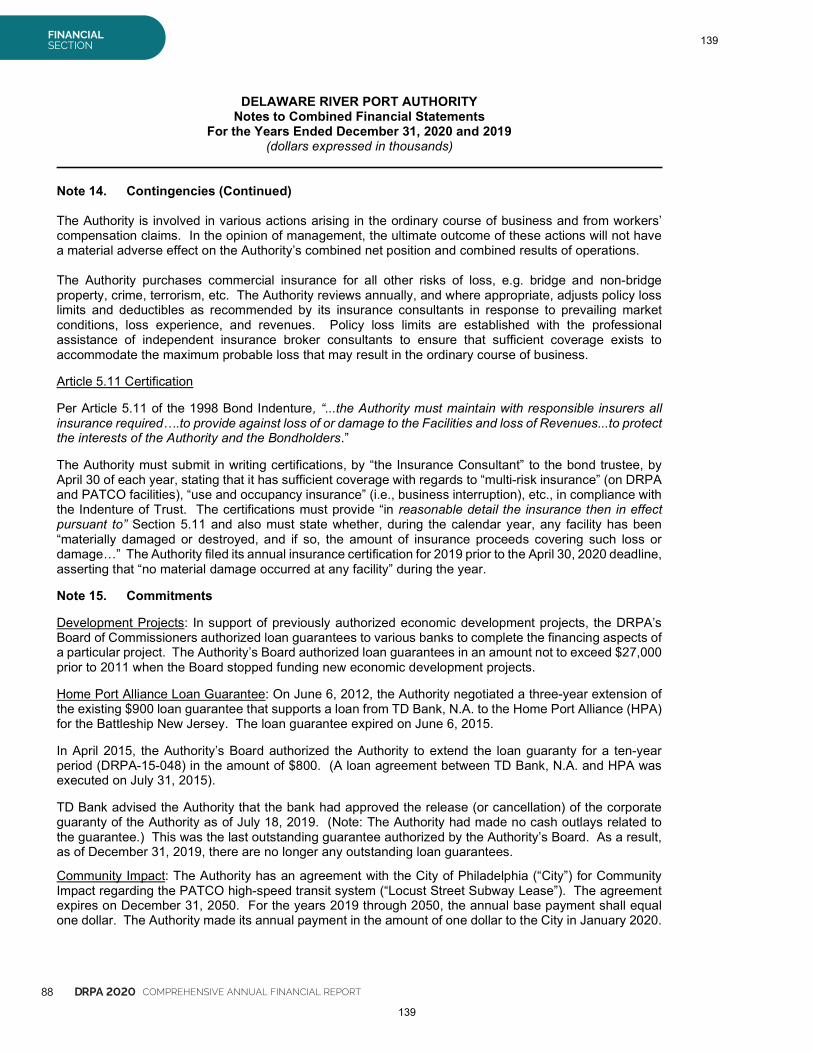
88 DRPA 2020 COMPREHENSIVE ANNUAL FINANCIAL REPORT
FINANCIALSECTION
DELAWARE RIVER PORT AUTHORITYNotes to Combined Financial Statements
For the Years Ended December 31, 2020 and 2019(dollars expressed in thousands)
Note 14. Contingencies (Continued)
The Authority is involved in various actions arising in the ordinary course of business and from workers’compensation claims. In the opinion of management, the ultimate outcome of these actions will not havea material adverse effect on the Authority’s combined net position and combined results of operations.
The Authority purchases commercial insurance for all other risks of loss, e.g. bridge and non-bridgeproperty, crime, terrorism, etc. The Authority reviews annually, and where appropriate, adjusts policy losslimits and deductibles as recommended by its insurance consultants in response to prevailing marketconditions, loss experience, and revenues. Policy loss limits are established with the professionalassistance of independent insurance broker consultants to ensure that sufficient coverage exists toaccommodate the maximum probable loss that may result in the ordinary course of business.
Article 5.11 Certification
Per Article 5.11 of the 1998 Bond Indenture, “...the Authority must maintain with responsible insurers allinsurance required….to provide against loss of or damage to the Facilities and loss of Revenues...to protectthe interests of the Authority and the Bondholders.”
The Authority must submit in writing certifications, by “the Insurance Consultant” to the bond trustee, byApril 30 of each year, stating that it has sufficient coverage with regards to “multi-risk insurance” (on DRPAand PATCO facilities), “use and occupancy insurance” (i.e., business interruption), etc., in compliance withthe Indenture of Trust. The certifications must provide “in reasonable detail the insurance then in effectpursuant to” Section 5.11 and also must state whether, during the calendar year, any facility has been“materially damaged or destroyed, and if so, the amount of insurance proceeds covering such loss ordamage…” The Authority filed its annual insurance certification for 2019 prior to the April 30, 2020 deadline,asserting that “no material damage occurred at any facility” during the year.
Note 15. Commitments
Development Projects: In support of previously authorized economic development projects, the DRPA’sBoard of Commissioners authorized loan guarantees to various banks to complete the financing aspects ofa particular project. The Authority’s Board authorized loan guarantees in an amount not to exceed $27,000prior to 2011 when the Board stopped funding new economic development projects.
Home Port Alliance Loan Guarantee: On June 6, 2012, the Authority negotiated a three-year extension ofthe existing $900 loan guarantee that supports a loan from TD Bank, N.A. to the Home Port Alliance (HPA)for the Battleship New Jersey. The loan guarantee expired on June 6, 2015.
In April 2015, the Authority’s Board authorized the Authority to extend the loan guaranty for a ten-yearperiod (DRPA-15-048) in the amount of $800. (A loan agreement between TD Bank, N.A. and HPA wasexecuted on July 31, 2015).
TD Bank advised the Authority that the bank had approved the release (or cancellation) of the corporateguaranty of the Authority as of July 18, 2019. (Note: The Authority had made no cash outlays related tothe guarantee.) This was the last outstanding guarantee authorized by the Authority’s Board. As a result,as of December 31, 2019, there are no longer any outstanding loan guarantees.
Community Impact: The Authority has an agreement with the City of Philadelphia (“City”) for CommunityImpact regarding the PATCO high-speed transit system (“Locust Street Subway Lease”). The agreementexpires on December 31, 2050. For the years 2019 through 2050, the annual base payment shall equalone dollar. The Authority made its annual payment in the amount of one dollar to the City in January 2020.
139
139
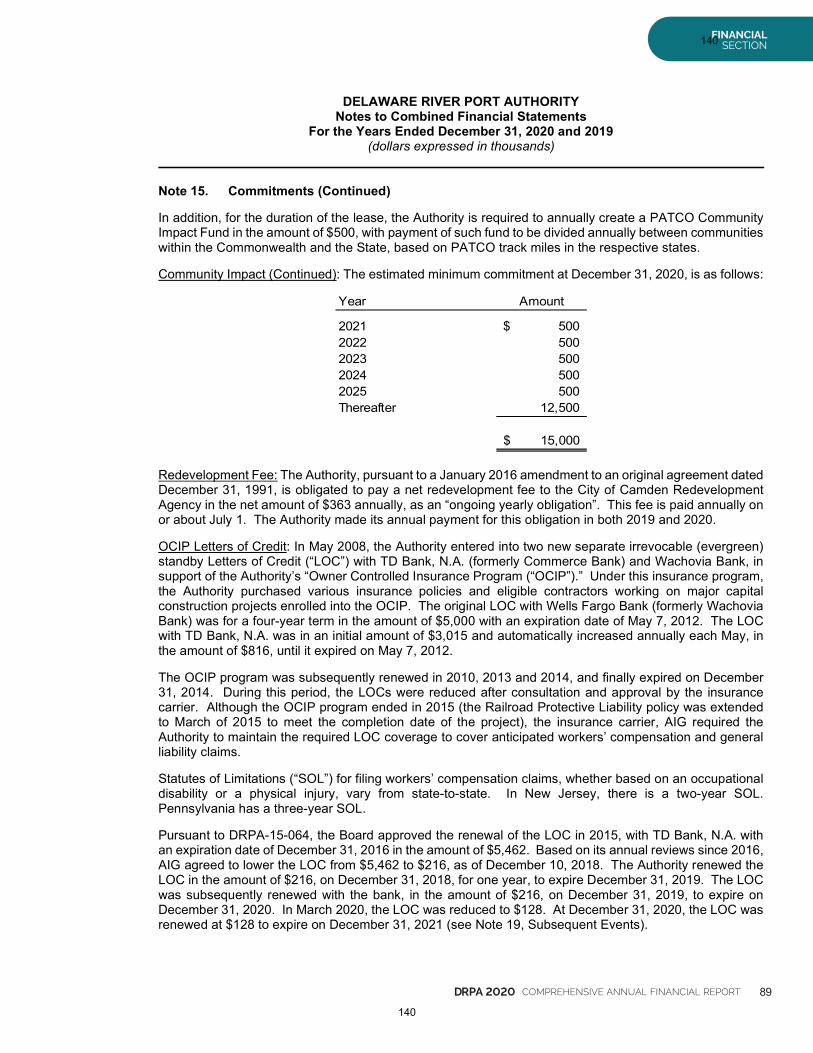
DRPA 2020 COMPREHENSIVE ANNUAL FINANCIAL REPORT 89
FINANCIALSECTION
DELAWARE RIVER PORT AUTHORITYNotes to Combined Financial Statements
For the Years Ended December 31, 2020 and 2019(dollars expressed in thousands)
Note 15. Commitments (Continued)
In addition, for the duration of the lease, the Authority is required to annually create a PATCO CommunityImpact Fund in the amount of $500, with payment of such fund to be divided annually between communitieswithin the Commonwealth and the State, based on PATCO track miles in the respective states.
Community Impact (Continued): The estimated minimum commitment at December 31, 2020, is as follows:
Year Amount
2021 500$2022 5002023 5002024 5002025 500Thereafter 12,500
15,000$
Redevelopment Fee: The Authority, pursuant to a January 2016 amendment to an original agreement datedDecember 31, 1991, is obligated to pay a net redevelopment fee to the City of Camden RedevelopmentAgency in the net amount of $363 annually, as an “ongoing yearly obligation”. This fee is paid annually onor about July 1. The Authority made its annual payment for this obligation in both 2019 and 2020.
OCIP Letters of Credit: In May 2008, the Authority entered into two new separate irrevocable (evergreen)standby Letters of Credit (“LOC”) with TD Bank, N.A. (formerly Commerce Bank) and Wachovia Bank, insupport of the Authority’s “Owner Controlled Insurance Program (“OCIP”).” Under this insurance program,the Authority purchased various insurance policies and eligible contractors working on major capitalconstruction projects enrolled into the OCIP. The original LOC with Wells Fargo Bank (formerly WachoviaBank) was for a four-year term in the amount of $5,000 with an expiration date of May 7, 2012. The LOCwith TD Bank, N.A. was in an initial amount of $3,015 and automatically increased annually each May, inthe amount of $816, until it expired on May 7, 2012.
The OCIP program was subsequently renewed in 2010, 2013 and 2014, and finally expired on December31, 2014. During this period, the LOCs were reduced after consultation and approval by the insurancecarrier. Although the OCIP program ended in 2015 (the Railroad Protective Liability policy was extendedto March of 2015 to meet the completion date of the project), the insurance carrier, AIG required theAuthority to maintain the required LOC coverage to cover anticipated workers’ compensation and generalliability claims.
Statutes of Limitations (“SOL”) for filing workers’ compensation claims, whether based on an occupationaldisability or a physical injury, vary from state-to-state. In New Jersey, there is a two-year SOL.Pennsylvania has a three-year SOL.
Pursuant to DRPA-15-064, the Board approved the renewal of the LOC in 2015, with TD Bank, N.A. withan expiration date of December 31, 2016 in the amount of $5,462. Based on its annual reviews since 2016,AIG agreed to lower the LOC from $5,462 to $216, as of December 10, 2018. The Authority renewed theLOC in the amount of $216, on December 31, 2018, for one year, to expire December 31, 2019. The LOCwas subsequently renewed with the bank, in the amount of $216, on December 31, 2019, to expire onDecember 31, 2020. In March 2020, the LOC was reduced to $128. At December 31, 2020, the LOC wasrenewed at $128 to expire on December 31, 2021 (see Note 19, Subsequent Events).
140
140
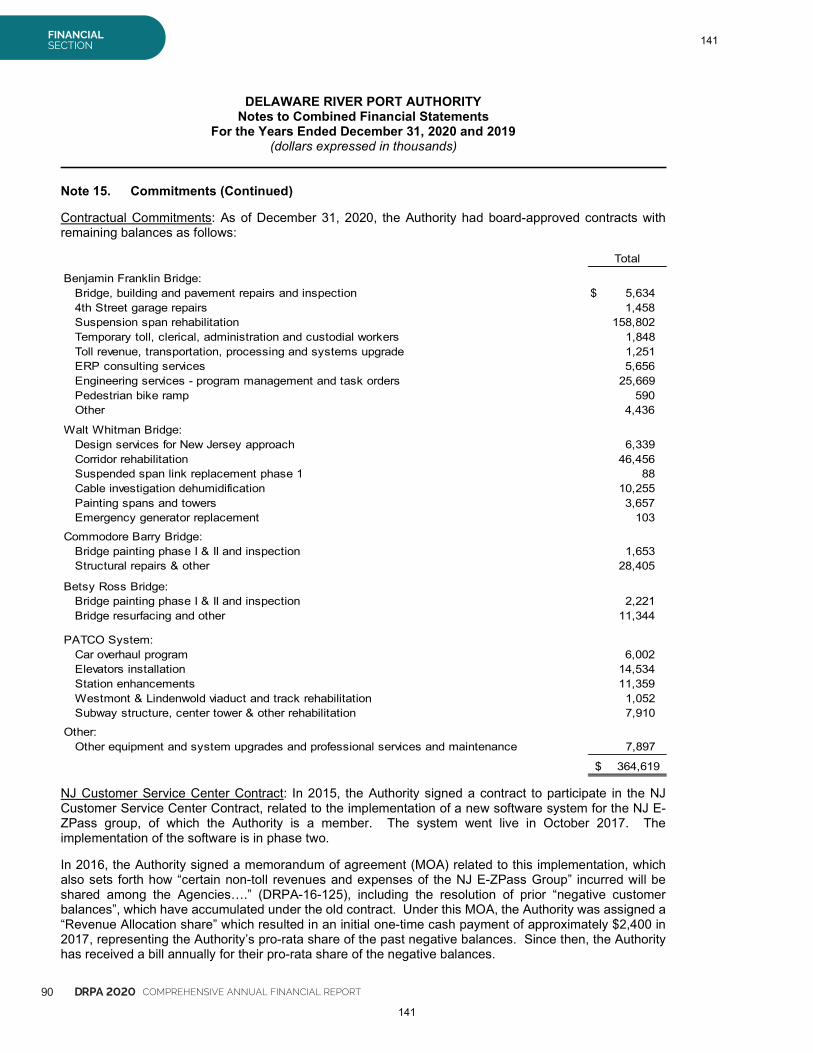
90 DRPA 2020 COMPREHENSIVE ANNUAL FINANCIAL REPORT
FINANCIALSECTION
DELAWARE RIVER PORT AUTHORITYNotes to Combined Financial Statements
For the Years Ended December 31, 2020 and 2019(dollars expressed in thousands)
Note 15. Commitments (Continued)
Contractual Commitments: As of December 31, 2020, the Authority had board-approved contracts withremaining balances as follows:
Total
Benjamin Franklin Bridge:Bridge, building and pavement repairs and inspection 5,634$4th Street garage repairs 1,458Suspension span rehabilitation 158,802Temporary toll, clerical, administration and custodial workers 1,848Toll revenue, transportation, processing and systems upgrade 1,251ERP consulting services 5,656Engineering services - program management and task orders 25,669Pedestrian bike ramp 590Other 4,436
Walt Whitman Bridge:Design services for New Jersey approach 6,339Corridor rehabilitation 46,456Suspended span link replacement phase 1 88Cable investigation dehumidification 10,255Painting spans and towers 3,657Emergency generator replacement 103
Commodore Barry Bridge:Bridge painting phase I & II and inspection 1,653Structural repairs & other 28,405
Betsy Ross Bridge:Bridge painting phase I & II and inspection 2,221Bridge resurfacing and other 11,344
PATCO System:Car overhaul program 6,002Elevators installation 14,534Station enhancements 11,359Westmont & Lindenwold viaduct and track rehabilitation 1,052Subway structure, center tower & other rehabilitation 7,910
Other:Other equipment and system upgrades and professional services and maintenance 7,897
364,619$
NJ Customer Service Center Contract: In 2015, the Authority signed a contract to participate in the NJCustomer Service Center Contract, related to the implementation of a new software system for the NJ E-ZPass group, of which the Authority is a member. The system went live in October 2017. Theimplementation of the software is in phase two.
In 2016, the Authority signed a memorandum of agreement (MOA) related to this implementation, whichalso sets forth how “certain non-toll revenues and expenses of the NJ E-ZPass Group” incurred will beshared among the Agencies….” (DRPA-16-125), including the resolution of prior “negative customerbalances”, which have accumulated under the old contract. Under this MOA, the Authority was assigned a“Revenue Allocation share” which resulted in an initial one-time cash payment of approximately $2,400 in2017, representing the Authority’s pro-rata share of the past negative balances. Since then, the Authorityhas received a bill annually for their pro-rata share of the negative balances.
141
141
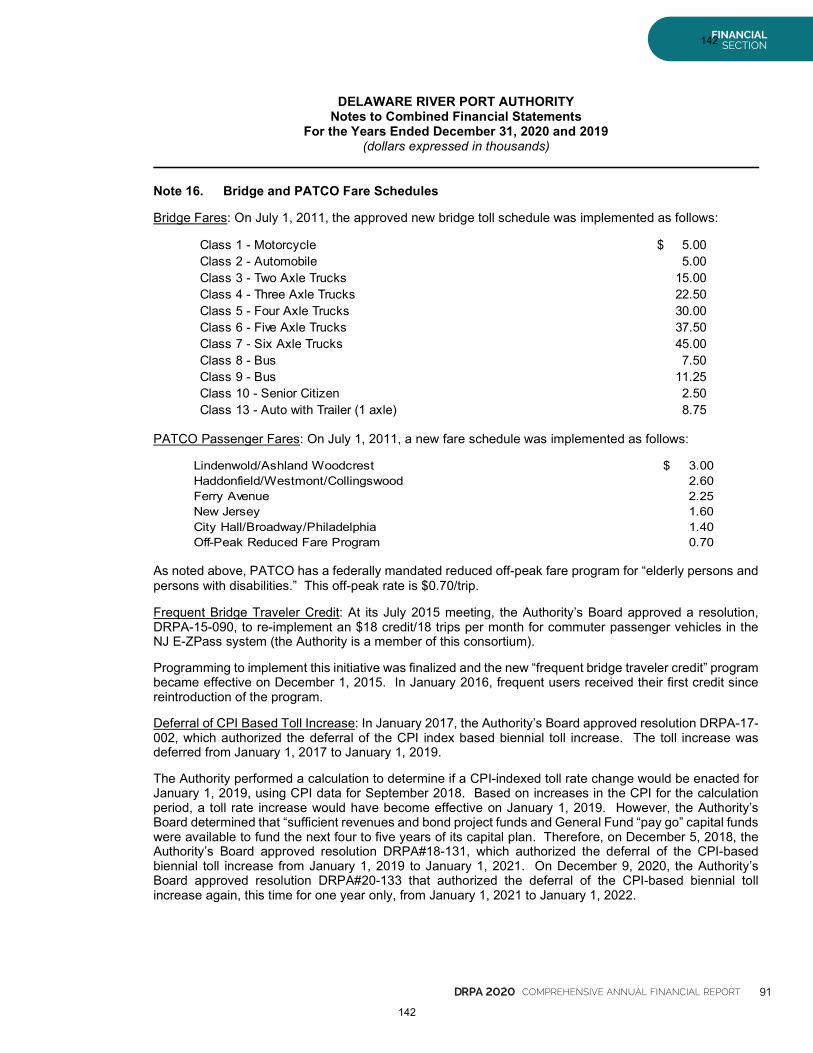
DRPA 2020 COMPREHENSIVE ANNUAL FINANCIAL REPORT 91
FINANCIALSECTION
DELAWARE RIVER PORT AUTHORITYNotes to Combined Financial Statements
For the Years Ended December 31, 2020 and 2019(dollars expressed in thousands)
Note 16. Bridge and PATCO Fare Schedules
Bridge Fares: On July 1, 2011, the approved new bridge toll schedule was implemented as follows:
PATCO Passenger Fares: On July 1, 2011, a new fare schedule was implemented as follows:
Lindenwold/Ashland Woodcrest 3.00$Haddonfield/Westmont/Collingswood 2.60Ferry Avenue 2.25New Jersey 1.60City Hall/Broadway/Philadelphia 1.40Off-Peak Reduced Fare Program 0.70
As noted above, PATCO has a federally mandated reduced off-peak fare program for “elderly persons andpersons with disabilities.” This off-peak rate is $0.70/trip.
Frequent Bridge Traveler Credit: At its July 2015 meeting, the Authority’s Board approved a resolution,DRPA-15-090, to re-implement an $18 credit/18 trips per month for commuter passenger vehicles in theNJ E-ZPass system (the Authority is a member of this consortium).
Programming to implement this initiative was finalized and the new “frequent bridge traveler credit” programbecame effective on December 1, 2015. In January 2016, frequent users received their first credit sincereintroduction of the program.
Deferral of CPI Based Toll Increase: In January 2017, the Authority’s Board approved resolution DRPA-17-002, which authorized the deferral of the CPI index based biennial toll increase. The toll increase wasdeferred from January 1, 2017 to January 1, 2019.
The Authority performed a calculation to determine if a CPI-indexed toll rate change would be enacted forJanuary 1, 2019, using CPI data for September 2018. Based on increases in the CPI for the calculationperiod, a toll rate increase would have become effective on January 1, 2019. However, the Authority’sBoard determined that “sufficient revenues and bond project funds and General Fund “pay go” capital fundswere available to fund the next four to five years of its capital plan. Therefore, on December 5, 2018, theAuthority’s Board approved resolution DRPA#18-131, which authorized the deferral of the CPI-basedbiennial toll increase from January 1, 2019 to January 1, 2021. On December 9, 2020, the Authority’sBoard approved resolution DRPA#20-133 that authorized the deferral of the CPI-based biennial tollincrease again, this time for one year only, from January 1, 2021 to January 1, 2022.
Class 1 - Motorcycle 5.00$Class 2 - Automobile 5.00Class 3 - Two Axle Trucks 15.00Class 4 - Three Axle Trucks 22.50Class 5 - Four Axle Trucks 30.00Class 6 - Five Axle Trucks 37.50Class 7 - Six Axle Trucks 45.00Class 8 - Bus 7.50Class 9 - Bus 11.25Class 10 - Senior Citizen 2.50Class 13 - Auto with Trailer (1 axle) 8.75
142
142
92 DRPA 2020 COMPREHENSIVE ANNUAL FINANCIAL REPORT
FINANCIALSECTION
DELAWARE RIVER PORT AUTHORITYNotes to Combined Financial Statements
For the Years Ended December 31, 2020 and 2019(dollars expressed in thousands)
Note 17. New Governmental Accounting Pronouncements
The Governmental Accounting Standards Board (GASB) has issued the following statements that haveeffective dates that may affect future financial presentations:
Statement No. 87, Leases. The objective of this Statement is to better meet the information needs offinancial statement users by improving accounting and financial reporting for leases by governments. ThisStatement increases the usefulness of governments' financial statements by requiring recognition of certainlease assets and liabilities for leases that previously were classified as operating leases and recognized asinflows of resources or outflows of resources based on the payment provisions of the contract. It establishesa single model for lease accounting based on the foundational principle that leases are financings of theright to use an underlying asset. Under this Statement, a lessee is required to recognize a lease liabilityand an intangible right-to-use lease asset, and a lessor is required to recognize a lease receivable and adeferred inflow of resources, thereby enhancing the relevance and consistency of information aboutgovernments' leasing activities. The Statement will become effective for the Authority’s year endingDecember 31, 2022. Management is currently evaluating whether or not this Statement will have an impacton the basic financial statements of the Authority.
Statement No. 89, Accounting for Interest Cost Incurred before the End of a Construction Period. Theobjectives of this Statement are (1) to enhance the relevance and comparability of information about capitalassets and the cost of borrowing for a reporting period and (2) to simplify accounting for interest costincurred before the end of a construction period. This Statement establishes accounting requirements forinterest cost incurred before the end of a construction period. This Statement requires that interest costincurred before the end of a construction period be recognized as an expense in the period in which thecost is incurred for financial statements prepared using the economic resources measurement focus. As aresult, interest cost incurred before the end of a construction period will not be included in the historical costof a capital asset reported in a business-type activity or enterprise fund. This Statement also reiterates thatin financial statements prepared using the current financial resources measurement focus, interest costincurred before the end of a construction period should be recognized as an expenditure on a basisconsistent with governmental fund accounting principles. The Statement will become effective for theAuthority’s year ending December 31, 2021. Management is currently evaluating whether or not thisStatement will have an impact on the basic financial statements of the Authority.
Statement No. 96, Subscription-Based Information Technology Arrangements. This Statement providesguidance on the accounting and financial reporting for subscription-based information technologyarrangements (SBITAs) for government end users (governments). This Statement (1) defines a SBITA; (2)establishes that a SBITA results in a right-to-use subscription asset, an intangible asset, and acorresponding subscription liability; (3) provides the capitalization criteria for outlays other than subscriptionpayments, including implementation costs of a SBITA; and (4) requires note disclosures regarding a SBITA.To the extent relevant, the standards for SBITAs are based on the standards established in Statement No.87, Leases, as amended. The Statement will become effective for the Authority’s year ending December31, 2023. Management is currently evaluating whether or not this Statement will have an impact on thebasic financial statements of the Authority.
143
143
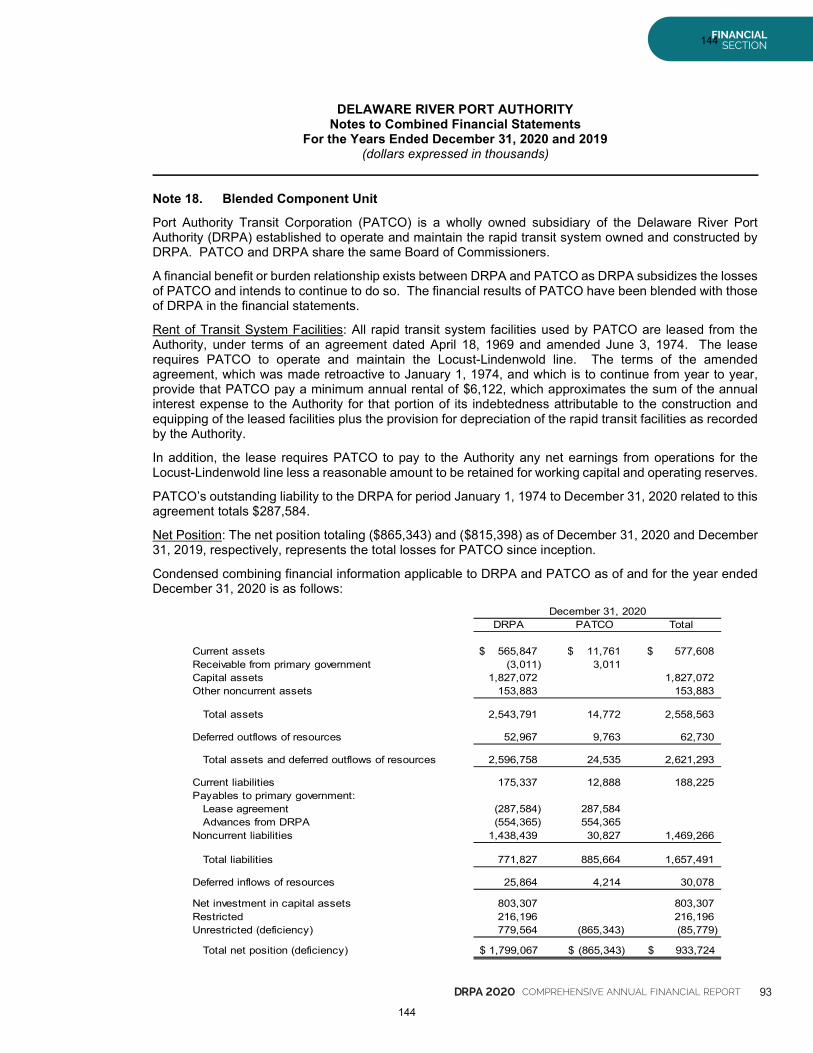
DRPA 2020 COMPREHENSIVE ANNUAL FINANCIAL REPORT 93
FINANCIALSECTION
DELAWARE RIVER PORT AUTHORITYNotes to Combined Financial Statements
For the Years Ended December 31, 2020 and 2019(dollars expressed in thousands)
Note 18. Blended Component Unit
Port Authority Transit Corporation (PATCO) is a wholly owned subsidiary of the Delaware River PortAuthority (DRPA) established to operate and maintain the rapid transit system owned and constructed byDRPA. PATCO and DRPA share the same Board of Commissioners.
A financial benefit or burden relationship exists between DRPA and PATCO as DRPA subsidizes the lossesof PATCO and intends to continue to do so. The financial results of PATCO have been blended with thoseof DRPA in the financial statements.
Rent of Transit System Facilities: All rapid transit system facilities used by PATCO are leased from theAuthority, under terms of an agreement dated April 18, 1969 and amended June 3, 1974. The leaserequires PATCO to operate and maintain the Locust-Lindenwold line. The terms of the amendedagreement, which was made retroactive to January 1, 1974, and which is to continue from year to year,provide that PATCO pay a minimum annual rental of $6,122, which approximates the sum of the annualinterest expense to the Authority for that portion of its indebtedness attributable to the construction andequipping of the leased facilities plus the provision for depreciation of the rapid transit facilities as recordedby the Authority.
In addition, the lease requires PATCO to pay to the Authority any net earnings from operations for theLocust-Lindenwold line less a reasonable amount to be retained for working capital and operating reserves.
PATCO’s outstanding liability to the DRPA for period January 1, 1974 to December 31, 2020 related to thisagreement totals $287,584.
Net Position: The net position totaling ($865,343) and ($815,398) as of December 31, 2020 and December31, 2019, respectively, represents the total losses for PATCO since inception.
Condensed combining financial information applicable to DRPA and PATCO as of and for the year endedDecember 31, 2020 is as follows:
December 31, 2020DRPA PATCO Total
Current assets 565,847$ 11,761$ 577,608$Receivable from primary government (3,011) 3,011Capital assets 1,827,072 1,827,072Other noncurrent assets 153,883 153,883
Total assets 2,543,791 14,772 2,558,563
Deferred outflows of resources 52,967 9,763 62,730
Total assets and deferred outflows of resources 2,596,758 24,535 2,621,293
Current liabilities 175,337 12,888 188,225Payables to primary government:
Lease agreement (287,584) 287,584Advances from DRPA (554,365) 554,365
Noncurrent liabilities 1,438,439 30,827 1,469,266
Total liabilities 771,827 885,664 1,657,491
Deferred inflows of resources 25,864 4,214 30,078
Net investment in capital assets 803,307 803,307Restricted 216,196 216,196Unrestricted (deficiency) 779,564 (865,343) (85,779)
Total net position (deficiency) 1,799,067$ (865,343)$ 933,724$
144
144
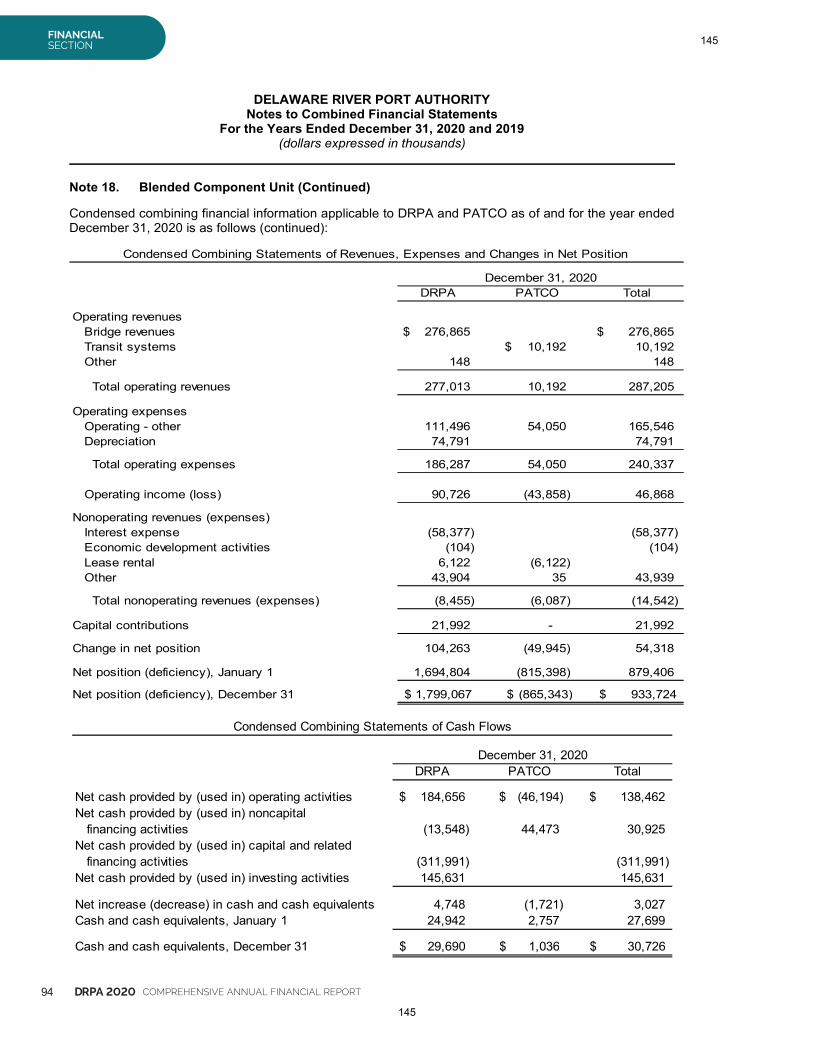
94 DRPA 2020 COMPREHENSIVE ANNUAL FINANCIAL REPORT
FINANCIALSECTION
DELAWARE RIVER PORT AUTHORITYNotes to Combined Financial Statements
For the Years Ended December 31, 2020 and 2019(dollars expressed in thousands)
Note 18. Blended Component Unit (Continued)
Condensed combining financial information applicable to DRPA and PATCO as of and for the year endedDecember 31, 2020 is as follows (continued):
Condensed Combining Statements of Revenues, Expenses and Changes in Net Position
December 31, 2020DRPA PATCO Total
Operating revenuesBridge revenues 276,865$ 276,865$Transit systems 10,192$ 10,192Other 148 148
Total operating revenues 277,013 10,192 287,205
Operating expensesOperating - other 111,496 54,050 165,546Depreciation 74,791 74,791
Total operating expenses 186,287 54,050 240,337
Operating income (loss) 90,726 (43,858) 46,868
Nonoperating revenues (expenses)Interest expense (58,377) (58,377)Economic development activities (104) (104)Lease rental 6,122 (6,122)Other 43,904 35 43,939
Total nonoperating revenues (expenses) (8,455) (6,087) (14,542)
Capital contributions 21,992 - 21,992
Change in net position 104,263 (49,945) 54,318
Net position (deficiency), January 1 1,694,804 (815,398) 879,406
Net position (deficiency), December 31 1,799,067$ (865,343)$ 933,724$
Condensed Combining Statements of Cash Flows
December 31, 2020DRPA PATCO Total
Net cash provided by (used in) operating activities 184,656$ (46,194)$ 138,462$Net cash provided by (used in) noncapital
financing activities (13,548) 44,473 30,925Net cash provided by (used in) capital and related
financing activities (311,991) (311,991)Net cash provided by (used in) investing activities 145,631 145,631
Net increase (decrease) in cash and cash equivalents 4,748 (1,721) 3,027Cash and cash equivalents, January 1 24,942 2,757 27,699
Cash and cash equivalents, December 31 29,690$ 1,036$ 30,726$
145
145
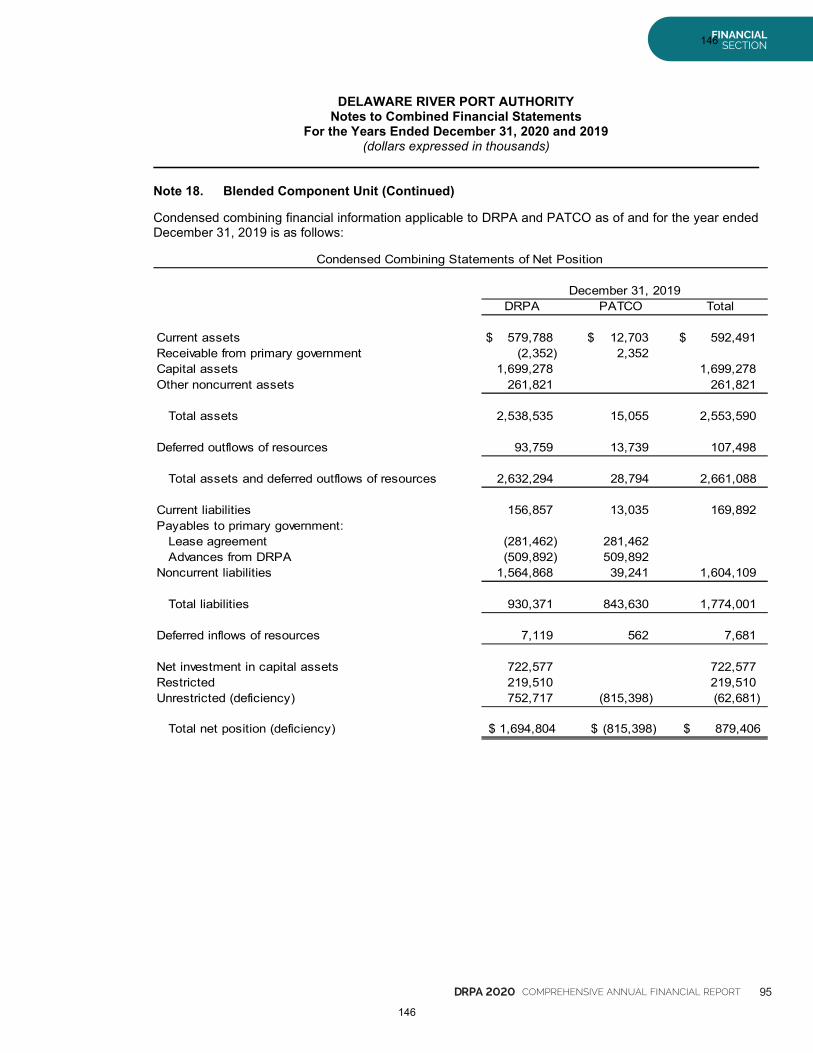
DRPA 2020 COMPREHENSIVE ANNUAL FINANCIAL REPORT 95
FINANCIALSECTION
DELAWARE RIVER PORT AUTHORITYNotes to Combined Financial Statements
For the Years Ended December 31, 2020 and 2019(dollars expressed in thousands)
Note 18. Blended Component Unit (Continued)
Condensed combining financial information applicable to DRPA and PATCO as of and for the year endedDecember 31, 2019 is as follows:
Condensed Combining Statements of Net Position
December 31, 2019DRPA PATCO Total
Current assets 579,788$ 12,703$ 592,491$Receivable from primary government (2,352) 2,352Capital assets 1,699,278 1,699,278Other noncurrent assets 261,821 261,821
Total assets 2,538,535 15,055 2,553,590
Deferred outflows of resources 93,759 13,739 107,498
Total assets and deferred outflows of resources 2,632,294 28,794 2,661,088
Current liabilities 156,857 13,035 169,892Payables to primary government:
Lease agreement (281,462) 281,462Advances from DRPA (509,892) 509,892
Noncurrent liabilities 1,564,868 39,241 1,604,109
Total liabilities 930,371 843,630 1,774,001
Deferred inflows of resources 7,119 562 7,681
Net investment in capital assets 722,577 722,577Restricted 219,510 219,510Unrestricted (deficiency) 752,717 (815,398) (62,681)
Total net position (deficiency) 1,694,804$ (815,398)$ 879,406$
146
146
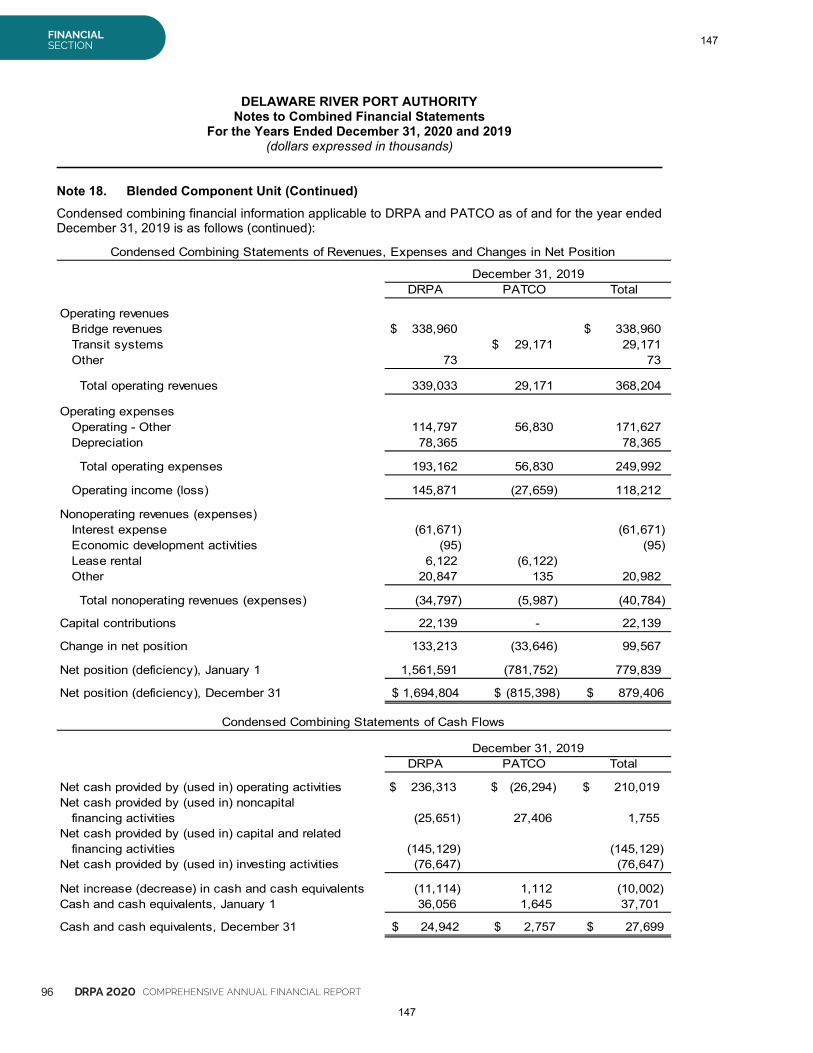
96 DRPA 2020 COMPREHENSIVE ANNUAL FINANCIAL REPORT
FINANCIALSECTION
DELAWARE RIVER PORT AUTHORITYNotes to Combined Financial Statements
For the Years Ended December 31, 2020 and 2019(dollars expressed in thousands)
Note 18. Blended Component Unit (Continued)
Condensed combining financial information applicable to DRPA and PATCO as of and for the year endedDecember 31, 2019 is as follows (continued):
Condensed Combining Statements of Revenues, Expenses and Changes in Net Position
December 31, 2019DRPA PATCO Total
Operating revenuesBridge revenues 338,960$ 338,960$Transit systems 29,171$ 29,171Other 73 73
Total operating revenues 339,033 29,171 368,204
Operating expensesOperating - Other 114,797 56,830 171,627Depreciation 78,365 78,365
Total operating expenses 193,162 56,830 249,992
Operating income (loss) 145,871 (27,659) 118,212
Nonoperating revenues (expenses)Interest expense (61,671) (61,671)Economic development activities (95) (95)Lease rental 6,122 (6,122)Other 20,847 135 20,982
Total nonoperating revenues (expenses) (34,797) (5,987) (40,784)
Capital contributions 22,139 - 22,139
Change in net position 133,213 (33,646) 99,567
Net position (deficiency), January 1 1,561,591 (781,752) 779,839
Net position (deficiency), December 31 1,694,804$ (815,398)$ 879,406$
Condensed Combining Statements of Cash Flows
December 31, 2019DRPA PATCO Total
Net cash provided by (used in) operating activities 236,313$ (26,294)$ 210,019$Net cash provided by (used in) noncapital
financing activities (25,651) 27,406 1,755Net cash provided by (used in) capital and related
financing activities (145,129) (145,129)Net cash provided by (used in) investing activities (76,647) (76,647)
Net increase (decrease) in cash and cash equivalents (11,114) 1,112 (10,002)Cash and cash equivalents, January 1 36,056 1,645 37,701
Cash and cash equivalents, December 31 24,942$ 2,757$ 27,699$
147
147
DRPA 2020 COMPREHENSIVE ANNUAL FINANCIAL REPORT 97
FINANCIALSECTION
DELAWARE RIVER PORT AUTHORITYNotes to Combined Financial Statements
For the Years Ended December 31, 2020 and 2019(dollars expressed in thousands)
Note 19. Subsequent Events
COVID-19 Impact: In late December of 2019, a novel strain of coronavirus causing the disease known as"COVID-19" was discovered in Wuhan, China. Since then, COVID-19 has spread throughout the world,including throughout the United States and the region in which the DRPA provides services, resulting in theWorld Health Organization proclaiming COVID-19 to be a pandemic, the President of the United Statesdeclaring a national emergency, and the governors of the Commonwealth of Pennsylvania (the“Commonwealth”) and the State of New Jersey (the “State”) declaring states of emergency. The spread ofCOVID-19 has altered the behavior of businesses and people in a manner that has caused significantdisruptions to the global, national, and regional economy. The effects of the spread of COVID-19 and therelated governmental, non-profit, and private responses continue to evolve. However, COVID-19 has, ingeneral, resulted in reduced traffic and corresponding reduced revenues for the Authority as describedbelow.
Traffic/ Revenue: Audited traffic data through April 2021, shows a 6.82% increase in overall traffic,as compared to April 2020 year-to-date figures. Toll revenues YTD are $6.0 million, or 7.22% above2020 figures. (Each 1.0% increase, or decrease, in traffic translates to a gain, or loss, about $275thousand in ( toll revenues). Notwithstanding the comparative year to date declines vs. 2019 volumes,DRPA traffic and toll revenues are 1.3 million (or 10.5%) and $9.9 million (or 12.5%) ahead of budget,respectively. These traffic and revenue figures are expected to continue to improve, based on trafficapproaching the 85% of 2019 (i.e. pre-COVID) traffic level in recent weeks.
PATCO Ridership/Fare Revenues: PATCO ridership numbers through May 2021, were about 54.7%(or 1.4 million riders) below May 2020 figures, with revenues down approximately $3.5 million (or57.3%). The drop in ridership and net passenger revenues since March 2020 has widened the overallsubsidy provided by the Authority to PATCO and, therefore, has required increased funding by theAuthority. PATCO ridership and net passenger revenue figures are approximately 17% under budgetthru May YTD.
Federal Transit Grants – CARES Act : Fortunately, the Authority was able to draw down $32.7 million,through May 2021, against a CARES Act federal transit grant for 2020 and has roughly $8 millionremaining from its grant to partially offset the continued loss in passenger fare revenues andoperational losses.
Other Awards: FY 2021 Coronavirus Response and Relief Supplemental Appropriations Act(CRRSAA) - The Authority has been advised that it has been appropriated $15.7 million ofCRRSAA grant funding. Drawdowns against the grant will commence once the award is executed.
FY 2021 American Rescue Plan Act (ARP) - In addition, the Authority has received notification itwill be appropriated another $27.9 million, of ARP grant funding. The application and award of theARP grant funding is projected to be completed in the fourth quarter of 2021. No assurances aregiven, however, as to the ultimate receipt of such Award.
Debt Service Payments and Liquidity: The Authority has made and continues to make all of itsrequired monthly debt service payments for all outstanding revenue and port district bonds throughMay 2021 and such payments are expected to continue uninterrupted given the Authority’s cash flowand sizeable General Fund balance of approximately $296 million, as of May 31, 2021.
Due to precipitous drops in interest rates and general market volatility, investment income has beensignificantly impacted year-to-date through 2020 and now into 2021. Management believes thatinvestment income will continue to underperform versus 2019 and 2020 due to the almost historiclow interest rates, not seen since the 2008 financial collapse.
148
148
98 DRPA 2020 COMPREHENSIVE ANNUAL FINANCIAL REPORT
FINANCIALSECTION
DELAWARE RIVER PORT AUTHORITYNotes to Combined Financial Statements
For the Years Ended December 31, 2020 and 2019(dollars expressed in thousands)
Note 19. Subsequent Events (Continued)
While no assurances can be given, and none is given, because of the evolving nature of the effects ofCOVID-19 on the Authority, based on the initial budget for 2021 management estimates that 2021 annualbridge toll revenues will improve versus 2020 figures by at least $10 million (or by 3.78%). Through May31, 2021, estimated traffic/revenues are surpassing budget expectations. As a result, the Authority iscautiously optimistic that toll revenues will surpass the estimated $278.3 million budgeted for 2021 (howeverno assurances are given as to final results for 2021). Management’s response, throughout the pandemic,has been among other things, implementation and continuation its cost-cutting strategies to help to offsetthe financial impact of reduced traffic/ridership volumes and revenues.
Termination of Forward Delivery Agreement (Maintenance Reserve Fund): In February 2021, the Authoritynegotiated a termination of its Maintenance Reserve Fund forward delivery agreement with Wells FargoBank (see Note 4). The Authority received net proceeds of $574 as a result of this termination.
Reduction in OCIP Letter of Credit (“LOC”): On February 4, 2021, after a review of outstanding claims, AIGadvised the Authority and its LOC bank that it was reducing the LOC requirement from $128 to $94. TheLOC will mature on December 31, 2021.
Labor Relations: The DRPA Board approved two (2) resolutions authorizing staff to negotiate one-yearextensions of its Collective Bargaining Agreements (“CBA”) with the International Union of OperatingEngineers Local 542 (“IUOE") and International Brotherhood of Electrical Workers Local 351 (“IBEW”), bothof which were set to expire on December 31, 2020. The PATCO Board approved a resolution authorizingstaff to negotiate a one-year extension for the CBA with the International Brotherhood of Teamsters Local676 (“Teamsters”) that expired effective December 31, 2020. The IUOE and Teamsters extensionagreements are fully executed, and each CBA expires December 31, 2021; the IBEW has not yet returnedthe extension agreement and IBEW represented employees continue to work under the terms of the expiredCBA. DRPA’s CBA with FOP Lodge 30 of Pennsylvania and New Jersey (“FOP”) expires on December31, 2021.
Possible Bond Refunding of the 2012 Port District Project Bonds: On May 19, 2021, the Authority’s Boardpassed DRPA resolution # 21-033, “Authorization for Issuance of Port District Project Refunding Bonds toRefund and Redeem all or a Portion of the Outstanding Port District Project Refunding Bonds, Series 2012.”With the expiration of the veto period for the May meeting, the Authority can execute a refunding to effectinterest cost savings, if prudent and if market conditions are favorable. The resolution does not obligatethe Authority to execute any transaction. As a result of this resolution, the” total debt authorized not issued”,has increased by $75,000 to total $1.18 billion as of May 2021.
Bond Ratings: In March 2021, S&P restored the “stable” outlook for the toll road sector and also on theAuthority’s bonds, from “negative”, after its review of the on-going recovery in the toll road sector, since thebeginning of 2021. (At the outset of the pandemic, both Moody’s and S&P had previously changed theoutlook for the entire toll sector in March of 2020 from “stable” to “negative”).
S&P cited “still depressed but generally improving trends in key operating metrics… particularly large, inter-or intrastate systems with balances commercial and passenger traffic transactions. To further quote: “Manytoll operators are at 75-85% of 2019 activity levels…We expect U.S. and regional economic growth willtranslate into continued improvement for these issuers. (Note, most recently, the Authority’s traffic hasreached the upper-end of this cited range, with numbers edging closer to 90% of pre-COVID volumes).
149
149
DRPA 2020 COMPREHENSIVE ANNUAL FINANCIAL REPORT 99
FINANCIALSECTION
DELAWARE RIVER PORT AUTHORITYNotes to Combined Financial Statements
For the Years Ended December 31, 2020 and 2019(dollars expressed in thousands)
Note 19. Subsequent Events (Continued)
Bond Indenture Compliance: Insurance Coverages and Certification: Pursuant to Article 5.11 of the 1998Bond Indenture, “...the Authority must maintain with responsible insurers all insurance required….to provideagainst loss of or damage to the Facilities and loss of Revenues...to protect the interests of the Authorityand the Bondholders.” The certifications must provide “in reasonable detail the insurance then in effectpursuant to” Section 5.11 and also must state whether, during the calendar year, any facility has been“materially damages or destroyed, and if so, the amount of insurance proceeds covering such loss ordamage…” The Authority filed its annual certification for the year-ending 2020 prior to the April 30, 2021deadline and certified that no material damage had occurred on its facilities.
150
150
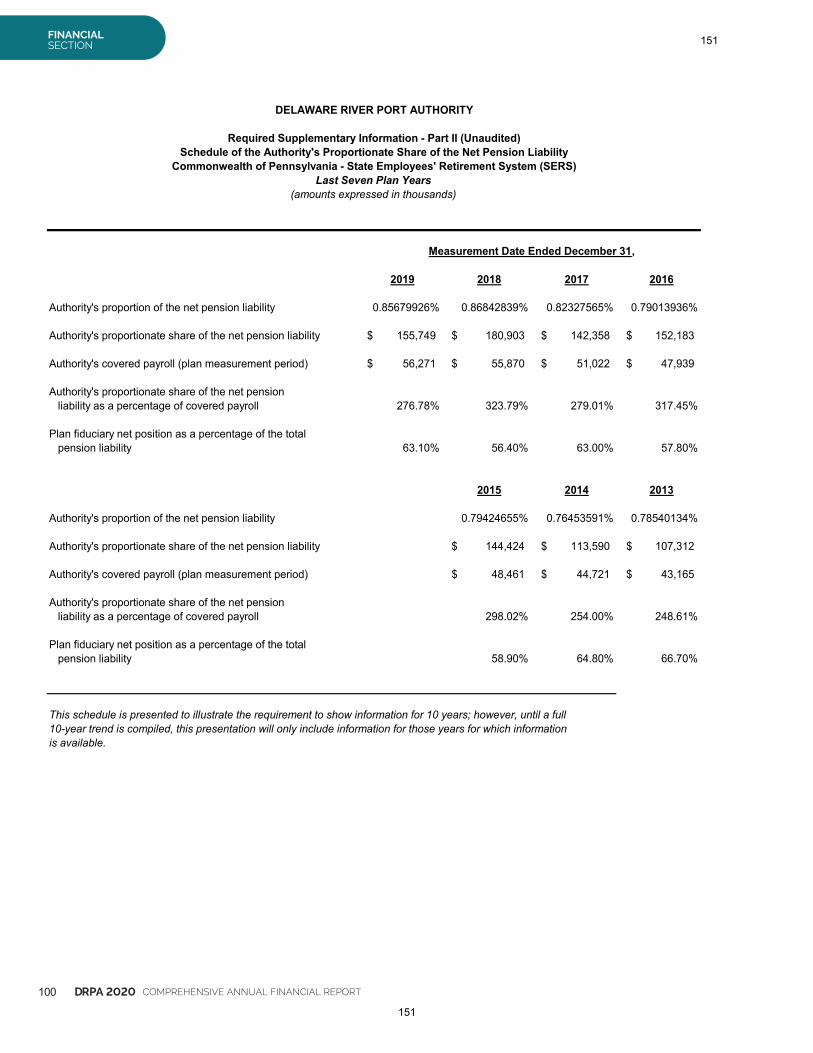
100 DRPA 2020 COMPREHENSIVE ANNUAL FINANCIAL REPORT
FINANCIALSECTION
DELAWARE RIVER PORT AUTHORITY
Required Supplementary Information - Part II (Unaudited)Schedule of the Authority's Proportionate Share of the Net Pension Liability
Commonwealth of Pennsylvania - State Employees' Retirement System (SERS)Last Seven Plan Years
(amounts expressed in thousands)
Measurement Date Ended December 31,
2019 2018 2017 2016
Authority's proportion of the net pension liability 0.85679926% 0.86842839% 0.82327565% 0.79013936%
Authority's proportionate share of the net pension liability 155,749$ 180,903$ 142,358$ 152,183$
Authority's covered payroll (plan measurement period) 56,271$ 55,870$ 51,022$ 47,939$
Authority's proportionate share of the net pensionliability as a percentage of covered payroll 276.78% 323.79% 279.01% 317.45%
Plan fiduciary net position as a percentage of the totalpension liability 63.10% 56.40% 63.00% 57.80%
2015 2014 2013
Authority's proportion of the net pension liability 0.79424655% 0.76453591% 0.78540134%
Authority's proportionate share of the net pension liability 144,424$ 113,590$ 107,312$
Authority's covered payroll (plan measurement period) 48,461$ 44,721$ 43,165$
Authority's proportionate share of the net pensionliability as a percentage of covered payroll 298.02% 254.00% 248.61%
Plan fiduciary net position as a percentage of the totalpension liability 58.90% 64.80% 66.70%
This schedule is presented to illustrate the requirement to show information for 10 years; however, until a full10-year trend is compiled, this presentation will only include information for those years for which informationis available.
151
151
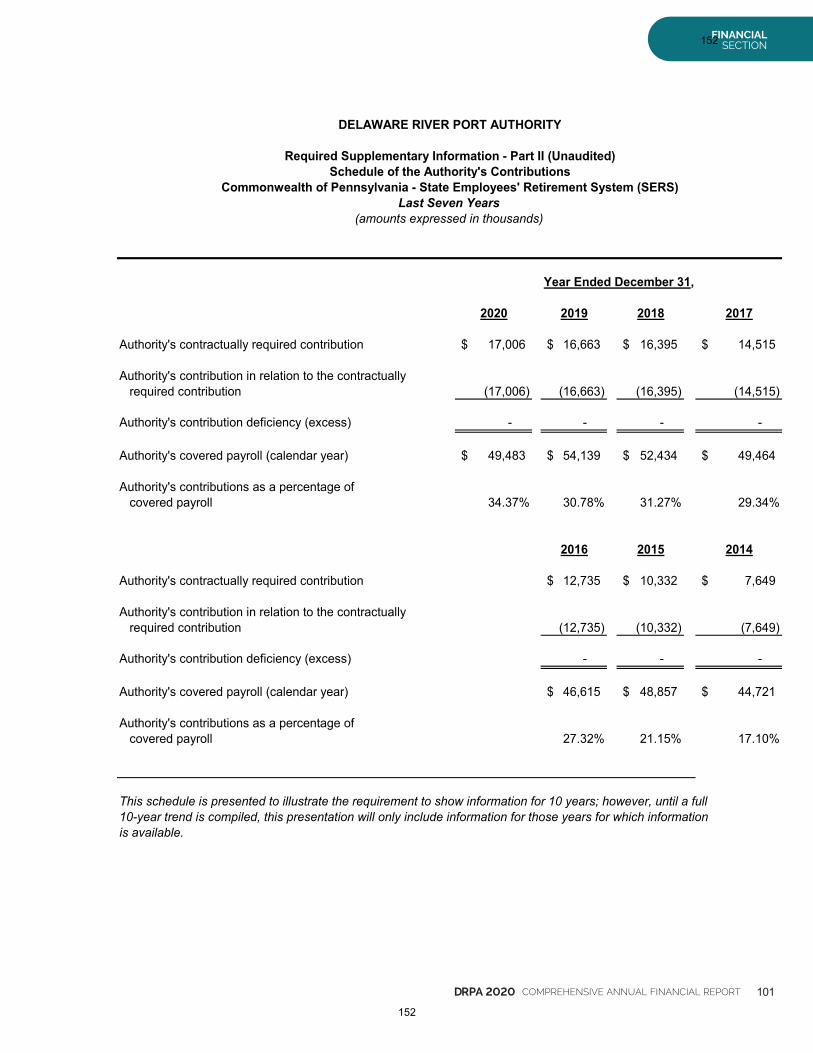
DRPA 2020 COMPREHENSIVE ANNUAL FINANCIAL REPORT 101
FINANCIALSECTION
DELAWARE RIVER PORT AUTHORITY
Required Supplementary Information - Part II (Unaudited)Schedule of the Authority's Contributions
Commonwealth of Pennsylvania - State Employees' Retirement System (SERS)Last Seven Years
(amounts expressed in thousands)
Year Ended December 31,
2020 2019 2018 2017
Authority's contractually required contribution 17,006$ 16,663$ 16,395$ 14,515$
Authority's contribution in relation to the contractuallyrequired contribution (17,006) (16,663) (16,395) (14,515)
Authority's contribution deficiency (excess) - - - -
Authority's covered payroll (calendar year) 49,483$ 54,139$ 52,434$ 49,464$
Authority's contributions as a percentage ofcovered payroll 34.37% 30.78% 31.27% 29.34%
2016 2015 2014
Authority's contractually required contribution 12,735$ 10,332$ 7,649$
Authority's contribution in relation to the contractuallyrequired contribution (12,735) (10,332) (7,649)
Authority's contribution deficiency (excess) - - -
Authority's covered payroll (calendar year) 46,615$ 48,857$ 44,721$
Authority's contributions as a percentage ofcovered payroll 27.32% 21.15% 17.10%
This schedule is presented to illustrate the requirement to show information for 10 years; however, until a full10-year trend is compiled, this presentation will only include information for those years for which informationis available.
152
152
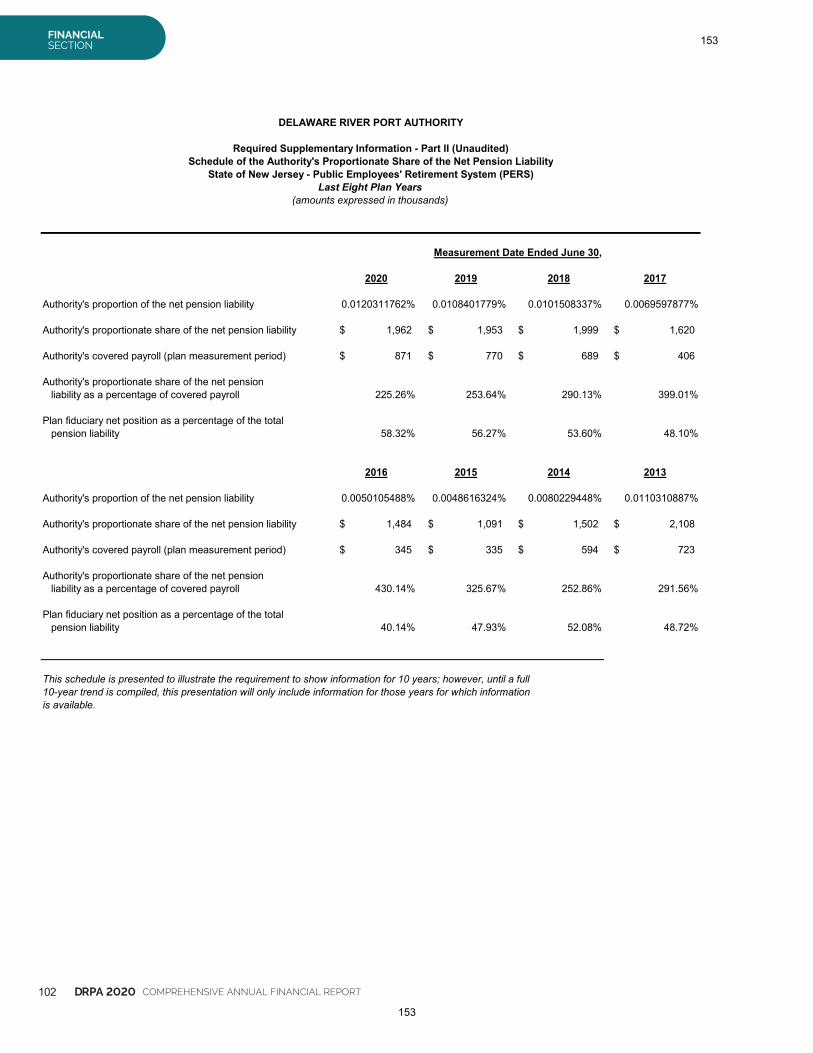
102 DRPA 2020 COMPREHENSIVE ANNUAL FINANCIAL REPORT
FINANCIALSECTION
DELAWARE RIVER PORT AUTHORITY
Required Supplementary Information - Part II (Unaudited)Schedule of the Authority's Proportionate Share of the Net Pension Liability
State of New Jersey - Public Employees' Retirement System (PERS)Last Eight Plan Years
(amounts expressed in thousands)
Measurement Date Ended June 30,
2020 2019 2018 2017
Authority's proportion of the net pension liability 0.0120311762% 0.0108401779% 0.0101508337% 0.0069597877%
Authority's proportionate share of the net pension liability 1,962$ 1,953$ 1,999$ 1,620$
Authority's covered payroll (plan measurement period) 871$ 770$ 689$ 406$
Authority's proportionate share of the net pensionliability as a percentage of covered payroll 225.26% 253.64% 290.13% 399.01%
Plan fiduciary net position as a percentage of the totalpension liability 58.32% 56.27% 53.60% 48.10%
2016 2015 2014 2013
Authority's proportion of the net pension liability 0.0050105488% 0.0048616324% 0.0080229448% 0.0110310887%
Authority's proportionate share of the net pension liability 1,484$ 1,091$ 1,502$ 2,108$
Authority's covered payroll (plan measurement period) 345$ 335$ 594$ 723$
Authority's proportionate share of the net pensionliability as a percentage of covered payroll 430.14% 325.67% 252.86% 291.56%
Plan fiduciary net position as a percentage of the totalpension liability 40.14% 47.93% 52.08% 48.72%
This schedule is presented to illustrate the requirement to show information for 10 years; however, until a full10-year trend is compiled, this presentation will only include information for those years for which informationis available.
153
153

DRPA 2020 COMPREHENSIVE ANNUAL FINANCIAL REPORT 103
FINANCIALSECTION
DELAWARE RIVER PORT AUTHORITY
Required Supplementary Information - Part II (Unaudited)Schedule of the Authority's Contributions
State of New Jersey - Public Employees' Retirement System (PERS)Last Eight Years
(amounts expressed in thousands)
Year Ended December 31,
2020 2019 2018 2017
Authority's contractually required contribution 132$ 106$ 101$ 64$
Authority's contribution in relation to the contractuallyrequired contribution (132) (106) (101) (64)
Authority's contribution deficiency (excess) - - - -
Authority's covered payroll (calendar year) 837$ 852$ 776$ 692$
Authority's contributions as a percentage ofcovered payroll 15.77% 12.44% 13.02% 9.25%
2016 2015 2014 2013
Authority's contractually required contribution 45$ 42$ 66$ 83$
Authority's contribution in relation to the contractuallyrequired contribution (45) (42) (66) (83)
Authority's contribution deficiency (excess) - - - -
Authority's covered payroll (calendar year) 438$ 369$ 355$ 601$
Authority's contributions as a percentage ofcovered payroll 10.27% 11.38% 18.59% 13.81%
This schedule is presented to illustrate the requirement to show information for 10 years; however, until a full10-year trend is compiled, this presentation will only include information for those years for which informationis available.
154
154
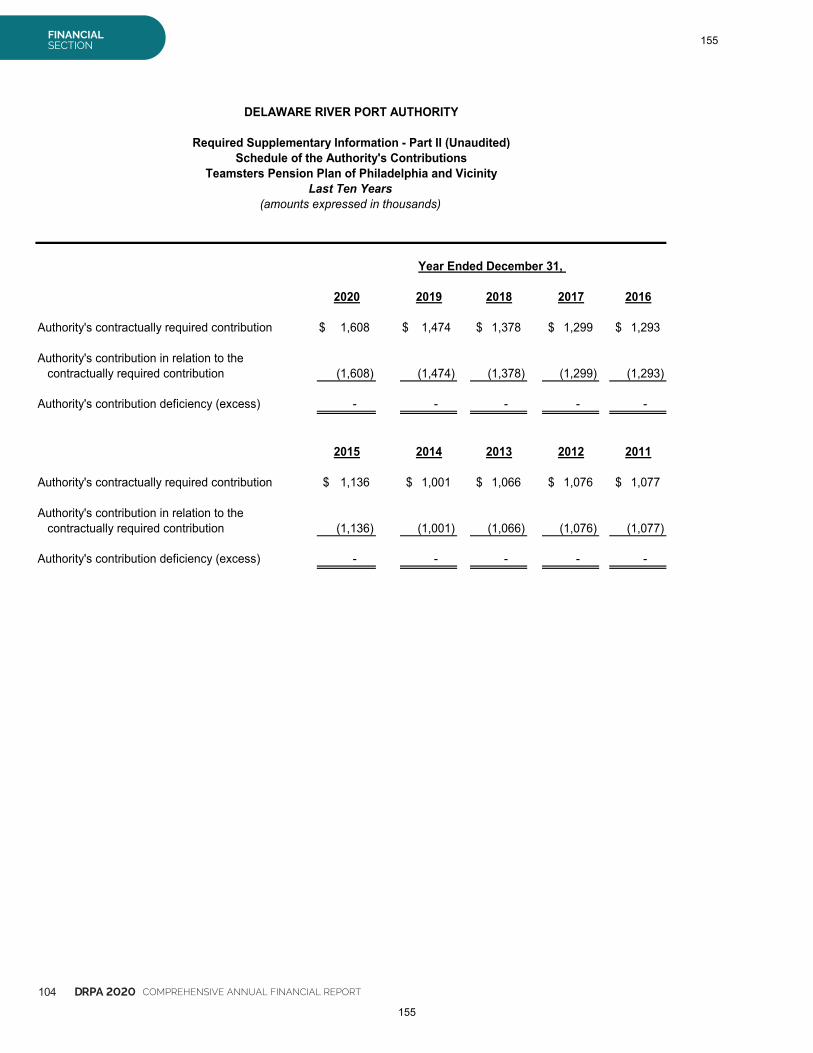
104 DRPA 2020 COMPREHENSIVE ANNUAL FINANCIAL REPORT
FINANCIALSECTION
DELAWARE RIVER PORT AUTHORITY
Required Supplementary Information - Part II (Unaudited)Schedule of the Authority's Contributions
Teamsters Pension Plan of Philadelphia and VicinityLast Ten Years
(amounts expressed in thousands)
Year Ended December 31,
2020 2019 2018 2017 2016
Authority's contractually required contribution 1,608$ 1,474$ 1,378$ 1,299$ 1,293$
Authority's contribution in relation to thecontractually required contribution (1,608) (1,474) (1,378) (1,299) (1,293)
Authority's contribution deficiency (excess) - - - - -
2015 2014 2013 2012 2011
Authority's contractually required contribution 1,136$ 1,001$ 1,066$ 1,076$ 1,077$
Authority's contribution in relation to thecontractually required contribution (1,136) (1,001) (1,066) (1,076) (1,077)
Authority's contribution deficiency (excess) - - - - -
155
155
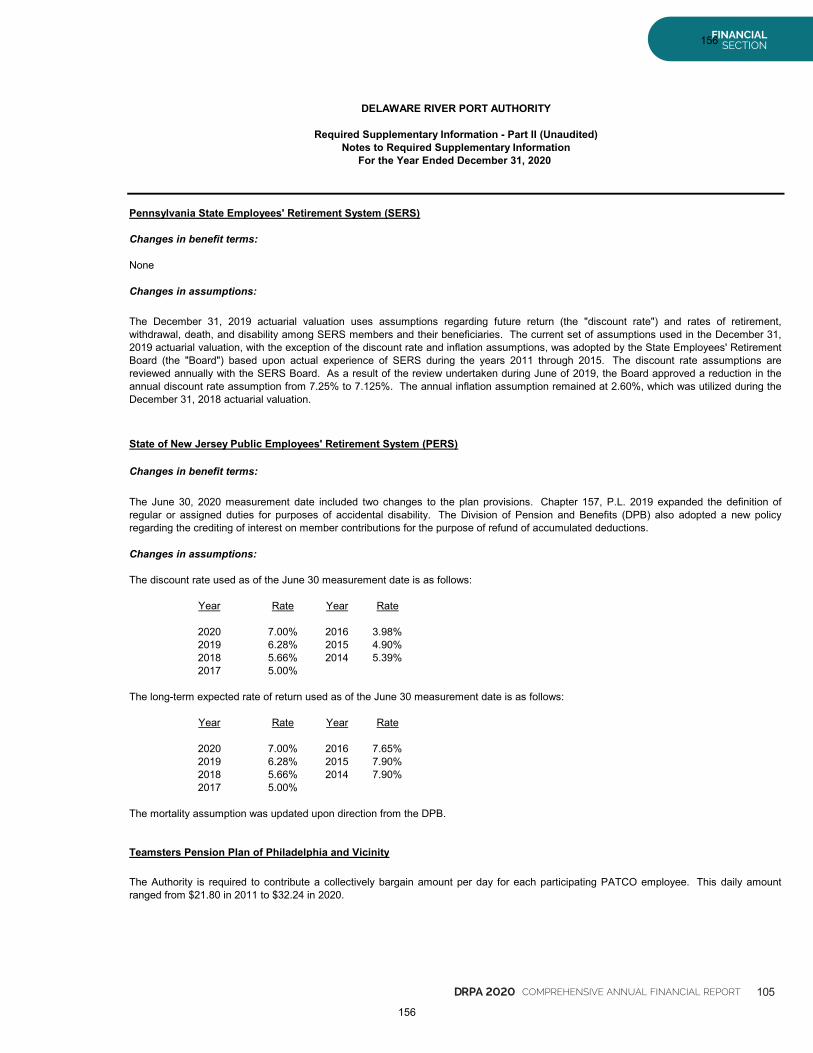
DRPA 2020 COMPREHENSIVE ANNUAL FINANCIAL REPORT 105
FINANCIALSECTION
DELAWARE RIVER PORT AUTHORITY
Required Supplementary Information - Part II (Unaudited)Notes to Required Supplementary Information
For the Year Ended December 31, 2020
Pennsylvania State Employees' Retirement System (SERS)
Changes in benefit terms:
Changes in assumptions:
State of New Jersey Public Employees' Retirement System (PERS)
Changes in benefit terms:
Changes in assumptions:
Year Rate Year Rate
2020 7.00% 2016 3.98%2019 6.28% 2015 4.90%2018 5.66% 2014 5.39%2017 5.00%
Year Rate Year Rate
2020 7.00% 2016 7.65%2019 6.28% 2015 7.90%2018 5.66% 2014 7.90%2017 5.00%
Teamsters Pension Plan of Philadelphia and Vicinity
The mortality assumption was updated upon direction from the DPB.
The Authority is required to contribute a collectively bargain amount per day for each participating PATCO employee. This daily amountranged from $21.80 in 2011 to $32.24 in 2020.
None
The December 31, 2019 actuarial valuation uses assumptions regarding future return (the "discount rate") and rates of retirement,withdrawal, death, and disability among SERS members and their beneficiaries. The current set of assumptions used in the December 31,2019 actuarial valuation, with the exception of the discount rate and inflation assumptions, was adopted by the State Employees' RetirementBoard (the "Board") based upon actual experience of SERS during the years 2011 through 2015. The discount rate assumptions arereviewed annually with the SERS Board. As a result of the review undertaken during June of 2019, the Board approved a reduction in theannual discount rate assumption from 7.25% to 7.125%. The annual inflation assumption remained at 2.60%, which was utilized during theDecember 31, 2018 actuarial valuation.
The June 30, 2020 measurement date included two changes to the plan provisions. Chapter 157, P.L. 2019 expanded the definition ofregular or assigned duties for purposes of accidental disability. The Division of Pension and Benefits (DPB) also adopted a new policyregarding the crediting of interest on member contributions for the purpose of refund of accumulated deductions.
The discount rate used as of the June 30 measurement date is as follows:
The long-term expected rate of return used as of the June 30 measurement date is as follows:
156
156
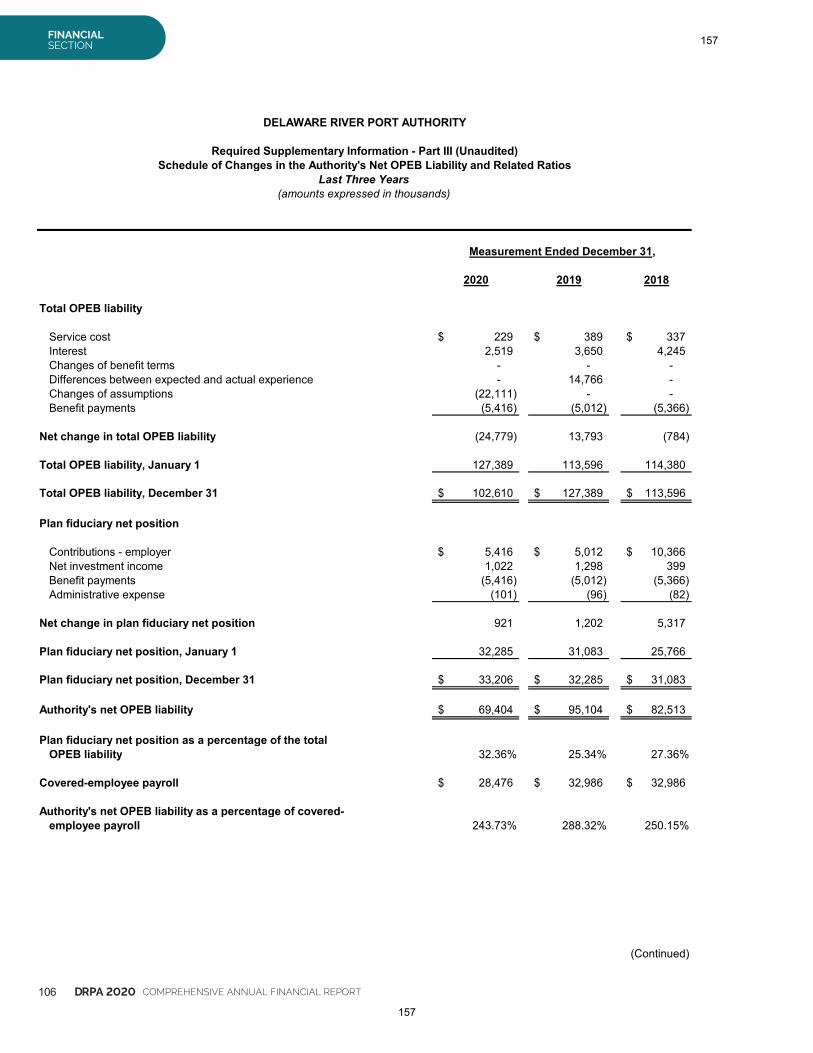
106 DRPA 2020 COMPREHENSIVE ANNUAL FINANCIAL REPORT
FINANCIALSECTION
DELAWARE RIVER PORT AUTHORITY
Required Supplementary Information - Part III (Unaudited)Schedule of Changes in the Authority's Net OPEB Liability and Related Ratios
Last Three Years(amounts expressed in thousands)
Measurement Ended December 31,
2020 2019 2018
Total OPEB liability
Service cost 229$ 389$ 337$Interest 2,519 3,650 4,245Changes of benefit terms - - -Differences between expected and actual experience - 14,766 -Changes of assumptions (22,111) - -Benefit payments (5,416) (5,012) (5,366)
Net change in total OPEB liability (24,779) 13,793 (784)
Total OPEB liability, January 1 127,389 113,596 114,380
Total OPEB liability, December 31 102,610$ 127,389$ 113,596$
Plan fiduciary net position
Contributions - employer 5,416$ 5,012$ 10,366$Net investment income 1,022 1,298 399Benefit payments (5,416) (5,012) (5,366)Administrative expense (101) (96) (82)
Net change in plan fiduciary net position 921 1,202 5,317
Plan fiduciary net position, January 1 32,285 31,083 25,766
Plan fiduciary net position, December 31 33,206$ 32,285$ 31,083$
Authority's net OPEB liability 69,404$ 95,104$ 82,513$
Plan fiduciary net position as a percentage of the totalOPEB liability 32.36% 25.34% 27.36%
Covered-employee payroll 28,476$ 32,986$ 32,986$
Authority's net OPEB liability as a percentage of covered-employee payroll 243.73% 288.32% 250.15%
(Continued)
157
157
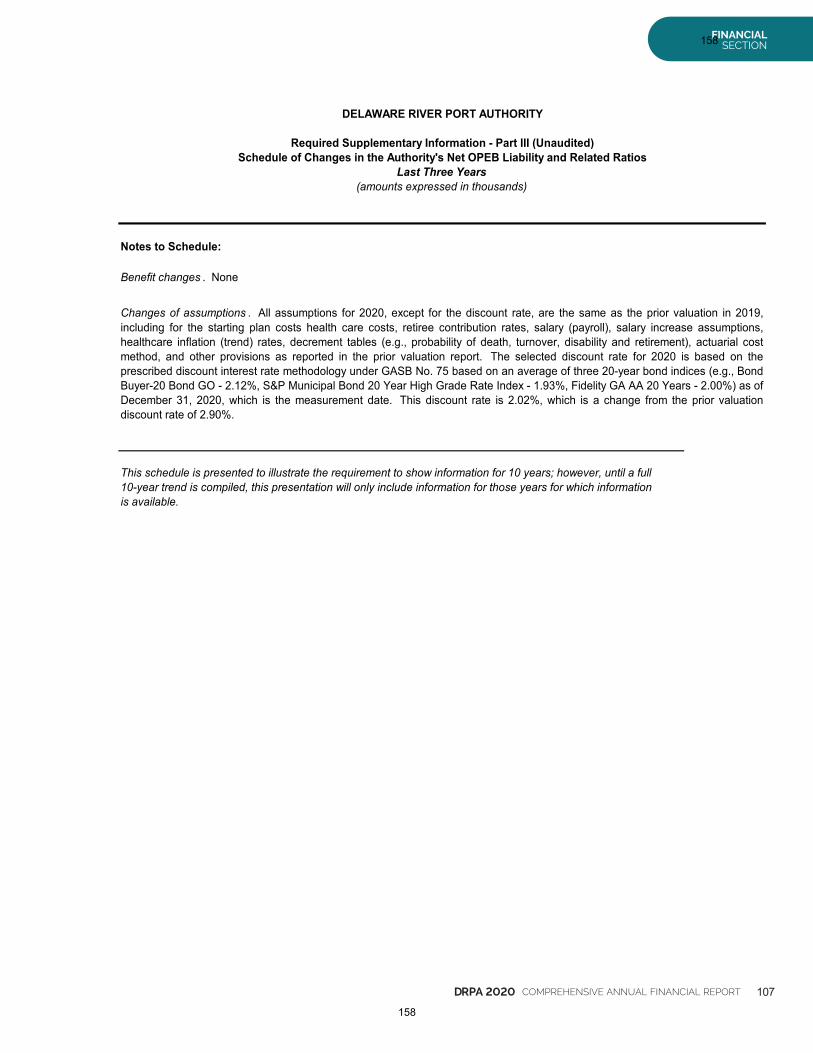
DRPA 2020 COMPREHENSIVE ANNUAL FINANCIAL REPORT 107
FINANCIALSECTION
DELAWARE RIVER PORT AUTHORITY
Required Supplementary Information - Part III (Unaudited)Schedule of Changes in the Authority's Net OPEB Liability and Related Ratios
Last Three Years(amounts expressed in thousands)
Notes to Schedule:
This schedule is presented to illustrate the requirement to show information for 10 years; however, until a full10-year trend is compiled, this presentation will only include information for those years for which informationis available.
Benefit changes . None
Changes of assumptions . All assumptions for 2020, except for the discount rate, are the same as the prior valuation in 2019,including for the starting plan costs health care costs, retiree contribution rates, salary (payroll), salary increase assumptions,healthcare inflation (trend) rates, decrement tables (e.g., probability of death, turnover, disability and retirement), actuarial costmethod, and other provisions as reported in the prior valuation report. The selected discount rate for 2020 is based on theprescribed discount interest rate methodology under GASB No. 75 based on an average of three 20-year bond indices (e.g., BondBuyer-20 Bond GO - 2.12%, S&P Municipal Bond 20 Year High Grade Rate Index - 1.93%, Fidelity GA AA 20 Years - 2.00%) as ofDecember 31, 2020, which is the measurement date. This discount rate is 2.02%, which is a change from the prior valuationdiscount rate of 2.90%.
158
158
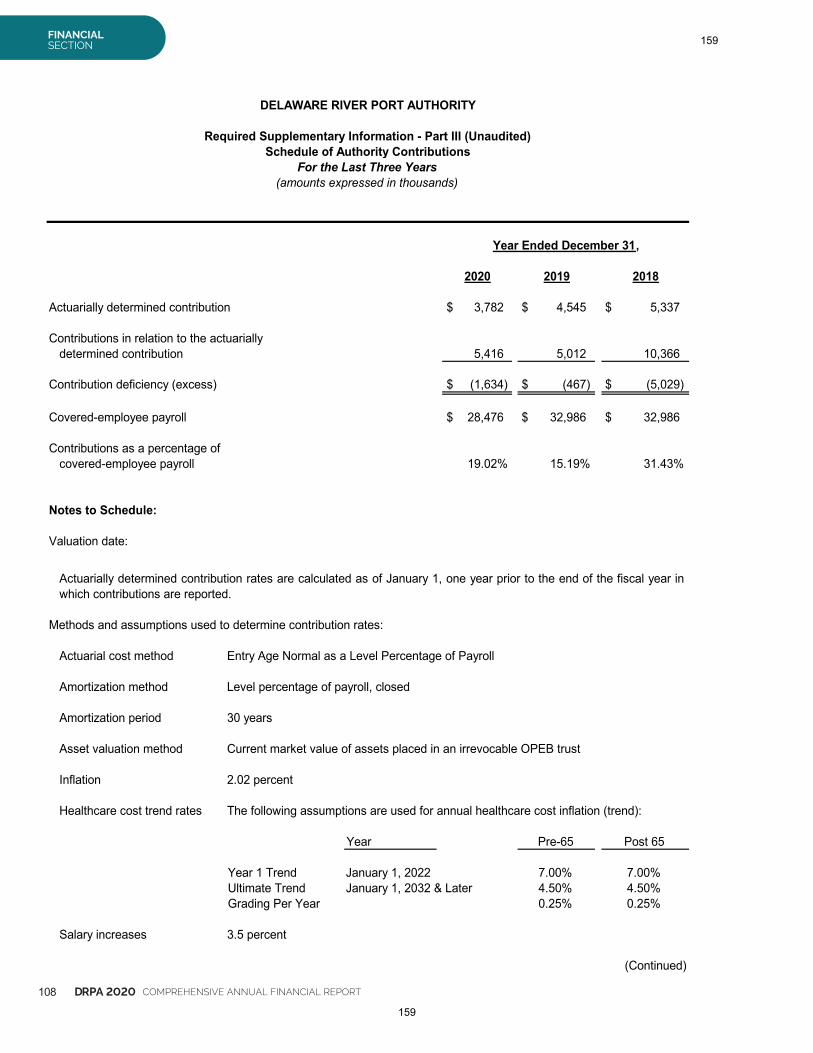
108 DRPA 2020 COMPREHENSIVE ANNUAL FINANCIAL REPORT
FINANCIALSECTION
DELAWARE RIVER PORT AUTHORITY
Required Supplementary Information - Part III (Unaudited)Schedule of Authority Contributions
For the Last Three Years(amounts expressed in thousands)
Year Ended December 31,
2020 2019 2018
Actuarially determined contribution 3,782$ 4,545$ 5,337$
Contributions in relation to the actuariallydetermined contribution 5,416 5,012 10,366
Contribution deficiency (excess) (1,634)$ (467)$ (5,029)$
Covered-employee payroll 28,476$ 32,986$ 32,986$
Contributions as a percentage ofcovered-employee payroll 19.02% 15.19% 31.43%
Notes to Schedule:
Valuation date:
Methods and assumptions used to determine contribution rates:
Actuarial cost method Entry Age Normal as a Level Percentage of Payroll
Amortization method Level percentage of payroll, closed
Amortization period 30 years
Asset valuation method Current market value of assets placed in an irrevocable OPEB trust
Inflation 2.02 percent
Healthcare cost trend rates The following assumptions are used for annual healthcare cost inflation (trend):
Year Pre-65 Post 65
Year 1 Trend January 1, 2022 7.00% 7.00%Ultimate Trend January 1, 2032 & Later 4.50% 4.50%Grading Per Year 0.25% 0.25%
Salary increases 3.5 percent
(Continued)
Actuarially determined contribution rates are calculated as of January 1, one year prior to the end of the fiscal year inwhich contributions are reported.
159
159
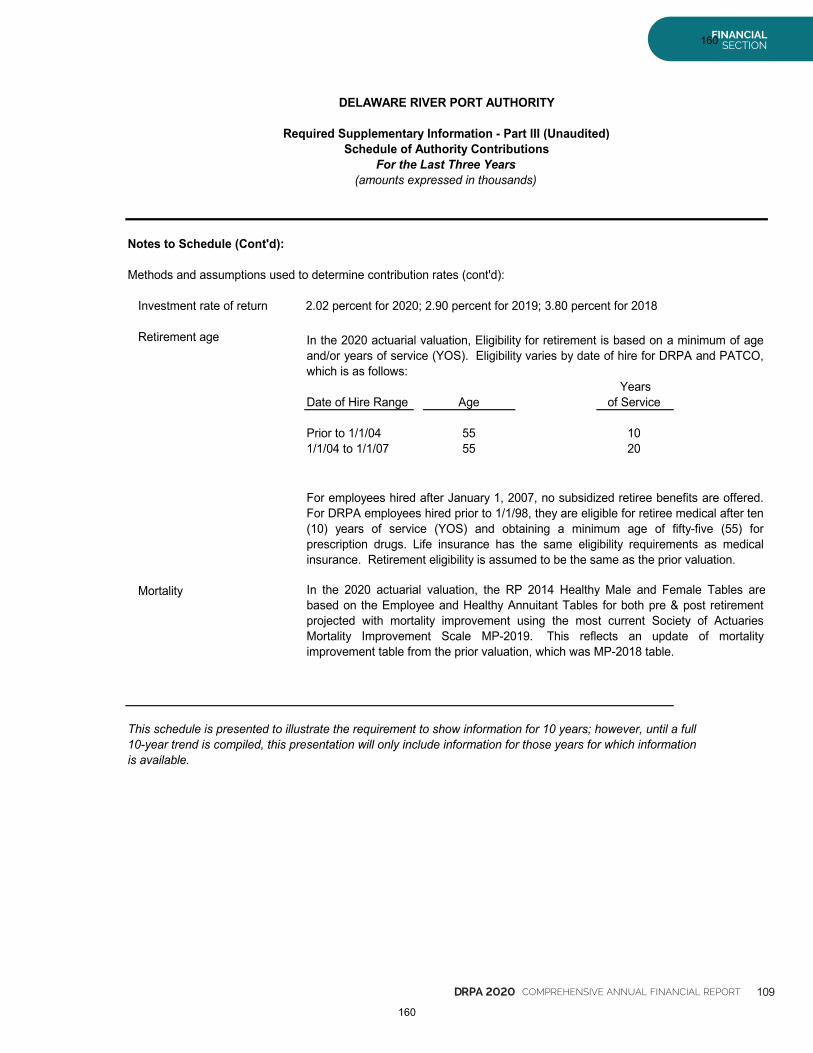
DRPA 2020 COMPREHENSIVE ANNUAL FINANCIAL REPORT 109
FINANCIALSECTION
DELAWARE RIVER PORT AUTHORITY
Required Supplementary Information - Part III (Unaudited)Schedule of Authority Contributions
For the Last Three Years(amounts expressed in thousands)
Notes to Schedule (Cont'd):
Methods and assumptions used to determine contribution rates (cont'd):
Investment rate of return 2.02 percent for 2020; 2.90 percent for 2019; 3.80 percent for 2018
Retirement age
YearsDate of Hire Range Age of Service
Prior to 1/1/04 55 101/1/04 to 1/1/07 55 20
Mortality
This schedule is presented to illustrate the requirement to show information for 10 years; however, until a full10-year trend is compiled, this presentation will only include information for those years for which informationis available.
In the 2020 actuarial valuation, Eligibility for retirement is based on a minimum of ageand/or years of service (YOS). Eligibility varies by date of hire for DRPA and PATCO,which is as follows:
For employees hired after January 1, 2007, no subsidized retiree benefits are offered.For DRPA employees hired prior to 1/1/98, they are eligible for retiree medical after ten(10) years of service (YOS) and obtaining a minimum age of fifty-five (55) forprescription drugs. Life insurance has the same eligibility requirements as medicalinsurance. Retirement eligibility is assumed to be the same as the prior valuation.
In the 2020 actuarial valuation, the RP 2014 Healthy Male and Female Tables arebased on the Employee and Healthy Annuitant Tables for both pre & post retirementprojected with mortality improvement using the most current Society of ActuariesMortality Improvement Scale MP-2019. This reflects an update of mortalityimprovement table from the prior valuation, which was MP-2018 table.
160
160
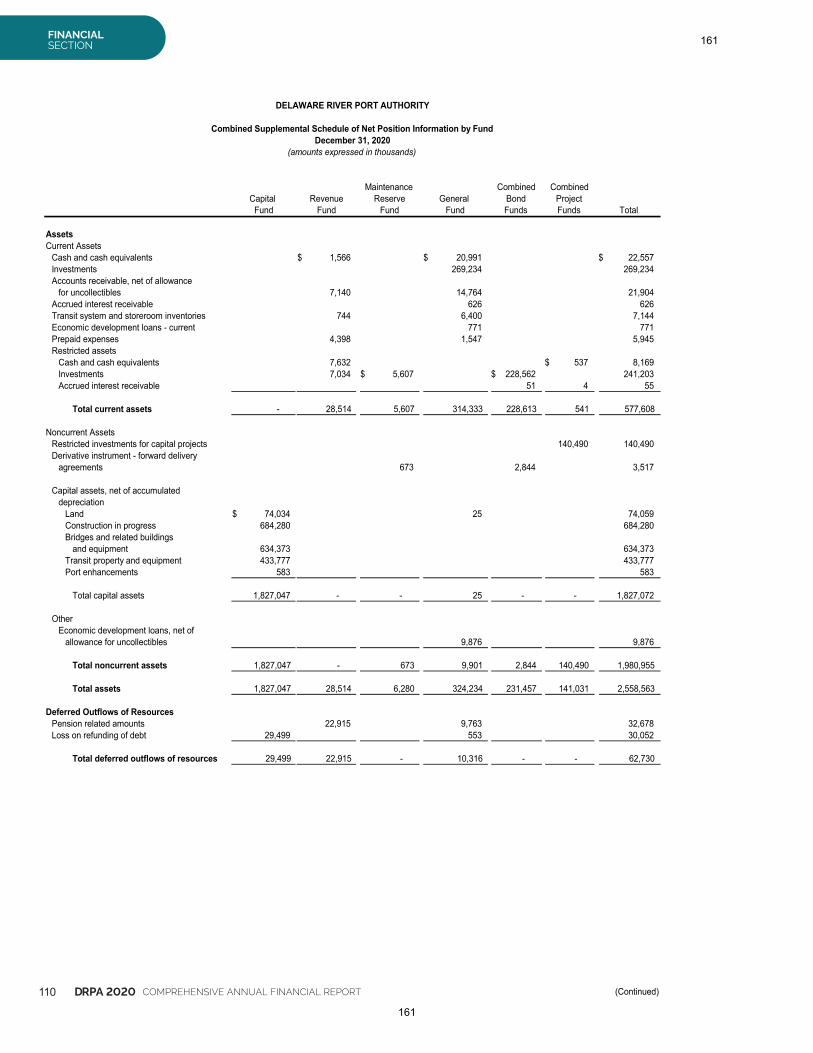
110 DRPA 2020 COMPREHENSIVE ANNUAL FINANCIAL REPORT
FINANCIALSECTION
DELAWARE RIVER PORT AUTHORITY
Combined Supplemental Schedule of Net Position Information by FundDecember 31, 2020
(amounts expressed in thousands)
Maintenance Combined CombinedCapital Revenue Reserve General Bond Project
Fund Fund Fund Fund Funds Funds Total
AssetsCurrent Assets
Cash and cash equivalents 1,566$ 20,991$ 22,557$Investments 269,234 269,234Accounts receivable, net of allowance
for uncollectibles 7,140 14,764 21,904Accrued interest receivable 626 626Transit system and storeroom inventories 744 6,400 7,144Economic development loans - current 771 771Prepaid expenses 4,398 1,547 5,945Restricted assets
Cash and cash equivalents 7,632 537$ 8,169Investments 7,034 5,607$ 228,562$ 241,203Accrued interest receivable 51 4 55
Total current assets - 28,514 5,607 314,333 228,613 541 577,608
Noncurrent AssetsRestricted investments for capital projects 140,490 140,490Derivative instrument - forward delivery
agreements 673 2,844 3,517
Capital assets, net of accumulateddepreciation
Land 74,034$ 25 74,059Construction in progress 684,280 684,280Bridges and related buildings
and equipment 634,373 634,373Transit property and equipment 433,777 433,777Port enhancements 583 583
Total capital assets 1,827,047 - - 25 - - 1,827,072
OtherEconomic development loans, net of
allowance for uncollectibles 9,876 9,876
Total noncurrent assets 1,827,047 - 673 9,901 2,844 140,490 1,980,955
Total assets 1,827,047 28,514 6,280 324,234 231,457 141,031 2,558,563
Deferred Outflows of ResourcesPension related amounts 22,915 9,763 32,678Loss on refunding of debt 29,499 553 30,052
Total deferred outflows of resources 29,499 22,915 - 10,316 - - 62,730
(Continued)
161
161

DRPA 2020 COMPREHENSIVE ANNUAL FINANCIAL REPORT 111
FINANCIALSECTION
DELAWARE RIVER PORT AUTHORITY
Combined Supplemental Schedule of Net Position Information by FundDecember 31, 2020
(amounts expressed in thousands)
Maintenance Combined CombinedCapital Revenue Reserve General Bond Project
Fund Fund Fund Fund Funds Funds Total
LiabilitiesCurrent Liabilities
Accounts payableRetained amounts on contracts 334$ 22,923$ 23,257$Other 7,426 40,984 48,410
Accrued liabilitiesClaims and judgments 21 719 740Self-insurance 1,449 1,591 3,040Pension 878 136 1,014Sick and vacation leave benefits 1,776 440 2,216Other 10 1,231 1,241
Unearned revenue 6,835 6,835Liabilities payable from restricted assets
Accrued interest payable 30,687$ 30,687Bonds payable - current 57,400$ 13,385 70,785
Total current liabilities 57,400 11,894 - 88,244 30,687 - 188,225
Noncurrent LiabilitiesAccrued liabilities
Claims and judgments 4 127 131Self-insurance 713 783 1,496Sick and vacation leave benefits 2,665 660 3,325Net pension liability 137,738 19,973 157,711Other postemployment benefits 60,069 9,335 69,404
Unearned revenue 965 965Bonds payable, net of unamortized discounts
and premiums 1,134,896 101,338 1,236,234
Total noncurrent liabilities 1,134,896 202,154 - 132,216 - - 1,469,266
Total liabilities 1,192,296 214,048 - 220,460 30,687 - 1,657,491
Deferred Inflows of ResourcesPension related amounts 14,004 2,463 16,467Forward delivery agreements 673$ 2,844 3,517Postemployment benefit related amounts 8,343 1,751 10,094
Total deferred inflows of resources - 22,347 673 4,214 2,844 - 30,078
Net Positionrelated debtNet investment in capital assets 664,250 25 139,032$ 803,307Restricted for:
Debt requirements 16,705 3,000 194,492 214,197Capital and port district projects 1,999 1,999
Unrestricted (deficiency) (201,671) 2,607 109,851 3,434 (85,779)
Total net position (deficiency) 664,250$ (184,966)$ 5,607$ 109,876$ 197,926$ 141,031$ 933,724$
162
162
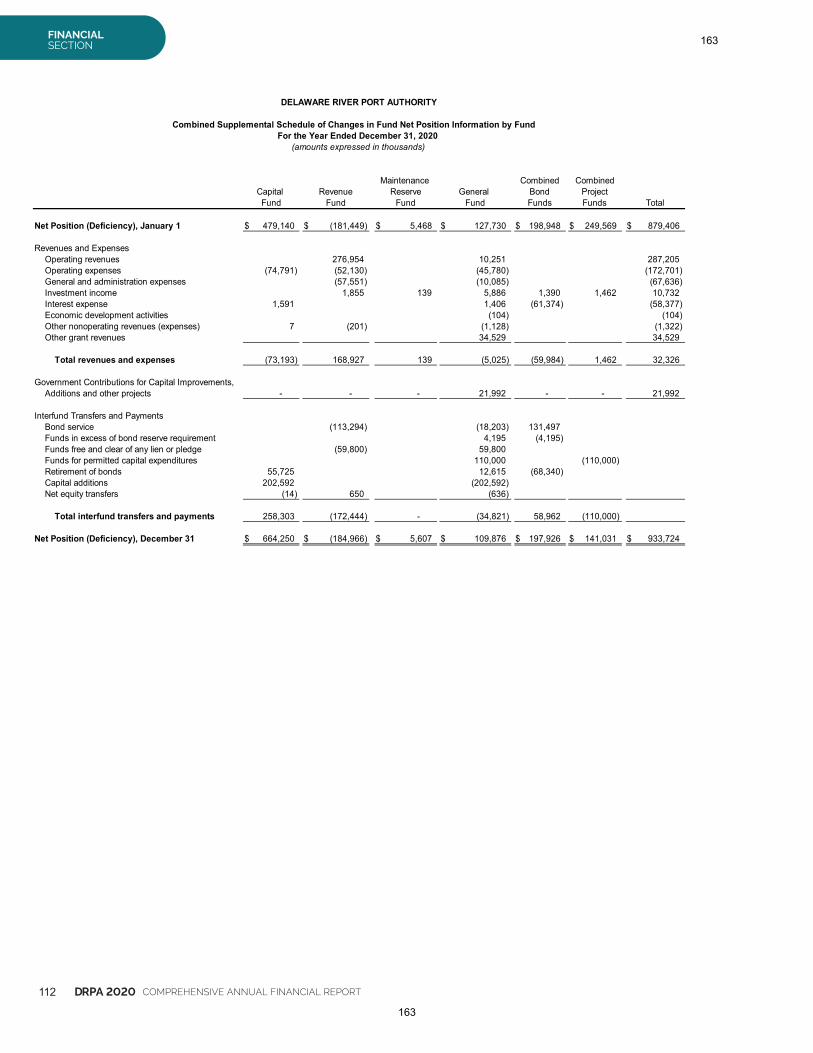
112 DRPA 2020 COMPREHENSIVE ANNUAL FINANCIAL REPORT
FINANCIALSECTION
DELAWARE RIVER PORT AUTHORITY
Combined Supplemental Schedule of Changes in Fund Net Position Information by FundFor the Year Ended December 31, 2020
(amounts expressed in thousands)
Maintenance Combined CombinedCapital Revenue Reserve General Bond ProjectFund Fund Fund Fund Funds Funds Total
Net Position (Deficiency), January 1 479,140$ (181,449)$ 5,468$ 127,730$ 198,948$ 249,569$ 879,406$
Revenues and ExpensesOperating revenues 276,954 10,251 287,205Operating expenses (74,791) (52,130) (45,780) (172,701)General and administration expenses (57,551) (10,085) (67,636)Investment income 1,855 139 5,886 1,390 1,462 10,732Interest expense 1,591 1,406 (61,374) (58,377)Economic development activities (104) (104)Other nonoperating revenues (expenses) 7 (201) (1,128) (1,322)Other grant revenues 34,529 34,529
Total revenues and expenses (73,193) 168,927 139 (5,025) (59,984) 1,462 32,326
Government Contributions for Capital Improvements,Additions and other projects - - - 21,992 - - 21,992
Interfund Transfers and PaymentsBond service (113,294) (18,203) 131,497Funds in excess of bond reserve requirement 4,195 (4,195)Funds free and clear of any lien or pledge (59,800) 59,800Funds for permitted capital expenditures 110,000 (110,000)Retirement of bonds 55,725 12,615 (68,340)Capital additions 202,592 (202,592)Net equity transfers (14) 650 (636)
Total interfund transfers and payments 258,303 (172,444) - (34,821) 58,962 (110,000)
Net Position (Deficiency), December 31 664,250$ (184,966)$ 5,607$ 109,876$ 197,926$ 141,031$ 933,724$
163
163
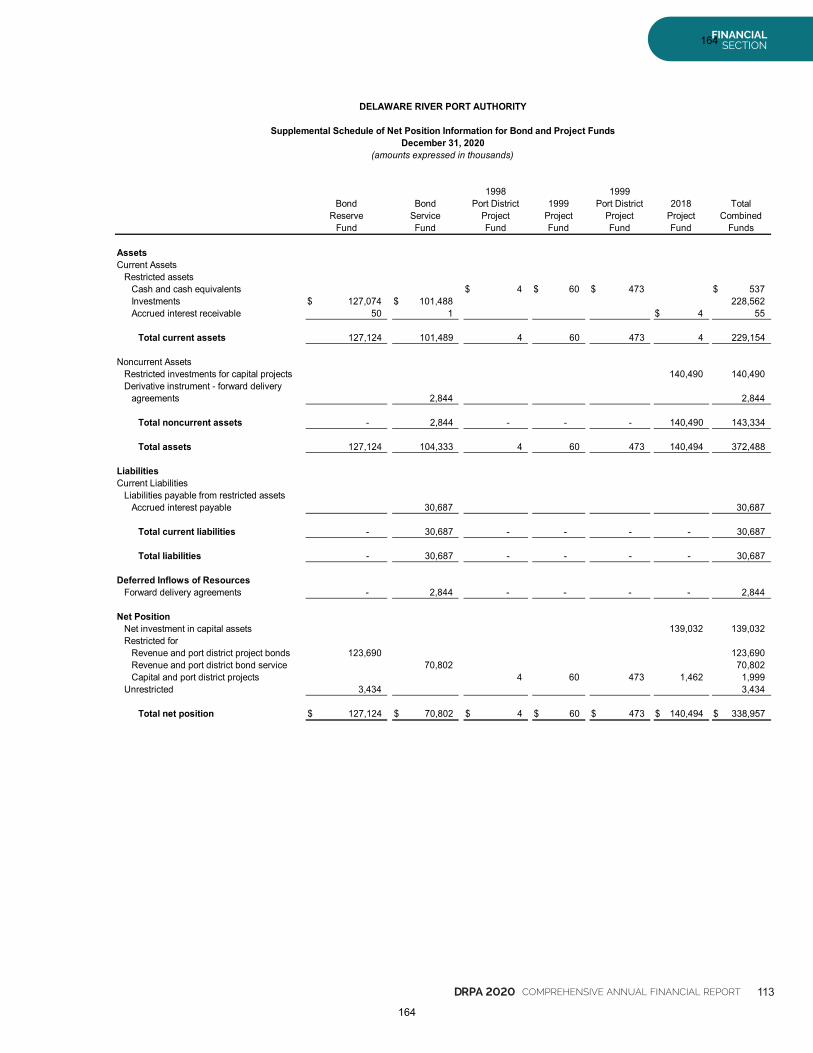
DRPA 2020 COMPREHENSIVE ANNUAL FINANCIAL REPORT 113
FINANCIALSECTION
DELAWARE RIVER PORT AUTHORITY
Supplemental Schedule of Net Position Information for Bond and Project FundsDecember 31, 2020
(amounts expressed in thousands)
1998 1999Bond Bond Port District 1999 Port District 2018 Total
Reserve Service Project Project Project Project CombinedFund Fund Fund Fund Fund Fund Funds
AssetsCurrent Assets
Restricted assetsCash and cash equivalents 4$ 60$ 473$ 537$Investments 127,074$ 101,488$ 228,562Accrued interest receivable 50 1 4$ 55
Total current assets 127,124 101,489 4 60 473 4 229,154
Noncurrent AssetsRestricted investments for capital projects 140,490 140,490Derivative instrument - forward delivery
agreements 2,844 2,844
Total noncurrent assets - 2,844 - - - 140,490 143,334
Total assets 127,124 104,333 4 60 473 140,494 372,488
LiabilitiesCurrent Liabilities
Liabilities payable from restricted assetsAccrued interest payable 30,687 30,687
Total current liabilities - 30,687 - - - - 30,687
Total liabilities - 30,687 - - - - 30,687
Deferred Inflows of ResourcesForward delivery agreements - 2,844 - - - - 2,844
Net PositionNet investment in capital assets 139,032 139,032Restricted for
Revenue and port district project bonds 123,690 123,690Revenue and port district bond service 70,802 70,802Capital and port district projects 4 60 473 1,462 1,999
Unrestricted 3,434 3,434
Total net position 127,124$ 70,802$ 4$ 60$ 473$ 140,494$ 338,957$
164
164
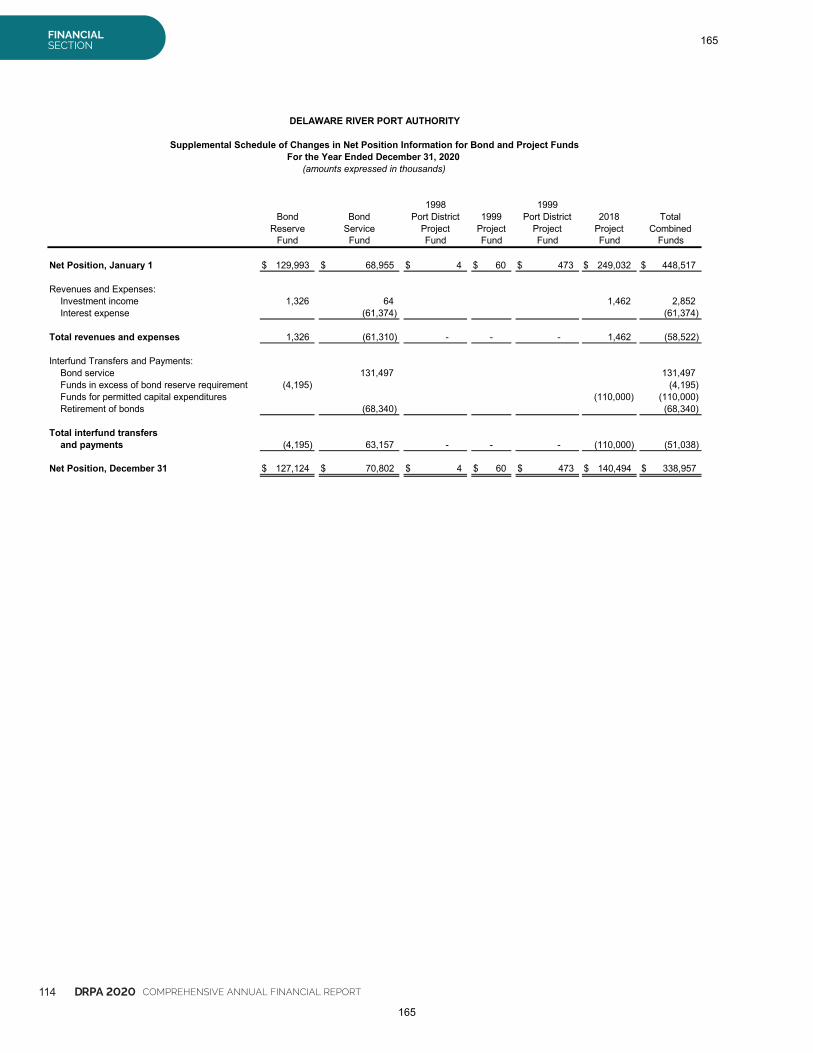
114 DRPA 2020 COMPREHENSIVE ANNUAL FINANCIAL REPORT
FINANCIALSECTION
DELAWARE RIVER PORT AUTHORITY
Supplemental Schedule of Changes in Net Position Information for Bond and Project FundsFor the Year Ended December 31, 2020
(amounts expressed in thousands)
1998 1999Bond Bond Port District 1999 Port District 2018 Total
Reserve Service Project Project Project Project CombinedFund Fund Fund Fund Fund Fund Funds
Net Position, January 1 129,993$ 68,955$ 4$ 60$ 473$ 249,032$ 448,517$
Revenues and Expenses:Investment income 1,326 64 1,462 2,852Interest expense (61,374) (61,374)
Total revenues and expenses 1,326 (61,310) - - - 1,462 (58,522)
Interfund Transfers and Payments:Bond service 131,497 131,497Funds in excess of bond reserve requirement (4,195) (4,195)Funds for permitted capital expenditures (110,000) (110,000)Retirement of bonds (68,340) (68,340)
Total interfund transfersand payments (4,195) 63,157 - - - (110,000) (51,038)
Net Position, December 31 127,124$ 70,802$ 4$ 60$ 473$ 140,494$ 338,957$
165
165

StatisticalSection
166
166

StatisticalSection
Financial Trend DataLast Ten Fiscal Years
Unaudited
NET POSITION (In Thousands)
2020 2019 2018 2017 2016 2015 2014 2013 2012 2011
Net investment in capital assets 803,307$ 722,577$ 727,790$ 271,323$ 235,795$ 203,366$ 174,762$ 213,138$ 272,905$ 214,632$Restricted 216,196 219,510 157,143 205,742 209,924 219,485 215,004 159,521 143,692 185,219Unrestricted (deficiency) (85,779) (62,681) (105,094) 267,069 209,522 165,519 198,079 138,730 2,232 (67,153)
Total Net Position 933,724$ 879,406$ 779,838$ 744,134$ 655,241$ 588,370$ 587,845$ 511,389$ 418,829$ 332,698$
CHANGES IN NET POSITION (In Thousands)
2020 2019 2018 2017 2016 2015 2014 2013 2012 2011Operating RevenuesBridges:
Tolls 268,141$ 332,231$ 335,588$ 331,537$ 319,778$ 307,240$ 297,267$ 293,863$ 292,810$ 267,685$Other operating revenues 8,724 6,729 7,201 5,856 6,675 6,435 7,702 6,451 6,372 5,049
Total bridge operating revenues 276,865 338,960 342,789 337,393 326,453 313,675 304,969 300,314 299,182 272,734
Transit system:Passenger fares 9,260 27,127 26,215 26,562 26,073 24,943 24,257 25,908 26,035 24,004Other operating revenues 932 2,044 2,733 1,799 1,943 1,661 1,506 1,699 1,957 1,817
Total transit system operatingrevenues 10,192 29,171 28,948 28,361 28,016 26,604 25,763 27,607 27,992 25,821
Port of Philadelphia and Camden:Cruise terminal 2 369RiverLink 27 30 68
Total Port of Philadelphia andCamden - - - - 27 30 - - 2 437
Other:Miscellaneous 148 73 170 226 216 985 150 203 224 556
Total operating revenues 287,205 368,204 371,907 365,980 354,712 341,294 330,882 328,124 327,400 299,548
Operating ExpensesOperations 97,410 103,195 98,391 96,310 93,443 89,213 100,596 97,436 98,581 94,259Community impact 500 500 500 3,791 3,790 3,781 3,745 3,688 3,611 3,560General and administration 67,636 67,932 68,756 60,142 66,964 56,309 41,347 38,932 44,277 40,536Port of Philadelphia and Camden 49 189 62 29 246Depreciation 74,791 78,365 71,816 61,270 58,933 57,614 57,425 54,801 55,018 49,216
Total operating expenses 240,337 249,992 239,463 221,513 223,130 206,966 203,302 194,919 201,516 187,817
Operating Income 46,868 118,212 132,444 144,467 131,582 134,328 127,580 133,205 125,884 111,731
Nonoperating Revenues (Expenses)Investment income (net of change in fair
value of derivative instruments) 10,732 17,331 25,020 9,128 7,944 7,834 8,479 4,628 7,638 13,633Interest expense (58,377) (61,671) (66,736) (72,556) (74,419) (75,792) (78,377) (58,784) (66,540) (77,870)Amortization expense (61) (97) (100) (100) (100) (100) (100) (100) (100)Economic development activities (104) (95) (68) (4,194) (3,404) (4,167) (2,401) (4,371) (8,695) (2,025)Loss on defeasance of debt (9,266)Other 33,200 973 1,549 4,591 3,115 5,156 4,844 2,825 4,276 3,055Bond issuance costs (2,516) (1,374)Loss on abandonment of Aerial
Tram project (18,318)Loss on disposal of capital assets 7 2,739 (84) (1,732) (7,929)
Total nonoperating revenues (expenses) (14,542) (40,784) (49,598) (63,131) (66,948) (68,801) (67,555) (58,318) (64,795) (89,554)
Income (Loss) Before CapitalContributions 32,326 77,428 82,846 81,336 64,634 65,527 60,025 74,887 61,089 22,177
Capital ContributionsFederal and state capital
improvement grants 21,992 22,139 26,994 7,557 2,237 36,758 16,431 17,673 25,042 33,021
Change in Net Position 54,318$ 99,567$ 109,840$ 88,893$ 66,871$ 102,285$ 76,456$ 92,560$ 86,131$ 55,198$
Figures for 2015 through 2020 include the implementation of Governmental Accounting Standards Board Statement No. 68, Accounting and Financial Reporting for Pensions - an amendmentof GASB Statement No. 27 , and GASB Statement No. 71, Pension Transition for Contributions Made Subsequent to the Measurement Date - an amendment of GASB Statement No. 68.
Figures for 2018 through 2020 include the implementation of Governmental Accounting Standards Board Statement No. 75, Accounting and Financial Reporting for Postemployment BenefitsOther Than Pensions.
The Authority's net position in 2020 increased by $54.3 million despite poorer operating results than in previous years. (Changes in net position over the past three years averaged close to $100million per year). Income before capital contributions in 2020 totaled $32.2 million down from $77.4 million in the previous year, despite a $32 million increase in other nonoperating revenues,principally new federal transit grants from the CARES Act. The $45.1 million decrease in income before capital contributions was directly related to a $62.1 million decrease in total bridgerevenues and an $19.0 million decrease in total PATCO revenues. Fortunately, the combined $81.1 million reduction, in total bridge and PATCO operating revenues, was partially offset by $9.7million in reduced overall expenses (incl. depreciation), and by CARES Act transit grant revenues of $32.7 million.
The Authority's net position has improved from $332.7 million to $933.7 million (a $601 million increase) since 2011, fueled largely by higher toll revenues and operating income since then.During the period 2011 through 2019, total operating revenues exceeded $325 million and the average increase in operating income averaged close to $130 million annually. As a result, netadditions, or changes, to net position averaged an increase of over $86 million annually. As mentioned during 2020, this recent trend of past years was disrupted, as operating income fell to itslowest level during the decade, or $46.9 million.
167
167
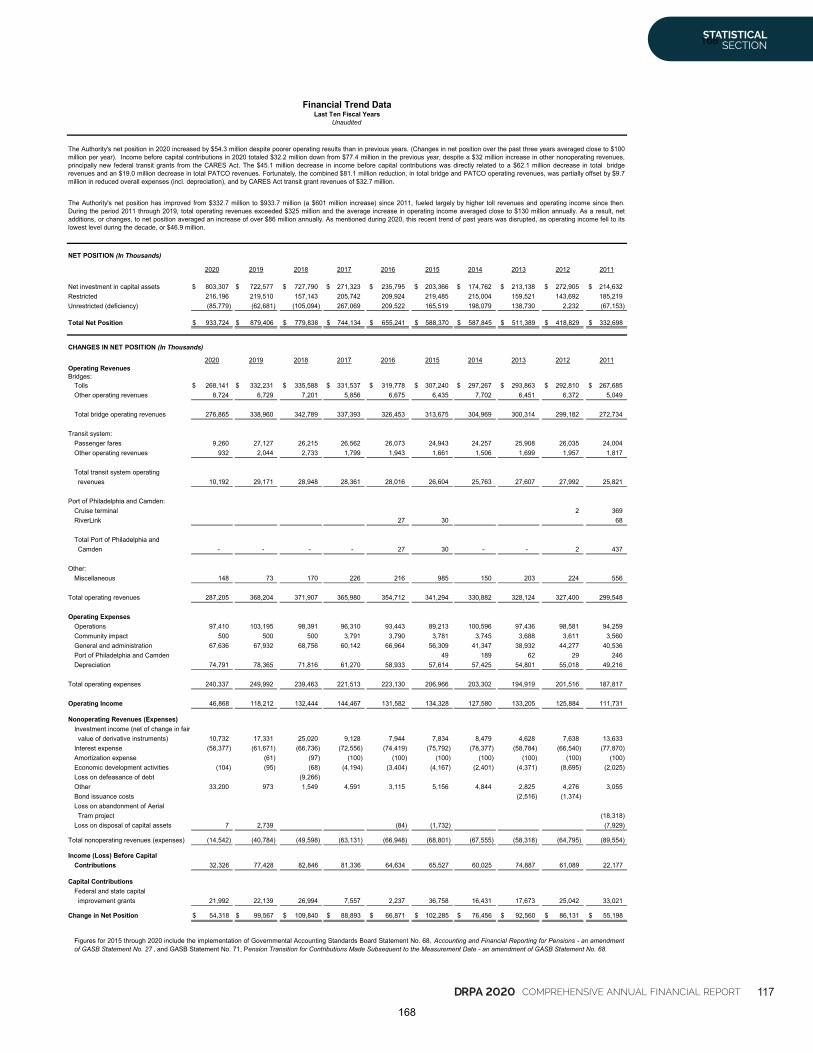
DRPA 2020 COMPREHENSIVE ANNUAL FINANCIAL REPORT 117
STATISTICAL SECTION
Financial Trend DataLast Ten Fiscal Years
Unaudited
NET POSITION (In Thousands)
2020 2019 2018 2017 2016 2015 2014 2013 2012 2011
Net investment in capital assets 803,307$ 722,577$ 727,790$ 271,323$ 235,795$ 203,366$ 174,762$ 213,138$ 272,905$ 214,632$Restricted 216,196 219,510 157,143 205,742 209,924 219,485 215,004 159,521 143,692 185,219Unrestricted (deficiency) (85,779) (62,681) (105,094) 267,069 209,522 165,519 198,079 138,730 2,232 (67,153)
Total Net Position 933,724$ 879,406$ 779,838$ 744,134$ 655,241$ 588,370$ 587,845$ 511,389$ 418,829$ 332,698$
CHANGES IN NET POSITION (In Thousands)
2020 2019 2018 2017 2016 2015 2014 2013 2012 2011Operating RevenuesBridges:
Tolls 268,141$ 332,231$ 335,588$ 331,537$ 319,778$ 307,240$ 297,267$ 293,863$ 292,810$ 267,685$Other operating revenues 8,724 6,729 7,201 5,856 6,675 6,435 7,702 6,451 6,372 5,049
Total bridge operating revenues 276,865 338,960 342,789 337,393 326,453 313,675 304,969 300,314 299,182 272,734
Transit system:Passenger fares 9,260 27,127 26,215 26,562 26,073 24,943 24,257 25,908 26,035 24,004Other operating revenues 932 2,044 2,733 1,799 1,943 1,661 1,506 1,699 1,957 1,817
Total transit system operatingrevenues 10,192 29,171 28,948 28,361 28,016 26,604 25,763 27,607 27,992 25,821
Port of Philadelphia and Camden:Cruise terminal 2 369RiverLink 27 30 68
Total Port of Philadelphia andCamden - - - - 27 30 - - 2 437
Other:Miscellaneous 148 73 170 226 216 985 150 203 224 556
Total operating revenues 287,205 368,204 371,907 365,980 354,712 341,294 330,882 328,124 327,400 299,548
Operating ExpensesOperations 97,410 103,195 98,391 96,310 93,443 89,213 100,596 97,436 98,581 94,259Community impact 500 500 500 3,791 3,790 3,781 3,745 3,688 3,611 3,560General and administration 67,636 67,932 68,756 60,142 66,964 56,309 41,347 38,932 44,277 40,536Port of Philadelphia and Camden 49 189 62 29 246Depreciation 74,791 78,365 71,816 61,270 58,933 57,614 57,425 54,801 55,018 49,216
Total operating expenses 240,337 249,992 239,463 221,513 223,130 206,966 203,302 194,919 201,516 187,817
Operating Income 46,868 118,212 132,444 144,467 131,582 134,328 127,580 133,205 125,884 111,731
Nonoperating Revenues (Expenses)Investment income (net of change in fair
value of derivative instruments) 10,732 17,331 25,020 9,128 7,944 7,834 8,479 4,628 7,638 13,633Interest expense (58,377) (61,671) (66,736) (72,556) (74,419) (75,792) (78,377) (58,784) (66,540) (77,870)Amortization expense (61) (97) (100) (100) (100) (100) (100) (100) (100)Economic development activities (104) (95) (68) (4,194) (3,404) (4,167) (2,401) (4,371) (8,695) (2,025)Loss on defeasance of debt (9,266)Other 33,200 973 1,549 4,591 3,115 5,156 4,844 2,825 4,276 3,055Bond issuance costs (2,516) (1,374)Loss on abandonment of Aerial
Tram project (18,318)Loss on disposal of capital assets 7 2,739 (84) (1,732) (7,929)
Total nonoperating revenues (expenses) (14,542) (40,784) (49,598) (63,131) (66,948) (68,801) (67,555) (58,318) (64,795) (89,554)
Income (Loss) Before CapitalContributions 32,326 77,428 82,846 81,336 64,634 65,527 60,025 74,887 61,089 22,177
Capital ContributionsFederal and state capital
improvement grants 21,992 22,139 26,994 7,557 2,237 36,758 16,431 17,673 25,042 33,021
Change in Net Position 54,318$ 99,567$ 109,840$ 88,893$ 66,871$ 102,285$ 76,456$ 92,560$ 86,131$ 55,198$
Figures for 2015 through 2020 include the implementation of Governmental Accounting Standards Board Statement No. 68, Accounting and Financial Reporting for Pensions - an amendmentof GASB Statement No. 27 , and GASB Statement No. 71, Pension Transition for Contributions Made Subsequent to the Measurement Date - an amendment of GASB Statement No. 68.
Figures for 2018 through 2020 include the implementation of Governmental Accounting Standards Board Statement No. 75, Accounting and Financial Reporting for Postemployment BenefitsOther Than Pensions.
The Authority's net position in 2020 increased by $54.3 million despite poorer operating results than in previous years. (Changes in net position over the past three years averaged close to $100million per year). Income before capital contributions in 2020 totaled $32.2 million down from $77.4 million in the previous year, despite a $32 million increase in other nonoperating revenues,principally new federal transit grants from the CARES Act. The $45.1 million decrease in income before capital contributions was directly related to a $62.1 million decrease in total bridgerevenues and an $19.0 million decrease in total PATCO revenues. Fortunately, the combined $81.1 million reduction, in total bridge and PATCO operating revenues, was partially offset by $9.7million in reduced overall expenses (incl. depreciation), and by CARES Act transit grant revenues of $32.7 million.
The Authority's net position has improved from $332.7 million to $933.7 million (a $601 million increase) since 2011, fueled largely by higher toll revenues and operating income since then.During the period 2011 through 2019, total operating revenues exceeded $325 million and the average increase in operating income averaged close to $130 million annually. As a result, netadditions, or changes, to net position averaged an increase of over $86 million annually. As mentioned during 2020, this recent trend of past years was disrupted, as operating income fell to itslowest level during the decade, or $46.9 million.
168
168
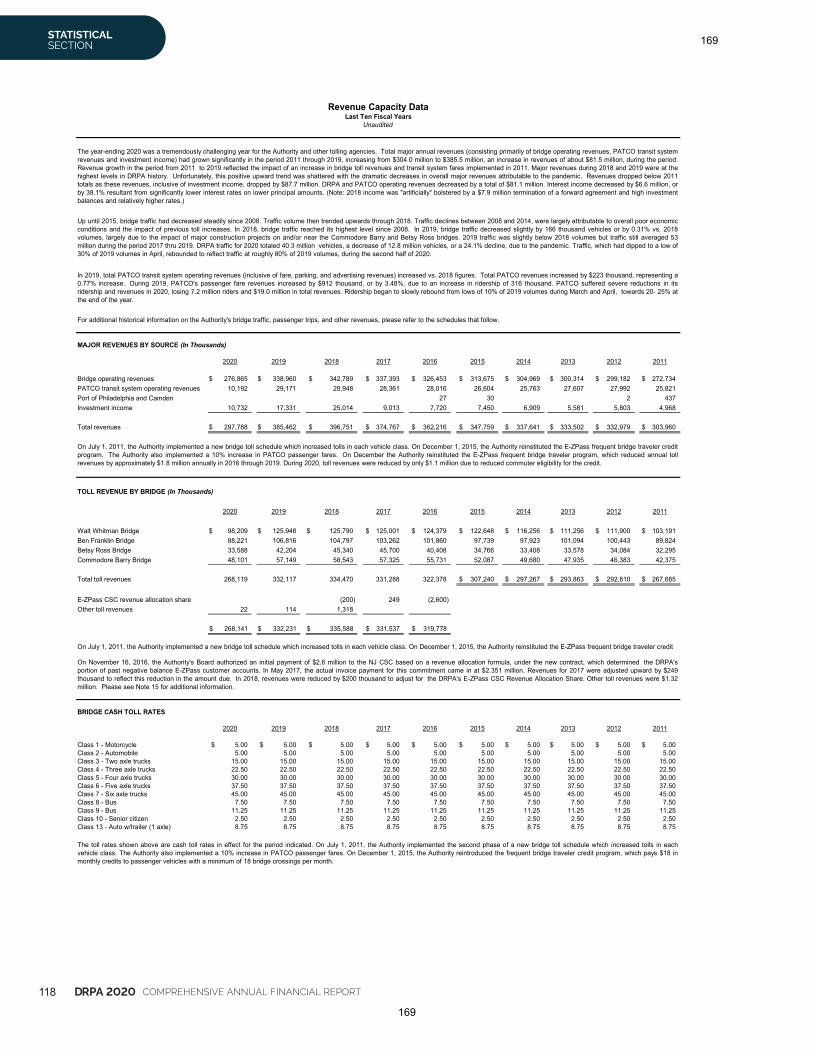
118 DRPA 2020 COMPREHENSIVE ANNUAL FINANCIAL REPORT
STATISTICAL SECTION
Revenue Capacity DataLast Ten Fiscal Years
Unaudited
MAJOR REVENUES BY SOURCE (In Thousands)
2020 2019 2018 2017 2016 2015 2014 2013 2012 2011
Bridge operating revenues 276,865$ 338,960$ 342,789$ 337,393$ 326,453$ 313,675$ 304,969$ 300,314$ 299,182$ 272,734$PATCO transit system operating revenues 10,192 29,171 28,948 28,361 28,016 26,604 25,763 27,607 27,992 25,821Port of Philadelphia and Camden 27 30 2 437Investment income 10,732 17,331 25,014 9,013 7,720 7,450 6,909 5,581 5,803 4,968
Total revenues 297,788$ 385,462$ 396,751$ 374,767$ 362,216$ 347,759$ 337,641$ 333,502$ 332,979$ 303,960$
TOLL REVENUE BY BRIDGE (In Thousands)
2020 2019 2018 2017 2016 2015 2014 2013 2012 2011
Walt Whitman Bridge 98,209$ 125,948$ 125,790$ 125,001$ 124,379$ 122,648$ 116,256$ 111,256$ 111,900$ 103,191$Ben Franklin Bridge 88,221 106,816 104,797 103,262 101,860 97,739 97,923 101,094 100,443 89,824Betsy Ross Bridge 33,588 42,204 45,340 45,700 40,408 34,766 33,408 33,578 34,084 32,295Commodore Barry Bridge 48,101 57,149 58,543 57,325 55,731 52,087 49,680 47,935 46,383 42,375
Total toll revenues 268,119 332,117 334,470 331,288 322,378 307,240$ 297,267$ 293,863$ 292,810$ 267,685$
E-ZPass CSC revenue allocation share (200) 249 (2,600)Other toll revenues 22 114 1,318
268,141$ 332,231$ 335,588$ 331,537$ 319,778$
BRIDGE CASH TOLL RATES
2020 2019 2018 2017 2016 2015 2014 2013 2012 2011
Class 1 - Motorcycle 5.00$ 5.00$ 5.00$ 5.00$ 5.00$ 5.00$ 5.00$ 5.00$ 5.00$ 5.00$Class 2 - Automobile 5.00 5.00 5.00 5.00 5.00 5.00 5.00 5.00 5.00 5.00Class 3 - Two axle trucks 15.00 15.00 15.00 15.00 15.00 15.00 15.00 15.00 15.00 15.00Class 4 - Three axle trucks 22.50 22.50 22.50 22.50 22.50 22.50 22.50 22.50 22.50 22.50Class 5 - Four axle trucks 30.00 30.00 30.00 30.00 30.00 30.00 30.00 30.00 30.00 30.00Class 6 - Five axle trucks 37.50 37.50 37.50 37.50 37.50 37.50 37.50 37.50 37.50 37.50Class 7 - Six axle trucks 45.00 45.00 45.00 45.00 45.00 45.00 45.00 45.00 45.00 45.00Class 8 - Bus 7.50 7.50 7.50 7.50 7.50 7.50 7.50 7.50 7.50 7.50Class 9 - Bus 11.25 11.25 11.25 11.25 11.25 11.25 11.25 11.25 11.25 11.25Class 10 - Senior citizen 2.50 2.50 2.50 2.50 2.50 2.50 2.50 2.50 2.50 2.50Class 13 - Auto w/trailer (1 axle) 8.75 8.75 8.75 8.75 8.75 8.75 8.75 8.75 8.75 8.75
On July 1, 2011, the Authority implemented a new bridge toll schedule which increased tolls in each vehicle class. On December 1, 2015, the Authority reinstituted the E-ZPass frequent bridge traveler creditprogram. The Authority also implemented a 10% increase in PATCO passenger fares. On December the Authority reinstituted the E-ZPass frequent bridge traveler program, which reduced annual tollrevenues by approximately $1.8 million annually in 2016 through 2019. During 2020, toll revenues were reduced by only $1.1 million due to reduced commuter eligibility for the credit.
On July 1, 2011, the Authority implemented a new bridge toll schedule which increased tolls in each vehicle class. On December 1, 2015, the Authority reinstituted the E-ZPass frequent bridge traveler credit
The toll rates shown above are cash toll rates in effect for the period indicated. On July 1, 2011, the Authority implemented the second phase of a new bridge toll schedule which increased tolls in eachvehicle class. The Authority also implemented a 10% increase in PATCO passenger fares. On December 1, 2015, the Authority reintroduced the frequent bridge traveler credit program, which pays $18 inmonthly credits to passenger vehicles with a minimum of 18 bridge crossings per month.
On November 16, 2016, the Authority's Board authorized an initial payment of $2.6 million to the NJ CSC based on a revenue allocation formula, under the new contract, which determined the DRPA'sportion of past negative balance E-ZPass customer accounts. In May 2017, the actual invoice payment for this commitment came in at $2.351 million. Revenues for 2017 were adjusted upward by $249thousand to reflect this reduction in the amount due. In 2018, revenues were reduced by $200 thousand to adjust for the DRPA's E-ZPass CSC Revenue Allocation Share. Other toll revenues were $1.32million. Please see Note 15 for additional information.
The year-ending 2020 was a tremendously challenging year for the Authority and other tolling agencies. Total major annual revenues (consisting primarily of bridge operating revenues, PATCO transit systemrevenues and investment income) had grown significantly in the period 2011 through 2019, increasing from $304.0 million to $385.5 million, an increase in revenues of about $81.5 million, during the period.Revenue growth in the period from 2011 to 2019 reflected the impact of an increase in bridge toll revenues and transit system fares implemented in 2011. Major revenues during 2018 and 2019 were at thehighest levels in DRPA history. Unfortunately, this positive upward trend was shattered with the dramatic decreases in overall major revenues attributable to the pandemic. Revenues dropped below 2011totals as these revenues, inclusive of investment income, dropped by $87.7 million. DRPA and PATCO operating revenues decreased by a total of $81.1 million. Interest income decreased by $6.6 million, orby 38.1% resultant from significantly lower interest rates on lower principal amounts. (Note: 2018 income was "artificially" bolstered by a $7.9 million termination of a forward agreement and high investmentbalances and relatively higher rates.)
Up until 2015, bridge traffic had decreased steadily since 2008. Traffic volume then trended upwards through 2018. Traffic declines between 2008 and 2014, were largely attributable to overall poor economicconditions and the impact of previous toll increases. In 2018, bridge traffic reached its highest level since 2008. In 2019, bridge traffic decreased slightly by 166 thousand vehicles or by 0.31% vs. 2018volumes, largely due to the impact of major construction projects on and/or near the Commodore Barry and Betsy Ross bridges. 2019 traffic was slightly below 2018 volumes but traffic still averaged 53million during the period 2017 thru 2019. DRPA traffic for 2020 totaled 40.3 million vehicles, a decrease of 12.8 million vehicles, or a 24.1% decline, due to the pandemic. Traffic, which had dipped to a low of30% of 2019 volumes in April, rebounded to reflect traffic at roughly 80% of 2019 volumes, during the second half of 2020.
In 2019, total PATCO transit system operating revenues (inclusive of fare, parking, and advertising revenues) increased vs. 2018 figures. Total PATCO revenues increased by $223 thousand, representing a0.77% increase. During 2019, PATCO's passenger fare revenues increased by $912 thousand, or by 3.48%, due to an increase in ridership of 316 thousand. PATCO suffered severe reductions in itsridership and revenues in 2020, losing 7.2 million riders and $19.0 million in total revenues. Ridership began to slowly rebound from lows of 10% of 2019 volumes during March and April, towards 20- 25% atthe end of the year.
For additional historical information on the Authority's bridge traffic, passenger trips, and other revenues, please refer to the schedules that follow.
169
169
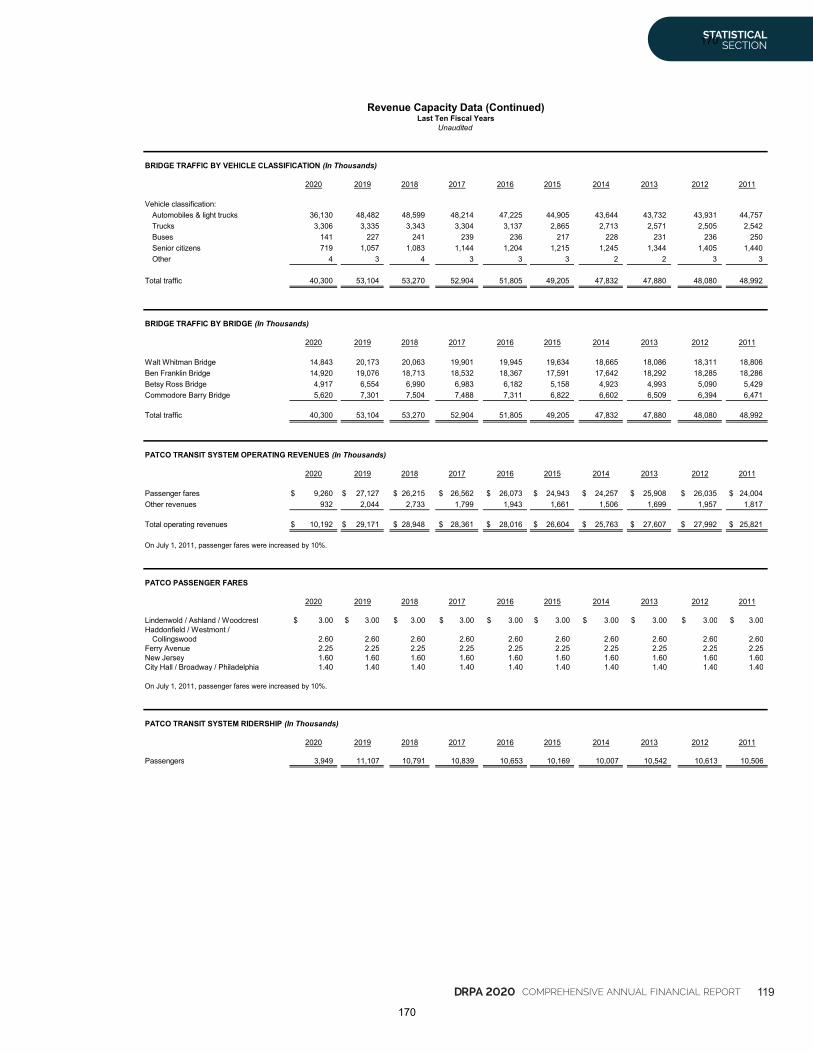
DRPA 2020 COMPREHENSIVE ANNUAL FINANCIAL REPORT 119
STATISTICAL SECTION
Revenue Capacity Data (Continued)Last Ten Fiscal Years
Unaudited
BRIDGE TRAFFIC BY VEHICLE CLASSIFICATION (In Thousands)
2020 2019 2018 2017 2016 2015 2014 2013 2012 2011
Vehicle classification:Automobiles & light trucks 36,130 48,482 48,599 48,214 47,225 44,905 43,644 43,732 43,931 44,757Trucks 3,306 3,335 3,343 3,304 3,137 2,865 2,713 2,571 2,505 2,542Buses 141 227 241 239 236 217 228 231 236 250Senior citizens 719 1,057 1,083 1,144 1,204 1,215 1,245 1,344 1,405 1,440Other 4 3 4 3 3 3 2 2 3 3
Total traffic 40,300 53,104 53,270 52,904 51,805 49,205 47,832 47,880 48,080 48,992
BRIDGE TRAFFIC BY BRIDGE (In Thousands)
2020 2019 2018 2017 2016 2015 2014 2013 2012 2011
Walt Whitman Bridge 14,843 20,173 20,063 19,901 19,945 19,634 18,665 18,086 18,311 18,806Ben Franklin Bridge 14,920 19,076 18,713 18,532 18,367 17,591 17,642 18,292 18,285 18,286Betsy Ross Bridge 4,917 6,554 6,990 6,983 6,182 5,158 4,923 4,993 5,090 5,429Commodore Barry Bridge 5,620 7,301 7,504 7,488 7,311 6,822 6,602 6,509 6,394 6,471
Total traffic 40,300 53,104 53,270 52,904 51,805 49,205 47,832 47,880 48,080 48,992
PATCO TRANSIT SYSTEM OPERATING REVENUES (In Thousands)
2020 2019 2018 2017 2016 2015 2014 2013 2012 2011
Passenger fares 9,260$ 27,127$ 26,215$ 26,562$ 26,073$ 24,943$ 24,257$ 25,908$ 26,035$ 24,004$Other revenues 932 2,044 2,733 1,799 1,943 1,661 1,506 1,699 1,957 1,817
Total operating revenues 10,192$ 29,171$ 28,948$ 28,361$ 28,016$ 26,604$ 25,763$ 27,607$ 27,992$ 25,821$
On July 1, 2011, passenger fares were increased by 10%.
PATCO PASSENGER FARES
2020 2019 2018 2017 2016 2015 2014 2013 2012 2011
Lindenwold / Ashland / Woodcrest 3.00$ 3.00$ 3.00$ 3.00$ 3.00$ 3.00$ 3.00$ 3.00$ 3.00$ 3.00$Haddonfield / Westmont /
Collingswood 2.60 2.60 2.60 2.60 2.60 2.60 2.60 2.60 2.60 2.60Ferry Avenue 2.25 2.25 2.25 2.25 2.25 2.25 2.25 2.25 2.25 2.25New Jersey 1.60 1.60 1.60 1.60 1.60 1.60 1.60 1.60 1.60 1.60City Hall / Broadway / Philadelphia 1.40 1.40 1.40 1.40 1.40 1.40 1.40 1.40 1.40 1.40
On July 1, 2011, passenger fares were increased by 10%.
PATCO TRANSIT SYSTEM RIDERSHIP (In Thousands)
2020 2019 2018 2017 2016 2015 2014 2013 2012 2011
Passengers 3,949 11,107 10,791 10,839 10,653 10,169 10,007 10,542 10,613 10,506
170
170
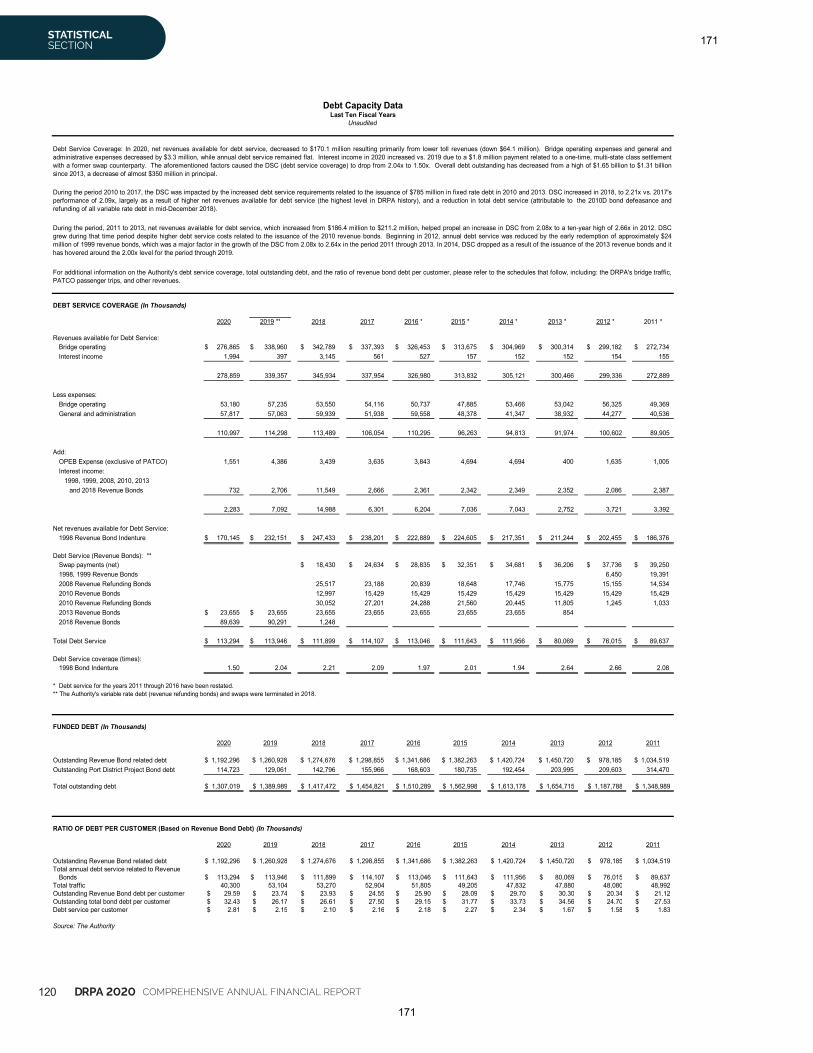
120 DRPA 2020 COMPREHENSIVE ANNUAL FINANCIAL REPORT
STATISTICAL SECTION
Debt Capacity DataLast Ten Fiscal Years
Unaudited
DEBT SERVICE COVERAGE (In Thousands)
2020 2019 ** 2018 2017 2016 * 2015 * 2014 * 2013 * 2012 * 2011 *
Revenues available for Debt Service:Bridge operating 276,865$ 338,960$ 342,789$ 337,393$ 326,453$ 313,675$ 304,969$ 300,314$ 299,182$ 272,734$Interest income 1,994 397 3,145 561 527 157 152 152 154 155
278,859 339,357 345,934 337,954 326,980 313,832 305,121 300,466 299,336 272,889
Less expenses:Bridge operating 53,180 57,235 53,550 54,116 50,737 47,885 53,466 53,042 56,325 49,369General and administration 57,817 57,063 59,939 51,938 59,558 48,378 41,347 38,932 44,277 40,536
110,997 114,298 113,489 106,054 110,295 96,263 94,813 91,974 100,602 89,905
Add:OPEB Expense (exclusive of PATCO) 1,551 4,386 3,439 3,635 3,843 4,694 4,694 400 1,635 1,005Interest income:
1998, 1999, 2008, 2010, 2013and 2018 Revenue Bonds 732 2,706 11,549 2,666 2,361 2,342 2,349 2,352 2,086 2,387
2,283 7,092 14,988 6,301 6,204 7,036 7,043 2,752 3,721 3,392
Net revenues available for Debt Service:1998 Revenue Bond Indenture 170,145$ 232,151$ 247,433$ 238,201$ 222,889$ 224,605$ 217,351$ 211,244$ 202,455$ 186,376$
Debt Service (Revenue Bonds): **Swap payments (net) 18,430$ 24,634$ 28,835$ 32,351$ 34,681$ 36,206$ 37,736$ 39,250$1998, 1999 Revenue Bonds 6,450 19,3912008 Revenue Refunding Bonds 25,517 23,188 20,839 18,648 17,746 15,775 15,155 14,5342010 Revenue Bonds 12,997 15,429 15,429 15,429 15,429 15,429 15,429 15,4292010 Revenue Refunding Bonds 30,052 27,201 24,288 21,560 20,445 11,805 1,245 1,0332013 Revenue Bonds 23,655$ 23,655$ 23,655 23,655 23,655 23,655 23,655 8542018 Revenue Bonds 89,639 90,291 1,248
Total Debt Service 113,294$ 113,946$ 111,899$ 114,107$ 113,046$ 111,643$ 111,956$ 80,069$ 76,015$ 89,637$
Debt Service coverage (times):1998 Bond Indenture 1.50 2.04 2.21 2.09 1.97 2.01 1.94 2.64 2.66 2.08
* Debt service for the years 2011 through 2016 have been restated.** The Authority's variable rate debt (revenue refunding bonds) and swaps were terminated in 2018.
FUNDED DEBT (In Thousands)
2020 2019 2018 2017 2016 2015 2014 2013 2012 2011
Outstanding Revenue Bond related debt 1,192,296$ 1,260,928$ 1,274,676$ 1,298,855$ 1,341,686$ 1,382,263$ 1,420,724$ 1,450,720$ 978,185$ 1,034,519$Outstanding Port District Project Bond debt 114,723 129,061 142,796 155,966 168,603 180,735 192,454 203,995 209,603 314,470
Total outstanding debt 1,307,019$ 1,389,989$ 1,417,472$ 1,454,821$ 1,510,289$ 1,562,998$ 1,613,178$ 1,654,715$ 1,187,788$ 1,348,989$
RATIO OF DEBT PER CUSTOMER (Based on Revenue Bond Debt) (In Thousands)
2020 2019 2018 2017 2016 2015 2014 2013 2012 2011
Outstanding Revenue Bond related debt 1,192,296$ 1,260,928$ 1,274,676$ 1,298,855$ 1,341,686$ 1,382,263$ 1,420,724$ 1,450,720$ 978,185$ 1,034,519$Total annual debt service related to Revenue
Bonds 113,294$ 113,946$ 111,899$ 114,107$ 113,046$ 111,643$ 111,956$ 80,069$ 76,015$ 89,637$Total traffic 40,300 53,104 53,270 52,904 51,805 49,205 47,832 47,880 48,080 48,992Outstanding Revenue Bond debt per customer 29.59$ 23.74$ 23.93$ 24.55$ 25.90$ 28.09$ 29.70$ 30.30$ 20.34$ 21.12$Outstanding total bond debt per customer 32.43$ 26.17$ 26.61$ 27.50$ 29.15$ 31.77$ 33.73$ 34.56$ 24.70$ 27.53$Debt service per customer 2.81$ 2.15$ 2.10$ 2.16$ 2.18$ 2.27$ 2.34$ 1.67$ 1.58$ 1.83$
Source: The Authority
Debt Service Coverage: In 2020, net revenues available for debt service, decreased to $170.1 million resulting primarily from lower toll revenues (down $64.1 million). Bridge operating expenses and general andadministrative expenses decreased by $3.3 million, while annual debt service remained flat. Interest income in 2020 increased vs. 2019 due to a $1.8 million payment related to a one-time, multi-state class settlementwith a former swap counterparty. The aforementioned factors caused the DSC (debt service coverage) to drop from 2.04x to 1.50x. Overall debt outstanding has decreased from a high of $1.65 billion to $1.31 billionsince 2013, a decrease of almost $350 million in principal.
During the period 2010 to 2017, the DSC was impacted by the increased debt service requirements related to the issuance of $785 million in fixed rate debt in 2010 and 2013. DSC increased in 2018, to 2.21x vs. 2017'sperformance of 2.09x, largely as a result of higher net revenues available for debt service (the highest level in DRPA history), and a reduction in total debt service (attributable to the 2010D bond defeasance andrefunding of all variable rate debt in mid-December 2018).
During the period, 2011 to 2013, net revenues available for debt service, which increased from $186.4 million to $211.2 million, helped propel an increase in DSC from 2.08x to a ten-year high of 2.66x in 2012. DSCgrew during that time period despite higher debt service costs related to the issuance of the 2010 revenue bonds. Beginning in 2012, annual debt service was reduced by the early redemption of approximately $24million of 1999 revenue bonds, which was a major factor in the growth of the DSC from 2.08x to 2.64x in the period 2011 through 2013. In 2014, DSC dropped as a result of the issuance of the 2013 revenue bonds and ithas hovered around the 2.00x level for the period through 2019.
For additional information on the Authority's debt service coverage, total outstanding debt, and the ratio of revenue bond debt per customer, please refer to the schedules that follow, including: the DRPA's bridge traffic,PATCO passenger trips, and other revenues.
171
171
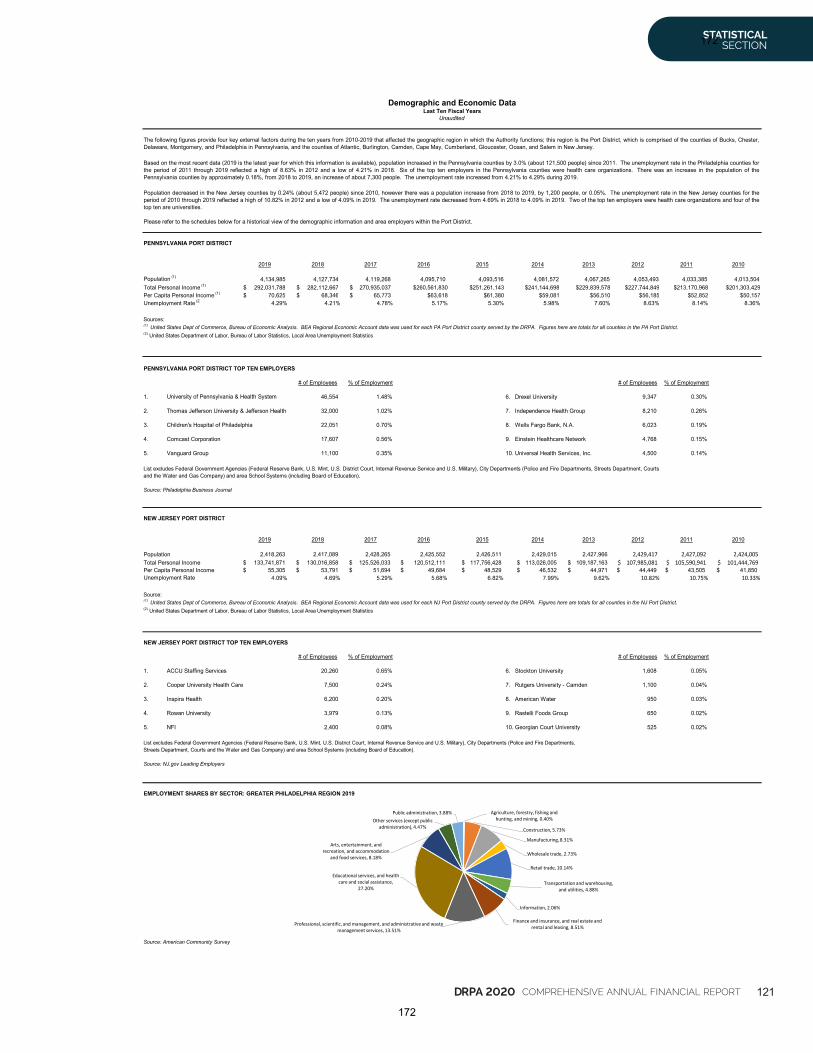
DRPA 2020 COMPREHENSIVE ANNUAL FINANCIAL REPORT 121
STATISTICAL SECTION
Demographic and Economic DataLast Ten Fiscal Years
Unaudited
PENNSYLVANIA PORT DISTRICT
2019 2018 2017 2016 2015 2014 2013 2012 2011 2010
Population (1) 4,134,985 4,127,734 4,119,268 4,095,710 4,093,516 4,081,572 4,067,265 4,053,493 4,033,385 4,013,504Total Personal Income (1) 292,031,788$ 282,112,667$ 270,935,037$ $260,561,830 $251,261,143 $241,144,698 $229,839,578 $227,744,849 $213,170,968 $201,303,429Per Capita Personal Income (1) 70,625$ 68,346$ 65,773$ $63,618 $61,380 $59,081 $56,510 $56,185 $52,852 $50,157Unemployment Rate (2) 4.29% 4.21% 4.78% 5.17% 5.30% 5.98% 7.60% 8.63% 8.14% 8.36%
Sources:(1) United States Dept of Commerce, Bureau of Economic Analysis. BEA Regional Economic Account data was used for each PA Port District county served by the DRPA. Figures here are totals for all counties in the PA Port District.(2) United States Department of Labor, Bureau of Labor Statistics, Local Area Unemployment Statistics
PENNSYLVANIA PORT DISTRICT TOP TEN EMPLOYERS
# of Employees % of Employment # of Employees % of Employment
1. 46,554 1.48% 6. Drexel University 9,347 0.30%
2. Thomas Jefferson University & Jefferson Health 32,000 1.02% 7. Independence Health Group 8,210 0.26%
3. Children's Hospital of Philadelphia 22,051 0.70% 8. Wells Fargo Bank, N.A. 6,023 0.19%
4. Comcast Corporation 17,607 0.56% 9. Einstein Healthcare Network 4,768 0.15%
5. Vanguard Group 11,100 0.35% 10. Universal Health Services, Inc. 4,500 0.14%
List excludes Federal Government Agencies (Federal Reserve Bank, U.S. Mint, U.S. District Court, Internal Revenue Service and U.S. Military), City Departments (Police and Fire Departments, Streets Department, Courtsand the Water and Gas Company) and area School Systems (including Board of Education).
Source: Philadelphia Business Journal
NEW JERSEY PORT DISTRICT
2019 2018 2017 2016 2015 2014 2013 2012 2011 2010
Population 2,418,263 2,417,089 2,428,265 2,425,552 2,426,511 2,429,015 2,427,966 2,429,417 2,427,092 2,424,005
Total Personal Income 133,741,871$ 130,016,858$ 125,526,033$ 120,512,111$ 117,756,428$ 113,026,005$ 109,187,163$ 107,985,081$ 105,590,941$ 101,444,769$Per Capita Personal Income 55,305$ 53,791$ 51,694$ 49,684$ 48,529$ 46,532$ 44,971$ 44,449$ 43,505$ 41,850$Unemployment Rate 4.09% 4.69% 5.29% 5.68% 6.82% 7.99% 9.62% 10.82% 10.75% 10.33%
Source:(1) United States Dept of Commerce, Bureau of Economic Analysis. BEA Regional Economic Account data was used for each NJ Port District county served by the DRPA. Figures here are totals for all counties in the NJ Port District.(2) United States Department of Labor, Bureau of Labor Statistics, Local Area Unemployment Statistics
NEW JERSEY PORT DISTRICT TOP TEN EMPLOYERS
# of Employees % of Employment # of Employees % of Employment
1. ACCU Staffing Services 20,260 0.65% 6. Stockton University 1,608 0.05%
2. Cooper University Health Care 7,500 0.24% 7. Rutgers University - Camden 1,100 0.04%
3. Inspira Health 6,200 0.20% 8. American Water 950 0.03%
4. Rowan University 3,979 0.13% 9. Rastelli Foods Group 650 0.02%
5. NFI 2,400 0.08% 10. Georgian Court University 525 0.02%
List excludes Federal Government Agencies (Federal Reserve Bank, U.S. Mint, U.S. District Court, Internal Revenue Service and U.S. Military), City Departments (Police and Fire Departments,Streets Department, Courts and the Water and Gas Company) and area School Systems (including Board of Education).
Source: NJ.gov Leading Employers
EMPLOYMENT SHARES BY SECTOR: GREATER PHILADELPHIA REGION 2019
Source: American Community Survey
University of Pennsylvania & Health System
The following figures provide four key external factors during the ten years from 2010-2019 that affected the geographic region in which the Authority functions; this region is the Port District, which is comprised of the counties of Bucks, Chester,Delaware, Montgomery, and Philadelphia in Pennsylvania, and the counties of Atlantic, Burlington, Camden, Cape May, Cumberland, Gloucester, Ocean, and Salem in New Jersey.
Based on the most recent data (2019 is the latest year for which this information is available), population increased in the Pennsylvania counties by 3.0% (about 121,500 people) since 2011. The unemployment rate in the Philadelphia counties forthe period of 2011 through 2019 reflected a high of 8.63% in 2012 and a low of 4.21% in 2018. Six of the top ten employers in the Pennsylvania counties were health care organizations. There was an increase in the population of thePennsylvania counties by approximately 0.18%, from 2018 to 2019, an increase of about 7,300 people. The unemployment rate increased from 4.21% to 4.29% during 2019.
Population decreased in the New Jersey counties by 0.24% (about 5,472 people) since 2010, however there was a population increase from 2018 to 2019, by 1,200 people, or 0.05%. The unemployment rate in the New Jersey counties for theperiod of 2010 through 2019 reflected a high of 10.82% in 2012 and a low of 4.09% in 2019. The unemployment rate decreased from 4.69% in 2018 to 4.09% in 2019. Two of the top ten employers were health care organizations and four of thetop ten are universities.
Please refer to the schedules below for a historical view of the demographic information and area employers within the Port District.
Agriculture, forestry, fishing andhunting, and mining, 0.40%
Construction, 5.73%
Manufacturing, 8.31%
Wholesale trade, 2.73%
Retail trade, 10.14%
Transportation and warehousing,and utilities, 4.88%
Information, 2.06%
Finance and insurance, and real estate andrental and leasing, 8.51%
Professional, scientific, and management, and administrative and wastemanagement services, 13.51%
Educational services, and healthcare and social assistance,
27.20%
Arts, entertainment, andrecreation, and accommodation
and food services, 8.18%
Other services (except publicadministration), 4.47%
Public administration, 3.88%
172
172
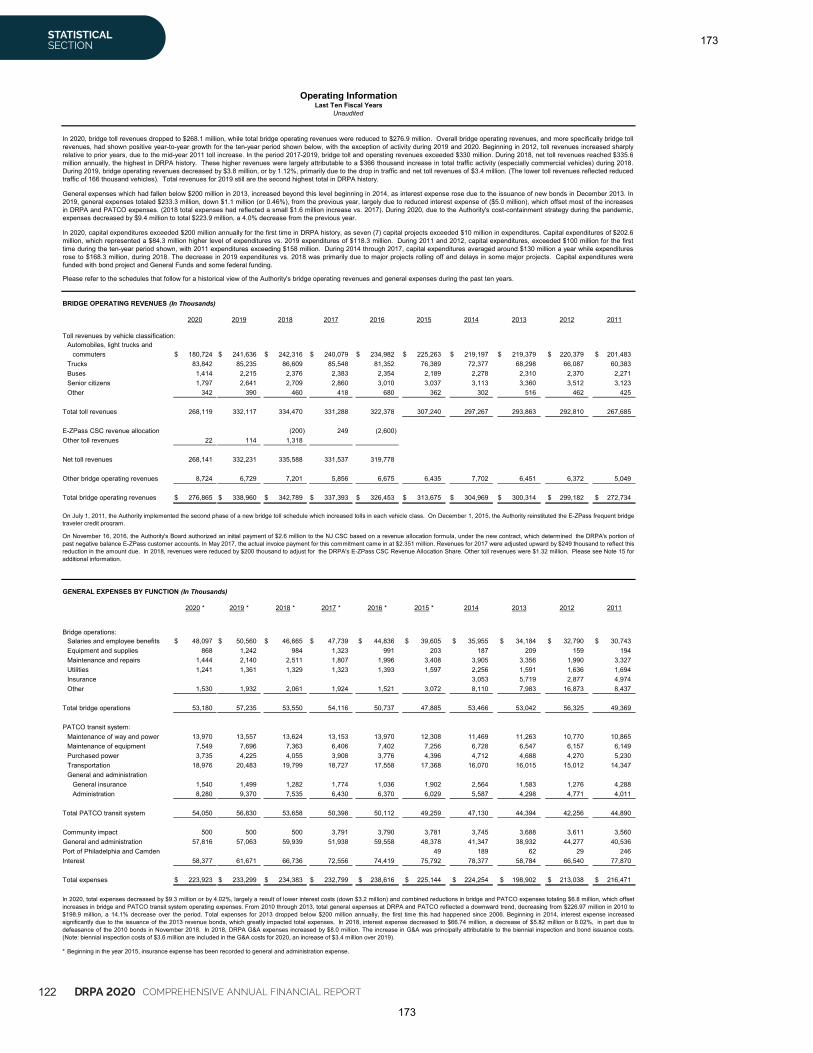
122 DRPA 2020 COMPREHENSIVE ANNUAL FINANCIAL REPORT
STATISTICAL SECTION
Operating InformationLast Ten Fiscal Years
Unaudited
BRIDGE OPERATING REVENUES (In Thousands)
2020 2019 2018 2017 2016 2015 2014 2013 2012 2011
Toll revenues by vehicle classification:Automobiles, light trucks and
commuters 180,724$ 241,636$ 242,316$ 240,079$ 234,982$ 225,263$ 219,197$ 219,379$ 220,379$ 201,483$Trucks 83,842 85,235 86,609 85,548 81,352 76,389 72,377 68,298 66,087 60,383Buses 1,414 2,215 2,376 2,383 2,354 2,189 2,278 2,310 2,370 2,271Senior citizens 1,797 2,641 2,709 2,860 3,010 3,037 3,113 3,360 3,512 3,123Other 342 390 460 418 680 362 302 516 462 425
Total toll revenues 268,119 332,117 334,470 331,288 322,378 307,240 297,267 293,863 292,810 267,685
E-ZPass CSC revenue allocation (200) 249 (2,600)Other toll revenues 22 114 1,318
Net toll revenues 268,141 332,231 335,588 331,537 319,778
Other bridge operating revenues 8,724 6,729 7,201 5,856 6,675 6,435 7,702 6,451 6,372 5,049
Total bridge operating revenues 276,865$ 338,960$ 342,789$ 337,393$ 326,453$ 313,675$ 304,969$ 300,314$ 299,182$ 272,734$
GENERAL EXPENSES BY FUNCTION (In Thousands)
2020 * 2019 * 2018 * 2017 * 2016 * 2015 * 2014 2013 2012 2011
Bridge operations:Salaries and employee benefits 48,097$ 50,560$ 46,665$ 47,739$ 44,836$ 39,605$ 35,955$ 34,184$ 32,790$ 30,743$Equipment and supplies 868 1,242 984 1,323 991 203 187 209 159 194Maintenance and repairs 1,444 2,140 2,511 1,807 1,996 3,408 3,905 3,356 1,990 3,327Utilities 1,241 1,361 1,329 1,323 1,393 1,597 2,256 1,591 1,636 1,694Insurance 3,053 5,719 2,877 4,974Other 1,530 1,932 2,061 1,924 1,521 3,072 8,110 7,983 16,873 8,437
Total bridge operations 53,180 57,235 53,550 54,116 50,737 47,885 53,466 53,042 56,325 49,369
PATCO transit system:Maintenance of way and power 13,970 13,557 13,624 13,153 13,970 12,308 11,469 11,263 10,770 10,865Maintenance of equipment 7,549 7,696 7,363 6,406 7,402 7,256 6,728 6,547 6,157 6,149Purchased power 3,735 4,225 4,055 3,908 3,776 4,396 4,712 4,688 4,270 5,230Transportation 18,976 20,483 19,799 18,727 17,558 17,368 16,070 16,015 15,012 14,347General and administration
General insurance 1,540 1,499 1,282 1,774 1,036 1,902 2,564 1,583 1,276 4,288Administration 8,280 9,370 7,535 6,430 6,370 6,029 5,587 4,298 4,771 4,011
Total PATCO transit system 54,050 56,830 53,658 50,398 50,112 49,259 47,130 44,394 42,256 44,890
Community impact 500 500 500 3,791 3,790 3,781 3,745 3,688 3,611 3,560General and administration 57,816 57,063 59,939 51,938 59,558 48,378 41,347 38,932 44,277 40,536Port of Philadelphia and Camden 49 189 62 29 246Interest 58,377 61,671 66,736 72,556 74,419 75,792 78,377 58,784 66,540 77,870
Total expenses 223,923$ 233,299$ 234,383$ 232,799$ 238,616$ 225,144$ 224,254$ 198,902$ 213,038$ 216,471$
* Beginning in the year 2015, insurance expense has been recorded to general and administration expense.
On July 1, 2011, the Authority implemented the second phase of a new bridge toll schedule which increased tolls in each vehicle class. On December 1, 2015, the Authority reinstituted the E-ZPass frequent bridgetraveler credit program.
On November 16, 2016, the Authority's Board authorized an initial payment of $2.6 million to the NJ CSC based on a revenue allocation formula, under the new contract, which determined the DRPA's portion ofpast negative balance E-ZPass customer accounts. In May 2017, the actual invoice payment for this commitment came in at $2.351 million. Revenues for 2017 were adjusted upward by $249 thousand to reflect thisreduction in the amount due. In 2018, revenues were reduced by $200 thousand to adjust for the DRPA's E-ZPass CSC Revenue Allocation Share. Other toll revenues were $1.32 million. Please see Note 15 foradditional information.
In 2020, total expenses decreased by $9.3 million or by 4.02%, largely a result of lower interest costs (down $3.2 million) and combined reductions in bridge and PATCO expenses totaling $6.8 million, which offsetincreases in bridge and PATCO transit system operating expenses. From 2010 through 2013, total general expenses at DRPA and PATCO reflected a downward trend, decreasing from $226.97 million in 2010 to$198.9 million, a 14.1% decrease over the period. Total expenses for 2013 dropped below $200 million annually, the first time this had happened since 2006. Beginning in 2014, interest expense increasedsignificantly due to the issuance of the 2013 revenue bonds, which greatly impacted total expenses. In 2018, interest expense decreased to $66.74 million, a decrease of $5.82 million or 8.02%, in part due todefeasance of the 2010 bonds in November 2018. In 2018, DRPA G&A expenses increased by $8.0 million. The increase in G&A was principally attributable to the biennial inspection and bond issuance costs.(Note: biennial inspection costs of $3.6 million are included in the G&A costs for 2020, an increase of $3.4 million over 2019).
In 2020, bridge toll revenues dropped to $268.1 million, while total bridge operating revenues were reduced to $276.9 million. Overall bridge operating revenues, and more specifically bridge tollrevenues, had shown positive year-to-year growth for the ten-year period shown below, with the exception of activity during 2019 and 2020. Beginning in 2012, toll revenues increased sharplyrelative to prior years, due to the mid-year 2011 toll increase. In the period 2017-2019, bridge toll and operating revenues exceeded $330 million. During 2018, net toll revenues reached $335.6million annually, the highest in DRPA history. These higher revenues were largely attributable to a $366 thousand increase in total traffic activity (especially commercial vehicles) during 2018.During 2019, bridge operating revenues decreased by $3.8 million, or by 1.12%, primarily due to the drop in traffic and net toll revenues of $3.4 million. (The lower toll revenues reflected reducedtraffic of 166 thousand vehicles). Total revenues for 2019 still are the second highest total in DRPA history.
General expenses which had fallen below $200 million in 2013, increased beyond this level beginning in 2014, as interest expense rose due to the issuance of new bonds in December 2013. In2019, general expenses totaled $233.3 million, down $1.1 million (or 0.46%), from the previous year, largely due to reduced interest expense of ($5.0 million), which offset most of the increasesin DRPA and PATCO expenses. (2018 total expenses had reflected a small $1.6 million increase vs. 2017). During 2020, due to the Authority's cost-containment strategy during the pandemic,expenses decreased by $9.4 million to total $223.9 million, a 4.0% decrease from the previous year.
In 2020, capital expenditures exceeded $200 million annually for the first time in DRPA history, as seven (7) capital projects exceeded $10 million in expenditures. Capital expenditures of $202.6million, which represented a $84.3 million higher level of expenditures vs. 2019 expenditures of $118.3 million. During 2011 and 2012, capital expenditures, exceeded $100 million for the firsttime during the ten-year period shown, with 2011 expenditures exceeding $158 million. During 2014 through 2017, capital expenditures averaged around $130 million a year while expendituresrose to $168.3 million, during 2018. The decrease in 2019 expenditures vs. 2018 was primarily due to major projects rolling off and delays in some major projects. Capital expenditures werefunded with bond project and General Funds and some federal funding.
Please refer to the schedules that follow for a historical view of the Authority's bridge operating revenues and general expenses during the past ten years.
173
173
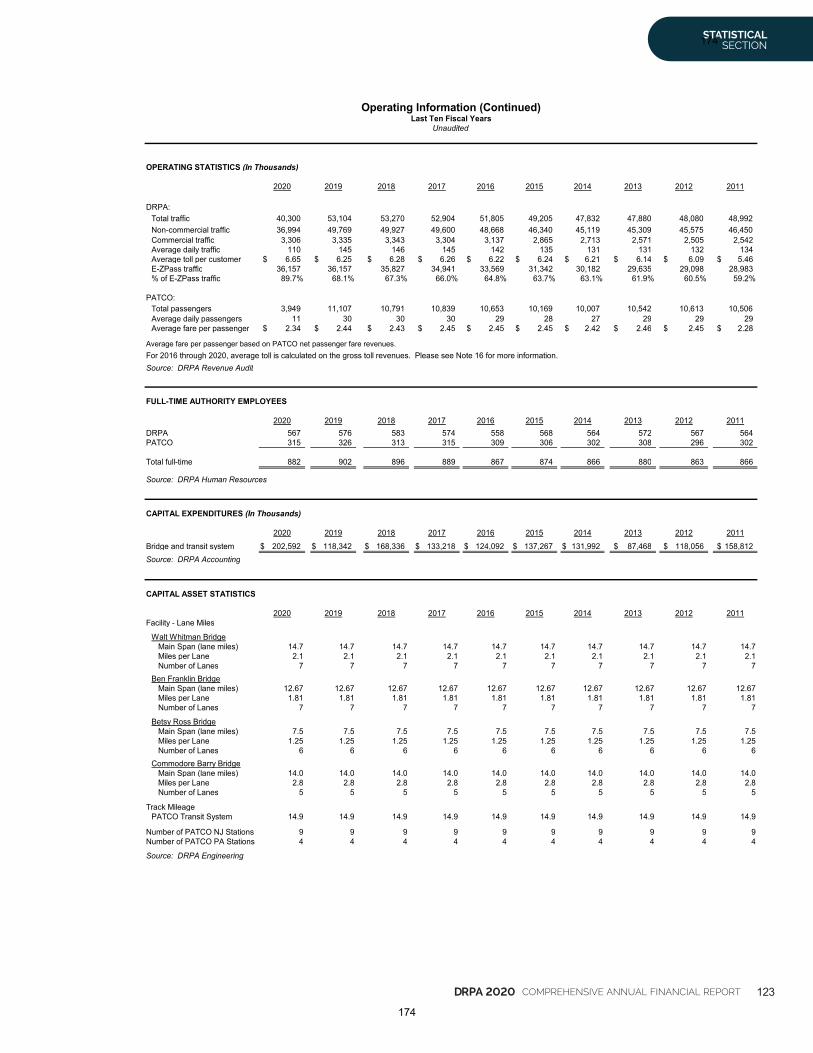
DRPA 2020 COMPREHENSIVE ANNUAL FINANCIAL REPORT 123
STATISTICAL SECTION
Operating Information (Continued)Last Ten Fiscal Years
Unaudited
OPERATING STATISTICS (In Thousands)
2020 2019 2018 2017 2016 2015 2014 2013 2012 2011
DRPA:Total traffic 40,300 53,104 53,270 52,904 51,805 49,205 47,832 47,880 48,080 48,992Non-commercial traffic 36,994 49,769 49,927 49,600 48,668 46,340 45,119 45,309 45,575 46,450Commercial traffic 3,306 3,335 3,343 3,304 3,137 2,865 2,713 2,571 2,505 2,542Average daily traffic 110 145 146 145 142 135 131 131 132 134Average toll per customer 6.65$ 6.25$ 6.28$ 6.26$ 6.22$ 6.24$ 6.21$ 6.14$ 6.09$ 5.46$E-ZPass traffic 36,157 36,157 35,827 34,941 33,569 31,342 30,182 29,635 29,098 28,983% of E-ZPass traffic 89.7% 68.1% 67.3% 66.0% 64.8% 63.7% 63.1% 61.9% 60.5% 59.2%
PATCO:Total passengers 3,949 11,107 10,791 10,839 10,653 10,169 10,007 10,542 10,613 10,506Average daily passengers 11 30 30 30 29 28 27 29 29 29Average fare per passenger 2.34$ 2.44$ 2.43$ 2.45$ 2.45$ 2.45$ 2.42$ 2.46$ 2.45$ 2.28$
Average fare per passenger based on PATCO net passenger fare revenues.
Source: DRPA Revenue Audit
FULL-TIME AUTHORITY EMPLOYEES
2020 2019 2018 2017 2016 2015 2014 2013 2012 2011DRPA 567 576 583 574 558 568 564 572 567 564PATCO 315 326 313 315 309 306 302 308 296 302
Total full-time 882 902 896 889 867 874 866 880 863 866
Source: DRPA Human Resources
CAPITAL EXPENDITURES (In Thousands)
2020 2019 2018 2017 2016 2015 2014 2013 2012 2011
Bridge and transit system 202,592$ 118,342$ 168,336$ 133,218$ 124,092$ 137,267$ 131,992$ 87,468$ 118,056$ 158,812$Source: DRPA Accounting
CAPITAL ASSET STATISTICS
2020 2019 2018 2017 2016 2015 2014 2013 2012 2011Facility - Lane Miles
Walt Whitman BridgeMain Span (lane miles) 14.7 14.7 14.7 14.7 14.7 14.7 14.7 14.7 14.7 14.7Miles per Lane 2.1 2.1 2.1 2.1 2.1 2.1 2.1 2.1 2.1 2.1Number of Lanes 7 7 7 7 7 7 7 7 7 7
Ben Franklin BridgeMain Span (lane miles) 12.67 12.67 12.67 12.67 12.67 12.67 12.67 12.67 12.67 12.67Miles per Lane 1.81 1.81 1.81 1.81 1.81 1.81 1.81 1.81 1.81 1.81Number of Lanes 7 7 7 7 7 7 7 7 7 7
Betsy Ross BridgeMain Span (lane miles) 7.5 7.5 7.5 7.5 7.5 7.5 7.5 7.5 7.5 7.5Miles per Lane 1.25 1.25 1.25 1.25 1.25 1.25 1.25 1.25 1.25 1.25Number of Lanes 6 6 6 6 6 6 6 6 6 6
Commodore Barry BridgeMain Span (lane miles) 14.0 14.0 14.0 14.0 14.0 14.0 14.0 14.0 14.0 14.0Miles per Lane 2.8 2.8 2.8 2.8 2.8 2.8 2.8 2.8 2.8 2.8Number of Lanes 5 5 5 5 5 5 5 5 5 5
Track MileagePATCO Transit System 14.9 14.9 14.9 14.9 14.9 14.9 14.9 14.9 14.9 14.9
Number of PATCO NJ Stations 9 9 9 9 9 9 9 9 9 9Number of PATCO PA Stations 4 4 4 4 4 4 4 4 4 4
Source: DRPA Engineering
For 2016 through 2020, average toll is calculated on the gross toll revenues. Please see Note 16 for more information.
174
174

124 DRPA 2020 COMPREHENSIVE ANNUAL FINANCIAL REPORT
STATISTICAL SECTION
‘18
‘18 0 0
$300
$225
$150
$75
$8
$4
0
$12
$16
$20
$24
10
20
30
40
50
60
4
2
0
6
8
12
10
Notes:• On July 1, 2011, the Authority implemented the second phase of a new bridge toll schedule which
increased tolls in each vehicle class and a 10% PATCO passenger fare increase.• On December 1, 2015, the Authority reinstituted the E-ZPass frequent bridge traveler credit program.• During 2020, bridge traffic, toll revenues, PATCO ridership and net passenger revenues were significantly
impacted for the period from mid-March through December, as a result of the COVID-19 pandemic.
‘16 ‘17 ‘19 ‘20‘11 ‘12 ‘13 ‘14 ‘15
‘16 ‘17 ‘19 ‘20‘11 ‘12 ‘13 ‘14 ‘15 ‘16 ‘17 ‘19 ‘20‘11 ‘12 ‘13 ‘14 ‘15
‘17‘18
‘18
‘19 ‘20‘11 ‘12 ‘13 ‘14 ‘15 ‘16
DRPA Bridge Traffic 2011-2020(in millions of vehicles)
PATCO Passenger Ridership 2011-2020(in millions of passengers)
DRPA Bridge Toll Revenues 2011-2020(in millions of dollars)
PATCO Passenger Fare Revenues 2011-2020(in millions of dollars)
Bridge & PATCO Operations
$28
175
175
Delaware River Port Authority
Comprehensive Annual Financial Report
for the Years Ended December 31, 2020 and 2019
PRODUCED BY:
DRPA Corporate Communications Dierdre M. DonatucciMichael D. Williams
FINANCIAL DATA COMPILED BY:
James M. White, Jr., CCMJohn F. Lotierzo, CPA, CGMA
Mark S. Ciechon, MBADarcie DeBeaumont, MBA, CPA
Orville Parker Jennifer A. DePoder
PRINTED BY:DRPA Printing Services
176
176
STATISTICAL SECTION
One Port Center • 2 Riverside DrivePO Box 1949
Camden, NJ 08101-1949
(856) 968-2000 www.drpa.org
Government Finance Officers Association
Certificate ofAchievementfor Excellence
in FinancialReporting
Presented to
Delaware River Port AuthorityFor its Comprehensive Annual
Financial Reportfor the Fiscal Year Ended
December 31, 2019
Executive Director/CEO
For the twenty-eigth consecutive year the
Delaware River Port Authority was awarded the
Certificate of Achievement for Excellence in Financial Reporting
by the Government Finance Officers Association of the United States and Canada for its 2019 Comprehensive
Annual Financial Report.
OF PENNSYLVANIA & NEW JERSEY
177
177
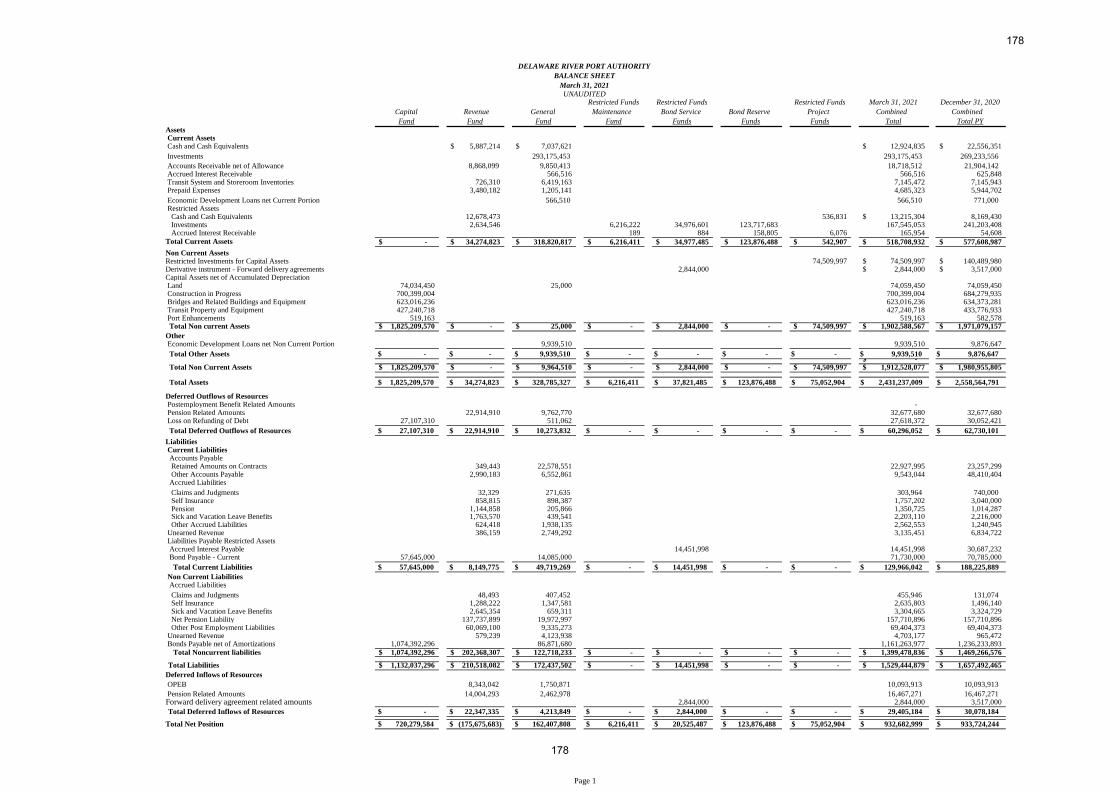
Restricted Funds Restricted Funds Restricted Funds March 31, 2021 December 31, 2020
Capital Revenue General Maintenance Bond Service Bond Reserve Project Combined Combined
Fund Fund Fund Fund Funds Funds Funds Total Total PYAssetsCurrent AssetsCash and Cash Equivalents 5,887,214$ 7,037,621$ 12,924,835$ 22,556,351$
Investments 293,175,453 293,175,453 269,233,556
Accounts Receivable net of Allowance 8,868,099 9,850,413 18,718,512 21,904,142Accrued Interest Receivable 566,516 566,516 625,848Transit System and Storeroom Inventories 726,310 6,419,163 7,145,472 7,145,943Prepaid Expenses 3,480,182 1,205,141 4,685,323 5,944,702
Economic Development Loans net Current Portion 566,510 566,510 771,000Restricted Assets
Cash and Cash Equivalents 12,678,473 536,831 13,215,304$ 8,169,430Investments 2,634,546 6,216,222 34,976,601 123,717,683 167,545,053 241,203,408Accrued Interest Receivable 189 884 158,805 6,076 165,954 54,608
Total Current Assets -$ 34,274,823$ 318,820,817$ 6,216,411$ 34,977,485$ 123,876,488$ 542,907$ 518,708,932$ 577,608,987$
Non Current AssetsRestricted Investments for Capital Assets 74,509,997 74,509,997$ 140,489,980$Derivative instrument - Forward delivery agreements 2,844,000 2,844,000$ 3,517,000$Capital Assets net of Accumulated DepreciationLand 74,034,450 25,000 74,059,450 74,059,450Construction in Progress 700,399,004 700,399,004 684,279,935Bridges and Related Buildings and Equipment 623,016,236 623,016,236 634,373,281Transit Property and Equipment 427,240,718 427,240,718 433,776,933Port Enhancements 519,163 519,163 582,578Total Non current Assets 1,825,209,570$ -$ 25,000$ -$ 2,844,000$ -$ 74,509,997$ 1,902,588,567$ 1,971,079,157$
OtherEconomic Development Loans net Non Current Portion 9,939,510 9,939,510 9,876,647
Total Other Assets -$ -$ 9,939,510$ -$ -$ -$ -$ 9,939,510$ 9,876,647$-$
Total Non Current Assets 1,825,209,570$ -$ 9,964,510$ -$ 2,844,000$ -$ 74,509,997$ 1,912,528,077$ 1,980,955,805$
Total Assets 1,825,209,570$ 34,274,823$ 328,785,327$ 6,216,411$ 37,821,485$ 123,876,488$ 75,052,904$ 2,431,237,009$ 2,558,564,791$
Deferred Outflows of ResourcesPostemployment Benefit Related Amounts -Pension Related Amounts 22,914,910 9,762,770 32,677,680 32,677,680Loss on Refunding of Debt 27,107,310 511,062 27,618,372 30,052,421
Total Deferred Outflows of Resources 27,107,310$ 22,914,910$ 10,273,832$ -$ -$ -$ -$ 60,296,052$ 62,730,101$
LiabilitiesCurrent LiabilitiesAccounts PayableRetained Amounts on Contracts 349,443 22,578,551 22,927,995 23,257,299Other Accounts Payable 2,990,183 6,552,861 9,543,044 48,410,404
Accrued Liabilities
Claims and Judgments 32,329 271,635 303,964 740,000Self Insurance 858,815 898,387 1,757,202 3,040,000Pension 1,144,858 205,866 1,350,725 1,014,287Sick and Vacation Leave Benefits 1,763,570 439,541 2,203,110 2,216,000Other Accrued Liabilities 624,418 1,938,135 2,562,553 1,240,945
Unearned Revenue 386,159 2,749,292 3,135,451 6,834,722Liabilities Payable Restricted AssetsAccrued Interest Payable 14,451,998 14,451,998 30,687,232Bond Payable - Current 57,645,000 14,085,000 71,730,000 70,785,000
Total Current Liabilities 57,645,000$ 8,149,775$ 49,719,269$ -$ 14,451,998$ -$ -$ 129,966,042$ 188,225,889$
Non Current LiabilitiesAccrued Liabilities
Claims and Judgments 48,493 407,452 455,946 131,074Self Insurance 1,288,222 1,347,581 2,635,803 1,496,140Sick and Vacation Leave Benefits 2,645,354 659,311 3,304,665 3,324,729Net Pension Liability 137,737,899 19,972,997 157,710,896 157,710,896Other Post Employment Liabilities 60,069,100 9,335,273 69,404,373 69,404,373
Unearned Revenue 579,239 4,123,938 4,703,177 965,472Bonds Payable net of Amortizations 1,074,392,296 86,871,680 1,161,263,977 1,236,233,893
Total Noncurrent liabilities 1,074,392,296$ 202,368,307$ 122,718,233$ -$ -$ -$ -$ 1,399,478,836$ 1,469,266,576$
Total Liabilities 1,132,037,296$ 210,518,082$ 172,437,502$ -$ 14,451,998$ -$ -$ 1,529,444,879$ 1,657,492,465$
Deferred Inflows of Resources
OPEB 8,343,042 1,750,871 10,093,913 10,093,913
Pension Related Amounts 14,004,293 2,462,978 16,467,271 16,467,271Forward delivery agreement related amounts 2,844,000 2,844,000 3,517,000
Total Deferred Inflows of Resources -$ 22,347,335$ 4,213,849$ -$ 2,844,000$ -$ -$ 29,405,184$ 30,078,184$
Total Net Position 720,279,584$ (175,675,683)$ 162,407,808$ 6,216,411$ 20,525,487$ 123,876,488$ 75,052,904$ 932,682,999$ 933,724,244$
DELAWARE RIVER PORT AUTHORITY
BALANCE SHEET
March 31, 2021UNAUDITED
Page 1
178
178
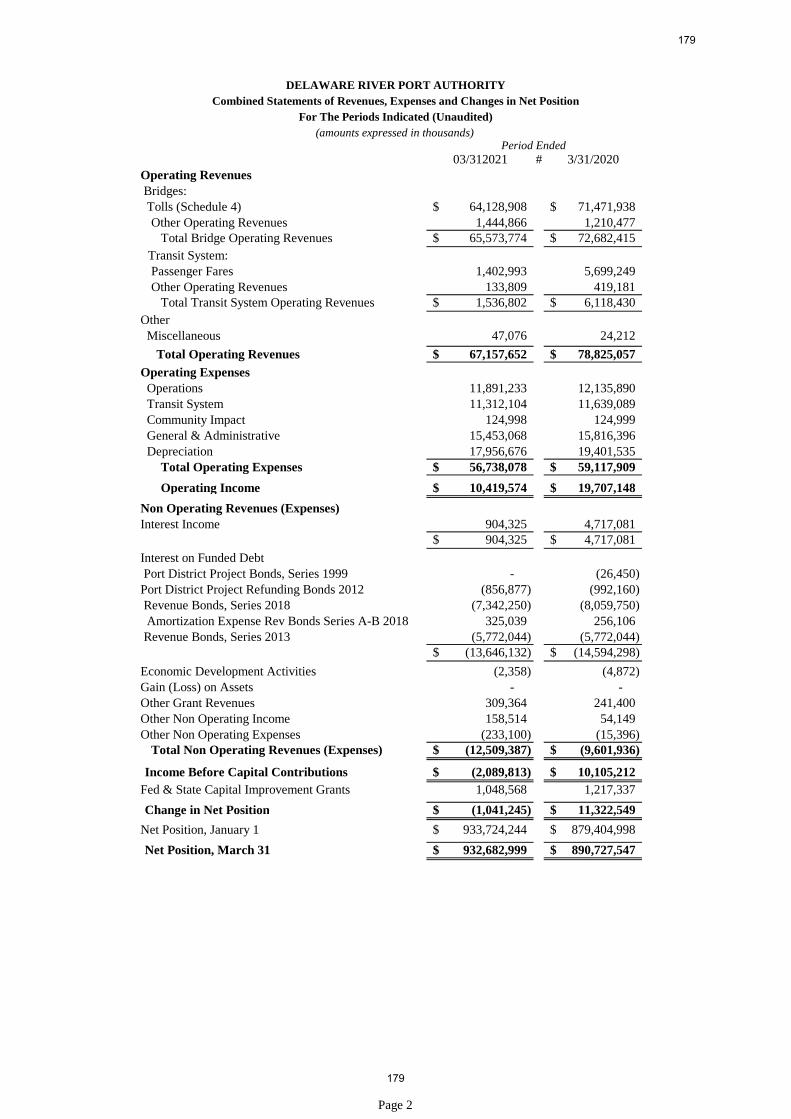
03/312021 # 3/31/2020Operating RevenuesBridges:Tolls (Schedule 4) 64,128,908$ 71,471,938$Other Operating Revenues 1,444,866 1,210,477
Total Bridge Operating Revenues 65,573,774$ 72,682,415$
Transit System:Passenger Fares 1,402,993 5,699,249Other Operating Revenues 133,809 419,181
Total Transit System Operating Revenues 1,536,802$ 6,118,430$
OtherMiscellaneous 47,076 24,212
Total Operating Revenues 67,157,652$ 78,825,057$
Operating ExpensesOperations 11,891,233 12,135,890Transit System 11,312,104 11,639,089Community Impact 124,998 124,999General & Administrative 15,453,068 15,816,396Depreciation 17,956,676 19,401,535
Total Operating Expenses 56,738,078$ 59,117,909$
Operating Income 10,419,574$ 19,707,148$
Non Operating Revenues (Expenses)Interest Income 904,325 4,717,081
904,325$ 4,717,081$
Interest on Funded DebtPort District Project Bonds, Series 1999 - (26,450)
Port District Project Refunding Bonds 2012 (856,877) (992,160)Revenue Bonds, Series 2018 (7,342,250) (8,059,750)Amortization Expense Rev Bonds Series A-B 2018 325,039 256,106
Revenue Bonds, Series 2013 (5,772,044) (5,772,044)(13,646,132)$ (14,594,298)$
Economic Development Activities (2,358) (4,872)Gain (Loss) on Assets - -Other Grant Revenues 309,364 241,400Other Non Operating Income 158,514 54,149Other Non Operating Expenses (233,100) (15,396)
Total Non Operating Revenues (Expenses) (12,509,387)$ (9,601,936)$
Income Before Capital Contributions (2,089,813)$ 10,105,212$
Fed & State Capital Improvement Grants 1,048,568 1,217,337
Change in Net Position (1,041,245)$ 11,322,549$
Net Position, January 1 933,724,244$ 879,404,998$
Net Position, March 31 932,682,999$ 890,727,547$
Period Ended
DELAWARE RIVER PORT AUTHORITY
Combined Statements of Revenues, Expenses and Changes in Net Position
For The Periods Indicated (Unaudited)
(amounts expressed in thousands)
Page 2
179
179
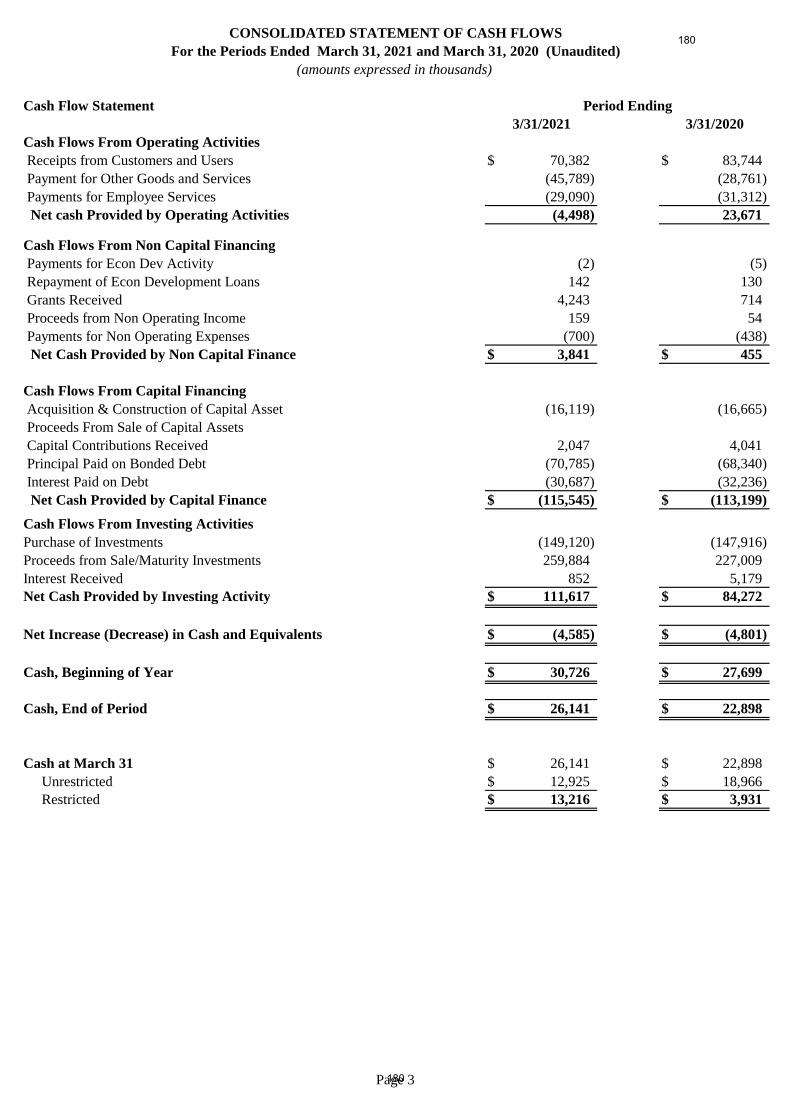
Cash Flow Statement
3/31/2021 3/31/2020
Cash Flows From Operating Activities
Receipts from Customers and Users 70,382$ 83,744$
Payment for Other Goods and Services (45,789) (28,761)
Payments for Employee Services (29,090) (31,312)
Net cash Provided by Operating Activities (4,498) 23,671
Cash Flows From Non Capital Financing
Payments for Econ Dev Activity (2) (5)
Repayment of Econ Development Loans 142 130
Grants Received 4,243 714
Proceeds from Non Operating Income 159 54
Payments for Non Operating Expenses (700) (438)
Net Cash Provided by Non Capital Finance 3,841$ 455$
Cash Flows From Capital Financing
Acquisition & Construction of Capital Asset (16,119) (16,665)
Proceeds From Sale of Capital Assets
Capital Contributions Received 2,047 4,041
Principal Paid on Bonded Debt (70,785) (68,340)
Interest Paid on Debt (30,687) (32,236)
Net Cash Provided by Capital Finance (115,545)$ (113,199)$
Cash Flows From Investing Activities
Purchase of Investments (149,120) (147,916)
Proceeds from Sale/Maturity Investments 259,884 227,009
Interest Received 852 5,179Net Cash Provided by Investing Activity 111,617$ 84,272$
Net Increase (Decrease) in Cash and Equivalents (4,585)$ (4,801)$
Cash, Beginning of Year 30,726$ 27,699$
Cash, End of Period 26,141$ 22,898$
Cash at March 31 26,141$ 22,898$
Unrestricted 12,925$ 18,966$Restricted 13,216$ 3,931$
Period Ending
CONSOLIDATED STATEMENT OF CASH FLOWS
For the Periods Ended March 31, 2021 and March 31, 2020 (Unaudited)
(amounts expressed in thousands)
Page 3180
180
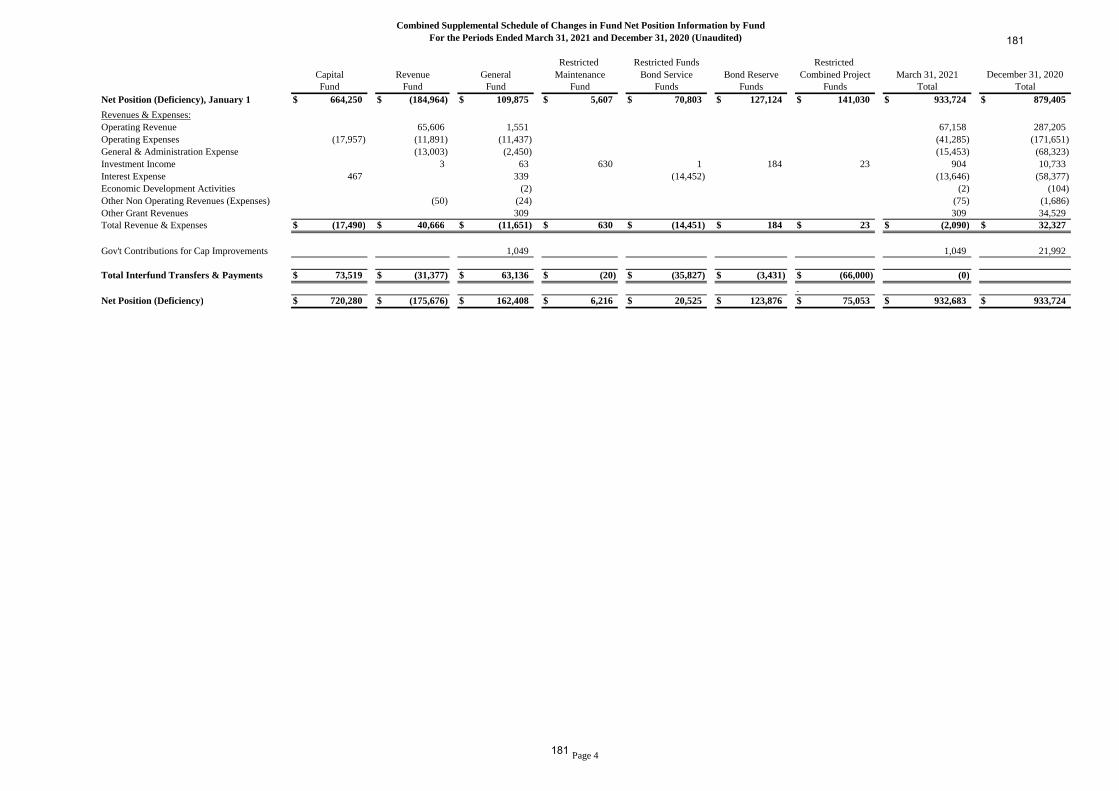
Restricted Restricted Funds Restricted
Capital Revenue General Maintenance Bond Service Bond Reserve Combined Project March 31, 2021 December 31, 2020Fund Fund Fund Fund Funds Funds Funds Total Total
Net Position (Deficiency), January 1 664,250$ (184,964)$ 109,875$ 5,607$ 70,803$ 127,124$ 141,030$ 933,724$ 879,405$
Revenues & Expenses:
Operating Revenue 65,606 1,551 67,158 287,205
Operating Expenses (17,957) (11,891) (11,437) (41,285) (171,651)
General & Administration Expense (13,003) (2,450) (15,453) (68,323)
Investment Income 3 63 630 1 184 23 904 10,733
Interest Expense 467 339 (14,452) (13,646) (58,377)
Economic Development Activities (2) (2) (104)
Other Non Operating Revenues (Expenses) (50) (24) (75) (1,686)
Other Grant Revenues 309 309 34,529Total Revenue & Expenses (17,490)$ 40,666$ (11,651)$ 630$ (14,451)$ 184$ 23$ (2,090)$ 32,327$
Gov't Contributions for Cap Improvements 1,049 1,049 21,992
Total Interfund Transfers & Payments 73,519$ (31,377)$ 63,136$ (20)$ (35,827)$ (3,431)$ (66,000)$ (0)
.Net Position (Deficiency) 720,280$ (175,676)$ 162,408$ 6,216$ 20,525$ 123,876$ 75,053$ 932,683$ 933,724$
Combined Supplemental Schedule of Changes in Fund Net Position Information by Fund
For the Periods Ended March 31, 2021 and December 31, 2020 (Unaudited)
Page 4181
181
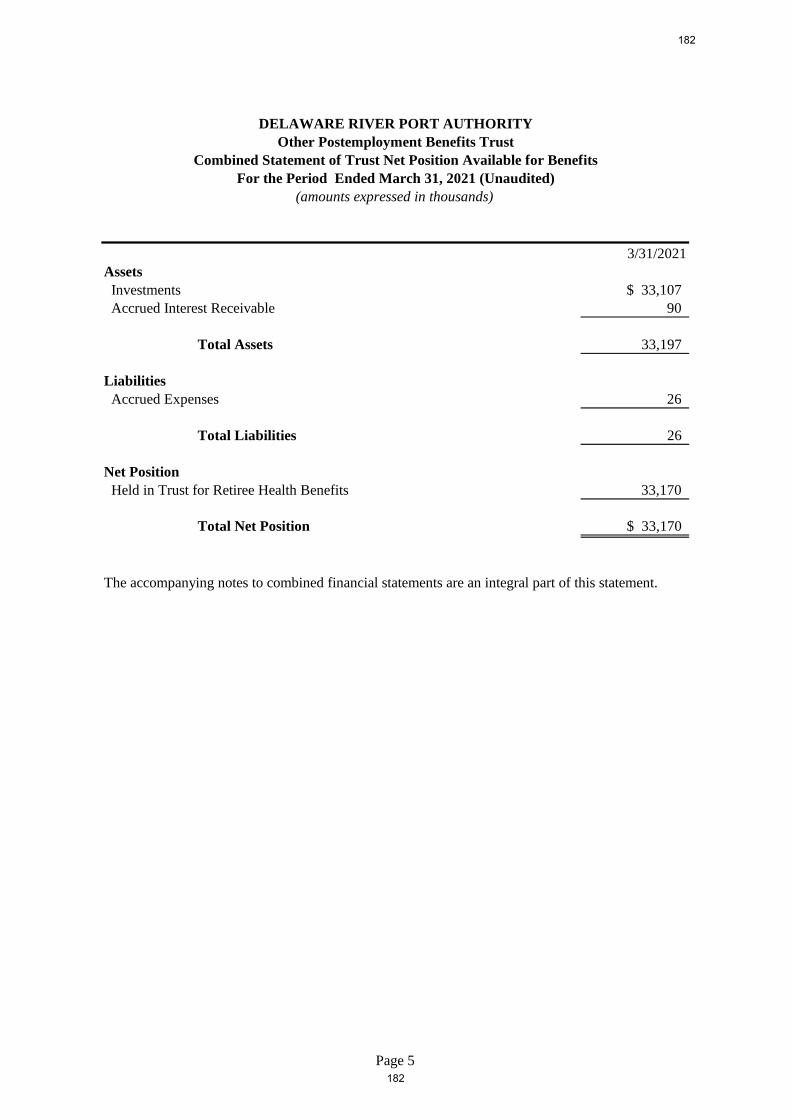
3/31/2021
Assets
Investments $ 33,107
Accrued Interest Receivable 90
Total Assets 33,197
Liabilities
Accrued Expenses 26
Total Liabilities 26
Net Position
Held in Trust for Retiree Health Benefits 33,170
Total Net Position $ 33,170
The accompanying notes to combined financial statements are an integral part of this statement.
DELAWARE RIVER PORT AUTHORITY
Other Postemployment Benefits Trust
Combined Statement of Trust Net Position Available for Benefits
For the Period Ended March 31, 2021 (Unaudited)
(amounts expressed in thousands)
Page 5182
182
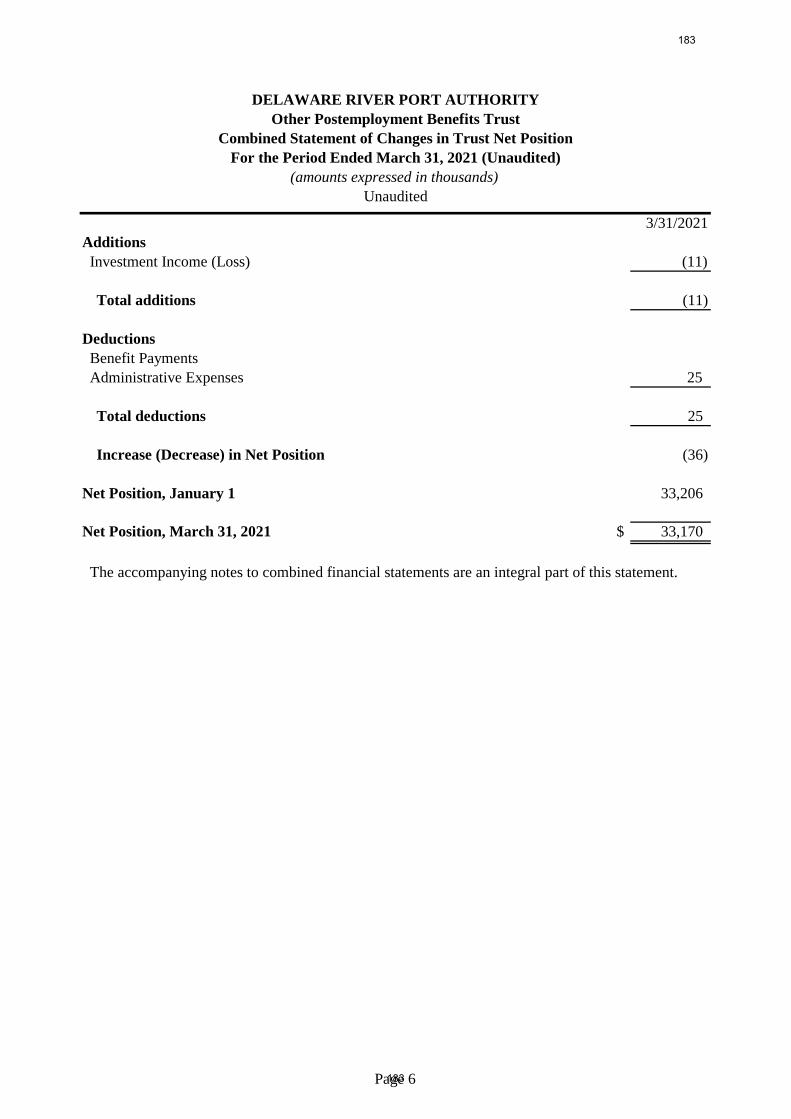
3/31/2021
Additions
Investment Income (Loss) (11)
Total additions (11)
Deductions
Benefit Payments
Administrative Expenses 25
Total deductions 25
Increase (Decrease) in Net Position (36)
Net Position, January 1 33,206
Net Position, March 31, 2021 $ 33,170
The accompanying notes to combined financial statements are an integral part of this statement.
(amounts expressed in thousands)
Unaudited
DELAWARE RIVER PORT AUTHORITY
Other Postemployment Benefits Trust
Combined Statement of Changes in Trust Net Position
For the Period Ended March 31, 2021 (Unaudited)
Page 6183
183
DELAWARE RIVER PORT AUTHORITYNotes to Combined Financial Statements
For the Period and Year Ended March 31, 2021 (unaudited) and December 31, 2020(dollars expressed in thousands)
Page 7
Note 1. Summary of Significant Accounting Policies
Description of Operations: The Delaware River Port Authority (the “Authority”) is a public corporateinstrumentality of the Commonwealth of Pennsylvania (the “Commonwealth”) and the State of New Jersey(the “State”), created with the consent of Congress by compact legislation between the Commonwealth andthe State. The Authority has no stockholders or equity holders. The Authority is vested with the ownership,control, operation, and collection of tolls and revenues of certain bridges spanning the Delaware River;namely, the Benjamin Franklin, Walt Whitman, Commodore Barry, and Betsy Ross bridges. The Authorityhas also constructed, and owns, a high-speed transit system that is operated by the Port Authority TransitCorporation (“PATCO”). The transit system operates between Philadelphia, Pennsylvania and Lindenwold,New Jersey.
The costs of providing facilities and services to the general public on a continuing basis are recoveredprimarily in the form of tolls and fares. The Authority is a member of the E-ZPass Interagency Group, thelargest interoperable electronic toll collection system in the world, comprised of thirty-four (34) agencies innineteen (19) states. Through March 31, 2021, customer participation in the E-ZPass electronic tollcollection process exceeded seventy-six percent (76.5%) of its toll collection activity during rush hourperiods. Toll revenues collected through E-ZPass are seventy-four percent (74.5%) of total toll revenues.
The Authority owns its One Port Center headquarters building and leases several floors to various tenants.The building is managed by a real estate management firm, which is overseen by Authority seniormanagement.
Basis of Presentation: The combined financial statements of the Authority have been prepared in conformitywith accounting principles generally accepted in the United States of America, as applied to governmentalunits. The Governmental Accounting Standards Board (“GASB”) is the accepted standard setting body forestablishing governmental accounting and financial reporting principles.
As part of the Authority’s combined financial statements, two funds are maintained: a proprietary fund(enterprise fund) and a fiduciary fund (other employee benefit trust fund). The focus of enterprise funds isthe measurement of economic resources, that is, the determination of operating income, changes in netposition (or cost recovery), financial position, and cash flows. The focus of fiduciary funds is also themeasurement of economic resources.
The enterprise fund is maintained on the accrual basis of accounting. Enterprise funds account for activities(i) that are financed with debt that is secured solely by a pledge of the net revenues from fees and chargesof the activity; or (ii) that are required by law or regulations that the activity’s cost of providing services,including capital cost (such as depreciation or debt service), be recovered with fees and charges, ratherthan with taxes or similar revenues; or (iii) that the pricing policies of the activity establish fees and chargesdesigned to recover its costs, including capital costs (such as depreciation or debt service). Under thismethod, revenues are recorded when earned and expenses are recorded when the related liability isincurred.
The fiduciary fund is also maintained on the accrual basis of accounting. The fiduciary fund accounts forthe recording and accumulation of other postemployment benefit resources, which are held in trust for theexclusive benefit of the Authority’s retirees. This fund is referred to as the “Other Postemployment Benefits(“OPEB”) Trust.
Cash and Cash Equivalents: The Authority considers all highly liquid investments with a maturity of threemonths or less when purchased to be cash equivalents (Note 2) for purposes of the combined statementsof cash flows. In addition, according to the various Indentures of Trust, which govern the flow andaccounting of the Authority’s financial resources, certain accounts are required to be maintained in order tocomply with the provisions of the Indentures of Trust. For the accounts that are restricted, the Authorityhas recorded the applicable cash and cash equivalents as restricted on the combined financial statements(Note 11).
184
184
DELAWARE RIVER PORT AUTHORITYNotes to Combined Financial Statements
For the Period and Year Ended March 31, 2021 (unaudited) and December 31, 2020(dollars expressed in thousands)
Page 8
Note 1. Summary of Significant Accounting Policies (Continued)
Investment in Securities: Investments are stated at fair value, generally based on quoted market prices.Certain investments are maintained in connection with the Authority’s bonded debt (Notes 3 and 12) andthe OPEB Trust. Likewise, as with cash and cash equivalents, the accounts that are restricted as per thevarious Indentures of Trust have been recorded as restricted investments on the combined financialstatements (Note 11).
Accounts Receivable: The Authority establishes a provision for the estimated amount of uncollectibleaccounts based upon periodic analysis of collection history.
Transit System Inventory: Transit system inventory, consisting principally of spare parts for maintenance oftransit system facilities, is stated at the lower of cost (first-in, first-out method) or market.
Debt Insurance Costs, Bond Premiums, Bond Discounts, and Loss on Refunding: Insurance purchased aspart of the issuance of debt is amortized by the straight-line method from the issue date to maturity and isrecorded as a noncurrent asset on the combined statements of net position. Bond premiums and discountsare amortized by the effective interest method from the issue date to maturity, and are presented as anadjustment to the face amount of the bonds. Likewise, a loss on refunding arising from the issuance of therevenue bonds and port district project bonds is amortized by the effective interest method from the issuedate to maturity. The loss on refunding of debt, however, is classified as a deferred outflow of resourceson the combined statements of net position.
Investment in Facilities: Investment in facilities is stated at cost, which generally includes expenses for legalexpenses incurred during the construction period. Investment in facilities also includes the cost incurredfor port-related projects, and improvements, enlargements and betterments to the original facilities.Replacements of existing facilities (except for primarily police and certain other vehicles whose estimateduseful life is two years or less) are also recorded at cost. The related costs and accumulated depreciationof the property replaced are removed from the respective accounts, and any gain or loss on disposition iscredited or charged to non-operating revenues or expenses. Assets capitalizable generally have an originalcost of five thousand dollars or more and a useful life in excess of three years. Depreciation andamortization are provided using the straight-line method over the estimated useful lives of the relatedassets, including those financed by federal and state contributions (Notes 7 and 13).
Asset lives used in the calculation of depreciation are generally as follows:
Bridges, freeways and tunnels 100 years
Buildings, stations and certain bridge components 35 - 50 years
Electrification, signals and communications system 30 - 40 years
Transit cars, machinery and equipment 10 - 25 years
Computer equipment, automobiles and other equipment 3 - 10 years
Maintenance and Repairs: Maintenance and repair costs considered necessary to maintain bridge facilitiesin good operating condition are charged to operations as incurred.
Self-insurance: The Authority provides for the uninsured portion of potential public liability and workers’compensation claims through self-insurance programs and charges current operations for estimated claimsto be paid (Note 14).
185
185

DELAWARE RIVER PORT AUTHORITYNotes to Combined Financial Statements
For the Period and Year Ended March 31, 2021 (unaudited) and December 31, 2020(dollars expressed in thousands)
Page 9
Note 1. Summary of Significant Accounting Policies (Continued)
Pensions: For purposes of measuring the net pension liability, deferred outflows of resources and deferredinflows of resources related to pensions, and pension expense, information about the fiduciary net positionof the Pennsylvania State Employees’ Retirement System (“SERS”) and the State of New Jersey PublicEmployees' Retirement System (“PERS”), and additions to/deductions from SERS and PERS fiduciary netposition, have been determined on the same basis as reported by the plans. For this purpose, benefitpayments (including refunds of employee contributions) are recognized when due and payable inaccordance with the benefit terms. Investments are reported at fair value.
Postemployment Benefits Other Than Pensions (“OPEB”): For purposes of measuring the net OPEBliability, deferred outflows of resources and deferred inflows of resources related to OPEB, and OPEBexpense, information about the fiduciary net position of the Authority’s OPEB Trust and additionsto/deductions from the OPEB Trust's fiduciary net position have been determined on the same basis asthey are reported by the OPEB Trust. For this purpose, the OPEB Trust recognizes benefit payments whendue and payable in accordance with the benefit terms. Investments are reported at fair value.
Economic Development Activities: The Authority establishes loan loss provisions for economicdevelopment loans receivable, based upon collection history and analysis of creditor’s ability to pay. TheAuthority has established a loss reserve in the amount of $1,345 as of March 31, 2021 and December 31,2020 for its economic development loans outstanding.
Net Position: Net position is classified in the following three components:
Net Investment in Capital Assets: This component of net position consists of capital assets, net ofaccumulated depreciation, reduced by the outstanding balances of any bonds, notes or otherborrowings, and deferred outflows of resources and deferred inflows of resources that are attributableto the acquisition, construction, or improvement of those assets or related debt. If there are significantunspent related debt proceeds at year-end, the portion of the debt attributable to the unspent proceedsis not included in the calculation of net investment in capital assets. Rather, that portion of the debt isincluded in the same net position component as the unspent proceeds.
Restricted: This component of net position consists of external constraints imposed by creditors (suchas debt covenants), grantors, contributors, laws or regulations of other governments, or constraintsimposed by law through constitutional provisions or enabling legislation, that restricts the use of netposition.
Unrestricted: This component of net position consists of a net position that does not meet the definitionof “restricted” or “net investment in capital assets.” This component includes net position that may beallocated for specific purposes by the Board. A deficiency will require future funding.
Operating and Non-Operating Revenues and Expenses: Operating revenues include all revenues derivedfrom facility charges (i.e., toll revenues, which include E-ZPass revenues), PATCO operations (passengerfare, advertising and parking), and other revenue sources. Non-operating revenues principally consist ofinterest income earned on various interest-bearing accounts and on investments in debt securities.
Operating expenses include expenses associated with the operation, maintenance, and repair of thebridges, PATCO, and general administrative expenses. Non-operating expenses principally includeexpenses attributable to the Authority’s interest on funded debt and economic development activities.
When both restricted and unrestricted resources are available for use, it is the Authority’s policy to userestricted resources first, then unrestricted resources as they are needed.
186
186

DELAWARE RIVER PORT AUTHORITYNotes to Combined Financial Statements
For the Period and Year Ended March 31, 2021 (unaudited) and December 31, 2020(dollars expressed in thousands)
Page 10
Note 1. Summary of Significant Accounting Policies (Continued)
Debt Management: Total outstanding bond debt reflected on the combined statements of net position is netof unamortized bond discounts and premiums (Note 12).
Derivative Instruments: The Authority was a party to two (2) forward delivery agreements during 2020 and2019; one related to its maintenance reserve and the other related to the debt service reserve for the 2012Port District Project Bonds (Note 4). These forward delivery agreements allowed the Authority to earn aguaranteed fixed rate of return over the life of the investments in both reserves. As of February 2021, theAuthority terminated the maintenance reserve forward agreement and now only has one active forwardagreement, specificially the one related to the 2012 PDP debt service reserve.
Budget: In accordance with Section 5.15 of the 1998 Revenue Refunding Bonds Indenture of Trust and itsSupplemental Indentures and Section 5.07 of the 1999 and 2012 Port District Project (“PDP”) BondIndentures of Trust, the Authority must annually adopt an Annual Budget on or before December 31 for theensuing year. (Note: an Annual Budget for the 1999 PDP Bonds was not necessary for the year 2021since all remaining bonds matured on January 1, 2021.) For the Revenue Bonds, Section 5.15 of the 1998Revenue Refunding Bond Indenture of Trust requires that the Authority, on or before December 31, in eachyear, adopt a final budget for the ensuing year of (i) operational expenses, (ii) the PATCO Subsidy, (iii) theamount to be deposited to the credit of the Maintenance Reserve Fund, and (iv) the estimated amounts tobe deposited into the Debt Service Fund, the Debt Service Reserve Fund, and the Rebate Fund. EachAnnual Budget must also contain the Authority’s projections of revenues for the ensuing year demonstratingcompliance with the covenant as to facility charges as set forth in Section 5.09 of the Indentures of Trust.On or before December 31 in each year, the Authority must file a copy of the Annual Budget for the ensuingyear with the Trustee.
The Port District Project Bond Indentures require the following: the adopted budget must set forth, inter alia,the PATCO Subsidiary, the amount of any operating subsidy paid or payable by the Authority to or for theaccount of any other subsidiary of the Authority (including, without limitation, the Port of Philadelphia andCamden) and all other material operating expenses of the Authority payable from the General Fund (seeNote 11 for description of funds established under the Trust Indentures). The Authority must also includethe debt service payable on the bonds and any additional subordinated indebtedness during the ensuingyear and all amounts required to be paid by the Authority into the Debt Service Reserve Fund or the RebateFund or to any Reserve Fund Credit Facility issuer during the ensuing year. On or before December 31, ineach year, the Authority must file a copy of the Annual Budget for the ensuing year with the Trustees andCredit Facility Issuer.
The Authority filed the appropriate budgets for 2020 and 2021, as described above, to its bond trustees byDecember 31, 2019 and 2020, in compliance with the bond indentures. These budgets became effectiveon January 1, 2020 and January 1, 2021, respectively.
The Authority may at any time adopt an amended or supplemental Annual Budget for the remainder of thethen-current year, which shall be treated as the Annual Budget under the provisions of the Indentures ofTrust. A copy of any amended or supplemental Annual Budget must be promptly filed with the Trustees.
187
187
DELAWARE RIVER PORT AUTHORITYNotes to Combined Financial Statements
For the Period and Year Ended March 31, 2021 (unaudited) and December 31, 2020(dollars expressed in thousands)
Page 11
Note 1. Summary of Significant Accounting Policies (Continued)
Interfunds: Interfund receivables/payables represent amounts that are owed, other than charges for goodsand services rendered, to/from a particular fund. These receivables/payables are eliminated during theaggregation process.
Use of Estimates: The preparation of financial statements in conformity with accounting principles generallyaccepted in the United States of America requires management to make estimates and assumptions thataffect the reported amounts of assets and liabilities and disclosure of contingent assets and liabilities at thedate of the combined financial statements and the reported amounts of revenues and expenses during thereporting period. Actual results could differ from those estimates.
Income Taxes: The Authority is a public corporate instrumentality of the State of New Jersey and theCommonwealth of Pennsylvania, and is described in its amended governing Compact, has been “deemedto be exercising an essential government function in effectuating such purposes,” and therefore is exemptfrom income taxes pursuant to the Internal Revenue Code (Section 115).
Note 2. Cash and Cash Equivalents
Custodial Credit Risk Related to Deposits: Custodial credit risk is the risk that, in the event of a bank failure,the Authority’s deposits might not be recovered. The Authority does not have a deposit policy for custodialcredit risk, however, the Authority has agreements with various banks where most of the deposits arecollateralized or secured by U.S. Treasury notes or through a Federal Home Loan Bank Letter of Credit.
Note 3. Investment in Securities
Excluding the investments of the OPEB Trust, the Authority’s investments in various securities aremaintained for specified funds in accordance with the provisions of the Indenture of Trust adopted as ofJuly 1, 1998 (revised in 2018) or the Authority’s General Fund investment policy (for unrestrictedinvestments), which was revised and became effective on March 15, 2019 (see reference below underInterest Rate Risk).
Custodial Credit Risk Related to Investments: For an investment, custodial credit risk is the risk that, in theevent of the failure of the counterparty, the Authority will not be able to recover the value of its investmentsor collateral securities that are in possession of an outside party. The Authority’s investments at March 31,2021 and December 31, 2020 totaled $535,231 and $650,927, respectively. These investments consistedof short-term investments, asset backed securities, commercial paper, corporate bonds and notes, U.S.federal agency notes and bonds, and U.S. government treasuries. All of the Authority’s investments aremaintained in the Authority’s name, by a third-party financial institution acting as the Authority’s agent.
The short-term investments primarily consist of money market funds and certificates of deposits with amaturity of greater than one year. Since these funds are held by a third party financial institution, and it isthe policy of the Authority to re-invest these funds in investments with longer maturities, these amountshave been classified as investments, as opposed to cash and cash equivalents, in the combined statementsof net position.
Interest Rate Risk: The Authority’s General Fund investment policy (approved by the Board in February2019) limits investment maturities (on unrestricted investments) as a means of managing its exposure tofair value losses arising from increasing interest rates and is as follows: the average effective duration ofthe portfolio is not to exceed thirty-six (36) months, and the maximum effective duration of any individualsecurity is not to exceed seven (7) years, unless otherwise specified.
188
188
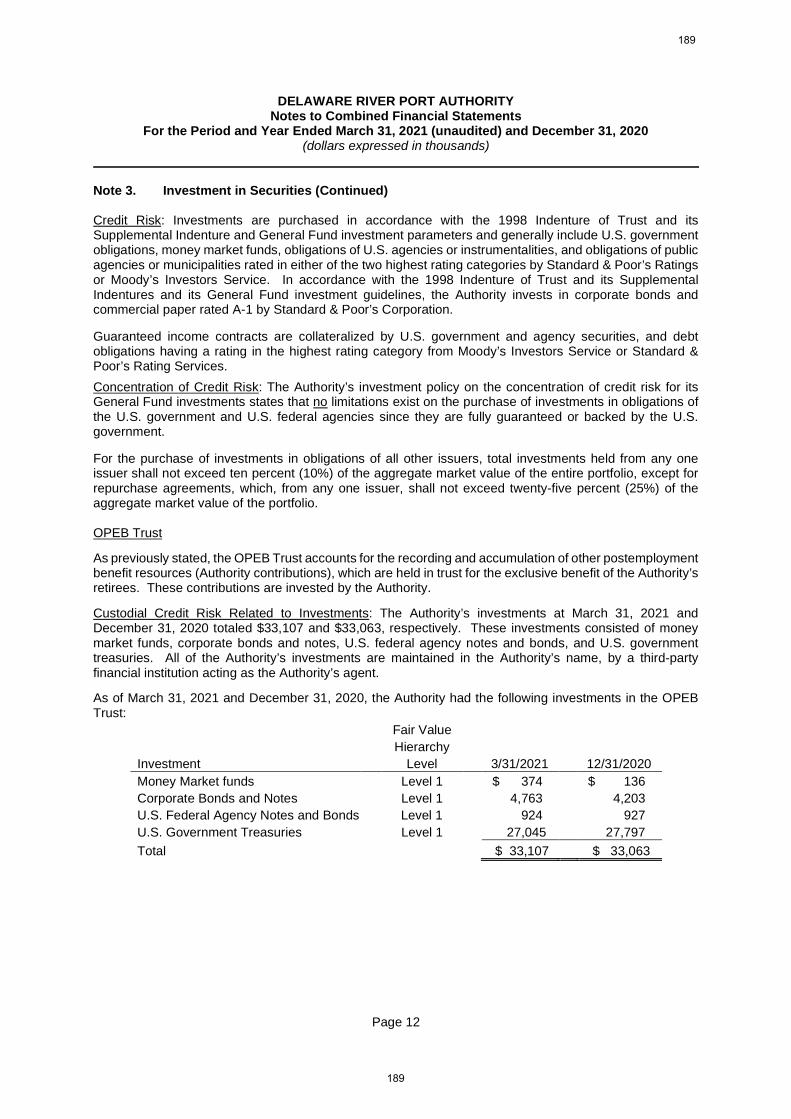
DELAWARE RIVER PORT AUTHORITYNotes to Combined Financial Statements
For the Period and Year Ended March 31, 2021 (unaudited) and December 31, 2020(dollars expressed in thousands)
Page 12
Note 3. Investment in Securities (Continued)
Credit Risk: Investments are purchased in accordance with the 1998 Indenture of Trust and itsSupplemental Indenture and General Fund investment parameters and generally include U.S. governmentobligations, money market funds, obligations of U.S. agencies or instrumentalities, and obligations of publicagencies or municipalities rated in either of the two highest rating categories by Standard & Poor’s Ratingsor Moody’s Investors Service. In accordance with the 1998 Indenture of Trust and its SupplementalIndentures and its General Fund investment guidelines, the Authority invests in corporate bonds andcommercial paper rated A-1 by Standard & Poor’s Corporation.
Guaranteed income contracts are collateralized by U.S. government and agency securities, and debtobligations having a rating in the highest rating category from Moody’s Investors Service or Standard &Poor’s Rating Services.
Concentration of Credit Risk: The Authority’s investment policy on the concentration of credit risk for itsGeneral Fund investments states that no limitations exist on the purchase of investments in obligations ofthe U.S. government and U.S. federal agencies since they are fully guaranteed or backed by the U.S.government.
For the purchase of investments in obligations of all other issuers, total investments held from any oneissuer shall not exceed ten percent (10%) of the aggregate market value of the entire portfolio, except forrepurchase agreements, which, from any one issuer, shall not exceed twenty-five percent (25%) of theaggregate market value of the portfolio.
OPEB Trust
As previously stated, the OPEB Trust accounts for the recording and accumulation of other postemploymentbenefit resources (Authority contributions), which are held in trust for the exclusive benefit of the Authority’sretirees. These contributions are invested by the Authority.
Custodial Credit Risk Related to Investments: The Authority’s investments at March 31, 2021 andDecember 31, 2020 totaled $33,107 and $33,063, respectively. These investments consisted of moneymarket funds, corporate bonds and notes, U.S. federal agency notes and bonds, and U.S. governmenttreasuries. All of the Authority’s investments are maintained in the Authority’s name, by a third-partyfinancial institution acting as the Authority’s agent.
As of March 31, 2021 and December 31, 2020, the Authority had the following investments in the OPEBTrust:
Fair Value
Hierarchy
Investment Level 3/31/2021 12/31/2020
Money Market funds Level 1 $ 374 $ 136
Corporate Bonds and Notes Level 1 4,763 4,203
U.S. Federal Agency Notes and Bonds Level 1 924 927
U.S. Government Treasuries Level 1 27,045 27,797
Total $ 33,107 $ 33,063
189
189
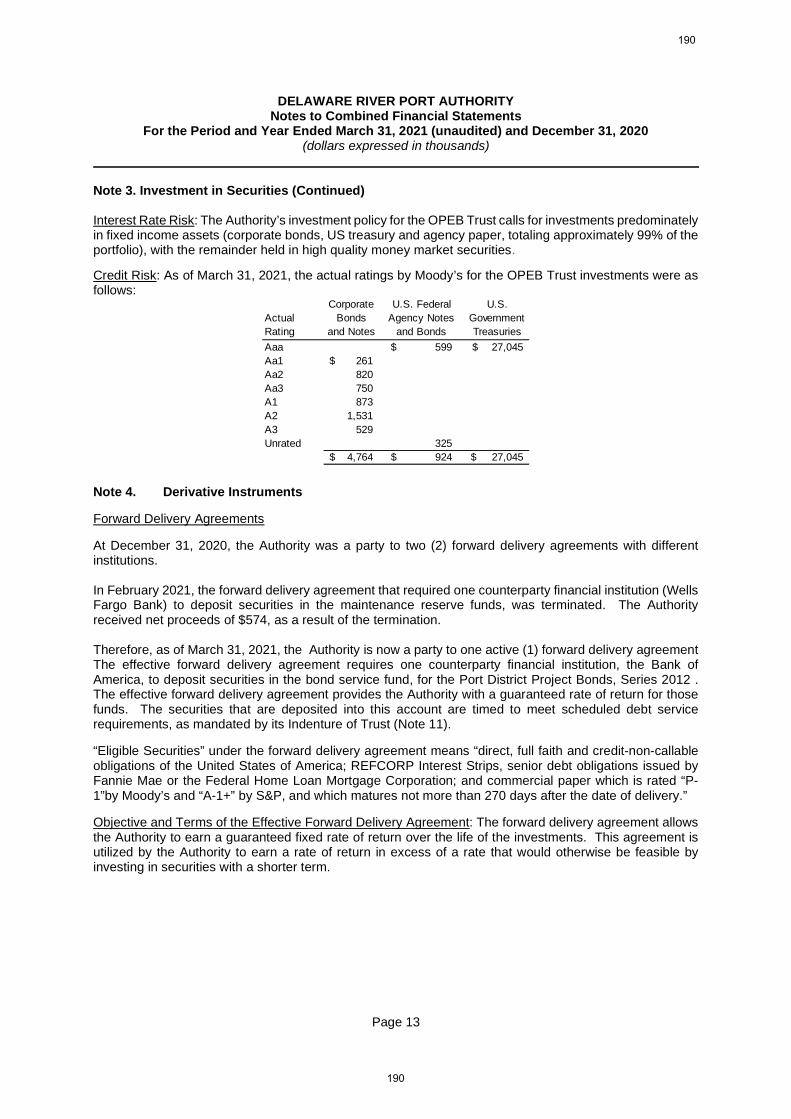
DELAWARE RIVER PORT AUTHORITYNotes to Combined Financial Statements
For the Period and Year Ended March 31, 2021 (unaudited) and December 31, 2020(dollars expressed in thousands)
Page 13
Note 3. Investment in Securities (Continued)
Interest Rate Risk: The Authority’s investment policy for the OPEB Trust calls for investments predominatelyin fixed income assets (corporate bonds, US treasury and agency paper, totaling approximately 99% of theportfolio), with the remainder held in high quality money market securities.
Credit Risk: As of March 31, 2021, the actual ratings by Moody’s for the OPEB Trust investments were asfollows:
Note 4. Derivative Instruments
Forward Delivery Agreements
At December 31, 2020, the Authority was a party to two (2) forward delivery agreements with differentinstitutions.
In February 2021, the forward delivery agreement that required one counterparty financial institution (WellsFargo Bank) to deposit securities in the maintenance reserve funds, was terminated. The Authorityreceived net proceeds of $574, as a result of the termination.
Therefore, as of March 31, 2021, the Authority is now a party to one active (1) forward delivery agreementThe effective forward delivery agreement requires one counterparty financial institution, the Bank ofAmerica, to deposit securities in the bond service fund, for the Port District Project Bonds, Series 2012 .The effective forward delivery agreement provides the Authority with a guaranteed rate of return for thosefunds. The securities that are deposited into this account are timed to meet scheduled debt servicerequirements, as mandated by its Indenture of Trust (Note 11).
“Eligible Securities” under the forward delivery agreement means “direct, full faith and credit-non-callableobligations of the United States of America; REFCORP Interest Strips, senior debt obligations issued byFannie Mae or the Federal Home Loan Mortgage Corporation; and commercial paper which is rated “P-1”by Moody’s and “A-1+” by S&P, and which matures not more than 270 days after the date of delivery.”
Objective and Terms of the Effective Forward Delivery Agreement: The forward delivery agreement allowsthe Authority to earn a guaranteed fixed rate of return over the life of the investments. This agreement isutilized by the Authority to earn a rate of return in excess of a rate that would otherwise be feasible byinvesting in securities with a shorter term.
Corporate U.S. Federal U.S.
Actual Bonds Agency Notes Government
Rating and Notes and Bonds Treasuries
Aaa 599$ 27,045$
Aa1 261$
Aa2 820
Aa3 750
A1 873
A2 1,531
A3 529
Unrated 325
4,764$ 924$ 27,045$
190
190
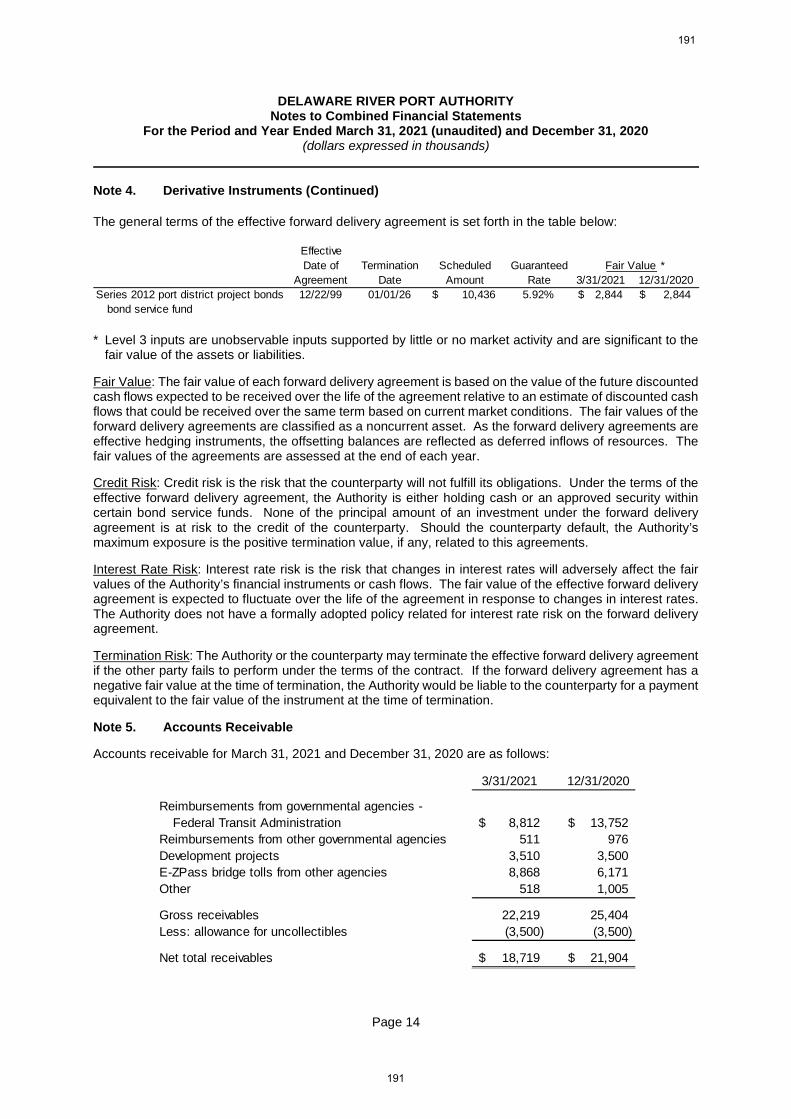
DELAWARE RIVER PORT AUTHORITYNotes to Combined Financial Statements
For the Period and Year Ended March 31, 2021 (unaudited) and December 31, 2020(dollars expressed in thousands)
Page 14
Note 4. Derivative Instruments (Continued)
The general terms of the effective forward delivery agreement is set forth in the table below:
* Level 3 inputs are unobservable inputs supported by little or no market activity and are significant to thefair value of the assets or liabilities.
Fair Value: The fair value of each forward delivery agreement is based on the value of the future discountedcash flows expected to be received over the life of the agreement relative to an estimate of discounted cashflows that could be received over the same term based on current market conditions. The fair values of theforward delivery agreements are classified as a noncurrent asset. As the forward delivery agreements areeffective hedging instruments, the offsetting balances are reflected as deferred inflows of resources. Thefair values of the agreements are assessed at the end of each year.
Credit Risk: Credit risk is the risk that the counterparty will not fulfill its obligations. Under the terms of theeffective forward delivery agreement, the Authority is either holding cash or an approved security withincertain bond service funds. None of the principal amount of an investment under the forward deliveryagreement is at risk to the credit of the counterparty. Should the counterparty default, the Authority’smaximum exposure is the positive termination value, if any, related to this agreements.
Interest Rate Risk: Interest rate risk is the risk that changes in interest rates will adversely affect the fairvalues of the Authority’s financial instruments or cash flows. The fair value of the effective forward deliveryagreement is expected to fluctuate over the life of the agreement in response to changes in interest rates.The Authority does not have a formally adopted policy related for interest rate risk on the forward deliveryagreement.
Termination Risk: The Authority or the counterparty may terminate the effective forward delivery agreementif the other party fails to perform under the terms of the contract. If the forward delivery agreement has anegative fair value at the time of termination, the Authority would be liable to the counterparty for a paymentequivalent to the fair value of the instrument at the time of termination.
Note 5. Accounts Receivable
Accounts receivable for March 31, 2021 and December 31, 2020 are as follows:
Effective
Date of Termination Scheduled Guaranteed Fair Value *
Agreement Date Amount Rate 3/31/2021 12/31/2020
Series 2012 port district project bonds 12/22/99 01/01/26 10,436$ 5.92% 2,844$ 2,844$
bond service fund
3/31/2021 12/31/2020
Reimbursements from governmental agencies -
Federal Transit Administration 8,812$ 13,752$
Reimbursements from other governmental agencies 511 976
Development projects 3,510 3,500
E-ZPass bridge tolls from other agencies 8,868 6,171
Other 518 1,005
Gross receivables 22,219 25,404
Less: allowance for uncollectibles (3,500) (3,500)
Net total receivables 18,719$ 21,904$
191
191
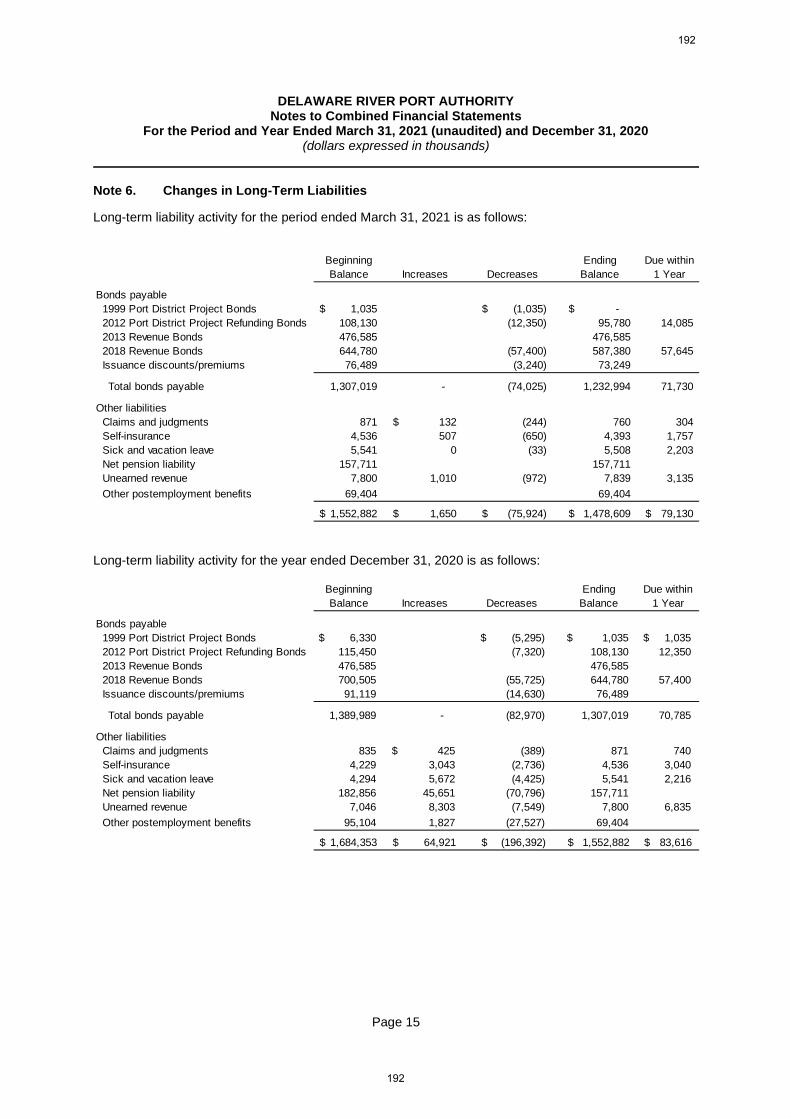
DELAWARE RIVER PORT AUTHORITYNotes to Combined Financial Statements
For the Period and Year Ended March 31, 2021 (unaudited) and December 31, 2020(dollars expressed in thousands)
Page 15
Note 6. Changes in Long-Term Liabilities
Long-term liability activity for the period ended March 31, 2021 is as follows:
Long-term liability activity for the year ended December 31, 2020 is as follows:
Beginning Ending Due within
Balance Increases Decreases Balance 1 Year
Bonds payable
1999 Port District Project Bonds 1,035$ (1,035)$ -$
2012 Port District Project Refunding Bonds 108,130 (12,350) 95,780 14,085
2013 Revenue Bonds 476,585 476,585
2018 Revenue Bonds 644,780 (57,400) 587,380 57,645
Issuance discounts/premiums 76,489 (3,240) 73,249
Total bonds payable 1,307,019 - (74,025) 1,232,994 71,730
Other liabilities
Claims and judgments 871 132$ (244) 760 304
Self-insurance 4,536 507 (650) 4,393 1,757
Sick and vacation leave 5,541 0 (33) 5,508 2,203
Net pension liability 157,711 157,711
Unearned revenue 7,800 1,010 (972) 7,839 3,135
Other postemployment benefits 69,404 69,404
1,552,882$ 1,650$ (75,924)$ 1,478,609$ 79,130$
Beginning Ending Due within
Balance Increases Decreases Balance 1 Year
Bonds payable
1999 Port District Project Bonds 6,330$ (5,295)$ 1,035$ 1,035$
2012 Port District Project Refunding Bonds 115,450 (7,320) 108,130 12,350
2013 Revenue Bonds 476,585 476,585
2018 Revenue Bonds 700,505 (55,725) 644,780 57,400
Issuance discounts/premiums 91,119 (14,630) 76,489
Total bonds payable 1,389,989 - (82,970) 1,307,019 70,785
Other liabilities
Claims and judgments 835 425$ (389) 871 740
Self-insurance 4,229 3,043 (2,736) 4,536 3,040
Sick and vacation leave 4,294 5,672 (4,425) 5,541 2,216
Net pension liability 182,856 45,651 (70,796) 157,711
Unearned revenue 7,046 8,303 (7,549) 7,800 6,835
Other postemployment benefits 95,104 1,827 (27,527) 69,404
1,684,353$ 64,921$ (196,392)$ 1,552,882$ 83,616$
192
192

DELAWARE RIVER PORT AUTHORITYNotes to Combined Financial Statements
For the Period and Year Ended March 31, 2021 (unaudited) and December 31, 2020(dollars expressed in thousands)
Page 16
Note 7. Investment in Facilities
Capital assets for the period ended March 31, 2021 were as follows:
Capital assets for the year ended December 31, 2020 were as follows:
Total depreciation expense for the periods ended March 31, 2021 and December 31, 2020 was $17,957and $74,791, respectively.
Beginning Ending
Balance Increases Decreases Balance
Capital assets not being depreciated
Land 74,059$ 74,059$
Construction in progress 684,280 16,119$ 700,399
Total capital assets not being depreciated 758,339 16,119 - 774,458
Capital assets being depreciated
Bridges and related building and equipment 1,387,548 1,387,548
Transit property and equipment 789,434 789,434
Port enhancements 6,703 6,703
Total capital assets being depreciated 2,183,685 - - 2,183,685
Less: accumulated depreciation for:
Bridges and related building and equipment (753,175) (11,357) (764,532)
Transit property and equipment (355,657) (6,536) (362,193)
Port enhancements (6,120) (63) (6,183)
Total accumulated depreciation (1,114,952) (17,957) (1,132,909)
Total capital assets being depreciated, net 1,068,733 (17,957) - 1,050,776
Total capital assets, net 1,827,072$ (1,837)$ -$ 1,825,235$
Beginning Ending
Balance Increases Decreases Balance
Capital assets not being depreciated
Land 74,059$ 74,059$
Construction in progress 519,295 196,362$ (31,377)$ 684,280
Total capital assets not being depreciated 593,354 196,362 (31,377) 758,339
Capital assets being depreciated
Bridges and related building and equipment 1,371,382 16,166 1,387,548
Transit property and equipment 769,865 21,440 (1,871) 789,434
Port enhancements 6,703 6,703
Total capital assets being depreciated 2,147,950 37,606 (1,871) 2,183,685
Less: accumulated depreciation for:
Bridges and related building and equipment (704,040) (49,135) (753,175)
Transit property and equipment (332,119) (25,403) 1,865 (355,657)
Port enhancements (5,867) (253) (6,120)
Total accumulated depreciation (1,042,026) (74,791) 1,865 (1,114,952)
Total capital assets being depreciated, net 1,105,924 (37,185) (6) 1,068,733
Total capital assets, net 1,699,278$ 159,177$ (31,383)$ 1,827,072$
193
193

DELAWARE RIVER PORT AUTHORITYNotes to Combined Financial Statements
For the Period and Year Ended March 31, 2021 (unaudited) and December 31, 2020(dollars expressed in thousands)
Page 17
Note 8. Deferred Compensation Plan
The Authority offers its employees a deferred compensation plan in accordance with Internal RevenueCode Section 457. The plan, available to all full-time employees, permits them to defer a portion of theirsalary until future years. The deferred compensation is not available to employees until termination,retirement, death, or unforeseeable emergency. The Authority does not make any contributions to the plan.To comply with changes in federal regulations and GASBS 32, Accounting and Financial Reporting forInternal Revenue Code 457 Deferred Compensation Plans, the Authority amended the plan in 1998 so thatall amounts of compensation deferred under the plan, all property and rights purchased with those amounts,and all income attributable to those amounts, property, or rights are solely the property of the employees.
Note 9. Pension Plans
Employees of the Authority participate in the Pennsylvania State Employees’ Retirement System (“SERS”),the State of New Jersey Public Employees’ Retirement System (“PERS”), or the Teamsters Pension Planof Philadelphia and Vicinity.
General Information about the Plans
Plan Descriptions
Pennsylvania State Employees’ Retirement System: The Pennsylvania State Employees' RetirementSystem is the administrator of a cost-sharing multiple-employer defined benefit pension plan establishedby the Commonwealth of Pennsylvania (“Commonwealth”) to provide pension benefits for employees ofstate government and certain independent agencies. SERS is a component unit of the Commonwealth andis included in the Commonwealth's financial report as a pension trust fund. Membership in SERS ismandatory for most state employees. Members and employees of the General Assembly, certain electedor appointed officials in the executive branch, department heads, and certain employees in the field ofeducation are not required, but are given the option to participate.
SERS provides retirement, death, and disability benefits. Article II of the Commonwealth's constitutionassigns the authority to establish and amend the benefit provision of the plan to the General Assembly.Member retirement benefits are determined by taking years of credited service, multiplied by final averagesalary, multiplied by 2%, multiplied by class of service multiplier. According to the State Employees'Retirement Code, all obligations of SERS will be assumed by the Commonwealth should SERS terminate.
The Pennsylvania State Employees’ Retirement System issues a publicly available annual financial report,including financial statements, which may be obtained by writing to Pennsylvania State Employees’Retirement System, 30 North 3rd Street, Suite 150, Harrisburg, Pennsylvania 17101.
State of New Jersey Public Employees' Retirement System: The Public Employees' Retirement System(“PERS”) is the administrator of a cost-sharing multiple-employer defined benefit pension plan establishedby the State of New Jersey (“State”) which was established as of January 1, 1955 under the provisions ofN.J.S.A. 43:15A. The PERS’ designated purpose is to provide retirement, death, disability, and medicalbenefits to certain qualified members. Membership in the PERS is mandatory for some full-time employeesof the Authority, provided the employee is not required to be a member of another state-administeredretirement system or other state pensions fund or local jurisdiction’s pension fund. The PERS’ Board ofTrustees is primarily responsible for the administration of the PERS.
The State of New Jersey Public Employees’ Retirement System issues a publicly available annual financialreport, including financial statements, which may be obtained by writing to State of New Jersey, Division ofPensions and Benefits, P.O. Box 295, Trenton, New Jersey 08625-0295.
194
194
DELAWARE RIVER PORT AUTHORITYNotes to Combined Financial Statements
For the Period and Year Ended March 31, 2021 (unaudited) and December 31, 2020(dollars expressed in thousands)
Page 18
Note 9. Pension Plans (Continued)
General Information about the Plans (Continued)
Plan Descriptions (Continued)
Teamsters Pension Plan of Philadelphia and Vicinity: The Teamsters Health and Welfare Fund ofPhiladelphia and Vicinity (the “Fund”) covers all eligible employees working for employers who have acollective bargaining agreement with a Teamsters local union which is party to the Fund and under whichthe employers have agreed to make contributions to the Fund on the employees' behalf in accordance withnegotiated hourly rates. The Fund is a cost-sharing multiple-employer defined benefit that was establishedunder the terms of collective bargaining agreements between the employers and Teamsters local unions(the local unions), located in central and northeast portions of Pennsylvania, along the eastern shore ofMaryland, Maine, New York and Ohio, and is not a state or local governmental pension plan. The Fund isgenerally non-contributory, but does provide for participant contributions under the Consolidated OmnibusBudget Reconciliation Act (COBRA). The Fund provides health and other benefits to eligible participantswho are covered under collective bargaining agreements, or other written agreements, with the local unions.The Fund is administered by a Board of Trustees (Trustees) with equal representation by the employersand the local unions and is subject to the provisions of the Employee Retirement Income Security Act of1974, as amended (ERISA). Benefit terms are established, and amended, by the Trustees. The Authorityis not subject to any provisions regarding withdrawal from the Fund.
The Teamsters Pension Plan of Philadelphia and Vicinity issues a publicly available annual financial report,including financial statements, which may be obtained by writing to Teamsters Pension Plan of Philadelphiaand Vicinity, Fourth and Cherry Streets, Philadelphia, Pennsylvania 19106.
Vesting and Benefit Provisions
Pennsylvania State Employees’ Retirement System: A member may retire after completing three years ofservice and after reaching normal retirement age (the age of 60, except police officers at age 50, or the ageat which 35 years of service has been completed, whichever occurs first). Benefits vest after five years ofservice, or after 10 years of service for those hired on or after January 1, 2011. If an employee terminateshis or her employment after at least five years of service (10 years if hired on or after January 1, 2011) butbefore the normal retirement age, he or she may receive pension benefits immediately or defer pensionbenefits until reaching retirement age. Employees who retire after reaching the normal retirement age withat least three years of credited service who started on or prior to December 31, 2010 are entitled to receivepension benefits equal to 2.5% (2.0% for employees starting on or after January 1, 2011, unless they optto pay more to be eligible for the 2.5%) of their final average compensation (average of the three highestyears in earnings) times the number of years for which they were a participant in the plan. The pensionbenefits received by an employee who retires after five years of credited service but before normalretirement age are reduced for the number of years that person is under normal retirement age.
Pension provisions include death benefits, under which the surviving beneficiary may be entitled to receivethe employee’s accumulated contributions less the amount of pension payments that the employeereceived, the present value of the employees’ account at retirement less the amount of pension benefitsreceived by the employee, the same pension benefits formerly received by the employee, or one-half of themonthly pension payment formerly received by the employee. The maximum pension benefit to theemployee previously described may be reduced depending on the benefits elected for the survivingbeneficiary.
195
195
DELAWARE RIVER PORT AUTHORITYNotes to Combined Financial Statements
For the Period and Year Ended March 31, 2021 (unaudited) and December 31, 2020(dollars expressed in thousands)
Page 19
Note 9. Pension Plans (Continued)
General Information about the Plans (Continued)
Vesting and Benefit Provisions (Continued)
State of New Jersey Public Employees’ Retirement System: The vesting and benefit provisions are set byN.J.S.A. 43:15A. PERS provides retirement, death and disability benefits. All benefits vest after ten yearsof service, except for medical benefits, which vest after 25 years of service or under the disability provisionsof the PERS.
The following represents the membership tiers for PERS:
Tier Definition
1 Members who were enrolled prior to July 1, 20072 Members who were eligible to enroll on or after July 1, 2007 and prior to November 2, 20083 Members who were eligible to enroll on or after November 2, 2008 and prior to May 21, 20104 Members who were eligible to enroll after May 21, 2010 and prior to June 28, 20115 Members who were eligible to enroll on or after June 28, 2011
Service retirement benefits of 1/55th of final average salary for each year of service credit is available totiers 1 and 2 members upon reaching age 60 and to tier 3 members upon reaching age 62. Serviceretirement benefits of 1/60th of final average salary for each year of service credit is available to tier 4members upon reaching age 62 and tier 5 members upon reaching age 65. Early retirement benefits areavailable to tiers 1 and 2 members before reaching age 60, tiers 3 and 4 with 25 years or more of servicecredit before age 62, and tier 5 with 30 or more years of service credit before age 65. Benefits are reducedby a fraction of a percent for each month that a member retires prior to the age at which a member canreceive full early retirement benefits in accordance with their respective tier. Tier 1 members can receivean unreduced benefit from age 55 to age 60 if they have at least 25 years of service. Deferred retirementis available to members who have at least 10 years of service credit and have not reached the serviceretirement age for the respective tier.
Teamsters Pension Plan of Philadelphia and Vicinity: A member may retire at the later of (a) the date theemployee reaches 65 or (b) the tenth anniversary of the employee’s commencement of participation in theplan. Additionally, employees are eligible for early retirement after 10 years of participation in the plan and(a) completion of 30 years of vested service or (b) attainment of age 50 and completion of 10 years ofvested service. Benefits vest after 10 years of service. An employee who retires on or after his or hernormal retirement age is entitled to receive benefits based on his or her credited years of service multipliedby a monthly benefit rate, which is determined based on the employer’s daily contributions. The benefitsare subject to maximum rates that vary according to employer daily contribution rates. Members may alsoreceive benefits after early retirement at reduced rates, depending on age at retirement.
An employee who qualifies for disability retirement benefits (total and permanent disability with 10 years ofvested service and 5 years of continuous service with at least 300 covered days of contributions) is entitledto receive two hundred dollars per month until retirement age, when retirement benefits would commence.
Provisions include surviving spouse death benefits, under which the surviving spouse is entitled to a 50%survivor annuity in certain cases.
At December 31, 2020, 2019, and 2018, the Authority had 220, 203, and 218 employees, respectively,covered by the Fund.
196
196
DELAWARE RIVER PORT AUTHORITYNotes to Combined Financial Statements
For the Period and Year Ended March 31, 2021 (unaudited) and December 31, 2020(dollars expressed in thousands)
Page 20
Note 9. Pension Plans (Continued)
General Information about the Plans (Continued)
Contributions
Pennsylvania State Employees’ Retirement System: The contribution requirements of plan members andthe Authority are established and amended by the Pennsylvania State Employees’ Retirement SystemBoard. As of January 1, 2011, employee’s contribution rates range from 5% to 9.3% of their gross earningsdepending on their plan selection.
Employer contribution rates are certified by the SERS Board annually, typically in April of each year tobecome effective the following fiscal year beginning in June. It is customary for rates to result from anindependent actuarial valuation of the pension fund. The employer contribution rate is set so that it canfund all retirement benefits earned by employees working during the year and pay toward any unfundedliability that may exist. In some cases, however, the actuarially calculated employer contribution rate hasbeen set or adjusted by Pennsylvania law.
The Authority’s contractually required contribution rate for the years ended December 31, 2020 and 2019was 34.37% and 30.78%, respectively, of the Authority’s covered payroll, and the Authority’s contractuallyrequired quarterly contributions to the pension plan for 2020 and 2019 totaled $17,006 (includes $940 ofaccrued pension liability) and $16,663 (includes $12,052 of accrued pension liability), respectively.Employee contributions to the plan during 2020 and 2019 were $3,599 and $3,593, respectively.
State of New Jersey Public Employees’ Retirement System: The contribution policy is set by N.J.S.A.43:15A and requires contributions by active members and contributing employers. Pursuant to theprovisions of Chapter 78, P.L. 2011, the active member contribution rate increased from 5.5% of annualcompensation to 6.5% plus an additional 1% phased-in over 7 years beginning in July 2012. The membercontribution rate was 7.34% in State fiscal year 2018. The phase-in of the additional incremental membercontribution rate takes place in July of each subsequent State fiscal year. Employers' contribution arebased on an actuarially determined amount, which includes the normal cost and unfunded accrued liability.
The Authority’s contractually required contribution rate for the years ended December 31, 2020 and 2019was 15.72% and 12.37%, respectively, of the Authority’s covered payroll. This amount was actuariallydetermined as the amount that, when combined with employee contributions, is expected to finance thecosts of benefits earned by employees during the year, including an additional amount to finance anyunfunded accrued liability. The Authority’s contractually required contributions to the pension plan for theyears ended December 31, 2020 and 2019 were $132 and $106, which is and was due on April 1, 2021and April 1, 2020, respectively. Employee contributions to the plan during 2020 and 2019 were $63 and$66, respectively.
Teamsters Pension Plan of Philadelphia and Vicinity: The employer’s contribution requirements aredetermined under the terms of one Collective Bargaining Agreement (“CBA”) in force. The CBA betweenPort Authority Transit Corporation (“PATCO”) and Teamsters Local 676 (“Teamsters”) expired December31, 2017. PATCO and Teamsters subsequently entered into an Agreement executed by PATCO on July23, 2018. That Agreement extended the CBA without change and provided that PATCO will continue tomake contributions to the Teamsters Health and Welfare Fund of Philadelphia and Vicinity and theTeamsters Pension Trust Fund of Philadelphia and Vicinity in the same manner and method as set forth inthe CBA at the contribution rates established by the Trustees of the respective Funds, increasing effectiveJune 1, 2018 and August 1, 2018, respectively, subject to increases on a yearly basis, until such time as anew CBA is reached or either party terminates the Agreement. During 2020, the Authority was required toand did contribute thirty dollars and seventy cents ($30.70) per day from January 1 through July 31, andthirty-two dollars and twenty-four cents ($32.24) per day from August 1 through December 31 for eachPATCO participating employee. For the 2019 year, the Authority was required to and did contribute twenty-nine dollars and twenty-four cents ($29.24) per day from January 1 through June 30, and thirty dollars andseventy cents ($30.70) per day, from July 1 through December 31 for each PATCO participating employee.
197
197
DELAWARE RIVER PORT AUTHORITYNotes to Combined Financial Statements
For the Period and Year Ended March 31, 2021 (unaudited) and December 31, 2020(dollars expressed in thousands)
Page 21
Note 9. Pension Plans (Continued)
General Information about the Plans (Continued)
Contributions (Continued)
Teamsters Pension Plan of Philadelphia and Vicinity (Continued): The Authority’s contributions totaled10.02%, 9.27%, and 9.55% of covered payroll in 2020, 2019 and 2018, respectively.
The employees of the Authority do not contribute to the Fund. The Authority contributed $1,608, $1,474,and $1,378 in 2020, 2019 and 2018, respectively, which represented 100% of the required contributionsfor the aforementioned years.
Pension Liabilities, Pension Expense, and Deferred Outflows of Resources and Deferred Inflows ofResources Related to Pensions
Pennsylvania State Employees’ Retirement System: At December 31, 2020, the Authority’s proportionateshare of the SERS net pension liability was $155,749. The net pension liability was measured as ofDecember 31, 2019, and the total pension liability used to calculate the net pension liability was determinedby an actuarial valuation as of December 31, 2019. The Authority’s proportion of the net pension liabilitywas based on a projection of the Authority’s long-term share of contributions to the pension plan relative tothe projected contributions of all participating employers, actuarially determined. For the December 31,2019 measurement date, the Authority’s proportion was .85679926%, which was a decrease of.01162913% from its proportion measured as of December 31, 2018.
At December 31, 2019, the Authority’s proportionate share of the SERS net pension liability was $180,903.The net pension liability was measured as of December 31, 2018, and the total pension liability used tocalculate the net pension liability was determined by an actuarial valuation as of December 31, 2018. TheAuthority’s proportion of the net pension liability was based on a projection of the Authority’s long-termshare of contributions to the pension plan relative to the projected contributions of all participatingemployers, actuarially determined. For the December 31, 2018 measurement date, the Authority’sproportion was .86842839%, which was an increase of .04515274% from its proportion measured as ofDecember 31, 2017.
At December 31, 2020 and 2019, the Authority’s proportionate share of the SERS pension expense,calculated by the Plan as of the December 31, 2019 and 2018 measurement dates, was $24,216 and$28,225, respectively.
State of New Jersey Public Employees’ Retirement System: At December 31, 2020, the Authority’sproportionate share of the PERS net pension liability was $1,962. The net pension liability was measuredas of June 30, 2020, and the total pension liability used to calculate the net pension liability was determinedby an actuarial valuation as of July 1, 2019. The total pension liability was calculated using updatedprocedures to roll forward from the actuarial valuation date to the measurement date of June 30, 2020. TheAuthority’s proportion of the net pension liability was based on a projection of the Authority’s long-termshare of contributions to the pension plan relative to the projected contributions of all participatingemployers, actuarially determined. For the June 30, 2020 measurement date, the Authority’s proportionwas .0120311762%, which was an increase of .0011909983% from its proportion measured as of June 30,2019.
198
198
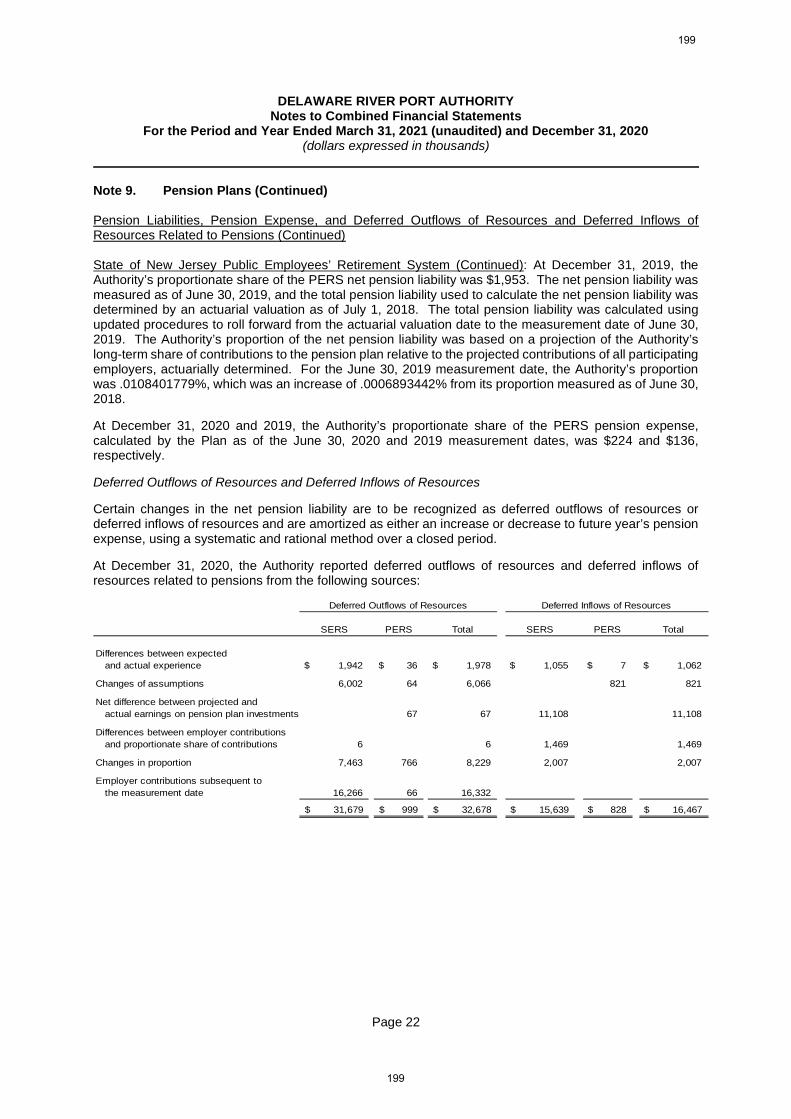
DELAWARE RIVER PORT AUTHORITYNotes to Combined Financial Statements
For the Period and Year Ended March 31, 2021 (unaudited) and December 31, 2020(dollars expressed in thousands)
Page 22
Note 9. Pension Plans (Continued)
Pension Liabilities, Pension Expense, and Deferred Outflows of Resources and Deferred Inflows ofResources Related to Pensions (Continued)
State of New Jersey Public Employees’ Retirement System (Continued): At December 31, 2019, theAuthority’s proportionate share of the PERS net pension liability was $1,953. The net pension liability wasmeasured as of June 30, 2019, and the total pension liability used to calculate the net pension liability wasdetermined by an actuarial valuation as of July 1, 2018. The total pension liability was calculated usingupdated procedures to roll forward from the actuarial valuation date to the measurement date of June 30,2019. The Authority’s proportion of the net pension liability was based on a projection of the Authority’slong-term share of contributions to the pension plan relative to the projected contributions of all participatingemployers, actuarially determined. For the June 30, 2019 measurement date, the Authority’s proportionwas .0108401779%, which was an increase of .0006893442% from its proportion measured as of June 30,2018.
At December 31, 2020 and 2019, the Authority’s proportionate share of the PERS pension expense,calculated by the Plan as of the June 30, 2020 and 2019 measurement dates, was $224 and $136,respectively.
Deferred Outflows of Resources and Deferred Inflows of Resources
Certain changes in the net pension liability are to be recognized as deferred outflows of resources ordeferred inflows of resources and are amortized as either an increase or decrease to future year’s pensionexpense, using a systematic and rational method over a closed period.
At December 31, 2020, the Authority reported deferred outflows of resources and deferred inflows ofresources related to pensions from the following sources:
SERS PERS Total SERS PERS Total
Differences between expected
and actual experience 1,942$ 36$ 1,978$ 1,055$ 7$ 1,062$
Changes of assumptions 6,002 64 6,066 821 821
Net difference between projected and
actual earnings on pension plan investments 67 67 11,108 11,108
Differences between employer contributions
and proportionate share of contributions 6 6 1,469 1,469
Changes in proportion 7,463 766 8,229 2,007 2,007
Employer contributions subsequent to
the measurement date 16,266 66 16,332
31,679$ 999$ 32,678$ 15,639$ 828$ 16,467$
Deferred Outflows of Resources Deferred Inflows of Resources
199
199
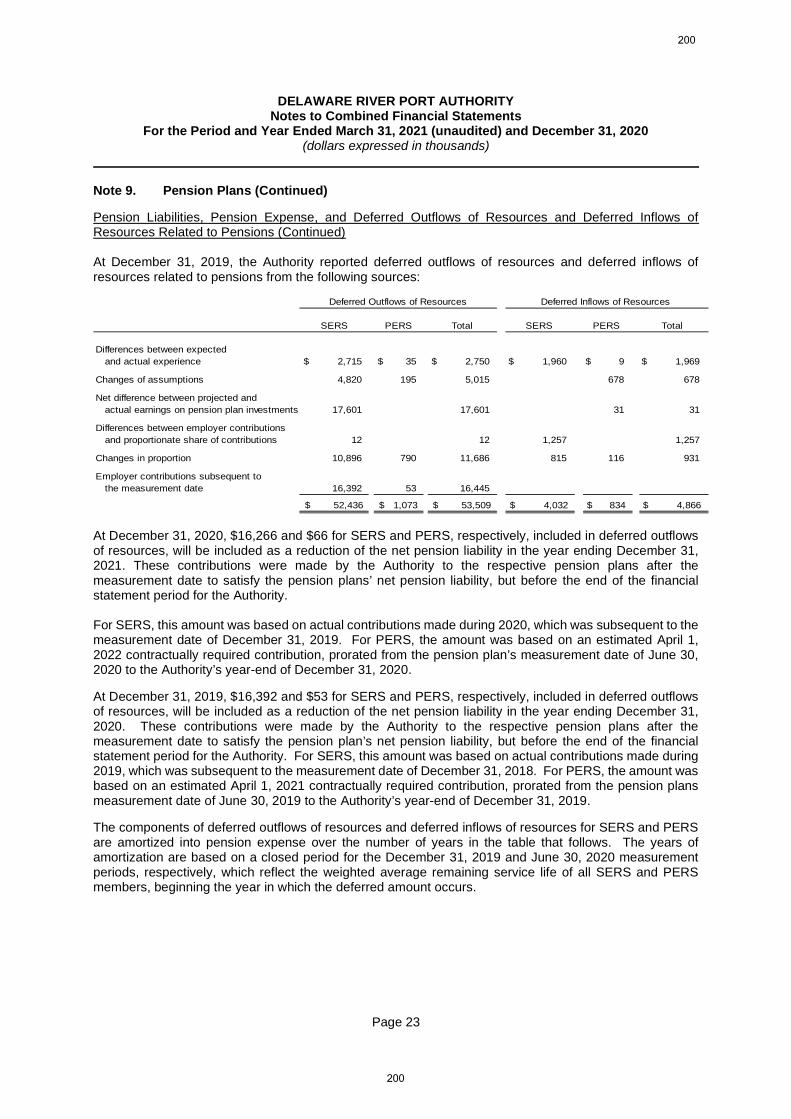
DELAWARE RIVER PORT AUTHORITYNotes to Combined Financial Statements
For the Period and Year Ended March 31, 2021 (unaudited) and December 31, 2020(dollars expressed in thousands)
Page 23
Note 9. Pension Plans (Continued)
Pension Liabilities, Pension Expense, and Deferred Outflows of Resources and Deferred Inflows ofResources Related to Pensions (Continued)
At December 31, 2019, the Authority reported deferred outflows of resources and deferred inflows ofresources related to pensions from the following sources:
SERS PERS Total SERS PERS Total
Differences between expected
and actual experience 2,715$ 35$ 2,750$ 1,960$ 9$ 1,969$
Changes of assumptions 4,820 195 5,015 678 678
Net difference between projected and
actual earnings on pension plan investments 17,601 17,601 31 31
Differences between employer contributions
and proportionate share of contributions 12 12 1,257 1,257
Changes in proportion 10,896 790 11,686 815 116 931
Employer contributions subsequent to
the measurement date 16,392 53 16,445
52,436$ 1,073$ 53,509$ 4,032$ 834$ 4,866$
Deferred Outflows of Resources Deferred Inflows of Resources
At December 31, 2020, $16,266 and $66 for SERS and PERS, respectively, included in deferred outflowsof resources, will be included as a reduction of the net pension liability in the year ending December 31,2021. These contributions were made by the Authority to the respective pension plans after themeasurement date to satisfy the pension plans’ net pension liability, but before the end of the financialstatement period for the Authority.
For SERS, this amount was based on actual contributions made during 2020, which was subsequent to themeasurement date of December 31, 2019. For PERS, the amount was based on an estimated April 1,2022 contractually required contribution, prorated from the pension plan’s measurement date of June 30,2020 to the Authority’s year-end of December 31, 2020.
At December 31, 2019, $16,392 and $53 for SERS and PERS, respectively, included in deferred outflowsof resources, will be included as a reduction of the net pension liability in the year ending December 31,2020. These contributions were made by the Authority to the respective pension plans after themeasurement date to satisfy the pension plan’s net pension liability, but before the end of the financialstatement period for the Authority. For SERS, this amount was based on actual contributions made during2019, which was subsequent to the measurement date of December 31, 2018. For PERS, the amount wasbased on an estimated April 1, 2021 contractually required contribution, prorated from the pension plansmeasurement date of June 30, 2019 to the Authority’s year-end of December 31, 2019.
The components of deferred outflows of resources and deferred inflows of resources for SERS and PERSare amortized into pension expense over the number of years in the table that follows. The years ofamortization are based on a closed period for the December 31, 2019 and June 30, 2020 measurementperiods, respectively, which reflect the weighted average remaining service life of all SERS and PERSmembers, beginning the year in which the deferred amount occurs.
200
200
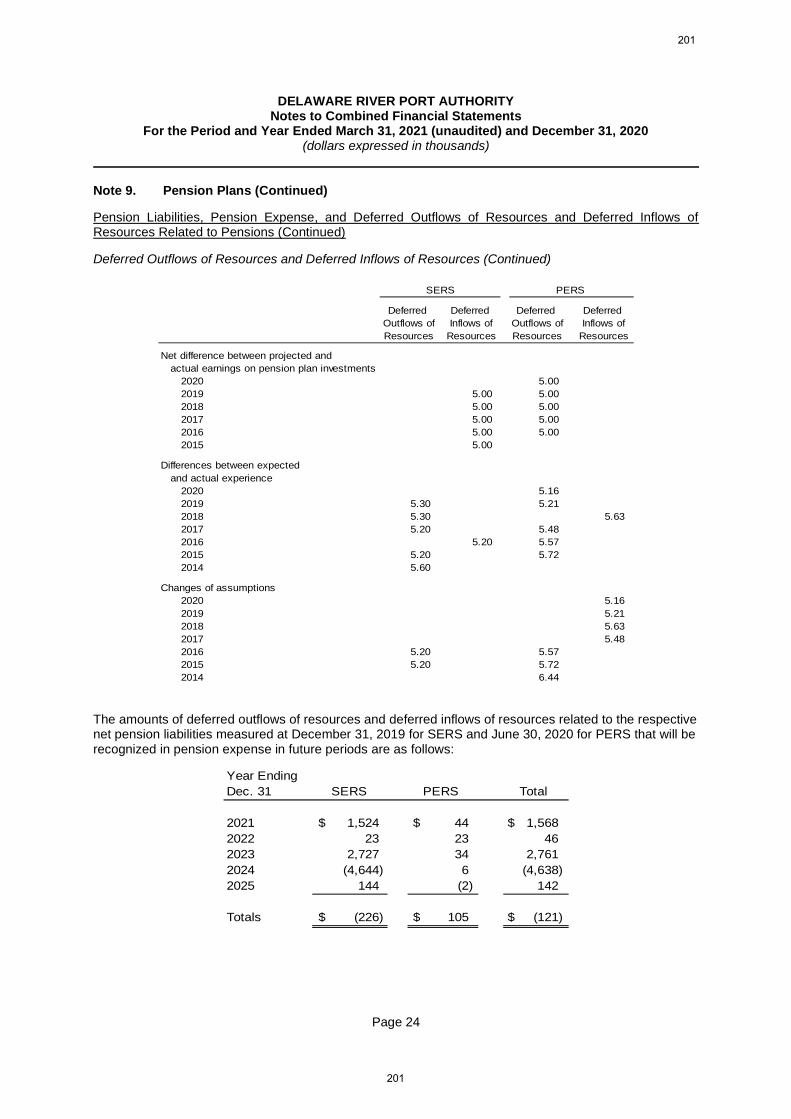
DELAWARE RIVER PORT AUTHORITYNotes to Combined Financial Statements
For the Period and Year Ended March 31, 2021 (unaudited) and December 31, 2020(dollars expressed in thousands)
Page 24
Note 9. Pension Plans (Continued)
Pension Liabilities, Pension Expense, and Deferred Outflows of Resources and Deferred Inflows ofResources Related to Pensions (Continued)
Deferred Outflows of Resources and Deferred Inflows of Resources (Continued)
SERS PERS
Deferred Deferred Deferred Deferred
Outflows of Inflows of Outflows of Inflows of
Resources Resources Resources Resources
Net difference between projected and
actual earnings on pension plan investments
2020 5.00
2019 5.00 5.00
2018 5.00 5.00
2017 5.00 5.00
2016 5.00 5.00
2015 5.00
Differences between expected
and actual experience
2020 5.16
2019 5.30 5.21
2018 5.30 5.63
2017 5.20 5.48
2016 5.20 5.57
2015 5.20 5.72
2014 5.60
Changes of assumptions
2020 5.16
2019 5.21
2018 5.63
2017 5.48
2016 5.20 5.57
2015 5.20 5.72
2014 6.44
The amounts of deferred outflows of resources and deferred inflows of resources related to the respectivenet pension liabilities measured at December 31, 2019 for SERS and June 30, 2020 for PERS that will berecognized in pension expense in future periods are as follows:
Year Ending
Dec. 31 SERS PERS Total
2021 1,524$ 44$ 1,568$
2022 23 23 46
2023 2,727 34 2,761
2024 (4,644) 6 (4,638)
2025 144 (2) 142
Totals (226)$ 105$ (121)$
201
201
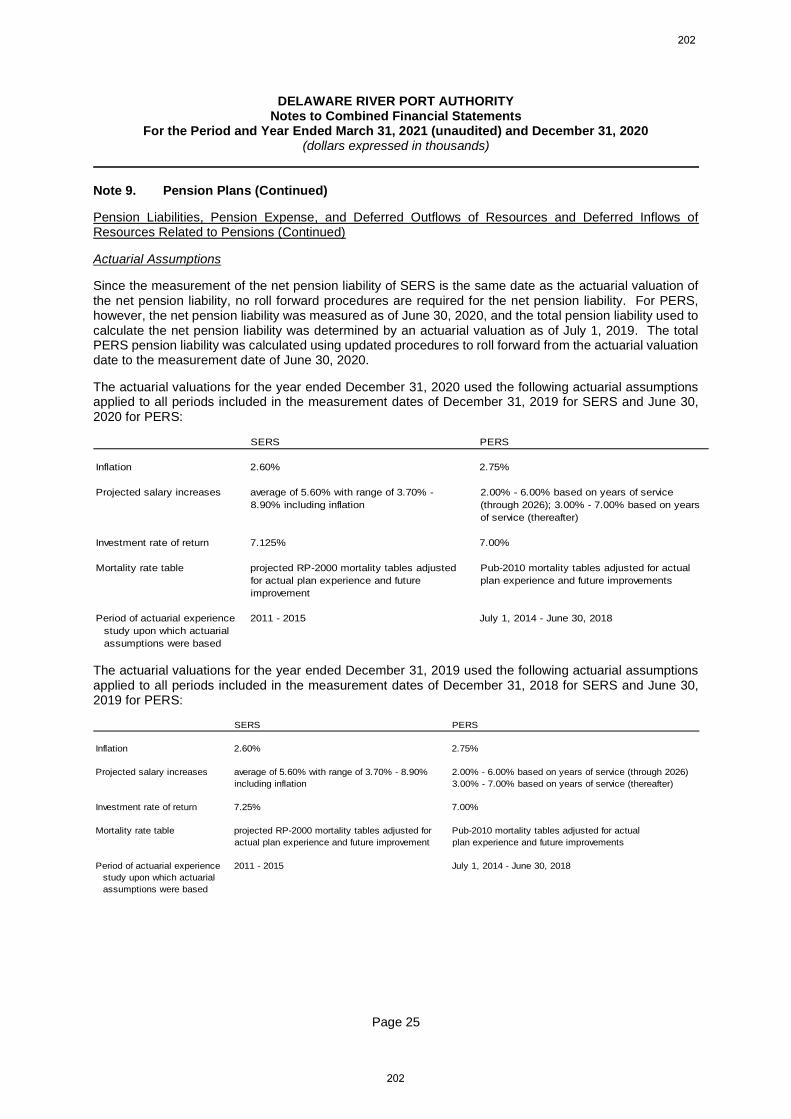
DELAWARE RIVER PORT AUTHORITYNotes to Combined Financial Statements
For the Period and Year Ended March 31, 2021 (unaudited) and December 31, 2020(dollars expressed in thousands)
Page 25
Note 9. Pension Plans (Continued)
Pension Liabilities, Pension Expense, and Deferred Outflows of Resources and Deferred Inflows ofResources Related to Pensions (Continued)
Actuarial Assumptions
Since the measurement of the net pension liability of SERS is the same date as the actuarial valuation ofthe net pension liability, no roll forward procedures are required for the net pension liability. For PERS,however, the net pension liability was measured as of June 30, 2020, and the total pension liability used tocalculate the net pension liability was determined by an actuarial valuation as of July 1, 2019. The totalPERS pension liability was calculated using updated procedures to roll forward from the actuarial valuationdate to the measurement date of June 30, 2020.
The actuarial valuations for the year ended December 31, 2020 used the following actuarial assumptionsapplied to all periods included in the measurement dates of December 31, 2019 for SERS and June 30,2020 for PERS:
SERS PERS
Inflation 2.60% 2.75%
Projected salary increases average of 5.60% with range of 3.70% -
8.90% including inflation
2.00% - 6.00% based on years of service
(through 2026); 3.00% - 7.00% based on years
of service (thereafter)
Investment rate of return 7.125% 7.00%
Mortality rate table projected RP-2000 mortality tables adjusted
for actual plan experience and future
improvement
Pub-2010 mortality tables adjusted for actual
plan experience and future improvements
Period of actuarial experience 2011 - 2015 July 1, 2014 - June 30, 2018
study upon which actuarial
assumptions were based
The actuarial valuations for the year ended December 31, 2019 used the following actuarial assumptionsapplied to all periods included in the measurement dates of December 31, 2018 for SERS and June 30,2019 for PERS:
SERS PERS
Inflation 2.60% 2.75%
Projected salary increases average of 5.60% with range of 3.70% - 8.90% 2.00% - 6.00% based on years of service (through 2026)
including inflation 3.00% - 7.00% based on years of service (thereafter)
Investment rate of return 7.25% 7.00%
Mortality rate table projected RP-2000 mortality tables adjusted for Pub-2010 mortality tables adjusted for actual
actual plan experience and future improvement plan experience and future improvements
Period of actuarial experience 2011 - 2015 July 1, 2014 - June 30, 2018
study upon which actuarial
assumptions were based
202
202
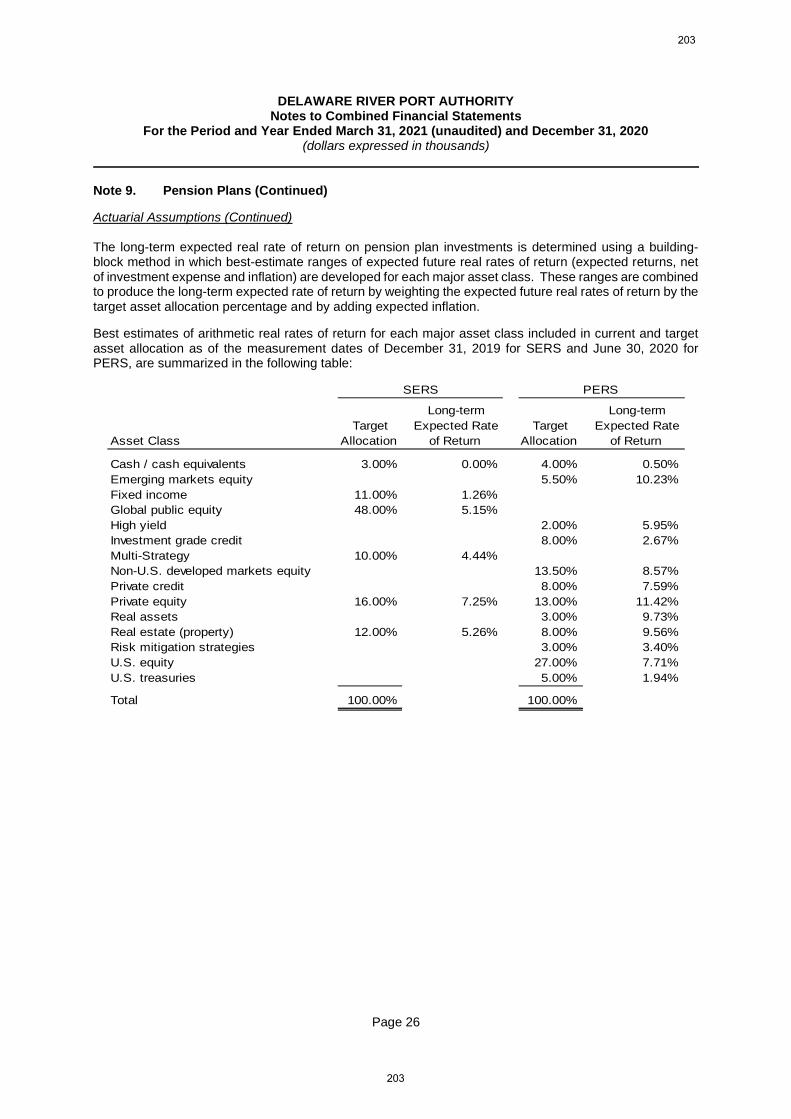
DELAWARE RIVER PORT AUTHORITYNotes to Combined Financial Statements
For the Period and Year Ended March 31, 2021 (unaudited) and December 31, 2020(dollars expressed in thousands)
Page 26
Note 9. Pension Plans (Continued)
Actuarial Assumptions (Continued)
The long-term expected real rate of return on pension plan investments is determined using a building-block method in which best-estimate ranges of expected future real rates of return (expected returns, netof investment expense and inflation) are developed for each major asset class. These ranges are combinedto produce the long-term expected rate of return by weighting the expected future real rates of return by thetarget asset allocation percentage and by adding expected inflation.
Best estimates of arithmetic real rates of return for each major asset class included in current and targetasset allocation as of the measurement dates of December 31, 2019 for SERS and June 30, 2020 forPERS, are summarized in the following table:
SERS PERS
Long-term Long-term
Target Expected Rate Target Expected Rate
Asset Class Allocation of Return Allocation of Return
Cash / cash equivalents 3.00% 0.00% 4.00% 0.50%
Emerging markets equity 5.50% 10.23%
Fixed income 11.00% 1.26%
Global public equity 48.00% 5.15%
High yield 2.00% 5.95%
Investment grade credit 8.00% 2.67%
Multi-Strategy 10.00% 4.44%
Non-U.S. developed markets equity 13.50% 8.57%
Private credit 8.00% 7.59%
Private equity 16.00% 7.25% 13.00% 11.42%
Real assets 3.00% 9.73%
Real estate (property) 12.00% 5.26% 8.00% 9.56%
Risk mitigation strategies 3.00% 3.40%
U.S. equity 27.00% 7.71%
U.S. treasuries 5.00% 1.94%
Total 100.00% 100.00%
203
203
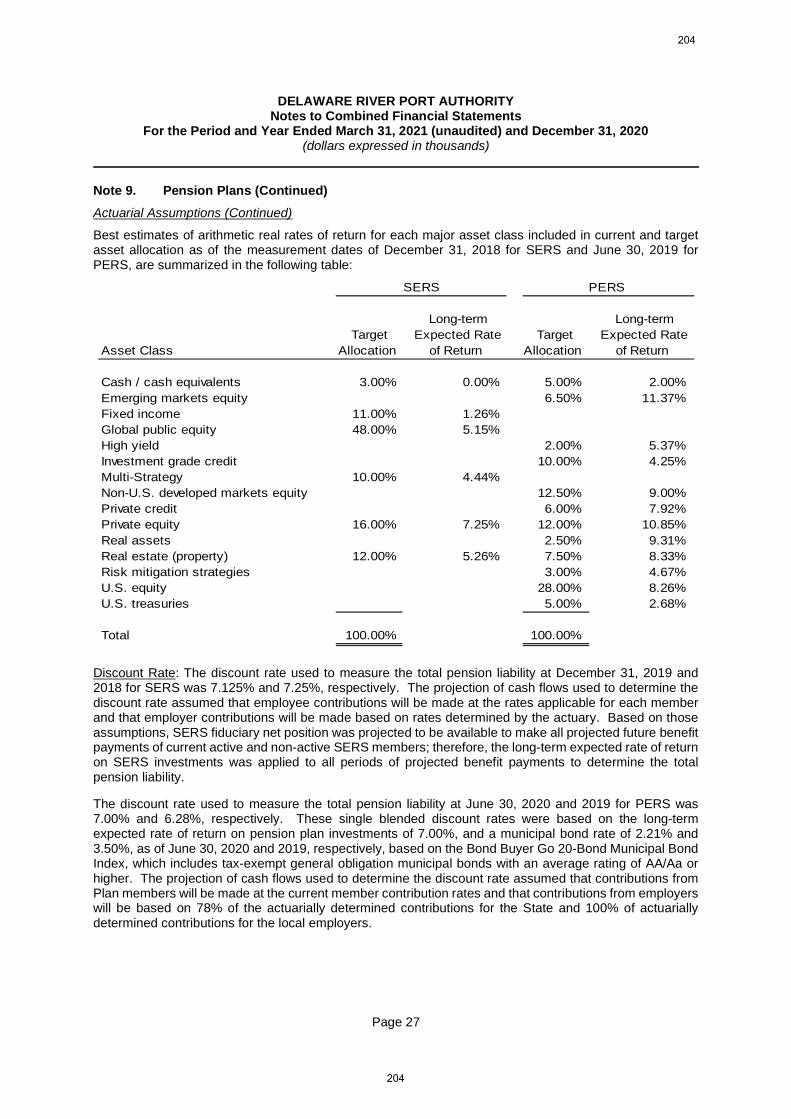
DELAWARE RIVER PORT AUTHORITYNotes to Combined Financial Statements
For the Period and Year Ended March 31, 2021 (unaudited) and December 31, 2020(dollars expressed in thousands)
Page 27
Note 9. Pension Plans (Continued)
Actuarial Assumptions (Continued)
Best estimates of arithmetic real rates of return for each major asset class included in current and targetasset allocation as of the measurement dates of December 31, 2018 for SERS and June 30, 2019 forPERS, are summarized in the following table:
SERS PERS
Long-term Long-term
Target Expected Rate Target Expected Rate
Asset Class Allocation of Return Allocation of Return
Cash / cash equivalents 3.00% 0.00% 5.00% 2.00%
Emerging markets equity 6.50% 11.37%
Fixed income 11.00% 1.26%
Global public equity 48.00% 5.15%
High yield 2.00% 5.37%
Investment grade credit 10.00% 4.25%
Multi-Strategy 10.00% 4.44%
Non-U.S. developed markets equity 12.50% 9.00%
Private credit 6.00% 7.92%
Private equity 16.00% 7.25% 12.00% 10.85%
Real assets 2.50% 9.31%
Real estate (property) 12.00% 5.26% 7.50% 8.33%
Risk mitigation strategies 3.00% 4.67%
U.S. equity 28.00% 8.26%
U.S. treasuries 5.00% 2.68%
Total 100.00% 100.00%
Discount Rate: The discount rate used to measure the total pension liability at December 31, 2019 and2018 for SERS was 7.125% and 7.25%, respectively. The projection of cash flows used to determine thediscount rate assumed that employee contributions will be made at the rates applicable for each memberand that employer contributions will be made based on rates determined by the actuary. Based on thoseassumptions, SERS fiduciary net position was projected to be available to make all projected future benefitpayments of current active and non-active SERS members; therefore, the long-term expected rate of returnon SERS investments was applied to all periods of projected benefit payments to determine the totalpension liability.
The discount rate used to measure the total pension liability at June 30, 2020 and 2019 for PERS was7.00% and 6.28%, respectively. These single blended discount rates were based on the long-termexpected rate of return on pension plan investments of 7.00%, and a municipal bond rate of 2.21% and3.50%, as of June 30, 2020 and 2019, respectively, based on the Bond Buyer Go 20-Bond Municipal BondIndex, which includes tax-exempt general obligation municipal bonds with an average rating of AA/Aa orhigher. The projection of cash flows used to determine the discount rate assumed that contributions fromPlan members will be made at the current member contribution rates and that contributions from employerswill be based on 78% of the actuarially determined contributions for the State and 100% of actuariallydetermined contributions for the local employers.
204
204
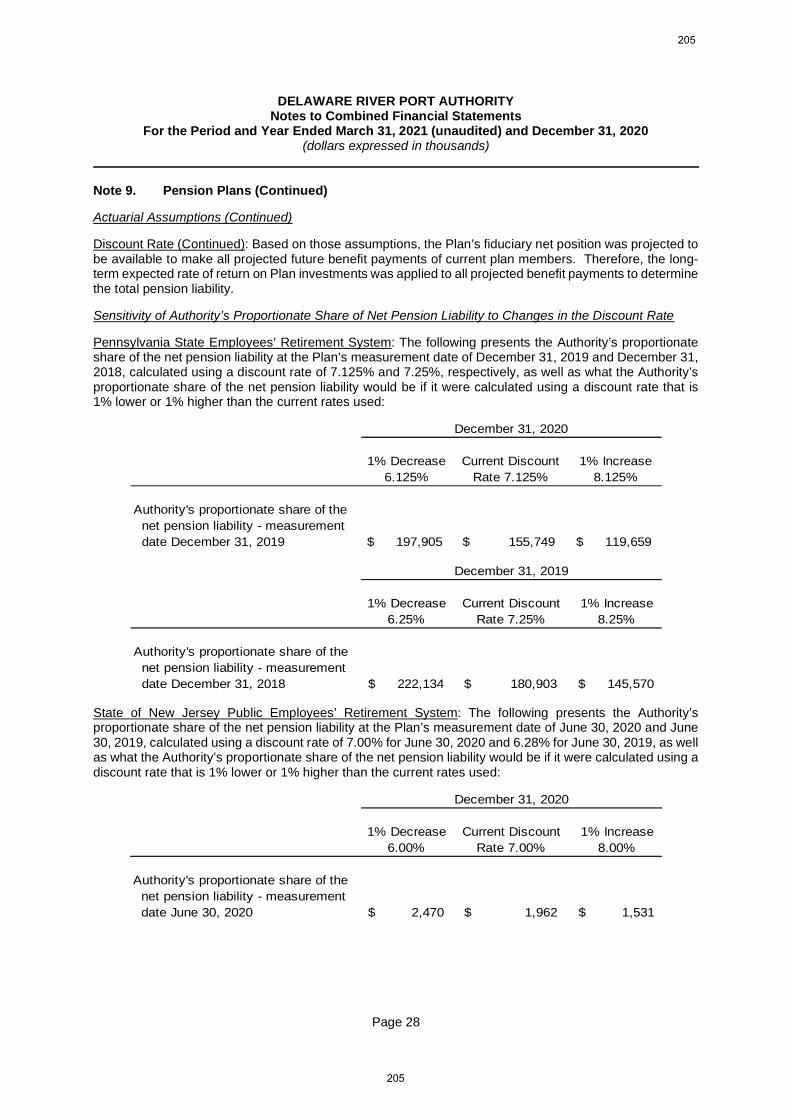
DELAWARE RIVER PORT AUTHORITYNotes to Combined Financial Statements
For the Period and Year Ended March 31, 2021 (unaudited) and December 31, 2020(dollars expressed in thousands)
Page 28
Note 9. Pension Plans (Continued)
Actuarial Assumptions (Continued)
Discount Rate (Continued): Based on those assumptions, the Plan’s fiduciary net position was projected tobe available to make all projected future benefit payments of current plan members. Therefore, the long-term expected rate of return on Plan investments was applied to all projected benefit payments to determinethe total pension liability.
Sensitivity of Authority’s Proportionate Share of Net Pension Liability to Changes in the Discount Rate
Pennsylvania State Employees’ Retirement System: The following presents the Authority’s proportionateshare of the net pension liability at the Plan’s measurement date of December 31, 2019 and December 31,2018, calculated using a discount rate of 7.125% and 7.25%, respectively, as well as what the Authority’sproportionate share of the net pension liability would be if it were calculated using a discount rate that is1% lower or 1% higher than the current rates used:
December 31, 2020
1% Decrease Current Discount 1% Increase
6.125% Rate 7.125% 8.125%
Authority's proportionate share of the
net pension liability - measurement
date December 31, 2019 197,905$ 155,749$ 119,659$
December 31, 2019
1% Decrease Current Discount 1% Increase
6.25% Rate 7.25% 8.25%
Authority's proportionate share of the
net pension liability - measurement
date December 31, 2018 222,134$ 180,903$ 145,570$
State of New Jersey Public Employees’ Retirement System: The following presents the Authority’sproportionate share of the net pension liability at the Plan’s measurement date of June 30, 2020 and June30, 2019, calculated using a discount rate of 7.00% for June 30, 2020 and 6.28% for June 30, 2019, as wellas what the Authority’s proportionate share of the net pension liability would be if it were calculated using adiscount rate that is 1% lower or 1% higher than the current rates used:
December 31, 2020
1% Decrease Current Discount 1% Increase
6.00% Rate 7.00% 8.00%
Authority's proportionate share of the
net pension liability - measurement
date June 30, 2020 2,470$ 1,962$ 1,531$
205
205

DELAWARE RIVER PORT AUTHORITYNotes to Combined Financial Statements
For the Period and Year Ended March 31, 2021 (unaudited) and December 31, 2020(dollars expressed in thousands)
Page 29
Note 9. Pension Plans (Continued)
Sensitivity of Authority’s Proportionate Share of Net Pension Liability to Changes in the Discount Rate(Continued)
State of New Jersey Public Employees’ Retirement System (Continued):
December 31, 2019
1% Decrease Current Discount 1% Increase
5.28% Rate 6.28% 7.28%
Authority's proportionate share of the
net pension liability - measurement
date June 30, 2019 2,467$ 1,953$ 1,520$
Note 10. Postemployment Healthcare Plan (“OPEB”)
General Information about the OPEB Plan
Plan Description: The Authority’s defined benefit OPEB plan (“Plan”) provides OPEB for all permanent full-time employees of the Authority hired prior to January 1, 2007. The Plan is a single-employer definedbenefit OPEB plan administered by the Authority through a trust that meets the criteria of paragraph 4 ofGASBS No. 75. The trust is fiscally dependent upon funding contributions from the Authority. TheAuthority’s Board of Commissioners (“Commissioners”) establish and amend the benefit terms of the Plan.As such, the Plan is considered a fiduciary component unit of the Authority. The Plan does not issue astand-alone financial report.
Benefits Provided: The Plan provides medical, including prescription drug coverage, and life insurancebenefits for retirees and their dependents. Benefits are provided through a third-party insurer, and the fullcost of the benefits is covered by the Plan, along with retiree contributions.
Employees Covered by Benefit Terms: Based on the December 31, 2020 actuarial valuation, the followingemployees were covered by the benefit terms:
Inactive plan members or beneficiaries
currently receiving benefit payments 781
Inactive plan members entitled to but not
yet receiving benefit payments 2
Active plan members 362
1,145
The Plan is closed to new entrants. Employees hired after January 1, 2007 are not eligible for retirementbenefits.
Contributions: The contribution requirements of plan members and the Authority are established, andamended, by the Commissioners. For the years ended December 31, 2020 and 2019, the Authority’saverage contribution rate was 19.02% and 15.19%, respectively, of covered-employee payroll. Totalcontributions to the Plan by the Authority during 2020 and 2019 were $5,416 and $5,012, respectively.Contributions for 2020 and 2019 by plan members receiving benefits for medical and prescription rangedfrom $10.00 to $2,936.25 per month depending on the plan type and coverage selected.
Net OPEB Liability
The Authority’s net OPEB liability was measured as of December 31, 2020, and had a valuation date as ofJanuary 1, 2020.
206
206

DELAWARE RIVER PORT AUTHORITYNotes to Combined Financial Statements
For the Period and Year Ended March 31, 2021 (unaudited) and December 31, 2020(dollars expressed in thousands)
Page 30
Note 10. Postemployment Healthcare Plan (“OPEB”) (Continued)
Actuarial Assumptions: The total OPEB liability in the December 31, 2020 actuarial valuation wasdetermined using the following actuarial assumptions, applied to all periods included in the measurement,unless otherwise specified:
Salary increase 3.5 percent
Healthcare cost trend rates The following assumptions are used for annual healthcare cost inflation (trend):
Year Pre-65 Post 65
Year 1 Trend January 1, 2022 7.0% 7.0%
Ultimate Trend January 1, 2032 & Later 4.5% 4.5%
Grading Per Year 0.25% 0.25%
Mortality rates were based on the RP 2014 Healthy Male and Female Tables that are based on theEmployee and Healthy Annuitant Tables for both pre & post retirement projected with mortality improvementusing the most current Society of Actuaries Mortality Improvement Scale MP-2019.
The OPEB Plan fiduciary net position was projected with an investment return of 2.02% and 2.90% for theyears ended December 31, 2020 and 2019, respectively.
Discount Rate: The discount rate used to measure the total OPEB liability as of December 31, 2020 was2.02%. This discount rate was based on the prescribed discount interest rate methodology under GASBSNo. 75 using an average of three 20-year bond indices (e.g., Bond Buyer-20 Bond GO - 2.12%, S&PMunicipal Bond 20 Year High Grade Rate Index - 1.93%, Fidelity GA AA 20 Years - 2.00%).
The discount rate used to measure the total OPEB liability as of December 31, 2019 was 2.90%. Thisdiscount rate was based on the prescribed discount interest rate methodology under GASBS No. 75 usingan average of three 20-year bond indices (e.g., Bond Buyer-20 Bond GO - 2.74%, S&P Municipal Bond 20Year High Grade Rate Index - 3.26%, and Fidelity GA AA 20 Years - 2.75%).
The projection of cash flows used to determine the discount rates assumed that Authority contributionswould be made at rates equal to the actuarial determined contribution rates. Based on those assumptions,the OPEB Plan’s fiduciary net position was projected to be available to make all projected OPEB paymentsfor current active and inactive employees assuming that such payments are paid separate from the OPEBPlan fiduciary fund. Therefore, the long-term expected rate of return on OPEB Plan investments wasapplied to all periods of projected benefit payments to determine the total OPEB liability.
Changes in the Net OPEB Liability
Plan
Total OPEB Fiduciary Net OPEB
Liability Net Position Liability
(a) (b) (a) - (b)
Balances at January 1, 2020 127,389$ 32,285$ 95,104$
Changes for the year:
Service cost 229 229
Interest 2,519 2,519
Differences between expected
and actual experience (22,111) (22,111)
Contributions - employer:
Pay-as-you-go costs 5,416 (5,416)
Net investment income 1,022 (1,022)
Benefit payments (5,416) (5,416)
Administrative expense (101) 101
Net changes (24,779) 921 (25,700)
Balances at December 31, 2020 102,610$ 33,206$ 69,404$
207
207
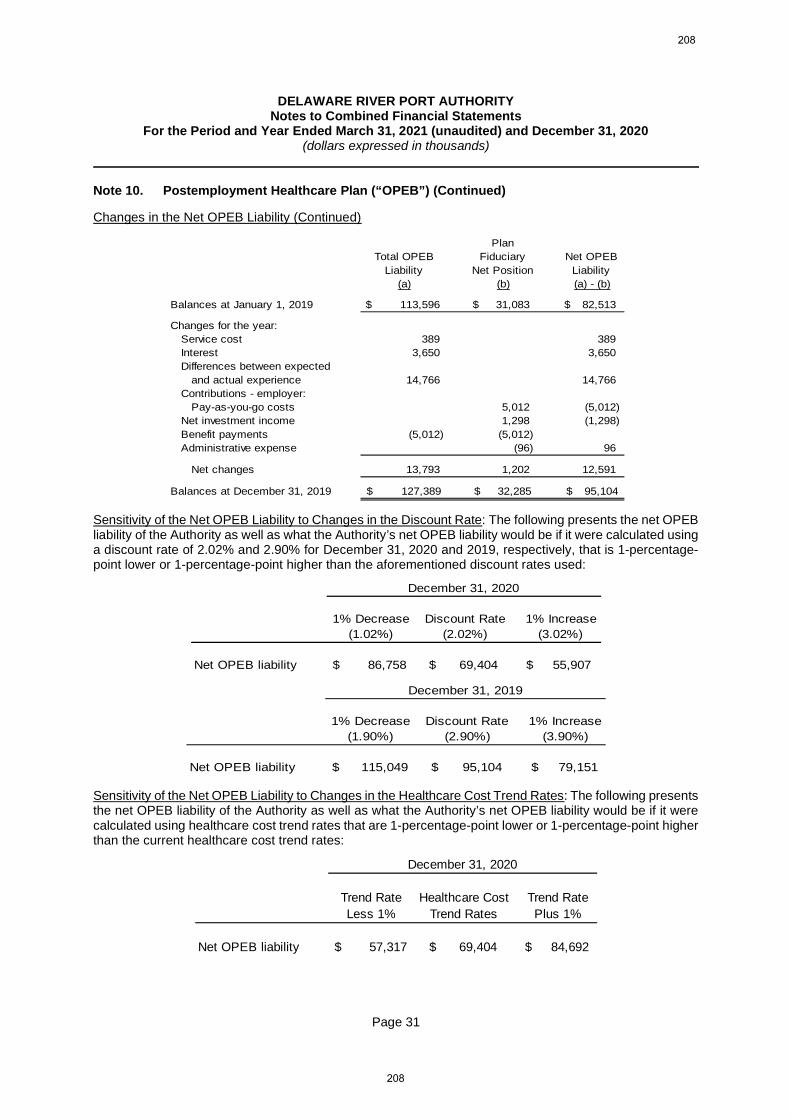
DELAWARE RIVER PORT AUTHORITYNotes to Combined Financial Statements
For the Period and Year Ended March 31, 2021 (unaudited) and December 31, 2020(dollars expressed in thousands)
Page 31
Note 10. Postemployment Healthcare Plan (“OPEB”) (Continued)
Changes in the Net OPEB Liability (Continued)
Plan
Total OPEB Fiduciary Net OPEB
Liability Net Position Liability
(a) (b) (a) - (b)
Balances at January 1, 2019 113,596$ 31,083$ 82,513$
Changes for the year:
Service cost 389 389
Interest 3,650 3,650
Differences between expected
and actual experience 14,766 14,766
Contributions - employer:
Pay-as-you-go costs 5,012 (5,012)
Net investment income 1,298 (1,298)
Benefit payments (5,012) (5,012)
Administrative expense (96) 96
Net changes 13,793 1,202 12,591
Balances at December 31, 2019 127,389$ 32,285$ 95,104$
Sensitivity of the Net OPEB Liability to Changes in the Discount Rate: The following presents the net OPEBliability of the Authority as well as what the Authority’s net OPEB liability would be if it were calculated usinga discount rate of 2.02% and 2.90% for December 31, 2020 and 2019, respectively, that is 1-percentage-point lower or 1-percentage-point higher than the aforementioned discount rates used:
December 31, 2020
1% Decrease Discount Rate 1% Increase
(1.02%) (2.02%) (3.02%)
Net OPEB liability 86,758$ 69,404$ 55,907$
December 31, 2019
1% Decrease Discount Rate 1% Increase
(1.90%) (2.90%) (3.90%)
Net OPEB liability 115,049$ 95,104$ 79,151$
Sensitivity of the Net OPEB Liability to Changes in the Healthcare Cost Trend Rates: The following presentsthe net OPEB liability of the Authority as well as what the Authority’s net OPEB liability would be if it werecalculated using healthcare cost trend rates that are 1-percentage-point lower or 1-percentage-point higherthan the current healthcare cost trend rates:
December 31, 2020
Trend Rate Healthcare Cost Trend Rate
Less 1% Trend Rates Plus 1%
Net OPEB liability 57,317$ 69,404$ 84,692$
208
208
DELAWARE RIVER PORT AUTHORITYNotes to Combined Financial Statements
For the Period and Year Ended March 31, 2021 (unaudited) and December 31, 2020(dollars expressed in thousands)
Page 32
Note 10. Postemployment Healthcare Plan (“OPEB”) (Continued)
Sensitivity of the Net OPEB Liability to Changes in the Healthcare Cost Trend Rates (Continued):
OPEB Expense and Deferred Outflows of Resources and Deferred Inflows of Resources Related to OPEB
For the years ended December 31, 2020 and 2019, the Authority recognized OPEB expense of $2,115 and$5,298, respectively. At December 31, 2020, the Authority reported deferred inflows of resources relatedto OPEB from the changes in assumptions of $10,094. No deferred outflows of resources were reported.
At December 31, 2019, the Authority reported deferred outflows of resources related to OPEB from thechanges in assumptions of $12,304. No deferred inflows of resources were reported.
Amounts reported as deferred inflows of resources related to OPEB will be recognized in OPEB expenseas follows: $10,094 during the year ending December 31, 2021.
Payable to the OPEB Plan
At December 31, 2020 and 2019, there were no payables reported to the OPEB Plan.
Note 11. Indentures of Trust
The Authority’s outstanding Revenue Bonds are subject to the provisions of the following Indentures ofTrust: Revenue Refunding Bonds of 1998, dated July 1, 1998; the 2013 Revenue Bonds, dated December1, 2013, and the 2018 Revenue and Revenue Refunding Bonds, dated December 18, 2018 (collectivelythe “Bond Resolution”).
In addition, the Port District Project Bonds of 1999, dated December 1, 1999, and the 2012 Port DistrictProject Refunding Bonds, dated December 1, 2012, are governed by separate, individual indentures.
The Bond Resolution requires the maintenance of the following accounts:
Project Fund: This restricted account was established in accordance with Section 6.02 of the BondResolution. The Project Fund is held by the Trustee and is applied to pay the cost of the Projects andis pledged, pending application to such payment of costs for the security of the payment of principaland interest on the Revenue, Revenue Refunding, and Project Bonds (the “Bonds”).
December 31, 2019
Trend Rate Healthcare Cost Trend Rate
Less 1% Trend Rates Plus 1%
Net OPEB liability 77,377$ 95,104$ 117,604$
209
209
DELAWARE RIVER PORT AUTHORITYNotes to Combined Financial Statements
For the Period and Year Ended March 31, 2021 (unaudited) and December 31, 2020(dollars expressed in thousands)
Page 33
Note 11. Indentures of Trust (Continued)
The Bond Resolution requires the maintenance of the following accounts (continued):
Debt Service Fund: This restricted account was established in accordance with Section 6.04 of theBond Resolution for the payment of maturing interest and principal on the Bonds. The balance ondeposit must be sufficient to enable the Trustee to withdraw amounts equal to interest due on theBonds, principal amounts maturing on Bonds, accrued interest included in the purchase price of thebonds purchased for retirement, and sinking fund installments when payments are required.
Debt Service Reserve Fund: This restricted account was established in accordance with Section 6.05of the Bond Resolution. The amount of funds on deposit must be maintained at a level equal to theMaximum Debt Service to insure funds are available for payment of Debt Service.
Bond Redemption Fund: This restricted account was established in accordance with section 6.06 ofthe Bond Resolution to account for amounts received from any source for the redemption of Bonds,other than mandatory sinking fund payments.
Rebate Fund: This restricted account was established in accordance with Section 6.07 of the bondResolution account for amounts deposited from time to time in order to comply with the arbitragerebate requirements of Section 148 of the Code as applicable to any Series of Tax-Exempt Bondsissued.
Revenue Fund: This unrestricted account was established in accordance with Section 6.03 of theBond Resolution for the Authority to deposit all Revenues. On or before the 20th day of each calendarmonth, the Trustee shall, to the extent money is available, after deduction of cash and investmentbalances for the 15% working capital reserve, transfer to or credit funds needed in the following order:(1) the Debt Service Fund, (2) the Debt Service Reserve Fund, (3) any Reserve Fund Credit FacilityIssuer, (4) the Trustee’s Rebate Fund, (5) the Maintenance Reserve Fund, (6) the General Fund.
Maintenance Reserve Fund: This restricted account was established in accordance with Section 6.08of the Bond Resolution. These funds are maintained for reasonable and necessary expenses withrespect to the system for major repairs, renewals, replacements, additions, betterments,enlargements, improvements and extraordinary expenses, all to the extent not provided for in the thencurrent Annual Budget. Money in this account is pledged for the security of payment of principal andinterest on the bonds. Whenever the amount in this account exceeds the “Maintenance Reserve FundRequirement,” the excess shall be deposited in the General Fund. The “Maintenance Reserve FundRequirement” on any date is at least $3,000.
General Fund: This unrestricted account was established in accordance with Section 6.09 of the BondResolution. All excess funds of the Authority are recorded in the General Account. If the Authority isnot in default in the payment of bond principal or interest and all fund requirements are satisfied, theexcess funds may be used by the Authority for any lawful purpose.
210
210
DELAWARE RIVER PORT AUTHORITYNotes to Combined Financial Statements
For the Period and Year Ended March 31, 2021 (unaudited) and December 31, 2020(dollars expressed in thousands)
Page 34
Note 12. Funded and Long-Term Debt
Total Outstanding Funded Debt: At March 31, 2021 and December 31, 2020, the Authority had $1,232,994and $1,307,019; respectively, in Revenue, Revenue Refunding, and Port District Project and ProjectRefunding Bonds outstanding (including unamortized premiums), consisting of bonds issued in 1999 (notoutstanding as of January 2021), 2012, 2013, and 2018. The 1999 Port District Project Bonds were issuedpursuant to an Indenture of Trust dated December 1, 1999. The 2012 Port District Project Refunding Bondswere issued pursuant to an Indenture of Trust dated December 1, 2012. The 2013 Revenue Bonds wereissued pursuant to an Indenture of Trust, a Ninth Supplemental Indenture, dated as of December 1, 2013.The 2018 Revenue and Revenue Refunding Bonds were issued pursuant to a Fourteenth SupplementalIndenture dated December 18, 2018.
1999 Port District Project Bonds (Fully matured January 1, 2021): On December 22, 1999, the Authorityissued $272,095 to provide funds to finance (a) all or a portion of the cost of certain port improvement andeconomic development projects within the Port District, (b) a deposit of cash or a Reserve Fund CreditFacility to the credit of the Debt Service Reserve Fund established under the 1999 Port District ProjectBond Indenture and (c) all or a portion of the costs and expenses of the Authority relating to the issuanceand sale of the 1999 Port District Project Bonds (Series A and B).
The 1999 Port District Project Bonds were general corporate obligations of the Authority. The 1999 PortDistrict Project Bonds were not secured by a lien or charge on, or pledge of, any revenues or other assetsof the Authority other than the monies, if any, on deposit from time to time in the Funds established underthe 1999 Port District Project Bond Indenture. No tolls, rents, rates or other such charges were pledged forthe benefit of the 1999 Port District Project Bonds. The 1999 Port District Project Bonds were equally andratably secured by the funds on deposit in the Funds established under the 1999 Port District Project BondIndenture, except for the Rebate Fund. The 1999 Port District Project Bonds were payable from such Fundsand from other monies of the Authority legally available.
The 1999 Port District Project Bonds were subject to optional redemption and mandatory sinking fundredemption prior to maturity. The scheduled payment of principal and interest on the 1999 Port DistrictProject Bonds when due were guaranteed under an insurance policy issued concurrently with the deliveryof the 1999 Port District Project Bonds by Financial Security Assurance Inc. The Authority paid off thebalance of the 1999 Port District Project bonds, in full, on January 1, 2021.
2012 Port District Project Refunding Bonds: On December 20, 2012, the Authority issued $153,030 in PortDistrict Project Refunding Bonds, Series 2012. The Port District Project Refunding Bonds, Series 2012(the “2012 Bonds”) were issued pursuant to the Compact, the New Jersey Act, the Pennsylvania Act (assuch terms are defined herein) and an Indenture of Trust (the "Indenture") dated as of December 1, 2012,between the Authority and TD Bank, N.A., Cherry Hill, New Jersey, as trustee (the "Trustee").
The 2012 Bonds were issued to (i) refund and redeem all of the outstanding principal balance of and interestaccrued on the Authority's outstanding Port District Project Bonds, Series B of 1998, Port District ProjectBonds, Series B of 1999, and Port District Project Bonds, Series A of 2001.
The refunding resulted in a loss (difference between the reacquisition price and the net carrying amount ofthe old debt) of $7,000. This difference, reported in the accompanying combined financial statements as adeferred outflow of resources, is being charged to operations through the year 2025 using the effectiveinterest method.
The 2012 Bonds are general corporate obligations of the Authority. The 2012 Bonds are not secured by alien or charge on, or pledge of, any revenues or other assets of the Authority other than the moneys, if any,on deposit from time to time in the Funds established under the Indenture, except for the Rebate Fund. Notolls, rents, rates or other charges are pledged for the benefit of the 2012 Bonds. The 2012 Bonds areequally and ratably secured by the monies, if any, on deposit in the Funds established under Indenture,except for the Rebate Fund. The 2012 Bonds are payable from such Funds and from other monies of theAuthority legally available therefore.
211
211

DELAWARE RIVER PORT AUTHORITYNotes to Combined Financial Statements
For the Period and Year Ended March 31, 2021 (unaudited) and December 31, 2020(dollars expressed in thousands)
Page 35
Note 12. Funded and Long-Term Debt (Continued)
2012 Port District Project Refunding Bonds (Continued):
Redemption Provisions:
Optional Redemption: The 2012 Bonds maturing on or after January 1, 2024 are subject to redemption priorto maturity at the option of the Authority on or after January 1, 2023, in whole at any time, or in part at anytime and from time to time, in any order of maturity specified by the Authority and within a maturity asselected by the Trustee as provided in the Indenture and as summarized below under the subheading“Redemption Provisions - Selection of 2012 Bonds to be Redeemed.” Any such redemption shall be madeat a redemption price equal to the principal amount of the Bonds to be redeemed, plus interest accrued tothe date fixed for redemption.
Payment of Redemption Price: Notice of redemption having been given in the manner provided in theIndenture, or written waivers of notice having been filed with the Trustee prior to the date set for redemption,the 2012 Bonds (or portions thereof) so called for redemption shall become due and payable on theredemption date so designated and interest on such 2012 Bonds (or portions thereof) shall cease to accruefrom the redemption date whether or not such Bonds shall be presented for payment. The principal amountof all 2012 Bonds so called for redemption, together with the redemption premium, if any, payable withrespect thereto and accrued and unpaid interest thereon to the date of redemption, shall be paid (uponpresentation and surrender of such 2012 Bonds) by the Paying Agent out of the appropriate Fund or otherfunds deposited for the purpose.
Selection of 2012 Bonds to be Redeemed: If less than all of the 2012 Bonds are to be redeemed and paidprior to maturity, 2012 Bonds registered in the name of the Authority shall be redeemed before other 2012Bonds are redeemed. Thereafter, the portion of 2012 Bonds to be redeemed shall be selected by theAuthority, or if no such selection is made, by lot by the Trustee from among all outstanding 2012 Bondseligible for redemption.
In the case of a partial redemption of 2012 Bonds when 2012 Bonds of denominations greater than theminimum Authorized Denomination are outstanding, then for all purposes in connection with suchredemption, each principal amount equal to the minimum authorized denomination shall be treated asthough it were a separate 2012 Bond for purposes of selecting the 2012 Bonds to be redeemed, providedthat no 2012 Bonds shall be redeemed in part if the principal amount to be outstanding following such partialredemption is not an authorized denomination.
Selecition of 2012 Bonds to be Redeemed (Continued):
The 2012 Port District Project Refunding Bonds outstanding at March 31, 2021 are as follows:
Maturity Date Interest Principal Maturity Date Interest Principal
(January 1) Rate/Yield Amount (January 1) Rate/Yield Amount
2022 5.00% 14,085 2024 5.00% 15,520$
2023 3.00% 240 2025 5.00% 16,300
2023 5.00% 14,545 2026 5.00% 17,115
2027 5.00% 17,975
Total par value of 2012 Port District Project Refunding Bonds 95,780
Add: unamortized bond premium 5,177
Total 2012 Port District Project Refunding Bonds, net 100,957$
212
212
DELAWARE RIVER PORT AUTHORITYNotes to Combined Financial Statements
For the Period and Year Ended March 31, 2021 (unaudited) and December 31, 2020(dollars expressed in thousands)
Page 36
Note 12. Funded and Long-Term Debt (Continued)
2013 Revenue Bonds: On December 18, 2013, the Delaware River Port Authority issued its RevenueBonds, Series of 2013 in the aggregate principal amount of $476,585. The 2013 Revenue Bonds wereissued by means of a book-entry-only system evidencing ownership and transfer of 2013 Revenue Bondson the records of The Depository Trust Company, New York, New York, and its participants. Interest onthe 2013 Revenue Bonds will be payable semi-annually on January 1 and July 1 of each year commencingJuly 1, 2014.
The 2013 Revenue Bonds were issued pursuant to the Compact, the New Jersey Act, the PennsylvaniaAct and an Indenture of Trust, dated as of July 1, 1998, by and between the Authority and TD Bank, N.A.,Cherry Hill, New Jersey, as successor to Commerce Bank, N.A., as trustee, as heretofore supplementedfrom time to time, including as supplemented by a Ninth Supplemental Indenture, dated as of December 1,2013 (collectively, the “1998 Revenue Bond Indenture”). The 2013 Revenue Bonds are being issued forthe purpose of: (i) financing a portion of the costs of the Authority’s approved capital improvement program;(ii) funding a deposit to the 1998 Debt Service Reserve Fund established under and as specifically definedin the 1998 Revenue Bond Indenture; and (iii) paying the costs of issuance of the 2013 Revenue Bonds.
The 2013 Revenue Bonds are limited obligations of the Authority and are payable solely from the sourcesreferred to in the 2013 Revenue Bonds and the 1998 Revenue Bond Indenture. Neither the credit nor thetaxing power of the Commonwealth of Pennsylvania (the “Commonwealth”) or the State of New Jersey (the“State”) or of any county, city, borough, village, township or other municipality of the Commonwealth or theState is or shall be pledged for the payment of the principal, redemption premium, if any, or interest on the2013 Revenue Bonds. The 2013 Revenue Bonds are not and shall not be deemed to be a debt or liabilityof the Commonwealth or the State or of any such county, city, borough, village, township or othermunicipality, and neither the Commonwealth nor the State nor any such county, city, borough, village,township or other municipality is or shall be liable for the payment of such principal, redemption premium,or interest. The Authority has no taxing power.
The 2013 Revenue Bonds outstanding at March 31, 2021 are as follows:
Optional Redemption: The 2013 Revenue Bonds are subject to redemption at the option of the Authority,prior to maturity, in whole or in part (and if in part, in such order of maturity or within a maturity as theAuthority shall specify, or if the Authority shall fail to specify, by lot or by such other method as the PayingAgent determines to be fair and reasonable and in any principal amount in Authorized Denominations), atany time on or after January 1, 2024. Any such redemption shall be made at a redemption price equal to100% of the principal amount of the 2013 Revenue Bonds to be redeemed, plus accrued interest to theRedemption Date.
Maturity Date Interest Principal Maturity Date Interest Principal
(January 1) Rate/Yield Amount (January 1) Rate/Yield Amount
2027 5.000% 23,560$ 2034 4.625% 810$
2027 4.125% 845 2035 5.000% 34,870
2028 5.000% 25,615 2035 4.750% 1,000
2029 5.000% 26,895 2036 5.000% 36,660
2030 5.000% 28,070 2036 4.750% 1,000
2030 4.500% 170 2037 5.000% 38,540
2031 5.000% 29,650 2037 4.750% 1,000
2032 4.500% 31,135 2038 5.000% 41,515
2033 5.000% 32,535 2039 5.000% 43,590
2034 5.000% 33,355 2040 5.000% 45,770
Total par value of 2013 Revenue Bonds 476,585
Add: unamortized bond premium 7,663
Total 2013 Revenue Bonds, net 484,248$
213
213
DELAWARE RIVER PORT AUTHORITYNotes to Combined Financial Statements
For the Period and Year Ended March 31, 2021 (unaudited) and December 31, 2020(dollars expressed in thousands)
Page 37
Note 12. Funded and Long-Term Debt (Continued)
2018 Revenue Bonds: On December 18, 2018, the Delaware River Port Authority issued its RevenueBonds, Series of 2018, totaling $700,505, consisting of: its Revenue Bonds, Series A of 2018 in theaggregate principal amount of $273,475, its Revenue Refunding Bonds, Series B of 2018 (the “2018BRevenue Refunding Bonds”) in the aggregate principal amount of $404,060, and its Revenue Bonds, SeriesC of 2018 (Federally Taxable) (the “2018C Revenue Bonds) in the aggregate principal amount of $22,970,and together with the 2018A Revenue Bonds, the 2018B Revenue Refunding Bonds, and the 2018CRevenue Bonds collectively called the “2018 Revenue Bonds”. The 2018 Revenue Bonds were issued bymeans of a book-entry-only system evidencing ownership and transfer of 2018 Revenue Bonds on therecords of The Depository Trust Company, New York, New York, and its participants. Interest on the 2018Revenue Bonds is payable semi-annually on January 1 and July 1 of each year commencing July 1, 2019.
The 2018 Revenue Bonds were issued pursuant to the Compact, the New Jersey Act, the PennsylvaniaAct and an Indenture of Trust, dated as of July 1, 1998, by and between the Authority and TD Bank, N.A.,Cherry Hill, New Jersey, as successor to Commerce Bank, National Association, as trustee, as heretoforeamended and supplemented from time to time, including as amended and supplemented by a FourteenthSupplemental Indenture, dated as of December 18, 2018 (collectively, the “1998 Revenue BondIndenture”).
The 2018 Revenue Bonds, Series A, B and C, as more particularly specified within, were issued for thepurpose of: (i) financing a portion of the costs of the Authority’s approved capital improvement program; (ii)current refunding all of (1) $100,120 aggregate principal amount of the Authority’s Revenue RefundingBonds, Series A of 2008, (2) $111,240 aggregate principal amount of the Authority’s Revenue RefundingBonds, Series B of 2008, (3) $51,305 aggregate principal amount of the Authority’s Revenue RefundingBonds, Series A-1 of 2010, (4) $55,330 aggregate principal amount of the Authority’s Revenue RefundingBonds, Series A-2 of 2010, (5) $106,635 aggregate principal amount of the Authority’s Revenue RefundingBonds, Series B of 2010, and (6) $35,535 aggregate principal amount of the Authority’s Revenue RefundingBonds, Series C of 2010; (iii) financing a portion of the cash settlement cost to terminate all of the Authority’s1995 Revenue Bond Swaption and 1999 Revenue Bond Swaption; (iv) funding a deposit to the 1998 DebtService Reserve Fund established under and as specifically defined in the 1998 Revenue Bond Indenture;and (v) paying the costs of issuance of the 2018 Revenue Bonds.
The 2018 Revenue Bonds are limited obligations of the Authority and are payable solely from the sourcesreferred to in the 2018 Revenue Bonds and the 1998 Revenue Bond Indenture. Neither the credit nor thetaxing power of the Commonwealth of Pennsylvania (the “Commonwealth”) or the State of New Jersey (the“State”) or of any county, city, borough, village, township or other municipality of the Commonwealth or theState is or shall be pledged for the payment of the principal, redemption premium, if any, or interest on the2018 Revenue Bonds. The 2018 Revenue Bonds are not and shall not be deemed to be a debt or liabilityof the Commonwealth or the State or of any such county, city, borough, village, township or othermunicipality, and neither the Commonwealth nor the State nor any such county, city, borough, village,township or other municipality is or shall be liable for the payment of such principal, redemption premium,or interest. The Authority has no taxing power.
2018A Revenue Bonds: On December 18, 2018, the Authority issued new fixed rate bonds, in the amountof $273,475, at a premium of $43,893. As a result of this transaction (including payment of debt servicereserve and cost of issuance requirements), $290,000 was deposited into the 2018 new bond project fundaccount, to support the 2019 5-year Capital Plan.
214
214
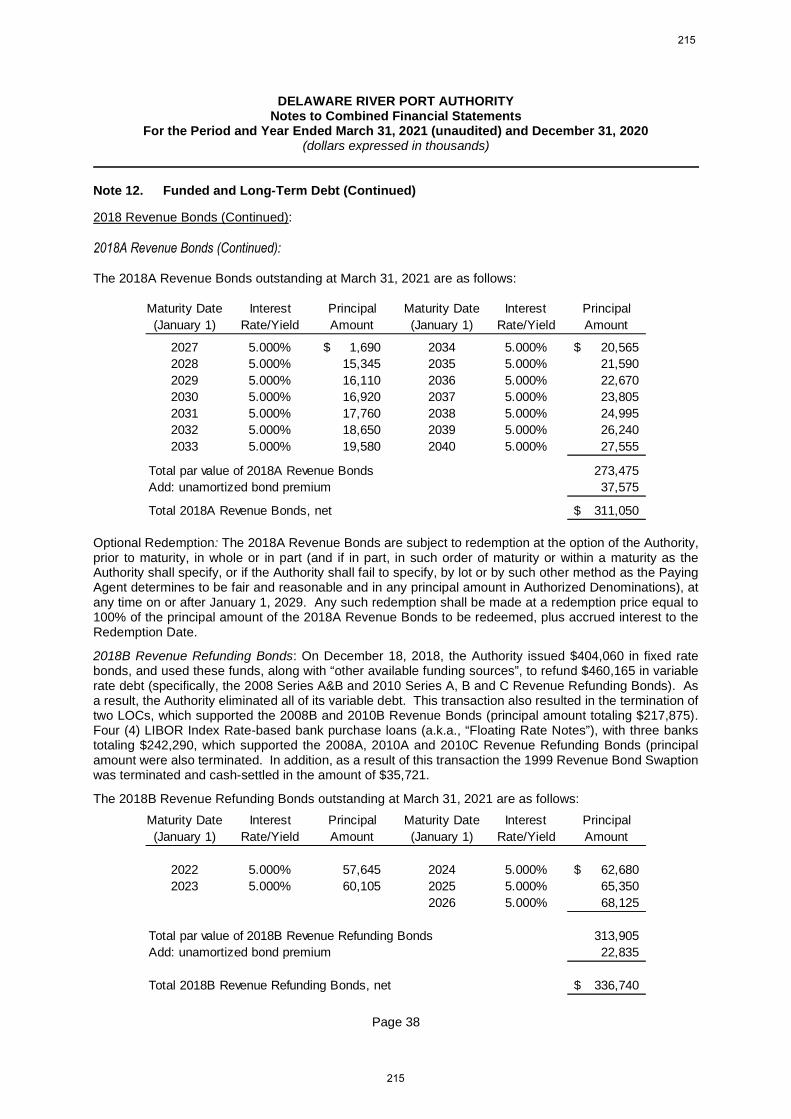
DELAWARE RIVER PORT AUTHORITYNotes to Combined Financial Statements
For the Period and Year Ended March 31, 2021 (unaudited) and December 31, 2020(dollars expressed in thousands)
Page 38
Note 12. Funded and Long-Term Debt (Continued)
2018 Revenue Bonds (Continued):
2018A Revenue Bonds (Continued):
The 2018A Revenue Bonds outstanding at March 31, 2021 are as follows:
Optional Redemption: The 2018A Revenue Bonds are subject to redemption at the option of the Authority,prior to maturity, in whole or in part (and if in part, in such order of maturity or within a maturity as theAuthority shall specify, or if the Authority shall fail to specify, by lot or by such other method as the PayingAgent determines to be fair and reasonable and in any principal amount in Authorized Denominations), atany time on or after January 1, 2029. Any such redemption shall be made at a redemption price equal to100% of the principal amount of the 2018A Revenue Bonds to be redeemed, plus accrued interest to theRedemption Date.
2018B Revenue Refunding Bonds: On December 18, 2018, the Authority issued $404,060 in fixed ratebonds, and used these funds, along with “other available funding sources”, to refund $460,165 in variablerate debt (specifically, the 2008 Series A&B and 2010 Series A, B and C Revenue Refunding Bonds). Asa result, the Authority eliminated all of its variable debt. This transaction also resulted in the termination oftwo LOCs, which supported the 2008B and 2010B Revenue Bonds (principal amount totaling $217,875).Four (4) LIBOR Index Rate-based bank purchase loans (a.k.a., “Floating Rate Notes”), with three bankstotaling $242,290, which supported the 2008A, 2010A and 2010C Revenue Refunding Bonds (principalamount were also terminated. In addition, as a result of this transaction the 1999 Revenue Bond Swaptionwas terminated and cash-settled in the amount of $35,721.
The 2018B Revenue Refunding Bonds outstanding at March 31, 2021 are as follows:
Maturity Date Interest Principal Maturity Date Interest Principal
(January 1) Rate/Yield Amount (January 1) Rate/Yield Amount
2027 5.000% 1,690$ 2034 5.000% 20,565$
2028 5.000% 15,345 2035 5.000% 21,590
2029 5.000% 16,110 2036 5.000% 22,670
2030 5.000% 16,920 2037 5.000% 23,805
2031 5.000% 17,760 2038 5.000% 24,995
2032 5.000% 18,650 2039 5.000% 26,240
2033 5.000% 19,580 2040 5.000% 27,555
Total par value of 2018A Revenue Bonds 273,475
Add: unamortized bond premium 37,575
Total 2018A Revenue Bonds, net 311,050$
Maturity Date Interest Principal Maturity Date Interest Principal
(January 1) Rate/Yield Amount (January 1) Rate/Yield Amount
2022 5.000% 57,645 2024 5.000% 62,680$
2023 5.000% 60,105 2025 5.000% 65,350
2026 5.000% 68,125
Total par value of 2018B Revenue Refunding Bonds 313,905
Add: unamortized bond premium 22,835
Total 2018B Revenue Refunding Bonds, net 336,740$
215
215
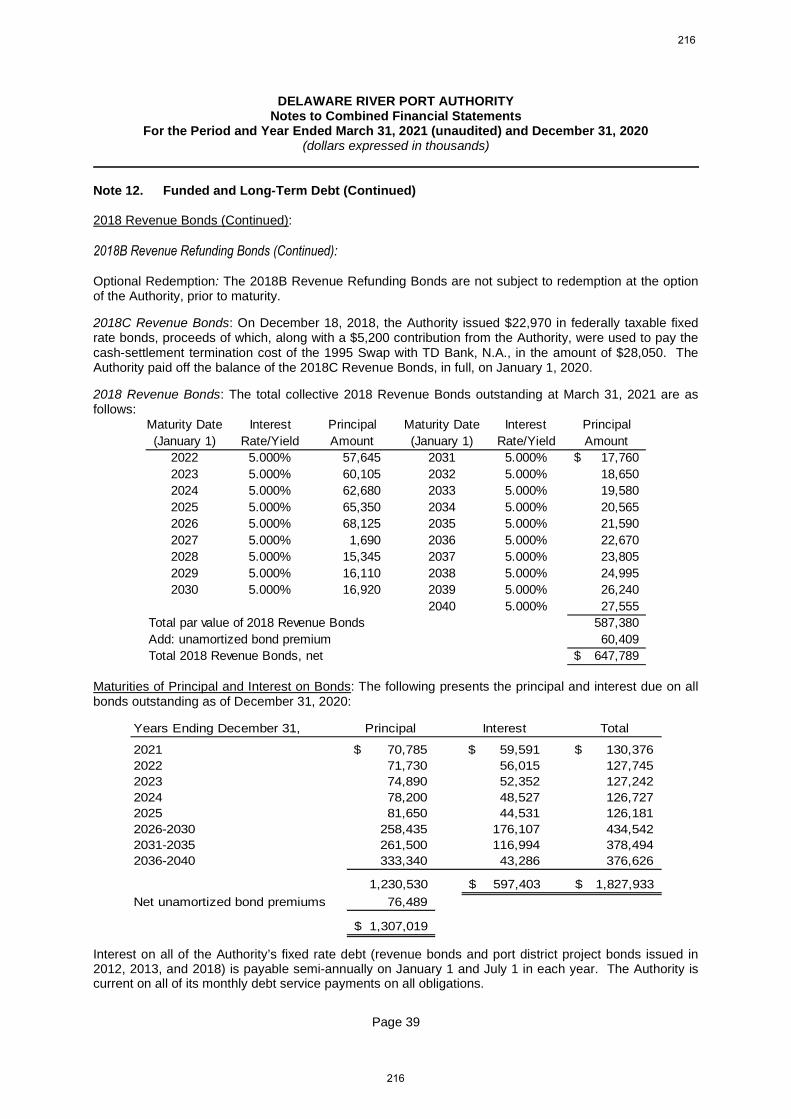
DELAWARE RIVER PORT AUTHORITYNotes to Combined Financial Statements
For the Period and Year Ended March 31, 2021 (unaudited) and December 31, 2020(dollars expressed in thousands)
Page 39
Note 12. Funded and Long-Term Debt (Continued)
2018 Revenue Bonds (Continued):
2018B Revenue Refunding Bonds (Continued):
Optional Redemption: The 2018B Revenue Refunding Bonds are not subject to redemption at the optionof the Authority, prior to maturity.
2018C Revenue Bonds: On December 18, 2018, the Authority issued $22,970 in federally taxable fixedrate bonds, proceeds of which, along with a $5,200 contribution from the Authority, were used to pay thecash-settlement termination cost of the 1995 Swap with TD Bank, N.A., in the amount of $28,050. TheAuthority paid off the balance of the 2018C Revenue Bonds, in full, on January 1, 2020.
2018 Revenue Bonds: The total collective 2018 Revenue Bonds outstanding at March 31, 2021 are asfollows:
Maturities of Principal and Interest on Bonds: The following presents the principal and interest due on allbonds outstanding as of December 31, 2020:
Years Ending December 31, Principal Interest Total
2021 70,785$ 59,591$ 130,376$
2022 71,730 56,015 127,745
2023 74,890 52,352 127,242
2024 78,200 48,527 126,727
2025 81,650 44,531 126,181
2026-2030 258,435 176,107 434,542
2031-2035 261,500 116,994 378,494
2036-2040 333,340 43,286 376,626
1,230,530 597,403$ 1,827,933$
Net unamortized bond premiums 76,489
1,307,019$
Interest on all of the Authority’s fixed rate debt (revenue bonds and port district project bonds issued in2012, 2013, and 2018) is payable semi-annually on January 1 and July 1 in each year. The Authority iscurrent on all of its monthly debt service payments on all obligations.
Maturity Date Interest Principal Maturity Date Interest Principal
(January 1) Rate/Yield Amount (January 1) Rate/Yield Amount
2022 5.000% 57,645 2031 5.000% 17,760$
2023 5.000% 60,105 2032 5.000% 18,650
2024 5.000% 62,680 2033 5.000% 19,580
2025 5.000% 65,350 2034 5.000% 20,565
2026 5.000% 68,125 2035 5.000% 21,590
2027 5.000% 1,690 2036 5.000% 22,670
2028 5.000% 15,345 2037 5.000% 23,805
2029 5.000% 16,110 2038 5.000% 24,995
2030 5.000% 16,920 2039 5.000% 26,240
2040 5.000% 27,555
Total par value of 2018 Revenue Bonds 587,380
Add: unamortized bond premium 60,409
Total 2018 Revenue Bonds, net 647,789$
216
216
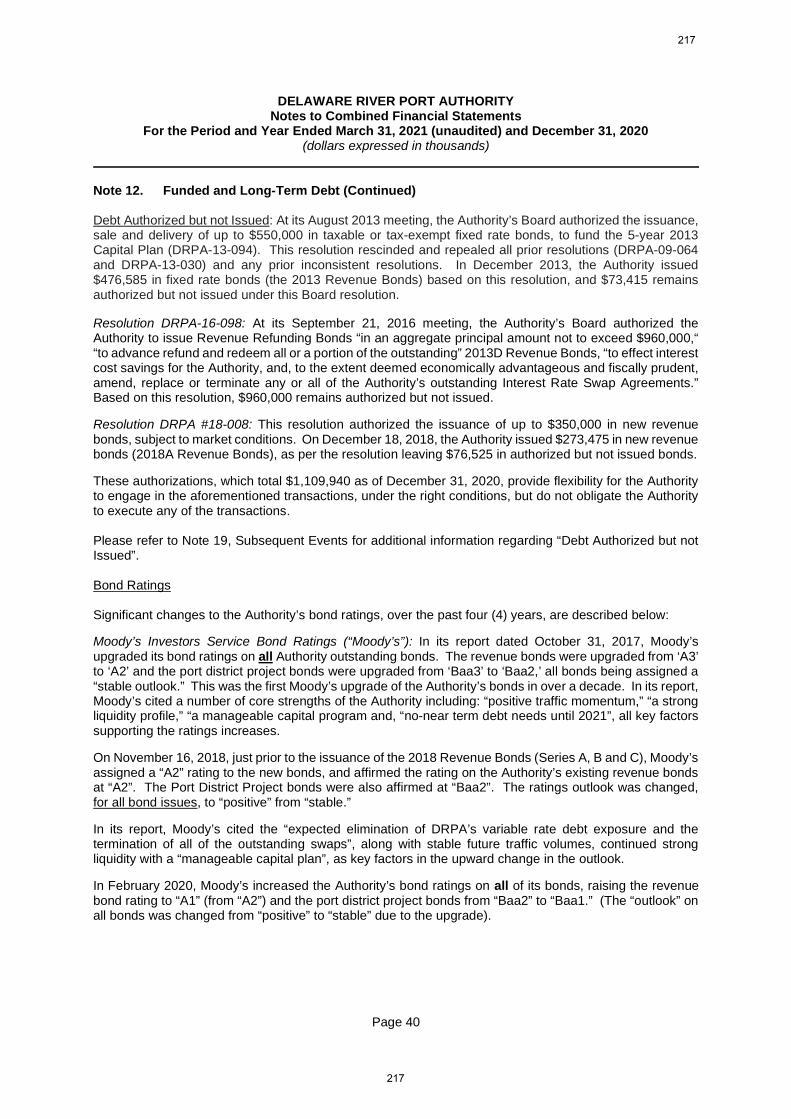
DELAWARE RIVER PORT AUTHORITYNotes to Combined Financial Statements
For the Period and Year Ended March 31, 2021 (unaudited) and December 31, 2020(dollars expressed in thousands)
Page 40
Note 12. Funded and Long-Term Debt (Continued)
Debt Authorized but not Issued: At its August 2013 meeting, the Authority’s Board authorized the issuance,sale and delivery of up to $550,000 in taxable or tax-exempt fixed rate bonds, to fund the 5-year 2013Capital Plan (DRPA-13-094). This resolution rescinded and repealed all prior resolutions (DRPA-09-064and DRPA-13-030) and any prior inconsistent resolutions. In December 2013, the Authority issued$476,585 in fixed rate bonds (the 2013 Revenue Bonds) based on this resolution, and $73,415 remainsauthorized but not issued under this Board resolution.
Resolution DRPA-16-098: At its September 21, 2016 meeting, the Authority’s Board authorized theAuthority to issue Revenue Refunding Bonds “in an aggregate principal amount not to exceed $960,000,““to advance refund and redeem all or a portion of the outstanding” 2013D Revenue Bonds, “to effect interestcost savings for the Authority, and, to the extent deemed economically advantageous and fiscally prudent,amend, replace or terminate any or all of the Authority’s outstanding Interest Rate Swap Agreements.”Based on this resolution, $960,000 remains authorized but not issued.
Resolution DRPA #18-008: This resolution authorized the issuance of up to $350,000 in new revenuebonds, subject to market conditions. On December 18, 2018, the Authority issued $273,475 in new revenuebonds (2018A Revenue Bonds), as per the resolution leaving $76,525 in authorized but not issued bonds.
These authorizations, which total $1,109,940 as of December 31, 2020, provide flexibility for the Authorityto engage in the aforementioned transactions, under the right conditions, but do not obligate the Authorityto execute any of the transactions.
Please refer to Note 19, Subsequent Events for additional information regarding “Debt Authorized but notIssued”.
Bond Ratings
Significant changes to the Authority’s bond ratings, over the past four (4) years, are described below:
Moody’s Investors Service Bond Ratings (“Moody’s”): In its report dated October 31, 2017, Moody’supgraded its bond ratings on all Authority outstanding bonds. The revenue bonds were upgraded from ‘A3’to ‘A2’ and the port district project bonds were upgraded from ‘Baa3’ to ‘Baa2,’ all bonds being assigned a“stable outlook.” This was the first Moody’s upgrade of the Authority’s bonds in over a decade. In its report,Moody’s cited a number of core strengths of the Authority including: “positive traffic momentum,” “a strongliquidity profile,” “a manageable capital program and, “no-near term debt needs until 2021”, all key factorssupporting the ratings increases.
On November 16, 2018, just prior to the issuance of the 2018 Revenue Bonds (Series A, B and C), Moody’sassigned a “A2” rating to the new bonds, and affirmed the rating on the Authority’s existing revenue bondsat “A2”. The Port District Project bonds were also affirmed at “Baa2”. The ratings outlook was changed,for all bond issues, to “positive” from “stable.”
In its report, Moody’s cited the “expected elimination of DRPA’s variable rate debt exposure and thetermination of all of the outstanding swaps”, along with stable future traffic volumes, continued strongliquidity with a “manageable capital plan”, as key factors in the upward change in the outlook.
In February 2020, Moody’s increased the Authority’s bond ratings on all of its bonds, raising the revenuebond rating to “A1” (from “A2”) and the port district project bonds from “Baa2” to “Baa1.” (The “outlook” onall bonds was changed from “positive” to “stable” due to the upgrade).
217
217
DELAWARE RIVER PORT AUTHORITYNotes to Combined Financial Statements
For the Period and Year Ended March 31, 2021 (unaudited) and December 31, 2020(dollars expressed in thousands)
Page 41
Note 12. Funded and Long-Term Debt (Continued)
Bond Ratings (Continued):
Standard & Poor’s Ratings Services Bond Ratings (“S&P”): On April 21, 2016, S&P issued a bond ratingsreport on the Authority’s debt, using its new joint ratings criteria, wherein the Authority’s Port District ProjectBonds were upgraded from “BBB” to “A-“ (with stable outlook) and the Revenue Bonds were affirmed at“A”, with a stable outlook. S&P cited the Authority’s historical performance against budget, its strongfinancial stability and liquidity (including its capital “pay-go” fund), and its affordable 5-year capital plan of$662,400, as underlying strengths supporting its ratings actions.
In its report dated August 1, 2017, S&P reaffirmed the Authority’s ratings on both its Revenue and PortDistrict Project Bonds. The report cited “historically strong liquidity levels,” “DRPA’s long history of stabletransaction and revenue growth,” “the maintenance of good debt service coverage, and “conservative”capital and operating budgets.
On November 16, 2018, just prior to the issuance of $700,505 in 2018 Revenue Bonds (Series A, B andC), S&P assigned a rating of “A+” to the new bonds and upgraded its underlying rating on the existingrevenue bonds to “A+” from “A”, with a stable outlook. The Authority Port District Project Bonds were alsoupgraded to “A” from “A-“, with a stable outlook. The upgrades reflected the application of S&P’s newupdated ratings criteria, published on March 12, 2018. S&P cited the Authority’s “very strong enterpriserisk profile and strong financial risk profile”, along with the “long history of favorable net revenue growth andstrategic capital funding leading to strong sustainable debt service coverage” and the Authority’s strongliquidity and financial flexibility, which supported the upgrade decision.
Impact of COVID-19 on Ratings Outlook:
As mentioned above, the Authority’s bonds were upgraded by Moody’s in February 2020, prior to theexplosion of the COVID-19 pandemic. As a result of the pandemic’s impact on traffic and toll revenues, inMarch 2020, both Moody’s and S&P changed the outlook for the entire toll sector to “negative”. S&P alsochanged the Authority’s outlook from “stable” to “negative”; however, Moody’s did not change the Authority’s“stable” outlook.
In March 2021, S&P restored the “stable” outlook for the toll road sector and also on the Authority’s bonds,from “negative”, after its review of the on-going recovery in the toll road sector, since the beginning of 2021.
Note 13. Government Contributions for Capital Improvements, Additions, and Other Projects
The Authority receives contributions in aid for financing capital improvements to the rapid transit systemfrom the Federal Transit Administration and other government agencies. Capital improvement grant fundsof $1,049 and $21,992 were received as of March 31, 2021 and in the full year 2020, respectively. TheAuthority receives federal and state grants for specific construction purposes that are subject to review andaudit by the grantor agencies. Although such audits could result in disallowances under terms of the grants,it is the opinion of management that any required reimbursements will not be material to the Authority’s netposition.
Note 14. Contingencies
Public liability claim exposures are self-insured by the Authority within its self-insured retention limit of $5million for each occurrence, after which, exists a claims-made excess liability policy with a limit of $25 millionper occurrence, and in the aggregate, to respond to any large losses exceeding the self-retention. Theclaims and judgments liability of $760 and $871 reported at March 31, 2021 and December 31, 2020,respectively, is based on the requirements of GASBS No. 10, as amended, which requires that a liabilityfor claims and judgments be reported if information prior to the issuance of the combined financialstatements indicates that it is probable that a liability has been incurred at the date of the combined financialstatements and the amount off the loss can be reasonably estimated. The amount of the loss liability, which
218
218
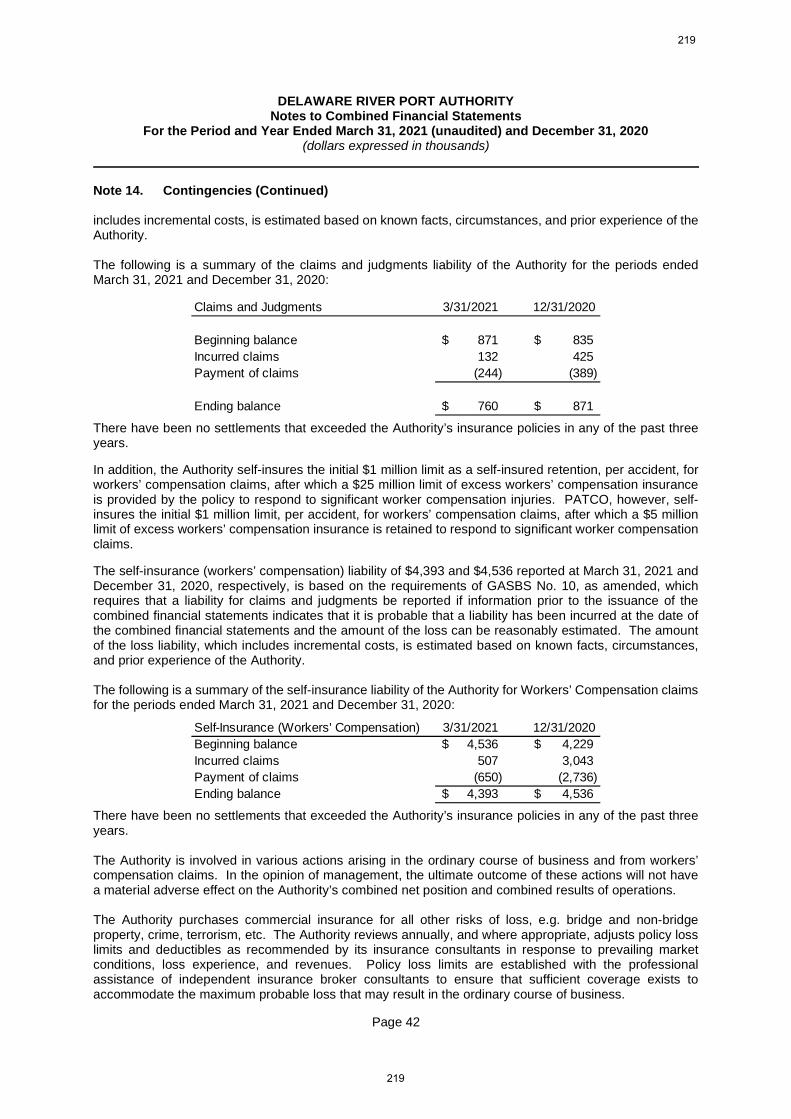
DELAWARE RIVER PORT AUTHORITYNotes to Combined Financial Statements
For the Period and Year Ended March 31, 2021 (unaudited) and December 31, 2020(dollars expressed in thousands)
Page 42
Note 14. Contingencies (Continued)
includes incremental costs, is estimated based on known facts, circumstances, and prior experience of theAuthority.
The following is a summary of the claims and judgments liability of the Authority for the periods endedMarch 31, 2021 and December 31, 2020:
There have been no settlements that exceeded the Authority’s insurance policies in any of the past threeyears.
In addition, the Authority self-insures the initial $1 million limit as a self-insured retention, per accident, forworkers’ compensation claims, after which a $25 million limit of excess workers’ compensation insuranceis provided by the policy to respond to significant worker compensation injuries. PATCO, however, self-insures the initial $1 million limit, per accident, for workers’ compensation claims, after which a $5 millionlimit of excess workers’ compensation insurance is retained to respond to significant worker compensationclaims.
The self-insurance (workers’ compensation) liability of $4,393 and $4,536 reported at March 31, 2021 andDecember 31, 2020, respectively, is based on the requirements of GASBS No. 10, as amended, whichrequires that a liability for claims and judgments be reported if information prior to the issuance of thecombined financial statements indicates that it is probable that a liability has been incurred at the date ofthe combined financial statements and the amount of the loss can be reasonably estimated. The amountof the loss liability, which includes incremental costs, is estimated based on known facts, circumstances,and prior experience of the Authority.
The following is a summary of the self-insurance liability of the Authority for Workers’ Compensation claimsfor the periods ended March 31, 2021 and December 31, 2020:
There have been no settlements that exceeded the Authority’s insurance policies in any of the past threeyears.
The Authority is involved in various actions arising in the ordinary course of business and from workers’compensation claims. In the opinion of management, the ultimate outcome of these actions will not havea material adverse effect on the Authority’s combined net position and combined results of operations.
The Authority purchases commercial insurance for all other risks of loss, e.g. bridge and non-bridgeproperty, crime, terrorism, etc. The Authority reviews annually, and where appropriate, adjusts policy losslimits and deductibles as recommended by its insurance consultants in response to prevailing marketconditions, loss experience, and revenues. Policy loss limits are established with the professionalassistance of independent insurance broker consultants to ensure that sufficient coverage exists toaccommodate the maximum probable loss that may result in the ordinary course of business.
Claims and Judgments 3/31/2021 12/31/2020
Beginning balance 871$ 835$
Incurred claims 132 425
Payment of claims (244) (389)
Ending balance 760$ 871$
Self-Insurance (Workers' Compensation) 3/31/2021 12/31/2020
Beginning balance 4,536$ 4,229$
Incurred claims 507 3,043
Payment of claims (650) (2,736)
Ending balance 4,393$ 4,536$
219
219
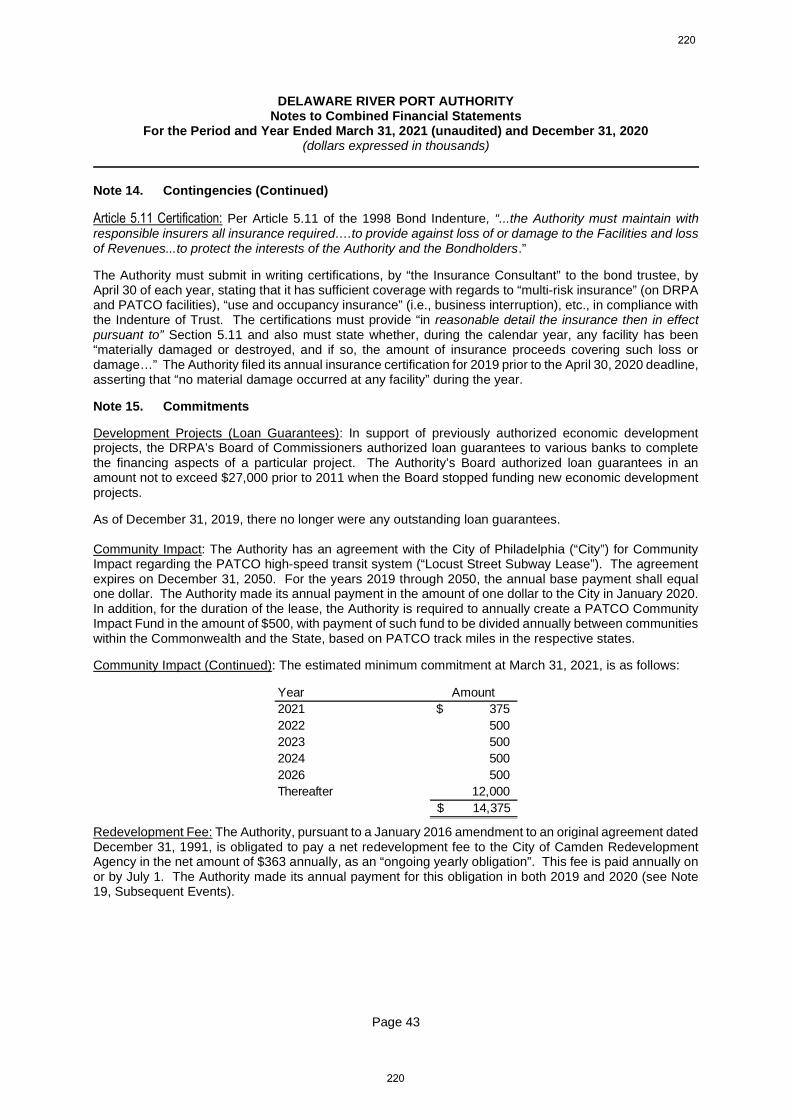
DELAWARE RIVER PORT AUTHORITYNotes to Combined Financial Statements
For the Period and Year Ended March 31, 2021 (unaudited) and December 31, 2020(dollars expressed in thousands)
Page 43
Note 14. Contingencies (Continued)
Article 5.11 Certification: Per Article 5.11 of the 1998 Bond Indenture, “...the Authority must maintain withresponsible insurers all insurance required….to provide against loss of or damage to the Facilities and lossof Revenues...to protect the interests of the Authority and the Bondholders.”
The Authority must submit in writing certifications, by “the Insurance Consultant” to the bond trustee, byApril 30 of each year, stating that it has sufficient coverage with regards to “multi-risk insurance” (on DRPAand PATCO facilities), “use and occupancy insurance” (i.e., business interruption), etc., in compliance withthe Indenture of Trust. The certifications must provide “in reasonable detail the insurance then in effectpursuant to” Section 5.11 and also must state whether, during the calendar year, any facility has been“materially damaged or destroyed, and if so, the amount of insurance proceeds covering such loss ordamage…” The Authority filed its annual insurance certification for 2019 prior to the April 30, 2020 deadline,asserting that “no material damage occurred at any facility” during the year.
Note 15. Commitments
Development Projects (Loan Guarantees): In support of previously authorized economic developmentprojects, the DRPA’s Board of Commissioners authorized loan guarantees to various banks to completethe financing aspects of a particular project. The Authority’s Board authorized loan guarantees in anamount not to exceed $27,000 prior to 2011 when the Board stopped funding new economic developmentprojects.
As of December 31, 2019, there no longer were any outstanding loan guarantees.
Community Impact: The Authority has an agreement with the City of Philadelphia (“City”) for CommunityImpact regarding the PATCO high-speed transit system (“Locust Street Subway Lease”). The agreementexpires on December 31, 2050. For the years 2019 through 2050, the annual base payment shall equalone dollar. The Authority made its annual payment in the amount of one dollar to the City in January 2020.In addition, for the duration of the lease, the Authority is required to annually create a PATCO CommunityImpact Fund in the amount of $500, with payment of such fund to be divided annually between communitieswithin the Commonwealth and the State, based on PATCO track miles in the respective states.
Community Impact (Continued): The estimated minimum commitment at March 31, 2021, is as follows:
Redevelopment Fee: The Authority, pursuant to a January 2016 amendment to an original agreement datedDecember 31, 1991, is obligated to pay a net redevelopment fee to the City of Camden RedevelopmentAgency in the net amount of $363 annually, as an “ongoing yearly obligation”. This fee is paid annually onor by July 1. The Authority made its annual payment for this obligation in both 2019 and 2020 (see Note19, Subsequent Events).
Year Amount
2021 375$
2022 500
2023 500
2024 500
2026 500
Thereafter 12,000
14,375$
220
220
DELAWARE RIVER PORT AUTHORITYNotes to Combined Financial Statements
For the Period and Year Ended March 31, 2021 (unaudited) and December 31, 2020(dollars expressed in thousands)
Page 44
Note 15. Commitments (Continued)
OCIP Letters of Credit: In May 2008, the Authority entered into two new separate irrevocable (evergreen)standby Letters of Credit (“LOC”) with TD Bank, N.A. (formerly Commerce Bank) and Wachovia Bank, insupport of the Authority’s “Owner Controlled Insurance Program (“OCIP”).” Under this insurance program,the Authority purchased various insurance policies and eligible contractors working on major capitalconstruction projects enrolled into the OCIP. The original LOC with Wells Fargo Bank (formerly WachoviaBank) was for a four-year term in the amount of $5,000 with an expiration date of May 7, 2012. The LOCwith TD Bank, N.A. was in an initial amount of $3,015 and automatically increased annually each May, inthe amount of $816, until it expired on May 7, 2012.
The OCIP program was subsequently renewed in 2010, 2013 and 2014, and finally expired on December31, 2014. During this period, the LOCs were reduced after consultation and approval by the insurancecarrier. Although the OCIP program ended in 2015 (the Railroad Protective Liability policy was extendedto March of 2015 to meet the completion date of the project), the insurance carrier, AIG required theAuthority to maintain the required LOC coverage to cover anticipated workers’ compensation and generalliability claims.
Statutes of Limitations (“SOL”) for filing workers’ compensation claims, whether based on an occupationaldisability or a physical injury, vary from state-to-state. In New Jersey, there is a two-year SOL.Pennsylvania has a three-year SOL.
Pursuant to DRPA-15-064, the Board approved the renewal of the LOC in 2015, with TD Bank, N.A. withan expiration date of December 31, 2016 in the amount of $5,462. Based on its annual reviews since 2016,AIG agreed to lower the LOC from $5,462 to $216, as of December 10, 2018. The Authority renewed theLOC in the amount of $216, on December 31, 2018, for one year, to expire December 31, 2019. The LOCwas subsequently renewed with the bank, in the amount of $216, on December 31, 2019, to expire onDecember 31, 2020. In March 2020, the LOC was reduced to $128. At December 31, 2020, the LOC wasrenewed at $128 to expire on December 31, 2021. On February 4, 2021, after a review of outstandingclaims, AIG advised the Authority and its LOC bank that it was reducing the LOC requirement from $128 to$94. The LOC will mature on December 31, 2021.
221
221
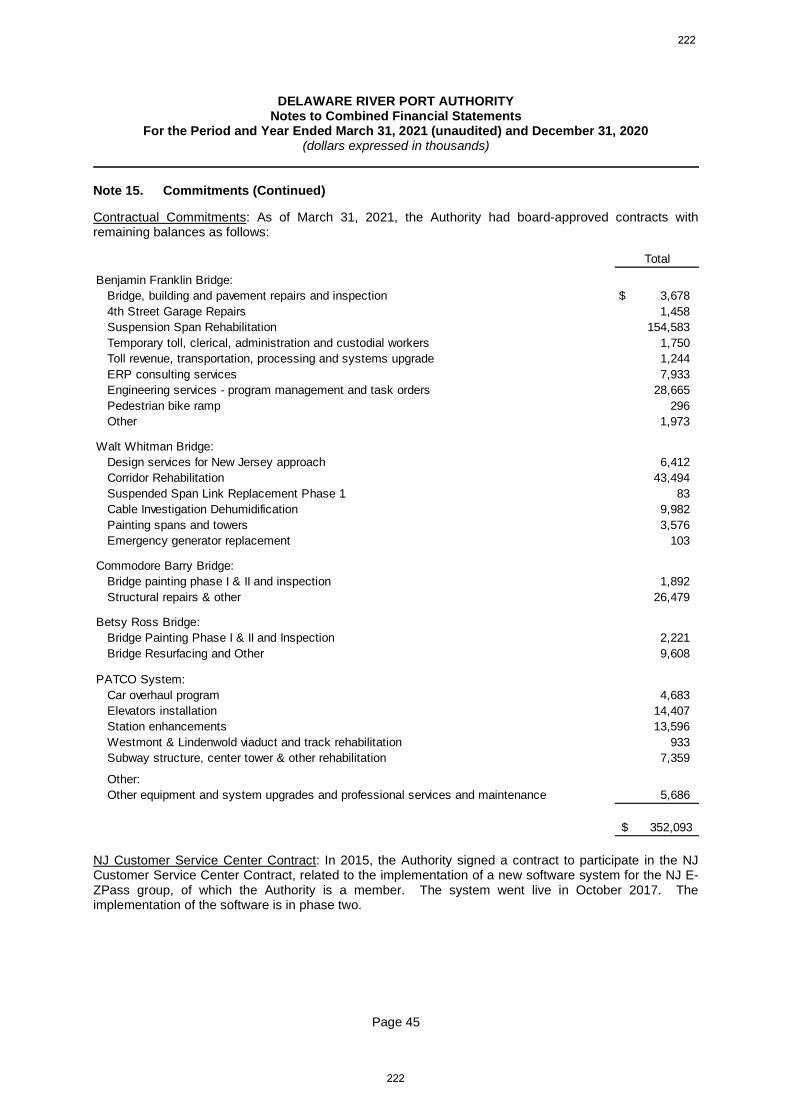
DELAWARE RIVER PORT AUTHORITYNotes to Combined Financial Statements
For the Period and Year Ended March 31, 2021 (unaudited) and December 31, 2020(dollars expressed in thousands)
Page 45
Note 15. Commitments (Continued)
Contractual Commitments: As of March 31, 2021, the Authority had board-approved contracts withremaining balances as follows:
NJ Customer Service Center Contract: In 2015, the Authority signed a contract to participate in the NJCustomer Service Center Contract, related to the implementation of a new software system for the NJ E-ZPass group, of which the Authority is a member. The system went live in October 2017. Theimplementation of the software is in phase two.
Total
Benjamin Franklin Bridge:
Bridge, building and pavement repairs and inspection 3,678$
4th Street Garage Repairs 1,458
Suspension Span Rehabilitation 154,583
Temporary toll, clerical, administration and custodial workers 1,750
Toll revenue, transportation, processing and systems upgrade 1,244
ERP consulting services 7,933
Engineering services - program management and task orders 28,665
Pedestrian bike ramp 296
Other 1,973
Walt Whitman Bridge:
Design services for New Jersey approach 6,412
Corridor Rehabilitation 43,494
Suspended Span Link Replacement Phase 1 83
Cable Investigation Dehumidification 9,982
Painting spans and towers 3,576
Emergency generator replacement 103
Commodore Barry Bridge:
Bridge painting phase I & II and inspection 1,892
Structural repairs & other 26,479
Betsy Ross Bridge:
Bridge Painting Phase I & II and Inspection 2,221
Bridge Resurfacing and Other 9,608
PATCO System:
Car overhaul program 4,683
Elevators installation 14,407
Station enhancements 13,596
Westmont & Lindenwold viaduct and track rehabilitation 933
Subway structure, center tower & other rehabilitation 7,359
Other:
Other equipment and system upgrades and professional services and maintenance 5,686
352,093$
222
222
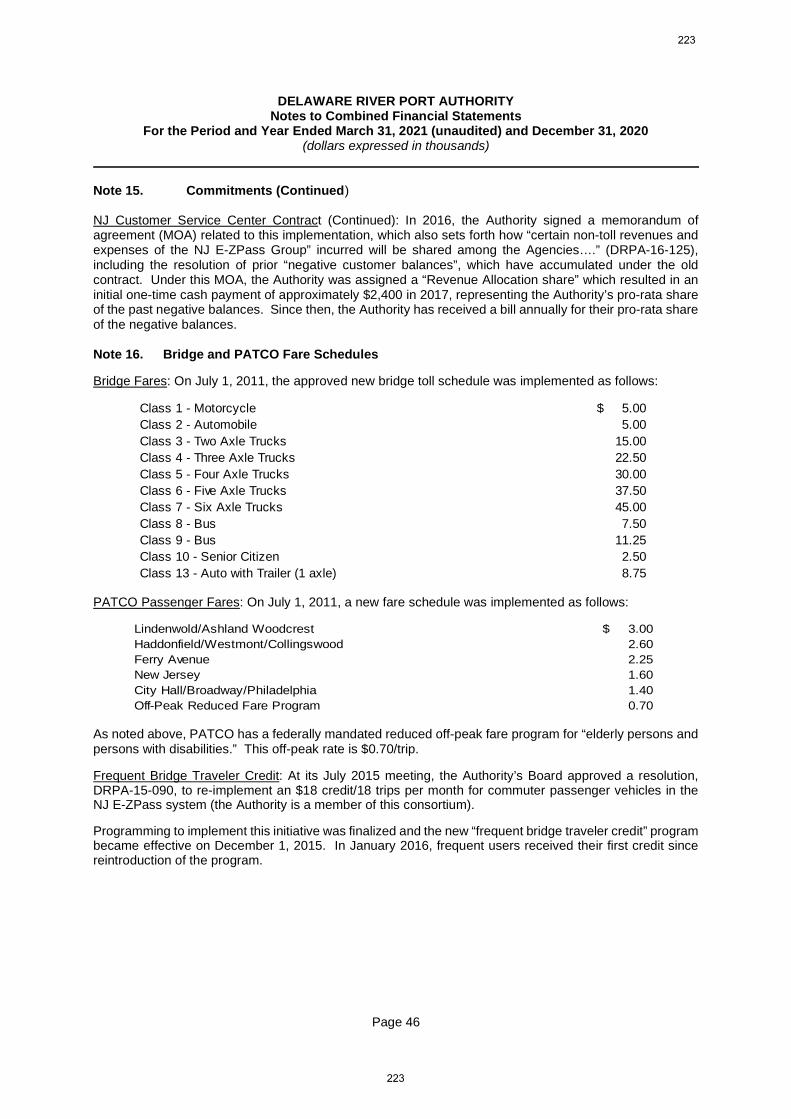
DELAWARE RIVER PORT AUTHORITYNotes to Combined Financial Statements
For the Period and Year Ended March 31, 2021 (unaudited) and December 31, 2020(dollars expressed in thousands)
Page 46
Note 15. Commitments (Continued)
NJ Customer Service Center Contract (Continued): In 2016, the Authority signed a memorandum ofagreement (MOA) related to this implementation, which also sets forth how “certain non-toll revenues andexpenses of the NJ E-ZPass Group” incurred will be shared among the Agencies….” (DRPA-16-125),including the resolution of prior “negative customer balances”, which have accumulated under the oldcontract. Under this MOA, the Authority was assigned a “Revenue Allocation share” which resulted in aninitial one-time cash payment of approximately $2,400 in 2017, representing the Authority’s pro-rata shareof the past negative balances. Since then, the Authority has received a bill annually for their pro-rata shareof the negative balances.
Note 16. Bridge and PATCO Fare Schedules
Bridge Fares: On July 1, 2011, the approved new bridge toll schedule was implemented as follows:
PATCO Passenger Fares: On July 1, 2011, a new fare schedule was implemented as follows:
Lindenwold/Ashland Woodcrest 3.00$
Haddonfield/Westmont/Collingswood 2.60
Ferry Avenue 2.25
New Jersey 1.60
City Hall/Broadway/Philadelphia 1.40
Off-Peak Reduced Fare Program 0.70
As noted above, PATCO has a federally mandated reduced off-peak fare program for “elderly persons andpersons with disabilities.” This off-peak rate is $0.70/trip.
Frequent Bridge Traveler Credit: At its July 2015 meeting, the Authority’s Board approved a resolution,DRPA-15-090, to re-implement an $18 credit/18 trips per month for commuter passenger vehicles in theNJ E-ZPass system (the Authority is a member of this consortium).
Programming to implement this initiative was finalized and the new “frequent bridge traveler credit” programbecame effective on December 1, 2015. In January 2016, frequent users received their first credit sincereintroduction of the program.
Class 1 - Motorcycle 5.00$
Class 2 - Automobile 5.00
Class 3 - Two Axle Trucks 15.00
Class 4 - Three Axle Trucks 22.50
Class 5 - Four Axle Trucks 30.00
Class 6 - Five Axle Trucks 37.50
Class 7 - Six Axle Trucks 45.00
Class 8 - Bus 7.50
Class 9 - Bus 11.25
Class 10 - Senior Citizen 2.50
Class 13 - Auto with Trailer (1 axle) 8.75
223
223
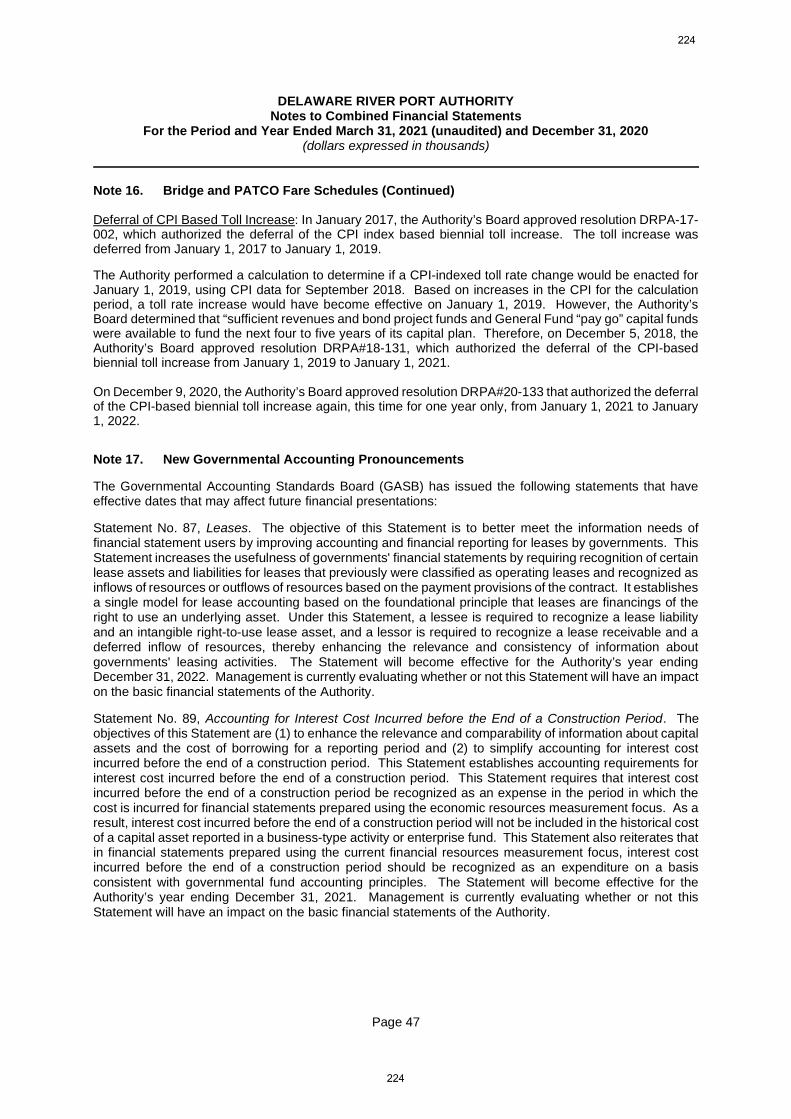
DELAWARE RIVER PORT AUTHORITYNotes to Combined Financial Statements
For the Period and Year Ended March 31, 2021 (unaudited) and December 31, 2020(dollars expressed in thousands)
Page 47
Note 16. Bridge and PATCO Fare Schedules (Continued)
Deferral of CPI Based Toll Increase: In January 2017, the Authority’s Board approved resolution DRPA-17-002, which authorized the deferral of the CPI index based biennial toll increase. The toll increase wasdeferred from January 1, 2017 to January 1, 2019.
The Authority performed a calculation to determine if a CPI-indexed toll rate change would be enacted forJanuary 1, 2019, using CPI data for September 2018. Based on increases in the CPI for the calculationperiod, a toll rate increase would have become effective on January 1, 2019. However, the Authority’sBoard determined that “sufficient revenues and bond project funds and General Fund “pay go” capital fundswere available to fund the next four to five years of its capital plan. Therefore, on December 5, 2018, theAuthority’s Board approved resolution DRPA#18-131, which authorized the deferral of the CPI-basedbiennial toll increase from January 1, 2019 to January 1, 2021.
On December 9, 2020, the Authority’s Board approved resolution DRPA#20-133 that authorized the deferralof the CPI-based biennial toll increase again, this time for one year only, from January 1, 2021 to January1, 2022.
Note 17. New Governmental Accounting Pronouncements
The Governmental Accounting Standards Board (GASB) has issued the following statements that haveeffective dates that may affect future financial presentations:
Statement No. 87, Leases. The objective of this Statement is to better meet the information needs offinancial statement users by improving accounting and financial reporting for leases by governments. ThisStatement increases the usefulness of governments' financial statements by requiring recognition of certainlease assets and liabilities for leases that previously were classified as operating leases and recognized asinflows of resources or outflows of resources based on the payment provisions of the contract. It establishesa single model for lease accounting based on the foundational principle that leases are financings of theright to use an underlying asset. Under this Statement, a lessee is required to recognize a lease liabilityand an intangible right-to-use lease asset, and a lessor is required to recognize a lease receivable and adeferred inflow of resources, thereby enhancing the relevance and consistency of information aboutgovernments' leasing activities. The Statement will become effective for the Authority’s year endingDecember 31, 2022. Management is currently evaluating whether or not this Statement will have an impacton the basic financial statements of the Authority.
Statement No. 89, Accounting for Interest Cost Incurred before the End of a Construction Period. Theobjectives of this Statement are (1) to enhance the relevance and comparability of information about capitalassets and the cost of borrowing for a reporting period and (2) to simplify accounting for interest costincurred before the end of a construction period. This Statement establishes accounting requirements forinterest cost incurred before the end of a construction period. This Statement requires that interest costincurred before the end of a construction period be recognized as an expense in the period in which thecost is incurred for financial statements prepared using the economic resources measurement focus. As aresult, interest cost incurred before the end of a construction period will not be included in the historical costof a capital asset reported in a business-type activity or enterprise fund. This Statement also reiterates thatin financial statements prepared using the current financial resources measurement focus, interest costincurred before the end of a construction period should be recognized as an expenditure on a basisconsistent with governmental fund accounting principles. The Statement will become effective for theAuthority’s year ending December 31, 2021. Management is currently evaluating whether or not thisStatement will have an impact on the basic financial statements of the Authority.
224
224
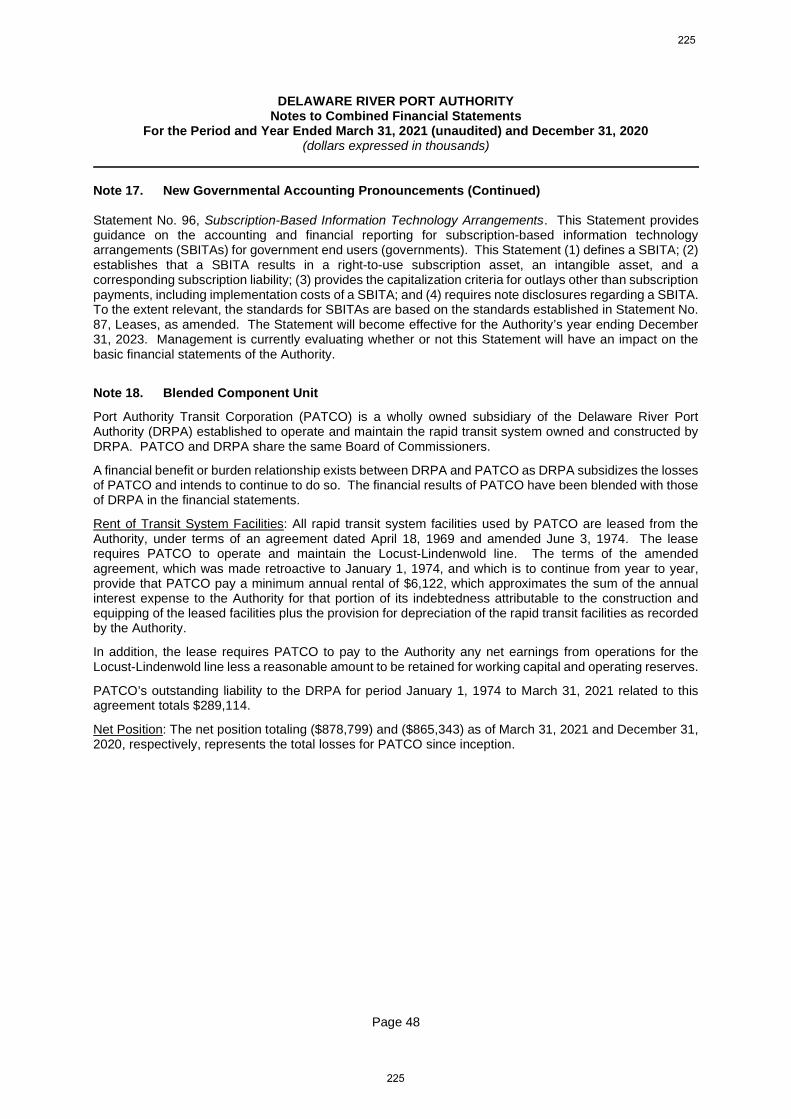
DELAWARE RIVER PORT AUTHORITYNotes to Combined Financial Statements
For the Period and Year Ended March 31, 2021 (unaudited) and December 31, 2020(dollars expressed in thousands)
Page 48
Note 17. New Governmental Accounting Pronouncements (Continued)
Statement No. 96, Subscription-Based Information Technology Arrangements. This Statement providesguidance on the accounting and financial reporting for subscription-based information technologyarrangements (SBITAs) for government end users (governments). This Statement (1) defines a SBITA; (2)establishes that a SBITA results in a right-to-use subscription asset, an intangible asset, and acorresponding subscription liability; (3) provides the capitalization criteria for outlays other than subscriptionpayments, including implementation costs of a SBITA; and (4) requires note disclosures regarding a SBITA.To the extent relevant, the standards for SBITAs are based on the standards established in Statement No.87, Leases, as amended. The Statement will become effective for the Authority’s year ending December31, 2023. Management is currently evaluating whether or not this Statement will have an impact on thebasic financial statements of the Authority.
Note 18. Blended Component Unit
Port Authority Transit Corporation (PATCO) is a wholly owned subsidiary of the Delaware River PortAuthority (DRPA) established to operate and maintain the rapid transit system owned and constructed byDRPA. PATCO and DRPA share the same Board of Commissioners.
A financial benefit or burden relationship exists between DRPA and PATCO as DRPA subsidizes the lossesof PATCO and intends to continue to do so. The financial results of PATCO have been blended with thoseof DRPA in the financial statements.
Rent of Transit System Facilities: All rapid transit system facilities used by PATCO are leased from theAuthority, under terms of an agreement dated April 18, 1969 and amended June 3, 1974. The leaserequires PATCO to operate and maintain the Locust-Lindenwold line. The terms of the amendedagreement, which was made retroactive to January 1, 1974, and which is to continue from year to year,provide that PATCO pay a minimum annual rental of $6,122, which approximates the sum of the annualinterest expense to the Authority for that portion of its indebtedness attributable to the construction andequipping of the leased facilities plus the provision for depreciation of the rapid transit facilities as recordedby the Authority.
In addition, the lease requires PATCO to pay to the Authority any net earnings from operations for theLocust-Lindenwold line less a reasonable amount to be retained for working capital and operating reserves.
PATCO’s outstanding liability to the DRPA for period January 1, 1974 to March 31, 2021 related to thisagreement totals $289,114.
Net Position: The net position totaling ($878,799) and ($865,343) as of March 31, 2021 and December 31,2020, respectively, represents the total losses for PATCO since inception.
225
225

DELAWARE RIVER PORT AUTHORITYNotes to Combined Financial Statements
For the Period and Year Ended March 31, 2021 (unaudited) and December 31, 2020(dollars expressed in thousands)
Page 49
Note 18. Blended Component Unit (Continued)
Condensed combining financial information applicable to DRPA and PATCO as of and for the period endedMarch 31, 2021 is as follows:
March 31, 2021
DRPA PATCO Total
Current assets 506,541$ 12,168$ 518,709$
Receivable from primary government (1,558) 1,558 0
Capital assets 1,825,235 1,825,235
Other noncurrent assets 87,294 87,294
Total assets 2,417,512 13,725 2,431,237
Deferred outflows of resources 50,533 9,763 60,296
Total assets and deferred outflows of resources 2,468,045 23,488 2,491,533
Current liabilities 123,913 6,053 129,966
Payables to primary government:
Lease agreement (289,114) 289,114 0
Advances from DRPA (566,113) 566,113 0
Noncurrent liabilities 1,362,686 36,793 1,399,479
Total liabilities 631,372 898,073 1,529,445
Deferred inflows of resources 25,191 4,214 29,405
Total net position (deficiency) 1,811,482$ (878,799)$ 932,683$
226
226

DELAWARE RIVER PORT AUTHORITYNotes to Combined Financial Statements
For the Period and Year Ended March 31, 2021 (unaudited) and December 31, 2020(dollars expressed in thousands)
Page 50
Note 18. Blended Component Unit (Continued)
Condensed combining financial information applicable to DRPA and PATCO as of and for the period endedMarch 31, 2021 is as follows (continued):
March 31, 2021
DRPA PATCO Total
Operating revenues
Bridge revenues 65,574$ 65,574$
Transit systems 1,537$ 1,537
Other 47 47
Total operating revenues 65,621 1,537 67,158
Operating expenses
Operating - other 25,312 13,470 38,781
Depreciation 17,957 17,957
Total operating expenses 43,268 13,470 56,738
Operating income (loss) 22,353 (11,933) 10,420
Nonoperating revenues (expenses)
Interest expense (12,742) (12,742)
Economic development activities (2) (2)
Lease rental 1,530 (1,530) 0
Other 227 7 235
Total nonoperating revenues (expenses) (10,986) (1,523) (12,509)
Capital contributions 1,049 - 1,049
Change in net position 12,415 (13,456) (1,041)
Net position (deficiency), January 1 1,799,067 (865,343) 933,724
Net position (deficiency), March 31, 2021 1,811,482$ (878,799)$ 932,683$
March 31, 2021
DRPA PATCO Total
Net cash provided by (used in) operating activities 4,986$ (9,484)$ (4,498)$
Net cash provided by (used in) noncapitalfinancing activities (6,384) 10,225 3,841
Net cash provided by (used in) capital and related
financing activities (115,545) (115,545)
Net cash provided by (used in) investing activities 111,617 111,617
Net increase (decrease) in cash and cash equivalents (5,326) 741 (4,585)
Cash and cash equivalents, January 1 29,690 1,036 30,726
Cash and cash equivalents, March 31 24,364$ 1,777$ 26,141$
227
227
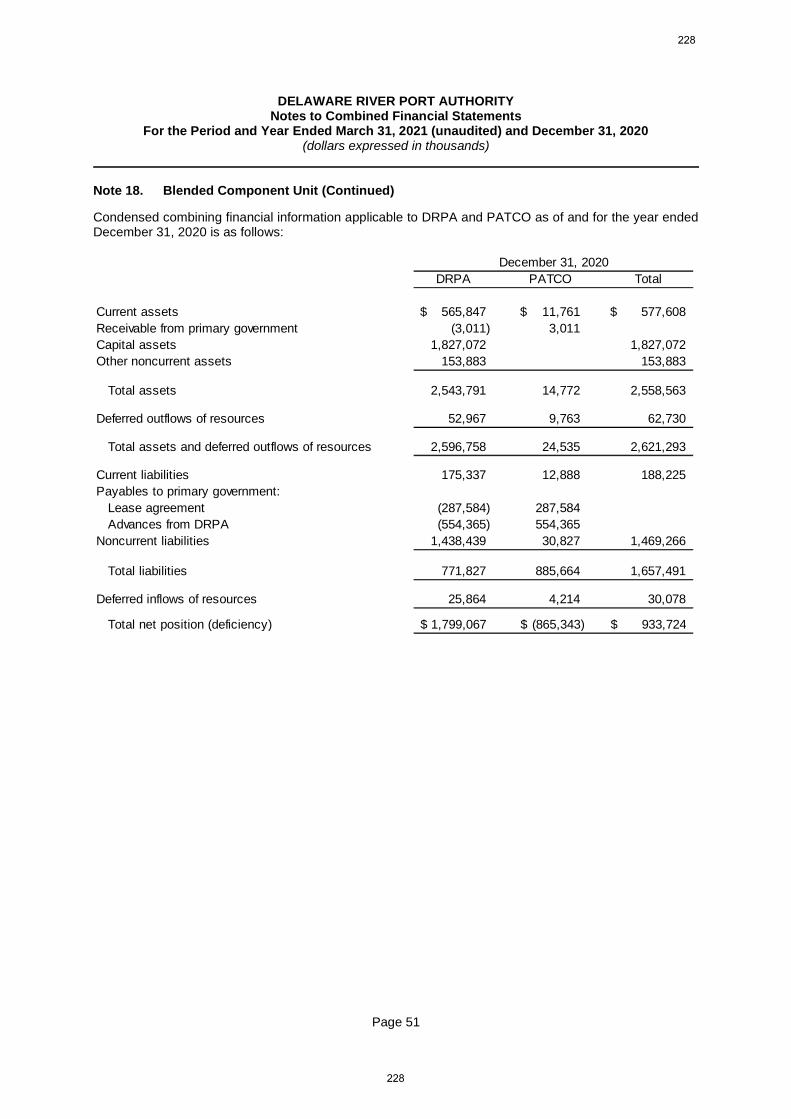
DELAWARE RIVER PORT AUTHORITYNotes to Combined Financial Statements
For the Period and Year Ended March 31, 2021 (unaudited) and December 31, 2020(dollars expressed in thousands)
Page 51
Note 18. Blended Component Unit (Continued)
Condensed combining financial information applicable to DRPA and PATCO as of and for the year endedDecember 31, 2020 is as follows:
December 31, 2020
DRPA PATCO Total
Current assets 565,847$ 11,761$ 577,608$
Receivable from primary government (3,011) 3,011
Capital assets 1,827,072 1,827,072
Other noncurrent assets 153,883 153,883
Total assets 2,543,791 14,772 2,558,563
Deferred outflows of resources 52,967 9,763 62,730
Total assets and deferred outflows of resources 2,596,758 24,535 2,621,293
Current liabilities 175,337 12,888 188,225
Payables to primary government:
Lease agreement (287,584) 287,584
Advances from DRPA (554,365) 554,365
Noncurrent liabilities 1,438,439 30,827 1,469,266
Total liabilities 771,827 885,664 1,657,491
Deferred inflows of resources 25,864 4,214 30,078
Total net position (deficiency) 1,799,067$ (865,343)$ 933,724$
228
228
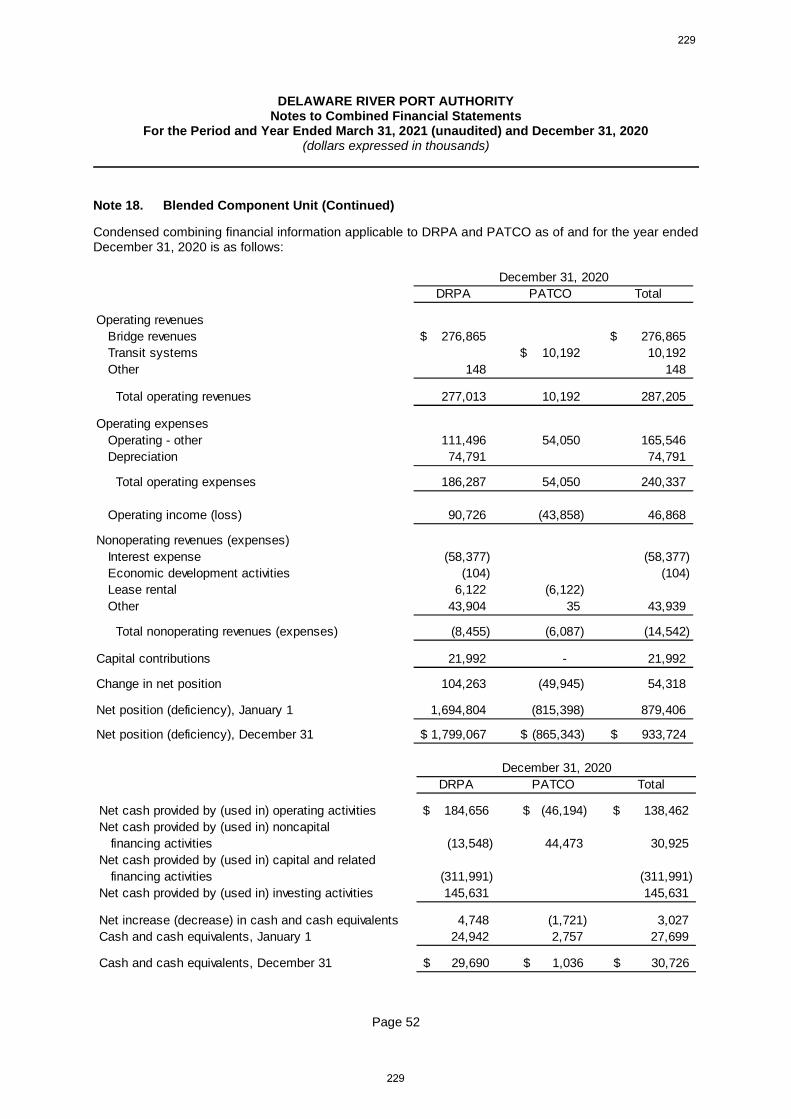
DELAWARE RIVER PORT AUTHORITYNotes to Combined Financial Statements
For the Period and Year Ended March 31, 2021 (unaudited) and December 31, 2020(dollars expressed in thousands)
Page 52
Note 18. Blended Component Unit (Continued)
Condensed combining financial information applicable to DRPA and PATCO as of and for the year endedDecember 31, 2020 is as follows:
December 31, 2020
DRPA PATCO Total
Operating revenues
Bridge revenues 276,865$ 276,865$
Transit systems 10,192$ 10,192
Other 148 148
Total operating revenues 277,013 10,192 287,205
Operating expenses
Operating - other 111,496 54,050 165,546
Depreciation 74,791 74,791
Total operating expenses 186,287 54,050 240,337
Operating income (loss) 90,726 (43,858) 46,868
Nonoperating revenues (expenses)
Interest expense (58,377) (58,377)
Economic development activities (104) (104)
Lease rental 6,122 (6,122)
Other 43,904 35 43,939
Total nonoperating revenues (expenses) (8,455) (6,087) (14,542)
Capital contributions 21,992 - 21,992
Change in net position 104,263 (49,945) 54,318
Net position (deficiency), January 1 1,694,804 (815,398) 879,406
Net position (deficiency), December 31 1,799,067$ (865,343)$ 933,724$
December 31, 2020
DRPA PATCO Total
Net cash provided by (used in) operating activities 184,656$ (46,194)$ 138,462$
Net cash provided by (used in) noncapital
financing activities (13,548) 44,473 30,925
Net cash provided by (used in) capital and related
financing activities (311,991) (311,991)
Net cash provided by (used in) investing activities 145,631 145,631
Net increase (decrease) in cash and cash equivalents 4,748 (1,721) 3,027
Cash and cash equivalents, January 1 24,942 2,757 27,699
Cash and cash equivalents, December 31 29,690$ 1,036$ 30,726$
229
229
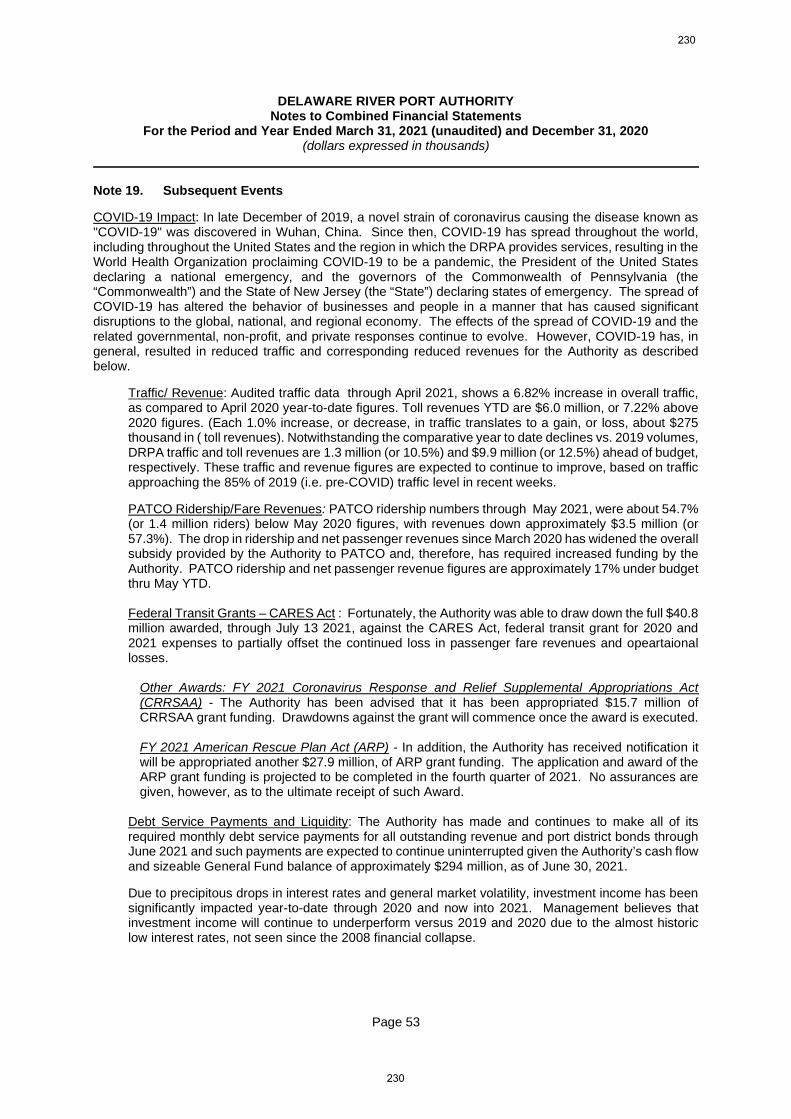
DELAWARE RIVER PORT AUTHORITYNotes to Combined Financial Statements
For the Period and Year Ended March 31, 2021 (unaudited) and December 31, 2020(dollars expressed in thousands)
Page 53
Note 19. Subsequent Events
COVID-19 Impact: In late December of 2019, a novel strain of coronavirus causing the disease known as"COVID-19" was discovered in Wuhan, China. Since then, COVID-19 has spread throughout the world,including throughout the United States and the region in which the DRPA provides services, resulting in theWorld Health Organization proclaiming COVID-19 to be a pandemic, the President of the United Statesdeclaring a national emergency, and the governors of the Commonwealth of Pennsylvania (the“Commonwealth”) and the State of New Jersey (the “State”) declaring states of emergency. The spread ofCOVID-19 has altered the behavior of businesses and people in a manner that has caused significantdisruptions to the global, national, and regional economy. The effects of the spread of COVID-19 and therelated governmental, non-profit, and private responses continue to evolve. However, COVID-19 has, ingeneral, resulted in reduced traffic and corresponding reduced revenues for the Authority as describedbelow.
Traffic/ Revenue: Audited traffic data through April 2021, shows a 6.82% increase in overall traffic,as compared to April 2020 year-to-date figures. Toll revenues YTD are $6.0 million, or 7.22% above2020 figures. (Each 1.0% increase, or decrease, in traffic translates to a gain, or loss, about $275thousand in ( toll revenues). Notwithstanding the comparative year to date declines vs. 2019 volumes,DRPA traffic and toll revenues are 1.3 million (or 10.5%) and $9.9 million (or 12.5%) ahead of budget,respectively. These traffic and revenue figures are expected to continue to improve, based on trafficapproaching the 85% of 2019 (i.e. pre-COVID) traffic level in recent weeks.
PATCO Ridership/Fare Revenues: PATCO ridership numbers through May 2021, were about 54.7%(or 1.4 million riders) below May 2020 figures, with revenues down approximately $3.5 million (or57.3%). The drop in ridership and net passenger revenues since March 2020 has widened the overallsubsidy provided by the Authority to PATCO and, therefore, has required increased funding by theAuthority. PATCO ridership and net passenger revenue figures are approximately 17% under budgetthru May YTD.
Federal Transit Grants – CARES Act : Fortunately, the Authority was able to draw down the full $40.8million awarded, through July 13 2021, against the CARES Act, federal transit grant for 2020 and2021 expenses to partially offset the continued loss in passenger fare revenues and opeartaionallosses.
Other Awards: FY 2021 Coronavirus Response and Relief Supplemental Appropriations Act(CRRSAA) - The Authority has been advised that it has been appropriated $15.7 million ofCRRSAA grant funding. Drawdowns against the grant will commence once the award is executed.
FY 2021 American Rescue Plan Act (ARP) - In addition, the Authority has received notification itwill be appropriated another $27.9 million, of ARP grant funding. The application and award of theARP grant funding is projected to be completed in the fourth quarter of 2021. No assurances aregiven, however, as to the ultimate receipt of such Award.
Debt Service Payments and Liquidity: The Authority has made and continues to make all of itsrequired monthly debt service payments for all outstanding revenue and port district bonds throughJune 2021 and such payments are expected to continue uninterrupted given the Authority’s cash flowand sizeable General Fund balance of approximately $294 million, as of June 30, 2021.
Due to precipitous drops in interest rates and general market volatility, investment income has beensignificantly impacted year-to-date through 2020 and now into 2021. Management believes thatinvestment income will continue to underperform versus 2019 and 2020 due to the almost historiclow interest rates, not seen since the 2008 financial collapse.
230
230
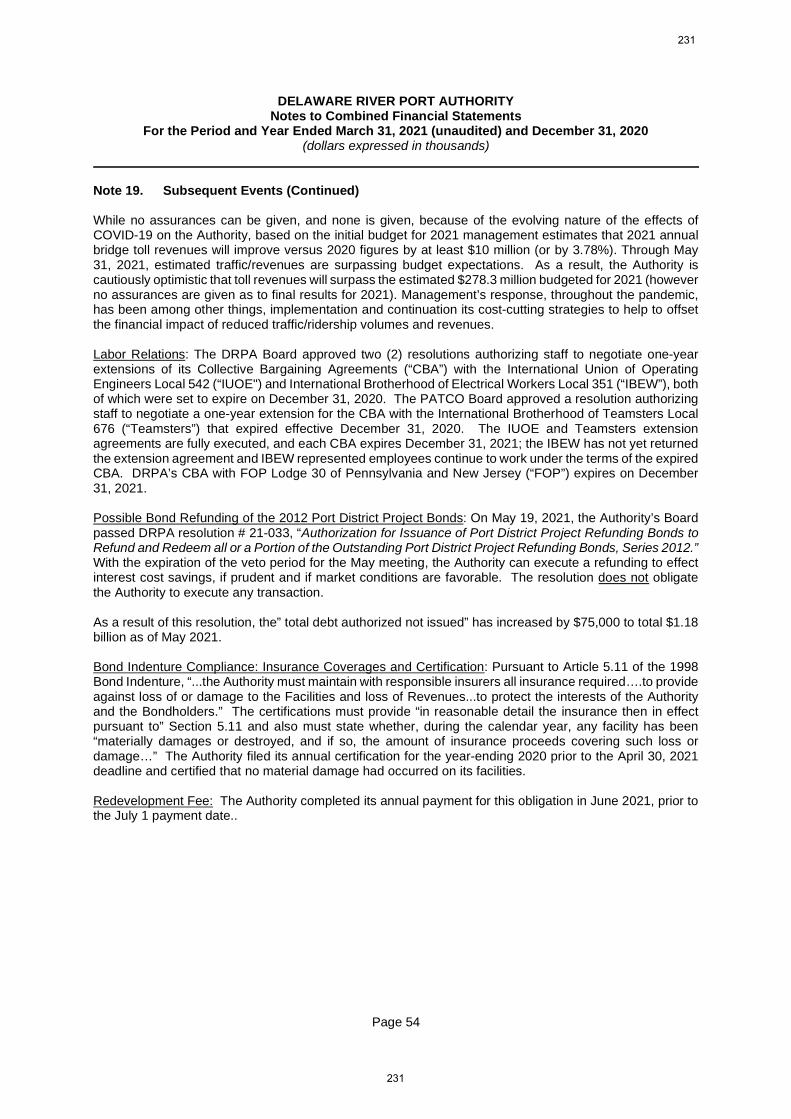
DELAWARE RIVER PORT AUTHORITYNotes to Combined Financial Statements
For the Period and Year Ended March 31, 2021 (unaudited) and December 31, 2020(dollars expressed in thousands)
Page 54
Note 19. Subsequent Events (Continued)
While no assurances can be given, and none is given, because of the evolving nature of the effects ofCOVID-19 on the Authority, based on the initial budget for 2021 management estimates that 2021 annualbridge toll revenues will improve versus 2020 figures by at least $10 million (or by 3.78%). Through May31, 2021, estimated traffic/revenues are surpassing budget expectations. As a result, the Authority iscautiously optimistic that toll revenues will surpass the estimated $278.3 million budgeted for 2021 (howeverno assurances are given as to final results for 2021). Management’s response, throughout the pandemic,has been among other things, implementation and continuation its cost-cutting strategies to help to offsetthe financial impact of reduced traffic/ridership volumes and revenues.
Labor Relations: The DRPA Board approved two (2) resolutions authorizing staff to negotiate one-yearextensions of its Collective Bargaining Agreements (“CBA”) with the International Union of OperatingEngineers Local 542 (“IUOE") and International Brotherhood of Electrical Workers Local 351 (“IBEW”), bothof which were set to expire on December 31, 2020. The PATCO Board approved a resolution authorizingstaff to negotiate a one-year extension for the CBA with the International Brotherhood of Teamsters Local676 (“Teamsters”) that expired effective December 31, 2020. The IUOE and Teamsters extensionagreements are fully executed, and each CBA expires December 31, 2021; the IBEW has not yet returnedthe extension agreement and IBEW represented employees continue to work under the terms of the expiredCBA. DRPA’s CBA with FOP Lodge 30 of Pennsylvania and New Jersey (“FOP”) expires on December31, 2021.
Possible Bond Refunding of the 2012 Port District Project Bonds: On May 19, 2021, the Authority’s Boardpassed DRPA resolution # 21-033, “Authorization for Issuance of Port District Project Refunding Bonds toRefund and Redeem all or a Portion of the Outstanding Port District Project Refunding Bonds, Series 2012.”With the expiration of the veto period for the May meeting, the Authority can execute a refunding to effectinterest cost savings, if prudent and if market conditions are favorable. The resolution does not obligatethe Authority to execute any transaction.
As a result of this resolution, the” total debt authorized not issued” has increased by $75,000 to total $1.18billion as of May 2021.
Bond Indenture Compliance: Insurance Coverages and Certification: Pursuant to Article 5.11 of the 1998Bond Indenture, “...the Authority must maintain with responsible insurers all insurance required….to provideagainst loss of or damage to the Facilities and loss of Revenues...to protect the interests of the Authorityand the Bondholders.” The certifications must provide “in reasonable detail the insurance then in effectpursuant to” Section 5.11 and also must state whether, during the calendar year, any facility has been“materially damages or destroyed, and if so, the amount of insurance proceeds covering such loss ordamage…” The Authority filed its annual certification for the year-ending 2020 prior to the April 30, 2021deadline and certified that no material damage had occurred on its facilities.
Redevelopment Fee: The Authority completed its annual payment for this obligation in June 2021, prior tothe July 1 payment date..
231
231
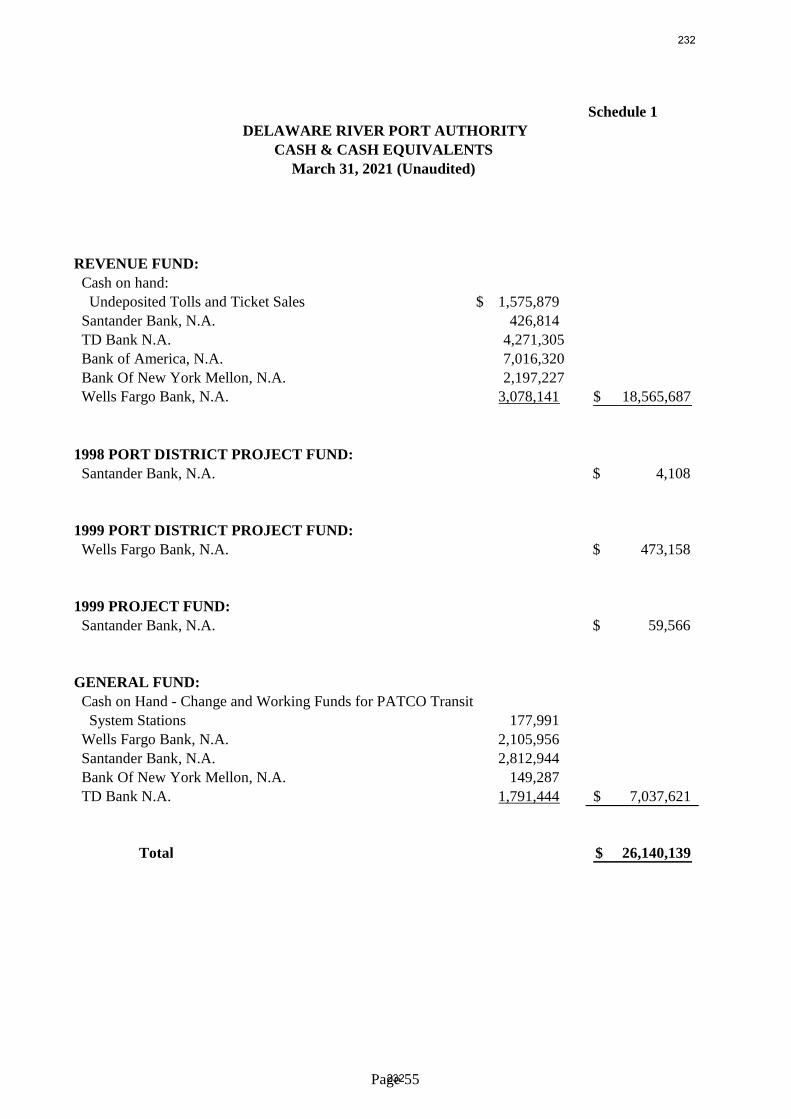
Schedule 1
REVENUE FUND:
Cash on hand:
Undeposited Tolls and Ticket Sales 1,575,879$
Santander Bank, N.A. 426,814
TD Bank N.A. 4,271,305
Bank of America, N.A. 7,016,320
Bank Of New York Mellon, N.A. 2,197,227Wells Fargo Bank, N.A. 3,078,141 18,565,687$
1998 PORT DISTRICT PROJECT FUND:
Santander Bank, N.A. 4,108$
1999 PORT DISTRICT PROJECT FUND:
Wells Fargo Bank, N.A. 473,158$
1999 PROJECT FUND:
Santander Bank, N.A. 59,566$
GENERAL FUND:
Cash on Hand - Change and Working Funds for PATCO Transit
System Stations 177,991
Wells Fargo Bank, N.A. 2,105,956
Santander Bank, N.A. 2,812,944
Bank Of New York Mellon, N.A. 149,287
TD Bank N.A. 1,791,444 7,037,621$
Total 26,140,139$
DELAWARE RIVER PORT AUTHORITY
CASH & CASH EQUIVALENTS
March 31, 2021 (Unaudited)
Page 55232
232
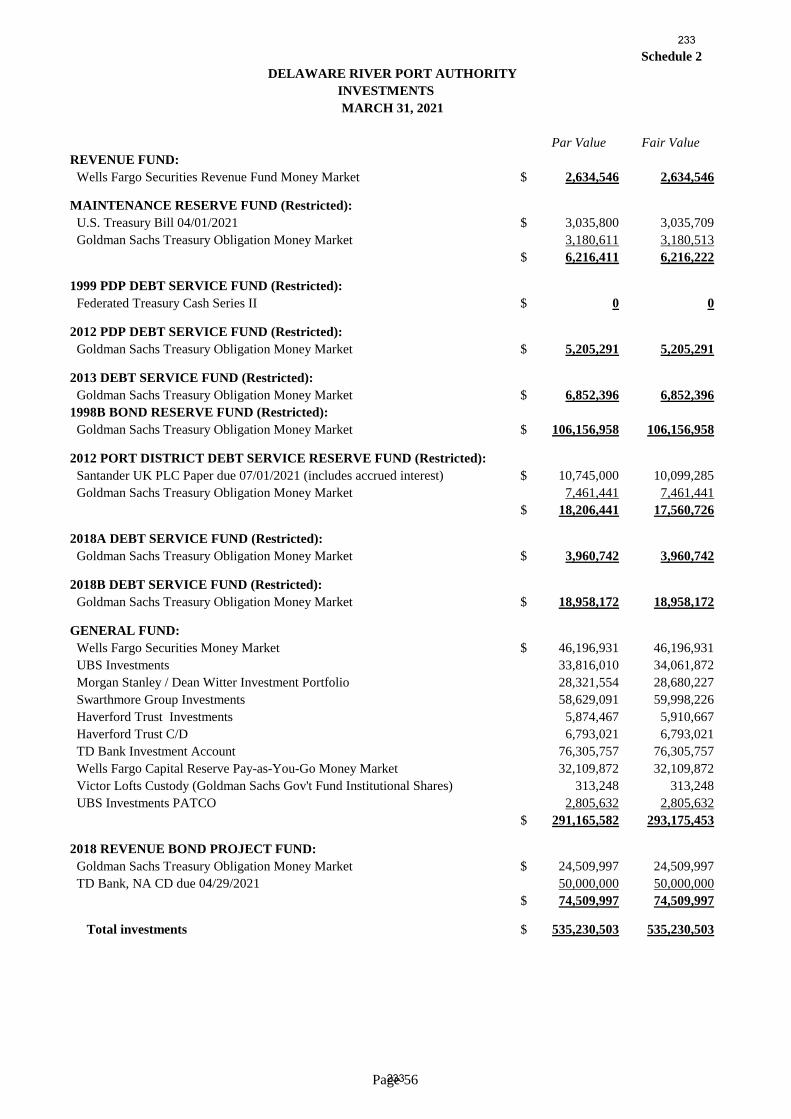
Schedule 2
Par Value Fair Value
REVENUE FUND:
Wells Fargo Securities Revenue Fund Money Market $ 2,634,546 2,634,546
MAINTENANCE RESERVE FUND (Restricted):
U.S. Treasury Bill 04/01/2021 $ 3,035,800 3,035,709
Goldman Sachs Treasury Obligation Money Market 3,180,611 3,180,513
$ 6,216,411 6,216,222
1999 PDP DEBT SERVICE FUND (Restricted):
Federated Treasury Cash Series II $ 0 0
2012 PDP DEBT SERVICE FUND (Restricted):
Goldman Sachs Treasury Obligation Money Market $ 5,205,291 5,205,291
2013 DEBT SERVICE FUND (Restricted):
Goldman Sachs Treasury Obligation Money Market $ 6,852,396 6,852,396
1998B BOND RESERVE FUND (Restricted):
Goldman Sachs Treasury Obligation Money Market $ 106,156,958 106,156,958
2012 PORT DISTRICT DEBT SERVICE RESERVE FUND (Restricted):
Santander UK PLC Paper due 07/01/2021 (includes accrued interest) $ 10,745,000 10,099,285
Goldman Sachs Treasury Obligation Money Market 7,461,441 7,461,441
$ 18,206,441 17,560,726
2018A DEBT SERVICE FUND (Restricted):
Goldman Sachs Treasury Obligation Money Market $ 3,960,742 3,960,742
2018B DEBT SERVICE FUND (Restricted):
Goldman Sachs Treasury Obligation Money Market $ 18,958,172 18,958,172
GENERAL FUND:
Wells Fargo Securities Money Market $ 46,196,931 46,196,931
UBS Investments 33,816,010 34,061,872
Morgan Stanley / Dean Witter Investment Portfolio 28,321,554 28,680,227
Swarthmore Group Investments 58,629,091 59,998,226
Haverford Trust Investments 5,874,467 5,910,667
Haverford Trust C/D 6,793,021 6,793,021
TD Bank Investment Account 76,305,757 76,305,757
Wells Fargo Capital Reserve Pay-as-You-Go Money Market 32,109,872 32,109,872
Victor Lofts Custody (Goldman Sachs Gov't Fund Institutional Shares) 313,248 313,248
UBS Investments PATCO 2,805,632 2,805,632
$ 291,165,582 293,175,453
2018 REVENUE BOND PROJECT FUND:
Goldman Sachs Treasury Obligation Money Market $ 24,509,997 24,509,997
TD Bank, NA CD due 04/29/2021 50,000,000 50,000,000
$ 74,509,997 74,509,997
Total investments $ 535,230,503 535,230,503
DELAWARE RIVER PORT AUTHORITY
INVESTMENTS
MARCH 31, 2021
Page 56233
233
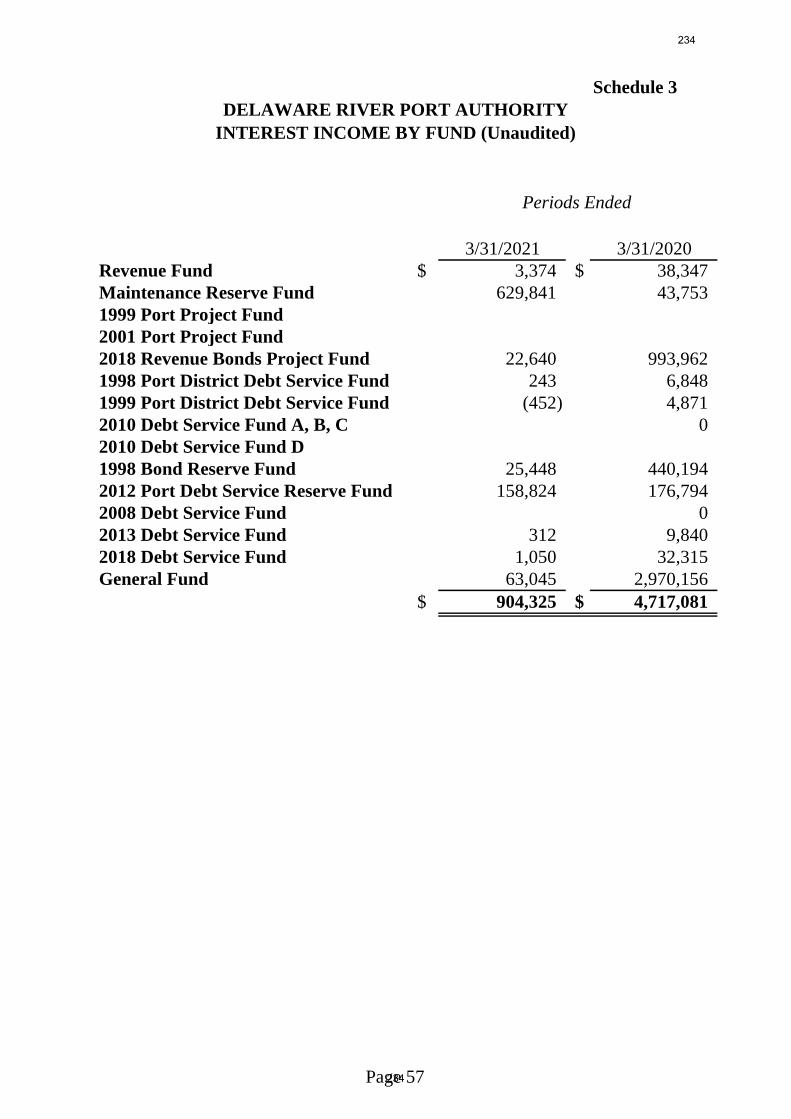
Schedule 3
3/31/2021 3/31/2020Revenue Fund $ 3,374 $ 38,347Maintenance Reserve Fund 629,841 43,7531999 Port Project Fund2001 Port Project Fund2018 Revenue Bonds Project Fund 22,640 993,9621998 Port District Debt Service Fund 243 6,8481999 Port District Debt Service Fund (452) 4,8712010 Debt Service Fund A, B, C 02010 Debt Service Fund D1998 Bond Reserve Fund 25,448 440,1942012 Port Debt Service Reserve Fund 158,824 176,7942008 Debt Service Fund 02013 Debt Service Fund 312 9,8402018 Debt Service Fund 1,050 32,315General Fund 63,045 2,970,156
$ 904,325 $ 4,717,081
DELAWARE RIVER PORT AUTHORITY
INTEREST INCOME BY FUND (Unaudited)
Periods Ended
Page 57234
234
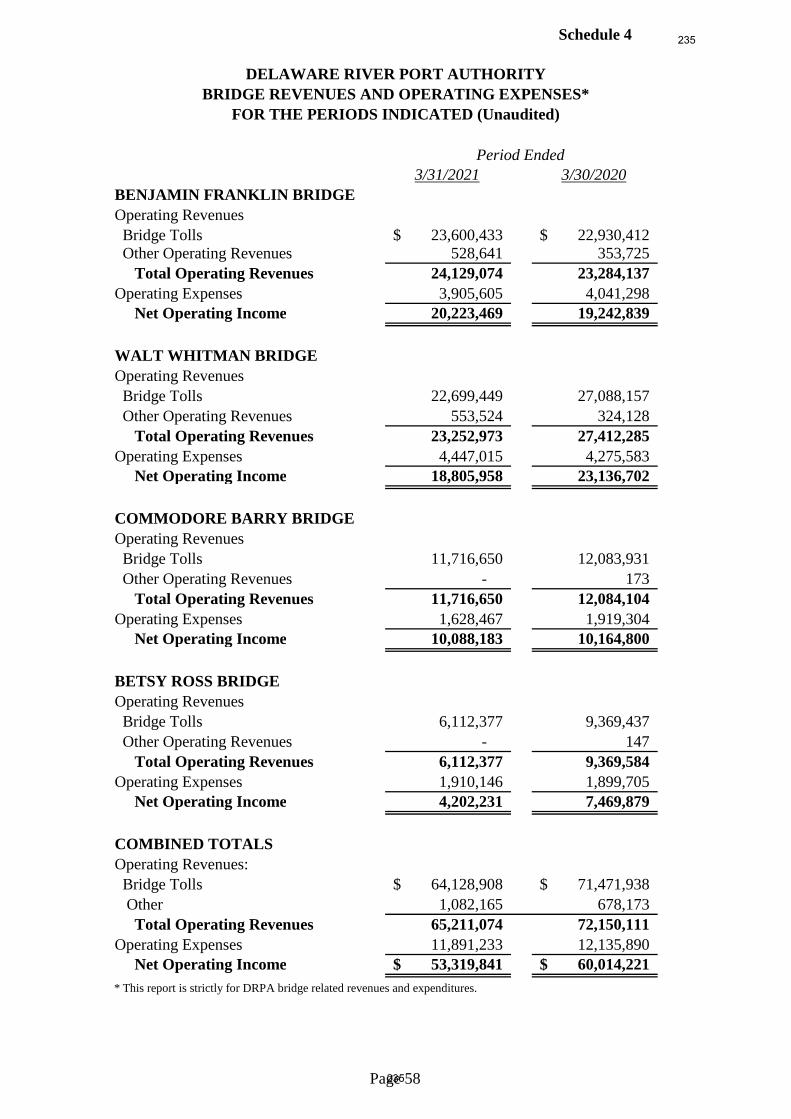
Schedule 4
Period Ended3/31/2021 3/30/2020
BENJAMIN FRANKLIN BRIDGE
Operating Revenues
Bridge Tolls 23,600,433$ 22,930,412$Other Operating Revenues 528,641 353,725
Total Operating Revenues 24,129,074 23,284,137
Operating Expenses 3,905,605 4,041,298Net Operating Income 20,223,469 19,242,839
WALT WHITMAN BRIDGE
Operating Revenues
Bridge Tolls 22,699,449 27,088,157
Other Operating Revenues 553,524 324,128
Total Operating Revenues 23,252,973 27,412,285
Operating Expenses 4,447,015 4,275,583Net Operating Income 18,805,958 23,136,702
COMMODORE BARRY BRIDGE
Operating Revenues
Bridge Tolls 11,716,650 12,083,931
Other Operating Revenues - 173
Total Operating Revenues 11,716,650 12,084,104
Operating Expenses 1,628,467 1,919,304Net Operating Income 10,088,183 10,164,800
BETSY ROSS BRIDGE
Operating Revenues
Bridge Tolls 6,112,377 9,369,437
Other Operating Revenues - 147
Total Operating Revenues 6,112,377 9,369,584
Operating Expenses 1,910,146 1,899,705Net Operating Income 4,202,231 7,469,879
COMBINED TOTALS
Operating Revenues:
Bridge Tolls 64,128,908$ 71,471,938$
Other 1,082,165 678,173
Total Operating Revenues 65,211,074 72,150,111
Operating Expenses 11,891,233 12,135,890Net Operating Income 53,319,841$ 60,014,221$
* This report is strictly for DRPA bridge related revenues and expenditures.
DELAWARE RIVER PORT AUTHORITY
BRIDGE REVENUES AND OPERATING EXPENSES*
FOR THE PERIODS INDICATED (Unaudited)
Page 58235
235
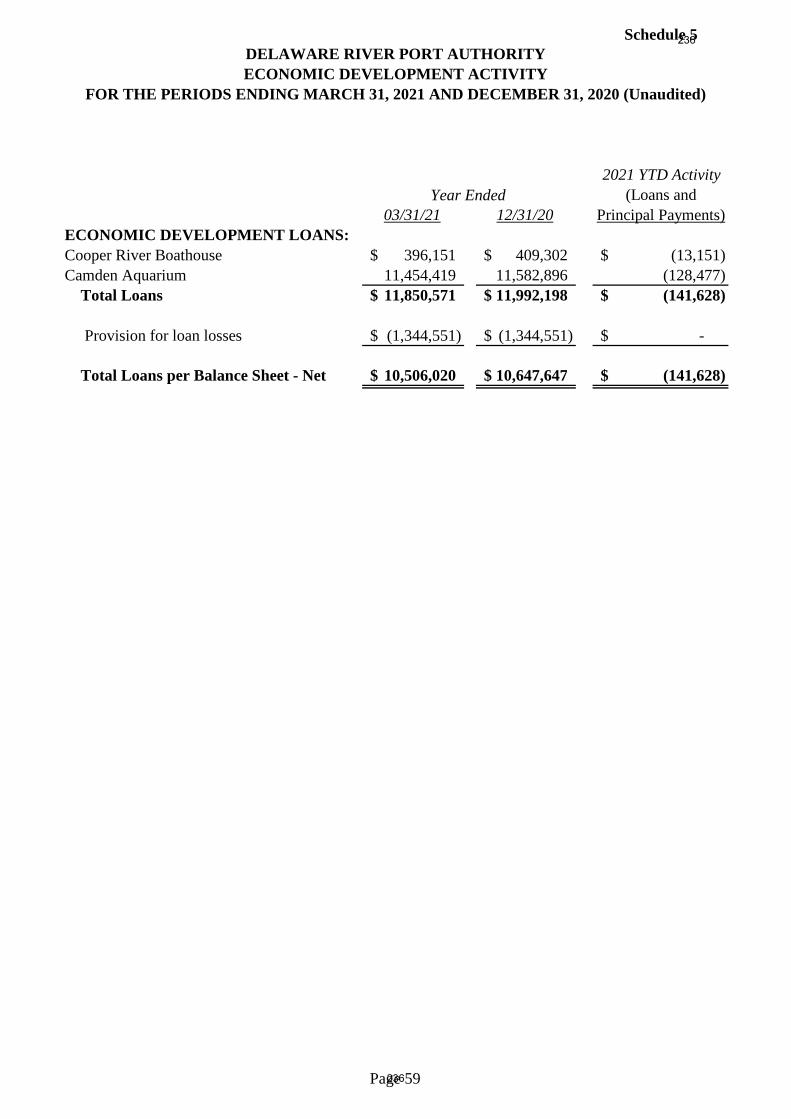
Schedule 5
2021 YTD Activity
Year Ended (Loans and
03/31/21 12/31/20 Principal Payments)
ECONOMIC DEVELOPMENT LOANS:
Cooper River Boathouse 396,151$ 409,302$ (13,151)$
Camden Aquarium 11,454,419 11,582,896 (128,477)
Total Loans 11,850,571$ 11,992,198$ (141,628)$
Provision for loan losses (1,344,551)$ (1,344,551)$ -$
Total Loans per Balance Sheet - Net 10,506,020$ 10,647,647$ (141,628)$
DELAWARE RIVER PORT AUTHORITY
ECONOMIC DEVELOPMENT ACTIVITY
FOR THE PERIODS ENDING MARCH 31, 2021 AND DECEMBER 31, 2020 (Unaudited)
Page 59236
236
DRPA BOARD MINUTES
237
237
DELAWARE RIVER PORT AUTHORITY
BOARD MEETING
One Port Center/Zoom
Wednesday, June 16, 2021
Due to the coronavirus pandemic, all participants, except where noted, attended via telephone/web
conference.
Pennsylvania Commissioners
Cherelle Parker, Chair of the Board
Hayden Rigo (for Pennsylvania Auditor General Timothy DeFoor)
Donna Powell
Ted Christian (for Pennsylvania Treasurer Stacy Garrity)
Christopher Lewis
Joseph Martz
Kathleen McGinty
New Jersey Commissioners
Jeffrey Nash, Esq., Vice Chair of the Board
Albert Frattali
Sara Lipsett
Charles Fentress
Aaron Nelson
Bruce Garganio
Richard Sweeney
Daniel Christy
DRPA/PATCO Staff
John T. Hanson, Chief Executive Officer (in person)
Maria Wing, Deputy Chief Executive Officer
Raymond J. Santarelli, General Counsel and Corporate Secretary (in person)
Stephen Holden, Deputy General Counsel (in person)
James White, Chief Financial Officer (in person)
Toni Brown, Chief Administrative Officer
David Aubrey, Inspector General
John Rink, General Manager, PATCO
Michael Venuto, Chief Engineer
Robert Finnegan, Acting Chief of Police
John Lotierzo, Director of Finance (in person)
Richard Mosback, Director, Procurement DRPA/PATCO
Kathleen Vandy, Assistant General Counsel
William Shanahan, Director, Government Relations
Tonyelle Cook-Artis, Manager, Government Relations
Joseph McAroy, Bridge Director, BFB & BRB
Richard Tutak, Acting Bridge Director, WWB & CBB
Darlene Callands, Manager Community Relations
Christina Maroney, Director, Strategic Initiatives
Amy Ash, Manager, Contracts Administration
Michael Williams, Manager, Corporate Communications
Annette Melendez-Freeman, Toll Manager, BFB & BRB
Elizabeth Saylor, Administrative Coordinator, Corporate Secretary, OGC (in person)
238
238
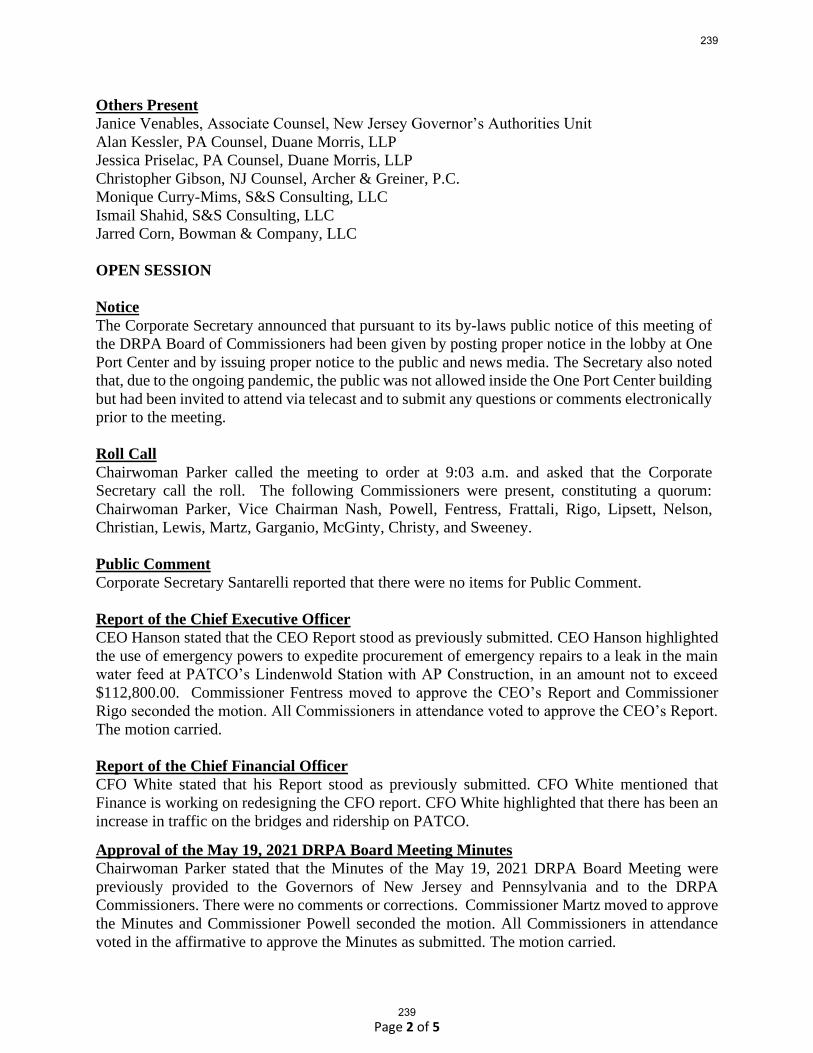
Page 2 of 5
Others Present
Janice Venables, Associate Counsel, New Jersey Governor’s Authorities Unit
Alan Kessler, PA Counsel, Duane Morris, LLP
Jessica Priselac, PA Counsel, Duane Morris, LLP
Christopher Gibson, NJ Counsel, Archer & Greiner, P.C.
Monique Curry-Mims, S&S Consulting, LLC
Ismail Shahid, S&S Consulting, LLC
Jarred Corn, Bowman & Company, LLC
OPEN SESSION
Notice
The Corporate Secretary announced that pursuant to its by-laws public notice of this meeting of
the DRPA Board of Commissioners had been given by posting proper notice in the lobby at One
Port Center and by issuing proper notice to the public and news media. The Secretary also noted
that, due to the ongoing pandemic, the public was not allowed inside the One Port Center building
but had been invited to attend via telecast and to submit any questions or comments electronically
prior to the meeting.
Roll Call
Chairwoman Parker called the meeting to order at 9:03 a.m. and asked that the Corporate
Secretary call the roll. The following Commissioners were present, constituting a quorum:
Chairwoman Parker, Vice Chairman Nash, Powell, Fentress, Frattali, Rigo, Lipsett, Nelson,
Christian, Lewis, Martz, Garganio, McGinty, Christy, and Sweeney.
Public Comment
Corporate Secretary Santarelli reported that there were no items for Public Comment.
Report of the Chief Executive Officer
CEO Hanson stated that the CEO Report stood as previously submitted. CEO Hanson highlighted
the use of emergency powers to expedite procurement of emergency repairs to a leak in the main
water feed at PATCO’s Lindenwold Station with AP Construction, in an amount not to exceed
$112,800.00. Commissioner Fentress moved to approve the CEO’s Report and Commissioner
Rigo seconded the motion. All Commissioners in attendance voted to approve the CEO’s Report.
The motion carried.
Report of the Chief Financial Officer
CFO White stated that his Report stood as previously submitted. CFO White mentioned that
Finance is working on redesigning the CFO report. CFO White highlighted that there has been an
increase in traffic on the bridges and ridership on PATCO.
Approval of the May 19, 2021 DRPA Board Meeting Minutes
Chairwoman Parker stated that the Minutes of the May 19, 2021 DRPA Board Meeting were
previously provided to the Governors of New Jersey and Pennsylvania and to the DRPA
Commissioners. There were no comments or corrections. Commissioner Martz moved to approve
the Minutes and Commissioner Powell seconded the motion. All Commissioners in attendance
voted in the affirmative to approve the Minutes as submitted. The motion carried.
239
239
Page 3 of 5
Receipt and Filing of the List of Previously Approved Payments and List of Previously
Approved Purchase Orders and Contracts covering the Month of May 2021.
Chairwoman Parker stated that the Lists of Previously Approved Payments and Previously
Approved Purchase Orders and Contracts covering the month of May 2021, were previously
provided to all Commissioners. Commissioner Lewis moved to receive and file the lists and
Commissioner Frattali seconded the motion. There were no questions or comments. All
Commissioners in attendance voted in the affirmative. The motion carried.
Approval of Operations & Maintenance Committee Meeting Minutes of June 1, 2021
Chairwoman Parker stated that the Minutes of the June 1, 2021 Operations & Maintenance
Committee Meetings were previously provided to all Commissioners. There were no comments or
corrections. Commissioner Martz moved to approve the Minutes and Commissioner Fentress
seconded the motion. All Commissioners in attendance voted in the affirmative to approve the
Minutes as submitted. The motion carried.
Adoption of Resolutions Approved by the Operations & Maintenance Committee on June 2,
2021
Chairwoman Parker stated that there were three (3) Resolutions from the June 2, 2021 Operations
& Maintenance Committee Meetings for consideration:
DRPA-21-037 Capital Project Contract Modification.
Chairwoman Parker presented Resolution No. DRPA-21-037. Chief Engineer Venuto explained
that the Resolution requested Board authorization of the execution of contract modifications to one
(1) contract within the Authority’s Capital Projects and that the Board amend the 2021 DRPA
Capital Budget to include these changes. The contract in question was Capital Project Number
BFB.01910, The BFB Suspension Spans Rehabilitation. The contract was increased by $395,848,
for an adjusted contract amount of $4,466,086.00. Chairwoman Parker inquired whether
Commissioners had any questions for staff concerning the Resolution. There were no questions.
Commissioner Martz moved to adopt Resolution No. DRPA-21-037 and Commissioner Sweeney
seconded the motion. All Commissioners in attendance voted in the affirmative to approve the
Resolution. The motion carried.
DRPA-21-038 Electric Energy Procurement.
Chairwoman Parker presented Resolution No. DRPA-21-038. PATCO General Manager John
Rink explained that the Resolution requested Board authorization to negotiate a three-year
agreement with Concord Engineering to provide consulting services required to competitively
purchase electricity for the DRPA and PATCO. Chairwoman Parker inquired whether
Commissioners had any questions for staff concerning the Resolution. There were no questions.
Commissioner Frattali moved to adopt Resolution No. DRPA-21-038 and Commissioner Powell
seconded the motion. All Commissioners in attendance voted in the affirmative to approve the
Resolution. The motion carried.
240
240
Page 4 of 5
DRPA-21-039 Agreements for Use of DRPA Property.
Chairwoman Parker presented Resolution No. DRPA-21-039. Director William Shanahan
explained that the Resolution requested Board authorization to negotiate five (5) individual
agreements with five (5) Philadelphia non-profit organizations permitting use of DRPA properties
at five (5) DRPA locations for the purpose of youth sports activities: Bridesburg Cougars,
Delaware Valley Youth Athletic Association (DVYAA), Southeast Youth Athletic Association
(SEYAA), Philly Dragons and the Preparatory Charter School of Philadelphia. Chairwoman
Parker inquired whether Commissioners had any questions for staff concerning the Resolution.
There were no questions. Commissioner Garganio moved to adopt Resolution No. DRPA-21-039
and Commissioner McGinty seconded the motion. All Commissioners in attendance voted in the
affirmative to approve the Resolution. The motion carried.
Approval of Audit Committee Meeting Minutes of June 2, 2021
Chairwoman Parker stated that the Minutes of the June 2, 2021 Audit Committee Meeting were
previously provided to all Commissioners. There were no comments or corrections. Commissioner
Powell moved to approve the Minutes and Commissioner Nelson seconded the motion. All
Commissioners in attendance voted in the affirmative to approve the Minutes as submitted. The
motion carried.
Adoption of Resolutions Approved by the Audit Committee on June 2, 2021
Chairwoman Parker stated that there was one (1) Resolution from the June 2, 2021 Audit
Committee Meetings for consideration:
DRPA-21-040 Approval of 2020 Financial Audit Exit Conference
Report and Required Communications.
Chairwoman Parker presented Resolution No. DRPA-21-040. Inspector General David Aubrey
explained that the Resolution seeks Board acknowledgement of the receipt of the 2020 Financial
Audit Exit Conference Report and Required Communications as presented by Bowman and
Company (external Auditors) and approved by the Audit Committee. Chairwoman Parker inquired
whether Commissioners had any questions for staff concerning the Resolution. There were no
questions. Commissioner Fentress moved to adopt Resolution No. DRPA-21-040 and
Commissioner Garganio seconded the motion. All Commissioners in attendance voted in the
affirmative to approve the Resolution. The motion carried.
Citizens Advisory Committee Report
There was no report by the Citizens Advisory Committee.
Unfinished Business
There were no items for Unfinished Business.
New Business
Chairwoman Parker introduced two (2) items of New Business for consideration, and introduced
the following:
241
241
Page 5 of 5
DRPA-21-041 Consideration of Pending DRPA Contracts
(Between $25,000 and $100,000).
Chairwoman Parker presented Summary Statement and Resolution No. DRPA-21-041 for the
consideration of pending DRPA contracts between $25,000 and $100,000. Director of
Procurement Mosback stated that there were four (4) contracts for consideration. Chairwoman
Parker inquired whether Commissioners had any questions for staff concerning the Resolution.
There were no questions. Commissioner Sweeney moved to adopt Resolution No. DRPA-21-041
and Commissioner Martz seconded the motion. All Commissioners in attendance voted to approve
the motion. The motion carried and the Board adopted the Resolution.
Chairwoman Parker announced that DRPA and PATCO are e recognizing Juneteenth/Freedom
Day, a day commemorating the end of slavery on June 19, 1865. Friday, June 18, 2021 will be the
observance of Juneteenth/Freedom Day for 2021 and will be a paid holiday. The Labor Committee
will move forward to recognize this as a DRPA and PATCO holiday annually.
The DRPA Board Meeting was held in abeyance at 9:27 a.m.
Adjournment
With no further business, Commissioner Fentress moved to adjourn. Commissioner Powell
seconded the motion. All Commissioners in attendance voted to approve the motion and the
meeting adjourned at 9:34 a.m.
Respectfully Submitted,
Raymond J. Santarelli, Esquire
General Counsel and Corporate Secretary
242
242
DRPA MONTHLY LIST OF
PREVIOUSLY APPROVED PAYMENTS
243
243
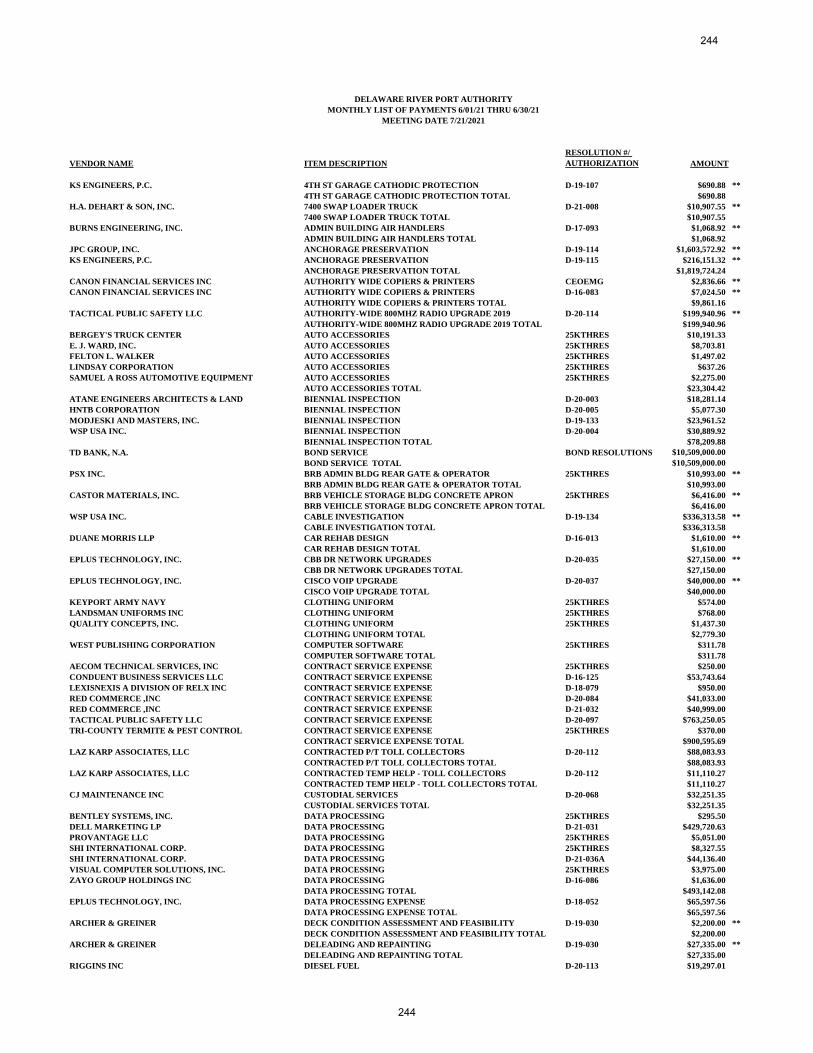
DELAWARE RIVER PORT AUTHORITY
MONTHLY LIST OF PAYMENTS 6/01/21 THRU 6/30/21
MEETING DATE 7/21/2021
VENDOR NAME ITEM DESCRIPTION
RESOLUTION #/
AUTHORIZATION AMOUNT
KS ENGINEERS, P.C. 4TH ST GARAGE CATHODIC PROTECTION D-19-107 $690.88 **
4TH ST GARAGE CATHODIC PROTECTION TOTAL $690.88
H.A. DEHART & SON, INC. 7400 SWAP LOADER TRUCK D-21-008 $10,907.55 **
7400 SWAP LOADER TRUCK TOTAL $10,907.55
BURNS ENGINEERING, INC. ADMIN BUILDING AIR HANDLERS D-17-093 $1,068.92 **
ADMIN BUILDING AIR HANDLERS TOTAL $1,068.92
JPC GROUP, INC. ANCHORAGE PRESERVATION D-19-114 $1,603,572.92 **
KS ENGINEERS, P.C. ANCHORAGE PRESERVATION D-19-115 $216,151.32 **
ANCHORAGE PRESERVATION TOTAL $1,819,724.24
CANON FINANCIAL SERVICES INC AUTHORITY WIDE COPIERS & PRINTERS CEOEMG $2,836.66 **
CANON FINANCIAL SERVICES INC AUTHORITY WIDE COPIERS & PRINTERS D-16-083 $7,024.50 **
AUTHORITY WIDE COPIERS & PRINTERS TOTAL $9,861.16
TACTICAL PUBLIC SAFETY LLC AUTHORITY-WIDE 800MHZ RADIO UPGRADE 2019 D-20-114 $199,940.96 **
AUTHORITY-WIDE 800MHZ RADIO UPGRADE 2019 TOTAL $199,940.96
BERGEY'S TRUCK CENTER AUTO ACCESSORIES 25KTHRES $10,191.33
E. J. WARD, INC. AUTO ACCESSORIES 25KTHRES $8,703.81
FELTON L. WALKER AUTO ACCESSORIES 25KTHRES $1,497.02
LINDSAY CORPORATION AUTO ACCESSORIES 25KTHRES $637.26
SAMUEL A ROSS AUTOMOTIVE EQUIPMENT AUTO ACCESSORIES 25KTHRES $2,275.00
AUTO ACCESSORIES TOTAL $23,304.42
ATANE ENGINEERS ARCHITECTS & LAND BIENNIAL INSPECTION D-20-003 $18,281.14
HNTB CORPORATION BIENNIAL INSPECTION D-20-005 $5,077.30
MODJESKI AND MASTERS, INC. BIENNIAL INSPECTION D-19-133 $23,961.52
WSP USA INC. BIENNIAL INSPECTION D-20-004 $30,889.92
BIENNIAL INSPECTION TOTAL $78,209.88
TD BANK, N.A. BOND SERVICE BOND RESOLUTIONS $10,509,000.00
BOND SERVICE TOTAL $10,509,000.00
PSX INC. BRB ADMIN BLDG REAR GATE & OPERATOR 25KTHRES $10,993.00 **
BRB ADMIN BLDG REAR GATE & OPERATOR TOTAL $10,993.00
CASTOR MATERIALS, INC. BRB VEHICLE STORAGE BLDG CONCRETE APRON 25KTHRES $6,416.00 **
BRB VEHICLE STORAGE BLDG CONCRETE APRON TOTAL $6,416.00
WSP USA INC. CABLE INVESTIGATION D-19-134 $336,313.58 **
CABLE INVESTIGATION TOTAL $336,313.58
DUANE MORRIS LLP CAR REHAB DESIGN D-16-013 $1,610.00 **
CAR REHAB DESIGN TOTAL $1,610.00
EPLUS TECHNOLOGY, INC. CBB DR NETWORK UPGRADES D-20-035 $27,150.00 **
CBB DR NETWORK UPGRADES TOTAL $27,150.00
EPLUS TECHNOLOGY, INC. CISCO VOIP UPGRADE D-20-037 $40,000.00 **
CISCO VOIP UPGRADE TOTAL $40,000.00
KEYPORT ARMY NAVY CLOTHING UNIFORM 25KTHRES $574.00
LANDSMAN UNIFORMS INC CLOTHING UNIFORM 25KTHRES $768.00
QUALITY CONCEPTS, INC. CLOTHING UNIFORM 25KTHRES $1,437.30
CLOTHING UNIFORM TOTAL $2,779.30
WEST PUBLISHING CORPORATION COMPUTER SOFTWARE 25KTHRES $311.78
COMPUTER SOFTWARE TOTAL $311.78
AECOM TECHNICAL SERVICES, INC CONTRACT SERVICE EXPENSE 25KTHRES $250.00
CONDUENT BUSINESS SERVICES LLC CONTRACT SERVICE EXPENSE D-16-125 $53,743.64
LEXISNEXIS A DIVISION OF RELX INC CONTRACT SERVICE EXPENSE D-18-079 $950.00
RED COMMERCE ,INC CONTRACT SERVICE EXPENSE D-20-084 $41,033.00
RED COMMERCE ,INC CONTRACT SERVICE EXPENSE D-21-032 $40,999.00
TACTICAL PUBLIC SAFETY LLC CONTRACT SERVICE EXPENSE D-20-097 $763,250.05
TRI-COUNTY TERMITE & PEST CONTROL CONTRACT SERVICE EXPENSE 25KTHRES $370.00
CONTRACT SERVICE EXPENSE TOTAL $900,595.69
LAZ KARP ASSOCIATES, LLC CONTRACTED P/T TOLL COLLECTORS D-20-112 $88,083.93
CONTRACTED P/T TOLL COLLECTORS TOTAL $88,083.93
LAZ KARP ASSOCIATES, LLC CONTRACTED TEMP HELP - TOLL COLLECTORS D-20-112 $11,110.27
CONTRACTED TEMP HELP - TOLL COLLECTORS TOTAL $11,110.27
CJ MAINTENANCE INC CUSTODIAL SERVICES D-20-068 $32,251.35
CUSTODIAL SERVICES TOTAL $32,251.35
BENTLEY SYSTEMS, INC. DATA PROCESSING 25KTHRES $295.50
DELL MARKETING LP DATA PROCESSING D-21-031 $429,720.63
PROVANTAGE LLC DATA PROCESSING 25KTHRES $5,051.00
SHI INTERNATIONAL CORP. DATA PROCESSING 25KTHRES $8,327.55
SHI INTERNATIONAL CORP. DATA PROCESSING D-21-036A $44,136.40
VISUAL COMPUTER SOLUTIONS, INC. DATA PROCESSING 25KTHRES $3,975.00
ZAYO GROUP HOLDINGS INC DATA PROCESSING D-16-086 $1,636.00
DATA PROCESSING TOTAL $493,142.08
EPLUS TECHNOLOGY, INC. DATA PROCESSING EXPENSE D-18-052 $65,597.56
DATA PROCESSING EXPENSE TOTAL $65,597.56
ARCHER & GREINER DECK CONDITION ASSESSMENT AND FEASIBILITY D-19-030 $2,200.00 **
DECK CONDITION ASSESSMENT AND FEASIBILITY TOTAL $2,200.00
ARCHER & GREINER DELEADING AND REPAINTING D-19-030 $27,335.00 **
DELEADING AND REPAINTING TOTAL $27,335.00
RIGGINS INC DIESEL FUEL D-20-113 $19,297.01
244
244
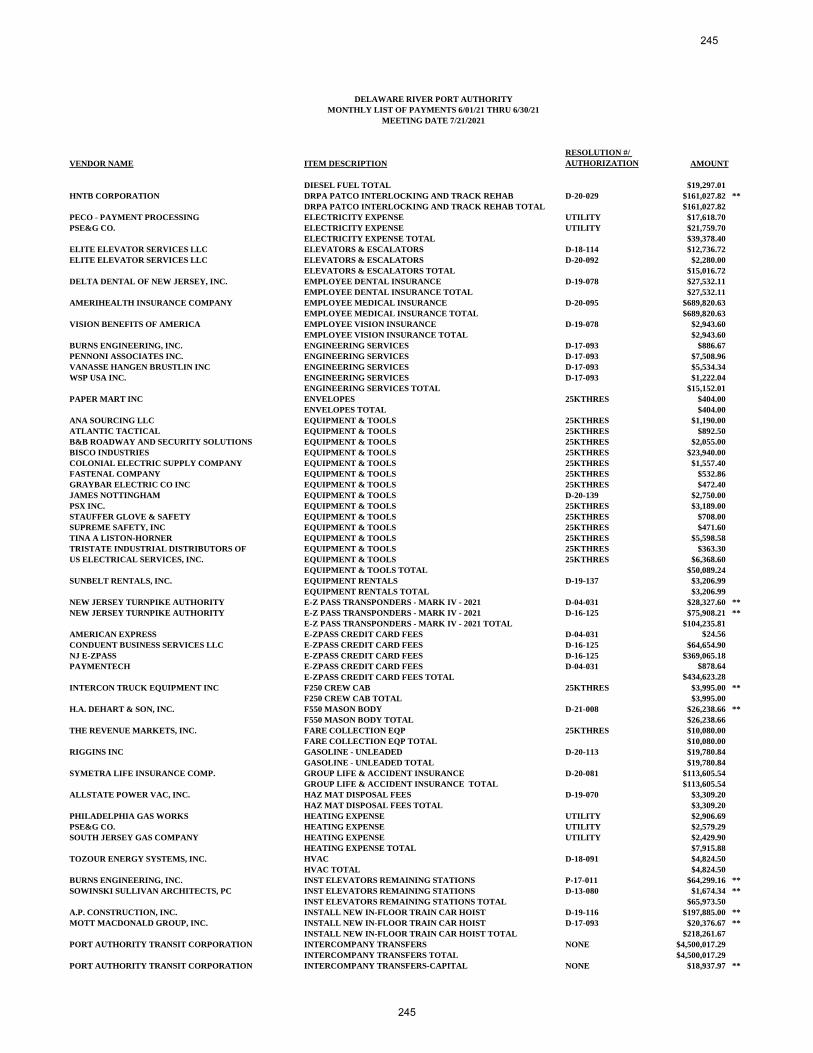
DELAWARE RIVER PORT AUTHORITY
MONTHLY LIST OF PAYMENTS 6/01/21 THRU 6/30/21
MEETING DATE 7/21/2021
VENDOR NAME ITEM DESCRIPTION
RESOLUTION #/
AUTHORIZATION AMOUNT
DIESEL FUEL TOTAL $19,297.01
HNTB CORPORATION DRPA PATCO INTERLOCKING AND TRACK REHAB D-20-029 $161,027.82 **
DRPA PATCO INTERLOCKING AND TRACK REHAB TOTAL $161,027.82
PECO - PAYMENT PROCESSING ELECTRICITY EXPENSE UTILITY $17,618.70
PSE&G CO. ELECTRICITY EXPENSE UTILITY $21,759.70
ELECTRICITY EXPENSE TOTAL $39,378.40
ELITE ELEVATOR SERVICES LLC ELEVATORS & ESCALATORS D-18-114 $12,736.72
ELITE ELEVATOR SERVICES LLC ELEVATORS & ESCALATORS D-20-092 $2,280.00
ELEVATORS & ESCALATORS TOTAL $15,016.72
DELTA DENTAL OF NEW JERSEY, INC. EMPLOYEE DENTAL INSURANCE D-19-078 $27,532.11
EMPLOYEE DENTAL INSURANCE TOTAL $27,532.11
AMERIHEALTH INSURANCE COMPANY EMPLOYEE MEDICAL INSURANCE D-20-095 $689,820.63
EMPLOYEE MEDICAL INSURANCE TOTAL $689,820.63
VISION BENEFITS OF AMERICA EMPLOYEE VISION INSURANCE D-19-078 $2,943.60
EMPLOYEE VISION INSURANCE TOTAL $2,943.60
BURNS ENGINEERING, INC. ENGINEERING SERVICES D-17-093 $886.67
PENNONI ASSOCIATES INC. ENGINEERING SERVICES D-17-093 $7,508.96
VANASSE HANGEN BRUSTLIN INC ENGINEERING SERVICES D-17-093 $5,534.34
WSP USA INC. ENGINEERING SERVICES D-17-093 $1,222.04
ENGINEERING SERVICES TOTAL $15,152.01
PAPER MART INC ENVELOPES 25KTHRES $404.00
ENVELOPES TOTAL $404.00
ANA SOURCING LLC EQUIPMENT & TOOLS 25KTHRES $1,190.00
ATLANTIC TACTICAL EQUIPMENT & TOOLS 25KTHRES $892.50
B&B ROADWAY AND SECURITY SOLUTIONS EQUIPMENT & TOOLS 25KTHRES $2,055.00
BISCO INDUSTRIES EQUIPMENT & TOOLS 25KTHRES $23,940.00
COLONIAL ELECTRIC SUPPLY COMPANY EQUIPMENT & TOOLS 25KTHRES $1,557.40
FASTENAL COMPANY EQUIPMENT & TOOLS 25KTHRES $532.86
GRAYBAR ELECTRIC CO INC EQUIPMENT & TOOLS 25KTHRES $472.40
JAMES NOTTINGHAM EQUIPMENT & TOOLS D-20-139 $2,750.00
PSX INC. EQUIPMENT & TOOLS 25KTHRES $3,189.00
STAUFFER GLOVE & SAFETY EQUIPMENT & TOOLS 25KTHRES $708.00
SUPREME SAFETY, INC EQUIPMENT & TOOLS 25KTHRES $471.60
TINA A LISTON-HORNER EQUIPMENT & TOOLS 25KTHRES $5,598.58
TRISTATE INDUSTRIAL DISTRIBUTORS OF EQUIPMENT & TOOLS 25KTHRES $363.30
US ELECTRICAL SERVICES, INC. EQUIPMENT & TOOLS 25KTHRES $6,368.60
EQUIPMENT & TOOLS TOTAL $50,089.24
SUNBELT RENTALS, INC. EQUIPMENT RENTALS D-19-137 $3,206.99
EQUIPMENT RENTALS TOTAL $3,206.99
NEW JERSEY TURNPIKE AUTHORITY E-Z PASS TRANSPONDERS - MARK IV - 2021 D-04-031 $28,327.60 **
NEW JERSEY TURNPIKE AUTHORITY E-Z PASS TRANSPONDERS - MARK IV - 2021 D-16-125 $75,908.21 **
E-Z PASS TRANSPONDERS - MARK IV - 2021 TOTAL $104,235.81
AMERICAN EXPRESS E-ZPASS CREDIT CARD FEES D-04-031 $24.56
CONDUENT BUSINESS SERVICES LLC E-ZPASS CREDIT CARD FEES D-16-125 $64,654.90
NJ E-ZPASS E-ZPASS CREDIT CARD FEES D-16-125 $369,065.18
PAYMENTECH E-ZPASS CREDIT CARD FEES D-04-031 $878.64
E-ZPASS CREDIT CARD FEES TOTAL $434,623.28
INTERCON TRUCK EQUIPMENT INC F250 CREW CAB 25KTHRES $3,995.00 **
F250 CREW CAB TOTAL $3,995.00
H.A. DEHART & SON, INC. F550 MASON BODY D-21-008 $26,238.66 **
F550 MASON BODY TOTAL $26,238.66
THE REVENUE MARKETS, INC. FARE COLLECTION EQP 25KTHRES $10,080.00
FARE COLLECTION EQP TOTAL $10,080.00
RIGGINS INC GASOLINE - UNLEADED D-20-113 $19,780.84
GASOLINE - UNLEADED TOTAL $19,780.84
SYMETRA LIFE INSURANCE COMP. GROUP LIFE & ACCIDENT INSURANCE D-20-081 $113,605.54
GROUP LIFE & ACCIDENT INSURANCE TOTAL $113,605.54
ALLSTATE POWER VAC, INC. HAZ MAT DISPOSAL FEES D-19-070 $3,309.20
HAZ MAT DISPOSAL FEES TOTAL $3,309.20
PHILADELPHIA GAS WORKS HEATING EXPENSE UTILITY $2,906.69
PSE&G CO. HEATING EXPENSE UTILITY $2,579.29
SOUTH JERSEY GAS COMPANY HEATING EXPENSE UTILITY $2,429.90
HEATING EXPENSE TOTAL $7,915.88
TOZOUR ENERGY SYSTEMS, INC. HVAC D-18-091 $4,824.50
HVAC TOTAL $4,824.50
BURNS ENGINEERING, INC. INST ELEVATORS REMAINING STATIONS P-17-011 $64,299.16 **
SOWINSKI SULLIVAN ARCHITECTS, PC INST ELEVATORS REMAINING STATIONS D-13-080 $1,674.34 **
INST ELEVATORS REMAINING STATIONS TOTAL $65,973.50
A.P. CONSTRUCTION, INC. INSTALL NEW IN-FLOOR TRAIN CAR HOIST D-19-116 $197,885.00 **
MOTT MACDONALD GROUP, INC. INSTALL NEW IN-FLOOR TRAIN CAR HOIST D-17-093 $20,376.67 **
INSTALL NEW IN-FLOOR TRAIN CAR HOIST TOTAL $218,261.67
PORT AUTHORITY TRANSIT CORPORATION INTERCOMPANY TRANSFERS NONE $4,500,017.29
INTERCOMPANY TRANSFERS TOTAL $4,500,017.29
PORT AUTHORITY TRANSIT CORPORATION INTERCOMPANY TRANSFERS-CAPITAL NONE $18,937.97 **
245
245
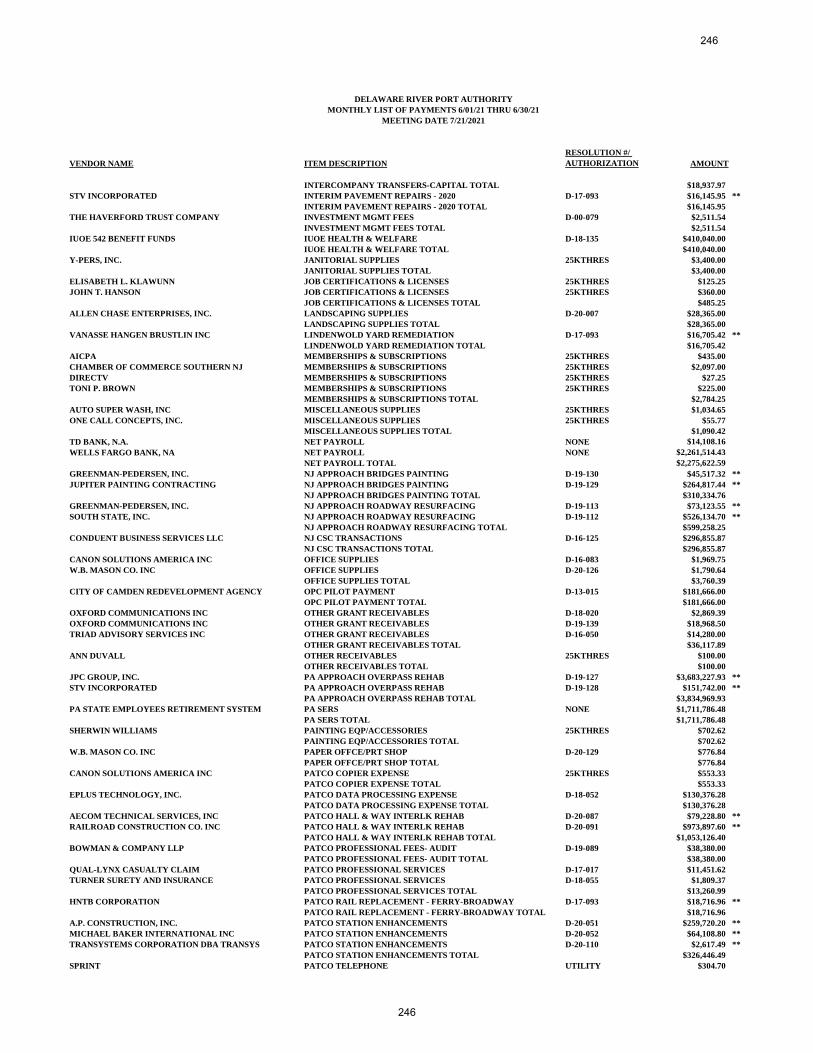
DELAWARE RIVER PORT AUTHORITY
MONTHLY LIST OF PAYMENTS 6/01/21 THRU 6/30/21
MEETING DATE 7/21/2021
VENDOR NAME ITEM DESCRIPTION
RESOLUTION #/
AUTHORIZATION AMOUNT
INTERCOMPANY TRANSFERS-CAPITAL TOTAL $18,937.97
STV INCORPORATED INTERIM PAVEMENT REPAIRS - 2020 D-17-093 $16,145.95 **
INTERIM PAVEMENT REPAIRS - 2020 TOTAL $16,145.95
THE HAVERFORD TRUST COMPANY INVESTMENT MGMT FEES D-00-079 $2,511.54
INVESTMENT MGMT FEES TOTAL $2,511.54
IUOE 542 BENEFIT FUNDS IUOE HEALTH & WELFARE D-18-135 $410,040.00
IUOE HEALTH & WELFARE TOTAL $410,040.00
Y-PERS, INC. JANITORIAL SUPPLIES 25KTHRES $3,400.00
JANITORIAL SUPPLIES TOTAL $3,400.00
ELISABETH L. KLAWUNN JOB CERTIFICATIONS & LICENSES 25KTHRES $125.25
JOHN T. HANSON JOB CERTIFICATIONS & LICENSES 25KTHRES $360.00
JOB CERTIFICATIONS & LICENSES TOTAL $485.25
ALLEN CHASE ENTERPRISES, INC. LANDSCAPING SUPPLIES D-20-007 $28,365.00
LANDSCAPING SUPPLIES TOTAL $28,365.00
VANASSE HANGEN BRUSTLIN INC LINDENWOLD YARD REMEDIATION D-17-093 $16,705.42 **
LINDENWOLD YARD REMEDIATION TOTAL $16,705.42
AICPA MEMBERSHIPS & SUBSCRIPTIONS 25KTHRES $435.00
CHAMBER OF COMMERCE SOUTHERN NJ MEMBERSHIPS & SUBSCRIPTIONS 25KTHRES $2,097.00
DIRECTV MEMBERSHIPS & SUBSCRIPTIONS 25KTHRES $27.25
TONI P. BROWN MEMBERSHIPS & SUBSCRIPTIONS 25KTHRES $225.00
MEMBERSHIPS & SUBSCRIPTIONS TOTAL $2,784.25
AUTO SUPER WASH, INC MISCELLANEOUS SUPPLIES 25KTHRES $1,034.65
ONE CALL CONCEPTS, INC. MISCELLANEOUS SUPPLIES 25KTHRES $55.77
MISCELLANEOUS SUPPLIES TOTAL $1,090.42
TD BANK, N.A. NET PAYROLL NONE $14,108.16
WELLS FARGO BANK, NA NET PAYROLL NONE $2,261,514.43
NET PAYROLL TOTAL $2,275,622.59
GREENMAN-PEDERSEN, INC. NJ APPROACH BRIDGES PAINTING D-19-130 $45,517.32 **
JUPITER PAINTING CONTRACTING NJ APPROACH BRIDGES PAINTING D-19-129 $264,817.44 **
NJ APPROACH BRIDGES PAINTING TOTAL $310,334.76
GREENMAN-PEDERSEN, INC. NJ APPROACH ROADWAY RESURFACING D-19-113 $73,123.55 **
SOUTH STATE, INC. NJ APPROACH ROADWAY RESURFACING D-19-112 $526,134.70 **
NJ APPROACH ROADWAY RESURFACING TOTAL $599,258.25
CONDUENT BUSINESS SERVICES LLC NJ CSC TRANSACTIONS D-16-125 $296,855.87
NJ CSC TRANSACTIONS TOTAL $296,855.87
CANON SOLUTIONS AMERICA INC OFFICE SUPPLIES D-16-083 $1,969.75
W.B. MASON CO. INC OFFICE SUPPLIES D-20-126 $1,790.64
OFFICE SUPPLIES TOTAL $3,760.39
CITY OF CAMDEN REDEVELOPMENT AGENCY OPC PILOT PAYMENT D-13-015 $181,666.00
OPC PILOT PAYMENT TOTAL $181,666.00
OXFORD COMMUNICATIONS INC OTHER GRANT RECEIVABLES D-18-020 $2,869.39
OXFORD COMMUNICATIONS INC OTHER GRANT RECEIVABLES D-19-139 $18,968.50
TRIAD ADVISORY SERVICES INC OTHER GRANT RECEIVABLES D-16-050 $14,280.00
OTHER GRANT RECEIVABLES TOTAL $36,117.89
ANN DUVALL OTHER RECEIVABLES 25KTHRES $100.00
OTHER RECEIVABLES TOTAL $100.00
JPC GROUP, INC. PA APPROACH OVERPASS REHAB D-19-127 $3,683,227.93 **
STV INCORPORATED PA APPROACH OVERPASS REHAB D-19-128 $151,742.00 **
PA APPROACH OVERPASS REHAB TOTAL $3,834,969.93
PA STATE EMPLOYEES RETIREMENT SYSTEM PA SERS NONE $1,711,786.48
PA SERS TOTAL $1,711,786.48
SHERWIN WILLIAMS PAINTING EQP/ACCESSORIES 25KTHRES $702.62
PAINTING EQP/ACCESSORIES TOTAL $702.62
W.B. MASON CO. INC PAPER OFFCE/PRT SHOP D-20-129 $776.84
PAPER OFFCE/PRT SHOP TOTAL $776.84
CANON SOLUTIONS AMERICA INC PATCO COPIER EXPENSE 25KTHRES $553.33
PATCO COPIER EXPENSE TOTAL $553.33
EPLUS TECHNOLOGY, INC. PATCO DATA PROCESSING EXPENSE D-18-052 $130,376.28
PATCO DATA PROCESSING EXPENSE TOTAL $130,376.28
AECOM TECHNICAL SERVICES, INC PATCO HALL & WAY INTERLK REHAB D-20-087 $79,228.80 **
RAILROAD CONSTRUCTION CO. INC PATCO HALL & WAY INTERLK REHAB D-20-091 $973,897.60 **
PATCO HALL & WAY INTERLK REHAB TOTAL $1,053,126.40
BOWMAN & COMPANY LLP PATCO PROFESSIONAL FEES- AUDIT D-19-089 $38,380.00
PATCO PROFESSIONAL FEES- AUDIT TOTAL $38,380.00
QUAL-LYNX CASUALTY CLAIM PATCO PROFESSIONAL SERVICES D-17-017 $11,451.62
TURNER SURETY AND INSURANCE PATCO PROFESSIONAL SERVICES D-18-055 $1,809.37
PATCO PROFESSIONAL SERVICES TOTAL $13,260.99
HNTB CORPORATION PATCO RAIL REPLACEMENT - FERRY-BROADWAY D-17-093 $18,716.96 **
PATCO RAIL REPLACEMENT - FERRY-BROADWAY TOTAL $18,716.96
A.P. CONSTRUCTION, INC. PATCO STATION ENHANCEMENTS D-20-051 $259,720.20 **
MICHAEL BAKER INTERNATIONAL INC PATCO STATION ENHANCEMENTS D-20-052 $64,108.80 **
TRANSYSTEMS CORPORATION DBA TRANSYS PATCO STATION ENHANCEMENTS D-20-110 $2,617.49 **
PATCO STATION ENHANCEMENTS TOTAL $326,446.49
SPRINT PATCO TELEPHONE UTILITY $304.70
246
246
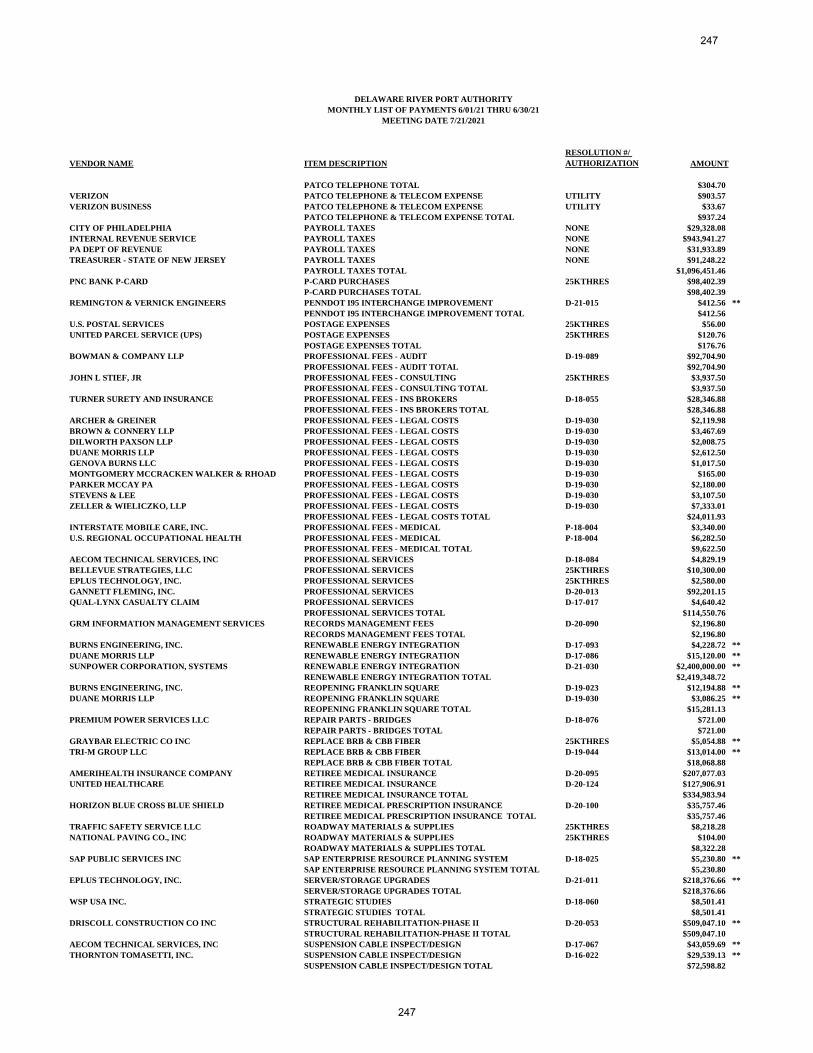
DELAWARE RIVER PORT AUTHORITY
MONTHLY LIST OF PAYMENTS 6/01/21 THRU 6/30/21
MEETING DATE 7/21/2021
VENDOR NAME ITEM DESCRIPTION
RESOLUTION #/
AUTHORIZATION AMOUNT
PATCO TELEPHONE TOTAL $304.70
VERIZON PATCO TELEPHONE & TELECOM EXPENSE UTILITY $903.57
VERIZON BUSINESS PATCO TELEPHONE & TELECOM EXPENSE UTILITY $33.67
PATCO TELEPHONE & TELECOM EXPENSE TOTAL $937.24
CITY OF PHILADELPHIA PAYROLL TAXES NONE $29,328.08
INTERNAL REVENUE SERVICE PAYROLL TAXES NONE $943,941.27
PA DEPT OF REVENUE PAYROLL TAXES NONE $31,933.89
TREASURER - STATE OF NEW JERSEY PAYROLL TAXES NONE $91,248.22
PAYROLL TAXES TOTAL $1,096,451.46
PNC BANK P-CARD P-CARD PURCHASES 25KTHRES $98,402.39
P-CARD PURCHASES TOTAL $98,402.39
REMINGTON & VERNICK ENGINEERS PENNDOT I95 INTERCHANGE IMPROVEMENT D-21-015 $412.56 **
PENNDOT I95 INTERCHANGE IMPROVEMENT TOTAL $412.56
U.S. POSTAL SERVICES POSTAGE EXPENSES 25KTHRES $56.00
UNITED PARCEL SERVICE (UPS) POSTAGE EXPENSES 25KTHRES $120.76
POSTAGE EXPENSES TOTAL $176.76
BOWMAN & COMPANY LLP PROFESSIONAL FEES - AUDIT D-19-089 $92,704.90
PROFESSIONAL FEES - AUDIT TOTAL $92,704.90
JOHN L STIEF, JR PROFESSIONAL FEES - CONSULTING 25KTHRES $3,937.50
PROFESSIONAL FEES - CONSULTING TOTAL $3,937.50
TURNER SURETY AND INSURANCE PROFESSIONAL FEES - INS BROKERS D-18-055 $28,346.88
PROFESSIONAL FEES - INS BROKERS TOTAL $28,346.88
ARCHER & GREINER PROFESSIONAL FEES - LEGAL COSTS D-19-030 $2,119.98
BROWN & CONNERY LLP PROFESSIONAL FEES - LEGAL COSTS D-19-030 $3,467.69
DILWORTH PAXSON LLP PROFESSIONAL FEES - LEGAL COSTS D-19-030 $2,008.75
DUANE MORRIS LLP PROFESSIONAL FEES - LEGAL COSTS D-19-030 $2,612.50
GENOVA BURNS LLC PROFESSIONAL FEES - LEGAL COSTS D-19-030 $1,017.50
MONTGOMERY MCCRACKEN WALKER & RHOAD PROFESSIONAL FEES - LEGAL COSTS D-19-030 $165.00
PARKER MCCAY PA PROFESSIONAL FEES - LEGAL COSTS D-19-030 $2,180.00
STEVENS & LEE PROFESSIONAL FEES - LEGAL COSTS D-19-030 $3,107.50
ZELLER & WIELICZKO, LLP PROFESSIONAL FEES - LEGAL COSTS D-19-030 $7,333.01
PROFESSIONAL FEES - LEGAL COSTS TOTAL $24,011.93
INTERSTATE MOBILE CARE, INC. PROFESSIONAL FEES - MEDICAL P-18-004 $3,340.00
U.S. REGIONAL OCCUPATIONAL HEALTH PROFESSIONAL FEES - MEDICAL P-18-004 $6,282.50
PROFESSIONAL FEES - MEDICAL TOTAL $9,622.50
AECOM TECHNICAL SERVICES, INC PROFESSIONAL SERVICES D-18-084 $4,829.19
BELLEVUE STRATEGIES, LLC PROFESSIONAL SERVICES 25KTHRES $10,300.00
EPLUS TECHNOLOGY, INC. PROFESSIONAL SERVICES 25KTHRES $2,580.00
GANNETT FLEMING, INC. PROFESSIONAL SERVICES D-20-013 $92,201.15
QUAL-LYNX CASUALTY CLAIM PROFESSIONAL SERVICES D-17-017 $4,640.42
PROFESSIONAL SERVICES TOTAL $114,550.76
GRM INFORMATION MANAGEMENT SERVICES RECORDS MANAGEMENT FEES D-20-090 $2,196.80
RECORDS MANAGEMENT FEES TOTAL $2,196.80
BURNS ENGINEERING, INC. RENEWABLE ENERGY INTEGRATION D-17-093 $4,228.72 **
DUANE MORRIS LLP RENEWABLE ENERGY INTEGRATION D-17-086 $15,120.00 **
SUNPOWER CORPORATION, SYSTEMS RENEWABLE ENERGY INTEGRATION D-21-030 $2,400,000.00 **
RENEWABLE ENERGY INTEGRATION TOTAL $2,419,348.72
BURNS ENGINEERING, INC. REOPENING FRANKLIN SQUARE D-19-023 $12,194.88 **
DUANE MORRIS LLP REOPENING FRANKLIN SQUARE D-19-030 $3,086.25 **
REOPENING FRANKLIN SQUARE TOTAL $15,281.13
PREMIUM POWER SERVICES LLC REPAIR PARTS - BRIDGES D-18-076 $721.00
REPAIR PARTS - BRIDGES TOTAL $721.00
GRAYBAR ELECTRIC CO INC REPLACE BRB & CBB FIBER 25KTHRES $5,054.88 **
TRI-M GROUP LLC REPLACE BRB & CBB FIBER D-19-044 $13,014.00 **
REPLACE BRB & CBB FIBER TOTAL $18,068.88
AMERIHEALTH INSURANCE COMPANY RETIREE MEDICAL INSURANCE D-20-095 $207,077.03
UNITED HEALTHCARE RETIREE MEDICAL INSURANCE D-20-124 $127,906.91
RETIREE MEDICAL INSURANCE TOTAL $334,983.94
HORIZON BLUE CROSS BLUE SHIELD RETIREE MEDICAL PRESCRIPTION INSURANCE D-20-100 $35,757.46
RETIREE MEDICAL PRESCRIPTION INSURANCE TOTAL $35,757.46
TRAFFIC SAFETY SERVICE LLC ROADWAY MATERIALS & SUPPLIES 25KTHRES $8,218.28
NATIONAL PAVING CO., INC ROADWAY MATERIALS & SUPPLIES 25KTHRES $104.00
ROADWAY MATERIALS & SUPPLIES TOTAL $8,322.28
SAP PUBLIC SERVICES INC SAP ENTERPRISE RESOURCE PLANNING SYSTEM D-18-025 $5,230.80 **
SAP ENTERPRISE RESOURCE PLANNING SYSTEM TOTAL $5,230.80
EPLUS TECHNOLOGY, INC. SERVER/STORAGE UPGRADES D-21-011 $218,376.66 **
SERVER/STORAGE UPGRADES TOTAL $218,376.66
WSP USA INC. STRATEGIC STUDIES D-18-060 $8,501.41
STRATEGIC STUDIES TOTAL $8,501.41
DRISCOLL CONSTRUCTION CO INC STRUCTURAL REHABILITATION-PHASE II D-20-053 $509,047.10 **
STRUCTURAL REHABILITATION-PHASE II TOTAL $509,047.10
AECOM TECHNICAL SERVICES, INC SUSPENSION CABLE INSPECT/DESIGN D-17-067 $43,059.69 **
THORNTON TOMASETTI, INC. SUSPENSION CABLE INSPECT/DESIGN D-16-022 $29,539.13 **
SUSPENSION CABLE INSPECT/DESIGN TOTAL $72,598.82
247
247
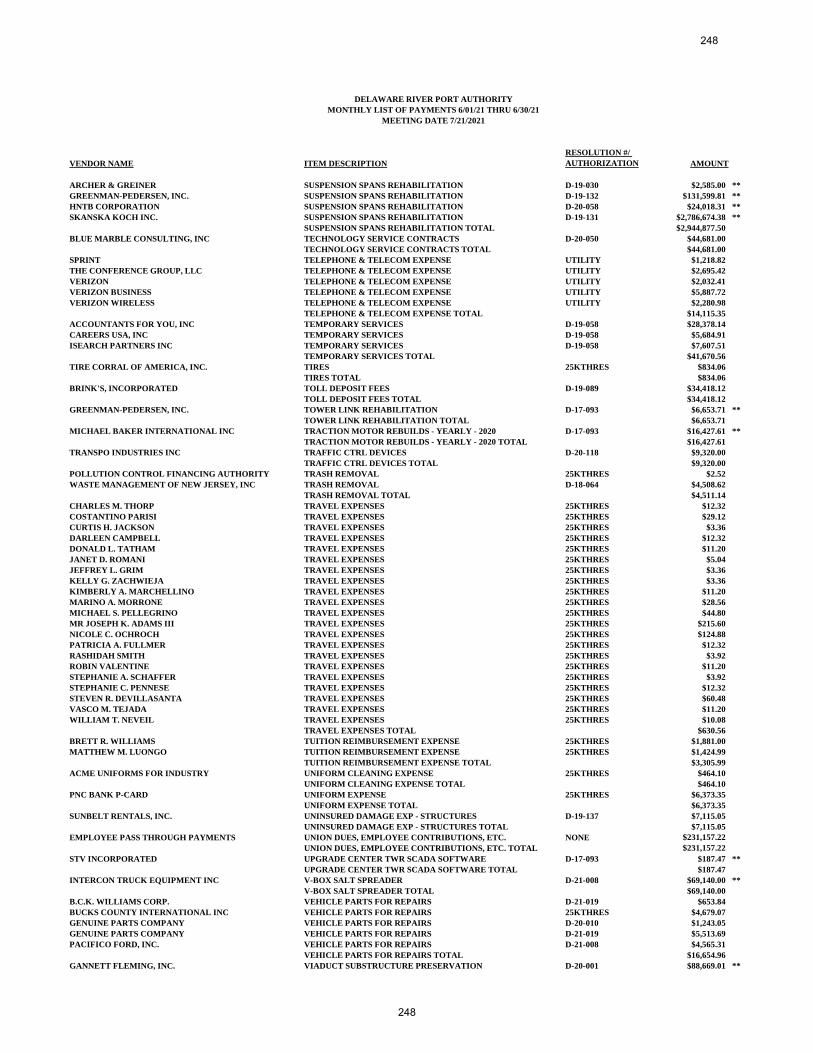
DELAWARE RIVER PORT AUTHORITY
MONTHLY LIST OF PAYMENTS 6/01/21 THRU 6/30/21
MEETING DATE 7/21/2021
VENDOR NAME ITEM DESCRIPTION
RESOLUTION #/
AUTHORIZATION AMOUNT
ARCHER & GREINER SUSPENSION SPANS REHABILITATION D-19-030 $2,585.00 **
GREENMAN-PEDERSEN, INC. SUSPENSION SPANS REHABILITATION D-19-132 $131,599.81 **
HNTB CORPORATION SUSPENSION SPANS REHABILITATION D-20-058 $24,018.31 **
SKANSKA KOCH INC. SUSPENSION SPANS REHABILITATION D-19-131 $2,786,674.38 **
SUSPENSION SPANS REHABILITATION TOTAL $2,944,877.50
BLUE MARBLE CONSULTING, INC TECHNOLOGY SERVICE CONTRACTS D-20-050 $44,681.00
TECHNOLOGY SERVICE CONTRACTS TOTAL $44,681.00
SPRINT TELEPHONE & TELECOM EXPENSE UTILITY $1,218.82
THE CONFERENCE GROUP, LLC TELEPHONE & TELECOM EXPENSE UTILITY $2,695.42
VERIZON TELEPHONE & TELECOM EXPENSE UTILITY $2,032.41
VERIZON BUSINESS TELEPHONE & TELECOM EXPENSE UTILITY $5,887.72
VERIZON WIRELESS TELEPHONE & TELECOM EXPENSE UTILITY $2,280.98
TELEPHONE & TELECOM EXPENSE TOTAL $14,115.35
ACCOUNTANTS FOR YOU, INC TEMPORARY SERVICES D-19-058 $28,378.14
CAREERS USA, INC TEMPORARY SERVICES D-19-058 $5,684.91
ISEARCH PARTNERS INC TEMPORARY SERVICES D-19-058 $7,607.51
TEMPORARY SERVICES TOTAL $41,670.56
TIRE CORRAL OF AMERICA, INC. TIRES 25KTHRES $834.06
TIRES TOTAL $834.06
BRINK'S, INCORPORATED TOLL DEPOSIT FEES D-19-089 $34,418.12
TOLL DEPOSIT FEES TOTAL $34,418.12
GREENMAN-PEDERSEN, INC. TOWER LINK REHABILITATION D-17-093 $6,653.71 **
TOWER LINK REHABILITATION TOTAL $6,653.71
MICHAEL BAKER INTERNATIONAL INC TRACTION MOTOR REBUILDS - YEARLY - 2020 D-17-093 $16,427.61 **
TRACTION MOTOR REBUILDS - YEARLY - 2020 TOTAL $16,427.61
TRANSPO INDUSTRIES INC TRAFFIC CTRL DEVICES D-20-118 $9,320.00
TRAFFIC CTRL DEVICES TOTAL $9,320.00
POLLUTION CONTROL FINANCING AUTHORITY TRASH REMOVAL 25KTHRES $2.52
WASTE MANAGEMENT OF NEW JERSEY, INC TRASH REMOVAL D-18-064 $4,508.62
TRASH REMOVAL TOTAL $4,511.14
CHARLES M. THORP TRAVEL EXPENSES 25KTHRES $12.32
COSTANTINO PARISI TRAVEL EXPENSES 25KTHRES $29.12
CURTIS H. JACKSON TRAVEL EXPENSES 25KTHRES $3.36
DARLEEN CAMPBELL TRAVEL EXPENSES 25KTHRES $12.32
DONALD L. TATHAM TRAVEL EXPENSES 25KTHRES $11.20
JANET D. ROMANI TRAVEL EXPENSES 25KTHRES $5.04
JEFFREY L. GRIM TRAVEL EXPENSES 25KTHRES $3.36
KELLY G. ZACHWIEJA TRAVEL EXPENSES 25KTHRES $3.36
KIMBERLY A. MARCHELLINO TRAVEL EXPENSES 25KTHRES $11.20
MARINO A. MORRONE TRAVEL EXPENSES 25KTHRES $28.56
MICHAEL S. PELLEGRINO TRAVEL EXPENSES 25KTHRES $44.80
MR JOSEPH K. ADAMS III TRAVEL EXPENSES 25KTHRES $215.60
NICOLE C. OCHROCH TRAVEL EXPENSES 25KTHRES $124.88
PATRICIA A. FULLMER TRAVEL EXPENSES 25KTHRES $12.32
RASHIDAH SMITH TRAVEL EXPENSES 25KTHRES $3.92
ROBIN VALENTINE TRAVEL EXPENSES 25KTHRES $11.20
STEPHANIE A. SCHAFFER TRAVEL EXPENSES 25KTHRES $3.92
STEPHANIE C. PENNESE TRAVEL EXPENSES 25KTHRES $12.32
STEVEN R. DEVILLASANTA TRAVEL EXPENSES 25KTHRES $60.48
VASCO M. TEJADA TRAVEL EXPENSES 25KTHRES $11.20
WILLIAM T. NEVEIL TRAVEL EXPENSES 25KTHRES $10.08
TRAVEL EXPENSES TOTAL $630.56
BRETT R. WILLIAMS TUITION REIMBURSEMENT EXPENSE 25KTHRES $1,881.00
MATTHEW M. LUONGO TUITION REIMBURSEMENT EXPENSE 25KTHRES $1,424.99
TUITION REIMBURSEMENT EXPENSE TOTAL $3,305.99
ACME UNIFORMS FOR INDUSTRY UNIFORM CLEANING EXPENSE 25KTHRES $464.10
UNIFORM CLEANING EXPENSE TOTAL $464.10
PNC BANK P-CARD UNIFORM EXPENSE 25KTHRES $6,373.35
UNIFORM EXPENSE TOTAL $6,373.35
SUNBELT RENTALS, INC. UNINSURED DAMAGE EXP - STRUCTURES D-19-137 $7,115.05
UNINSURED DAMAGE EXP - STRUCTURES TOTAL $7,115.05
EMPLOYEE PASS THROUGH PAYMENTS UNION DUES, EMPLOYEE CONTRIBUTIONS, ETC. NONE $231,157.22
UNION DUES, EMPLOYEE CONTRIBUTIONS, ETC. TOTAL $231,157.22
STV INCORPORATED UPGRADE CENTER TWR SCADA SOFTWARE D-17-093 $187.47 **
UPGRADE CENTER TWR SCADA SOFTWARE TOTAL $187.47
INTERCON TRUCK EQUIPMENT INC V-BOX SALT SPREADER D-21-008 $69,140.00 **
V-BOX SALT SPREADER TOTAL $69,140.00
B.C.K. WILLIAMS CORP. VEHICLE PARTS FOR REPAIRS D-21-019 $653.84
BUCKS COUNTY INTERNATIONAL INC VEHICLE PARTS FOR REPAIRS 25KTHRES $4,679.07
GENUINE PARTS COMPANY VEHICLE PARTS FOR REPAIRS D-20-010 $1,243.05
GENUINE PARTS COMPANY VEHICLE PARTS FOR REPAIRS D-21-019 $5,513.69
PACIFICO FORD, INC. VEHICLE PARTS FOR REPAIRS D-21-008 $4,565.31
VEHICLE PARTS FOR REPAIRS TOTAL $16,654.96
GANNETT FLEMING, INC. VIADUCT SUBSTRUCTURE PRESERVATION D-20-001 $88,669.01 **
248
248
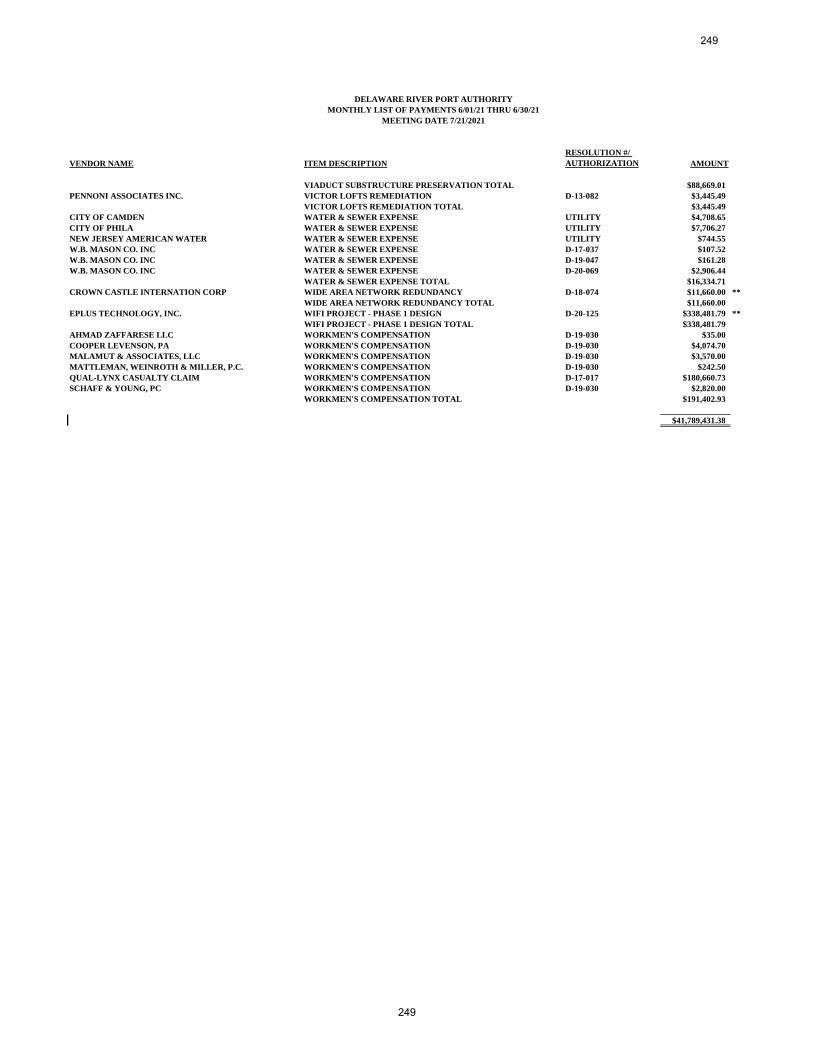
DELAWARE RIVER PORT AUTHORITY
MONTHLY LIST OF PAYMENTS 6/01/21 THRU 6/30/21
MEETING DATE 7/21/2021
VENDOR NAME ITEM DESCRIPTION
RESOLUTION #/
AUTHORIZATION AMOUNT
VIADUCT SUBSTRUCTURE PRESERVATION TOTAL $88,669.01
PENNONI ASSOCIATES INC. VICTOR LOFTS REMEDIATION D-13-082 $3,445.49
VICTOR LOFTS REMEDIATION TOTAL $3,445.49
CITY OF CAMDEN WATER & SEWER EXPENSE UTILITY $4,708.65
CITY OF PHILA WATER & SEWER EXPENSE UTILITY $7,706.27
NEW JERSEY AMERICAN WATER WATER & SEWER EXPENSE UTILITY $744.55
W.B. MASON CO. INC WATER & SEWER EXPENSE D-17-037 $107.52
W.B. MASON CO. INC WATER & SEWER EXPENSE D-19-047 $161.28
W.B. MASON CO. INC WATER & SEWER EXPENSE D-20-069 $2,906.44
WATER & SEWER EXPENSE TOTAL $16,334.71
CROWN CASTLE INTERNATION CORP WIDE AREA NETWORK REDUNDANCY D-18-074 $11,660.00 **
WIDE AREA NETWORK REDUNDANCY TOTAL $11,660.00
EPLUS TECHNOLOGY, INC. WIFI PROJECT - PHASE 1 DESIGN D-20-125 $338,481.79 **
WIFI PROJECT - PHASE 1 DESIGN TOTAL $338,481.79
AHMAD ZAFFARESE LLC WORKMEN'S COMPENSATION D-19-030 $35.00
COOPER LEVENSON, PA WORKMEN'S COMPENSATION D-19-030 $4,074.70
MALAMUT & ASSOCIATES, LLC WORKMEN'S COMPENSATION D-19-030 $3,570.00
MATTLEMAN, WEINROTH & MILLER, P.C. WORKMEN'S COMPENSATION D-19-030 $242.50
QUAL-LYNX CASUALTY CLAIM WORKMEN'S COMPENSATION D-17-017 $180,660.73
SCHAFF & YOUNG, PC WORKMEN'S COMPENSATION D-19-030 $2,820.00
WORKMEN'S COMPENSATION TOTAL $191,402.93
$41,789,431.38
249
249
DRPA MONTHLY LIST
OF PREVIOUSLY APPROVED
PURCHASE ORDERS & CONTRACTS
250
250
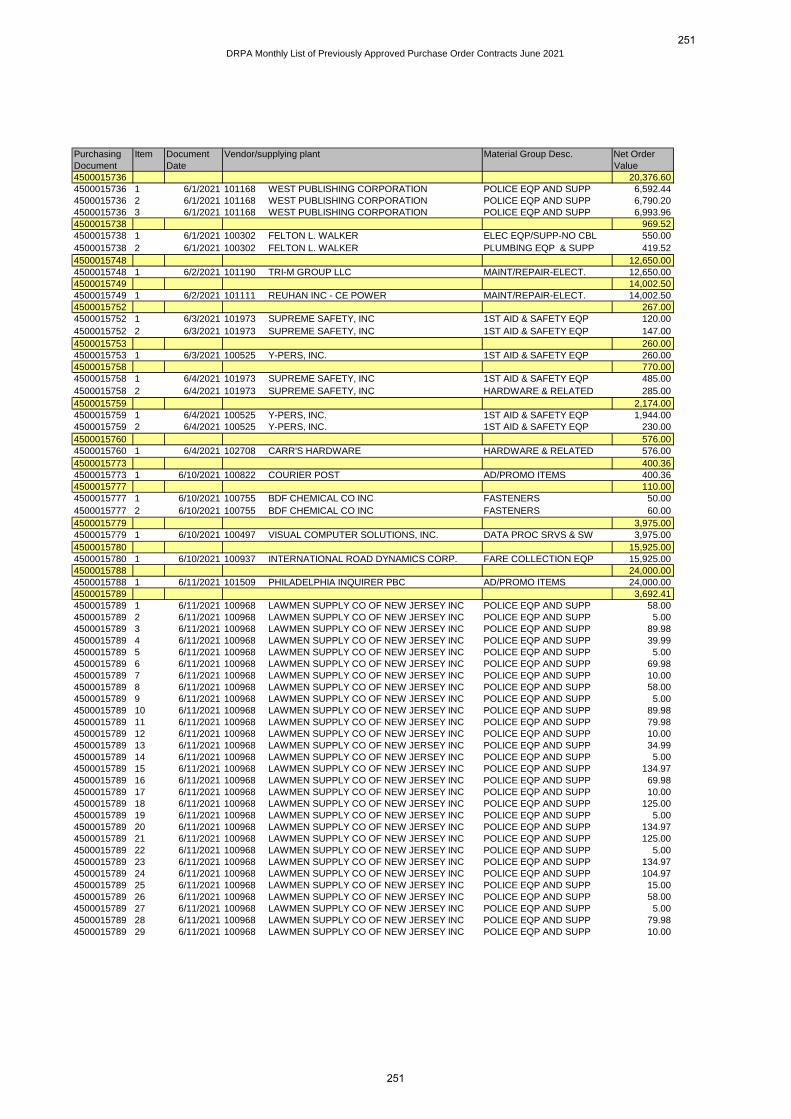
DRPA Monthly List of Previously Approved Purchase Order Contracts June 2021
PurchasingDocument
Item DocumentDate
Vendor/supplying plant Material Group Desc. Net OrderValue
4500015736 20,376.604500015736 1 6/1/2021 101168 WEST PUBLISHING CORPORATION POLICE EQP AND SUPP 6,592.444500015736 2 6/1/2021 101168 WEST PUBLISHING CORPORATION POLICE EQP AND SUPP 6,790.204500015736 3 6/1/2021 101168 WEST PUBLISHING CORPORATION POLICE EQP AND SUPP 6,993.964500015738 969.524500015738 1 6/1/2021 100302 FELTON L. WALKER ELEC EQP/SUPP-NO CBL 550.00
4500015738 2 6/1/2021 100302 FELTON L. WALKER PLUMBING EQP & SUPP 419.52
4500015748 12,650.004500015748 1 6/2/2021 101190 TRI-M GROUP LLC MAINT/REPAIR-ELECT. 12,650.004500015749 14,002.504500015749 1 6/2/2021 101111 REUHAN INC - CE POWER MAINT/REPAIR-ELECT. 14,002.504500015752 267.004500015752 1 6/3/2021 101973 SUPREME SAFETY, INC 1ST AID & SAFETY EQP 120.00
4500015752 2 6/3/2021 101973 SUPREME SAFETY, INC 1ST AID & SAFETY EQP 147.00
4500015753 260.004500015753 1 6/3/2021 100525 Y-PERS, INC. 1ST AID & SAFETY EQP 260.004500015758 770.004500015758 1 6/4/2021 101973 SUPREME SAFETY, INC 1ST AID & SAFETY EQP 485.00
4500015758 2 6/4/2021 101973 SUPREME SAFETY, INC HARDWARE & RELATED 285.00
4500015759 2,174.004500015759 1 6/4/2021 100525 Y-PERS, INC. 1ST AID & SAFETY EQP 1,944.004500015759 2 6/4/2021 100525 Y-PERS, INC. 1ST AID & SAFETY EQP 230.00
4500015760 576.004500015760 1 6/4/2021 102708 CARR'S HARDWARE HARDWARE & RELATED 576.00
4500015773 400.364500015773 1 6/10/2021 100822 COURIER POST AD/PROMO ITEMS 400.364500015777 110.004500015777 1 6/10/2021 100755 BDF CHEMICAL CO INC FASTENERS 50.00
4500015777 2 6/10/2021 100755 BDF CHEMICAL CO INC FASTENERS 60.00
4500015779 3,975.004500015779 1 6/10/2021 100497 VISUAL COMPUTER SOLUTIONS, INC. DATA PROC SRVS & SW 3,975.00
4500015780 15,925.004500015780 1 6/10/2021 100937 INTERNATIONAL ROAD DYNAMICS CORP. FARE COLLECTION EQP 15,925.004500015788 24,000.004500015788 1 6/11/2021 101509 PHILADELPHIA INQUIRER PBC AD/PROMO ITEMS 24,000.004500015789 3,692.414500015789 1 6/11/2021 100968 LAWMEN SUPPLY CO OF NEW JERSEY INC POLICE EQP AND SUPP 58.004500015789 2 6/11/2021 100968 LAWMEN SUPPLY CO OF NEW JERSEY INC POLICE EQP AND SUPP 5.004500015789 3 6/11/2021 100968 LAWMEN SUPPLY CO OF NEW JERSEY INC POLICE EQP AND SUPP 89.984500015789 4 6/11/2021 100968 LAWMEN SUPPLY CO OF NEW JERSEY INC POLICE EQP AND SUPP 39.994500015789 5 6/11/2021 100968 LAWMEN SUPPLY CO OF NEW JERSEY INC POLICE EQP AND SUPP 5.004500015789 6 6/11/2021 100968 LAWMEN SUPPLY CO OF NEW JERSEY INC POLICE EQP AND SUPP 69.984500015789 7 6/11/2021 100968 LAWMEN SUPPLY CO OF NEW JERSEY INC POLICE EQP AND SUPP 10.004500015789 8 6/11/2021 100968 LAWMEN SUPPLY CO OF NEW JERSEY INC POLICE EQP AND SUPP 58.004500015789 9 6/11/2021 100968 LAWMEN SUPPLY CO OF NEW JERSEY INC POLICE EQP AND SUPP 5.004500015789 10 6/11/2021 100968 LAWMEN SUPPLY CO OF NEW JERSEY INC POLICE EQP AND SUPP 89.984500015789 11 6/11/2021 100968 LAWMEN SUPPLY CO OF NEW JERSEY INC POLICE EQP AND SUPP 79.984500015789 12 6/11/2021 100968 LAWMEN SUPPLY CO OF NEW JERSEY INC POLICE EQP AND SUPP 10.004500015789 13 6/11/2021 100968 LAWMEN SUPPLY CO OF NEW JERSEY INC POLICE EQP AND SUPP 34.994500015789 14 6/11/2021 100968 LAWMEN SUPPLY CO OF NEW JERSEY INC POLICE EQP AND SUPP 5.004500015789 15 6/11/2021 100968 LAWMEN SUPPLY CO OF NEW JERSEY INC POLICE EQP AND SUPP 134.974500015789 16 6/11/2021 100968 LAWMEN SUPPLY CO OF NEW JERSEY INC POLICE EQP AND SUPP 69.984500015789 17 6/11/2021 100968 LAWMEN SUPPLY CO OF NEW JERSEY INC POLICE EQP AND SUPP 10.004500015789 18 6/11/2021 100968 LAWMEN SUPPLY CO OF NEW JERSEY INC POLICE EQP AND SUPP 125.004500015789 19 6/11/2021 100968 LAWMEN SUPPLY CO OF NEW JERSEY INC POLICE EQP AND SUPP 5.004500015789 20 6/11/2021 100968 LAWMEN SUPPLY CO OF NEW JERSEY INC POLICE EQP AND SUPP 134.974500015789 21 6/11/2021 100968 LAWMEN SUPPLY CO OF NEW JERSEY INC POLICE EQP AND SUPP 125.004500015789 22 6/11/2021 100968 LAWMEN SUPPLY CO OF NEW JERSEY INC POLICE EQP AND SUPP 5.004500015789 23 6/11/2021 100968 LAWMEN SUPPLY CO OF NEW JERSEY INC POLICE EQP AND SUPP 134.974500015789 24 6/11/2021 100968 LAWMEN SUPPLY CO OF NEW JERSEY INC POLICE EQP AND SUPP 104.974500015789 25 6/11/2021 100968 LAWMEN SUPPLY CO OF NEW JERSEY INC POLICE EQP AND SUPP 15.004500015789 26 6/11/2021 100968 LAWMEN SUPPLY CO OF NEW JERSEY INC POLICE EQP AND SUPP 58.004500015789 27 6/11/2021 100968 LAWMEN SUPPLY CO OF NEW JERSEY INC POLICE EQP AND SUPP 5.004500015789 28 6/11/2021 100968 LAWMEN SUPPLY CO OF NEW JERSEY INC POLICE EQP AND SUPP 79.984500015789 29 6/11/2021 100968 LAWMEN SUPPLY CO OF NEW JERSEY INC POLICE EQP AND SUPP 10.00
251
251
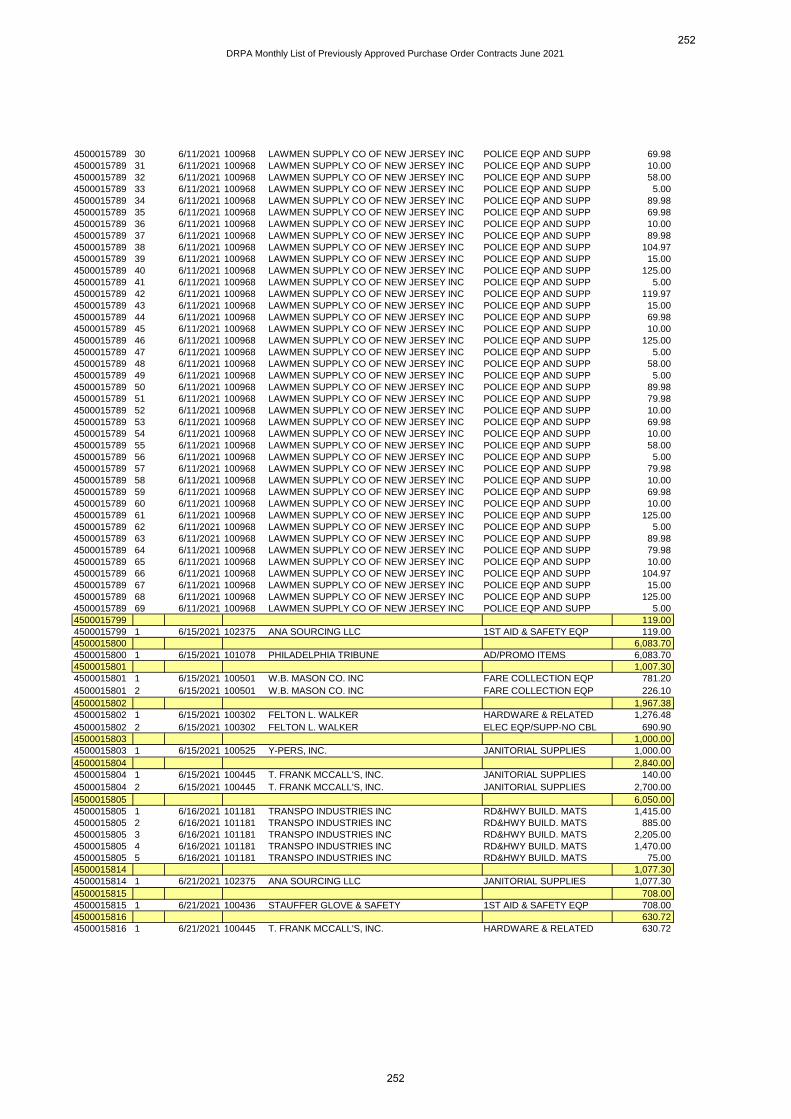
DRPA Monthly List of Previously Approved Purchase Order Contracts June 2021
4500015789 30 6/11/2021 100968 LAWMEN SUPPLY CO OF NEW JERSEY INC POLICE EQP AND SUPP 69.984500015789 31 6/11/2021 100968 LAWMEN SUPPLY CO OF NEW JERSEY INC POLICE EQP AND SUPP 10.004500015789 32 6/11/2021 100968 LAWMEN SUPPLY CO OF NEW JERSEY INC POLICE EQP AND SUPP 58.004500015789 33 6/11/2021 100968 LAWMEN SUPPLY CO OF NEW JERSEY INC POLICE EQP AND SUPP 5.004500015789 34 6/11/2021 100968 LAWMEN SUPPLY CO OF NEW JERSEY INC POLICE EQP AND SUPP 89.984500015789 35 6/11/2021 100968 LAWMEN SUPPLY CO OF NEW JERSEY INC POLICE EQP AND SUPP 69.984500015789 36 6/11/2021 100968 LAWMEN SUPPLY CO OF NEW JERSEY INC POLICE EQP AND SUPP 10.004500015789 37 6/11/2021 100968 LAWMEN SUPPLY CO OF NEW JERSEY INC POLICE EQP AND SUPP 89.984500015789 38 6/11/2021 100968 LAWMEN SUPPLY CO OF NEW JERSEY INC POLICE EQP AND SUPP 104.974500015789 39 6/11/2021 100968 LAWMEN SUPPLY CO OF NEW JERSEY INC POLICE EQP AND SUPP 15.004500015789 40 6/11/2021 100968 LAWMEN SUPPLY CO OF NEW JERSEY INC POLICE EQP AND SUPP 125.004500015789 41 6/11/2021 100968 LAWMEN SUPPLY CO OF NEW JERSEY INC POLICE EQP AND SUPP 5.004500015789 42 6/11/2021 100968 LAWMEN SUPPLY CO OF NEW JERSEY INC POLICE EQP AND SUPP 119.974500015789 43 6/11/2021 100968 LAWMEN SUPPLY CO OF NEW JERSEY INC POLICE EQP AND SUPP 15.004500015789 44 6/11/2021 100968 LAWMEN SUPPLY CO OF NEW JERSEY INC POLICE EQP AND SUPP 69.984500015789 45 6/11/2021 100968 LAWMEN SUPPLY CO OF NEW JERSEY INC POLICE EQP AND SUPP 10.004500015789 46 6/11/2021 100968 LAWMEN SUPPLY CO OF NEW JERSEY INC POLICE EQP AND SUPP 125.004500015789 47 6/11/2021 100968 LAWMEN SUPPLY CO OF NEW JERSEY INC POLICE EQP AND SUPP 5.004500015789 48 6/11/2021 100968 LAWMEN SUPPLY CO OF NEW JERSEY INC POLICE EQP AND SUPP 58.004500015789 49 6/11/2021 100968 LAWMEN SUPPLY CO OF NEW JERSEY INC POLICE EQP AND SUPP 5.004500015789 50 6/11/2021 100968 LAWMEN SUPPLY CO OF NEW JERSEY INC POLICE EQP AND SUPP 89.984500015789 51 6/11/2021 100968 LAWMEN SUPPLY CO OF NEW JERSEY INC POLICE EQP AND SUPP 79.984500015789 52 6/11/2021 100968 LAWMEN SUPPLY CO OF NEW JERSEY INC POLICE EQP AND SUPP 10.004500015789 53 6/11/2021 100968 LAWMEN SUPPLY CO OF NEW JERSEY INC POLICE EQP AND SUPP 69.984500015789 54 6/11/2021 100968 LAWMEN SUPPLY CO OF NEW JERSEY INC POLICE EQP AND SUPP 10.004500015789 55 6/11/2021 100968 LAWMEN SUPPLY CO OF NEW JERSEY INC POLICE EQP AND SUPP 58.004500015789 56 6/11/2021 100968 LAWMEN SUPPLY CO OF NEW JERSEY INC POLICE EQP AND SUPP 5.004500015789 57 6/11/2021 100968 LAWMEN SUPPLY CO OF NEW JERSEY INC POLICE EQP AND SUPP 79.984500015789 58 6/11/2021 100968 LAWMEN SUPPLY CO OF NEW JERSEY INC POLICE EQP AND SUPP 10.004500015789 59 6/11/2021 100968 LAWMEN SUPPLY CO OF NEW JERSEY INC POLICE EQP AND SUPP 69.984500015789 60 6/11/2021 100968 LAWMEN SUPPLY CO OF NEW JERSEY INC POLICE EQP AND SUPP 10.004500015789 61 6/11/2021 100968 LAWMEN SUPPLY CO OF NEW JERSEY INC POLICE EQP AND SUPP 125.004500015789 62 6/11/2021 100968 LAWMEN SUPPLY CO OF NEW JERSEY INC POLICE EQP AND SUPP 5.004500015789 63 6/11/2021 100968 LAWMEN SUPPLY CO OF NEW JERSEY INC POLICE EQP AND SUPP 89.984500015789 64 6/11/2021 100968 LAWMEN SUPPLY CO OF NEW JERSEY INC POLICE EQP AND SUPP 79.984500015789 65 6/11/2021 100968 LAWMEN SUPPLY CO OF NEW JERSEY INC POLICE EQP AND SUPP 10.004500015789 66 6/11/2021 100968 LAWMEN SUPPLY CO OF NEW JERSEY INC POLICE EQP AND SUPP 104.974500015789 67 6/11/2021 100968 LAWMEN SUPPLY CO OF NEW JERSEY INC POLICE EQP AND SUPP 15.004500015789 68 6/11/2021 100968 LAWMEN SUPPLY CO OF NEW JERSEY INC POLICE EQP AND SUPP 125.004500015789 69 6/11/2021 100968 LAWMEN SUPPLY CO OF NEW JERSEY INC POLICE EQP AND SUPP 5.004500015799 119.004500015799 1 6/15/2021 102375 ANA SOURCING LLC 1ST AID & SAFETY EQP 119.004500015800 6,083.704500015800 1 6/15/2021 101078 PHILADELPHIA TRIBUNE AD/PROMO ITEMS 6,083.704500015801 1,007.304500015801 1 6/15/2021 100501 W.B. MASON CO. INC FARE COLLECTION EQP 781.20
4500015801 2 6/15/2021 100501 W.B. MASON CO. INC FARE COLLECTION EQP 226.10
4500015802 1,967.384500015802 1 6/15/2021 100302 FELTON L. WALKER HARDWARE & RELATED 1,276.48
4500015802 2 6/15/2021 100302 FELTON L. WALKER ELEC EQP/SUPP-NO CBL 690.904500015803 1,000.004500015803 1 6/15/2021 100525 Y-PERS, INC. JANITORIAL SUPPLIES 1,000.00
4500015804 2,840.004500015804 1 6/15/2021 100445 T. FRANK MCCALL'S, INC. JANITORIAL SUPPLIES 140.00
4500015804 2 6/15/2021 100445 T. FRANK MCCALL'S, INC. JANITORIAL SUPPLIES 2,700.00
4500015805 6,050.004500015805 1 6/16/2021 101181 TRANSPO INDUSTRIES INC RD&HWY BUILD. MATS 1,415.004500015805 2 6/16/2021 101181 TRANSPO INDUSTRIES INC RD&HWY BUILD. MATS 885.004500015805 3 6/16/2021 101181 TRANSPO INDUSTRIES INC RD&HWY BUILD. MATS 2,205.004500015805 4 6/16/2021 101181 TRANSPO INDUSTRIES INC RD&HWY BUILD. MATS 1,470.004500015805 5 6/16/2021 101181 TRANSPO INDUSTRIES INC RD&HWY BUILD. MATS 75.004500015814 1,077.304500015814 1 6/21/2021 102375 ANA SOURCING LLC JANITORIAL SUPPLIES 1,077.30
4500015815 708.004500015815 1 6/21/2021 100436 STAUFFER GLOVE & SAFETY 1ST AID & SAFETY EQP 708.004500015816 630.724500015816 1 6/21/2021 100445 T. FRANK MCCALL'S, INC. HARDWARE & RELATED 630.72
252
252
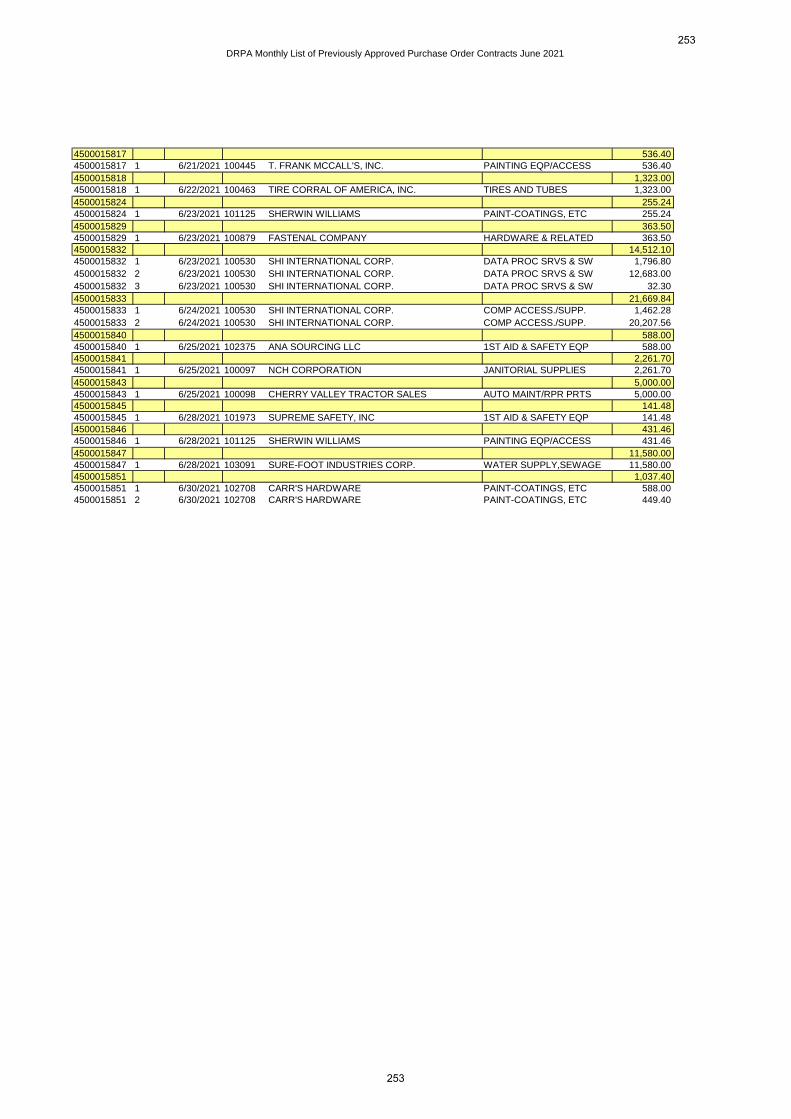
DRPA Monthly List of Previously Approved Purchase Order Contracts June 2021
4500015817 536.404500015817 1 6/21/2021 100445 T. FRANK MCCALL'S, INC. PAINTING EQP/ACCESS 536.40
4500015818 1,323.004500015818 1 6/22/2021 100463 TIRE CORRAL OF AMERICA, INC. TIRES AND TUBES 1,323.00
4500015824 255.244500015824 1 6/23/2021 101125 SHERWIN WILLIAMS PAINT-COATINGS, ETC 255.24
4500015829 363.504500015829 1 6/23/2021 100879 FASTENAL COMPANY HARDWARE & RELATED 363.504500015832 14,512.104500015832 1 6/23/2021 100530 SHI INTERNATIONAL CORP. DATA PROC SRVS & SW 1,796.80
4500015832 2 6/23/2021 100530 SHI INTERNATIONAL CORP. DATA PROC SRVS & SW 12,683.00
4500015832 3 6/23/2021 100530 SHI INTERNATIONAL CORP. DATA PROC SRVS & SW 32.30
4500015833 21,669.844500015833 1 6/24/2021 100530 SHI INTERNATIONAL CORP. COMP ACCESS./SUPP. 1,462.28
4500015833 2 6/24/2021 100530 SHI INTERNATIONAL CORP. COMP ACCESS./SUPP. 20,207.56
4500015840 588.004500015840 1 6/25/2021 102375 ANA SOURCING LLC 1ST AID & SAFETY EQP 588.004500015841 2,261.704500015841 1 6/25/2021 100097 NCH CORPORATION JANITORIAL SUPPLIES 2,261.70
4500015843 5,000.004500015843 1 6/25/2021 100098 CHERRY VALLEY TRACTOR SALES AUTO MAINT/RPR PRTS 5,000.004500015845 141.484500015845 1 6/28/2021 101973 SUPREME SAFETY, INC 1ST AID & SAFETY EQP 141.484500015846 431.464500015846 1 6/28/2021 101125 SHERWIN WILLIAMS PAINTING EQP/ACCESS 431.46
4500015847 11,580.004500015847 1 6/28/2021 103091 SURE-FOOT INDUSTRIES CORP. WATER SUPPLY,SEWAGE 11,580.004500015851 1,037.404500015851 1 6/30/2021 102708 CARR'S HARDWARE PAINT-COATINGS, ETC 588.004500015851 2 6/30/2021 102708 CARR'S HARDWARE PAINT-COATINGS, ETC 449.40
253
253
OPERATIONS & MAINTENANCE
COMMITTEE
254
254
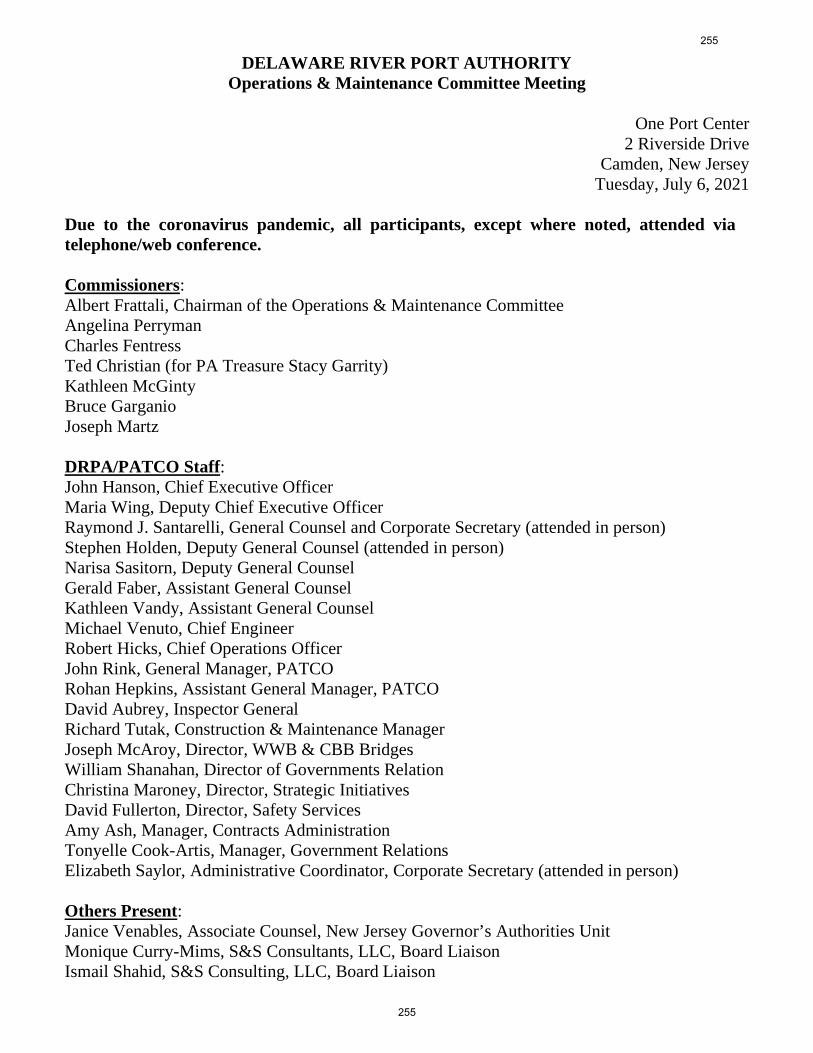
DELAWARE RIVER PORT AUTHORITYOperations & Maintenance Committee Meeting
One Port Center2 Riverside Drive
Camden, New JerseyTuesday, July 6, 2021
Due to the coronavirus pandemic, all participants, except where noted, attended viatelephone/web conference.
Commissioners:Albert Frattali, Chairman of the Operations & Maintenance CommitteeAngelina PerrymanCharles FentressTed Christian (for PA Treasure Stacy Garrity)Kathleen McGintyBruce GarganioJoseph Martz
DRPA/PATCO Staff:John Hanson, Chief Executive OfficerMaria Wing, Deputy Chief Executive OfficerRaymond J. Santarelli, General Counsel and Corporate Secretary (attended in person)Stephen Holden, Deputy General Counsel (attended in person)Narisa Sasitorn, Deputy General CounselGerald Faber, Assistant General CounselKathleen Vandy, Assistant General CounselMichael Venuto, Chief EngineerRobert Hicks, Chief Operations OfficerJohn Rink, General Manager, PATCORohan Hepkins, Assistant General Manager, PATCODavid Aubrey, Inspector GeneralRichard Tutak, Construction & Maintenance ManagerJoseph McAroy, Director, WWB & CBB BridgesWilliam Shanahan, Director of Governments RelationChristina Maroney, Director, Strategic InitiativesDavid Fullerton, Director, Safety ServicesAmy Ash, Manager, Contracts AdministrationTonyelle Cook-Artis, Manager, Government RelationsElizabeth Saylor, Administrative Coordinator, Corporate Secretary (attended in person)
Others Present:Janice Venables, Associate Counsel, New Jersey Governor’s Authorities UnitMonique Curry-Mims, S&S Consultants, LLC, Board LiaisonIsmail Shahid, S&S Consulting, LLC, Board Liaison
255
255
CALL TO ORDER
Committee Chairman Frattali called the meeting of the Operations & Maintenance Committeeof the Delaware River Port Authority to order at 9:02 a.m. and asked the Corporate Secretary tocall the roll.
ROLL CALL
The following Commissioners were present, constituting a quorum: Frattali, Perryman, Fentress,Garganio, McGinty, Martz and Christian.
OPEN SESSION
Summary Statements and Resolutions for Consideration
Committee Chairman Frattali stated that there were eight (8) Summary Statements andResolutions for the Committee:
1) DRPA-21-044 Capital Project Contract Modifications.
PATCO General Manager Rink presented Summary Statement and Resolution No. DRPA-21-044seeking Board authorization to negotiate a contract with Atlantic Track & Turnout, Inc. for theprocurement and delivery of 136# RE Head Hardened Rails, in an amount not to exceed$235,797.90. Commissioner Fentress moved to forward DRPA-21-044 to the Board forconsideration and Commissioner Garganio seconded the motion. There were no questions orcomments. All Commissioners in attendance voted to approve the motion.
2) DRPA-21-045 Capital Project Contract Modifications.
PATCO General Manager Rink presented Summary Statement and Resolution No. DRPA-21-045seeking Board authorization for execution of a contract modification to one (1) of the Authority’sCapital Project contracts and the amendment to the DRPA 2021 Capital Budget to include anincrease in to the Cubic Transportation Systems, Inc. contract relating to PATCO EMV Upgradeof Ticket Vending Machines, Bank Interface Files and Cubic Payment Application, in an amountnot to exceed $26,378.10. Commissioner Garganio moved to forward DRPA-21-045 to the Boardfor consideration and Commissioner Martz seconded the motion. There were no questions orcomments. All Commissioners in attendance voted to approve the motion.
3) DRPA-21-046 Procurement and Installation of New Fare Collection Equipment forFranklin Square Station.
PATCO General Manager Rink presented Summary Statement and Resolution No. DRPA-21-046seeking Board authorization for staff to negotiate a contract with Cubic Transportation Systems,Inc. to fabricate and install new fare collection equipment needed for the re-opening of theFranklin Square Station, in an amount not to exceed $1,625,714.00. Commissioner Martz movedto forward DRPA-21-046 to the Board for consideration and Commissioner Fentress seconded themotion. There were no questions or comments. All Commissioners in attendance voted to approvethe motion.
256
256
4) PATCO-21-008 DRPA/PATCO Medical Service Provider for Drug & AlcoholTesting/Training, Physical Exams, Medical Evaluations and Health Screening.
PATCO General Manager Rink presented Summary Statement and Resolution No. PATCO-21-008 seeking Board authorization for staff to negotiate two (2), three-year General ServicesContracts with the firms Interstate Mobile Care, Inc. and WorkNet Occupational Medicine toprovide the medical services that are required by the United States Department of Transportation(DOT) and DRPA/PATCO Policies and Procedures, in an amount not to exceed $750,000.00 overa three-year term. Commissioner Fentress moved to forward PATCO-21-008 to the Board forconsideration and Commissioner Garganio seconded the motion. There were no questions orcomments. All Commissioners in attendance voted to approve the motion.
5) DRPA-21-047 Procurement of Fifty (50) New Escalator Step Chains with Axles.
PATCO General Manager Rink presented Summary Statement and Resolution No. DRPA-21-047seeking Board authorization for staff to negotiate a contract with KettenWulf, Inc. for theprocurement and delivery of fifty (50) new step chain assemblies with axles to be used on PATCOescalators, in an amount not to exceed $129,660.87. Commissioner Martz moved to forwardDRPA-21-047 to the Board for consideration and Commissioner Perryman seconded the motion.There were no questions or comments. All Commissioners in attendance voted to approve themotion.
6) DRPA-21-048 FHWA/NJ DOT Transportation Highway Infrastructure ProgramGrant for BFB Interim Repairs and Improvement Project.
Director of Government Relations Shanahan presented Summary Statement and Resolution No.DRPA-21-048 seeking Board authorization for staff to apply for and receive grant funding throughthe Federal Highway Administration’s (Highway Infrastructure Program in the amount of$3,000,000.00 administered through the New Jersey Department of Transportation.Commissioner Martz moved to forward DRPA-21-048 to the Board for consideration andCommissioner Fentress seconded the motion. There were no questions or comments. AllCommissioners in attendance voted to approve the motion.
7) DRPA-21-049 Procurement and Installation of New Fare Collection Equipment forFranklin Square Station.
Bridge Director McAroy presented Summary Statement and Resolution No. DRPA-21-049seeking Board authorization for staff to negotiate a contract with Waste Management of NewJersey, Inc. to perform non-hazardous solid waste removal services for DRPA’s Bridge Facilitiesfor a period of three (3) years, in an amount not to exceed $240,013.00. Commissioner Martzmoved to forward DRPA-21-049 to the Board for consideration and Commissioner McGintyseconded the motion. There were no questions or comments. All Commissioners in attendancevoted to approve the motion.
257
257
8) DRPA-21-050 Northeast Work and Safety Boats.
Bridge Director McAroy presented Summary Statement and Resolution No. DRPA-21-050seeking Board authorization for staff to extend the current contract with Northeast Work and SafetyBoats, LLC for safety boat services for all four (4) of the DRPA bridges for two (2) additionalyears, in an amount not to exceed $200,000,00. Commissioner Fentress moved to forward DRPA-21-050 to the Board for consideration and Commissioner Garganio seconded the motion. Therewere no questions or comments. All Commissioners in attendance voted to approve the motion.
General Discussion
Committee Chairman Frattali stated that there were two (2) items for general discussion.
1. Committee Chairman Frattali stated the first item was in regard to four Change Orders:
Contract No. BF-54-2019, Rehabilitation of Suspension Spans and Anchorages.
Chief Engineer Venuto explained that this was the fifth change order for Contract No. BF-54-2019, Rehabilitation of Suspension Spans and Anchorages. The original contractamount was $194,000,000.00, with $10 million in Unforeseen Sight Conditions. Thechange is an allocation of $420,418.55 from the project’s Unforeseen Site Conditions; theamount covers the decrease in one (1) contract item, the increase in four (4) contract itemsand the addition of three (3) new contract items.
Contract No. WW-32-2018, WWB Corridor Rehabilitation – Pennsylvania Approach.
Chief Engineer Venuto explained that this was the fifth change order for Contract No.WW-32-2018, WWB Corridor Rehabilitation – Pennsylvania Approach. The originalcontract amount was $67,000,000.00, with $3 million in Unforeseen Sight Conditions.The change is an allocation of $324,672.45 from the project’s Unforeseen Site Conditions;the amount covers the decrease in one (1) contract item, the increase in sixteen (16)contract items and the addition of thirteen (13) new contract items.
Contract No. CB-33-2017, CB Substructure Rehabilitation Phase 2.
Chief Engineer Venuto explained that this was the first change order for Contract No. CB-33-2017, CB Substructure Rehabilitation Phase 2. The original contract amount was$19,000,000.00, with $800,000.00 in Unforeseen Sight Conditions. The change is anallocation of $263,092.12 from the project’s Unforeseen Site Conditions; the amountcovers the decrease in one (1) contract item, the increase in sixteen (16) contract itemsand the addition of thirteen (13) new contract items.
Contract No. 11-G, PATCO SCADA-CTC Office System Upgrade.
Chief Engineer Venuto explained that this was the first change order for Contract No. 11-G, PATCO SCADA-CTC Office System Upgrade. This is a time change only; there isno cost change. 258
258

2. Committee Chairman Frattali stated the second item was in regard to the Job OrderingContract – Baird Pier Restoration.
Chief Engineer Venuto stated that, under the Job Ordering Contract, the Authority willuse A.P. Construction for On-Call Construction Services on the Baird Pier RestorationProject, in an amount not to exceed $106,396.12.
Adjournment
With no further business, Committee Chairman Frattali proposed to adjourn the Operations andMaintenance Committee meeting. Commissioner Fentress moved to adjourn the meeting.Commissioner Perryman seconded the motion. All Commissioners in attendance voted to approvethe motion and the meeting adjourned at 9:22 a.m.
259
259
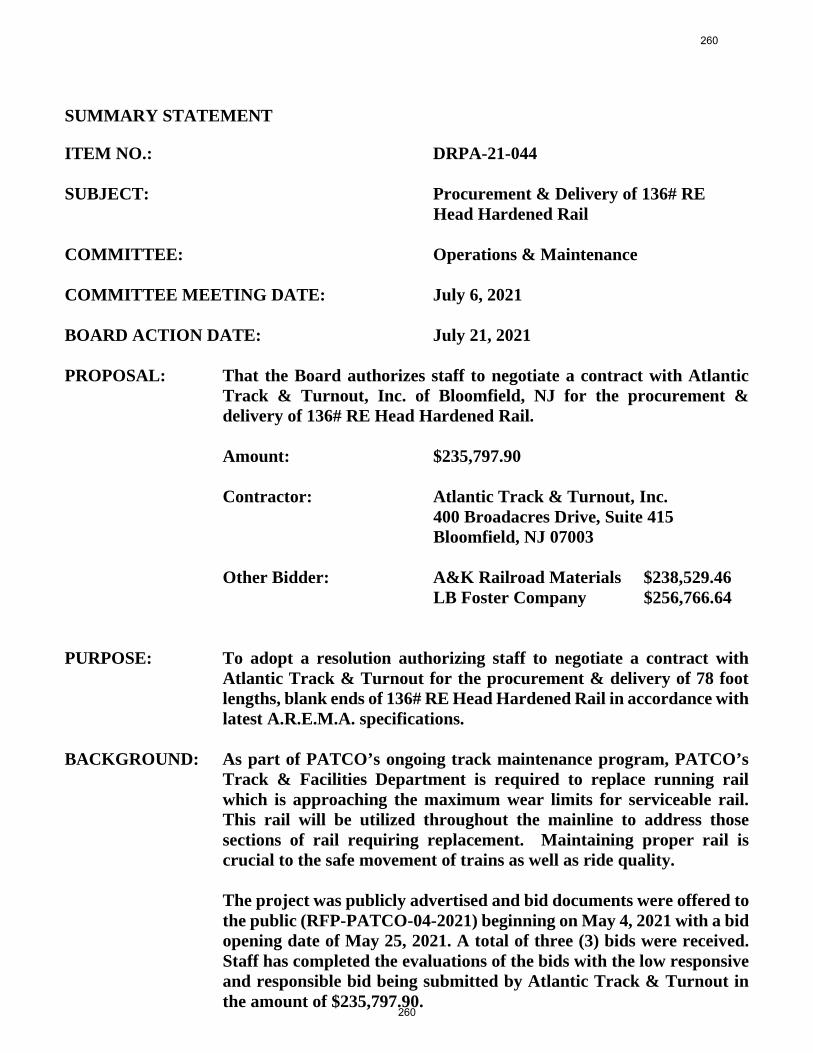
SUMMARY STATEMENT
ITEM NO.: DRPA-21-044
SUBJECT: Procurement & Delivery of 136# REHead Hardened Rail
COMMITTEE: Operations & Maintenance
COMMITTEE MEETING DATE: July 6, 2021
BOARD ACTION DATE: July 21, 2021
PROPOSAL: That the Board authorizes staff to negotiate a contract with AtlanticTrack & Turnout, Inc. of Bloomfield, NJ for the procurement &delivery of 136# RE Head Hardened Rail.
Amount: $235,797.90
Contractor: Atlantic Track & Turnout, Inc.400 Broadacres Drive, Suite 415Bloomfield, NJ 07003
Other Bidder: A&K Railroad Materials $238,529.46LB Foster Company $256,766.64
PURPOSE: To adopt a resolution authorizing staff to negotiate a contract withAtlantic Track & Turnout for the procurement & delivery of 78 footlengths, blank ends of 136# RE Head Hardened Rail in accordance withlatest A.R.E.M.A. specifications.
BACKGROUND: As part of PATCO’s ongoing track maintenance program, PATCO’sTrack & Facilities Department is required to replace running railwhich is approaching the maximum wear limits for serviceable rail.This rail will be utilized throughout the mainline to address thosesections of rail requiring replacement. Maintaining proper rail iscrucial to the safe movement of trains as well as ride quality.
The project was publicly advertised and bid documents were offered tothe public (RFP-PATCO-04-2021) beginning on May 4, 2021 with a bidopening date of May 25, 2021. A total of three (3) bids were received.Staff has completed the evaluations of the bids with the low responsiveand responsible bid being submitted by Atlantic Track & Turnout inthe amount of $235,797.90.
260
260
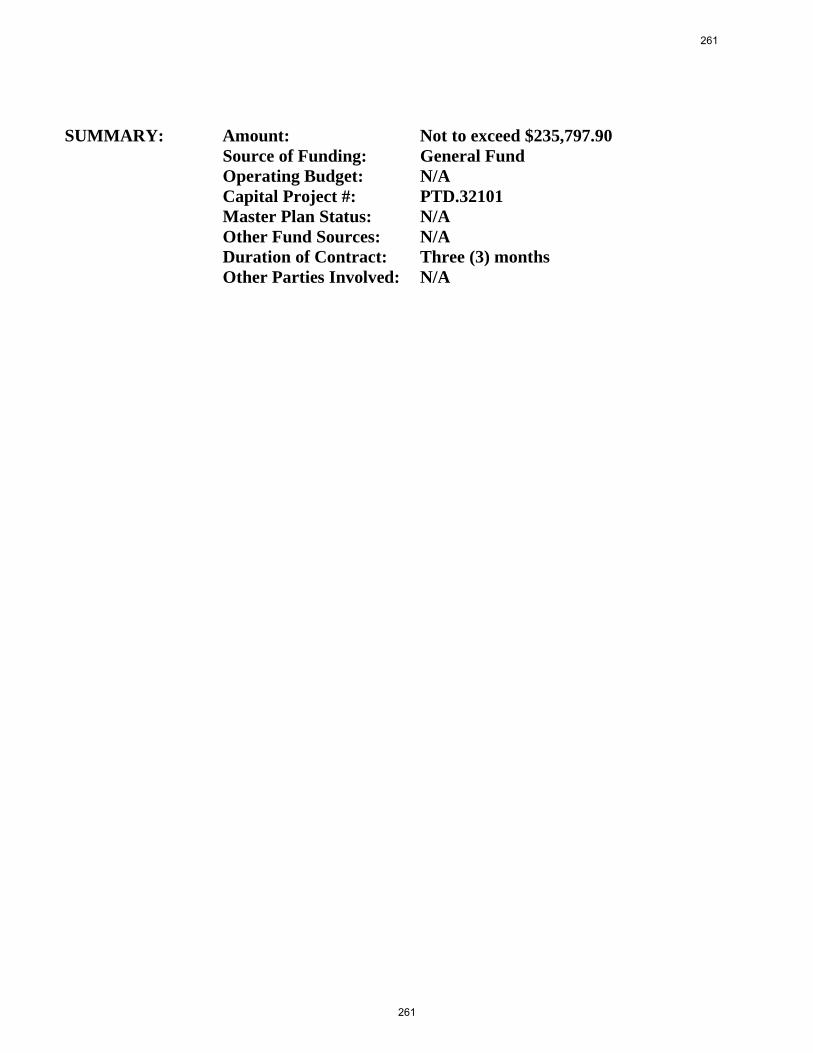
SUMMARY: Amount: Not to exceed $235,797.90Source of Funding: General FundOperating Budget: N/ACapital Project #: PTD.32101Master Plan Status: N/AOther Fund Sources: N/ADuration of Contract: Three (3) monthsOther Parties Involved: N/A
261
261
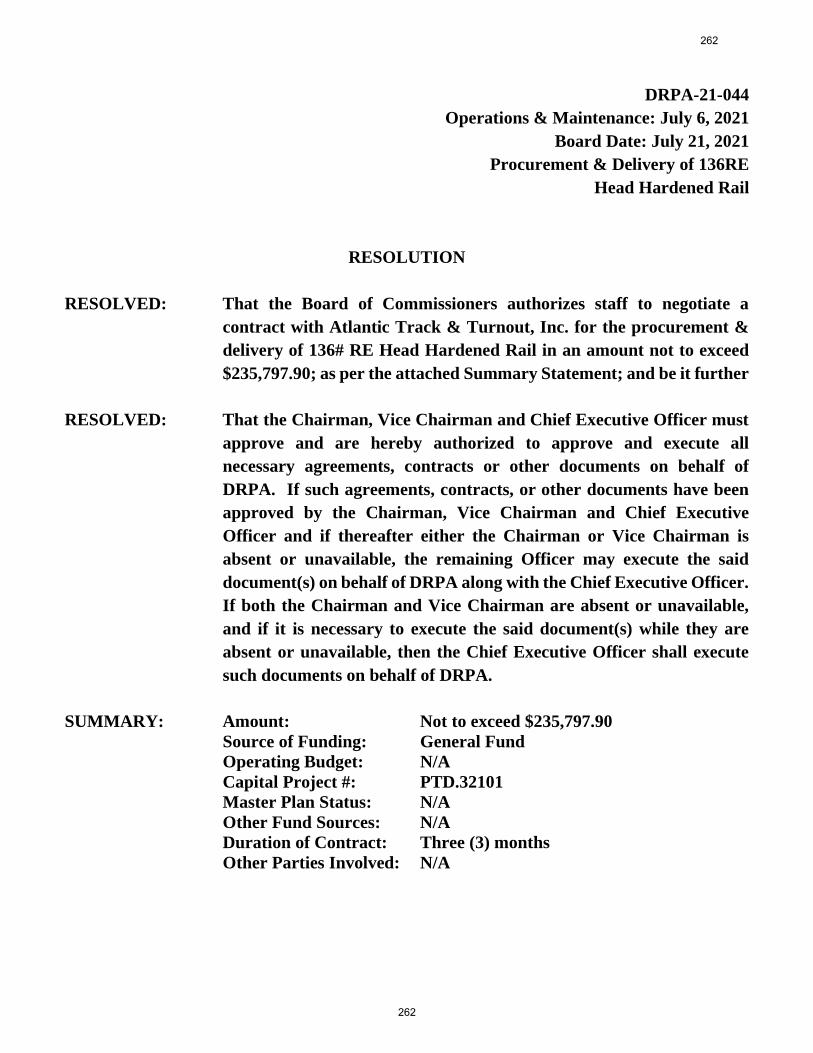
DRPA-21-044
Operations & Maintenance: July 6, 2021
Board Date: July 21, 2021
Procurement & Delivery of 136RE
Head Hardened Rail
RESOLUTION
RESOLVED: That the Board of Commissioners authorizes staff to negotiate a
contract with Atlantic Track & Turnout, Inc. for the procurement &
delivery of 136# RE Head Hardened Rail in an amount not to exceed
$235,797.90; as per the attached Summary Statement; and be it further
RESOLVED: That the Chairman, Vice Chairman and Chief Executive Officer must
approve and are hereby authorized to approve and execute all
necessary agreements, contracts or other documents on behalf of
DRPA. If such agreements, contracts, or other documents have been
approved by the Chairman, Vice Chairman and Chief Executive
Officer and if thereafter either the Chairman or Vice Chairman is
absent or unavailable, the remaining Officer may execute the said
document(s) on behalf of DRPA along with the Chief Executive Officer.
If both the Chairman and Vice Chairman are absent or unavailable,
and if it is necessary to execute the said document(s) while they are
absent or unavailable, then the Chief Executive Officer shall execute
such documents on behalf of DRPA.
SUMMARY: Amount: Not to exceed $235,797.90Source of Funding: General FundOperating Budget: N/ACapital Project #: PTD.32101Master Plan Status: N/AOther Fund Sources: N/ADuration of Contract: Three (3) monthsOther Parties Involved: N/A
262
262
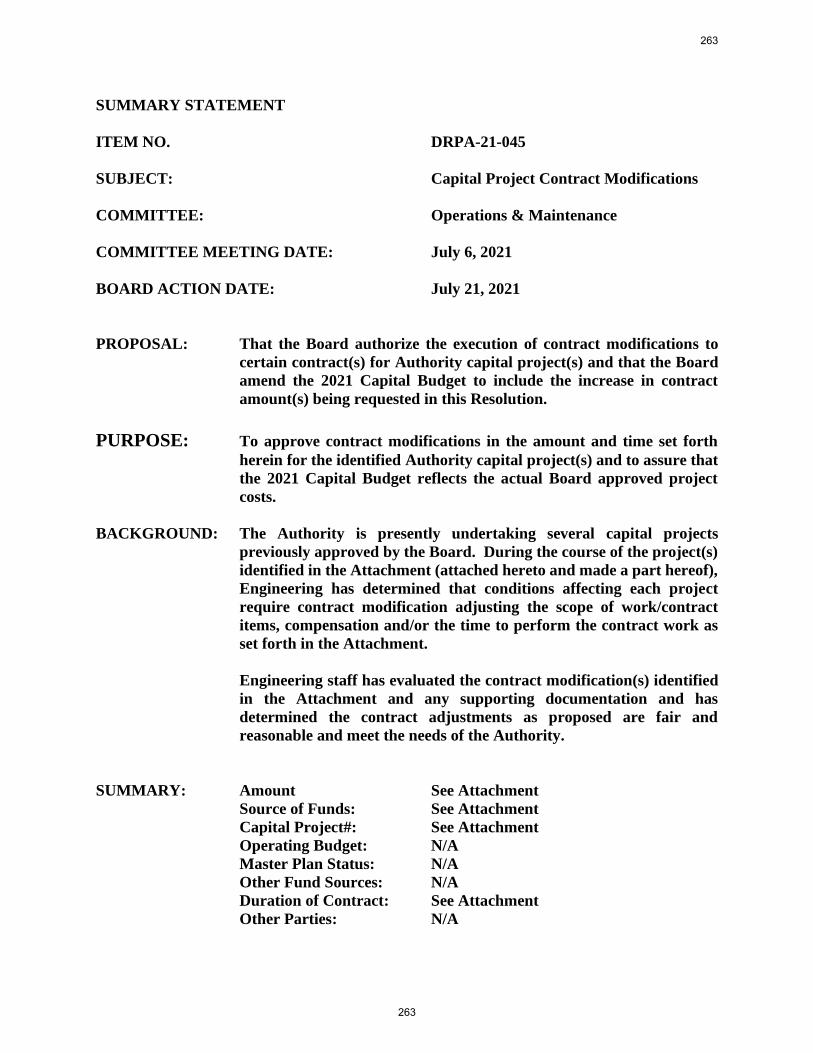
SUMMARY STATEMENT
ITEM NO. DRPA-21-045
SUBJECT: Capital Project Contract Modifications
COMMITTEE: Operations & Maintenance
COMMITTEE MEETING DATE: July 6, 2021
BOARD ACTION DATE: July 21, 2021
PROPOSAL: That the Board authorize the execution of contract modifications to
certain contract(s) for Authority capital project(s) and that the Board
amend the 2021 Capital Budget to include the increase in contract
amount(s) being requested in this Resolution.
PURPOSE: To approve contract modifications in the amount and time set forth
herein for the identified Authority capital project(s) and to assure that
the 2021 Capital Budget reflects the actual Board approved project
costs.
BACKGROUND: The Authority is presently undertaking several capital projects
previously approved by the Board. During the course of the project(s)
identified in the Attachment (attached hereto and made a part hereof),
Engineering has determined that conditions affecting each project
require contract modification adjusting the scope of work/contract
items, compensation and/or the time to perform the contract work as
set forth in the Attachment.
Engineering staff has evaluated the contract modification(s) identified
in the Attachment and any supporting documentation and has
determined the contract adjustments as proposed are fair and
reasonable and meet the needs of the Authority.
SUMMARY: Amount See Attachment
Source of Funds: See Attachment
Capital Project#: See Attachment
Operating Budget: N/A
Master Plan Status: N/A
Other Fund Sources: N/A
Duration of Contract: See Attachment
Other Parties: N/A
263
263
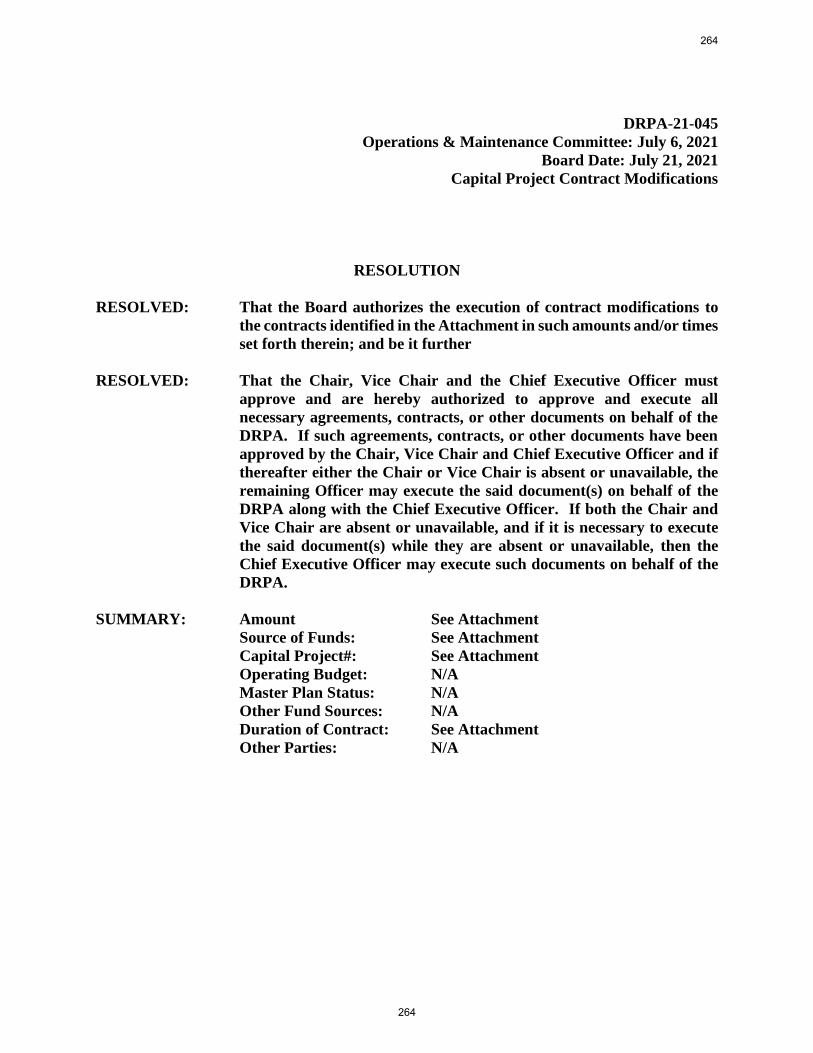
DRPA-21-045
Operations & Maintenance Committee: July 6, 2021
Board Date: July 21, 2021
Capital Project Contract Modifications
RESOLUTION
RESOLVED: That the Board authorizes the execution of contract modifications to
the contracts identified in the Attachment in such amounts and/or times
set forth therein; and be it further
RESOLVED: That the Chair, Vice Chair and the Chief Executive Officer must
approve and are hereby authorized to approve and execute all
necessary agreements, contracts, or other documents on behalf of the
DRPA. If such agreements, contracts, or other documents have been
approved by the Chair, Vice Chair and Chief Executive Officer and if
thereafter either the Chair or Vice Chair is absent or unavailable, the
remaining Officer may execute the said document(s) on behalf of the
DRPA along with the Chief Executive Officer. If both the Chair and
Vice Chair are absent or unavailable, and if it is necessary to execute
the said document(s) while they are absent or unavailable, then the
Chief Executive Officer may execute such documents on behalf of the
DRPA.
SUMMARY: Amount See Attachment
Source of Funds: See Attachment
Capital Project#: See Attachment
Operating Budget: N/A
Master Plan Status: N/A
Other Fund Sources: N/A
Duration of Contract: See Attachment
Other Parties: N/A
264
264
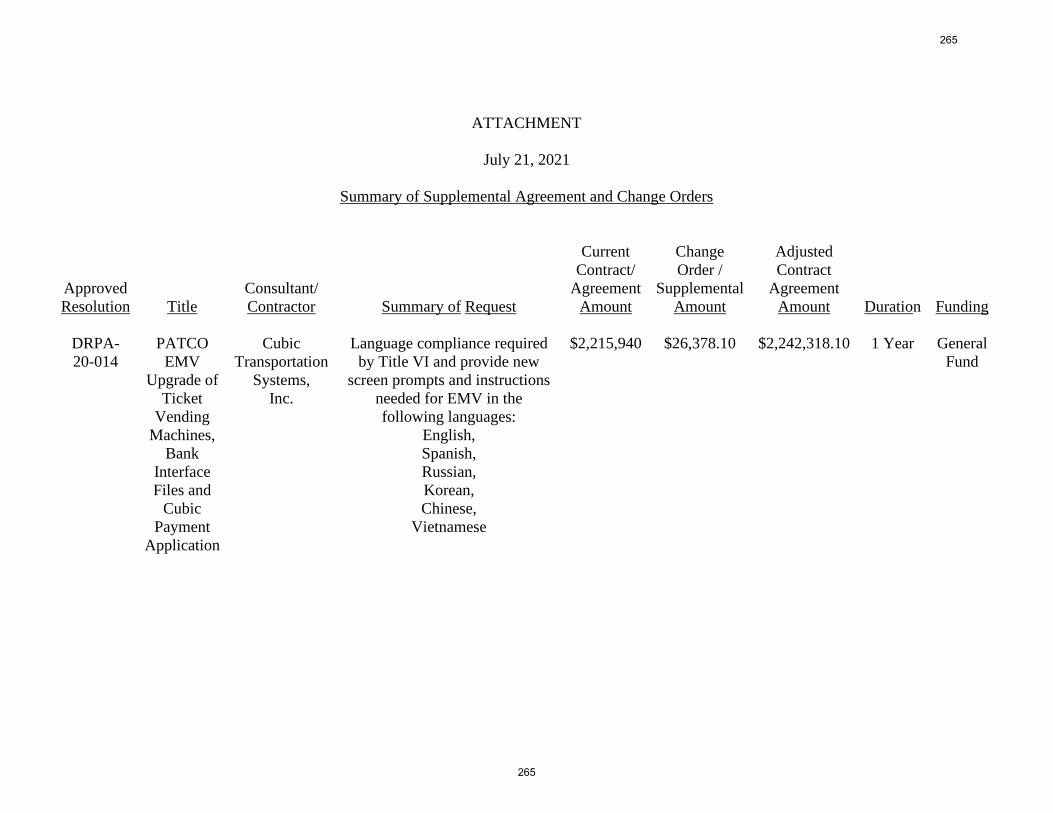
ATTACHMENT
July 21, 2021
Summary of Supplemental Agreement and Change Orders
Approved
Resolution Title
Consultant/
Contractor
Summary of Request
Current
Contract/
Agreement
Amount
Change
Order /
Supplemental
Amount
Adjusted
Contract
Agreement
Amount Duration Funding
DRPA-
20-014
PATCO
EMV
Upgrade of
Ticket
Vending
Machines,
Bank
Interface
Files and
Cubic
Payment
Application
Cubic
Transportation
Systems,
Inc.
Language compliance required
by Title VI and provide new
screen prompts and instructions
needed for EMV in the
following languages:
English,
Spanish,
Russian,
Korean,
Chinese,
Vietnamese
$2,215,940 $26,378.10 $2,242,318.10 1 Year General
Fund
265
265
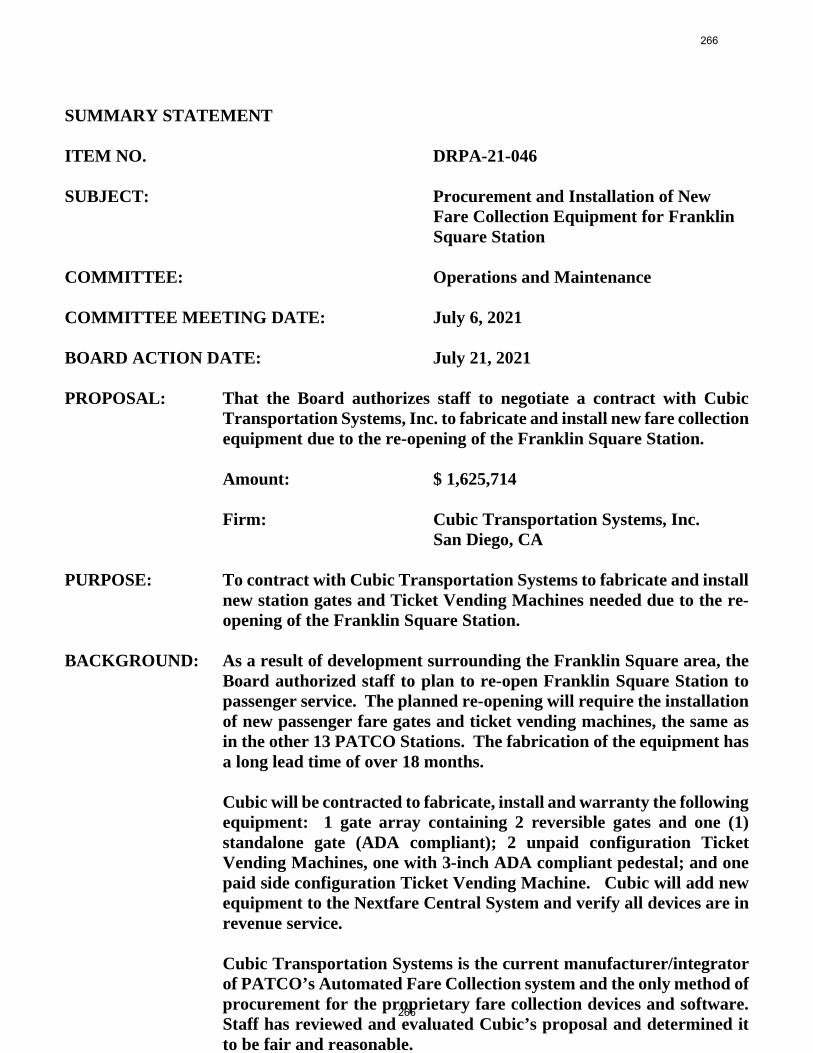
SUMMARY STATEMENT
ITEM NO. DRPA-21-046
SUBJECT: Procurement and Installation of NewFare Collection Equipment for FranklinSquare Station
COMMITTEE: Operations and Maintenance
COMMITTEE MEETING DATE: July 6, 2021
BOARD ACTION DATE: July 21, 2021
PROPOSAL: That the Board authorizes staff to negotiate a contract with CubicTransportation Systems, Inc. to fabricate and install new fare collectionequipment due to the re-opening of the Franklin Square Station.
Amount: $ 1,625,714
Firm: Cubic Transportation Systems, Inc.San Diego, CA
PURPOSE: To contract with Cubic Transportation Systems to fabricate and installnew station gates and Ticket Vending Machines needed due to the re-opening of the Franklin Square Station.
BACKGROUND: As a result of development surrounding the Franklin Square area, theBoard authorized staff to plan to re-open Franklin Square Station topassenger service. The planned re-opening will require the installationof new passenger fare gates and ticket vending machines, the same asin the other 13 PATCO Stations. The fabrication of the equipment hasa long lead time of over 18 months.
Cubic will be contracted to fabricate, install and warranty the followingequipment: 1 gate array containing 2 reversible gates and one (1)standalone gate (ADA compliant); 2 unpaid configuration TicketVending Machines, one with 3-inch ADA compliant pedestal; and onepaid side configuration Ticket Vending Machine. Cubic will add newequipment to the Nextfare Central System and verify all devices are inrevenue service.
Cubic Transportation Systems is the current manufacturer/integratorof PATCO’s Automated Fare Collection system and the only method ofprocurement for the proprietary fare collection devices and software.Staff has reviewed and evaluated Cubic’s proposal and determined itto be fair and reasonable.
266
266
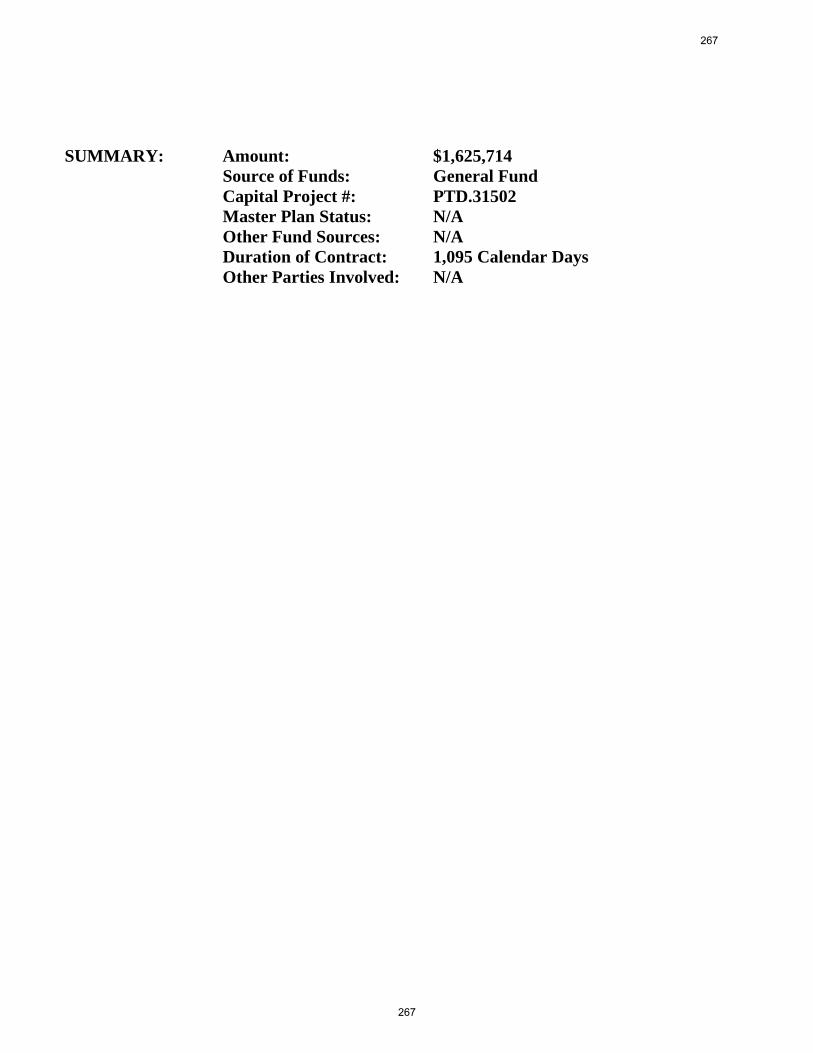
SUMMARY: Amount: $1,625,714Source of Funds: General FundCapital Project #: PTD.31502Master Plan Status: N/AOther Fund Sources: N/ADuration of Contract: 1,095 Calendar DaysOther Parties Involved: N/A
267
267

DRPA-21-046Operations & Maintenance: July 6, 2021
Board Date: July 21, 2021Procurement and Installation of
New Fare Collection Equipment forFranklin Square Station
RESOLUTION
RESOLVED: That the Board of Commissioners of the Delaware River PortAuthority authorizes staff to negotiate a contract with CubicTransportation Systems whereby Cubic will fabricate and install newfare equipment in support of the re-opening of Franklin Square Stationin an amount not to exceed $1,625,714 per the attached SummaryStatement; and be it further
RESOLVED: The Chair, Vice Chair and the Chief Executive Officer must approveand are hereby authorized to approve and execute all necessaryagreements, contracts, or other documents on behalf of the DRPA. Ifsuch agreements, contracts, or other documents have been approved bythe Chair, Vice Chair and Chief Executive Officer and if thereaftereither the Chair of Vice Chair is absent or unavailable, the remainingOfficer may execute the said document(s) on behalf of DRPA alongwith the Chief Executive Officer. If both the Chair and Vice Chair areabsent or unavailable, and if it is necessary to execute the saiddocument(s) while they are absent or unavailable, then the ChiefExecutive Officer shall execute such documents on behalf of the DRPA.
SUMMARY: Amount: $1,625,714Source of Funds: General FundCapital Project #: PTD.31502Master Plan Status: N/AOther Fund Sources: N/ADuration of Contract: 1,095 Calendar DaysOther Parties Involved: N/A
268
268
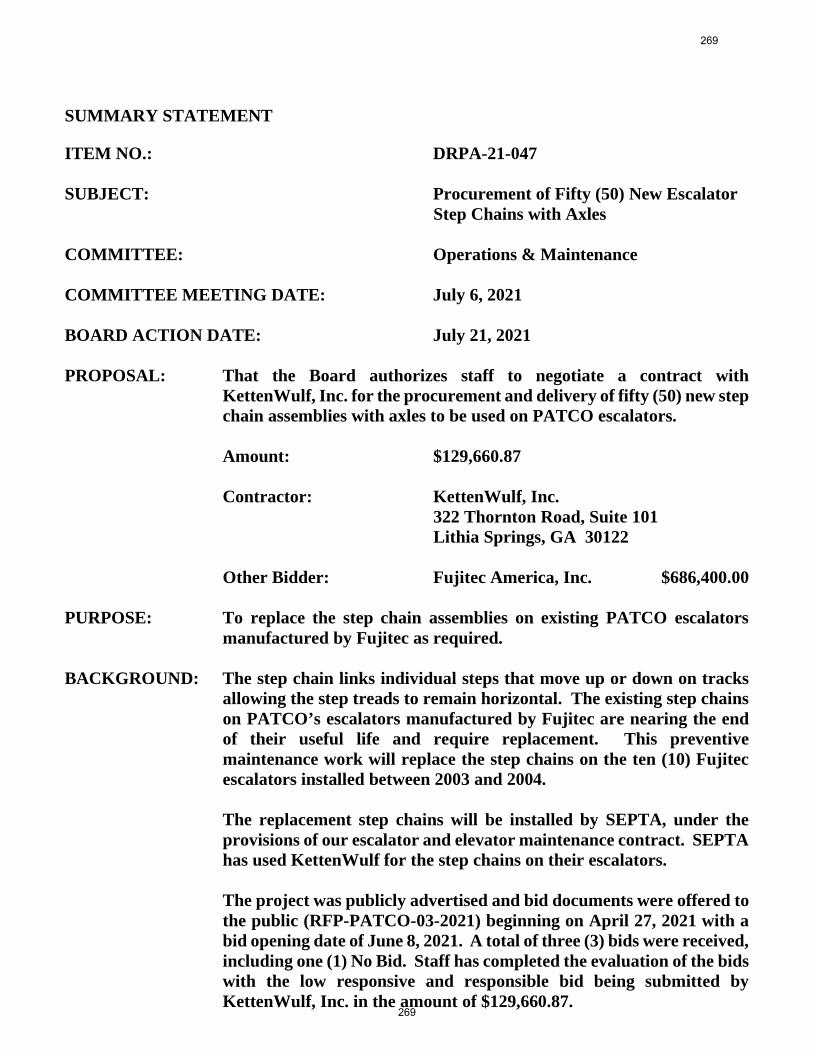
SUMMARY STATEMENT
ITEM NO.: DRPA-21-047
SUBJECT: Procurement of Fifty (50) New EscalatorStep Chains with Axles
COMMITTEE: Operations & Maintenance
COMMITTEE MEETING DATE: July 6, 2021
BOARD ACTION DATE: July 21, 2021
PROPOSAL: That the Board authorizes staff to negotiate a contract withKettenWulf, Inc. for the procurement and delivery of fifty (50) new stepchain assemblies with axles to be used on PATCO escalators.
Amount: $129,660.87
Contractor: KettenWulf, Inc.322 Thornton Road, Suite 101Lithia Springs, GA 30122
Other Bidder: Fujitec America, Inc. $686,400.00
PURPOSE: To replace the step chain assemblies on existing PATCO escalatorsmanufactured by Fujitec as required.
BACKGROUND: The step chain links individual steps that move up or down on tracksallowing the step treads to remain horizontal. The existing step chainson PATCO’s escalators manufactured by Fujitec are nearing the endof their useful life and require replacement. This preventivemaintenance work will replace the step chains on the ten (10) Fujitecescalators installed between 2003 and 2004.
The replacement step chains will be installed by SEPTA, under theprovisions of our escalator and elevator maintenance contract. SEPTAhas used KettenWulf for the step chains on their escalators.
The project was publicly advertised and bid documents were offered tothe public (RFP-PATCO-03-2021) beginning on April 27, 2021 with abid opening date of June 8, 2021. A total of three (3) bids were received,including one (1) No Bid. Staff has completed the evaluation of the bidswith the low responsive and responsible bid being submitted byKettenWulf, Inc. in the amount of $129,660.87.
269
269
SUMMARY: Amount: $129,660.87Source of Funding: General FundOperating Budget: N/ACapital Project #: SCD.32004/SCD.32101Master Plan Status: N/AOther Fund Sources: N/ADuration of Contract: N/AOther Parties Involved: N/A
270
270
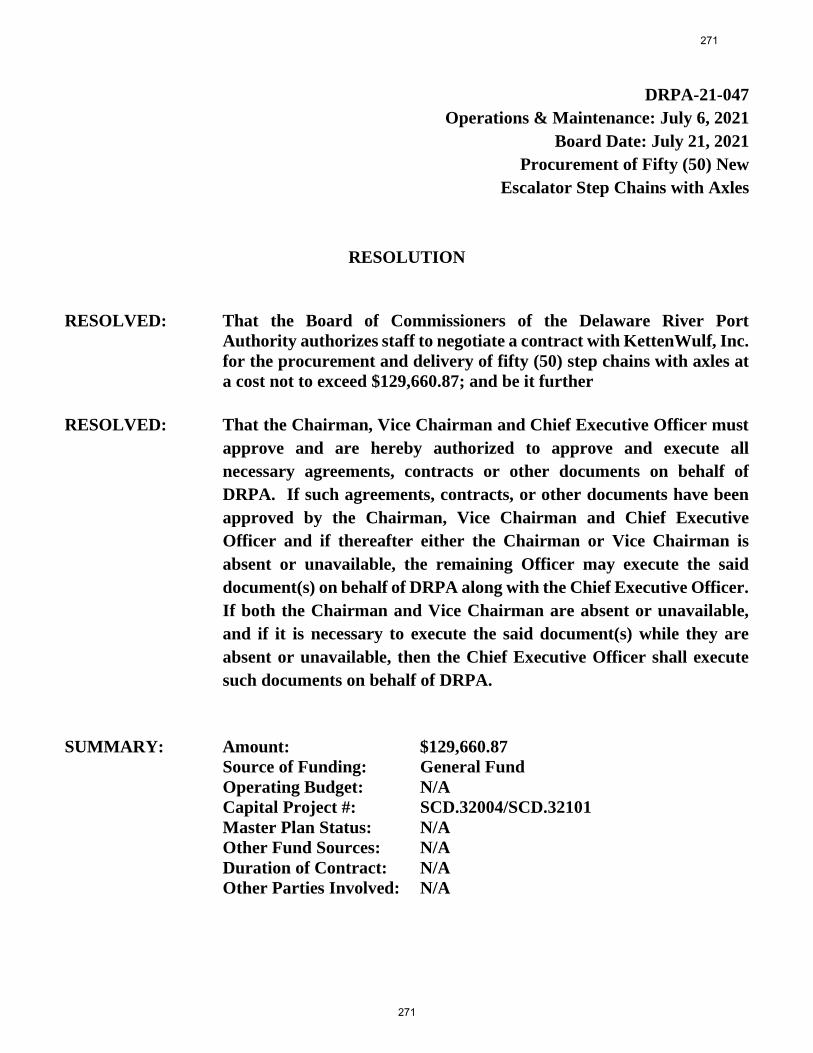
DRPA-21-047
Operations & Maintenance: July 6, 2021
Board Date: July 21, 2021
Procurement of Fifty (50) New
Escalator Step Chains with Axles
RESOLUTION
RESOLVED: That the Board of Commissioners of the Delaware River PortAuthority authorizes staff to negotiate a contract with KettenWulf, Inc.for the procurement and delivery of fifty (50) step chains with axles ata cost not to exceed $129,660.87; and be it further
RESOLVED: That the Chairman, Vice Chairman and Chief Executive Officer must
approve and are hereby authorized to approve and execute all
necessary agreements, contracts or other documents on behalf of
DRPA. If such agreements, contracts, or other documents have been
approved by the Chairman, Vice Chairman and Chief Executive
Officer and if thereafter either the Chairman or Vice Chairman is
absent or unavailable, the remaining Officer may execute the said
document(s) on behalf of DRPA along with the Chief Executive Officer.
If both the Chairman and Vice Chairman are absent or unavailable,
and if it is necessary to execute the said document(s) while they are
absent or unavailable, then the Chief Executive Officer shall execute
such documents on behalf of DRPA.
SUMMARY: Amount: $129,660.87Source of Funding: General FundOperating Budget: N/ACapital Project #: SCD.32004/SCD.32101Master Plan Status: N/AOther Fund Sources: N/ADuration of Contract: N/AOther Parties Involved: N/A
271
271
SUMMARY STATEMENT
ITEM NO.: DRPA-21-048
SUBJECT: FHWA/NJ DOT Transportation HighwayInfrastructure Program Grant for BFBInterim Repairs and ImprovementProject
COMMITTEE: Operations & Maintenance
COMMITTEE MEETING DATE: July 6, 2021
BOARD ACTION DATE: July 21, 2021
PROPOSAL: That the DRPA Board of Commissioners authorize staff to apply for andreceive grant funding through the Federal Highway Administration(FHWA) HIP (Highway Infrastructure Program) in the amount of$3,000,000, administered through the New Jersey Department ofTransportation.
PURPOSE: To make application to FHWA HIP program to secure grant funding forthe Construction of the Ben Franklin Bridge Interim Repairs andImprovements.
BACKGROUND: During the early months of the COVID-19 pandemic and the reductionin traffic, DRPA seized the opportunity to mill and overlay lanes 3, 4,and 5 of the Ben Franklin Bridge. Utilizing this grant funding, DRPAwill resurface Lanes 1, 2, 6, and 7 across the Ben Franklin Bridge andapproaches. This project will also include signing and pavementmarking improvements on the Pennsylvania Approach to increase thesafety and connectivity of vehicular, pedestrian, and bicycle facilities.
The Highway Infrastructure Program (HIP) provides funding forconstruction ready projects for highways, bridges, tunnels includingdesignated routes of the Appalachian development highway system andlocal access roads under section 14501 of title 40. HIP was authorizedunder Section 1122 of the Moving Ahead for Progress of the 21st CenterAct (MAP-21) and continued under the Fixing America’s SurfaceTransportation (FAST) Act and is codified under 23 U.S.C. §133(a)(b)(1).
272
272
The accompanying resolution has been drawn to satisfy federal requirements concerningspecific Board approvals which are necessary to the grant approval process.
SUMMARY: Amount: $3,000,000Source of Funds: FHWA/NJ DOT – HIP (Grant Funded)Capital Project #: BFB.02104Duration of Contract: Grant CompletionOther Parties Involved: DVRPC
273
273

DRPA-21-048Operations & Maintenance Committee: July 6, 2021
Board Date: July 21, 2021Grant for the BFB Interim Repairs and Improvement Project
RESOLUTION
RESOLVED: That the appropriate Staff at the Delaware River Port Authority be andhereby are authorized to make application and receive awarded grantfunding through Federal Highway Administration’s (FHWA) HIP in theamount of $3,000,000 which will be administered through New JerseyDepartment of Transportation (NJDOT) for the Ben Franklin BridgeInterim Repairs and Improvement Project.
RESOLVED: The Chair, Vice Chair and the Chief Executive Officer must approveand are hereby authorized to approve and execute all necessaryagreements, contracts, or other documents on behalf of the DRPA. Ifsuch agreements, contracts, or other documents have been approved bythe Chair, Vice Chair and Chief Executive Officer and if thereaftereither the Chair or Vice Chair is absent or unavailable, the remainingOfficer may execute the said document(s) on behalf of DRPA along withthe Chief Executive Officer. If both the Chair and Vice Chair are absentor unavailable, and if it is necessary, to execute the said document(s)while they are absent or unavailable, then the Chief Executive Officershall execute such documents on behalf of DRPA.
SUMMARY: Amount: $3,000,000Source of Funds: FHWA/NJ DOT – HIP (Grant Funded)Capital Project #: BFB.02104Duration of Contract: Grant CompletionOther Parties Involved: DVRPC
274
274

SUMMARY STATEMENT
ITEM NO.: DRPA-21-049
SUBJECT: Non-Hazardous Solid Waste Removal for
DRPA Bridge Facilities
COMMITTEE: Operations and Maintenance
COMMITTEE MEETING DATE: July 6, 2021
BOARD ACTION DATE: July 21, 2021
PROPOSAL: That the Board authorizes staff to negotiate a contract with Waste
Management of New Jersey, Inc., to perform non-hazardous solid waste
removal services for DRPA’s Bridge Facilities for a period of three (3)
years in the amount of $240,013.00.
Amount: $240,013.00
Contractor: Waste Management of New Jersey, Inc.
Ewing, New Jersey
PURPOSE: To remove non-hazardous solid waste from the DRPA Bridge Facilities;
Ben Franklin, Commodore Barry, Walt Whitman, and Betsy Ross Bridges
on a scheduled basis.
BACKGROUND: DRPA maintains an outside company to provide non-hazardous waste
containers and to remove and dispose of the waste and recyclables on a
scheduled basis. Additionally, services are required on an as needed basis
for disposal of construction debris and street sweepings. Waste is disposed
of in accordance with all local, state and federal regulations.
Request to bid was publicly advertised on DRPA’s website on May 6, 2021.
Bid documents were sent to five (5) bidders via ARIBA. Two (2) bids were
received on May 27, 2021 and are listed below:
Vendor Location Total Bid
Waste Management of NJ Ewing, NJ $240.013.00
Republic Service of NJ Philadelphia., PA $244,464.40
Bid Prime Austin, TX Non-Responsive
Gold Medal Environmental of NJ Sewell, NJ Non-Responsive
American Disposal System Philadelphia, PA Non-Responsive
275
275

It is recommended that a three (3) year contract be awarded for Solid
Waste/Non-Hazardous Disposal Service for the DRPA Bridge Facilities
to Waste Management of NJ located in Ewing, N.J., in the amount of
$240,013.00.
SUMMARY: Amount: $240,013.00
Source of Funds: General Fund
Capital Project #: N/A
Operating Budget: 2021-2024
Master Plan Status: N/A
Other Fund Sources: N/A
Duration of Contract: Three (3) years
Other Parties Involved: N/A
276
276

DRPA-21-049
O&M Committee: July 6, 2021
Board Date: July 21, 2021
Non-Hazardous Solid Waste Removal
for DRPA Bridge Facilities
RESOLUTION
RESOLVED: that the Board authorize staff to negotiate a contract with Waste Management
of NJ, Inc., to perform non-hazardous solid waste removal services for DRPA’s
Bridge Facilities for a period of three (3) years, in the amount of $240,013.00.
RESOLVED: The Chairman, Vice Chairman and the Chief Executive Officer approve and
are hereby authorized to approve and execute all necessary agreements,
contracts, or other documents on behalf of the DRPA. If such agreements,
contracts, or other documents have been approved by the Chairman, Vice
Chairman and Chief Executive Officer and if thereafter either the Chairman
or Vice Chairman is absent or unavailable, the remaining Officer may execute
the said document(s) on behalf of DRPA and PATCO along with the Chief
Executive Officer. If both the Chairman and Vice Chairman are absent or
unavailable, and if it is necessary to execute the said document(s) while they are
absent or unavailable, then the Chief Executive Officer shall execute such
documents on behalf of DRPA and PATCO.
SUMMARY: Amount: $240,013.00
Source of Funds: General Fund
Capital Project #: N/A
Operating Budget: 2021-2021
Master Plan Status: N/A
Other Fund Sources: N/A
Duration of Contract: Three (3) Years
Other Parties Involved: N/A
277
277
SUMMARY STATEMENT
ITEM NO.: DRPA-21-050
SUBJECT: Northeast Work and Safety Boats, LLC
COMMITTEE: Operations & Maintenance
COMMITTEE MEETING DATE: July 6, 2021
BOARD ACTION DATE: July 21, 2021
PROPOSAL: That the Board authorizes staff to extend the current contract with
Northeast Work and Safety Boats, LLC, for safety boat services for all
four (4) of the DRPA bridges for two (2) additional years totaling
$200,000.00.
PURPOSE: To provide safety boats and work boats with crew, safety equipment and
rescue equipment for water rescue and transportation services for
ongoing construction and maintenance activity by DRPA personnel at all
four (4) bridges.
BACKGROUND: DRPA has retained safety boats and work boat services for several years
for bridge construction maintenance and inspection activity directly
above or near water where the potential need for water rescue may exist.
Such water rescue safety provisions are required by OSHA.
Northeast Work and Safety Boats, LLC was awarded a three (3) year
contract in February, 2018 in the amount of $95,000.00 with two (2) one
(1) year options, that was approved by the Board under DRPA 17-117.
SUMMARY: Amount: $200,000.00
Source of Funds: General Fund
Capital Project #: N/A
Operating Budget: DRPA Operation 2021
Master Plan Status: N/A
Other Fund Sources: N/A
Duration of Contract: Two (2)-Years
Other Parties Involved: N/A
278
278
DRPA-21-050
Operations & Maintenance
Board Date: July 21, 2021
Northeast Work and Safety Boat LLC
RESOLUTION
RESOLVED: That the Board authorizes staff to extend the current contract with
Northeast Work and Safety Boats, LLC, for safety boat services for all
four (4) of the DRPA for two (2) additional years, in an amount not to
exceed $200,000.00.
RESOLVED: That the Chairman, Vice Chairman and the Chief Executive Officer
must approve and are hereby authorized to approve and execute all
necessary agreements, contracts, or other documents on behalf of the
DRPA. If such agreements, contracts, or other documents have been
approved by the Chairman, Vice Chairman and Chief Executive Officer
and if thereafter either the Chairman or Vice Chairman is absent or
unavailable, the remaining Officer may execute the said document(s) on
behalf of DRPA along with the Chief Executive Officer. If both the
Chairman and Vice Chairman are absent or unavailable and if it is
necessary to execute the said document(s) while they are absent or
unavailable, then the Chief Executive Officer shall execute such
documents on behalf of DRPA.
SUMMARY: Amount: $200,000.00
Source of Funds: General Fund
Capital Project #: N/A
Operating Budget: DRPA Operation 2021
Master Plan Status: N/A
Other Fund Sources: N/A
Duration of Contract: Two (2) Years
Other Parties Involved: N/A
279
279
FINANCE COMMITTEE
280
280
DELAWARE RIVER PORT AUTHORITY
Finance Committee Meeting
One Port Center
2 Riverside Drive
Camden, New Jersey
Wednesday, July 7, 2021
Due to the coronavirus pandemic, all participants, except where noted, attended via
telephone/web conference.
Commissioners:
Jeffrey Nash, Esq., Committee Chairman and Board Vice Chairman
Ted Christian (for Committee Vice Chair and PA Treasurer Stacy Garrity)
Donna Powell
Charles Fentress
Joseph Martz
Daniel Christy
DRPA/PATCO Staff:
John Hanson, Chief Executive Officer
Maria Wing, Deputy Chief Executive Officer
Raymond Santarelli, General Counsel and Corporate Secretary (attended in person)
Stephen Holden, Deputy General Counsel (attended in person)
Narisa Sasitorn, Deputy General Counsel
James White, Chief Financial Officer (attended in person)
John Rink, General Manager, PATCO
Rohan Hepkins, Assistant General Manager, PATCO
David Aubrey, Inspector General
Richard Mosback, Director of Procurement
Kevin LaMarca, Director Information Services
Christina Maroney, Director, Strategic Initiatives
Kathleen Vandy, Assistant General Counsel
John Lotierzo, Director of Finance, DRPA (attended in person)
Orville Parker, Manager Budget/Financial Analysis
Joseph McAroy, Bridge Director, BFB/BRB
Richard Tutak, Bridge Director, WWB/CBB
Elizabeth Saylor, Administrative Coordinator, Corporate Secretary (attended in person)
Others Present:
Janice Venables, Associate Counsel, New Jersey Governor’s Authorities Unit
Monique Curry-Mims, S&S Consultants, LLC, Board Liaison
Ismail Shahid, S&S Consulting, LLC, Board Liaison
OPEN SESSION
Committee Chair Nash called the meeting of the Finance Committee of the Delaware River Port
Authority to order at 9:06 a.m. and asked the Corporate Secretary to call the roll.
281
281
Page 2 of 3
ROLL CALL
The following Commissioners were present, constituting a quorum: Committee Chair Nash,
Christian, Powell, Fentress, Christy, and Martz.
OPEN SESSION
Committee Chair Nash stated that there were three (3) items for Open Session.
1) Financial Update
Chief Financial Officer/Treasurer White highlighted several areas from the DRPA/PATCO
Unaudited Financial Summary. He discussed DRPA bridge traffic and PATCO ridership volume
and revenue, the Capital Program, General Fund, and the COVID-19 pandemic’s effect on same.
Chief Executive Officer Hanson provided additional information on the traffic and ridership
revenues. General Manager Rink provided additional information on PATCO ridership and
revenue. Chief Financial Officer White noted that the Annual Report will be included in the July
Board packet.
2) DRPA-21-042 Ciena 6500 Maintenance Agreement.
Information Services Director LaMarca presented Summary Statement and Resolution No. DRPA-
21-042 seeking Board authorization to negotiate a contract with SHI International Corporation for
the renewal of the Ciena 6500 maintenance agreement, in an amount not to exceed $928,987.34.
This purchase is provided with pricing under the Commonwealth of Pennsylvania COSTARS 3
Hardware Contract. Commissioner Fentress moved to forward DRPA-21-042 to the Board for
consideration and Commissioner Powell seconded the motion. There were no questions or
comments. Commissioner Christian abstained from the vote. All other Commissioners in
attendance voted to approve the motion.
3) DRPA-21-043 Communications Consulting Services.
Director of Strategic Initiatives Maroney presented Summary Statement and Resolution No.
DRPA-21-043 seeking Board authorization to negotiate separate contracts with three
communications firms; Bellevue Strategies, LLC, Perry Media Group, LLC, and Stokes Creative
Group, Inc. These firms have been recommended to provide specialized communication services
to the DRPA on an as-needed basis including, but not limited to, strategic communications, public
and media relations, crisis communications, and digital communications. The contracts would be
for two (2) years, with two (2) one-year exercisable options at the DRPA’s sole discretion. The
total amount over the full five years would be for an amount not to exceed $700,000.00.
Commissioner Fentress moved to forward DRPA-21-043 to the Board for consideration and
Commissioner Christy seconded the motion. There were no questions or comments. All
Commissioners in attendance voted to approve the motion.
282
282

Page 3 of 3
ADJOURNMENT
With no further business, Committee Chair Nash called for a motion to adjourn the Finance Committee
meeting. Commissioner Fentress moved to adjourn the meeting. Commissioner Christy seconded the
motion. All Commissioners in attendance voted to approve the motion. The Finance Committee Meeting
adjourned at 9:30 a.m
283
283
SUMMARY STATEMENT
ITEM NO.: DRPA-21-042
SUBJECT: Ciena 6500 Maintenance Agreement
COMMITTEE: Finance
COMMITTEE MEETING DATE: July 7, 2021
BOARD ACTION DATE: July 21, 2021
PROPOSAL: That the Board authorizes staff to negotiate a five (5) year contract with
SHI International Corp., Somerset, NJ for an amount not to exceed
$928,987.34 for the renewal of our Ciena 6500 maintenance agreement.
This purchase is provided with pricing under the Commonwealth of
Pennsylvania COSTARS 3 Hardware Contract.
PURPOSE: To provide the Delaware River Port Authority with hardware and
software maintenance for our wide-area network (WAN) devices.
BACKGROUND: To increase the performance and availability of our critical wide-area
network devices it is necessary to enter into an agreement with ePlus
Technology for Ciena 6500 comprehensive support services. This
agreement provides the DRPA with comprehensive, consistent hardware
and software services. It allows us to work with Ciena services engineers
to deliver onsite hardware support and over-the-phone software support
around the clock 365 days per year. With these services we improve our
network uptime with responsive hardware and software services with a
24x7 availability. Other services include hardware replacement services,
software update services, incident and problem management, and 4-
hour managed spares and engineer dispatch.
Staff therefore recommends negotiating a contract with SHI
International Corp. for an amount not to exceed $928,987.34 for the
renewal of our Ciena 6500 maintenance agreement.
SUMMARY: Amount: $928,987.34
Source of Funds: General Fund
Capital Project #: N/A
Operating Budget: 2021-26 DRPA 610100 – Repairs & Maint.
2021-26 PATCO 610100 – Repairs & Maint.
Master Plan Status: N/A
Other Fund Sources: N/A
Duration of Contract: October 25, 2021, through October 24, 2026
Other Parties Involved: N/A
284
284
DRPA-21-042
Finance Committee: July 7, 2021
Board: July 21, 2021
Ciena 6500 Maintenance Agreement
RESOLUTION
RESOLVED: That the Board authorizes staff to negotiate a five (5) year contract with
SHI International Corp. for an amount not to exceed $928,987.34 for the
renewal of our Ciena 6500 maintenance agreement. This purchase is
provided with pricing under the Commonwealth of Pennsylvania
COSTARS 3 Hardware Contract.
RESOLVED: The Chair, Vice Chair and the Chief Executive Officer must approve
and are hereby authorized to approve and execute all necessary
agreements, contracts, or other documents on behalf of the DRPA. If
such agreements, contracts, or other documents have been approved by
the Chair, Vice Chair and Chief Executive Officer and if thereafter
either the Chair or Vice Chair is absent or unavailable, the remaining
Officer may execute the said document(s) on behalf of DRPA along with
the Chief Executive Officer. If both the Chair and Vice Chair are
absent or unavailable, and if it is necessary to execute the said
document(s) while they are absent or unavailable, then the Chief
Executive Officer shall execute such documents on behalf of DRPA.
SUMMARY: Amount: $928,987.34
Source of Funds: General Fund
Capital Project #: N/A
Operating Budget: 2021 DRPA 610100 – Repairs & Maint.
2021 PATCO 610100 – Repairs & Maint.
Master Plan Status: N/A
Other Fund Sources: N/A
Duration of Contract: October 25, 2021, through October 24, 2026
Other Parties Involved: N/A
285
285
SUMMARY STATEMENT
ITEM NO.: DRPA-21-043
SUBJECT: Communication Consulting Services
COMMITTEE: Finance
COMMITTEE MEETING DATE: July 7, 2021
BOARD ACTION DATE: July 21, 2021
PROPOSAL: That the Board authorizes staff to negotiate separate contracts with
three communications firms recommended to provide specialized
communication services to the DRPA on an as-needed basis including,
but not limited to, strategic communications, public and media
relations, crisis communications, and digital communications.
AMOUNT: Up to $700,000 Total
Five firms submitted responses to the Request for Proposals:
Recommended Consultants:
Bellevue Strategies, LLC
Philadelphia, PA
Perry Media Group, LLC
Hummelstown, PA
Stokes Creative Group, Inc.
Vincentown, NJ
Other Consultants: CaraTec, LLC
Envision Consultants, LTD
PURPOSE: To approve the selection of qualified communications firms to assist
DRPA on an “as needed” basis with urgent and high priority issues
management and communications services to enable the DRPA to
communicate with the public, the media, and all stakeholders in a
timely, practical, credible, and transparent manner.
Tasks will be assigned to firms on a Task Order basis after receipt and
approval of a written proposal from the firm for each assignment
specifically requested and outlined by the DRPA. The execution of a
286
286
contract with each firm is not a guarantee of a work assignment. The
Chief Executive Officer will determine the assignment of work based
on the specific needs of DRPA and/or PATCO.
BACKGROUND: DRPA’s Corporate Communications Department executes the day-to-
day activities related to all areas of external and internal
communications. On occasion, the DRPA may require communications
and public relations firm’s services to support in-house staff in
developing and implementing communication strategies that amplify
the DRPA’s mission and vision as well as in response to matters and
events related to its image, assets, and operations.
The Authority publicly advertised its intent to retain consultants and
invited interested firms to submit responses to the Request for
Proposal.
Technical and Price Proposals were submitted by five (5) firms to the
DRPA on April 9, 2021.
An Evaluation Committee consisting of members of Strategic
Initiatives, Corporate Communications, Engineering, Administration
and PATCO staff were assembled to evaluate the qualifications on the
basis of technical merit. Based on review by the committees, the firms
selected were the most responsive to the Authority’s anticipated need
for specialized communications services.
Three (3) of the firms that were technically evaluated are recommended
by the selection committee to provide the DRPA with specialized
communications services on an as-needed basis to supplement and
support the DRPA’s in-house Corporate Communications staff.
The selection of the three (3) recommended firms provides a diversity
of skills and a level of experience to help ensure that the DRPA
continues to communicate with the public, the media, and all
stakeholders in a timely, practical, credible, and transparent manner.
In accordance with the Delaware River Port Authority’s qualification
based selection procedure, the Price Proposals were evaluated for the
firms being recommended. There is a fair and competitive balance
among the pricing for the firms.
It is recommended that consulting contracts be negotiated with the
following firms for the costs and associated fees to provide specialized
communications services in accordance with the Request for Proposal.
▪ Bellevue Strategies, LLC
287
287
▪ Perry Media Group, LLC
▪ Stokes Creative Group, Inc.
SUMMARY: Amount: Up to $700,000 Total
Source of Funds: Revenue Fund
Capital Project #: N/A
Operating Budget: DRPA Budget – Professional Fees –
Consulting - Commitment # 700180
Master Plan Status: N/A
Other Fund Sources: N/A
Duration of Contract: Up to two (2) years, with two (2) one (1)
year exercisable options, at the DRPA’s
sole discretion.
Other Parties Involved: N/A
288
288
DRPA-21-043
Finance Committee: July 7, 2021
Board Date: July 21, 2021
Communication Consulting Services
RESOLUTION
RESOVLED: That the Board authorizes staff to negotiate separate contracts with the
following communications firms to provide specialized communication
services to the DRPA on an as-needed basis including, but not limited
to, strategic communications, public and media relations, crisis
communications, and digital communications.
Amount: Up to $700,000 total over the contract term
▪ Bellevue Strategies, LLC
▪ Perry Media Group, LLC
▪ Stokes Creative Group, Inc.
RESOLVED: Tasks will be assigned to firms on a Task Order basis after receipt and
approval of a written proposal from the firm for each assignment
specifically requested and outlined by the DRPA. The execution of a
contract with each firm is not a guarantee of a work assignment. The
Chief Executive Officer will determine the assignment of work based
on the specific needs of DRPA and/or PATCO.
RESOLVED: The annual funding allocation will be subject to inclusion in the
DRPA’s Annual Operating Budget, and approval by the Board.
RESOLVED: The Chair, Vice Chair and the Chief Executive Officer must approve
and are hereby authorized to approve and execute all necessary
agreements, contracts, or other documents on behalf of DRPA and
PATCO. If such agreements, contracts, or other documents have been
approved by the Chair, Vice Chair and Chief Executive Officer, and if
thereafter, either the Chair or Vice Chair is absent or unavailable, the
remaining Officer may execute the said document(s) on behalf of DRPA
and PATCO, along with the Chief Executive Officer. If both the Chair
and Vice Chair are absent or unavailable, and if it is necessary to
execute the said document(s) while they are absent or unavailable, then
the Chief Executive Officer shall execute such documents on behalf of
DRPA and PATCO.
289
289
SUMMARY: Amount: Up to $700,000 Total
Source of Funds: Revenue Fund
Capital Project #: N/A
Operating Budget: DRPA Budget – Professional Fees –
Consulting - Commitment # 700180
Master Plan Status: N/A
Other Fund Sources: N/A
Duration of Contract: Up to two (2) years, with two (2) one (1)
year exercisable options, at the DRPA’s
sole discretion.
Other Parties Involved: N/A
290
290

UNFINISHED BUSINESS
291
291

NEW BUSINESS
292
292
SUMMARY STATEMENT
ITEM NO.: DRPA-21-051
SUBJECT: Consideration of Pending DRPA Contracts
(Between $25,000 and $100,000)
COMMITTEE: New Business
COMMITTEE MEETING DATE: N/A
BOARD ACTION DATE: July 21, 2021
PROPOSAL: That the Board consider authorizing staff to enter into contracts as shown
on the Attachment to this Resolution.
PURPOSE: To permit staff to continue and maintain DRPA operations in a safe and
orderly manner.
BACKGROUND: At the Meeting held August 18, 2010 the DRPA Commission adopted
Resolution 10-046 providing that all DRPA contracts must be adopted at an
open meeting of the DRPA Board. The Board proposed modifications to
that Resolution at its meeting of September 15, 2010; specifically that all
contracts between $25,000 and $100,000 be brought to the Board for
approval. The contracts are listed on the Attachment hereto with the
understanding that the Board may be willing to consider all of these
contracts at one time, but if any member of the Board wishes to remove any
one or more items from the list for separate consideration, each member
will have that privilege.
SUMMARY: Amount: N/A
Source of Funds: See Attached List
Capital Project #: N/A
Operating Budget: N/A
Master Plan Status: N/A
Other Fund Sources: N/A
Duration of Contract: N/A
Other Parties Involved: N/A
293
293
DRPA-21-051
New Business: July 21, 2021
Board Date: July 21, 2021
Consideration of Pending DRPA Contracts
(Between $25,000 and $100,000)
RESOLUTION
RESOLVED: That the Board authorizes and directs that subject to approval by the
Chair, Vice Chair, General Counsel and the Chief Executive Officer,
staff proceed to negotiate and enter into the contracts listed on the
Attachment hereto.
SUMMARY: Amount: N/A
Source of Funds: See Attached List
Capital Project #: N/A
Operating Budget: N/A
Master Plan Status: N/A
Other Fund Sources: N/A
Duration of Contract: N/A
Other Parties Involved: N/A
294
294
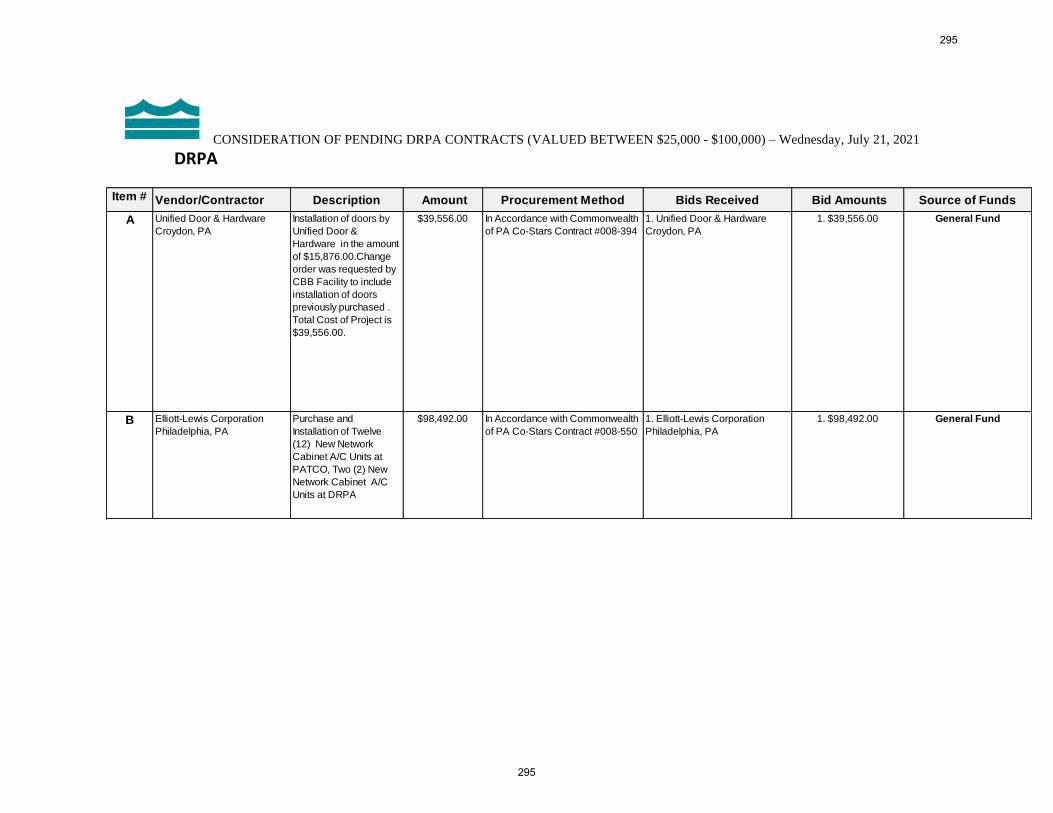
CONSIDERATION OF PENDING DRPA CONTRACTS (VALUED BETWEEN $25,000 - $100,000) – Wednesday, July 21, 2021
DRPA Item # Vendor/Contractor Description Amount Procurement Method Bids Received Bid Amounts Source of Funds
A Unified Door & Hardware
Croydon, PA
Installation of doors by
Unified Door &
Hardware in the amount
of $15,876.00.Change
order was requested by
CBB Facility to include
installation of doors
previously purchased .
Total Cost of Project is
$39,556.00.
$39,556.00 In Accordance with Commonwealth
of PA Co-Stars Contract #008-394
1. Unified Door & Hardware
Croydon, PA
1. $39,556.00 General Fund
B Elliott-Lewis Corporation
Philadelphia, PA
Purchase and
Installation of Twelve
(12) New Network
Cabinet A/C Units at
PATCO, Two (2) New
Network Cabinet A/C
Units at DRPA
$98,492.00 In Accordance with Commonwealth
of PA Co-Stars Contract #008-550
1. Elliott-Lewis Corporation
Philadelphia, PA
1. $98,492.00 General Fund
295
295
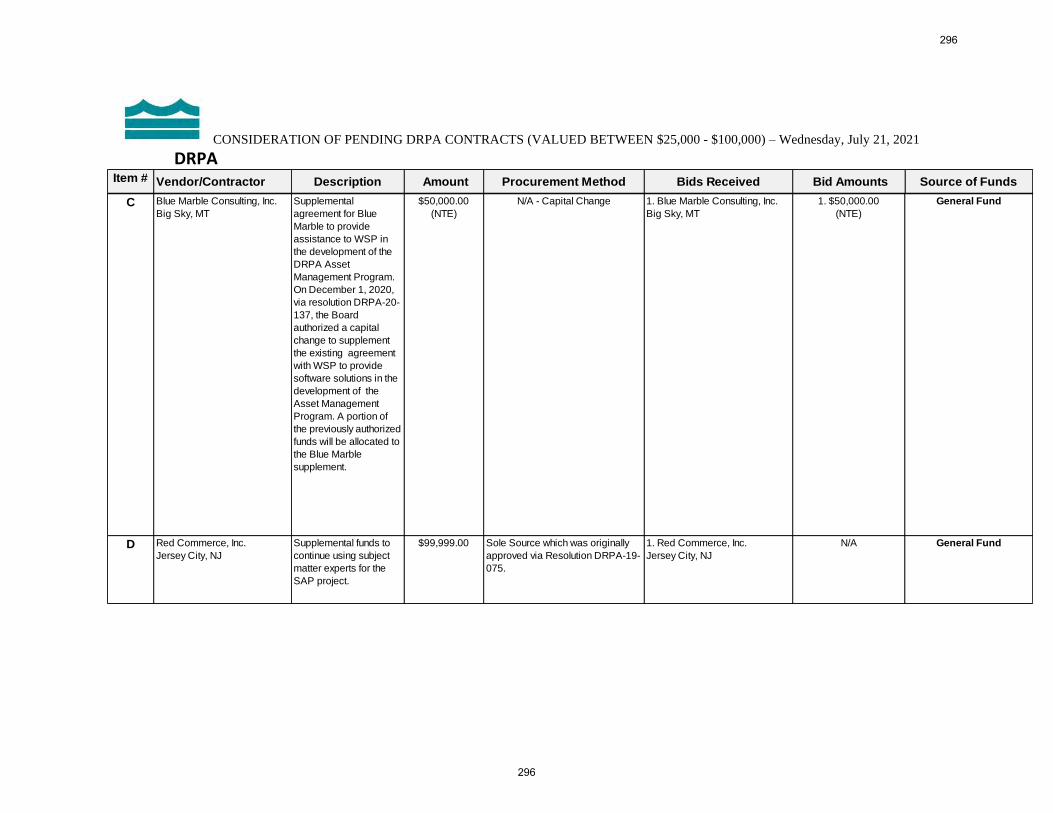
CONSIDERATION OF PENDING DRPA CONTRACTS (VALUED BETWEEN $25,000 - $100,000) – Wednesday, July 21, 2021
DRPA Item # Vendor/Contractor Description Amount Procurement Method Bids Received Bid Amounts Source of Funds
C Blue Marble Consulting, Inc.
Big Sky, MT
Supplemental
agreement for Blue
Marble to provide
assistance to WSP in
the development of the
DRPA Asset
Management Program.
On December 1, 2020,
via resolution DRPA-20-
137, the Board
authorized a capital
change to supplement
the existing agreement
with WSP to provide
software solutions in the
development of the
Asset Management
Program. A portion of
the previously authorized
funds will be allocated to
the Blue Marble
supplement.
$50,000.00
(NTE)
N/A - Capital Change 1. Blue Marble Consulting, Inc.
Big Sky, MT
1. $50,000.00
(NTE)
General Fund
D Red Commerce, Inc.
Jersey City, NJ
N/A General FundSupplemental funds to
continue using subject
matter experts for the
SAP project.
Sole Source which was originally
approved via Resolution DRPA-19-
075.
1. Red Commerce, Inc.
Jersey City, NJ
$99,999.00
296
296
SUMMARY STATEMENT
ITEM NO.: DRPA-21-052
SUBJECT: Right of Entry agreement with a five (5)
year term, with United States of America
(“United States”)
COMMITTEE: New Business
COMMITTEE MEETING DATE: N/A
BOARD ACTION DATE: July 21, 2021
PROPOSAL: That the Board authorizes staff to extend a Right of Entry (“ROE”)
agreement for a five (5) year term, with the United States, permitting
use of Delaware River Port Authority (“DRPA”) property adjacent,
above, and underneath the Route I-76 expressway leading to and from
the Walt Whitman Bridge, in the vicinity of South 20th Street and
Passyunk Avenue in South Philadelphia, for maintenance and
monitoring of two (2) high-density polyethylene conduits (“HDPC”).
PURPOSE: To enter into a Right of Entry agreement with United States, allowing
the use of DRPA property for routine maintenance and monitoring of
two (2) used in remediation projects of the former Defense Logistics
Center adjacent to the DRPA’s portion of the I-76 Expressway.
BACKGROUND: The United States Army Corps of Engineers, is responsible for
providing ongoing maintenance and monitoring of the HDPC conduits
used in the remediation efforts of the former Defense Logistics Center.
The federal government has been remediating the site since 2003 and
has maintained agreements with the DRPA in support of the
remediation project since then. The federal government agrees to
ensure that its non-federal grantee indemnify the DRPA and, hold
DRPA harmless for their actions associated with the project.
Grantee will provide DRPA, prior to any Non-Federal Grantee
entering DRPA property, and throughout the term of agreement,
current Certificates of Insurance for such person or entity evidencing
insurance coverage covering applicable risks of loss during the term
of this License in such amounts as are acceptable to the DRPA.
Specifically, DRPA requires submittal of a Certificate of Insurance
establishing that policies of the same prescribed types and amounts as
previously set forth in paragraph 13 of the ROE executed and
expiring on July 25, 2021. The Certificate of Insurance must be
provided to DRPA prior to any use and/or occupancy of the Lands, or
297
297
the commencement of any activities upon the Lands, by any Non-
Federal Grantees.
All costs associated with this project are incurred by the United States.
SUMMARY: Amount: $0
Source of Funds: N/A
Capital Project #: N/A
Operating Budget: $0
Master Plan Status: N/A
Other Fund Sources: N/A
Duration of Contract: 5 Years
Other Parties Involved: 0
298
298
DRPA-21-052
New Business: July 21, 2021
Board Date: July 21, 2021
Right of Entry (“ROE”) agreement with a
five (5) year term, with United States of
America (“United States”)
RESOLUTION
RESOLVED: That the Board authorizes the United States to use DRPA property
in the vicinity of the Walt Whitman Bridge’s portion of the I-76
Expressway between South 20th Street and Passyunk Avenue in
South Philadelphia for maintenance and monitoring activities
associated with a federal government remediation project in
accordance with an executed ROE for the term of five (5) years.
SUMMARY: Amount: $0
Source of Funds: N/A
Capital Project #: N/A
Operating Budget: $0
Master Plan Status: N/A
Other Fund Sources: N/A
Duration of Contract: 5 Years
Other Parties Involved: 0
299
299
PORT AUTHORITY TRANSIT CORP.
BOARD MEETING
Wednesday, July 21, 2021
Immediately following the DRPA Board Meeting
One Port Center
Board Room/Zoom
Camden, NJJohn T. Hanson, Chief Executive Officer
300
300

PATCO BOARD
301
301
PORT AUTHORITY TRANSIT CORPORATION
BOARD MEETING
Wednesday, July 21, 2021
Immediately following the DRPA Board Meeting
One Port Center
Camden, New Jersey
ORDER OF BUSINESS
1. Roll Call
2. Public Comment
3. Report of the General Manager – July 2021
4. Approval of June 16, 2021 PATCO Board Meeting Minutes
5. Monthly List of Previously Approved List of Payments – June 2021
6. Monthly List of Previously Approved Purchase Orders and Contracts - June 2021
7. Approval of Balance Sheet and Equity Statement dated April 30, 2021.
8. Approval of Operations & Maintenance Committee Meeting Minutes – July 6, 2021
9. Adopt Resolutions Approved by Operations & Maintenance Committee – July 6, 2021
PATCO-21-008 Medical Service Provider for Drug & Alcohol Testing/Training,
Physical Exams, Medical Evaluations and Health Screening.
10. Unfinished Business
11. New Business
12. Executive Session
13. Adjournment
302
302
GENERAL MANAGER’S REPORT
303
303
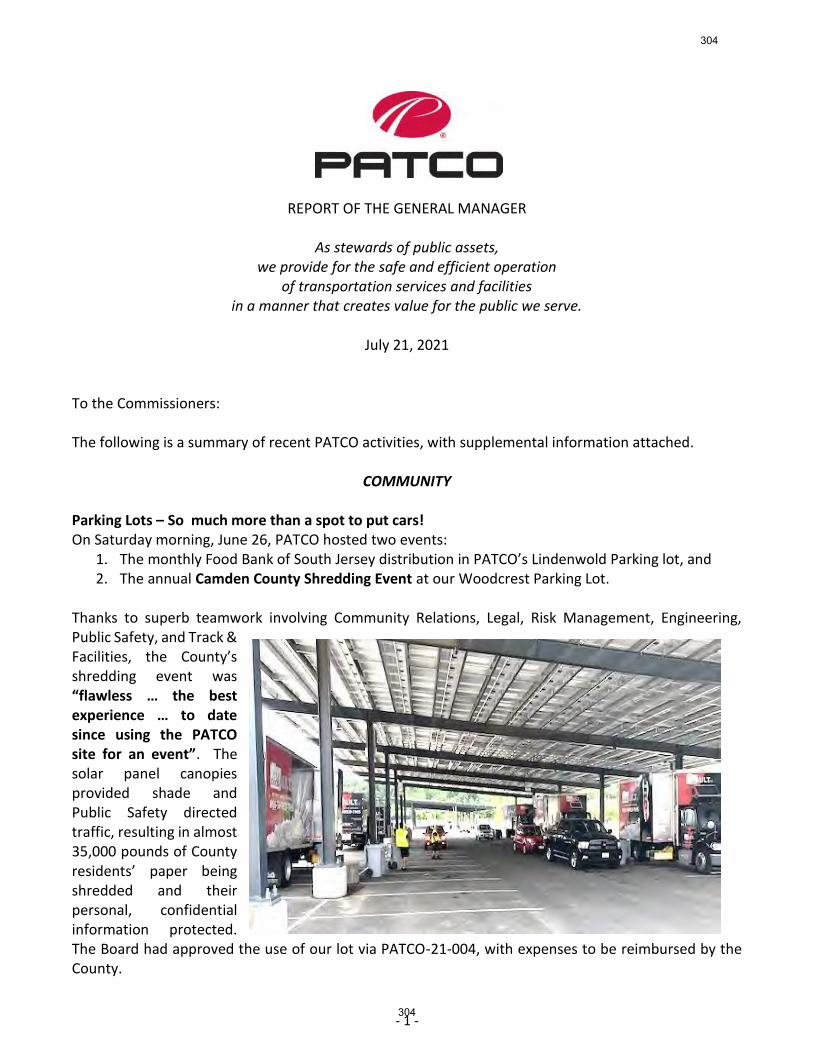
- 1 -
REPORT OF THE GENERAL MANAGER
As stewards of public assets, we provide for the safe and efficient operation
of transportation services and facilities in a manner that creates value for the public we serve.
July 21, 2021
To the Commissioners: The following is a summary of recent PATCO activities, with supplemental information attached.
COMMUNITY
Parking Lots – So much more than a spot to put cars! On Saturday morning, June 26, PATCO hosted two events:
1. The monthly Food Bank of South Jersey distribution in PATCO’s Lindenwold Parking lot, and 2. The annual Camden County Shredding Event at our Woodcrest Parking Lot.
Thanks to superb teamwork involving Community Relations, Legal, Risk Management, Engineering, Public Safety, and Track & Facilities, the County’s shredding event was “flawless … the best experience … to date since using the PATCO site for an event”. The solar panel canopies provided shade and Public Safety directed traffic, resulting in almost 35,000 pounds of County residents’ paper being shredded and their personal, confidential information protected. The Board had approved the use of our lot via PATCO-21-004, with expenses to be reimbursed by the County.
304
304
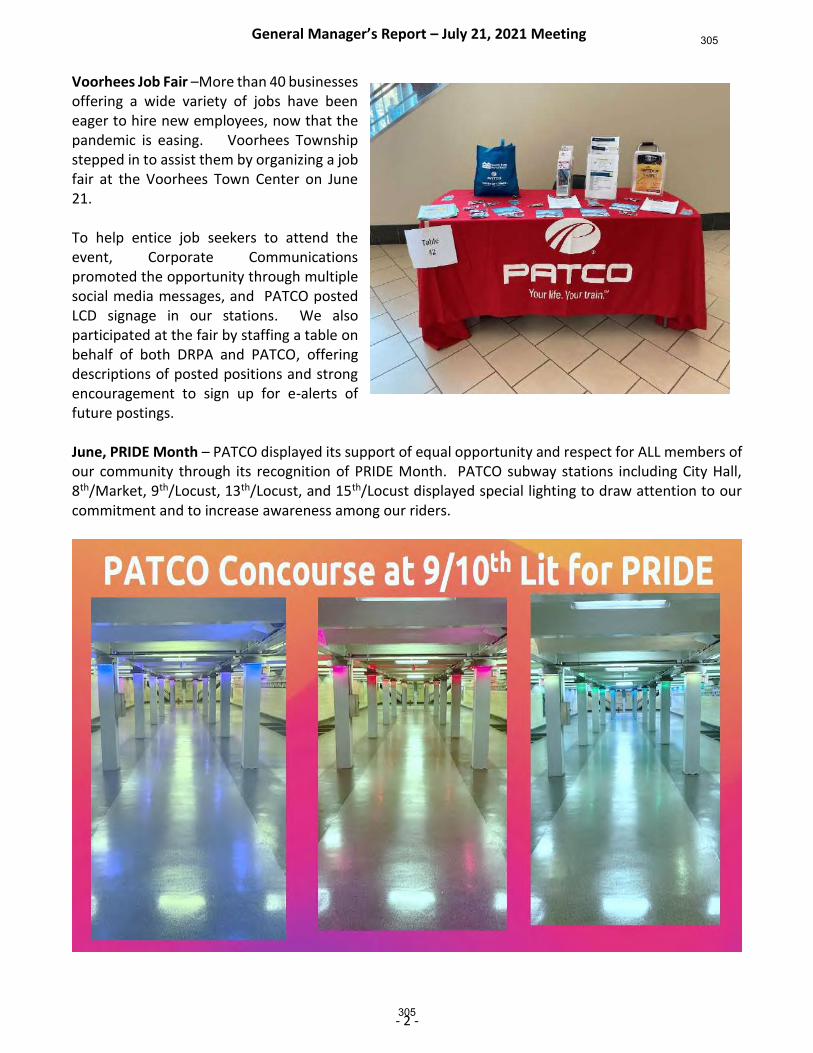
General Manager’s Report – July 21, 2021 Meeting
- 2 -
Voorhees Job Fair –More than 40 businesses offering a wide variety of jobs have been eager to hire new employees, now that the pandemic is easing. Voorhees Township stepped in to assist them by organizing a job fair at the Voorhees Town Center on June 21. To help entice job seekers to attend the event, Corporate Communications promoted the opportunity through multiple social media messages, and PATCO posted LCD signage in our stations. We also participated at the fair by staffing a table on behalf of both DRPA and PATCO, offering descriptions of posted positions and strong encouragement to sign up for e-alerts of future postings. June, PRIDE Month – PATCO displayed its support of equal opportunity and respect for ALL members of our community through its recognition of PRIDE Month. PATCO subway stations including City Hall, 8th/Market, 9th/Locust, 13th/Locust, and 15th/Locust displayed special lighting to draw attention to our commitment and to increase awareness among our riders.
305
305
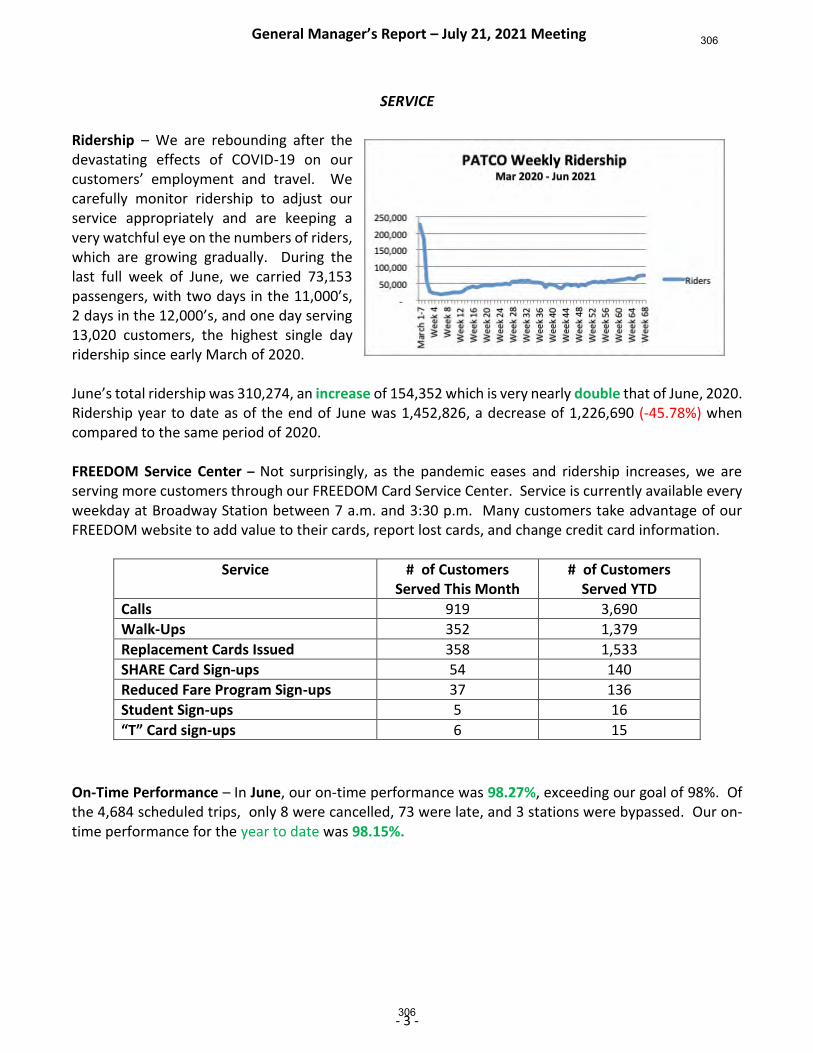
General Manager’s Report – July 21, 2021 Meeting
- 3 -
SERVICE
Ridership – We are rebounding after the devastating effects of COVID-19 on our customers’ employment and travel. We carefully monitor ridership to adjust our service appropriately and are keeping a very watchful eye on the numbers of riders, which are growing gradually. During the last full week of June, we carried 73,153 passengers, with two days in the 11,000’s, 2 days in the 12,000’s, and one day serving 13,020 customers, the highest single day ridership since early March of 2020. June’s total ridership was 310,274, an increase of 154,352 which is very nearly double that of June, 2020. Ridership year to date as of the end of June was 1,452,826, a decrease of 1,226,690 (-45.78%) when compared to the same period of 2020. FREEDOM Service Center – Not surprisingly, as the pandemic eases and ridership increases, we are serving more customers through our FREEDOM Card Service Center. Service is currently available every weekday at Broadway Station between 7 a.m. and 3:30 p.m. Many customers take advantage of our FREEDOM website to add value to their cards, report lost cards, and change credit card information.
Service # of Customers Served This Month
# of Customers Served YTD
Calls 919 3,690
Walk-Ups 352 1,379
Replacement Cards Issued 358 1,533
SHARE Card Sign-ups 54 140
Reduced Fare Program Sign-ups 37 136
Student Sign-ups 5 16
“T” Card sign-ups 6 15
On-Time Performance – In June, our on-time performance was 98.27%, exceeding our goal of 98%. Of the 4,684 scheduled trips, only 8 were cancelled, 73 were late, and 3 stations were bypassed. Our on-time performance for the year to date was 98.15%.
306
306
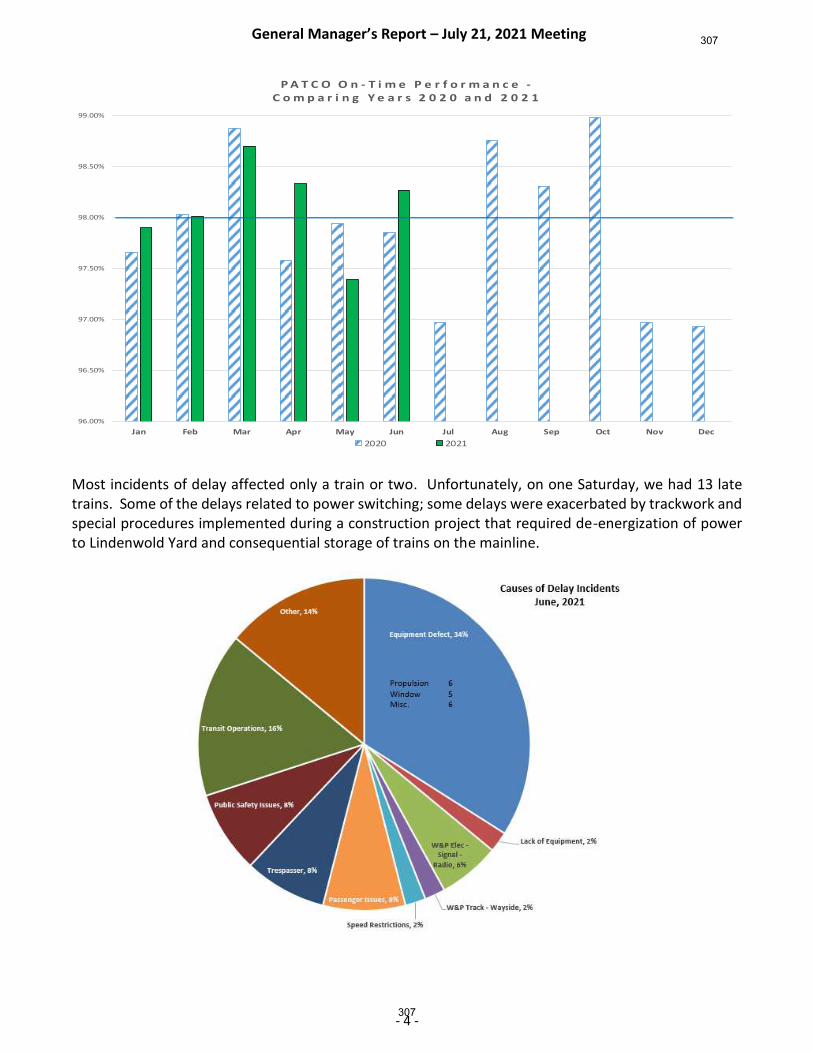
General Manager’s Report – July 21, 2021 Meeting
- 4 -
Most incidents of delay affected only a train or two. Unfortunately, on one Saturday, we had 13 late trains. Some of the delays related to power switching; some delays were exacerbated by trackwork and special procedures implemented during a construction project that required de-energization of power to Lindenwold Yard and consequential storage of trains on the mainline.
96.00%
96.50%
97.00%
97.50%
98.00%
98.50%
99.00%
Jan Feb Mar Apr May Jun Jul Aug Sep Oct Nov Dec
P A T C O O n - T i m e P e r f o r m a n c e -C o m p a r i n g Y e a r s 2 0 2 0 a n d 2 0 2 1
2020 2021
307
307
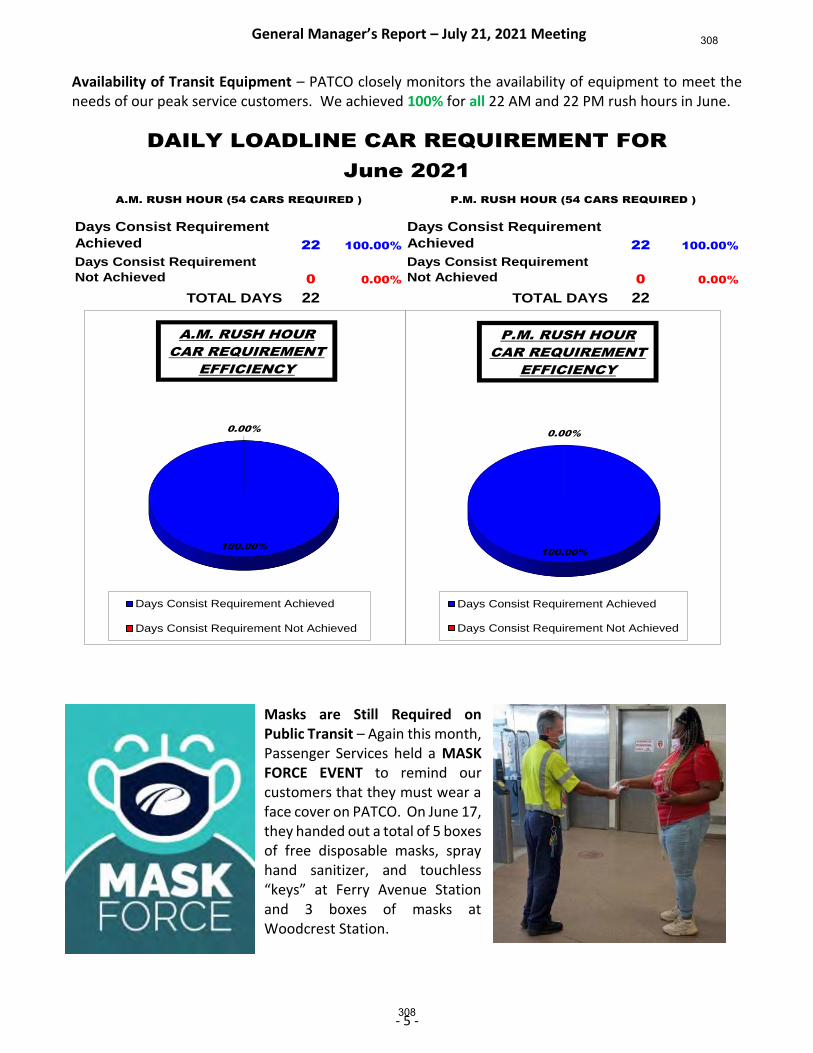
General Manager’s Report – July 21, 2021 Meeting
- 5 -
Availability of Transit Equipment – PATCO closely monitors the availability of equipment to meet the needs of our peak service customers. We achieved 100% for all 22 AM and 22 PM rush hours in June.
Masks are Still Required on Public Transit – Again this month, Passenger Services held a MASK FORCE EVENT to remind our customers that they must wear a face cover on PATCO. On June 17, they handed out a total of 5 boxes of free disposable masks, spray hand sanitizer, and touchless “keys” at Ferry Avenue Station and 3 boxes of masks at Woodcrest Station.
22 100.00% 22 100.00%
0 0.00% 0 0.00%
22 22
DAILY LOADLINE CAR REQUIREMENT FOR
June 2021
A.M. RUSH HOUR (54 CARS REQUIRED ) P.M. RUSH HOUR (54 CARS REQUIRED )
Days Consist Requirement
Achieved
Days Consist Requirement
Achieved
Days Consist Requirement
Not Achieved
Days Consist Requirement
Not Achieved
TOTAL DAYS TOTAL DAYS
100.00%
0.00%
Days Consist Requirement Achieved
Days Consist Requirement Not Achieved
A.M. RUSH HOUR
CAR REQUIREMENT
EFFICIENCY
100.00%
0.00%
Days Consist Requirement Achieved
Days Consist Requirement Not Achieved
P.M. RUSH HOUR
CAR REQUIREMENT
EFFICIENCY
308
308
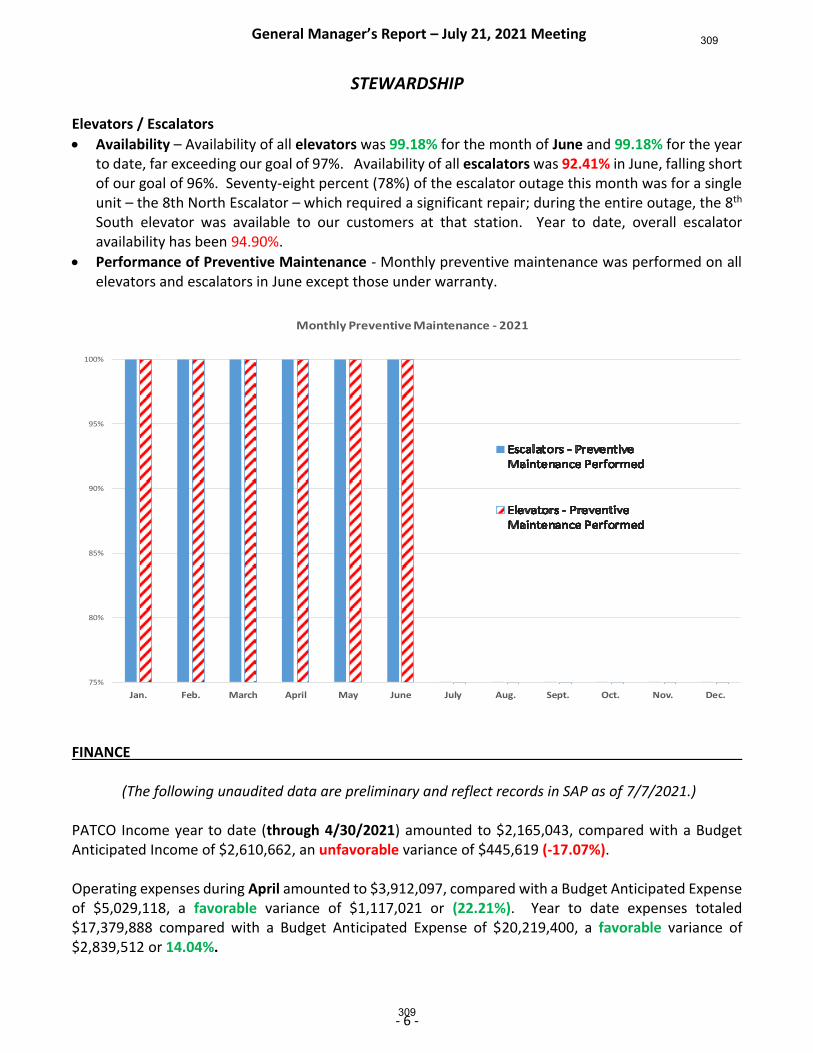
General Manager’s Report – July 21, 2021 Meeting
- 6 -
STEWARDSHIP Elevators / Escalators
• Availability – Availability of all elevators was 99.18% for the month of June and 99.18% for the year to date, far exceeding our goal of 97%. Availability of all escalators was 92.41% in June, falling short of our goal of 96%. Seventy-eight percent (78%) of the escalator outage this month was for a single unit – the 8th North Escalator – which required a significant repair; during the entire outage, the 8th South elevator was available to our customers at that station. Year to date, overall escalator availability has been 94.90%.
• Performance of Preventive Maintenance - Monthly preventive maintenance was performed on all elevators and escalators in June except those under warranty.
FINANCE
(The following unaudited data are preliminary and reflect records in SAP as of 7/7/2021.)
PATCO Income year to date (through 4/30/2021) amounted to $2,165,043, compared with a Budget Anticipated Income of $2,610,662, an unfavorable variance of $445,619 (-17.07%). Operating expenses during April amounted to $3,912,097, compared with a Budget Anticipated Expense of $5,029,118, a favorable variance of $1,117,021 or (22.21%). Year to date expenses totaled $17,379,888 compared with a Budget Anticipated Expense of $20,219,400, a favorable variance of $2,839,512 or 14.04%.
75%
80%
85%
90%
95%
100%
Jan. Feb. March April May June July Aug. Sept. Oct. Nov. Dec.
Monthly Preventive Maintenance - 2021
309
309
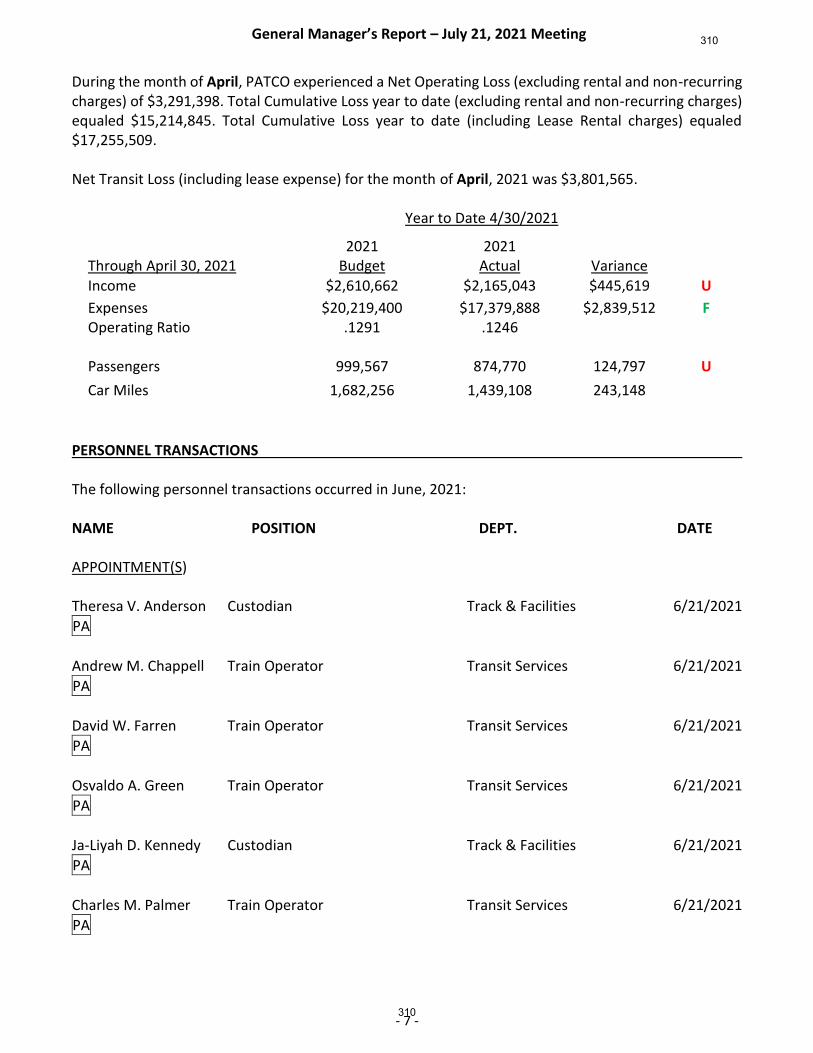
General Manager’s Report – July 21, 2021 Meeting
- 7 -
During the month of April, PATCO experienced a Net Operating Loss (excluding rental and non-recurring charges) of $3,291,398. Total Cumulative Loss year to date (excluding rental and non-recurring charges) equaled $15,214,845. Total Cumulative Loss year to date (including Lease Rental charges) equaled $17,255,509. Net Transit Loss (including lease expense) for the month of April, 2021 was $3,801,565.
Year to Date 4/30/2021
Through April 30, 2021
2021 Budget
2021 Actual
Variance
Income $2,610,662 $2,165,043 $445,619 U
Expenses $20,219,400 $17,379,888 $2,839,512 F Operating Ratio .1291 .1246 Passengers 999,567 874,770 124,797 U
Car Miles 1,682,256 1,439,108 243,148
PERSONNEL TRANSACTIONS The following personnel transactions occurred in June, 2021: NAME POSITION DEPT. DATE APPOINTMENT(S) Theresa V. Anderson Custodian Track & Facilities 6/21/2021
PA
Andrew M. Chappell Train Operator Transit Services 6/21/2021
PA
David W. Farren Train Operator Transit Services 6/21/2021
PA
Osvaldo A. Green Train Operator Transit Services 6/21/2021
PA
Ja-Liyah D. Kennedy Custodian Track & Facilities 6/21/2021
PA
Charles M. Palmer Train Operator Transit Services 6/21/2021
PA
310
310
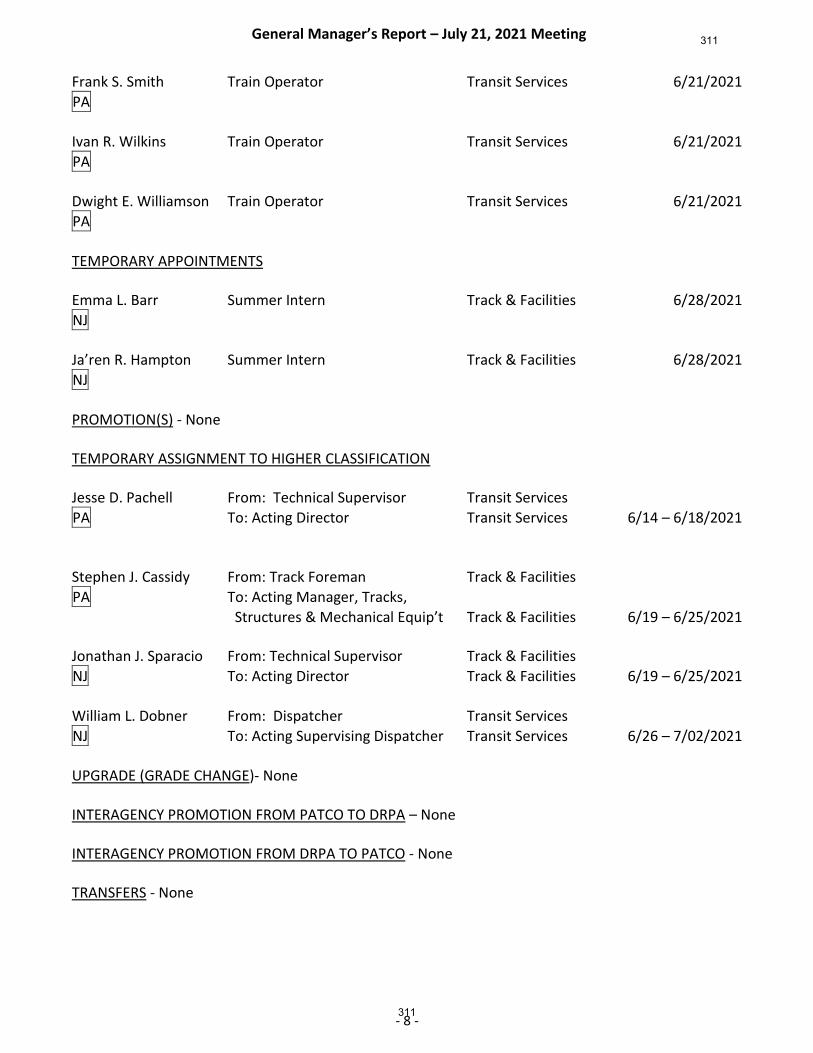
General Manager’s Report – July 21, 2021 Meeting
- 8 -
Frank S. Smith Train Operator Transit Services 6/21/2021
PA
Ivan R. Wilkins Train Operator Transit Services 6/21/2021
PA
Dwight E. Williamson Train Operator Transit Services 6/21/2021
PA
TEMPORARY APPOINTMENTS Emma L. Barr Summer Intern Track & Facilities 6/28/2021
NJ
Ja’ren R. Hampton Summer Intern Track & Facilities 6/28/2021
NJ
PROMOTION(S) - None TEMPORARY ASSIGNMENT TO HIGHER CLASSIFICATION Jesse D. Pachell From: Technical Supervisor Transit Services
PA To: Acting Director Transit Services 6/14 – 6/18/2021
Stephen J. Cassidy From: Track Foreman Track & Facilities
PA To: Acting Manager, Tracks,
Structures & Mechanical Equip’t Track & Facilities 6/19 – 6/25/2021 Jonathan J. Sparacio From: Technical Supervisor Track & Facilities
NJ To: Acting Director Track & Facilities 6/19 – 6/25/2021
William L. Dobner From: Dispatcher Transit Services
NJ To: Acting Supervising Dispatcher Transit Services 6/26 – 7/02/2021
UPGRADE (GRADE CHANGE)- None INTERAGENCY PROMOTION FROM PATCO TO DRPA – None INTERAGENCY PROMOTION FROM DRPA TO PATCO - None TRANSFERS - None
311
311
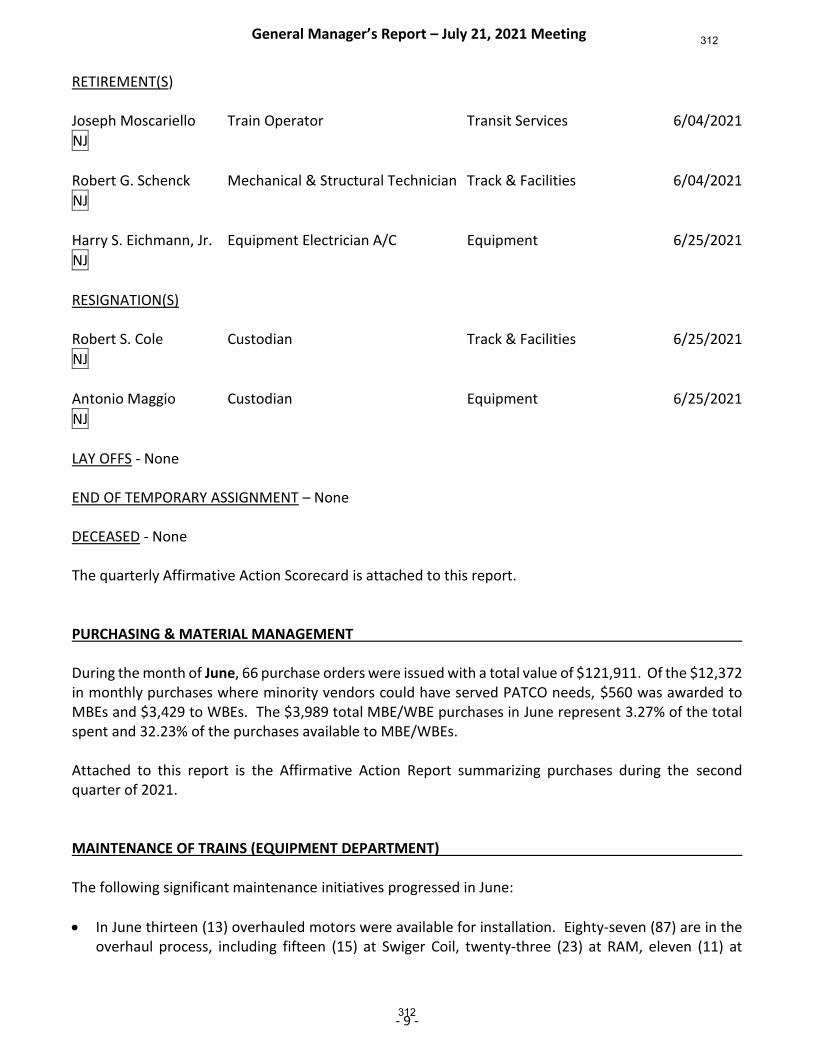
General Manager’s Report – July 21, 2021 Meeting
- 9 -
RETIREMENT(S) Joseph Moscariello Train Operator Transit Services 6/04/2021
NJ
Robert G. Schenck Mechanical & Structural Technician Track & Facilities 6/04/2021
NJ
Harry S. Eichmann, Jr. Equipment Electrician A/C Equipment 6/25/2021
NJ
RESIGNATION(S) Robert S. Cole Custodian Track & Facilities 6/25/2021
NJ
Antonio Maggio Custodian Equipment 6/25/2021
NJ
LAY OFFS - None END OF TEMPORARY ASSIGNMENT – None DECEASED - None The quarterly Affirmative Action Scorecard is attached to this report. PURCHASING & MATERIAL MANAGEMENT During the month of June, 66 purchase orders were issued with a total value of $121,911. Of the $12,372 in monthly purchases where minority vendors could have served PATCO needs, $560 was awarded to MBEs and $3,429 to WBEs. The $3,989 total MBE/WBE purchases in June represent 3.27% of the total spent and 32.23% of the purchases available to MBE/WBEs. Attached to this report is the Affirmative Action Report summarizing purchases during the second quarter of 2021. MAINTENANCE OF TRAINS (EQUIPMENT DEPARTMENT) The following significant maintenance initiatives progressed in June:
• In June thirteen (13) overhauled motors were available for installation. Eighty-seven (87) are in the overhaul process, including fifteen (15) at Swiger Coil, twenty-three (23) at RAM, eleven (11) at
312
312
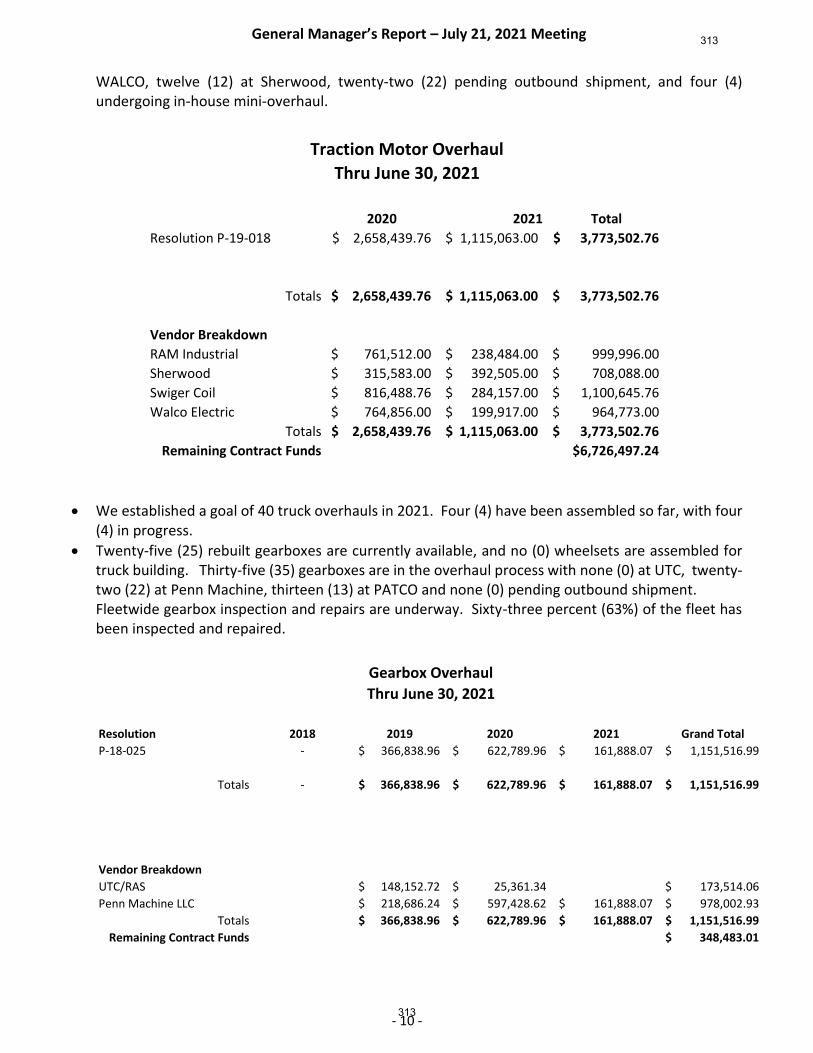
General Manager’s Report – July 21, 2021 Meeting
- 10 -
WALCO, twelve (12) at Sherwood, twenty-two (22) pending outbound shipment, and four (4) undergoing in-house mini-overhaul.
• We established a goal of 40 truck overhauls in 2021. Four (4) have been assembled so far, with four (4) in progress.
• Twenty-five (25) rebuilt gearboxes are currently available, and no (0) wheelsets are assembled for truck building. Thirty-five (35) gearboxes are in the overhaul process with none (0) at UTC, twenty-two (22) at Penn Machine, thirteen (13) at PATCO and none (0) pending outbound shipment. Fleetwide gearbox inspection and repairs are underway. Sixty-three percent (63%) of the fleet has been inspected and repaired.
2020 2021 Total
Resolution P-19-018 2,658,439.76$ 1,115,063.00$ 3,773,502.76$
Totals 2,658,439.76$ 1,115,063.00$ 3,773,502.76$
Vendor Breakdown
RAM Industrial 761,512.00$ 238,484.00$ 999,996.00$
Sherwood 315,583.00$ 392,505.00$ 708,088.00$
Swiger Coil 816,488.76$ 284,157.00$ 1,100,645.76$
Walco Electric 764,856.00$ 199,917.00$ 964,773.00$
Totals 2,658,439.76$ 1,115,063.00$ 3,773,502.76$
Remaining Contract Funds $6,726,497.24
Traction Motor Overhaul
Thru June 30, 2021
Resolution 2018 2019 2020 2021 Grand Total
P-18-025 - 366,838.96$ 622,789.96$ 161,888.07$ 1,151,516.99$
Totals - 366,838.96$ 622,789.96$ 161,888.07$ 1,151,516.99$
1,151,516.99$
Vendor Breakdown
UTC/RAS 148,152.72$ 25,361.34$ 173,514.06$
Penn Machine LLC 218,686.24$ 597,428.62$ 161,888.07$ 978,002.93$
Totals 366,838.96$ 622,789.96$ 161,888.07$ 1,151,516.99$
Remaining Contract Funds 348,483.01$
Gearbox Overhaul
Thru June 30, 2021
313
313
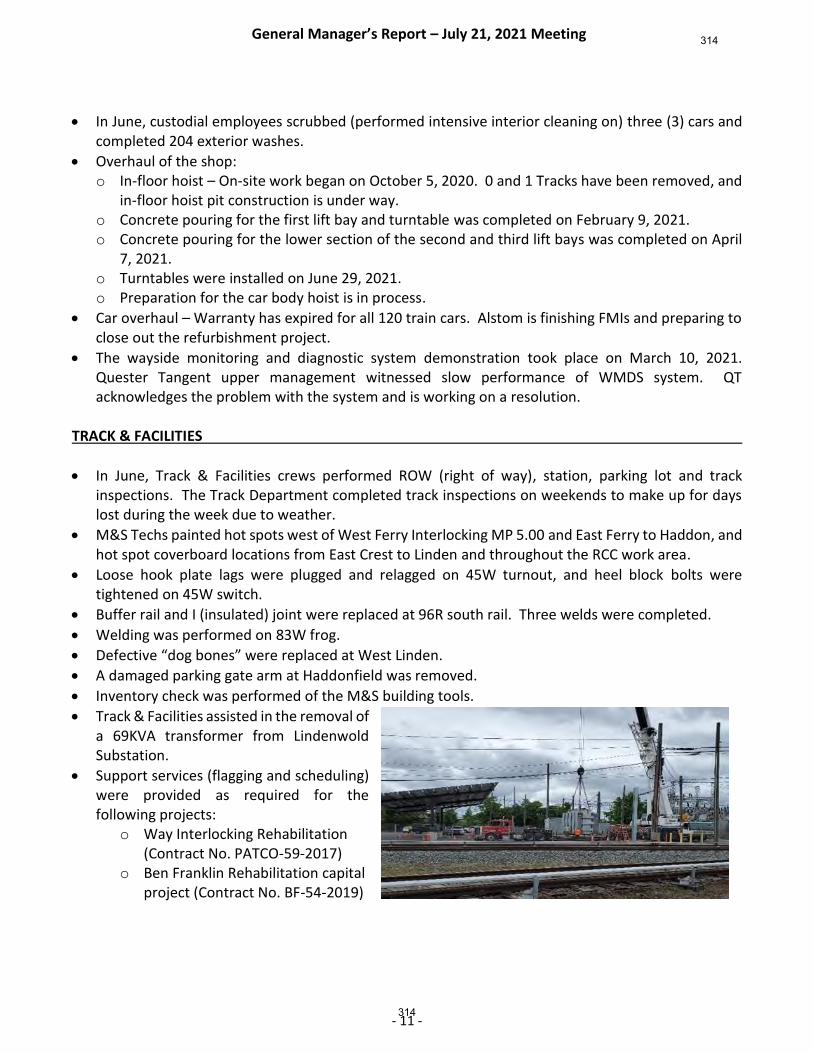
General Manager’s Report – July 21, 2021 Meeting
- 11 -
• In June, custodial employees scrubbed (performed intensive interior cleaning on) three (3) cars and completed 204 exterior washes.
• Overhaul of the shop: o In-floor hoist – On-site work began on October 5, 2020. 0 and 1 Tracks have been removed, and
in-floor hoist pit construction is under way. o Concrete pouring for the first lift bay and turntable was completed on February 9, 2021. o Concrete pouring for the lower section of the second and third lift bays was completed on April
7, 2021. o Turntables were installed on June 29, 2021. o Preparation for the car body hoist is in process.
• Car overhaul – Warranty has expired for all 120 train cars. Alstom is finishing FMIs and preparing to close out the refurbishment project.
• The wayside monitoring and diagnostic system demonstration took place on March 10, 2021. Quester Tangent upper management witnessed slow performance of WMDS system. QT acknowledges the problem with the system and is working on a resolution.
TRACK & FACILITIES
• In June, Track & Facilities crews performed ROW (right of way), station, parking lot and track inspections. The Track Department completed track inspections on weekends to make up for days lost during the week due to weather.
• M&S Techs painted hot spots west of West Ferry Interlocking MP 5.00 and East Ferry to Haddon, and hot spot coverboard locations from East Crest to Linden and throughout the RCC work area.
• Loose hook plate lags were plugged and relagged on 45W turnout, and heel block bolts were tightened on 45W switch.
• Buffer rail and I (insulated) joint were replaced at 96R south rail. Three welds were completed.
• Welding was performed on 83W frog.
• Defective “dog bones” were replaced at West Linden.
• A damaged parking gate arm at Haddonfield was removed.
• Inventory check was performed of the M&S building tools.
• Track & Facilities assisted in the removal of a 69KVA transformer from Lindenwold Substation.
• Support services (flagging and scheduling) were provided as required for the following projects:
o Way Interlocking Rehabilitation (Contract No. PATCO-59-2017)
o Ben Franklin Rehabilitation capital project (Contract No. BF-54-2019)
314
314
General Manager’s Report – July 21, 2021 Meeting
- 12 -
POWER AND SIGNALS
• Mainline traffic testing was completed this month.
• Established mainline track outages for the Track & Facilities Department.
• Traction return bonding was applied to new rail replacement as required.
• Right of Way (ROW), switch and signal inspections were performed.
• Substation breaker maintenance was performed.
• Relay testing and repairs were performed at interlockings and substations.
• Stations, subway tunnels, and parking lots were relamped as necessary.
• Support services were also provided as required for the following projects: o Lindenwold Substation switchgear renewal o Way Interlocking signal and rail renewal - provided flagging and scheduling o Ferry Station platform lamp replacement upgrades - provided flagging and scheduling o BFB suspension cable – provided support personnel o City Hall and 13th Street Elevator capital projects – provided flagging and scheduling o Maintenance and repairs of escalators and elevators
SAFETY The monthly report of the Safety Department is enclosed with this report. Respectfully submitted, John D. Rink General Manager
315
315
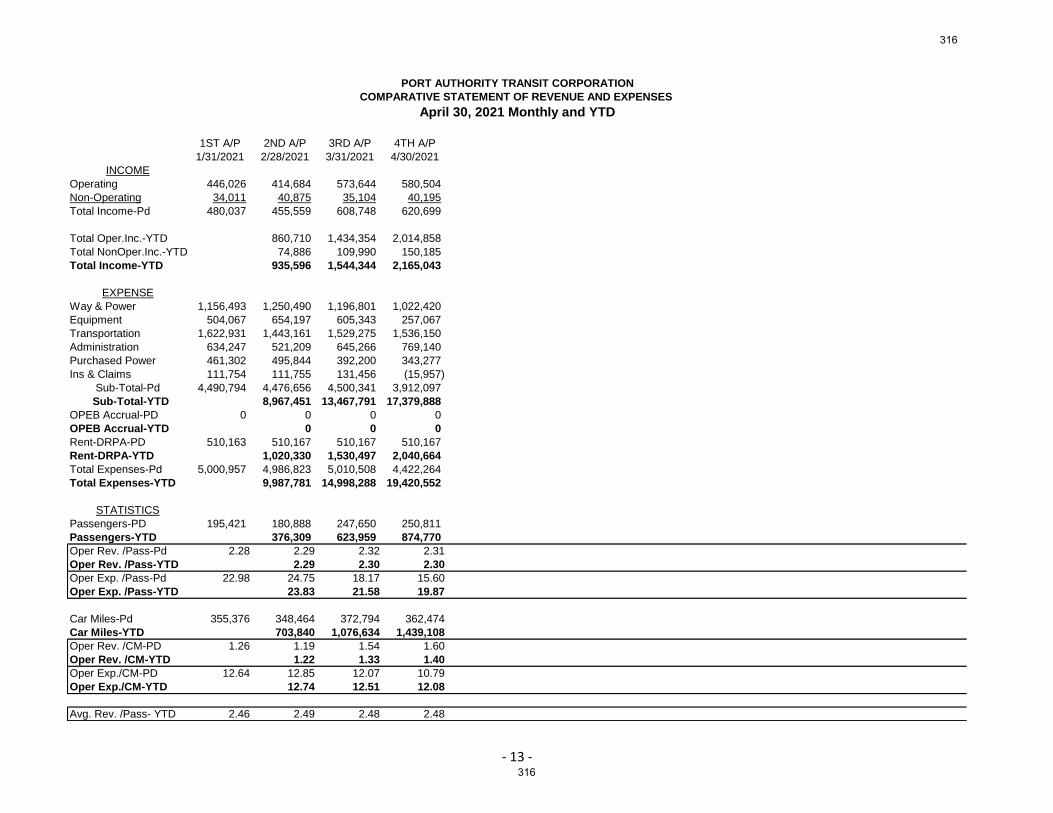
- 13 -
1ST A/P 2ND A/P 3RD A/P 4TH A/P
1/31/2021 2/28/2021 3/31/2021 4/30/2021
INCOME
Operating 446,026 414,684 573,644 580,504
Non-Operating 34,011 40,875 35,104 40,195
Total Income-Pd 480,037 455,559 608,748 620,699
Total Oper.Inc.-YTD 860,710 1,434,354 2,014,858
Total NonOper.Inc.-YTD 74,886 109,990 150,185
Total Income-YTD 935,596 1,544,344 2,165,043
EXPENSE
Way & Power 1,156,493 1,250,490 1,196,801 1,022,420
Equipment 504,067 654,197 605,343 257,067
Transportation 1,622,931 1,443,161 1,529,275 1,536,150
Administration 634,247 521,209 645,266 769,140
Purchased Power 461,302 495,844 392,200 343,277
Ins & Claims 111,754 111,755 131,456 (15,957)
Sub-Total-Pd 4,490,794 4,476,656 4,500,341 3,912,097
Sub-Total-YTD 8,967,451 13,467,791 17,379,888
OPEB Accrual-PD 0 0 0 0
OPEB Accrual-YTD 0 0 0
Rent-DRPA-PD 510,163 510,167 510,167 510,167
Rent-DRPA-YTD 1,020,330 1,530,497 2,040,664
Total Expenses-Pd 5,000,957 4,986,823 5,010,508 4,422,264
Total Expenses-YTD 9,987,781 14,998,288 19,420,552
STATISTICS
Passengers-PD 195,421 180,888 247,650 250,811
Passengers-YTD 376,309 623,959 874,770
Oper Rev. /Pass-Pd 2.28 2.29 2.32 2.31
Oper Rev. /Pass-YTD 2.29 2.30 2.30
Oper Exp. /Pass-Pd 22.98 24.75 18.17 15.60
Oper Exp. /Pass-YTD 23.83 21.58 19.87
Car Miles-Pd 355,376 348,464 372,794 362,474
Car Miles-YTD 703,840 1,076,634 1,439,108
Oper Rev. /CM-PD 1.26 1.19 1.54 1.60
Oper Rev. /CM-YTD 1.22 1.33 1.40
Oper Exp./CM-PD 12.64 12.85 12.07 10.79
Oper Exp./CM-YTD 12.74 12.51 12.08
Avg. Rev. /Pass- YTD 2.46 2.49 2.48 2.48
PORT AUTHORITY TRANSIT CORPORATION
COMPARATIVE STATEMENT OF REVENUE AND EXPENSES
April 30, 2021 Monthly and YTD
316
316
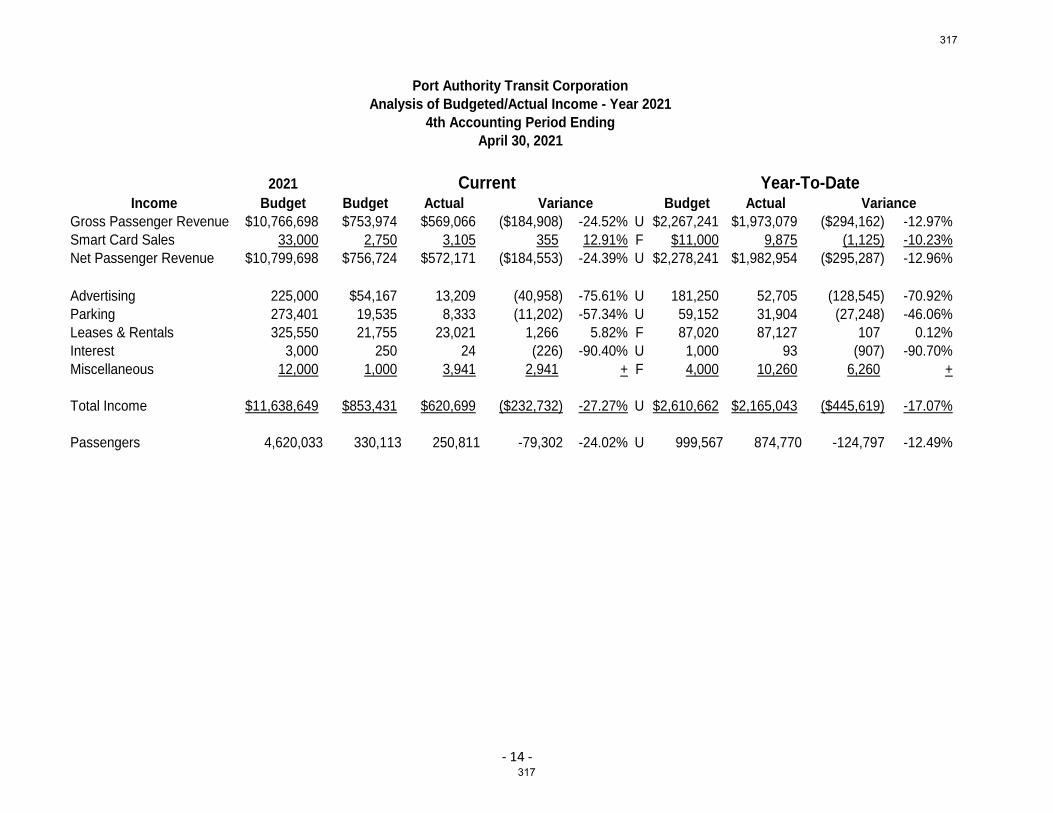
- 14 -
Port Authority Transit Corporation
Analysis of Budgeted/Actual Income - Year 2021
4th Accounting Period Ending
April 30, 2021
2021 Current Year-To-DateIncome Budget Budget Actual Variance Budget Actual Variance
Gross Passenger Revenue $10,766,698 $753,974 $569,066 ($184,908) -24.52% U $2,267,241 $1,973,079 ($294,162) -12.97%
Smart Card Sales 33,000 2,750 3,105 355 12.91% F $11,000 9,875 (1,125) -10.23%
Net Passenger Revenue $10,799,698 $756,724 $572,171 ($184,553) -24.39% U $2,278,241 $1,982,954 ($295,287) -12.96%
Advertising 225,000 $54,167 13,209 (40,958) -75.61% U 181,250 52,705 (128,545) -70.92%
Parking 273,401 19,535 8,333 (11,202) -57.34% U 59,152 31,904 (27,248) -46.06%
Leases & Rentals 325,550 21,755 23,021 1,266 5.82% F 87,020 87,127 107 0.12%
Interest 3,000 250 24 (226) -90.40% U 1,000 93 (907) -90.70%
Miscellaneous 12,000 1,000 3,941 2,941 + F 4,000 10,260 6,260 +
Total Income $11,638,649 $853,431 $620,699 ($232,732) -27.27% U $2,610,662 $2,165,043 ($445,619) -17.07%
Passengers 4,620,033 330,113 250,811 -79,302 -24.02% U 999,567 874,770 -124,797 -12.49%
317
317
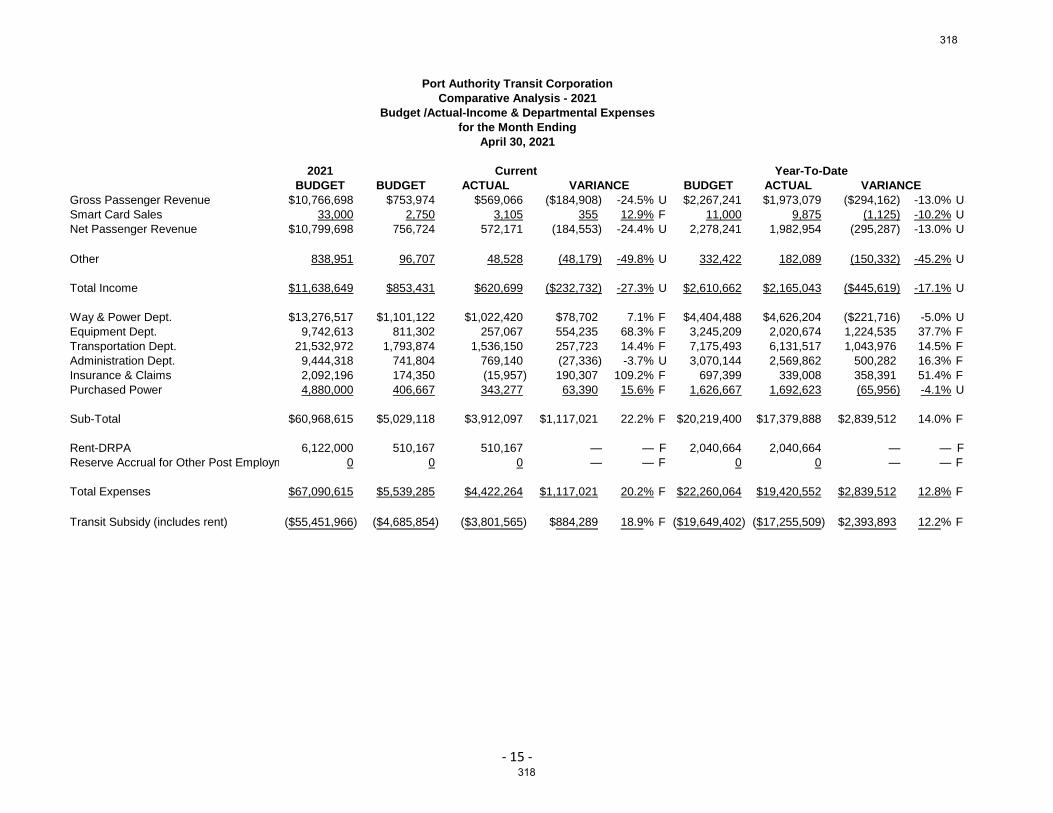
- 15 -
Port Authority Transit Corporation
Comparative Analysis - 2021
Budget /Actual-Income & Departmental Expenses
for the Month Ending
April 30, 2021
2021 Current Year-To-Date
BUDGET BUDGET ACTUAL VARIANCE BUDGET ACTUAL VARIANCE
Gross Passenger Revenue $10,766,698 $753,974 $569,066 ($184,908) -24.5% U $2,267,241 $1,973,079 ($294,162) -13.0% U
Smart Card Sales 33,000 2,750 3,105 355 12.9% F 11,000 9,875 (1,125) -10.2% U
Net Passenger Revenue $10,799,698 756,724 572,171 (184,553) -24.4% U 2,278,241 1,982,954 (295,287) -13.0% U
Other 838,951 96,707 48,528 (48,179) -49.8% U 332,422 182,089 (150,332) -45.2% U
Total Income $11,638,649 $853,431 $620,699 ($232,732) -27.3% U $2,610,662 $2,165,043 ($445,619) -17.1% U
Way & Power Dept. $13,276,517 $1,101,122 $1,022,420 $78,702 7.1% F $4,404,488 $4,626,204 ($221,716) -5.0% U
Equipment Dept. 9,742,613 811,302 257,067 554,235 68.3% F 3,245,209 2,020,674 1,224,535 37.7% F
Transportation Dept. 21,532,972 1,793,874 1,536,150 257,723 14.4% F 7,175,493 6,131,517 1,043,976 14.5% F
Administration Dept. 9,444,318 741,804 769,140 (27,336) -3.7% U 3,070,144 2,569,862 500,282 16.3% F
Insurance & Claims 2,092,196 174,350 (15,957) 190,307 109.2% F 697,399 339,008 358,391 51.4% F
Purchased Power 4,880,000 406,667 343,277 63,390 15.6% F 1,626,667 1,692,623 (65,956) -4.1% U
Sub-Total $60,968,615 $5,029,118 $3,912,097 $1,117,021 22.2% F $20,219,400 $17,379,888 $2,839,512 14.0% F
Rent-DRPA 6,122,000 510,167 510,167 — — F 2,040,664 2,040,664 — — F
Reserve Accrual for Other Post Employment Benefits0 0 0 — — F 0 0 — — F
Total Expenses $67,090,615 $5,539,285 $4,422,264 $1,117,021 20.2% F $22,260,064 $19,420,552 $2,839,512 12.8% F
Transit Subsidy (includes rent) ($55,451,966) ($4,685,854) ($3,801,565) $884,289 18.9% F ($19,649,402) ($17,255,509) $2,393,893 12.2% F
318
318
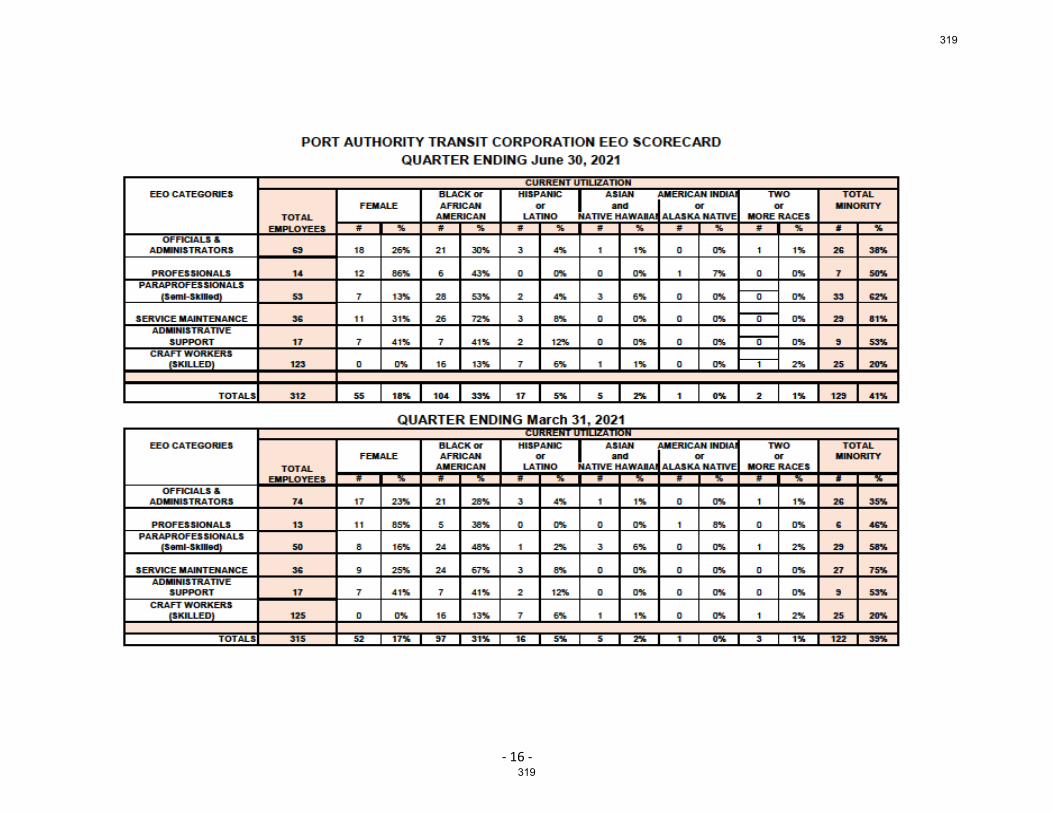
- 16 - 319
319
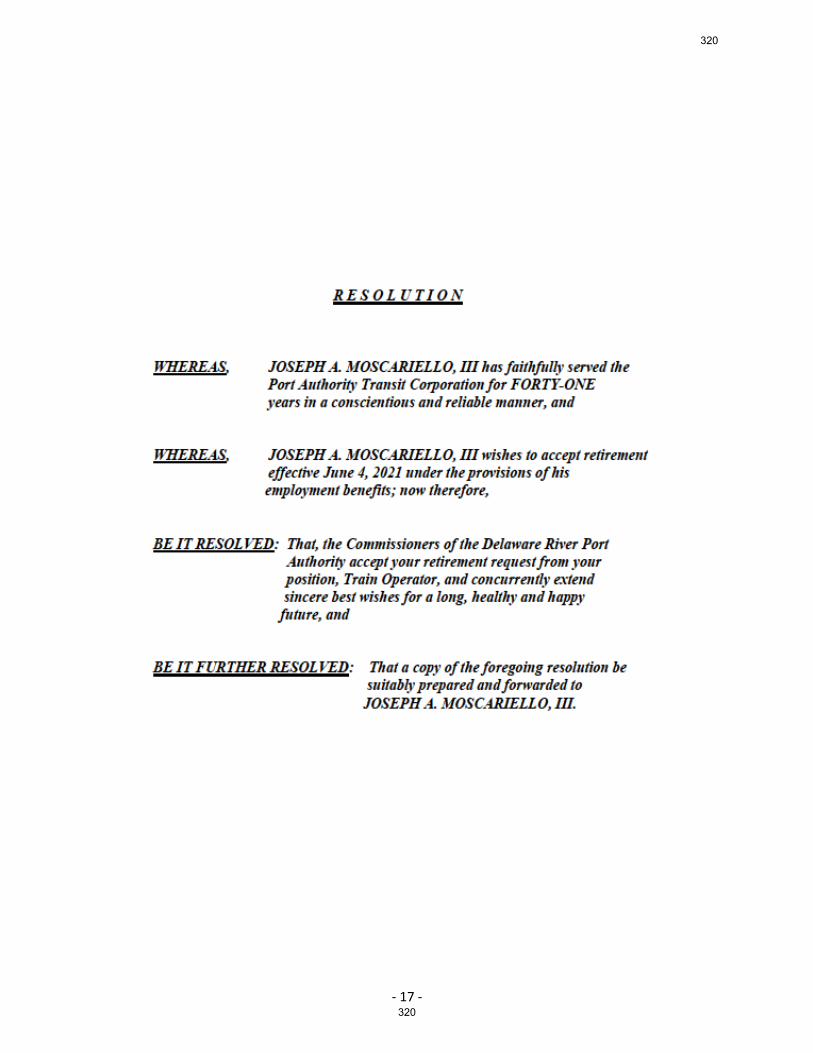
- 17 - 320
320
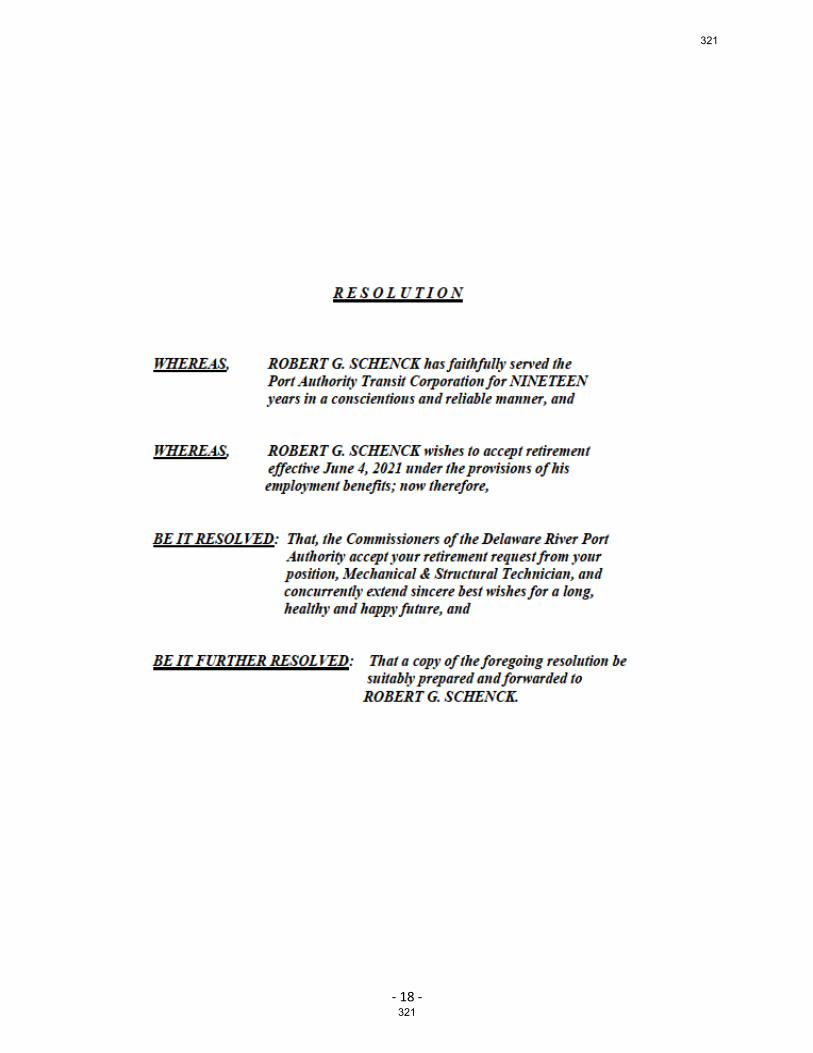
- 18 - 321
321
- 19 - 322
322
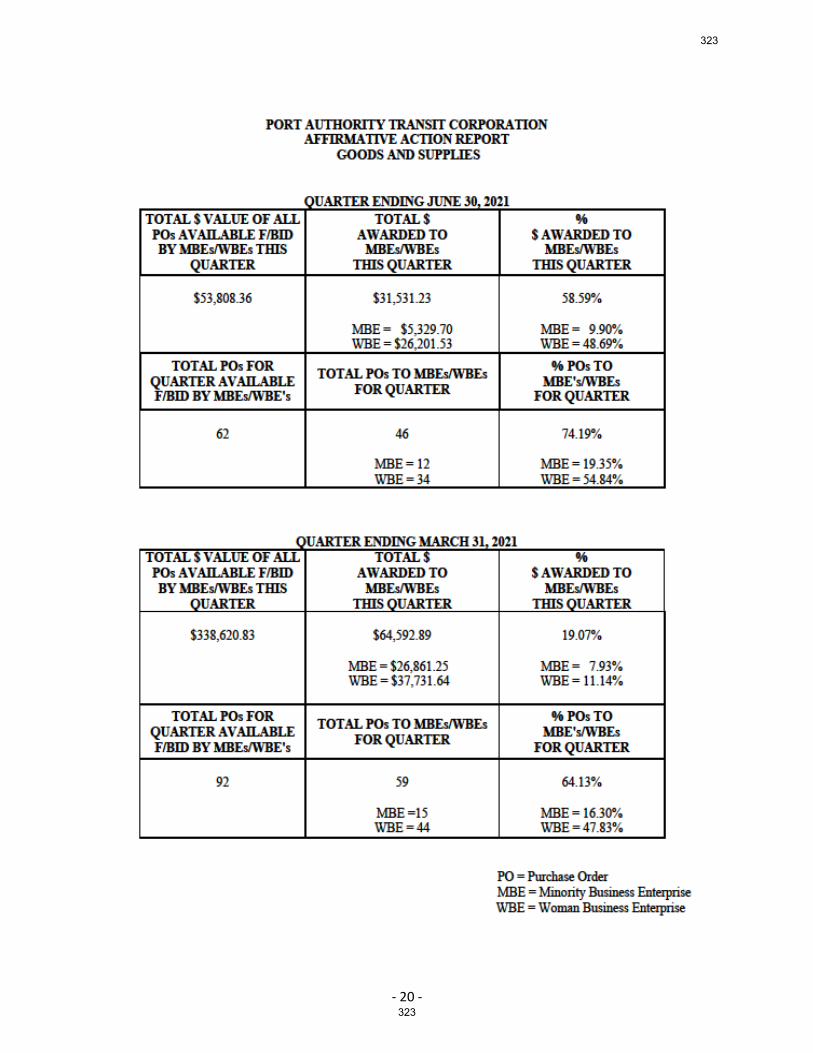
- 20 - 323
323

- 21 - 324
324
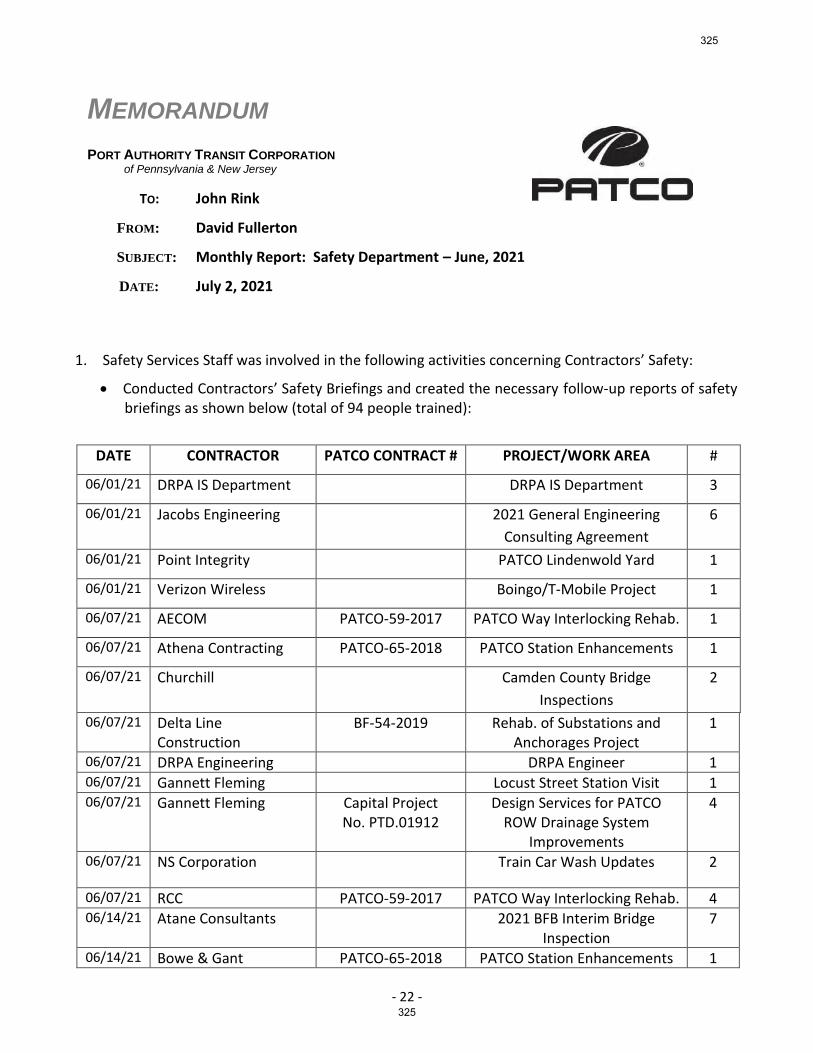
- 22 -
1. Safety Services Staff was involved in the following activities concerning Contractors’ Safety:
• Conducted Contractors’ Safety Briefings and created the necessary follow-up reports of safety briefings as shown below (total of 94 people trained):
DATE CONTRACTOR PATCO CONTRACT # PROJECT/WORK AREA #
06/01/21 DRPA IS Department DRPA IS Department 3
06/01/21 Jacobs Engineering 2021 General Engineering
Consulting Agreement
6
06/01/21 Point Integrity PATCO Lindenwold Yard 1
06/01/21 Verizon Wireless Boingo/T-Mobile Project 1
06/07/21 AECOM PATCO-59-2017 PATCO Way Interlocking Rehab. 1
06/07/21 Athena Contracting PATCO-65-2018 PATCO Station Enhancements 1
06/07/21 Churchill Camden County Bridge
Inspections
2
06/07/21
Delta Line Construction
BF-54-2019 Rehab. of Substations and Anchorages Project
1
06/07/21 DRPA Engineering DRPA Engineer 1 06/07/21 Gannett Fleming Locust Street Station Visit 1 06/07/21
Gannett Fleming Capital Project
No. PTD.01912 Design Services for PATCO
ROW Drainage System Improvements
4
06/07/21
NS Corporation Train Car Wash Updates 2
06/07/21 RCC PATCO-59-2017 PATCO Way Interlocking Rehab. 4 06/14/21
Atane Consultants 2021 BFB Interim Bridge
Inspection 7
06/14/21 Bowe & Gant PATCO-65-2018 PATCO Station Enhancements 1
MEMORANDUM PORT AUTHORITY TRANSIT CORPORATION of Pennsylvania & New Jersey
TO: John Rink
FROM: David Fullerton
SUBJECT: Monthly Report: Safety Department – June, 2021
DATE: July 2, 2021
325
325
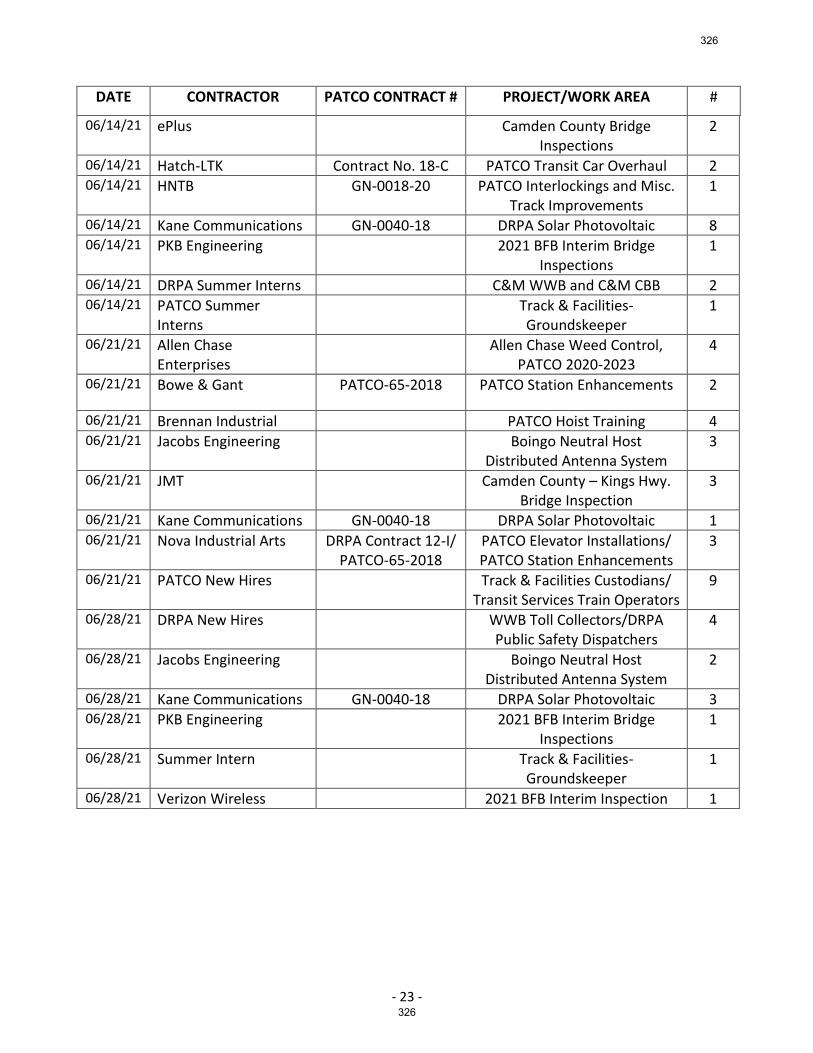
- 23 -
DATE CONTRACTOR PATCO CONTRACT # PROJECT/WORK AREA #
06/14/21
ePlus Camden County Bridge Inspections
2
06/14/21 Hatch-LTK Contract No. 18-C PATCO Transit Car Overhaul 2 06/14/21
HNTB GN-0018-20 PATCO Interlockings and Misc.
Track Improvements 1
06/14/21 Kane Communications GN-0040-18 DRPA Solar Photovoltaic 8 06/14/21 PKB Engineering 2021 BFB Interim Bridge
Inspections 1
06/14/21 DRPA Summer Interns C&M WWB and C&M CBB 2 06/14/21
PATCO Summer Interns
Track & Facilities-Groundskeeper
1
06/21/21
Allen Chase Enterprises
Allen Chase Weed Control, PATCO 2020-2023
4
06/21/21
Bowe & Gant PATCO-65-2018 PATCO Station Enhancements 2
06/21/21 Brennan Industrial PATCO Hoist Training 4 06/21/21
Jacobs Engineering Boingo Neutral Host
Distributed Antenna System 3
06/21/21
JMT Camden County – Kings Hwy. Bridge Inspection
3
06/21/21 Kane Communications GN-0040-18 DRPA Solar Photovoltaic 1 06/21/21
Nova Industrial Arts DRPA Contract 12-I/
PATCO-65-2018 PATCO Elevator Installations/ PATCO Station Enhancements
3
06/21/21
PATCO New Hires Track & Facilities Custodians/ Transit Services Train Operators
9
06/28/21
DRPA New Hires WWB Toll Collectors/DRPA Public Safety Dispatchers
4
06/28/21
Jacobs Engineering Boingo Neutral Host Distributed Antenna System
2
06/28/21 Kane Communications GN-0040-18 DRPA Solar Photovoltaic 3 06/28/21
PKB Engineering 2021 BFB Interim Bridge
Inspections 1
06/28/21 Summer Intern Track & Facilities-Groundskeeper
1
06/28/21 Verizon Wireless 2021 BFB Interim Inspection 1
326
326
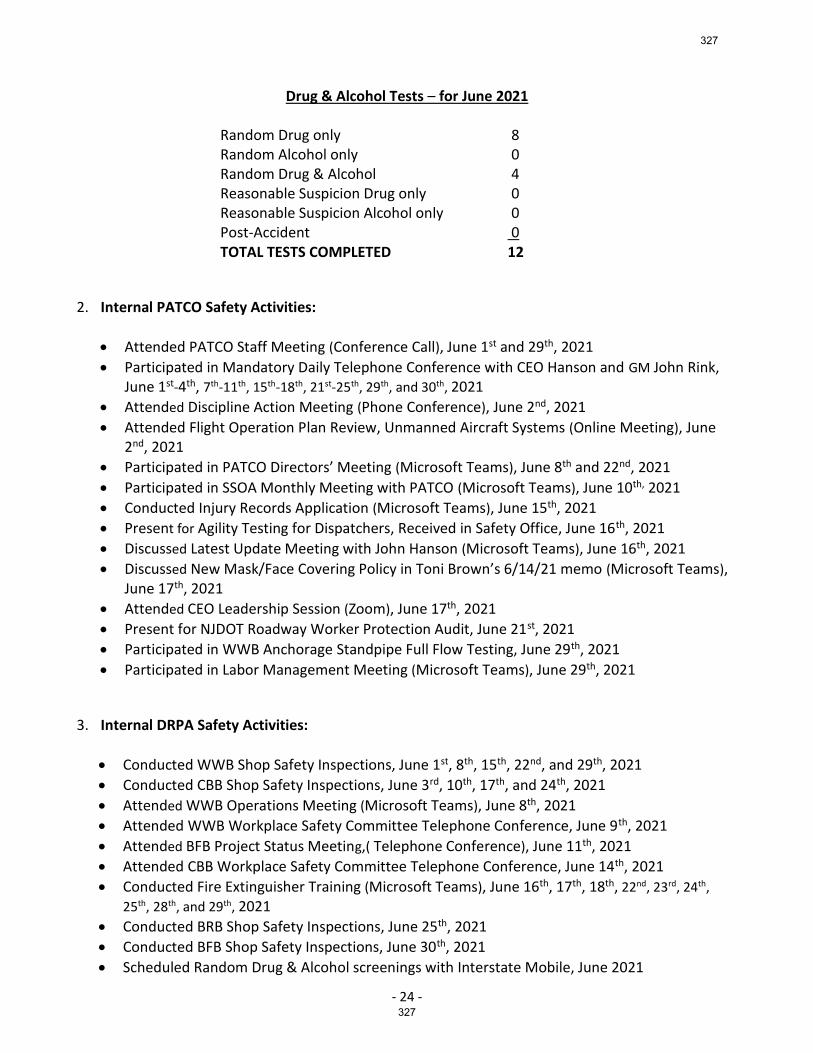
- 24 -
Drug & Alcohol Tests – for June 2021
Random Drug only 8 Random Alcohol only 0 Random Drug & Alcohol 4 Reasonable Suspicion Drug only 0 Reasonable Suspicion Alcohol only 0 Post-Accident 0 TOTAL TESTS COMPLETED 12
2. Internal PATCO Safety Activities:
• Attended PATCO Staff Meeting (Conference Call), June 1st and 29th, 2021
• Participated in Mandatory Daily Telephone Conference with CEO Hanson and GM John Rink, June 1st-4th, 7th-11th, 15th-18th, 21st-25th, 29th, and 30th, 2021
• Attended Discipline Action Meeting (Phone Conference), June 2nd, 2021
• Attended Flight Operation Plan Review, Unmanned Aircraft Systems (Online Meeting), June 2nd, 2021
• Participated in PATCO Directors’ Meeting (Microsoft Teams), June 8th and 22nd, 2021
• Participated in SSOA Monthly Meeting with PATCO (Microsoft Teams), June 10th, 2021
• Conducted Injury Records Application (Microsoft Teams), June 15th, 2021
• Present for Agility Testing for Dispatchers, Received in Safety Office, June 16th, 2021
• Discussed Latest Update Meeting with John Hanson (Microsoft Teams), June 16th, 2021
• Discussed New Mask/Face Covering Policy in Toni Brown’s 6/14/21 memo (Microsoft Teams), June 17th, 2021
• Attended CEO Leadership Session (Zoom), June 17th, 2021
• Present for NJDOT Roadway Worker Protection Audit, June 21st, 2021
• Participated in WWB Anchorage Standpipe Full Flow Testing, June 29th, 2021
• Participated in Labor Management Meeting (Microsoft Teams), June 29th, 2021
3. Internal DRPA Safety Activities:
• Conducted WWB Shop Safety Inspections, June 1st, 8th, 15th, 22nd, and 29th, 2021
• Conducted CBB Shop Safety Inspections, June 3rd, 10th, 17th, and 24th, 2021
• Attended WWB Operations Meeting (Microsoft Teams), June 8th, 2021
• Attended WWB Workplace Safety Committee Telephone Conference, June 9th, 2021
• Attended BFB Project Status Meeting,( Telephone Conference), June 11th, 2021
• Attended CBB Workplace Safety Committee Telephone Conference, June 14th, 2021
• Conducted Fire Extinguisher Training (Microsoft Teams), June 16th, 17th, 18th, 22nd, 23rd, 24th,
25th, 28th, and 29th, 2021
• Conducted BRB Shop Safety Inspections, June 25th, 2021
• Conducted BFB Shop Safety Inspections, June 30th, 2021
• Scheduled Random Drug & Alcohol screenings with Interstate Mobile, June 2021
327
327

- 25 -
• Reviewed various Health and Safety plans from contractors who were awarded construction and/or design projects during the month of June.
• Reviewed and commented on various Engineering Technical and Special Provisions documents for future DRPA projects. Conducted various site safety visits and inspections at DRPA Non-OCIP construction projects at the four bridges.
4. Joint PATCO/DRPA Safety Activities:
• Conducted and participated in Weekly PATCO Contractor Safety Briefings on June 1st, 7th, 14th, 21st, and 28th, 2021
• Participated in Safety Services Daily Telephone Conference with Director Fullerton, June 1st-4th,
7th-11th, 14th-18th, 21st-25th, and 28th-30th, 2021
• Attended and Participated in IAIC Committee Meeting via Zoom, June 8th, 2021
• Attended Proposal Evaluation—Occupational Health & Alcohol Testing (Microsoft Teams), June 9th, 2021
• Conducted and participated in monthly SACC/Joint Workplace Committee meeting (Microsoft Teams and Telephone Conference), June 10th, 2021
• Conducted and participated in New Hire Orientations for three (3) Summer Interns on June 14th , nine (9) PATCO New Hires on June 21st, and one (1) Summer Intern and four (4) DRPA New Hires on June 28th, 2021
• Opened Joint Workplace Members Committee Virtual Meeting, No Committee Members Attended, June 22nd, 2021
• Participated in monthly Central Safety and Health Committee Meeting (Microsoft Teams and Telephone Conference), June 23rd, 2021
5. Joint PATCO/DRPA Safety Outside Agency Involvement. None.
328
328
PATCO BOARD MINUTES
329
329
PORT AUTHORITY TRANSIT CORPORATION
BOARD MEETING
One Port Center/Zoom
Wednesday, June 16, 2021
Due to the coronavirus pandemic, all participants, except where noted, attended via telephone/web
conference.
Pennsylvania Commissioners
Cherelle Parker, Chair of the Board
Hayden Rigo (for Pennsylvania Auditor General Timothy DeFoor)
Donna Powell
Ted Christian (for Pennsylvania Treasurer Stacy Garrity)
Christopher Lewis
Joseph Martz
Kathleen McGinty
New Jersey Commissioners
Jeffrey Nash, Esq., Vice Chair of the Board
Albert Frattali
Sara Lipsett
Charles Fentress
Aaron Nelson
Bruce Garganio
Richard Sweeney
Daniel Christy
DRPA/PATCO Staff
John T. Hanson, Chief Executive Officer (in person)
Maria Wing, Deputy Chief Executive Officer
Raymond J. Santarelli, General Counsel and Corporate Secretary (in person)
Stephen Holden, Deputy General Counsel (in person)
James White, Chief Financial Officer (in person)
Toni Brown, Chief Administrative Officer
David Aubrey, Inspector General
John Rink, General Manager, PATCO
Michael Venuto, Chief Engineer
Robert Finnegan, Acting Chief of Police
John Lotierzo, Director of Finance (in person)
Richard Mosback, Director, Procurement DRPA/PATCO
Kathleen Vandy, Assistant General Counsel
William Shanahan, Director, Government Relations
Tonyelle Cook-Artis, Manager, Government Relations
Joseph McAroy, Bridge Director, BFB & BRB
Richard Tutak, Acting Bridge Director, WWB & CBB
Darlene Callands, Manager Community Relations
Christina Maroney, Director, Strategic Initiatives
Amy Ash, Manager, Contracts Administration
Michael Williams, Manager, Corporate Communications
Annette Melendez-Freeman, Toll Manager, BFB & BRB
Elizabeth Saylor, Administrative Coordinator, Corporate Secretary, OGC (in person)
330
330

Page 2 of 3
Others Present
Janice Venables, Associate Counsel, New Jersey Governor’s Authorities Unit
Alan Kessler, PA Counsel, Duane Morris, LLP
Jessica Priselac, PA Counsel, Duane Morris, LLP
Christopher Gibson, NJ Counsel, Archer & Greiner, P.C.
Monique Curry-Mims, S&S Consulting, LLC
Ismail Shahid, S&S Consulting, LLC
Jarred Corn, Bowman & Company, LLC
OPEN SESSION
Notice
The Corporate Secretary announced that pursuant to its by-laws public notice of this meeting of
the PATCO Board of Commissioners had been given by posting proper notice in the lobby at One
Port Center and by issuing proper notice to the public and news media. The Secretary also noted
that, due to the ongoing pandemic, the public was not allowed inside the One Port Center building
but had been invited to attend via telecast and to submit any questions or comments electronically
prior to the meeting.
Roll Call
Chairwoman Parker called the meeting to order at 9:27 a.m. and asked that the Corporate
Secretary call the roll. The following Commissioners were present, constituting a quorum:
Chairwoman Parker, Vice Chairman Nash, Powell, Fentress, Frattali, Rigo, Lipsett, Nelson,
Christian, Lewis, Martz, Garganio, McGinty, Christy, and Sweeney.
Public Comment
Corporate Secretary Santarelli reported that there were no items for public comment.
Report of the General Manager
General Manager Rink stated that his report stood as previously submitted. Commissioner
Garganio moved to approve the General Manager’s Report and Commissioner Sweeney seconded
the motion. There were no questions or comments. All Commissioners in attendance voted in the
affirmative to approve the General Manager’s Report. The motion carried.
Approval of the May 19, 2021 PATCO Board Meeting Minutes
Chairwoman Parker stated that the Minutes of the May 19, 2021 PATCO Board Meeting were
previously provided to the Governors of New Jersey and Pennsylvania and to the PATCO
Commissioners. Commissioner Fentress moved to approve the Minutes and Commissioner Rigo
seconded the motion. There were no comments on or corrections to the Minutes. All
Commissioners in attendance voted in the affirmative to approve the Minutes as submitted. The
motion carried.
Receipt and Filing of the List of Previously Approved Payments and the List of Previously
Approved Purchase Orders and Contracts covering the Month of May 2021.
Chairwoman Parker stated that the Lists of Previously Approved List of Payments and Previously
Approved Purchase Orders and Contracts covering the month of May 2021, were previously
provided to all Commissioners. Commissioner Powell moved to receive and file the lists and
331
331
Page 3 of 3
Commissioner Martz seconded the motion. There were no questions or comments. All
Commissioners in attendance voted in the affirmative. The motion carried.
Approval of Balance Sheet and Equity Statement dated March 31, 2021.
Chairwoman Parker stated that the Balance Sheet and Equity Statement dated March 31, 2021,
were previously provided to all Commissioners. Commissioner Nelson moved to approve the
statement and Commissioner Powell seconded the motion. There were no questions or comments
on the list. All Commissioners in attendance voted in the affirmative. The motion carried.
Unfinished Business
Chairwoman Parker stated there were no items for Unfinished Business.
New Business
Chairwoman Parker introduced one (1) item of New Business for consideration, and introduced
the following:
PATCO-21-007 Consideration of Pending DRPA Contracts
(Between $25,000 and $100,000).
Chairwoman Parker presented Summary Statement and Resolution No. PATCO-21-007 for the
consideration of pending DRPA contracts between $25,000 and $100,000. Director of
Procurement Mosback stated that there was one (1) contract for consideration. Chairwoman Parker
inquired whether Commissioners had any questions for staff concerning the Resolution. There
were no questions. Commissioner Lewis moved to adopt Resolution No. PATCO-21-007 and
Commissioner Martz seconded the motion. All Commissioners in attendance voted to approve the
motion. The motion carried and the Board adopted the Resolution.
Executive Session
Chairwoman Parker stated that there were no items for Executive Session.
Adjournment
With no further business, Commissioner Fentress moved to adjourn. Commissioner Frattali
seconded the motion. All Commissioners in attendance voted to approve the motion and the
meeting adjourned at 9:34 a.m.
Respectfully Submitted,
Raymond J. Santarelli, Esquire
General Counsel and Corporate Secretary
332
332
PATCO MONTHLY LIST OF
PREVIOUSLY APPROVED PAYMENTS
333
333
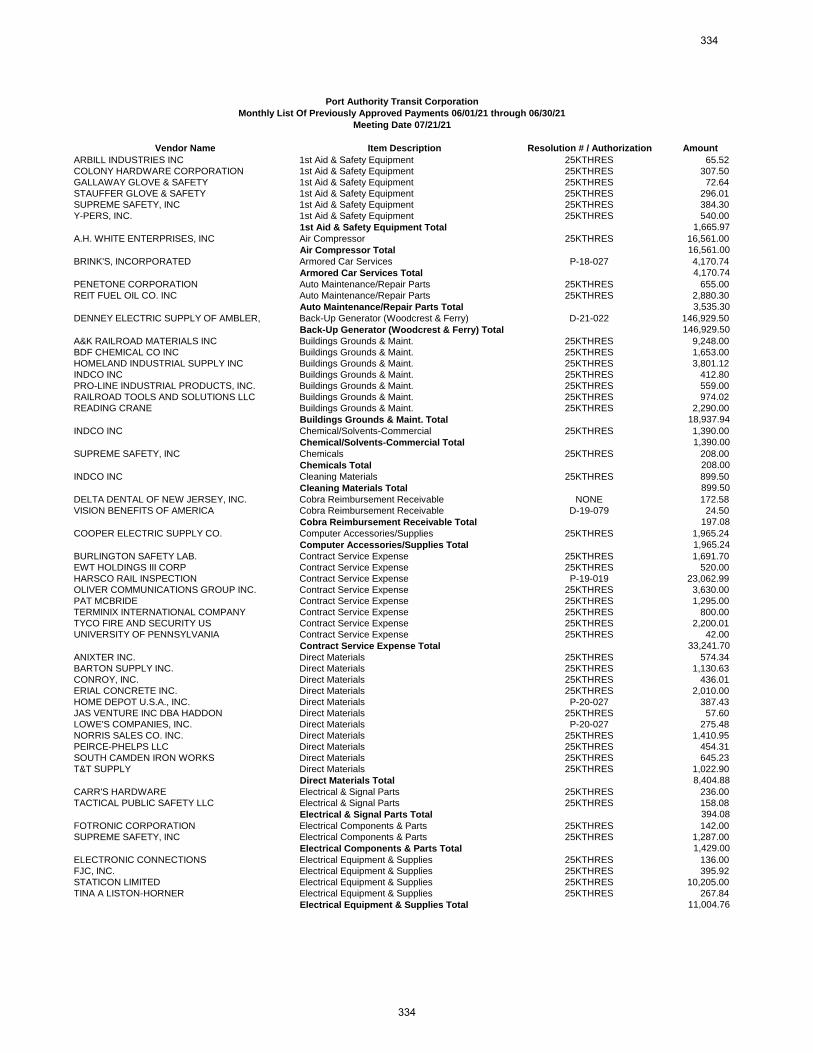
Vendor Name Item Description Resolution # / Authorization Amount
ARBILL INDUSTRIES INC 1st Aid & Safety Equipment 25KTHRES 65.52COLONY HARDWARE CORPORATION 1st Aid & Safety Equipment 25KTHRES 307.50GALLAWAY GLOVE & SAFETY 1st Aid & Safety Equipment 25KTHRES 72.64STAUFFER GLOVE & SAFETY 1st Aid & Safety Equipment 25KTHRES 296.01SUPREME SAFETY, INC 1st Aid & Safety Equipment 25KTHRES 384.30Y-PERS, INC. 1st Aid & Safety Equipment 25KTHRES 540.00
1st Aid & Safety Equipment Total 1,665.97A.H. WHITE ENTERPRISES, INC Air Compressor 25KTHRES 16,561.00
Air Compressor Total 16,561.00BRINK'S, INCORPORATED Armored Car Services P-18-027 4,170.74
Armored Car Services Total 4,170.74PENETONE CORPORATION Auto Maintenance/Repair Parts 25KTHRES 655.00REIT FUEL OIL CO. INC Auto Maintenance/Repair Parts 25KTHRES 2,880.30
Auto Maintenance/Repair Parts Total 3,535.30DENNEY ELECTRIC SUPPLY OF AMBLER, Back-Up Generator (Woodcrest & Ferry) D-21-022 146,929.50
Back-Up Generator (Woodcrest & Ferry) Total 146,929.50A&K RAILROAD MATERIALS INC Buildings Grounds & Maint. 25KTHRES 9,248.00BDF CHEMICAL CO INC Buildings Grounds & Maint. 25KTHRES 1,653.00HOMELAND INDUSTRIAL SUPPLY INC Buildings Grounds & Maint. 25KTHRES 3,801.12INDCO INC Buildings Grounds & Maint. 25KTHRES 412.80PRO-LINE INDUSTRIAL PRODUCTS, INC. Buildings Grounds & Maint. 25KTHRES 559.00RAILROAD TOOLS AND SOLUTIONS LLC Buildings Grounds & Maint. 25KTHRES 974.02READING CRANE Buildings Grounds & Maint. 25KTHRES 2,290.00
Buildings Grounds & Maint. Total 18,937.94INDCO INC Chemical/Solvents-Commercial 25KTHRES 1,390.00
Chemical/Solvents-Commercial Total 1,390.00SUPREME SAFETY, INC Chemicals 25KTHRES 208.00
Chemicals Total 208.00INDCO INC Cleaning Materials 25KTHRES 899.50
Cleaning Materials Total 899.50DELTA DENTAL OF NEW JERSEY, INC. Cobra Reimbursement Receivable NONE 172.58VISION BENEFITS OF AMERICA Cobra Reimbursement Receivable D-19-079 24.50
Cobra Reimbursement Receivable Total 197.08COOPER ELECTRIC SUPPLY CO. Computer Accessories/Supplies 25KTHRES 1,965.24
Computer Accessories/Supplies Total 1,965.24BURLINGTON SAFETY LAB. Contract Service Expense 25KTHRES 1,691.70EWT HOLDINGS III CORP Contract Service Expense 25KTHRES 520.00HARSCO RAIL INSPECTION Contract Service Expense P-19-019 23,062.99OLIVER COMMUNICATIONS GROUP INC. Contract Service Expense 25KTHRES 3,630.00PAT MCBRIDE Contract Service Expense 25KTHRES 1,295.00TERMINIX INTERNATIONAL COMPANY Contract Service Expense 25KTHRES 800.00TYCO FIRE AND SECURITY US Contract Service Expense 25KTHRES 2,200.01UNIVERSITY OF PENNSYLVANIA Contract Service Expense 25KTHRES 42.00
Contract Service Expense Total 33,241.70ANIXTER INC. Direct Materials 25KTHRES 574.34BARTON SUPPLY INC. Direct Materials 25KTHRES 1,130.63CONROY, INC. Direct Materials 25KTHRES 436.01ERIAL CONCRETE INC. Direct Materials 25KTHRES 2,010.00HOME DEPOT U.S.A., INC. Direct Materials P-20-027 387.43JAS VENTURE INC DBA HADDON Direct Materials 25KTHRES 57.60LOWE'S COMPANIES, INC. Direct Materials P-20-027 275.48NORRIS SALES CO. INC. Direct Materials 25KTHRES 1,410.95PEIRCE-PHELPS LLC Direct Materials 25KTHRES 454.31SOUTH CAMDEN IRON WORKS Direct Materials 25KTHRES 645.23T&T SUPPLY Direct Materials 25KTHRES 1,022.90
Direct Materials Total 8,404.88CARR'S HARDWARE Electrical & Signal Parts 25KTHRES 236.00TACTICAL PUBLIC SAFETY LLC Electrical & Signal Parts 25KTHRES 158.08
Electrical & Signal Parts Total 394.08FOTRONIC CORPORATION Electrical Components & Parts 25KTHRES 142.00SUPREME SAFETY, INC Electrical Components & Parts 25KTHRES 1,287.00
Electrical Components & Parts Total 1,429.00ELECTRONIC CONNECTIONS Electrical Equipment & Supplies 25KTHRES 136.00FJC, INC. Electrical Equipment & Supplies 25KTHRES 395.92STATICON LIMITED Electrical Equipment & Supplies 25KTHRES 10,205.00TINA A LISTON-HORNER Electrical Equipment & Supplies 25KTHRES 267.84
Electrical Equipment & Supplies Total 11,004.76
Port Authority Transit CorporationMonthly List Of Previously Approved Payments 06/01/21 through 06/30/21
Meeting Date 07/21/21
334
334
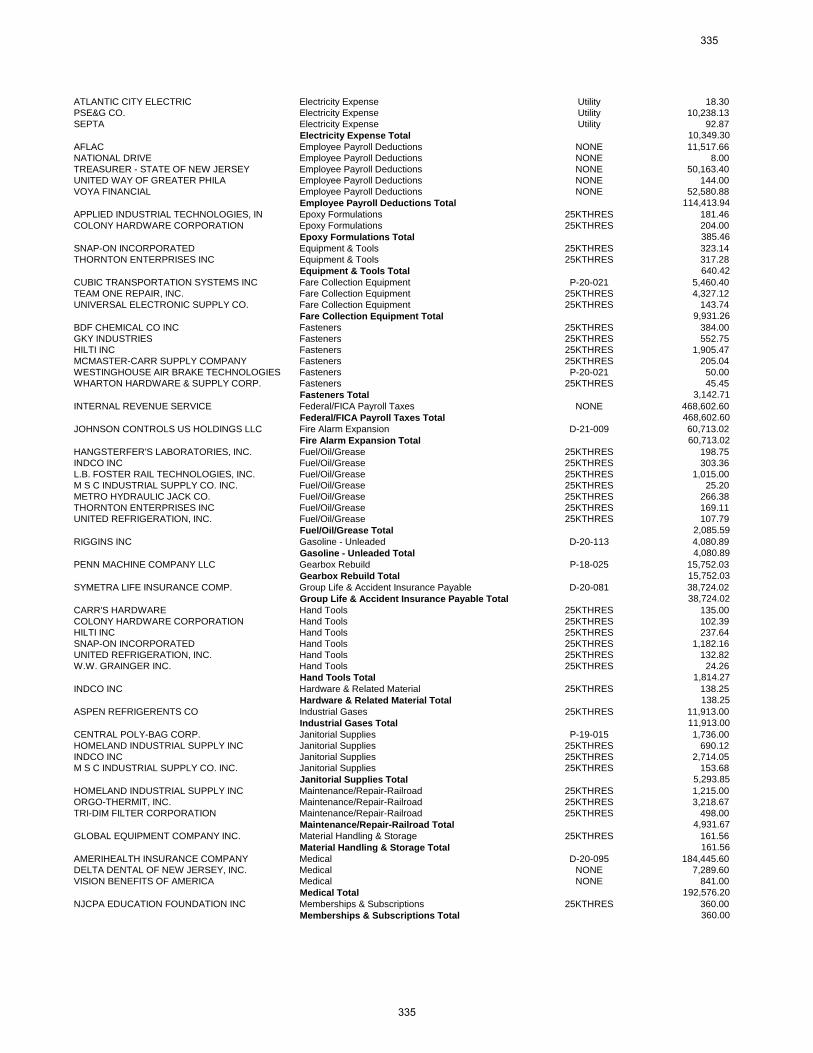
ATLANTIC CITY ELECTRIC Electricity Expense Utility 18.30PSE&G CO. Electricity Expense Utility 10,238.13SEPTA Electricity Expense Utility 92.87
Electricity Expense Total 10,349.30AFLAC Employee Payroll Deductions NONE 11,517.66NATIONAL DRIVE Employee Payroll Deductions NONE 8.00TREASURER - STATE OF NEW JERSEY Employee Payroll Deductions NONE 50,163.40UNITED WAY OF GREATER PHILA Employee Payroll Deductions NONE 144.00VOYA FINANCIAL Employee Payroll Deductions NONE 52,580.88
Employee Payroll Deductions Total 114,413.94APPLIED INDUSTRIAL TECHNOLOGIES, IN Epoxy Formulations 25KTHRES 181.46COLONY HARDWARE CORPORATION Epoxy Formulations 25KTHRES 204.00
Epoxy Formulations Total 385.46SNAP-ON INCORPORATED Equipment & Tools 25KTHRES 323.14THORNTON ENTERPRISES INC Equipment & Tools 25KTHRES 317.28
Equipment & Tools Total 640.42CUBIC TRANSPORTATION SYSTEMS INC Fare Collection Equipment P-20-021 5,460.40TEAM ONE REPAIR, INC. Fare Collection Equipment 25KTHRES 4,327.12UNIVERSAL ELECTRONIC SUPPLY CO. Fare Collection Equipment 25KTHRES 143.74
Fare Collection Equipment Total 9,931.26BDF CHEMICAL CO INC Fasteners 25KTHRES 384.00GKY INDUSTRIES Fasteners 25KTHRES 552.75HILTI INC Fasteners 25KTHRES 1,905.47MCMASTER-CARR SUPPLY COMPANY Fasteners 25KTHRES 205.04WESTINGHOUSE AIR BRAKE TECHNOLOGIES Fasteners P-20-021 50.00WHARTON HARDWARE & SUPPLY CORP. Fasteners 25KTHRES 45.45
Fasteners Total 3,142.71INTERNAL REVENUE SERVICE Federal/FICA Payroll Taxes NONE 468,602.60
Federal/FICA Payroll Taxes Total 468,602.60JOHNSON CONTROLS US HOLDINGS LLC Fire Alarm Expansion D-21-009 60,713.02
Fire Alarm Expansion Total 60,713.02HANGSTERFER'S LABORATORIES, INC. Fuel/Oil/Grease 25KTHRES 198.75INDCO INC Fuel/Oil/Grease 25KTHRES 303.36L.B. FOSTER RAIL TECHNOLOGIES, INC. Fuel/Oil/Grease 25KTHRES 1,015.00M S C INDUSTRIAL SUPPLY CO. INC. Fuel/Oil/Grease 25KTHRES 25.20METRO HYDRAULIC JACK CO. Fuel/Oil/Grease 25KTHRES 266.38THORNTON ENTERPRISES INC Fuel/Oil/Grease 25KTHRES 169.11UNITED REFRIGERATION, INC. Fuel/Oil/Grease 25KTHRES 107.79
Fuel/Oil/Grease Total 2,085.59RIGGINS INC Gasoline - Unleaded D-20-113 4,080.89
Gasoline - Unleaded Total 4,080.89PENN MACHINE COMPANY LLC Gearbox Rebuild P-18-025 15,752.03
Gearbox Rebuild Total 15,752.03SYMETRA LIFE INSURANCE COMP. Group Life & Accident Insurance Payable D-20-081 38,724.02
Group Life & Accident Insurance Payable Total 38,724.02CARR'S HARDWARE Hand Tools 25KTHRES 135.00COLONY HARDWARE CORPORATION Hand Tools 25KTHRES 102.39HILTI INC Hand Tools 25KTHRES 237.64SNAP-ON INCORPORATED Hand Tools 25KTHRES 1,182.16UNITED REFRIGERATION, INC. Hand Tools 25KTHRES 132.82W.W. GRAINGER INC. Hand Tools 25KTHRES 24.26
Hand Tools Total 1,814.27INDCO INC Hardware & Related Material 25KTHRES 138.25
Hardware & Related Material Total 138.25ASPEN REFRIGERENTS CO Industrial Gases 25KTHRES 11,913.00
Industrial Gases Total 11,913.00CENTRAL POLY-BAG CORP. Janitorial Supplies P-19-015 1,736.00HOMELAND INDUSTRIAL SUPPLY INC Janitorial Supplies 25KTHRES 690.12INDCO INC Janitorial Supplies 25KTHRES 2,714.05M S C INDUSTRIAL SUPPLY CO. INC. Janitorial Supplies 25KTHRES 153.68
Janitorial Supplies Total 5,293.85HOMELAND INDUSTRIAL SUPPLY INC Maintenance/Repair-Railroad 25KTHRES 1,215.00ORGO-THERMIT, INC. Maintenance/Repair-Railroad 25KTHRES 3,218.67TRI-DIM FILTER CORPORATION Maintenance/Repair-Railroad 25KTHRES 498.00
Maintenance/Repair-Railroad Total 4,931.67GLOBAL EQUIPMENT COMPANY INC. Material Handling & Storage 25KTHRES 161.56
Material Handling & Storage Total 161.56AMERIHEALTH INSURANCE COMPANY Medical D-20-095 184,445.60DELTA DENTAL OF NEW JERSEY, INC. Medical NONE 7,289.60VISION BENEFITS OF AMERICA Medical NONE 841.00
Medical Total 192,576.20NJCPA EDUCATION FOUNDATION INC Memberships & Subscriptions 25KTHRES 360.00
Memberships & Subscriptions Total 360.00
335
335
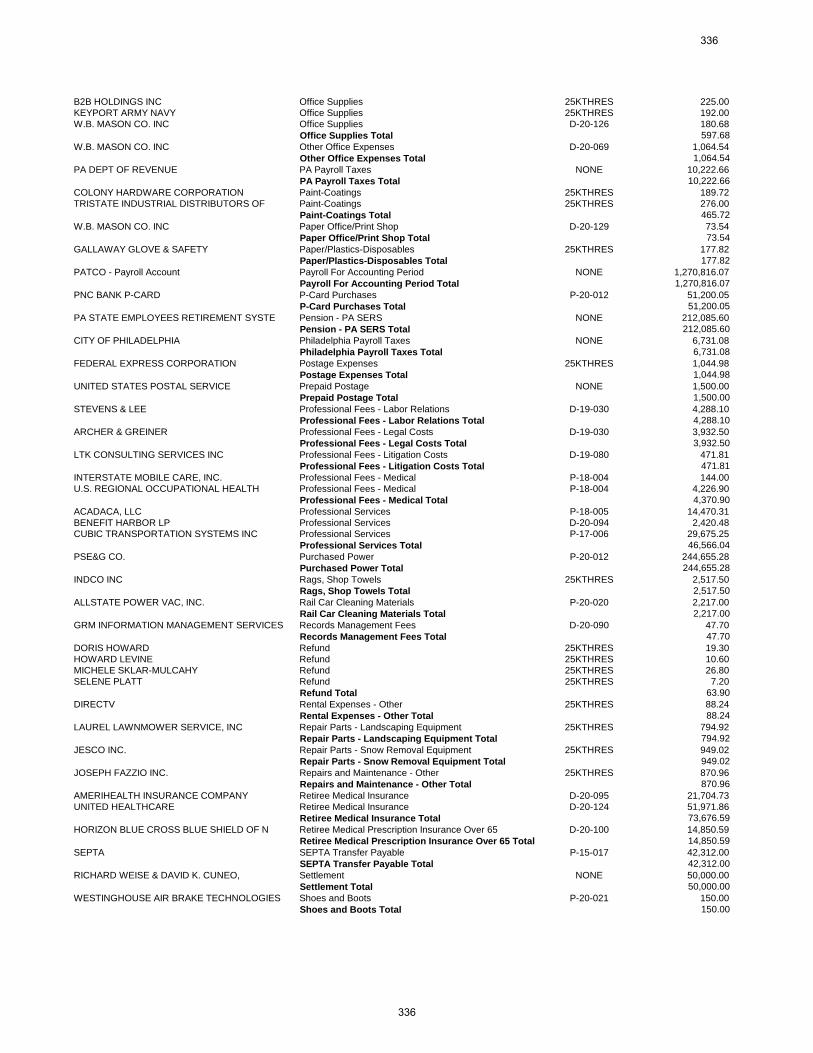
B2B HOLDINGS INC Office Supplies 25KTHRES 225.00KEYPORT ARMY NAVY Office Supplies 25KTHRES 192.00W.B. MASON CO. INC Office Supplies D-20-126 180.68
Office Supplies Total 597.68W.B. MASON CO. INC Other Office Expenses D-20-069 1,064.54
Other Office Expenses Total 1,064.54PA DEPT OF REVENUE PA Payroll Taxes NONE 10,222.66
PA Payroll Taxes Total 10,222.66COLONY HARDWARE CORPORATION Paint-Coatings 25KTHRES 189.72TRISTATE INDUSTRIAL DISTRIBUTORS OF Paint-Coatings 25KTHRES 276.00
Paint-Coatings Total 465.72W.B. MASON CO. INC Paper Office/Print Shop D-20-129 73.54
Paper Office/Print Shop Total 73.54GALLAWAY GLOVE & SAFETY Paper/Plastics-Disposables 25KTHRES 177.82
Paper/Plastics-Disposables Total 177.82PATCO - Payroll Account Payroll For Accounting Period NONE 1,270,816.07
Payroll For Accounting Period Total 1,270,816.07PNC BANK P-CARD P-Card Purchases P-20-012 51,200.05
P-Card Purchases Total 51,200.05PA STATE EMPLOYEES RETIREMENT SYSTE Pension - PA SERS NONE 212,085.60
Pension - PA SERS Total 212,085.60CITY OF PHILADELPHIA Philadelphia Payroll Taxes NONE 6,731.08
Philadelphia Payroll Taxes Total 6,731.08FEDERAL EXPRESS CORPORATION Postage Expenses 25KTHRES 1,044.98
Postage Expenses Total 1,044.98UNITED STATES POSTAL SERVICE Prepaid Postage NONE 1,500.00
Prepaid Postage Total 1,500.00STEVENS & LEE Professional Fees - Labor Relations D-19-030 4,288.10
Professional Fees - Labor Relations Total 4,288.10ARCHER & GREINER Professional Fees - Legal Costs D-19-030 3,932.50
Professional Fees - Legal Costs Total 3,932.50LTK CONSULTING SERVICES INC Professional Fees - Litigation Costs D-19-080 471.81
Professional Fees - Litigation Costs Total 471.81INTERSTATE MOBILE CARE, INC. Professional Fees - Medical P-18-004 144.00U.S. REGIONAL OCCUPATIONAL HEALTH Professional Fees - Medical P-18-004 4,226.90
Professional Fees - Medical Total 4,370.90ACADACA, LLC Professional Services P-18-005 14,470.31BENEFIT HARBOR LP Professional Services D-20-094 2,420.48CUBIC TRANSPORTATION SYSTEMS INC Professional Services P-17-006 29,675.25
Professional Services Total 46,566.04PSE&G CO. Purchased Power P-20-012 244,655.28
Purchased Power Total 244,655.28INDCO INC Rags, Shop Towels 25KTHRES 2,517.50
Rags, Shop Towels Total 2,517.50ALLSTATE POWER VAC, INC. Rail Car Cleaning Materials P-20-020 2,217.00
Rail Car Cleaning Materials Total 2,217.00GRM INFORMATION MANAGEMENT SERVICES Records Management Fees D-20-090 47.70
Records Management Fees Total 47.70DORIS HOWARD Refund 25KTHRES 19.30HOWARD LEVINE Refund 25KTHRES 10.60MICHELE SKLAR-MULCAHY Refund 25KTHRES 26.80SELENE PLATT Refund 25KTHRES 7.20
Refund Total 63.90DIRECTV Rental Expenses - Other 25KTHRES 88.24
Rental Expenses - Other Total 88.24LAUREL LAWNMOWER SERVICE, INC Repair Parts - Landscaping Equipment 25KTHRES 794.92
Repair Parts - Landscaping Equipment Total 794.92JESCO INC. Repair Parts - Snow Removal Equipment 25KTHRES 949.02
Repair Parts - Snow Removal Equipment Total 949.02JOSEPH FAZZIO INC. Repairs and Maintenance - Other 25KTHRES 870.96
Repairs and Maintenance - Other Total 870.96AMERIHEALTH INSURANCE COMPANY Retiree Medical Insurance D-20-095 21,704.73UNITED HEALTHCARE Retiree Medical Insurance D-20-124 51,971.86
Retiree Medical Insurance Total 73,676.59HORIZON BLUE CROSS BLUE SHIELD OF N Retiree Medical Prescription Insurance Over 65 D-20-100 14,850.59
Retiree Medical Prescription Insurance Over 65 Total 14,850.59SEPTA SEPTA Transfer Payable P-15-017 42,312.00
SEPTA Transfer Payable Total 42,312.00RICHARD WEISE & DAVID K. CUNEO, Settlement NONE 50,000.00
Settlement Total 50,000.00WESTINGHOUSE AIR BRAKE TECHNOLOGIES Shoes and Boots P-20-021 150.00
Shoes and Boots Total 150.00
336
336
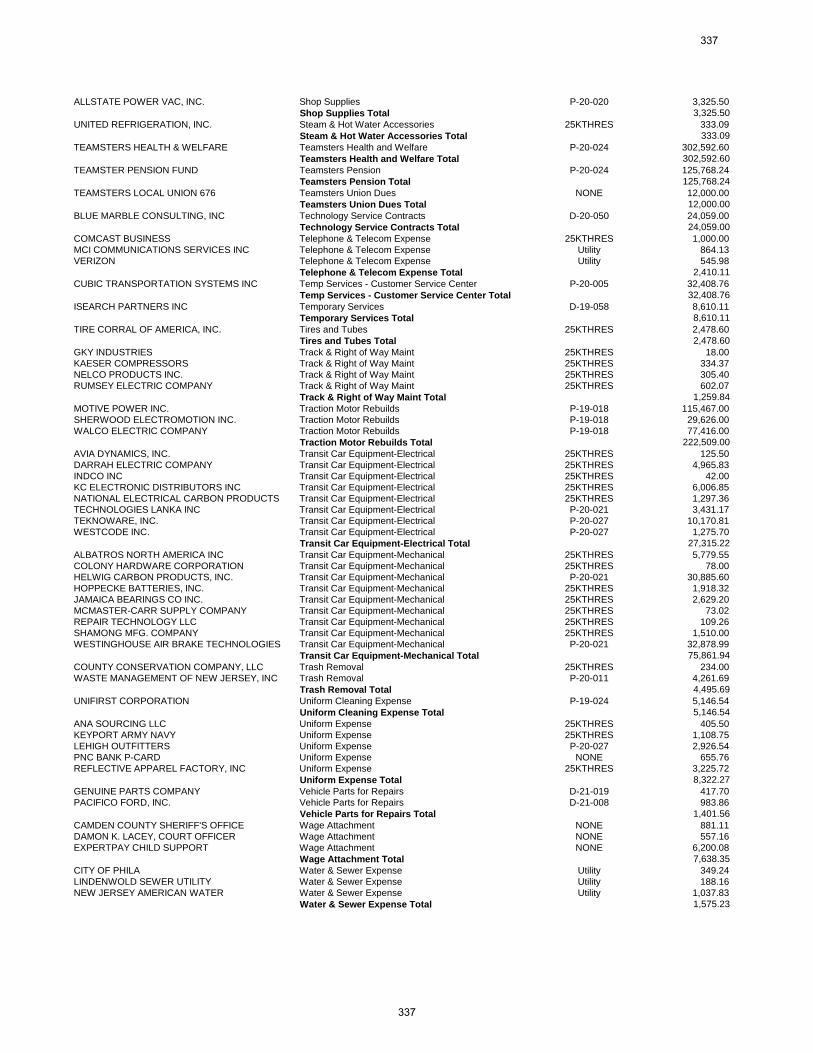
ALLSTATE POWER VAC, INC. Shop Supplies P-20-020 3,325.50Shop Supplies Total 3,325.50
UNITED REFRIGERATION, INC. Steam & Hot Water Accessories 25KTHRES 333.09Steam & Hot Water Accessories Total 333.09
TEAMSTERS HEALTH & WELFARE Teamsters Health and Welfare P-20-024 302,592.60Teamsters Health and Welfare Total 302,592.60
TEAMSTER PENSION FUND Teamsters Pension P-20-024 125,768.24Teamsters Pension Total 125,768.24
TEAMSTERS LOCAL UNION 676 Teamsters Union Dues NONE 12,000.00Teamsters Union Dues Total 12,000.00
BLUE MARBLE CONSULTING, INC Technology Service Contracts D-20-050 24,059.00Technology Service Contracts Total 24,059.00
COMCAST BUSINESS Telephone & Telecom Expense 25KTHRES 1,000.00MCI COMMUNICATIONS SERVICES INC Telephone & Telecom Expense Utility 864.13VERIZON Telephone & Telecom Expense Utility 545.98
Telephone & Telecom Expense Total 2,410.11CUBIC TRANSPORTATION SYSTEMS INC Temp Services - Customer Service Center P-20-005 32,408.76
Temp Services - Customer Service Center Total 32,408.76ISEARCH PARTNERS INC Temporary Services D-19-058 8,610.11
Temporary Services Total 8,610.11TIRE CORRAL OF AMERICA, INC. Tires and Tubes 25KTHRES 2,478.60
Tires and Tubes Total 2,478.60GKY INDUSTRIES Track & Right of Way Maint 25KTHRES 18.00KAESER COMPRESSORS Track & Right of Way Maint 25KTHRES 334.37NELCO PRODUCTS INC. Track & Right of Way Maint 25KTHRES 305.40RUMSEY ELECTRIC COMPANY Track & Right of Way Maint 25KTHRES 602.07
Track & Right of Way Maint Total 1,259.84MOTIVE POWER INC. Traction Motor Rebuilds P-19-018 115,467.00SHERWOOD ELECTROMOTION INC. Traction Motor Rebuilds P-19-018 29,626.00WALCO ELECTRIC COMPANY Traction Motor Rebuilds P-19-018 77,416.00
Traction Motor Rebuilds Total 222,509.00AVIA DYNAMICS, INC. Transit Car Equipment-Electrical 25KTHRES 125.50DARRAH ELECTRIC COMPANY Transit Car Equipment-Electrical 25KTHRES 4,965.83INDCO INC Transit Car Equipment-Electrical 25KTHRES 42.00KC ELECTRONIC DISTRIBUTORS INC Transit Car Equipment-Electrical 25KTHRES 6,006.85NATIONAL ELECTRICAL CARBON PRODUCTS Transit Car Equipment-Electrical 25KTHRES 1,297.36TECHNOLOGIES LANKA INC Transit Car Equipment-Electrical P-20-021 3,431.17TEKNOWARE, INC. Transit Car Equipment-Electrical P-20-027 10,170.81WESTCODE INC. Transit Car Equipment-Electrical P-20-027 1,275.70
Transit Car Equipment-Electrical Total 27,315.22ALBATROS NORTH AMERICA INC Transit Car Equipment-Mechanical 25KTHRES 5,779.55COLONY HARDWARE CORPORATION Transit Car Equipment-Mechanical 25KTHRES 78.00HELWIG CARBON PRODUCTS, INC. Transit Car Equipment-Mechanical P-20-021 30,885.60HOPPECKE BATTERIES, INC. Transit Car Equipment-Mechanical 25KTHRES 1,918.32JAMAICA BEARINGS CO INC. Transit Car Equipment-Mechanical 25KTHRES 2,629.20MCMASTER-CARR SUPPLY COMPANY Transit Car Equipment-Mechanical 25KTHRES 73.02REPAIR TECHNOLOGY LLC Transit Car Equipment-Mechanical 25KTHRES 109.26SHAMONG MFG. COMPANY Transit Car Equipment-Mechanical 25KTHRES 1,510.00WESTINGHOUSE AIR BRAKE TECHNOLOGIES Transit Car Equipment-Mechanical P-20-021 32,878.99
Transit Car Equipment-Mechanical Total 75,861.94COUNTY CONSERVATION COMPANY, LLC Trash Removal 25KTHRES 234.00WASTE MANAGEMENT OF NEW JERSEY, INC Trash Removal P-20-011 4,261.69
Trash Removal Total 4,495.69UNIFIRST CORPORATION Uniform Cleaning Expense P-19-024 5,146.54
Uniform Cleaning Expense Total 5,146.54ANA SOURCING LLC Uniform Expense 25KTHRES 405.50KEYPORT ARMY NAVY Uniform Expense 25KTHRES 1,108.75LEHIGH OUTFITTERS Uniform Expense P-20-027 2,926.54PNC BANK P-CARD Uniform Expense NONE 655.76REFLECTIVE APPAREL FACTORY, INC Uniform Expense 25KTHRES 3,225.72
Uniform Expense Total 8,322.27GENUINE PARTS COMPANY Vehicle Parts for Repairs D-21-019 417.70PACIFICO FORD, INC. Vehicle Parts for Repairs D-21-008 983.86
Vehicle Parts for Repairs Total 1,401.56CAMDEN COUNTY SHERIFF'S OFFICE Wage Attachment NONE 881.11DAMON K. LACEY, COURT OFFICER Wage Attachment NONE 557.16EXPERTPAY CHILD SUPPORT Wage Attachment NONE 6,200.08
Wage Attachment Total 7,638.35CITY OF PHILA Water & Sewer Expense Utility 349.24LINDENWOLD SEWER UTILITY Water & Sewer Expense Utility 188.16NEW JERSEY AMERICAN WATER Water & Sewer Expense Utility 1,037.83
Water & Sewer Expense Total 1,575.23
337
337

W.W. GRAINGER INC. Welding Equipment & Supplies 25KTHRES 75.11Welding Equipment & Supplies Total 75.11
CAPEHART & SCATCHARD Worker's Comp Reserve D-19-030 361.00COOPER LEVENSON, PA Worker's Comp Reserve D-19-030 3,112.50MALAMUT & ASSOCIATES, LLC Worker's Comp Reserve D-19-030 1,505.00MATTLEMAN, WEINROTH & MILLER, P.C. Worker's Comp Reserve D-19-030 95.00QUAL LYNX (ACH TRANSFER) Worker's Comp Reserve P-20-023 44,196.80
Worker's Comp Reserve Total 49,270.30
Grand Total 4,164,604.58* D indicates a DRPA resolution* P indicates a PATCO resolution
338
338
PATCO MONTHLY LIST OF
PREVIOUSLY APPROVED
PURCHASE ORDERS & CONTRACTS
339
339

BALANCE SHEET
340
340

341
341
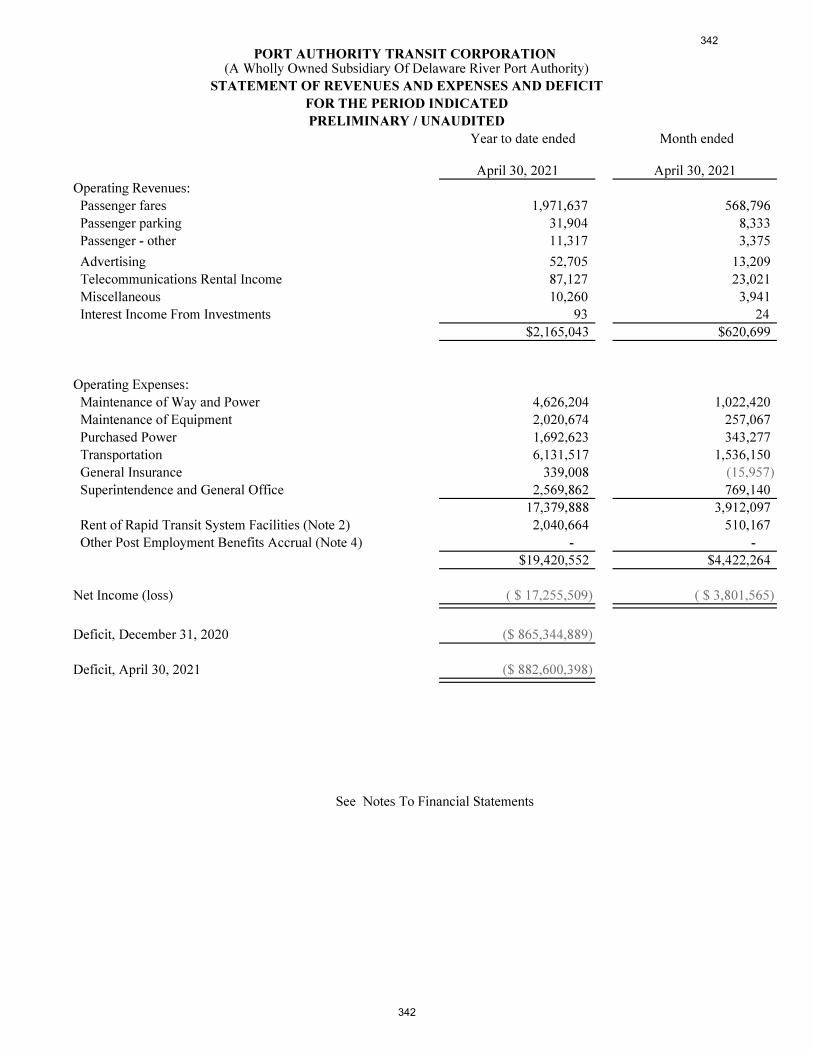
342
342
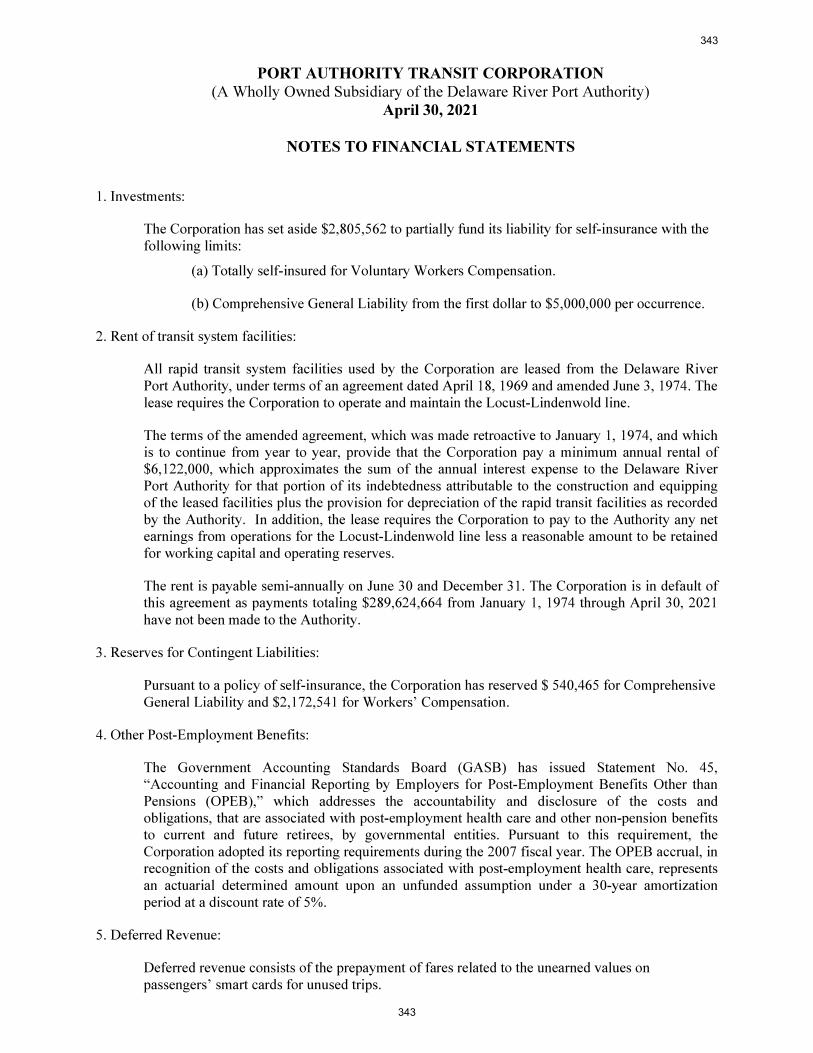
343
343

Refer to Operations and
Maintenance Minutes
in the DRPA Board Packet
344
344
SUMMARY STATEMENT
ITEM NO. PATCO-21-008
SUBJECT: DRPA/PATCO Medical Service Provider
for Drug & Alcohol Testing/Training,
Physical Exams, Medical Evaluations and
Health Screening
COMMITTEE: Operations & Maintenance
COMMITTEE MEETING DATE: July 6, 2021
BOARD ACTION DATE: July 21, 2021
PROPOSAL: That the Board authorizes staff to negotiate two (2) three-year General
Services Contracts with the firms of Interstate Mobile Care, Inc. and
WorkNet Occupational Medicine to provide the medical services that
are required by the United States Department of Transportation
(DOT) and the DRPA/PATCO Policies and Procedures. The total cost
of these two (2) General Services Contracts shall not exceed $750,000
over a three-year term.
All firms shall be advised, in writing, that no firm will be guaranteed
any portion of the $750,000 over the three-year term.
The n-t-e $750,000 contract value is based on an average yearly
expenditure (based on historical data) averaging approximately
$250,000 per year for medical services. For budgetary purposes, we
intend that these funds will be budgeted in the amount of $250,000 per
year over the three-year contract term. If all budgeted funds are not
expended in any given year, the unexpended funds will be moved to the
following budget year. Conversely, if more than $250,000 is needed in
the first contract year, the additional monies required for medical
services will be deducted from the remaining total contract amount and
thus the allocations for second and third years will be adjusted
accordingly.
AMOUNT: Not To Exceed $750,000 (three year term)
Firms: Interstate Mobile Care, Inc. (WBE)
PO Box 64
Sewell, NJ 08080
WorkNet Occupational Medicine
1001 James Drive, Suite B30
Leesport, PA 19533
345
345
PURPOSE: To retain firms to provide medical services that are required by the
United States Department of Transportation (DOT) and Authority
Policies and Procedures.
BACKGROUND: The Authority publicly advertised its intent to retain a Medical Service
Provider and invited interested vendors to submit Technical and Cost
Proposals. We advertised the Request for Proposal (RFP) on DRPA’s
website beginning on March 19, 2021. The proposals were due on April
23, 2021.
Each proposer was required to submit a Technical Proposal and a Cost
Proposal using Ariba. The committee received proposals from the
following three (3) Medical Service Providers:
Interstate Mobile Care, Inc. (WBE)
PO Box 64
Sewell, NJ 08080
WorkNet Occupational Medicine
1001 James Drive, Suite B30
Leesport, PA 19533
DSI Medical Services
300 Welsh Road #160
Horsham, PA 19044
The review committee to evaluate the Technical and Cost Proposals
consisted of authority staff and was overseen by Contract
Administration. The committee agreed that the Authority would
benefit by having the ability to choose the vendor who could provide
the required medical services at the best rate and with minimal
disruption to Authority operations. The selection of two highly
qualified vendors – Interstate Mobile Care, Inc. and WorkNet
Occupational Medicine – will afford staff the flexibility to meet the
Authority’s medical service needs in a cost effective and efficient
manner.
In making its recommendation, the committee also considered that
both Interstate Mobile Care and WorkNet Occupational Medicine have
provided services and training to the Authority for many years. Both
vendors are known for their strong technical skills and knowledge of
DOT regulations, as well as DRPA/PATCO policies and procedures.
Therefore, staff seeks authorization to negotiate agreements with
Interstate Mobile Care, Inc. and WorkNet Occupational Medicine at a
not-to-exceed cost of $750,000.
346
346

SUMMARY: Amount: Not to exceed $750,000 over 3 year term
Source of Funds: General Fund
Operating Budget: DRPA and PATCO Operating Budgets
Master Plan Status N/A
Other Fund Sources: N/A
Duration of Contract: Three Years
Other Parties Involved: N/A
347
347
PATCO-21-008
Operations & Maintenance: July 6, 2021
Board Date: July 21, 2021
DRPA/PATCO Medical Service Provider for
Drug & Alcohol Testing/Training,
Physical Exams, Medical Evaluations
and Health Screening
RESOLUTION
RESOLVED: That the Board of Commissioners of Port Authority Transit
Corporation authorizes staff to negotiate two (2) General Services
Contracts for a term of three (3) years with Interstate Mobile Care,
Inc., and WorkNet Occupational Medicine to provide medical services
that are required by the US Department of Transportation (DOT) and
Authority Policies and Procedures at a not-to-exceed cost of $750,000;
and be it further
RESOLVED: The Chair, Vice Chair and the President must approve and are hereby
authorized to approve and execute all necessary agreements, contracts,
or other documents on behalf of PATCO. If such agreements,
contracts, or other documents have been approved by the Chair, Vice
Chair and President and if thereafter, either the Chair or Vice Chair is
absent or unavailable, the remaining Officer may execute the said
document(s) on behalf of PATCO along with the President. If both the
Chair and Vice Chair are absent or unavailable, and if it is necessary
to execute the said document(s) while they are absent or unavailable,
then the President shall execute such documents on behalf of PATCO.
SUMMARY: Amount: Not to exceed $750,000 over 3 year term
Source of Funds: General Fund
Operating Budget: DRPA and PATCO Operating Budgets
Master Plan Status N/A
Other Fund Sources: N/A
Duration of Contract: Three Years
Other Parties Involved: N/A
348
348

NEW BUSINESS
349
349