Embed Size (px)
Citation preview

arX
iv:h
ep-p
h/98
0653
5v2
5 M
ar 1
999
Deeply Virtual Compton Scattering at HERA - A Probe of
Asymptotia
L.L.Frankfurta, A.Freundb, M. Strikmanb
aPhysics Department, Tel Aviv University, Tel Aviv, Israel
bDepartment of Physics, Penn State University
University Park, PA 16802, U.S.A.
Abstract
We demonstrate that the measurement of an azimuthal angle asymmetry in
deeply virtual Compton scattering (DVCS) at HERA energies, is experimen-
tally feasible and allows one to determine for the first time the ratio, η, of
the real to imaginary part of the DIS amplitude. We further show that such
measurements would discriminate between different scenarios for the energy
dependence of F2(x,Q2) at energies beyond those reachable at HERA.
I. INTRODUCTION
It is generally agreed that the x-range currently available at HERA is not sufficient to test
the current ideas about the onset of asymptotia via measurements of the parton densities.
Therefore, the aim of this paper is to draw attention to the fact that the derivative of parton
distributions with respect to ln x, which can be measured at HERA, is rather sensitive to the
asymptotic behaviour of parton densities at x → 0 which can be probed at the LHC only.
Actually, the experience in studies of soft processes tells us that the real part of the zero
angle scattering amplitude, provides us, through the dispersion representation with respect
to the invariant energy of the collision, with information about the energy dependence of
the cross section well beyond the energy where real part of amplitude is measured. The
1

reason for this is that η, the ratio of the real to imaginary part of the amplitude essentially
measures the ln s derivative of the cross section [1]:
η =π
2
d ln(F2(x, Q2))
d ln(1/x). (1)
One can also use analyticity relations to derive a more accurate formula [2], leading to
η =sα
ImA(s, t)tan
[
π
2
(
α − 1 +d
d ln s
)]
ImA(s, t)
sα. (2)
for F2(x, Q2) ∝ x−α.
We propose a new methodology for investigating the energy dependence of hard processes
through the real part of the amplitudes of high energy processes and also through the shapes
of nondiagonal parton distributions. DVCS offers us a direct way to study of nondiagonal
parton distributions. The idea is that at sufficiently small x the difference between diagonal
and off-diagonal effects influences the x dependence of parton distributions only weakly.
This has been known for a long time from calculations of Regge pole behaviour in quantum
field theory. We also check that this statement is valid within the DGLAP approximation.
Thus DVCS can be used to investigate asymptotia of parton distribution through the real
part of the amplitude for DVCS.
Note that from a mathematical point of view, the actual extraction of nondiagonal parton
distributions with the help of a factorization theorem from the data is not possible in DVCS
due to the fact that the parton distributions depend on y1 and y2 = y1 − x which are
dependent variables rather than independent as one would need and thus the inverse Mellin
transform of the factorization formula cannot be found1. However, in practice, one will be
able to neglect the dependence on y2 at sufficiently small x and by encoding the difference
in the evolution of nondiagonal to diagonal distribution in a Q-dependent function, one can
indeed extract the nondiagonal parton distribution at small x with an uncertainty associated
with the Q dependent function.
1This is not true for diffractive di-muon production since there, we have two independent variables
x and ξ1, the longitudinal momentum fraction of the produced di-muon.
2
The major new result of our analysis is that the current successful fits to the F2N (x, Q2)
HERA data lead to qualitatively different predictions for the asymmetry, reflecting different
underlying assumptions of the fits about the behavior of parton densities at x below the
HERA range. A recent analysis in Ref. [3] has shown that DVCS studies at HERA are
feasible and we made predictions for the expected DVCS counting rate compared to DIS as
well as the asymmetry A in the combined DVCS and Bethe-Heitler cross section for recent
H1 data.
The paper is structured as follows. In Sec. II we review the necessary formulas of Ref.
[3] for our analysis. In this context, the formula pertaining to the ratio of real to imaginary
part of a scattering amplitude at small x is of particular importance. We then present the
different fits to F2(x, Q2) in Sec. III and present the different results for the asymmetry A
with respect to t and y, at fixed y and t respectively. Sec. V contains our conclusions and
outlook.
II. RELATIONS BETWEEN DVCS AND DIS
In order to compute the asymmetry A, we need the ratio of the imaginary part of the DIS
amplitude to the imaginary part of the DVCS amplitude and the relative DVCS counting
rate Rγ, expected at HERA in the interesting kinematic regime of 10−4 < x < 10−2 and
moderate Q2, i.e. , 3.5 GeV2 < Q2 < 45 GeV2. The relative counting rate Rγ is given by [3]
Rγ ≃πα
4R2Q2BF2(x, Q2)(1 + η2). (3)
where R is the ratio of the imaginary parts of the DIS to DVCS amplitude as given in [3]2,
B is the slope of the t dependence (for more details see Ref. [3].) and η is the ratio of real
to imaginary part of the DIS amplitude, i.e. , F2(x, Q2), given by Eq. (1).
We also need the differential cross section for DVCS which can be simply expressed
2We will use the results for R from [3] in our present analysis.
3
N
φ
φ
e
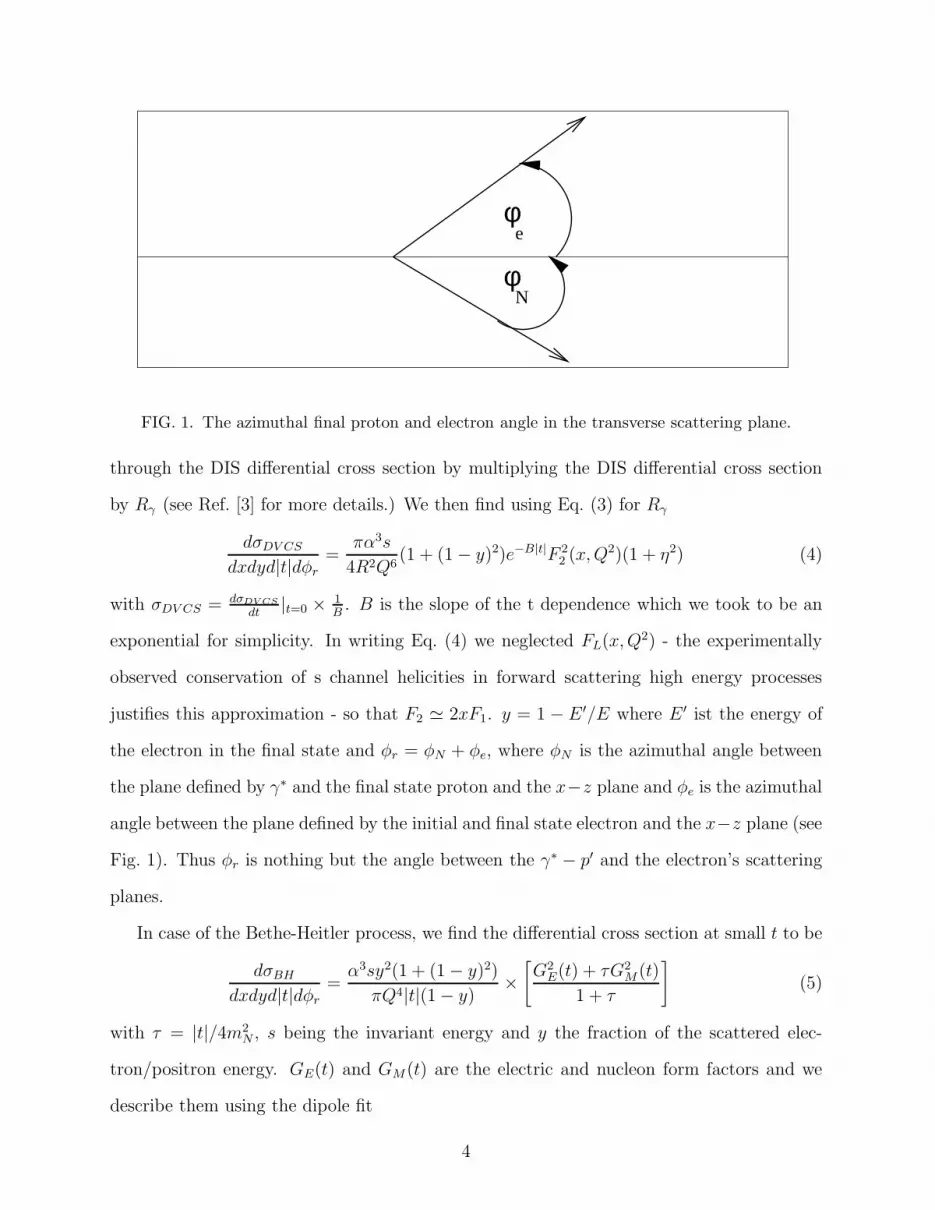
FIG. 1. The azimuthal final proton and electron angle in the transverse scattering plane.
through the DIS differential cross section by multiplying the DIS differential cross section
by Rγ (see Ref. [3] for more details.) We then find using Eq. (3) for Rγ
dσDV CS
dxdyd|t|dφr
=πα3s
4R2Q6(1 + (1 − y)2)e−B|t|F 2
2 (x, Q2)(1 + η2) (4)
with σDV CS = dσDV CS
dt|t=0 ×
1
B. B is the slope of the t dependence which we took to be an
exponential for simplicity. In writing Eq. (4) we neglected FL(x, Q2) - the experimentally
observed conservation of s channel helicities in forward scattering high energy processes
justifies this approximation - so that F2 ≃ 2xF1. y = 1 − E ′/E where E ′ ist the energy of
the electron in the final state and φr = φN + φe, where φN is the azimuthal angle between
the plane defined by γ∗ and the final state proton and the x−z plane and φe is the azimuthal
angle between the plane defined by the initial and final state electron and the x−z plane (see
Fig. 1). Thus φr is nothing but the angle between the γ∗ − p′ and the electron’s scattering
planes.
In case of the Bethe-Heitler process, we find the differential cross section at small t to be
dσBH
dxdyd|t|dφr
=α3sy2(1 + (1 − y)2)
πQ4|t|(1 − y)×
[
G2E(t) + τG2
M (t)
1 + τ
]
(5)
with τ = |t|/4m2N , s being the invariant energy and y the fraction of the scattered elec-
tron/positron energy. GE(t) and GM(t) are the electric and nucleon form factors and we
describe them using the dipole fit
4

GE(t) ≃ GD(t) = (1 +|t|
0.71)−2 and GM(t) = µpGD(t), (6)
where µp = 2.7 is the proton magnetic moment. We make the standard assumption that
the spin flip term is small in the strong amplitude for small t.
In order to write down the complete total cross section of exclusive photon production
we need the interference term between DVCS and Bethe-Heitler. Note that in the case of
the interference term one does not have a spinflip in the Bethe-Heitler amplitude, i.e. , one
only has F1(t), as compared to Eq. 5 containing a spinflip part, i.e. , F2(t). The appropriate
combination of GE(t) and GM(t) which yields F1(t) is
GE(t) + |t|4m2
N
GM(t)
1 + |t|4m2
N
. (7)
We then find for the interference term of the differential cross section, where we already
use Eq. 5,
dσintDV CS+BH
dxdyd|t|dφr= ±
ηα3sy(1 + (1 − y)2)cos(φr)e−B|t|/2F2(x, Q2)
2Q5
√
(|t|)√
(1 − y)R
×
[
GE(t) + τGM(t)
1 + τ
]
(8)
with the + sign corresponding to electron scattering off a proton and the - sign corresponding
to the positron. The total cross section is then just the sum of Eq. 4,5 and 8.
We define the asymmetry A as [3]
A =
∫ π/2
−π/2dφrdσDV CS+BH −
∫ 3π/2
π/2dφrdσDV CS+BH
∫
2π0
dφrdσDV CS+BH
, (9)
where dσDV CS+BH is given by the sum of Eq. (4),(5),(8). As explained in [3] this azimuthal
angle asymmetry is due to the fact that the interference term in the combined DVCS and
Bethe-Heitler cross section is ∝ pt
ǫ. Here pt is the component of the final proton momentum
transverse to the momentum of the initial electron and proton with ǫ being polarization
of the produced photon. Integrating over the upper hemisphere, from −π/2 to π/2, one
obtains a + sign from the intereference term and a − sign from integrating over the lower
hemisphere of the detector, from π/2 to 3π/2.
5

The real part of the DVCS amplitude is isolated through this asymmetry. Therefore, we
investigate the influence of different F2 fits on the asymmetry through the relative counting
rate which is directly sensitive to the ratio of real to imaginary parts of F2 as shown in Eq.
(3).
III. THE DIFFERENT FITS TO F2(X,Q2)
In the calculation of the asymmetry A we use the recent H1 data from Ref. [4] as previ-
ously used in Ref. [3], a logarithmic fit by Buchmuller and Haidt (BH) [5], the ALLM97 fit
[6] and a leading order BFKL-fit [7] for illustrative purposes.
In the H1 data, F2 behaves for small x as x−λ and hence η is just π2λ where η2 = 0.09−0.27
in the Q2 range given in the previous section. Note that η has no x dependence, for small
enough x, and thus depends only on Q2. This is not true for all of the other fits.
F2 in the BH fit 3 takes on the following form
F2(x, Q2) = 0.078 + 0.364 log(Q2
0.5 GeV2) log(
0.074
x), (10)
and hence we find for η
η =π
20.364
log( Q2
0.5 GeV2 )
F2(x, Q2). (11)
Note that this η has not only the usual Q2 dependence but depends rather strongly on x
also.
In the ALLM97 fit F2 at small x takes on the following form
F2(x, Q2) =Q2
Q2 + m20
(F ps (x, Q2) + F R
2 (x, Q2)), (12)
3In a more recent fit Haidt [8] also used a double logarithmic fit with log(
Q2
Q20
)
→ log(
1 + Q2
Q20
)
being the essential difference, save some minor adjustments for some constants, in order to be able
to describe more recent low Q2 data from HERA [9]. In the Q2 range considered in this analysis
the difference is negligible.
6
where η is then given by
η = −π
2
aP cPxaP
P + aRcRxaR
R
cP xaP
P + cRxaR
R
. (13)
The different variables and constants used in the fit can be found in [6].
In the case of the leading order BFKL approximation where F2 ≃ x−4Nc ln(2)αs
π , we find η
to be
η =π
2
4Nc ln(2)αs
π. (14)
IV. RESULTS FOR THE ASYMMETRY A
In Fig. 2 - 4, we plot the asymmetry A as a function of t and y for fixed Q2 = 12 GeV2,
fixed y = 0.4 and −t = 0.1 GeV2 and x = 10−4, 10−3, 10−2. The slope B of the t-
dependence for DVCS was taken to be B = 5 GeV−2 whereas for the Bethe-Heitler cross
section we used the nucleon form factor as used in chapter 5. The counting rate Rγ was
appropriately adjusted for the different fits according to Eq. (3). The solid curves in Fig. 2
- 4 are our benchmarks4.
Comparing the BH fit (medium-dashed curves), against our benchmarks we find a strong
x dependence of the asymmetry in the BH fit as well as different shapes and absolute values.
As far as the ALLM97 fit is concerned (short-dashed curves), there is hardly a difference,
as compared to the H1 fit in the asymmetry as a function of t and y in absolute value, shape
and x dependence, except for x = 10−2 but this is due to the approximations we made for
xP and xR which are not that good anymore at x = 10−2.
4Though actual H1 data is used, we are still dealing with a leading order approximation and a
particular model for the nondiagonal parton distributions at the normalization point was used in
computing Rγ(see [3] for more details on the type of model ansatz and approximations used.).
7

If one compares the LO BFKL fit (long-dashed curves) to the H1 fit one sees immediately
that the BFKL fit is totally off in almost all aspects and was only included here as an
illustrative example.
V. CONCLUSIONS
In the above we have shown the sensitivity of the exclusive DVCS asymmetry A to
different F2 fits and made comments on the viability of each fit. Note that even a fit which
reproduces F2 data, as well as its slope, in a satisfactory manner can be shown to lead to
differences in the asymmetry shape. The sensitivity of the asymmetry to y and t will allow
us, once experimentally determined, to make a shape fit and hence make a shape fit to
nondiagonal parton distributions for the first time.
ACKNOWLEDGMENTS
This work was supported under DOE grant number DE-FG02-93ER40771.
8
REFERENCES
[1] V.N.Gribov and A.A.Migdal, Yad.Fiz. 8(1968)1002 Sov.J.Nucl.Phys.8(1969)583.
[2] J.B.Bronzan, Argonne symposium on the Pomeron, ANL/HEP-7327(1973)p.33;
J.B.Bronzan, G.L.Kane, and U.P.Sukhatme, Phys. Lett. B49 (1974) 272.
[3] L. Frankfurt, A. Freund and M. Strikman, hep-ph/9710356 to appear In Phys. Rev. D. .
[4] H1 Collaboration, Nucl. Phys. B470, 3 (1996).
[5] W. Buchmuller and D. Haidt, hep-ph/9605428.
[6] H. Abramowicz and A. Levy, hep-ph/9712415.
[7] E.A. Kuraev, L.N. Lipatov, V.S. Fadin, Sov. Phys. JETP 45, 199 (1977), Ya.Ya. Balitskii
and L.N. Lipatov, Sov. J. Nucl. Phys. 28, 822 (1978).
[8] Proceedings of the 5th. International Workshop on Deep Inelastic Scattering and QCD,
p. 386 (1997).
[9] H1 Collaboration, Nucl. Phys. B497, 3 (1997).
9

0
0.05
0.1
0.15
0.2
0.25
0.3
0.05 0.06 0.070.080.090.1 0.2 0.3 0.4 0.5 0.6 0.7 0.8 0.9 1-t
0
0.05
0.1
0.15
0.2
0.25
0.3
0.2 0.3 0.4 0.5 0.6 0.7 0.8y
FIG. 2. H1 fit (solid curve), the BH fit (dotted curve), ALLM97 fit (short-dash curve) and
BFKL fit (dash-dot curve) for x = 10−4. a) Asymmetry A versus t for fixed y = 0.4. b) Asymmetry
A versus y for fixed −t = 0.1 GeV2.
10

0
0.05
0.1
0.15
0.2
0.25
0.3
0.05 0.06 0.070.080.090.1 0.2 0.3 0.4 0.5 0.6 0.7 0.8 0.9 1-t
0
0.05
0.1
0.15
0.2
0.25
0.3
0.2 0.3 0.4 0.5 0.6 0.7 0.8y
FIG. 3. H1 fit (solid curve), the BH fit (dotted curve), ALLM97 fit (short-dash curve) and
BFKL fit (dash-dot curve) for x = 10−3. a) Asymmetry A versus t for fixed y = 0.4. b) Asymmetry
A versus y for fixed −t = 0.1 GeV2
11

0
0.05
0.1
0.15
0.2
0.25
0.3
0.05 0.06 0.070.080.090.1 0.2 0.3 0.4 0.5 0.6 0.7 0.8 0.9 1-t
0
0.05
0.1
0.15
0.2
0.25
0.3
0.2 0.3 0.4 0.5 0.6 0.7 0.8y
FIG. 4. H1 fit (solid curve), the BH fit (dotted), ALLM97 fit (short-dash curve) and BFKL
fit (dash-dot curve) for x = 10−2. a) Asymmetry A versus t for fixed y = 0.4. b) Asymmetry A
versus y for fixed −t = 0.1 GeV2
12


